
WATER RESOURCES DEVELOPMENT - CiteSeerX
104
ADDIS ABABA UNIVERSITY FACULTY OF TECHNOLOGY DEPARTMENT OF CIVIL ENGINEERING WATER RESOURCES DEVELOPMENT Course Material Prepared By: Abdulkarim H. Seid Shimelis B. Dessu Addis Ababa Ethiopia May 2006.
-
Upload
khangminh22 -
Category
Documents
-
view
2 -
download
0
Transcript of WATER RESOURCES DEVELOPMENT - CiteSeerX
ADDIS ABABA UNIVERSITY FACULTY OF TECHNOLOGY
DEPARTMENT OF CIVIL ENGINEERING
WATER RESOURCES DEVELOPMENT Course Material
Prepared By:
Abdulkarim H. Seid Shimelis B. Dessu
Addis Ababa
Ethiopia
May 2006.

Water Resources Development (CE )
May 2006
Objective
This course provides a broad understanding of the basics of Water Resources Development. The emphasis is on importance, assessment, project
conception, planning and operation principles and procedures, evaluation and implementation of water resource development projects. Computer
applications included.
Course Outline
Reference: - Water Resources Engineering, by R. K. Linsely and J.B. Franzini
- Water Resources Planning, By Neil S. Grigg
- Environmental Impact of Water Resources Projects. By Larry W. Canter
Student Assessment
Assignment 10 %
Project 10%
Mid Exam 30 %
Final Exam 50 %
Total 100 %
Inst.. E-mail:
Tel.
Unit 1 Introduction
Basic problems
Basin as the unit
for planning
Water Budget
Characteristics of a
Basin
Unit 2 Assessment of Water
Resources
Introduction
Demand for Water
Types of WR
information
Data requiremtn of
WRP
Regional analysis
Time series
Analysis
Unit 3 Planning and
Operation Tools
Introduction
Optimization
LP
Introduction to DP
Economics for WR
Systems
Unit 4 River Basin
Development plan
General
Components of
RBD
Phases of RB
master plan study
Unit 5 Planning for WRD
Hydrologic estimates
required for
Reservoir project
Non reservoir project
Basin wide planning
Unit 6 Elements of WR
project Formulation
Stages of WRP
Project formulation
Project appraisal

Civil Engineering Dept., AAU WATER RESOURCES DEVELOPMENT
May, 2006 ii
Table of Content
1 Introduction ...................................................................................................................................... 1
1.1 Some basic concepts ......................................................................................................... 1
1.2 The basic problem: uneven distribution of water ............................................................. 2
1.3 The basin as the unit for planning .................................................................................... 4
1.4 The water budget of a basin ............................................................................................. 6
1.5 Major characteristics of a basin ........................................................................................ 8
1.5.1 General setting of the basin ...................................................................................... 8
1.5.2 Socio-economic setting of the basin ......................................................................... 8
1.5.3 Physical environment ............................................................................................... 9
2 Assessment of Water Resources ................................................................................................. 11
2.1 Introduction .................................................................................................................... 11
2.2 Types of water resources information ............................................................................ 12
2.3 Classification and Data requirements of water Resources Development projects ......... 14
2.4 Regional analysis for the generation of missing data ..................................................... 15
2.5 Reestablishment of natural flows ................................................................................... 16
2.6 Regional Analysis ........................................................................................................... 17
2.6.1 Correlation and Regression .................................................................................... 17
2.7 Time Series Analysis and Monte Carlo Simulation ....................................................... 20
2.8 Decomposing a time series into its components ............................................................ 22
2.9 Statistical properties of time series ................................................................................. 24
2.10 Hydrologic Models ......................................................................................................... 25
2.11 SCS model for estimating runoff volume and peak flood .............................................. 26
2.11.1 Runoff Volume ....................................................................................................... 26
2.11.2 Runoff curve Numbers for selected Agricultural, suburban and urban land uses .. 27
2.11.3 Peak discharge and flood hydrograph .................................................................... 29
2.12 Demand for water ........................................................................................................... 30
2.12.1 Introduction ............................................................................................................ 30
2.12.2 Category of Demand .............................................................................................. 30
2.12.3 Demand Projections and Policy Formulation ......................................................... 31
2.12.4 Water Demand for Human Settlements .................................................................. 34
2.12.5 Industrial Demand .................................................................................................. 35
2.12.6 Electric Power Demand .......................................................................................... 37
2.12.7 Agricultural Demand .............................................................................................. 37
2.12.8 Navigation, waterways and Recreation .................................................................. 38
3 Planning and Operation Tools ...................................................................................................... 40
3.1 The system approach to water resources development .................................................. 40
3.1.1 Systems Engineering .............................................................................................. 40
3.1.2 Terminologies and definitions ................................................................................ 41
3.1.3 Basic water accounting modeling concepts ............................................................ 42
3.2 Feasibility Tests .............................................................................................................. 44
3.3 Optimization ................................................................................................................... 45
3.4 Linear programming ....................................................................................................... 46
3.2.1 Forms of Linear Programming ............................................................................... 48
3.2.2 Solution algorithms for LP problems ..................................................................... 49

Civil Engineering Dept., AAU WATER RESOURCES DEVELOPMENT
May, 2006 iii
3.5 Dynamic Programming (DP) .......................................................................................... 53
3.6 Economics for WR Systems ........................................................................................... 56
3.6.1 General ................................................................................................................... 56
3.6.2 Formulating the Analysis ....................................................................................... 56
3.6.3 Defining the Alternatives ....................................................................................... 56
3.6.4 Physical consequences -Benefits and Costs ........................................................... 57
3.6.5 Benefit-Cost Analysis (BCA) ................................................................................. 60
3.6.6 Methods of Economic Appraisal (Discounting Techniques) ................................. 62
3.7 Environmental Considerations in Planning .................................................................... 66
4 River Basin Development (Master) Plan ...................................................................................... 70
4.1 General ........................................................................................................................... 70
4.2 Components of a River Basin Development Master Plan .............................................. 70
4.3 Phases of a Master Plan Study ....................................................................................... 72
5 Planning for Water Resources Development .............................................................................. 73
5.1 Introduction .................................................................................................................... 73
5.2 Hydrologic estimates required for reservoir projects ..................................................... 77
5.3 Hydrologic Estimates Required For Non-reservoir Projects .......................................... 79
5.4 Hydrologic Estimates Required For Basin-wide Long-term Planning for Integrated
Development of Water Resources .............................................................................................. 82
6 Elements of (WR) Project Formulation ......................................................................................... 84
6.1 Stages of WR project ...................................................................................................... 84
First Stage: Preliminary (or Reconnaissance) Report ............................................................ 84
Second Stage: Feasibility Report ........................................................................................... 84
Third Stage: Final Design and Preparation of Contract Documents ...................................... 85
Fourth Stage: Construction ..................................................................................................... 85
Fifth Stage: Operation ............................................................................................................ 85
6.2 Formulation of a single engineering project ................................................................... 85
6.3 Project Appraisal ............................................................................................................ 87
Reference..................................................................................................................................................... 88
Sample Exam Questions and Partial Solutions/Answers ........................................................................ 89
Civil Engineering Dept., AAU WATER RESOURCES DEVELOPMENT
May, 2006 1
1 Introduction
1.1 Some basic concepts
The concepts of river as a watercourse, of natural drainage network consisting of a main water course and
its tributaries and of river basin as a geographically defined area that is drained by drainage network are
certainly quite intuitive and have already been understood for long time. Less intuitive, since not seen
from the Earth surface, are the concepts of aquifer as a water carry geological stratum or strata and of
underground storage as a volume of water stored in geology strata located under the surface. The
understanding that such entities are parts but not the totality of a system which incorporates other
components or factors affected by or affecting water resource physical, biological, human society and its
activities as well as all their complex mechanics of interdependence is a relatively new and unfortunately
not always well digested concept in the area of water resources.
Undoubtedly river basins (regional, inter-regional, national, international according to a geographic and
political point of view) or their subdivisions have played and will continue to play very relevant role,
being clearly identifiable as conceptual units in which a strong interaction of factors important to human
society may be expected. It has however to be understood that along the line of the system concept for
which the river basin is a component part, many involved factors can be limited to the exclusive
consideration of the boundaries represented by water divides or the internal physical or socio-political sub
divisions. Their areas of influence and dependence may by far extrapolate the basin’s geographical
boundaries. Typical examples are for instance cases when two adjacent basins are physically connected by
underground aquifers or when the use of water resources has far reaching consequences for human
communities not only regionally but also at global, national or international level.
A further important concept, water resources development may be interpreted as being the endeavour or
activities aimed at improving the beneficial use of water for human society. In this definition, all possible
uses such as consumptive (e.g. water supply, irrigation) or non consumptive (eg. Hydropower, navigation),
as well as all aspects related to the considered resource (quantity, time distribution, quality) are involved.
The concept of water resources development intends to integrate the different views and perceptions of
individuals or society affected by the availability of water as portrayed below:
To people in arid zones:- drought relief, irrigation, food, employment
To people in wet zones:- flood protection, hydropower, navigation
To the hydraulic engineer:- dam, reservoir, river training, water treatment plants, pumping stations, power
plants
To the environmentalist:- habitat deterioration, pollution, deforestation, destruction of wetland
To the lawyer:- water rights, legislation, institutional questions
To the economist:- economic growth, alleviation of poverty, generation or opportunities
Water resource development projects have often- as a concept- been used to represent the engineering
works or systems such as dams, canals, hydropower stations, etc. designed to develop a specific water
potential. In a broader sense such definitions does not appear sufficient or even entirely consistent with the
systems approach. An improved definition results when the project is considered as being a set of policies,
allocation of means and actions required to achieve specific water resources development objectives
within a pre-established time horizon.
Following the same line of ideas a water resources development plan would then represent an articulate set
of projects located in the region, sub-basin, a basin or any other geographic or administrative unit that
might be defined. In the virtue of their articulation the ideal geographic units or the establishment of a
water resources development plan are the river basins (or their sub-basins)

Civil Engineering Dept., AAU WATER RESOURCES DEVELOPMENT
May, 2006 2
1.2 The basic problem - uneven distribution of water
Water is one of the essential prerequisites of life. A country's water resources include all the water in
rivers, lakes, seas, and groundwater. The distribution of water in nature in space and time, however, is
such that it is scarce at some locations and at particular times and excess at other locations (and at another
time at same location). Rainfall, which is the main water input to our ecosystem, is variable in space and
time. This is then reflected, for instance, in river flow, groundwater and lake-levels. Some areas get more
or less uniform and good amount of rainfall most of the year (like areas in Southwest Ethiopia), whereas
other places get their rainfall concentrated in few months (the wet season). Still there are places that get
very scanty rainfall. On the other hand the society's demand is not in general synchronised with the
availability of water. In fact, some needs, such as irrigation water requirements are high during periods of
no, or less rainfall. Hence man is faced with the task of developing the available water resources to meet
his needs.
With water needs for domestic use and that for food production being the basic requirements, water needs
of a society, both in quantity and quality depend upon its level of development. Water is needed for energy
production (hydropower), industrial use, recreation, and navigation (waterways), to mention the most
common and traditional ones. Thus projects are designed and implemented to meet all or some of these
needs.
The very water that is essential for life may also threaten life. Floods cause from time to time great losses
to human life and property. Thus settlements and developments on banks of rivers should be protected
from occurring floods, high flows in streams should not cause damage to bridges, etc., for instance by
building dykes, In such cases the water has to be controlled so that its harmful consequences are
minimised, if not totally prevented.
Consumptive and non-consumptive uses of water: Some of the uses of water, such as hydropower
generation and recreation do not actually 'use up' the water. That is the water is still available after it is
'used'. For instance in a hydropower plant, once the water hits the turbine blades it is still available
downstream with its quantity and quality not materially affected. On the other hand, water use for
irrigation of crops is a consumptive use. The water that is applied on the fields is taken up by the plants,
which is then to a greater extent transpired into the atmosphere. Hence most of the water applied is
consumed and no more available downstream. Depending up on the method of water application,
however, some of the excess water is returned into the stream (or any other water source), or into the
groundwater aquifer.
Part of the water that is used for domestic and industrial purposes may be returned into the hydrologic
system in the form of used-up water, or sewage (industrial and domestic). This if not properly treated
before it is injected into the water bodies of a basin (streams, lakes or groundwater) seriously affects the
quality of the water in hydrologic system, which in turn damages the quality of the environment we live
in. Polluted water can not support life, particularly the aquatic one. Thus one has to cope with not only
quantity of water but also quality of the water resources.
Structural and non-structural measures: Water resources development deals with projects that are
implemented for the proper utilisation and control of water. A (WR) project consists of constructed
facilities and other measures that control, utilize or limit the use of water. All measures that involve
constructed facilities are called structural measures. These could involve the building of an impoundment
behind a dam, for irrigation, water supply, or hydropower development purposes, the construction of
dykes, culverts and other drainage structures, or restricting the use of flood plains only to uses that are not
damaged by flooding (an example of a non-structural measure for flood mitigation), or the rehabilitation
of stream courses to cope with problems of environmental degradation and water quality. Measures that do
not involve constructed facilities but make use of other management tools to achieve some specified goals
are known as non-structural. Examples of such measures include, rules (regulations) to limit or control
water and land use (e.g., flood warning systems, restrictive zoning on flood plains). A project may consist
of one or more structural or non-structural measures.

Civil Engineering Dept., AAU WATER RESOURCES DEVELOPMENT
May, 2006 3
The planning and design of all these measures needs then answers to such questions as how much water
is needed for the specific project in question?, how much water is expected at a particular site in a
basin?, and what are the legal constraints?, i.e. who may use the water, how economical is a given
project?, what are the impacts of the project(s) on the society and the environment?, etc. The water
resources engineer deals mainly with such questions. As society's needs grow more and more issues have
to be addressed in the planning and implementation of water resources projects.
Water resources development is a multi-phase process, which starts from inception of a given project, be it
water supply, irrigation, or a basin master plan. This might come from different bodies, depending upon
the type and size of the project and the type of economic and administrative set-up of a country. For
example, the local community, or a regional administration can initiate a project to provide safe drinking
water for a selected settlements (towns) within the region, whereas projects like water master plan for a
basin are beyond scopes of regional administrations and hence are tasks of the central government.
Once a project is initiated and it is taken for further follow-up, the planning phase begins. Depending upon
the size of the project this can involve in itself various people and stages. The outcome of this phase could
be appropriate alternative(s) (or scenarios) for the implementation, for instance source of water (surface or
groundwater), type of scheme single- or multi-purpose, etc. The alternative which is taken as the most
appropriate (?) is then designed and implemented (constructed if a structural measure).
After a project is implemented (constructed) there is a need for the proper operation of the implemented
scheme so that the benefits for the implantation of the project can be derived. For instance, if the project
involves an irrigation scheme, water application to the fields should follow according to the needs (in
space and time). A scheme that is not properly operated not only adversely affects the success of the
project but also brings about undesirable consequences such as environmental problems.
Once a project is implemented then follow the operation of the constructed schemes and the monitoring of
the overall performance.

Civil Engineering Dept., AAU WATER RESOURCES DEVELOPMENT
May, 2006 4
Figure 1-1 Steps in Water Resources Development
1.3 The basin as the unit for planning
A drainage basin is an area that is tributary to a point on a stream. It is separated from neighbouring basins
by the drainage divide, which is formed by the mountain ridges. Thus all surface water derived from
rainfall received in the basin leaves the basin through the lowest point on the ridge. The concept can also
be applied to groundwater although the boundaries of surface water and groundwater basins may not
necessarily coincide. In practice, however, it is frequently assumed that the two coincide. Thus it is
Inception of WS project
Planning
Criteria Evaluation
Detailed design
Alternative 1 Alternative n Alternative 2 …
Best alternative
Implementation
Operation
Political Initiative
- Society’s WS need - Environmental challenge
- Regional development, etc.
- Professionals - Technology
- Man’s demands - Nature’s constraint - Natural system
Hydrological & Ecological - Social system Legal, Administrative, etc
Tools (eg. Models)
Key
Input
Flow of
activities

Civil Engineering Dept., AAU WATER RESOURCES DEVELOPMENT
May, 2006 5
common to speak about water resources of a basin, which include both surface waters within the basin's
watershed and the underground water resources that are physically interconnected into one system of
water.
Obvious even to the particular user is the impact his use may have when he is diverting water for a
consumptive use or into another basin. The water is, of course, not ordinarily "consumed". It is, for
example, spread out on the land or discharged into a flume, canal or cistern. Evaporation and transpiration
eventually return high percentage to the atmosphere, resulting in a sizable net loss to the available surface
supply. That portion of the water that joins the groundwater by percolation may eventually be recoverable
downstream or locally, but the quality of the groundwater may be affected in the process and surface water
availability will be diminished. For example decreased flow, for example, may bring about increased salt-
water intrusion into the groundwater system.
In other words, man's and nature's works within the basin effect alterations, directly or indirectly, in the
water's quantity, quality or rate and timing of flow. These changes in the behaviour of the hydrosystem
may be felt at distant points in the basin.
Traditionally water resources development has been largely project based without due regard to the overall
basin development. Projects are initiated in response to some pressing needs. This could be a flood
damage, soil erosion, food or power shortage, etc. Schemes were planned and implemented for single or
multiple objectives. A single purpose project is designed and implemented to serve one purpose, which
could be energy production, i.e. hydropower scheme. If the scheme involves storage of water, then the
regulated flow that is used for energy production can be used further downstream for irrigation, in which
case the project serves two purposes, namely energy production and irrigation. The reservoir can still be
used for retaining high flows during wet season thereby serving as flood control reservoir. Such
multipurpose projects need, however, good operating procedures so that all the objectives are met to
some acceptable degree. For instance, to maximise power generation in this example the reservoir level
should be high always, whereas for flood control, at the beginning of the wet season the reservoir should
have more space (less water), so that it can accommodate more of the incoming floods. This means the
two uses, i.e. power generation and flood control, look contradictory and hence a compromise should be
reached to maximise both benefits. The benefits from a flood control scheme can be estimated by the
amount of damage that could be averted (both life and property) if a certain proportion of the high flow is
retained in the reservoir. In the past the benefits derived from water resources projects have been thought
in monetary terms, i.e. projects were considered for implementation based on their benefit cost (B/C)
ratios. This is, however, changing as more emphasis is being given to the preservation of the environment.
Thus environmental objectives are nowadays almost always part of any project.
As mentioned above, the water resources of a river basin are interrelated. Water flows in a basin from the
drainage divide towards the outlet point. Thus projects located upstream are better situated than those near
the downstream end of the basin, in terms of quantity and quality of water. Thus the proper utilisation of
the water resources of a basin calls for the integrated approach in the planning and implementation of the
projects so that the overall benefit, as seen basin wide, is maximised. Development of other resources such
as land and minerals poses some demand of water supply, hence the same can not be treated alone without
considering it in the plan for water resources development.
Recognising this, contemporary basin development plans are prepared taking into account all the resources
(human, water, land, mineral, etc) of the basin. Projects are then identified in the basin-wide plan and their
combined effects studied and different scenarios of development produced. This approach, which in
contrast to the traditional project-based one considers the entire basin as a unit of planning, is known as
Integrated River Basin Development. In this regard the comprehensive water resources development
plan that is developed for the entire basin and which serves as the reference based on which projects are
initiated is called the Master Plan for the development of water resources of the basin. The trend today is
that master plans encompass 'all' available resources of the basin and are called Integrated River Basin
Development Master Plan.

Civil Engineering Dept., AAU WATER RESOURCES DEVELOPMENT
May, 2006 6
Figure 1-2 The drainage basin with some human interventions
As mentioned above the development of the basin's water resources can not be separately treated from the
development of other resources of the basin. For example, the availability of large area of arable land
indicates the need for irrigation water, if the rainfall is not sufficient, etc. Hence in studying a given basin,
a multitude of factors are used to characterise it, which have some bearing on the development of its
resources.
1.4 The water budget of a basin
The water budget of a basin is a concept used to express quantitatively the components of the hydrologic
cycle. A schematic illustration of the water budget of a basin is shown in Figure 1-3:
The general hydrologic equation of water budget can be written in the form
P - R - G - ET = S,
Where P = precipitation received at the ground level. Precipitation is one of the most frequently measured
hydrologic variables. Estimated aerial values of precipitation are used in the equation.
R = surface runoff (i.e. excess water that has left the region in the form of stream flow). This can
be estimated from hydrometric measurements at the outlet of the study area.
G = amount of water that moves from or to the basin as deep seepage. It is very difficult to
estimate this component although, however, its magnitude is in general very small.
ET = evapotranspiration, i.e. the sum of evaporation and transpiration. Point estimates can be made
using instruments like Pans or using ET equations based on some meteorological variables.
Areal estimates of ET are made either using the hydrologic equation above, or by correlating
point estimates with some influencing factors, like temperature or altitude.
S = is change in storage both in unsaturated soil moisture and the saturated (groundwater) zones.
The hydrologic (water budget) equation can be applied to an entire basin, some part of it or isolated water
bodies, such as lakes. It can be applied over any period of time of interest. To use the equation in a
meaningful way one has to determine the components of the hydrologic cycle in the equation.

Civil Engineering Dept., AAU WATER RESOURCES DEVELOPMENT
May, 2006 7
Figure 1-3 A schematic illustration of the water budget of a basin
Q
t
Streamflow (hydrograph)
Interception
Depression
storage
Infiltration
Overland
flow
Interflow
Percolation
(to GW)
Deep
groundwater
Channel
input
Channel
input
Channel
input
E
E
T
E
T
i
t
Precipitation input
(heytograph)
ET

Civil Engineering Dept., AAU WATER RESOURCES DEVELOPMENT
May, 2006 8
Surface water in Ethiopia amount to 110 BM3, much of which leaves the country through its
transboundary rivers. Groundwater availability is estimated as 2.6 BM3. The highest surplus water is to be
found in the Abay basin (52.62 BM3) followed by Ghibe-Omo (17.96 BM
3).
Table 1-1 Water Resources Development in Ethiopia
No Uses Coverage
1
Water supply (total)
rural
urban
Livestock watering
17 % (population)
15 %
31 %
Negligible
2 Sanitation (total)
rural
Urban
8 % (population)
1 %
60 %
3 Irrigation 3 % of potential
4 Hydropower 1.5 % of potential
5 Aquatic Resources (fisheries) < 10 % of potential
6 Inland Water Transport Negligible
1.5 Major characteristics of a basin
1.5.1 General setting of the basin
This refers to the physical size of the basin, which is commonly given in km2, the orientation, and its
location. The size of a basin can be an indication of the significance the basin may have on the national
economy, in terms of available water, human and other resources. Depending upon whether a basin finds
itself within the boundaries of a country or not the basin can be classified as either a national or
international one. A basin whose entire area lies within one country is a national basin, whereas an
international basin has its area distributed over at least two countries. The development of an international
basin is more complicated than a national one while the issue of water sharing among the riparian
countries (those that share the basin, also known as basin states) is often difficult to deal with. A good
example of such an international basin is the Abay basin, which together with that of the White Nile
extends over ten countries. Thus development of the water resources of an international basin should
address issues that can not be solved at the national level. In such cases the legal constraint is the most
difficult one to overcome.
1.5.2 Socio-economic setting of the basin
Important elements of the socio-economic setting are the administrative setup, the economy, land tenure
system, settlements and the extent of urbanisation, and the population characteristics. The administrative
setup plays an important role in the implementation of the overall plan for a basin. The responsibilities of
the regional and federal (central) government should complement each other for a better coordination of
development activities. A basin in a predominantly urban area is expected to have more problem of water
quality, as domestic and industrial outflows are frequently discharged into the river system of the basin
with no or inadequate treatment. A typical drainage basin in Ethiopia is the Awash. The size of population
(per unit area) is also an indication of the stress the basin is exposed to. This could be expressed, for
instance, in terms of the average size of land a family owns. Higher population density would mean more

Civil Engineering Dept., AAU WATER RESOURCES DEVELOPMENT
May, 2006 9
intensive use of the land resources, which could lead to land degradation. A good performing economy is
an important ground for development. Recurrent famine and war often distract the growth of the national
economy and hence also adversely affect the development of the resources of the river basin.
1.5.3 Physical environment
The physical environment consists mainly of the topography, climate, the water resources, mineral
resources, and the soils of the basin. These factors substantially determine the potentials and constraints of
the basin, particularly in a predominantly agricultural economy. The topography to a great extent
determines the mirco-climate of the basin, which leads to the different Agro-climatic zones. Moreover, the
prevalence of steep slopes would indicate soil erosion risks, and possible land degradation. Rainfall is
certainly the most important climatic variable affecting the water resources of the basin. The moisture
input to the basin is in the form of rainfall, which varies in space and time. The water resources of a basin
are all the waters in the surface water bodies and underground water. The assessment of the water
resources of a basin is the first step in the overall planning for development. The various steps and
methods involved in this procedure are discussed in section 2 and a review of the hydrologic cycle is given
in Figure 1-4 below:
Figure 1-4 The Hydrologic Cycle with yearly flow volumes based on annual surface precipitation on earth,
~119,000 km3/year.
The hydrologic cycle describes the path followed by water in its continuous transformation from oceans to
the atmosphere, to the land and back to the sea. Powered by solar radiation, water evaporates from oceanic
surfaces and joins the atmospheric moisture. This is then transported inland by means of winds, where it
gains elevation as a result of which it condenses. The clouds so formed become the very source of
moisture to the river basin. The water that reaches the ground in the form of precipitation (rainfall and
snowfall) partly gets into the ground while the remaining to a large extent flows overland and reaches the

Civil Engineering Dept., AAU WATER RESOURCES DEVELOPMENT
May, 2006 10
stream networks. Streams join to make large rivers, which drain the basin and eventually the water reaches
the seas and oceans thus completing the cycle. The water that infiltrates into the ground partly stays
temporarily in the soil formation, thus becoming soil moisture, and the rest may percolate deep into the
groundwater system, which flows towards seas and oceans.
The different components of the hydrologic cycle can be grouped together into subsystems or broken
down into new sub-processes, depending on the level of detail in the analysis and purpose of the analysis.
A hydrologic system can be defined as a structure or volume in space, surrounded by a boundary that
accepts water and other inputs, operates on them internally and produces and output.
The objective of hydrological system analysis is to study the system operation and predict its internal
states and output. A hydrological system model is an approximation of the actual system. Its inputs and
outputs are measurable hydrological variables and the model’s structure is a set of equations linking input
to output. Central to model structure is the concept of system transformation. The input and output can be
expressed as functions of time I(t) and O(t) respectively. A system performs a transformation of the input
into output represented by transformation operator or equation.
Example: A watershed
The watershed can be looked upon as an operator transforming the moisture input, I(t): precipitation, into
output, O(t): runoff, evaporation and transpirataion.

Civil Engineering Dept., AAU WATER RESOURCES DEVELOPMENT
May, 2006 11
2 Assessment of Water Resources
2.1 Introduction
Water resources can be neither developed nor managed rationally without an assessment of the quantity
and quality of water available. A basic water resources assessment activity involves the collection and
processing of hydrological, meterological, and hydrogeological data, plus the auxiliary data required for
their areal interpolation, in order to permit a preliminary assessment to be made of available water
resources on which to found national or regional long-term plans for overall water resources development.
The information is particularly required for the purpose of:
assessing a country's water resources (quantity, quality, distribution in time and space), the
potential for water-related development, and the ability of the supply to meet actual and
foreseeable demand,
planning, designing and operating water projects, such as water supply, irrigation and hydropower
projects,
assessing the environmental, economic and social impacts of water management practices,
existing and proposed, and planning sound management strategies,
assessing of the response of water resources to other, non-water sector activities, such as
urbanization or forest harvesting,
providing security for people and property against water-related hazards, particularly floods and
droughts
Thus a WRA program in its broad sense comprises of the following:
the institutional framework and the manpower involved in the collection, maintenance and
dissemination of the hydrological, hydro-geological, and physiographic data
a network of measurement stations where the hydrological and hydrogeological data are collected
the set of techniques, procedures and software that are used in the processing, interpreting and
final dissemination of the collected data
The entire activity is illustrated in the block diagram shown below (source: WRA Activities - Handbook
for National Evaluation, UNESCO/WMO 1988).

Civil Engineering Dept., AAU WATER RESOURCES DEVELOPMENT
May, 2006 12
Figure 2-1 Component of Activities involved in water resources assessment program
2.2 Types of water resources information
The diversity of possible uses of water resources information implies that there is a considerable range of
types of data. Conventional water resources information comprises that statistics of a variety of
meteorological and hydrological elements. These elements include:
precipitation (rainfall, snow)
river levels and flows, and lake or reservoir levels
groundwater levels,
evapotranspiration
sediment concentrations and loads in rivers
Water quality (bacteriological, chemical and physical) of surface water and groundwater.
The primary data collected should then be converted into useful information on the water resources.
Collection of Hydrological
Data (components of the
hydrologic cycle- including
quantity and quality of
surface and groundwater)
Collection of
Physiographic Data
(topography, soils,
geology)
Techniques of Areal Assessment
of Water Resources
(regionalization techniques)
Education and
Training Basic and Applied
Research
Water resources information (data banks, maps)
Users
(planning, design and
operation of water
resources facilities)

Civil Engineering Dept., AAU WATER RESOURCES DEVELOPMENT
May, 2006 13
Frequently needed pieces of information include:
mean annual, monthly, or seasonal values,
maxima and minima, and selected percentiles,
measures of variability, such as standard deviation,
Continuous records in the form, for example, of river flow hydrographs.
There is a requirement for both historical and real-time data, to cater for the full range of needs, from
project design through to flood warning. For planning purpose one may do well with monthly data (of
stream flow, for example), whereas for design and operation data of higher time resolution are needed.
The information needed usually depends upon the type of project under consideration, whether single
(multi) purpose projects, or basin wide master plans.
The raw data collected as part of the routine measurement procedures have to be processed in order to
obtain the information required for a specific application. For instance sediment measurements could be
used to assess the accumulation of sediment behind a proposed dam, which in turn is used to estimate the
dead storage space.
In the processing of the primary data to get the information needed for a specific application, however,
there are frequent problems that have to be dealt with. These are:
1. There are gaps in the series of observed data
2. The observation period is too short
3. Data are not available at the site of interest but in neighbouring region.
In addition, the need to investigate the response of the scheme to be designed, for instance an irrigation
development, requires the estimation of extreme events (floods and low flows). In the study of reliability
of the system in meeting its objectives there is a need for the generation of synthetic data (streamflow, for
example). There are hydrologic techniques that are applied to solve the above problems. These techniques
are briefly discussed below, which are then presented in detail later in this chapter.
In addition, the data collected as part of the routine measurement procedures may need further treatment
before it can be used for the specific purpose it is needed. Two of the typical cases are:
the data collected may not be directly from the same area as the location of the intended project,
there could be gaps and interruptions in the records due to several reasons, such as instrument
breakup, security problems, etc.
The processing of hydrometeorological data for engineering purposes is the subject matter of engineering
hydrology, hence will not be dealt with here [Students are advised to review hydrology lessons]. However,
a few selected topics shall be included in this discussion, which are not commonly treated but are useful in
the practice.

Civil Engineering Dept., AAU WATER RESOURCES DEVELOPMENT
May, 2006 14
2.3 Classification and Data requirements of water Resources Development projects
Water projects defer on their need for data on the hydrology of the site where they are implemented. A
description of the various water projects is given in Table 2-1 below:
Table 2-1 Project purposes, their objectives and their associated structural measures
Project purpose Objectives Structural measures
Flood Control Flood-damage prevention or
reduction, protection of life and
economic development
Dams, storage reservoirs, levees, floodwalls,
channel improvements, floodways, pumping
stations, flood warning systems, diversions and
other flow retarding measures
Hydroelectric
power generation
Provision of electric power for
economic development and improving
living standards
Dams (weirs), storage reservoirs, penstocks,
power plants
Municipal and
industrial water
supply
Provision of water for municipal and
industrial uses
Dams, reservoirs, wells, conduits, pumping
plants, intake works, water treatment plants,
saline-water conversion, distribution systems
Irrigation Increase and stabilization of
agricultural production
Dams, storage reservoirs, wells, canals, pumping
stations, weed control and desilting works,
distribution systems
Drainage Increase and stabilization of
agricultural production, urban
development, protection of public
health
Ditches, tile drains, pumping stations, sluices
Navigation Transportation of goods and
passengers
Dams, storage reservoirs, canals, locks, channel
improvements, harbor works
Water quality
control
Protection or improvement of water
supplies for municipal, industrial and
agricultural uses, protection of fish
and wildlife, development of
commercial fishing
Waste treatment facilities, reservoir storage for
low-flow augmentation, waste-water collection
systems
Recreation enhancement of recreation and sport
opportunities
Storage reservoirs, facilities for recreational use,
pollution control works
Fish and wildlife
enhancement
Improvement of habitat for fish and
wildlife, reduction or prevention of
fish and wildlife losses associated with
men's activities, provision for
expansion of commercial fishing
fish hatcheries, fish ladders and screens,
reservoir storage, pollution control works
Sediment control Reduction and control of silt load in
streams and protection of reservoirs
Desilting works, channel and revetment works,
band stabilization, special dam construction

Civil Engineering Dept., AAU WATER RESOURCES DEVELOPMENT
May, 2006 15
Table 2-2 summarizes data needs of the various water resource projects. Detailed steps involved in making
hydrologic estimates for the projects are presented subsequently.
Table 2-2 Water Resource Projects and their respective Data need.
Water projects
water levels
river flow
sediment
water quality
time
series
max
min
time
series
max
min
time
series
max min time
series
max min
redistribution of
water (diversions,
intakes, canals)
M
M
M
H
H
H
H
M
M
H
M
M
redistribution of
water in time
(reservoirs)
M
M
M
H
H
H
M
M
M
H
M
M
energy production
(hydropower)
H
M
M
H
M
H
H
M
M
M
M
M
water confiners
(dams, floodbanks)
H
H
M
M
H
M
M
M
M
M
M
M
water relievers
(spillways)
M
H
M
H
H
M
M
quality
improvements
(water and sewage
treatment)
H
M
H
M
M
M
H
H
H
flow and level
forecasts
(flood control,
reservoir operation)
H
H
H
H
H
H
H = high level or priority, M = medium level of priority
2.4 Regional analysis for the generation of missing data
Regional analysis is needed when hydrological data, in particular streamflow series, are either nonexistent
of too short for solving major problems in a given river basin. The technique is based on a comparison of
watershed characteristics between the one with unknown or short streamflow series and neighboring
watersheds for which these series are available. Among the principal characteristics upon which the
comparison is based are the sizes of the watersheds, the topography, soils and land cover, precipitation and
other meteorological factors (if available). When the homogeneity among watersheds is established, cross
correlation between records can be evaluated. If this correlation is acceptable, the time series can be
extended mostly by linear regression models. If no flow records are available in the problem area, runoff
can be estimated using the known watershed data by simple proportion with drainage area ratios and /or
rainfall ratios when they exist.
Regional analysis is applicable to problems in which historical series are needed, for instance for reservoir
sizing and nonreservoir structures for flood control, irrigation and water supply, determination of flooding
potential, and for integrated river basin planning.

Civil Engineering Dept., AAU WATER RESOURCES DEVELOPMENT
May, 2006 16
2.5 Reestablishment of natural flows
Most historical streamflow records reflect upstream extractions for various useful purposes. The flow
values measured at these gaging stations must be corrected in order to obtain natural flows which are
necessary for several hydrological analyses, such as statistical analyses, water budgets, establishment of
prior water rights (legal aspects) and benefits and costs with and without proposed or existing structures.
The correction method would seem very simple, namely eliminating the effects of man-made structures
such as dams. However, in many cases, information about these effects is not available and must be
estimated. The problem is further complicated by the return flows from extractions that occur upstream of
the gaging station and for which only rough estimates can be made. Streamflow routing procedures are
often required to determine natural flows.
Analysis of flow variability
The annual flow distribution shows long-term variations in mean flow. In particular, the data on dry and
wet periods and trends are needed. Variations can also result from changes in land use pattern. Time
series analysis can be applied to long historical records to obtain flow distributions.
Low-flow frequency analysis is also based on historical records and, in some cases, is used for
determining the required conservation storage of a reservoir, a system of reservoirs, or a complete water
supply system in a region. These analyses are useful for showing the necessity for low-flow augmentation.
Frequency curves of reservoir storage are used to evaluate the probability of failure to meet demands when
a reservoir runs dry, or to estimate power production potential or recreational benefits. The latter are based
upon the frequency with which a reservoir is filled over a given level at certain time periods. Modern
techniques such as queuing theory and simulation can be used to develop these storage frequency curves.
For analysis of flood protection measures, several flood characteristics are required. These include the
design flood peak discharge and its corresponding recurrence interval and shape, total flood volume and
time-to-peak. With the knowledge of these characteristics, the storage for flood control and the design of
other structural or nonsturctural measures to prevent flooding of valuable areas can be estimated for a
given probability of failure. Reservoir and channel routing techniques are used to determine inundated
areas.
Hydrologic Modelling
The planning and management of water resources system are dependent upon information relating to the
spatial and temporal distribution of hydrologic phenomena. In a country like Ethiopia, hydro
meteorological data base is insufficient, scarce or unavailable. As a result, planning and management
decisions are subject to hydrologic uncertainties in addition to uncertainties of the non hydrologic nature.
More precise information can be extracted from more extensive data bases: however, it is often difficult to
justify delay in decision making pending the acquisition of additional data because resulting benefits
would have to be forgone. A more feasible course of action is to use mathematical models of hydrologic
processes in order to extrapolate and interpolate information over time and space.
When historical flood data do not exist or are insufficient, the unit hydrograph or other rainfall-runoff
modelling techniques can be used to estimate them using meteorological data. Rainfall-runoff models are
valuable to develop long records of flows which are needed for several of the analyses mentioned above.
Their inputs are generally rainfall and temperature (if snowmelt is relevant), evapotranspiration and soil
moisture data and the watershed characteristics. This method is applied when, as often occurs,
hydrological data series are short compared to the meteorological series. Another important application of
these models is the short-term prediction of flows and flood forecasting. A reliable flood forecasting
model linked with a warning system may provide a valuable nonstructural flood protection system. With
these warning systems, larger damages can be prevented through evacuation of the flood prone areas or
regulation of reservoirs.
Stochastic hydrology may be used to develop a number of flow records of any given length which have
about the same statistical parameters as the historical record. These records are used mainly in simulation
analysis to determine reservoir capacity and operation policies. In applying this technique, several series

Civil Engineering Dept., AAU WATER RESOURCES DEVELOPMENT
May, 2006 17
of equal length should be generated and used in the simulation to obtain reliable statistical evaluations of
the system's performance.
The most widely used method of reservoir storage requirements is simulation. For flood control purposes,
a short-term simulation is needed, in which the time step is much smaller than the usual monthly routings
for other project purposes. Usually short interval flood studies are made for each major historical flood by
simulating the operation of the reservoir projects. Regardless of the purpose of the dam, reservoir routing
procedures are needed to test the ability of the spillways to evacuate the flood. For conservation purposes,
such as water supply, irrigation and hydroelectric power production, a monthly simulation analysis will
also be required. For single purpose conservation reservoirs, Rippl-diagram analysis can sometimes
provide sufficient accuracy.
Advanced mathematical techniques, such as optimization and simulation, are applied, in particular for
integrated river basin planning. They may also be useful for analysis of reservoir operation problems.
The objective of all these techniques is directly or indirectly an optimization of the system's parameters.
Therefore, a quantitative measure of benefits and costs of each alternative design or operation must be
developed. The characteristics of this system, namely mass balances, power productions, hydrologic
inputs, water quality and several water demands should be developed as constraints in mathematical form.
This constitutes the set of constraints under which the system's parameters to be optimized can be varied.
Mathematical models may also be used on a real-time basis to determine optimal operation of an existing
reservoir or reservoir system. Such applications require the existence of a reliable flood forecasting
system.
Other Hydrologic Techniques
In addition to the above, other types of information are needed in the design and operation of water
projects. Sediment reserve storage is generally estimated separately. Sediment transport is calculated on
the basis of direct measurement of bed load and suspended sediment at the reservoir site. When no data is
available at the site of interest indirect methods, based on discharge, river slope, soil cover and other
parameters, may have to be applied. They have, however, limited accuracy.
Water surface profiles are needed to establish the height of levees for flood protection. They are based on
backwater calculations or on stage-discharge curves such as available for river gaging stations.
Water requirements for fish and wildlife protection are estimated separately and included in storage
capacity and operation studies as constraints. For this purpose, interdisciplinary teamwork among
engineers, biologists, ecologists, etc. is necessary.
2.6 Regional Analysis
2.6.1 Correlation and Regression
Among the techniques used in the regional analysis of hydrologic variables, correlation and regression are
the most frequently used techniques. The main objectives of this analysis are the transfer of information
between points at which the same variable is observed, or between two among several variables observed
simultaneously. This includes the completion of missing data in hydrologic series, and the prediction of a
variable from the observed one or several other variables.
Correlation is a mathematical description of the relationship between two variables. Regression represents
a mathematical equation expressing one random variable as being correlatively related to another random
variable, or to several random variables. The regression equation may be any function that can be fitted to
a set of points of observed variables. Determining mathematical models of correlative association to two
or more variables, so that the best prediction of one variable can be obtained from the other variables, is
referred to as regression analysis, and the models are called regression functions.
The case of two random variables is referred to as bivariate (or bivariable) distribution and the relation
between these two variables is called the simple or bivariate correlative association, and the simple or
bivariate regression. The case of a random variable related to several (more than one) random variables is

Civil Engineering Dept., AAU WATER RESOURCES DEVELOPMENT
May, 2006 18
referred to as the multiple correlative association and the multiple regression. The linear equation of
relations represents the simple linear and the multiple linear correlation and regression, which depends on
whether two or more variables are involved. The opposite cases are the simple nonlinear and multiple
nonlinear correlation and regression.
Steps in the regression analysis: whether a simple or multiple correlation or regression analysis is
performed, the five steps are necessary for complete information about this association:
1. Selecting a function of correlative relation, simple or multiple of linear or any nonlinear type;
2. Estimating parameters (statistics) that measure the degree or correlative association;
3. Testing the significance of statistics that measure the correlative association;
4. Estimating parameters of regression equation, and
5. Testing the significance of regression parameters, or drawing the confidence limits about the fitted
regression function.
The following two types of regressions are current in hydrology:
a) Cause-effect based relations, where a random variable, y, is correlatively related to causal factors,
xI, which produce or affect the outcomes of y. Typical examples are a runoff-rainfall relation,
because the rain is the basic causal factor of runoff, with river geometric, soil, moisture and
climatic factors affecting the basic cause-effect relation.
b) relations or random variables, which have the same causative factors, such as the correlative
association of the runoff of a river tot he runoff of an adjacent river, or the association of rainfall
variables at the adjacent precipitation stations , and similar. Both cases are similarly treated in
correlative association.
In fitting a linear regression model, the linear association of the random variables should be checked first.
This can be done, for example, by testing the correlation coefficient for significance, or by making a
scatter plot of the variables. Important observations should be made if the relationship of the two variables
appear linear, and if the variance of the dependent variable is constant over a range of values of the
independent variable. A relationship where the variance is constant is called homoscedastic. If the original
data do not exhibit linear relationship, some transformations (particularly the log transformation) may
render them linear.
The correlation coefficient is also used to measure the linear association between the variables. Its
magnitude determines the strength of the linear association, whereas the sign indicates whether one of the
variables increases when the other decreases.
Estimation of the correlation coefficient: assume that N simultaneous observations of the random variables
x and y are available. The ith pair of observations is denoted by (xi, yi), i = 1, …, N. The sample estimate, r,
of the population correlation coefficient, r is given by
N
i
iy
N
i
ix
yx
N
i
ii
yx
xy
yNyS
xNxS
SS
yxNyx
SS
Sr
1
22
1
22
1
in which Sxy is the estimate of the covariance, xy , x, and y are the estimates of the population means of x
and y, respectively, and sx and sy are estimates of the variance of x and y.
Once the correlation coefficient is computed a statistical test of significance is performed to check if the
population correlation coefficient is different from zero. To make the test of significance, compute the
statistic

Civil Engineering Dept., AAU WATER RESOURCES DEVELOPMENT
May, 2006 19
21
2
r
Nrt
The null hypothesis (that = 0) is rejected, hence the value of r computed above is taken as significant, if
/t/ > tcrit, where tcrit is the point on the Student's t distribution with n-2 degrees of freedom that has a
probability of exceedence of /2. If the correlation between the variables is found significant, estimate the
parameters of the regression model as outline below.
The linear regression model to be used is
Nixy iioi ,...,2,11
where: yI = ith observation of the response (or dependent) variable
xI = ith observation of the explanatory variable
o =intercept
1 = slope
= random error or residual for the ith observation
It is assumed that I is a (normally distributed) random variable which is independent of xi and has a mean
of zero and a constant variance 2, which does not depend on x.
The sample estimates of the slope and the intercept of the linear regression model are given by
lyrespectivexandyofmeansthearexandywhere
xbyb
and
xxn
yxxynb
o
,
,
)(
1
221
The above is an example if a simple linear regression, which is used with one explanatory variable. Some
hydrologic variables, such as the stream flow, are functions of several other variables, for example, basin
area, mean altitude of the basin, percentage of basin forested, average slope, etc. In such cases the used of
multiple regression gives better results.
Application to hydrology
As described in the previous sections, the method of linear regression can be used to extend a short record
using a longer record, between which there exists a significant, correlation, fill in missing data, again
using data from adjacent stations, extend short records by using other climatic and basin characteristics,
such as the use of rainfall with (or without) basin characteristics.
In all the above cases either linear or multiple regression can be used to establish the relationship between
the dependent and the independent variable(s). For instance, if x and y represent hydrologic variables
measured at two neighboring stations with y being of shorter duration than x, then a regression equation
between y and x can be used to predict values of y from x values.
Regional Flood Frequency Analysis: Correlation and regression of hydrologic and related variables on a
regional basis are frequently used to extend short records, fill in gaps in records, and estimate flow at
ungauged sites. Regional analysis of hydrologic data is also applied to produce regional (rainfall)
Intensity-Depth-Frequency curves, regional flow-duration curves, regional flood and low-flow frequency
curves, and regional values of other relevant hydrologic variables. An outline of the regional flood
frequency analysis method, is given below.
Hydrologic records at most gauged sites are usually too short to justify the type of extrapolations made in
estimating floods of low frequency. Commonly one estimates a flood of a 100 years return period based
on a record length of 25 years. Given that sufficient data will seldom be available at the site of interest, it

Civil Engineering Dept., AAU WATER RESOURCES DEVELOPMENT
May, 2006 20
makes sense to climatic and hydrologic data from nearby and similar locations. A successful example of
regionalisation is the index flood method.
The concept underlying the index flood method is that the distribution of floods at different sites in a
region are the same except for a scale or index-flood parameter which reflects the size, rainfall, and runoff
characteristics of each watershed. Generally the mean is taken as the index flood. The steps in the
application of the index flood method are summarized below:
a) Prepare single-station flood-frequency curves for each station within the homogeneous region
b) Compute the ratio of flood discharges taken from the curves at various frequencies to the mean
annual flood from the same station
c) Compile ratios for all stations and find the median ratio for each frequency
d) Plot the median ratios against recurrence interval to produce a regional frequency curve.
Hence, to estimate the T-year flood for any site within the homogeneous region,
estimate mean annual flood (the index flood, a flood with a return period of 2.33 years) for the site
read the ratio from the regional frequency curve for the given recurrence interval
estimate the T-year flood as the product of the mean annual flood and the ratio from the regional
frequency curve.
Application to ungauged basins: Regional frequency curves are most useful to estimate floods in
ungauged basins. Since the regional curves show the relation between the flood of any recurrence interval
and the mean annual flow, an estimate of the mean annual flood is sufficient to estimate the flood for the
required recurrence interval. The mean annual flood is usually estimated by applying regression analysis
with the factors that affect the flood, such as the drainage area. The flood of any given recurrence interval
for the ungauged basin is estimated by determining the corresponding flood ratio from the regional-
frequency curve for the region of which the ungauged basin is a part and multiplying it by the estimated
mean annual flood of the ungauged basin.
2.6.2 Time Series Analysis and Monte Carlo Simulation
In the design and operation of water resources systems, engineers have always recognized the variability
and uncertainty of the hydrologic inputs. Rainfall, streamflow, evapotranspiration and groundwater flow
are all more or less unpredictable processes. A sequence of hydrologic events will rarely repeats itself.
Operational, or synthetic hydrology is used to solve the limitation of historical hydrologic inputs.
Recognizing that streamflows and other hydrologic time series are random processes, operational
hydrology attempts to generate sequences with the correct probability behavior. These sequences can then
be used in a series of Monte Carlo experiments directed toward defining the probabilistic behavior of the
output.

Civil Engineering Dept., AAU WATER RESOURCES DEVELOPMENT
May, 2006 21
Figure 2-2 Concept of Monte Carlo Simulation
Time Series: observed realizations of a random process are usually called time series, i.e. time series is in
short the sequence of records of a hydrologic process in time, such as streamflow. Time series analysis is
the exercise of estimating the properties of the underlying process that lead to the observed time series.
Operational, or synthetic, hydrology utilizes the results of time-series analysis to hypothesize
mathematical models capable of producing realizations that would be statistically indistinguishable form
the observed hydrologic series. The sequences generated using these models are commonly known as
synthetic sequences to distinguish them from the historic ones. Synthetic streamflows are used in problems
of reservoir design and operation of river-basin water resources-systems.
Single and multiple time series: a single time series (or univariate series) is simply a time series of one
hydrologic variable at a given site. In contrast, a multiple time series (multivariate series) is a set of two or
more time series.
Uncorrelated and correlated time series: given a time series X, if the x's at time t depend on those at
some time t-k, then the series is said to be autocorrelated, serially correlated, or correlated in time. An
uncorrelated series is also called independent. For two series X and Y, if the y's at time t are dependent on
the x's at some time t-k, for k = 0, 1, 2, …., then the series are called cross-correlated. The individual
series could be autocorrelated or independent but cross-correlated.
Stationary and nonstationary time series: A hydrologic time series is stationary if it is free from trends,
shifts, or periodicity (cyclicity). This implies that the statistical parameters of the series, such as the mean
and variance, remain constant through time. Otherwise, the time series is nonstationary. Generally,
hydrologic time series defined on an annual time scales are stationary, although this assumption may be
incorrect as a result of large-scale climatic variability, etc. Hydrologic time series defined at time scales
smaller than a year, such as monthly series, are typically nonstationary, mainly because of the annual
cycle.
.
.
.
.
.
.
Deterministic
Model
(i.e. Basin
Model)
.
.
.
Input distribution Sample input realizations range of otputs

Civil Engineering Dept., AAU WATER RESOURCES DEVELOPMENT
May, 2006 22
2.7 Decomposing a time series into its components
Attributes of a time series such as trend, shift and seasonality are called its components. In fitting
stationary time series models, it is necessary to reduce the time series to stationarity. This is effected by
removing any trends, shifts and periodicity from the series.
Trends and shifts: a trend is a gradual change in sample statistics of a time series, such as the mean and
variance, whereas a shift is a sudden change in these parameters. There could be both linear and nonlinear
trends in a time series.
Removing trends: A linear trend in a time series yt in the mean can be removed by subtracting the mean
from the series, whereas the trend in the variance, if any, can be removed by dividing the difference (yt -
ymean) by the standard deviation of the series.
Removing shifts: Shifts in the mean are removed by deducting the mean and shift in the variance is
removed by dividing the difference by the appropriate standard deviation.
Seasonality: Hydrologic series defined at time intervals smaller than a year (such as monthly series)
generally exhibit distinct seasonal (or periodic) patterns. These result from the annual revolution of the
earth around the sun which produces the annual cycle in most hydrologic processes. Generally seasonal or
periodic variations in the mean, variance, covariance and skewness are of interest.
Removing seasonality in the mean and variance: removing the seasonality in the mean is accomplished by
taking the difference yt- yt, where yt is the monthly mean for January, February, …, if t is a monthly index.
The seasonality in variance can then be removed by dividing the difference by the standard deviation of
the respective months. This operation is called seasonal standardization (or deseasonalizing) of the
original series.
Apart from the seasonality in the mean and variance, the seasonality in the autocorrelation coefficient is of
interest. But this is not readily apparent from the time series plot. Hence a special plot is made to see the
seasonality in the autocorrelation coefficient. This is done by computing the correlation coefficient, for
instance for monthly series, between the February flow (for all years) with those of January, to obtain r1,2,
similarly for other months to obtain r1,1, . . . . , r1,12 and, in general, rk,1, . . . , rk,12. The plot of rk,t for k > 0,
may, depending on the hydrologic series under consideration, exhibit a seasonal or periodic pattern. In
contrast, for annual series, the correlation coefficient rk is assumed to remain constant.

Civil Engineering Dept., AAU WATER RESOURCES DEVELOPMENT
May, 2006 23
t
yt
yt
t
yt
yt
y1
y2
yt-yt
t
yt-yt
t
t
st
constant s
st
s1
s2
t
t
(yt - yt)/s
t
(yt - yt)/s
Removing trends Removing shifts

Civil Engineering Dept., AAU WATER RESOURCES DEVELOPMENT
May, 2006 24
2.8 Statistical properties of time series
Table 2-3 Overall sample statistics
Statistical Measure Formula
Mean
Variance
Skewness coefficient
Sample autocorrelation coefficient
where N = sample size. Cv = s/y, is the coefficient of variation.
Table 2-4 Statistical Measures for assessment of simulation result
Statistical Measure Formula
Correlation Coefficient
Root mean square
n
t
tt SOn
rms1
2)(1
Mean absolute error
Maximum absolute error
Bias from the mean
Nash and Sutcliff coefficient
where Ot = Observed or historical data, St = Simulated result
The overall sample statistics computed above are normally used for annual series. Seasonal hydrologic
time series, such as monthly flows, may be better described by considering statistics on a seasonal basis.
Let the seasonal time series yv,t, in which v = year; v = 1, . . . N; and t = 1, . . . w, with N and w denoting
N
t
t yyN
s1
22 )()1
1(
3
1
3
)2)(1(
)(
sNN
yyN
g
N
t
t
kN
t
tktk
kk
kyyyyN
c
c
cr
1
0
0),)((1
so
n
t
tt SSOO1
))((
n
t
tt SOn
mae1
1
ttnt
SOae1maxmax
n
t
tt SOn
mde1
)(1
n
t
t
n
t
tt
OO
SO
R
1
2
1
2
2
)(
)(
1
N
t
tyN
y1
)1
(

Civil Engineering Dept., AAU WATER RESOURCES DEVELOPMENT
May, 2006 25
the number of years of record and the number of seasons per year, respectively. The seasonal mean is
obtained as
Similar concept is applied to determine the seasonal variance. Furthermore, the season-to-season
coefficient of correlation, rk,t is determined by
For instance, for monthly stream-flow time series, r1,3 represents the correlation between the flows January
and March.
2.9 Hydrologic Models
The problems of decision making in both the design and operation of water resources systems, such as
flood control reservoirs, canals, water supply systems and irrigation schemes have resulted in a need for
mathematical approaches such as simulation and synthesis to investigate the different scenarios of project
implementation and operation.
Simulation is defined as the mathematical description (imitation) of the response of a hydrologic water
resources system to a series of events during the selected period of time. It could mean, for example, the
calculation of reservoir levels for different draw off levels, or the computation of the catchment runoff for
different land use patterns in the drainage basin, etc. Simulation requires an abstraction of the real life
system, a component of it, in some form, i.e. model. Hence the model 'reproduces' some desired response
of the catchment behaviour, such as the daily runoff.
Models can be classified as Physical or mathematical, continuous or discrete (time), lumped or distributed
parameter, black-box or structure-imitating, stochastic or deterministic, event-based or continuous models.
wtyN
yN
vtvt ,1)
1(
1,
,
1/ 2
0, 0,
, , ,
1
2
0, ,
1
2
0, ,
1
( )
1( )( ), 0
1( ) , 0
1( ) , 0
k t
k
t t k
N
k t v t t v t k t k
v
N
t v t t
v
N
t k v t k t k
v
cr
c c
c y y y y kN
c y y kN
c y y kN

Civil Engineering Dept., AAU WATER RESOURCES DEVELOPMENT
May, 2006 26
2.10 SCS model for estimating runoff volume and peak flood
2.10.1 Runoff Volume
The US Soil Conservation Service model (SCS, 1972) is widely used for estimating floods on small to
medium-sized ungauged drainage basins. It was the product of more than 20 years of studies involving
rainfall-runoff relationships from small rural watersheds across the U.S. The model was developed to
provide a consistent basis for estimating the amounts of runoff under varying land use and soil types.
Together with the SCS triangular unit hydrograph, the method can be used to estimate peak floods from a
known rainfall hyetograph. According to this method, the volume of direct runoff resulting from a rainfall
of P is given by
Where Ia is the initial abstraction, and S is the potential retention in the basin, which equals the initial
abstraction Ia plus the cumulative infiltration, F. No runoff occurs until rainfall equals an initial abstraction
Ia is satisfied. After allowing for Ia the depth of runoff Q is the residual after subtracting F. Commonly the
initial abstraction, Ia, is taken that the initial abstraction is about 20 % of the potential retention in any
storm, i.e. Ia = 0.2S, hence,
The potential retention is expressed in terms of a dimensionless curve number CN, which depends on soil
type and land use/cover in the drainage basin.
Where CN is in English units and S is in inches.
The value of CN depends on the soil, cover, and hydrologic conditions of the land surface. Accordingly,
soils may be put into one of the four groups, A, B, C, and D; or one of three dual classes, A/D, B/D and
C/D. Definition of the classes are:
A: (Low runoff potential) The soils have a high infiltration rate and low runoff even when thoroughly
wetted. They chiefly consist of deep, well drained to excessively drained sands or gravels. They
have a high rate of water transmission as for deep sand or loess, aggregated silts.
B: The soils have a moderate infiltration rate when thoroughly wetted, as for moderately fine to
moderately coarse-textured soils such as sandy loam. They have a moderate rate of water
transmission.
C: The soils have a slow infiltration rate when thoroughly wetted, as for fine-textured soils such as
clay loam, shallow sandy loam, soils low in organic content. They chiefly have a layer that impedes
downward movement of water or have moderately fine to fine texture. They have a slow rate of
water transmission.
D: (High runoff potential).The soils have a very slow infiltration rate when thoroughly wetted, such as
swelling and plastic clays, and clay pan. They have a very slow rate of water transmission.
Dual hydrologic groups are given for certain wet soils that can be adequately drained. The first letter
applies to the drained condition, the second to the undrained. Only soils that are rated D in their natural
condition are assigned to dual classes.
SIP
IPQ
a
a
2)(
SP
SPQ
8.0
)2.0( 2
SCN
10
1000

Civil Engineering Dept., AAU WATER RESOURCES DEVELOPMENT
May, 2006 27
Cover: relates to various types of vegetation and crops, land treatments and crop practices, paving and
urbanization.
2.10.2 Runoff curve Numbers for selected Agricultural, suburban and urban land uses
____Table 2-5 Runoff Curve Numbers for AMC II______________________ ______
Hydrologic Soil Group
Land use description A B C D
Cultivated land
Without conservation treatment 72 81 88 91
With conservation treatment 62 71 78 81
Pasture or range land:
Poor condition 68 79 86 89
Good condition 39 61 74 78
Meadow: Good condition 30 58 71 78
Wood or forest land:
Thin stand, poor cover, no mulch 45 66 77 83
Good cover 25 55 70 78
Open spaces, lawns, parks, etc:
Good condition: grass cover on 75 % or more
of the area 39 61 74 80
Fair condition: grass cover on 50 to 75 %
of the area 49 69 79 84
Commercial and business area (85 % impervious) 89 92 94 95
Industrial districts (72 %) 81 88 91 93
Streets and roads:
Paved with curbs and storm sewers 98 98 98 98
Gravel 76 85 89 91
Dirt 72 82 87 89
Arid and semi-arid range areas
Herbaceaou- mixture of grass, weeds, and low-growing
brush, with brush the minor element (poor) 80 87 93
(fair) 71 87 89
(good) 62 74 85
Desert shrub - major plants include saltbush (poor) 63 77 85 88
greasewood, creosotebush, blackbrush, brusage 55 72 81 86
ple verde, mesquite, and cactus (good) 49 68 79 84

Civil Engineering Dept., AAU WATER RESOURCES DEVELOPMENT
May, 2006 28
Hydrologic condition: refers to the condition whether the vegetation is dense and in good condition, and
whether the soil is rich in organic matter and has a well-aggregated structure, resulting in high infiltration
and low runoff.
CN also depends on the antecedent moisture condition of the drainage basin (wetness), and three classes of
antecedent moisture condition (AMC) are defined, AMC I - dry(wilting point), AMC II - average, and
AMC III - wet(field capacity). The values of CN listed in the table (above) are standard values
corresponding to AMC II. For the other two cases (AMC I and III) the following table can be used.
___ Table 2-6 Runoff Curve Numbers for AMC I and AMC III _______
Corresponding CNs
CN for AMC II AMC I AMC III
100 100 100
95 87 98
90 78 96
85 70 94
80 63 91
75 57 88
70 51 85
65 45 82
60 40 78
55 35 74
50 31 70
45 26 65
40 22 60
35 18 55
30 15 50
25 12 43
20 9 37
15 6 30
10 4 22
5 2 13

Civil Engineering Dept., AAU WATER RESOURCES DEVELOPMENT
May, 2006 29
2.10.3 Peak discharge and flood hydrograph
A triangular (SCS) approximation to the unit hydrograph is used to estimate the peak flood from the
effective rainfall determined above. This triangular unit hydrograph is shown below:
The time to peak flow,
Tp = 0.5D + 00.6tc, where tc is the time of concentration.
The peak flow is given by,
qp = 0.208 A/Tp, where a is km2, and Tp is in h, and qp in m
3/s.
The time of concentration is estimated using a number of empirical formulae in the literature. The one
most commonly used is the Kirpich formula, which in English units has the form
tc = 0.0078L0.77
S-0.385
,
Where L is the length of channel from headwater to outlet,
ft, and S is the average slope of the watershed, ft/ft, and
tc is in minutes.
In metric units,
tc = L0.77
S-0.385
/3000,
Where L is in meters and tc in hours.
Tb =2.67Tp
1.67Tp Tp D
D/2
La
qp

Civil Engineering Dept., AAU WATER RESOURCES DEVELOPMENT
May, 2006 30
2.11 Demand for water
2.11.1 Introduction
Water use can be divided in to two categories, consumptive use, in which water is an end to itself, and
nonconsumptive use, in which water is a means to an end. Consumptive use includes municipal,
agriculture, industry and mining. Nonconsumptive use includes instream uses such as hydropower,
transportation and recreation. From an economic viewpoint, we have the greatest ability to model
consumptive uses. Consumptive uses are modelled using consumptive functions and nonconsumptive uses
are modelled using production functions. Water use refers to the amount of water applied to achieve
various ends so that it is a descriptive concept. Water demand is the scheduling of quantities that
consumers use per unit of time for particular prices of water, which is an analytical concept.
A forecast is an estimate of the future state of a parameter that has four dimensions: quantity, quality, time
and space. In the context of water-demand forecasting, the parameter of interest could be the daily average
use, daily maximum use, and others. In water project design and planning, the major factors determining
the project cost are the quantity of water that must be supplied, treated, distributed, and of waste water to
be collected , treated, and disposed of each year. The character, size, and timing-of engineering works for
water facilities in the future largely depend on the future-water use which must be forecasted. Therefore,
the ability to manage and operate existing water supply facilities and then to plan and design new water
supply facilities is directly tied to the ability to describe both present and future water use.
Future in forecasting could refer to hours, days, weeks, months or years, depending upon the particular
problem. Because of the size and capital intensiveness of most water projects, the time scale in water
demand forecasting generally is years with 15-25 years for medium-range forecasting and 50 years for
long-range forecasting. Forecasting can not strictly be a scientific procedure, since the future, properly
speaking, does not exist. Water demand is defined in economic terms that are related to its price. It differ
form the concept of water requirement used in engineering analysis. Forecast of water demand should also
reflect technological changes in production processes, product outputs, raw materials, water handling and
waste treatment methods, social taste, and public policies with respect to water use and development.
Explicit inclusion of these factors is important in medium and long-range forecasts. Otherwise, forecast
results would be of limited value to decision-makers. Therefore, simplistic methods such as linear
extrapolation of past water demand (called projection) are generally not appropriate for long-term
forecasting. However, the methods remain appropriate to assist in managing water during a crisis period,
during which the forecast-time horizon is short.
Due to the ever changing nature of social, economic and political environments in a region, there exist
numerous uncertainties in any forecast, Errors in water use forecasts may arise form inappropriate or
unintended assumptions made in determining the parameters of forecast. These include future population,
industry mix, and relationships between the values of model parameters and level of water use. Whatever
the causes, errors in forecasting produce excess economic and environmental costs; such costs may be
avoided through the use of improved forecasting approaches. In addition, improved methodologies for
forecasting water demands are needed to account for:
(1) Growing number of conflicts among water uses and water users;
(2) Increasing realization of interrelationships among the different outputs from water resource systems
(3) Increasing scope and scale of water resources development.
2.11.2 Category of Demand
The principal components of water demands are usually grouped as municipal and rural, agricultural,
industrial and infrastructural demand as indicated on the left side of Table 2-7, but there is no standardized
procedure for this subdivision. This scheme also indicates that, beyond the above mentioned four major
categories. Water demands arise in other fields of regional and national planning, Such as transportation,

Civil Engineering Dept., AAU WATER RESOURCES DEVELOPMENT
May, 2006 31
recreation, preservation or extension of swamp and wetland habitat and conservation or utilization of
estuaries.
On the right hand side in Table 2-7, water demands are grouped according to their effect on the sources of
water supply such as withdrawal, in-stream and on-site uses (U.N.,1976)
Table 2-7 Principal categories of water demand (U.N. 1976)
Municipal & rural demand M M Drinking W W Withdrawal
Agricultural demand A M Domestic uses W N Instream use
Industry I M Public uses in settlements W O Onsite use
Infrastructure F A,M Livestock W
A Fish and wildlife
M,A,F Flood loss management N,O,W
M,A Drainage O,W
A Swamp and wetland habitat O,W
A Utilization of estuaries N,O
A Soil moisture conservation O
F Navigation N
F Hydropower N
A,M Irrigation W
I Mining W
I,M Steam power W
I,M Cooling W
I,M Processing W
I,M Boiling W
M,I,A Waste disposal N
M,F Recreation N
M,F Water sports N
M,F Aesthetic enjoyment N
2.11.3 Demand Projections and Policy Formulation
Water demand projection is required at each of the four levels of planning, Viz. (i) project level (ii)
regional level, (iii) national level, and (iv)international level. The planning at these levels is interrelated
and iterative. Correspondingly, water demands have to be derived interactively. Furthermore, since water
demand and development are embedded and circularly related with economic development and
demographic change, alternative scenarios of development have to be projected and water demand
estimated interactively.

Civil Engineering Dept., AAU WATER RESOURCES DEVELOPMENT
May, 2006 32
Water demand estimates over a long period, say about 50 years, should be the first study in any national or
regional planning process. This unfortunately, has been generally neglected.
The flow chart of a regional demand projection as based on alternative scenarios is given in Figure 2-3. It
will be noted that the demand estimate is closely linked with general developmental planning and project-
oriented supply planning.
Even if detailed models of water demand interlinked with economic development through input-output
analysis and demographic projections as discussed above are not developed, advancement can be made by
improving the simple projections on the following basis. First the storage cost data and storage-yield
relationships may be based on detailed regional data. Second, the alternative water supply standards and
water reliability could be explicitly costed. Third, alternative programmers of water development may be
developed for each region.

Civil Engineering Dept., AAU WATER RESOURCES DEVELOPMENT
May, 2006 33
3(c)
3(c)
3(b)
3(a)
3(a)3(c)
3(b)
3(a)
3(b)
Water shortage
occure in the region
as a whole
Available supplies
cover demands in each
of the subsystems
Water shortage may
occure in some of the
subsystems
Development of new sources of water supply
International water grid
Regional water grid
Design of water supply systems (
including development of resources)
Analysis of water use technologies and
iterative revisions of the preliminary
projections of water demands
Regrouping of the demand against the
potential source of supply
22
Priliminary projecteion on
water demands and
comparison with local water
availabilities based on
alternative future scenarios
44
Formulation of policies and programmes
for managing and developing water
resources; integration with other studies
55
Periodic comparison of the the projected
scenarios with the actual one and revision
of the demand projection
77
Periodic revision of the economic and
social base study leading to new or
modified scenarios
11
Economic and social base study;
preliminary formulation of alternative
scenarios
66
Projection on other resources and services
(land, labour, capital, minerals, energy,
transport, etc.)
Figure 2-3 Flow chart of regional water demand projection based on alternative scenarios (U.N. 1976)

Civil Engineering Dept., AAU WATER RESOURCES DEVELOPMENT
May, 2006 34
2.11.4 Water Demand for Human Settlements
This category covers the usual categories expressed under domestic and municipal use for urban and rural
settlements. The major categories covered under urban water demands, in addition to domestic uses, are
public facilities and services (street cleaning, fire-fighting, parks, schools, hospitals, etc) commercial units
(stores, apartment house, laundries, etc.) and industrials establishments Rural settlements need water for
livestock in addition to domestic uses.
The daily water demand of a human being varies between 1.5 and 20 liters, depending mainly on climate
and on physical activity. Daily per capita in-house water uses average about 15 to 20 liters in rural areas
and about 100 to 150 liters in residential districts of urban areas. The household and other urban water
demands depend upon the economic levels of community, climate conditions, cultural practices, pricing
policies and economics of supply and demand. There is a distinct difference between the developed and
the developing countries. In the former, the basic aim of planning is to arrive at the desired level of water
supply at minimum cost. In developing countries, the aim of planning has been to determine the allocation
of the available scarce capital to achieve a social minimum of adequate water supply.
The raw demands shall be converted in to economic demands by evaluating the elasticity of demand in
various categories as supply water is going to be more and more expansive in future.
The project requirements for different categories of use has to be corrected for non primary benefits and
conveyance losses (Figure 2-4) The latter average roughly to about 15 per cent of demand. It must also
be adjusted for the ratio of other benefits to direct primary benefit as shown in Figure 2-4. The other
benefit represents attraction of new developments in view of better water supply. Correspondingly,
marginal cost curves for supplying increasing demand can be worked out. From these two studies the
economic demands and corresponding unit cost can be obtained. Thus economic demand over a period of
time and optimum capacities to be installed in due time can be determined.
Demand curve adjusted for
conveyance losses
GI=GH / (1-Lf)
Adjusted demand curve
FD=(1-Lf) FE
Water requirement adjusted for losses in the system
AC=AB/1-Lf (Where Lf = function of water loss)
Raw demand curve
PR
ICE
OF
WA
TE
R (
doll
ars/
ha
m)
DEMAND FOR WATER (ha-m/ha)E
D
EFIHG
CBA
Figure 2-4 Adjusted demand curve for all losses
Although there are difficulties in quantifying the above procedure, even a conceptual appreciation will
mean improvement over the present insensitiveness to issues. In view of the above it has been suggested
that the forecasts should take in to account (1) regulation (ii) pricing policy, (iii) education campaign,
(iv)housing trend (v) supply cost, and (vi) change in technology. Since these changes are uncertain,
probabilistic future forecasts may be worked out. The approach can also be extended to agricultural
demands.

Civil Engineering Dept., AAU WATER RESOURCES DEVELOPMENT
May, 2006 35
In developing countries, according to World Health Organization (WHO) study, 77 percent of the
population were not adequately served with community water supply, and this percentage was estimated to
increase to 83 percent by 1980, in view of rapid population increase and slow rate of water supply
provision (Wollman, 1972). The central problem is scarcity of funds and organization. A three stage
development has accordingly been proposed by WHO. In the primary stage a rudimentary system to
provide minimum amount of water, mainly through public stand posts with only a limited number (up to
10 percent) of the consumers receiving water services in their houses or premises is proposed (U.N., 1976
). In addition to quantity figures, quality specifications are also important.
2.11.5 Industrial Demand
Industrial water demand varies considerably with the type of industry and even for the same industry
depending upon the age of the technology used. This makes demand estimation difficult. However, only
few industries account for most of the demand. Excluding the steam electric plants, which require the
maximum amount of water, the major users are the steel industry, petroleum refining and wood and pulp
production.
The major groups of water use in industry are (a) cooling; (b) Processing; (c) boiler water: and (d) general
use (drinking water; air-conditioning; cleaning, etc.) About three fourths of industrial water is used for
cooling. To give an idea, estimated withdrawal demand according to categorized grouping of industries is
given in Table 2-8.
Table 2-8 Water requirements for selected industries
S. No. Product
Unit
Water required per
unit (Litres)
1 Bread USA per tonne 2,100 - 4,200
2
Canned foods, average for fruits,
vegetables and juices 1965, USA, per tonne 24,000
3 Meat Packaging USA per tonne 23,000
4 Canned fish Canada, per tonne 58,000
5 Chicken per bird, USA 25
6 Milk USA per litres 3,000
7 Sugar [from sugar beet] USA, avg. per tonne 6,000
8 Beer USA, kilolitres 15,000
9 Pulp and paper USA, avg. per tonne 236,000
10 Gasoline USA, kilolitres 7,000 - 10,000
11 Synthetic gasoline USA, per kilolitres 377,000
12 Oil refinery
Sweden, per tonne
of crude Petrolium 10,000
13 Synthetic fuel
From coal USA, per kilolitres 265,500
From shale USA, per kilolitres 20,800

Civil Engineering Dept., AAU WATER RESOURCES DEVELOPMENT
May, 2006 36
14
Sulphuric acid [contact process]
(100% H2SO4) USA, per tonne 2,700 - 20,300
15 Textiles [steeping and dressing flax] per tonne 30,000 - 40,000
16 Textiles [bleaching] per tonne 80,000 (?)
17 Textiles [dying and finishing] per tonne 60,000 - 100,000
18 Textiles mills [synthetic fibers] per tonne 2,000,000
19 Iron and steel mills per tonne 86,000
20 Automobiles per vehicle 38,000
Note: These values are dependent on technology and are indicatives based on figures given by Leeden, 1975.
Since the cost of water as a proportion of the finished product is very small (usually below 1 percent),
there is little possibility of reduction in demand. While the industry gets the water almost free, socially the
water is very expensive.
Figure 2-5 suggests a definition format for important aspects of industrial water uses. In fact, the three
parameters which represent the minimum for each industrial water use are (i) Gross water requirement
(G); (ii) consumption use (U); and (iii) waste load in the wastewater discharge (WD) Usually in kg of
biological oxygen demand .Regarding the other elements of the scheme amount of gross water use might
be provided in a wide variety of combinations of re-circulated water (R) and intake water (I). Similarly,
the waste load in the final effluent (WE) can largely differ from that in the water discharge leaving the
production as a result of treatments within the subsequent phases. In other words, the water demands of an
industrial unit can not be defined in terms of intake water and effluent waste loads unless the degree of in-
plant recirculation and treatments are also specified.
In projecting the water requirements for industry, the first problem, is to estimate what will be produced.
For developing countries, investments in manufacturing facilities are likely to be relatively discrete events
that can be identified, placed in their foreseeable locations and given a probable scale of output.
Production units that are small in size and relatively numerous can be projected as a function of GNP or
population, based upon present conditions. New plants are likely to use the best technologies available at
the time of their construction unless some restriction on choice of technology is imposed by local
conditions.
ED
R
GIWE
UD
UR
WD
Up
Production process
Lagoon, spray irrigation
system, and/or
underground disposal
Water treatment
facility other than
lagoon, etc.
Water
treatment facility
Figure 2-5 Definition of terms relating to Industrial water demand (U.N. 1976)
I = Water intake
R = Water re-circulated
G = Gross water applied for all in-plant uses

Civil Engineering Dept., AAU WATER RESOURCES DEVELOPMENT
May, 2006 37
U = Consumptive use or net depletion of water
= UP + UD + UR where: Up = Consumptive use in the production process; UD = Consumptive use in
the waste water disposal system; and UR = Consumptive use in the recirculation system
D = Waste water discharge from the production process
E = Final effluent from the production unit (available for reuse). Where a lagoon or spray irrigation
systems is involved, the final effluent, if any, consists of lagoon overflow, seepage and/or surface
runoff
WD = Waste load in the waste water discharge, for example, kg of Biochemical oxygen demand
(BOD)
WE = Waste load in the final effluent, i.e., kg of BOD, Degree of recirculation = R/G x 100 percent.
The rate of water use for a new industry may, therefore, be different from that found in a country in which
plants are old. There are considerable options for reducing the water intake by industry and improving the
quality of effluents. Long-term forecasts are dependent on policy and technology and the procedure
adopted by Whitford (1972) for municipal demand may be followed effectively for industrial forecasts as
well (Collins and plummer, 1974).
In addition to water demand, it is also necessary to estimate the waste load.
2.11.6 Electric Power Demand
Water is a factor in the production of all electric power from thermal and hydro-electric plants. No
permanent withdrawals are involved in hydro plants.
Power Demand Curves
Power Demand curves for power within a given service area could be established by projecting usage at
the base price and correcting for elasticity of demand in the manner described previosly.
Power Market survey
A power market survey is a study to predict power use within a selected geographical area for a series of
dates in to the future. The projection utilizes per capita usages based on the existing price structure,
anticipated technological changes, and projected population.
For estimation of future water use for power generation the future projection of power requirements is
needed which is complicated on the account of several factors. One is the usual interaction of supply and
demand for a mix of demand of varying elasticities and a mix of supply possibilities. The second is the
cyclic interrelation of supply of power and growth of economy as power is one of the essential inputs for
all sectors. Further, technology is changing rapidly.
2.11.7 Agricultural Demand
Water is on of the most important input factors of agricultural production. In humid regions rainfall
usually supplies water in adequate quantities and agriculture is an on-site water use having significant
effects on the amount of quality of run-off available for other water uses in the downstream areas. In arid
regions virtually all the water required for agricultural production is to be provided from outside, i.e. from
neighbouring rivers or groundwater through water supply or irrigation systems. Within intermediate (semi-
arid, temperate and semi-humid climatic conditions, agricultural water demands are frequently satisfied by
a combination of on-site and external supplies.
Irrigation, already accounting for the major proportion of water use is expected to become a key issue of
water resources development on a world-wide scale and in a long range perspective (U.N., 1976). This
conclusion follows from the need to increase food production for the increasing population, the fact that
irrigation is essentially off-line consumption use, and finally because large scale irrigation schemes and
their supply system have a significant impact on the local environment with potential long-term effect on
regions far from the sites of irrigation schemes.
Civil Engineering Dept., AAU WATER RESOURCES DEVELOPMENT
May, 2006 38
Agricultural water requirements vary from country to country and in different parts of the country
depending upon agro-climatic, hydrologic, economic, social, institutional and political factors, all of which
are circularly related.
Agricultural water demands are estimated on three levels:
(a) the end-product level, where total agricultural production and its combinations are analyzed;
(b) the input-factor level, where desirable combinations of production factors (seeds, fertilizers, water,
equipment, human and institutional resources) are analyzed for a given level of total agricultural
production; and
(c) level of the water supply system where structural and managerial alternatives (in terms of gross water
demands) are analyzed for the given water demand.
Water demand in levels (a) and (b) largely depends on its overall availability and the specific cost of water
supplies within the region concerned. In humid regions, conditions of adequate and inexpensive water
supply can mostly be taken for-granted. As soon as the need for external water resources (irrigation
demand) emerges the need to decrease the cost of water supply requires extensive studies on level (c) and
their results may influence decisions on level (b) Under conditions of severe aridity, irrigation water
becomes one of the decisive input factors for consideration on level (b) and may have a significant role
also in decisions for level (a). Therefore, a reasonable combination and substitution possibilities among
the various production sectors are to be carefully spelt out for each specific set of conditions. The
projection of water demands for irrigation and the construction or a water supply system will lead to
desired results on the end-product level only if planning and development are multidimensional.
Agricultural demand planning also involves decisions on several hierarchical levels. At the national level
decisions have to be made about the development and cropping pattern several agro-climatic, hydrologic
and administrative regions. At the regional level decisions have to be made about water resources
development level, cropping pattern and unit of water supplies. At the farm level the issue is about
technology of irrigation, water management and choice of crop. All these decisions are interrelated.
2.11.8 Navigation, waterways and Recreation
Water demands for navigation can be estimated either arbitrarily by determining when navigation can be
supported of by ascertaining the relative merits of different forms of transportation on the basis of
projected tonnage movement between various points. Since the latter requires a cost benefit analysis, the
estimated costs of maintaining waterways to various depths will have to be made available at least in
rough form.
The use of barriers and locks reduces navigation water requirements as compared to what is needed in a
free flowing stream. Thus, for a given increase in carrying capacity, the choice will lie between diverting
water for other uses or a capital investment designed to reduce the use of water. The water-resource
planner may be able to conclude that a designated number of navigable waterways constitute an inviolate
minimum, but even this knowledge will not be enough to support minimum water requirements unless
physical circumstances prohibit barriers and locks. The planners and transportation specialists may not be
able to do more than reach an informed, albeit arbitrary, judgement once they have estimate the probable
volume and movement of freight and size of vessels. Whether navigation flows appear explicitly in the
projected demand will depend upon their magnitude and seasonality as compared with other flows over
the navigable reaches of the river.
The recreational uses of streams are likely to imply requirements that coincide with those implicit in the
maintenance of high environmental quality. It may be possible, therefore, for the demands of
environmentalists to be analyzed first of all in terms of the comparative merits of alternative economic
activities, e.g tourism versus industry, before attempting to measure the intangibles, i.e aesthetic
satisfaction not reflected in the money measurement of the national bill of goods. One recreational use of
water, boating itself is a polluting activity, but is partly controlled by regulations regarding the disposition
of wastes; escaping oil and gasoline may also be a problem. These sources of pollution, except for special
cases, are still minor compared with municipal and industrial wastes.

Civil Engineering Dept., AAU WATER RESOURCES DEVELOPMENT
May, 2006 39
Evaluation of the recreational uses of water is relatively difficult because water perse does not usually
figure in the price system. This means that either the prices of complementary goods-boats, flippers and
fishing rods have absorbed the economic rents that would otherwise be inputed to water or, as is more
likely in view of the relatively competitive nature of the markets for recreational commodities, the value of
water in recreational usage perse escapes from the accounting system. In a study on the values of water in
alternative uses, the recreational value of water was five times its value in agriculture and only 1/14 of its
value in industry;
Participation in water-based recreation activities is a function of many variables. Time is an especially
important variable not only in terms of changes in the aggregate, i.e. increased personal income, increased
leisure time and changing social tastes, but also with respect to the recreational behaviour of a single
family group. Of particular importance is the determination of typical patterns of participation in mixes of
water based recreation activities. This problem is in addition to that of determining whether or not positive
enjoyment is derived from a journey to and form the location of the recreation. Except for fervent white-
water canoeists, fishermen and scuba divers, the typical receptionist probably has a bundle of activities as
his objective.
The demands for water-based recreation are sometimes expressed by required per capital length of shore-
lines and area of water surface. An are indicative value of 0.2 meter per capita of lake shore and 0.05
hectare per capital of water surface was applied in recent regional planning in Hungary ( U.N., 1976).

Civil Engineering Dept., AAU WATER RESOURCES DEVELOPMENT
May, 2006 40
3 Planning and Operation Tools
3.1 The system approach to water resources development
3.1.1 Systems Engineering
Systems Engineering (Hall and Dracup): systems engineering may be defined as the art and science of
selecting from a large number of feasible alternatives, involving substantial engineering content, that
particular set of actions which will best accomplish the overall engineering objectives of decision makers,
within the constraints of law, morality, economics, resources, political and social pressures, and laws
governing the physical, life and other natural resources.
Water resources Engineers and Planners should develop a number of reasonable alternatives for public
officials to consider; they should also evaluate the economic, environmental, political, and social impacts
(consequences) that might result from each alternative.
Tools and methodologies are required for defining and evaluating the alternatives for managing the water
resources system (Optimization, model development and simulation).
However, use of these tools can not guarantee development of optimal plans for water resources
development and management; objectives and priorities of different interest groups, that somehow
influence the decision making process and are stake holders, are competing each other and change with
time.
What systems methodology can do:
Help define and evaluate, in a rather detailed manner, numerous alternatives that represent various
possible compromises among conflicting groups (or purposes), values, and management objectives.
In particular, a rigorous and objective analysis should help to identify possible trade-offs between
quantifiable objectives so that further debate and analysis can be more informed.
The system concept:
A system may be defined as a set of objects which interact in a regular, interdependent manner. Such a
system can be characterized by
A rule which determines whether any particular object is to be considered as part of the
system or of the environment (i.e. definition of the system boundary)
A statement of the input and output interactions with the environment,
A statement of the interrelationships between the elements of the system, the inputs and the
outputs, including any external interactions between output and input (feedback)
Figure 3-1 Representation of the system concept

Civil Engineering Dept., AAU WATER RESOURCES DEVELOPMENT
May, 2006 41
Usual objectives: to modify the controllable and partially controllable inputs so as to maximize the
desirable outputs and to minimize the undesirable outputs.
3.1.2 Terminologies and definitions
Decision variables: these are the controllable and partially controllable variables, which could be varied to
attain optimality of some ‘objective function’. For example, in a reservoir operation study, the amount of
release in any time period, such as a month, can be fixed in accordance to some pre-set rule, thus it is a
decision variable. Obviously, there are limits which the release can not violate. For instance, at any time,
the total volume of water to be released can not exceed the amount of water available. Thus, in deciding
the value of the release, one has to know the possible values the release can attain without violating some
constraints, volume available in the reservoir in this particular case.
In general, there are quite many constraints that limit the values the decision variables can assume. Hence
the question of feasibility of the set of values assigned to a set of decision variables is an important one.
The set of decision variables that do not violate any of the constraints for the particular problem at hand is
called a feasible solution, or feasible policy, where the policy refers to the set of values the decision
variable have been assigned.
The subset of all possible feasible policies (sets of values of the decision variables) is called the policy
space.
State variables: are those variables that describe the status of the system in terms of some quantifiable
entities. For instance, for a storage reservoir, the amount of water available in it at any time is a state
variable relevant in reservoir operation studies. In general, if V and Q denote the magnitude and quality of
water in a given system, which are functions of space (location) and time, then the state of the system can
be described by
S = [V(x,y,z,t), Q(x,y,z,t)] ; where: V and Q are examples of state variables.
Thus, Water resources development is aimed at altering the current state of the system in accordance to
‘optimal’ policy, i.e. set of values of decision variables.
System Parameters: these are similar to state variables in that they describe some attributes of the system
but are less variable (less time-variant) than the state variables. For instance, in a reservoir operation study,
the capacity of the reservoir, which is fixed by the normal pool level, is an example of a system parameter.
It is constraint on the state variable in that the state variable can not assume values greater that the active
storage capacity (of course, neglecting the surcharge storage).
State Transition or System Equation: these are equations that compute the output state of a system given
the value of the current state variable and the value of the decision variables.
Objective/Performance Measures: these are quantitative measures of the performance of a specific aspect
of a system. Often the phrase ‘Objective function(s)’ is used to refer to the mathematical form of the
formulation of the performance measure. The general objective can be, for instance, stated as
‘maximization of net profit’, or ‘minimization of cost’, etc. These objectives are then put in mathematical
form by using the decision variables and other relevant parameters.
Simulation: this is an iterative process of running a mathematical model with various feasible values of
the decision variables until the user decides that best solution has been found to achieve a specific
performance measure.
Optimization: this is similar to simulation, except that a mathematical procedure is used to control the
iterative process and adjust the decision variables until the procedure determines it has found the best
solution.

Civil Engineering Dept., AAU WATER RESOURCES DEVELOPMENT
May, 2006 42
Decision Support System (DSS): an integrated computing framework consisting of a database, model base
and user interface/dialogue facility that facilitates the development and evaluation of alternative courses of
action. It is used to transform data to information to support the decision process.
Mathematical Model: conceptualization of a system that retains the essential characteristics of that system
for a specific purpose.
In water resources engineering models:
Can represent important interdependencies and interaction among the various control
structures and users of water resources systems.
Permit an evaluation of the economic and physical consequences of alternative engineering
structures, of various operating and allocating policies, and of different assumptions
regarding future flows, technology, costs and social and legal requirements.
However, models have inherent limitations in representing the real world and hence results based on
simulation models should adequately be checked before it is mapped to the real world.
3.1.3 Basic water accounting modeling concepts
Consider the schematic diagram shown below
a b c
Figure 3-2 Schematic diagram of water accounting modeling
This schematic diagram is actually a basic underlying concept of water accounting modelling. A schematic
diagram represents the spatial relationship of features in a water resources system (upstream to
downstream) although it does not represent the actual spatial scale.
Suppose you were asked to determine how much water to release from the reservoir to meet the
downstream demand of the city, irrigation area, and the environmentally sensitive wetland area. You could
not simply add up the individual requirement because there are other loses and gains in the system, some
of which depend upon the amount of water in the river. Rather you would decide upon a value for release
and perform a water balance as the water moved from point to point downstream. This is where a
mathematical model is useful; it allows one to try different options on the computer, rather than in the
‘field’ in the hope of finding a reasonable approximation of the desired value.
This section of river could be modelled for a variety of purposes. We might need hydraulic model to
compute stages and velocities in some reaches, water quality model to predict quality conditions in the
river, ecological models to predict species survivability, etc. While all these models have their uses, often
the problem at hand is more basic, i.e. the question is how much water is required to meet the demand in

Civil Engineering Dept., AAU WATER RESOURCES DEVELOPMENT
May, 2006 43
the system. Water accounting models can answer this question and in fact, they are probably the most used
type of model in water resources.
To develop an accounting model, we begin by converting the schematic diagram to a node-link diagram as
seen in Figure 3-2c.
The links represent the river reaches and the nodes represent computation points for a model. This
computation points could be reservoirs, confluence points, diversions, inflow points, etc. For each node we
want to solve the equation
OIdt
dV
Where: V is the volume, I the inflow and O the outflow from the node.
This equation represents the basic principle of conservation of mass. Since water does not compress, this
is equivalent to conservation of volume, which can be termed a volume balance. Since we are dealing with
water, this is often called a water balance or water accounting equation. The time scales of interest in
managing water resources often vary from hours to days to weeks to months. Therefore, we convert the
differential equation into a difference equation:
OIt
V ; rearranging terms yields: V = (I-O) t = I t - O t
Since V is volume then I t must be in volume units, implying that I (and also O) is a rate (volume/unit
time). If a node has either no storage (non-storage node) or constant storage then,
V = 0 = I t - O t I t = O t
or the outputs from a node must equal the inputs to the node.
We can expand this equation to account for multiple inputs and outputs by
n
k
k
n
j
j tOtI11
Since we solve the above equation at each node, this implies an order of computation from upstream to
downstream. The outputs from an upstream node become an input for the next downstream node. This
also suggests a strategy of guessing a value of water input (reservoir release) at the most upstream node
and computing the water balance downstream to the final node. If all demands are not met, the input to the
most upstream node is too small. Likewise if all demands are met and excess water is available at the most
downstream node, then the input to the most upstream node is too large.
We can extend this analysis over time, by repeating the water balance calculations from upstream to
downstream for each time period of interest (for example, monthly).
Model Errors:
Formulation error: this occur when the basic mathematical and logical formulation of the model are
incorrect. This could be due to inadequate process description, incorrect model components, etc.
Implementation: these occur when the implementation computer coding is incorrect.
Application: these occur when the model is applied to a situation that does not match what the model is
intended to represent; the wrong model for the intended use.
Model testing:
Calibration: this is a process that might be considered as a part of verification. It consists of determining
the most appropriate values of model parameters, such that the model adequately reproduces observed
conditions. Attempting to minimize the difference between computed and observed condition is a common
measure used in calibration effort.
Verification: this is a process of determining that the model is “doing things right.” It involves testing the
model under various conditions to determine if it has formulation and implementation errors.

Civil Engineering Dept., AAU WATER RESOURCES DEVELOPMENT
May, 2006 44
Validation: this is a process of determining that the model is “doing the right things.” It involves testing
the model under situation for which it was designed and determining if the results seem reasonable. It is
focused on finding application errors. A common approach is to split the data on observed conditions into
one part used for verification and calibration and the other part is used to test the quality of the computed
answers as a validation effort.
Deterministic analysis: this involves using limited sets of input data considered to be representative for a
problem. The model output is interpreted as representative for the input conditions.
Stochastic analysis: this involves using either many sets of input data or a statistical characterization of
the input data representative of a broad range of input possibilities. The model output is statistically
analyzed to determine expectations and ranges of uncertainty.
Expert systems: these are models that represent the logic of evaluating a specific situation in the form of
symbolic “If-then” rules. They are often used to model procedural, heuristic knowledge.
3.2 Feasibility Tests
Project planners must select from a myriad of proposed projects. Each proposal must pass five feasibility
tests.
The test of engineering feasibility: is passed if the proposed project is physically capable of performing
its intended function. The point is not that almost any desired water resources project could be built if
expense were no object. A specific proposal consists of a specific physical system which may not work
satisfactorily.
The test of economic feasibility: is passed if the total benefits that result from the project exceed those
which would accrue without the project by an amount in excess of the project cost. It is important that the
comparison be with and without rather than before and after because many of the after affects may even
occur without the project and can thus not properly be used in project justification. Economic feasibility is
contingent on engineering feasibility because a project incapable of producing the desired output is not
going to produce the benefits needed for its justification.
The test of financial feasibility: is passed if sufficient funds can be raised to pay for project installation
and operation. While financial feasibility should always be contingent on engineering feasibility, projects
have been constructed which simply do not work. A project may be economically feasible but financially
infeasible because the benefits are insufficiently concrete for the beneficiaries to appreciate their true
value or are distributed among too many people for payment to be practical. A project may be
economically infeasible but financially feasible because someone is willing to pay for the fulfilment of
non-economic goals. Financial feasibility also depends on local interests believing estimated economic
benefit to the degree that they are willing to raise their portion of the required funds.
The test of political feasibility: is passed if the required political approval can be secured. Ordinarily
political support follows proof of economic and engineering feasibility.
Political pressure for project construction may even be quite strong despite proof of economic
infeasibility. On the other hand, groups which feel they are adversely affected often oppose project
installation. For example, a humid region may oppose water export to an arid region. Almost every project
harms someone, and if enough people are harmed or if those who are harmed are sufficiently vocal, they
may be able to use political processes to prevent project construction.
The test of social feasibility: is passed if the potential users will respond favourably to project
construction. Project success depends on the users of project output being motivated to shift to irrigated
agriculture, to utilize electrical equipment, or to do whatever else is needed to realize potential project
benefits. The more drastic the changes are that the project requires in the lives of the beneficiaries, the
greater is the inertia that can be expected from those slow to change their way of living. The infusion of
productive capital will not automatically transform a tradition-bound society. Some projects, such as
recirculation of municipal waste water after treatment, may encounter increased inertia because of
psychological connotations or cultural unacceptability.

Civil Engineering Dept., AAU WATER RESOURCES DEVELOPMENT
May, 2006 45
3.3 Optimization
The major types of problems that must be solved for various types of WR systems are:
determining the optimal scale of development of the project
determining the optimal dimensions of the various components of the system; and
determination of the optimal operation of the system.
Let the solutions to these problems be denoted by X1, X2, and X3, and then the benefit associated with
these solutions is
B = f(X1, X2, and X3)
The determination of X1, X2, and X3 involves maximisation of the benefit function, which in this case is
the objective function. Thus, in many WR projects the problems can be formulated as
Maximise B = f(X1, X2, and X3)
In most cases, there are several constraints under which the maximisation has to be achieved, such as
technological, economic (or budgetary), etc.
Conventional procedures for deign and analysis are basically iterative trial-and-error procedures. The
effectiveness of conventional procedures is dependent upon an engineer’s intuition, experience, skill and
knowledge of the WR system. Conventional procedures are typically based upon using simulation models
in a trial-and-error process.
Optimisation eliminates the trial-and-error process of changing a design and re-simulating with each new
design change. Instead, an optimisation model automatically changes the design parameters. An
optimisation procedure has mathematical expressions that describe the system and its response to the
system inputs for various design parameters.
An optimisation problem in WR may be formulated in a general framework in terms of the decision
variables (x) with an objective function to
Optimise f(x)
Subject to constraints
G(x) = 0
And bound constraints on the decision variables
xl < x <xu
Where x is a vector of n decision variables (x1, x2, . . . ,xn), g(x) is a vector of m equations called
constraints and xl and xu represent the lower and upper bounds, respectively, on the decision variables. The
sets of variables that describe the system (the project or the set of management plans or operating rules)
are known as decision variables, in the terminology of mathematical models. Thus, selecting the decision
variables for a particular plan means defining the plan completely.
Every optimisation problem has two essential parts: the objective function and the set of constraints. The
objective function describes the performance criteria of the system. Constraints describe the system or
process that is being designed or analysed and cab of two forms: equality constraints and inequality
constraints. A feasible solution of the optimisation problems is a set of values of the decision variables that
simultaneously satisfy the constraints. An optimal solution is a set of values of the decision variables that
satisfy the constraints and provides an optimal value of the objective function.
Depending upon the nature of the objective function and the constraints, an optimisation problem can be
classified as: (a) linear vs. nonlinear, (b) deterministic vs. probabilistic; (c) static vs. dynamic; (d)
continuous vs. discrete; and (e) lumped parameter vs. distributed parameter. Linear programming
problems consist of both a linear objective function and all constraints are linear.

Civil Engineering Dept., AAU WATER RESOURCES DEVELOPMENT
May, 2006 46
3.4 Linear programming
This technique is used when the objective function as well as all constraint equations are linear. Unlike
most optimization techniques, linear programming software packages are available and this has made the
method more attractive. If the planning problem involves only two decision variables (i.e. two-
dimensional problem) then it can be solved using a simple graphical approach (see examples below). For
more complex problems one resorts to analytical means using the linear programming algorithm or use is
made of software packages.
The general form of an LP model can be expressed as
n
j
jjo xcxMinorMax1
)(
subject to
njforx
miforbxa
j
n
j
ijij
,,2,10
,,2,11
where cj is the objective function coefficients, aij is the technological coefficients and bi is the right-hand
side (RHS) coefficient.
Formulation example 1 [Lucks, Water Resources Systems Planning and Analysis]
Two types of crops can be grown in a particular irrigation area each year. Each unit quantity of crop A can
be sold for a price of PA and requires WA units of water, LA units of land, FA units of fertilizer and HA units
of labor. Similarly crop B can be sold for a price of PB and requires WB, LB, FB and HB units of water,
land, fertilizer and labor, respectively, per unit of crop. If the available quantities of water, land, fertilizer
and labor are W, L, F, and H, respectively,
Formulate a linear programming model for estimating the quantities of each of the two crops that should
be produced in order to maximize the total income.
Formulation Example 2 [Mays and Tung, Hydrosystems Engineering and Management]
Consider a system composed of a manufacturing factory and a waste treatment plant owned by a
manufacturer. The manufacturing plant produces finished goods that sell for a unit price of B 10 K.
However, the finished goods cost B 3 K per unit to produce. In the manufacturing process two units of
waste are generated for each unit of finished goods produced. In addition to deciding how many units of
goods to produce, the plant manager must also decide how much waste will be discharged without
treatment so that the total net benefit to the company can be maximised and the water quality requirement
of the watercourse is met.
The treatment plant has a maximum capacity of treating 10 units of waste with 80 percent waste removal
efficiency at a treatment cost of B 0.6 k per unit of waste. There is also an effluent tax imposed on the
waste discharged to the receiving water body (B 2 k for each unit of waste discharged). The water
pollution control authority has set an upper limit of four units on the amount of waste any manufacturer
may discharge. Formulate an LP model for this problem.
Formulation:
Treatment plant capacity KT
Amount of product X1
Waste discharged directly to river X2
Treatment plant efficiency ( ) = 80%
2X1 – X2 KT

Civil Engineering Dept., AAU WATER RESOURCES DEVELOPMENT
May, 2006 47
2X1 – X2 0
X1 0
X2 0
X2 + (1- )(2X1 – X2) 4
Money
Sell 10X1
Cost 3X1 Production cost
2[X2 + (1- )(2X1 – X2)] Tax
0.6[X2 + (1- )(2X1 – X2)] Treatment cost
The objective is maximizing the benefit.
Benefit = [Sell – Cost] - 2.6[X2 + (1- )(2X1 – X2)]
= 10X1 - 3X1 - 2.6[X2 + (1- )(2X1 – X2)]
= -6.6X1 + 2.6X2
Formulation Example 3 [H.A. Wagner, Principles of Operations Research]
The Haut Dam Water System is comprised of several dams, reservoirs, and river tributaries. One of these,
the Gaul Dam Reservoir, is used for recreation (swimming, water sking, canoeing). It is important to keep
the average depth of this reservoir within the prescribed limits, which vary from one month to the next.
The section chief in the State’s waterways department is responsible for monthly decision on how much
water to release from the Haut Dam into the Gaul Dam. The engineers in the department have estimated a
rapid rate of seepage and evaporation at Gaul Dam, gt, and Et; since rainfall is negligible, Gaul Dam must
be maintained by spillage from Haut Dam.
Suppose that the chief’s department plans ahead for 20 months. During month t, let St denote the average
depth of the reservoir prior to augmenting with Haut Dam water; S1 = 20 for month 1. Let yt be the
number of meters the chief decides to add to the average depth in month t, i.e. a positive value for yt
indicates a decision to augment the reservoir with dam water. Let Lt and Ut represent the lower and upper
prescribed limits, respectively, of the average reservoir depth after augmentation of dam water in month t.
River RiverGaul Dam
Reservoir
River
Haut Dam
Reservoir
River
a. Suppose that the cost of augmenting the reservoir is ct per meter in month t, formulate an
appropriate optimization model.
b. Suppose that the cost of augmenting the reservoir is ct per meter in month t, provided that the
augmentation amount does not exceed 1.5 meters. Any augmentation in excess of 1.5 meters incurs
a cost of dt per meter per month t, revise your answer in part a) to reflect this cost structure.
Formulation:
yt – Decision Variable [release in depth from Haut Dam]
20
1
cost
tt yct
River
(1- )(2X1- X2)X2
2X1- X2
2X1
T.Plant
Plant

Civil Engineering Dept., AAU WATER RESOURCES DEVELOPMENT
May, 2006 48
Constraints:
St+1 = St + yt – Et -gt
St Ut
St Lt
3.2.1 Forms of Linear Programming
The two types of LP model formulations used are known as the standard form and the canonical form.
The standard form is used for solving the LP model algebraically. An LP model is said to be in the
standard form if the following are satisfied:
all constraints are equality except for the nonnegativity constraints associated with the decision
variables which remain inequality of the type;
all RHS coefficients of the constraint equations are nonnegative;
all decision variables are nonnegative; and
the objective function can either be maximised or minimised.
An LP model expressed in the standard form takes the following form:
n
j
jjo xcxMinorMax1
)(
njforx
miforb
miforbxa
j
i
n
j
ijij
,,2,10
,,2,10
,,2,11
An LP model expressed in the canonical form has the following characteristics:
all decision variables are nonnegative;
all constraints are of the type
the objective function is of the maximisation type.
n
j
jjo xcxMax1
njforx
miforbxa
j
n
j
ijij
,,2,10
,,2,11
Frequently, the LP model originally constructed does not satisfy the characteristics of a standard form or a
canonical form. The following elementary operations can be used to transform the LP model into any
desired form.
1. Maximisation of a function f(x) is equal to the minimisation of its negative counterpart,
2. constraints of the type can be converted to the type by multiplying by -1 on both side of the
inequality
3. Equality can be replaced by two inequalities of the opposite sign. For example, an equation g(x) =
b can be substituted by g(x) b and g(x) b.
4. An inequality involving an absolute expression can be replaced by two inequalities without an
absolute sign. For example, /g(x)/ b can be replaced by g(x) b and g(x) -b.

Civil Engineering Dept., AAU WATER RESOURCES DEVELOPMENT
May, 2006 49
5. If a decision variable x is unrestricted in sign (i.e. it can be positive, zero or negative), then it can
be replaced by the difference of two nonnegative decision variables; x = x+- x-, where x+ 0, and
x- 0.
6. To transform an inequality into an equation, a nonnegative variable can be added or subtracted.
Convexity: if two points P1(x11,x12) and P2(x21,x22) are within the feasible space, these spce is convex, if all
points on the straight line joining P1 and P2 are feasible solutions.
3.2.2 Solution algorithms for LP problems
1. Graphical method
The procedure in this method consists of defining the feasible region (or space) graphically and
determining the maximum (or minimum) value of the objective function in the region. It is, however,
limited to cases where there are at most two decision variables. For all LP problems, if the optimum
solution exists, then it always falls on the boundary of the feasible space (more specifically, at one of the
corner points along the boundary. Such points are called feasible extreme points).
The following are the three important properties of feasible extreme points in an LP problem:
Property 1a: if there is only one optimal solution to an LP model, then it must be a feasible extreme point.
Property 1b: If there are multiple optimal solutions, then at lease two must be adjacent feasible extreme
points.
Property 2: there are only finite number of feasible extreme points.
Property 3: If a feasible extreme point is better (measured with respect to xo) than all its adjacent feasible
points, then it is better than all other feasible extreme points, i.e. it is a global optimum.
Example
An irrigation project is to be developed. There is 1800 ha-m of water available annually. Two high value
speciality crops, A and B, are considered for which water consumption requirements are 3 ha-m and 2 ha-
m per hectare, respectively. It has also been determined that the planting of more than 400 ha crop A or
600 ha crop B would cause an adverse effect on the market for these special crops. It has been estimated
that each hectare devoted to crop A will result in Birr 300 profit, while a hectare of crop B will net Birr
500. Develop an LP model and solve for the maximum benefit from the project.
Solution:
From the description, the decision variables will be the hectare of crop A, Xa, and the hectare of crop B,
Xb, and the objective function may be formulated as
Max Z = 300Xa + 500Xb
Subjected to
Xa 400
Xb 600
3Xa + 2Xb 1800 Water availability.
Xa 0, Xb 0
Evaluate Z based on Feasibility and optimality conditions.
Xa = 200
Xb = 600
Z = 360,000
3Xa + 2X
b= 1800
Xa
= 4
00
Xb = 600
0Xa
800600400200
Xb
1000
800
600
400
200

Civil Engineering Dept., AAU WATER RESOURCES DEVELOPMENT
May, 2006 50
Example 2
Two types of crops can be grown in a particular irrigation area each year. Each unit quantity of crop A can
be sold for a price of PA and requires WA units of water, LA units of land, FA units of fertilizer and HA units
of labor. Similarly crop B can be sold for a price of PB and requires WB, LB, FB and HB units of water,
land, fertilizer and labor, respectively, per unit of crop. If the available quantities of water, land, fertilizer
and labor are W, L, F, and H, respectively,
a) Formulate a linear programming model for estimating the quantities of each of the two crops that
should be produced in order to maximize the total income
b) What quantity of each crop should be produced to gain maximum income. Use the data given in
the table below:
Requirements per unit of crop and available resources
No Resource Crop A Crop B Maximum available resource
1. Water 2 3 60
2. Land 5 2 80
3. Fertilizer 3 2 60
4. Labour 1 2 40
Unit price 30 25
The objective function can be written as
F = 30X1 + 25X2
Subjected to
5X1 + 3X2 60
5X1 + 2X2 80
3X1 + 2X2 60
X1 + 2X2 40
X1 0, X2 0
Solve Formulation example 3 (above) using the graphical method.
2. The Simplex Method
The simplex method is a very well-known and most commonly used algorithm for solving LP problems
algebraically. It can be applied to solve problems involving thousands of decision variables. In practice,
computer codes (programs) are available that employ this method and seldom is the solution sought
manually.
Summary of the Simplex Method (refer also to examples given below)
From the descriptions of the simplex algorithm for solving an LP problem, the solution procedure follows
two basic conditions, that is, the optimality condition and the feasibility condition. More specifically on
the algebraic operations, these two conditions can be phrased as follows.
3Xa + 2X
b= 60
2Xa + 3X
b= 60
Xa + 2X
b= 40
5Xa +
2Xb=
80
40
30
20
10
Xb
3010 20 400XaXa
800

Civil Engineering Dept., AAU WATER RESOURCES DEVELOPMENT
May, 2006 51
The optimality condition dictates the selection of an entering variable which has the potential to further
improve that value of the current objective function. Given the xo row re-expressed in terms of the non-
basic variables only, one selects the entering variable in maximization (minimization) from the non-basic
variables having the most negative (most positive) coefficient in the xo row. When all the LHS coefficients
of the xo row in the simplex tableau are nonnegative (non-positive), the optimum solution to the problem
is reached.
The feasibility condition dictates the selection of a leaving variable so that solutions obtained during
simplex iterations always remain feasible. The leaving variable is the basic variable corresponding to the:
smallest positive ratio of the current value of the basic variables to the positive constraint coefficients of
the entering variable regardless of whether the problem is a maximization or minimization type.
The following steps summarize the simplex method for maximization:
Step 0: Express the problem in standard form with a starting basic feasible solution and then develop the
tableau format. The initial tableau must always contain a basic feasible solution (check for an identity
matrix).
Step 1: Scan the Xo row; if all elements are nonnegative, stop; the optimal solution has been found;
otherwise, go to step 2.
Step 2: Select the entering variable as the one corresponding to the most negative Xo coefficient. This
identifies the pivot column or the key column.
Step 3: Scan the pivot (key) column coefficient; if all are non-positive, stop; the solution is unbounded. If
at least one element is positive, go to step 4.
Step 4: Calculate
0/ ikikii aallforab
Where aik is the ith element of the pivot column. Then find ( )min(
_
i .The variable defined in step 2
replaces the variable of the pivot row in the next solution.
Step 5: To get the next tableau divide the pivot row by the pivot element. Now use this row to perform
row operations (addition of multiples of this row) on the other rows to get all zeros in the rest of the pivot
column (including the xo row).
Return to step 1.
Pivot equation:
New pivot equation = old pivot equation / pivot element
Other equations = old equation – (its entering column coefficient)*(new pivot equation)
Example
Consider Example 2 of the Graphical Method
The objective function can be written as
F = 30X1 + 25X2
Subjected to
5X1 + 3X2 60
5X1 + 2X2 80
3X1 + 2X2 60
X1 + 2X2 40
X1 0, X2 0
Standardize
Max F = 30X1 + 25X2 F - 30X1 - 25X2 = 0

Civil Engineering Dept., AAU WATER RESOURCES DEVELOPMENT
May, 2006 52
Subject to
5X1 + 3X2 + X3 = 60
5X1 + 2X2 + X4 = 80
3X1 + 2X2 + X5 = 60
X1 + 2X2 + X6 = 40
Select set of m (no. of constraint equations) variables that yield feasible trial solution and set the n-m
(where n is the number of unknown) variables to zero, then solve the m equations for the selected m
variables to obtain a solution. Such a solution is called a basic solution. The selected variables are called
the basic solution variables or simply the basis. The variables set equal to zero are the outside variables or
nonbasic variables.
X1 = X2 = 0 ; hence nonbasic solution.
Reading Assignment
Shadow price
Degenerecy
crop
Variables
Basic V f x1 x2 x3 x4 x5 x6 b b/a
f 1 -30 -25 0 0 0 0 0
x3 0 2 3 1 0 0 0 60 30
x4 0 5 2 0 1 0 0 80 16
0 1 0.4 0 0.2 0 0 16
x5 0 1 2 0 0 1 0 40 40
x6 0 3 2 0 0 0 1 60 20
f 1 0 -13 0 6 0 0 480
x3 0 0 2.2 1 -0.4 0 0 28 12.72727
0 0 1 0.4545 -0.18182 0 0 12.73
x1 0 1 0.4 0 0.2 0 0 16 40
x5 0 0 1.6 0 -0.2 1 0 24 15
x6 0 0 0.8 0 -0.6 0 1 12 15
f 1 0 0 5.9091 3.636364 0 0 645.5
x2 0 0 1 0.4545 -0.18182 0 0 12.73
x1 0 1 0 -0.182 0.272727 0 0 10.91
x5 0 0 1 0 -0.125 0.625 0 15
x6 0 0 0 -0.364 -0.45455 0 1 1.8182

Civil Engineering Dept., AAU WATER RESOURCES DEVELOPMENT
May, 2006 53
3.5 Dynamic Programming (DP)
Dynamic programming (DP) is a mathematical procedure designed primarily to improve the
computational efficiency of solving selected mathematical programming problems by decomposing them
into smaller, and hence computationally simpler, subprograms. Dynamic programming typically solves the
problem in stages, with each stage involving exactly one optimizing variable.
DP transforms a complicated n-variable decision process into a series of n-stages with a single decision at
each stage. For instance, take the case of maximizing a monthly (variable) yield for a reservoir of known
capacity. Assume further that there are n-months of historic (or synthetic, for that matter) flow records.
Typically this is an optimization problem in which the n-months’ releases are to be optimized. In an LP
formulation, the optimization algorithm attempts to maximize the releases by formulating an appropriate
objective function that involves the releases of all the months. DP, on the other hand, approaches the
problem from a different angle. The optimization problem is transformed as a sequence of n decision
processes, or stages, at which the single monthly release at, say month i, is “optimally” selected to
maximize the total release over the entire length of record. Thus, decision is made at each stage; in the
present example, at each month. This sequential decision process can be shown as in the following figure:
Figure 3-3 Basic elements and terminologies:
Stages: are the points, in time or space, where decision are made.
Decision Variables (di) : are courses of action to be taken for each stage. In the example discussed above,
the release to be made at each stage (i.e. month) is an example of a decision variable.
State variables (Si): are variables that describe the state of the system at any stage i. In the example above,
for instance, the amount of water available in the reservoir at the end of each stage is a state variable.
Stage return (ri): is a scalar measure of the effectiveness of the decision making at each stage. This can be
viewed as a component of the objective function in the context of LP optimization. The stage return is a
function of the input state, the output state, and very importantly, the value of the decision variable at that
stage.
Stage transformation or state transition (tn): is a single-valued transformation which expresses the
relationships between the input state, the output state, and the decision. The state transition is used to
estimate feasible states in the next stage, given the state at the end of the current stage.
Consider the following example (to be discussed in the class): suppose there is a volume Q of water to be
allocated to 3 users and let X1, X2, and X3 be the quantities allocated to the three users and R1(x1), R2(x2)
and R3(x3) denote the corresponding benefits realized from these allocations. It is desired to allocate the Q
amount of water to the three users so that the total revenue is to be maximized. The problem can be
formulated as a sequential decision process and then solved using DP.
S1 S2
r1
1
d1
r2
S3
1
d2
i
di
ri
Si Si+1
N-1
dN-1
N
dN
rN-1 rN

Civil Engineering Dept., AAU WATER RESOURCES DEVELOPMENT
May, 2006 54
The allocation made to the first user affects the subsequent allocations to be made to the remaining two
users as water that is allocated to user 1 is no more available for downstream uses. Thus, the allocations to
made to any of the users should be made in such a way as to maximize the total benefit. The feasible space
for the decision variables x1, x2, and x3 also are not the same. Because of the locations of the users,
allocation to the first user can be made from the total mount of water available, Q, while that for the
second user can be made only from the amount S2 = Q – X1. Similarly, X3 can take values between zero,
no allocation, and a maximum of S3 = Q – X1 – X2 = S2 – X2.
Let f1(Q) be the maximum possible net benefits from allocations x1, x2, and x3, for a given quantity of
water, Q. Then
)x(R)x(R)x(R)Q(f maxmaxmaxxxx
\
3322111
321
(1)
where
2133
122
1
0
0
0
XXQSX
XQSX
QX
by the same reasoning, if f2(S2) is the maximum possible net benefit from allocations made after the first
stage, i.e. x2, and x3, then
)x(R)x(R)S(f maxmaxxx
\
332222
32
(2)
From the above two equations,
)S(f)x(R)Q(f maxx
22111
1
, but since S2 = Q – X1,
Q = S1
Stage 1: (User 1)
Benefit R1 Stage 2: (User 2)
Benefit R2
Stage 3: (User 3)
Benefit R3
X1
X2 X3
S2 = S1-X1 S3 = S2-X2
S4 = S3-X3

Civil Engineering Dept., AAU WATER RESOURCES DEVELOPMENT
May, 2006 55
)XQ(f)x(R)Q(f maxx
12111
1
(3)
Where QX10
The solution to the above problem is recursive, since, to solve (3), the value of f2(Q-X1) must be known.
On the other hand, f2(Q-X1) can be evaluated if f3(Q-X1-X2) is known. The above is what is known as
backward formulation of the DP solution procedure. The problem could also be formulated as a forward
problem, in which solution starts from the first stage.
Recursive computation is a feature of DP; the computations at the current stage utilize a summary
information of the cumulative optimal values of the objective (revenues in the above example) of all the
stages previously considered. The forward and backward recursive equations for a general case depicted in
the above picture are given below:
)S(f)d,S(r)S(f
)S(f)d,S(r)S(f
i
*
iiii
d
i
*
i
i
*
iiii
d
i
*
i
opt
opt
i
i
11
11
DP solution procedure is based on a principle forwarded by Bellman: No matter in what state of what
stage one may be, in order for a policy to be optimal one must proceed from that state and stage in an
optimal matter; this is known as Bellman’s principle of optimality.
Multiple state variables
The problem discussed involved the optimal allocation of a single variable, i.e. water, and as such involves
only one state variable. There are, however, cases where two or more state variables are involved, such as
the case of finding optimal operation of two interconnected reservoirs. In such cases, for each stage, the
decision has to be made on the values of the releases from both reservoirs. Such cases where multiple state
variables are involved increase the required computational effort. In general, the total number of discrete
states that have to be considered increases exponentially as the number of state variables increases, a
phenomenon terms “curse of dimensionality” of multiple-state-variable dynamic programming problems.

Civil Engineering Dept., AAU WATER RESOURCES DEVELOPMENT
May, 2006 56
3.6 Economics for WR Systems
3.6.1 General
The task of water resources planners can be broadly summarised as
identification or development of alternative water resource design (or management) plans
and the evaluation of the economic, ecological, environmental and social impacts of these
alternative plans
select (or advise on the selection of ) most appropriate alternative plan
Among the various criteria that are used for the comparison of alternative plans the economic one is the
most frequently used and quantifiable criterion. It involves basically the computation of the benefits and
costs a plan would entail should it be implemented, i.e. Benefit Cost Analysis (BCA).
Below are listed some steps (from Linsley) that could be followed in an economy study for WR planning:
1. Each alternative that seems promising should be identified and clearly defined in physical terms
2. Insofar as practicable, the physical estimates for each alternative should be translated into money
estimates
3. Usually the money estimates need to be placed on a comparable basis by appropriate conversion
that make use of the mathematics of compound interest.
4. A choice (or recommendation for a choice) among the alternatives must be made. This choice is
properly influenced both by the comparison in terms of money units and by other matters that it
has not been practicable to reduce to money terms (so-called "irreducibles" or "intangibles").
3.6.2 Formulating the Analysis
Economic analysis is performed in a series of steps. Each alternative must be explicitly defined and the
resulting physical consequences must be predicted. A monetary value must be placed on each physical
consequence. A discount rate must be selected and applied to convert the predicted time stream of
monetary values into an equivalent single number. Only then can the alternatives be directly compared.
Each step is developed as follows.
3.6.3 Defining the Alternatives
An engineering alternative is a course of action physically capable of achieving the design objective.
Structural alternatives (a dam, for example) characteristically involve a large first cost for project
construction to produce benefits throughout the project life. Nonstructural alternatives (flood-plain zoning,
for example) involve benefits and costs which are both fairly well distributed over project life. A properly
defined alternative must be specified by the engineer with sufficient clarity for its economic and intangible
consequences to be evaluated and its nature understood by those responsible for the final selection.
Properly defined alternatives are an evidence of clear thinking and a necessity for adequate consequence
prediction. A properly formulated set of engineering alternatives includes all possibilities for action
(including taking no action at all) which have a realistic chance of proving optimum. Special care is
necessary to include nonstructural alternatives with which engineers may be less familiar. The alternatives
are called mutually exclusive if only one of a set can be selected. Alternatives may be mutually exclusive
because of conflicting space requirements, limited financial resources, limited resource inputs (water, for
example), or limited demand or need for resulting output. At other times, it may be practical to implement
two or more of the alternatives.

Civil Engineering Dept., AAU WATER RESOURCES DEVELOPMENT
May, 2006 57
3.6.4 Physical consequences - Benefits and Costs
Definition
Benefits and costs can only be measured with respect to a goal. Each alternative course of action requires
the commitment of resources. Benefits measure the effectiveness of the action in achieving the goal. The
resources once committed cannot be used elsewhere. Their commitment has the opportunity cost of other
uses sacrificed. Costs measure the effectiveness of the sacrificed action in achieving the goal.
Theoretically, benefits and costs may be based on any desired goal. Ideally, the goal would be an
unambiguous and unanimously accepted social welfare function. Practically, the goal becomes the second-
order efficiency objective of economic efficiency or maximum national income. However, numerical
estimates of benefits and costs with respect to other goals are sometimes also included. Strictly speaking,
such effects cannot be measured in the same units as efficiency benefits or efficiency costs. Combining the
two requires a value judgement on the relative merits of the goals.
The effectiveness of alternative courses of action in reaching the efficiency goal is measured with
reference to the pure-competition model. Even though planning from the public viewpoint is based on a
market model, the analysis differs from that which would be made by a private firm. The primary
differences are:
1. The public viewpoint incorporates all costs and all benefits to whomsoever they may accrue.
External economies and diseconomies need to be evaluated.
2. The discount rate may be lower than that used by private firms because of the substitution of
collective time preference for the financial const of borrowed money.
3. When market prices lose their normative significance because of deviation from the pure
competition model, the government planner, rather than continue to use them as does the private
planner, should attempt to evaluate the true economic worth of each input and output.
4. When analyzing projects producing products or outputs which are not marketable, the government
planner must derive an equivalent market value through demand analysis.
Benefit – Cost Categories
Project consequences fall into four main classes:
1. Tangible (Market) benefits
2. Intangible (Extra market) benefits,
3. Project construction associated/induced costs, and
4. Project installation cost.
1. Tangible (Market) benefits: result from the consequences to private parties which can be assigned a
monetary value. Many consequences are evaluated in the market place but consequences are still
considered tangible even though they must be established by a more elaborate deductive process. The
decision of how abstract a consequence must be before it can no longer be assigned a meaningful
monetary value is essentially a value judgement, and hence some agencies set numerical values on
consequences which other agencies consider intangibles. Benefit as used in the following discussion is a
net value incorporating both adverse and favourable consequences and may on occasion be negative.
a) Primary benefits denote the value obtained fro project-produced goods and services. The benefits
accrue from physical effects of the project on the user as contrasted with effects transmitted through
market transactions.
(i) Direct benefits accrue to those who put project output to its intended use. By project purpose,
they may consist of a reduction in physical damage to items coming in contact with flood-water,
increase in farm income resulting from application of irrigation water, the value the consumer

Civil Engineering Dept., AAU WATER RESOURCES DEVELOPMENT
May, 2006 58
received from the use of electric power, the savings in transportation cost for goods moved by
navigation, or the satisfaction the re-creationist derives fro this experience.
(ii) Indirect benefits result as individuals realize the economic consequences of technological
external effects. The effects may result either from the production of project output or from its use
by others. Output intended for one purpose (low-flow augmentation for water quality control) may
also achieve other beneficial effects (navigation). Flood control projects may benefit users of
transportation and communication systems by reducing interruptions and reduce the wages lost by
workers or crop losses by farmers when industrial or food-processing plants are closed by flooding,
Irrigation may reduce dust storms.
(iii) Land-enhancement benefits result when a more productive land use is made possible by the
project and are distinguished from direct benefits to the land use, which would prevail without the
project. For example, a flood control project may enable farmers to shift from a lower- to a higher-
value crop by reducing flooding. Land-enhancement benefits equal the net crop income from the
higher-value crop with flood protection less the net crop income from the lower-value crop with
flood protection. The direct benefits are the net gain in crop income from the lower-value crop
which results because of the prevention of flood losses. Sometimes flood protection causes
agriculture to be replaced by urban development, and the increase in land productivity is considered
a land-enhancement benefit. Agricultural land-enhancement benefit is not distinguished from other
primary benefits in irrigation projects where the crop pattern radically changes with the arrival of
irrigation water. However, the enhancement of land value within urban areas surrounded by newly
irrigated land is a benefit which may be properly attributed to project construction.
b) Secondary benefits denote value added to activities influenced by the project through economic rather
than technological linkages. They result from pecuniary external effects.
i. Secondary benefits (“steming-from” benefits) may result from forward production linkages that
increase the net income of those who process project output. Cotton production by an irrigation
project must be processed a number of times before it is sold as clothing, and each intermediate
processor may profit from the increased business. The net stemming-from benefit is the income
from processing project output net of the sum of the income which would be obtained from
processing output displaced by the project and output which would result were the money spent on
the project devoted to an alternative investment.
ii. Secondary benefits ("induced-by" benefits) may result from backward production linkages which
increase the net income of those who provide goods and services to the project area. Cotton
produced by an irrigation project will require the purchase of farm machinery, fertilizer, and other
materials and thus initiate a chain reaction profiting all these businesses and all those who in turn
supply them. Again, the net induced-by benefit would be the increased income of those serving the
project area less the loss in income of those who would otherwise provide input for the alternate and
the displaced investments.
c) Employment benefits: denote the economic-value gained from the increased employment opportunity
from new jobs created to construct, maintain, or operate the project. A related effect is the increased
employment opportunity induced by production of project output. Irrigation projects attract those
living elsewhere on a marginal income to a new productive rural enterprise. Project output may also
stimulate investment opportunity on the farms and within the communities where it is used.
d) Public benefits: are realized in achievement of goals other than economic efficiency and thus can be
evaluated in efficiency dollars only by means of a value judgment on the relative desirability of the
second goal. Specific recognition is most often given economic stabilization, income redistribution,
regional development, and environmental quality.
2) Intangible (extra market) benefits: describe consequences which cannot be assigned a monetary
value but which should be considered when deciding whether or not to build a project. Examples are the
saving of life or improvement of health, improved environmental aesthetics, and the preservation of areas
of unique natural beauty and scenic, historical, or scientific interest.

Civil Engineering Dept., AAU WATER RESOURCES DEVELOPMENT
May, 2006 59
3) Project construction: requires private parties to bear costs as well as realize benefits. These costs are
subtracted from the benefits to calculate a net benefit realized.
(a) Associated costs: include private investment to produce or utilize project output. An example is
the farm costs required to prepare the land for irrigation, convert to a new cropping pattern, and
purchase the machinery required by the new crops. Whenever secondary benefits are counted for
project justification their associated costs should also be counted. Sometimes non-sponsoring public
agencies may be required to pay the cost of such items as schools and better roads to serve the more
intensive land use.
(b) Induced costs: evaluate adverse consequences of project construction and should be evaluated
whether or not the sponsoring agency has a legal financial obligation to pay damages. Examples are
the cost of downstream flood control measures necessitated by upstream land drainage, the
increased cost of transportation required for the discharge of the excess flow, and the cost of
drainage system to remove excess irrigation water.
4) The cost of project installation: is placed in the denominator of the benefit-cost ratio. The initial cost
includes construction cost, engineering and administration cost, right-of-way cost, the cost of relocating
facilities, and other minor costs. Construction cost is the amount paid to the contractor for completing the
work outlined in the plans and specifications. Engineering and administration cost is the expense of
preparing the necessary plans and specifications, inspecting construction work, providing technical review
of engineering details, conducting special investigations such as hydraulic-model studies or geologic
exploration, and completing the incidental administrative paper work. Right-of-way cost is the opportunity
cost of using the land required for project installation and maintenance. Lands which may still be used by
the original owner such as lands along a reservoir periphery, inundated only during exceedingly rare
floods, or lands under overhead power lines or over underground pipelines may be secured by easements.
The cost of relocating facilities is the amount required to move or to modify bridges, roads, railroads,
pipelines, and power lines located on the project right-of-way. Other costs include state dam filing fees or
payments for water-rights acquisition.
After installation, the project has continuing costs of operation, maintenance, and replacement. Operation
includes the opening and closing of gates, overseeing hydroelectric plants, purchasing power for pumping,
and other activities required to produce project output on a continuing basis. Maintenance includes
preventive maintenance to reduce anticipated breakdowns and repairs to the project production
mechanism. Weeds must be cleaned out of channels and erosion damage repaired. Machinery must be
serviced. Recreational areas must be kept clean and attractive. Trash blocking flow through culverts must
be removed. Major repairs may be needed after large floods. Replacement includes installing at periodic
intervals new pumps, well casings, or machinery whose useful life is less than that of the project as a
whole.

Civil Engineering Dept., AAU WATER RESOURCES DEVELOPMENT
May, 2006 60
3.6.5 Benefit-Cost Analysis (BCA)
General
Having identified the physical consequences of each alternative, it is necessary to decide which ones are
relevant to the analysis. Some may not be because of the viewpoint taken in the study, a neutral effect
which is neither desirable nor undesirable, a tenuous connection to the project, their small magnitude, or
some other reason. Other consequences may be dropped from further evaluation because they are identical
for each alternative and an economic study is concerned only with differences (incremental costs). The
relevant consequences can be separated into two groups. Some can be assigned a reasonable monetary
value. The others may have some monetary value but also require supplemental determination of the
intangible factors.
Essentially BCA offers a way of comparing benefits and costs of a given alternative plan. The basic
problem associated with such procedure is, however, the fact that the different alternatives considered may
involve components that may have different design life. Moreover, the costs and benefits may occur at
different times. In most of the cases a major portion of the total cost of a project occurs at the beginning.
For example, a hydropower development involving the construction of a dam requires that the dam and all
the other necessary structures (conveyance, turbines, etc) be built at the beginning. The benefits in the
form of revenue from sale of electrical energy come over an extended period of time. Hence the costs and
benefits should be reduced to some common time to be compared. This is usually done making use of the
"time value of money".
To do this, estimated lives of elements are needed in the computation of annual benefits and costs of
projects. The table below is taken from US experience and the values given should serve as guide. Actual
local data should preferably be used whenever available. The life of a component of a project (say
reservoir) is governed by many other factors than the actual deterioration of the involved hydraulic
structures. In addition to the useful lives of the elements a project one has to select the rate at which the
discounting is going to be done, i.e. fix discount rate. Values used depend on the economy of the country,
and whether the project is implemented by a private enterprise or is part of public work.
Cash flow diagram
The graphic presentation of each value plotted by time is called a cash flow diagram. The standard
representation for a cash flow diagram is that receipts (benefits) are represented by arrows pointing
upward, while costs are represented by arrows pointing downward. Arrows pointing toward the centerline
indicate cash flows which may be taken either way in a general diagram. The length of the arrow is made
proportional to the cost or benefit. The horizontal axis denotes time. For convenience in analysis and with
little loss in accuracy for long-lived projects, all cash flows during a year are by convention combined into
lump sums occurring at the end of the year. Figure 3-4 is a cash flow diagram which might be predicted
for our hypothetical irrigation project.
Time
Envelope curves
Annual operation and maintainance cost
with periodic larger replacement cost
Large expenditure during period of initial
project construction
Additional benefit as
irrigation extends to
new land
Benefit from average crop production

Civil Engineering Dept., AAU WATER RESOURCES DEVELOPMENT
May, 2006 61
Figure 3-4 Cash flow diagram for a hypothetical irrigation project
Annual benefits and costs will not in fact be constant every year but will vary around average values in an
almost random fashion with crop production and maintenance needs. However, only expected average
values are normally predicted in advance, even though the random component could conceivably be
introduced through simulation. Drawing of the cash flow diagram can be greatly simplified by use of
envelope curves as a substitute for the many arrows.
Discounting factors
There are discounting formulae that are used to worth of money at different times. The forms of payment
considered could either be single payment at some time (say at the beginning) or a stream (or series) of
payments. The problem could be to find the present worth of series of payments in the future, or a single
amount at some time in the future, or to find the equivalent stream of payments for a given present value,
etc. The six basic formulae are given below:
1. Single-payment compound amount factor
F = P(1+ i)n
2. Single-payment present worth factor
P = F/(1+ i)n
3. Sinking fund factor
4. Capital recovery factor
5. Uniform series compound amount factor
6. Uniform series present worth factor
n
n
ii
iAP
)1(
1)1(
Where F = a future sum of money
P = present sum of money
A= an end-of-period payment (say annual, or monthly)
i = interest (discount) rate
1)1( ni
iFA
1)1(
)1(n
n
i
iiPA
i
iAF
n 1)1(

Civil Engineering Dept., AAU WATER RESOURCES DEVELOPMENT
May, 2006 62
Table 3-1Lives (in years) for some elements of hydraulic projects (Linsley)
Item Years Item Years
Canals and ditches
Coagulating basins
Construction equipment
Dams:
Crib
Earthen, concrete, or masonry
Loose rock
Steel
Filters
Flumes:
Concrete or masonry
Steel
Wood
Fossil-fuel power plants
Generators:
above 3000 kva
1000 - 3000 kva
50 hp - 1000 kva
below 50 hp
Hydrants
Marine construction equipment
Meters, water
Nuclear power plants
Penstocks
75
50
5
25
150
60
40
50
75
50
25
28
28
25
17-25
14-17
50
12
30
20
50
Pipes:
Cast-iron
2 - 4 in.
4 - 6 in.
8 - 10 in.
12 in. and above
Concrete
Steel
Under 4 in.
over 4 in.
Transmission lines
Tugs
Wood-stave
14 in. and larger
3 - 12 in.
Pumps
Reservoirs
Standpipes
Tanks:
Concrete
Steel
Wood
Tunnels
Turbines, hydraulic
Wells
50
65
75
100
20
30
40
30
12
33
20
18-25
75
50
50
40
20
100
35
40-50
3.6.6 Methods of Economic Appraisal (Discounting Techniques)
Once the lives of elements of a project and the discount rate are fixed the BCA can be made in one of the
following ways:
I. Present worth Method (PW)
In the present worth method a project is selected as best if it results in largest present worth (PW) of the
discounted algebraic sum of benefits and costs over the project’s lifetime.
n
t
tt CBtiF
PPW
1
(%),,
Where Ct is the cost and Bt the benefit with the subscripted year, n is the period of analysis in years, and i
is the discount rate. When the annual net benefits B = Bt -Ct are constant over the project life except for
the initial first cost K the formula may be simplified to:

Civil Engineering Dept., AAU WATER RESOURCES DEVELOPMENT
May, 2006 63
niF
PKPW (%),,B
When the net benefits vary according to some regular gradient, the appropriate gradient factor should be
used. Calculation of present worth from a cash flow diagram is a purely mechanical process. However,
certain rules must be followed in comparing the calculated present worth to make correct choices.
RULE 1: Figure all present worths to the same time base. Whether or not alternatives are to be initiated at
the same time, each present worth must be discounted to the same base year because sums of
money at different times are different economic goods.
RULE 2: Figure all present worths by using the same discount rate. Whether or not alternatives are to be
financed from the same funds, each must be discounted at the same rate if the result is to be an
index of intrinsic project merit.
RULE 3: Base all present worths on the same period of analysis. Whether or not alternatives have a
common economic life, the comparison must be based on a service provided over a common
period of time. This may be done either by evaluating the- cost of extending the service past the
termination of the shorter-lived alternatives or by calculating the value of the unused life of the
longer-lived alternatives.
RULE 4: Calculate the present worth of each alternative. Choose all alternatives having a positive present
worth. Reject the rest. This ends the procedure if no sets of mutually exc1usive a1tematives are
involved. The choice among alternatives in such a set is made by Rule 5.
RULE 5: Choose the alternative in a set of mutually exclusive alternatives having the greatest present
worth.
RULE 6: If the alternatives in the set of mutually exclusive alternatives have benefits which cannot be
quantified but are approximately equal, choose the alternative having least cost.
Example
A single example based on the two mutually exclusive alternative water supply projects described in Table
shown below will be used to illustrate all four discounting techniques. Project A provides an initial
investment large enough to meet the demands for water for 40 years, and project B uses investment in two
stages to meet the same demand. The present worths are calculated to be
No Item Project A Project B A - B
1 Construction cost
$40,000,000 $25,000,000 1st stage $ 15,000,000
$30,000,000 2nd stage $ -30,000,000
2
O and M (per year)
$160,000 for 40 years
$100,000 1st 20 years $ 60,000
$220,000 2nd 20 years $ - 60,000
3 Economic life (years) 40 40 for each stage
4 Period of analysis (Years) 40 40
5 Annual benefits $2,500,000 $2,500,000
6 Discount rate 5% 5%
For Project A
PW of Benefits = 2,500,000[P/A, 5%, 40] = 42,900,000
PW of Cost = 40,000,000 + 160,000[P/A, 5%, 40] = 42,740,000
PW of A = PW of Benefits - PW of Cost
= 2,500,000[P/A, 5%, 40] - 40,000,000 – 160,000[P/A, 5%, 40] = 153,000
For project B
PW of Benefits = 2,500,000[P/A, 5%, 40] = 42,900,000

Civil Engineering Dept., AAU WATER RESOURCES DEVELOPMENT
May, 2006 64
PW of costs = 25,000,000 + 30,000,000[P/F, 5%, 20] + 100,000[P/A, 5%, 20] + 220,000[P/A, 5%, 20]
[P/F, 5%, 20] = 38,590,000
PW of B = 42,900,000 – 38,590,000 = 4,308,000
Therefore we should choose project B since its present worth is greater. If the role of analyzing only
differences were strictly applied, the equal annual benefits could be deleted from the evaluation of each
alternative to provide the same conclusion with less work.
II. Benefit-Cost-Ratio Method (BCR)
Benefit cost ratio method computes the BCR to select the most promising project among alternative
projects. The BCR is defined as the ratio of present worth of benefits (PWb) and present worth of costs
(PWc).
c
b
PW
PWBCR
n
i
c
n
i
b
CniF
PPW
BniF
PPW
1
1
(%),,
(%),,
Annual values can alternatively be used without affecting the ratio. Series discounting factors may be used
in either summation as appropriate.
The decision on whether particular cash flows should be considered costs or negative benefits is
sometimes arbitrary and affects the benefit-cost ratio. While it does not affect project selection by the
procedure described below, it is important to recognize that the best project has the greatest net benefits,
not the largest benefit-cost ratio. Several authors have suggested that the benefit-cost ratio method leads to
different decisions than the other techniques do. However, this conflict only occurs when the incremental-
cost principle of Rule 4 is neglected.
Four rules must he followed to apply the method correctly.
RULE 1 Figure all benefit-cost ratios by using the same discount rate.
RULE 2 Compare all alternatives over the same period of analysis.
RULE 3 Calculate the benefit-cost ratio for each alternative. Choose all alternatives having a benefit-cost
ratio exceeding unity; Reject the rest. If sets of mutually exclusive alternatives are involved,
proceed to Rule 4.
RULE 4 Rank the alternatives in the set of mutually exclusive alternatives in order of increasing cost.
Calculate the benefit-cost ratio by using the incremental cost and incremental benefit of the next
alternative above the least costly alternatives. Choose the more costly alternative if the
incremental benefit-cost ratio exceeds unity. Otherwise, choose the less costly alternative.
Continue the analysis by considering the alternatives in order of increased costliness, the
alternative on the less costly side of each increment being the most costly project chosen thus far.
Example:
Project A and B considered before are mutually exclusive.
Project Benefit Cost B C B/ C
B 42,900,000 38,590,000 0 4,150,000 0
A 42,900,000 42,740,000
B/ C = 0 << 1 hence Project B shall be selected based on the Benefit cost ratio method of analysis.
III. Rate-of-Return Method (ROR)
The rate of return is defined as the discount rate at which the present worth equals zero and is found by
trial and error. The project with highest rate of return is selected from alternative projects.

Civil Engineering Dept., AAU WATER RESOURCES DEVELOPMENT
May, 2006 65
RULE 1 Compare all alternatives over the same period of analysis. Rates of return over different
economic lives can not be meaningfully compared because investment opportunity for the returns
from the shorter-lived alternatives must be considered in determining whether capital should
remain committed to the longer-lived alternative.
RULE 2 Calculate the rate of return for each alternative. Choose all alternatives having a rate of return
exceeding the minimum acceptable value. Reject the rest. If sets of mutually exclusive alternatives
are involved, proceed to Rule 3.
RULE 3 Rank the alternatives in the set of mutually exclusive alternatives in order of increasing cost.
Calculate the rate of return on the incremental cost and incremental benefits of the next alternative
above the least costly alternative. Choose the more costly alternative if the incremental rate of
return exceeds the minimum acceptable discount rate. Otherwise choose the less costly alternative.
Continue the analysis by considering the alternatives in order of increased costliness, the
alternative on the less costly side of each increment being the most costly project chosen thus far.
The rate-of-return method will not lead to the same decisions as the present-worth method unless the
incremental analysis of Rule 3 is used in place of selecting the mutually exclusive alternative with the
highest rate of return. The rate-of-return method must be applied with caution because more than one rate
of return exists when annual costs exceed annual benefits in years after annual benefits first exceed annual
costs, but Heebink has shown that the rate-of-return method using Rule 3 still gives consistent answers
even when dual solutions exist. The water resources planner needs to be alert to this problem in comparing
stage construction or non-structural alternatives by the rate-of-return method.
Example:
Referring to the Table of the previous example
PW = PW of Benefits - PW of Cost = 0
PW of A = 2,500,000[P/A, i%, 40] - 40,000,000 – 160,000[P/A, i%, 40] =0
i = 5.03%
PW of B = 2,500,000[P/A, 5%, 40] - [ 25,000,000 + 30,000,000[P/F, 5%, 20] + 100,000[P/A, 5%, 20] +
220,000[P/A, 5%, 20] [P/F, 5%, 20]] = 0
i = 6.5%
Since both return values are greater than the minimum (5%) the rate of return for the increamental cost
and benefit shall be determined.
Rate of return by for selecting project A against B
15,000,000 – 30,000,000[P/F ,i% ,20] + 60[P/A ,i% ,20] - 60[P/A ,i% ,20] = 0
By trial and error i = 3.39% which is less than 5%
Hence project B is selected as its cost is less than that of project A
IV. Annual Cost Method (AC)
The annual cost method converts all benefits and costs into equivalent uniform annual figures and net
annual benefits are computed. Decision rules resemble those for the present-worth method because each
annual cost is a present worth times a constant capital recovery factor.
RULE 1 Figure all annual costs by using the same discount rate.
RULE 2 Base all annual costs on the same period of analysis.
RULE 3 Calculate the net annual benefit of each alternative. Choose all alternatives having a positive net
annual benefit. Reject the rest. If sets of mutually exclusive alternatives are involved, proceed to
Rule 4.
RULE 4 Choose the alternative in a set of mutually exclusive alternatives, having the greatest net annual
benefit.
RULE 5 If the alternatives in the set of mutually exclusive alternatives have benefits which can not be
quantified but are approximately equal, choose the alternative having the least annual cost.

Civil Engineering Dept., AAU WATER RESOURCES DEVELOPMENT
May, 2006 66
A simple comparison of benefits and costs requires that one computes the present values (worth) of all
costs (initial as well as others) and benefits and compare the sums and compute the net benefit, i.e.
Benefits minus Costs. Alternatively the benefit-cost ratio can be computed based on the present worth of
the benefits and costs.
The (internal) rate of return (ROR) is that discount rate at which the present worth of benefits and costs
become equal.
3.7 Environmental Considerations in Planning
The growing environmental concern poses a dilemma for engineers faced at one extreme by demands that
all construction cease and at the other extreme by pressure to get on with building as rapidly as possible. A
new set of social values- moral, philosophic, and aesthetic- join technical standards and economic
evaluation as decision factors in the planning process. Although many planners were taken by surprise,
these changes were long overdue. The basic problem of population control will be met, either by man or
nature, but the water-resources planner of the future must give more thought to the environmental
problems.
Planners of the future must be innovative, broad-gaged, and more critical of evaluations of "need." They
cannot look to quantitative measures of beauty or ecology to develop their plans. They cannot rely solely
on a showing of economic benefits. Innovation may require such steps as devising ways to lower water
requirements, encouraging nonstructural solutions in flood mitigation, and finding better ways to treat
wastes and reclaim wastewater. A broad-gage view-point must recognize the interrelationships among
water pollution, air pollution, and solid-waste disposal; the role of water supply in population dispersion;
the consequences of water, project construction on local ecologic relationships, and the effect of projects
on water pollution. Most important of all, however, is the critical evaluation of the real need for a project
It is a reasonable assumption that public works necessary to maintain needed services will continue to be
constructed. Water projects needed to maintain public health and safety and the accepted amenities will be
included in these public works. Hydroelectric projects may be considered as essential replacements for
scarce fossil fuel. Irrigation projects which could be replaced by increased productions in humid regions,
flood mitigation projects which are substitutes for good land management, storage to modify pollution by
dilution when better treatment could serve more effectively, water supply projects to encourage growth of
major metropolitan areas, and recreation projects which compete with nearby projects or natural areas are
also nonessential. The planner will have to be more alert to alternatives than ever before.
Where projects seem to be essential, the planner will find it necessary to consider carefully the ecological
impact on the stream and adjacent areas and try to develop a plan which will have a minimum of
detrimental effects. In the architectural design of structures special thought must be given to appearance.
Special treatment of surfaces to avoid large expanses of concrete, colouring to blend with the
surroundings, planting of grass, shrubs, or trees to enhance visual feeling, and other similar measures
should be considered.
A partial list of environmental consequences of water-resource projects might include:
1. Degradation of downstream channel or coastal beaches by loss of sediment trapped in a reservoir
2. Loss of unique geological, historical, archaeological, or scenic sites flooded by a reservoir
3. Flooding of spawning beds for migratory fish preventing their reproduction or destruction of
spawning gravel by channel dredging or lining
4. Change in stream water temperature as a result of a reservoir leading to changes in aquatic species
in the stream
5. Release of reservoir bottom water which may be high in dissolved salts or low in oxygen resulting
in a change in aquatic species
6. Drainage of swamps, potholes, etc., decreasing the opportunity for survival of aquatic or
amphibious animals or waterfowl

Civil Engineering Dept., AAU WATER RESOURCES DEVELOPMENT
May, 2006 67
7. Change in water quality as a result of drainage from an irrigation project which may encourage
growth of algae in the receiving water or lead to a change in aquatic species as salinity of the
receiving body increases
8. Creation of a barrier to normal migration routes of land animals by a reservoir
9. Altering aquatic species by increased turbidity from man-induced erosion or from dredging
operations
10. Damage to higher species by reason of toxic materials (pesticides, toxic metals, etc.) discharged to
a stream and concentrated in the food chain
11. Damage to fish by passage through pumps or turbines or over the spillways of high dams
12. Damage to stream-bank vegetation by alteration of flow patterns in a stream.
Many more items could be added to this list and there are probably subtle effects which have not yet been
identified. A clear distinction should be made between damage which is temporary (construction
operations, tree clearing, sanitary landfill, etc.) and effects which are long-term and irreversible.

Civil Engineering Dept., AAU WATER RESOURCES DEVELOPMENT
May, 2006 68
Dams and Reservoirs
Potential Negative Impact Mitigating Measures
Direct
1. Negative environmental effects of construction:
Air and water pollution from construction and waste
disposal.
Soi1 erosion
Destruction of vegetation, sanitary and health problems from
construction camps
2. Dislocation of people living in inundation zone
3. Loss of land (agricultural, forest, range, wetlands) by inundation to
form reservoir.
4. Loss of Historic, cultural or aesthetic features by inundation
5. Loss of wild lands and wildlife habitat
6. Proliferation of aquatic weeds in reservoir and downstream impairing
dam discharge, irrigation systems, navigation and fisheries and
increasing water 1oss through transpiration.
7. Deterioration of water quality in reservoir
8. Sedimentation of reservoir and loss of storage capacity.
9. Formation of sediment deposits at reservoir entrance creating
backwater effect and flooding and water logging upstream
1. Measures to minimize impacts:
Air and water pollution control
Careful location of camps, buildings, burrow pits, quarries,
spoil and disposal sites
Precaution to minimize erosion
2. Relocation of people to suitable area, provision of compensation in kind
for resources lost, provision of adequate health services, infrastructure,
and employment opportunities.
3. Siting of darn to decrease losses; decrease size of dam and reservoir,
protect equal areas in region to offset losses.
4. Siting of dam or decrease of reservoir size to avoid loss; salvage or
Protection of cultural properties.
5. Siting of dam or decrease of reservoir size to avoid/minimize loss;
establishment of compensatory parks or reserved areas; animal rescue
and relocation.
6. Clearance of woody vegetation from inundation zone prior to flooding
(nutrient removal); provide weed control measures; harvest of weeds for
compost, fodder or biogas; regulation of water discharge and
manipulation of water levels to discourage weed growth.
7. Clearance of woody vegetation from inundation zone prior to flooding
Control for land uses, wastewater discharges, and agricultural
chemical use in watershed.
Limit retention time of water in reservoir.
Provision for multi-level releases to avoid discharge of anoxic water.
8. Control of land use in watershed (especial1y prevention of conversion
of forests to agriculture)
Reforestation and/or soil conservation activities in watersheds(1imited
effect)
Hydraulic removal of sediments (flushing, sluicing, release of density
currents)
9. Sediment flushing, sluicing

Civil Engineering Dept., AAU WATER RESOURCES DEVELOPMENT
May, 2006 69
10. Scouring of river bed below dam.
11. Decrease in floodplain (recession) agriculture.
12. Salination of flood plain lands.
13. Salt water intrusion in estuary and upstream.
14. Disruption of riverine fisheries due to changes in flow, blocking of fish
migration and changes in water quality and liminology.
15. Snagging of water related diseases
16. Increase of water related diseases
17. Conflicting demands for water use.
18. Social disruption and decrease in standard of living of resettled people.
19. Environmental degradation from increased pressure on land.
20. Disruption/destruction of tribal/indigenous groups.
21. Increase in humidity and fog locally, creating favourable habitat for
insect disease vectors (mosquitoes, tsetses.).
10. Design of tap efficiency and sediment re1ease (e.g. sediment flushing,
sluicing) to increase salt content of released water
11. Regulation of dam releases to partially replicate natural flooding regime
12. Regulation of flow to minimize effect.
13. Maintenance of at least minimum flow to prevent intrusion.
14. Maintenance of at least minimum flow for fisheries, provision of fish
ladders) and other means of passage; provide protection of spawning
grounds; aquaculture and development of reservoir fisheries in
compensation.
15. Selective clearance of vegetation before flooding.
16. Design and operation of dam to decrease habitat for vector
Vector control
Disease prophylaxis and treatment
17. Planning and management of dam in context of regional development
plans; equitable allocation of water between large and small holders and
between geographic regions of valley.
18. Maintenance of standard of living by ensuring access to resources at
least equalling those lost, provision of health and social services.
19. Choice of resettlement site to avoid surpassing carrying capacity of land.
Increase of productivity or improve management of land (agricultural,
range, forestry improvements) to accommodate higher population.
20. Avoid dislocation of un-acculturated people; where not possible, relocate
in area allowing them to retain lifecyc1e and customs.
21. Vector control.
Indirect
22. Uncontrolled migration of people into the area, made possible by
access roads and transmission lines.
23. Environmental problems arising from development made possible by
dam - (irrigated agriculture, industries and municipal growth).
22. Limitation of access, provision of rural development and health services
to try to minimize impact.
23. Basin wide integrated planning to avoid overuse, misuse, and conflicting
of water and land resources.
External
24. Poor land use protection in catchment areas above reservoir resulting
in increased siltation and change in water quality.
24. Land use planning efforts which include watershed areas above dam

Civil Engineering Dept., AAU WATER RESOURCES DEVELOPMENT
May, 2006 70
4 River Basin Development (Master) Plan
4.1 General
Master Plan (for the integrated development of resources): is a phased development plan formulated to
exploit the opportunities for single and multipurpose water resources projects in a defined geographic area
over a specific period of time. Often the development of other resources, such as land, mineral, etc, is also
considered in such studies. The terms ‘River Basin Development Plan’, or ‘Master Plan for the Integrated
Development of Resources’ are also used with more or less the same meaning.
The basic objectives of RB development master plans are:
The preparation of the river basin development master plan that will guide the development of
resources in the basin particularly with respect to the occurrence, distribution, quality and quantity
of water resources for a period of about 30 to 50 years,
The preparation of water allocation and utilisation plan(s) under alternative development scenarios
and to generate data, information and knowledge that will contribute to the future water allocation
negotiations with other co-riparian regions (or countries).
Regional plans of this type often include a schedule showing the phased development of programs,
sufficient information on the characteristics of each project to indicate clearly general physical
arrangements, scale, controlling parameters (such as dam elevation, capacities), and a schedule of
investment costs.
These plans are based on a review of previous reports on individual projects, on discussions with planners
in governmental agencies and other organisations, with private individuals, on the results of screening
studies; and on topographic, geological, hydrological and other information.
Integrated WR master planning can be classified as: single-jurisdiction, multi-jurisdiction, international (or
inter-state), and those involving inter-basin water transfer.
(Elaborate this, together with maps showing)
4.2 Components of a River Basin Development Master Plan
Most river basin development plans comprise of three basic components, namely, WR Planning, Regional
Planning and Landuse Planning.
Water Resources Planning: this unit addresses the development of water and associated resources within
the physical boundaries of the river basin. The activities under this component of the master plan include
the following tasks:
a) Assessment of water resources
Studies are conducted with the aim of assessing the WR potential of the basin. Below is a brief outline of
these studies and the results expected:
Hydrogeology: types, and extents of aquifers, hydraulic and other relevant parameters of the groundwater
aquifer, groundwater level maps, recharge rates, safe yields, etc. Inventory of existing groundwater
exploitation schemes such as boreholes, springs, long-term forecast of probable change in quantity and
quality of groundwater, etc.
Hydrology-Climatology: climatic and hydrometric variables required for other studies, such as land use
planning, hydrogeology, irrigation and drainage, dams and reservoirs. Such information include: design
floods for hydraulic structures, yield of catchments for selected storage sites, sediment yields, water
quality (such as for irrigation).
b) WR development studies (projects)
Irrigation and drainage: deals with existing irrigation development in the basin and
identification of future development sites and design of selected schemes.

Civil Engineering Dept., AAU WATER RESOURCES DEVELOPMENT
May, 2006 71
o assessment of irrigation potentials of the basin (small, medium and large scale
development), identification of irrigation schemes that will be considered for further
analysis, collection and analysis of or related data, the preparation of technical data such
as evaluation of irrigation water requirement, and typical design criteria, typical designs
and quantities.
o Identification of possible problems of drainage, soils salinity, and proposal preparation to
deal with these problems, if they exist.
Dams and reservoirs: deals with assessment of possibilities for water storage for other uses (such
as irrigation, power production, etc). Moreover, preliminary designs are made and economic
analysis conducted to screen out the less suitable sites.
o Identification of possible storage sites,
o Preliminary design works and determination of dam sections, economic analysis of
selected dams and their viability assessed,
Hydropower development: deals with the identification and study of potential hydropower
development sites. In particular the following are carried out:
o Analysis of project natural conditions (topography, hydrology, geology, and geotechnics),
o Preliminary design of involved hydraulic structures,
o Preliminary cost estimate of the selected projects and prioritisation for future
development.
Water supply and sanitation/sewerage: is concerned with urban and rural community water
supply and sanitation, i.e. water supply for human consumption, livestock, industrial use, for
mining operations, etc. The following are main activities:
o Assessment of exiting water supply coverage in the basin, problems and identification of
gaps,
o Forecast of population and demand trends for the period of the master plan,
o Evaluation of the performances of community water supplies and identification of their
adequacy (in quality and quantity).
o Identify water supply and sanitation projects to be studied in more detail,
o Review and evaluation of existing and/or proposed policy, strategies, legislation and
institutions existing water tariffs and formulation of recommendations.
c) Water Resources Development Planning:
Deals with the formulation of alternative development scenarios. The various projects identified in the
different sectors, mainly under irrigation and drainage, hydropower development, is considered and
alternative scenarios are played to assess the response of the WR system.
Regional planning deals with development and spatial distribution of all human (economic) activity within
the basin.
Land use planning is concerned with the allocation and use of land between competing purposes.
Often the preparation of RB master plan involves large number of people organised in groups. The studies
may take, depending on size and complexity of basin, up to 3 to 4 years to complete. The grouping of
experts in a typical RB master plan study is shown below:
Natural Resources
Geology and Mineral Resources
Wildlife
Fishery
Energy
Forestry

Civil Engineering Dept., AAU WATER RESOURCES DEVELOPMENT
May, 2006 72
Water Resources
climatology/hydrology
hydrogeology
irrigation and drainage
dams and hydropower
dam geology
WR development planning
Socio-Economy
Regional planning, economy and institutions
Urban development planning (and tourism)
Demography/sociology
Environment
environment
soil conservation
health
Agriculture
agriculture
livestock
land use planning/ agro economy
soils survey
Technical support groups
GIS
Surveying and Drafting
Laboratories (soils, water quality, etc)
4.3 Phases of a Master Plan Study
RB planning studies are conducted in three phases as outlined below:
Phase I: Reconnaissance level investigation and preparation of indicative master plan
Phase II: Data Collection, site investigation, survey and analysis,
Phase III: Preparation of final master plan (includes also feasibility-level study of selected projects).

Civil Engineering Dept., AAU WATER RESOURCES DEVELOPMENT
May, 2006 73
5 Planning for Water Resources Development
5.1 Introduction
To meet the demands for the desired quantity and quality of water at particular locations and times,
engineers, economists, political scientists, lawyers, planners and conservationists often have to collaborate
in planning, designing, constructing, and operating structures and implementing non-structural measures
that will permit improved management of natural water supplies.
The incentive to plan for increased control of any water resource often follows a major disaster, such as a
flood, drought (which might bring about famine), intolerable water quality conditions, or a waterborne
disease epidemic. The need for a co-ordinated (or integrated) development of a basin's water resources and
thus mitigating the consequences of haphazard utilisation of the water resources also initiates planning for
the Basin Master Plan.
Planning involves the systematic and orderly study of a project right from its inception to the evaluation of
alternatives and then to the final selection of the preferred alternative. Thus planning also involves the
steps followed in the design of the alternatives considered for selection, except of course the detailed
design of any of the alternative candidates. Water resources engineers and planners should develop a
number of reasonable alternatives for public officials to consider; they should also evaluate the economic,
environmental, political and social impacts that might result from each alternative.
To engage in a successful water resources development study, the engineer must possess not only the
requisite mathematical and systems methodology skills, but also an understanding of the environmental
engineering, economic, legal, political, cultural and social aspects of water resources planning problems.
A reasonable knowledge of economic theory is just as important as an understanding of hydraulic,
hydrologic and environmental engineering disciplines. Economics has always had, and will continue to
have, a significant role in the planning of water resources investments. It is obvious that the results of most
water resources management decisions have a direct impact on people and their relationships. Hence
inputs from those having a knowledge of law, regional planning, and political science are also needed
during the comprehensive planning of water resources systems, especially during the development and
evaluation of the results various planning models. Politics has always played, will also play, the major role
in the final decision, hence the water resources engineer (planner) should always be aware of this fact.
Some knowledge of the politics of the day is then desirable.
Two definitions of planning are given below, one from a UN planning team and the other from the US
NWC.
Planning aims at the optional use of available resources. Water resources development planning involves
examination of short-term and long-term needs and ways to meet these needs. It involves the comparative
evaluation of alternative solutions with respect to their technical, economic and social merits. Planning
means looking into the future and looking from a broad spectrum of disciplines.
Planning is the creative and analytical process of : (1) hypothesising sets of possible goals. (2) assembling
needed information to develop and systematically analyse alternative courses of action for attainment of
such goals. (3) displaying the information and consequences of alternative actions in an authoritative
manner, (4) devising detailed procedures for carrying out the actions, and (5) recommending courses of
action as an aid to decision makers in deciding a set of goals and courses of action to pursue.
Thus, in short, planning for water resources development involves the systematic consideration of
alternatives to achieve some pre-set objectives. The alternatives have to be evaluated based on the degree
to which each alternative meets the objective(s) with the undesirable consequences being at acceptable
level. It is a multi-phase, multi-level process that draws the attention of politicians, engineers,
conservationists, economists, the public, lawyers, etc. Thus planning for water resources has political,
technical, legal, economic, environmental and financial aspects.
Advantages and disadvantages of planning (pros and contras): although planing for water resources
development might seem quite obvious, there are, however, some criticisms and, in some instances, even
Civil Engineering Dept., AAU WATER RESOURCES DEVELOPMENT
May, 2006 74
objections to planning. If planning is viewed as a tool using which allocation of water resources for
various uses is done efficiently then there seems to be a strong argument for it. However, it is a common
observation that several development plans did not meet their objectives, i.e. have failed. Various reasons
could be cited for the failure, for instance:
lack of institutional support for the implementation of the plans
changing economic and political conditions and failure to update the plans when conditions
change, such as change of leadership
failure by the plans to consider all possible alternatives
inadequate evaluation of alternatives
inadequate information (knowledge) on the problems and boundary conditions during planning
The major argument against planning for such undertaking as regional (or basin-wide) resources
development is that the conditions that govern the selection of a particular alternative (or series of
alternatives) are not static but rather change continuously. This would mean that major factors such as
objectives, economic and political conditions, administrative set-ups, etc., change with time. This is in fact
a strong argument and should be taken seriously. Planning often involves the forecasting of future
conditions for some duration of time ahead. Hence, if the assumptions made about the future fail to hold to
the extent which could affect the decision-making procedure then such plans could not bring the desired
results. For instance, if the socio-economic situation in a country changes radically (like change of system
from planned economy to a market economy) within the planning horizon then such a plan should be
revisited. Hence a continuous reviewing and updating of plans are needed in order for the plans to be of
use even during the duration of time they apply.
Objectives: Identifying relevant planning objectives, and defining the relative importance of each of these
objectives, is one of the most difficult aspects of water resources planning. In fact planning is a problem
solving process. In the society's endeavour to develop (and strive for survival) quite a number of problems
have to be dealt with. Identifying a problem and committing oneself to deal with the problem leads to the
setting of the goals of development, hence the objective the planning exercise is fixed.
There are always many social groups (or individuals) that are influenced by the implementation of a
particular project to a greater or lesser extent. Moreover, these social groups can be involved in the
decision-making process and hence the overall fate of a particular alternative selected for consideration
may depend on the extent to which it fulfils the needs (objectives) of the social groups involved in the
process. In addition, the problem becomes more complex due to the fact that some of the objectives, such
as environmental quality for instance, may not be quantifiable in comparable units with the other
objectives, such as economic return from irrigated agriculture.
Water resources planning objectives can be either 'global' or specific. The former refers to the overall
objective, stated in broad terms, of developing a nation's (region's) water resources. These could be stated
as, for instance, national development and enhancement of environmental quality. Specific objectives
often pertain to projects and are more precise and limited in scope. They should, however, agree with the
'global' objectives.
In Ethiopia, the Federal Water Policy (FWP) incorporates the overall objectives of developing the
country's water resources. These objectives are:
Develop the water resources of the country for the benefits of the people, for strategic planning
and national well-being and for security on sustainable basis
Conserve, protect and enhance water resources and the overall aquatic environment of the country
and protect them from degradation, pollution, depletion, waste and misuse on sustainable basis.
Ensure the provision of basic necessities of water at the household level
Allocate and apportion water, based on comprehensive and integrated plans and optimum
allocation principles that incorporate efficiency of use, equity of access and sustainability of the
resource.

Civil Engineering Dept., AAU WATER RESOURCES DEVELOPMENT
May, 2006 75
Manage and combat drought and famine as well as other associated slow on-set disasters through
efficient allocation, redistribution, transfer, storage and efficient use of measures
Maintain, improve regulate and monitor the quality of all water resources
Utilise, protect, and conserve the country's trans-boundary water resources for socio-economic
development of all the peoples of Ethiopia.
The following principles are adopted in drafting the FWP
Water is the common and indivisible natural endowment and asset of all the peoples of Ethiopia
Every Ethiopian citizen has the inalienable right to have access to sufficient water of acceptable
quality, to satisfy basic human needs
Water shall be recognised both as economic and social good and as well as a private and public
good for all-round, viable, fair and sustainable management (emphasis added)
Water resources development shall be under-pined on:
An integrated framework
Needs assessment (demand oriented)
Objective oriented and capacity based planning
Management of water resources shall recognise and incorporate social equity norms including
equity to access for water use
Economic efficiency in water resources management shall be insured
System reliability and sustainability shall form the basis of plans, programmes, projects,
infrastructures and schemes in water resources
Environmental integrity shall constitute a central part of water resources management.
Stakeholders' participation including community and women participation in the relevant aspects
of water resources management shall be promoted and ensured and the participatory approach,
involving users, decision and policy makers, planers, implementers, and donors shall be promoted.
The principle of "some for all and not all for some" shall be adopted and promoted.
Classification of plans: water resources development plans are conducted at different levels of
administration, at different stages and with different scopes. These pertain to the questions such as who,
for what purpose, and to what extent. Below is listed a descriptive structure of planning (source US-
NWC):
Planning Jurisdictions
Federal
Interstate regional
State
Intrastate regional
Local
Scope of planning programs
Multi-sectoral planning: co-ordinated planning for all sectors of public endeavour, such as land
use, housing, transportation, water resources, waste disposal, and energy supply
Sectorial planning: integrated planning for all functions within one sector, such as water resources
functional planning: planning to meet specific need within a sector, such as flood control or
preservation of wild life
Stages of planning
Policy planning: definition of overall goals and program objectives, policy development, overall
budget and priority analysis, dissemination of program guides, and evaluation results
Framework planning: identification of general problems and needs, outlining a range of possible
alternative futures, inventory of available resources and general opportunities, assessment of
overall adequacy of resources, determination of need for further specific investigations
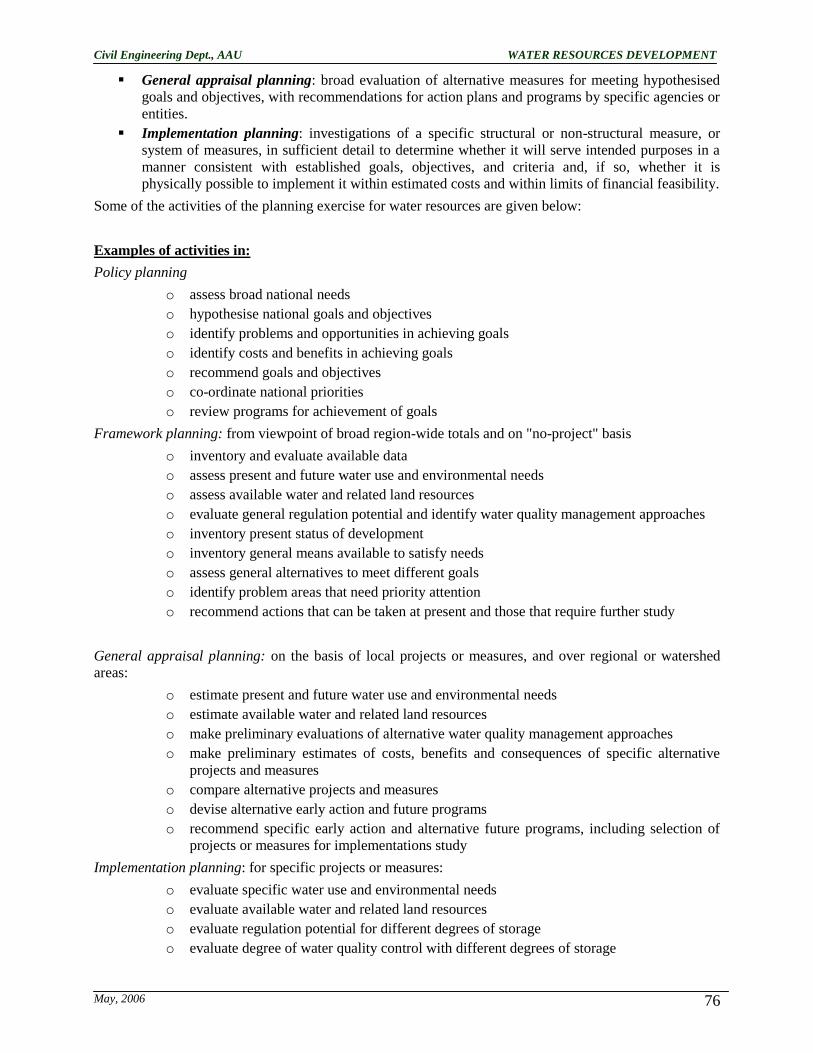
Civil Engineering Dept., AAU WATER RESOURCES DEVELOPMENT
May, 2006 76
General appraisal planning: broad evaluation of alternative measures for meeting hypothesised
goals and objectives, with recommendations for action plans and programs by specific agencies or
entities.
Implementation planning: investigations of a specific structural or non-structural measure, or
system of measures, in sufficient detail to determine whether it will serve intended purposes in a
manner consistent with established goals, objectives, and criteria and, if so, whether it is
physically possible to implement it within estimated costs and within limits of financial feasibility.
Some of the activities of the planning exercise for water resources are given below:
Examples of activities in:
Policy planning
o assess broad national needs
o hypothesise national goals and objectives
o identify problems and opportunities in achieving goals
o identify costs and benefits in achieving goals
o recommend goals and objectives
o co-ordinate national priorities
o review programs for achievement of goals
Framework planning: from viewpoint of broad region-wide totals and on "no-project" basis
o inventory and evaluate available data
o assess present and future water use and environmental needs
o assess available water and related land resources
o evaluate general regulation potential and identify water quality management approaches
o inventory present status of development
o inventory general means available to satisfy needs
o assess general alternatives to meet different goals
o identify problem areas that need priority attention
o recommend actions that can be taken at present and those that require further study
General appraisal planning: on the basis of local projects or measures, and over regional or watershed
areas:
o estimate present and future water use and environmental needs
o estimate available water and related land resources
o make preliminary evaluations of alternative water quality management approaches
o make preliminary estimates of costs, benefits and consequences of specific alternative
projects and measures
o compare alternative projects and measures
o devise alternative early action and future programs
o recommend specific early action and alternative future programs, including selection of
projects or measures for implementations study
Implementation planning: for specific projects or measures:
o evaluate specific water use and environmental needs
o evaluate available water and related land resources
o evaluate regulation potential for different degrees of storage
o evaluate degree of water quality control with different degrees of storage

Civil Engineering Dept., AAU WATER RESOURCES DEVELOPMENT
May, 2006 77
o prepare conceptual designs and cost estimates
o make economic analyses of benefits and consequences
o make financial analyses to demonstrate payout
o recommend an alternative to be selected
o recommend concerning authorisation
5.2 Hydrologic estimates required for reservoir projects
General steps for all reservoirs
1. In the case of ungaged sites or sites with insufficient flow records, perform regional studies
utilizing data from nearby locations. Regionalized quantities may include average annual
precipitation, precipitation intensity-duration-frequency relations, unit hydrograph parameters,
annual runoff and extreme runoff-frequency relations
2. Determine natural flows at the reservoir and downstream damage centers
3. Determine reservoir characteristics such as area/capacity/elevation curves
4. Determine reservoir storage and pool elevation frequency curves from results of sequential
routings where reservoir is operated for all authorized project purposes
5. Determine design floods for establishing reservoir spillway capacity. Determine reservoir and
channel routing criteria
6. Determine maximum reservoir elevation by routing the spillway design flood
7. Determine reservoir freeboard requirements for wind and wave action
8. Determine water surface elevations throughout reservoir and tributaries for hypothetical dam
failures and for selected design floods
9. Determine quantity and distribution of sediment deposited in the reservoir (sediment storage) for
selected future time periods
10. Determine reservoir inactive storage, and minimum pool elevation to satisfy requirements for fish
and wildlife, recreation, etc.
11. Consider requirements for emergency evacuation of flood water in sizing outlet works
12. Determine reservoir operation rules
13. Determine the probability of failure of meeting the reservoir purpose
14. Determine effects of reservoir on streamflows, environmental quality (including temperature, DO,
BOD, etc.), sediment movement within the backwater reach and below the project, downstream
channel degradation, bank sloughing, evaporation, fish and wildlife, and groundwater regime, etc.
Complementary steps for reservoirs with flood control storage
1. Determine reservoir operating plan considering ability to forecast future flows during flood
emergency, including selection of downstream locations for which the reservoir should be
operated to reduce flood damages
2. Establish minimum foresight period of streamflow forecasts that can influence operation of
reservoirs and the corresponding average forecast accuracy for that length of forecasts (fore
example, a 20 per cent error for flows up to 12 hours in the future)
3. Determine flood control storage requirements and corresponding regulated flows for proposed
reservoir by performing sequential routing studies in which flooding at major damage centers is
minimized
4. Determine peak discharge-frequency curves for natural and regulated conditions at each major
damage centers below the proposed reservoir for a range of flood storage capacities
5. Determine outlet capacity requirements considering downstream channel capacities and desired
rate of evacuation (drawdown)

Civil Engineering Dept., AAU WATER RESOURCES DEVELOPMENT
May, 2006 78
6. On the basis of stage-discharge-flood damage relationship and the peak average annual preproject
flood damages at each major flood damages frequency curve and average annual preproject flood
damages at each major flood damage center
7. Select range of feasible flood control storages and compute the associated mean annual costs
8. For each flood control alternatives, determine the modified flood damage frequency curve.
Estimate the expected value of mean annual flood losses averted (flood control benefits)
9. Develop functional relationship between mean annual costs of flood control (item 7) and expected
annual magnitude of flood losses averted (item 8)
10. Apply economic (cost-benefit analysis) and other criteria applicable in the given context (social,
ecological, etc) for selection of the most advisable flood control alternative. Whenever necessary,
the procedure should be based not only on the single valued flood discharge-flood loss
relationship but should also take into account seasonal and duration effects
Complementary steps for reservoirs with hydroelectric storage
1. Determine at-site energy demands, which the project must meet. For power systems, determine
system demands and the minimum project demands
2. Determine reservoir evaporation rates for normal and drought conditions
3. determine reservoir inflows to be used in sequential routings under project conditions on monthly,
10-day or weekly basis
4. Determine the reservoir power storage requirements and pool elevations which are necessary to
provide the annual firm energy
5. Determine the installed capacity for the project from the regionally selected marketable plant
factor and the annual firm energy
6. Determine the annual secondary energy and dependable capacity from long-term sequential
routings
7. Based on plant factor, power schedule, and channel characteristics, determine need for
reregulating structure and/or effect of tailwater fluctuations
Complementary steps for reservoirs with conservation storage
1. Determine demands on the reservoir for conservation purposes, such as municipal and irrigation
demands (generally monthly, 10-day or weekly schedules)
2. Determine reservoir evaporation rates for normal and drought conditions
3. determine reservoir inflows to be used in sequential routings under project conditions on a
monthly, 10-day or weekly basis
4. determine reservoir conservation storage required to meet the demands on the reservoir
Complementary steps for multipurpose reservoirs
1. Determine reservoir purposes and magnitude of demands corresponding to each purpose and their
variability; determine priorities among reservoir purposes
2. determine if water delivery will be direct from reservoir or if it will be diverted from a
downstream point which will allow release to go through turbines
3. Determine need, size and elevation of multiple level outlet capacity
4. Determine reservoir storage and corresponding pool elevations to accomplish multiple use of
storage as determined by sequential routings for all purposes
Complementary steps for mixes of reservoirs and other structural and nonstructural measures

Civil Engineering Dept., AAU WATER RESOURCES DEVELOPMENT
May, 2006 79
1. Determine design floods for selected degrees of protection for reservoirs, levees, channel
improvements, diversions, relocations, flood-proofing, flood plain zoning, etc.
2. Determine selected combination of reservoir storage, levees, channels, diversions, relocations,
etc., which produce the best plan for the whole basin considering all pertinent hydrologic,
economic, and social criteria.
5.3 Hydrologic Estimates Required For Non-reservoir Projects
The following hydrologic estimates (procedural steps) refer to specific types of water projects, which do
not provide for flow control by means of storage reservoirs.
Irrigation Projects
1. Determine water requirements for various crops
2. Determine irrigation requirements (the amount of water that should be supplied to 1 hectare of a
field during the irrigation period to create conditions most favorable for the crop growth)
3. Determine water intake needs on the basis of irrigation requirements (with due consideration
given to their seasonal variability), irrigation area, crop rotation, and the efficiency of the future
irrigation system
4. On the basis of historical flow records (or maps of runoff isolines) compute long-term normal
flow which is to be used for determining irrigation capacity of the stream
5. Analyze intra-annual flow distribution. Identify critical flow values and critical season of the year.
6. perform flood flow analysis for determining the size of the flow control structures, storm water
inlets, mudflow channels, and flood gates in order to avoid destruction of hydraulic structures and
erosion of the irrigation network
7. Perform analysis of water level (stage) variability in order to determine location, type and size of
irrigation water intake structures
8. Compute water sediment concentration and its variability with respect to streamflow rate, stream
depth, width and length
9. Analyze chemical composition of irrigation water during different seasons of a year (high flows,
low flows, etc)
10. Perform water-balance computations based on the surface water measurements of inflow, outflow,
evaporation, groundwater regime, moisture dynamics in the aeration zone, meteorological
conditions, vegetation state and its growth
11. Estimate the volume of irrigation runoff, return flow and evapotranspiration losses; analyze the
possibilities of irrigation runoff reuse for other purposes
12. Assess the environmental impact of the contemplated irrigation project (soil salinization, water-
logging, water quality deterioration, streamflow reduction, etc)
Drainage projects
1. Carry out regional study of rivers in the regions future drainage of swamps and marsh-ridden areas
in order to estimate their water-carrying capacity during rainfall-flood period
2. Investigate areas to be drained and arrange for hydrologic data collection
3. Investigate river basins with existing drainage projects to obtain :
a. detailed description of drainage systems
b. present use of drained lands,
c. the state of drainage canals and rivers
d. the character of man's activity within the watershed, and
e. description of the state of lands adjacent to drainage systems within natural landscapes

Civil Engineering Dept., AAU WATER RESOURCES DEVELOPMENT
May, 2006 80
4. Investigate hydrological regime of reclaimed areas in order to develop regional estimates for
hydrological computation of drainage systems, namely:
a. mean flow
b. maximum and minimum discharges during various seasons
c. local runoff
5. Investigate influence of reclamation works on water and (heat) regime, water resources and water
content of reclaimed and adjacent areas, including :
a. moisture exchange within the aeration zone
b. water level regime
c. flow regime
d. evaporation
e. infiltration of precipitation and waters for irrigation from reclamation systems
f. moisture content of soils and subsoils
g. regime of water use by different kinds of crops
h. water quality
6. Develop regional recommendations for purposeful management of water, air and feeding regimes
within the zone of active water exchange, and first of all of the active zone with roots layer, under
reclamation
7. Investigate the influence of reclamation on natural landscapes in different physiographical and
climatic conditions in order to evaluate the character of their change and change of biological
productivity
8. Organize collection of necessary observational data to provide hydrometeorological information
for reclamation systems in order to increase their efficiency and the productivity of drained lands
Municipal and industrial water supply projects
1. Forecast alternative levels of water demand by industry and municipalities
2. Perform regional studies to define location of potential sources of water supply (surface and
groundwater resources)
3. For each potential supply source, determine:
a. volume and quality of water available as related to different water supply reliability levels
b. time-distribution of available water resources, both in terms of their quantity and quality,
and
c. cost of resource development alternatives
4. Perform demand/supply analysis to select the most desirable (e.g. least costly) supply scheme
5. Determine design parameters of diversion and intake facilities (e.g. head-gates, pumps,
compensation reservoir)
6. Determine design parameters of water treatment (purification) plants, if necessary
7. Determine design parameters of the delivery system
8. Determine effects of proposed solution on basin-wide flows, water quality, sediment movement,
etc.
Water Quality Projects
1. Perform regional studies to locate all present and potential water uses that affect or are affected by
water quality. The major water uses of interest are:
a. municipal, including storm water runoff
b. industrial
c. agricultural

Civil Engineering Dept., AAU WATER RESOURCES DEVELOPMENT
May, 2006 81
d. commercial fishing
e. water contact recreation
f. non-water contact recreation
2. For each of the present and potential water uses, determine:
a. intake water quality requirements
b. intake water treatment alternatives (technical and economic data)
c. wastewater discharge loads in relation to different water use technologies, and temporal
distribution of wastewater discharges, and
d. wastewater treatment alternatives (technical and economic data)
3. Perform hydrologic studies to determine design streamflow rates for further analysis of waste-
assimilative capacity of the river system. These studies should be concerned with:
a. duration of low-flow periods
b. possibility of occurrence of low flows of selected durations,
c. severity (e.g. total deficiency in water supply with respect to some reference flow and
some duration),
d. time of occurrence within the annual cycle and
e. areal extent of low-flow phenomena
4. Perform waste-assimilative studies for the given river system (including estimation of dispersion
and mixing zones), for different design (reference) and streamflow rates
5. Perform water quality management studies to determine the most desirable (e.g. least costly) way
of achieving specific water quality objectives
Flood control projects
6. Determine preproject peak discharge-frequency curves at each major flood damage center
7. In the case of ungaged sites or sites with insufficient flow records, perform regional studies
utilizing data from nearby stations
8. Determine natural flows at the reservoirs and at downstream damage centers
9. Determine design floods for nonreservoir structures
10. Determine freeboard requirements for wind and wave action for nonreservoir structures
11. Determine water surface elevations for length of channel or levee and beyond
12. Determine effects of changes on flows, environmental quality, etc.
13. Determine probability of failure during life of proposed structure
14. On the basis of stage-discharge-flood damage relationships and the peak discharge-frequency
curves, determine a preproject flood damage frequency curve and average annual preproject flood
damage at each major flood damage center
15. select range of feasible structural and nonstructural flood control alternatives and compute the
associated mean annual costs
16. For each flood control alternative, determine the modified flood damage frequency curve.
Estimate the expected value of mean annual flood losses averted (flood control benefits)
17. Develop functional relationship between mean annual costs of flood control (item 10) and
expected annual magnitude of flood losses averted (item 11)
18. Apply economic (cost-benefit analysis) and other criteria applicable in the given context (social,
ecological, etc.) for selection of the most advisable flood control alternative. Whenever possible,
the procedure should be based not only on the single valued flood discharge-flood loss
relationship but should also take into account seasonal and duration effects

Civil Engineering Dept., AAU WATER RESOURCES DEVELOPMENT
May, 2006 82
5.4 Hydrologic Estimates Required For Basin-wide Long-term Planning for Integrated Development of Water Resources
There are nearly as many study procedures for integrated basin-wide development as there have been
basin projects. The following specification, basin on United Nations1, serves primarily as an illustrative
example and also as a checklist of the major steps in hydrologic investigations for basin-wide planning
concerning integrated development of water resources
1. Appraise the adequacy of available hydrometeorological data (e.g. precipitation, evaporation,
evapotranspiration, air temperature) and hydrological data (e.g. flow time series, flood
hydrographs, aquifer recharge characteristics, quality parameters, sediment transport parameters)
2. Select key control points in the river system taking into consideration location of stream-gaging
stations, major water users, present and planned flow control
3. Determine what additional data are required with consideration given to the purpose of the
investigations and the methods which are to be used for subsequent water management analysis
(e.g. classical balances, simulation, optimization)
4. Devise methods, standards, and schedules for acquiring additional data (e.g. extension of flow
records, application of rainfall-runoff models, regional analysis)
5. Arrange for acquisition of additional data
6. Analyze and organize the data for studying problems of
a. municipal, industrial, and agricultural water supply
b. flood control
c. water quality control
d. hydroelectric power generation
e. inland navigation
f. recreational use of water, and
g. nature conservation
7. Estimate annual flow variability and characteristics of intra-annual flow distribution
8. Estimate the amount of water which can be withdrawn from groundwater resources without
producing undesired results
9. Estimate the minimum flow requirements in the control profiles (i.e. flow which must be
maintained because of aesthetic, scenic, sanitary and/or biological reasons)
10. Determine available water resources and analyze potential peak storage alternatives
11. Estimate flood characteristics for selected profile (e.g. peak flow frequency curves for natural and
regulated flow, design flood flow, channel routing criteria)
12. Develop flood control alternatives (e.g. storage, flow retardation measures, levees, flood walls,
channel improvements, floodways)
13. Estimate low-flow characteristics for selected profiles (e.g. minimum flow frequency curves for
natural and regulated flow, design low flows)
14. Develop water quality control alternatives (e.g. low flow augmentation)
15. Estimate hydrologic characteristics for hydroelectric power generation studies
16. Develop hydroelectric power generation alternatives
17. Estimate hydrologic characteristics for irrigation studies
18. Develop irrigation alternatives
19. Estimate hydrologic characteristics for inland navigation studies (e.g. depth, width, current
velocity)
1 United Nations (1970). Integrated river basin development. New York, United Nations

Civil Engineering Dept., AAU WATER RESOURCES DEVELOPMENT
May, 2006 83
20. Develop navigation development alternatives
21. Estimate hydrologic characteristics for recreational studies (e.g. depth, area of water surface,
water quality )
22. Develop alternatives for recreational use of water
23. Estimate hydrologic characteristics for fish and wildlife studies (e.g. water temperature, water
quality)
24. Develop alternatives of habitat improvements for fish and wildlife
25. Analyze the present and potential institutional arrangements for water resources management
26. Evaluate all alternatives and prepare a comprehensive long-term plan for the integrated
development of water resources in the river basin, including an assessment of impacts of projects
on the environment and hydrologic regime.

Civil Engineering Dept., AAU WATER RESOURCES DEVELOPMENT
May, 2006 84
6 Elements of (WR) Project Formulation
6.1 Stages of WR project
This section outlines the process by which WR projects are identified, and formulated. It starts by
describing the levels of studies conducted in a typical study involving the evaluation and implementation
of a structural measure or non-structural measure to achieve a pre-set goal of WR development. The
following is a typical five-stage sequence of reports, documents, and actions for a (WR) project, including
the preliminary (or reconnaissance) report, the feasibility report, the contract documents, and activities
during construction and operation.
First Stage: Preliminary (or Reconnaissance) Report
This consists of office studies, field studies, and the preparation of a report. The report prepared as a result
of these studies should answer the following questions:
Is a feasible project likely?
What are approximate estimates of capacity and cost?
What additional studies are needed to confirm feasibility?
The investigation begins with office studies, using available information contained in previous reports,
maps, and data. Basic materials include maps and photographs (topographic maps, land surveys, county
and city tax maps, transportation maps, aerial photographs); geologic and soil surveys and data;
climatological data; stream flow and ground water records; water quality and sediment measurements;
information on ecological and environmental conditions; and data and forecasts pertinent to the specific
purpose of the project (e.g., projection of water supply requirements, or electric power demands;
characteristics of existing water supply, or electric generation and transmission systems; etc.).
Office studies may be adequate to make initial determinations of the general arrangement of the project
components, the capacity of the project or the services it can provide, and its cost. Better estimates can be
made by supplementing office studies by field reconnaissance and surveys. This work is needed to
confirm the estimates made in office studies, to suggest changes in them, and to obtain detailed
information concerning such matters as needed relocations in cases where the available maps are not
recent.
Topographic surveys, stream flow measurements, and geological and soils investigations may be needed,
but these should be kept to a minimum, consistent with the nature of the preliminary report. The personnel
involved in this work are normally engineers and geologists, but they may also include environmentalists
and other specialists.
Second Stage: Feasibility Report
If the project sponsor determines that additional studies are warranted based on the preliminary report and
other considerations, a feasibility report will be prepared. This report should contain enough information
to permit a decision on whether or not to implement the project. This implies technical studies more
detailed than those required for the preliminary report, financial and economic analyses, and a plan for
project implementation. The feasibility report should include the following:
a. Descriptions and analyses of the data
b. Confirmation of construction feasibility based on additional field and laboratory investigations,
studies of project arrangements and individual project features, and analysis of construction methods
(sources of construction materials, access to the project site, diversion of water during construction,
etc.)
c. Final recommendations for arrangement of project works, preliminary plans and other analyses to
determine the principal quantities of construction, a reliable cost estimate, and discussions of the
design criteria
d. Construction schedule showing the timing and costs of project features

Civil Engineering Dept., AAU WATER RESOURCES DEVELOPMENT
May, 2006 85
e. Economic analyses of the project
f. Financial analyses projecting the year-by-year costs, revenues, and subsidies for the project
g. Plans for financing construction, and for managing the construction and operation of the project
h. Institutional and legal requirements
i. Assessments of the environmental and social impacts of construction and operation, and other
impact studies if required depending on the extent of detailed drawings and of analyses needed to
confirm construction feasibility and make reliable estimates of project cost, the work in this phase
consists of designs in addition to planning studies.
Third Stage: Final Design and Preparation of Contract Documents
Contract documents include plans and specifications which are sufficiently detailed to obtain tenders
(bids) from qualified construction and equipment contractors. The plans (drawings) and specifications are
based on additional studies of the details of project works, the logistics of construction, other aspects
related to temporary and permanent facilities, and the performance of contractors. The contract documents
also contain additional information on the responsibilities of the project sponsor and the contractor.
Various forms to be completed by the contractor provide information on the contractor's legal status and
financial capabilities, set forth the quantities and prices for construction and for equipment, and elaborate
on the construction methods proposed by the contractor.
The sponsor and engineers review the tenders made by contractors. A major factor is the prices offered by
a contractor, but other factors considered may include the reputation and previous experience of the
contractor, the specific working methods proposed to carry out the construction or manufacture of
equipment, and in the case of the latter, the operating efficiency of the equipment to be provided.
Contractors' tenders are usually ranked after weighting the factors, in order to determine which tenders are
in the sponsor's best interest, and awards are made accordingly.
Fourth Stage: Construction
Additional detailed drawings needed during construction are prepared by the sponsor's engineers and by
the contractors subject to the sponsor's approval. Payments to the contractors are usually made based on
measurements of work in progress or completed, in accordance with the terms of the contract documents.
Usually, a percentage of each payment is withheld by the sponsor and released only when the work is
entirely completed and accepted. Supervision of construction by the sponsor's engineers often includes
field layout of major works, approval of contractors' choices of working procedures and materials,
interpretation of the plans and specifications, approval of the contractors' drawings needed to supplement
the engineers' drawings, inspection of construction activities and of finished work to ensure conformance
with plans and specifications, measurement of quantities of construction, and certifications required as a
basis for payments to the contractors.
Fifth Stage: Operation
The sponsor may employ outside engineers and other consultants to assist in operation for a limited
period, train operators, prepare manuals for operation and maintenance, and monitor the performance of
the various features (structural, hydrologic, hydraulic, etc.). Studies of operating rules may continue as
experience develops.
6.2 Formulation of a single engineering project
The engineers (or the interdisciplinary team of specialists) that formulate a water resources project define
the arrangement of project components, and sufficient details concerning their sizes and functions so that
realistic cost estimates can be prepared.
Project formulation relates to stages 1 to 3, above; it begins in a rudimentary way in the reconnaissance
level work required for the preliminary report, is refined and elaborated in the feasibility report stage, and

Civil Engineering Dept., AAU WATER RESOURCES DEVELOPMENT
May, 2006 86
undergoes additional changes and detailed definition in the preparation of the plans and specifications for
the contract documents.
During project formulation, the planner evaluates the available data and conceives a plan to utilize water
and related land resources to meet project needs. This work draws on scientific training, experience with
other projects of similar type or with similar components, and imagination and judgment to layout a
project that fits the available topographic, geologic, and soils conditions. Account is also taken of
information on water volumes and flow rates, nature and magnitude of project products and services that
are desired, and existing or potential constraints.
Constraints may include legal limitations on water or land involving quantities or uses; practical
limitations on relocations, land purchase, and easements permitted for buildings, roads, railroads, utilities
and other human-made features; or obvious unsuitability of a site for certain types of developments (e.g., a
type of dam may be unsuitable for certain topographic configurations, geology, or construction material
availabilities). In most cases more than one layout is possible. A good planner will eliminate the most
unsuitable alternatives while assessing the remaining alternatives fairly and comprehensively. With some
sites and service requirements, the planner may be able to proceed directly to the optimal solution. In the
more usual case, alternative layouts will need to be prepared and examined for cost, function, construction
suitability, and other factors.
The planner may approach a solution for a site starting with the perspective of a water need of a particular
type and magnitude (e.g., municipal and industrial water supply) and then consider the possibilities for
modifying the project to make it suitable for multipurpose operations (e.g., recreation, hydroelectric
power). Or, the planner may from the beginning examine a variety of plans that exploit the site for all the
opportunities for multipurpose development.
The formulation of a project as discussed above emphasizes structural details, costs, project services,
reliability, safety, and other engineering matters. It is necessary, however, to consider the impacts of a
project that are not primarily of an engineering or cost nature. If the formulation team is dominated by
engineers, it will be necessary to consult with or have formal assessments by other specialists at various
stages to ensure that environmental, sociological, institutional, and other factors are adequately taken into
account. Otherwise, projects may be proposed that cannot be implemented. At the early stages of planning,
impact analysis can be limited to identifying the most obvious problems, but studies at later stages need to
be more comprehensive.
As the work of formulation proceeds, the planner gains an improved understanding of site conditions,
advantages and disadvantages of alternative project arrangements, and possible opportunities for using the
site to produce more or different project services. The planner is, therefore, better able to communicate
with the sponsor of the project, and reconsideration of project objectives and purposes, scale, or other
aspects may result from such communication.
As an example of the formulation process, the process of considering and assessing alternatives for
protecting an urban riverside community against flood damage will be discussed here. Alternative projects
are to be evaluated utilizing possible methods of reducing flood damages to existing buildings and other
facilities and reducing flood risk to permit additional urban growth. Three principal approaches to
reducing flood damage may be considered: (1) management measures; (2) local protection facilities; and
(3) upstream flood control reservoirs.
The first approach is primarily a nonstructural solution. It includes some or all of the following
components: (a) zoning, to limit the types of land uses permitted to those which may not be severely
damaged by floods (e.g., agriculture, recreation, wild areas), and to specify the types of construction if
facilities are permitted; (b) protection of individual properties, by waterproofing the lower floors of
existing buildings; (c) flood warning system, to evacuate residents and to move valuables; and (d) flood
insurance, to recognize the risks of floods and to provide compensation when damages are not avoidable at
acceptable cost.
The second approach emphasizes the construction of levees or walls to prevent inundation from floods
below some specified design flood flow (often the highest flood of record). Additional works may include

Civil Engineering Dept., AAU WATER RESOURCES DEVELOPMENT
May, 2006 87
drainage and pumping facilities for areas that are sealed off from precipitation runoff to the river by the
levees; and modifications to increase the hydraulic capacity or stability of the river, such as changes in
profile or direction, channelization, and paving.
The third approach is based on the construction of one or more reservoirs upstream from the community.
This implies the availability of site(s) that are suitable for a dam, spillway, and outlet works, and a large
enough reservoir to capture the volume of a design flood and release it at non-damaging rates. Alternative
sites as well as alternative layouts of works enter into this analysis. This approach to flood control lends
itself to consideration of multipurpose reservoir uses; these may typically be recreation, hydroelectric
energy generation, and water supply.
Depending on the risk that floods will occur which are larger than the design flood for local protection
works, or the design floods for upstream reservoirs, these second and third approaches should also include
management (nonstructural) elements such as those in the first approach.
6.3 Project Appraisal
Project appraisal is the process by which a reviewing authority determines whether a water resources
project meets appropriate criteria for authorization and/or funding, or whether a regional plan meets
appropriate standards for proceeding with implementation studies of one or more component projects.
Different governmental, lending and other agencies have, to some extent, varying criteria, which are used
to appraise projects, submitted for approval of funding.

Civil Engineering Dept., AAU WATER RESOURCES DEVELOPMENT
May, 2006 88
Reference
1. Ray K. Linsley, Joseph B. Franzini, David L. Freyberg, George Tchobanoglous: “Water
Resources Engineering,” 4th
Edition, McGraw-Hill Inc, New York, 1992.
2. Neil S. Grigg, “Water Resources Planning,”
3. Larry W. Canter, “Environmental Impact of Water Resources Projects,”
4. Chow, Ven Te, Maidment, Daivd R. and Mays, Larry W., “Applied Hydrology”, McGraw-
Hill Publishing Company, New York, New York, 1998.
5. Maidment, David R., “Handbook of Hydrology”, McGraw-Hill Publishing Company, New
York, New York, 1993.

Civil Engineering Dept., AAU WATER RESOURCES DEVELOPMENT
May, 2006 89
Sample Exam Questions and Partial Solutions/Answers
Instruction: Show all the necessary steps clearly.
Assume any missed data with justification.
1. Discuss briefly
a. the definition of Water Resources Development
b. Sustainability Criteria for design of Water Resources Development Project
c. Steps of planning in Water Resources Development and
d. What EIA is and the steps for carrying out EIA.
2. Find the maximum value of the following function
F(X1, X2, X3) = X1 + 2X3 + X2X3 – X12 – X2
2 – X3
2
3. Construct an optimization model for estimating the least-cost combination of active storage
capacities, K1 and K2, of two reservoirs located on a single stream, used to produce a constant
flow or yield downstream of the two reservoirs. Assume that the cost functions Cs(Ks) at each
reservoir site S are known and there is no dead storage and no evaporation. Assume that 10
years of monthly unregulated flows are available at site S. the system diagram is as shown in
Fig. 1.
Fig. 1. Two Reservoirs in series
Where Q1,t and Q2,t are the unregulated streamflows at sites 1, and 2, respectively. Q2,t – Q1,t is the
incremental inflow between site 1 and site 2, R1,t is the release from the upstream reservoir, and Y
is the constant yield from the downstream reservoir, S1,t and S2,t are the reservoir storages and K1
and K2 are the reservoir capacities.
Q1,t R1,t Y
S2,t S1,t
K1 K2
Q2,t – Q1,t

Civil Engineering Dept., AAU WATER RESOURCES DEVELOPMENT
May, 2006 90
4. A city administration is planning for a flood control project. The goal being to protect parts of
the city against the 100-years flood. One of the alternatives under consideration is to use an
existing reservoir, which is currently the source of water for the city. Because the current
reservoir size is not sufficient to fulfill the flood-control objective, raising the dam height by
2m is being considered with the aim of using the additional storage thus obtained for flood
control purposes. the flood-damage costs can be approximated by the following:
For Q 25, D = 0
For 25 < Q 60, D = 0.06 + 0.0025 x (Q – 25)
For Q > 60, D = 0.12 + 0.340 x (Q – 60)
Where, Q = fow rate at flood risk zone in m3/sec,
D = Damage cost in Millions of Birr
The flood-frequency relationships for the two cases can ba approximated by the following
regression equations:
Case 1: Current situation
QT = 9.2833 + 29.293 x ln(T)
Case 2: With raised dam
QT = 3.4415 + 19.8683 x ln(T)
Where QT is flow at damage-risk zone in m3/sec for a return period T in years.
Considering return periods of 2, 5, 10, 20, 50 and 100 years
i. Determine the damage-frequency curves for both , i.e. current situation and with the
proposed measure,
ii. Determine the expected annual damages for both no-project case and the proposed
alternative,
iii. Taking the remaining useful life of the reservoir to be 50 years and with a discounting
rate of 5%, determine the present worth of the reduction in flood damage cost should
the proposed structural measure be implemented.
5. Consider the following LP Problem:
Maximize X0=3X1+5X2
Subject to
X1 < 4
X2 < 6
3X1 +2X2 < 18
a) Identify the feasible extreme points for the problem
b) Find the optimum feasible solution
c) Determine the amounts of reduction of the non-binding constraints without affecting the
feasibility of the current optimal solution.

Civil Engineering Dept., AAU WATER RESOURCES DEVELOPMENT
May, 2006 91
6. A city administration is planning for a flood control project the goal being to protect parts of
the city against the 100-years flood. One of the alternatives under consideration is to use an
existing reservoir, which is currently the source of water for the city. Because the current
reservoir size is not sufficient to fulfill the flood-control objective, raising the dam height by 2
meters is being considered with the aim of using the additional storage thus obtained for flood
control purposes. The flood-damage costs can be approximated by the following.
7. A reservoir shown in figure 1, which is part of a hydroelectric power scheme, has lost about 40
percent of its capacity due to sedimentation. In order to maintain the power generating
capacity of the plant, it was proposed to use a (natural) lake as temporary storage of ‘kiremt’
flows, which could later be diverted to the reservoir. Records of stream flow are available for
a gauging station located on a river A upstream of the dam, for the streams that flow in to and
out of the lake, as well as records of the lake water level. There are also meteorological
stations nearby all then important sites, from which required climate data can be obtained. As
part of the study for the feasibility of the proposed scheme, it is proposed to carry out
simulation of the scheme.
River
River
River B
River M
River A
Proposed diversion site
El. 1800masl
Lake
El. 1400masl
Lake
El. 1600masl
Fig. 1. Schematic layout of the proposed scheme
i) List the major types of information /data required to carry out the proposed
simulation of the system?
ii) Write down the relevant equations for the reservoir, and the lake, you may neglect
losses in channels and river segments.
iii) What result would be expected from the simulation exercise?

Civil Engineering Dept., AAU WATER RESOURCES DEVELOPMENT
May, 2006 92
8. Data: Water availability, Land Extension, Crop Productivity, Manpower, Specific Benefit
Problem: Determine the amount of each crop that maximizes the benefits
Resource/input Maximum
Availabel Input
Crop1 Crop 2
Land 50ha 2 ha/ton 3 ha/ton
Water 250 Mill. m3 20 mill m3 5 mill m3
Manpower 90 Man Months 6 MM/ton 4 MM/ton
Benefit Max? 180 Birr/ton 210 Birr/ton
9. Dynamic programming – Hydropower and reservoire
Reservoir Storage, Si
Reservoir Capacity, k
Return from Energy,
ri(xi)
Release Xi
i = stage(Season) 1,..,4
Inflow, Ii
Data
Season/stage i = 4 i = 3 i = 2 i = 1
Inflow, Ii 2 x 10⁶ m
3 4 x 10
6 m
3 6 x 10
6 m
3 4 x 10
6 m
3
Release
xi x106 m
3
Return, ri (xi)
i = 4 i = 3 i = 2 i = 1
0 0 0 0 0
2 1.9 2.2 1.7 1.6
4 3.9 4.1 3.6 3.4
6 4.8 5.9 5.0 4.5
k = 8 x 10⁶ m
3
xi x106 m
3 [Turbines]
Sin = Sfin = 6 x 10⁶ m
3 [= keep some water in the reservoir]
Which are the seasonal releases that maximize the return?

Civil Engineering Dept., AAU WATER RESOURCES DEVELOPMENT
May, 2006 93
10. Describe briefly: [5pts each]
a. the importance of economic analysis Water Resources Development project
i. Help planners with quantification of benefit and cost of alternative WR projects
ii. Involves basically the computation of the benefits and costs a plan would entail should
it be implemented,
iii. Helps to express each item and step in moneyary unit with the time value of money
iv. Reinforces the technical feasibility of projects
v. Help in budget allocation of the funding body, etc.
b. What do you understand by the terms “Integrated River Basin Development Master Plan”
Integrated River basin development master plan:
i. is a phased development plan formulated to exploit the opportunities for single and
multipurpose water resources projects
ii. is prepared in a defined geographic area over a specific period of time.
iii. Encompasses development of other resources such as human, land, minerals, etc.
iv. Identifies projects basin wide and investigates their combined effect basin wide.
v. Alternative scenarios for different projects
vi. Serves as a reference based on which projects can be initiated, etc.
c. The major river basins in Ethiopia.

Civil Engineering Dept., AAU WATER RESOURCES DEVELOPMENT
May, 2006 94
11. a. Using illustrative examples and/or sketches discuss the major feasibility tests to be done
for a water resource development project. [7 pts]
Major feasibility tests:[Refer your hand out for the detail]
i. Technical feasibility
ii. Economic feasibility
iii. Financial feasibility
iv. Political feasibility
v. Social feasibility
b. Take one water resource development project that you are familiar with and enumerate
exhaustively the physical consequences with respect to cost and benefit related to its
implementation and operation.[8 pts]
Physical consequences with respect to cost and benefit:
i. Primary benefit: denote value added to activities influenced by the project through
technological linkages.
ii. Secondary benefit: denote value added to activities influenced by the project through
economic rather than technological linkages.
iii. Employment benefits: denote the economic-value gained from the increased employment
opportunity from new jobs created to construct, maintain, or operate the project.
iv. Public benefits: are realized in achievement of goals other than economic efficiency and
thus can be evaluated in efficiency dollars only by means of a value judgment on the
relative desirability of the second goal.
v. Intangible (extra market) benefits: describe consequences which cannot be assigned a
monetary value but which should be considered when deciding whether or not to build a
project.
12. Four alternative projects presented in Table 1 can be used for developing a water supply for a
community for the next 40 years. Use the benefit –cost ratio method to compare and select an
alternative. Use 6% interest rate.[15 pts]
Year Project I Project II Project III Project IV
Construction cost (Mill. Birr)
0 40 30 20 10
10 0 0 0 10
20 0 10 20 10
30 0 0 0 10
Operation and Maintenance cost (thousand Birr)
0 – 10 120 110 120 120
10 – 20 120 110 130 120
20 – 30 140 120 130 130
30 – 40 160 140 150 130
For Project I
PW of costs = 40,000,000 + 120,000[P/A, 6%, 20] + 140,000[P/A, 6%, 10] [P/F, 6%, 20] +
160,000[P/A, 6%, 10] [P/F, 6%, 30]
=40,000,000 + 1,376,391+321,287 + 205,035
=41,902,713

Civil Engineering Dept., AAU WATER RESOURCES DEVELOPMENT
May, 2006 95
For Project II
PW of costs = 30,000,000 + 110,000[P/A, 6%, 20] + 10,000,000[P/F, 6%, 20] + 120,000[P/A, 6%, 10]
[P/F, 6%, 20] + 140,000[P/A, 6%, 10] [P/F, 6%, 30]
= 30,000,000 + 1,261,691 + 3,118,047 + 275,389 +227,061
= 34,882,189
For Project III
PW of costs = 20,000,000 + 110,000[P/A, 6%,10] + 130,000[P/A, 6%, 20] [P/F, 6%, 10] +
20,000,000[P/F, 6%, 20] + 150,000[P/A, 6%, 10] [P/F, 6%, 30]
=20,000,000 + 883,210 + 832,617 + 6,236,095 +192,220
=28,144,142
For Project IV
PW of costs = 10,000,000 + 120,000[P/A, 6%,20] + 10,000,000[P/F, 6%, 10] + 10,000,000[P/F, 6%, 20]
+ 130,000[P/A, 6%, 20] [P/F, 6%, 20] + 10,000,000[P/F, 6%, 30]
=10,000,000 + 1,376,391 + 5,583,948 + 3,118,047 +1,741,101 + 464,929 =22,284,439
Assigning equal benefit for all the four alternatives, the benefit cost ratio for Project IV will be
the highest and hence it will be the best alternative for implementation.
13. All the rivers crossing Addis Ababa are almost serving as a sewer line with regard to their waste
content. It is planned to launch a pilot study on the Banteyiketu river which flows through the center
of Addis Ababa. The Banteyiketu river is chosen as a pilot river for the recurrent flooding along the
river and the extent of pollution induced by the domestic and industrial waste disposed directly to the
river which finally joins the highly utilized Awash river. Existing challenges of urban centers includes
drainage, land scarcity, industrialization, increasing population, etc.. Water related natural hazard such
as flooding, low flow, destruction of the ecosystem, etc. go hand in hand with the aforementioned
urban problems. Taking the above challenges into account in the context of water resource
development,
a. list down the exhaustively the types of data required for the pilot study, [8.0 pts]
Required data list
i. Topography
1. Location of infrastructures,
2. River and drainage network
3. Contour map
4. Boundary of the catchment
5. Location of WR projects
ii. Meteorological data,
1. Rainfall: intensity, duration, frequency
2. Temperature
3. Humidity
4. Wind,
5. Evaporation, etc.
iii. Geology,
iv. Hydrologic:
1. runoff amount, and river stage,
2. Peak flow
3. Low flow
4. Average flow,
Civil Engineering Dept., AAU WATER RESOURCES DEVELOPMENT
May, 2006 96
5. Ground water level, yield, etc.,
v. Socio-economic situation,
1. Population,
2. Population density and pattern,
3. Life standard,
4. Water supply coverage and drainage,
5. Education and health service coverage, etc.
vi. Previous hazard/damage record,
vii. Existing WR projects
1. Structures: dams, weirs, barrages,
2. Irrigation, water supply,
3. Drainage and sewerage, etc.
viii. Water quality; physical, chemical, bacteriological,
ix. Catchment characteristics,
1. Soil : texture, structure, infiltration rate, etc.
2. Slope: drainage area and channels/river,
3. Sediment yield and transport mechanism,
4. Land use and land cover, etc.
x. Environmental/ecosystem, etc.
b. Suggest methods of analysis and important consideration as a water resource engineer. [7.0 pts]
Statistical Analysis of data
Measures of tendencies
Regression analysis
Correlation
i. Check adequacy, consistency and reliability of collected data [statistical methods]
ii. Summarize the data as per the expected result of the WR project.
Socio-economic and environmental data shall be processed in accordance to make
sure that the recommended solutions will be effective and sustainable.
iii. Search for any relationship between the collected data [statistical methods]
iv. Select or develop a model that will help to simulate the processes in consideration
Proper model for population forecast
Due to the size of the catchment application of large watershed models will not be
feasible for Banteyiketu river. Hence, small scale models like the rational method and
the US-SCS (United States Soil Conservation Service) method were used to determine
the peak discharge flood protection works.
The dry period flow quantity will be analyzed for its capacity to carry the waste
disposed into the river and its suitability to keep the ecosystem along the river.
v. Check the model results through validation process
vi. Draw conclusions and Make recommendations based on the analysis, etc.

Civil Engineering Dept., AAU WATER RESOURCES DEVELOPMENT
May, 2006 97
14. A flood control district can construct a number of alternative control works to alleviate the flood
pattern in the district. These alternatives include dam A, dam B, and a levee system C. The levee
system can be built alone or in combination with dam A or B. Both dams can not be built together but
either one can function alone. The life of each dam is 80 years and the life of the levee system is 60
years. The cost of capital is 6%. Information on total investment, operation and maintenance costs,
and average annual flood damage is given below. What form of flood control would be the most
economical? [15.0 pts]
Project Life
(Years)
Total investment
(Million $)
Annual O & M
(Thousand $)
Average annual Flood
damages (Million $)
A (dam) 80 6.2 93 1.10
B (dam) 80 5.3 89 1.40
C (levee) 60 6.7 110 0.80
AC 12.9 203 0.40
BC 12.0 199 0.50
Do Nothing 0 0 2.15
For A
PW of costs = 6,200,000 + 93,000[P/A, 6%, 80] + 110,000[P/A, 6%, 80]
=6,200,000 + 1,535,000 + 321,287 + 18,160,000
=25,895,000 [2.0 pts]
For B
PW of costs = 5,300,000 + 89,000[P/A, 6%, 80] + 1,400,000[P/F, 6%, 80]
= 5,300,000 + 1,469,000 + 23,113,000
= 29,882,000 [2.0 pts]
For C
PW of costs = 6,700,000 + 110,000[P/A, 6%, 60] + 80,000[P/A, 6%, 60] + 2,150,000[P/F, 6%, 60] [P/A,
6%, 20]
=6,700,000 + 1,778,000 + 12,929,000 + 740,000
=22,147,000 [2.0 pts]
For A and C
PW of costs = 12,900,000 + 93,000[P/A, 6%, 80] + 110,000[P/A, 6%, 60] + 400,000[P/A, 6%, 60] +
110,000[P/F, 6%, 60] [P/A, 6%, 20]
=12,900,000 + 1,535,000 + 1,778,000 + 6,464,000 + 379,000
=19,942,000 [2.0 pts]
For B and C
PW of costs = 12,000,000 + 89,000[P/A, 6%, 80] + 110,000[P/A, 6%, 60] + 500,000[P/A, 6%, 60] +
140,000[P/F, 6%, 60] [P/A, 6%, 20]
=12,000,000 + 1,469,000 + 1,778,000 + 8,081,000 + 482,000
=20,758,000 [2.0 pts]
Do Nothing
PW of costs = 2150,000[P/A, 6%, 80]
=35,494,000 [2.0 pts]
By the present worth method of analysis, the total cost for option AC (Dam A and Levee) is the
least among the six options; hence, best alternative for implementation. [3.0 pts]

Civil Engineering Dept., AAU WATER RESOURCES DEVELOPMENT
May, 2006 98
15. Despite the name” The Water Tower of Africa” in recognition to the number of fresh water lakes,
inland rivers and cross boundary rivers including the Nile river, Ethiopia has paradoxically been
stricken by recurrent drought. Although, the annual total volume of water available [about 113 Bm3]
by far exceeds the total demand the country has remained unable to use its water resources potential. a. Discuss in brief the causes of this paradoxical challenge and [8.0 pts]
i. International water right policy on cross boundary rivers
ii. Lack of well defined WR development plan and strategy in national as well as regional
level
iii. Low economic capacity to implement WR projects
iv. Political instability of the country
1. Unstable economic and investment policy
2. Discourages investors
3. Consumes the budget
v. Lack of accountability of professionals, leaders, and beurocracy;
vi. Inadequate knowledge of the existing challenges in WR development
vii. Lack of institutional support for water resources assessment, development planning,
implementation and operation,
viii. Lack of data and information about the available water resource,
ix. Lack of proper communication mechanism for exchange of information (Database)
between professionals, researchers and decision/policy makers
x. Poor Technical capacity (Technology and human resource)
xi. Topography
1. Most rivers flow in deep gorges
2. Irrigable land is far from the water source,
3. Settlement of population is far from either the source or the utilizable land, etc.
xii. Traditional farming and deforestation,
xiii. Poor infrastructure: roads, power, communication facilities, etc.

Civil Engineering Dept., AAU WATER RESOURCES DEVELOPMENT
May, 2006 99
b. its possible remedial measures in the context of Water Resources Development. [7.0 pts] i. Encourage Public participation in WR project planning and implementation,
ii. Encourage involvement of professionals on international water related decisions and
agreements
iii. National coordination in WR development with respect to;
1. preparation of National WR development plan and strategy
2. Development of Water right legislation
3. Information/data exchange,
4. Technological exchange and update,
5. Experience sharing, etc.
iv. Develop human resource capacity;
1. Produce professionals in WR related fields,
2. Produce skilled manpower through long term or short term trainings, etc.
v. Control of population overgrowth for optimum resource allocation
vi. Improved methods of farming (from rain fed agriculture to irrigation)
vii. Create Awareness of WR development projects for
1. Decision makers,
2. Politicians,
3. The society,
4. Concerned bodies and development partners, etc.
viii. Equitable distribution of resources
ix. Afforestaion
x. Encourage participation of private investors in WR development
xi. Use of local technologies and materials for WR development, etc.
16. Consider the following LP Problem:
Maximize X0=3X1+5X2
Subject to
X1 < 4
X2 < 6
3X1 +2X2 < 18
d) Identify the feasible extreme points for the problem
e) Find the optimum feasible solution
f) Determine the amounts of reduction of the non-binding constraints without affecting the
feasibility of the current optimal solution.
This is almost the same as the irrigation scheme
example discussed in class.
From the description, the decision variables will be X1 and
X2 and the objective function may be formulated as
Max X0 = 3X1 + 5X2
Subjected to
X1 4
X2 6
3 X1 + 2 X2 18
X1 0, X2 0

Civil Engineering Dept., AAU WATER RESOURCES DEVELOPMENT
May, 2006 100
As there are only two decision variables a graphical technique can be employed for optimization
From the graph the feasible space is the shaded region and the feasible extreme points and their
respective output in the objective function is given in the following Table.
Point X1 X2 X0
A 0 0 0
B 0 6 30
C 2 6 36
D 4 3 27
E 0 4 20
Hence, the optimum feasible solution is X1 = 2 and X2 = 6 that produces X0 = 36
At the optimum feasible solution, only half of the available X1 is utilized whereas X2 is totally
consumed. Hence, the remaining half could be reduced without affecting the output.