Water Resources: Management and Development
50
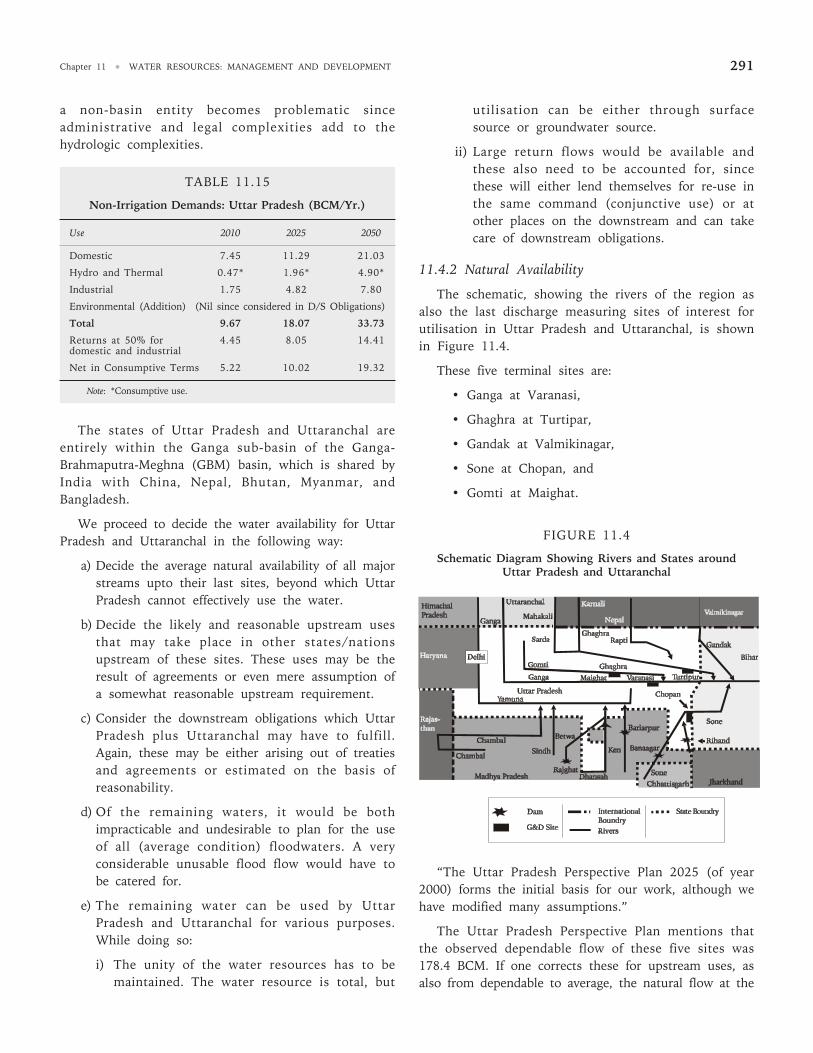
11.1 Introduction This chapter reviews the status of availability, demand and development possibilities with regard to the water resources in Uttar Pradesh. It also discusses the main issues faced, and likely to be faced by this state, in the water sector. The analysis carried out takes into account work done for the Indian Water Sector, in recent years, and more notably the reports of the “National Commission for Integrated Water Resources Development” (1999). The chapter is organised as follows: Section 11.2 discusses the status of land use, irrigation and population for the area as a whole and for different regions. It also presents the population and food demand projections up to 2050 as well as the land use planning. The water required for irrigation, domestic use and for electric power is presented in Section 11.3. Section 11.4 discusses the water resources, their availability and usability. The development possibilities, project-wise, as studied by the state are brought out, and compared with the requirements in land use projections in Section 11.5. Section 11.6 brings out the limitations of the land and water-use plan. The environmental issues regarding water quality, water logging and salinity, land drainage are discussed in Section 11.7. Section 11.8 is on floods. Section 11.10 discusses issues in water management. Water conflict related issues are presented in Section 11.11. Section 11.12 deals with water pricing and Section 11.13 deals with issues in sustainability and participatory management. The institutional issues are discussed in Section 11.14. The last Section 11.15 brings out the short and medium-term strategies and the action plan. Chapter 11 Water Resources: Management and Development U T T A R P R A D E S H 11.2 Land Use, Irrigation, Population and Food 11.2.1 Status Undivided Uttar Pradesh (UUP) had the largest irrigated area amongst all states. Large tracts of canal irrigation cover much of the plains, and groundwater structures dot the landscape. The irrigation map of UUP is shown in Figure 11.1. UUP had varied land use amongst its regions. While only a small percentage of the area was sown in the hills; in west UUP, almost 70 per cent of the area was sown. Out of the total sown area, only about one-third in the hills was irrigated; while in West UUP, more than 80 per cent of the sown area was irrigated. Rainfed agriculture is not an important activity in West UUP and even in Central UUP. The inter-regional comparison is depicted in Figure 11.2. The present land use of Uttar Pradesh (new) is given in the table below: TABLE 11.1 Land Use of Uttar Pradesh (1997–98) (in Million Ha) Description Uttar Pradesh Reporting Area 24.20 Forests 1.780 Barren and Unculturable Land 0.641 Land under Non Agricultural Use 2.376 Culturable Waste 0.586 Permanent Pastures and Land 0.365 under Miscellaneous Trees and Groves not Included in Sown Area Current and other Fallow 1.723 Net Sown Area 16.732 Area Sown More than Once 8.075 Net Irrigated Area 11.662 Source: GoI, 1999.
-
Upload
khangminh22 -
Category
Documents
-
view
2 -
download
0
Transcript of Water Resources: Management and Development
11.1 Introduction
This chapter reviews the status of availability,demand and development possibilities with regard tothe water resources in Uttar Pradesh. It also discussesthe main issues faced, and likely to be faced by thisstate, in the water sector. The analysis carried out takesinto account work done for the Indian Water Sector, inrecent years, and more notably the reports of the“National Commission for Integrated Water ResourcesDevelopment” (1999).
The chapter is organised as follows: Section 11.2discusses the status of land use, irrigation andpopulation for the area as a whole and for differentregions. It also presents the population and fooddemand projections up to 2050 as well as the landuse planning. The water required for irrigation,domestic use and for electric power is presented inSection 11.3. Section 11.4 discusses the waterresources, their availability and usability. Thedevelopment possibilities, project-wise, as studied bythe state are brought out, and compared with therequirements in land use projections in Section 11.5.Section 11.6 brings out the limitations of the landand water-use plan. The environmental issuesregarding water quality, water logging and salinity,land drainage are discussed in Section 11.7. Section11.8 is on floods. Section 11.10 discusses issues inwater management. Water conflict related issues arepresented in Section 11.11. Section 11.12 deals withwater pricing and Section 11.13 deals with issues insustainability and participatory management. Theinstitutional issues are discussed in Section 11.14.The last Section 11.15 brings out the short andmedium-term strategies and the action plan.
Chapter 11
Water Resources: Managementand Development
UTTAR PRADESH
11.2 Land Use, Irrigation, Population and Food
11.2.1 Status
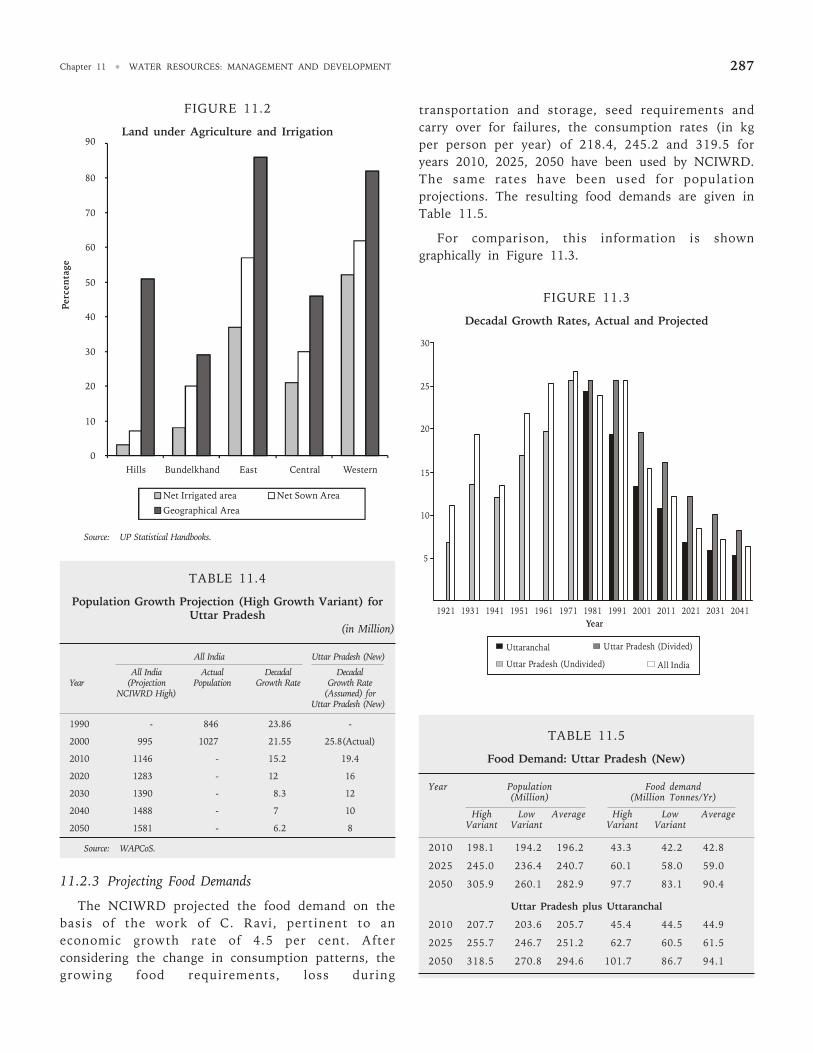
Undivided Uttar Pradesh (UUP) had the largestirrigated area amongst all states. Large tracts of canalirrigation cover much of the plains, and groundwaterstructures dot the landscape. The irrigation map ofUUP is shown in Figure 11.1.
UUP had varied land use amongst its regions. Whileonly a small percentage of the area was sown in thehills; in west UUP, almost 70 per cent of the area wassown. Out of the total sown area, only about one-thirdin the hills was irrigated; while in West UUP, morethan 80 per cent of the sown area was irrigated.Rainfed agriculture is not an important activity in WestUUP and even in Central UUP. The inter-regionalcomparison is depicted in Figure 11.2.
The present land use of Uttar Pradesh (new) isgiven in the table below:
TABLE 11.1Land Use of Uttar Pradesh (1997–98) (in Million Ha)
Description Uttar Pradesh
Reporting Area 24.20Forests 1.780Barren and Unculturable Land 0.641Land under Non Agricultural Use 2.376Culturable Waste 0.586Permanent Pastures and Land 0.365under Miscellaneous Trees andGroves not Included in Sown AreaCurrent and other Fallow 1.723Net Sown Area 16.732Area Sown More than Once 8.075Net Irrigated Area 11.662
Source: GoI, 1999.
UTTAR PRADESH DEVELOPMENT REPORT—VOL. 2284
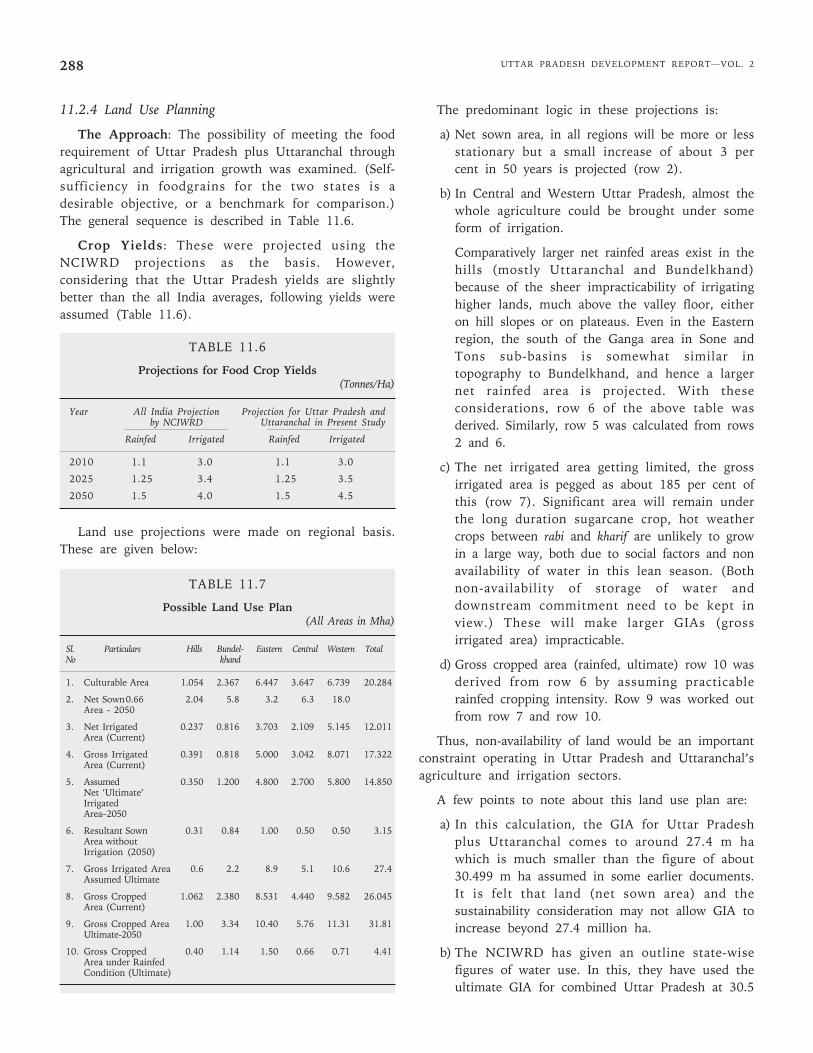
and exceeded the all-India rates thereafter. Between1981-1991 and 1991-2001, the all-India decadal growthdeclined from 23.84 per cent to 21.35 per cent, whereasfor UUP, it increased from 25.42 per cent to 25.45 percent.
These growth rates are given below:
The decadal population growth rate for UttarPradesh seems to be following the same trend as AllIndia, but with a time lag. Considering the fact thatcurrently the population growth rate of UttarPradesh is considerably higher than the all-Indiarate (1991-2001), the decadal growth for UttarPradesh up to 2050 is projected. For all-Indiaprojection, the NCIWRD (1999) projections, basedon Visaria and Visaria (standard) as also UN (low)were used, as high and low variants, respectively.These have been used as a basis for projections forUttar Pradesh.
The decadal growth rates, as projected for all-india (NCIWRD-High growth variant) and asprojected by WAPCOS for Uttar Pradesh are given inTable 11.4.
TABLE 11.3
Population and Growth: Undivided Uttar Pradeshand India
Year Population (in Million) Decadal Growth (Per Cent)
Uttar All- Uttar Uttar All-Pradesh India Pradesh Pradesh India
as % ofAll-India
1921 46.7 251.3 18.46 - -
1931 49.8 279.0 17.84 6.638 11.02
1941 56.5 318.7 17.72 13.45 19.22
1951 63.2 361.1 17.5 11.85 13.30
1961 73.8 439.2 16.8 16.77 21.62
1971 88.3 548.2 16.10 19.69 25.23
1981 110.9 683.3 16.23 25.59 26.64
1991 131.0* 846.3 16.43 N.A. 23.85+8.1# 24.23
139.1 25.42
2001 166.0* 16.17* 25.80(Prov- +8.50# 19.20isional) 174.5 1027.0 16.99 25.45 21.35
Source: National Census (Various).
Notes: * Reorganised Uttar Pradesh; # Uttaranchal.
TABLE 11.2
Important Features of Different Regions of Uttar Pradesh(Including Uttaranchal)
Region
Particulars Hill Bundel- Eastern Central Western Totalkhand Average
Total Population 5.927 6.726 52.722 24.187 49.547139.112Million(1991 Census)
Percentage of 4.26 4.85 37.90 17.38 35.61 100State’s Population
Density of 116 229 614 528 603 473Population PersonPer Square Km.
Urban Population 21.5 2.34 11.58 23.99 25.36 19.88as Percentageof Total
Geographical 5.112 2.942 8.585 4.583 8.219 29.441Area m.ha
CulturableArea m-ha. 1.054 2.367 6.447 3.647 6.739 20.284
Net SownArea m.ha 0.657 2.015 5.677 2.967 6.197 17.513
Area Sown More 0.405 0.365 2.854 1.523 3.385 8.532than Once-m.ha
Gross Sown 1.062 2.380 8.531 4.490 9.582 26.045Area–m.ha
Intensity of 163.0 118.0 150.2 151.3 154.5 148.7copping 9/7x100
Net irrigated 0.237 0.816 3.705 2.109 5.145 12.012Area m.ha
Percentage of Net 36.2 40.5 65.26 71.1 83.0 68.6Irrigated Areato Net SownArea 11/7x100
Gross Irrigated 0.391 0.818 5.000 3.042 8.071 17.322Area
Percentage of 36.5 34.36 58.6 67.75 84.3 66.5Gross IrrigatedArea to GrossSown Area13/7x100
Source: GoI, 1999.
The comparison, amongst regions, is given in Table11.2.
11.2.2 Population Projections
In the past, from 1921 to 1961-1971, growth rate ofUUP population was less than all-India, but it equalled
Chapter 11 • WATER RESOURCES: MANAGEMENT AND DEVELOPMENT 285

UTTAR PRADESH DEVELOPMENT REPORT—VOL. 2286
Chapter 11 • WATER RESOURCES: MANAGEMENT AND DEVELOPMENT 287
TABLE 11.4
Population Growth Projection (High Growth Variant) forUttar Pradesh
(in Million)
All India Uttar Pradesh (New)
All India Actual Decadal DecadalYear (Projection Population Growth Rate Growth Rate
NCIWRD High) (Assumed) for Uttar Pradesh (New)
1990 - 846 23.86 -
2000 995 1027 21.55 25.8(Actual)
2010 1146 - 15.2 19.4
2020 1283 - 12 16
2030 1390 - 8.3 12
2040 1488 - 7 10
2050 1581 - 6.2 8
Source: WAPCoS.
11.2.3 Projecting Food Demands
The NCIWRD projected the food demand on thebasis of the work of C. Ravi, pertinent to aneconomic growth rate of 4.5 per cent. Afterconsidering the change in consumption patterns, thegrowing food requirements, loss during
transportation and storage, seed requirements andcarry over for failures, the consumption rates (in kgper person per year) of 218.4, 245.2 and 319.5 foryears 2010, 2025, 2050 have been used by NCIWRD.The same rates have been used for populationprojections. The resulting food demands are given inTable 11.5.
For comparison, this information is showngraphically in Figure 11.3.
FIGURE 11.3
Decadal Growth Rates, Actual and Projected
TABLE 11.5
Food Demand: Uttar Pradesh (New)
Year Population Food demand(Million) (Million Tonnes/Yr)
High Low Average High Low AverageVariant Variant Variant Variant
2010 198.1 194.2 196.2 43.3 42.2 42.8
2025 245.0 236.4 240.7 60.1 58.0 59.0
2050 305.9 260.1 282.9 97.7 83.1 90.4
Uttar Pradesh plus Uttaranchal
2010 207.7 203.6 205.7 45.4 44.5 44.9
2025 255.7 246.7 251.2 62.7 60.5 61.5
2050 318.5 270.8 294.6 101.7 86.7 94.1
1921 1931 1941 1951 1961 1971 1981 1991 2001 2011 2021 2031 2041
Uttaranchal Uttar Pradesh (Divided)
Uttar Pradesh (Undivided) All India
5
10
15
20
25
30
Year
FIGURE 11.2
Land under Agriculture and Irrigation
Source: UP Statistical Handbooks.
0
10
20
30
40
50
60
70
80
90
Hills Bundelkhand East Central Western
Net Irrigated area Net Sown Area
Geographical Area
Perc
enta
ge
UTTAR PRADESH DEVELOPMENT REPORT—VOL. 2288
11.2.4 Land Use Planning
The Approach: The possibility of meeting the foodrequirement of Uttar Pradesh plus Uttaranchal throughagricultural and irrigation growth was examined. (Self-sufficiency in foodgrains for the two states is adesirable objective, or a benchmark for comparison.)The general sequence is described in Table 11.6.
Crop Yields: These were projected using theNCIWRD projections as the basis. However,considering that the Uttar Pradesh yields are slightlybetter than the all India averages, following yields wereassumed (Table 11.6).
TABLE 11.6
Projections for Food Crop Yields(Tonnes/Ha)
Year All India Projection Projection for Uttar Pradesh andby NCIWRD Uttaranchal in Present Study
Rainfed Irrigated Rainfed Irrigated
2010 1.1 3.0 1.1 3.0
2025 1.25 3.4 1.25 3.5
2050 1.5 4.0 1.5 4.5
Land use projections were made on regional basis.These are given below:
TABLE 11.7
Possible Land Use Plan(All Areas in Mha)
Sl. Particulars Hills Bundel- Eastern Central Western TotalNo khand
1. Culturable Area 1.054 2.367 6.447 3.647 6.739 20.284
2. Net Sown0.66 2.04 5.8 3.2 6.3 18.0Area - 2050
3. Net Irrigated 0.237 0.816 3.703 2.109 5.145 12.011Area (Current)
4. Gross Irrigated 0.391 0.818 5.000 3.042 8.071 17.322Area (Current)
5. Assumed 0.350 1.200 4.800 2.700 5.800 14.850Net ‘Ultimate’IrrigatedArea–2050
6. Resultant Sown 0.31 0.84 1.00 0.50 0.50 3.15Area withoutIrrigation (2050)
7. Gross Irrigated Area 0.6 2.2 8.9 5.1 10.6 27.4Assumed Ultimate
8. Gross Cropped 1.062 2.380 8.531 4.440 9.582 26.045Area (Current)
9. Gross Cropped Area 1.00 3.34 10.40 5.76 11.31 31.81Ultimate-2050
10. Gross Cropped 0.40 1.14 1.50 0.66 0.71 4.41Area under RainfedCondition (Ultimate)
The predominant logic in these projections is:
a) Net sown area, in all regions will be more or lessstationary but a small increase of about 3 percent in 50 years is projected (row 2).
b) In Central and Western Uttar Pradesh, almost thewhole agriculture could be brought under someform of irrigation.
Comparatively larger net rainfed areas exist in thehills (mostly Uttaranchal and Bundelkhand)because of the sheer impracticability of irrigatinghigher lands, much above the valley floor, eitheron hill slopes or on plateaus. Even in the Easternregion, the south of the Ganga area in Sone andTons sub-basins is somewhat similar intopography to Bundelkhand, and hence a largernet rainfed area is projected. With theseconsiderations, row 6 of the above table wasderived. Similarly, row 5 was calculated from rows2 and 6.
c) The net irrigated area getting limited, the grossirrigated area is pegged as about 185 per cent ofthis (row 7). Significant area will remain underthe long duration sugarcane crop, hot weathercrops between rabi and kharif are unlikely to growin a large way, both due to social factors and nonavailability of water in this lean season. (Bothnon-availability of storage of water anddownstream commitment need to be kept inview.) These will make larger GIAs (grossirrigated area) impracticable.
d) Gross cropped area (rainfed, ultimate) row 10 wasderived from row 6 by assuming practicablerainfed cropping intensity. Row 9 was worked outfrom row 7 and row 10.
Thus, non-availability of land would be an importantconstraint operating in Uttar Pradesh and Uttaranchal’sagriculture and irrigation sectors.
A few points to note about this land use plan are:
a) In this calculation, the GIA for Uttar Pradeshplus Uttaranchal comes to around 27.4 m hawhich is much smaller than the figure of about30.499 m ha assumed in some earlier documents.It is felt that land (net sown area) and thesustainability consideration may not allow GIA toincrease beyond 27.4 million ha.
b) The NCIWRD has given an outline state-wisefigures of water use. In this, they have used theultimate GIA for combined Uttar Pradesh at 30.5
Chapter 11 • WATER RESOURCES: MANAGEMENT AND DEVELOPMENT 289
m ha, made up of 13.7 m ha from surface and16.8 m ha from ground sources. Our estimatesfall somewhat short of these.
As regards the ultimate cropping intensities, theproposals made above are based on the considerationsthat though reclamation of degraded lands could bepossible, but due to rapid urbanisation and round theyear occupancy of sugarcane both the cropping intensityand the irrigation intensity cannot be increased beyondthe proposed limits (any proposal for such an increaseneeds to be tested by drawing a land occupancy diagramdepicting all the unirrigated and irrigated crops).
intensities and average figures of ‘Delta’ as presented inour report are based on the national perspective of foodgrain requirement and the assumed consumptive use.Diversified agricultural practices as suggested in theagriculture sector report are not likely to significantlychange the overall irrigation water requirements.
11.3 Water Requirements
11.3.1 Water Requirement for Irrigation
The NCIWRD national figures about water depthsrequirement for irrigation are used. These are depictedin Table 11.9.
11.2.5 Land Use Plan vis-à-vis Food Requirement
Using the yields and land use as projected, andmaking assumptions about land for non food crops, theagricultural production possible is computed as follows(Table 11. 8).
A comparison of these capacities with demandshows that in general, regional self-sufficiency may bepossible, but some shortages under the high populationvariant may occur. However, this is a conclusion basedon the land availability constraints, but withoutconsidering the usable water availability constraints andconstraints of engineering possibilities. (These aspectsare studied later, and the conclusion is found to stand.)
The report on Revitalising Agriculture in UttarPradesh and Uttaranchal has made certain generalobservations regarding diversification of agriculturalpractices to improve the financial returns fromagriculture. No specifics regarding the changes incropping pattern have been suggested. The quantum ofwater earmarked for irrigation based on irrigation
TABLE 11.9
Irrigation Water Requirements (Depth/Season)(Ultimate, 2050)
Gross Irrigation Net IrrigationRequirements at RequirementsHead (Metres) (Consumption)
(Metres)
Surface Water Irrigation 0.61 0.36
Groundwater Irrigation 0.49 0.36
Using these on the land use plan, and by assumingthat the ultimate irrigation of 27.4 m ha is composed of12.4 m ha of surface water irrigation and 15.0 millionha of groundwater irrigation, the irrigation waterrequirements are computed in Table 11.10.
11.3.2 Water Requirements for Domestic(Municipal) Use
Norms: Different supply norms are being used byCentral Public Health Engineering Organisation and the
TABLE 11.8
Assumed ‘Ultimate’ Development Scenarios (Agricultural Production Capacities)All Figures as Areas in Mha
Particulars Hills Bundelkhand Eastern Central Western Total
Gross Cropped (Total 2050) 1.00 3.34 10.40 5.76 11.31 31.81
Gross Crop Irrigated Area 0.60 2.2 8.9 5.1 10.6 27.40
Gross Cropped Rainfed 0.40 1.14 1.50 0.66 0.71 4.41
Gross Food Crop (Irrigated)(about 75% of GIA) 0.45 1.65 6.47 3.82 7.95 20.34
Gross Food Crop under Rainfed Area (about 70% ) 0.30 0.80 1.05 0.46 0.50 3.11
All Figures in Million Tonnes/Year
Ultimate Yield Irrigated Area Yield 4.5 t/ha (2050) 2.03 7.43 29.11 17.19 35.77 91.53
Ultimate Rainfed Area Yield 1.5 t/ha (2050) 0.45 1.20 1.58 0.69 0.75 4.67
Total Yield 2050 2.48 8.63 30.69 17.88 36.52 96.20
UTTAR PRADESH DEVELOPMENT REPORT—VOL. 2290
Uttar Pradesh Jal Nigam. Norms again vary betweenrural and urban areas, with population, by type ofsupply (stand posts, home connection, etc), betweenhills and plains etc; and range from 40 lpcd (litres percapita per day) to 200 lpcd. NCIWRD norms, as givenin Table 11.1, have been used.
TABLE 11.10
Irrigation Water Requirements
(All Figures in Billion Ms/Yr i.e. BCM/Yr.)
Gross Net(Withdrawals) (Consumption)
Surface Water Irrigation of 12.4 m ha 75.6 44.6
Groundwater Irrigational 15.0 m ha 72.0 54.0
Total 147.6 98.6
TABLE 11.11
Domestic Water: Projection of Norms forDrinking Water (in LPCD)
Population Type Year 2010 Year 2025 Year 2050
Class I Cities 220 220 220
Other than Class I 150 165 220
Rural 55 70 150
Population: To use these norms, the projectedpopulation was to be divided between urban and ruralareas, as also between Class I cities and other cities.The NCIWRD has already projected urban and ruralpopulation on an All India basis, and guidance wastaken from these. The urban population was assumedto be 32 per cent, 37 per cent, 44 per cent and 55 percent of the total, for 2001, 2010, 2025 and 2050respectively. It was assumed that this is equally dividedbetween Class I cities and the other cities. On the basisof these, the water requirements were worked out(Table 11.12).
TABLE 11.12
Domestic Water Demand (Withdrawals)
Year 2010 Year 2025 Year 2050Uttar Pradesh Uttar Pradesh Uttar Pradesh
Population (in Million) 198.2 245 305.9
Water Demands (in BCM/Yr.)
Urban 4.95 7.77 13.5
Rural 2.5 3.52 7.53
Total 7.45 11.29 21.03
11.3.3 Water Demand for Electric Power
These are computed as follows (Table 11.13), basedon UPSEB projections:
TABLE 11.13
Consumptive Use of Power
Item Rate Consumptive Use(BCM/Yr.)
2025 2050
Hydropower (Ultimate 10% of storage 1.50 2.83Storage 28.36 (BCM)
Thermal Power 50000 3.92 million m3 per 1.96 4.9MW by 2025 125000 100 MW per yearMW by 2050
Industrial Requirements: NCIWRD has made AllIndia projections for water requirements for differenttypes of industries. Considering that the present statusof low industrial development of Uttar Pradesh andUttaranchal may improve in the future, the followingassumptions have been made (Table 11.14).
TABLE 11.14
Industrial Water Requirement (Withdrawals)(All Figures in BCM/Yr.)
2010 2025 2050
All India (NCIWRD) 37 67 81
Share of Uttar Pradesh 5% 7.5% 10%+ Uttaranchal
Uttar Pradesh + Uttaranchal 1.85 5.02 8.1
As per NCIWRD, 50 per cent of this is assumed asreturn flow.
Environmental Requirements: No estimates ornorms for low flow requirements for maintenance ofriver ecology exist. However, separate provisions of largequantities for meeting downstream obligations havebeen made, and hence no special release for thispurpose would be required.
The non-irrigation demands for Uttar Pradesh are asfollows (Table 11.15).
11.4 Water Resources-Their Availabilityand Usability
11.4.1 The Approach
Water resources of a basin, which is a self-containedhydrologic unit, can be defined in a conceptuallysatisfying way. Deciding the availability and usability of
Chapter 11 • WATER RESOURCES: MANAGEMENT AND DEVELOPMENT 291
a non-basin entity becomes problematic sinceadministrative and legal complexities add to thehydrologic complexities.
TABLE 11.15
Non-Irrigation Demands: Uttar Pradesh (BCM/Yr.)
Use 2010 2025 2050
Domestic 7.45 11.29 21.03
Hydro and Thermal 0.47* 1.96* 4.90*
Industrial 1.75 4.82 7.80
Environmental (Addition) (Nil since considered in D/S Obligations)
Total 9.67 18.07 33.73
Returns at 50% for 4.45 8.05 14.41domestic and industrial
Net in Consumptive Terms 5.22 10.02 19.32
Note: *Consumptive use.
The states of Uttar Pradesh and Uttaranchal areentirely within the Ganga sub-basin of the Ganga-Brahmaputra-Meghna (GBM) basin, which is shared byIndia with China, Nepal, Bhutan, Myanmar, andBangladesh.
We proceed to decide the water availability for UttarPradesh and Uttaranchal in the following way:
a) Decide the average natural availability of all majorstreams upto their last sites, beyond which UttarPradesh cannot effectively use the water.
b) Decide the likely and reasonable upstream usesthat may take place in other states/nationsupstream of these sites. These uses may be theresult of agreements or even mere assumption ofa somewhat reasonable upstream requirement.
c) Consider the downstream obligations which UttarPradesh plus Uttaranchal may have to fulfill.Again, these may be either arising out of treatiesand agreements or estimated on the basis ofreasonability.
d) Of the remaining waters, it would be bothimpracticable and undesirable to plan for the useof all (average condition) floodwaters. A veryconsiderable unusable flood flow would have tobe catered for.
e) The remaining water can be used by UttarPradesh and Uttaranchal for various purposes.While doing so:
i) The unity of the water resources has to bemaintained. The water resource is total, but
utilisation can be either through surfacesource or groundwater source.
ii) Large return flows would be available andthese also need to be accounted for, sincethese will either lend themselves for re-use inthe same command (conjunctive use) or atother places on the downstream and can takecare of downstream obligations.
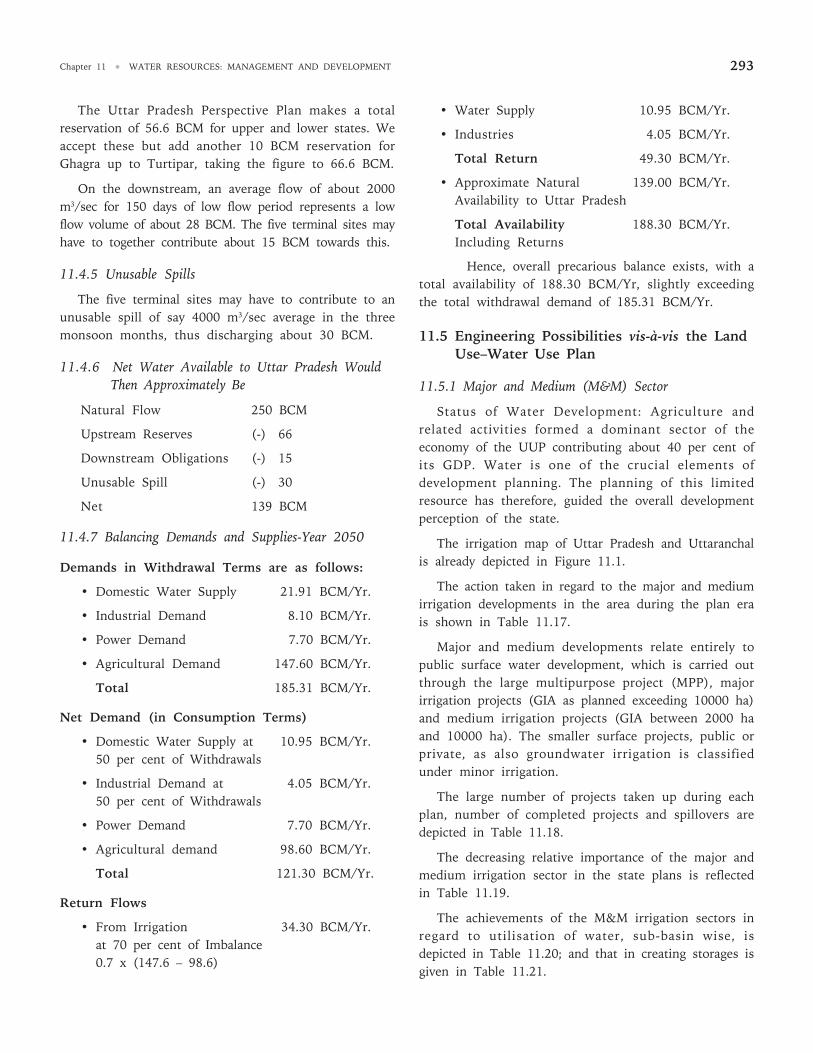
11.4.2 Natural Availability
The schematic, showing the rivers of the region asalso the last discharge measuring sites of interest forutilisation in Uttar Pradesh and Uttaranchal, is shownin Figure 11.4.
These five terminal sites are:
• Ganga at Varanasi,
• Ghaghra at Turtipar,
• Gandak at Valmikinagar,
• Sone at Chopan, and
• Gomti at Maighat.
FIGURE 11.4
Schematic Diagram Showing Rivers and States aroundUttar Pradesh and Uttaranchal
“The Uttar Pradesh Perspective Plan 2025 (of year2000) forms the initial basis for our work, although wehave modified many assumptions.”
The Uttar Pradesh Perspective Plan mentions thatthe observed dependable flow of these five sites was178.4 BCM. If one corrects these for upstream uses, asalso from dependable to average, the natural flow at the
UTTAR PRADESH DEVELOPMENT REPORT—VOL. 2292
five sites, (which will already include the groundwaterbase flow component) would be about 250 BCM.
11.4.3 Water Rights of Uttar Pradesh and Uttaranchal
In the absence of an accepted and enforceable law onwater, the water rights of nations/states sharing aninternational basin are often nebulous unless thesehave been mutually agreed upon through treaties,agreements, accepted arbitration awards oradjudications. In this background, the positions of UUPand the successor states of Uttar Pradesh andUttaranchal have been examined.
A. International Matters
The rights of UUP would thus be regulated by therights of India on the Ganga. These are unquantifiedbut partially regulated through the followingagreements/treaties, etc.
(i) The Ganga water treaty dated 12-12-96 betweenIndia and Bangladesh for sharing Ganga watersat Farakka Barrage; Article VIII regardingcooperation in finding solutions to the longterm problem of augmenting the flow of Gangaand clause (ii) of Article II regarding effortsbeing made by the upper riparians to protect theflows at Farakka are of comparative importance.
(ii) The Mahakali Treaty dated the 12-2-1996between HMG of Nepal and India about theintegrated development of Mahakali river.
B. Interstate Matters
There are a number of existing interstate agreementson the Ganga. The CWC compilation Legal instrumentson Rivers in India, volume III, “Agreements on InterstateRivers” (March 1995), lists and reproduces 21 such
agreements and between 1892 to 1994. The moreimportant agreements in regard to regulation of theUUP rights are given in Table 11.16.
Summarising, the Uttar Pradesh water developmentwould have to take into consideration:
(a) Upstream Uses
(i) Upstream uses, as flowing out of Yamuna,Sone, Rajghat and other agreement, and Indo-Nepal agreements.
(ii) Upstream established uses in rivers like Chambal.
(iii) Likely future upstream uses, which can takeplace in the absence of any agreement.
(b) Downstream Obligations
(i) Rights of Bihar in regard to use of Gandakwater, which is a boundary river.
(ii) The need to not cause appreciable or significantharm to Bihar, West Bengal or also toBangladesh, in regard to the Ganga. Mostly,maintaining the low flows from January to Maywould be the main concern.
(iii) In regard to the southern tributaries of Ganga,UUP is the upper or middle riparian and Biharis the lower riparian. The obligation would bein allowing the agreed share to Bihar on Soneor its tributaries (and not low flows alone since,for Sone sub-basin, there is a considerablepossibility of storage development).
11.4.4 Upstream and Downstream Reservations as Made
After considering the position in 11.4.3, upstream anddownstream reservations/obligations are considered as follows:
TABLE 11.16
Important Interstate Agreements
Date Parties Subject
12-05-1994 UP, Haryana, Rajasthan, Himachal Pradesh and Delhi Yamuna water sharing
20-02-1952 UP, Madhya Pradesh and Bihar Sharing of Kanhar waters
13-01-1977 UP and Madhya Pradesh Rajghat, Paisuni, Ken canals, Kanhar, Urmil Ban sagaand Bhander canal
9-12-1973 UP and Madhya Pradesh Rajghat Project
16-09-1973 UP, Madhya Pradesh and Bihar Bansagar Project
16-09-1973 Bihar and UP Rihand
01-08-1972 UP and Madhya Pradesh. Irrigation projects in Bundelkhand
18-10-1985 UP and Madhya Pradesh Bhander canals Rangawa and Jamni Dam
Chapter 11 • WATER RESOURCES: MANAGEMENT AND DEVELOPMENT 293
The Uttar Pradesh Perspective Plan makes a totalreservation of 56.6 BCM for upper and lower states. Weaccept these but add another 10 BCM reservation forGhagra up to Turtipar, taking the figure to 66.6 BCM.
On the downstream, an average flow of about 2000m3/sec for 150 days of low flow period represents a lowflow volume of about 28 BCM. The five terminal sites mayhave to together contribute about 15 BCM towards this.
11.4.5 Unusable Spills
The five terminal sites may have to contribute to anunusable spill of say 4000 m3/sec average in the threemonsoon months, thus discharging about 30 BCM.
11.4.6 Net Water Available to Uttar Pradesh WouldThen Approximately Be
Natural Flow 250 BCM
Upstream Reserves (-) 66
Downstream Obligations (-) 15
Unusable Spill (-) 30
Net 139 BCM
11.4.7 Balancing Demands and Supplies-Year 2050
Demands in Withdrawal Terms are as follows:
• Domestic Water Supply 21.91 BCM/Yr.
• Industrial Demand 8.10 BCM/Yr.
• Power Demand 7.70 BCM/Yr.
• Agricultural Demand 147.60 BCM/Yr.
Total 185.31 BCM/Yr.
Net Demand (in Consumption Terms)
• Domestic Water Supply at 10.95 BCM/Yr.50 per cent of Withdrawals
• Industrial Demand at 4.05 BCM/Yr.50 per cent of Withdrawals
• Power Demand 7.70 BCM/Yr.
• Agricultural demand 98.60 BCM/Yr.
Total 121.30 BCM/Yr.
Return Flows
• From Irrigation 34.30 BCM/Yr.at 70 per cent of Imbalance0.7 x (147.6 – 98.6)
• Water Supply 10.95 BCM/Yr.
• Industries 4.05 BCM/Yr.
Total Return 49.30 BCM/Yr.
• Approximate Natural 139.00 BCM/Yr.Availability to Uttar Pradesh
Total Availability 188.30 BCM/Yr.Including Returns
Hence, overall precarious balance exists, with atotal availability of 188.30 BCM/Yr, slightly exceedingthe total withdrawal demand of 185.31 BCM/Yr.
11.5 Engineering Possibilities vis-à-vis the LandUse–Water Use Plan
11.5.1 Major and Medium (M&M) Sector
Status of Water Development: Agriculture andrelated activities formed a dominant sector of theeconomy of the UUP contributing about 40 per cent ofits GDP. Water is one of the crucial elements ofdevelopment planning. The planning of this limitedresource has therefore, guided the overall developmentperception of the state.
The irrigation map of Uttar Pradesh and Uttaranchalis already depicted in Figure 11.1.
The action taken in regard to the major and mediumirrigation developments in the area during the plan erais shown in Table 11.17.
Major and medium developments relate entirely topublic surface water development, which is carried outthrough the large multipurpose project (MPP), majorirrigation projects (GIA as planned exceeding 10000 ha)and medium irrigation projects (GIA between 2000 haand 10000 ha). The smaller surface projects, public orprivate, as also groundwater irrigation is classifiedunder minor irrigation.
The large number of projects taken up during eachplan, number of completed projects and spillovers aredepicted in Table 11.18.
The decreasing relative importance of the major andmedium irrigation sector in the state plans is reflectedin Table 11.19.
The achievements of the M&M irrigation sectors inregard to utilisation of water, sub-basin wise, isdepicted in Table 11.20; and that in creating storages isgiven in Table 11.21.
UTTAR PRADESH DEVELOPMENT REPORT—VOL. 2294
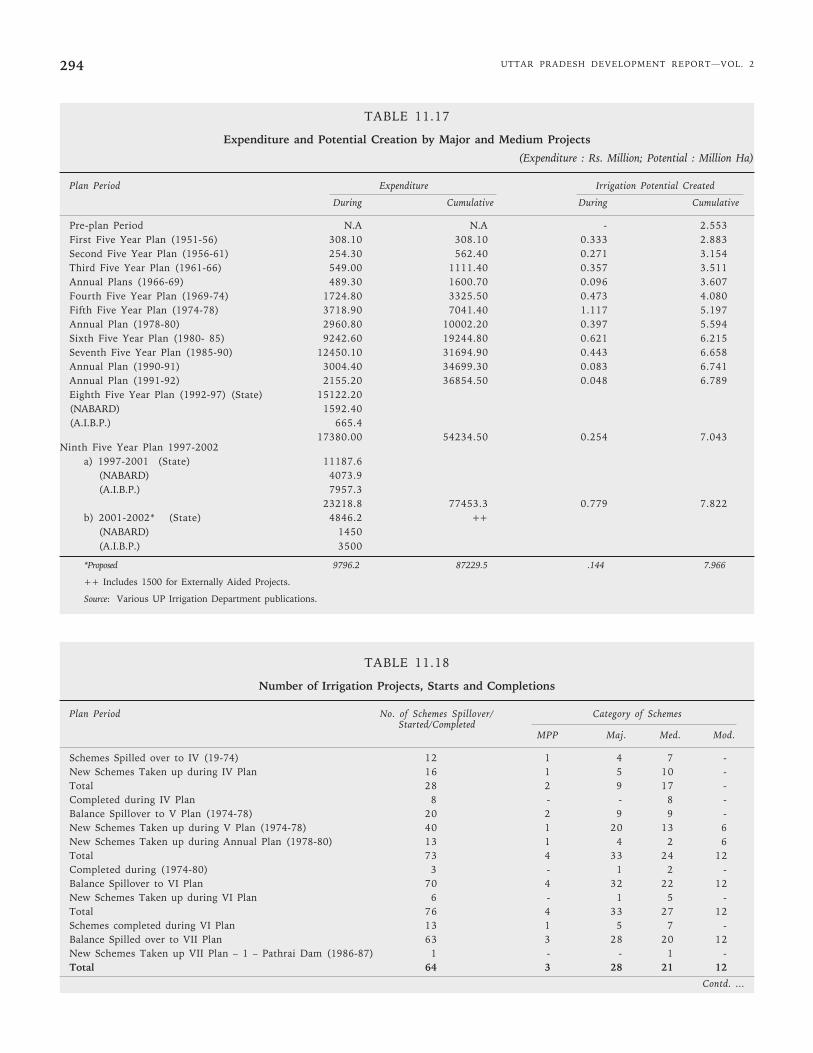
TABLE 11.17
Expenditure and Potential Creation by Major and Medium Projects
(Expenditure : Rs. Million; Potential : Million Ha)
Plan Period Expenditure Irrigation Potential Created
During Cumulative During Cumulative
Pre-plan Period N.A N.A - 2.553First Five Year Plan (1951-56) 308.10 308.10 0.333 2.883Second Five Year Plan (1956-61) 254.30 562.40 0.271 3.154Third Five Year Plan (1961-66) 549.00 1111.40 0.357 3.511Annual Plans (1966-69) 489.30 1600.70 0.096 3.607Fourth Five Year Plan (1969-74) 1724.80 3325.50 0.473 4.080Fifth Five Year Plan (1974-78) 3718.90 7041.40 1.117 5.197Annual Plan (1978-80) 2960.80 10002.20 0.397 5.594Sixth Five Year Plan (1980- 85) 9242.60 19244.80 0.621 6.215Seventh Five Year Plan (1985-90) 12450.10 31694.90 0.443 6.658Annual Plan (1990-91) 3004.40 34699.30 0.083 6.741Annual Plan (1991-92) 2155.20 36854.50 0.048 6.789Eighth Five Year Plan (1992-97) (State) 15122.20(NABARD) 1592.40(A.I.B.P.) 665.4
17380.00 54234.50 0.254 7.043Ninth Five Year Plan 1997-2002
a) 1997-2001 (State) 11187.6(NABARD) 4073.9(A.I.B.P.) 7957.3
23218.8 77453.3 0.779 7.822b) 2001-2002* (State) 4846.2 ++
(NABARD) 1450(A.I.B.P.) 3500
*Proposed 9796.2 87229.5 .144 7.966
++ Includes 1500 for Externally Aided Projects.
Source: Various UP Irrigation Department publications.
TABLE 11.18
Number of Irrigation Projects, Starts and Completions
Plan Period No. of Schemes Spillover/ Category of SchemesStarted/Completed
MPP Maj. Med. Mod.
Schemes Spilled over to IV (19-74) 12 1 4 7 -New Schemes Taken up during IV Plan 16 1 5 10 -Total 28 2 9 17 -Completed during IV Plan 8 - - 8 -Balance Spillover to V Plan (1974-78) 20 2 9 9 -New Schemes Taken up during V Plan (1974-78) 40 1 20 13 6New Schemes Taken up during Annual Plan (1978-80) 13 1 4 2 6Total 73 4 33 24 12Completed during (1974-80) 3 - 1 2 -Balance Spillover to VI Plan 70 4 32 22 12New Schemes Taken up during VI Plan 6 - 1 5 -Total 76 4 33 27 12Schemes completed during VI Plan 13 1 5 7 -Balance Spilled over to VII Plan 63 3 28 20 12New Schemes Taken up VII Plan – 1 – Pathrai Dam (1986-87) 1 - - 1 -Total 64 3 28 21 12
Contd. ...
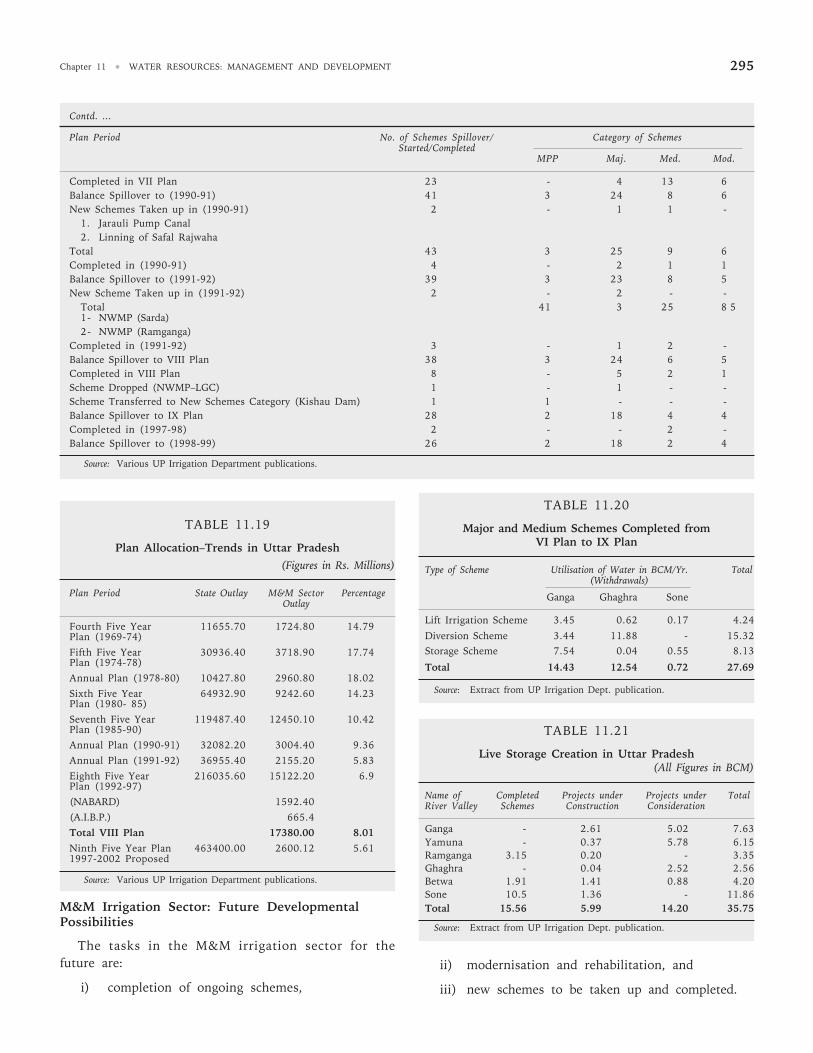
Chapter 11 • WATER RESOURCES: MANAGEMENT AND DEVELOPMENT 295
TABLE 11.19
Plan Allocation–Trends in Uttar Pradesh(Figures in Rs. Millions)
Plan Period State Outlay M&M Sector PercentageOutlay
Fourth Five Year 11655.70 1724.80 14.79Plan (1969-74)
Fifth Five Year 30936.40 3718.90 17.74Plan (1974-78)
Annual Plan (1978-80) 10427.80 2960.80 18.02
Sixth Five Year 64932.90 9242.60 14.23Plan (1980- 85)
Seventh Five Year 119487.40 12450.10 10.42Plan (1985-90)
Annual Plan (1990-91) 32082.20 3004.40 9.36
Annual Plan (1991-92) 36955.40 2155.20 5.83
Eighth Five Year 216035.60 15122.20 6.9Plan (1992-97)
(NABARD) 1592.40
(A.I.B.P.) 665.4
Total VIII Plan 17380.00 8.01
Ninth Five Year Plan 463400.00 2600.12 5.611997-2002 Proposed
M&M Irrigation Sector: Future DevelopmentalPossibilities
The tasks in the M&M irrigation sector for thefuture are:
i) completion of ongoing schemes,
TABLE 11.20
Major and Medium Schemes Completed fromVI Plan to IX Plan
Type of Scheme Utilisation of Water in BCM/Yr. Total(Withdrawals)
Ganga Ghaghra Sone
Lift Irrigation Scheme 3.45 0.62 0.17 4.24
Diversion Scheme 3.44 11.88 - 15.32Storage Scheme 7.54 0.04 0.55 8.13
Total 14.43 12.54 0.72 27.69
TABLE 11.21
Live Storage Creation in Uttar Pradesh(All Figures in BCM)
Name of Completed Projects under Projects under TotalRiver Valley Schemes Construction Consideration
Ganga - 2.61 5.02 7.63Yamuna - 0.37 5.78 6.15Ramganga 3.15 0.20 - 3.35Ghaghra - 0.04 2.52 2.56Betwa 1.91 1.41 0.88 4.20Sone 10.5 1.36 - 11.86Total 15.56 5.99 14.20 35.75
ii) modernisation and rehabilitation, and
iii) new schemes to be taken up and completed.
Contd. ...
Plan Period No. of Schemes Spillover/ Category of SchemesStarted/Completed
MPP Maj. Med. Mod.
Completed in VII Plan 23 - 4 13 6Balance Spillover to (1990-91) 41 3 24 8 6New Schemes Taken up in (1990-91) 2 - 1 1 -
1. Jarauli Pump Canal2. Linning of Safal Rajwaha
Total 43 3 25 9 6Completed in (1990-91) 4 - 2 1 1Balance Spillover to (1991-92) 39 3 23 8 5New Scheme Taken up in (1991-92) 2 - 2 - -
Total 41 3 25 8 51- NWMP (Sarda)2- NWMP (Ramganga)
Completed in (1991-92) 3 - 1 2 -Balance Spillover to VIII Plan 38 3 24 6 5Completed in VIII Plan 8 - 5 2 1Scheme Dropped (NWMP–LGC) 1 - 1 - -Scheme Transferred to New Schemes Category (Kishau Dam) 1 1 - - -Balance Spillover to IX Plan 28 2 18 4 4Completed in (1997-98) 2 - - 2 -Balance Spillover to (1998-99) 26 2 18 2 4
Source: Various UP Irrigation Department publications.
Source: Various UP Irrigation Department publications.
Source: Extract from UP Irrigation Dept. publication.
Source: Extract from UP Irrigation Dept. publication.
UTTAR PRADESH DEVELOPMENT REPORT—VOL. 2296
The Ninth Plan targets, in regard to items (i) and(ii), as planned by the state, are given in Table 11.22.
TABLE 11.22
Schemes Proposed for Completion duringthe Ninth Plan Period
Year Major Projects Medium andModernisation Project
1997-98 1. Revised tonnes pump canal2. Chittaurgarh reservoir
1998-99 1. Bewar Feeder 1. Modernisation ofGhaghar Canal
1999-00 - 1. Gunta Nala Dam2000-01 1. Maudaha Dam
(Excluding Charkhari P.C.)2. Sarda Sahayak Phase-I
2001-02* 1. Maudaha Dam 1. Pathrai Dam(Including Charkhari P.C.)
2. Upper Ganga IrrigationModernisation Proejct
3. Madhya Ganga Canal4. Rajghat Dam and Canal5. Eastern Ganga Canal6. Gyanpur Pump Canal7. NWMP Sarda Canal8. New Tajewala Barrage9. Providing Paddy Channel
in H.K. Doab10. Jarauli Pump Canal11. Chambal Lift Scheme
Note: * Proposed.
With the completion of these projects, a totaladditional irrigation potential of 1.0 m ha is expected.The remaining ongoing schemes when completed willcreate an additional potential of about 2.0 m ha. Thebalance of 2.5 m ha out of the total 12.5 m ha ultimatepotential can be created on completion of the identifiedschemes which have not been taken up so for.
In regard to new schemes, the Uttar PradeshGovernment has identified 33 schemes, which can beabstracted as follows: (Table11.23)
TABLE 11.23
Abstract of New Development Schemes
Numbers Water Utilisation Irrigation Poten-Possible (BCM/Yr.) tial(M Ha)
Storage Schemes 20 11.085 2.42
Lift/Diversion Schemes 13 1.263
Note: The 33 listed schemes include both Pancheshwer (Indo Nepal)and its Indian alternative, Chamgadh. Only Chamgadh isconsidered in this abstract.
The future schemes thus heavily rely on storagedevelopment, mostly in Uttaranchal. Some of the
notable storages amongst these are Uttayasu, ViratSagar, Kosi, Kotli Behl in Uttaranchal as well asPanchanad, New Pathri and Rivai in Uttar Pradesh.Some of these new schemes may not be techno-economically or socially feasible.
Summary: M&M Sector
It can be seen that:
1) Large increases in the M&M irrigation potential(2.6 m ha to 8.0 m ha) have been achieved duringthe plan era of development through largeinvestments.
2) The large spillover of projects (70, from Fifth toSixth Plan) has been reduced (28, from Eighth toNinth plan)
3) The relative outlay on the sector has reduced.
4) M&M schemes for further increasing irrigationpotential by 2.42 million ha have already beenidentified. (However, all of them may perhaps notbe feasible.)
The abstract of potential M&M schemes is as follows:
BOX 11.1
M&M Sector Irrigation Potential
i) Irrigation Potential Expected to be 8.00 m haCreated up to End of Ninth Plan
ii) Additional Irrigation Potential 2.00 m haLikely by Completion of SpilloverSchemes of Ninth Plan
iii) Potential Likely from Schemes 2.42 m haIdentified but Not Taken upto Ninth Plan
Total 12.42 m ha
11.5.2 Minor Surface Sector
Minor surface irrigation sector consists mainly ofsmall surface tanks and small lifts.
The development statistics for UUP are given in(Table 11.24).
TABLE 11.24
Surface Minor Irrigation (Ultimate Potential 1.2 M Ha)
End of Year 1984-85 1989-90 1997-98
Cumulate Potential Created (m ha) 0.851 0.991 1.063
Cumulate Potential Utilised (m ha) 0.822 0.933 0.997
Thus, this sector has a small potential and littlegrowth potential. Ultimately, the potential will increasefrom 1.0 m ha to 1.2 m ha.
Chapter 11 • WATER RESOURCES: MANAGEMENT AND DEVELOPMENT 297
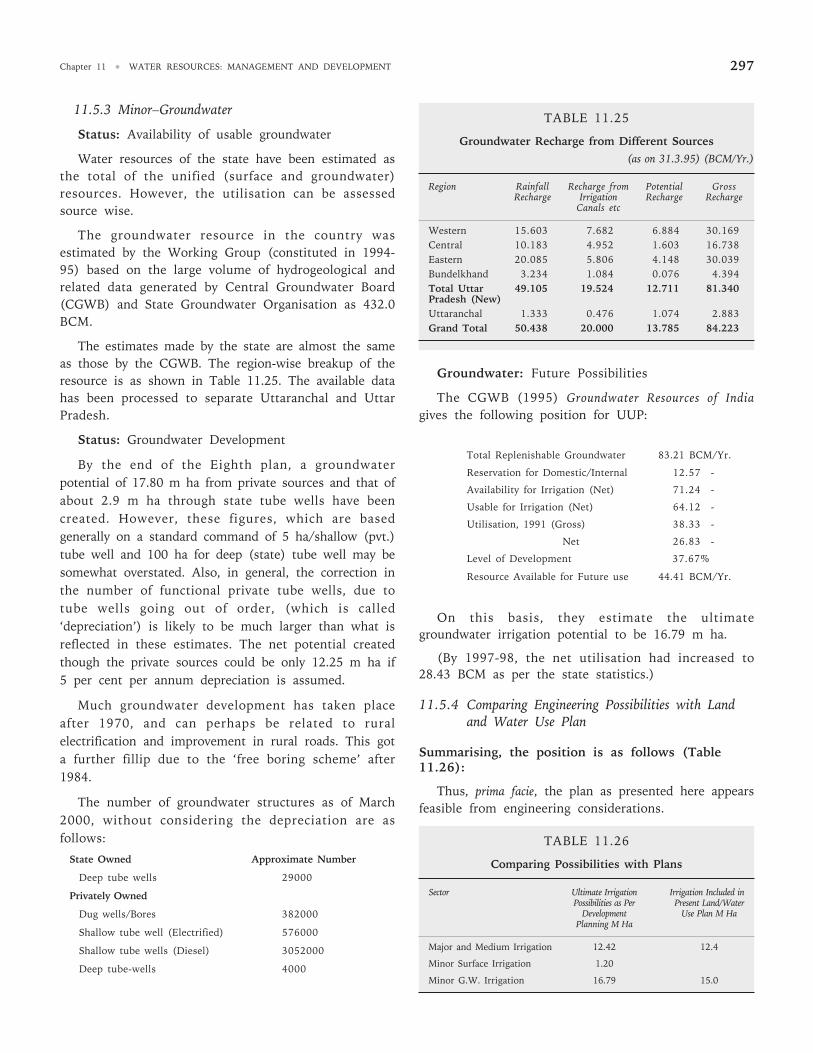
11.5.3 Minor–Groundwater
Status: Availability of usable groundwater
Water resources of the state have been estimated asthe total of the unified (surface and groundwater)resources. However, the utilisation can be assessedsource wise.
The groundwater resource in the country wasestimated by the Working Group (constituted in 1994-95) based on the large volume of hydrogeological andrelated data generated by Central Groundwater Board(CGWB) and State Groundwater Organisation as 432.0BCM.
The estimates made by the state are almost the sameas those by the CGWB. The region-wise breakup of theresource is as shown in Table 11.25. The available datahas been processed to separate Uttaranchal and UttarPradesh.
Status: Groundwater Development
By the end of the Eighth plan, a groundwaterpotential of 17.80 m ha from private sources and that ofabout 2.9 m ha through state tube wells have beencreated. However, these figures, which are basedgenerally on a standard command of 5 ha/shallow (pvt.)tube well and 100 ha for deep (state) tube well may besomewhat overstated. Also, in general, the correction inthe number of functional private tube wells, due totube wells going out of order, (which is called‘depreciation’) is likely to be much larger than what isreflected in these estimates. The net potential createdthough the private sources could be only 12.25 m ha if5 per cent per annum depreciation is assumed.
Much groundwater development has taken placeafter 1970, and can perhaps be related to ruralelectrification and improvement in rural roads. This gota further fillip due to the ‘free boring scheme’ after1984.
The number of groundwater structures as of March2000, without considering the depreciation are asfollows:
State Owned Approximate Number
Deep tube wells 29000
Privately Owned
Dug wells/Bores 382000
Shallow tube well (Electrified) 576000
Shallow tube wells (Diesel) 3052000
Deep tube-wells 4000
Groundwater: Future Possibilities
The CGWB (1995) Groundwater Resources of Indiagives the following position for UUP:
Total Replenishable Groundwater 83.21 BCM/Yr.
Reservation for Domestic/Internal 12.57 -
Availability for Irrigation (Net) 71.24 -
Usable for Irrigation (Net) 64.12 -
Utilisation, 1991 (Gross) 38.33 -
Net 26.83 -
Level of Development 37.67%
Resource Available for Future use 44.41 BCM/Yr.
On this basis, they estimate the ultimategroundwater irrigation potential to be 16.79 m ha.
(By 1997-98, the net utilisation had increased to28.43 BCM as per the state statistics.)
11.5.4 Comparing Engineering Possibilities with Landand Water Use Plan
Summarising, the position is as follows (Table11.26):
Thus, prima facie, the plan as presented here appearsfeasible from engineering considerations.
TABLE 11.26
Comparing Possibilities with Plans
Sector Ultimate Irrigation Irrigation Included inPossibilities as Per Present Land/Water
Development Use Plan M HaPlanning M Ha
Major and Medium Irrigation 12.42 12.4
Minor Surface Irrigation 1.20
Minor G.W. Irrigation 16.79 15.0
TABLE 11.25
Groundwater Recharge from Different Sources(as on 31.3.95) (BCM/Yr.)
Region Rainfall Recharge from Potential GrossRecharge Irrigation Recharge Recharge
Canals etc
Western 15.603 7.682 6.884 30.169Central 10.183 4.952 1.603 16.738Eastern 20.085 5.806 4.148 30.039Bundelkhand 3.234 1.084 0.076 4.394Total Uttar 49.105 19.524 12.711 81.340Pradesh (New)Uttaranchal 1.333 0.476 1.074 2.883Grand Total 50.438 20.000 13.785 84.223
UTTAR PRADESH DEVELOPMENT REPORT—VOL. 2298
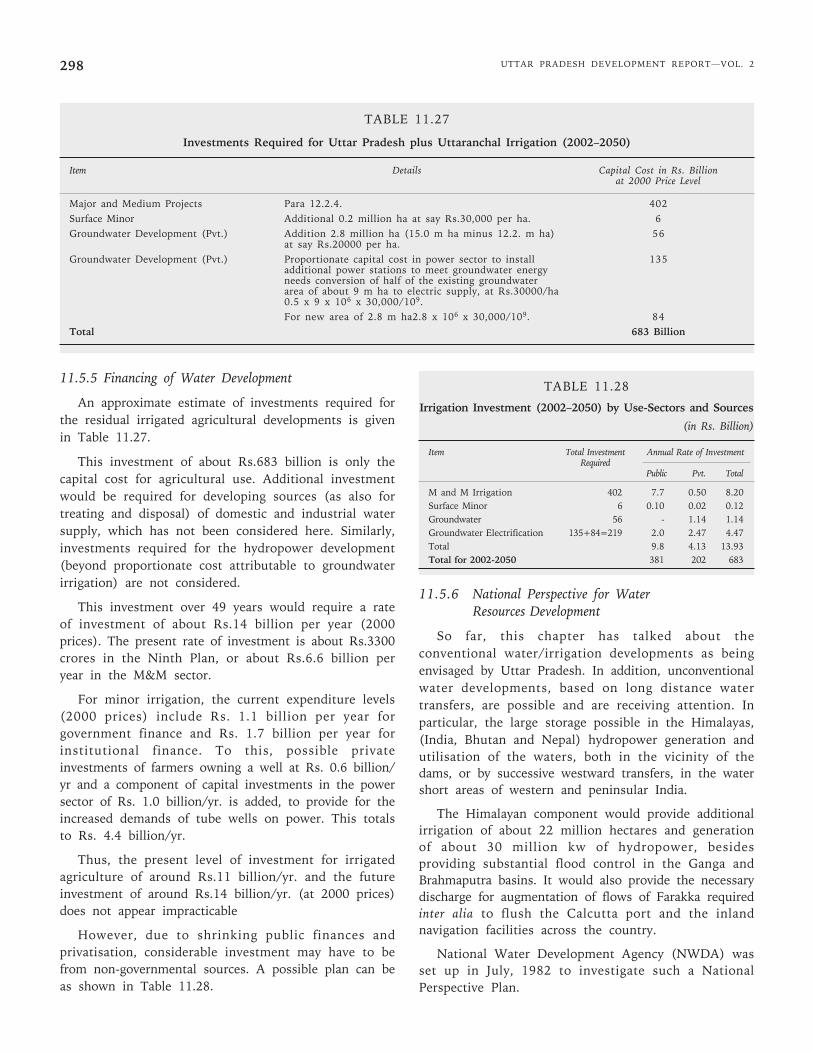
11.5.5 Financing of Water Development
An approximate estimate of investments required forthe residual irrigated agricultural developments is givenin Table 11.27.
This investment of about Rs.683 billion is only thecapital cost for agricultural use. Additional investmentwould be required for developing sources (as also fortreating and disposal) of domestic and industrial watersupply, which has not been considered here. Similarly,investments required for the hydropower development(beyond proportionate cost attributable to groundwaterirrigation) are not considered.
This investment over 49 years would require a rateof investment of about Rs.14 billion per year (2000prices). The present rate of investment is about Rs.3300crores in the Ninth Plan, or about Rs.6.6 billion peryear in the M&M sector.
For minor irrigation, the current expenditure levels(2000 prices) include Rs. 1.1 billion per year forgovernment finance and Rs. 1.7 billion per year forinstitutional finance. To this, possible privateinvestments of farmers owning a well at Rs. 0.6 billion/yr and a component of capital investments in the powersector of Rs. 1.0 billion/yr. is added, to provide for theincreased demands of tube wells on power. This totalsto Rs. 4.4 billion/yr.
Thus, the present level of investment for irrigatedagriculture of around Rs.11 billion/yr. and the futureinvestment of around Rs.14 billion/yr. (at 2000 prices)does not appear impracticable
However, due to shrinking public finances andprivatisation, considerable investment may have to befrom non-governmental sources. A possible plan can beas shown in Table 11.28.
TABLE 11.28
Irrigation Investment (2002–2050) by Use-Sectors and Sources
(in Rs. Billion)
Item Total Investment Annual Rate of InvestmentRequired
Public Pvt. Total
M and M Irrigation 402 7.7 0.50 8.20Surface Minor 6 0.10 0.02 0.12Groundwater 56 - 1.14 1.14Groundwater Electrification 135+84=219 2.0 2.47 4.47Total 9.8 4.13 13.93Total for 2002-2050 381 202 683
11.5.6 National Perspective for WaterResources Development
So far, this chapter has talked about theconventional water/irrigation developments as beingenvisaged by Uttar Pradesh. In addition, unconventionalwater developments, based on long distance watertransfers, are possible and are receiving attention. Inparticular, the large storage possible in the Himalayas,(India, Bhutan and Nepal) hydropower generation andutilisation of the waters, both in the vicinity of thedams, or by successive westward transfers, in the watershort areas of western and peninsular India.
The Himalayan component would provide additionalirrigation of about 22 million hectares and generationof about 30 million kw of hydropower, besidesproviding substantial flood control in the Ganga andBrahmaputra basins. It would also provide the necessarydischarge for augmentation of flows of Farakka requiredinter alia to flush the Calcutta port and the inlandnavigation facilities across the country.
National Water Development Agency (NWDA) wasset up in July, 1982 to investigate such a NationalPerspective Plan.
TABLE 11.27
Investments Required for Uttar Pradesh plus Uttaranchal Irrigation (2002–2050)
Item Details Capital Cost in Rs. Billionat 2000 Price Level
Major and Medium Projects Para 12.2.4. 402Surface Minor Additional 0.2 million ha at say Rs.30,000 per ha. 6Groundwater Development (Pvt.) Addition 2.8 million ha (15.0 m ha minus 12.2. m ha) 56
at say Rs.20000 per ha.Groundwater Development (Pvt.) Proportionate capital cost in power sector to install 135
additional power stations to meet groundwater energyneeds conversion of half of the existing groundwaterarea of about 9 m ha to electric supply, at Rs.30000/ha0.5 x 9 x 106 x 30,000/109.For new area of 2.8 m ha2.8 x 106 x 30,000/109. 84
Total 683 Billion
Chapter 11 • WATER RESOURCES: MANAGEMENT AND DEVELOPMENT 299
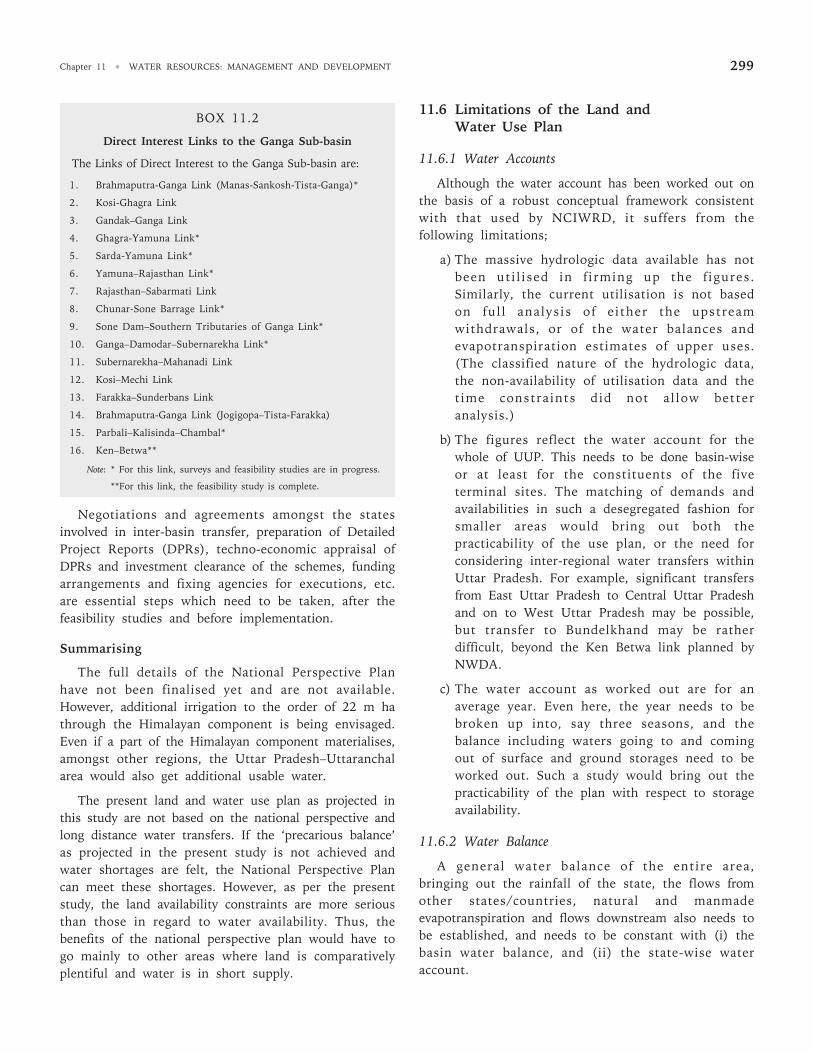
BOX 11.2
Direct Interest Links to the Ganga Sub-basin
The Links of Direct Interest to the Ganga Sub-basin are:
1. Brahmaputra-Ganga Link (Manas-Sankosh-Tista-Ganga)*
2. Kosi-Ghagra Link
3. Gandak–Ganga Link
4. Ghagra-Yamuna Link*
5. Sarda-Yamuna Link*
6. Yamuna–Rajasthan Link*
7. Rajasthan–Sabarmati Link
8. Chunar-Sone Barrage Link*
9. Sone Dam–Southern Tributaries of Ganga Link*
10. Ganga–Damodar–Subernarekha Link*
11. Subernarekha–Mahanadi Link
12. Kosi–Mechi Link
13. Farakka–Sunderbans Link
14. Brahmaputra-Ganga Link (Jogigopa–Tista-Farakka)
15. Parbali–Kalisinda–Chambal*
16. Ken–Betwa**
Note: * For this link, surveys and feasibility studies are in progress.
**For this link, the feasibility study is complete.
Negotiations and agreements amongst the statesinvolved in inter-basin transfer, preparation of DetailedProject Reports (DPRs), techno-economic appraisal ofDPRs and investment clearance of the schemes, fundingarrangements and fixing agencies for executions, etc.are essential steps which need to be taken, after thefeasibility studies and before implementation.
Summarising
The full details of the National Perspective Planhave not been finalised yet and are not available.However, additional irrigation to the order of 22 m hathrough the Himalayan component is being envisaged.Even if a part of the Himalayan component materialises,amongst other regions, the Uttar Pradesh–Uttaranchalarea would also get additional usable water.
The present land and water use plan as projected inthis study are not based on the national perspective andlong distance water transfers. If the ‘precarious balance’as projected in the present study is not achieved andwater shortages are felt, the National Perspective Plancan meet these shortages. However, as per the presentstudy, the land availability constraints are more seriousthan those in regard to water availability. Thus, thebenefits of the national perspective plan would have togo mainly to other areas where land is comparativelyplentiful and water is in short supply.
11.6 Limitations of the Land andWater Use Plan
11.6.1 Water Accounts
Although the water account has been worked out onthe basis of a robust conceptual framework consistentwith that used by NCIWRD, it suffers from thefollowing limitations;
a) The massive hydrologic data available has notbeen uti l ised in f irming up the f igures.Similarly, the current utilisation is not basedon ful l analysis of either the upstreamwithdrawals, or of the water balances andevapotranspiration estimates of upper uses.(The classified nature of the hydrologic data,the non-availability of utilisation data and thetime constraints did not al low betteranalysis.)
b) The figures reflect the water account for thewhole of UUP. This needs to be done basin-wiseor at least for the constituents of the fiveterminal sites. The matching of demands andavailabilities in such a desegregated fashion forsmaller areas would bring out both thepracticability of the use plan, or the need forconsidering inter-regional water transfers withinUttar Pradesh. For example, significant transfersfrom East Uttar Pradesh to Central Uttar Pradeshand on to West Uttar Pradesh may be possible,but transfer to Bundelkhand may be ratherdifficult, beyond the Ken Betwa link planned byNWDA.
c) The water account as worked out are for anaverage year. Even here, the year needs to bebroken up into, say three seasons, and thebalance including waters going to and comingout of surface and ground storages need to beworked out. Such a study would bring out thepracticability of the plan with respect to storageavailability.
11.6.2 Water Balance
A general water balance of the entire area,bringing out the rainfall of the state, the flows fromother states/countries, natural and manmadeevapotranspiration and flows downstream also needs tobe established, and needs to be constant with (i) thebasin water balance, and (ii) the state-wise wateraccount.
UTTAR PRADESH DEVELOPMENT REPORT—VOL. 2300
11.6.3 Refinements
Refinements in water demands, including explicitconsideration of water quality and ecology relateddemands are necessary. Similarly, the share of each ofthe five terminal sites in meeting the downstream lowflow obligation is to be determined. More importantly,the division in this regard between the five terminalsites listed here and the areas/rivers downstream ofthese up to Farakka would have to be determined.
11.6.4 Recommendation
A review and reworking of these studies, overcomingthese limitations, needs to be taken up, discussed,shared with other states, finalised as a workingarrangement and reviewed where necessary.
11.7 Environmental Issues
11.7.1 Water Quality
Central Pollution Control Board (CPCB) classifiesriver water quality in five classes according to fitness,as following:
Class A: Drinking water source without conventionaltreatment but after disinfecting
Class B: Outdoor bathing
Class C: Drinking water with conventional treatmentand disinfecting.
Class D: Propagation of wildlife and fisheries
Class E: Irrigation, industrial cooling, controlledwastewater disposal
The standards for these classes have been specifiedon the basis of chemical and biological parameters.
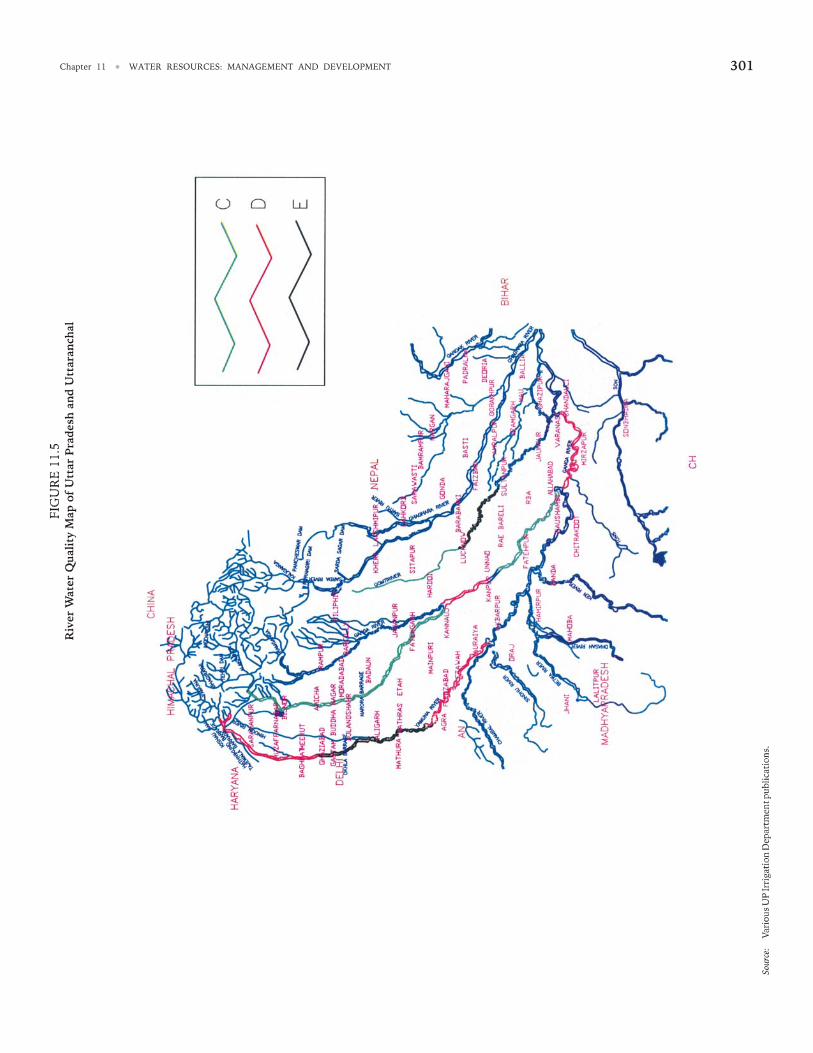
The surface and groundwater quality map of UttarPradesh is shown in Figure 11.5 and Figure 11.6. Theproblem reaches of river water quality are as follows:
1. Ganga
i) From Rishikesh to Kannauj - C
ii) Upstream Kannauj to Kanpur - D
iii) Kanpur downstream to Allahabad - C
iv) Varanasi - D
2. Yamuna
i) Delhi to confluence with Chambal - D
ii) In city areas of Delhi, Agra - Partly E and Malhara
3. Gomti
i) Upstream of Lucknow - C
ii) Lucknow to Junction with - Partly D Ganga and
Partly E
4. Hindon
i) Saharanpur to Junction with Yamuna - E
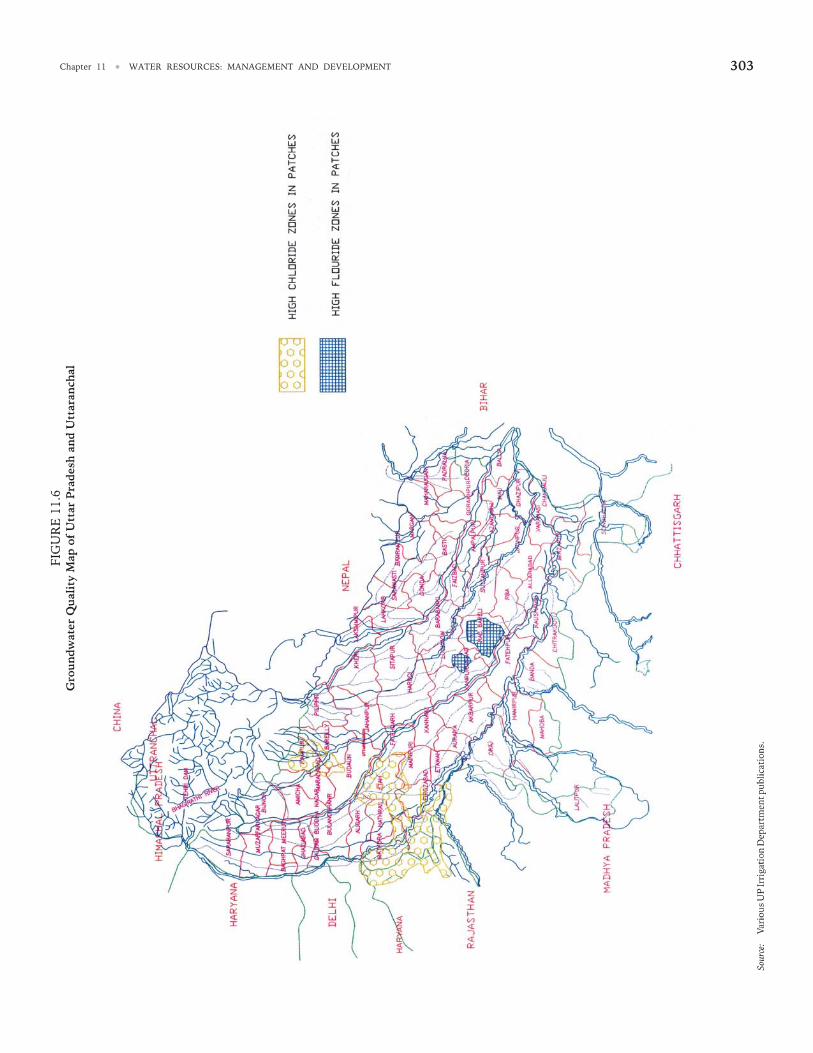
The quality of groundwater in general is good butcertain districts have patches of harmful contaminants.Fluoride limits in groundwater are considerably higherthan permissible limits in many areas of UttarPradesh. Unnao, Rae Bareli and west of Bulandshahr,Aligarh, Agra axis have areas of concentrationexceeding 1.5 mg/l. The western part of the statespecially Aligarh, Mathura, Agra show a concentrationof chlorides in isolated patches whereas in parts ofEtah, west Bulandshahr and North Rampur theconcentration is marginally higher than thepermissible limits. Similarly, north west of Banda andFatehpur and east of Allahabad have marginally highchloride concentration. Also, in the Orai-Jhansi-Lalitpur sector and Faizabad Sultanpur sector, nitrateconcentrations in patches, exceed the permissiblelimit of 45 mg/l for drinking water, and reach up to90 mg/1. Non-point sources of pollution fromagriculture and other sources combined with pointsource pollution represent a major challenge forgroundwater management.
11.7.2 Waterlogging and Salinity
Reliable data about waterlogging and salinity, incommands of M&M irrigation projects as also outsidethe commands is not available.
a) The working group of the Ministry of WaterResources (MOWR) mentioned the water loggedarea in M&M command in Uttar Pradesh as 0.43m ha in 1991.
b) The earlier figure on the same given by theIrrigation Commission (1972) was 0.81 m ha.Similar figures were given by the NationalCommission on Agriculture (1976).
c) A National Seminar (Oct. 1992) of the state landuse board brought out that three importantcommands (Gandak, Sarda Sahayak andRamganga) had a waterlogged area of 0.71 m ha.
d) A study of waterlogged area (1999) using IRS–IBLiss for remotely sensed data was conducted for
Chapter 11 • WATER RESOURCES: MANAGEMENT AND DEVELOPMENT 301

UTTAR PRADESH DEVELOPMENT REPORT—VOL. 2302
Chapter 11 • WATER RESOURCES: MANAGEMENT AND DEVELOPMENT 303

UTTAR PRADESH DEVELOPMENT REPORT—VOL. 2304
Chapter 11 • WATER RESOURCES: MANAGEMENT AND DEVELOPMENT 305
15 districts of Uttar Pradesh. This brought outthe following:
Geographic Area of the 15 Districts : 5.05 m ha
Permanently Waterlogged Area : 53321 ha
Temporarily Waterlogged Area : 56200 ha
The position of the salinised area is also similar. The1991 MoWR working group put the figure of salinisedarea in M&M commands as 1.15 m ha. However, as perthe Uttar Pradesh Agriculture, Directorate, 1.15 m ha isthe total salinised land, including non-command lands.Of this 0.15 m ha has been reclaimed.
Data about groundwater, surface waterlogging andquality of soils and groundwater needs to be collatedand firm estimates and maps about waterlogging andsalinity need to be prepared every five years.
Where quality problems do not predominate,conjunctive use of groundwater can be very effective inwater table control and can increase irrigation. Thefigures incorporated in our report are based on datamade available by the MoWR, Government. of India,Government. of Uttar Pradesh and those adopted by theNCIWRD based on the MoWR working group (TheDesai Committee). The area affected by sodicity in UttarPradesh is reported as 0.43 m ha while that affected bywater logging is reported as 0.81 m ha.
11.7.3 Land Drainage
Surface and sub-surface drainage of agricultural landin general, and irrigated land in particular is essentialto ensure productivity and sustainability.
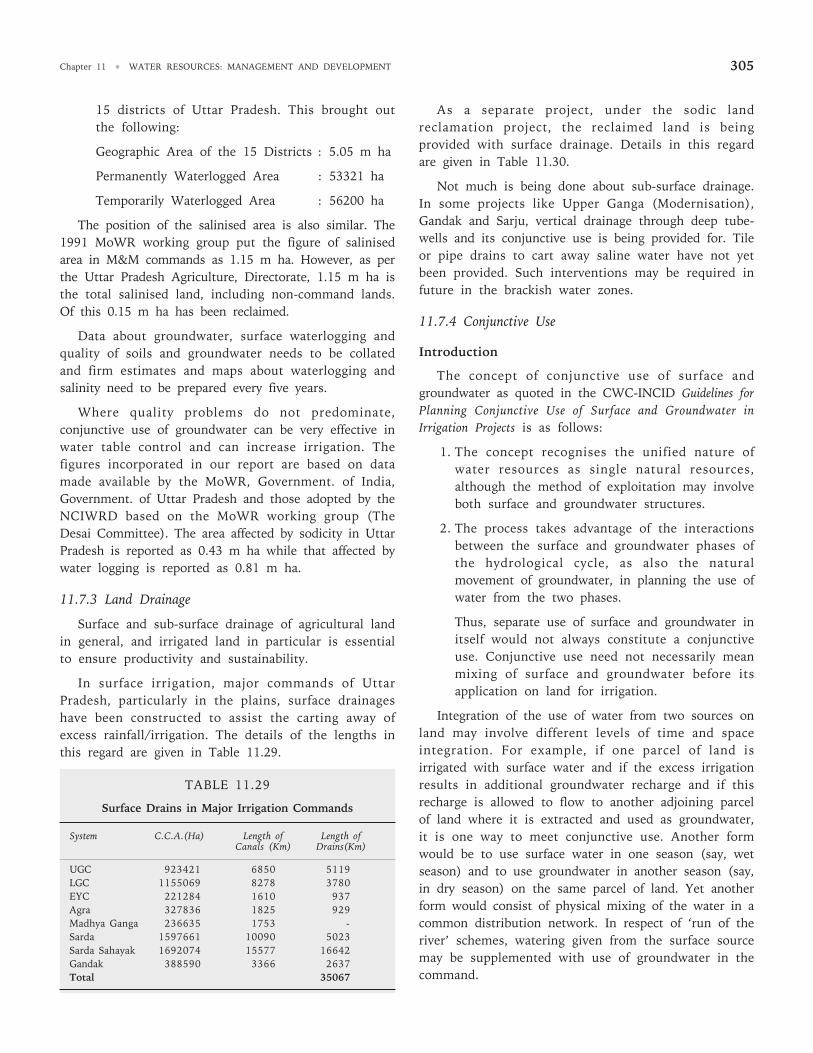
In surface irrigation, major commands of UttarPradesh, particularly in the plains, surface drainageshave been constructed to assist the carting away ofexcess rainfall/irrigation. The details of the lengths inthis regard are given in Table 11.29.
TABLE 11.29
Surface Drains in Major Irrigation Commands
System C.C.A.(Ha) Length of Length ofCanals (Km) Drains(Km)
UGC 923421 6850 5119LGC 1155069 8278 3780EYC 221284 1610 937Agra 327836 1825 929Madhya Ganga 236635 1753 -Sarda 1597661 10090 5023Sarda Sahayak 1692074 15577 16642Gandak 388590 3366 2637Total 35067
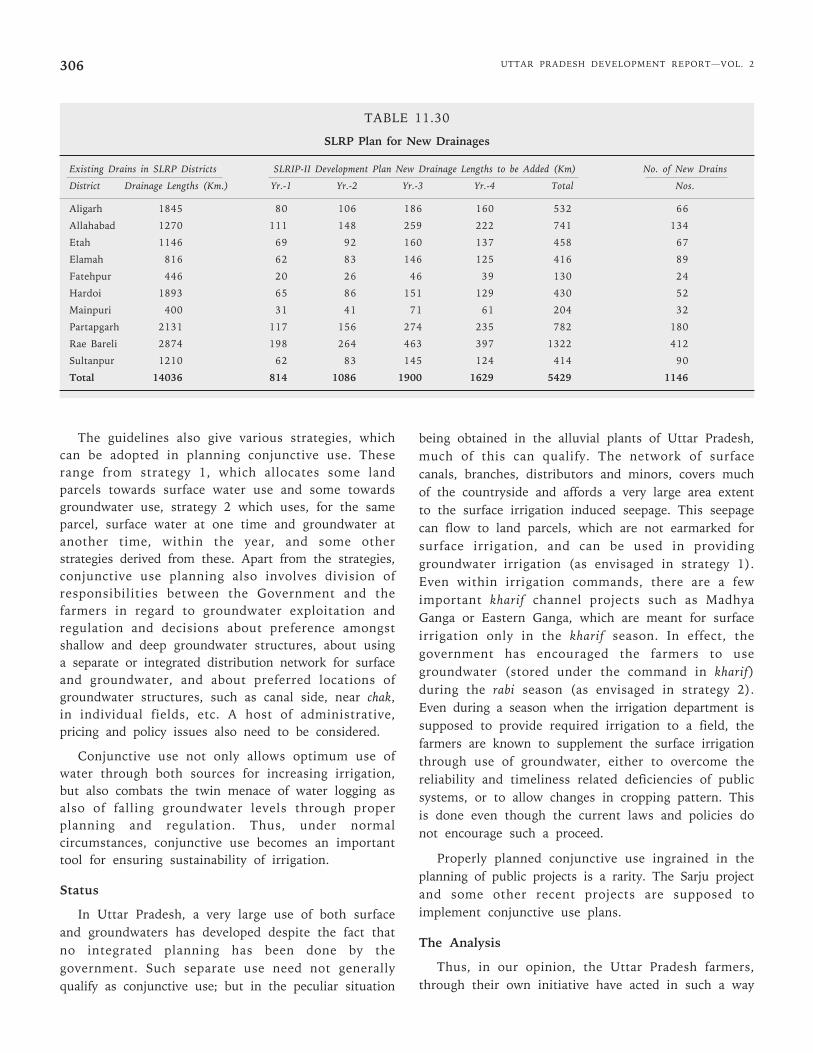
As a separate project, under the sodic landreclamation project, the reclaimed land is beingprovided with surface drainage. Details in this regardare given in Table 11.30.
Not much is being done about sub-surface drainage.In some projects like Upper Ganga (Modernisation),Gandak and Sarju, vertical drainage through deep tube-wells and its conjunctive use is being provided for. Tileor pipe drains to cart away saline water have not yetbeen provided. Such interventions may be required infuture in the brackish water zones.
11.7.4 Conjunctive Use
Introduction
The concept of conjunctive use of surface andgroundwater as quoted in the CWC-INCID Guidelines forPlanning Conjunctive Use of Surface and Groundwater inIrrigation Projects is as follows:
1. The concept recognises the unified nature ofwater resources as single natural resources,although the method of exploitation may involveboth surface and groundwater structures.
2. The process takes advantage of the interactionsbetween the surface and groundwater phases ofthe hydrological cycle, as also the naturalmovement of groundwater, in planning the use ofwater from the two phases.
Thus, separate use of surface and groundwater initself would not always constitute a conjunctiveuse. Conjunctive use need not necessarily meanmixing of surface and groundwater before itsapplication on land for irrigation.
Integration of the use of water from two sources onland may involve different levels of time and spaceintegration. For example, if one parcel of land isirrigated with surface water and if the excess irrigationresults in additional groundwater recharge and if thisrecharge is allowed to flow to another adjoining parcelof land where it is extracted and used as groundwater,it is one way to meet conjunctive use. Another formwould be to use surface water in one season (say, wetseason) and to use groundwater in another season (say,in dry season) on the same parcel of land. Yet anotherform would consist of physical mixing of the water in acommon distribution network. In respect of ‘run of theriver’ schemes, watering given from the surface sourcemay be supplemented with use of groundwater in thecommand.
UTTAR PRADESH DEVELOPMENT REPORT—VOL. 2306
The guidelines also give various strategies, whichcan be adopted in planning conjunctive use. Theserange from strategy 1, which allocates some landparcels towards surface water use and some towardsgroundwater use, strategy 2 which uses, for the sameparcel, surface water at one time and groundwater atanother time, within the year, and some otherstrategies derived from these. Apart from the strategies,conjunctive use planning also involves division ofresponsibilities between the Government and thefarmers in regard to groundwater exploitation andregulation and decisions about preference amongstshallow and deep groundwater structures, about usinga separate or integrated distribution network for surfaceand groundwater, and about preferred locations ofgroundwater structures, such as canal side, near chak,in individual fields, etc. A host of administrative,pricing and policy issues also need to be considered.
Conjunctive use not only allows optimum use ofwater through both sources for increasing irrigation,but also combats the twin menace of water logging asalso of falling groundwater levels through properplanning and regulation. Thus, under normalcircumstances, conjunctive use becomes an importanttool for ensuring sustainability of irrigation.
Status
In Uttar Pradesh, a very large use of both surfaceand groundwaters has developed despite the fact thatno integrated planning has been done by thegovernment. Such separate use need not generallyqualify as conjunctive use; but in the peculiar situation
being obtained in the alluvial plants of Uttar Pradesh,much of this can qualify. The network of surfacecanals, branches, distributors and minors, covers muchof the countryside and affords a very large area extentto the surface irrigation induced seepage. This seepagecan flow to land parcels, which are not earmarked forsurface irrigation, and can be used in providinggroundwater irrigation (as envisaged in strategy 1).Even within irrigation commands, there are a fewimportant kharif channel projects such as MadhyaGanga or Eastern Ganga, which are meant for surfaceirrigation only in the kharif season. In effect, thegovernment has encouraged the farmers to usegroundwater (stored under the command in kharif)during the rabi season (as envisaged in strategy 2).Even during a season when the irrigation department issupposed to provide required irrigation to a field, thefarmers are known to supplement the surface irrigationthrough use of groundwater, either to overcome thereliability and timeliness related deficiencies of publicsystems, or to allow changes in cropping pattern. Thisis done even though the current laws and policies donot encourage such a proceed.
Properly planned conjunctive use ingrained in theplanning of public projects is a rarity. The Sarju projectand some other recent projects are supposed toimplement conjunctive use plans.
The Analysis
Thus, in our opinion, the Uttar Pradesh farmers,through their own initiative have acted in such a way
TABLE 11.30
SLRP Plan for New Drainages
Existing Drains in SLRP Districts SLRIP-II Development Plan New Drainage Lengths to be Added (Km) No. of New Drains
District Drainage Lengths (Km.) Yr.-1 Yr.-2 Yr.-3 Yr.-4 Total Nos.
Aligarh 1845 80 106 186 160 532 66
Allahabad 1270 111 148 259 222 741 134
Etah 1146 69 92 160 137 458 67
Elamah 816 62 83 146 125 416 89
Fatehpur 446 20 26 46 39 130 24
Hardoi 1893 65 86 151 129 430 52
Mainpuri 400 31 41 71 61 204 32
Partapgarh 2131 117 156 274 235 782 180
Rae Bareli 2874 198 264 463 397 1322 412
Sultanpur 1210 62 83 145 124 414 90
Total 14036 814 1086 1900 1629 5429 1146
Chapter 11 • WATER RESOURCES: MANAGEMENT AND DEVELOPMENT 307
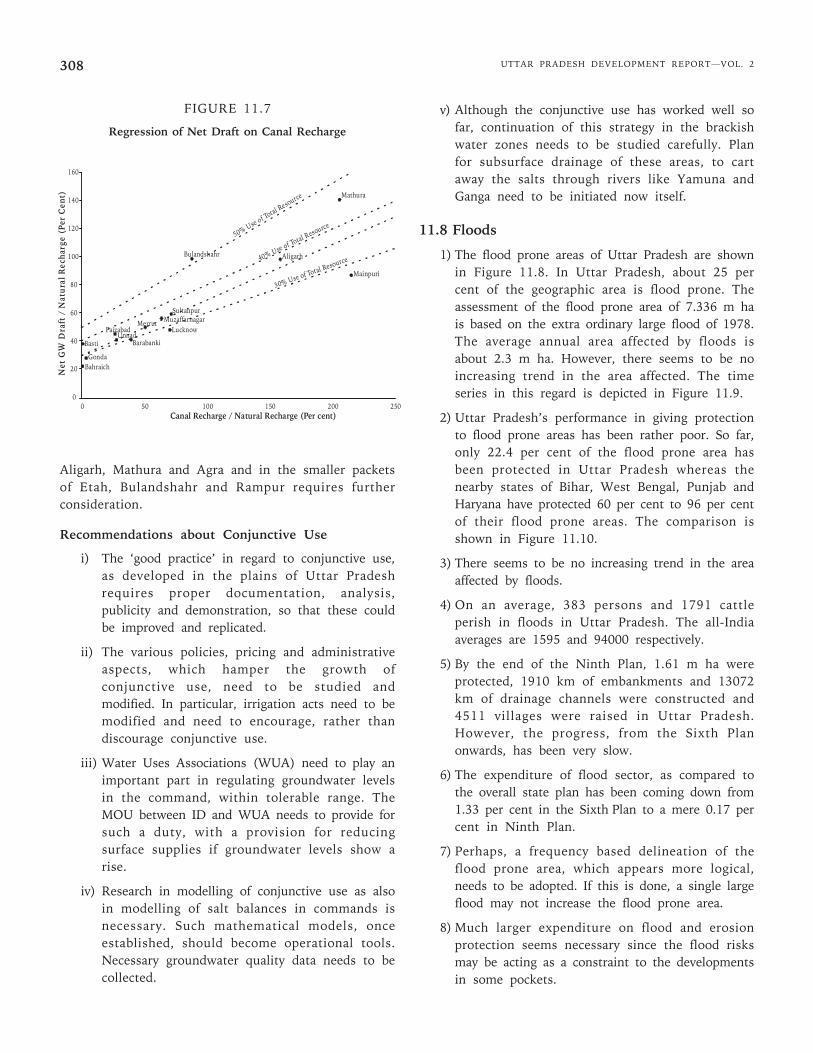
that a replicable ‘good practice’ model of conjunctiveuse has developed on its own. To test this, thefollowing analysis was undertaken:
(i) Fourteen districts in Uttar Pradesh alluvialplains fairly covered by canal network werechosen.
(ii) The agricultural statistics like reporting area,NSA, GCA, NIA, GIA, etc. for the above 14districts were noted from the Uttar Pradeshstatistical publication.
(iii) The expected natural groundwater recharge,recharge from canals and groundwater draftrelated information was collected fromGroundwater Resources of India, CGWB (1995).
(iv) Using the CGWB data, the net draft as apercentage of natural recharge (ND/NR) wascomputed. Similarly, the canal recharge as apercentage of natural recharge (CR/NR) wascomputed.
(v) A regression of ND/NR on CR/NR was carriedout and is shown in Figure 11.7.
The coefficient of correlation is very high at 0.8875.The graph also shows a family of curves, which depictthe percentage of the net groundwater draft to the totalrecharge available from nature and from the canal. Ofthe total available recharge, only a part of it can beused for irrigation.
Results
From this analysis, it can be seen that:
(a) The quantum of groundwater use, which hasdeveloped in the Uttar Pradesh plains, is directlyrelated to the quantum or recharge available fromcanals. Where no such recharge is available, onlyabout 32 per cent of the natural recharge is usedfor groundwater irrigation. Districts, say, havinga canal recharge equalling the natural rechargetend to use almost double the quantity (at 60%)and a few districts where the canal recharge istwice the natural recharge, triple the quantity ofgroundwater is used, compared to what theywould have used in the absence of canals.
(b) The scatter of this graph indicates that thereare no strong regional trends in this pattern ofdevelopment of use. For example, districts usingmore groundwater than that indicated by thetrend line include Basti in the east Uttar Pradesh,and Bulandshahr and Mathura in West Uttar
Pradesh. Similarly, districts with lessgroundwater use, compared to the trend includedistricts from western Uttar Pradesh (Mainpuri),central Uttar Pradesh (Lucknow) and easternUttar Pradesh (Gonda, Baharaich).
(c) In general, in terms of net groundwater draft forirrigation, only 30 to 40 per cent of the totalrecharge is being used. With increasing per cent ofcanal recharge, this level tends to increase a little.
Discussions
The analysis supports the hypothesis about themodel of ‘good practice’ in regard to conjunctive usehaving developed in Uttar Pradesh plains. However, afew districts like Bulandshahr, Mathura need to becareful in using the groundwater so that it does notbecome unsustainable.
In general, the conjunctive use has succeeded inboth avoiding large-scale water logging and also inavoiding overexploitation of resources. As discussedunder ‘analysis’ the total use of resources throughgroundwater irrigation seems to range from little below30 per cent (Mainpuri) to little above 40 per cent(Bulandshahr). The CGWB (1995) publication definesthe level of groundwater development in a slightlydifferent way. The districts listed by them as havinglevels exceeding 50 per cent include Badaun,Bulandshahr, Brjnor, Farrukhabad, Firozabad, Jaunpur,Mathura and Moradabad. CGWB (1995) also classifiesblocks as overexploited or dark. In Uttar Pradesh, out of895 blocks, only 19 are overexploited and 22 are dark.Thus, the overall situation is not very serious. (Thiscan be contrasted with Tamil Nadu, where out of 384blocks, 54 are over exploited and 43 are dark.)
Conjunctive use involves further disturbance of thegroundwater balance, and involves larger recycling. Inturn, this disturbs the salt balance of the area, both inthe soils and in the groundwater. It is thereforenecessary to work out the mass balance of the saltstaking into account the salts brought in from thesurface sources, the salts present in the soil andgroundwater, the salts in the water infiltrating to theroot zones and the salts percolating to the groundwater.Dilution of saline groundwater with better surface waterand use of this mixture for irrigation is a workableconjunctive use strategy, but it could lead to problem inthe long run. In long run, carting away the saline waterto the sea is a more sustainable strategy.
In this background, the large-scale use ofconjunctive use in the brackish water zones in
UTTAR PRADESH DEVELOPMENT REPORT—VOL. 2308
Aligarh, Mathura and Agra and in the smaller packetsof Etah, Bulandshahr and Rampur requires furtherconsideration.
Recommendations about Conjunctive Use
i) The ‘good practice’ in regard to conjunctive use,as developed in the plains of Uttar Pradeshrequires proper documentation, analysis,publicity and demonstration, so that these couldbe improved and replicated.
ii) The various policies, pricing and administrativeaspects, which hamper the growth ofconjunctive use, need to be studied andmodified. In particular, irrigation acts need to bemodified and need to encourage, rather thandiscourage conjunctive use.
iii) Water Uses Associations (WUA) need to play animportant part in regulating groundwater levelsin the command, within tolerable range. TheMOU between ID and WUA needs to provide forsuch a duty, with a provision for reducingsurface supplies if groundwater levels show arise.
iv) Research in modelling of conjunctive use as alsoin modelling of salt balances in commands isnecessary. Such mathematical models, onceestablished, should become operational tools.Necessary groundwater quality data needs to becollected.
v) Although the conjunctive use has worked well sofar, continuation of this strategy in the brackishwater zones needs to be studied carefully. Planfor subsurface drainage of these areas, to cartaway the salts through rivers like Yamuna andGanga need to be initiated now itself.
11.8 Floods
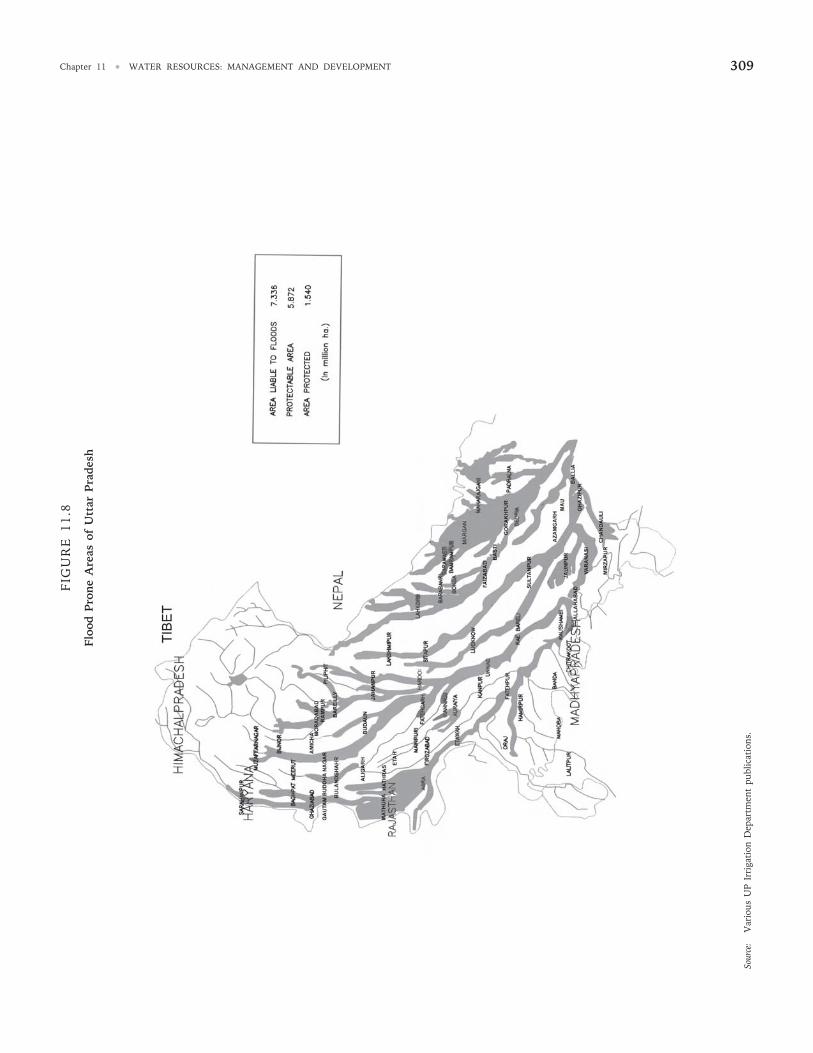
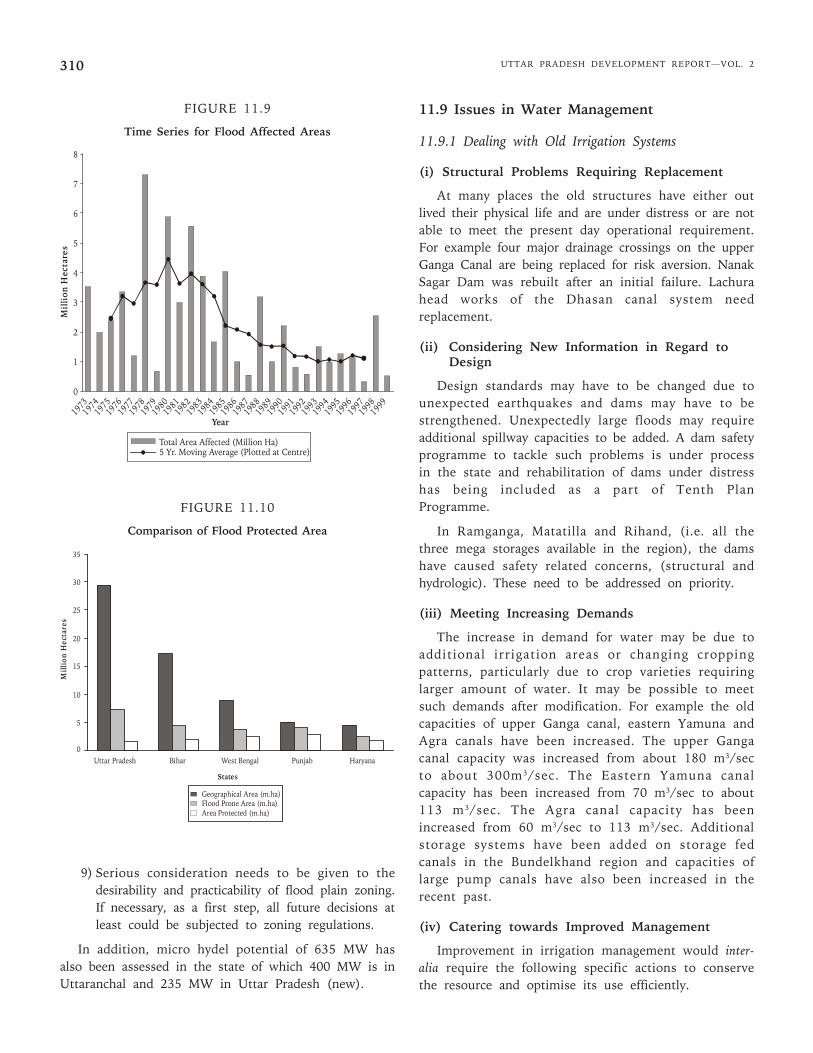
1) The flood prone areas of Uttar Pradesh are shownin Figure 11.8. In Uttar Pradesh, about 25 percent of the geographic area is flood prone. Theassessment of the flood prone area of 7.336 m hais based on the extra ordinary large flood of 1978.The average annual area affected by floods isabout 2.3 m ha. However, there seems to be noincreasing trend in the area affected. The timeseries in this regard is depicted in Figure 11.9.
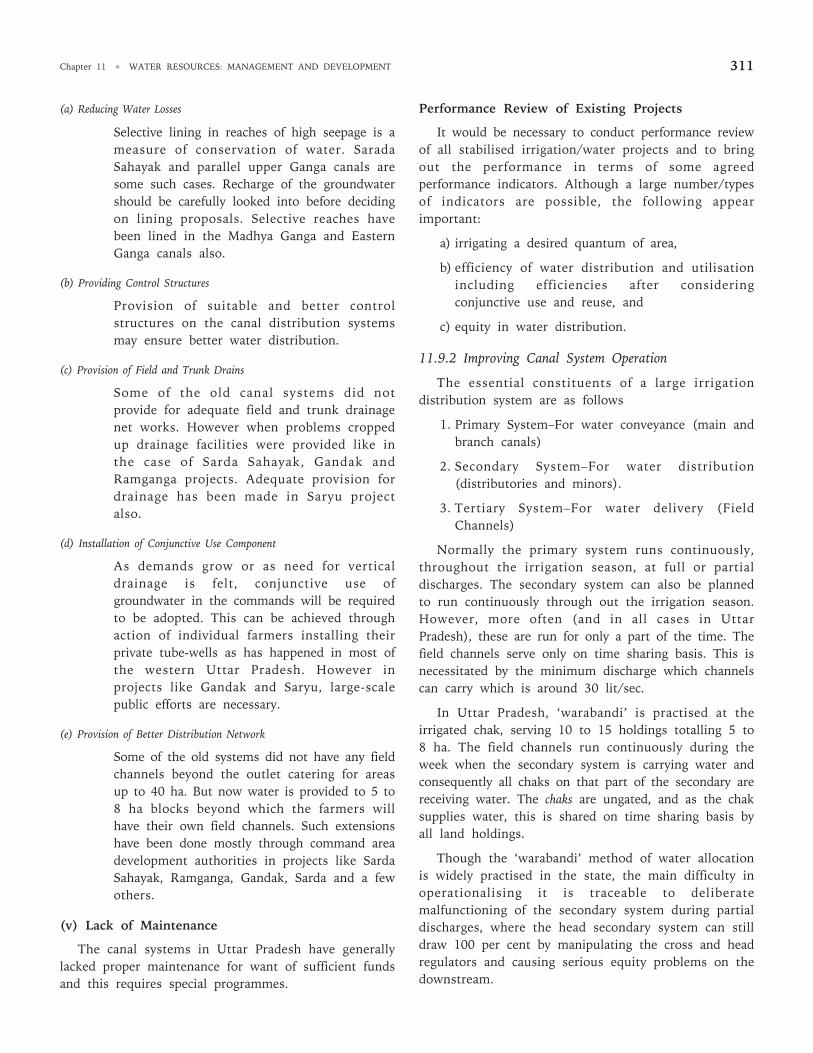
2) Uttar Pradesh’s performance in giving protectionto flood prone areas has been rather poor. So far,only 22.4 per cent of the flood prone area hasbeen protected in Uttar Pradesh whereas thenearby states of Bihar, West Bengal, Punjab andHaryana have protected 60 per cent to 96 per centof their flood prone areas. The comparison isshown in Figure 11.10.
3) There seems to be no increasing trend in the areaaffected by floods.
4) On an average, 383 persons and 1791 cattleperish in floods in Uttar Pradesh. The all-Indiaaverages are 1595 and 94000 respectively.
5) By the end of the Ninth Plan, 1.61 m ha wereprotected, 1910 km of embankments and 13072km of drainage channels were constructed and4511 villages were raised in Uttar Pradesh.However, the progress, from the Sixth Planonwards, has been very slow.
6) The expenditure of flood sector, as compared tothe overall state plan has been coming down from1.33 per cent in the Sixth Plan to a mere 0.17 percent in Ninth Plan.
7) Perhaps, a frequency based delineation of theflood prone area, which appears more logical,needs to be adopted. If this is done, a single largeflood may not increase the flood prone area.
8) Much larger expenditure on flood and erosionprotection seems necessary since the flood risksmay be acting as a constraint to the developmentsin some pockets.
FIGURE 11.7
Regression of Net Draft on Canal Recharge
Basti
GondaBahraich
FaizabadUnnad
Barabanki
Merrut MuzaffarnagarLucknow
Sultanpur
Bulandshahr
50% Use of Total Resource
40% Use of Total Resource
Aligarh
Mathura
Mainpuri
30% Use of Total Resource
20
0
40
60
80
100
120
140
160
0 50 100 150 200 250
Net
GW
Dra
ft /
Nat
ura
l Rec
harg
e (P
er C
ent)
Canal Recharge / Natural Recharge (Per cent)
Chapter 11 • WATER RESOURCES: MANAGEMENT AND DEVELOPMENT 309F
IGU
RE
11
.8
Floo
d P
rone
Are
as o
f U
ttar
Pra
desh
Sour
ce:
Var
ious
UP
Irri
gati
on D
epar
tmen
t pu
blic
atio
ns.
UTTAR PRADESH DEVELOPMENT REPORT—VOL. 2310
9) Serious consideration needs to be given to thedesirability and practicability of flood plain zoning.If necessary, as a first step, all future decisions atleast could be subjected to zoning regulations.
In addition, micro hydel potential of 635 MW hasalso been assessed in the state of which 400 MW is inUttaranchal and 235 MW in Uttar Pradesh (new).
FIGURE 11.9
Time Series for Flood Affected Areas
Total Area Affected (Million Ha)5 Yr. Moving Average (Plotted at Centre)
1973
0
1
2
3
4
5
6
7
8
1974
1975
1976
1977
1978
1979
1980
1981
1982
1983
1984
1985
1986
1987
1988
19
89
1990
19
9119
9219
9319
9419
9519
9619
9719
9819
99
Year
Mil
lion
Hec
tare
s
11.9 Issues in Water Management
11.9.1 Dealing with Old Irrigation Systems
(i) Structural Problems Requiring Replacement
At many places the old structures have either outlived their physical life and are under distress or are notable to meet the present day operational requirement.For example four major drainage crossings on the upperGanga Canal are being replaced for risk aversion. NanakSagar Dam was rebuilt after an initial failure. Lachurahead works of the Dhasan canal system needreplacement.
(ii) Considering New Information in Regard toDesign
Design standards may have to be changed due tounexpected earthquakes and dams may have to bestrengthened. Unexpectedly large floods may requireadditional spillway capacities to be added. A dam safetyprogramme to tackle such problems is under processin the state and rehabilitation of dams under distresshas being included as a part of Tenth PlanProgramme.
In Ramganga, Matatilla and Rihand, (i.e. all thethree mega storages available in the region), the damshave caused safety related concerns, (structural andhydrologic). These need to be addressed on priority.
(iii) Meeting Increasing Demands
The increase in demand for water may be due toadditional irrigation areas or changing croppingpatterns, particularly due to crop varieties requiringlarger amount of water. It may be possible to meetsuch demands after modification. For example the oldcapacities of upper Ganga canal, eastern Yamuna andAgra canals have been increased. The upper Gangacanal capacity was increased from about 180 m3/secto about 300m3/sec. The Eastern Yamuna canalcapacity has been increased from 70 m3/sec to about113 m3/sec. The Agra canal capacity has beenincreased from 60 m3/sec to 113 m3/sec. Additionalstorage systems have been added on storage fedcanals in the Bundelkhand region and capacities oflarge pump canals have also been increased in therecent past.
(iv) Catering towards Improved Management
Improvement in irrigation management would inter-alia require the following specific actions to conservethe resource and optimise its use efficiently.
FIGURE 11.10
Comparison of Flood Protected Area
Geographical Area (m.ha)Flood Prone Area (m.ha)Area Protected (m.ha)
Uttar Pradesh Bihar West Bengal Punjab Haryana0
5
10
15
20
25
30
35
Mill
ion
Hec
tare
s
States
Chapter 11 • WATER RESOURCES: MANAGEMENT AND DEVELOPMENT 311
(a) Reducing Water Losses
Selective lining in reaches of high seepage is ameasure of conservation of water. SaradaSahayak and parallel upper Ganga canals aresome such cases. Recharge of the groundwatershould be carefully looked into before decidingon lining proposals. Selective reaches havebeen lined in the Madhya Ganga and EasternGanga canals also.
(b) Providing Control Structures
Provision of suitable and better controlstructures on the canal distribution systemsmay ensure better water distribution.
(c) Provision of Field and Trunk Drains
Some of the old canal systems did notprovide for adequate field and trunk drainagenet works. However when problems croppedup drainage facilities were provided like inthe case of Sarda Sahayak, Gandak andRamganga projects. Adequate provision fordrainage has been made in Saryu projectalso.
(d) Installation of Conjunctive Use Component
As demands grow or as need for verticaldrainage is felt, conjunctive use ofgroundwater in the commands will be requiredto be adopted. This can be achieved throughaction of individual farmers installing theirprivate tube-wells as has happened in most ofthe western Uttar Pradesh. However inprojects like Gandak and Saryu, large-scalepublic efforts are necessary.
(e) Provision of Better Distribution Network
Some of the old systems did not have any fieldchannels beyond the outlet catering for areasup to 40 ha. But now water is provided to 5 to8 ha blocks beyond which the farmers willhave their own field channels. Such extensionshave been done mostly through command areadevelopment authorities in projects like SardaSahayak, Ramganga, Gandak, Sarda and a fewothers.
(v) Lack of Maintenance
The canal systems in Uttar Pradesh have generallylacked proper maintenance for want of sufficient fundsand this requires special programmes.
Performance Review of Existing Projects
It would be necessary to conduct performance reviewof all stabilised irrigation/water projects and to bringout the performance in terms of some agreedperformance indicators. Although a large number/typesof indicators are possible, the following appearimportant:
a) irrigating a desired quantum of area,
b) efficiency of water distribution and utilisationincluding efficiencies after consideringconjunctive use and reuse, and
c) equity in water distribution.
11.9.2 Improving Canal System Operation
The essential constituents of a large irrigationdistribution system are as follows
1. Primary System–For water conveyance (main andbranch canals)
2. Secondary System–For water distribution(distributories and minors).
3. Tertiary System–For water delivery (FieldChannels)
Normally the primary system runs continuously,throughout the irrigation season, at full or partialdischarges. The secondary system can also be plannedto run continuously through out the irrigation season.However, more often (and in all cases in UttarPradesh), these are run for only a part of the time. Thefield channels serve only on time sharing basis. This isnecessitated by the minimum discharge which channelscan carry which is around 30 lit/sec.
In Uttar Pradesh, ‘warabandi’ is practised at theirrigated chak, serving 10 to 15 holdings totalling 5 to8 ha. The field channels run continuously during theweek when the secondary system is carrying water andconsequently all chaks on that part of the secondary arereceiving water. The chaks are ungated, and as the chaksupplies water, this is shared on time sharing basis byall land holdings.
Though the ‘warabandi’ method of water allocationis widely practised in the state, the main difficulty inoperationalising it is traceable to deliberatemalfunctioning of the secondary system during partialdischarges, where the head secondary system can stilldraw 100 per cent by manipulating the cross and headregulators and causing serious equity problems on thedownstream.
UTTAR PRADESH DEVELOPMENT REPORT—VOL. 2312
In this method the canal system serves both as aconveyance and a storage element.
11.9.4 Summary
(i) Since Uttar Pradesh has many old irrigationsystems, improving water management in theold public irrigation systems is an importantproblem for Uttar Pradesh. It is recommendedthat all old stabilised irrigation/water projectsin Uttar Pradesh be subject to a performancereview.
The review needs to bring out importantperformance indicators, as discussed in 11.10.1
(ii) Based on the performance review, projects withpoor performance and scope for improvementneed to be chosen for framing andimplementing ERM projects, or for specialmaintenance/repairs.
(iii) When implementation of restoration/improvement works is time taking, during thetransition period, operational plans based on theexisting system capabilities need to be framed.
(iv) Uttar Pradesh’s canal operation and field waterdistribution methods are based on warabandi,but the performance of warabandi is notuniformly good.
There seems to be a significant scope foradopting the ON-OFF system, withproportionate distributories at the secondarylevel, by giving up control structures onsecondaries which cannot be managed well.Such systems may provide better upstream-downstream equity since manipulation maybecome difficult. Pilot implementation of suchsystems, particularly in the central UttarPradesh areas is recommended.
(v) In different topographic conditions such as inBundelkhand or in Sone–Tons areas, use ofsmall chalk size and use of gated turnouts (asis common in the Shejpali areas of westernIndia) seem to have some advantages. Thissystem would require rotational supplies at thesecondary–tertiary interface, by forming groupsof such gated outlets.
Pilot implementation of such operationalpractices is recommended.
Three broad methods have been advocated to avoidthis situation:
1. Actively involve farmers in management of notonly tertiary (which is the present norm) but alsothe secondary system; have deliberativecommittees where farmers of different secondarysystems discuss problems together. This will curbtendency of manipulation. This method laysstress on PIM.
2. Avoid partial running. All systems should run at100 per cent discharge and cuts can be imposedon time (say two weeks running in one month).Also have proportionate distributories instead ofhead and cross regulators on secondary system,so that only a specified percentage flow can betaken in an off taking channel.
3. Have a full scale automated system withcomputerised controls.
Currently, in Uttar Pradesh the situation can bedescribed as follows:
a) In West Uttar Pradesh, because of water stressand larger awareness, warabandi works fairlywell.
b) In other parts of the state, warabandi does notwork very well and the state government. isstressing the need for formulating active F.O.’sand encouraging PIM to make it work.
11.9.3 Canal Automation
In the conventional design of a canal system, asteady state condition with a steady (time invariable)flow in all the elements is assumed. In actual fieldconditions, water demand changes from day to day dueto weather conditions, rainfall and field operations.
The supplies from the headworks take considerabletime to reach the place of demand, thus balancingsupply and demand becomes difficult when the demandreduces. Even if supplies are reduced after receiving thereports of rainfall, the reduction may take 3 to 4 daysto be effective in the command.
Canal automation upgrades the system and providesbetter match between the canal deliveries and currentdemand. Automation works on the principle of ‘ondemand’ deliveries, to the user. Thus anyone whowants water gets it from the storage in the canal.Similarly, in case of any breach, or even a quickreduction in demand, the water flowing in theupstream canals gets stored, and this reduces wastage.
Chapter 11 • WATER RESOURCES: MANAGEMENT AND DEVELOPMENT 313
(vi) Canal automation saves considerable water andaffords ‘on demand’ irrigation. Such automatedprojects may be of much use where:
a) the system is storage based,
b) water scarcity conditions exist andimportance of water is realised, and
c) water distribution system is lined and wellmaintained.
Considering that many states in India are slowlyimplementing pilot automation schemes, but UttarPradesh has still not moved in this direction, it isrecommended that Uttar Pradesh also undertake theseschemes on a pilot basis. A suitable storage basedproject, in the Bundelkhand or in the Sone-Tons areacan be chosen for this purpose.
11.10 Water Conflict Related Issues
1. Conflicts between uses and users are likely togrow. The main concerns are:
a) Irrigation versus domestic use.
b) Irrigation versus hydro-power, and water useversus ecologic flows.
2. Water rights of individuals and group ofindividuals need better delineation through alegalised process of allocations and review ofallocations. This system needs to cover returnedwaters, water quality, and meeting demandthrough water of a quality appropriate to thedemand.
3. Fluvial groundwater also needs to be broughtunder the allocation system, and the proprietaryrights of landowner over groundwater need tocease.
Water rights of individuals and groups need to belinked with obligation to return a predeterminedquantity of acceptable quality to the system. The‘user pays–polluter pays’ principle needs to beadopted.
4. Water management for hydrologic units likebasins/sub-basins needs to involve stakeholders.For homogenous areas with only irrigation use,WUA’s could be the vehicle for management. Forheterogeneous uses, stakeholder committeeswould have to be formed and empowered tomanage the resource, within allocations andfinancial sustainability.
5. Important interstate issues are being faced:
a) A large number of storage dams includingthose under construction and those proposed,would be located in Uttaranchal, with benefitsshared by Uttar Pradesh. Joint actions wouldbe required in implementing such projects.
b) Institutional provisions made in the UttarPradesh Reorganisation Act (2000) need to befollowed.
c) A number of issues with Madhya Pradesh,particularly regarding Chambal lift, Urmil,Left Bariarpur, Rangawan Ken Multipurposeand Orchha Multipurpose would have to besettled.
d) Sone water re-assessment and distribution andthe problems regarding Kadwan dam requireurgent attention.
e) Uttar Pradesh needs to get more involved inregard to negotiations and studies connectedwith Indo-Nepal and within Nepal Water andPower Developments.
11.11 Water Pricing
1. While the norms of the Tenth FinanceCommission would require an O&M expenditurefor Uttar Pradesh irrigation of about Rs. 2300million per year, the actual allocations have beenonly around Rs. 650 million per year, on actualO&M works. However another Rs. 3000 millionper year are being spent on irrigationestablishment and about Rs. 1200 million onenergy charges. Revenue assessments have beenvery low at about Rs. 1100 million.
2. Currently water prices constitute an expense of amere 1 to 2 per cent of the farm budget.
3. Farmers seem to be readily paying about 10times the ‘public water’ price for purchase ofirrigation water in the unorganised grey watermarket.
4. The present prices and rate structures have beendiscussed.
5. Recommendations and views of variouscommittees about water pricing have beendiscussed.
6. A large increase in water prices and a uniformvolumetric water price for all crops needs to beeffected.
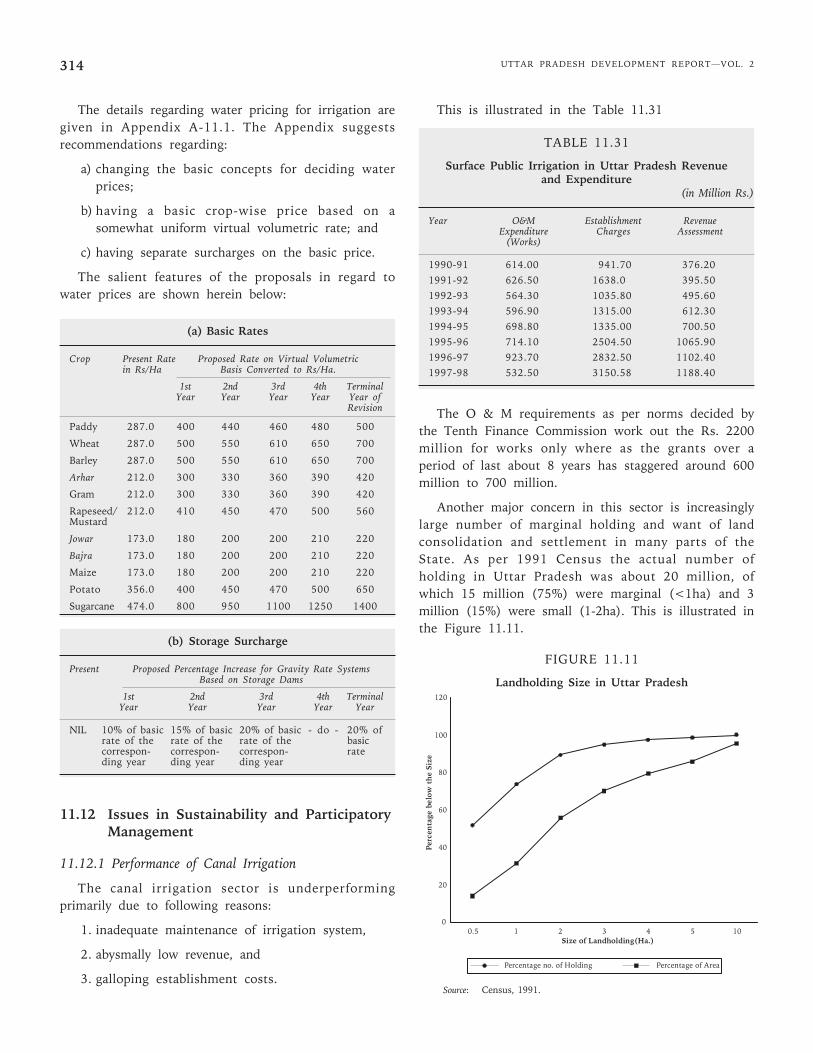
UTTAR PRADESH DEVELOPMENT REPORT—VOL. 2314
The details regarding water pricing for irrigation aregiven in Appendix A-11.1. The Appendix suggestsrecommendations regarding:
a) changing the basic concepts for deciding waterprices;
b) having a basic crop-wise price based on asomewhat uniform virtual volumetric rate; and
c) having separate surcharges on the basic price.
The salient features of the proposals in regard towater prices are shown herein below:
(a) Basic Rates
Crop Present Rate Proposed Rate on Virtual Volumetricin Rs/Ha Basis Converted to Rs/Ha.
1st 2nd 3rd 4th TerminalYear Year Year Year Year of
Revision
Paddy 287.0 400 440 460 480 500
Wheat 287.0 500 550 610 650 700
Barley 287.0 500 550 610 650 700
Arhar 212.0 300 330 360 390 420
Gram 212.0 300 330 360 390 420
Rapeseed/ 212.0 410 450 470 500 560Mustard
Jowar 173.0 180 200 200 210 220
Bajra 173.0 180 200 200 210 220
Maize 173.0 180 200 200 210 220
Potato 356.0 400 450 470 500 650
Sugarcane 474.0 800 950 1100 1250 1400
(b) Storage Surcharge
Present Proposed Percentage Increase for Gravity Rate SystemsBased on Storage Dams
1st 2nd 3rd 4th TerminalYear Year Year Year Year
NIL 10% of basic 15% of basic 20% of basic - do - 20% ofrate of the rate of the rate of the basiccorrespon- correspon- correspon- rateding year ding year ding year
11.12 Issues in Sustainability and ParticipatoryManagement
11.12.1 Performance of Canal Irrigation
The canal irrigation sector is underperformingprimarily due to following reasons:
1. inadequate maintenance of irrigation system,
2. abysmally low revenue, and
3. galloping establishment costs.
This is illustrated in the Table 11.31
TABLE 11.31
Surface Public Irrigation in Uttar Pradesh Revenueand Expenditure
(in Million Rs.)
Year O&M Establishment RevenueExpenditure Charges Assessment
(Works)
1990-91 614.00 941.70 376.201991-92 626.50 1638.0 395.501992-93 564.30 1035.80 495.601993-94 596.90 1315.00 612.301994-95 698.80 1335.00 700.501995-96 714.10 2504.50 1065.901996-97 923.70 2832.50 1102.401997-98 532.50 3150.58 1188.40
The O & M requirements as per norms decided bythe Tenth Finance Commission work out the Rs. 2200million for works only where as the grants over aperiod of last about 8 years has staggered around 600million to 700 million.
Another major concern in this sector is increasinglylarge number of marginal holding and want of landconsolidation and settlement in many parts of theState. As per 1991 Census the actual number ofholding in Uttar Pradesh was about 20 million, ofwhich 15 million (75%) were marginal (<1ha) and 3million (15%) were small (1-2ha). This is illustrated inthe Figure 11.11.
FIGURE 11.11
Landholding Size in Uttar Pradesh
0
20
40
60
80
100
120
0.5 1 2 3 4 5 10Size of Landholding(Ha.)
Percentage no. of Holding Percentage of Area
Perc
enta
ge b
elow
th
e Si
ze
Source: Census, 1991.
Chapter 11 • WATER RESOURCES: MANAGEMENT AND DEVELOPMENT 315
With small holdings, agriculture on its own is noteconomically viable and the task of irrigation delivery,recording of irrigated area, revenue collection, day today water distribution, conflict management, etc alsobecome extremely cumbersome for government. agencies.Unless the marginal land holders form some organisationfor adopting modern package of agriculture practices,irrigation and other input management the productivityof marginal land holding will keep on declining
11.12.2 Participatory Irrigation Management (PIM)and Water Users’ Association
For the equitable and optimal utilisation of canalirrigation there is an urgent need to evolve a strategyfor community participation. There is a generalconsensus now that the participation of the users inirrigation management has improved the efficiency ofthe systems.
Two of the most dramatic management transferprogrammes have been under taken in Mexico andTurkey. In many of the developed countries participatoryirrigation management has been in practice for a longtime, for e.g. in countries like, Australia, USA, Japanand Spain. In India, PIM initiative has started in someof the states. For example, Maharashtra and Gujarathave taken up the programme in a phased manner,whereas, Andhra Pradesh, through an Act of thelegislature, has turned over the canal systems to farmerorganisation for management. Tamil Nadu and MadhyaPradesh have also enacted similar Acts. The UttarPradesh government, having realised the importanceand inevitability of PIM, has adopted a policy resolutionto introduce it on the minors of canal systems in aphased manner. Salient features of the resolution are asfollows:
1. Government invites water users (farmers)association belonging to canal commands onminors and having membership of at least 51 percent water users (covering at least 51% of areaalso) to come forward to take responsibility ofirrigation management of the command.
2. Water users’ association should be registeredunder Uttar Pradesh Cooperative Act, 1965 orSocieties Registration Act. However, in the initialphase the WUA’S may be given recognition as aproposed society by the Uttar Pradesh IrrigationDepartment (UPID).
3. Before turnover of the minor, the executiveengineer of UPID shall sign an MOU with WUA.
4. The ownership of canal systems and appurtenantstructures shall be vested in the stategovernment, whereas WUAS will be responsiblefor water distribution, O&M, irrigation chargesrecovery, etc. The government will continue to beresponsible for providing technical guidance andfinancial assistance towards essentialconstruction, additions, alterations andmodernisation as well as rehabilitation.
5. Water users association would be expected toadopt appropriate water economising measuresincluding installation of water saving devicessuch as drip and sprinkler irrigation and also cropvarieties which are less water intensive.
6. Initially farmer’s participation in managementshall cover Sarda Sahayak and Saryu canal projectsand ‘Bundhis’ of Mirzapur and Sonebhadra, etc.
7. Uttar Pradesh WALMI shall be designated as thenodal agency for training of representatives ofWUA, UPID and other line agencies.
11.13 Institutional Issues
11.13.1 The Status
The present institutional arrangement in UttarPradesh, for the water resources sector as a whole canbe described as one which is highly desegregated,loosely coordinated and highly governmental andbureaucratic with very little effective participation ofother stakeholders. The irrigation department is themain line department for controlling the functions of
(c) Energy Surcharge
Present Rate Range Present Rate Proposed Percentage Increase for Lift Schemesof Pumping Head
1st Year 2nd Year 3rd Yearover 4th Year Terminal Year inthe Basic Rates % of Basic Rate
0–20 m Nil 20 40 50 60 60%
20–50 m Nil 50 100 120 140 150%
50–100 m above 100 m Nil 80 120 150 180 200%
UTTAR PRADESH DEVELOPMENT REPORT—VOL. 2316
providing irrigation through public surface sources andfor flood control services. Till the recent past, thedepartment was also engaged in providing irrigationservices through deep public tube-wells. (These tubewells have now been transferred to the villagepanchayats. However, the Irrigation Department is stillcarrying out their maintenance work.) The IrrigationDepartment is dominated by the civil engineering wing.It currently employs about 84700 regular employeesapart from about 7000 skilled and unskilled workersand daily wage employees for inhouse maintenance andsupervision, although most of the construction and amajor part of the maintenance is done throughcontracts. The department employs about 3890professional engineers and 7461 junior engineers. TheOrganisational Chart of the Irrigation Department ofUUP is shown in Figure 11.12.
Domestic water supply is dealt with by UttarPradesh Jal Nigam, Jal Sansthan and Local Bodies.
Internal Coordination amongst Departments ofUttar Pradesh
A State Water Board has been constituted under thechairmanship of the Chief Secretary with the Engineer-in-Chief of the Irrigation Department as its membersecretary. However the meetings of the board are veryinfrequent and most of the decisions are being taken byfollowing normal departmental procedures.
11.13.2 Capacity Building Inculcating Excellence andFacilitating Decision Making
The Irrigation Department recruits its professional(engineering) staff from amongst degree holders. WhileUttar Pradesh and Uttaranchal have some of the bestengineering colleges/universities the governmentrecruitment to line departments does not provide forrecruitment to specialised posts from post graduates ordoctorates.
In service, professional training is provided by thetraining institute at Kalagarh and Water and LandManagement Institute, Lucknow with a sub centre atOkhla, Delhi. However, WALMI does not have anyinterdisciplinary faculty or a core faculty, and is notundertaking any serious action on this.
Satisfaction levels in the professional staff are saidto be low. Lack of promotion to higher responsibilities,dearth of ‘preferred’ postings in jobs having largefinancial budgets on construction and maintenance,lack of participation in decision making process, etc.could be the main cause. A large ‘in breeding’ of
professional thinking with inadequate interactionwith academic institutes, research institutes, withprofessional developments in other states and countries,preoccupation with departmental practices, etc. are thereasons for a general lack of professionalism.
11.13.3 The Need for Institutional Reforms
The need and desirability of institutional reformsbased on institutional consolidation and professionalgrowth was viewed and discussed with thisbackground. It was found that there is a largeopposition to or apprehensions about large scalereforms.
The main apprehensions against reforms seem to bethe following:
1. Whereas inculcating interdisciplinary work andprofessionalism may be slated as an objective ofthe reforms, it is feared that a top heavy umbrelladepartment, which favours generalists at decision-making levels by bringing out themultidisciplinary nature of work may finallyprevail. In the process, the professional autonomyenjoyed today may come to an end.
2. It is felt by some that by improvements short ofstructural reforms, the past health and vitality ofthe Irrigation Department can be regained, and itcan take care of all major issues by effectivecoordination with other departments, without anyumbrella type arrangements.
The Alternate Proposals
While it is agreed that this is a weighty argument,it needs to be considered carefully. (In particular, ifwater resources is going to become a generaladministrative setup in the state, reforms better not bedone.)
However, based on our analysis of the strengths andweaknesses of the Uttar Pradesh water sector and itsinstitutions, as also on the basis of the opinionsexpressed in the report of the National Commission forIntegrated Water Resources Development (Govt. of India,1999) and the earlier reports of approach to operationaland procedural changes (C.W.C.), we are giving anindicative report on the possible lines these institutionalchanges need to take. This proposal is given in AppendixA-11.2. However, this is only one possible model and adetailed study is necessary. It is understood that theWorld Bank aided ‘Uttar Pradesh Water SectorRestructuring Project’ already envisages such studies.
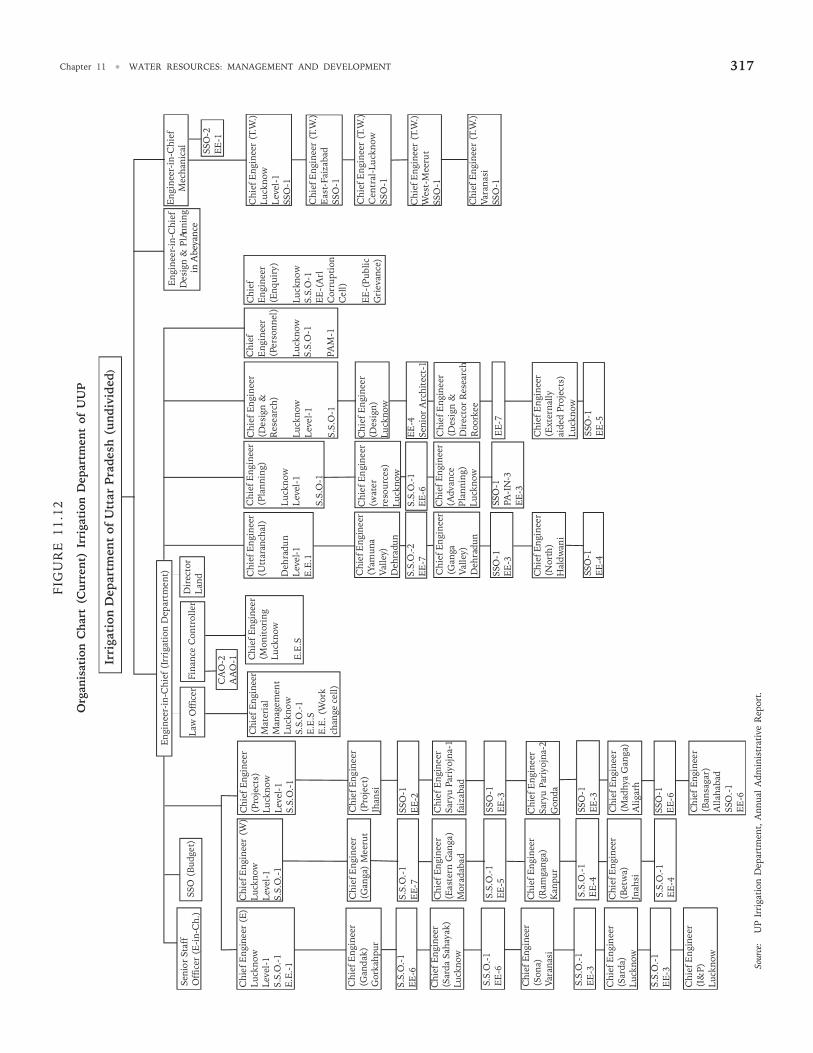
Chapter 11 • WATER RESOURCES: MANAGEMENT AND DEVELOPMENT 317F
IGU
RE
11
.12
Org
anis
atio
n C
hart
(C
urre
nt)
Irri
gati
on D
epar
tmen
t of
UU
P
Sour
ce:
UP
Irri
gati
on D
epar
tmen
t, A
nnua
l A
dmin
istr
ativ
e R
epor
t.
Irri
gati
onD
epar
tmen
tof
Utt
arP
rade
sh(u
ndiv
ided
)
Engi
neer
-in-
Chi
ef(I
rrig
atio
nD
epar
tmen
t)
Seni
orSt
aff
Off
icer
(E-i
n-C
h.)
SSO
(Bud
get)
Chi
efE
ngin
eer
(E)
Luck
now
Leve
l-1
S.S.
O.-
1E.
E.-1
Law
Off
icer
Fina
nce
Con
trol
ler
Dir
ecto
rLa
nd
CA
O-2
AA
O-1
Chi
efE
ngin
eer
(W)
Luck
now
Leve
l-1
S.S.
O.-
1
Chi
efE
ngin
eer
(Pro
ject
s)Lu
ckno
wLe
vel-
1S.
S.O
.-1
Chi
efEn
gine
er(M
onit
orin
gLu
ckno
w
E.E
.S
Chi
efEn
gine
erM
ater
ial
Man
agem
ent
Luck
now
S.S.
O.-
1E
.E.S
E.E
.(W
ork
chan
gece
ll)
Chi
efE
ngin
eer
(Gan
dak)
Gor
kahp
ur
Chi
efEn
gine
er(P
roje
ct)
Jhan
si
Chi
efE
ngin
eer
(Gan
ga)
Mee
rut
S.S.
O.-
1E
E-6
Chi
efE
ngin
eer
(Sar
daSa
haya
k)Lu
ckno
w
Chi
efE
ngin
eer
(Eas
tern
Gan
ga)
Mor
adab
ad
Chi
efE
ngin
eer
Sary
uPa
riyo
jna-
1fa
izab
ad
SSO
-1E
E-3
S.S.
O.-
1EE
-5S.
S.O
.-1
EE
-6
S.S.
O.-
1E
E-7
SSO
-1E
E-2
Chi
efE
ngin
eer
(Son
a)Va
rana
si
Chi
efE
ngin
eer
(Ram
gang
a)K
anpu
r
Chi
efE
ngin
eer
Sary
uPa
riyo
jna-
2G
onda
SSO
-1E
E-3
S.S.
O.-
1E
E-4
S.S.
O.-
1E
E-3
Chi
efE
ngin
eer
(Sar
da)
Luck
now
Chi
efE
ngin
eer
(Bet
wa)
Jnah
si
Chi
efEn
gine
er(M
adhy
aG
anga
)A
ligar
h
SSO
-1E
E-6
S.S.
O.-
1E
E-4
S.S.
O.-
1E
E-3
Chi
efE
ngin
eer
(I&
P)Lu
ckno
w
Ch
ief
Engi
neer
(Ban
saga
r)A
llaha
bad
SSO
.-1
EE
-6
Chi
efE
ngin
eer
(Utt
aran
chal
)
Deh
radu
nL
evel
-1E
.E.1
Chi
efE
ngin
eer
(Pla
nnin
g)
Luck
now
Lev
el-1
S.S.
O-1
Chi
efE
ngin
eer
(Des
ign
&R
esea
rch)
Luck
now
Lev
el-1
S.S.
O-1
Chi
efE
ngin
eer
(Per
sonn
el)
Luck
now
S.S.
O-1
PAM
-1
Chi
efE
ngin
eer
(Enq
uiry
)
Luck
now
S.S.
O-1
EE
-(A
rlC
orru
ptio
nC
ell)
EE
-(Pu
blic
Gri
evan
ce)
Chi
efE
ngin
eer
(Yam
una
Val
ley)
Deh
radu
n
Chi
efEn
gine
er(w
ater
reso
urce
s)Lu
ckno
w
Chi
efE
ngin
eer
(Des
ign)
Luck
now
S.S.
O.-2
EE
-7S.
S.O
.-1
EE
-6E
E-4
Seni
orA
rchi
tect
-1
Chi
efE
ngin
eer
(Gan
gaV
alle
y)D
ehra
dun
Chi
efEn
gine
er(A
dvan
ceP
lann
ing)
Luck
now
Chi
efE
ngin
eer
(Des
ign
&D
irec
tor
Res
earc
hR
oork
ee
SSO
-1E
E-3
SSO
-1PA
-IN
-3E
E-3
EE
-7
Chi
efE
ngin
eer
(Nor
th)
Hal
dwan
i
Chi
efE
ngin
eer
(Ext
erna
llyai
ded
Proj
ects
)Lu
ckno
w
SSO
-1E
E-4
SSO
-1E
E-5
SSO
-2E
E-1
Engi
neer
-in-
Chi
efD
esig
n&
PlAn
ning
Eng
inee
r-in
-Chi
efM
echa
nica
l
Chi
efE
ngin
eer
(T.W
.)Lu
ckno
wL
evel
-1SS
O-1
Chi
efE
ngin
eer
(T.W
.)E
ast-
Faiz
abad
SSO
-1
Chi
efE
ngin
eer
(T.W
.)C
entr
al-L
uck
now
SSO
-1
Chi
efE
ngin
eer
(T.W
.)W
est-
Mee
rut
SSO
-1
Chi
efE
ngin
eer
(T.W
.)Va
rana
siSS
O-1
in A
beya
nce
UTTAR PRADESH DEVELOPMENT REPORT—VOL. 2318
3. Earmarking of funds should be made for theprojects with incurred expenditure of more than85 per cent of the estimated cost.
4. Inter se priority among the ongoing projects forcompletion need to be carried out taking intoaccount various aspects such as externally aidedprojects, inter-state projects, benefit to droughtprone or tribal areas, drinking water supply,regional imbalance, etc. using the guidelinesprepared by the National Commission forIntegrated Water Resources Development Plan(NICWRDP).
5. High priority may be accorded to the Pre-Fifthand Fifth Plan Projects for funding under AIBPwith emphasis to complete these projects duringthe Tenth Plan. Fund allocation under AIBPshould be enhanced for this purpose, if necessary.
6. Earmarking of funding should be done for inter-state projects to ensure desired progress of worksin all the associated states for early completion ofsuch projects.
7. It is necessary to ensure that only those projectsare posed for external assistance where allinfrastructural works, layouts and detaileddesigns are ready or could be provided within thetime schedule. The concerned state governmentsshould also take simultaneous action forclearances of such projects from the AdvisoryCommittee and subsequently investment clearancefrom Planning Commission.
8. Given the situation of the resource crunch,foremost priority should be given to completionof ongoing projects. New projects should betaken up very selectively keeping in view thenecessity for removal of regional imbalances anddevelopment of drought prone and tribal areas.
9. Since the fund requirements for medium projectsare less, maximum possible fund may be madeavailable for completion of the medium projects,without jeopardising the programmes forimportant major projects.
10. A separate budget head as Irrigation MaintenanceFund (IMF) may be provided for maintenanceworks of the irrigation projects which willcomprise of up to 15 per cent of the plan fundand full amount of irrigation revenue as collectedshould be credited to IMF.
11.14 Fifteen Short-and Medium-term Strategies and Action Plan
11.14.1 Introduction
So far, we have discussed the integrated andoptimum water development and management necessaryfor the Uttar Pradesh and Uttaranchal regions, in thelong-term context, i.e. up to 2050.
Water developments are slow in implementation andacceptance by users. They also are, more or less,irreversible. Management practices also evolve andchange slowly. Therefore, the long time horizon isrelevant. However, we also need to look at a shortertime period scenario as also the present state and paceof activities to develop short or medium term strategiesand indicate the mid course corrections necessary to beimplemented now itself. These are being discussed inthe present section.
In developing this, we have taken into account someadditional sources of information. These are:
1. Report of the Working Group on Major andMedium Irrigation Programmes for the Tenth FiveYear Plan, Ministry of Water Resources, CentralWater Commission (October, 2001).
2. Draft Report of the Working Group on Major andMedium Irrigation for the Tenth Five Year Plan,Irrigation Department (Uttar Pradesh) (December,2001).
3. Tenth Five Year Plan 2002–2007, SectoralProgrammes–Government of Uttaranchal, April2002.
The development strategy in regard to the Major andMedium Irrigation, as documented in the PlanningCommission Working Group Report for Tenth Five YearPlan is as follows:
1. Continuing old projects which have alreadyachieved 90 per cent or more of the ultimatepotential should be considered as completedprojects and projects with 70 per cent to 80 percent achievement of the potential should bereviewed for the achievable potential, so as todecide on the completion status of these projects.
2. According to status of completion of variouscomponents of all the ongoing projects of pre-Fifth and Fifth Plan period, the projects shouldbe split into Phase-I, Phase-II, etc. and phase-wise completion indicated.
Chapter 11 • WATER RESOURCES: MANAGEMENT AND DEVELOPMENT 319
11. The IMF will be spent on works only withoutinclusion of any component of establishment costor salaries. Expenditure on staff componentshould not exceed 20 to 30 per cent of overall O& M fund.
12. In addition to liabilities of completed projects andprovisions for on-going and new projects, thestate Plan proposals should incorporate provisionsfor (i) special repairs of existing irrigationsystems (ii) dam safety measures (iii) improvedwater management and (iv) water developmentaspects encompassing survey and investigation,research & development training and newlyproposed National Hydrology Projects.
13. It is necessary to provide substantially higheroutlays in order to bring out the effective role inplan activities of the Central Institutions by wayof suitably strengthening them and providingadequate funds for taking new initiatives in R&Dprogrammes.
14. Reassessment of the ultimate irrigation potentialin major and medium irrigation sector isnecessary.
15. The existing regional/state level institutions suchas WALMIS should be strengthened and broughtinto the mainstream activities for irrigationmanagement improvement.
16. Dam safety measures should be taken up all overthe country which are very essential in thecontext of disaster prevention and management.
Basing, its recommendation on this strategy, theUttar Pradesh Working Group report has classified andfixed inter se priority amongst the new and ongoingprojects as follows:
1. Projects externally aided in the past (up to 9/94).
2. Interstate projects, to ensure desired progress ofworks for early completion of each project.
3. Other ongoing projects where substantialexpenditure has been incurred.
4. Medium and modernisation schemes that can becompleted during the Tenth Plan.
5. Selected new schemes, mostly with a view toreduce the regional imbalances.
6. Projects for restoration of existing capacity whichincludes modernisation and rehabilitation of oldgravity canals as well as major lift canals andstrengthening of dams under distress, to reducethe gap between potential created and utilised.
7. Provision has been made for Special Repairs ofExisting Irrigation System and WaterDevelopment Programme comprising surveyinvestigation, research and training, etc.
11.14.2 Short-and Medium-term Strategies
Although, we generally agree with the above, aftersome modification, we would indicate the followingshort and medium term strategies grouped as below:
i) improving information, knowledge andcapacities,
ii) improved management of existing developmentsand system,
iii) completion of major and medium scheme, and
iv) improved planning of new development.
We now discuss each strategy group by listing possiblestrategies also actions necessary to achieve there.
Strategy-1: Improving Information Knowledge andCapacities
Actions for achieving this strategy objective
1.1 Creation of a water data centre.
1.1.a. Preparing a plan of water data centrethrough consultants, includingequipment specification.
1.1.b. Procurement of hardware and software.
1.1.c. Manning and training of personnel .
1.2 Prepare a plan for institutional restructuring
1.2.a. Consultancy.
1.2.b. Discussions and decision making.
1.2.c. Setting up a performance, evaluation andpolicy wing.
1.2.d. Commissioning an independent review ofperformance and policy analysis.
1.3 Developing a personnel & HRD policy for watersector.
1.4 Develop WALMI as an interdisciplinary institutefor action research and training.
1.4.a. Commission an independent study on theperformance of WALMI and itsconsolidation.
1.4.b. Investigating the possibility of financialviability and self sustainability ofWALMI.
UTTAR PRADESH DEVELOPMENT REPORT—VOL. 2320
1.4.c. Change personnel policies in line withdepartments making training as a pre-requisite for advancement.
1.5 Give a legal basis to PIM through modificationand simplification of laws and procedures
1.5.a. Commission inter-disciplinary (Irrigation,Administration and Law) study forchanges in acts, procedures and rules.
1.5.b. Set up a high level committee forimplementing changes.
1.6 Establishing and empowering local sub-basinwise users committees for inter-sectoral wateruse related issues, including water qualitymaintenance.
1.6.a Set up area water partnerships (AWPs)and stakeholder committees.
1.6.b. Evaluate working of stakeholdercommittees elsewhere (other countriesand states of India) and plan changes inUttar Pradesh.
1.6.c. Amend laws and procedures forempowering the stakeholder committee.
1.7 Prepare a state water plan, through thedepartment and with the help of consultants,which inter alia estimates the basin-wiseavailability and usability of water and developsan integrated plan of use.
1.8 Coordinate amongst the basin states for thesolution of unresolved interstate problems.
1.9 Draft and enact legislation for groundwaterregulation.
1.10 Draft and enact legislation or lay downexecutive procedures to regulate developmentsin the flood plains.
Strategy–2: Improved Management of ExistingDevelopment and Systems
Actions for achieving this strategy objective:
2.1 Stress on CAD Programme
2.1.a. Study performance evaluation reports andsuggest changes in CAD programmes.
2.1.b. Reassess commandable areas of majorsystems, considering inter alia, planned,desirable and actual cropping patterns,topographic and other difficulties incommanding the area.
2.1.c. Plan conjunctive use of surface andgroundwater as a part of the CADactivity, on a pilot basis for one largecommand.
2.1.d. Plan drips, sprinklers and associated onfarm/off line storage creation as a part ofthe CAD activities, on a pilot basis, forone large command.
2.1.e. Plan and implement proportionatedistribution by removing lower levelgated structures on a pilot, for onecommand.
2.2 Prepare performance evaluation studies leadingto ERM schemes for all old projects and for afew other projects with known unsatisfactoryperformance:
The objective need not be one of restoring theearlier planned hydraulic capacities, but one ofmaking the best use of available supplies andsystems, through minimum necessaryimprovements to achieve the optimumproduction. Aspects like water saving,conjunctive use, proportionate distributionautomation, setting up of an MIS for thesystem, etc. need to be included.
2.3 Strengthen dam safety organisation
2.3.a Conduct external dam safety evaluationsperiodically.
2.3.b Study desirability of additional dam safetycess on storage based irrigation system.
2.3.c. Draft dam safety legislation and decidedesirability of enactment. In particular,consider the future situation in whichdams may be owned by non-governmentalentities in large numbers.
2.4 A precedence needs to be built up in which thefull maintenance grants, as per the normsadopted by the finance commission are madeavailable towards irrigation O&M. While thestate has the inherent authority in changingthese amounts in its budget exercise, thedeviations, the reasons and their likelyimplications need to be brought out in thebudget.
2.5 Decide on the desirability of setting up anautonomous irrigation management corporationfor a large system, which would be empoweredto collect and spend revenues from irrigation. If
Chapter 11 • WATER RESOURCES: MANAGEMENT AND DEVELOPMENT 321
possible, set up one such corporation and planfor its financial viability in phases. Initially,subsidies and capital would have to be arrangedby the government, since at present the waterrates are low. The revenues may not besufficient for the O&M activities.
2.6 Expedite downsizing of maintenance staffthrough redeployment and VRS.
2.7 Consider privatisation of irrigation distributionand O&M on a small pilot, as an alternative toWUAs thus using small private entrepreneurs.
2.8 Transfer maintenance of the tertiary systementirely to the stakeholders through the PIM.
2.9 Encourage watershed management andrainwater harvesting. Prepare a strategy paper ofdesired package for different slopes, differentsoils and for rainfed areas as also for commandareas.
2.10 Start pilot studies on rainwater harvesting in oneof the large command areas, as a part of CAD.
2.11 Decide on legal, procedural and policy changesnecessary for encouraging conjunctive use incommand areas. The aim can be to:
2.11.a. Allocate downstream lands, wherereliability of surface supplies may be lowto groundwater use.
2.11.b. Ensure that the farmers usinggroundwater conjunctively do not haveto pay a disproportionately higher pricethan the farmers obtaining surfacewater.
2.11.c. Develop a model MOU with WUA,which has provisions relating to WUAsresponsibility in regulating groundwaterin their area and a possibility ofreduction of surface supplies ifgroundwater is rising.
2.12 Increase water prices, to reflect the scarcityvalue of water and to give incentives to theusers to save water.
2.12.a. Decide on increasing and rationalisingwater prices on virtual volumetric basis,with additional charges for rabi or zaidand energy surcharge for lifts, etc.
2.12.b. For a suitable pilot area with sufficientland slope (perhaps in Bundelkhand onforth hills), try volumetric deliveries and
document pre and post situationscenarios, responses of users, etc.
2.12.c. Decide on a policy for WUAs, coveringissues like: i) percentage of revenuewhich they may keep, and (ii) if theyhave liberty to charge more for thewater, etc.
2.13 Management of Water Quality
2.13.a Enhancing information throughcollection and collation of data.
2.13.b. Analysing data to locate problem reachesand aquifers.
2.13.c. Preparing water quality models forproblem areas.
2.13.d. Drafting guide lines for minimum flowsrequired.
2.13.e. Improving mechanism for achievingacceptable quality norms through lawsand policies.
2.13.f. Improving mechanism for achievingacceptable quality norms through newtechnologies and development.
2.13.g. Improving mechanism for achievingacceptable low flows through reductionin other uses.
2.14 Adjusting inter-sectoral uses to changingsituations
2.14.a. Developing strategy for changingallocation from low priority to highpriority uses.
2.14.b Establishing a reviewable regime of waterrights amongst users within the state.
2.15 Improve availability of electric energy andencourage electrification of tube wellsrunning on diesel.
Strategy–3: Completion of Major and MediumProjects
Actions for achieving this strategy objective:
3.1 Action to be taken by the state to get the costestimates of ongoing new schemes approved atappropriate levels and subsequent investmentclearance from the Planning Commission forcorrect assessment of spillover and new projectcosts.
UTTAR PRADESH DEVELOPMENT REPORT—VOL. 2322
3.2 Completion of projects which have achieved 90per cent or more of the ultimate potential benotified and fresh DPR be made if there is arequirement for any essential balance work.
3.3 The projects need to be prioritised forimplementation as per the detailed guidelinesincorporated in the report of the NCIWD,which have been endorsed by the PlanningCommission Working Group on Major andMedium projects. Having prioritised theschemes competing for the funds, higherpriority schemes need to be fully financedbefore funding of schemes with lower priorityranking is considered. In this way, even withlimited funds, some high priority (and highlybeneficial) schemes would get completed. Thisexercise needs to be taken up. The UttarPradesh Working Group on Major and Mediumschemes does seem to be based on such anexercise.
3.4 Government/Planning Department of the stateshould take suitable action to enhance theoverall plan allocation under this sector toabout 10 per cent of the total Plan outlay asagainst 5 to 7 per cent being provided atpresent.
3.5 Allocation under RIDF (NABARD) and AIBPshould be substantially enhanced to ensureresource mobilisation for the planimplementation as decided by the WorkingGroup. However, (a) the performance of watersector depends not only on the availability offinances but also on the other reform measures.Preference for higher funding through AIBPmay be linked to sectoral reforms, and (b) amore efficient process of ensuring a quick orautomatic transmission of the RIDF/AIBP tothe project authorities as also a strongermonitoring system which links funding toproper execution, need to be put into place.
3.6 Schemes which have been under constructionfor a long period (say Fifth Plan and earlierschemes) need to be reviewed afresh. If theschemes have developed somewhatinsurmountable constraints, or if they havebecome unattractive, these could be downsizedand reshaped to give some early benefits withreduced cost. In any case, attempts could bemade for their break-up in phases so that thebenefits can start flowing in early and inphases.
Strategy–4: Improved Planning of NewDevelopment
Actions for achieving this strategy objective
4.1 Groundwater Development strategy
In general, exploration of deep seatedgroundwater through deep tube wells (whichwere publicly owned) has received a setbacksince the government is withdrawing from thisfunction.
At a few places, water quality or geo-hydrologymay be such as to make the use of deepergroundwater for irrigation more attractive thanthe exploration of upper layers through privateshallow tube-wells.
Studies need to be done to (4.1.a) locate suchareas and (4.1.b) to develop a strategy forexploiting and developing the deeper waters, inregard to ownership, financing, etc.
4.2.a The preparation of the state water plan,and its subsequent detailing needs to bedone in order to allocate sources andschemes (of all sizes) to variousproposed water uses like domestic andindustrial waters, irrigation, etc. Largerprojects would have to be multipurpose,but with well documented use-wiseallocations.
4.2.b Preparation of detailed sub basin masterplans for all uses is a prerequisite fordevelopment. Reuse of effluents needs tobe a part of the plan. Such developedplans need to be taken up.
4.3 New development projects need to integrate theuse of local rainwater, surface water andgroundwaters. Guidelines for conjunctivesurface and groundwater are available but thesein regard to integration of rainwater harvestingwith other developments need to be drafted.These need to consider aspects like land slope,soils and crops.
4.4 New irrigation development needs to provide fora balance between lifts from head pond/reservoir, lifts from canals, etc. and longdistance gravity conveyance. Both theeconomics of lifting versus. gravity conveyanceand the social desirability of giving benefits tomarginally higher lands near the water sourceneed to be considered. Guidelines andprocedures need to be developed.
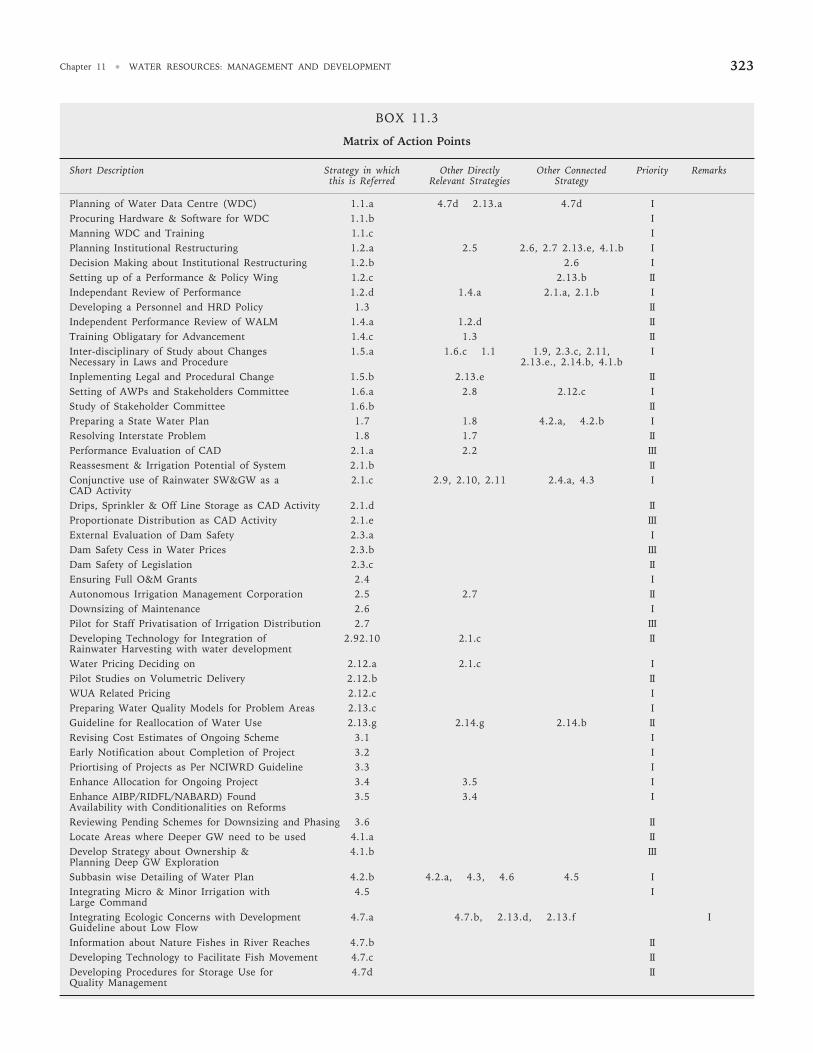
Chapter 11 • WATER RESOURCES: MANAGEMENT AND DEVELOPMENT 323
BOX 11.3
Matrix of Action Points
Short Description Strategy in which Other Directly Other Connected Priority Remarksthis is Referred Relevant Strategies Strategy
Planning of Water Data Centre (WDC) 1.1.a 4.7d 2.13.a 4.7d IProcuring Hardware & Software for WDC 1.1.b IManning WDC and Training 1.1.c IPlanning Institutional Restructuring 1.2.a 2.5 2.6, 2.7 2.13.e, 4.1.b IDecision Making about Institutional Restructuring 1.2.b 2.6 ISetting up of a Performance & Policy Wing 1.2.c 2.13.b IIIndependant Review of Performance 1.2.d 1.4.a 2.1.a, 2.1.b IDeveloping a Personnel and HRD Policy 1.3 IIIndependent Performance Review of WALM 1.4.a 1.2.d IITraining Obligatary for Advancement 1.4.c 1.3 IIInter-disciplinary of Study about Changes 1.5.a 1.6.c 1.1 1.9, 2.3.c, 2.11, INecessary in Laws and Procedure 2.13.e., 2.14.b, 4.1.bInplementing Legal and Procedural Change 1.5.b 2.13.e IISetting of AWPs and Stakeholders Committee 1.6.a 2.8 2.12.c IStudy of Stakeholder Committee 1.6.b IIPreparing a State Water Plan 1.7 1.8 4.2.a, 4.2.b IResolving Interstate Problem 1.8 1.7 IIPerformance Evaluation of CAD 2.1.a 2.2 IIIReassesment & Irrigation Potential of System 2.1.b IIConjunctive use of Rainwater SW&GW as a 2.1.c 2.9, 2.10, 2.11 2.4.a, 4.3 ICAD ActivityDrips, Sprinkler & Off Line Storage as CAD Activity 2.1.d IIProportionate Distribution as CAD Activity 2.1.e IIIExternal Evaluation of Dam Safety 2.3.a IDam Safety Cess in Water Prices 2.3.b IIIDam Safety of Legislation 2.3.c IIEnsuring Full O&M Grants 2.4 IAutonomous Irrigation Management Corporation 2.5 2.7 IIDownsizing of Maintenance 2.6 IPilot for Staff Privatisation of Irrigation Distribution 2.7 IIIDeveloping Technology for Integration of 2.92.10 2.1.c IIRainwater Harvesting with water developmentWater Pricing Deciding on 2.12.a 2.1.c IPilot Studies on Volumetric Delivery 2.12.b IIWUA Related Pricing 2.12.c IPreparing Water Quality Models for Problem Areas 2.13.c IGuideline for Reallocation of Water Use 2.13.g 2.14.g 2.14.b IIRevising Cost Estimates of Ongoing Scheme 3.1 IEarly Notification about Completion of Project 3.2 IPriortising of Projects as Per NCIWRD Guideline 3.3 IEnhance Allocation for Ongoing Project 3.4 3.5 IEnhance AIBP/RIDFL/NABARD) Found 3.5 3.4 IAvailability with Conditionalities on ReformsReviewing Pending Schemes for Downsizing and Phasing 3.6 IILocate Areas where Deeper GW need to be used 4.1.a IIDevelop Strategy about Ownership & 4.1.b IIIPlanning Deep GW ExplorationSubbasin wise Detailing of Water Plan 4.2.b 4.2.a, 4.3, 4.6 4.5 IIntegrating Micro & Minor Irrigation with 4.5 ILarge CommandIntegrating Ecologic Concerns with Development 4.7.a 4.7.b, 2.13.d, 2.13.f IGuideline about Low FlowInformation about Nature Fishes in River Reaches 4.7.b IIDeveloping Technology to Facilitate Fish Movement 4.7.c IIDeveloping Procedures for Storage Use for 4.7d IIQuality Management
UTTAR PRADESH DEVELOPMENT REPORT—VOL. 2324
4.5 Similarly, new water developments for irrigationneed to integrate the existing micro, minor andmedium projects in the command for optimaluse. Minor tanks, etc. could be fed from canalsto enhance their utility. Some minor tanks,open wells, etc. can be used as off line storage,which allow the use of sprinklers and dripseven when the major canal distribution systemis in the off mode during a rotation. Guidelinesand procedures need to be drafted for this.
4.6 Integration of various types of water uses in anarea such as a sub-basin requires preparation ofa detailed master plan, based on projecteddemands of domestic and industrial water asalso of irrigation.
The plan needs to indicate how each demandwould be met, and how the priority for watersupply gets reflected by allocating the morereliable and better quality water for thispurpose. It will also treat groundwaterutilisation possibility and consider theadditional withdrawals and enhanced rechargeto groundwater. Maintenance of groundwaterlevels and maintenance of low flows need to beprovided for. Preparation of such outline plansfor 3 or 4 pilot areas in different agroclimatic/topographical regions need to be taken up forgetting more experience.
4.7 Integrating the concept of water for nature innew developments
4.7.a. Prepare a guideline for deciding theminimum low flows which need to bemaintained in rivers from ecologicalconsiderations (maintenance of naturalfish and aquatic life, etc).
4.7.b. Prepare information about the types offishes native to various river reaches andthe special considerations required forthe sustenance of each type.
4.7.c. Evolve, test and standardise fish ladders,fish locks, etc. suitable for each type offish.
4.7.d. Evolve a procedure for reserving a part ofthe storage in a reservoir for water qualitymanagement during periods of distress.
11.14.3 Developing a Short-term Plan of Action
Having decided on four strategy groups for obtaininga marked improvement in the water sector and having
listed the possible actions to achieve the stated strategy(section 11.14.2), we now proceed to develop apreliminary plan of short-term actions.
This is done by preparing a matrix of action pointsand its direct or indirect correspondence with otheraction points (Box 11.3).
Some actions would be relevant to many strategiesand sub-strategies and may be of indirect relevance toother sub-strategies. These automatically come out aspriority actions, since these will have larger multipliereffects elsewhere. Some strategies would be of basicimportance due to the intrinsic nature of the studiesinvolved. Considering both these aspects the somewhatsubjective priority groups are indicated in the matrix forthe action points.
For all Priority I action points, implementation maystart immediately and the aim could be to completethese actions (such as studies, pilot implementationareas) within the Tenth Plan. Priority II action alsocould start within the Tenth Plan period, whereasPriority III actions can perhaps be started in theEleventh Plan.
The mode of implementing these actions (such asentrusting the work to an office, setting up acommittee, setting up an internal review group orassigning this as a job to a consultant, etc.) and theexact terms of references (ToRs) would have to be donejudiciously to cover the basic issues involved in thataction as also those in other actions, directly orindirectly related to that action. Again the matrixwould give an initial guidance in this regard. Althoughthe matrix gives only a short description of the action,discussions in this section as also in the report wouldhelp in understanding the type of issues involved.
ReferencesGovernment of India (GoI)
—————. Reports of National Commission for Integrated Water ResourcesDevelopment, 1999.
—————. Report of the Working Group on Major & Medium Irrigation Programmes for theTenth Five Year Plan, Ministry of Water resources, Central WaterCommission, October 2001.
—————. Draft Report of the Working Group on Major & Medium Irrigation for the TenthFive Year Plan, Irrigation Department (Uttar Pradesh), December2001.
—————. Tenth Five Year Plan 2002-2007, “Sectoral Programmes”, Governmentof Uttaranchal, April 2002.
Census, Planning Commission.
Report of Central Pollution Control Board (CPCB).
Groundwater Resources of India, CGWB, 1995.
Planning Commission, Tenth Plan Document.
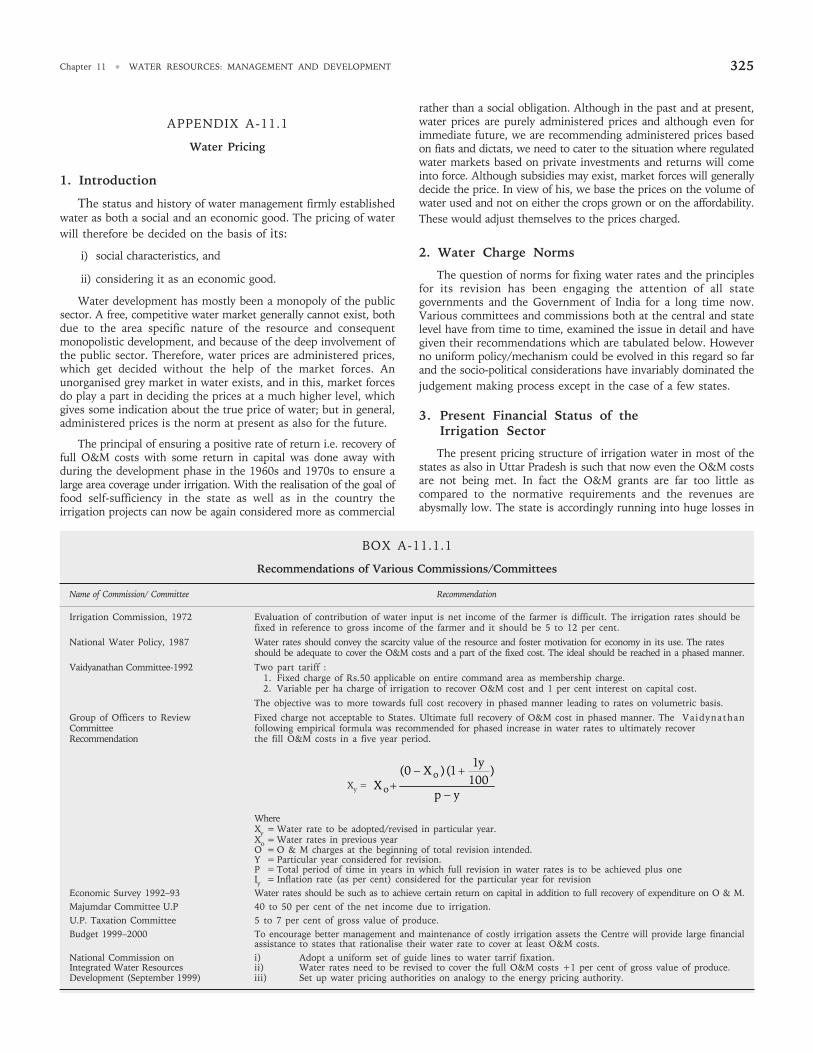
Chapter 11 • WATER RESOURCES: MANAGEMENT AND DEVELOPMENT 325
APPENDIX A-11.1
Water Pricing
1. Introduction
The status and history of water management firmly establishedwater as both a social and an economic good. The pricing of waterwill therefore be decided on the basis of its:
i) social characteristics, and
ii) considering it as an economic good.
Water development has mostly been a monopoly of the publicsector. A free, competitive water market generally cannot exist, bothdue to the area specific nature of the resource and consequentmonopolistic development, and because of the deep involvement ofthe public sector. Therefore, water prices are administered prices,which get decided without the help of the market forces. Anunorganised grey market in water exists, and in this, market forcesdo play a part in deciding the prices at a much higher level, whichgives some indication about the true price of water; but in general,administered prices is the norm at present as also for the future.
The principal of ensuring a positive rate of return i.e. recovery offull O&M costs with some return in capital was done away withduring the development phase in the 1960s and 1970s to ensure alarge area coverage under irrigation. With the realisation of the goal offood self-sufficiency in the state as well as in the country theirrigation projects can now be again considered more as commercial
rather than a social obligation. Although in the past and at present,water prices are purely administered prices and although even forimmediate future, we are recommending administered prices basedon fiats and dictats, we need to cater to the situation where regulatedwater markets based on private investments and returns will comeinto force. Although subsidies may exist, market forces will generallydecide the price. In view of his, we base the prices on the volume ofwater used and not on either the crops grown or on the affordability.These would adjust themselves to the prices charged.
2. Water Charge Norms
The question of norms for fixing water rates and the principlesfor its revision has been engaging the attention of all stategovernments and the Government of India for a long time now.Various committees and commissions both at the central and statelevel have from time to time, examined the issue in detail and havegiven their recommendations which are tabulated below. Howeverno uniform policy/mechanism could be evolved in this regard so farand the socio-political considerations have invariably dominated thejudgement making process except in the case of a few states.
3. Present Financial Status of theIrrigation Sector
The present pricing structure of irrigation water in most of thestates as also in Uttar Pradesh is such that now even the O&M costsare not being met. In fact the O&M grants are far too little ascompared to the normative requirements and the revenues areabysmally low. The state is accordingly running into huge losses in
BOX A-11.1.1
Recommendations of Various Commissions/Committees
Name of Commission/ Committee Recommendation
Irrigation Commission, 1972 Evaluation of contribution of water input is net income of the farmer is difficult. The irrigation rates should befixed in reference to gross income of the farmer and it should be 5 to 12 per cent.
National Water Policy, 1987 Water rates should convey the scarcity value of the resource and foster motivation for economy in its use. The ratesshould be adequate to cover the O&M costs and a part of the fixed cost. The ideal should be reached in a phased manner.
Vaidyanathan Committee-1992 Two part tariff :1. Fixed charge of Rs.50 applicable on entire command area as membership charge.2. Variable per ha charge of irrigation to recover O&M cost and 1 per cent interest on capital cost.
The objective was to more towards full cost recovery in phased manner leading to rates on volumetric basis.
Group of Officers to Review Fixed charge not acceptable to States. Ultimate full recovery of O&M cost in phased manner. The VaidynathanCommittee following empirical formula was recommended for phased increase in water rates to ultimately recoverRecommendation the fill O&M costs in a five year period.
Xy =
yp
)100
y11)(X0(
Xo
o −
+−+
WhereXy = Water rate to be adopted/revised in particular year.Xo = Water rates in previous yearO = O & M charges at the beginning of total revision intended.Y = Particular year considered for revision.P = Total period of time in years in which full revision in water rates is to be achieved plus oneIy = Inflation rate (as per cent) considered for the particular year for revision
Economic Survey 1992–93 Water rates should be such as to achieve certain return on capital in addition to full recovery of expenditure on O & M.Majumdar Committee U.P 40 to 50 per cent of the net income due to irrigation.U.P. Taxation Committee 5 to 7 per cent of gross value of produce.Budget 1999–2000 To encourage better management and maintenance of costly irrigation assets the Centre will provide large financial
assistance to states that rationalise their water rate to cover at least O&M costs.National Commission on i) Adopt a uniform set of guide lines to water tarrif fixation.Integrated Water Resources ii) Water rates need to be revised to cover the full O&M costs +1 per cent of gross value of produce.Development (September 1999) iii) Set up water pricing authorities on analogy to the energy pricing authority.
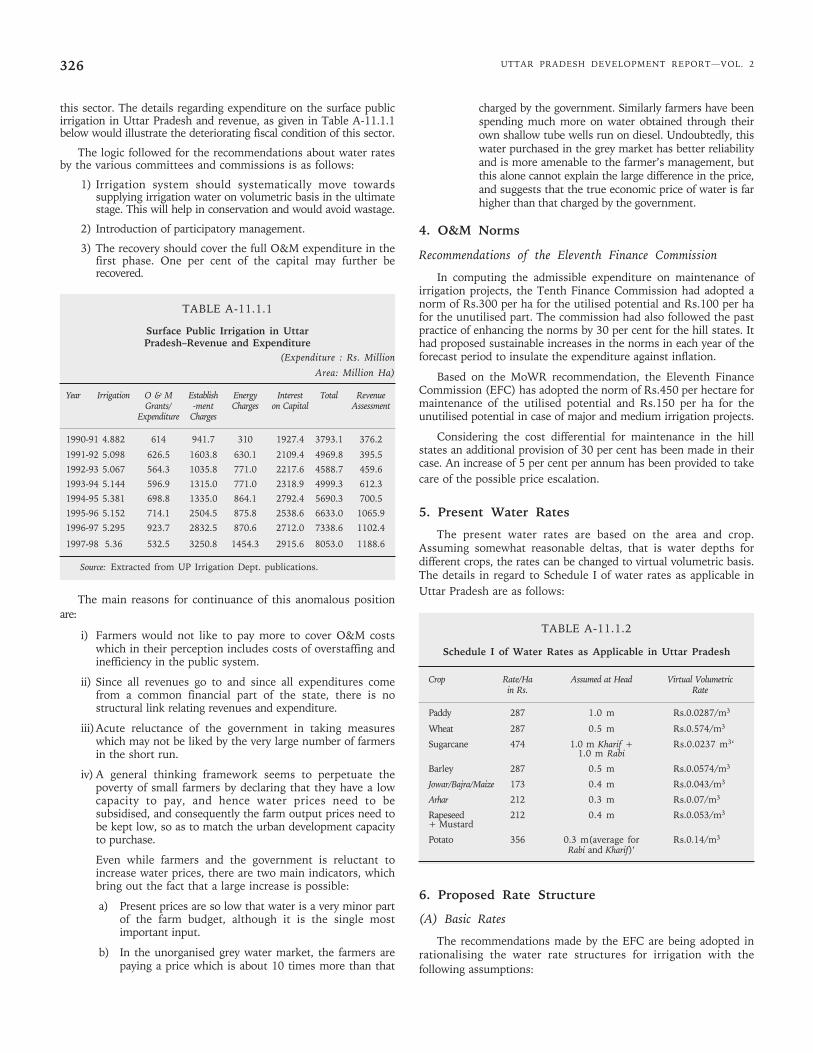
UTTAR PRADESH DEVELOPMENT REPORT—VOL. 2326
this sector. The details regarding expenditure on the surface publicirrigation in Uttar Pradesh and revenue, as given in Table A-11.1.1below would illustrate the deteriorating fiscal condition of this sector.
The logic followed for the recommendations about water ratesby the various committees and commissions is as follows:
1) Irrigation system should systematically move towardssupplying irrigation water on volumetric basis in the ultimatestage. This will help in conservation and would avoid wastage.
2) Introduction of participatory management.
3) The recovery should cover the full O&M expenditure in thefirst phase. One per cent of the capital may further berecovered.
TABLE A-11.1.1
Surface Public Irrigation in UttarPradesh–Revenue and Expenditure
(Expenditure : Rs. Million
Area: Million Ha)
Year Irrigation O & M Establish Energy Interest Total RevenueGrants/ -ment Charges on Capital Assessment
Expenditure Charges
1990-91 4.882 614 941.7 310 1927.4 3793.1 376.2
1991-92 5.098 626.5 1603.8 630.1 2109.4 4969.8 395.5
1992-93 5.067 564.3 1035.8 771.0 2217.6 4588.7 459.6
1993-94 5.144 596.9 1315.0 771.0 2318.9 4999.3 612.3
1994-95 5.381 698.8 1335.0 864.1 2792.4 5690.3 700.5
1995-96 5.152 714.1 2504.5 875.8 2538.6 6633.0 1065.9
1996-97 5.295 923.7 2832.5 870.6 2712.0 7338.6 1102.4
1997-98 5.36 532.5 3250.8 1454.3 2915.6 8053.0 1188.6
Source: Extracted from UP Irrigation Dept. publications.
The main reasons for continuance of this anomalous positionare:
i) Farmers would not like to pay more to cover O&M costswhich in their perception includes costs of overstaffing andinefficiency in the public system.
ii) Since all revenues go to and since all expenditures comefrom a common financial part of the state, there is nostructural link relating revenues and expenditure.
iii)Acute reluctance of the government in taking measureswhich may not be liked by the very large number of farmersin the short run.
iv) A general thinking framework seems to perpetuate thepoverty of small farmers by declaring that they have a lowcapacity to pay, and hence water prices need to besubsidised, and consequently the farm output prices need tobe kept low, so as to match the urban development capacityto purchase.
Even while farmers and the government is reluctant toincrease water prices, there are two main indicators, whichbring out the fact that a large increase is possible:
a) Present prices are so low that water is a very minor partof the farm budget, although it is the single mostimportant input.
b) In the unorganised grey water market, the farmers arepaying a price which is about 10 times more than that
charged by the government. Similarly farmers have beenspending much more on water obtained through theirown shallow tube wells run on diesel. Undoubtedly, thiswater purchased in the grey market has better reliabilityand is more amenable to the farmer’s management, butthis alone cannot explain the large difference in the price,and suggests that the true economic price of water is farhigher than that charged by the government.
4. O&M Norms
Recommendations of the Eleventh Finance Commission
In computing the admissible expenditure on maintenance ofirrigation projects, the Tenth Finance Commission had adopted anorm of Rs.300 per ha for the utilised potential and Rs.100 per hafor the unutilised part. The commission had also followed the pastpractice of enhancing the norms by 30 per cent for the hill states. Ithad proposed sustainable increases in the norms in each year of theforecast period to insulate the expenditure against inflation.
Based on the MoWR recommendation, the Eleventh FinanceCommission (EFC) has adopted the norm of Rs.450 per hectare formaintenance of the utilised potential and Rs.150 per ha for theunutilised potential in case of major and medium irrigation projects.
Considering the cost differential for maintenance in the hillstates an additional provision of 30 per cent has been made in theircase. An increase of 5 per cent per annum has been provided to takecare of the possible price escalation.
5. Present Water Rates
The present water rates are based on the area and crop.Assuming somewhat reasonable deltas, that is water depths fordifferent crops, the rates can be changed to virtual volumetric basis.The details in regard to Schedule I of water rates as applicable inUttar Pradesh are as follows:
TABLE A-11.1.2
Schedule I of Water Rates as Applicable in Uttar Pradesh
Crop Rate/Ha Assumed at Head Virtual Volumetricin Rs. Rate
Paddy 287 1.0 m Rs.0.0287/m3
Wheat 287 0.5 m Rs.0.574/m3
Sugarcane 474 1.0 m Kharif + Rs.0.0237 m3‘1.0 m Rabi
Barley 287 0.5 m Rs.0.0574/m3
Jowar/Bajra/Maize 173 0.4 m Rs.0.043/m3
Arhar 212 0.3 m Rs.0.07/m3
Rapeseed 212 0.4 m Rs.0.053/m3
+ Mustard
Potato 356 0.3 m(average for Rs.0.14/m3
Rabi and Kharif)‘
6. Proposed Rate Structure
(A) Basic Rates
The recommendations made by the EFC are being adopted inrationalising the water rate structures for irrigation with thefollowing assumptions:
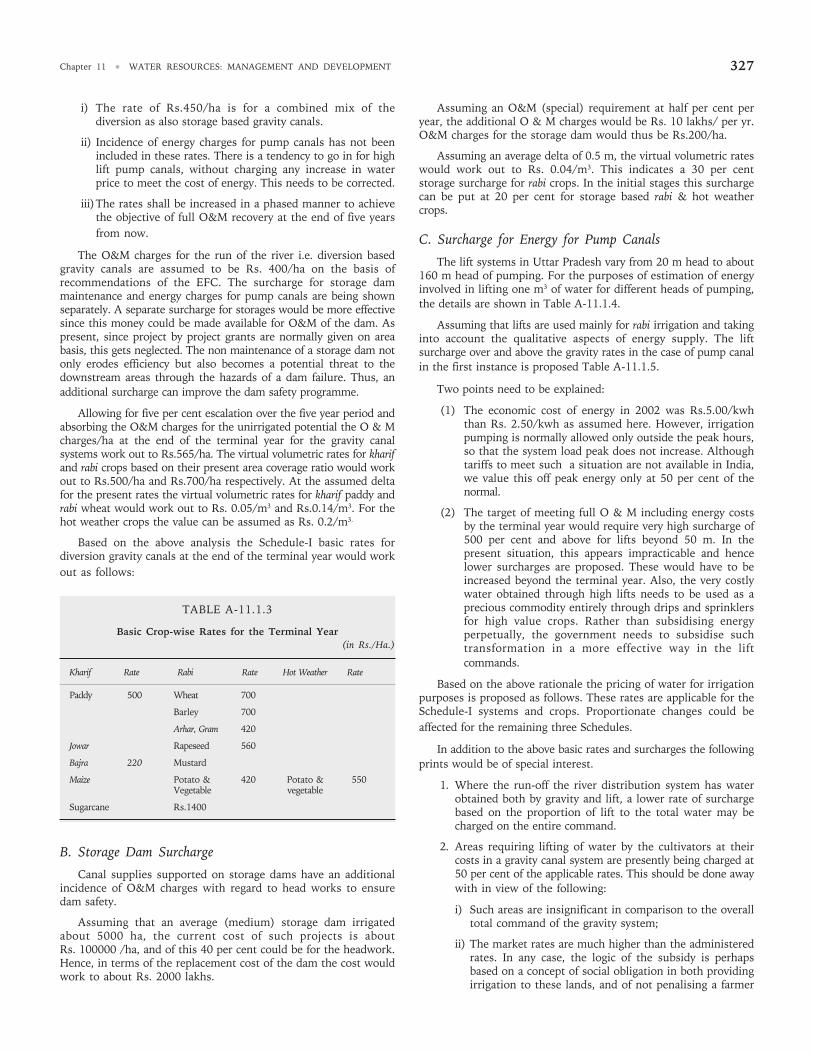
Chapter 11 • WATER RESOURCES: MANAGEMENT AND DEVELOPMENT 327
i) The rate of Rs.450/ha is for a combined mix of thediversion as also storage based gravity canals.
ii) Incidence of energy charges for pump canals has not beenincluded in these rates. There is a tendency to go in for highlift pump canals, without charging any increase in waterprice to meet the cost of energy. This needs to be corrected.
iii)The rates shall be increased in a phased manner to achievethe objective of full O&M recovery at the end of five yearsfrom now.
The O&M charges for the run of the river i.e. diversion basedgravity canals are assumed to be Rs. 400/ha on the basis ofrecommendations of the EFC. The surcharge for storage dammaintenance and energy charges for pump canals are being shownseparately. A separate surcharge for storages would be more effectivesince this money could be made available for O&M of the dam. Aspresent, since project by project grants are normally given on areabasis, this gets neglected. The non maintenance of a storage dam notonly erodes efficiency but also becomes a potential threat to thedownstream areas through the hazards of a dam failure. Thus, anadditional surcharge can improve the dam safety programme.
Allowing for five per cent escalation over the five year period andabsorbing the O&M charges for the unirrigated potential the O & Mcharges/ha at the end of the terminal year for the gravity canalsystems work out to Rs.565/ha. The virtual volumetric rates for kharifand rabi crops based on their present area coverage ratio would workout to Rs.500/ha and Rs.700/ha respectively. At the assumed deltafor the present rates the virtual volumetric rates for kharif paddy andrabi wheat would work out to Rs. 0.05/m3 and Rs.0.14/m3. For thehot weather crops the value can be assumed as Rs. 0.2/m3.
Based on the above analysis the Schedule-I basic rates fordiversion gravity canals at the end of the terminal year would workout as follows:
TABLE A-11.1.3
Basic Crop-wise Rates for the Terminal Year(in Rs./Ha.)
Kharif Rate Rabi Rate Hot Weather Rate
Paddy 500 Wheat 700
Barley 700
Arhar, Gram 420
Jowar Rapeseed 560
Bajra 220 Mustard
Maize Potato & 420 Potato & 550Vegetable vegetable
Sugarcane Rs.1400
B. Storage Dam Surcharge
Canal supplies supported on storage dams have an additionalincidence of O&M charges with regard to head works to ensuredam safety.
Assuming that an average (medium) storage dam irrigatedabout 5000 ha, the current cost of such projects is aboutRs. 100000 /ha, and of this 40 per cent could be for the headwork.Hence, in terms of the replacement cost of the dam the cost wouldwork to about Rs. 2000 lakhs.
Assuming an O&M (special) requirement at half per cent peryear, the additional O & M charges would be Rs. 10 lakhs/ per yr.O&M charges for the storage dam would thus be Rs.200/ha.
Assuming an average delta of 0.5 m, the virtual volumetric rateswould work out to Rs. 0.04/m3. This indicates a 30 per centstorage surcharge for rabi crops. In the initial stages this surchargecan be put at 20 per cent for storage based rabi & hot weathercrops.
C. Surcharge for Energy for Pump Canals
The lift systems in Uttar Pradesh vary from 20 m head to about160 m head of pumping. For the purposes of estimation of energyinvolved in lifting one m3 of water for different heads of pumping,the details are shown in Table A-11.1.4.
Assuming that lifts are used mainly for rabi irrigation and takinginto account the qualitative aspects of energy supply. The liftsurcharge over and above the gravity rates in the case of pump canalin the first instance is proposed Table A-11.1.5.
Two points need to be explained:
(1) The economic cost of energy in 2002 was Rs.5.00/kwhthan Rs. 2.50/kwh as assumed here. However, irrigationpumping is normally allowed only outside the peak hours,so that the system load peak does not increase. Althoughtariffs to meet such a situation are not available in India,we value this off peak energy only at 50 per cent of thenormal.
(2) The target of meeting full O & M including energy costsby the terminal year would require very high surcharge of500 per cent and above for lifts beyond 50 m. In thepresent situation, this appears impracticable and hencelower surcharges are proposed. These would have to beincreased beyond the terminal year. Also, the very costlywater obtained through high lifts needs to be used as aprecious commodity entirely through drips and sprinklersfor high value crops. Rather than subsidising energyperpetually, the government needs to subsidise suchtransformation in a more effective way in the liftcommands.
Based on the above rationale the pricing of water for irrigationpurposes is proposed as follows. These rates are applicable for theSchedule-I systems and crops. Proportionate changes could beaffected for the remaining three Schedules.
In addition to the above basic rates and surcharges the followingprints would be of special interest.
1. Where the run-off the river distribution system has waterobtained both by gravity and lift, a lower rate of surchargebased on the proportion of lift to the total water may becharged on the entire command.
2. Areas requiring lifting of water by the cultivators at theircosts in a gravity canal system are presently being charged at50 per cent of the applicable rates. This should be done awaywith in view of the following:
i) Such areas are insignificant in comparison to the overalltotal command of the gravity system;
ii) The market rates are much higher than the administeredrates. In any case, the logic of the subsidy is perhapsbased on a concept of social obligation in both providingirrigation to these lands, and of not penalising a farmer
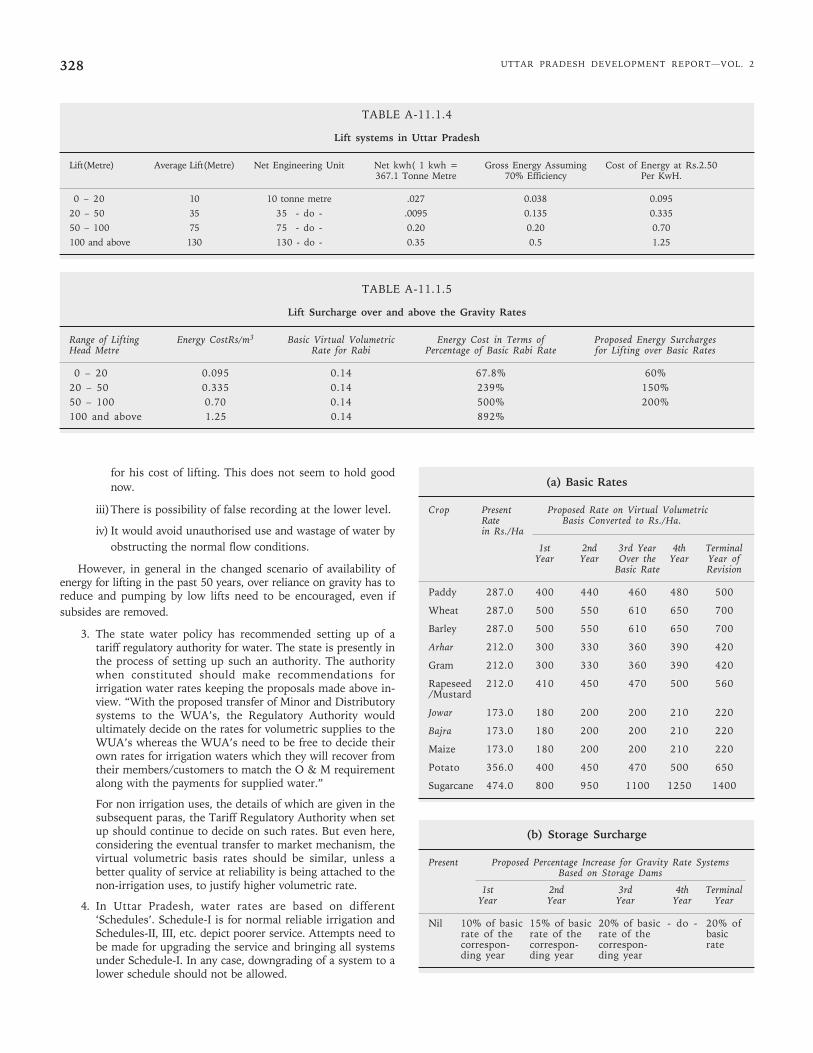
UTTAR PRADESH DEVELOPMENT REPORT—VOL. 2328
for his cost of lifting. This does not seem to hold goodnow.
iii)There is possibility of false recording at the lower level.
iv) It would avoid unauthorised use and wastage of water byobstructing the normal flow conditions.
However, in general in the changed scenario of availability ofenergy for lifting in the past 50 years, over reliance on gravity has toreduce and pumping by low lifts need to be encouraged, even ifsubsides are removed.
3. The state water policy has recommended setting up of atariff regulatory authority for water. The state is presently inthe process of setting up such an authority. The authoritywhen constituted should make recommendations forirrigation water rates keeping the proposals made above in-view. “With the proposed transfer of Minor and Distributorysystems to the WUA’s, the Regulatory Authority wouldultimately decide on the rates for volumetric supplies to theWUA’s whereas the WUA’s need to be free to decide theirown rates for irrigation waters which they will recover fromtheir members/customers to match the O & M requirementalong with the payments for supplied water.”
For non irrigation uses, the details of which are given in thesubsequent paras, the Tariff Regulatory Authority when setup should continue to decide on such rates. But even here,considering the eventual transfer to market mechanism, thevirtual volumetric basis rates should be similar, unless abetter quality of service at reliability is being attached to thenon-irrigation uses, to justify higher volumetric rate.
4. In Uttar Pradesh, water rates are based on different‘Schedules’. Schedule-I is for normal reliable irrigation andSchedules-II, III, etc. depict poorer service. Attempts need tobe made for upgrading the service and bringing all systemsunder Schedule-I. In any case, downgrading of a system to alower schedule should not be allowed.
(a) Basic Rates
Crop Present Proposed Rate on Virtual VolumetricRate Basis Converted to Rs./Ha.in Rs./Ha
1st 2nd 3rd Year 4th TerminalYear Year Over the Year Year of
Basic Rate Revision
Paddy 287.0 400 440 460 480 500
Wheat 287.0 500 550 610 650 700
Barley 287.0 500 550 610 650 700
Arhar 212.0 300 330 360 390 420
Gram 212.0 300 330 360 390 420
Rapeseed 212.0 410 450 470 500 560/Mustard
Jowar 173.0 180 200 200 210 220
Bajra 173.0 180 200 200 210 220
Maize 173.0 180 200 200 210 220
Potato 356.0 400 450 470 500 650
Sugarcane 474.0 800 950 1100 1250 1400
TABLE A-11.1.4
Lift systems in Uttar Pradesh
Lift(Metre) Average Lift(Metre) Net Engineering Unit Net kwh( 1 kwh = Gross Energy Assuming Cost of Energy at Rs.2.50367.1 Tonne Metre 70% Efficiency Per KwH.
0 – 20 10 10 tonne metre .027 0.038 0.095
20 – 50 35 35 - do - .0095 0.135 0.335
50 – 100 75 75 - do - 0.20 0.20 0.70
100 and above 130 130 - do - 0.35 0.5 1.25
TABLE A-11.1.5
Lift Surcharge over and above the Gravity Rates
Range of Lifting Energy CostRs/m3 Basic Virtual Volumetric Energy Cost in Terms of Proposed Energy SurchargesHead Metre Rate for Rabi Percentage of Basic Rabi Rate for Lifting over Basic Rates
0 – 20 0.095 0.14 67.8% 60%20 – 50 0.335 0.14 239% 150%50 – 100 0.70 0.14 500% 200%100 and above 1.25 0.14 892%
(b) Storage Surcharge
Present Proposed Percentage Increase for Gravity Rate SystemsBased on Storage Dams
1st 2nd 3rd 4th TerminalYear Year Year Year Year
Nil 10% of basic 15% of basic 20% of basic - do - 20% ofrate of the rate of the rate of the basiccorrespon- correspon- correspon- rateding year ding year ding year
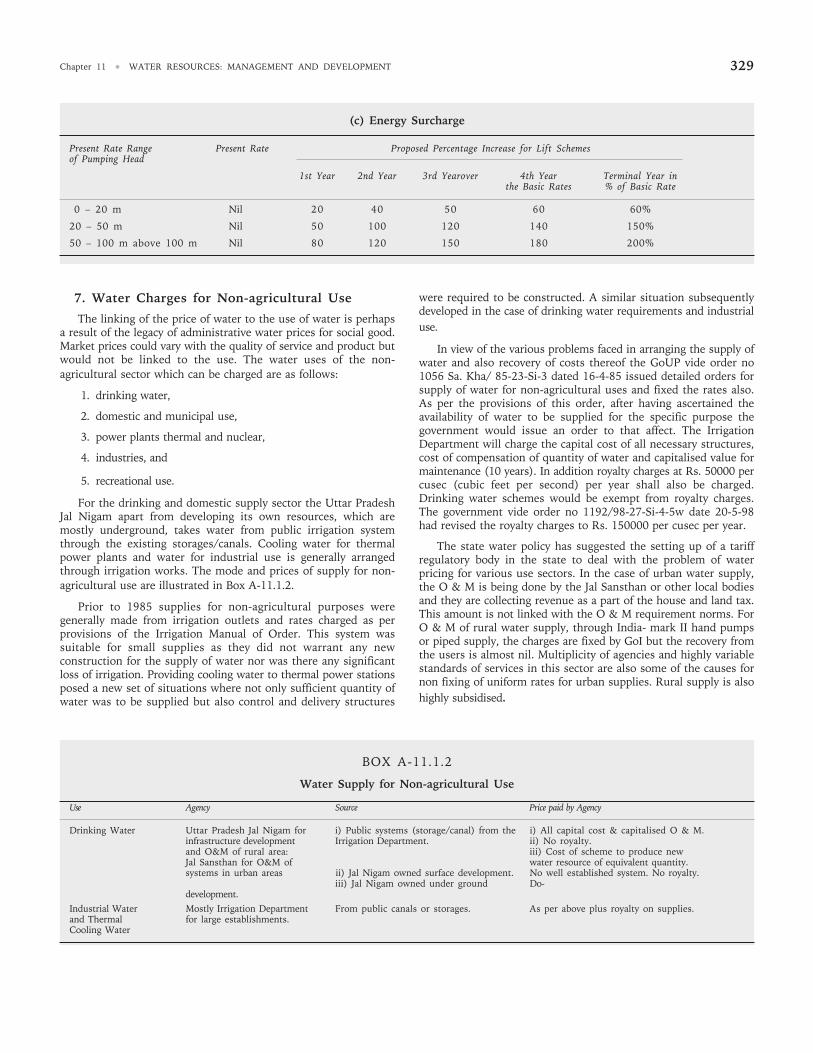
Chapter 11 • WATER RESOURCES: MANAGEMENT AND DEVELOPMENT 329
7. Water Charges for Non-agricultural Use
The linking of the price of water to the use of water is perhapsa result of the legacy of administrative water prices for social good.Market prices could vary with the quality of service and product butwould not be linked to the use. The water uses of the non-agricultural sector which can be charged are as follows:
1. drinking water,
2. domestic and municipal use,
3. power plants thermal and nuclear,
4. industries, and
5. recreational use.
For the drinking and domestic supply sector the Uttar PradeshJal Nigam apart from developing its own resources, which aremostly underground, takes water from public irrigation systemthrough the existing storages/canals. Cooling water for thermalpower plants and water for industrial use is generally arrangedthrough irrigation works. The mode and prices of supply for non-agricultural use are illustrated in Box A-11.1.2.
Prior to 1985 supplies for non-agricultural purposes weregenerally made from irrigation outlets and rates charged as perprovisions of the Irrigation Manual of Order. This system wassuitable for small supplies as they did not warrant any newconstruction for the supply of water nor was there any significantloss of irrigation. Providing cooling water to thermal power stationsposed a new set of situations where not only sufficient quantity ofwater was to be supplied but also control and delivery structures
were required to be constructed. A similar situation subsequentlydeveloped in the case of drinking water requirements and industrialuse.
In view of the various problems faced in arranging the supply ofwater and also recovery of costs thereof the GoUP vide order no1056 Sa. Kha/ 85-23-Si-3 dated 16-4-85 issued detailed orders forsupply of water for non-agricultural uses and fixed the rates also.As per the provisions of this order, after having ascertained theavailability of water to be supplied for the specific purpose thegovernment would issue an order to that affect. The IrrigationDepartment will charge the capital cost of all necessary structures,cost of compensation of quantity of water and capitalised value formaintenance (10 years). In addition royalty charges at Rs. 50000 percusec (cubic feet per second) per year shall also be charged.Drinking water schemes would be exempt from royalty charges.The government vide order no 1192/98-27-Si-4-5w date 20-5-98had revised the royalty charges to Rs. 150000 per cusec per year.
The state water policy has suggested the setting up of a tariffregulatory body in the state to deal with the problem of waterpricing for various use sectors. In the case of urban water supply,the O & M is being done by the Jal Sansthan or other local bodiesand they are collecting revenue as a part of the house and land tax.This amount is not linked with the O & M requirement norms. ForO & M of rural water supply, through India- mark II hand pumpsor piped supply, the charges are fixed by GoI but the recovery fromthe users is almost nil. Multiplicity of agencies and highly variablestandards of services in this sector are also some of the causes fornon fixing of uniform rates for urban supplies. Rural supply is alsohighly subsidised.
BOX A-11.1.2
Water Supply for Non-agricultural Use
Use Agency Source Price paid by Agency
Drinking Water Uttar Pradesh Jal Nigam for i) Public systems (storage/canal) from the i) All capital cost & capitalised O & M.infrastructure development Irrigation Department. ii) No royalty.and O&M of rural area: iii) Cost of scheme to produce newJal Sansthan for O&M of water resource of equivalent quantity.systems in urban areas ii) Jal Nigam owned surface development. No well established system. No royalty.
iii) Jal Nigam owned under ground Do-development.
Industrial Water Mostly Irrigation Department From public canals or storages. As per above plus royalty on supplies.and Thermal for large establishments.Cooling Water
(c) Energy Surcharge
Present Rate Range Present Rate Proposed Percentage Increase for Lift Schemesof Pumping Head
1st Year 2nd Year 3rd Yearover 4th Year Terminal Year inthe Basic Rates % of Basic Rate
0 – 20 m Nil 20 40 50 60 60%
20 – 50 m Nil 50 100 120 140 150%
50 – 100 m above 100 m Nil 80 120 150 180 200%
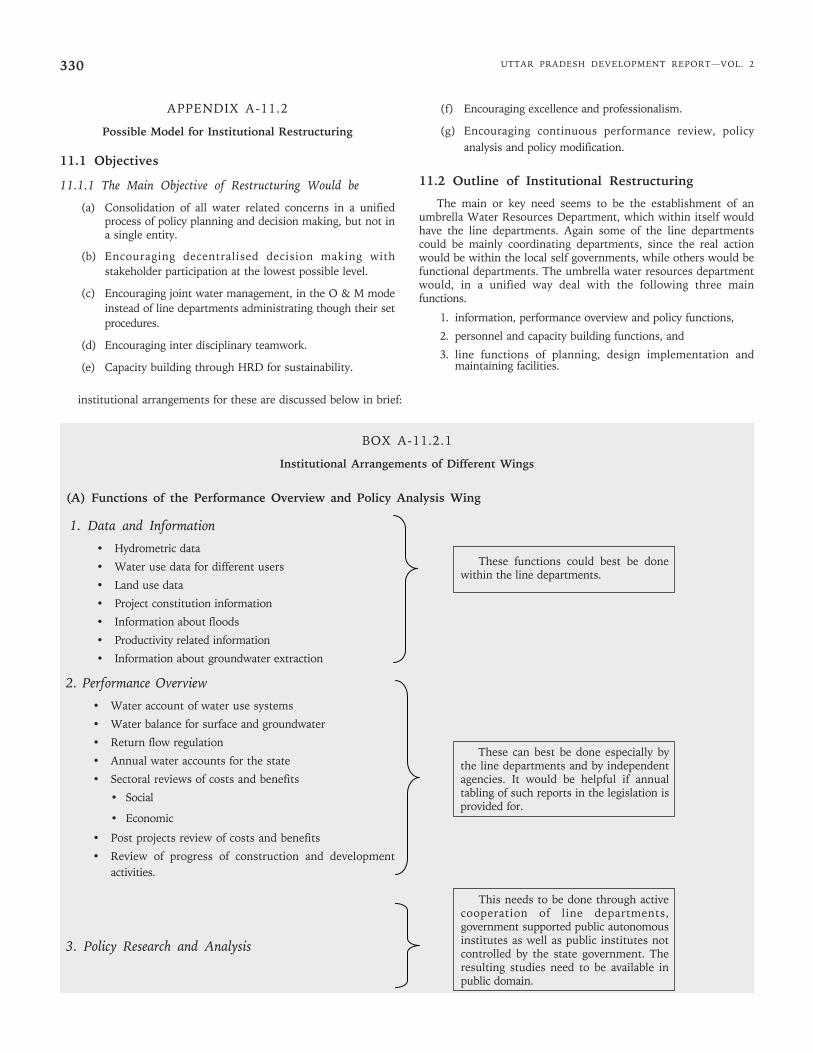
UTTAR PRADESH DEVELOPMENT REPORT—VOL. 2330
APPENDIX A-11.2
Possible Model for Institutional Restructuring
11.1 Objectives
11.1.1 The Main Objective of Restructuring Would be
(a) Consolidation of all water related concerns in a unifiedprocess of policy planning and decision making, but not ina single entity.
(b) Encouraging decentralised decision making withstakeholder participation at the lowest possible level.
(c) Encouraging joint water management, in the O & M modeinstead of line departments administrating though their setprocedures.
(d) Encouraging inter disciplinary teamwork.
(e) Capacity building through HRD for sustainability.
(f) Encouraging excellence and professionalism.
(g) Encouraging continuous performance review, policyanalysis and policy modification.
11.2 Outline of Institutional Restructuring
The main or key need seems to be the establishment of anumbrella Water Resources Department, which within itself wouldhave the line departments. Again some of the line departmentscould be mainly coordinating departments, since the real actionwould be within the local self governments, while others would befunctional departments. The umbrella water resources departmentwould, in a unified way deal with the following three mainfunctions.
1. information, performance overview and policy functions,
2. personnel and capacity building functions, and
3. line functions of planning, design implementation andmaintaining facilities.
These functions could best be donewithin the line departments.
institutional arrangements for these are discussed below in brief:
BOX A-11.2.1
Institutional Arrangements of Different Wings
(A) Functions of the Performance Overview and Policy Analysis Wing
1. Data and Information
• Hydrometric data
• Water use data for different users
• Land use data
• Project constitution information
• Information about floods
• Productivity related information
• Information about groundwater extraction
2. Performance Overview
• Water account of water use systems
• Water balance for surface and groundwater
• Return flow regulation
• Annual water accounts for the state
• Sectoral reviews of costs and benefits
• Social
• Economic
• Post projects review of costs and benefits
• Review of progress of construction and developmentactivities.
3. Policy Research and Analysis
These can best be done especially bythe line departments and by independentagencies. It would be helpful if annualtabling of such reports in the legislation isprovided for.
This needs to be done through activecooperation of line departments,government supported public autonomousinstitutes as well as public institutes notcontrolled by the state government. Theresulting studies need to be available inpublic domain.
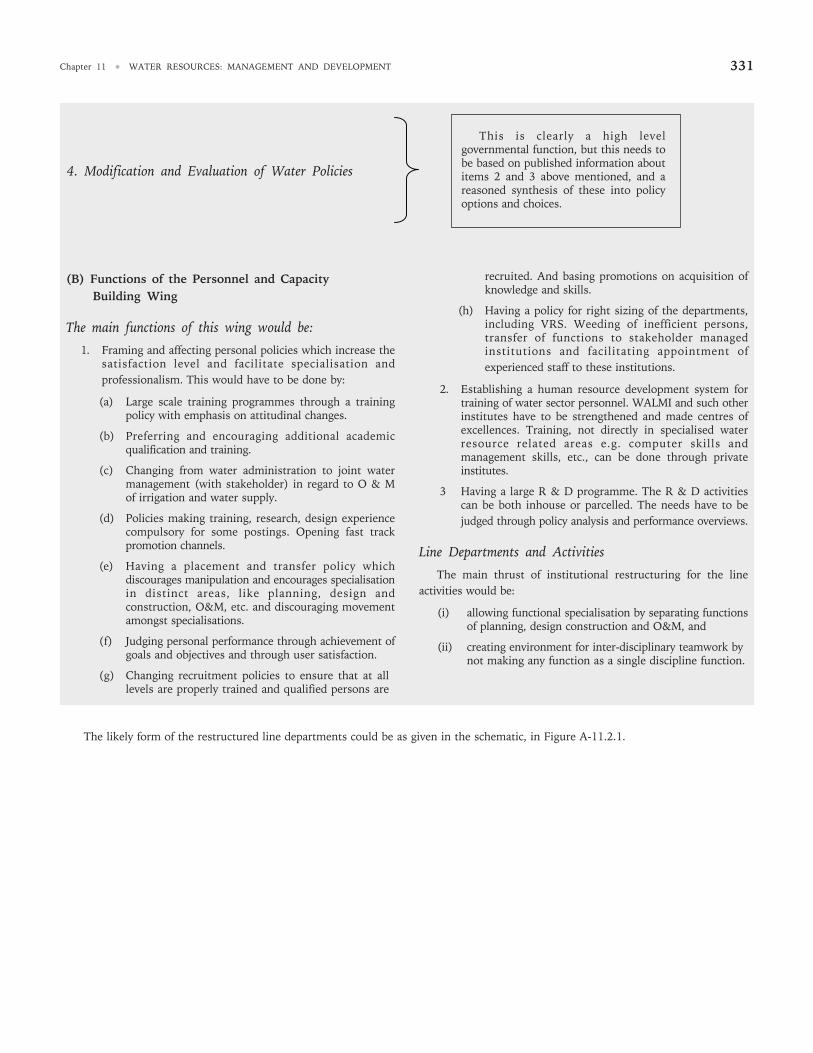
Chapter 11 • WATER RESOURCES: MANAGEMENT AND DEVELOPMENT 331
(B) Functions of the Personnel and CapacityBuilding Wing
The main functions of this wing would be:
1. Framing and affecting personal policies which increase thesatisfaction level and facilitate specialisation andprofessionalism. This would have to be done by:
(a) Large scale training programmes through a trainingpolicy with emphasis on attitudinal changes.
(b) Preferring and encouraging additional academicqualification and training.
(c) Changing from water administration to joint watermanagement (with stakeholder) in regard to O & Mof irrigation and water supply.
(d) Policies making training, research, design experiencecompulsory for some postings. Opening fast trackpromotion channels.
(e) Having a placement and transfer policy whichdiscourages manipulation and encourages specialisationin distinct areas, like planning, design andconstruction, O&M, etc. and discouraging movementamongst specialisations.
(f) Judging personal performance through achievement ofgoals and objectives and through user satisfaction.
(g) Changing recruitment policies to ensure that at alllevels are properly trained and qualified persons are
This is clearly a high levelgovernmental function, but this needs tobe based on published information aboutitems 2 and 3 above mentioned, and areasoned synthesis of these into policyoptions and choices.
4. Modification and Evaluation of Water Policies
recruited. And basing promotions on acquisition ofknowledge and skills.
(h) Having a policy for right sizing of the departments,including VRS. Weeding of inefficient persons,transfer of functions to stakeholder managedinstitutions and facilitating appointment ofexperienced staff to these institutions.
2. Establishing a human resource development system fortraining of water sector personnel. WALMI and such otherinstitutes have to be strengthened and made centres ofexcellences. Training, not directly in specialised waterresource related areas e.g. computer skills andmanagement skills, etc., can be done through privateinstitutes.
3 Having a large R & D programme. The R & D activitiescan be both inhouse or parcelled. The needs have to bejudged through policy analysis and performance overviews.
Line Departments and Activities
The main thrust of institutional restructuring for the lineactivities would be:
(i) allowing functional specialisation by separating functionsof planning, design construction and O&M, and
(ii) creating environment for inter-disciplinary teamwork bynot making any function as a single discipline function.
The likely form of the restructured line departments could be as given in the schematic, in Figure A-11.2.1.
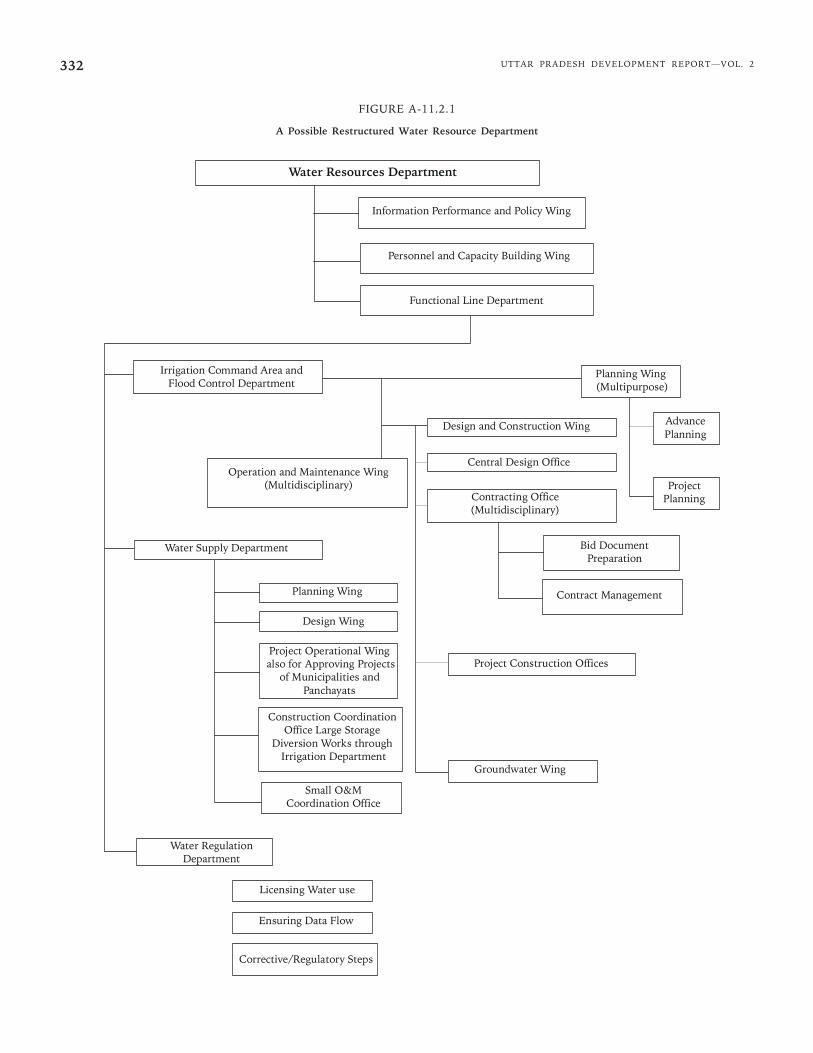
UTTAR PRADESH DEVELOPMENT REPORT—VOL. 2332
FIGURE A-11.2.1
A Possible Restructured Water Resource Department
Water Resources Department
Information Performance and Policy Wing
Personnel and Capacity Building Wing
Functional Line Department
Irrigation Command Area and Flood Control Department
Planning Wing (Multipurpose)
Design and Construction Wing Advance Planning
Operation and Maintenance Wing (Multidisciplinary)
Central Design Office
Project Planning Contracting Office
(Multidisciplinary)
Bid Document Preparation
Contract Management
Water Supply Department
Planning Wing
Design Wing
Project Operational Wing also for Approving Projects
of Municipalities and Panchayats
Project Construction Offices
Construction Coordination Office Large Storage
Diversion Works through Irrigation Department
Groundwater Wing
Small O&M Coordination Office
Water Regulation Department
Licensing Water use
Ensuring Data Flow
Corrective/Regulatory Steps