
Sectoral Report (H) Water Resources Management
235
Volume – V Sectoral Report (2/3) Sectoral Report (H) Water Resources Management
-
Upload
khangminh22 -
Category
Documents
-
view
1 -
download
0
Transcript of Sectoral Report (H) Water Resources Management

Volume – V Sectoral Report (2/3)
Sectoral Report (H) Water Resources Management

Final Report Sectoral Report (H) Water Resources Management Table of Contents
Nippon Koei Co., Ltd. H - i The Development of the National Water Master Plan 2030
THE PROJECT ON
THE DEVELOPMENT OF THE NATIONAL WATER MASTER PLAN 2030
IN THE REPUBLIC OF KENYA
FINAL REPORT
VOLUME - V SECTORAL REPORT (2/3)
H: WATER RESOURCES MANAGEMENT
Abbreviation
Table of Contents
Page
CHAPTER 1 INTRODUCTION ................................................................................................. H-1
CHAPTER 2 CURRENT SITUATION OF WATER RESOURCES MANAGEMENT ...... H-2
2.1 Relevant Policies and Strategies ......................................................................................... H-2
2.2 Relevant Organizations ....................................................................................................... H-4
2.3 Current Situation of Water Resources Management ........................................................... H-6 2.3.1 Overview .............................................................................................................. H-6 2.3.2 Lake Victoria North Catchment Area (LVNCA) ............................................... H-20 2.3.3 Lake Victoria South Catchment Area (LVSCA) ............................................... H-21 2.3.4 Rift Valley Catchment Area (RVCA) ................................................................ H-23 2.3.5 Athi Catchment Area (ACA) ............................................................................. H-25 2.3.6 Tana Catchment Area (TCA) ............................................................................. H-26 2.3.7 Ewaso Ng’iro North Catchment Area (ENNCA) ............................................... H-28
2.4 On-going Projects and Existing Plans ............................................................................... H-30
2.5 Operation and Maintenance Issues .................................................................................... H-30
2.6 Challenges and Key Issues ................................................................................................ H-30
CHAPTER 3 WATER RESOURCES MANAGEMENT PLAN ........................................... H-34
3.1 General .............................................................................................................................. H-34
3.2 Overall Planning Concept and Framework ....................................................................... H-35
3.3 Water Resources Management Plan for the LVNCA ....................................................... H-42 3.3.1 Management Strategy ........................................................................................ H-42 3.3.2 Proposed Water Resources Management Plan ................................................... H-44
3.4 Water Resources Management Plan for LVSCA .............................................................. H-48 3.4.1 Management Strategy ........................................................................................ H-48

Final Report Table of Contents Sectoral Report (H) Water Resources Management
The Development of H - ii Nippon Koei Co., Ltd. the National Water Master Plan 2030
3.4.2 Proposed Water Resources Management Plan ................................................... H-50
3.5 Water Resources Management Plan for the RVCA .......................................................... H-54 3.5.1 Management Strategy ........................................................................................ H-54 3.5.2 Proposed Water Resources Management Plan ................................................... H-56
3.6 Water Resources Management Plan for the ACA ............................................................. H-59 3.6.1 Management Strategy ........................................................................................ H-60 3.6.2 Proposed Water Resources Management Plan ................................................... H-62
3.7 Water Resources Management Plan for the TCA ............................................................. H-65 3.7.1 Management Strategy ........................................................................................ H-65 3.7.2 Proposed Water Resources Management Plan ................................................... H-67
3.8 Water Resources Management Plan for the ENNCA ....................................................... H-71 3.8.1 Management Strategy ........................................................................................ H-71 3.8.2 Proposed Water Resources Management Plan ................................................... H-73
CHAPTER 4 COST ESTIMATE ............................................................................................. H-77
4.1 Basic Conditions for Cost Estimate .................................................................................. H-77
4.2 Cost Estimates for the Proposed Plans .............................................................................. H-79 4.2.1 Development Cost .............................................................................................. H-79 4.2.2 Recurrent Cost ................................................................................................... H-79
CHAPTER 5 IMPLEMENTATION PROGRAMME ............................................................ H-80
5.1 General .............................................................................................................................. H-80
5.2 Criteria for Prioritization of Implementation .................................................................... H-80
5.3 Recommendations for the further surveys and studies for NWMP2030 ........................... H-80
List of Tables
Page Table 2.3.1 An Example of Surface Water Thresholds (Lake Victoria North
Catchment Area) ................................................................................................... H-T-1
Table 2.3.2 An Example of Aquifer Classification and Thresholds (Ewaso Ng’iro North Catchment Area) ........................................................................................ H-T-2
Table 2.3.3 Guideline Standards for Effluent Discharge ......................................................... H-T-3
Table 2.6.1 List of Issues Identified from Catchment Management Strategies ....................... H-T-4
Table 3.2.1 Estimated Reserves for River Gauging Stations ................................................. H-T-5
Table 3.3.1 Number of Target, Operational and Proposed Monitoring Stations of WRMA ............................................................................................................... H-T-6
Table 4.2.1 Breakdown of Water Resources Management Cost ............................................. H-T-7

Final Report Sectoral Report (H) Water Resources Management Table of Contents
Nippon Koei Co., Ltd. H - iii The Development of the National Water Master Plan 2030
List of Figures Page
Figure 1.1.1 Study Flow for Water Resources Management Plan ............................................ H-F-1
Figure 2.2.1 Organization Chart of WRMA Headquarters ....................................................... H-F-2
Figure 2.2.2 Organization Chart of WRMA Regional Offices ................................................. H-F-3
Figure 2.2.3 Locations of WRMA Headquarters, Regional and Sub-Regional Offices ........... H-F-4
Figure 2.3.1 Forest Areas and Protected Areas in Kenya ......................................................... H-F-5
Figure 2.3.2 Roles of WRUAs, WRMA and WSTF in WDC .................................................. H-F-6
Figure 2.3.3 Rivers and Boundaries for Administration in LVNCA ........................................ H-F-7
Figure 2.3.4 Locations of Gazetted Surface Water Monitoring Stations in LVNCA ............... H-F-8
Figure 2.3.5 Locations of Gazetted Surface Water Monitoring Stations in LVSCA ................ H-F-9
Figure 2.3.6 Rivers and Boundaries for Administration in Tana Catchment Area ................. H-F-10
Figure 2.3.7 Rivers and Boundaries for Administration in RVCA ......................................... H-F-11
Figure 2.3.8 Locations of Gazetted Surface Water Monitoring Stations in RVCA ................ H-F-12
Figure 2.3.9 Rivers and Boundaries for Administration in ACA ........................................... H-F-13
Figure 2.3.10 Locations of Gazetted Surface Water Monitoring Stations in ACA .................. H-F-14
Figure 2.3.11 Rivers and Boundaries for Administration in TCA ............................................ H-F-15
Figure 2.3.12 Locations of Gazetted Surface Water Monitoring Stations in TCA ................... H-F-16
Figure 2.3.13 Rivers and Boundaries for Administration in ENNCA ...................................... H-F-17
Figure 2.3.14 Locations of Gazetted Surface Water Monitoring Stations in ENNCA ............. H-F-18
Figure 3.2.1 Current Situation of Forest Areas and Potential Areas for Forestation .............. H-F-19
Figure 3.3.1 Locations of Proposed Monitoring Stations for Water Resources Management (LVNCA) ...................................................................................... H-F-20
Figure 3.3.2 Current Situation of Forest Areas and Potential Forestation Areas (LVNCA) ............................................................................................................ H-F-21
Figure 3.3.3 Locations of Proposed Monitoring Stations for Water Resources Management (LVSCA) ....................................................................................... H-F-22
Figure 3.3.4 Current Situation of Forest Areas and Potential Forestation Areas (LVSCA) ............................................................................................................ H-F-23
Figure 3.3.5 Locations of Proposed Monitoring Stations for Water Resources Management (RVCA) ......................................................................................... H-F-24
Figure 3.3.6 Current Situation of Forest Areas and Potential Forestation Areas (RVCA) .............................................................................................................. H-F-25
Figure 3.3.7 Locations of Proposed Monitoring Stations for Water Resources Management (ACA) ........................................................................................... H-F-26
Figure 3.3.8 Current Situation of Forest Areas and Potential Forestation Areas (ACA) ........ H-F-27
Figure 3.3.9 Locations of Proposed Monitoring Stations for Water Resources Management (TCA) ............................................................................................ H-F-28
Figure 3.3.10 Current Situation of Forest Areas and Potential Forestation Areas (TCA) ........ H-F-29

Final Report Table of Contents Sectoral Report (H) Water Resources Management
The Development of H - iv Nippon Koei Co., Ltd. the National Water Master Plan 2030
Figure 3.3.11 Locations of Proposed Monitoring Stations for Water Resources Management (ENNCA) ...................................................................................... H-F-30
Figure 3.3.12 Current Situation of Forest Areas and Potential Forestation Areas (ENNCA) ............................................................................................................ H-F-31
Figure 5.2.1 Implementation Schedule for Water Resources Management Plan .................... H-F-32

Final Report Sectoral Report (H) Water Resources Management Abbreviations
Nippon Koei Co., Ltd. H - I The Development of the National Water Master Plan 2030
List of Abbreviations and Acronyms
ACA : Athi Catchment Area ASAL : Arid and Semi-arid Land BHN : Basic Human Need CAAC : Catchment Areas Advisory Committee CMS : Catchment Management Strategy EDCP : Effluent Discharge Control Plan ENN : Ewaso Ng'iro North ENNCA : Ewaso Ng'iro North Catchment Area GW : Groundwater IWRM : Integrated Water Resources Management KFS : Kenya Forest Service LVN : Lake Victoria North LVNCA : Lake Victoria North Catchment Area LVS : Lake Victoria South LVSCA : Lake Victoria South Catchment Area MWI : Ministry of Water and Irrigation NEMA : National Environment Management Authority NGO : Non-Governmental Organization NRM : Natural Resources Management NWMP : National Water Master Plan NWRMS : National Water Resources Management Strategy RO : Regional Office RV : Rift Valley RVCA : Rift Valley Catchment Area SCMP : Sub-catchment Management Plan SRO : Sub-regional Office SW : Surface Water TCA : Tana Catchment Area WDC : Water Resources Users Association Development Cycle WRMA : Water Resource Management Authority WRMR : Water Resources Management Rules WRUA : Water Resources Users Association WSTF : Water Services Trust Fund

Final Report Abbreviations Sectoral Report (H) Water Resources Management
The Development of H - II Nippon Koei Co., Ltd. the National Water Master Plan 2030
Abbreviations of Measures
Length mm = millimeter cm = centimeter m = meter km = kilometer
Money KSh = Kenya shilling US$ = U.S. dollar
Area ha = hectare m2 = square meter km2 = square kilometer
Energy kcal = Kilocalorie kW = kilowatt MW = megawatt kWh = kilowatt-hour GWh = gigawatt-hour
Volume 1, lit = liter m3 = cubic meter m3/s, cms = cubic meter per second CM = cubic meter MCM = million cubic meter BCM = billion cubic meter m3/d, cmd = cubic meter per day BBL = Barrel
Others % = percent o = degree ' = minute " = second °C = degree Celsius cap. = capital LU = livestock unit md = man-day mil. = million no. = number pers. = person mmho = micromho ppm = parts per million ppb = parts per billion lpcd = litter per capita per day
Weight mg = milligram g = gram kg = kilogram t = ton MT = metric ton Time s = second hr = hour d = day yr = year

NOTE 1. The National Water Master Plan 2030 was prepared based on the material and data provided from
Kenyan Government and its relevant organisations during field surveys in Kenya carried out until November 2012. The sources etc. of the material and data utilised for the study are described in the relevant part of the reports.
2. The names of ministries and related organisations of Kenyan Government are as of November 2012.
3. Information to be updated
The following information which is given in the report is needed to be updated properly:
(1) Information on the proposed development projects
The features and implementation schedules of the proposed development projects may be changed toward implementation of the project. After the subject projects were clearly featured for implementation, the project features and implementation schedules in this report should be updated.
(2) Information on the water demand
The water demand projected in this master plan should be revised when the large scale development plans, other than the projects proposed in this master plan, were formulated, as they will significantly affect to the water resources development and management.
4. Exchange rate for cost estimate
The costs of the proposed development and management plans were estimated by applying the following exchange rate as of November 1, 2012.
EXCHANGE RATE
US$1.00 = KSh 85.24 = ¥79.98 as of November 1, 2012

Final Report Introduction Sectoral Report (H) Water Resources Management Chapter 1
Nippon Koei Co., Ltd. H - 1 The Development of the National Water Master Plan 2030
CHAPTER 1 INTRODUCTION
This sectoral report provides information on water resources management plan in NWMP 2030. Contents of this sectoral report include: (i) Current situation of water resources management in the country; (ii) Proposed water resources management plan; (iii) Aggregate cost required to implement the water resources management plan; and (iv) Implementation programme of the management plan.
Figure 1.1.1 shows the flow of the study on water resources management plan.
Current Situation of WRM Final Report Chapter 2 Sectoral Report (H) Water Resources Management
The Development of H - 2 Nippon Koei Co., Ltd. the National Water Master Plan 2030
CHAPTER 2 CURRENT SITUATION OF WATER RESOURCES MANAGEMENT
2.1 Relevant Policies and Strategies
Before the enactment of Water Act in 2002, the Sessional Paper No. 1 of 1999 on National Policy on Water Resources Management and Development provided the general policy direction that addressed the critical water related issues and challenges. After the enactment of Water Act 2002, the Ministry of Water and Irrigation (MWI) prepared the first National Water Resources Management Strategy 2007-2009 (NWRMS 2007-2009) in January 2007, and the Water Resources Management Rules 2007 (WRMR 2007) in September 2007. The NWRMS 2007-2009 serves as an overall guide in the management of water resources while WRMR 2007 enables the provisions in Water Act 2002.
The Water Resources Management Authority (WRMA), which is responsible for the management of water resources, prepared the first Strategic Plan (SP) 2005-2008 in 2005, and its second edition, SP 2009-2012 in September 2009, taking into account the Kenya Vision 2030. The SP (2009-2012) outlines the strategic direction of WRMA and highlights the key issues related to water resources and actions to be undertaken. The SP 2009-2012 was prepared taking cognisance of the Catchment Management Strategies (CMSs) formulated by six regional offices of WRMA. The CMSs aim to enhance the management, use, development, conservation, protection, and control of water resources in the catchment areas.
The policy and strategy documents related to water resources management are briefly introduced as follows:
(1) Sessional Paper No. 1 of 1999 on National Policy on Water Resources Management and Development
The Sessional Paper No. 1 of 1999 issued in April 1999 which provides the policy directions for water resources management and development is summarized below:
1) Treat water as a social and economic good; 2) Preservation, conservation, and protection of available water resources; 3) Sustainable, rational, and economical allocations of water resources; 4) Supplying adequate amounts of water that meet acceptable water quality standards for
various needs; 5) Ensuring safe wastewater disposal for environmental protection; and 6) Developing a sound and sustainable financial system, for effective and efficient water
resources management, water supply and water borne sewage collection, treatment, and disposal.
(2) NWRMS 2007-2009
In Water Act 2002, Section 11 (1) states that following the guidelines on public consultations, MWI shall formulate and publish in the gazette, the NWRMS, in accordance with which the water resources of Kenya shall be managed, protected, used, developed, conserved, and controlled. Moreover, Section 11 (2) states that MWI shall periodically review and publish the NWRMS in the gazette.

Final Report Current Situation of WRM Sectoral Report (H) Water Resources Management Chapter 2
Nippon Koei Co., Ltd. H - 3 The Development of the National Water Master Plan 2030
Section 11 (3) states that the NWRMS shall prescribe the principles, objectives, procedures, and institutional arrangements for the management, protection, use, development, conservation, and control of water resources.
The first edition of the NWRMS was issued in January 2007. The overall principles adopted in the formulation of NWRMS are as follows:
1) To achieve equitable access to water, that is, equity of access to water services, to the use of water resources, and to the benefits generated from the use of water resources;
2) To achieve sustainable use of water by making progressive adjustments to water use with the objective of striking a balance between water availability and legitimate water requirements, and by implementing measures to protect water resources;
3) To achieve efficient and effective water use for optimum social and economic benefits; 4) To effect the catchment management strategies; and 5) To enhance cooperation in the management and utilization of transboundary water resources
(shared waters).
Based on the above principles, the following ten strategies are provided in NWRMS (2007-2009):
1) Improving water resources assessment (classification of water resources, the reserve water, etc.);
2) Putting in place mechanisms to promote equal access to water for all people (legal and institutional provisions, water allocation, etc.);
3) Gender mainstreaming in water resources management (role, responsibility, participation, etc.);
4) Mechanisms for an integrated approach to land and water resources management (integrated catchment planning, legislative measures, pollution prevention approaches, control of invasive alien vegetation, etc.);
5) Measures that would enhance the availability of water resources of suitable quality and quantity (market-based strategy, technology-based strategy, mandatory strategy, public awareness, etc.);
6) Production of accurate data on water use and demand for both surface water and groundwater (data acquisition, monitoring and information arrangement, national system, etc.);
7) Providing guidelines for water sector financing (government financing, commercialization of water utilities, money market financing, external financing, etc.);
8) Developing effective water pricing policies and mechanisms which recognize water as an economic good (average cost pricing, targeted subsidies, levees, and fees);
9) Developing policies and mechanisms for disaster management (flood, drought, landslide, etc.); and
10) Promoting integration of sectoral and regional water policies (transboundary waters).
(3) Water Resources Management Rules (WRMR) 2007
The WRMR 2007 have been promulgated and gazetted by MWI in 2007 as enabling provisions to the Water Act 2002. The key issues addressed by the rules are as follows:

Current Situation of WRM Final Report Chapter 2 Sectoral Report (H) Water Resources Management
The Development of H - 4 Nippon Koei Co., Ltd. the National Water Master Plan 2030
1) Catchment destruction;
2) Enforcement of standards;
3) Permitting/water allocation;
4) Pollution control;
5) Protection of water bodies;
6) Stakeholders’ participation; and
7) Decentralization of services.
(4) WRMA Strategic Plan 2009-2012
The second WRMA Strategic Plan 2009-2012 was prepared taking cognisance of the CMSs formulated for six WRMA catchment areas. Furthermore, the following eight strategic objectives were set with emphasis on the core functions of WRMA:
1) To develop and implement water allocation plans for equitable and sustainable water resource use;
2) To strengthen the institutional capacity of WRMA to effectively discharge its mandate; 3) To establish efficient water resource monitoring networks and improve the water resources
information systems; 4) To streamline and strengthen legislative provisions for enhancement of the water resources
management;
5) To implement policies and develop mechanisms that will improve water availability; 6) To develop and strengthen financing policies and mechanisms to ensure sustainable WRMA
operation and plough back for catchment management;
7) To restore degraded water catchment areas and guard against water pollution; and 8) To develop and implement mechanisms that mainstream cross cutting issues (climate change,
curbing corruption, HIV/AIDs, and gender parity).
(5) WRMA Catchment Management Strategy (CMS)
The CMS was prepared for six WRMA catchment areas namely; (i) Lake Victoria North (LVNCA), (ii) Lake Victoria South (LVSCA), (iii) Rift Valley (RVCA), (iv) Athi (ACA), (v) Tana (TCA), and (vi) Ewaso Ng’iro North (ENNCA). The CMSs presented the consolidated strategic actions for the Integrated Water Resources Management (IWRM) Plan together with the framework for stakeholder participation in accordance with the NWRMS.
2.2 Relevant Organizations
The institutional framework of water resources management is shown in the figure below. There are four major government organizations related to water resources management. MWI act as the policy maker while WRMA is the regulator at the national and regional levels under MWI. The Catchment Area Advisory Committees (CAACs) are advisers of WRMA at catchment level while the Water Resource Users Associations (WRUAs) are the regulators at local level.

Final Report Current Situation of WRM Sectoral Report (H) Water Resources Management Chapter 2
Nippon Koei Co., Ltd. H - 5 The Development of the National Water Master Plan 2030
MWI
Na
tio
na
l Le
ve
lR
eg
ion
al
Le
ve
lL
oc
al L
ev
el
Po
licy
Fo
rmat
ion
Reg
ula
tio
nC
on
sum
p-
tio
n, u
seS
erv
ice
s P
rov
isio
n
Consumers, Users
WRMAWater Resources
Management Authority
Regulation of Water Resources
WASREBWaterServices Regulatory Board
WRMA Regions, CAACs
Catchment Areas Advisory Committees
WSBsWater ServicesBoards
WSPsWater Services Providers
WRUAsWater Resources Users
Associations
Regulation of Water Supply and Sewerage
WABWater Appeal Board
WSTFWater Services Trust Fund
Source: WRMA modified by JICA Study Team (As of November 2012)
Water Act 2002 Institutional Arrangements
The roles and responsibilities of the relevant organizations are tabulated below:
Roles and Responsibilities in Water Resources Management
Institution Roles and Responsibilities Ministry of Water and Irrigation (MWI)
Development of legislation, policy formulation, sector coordination and guidance, and monitoring and evaluation.
Water Resources Management Authority (WRMA)
Planning, management, protection, and conservation of water resources. Planning, allocation, apportionment, assessment, and monitoring of water resources. Issuance of water permits. Water rights and enforcement of permit conditions. Regulation of conservation and abstraction structures. Catchment and water quality management. Regulation and control of water use. Coordination of the IWRM Plan.
Catchment Area Advisory Committees (CAACs)
Advising the WRMA on water resources issues at catchment level.
Water Resource Users Associations (WRUAs)
Involvement in the decision making process to identify and register water users. Collaboration in water allocation and catchment management. Assisting in water monitoring and information gathering. Conflict resolution and cooperative management of water resources.
Source: National Water Resources Management Strategy (2007-2009) (As of November 2012)
The organizational charts of the WRMA headquarters and regional offices are shown in Figures 2.2.1 and 2.2.2.
The locations of the WRMA regional and subregional offices are shown in Figure 2.2.3 together with the delineation of their catchment areas.
As for watershed conservation, there are organisations related to specific issues of i) deforestation, ii) vegetation loss surrounding the water bodies, and iii) soil erosion and sediment control described as follows:

Current Situation of WRM Final Report Chapter 2 Sectoral Report (H) Water Resources Management
The Development of H - 6 Nippon Koei Co., Ltd. the National Water Master Plan 2030
(1) Deforestation
The Ministry of Forestry and Wildlife (MOFW) and the Ministry of Environment and Mineral Resources (MOEMR) prepare the policies on deforestation issues. The Kenya Forest Service (KFS) prepares regulations and takes all necessary enforcement actions.
(2) Vegetation Loss Surrounding Water Bodies
MWI prepares the policies on the vegetation issues while WRMA prepares regulations and takes all necessary enforcement actions.
(3) Soil Erosion and Sedimentation Control
Soil and water conservation issues are mainly covered by the Ministry of Agriculture (MOA) while MWI covers the riparian zone conservation. The riparian zone and agricultural fields are usually located close to each other and the consequence between soil erosion and sedimentation should be considered in an integrated manner. MOA and MWI (mainly NWCPC) should have close coordination. MOA is responsible for the conservation of the sedimentation source while NWCPC is responsible for the control of sedimentation.
2.3 Current Situation of Water Resources Management
2.3.1 Overview
There are many challenges and issues in the water resources management subsector as pointed out in the WRMA CMSs for six catchment areas, WRMA Strategic Plan 2009-2012, and WRMA Performance Report 1 (2010). Amongst them, the WRMA Performance Report 1 (July 2010) presented the following six major challenges in the management of water resources:
1) Water resources data and information generation; 2) Water scarcity and variability; 3) Water pollution; 4) Enforcement; 5) Catchment degradation; and 6) Climate change impacts.
The current situation of water resources management in Kenya can be explained hereunder based mainly on the abovementioned challenges.
(1) Water Resources Data and Information Generation1
The water resources data and information on surface water and groundwater are important for sustainable water resources management. However, due to the limited financial resources, human resources, and equipment, the data and information on surface water and groundwater such as i)
1 As a part of pilot activities,”a manual on hydro-meteorological information management (first edition)” was prepared during this study. The manual is attached in VOLUME – VII, DATA BOOK, Part C: Subletting Works.

Final Report Current Situation of WRM Sectoral Report (H) Water Resources Management Chapter 2
Nippon Koei Co., Ltd. H - 7 The Development of the National Water Master Plan 2030
quantity, ii) abstraction, iii) water permit, and iv) water quality were not sufficiently generated. Also, the data and information obtained were not properly stored in the database.
The water use survey conducted in this study also indicates that there are many missing data in the water permit database of WRMA, and the water permit data compilation method is not consistent within WRMA. Uniform rules for data processing and compilation are required. Furthermore, most of the guidelines and planning documents are referred to the old water resources data of the NWMP (1992).
Water resources monitoring is one of the key factors of water resources management. For the proper apportionment of water resources, it is important to grasp the temporal and spatial variation in water resources availability. WRMA is monitoring four major items i.e., surface water, rainfall, groundwater, and water quality for the said purpose. They are explained as follows:
1) Surface Water Monitoring
WRMA targets to operate 223 strategic surface water monitoring stations in total and 146 surface water monitoring stations are operational as shown in the table below. Water level, discharge and water quality are monitored in these surface water monitoring stations.
Water level is observed twice a day at 9:00 a.m. and 4:00 p.m. by reading staff gauge installed in the monitoring point of the river. This work is done by an honorarium gauge reader. Observed data is sent to WRMA regional/sub-regional office once a month and inputted into database. Observed water level data is then converted to discharge data using rating curves.
For preparation of rating curves discharge measurement is conducted once a month by WRMA staff using current meter.
Status of Strategic Surface Water Monitoring Stations
Catchment Area
National Management Unit (MU) Intra-MU Special Total
Target Optl. Target Optl. Target Optl. Target Optl. Target Optl. % Optl.LVNCA 5 5 6 6 10 7 7 3 28 21 75 LVSCA 5 4 13 9 19 16 1 1 38 30 79 RVCA 7 4 13 7 20 14 1 0 41 25 61 ACA 3 3 4 3 21 10 3 2 31 18 58 TCA 1 1 7 7 21 12 16 8 45 28 62
ENNCA 1 1 5 3 30 20 4 0 40 24 60 Total 22 18 48 35 121 79 32 14 223 146 65
Note: Optl: Operational
Source: WRMA Performance Report 1, July 2010 The monitoring stations are classified into four categories, namely, National Stations, Management Unit Stations, Intramanagement Unit Stations, and Special Stations. According to WRMA, definitions of these four categories are as follows:
a) National Stations: These are stations whose data and information on water resources reflect the
national interests within the catchment areas.
b) Management Unit Stations: These are stations whose data and information on water resources

Current Situation of WRM Final Report Chapter 2 Sectoral Report (H) Water Resources Management
The Development of H - 8 Nippon Koei Co., Ltd. the National Water Master Plan 2030
reflect the situation of water resources within the catchment area of the management unit.
c) Intramanagement Unit Stations: These are stations whose data and information on water resources
reflect the situation of water resources within the subcatchment area within the catchment area of the
management unit.
d) Special Stations: Special stations are stations whose data and information on water resources
reflect the situation of water resources within a given special catchment area, special conditions being
monitored, or for use for a specific purpose.
According to the WRMA staff, the target and operational surface water monitoring stations are not ultimate but to some extent optimal in terms of budget and required numbers of data.
To support the enhancement of the monitoring stations, a total of 24 surface water monitoring stations were installed or rehabilitated in this study. Moreover, several other stations are being installed or rehabilitated through the Natural Resources Management Project under the World Bank assistance.
2) Rainfall Monitoring
WRMA is monitoring the rainfall to provide the necessary information on rainfall characteristics of each catchment area. Rainfall is observed once a day either by WRMA staff or honorarium observers. The following table shows the status of the rainfall monitoring stations of WRMA.
Status of the Rainfall Monitoring Stations
Catchment Area
Target Operational % Achieved
LVNCA 65 52 80 LVSCA 65 53 82 RVCA 60 45 75 ACA 50 33 66 TCA 35 25 71
ENNCA 26 8 31 Total 301 216 72
Source: WRMA Performance Report 1, July 2010
3) Groundwater Monitoring
A lot of boreholes are being used without registration or an official groundwater abstraction permit from WRMA. In some areas, there are many boreholes located very close to each other, which results in over abstraction from the same aquifer. The boreholes used by WRMA for groundwater monitoring are all production ones. As of July 2010, there is no borehole used exclusively for monitoring. Therefore, it is necessary to construct an adequate number of dedicated boreholes exclusively for the said purpose. In the groundwater monitoring points, water level is measured once a month and water quality is monitored quarterly.

Final Report Current Situation of WRM Sectoral Report (H) Water Resources Management Chapter 2
Nippon Koei Co., Ltd. H - 9 The Development of the National Water Master Plan 2030
As of July 2010, there are around 92 operational monitoring boreholes as against the target of 202 boreholes in six catchment areas as shown in the table below. There is no operational dedicated borehole as against the 20 target boreholes per region.
Groundwater Monitoring Stations by Catchment Area
Catchment Area
Total No. of Boreholes
Monitoring Boreholes Total No. of Dedicated Boreholes per Region
Target Operational % of Operational Target OperationalLVNCA 1,400 13 9 69 1 0 LVSCA 1,361 30 15 50 8 0 RVCA 1,574 37 24 65 3 0 ACA 14,739 71 25 35 5 0 TCA 2,000 41 14 34 1 0
ENNCA 1,500 10 5 50 2 0 Total 22,574 202 92 46 20 0
Source: WRMA Performance Report 1, July 2010
4) Water Quality Monitoring
There are two ways of monitoring water quality, namely, nonpoint and point source pollution monitoring. The nonpoint source pollution is being monitored at the same locations as the surface water monitoring. In such locations, water quality is monitored quarterly in January, April, July and October of every year through sampling at the monitoring stations and analysis in the laboratory of WRMA. The status of water quality monitoring stations for nonpoint source pollution for both surface water and groundwater are shown in the table below. According to WRMA Performance Report 1, July 2010, it is reported that the pollution of water resources from nonpoint sources continue to increase due to the continued destruction of catchment areas and poor management of solid wastes and waste water.
Water Quality Monitoring Stations for Nonpoint Sources Pollution
Catchment Area
Surface Water Groundwater Target Operational % Achieved Target Operational % Achieved
LVNCA 24 24 100 11 10 91 LVSCA 61 47 77 17 13 76 RVCA 20 18 90 8 8 100 ACA 31 26 84 18 18 100 TCA 45 18 40 41 14 34
ENNCA 40 24 60 10 3 30 Total 221 157 71 105 66 63
Source: WRMA Performance Report 1, July 2010
The point source pollution is monitored through the Effluent Discharge Control Plan (EDCP) which is a tool designed to monitor the quality of effluent discharged from treatment plants.
The EDCP for point source pollution control involves seven monitoring parameters stated in the WRMR 2007. The table below shows the status of the EDCP implementation for point source pollution control. The level of implementation of the EDCP is low due to weak enforcement of the effluent discharge quality standards.

Current Situation of WRM Final Report Chapter 2 Sectoral Report (H) Water Resources Management
The Development of H - 10 Nippon Koei Co., Ltd. the National Water Master Plan 2030
Implementation of the EDCP for Point Source Pollution Control
Catchment Area
EDCP Implementation Target
No. of EDCPs under Implementation
% No. of EDCPs under Implementation
No. Compliant to EDCP
LVNCA 15 4 27 0 LVSCA 23 8 35 5 RVCA 15 0 0 0 ACA 13 4 31 0 TCA 15 6 40 3
ENNCA 15 0 0 0 Total 96 22 23 8
Source: WRMA Performance Report 1, July 2010
(2) Water Scarcity and Variability
Although the total amount of water demand is less than the potential water resources, the unequal spatial distribution causes water scarcity issues in some regions. For example, Lake Naivasha in the Rift Valley Catchment Area is facing water scarcity issues caused by the rapid growth of population from 50,000 to between 400,000-500,000 in about two or three decades. Also, many horticultural enterprises developed along the lake shore are abstracting groundwater sources from the lake. The MWI and WRMA decided to establish new rules for water use by amending the Water Act in April 2011. Another incident of water scarcity occurred in the Ewaso Ng’iro North Catchment Area since December 2010. WRMA announced the guidelines for sustainable water users of the Isiolo River. The development of water storage facilities should be considered as long-term countermeasures.
(3) Water Pollution
The water resources have been increasingly polluted by both point and nonpoint sources. The point source pollution is caused by inefficient effluent treatment of plants and the discharging of waste water into water bodies. The nonpoint source pollution is caused by catchment degradation, poor sanitation, and disposal of solid waste into water bodies. There seems to be no clear rules/regulations on solid waste disposal control among WRMA, NEMA, and local authorities. The close coordination among these government authorities is not adequate for the prevention of solid waste disposal into the water bodies.
The surface water pollution is worse in urban centres to the extent that the people have resorted to groundwater for domestic use. This tendency will lead to scarcity and groundwater quality deterioration in the future.
(4) Enforcement of Regulations
Enforcement of the regulations is a major issue in water resources management. The WRMR 2007 contains the regulations that ensure equity in water allocation and protection of water resources. In the WRMR 2007, WRMA have developed guidelines for payment of water use and penalties for effluent discharges. However, many water abstractors flout some of the permit requirements, especially the payment of water use charges. Illegal water abstractions at night using portable water pumps make it difficult for WRMA to monitor. Though the WRMA arrests illegal abstractors during regular patrols and imposes fines on them, most of them do not stop the illegal abstraction due to the
Final Report Current Situation of WRM Sectoral Report (H) Water Resources Management Chapter 2
Nippon Koei Co., Ltd. H - 11 The Development of the National Water Master Plan 2030
extremely low rate of fines and penalties. Moreover, this might be due to lack of awareness on the WRMR.
The present categories of water resources use activities and water permit application process are briefly explained as follows:
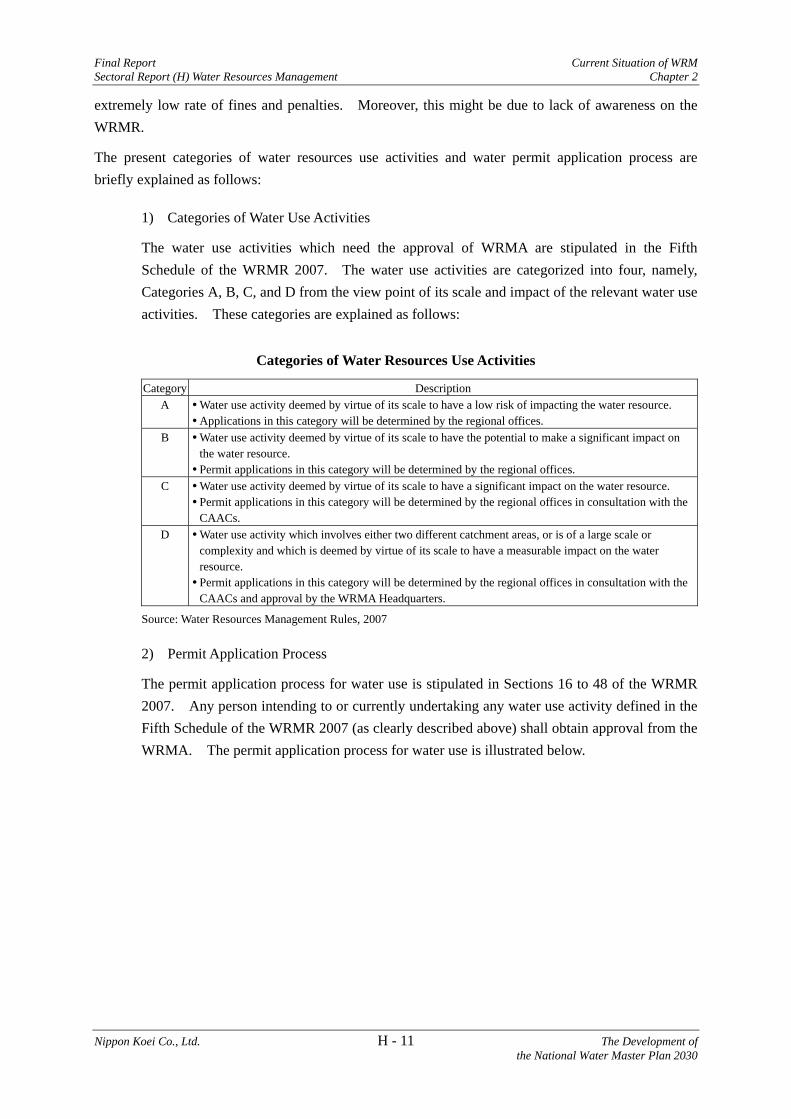
1) Categories of Water Use Activities
The water use activities which need the approval of WRMA are stipulated in the Fifth Schedule of the WRMR 2007. The water use activities are categorized into four, namely, Categories A, B, C, and D from the view point of its scale and impact of the relevant water use activities. These categories are explained as follows:
Categories of Water Resources Use Activities
Category Description A Water use activity deemed by virtue of its scale to have a low risk of impacting the water resource.
Applications in this category will be determined by the regional offices. B Water use activity deemed by virtue of its scale to have the potential to make a significant impact on
the water resource. Permit applications in this category will be determined by the regional offices.
C Water use activity deemed by virtue of its scale to have a significant impact on the water resource. Permit applications in this category will be determined by the regional offices in consultation with the CAACs.
D Water use activity which involves either two different catchment areas, or is of a large scale or complexity and which is deemed by virtue of its scale to have a measurable impact on the water resource. Permit applications in this category will be determined by the regional offices in consultation with the CAACs and approval by the WRMA Headquarters.
Source: Water Resources Management Rules, 2007
2) Permit Application Process
The permit application process for water use is stipulated in Sections 16 to 48 of the WRMR 2007. Any person intending to or currently undertaking any water use activity defined in the Fifth Schedule of the WRMR 2007 (as clearly described above) shall obtain approval from the WRMA. The permit application process for water use is illustrated below.

Current Situation of WRM Final Report Chapter 2 Sectoral Report (H) Water Resources Management
The Development of H - 12 Nippon Koei Co., Ltd. the National Water Master Plan 2030
APPLICANT
WRMA-SRO
WRMA-RO
WRUA
Qualif ied Professional
Rejected
WRMA-RO
Applicantnotified of rejection
Public Notification Process
ISSUE APPROVAL
WRMA Permit Vetting Process
CAACCAAC & WRMA-HQ
Database
Rejected
ISSUE AUTHORISATION TO
CONSTRUCT
CLASS DCLASS B CLASS C
CLASS A
Source: WRMA Performance Report 1, July 2010
Permit Application Process
(5) Catchment Degradation
1) General
According to hearing survey from WRMA, KFS, and other stakeholders during this study, it was realised that catchment degradation has been caused by: i) deforestation and forest degradation; ii) inadequate management of small water sources including vegetation degradation surrounding water sources; and iii) soil erosion and inflow into rivers and reservoirs. Such phenomena are supposed to lead to shortage of water resources and major water quality degradation. However, no effective measures have been taken for the last two decades, which made the situation worse.
Three reasons are pointed out as the causes of deforestation and forest degradation i.e.,: i) expansion of cultivated areas for increased agriculture development; ii) expansion of residential areas; and iii) increase of grazing areas. Deforestation and forest degradation are supposed to lead the decrease of infiltration flow, increase of direct surface water runoff, and decrease of evaporation, thereby decreasing the amount of water resources in the catchment in the long term. Such problem is significant in the Five Water Towers and in other forest areas.
As for the causes and problems on small water sources, four reasons are pointed out namely, i) decrease of water resources caused by the degradation of vegetation around small water sources, ii) degradation of water quality caused by effluent from the cultivated areas, iii) degradation of water quality and decrease of water quantity caused by cultivation activities in wetlands, and iv) excessive water abstraction.
As for the causes of soil erosion, three reasons are pointed out namely, i) deforestation and forest degradation, ii) sheet erosion in cultivated areas, and iii) soil erosion between roads and rivers which are caused by surface water flow from the roads.
Detailed descriptions on specific items are given for items a) catchment degradation mechanism, b) deforestation, c) vegetation loss surrounding water bodies, and d) soil erosion and sedimentation.
Final Report Current Situation of WRM Sectoral Report (H) Water Resources Management Chapter 2
Nippon Koei Co., Ltd. H - 13 The Development of the National Water Master Plan 2030
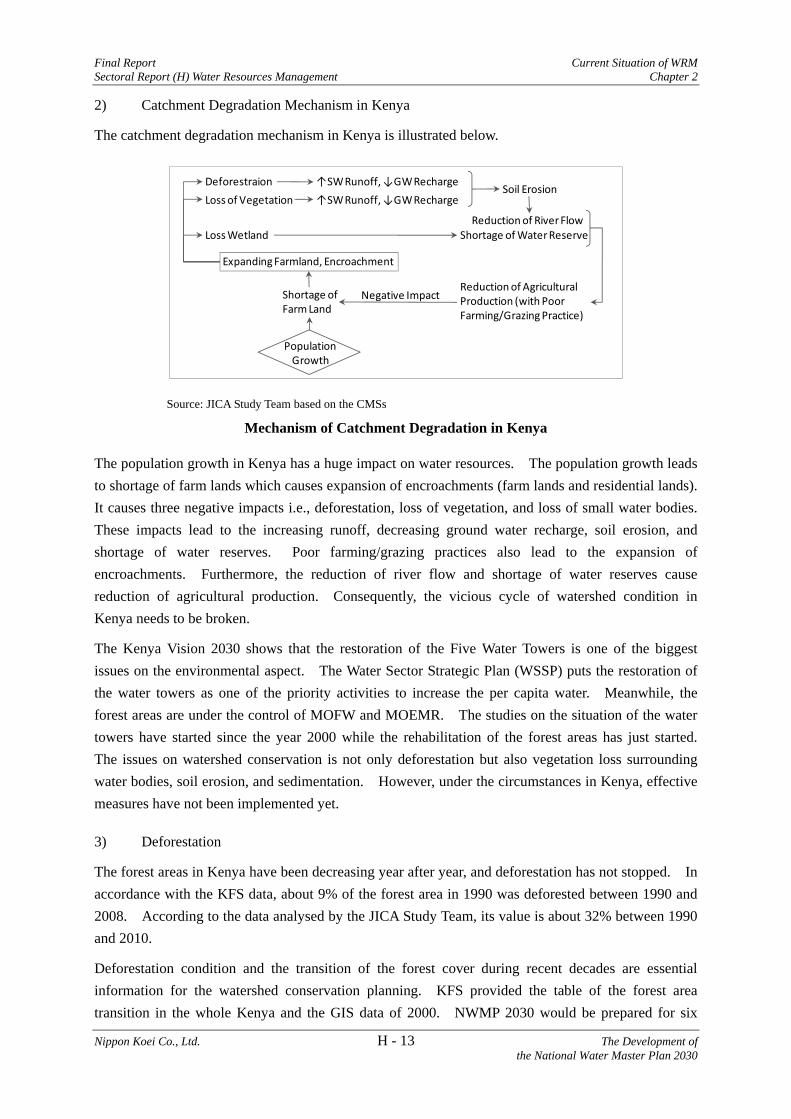
2) Catchment Degradation Mechanism in Kenya
The catchment degradation mechanism in Kenya is illustrated below.
Deforestraion
Loss of Vegetation
Loss Wetland
Expanding Farmland, Encroachment
↑SW Runoff, ↓GW Recharge
↑SW Runoff, ↓GW RechargeSoil Erosion
Reduction of River FlowShortage of Water Reserve
Shortage of Farm Land
Reduction of Agricultural Production (with Poor Farming/Grazing Practice)
Negative Impact
Population Growth
Source: JICA Study Team based on the CMSs
Mechanism of Catchment Degradation in Kenya
The population growth in Kenya has a huge impact on water resources. The population growth leads to shortage of farm lands which causes expansion of encroachments (farm lands and residential lands). It causes three negative impacts i.e., deforestation, loss of vegetation, and loss of small water bodies. These impacts lead to the increasing runoff, decreasing ground water recharge, soil erosion, and shortage of water reserves. Poor farming/grazing practices also lead to the expansion of encroachments. Furthermore, the reduction of river flow and shortage of water reserves cause reduction of agricultural production. Consequently, the vicious cycle of watershed condition in Kenya needs to be broken.
The Kenya Vision 2030 shows that the restoration of the Five Water Towers is one of the biggest issues on the environmental aspect. The Water Sector Strategic Plan (WSSP) puts the restoration of the water towers as one of the priority activities to increase the per capita water. Meanwhile, the forest areas are under the control of MOFW and MOEMR. The studies on the situation of the water towers have started since the year 2000 while the rehabilitation of the forest areas has just started. The issues on watershed conservation is not only deforestation but also vegetation loss surrounding water bodies, soil erosion, and sedimentation. However, under the circumstances in Kenya, effective measures have not been implemented yet.
3) Deforestation
The forest areas in Kenya have been decreasing year after year, and deforestation has not stopped. In accordance with the KFS data, about 9% of the forest area in 1990 was deforested between 1990 and 2008. According to the data analysed by the JICA Study Team, its value is about 32% between 1990 and 2010.
Deforestation condition and the transition of the forest cover during recent decades are essential information for the watershed conservation planning. KFS provided the table of the forest area transition in the whole Kenya and the GIS data of 2000. NWMP 2030 would be prepared for six

Current Situation of WRM Final Report Chapter 2 Sectoral Report (H) Water Resources Management
The Development of H - 14 Nippon Koei Co., Ltd. the National Water Master Plan 2030
catchment areas namely, Lake Victoria North, Lake Victoria South, Rift Valley, Athi, Tana, and Ewaso Ng’iro North. However, the data provided is not enough to determine the current forest condition and transition of the forest areas in each catchment area. Therefore, the JICA Study Team grasped the forest area and its transition in each catchment area using the Landsat imagery analysis. KFS will provide the appropriate data to the JICA Study Team before the next field survey. The data which will be provided by KFS would be used to revise the forest area and its transition in each catchment area.
Figure 2.3.1 shows the distribution of forest and protected areas. The figure was prepared in this study based on the GIS data from KFS and KWS.
Change of Forest Area (KFS)
Category of Land/Forest Type
1990 (A)
('000 ha)
2000
('000 ha)
2005
('000 ha)
2008 (B)
('000 ha)
(2008-1990)(C: B-A)('000 ha)
Ratio(C/A)(%)
Remarks
Indigenous closed canopy
1,240 1,190 1,165 1,140 -100 Decreasing forest cover (25,000 ha) in 2005-2008 is due to forest invasions in Cherangani, Mau, and Samburu.
Mangroves 80 80 80 80 0 Kilifi, Malindi, and Lamu coastal areas.
Public plantation forests
170 134 119 107 -63 This is in addition to the 16,000 ha of unplanted designated areas.
Private plantation forests
68 78 83 90 22 Increasing trend due to accelerated commercial planting by private sector and farmers.
Total 1,558 1,482 1,447 1,417 -141 -9.1
Source: KFS document provided in November 2010
0
400
800
1,200
1,600
1990 2000 2005 2008
Fore
st A
rea
('000
ha)
Private plantation forests
Public plantation forests
Mangroves
Indigenous closed canopy
Source: JICA Study Team based on KFS document provided in November 2010
Change of Forest Area (KFS)

Final Report Current Situation of WRM Sectoral Report (H) Water Resources Management Chapter 2
Nippon Koei Co., Ltd. H - 15 The Development of the National Water Master Plan 2030
Change of Forest Area
1990 2010 Difference Ratio Catchment Area (a) (b) (c: b-a) (c/a) Major Water Towers
('000 ha) ('000 ha) ('000 ha) (%) LVNCA 154 107 -47 -30.5 Mt. Elgon and Mau LVSCA 266 159 -107 -40.2 Mau
RVCA 439 261 -178 -40.5 Mau, Cherangani, and Aberdares
ACA 253 120 -133 -52.6 Aberdares TCA 501 446 -55 -11.0 Mt. Kenya and Aberdares
ENNCA 220 184 -36 -16.4 Mt. Kenya and Aberdares Total 1,833 1,277 -556 -30.3
Source: JICA Study Team based on the satellite imagery analysis for 1990 and 2010
0
1,000
2,000
3,000
4,000
5,000
6,000
Lake Victoria North
Lake Victoria South
Rift Valley Athi Tana Ewaso Ngiro North
Are
a (km
2 )
19902010
Source: JICA Study Team based on the satellite imagery analysis for 1990 and 2010
Change of Forest Area (Comparison between 1990 and 2010)
Current Situation of WRM Final Report Chapter 2 Sectoral Report (H) Water Resources Management
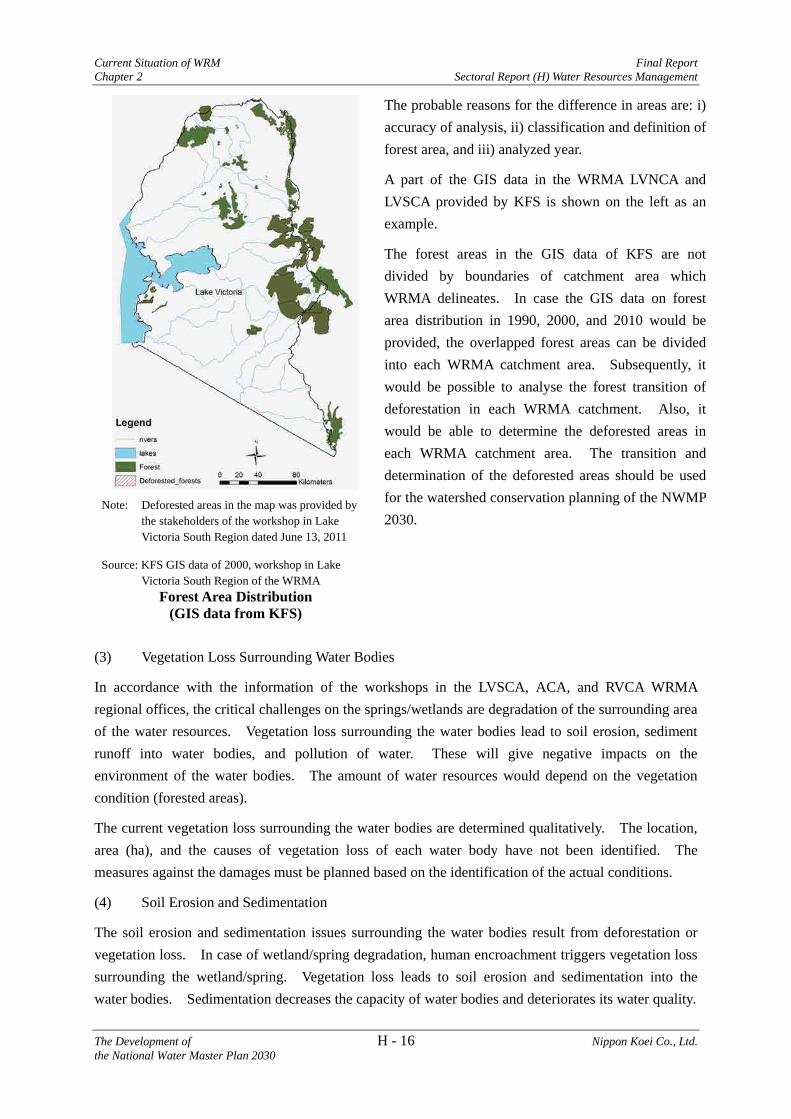
The Development of H - 16 Nippon Koei Co., Ltd. the National Water Master Plan 2030
Note: Deforested areas in the map was provided by
the stakeholders of the workshop in Lake Victoria South Region dated June 13, 2011
Source: KFS GIS data of 2000, workshop in Lake Victoria South Region of the WRMA
Forest Area Distribution (GIS data from KFS)
The probable reasons for the difference in areas are: i) accuracy of analysis, ii) classification and definition of forest area, and iii) analyzed year.
A part of the GIS data in the WRMA LVNCA and LVSCA provided by KFS is shown on the left as an example.
The forest areas in the GIS data of KFS are not divided by boundaries of catchment area which WRMA delineates. In case the GIS data on forest area distribution in 1990, 2000, and 2010 would be provided, the overlapped forest areas can be divided into each WRMA catchment area. Subsequently, it would be possible to analyse the forest transition of deforestation in each WRMA catchment. Also, it would be able to determine the deforested areas in each WRMA catchment area. The transition and determination of the deforested areas should be used for the watershed conservation planning of the NWMP 2030.
(3) Vegetation Loss Surrounding Water Bodies
In accordance with the information of the workshops in the LVSCA, ACA, and RVCA WRMA regional offices, the critical challenges on the springs/wetlands are degradation of the surrounding area of the water resources. Vegetation loss surrounding the water bodies lead to soil erosion, sediment runoff into water bodies, and pollution of water. These will give negative impacts on the environment of the water bodies. The amount of water resources would depend on the vegetation condition (forested areas).
The current vegetation loss surrounding the water bodies are determined qualitatively. The location, area (ha), and the causes of vegetation loss of each water body have not been identified. The measures against the damages must be planned based on the identification of the actual conditions.
(4) Soil Erosion and Sedimentation
The soil erosion and sedimentation issues surrounding the water bodies result from deforestation or vegetation loss. In case of wetland/spring degradation, human encroachment triggers vegetation loss surrounding the wetland/spring. Vegetation loss leads to soil erosion and sedimentation into the water bodies. Sedimentation decreases the capacity of water bodies and deteriorates its water quality.

Final Report Current Situation of WRM Sectoral Report (H) Water Resources Management Chapter 2
Nippon Koei Co., Ltd. H - 17 The Development of the National Water Master Plan 2030
Soil erosion increases surface water runoff at the slope area and causes sedimentation in water bodies.
Wetland
Vegetation Encroachment
Loss of vegetation
Soil erosion
Sedimentationinto wetland
Loss of wetland capacity
Case 1: Water body Case 2: Deforestation
Forest
Tee Plantation
River EncroachmentIncreasing Runoff
Soil erosion (at tee plantation)
Sedimentationinto water bodies
Flashflood/flood Source: JICA Study Team
Mechanism of Soil Erosion and Sediment Flow
(6) Climate Change Impacts
As what was experienced in 2009, the prolonged drought caused deaths of many cattle and stoppage of irrigation water use. In addition, the flooding with long rainy season also occurred in 2009 in many parts of the country. It might have been the effect of climate change. Such climate severity should be taken into account in the water resource management activities.
(7) Tools for Water Resources Management Activities
The water resources management activities are procedural ones which require referential plans and documents. To make the water resources management activities more effective, WRMA developed a series of tools to be used for the activities other than the National Water Resources Management Strategies of the MWI and the Catchment Management Strategy of WRMA mentioned in the previous subsection. They are listed as follows:
a) Subcatchment Management Plan; b) WRUA Development Cycle; c) Water Resources Allocation Thresholds for Classification of Permits; d) Effluent Discharge Control Plan; and e) Guideline for Water Allocation.
The outline and structures of the above management tools are described hereunder.

Current Situation of WRM Final Report Chapter 2 Sectoral Report (H) Water Resources Management
The Development of H - 18 Nippon Koei Co., Ltd. the National Water Master Plan 2030
1) Subcatchment Management Plans (SCMPs)
The SCMP is a rolling operational tool for implementing integrated water resources management in conjunction with WRUAs and other stakeholders. It provides an analysis of the water resources challenges within a particular subcatchment and defines a set of the prioritized activities to address the challenges over the next three to five years. The SCMP is normally prepared by WRUA with the local stakeholders.
2) WRUA Development Cycle (WDC)
The WDC is a manual that guides the development and implementation of the SCMPs and it is a transparent process designed to provide technical and financial support for community-based activities in water resources management. The Water Service Trust Fund (WSTF) and WRMA jointly prepared a guidebook on the WDC. Because of the limited financial resources, it is necessary to prioritize the investment schemes. To establish priorities, WRMA set three categories by analysing the current status of water resources with respect to (i) quantity, (ii) quality, (iii) catchment condition, and (iv) risk of conflicts. The three categories are shown below.
Category and Current Status for Prioritization
Category Current Status Surface Water Groundwater Water Quality Conflicts
Category 1: ALARM
Resource is periodically or frequently scarce. Water reserve is threatened.
Water quality or declining levels.
Catchment severely degraded. Pollution levels are high. Risk to human life is high.
Potential for conflicts is high.
Category 2: ALERT
Trend is toward scarcity. Trend is towards over abstraction.
Declining trend in water quality.
Ingredients for conflicts, e.g. ethnic, religious, and language divisions.
Category 3: CONCERN
Water resource of sufficient quality and quantity.
No significant impact.
Water quality adequate, low risk.
Low risk of conflict.
Source: Water Resource Users Association Development Cycle (WDC)
The WDC provides an opportunity for WRUAs to apply for funding to implement activities specified in the SCMP. The WRUAs are able to apply repeatedly to WDC for funding as long as the WRUA passes audit checks on the funds received. The following figure shows the WDC Funding Cycle.
WRUA prepares & submits application for
WDC funds
WRUA uses WDC funds to implement
SCMP activities
After WRMA & WSTF appraisal, WRUA
receives funds
WRMA & WSTF Audit Outputs & Records
Source: Water Resource Users Association Development Cycle (WDC)
WDC Funding Cycle

Final Report Current Situation of WRM Sectoral Report (H) Water Resources Management Chapter 2
Nippon Koei Co., Ltd. H - 19 The Development of the National Water Master Plan 2030
The roles of WRUAs, WRMA, and WSTF in the WDC process are shown in Figure 2.3.2.
3) Water Resources Allocation Thresholds for Classification of Water Permits
The first edition of the “Water Resources Allocation Thresholds for Classification of Permits” was issued in October 2007 to provide a basis for water permit classification which is used to manage the water permit application, compliance, and enforcement process. This guideline provides the following water permit classifications:
a) Surface water thresholds by subcatchment areas; and b) Aquifer classification and thresholds.
Both water permit classifications are tabulated by catchment of WRMA with in-depth classification by subcatchment. Table 2.3.1 shows an example of surface water thresholds for Lake Victoria North Catchment Area while Table 2.3.2 shows an example of aquifer classification and thresholds for Ewaso Ng’iro North Catchment Area.
The Categories A to D in Tables 2.3.1 and 2.3.2 correspond to the classifications in the Water Permit Classifications of the WRMR 2007 shown in the Fifth Schedule. The thresholds and classifications in the guideline are all approved by the CEO of WRMA. To modify or amend the approved thresholds, a recommendation shall be forwarded to the CEO of WRMA for consideration.
4) Effluent Discharge Control Plan (EDCP)
As mentioned before, the Effluent Discharge Control Plan (EDCP) is a tool for water quality monitoring especially for point source pollution monitoring. In the Third Schedule of the WRMR 2007, the maximum allowable values for effluent discharges are provided for both into surface water resources and onto land. The Third Schedule is presented in Table 2.3.3.
According to interviews with water quality officers in WRMA, most of the applicants are not able to satisfy the conditions given in the guideline standards in the Third Schedule of the WRMR 2007 (Table 2.3.3). Therefore, it is a joint effort of WRMA and applicants to improve the quality of effluent discharge from the current status to the standard value. WRMA periodically checks the status of effluent discharge, and gives advices to the applicants until the parameters of the effluent discharge become in compliance with the standards.
5) Guidelines for Water Allocation
The Water Act 2002 Section 8 (1) (a) mandates WRMA “to develop the principles, guideline, and procedures for the allocation of water resources.” The first edition of the “Guidelines for Water Allocation” was issued in March 2010 to set out the guidelines to be followed by WRMA in decision making on the allocation of the available water resources. The guidelines were developed to establish a framework which can be used by water users, consultants, NGOs, community-based organizations, government departments, WRUAs,

Current Situation of WRM Final Report Chapter 2 Sectoral Report (H) Water Resources Management
The Development of H - 20 Nippon Koei Co., Ltd. the National Water Master Plan 2030
CAACs, and WRMA when making water allocation requests by applicants, and when making water allocation decisions by WRMA.
The guidelines generally consider the allocation of four demands of (i) ecological demand, (ii) basic human needs (BHNs)2, (iii) international obligations and interbasin transfers, and (iv) demand allocated for individual use by means of permit. The figure below shows the abovementioned concept of allocation of water from a water body.
Nat
ural
Yie
ld
Ecological NeedBasic Human Needs
International Obligations & Interbasin transfers
Individual Uses by means of Permit
Reserve
Source: Guidelines for Water Allocation, First Edition, March 2010
Concept of Allocation of Water
2.3.2 Lake Victoria North Catchment Area (LVNCA)
The LVNCA has a basin mean annual rainfall of 1,420 mm, which is the highest among the six catchment areas of WRMA, and available water resource is abundant. The catchment area includes major cities such as Eldoret, Kitale, and Kakamega, and is the most populated area in Kenya with its population density of 379 persons per sq km. High water demand is expected in the future that will be led by domestic and industrial water supply as well as irrigation water uses.
The major rivers in the LVNCA are Nzoia and Yala rivers that flow into Lake Victoria. There are three international rivers, namely, Sio, Malaba, and Malakisi that flow across the national border into Uganda. WRMA has its Lake Victoria North Regional Office in Kakamega. Under the regional office, there are three subregional offices of Kitale that covers the northern part, Siaya that covers the southwestern part, and Eldoret that covers the southeastern part of the catchment. Kakamega regional office covers the rest of the catchment area, namely, Sio-Malaba-Malakisi River basins and middle Nzoia. Figure 2.3.3 shows the management unit boundary and subregional office management boundary.
The following table shows the current monitoring targets of WRMA, numbers of operational stations, and their achievement ratio for surface water and groundwater, water quality, and rainfall. Surface water monitoring stations are well maintained while groundwater and rainfall stations are fairly maintained.
2 Water Resources Management Rules 2007 defines basic human needs as follows: “basic human needs” means the quantity of water required for drinking, food preparation, washing of clothes, bathing, basic sanitation and is assumed to be equal to twenty five (25) litres per person per day.

Final Report Current Situation of WRM Sectoral Report (H) Water Resources Management Chapter 2
Nippon Koei Co., Ltd. H - 21 The Development of the National Water Master Plan 2030
Current Monitoring Situations of Water Resources (LVNCA)
Item Surface Water (SW) Level
Groundwater (GW) Level
SW Water Quality
GW Water Quality Rainfall
Target 28 13 24 11 65 Operational 21 9 24 10 52 Achievement (%) 75 69 100 90 80
Source: WRMA Performance Report 1 (July 2010)
Of these monitoring stations, locations of the target surface water monitoring stations (gazetted surface water monitoring stations) are shown in Figure 2.3.4.
The current situations of water permit issuance and management are shown in the table below. The ratio of valid permits against issued permits is relatively high.
Current Situations of Water Permits (LVNCA)
Item Application Authorized Issued Permits Valid Permits Ratio of Validity (%)
Surface Water 919 432 269 180 67 Groundwater 878 540 140 110 79 Total 1,797 972 409 290 71
Source: WRMA Performance Report 1 (July 2010)
As for the watershed conservation in the LVNCA, it is important to conserve Mt. Elgon, Cherangani Hills, and Mau Forest Complex which are the major water sources of the Nzoia and Yala rivers. Deforestation and forest degradation are significant in these water source forests.
According to the result of the satellite imagery analysis in this study3, the forest area in the LVNCA in 2010 was about 107,000 ha which corresponded to 5.8% of forest cover in the LVNCA. The deforested areas during the last two decades were about 47,000 ha, which meant the decrease of about 30% of the forest areas in 20 years since 1990.
According to interviews with stakeholders of watershed conservation including WRMA and KFS in the LVNCA, there are deteriorations on small water sources such as 23 springs and 14 wetlands. However, there are no significant problems reported because of less dependency on such small water sources in the LVNCA.
WRMA pointed out that deforestation and forest degradation cause soil erosion and its inflow into rivers is one of the major causes of flood. There are other causes of soil erosion and inflow into rivers such as sheet erosion from cultivated areas. As detailed information on soil erosion areas such as location, magnitude, water use, water quality, vegetation, and method of management are not known, further study is required.
2.3.3 Lake Victoria South Catchment Area (LVSCA)
LVSCA has a basin mean annual rainfall of 1,280 mm, which is the second highest among the six catchment areas of WRMA, and available water resource is abundant. The catchment area includes 3 Sectoral Report (B) Chapter 8 Land Use Analysis

Current Situation of WRM Final Report Chapter 2 Sectoral Report (H) Water Resources Management
The Development of H - 22 Nippon Koei Co., Ltd. the National Water Master Plan 2030
major cities such as Kisumu, Kisii, and Kericho, and is one of the most populated areas in Kenya with its population density of 232 persons per sq km. High water demand is expected in the future that will be led by domestic and industrial water supply as well as irrigation water uses.
There are four major rivers in LVSCA, namely, Nyando, Sondu, Gucha-Migori, and Mala. Nyando, Sondu and Gucha-Migori rivers flow into Lake Victoria, and the Mala River is an international river that flows across the national border into Tanzania. WRMA has its Lake Victoria South Regional Office in Kisumu. Under the regional office, there are three subregional offices of Kisumu that covers the northern part (northern shore of Lake Victoria and the Nyando River), Kisii that covers the southwestern part (southern shore of the Lake Victoria and Kuja River), and Kericho that covers the southeastern part (Sondu and Mara rivers) of the catchment. Figure 2.3.5 shows the management unit boundary and subregional office management boundary.
The following table shows the current monitoring targets of WRMA, numbers of operational stations, and their achievement ratio for surface water and groundwater, water quality, and rainfall. Surface water quality and groundwater monitoring stations are not well maintained.
Current Monitoring Situations of Water Resources (LVSCA)
Item Surface Water (SW) Level
Groundwater (GW) Level
SW Water Quality
GW Water Quality Rainfall
Target 39 30 61 17 65 Operational 34 15 47 13 53 Achievement (%) 87 50 77 76 82
Source: WRMA Performance Report 1 (July 2010)
Of these monitoring stations, locations of the target surface water monitoring stations (gazetted surface water monitoring stations) are shown in Figure 2.3.6.
The current situations of water permit issuance and management are shown in the table below. The ratio of valid permits against issued permits is relatively high.
Current Situations of Water Permits (LVSCA)
Item Application Authorized Issued Permits Valid Permits Ratio of Validity (%)
Surface Water 1,790 1,303 283 227 80 Groundwater 1,361 1,326 35 34 97 Total 3,151 2,629 318 261 82
Source: WRMA Performance Report 1 (July 2010)
As for the watershed conservation in LVSCA, it is important to conserve the Mau Forest Complex which is the major water sources of the major rivers in the catchment. Deforestation and forest degradation are significant in the water source forests such as the Mau Forest Complex and private forests in the middle to upper reaches of the Migori River.

Final Report Current Situation of WRM Sectoral Report (H) Water Resources Management Chapter 2
Nippon Koei Co., Ltd. H - 23 The Development of the National Water Master Plan 2030
According to the result of the satellite imagery analysis in this study4, the forest area in LVSCA in 2010 was about 159,000 ha which corresponded to 5.0% of forest cover in LVSCA. The deforested areas during the last two decades were about 107,000 ha, which meant the decrease of about 40% of the forest areas in 20 years since 1990.
According to interviews with stakeholders of watershed conservation including WRMA and KFS in LVSCA, there are deteriorations on small water sources such as 20 springs and 58 wetlands.
WRMA pointed out that deforestation and forest degradation cause soil erosion and its inflow into rivers is one of the major causes of flood. There are other causes of soil erosion and inflow into rivers such as sheet erosion from the cultivated areas. As detailed information on soil erosion areas such as location, magnitude, water use, water quality, vegetation, and method of management are not known, further study is required.
2.3.4 Rift Valley Catchment Area (RVCA)
The RVCA ranges about 800 km in the north and south direction, and has different water resources characteristics by different regions in the catchment.
In the northern part of the catchment area, which includes the lower reaches of Turkwel and Kerio rivers, and other arid and semi-arid areas in the northern part, has little rainfall. People rely more on groundwater than surface water.
In the central part, which includes high lands with Nakuru Town in the centre with relatively significant rainfall areas, is expected to have pressed water demand and supply balance in the future. The southern part includes Ewaso Ng’iro South River, an international river that flows south toward Tanzania, and Lake Magadi.
WRMA has its Rift Valley Regional Office in Nakuru. There are five subregional offices under the regional office as follows:
(i) Lodwar that covers the northern part (Tarach River, east and west part along the Lake Turkana, downstream reaches of Turkwel River, and the middle reaches of Kerio River);
(ii) Kapenguria that covers the central-western part (upstream reaches of Turkwel River and the middle reaches of Kerio River);
(iii) Kabarnet that covers the central part (Suguta River, upstream reaches of Keio River and the lakes of Baringo and Bogoria);
(iv) Naivasha that covers the central-southern part (the lakes of Nakuru, Elementaita, and Naivasha); and
(v) Narok that covers the southern part (Lake Magadi and Ewaso Ng’iro South River) of the catchment.
Figure 2.3.7 shows the management unit boundary and subregional office management boundary.
4 Sectoral Report (B) Chapter 8 Land Use Analysis

Current Situation of WRM Final Report Chapter 2 Sectoral Report (H) Water Resources Management
The Development of H - 24 Nippon Koei Co., Ltd. the National Water Master Plan 2030
There are three major rivers and seven major lakes in the RVCA, namely Turkwel, Kerio, and Ewaso Ng’iro South rivers and lakes of Turkana, Baringo, Bogoria, Nakuru, Elementaita, Naivasha, and Magadi. The following table shows the current monitoring targets of WRMA, numbers of operational stations, and their achievement ratio for surface water and groundwater, water quality, and rainfall. Surface water level and groundwater level monitoring stations are not well maintained.
Current Monitoring Situations of Water Resources (RVCA)
Item Surface Water (SW) Level
Groundwater (GW) Level
SW Water Quality
GW Water Quality Rainfall
Target 40 37 20 8 60 Operational 20 24 18 8 45 Achievement (%) 50 65 90 100 75
Source: WRMA Performance Report 1 (July 2010)
Of these monitoring stations, locations of the target surface water monitoring stations (gazetted surface water monitoring stations) are shown in Figure 2.3.8.
The current situations of water permit issuance and management are shown in the table below. The ratio of valid permits against issued permits is relatively low, especially for surface water permits.
Current Situations of Water Permits (RVCA)
Item Application Authorized Issued Permits Valid Permits Ratio of Validity (%)
Surface Water 252 663 503 162 32 Groundwater 389 1,390 183 124 68 Total 641 2,053 686 286 42
Source: WRMA Performance Report 1 (July 2010)
As for the watershed conservation in the RVCA, it is important to conserve the Mau Forest Complex, Cherangani Hills, and Aberdare Range which are the major water sources of the rivers and lakes in the catchment area. Deforestation and forest degradation are significant in these water source forests, especially in the Mau Forest Complex and private forests in the west of Lake Naivasha.
According to the result of the satellite imagery analysis in this study5, the forest area in the RVCA in 2010 was about 261,000 ha which corresponded to 2.0% of forest cover in the RVCA. The deforested areas during the last two decades were about 178,000 ha, which meant the decrease of about 40% of the forest areas in 20 years since 1990.
According to interviews with stakeholders of watershed conservation including WRMA and KFS in the RVCA, there are deteriorations on small water sources such as 11 springs and 12 wetlands. Such issues badly affect the availability of water resources in the catchment area as there are many arid and semi-arid lands (ASALs) in the RVCA that highly depend on the small water sources. However, as detailed information on deterioration of small water sources such as location, magnitude, water use, water quality, vegetation, and method of management are not known, further study is required.
5 Sectoral Report (B) Chapter 8 Land Use Analysis
Final Report Current Situation of WRM Sectoral Report (H) Water Resources Management Chapter 2
Nippon Koei Co., Ltd. H - 25 The Development of the National Water Master Plan 2030
On the other hand, issues on soil erosion are not significant in the RVCA.
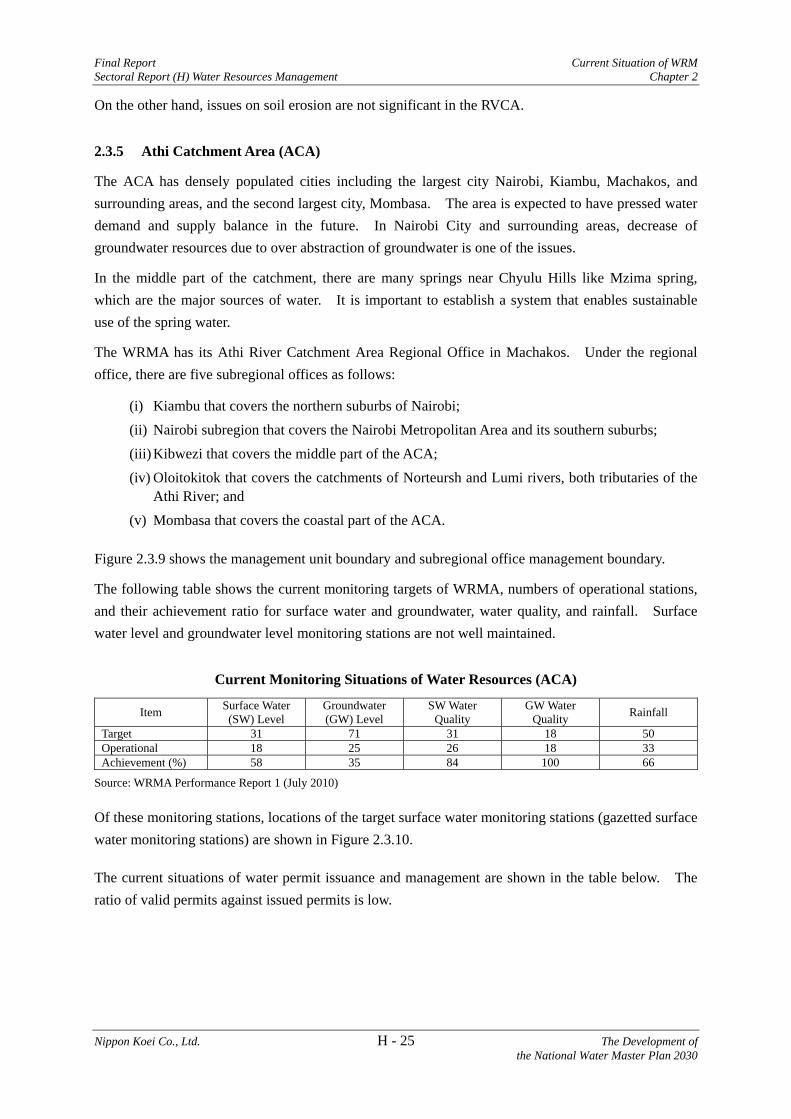
2.3.5 Athi Catchment Area (ACA)
The ACA has densely populated cities including the largest city Nairobi, Kiambu, Machakos, and surrounding areas, and the second largest city, Mombasa. The area is expected to have pressed water demand and supply balance in the future. In Nairobi City and surrounding areas, decrease of groundwater resources due to over abstraction of groundwater is one of the issues.
In the middle part of the catchment, there are many springs near Chyulu Hills like Mzima spring, which are the major sources of water. It is important to establish a system that enables sustainable use of the spring water.
The WRMA has its Athi River Catchment Area Regional Office in Machakos. Under the regional office, there are five subregional offices as follows:
(i) Kiambu that covers the northern suburbs of Nairobi; (ii) Nairobi subregion that covers the Nairobi Metropolitan Area and its southern suburbs; (iii) Kibwezi that covers the middle part of the ACA; (iv) Oloitokitok that covers the catchments of Norteursh and Lumi rivers, both tributaries of the
Athi River; and (v) Mombasa that covers the coastal part of the ACA.
Figure 2.3.9 shows the management unit boundary and subregional office management boundary.
The following table shows the current monitoring targets of WRMA, numbers of operational stations, and their achievement ratio for surface water and groundwater, water quality, and rainfall. Surface water level and groundwater level monitoring stations are not well maintained.
Current Monitoring Situations of Water Resources (ACA)
Item Surface Water (SW) Level
Groundwater (GW) Level
SW Water Quality
GW Water Quality Rainfall
Target 31 71 31 18 50 Operational 18 25 26 18 33 Achievement (%) 58 35 84 100 66
Source: WRMA Performance Report 1 (July 2010)
Of these monitoring stations, locations of the target surface water monitoring stations (gazetted surface water monitoring stations) are shown in Figure 2.3.10.
The current situations of water permit issuance and management are shown in the table below. The ratio of valid permits against issued permits is low.

Current Situation of WRM Final Report Chapter 2 Sectoral Report (H) Water Resources Management
The Development of H - 26 Nippon Koei Co., Ltd. the National Water Master Plan 2030
Current Situations of Water Permits (ACA)
Item Application Authorized Issued Permits Valid Permits Ratio of Validity (%)
Surface Water 2,999 2,751 470 199 42 Groundwater 7,449 5,895 571 217 38 Total 10,448 8,646 1,041 416 40
Source: WRMA Performance Report 1 (July 2010)
As for the watershed conservation in the ACA, it is important to conserve the Aberdare Range which is the major water sources of the Athi River. Deforestation and forest degradation are significant in the gazetted forest and private forest in the southern part of the Aberdare Range, private forests in the upstream reaches of the Lokerish and Kaiti rivers, and in the west of Voi Town. According to the result of the satellite imagery analysis in this study6 the forest area in the ACA in 2010 was about 120,000 ha which corresponded to 2.0% of forest cover in the ACA. The deforested areas during the last two decades were about 133,000 ha, which meant the decrease of about 52.5% of the forest areas in 20 years since 1990.
According to interviews with stakeholders of watershed conservation including WRMA and KFS in the ACA, there are deteriorations on small water sources such as 20 springs and 17 wetlands. Such issues badly affect the availability of water resources in the catchment area as there are many semi-arid lands in the ACA that highly depend on the small water sources. However, as detailed information on deterioration of small water sources such as location, magnitude, water use, water quality, vegetation, and method of management are not known, further study is required.
On the other hand, issues on soil erosion are not significant in the ACA.
2.3.6 Tana Catchment Area (TCA)
The TCA includes the Tana River (95,884 km2) as its main river. There are two water supply dams (for transferring supply to the ACA) and five hydropower dams in the catchment area. The middle reaches of the Tana River is a semi-arid area with relatively little rainfall. In the downstream area, it rains more as we go closer to the Indian Ocean.
Among the six catchment areas of WRMA, the TCA has the largest number of water permit applications. In the future, as catchment population increases, it is anticipated that the water demand and supply balance will be more critical.
WRMA has its Tana River Catchment Area Regional Office in Embu. Under the regional office, there are five subregional offices as follows:
1) Muranga that covers upper Tana in the western side which includes the Thika, Chania, Mathioya and Gura river systems that discharges into Masinga reservoir;
2) Kerugoya that covers the middle of upper Tana, in particular the Thiba River system; 3) Meru that covers upper Tana in the eastern side which includes the Mutonga, Kazita, Ura,
and Rojiwero river systems; 6 Sectoral Report (B) Chapter 8 Land Use Analysis

Final Report Current Situation of WRM Sectoral Report (H) Water Resources Management Chapter 2
Nippon Koei Co., Ltd. H - 27 The Development of the National Water Master Plan 2030
4) Kitui that covers part of the middle and lower Tana in the western side including the Tiva River systems which is seasonal, plus the lower reservoir areas including Kindaruma, Kamburu, and Kiambere reservoirs; and
5) Garissa that covers the middle and lower part of the Tana Catchment in the eastern side including the coastal zone.
Figure 2.3.11 shows the management unit boundary and subregional office management boundary.
The following table shows the current monitoring targets of WRMA, numbers of operational stations, and their achievement ratio for surface water and groundwater, water quality, and rainfall. The achievement ratio of groundwater level, surface water quality, and groundwater quality monitoring stations are very low.
Current Monitoring Situations of Water Resources (TCA)
Item Surface Water (SW) Level
Groundwater (GW) Level
SW Water Quality
GW Water Quality Rainfall
Target 43 41 45 41 35 Operational 30 14 18 14 25 Achievement (%) 70 34 40 38 71
Source: WRMA Performance Report 1 (July 2010)
Of these monitoring stations, locations of the target surface water monitoring stations (gazetted surface water monitoring stations) are shown in Figure 2.3.12.
The current situations of water permit issuance and management are shown in the table below. The ratio of valid permits against issued permits is the lowest among the six catchment areas of WRMA, especially for surface water permits.
Current Situations of Water Permits (TCA)
Item Application Authorized Issued Permits Valid Permits Ratio of Validity (%)
Surface Water 6,434 3,436 1,622 239 15 Groundwater 1,710 1,057 145 68 47 Total 8,144 4,493 1,767 307 17
Source: WRMA Performance Report 1 (July 2010)
As for the watershed conservation of the TCA, it is important to conserve Mt. Kenya and the Aberdare Range of the Five Water Towers which are the major water sources of the Tana River. The forest areas of Mt. Kenya and the Aberdare Range are relatively well maintained. However, deforestation and forest degradation are significant in the small gazetted forests in the upper reaches of the Tana River, in the private forests, in the middle to lower reaches of the Tana River on the right bank, and in the low land area located about 50 km north of Lamu Town. According to the result of the satellite imagery analysis in this study7, the forest area in the TCA in 2010 was about 446,000 ha which corresponded to 3.5% of forest cover in the TCA. The total deforested area during the last two
7 Sectoral Report (B) Chapter 8 Land Use Analysis

Current Situation of WRM Final Report Chapter 2 Sectoral Report (H) Water Resources Management
The Development of H - 28 Nippon Koei Co., Ltd. the National Water Master Plan 2030
decades is about 55,000 ha, which indicates a decrease of about 11% of the forest areas in 20 years since 1990.
According to interviews with stakeholders of watershed conservation including WRMA and KFS in the TCA, there are deteriorations on small water sources such as eight springs and five wetlands. However, there are no significant problems reported because of less dependency on such small water sources in the TCA.
On the other hand, issues on soil erosion caused by deforestation and degradation of forest areas are the issues in the TCA. As detailed information on soil erosion areas such as location, magnitude, water use, water quality, vegetation, and method of management are not known, further study is required.
2.3.7 Ewaso Ng’iro North Catchment Area (ENNCA)
The ENNCA is located in arid and semi-arid areas in the northeastern part of Kenya, with a total catchment area of 210,226 km2 which is 36.8% of the total area of Kenya, the largest among the six catchment areas of WRMA. The basin mean annual rainfall is 510 mm, which is almost the same as the one for the RVCA, the smallest among six catchment areas.
The major rivers in the catchment area are the Ewaso Ng’iro North River that originates from Mount Kenya (5,199 m) and flows in the central part of the country eastward, and the Daua River that flows along the border with Ethiopia. Usage of surface water is mainly limited in the upper most area of Ewaso Ng’iro North River. There are many locations in the northern part of the catchment that rely on groundwater only for their water sources.
The WRMA has its ENNCA Regional Office in Nanyuki. Under the regional office, there are five subregional offices as follows:
(i) Mandera that covers the areas between the Ewaso Ng’iro North and Daua rivers; (ii) Isiolo that covers the middle reaches of the Ewaso Ng’iro North River; (iii) Rumuruti that covers the upper reaches of the Ewaso Ng’iro North River at its southwestern
edge of the ENNCA; (iv) Marsabit that covers the northwestern part of the ENNCA that includes Moyale, Marsabit,
and Laisamis; and (v) Nanyuki that covers the upper reaches of the Ewaso Ng’iro North River in the northern
outskirt of Mt. Kenya.
Figure 2.3.13 shows the management unit boundary and subregional office management boundary.
The following table shows the current monitoring targets of WRMA, numbers of operational stations, and their achievement ratio for surface water and groundwater, water quality, and rainfall. The achievement ratio of groundwater level, surface water quality, and groundwater quality monitoring stations are very low.

Final Report Current Situation of WRM Sectoral Report (H) Water Resources Management Chapter 2
Nippon Koei Co., Ltd. H - 29 The Development of the National Water Master Plan 2030
Current Monitoring Situations of Water Resources (ENNCA)
Item Surface Water (SW) Level
Groundwater (GW) Level
SW Water Quality
GW Water Quality
Rainfall
Target 40 10 40 10 26 Operational 25 5 24 3 8 Achievement (%) 63 50 60 30 31
Source: WRMA Performance Report 1 (July 2010)
Of these monitoring stations, locations of the target surface water monitoring stations (gazetted surface water monitoring stations) are shown in Figure 2.3.14.
The current situations of water permit issuance and management are shown in the table below. The ratio of valid permits against issued permits is the lowest among the six catchment areas of WRMA, especially for surface water permits:
Current Situations of Water Permits (ENNCA)
Item Application Authorized Issued Permits Valid Permits Ratio of Validity
(%) Surface Water 1,566 1,031 201 38 19 Groundwater 1,421 871 31 28 90 Total 2,987 1,902 232 66 28
Source: WRMA Performance Report 1 (July 2010)
As for the watershed conservation in the ENNCA, it is important to conserve Mt. Kenya and the gazetted forests located in the western part of the catchment area which are the major water sources of the catchment area. Deforestation and forest degradation are significant in the water source forests such as the northern skirt of Mt. Kenya. According to the result of the satellite imagery analysis in this study8 the forest area in the ENNCA in 2010 was about 184,000 ha which corresponded to 0.9% of forest cover in the ENNCA. The deforested area during the last two decades has a total of about 36,000 ha, which indicate a decrease of about 16% of the forest areas in 20 years since 1990.
According to interviews with stakeholders of watershed conservation including WRMA and KFS in the ENNCA, there are deteriorations on small water sources in 12 springs in the catchment area. Such issues badly affect the availability of water resources in the catchment area as most of the areas in the ENNCA belong to arid and semi-arid lands (ASALs) that highly depend on the small water sources. However, as detailed information on deterioration of small water sources such as location, magnitude, water use, water quality, vegetation, and method of management are not known, further study is required.
Further, WRMA pointed out that deforestation and forest degradation cause soil erosion and its inflow into rivers is one of the major causes of flood. As detailed information on soil erosion areas such as location, magnitude, water use, water quality, vegetation, and method of management are not known, further study is required. 8 Sectoral Report (B) Chapter 8 Land Use Analysis

Current Situation of WRM Final Report Chapter 2 Sectoral Report (H) Water Resources Management
The Development of H - 30 Nippon Koei Co., Ltd. the National Water Master Plan 2030
2.4 On-going Projects and Existing Plans
The major on-going projects related to water resources management is the Natural Resources Management (NRM) Project funded by the World Bank. The project started in May 2007 and will continue until June 2013. There are four major project components namely; 1) Water Resources Management and Irrigation; 2) Management of Forest Resources; 3) Livelihood Investments in the Upper Tana Catchment; and 4) Management, Monitoring, and Evaluation.
Among them, the water resources management and irrigation component are closely related to WRMA and its water resources management activities. This component includes two major work items of:
a) Strengthening the capacity of WRMA, with direct investments in the Upper Tana Catchment, such as erosion control and terracing, small to medium water storage investments as well as improvements of on-farm agronomic practices; and
b) Consolidation of irrigation reforms and investments, including the development of a new irrigation infrastructure in the Lower Nzoia and rehabilitation of existing structures in the Mwea irrigation scheme.
As part of item a), the Physiographical Baseline Survey for the Upper TCA was initiated and its second draft report was prepared in December 2010. The survey was conducted to assess the soil erosion and sediment loads in the upper TCA and estimate the impact of sediment deposition on the reservoir capacities of the Masinga, Kamburu, Sasumua, and Ndakaini dams. The NRM project assists WRMA in rehabilitating/installing the water level gauging stations to enhance its surface water monitoring network.
2.5 Operation and Maintenance Issues
During this study, information on operation and maintenance issues on water resources management activities were provided by WRMA through interviews with the WRMA headquarters and regional offices. The following are the major issues:
a) Insufficient professional staff, equipment, and facilities for water resources management activities;
b) Illegal abstractions and illegal effluent discharges; and c) Inadequate funding sources for activities.
2.6 Challenges and Key Issues
Since the establishment of WRMA in 2005, WRMA has been tackling water resources management and has accumulated valuable experiences on management issues. Such issues on water resources management can be obtained from the relevant reports of WRMA as follows:
a) Catchment Management Strategy; b) WRMA Strategic Plan 2009-2012; and c) WRMA Performance Report 1.
The review results from the above reports and issues identified are described below:

Final Report Current Situation of WRM Sectoral Report (H) Water Resources Management Chapter 2
Nippon Koei Co., Ltd. H - 31 The Development of the National Water Master Plan 2030
(1) Issues from CMS of the Six Regional Offices of WRMA
Issues on water resources management are abstracted from the CMS of the six regional offices of WRMA. The major issues are as follows:
a) In terms of water resources assessment, water scarcity is a biggest issue in most of the catchment areas. Over abstraction of both surface water and groundwater and illegal abstraction are the next biggest issues;
b) For water quality, pollution of water resources is the most crucial issue among others; and c) Catchment degradation issue can be seen in almost all the catchment areas.
(2) Issues Identified in the WRMA Strategic Plan 2009-2012
In the WRMA Strategic Plan 2009-2012, key issues were derived from a comprehensive Strengths, Weaknesses, Opportunities, and Threats (SWOT) analysis conducted by the National Task Technical Team and by the staff of the regional and subregional WRMA offices. Consequently, the objectives and strategies were formulated to address the key issues. The key issues are clustered according to strategic thematic areas as outlined below which were based on the CMSs of the regional offices.
1) Water Allocation, Use, and Compliance with Water Resources Regulations
a) Inadequate quality data and information for decision-making; b) Lack of water allocation plans; c) Low compliance and weak enforcement; d) Low levels of revenue collection; and e) Water resource use inefficiencies.
2) Institutional Development
a) Poor working conditions for the WRMA staff (inadequate human resources policies, practices, and remuneration);
b) High staff turnover; c) Limited professional and technical skills of the WRMA staff in specialised fields; d) Inadequate resources (financial, logistics (transport), equipment, and material resources, e.g.
SROs, office space, and laboratories); e) Inadequate procurement systems and ineffective ICT systems; and f) Limited collaboration and partnerships with stakeholders.
3) Water Resource Assessment, Monitoring, and Information Management
a) Nonfunctioning monitoring stations, obsolete monitoring equipment, and vandalism; b) Inadequate and unreliable water resources data; c) Limited capacity and funding to carry out water resource assessments and classification; d) Inadequate monitoring networks and poor monitoring infrastructure; and e) Limited dissemination of water resources information and underdeveloped database.

Current Situation of WRM Final Report Chapter 2 Sectoral Report (H) Water Resources Management
The Development of H - 32 Nippon Koei Co., Ltd. the National Water Master Plan 2030
4) Legislative Framework
a) Conflicting legislation on the roles and responsibilities of various players in the water sector; b) Inadequate legal framework to address transboundary water resource management; and c) Unclear policy on water storage.
5) Water Resources Infrastructure Development for the Enhancement of Water Storage
a) Limited water resources availability; b) Inadequate storage facilities; c) Safety of storage infrastructure; d) Poor collaboration between public and private institutions; e) Inadequate financing of infrastructure development; f) Impacts of climate change (threats) to water resources infrastructure (extreme events); and g) Spatial and temporal water resources availability.
6) Financing and Resource Mobilization
a) Limited financial resources available to water resource management institutions; b) Low private sector participation in water resources management; c) Low revenue collection; and d) High dependence on external funding.
7) Water Resource Protection
a) Catchment degradation and human encroachment into the watershed; b) Deteriorating water resources quality (water pollution); c) Inadequate water resource protection measures; d) Lack of enforcement; e) Poor collaboration and coordination between WRMA and stakeholders; and f) Lengthy procedures due to conflicting interests (e.g. publishing the catchment areas in the
gazette).
8) Mainstreaming Cross Cutting Issues
a) Inadequate data and systems to ensure timely response to impacts of climate change and variability;
b) Poor information dissemination and communication with stakeholders; c) Limited role of women, youth, and the elderly in decision making with respect to water
resources management;
d) High HIV-Aids prevalence and mortality rate; and e) Corruption.
(3) Issues Identified in the WRMA Performance Report
The WRMA Performance Report 1 (July 2010) presents issues in its Chapter 1 as the “Challenges in the management of water resources.” There are six major issues described in the report as follows:

Final Report Current Situation of WRM Sectoral Report (H) Water Resources Management Chapter 2
Nippon Koei Co., Ltd. H - 33 The Development of the National Water Master Plan 2030
1) Water resources data and information generation; 2) Water scarcity and variability; 3) Water pollution; 4) Enforcement; 5) Catchment degradation; and 6) Impacts of climate change.
The challenges and issues listed above are classified as shown in Table 2.6.1. As shown in the table, water scarcity, pollution of water resources, and catchment degradation are recognized as major issues.

Water Resources Management Plan Final Report Chapter 3 Sectoral Report (H) Water Resources Management
The Development of H - 34 Nippon Koei Co., Ltd. the National Water Master Plan 2030
CHAPTER 3 WATER RESOURCES MANAGEMENT PLAN
3.1 General
As described in Chapter 2, review works were made on the existing key documents related to water resources management. Issues on current water resources management were identified for further considerations through the said review works. In addition to the current issues, expected future issues were examined which are expected to occur with the impeding water demand in the future.
To cope with the existing and expected issues in the future, evaluations were made on how the current water resources management system should be handled in the future. Through the evaluations, the following four key aspects were regarded as the most important:
Water Resources Monitoring; Water Resources Evaluation; Water Permit Issuance and Control; and Watershed Conservation.
Monitoring, evaluation, and permit issuance are the key elements that are closely related to each other and form the water resources management cycle. In addition, watershed conservation activities should also be included in the water resources management activities to maintain sound water resources circulation. The table below shows the water resources management cycle.
Monitoring
EvaluationPermitting
SWGW
QualityQuantity
Evaluation of Water
Resources
Issuance of Water Permit
Water Abstraction
Permit Status Control
Rainfall
WRM Cycle
Water Resources Management Cycle
Fully functionalisation of the water resources management cycle will effectively and efficiently manage, regulate, and conserve all the water resources.
Concrete ideas on water resources management is described in the next section.

Final Report Water Resources Management Plan Sectoral Report (H) Water Resources Management Chapter 3
Nippon Koei Co., Ltd. H - 35 The Development of the National Water Master Plan 2030
3.2 Overall Planning Concept and Framework
With regard to the water resources management activities in Kenya, the MWI is a policy maker and WRMA is a regulator at the national and regional levels under the supervision of MWI. According to the mission statement of WRMA, the objectives of water resources management are to manage, regulate, and conserve all water resources in an effective and efficient manner by involving the stakeholders. Moreover, it aims to guarantee sustained access to water and equitable allocation of water while ensuring environmental sustainability.
To achieve the objectives of water resources management, it is necessary to accurately grasp the quantity and quality of water resources, to allocate water impartially, and to satisfy water demand. In Kenya, such system is established by WRMA through water permit issuance procedures for equitable allocation of water.
The water resources management activities should be considered to ensure the safety of lives during flood as well as to coordinate water use among different water users not only under normal conditions but also during water scarcity period such as drought. Further, from the perspective of keeping water retaining capacity and water quality in the basin, watershed conservation activities should be considered in parallel aiming at conservation of water source forests, conservation of small water sources, and soil erosion control.
Taking into account the current situations of each component of water resources management activities, review will be made by focusing on the current issues of water resources management.
In this master plan, the water resources management plan is formulated: (i) to monitor and (ii) evaluate water resources; (iii) to achieve equitable allocation of water resources through water permit issuance, and (iv) to include watershed conservation activities as long-term measures in the water resources management activities. These four activities will be the major components of the water resources management plan. The flood and drought aspects will be discussed separately from the water resources management plan in different parts which is entitled as the Flood and Drought Disaster Management.
The overall concept of the above four major components are described hereunder:
(1) Monitoring
WRMA monitors the following five items for management of water resources:
1) Surface Water Level; 2) Surface Water Quality; 3) Groundwater Level; 4) Groundwater Quality; and 5) Rainfall.
Through review of the existing key documents, issues identified are: a) lack of budget for monitoring; b) lack of human resources; c) damages, theft, and vandalism of measurement equipment; and d)

Water Resources Management Plan Final Report Chapter 3 Sectoral Report (H) Water Resources Management
The Development of H - 36 Nippon Koei Co., Ltd. the National Water Master Plan 2030
groundwater monitoring using production boreholes (not dedicated boreholes used exclusively for monitoring).
To cope with these issues, the current monitoring systems were reviewed to establish effective monitoring systems. The criteria for review and the proposed method of monitoring are explained as follows:
1) Surface Water Level
Surface water level is observed twice a day by an honorarium gauge reader. Observed water levels are submitted to WRMA regional offices once a month. In addition, WRMA staff conducts discharge measurement by current meter once a month. Surface water level monitoring stations should be reviewed and selected at: a) important points that can capture the runoff characteristics of the basin, which are located in major rivers, or points where flow regime changes in representative tributaries; b) major lakes; c) major springs; d) an outflow point of international rivers into neighbouring countries, or an inflow point of international rivers from neighbouring countries.
In the above monitoring stations, the establishment of reference points should be considered for water resources development and management purposes. Selected reference points should have sufficient hydrological data that can be used for hydrological analysis. At the reference point, a normal discharge value is set for monitoring, which value should be kept during drought periods. The normal discharge value is calculated as reserve9 plus amount of water permits issued (water demand) downstream of a certain point. The normal discharge value is a discharge which ensures domestic and industrial water supply against 10-year probable drought and irrigation water supply against 5-year probable drought. As a base data for setting normal discharge, reserve is set for each monitoring points of the river as shown in Table 3.2.1.
2) Surface Water Quality
Surface water quality is monitored and analysed by WRMA staff quarterly. Surface water quality monitoring stations should be reviewed and selected at: a) points where effluent discharge from cities may affect water quality of rivers, springs, and lakes; b) points where pollutants such as fertilizers from irrigation areas may be discharged into rivers, springs, and lakes; and c) major surface water level monitoring points.
Water quality monitoring points proposed in the water resources management plan is for observing and managing water quality for the purpose of water use. Monitored data is used as references when issuing water permits. There are also water quality monitoring points proposed in the environmental management plan10. These monitoring points are set to check the effects of water quality for conservation of the ecosystems. In this connection, water quality monitoring points in the water
9 The amount of the reserve, consisting of ecological and basic human needs, was determined as the 95% value of the naturalised daily flow duration curve for each river, in accordance with “Guidelines for Water Allocation (WRMA, 2010)” and the results of the discussions with WRMA. Ref. Sectoral Report (G), Subsection 4.3.2, (2) 4). 10 Refer to Sectoral Report (K)

Final Report Water Resources Management Plan Sectoral Report (H) Water Resources Management Chapter 3
Nippon Koei Co., Ltd. H - 37 The Development of the National Water Master Plan 2030
resources management plan and environmental management plan are not necessarily the same, though there are several common points for monitoring.
3) Groundwater Level
Groundwater level is monitored once a month by WRMA staff. Groundwater level monitoring stations should be reviewed and selected at points where current and future groundwater uses are significant. In the master plan, such points are assumed at urban centres that have both water supply and sanitation development plans (in the Water Supply and Sanitation Plan).
4) Groundwater Quality
Groundwater quality is monitored and analysed by WRMA staff quarterly. Groundwater quality monitoring stations should be reviewed and selected at the same points as the groundwater level monitoring stations.
5) Rainfall
Rainfall is monitored once a day by WRMA staff or honorarium observers. By classifying the current distribution of rainfall stations based on climatic region (arid, semi-arid, and humid areas), the following standard densities of stations are observed:
a) One station in 8,000 km2 to 10,000 km2 in arid areas; b) One station in 3,000 km2 to 5,000 km2 in semi-arid areas; and c) One station in 500 km2 to 1,000 km2 in humid areas.
In this master plan, the above criteria applied as the current distribution in the review of rainfall stations is to some extent optimum in terms of analytical requirement and available budget. In some part of the arid areas, due to sparse distribution of residential areas, even the above criteria of one station in 10,000 km2 may not be satisfied, however, review will be made based on the criteria as much as possible. Those stations which are located close to each other will be merged or shifted as necessary to make the monitoring network effective.
Taking into account the abovementioned five criteria, monitoring networks are reviewed by each catchment area of WRMA.
(2) Evaluation
According to interview results from the WRMA regional offices, at present, there is no unified system in WRMA for water resources evaluation based on the monitoring data on both quantity and quality of water resources and water permits. For equitable allocation of water resources through water permit issuance, monitored data need to be duly evaluated to know the available water in the catchment areas. For the evaluation of water resources, both quantity and quality are important. Therefore, the water quality evaluation system is also considered as water resources evaluation system.

Water Resources Management Plan Final Report Chapter 3 Sectoral Report (H) Water Resources Management
The Development of H - 38 Nippon Koei Co., Ltd. the National Water Master Plan 2030
1) Enhancement of the Water Resources Quantity Evaluation System
According to the survey done through questionnaire sheets to the WRMA regional offices in November 2012, there are some regional offices which evaluated the water resources of the catchments. However, there is no unified method applied in all the regional offices.
For a unified evaluation of water resources, it is recommended to evaluate water resources annually using the monitored water resources and water permit data. Such evaluation works should be done at regional office level with the assistance of subregional offices. Moreover, an evaluation team should be formed by each regional office as follows:
One chief hydrologist nominated from the regional office, and one assistant hydrologist each from subregional offices will form the water resources evaluation team. The team should analyse the water resources of each catchment area of WRMA with the chief hydrologist from the regional office as the team leader and assistant hydrologists from subregional offices as members. The evaluation work should be done once a year and the results should be compiled in a report so that it can be used for water resources allocation activities such as water permit issuance.
* Note: Number of assistant hydrologists depends on the number of subregional offices. Source: JICA Study Team
Water Resources Evaluation Team for Each Regional Office of WRMA
2) Enhancement of Water Resources Quality Evaluation System
WRMA currently owns seven water quality test laboratories in Nairobi and which are under the control of six regional offices. Six water quality test laboratories are located in Kakamega for Lake Victoria North, Kisumu for Lake Victoria South, Nakuru for Rift Valley, Machakos for Athi, Embu for Tana, and Nyeri for Ewaso Ng’iro North catchment areas. However, due to extent of the area under the control of each regional office, timely analysis of water quality sample is not possible in some catchment areas. Considering the relatively wide catchment areas, especially for Rift Valley, Athi, Tana, and Ewaso Ng’iro North Catchment Areas, additional water quality test laboratories should be established. Candidate locations for the new water quality test laboratories are Kapenguria and Lodwar for Rift Valley, Mombasa for Athi, Garissa for Tana, Marsabit and Wajir for Ewaso Ng’iro North taking into account the proposed locations of water quality monitoring for surface and groundwater. Appropriate numbers of water quality experts are to be assigned in each water quality test laboratory to establish a system to analyse and control water quality both for surface and groundwater.
Chief Hydrologist (from regional office)
Assistant Hydrologist (from subregional office)
Assistant Hydrologist (from subregional office)
Assistant Hydrologist (from subregional office)

Final Report Water Resources Management Plan Sectoral Report (H) Water Resources Management Chapter 3
Nippon Koei Co., Ltd. H - 39 The Development of the National Water Master Plan 2030
(3) Water Permit Issuance and Control
Water permits are issued and managed by WRMA regional offices. Water permit applications, authorizations, and issuance status are summarized below based on the WRMA Performance Report (2009):
Current Situations of Water Permits
Region
Applications Authorizations Permits Valid Permits
No. Vol.
No. Vol.
No. Vol.
No. Vol.
% (Mm3
/day) (Mm3/day)
(Mm3/day)
(Mm3/day)
LVN SW 919 - 432 0.161 269 0.868 180 0.308 71 GW 878 - 540 0.007 140 0.005 110 0.005
LVS SW 1,790 - 1,303 5.138 283 2.632 227 2.16 82 GW 1,361 - 1,326 0.018 35 0.002 34 0.002
RV SW 252 - 663 0.168 503 1.752 162 1.625 42 GW 389 - 1,390 0.134 183 0.116 124 0.11
Athi SW 2,999 - 2,751 - 470 0.202 199 0.134 40 GW 7,449 - 5,895 - 571 0.028 217 0.01
Tana SW 6,434 - 3,436 1.631 1,622 2.204 239 0.213 17 GW 1,710 - 1,057 0.039 145 0.015 68 0.013
ENN SW 1,566 - 1,031 1.195 201 0.309 38 0.093 28 GW 1,421 - 871 0.044 31 0.007 28 0.005
Total SW 13,960 - 9,616 8.293 3,348 7.967 1,045 4.533 37 GW 13,208 - 11,079 0.242 1,105 0.173 581 0.145
Source: WRMA Performance Report 1(July 2010)
As seen in the table above, the percentage of valid permits is as low as 37%, which means that the latest accurate amount of water abstraction is not well controlled. According to interviews with the WRMA regional offices, the major reasons for the low percentage of valid permits are as follows:
1) Accurate status of individual water permits is not fully controlled; and 2) Water permit holders do not renew their expired permits which is noncompliant to water
resources management rules.
The abovementioned reasons are due to (i) lack of sufficient water rights officers assigned in regional/subregional offices and (ii) lack of awareness on water resources management rules and lack of workforces to remind said permit holders to take necessary actions, respectively.
To cope with the existing issues and expected impeding water demand in the future, it is a prerequisite to control the latest status of issued permits and to grasp the amount of available water resources, amount of water used by issued permits, and possible amount of water that can be used by new permits to be issued.
Taking into account the current situation, water permit issuance and control activities should be managed through the following concept:
1) Enhance Water Permit Issuance and Control System
A key point is how to know the latest status of water permits. Considering the present issues, the following actions are proposed:

Water Resources Management Plan Final Report Chapter 3 Sectoral Report (H) Water Resources Management
The Development of H - 40 Nippon Koei Co., Ltd. the National Water Master Plan 2030
a) A periodical update of the water permit database
Registration of all the water permits issued should be made timely and accurately. The expiry dates of registered water permits should be confirmed periodically, such as once a month.
b) Enhancement of the notification system on permit expiry
Through the periodical update of the water permit database, water permit holders can be notified before the expiry dates of the water permits issued to them.
2) Revision of “Guidelines for Water Allocation (WRMA, 2010)”
To cope with the existing and future water demands, it is necessary to formulate water allocation plans based on the latest water resources information and future water demand. In this connection, revision of “Guidelines for Water Allocation (WRMA, 2010)” is necessary. For this work, close collaboration with the water resources evaluation team and full utilisation of the evaluation results are recommended.
3) Assignment of appropriate number of water right officers in each regional and subregional offices who handle water permit issuance and control
Taking into account the actual situation of water permit issuance and control in the WRMA regional offices, increase in the number of water rights officers for the smooth execution of works should be considered.
(4) Watershed Conservation
Against the vast territorial area of Kenya, sources of rivers depend mainly on the Five Water Towers of Mt. Kenya, Mau Forest Complex, Cherangani Hills, Aberdare Range, and Mount Elgon. The forest area in Kenya is decreasing since 1990. It is estimated that about 30% of the forest area disappeared in 20 years according to the satellite imagery analysis results conducted during this study. Decrease of forest areas gives adverse effects to water resources therefore, from the view point of water resources management, it is necessary to restore such decreased forest areas.
On the other hand, in the arid or semi-arid areas in Rift Valley, Athi, and Ewaso Ng’iro North, there are growing concerns on the decrease of water quantity and degradation of water quality due to increased use of small water sources such as springs and wetlands.
In view of the current situation, in the master plan, the watershed conservation plan will be formulated following three aspects:
a) Recovery of forest areas through forestation in the deforested areas particularly in the Five Water Towers;
b) Recovery of water quantity and quality of small water sources; and c) Control of soil outflow caused by deforestation, sheet erosion at cultivation areas, and road
surface water.

Final Report Water Resources Management Plan Sectoral Report (H) Water Resources Management Chapter 3
Nippon Koei Co., Ltd. H - 41 The Development of the National Water Master Plan 2030
1) Recovery of Forest Areas
The devastated forests should be recovered by forestation. The Five Water Towers are origins of the major rivers in Kenya; hence, forest recovery should be carried out particularly in the said area. Kenya Vision 2030 targets forest cover of 10% by 2030. This study adopted the targets of Kenya Vision 2030. The target forestation area in each catchment area, as shown in the table below, was estimated based on the current situation of forest area and potential areas for forestation as shown in Figure 3.2.1. In Figure 3.2.1, potential areas for forestation were identified to achieve the target coverage of 10%.
Target Forestation Area by Catchment Area
Catchment Area
Area (km2)
Forest Area in 2010 (ha)
Coverage in 2010
Forestation Area (ha)
Forest Area in 2030 (ha)
Coverage in 2030
LVNCA 18,374 107,000 8.4% 234,000 341,000 18.5% LVSCA 31,734 159,000 8.4% 412,000 571,000 18.0% RVCA 130,452 261,000 3.4% 1,006,000 1,267,000 9.7% ACA 58,639 120,000 4.3% 868,000 988,000 16.8% TCA 126,026 446,000 4.0% 1,366,000 1,812,000 14.4%
ENNCA 210,226 184,000 1.0% 592,000 776,000 3.7% Total 575,451 1,277,000 3.2% 4,478,000 5,755,000 10.0%
Source: JICA Study Team, based on Kenya Vision 2030
Recovery of gazetted forests is under the responsibility of KFS, while those of non-gazetted forests should be done by other stakeholders.
The following are considered for the planning of forestation areas 1) forestation of the Five Water Towers and deforested areas between 1990 to 2010, 2) aiming significant amount of forest area, 3) connections between isolated small-scaled forests. The reasons why these considerations are necessary are 1) The Five Water Towers are the main water resources in Kenya therefore, water resource conservation will not be possible without forest recovery in this area. Due to severe weather conditions, it is potentially better to formulate forest in the previously forested areas rather than in other lands. 2) Generally, the procreative power of a forest depends on its area and small-scale forestry tends to decrease the area gradually. Therefore, a significant amount of forest area is required to keep itself. 3) In case small-scale forests are connected by corridor, it would be expected that animals and birds will leave and go back to each forest. It can support procreation of forests.
For the implementation of forestation, the Five Water Towers and also the gazetted forests are the priority. Forestation on private lands will not be easy because education on the importance of water source forests to people and development of consensus among stakeholders for land forestation, where the other land-use has been done, are necessary. Therefore, forestation on the gazetted forest areas will be done at the beginning and at the same time consensus development will be aimed on private lands.
Additionally, KFS has an idea where trees will be planted with about 10% tree cover and will be taken as part of forest cover. Facing reality, forestation on the lands where land-use has been changed such as cultivation area is not easy, because most of the land owners would not agree to change the
Water Resources Management Plan Final Report Chapter 3 Sectoral Report (H) Water Resources Management
The Development of H - 42 Nippon Koei Co., Ltd. the National Water Master Plan 2030
cultivation area to forest. On this point of view, the valuable idea of KFS should be considered. It will depend on the results of the negotiation between the Government of Kenya and KFS whether the tree land concept can be used and will be considered for the forestation of the surrounding areas of the Five Water Towers and corridors which connects the small-scaled gazetted forests.
2) Conservation of Small Water Sources
To conserve the quantity and quality of the important water sources such as springs and wetlands, the following countermeasures are necessary i.e., 1) conservation of the forests surrounding the water source and recovery of vegetation (as countermeasure against the decreasing water quantity caused by evaporation), 2) preparation and implementation of the rules to control pollution emissions and monitoring of water quality (as countermeasure against pollution inflow into the water source), from the cultivation areas surrounding the water source to reduce evaporation, 3) management of the land-use surrounding the water source (as countermeasure against the reduction of water quantity and quality caused by cultivation in wetlands), and 4) strengthen the management of water use. Comprehensive management of the water source can attain the conservation of small water sources.
Major issues on the conservation of small water sources are insufficient management of the water source area including surrounding areas. In order to make a conservation plan, the actual situations of each water sources should be made clear; however, no data are available at present.
It is proposed to carry out a survey on small water resources, which includes location, scale, water use, water quality, vegetation condition, management method, and major issues.
3) Control of Soil Erosion
Soil erosion is caused by devastation of catchment area, especially deforestation; however, no actual data are available for the planning of soil erosion control. It is proposed to carry out a survey on the devastated areas in the catchment area which incurred soil erosion. The survey should investigate the location, scale, current situation, and the required countermeasures.
3.3 Water Resources Management Plan for the LVNCA
The LVNCA consists of the major rivers of Nzoia and Yala, international rivers of Sio, Malaba, and Malakisi that flow into Uganda across the border.
3.3.1 Management Strategy
Based on the overall planning concept and framework described in Section 3.2, Water Resources Management Strategy for the LVNCA is set for the major components of i) monitoring, ii) evaluation, iii) water permit issuance and control, and iv) watershed conservation, as follows:
1) Monitoring
Monitoring strategies are described for five monitoring items, which are i) surface water level, ii) surface water quality, iii) groundwater level, iv) groundwater quality, and v) rainfall.

Final Report Water Resources Management Plan Sectoral Report (H) Water Resources Management Chapter 3
Nippon Koei Co., Ltd. H - 43 The Development of the National Water Master Plan 2030
a) Surface Water Level
The Nzoia and Yala rivers are selected as representative rivers to capture the runoff characteristics of the basin. The Nozia River has several tributaries in the upper, middle, and lower reaches (refer to Figure 2.3.3), while Yala River has three tributaries in the upper and middle reaches. Surface water level monitoring stations are reviewed to capture the major points in the Nzoia and Yala rivers and their tributaries. The Nzoia River covers 70% of the LVNCA while the Yala River covers only 18%. The rest of the 12% of the basin is covered by the international rivers of Sio, Malaba, and Malakisi. Surface water level of Sio, Malaba, and Malakisi rivers are also monitored at points where these rivers are flowing out from Kenya.
As one of the major lakes, the surface water level of Lake Victoria should be monitored; however, since there is a monitoring point in Kisumu (1HB04), which is under the responsibility of the LVSCA, no measurement is made in the LVNCA. Also, there is no major spring to be monitored in the LVNCA.
b) Surface Water Quality
The same as surface water level, the surface water quality monitoring points are also selected from the representative rivers of Nzoia and Yala. For these two rivers, selected monitoring points should be located downstream of pollution sources such as major cities and irrigation schemes. Such points should be monitored monthly.
In addition, other surface water level monitoring points are selected for water quality monitoring done on a quarterly basis. Such monitoring data is required as reference water quality in the evaluation of water permit application in the relevant basin.
c) Groundwater Level
Groundwater monitoring points are set at locations where significant groundwater use is expected in the future. Such points are in urban centres which have both water supply and sanitation plans. In the selected monitoring points, groundwater levels are monitored monthly with dedicated boreholes. It is important to monitor and confirm that the groundwater levels for sustainable use are recoverable in an annual cycle.
d) Groundwater Quality
Groundwater quality is monitored at the same points where groundwater level monitoring stations are located. Monitoring of groundwater quality is conducted quarterly.
e) Rainfall
The rainfall station density should be considered by climatic regions for arid, semi-arid or humid areas. Since the LVNCA mostly belongs to humid areas, the criterion of one station in 500 km2 to 1,000 km2 is applied for the selection of rainfall monitoring stations.

Water Resources Management Plan Final Report Chapter 3 Sectoral Report (H) Water Resources Management
The Development of H - 44 Nippon Koei Co., Ltd. the National Water Master Plan 2030
2) Evaluation
a) Water Resources Quantity Evaluation
Water resources quantity evaluation is conducted annually based on i) monitoring data for surface water, groundwater, and rainfall and ii) water permit issuance data. Abstraction survey data will be used as necessary to grasp the actual water use status. For surface water resources evaluation, focus should be on the Nzoia and Yala rivers as they are the representative rivers in the LVNCA.
b) Water Resources Quality Evaluation
Water resources quality evaluation is also conducted annually based on the monitoring data for surface water and groundwater quality.
3) Water Permit Issuance and Control
Prior to the future impeding water demand in the basin, water permits should be duly controlled and issued based on the actual status of water use. In view of this, the latest version of issued permits should be controlled. In addition, “Guidelines for Water Allocation (WRMA, 2010)” should be revised considering future demand and water resources development plans. To conduct these activities, the enforcement of water rights officers should be considered by reflecting the current staffing situation.
4) Watershed Conservation
Following the overall planning concept and framework on watershed conservation, management strategy for the LVNCA will be formulated. Of the three major items of: a) recovery of forest areas; b) conservation of small water sources; and c) control of soil erosion, item b) is not an issue in the LVNCA. Therefore, items a) and c) will be considered in the LVNCA.
a) Recovery of forest areas
Forest recovery will be implemented through forestation focusing on Mt. Elgon, Cherangani Hills, and the Mau Forest Complex of the Five Water Towers.
b) Control of soil erosion
Preventive measures for soil erosion caused by deforestation in the catchment area should be considered.
3.3.2 Proposed Water Resources Management Plan
Based on the management strategy described in Subsection 3.3.1, the proposed water resources management plan in the LVNCA will be as follows:
1) Monitoring
Monitoring plans are described for five monitoring items, which are i) surface water level, ii) surface water quality, iii) groundwater level, iv) groundwater quality, and v) rainfall. Locations of the

Final Report Water Resources Management Plan Sectoral Report (H) Water Resources Management Chapter 3
Nippon Koei Co., Ltd. H - 45 The Development of the National Water Master Plan 2030
proposed monitoring stations are shown in Figure 3.3.1. The number of target, operational, and proposed monitoring stations are shown in Table 3.3.1.
a) Surface Water Level
As for the major rivers in the catchment area, 15 monitoring points were selected as representative points for the Nzoia River and six points for the Yala River. Each of the international rivers of Sio, Malaba, and Malakisi, has one point selected for monitoring to confirm that appropriate amount of water is flowing into Uganda. In total, 24 monitoring points were selected. For the Nzoia and Yala rivers, the reference points were selected as follows:
i) 1DA02 is located in the middle reaches of the Nzoia River near Webuye Town. Monitoring started in 1947.
ii) 1FG01 is located in the middle to lower reaches of the Yala River near Bondo Town. Monitoring started in 1947.
Both reference points are set to check the flow regime of the river after satisfying upstream water demand and to confirm the available discharge to satisfy the downstream demand. For that purpose, based on the management strategy described in Section 3.2, normal discharge values are set at the above two reference points as shown below. These normal discharge values are used for low water management.
Normal Discharge at Reference Point (LVNCA) (Unit: m3/sec)
Reference Point Normal Discharge (Reserve + Water Demand for the
Downstream of Reference Point) 2010 2030
Nzoia River (1DA02) 16.1 (=15.9+0.2) 19.5 (=15.9+3.6) Yala River (1FG01) 6.8 (=6.7+0.1) 6.9 (=6.7+0.2)
Source: JICA Study Team
The above normal discharges are to be reviewed and revised as necessary in the “Water Resources Quantity Evaluation” based on monitoring, which is to be mentioned in the following clause. Such review and revision works are to be made based on issued water permits (water demand) and reserve of that year. In case the observed discharge at a reference point is lower than the normal discharge, it is probable that there would be over-abstraction of water in the upstream or decreased reserve caused by an extreme drought. In such a case it is necessary to identify the reason and take measures such as increase of the level of oversight for water abstraction or drought conciliation.
b) Surface Water Quality
Stations monitoring on a monthly basis
The water quality of the five points is monitored on a monthly basis as discussed below. This monitoring is for watching and detecting possible pollutant sources that may affect water usage in the relevant rivers.

Water Resources Management Plan Final Report Chapter 3 Sectoral Report (H) Water Resources Management
The Development of H - 46 Nippon Koei Co., Ltd. the National Water Master Plan 2030
i) 1BD02 (upstream area of the Nzoia River near Hemsted Bridge): To monitor the impacts of used urban water from major towns of Kitale and Kapenguria as well as irrigation drainages on river water quality;
ii) 1CE01 (at the confluence of tributaries located in the left side of the Nzoia River near Lumakanda Town): To monitor the impacts of urban and factory effluents from the largest town, Eldoret, and effluent from irrigation schemes on river water quality;
iii) 1DA02 (in the middle reaches of the Nzoia River near Webuye, as the reference point): To monitor the impacts of urban effluent from major towns in the upper reaches as well as effluent from irrigation schemes on river water quality;
iv) 1EE01 (in the downstream reaches of the Nzoia River near Ukwala): To monitor the impacts of urban effluent from Kakamega and Mumias in the middle to lower reaches of the Nzoia River as well as effluent from irrigation schemes on river water quality; and
v) 1FG01 (in the middle reaches of the Yala River near Yala Town): To monitor the impacts of urban effluent from Nandi Hills, Kapsabet, and Vihiga, which are located in the upstream reaches as well as effluent from irrigation schemes on river water quality.
Stations monitoring on a quarterly basis
Apart from the above five monitoring stations, water quality of the other surface water monitoring stations (19 points) should be monitored on a quarterly basis (January, April, July and October of every year). Such data are used as reference when WRMA issues water permits. The said 19 monitoring stations are 1AA01, 1AD02, 1AH01, 1BB01, 1BE06, 1BH01, 1CA02, 1CB05, 1DB01, 1DD01, 1EB02, 1ED01, 1EF01, 1EG02, 1FD02, 1FE02, 1FF03, 1FG01, and 1FG03.
c) Groundwater Level
There were 19 points selected for groundwater level monitoring through dedicated boreholes. These points are located near urban centres where there are both water supply and sanitation plans with expected high growth of groundwater demand in the future. The said 19 points are located in the towns of Kapenguria, Kitale, Kimilili, Malaba, Bungoma, Webuye, Iten, Eldoret, Busia, Mumias, Luanda, Kakamega, Kapsabet, Bondo, Vihiga, Malakisi, Siaya Moi’s Bridge, and Matunda.
d) Groundwater Quality
Groundwater quality is monitored at the same locations where groundwater level monitoring stations are located. Monitoring of groundwater quality is conducted quarterly.
e) Rainfall
The LVNCA mostly belongs to humid area in the climatic region. As what was described in the overall concept, the distribution of rainfall monitoring stations was reviewed with the criteria of one location in 500 km2 to 1,000 km2. As a result of the review, 42 rainfall monitoring stations were proposed.
2) Evaluation
a) Water Resources Quantity Evaluation
The water resources quantity evaluation is conducted annually based on i) monitoring data for surface water, groundwater, and rainfall and ii) water permit issuance data. In view of this, a water resources
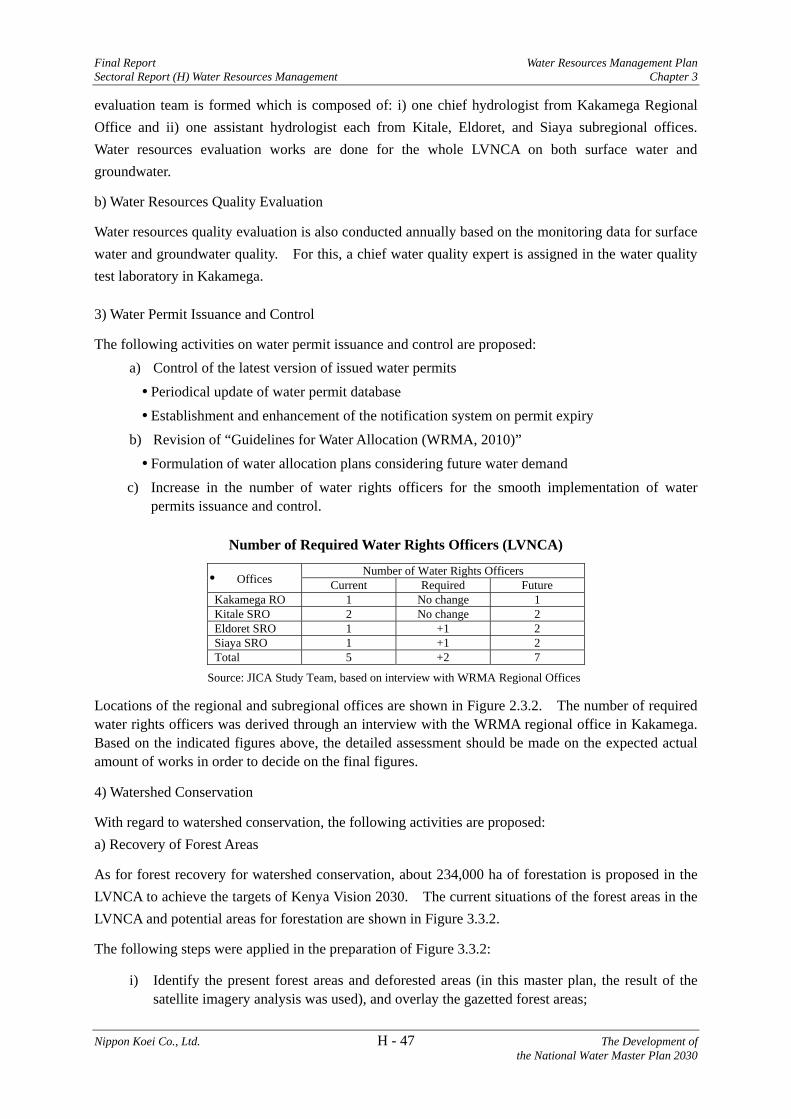
Final Report Water Resources Management Plan Sectoral Report (H) Water Resources Management Chapter 3
Nippon Koei Co., Ltd. H - 47 The Development of the National Water Master Plan 2030
evaluation team is formed which is composed of: i) one chief hydrologist from Kakamega Regional Office and ii) one assistant hydrologist each from Kitale, Eldoret, and Siaya subregional offices. Water resources evaluation works are done for the whole LVNCA on both surface water and groundwater.
b) Water Resources Quality Evaluation
Water resources quality evaluation is also conducted annually based on the monitoring data for surface water and groundwater quality. For this, a chief water quality expert is assigned in the water quality test laboratory in Kakamega.
3) Water Permit Issuance and Control
The following activities on water permit issuance and control are proposed: a) Control of the latest version of issued water permits
Periodical update of water permit database Establishment and enhancement of the notification system on permit expiry
b) Revision of “Guidelines for Water Allocation (WRMA, 2010)” Formulation of water allocation plans considering future water demand
c) Increase in the number of water rights officers for the smooth implementation of water permits issuance and control.
Number of Required Water Rights Officers (LVNCA)
Offices Number of Water Rights OfficersCurrent Required Future
Kakamega RO 1 No change 1 Kitale SRO 2 No change 2 Eldoret SRO 1 +1 2 Siaya SRO 1 +1 2 Total 5 +2 7
Source: JICA Study Team, based on interview with WRMA Regional Offices
Locations of the regional and subregional offices are shown in Figure 2.3.2. The number of required water rights officers was derived through an interview with the WRMA regional office in Kakamega. Based on the indicated figures above, the detailed assessment should be made on the expected actual amount of works in order to decide on the final figures.
4) Watershed Conservation
With regard to watershed conservation, the following activities are proposed: a) Recovery of Forest Areas
As for forest recovery for watershed conservation, about 234,000 ha of forestation is proposed in the LVNCA to achieve the targets of Kenya Vision 2030. The current situations of the forest areas in the LVNCA and potential areas for forestation are shown in Figure 3.3.2.
The following steps were applied in the preparation of Figure 3.3.2:
i) Identify the present forest areas and deforested areas (in this master plan, the result of the satellite imagery analysis was used), and overlay the gazetted forest areas;

Water Resources Management Plan Final Report Chapter 3 Sectoral Report (H) Water Resources Management
The Development of H - 48 Nippon Koei Co., Ltd. the National Water Master Plan 2030
ii) Identify the important forest areas including deforested areas as water source forests; iii) Delineate the potential forestation areas on those located in step ii), and formulate the area
with consideration of significant forest area; and iv) Connect the isolated small gazetted forest areas by corridor and delineate the potential
forestation area with the combination of these two areas.
Of the targets, the gazetted forest is supposed to be implemented by KFS.
b) Control of Soil Erosion
As for the control of soil erosion, it is proposed to carry out a survey on damaged areas where soil erosion occurred in the catchment area. The survey should investigate location, scale of the current situation, required countermeasures, etc.
3.4 Water Resources Management Plan for LVSCA
The LVSCA consists of the major rivers of Nyando, Sondu, Gucha-Migori, and Mara, and a group of small rivers that drain into Winum Gulf of Lake Victoria.
3.4.1 Management Strategy
Based on the overall planning concept and framework as described in Section 3.2, Water Resources Management Strategy for the LVSCA is set for the major components of i) monitoring, ii) evaluation, iii) water permit issuance and control, and iv) watershed conservation, as follows:
1) Monitoring
Monitoring strategies are described for five monitoring items, which are i) surface water level, ii) surface water quality, iii) groundwater level, iv) groundwater quality, and v) rainfall.
a) Surface Water Level
The Nyando, Sondu, Gucha-Migori, and Mara rivers are selected as representative rivers to capture the runoff characteristics of the basin. The Nyando, Sondu, and Gucha-Migori rivers drain into Lake Victoria, while the Mara River flows across the border to Tanzania (refer to Figure 2.3.5). Surface water level monitoring stations are reviewed to determine the major reference points of these four rivers.
As one of the major lakes, the surface water level of Lake Victoria should be monitored. There is no major spring to be monitored in the LVSCA.
b) Surface Water Quality
The same as surface water level, the surface water quality monitoring points are also selected from the four representative rivers of Nyando, Sondu, Gucha-Migori, and Mara. For these four rivers, selected monitoring points should be located downstream of pollution sources such as major cities and irrigation schemes. Such points should be monitored monthly.
Final Report Water Resources Management Plan Sectoral Report (H) Water Resources Management Chapter 3
Nippon Koei Co., Ltd. H - 49 The Development of the National Water Master Plan 2030
In addition, other surface water level monitoring points are selected for water quality monitoring done on a quarterly basis. Such monitoring data is required as reference water quality in the evaluation of water permit application in the relevant basin.
c) Groundwater Level
Groundwater monitoring points are set at locations where significant groundwater use is expected in the future. Such points are in urban centres which have both water supply and sanitation plans. In the selected monitoring points, groundwater levels are monitored monthly through dedicated boreholes. It is important to monitor and confirm that the groundwater levels for sustainable use are recoverable in an annual cycle.
d) Groundwater Quality
Groundwater quality is monitored at the same points where groundwater level monitoring stations are located. Monitoring of groundwater quality is conducted quarterly.
e) Rainfall
The rainfall station density should be considered by climatic regions for arid, semi-arid or humid areas. Since most of the LVSCA belongs to humid areas, the criterion of one station in 500 km2 to 1,000 km2 is applied for the selection of rainfall monitoring stations. There are areas that belong to semi-arid area in the southeastern part of the LVSCA. For such areas, the criterion of one station in 3,000 km2
to 5,000 km2 is applied.
2) Evaluation
a) Water Resources Quantity Evaluation
Water resources quantity evaluation is conducted annually based on i) monitoring data for surface water, groundwater, and rainfall and ii) water permit issuance data. Abstraction survey data will be used as necessary to grasp the actual water use status. For surface water resources evaluation, focus should be on the four major rivers of Nyando, Sondu, Gucha-Migori, and Mara as they are the representative rivers in the LVSCA.
b) Water Resources Quality Evaluation
Water resources quality evaluation is also conducted annually based on the monitoring data for surface water and groundwater quality.
3) Water Permit Issuance and Control
Prior to the future impeding water demand in the basin, water permits should be duly controlled and issued based on the actual status of water use. In view of this, the latest version of issued permits should be controlled. In addition, “Guidelines for Water Allocation (WRMA, 2010)” should be revised considering future demand and water resources development plans. To conduct these activities, the enforcement of water rights officers should be considered by reflecting the current staffing situation.

Water Resources Management Plan Final Report Chapter 3 Sectoral Report (H) Water Resources Management
The Development of H - 50 Nippon Koei Co., Ltd. the National Water Master Plan 2030
4) Watershed Conservation
Following the overall planning concept and framework on watershed conservation, management strategy for the LVSCA will be formulated. All of the three major items of: a) recovery of forest areas; b) conservation of small water sources; and c) control of soil erosion should be considered in the LVSCA.
a) Recovery of forest areas
Forest recovery will be implemented through forestation focusing on the Mau Forest Complex of the Five Water Towers.
b) Conservation of small water sources
Conservation of small water sources in the catchment area should be considered.
c) Control of soil outflow caused by deforestation
Preventive measures for soil erosion caused by deforestation in the catchment area should be considered.
3.4.2 Proposed Water Resources Management Plan
Based on the management strategy described in Subsection 3.4.1, the proposed water resources management plan in the LVSCA will be as follows:
1) Monitoring
Monitoring plans are described for five monitoring items which are i) surface water level, ii) surface water quality, iii) groundwater level, iv) groundwater quality, and v) rainfall. Locations of the proposed monitoring stations are shown in Figure 3.3.3. The number of target, operational, and proposed monitoring stations are shown in Table 3.3.1.
a) Surface Water Level
As for the major rivers in the catchment area, five monitoring points were selected as representative points for the Nyando River, five for the Sondu River, four for the Gucha-Migori River, and three for the Mara River. In addition, there are five monitoring points along the small rivers located in the northern and southern shores of the Winum Gulf, and one monitoring point for the water level of Lake Victoria. In total, 23 monitoring points were selected. For the four major rivers, the reference points were selected as follows:
i) 1GD03 is located in the lower reaches of the Nyando River. Monitoring started in 1967. ii) 1JG05 is located in the lower reaches of the Sondu River. Monitoring started in 1946. iii) 1KB03 is located in the middle reaches of the Gucha River. Monitoring started in 1965. iv) 1KC03 is located in the middle reaches of the Migori River. Monitoring started in 1951. v) 1LA04 is located in the middle reaches of the Mara River. Monitoring started in 1970.

Final Report Water Resources Management Plan Sectoral Report (H) Water Resources Management Chapter 3
Nippon Koei Co., Ltd. H - 51 The Development of the National Water Master Plan 2030
All the abovementioned reference points are set to check the flow regime of the river after satisfying upstream water demand and to confirm the available discharge to satisfy the downstream demand. For that purpose, based on the management strategy described in Section 3.2, normal discharge values are set at the above five reference points as shown below. These normal discharge values are used for low water management.
Normal Discharge at Reference Point (LVSCA) (Unit: m3/sec)
Reference Point Normal Discharge (Reserve + Water Demand for the
Downstream of Reference Point) 2010 2030
Nyando River (1GD03) 2.0 (=1.6+0.4) 6.1 (=1.6+4.5) Sondu River (1JG05) 10.6 (=10.4+0.2) 15.8 (=10.4+5.4) Gucha River (1KB03) 1.3 (=0.4+0.9) 1.4 (=0.4+1.0) Migori River (1KC03) 1.9 (=1.5+0.4) 3.8 (=1.5+2.3) Mara River(1LA04) 4.4 (=4.3+0.1) 4.4 (=4.3+0.1)
Source: JICA Study Team
The above normal discharges are to be reviewed and revised as necessary in the “Water Resources Quantity Evaluation” based on monitoring, which is to be mentioned in the following clause. Such review and revision works are to be made based on issued water permits (water demand) and reserve of that year. In case the observed discharge at a reference point is lower than the normal discharge, it is probable that there would be over-abstraction of water in the upstream or decreased reserve caused by an extreme drought. In such a case it is necessary to identify the reason and take measures such as increase of the level of oversight for water abstraction or drought conciliation.
b) Surface Water Quality
Stations monitoring on a monthly basis
The water quality of the five points is monitored on a monthly basis as discussed below. This monitoring is for watching and detecting possible pollutant sources that may affect water usage in the relevant rivers.
i) 1GD03 (downstream area of the Nyando River near Ahero Town, as the reference point): To monitor the impacts of urban effluent from the major towns of Londiani, Kipkelion, and Muhoroni as well as effluent from irrigation on river water quality;
ii) 1JG05 (downstream area of the Sondu River near Sondu Town, as the reference point): To monitor the impacts of urban effluent from the major towns of Kericho and Sotik and effluent from irrigation schemes on river water quality;
iii) 1KB03 (in the middle reaches of the Gucha River, as the reference point): To monitor the impacts of urban effluent from the major towns of Kisii and Ogembo as well as effluent from irrigation schemes on river water quality;
iv) 1KC03 (in the downstream reaches of the Migori River): To monitor the impacts of urban effluent from the towns of Kehancha and Migori on river water quality; and
v) 1LA04 (in the middle reaches of the Mara River near the gate to Masai Mara National Reserve): To monitor the impacts of urban effluent from Bomet Town on river water quality.

Water Resources Management Plan Final Report Chapter 3 Sectoral Report (H) Water Resources Management
The Development of H - 52 Nippon Koei Co., Ltd. the National Water Master Plan 2030
Stations monitoring on a quarterly basis
Apart from the above five monitoring stations, water quality of the other surface water monitoring stations (18 points) should be monitored on a quarterly basis (January, April, July and October of every year). Such data are used as reference when WRMA issues water permits. The said 18 monitoring points are 1GC04, 1JF08, 1LA03, 1GB06A, 1GD07, 1GG01, 1HA14, 1HB04, 1HB05, 1HD03, 1HD05, 1HE01, 1JA02, 1JD03, 1JG04, 1KA09, 1KB05 and 1LB02.
c) Groundwater Level
There were 19 points selected for groundwater level monitoring through dedicated boreholes. These points are located near urban centres where there are both water supply and sanitation plans with expected high growth of groundwater demand in the future. The said 19 points are located in the towns of Kisumu, Ahero, Awasi, Mohoroni, Kipkelion, Londiani, Kericho, Homa Bay, Oyugis, Nyamira, Suneka, Kisii, Rongo, Koroka, Bomet, Awendo, Migori, Kehancha and Kendu Bay.
d) Groundwater Quality
Groundwater quality is monitored at same locations where groundwater level monitoring stations are located. Monitoring of groundwater quality is conducted quarterly.
e) Rainfall
The LVSCA mostly belongs to the region that relatively experience heavy rainfall. As what was described in the overall concept, the distribution of rainfall monitoring stations was reviewed with the criteria of one location in 500 km2 to 1,000 km2. For the areas that belong to semi-arid areas in the southeastern part of the LVSCA, review was made with the criterion of one station in 3,000 km2 to 5,000 km2. As a result of the review, 50 rainfall monitoring stations were proposed.
2) Evaluation
a) Water Resources Quantity Evaluation
The water resources quantity evaluation is conducted annually based on i) monitoring data for surface water, groundwater and rainfall and ii) water permit issuance data. In view of this, a water resources evaluation team is formed which is composed of: i) one chief hydrologist from Kisumu Regional Office and ii) one assistant hydrologist each from Kisumu, Kericho, and Kisii subregional offices. Water resources evaluation works are done for the whole LVSCA on both surface water and groundwater.
b) Water Resources Quality Evaluation
Water resources quality evaluation is also conducted annually based on the monitoring data for surface water and groundwater quality. For this, a chief water quality expert is assigned in the water quality test laboratory in Kisumu.
3) Water Permit Issuance and Control
The following activities on water permit issuance and control are proposed:

Final Report Water Resources Management Plan Sectoral Report (H) Water Resources Management Chapter 3
Nippon Koei Co., Ltd. H - 53 The Development of the National Water Master Plan 2030
a) Control of the latest version of issued water permits Periodical update of water permit database Establishment and enhancement of the notification system on permit expiry
b) Revision of “Guidelines for Water Allocation (WRMA, 2010)” Formulation of water allocation plans considering future water demand
c) Increase in the number of water rights officers for the smooth implementation of water permits issuance and control.
Number of Required Water Rights Officers (LVSCA)
Offices Number of Water Rights Officers Current Required Future
Kisumu RO 0 +1 1 Kisumu SRO 1 +1 2 Kericho SRO 1 +1 2 Kisii SRO 2 No change 2 Total 4 +3 7
Source: JICA Study Team, based on interview with WRMA Regional Offices
Locations of the regional and subregional offices are shown in Figure 2.3.4. The number of required water rights officers was derived through an interview with the WRMA regional office in Kisumu. Based on the indicated figures above, detailed assessment should be made on the expected actual amount of works in order to decide on the final figures.
4) Watershed Conservation
With regard to watershed conservation, the following activities are proposed: a) Recovery of Forest Areas
As for forest recovery for watershed conservation, about 412,000 ha of forestation is proposed in the LVSCA to achieve the targets of Kenya Vision 2030. The current situations of the forest areas in the LVSCA and potential areas for forestation are shown in Figure 3.3.4.
The following steps were applied in the preparation of Figure 3.3.4:
i) Identify the present forest areas and deforested areas (in this master plan, the result of the satellite imagery analysis was used), and overlay the gazetted forest areas;
ii) Identify the important forest areas including deforested areas as water source forests; iii) Delineate the potential forestation areas on those located in step ii), and formulate the area
with consideration of significant forest area; and iv) Connect the isolated small gazetted forest areas by corridor and delineate the potential
forestation area with the combination of these two areas.
Of the target, the gazetted forest is supposed to be implemented by KFS.
b) Conservation of Small Water Sources
As for the conservation of small water sources, it is proposed to carry out a survey on small water sources, which includes location, scale, water use, water quality, vegetation condition, management method, major issues, etc.

Water Resources Management Plan Final Report Chapter 3 Sectoral Report (H) Water Resources Management
The Development of H - 54 Nippon Koei Co., Ltd. the National Water Master Plan 2030
c) Control of Soil Erosion
As for the control of soil erosion, it is proposed to carry out a survey on damaged areas where soil erosion occurred in the catchment area. The survey should investigate location, scale of the current situation, required countermeasures, etc.
3.5 Water Resources Management Plan for the RVCA
The RVCA is located in the central-western part of Kenya, which includes the rivers flowing in the so called Rift Valley. The RVCA borders with South Sudan and Ethiopia in the north, Uganda in the northwest. and Tanzania in the south.
There are seven lakes along the Rift Valley from the north, namely, lakes of Turkana, Baringo, Bogoria, Nakuru, Elementaita, Naivasha, and Magadi. Rivers in the RVCA originate from the Mount Elgon, Mau Forest Complex, Cherangani Hills, and the Abadare Range. Most of them flow into the abovementioned seven lakes. There are three major seasonal rivers namely Turkwel, Kerio, and Ewaso Ng’iro South and small rivers flowing into the above seven lakes.
3.5.1 Management Strategy
Based on the overall planning concept and framework as described in Section 3.2, Water Resources Management Strategy for the RVCA is set for the major components of i) monitoring, ii) evaluation, iii) water permit issuance and control, and iv) watershed conservation as follows:
1) Monitoring
Monitoring strategies are described for five monitoring items, which are i) surface water level, ii) surface water quality, iii) groundwater level, iv) groundwater quality, and v) rainfall.
a) Surface Water Level
The Turkwel, Kerio, and Ewaso Ng’iro South rivers are selected as representative rivers to capture the runoff characteristics of the basin. As major lakes, seven lakes in the RVCA are selected. Surface water level monitoring stations are reviewed to capture the major points of these three rivers, seven major lakes, and the rivers flowing into these lakes (refer to Figure 2.3.7).
b) Surface Water Quality
The same as surface water level, the surface water quality monitoring points are also selected from three representative rivers and seven major lakes, and rivers flowing into these lakes.
For the three rivers, selected monitoring points should be located at the downstream of pollution sources such as major cities and irrigation schemes. Such points should be monitored monthly.
One location for lake water quality should be monitored on a quarterly basis.
In addition, other surface water level monitoring points are selected for water quality monitoring done on a quarterly basis. Such monitoring data is required as reference water quality in the evaluation of water permit application in the relevant basin.

Final Report Water Resources Management Plan Sectoral Report (H) Water Resources Management Chapter 3
Nippon Koei Co., Ltd. H - 55 The Development of the National Water Master Plan 2030
c) Groundwater Level
Groundwater monitoring points are set at locations where significant groundwater use is expected in the future. Such points are in urban centres which have both water supply and sanitation plans. In the selected monitoring points, groundwater levels are monitored monthly with dedicated boreholes. It is important to monitor and confirm that the groundwater levels for sustainable use are recoverable in an annual cycle.
d) Groundwater Quality
Groundwater quality is monitored at the same points where groundwater level monitoring stations are located. Monitoring of groundwater quality is conducted quarterly.
e) Rainfall
The rainfall station density should be considered by climatic regions for arid, semi-arid or humid areas. In the arid area of the northern part, the criterion of one station in 8,000 km2 to 10,000 km2 is applied. For the semi-arid areas in central western part in the upper Turkwel River and whole of Ewaso Ng’iro South River, the criterion of one station in 3,000 km2 to 5,000 km2 is applied. For the rest of the basin in the central part, that belongs to humid areas, the criterion of one station in 500 km2 to 1,000 km2 is applied for the selection of rainfall monitoring stations.
2) Evaluation
a) Water Resources Quantity Evaluation
Water resources quantity evaluation is conducted annually based on i) monitoring data for surface water, groundwater and rainfall and ii) water permit issuance data. Abstraction survey data will be used as necessary to grasp the actual water use status. For surface water resources evaluation, focus should be on the three major rivers of Turkwel, Kerio, and Ewaso Ng’iro South as these are representative rivers in the RVCA. In the northern part, evaluation of groundwater resources is quite important.
b) Water Resources Quality Evaluation
Water resources quality evaluation is also conducted annually based on the monitoring data for surface water and groundwater quality.
3) Water Permit Issuance and Control
Prior to the future impeding water demand in the basin, water permits should be duly controlled and issued based on the actual status of water use. In view of this, the latest version of issued permits should be controlled. In addition, “Guidelines for Water Allocation (WRMA, 2010)” should be revised considering the future demand and water resources development plans. To conduct these activities, the enforcement of water rights officers should be considered by reflecting the current staffing situation.

Water Resources Management Plan Final Report Chapter 3 Sectoral Report (H) Water Resources Management
The Development of H - 56 Nippon Koei Co., Ltd. the National Water Master Plan 2030
4) Watershed Conservation
Following the overall planning concept and framework on watershed conservation, management strategy for the RVCA will be formulated. Of the three major items of: a) recovery of forest areas; b) conservation of small water sources; and c) control of soil erosion, item c) is not an issue in the RVCA. Therefore, items a) and b) will be considered in the RVCA.
a) Recovery of forest areas
Forest recovery will be implemented through reforestation focusing on Cherangani Hills and the Mau Forest Complex of the Five Water Towers.
b) Conservation of small water sources
Conservation of small water sources in the catchment area should be considered.
3.5.2 Proposed Water Resources Management Plan
Based on the management strategy described in Subsection 3.5.1, the proposed water resources management plan in the RVCA will be as follows:
1) Monitoring
Monitoring plan are described for five monitoring items, which are i) surface water level, ii) surface water quality, iii) groundwater level, iv) groundwater quality, and v) rainfall. Locations of proposed monitoring stations are shown in Figure 3.3.5. The number of target, operational, and proposed monitoring stations are shown in Table 3.3.1.
a) Surface Water Level
As for the major rivers and lakes in the catchment area, two monitoring points were selected as representative points for each of the Turkwel, Kerio, and Ewaso Ng’iro South rivers, one monitoring point each for the seven lakes, ten locations for rivers flowing into major lakes. In total, 23 monitoring points were selected. For major rivers, the following reference points were selected as follows:
i) 2B21 is located in the lower reaches of the Turkwel River. Monitoring started in 1974, with relatively long term data which seems to be sufficient for evaluation of water resources in the river.
ii) 2C16 is located in the upper reaches of the Kerio River. Monitoring started in 1988. The station has a dam development plan in the upstream and irrigation development plan in the downstream.
iii) 2K06 is located in the upper reaches of the Ewaso Ng’iro South River. It is appropriate to set a reference point at this location as the downstream reach is not a perennial river.
iv) 2GB01 is located in the lower reaches of the Malewa River before the river flows into Lake Naivasha. Monitoring started in 1931 with long term data which is required for evaluation of water resources in the river.
All the above reference points are set to check the flow regime of the river after satisfying upstream water demand and to confirm the available discharge to satisfy the downstream

Final Report Water Resources Management Plan Sectoral Report (H) Water Resources Management Chapter 3
Nippon Koei Co., Ltd. H - 57 The Development of the National Water Master Plan 2030
demand. For that purpose, based on the management strategy described in Section 3.2, normal discharge values are set at the above four reference points as shown below. These normal discharge values are used for low water management.
Normal Discharge at Reference Point (RVCA) (Unit: m3/sec)
Reference Point Normal Discharge (Reserve + Water Demand for the
Downstream of Reference Point) 2010 2030
Turkwel River (2B21) 0.3 (=0.0+0.3) 0.3 (=0.0+0.3) Kerio River (2C16) 0.1 (=0.0+0.1) 0.1 (=0.0+0.1) Ewaso Ng’iro South River (2K06) 0.1 (=0.0+0.1) 0.1 (=0.0+0.1) Malewa River (2GB01) 0.1 (=0.0+0.1) 2.0 (=0.0+2.0)
Source: JICA Study Team
The above normal discharges are to be reviewed and revised as necessary in the “Water Resources Quantity Evaluation” based on monitoring, which is to be mentioned in the following clause. Such review and revision works are to be made based on issued water permits (water demand) and reserve of that year. In case the observed discharge at a reference point is lower than the normal discharge, it is probable that there would be over-abstraction of water in the upstream or decreased reserve caused by an extreme drought. In such a case it is necessary to identify the reason and take measures such as increase of the level of oversight for water abstraction or drought conciliation.
b) Surface Water Quality
Stations monitoring on a monthly basis
The water quality of the five points is monitored on a monthly basis as discussed below. This monitoring is for watching and detecting possible pollutant sources that may affect water usage in the relevant rivers.
i) 2B21 (downstream area of the Turkwel River near Lodwar Town as the reference point): To monitor the impacts of effluent from irrigation on river water quality;
ii) 2GB01 (downstream area of the Malewa River as the reference point): To monitor the river water quality before flowing into the lake;
iii) 2GD06 (Lake Naivasha): To monitor the lake water quality.
Stations monitoring on a quarterly basis
Apart from the above three monitoring stations, water quality of the other surface water monitoring stations (20 points) should be monitored on a quarterly basis (January, April, July and October of every year). Such data are used as reference when WRMA issues water permits. The said 20 monitoring stations are 2B13, 2B33, 2C14, 2C16, 2EB03, 2EB10, 2ED01, 2ED02, 2ED03, 2EH01, 2FA08, 2FA09, 2FC04, 2FC19, 2GA01, 2GD07, 2H03, 2K04, 2K06 and Lake Magadi (newly proposed).
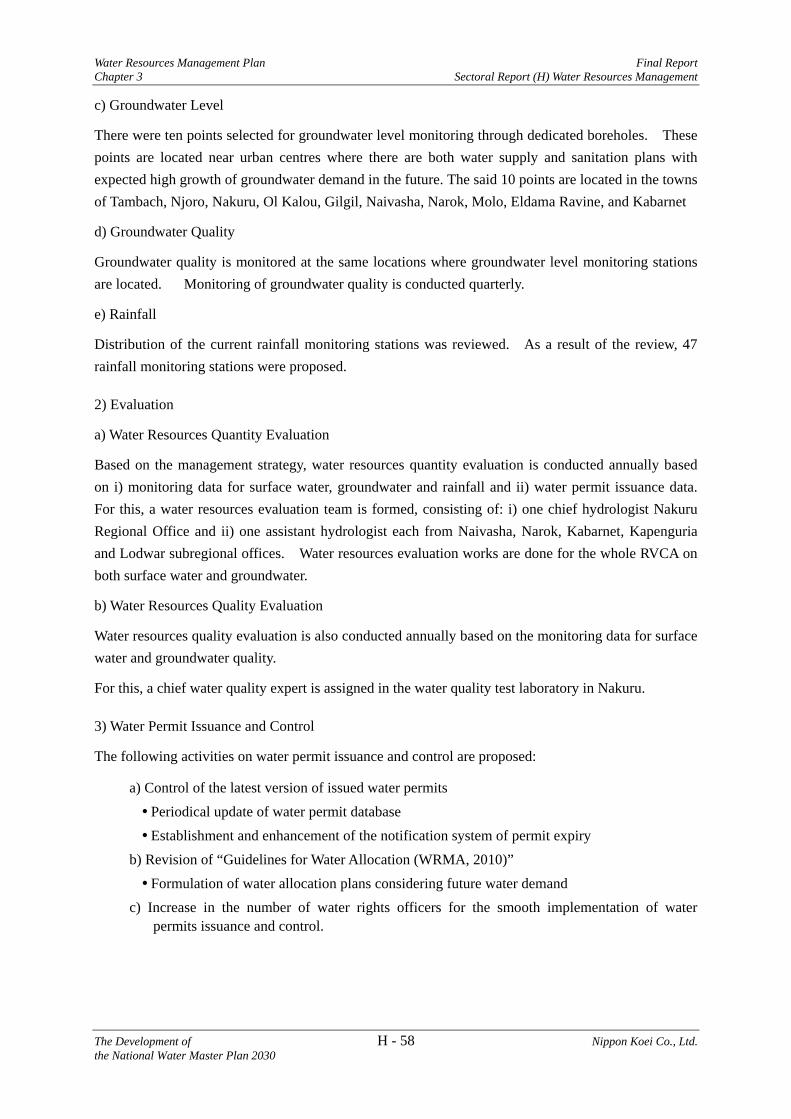
Water Resources Management Plan Final Report Chapter 3 Sectoral Report (H) Water Resources Management
The Development of H - 58 Nippon Koei Co., Ltd. the National Water Master Plan 2030
c) Groundwater Level
There were ten points selected for groundwater level monitoring through dedicated boreholes. These points are located near urban centres where there are both water supply and sanitation plans with expected high growth of groundwater demand in the future. The said 10 points are located in the towns of Tambach, Njoro, Nakuru, Ol Kalou, Gilgil, Naivasha, Narok, Molo, Eldama Ravine, and Kabarnet
d) Groundwater Quality
Groundwater quality is monitored at the same locations where groundwater level monitoring stations are located. Monitoring of groundwater quality is conducted quarterly.
e) Rainfall
Distribution of the current rainfall monitoring stations was reviewed. As a result of the review, 47 rainfall monitoring stations were proposed.
2) Evaluation
a) Water Resources Quantity Evaluation
Based on the management strategy, water resources quantity evaluation is conducted annually based on i) monitoring data for surface water, groundwater and rainfall and ii) water permit issuance data. For this, a water resources evaluation team is formed, consisting of: i) one chief hydrologist Nakuru Regional Office and ii) one assistant hydrologist each from Naivasha, Narok, Kabarnet, Kapenguria and Lodwar subregional offices. Water resources evaluation works are done for the whole RVCA on both surface water and groundwater.
b) Water Resources Quality Evaluation
Water resources quality evaluation is also conducted annually based on the monitoring data for surface water and groundwater quality.
For this, a chief water quality expert is assigned in the water quality test laboratory in Nakuru.
3) Water Permit Issuance and Control
The following activities on water permit issuance and control are proposed:
a) Control of the latest version of issued water permits Periodical update of water permit database Establishment and enhancement of the notification system of permit expiry
b) Revision of “Guidelines for Water Allocation (WRMA, 2010)” Formulation of water allocation plans considering future water demand
c) Increase in the number of water rights officers for the smooth implementation of water permits issuance and control.

Final Report Water Resources Management Plan Sectoral Report (H) Water Resources Management Chapter 3
Nippon Koei Co., Ltd. H - 59 The Development of the National Water Master Plan 2030
Number of Required Water Rights Officers (RVCA)
Offices Number of Water Rights Officers Current Required Future
Nakuru RO 1 No change 1 Naivasha SRO 1 +3 4 Narok SRO 2 No change 2 Kabarnet SRO 1 +2 3 Kapenguria SRO 1 +1 2
Lodwar SRO 0 +3 3 Total 6 +9 15
Source: JICA Study Team, based on interview with WRMA Regional Offices
Locations of regional and subregional offices are shown in Figure 2.3.6. The number of required water rights officers was derived through an interview with the WRMA regional office in Nakuru. Based on the indicated figures above, detailed assessment should be made on the expected actual amount of works in order to decide the final figures.
4) Watershed Conservation
With regard to watershed conservation, the following activities are proposed:
a) Recovery of Forest Areas
As for forest recovery for watershed conservation, about 1,006,000 ha of forestation is proposed in the RVCA to achieve the targets of Kenya Vision 2030. The current situations of the forest areas in the RVCA and potential areas for forestation are shown in Figure 3.3.6.
The following steps were applied in the preparation of Figure 3.3.6.
i) Identify the present forest areas and deforested areas (in this master plan, the result of the satellite imagery analysis was used), and overlay the gazetted forest areas;
ii) Identify the important forest areas including deforested areas as water source forests; iii) Delineate the potential forestation areas on those located in step ii), and formulate the area
with consideration of significant forest area; and iv) Connect the isolated small gazetted forest areas by corridor and delineate the potential
forestation area with the combination of these two areas.
Of the targets, the gazetted forest is supposed to be implemented by KFS.
b) Conservation of Small Water Sources
As for the conservation of small water sources, it is proposed to carry out a survey on small water sources, which includes location, scale, water use, water quality, vegetation condition, management method, major issues, etc.
3.6 Water Resources Management Plan for the ACA
The ACA is located in the southeastern part of Kenya, which consists of the major rivers of Athi, international rivers of Namanga and Lumi, and other rivers that flow into the Indian Ocean.

Water Resources Management Plan Final Report Chapter 3 Sectoral Report (H) Water Resources Management
The Development of H - 60 Nippon Koei Co., Ltd. the National Water Master Plan 2030
3.6.1 Management Strategy
Based on the overall planning concept and framework as described in Section 3.2, Water Resources Management Strategy for the ACA is set for the major components of i) monitoring, ii) evaluation, iii) water permit issuance and control, and iv) watershed conservation, as follows:
1) Monitoring
Monitoring strategies are described for five monitoring items, which are i) surface water level, ii) surface water quality, iii) groundwater level, iv) groundwater quality, and v) rainfall.
a) Surface Water Level
The Athi River and its major tributaries are selected as representative rivers to capture the runoff characteristics of the basin. In addition, rivers with relatively small catchment area that flow into the Indian Ocean, international rivers of Namanga and Lumi are also regarded as representative rivers. As for the major international lakes of Chala and Jipe, the major springs of Mzima and Kibwezi are selected for monitoring. Surface water level monitoring stations are reviewed to capture the major points of these three rivers, major lakes, and major springs (refer to Figure 2.3.9).
b) Surface Water Quality
The same as surface water level, the surface water quality monitoring points are also selected from the representative rivers, lakes, and springs.
For the three rivers, selected monitoring points should be located downstream of pollution sources such as major cities and irrigation schemes. Such points should be monitored monthly.
One location for lake water quality and spring water quality should be monitored on a quarterly basis.
In addition, other surface water level monitoring points are selected for water quality monitoring done on a quarterly basis. Such monitoring data is required as reference water quality in the evaluation of water permit application in the relevant basin.
c) Groundwater Level
Groundwater monitoring points are set at locations where significant groundwater use is expected in the future. Such points are in urban centres which have both water supply and sanitation plans. In the selected monitoring points, groundwater levels are monitored monthly with dedicated boreholes. It is important to monitor and confirm that the groundwater levels for sustainable use are recoverable in an annual cycle.
d) Groundwater Quality
Groundwater quality is monitored at the same points where groundwater level monitoring stations are located. Monitoring of groundwater quality is conducted quarterly.
e) Rainfall
The rainfall station density should be considered by climatic regions for arid, semi-arid or humid areas. Most of the catchment area belongs to semi-arid area except northwestern part of the catchment in Nairobi and surrounding area. For the semi-arid areas in most of the catchment area, the criterion of

Final Report Water Resources Management Plan Sectoral Report (H) Water Resources Management Chapter 3
Nippon Koei Co., Ltd. H - 61 The Development of the National Water Master Plan 2030
one station in 3,000 km2 to 5,000 km2 is applied. For the rest of the basin in the northwestern part, that belongs to humid areas, the criterion of one station in 500 km2 to 1,000 km2 is applied for the selection of rainfall monitoring stations.
2) Evaluation
a) Water Resources Quantity Evaluation
Water resources quantity evaluation is conducted annually based on i) monitoring data for surface water, groundwater, and rainfall and ii) water permit issuance data. Abstraction survey data will be used as necessary to grasp the actual water use status. For surface water resources evaluation, focus should be on the major rivers of Athi and its tributaries as they are the representative rivers in the ACA. In the major cities of Nairobi and Mombasa including the surrounding areas, evaluation of groundwater resources is also important.
b) Water Resources Quality Evaluation
Water resources quality evaluation is conducted annually based on the monitoring data for surface water and groundwater quality. Currently, there is only one water quality test laboratory in Machakos located in the catchment area. For timely analysis of monitored water quality, especially in the coastal area, additional water quality test laboratory should be established.
3) Water Permit Issuance and Control
Prior to the future impeding water demand in the basin, water permits should be duly controlled and issued based on the actual status of water use. In view of this, the latest version of issued permits should be controlled. In addition, “Guidelines for Water Allocation (WRMA, 2010)” should be revised considering future demand and water resources development plans. To conduct these activities, the enforcement of water rights officers should be considered by reflecting the current staffing situation.
4) Watershed Conservation
Following the overall planning concept and framework on watershed conservation, management strategy for the ACA will be formulated. Of the three major items namely, a) recovery of forest areas; b) conservation of small water sources; and c) control of soil erosion, item c) is not an issue in the ACA. Therefore, only items a) and b) will be considered in the ACA.
a) Recovery of forest areas
Forest recovery will be implemented through forestation focusing on the Aberdare Range of the Five Water Towers and gazetted forests in the coastal areas.
b) Conservation of small water sources
Conservation of small water sources in the catchment area will be considered.

Water Resources Management Plan Final Report Chapter 3 Sectoral Report (H) Water Resources Management
The Development of H - 62 Nippon Koei Co., Ltd. the National Water Master Plan 2030
3.6.2 Proposed Water Resources Management Plan
Based on the management strategy described in Subsection 3.6.1, the proposed water resources management plan in the ACA will be as follows:
1) Monitoring
Monitoring plans are described for five monitoring items, which are i) surface water level, ii) surface water quality, iii) groundwater level, iv) groundwater quality, and v) rainfall. Locations of the proposed monitoring stations are shown in Figure 3.3.7. The number of target, operational, and proposed monitoring stations are shown in Table 3.3.1.
a) Surface Water Level
Based on the overall concept, the current monitoring network was reviewed mainly for the Athi River and its tributaries, there were six monitoring points selected in the Athi River, five in the tributaries of the Athi River in its upper reaches, two in the tributary of Athi in its middle reaches, two in the major springs of Mzima and Kibwezi one each for international rivers and lakes, namely, Lumi and Namanga Rivers, lakes of Jipe and Chala, and five locations for rivers flowing into the Indian Ocean. In total, 26 monitoring points were selected. For major rivers, the following reference points were selected as follows:
i) 3DB01 is located in the middle reaches of the Athi River. Monitoring started in 1980. ii) 3HA12 is located in the lower reaches of the Athi River. Monitoring started in 1980 but
the monitoring is currently suspended. The point is used for checking whether sufficient river maintenance flow (reserve) is available in case water transfer from Mzima Spring to Mombasa increases in the future.
All the above reference points are set to check the flow regime of the river after satisfying upstream water demand and to confirm the available discharge to satisfy the downstream demand. For that purpose, based on the management strategy described in Section 3.2, normal discharge values are set at the above two reference points as shown below. These normal discharge values are used for low water management.
Normal Discharge at Reference Point (ACA) (Unit: m3/sec)
Reference Point Normal Discharge (Reserve + Water Demand for the
Downstream of Reference Point) 2010 2030
Athi River (middle) (3DB01) 8.7 (=8.6+0.1) 8.7 (=8.6+0.1) Athi River (lower) (3HA12) 9.0 (=8.9+0.1) 9.0 (=8.9+0.1)
Source: JICA Study Team
The above normal discharges are to be reviewed and revised as necessary in the “Water Resources Quantity Evaluation” based on monitoring, which is to be mentioned in the following clause. Such review and revision works are to be made based on issued water permits (water demand) and reserve of that year. In case the observed discharge at a reference point is lower than the normal discharge, it is probable that there would be over-abstraction of water in the upstream or decreased reserve caused

Final Report Water Resources Management Plan Sectoral Report (H) Water Resources Management Chapter 3
Nippon Koei Co., Ltd. H - 63 The Development of the National Water Master Plan 2030
by an extreme drought. In such a case it is necessary to identify the reason and take measures such as increase of the level of oversight for water abstraction or drought conciliation.
b) Surface Water Quality
Stations monitoring on a monthly basis
The water quality of the five points is monitored on a monthly basis as discussed below. This monitoring is for watching and detecting possible pollutant sources that may affect water usage in the relevant rivers.
i) 3DB01 (located in the lower reaches of the Athi River, as the reference point): To monitor the impacts of urban effluent from Nairobi and surrounding areas on river water quality;
ii) 3HA12 (located in the lower reaches of Athi River, as the reference point): To monitor the impacts of effluent from irrigation schemes in the upper and middle Athi on river water quality. In addition, to check the river water quality in case water transfer from Mzima Spring to Mombasa increases in the future.
Stations monitoring on a quarterly basis
Apart from the above three monitoring stations, water quality of the other surface water monitoring stations (24 points) should be monitored on a quarterly basis (January, April, July and October of year). Such data are used as reference when WRMA issues water permits. The said 24 monitoring stations are 3AA06, 3BA10, 3BA29, 3BC08, 3BD05, 3CB05, 3EA02, 3F02, 3F06, 3F09, 3F11, 3G01, 3G02 , 3HA13, 3J02, 3J12, 3J15C, 3KB01, 3KD06, 3KG01, 3LA05, 3MH26, Namanga (new), and Lokerish (new).
c) Groundwater Level
There were 24 points selected for groundwater level monitoring through dedicated boreholes. These points are located near urban centres where there are both water supply and sanitation plans with expected high growth of groundwater demand in the future. The said 24 points are located in the towns of Karui, Limuru, Kikuyu, Ngong, Ongata Rongai, Kitengela, Kiambu, Ruiru, Nairobi City, Juja, Mavoko, Kangundo, Machakos, Malindi, Kilifi, Mtwapa, Mombasa, Kwale, Ukunda, Kiserian, Taveta, Mariakani, Voi, and Kajiado.
d) Groundwater Quality
Groundwater quality is monitored at the same locations where groundwater level monitoring stations are located. Monitoring of groundwater quality is conducted quarterly.
e) Rainfall
Distribution of current rainfall monitoring stations was reviewed. As a result the review, 38 rainfall monitoring stations were proposed.

Water Resources Management Plan Final Report Chapter 3 Sectoral Report (H) Water Resources Management
The Development of H - 64 Nippon Koei Co., Ltd. the National Water Master Plan 2030
2) Evaluation
a) Water Resources Quantity Evaluation
The water resources quantity evaluation is conducted annually based on i) monitoring data for surface water, groundwater, and rainfall and ii) water permit issuance data. In view of this, a water resources evaluation team is formed which is composed of: i) one chief hydrologist from Machakos Regional Office and ii) one assistant hydrologist each from Kiambu, Nairobi, Kibwezi, Loitoktok, and Mombasa subregional offices. Water resources evaluation works are done for the whole ACA on both surface water and groundwater.
b) Water Resources Quality Evaluation
Water resources quality evaluation is also conducted annually based on the monitoring data for surface water and groundwater quality.
Additional water quality test laboratory should be established in Mombasa for timely analysis of water quality sample especially in the coastal region. For the management of laboratory and evaluation of water quality, a chief water quality expert with appropriate staff should be assigned in the water quality test laboratories in Nakuru and Mombasa.
3) Water Permit Issuance and Control
The following activities on water permit issuance and control are proposed:
a) Control of the latest version of issued water permits Periodical update of water permit database Establishment and enhancement of the notification system on permit expiry
b) Revision of “Guidelines for Water Allocation (WRMA, 2010)” Formulation of water allocation plans considering future water demand
c) Increase in the number of water rights officers for the smooth implementation of water permits issuance and control.
Number of Required Water Rights Officers (ACA)
Offices Number of Water Rights Officers Current Required Future
Machakos RO 1 +2 3 Kiambu SRO 1 +1 2 Nairobi SRO 1 +2 3 Kibwezi SRO 1 +1 2 Loitoktok SRO 1 +1 2 Mombasa SRO 1 +3 4 Total 6 +10 16
Source: JICA Study Team, based on interview with WRMA Regional Offices
Locations of regional and subregional offices are shown in Figure 2.3.8. The number of required water rights officers was derived through an interview with the WRMA regional office in Machakos. Based on the indicated figures above, detailed assessment should be made on the expected actual amount of works in order to decide on the final figures.

Final Report Water Resources Management Plan Sectoral Report (H) Water Resources Management Chapter 3
Nippon Koei Co., Ltd. H - 65 The Development of the National Water Master Plan 2030
4) Watershed Conservation
With regard to watershed conservation, the following activities are proposed:
a) Recovery of Forest Areas
As for forest recovery for watershed conservation, about 868,000 ha of forestation is proposed in the ACA to achieve the targets of Kenya Vision 2030. The current situations of the forest areas in the ACA and potential areas for forestation are shown in Figure 3.3.8.
The following steps were applied in the or preparation of Figure 3.3.8:
i) Identify the present forest areas and deforested areas (in this master plan, the result of the satellite imagery analysis was used), and overlay the gazetted forest areas;
ii) Identify the important forest areas including deforested areas as water source forests; iii) Delineate the potential forestation areas on those located in step ii), and formulate the area
with consideration of significant forest area; and iv) Connect the isolated small gazetted forest areas by corridor and delineate the potential
forestation area with the combination of these two areas.
Of the targets, the gazetted forest is supposed to be implemented by the KFS.
b) Conservation of Small Water Sources
As for the conservation of small water sources, it is proposed to carry out a survey on small water sources, which includes location, scale, water use, water quality, vegetation condition, management method, major issues, etc.
3.7 Water Resources Management Plan for the TCA
The TCA is located in the eastern part of Kenya, which consists of its major rivers of Tana and its tributaries.
3.7.1 Management Strategy
Based on the overall planning concept and framework as described in Section 3.2, Water Resources Management Strategy for the TCA is set for the major components of i) monitoring, ii) evaluation, iii) water permit issuance and control, and iv) watershed conservation, as follows:
1) Monitoring
Monitoring strategies are described for five monitoring items, which are i) surface water level, ii) surface water quality, iii) groundwater level, iv) groundwater quality, and v) rainfall.
a) Surface Water Level
The Tana River and its major tributaries are selected as representative rivers to capture the runoff characteristics of the basin. As the current surface water level monitoring stations are concentrated in the upper reaches and its tributaries, locations of these monitoring stations should be reviewed so that the monitoring points would be the representative for each tributary. (refer to Figure 2.3.11).
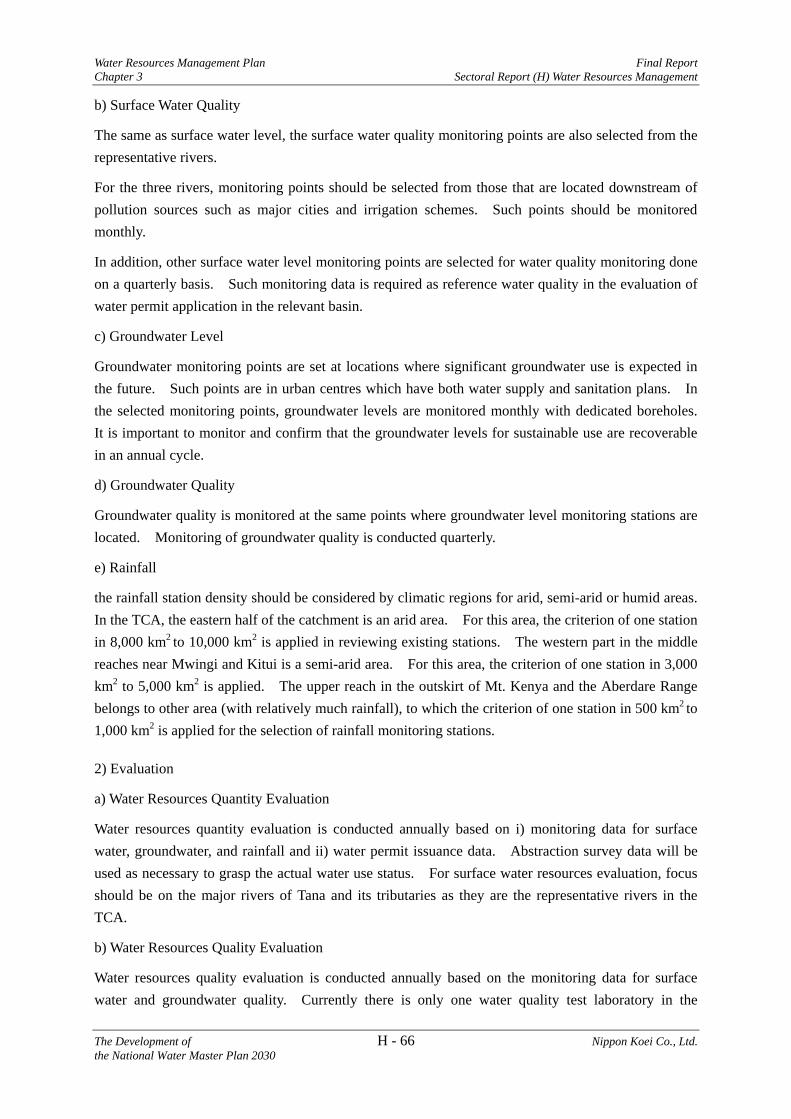
Water Resources Management Plan Final Report Chapter 3 Sectoral Report (H) Water Resources Management
The Development of H - 66 Nippon Koei Co., Ltd. the National Water Master Plan 2030
b) Surface Water Quality
The same as surface water level, the surface water quality monitoring points are also selected from the representative rivers.
For the three rivers, monitoring points should be selected from those that are located downstream of pollution sources such as major cities and irrigation schemes. Such points should be monitored monthly.
In addition, other surface water level monitoring points are selected for water quality monitoring done on a quarterly basis. Such monitoring data is required as reference water quality in the evaluation of water permit application in the relevant basin.
c) Groundwater Level
Groundwater monitoring points are set at locations where significant groundwater use is expected in the future. Such points are in urban centres which have both water supply and sanitation plans. In the selected monitoring points, groundwater levels are monitored monthly with dedicated boreholes. It is important to monitor and confirm that the groundwater levels for sustainable use are recoverable in an annual cycle.
d) Groundwater Quality
Groundwater quality is monitored at the same points where groundwater level monitoring stations are located. Monitoring of groundwater quality is conducted quarterly.
e) Rainfall
the rainfall station density should be considered by climatic regions for arid, semi-arid or humid areas. In the TCA, the eastern half of the catchment is an arid area. For this area, the criterion of one station in 8,000 km2 to 10,000 km2 is applied in reviewing existing stations. The western part in the middle reaches near Mwingi and Kitui is a semi-arid area. For this area, the criterion of one station in 3,000 km2 to 5,000 km2 is applied. The upper reach in the outskirt of Mt. Kenya and the Aberdare Range belongs to other area (with relatively much rainfall), to which the criterion of one station in 500 km2 to 1,000 km2 is applied for the selection of rainfall monitoring stations.
2) Evaluation
a) Water Resources Quantity Evaluation
Water resources quantity evaluation is conducted annually based on i) monitoring data for surface water, groundwater, and rainfall and ii) water permit issuance data. Abstraction survey data will be used as necessary to grasp the actual water use status. For surface water resources evaluation, focus should be on the major rivers of Tana and its tributaries as they are the representative rivers in the TCA.
b) Water Resources Quality Evaluation
Water resources quality evaluation is conducted annually based on the monitoring data for surface water and groundwater quality. Currently there is only one water quality test laboratory in the

Final Report Water Resources Management Plan Sectoral Report (H) Water Resources Management Chapter 3
Nippon Koei Co., Ltd. H - 67 The Development of the National Water Master Plan 2030
catchment area in Embu. For the timely analysis of monitored water quality especially in the eastern part of the catchment area, additional water quality test laboratory should be established.
3) Water Permit Issuance and Control
Prior to the future impeding water demand in the basin, water permits should be duly controlled and issued based on the actual status of water use. In view of this, the latest version of issued permits should be controlled. In addition, “Guidelines for Water Allocation (WRMA, 2010)” should be revised considering future demand and water resources development plans. To conduct these activities, the enforcement of water rights officers should be considered by reflecting the current staffing situation.
4) Watershed Conservation
Following the overall planning concept and framework watershed conservation, management strategy for the TCA will be formulated. Of the three major items of: a) recovery of forest areas; b) conservation of small water sources; and c) control of soil erosion, item b) is not an issue in the TCA. Therefore, items a) and c) will be considered in the TCA.
a) Recovery of forest areas
Forest recovery will be implemented through forestation focusing on the degraded forest areas in the catchment area.
b) Control of soil erosion
Preventive measures for soil erosion caused by deforestation in the catchment area will be considered.
3.7.2 Proposed Water Resources Management Plan
Based on the management strategy described in Subsection 3.7.1, the proposed water resources management plan in the TCA will be as follows:
1) Monitoring
Monitoring plan are described for five monitoring items, which are i) surface water level, ii) surface water quality, iii) groundwater level, iv) groundwater quality, and v) rainfall. Locations of the proposed monitoring stations are shown in Figure 3.3.9. The number of target, operational, and proposed monitoring stations are shown in Table 3.3.1.
a) Surface Water Level
Based on the overall concept, the current monitoring network was reviewed mainly for the Tana River and its tributaries, 16 monitoring points were selected in the Tana River and its tributaries in the upper reaches, seven in the middle reaches, and three in the lower reaches of the river. In total, 26 monitoring points were selected. For the major rivers, the following reference points were selected as follows:

Water Resources Management Plan Final Report Chapter 3 Sectoral Report (H) Water Resources Management
The Development of H - 68 Nippon Koei Co., Ltd. the National Water Master Plan 2030
i) 4CC03 (Yatta Furrow) is located in the Thika River, a tributary in the upper reaches of the Tana River. There is an interbasin transfer to the ACA in the upstream of this point. Monitoring started in 1961.
ii) 4BE10 (Tana Rukanga) is located in the upper reaches of the Tana River. There is a plan for interbasin transfer in the Maragua River, the upstream tributary. This point monitors the available flow after water use in the upper reaches of the Tana River.
iii) 4G01 (Garissa) is located in the middle reaches of Tana River. Monitoring started in 1934. This point is one of the most important reference points in the Tana River to monitor the discharge after water use in the upper reaches and confirm the available discharge for the downstream demands.
At reference points it is necessary to check the flow regime of the river after satisfying upstream water demand and to confirm the available discharge to satisfy the downstream demand. For that purpose, based on the management strategy described in Section 3.2, normal discharge values are set at the above three reference points as shown below. These normal discharge values are used for low water management.
Normal Discharge at Reference Point (TCA) (Unit: m3/sec)
Reference Point Normal Discharge (Reserve + Water Demand for the
Downstream of Reference Point) 2010 2030
Tana River (upper) (4BE10) 14.2 (=13.5+0.7) 14.4 (=13.5+0.9) Thika River (4CC03) 9.8 (=8.4+1.4) 10.1 (=8.4+1.7) Tana River (lower) (4G01) 57.0 (=53.5+3.5) 153.2 (=53.5+99.7)
Source: JICA Study Team
The above normal discharges are to be reviewed and revised as necessary in the “Water Resources Quantity Evaluation” based on monitoring, which is to be mentioned in the following clause. Such review and revision works are to be made based on issued water permits (water demand) and reserve of that year. In case the observed discharge at a reference point is lower than the normal discharge, it is probable that there would be over-abstraction of water in the upstream or decreased reserve caused by an extreme drought. In such a case it is necessary to identify the reason and take measures such as increase of the level of oversight for water abstraction or drought conciliation.
b) Surface Water Quality
Stations monitoring on a monthly basis
The water quality of the five points is monitored on a monthly basis as discussed below. This monitoring is for watching and detecting possible pollutant sources that may affect water usage in the relevant rivers.
i) 4BE10 (Tana Rukanga) is located in the upper reaches of the Tana River: To monitor the impacts of urban and irrigation effluent in the upper reaches on river water quality;
ii) 4G01 (Garissa) is located in the middle reaches of the Tana River: To monitor the impacts of urban effluent from Garissa Town on river water quality; and
iii) 4G02 (Garsen) is located in the lower reaches of the Tana River: To monitor the impacts of irrigation effluent in the middle to lower reaches on river water quality. Also, to monitor

Final Report Water Resources Management Plan Sectoral Report (H) Water Resources Management Chapter 3
Nippon Koei Co., Ltd. H - 69 The Development of the National Water Master Plan 2030
the deterioration of water quality caused by decreased discharge and effects of sea water intrusion.
Stations monitoring on a quarterly basis
Apart from the above three monitoring stations, water quality of the other surface water monitoring stations (23 points) should be monitored on a quarterly basis (January, April, July and October of every year). Such data are used as reference when WRMA issues water permits. The said 23 monitoring points are 4AA05, 4AB06, 4AC04, 4AD01, 4BB01, 4BC05, 4BD01, 4BE01, 4BF01, 4CA02, 4CC03, 4DA10, 4DB04, 4DC06 II, 4DD02, 4EA07, 4EB07, 4EC04, 4F09, 4F13, 4F19, 4F28 and Hola (new).
c) Groundwater Level
There were 18 points selected for groundwater level monitoring through dedicated boreholes. These points are located near urban centres where there are both water supply and sanitation plans with expected high growth of groundwater demand in the future. The said 18 points are located in the towns of Nyeri, Thika, Muranga, Maragua, Makuyu, Meru, Chogoria, Chuka, Embu, Matuu, Kitui, Garissa, Lamu, Wanguru, Runyenjes, Kerugoya, Maua, and Mwingi.
d) Groundwater Quality
Groundwater quality is monitored at the same locations where groundwater level monitoring stations are located. Monitoring of groundwater quality is conducted quarterly.
e) Rainfall
The distribution of current rainfall monitoring stations was reviewed. As a result of the review, 47 rainfall monitoring stations were proposed.
2) Evaluation
a) Water Resources Quantity Evaluation
The water resources quantity evaluation is conducted annually based on i) monitoring data for surface water, groundwater, and rainfall and ii) water permit issuance data. In view of this, a water resources evaluation team is formed which is composed of: i) one chief hydrologist from Embu Regional Office and ii) one assistant hydrologist each from Muranga, Kerugoya, Meru, Kitui, and Garissa subregional offices. Water resources evaluation works are done for the whole TCA on both surface water and groundwater.
b) Water Resources Quality Evaluation
Water resources quality evaluation is also conducted annually based on the monitoring data for surface water and groundwater quality.
Additional water quality test laboratory should be established in Garissa for the timely analysis of water quality sample especially in the middle to lower Tana. For the management of laboratory and

Water Resources Management Plan Final Report Chapter 3 Sectoral Report (H) Water Resources Management
The Development of H - 70 Nippon Koei Co., Ltd. the National Water Master Plan 2030
evaluation of water quality, a chief water quality expert with appropriate staffs should be assigned in the water quality test laboratories in Embu and Garissa.
3) Water Permit Issuance and Control
The following activities on water permit issuance and control are proposed:
a) Control of the latest version of issued water permits Periodical update of water permit database Establishment and enhancement of the notification system of permit expiry
b) Revision of “Guidelines for Water Allocation (WRMA, 2010)” Formulation of water allocation plans considering future water demand
c) Increase in the number of water rights officers for the smooth implementation of water permits issuance and control.
Number of Required Water Rights Officers (TCA)
Offices Number of Water Right Officers Current Required Future
Embu RO 2 No change 2 Muranga SRO 1 +2 3 Kerugoya SRO 1 +2 3 Meru SRO 1 +2 3 Kitui SRO 1 +1 2 Garissa SRO 1 +1 2 Total 7 +8 15
Source: JICA Study Team, based on interview with WRMA Regional Offices
Locations of regional and subregional offices are shown in Figure 2.3.10. |The number of required water rights officers was derived through interview with the WRMA regional office in Embu. Based on the indicated figures above, the detailed assessment should be made on the expected actual amount of works in order to decide the final figures.
4) Watershed Conservation
With regard to watershed conversation, the following activities are proposed:
a) Recovery of Forest Areas
As for forest recovery for watershed conservation, about 1,366,000 ha of forestation is proposed in the TCA to achieve the targets of Kenya Vision 2030. The current situations of the forest areas in the TCA and potential areas for forestation are shown in Figure 3.3.10.
The following steps were applied in the preparation of Figure 3.3.10
i) Identify the present forest areas and deforested areas (in this master plan, the result of the satellite imagery analysis was used), and overlay the gazetted forest areas;
ii) Identify the important forest areas including deforested areas as water source forests; iii) Delineate the potential forestation areas on those located in step ii), and formulate the area
with consideration of significant forest area; and iv) Connect the isolated small gazetted forest areas by corridor and delineate the potential
forestation area with the combination of these two areas.

Final Report Water Resources Management Plan Sectoral Report (H) Water Resources Management Chapter 3
Nippon Koei Co., Ltd. H - 71 The Development of the National Water Master Plan 2030
Of the target, the gazetted forest is supposed to be implemented by KFS.
b) Control of Soil Erosion
As for the control of soil erosion, it is proposed to carry out a survey on damaged areas where soil erosion occurred in the catchment area. The survey should investigate location, scale of the current situation, required countermeasures, etc.
3.8 Water Resources Management Plan for the ENNCA
The ENNCA is located in the northeastern part of Kenya, which consists of the major rivers of Ewaso Ng’iro North and its tributaries.
3.8.1 Management Strategy
Based on the overall planning concept and framework as described in Section 3.2, Water Resources Management Strategy for the ENNCA is set for the major components of i) monitoring, ii) evaluation, iii) water permit issuance and control, and iv) watershed conservation, as follows:
1) Monitoring
Monitoring strategies are described for five monitoring items, which are i) surface water level, ii) surface water quality, iii) groundwater level, iv) groundwater quality, and v) rainfall.
a) Surface Water Level
The Ewaso Ng’iro North River and its major tributaries are selected as representative rivers to capture the runoff characteristics of the basin. However, most of the surface water use is concentrated in the upper reaches of Archer’s Post, and surface water level monitoring stations are concentrated in the area. Locations of these monitoring stations should be reviewed so that the monitoring points would be the representative for each tributary. (refer to Figure 2.3.13).
b) Surface Water Quality
The same as surface water level, the surface water quality monitoring points are also selected from the representative rivers.
For the Ewaso Ng’iro North River, monitoring points should be located downstream of pollution sources such as major cities and irrigation schemes. Such points should be monitored monthly.
In addition, other surface water level monitoring points are selected for water quality monitoring done on a quarterly basis. Such monitoring data is required as reference water quality in the evaluation of water permit application in the relevant basin.
c) Groundwater Level
Groundwater monitoring points are set at locations where significant groundwater use is expected in the future. Such points are in urban centres which have both water supply and sanitation plans. In the selected monitoring points, groundwater levels are monitored monthly with dedicated boreholes.

Water Resources Management Plan Final Report Chapter 3 Sectoral Report (H) Water Resources Management
The Development of H - 72 Nippon Koei Co., Ltd. the National Water Master Plan 2030
It is important to monitor and confirm that the groundwater levels for sustainable are recoverable in an annual cycle.
d) Groundwater Quality
Groundwater quality is monitored at the same points where groundwater level monitoring stations are located. Monitoring of groundwater quality is conducted quarterly.
e) Rainfall
The rainfall station density should be considered by climatic regions for arid, semi-arid or humid areas. The ENNCA mostly belongs to arid area. For this area, the criterion of one station in 8,000 km2 to 10,000 km2 is applied in reviewing the existing stations. The upper reaches of Ewaso Ng’iro North River belong to semi-arid or humid areas. For these areas, the criteria of one station in 3,000 km2 to 5,000 km2 for semi-arid and one station in 500 km2 to 1,000 km2 for humid areas are applied.
2) Evaluation
a) Water Resources Quantity Evaluation
Water resources quantity evaluation is conducted annually based on i) monitoring data for surface water, groundwater, and rainfall and ii) water permit issuance data. Abstraction survey data will be used as necessary to grasp the actual water use status. For surface water resources evaluation, focus should be on the major rivers of Tana and its tributaries as they are representative rivers in the ENNCA.
b) Water Resources Quality Evaluation
Water resources quality evaluation is conducted annually based on the monitoring data for surface water and groundwater quality. Currently, there is only one water quality test laboratory in Nyeri for the analysis of water quality in the catchment area. For the timely analysis of monitored water quality especially in the northeastern part of the catchment area, additional water quality test laboratory should be established.
3) Water Permit Issuance and Control
Prior to the future impeding water demand in the basin, water permits should be duly controlled and issued based on the actual status of water use. In view of this, the latest version of issued permits should be controlled. In addition, “Guidelines for Water Allocation (WRMA, 2010)” should be revised considering future demand and water resources development plans. To conduct these activities, the enforcement of water rights officers should be considered by reflecting the current staffing situation.
4) Watershed Conservation
Following the overall planning concept and framework on watershed conservation, management strategy for the ENNCA will be formulated. All of the three major items of: a) recovery of forest areas; b) conservation of small water sources; and c) control of soil erosion should be considered in the ENNCA.

Final Report Water Resources Management Plan Sectoral Report (H) Water Resources Management Chapter 3
Nippon Koei Co., Ltd. H - 73 The Development of the National Water Master Plan 2030
a) Recovery of forest areas
Forest recovery will be implemented through forestation focusing on the northern skirt of Mt. Kenya of the Five Water Towers and gazetted forests located in the western part of the catchment area.
b) Conservation of small water sources
Conservation of small water sources in the catchment area will be considered.
c) Control of soil outflow caused by deforestation
Preventive measures for soil erosion caused by deforestation in the catchment area should be considered.
3.8.2 Proposed Water Resources Management Plan
Based on the management strategy described in Subsection 3.8.1, the proposed water resources management plan in the ENNCA will be as follows:
1) Monitoring
Monitoring plans are described for five monitoring items, which are i) surface water level, ii) surface water quality, iii) groundwater level, iv) groundwater quality, and v) rainfall. Locations of the proposed monitoring stations are shown in Figure 3.3.11. The number of target, operational, and proposed monitoring stations are shown in Table 3.3.1.
a) Surface Water Level
The current monitoring network was reviewed mainly for the Ewaso Ng’iro North River and its tributaries, 11 monitoring points were selected in the upper reaches of the Ewaso Ng’iro North River and its tributaries and three more in the humid areas of the catchment. In total, 14 monitoring points were selected. For the Ewaso Ng’iro North River, the following reference point was selected:
i) 5ED01 (Archer’s Post) is located in the upper reaches of the Ewaso Ng’iro North River. This reference point was set to confirm available discharge for the irrigation demand located downstream after satisfying upstream water demand. This point is an appropriate reference point to grasp river water discharge because the river water does not dry up throughout the year. Monitoring started in 1949.
The above reference point is set to check the flow regime of the river after satisfying upstream water demand and to confirm the available discharge to satisfy the downstream demand. For that purpose, based on the management strategy described in Section 3.2, normal discharge values are set at the above reference point as shown below. This normal discharge value is used for low water management.
Normal Discharge at Reference Point (ENNCA) (Unit: m3/sec)
Reference Point Normal Discharge (Reserve + Water Demand for the
Downstream of Reference Point) 2010 2030
Ewaso Ng’iro North River (5ED01) 3.0 (=1.6+1.4) 6.5 (=1.6+4.9) Source: JICA Study Team

Water Resources Management Plan Final Report Chapter 3 Sectoral Report (H) Water Resources Management
The Development of H - 74 Nippon Koei Co., Ltd. the National Water Master Plan 2030
The above normal discharges are to be reviewed and revised as necessary in the “Water Resources Quantity Evaluation” based on monitoring, which is to be mentioned in the following clause. Such review and revision works are to be made based on issued water permits (water demand) and reserve of that year. In case the observed discharge at a reference point is lower than the normal discharge, it is probable that there would be over-abstraction of water in the upstream or decreased reserve caused by an extreme drought. In such a case it is necessary to identify the reason and take measures such as increase of the level of oversight for water abstraction or drought conciliation.
b) Surface Water Quality
Stations monitoring on a monthly basis
The water quality of the following point is monitored on a monthly basis. This monitoring is for watching and detecting possible pollutant sources that may affect water usage in the relevant river.
i) 5ED01 (Archer’s Post) is located in the upper reaches of the Ewaso Ng’iro North River: To monitor the impacts urban and irrigation effluent in the upper reaches on river water quality.
Stations monitoring on a quarterly basis
Apart from the above three monitoring stations, water quality of the other surface water monitoring stations (13 points) should be monitored on a quarterly basis (January, April, July and October of every year). Such data are used as reference when WRMA issues water permits. The said 13 monitoring stations are 5AB04, 5AC10, 5AC15, 5AD04, 5BC04, 5BE02, 5DA02, 5DA07, 5DC02 (5D), 5EC01, 5EC02, 5ED01, and 5HA01.
c) Groundwater Level
There were five points selected for groundwater level monitoring through dedicated boreholes. These points are located near urban centres where there are both water supply and sanitation plans with expected high growth of groundwater demand in the future. The said five points are located in the towns of Nyahururu, Nanyuki, Isiolo, Wajir, and Mandera.
d) Groundwater Quality
Groundwater quality is monitored at the same locations where groundwater level monitoring stations are located. Monitoring of groundwater quality is conducted quarterly.
e) Rainfall
The distribution of current rainfall monitoring stations was reviewed. As a result of the review, 34 rainfall monitoring stations were proposed.

Final Report Water Resources Management Plan Sectoral Report (H) Water Resources Management Chapter 3
Nippon Koei Co., Ltd. H - 75 The Development of the National Water Master Plan 2030
2) Evaluation
a) Water Resources Quantity Evaluation
The water resources quantity evaluation is conducted annually based on i) monitoring data for surface water, groundwater, and rainfall and ii) water permit issuance data. In view of this, a water resources evaluation team is formed which is composed of: i) one chief hydrologist from Nanyuki Regional Office and ii) one assistant hydrologist each from Nanyuki, Rumuruti, Isiolo, Marsabit, and Mandera subregional offices. Water resources evaluation works are done for the whole ENNCA on both surface water and groundwater.
b) Water Resources Quality Evaluation
Water resources quality evaluation is also conducted annually based on the monitoring data for surface water and groundwater quality.
Additional water quality test laboratory should be established in the towns of Marsabit and Wajir for the timely analysis of water quality samples especially in the northeastern part of the catchment. For the management of laboratory and evaluation of water quality, a chief water quality expert with appropriate staff should be assigned in the water quality test laboratories in Nyeri, Marsabit, and Wajir.
3) Water Permit Issuance and Control
The following activities on water permit issuance and control are proposed:
a) Control of the latest version of issued water permits Periodical update of water permit database Establishment and enhancement of the notification system on permit expiry
b) Revision of “Guidelines for Water Allocation (WRMA, 2010)” Formulation of water allocation plans considering future water demand
c) Increase in the number of water rights officers for the smooth implementation of water permits issuance and control.
Number of Required Water Rights Officers (ENNCA)
Offices Number of Water Right Officers Current Required Future
Nanyuki RO 2 No change 2 Nanyuki SRO 1 +1 2 Rumuruti SRO 2 No change 2 Isiolo SRO 2 No change 2 Marsabit SRO 0 +2 2 Mandera SRO 1 +1 2 Total 8 +4 12
Source: JICA Study Team, based on interview with WRMA Regional Offices
Locations of the regional and subregional offices are shown in Figure 2.3.12. The number of required water rights officers was derived through an interview with the WRMA regional office in Nanyuki. Based on the indicated figures above, detailed assessment should be made on the expected actual amount of works in order to decide on the final figures.

Water Resources Management Plan Final Report Chapter 3 Sectoral Report (H) Water Resources Management
The Development of H - 76 Nippon Koei Co., Ltd. the National Water Master Plan 2030
4) Watershed Conservation
With regard to watershed conservation, the following activities are proposed:
a) Recovery of Forest Areas
As for the forest recovery for watershed conservation, about 592,000 ha of forestation is proposed in the ENNCA to achieve the targets of Kenya Vision 2030. The current situations of the forest areas in the ENNCA and potential areas for forestation are shown in Figure 3.3.12.
The following steps were applied in the preparation of Figure 3.3.12.
i) Identify the present forest areas and deforested areas (in this master plan, the result of the satellite imagery analysis was used), and overlay the gazetted forest areas;
ii) Identify the important forest areas including deforested areas as water source forests; iii) Delineate the potential forestation areas on those located in step ii), and formulate the area
with consideration of significant forest area; and iv) Connect the isolated small gazetted forest areas by corridor and delineate the potential
forestation area with the combination of these two areas.
Of the targets, the gazetted forest is supposed to be implemented by KFS.
b) Conservation of Small Water Sources
As for the conservation of small water sources, it is proposed to carry out a survey on small water sources, which includes location, scale, water use, water quality, vegetation condition, management method, major issues, etc.
c) Control of Soil Erosion
As for the control of soil erosion, it is proposed to carry out a survey on damaged areas where soil erosion occurred in the catchment area. The survey should investigate location, scale of the current situation, required countermeasures, etc.

Final Report Cost Estimate Sectoral Report (H) Water Resources Management Chapter 4
Nippon Koei Co., Ltd. H - 77 The Development of the National Water Master Plan 2030
CHAPTER 4 COST ESTIMATE
4.1 Basic Conditions for Cost Estimate
The required cost for water resources management activities were estimated based on the proposed water resources management plans as described in Chapter 3. In addition, costs were also estimated for the implementation of action plans for WRMA regional offices toward 2022 for strengthening the system and capacity for water resources management (described in the Main Report, Part H), which are also regarded as a part of the water resources management activities.
By referring to cost items which are generally applied for management plans and also to budget items of the existing annual budget of WRMA, the required costs were estimated with the two major items of development cost and recurrent cost. Detailed descriptions of the relevant items are described below.
(1) Development Cost
Development cost is used for construction or installation of water resources management facilities, equipment, or systems.
The following are items for estimation by each category:
1) Based on the proposed water resources management plan in Chapter 3, the following items were estimated:
Installation and rehabilitation of the river gauging stations; Installation and rehabilitation of the rainfall gauging stations; Installation of dedicated boreholes for groundwater monitoring; Establishment of additional water quality test laboratories (Lodwar, Kapenguria, Mombasa,
Garissa, Marsabit, Wajir) - Building and Utility; and Forestation activities for the recovery of forest areas.
Based on the proposed action plans for WRMA regional offices toward 2022 in the Main Report, Part H, the following items were estimated:
1) For strengthening of river basin governance
Establishment and periodical holding of a “catchment forum” in six regional offices of WRMA
2) For improvement of the operations of monitoring stations
Replacement of iron post for river gauge to concrete post as against vandalism; Upgrade of the manual gauge to automatic (for surface water level, groundwater level, and
rainfall); and Introduction of flood discharge measurement equipment in each subregional offices of WRMA
for the preparation of accurate discharge rating curves.

Cost Estimate Final Report Chapter 4 Sectoral Report (H) Water Resources Management
The Development of H - 78 Nippon Koei Co., Ltd. the National Water Master Plan 2030
3) For the improvement of hydrometeorological database management
Renewal and updating of the hydrometeorological database system (within five years and every five years)
4) For the improvement of permit control
Renewal and updating of the water permit database system (within five years and every five years)
(2) Recurrent Cost
Recurrent cost is used for the periodical monitoring works for water resources and operation of the catchment forum. Based on the proposed water resources management plan in Chapter 3, the following items were estimated:
1) For Monitoring and Analysis Activities
Surface water monitoring; River discharge measurement; Groundwater monitoring; Rainfall monitoring; Flood discharge measurement; Surface water quality monitoring; and Groundwater quality monitoring.
2) For Other Recurrent Activities
Catchment forum operation (Venue and Allowances of WRUAs)
Unit cost applied for cost estimates were derived from the WRMA staff in charge of the relevant water resources management activities. For watershed conservation activities, unit cost for forestation was derived from KFS.

Final Report Cost Estimate Sectoral Report (H) Water Resources Management Chapter 4
Nippon Koei Co., Ltd. H - 79 The Development of the National Water Master Plan 2030
Unit Costs Applied for Estimating the Development Cost for Water Resources Management
1) Monitoring Unit Cost (KSh) Installation and rehabilitation of river gauging stations 240,000 Installation and rehabilitation of rainfall gauging stations 100,000 Installation of dedicated boreholes for groundwater monitoring 2,000,000 Replacement of iron post for river gauge to concrete post 100,000 Upgrade of the manual gauge to automatic (surface water level) 1,000,000 Upgrade of the manual gauge to automatic (groundwater level) 200,000 Upgrade of the manual gauge to automatic (rainfall) 1,000,000 Flood discharge measurement equipment (each subregion) 1,000,0002) Evaluation Hydromet DB Upgrade (Software + Hardware) including training 2,500,000
Establishment of additional water quality test laboratories (Lodwar, Kapenguria, Mombasa, Garissa, Marsabit, Wajir) - Building and Utility 6,750,000
Laboratory equipment and reagents 2,105,0003) Permitting PDB Upgrade (Software + Hardware) including training 1,500,0004) Watershed Conservation
Forestation cost per hectare 78,600
Source: JICA Study Team
4.2 Cost Estimates for the Proposed Plans
Based on the items described in Section 4.1, costs were estimated as follows:
Estimated Costs for the Proposed Water Resources Management Plan
No. Proposed Plans Development
Costs (KSh million)
Recurrent Costs(KSh million/
year) 1 Monitoring 665 714 2 Evaluation 293 - 3 Permits 144 - 4 Watershed Conservation (4,478,000 ha) 353,762 - 5 Operation of Catchment Forum - 6
Subtotal (1,2,3,5, excluding watershed conservation) 1,102 720 Total 354,864 720
Source: JICA Study Team
Breakdown of the costs are shown in Table 4.2.1.
4.2.1 Development Cost
For the period of 18 years from 2013 to 2030, the total required development cost for water resources management activities are estimated at KSh1004 million excluding watershed conservation cost for forestation. Cost for forestation is supposed to be borne by the Kenya Forest Service (KFS). Required cost is about KSh354 billion.
4.2.2 Recurrent Cost
For the period of 18 years from 2013 to 2030, the total required recurrent cost for water resources management activities are estimated at KSh719.5 million per year. Total required cost for 18 years is KSh12,951 million.

Implementation Programme Final Report Chapter 5 Sectoral Report (G) Water Resources Development
The Development of H - 80 Nippon Koei Co., Ltd. the National Water Master Plan 2030
CHAPTER 5 IMPLEMENTATION PROGRAMME
5.1 General
(1) Implementation Programme for Short-, Medium- and Long- Terms
Implementation schedule for the proposed water resources management plan was prepared for a period of 18 years from 2013 to 2030 by dividing it into three terms, namely, short, medium and long terms. Short term was set for five years from 2013 to 2017, medium term for five years from 2018 to 2022, and long term for eight years from 2023 to 2030.
(2) Implementation Programme for Development and Recurrent Activities
Implementation programme was also divided into two categories of development and recurrent activities. Development activities are to be executed for the construction or rehabilitation of structures and installation of equipment and systems. On the other hand, recurrent activities are to be executed for periodical works such as monitoring of water resources.
5.2 Criteria for Prioritization of Implementation
For the water resources management plan, monitoring and evaluation of hydrometeorological data were prioritised because of their immediate effects and contribution to the effective, stable, and sustainable management of water resources. Forestation for watershed conservation activities were divided into two categories. Forestation of gazetted forest areas were prioritised because such areas were under the control of KFS and rather easy for forestation activities. On the other hand, forestation of non-gazetted forest areas would take longer because of land ownership and consensus building for forestation activities.
Implementation schedule for water resources management activities are shown in Figure 5.2.1.
5.3 Recommendations for the further surveys and studies for NWMP2030
In the course of the formulation of water resources management plan, several assumptions had to be introduced due to lack or insufficiency of the required data and information. For the betterment of the proposed water resources management plan, the following actions are recommended:
(1) Review of the Proposed Monitoring Networks
The present monitoring networks for surface water, groundwater, and rainfall were reviewed and the recommendable monitoring networks were proposed in this study for a more efficient monitoring. The review was made based on the general considerations such as strategic monitoring points and monitoring intensity, without taking into account the specific condition and purpose of each existing station.
It is recommended to finally determine the efficient monitoring networks by reviewing the proposal of this study taking into account the specific conditions or purposes of the existing stations.

Final Report Implementation Programme Sectoral Report (H) Water Resources Management Chapter 5
Nippon Koei Co., Ltd. H - 81 The Development of the National Water Master Plan 2030
(2) Sharing of Long-term Forecast Information with Kenya Meteorological Department (KMD)
The proposed water resources monitoring networks of WRMA includes the rainfall observation network for the purpose of water resources evaluation. On the other hand, KMD is also carrying out the meteorological observation including rainfall for weather forecasting.
It is recommended that both organizations should cooperate to effectively use the meteorological data for weather forecasting, flood and drought forecasting, water resources management, etc.
(3) Clear Demarcation on Forestation Activities between KFS and WRMA
The proposed watershed conservation includes reforestation activities for water resources conservation. It is understood that forestation in the gazetted forest areas is managed by KFS while the non-gazetted forest areas is managed by WRMA in principle. However, the actual demarcation of reforestation is not clear.
It is recommended to clearly delineate the roles of forestation in the catchment areas between KFS and WRMA .
(4) Earlier Surveys on Soil Erosion and Small Water Sources
The proposed watershed conservation intended to propose the soil erosion control plan and small water sources protection plan. However, the detailed information and data on the current situation of soil erosion and small water sources were not available. Therefore, it was not able to propose the concrete countermeasures for soil erosion control and small water sources protection.
It is recommended to conduct surveys to know the current situation on soil erosion and small water sources in each catchment area as early as possible.
(5) Water Rights Officers for Water Permit Issuance and Control
For the reinforcement of the water permit issuance and control, it was proposed to increase the water rights officers in WRMA regional and subregional offices. The required number of water rights officers was estimated based on the proposals of WRMA regional offices through the questionnaire survey.
It is recommended to reassess the proposed required number of water rights officers based on the volume of work that will be assigned.

Tables

Table 2.3.1 An Example of Surface Water Thresholds (Lake Victoria North Catchment Area)
Sub-catchments covered
Category
(Threshold in m3/day)
A B C D
1AA-Malaba river Up to 100>100 to
500
>500 to
2,000 >2,000
1AD-Malakisi river,
1AH-Sio river Up to 100
>100 to
2,000
>2,000 to
5,000 >5,000
1BD-Upper Nzoia
(Koitobos-Moiben river
system)
Up to 200>200 to
1,000
>1,000 to
5,000 >5,000
1CE-Kipkaren-Sosian
river system,
1DD-Middle Nzoia
(Kuywa river system),
1FG-Lower Yala
Sub-catchment
Up to 100>100 to
2,000
>2,000 to
10,000 >10,000
1FF-Upper Yala
Sub-catchment Up to 100
>100 to
1,000
>1,000 to
5,000 >5,000
1EG-Lower Nzoia
Sub-catchment Up to 200
>200 to
1,000
>1,000 to
10,000 >10,000
Source: Water Resources Allocation Thresholds For Classification of Permits, WRMA
H - T - 1

Table 2.3.2 An Example of Aquifer Classification and Thresholds (Ewaso Ng’iro North Catchment Area)
Name District(s) Type Remarks Status Threshold, m3/d
STRATEGIC AQUIFERS
Walda- Rawana Moyale Basalts over basement
(intergranular & fissure) Significant livestock water source
Few BHs in area SATISFACTORY
A: < 5 B: > 5 - < 20 C: > 20 - < 100 D: > 100
Oda Moyale Alluvium/ Weathered basement (intergranular & fissure)
Future Moyale Town supply
Increasing no. of BHs (NWCPC x 6 BHs) ALERT
A: < 10 B: > 10 - < 50 C: > 50 - < 300 D: > 300
Logologo Marsabit Basalts over basement (fissure)
Future Marsabit Town supply SATISFACTORY
A: < 10 B: > 10 - < 50 C: > 50 - < 300 D: > 300
Main Merti Wajir/Garissa Miocene sediments (intergranular)
Sole fresh water between Habaswein & Liboi
SATISFACTORY
A: < 10 B: > 10 - < 50 C: > 50 - < 300 D: > 300
Ol Bolossat Nyandarua Superficials & weathered tuffs (intergranular)
Source of Lake Ol Bolossat & Ewaso Narok River
Anticipated land use by floriculture ALERT
A: < 10 B: > 10 - < 100 C: > 100 - < 300 D: > 300
Timau (Timau Town towards Isiolo)
Meru Mt. Kenya volcanic (intergranular & fissure)
Key water resource for horticultural activities
Major water uses expanding ALERT
A: < 20 B: > 20 - < 150 C: > 150 - < 500 D: > 500
MAJOR AQUIFERS
Daua Parama Mandera Alluvium (intergranular) Mandera Town water supply
Expanding drilling activity. ALERT
A: < 20 B: > 20 - < 50 C: > 50 - < 300 D: > 300
Mt. Kenya (Mt. Kenya) Weathered/ Fractured phonolites & basalts (fissure & intergranular)
Locally important resourcelying in the recharge zone of regional aquifer system
SATISFACTORY
A: < 20 B: > 20 - < 50 C: > 50 - < 300 D: > 300
Aberdares (Abadares)
MINOR AQUIFERS
Mandera Jurassic Mandera Jurassic sediments
(intergranular & fissure)
Locally important human & livestock resource
SATISFACTORY
A: < 10 B: > 10 - < 50 C: > 50 - < 100 D: > 100
El Wak/ Wajir
Mandera & Wajir
Pleistocene lacustrine sediments (fissure)
Locally important human & livestock resource
WQ issues (pollution); and over-abstraction ALARM
A: < 10 B: > 10 - < 40 C: > 40 - < 100 D: > 100
POOR AQUIFERS (colluvials are variable and not always poor)
Basement Various
Weathered/ Poorly weathered Pre-Cambrian metamorhics (intergranular& fissure)
Across parts of Samburu, Marsabit, Moyale, Laikipia and Isiolo
SATISFACTORY
A: < 5 B: > 5 - < 20 C: > 20 - < 100 D: > 100
Colluvial Various Erosion debris – various sources (intergranular)
Irregularly distributed across Basin SATISFACTORY
A: < 20 B: > 20 - < 50 C: > 50 - < 200 D: > 200
SPECIAL AQUIFERS
Merti (Dadaab) Garissa Miocene sediments
(intergranular)
Refugee water supply (UNICEF/ CARE)
Possible over-abstraction ALERT
A: < 20 B: > 20 - < 100 C: > 100 - < 500 D: > 500
Marsabit Marsabit Fractured/ Faulted basalts (fissure)
Parkinson, Jaldessa & Dirib Gombo: current strategic resource for Marsabit Town
Recharge source for Logologo, may need explicit protection SATISFACTORY
A: < 10 B: > 10 - < 50 C: > 50 - < 200 D: > 200
Source: Water Resources Allocation Thresholds For Classification of Permits, WRMA
H - T - 2

Table 2.3.3 Guideline Standards for Effluent Discharge
THIRD SCHEDULE
(Rule 81)
GUIDELINE STARNDARDS FOR EFFLUENT DISCHARGE
1) Guidelines for Effluent Discharge into surface water resources
Parameter Max Allowable (Limits)
Arsenic as As (mg/l) 0.1
Biochemical Oxygen Demand (BOD 5days at 20 °C) (mg/l) 30
Cadmium as Cd (mg/l) 1.0
Chemical Oxygen Demand (COD (mg/l)) 100
Chromium as Cr (mg/l) Less than 0.01
Lead as Pb (mg/l) Less than 0.01
Oil and grease Absent
pH (Hydrogen ion activity) 5.0-9.0
Phenols, total (mg/l) 0.05
Sulphide as S (mg/l) 2.0
Total Suspended Solids (mg/l) 30
Temperature (in degrees Celsius) based on ambient ±5
Cyanides as CN (mg/l) Less than 0.2
Nickel as Ni (mg/l) Less than 2.0
Detergents (ABS) (mg/l) Less than 5.0
Mercury as Hg (mg/l) Less than 0.01
Total Phosphorus as P (mg/l) 2
Total Nitrogen as N (mg/l) 10
Total Pesticide Residues Absent
Remarks:
The Authority may issue industry-specific guidelines for effluent discharge based on the water quality objectives. The
Reserve water quality and dry weather streamflow for individual water courses or water bodies.
2) Guidelines for Discharge of Effluent onto Land
Parameter Max Allowable (Limits)
pH 5.0-9.0
Boron (mg/l) 2.0
BOD (mg/l) 500
Chloride (mg/l) 600
Total Dissolved Solid (mg/l) 2100
Oil and grease (mg/l) 30
Sulphates (mg/l) 1000
Sodium (as percentage of total cation concentration) 60
Source: Water Resource Management Rules, 2007
H - T - 3
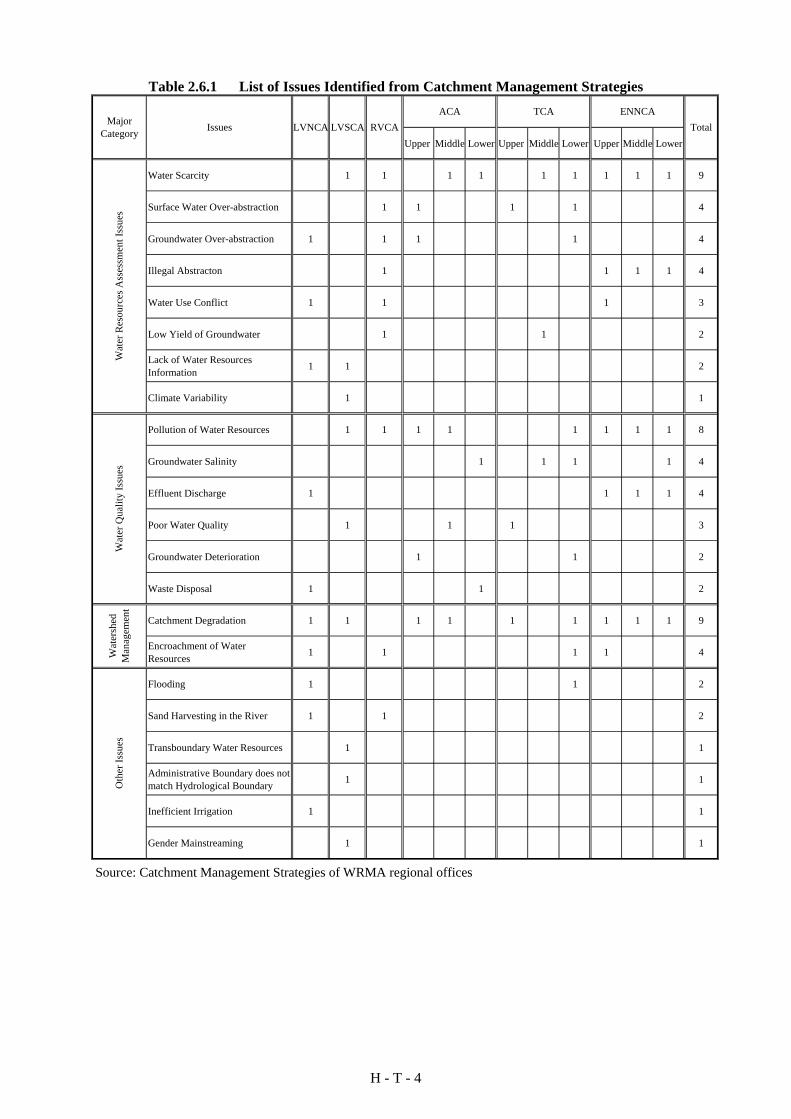
Table 2.6.1 List of Issues Identified from Catchment Management Strategies
Upper Middle Lower Upper Middle Lower Upper Middle Lower
Water Scarcity 1 1 1 1 1 1 1 1 1 9
Surface Water Over-abstraction 1 1 1 1 4
Groundwater Over-abstraction 1 1 1 1 4
Illegal Abstracton 1 1 1 1 4
Water Use Conflict 1 1 1 3
Low Yield of Groundwater 1 1 2
Lack of Water ResourcesInformation 1 1 2
Climate Variability 1 1
Pollution of Water Resources 1 1 1 1 1 1 1 1 8
Groundwater Salinity 1 1 1 1 4
Effluent Discharge 1 1 1 1 4
Poor Water Quality 1 1 1 3
Groundwater Deterioration 1 1 2
Waste Disposal 1 1 2
Catchment Degradation 1 1 1 1 1 1 1 1 1 9
Encroachment of WaterResources 1 1 1 1 4
Flooding 1 1 2
Sand Harvesting in the River 1 1 2
Transboundary Water Resources 1 1
Administrative Boundary does notmatch Hydrological Boundary 1 1
Inefficient Irrigation 1 1
Gender Mainstreaming 1 1
Wat
er R
esou
rces
Ass
essm
ent I
ssue
sW
ater
Qua
lity
Issu
esW
ater
shed
Man
agem
ent
TotalO
ther
Issu
esLVNCA LVSCA RVCAIssuesMajor
Category
ACA TCA ENNCA
Source: Catchment Management Strategies of WRMA regional offices
H - T - 4

Table 3.2.1 Estimated Reserves for River Gauging Stations
C.A. No. River
Gauging Station
Estimated Reserve (m3/s)
C.A. No.River
Gauging Station
Estimated Reserve (m3/s)
C.A. No. River
Gauging Station
Estimated Reserve (m3/s)
LVN
CA
1 1AA01 0.3
RV
CA
1 2B21(*) 0.0
TCA
1 4AA05 0.82 1AD02 0.8 2 2B33 0.0 2 4AB06 1.23 1AH01 1.0 3 2C14 0.0 3 4AC04 1.44 1BB01 2.5 4 2C16(*) 0.0 4 4AD01 1.25 1BD02 3.6 5 2EB03 0.0 5 4BB01 1.66 1BE06 0.1 6 2EB10 0.0 6 4BC05 0.17 1BH01 0.0 7 2ED02 0.0 7 4BD01 0.78 1CA02 1.4 8 2ED03 0.0 8 4BE01 1.59 1CB05 1.1 9 2FA08 0.0 9 4BE10(*) 13.5
10 1CE01 7.0 10 2FC19 0.0 10 4BF01 0.711 1DA02(*) 15.9 11 2GA01 0.0 11 4CA02 3.912 1DB01 2.6 12 2GB01(*) 0.0 12 4CC03(*) 8.513 1DD01 23.5 13 2GD07 0.0 13 4DA10 0.014 1EB02 4.1 14 2H03 0.0 14 4DB04 0.415 1ED01 10.4 15 2K04 0.0 15 4DC06 II 0.116 1EE01 34.1 16 2K06(*) 0.0 16 4DD02 3.317 1EF01 33.9
AC
A
1 3AA06 0.0 17 4EA07 8.118 1EG02 0.8 2 3BA10 0.2 18 4EB07 3.719 1FC01 2.9 3 3BA29 1.1 19 4EC04 3.120 1FD02 1.2 4 3BC08 1.7 20 4F09 0.621 1FE02 5.1 5 3BD05 1.0 21 4F13 52.122 1FF03 6.8 6 3CB05 0.0 22 4F19 2.923 1FG01(*) 6.7 7 3DB01(*) 8.6 23 4F28 1.624 1FG03 5.6 8 3EA02 0.0 24 4G01(*) 53.5
LVSC
A
1 1GB06A 1.1 9 3F02 8.8 25 4G02 42.72 1GC04 0.6 10 3F09 9.8 26 New (Hola) 49.13 1GD03 1.7 11 3F11 0.0
ENN
CA
1 5AB04 0.04 1GD07(*) 1.9 12 3G02 0.0 2 5AC10 0.05 1GG01 0.2 13 3HA12(*) 8.9 3 5AC15 0.26 1HA14 1.2 14 3HA13 5.7 4 5AD04 0.17 1HB05 0.0 15 3J15 0.0 5 5BC04 0.58 1HD03 0.0 16 3KB01 0.0 6 5BE02 0.09 1HD05 0.0 17 3KD06 0.0 7 5DA02 0.1
10 1HE01 0.0 18 3KG01 0.0 8 5DA07 0.211 1JA02 2.6 19 3LA05 0.0 9 5DC02 1.312 1JD03 6.1 20 3MH26 0.0 10 5ED01(*) 1.6
13 1JF08 3.7 21 New (Lokerish) 0.0 11 5HA01 0.0
14 1JG04 10.4 22 New (Namanga)
0.0
15 1JG05(*) 10.5 16 1KA09 0.0 17 1KB03(*) 0.4 18 1KB05 2.4 19 1KC03(*) 1.5 20 1LA03 0.8 21 1LA04(*) 4.3 22 1LB02 1.5
Note: C.A.: Catchment Area, (*): Reference Point, Of the proposed 135 monitoring points, only river gauging stations are taken up. (Ten lakes and four springs are excluded.) Locations of the above stations are shown in Figures 3.3.1, 3.3.3, 3.3.5, 3.3.7, 3.3.9 and 3.3.11, respectively
Source: JICA Study Team
H - T - 5

a) Surface Water Level
Catchment Area Target Operational % of Operational Proposed number inNWMP 2030
Difference betweenTarget and Proposed
LVNCA 28 21 75% 24 -4 LVSCA 38 30 79% 23 -15 RVCA 41 25 61% 23 -18 ACA 31 18 58% 26 -5 TCA 45 28 62% 26 -19
ENNCA 40 24 60% 13 -27 Total 223 146 65% 135 -88
b) Surface Water Quality
Catchment Area Target Operational % of Operational Proposed number inNWMP 2030
Difference betweenTarget and Proposed
LVNCA 24 24 100% 24 0LVSCA 61 47 77% 23 -38RVCA 20 18 90% 23 3ACA 31 26 84% 26 -5TCA 45 18 40% 26 -19
ENNCA 40 24 60% 13 -27Total 221 157 71% 135 -86
c) Groundwater Level
Catchment Area Target Operational % of Operational Proposed number inNWMP 2030
Difference betweenTarget and Proposed
LVNCA 13 9 69% 19 6LVSCA 30 15 50% 19 -11RVCA 37 24 65% 10 -27ACA 71 25 35% 24 -47TCA 41 14 34% 18 -23
ENNCA 10 5 50% 5 -5Total 202 92 46% 95 -107
d) Groundwater Quality
Catchment Area Target Operational % of Operational Proposed number inNWMP 2030
Difference betweenTarget and Proposed
LVNCA 11 10 91% 19 8LVSCA 17 13 76% 19 2RVCA 8 8 100% 10 2ACA 18 18 100% 24 6TCA 41 14 34% 18 -23
ENNCA 10 3 30% 5 -5Total 105 66 63% 95 -10
e) Rainfall
Catchment Area Target Operational % of Operational Proposed number inNWMP 2030
Difference betweenTarget and Proposed
LVNCA 65 52 80% 42 -23LVSCA 65 53 82% 50 -15RVCA 60 45 75% 47 -13ACA 50 33 66% 38 -12TCA 35 25 71% 47 12
ENNCA 26 8 31% 34 8Total 301 216 72% 258 -43
Source: WRMA Performance Repport No. 1 (July 2010), JICA Study Team
Table 3.3.1 Number of Target, Operational and Proposed Monitoring Stations of WRMA
H - T - 6

Development Cost (Unit KSh thousand)
Q'ty Cost Q'ty Cost Q'ty Cost Q'ty Cost Q'ty Cost Q'ty Cost Q'ty Cost
1) Monitoring 664,620 0 117,300 124,260 103,360 128,300 124,500 66,900Installation/Rehabilitation of River Gauging Stations 240 53 nos. 12,720 0 10 2,400 9 2,160 9 2,160 10 2,400 10 2,400 5 1,200Installation/Rehabilitation of Rainfall Gauging Stations 100 104 nos. 10,400 0 17 1,700 20 2,000 19 1,900 15 1,500 19 1,900 14 1,400Installation of Dedicated Boreholes for Groundwater Monitoring 2,000 95 nos. 190,000 0 19 38,000 19 38,000 10 20,000 24 48,000 18 36,000 5 10,000Replacement of iron post for river gauge to concrete post 100 135 nos. 13,500 0 24 2,400 23 2,300 23 2,300 26 2,600 26 2,600 13 1,300Upgrade manual gauge to automatic (surface water level) 1,000 135 nos. 135,000 0 24 24,000 23 23,000 23 23,000 26 26,000 26 26,000 13 13,000Upgrade manual gauge to automatic (groundwater level) 200 95 nos. 19,000 0 19 3,800 19 3,800 10 2,000 24 4,800 18 3,600 5 1,000Upgrade manual gauge to automatic (rainfall) 1,000 258 nos. 258,000 0 42 42,000 50 50,000 47 47,000 38 38,000 47 47,000 34 34,000Flood Discharge Measurement Equipment (each sub-region) 1,000 26 nos. 26,000 0 3 3,000 3 3,000 5 5,000 5 5,000 5 5,000 5 5,000
2) Evaluation 315,630 22,500 30,000 30,000 62,710 53,855 53,855 62,710Hydromet DB Upgrade (Software + Hardware) including training 2,500 105 nos. 262,500 9 22,500 12 30,000 12 30,000 18 45,000 18 45,000 18 45,000 18 45,000Establishment of additional Water Quality Test Laboratory(Lodwar, Kapenguria, Mombasa, Garissa, Marsabit, Wajir) -Building and Utility
6,750 6 nos. 40,500 0 0 0 0 0 0 2 13,500 1 6,750 1 6,750 2 13,500
Laboratory Equipment and Reagents 2,105 6 nos. 12,630 0 0 0 0 0 0 2 4,210 1 2,105 1 2,105 2 4,210
3) PermittingPDB Upgrade (Software + Hardware) including training 1,500 105 nos. 157,500 9 13,500 12 18,000 12 18,000 18 27,000 18 27,000 18 27,000 18 27,000
4) Watershed ConservationForestation to achieve 10% of Forest Cover 79 4,478,000 ha 353,762,000 234,000 18,486,000 412,000 32,548,000 1,006,000 79,474,000 868,000 68,572,000 1,366,000 107,914,000 592,000 46,768,000
Total 354,899,750 36,000 18,651,300 32,720,260 79,667,070 68,781,155 108,119,355 46,924,610
Recurrent Cost (Annual) (Unit thousand KSh)
Q'ty Cost Q'ty Cost Q'ty Cost Q'ty Cost Q'ty Cost Q'ty Cost Q'ty Cost
1) Monintoring and Analysis 713,532 126,900 123,228 120,480 136,992 137,064 68,868Surface Water Monitoring (Daily) 12 1,620 nos. 19,440 288 3,456 276 3,312 276 3,312 312 3,744 312 3,744 156 1,872River Discharge Measurement (Monthly) 80 1,620 nos. 129,600 288 23,040 276 22,080 276 22,080 312 24,960 312 24,960 156 12,480Groundwater Monitoring (Monthly) 12 1,140 nos. 13,680 228 2,736 228 2,736 120 1,440 288 3,456 216 2,592 60 720Rainfall Monitoring (Daily) 12 3,096 nos. 37,152 504 6,048 600 7,200 564 6,768 456 5,472 564 6,768 408 4,896Flood Discharge Measurement (Three times a year) 100 4,860 nos. 486,000 864 86,400 828 82,800 828 82,800 936 93,600 936 93,600 468 46,800Surface Water Quality Monitoring (Monthly) 30 288 nos. 8,640 60 1,800 60 1,800 36 1,080 60 1,800 60 1,800 12 360Surface Water Quality Monitoring (Quarterly) 30 444 nos. 13,320 76 2,280 72 2,160 80 2,400 84 2,520 84 2,520 48 1,440Gruondwater Quality Monitoring (Twice a year) 30 190 nos. 5,700 38 1,140 38 1,140 20 600 48 1,440 36 1,080 10 300
2) OthersCatchment Forum Operation (Venue and Allowances to WRUAs) 500 12 times 6,000 2 1,000 2 1,000 2 1,000 2 1,000 2 1,000 2 1,000
Total 719,532 127,900 124,228 121,480 137,992 138,064 69,868Source: JICA Study Team
Unit ofQ'tyNo. Item Q'ty
No. Item Q'tyENNCA
WRMA HQ LVNCA LVSCA RVCA ACA TCA
LVSCA RVCA ACA
Table 4.2.1 Breakdown of Water Resources Management Cost
Unit costCost for
Whole ofKenya
Unit cost Unit ofQ'ty
Cost forWhole of
Kenya
ENNCA
WRMA HQ LVNCA TCA
H - T - 7

Figures
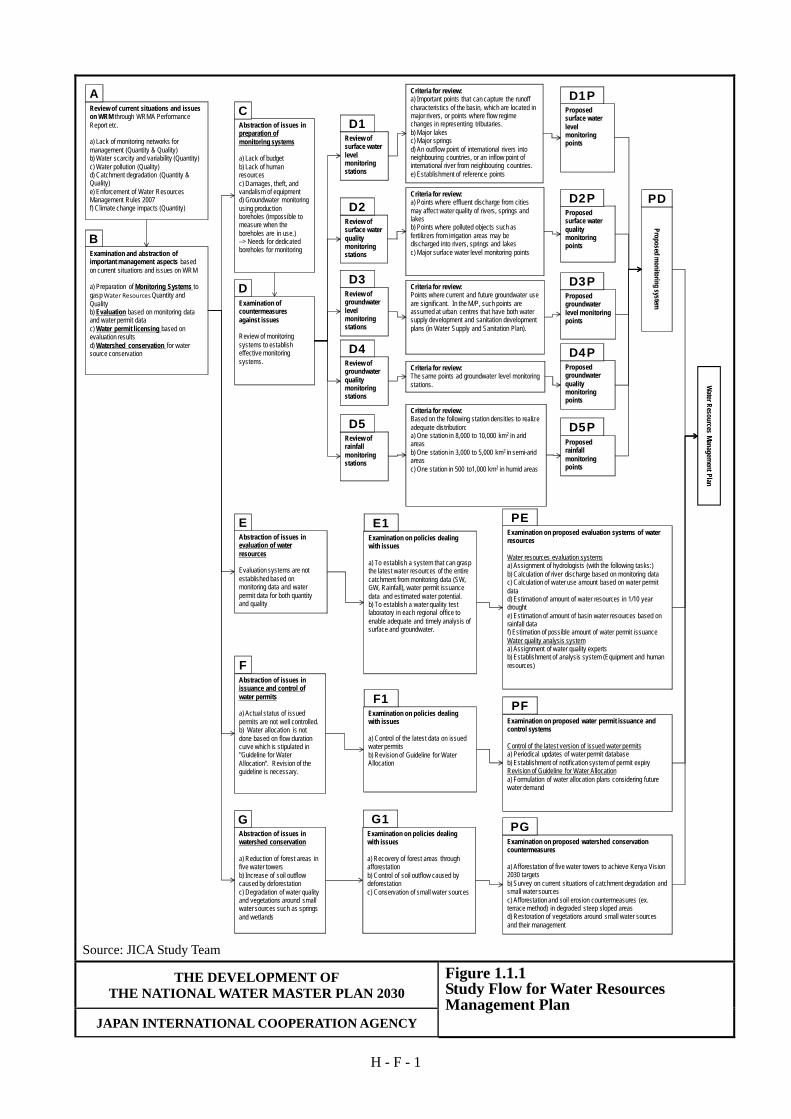
H - F - 1
Abstraction of issues in preparation of monitoring systems
a) Lack of budgetb) Lack of humanresourcesc) Damages, theft, and vandalism of equipmentd) Groundwater monitoring using production boreholes (impossible to measure when the boreholes are in use.)--> Needs for dedicated boreholes for monitoring
Examination of countermeasures against issues
Review of monitoring systems to establish effective monitoring systems.
Review of surface water level monitoring stations
Abstraction of issues in evaluation of water resources
Evaluation systems are not established based on monitoring data and water permit data for both quantity and quality
Abstraction of issues in issuance and control of water permits
a) Actual status of issued permits are not well controlled.b) Water allocation is not done based on flow duration curve which is stipulated in "Guideline for Water Allocation". Revision of the guideline is necessary.
Abstraction of issues in watershed conservation
a) Reduction of forest areas in five water towersb) Increase of soil outflow caused by deforestationc) Degradation of water quality and vegetations around small water sources such as springs and wetlands
Review of surface water quality monitoring stations
Criteria for review:a) Important points that can capture the runoff characteristics of the basin, which are located in major rivers, or points where flow regime changes in representing tributaries.b) Major lakesc) Major springsd) An outflow point of international rivers into neighbouring countries, or an inflow point of international river from neighbouring countries. e) Establishment of reference points
Criteria for review:a) Points where effluent discharge from cities may affect water quality of rivers, springs and lakesb) Points where polluted objects such as fertilizers from irrigation areas may be discharged into rivers, springs and lakesc) Major surface water level monitoring points
Review of groundwaterlevel monitoring stations
Criteria for review:Points where current and future groundwater use are significant. In the M/P, such points are assumed at urban centres that have both water supply development and sanitation development plans (in Water Supply and Sanitation Plan).
Review of groundwater quality monitoring stations
Criteria for review:The same points ad groundwater level monitoring stations.
Review of rainfall monitoring stations
Criteria for review:Based on the following station densities to realize adequate distribution:a) One station in 8,000 to 10,000 km2 in arid areasb) One station in 3,000 to 5,000 km2 in semi-aridareasc) One station in 500 to1,000 km2 in humid areas
Examination on policies dealing with issues
a) To establish a system that can graspthe latest water resources of the entire catchment from monitoring data (SW, GW, Rainfall), water permit issuance data and estimated water potential.b) To establish a water quality test laboratory in each regional office to enable adequate and timely analysis of surface and groundwater.
Examination on policies dealing with issues
a) Control of the latest data on issued water permitsb) Revision of Guideline for Water Allocation
Examination on policies dealing with issues
a) Recovery of forest areas throughafforestationb) Control of soil outflow caused by deforestationc) Conservation of small water sources
Proposed surface water levelmonitoring points
Proposed surface water quality monitoring points
Proposed groundwater level monitoring points
Proposed groundwater quality monitoring points
Proposed rainfall monitoring points
Examination on proposed evaluation systems of water resources
Water resources evaluation systemsa) Assignment of hydrologists (with the following tasks:)b) Calculation of river discharge based on monitoring datac) Calculation of water use amount based on water permit datad) Estimation of amount of water resources in 1/10 year droughte) Estimation of amount of basin water resources based on rainfall dataf) Estimation of possible amount of water permit issuanceWater quality analysis systema) Assignment of water quality expertsb) Establishment of analysis system (Equipment and human resources)
Examination on proposed water permit issuance and control systems
Control of the latest version of issued water permitsa) Periodical updates of water permit databaseb) Establishment of notification system of permit expiryRevision of Guideline for Water Allocationa) Formulation of water allocation plans considering future water demand
Examination on proposed watershed conservation countermeasures
a) Afforestation of five water towers to achieve Kenya Vision 2030 targetsb) Survey on current situations of catchment degradation and small water sourcesc) Afforestation and soil erosion countermeasures (ex. terrace method) in degraded steep sloped areas d) Restoration of vegetations around small water sources and their management
Water Resources Managem
entPlan
Review of current situations and issues on WRM through WRMA Performance Report etc.
a) Lack of monitoring networks for management (Quantity & Quality)b) Water scarcity and variability (Quantity)c) Water pollution (Quality)d) Catchment degradation (Quantity & Quality)e) Enforcement of Water Resources Management Rules 2007f) Climate change impacts (Quantity)
Examination and abstraction of important management aspects based on current situations and issues on WRM
a) Preparation of Monitoring Systems to gasp Water Resources Quantity and Qualityb) Evaluation based on monitoring data and water permit datac) Water permit licensing based on evaluation resultsd) Watershed conservation for water source conservation
Proposed monitoringsystem
A
B
C
D
E
F
G
D1
D2
D3
D4
D5
D1P
D2P
D3P
D4P
D5P
PD
E1 PE
F1 PF
G1 PG
Source: JICA Study Team
THE DEVELOPMENT OF THE NATIONAL WATER MASTER PLAN 2030
Figure 1.1.1 Study Flow for Water Resources Management Plan
JAPAN INTERNATIONAL COOPERATION AGENCY

H - F - 2
Source: WRMA (As of November 2012)
THE DEVELOPMENT OF THE NATIONAL WATER MASTER PLAN 2030
Figure 2.2.1 Organization Chart of WRMA Headquarters
JAPAN INTERNATIONAL COOPERATION AGENCY
Minister of Water & Irrigation
Board of Directors
WRMA HeadquarterChief Executive Off icer (CEO)
Finance & Admin.Manager
Human ResourceManager
HRDOffier
ChiefAccountant
Accountant(Revenue)
Accountant(Expenditure)
Procurement Off ier
AccountsAssistant
Internal Auditor
Admin. Ass.
Legarl Off ier
Operation Manager
Groundw aterOfficer
Surface Water Off icer
WaterConservation
Off
Water Quality & PollutionControl Off icer
ProjectOfficer
Land Survey Officer
ICTOfficer
Data Base/GIS Off icer
EnforcementOfficer
WR Monitoring Off icer(2 persons)
ExecutiveSecretery
( )
Receptionist
DriverOffice
Assistant
Regional Manager ofEw aso Ngiro North
Catchment
Regional Managerof Rift ValleyCatchment
Regional Managerof Lake VictoriaNorth Catchment
Regional Managerof Tana
Catchment
Regional Managerof Athi Catchment
Regional Manager ofLake Victoria South
Catchment
Technical Manager
Research andCooridination Officer
WRUA CooridinationOfficer

H - F - 3
Source: WRMA (As of November 2012)
THE DEVELOPMENT OF THE NATIONAL WATER MASTER PLAN 2030
Figure 2.2.2 Organization Chart of WRMA Regional Offices
JAPAN INTERNATIONAL COOPERATION AGENCY
Administration
Accounting
Human ResourcesManagement
HR Development
Human ResourcesAdministration
Registry
Finance &Administration
Procurement
Stakeholder & PublicRelations
Monitoring andEvaluation
WRUA Coodination
Public/StakeholderRelations
Technical Manager
CatchmentManagement
Groundw ater
Water Supply
Conservation
Surface Water
Finance &Administration
Water Rights/Enforcement
CatchmentManagement/ WRUA
Database
Sub Regions
Regional Manager
Water Rights
Enforcement
ICT
Laboratory
Pollution Control
Database
Projects Coordination

H - F - 4
Source: WRMA
THE DEVELOPMENT OF THE NATIONAL WATER MASTER PLAN 2030
Figure 2.2.3 Locations of WRMA Headquarters, Regional and Sub-Regional Offices
JAPAN INTERNATIONAL COOPERATION AGENCY

H - F - 5
Note: The areas are delineated on the Map, and not based on the actual condition of forest cover. Source: JICA Study Team based on KFS and KWS GIS data provided in November 2010
THE DEVELOPMENT OF THE NATIONAL WATER MASTER PLAN 2030
Figure 2.3.1 Forest Areas and Protected Areas in Kenya
JAPAN INTERNATIONAL COOPERATION AGENCY

H - F - 6
Application for Funding/
Request for Payment
Monitoring
Water Service Trust Fund
(WSTF)
Water Resources User Association
(WRUA)
Desk
Field
Implementation of Activities
Progress Report
Water Resources Management
Authority (WRMA)
Auditing
Release of Funds
Source: Water Resource Users Association Development Cycle (WDC)
THE DEVELOPMENT OF THE NATIONAL WATER MASTER PLAN 2030
Figure 2.3.2 Roles of WRUAs, WRMA and WSTF in WDC JAPAN INTERNATIONAL COOPERATION AGENCY

H - F - 7
Source: JICA
Study Team
TH
E D
EV
EL
OPM
EN
T OF
TH
E N
ATIO
NA
L WAT
ER
MA
STE
R PL
AN
2030 Figure 2.3.3 R
ivers and Boundaries for A
dministration
in LVN
CA
JA
PAN
INT
ER
NAT
ION
AL C
OO
PER
ATION
AG
EN
CY

H - F - 8
Source: JICA
Study Team
TH
E D
EV
EL
OPM
EN
T OF
TH
E N
ATIO
NA
L WAT
ER
MA
STE
R PL
AN
2030 Figure 2.3.4 L
ocations of Gazetted Surface W
ater M
onitoring Stations in LVN
CA
JA
PAN
INT
ER
NAT
ION
AL C
OO
PER
ATION
AG
EN
CY
Gazetted Surface Water Monitoring Station 28 locations

H - F - 9
Source: JICA
Study Team
TH
E D
EV
EL
OPM
EN
T OF
TH
E N
ATIO
NA
L WAT
ER
MA
STE
R PL
AN
2030 Figure 2.3.5 R
ivers and Boundaries for A
dministration
in LVSC
A
JAPA
N IN
TE
RN
ATIO
NA
L CO
OPE
RATIO
N A
GE
NC
Y

H - F - 10
Source: JICA
Study Team
TH
E D
EV
EL
OPM
EN
T OF
TH
E N
ATIO
NA
L WAT
ER
MA
STE
R PL
AN
2030 Figure 2.3.6 L
ocations of Gazetted Surface W
ater M
onitoring Stations in LVSC
A
JAPA
N IN
TE
RN
ATIO
NA
L CO
OPE
RATIO
N A
GE
NC
Y
Gazetted Surface Water Monitoring Station 38 locations

H - F - 11
Source: JICA Study Team
THE DEVELOPMENT OF THE NATIONAL WATER MASTER PLAN 2030
Figure 2.3.7 Rivers and Boundaries for Administration in RVCA
JAPAN INTERNATIONAL COOPERATION AGENCY

H - F - 12
Source: JICA Study Team
THE DEVELOPMENT OF THE NATIONAL WATER MASTER PLAN 2030
Figure 2.3.8 Locations of Gazetted Surface Water Monitoring Stations in RVCA
JAPAN INTERNATIONAL COOPERATION AGENCY
Gazetted Surface Water Monitoring Station 38 locations

H - F - 13
Source: JICA
Study Team
TH
E D
EV
EL
OPM
EN
T OF
TH
E N
ATIO
NA
L WAT
ER
MA
STE
R PL
AN
2030 Figure 2.3.9 R
ivers and Boundaries for A
dministration
in AC
A
JAPA
N IN
TE
RN
ATIO
NA
L CO
OPE
RATIO
N A
GE
NC
Y

H - F - 14
Source: JICA
Study Team
TH
E D
EV
EL
OPM
EN
T OF
TH
E N
ATIO
NA
L WAT
ER
MA
STE
R PL
AN
2030 Figure 2.3.10 L
ocations of Gazetted Surface W
ater M
onitoring Stations in AC
A
JAPA
N IN
TE
RN
ATIO
NA
L CO
OPE
RATIO
N A
GE
NC
Y
Gazetted S
urface W
ater Monitoring S
tation 31 locations

H - F - 15
Source: JICA
Study Team
TH
E D
EV
EL
OPM
EN
T OF
TH
E N
ATIO
NA
L WAT
ER
MA
STE
R PL
AN
2030 Figure 2.3.11 R
ivers and Boundaries for A
dministration
in TC
A
JAPA
N IN
TE
RN
ATIO
NA
L CO
OPE
RATIO
N A
GE
NC
Y

H - F - 16
Source: JICA
Study Team
TH
E D
EV
EL
OPM
EN
T OF
TH
E N
ATIO
NA
L WAT
ER
MA
STE
R PL
AN
2030 Figure 2.3.12 L
ocations of Gazetted Surface W
ater M
onitoring Stations in TC
A
JAPA
N IN
TE
RN
ATIO
NA
L CO
OPE
RATIO
N A
GE
NC
Y
Gazetted Surface Water Monitoring Station 42 locations

H - F - 17
Source: JICA
Study Team
TH
E D
EV
EL
OPM
EN
T OF
TH
E N
ATIO
NA
L WAT
ER
MA
STE
R PL
AN
2030 Figure 2.3.13 R
ivers and Boundaries for A
dministration
in EN
NC
A
JAPA
N IN
TE
RN
ATIO
NA
L CO
OPE
RATIO
N A
GE
NC
Y

H - F - 18
Source: JICA
Study Team
TH
E D
EV
EL
OPM
EN
T OF
TH
E N
ATIO
NA
L WAT
ER
MA
STE
R PL
AN
2030 Figure 2.3.14 L
ocations of Gazetted Surface W
ater M
onitoring Stations in EN
NC
A
JAPA
N IN
TE
RN
ATIO
NA
L CO
OPE
RATIO
N A
GE
NC
Y
Gazetted Surface Water Monitoring Station 40 locations

H - F - 19
Source: JICA Study Team, based on satellite images
THE DEVELOPMENT OF THE NATIONAL WATER MASTER PLAN 2030
Figure 3.2.1 Current Situation of Forest Areas and Potential Areas for Forestation
JAPAN INTERNATIONAL COOPERATION AGENCY
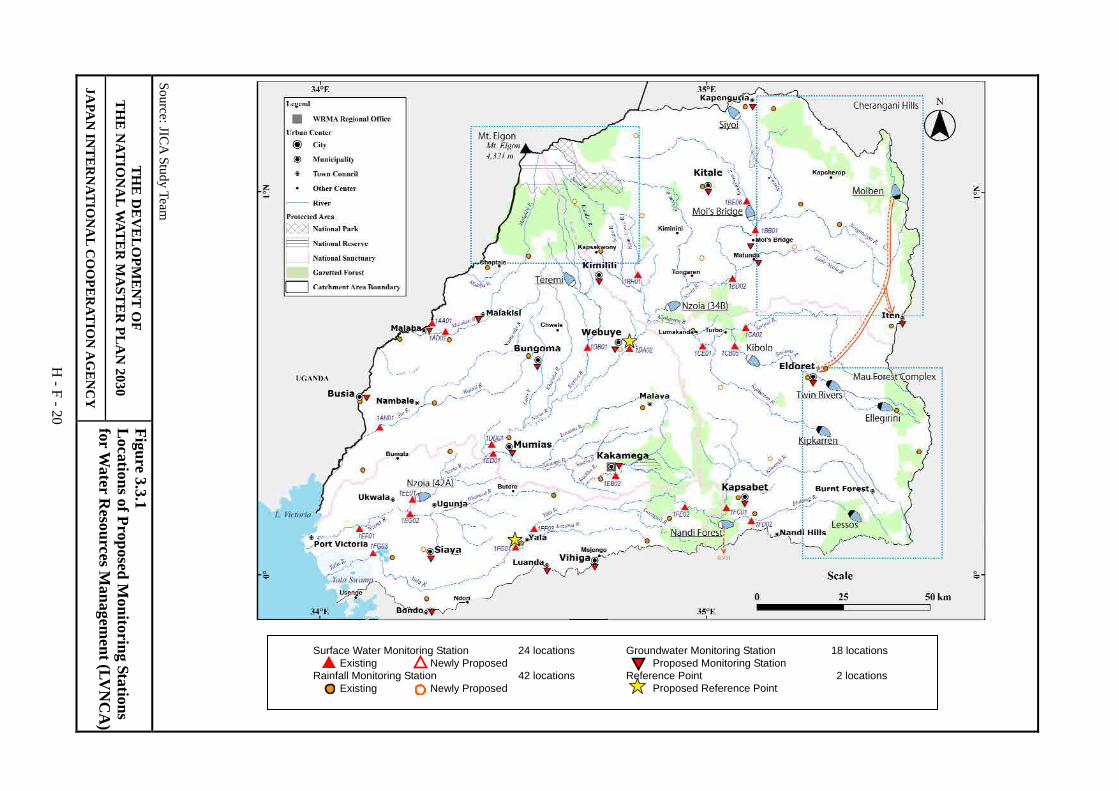
H - F - 20
Source: JIC
A Study Team
TH
E D
EV
EL
OPM
EN
T OF
TH
E N
ATIO
NA
L WAT
ER
MA
STE
R PL
AN
2030 Figure 3.3.1 L
ocations of Proposed Monitoring Stations
for Water R
esources Managem
ent (LVN
CA
)JA
PAN
INT
ER
NAT
ION
AL C
OO
PER
ATION
AG
EN
CY
Groundwater Monitoring Station 18 locations Proposed Monitoring Station Reference Point 2 locations Proposed Reference Point
Surface Water Monitoring Station 24 locations Existing Newly Proposed Rainfall Monitoring Station 42 locations Existing Newly Proposed

H - F - 21
Source: JICA
Study Team, based on satellite im
ages
TH
E D
EV
EL
OPM
EN
T OF
TH
E N
ATIO
NA
L WAT
ER
MA
STE
R PL
AN
2030 Figure 3.3.2 C
urrent Situation of Forest Areas and
Potential Forestation Areas
(LVN
CA
) JA
PAN
INT
ER
NAT
ION
AL C
OO
PER
ATION
AG
EN
CY

H - F - 22
Source: JIC
A Study Team
TH
E D
EV
EL
OPM
EN
T OF
TH
E N
ATIO
NA
L WAT
ER
MA
STE
R PL
AN
2030 Figure 3.3.3 L
ocations of Proposed Monitoring Stations
for Water R
esources Managem
ent (LV
SCA
) JA
PAN
INT
ER
NAT
ION
AL C
OO
PER
ATION
AG
EN
CY
Groundwater Monitoring Station 19locations Proposed Monitoring Station Reference Point 5 locations Proposed Reference Point
Surface Water Monitoring Station 23 locations Existing Newly Proposed Rainfall Monitoring Station 50 locations Existing Newly Proposed

H - F - 23
Source: JICA
Study Team, based on satellite im
ages
TH
E D
EV
EL
OPM
EN
T OF
TH
E N
ATIO
NA
L WAT
ER
MA
STE
R PL
AN
2030 Figure 3.3.4 C
urrent Situation of Forest Areas and
Potential Forestation Areas (LV
SCA
) JA
PAN
INT
ER
NAT
ION
AL C
OO
PER
ATION
AG
EN
CY

H - F - 24
Source: JICA Study Team
THE DEVELOPMENT OF THE NATIONAL WATER MASTER PLAN 2030
Figure 3.3.5 Locations of Proposed Monitoring Stations for Water Resources Management (RVCA)
JAPAN INTERNATIONAL COOPERATION AGENCY
Groundwater Monitoring Station 10locations Proposed Monitoring Station Reference Point 4 locations Proposed Reference Point
Surface Water Monitoring Station 23 locations Existing Newly Proposed Rainfall Monitoring Station 47 locations Existing Newly Proposed

H - F - 25
Source: JICA Study Team, based on satellite images
THE DEVELOPMENT OF THE NATIONAL WATER MASTER PLAN 2030
Figure 3.3.6 Current Situation of Forest Areas and Potential Forestation Areas (RVCA)
JAPAN INTERNATIONAL COOPERATION AGENCY

H - F - 26
Source: JICA
Study Team
TH
E D
EV
EL
OPM
EN
T OF
TH
E N
ATIO
NA
L WAT
ER
MA
STE
R PL
AN
2030 Figure 3.3.7 L
ocations of Proposed Monitoring Stations
for Water R
esources Managem
ent (AC
A)
JAPA
N IN
TE
RN
ATIO
NA
L CO
OPE
RATIO
N A
GE
NC
Y
Groundwater Monitoring Station 19locations Proposed Monitoring Station Reference Point 5 locations Proposed Reference Point
Surface Water Monitoring Station 23 locations Existing Newly Proposed Rainfall Monitoring Station 50 locations Existing Newly Proposed

H - F - 27
Source: JICA
Study Team, based on satellite im
ages
TH
E D
EV
EL
OPM
EN
T OF
TH
E N
ATIO
NA
L WAT
ER
MA
STE
R PL
AN
2030 Figure 3.3.8 C
urrent Situation of Forest Areas and
Potential Forestation Areas (A
CA
) JA
PAN
INT
ER
NAT
ION
AL C
OO
PER
ATION
AG
EN
CY

H - F - 28
Source: JICA
Study Team
TH
E D
EV
EL
OPM
EN
T OF
TH
E N
ATIO
NA
L WAT
ER
MA
STE
R PL
AN
2030 Figure 3.3.9 L
ocations of Proposed Monitoring Stations
for Water R
esources Managem
ent (TC
A)
JAPA
N IN
TE
RN
ATIO
NA
L CO
OPE
RATIO
N A
GE
NC
Y
Groundwater Monitoring Station 18 locations Proposed Monitoring Station Reference Point 3 locations Proposed Reference Point
Surface Water Monitoring Station 26 locations Existing Newly Proposed Rainfall Monitoring Station 47 locations Existing Newly Proposed

H - F - 29
Source: JIC
A Study Team
, based on satellite images
TH
E D
EV
EL
OPM
EN
T OF
TH
E N
ATIO
NA
L WAT
ER
MA
STE
R PL
AN
2030 Figure 3.3.10 C
urrent Situation of Forest Areas and
Potential Forestation Areas (T
CA
) JA
PAN
INT
ER
NAT
ION
AL C
OO
PER
ATION
AG
EN
CY

H - F - 30
Source: JICA
Study Team
TH
E D
EV
EL
OPM
EN
T OF
TH
E N
ATIO
NA
L WAT
ER
MA
STE
R PL
AN
2030 Figure 3.3.11 L
ocations of Proposed Monitoring Stations
for Water R
esources Managem
ent (E
NN
CA
) JA
PAN
INT
ER
NAT
ION
AL C
OO
PER
ATION
AG
EN
CY
Groundwater Monitoring Station 5 locations Proposed Monitoring Station Reference Point 1 location Proposed Reference Point
Surface Water Monitoring Station 13 locations Existing Newly Proposed Rainfall Monitoring Station 34 locations Existing Newly Proposed

H - F - 31
Source: JICA
Study Team, based on satellite im
ages
TH
E D
EV
EL
OPM
EN
T OF
TH
E N
ATIO
NA
L WAT
ER
MA
STE
R PL
AN
2030 Figure 3.3.12 C
urrent Situation of Forest Areas and
Potential Forestation Areas (E
NN
CA
) JA
PAN
INT
ER
NAT
ION
AL C
OO
PER
ATION
AG
EN
CY

H - F - 32
2013 2014 2015 2016 2017 2018 2019 2020 2021 2022 2023 2024 2025 2026 2027 2028 2029 2030
13/14 14/15 15/16 16/17 17/18 18/19 19/20 20/21 21/22 22/23 23/24 24/25 25/26 26/27 27/28 28/29 29/30 30/31
Development Activities
1) Monitoring
Replacement of iron post for river gauge to concrete post
Upgrade manual gauge to automatic (surface water level)
Upgrade manual gauge to automatic (groundwater level)
Upgrade manual gauge to automatic (rainfall)
Installation of Dedicated Boreholes for Groundwater Monitoring
Installation/Rehabilitation of River Gauging Stations
Installation/Rehabilitation of Rainfall Gauging Stations
Flood Discharge Measurement Equipment (Each SRO)
2) Evaluation
Hydromet DB Upgrade (Software + Hardware)
Establishment of additional Water Quality Test Laboratory(Lodwar, Kapenguria, Mombasa, Garissa, Marsabit, Wajir)Building
3) Permitting
PDB Upgrade (Software + Hardware)
4) Watershed Conservation
Forestation (Gazette Forest Area)
Forestation (Non Gazette Forest Area)
Recurrent Activities
1) Monintoring and Analysis
Surface Water Monitoring
River Discharge Measurement
Groundwater Monitoring
Rainfall Monitoring
Flood Discharge Measurement
Surface Water Quality Monitoring
Gruondwater Quality Monitoring
2) Others
Catchment Forum Operation
No.Medium Term Long Term
Implementation Schedule
ActivitiesShort Term
Source: JICA Study Team
THE DEVELOPMENT OF THE NATIONAL WATER MASTER PLAN 2030
Figure 5.2.1 Implementation Schedule for Water Resources Management Plan
JAPAN INTERNATIONAL COOPERATION AGENCY

Volume – V Sectoral Report (2/3)
Sectoral Report (J) Flood and Drought Disaster
Management

Final Report Sectoral Report (J) Flood and Drought Disaster Management Table of Contents
Nippon Koei Co., Ltd. J - i The Development of the National Water Master Plan 2030
THE PROJECT ON
THE DEVELOPMENT OF THE NATIONAL WATER MASTER PLAN 2030
IN THE REPUBLIC OF KENYA
FINAL REPORT
VOLUME – V SECTORAL REPORT (2/3)
J: FLOOD AND DROUGHT DISASTER MANAGEMENT
Abbreviation
Table of Contents
Page
CHAPTER 1 INTRODUCTION ................................................................................................. J-1
1.1 Scope of the Plan ................................................................................................................... J-1
1.2 Work Flow of Planning ......................................................................................................... J-1
1.3 Outline of the Flood Protection Plans in NWMP (1992) ...................................................... J-2 1.3.1 Proposal and Recommendations of NWMP (1992) ............................................... J-2 1.3.2 Latest Progress and Future Implementation Plan of the Proposed
Priority Projects ..................................................................................................... J-4 1.3.3 Remarks for NWMP2030 ...................................................................................... J-6
CHAPTER 2 CURRENT SITUATION OF FLOOD DISASTER MANAGEMENT ............. J-8
2.1 Relevant Policies and Strategies ........................................................................................... J-8
2.2 Relevant Organizations ....................................................................................................... J-11
2.3 Current Situation of Flood Disaster Management ............................................................... J-15 2.3.1 Overview of the Whole of Kenya ........................................................................ J-15 2.3.2 Lake Victoria North Catchment Area .................................................................. J-22 2.3.3 Lake Victoria South Catchment Area .................................................................. J-23 2.3.4 Rift Valley Catchment Area ................................................................................. J-24 2.3.5 Athi Catchment Area ........................................................................................... J-25 2.3.6 Tana Catchment Area........................................................................................... J-25 2.3.7 Ewaso Ng'iro North Catchment Area ................................................................... J-26
2.4 Ongoing Projects and Existing Plans .................................................................................. J-27 2.4.1 Ongoing Projects .................................................................................................. J-27 2.4.2 Existing Plans ....................................................................................................... J-28
2.5 Operations and Maintenance Issues .................................................................................... J-29
2.6 Challenges and Key Issues .................................................................................................. J-29

Final Report Table of Contents Sectoral Report (J) Flood and Drought Disaster Management
The Development of J - ii Nippon Koei Co., Ltd. the National Water Master Plan 2030
CHAPTER 3 CURRENT SITUATION OF DROUGHT DISASTER MANAGEMENT .... J-32
3.1 Relevant Policies and Strategies ......................................................................................... J-32
3.2 Relevant Organizations ....................................................................................................... J-34
3.3 Current Situation of Drought Disaster Management ........................................................... J-35 3.3.1 Overview of the Whole of Kenya ........................................................................ J-35 3.3.2 Lake Victoria North Catchment Area .................................................................. J-39 3.3.3 Lake Victoria South Catchment Area .................................................................. J-39 3.3.4 Rift Valley Catchment Area ................................................................................. J-40 3.3.5 Athi Catchment Area ........................................................................................... J-40 3.3.6 Tana Catchment Area........................................................................................... J-41 3.3.7 Ewaso Ng'iro North Catchment Area ................................................................... J-41
3.4 Ongoing Projects and Existing Plans .................................................................................. J-42
3.5 Operations and Maintenance Issues .................................................................................... J-42
3.6 Challenges and Key Issues .................................................................................................. J-42
CHAPTER 4 FLOOD DISASTER MANAGEMENT PLAN .................................................. J-44
4.1 General ................................................................................................................................ J-44
4.2 Overall Concept and Framework for Planning ................................................................... J-44
4.3 Flood Disaster Management Plan for the Lake Victoria North Catchment Area ................ J-46 4.3.1 Management Strategy .......................................................................................... J-46 4.3.2 Proposed Flood Disaster Management Plan ........................................................ J-47
4.4 Flood Disaster Management Plan for the Lake Victoria South Catchment Area ................ J-49 4.4.1 Management Strategy .......................................................................................... J-49 4.4.2 Proposed Flood Disaster Management Plan ........................................................ J-50
4.5 Flood Disaster Management Plan for the Rift Valley Catchment Area .............................. J-52 4.5.1 Management Strategy .......................................................................................... J-52 4.5.2 Proposed Flood Disaster Management Plan ........................................................ J-52
4.6 Flood Disaster Management Plan for the Athi Catchment Area ......................................... J-54 4.6.1 Management Strategy .......................................................................................... J-54 4.6.2 Proposed Flood Disaster Management Plan ........................................................ J-54
4.7 Flood Disaster Management Plan for the Tana Catchment Area ........................................ J-55 4.7.1 Management Strategy .......................................................................................... J-55 4.7.2 Proposed Flood Disaster Management Plan ........................................................ J-56
4.8 Flood Disaster Management Plan for the Ewaso Ng'iro North Catchment Area ................ J-58 4.8.1 Management Strategy .......................................................................................... J-58 4.8.2 Proposed Flood Disaster Management Plan ........................................................ J-59
CHAPTER 5 DROUGHT DISASTER MANAGEMENT PLAN ........................................... J-61
5.1 General ................................................................................................................................ J-61
5.2 Overall Concept and Framework for Planning ................................................................... J-62

Final Report Sectoral Report (J) Flood and Drought Disaster Management Table of Contents
Nippon Koei Co., Ltd. J - iii The Development of the National Water Master Plan 2030
5.3 Drought Disaster Management Plan ................................................................................... J-63 5.3.1 Preparation of Water Use Restriction Rule for Reservoirs .................................. J-64 5.3.2 Establishment of the Basin Drought Conciliation Council .................................. J-65 5.3.3 Drought Early Forecast ........................................................................................ J-65
CHAPTER 6 COST ESTIMATE .............................................................................................. J-66
6.1 Basic Conditions for Cost Estimate .................................................................................... J-66
6.2 Cost Estimates of Proposed Plans ....................................................................................... J-66 6.2.1 Project Cost .......................................................................................................... J-66 6.2.2 Recurrent Cost ..................................................................................................... J-67
CHAPTER 7 IMPLEMENTATION PROGRAMME ............................................................. J-68
7.1 General ................................................................................................................................ J-68
7.2 Prioritization Criteria for Implementation ........................................................................... J-68
7.3 Implementation Programmes of Proposed Plans ................................................................ J-68
7.4 Recommendation for the further Surveys and Studies for NWMP2030 ............................. J-69
List of Tables
Page Table 2.3.1 Recent History of Floods in Kenya (1/4)-(4/4) ...................................................... J-T-1
Table 2.4.1 Proposed Target Areas for Flood Disaster Management Plan ............................... J-T-5
Table 3.3.1 Recent History of Droughts in Kenya ................................................................... J-T-6
Table 5.3.1 Dams Managed by Each Drought Conciliation Councils by River System .......... J-T-7
Table 6.2.1 Cost Estimate for Proposed Flood Management Plan ........................................... J-T-8
Table 6.2.2 Cost Estimate for F/S on River Improvement Works ............................................ J-T-9
Table 7.3.1 Disbursement Schedule of Proposed Flood Management Plans by Term ........... J-T-10
List of Figures
Page Figure 1.2.1 Study Flow for Flood and Drought Disaster Management Plan ............................ J-F-1
Figure 2.2.1 Organizations in Relation to Flood Mitigation (Structural Measures) .................. J-F-2
Figure 2.3.1 Flood Area in Kenya .............................................................................................. J-F-3
Figure 3.3.1 Drought Area in Kenya .......................................................................................... J-F-4

Final Report Table of Contents Sectoral Report (J) Flood and Drought Disaster Management
The Development of J - iv Nippon Koei Co., Ltd. the National Water Master Plan 2030
Figure 4.3.1 Proposed Flood and Drought Disaster Management Plan (LVNCA) .................... J-F-5
Figure 4.4.1 Proposed Flood and Drought Disaster Management Plan (LVSCA) .................... J-F-6
Figure 4.4.2 Structural Measures and Network System for FFWS Proposed in Nyando Master Plan ............................................................................................................ J-F-7
Figure 4.5.1 Proposed Flood and Drought Disaster Management Plan (RVCA) ...................... J-F-8
Figure 4.6.1 Proposed Flood and Drought Disaster Management Plan (ACA) ......................... J-F-9
Figure 4.7.1 Proposed Flood and Drought Disaster Management Plan (TCA) ....................... J-F-10
Figure 4.8.1 Proposed Flood and Drought Disaster Management Plan (ENNCA) .................. J-F-11
Figure 5.3.1 Example for Water Use Restriction of Sameura Dam in 2005 Drought ............. J-F-12
Figure 7.3.1 Implementation Schedule for Proposed Flood Management Plan by Term ........ J-F-13
Figure 7.3.2 Implementation Schedule for Proposed Drought Management Plan by Term .................................................................................................................... J-F-14

Final Report Sectoral Report (J) Flood and Drought Disaster Management Abbreviations
Nippon Koei Co., Ltd. J - I The Development of the National Water Master Plan 2030
List of Abbreviations and Acronyms
ALRMP : Arid Land Resources Management Project APFM : Associated Programme on Flood Management ASAL : Arid and Semi-arid Land BWRB : Basin Water Resources Board CBD : Central Business District CBDM : Community-based Disaster Management CBO : Community Based Organization CDF : Constituency Development Fund CDMC : County Disaster Management Committee CDTF : Constituency Development Trust Fund CFMO : Community-based Flood Management Organization CMS : Catchment Management Strategy CRC : Crisis Response Centre DDMC : District Disaster Management Committee DOC : Disaster Operation Centre DRR : Disaster Risk Reduction DSG : District Steering Group EIA : Environmental Impact Assessment EMCA : Environmental Management and Coordination Act ENN : Ewaso Ng'iro North FDFC : Flood Diagnostic and Forecasting Centre FEWS : Flood Early Warning System FFWS : Flood Forecasting and Warning System FMU : Flood Management Unit GOK : Government of Kenya ICPAC : IGAD Climate Prediction and Application Centre IFM : Integrated Flood Management IGAD : Intergovernmental Authority on Development IP : Implementation Programme IWRM : Integrated Water Resources Management JICA : Japan International Cooperation Agency KenGen : Kenya Electric Generating Company KFS : Kenya Forest Service KFSSG : Kenya Food Security Steering Group KMD : Kenya Meteorological Department KRCS : Kenya Red Cross Society KVDA : Kerio Valley Development Authority KWS : Kenya Wildlife Service LBDA : Lake Basin Development Authority LVN : Lake Victoria North LVNCA : Lake Victoria North Catchment Area LVS : Lake Victoria South MOEMR : Ministry of Environment and Mineral Resources MOLG : Ministry of Local Government

Final Report Abbreviations Sectoral Report (J) Flood and Drought Disaster Management
The Development of J - II Nippon Koei Co., Ltd. the National Water Master Plan 2030
MOPW : Ministry of Public Works MORDA : Ministry of Regional Development Authority MOSSP : Ministry of State for Special Programmes MOWD : Ministry of Water Development MSDNKOAL : Ministry of State for Development of Northern Kenya and Other Arid LandsMWI : Ministry of Water and Irrigation MWRMD : Ministry of Water Resources Management and Development NBI : Nile Basin Initiative NCC : Nairobi City Council NDMA : National Drought Management Authority NDOC : National Disaster Operation Centre NEMA : National Environment Management Authority NET : National Environment Tribunal NGO : Non-Governmental Organization NIB : National Irrigation Board NPC : National Project Coordinator NWCPC : National Water Conservation and Pipeline Corporation NWMP : National Water Master Plan NWRMS : National Water Resources Management Strategy PDMC : Provincial Disaster Management Committee PS : Permanent Secretary RCMRD : Regional Centre for Mapping of Resources for Development RDA : Regional Development Authority RV : Rift Valley SCMP : Sub-catchment Management Plan TARDA : Tana and Athi River Development Authority VIRED : Victoria Institute of Research and Development
WKCDD&FMP : Western Kenya Community Driven Development & Flood Mitigation Project
WMO : World Meteorological Organization WRM : Water Resources Management WRMA : Water Resource Management Authority WRUA : Water Resources Users Association WSB : Water Service Board WSP : Water Service Provider WSTF : Water Services Trust Fund

Final Report Sectoral Report (J) Flood and Drought Disaster Management Abbreviations
Nippon Koei Co., Ltd. J - III The Development of the National Water Master Plan 2030
Abbreviations of Measures
Length mm = millimeter cm = centimeter m = meter km = kilometer
Money KSh = Kenya shilling US$ = U.S. dollar
Area ha = hectare m2 = square meter km2 = square kilometer
Energy kcal = Kilocalorie kW = kilowatt MW = megawatt kWh = kilowatt-hour GWh = gigawatt-hour
Volume 1, lit = liter m3 = cubic meter m3/s, cms = cubic meter per second CM = cubic meter MCM = million cubic meter BCM = billion cubic meter m3/d, cmd = cubic meter per day BBL = Barrel
Others % = percent o = degree ' = minute " = second °C = degree Celsius cap. = capital LU = livestock unit md = man-day mil. = million no. = number pers. = person mmho = micromho ppm = parts per million ppb = parts per billion lpcd = litter per capita per day
Weight mg = milligram g = gram kg = kilogram t = ton MT = metric ton Time s = second hr = hour d = day yr = year

NOTE 1. The National Water Master Plan 2030 was prepared based on the material and data provided from
Kenyan Government and its relevant organisations during field surveys in Kenya carried out until November 2012. The sources etc. of the material and data utilised for the study are described in the relevant part of the reports.
2. The names of ministries and related organisations of Kenyan Government are as of November 2012.
3. Information to be updated
The following information which is given in the report is needed to be updated properly:
(1) Information on the proposed development projects
The features and implementation schedules of the proposed development projects may be changed toward implementation of the project. After the subject projects were clearly featured for implementation, the project features and implementation schedules in this report should be updated.
(2) Information on the water demand
The water demand projected in this master plan should be revised when the large scale development plans, other than the projects proposed in this master plan, were formulated, as they will significantly affect to the water resources development and management.
4. Exchange rate for cost estimate
The costs of the proposed development and management plans were estimated by applying the following exchange rate as of November 1, 2012.
EXCHANGE RATE
US$1.00 = KSh 85.24 = ¥79.98 as of November 1, 2012

Final Report Introduction Sectoral Report (J) Flood and Drought Disaster Management Chapter 1
Nippon Koei Co., Ltd. J - 1 The Development of the National Water Master Plan 2030
CHAPTER 1 INTRODUCTION
1.1 Scope of the Plan
Among various natural disasters, the National Water Master Plan (NWMP) 2030 deals with water-related disasters, namely flood and drought, and focuses on the pre-disaster stage. Post-disaster related activities such as food provision, disease prevention, etc., have been basically dealt with by sectors other than the water sector. These sectors usually include National Disaster Operation Centre (NDOC) and Crisis Response Centre (CRC). The fundamental structure of disaster management components in NWMP 2030 is as shown in the figure below.
Disaster Management
Flood Management
Drought Management
Evacuation System
Flood Forecasting & Warning System
Flood Fighting System
Land Use Regulation
Structural Measures
Non-structural Measures
Structural Measures
Non-structural Measures
Observation
Data Transmission
Flood Analysis
Warning Dissemination
Drought Forecasting & Warning System
Drought Preparedness & Mitigation System
Drought Impact Assessment System
Arrangement of Emergency Water
Implementation ofWater Saving
Effective Water Use
Improvement of Public Awareness
Source: JICA Study Team
Structure of Disaster Management in NWMP 2030
In NWMP 2030, structural measures against flood were incorporated in the disaster management plan. However, structural measures against drought are separately discussed in the water resources development sector. Accordingly, this chapter for flood and drought disaster management basically deals with the general concept of water-related disaster management, planning of both structural and non-structural measures against flood, and planning of non-structural measures against drought.
1.2 Work Flow of Planning
The flood and drought disaster management plan was formulated in line with the following work flow: i) understanding the current situation, ii) identification of key issues, iii) consideration of planning policy, and iv) planning of necessary measures. The flowchart is shown in Figure 1.2.1.

Introduction Final Report Chapter 1 Sectoral Report (J) Flood and Drought Disaster Management
The Development of J - 2 Nippon Koei Co., Ltd. the National Water Master Plan 2030
1.3 Outline of the Flood Protection Plans in NWMP (1992)
This section describes an outline of the flood protection plans formulated and priority projects proposed in NWMP (1992) as the basic information for its renewal.
The flood protection plan in NWMP (1992) was formulated focusing on structural measures, in view of the certainty of their effect. Regarding non-structural measures, the following four measures were proposed as part of the recommendations on legal and institutional aspects:
i) Land use control in habitual flood prone areas ii) Installation of flood forecasting and warning system iii) Establishment of flood fighting team iv) Formulation of an evacuation system for widespread inundation
On the other hand, there was no drought management plan proposed in NWMP (1992), though a water resources development plan was formulated in the form of structural measures.
In this context, the following subsections describe principally about the structural measures proposed in NWMP (1992).
1.3.1 Proposal and Recommendations of NWMP (1992)
Flood protection projects proposed in NWMP (1992) were formulated taking the following points into consideration:
a) Nine target areas were selected to examine flood protection plans, judging from the magnitude of damage and the largeness of flooded areas. The target areas are: i) Yala Swamp, ii) Kano Plain, iii) Sondu Rivermouth, iv) Kuja Rivermouth, v) Middle Turkwel, vi) Downmost Athi, vii) Lumi Rivermouth, viii) Nairobi City, and ix) Lower Tana.
b) Flood protection plans were examined; focusing on the structural measures in view of the certainty of their effect.
c) Among the structural measures, the method of continuous dyke or polder was applied to the plans because of; i) negligible and unsure effects of flood regulation by dam and its difficult operation, ii) no suitable site for the retarding basin located upstream of the stretch, iii) no applicability of the diversion channel under the existing shortest river courses, and iv) uncertain effects of the channel excavation or dredging.
d) Economic evaluation and socio-environmental assessment were carried out to select the target areas of the proposed flood protection projects.
A total of five target areas were selected, in which the proposed flood protection projects were formulated in NWMP (1992). The five target areas are given in the following table.

Final Report Introduction Sectoral Report (J) Flood and Drought Disaster Management Chapter 1
Nippon Koei Co., Ltd. J - 3 The Development of the National Water Master Plan 2030
Proposed Target Areas and Priority Flood Protection Projects in NWMP (1992)
No. Target Area River Name Main Structural Measures Protection Level1 Yala Swamp Nzoia Rehabilitation (16 km) and construction (2 km) of dyke* 25-year flood
Yala Heightening (9 km) and construction (14 km) of dyke*,** 25-year flood2 Kano Plain Nyando Rehabilitation (2 km) and construction (18 km) of dyke** 25-year flood
Kibos, Luando, Nyaidho, Awach Kano
Construction of dyke (10 km for Kibos**, 24 km for Luando*,**, 12 km for Nyaidho**, 5 km for Awach Kano**)
25-year flood
Ombeyi, Miriu Only for usual drainage - 3 Kuja Rivermouth Kuja Construction of dyke (10 km) 25-year flood4 Lumi
Rivermouth Lumi Construction of dyke (11 km)*,** 25-year flood
5 Nairobi City Nairobi and Ngong Enlargement of bridges/culverts (13 sites), Channel works up/downstream of bridges/culverts (11 sites)
50-year flood
Notes: * = including sluice construction; ** = including bridge construction Source: NWMP (1992)
Other than the major flood protection projects proposed as above, there were other river improvement and drainage projects proposed in NWMP (1992) which need specific consideration. These projects were as follows:
Other Proposed Projects in NWMP (1992) Needing Specific Consideration
No. Project Title Description 1 Urban Drainage
Projects Urban drainage work is a network of main, secondary and tertiary drains for collecting and conveying drainage water. Priorities of urban drainage works were given to major urban centres. A total of 47 urban centres were selected.
2 Minor Ad-hoc River Improvement Projects
Other than specific flood protection plans, improvement of river channels was proposed on an ad-hoc basis, such as improvement associated with urban drainage, bank protection, removal of accumulated silt, channel clearing, canalisation, etc. particularly in urban areas.
3 Long-term Improvement of Lower Tana River
There were two major challenges in the Lower Tana reaches. One was flood challenge and the other was the unstable river course. The former could be possibly solved by dams and levees. The latter was causing a lot of inconveniences, and the stabilisation of the river channel deemed to be a primary step.
Source: NWMP (1992)
In addition, the following recommendations were made in NWMP (1992) in terms of flood protection and control, as well as the implementation of the proposed flood protection projects:
1) Accumulation of Flood Records and Technical Data on Rivers
There were only limited flood records and other technical data on rivers. This made it difficult to evaluate flood and river conditions including the formulation of flood protection plans. It was firstly recommended to collect actual information/data on floods and rivers as much as possible through interview surveys and field reconnaissance on-site. The collection of flood data would be managed by the River Management Division, which was proposed to be established, in cooperation with Hydrology Section and possibly with District Flood Disaster Committee.
Secondly, efforts should be attempted to get more detailed and quantitative information/data by preparing topographic maps of flood prone areas and areas along the rivers in question, preparing longitudinal profiles and cross sections along the rivers, and

Introduction Final Report Chapter 1 Sectoral Report (J) Flood and Drought Disaster Management
The Development of J - 4 Nippon Koei Co., Ltd. the National Water Master Plan 2030
rehabilitating/constructing water level gauging stations located immediately upstream of the flood prone areas in question.
2) Institutional Setup for River Management
It was recommended that a responsible division and/or section be set up in the headquarters of the Ministry of Water Development (MOWD) and possibly in provincial water offices to cope with the management requirements for increasing development activities in the rivers and land in flood prone areas in the future. The main responsibilities to be assigned might include: a) Management of rivers and riparian structures, including periodical patrol/inspection and planning of remedial measures/maintenances, b) Compilation of flood records and other technical data relevant to river statistics and behaviours, c) Planning, designing and implementation of river improvement works, and d) Direction of flood warning and fighting activities.
1.3.2 Latest Progress and Future Implementation Plan of the Proposed Priority Projects
Information on the current status and/or progress of priority flood protection projects proposed in NWMP (1992) were collected from the Ministry of Water and Irrigation (MWI), Water Resources Management Authority (WRMA) headquarters and regional offices, National Water Conservation and Pipeline Corporation (NWCPC) headquarters and site offices, Nairobi City Council (NCC), National Irrigation Board (NIB), Ministry of Regional Development Authorities (MORDA) and Regional Development Authorities (RDAs), Ministry of State for Special Programmes (MOSSP), etc. The information collected for the proposed priority flood protection projects are as summarised below:
Progress and Plan for Proposed Priority Flood Protection Projects
1) Projects in Yala Swamp (LVNCA)
Nzoia River
According to NWCPC, they carried out rehabilitation works in the existing dykes of the Nzoia River, including a 22 km long embankment raising and 21 km long seepage control works. They also conducted the construction of new dykes 2 km long. Although a drainage sluice proposed in NWMP (1992) was not constructed, the NWCPC achieved the proposal of the rehabilitation and construction of the dykes in terms of length.
Under the “Western Kenya Community Driven Development and Flood Mitigation Project” (WKCDD&FMP) by MOSSP, the assessment of the existing levee integrity, floodplain condition and final design of the new flood protection works in the downstream region of the Nzoia River are being conducted in collaboration with MWI and Kenya Meteorological Department (KMD). Details of the project are represented in the following section.
Yala River
No substantial construction works were carried out according to NWCPC and WRMA, although NWMP (1992) proposed to heighten and construct dykes with a total length of 23 km. According to information from MWI, a study for the improvement of the Yala River is in

Final Report Introduction Sectoral Report (J) Flood and Drought Disaster Management Chapter 1
Nippon Koei Co., Ltd. J - 5 The Development of the National Water Master Plan 2030
progress as carried out by Nile Basin Initiative (NBI). However details of the study are not available.
2) Projects in Kano Plain (LVSCA)
Nyando River
NWCPC carried out the construction of new dykes on both banks with a total length of 10 km from 2005 to 2010.
The Study on “Integrated Flood Management for Nyando River Basin”, which was completed in 2009 by JICA, formulated an integrated flood management plan for the capacity development of the Nyando River basin. The formulated plan proposed the following structural measures: i) raised evacuation roads, ii) dyke development, iii) river training, iv) desilting, v) retarding pond, and vi) catchment conservation.
Details of the study are discussed in the following section.
Kibos, Luando, Ombeyi, Miriu, Nyaidho and Awach Kano Rivers
There was no substantial implementation achievement on the projects proposed in NWMP (1992) according to NWCPC and WRMA, with the exception of some activities such as road raising and new bridge construction by the Ministry of Public Works (MOPW) in the Awach Kano River.
3) Projects in Kuja Rivermouth (LVSCA)
No implementation of the projects proposed in NWMP (1992) was made according to NWCPC and WRMA.
4) Projects in Lumi Rivermouth (ACA)
No implementation was made for the projects proposed in NWMP (1992), although some studies for the flood management project were proposed by NWCPC. No details of the studies are available so far.
5) Projects in Nairobi City (ACA)
According to NCC, four bridges were rehabilitated among the 13 bridges/culverts that were proposed to be enlarged in NWMP (1992).
Progress and Plan of the Other Proposed Projects Needing Specific Consideration
1) Urban Drainage Projects
Among the 47 urban centres selected for improvement in NWMP (1992), there are some studies that have been completed or are ongoing in three urban centres. The study report on the drainage improvement for Mombasa City is ready for the next stage of implementation according to MWI. The study for Kisumu was underway as of June 2011. The master plan

Introduction Final Report Chapter 1 Sectoral Report (J) Flood and Drought Disaster Management
The Development of J - 6 Nippon Koei Co., Ltd. the National Water Master Plan 2030
study for stormwater drainage management in Bungoma is in progress as carried out by the NBI.
2) Minor Ad-hoc River Improvement Projects
There were some river improvement and flood protection projects carried out by NWCPC from 2005 to 2010. In the Sondu River, bank stabilisation works for a total length of 0.6 km were carried out. In the Daua River, a 5 km long bank protection and 0.5 km long new dyke construction were carried out in Mandera.
3) Long-term Improvement of Lower Tana River
The river bank stabilisation for a length of 3 km was executed by NWCPC in Garissa town.
In addition, there were two recommendations in NWMP (1992) in terms of flood protection and flood control. The first was the accumulation of flood records and technical data on rivers, while the second was institutional setup for river management. According to the collected information, no substantial actions seemed to have been made by the relevant agencies to accumulate flood records and technical data. The activities carried out by the current organisations responsible for flood management have been very limited. Details on the current status and/or progress of implementation for the recommendations are provided in the following section.
To summarise the above, there is slow progress on the implementation of the proposed priority projects and recommendations of NWMP (1992). Some studies and rehabilitation and/or construction works of the dykes were or are being carried out in the Nzoia and Nyando Rivers, however, almost other priority projects for dyke rehabilitation and construction were not studied and/or implemented. In Nairobi City, only four bridges were rehabilitated as opposed to the proposed rehabilitation works of 13 bridges/culverts and 11 channel works. No substantial actions seemed to have been made to collect and accumulate information/data on past floods, inundation, damages, relevant maps and survey results. It is also noted that the activities carried out by the currently established organisations related to flood management were limited.
1.3.3 Remarks for NWMP 2030
The following points were examined in formulating flood and drought disaster management plans for NWMP 2030, taking into consideration the current basin conditions and new concepts in the flood management subsector:
1) Existing Flood Mitigation/Management Strategies
Situations surrounding the flood management subsector have been changed since the previous NWMP (1992). One of the changes is the preparation of “Flood Mitigation Strategy (June 2009) by MWI, following the Strategy for Flood Management for Lake Victoria Basin, Kenya (September 2004). The Lake Victoria Basin Strategy was prepared by World Meteorological Organisation (WMO) in collaboration with Kenyan experts, aiming at extending the strategy to the whole country. Flood management plans of NWMP 2030 need to be formulated in accordance with the Flood Mitigation Strategy.

Final Report Introduction Sectoral Report (J) Flood and Drought Disaster Management Chapter 1
Nippon Koei Co., Ltd. J - 7 The Development of the National Water Master Plan 2030
2) Concept of Integrated Flood Management
NWMP (1992) proposed only structural measures for flood protection. The main structures that were selected were dykes without flood control dams. It is recognised that concepts of Integrated Flood Management (IFM) have been internationally accepted as the appropriate approach for flood management. The IFM integrates land and water resources development in a river basin, within the context of Integrated Water Resources Management (IWRM). IFM aims at maximizing the efficient use of floodplains and minimizing the loss of life and property. The IFM should encourage the participation of users, planners and policy makers at all levels. The Kenyan government initiated the introduction of the concept of the IFM to the flood management projects in the Lake Victoria basin and intends to expand the concept to other basins. The IFM therefore needs to be applied for NWMP 2030.
3) Climate Change
The main impacts of climate change on the flood and drought management subsectors are changes in rainfall amount and its intensity, resulting in changes of flood or drought regime. Design floods or drought for preparing the flood and drought management plans of NWMP 2030 are estimated in the hydrological analysis when incorporating the effects of climate change.
4) Structural Measures and Non-structural Measures
The combination of structural and non-structural measures is an aspect of the IFM/IWRM and essential for flood and drought management planning. Although non-structural measures were not sufficiently discussed in NWMP (1992), the incorporation of non-structural measures is essential to develop both flood and drought management plans in views of its appearance speed of the effect and difficulty in financing construction costs for structural measures.
5) Urban Drainage Issues
The urban drainage works is a network of main, secondary and tertiary drains for collecting and conveying drainage water from specific areas in towns. NWMP (1992) had presumed that the priorities of urban drainage works would be given to major urban centres. The preliminary costs of the works composed of gravity drains were estimated.

Current Situation of Flood Disaster Management Final Report Chapter 2 Sectoral Report (J) Flood and Drought Disaster Management
The Development of J - 8 Nippon Koei Co., Ltd. the National Water Master Plan 2030
CHAPTER 2 CURRENT SITUATION OF FLOOD DISASTER MANAGEMENT
2.1 Relevant Policies and Strategies
This subsection describes policies, strategies and master plans of the Kenyan government in relation to flood disaster management. These policies, strategies, and master plans are provided in the table below. Their principles, directions to plan formulation, key items and requirements need to be incorporated into NWMP 2030.
Policy, Strategies and Plans for Flood Disaster Management
Category Title Organisation Year Policy National Disaster Management Policy (Final Draft) MOSSP Oct. 2010Strategy The National Water Resources Management Strategy MWI Jan. 2007 Strategy Flood Mitigation Strategy MWI Jun. 2009 Strategy Strategy for Flood Management for Lake Victoria Basin WMO / APFM Sep. 2004Strategy National Climate Change Response Strategy Government of Kenya Apr. 2010Plan MWI Ministerial Strategic Plan 2009-2012 MWI May 2009Plan WRMA Strategic Plan 2009-2012 WRMA Sep. 2009Plan Ministry of State for Special Programmes Strategic Plan 2008-2012 MOSSP ------- Plan National Disaster Response Plan MOSSP and NDOC 2009 Plan Contingency Plan for the 2009 El Niño Rains Gov. of Kenya and
Humanitarian Partners Oct. 2009
Note: MOSSP = Ministry of State for Special Programmes MWI = Ministry of Water and Irrigation WMO = World Meteorological Organisation APFM = Associated Programme on Flood Management WRMA = Water Resources Management Authority NDOC = National Disaster Operation Centre
Source: JICA Study Team based on collected documents
The policies, strategies and master plans for flood disaster management are as follows:
a) The policy and strategies on water resources development and management including flood matter include: (i) Sessional Paper No. 1 of 1999 on the National Policy on Water Resources Management and Development prepared by the Ministry of Water Resources, (ii) National Water Resources Management Strategy (NWRMS) (2007) prepared by MWI, and (iii) Catchment Management Strategy (CMS) (2008) prepared by WRMA. The National Policy on Water Resources Management and Development is the basic policy framework on water resources management and development. The framework basically outlines the policy direction on water resources in the country. The Water Act 2002 is the legal framework to support this national policy. The two latter strategies which is the National Water Resources Management Strategy and the Catchment Management Strategy, were formulated as directed by the Water Act 2002.
b) The policy and strategies on flood management include: (i) National Disaster Management Policy (2010) developed by the Kenya National Disaster Risk Reduction (DRR) Platform chaired by MOSSP, (ii) Strategy for Flood Management for Lake Victoria Basin (2004) undertaken by the WMO, and (iii) Flood Mitigation Strategy (2009) prepared by MWI. The National Disaster Management Policy provides principles and policies for overall disaster management, but focuses on non-structural measures in terms of flood management. The Strategy for Flood Management for Lake Victoria Basin is the outcome of a pilot project undertaken for developing a strategy for integrated flood management in that basin. Lastly, the Flood Mitigation Strategy is a nationwide strategy prepared based on the Strategy for Management for Lake Victoria Basin.

Final Report Current Situation of Flood Disaster Management Sectoral Report (J) Flood and Drought Disaster Management Chapter 2
Nippon Koei Co., Ltd. J - 9 The Development of the National Water Master Plan 2030
c) Kenya Vision 2030 is the long-term national planning strategy for multi-sectoral developments in Kenya. It is based on three pillars: the economic, the social and the political. Under Kenya Vision 2030, the environment, water and sanitation sector plan was prepared by identifying the programmes and projects to be implemented in the plan period of 2008-2012 to address to the various challenges facing the sector.
The policies and strategies above as well as Kenya Vision 2030 are outlined and discussed further in the following:
(1) Policy and Strategies on Water Resources Development and Management
The “National Policy on Water Resources Management and Development (Sessional Paper No. 1 of 1999)” prepared by the Ministry of Water Resources, states to “preserve, conserve and protect available water resources and allocate it in a sustainable, rational and economical way” as one of the policy’s objectives. However, this policy does not specifically describe the principles, directions, key items or requirements which would be adopted to the planning and/or implementation of the flood disaster management.
The Water Act 2002, which is the legal framework to support the National Policy on Water Resources Management and Development (Sessional Paper No. 1 of 1999), directs that:
a) A national water resources management strategy (NWRMS) shall be formulated by MWI, in accordance with the water resources of Kenya and shall be managed, protected, used, developed, conserved and controlled (Section 11); and
b) A catchment management strategy (CMS) shall be formulated by WRMA for the management, use, development, conservation, protection and control of water resource within each catchment area (Section 15).
The NWRMS 2007-2009, which was prepared by MWI in January 2007 as framework for the development of a CMS, enumerates the three following strategies in terms of flood management:
a) Strategies on prevention and mitigation include: (i) formulating policies on settlement in flood prone areas, (ii) improving catchment conservation and protection, (iii) developing infrastructure design parameters and regulations, and (iv) developing flood control infrastructure;
b) Strategies on preparedness to include: (i) improving data recording and information management system, (ii) increasing public awareness on dangers of settling in flood prone areas, (iii) developing flood forecasting and early warning systems, and (iv) training and building capacity for appropriate response; and
c) Strategies on response include: (i) promoting participation of key water sector institutions in flood management, and (ii) developing funding mechanisms.
The CMSs (2008) was prepared by WRMA conforming to the NWRMS for the respective six catchment areas describe WRMA’s general principles or measures and main activities in terms of flood protection as follows:
a) The general principles include: (i) land use measures to keep people away from floods, (ii) structural measures to keep flood water away from the people, (iii) flood preparedness

Current Situation of Flood Disaster Management Final Report Chapter 2 Sectoral Report (J) Flood and Drought Disaster Management
The Development of J - 10 Nippon Koei Co., Ltd. the National Water Master Plan 2030
measures to get people ready for floods, and (iv) flood emergency measures to help affected people cope with floods.
b) The main activities include: (i) compiling an inventory of high risk flood sites, (ii) studying hydrologic regime and elaborating hydrologic forecasting models, (iii) constructing flood protection structures such as dams and dykes, (iv) organizing land use and human activities in vulnerable zones, (v) designing and implementing flood warning systems, and (vi) developing and implementing an emergency plan in case of inundations.
c) It is noted that the CMS of ACA states that flooding does not much adversely affect ACA as a whole, but does affect the Sabaki, Lumi and Voi Rivers.
Both of the NWRMS and CMSs include descriptions of developing flood disaster management plans.
(2) Policy and Strategies on Flood Management
The National Disaster Management Policy (final draft, October 2010) was developed by the Kenya National Disaster Risk Reduction (DRR) Platform chaired by the MOSSP. The policy seeks to establish the guiding principles and policy architecture for management of disasters such as natural disasters (floods, droughts, landslides, lightning, and earthquakes), disease outbreaks, fire, transport and industrial accidents, environmental pollution, human conflicts, etc. Non-structural measures are substantial components to cope with flooding in this policy. This policy has no specific principles, directions, key items or requirements which would be adopted to the planning and implementation of structural measures for flood control or protection.
A pilot project for developing the Strategy for Flood Management for Lake Victoria Basin in Kenya was undertaken in 2004 by the WMO, with full participation of the national experts from various concerned ministries, as well as the Ministry of Water Resources Management and Development (MWRMD). Following the completion of the pilot project and based on policies applied for the strategy, a nationwide flood mitigation strategy was prepared by MWI in June 2009. According to MWI, the flood mitigation strategy is in the draft stage, and needs consultations or workshops with the stakeholders for finalisation.
The Strategy for Flood Management for Lake Victoria Basin, Kenya (September 2004) introduced various strategies and policies for flood management. These included: (i) an IFM approach, (ii) a linkage of flood management with water resources development, and (iii) mixture of structural and non-structural measures.
The Flood Mitigation Strategy (June 2009) was drafted, conforming to the concept of the IFM, outlines characteristics of river basins, floods, damages and the existing flood mitigation measures, and enumerates elements of the strategy to mitigate flood damages. The strategy was proposed to set up a flood management unit under WRMA and was realised in 2010. The specific interventions proposed in the strategy in terms of structural measures are as follows:
a) Large and medium sized reservoirs to store floodwaters in the upper catchment, b) Dykes for areas with high to medium vulnerability community and infrastructure, and c) River training and realignment of meandered points of the flow.
Final Report Current Situation of Flood Disaster Management Sectoral Report (J) Flood and Drought Disaster Management Chapter 2
Nippon Koei Co., Ltd. J - 11 The Development of the National Water Master Plan 2030
(3) Kenya Vision 2030
Kenya Vision 2030 is Kenya’s long-term national planning strategy covering the period 2008-2030. Kenya Vision 2030 sets a goal in the environmental management sector under the social pillar to substantially reduce losses due to floods and droughts, and identifies strategies to realise the goal to (i) shift policy from disaster response to disaster risk education, (ii) intensify research on the impacts of climatic changes, (iii) aggressively promote adaptation activities in high risk disaster zones, and (iv) undertake measures to integrate climate change into development planning.
The Vision’s First Medium-Term Plan of the “Sector Plan for Environment, Water and Sanitation 2008-2012” represents the following plans of activities in terms of flood management:
a) Development of two multipurpose dams with storage capacity of 2.4 billion m3 along the Nzoia and Nyando Rivers,
b) Undertaking of medium-term flood mitigation programme in areas prone to flooding like Budalangi, Kano plains, Taita Taveta, Garissa and other parts of Lower Tana River, and
c) Monitoring of progress of the WKCDD&FMP.
2.2 Relevant Organisations
The organisations relevant to flood disaster management include mainly MWI, WRMA, NWCPC, MORDA and RDAs, the Ministry of Local Government (MOLG), MOSSP, NDOC, KMD, County Disaster Management Committee (CDMC) and Water Resources Users Associations (WRUAs). Out of these, several organisations concerned to structural measures at each implementation stage are as illustrated in Figure 2.2.1.
MWI has the authority regarding water affairs including flood management in the country. MWI is responsible for policy formulation, sector coordination and monitoring/evaluation of water resources. Under MWI, several organisations are responsible for structural measures for flood control/protection, including WRMA and NWCPC. WRMA is responsible for compiling an inventory of high risk flood sites, constructing flood protection structures, and coordinating with other bodies for flood control/protection measures. NWCPC is almost the sole organisation to implement major flood control/protection structure projects.
MORDA and RDAs are undertaking integrated basin-based development programmes including flood management projects such as dam construction, river bank protection and watershed conservation. MOLG is mandated to undertake urban drainage schemes in coordination with MWI and local governments. MOSSP participates in planning the flood control/protection structural project.
NDOC is currently responsible for the management of all disaster prevention activities through the disaster management committees at the county level, according to the flood mitigation strategy. However, the major role of NDOC is the coordination of post-disaster related activities of various ministries up to the county level.
KMD is carrying out meteorological observation which is one of essential activities for flood forecasting. KMD is also currently participating in the establishment of flood early warning system in the Nzoia River basin through WKCDD&FMP.

Current Situation of Flood Disaster Management Final Report Chapter 2 Sectoral Report (J) Flood and Drought Disaster Management
The Development of J - 12 Nippon Koei Co., Ltd. the National Water Master Plan 2030
CDMCs and WRUAs play roles in coordination with public people such as evacuation assistance in the time of flood and community level collaboration, respectively.
The mandates/functions and current situations of the organisations are described below.
(1) MWI
The department responsible for flood management in MWI is the Department of Irrigation, Drainage and Water Storage. In the department, the Water Storage and Flood Management Division is mandated to deal with substantial works such as preparing development strategies and overall plans for implementation by providing guidelines and manuals for planning and designing structures including storage dams. This is based on the information obtained from officials concerned in MWI and NWCPC as well as the description in the MWI’s Flood Mitigation Strategy (2009).
However, according to the MWI’s Ministerial Strategic Plan 2009-2012, the Department of Water Resources Management has the function of mitigation against natural disasters, floods and droughts. This conflict between two departments for one specific function may suggest a general idea that one of the issues in the flood management sector is the unclear definition of mandates and/or functions of the government organisations.
The Water Storage and Flood Management Division consists of five sections, namely; the Water Storage, Flood Management and Standards and Guidelines Section. The division only has a total of five engineers as of November 2012, which seems to be insufficient to attain their functions.
No quantitative data or records on past floods regarding their magnitude, extension and duration, flood damages, and the existing flood management structures were available at MWI. Although there were few information available regarding ongoing flood management projects. This implies that no systematic data collection and accumulation were made in the flood management sector, resulting in no detailed implementation and management planning based on such data.
(2) WRMA
According to the WRMA Strategic Plan 2009-2012, one of the roles or functions of WRMA is coordination with other bodies for early warning, preparedness and mitigation measures. CMSs describe the WRMA’s general principles or measures and main activities in terms of flood protection including structural measures.
The Flood Management Unit (FMU) was established at the WRMA headquarters in 2010. The FMU is composed of the following staff: Water Conservation Officer, Surface Water Officer, Water Resources Planning Officer, Database/GIS Officer, and WRUA Coordination Officer. The functions of FMU are as follows: (i) coordination within WRMA on a) other stakeholders in flood management, b) implementation of early warning system, c) preparation of flood events reports and recommendations of intervention measures, and d) capacity building within WRMA and communities on flood management; (ii) carrying out regular inspection of flood management structures, and liaising with other bodies involved in flood management activities; and (iii) act as the permanent flood management focal point in WRMA and hold quarterly meetings for review and production of reports.

Final Report Current Situation of Flood Disaster Management Sectoral Report (J) Flood and Drought Disaster Management Chapter 2
Nippon Koei Co., Ltd. J - 13 The Development of the National Water Master Plan 2030
The FMU had their first meeting and was yet to meet and prepare the required reports or give more details on what to do in each of the functions.
A few data or information on the existing flood control structures and ongoing and future projects were gathered from the WRMA headquarters and regional offices. No data or records on past flood events and damages were however available from WRMA.
The current status of the inactive FMU and the poor database of past flood events may have been due to insufficient resources including manpower and budget.
(3) NWCPC
NWCPC is primarily the sole organisation in the Kenyan government to implement major flood control and protection structural projects. According to the NWCPC Strategic Plan 2010-2015, one of the core functions of NWCPC is to plan, develop and manage state schemes and other water infrastructure in Kenya and beyond, including flood control structures and dykes, as well as large- and medium-scale dams, small-scale dams and pans, boreholes, groundwater recharge facilities, canals, and water supplies.
NWCPC has its Flood Control Division at their headquarters and at four site offices in Budalangi, Nyando, Garsen and Rhamu for implementing flood control projects such as rehabilitation and construction of dykes, river training, desilting and river bank stabilisation. Only two engineers are assigned at the headquarters and site offices together with some technical and supporting staff. Their annual budget for construction is about KSh150 million in total. The small amount of staff and budget might make the expansion of their activities difficult. A detailed or updated design does not seem to have been prepared in implementing the current projects. It may be needed to review these plans for implementation from the viewpoint of the IFM concept.
In the Planning and Design Department of NWCPC, the Nzoia multipurpose dam scheme is studied and designed, in which flood control purpose is included.
Data/information on ongoing projects were collected from the NWCPC headquarters and site offices, however, no data were available on past floods including flood discharges, inundation areas, depths and duration, and flood damages. NWCPC will be involved in flood data collection as per the new report (draft) on the mandates and roles of NWCPC according to MWI.
According to the NWCPC Second Quarter Report for the period of July to December 2010, a research committee was reconstituted in the NWCPC in 2010 to undertake mapping of flood areas. However, such details are not available so far.
(4) MORDA and RDAs
According to the MORDA Strategic Plan 2008-2012, the MORDA with RDAs are undertaking flood management projects including: (i) feasibility studies to construct large water reservoirs that will impound runoff, (ii) catchment conservation, (iii) promotion of reforestation and afforestation programmes, and (iv) protection of riverbanks and water bodies.

Current Situation of Flood Disaster Management Final Report Chapter 2 Sectoral Report (J) Flood and Drought Disaster Management
The Development of J - 14 Nippon Koei Co., Ltd. the National Water Master Plan 2030
MORDA’s current main activities are the undertaking of feasibility studies and detailed designs for multipurpose dam schemes with the purpose of flood control. These multipurpose dams are the Magwagwa Dam, Mwachi Dam, Nandi Forest Dam, Arror Dam, and High Grand Falls Dam as of November 2012.
Among the above multipurpose dam schemes, separate studies have been carried out by MORDA and NWCPC at the same dam site (but not the same dam axes) for the Mwachi Dam. Such studies seem to have been conducted with less coordination between organisations.
(5) MOLG
MOLG, in coordination with MWI and local governments, is mandated to undertake schemes/plans for urban drainage.
(6) MOSSP
The ongoing WKCDD&FMP is undertaken by MOSSP in coordination with MWI. A multipurpose dam scheme with flood control purpose was identified at project site 42A and is in the process of final design. A separate study by NWCPC is also ongoing at site 34B in the same Nzoia River. Some coordination seems to be necessary between these studies for efficient development.
(7) NDOC
All kinds of disaster management at the national level are coordinated by NDOC in the Office of the President, MOSSP. NDOC was established on January 21, 1998 following the adverse effects of El Niño rains. The centre is the focal point for coordinating emergencies and disasters in the country. Officers drawn from various ministries and departments of the government man it on a 24-hour basis.
Currently NDOC is also involved in the WKCDD&FMP. Officers on loan from MWI are either engaged as hydrologist and structural flood control expert in the flood mitigation components of the project.
(8) KMD
KMD is one of the departments under the Ministry of Environment and Mineral Resources. The mandate of KMD is the provision of meteorological information and services for the safety of life, protection of property and conservation of the natural environment.
One of the designated functions and operations of KMD is to participate in the development, implementation and operations of national multi-hazard early warning systems. KMD usually makes indicative flood forecasting in the form of rainfall. Also, they contribute to the establishment of an early flood warning system in the Nzoia River basin under WKCDD&FMP, which is outlined in Subsection 2.3.1 (4) 4), in cooperation with MOSSP/NDOC, MWI and WRMA LVN Regional Office.
(9) CDMC
Every county has set up CDMC to deal with all kinds of disasters at the county level. Although there is no clear legal background of its establishment, the Office of the President, MOSSP established

Final Report Current Situation of Flood Disaster Management Sectoral Report (J) Flood and Drought Disaster Management Chapter 2
Nippon Koei Co., Ltd. J - 15 The Development of the National Water Master Plan 2030
CDMC through the official circular. CDMC is chaired by the County Commissioner. Membership of CDMC basically include county officers from various sectors, representatives from private organisations such as non-governmental organisations (NGOs), community based organisations (CBOs) and religious organisations, research institutions, etc.
CDMC is mainly responsible for rescue and relief operations through multidisciplinary teams at the county and community levels. During normal conditions, a regular meeting is held once a month. Once a disaster occurs, the meeting is held frequently as necessary. The regional offices of WRMA and KMD also participate in the meeting though they are not official members of CDMC.
(10) WRUA
WRUA is an association of water users, riparian land owners, or other stakeholders who have formally and voluntarily associated themselves for the purposes of cooperatively sharing, managing and conserving a common water resource (definition in the WRM Rules 2007). The regional offices of the WRMA work in consultation with stakeholders at the grassroots level through WRUAs.
WRUAs play a key role in flood disaster management through hydrological monitoring, reporting of water-related disasters to the WRMA regional and/or subregional offices, clearing of water ways to open up flooded flow channels, and dissemination of information on early flood warning.
(11) Unclear Mandates and Functions of Organisations
It is recognised that mandates and functions of the organisations relating to flood management have not been clearly defined, in particular for the roles of data collection/compilation and planning for implementation of flood management schemes.
Insufficient coordination seemed to exist in the planning of some multipurpose dams. An example of such situation is that two separate studies have been carried out for one dam scheme. A responsible organisation therefore needs to be mandated to coordinate with other stakeholders, lead the planning, and making the most efficient design.
The number of currently assigned staff seems generally to be insufficient compared to their current functions according to the JICA Study Team’s observation of MWI, WRMA and NWCPC. Clearly defined mandates and functions may serve good reasons for allocating reasonable resources including manpower and budget for operations.
2.3 Current Situation of Flood Disaster Management
2.3.1 Overview of the Whole of Kenya
(1) Flood Records
As a result of interviews regarding past flood information with all the available organisations, such as MWI, WRMA headquarters and six regional offices, NWCPC, NDOC, CRC, KMD, TARDA, LBDA, KVDA, DDMC of Garissa district, Kenya Red Cross Society (KRCS) and Regional Centre for Mapping of Resources for Development (RCMRD), it was found that all of them have not accumulated past flood data systematically. The limited available records are summarised below.

Current Situation of Flood Disaster Management Final Report Chapter 2 Sectoral Report (J) Flood and Drought Disaster Management
The Development of J - 16 Nippon Koei Co., Ltd. the National Water Master Plan 2030
1) Chronology of Flood Events
The sources of obtained flood records are mainly from website information in the form of a list, which does not show information on the inundated area. The list of past major floods is shown in Table 2.3.1.
2) Flood Area Map
Some flood area maps were collected through the internet as shown in Figure 2.3.1. This map shows the floodplains, which consist of land adjacent to a river channel that is seasonally covered by river water, as well as areas flooded between 2002 and 2006, as well as in 2007. According to the source of information, these past flooded areas are most likely an underestimate of the actual flooding.
Areas that experienced the most flooding are the shores of Lake Victoria in western Kenya, the banks of the Tana River in eastern Kenya, and the Lorian Swamp in central eastern Kenya, which are all highlighted on the map. Although the flooding near Lake Victoria does not appear to be extensive from this national map, it is important to understand that population density in that area is high and thus, flooding is very destructive.
(2) Characteristics of Flood and Damage
According to the Flood Mitigation Strategy (2009), floods occur in Kenya due to natural factors such as flash floods, river floods and coastal floods. Records of flood disasters indicate that the worst floods occurred in the periods of 1961-1962 and 1997-1998, the latter ones being the most intense, most widespread and most severe.
According to the strategy and NWCPC, the specific areas that experience floods almost annually include: (i) Nyanza Province (Kano plains, Nyakach area, Rachuonyo/Sondu and Migori/Gucha), (ii) Western Province (Budalangi), (iii) Coast Province (Kilifi, Kwale and Tana River basin), (iv) North Eastern Province (Garissa, Wajir, Ijara and Mandera), (v) Urban Centres (Nairobi, Nakuru, Mombasa and Kisumu), (vi) Tan River district (Lower parts), (vii) Eastern Province (Isiolo), and (viii) Rift Valley (Mogotio, Turkana and Narok).
Records show that the number of people affected by the floods in 1997-1998 (widespread) was 1.5 million, and the number in 2003 (Nyanza, Busia, and Tana River) was 170,000, according to the Flood Mitigation Strategy.
In recent trends, the occurrences of flash floods have been increasing as a result of watershed degradation. During the long rain season of 2010, the rains resulted in flash floods and landslides in many parts of the country. Field assessments carried out by KRCS indicated that at least 94 deaths were reported countrywide as a direct result of flash floods. An estimated 12,959 households were displaced with at least 145,000 people being affected by the floods.
The characteristics of respective catchment areas are described in Subsections 2.3.2 to 2.3.7.

Final Report Current Situation of Flood Disaster Management Sectoral Report (J) Flood and Drought Disaster Management Chapter 2
Nippon Koei Co., Ltd. J - 17 The Development of the National Water Master Plan 2030
(3) Existing Flood Control/Protection Structures
According to the Flood Mitigation Strategy (2009), NWCPC, and the JICA Study Team’s survey, the existing dykes are as follows:
a) River Nzoia: There are 16.6 km of dykes on the southern side of the river and 16.2 km on the northern side in the Bunyala area of Busia district.
b) River Nyando: A total of 15.1 km of dykes have been built on both banks. c) River Yala: There is 9 km of dykes on the right bank. d) River Daua: There is a new 0.5 km long dyke at Mandera.
NWCPC carried out river training works, river bank stabilisation works, and desilting works during the period of 2005-2010:
a) River training: At the Nzoia River (1.7 km), and the Nyando River (4.5 km), b) Bank stabilisation: At the Nzoia River (0.7 km), the Tana River (3 km), the Sondu River (0.6
km), and the Daua River (5.3 km),
c) Desilting: At the Nyando River (9.3 km),
As opposed to the identified areas that experience floods almost annually as described in the Flood Mitigation Strategy (2009), the existing flood control/protection structures are located at very limited areas. There is no existing flood control dam.
(4) Flood Forecasting and Warning System (FFWS)
Presently, there is no established flood forecasting system at any river basin with an exception of pilot installation. Thus, no early warning is provided to residents living in flooding areas. However, some seasonal rainfall forecasting for flood and drought are provided by KMD in the form of rainfall.
A basic FFWS generally is composed of four subsystems, namely: i) observation, ii) data transmission, iii) forecast analysis, and iv) warning dissemination systems. In line with these subsystems, the current status of partially established systems is outlined as follows:
1) Hydrological Observation and Forecasting System of KMD
As shown in Table 1.2.1 and Figure 1.2.1 of Sectoral Report (B), there are 36 automatic weather stations operated by KMD. Observation is made on an hourly basis and the observed data are automatically transmitted from the gauging stations to the data operation centre at the KMD headquarters. KMD makes weather forecasts including rainfall forecast on a daily, four-day, weekly, ten-day, monthly and seasonal basis.
2) Hydrological Observation System of WRMA
As shown in the table below, WRMA has planned to establish 220 river water level gauging stations in the entire Kenya. Out of the 220 stations, 27 stations are equipped with data loggers. At the other stations, observation and recording are made manually by local residents consigned by WRMA. All gauging stations for river water level observation are shown in Table 1.3.1 and Figure 1.3.2 of Sectoral Report (B).

Current Situation of Flood Disaster Management Final Report Chapter 2 Sectoral Report (J) Flood and Drought Disaster Management
The Development of J - 18 Nippon Koei Co., Ltd. the National Water Master Plan 2030
Summary of Surface Water Monitoring Network of WRMA
Catchment Area
No. of River Gauging Stations based on Catchment Management Strategies Number of Installed Water
Level DataLoggers
National Stations
ManagementUnits
Stations
Inter- Management Unit Stations
Special Management Unit Stations
Total
LVNCA 5 (5) 6 (6) 10 (10) 6 (6) 27 (27) 5 LVSCA 5 (4) 14 (8) 19 (18) 1 (1) 39 (31) 4 RVCA 7 (5) 12 (7) 20 (8) 1 (0) 40 (20) 4 ACA 3 (3) 4 (3) 21 (11) 3 (2) 31 (19) 5 TCA 1 (1) 6 (6) 22 (14) 14 (9) 43 (30) 5 ENNCA 1 (1) 5 (3) 30 (21) 4 (0) 40 (25) 4
Total 22 (19) 47 (33) 122 (82) 29 (18) 220 (152) 27 Note: Number in parenthesis indicates the number of gauging stations in operation as of November 2012 Source: Annual Water Sector Review 2010 (Draft), December 2010, WRMA
WRMA also has 258 rainfall gauging stations in the entire Kenya, which includes stations built in cooperation with other organisations such as KMD, Kenya Wildlife Service (KWS), Kenya Forest Service (KFS), etc. There are also stations that are to be installed in the near future. Out of the 258 stations, 12 stations are characterised as automatic weather stations.
However, the important point there is that WRMA has no telemetric gauging stations for both rainfall and river water level, which are fundamental equipment for the establishment of a FFWS. Only the WRMA LVS Regional Office attempted to install telemetric equipment at two river water level gauging stations in accordance with the results of the Study on Integrated Flood Management for Nyando River Basin. The installations were carried out by technical and financial assistance from JICA.
3) Flood Forecasting System of WRMA
With the exception of LVNCA, all other catchment areas do not have an established flood forecasting system. In LVNCA, attempts are being made to establish a flood forecasting and early warning system under the ongoing project ,namely WKCDD&FMP as described below.
Flood alert levels are set in the LVNCA and the TCA based on past experiences as given in the table below. These alert levels are used as criteria to disseminate warnings to people residing in the downstream area.
Flood Alert Levels at Water Level Gauging Stations
Catchment Area Station No. Gauge Height (m) Alert Alarm Flood
TCA 4G01: Garissa 3.0 3.5 4.0 4G02: Garsen 3.0 3.5 4.0
LVNCA 1EF01: Ruambwa 2.8 3.5 --- Source: Interview with the WRMA regional offices of TCA and LVNCA
The propagation time of floods from a point of upper reach to a point of lower reach is considered in the three catchment areas based on the past experiences as given in the table below. These propagation times are utilised for flood warning in the evacuation activities.

Final Report Current Situation of Flood Disaster Management Sectoral Report (J) Flood and Drought Disaster Management Chapter 2
Nippon Koei Co., Ltd. J - 19 The Development of the National Water Master Plan 2030
Propagation Time of Floods in Several Rivers
No. River From To Time Taken 1. Nzoia Upper parts of the catchment Rwambua RGS 1EF1 2 days
2. Nyando
Ogilo RGS (1GD3)
Ahero bridge RGS (1GD2)
1 hour Kibigori RGS (1GB3) 3 hours Ainamutua RGS (1GD11) 4 hours Muhoroni RGS (1GD7) 8-10 hours
3. Tana Kathita RGS (4F31) Garissa RGS (4G01) 3 days Source: Interview with WRMA regional offices of LVNCA, LVSCA and TCA
4) Ongoing Project on Establishment of Flood Early Warning System (FEWS) in the Nzoia River Basin
Currently, MOSSP/NDOC, MWI and KMD are cooperatively attempting to establish a FEWS in the Nzoia River basin as one of the components of WKCDD&FMP, which is funded by the Government of Kenya and World Bank. It will also serve as a model for the establishment of systems in other catchment areas. Also, the WRMA LVN Regional Office plays a role in hydrological monitoring at the catchment level in this project.
Flood forecasting analysis in the project is currently made on a daily basis by using the Galway flood forecasting system software developed by the University of Galway, Ireland. The system is able to forecast river water level at a reference point two days ahead. Based on the forecasted water level, flood risk is categorised into three levels, namely high, moderate and no flood risks. The data that are input daily into the system are as follows:
a) Daily rainfall at 20 automatic weather stations b) Daily evaporation c) Stream flow (river water level in the Nzoia River)
The project also attempts to establish an analysis system on an hourly basis because hourly forecasting is needed for FEWS in consideration of lead time for evacuation and other flood preparedness activities. After the establishment of the flood forecasting system in the Nzoia River basin, the same system is planned to be applied to other catchment areas.
5) Flood Warning System
According to the National Disaster Response Plan (MOSSP and NDOC, 2009), receipt and distribution of disaster warnings are designed as follows. Also, possible mass media is currently expected to be utilised for warning dissemination to the public.
Warnings of a natural hazard or occurrence of a rapid onset disaster shall be issued in the first instance by the relevant early warning agency, or any other early warning system available.
The information shall be passed to the Director of NDOC and the Permanent Secretary (PS) for activation of appropriate response activity as soon as possible.
Upon implementation of this plan, all public warnings will be distributed through the NDOC. Appropriate media and other channels will be used to distribute the warning to the public and concerned authorities for appropriate standby preparedness and response.

Current Situation of Flood Disaster Management Final Report Chapter 2 Sectoral Report (J) Flood and Drought Disaster Management
The Development of J - 20 Nippon Koei Co., Ltd. the National Water Master Plan 2030
On the other hand however, with exceptions of LVNCA and LVSCA, all the other four catchment areas currently do not have a structured flood warning system. In most instances, warnings are only given responsively during a flood event. This normally happens as community members living upstream inform those living downstream of impending floods. They communicate this information by the use of personal mobile phones.
In the LVNCA, there is an integrated approach of flood warning dissemination. Through the WKCDD&FMP, hydrological information collected from the Nzoia and Yala River basins are transmitted to the Flood Diagnostic and Forecasting Centre (FDFC) situated at the KMD headquarters. The situational report including analysis results are then passed to the Project Steering Committee chaired by the National Project Coordinator (NPC). In case of serious condition, the President declares the flood as an emergency disaster. The warning issued by the committee is disseminated to the public through mass media as well as the provincial administration, which means from the provincial level to the sublocation level. The flow of warning dissemination in LVNCA is shown in the figure below.
Source: Based on the interview with WRMA LVN Regional Office, National Disaster Operation Centre (NDOC) as
of November 2010
Warning Dissemination in LVNCA
The WKCDD&FMP has also funded the introduction of a community radio broadcasting in the local languages to disseminate such warnings. The radio frequency covers only the flood prone areas in the catchment area. Also, in LVNCA, the WRUA members have been encouraged to open their email so as to receive warning information from the WRMA LVN Regional Office.
The graph shown below is one of the results of the damage survey in 2011, which was carried out in flood prone areas in the whole of Kenya. Most people answered that they get information on flood occurrence from natural conditions. Actually, there must have been a
Monitoring Stations
WRMA – LVN
Communities
KMD
PDMC / DDMC
Catchment Level National Level
WKCDD&FMP
Flood Diagnostic and Forecasting Centre (FDFC)
at KMD
Project Steering Committee Chair: National Project CoordinatorMember: President, PS of MOSSP,
PS of MWI, PS of MEMR, Director of KMD
DOC
MWI
Media
Data Transmission Information Dissemination Coordination Warning Dissemination

Final Report Current Situation of Flood Disaster Management Sectoral Report (J) Flood and Drought Disaster Management Chapter 2
Nippon Koei Co., Ltd. J - 21 The Development of the National Water Master Plan 2030
lot of people who were provided with information from the government; however, this survey result implies that the public feel the need for more information.
Q3. How do you get information on flood in advance?
a. Cloud 69b. Torrential rain 168c. River water level 162d. Radio 90e. TV 32f. Neighbors 12g. Government info. 0h. Others ( __________ ) 0
Total (number of multiple answers) 533
13%
32%
30%
17%
6%2% 0%
0%
Source: JICA Study Team
Result of Damage Survey
(5) Evacuation System
There is no definite plan to deal with evacuation activities. However, such activities are conventionally operated by district officers at division levels and chiefs at location levels in cooperation with volunteer organisations such as churches and NGOs located within the flood prone areas.
In LVNCA, the WKCDD&FMP has come up with several evacuation methods in the Nzoia and Yala River basins. The project has assisted in building an evacuation centre at Budalangi. The project also bought seven speed boats for use during evacuation activities.
In LVSCA, an integrated approach is taken during evacuation activities with participant organisations including the government, NGOs, Red Cross, Victoria Institute of Research and Development (VIRED), etc. In terms of preparedness in this catchment area, evacuation drills are carried out in conjunction with public people living in flood prone areas. Currently, there are six evacuation centres with a capacity of 400 persons each. This mechanism is one of the outcomes of the Study on Integrated Flood Management for Nyando River Basin, which was undertaken by JICA.
In most areas of the country, public people have encroached on the lands along the rivers in order to use it for agricultural production. This has been worsened due to population increase. In most instances, those people show a lot of resistance especially to flood warnings. These cultural beliefs make it difficult to move people to safer grounds during floods.
(6) Flood Fighting System
There is no explicit plan to deal with flood fighting activities; however such activities are conventionally operated by district officers at division levels and chiefs at location levels in cooperation with NGOs.
In LVNCA, small-scale flood fighting activities are occasionally carried out. These activities include digging of drenches at the flood extent of water courses and manual removal of flood water from buildings and homesteads during flood events.

Current Situation of Flood Disaster Management Final Report Chapter 2 Sectoral Report (J) Flood and Drought Disaster Management
The Development of J - 22 Nippon Koei Co., Ltd. the National Water Master Plan 2030
(7) Land Use Regulation
In order to avoid flood damage to people, land use regulation around the flood area is one of the most effective solutions. However, there is currently no established regulation system guiding the use of land in flood prone areas. Though the Water Resources Management Rules 2007 outlines the extents of riparian land, such regulation have not been effective.
There has been difficulty in implementing land use rules and regulation since land use regulations in the Water Act, Agriculture Act and Lands Act have not been harmonised. All the stated acts have described riparian land differently and have allocated varying river width in defining these lands. Another difficulty is the fact the lands along water bodies including rivers have been irregularly surveyed, demarcated and allocated to individuals.
The Constitution that was passed in August 2010 stipulated the establishment of the “National Land Commission”. One of the functions of the National Land Commission is to manage public land on behalf of the national and county governments. Public lands include all rivers, lakes and other water bodies as defined by the act or parliament. Once established, it would be possible to solve these issues.
2.3.2 Lake Victoria North Catchment Area
(1) Flood Situation
LVNCA as well as LVSCA have been the most vulnerable areas to flood disasters in Kenya. In November 2006, in Budalangi, the collapsing of dykes led to flooding which displaced more than 10,000 people. From October to November 2008, due to heavy rains in the Western region, the Nzoia River burst its bank, causing massive flooding in the area.
(2) Flood Management
Due to this historical background, the WKCDD&FMP, which is funded by the Government of Kenya and World Bank, has been implemented since 2007 as described in Section 2.4 (1) later. The project is implemented based on the concept of integrated flood management consisting of various components including construction of multipurpose dam, construction and rehabilitation of dykes, river improvement works, establishment of FEWS, etc. It is therefore expected that flood damages will be mitigated by such structural and non-structural measures in the future once the project has been completed.
However, although the project is still ongoing, there have already been some issues on operations and maintenance such as theft or failure of monitoring equipment. In addition, although FEWS has been developed through cooperation among the WRMA LVN Regional Office, KMD and NDOC as described in Section 2.3.1 (4) 4), a post-project operation plan including transferring of office for the system has not been determined.
Dykes have so far been constructed with a length of 16.6 km on the left bank and 16.2 km on the right bank along the Nzoia River, as well as 9 km on the right bank along the Yala River. These dykes have contributed to flood control against normal floods, however, it was recorded that the dykes were
Final Report Current Situation of Flood Disaster Management Sectoral Report (J) Flood and Drought Disaster Management Chapter 2
Nippon Koei Co., Ltd. J - 23 The Development of the National Water Master Plan 2030
breached due to large-scale flooding in 2008. At the time, it was said that inadequate flood fighting activities have resulted in the expansion of inundation areas. In recent years, river improvement works of 1.7 km and revetment works of 0.7 km were implemented along the Nzoia River. The NWCPC’s activities in terms of river improvement works are in progress, mainly in the Nzoia River as of November 2012. The improvement works in the Nzoia River include heightening and realignment of the existing dykes, and river training.
As a current flood forecasting system before completion of the WKCDD&FMP, there are 27 river gauge stations under the management of WRMA. Out of those stations, the Ruambwa station in the Nzoia River has been provided with two warning water levels (alert and alarm levels), as shown in the table in Section 2.3.1 (4) 3). Once the river water level reaches the warning levels, the WRMA LVN Regional Office disseminates the warning information to the public through the relevant organisations.
2.3.3 Lake Victoria South Catchment Area
(1) Flood Situation
The LVSCA has suffered severe flood damages over the years. The 1997-1998 flooding was the consequence of the long and intensive El Niño related rainfall in October and November. Almost the entire Kano Plain, the Nyando River basin, was inundated and agricultural crops were completely destroyed. The floods also caused extensive damage to 240 river gauging facilities due to severe bank erosion. The dykes were overtopped and breached at several places. In November 2006, due to the overflow and dyke breaching of the Nyando River, the Wangaya, Nyangoma and Ombei areas were submerged. In October to November 2008, due to the heavy rains in the Nyanza regions, the Nyando River burst its bank, causing massive flooding in the area. The most recent urban floods in Kisumu City occurred in September 2009.
In the Sondu and Kuja River mouth areas, which were target areas of NWMP (1992), it was confirmed that the average inundation duration in times of normal flood which annually occur, was around five days according to the damage survey.
(2) Flood Management
Due to this historical background, in the Nyando River basin, which has the most severe damage in the LVSCA, the Integrated Flood Management Plan for Nyando River Basin was formulated in 2009 through technical and financial assistance from JICA. Following this, the Programme for Community-based Flood Disaster Management to Adapt to Climate Change in the Nyando River Basin was carried out from September 2009 to August 2011, and a community-based disaster management system has been developed in the Nyando River basin. The programme included small-scale structural measures as well as non-structural measures. The communities have completed, at their own initiatives, the preparation for mitigation of flood damages on by completing the construction of evacuation places, and formulation of evacuation plans. However, in the current system, while the occurrence of flood is identified based on visual judgement of river water level, the issue is that enough lead time for evacuation activities has not been secured because propagation time of flood in LVSCA is relatively short.

Current Situation of Flood Disaster Management Final Report Chapter 2 Sectoral Report (J) Flood and Drought Disaster Management
The Development of J - 24 Nippon Koei Co., Ltd. the National Water Master Plan 2030
The WRMA’s flood management scheme is implemented only in the above Nyando River basin. No particular flood management has been carried out in other flood prone areas such as the Sondu and Kuja River mouth areas.
Dykes have so far been constructed with a length of 15.1 km on both banks in total along the Nyando River. They have contributed to flood control against normal floods, however it was recorded that those dykes were breached and overtopped by large-scale flooding in 2006. At the time, it was even said that inadequate flood fighting activities have resulted in the expansion of inundation areas. In recent years, river improvement works of 4.5 km and dredging works of 9.3 km were implemented along the Nyando River by NWCPC. Also revetment works of 0.6 km were done along the Sondu River. The NWCPC’s activities in terms of river improvement are in progress mainly in the Nyando River as of November 2012. The improvement works in the Nyando River include new dyke construction, river training and desilting. The study on urban drainage in Kisumu City was ongoing as of June 2011.
2.3.4 Rift Valley Catchment Area
(1) Flood Situation
In RVCA, severe floods occur mainly around the water tower area. Particularly in recent years, a lot of deaths caused by flash floods have been reported in mountainous areas located at the central part of the catchment area.
Narok is located at the downstream of the confluence point of three rivers flowing from the Mau Forest. The area suffers from flooding every rainy season. In 1993, only 45 minutes of flash flood caused more than 50 deaths in Narok. The major cause of the increase in flash floods is considered to be the increase of runoff coefficient associated with watershed degradation of the Mau Forest in recent years. In Mogotio town, the Melo River that flows into the Baringo Lake overflows its banks in both urban and agricultural areas. The inundation depth of the flood in March 2010 was up to 1 m height and casualties were reported in Mogotio town. In the urban areas of Nakuru and Narok, urban floods occasionally outbreak due to poor drainage.
Meanwhile, even in areas other than the water tower, various parts of the catchment area have suffered from severe floods. In the latter part of 2002, flash floods in Baringo district resulted in six deaths, 3,000 displaced people, and destruction of household items and crops. During the short rainy season of 2009-2010, there were widespread flood damages including a lot of flash floods in various parts of RVCA. At least four deaths were reported in Athinai as a result of the flash floods. During the long rainy season of 2010 in North Rift, the Terem River in Mt. Elgon burst its banks and destroyed the Terem-Emia bridge. Turkana East was hit by floods after the Kerio River in Lokori burst its banks in March 2010, destroying irrigation canals of the Morulem and Lokubae irrigation schemes. However, the damages are not so severe as compared with the water tower area.

Final Report Current Situation of Flood Disaster Management Sectoral Report (J) Flood and Drought Disaster Management Chapter 2
Nippon Koei Co., Ltd. J - 25 The Development of the National Water Master Plan 2030
(2) Flood Management
At this time, it could be said that systematic flood management has not been implemented in the RVCA because neither setting of warning water levels, even at major river gauge stations nor construction of flood control structures, have been confirmed.
2.3.5 Athi Catchment Area
(1) Flood Situation
Coastal areas in ACA suffer from flood damages nearly every year due to heavy rains. It was recorded that the flood which occurred in the coastal area in September 1997 caused 86 deaths with 900,000 displaced people in total for Kilifi, Mombasa and Kwale.
In the Lumi River which flows near the border with Tanzania, flood damages have continuously occurred since before NWMP (1992) was formulated, with the occurrence of floods involving mudslides in Taita Taveta district in 2008. Most affected areas by the Lumi River-induced flood are located at the downstream side of the Taveta urban area. These villages are smaller compared to the Taveta urban area. Also in the affected area is the Njoro Spring, which is an important water source for this area.
On the other hand, large cities such as Nairobi and Mombasa, which are respectively located in the upstream and downstream part of the Athi River, have suffered from urban floods. Once heavy rains occur in these cities, undrained rainwater frequently results in traffic jam. In December 2009, thunderstorms, heavy rains and winds have been experienced in Nairobi where it caused floods in the central business district (CBD) and in several slums.
(2) Flood Management
At this time, it could be said that systematic flood management has not been implemented in ACA because the setting of warning water levels even at major river gauge stations have not been confirmed.
2.3.6 Tana Catchment Area
(1) Flood Situation
Within the middle to the lower parts of the Tana River basin, the areas susceptible to flood are stretching along the Tana River. Even arid and semi-arid areas of the lower Tana also experience flash floods. Flood damage in TCA is the largest in Kenya outside Lake Victoria areas, according to the MWI Flood Mitigation Strategy (2009).
The most severe flood event in Garissa occurred in 1997-1998. Following the 1997-1998 flood events, floods in 2006 and 2007 also severely affected Garissa Town. In these years, even at built-up areas 600-700 m away from the Tana River left bank, houses were inundated more than 1.0 m in depth and the residents around these areas had to evacuate for two to four months. In TCA, Garissa town is regarded as the most severely flood hit area.

Current Situation of Flood Disaster Management Final Report Chapter 2 Sectoral Report (J) Flood and Drought Disaster Management
The Development of J - 26 Nippon Koei Co., Ltd. the National Water Master Plan 2030
On the other hand, during the long rainy season of 2010 there were flood damages in the Tana Delta area as well. Some 75 households were affected by flash floods which occurred in Bura division in April 2010. However, human damages were relatively small compared to agricultural damages because enough lead time for evacuation was secured in the Tana Delta area. This is because the Tana River has a gentle slope, and the propagation times of flood were estimated at three days from the Masinga Dam to Garissa town and two weeks from the dam to Tana Delta near the river mouth.
(2) Flood Management
Although an official document specifying flood management has not been prepared in TCA, there are 43 river gauge stations under the management of the WRMA Tana Regional Office. Out of which, Garissa and Garsen stations have three warning water levels (alert, alarm and flood levels), as shown in the table in Section 2.3.1 (4) 3). Once the river water reaches the warning level, the WRMA Tana Regional Office disseminates information to the public residing in the downstream area through the relevant local government levels such as county, district, division, location and sublocation.
On the other hand, there are five hydropower dams units along the Tana River. Warning information is to be provided from KenGen (hydropower operator) to the public through TARDA (dam owner). The abovementioned local government offices issues these warnings before large volumes of water are released from the reservoirs.
Normally, residents living along the downstream reaches of the Tana River carry out evacuation activities on an empirical basis. Evacuation is based on government information or the resident’s own judgement because enough lead time for evacuation is secured as mentioned in the above clause (1).
As for flood structural measures, in recent years, revetment works with a length of 3.0 km along the Tana River has been implemented by NWCPC.
2.3.7 Ewaso Ng'iro North Catchment Area
(1) Flood Situation
Although most of ENNCA is regarded as an arid district, severe flood damages have been reported in various parts of the catchment area.
In 2005, the Daua River, which flows along the Kenya-Ethiopia border, burst its banks which destroyed many farms in the Ramu area of Mandera district. During the short rainy season in 2006, the Daua River overflowed rapidly and caused wide range of inundation in several divisions of Mandera district. The flood that occurred in 2009 caused 16 deaths in Mandera. In the urban area of Isiolo town, flood is frequently caused by the small channel flowing into the Isiolo River, the tributary of the Ewaso Ng'iro North River, due to lack of discharge capacity of the channel.
On the other hand, the MWI’s Flood Mitigation Strategy (2009) describes that the Wajir district which is located in the middle to the lower reaches of the Ewaso Ng'iro North River is one of the areas that experience floods almost annually. It was also confirmed through the damage survey that the inundation depth of this area is relatively larger than others. In addition, according to the WRMA
Final Report Current Situation of Flood Disaster Management Sectoral Report (J) Flood and Drought Disaster Management Chapter 2
Nippon Koei Co., Ltd. J - 27 The Development of the National Water Master Plan 2030
ENN Regional Office, occurrences of flash floods have been increasing in recent years in particular types of arid lands.
(2) Flood Management
Flood control structural measures are gradually underway, while in recent years, the construction of dykes with a length of 0.5 km and revetment works with a length of 5.3 km along the Daua River have been implemented in Mandera County by NWCPC. However, it could not be said that systematic flood management has been implemented in the ENNCA because the setting of warning water levels even at major river gauge stations have not been confirmed.
2.4 Ongoing Projects and Existing Plans
2.4.1 Ongoing Projects
(1) WKCDD&FMP
The ongoing WKCDD&FMP has several components. Among them is Component-2 which is on flood management. Item b) of Component-2 is for multipurpose flood management, and three dam sites, 33, 40C and 42A, for the multipurpose dam development have been identified as alternatives, and site 42A is in the process of final design as it is the most prospective one.
Item c) of Component-2 deals with floodplain management. Possible options for interventions in the Lower Nzoia Area have been listed according to its final report on the detailed assessment of the current situation (August 2009). The options include (i) embankment improvements (new dykes, or raising/strengthening the existing dykes), (ii) river improvements (shortcut, new channel, or enlarging the existing channel), (iii) flood/floodplain management (drainage, spillway, platform, or relocating villages), and (iv) baseline cases (minimum repair of the existing dykes).
In addition, Item d) of Component-2 is for the establishment of a FEWS as described in detail in Subsection 2.3.1 (4) 4). This project is valuable with respect to the first case of real-time flood forecasting by using a telemetric observation system in Kenya.
This project conforms with the Strategy for Flood Management for Lake Victoria Basin, Kenya (2004) reflecting the concept of the IFM.
(2) River Improvement Projects Implemented by NWCPC
The NWCPC’s activities in terms of river improvement are in progress; mainly in the Nzoia and Nyando Rivers as of November 2012. The improvement works in the Nzoia River include heightening and realignment of the existing dykes, and river training. The works in the Nyando River include new dyke construction, river training and desilting.
(3) Studies on Flood Control Dams by NWCPC and MORDA
In addition to the study on the multipurpose dams under the WKCDD&FMP described above, there are some studies on dams being carried out by NWCPC and MORDA in which the purpose of flood control is included.

Current Situation of Flood Disaster Management Final Report Chapter 2 Sectoral Report (J) Flood and Drought Disaster Management
The Development of J - 28 Nippon Koei Co., Ltd. the National Water Master Plan 2030
The NWCPC’s detailed design is in progress for the multipurpose Nzoia Dam at site 34B.
The MORDA’s ongoing feasibility studies and/or detailed designs include those for Magwagwa Dam, Mwachi Dam, Nandi Forest Dam, Arror Dam, and High Grand Falls Dam.
(4) Studies on Urban Drainage
The study on urban drainage improvement for Kisumu is underway. The master plan study for stormwater drainage management in Bungoma is in progress by NBI. Both are based on information from MWI.
2.4.2 Existing Plans
(1) NWCPC Strategic Plan
The NWCPC Strategic Plan 2010-2015 contains the following plans for study and implementation of flood management structure projects. The plan aims to achieve one of its strategic objectives which is to reduce the risks of (or mitigate the effects of) floods:
a) Construct five flood management projects, namely the Nyando, Nzoia, Lumi, Tana, and Daua River flood management projects (based on the study on causes and effects of floods in Nyanza and Western Provinces, Tana Basin and Taita-Taveta District)
b) Study and construct six flood management projects, namely the Narok, Turkana, Mogotio, River Gucha, Isiolo and Sabaki-Galana flood management projects.
The locations of the abovementioned projects are summarised in Table 2.4.1 together with the areas identified in the MWI Flood Mitigation Strategy and NWMP (1992) as flood areas. Information on the nature, extent of past floods and damages for the abovementioned areas will be collected in the next stage of the study in order to prepare the flood control/protection structural plans.
(2) JICA Study for Nyando River Basin
The Study on Integrated Flood Management for Nyando River Basin was conducted by JICA from 2006 to 2009. The study formulated an integrated flood management plan for the Nyando River basin, with three major components; structural measures, non-structural measures, and community initiative works. The formulated structural measures include: (i) raising roads for evacuation, (ii) dyke construction, (iii) river training, (iv) desilting, (v) retarding pond and dam development, and (vi) catchment conservation. The non-structural measures include the establishment of FFWS.
Based on the study result of the community initiative works, the Programme for Community-based Flood Disaster Management to Adapt to Climate Change in the Nyando River Basin was implemented from 2009 to 2011. The programme aims to establish an integrated flood management system by implementing structural and non-structural measures in the 24 villages of Nyando and Kisumu districts in the Nyanza province.
The programme consists of two components: 1) structural measures and 2) non-structural measures. The structural measures aim to provide evacuation places and safe evacuation routes by constructing culverts, boreholes, evacuation centres, toilets, weirs, storages and footbridges. The non-structural measures aim to build the communities’ capacity in flood disaster management through the packages

Final Report Current Situation of Flood Disaster Management Sectoral Report (J) Flood and Drought Disaster Management Chapter 2
Nippon Koei Co., Ltd. J - 29 The Development of the National Water Master Plan 2030
of: i) development of Community-based Flood Management Organisation (CFMO), ii) CFMO training on flood management, and iii) education programme and public awareness
2.5 Operations and Maintenance Issues
(1) High Incidence of Equipment Theft
In order to forecast flood events accurately and promptly, hydrological monitoring is one of the essential activities in flood management. However, the equipment of gauging stations are sometimes stolen for the purpose of resale. In the WKCDD&FMP, out of three telemetric water level gauging stations, one station has been malfunctioning because its solar panel was stolen. Also, staff gauges have been stolen even at manual gauging stations in the TCA just after reinstallation of the gauges.
River gauging stations are usually located at out-of-sight places. In order to monitor basic hydrological data continuously, it is necessary to give sufficient consideration on the installation method of the equipment.
(2) Operation Cost for FFWS
The use of telecommunication system is essential to real-time flood forecasting and warning dissemination. In addition to equipment operated by government organisations, WRUAs in LVNCA have been trained and requested to use email so as to receive any warning information when it arises. However, such electricity and telecommunications costs have been liable to be considered less serious in community-based disaster management. This is one of the most important elements in considering operations and maintenance planning.
(3) Sedimentation
Sedimentation is one of the issues identified by the CMSs of WRMA, although there are no detailed data available.
2.6 Challenges and Key Issues
(1) Lack of Data/Information
It was observed that no substantial actions on collecting and accumulating quantitative flood records and river data have been carried out by organisations relevant to flood management. Past flood records and other technical data on rivers are essential, not only to assess the floods and river conditions but also to formulate the flood management plans. In order to improve situations such as poor data collection, various improvements on the responsible organisations may be needed in terms of their clear mandates and functions, sufficient staff and financial resources, and clear work flows of data collection, verification, follow-up action, compilation and storage.
(2) No Clear Action Plans for Implementation
It was observed that the existing implementation plans for flood control/protection structures have been formulated without the detailed data/information on floods and rivers. This may lead to

Current Situation of Flood Disaster Management Final Report Chapter 2 Sectoral Report (J) Flood and Drought Disaster Management
The Development of J - 30 Nippon Koei Co., Ltd. the National Water Master Plan 2030
insufficient and inefficient plans. It is reiterated that the collection of relevant flood and river data is inevitable for proper planning.
(3) Insufficient FFWS
With some exceptions of the project areas of WKCDD&FMP and Nyando, there is no FFWS, which is considered as one of the most effective measures for flood management.
Although some necessary activities were implemented by the WRMA regional offices in the best possible manner, there has not been a telemetric hydrological monitoring system, an established flood analysis method based on hydrological and hydraulic studies, and a structured flood warning dissemination system. In addition, rainfall data observed by the telemetry system of KMD are not shared with WRMA.
(4) Insufficient Evacuation Plan and Flood Hazard Map for Evacuation Activities
An evacuation plan and a flood hazard map have not been prepared in most areas except for the Nyando River basin. Complete evacuation is therefore usually not confirmed.
The results of the public interview survey show that some people stay at their houses during flood events in order to guard their properties. Some residents have no available means to move all of their properties which is why they have chosen to stay. On the other hand, some communities believe that floods are natural phenomena which they should learn to live with as long as it lasts, no matter the damages. This has made it quite difficult to implement flood management activities in these localities. It would be effective to incorporate awareness creation into the planning as well as to take into consideration their cultural background.
(5) No Definite Plan on Flood Fighting Activities
Currently there is no definite plan which deals with flood fighting activities. However, past flood records indicate breaching of dykes in a lot of places of the country have resulted in widespread inundation and casualties. In order to avoid the expansion of the inundation area, flood fighting activities will be necessary.
(6) No Established Regulations on Land Use in Flood Prone Areas
There is no established regulation system that guides the use of land in flood prone areas. This makes it difficult to implement measures in basin or flood plain management. The Water Act, Agriculture Act and Lands Act describe riparian land differently, and allocate varying width. The lands along water bodies have been irregularly surveyed, demarcated and allocated to individuals.
(7) Low Rate of Development of Structural Measures for Flood Control and Protection
A total of five target areas were selected, in which the proposed flood protection projects were formulated in NWMP (1992). However, slow progress of the implementation of the proposed flood protection projects and recommendations were observed. This slow progress may be caused by unclear mandates and functions, insufficient resources of the organisations concerned, insufficient

Final Report Current Situation of Flood Disaster Management Sectoral Report (J) Flood and Drought Disaster Management Chapter 2
Nippon Koei Co., Ltd. J - 31 The Development of the National Water Master Plan 2030
detailed implementation plans due to limited flood records and river conditions data, insufficient budgets for implementation, etc.
(8) Unclear Demarcation of Roles and Responsibilities among Organisations Concerned
Due to the low frequency of widespread flooding issues in the country, flood issues have been considered less serious for a long time, especially prior to the 1997-1998 El Niño floods. Although the Flood Mitigation Strategy was developed in 2009 by MWI, an institutional arrangement focusing on flood management has not yet been set up appropriately. In order to perform appropriate flood management, it is essential to legally stipulate considerations and detail procedures in the process of various decisions making and planning. However, it is legally not clear at the moment which organisation would be responsible for such. Flood management is not consolidated among several involved relevant organisations. Therefore, it is necessary to clarify the demarcation of roles and responsibilities among organisations and to strengthen the connections between them.

Current Situation of Drought Disaster Management Final Report Chapter 3 Sectoral Report (J) Flood and Drought Disaster Management
The Development of J - 32 Nippon Koei Co., Ltd. the National Water Master Plan 2030
CHAPTER 3 CURRENT SITUATION OF DROUGHT DISASTER MANAGEMENT
3.1 Relevant Policies and Strategies
There are several papers on policy, strategies and plans concerning drought disaster management in the country as tabulated below. Among them, the National Disaster Management Policy (MOSSP) deals with the overall disaster management of Kenya.
However, there has not been a specialised paper for drought management in the country. MWI has developed two policies, namely the National Water Storage Policy and the National Water Harvesting and Storage Management Policy. Both policies have tendencies to focus on the development and operations of water storage infrastructure including multipurpose dams. On the other hand, the Ministry of State for Development of Northern Kenya and Other Arid Lands (MSDNKOAL) has its strategic plan (2008-2012), which includes drought management from the aspects of reinforcing preparedness and mitigation activities and improving the effectiveness of response interventions.
Although the WRM Rules 2007 of the Water Act 2002 stipulates orders to carry out corrective measures to improve compliance with the rules, there has not been a policy or strategy to explicitly guide water use restriction during drought periods.
In the formulation of NWMP 2030, from the viewpoint of water resources management, it is essential to take the approach of effectively and impartially using the limited water resources of Kenya. In this regard, the Water Act 2002 and its WRM Rules 2007 will be the basis for planning. The National Disaster Management Policy as well as the MSDNKOAL Strategic Plan 2008-2012 will be utilised as references for institutional arrangement.
Policy, Strategies and Plans for Drought Disaster Management
Category Title Organisation Year Policy National Disaster Management Policy (Final Draft) MOSSP Oct. 2010Policy National Water Storage Policy MWI Mar. 2009Policy National Water Harvesting and Storage Management Policy MWI May 2010Strategy The National Water Resources Management Strategy MWI Jan. 2007Strategy National Climate Change Response Strategy Government of Kenya Apr. 2010Plan MWI Ministerial Strategic Plan 2009-2012 MWI May 2009Plan WRMA Strategic Plan 2009-2012 WRMA Sep. 2009Plan MSDNKOAL Strategic Plan 2008-2012 MSDNKOAL Dec. 2008Plan National Disaster Response Plan MOSSP & NDOC 2009
Plan Contingency Plan for the 2009 El Niño Rains Gov. of Kenya and Humanitarian Partners Oct. 2009
Note: MOSSP = Ministry of State for Special Programmes MWI = Ministry of Water and Irrigation WRMA = Water Resources Management Authority MSDNKOAL = Ministry of State for Development of Northern Kenya and Other Arid Lands NDOC = National Disaster Operation Centre
Source: JICA Study Team based on collected documents
The highlights of the respective policy and strategies are summarised below.

Final Report Current Situation of Drought Disaster Management Sectoral Report (J) Flood and Drought Disaster Management Chapter 3
Nippon Koei Co., Ltd. J - 33 The Development of the National Water Master Plan 2030
(1) National Disaster Management Policy (Final Draft as of October 2010, MOSSP)
This policy was developed covering the country’s overall disaster institutionalisation without specialised policy for drought management. In view of the experiences gained and lessons learnt during the management of various past hazards and disasters, the government has formulated this policy to emphasise pro-active and preventive strategies in addressing disaster situations. The thrust of this policy is to institutionalise disaster management and mainstream disaster risk reduction in the country’s development initiatives.
This policy presents the institutional structures, roles, responsibilities, authorities and key processes required to achieve a coordinated, coherent and consistent approach. The policy provides overarching frameworks for decision making and coordination across disaster management sectors and actors including government ministries, civil society organisations, international organisations and the private sector.
(2) National Water Storage Policy (March 2009, MWI)
The overall policy goal is to sustainably accelerate the development and performance improvement of irrigation, drainage and water storage to contribute to the Kenya’s national aspirations.
It refers to resources mobilisation and financing, infrastructure development and management with the involvement of private sectors and communities, with the necessity of appropriate institutional arrangement to avoid duplication and possible institutional conflict. It also mentions small-scale water storage such as rainwater harvesting from roofs as well as groundwater recharge activities.
(3) National Water Harvesting and Storage Management Policy (May 2010, MWI)
This policy was formulated in response to Kenya Vision 2030 and the Water Sector Strategic Plan 2010. The overall policy goal, in line with Kenya Vision 2030, is to sustainably facilitate the expansion of water harvesting, storage and flood control capacity as well. It refers to the participation in planning, financing and investment by communities, development partners, NGOs, PPPs, and other stakeholders.
This policy also mentions that in order to meet the water demand, it is required to develop elaborate water storage systems such as the Grand Falls multipurpose reservoir, the two multipurpose dams on the Nyando and Nzoia River, and the 22 medium-sized multipurpose dams.
(4) The National Water Resources Management Strategy (January 2007, MWI)
With regard to drought disaster management, the strategy describes its developing policies and mechanisms in the forms of: i) prevention and mitigation, ii) preparedness, and iii) response. The strategy refers to soil infiltration, groundwater storage, public awareness, water saving, borehole drilling, infrastructure, water use restriction, monitoring system, etc.

Current Situation of Drought Disaster Management Final Report Chapter 3 Sectoral Report (J) Flood and Drought Disaster Management
The Development of J - 34 Nippon Koei Co., Ltd. the National Water Master Plan 2030
(5) National Climate Change Response Strategy (April 2010, Government of Kenya)
The strategy highlights interventions to droughts such as training farmers on better water use method, low interest loans for farmers, water harvesting structures, drought early warning, promoting drought tolerant crops, etc.
3.2 Relevant Organisations
Drought disaster management issues are mainly handled jointly by the MOSSP and the MSDNKOAL. In addition, the National Drought Management Authority (NDMA) was established in the Legal Notice No. 171 of November 24, 2011 under the State Corporations Act (Cap 446) of the Laws of Kenya. Among them, drought preparedness and mitigation measures except for water resources management have been basically dealt with by MSDNKOAL. Although they mainly focus on post-disaster related activities, they deal with both pre- and post-disaster stages.
Regarding preventive actions to minimise the famine hazard itself, the implementing organisation of each activity, focusing on water resources management at pre-disaster stage, is basically summarised as follows:
Policymaking: MWI Hydrological observation: KMD (rainfall), WRMA (rainfall and river water level) Drought forecasting: KMD in cooperation with ICPAC (long-term), WRMA (short-term) Water use restriction: WRMA Community level collaborator: WRUAs (hydrological observation, warning dissemination)
The functions of respective relevant organisation are outlined as below. Their general overviews are however described only in Subsection 2.2 to avoid duplications.
(1) MWI
MWI is primarily responsible for the development of legislation, policy formulation, sector coordination and guidelines, and monitoring and evaluation. However, currently there is no specialised division or section dealing with drought management in MWI. Drought management from the aspect of water control is usually treated as part of water resources management.
(2) WRMA
The WRMA regional offices have the legal mandate to order water use restrictions against any water user during drought periods as described in Subsection 3.3.1 (5) 4) below. In this regard, in the formulation of NWMP 2030, WRMA will be the key implementing organisation from the aspect of water resources management including drought management at pre-disaster stage.
(3) MSDNKOAL
One of the mandates of MSDNKOAL is the implementation of the Arid Land Resources Management Project (ALRMP), which is introduced in Subsection 3.4. In this project, drought management

Final Report Current Situation of Drought Disaster Management Sectoral Report (J) Flood and Drought Disaster Management Chapter 3
Nippon Koei Co., Ltd. J - 35 The Development of the National Water Master Plan 2030
system has been strengthened and institutionalised by reinforcing preparedness and mitigation activities and by improving the effectiveness of response interventions.
According to the National Disaster Response Plan (MOSSP and NDOC, 2009), MDNKOAL is a primary lead agency for drought emergency response from the aspect of water shortage and food insecurity.
(4) NDMA
The core mandate of this authority is to exercise general supervision and coordination over all matters relating to drought management in Kenya. NDMA also is to be the principal instrument of the government in ensuring the delivery of all policies and strategies that relate to drought management and climate change adaptation.
3.3 Current Situation of Drought Disaster Management
3.3.1 Overview of the Whole of Kenya
(1) Droughts Records
Drought affects mostly the Eastern, Coast, and North Eastern Provinces and parts of the Rift Valley Province. It was said that Kenya experiences drought on a cyclic basis. Major droughts occur every ten years and the minor ones happen almost every three to four years.
1) Chronology of Drought Events
The sources of obtained records are mainly website information in the form of a list. The list of past major droughts is shown in Table 3.3.1.
2) Drought Area Map
According to the National Policy for the Sustainable Development of Arid and Semi Arid Lands of Kenya (draft as of December 2004, MOSSP) as well as the ALRMP II, arid and semi-arid lands (ASALs) are defined as shown in Figure 3.3.1. These ASAL districts are usually known as areas exposed to drought. These districts cover about 467,200 km2 or about 80% of the total national territory of Kenya.
(2) Characteristics of Drought and Damage
In recent years, the 1983-1984 and 1999-2000 droughts were recorded as the most severe; resulting in loss of human life and livestock, heavy government expenditure for response, and general high economic losses of unprecedented levels. After the El Niño rains of 1997-1998, Kenya experienced prolonged drought in many areas leading to famine and starvation.
Vast areas in Kenya are prone to drought. Due to this, Kenya’s vulnerability to food insecurity was highest among the pastoralists and small-scale agriculturalists in ASAL areas of the country. Extreme weather and climate events influence the entire national economy, which depends mostly on agricultural products such as cash crops, food crops and animals.

Current Situation of Drought Disaster Management Final Report Chapter 3 Sectoral Report (J) Flood and Drought Disaster Management
The Development of J - 36 Nippon Koei Co., Ltd. the National Water Master Plan 2030
The characteristics of respective catchment areas are described in Subsections 3.3.2 to 3.3.7.
(3) Drought Forecasting and Warning System
There are short- and long-term forecasting methods. At first long-term forecasting result is utilised for preparedness activities in advance of drought occurrence. When drought condition becomes severe, short-term forecasting is made in order to judge necessary actions such as water use restriction.
1) Long-term Forecasting System
There is an established drought forecasting system in Kenya. Rainfall forecasting in the African region is provided by IGAD Climate Prediction and Application Centre (ICPAC) having long-term predictions of ten days, one month and three months. KMD downscales the results predicted by ICPAC and then utilises them for domestic rainfall forecasting for the long term.
2) Short-term Forecasting System
The WRMA regional offices of TCA and ENNCA make short-term drought forecasting based on the river water level. Drought alert levels are set as shown in the table below. These alert levels are used to judge the necessity of water use restriction during severe droughts. In the ENNCA, coloured gauge plates (red, amber and green) were installed to give an indication to abstract water for irrigation.
Drought Alert Levels at Water Level Gauging Stations
Catchment Area Station No. Gauge Height (m) (Discharge(m3/s)) Normal Alert Alarm
TCA 4G01: Garissa --- 1.5 1.2 4CB4: Thika --- to be confirmed to be confirmed
ENNCA 5BE02: Ontulili 0.22 (0.477) 0.12 (0.178) 0.05 (0.044) 5BE06: Timau 0.32 (0.374) 0.18 (0.151) 0.06 (0.028) 5BC02: Naro Moru 0.38 (0.505) 0.27 (0.197) 0.18 (0.057) 5AD04: Mutara 0.54 (0.498) 0.41 (0.190) 0.28 (0.056) 5D08: Isiolo 0.36 (0.426) 0.25 (0.156) 0.14 (0.031)
Source: Interview with the WRMA regional offices of TCA and ENNCA
3) Warning System
KMD gives out alerts on probable drought events based on the results of the forecast. Although there is no clear structure of warning dissemination and coordination system, drought alert information is broadcasted on local radio, television and also at barazas held by the provincial administration, including the chiefs and their assistants.
The ALRMP has established a community-based drought early warning system. The information source of this warning is the KMD’s forecast.
Also, the National Disaster Response Plan (MOSSP and NDOC, 2009) gives designed receipt and distribution of disaster warning as described in Subsection 2.3.1 (4) 5).

Final Report Current Situation of Drought Disaster Management Sectoral Report (J) Flood and Drought Disaster Management Chapter 3
Nippon Koei Co., Ltd. J - 37 The Development of the National Water Master Plan 2030
(4) Drought Impact Assessment System
Kenya Food Security Steering Group (KFSSG) conducts drought impact assessment twice a year, the first during the onset of the long rains (in March) and the second during the pre-harvest period (in August), for the purpose of informing humanitarian, recovery and short-term interventions across different sectors, namely; food, water and sanitation, health and nutrition, agriculture and livestock, markets and education.
Based on the results of assessment, required interventions for each sector are proposed in this system. In the case of the water sector, there are several approaches such as rehabilitation of boreholes, dams and pans, repair of water supplies, water trucking, purchase and distribution of plastic tanks, water quality surveillance and treatment chemical, drilling of emergency boreholes and fuel subsidy. The assessment system also estimates necessary cost for these intervention activities.
(5) Drought Preparedness and Mitigation System
The following preparedness and mitigation measure systems have been developed by the efforts of various organisations. It is usually difficult to separate between pre- and post-drought stages since the onset of drought is slow and drought situation usually continues for a long time. However, among the following systems, “2) arrangement of required water during emergency” was classified under post-drought stage, while the others were basically under pre-drought stage.
1) Coordination among Concerned Organisations
ALRMP II has established a coordination system on community-based drought management and food security issues in ASALs, covering 28 districts. During drought events, the provincial administration takes the responsibility of coordinating the response activities. However, the current coordination structures among concerned organisations within the affected districts have not been clear. Especially, the impact of the project has not been felt at the community level.
2) Arrangement of Required Water during Emergency
When drought sets in, most of the Water Services Boards (WSBs) in the catchment level mobilise and try to provide water to emergency areas within the catchment area. Water is supplied to drought stricken areas using water tank trucks mounted with pumps.
Emergency pumping of water to specific areas is currently not a common practice, except for a few hydropower dams in TCA including at Kiambere Dam which supplies water to Mwingi town and Masinga Dam which supplies water to Kitui town.
Utilisation of sewage treated water or industrial wastewater is not a major practice in Kenya.
3) Implementation of Water Saving Guidance
There is no structured water saving guidance in the country, however the WRMA regional offices train the WRUAs on best method of water use from the viewpoints of sustainability, efficiency and avoiding water wastage in the distribution systems. On the other hand the

Current Situation of Drought Disaster Management Final Report Chapter 3 Sectoral Report (J) Flood and Drought Disaster Management
The Development of J - 38 Nippon Koei Co., Ltd. the National Water Master Plan 2030
government also offers technical and financial support to the WRUAs by offering funds through the Water Services Trust Fund (WSTF), the Constituency Development Trust Fund (CDTF), and the Constituency Development Fund (CDF).
ALRMP II has established a system in which the District Steering Group (DSG) of every ASAL district disseminates information on the probable droughts through their monthly situational reports. These reports are used to encourage the WRUAs to save water for use during dry spells.
In the agricultural sector, planting drought resistant crops is practiced in order to save water use. Water saving at irrigations need to be encouraged in the future.
4) Effective Water Use
In Kenya, water is prioritised for domestic use. In accordance with Rule no. 8 of the WRM Rules 2007, the WRMA regional offices have legal authority to order water use restriction against major water users. There has, however, been a challenge with this restriction system because people still continue using water for their own use uncontrollably. These illegal abstractions exist because of there is an inadequate number of WRMA staff to secure the large catchment area.
Regarding agricultural water use, water storages are created for use during the dry season. The number of storages is however still few. MWI is promoting the change of cultivation method, which is to heighten the ridges of the cultivation area so that rainfall does not flow out easily.
Rainwater use has been embraced by many individuals and companies as a water source for miscellaneous use. In most ASAL districts, earth pans have been constructed to provide water for livestock and cleaning purposes. Others have also directed water from roadside catchments to their farms for irrigation purposes.
5) Improvement of Public Awareness
Daily public relations are done using mass media, chief barazas and public awareness forums. Water saving campaigns are also done by water service providers (WSPs) especially in regional cities and major towns by informing the public on efficient water use.
6) Securement of Water Resources for Long Term
Though most of the forests have been encroached and degraded, the government, through KWS and KFS in conjunction with land users and WRUAs, has tried to manage and improve the existing water towers. This is being done by watershed conservation through the planting of trees, sensitisation on catchment degradation, river bank protection and conservation of indigenous vegetation.
Artificial groundwater recharging is not a common practice in Kenya. Natural groundwater recharging occurs in wetlands, in areas with natural land cover capable of allowing water percolation into the soil, and in forest areas upstream of the catchments.

Final Report Current Situation of Drought Disaster Management Sectoral Report (J) Flood and Drought Disaster Management Chapter 3
Nippon Koei Co., Ltd. J - 39 The Development of the National Water Master Plan 2030
Unstable water intakes in rivers, wells or springs usually result in ineffective water use. This becomes a challenge when the intakes are not properly designed or planned. It is now common practice to secure water intakes through the construction of well designed weirs in rivers and water boxes in spring. These structures are regularly maintained to ensure its sustainability.
(6) Necessity of Long-term Drought Management Solutions
From time to time, the government has responded to drought related challenges in ASAL areas of the country. However, the responses to drought disasters normally include emergency food supplies and water supply from a short-term standpoint. This is effective for the affected people in times of emergency but it does not guarantee the elimination of drought damages in the long term. Therefore, long-term solutions including structural measures as well as artificial groundwater recharging will be necessary in the future. In NWMP 2030, these issues are considered in the sectors of water resources development and water resources management, respectively.
3.3.2 Lake Victoria North Catchment Area
(1) Drought Situation
Although drought damages have not been reported in LVNCA, the water balance situation in the future is expected to tighten. Irrigation and domestic water demands will largely increase according to the water balance study for NWMP 2030.
(2) Drought Management
There are five existing dams for domestic water supply purpose, namely Moiben, Twin Rivers, Ellegirini, Kipkarren, and Lessos Dams. However, drought management including water use restriction of the reservoirs has not been especially implemented.
3.3.3 Lake Victoria South Catchment Area
(1) Drought Situation
Although drought damages have not been reported in LVSCA, the water balance situation in the future is expected to tighten. Irrigation and domestic water demands will largely increase according to the water balance study for NWMP 2030.
(2) Drought Management
There are two existing dams for hydropower purpose, namely Gogo Falls and Sondu/Miriu Dams. However, drought management including water use restriction of the reservoirs has not been especially implemented.

Current Situation of Drought Disaster Management Final Report Chapter 3 Sectoral Report (J) Flood and Drought Disaster Management
The Development of J - 40 Nippon Koei Co., Ltd. the National Water Master Plan 2030
3.3.4 Rift Valley Catchment Area
(1) Drought Situation
Most of RVCA, except for its central part in and around Nakuru town, is categorised as arid land for its northern side, and as semi-arid land for its southern side.
In the time of drought in January 2011, civil insecurity and conflicts over water resources and grazing resources occurred particularly in the Turkana area. The insecurity resulted into displacement and destitution of households. Also, dysentery outbreaks occurred in several areas including Turkana due to the deterioration of water quality.
(2) Drought Management
As for drought disaster management at local government and community levels, the ALRMP II was completed in December 2010 with financial support from World Bank. The project formulated institutional arrangement for drought disaster management at local levels for all the arid and semi-arid land districts of Kenya.
On the other hand, as for drought management at the catchment level, the WRMA RV Regional Office conducts water use restriction. However, reference water levels for restriction have not been clearly determined in RVCA. This means there is an operational issue from the viewpoint of clear timing for actions against drought.
There are six existing dams for hydropower, irrigation and domestic water supply purposes, namely Turkwel, Chemeron, Kirandich, Turasha, Aram, and Ratat Dams. However, drought management including water use restriction of the reservoirs has not been especially implemented.
3.3.5 Athi Catchment Area
(1) Drought Situation
Most of ACA, except for its most upstream parts in and around Nairobi and Machakos, is categorised as semi-arid land.
Drought damage in ACA is relatively not severe compared to RVCA or ENNCA. However, during the drought in January 2011, it was reported that agricultural production remarkably decreased. Also, an outbreak of livestock epidemic occurred due to the deterioration of water quality because rains were exceptionally poor in localised parts of Malindi and Taita Taveta where only 10-20% of normal rains were received.
(2) Drought Management
As for drought disaster management at local government and community levels, and also at catchment level, the situation is almost similar to RVCA.
There are eight existing dams for domestic water supply purpose, namely Ruiru, Bathi, Mulima, Manooni, Muoni, Kikoneni, Maruba, and Kiserian (under construction) Dams. However, drought management including water use restriction of the reservoirs has not been especially implemented.

Final Report Current Situation of Drought Disaster Management Sectoral Report (J) Flood and Drought Disaster Management Chapter 3
Nippon Koei Co., Ltd. J - 41 The Development of the National Water Master Plan 2030
3.3.6 Tana Catchment Area
(1) Drought Situation
Most of TCA, except for its most upstream parts in and around Embu and Muranga, is categorised as arid land for the downstream parts, while semi-arid land for areas in the middle stream parts. TCA is therefore vulnerable to both flood and drought disasters.
During the drought in January 2011, less than 20% of normal irrigation water was obtained in irrigated areas from Garissa to Tana Delta. Conflicts over water resources and grazing resources occurred among pastoralists and agricultural farmers particularly in the lower Tana areas.
(2) Drought Management
As for drought disaster management at local government and community levels, the situation is almost similar to RVCA.
As for water resources management during drought, Garissa and Thika river gauge stations have two warning water levels (alert and alarm levels). Once the river water level reaches the warning level, the WRMA Tana Regional Office implements water use restriction by regulating water intake.
There are eight existing dams for hydropower and domestic water supply purposes, namely Sasumua, Thika, Masinga, Kamburu, Gitaru, Kindaruma, Kiambere, and Umaa (under construction) Dams. However, drought management including water use restriction of the reservoirs has not been especially implemented.
3.3.7 Ewaso Ng'iro North Catchment Area
(1) Drought Situation
Most of ENNCA, except for very limited parts in and around the water tower, is categorised as arid land. Also, drought damages in the catchment area are most severe in Kenya.
During the drought in January 2011, civil insecurity and conflicts over water resources and grazing resources occurred particularly in the Marsabit area. In Wajir and Mandera districts, the earlier than usual drying of water pans and dams increased the trekking distances for livestock to an average of 15-20 km and up to 40 km compared to the normal 5-10 km. As a result, livestock productivity declined precipitously. For instance, milk production dropped to less than 40% of normal; consequently, milk price increased threefold.
(2) Drought Management
As for drought disaster management at local government and community levels, the situation is almost similar to RVCA.
As for water resources management during drought, the WRMA ENN Regional Office has defined three warning water levels and its discharge (normal, alert and alarm levels) at five river gauge stations as reference level. Once the river water level reaches the warning level, the WRMA ENN Regional Office implements water use restriction by regulating water intake.

Current Situation of Drought Disaster Management Final Report Chapter 3 Sectoral Report (J) Flood and Drought Disaster Management
The Development of J - 42 Nippon Koei Co., Ltd. the National Water Master Plan 2030
There is one existing dam for domestic water supply purpose, namely Badas Dam (under construction).
3.4 Ongoing Projects and Existing Plans
Currently there is no ongoing project on drought management since the ALRMP II was just completed in December 2010. The project was implemented covering all 28 districts classified into ASAL, which are equal to about 80% of the whole Kenya. The objectives of the project are to: (i) enhance food security, (ii) enhance social service delivery, and (iii) reduce livelihood vulnerability.
As one of the project components, the ALRMP II has formulated a drought management system with particular emphasis on food security and differently from water resources management. From the aspect of connection with NWMP 2030, the project has achieved the establishment of a drought early warning system. Drought monthly bulletin for each ASAL county is continuously issued after the completion of the project. According to an interview with the project office, the strengthened and institutionalised drought management system is currently well-functioning in terms of food security management. They, however, insist on the necessity of additional construction of large-scale reservoirs.
3.5 Operations and Maintenance Issues
(1) High Incidence of Equipment Theft
River water level gauges are used for short-term drought forecasting as well. As described in Subsection 2.5 (1) of the section on operations and maintenance issues in flood management, it is necessary to give sufficient consideration on the installation method of equipment in order to avoid theft.
(2) Siltation of Storages
Siltation of storages leads to the in decrease water storage volume, which may cause an increase in drought damage. In order to avoid siltation of storages and ensure water storage volume as much as possible, the maintenance of storages, such as reservoirs, pans, and small-scale storages, is essential.
3.6 Challenges and Key Issues
Kenya’s drought management system has been relatively well-developed as compared with its flood management because the country has been suffering from severe drought for a long time now. The identified challenges and key issues in drought disaster management are listed below.
(1) No Detail Criteria for Water Use Restriction
Detail criteria for water use restriction rule have not been formulated in the WRMA regional offices except for ENNCA. Water use restriction is usually judged based on past river water level experiences.
Final Report Current Situation of Drought Disaster Management Sectoral Report (J) Flood and Drought Disaster Management Chapter 3
Nippon Koei Co., Ltd. J - 43 The Development of the National Water Master Plan 2030
Also, illegal water abstraction exists during the restriction period. This is caused by inadequate monitoring system and non-integrated intake system which allow water users to take the water with ease.
One of the most important things in drought management is how to effectively utilise the limited water resources. In that sense, the improvement of the water use restriction system will be one of the most valuable measures which may be considered in NWMP 2030.
(2) Insufficient Utilisation of Long-term Rainfall Forecast for Drought Management
As described in Subsection 3.3.1 (3) 1), a long-term rainfall forecasting system has been already established by KMD. However, the forecast result is not effectively utilised for the WRMA’s current water resources management.
(3) Unclear Demarcation of Roles and Responsibilities among Organisations Concerned
There are several policies and strategies that deal with drought management, as described in Subsection 3.1. However a specialised policy for drought management has not been formulated in the country. Therefore, the demarcation of roles and responsibilities among concerned organisations has not been clarified.
According to interviews conducted in the course of the study, the organisations regarded as responsible for drought management in Kenya are MSDNKOAL and MOSSP/NDOC. However, water-related management carried out by MWI and WRMA cooperatively. In that sense, the connection between disaster-related organisations and water-related ones should be enhanced.

Flood Disaster Management Plan Final Report Chapter 4 Sectoral Report (J) Flood and Drought Disaster Management
The Development of J - 44 Nippon Koei Co., Ltd. the National Water Master Plan 2030
CHAPTER 4 FLOOD DISASTER MANAGEMENT PLAN
4.1 General
A flood management system has not been established adequately. Looking at Kenya’s historical background, flood disasters have been less focused on as compared to the country’s severe drought disasters since the frequency of widespread flooding was low especially prior to the 1997-1998 El Niño floods.
In order to perform proper flood management, it is essential to legally stipulate considerations and detailed procedures in the process of various decisions making and planning. However, the organisation responsible for flood management is not clear legally at the moment. Flood management is not consolidated among the several relevant organisations involved in such management. Currently, MWI, WRMA, KMD, DOC, NWCPC, each DDMC, etc. are involved in flood management. In recent years, the Disaster Management and Risk Reduction Unit under MWI as well as FMU under WRMA were established in 2009 and in 2010, respectively; however, they have not been fulfilling their roles as governing bodies yet.
Out of the five priority projects proposed in NWMP (1992), only river improvement works in the Nzoia and Nyando Rivers have been implemented by NWCPC. However, these implementation works were not in a systematic manner, but they were implemented as finance becomes available.
FEWS, which is considered useful for reducing flood damages, has not been established except for one installation in the Nzoia River basin as pilot project. In the current management system, the WRMA regional offices give flood warnings based on their past experiences and disseminate the warning to the public through the DDMC, etc.; however, such information does not reach the public in most cases. One of the key issues regarding evacuation activities has been the sharing of information among the concerned organisations and providing information to the public.
4.2 Overall Concept and Framework for Planning
(1) Goal
Among various natural disasters, NWMP 2030 deals with water-related disasters, namely flood and drought, focusing on the preparedness in the pre-disaster stage. The goal is to minimise human and economic damages caused by flood.
(2) Overall Concept and Framework for Flood Disaster Management Plan
The flood protection plan in NWMP (1992) was formulated giving focus to structural measures; however, most of the projects have not been implemented yet. It is effective to incorporate non-structural measures as immediate measures to mitigate flood damage prior to the completion of structural measures, and as measures to mitigate damage caused by extraordinary floods exceeding the design level of structural measures. Considering the current situation and objective of the flood disaster management, the overall concept and framework for flood disaster management plan formulation to be applied commonly to six catchment areas were set as follows:
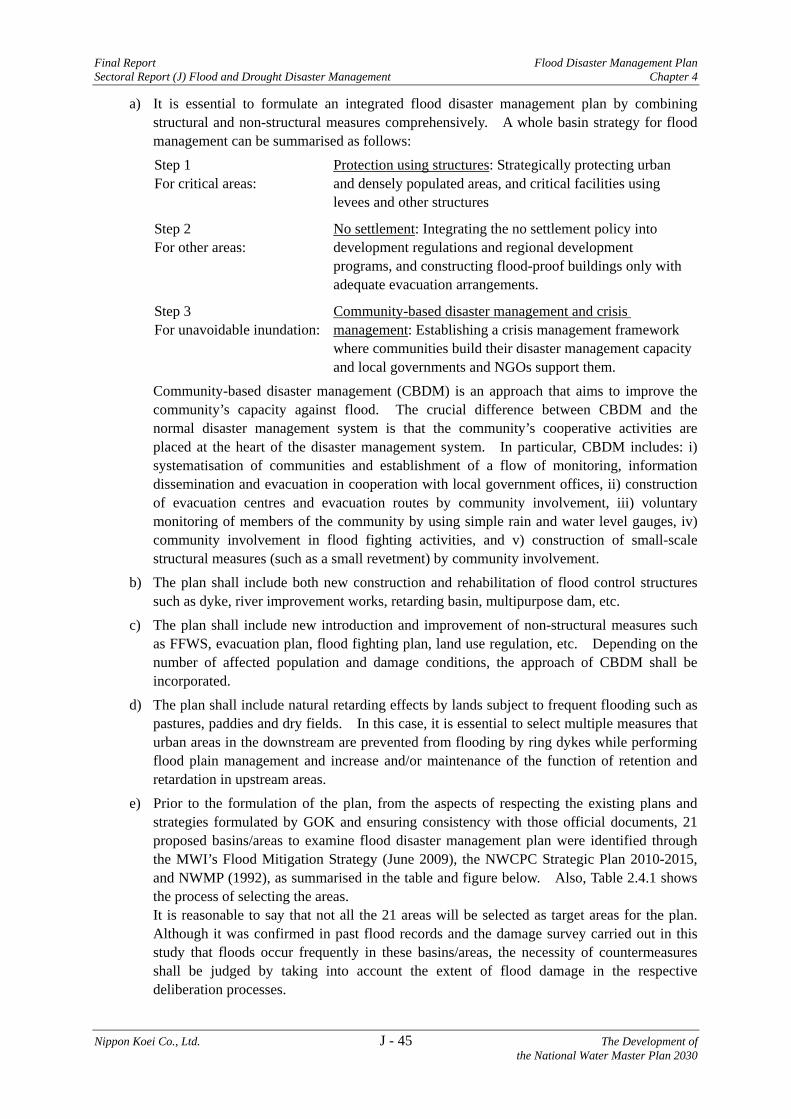
Final Report Flood Disaster Management Plan Sectoral Report (J) Flood and Drought Disaster Management Chapter 4
Nippon Koei Co., Ltd. J - 45 The Development of the National Water Master Plan 2030
a) It is essential to formulate an integrated flood disaster management plan by combining structural and non-structural measures comprehensively. A whole basin strategy for flood management can be summarised as follows: Step 1 Protection using structures: Strategically protecting urban
and densely populated areas, and critical facilities using levees and other structures
For critical areas:
Step 2 No settlement: Integrating the no settlement policy into development regulations and regional development programs, and constructing flood-proof buildings only with adequate evacuation arrangements.
For other areas:
Step 3 Community-based disaster management and crisis management: Establishing a crisis management framework where communities build their disaster management capacity and local governments and NGOs support them.
For unavoidable inundation:
Community-based disaster management (CBDM) is an approach that aims to improve the community’s capacity against flood. The crucial difference between CBDM and the normal disaster management system is that the community’s cooperative activities are placed at the heart of the disaster management system. In particular, CBDM includes: i) systematisation of communities and establishment of a flow of monitoring, information dissemination and evacuation in cooperation with local government offices, ii) construction of evacuation centres and evacuation routes by community involvement, iii) voluntary monitoring of members of the community by using simple rain and water level gauges, iv) community involvement in flood fighting activities, and v) construction of small-scale structural measures (such as a small revetment) by community involvement.
b) The plan shall include both new construction and rehabilitation of flood control structures such as dyke, river improvement works, retarding basin, multipurpose dam, etc.
c) The plan shall include new introduction and improvement of non-structural measures such as FFWS, evacuation plan, flood fighting plan, land use regulation, etc. Depending on the number of affected population and damage conditions, the approach of CBDM shall be incorporated.
d) The plan shall include natural retarding effects by lands subject to frequent flooding such as pastures, paddies and dry fields. In this case, it is essential to select multiple measures that urban areas in the downstream are prevented from flooding by ring dykes while performing flood plain management and increase and/or maintenance of the function of retention and retardation in upstream areas.
e) Prior to the formulation of the plan, from the aspects of respecting the existing plans and strategies formulated by GOK and ensuring consistency with those official documents, 21 proposed basins/areas to examine flood disaster management plan were identified through the MWI’s Flood Mitigation Strategy (June 2009), the NWCPC Strategic Plan 2010-2015, and NWMP (1992), as summarised in the table and figure below. Also, Table 2.4.1 shows the process of selecting the areas. It is reasonable to say that not all the 21 areas will be selected as target areas for the plan. Although it was confirmed in past flood records and the damage survey carried out in this study that floods occur frequently in these basins/areas, the necessity of countermeasures shall be judged by taking into account the extent of flood damage in the respective deliberation processes.

Flood Disaster Management Plan Final Report Chapter 4 Sectoral Report (J) Flood and Drought Disaster Management
The Development of J - 46 Nippon Koei Co., Ltd. the National Water Master Plan 2030
Catchment Area Proposed Target AreaLVNCA 1. Yala Swamp LVSCA 2. Kano Plain
3. Sondu Rivermouth 4. Kuja Rivermouth 5. Kisumu
RVCA 6. Middle/Lower Turkwel 7. Lower Kerio 8. Nakuru 9. Narok 10. Mogotio
ACA 11. Downmost Athi 12. Lumi Rivermouth 13. Nairobi City 14. Kwale 15. Mombasa
TCA 16. Lower Tana 17. Ijara
ENNCA 18. Middle/Lower Ewaso Ng'iro North19. Wajir 20. Mandera 21. Isiolo
Source: JICA Study Team based on Figure 2.3.1
Proposed Target Areas for Flood Disaster Management Plan
f) The plan is limited to proposing a basic idea due to insufficient flood data necessary for formulation of specific flood management plan. It is proposed to carry out the flood surveys for the above 21 proposed areas as early as possible to collect the basic data and information necessary for planning such as location, depth, area and time of flooding, flood discharge, river conditions, topographic maps, etc.
4.3 Flood Disaster Management Plan for Lake Victoria North Catchment Area
4.3.1 Management Strategy
The flood management disaster plan at the target area is formulated by the conceptual steps 1-3 as mentioned in Section 4.2 (2) a). As explained in the general concept and framework mentioned in Section 4.2 (2) e), the proposed target area in LVNCA is only at Yala Swamp. The area covers 200 km2 between the lower reaches of the Nzoia and Yala Rivers. It is expected that the critical areas in Yala Swamp including Budalangi will be protected by structural measures to be constructed through the ongoing WKCDD&FMP, which was described above. Also, a CBDM system is being established through the project as a measure to mitigate damage caused by extraordinary floods exceeding the design level of structural measures.
Therefore, the basic strategy for Yala Swamp is to incorporate the structural measures planned by the WKCDD&FMP into NWMP 2030. Meanwhile, the strategy in terms of non-structural measures is to focus on operations and maintenance issues for the existing and on-going flood management measures. The following are the basic policies in formulating the flood disaster management plan in LVNCA:
a) Implementation of flood control measures, which were planned in the WKCDD&FMP b) Operations of FEWS in the Nzoia River basin by the WRMA LVN Regional Office in
collaboration with KMD c) Preparation of flood fighting plan for both the existing and planned dykes along the lower
reaches of the Nzoia and Yala Rivers
1 23
4
5
6 7
8
9
10
11 12
13
14 15
16
17
18
19
20
21
Proposed Target Area

Final Report Flood Disaster Management Plan Sectoral Report (J) Flood and Drought Disaster Management Chapter 4
Nippon Koei Co., Ltd. J - 47 The Development of the National Water Master Plan 2030
The abovementioned FEWS should be initiated by the WRMA LVN Regional Office, which is a responsible organisation for water resources management at the catchment level after the project is completed. In this situation, KMD and NDOC will be positioned as the cooperative organisations from the viewpoint of flood management. In addition, it is required to minimise flooding damage against extraordinary floods by preparing a flood fighting plan based on past dyke failure experiences.
4.3.2 Proposed Flood Disaster Management Plan
In line with the above management strategy, the following are proposed flood disaster management plan for LVNCA. The proposed measures are illustrated in Figure 4.3.1.
(1) Implementation of Flood Control Measures Planned in the WKCDD&FMP
The plan of WKCDD&FMP included various flood control measures such as new construction of multipurpose dam, new construction of dykes, rehabilitation of existing dykes, and river improvement works. It was proposed to incorporate those existing plan into NWMP 2030. The plans were formulated in accordance with the concept of IFM and are considered reasonable and proper for the Nzoia River basin including Budalangi, one of severe flood prone areas. The Nzoia 34B and Nzoia 42A Dams, which are also proposed in the water resources development sub-sector of NWMP 2030, have flood control capacities. A reservoir operation rule for these dams should be prepared considering optimal flood control operation.
(2) Operation of FEWS in the Nzoia River Basin
It was proposed to improve the operational system for early flood warnings that is currently being established in the Nzoia River basin through the WKCDD&FMP. Both the current and proposed systems are compared in the figure below. The red characters in the figure denote the points of improvement. Although flood forecasting analysis is made primarily by the KMD headquarters during its project implementation period, forecasting should be done in the future by the WRMA regional office on its own initiative in cooperation with KMD. Warning information shall also be provided by the WRMA regional office. Incidentally, the target area of WKCDD&FMP makes up most of LVNCA.

Flood Disaster Management Plan Final Report Chapter 4 Sectoral Report (J) Flood and Drought Disaster Management
The Development of J - 48 Nippon Koei Co., Ltd. the National Water Master Plan 2030
Note: BWRB = Basin Water Resources Board, FDFC = Flood Diagnostic Forecasting Centre Source: JICA Study Team based on the interview with the WRMA LVN Regional Office, NDOC as of November 2012
Comparison of Current and Proposed Operational Systems for FEWS
(3) Preparation of Flood Fighting Plan for the Nzoia and Yala Rivers
The flood fighting plan for the existing dykes along the lower reaches of the Nzoia and Yala Rivers shall be prepared by the WRMA LVN Regional Office. The target section for the flood fighting plan is 18.4 km on the left bank and 16.2 km on the right bank of the Nzoia River, and 9 km on the right bank of the Yala River.
The flood fighting plan of NWMP 2030 shall aim mainly at avoiding the expansion of inundation area caused by dyke breaching and/or overtopping. The contents of flood fighting plan should focus on institutionalisation of flood fighting corps, activities during normal times, and flood fighting engineering methods, including but not limited to the following:
Institutionalisation of a flood fighting administration body consisting of administrative bodies such as Siaya County, Busia County, the relevant districts, etc.;
Institutionalisation of a flood fighting corps consisting of members who are summoned in times of emergency, while are engaged in their own business during normal times;
Setting of reference water level at the river gauging stations of Ruambua and Yala on the Nzoia and Yala Rivers in order to clarify corps activity steps such as standby, preparation, mobilisation, and release;
Preparing of dyke patrol system by specifying necessary monitoring points and procedures (situation of river water level, abnormalities in river structures, damage situation of traffic structures) in order to identify the risks of breaching, scouring and overtopping of dykes;
Describing the implementation method and procedures on flood fighting engineering methods that are applicable to both the Nzoia and Yala Rivers;
Describing the activities in normal times, namely flood fighting exercises intended for members of the flood fighting corps for the purpose of training on information dissemination, learning of flood fighting engineering methods, and raising awareness of flood fighting; and
FDFC
KMD
Catchment Level
WKCDD&FMP
Flood Diagnostic and Forecasting Centre (FDFC) at KMD
Project Steering CommitteeChair: National Project
Coordinator Member: President,
PS of MOSSP, PS of MWI, PS of MEMR, Director of KMD
DOC
MWI
Media
Data Transmission Information Dissemination Coordination Warning Dissemination
Monitoring Stations
WRMA LVN
Communities
National Level
National Level
Catchment Level
Monitoring Stations
WRMA LVN (BWRB)
Communities
KMD
DOC
MWI
Media
Current System Proposed System
PDMC / DDMC
PDMC / DDMC

Final Report Flood Disaster Management Plan Sectoral Report (J) Flood and Drought Disaster Management Chapter 4
Nippon Koei Co., Ltd. J - 49 The Development of the National Water Master Plan 2030
Describing the operations and maintenance methods of materials and equipment necessary for flood fighting activities.
4.4 Flood Disaster Management Plan for Lake Victoria South Catchment Area
4.4.1 Management Strategy
The flood management disaster plan at the target area is formulated by the conceptual steps 1-3 as mentioned in Section 4.2 (2) a). As explained in the general concept and framework mentioned in Section 4.2 (2) e), the proposed target areas in LVSCA are Kano Plain, Sondu Rivermouth, Kuja Rivermouth and Kisumu. Kano Plain is almost the lower part of the Nyando River basin.
Out of the above areas, in the Kano Plain/Nyando River basin, an integrated flood management plan was formulated in 2009 through the JICA project mentioned in Subsection 2.4.2 (2). In the study report, the number of affected people in the case of a 20-year probable flood is estimated at 250,000 as of 2006. Judging from the frequency of flood occurrences and the number of affected people in the area, this area shall be protected by structural measures for flood control, including multipurpose dam as proposed in the plan. In addition, to minimise the inundation area by avoiding dyke breaching or overtopping, a flood fighting plan shall be prepared for the existing dykes. Meanwhile, the existing CBDM system shall be improved in order to mitigate human damages caused by extraordinary floods. In the existing system, forecasting and confirmation of flood occurrence is judged by visual check of river water level. This method does not provide enough lead time for evacuation because the propagation time of flood is relatively short in this area due to topographical reasons. In order to secure a longer lead time, a telemetric type of FFWS should be developed in the area.
In the Sondu Rivermouth and Kuja Rivermouth, flood control measures will not be required because such areas have scarce population density according to satellite images. Therefore, in accordance with the conceptual steps 1-3 mentioned in Section 4.2 (2) a), the basic strategy for Sondu and Kuja is to develop CBDM systems by installing a simplified flood forecasting system based on water level observation in the upper reaches of the Sondu and Kuja Rivers. This strategy regarding the Kuja Rivermouth is also in line with the policy of the JICA Technical Assistance Project on Capacity Development for Effective Flood Management in Flood Prone Areas, which has an implementation period from 2011 to 2014. There are proposed dams on Sondu and Kuja Rivers, however those dams are not used for flood control purpose.
The floods which occurred in Kisumu were not river induced floods, but were rather due to urban drainage issues. In consideration of the high population density in Kisumu, the drainage system should be improved.
The following are the basic policies in formulating the flood disaster management plan in LVSCA: a) Implementation of flood control measures, which were planned in the Nyando Master Plan b) Establishment of FFWS in the Nyando River basin c) Preparation of flood fighting plan for the existing dykes along the lower reach of the Nyando
River d) Establishment of CBDM system in Sondu Rivermouth and Kuja Rivermouth e) Implementation of urban drainage measures in Kisumu

Flood Disaster Management Plan Final Report Chapter 4 Sectoral Report (J) Flood and Drought Disaster Management
The Development of J - 50 Nippon Koei Co., Ltd. the National Water Master Plan 2030
4.4.2 Proposed Flood Disaster Management Plan
In line with the above management strategy, the following were proposed for the flood disaster management plan of LVSCA. The proposed measures are illustrated in Figure 4.4.1.
(1) Implementation of Flood Control Measures in the Nyando River Basin
The Nyando Master Plan includes the following various flood control measures: i) raising roads for evacuation, ii) dyke construction, iii) river training, iv) desilting, v) retarding pond and dam development, and vi) catchment conservation. It was proposed to incorporate these existing plans into NWMP 2030. The Nyando Dam, which is also proposed in the water resources development sub-sector of NWMP 2030, has flood control capacity. A reservoir operation rule for the dam should be prepared considering optimal flood control operation. The arrangement of structural measures is illustrated in Figure 4.4.2.
(2) Establishment of FFWS in the Nyando River Basin
In addition to the structural measures mentioned above, non-structural measures were also proposed in the Nyando Master Plan because structural measures have limited safety against extraordinary floods. Therefore, the plan included the establishment of a telemetric type of FFWS in the Kano Plain/Nyando River basin as a medium-term plan. It was also proposed to incorporate this plan into NWMP 2030. The proposed network system is illustrated in Figure 4.4.2.
Although flood analysis system is not mentioned clearly in the Nyando Master Plan, the WRMA LVS Regional Office shall conduct flood/inundation analysis by using rainfall and river water level data, which are observed by telemetric monitoring facilities installed in the basin. Also, the WRMA LVS Regional Office shall issue a warning based on the forecasted river water level and probable flood area in the lower reaches that are obtained from the analysis of results.
(3) Preparation of Flood Fighting Plan for the Nyando River
A flood fighting plan for the existing dykes along the lower reaches of Nyando River shall be prepared by the WRMA LVS Regional Office. The target section for the flood fighting plan is 15.1 km on both sides of the bank of the Nyando River.
The flood fighting plan of NWMP 2030 shall aim mainly at avoiding the expansion of inundation area caused by dyke breaching and/or overtopping. The contents of flood fighting plan should focus on the institutionalisation of flood fighting corps, activities during normal times, and flood fighting engineering methods, including but not limited to the following:
Institutionalisation of flood fighting administration body consisting of administrative bodies such as Kisumu County, the relevant districts, etc.;
Institutionalisation of flood fighting corps consisting of members who are summoned in times of emergency, while are engaged in their own business during normal times;
Setting of reference water level at the river gauging stations of Nyando on the Nyando River in order to clarify the corps’ activity steps such as standby, preparation, mobilisation, and release;
Final Report Flood Disaster Management Plan Sectoral Report (J) Flood and Drought Disaster Management Chapter 4
Nippon Koei Co., Ltd. J - 51 The Development of the National Water Master Plan 2030
Preparing of dyke patrol system by specifying necessary monitoring points and procedures (situation of river water level, abnormalities in river structures, damage situation of traffic structures) in order to identify the risks of breaching, scouring and overtopping of dykes;
Describing the implementation method and procedures on flood fighting engineering methods that are applicable to the Nyando River;
Describing the activities in normal times, namely flood fighting exercises intended for members of the flood fighting corps for the purpose of training on information dissemination, learning of flood fighting engineering methods, and raising awareness of flood fighting; and
Describing the operations and maintenance methods of materials and equipment necessary for flood fighting activities.
(4) Establishment of CBDM System in Sondu Rivermouth and Kuja Rivermouth
In the Sondu Rivermouth and Kuja Rivermouth, CBDM system is proposed by reference to the system that has been already developed in the Nyando River basin.
It was proposed that the CBDM system includes the following various activities by involving the community: i) systematisation of communities and establishment of a flow of monitoring, information dissemination and evacuation in cooperation with the WRMA LVS Regional Office, Kisii Subregional Office and local government offices, ii) construction of evacuation centres and evacuation routes by community involvement, iii) voluntary monitoring by community by using simple rain gauge and water level gauge, iv) community involvement in flood fighting activities, and v) construction of small-scale structural measures, such as small revetments and culverts.
As for flood forecast, these areas shall basically adopt a simplified flood forecasting system by using river water level observations in the upper reaches. The communities themselves will recognise the occurrence of flood and carry out necessary activities in accordance with the hazard map and evacuation plan, which should be prepared in advance on their own.
In addition to CBDM system, the Magwagwa Dam with flood control capacity is proposed in the Sondu River basin in the water resources development sub-sector of NWMP 2030. A reservoir operation rule for the dam should be prepared considering optimal flood control operation.
(5) Implementation of Urban Drainage Measures in Kisumu
It was proposed to implement urban drainage measure works in Kisumu. Such work is the responsibility of local authorities, namely, Kisumu County and Kisumu Urban Centre. In the following section on cost estimation, the preliminary estimated costs of the drainage works comprised of gravity drains based on NWMP (1992) are shown. However, it is to be noted that drainage works are involved. In some cases, major associated works such as pumping station, retarding basin, improvement of receiving river channels, etc., should be planned in detail in the future.
In addition to urban drainage measures, the Kibos Dam with flood control capacity is proposed in the upper area of Kisumu in the water resources development sub-sector of NWMP 2030. A reservoir operation rule for the dam should be prepared considering optimal flood control operation.

Flood Disaster Management Plan Final Report Chapter 4 Sectoral Report (J) Flood and Drought Disaster Management
The Development of J - 52 Nippon Koei Co., Ltd. the National Water Master Plan 2030
4.5 Flood Disaster Management Plan for Rift Valley Catchment Area
4.5.1 Management Strategy
The flood management disaster plan at the target area is formulated by the conceptual steps 1-3 as mentioned in Section 4.2 (2) a). As explained in the general concept and framework mentioned in Section 4.2 (2) e), the proposed target areas in RVCA include Middle/Lower Turkwel, Lower Kerio, Nakuru, Narok and Mogotio. Out of these, Nakuru (population of 308,000 as of 2009) and Narok (population of 39,000 as of 2009) are the only urban areas.
First of all, Lower/Middle Turkwel and Lower Kerio are to be excluded from NWMP 2030 because severe flood damage has been rarely reported there, although river induced inundation was confirmed.
Narok has both river induced flood and urban drainage issues. Due to these complex causes, the primary route connecting Nairobi-Narok-Bomet frequently becomes impassable in the time of flood. In consideration of the impact to major transportation, the high population density and the high frequency of flood occurrence in Narok, this area should be protected by river structural measures. In addition, it is more effective to adopt a strategy to mitigate human damages since structural measures alone have limited safety against extraordinary floods exceeding their design level. A hazard map and an evacuation plan should be prepared. Regarding urban drainage issues in Narok, the drainage system should also be improved in consideration of the high population density.
Mogotio is relatively a small-scale urban centre (population of 3,700 as of 2009) located in Baringo district. However, the Melo River passes through the urban area of Mogotio which causes flood damage to the area. Since it is effective to drain flood water downstream, the discharge capacity of the Melo River shall be improved by river improvement works. In addition, it is more effective to adopt a strategy of mitigating human damages since structural measures alone have limited safety against extraordinary floods. Hazard maps and evacuation plans should be prepared.
The floods which occurred in Nakuru were not river induced floods, but were rather due to urban drainage issues. In consideration of the high population density in Nakuru, the drainage system should be improved.
The following are the basic policies in formulating the flood disaster management plan in RVCA:
a) Implementation of flood control measures as well as preparation of hazard map and evacuation plan in Narok
b) Implementation of flood control measures as well as preparation of hazard map and evacuation plan in Mogotio
c) Implementation of urban drainage measures in Narok d) Implementation of urban drainage measures in Nakuru
4.5.2 Proposed Flood Disaster Management Plan
In line with the above management strategy, the following were proposed for the flood disaster management plan of RVCA. The proposed measures are illustrated in Figure 4.5.1.

Final Report Flood Disaster Management Plan Sectoral Report (J) Flood and Drought Disaster Management Chapter 4
Nippon Koei Co., Ltd. J - 53 The Development of the National Water Master Plan 2030
(1) Implementation of Flood Control Measures in Narok
For the flood control measures in Narok, the following alternatives were proposed. The alternatives for Narok are limited to the two cases below because it is considered difficult to construct a retarding basin due to the relatively steep slope of land around Narok.
(A) River improvement works alone: construction of new dyke, reinforcing or heightening of existing dyke, widening of high water channel by realignment of existing dyke, widening of low water channel by excavation, etc.
(B) Flood discharge control by multipurpose dam + River improvement works: allocation of flood control capacity in the Upper Narok Dam, which is also proposed in the water resources development sub-sector of NWMP 2030, and preparation of a reservoir operation rule considering optimal flood control operation.
Also, it should be noted that although the case in which it is unallowable to inundate landside area was proposed in NWMP 2030, it is necessary to consider the possibility of adopting a strategy of natural retarding effects by the lands subject to frequent flooding such as pastures, paddies and dry fields in the time of detailed planning in the future.
In addition, a flood hazard map covering all flood plain areas in Narok shall be prepared and informed to the public. This map should be more accurate compared to the simplified hazard map prepared by communities and to show probable flood areas for several kinds of year probable flood and maximum experienced flood. The WRMA RV Regional Office should conduct flood analysis by using hydrological and topographical data. Based on the hazard map, an evacuation plan for Narok should also be formulated with attention to the classification of flood warnings and evacuation orders, dissemination method of warnings and orders, clear indication of evacuation place and route, confirmation method of evacuation activities, etc.
(2) Implementation of Flood Control Measures in Mogotio
In order to improve the discharge capacity of the Melo River, it is proposed to implement measures combining the construction of a new dyke, reinforcing or heightening of existing dykes, widening of high water channel by realignment of existing dykes, widening of low water channel by excavation, etc.
In addition, a flood hazard map and an evacuation plan should be prepared in the same method as the case of Narok mentioned above.
(3) Implementation of Urban Drainage Measures in Narok and Nakuru
It was proposed to implement urban drainage measure works in Narok and Nakuru. Such work is the responsibility of local authorities, namely, Narok/Nakuru County and the Narok/Nakuru Urban Centre. In the following section on cost estimation, the preliminary estimated costs of the drainage works comprised of gravity drains based on NWMP (1992) are shown. However, it is to be noted that in some cases, drainage works would involve major associated works such as pumping station, retarding
Flood Disaster Management Plan Final Report Chapter 4 Sectoral Report (J) Flood and Drought Disaster Management
The Development of J - 54 Nippon Koei Co., Ltd. the National Water Master Plan 2030
basin, improvement of receiving river channels, etc. These drainage works should be planned in detail in the future.
4.6 Flood Disaster Management Plan for Athi Catchment Area
4.6.1 Management Strategy
The flood management disaster plan at the target area is formulated by the conceptual steps 1-3 as mentioned in Section 4.2 (2) a). As explained in the general concept and framework mentioned in Section 4.2 (2) e), the proposed target areas in ACA are Downmost Athi, Lumi Rivermouth, Nairobi City, Kwale and Mombasa.
Downmost Athi, which is also known as lower Sabaki, has frequent inundation at the lower reach where there are a lot of small-scale migratory settlements, according to the interview with the WRMA Mombasa Subregional Office. In this case, flood control measures including dams will not be required because there is scarcely any densely populated area. Therefore, in accordance with the conceptual steps 1-3 mentioned in Section 4.2 (2) a), the basic strategy for Downmost Athi is to develop a CBDM system by installing a simplified flood forecasting system based on water level observation in the upper reaches of the Athi River.
Flooding in the Taita Taveta County frequently occur in small villages along the Lumi River on the south side of the Taveta urban area. The area has neither urban and densely populated areas nor critical facilities. However, rural settlements have been formed there. Therefore, for the same reason as Downmost Athi mentioned above, it is considered to be appropriate for the Lumi Rivermouth to develop a CBDM system. This strategy is also in line with the policy of the JICA Technical Assistance Project on Capacity Development for Effective Flood Management in Flood Prone Areas, which has an implementation period from 2011 to 2014.
In Kwale County, the most affected area due to flooding is Vanga, located at lower reach of the Umba River near the border with Tanzania, according to the interview with the WRMA Mombasa Subregional Office. In this area, it is confirmed from satellite images that the built-up area has been formed. Therefore, Vanga shall be protected by river structural measures.
Floods which occur in Nairobi and Mombasa were not river-induced floods but were rather due to urban drainage issues. In particular, severe drainage issues were found in the Kisauni area, which is located out of Mombasa Island. In consideration of the very high population density in Nairobi and Mombasa, the drainage systems should be improved.
The following are the basic policies in formulating the flood disaster management plan in ACA:
a) Establishment of CBDM system in Downmost Athi b) Establishment of CBDM system in Lumi Rivermouth c) Implementation of flood control measures as well as preparation of hazard map in Vanga,
Kwale d) Implementation of urban drainage measures in Nairobi e) Implementation of urban drainage measures in Mombasa

Final Report Flood Disaster Management Plan Sectoral Report (J) Flood and Drought Disaster Management Chapter 4
Nippon Koei Co., Ltd. J - 55 The Development of the National Water Master Plan 2030
4.6.2 Proposed Flood Disaster Management Plan
In line with the above management strategy, the following were proposed for the flood disaster management plan of ACA. The proposed measures are illustrated in Figure 4.6.1.
(1) Establishment of CBDM System in Downmost Athi and Lumi Rivermouth
In Downmost Athi and Lumi Rivermouth, CBDM systems were proposed with reference to the system that has been already developed in the Nyando River basin.
It was proposed that the CBDM system includes the following various activities by involving the community: i) systematisation of communities and establishment of a flow of monitoring, information dissemination and evacuation in cooperation with the WRMA Athi Regional Office, Mombasa/ Loitokitok Subregional Offices and local government offices, ii) construction of evacuation centres and evacuation routes by community involvement, iii) voluntary monitoring of members of the community by using simple rain and water level gauges, iv) community involvement in flood fighting activities, and v) construction of small-scale structural measures such as small revetment and culverts.
As for flood forecast, these areas shall basically adopt a simplified flood forecasting system by using river water level observation in the upper reaches. The communities themselves will recognise the occurrence of flood and carry out necessary activities in accordance with the hazard map and evacuation plan, which should be prepared in advance on their own.
In addition to CBDM system, the Lake Chala Dam with flood control capacity is proposed in the upper reach of Lumi River in the water resources development sub-sector of NWMP 2030. A reservoir operation rule for the dam should be prepared considering optimal flood control operation.
(2) Implementation of Flood Control Measures in Vanga, Kwale
In order to protect the built-up area of Vanga, it was proposed to implement measures combining the construction of a new dyke along the river, widening of low water channels by excavation, construction of a ring dyke around the built-up area, etc. Vanga shall be protected by only river training works since any dams are not proposed at the upstream area of Vanga.
In addition, a flood hazard map should be prepared and be informed to the public. This map should be more accurate compared to the simplified hazard map prepared by communities and it should show the probable flood areas for several kinds of year probable flood and maximum experienced flood. In order to create the map, the WRMA Athi Regional Office should conduct flood analysis by using hydrological and topographical data.
(3) Implementation of Urban Drainage Measures in Nairobi and Mombasa
It was proposed to implement urban drainage measure works in Nairobi and Mombasa. Such work is the responsibility of local authorities, namely, the Nairobi/Mombasa Urban Centre. In the following section on cost estimation, preliminary estimated costs of the drainage works comprised of gravity drains based on NWMP (1992) are shown. However, it is to be noted that drainage works involve, in some cases, major associated works such as pumping station, retarding basin, improvement of receiving river channels, etc., which should be planned in detail in the future.

Flood Disaster Management Plan Final Report Chapter 4 Sectoral Report (J) Flood and Drought Disaster Management
The Development of J - 56 Nippon Koei Co., Ltd. the National Water Master Plan 2030
4.7 Flood Disaster Management Plan for Tana Catchment Area
4.7.1 Management Strategy
The flood management disaster plan at the target area is formulated by the conceptual steps 1-3 as mentioned in Section 4.2 (2) a). As explained in the general concept and framework mentioned in Section 4.2 (2) e), the proposed target areas in TCA are Lower Tana and Ijara. Since the extent of Lower Tana has not been clearly defined in any document, the target area in NWMP 2030 shall be from Garissa to the mouth of the Tana River. In this case, Ijara is included into Lower Tana and hence Ijara will be examined together with Lower Tana. Out of this area, the urban area is limited to Garissa (population of 116,000 as of 2009).
In Garissa where flood damage is severe in the urban area, flood control measures shall be implemented by river structures, particularly taking note of the large number of affected people by long-term inundation. In addition, it is more effective to adopt a strategy to mitigate human damages since structural measures alone have limited safety against extraordinary floods that exceed their design level. A hazard map and an evacuation plan should be prepared.
In the lower part of the Tana River in Garissa, it is intended to mitigate human damages by establishing a CBDM system in accordance with the conceptual steps 1-3 mentioned in Section 4.2 (2) a), in consideration of the characteristics of gradual flood in the Tana River, the public’s evacuation capacity based on their past experience, and the avoidance of large-scale settlements along the river. This system should adopt a simplified flood forecasting system based on water level observation in the upper reach of the Tana River.
In addition, a warning system for discharge release from the existing hydropower dam in the area shall be improved. It was considered important to surely disseminate warning information to the public because they possess the ability to evacuate themselves if information is reached properly.
The following are the basic policies in formulating a flood disaster management plan in TCA:
a) Implementation of flood control measures as well as preparation of hazard map and evacuation plan in Garissa
b) Establishment of CBDM system in the lower part of the Tana River in Garissa c) Improvement of warning system regarding discharge release from the existing hydropower
dam
4.7.2 Proposed Flood Disaster Management Plan
In line with the above management strategy, the following were proposed for the flood disaster management plan for TCA. The proposed measures are illustrated in Figure 4.7.1.
(1) Implementation of Flood Control Measures in Garissa
For the flood control measures in Garissa, the following alternatives were proposed:
(A) River improvement works alone: construction of new dyke, reinforcing or heightening of existing dyke, widening of high
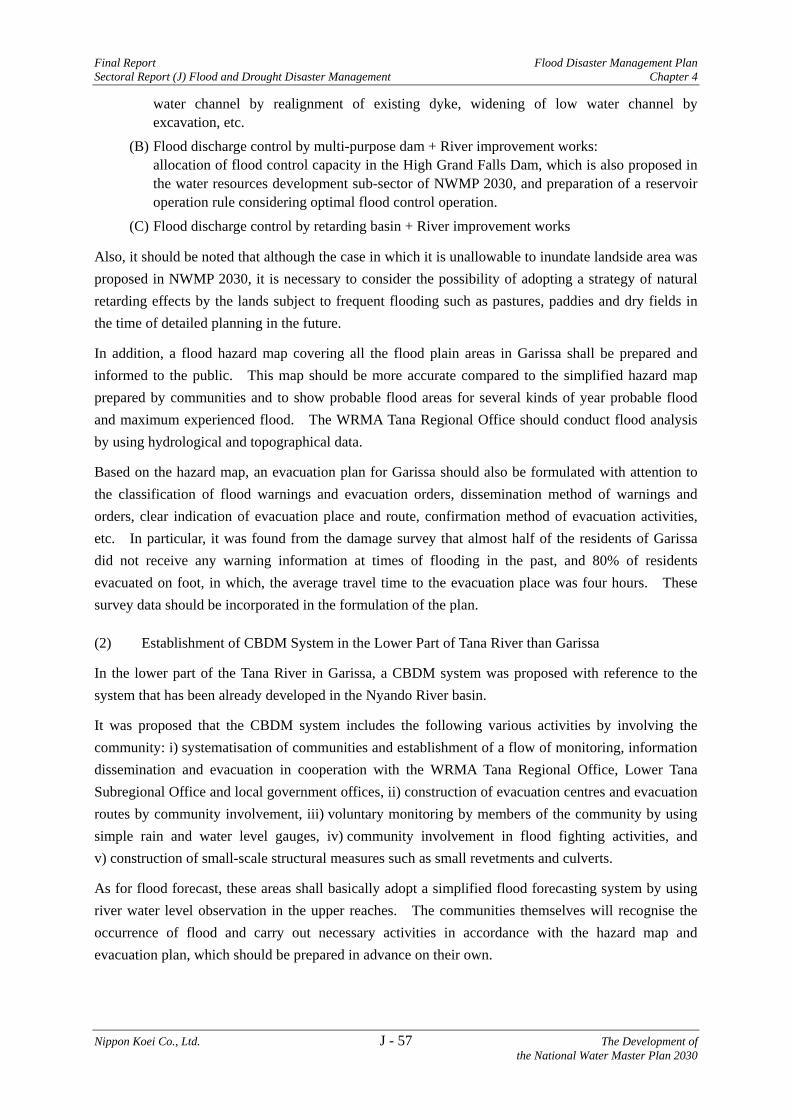
Final Report Flood Disaster Management Plan Sectoral Report (J) Flood and Drought Disaster Management Chapter 4
Nippon Koei Co., Ltd. J - 57 The Development of the National Water Master Plan 2030
water channel by realignment of existing dyke, widening of low water channel by excavation, etc.
(B) Flood discharge control by multi-purpose dam + River improvement works: allocation of flood control capacity in the High Grand Falls Dam, which is also proposed in the water resources development sub-sector of NWMP 2030, and preparation of a reservoir operation rule considering optimal flood control operation.
(C) Flood discharge control by retarding basin + River improvement works
Also, it should be noted that although the case in which it is unallowable to inundate landside area was proposed in NWMP 2030, it is necessary to consider the possibility of adopting a strategy of natural retarding effects by the lands subject to frequent flooding such as pastures, paddies and dry fields in the time of detailed planning in the future.
In addition, a flood hazard map covering all the flood plain areas in Garissa shall be prepared and informed to the public. This map should be more accurate compared to the simplified hazard map prepared by communities and to show probable flood areas for several kinds of year probable flood and maximum experienced flood. The WRMA Tana Regional Office should conduct flood analysis by using hydrological and topographical data.
Based on the hazard map, an evacuation plan for Garissa should also be formulated with attention to the classification of flood warnings and evacuation orders, dissemination method of warnings and orders, clear indication of evacuation place and route, confirmation method of evacuation activities, etc. In particular, it was found from the damage survey that almost half of the residents of Garissa did not receive any warning information at times of flooding in the past, and 80% of residents evacuated on foot, in which, the average travel time to the evacuation place was four hours. These survey data should be incorporated in the formulation of the plan.
(2) Establishment of CBDM System in the Lower Part of Tana River than Garissa
In the lower part of the Tana River in Garissa, a CBDM system was proposed with reference to the system that has been already developed in the Nyando River basin.
It was proposed that the CBDM system includes the following various activities by involving the community: i) systematisation of communities and establishment of a flow of monitoring, information dissemination and evacuation in cooperation with the WRMA Tana Regional Office, Lower Tana Subregional Office and local government offices, ii) construction of evacuation centres and evacuation routes by community involvement, iii) voluntary monitoring by members of the community by using simple rain and water level gauges, iv) community involvement in flood fighting activities, and v) construction of small-scale structural measures such as small revetments and culverts.
As for flood forecast, these areas shall basically adopt a simplified flood forecasting system by using river water level observation in the upper reaches. The communities themselves will recognise the occurrence of flood and carry out necessary activities in accordance with the hazard map and evacuation plan, which should be prepared in advance on their own.

Flood Disaster Management Plan Final Report Chapter 4 Sectoral Report (J) Flood and Drought Disaster Management
The Development of J - 58 Nippon Koei Co., Ltd. the National Water Master Plan 2030
(3) Improvement of Dam Discharge Warning
Out of the existing five hydropower dams, improvement shall be made for the warning system of the Kiambere Dam, which is mostly located downstream. In the current system, warning information is provided by KenGen, the hydropower operator, to the public through TARDA, the owner of dam, and the local government offices before large volume of water is released from the reservoirs. The contents of improvement should include, but are not limited, to the following:
Stipulating TARDA, the owner of dam, as a warning issuance authority for dam discharge release,
Improving dissemination method and route from sublocation, which is the lowest local administration, to the public,
Sharing/providing information with the WRMA Tana Regional Office, which is the implementing organisation for river administration at the catchment level, and
Scrutinizing the timing of warning issuance, information items to be provided to the public.
4.8 Flood Disaster Management Plan for Ewaso Ng'iro North Catchment Area
4.8.1 Management Strategy
The flood management disaster plan at the target area is formulated by the conceptual steps 1-3 as mentioned in Section 4.2 (2) a). As explained in the general concept and framework mentioned in Section 4.2 (2) e), the proposed target areas in ENNCA are the Middle/Lower Ewaso Ng'iro North, Wajir, Mandera and Isiolo. Here, the southern boundary of Wajir County is along the Ewaso Ng'iro North River. Hence, Wajir shall be treated as part of the Ewaso Ng'iro North River basin. Out of these, urban areas are limited to Mandera (population of 88,000 as of 2009) and Isiolo (population of 46,000 as of 2009).
First of all, Middle/Lower Ewaso Ng'iro North including Wajir is to be excluded from NWMP 2030 because severe flood damage has been rarely reported there, although river induced inundation was confirmed. If flood damage data for these areas are sufficiently accumulated, then these areas will be incorporated in the flood management plan when it is updated in the future.
Isiolo has both river induced flood and urban drainage issues. In consideration of the high population density of Isiolo, this area should be protected by river structural measures. In addition, it is more effective to adopt a strategy to mitigate human damages since structural measures alone have limited safety against extraordinary floods exceeding their design level. A hazard map and an evacuation plan should be prepared. Regarding urban drainage issues in Isiolo, the drainage system should also be improved in consideration of the high population density.
In Mandera, there are two causes of flood. One is overflow from the Daua River at the national boundary with Ethiopia, and the other is due to the two tributaries flowing from Somalia into the Daua River through the built-up area of Mandera. Both floods derive from international rivers; therefore, it was considered difficult to construct a flood control dam. In this regard, the urban area of Mandera should be protected by river improvement works, a retarding basin or a combination of them. In addition, it is also more effective to adopt strategies to mitigate human damages since structural

Final Report Flood Disaster Management Plan Sectoral Report (J) Flood and Drought Disaster Management Chapter 4
Nippon Koei Co., Ltd. J - 59 The Development of the National Water Master Plan 2030
measures alone have limited safety against extraordinary floods exceeding their design level. A hazard map and an evacuation plan should be prepared.
The following are the basic policies in formulating the flood disaster management plan in the ENNCA:
a) Implementation of flood control measures as well as preparation of hazard map and evacuation plan in Mandera
b) Implementation of flood control measures as well as preparation of hazard map and evacuation plan in Isiolo
c) Implementation of urban drainage measures in Isiolo
4.8.2 Proposed Flood Disaster Management Plan
In line with the above management strategy, the following were proposed for the flood disaster management plan of ENNCA. The proposed measures are illustrated in Figure 4.8.1.
(1) Implementation of Flood Control Measures in Mandera
For the flood control measures in Mandera, the following alternatives were proposed. The alternatives for Mandera are limited to the two cases below because it was considered difficult to construct a dam due to the difficulty in control of an international river.
(A) River improvement works alone: construction of new dyke, reinforcing or heightening of existing dyke, widening of high water channel by realignment of existing dyke, widening of low water channel by excavation, etc.
(B) Flood discharge control by retarding basin + River improvement works
Also, it should be noted that although the case in which it is unallowable to inundate landside area was proposed in NWMP 2030, it is necessary to consider the possibility of adopting a strategy of natural retarding effects by the lands subject to frequent flooding such as pastures, paddies and dry fields in the time of detailed planning in the future.
In addition, a flood hazard map covering all flood plain areas in Mandera shall be prepared and informed to the public. This map should be more accurate compared to the simplified hazard map prepared by communities and to show probable flood areas for several kinds of year probable flood and maximum experienced flood. The WRMA ENN Regional Office should conduct flood analysis by using hydrological and topographical data. Based on the hazard map, an evacuation plan for Mandera should also be formulated with attention to the classification of flood warnings and evacuation orders, dissemination method of warnings and orders, clear indication of evacuation place and route, confirmation method of evacuation activities, etc.
(2) Implementation of Flood Control Measures in Isiolo
For the flood control measures in Isiolo, the following alternatives were proposed. The alternatives for Isiolo are limited to the two cases below because: i) there is no plan to construct a multipurpose dam in the water resources development sector, and ii) it is considered difficult to construct a retarding

Flood Disaster Management Plan Final Report Chapter 4 Sectoral Report (J) Flood and Drought Disaster Management
The Development of J - 60 Nippon Koei Co., Ltd. the National Water Master Plan 2030
basin due to the relatively steep slope of land around Isiolo. In particular in Isiolo, it will be effective to implement a measure to increase the discharge capacity of small channels flowing through the built-up area of Isiolo into the tributary of Ewaso Ng'iro North River.
(A) River improvement works alone: construction of new dyke, reinforcing or heightening of existing dyke, widening of high water channel by realignment of existing dyke, widening of low water channel by excavation, etc.
(B) Flood discharge control by several small-scale dams/pans + river improvement works
Similar to Mandera’s case, it is necessary to consider the possibility of adopting natural retarding effects in the future. Also, a flood hazard map and an evacuation plan shall be prepared in the same manner as Mandera mentioned above.
(3) Implementation of Urban Drainage Measures in Isiolo
It was proposed to implement urban drainage measure works in Isiolo. Such work is the responsibility of local authorities, namely, the Isiolo County and the Isiolo Urban Centre. In the following section on cost estimation, the preliminarily estimated costs of the drainage works composed of gravity drains based on NWMP (1992) are shown. However, it is to be noted that drainage works involve, in some cases, major associated works such as pumping station, retarding basin, improvement of receiving river channels, etc., which should be planned in detail in the future.

Final Report Drought Disaster Management Plan Sectoral Report (J) Flood and Drought Disaster Management Chapter 5
Nippon Koei Co., Ltd. J - 61 The Development of the National Water Master Plan 2030
CHAPTER 5 DROUGHT DISASTER MANAGEMENT PLAN
5.1 General
Drought management systems have been generally established since the government has focused on drought disasters for a long time now. Regarding the drought crisis response system in terms of food, water, energy, etc., KFSSG and CRC have been organised. MWI is one of the member organisations of KFSSG.
In the ASAL districts, comprehensive drought management systems including early forecasting and warning, drought assessment, non-structural measures such as effective rainwater use, groundwater harvesting, public relation activities, etc. have been developed through the ALRMP II primarily by the MDNKOAL in cooperation with MWI. The drought early warning for every ASAL district is determined based on the result of long-term rainfall forecast issued by KMD.
In times of drought, WRMA adjusts its water provision by restricting water intake with priority on domestic, agriculture, industry and others. However, there are some issues in this system. For example, water resources are taken illegally when it is restricted or large water intake associations such as irrigation operators are outside the jurisdiction of the WRMA’s water restriction. In addition, although both long-term rainfall forecasting system and drought early warning system have been established and operated by KMD and MDNKOAL, respectively, those results have not been utilised effectively for the WRMA’s adjustment of water provision. This is because cooperation systems between WRMA and KMD or MDNKOAL are not sufficiently performed. The flow and image of existing systems are summarised in the figure below.
Source: Interview with MDNKOAL, Drought Early Warning Bulletin (January 2011, West Pokot District), and
The Outlook for the June-July-August (JJA) 2012 Period (Issue Date: June 4, 2012)
Images of Existing Rainfall Forecast System and Drought Early Warning System
ICPAC Provides rainfall forecasting in African region as a long-term prediction of 10-day, 1-month and 3-month.
KMD Downscales the ICPAC’s result and utilise for domestic rainfall forecasting of 4-day, 7-day, 1-month and 3-month.
MDNKOAL Determine monthly warning stages for every ASAL districts with 4 stages, namely Normal, Alert, Alarm and Emergency by livelihood zone types.
District Distribute warning information to the public.
Livelihood Zone Warning Stage Trend Agro pastoral Alert Worsening Mixed farming Normal Stable Pastoralist Alert Worsening District Alert Worsening
Rainfall Outlook

Drought Disaster Management Plan Final Report Chapter 5 Sectoral Report (J) Flood and Drought Disaster Management
The Development of J - 62 Nippon Koei Co., Ltd. the National Water Master Plan 2030
5.2 Overall Concept and Framework for Planning
(1) Goal
Among various natural disasters, NWMP 2030 deals with water-related disasters, namely flood and drought, focusing on the pre-disaster stage. The goal is to minimise human and economic damages caused by drought.
(2) General Concept and Framework for Drought Disaster Management Plan
Based on the current situation and objective of drought disaster management, the overall concept and framework for drought disaster management plan formulation to be applied commonly to six catchment areas were set as follows:
i) It is essential to take the approach of effectively and impartially using limited water resource stored in reservoirs by adjusting or restricting water intake during times of drought. The adjustment or restriction should be determined on the basis of the river basin unit from the perspective of adjustment of water intake reduction rate within the river basin. The restriction rules shall be prepared with the prospect that it is necessary to properly review the rules in association with construction of new reservoirs and change of water demand in the future.
ii) To impose restriction on water intake from reservoirs for the purpose of mitigation of drought damages, the Basin Drought Conciliation Council shall be newly established with the legal status to legally mediate water conflicts that are associated with drought damage.
iii) To commence water use restriction timely, it is necessary to effectively utilise both the existing long-term rainfall forecasting system and the drought early warning system, which are operated by KMD and MDNKOAL, respectively. A specialised drought early forecast system for water use restriction shall be established based on these two systems.
The basic ideas for reservoir water use restriction are as follows:
a) Target reservoir for water use restriction is all the reservoirs that are incorporated into the water resources development plan, including both the existing and proposed dams.
b) Three reference reservoir water levels (normal, alert, and alarm levels) shall be set for the respective reservoirs for the purpose of clearly understanding the timing of necessary actions for water use restriction.
c) The Basin Drought Conciliation Council shall be summoned to discuss actions to be taken when the reservoir water level is expected to become lower than the normal level.
d) Once the reservoir water level reaches the alert level, water use restriction shall commence. The reservoir water level shall not be lowered than the alarm level by controlling the outflow discharge from the reservoir.
e) In order to enable early actions based the existing drought forecasting and early warning system, a coordination system between KMD and WRMA regional offices shall be developed.
In addition, as the institutional framework for effective and impartial implementation of water use restriction, it is recommended to set up the following institutional arrangement:
a) In order to create a consultation mechanism, the Basin Drought Conciliation Councils shall be established consisting of relevant bodies and relevant organisations.

Final Report Drought Disaster Management Plan Sectoral Report (J) Flood and Drought Disaster Management Chapter 5
Nippon Koei Co., Ltd. J - 63 The Development of the National Water Master Plan 2030
b) All water users, including irrigation water users, shall be registered as members of the WRUA.
c) In times of water use restriction, conflicts between water users are likely to occur. In order to resolve such conflicts involving water resources, a specialised court shall be established. The court should be like the National Environmental Tribunal (NET)1, which plays the role of formal courts in environmental dispute settlement and also provides legal opinion to NEMA on complex matters where the authority seeks such advice.
5.3 Drought Disaster Management Plan
Drought disaster management plans for the respective six catchments are formulated based on the same concept. At the present stage of formulating NWMP 2030, the principal differences of plans between the catchments are the number/location of dams and river systems. Therefore, the plans are described together in this section with some specific descriptions for each catchment.
Prior to description of drought disaster management plan, it should be noted that drought disaster management is viewed apart from normal water resources management. The first step for water utilisation is monitoring of river discharge at reference points and identifying water demand of each water user. The details of these actions are parts of water resources management in normal time as described in the water resources management sub-sector of NWMP 2030. Following that, necessary actions against water deficit at each reference point in drought time are indicated in drought disaster management plan. The current status and future forecast of reserve and normal discharge at each reference point is as shown in the table below. The values in the table below will be used as basic information for judgement of drought time.
Current Status and Future Forecast of Reserve and Normal Discharge (Unit: m3/s)
Catchment Area
Reference Point
(Gauging Station No.)
Reserve
Normal Discharge
Catchment Area
Reference Point
(Gauging Station No.)
Reserve
Normal Discharge
Current Future (2030)
Current Future (2030)
LVNCA 1DA02 15.9 16.2 18.6 ACA 3DB01 8.6 8.7 8.7 1FG01 6.7 6.8 11.1 3HA12 8.9 9.0 9.0
LVSCA 1GD03 1.6 2.3 3.7 TCA 4BE10 13.5 13.6 14.0 1JG05 10.5 10.6 14.8 4CC03 8.5 9.2 9.5 1KB03 0.4 0.6 2.3 4G01 53.5 53.6 63.8 1KC03 1.5 2.0 5.1 ENNCA 5ED01 1.6 3.3 7.1 1LA04 4.3 4.4 4.4
RVCA 2B21 0.0 0.9 1.0 2C16 0.0 0.7 9.4 2K06 0.0 0.4 2.3 2GA01 0.0 0.1 0.6
Note: 1. Future reserve is viewed to be same as current reserve. 2. The amount of the reserve, consisting of ecological and basic human needs, was determined as the 95% value of the
naturalised present daily flow duration curve for each river, in accordance with the WRMA Guidelines for Water Allocation (First Edition, 2010) and results of the discussions with WRMA.
3. The normal discharge value is calculated as reserve plus amount of water permits issued (water demand) downstream of a certain point. The normal discharge value is a discharge which ensures domestic and industrial water supply against 10-year probable drought and irrigation water supply against 5-year probable drought.
Source: JICA Study Team based on Sectoral Report (G) 4.3.2 (2) 4) and Sectoral Report (H) 3.2 (1) 1) 1 NET was established under Section 125 of the Environmental Management and Coordination Act (EMCA) of 1999. NET reviews administrative decisions made by NEMA relating to issuance, revocation or denial of license and conditions of license. The Tribunal consists of five members: a Chairman, appointed by the Judicial Service Commission; two lawyers, one nominated by the law society of Kenya and the other appointed by the Minister for Environment and Natural Resources; and two persons, appointed by the Minister, with competence in environmental conservation.

Drought Disaster Management Plan Final Report Chapter 5 Sectoral Report (J) Flood and Drought Disaster Management
The Development of J - 64 Nippon Koei Co., Ltd. the National Water Master Plan 2030
In line with the overall concept and framework for planning mentioned in the above section, the following are the proposed drought disaster management plans for the six catchments.
5.3.1 Preparation of Water Use Restriction Rule for Reservoirs
(1) Target Dam
It is proposed to prepare water use restriction rule for the respective reservoirs. The number of dams for each catchment is summarised in the table below. The names of dams are shown in Table 5.3.1.
Number of Dams for Each Catchment Area
Catchment Area Number of Dams Existing Proposed Total
LVNCA 5 7 12 LVSCA 2 10 12 RVCA 6 10 16 ACA 8 16 24 TCA 8 11 19 ENNCA 1 5 6
Total 30 59 89 Note: “Existing” includes dams under construction. Source: JICA Study Team (Ref. Sectoral Report (G), 2.3.1 (1) and Table 4.4.1)
(2) Setting of Reference Reservoir Water Level
In order to clearly understand the timing of necessary actions for water use restriction, three reference reservoir water levels (normal, alert and alarm) shall be set for the respective reservoirs. The water level should be originally determined by percentage of reservoir water storage depending on season/month, water demand for each purpose, past experiences, etc. differently for each dam. The purposes of each reference water level are as follows:
Normal: The Basin Drought Conciliation Council is summoned to discuss actions to be taken when the reservoir water level is expected to become lower than the normal water level.
Alert: Water level in which water use restriction should commence. Alarm: Water level in which the reservoir water level shall not be lowered than this by
controlling outflow discharge from the reservoir.
(3) Determination of Reduction Rate
A method to determine the reduction rate of water intake among water users in times of drought shall be basically adjusted in the following manner:
a) Based on current water level of reservoirs, subsequent water level shall be determined by considering the weather forecast. Then, the necessary reduction rate in water intake for all basins will be determined.
b) Based on the above clause a), the reduction rate shall be determined for the respective intended purposes such as domestic water supply, industry, agriculture, etc. considering possible water saving volume for each purpose. At this time, it is essential to consider the order of priority which has been conventionally stipulated in Kenya.
c) While referring to the actual data on reduction rates during the past drought, the final reduction rate shall be determined.

Final Report Drought Disaster Management Plan Sectoral Report (J) Flood and Drought Disaster Management Chapter 5
Nippon Koei Co., Ltd. J - 65 The Development of the National Water Master Plan 2030
Figure 5.3.1 provides an example record of the reservoir water use restriction implemented in Sameura Dam of the Yoshino River in Japan during the severe drought in 2005.
5.3.2 Establishment of the Basin Drought Conciliation Council
(1) Jurisdiction of Council
It is proposed to establish the Basin Drought Conciliation Council on the basis of a river basin unit. In this case, a river basin represents a river system/drainage system, which is the pattern formed by the streams, rivers, and lakes in a particular drainage basin. This is because the adjustment or restriction of water use should be determined based on the river basin unit from the perspective of adjustment of water intake reduction rate within river basin in consideration of the balance between the upstream and downstream reaches. From the aspect of institutional setup, there should be a linkage between water rights and drought management in order to perform overall river basin management.
Table 5.3.1 shows all the dams, which are incorporated into the water resources development plan of NWMP 2030, and their river systems. One council shall be established in one river system. The number of councils to be established will be 22 in total. The boundaries of river basin units for each catchment area are shown in Figures 4.3.1 to 4.8.1, respectively.
(2) Formulation of Council
The council shall be basically composed of the WRMA regional office, relevant counties, representatives of water users (WRUAs), etc. The council shall be convened by WRMA regional manager. The chair of council shall be chosen by the members of council.
(3) Legal Status of Council
The council shall be established with legal status to legally avoid water conflict during drought times. It must be noted that the Catchment Forum that were established in TCA in the course of study period of NWMP 2030 is for water use aspect, while the council will handle drought aspects.
5.3.3 Drought Early Forecast
Drought damage does not occur suddenly, and the situation is progressing little by little over time. Water use restriction should be considered at the early stages, taking into account weather conditions, water storage in the reservoirs, social impact in the worst case scenario, etc. Therefore, drought information should be obtained at the soonest possible time.
Currently, KMD issues four day, seven day, one month and three month (seasonal) long-term rainfall forecasts, which are officially released on the website of KMD or published in newspaper. This information shall be utilised to commence timely water use restriction.
As described in Section 5.1 above, the drought early warning system in terms of livelihood zone has been established through the ALRMP II by using the KMD’s forecasts for the purpose of community preparedness against drought damage or for raising awareness on saving water. In a similar way, a specialised drought early forecast for water use restriction is necessary to be established. The system shall be linked to expected the fluctuation of the percentage of reservoir water storage.

Cost Estimate Final Report Chapter 6 Sectoral Report (J) Flood and Drought Disaster Management
The Development of J - 66 Nippon Koei Co., Ltd. the National Water Master Plan 2030
CHAPTER 6 COST ESTIMATE
6.1 Basic Conditions for Cost Estimate
(1) Basic Conditions for Cost Estimate
The basic conditions for project cost estimate are as follows:
a) The cost estimate was based on the price level of November 1, 2012. b) The exchange rate used for the cost estimate was US$1.0 = KSh 85.24 dated November 1,
2012. c) The project costs were estimated referring to the existing master plan studies such as the
Nyando Flood Management Master Plan (2009) and NWMP (1992) with adjustments. d) The annual recurrent costs were assumed to be an amount of 0.5% of the development costs.
As the development and recurrent costs estimated in this study are preliminary to grasp financial status in general, therefore these costs should not be used for the specific purposes of financial arrangements for the plans.
(2) Items for Cost Estimate
The basic conditions of estimated items are as follows:
a) The project costs of the dams having the flood control spaces were excluded because these were estimated separately in the water resources development plan.
b) The project costs for river improvement works were excluded because there were little basic data necessary for planning and cost estimate for the works. Instead, then cost of feasibility study on river structural measures was estimated except for Yala Swamp and Kano Plain that have on-going flood management project and completed master plan, respectively.
c) The project costs for drought management plan were excluded because these were considered to be within WRMA’s regular tasks.
6.2 Cost Estimates of Proposed Plans
6.2.1 Project Cost
The development costs for the flood disaster management plan were estimated for the construction of structures and preparation of hazard maps and evacuation plans. The recurrent costs were estimated for the operations and maintenance of the structures, updating of the documents and maps, and replacement of equipment.
The estimated cost is summarised in the table below and the details are shown in Table 6.2.1. The total project cost will be KSh3.9 billion for both structural and non-structural measures of the flood management plan. However, this KSh3.9 billion does not include costs for dam construction, river improvement and urban drainage measures due to the abovementioned reasons.
Costs for the item river improvement works except for Yala Swamp and Kano Plain were estimated as feasibility study costs, including necessary surveys. The details are shown in Table 6.2.2.
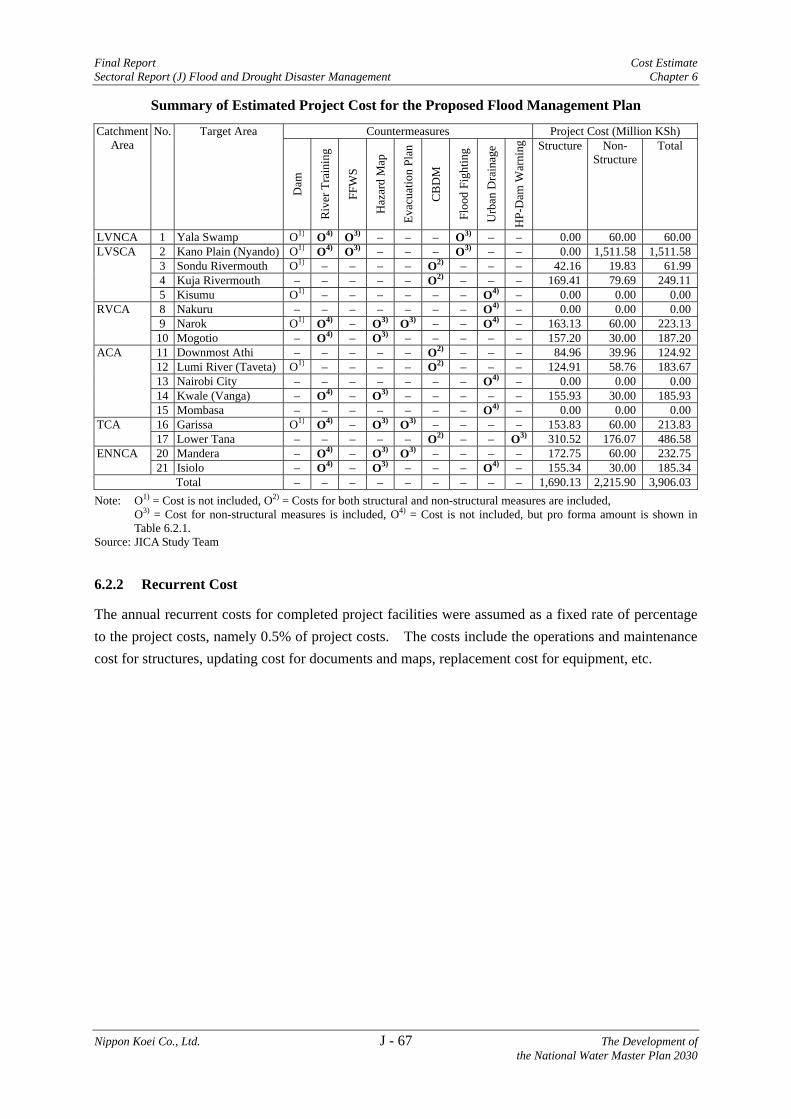
Final Report Cost Estimate Sectoral Report (J) Flood and Drought Disaster Management Chapter 6
Nippon Koei Co., Ltd. J - 67 The Development of the National Water Master Plan 2030
Summary of Estimated Project Cost for the Proposed Flood Management Plan
Catchment Area
No. Target Area Countermeasures Project Cost (Million KSh)
Dam
Riv
er T
rain
ing
FFW
S
Haz
ard
Map
Evac
uatio
n Pl
an
CB
DM
Floo
d Fi
ghtin
g
Urb
an D
rain
age
HP-
Dam
War
ning
Structure Non- Structure
Total
LVNCA 1 Yala Swamp O1) O4) O3) – – – O3) – – 0.00 60.00 60.00 LVSCA 2 Kano Plain (Nyando) O1) O4) O3) – – – O3) – – 0.00 1,511.58 1,511.58
3 Sondu Rivermouth O1) – – – – O2) – – – 42.16 19.83 61.99 4 Kuja Rivermouth – – – – – O2) – – – 169.41 79.69 249.11 5 Kisumu O1) – – – – – – O4) – 0.00 0.00 0.00
RVCA 8 Nakuru – – – – – – – O4) – 0.00 0.00 0.00 9 Narok O1) O4) – O3) O3) – – O4) – 163.13 60.00 223.13
10 Mogotio – O4) – O3) – – – – – 157.20 30.00 187.20 ACA 11 Downmost Athi – – – – – O2) – – – 84.96 39.96 124.92
12 Lumi River (Taveta) O1) – – – – O2) – – – 124.91 58.76 183.67 13 Nairobi City – – – – – – – O4) – 0.00 0.00 0.00 14 Kwale (Vanga) – O4) – O3) – – – – – 155.93 30.00 185.93 15 Mombasa – – – – – – – O4) – 0.00 0.00 0.00
TCA 16 Garissa O1) O4) – O3) O3) – – – – 153.83 60.00 213.83 17 Lower Tana – – – – – O2) – – O3) 310.52 176.07 486.58
ENNCA 20 Mandera – O4) – O3) O3) – – – – 172.75 60.00 232.75 21 Isiolo – O4) – O3) – – – O4) – 155.34 30.00 185.34
Total – – – – – – – – – 1,690.13 2,215.90 3,906.03 Note: O1) = Cost is not included, O2) = Costs for both structural and non-structural measures are included,
O3) = Cost for non-structural measures is included, O4) = Cost is not included, but pro forma amount is shown in Table 6.2.1.
Source: JICA Study Team
6.2.2 Recurrent Cost
The annual recurrent costs for completed project facilities were assumed as a fixed rate of percentage to the project costs, namely 0.5% of project costs. The costs include the operations and maintenance cost for structures, updating cost for documents and maps, replacement cost for equipment, etc.

Implementation Programme Final Report Chapter 7 Sectoral Report (J) Flood and Drought Disaster Management
The Development of J - 68 Nippon Koei Co., Ltd. the National Water Master Plan 2030
CHAPTER 7 IMPLEMENTATION PROGRAMME
7.1 General
The implementation programmes were prepared under the following conditions as well as the criteria for prioritisation as described in the preceding section:
a) All the proposed projects and plans should be realised by the target year of 2030. b) The implementation schedule is divided into three stages, the short, medium and long terms.
The scheduled period of each stage is a) Short term: 2012 to 2017, b) Medium term: 2018 to 2022, and c) Long term: 2023 to 2030.
b) The programmes follow the existing implementation schedules which have been prepared by the government.
d) The programmes should be prepared in close harmony with the requirements of other water subsectors.
e) The programmes need to be prepared, of which the annual disbursement costs are to be as even as possible.
7.2 Prioritisation Criteria for Implementation
The implementation schedule for flood management plan was prepared based on the following prioritisation conditions:
Non-structural measures are scheduled mostly in the short term because they serve as immediate measures to mitigate flood damage before the completion of structural measures.
The construction schedule of multipurpose dam is certainly in accordance with the water resources development subsector.
Urban drainage measures, which studies have been completed, are scheduled in the short term.
The implementation schedule for the drought management plan was prepared based on the following prioritisation conditions:
Drought disaster management plans such as preparation of water use restriction for reservoirs and establishment of basin drought conciliation council should be implemented as early as possible wherever applicable.
7.3 Implementation Programmes of Proposed Plans
(1) Implementation Schedule by 2030
In accordance with the above prioritisation criteria, the implementation programmes were prepared. The implementation schedule for the proposed flood management plan and drought management plan by each component and term are shown in Figures 7.3.1 and 7.3.2, respectively.

Final Report Implementation Programme Sectoral Report (J) Flood and Drought Disaster Management Chapter 7
Nippon Koei Co., Ltd. J - 69 The Development of the National Water Master Plan 2030
(2) Disbursement Schedule by 2030
The disbursement schedule of project cost, recurrent cost and total cost by each term for flood management plans is shown in Table 7.3.1 and summarised below.
Disbursement Schedule of Total Cost by Term
(Unit: Million KSh) Catchment
Area Total Cost by Term Total Cost
by 2030 Short Term Medium Term Long TermLVNCA 60.45 1.50 2.40 64.35 LVSCA 1,644.54 223.19 72.91 1,940.64 RVCA 411.53 2.25 3.60 417.38 ACA 262.71 233.01 13.54 509.27 TCA 473.47 230.54 21.86 725.87 ENNCA 419.14 2.25 3.60 424.99
Total 3,271.84 692.74 117.91 4,082.50
Source: JICA Study Team
7.4 Recommendation for the further Surveys and Studies for NWMP 2030
In the course of formulation of the flood and drought disaster management plan, several assumptions had to be introduced due to lack or insufficiency of the required data and information. For further study, the following actions are recommended.
(1) Earlier Implementation of Flood Survey
The flood disaster management plan proposed in NWMP 2030 had to be at a conceptual planning level because of insufficiency of the basic data necessary for planning such as location, depth, area and time of flooding, flood discharge, river conditions, topographic maps, etc.
It is recommended to conduct the flood survey including river cross section survey, plane topographic survey and flood damage survey for 21 target flood prone areas for planning of both structural and non-structural measures and also to accumulate the flood damage records for flood database. Those detail data will also contribute to planning of early warning system though its operation was proposed only for the Nzoia and Nyando River basins in NWMP 2030.
(2) Establishment of Collaboration System with KMD for Flood and Drought Forecasting
The existing flood forecasting and warning system that has been developed in the Nzoia River basin is operated by MWI, KMD and MOSSP collaboratively. River water level in the system is estimated by using 2-day advance forecasted rainfall data, which is able to be computed only by KMD. Long-term rainfall forecast necessary for the early drought forecasting is also provided by KMD. In order to make the proposed flood and drought forecasting systems operational, the nominated agency in charge should closely collaborate with KMD. It is recommended to establish the collaboration system between the agency in charge of flood and drought forecasting and KMD.

Implementation Programme Final Report Chapter 7 Sectoral Report (J) Flood and Drought Disaster Management
The Development of J - 70 Nippon Koei Co., Ltd. the National Water Master Plan 2030
(3) Development of Institutional Framework for Disaster Management
WRMA Tana Regional Office has established Catchment Forum in the course of study period of NWMP 2030. The Forum was developed through discussion on the issues investigated by the JICA Study and workshop of the pilot activities. On the other hand, WRMA regional and sub-regional offices sometimes attend the regular meeting of County Disaster Management Committee (CDMC) as an observer. The Forum and the CDMC are one of key organisations for consultation on water use adjustment during drought time and implementation of community-based disaster management, respectively. Accordingly, WRMA should continue to support/ establish the forum as the secretariat and coordinate with County administrations as a member of the CDMC.

Tables

J - T - 1
Table 2.3.1 Recent History of Floods in Kenya (1/4)
Date/Year Area Type / Main Cause
Number of Damages Catchments
Source
Kill
ed
Aff
ecte
d Po
pula
tion
Aff
ecte
d
Hou
seho
lds
Est
. Dam
age
(US$
Mill
ion)
LV
N
LN
S
RV
Ath
i
Tan
a
EN
N
Sep 2010 Sandai and Mbechot location- Marigat 142 23 O IFRCKokwo Island- Lake Baringo 22 O IFRC
Sep 6, 2010
Kwanza District: Namanjalala Floods 300 O
IFRC Kwanza District: Marinda Floods 128 O Kwanza District: Soymining Floods 40 O Kwanza District: Amuka Floods 30 O Kwanza District: Areas in Endegess Floods 150 O Kwanza District: Mifungu Floods 20 O
Sep 4, 2010 Amuka Floods 50 O IFRCSep 3, 2010 Saboti, Kwanza District Floods 1 100 O IFRC
Olkalau in Subukia Floods 38 O IFRCMay 17, 2010 Samburu National Park 3 O Red CrossMay 16, 2010 Narok, Mogotio, Nakuru, East Pokot and
Marigat Floods 3 O Red CrossMay 15, 2010 Swali- Samburu East Floods 2 O Red CrossMay 14, 2010 Ngilai Village- Samburu East District Floods 6 O Red CrossMay 13, 2010 Central Rigion Floods 3 O Red CrossMay 13, 2010 Kitilu Location, Machakos District Floods O Red CrossMay 13, 2010 Lodwa town-River Kawalathe in Turkana CD Heavy rains/
Floods 4 436 O Red Cross
May 12, 2010 Upper Eastern- Karanja Village, Kibera Division
Heavy rains/ Floods 1 O Red Cross
May 11, 2010
Wawiti Location Floods 7 O
Red CrossNyakach District
Heavy rains/ Floods
100 O Nyagoma location 16 O Thurdibour location 72 O Rangwor location 5 O
May 8, 2010 Western Kenya, Amoni, Osuret, Asing'e, Among'ura, Kamolo and Osajai; Salabani location, Marigat District in Rift Valley province
Heavy rain 100 70,000 O O O
Colorado Univ.
Mar 7, 2010 Marsabit North, Migori and Uriri districts in South Nyanza, Mandera; North Rift, Pokot Central District
Torrential rain 26 2,500 O O O Colorado
Univ. May 6, 2010 Homa Bay - Asego Divison 2 O Red CrossMay 5, 2010 Kithuku Location-Mukurueini in Nyeri Floods 115 O Red Cross
Mar 2010
Central Pokot Floods O
Red Cross
Kajiado District Floods 2 O Mogotio district Floods 2 O Marsabit North District Floods 1 OMandera Floods 1 OTindiret district Floods 3 O Nakuru district Floods 2 O Lake Victoria Floods 2 O Lower Eastern- Gando in Uthiru, Nairobi, Kajiado, Makindu Floods 2 46 O O O Red CrossDori Village of Moyale Floods 5 66 O Red CrossMarsabit- Burgobo, Tigo, Bobisa, Shegeni and Chalib Floods 1 O Red CrossGarfasa in Garbatula in Isiolo Floods 200 O Red CrossKerio River- Lokori, Turkana East Floods 300 O Red CrossAnapngetuny, Tindiret in Nandi South Floods 2 2,000 O Red Cross
Mar 7, 2010 Marsabit, Turkana Floods 94 141,164 O EM-DATMar 1, 2010 North Rift- Samburu General flood 600 O Red Cross
Dec 2009 - Jan 2010
Turkana General flood 5 20,000 4,000 O
Red Cross
Western Floods 300 O Mogotio Floods 1 150 O Marigat - River Nginyang burst Floods 400 O Nairobi Floods 4 66 O Narok Floods 1 70 O Kericho Floods O Isiolo Floods 7 OOloipito highlands Floods 1 75 O Kajiado Floods 3 O Turkana East District Floods 5 20,000 O West Pokot district- Floods 160 O Nyando and Homabay District Floods 1,670 250 O O Siaya- Masala sub-location in Rarieda district Floods 5 101 O Kisumu Floods O Rachuonyo Floods 1 O East Pokot-river Nginyang Burst Floods 1 30 O Lower Eastern- Makindu District Floods 180 20 O

J - T - 2
Table 2.3.1 Recent History of Floods in Kenya (2/4)
Date/Year Area Type / Main Cause
Number of Damages Catchments
Source
Kill
ed
Aff
ecte
d Po
pula
tion
Aff
ecte
d
Hou
seho
lds
Est
. Dam
age
(US$
Mill
ion)
LV
N
LN
S R
V
Ath
i T
ana
EN
N
Dec 27, 2009 South Rift- Naivasha District- Kikopey in gilgil and Moindabi in Naivasha Floods 509 150 O Red Cross
Dec 24, 2009 Nairobi, Turkana lake Floods 40 91,350 O O EM-DAT
Dec 21, 2009 Turkana East, Rarieda, Nairobi, Kajiado North, Narok, Rachuonyo, East Pokot, Mogotio, North Rift (Turkana East district, East and West Pokot districts)
Heavy rain 21 30,000 O O O Colorado Univ.
Oct 29, 2009 Mandera district General flood 16 44,850 O EM-DATOct 20, 2009 Tana Delta and Tana River; between Malindi
and Garsen Heavy rain 0 2,000 O Colorado Univ.
2008 Rift valley, Kitale, Transzoia, Makueni, Mwala/Kibwezi, Bundalangi
General flood 24 2,396 O O O MOSSP
2008 Mandera, Budalangi, Coast Province, Nyando, Migori, Wajir, Siaya, Nyatike, Trans Nzoia, Meru/Tharaka-Tigania, Pokot Central
Floods 300,000 O O O O O O MWI
Nov 16, 2008 Mwala/Kibwezi District General flood 16 O DOCNov 14, 2008 Makueni District Floods 2 O DOCNov 11, 2008 Porkot Central Floods 11 O DOCNov 10, 2008 Budalangi district Mudslide 17 30,770 O EM-DATNov 10, 2008 Western Kenya, Nzoia River Heavy rain 0 28,000 O
Colorado Univ.
Nov 8, 2008 Machakos- Kilale General flood 5 O DOCNov 4, 2008 Budalangi in Busia Floods 0 500 O DOCNov 1, 2008 Trans Nzoia Floods 1,896 O DOCOct 14, 2008 Heavy rain 3 10,000
Colorado Univ.
Oct 14, 2008 Mandera district Floods 3 6,000 O EM-DATOct 4, 2008 Katilu division Flash Flood 17 6,310 O EM-DATSep 10, 2008 Kawangware Riruta Area General flood 3 O DOCJul 25, 2008 Rift Valley- Ol-kalou Slums Floods 1 O DOCJun 13, 2008 Tana Delta district 16 8,658 O
Colorado Univ.
Apr 20, 2008 Homa Bay - Asego Division - Wahambla and Got Kokech villages Heavy rain 0 2,000 O
Colorado Univ.
Mar 28, 2008 Nyanza Province - Lower Nyakach Division -Rang’ul, North Nyakach, Pap Onditi and Asalo. Nyando district. Kasai. Kisumu's Nyalenda slums
Heavy rain 3 160 O Colorado Univ.
Mar 20, 2008
Rift Valley Province Chalbi District, North Horr Constituency - Bubisa Village, Mubisa area. Marsabit District. Meru Central District. Rachuonyo district - Naivasha area - Kodhoch, West Karachuonyo. Koyugi, Kawadhgone Nyongo and Wagwe. Onyege.
Heavy rain 2 10,000 O O O O Colorado Univ.
Mar 17, 2008 Taita, Taveta districts 700 O EM-DAT
Mar 17, 2008 Coast Province: Taita and Taveta districts -Kimorigo, Eldoro and Marodo. Kimorigo, Mbogoni and Mahoo. Voi
Heavy rain 1 9,600 O O Colorado Univ.
Dec 12, 2007 Taita Taveta District. Voi. Wundanyi Division. Mwatate. Heavy rain 4 2,000 O
Colorado Univ.
Nov 21, 2007 Tana River District - Garsen Division, Hweani, Mnazini Bahati. Bura, Wenje, Garsen, Boji, Ozi and Kau. Tana Delta. Iskadeck
Heavy rain 0 6,000 O Colorado Univ.
Sep 15, 2007 Budalangi General flood 0 O DOCAug 15, 2007 Budalangi region Floods 13 40,000 O EM-DATJun 5, 2007 Mpeketoni mombasa General flood 0 O May 15, 2007 Mombasa, Malindi Floods 2 651 O EM-DAT
May 15, 2007
Coast Province - districts: Mombasa (Likoni, Kadongo, Moroto, Junda, Kadzonzo, Mushomoroni, Kisauni, Changamwe), Malindi, Kwale, Kilifi (Kikambala). Lamu (Witu, Mpeketoni, Soroko, Bomani). Kaloleni. Tana River District
Heavy rain 5 8,500 O O Colorado Univ.
Apr 21, 2007 Busia District - Budalangi, Bwalwanga, Makhunda, Sitiri Heavy rain 0 2,460 O
Colorado Univ.
2006 Marsabit, Laisamis area General flood 4 3,500 O MOSSP2006 Widespread Flash floods 7 3,500 O O O O O O MOSSP2006 Isiolo Floods 3,000 O MOSSP

J - T - 3
Table 2.3.1 Recent History of Floods in Kenya (3/4)
Date/Year Area Type / Main Cause
Number of Damages Catchments
Source
Kill
ed
Aff
ecte
d Po
pula
tion
Aff
ecte
d
Hou
seho
lds
Est
. Dam
age
(US$
Mill
ion)
LV
N
LN
S R
V
Ath
i T
ana
EN
N
Oct 23, 2006
Coast, North-Eastern, Western and Rift Valley provinces - Isiolo (Ngarmara, Malkagala, Merti, Gafarsa). Garissa (Hagadera, Ahantabak, Alikune, Jarirot Amuma, Boralgi, Daadab, Ifo). Tana River District (Bula Bahati, Mnazini, Witu, Hola through Wenje to Garsen). Mandera (El Wak). Wajir (Guarar, Dajabula, Kursin). Kilifi, Mombasa, Kwale, Kilifi. Lodwar, Moyale (Bori). Ijara. Merti division. Machakos. Modogashe. Mwingi. Kwale. Nakuru. Nyando. Kisumu (Kajulu, Migori, Nyando), Busia (Budalangi, Maduma, South Bunyala,), Lugari, Keiyo (Epke). Malindi. Kisumu, Nyanza area
Heavy rain 150 700,000 O O O O O O Colorado Univ.
Oct 23, 2006 Dabaab, Kwale, Garissa General flood 114 723,000 O O O EM-DATOct 15, 2006 Isiolo, Garissa, Lodwar General flood 30 30,000 O O O EM-DAT
Oct 15, 2006 Coast Province - Kilifi and Kwale districts -Kaloleni, Mazeras, Ramisi. Kisauni Division, Mombasa District. Mishoromoni, Kiembeni, Malindi
Heavy rain 6 2,000 O Colorado Univ.
Apr 25, 2006 Nyanza, Mombasa provinces General flood 8 13,000 O O EM-DAT
Apr 4, 2006 Districts - Malindi, Kilifi, Kwale, Nyando, Homa Bay, Migori, Siaya, Rachuonyo, Isiolo, Samburu, Laikipia, Wajir, Garissa, Mandera
Heavy rain 60 17,300 O O O O Colorado Univ.
Jun 17, 2005 Western Kenya - Busia District - Bukhay, Walwasi Heavy rain 20 1,200 O
Colorado Univ.
May 18, 2005 Rift Valley, WestERN region General flood 5 10,000 O O EM-DAT
May 3, 2005
Nyanza, Western, Rift Valley, Coast and parts of North Eastern provinces - districts: Nyando (Kabonyo, Kakola, Kochogo, Ongeche) , Rachuonyo (Kayitir, Kawadhgone, Koyugi), Nyatike (Kaden), Migori, Garissa (Dadaab), Isiolo (Merti, Gulesa and Malkagala), Karachuonyo, Homa Bay (Kochia, West Kagan, Rangwe), Ijara, Tana River. Kisumu (Buoye, Winam, Kolwa). Kochia. Naivasha, Nakuru.
Heavy rain 4 40,000 O O O O Colorado Univ.
Apr 23, 2005 Rift Valley Flash flood 1 25,000 0.5 O EM-DATMay 1, 2004 Nyeri- Othaya Kihuri Village Flash flood 5 O DOC
Apr 9, 2004
Nyanza Province - districts: Nyando, Rachuonyo, Kisumu, Migori, Homa Bay. South West Kano. Nyakach, Miwani, Ombeyi. Nyatike, Kisii, Muhoroni, Ahero, Rangwe, Aywey. Rift Valley Province - districts: Nakuru, Baringo, Turkana, Nyamira, Machakos, Marakwet. Towns: Rangwe, Karachuonyo, Kobuya, Nasigir, Naivasha, Eldoret, Laikipia Budalangi - Busia district Nairobi area. Central - Thika, Murang'a, Nyeri, Kirinyaga Mount Kenya region - Meru, Othaya, Kirinyaga. Western Kenya - Ukambani - Coast Province - districts: Tana River, Taita Taveta. Homa Bay.
Heavy rain 50 15,000 O O O O O Colorado Univ.
Apr 9, 2004 Nairobi area , Tana River Floods 50 10,000 O O EM-DATApr 9, 2004 Nyando, Budalangi district General flood 4 2,000 O O EM-DAT2003 Nyanza, Busia, Tana River General flood 170,000 O O O UNDP

J - T - 4
Table 2.3.1 Recent History of Floods in Kenya (4/4)
Date/Year Area Type / Main Cause
Number of Damages Catchments
Source
Kill
ed
Aff
ecte
d Po
pula
tion
Aff
ecte
d
Hou
seho
lds
Est
. Dam
age
(US$
Mill
ion)
LV
N
LN
S R
V
Ath
i T
ana
EN
N
Aug 26, 2003 Western Kenya - Busia - Budalangi Division of Siaya District. Ugenya and Alego-Usonga constituencies. Bunyala South. villages neighbouring the Yala Swamp.
Heavy rain 1 2,100 O O Colorado Univ.
Aug 24, 2003 Kerio Valley - Chepsigot Ward Brief torrential rain 0 400 O
Colorado Univ.
Apr 2003 Nyando, Kisumu, Rachuonyo General flood 40 60,000 O EM-DAT
Apr 21, 2003
Nyanza Province - Districts: Nyando, Migori, Kisumu. Budalangi. Rift Valley Province - Districts: Nakuru, East Baringo, Kerhicho, Samburu, Koibatek, Nandi, West Pokot. Western Province - Busia, Trans-Nzoia, Bungoma, Kakamega, Siaya. Sifuno. Eastern Province - Districts: Turkana, Machakos. Yatta. Coast Province - Ndera, Malindi, Garissa.
Heavy rain 77 1,000,000 O O O O O Colorado Univ.
Jan 4, 2003 Western Kenya - Kisumu - Manyattta, Dunga and Nyalenda. Kisii. Heavy rain 0 300 O
Colorado Univ.
2002 Nyanza, Busia, Tana River Basin General flood 150,000 O O MOSSP
Dec 21, 2002 Marigat Division in Baringo District. Ng'ambo, Ng'arua, Eldume, Sintaan. Perkerra River
Heavy rain 6 3,000 O Colorado Univ.
Nov 18, 2002 Riara River, Kiambu District General flood 10 O DOCNov 17, 2002 Kiambu District Floods 12 2,000 EM-DATOct 30, 2002 Tana River District Flash flood 6 O DOCOct 29, 2002 Madogo (Tana river district) Floods 14 20,000 O EM-DAT
Sep 16, 2002 Mombasa, Matuga, Kipevu Districts: Kwale, Kilifi, Mobasa, Taita Taveta
Heavy rain 0 0 O Colorado Univ.
Apr 29, 2002 Nairobi area. Nairobi river Heavy rain 2 0 O Colorado Univ.
Apr 26, 2002 Migori, Kisumu, Nyando, General flood 53 150,008 O EM-DATJan 13, 2001 Nairobi and surrounding areas - Dagoretti,
Kibera Heavy rain 4 0 0.038 O Colorado Univ.
1997 - 1998 Widespread 2.1 O O O O O O DOC1997 - 1998 Widespread Floods 1,500,000 O O O O O O MOSSPMay 1998 Lake Victoria General flood 40 200 O EM-DATMay 27, 1998 Nairobi Heavy rain 19 800 O
Colorado Univ.
Apr 10, 1988 Nairobi area. Districts: Kisumu , South Nyanza, Laikipia. Nyando Division in West Kenya. Rivers: Tana, Nyando.
Heavy rain 60 10,000 O O O Colorado Univ.
Jan 1, 1998 Voi, Nairobi-Mombasa Highway, Tsavo National Park, Garissa
Tropical cyclone 86 346,000 45.0 O O
Colorado Univ.
Nov 30, 1997 Garissa Heavy rain 11 10,000 O Colorado Univ.
Oct 15, 1997 Coastal areas - Mombasa Heavy rain 23 0 O Colorado Univ.
Sep 1997 Kwale, Kilifi, Mombasa, 86 900,000 11.8 O EM-DAT
Apr 8, 1996 Nyanza province: Kano, Lower Nyakach, Karachuonyo, Kisumu district (West Nyakach), Homa Bay district (East Karachuonyo)
Heavy rain 0 1,000 O Colorado Univ.
Apr 6, 1996 Nyanza province El Nino Flood 1,000 O EM-DAT
Source: MWI Flood Mitigation Strategy (June 2009) DOC Disaster Operation Center, Ministry of State for Special Programmes UNDP Kenya Natural Disaster Profile (United Nations Development Program Enhanced Security Unit) EM-DAT [URL] http://www.emdat.be/database MOSSP [URL] http://www.sprogrammes.go.ke/images/disaster.pdf IFRC [URL] http://www.ifrc.org Red Cross [URL] http://www.kenyaredcross.org Colorado Univ. [URL] http://floodobservatory.colorado.edu/Archives/index.html (Dartmouth Flood Observatory, University of Colorado) Note: All the above URLs were accessed on May 31, 2013.

J - T - 5
Table 2.4.1 Proposed Target Areas for Flood Disaster Management Plan
CA
NWMP (1992) Flood Mitigation
Strategy (MWI, June 2009)
NWCPC Strategic Plan
2010-2015
Proposed Target Area
Major Flood Area Target Area
Proposed Project for
Implementation*
Areas Affected by Floods Identified
in the Strategy
Identified Flood Management
Project No. Name
LVN 1. Yala Swamp O O (by 2010) Budalangi Nzoia River 1. Yala Swamp
LVS
2. Kano Plain O O (by 2000) Kano Plains
Nyando River 2. Kano Plain Nyakach Area
3. Sondu Rivermouth O -
Nyakach Area 3. Sondu Rivermouth
Rachuonyo 4. Kuja Rivermouth O O (by 2010) Migori Gucha River 4. Kuja Rivermouth
Urban Center of Kisumu 5. Kisumu
RV
5. Middle/ O - Turkana 6. Middle/Lower
Turkwel Lower Turkwel - - 6. Lower Kerio - - 7. Lower Kerio
Urban Center of Nakuru 8. Nakuru
Narok 9. Narok Mogotio 10. Mogotio
Athi
7. Downmost Athi O - Kilifi Sabaki-Galana 11. Downmost Athi 8. Lumi Rivermouth O O (by 2010) Lumi River
(Taita Taveta) 12. Lumi Rivermouth
Nairobi City O O (by 2000) Urban Center of Nairobi 13. Nairobi City
Kwale 14. Kwale
Urban Center of Mombasa 15. Mombasa
Tana 9. Lower Tana O -
Tana River Basin in Coast Province
Tana River 16. Lower Tana Garissa Lower Parts in Tana River DistrictIjara 17. Ijara
ENN
10. Middle/ - - 18. Middle/Lower
Ewaso Ng'iro North Lower Ewaso Ng'iro North - -
Wajir 19. Wajir
Daua River (Mandera) 20. Mandera
Isiolo 21. Isiolo Notes 1.* NWMP (1992) proposes not only the above 5 projects, also:
1) 47 Urban Drainage Projects, 2) Minor Ad-hoc River Improvement Projects, 3) Long-term Improvement of Lower Tana River
2. O: Selected, -: Not selected Source: JICA Study Team

J - T - 6
Table 3.3.1 Recent History of Droughts in Kenya
Date/Year Area Type / Main Cause
Number of Damages Catchments
Source
Kill
ed
Aff
ecte
d Po
pula
tion
Aff
ecte
d
Hou
seho
lds
Est
. Dam
age
(US$
Mill
ion)
LV
N
LN
S R
V
Ath
i T
ana
EN
N
Feb 18, 2011 Pokot County, East Pokot Drought O Red CrossFeb 10, 2011 Marsabit District Drought O Red CrossJan 31, 2011 Courtrywide Drought 1,800,000 O O O O O O DOC
Jan 20, 2011 Eastern, North Eastern, R/Valley, Coast and Central province
Drought
O O O O DOC
Jan 14, 2011 Mwatete Drought 7,520 O DOC Jan 14, 2011 Voi Drought 30,000 O DOC Jan 12, 2011 Garissa, Isiolo, and Samburu Drought O O O DOC Jan 3, 2011 Marsabit North DC Drought 2 30,000 O DOC 2009 North Rift, Eastern, Central Drought O O O MOSSP Jul 2009 Burgobo, Torbi and Bubisa Drought O Red Cross Meru- Tharaka and Tigania Drought 13 O O Red CrossApr 2009 Turkana Drought 47.6% O Red Cross
Mar 2009
Lower Eastern- Nzaui Drought 61.5% O
Red Cross
Yatta Drought 80.2% O Kibwezi Drought 80.0% O Machakos drought 75.0% O Makueni Drought 74.9% O Mbooni East Drought 79.0% O Mutumo Drought 49.9% O Turkana, Marsabit, moyale, Samburu Districts Drought O O
Mar 2009 Mandera, Wajir, Garissa, Ijara, Tana River and Isiolo
Drought 600
O O Red Cross
Mar 2009 Greater Trans Nzoia, Larger Uasin Gishu, Mt. Elgon, Greater Nakuru, Kipkelion and Molo
Drought 150,000
O
Red Cross
Jul 2008 Sacho, Marigat, Mukutani, Drought 4 3,800,000 O EM-DAT 2006 Widespread Drought O O O O O O MOSSP Dec 2005 Makueni, Kitui, Malindi, Drought 27 3,500,000 O EM-DAT 2005 Widespread Drought O O O O O MOSSP Jul 2004 Kitui, Mbeere, Mwingi Drought 80 2,300,000 O EM-DAT 2004 Widespread Drought 3,000,000 O O O O O O MOSSP 1999 - 2000 Widespread Drought 4,400,000 O O O O O O MOSSP 1999 - 2000 Countrywide except west and coastal belt O O O O O UNDP Dec 1999 Baringo, Garissa, Isiolo Drought 85 23,000,000 O O O EM-DAT Jan 1997 Garissa, Isiolo, Wajir, Drought 1,600,000 O O EM-DAT 1995 - 1996 Widespread Drought 1,410,000 O O O O O O MOSSP Mar 1994 Northern & northeastern Drought 1,200,000 O EM-DAT 1992 - 1994 Northern, Central, Eastern Provinces O O UNDP 1992 - 1993 Widespread Drought 2,700,000 O O O O O O DOC
1991 - 1992 Arid and Semi-Arid Districts of North Eastern, Rift Valley, Eastern and Coast Provinces
Drought 1,500,000
O O O
MOSSP
Source: DOC Disaster Operation Center, Ministry of State for Special Programmes UNDP Kenya Natural Disaster Profile (United Nations Development Program Enhanced Security Unit) EM-DAT [URL] http://www.emdat.be/database MOSSP [URL] http://www.sprogrammes.go.ke/images/disaster.pdf IFRC [URL] http://www.ifrc.org Red Cross [URL] http://www.kenyaredcross.org Note: All the above URLs were accessed on May 31, 2013.

J - T - 7
Table 5.3.1 Dams to be Managed by Each Drought Conciliation Councils by River System
CA River System No. Dam Name Status CA River System No. Dam Name Status LVNCA Nzoia 1 Moiben Existing ACA Athi 41 Kikuyu Proposed
2 Siyoi Proposed 42 Ruaka (Kiambaa) Proposed3 Moi’s Bridge Proposed 43 Kamiti 1 Proposed4 Nzoia (34B) Proposed 44 Kiserian Existing 5 Ellegirini Existing 45 Upper Athi Proposed6 Twin Rivers Existing 46 Stony Athi Proposed7 Kibolo Proposed 47 Bathi Existing 8 Kipkarren Existing 48 Ruiru Existing 9 Teremi Proposed 49 Ruiru A (Ruiru 2) Proposed10 Nzoia (42A) Proposed 50 Ndarugu Proposed
Yala 11 Lessos Existing 51 Munyu Proposed12 Nandi Forest Proposed 52 Muoni Existing
LVSCA Nyando 13 Londiani Proposed 53 Mbuuni Proposed14 Nyando (Koru) Proposed 54 Maruba Existing
Kibos 15 Kibos Proposed 55 Mulima Existing Sondu 16 Itare Proposed 56 Kiteta Proposed
17 Magwagwa Proposed 57 Manooni Existing 18 Sondu Existing 58 Thwake Proposed
Kuja 19 Bunyunyu Proposed 59 Olkishunki Proposed20 Katieno Proposed Lumi 60 Lake Chala Proposed21 Gogo Falls Existing Ramisi 61 Kikoneni Existing 22 Ilooiterre Proposed Rare 62 Rare Proposed
Amala 23 Sand River (Naikara) Proposed Shimba 63 Pemba Proposed24 Amala Proposed Mwachi 64 Mwachi Proposed
RVCA Turkwel 25 Embobut Proposed TCA Tana 65 Maragua 4 Proposed26 Turkwel Existing 66 Sasumua Existing
Kerio 27 Kimwarer Proposed 67 Ndiara Proposed28 Arror Proposed 68 Chania-B Proposed29 Murung-Sebit Proposed 69 Karimenu 2 Proposed
Waseges 30 Waseges Proposed 70 Thika 3A ProposedPerkerra 31 Chemususu Existing 71 Thika Existing
32 Aram Existing 72 Yatta ProposedNdau 33 Kirandich Existing 73 Thiba Proposed 34 Chemeron Existing 74 Masinga Existing Malewa 35 Malewa Proposed 75 Kamburu Existing
36 Turasha Existing 76 Gitaru Existing Ewaso Ng'iro South
37 Upper Narok Proposed 77 Kindaruma Existing 38 Oletukat Proposed 78 Kiambere Existing 39 Leshota Proposed 79 High Grand Falls Proposed40 Oldorko Proposed 80 Umaa Existing
Source: JICA Study Team (Ref. Sectoral Report (G), 2.3.1 (1) and Table 4.4.1
81 Kora Proposed82 Kitimui Proposed83 Mutuni Proposed
ENNCA Ewaso Ng'iro North
84 Rumuruti Proposed85 Nyahururu Proposed86 Kihoto Proposed87 Isiolo Proposed88 Archers’ Post Proposed
89 Badasa Existing

J - T - 8
Table 6.2.1 Cost Estimate for Proposed Flood Management Plan
CA No. Description Project Costfor Structure
(KSh Million)
Project Costfor Non-Structure
(KSh Million)
Recurrent Cost*(KSh Million
/year)Source Remarks
LVN N1 Yala Swamp 0.00 60.00 0.30
N1.1 Construction of Multipurpose Dam - - Nzoia 34B Dam, Nzoia 42A Dam
N1.2 River Training Works (977.82) - US$11.47 million (WKCDD&FMP)
N1.3 Establishment of Flood Forecasting and Warning System 30.00 0.15 10M/M, Training
cost only N1.4 Formulation of Flood Fighting Plan 30.00 0.15 10M/M
LVS S1 Kano Plain (Nyando River Basin) 0.00 1,511.58 7.56 S1.1 Construction of Multipurpose Dam - - Nyando Dam S1.2 River Training Works (8,252.97) - Nyando MP
S1.3 Establishment of Flood Forecasting and Warning System 1,481.58 7.41 Nyando MP
S1.4 Formulation of Flood Fighting Plan 30.00 0.15 10M/MS2 Sondu Rivermouth 42.16 19.83 0.31
S2.1 Construction of Multipurpose Dam - - Magwagwa Dam
S2.2 Establishment of Community-based Flood Management System 42.16 19.83 0.31 Nyando MP
S3 Kuja Rivermouth 169.41 79.69 1.25
S3.1 Establishment of Community-based Flood Management System 169.41 79.69 1.25 Nyando MP
S4 Kisumu 0.00 0.00 0.00 S4.1 Construction of Multipurpose Dam - - Kibos Dam
S4.2 Implementation of Urban Drainage Measures (3,559.18) - NWMP (1992) US$33.48 million
in 1992RV R1 Nakuru 0.00 0.00 0.00
R1.1 Implementation of Urban Drainage Measures (5,506.73) - NWMP (1992) US$51.80 million
in 1992R2 Narok 163.13 60.00 0.30
R2.1 Construction of Multipurpose Dam - - Upper Narok Dam R2.2 River Training Works 163.13 - R2.3 Preparation of Hazard Map 30.00 0.15 10M/M R2.4 Formulation of Evacuation Plan 30.00 0.15 10M/M
R2.5 Implementation of Urban Drainage Measures (684.62) - NWMP (1992) US$6.44 million
in 1992R3 Mogotio 157.20 30.00 0.15
R3.1 River Training Works 157.20 - R3.2 Preparation of Hazard Map 30.00 0.15 10M/M
Athi A1 Downmost Athi (Kilifi, Lower Sabaki) 84.96 39.96 0.62
A1.1 Establishment of Community-based Flood Management System 84.96 39.96 0.62 Nyando MP
A2 Lumi River (Taveta) 124.91 58.76 0.92 A2.1 Construction of Multipurpose Dam - - Lake Chala Dam
A2.2 Establishment of Community-based Flood Management System 124.91 58.76 0.92 Nyando MP
A3 Nairobi City 0.00 0.00 0.00
A3.1 Implementation of Urban Drainage Measures (38,270.73) - NWMP (1992) US$360.0 million
in 1992A4 Kwale (Vanga) 155.93 30.00 0.15
A4.1 River Training Works 155.93 - A4.2 Preparation of Hazard Map 30.00 0.15 10M/M
A5 Mombasa 0.00 0.00 0.00
A5.1 Implementation of Urban Drainage Measures (4,948.62) - NWMP (1992) US$46.55 million
in 1992Tana T1 Garissa 153.83 60.00 0.30
T1.1 Construction of Multipurpose Dam - - High Grand Falls Dam
T1.2 River Training Works 153.83 - T1.3 Preparation of Hazard Map 30.00 0.15 10M/M T1.4 Formulation of Evacuation Plan 30.00 0.15 10M/M
T2 Tana River lower than Garissa 310.52 176.07 2.43
T2.1 Establishment of Community-based Flood Management System 310.52 146.07 2.28 Nyando MP
T2.2 Improvement of Warning System for Hydropower Dam 30.00 0.15 10M/M
ENN E1 Mandera 172.75 60.00 0.30 E1.1 River Training Works 172.75 - E1.2 Preparation of Hazard Map 30.00 0.15 10M/M E1.3 Formulation of Evacuation Plan 30.00 0.15 10M/M
E2 Isiolo 155.34 30.00 0.15 E2.1 River Training Works 155.34 - E2.2 Preparation of Hazard Map 30.00 0.15 10M/M
E2.3 Implementation of Urban Drainage Measures (382.71) - NWMP (1992) US$3.60 million
in 1992Total: excluding pro forma amount in parentheses ( ). 1,690.13 4,431.81 29.48 Total: including pro forma amount in parentheses ( ). (64,273.51)
Note: 1. US$1.0 = KSh 85.24 (as of November 1, 2012) 2. Cost for non-structural measures was estimated by multiplying Nyando MP (2006)'s cost by 1.95. 3. Cost for urban drainage implementation was estimated by multiplying NWMP (1992)'s cost by 1.25 (MUV Index) as pro forma amount. 4. Cost for river training works except for Yala Swamp and Kano Plain is estimated as cost for F/S including necessary surveys. (Table 6.2.2) 5. Cost for Community-based Disaster Management is estimated by multiplying Nyando MP (2006)'s cost by the percentage of Nyando
inundation area and sub-locations (15/55). 6. * Recurrent cost includes the operation cost and maintenance cost. Source: JICA Study Team

J - T - 9
Table 6.2.2 Cost Estimate for F/S on River Improvement Works
Narok
No. Item Unit Quantity Unit Price(KSh)
Amount (KSh) Remarks
1 River Cross Section Survey Section 100 93,000 9,300,000 Interval of 500 m, total length 50 km 2 Plane Topographic Survey km2 1.5 1,451,000 2,176,500 3 Flood Damage Survey Person 150 11,000 1,650,000 100 person / 1 km2 of inundation area 4 Remuneration for Expert M/M 50 1,000,000 50,000,000 5 Indirect Cost (200% of Remuneration for Expert) --- 200% --- 100,000,000
Total 163,126,500
Mogotio
No. Item Unit Quantity Unit Price(Kshs)
Amount (Kshs) Remarks
1 River Cross Section Survey Section 50 93,000 4,650,000 Interval of 500 m, total length 25 km 2 Plane Topographic Survey km2 1.0 1,451,000 1,451,000 3 Flood Damage Survey Person 100 11,000 1,100,000 100 person / 1 km2 of inundation area 4 Remuneration for Expert M/M 50 1,000,000 50,000,000 5 Indirect Cost (200% of Remuneration for Expert) --- 200% --- 100,000,000
Total 157,201,000
Kwale (Vanga)
No. Item Unit Quantity Unit Price(Kshs)
Amount (Kshs) Remarks
1 River Cross Section Survey Section 50 93,000 4,650,000 Interval of 500 m, total length 25 km 2 Plane Topographic Survey km2 0.5 1,451,000 725,500 3 Flood Damage Survey Person 50 11,000 550,000 100 person / 1 km2 of inundation area 4 Remuneration for Expert M/M 50 1,000,000 50,000,000 5 Indirect Cost (200% of Remuneration for Expert) --- 200% --- 100,000,000
Total 155,925,500
Lower Tana (Garissa)
No. Item Unit Quantity Unit Price(Kshs)
Amount (Kshs) Remarks
1 River Cross Section Survey Section --- --- --- Survey was conducted in 2011 (50 km)2 Plane Topographic Survey km2 1.5 1,451,000 2,176,500 3 Flood Damage Survey Person 150 11,000 1,650,000 100 person / 1 km2 of inundation area 4 Remuneration for Expert M/M 50 1,000,000 50,000,000 5 Indirect Cost (200% of Remuneration for Expert) --- 200% --- 100,000,000
Total 153,826,500
Mandera
No. Item Unit Quantity Unit Price(Kshs)
Amount (Kshs) Remarks
1 River Cross Section Survey Section 80 93,000 7,440,000 Interval of 500 m, total length 40 km 2 Plane Topographic Survey km2 6.0 1,451,000 8,706,000 3 Flood Damage Survey Person 600 11,000 6,600,000 100 person / 1 km2 of inundation area 4 Remuneration for Expert M/M 50 1,000,000 50,000,000 5 Indirect Cost (200% of Remuneration for Expert) --- 200% --- 100,000,000
Total 172,746,000
Isiolo
No. Item Unit Quantity Unit Price(Kshs)
Amount (Kshs) Remarks
1 River Cross Section Survey Section 30 93,000 2,790,000 Interval of 500 m, total length 15 km 2 Plane Topographic Survey km2 1.0 1,451,000 1,451,000 3 Flood Damage Survey Person 100 11,000 1,100,000 100 person / 1 km2 of inundation area 4 Remuneration for Expert M/M 50 1,000,000 50,000,000 5 Indirect Cost (200% of Remuneration for Expert) --- 200% --- 100,000,000
Total 155,341,000 Notes: 1. Unit price for river cross section survey and flood damage survey were referred to the NWMP 2030 Project.
2. Unit price for plane topographic survey was referred to the Mwea Irrigation Project.
Source: JICA Study Team
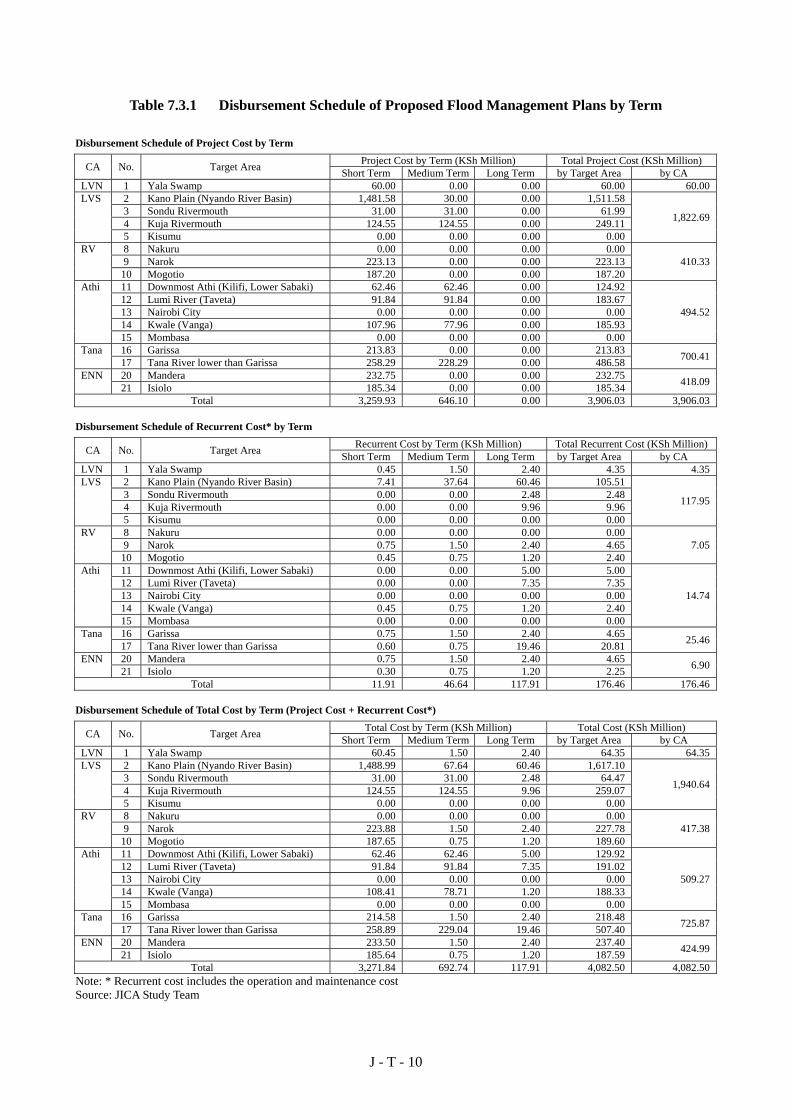
J - T - 10
Table 7.3.1 Disbursement Schedule of Proposed Flood Management Plans by Term
Disbursement Schedule of Project Cost by Term
CA No. Target Area Project Cost by Term (KSh Million) Total Project Cost (KSh Million)Short Term Medium Term Long Term by Target Area by CA
LVN 1 Yala Swamp 60.00 0.00 0.00 60.00 60.00 LVS 2 Kano Plain (Nyando River Basin) 1,481.58 30.00 0.00 1,511.58
1,822.69 3 Sondu Rivermouth 31.00 31.00 0.00 61.99 4 Kuja Rivermouth 124.55 124.55 0.00 249.11 5 Kisumu 0.00 0.00 0.00 0.00
RV 8 Nakuru 0.00 0.00 0.00 0.00 410.33 9 Narok 223.13 0.00 0.00 223.13
10 Mogotio 187.20 0.00 0.00 187.20 Athi 11 Downmost Athi (Kilifi, Lower Sabaki) 62.46 62.46 0.00 124.92
494.52 12 Lumi River (Taveta) 91.84 91.84 0.00 183.67 13 Nairobi City 0.00 0.00 0.00 0.00 14 Kwale (Vanga) 107.96 77.96 0.00 185.93 15 Mombasa 0.00 0.00 0.00 0.00
Tana 16 Garissa 213.83 0.00 0.00 213.83 700.41 17 Tana River lower than Garissa 258.29 228.29 0.00 486.58 ENN 20 Mandera 232.75 0.00 0.00 232.75 418.09 21 Isiolo 185.34 0.00 0.00 185.34
Total 3,259.93 646.10 0.00 3,906.03 3,906.03
Disbursement Schedule of Recurrent Cost* by Term
CA No. Target Area Recurrent Cost by Term (KSh Million) Total Recurrent Cost (KSh Million)Short Term Medium Term Long Term by Target Area by CA
LVN 1 Yala Swamp 0.45 1.50 2.40 4.35 4.35 LVS 2 Kano Plain (Nyando River Basin) 7.41 37.64 60.46 105.51
117.95 3 Sondu Rivermouth 0.00 0.00 2.48 2.48 4 Kuja Rivermouth 0.00 0.00 9.96 9.96 5 Kisumu 0.00 0.00 0.00 0.00
RV 8 Nakuru 0.00 0.00 0.00 0.00 7.05 9 Narok 0.75 1.50 2.40 4.65
10 Mogotio 0.45 0.75 1.20 2.40 Athi 11 Downmost Athi (Kilifi, Lower Sabaki) 0.00 0.00 5.00 5.00
14.74 12 Lumi River (Taveta) 0.00 0.00 7.35 7.35 13 Nairobi City 0.00 0.00 0.00 0.00 14 Kwale (Vanga) 0.45 0.75 1.20 2.40 15 Mombasa 0.00 0.00 0.00 0.00
Tana 16 Garissa 0.75 1.50 2.40 4.65 25.46 17 Tana River lower than Garissa 0.60 0.75 19.46 20.81 ENN 20 Mandera 0.75 1.50 2.40 4.65 6.90 21 Isiolo 0.30 0.75 1.20 2.25
Total 11.91 46.64 117.91 176.46 176.46
Disbursement Schedule of Total Cost by Term (Project Cost + Recurrent Cost*)
CA No. Target Area Total Cost by Term (KSh Million) Total Cost (KSh Million)Short Term Medium Term Long Term by Target Area by CA
LVN 1 Yala Swamp 60.45 1.50 2.40 64.35 64.35 LVS 2 Kano Plain (Nyando River Basin) 1,488.99 67.64 60.46 1,617.10
1,940.64 3 Sondu Rivermouth 31.00 31.00 2.48 64.47 4 Kuja Rivermouth 124.55 124.55 9.96 259.07 5 Kisumu 0.00 0.00 0.00 0.00
RV 8 Nakuru 0.00 0.00 0.00 0.00 417.38 9 Narok 223.88 1.50 2.40 227.78
10 Mogotio 187.65 0.75 1.20 189.60 Athi 11 Downmost Athi (Kilifi, Lower Sabaki) 62.46 62.46 5.00 129.92
509.27 12 Lumi River (Taveta) 91.84 91.84 7.35 191.02 13 Nairobi City 0.00 0.00 0.00 0.00 14 Kwale (Vanga) 108.41 78.71 1.20 188.33 15 Mombasa 0.00 0.00 0.00 0.00
Tana 16 Garissa 214.58 1.50 2.40 218.48 725.87 17 Tana River lower than Garissa 258.89 229.04 19.46 507.40 ENN 20 Mandera 233.50 1.50 2.40 237.40 424.99 21 Isiolo 185.64 0.75 1.20 187.59
Total 3,271.84 692.74 117.91 4,082.50 4,082.50 Note: * Recurrent cost includes the operation and maintenance cost Source: JICA Study Team

Figures

J - F - 1
Identification of Key Issues
Understanding of Current Situation
Collection of Past Disaster Data• Affected area• Monetary amount of damage• No. of affected people and casualty• Major causes of disaster• Duration of disaster
Collection of Information by Existing Documents• Relevant policy / strategy documents• Roles and responsibilities of relevant organization
• Existing plans
Status of Disaster Management • Flood / Drought monitoring• Flood / Drought early warning• Development of hazard map• Construction of flood control structures
• Response system to disasters, etc.
Geographical and Meteorological Issues• Identification of disaster prone area• Characteristics of disasters(In the case of flood, river induced flood, flash flood, urban flood, etc)
Organizational and Institutional Issues• Whether authority of responsible organization is legally clear
• Whether there is an overlap or a lack in the demarcation of roles of relevant organization
Management Issues• Out of necessary measures, what has not been implemented
• Why the measure has not been implemented (economical or technical reasons)
Consideration of Planning Policy
<<Consideration of Basic Policy for Flood Measures>>
• Combination of structural and non‐structural measures• A whole‐basin strategy for flood risk management can be summarized as follows:step 1) For critical areas: Protection using structuresstep 2) For other areas: No settlementstep 3) For unavoidable inundation: Community‐based
disaster management and crisis management• Effective utilization of existing structures
<<Consideration of Basic Policy for Drought Measures>>
• As middle‐long‐term measures, water resources development (= structural measures against drought), watershed conservation, rationalization of agricultural water, etc. will be proposed in each sector of NWMP2030.
• As measures in drought term, formulation of drought conciliation rule, establishment of basin drought conciliation council
• Commencement of timely drought conciliation by obtaining information at the soonest possible time
Planning of Necessary Measures
Determination of flood measures for each target area Determination of drought measures
Formulation of Flood and Drought Disaster Management Plan
Input from Water Resources Management
Determination of target areas (flood prone areas)
Categorize the target area into the above step1) – 3)
Selection of effective structural measures
Step1) Step2) Step3)
Applicability evaluation of land use regulation
Consideration of FFWS, CBDM, etc.
Confirmation of existing and proposed dams in each basin
Consideration of establishment of basin drought conciliation councilGrouping of several dams for each river basinInstitutional framework for effective and fair
implementation of drought conciliationMember organization of basin drought conciliation council
Consideration of formulation of drought conciliation rule for reservoirsMethod to determine reduction rate among water usersEmergency use of water for hydropower and storage capacity of sedimentation
Consideration of obtaining of early drought informationUtilization of KMD’s long‐term rainfall forecast
If there are existing/proposed dams in upstream, they shall be incorporated into measures.
Non‐structural measures shall be combined.
Note: FFWS = Flood Forecasting and Warning System, CBDM = Community-based Disaster Management Source: JICA Study Team
THE DEVELOPMENT OF THE NATIONAL WATER MASTER PLAN 2030
Figure 1.2.1 Study Flow for Flood and Drought DisasterManagement Plan
JAPAN INTERNATIONAL COOPERATION AGENCY

J - F - 2
Policy Strategy/ Plan F/S & Design Construction O & M
Notes: 1) = National water resources management strategy in accordance with Water Act 2002, Section 11 (January 2007)2) = Ministerial strategic plan 2009-2012 (May 2009), Water sector strategic plan 2010-2015 (June 2010), Flood mitigation strategy (June 2009) Strategy for flood management for Lake Victoria Basin (September 2004)3) = Catchment management strategy in accordance with Water Act 2002, Section 154) = WRMA strategic plan 2009-2012 (September 2009)5) = NWCPC strategic plan 2010-2015 (--)6) = MORDA strategic plan 2008-2012 (--)
a) = State schemes in accordance with Water Act 2002, Section 19b) = Construction of works for state scheme in accordance with Water Act 2002, Section 22
c) = KMD is involved to furnish with meteorological data.
Flood ControlDam includingMultipurposeDam
RiverStructures
UrbanDrainage
Na
tion
al P
olic
y o
n W
ate
r R
eso
urc
es
Ma
na
ge
me
nt a
nd
De
velo
pm
en
t (1
99
9)
MORDA
MWI
WRMA
NWCPC
NWCPC
NWCPC
MORDA RDAs RDAs
NWCPC
NWCPC NWCPC
NWCPC
Ke
nya
Vis
ion
20
30
1), 2), a), c)
3), 4)
5),b)
6)
MWI
MOLG
MOLG MOLG MOLG
Na
tion
al D
isa
ste
r Ma
na
ge
me
nt P
olic
y (
Fin
al D
raft
20
10
)
MOSSP MOSSP
Source: MWI, WRMA, NWCPC, MORDA
THE DEVELOPMENT OF THE NATIONAL WATER MASTER PLAN 2030
Figure 2.2.1 Organizations in Relation to Flood Mitigation (Structural Measures)
JAPAN INTERNATIONAL COOPERATION AGENCY

J - F - 3
Source: FAO 2000a (Wetlands, Floodplains), JICA NWMP 1992 (NWMP 1992 Flood Area) UNOSAT 2007 (Past Flood Aug 2007), Brakenridge et al. 2006 (Past Flood 2002-2006)
THE DEVELOPMENT OF THE NATIONAL WATER MASTER PLAN 2030
Figure 2.3.1 Flood Area in Kenya
JAPAN INTERNATIONAL COOPERATION AGENCY

J - F - 4
Source: Arid Land Resources Management Project II (ALRMP II)
THE DEVELOPMENT OF THE NATIONAL WATER MASTER PLAN 2030
Figure 3.3.1 Drought Area in Kenya
JAPAN INTERNATIONAL COOPERATION AGENCY

J - F - 5
Dam (Existing)
Dam (Proposed)
Flood Fighting Plan
Flood Control
Telemetric Rainfall Station for FFWS (Proposed)
Legend
Source: JICA
Study Team
Note:
The yellow line show
s the boundaries of river basin unit for establishment of B
asin Drought C
onciliation Council in
drought disaster managem
ent plan.
TH
E D
EV
EL
OPM
EN
T OF
TH
E N
ATIO
NA
L WAT
ER
MA
STE
R PL
AN
2030 Figure 4.3.1 Proposed Flood and D
rought Disaster
Managem
ent Plan (LVN
CA
) JA
PAN
INT
ER
NAT
ION
AL C
OO
PER
ATION
AG
EN
CY

J - F - 6
Dam (Existing)
Dam (Proposed)
Urban Drainage
Flood Fighting Plan Flood Control
Community-based Disaster Management
Telemetric Rainfall Station for FFWS (Proposed)
Telemetric River Gauging Station for FFWS (Proposed)
Legend
Source: JICA
Study Team
Note:
The yellow line show
s the boundaries of river basin unit for establishment of B
asin Drought C
onciliation Council in
drought disaster managem
ent plan.
TH
E D
EV
EL
OPM
EN
T OF
TH
E N
ATIO
NA
L WAT
ER
MA
STE
R PL
AN
2030 Figure 4.4.1 Proposed Flood and D
rought Disaster
Managem
ent Plan (LVSC
A)
JAPA
N IN
TE
RN
ATIO
NA
L CO
OPE
RATIO
N A
GE
NC
Y

J - F - 7
Source: Study on Integrated Flood Management for Nyando River Basin, 2009
THE DEVELOPMENT OF THE NATIONAL WATER MASTER PLAN 2030
Figure 4.4.2 Structural Measures (upper) and Network System for FFWS (lower) Proposed in Nyando Master Plan JAPAN INTERNATIONAL COOPERATION AGENCY

J - F - 8
Legend Flood Control Dam (Existing)
Urban Drainage Dam (Proposed) Source: JICA Study Team Note: The yellow line shows the boundaries of river basin unit for establishment of Basin Drought Conciliation Council in
drought disaster management plan.
THE DEVELOPMENT OF THE NATIONAL WATER MASTER PLAN 2030
Figure 4.5.1 Proposed Flood and Drought Disaster Management Plan (RVCA)
JAPAN INTERNATIONAL COOPERATION AGENCY

J - F - 9
Dam (Existing)
Dam (Proposed)
Urban Drainage
Flood Control
Community-based Disaster Management
Legend
Source: JICA
Study Team
Note:
The yellow line show
s the boundaries of river basin unit for establishment of B
asin Drought C
onciliation Council in
drought disaster managem
ent plan.
TH
E D
EV
EL
OPM
EN
T OF
TH
E N
ATIO
NA
L WAT
ER
MA
STE
R PL
AN
2030 Figure 4.6.1 Proposed Flood and D
rought Disaster
Managem
ent Plan (AC
A)
JAPA
N IN
TE
RN
ATIO
NA
L CO
OPE
RATIO
N A
GE
NC
Y

J - F - 10
Dam (Existing)
Dam (Proposed)
Improvement of Discharge Warning System
Flood Control
Community-based Disaster Management
Legend
Source: JICA
Study Team
Note:
The yellow line show
s the boundaries of river basin unit for establishment of B
asin Drought C
onciliation Council in
drought disaster managem
ent plan.
TH
E D
EV
EL
OPM
EN
T OF
TH
E N
ATIO
NA
L WAT
ER
MA
STE
R PL
AN
2030 Figure 4.7.1 Proposed Flood and D
rought Disaster
Managem
ent Plan (TC
A)
JAPA
N IN
TE
RN
ATIO
NA
L CO
OPE
RATIO
N A
GE
NC
Y

J - F - 11
Dam (Existing)
Dam (Proposed)
Urban Drainage
Flood Control
Legend
Source: JICA
Study Team
Note:
The yellow line show
s the boundaries of river basin unit for establishment of B
asin Drought C
onciliation Council in
drought disaster managem
ent plan.
TH
E D
EV
EL
OPM
EN
T OF
TH
E N
ATIO
NA
L WAT
ER
MA
STE
R PL
AN
2030 Figure 4.8.1 Proposed Flood and D
rought Disaster
Managem
ent Plan (EN
NC
A)
JAPA
N IN
TE
RN
ATIO
NA
L CO
OPE
RATIO
N A
GE
NC
Y

J - F - 12
Flow of Water Use Restriction of the Sameura Dam in the 2005 Drought Date Reserve Water Use Restriction Organizational Arrangement
May 26 96.40%
15:00 Setting up a head office of special task force for water restriction in Shikoku Regional Development Bureau (a) 15:00 Setting up a branch office of special task force for water restriction in Integrated Management Office of Dams in Yoshino River (b)
Jun 13 66.60% 0:00 Voluntary water-saving [Tokushima 5.9%]
Jun 15 61.20% 9:00 The first water restriction [Tokushima 14.1% (new 20%), Kagawa 20%]
9:00 Setting up a branch office of special task force for water restriction in Tokushima River and National Highway Office (c)
Jun 22 46.00% 9:00 The second water restriction [Tokushima 15.9% (new 35%), Kagawa 35%]
Jun 28 32.40% 9:00 The third water restriction [Tokushima 17.6% (new 50%), Kagawa 50%]
Jul 1 25.10% 22:00 Ease the second water restriction [Tokushima 17.2% (new 35%), Kagawa 35%]
Jul 2 22.80% 6:00 Temporary-clear water restriction
Jul 8 36.80% 0:00 The third water restriction [Tokushima 19.0% (new 50%), Kagawa 50%]
Jul 9 37.50% 15:00 Temporary-clear water restriction
Jul 13 51.20% 18:00 The second water restriction [Tokushima 17.2% (new 35%), Kagawa 35%]
Aug 1 32.90% 9:00 The third water restriction [Tokushima 19.0% (new 50%), Kagawa 50%]
Aug 11 15.10% 9:00 The forth water restriction [Tokushima 22.0% (new 75%), Kagawa 75%]
9:00 Setting up a head office of emergency task force for extraordinary drought in Shikoku Region (d)
Aug 19 (20:00)
1.5% (0.0%)
20:00 Start emergency release from power generation capacity [Tokushima 1.85 m3/s, Kagawa 1.81 m3/s]
Aug 20 0.00% 22:00 Temporary ease the forth water restriction [Tokushima 22.0% (new 75%), Kagawa 75%] Stop emergency release from power generation capacity
Aug 21 1.10% 11:00 Temporary-clear water restriction
Aug 22 4.90% 22:00 Restart the forth water restriction [Tokushima 22.4% (new 75%), Kagawa 75%]
Sep 1 (8:00)
0.5% (0.0%)
8:00 Start emergency release from power generation capacity [Tokushima 1.85m3/s, Kagawa 1.81m3/s]
Sep 5 0.00% 5:00 Stop emergency release from power generation capacity 9:00 Temporary-clear water restriction
Sep 6 (20:00)
4.6% (100%) 18:00 All-clear water restriction
18:00 Breaking up the office (a) 18:00 Breaking up the office (d) 18:00 Breaking up the office (c) 20:00 Breaking up the office (b)
Time Series Graph of Water Use Capacity of the Sameura Dam and Restriction Actions in the 2005 Drought
Source: Shikoku Regional Development Bureau, Ministry of Land, Infrastructure, Transport and Tourism, Japan
THE DEVELOPMENT OF THE NATIONAL WATER MASTER PLAN 2030
Figure 5.3.1 Example for Water Use Restriction of Sameura Dam in 2005 Drought
JAPAN INTERNATIONAL COOPERATION AGENCY
Target Capacity Average Year 1994 Year 1995 Year 2005
Cap
acity
for W
ater
Util
izat
ion
(x10
3 m3 )
1st Restriction 2nd Restriction 3rd Restriction 4th Restriction Temporary-clear RestrictionAll-clear Restriction
Emergency Release from Power Capacity
Jun-15
Jun-22
Jun-28
Jul-1Jul-2
Jul-8
Jul-9
Jul-13
Aug-11
Aug-19
Aug-22 Sep-1 Sep-6
May Jun Jul Aug SepAug20 Aug21 Sep-5
160,000
140,000
120,000
100,000
80,000
60,000
40,000
20,000
180,000
Aug-1
0

J - F - 13
Flood Disaster Management Plan
2013 2014 2015 2016 2017 2018 2019 2020 2021 2022 2023 2024 2025 2026 2027 2028 2029 2030
13/14 14/15 15/16 16/17 17/18 18/19 19/20 20/21 21/22 22/23 23/24 24/25 25/26 26/27 27/28 28/29 29/30 30/31
F/S
F/S
F/S
F/S
F/S
F/S
Note: Construction Schedule for River Training Works (to be determined in the Feasibility Study)
E2.3 Implementation of Urban Drainage Measures
E2.1 River Training Works
E2.2 Preparation of Hazard Map
E1.3 Formulation of Evacuation Plan
E2 Isiolo
E1.1 River Training Works
E1.2 Preparation of Hazard Map
T2.2 Improvement of Warning System for Hydropower Dam
ENN E1 Mandera
T2 Tana River lower than Garissa
T2.1 Establishment of Community-based Flood Management System
T1.3 Preparation of Hazard Map
T1.4 Formulation of Evacuation Plan
T1.1 Construction of Multipurpose DamHigh Grand FallsDam
T1.2 River Training Works
A5.1 Implementation of Urban Drainage Measures
Tana T1 Garissa
A4.2 Preparation of Hazard Map
A5 Mombasa
A4 Kwale (Vanga)
A4.1 River Training Works
A3 Nairobi City
A3.1 Implementation of Urban Drainage Measures
A2.1 Construction of Multipurpose Dam Lake Chala Dam
A2.2 Establishment of Community-based Flood Management System
A1.1 Establishment of Community-based Flood Management System
A2 Lumi River (Taveta)
R3.2 Preparation of Hazard Map
Athi A1 Downmost Athi (Kilifi, Lower Sabaki)
R3 Mogotio
R3.1 River Training Works
R2.4 Formulation of Evacuation Plan
R2.5 Implementation of Urban Drainage Measures
R2.2 River Training Works
R2.3 Preparation of Hazard Map
R2 Narok
R2.1 Construction of Multipurpose DamUpper NarokDam
RV R1 Nakuru
R1.1 Implementation of Urban Drainage Measures
S4.1 Construction of Multipurpose Dam Kibos Dam
S4.2 Implementation of Urban Drainage Measures
S3.1 Establishment of Community-based Flood Management System
S4 Kisumu
S2.2 Establishment of Community-based Flood Management System
S3 Kuja Rivermouth
S2 Sondu Rivermouth
S2.1 Construction of Multipurpose Dam Magwagwa Dam
S1.3 Establishment of Flood Forecasting and Warning System
S1.4 Formulation of Flood Fighting Plan
S1.1 Construction of Multipurpose Dam Nyando Dam
S1.2 River Training Works
N1.4 Formulation of Flood Fighting Plan
LVS S1 Kano Plain (Nyando River Basin)
N1.2 River Training Works
N1.3 Establishment of Flood Forecasting and Warning System
LVN N1 Yala Swamp
N1.1 Construction of Multipurpose DamNzoia 34B Dam,Nzoia 42A Dam
WR
MA
Cat
chm
ent
No. Description
Implementation Schedule
RemarksShort Term Medium Term Long Term
Source: JICA Study Team
THE DEVELOPMENT OF THE NATIONAL WATER MASTER PLAN 2030
Figure 7.3.1 Implementation Schedule for Proposed Flood Management Plan by Term
JAPAN INTERNATIONAL COOPERATION AGENCY

J - F - 14
Drought Disaster Management Plan
2013 2014 2015 2016 2017 2018 2019 2020 2021 2022 2023 2024 2025 2026 2027 2028 2029 2030
13/14 14/15 15/16 16/17 17/18 18/19 19/20 20/21 21/22 22/23 23/24 24/25 25/26 26/27 27/28 28/29 29/30 30/31
Legend: Establishment Update / Expansion
No. Description
Implementation Schedule
Short Term Medium Term Long Term
1 Preparation of Water Use Restriction Rule for Reservoirs
3 Establishment of Basin Drought Conciliation Councils
4 Development of Drought Early Forecast System
2 Monitoring of Reference Water Levels
Source: JICA Study Team
THE DEVELOPMENT OF THE NATIONAL WATER MASTER PLAN 2030
Figure 7.3.2 Implementation Schedule for Proposed Drought Management Plan by Term
JAPAN INTERNATIONAL COOPERATION AGENCY