Sectoral Report (C) Water Supply
237
Volume – IV Sectoral Report (1/3) Sectoral Report (C) Water Supply
-
Upload
khangminh22 -
Category
Documents
-
view
1 -
download
0
Transcript of Sectoral Report (C) Water Supply

Volume – IV Sectoral Report (1/3)
Sectoral Report (C) Water Supply
Final Report Sectoral Report (C) Water Supply Table of Contents
Nippon Koei Co., Ltd. C - i The Development of the National Water Master Plan 2030
THE PROJECT ON
THE DEVELOPMENT OF THE NATIONAL WATER MASTER PLAN 2030
IN THE REPUBLIC OF KENYA
FINAL REPORT
VOLUME – IV SECTORAL REPORT (1/3)
C: WATER SUPPLY
Abbreviation
Table of Contents
Page
CHAPTER 1 INTRODUCTION ................................................................................................ C-1
CHAPTER 2 CURRENT SITUATION OF WATER SUPPLY .............................................. C-2
2.1 Relevant Policies and Strategies .......................................................................................... C-2
2.2 Relevant Organizations ........................................................................................................ C-5
2.3 Current Situation ................................................................................................................ C-12 2.3.1 Overview ............................................................................................................. C-12 2.3.2 Summary of the Existing Master Plan Studies and Progress of
Identified Key Projects ........................................................................................ C-16 2.3.3 Lake Victoria North Catchment Area ................................................................. C-23 2.3.4 Lake Victoria South Catchment Area ................................................................. C-24 2.3.5 Rift Valley Catchment Area ................................................................................ C-26 2.3.6 Athi Catchment Area .......................................................................................... C-27 2.3.7 Tana Catchment Area.......................................................................................... C-29 2.3.8 Ewaso Ng’iro North Catchment Area ................................................................. C-30
2.4 Ongoing Projects and Existing Plans ................................................................................. C-31
2.5 Operation and Maintenance Issues ..................................................................................... C-32
2.6 Challenges and Key Issues ................................................................................................. C-32
CHAPTER 3 PRESENT AND FUTURE WATER DEMANDS ............................................ C-34
3.1 General ............................................................................................................................... C-34
3.2 Population Projection ......................................................................................................... C-35 3.2.1 Base Data ............................................................................................................ C-35 3.2.2 Planning Horizon ................................................................................................ C-36

Final Report Table of Contents Sectoral Report (C) Water Supply
The Development of C - ii Nippon Koei Co., Ltd. the National Water Master Plan 2030
3.2.3 Population Projection .......................................................................................... C-36 3.2.4 Population Distribution Forecast ........................................................................ C-38
3.3 Economic Indices Projection .............................................................................................. C-41 3.3.1 Base Data and Current Situation ......................................................................... C-41 3.3.2 GDP Projection ................................................................................................... C-41
3.4 Domestic Water Demand ................................................................................................... C-42 3.4.1 General ................................................................................................................ C-42 3.4.2 Present Water Demand ........................................................................................ C-42 3.4.3 Future Water Demand ......................................................................................... C-43
3.5 Industrial Water Demand ................................................................................................... C-46 3.5.1 General ................................................................................................................ C-46 3.5.2 Present Industrial Water Demand ....................................................................... C-46 3.5.3 Future Industrial Water Demand ......................................................................... C-48
3.6 Livestock Water Demand ................................................................................................... C-48 3.6.1 General ................................................................................................................ C-48 3.6.2 Present Livestock Water Demand ....................................................................... C-48 3.6.3 Future Livestock Water Demand ........................................................................ C-49
3.7 Wildlife Water Demand ..................................................................................................... C-52 3.7.1 General ................................................................................................................ C-52 3.7.2 Present Water Demand ........................................................................................ C-52 3.7.3 Future Water Demand ......................................................................................... C-53
3.8 Inland Fisheries Water Demand ......................................................................................... C-54 3.8.1 General ................................................................................................................ C-54 3.8.2 Present Water Demand ........................................................................................ C-55 3.8.3 Future Water Demand ......................................................................................... C-55
3.9 Summary of Future Water Demands .................................................................................. C-56
CHAPTER 4 WATER SUPPLY DEVELOPMENT PLAN ................................................... C-57
4.1 General ............................................................................................................................... C-57
4.2 Overall Concept and Framework for Planning .................................................................. C-58
4.3 Water Supply Development Plan for Lake Victoria North Catchment Area (LVNCA)C- ....................................................................................................................... C-60 4.3.1 Development Strategy ......................................................................................... C-60 4.3.2 Proposed Water Supply Development Plan ........................................................ C-62
4.4 Water Supply Development Plan for Lake Victoria South Catchment Area (LVSCA) ............................................................................................................................ C-63 4.4.1 Development Strategy ......................................................................................... C-63 4.4.2 Proposed Water Supply Development Plan ........................................................ C-66
4.5 Water Supply Development Plan for Rift Valley Catchment Area (RVCA) ..................... C-66 4.5.1 Development Strategy ......................................................................................... C-66 4.5.2 Proposed Water Supply Development Plan ........................................................ C-69
4.6 Water Supply Development Plan for Athi Catchment Area (ACA) .................................. C-70

Final Report Sectoral Report (C) Water Supply Table of Contents
Nippon Koei Co., Ltd. C - iii The Development of the National Water Master Plan 2030
4.6.1 Development Strategy ......................................................................................... C-70 4.6.2 Proposed Water Supply Development Plan ........................................................ C-72
4.7 Water Supply Development Plan for Tana Catchment Area (TCA) .................................. C-73 4.7.1 Development Strategy ......................................................................................... C-73 4.7.2 Proposed Water Supply Development Plan ........................................................ C-75
4.8 Water Supply Development Plan for Ewaso Ng’iro North Catchment Area (ENNCA) ........................................................................................................................... C-76 4.8.1 Development Strategy ......................................................................................... C-76 4.8.2 Proposed Water Supply Development Plan ........................................................ C-78
CHAPTER 5 COST ESTIMATE ............................................................................................. C-80
5.1 Basic Conditions for Cost Estimate ................................................................................... C-80
5.2 Cost Estimate ..................................................................................................................... C-80 5.2.1 Project Costs (Construction Costs) ..................................................................... C-80 5.2.2 Operation and Maintenance Costs ...................................................................... C-81 5.2.3 Replacement Costs .............................................................................................. C-82
CHAPTER 6 ECONOMIC EVALUATION ........................................................................... C-83
6.1 Evaluation Method and Basic Conditions .......................................................................... C-83
6.2 Economic Benefit ............................................................................................................... C-84
6.3 Economic Cost ................................................................................................................... C-84
6.4 Results of Economic Evaluation ........................................................................................ C-85
CHAPTER 7 IMPLEMENTATION PROGRAMME ............................................................ C-86
7.1 General ............................................................................................................................... C-86
7.2 Prioritization Criteria for Implementation .......................................................................... C-86
7.3 Implementation Schedule for Water Supply Development Toward 2030 ......................... C-87
7.4 Recommendations for Further Surveys and Studies for the NWMP 2030 ........................ C-87
List of Tables
Page Table 2.2.1 Basic Data of Water Service Providers ................................................................ C-T-1
Table 2.2.2 Performance Records of Water Service Providers ............................................... C-T-2
Table 2.3.1 Service Population of Each Water Connection .................................................... C-T-3
Table 2.3.2 Capacities of Existing Water Supply Systems ...................................................... C-T-4
Table 2.3.3 Existing Urban Water Supply System .................................................................. C-T-4
Table 2.3.4 Existing Water Supply and Capacity (1/8) ~(8/8) ................................................ C-T-5
Table 2.3.5 Ongoing Water Supply Schemes and Capacities (1/2)~(2/2) ............................. C-T-13
Table 2.3.6 Water Service Providers (WSPs) (LVNCA) ...................................................... C-T-15

Final Report Table of Contents Sectoral Report (C) Water Supply
The Development of C - iv Nippon Koei Co., Ltd. the National Water Master Plan 2030
Table 2.3.7 Water Service Providers (WSPs) (LVSCA) ....................................................... C-T-15
Table 2.3.8 Water Service Providers (WSPs) (RVCA) ......................................................... C-T-16
Table 2.3.9 Water Service Providers (WSPs) in Nairobi and Satellite Towns (ACA) .......... C-T-16
Table 2.3.10 Water Service Providers (WSPs) in Mombasa Coastal Area (ACA) ................. C-T-17
Table 2.3.11 Water Service Providers (WSPs) in Remaining Area (ACA) ............................ C-T-17
Table 2.3.12 Water Service Providers (WSPs) (TCA) ............................................................ C-T-18
Table 2.3.13 Water Service Providers (WSPs) (ENNCA) ...................................................... C-T-19
Table 2.4.1 Reproduction of MWI's Internal Donor Matrix (Water Supply and Sanitation) (1/7)-(7/7) ......................................................................................... C-T-20
Table 2.4.2 Urban Water Supply Projects Proposed by WSBs, 2012 (1/2)-(2/2) ................. C-T-27
Table 3.2.1 Population Projection of 137 Major urban Centres (1/3)-(3/3) .......................... C-T-29
Table 3.2.2 Population Projection by Catchment Area ......................................................... C-T-32
Table 3.2.3 Population Distribution by County and Catchment Area ................................... C-T-33
Table 3.5.1 List of Districts for Each Industrial Activity Group ........................................... C-T-34
Table 4.2.1 Target 137 Urban Centres for Urban Water Supply Development..................... C-T-35
Table 4.3.1 Proposed Water Supply Development for UWSS (LVNCA) ............................. C-T-36
Table 4.3.2 Proposed Water Supply Development Plan for LSRWSS (LVNCA) ................ C-T-37
Table 4.3.3 Water Demand Projection for SSRWSS (LVNCA) ........................................... C-T-37
Table 4.4.1 Proposed Water Supply Development for UWSS (LVSCA) ............................. C-T-38
Table 4.4.2 Proposed Water Supply Development Plan for LSRWSS (LVSCA) ................. C-T-39
Table 4.4.3 Water Demand Projection for SSRWSS (LVSCA) ............................................ C-T-39
Table 4.5.1 Proposed Water Supply Development for UWSS (RVCA) ............................... C-T-40
Table 4.5.2 Proposed Water Supply Development Plan for LSRWSS (RVCA) ................... C-T-40
Table 4.5.3 Water Demand Projection for SSRWSS (RVCA) .............................................. C-T-40
Table 4.6.1 Proposed Water Supply Development for UWSS (ACA) .................................. C-T-41
Table 4.6.2 Proposed Water Supply Development Plan for LSRWSS (ACA) ..................... C-T-42
Table 4.6.3 Water Demand Projection for SSRWSS (ACA) ................................................ C-T-42
Table 4.7.1 Proposed Water Supply Development for UWSS (TCA) .................................. C-T-43
Table 4.7.2 Proposed Water Supply Development Plan for LSRWSS (TCA) ...................... C-T-44
Table 4.7.3 Water Demand Projection for SSRWSS (TCA) ................................................. C-T-44
Table 4.8.1 Proposed Water Supply Development for UWSS (ENNCA) ............................. C-T-45
Table 4.8.2 Proposed Water Supply Development Plan for LSRWSS (ENNCA) ................ C-T-45
Table 4.8.3 Water Demand Projection for SSRWSS (ENNCA) ........................................... C-T-45
Table 5.2.1 Project Cost and O&M Cost for Urban Water Supply Development (LVNCA) ............................................................................................................ C-T-46
Table 5.2.2 Project Cost and O&M Cost for LSRWSS (LVNCA) ....................................... C-T-46
Table 5.2.3 Project Cost and O&M Cost for Urban Water Supply Development (LVSCA) ............................................................................................................ C-T-47

Final Report Sectoral Report (C) Water Supply Table of Contents
Nippon Koei Co., Ltd. C - v The Development of the National Water Master Plan 2030
Table 5.2.4 Project Cost and O&M Cost for LSRWSS (LVSCA) ........................................ C-T-47
Table 5.2.5 Project Cost and O&M Cost for Urban Water Supply Development (RVCA) .............................................................................................................. C-T-48
Table 5.2.6 Project Cost and O&M Cost for LSRWSS (RVCA) .......................................... C-T-48
Table 5.2.7 Project Cost and O&M Cost for Urban Water Supply Development (ACA) ................................................................................................................. C-T-49
Table 5.2.8 Project Cost and O&M Cost for LSRWSS (ACA) ............................................. C-T-50
Table 5.2.9 Project Cost and O&M Cost for Urban Water Supply Developmen (TCA) ................................................................................................................. C-T-50
Table 5.2.10 Project Cost and O&M Cost for LSRWSS (TCA) ............................................. C-T-50
Table 5.2.11 Project Cost and O&M Cost for Urban Water Supply Development (ENNCA) ............................................................................................................ C-T-51
Table 5.2.12 Project Cost and O&M Cost for LSRWSS (ENNCA) ....................................... C-T-51
Table 5.2.13 Project Cost and O&M Cost for Urban Water Supply Development for Whole of Kenya .................................................................................................. C-T-52
Table 5.2.14 Project Cost and O&M Cost for Large Scale Rural Water Supply Development for Whole of Kenya ...................................................................... C-T-52
List of Figures
Page Figure 1.1.1 Study Flow of Water Supply Development Plan .................................................. C-F-1
Figure 2.2.1 Extent of the WSBs .............................................................................................. C-F-2
Figure 2.3.1 Percentage of Usage of Surface Water without Treatment ................................... C-F-3
Figure 2.3.2 Percentage of Connection of Piped Water Supply ............................................... C-F-4
Figure 2.3.3 Percentage of Usage of Well, Borehole and Spring (Individual basis) ................ C-F-5
Figure 3.2.1 Population Density in 2010 .................................................................................. C-F-6
Figure 3.2.2 Population Density in 2030 .................................................................................. C-F-7
Figure 4.3.1 Proposed Urban Water Supply and Sewerage Development Plans (LVNCA) .............................................................................................................. C-F-8
Figure 4.4.1 Proposed Urban Water Supply and Sewerage Development Plans (LVSCA) .............................................................................................................. C-F-9
Figure 4.5.1 Proposed Urban Water Supply and Sewerage Development Plans (RVCA) (1/2)-(2/2) ............................................................................................. C-F-10
Figure 4.6.1 Proposed Urban Water Supply and Sewerage Development Plans (ACA) ........ C-F-12
Figure 4.7.1 Proposed Urban Water Supply and Sewerage Development Plans (TCA) ........ C-F-13
Figure 4.8.1 Proposed Urban Water Supply and Sewerage Development Plans (ENNCA) ............................................................................................................ C-F-14
Figure 7.3.1 Implementation Schedule of Proposed Water Supply Development Plan (LVNCA) ............................................................................................................ C-F-15

Final Report Table of Contents Sectoral Report (C) Water Supply
The Development of C - vi Nippon Koei Co., Ltd. the National Water Master Plan 2030
Figure 7.3.2 Implementation Schedule of Proposed Water Supply Development Plan (LVSCA) ............................................................................................................ C-F-16
Figure 7.3.3 Implementation Schedule of Proposed Water Supply Development Plan (RVCA) .............................................................................................................. C-F-17
Figure 7.3.4 Implementation Schedule of Proposed Water Supply Development Plan (ACA) ................................................................................................................. C-F-18
Figure 7.3.5 Implementation Schedule of Proposed Water Supply Development Plan (TCA) ................................................................................................................. C-F-19
Figure 7.3.6 Implementation Schedule of Proposed Water Supply Development Plan (ENNCA) ............................................................................................................ C-F-20

Final Report Sectoral Report (C) Water Supply Abbreviations
Nippon Koei Co., Ltd. C - I The Development of the National Water Master Plan 2030
List of Abbreviations and Acronyms
ACA : Athi Catchment Area AFD : Agence Francaise de Developpement AfDB : African Development Bank ASAL : arid and semi-arid land B/C : Benefit and Cost BOPA : Budget Outline Paper CA : catchment area CAAC : Catchment Areas Advisory Committee CBO : community based organization CBS : Central Bureau of Statistics CPC : Community Project Cycle Danida : Danish International Development Agency DRSRS Department of Resource Surveys and Remote Sensing EIRR : Economic Internal Rate of Return ENN : Ewaso Ng'iro North ENNCA : Ewaso Ng'iro North Catchment Area ESP : Economic Stimulus Programme EU : European Union F/S : feasibility study FAO : Food and Agriculture Organization FINNIDA : Finnish Department for International Development Cooperation FY : Fiscal Year GDP : Gross Domestic Product GOK : Government of Kenya GTZ : Deutsche Gesellschaft fur Internationale Zusammenarabeit IFAD : International Fund for Agricultural Development JICA : Japan International Cooperation Agency JMP : Joint Monitoring Programme KEWI : Kenya Water Institute KfW : German Development Bank KIDDP : Kenya Italian Debt Swap for Development LSRWSS : Large Scale Rural Water Supply System LU : livestock unit LVN : Lake Victoria North LVNCA : Lake Victoria North Catchment Area LVS : Lake Victoria South LVSCA : Lake Victoria South Catchment Area MDG : Millennium Development Goals MOFD : Ministry of Fisheries Development MOLD : Ministry of Livestock Development MTP : First Medium Term Plan (2008 – 2012) of Kenya Vision 2030 MWI : Ministry of Water and Irrigation NIB : National Irrigation Board NPV : Net Present Value

Final Report Abbreviations Sectoral Report (C) Water Supply
The Development of C - II Nippon Koei Co., Ltd. the National Water Master Plan 2030
NRW : Non-revenue Water NWCPC : National Water Conservation and Pipeline Corporation NWMP : National Water Master Plan NWRMS : National Water Resources Management Strategy NWSS : National Water Services Strategy O&M : Operation and Maintenance PPIP : Pro-Poor Implementation Plan RV : Rift Valley RVCA : Rift Valley Catchment Area SIDA : Swedish International Development Agency SNV : SNV Netherlands Development Organisation SO : support organization SSRWSS : Small Scale Rural Water Supply System SSWSS : Small Scale Water Supply System SWAp : sector-wide approach TCA : Tana Catchment Area UC : Urban Centre UN : United Nations UNICEF : United Nations Children's Fund UPC : Urban Project Cycle USAID : United States Agency for International Development UWSS : Urban Water Supply System WAB : Water Appeal Board WARIS : Water Regulation Information System WaSBIT : Water Service Board's Investment Tool WASREB : Water Services Regulatory Board WDC : Water Resources Users Association Development Cycle WHO : World Health Organization WRMA : Water Resource Management Authority WRUA : Water Resources Users Association WSB : Water Service Board WSC Water Service Company / Water and Sewerage Company WSP : Water Service Provider WSSP : Water Sector Strategic Plan WSTF : Water Services Trust Fund

Final Report Sectoral Report (C) Water Supply Abbreviations
Nippon Koei Co., Ltd. C - III The Development of the National Water Master Plan 2030
Abbreviations of Measures
Length mm = millimeter cm = centimeter m = meter km = kilometer
Money KSh = Kenya shilling US$ = U.S. dollar
Area ha = hectare m2 = square meter km2 = square kilometer
Energy kcal = Kilocalorie kW = kilowatt MW = megawatt kWh = kilowatt-hour GWh = gigawatt-hour
Volume 1, lit = liter m3 = cubic meter m3/s, cms = cubic meter per second CM = cubic meter MCM = million cubic meter BCM = billion cubic meter m3/d, cmd = cubic meter per day BBL = Barrel
Others % = percent o = degree ' = minute " = second °C = degree Celsius cap. = capital LU = livestock unit md = man-day mil. = million no. = number pers. = person mmho = micromho ppm = parts per million ppb = parts per billion L/p/d = litter per person per day
Weight mg = milligram g = gram kg = kilogram t = ton MT = metric ton Time s = second hr = hour d = day yr = year
NOTE 1. The National Water Master Plan 2030 was prepared based on the material and data provided from
Kenyan Government and its relevant organisations during field surveys in Kenya carried out until November 2012. The sources etc. of the material and data utilised for the study are described in the relevant part of the reports.
2. The names of ministries and related organisations of Kenyan Government are as of November 2012.
3. Information to be updated
The following information which is given in the report is needed to be updated properly:
(1) Information on the proposed development projects
The features and implementation schedules of the proposed development projects may be changed toward implementation of the project. After the subject projects were clearly featured for implementation, the project features and implementation schedules in this report should be updated.
(2) Information on the water demand
The water demand projected in this master plan should be revised when the large scale development plans, other than the projects proposed in this master plan, were formulated, as they will significantly affect to the water resources development and management.
4. Exchange rate for cost estimate
The costs of the proposed development and management plans were estimated by applying the following exchange rate as of November 1, 2012.
EXCHANGE RATE
US$1.00 = KSh 85.24 = ¥79.98 as of November 1, 2012

Final Report Introduction Sectoral Report (C) Water Supply Chapter 1
Nippon Koei Co., Ltd. C - 1 The Development of the National Water Master Plan 2030
CHAPTER 1 INTRODUCTION
This Sectoral Report C presents the results of the study on the water supply sector in Kenya. The objectives of the study are the following:
1) To clarify the present conditions of the water supply sector in Kenya, 2) To carry out population projection and water demand projection in 2030 and 2050, and 3) To prepare a project list and implementation plan of water supply systems to cover the water
demand by 2030.
The development target is based on Kenya Vision 2030, the Water Service Strategic Plan 2009, and other relevant documents. This study does not intend to cover specific water supply schemes.
The work flowchart of the study is shown in Figure 1.1.1.
Current Situation of Water Supply Final Report Chapter 2 Sectoral Report (C) Water Supply
The Development of C - 2 Nippon Koei Co., Ltd. the National Water Master Plan 2030
CHAPTER 2 CURRENT SITUATION OF WATER SUPPLY
2.1 Relevant Policies and Strategies
(1) General
Over recent years, a large number of government strategy and policy documents have been prepared. The most important documents applicable to the water supply and sanitation sector are the following:
a) Kenya Vision 2030 b) The National Water Services Strategy (NWSS), September 2007 c) Implementation Plan for the National Water Services Strategy, July 2008 (also known as the
Pro-Poor Implementation Plan (PPIP)) d) Water Sector Strategic Plan (WSSP) 2009-14, April 2010 e) The Eight WSB Strategic Plans.
The key aspects of each of the above documents are summarised below.
(2) Kenya Vision 2030
Kenya Vision 2030 sets out the overall vision for the development of the country. It covers the period from 2008 to 2030 and aims to “transform Kenya into a newly industrializing middle-income country providing a high quality of life to its citizens by 2030”. Kenya Vision 2030 is based on three pillars, namely economic, social and political, and is to be implemented in a series of successive five-year medium-term plans, the first of which covers the period 2008 to 2012.
The popular version of Kenya Vision 2030 refers to Kenya’s expectation “to have met its Millennium Development Goals (MDGs) whose deadline is 2015”. The document goes on to state that some of the goals have already been met and that “Kenya Vision 2030 spells out action that will be taken to achieve the rest.”
The key MDGs applicable under this section of this study is “to halve by 2015, the proportion of people without sustainable access to safe drinking water and basic sanitation”.
In the longer term, a key aim of Kenya Vision 2030 is to ensure that improved water and sanitation are available for all. Kenya Vision 2030 anticipates that more than half of the population are likely to be living in an urban environment by 2030. This is confirmed by the NWMP 2030 estimates.
Kenya Vision 2030 includes the following specific target projects:
a) Rehabilitation and augmentation of the Mzima pipeline; b) Expand the coverage for Nairobi, Mombasa, Kisumu, Nakuru and Kisii; c) Rehabilitation of water supplies in 26 medium sized towns; and d) Rehabilitation and expansion of sewerage works in urban areas.

Final Report Current Situation of Water Supply Sectoral Report (C) Water Supply Chapter 2
Nippon Koei Co., Ltd. C - 3 The Development of the National Water Master Plan 2030
(3) The National Water Services Strategy (NWSS), September 2007
The NWSS was prepared in accordance with Section 49 of the Water Act 2002 and provides a review of the water supply and sanitation situation as it was in 2007. It recognizes that service coverage is poor and indeed has been going backwards. Furthermore, it sets out the background to the Water Act 2002 and describes the main provisions of the law.
The stated vision of the NWSS is:
“Assured water supply, sewerage services and basic sanitation for all Kenyans for improved health and wealth creation on an individual level and for the nation”
The mission is:
“To realise the goals of the MDG declaration and the Vision 2030 of the Kenyan Government concerning access to safe and affordable water and basic sanitation by responsive institutions within a regime of well-defined standards and regulation”
The NWSS sets out five key goals as follows:
a) Reach at least 50% of the underserved urban population with safe and affordable water by 2015 (MDG) and thereafter, move to access for all by 2030;
b) Reach through sustainable waterborne sewage collection, treatment and disposal systems 40% of the urban population and 10% of the rural population by 2015, and total coverage in all urban centres by 2030;
c) Increased access to safe and improved basic sanitation facilities particularly for the poor to 77.5% in the urban setting and 72.5% in the rural setting by 2015;
d) Achieve the MDGs by fast tracking affordable and sustainable access to safe water in the settlements of the urban poor; and
e) Reach at least 50% of the underserved population in rural areas with safe and affordable water by 2015 (MDG) and thereafter move to sustainable access for all by 2030.
In each case, the NWSS sets out the medium-term indicators for achievement, the challenges, the recent developments and the strategic response. The NWSS also sets a number of cross-cutting goals covering information systems, sector coordination, human rights and poverty alleviation, financing, gender mainstreaming, HIV/AIDS, environmental sustainability, and disaster management.
(4) Implementation Plan for the National Water Services Strategy, July 2008
Also known as the PPIP, this document was prepared to supplement the NWSS and specifically addresses the needs of the underserved population from a social standpoint. The PPIP sets out the actions to be undertaken by each of the key institutions created under the provisions of the Water Act 2002.
It should be noted that the PPIP is significantly more user-friendly and informative than the rather cumbersome NWSS. In order to aid dissemination to all stakeholders, the PPIP has been released in both full and popular formats.

Current Situation of Water Supply Final Report Chapter 2 Sectoral Report (C) Water Supply
The Development of C - 4 Nippon Koei Co., Ltd. the National Water Master Plan 2030
(5) Water Sector Strategic Plan (WSSP) 2009-2014, April 2010
The vision of the WSSP is:
“A Kenya where water resources are protected, harnessed and sustainably managed to ensure availability and accessibility to all for the present and future generations, thereby increasing prosperity through effective and efficient use and a clean and healthy environment”.
The WSSP aims to meet the demand tasks and challenges by:
a) Increasing the knowledge among sector stakeholders of the current challenges and changes in the sector;
b) Providing policy and regulatory guidance to stakeholders as to how the challenges should be met;
c) Providing a conducive environment for improved collaboration and coordination by stakeholders, ensuring that interventions pull in the same direction and resources are used effectively and efficiently;
d) Providing a structure for follow-up and evaluation that covers all aspects of water development and allows us to jointly adjust our combined efforts over time, as required by circumstances.
The WSSP is based on the adoption of integrated water resources management and guided by Kenya Vision 2030. It provides an excellent summary of the sector as it stands today and addresses all of the key issues. The WSSP targets sustainable and affordable access to safe water and sanitation to all, through the increased formalization of services including low income urban and rural areas, promoting sustainable operation through scheme clustering and improved access through the work of the WSTF.
(6) WSB Strategic Plans
Copies of the eight WSB Strategic Plans have been collected and reviewed. In general, the plans are vague and lack substance, and sanitation is poorly covered in comparison to water supply.
Through interviews conducted with the WSBs, it was clear that the plans were too ambitious and, as a result, have not been adhered to. Some WSBs indicated that their starting point, in terms of water supply coverage, was not as advanced as they had been led to believe. It therefore seems that their progress has been limited and they consider this to be an unfair reflection on their performance.
Most WSBs have rewritten their plans to end in 2012, and are writing new plans to cover the period 2013 to 2017 in order to tie in with Kenya Vision 2030.

Final Report Current Situation of Water Supply Sectoral Report (C) Water Supply Chapter 2
Nippon Koei Co., Ltd. C - 5 The Development of the National Water Master Plan 2030
2.2 Relevant Organizations
(1) Background
At the time of the Aftercare Study (1998), it was evident that progress in the sector was being hampered by the poor institutional arrangements in place. Indeed it was noted that donors were paying significant attention to institutional and operational aspects as a precursor to further investment and this led the study to make several important recommendations regarding institutional change.
With the urgent need to accelerate social and economic development in Kenya, the government initiated a reform process that led to the passing, and subsequent implementation, of Act No. 8 of 2002 – Water Act, more commonly known as the Water Act 2002. The principal outcome of the Water Act 2002 was the reorganisation of the institutional arrangements under the MWI and the introduction of measures for the regulation and management of the country’s water supply and sanitation services.
The following diagram (abstracted from the NWSS) clearly conveys the new institutional arrangements implemented under the Water Act 2002.
MWI
WaterServicesRegulatoryBoardWASREB
Water ServicesBoards WSBs
WaterResources
ManagementAuthority
WRMACatchment Areas
Advisory Committees CAACs
Regional WRMA Office
Water ResourcesUser’s Associations
WRUAs
Water ServicesProvidersWSPs
Consumers, Users
Water ServicesTrust Fund
WSTF
National WaterCons & Pipeline Corp
NWCPC
Kenya WaterInstituteKEWI
National IrrigationBoard NIB
Water AppealBoardWAB
Water and Sewerage ServiceWater Resources Management
Source: WRMA, modified by JICA Study Team (As of November 2012)
Water Act 2002 Institutional Arrangements
The NWRMS published in January 2007 provides a clear definition of the roles and responsibilities of the key institutions created under the provisions of the Water Act 2002.
a) Ministry of Water and Irrigation (MWI) Development of legislation, policy formation, sector coordination and guidance, and
monitoring and evaluation.
b) Water Resources Management Authority (WRMA) Planning, management, protection and conservation of water resources; Planning, allocation, appointment, assessment and monitoring of water resources; Issuance of water permits;

Current Situation of Water Supply Final Report Chapter 2 Sectoral Report (C) Water Supply
The Development of C - 6 Nippon Koei Co., Ltd. the National Water Master Plan 2030
Water rights and enforcement of permit conditions; Regulation of conservation and abstraction structures; Catchment and water quality management; Regulation and control of water use; and Coordination of the IWRM Plan.
c) Catchment Area Advisory Committees (CAACs) Advising the WRMA on water resource issues at the catchment level.
d) Water Resource Users Associations (WRUAs) Involvement in the decision making process to identify and register water users; Collaboration in water allocation and catchment management; Assisting in water monitoring and information gathering; and Conflict resolution and cooperative management of water resources.
e) Water Services Regulatory Board (WASREB) Regulation and monitoring of Water Services Boards; Issuance of licenses to Water Services Boards; Setting standards for provision of water services; and Developing guidelines for water tariffs.
f) Water Services Boards (WSBs) Responsible for efficient and economical provision of water services; Developing water facilities; Applying regulations on water services and tariffs; Procuring and leasing water and sewerage facilities; and Contracting water service providers.
g) Water Services Providers (WSPs) Provision of water and sewerage services.
h) Water Services Trust Fund (WSTF) Financing provision of water and sanitation to disadvantaged groups.
From the water supply and sanitation point of view, the most relevant organizations in the new institutional structure are the following:
a) WASREB, b) Eight WSBs, c) WSPs, and d) WSTF.
Although not specifically indicated on the organization diagram, community-based organizations (CBOs) are one type of WSP and are critical to the water supply and sanitation sector, particularly in the rural areas. Furthermore, it is evident that the various multi- and bi-lateral agencies have a critical role to play in the sector.
Each of the above organizations and their role are discussed below in more detail.

Final Report Current Situation of Water Supply Sectoral Report (C) Water Supply Chapter 2
Nippon Koei Co., Ltd. C - 7 The Development of the National Water Master Plan 2030
(2) Water Services Regulatory Board
WASREB is primarily responsible for the regulation and monitoring of the WSBs and WSPs, the issuance of licenses to WSBs, the setting of standards for the provision of water services, and the development of guidelines for water tariffs. WASREB is a dynamic organization staffed by excellent professionals dedicated to bringing about transformation in Kenya’s water sector.
It is evident that the WASREB has good political support and it is unlikely that there will be any significant interference in their regulation work. The response from the public is positive as they now have a vehicle through which to judge their service providers. It is very clear that WASREB is one of the key bodies leading culture change and improvement.
WASREB has a staff of only 25 people and this makes it very difficult to police all 122 WSPs. As a result, the WASREB is concentrating on the monitoring of the performance of the large WSPs as it is important to ensure that the large WSPs are functioning properly so that they can set an example to the smaller ones. Furthermore, the large WSPs provide the majority of water and hence they can have the maximum impact.
The WASREB points out that only the larger WSPs are in fact financially viable and are able to cover their costs. Most of the smaller WSPs are losing money and need support. The WASREB, therefore, considers that clustering is the way forward as together, individual schemes can benefit from the economy of scale.
The WASREB produces a very good performance report on the water services subsector termed IMPACT. The latest issue of IMPACT is Issue No. 3, which reports on performance during FY 2008/09. Issue No. 4 is under preparation, having completed the data collection phase. Through IMPACT, the WASREB has both praised good performing WSBs and WSPs but also sanctioned those that are underperforming. The WASREB has made powerful statements regarding the need for improvements and has, in some cases, revoked operating licenses. The WASREB reports that all major towns in Kenya now have a WSP. Table 3.1 of IMPACT Issue No. 3 indicates that the 77 listed WSPs serve a total of 221 towns.
Despite the introduction of Water Act 2002, compliance remains an issue as key people and organizations are reluctant to change their culture and to accept the separation of management and operations. They do not want to lose the opportunity to make money. The WASREB has been more critical of the WSBs than the WSPs. It seems that the boards have been slower to accept the required cultural change, and to understand that it is not their role to do the job of the WSPs. It is also apparent that there are communication issues between the WASREB, the WSBs and the WSPs.
To date it is evident that the WASREB has been concentrating on the supply of water and sanitation services and has not considered water quality in any great depth. This is beginning to change as concern has been mounting on issues such as high fluoride concentrations in the groundwater in some areas of Kenya.

Current Situation of Water Supply Final Report Chapter 2 Sectoral Report (C) Water Supply
The Development of C - 8 Nippon Koei Co., Ltd. the National Water Master Plan 2030
(3) Water Services Boards (WSBs)
There are currently eight WSBs, as follows:
Athi Northern Coast Rift Valley Lake Victoria North Tana Lake Victoria South Tanathi
The WSBs are responsible for efficient and economic provision of water services, developing water and sanitation facilities, applying regulations on water services and tariffs, procuring and leasing water and sewerage facilities and contracting WSPs, whereas it is the WSPs that are responsible for the actual provision of water and sewerage services. The eight WSBs are responsible for investment in the water sector. Indeed their licence is conditional on the submission and approval of a ten year plan. The WASREB is monitoring progress through annual visits.
The limits of the areas covered by the WSBs follow the boundaries of the “original” 46 districts but do not coincide with either the provincial boundaries or the water catchment boundaries. The extent of each WSB is indicated in Figure 2.2.1. The NWMP 2030 requires this study to prepare development plans on a catchment basis for the six WRMA catchments.
Service Areas of the WRMA and WSBs
WRMA Catchment Area Water Service Boards
1) Athi 2) Ewaso Ngiro North 3) Lake Victoria North 4) Lake Victoria South 5) Rift Valley 6) Tana
1) Athi 2) Northern 3) Coast 4) Lake Victoria North 5) Lake Victoria South 6) Rift Valley 7) Tana 8) Tanathi
Source: JICA Study Team based on information from WRMA and WSBs
Furthermore, it is important to note that in a number of cases, the division boundaries between two WSBs overlap in a newly created county, and this may lead to institutional problems in the future. It is clear that the aforementioned facts will have to be taken into account during the formulation of the water supply and sanitation components of the NWMP 2030.
The estimated 2010 population, land area, and overall population density in each WSB service region are presented in the following table.

Final Report Current Situation of Water Supply Sectoral Report (C) Water Supply Chapter 2
Nippon Koei Co., Ltd. C - 9 The Development of the National Water Master Plan 2030
WSB Basic Information
WSB Projected Population 2010 Area (km2) Density (population/km2) Athi 5,201,000 3,838 1,355 Coast 3,437,000 82,893 41 Lake Victoria North 6,772,000 16,477 411 Lake Victoria South 7,725,000 22,569 342 Northern 2,601,000 253,634 10 Rift Valley 4,696,000 116,121 40 Tana 4,315,000 19,169 225 Tanathi 3,778,000 66,614 57 Total 38,525,000 581,315 66
Source: JICA Study Team based on relevant information from WSBs
All WSBs have websites stating their visions, missions, strategic objectives, latest news, and contact details.
During the period from February to March 2011, open and frank discussions were held at each WSB. It is evident that all are experiencing similar challenges, as discussed in more detail in Subsection 5.2.7.
(4) Water Services Providers (WSPs)
The WASREB reported that there are currently 122 WSPs operating in Kenya. Although it should be noted that this number is changing on a regular basis, as:
a) New WSPs are being created in the rural areas through the work of the WSTF; and b) Some WSPs, particularly those which are financially fragile and are struggling to operate,
are opting to join with neighbouring WSPs in order to improve sustainability through the sharing of resources. This process is termed “clustering” and is being actively encouraged by numerous government organizations and donors.
IMPACT Issue No. 3 provides an in-depth report on the 77 WSPs that have supplied the required data through the Water Regulation Information System (WARIS). The WASREB has had numerous difficulties obtaining data from both the WSBs and WSPs, but it is understood that IMPACT Issue No. 4 will provide data on at least 100 WSPs. The data provided in Issue No. 3 for FY 2008/09 is reproduced in the Table 2.2.1. The key points to note include the following:
a) The total population served by the 77 WSPs is 8,053,989, which is approximately 21% of the country’s population in 2010;
b) The average percentage of the population served in each service area is 45%; c) The average consumption is 65 L/person/day; and d) On average, there are 7.5 persons per connection.
In order to assess the performance of the WSPs, the WASREB has established sector benchmarks and has adopted nine key performance indicators, as shown in the following table.

Current Situation of Water Supply Final Report Chapter 2 Sectoral Report (C) Water Supply
The Development of C - 10 Nippon Koei Co., Ltd. the National Water Master Plan 2030
Sector Benchmarks
Indicator Sector Benchmarks Good Acceptable Not Acceptable
Collection efficiency >90% 85-90% <85% Non-revenue water <20% 20-25% >25% Water quality Drinking quality >95% 90-95% <90%
Compliance with residual Cl2 test >95% 90-95% <90% Hours of supply Population > 100,000 21-24 16-20 <16
Population < 100,000 17-24 12-16 <12 O&M cost coverage >150% 100-149% <100% Metering ratio 100% 95-99% <95% No. of staff per 1,000 connections
Very large and large WSPs <5 5-8 >8 Medium and small WSPs (up to three towns) <7 7-11 >11 Medium and small WSPs (more than three towns)
<9 9-14 >14
Water coverage >90% 80-90% <80% Sanitation coverage >90% 80-90% <80%
Source: IMPACT Issue No.3
The performance and ranking of each WSP are summarised in Table 2.2.2. Based on the examination of data, it is evident that there may be some reporting errors. For example, it seems very unlikely that NRW in Karimenu is really 93%. This reinforces WASREB’s concerns regarding data quality.
(5) Water Services Trust Fund (WSTF)
The WSTF is a state corporation which was established under Section 83 (1) of the Water Act 2002. Its mandate is “to assist in financing the provision of water services to areas of Kenya which are without adequate water services”. The WSTF is funded by the government in cooperation with the following development partners:
The Swedish International Development Agency; The Danish International Development Agency; The European Union; The African Development Bank; The German Development Agency ; The German Development Bank; and The United Nations Children’s Fund.
The WSTF, which specifically targets the poor, was established in March 2005. During the period of its first Strategic Plan (2005-2008), the following three funding systems or “windows” were set up:
a) The Community Project Cycle (CPC) – for rural water and sanitation projects; b) The Urban Project Concept (UPC) – for urban water and sanitation projects; and c) The Water Resources Users Association Development Cycle (WDC) – for water resources
projects.
The CPC was developed to help even the poorest rural communities in Kenya to plan, build, operate and maintain their own water supply and sanitation facilities. The emphasis is very much on self-help but with strong support from the WSBs, and of course, the WSTF. The CPC promotes transparency,
Final Report Current Situation of Water Supply Sectoral Report (C) Water Supply Chapter 2
Nippon Koei Co., Ltd. C - 11 The Development of the National Water Master Plan 2030
community participation, and community capacity development. The stages in the cycle are as follows:
a) Pre Application – the WSBs and the WSTF select the 50 poorest locations; b) Application – WSBs raise awareness of the facility and assist CBOs to apply; c) Preparation – initial meetings, training, the registration of the CBO as a WSP and the
preparation of the outline design for WSB checking and approval; d) Design – an appointed support organization (SO) helps the community to develop detailed
plans including cost estimates. Following community approval, the plans are forwarded to the WSB for review before submitting to the WSTF for approval. Once agreed, a contract is signed and funds are released to the CBO and SO;
e) Implementation – the construction proceeds with appropriate community involvement and training. Monitoring is conducted by the CBO management committee with the WSB and WSTF oversight;
f) Post Implementation – the WSB monitors the performance of the newly formed WSP, which may merge with another WSP, if preferred. Water tariffs are set to ensure the sustainability of the scheme.
Ownership of the facilities constructed should be transferred to the responsible WSB, but this does not always happen in practice as the communities tend to resent the WSB’s involvement.
Although originally established to cater to poor rural communities, the mandate of the WSTF was expanded in July 2007 to include low income urban areas. The UPC is similar to the CPC but funds can only be accessed by registered WSPs. The concept consists of the following eight steps:
a) Launch of the call for proposals by the WSTF – Twice a year, WSPs are invited to submit proposals that will benefit the urban poor;
b) Collection of data by the WSP – Socioeconomic, technical, community participation, legal and gender information are required as part of the submission;
c) Preparation of project proposals by WSPs and WSBs – A detailed document prepared by the applicant WSP but with assistance from the relevant WSB;
d) Evaluation of proposals by the WSTF – Following a transparent procedure covering key issues such as sustainability, technical viability, the WSP’s capacity and community participation;
e) Approval and award of projects by the WSTF – The best proposals are approved by the WSTF Board of Trustees and, subject to certain conditions, the first disbursement is made;
f) Project implementation by the WSP and WSB – A holistic and localized approach is adopted involving the community at all implementation sub-stages;
g) Operation of the project by the WSP – Customers are charged a tariff which is approved by the WASREB; and
h) Evaluation by the WSTF – Designed to involve the community and give feedback to improve the UPC process.
Again, any facilities constructed should be transferred to the WSBs.
In order to assist the UPC process, the WSTF have, with assistance from the GTZ and the UN Habitat, created MajiData, a system for storing data regarding the water and sanitation situation in poor urban

Current Situation of Water Supply Final Report Chapter 2 Sectoral Report (C) Water Supply
The Development of C - 12 Nippon Koei Co., Ltd. the National Water Master Plan 2030
areas. The WSTF has prepared an excellent series of booklets and toolkits to guide potential applicants.
The WDC follows a similar concept to that of the CPC and the UPC but covers the wider issues of water resources management including water quantity and quality, stakeholder participation in water resources management, compliance with water and environmental regulations and the development of well-governed and self-reliant WRUAs.
The WSTF reported that in the period of its first Strategic Plan (2005 to 2008), over 192 water and sanitation projects in the rural areas have received funding from the WSTF which, once completed, will benefit over 1.4 million people.
(6) Donors
Since 2006, donors have been working together under a sector-wide approach (SWAp) and taking part in annual joint sector reviews and conferences. There are a large number of donors active in the water and sanitation sector in Kenya, as follows:
African Development Bank (AfDB) Agence Francaise de Developpement (AFD) Danish International Development Agency (Danida) Deutsche Gesellschaft fur Internationale Zusammenarabeit (GTZ) European Union (EU) International Fund for Agricultural Development (IFAD) Italian Cooperation Finnish Department for International Development Cooperation (FINNIDA) German Development Bank (KfW) Japan International Cooperation Agency (JICA) Kenya Italian Debt Swap for Development (KIDDP) SNV Netherlands Development Organisation (SNV) Swedish International Development Agency (SIDA) The World Bank UN Habitat United Nations Children’s Fund (UNICEF) United States Agency for International Development (USAID)
The roles of the donors are discussed in more detail in Subsection 5.2.6.
2.3 Current Situation
2.3.1 Overview
(1) General (Water Supply and Sanitation Coverage)
At the time of the Aftercare Study (1998), it was estimated that 53% of the population of Kenya was served by water supply schemes. This equated to 94% of the urban population and 44% of the rural

Final Report Current Situation of Water Supply Sectoral Report (C) Water Supply Chapter 2
Nippon Koei Co., Ltd. C - 13 The Development of the National Water Master Plan 2030
population. From in-depth discussions with key government officials and donor agencies, it is evident that there was very little progress in the water and sanitation sector in the period immediately following the completion of the Aftercare Study (1998). Indeed, in many regards the sector is seen as going backwards as facilities were not maintained and were allowed to fall into disrepair.
However, since the passing of the Water Act 2002 and the establishment of key institutions and agencies, it is clear that tremendous progress has been made in the water sector. The MWI Annual Water Sector Reviews for 2009 and 2010 show that since FY 2004, there has been a significant increase in the approved government budget, as shown in the table below.
Sector Investment (Unit: KSh million)
Item FY Budget
FY 2004/05 FY 2005/06 FY 2006/07 FY 2007/08 FY 2008/09 FY 2009/10 Recurrent 2,411 2,329 3,014 4,159 4,678 4,536.2 Development 4,224 8,524 9,325 13,206 18,197 23,252.9 Total 6,635 10,853 12,339 17,365 22,875 27,789.1
Source: 2009 and 2010 Annual Water Sector Review Reports
It should be noted that the above figures represent the MWI’s total budget and should be broken down into water supply and sanitation, water resources management, irrigation, drainage and water storage, and land reclamation. In 2008/09, 83% of the development budget (KSh 15,025 million) was spent on water supply and sanitation, and in 2009/10, it was 72% or KSh 16,782 million.
There has also been a significant increase in investment from the donor community as confidence in the sector’s institutional capacity grows. With the normal project cycle of study, design, tendering and implementation, it is taking time for this increased investment to produce quantifiable results but it is clear that the negative trend in the level of services provided has been reversed and the indications are that the situation is now steadily improving.
It is evident that there is still no effective means by which to establish the water supply and sanitation coverage in Kenya. It is therefore very difficult to establish how the country is performing in relation to either the MDGs or the national targets. This challenge is well-known within the water sector in Kenya and efforts are being made to find a solution through the introduction of improved data systems such as MajiData, which focuses on the poor urban areas, and the WSB’s Investment Tool (WaSBIT), which compiles data at a sublocation level and is currently being pilot tested in three areas of the country.
(2) Current Situation of Water Supply
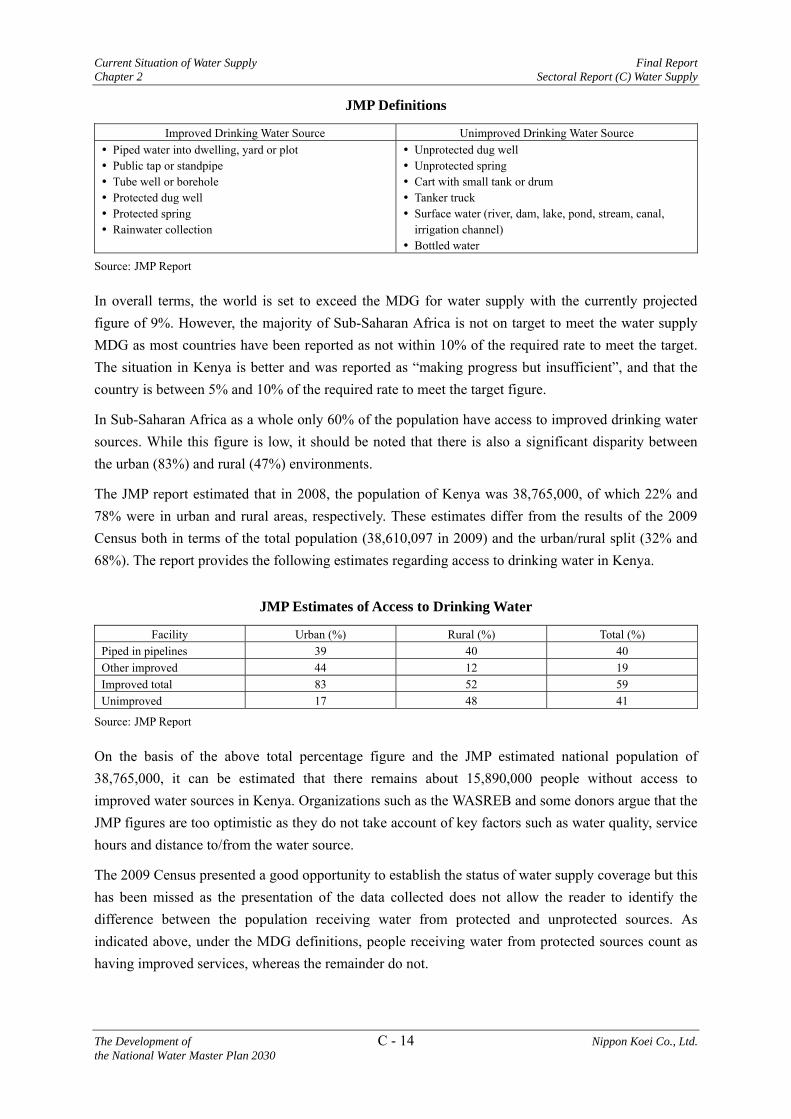
The WHO/UNICEF Joint Monitoring Programme (JMP) Water Supply and Sanitation Progress Report on Sanitation and Drinking Water 2010 Update is a useful indication of global, regional and country progress towards achieving the MDGs. The MDG target for water supply is to reduce the proportion of the population without sustainable access to safe drinking water from 23% in 1990 to 12% by 2015. The JMP report adopts the following definitions for improved and unimproved drinking water facilities:
Current Situation of Water Supply Final Report Chapter 2 Sectoral Report (C) Water Supply
The Development of C - 14 Nippon Koei Co., Ltd. the National Water Master Plan 2030
JMP Definitions
Improved Drinking Water Source Unimproved Drinking Water Source Piped water into dwelling, yard or plot Public tap or standpipe Tube well or borehole Protected dug well Protected spring Rainwater collection
Unprotected dug well Unprotected spring Cart with small tank or drum Tanker truck Surface water (river, dam, lake, pond, stream, canal,
irrigation channel) Bottled water
Source: JMP Report
In overall terms, the world is set to exceed the MDG for water supply with the currently projected figure of 9%. However, the majority of Sub-Saharan Africa is not on target to meet the water supply MDG as most countries have been reported as not within 10% of the required rate to meet the target. The situation in Kenya is better and was reported as “making progress but insufficient”, and that the country is between 5% and 10% of the required rate to meet the target figure.
In Sub-Saharan Africa as a whole only 60% of the population have access to improved drinking water sources. While this figure is low, it should be noted that there is also a significant disparity between the urban (83%) and rural (47%) environments.
The JMP report estimated that in 2008, the population of Kenya was 38,765,000, of which 22% and 78% were in urban and rural areas, respectively. These estimates differ from the results of the 2009 Census both in terms of the total population (38,610,097 in 2009) and the urban/rural split (32% and 68%). The report provides the following estimates regarding access to drinking water in Kenya.
JMP Estimates of Access to Drinking Water
Facility Urban (%) Rural (%) Total (%) Piped in pipelines 39 40 40 Other improved 44 12 19 Improved total 83 52 59 Unimproved 17 48 41
Source: JMP Report
On the basis of the above total percentage figure and the JMP estimated national population of 38,765,000, it can be estimated that there remains about 15,890,000 people without access to improved water sources in Kenya. Organizations such as the WASREB and some donors argue that the JMP figures are too optimistic as they do not take account of key factors such as water quality, service hours and distance to/from the water source.
The 2009 Census presented a good opportunity to establish the status of water supply coverage but this has been missed as the presentation of the data collected does not allow the reader to identify the difference between the population receiving water from protected and unprotected sources. As indicated above, under the MDG definitions, people receiving water from protected sources count as having improved services, whereas the remainder do not.

Final Report Current Situation of Water Supply Sectoral Report (C) Water Supply Chapter 2
Nippon Koei Co., Ltd. C - 15 The Development of the National Water Master Plan 2030
The 2009 Census reported a total of 8,767,954 households in Kenya. Based on the 2009 Census data, the population and ratio of water connection to each drinking water source in 2010 were estimated as shown in the table below.
Drinking Water Source Connection in 2010 (Unit: million persons)
Drinking Water Source/
Evaluation
Piped by WSP Spring/ Well/ Borehole
Water Vendor Stream, lake, pond, others
Total
Improved Source
Improved and Unimproved
Unimproved Source
Unimproved Source
Urban Population 7.1 (54%)
3.1 (24%)
1.7 (13%)
1.2 (9%)
13.1 (100%)
Rural Population 4.1 (16%)
10.9 (43%)
0.5 (2%)
9.9 (39%)
25.4 (100%)
Total
11.2 (28%)
14.0 (37%)
2.2 (6%)
11.1 (29%)
38.5 (100%)
Source: JICA Study Team, based on Census 2009 data
Figures 2.3.1, 2.3.2, and 2.3.3 show the percentages of “Usage of surface water without treatment”, “Connection of piped water supply”, and “Usage of well, borehole and spring (individual basis)” in each district, respectively.
The definitions of “Improved” and “Unimproved” drinking water sources were based on the WHO/UNICEF JMP report. Water from unregistered water vendors and water from streams, lakes and ponds without proper treatment are categorized as unimproved drinking water sources. In addition, water from unprotected springs, wells or boreholes are also categorized as unimproved drinking water sources; however, the details of unprotected water resources are not known. Only 28% of the population have water service from registered WSPs, which are clearly improved drinking water sources. Unimproved drinking water sources shall be changed to improved water sources by 2030.
According to the Performance Report of Kenya’s Water Service Sector, Issue No. 4, 2011, the current average unit water consumption of urban water supply is estimated as shown below.
Average Unit Water Consumption of Urban Water Supply, 2010 (Unit: L/person/day)
WSP Nairobi Mombasa Kisumu Nakuru Eldoret National AverageAverage Water Consumption (except for NRW)
57
27
15
29
75
36
Source: JICA Study Team, based on the Performance Report of Kenya’s Water Services, No. 4, 2011
The table below shows the design unit water consumption of urban water supply in Kenya, which is indicated in the MWI Design Manual.

Current Situation of Water Supply Final Report Chapter 2 Sectoral Report (C) Water Supply
The Development of C - 16 Nippon Koei Co., Ltd. the National Water Master Plan 2030
Design Unit Water Consumption of Urban Water Supply in Kenya
Category Design Unit Water Consumption
(except for allowance for water loss) High-class housing 200 L/person/day Middle-class housing 120 L/person/day Low class housing :Individual connection :Non-individual connection
60 L/person/day 20 L/person/day
Source: MWI Design Manual
According to the Draft Water Bill 2012 (new Water Act), the minimum unit residential water demand is proposed at 25 L/person/day. The national average of current unit water consumption of 36 L/person/day is higher than the minimum requirement and the design amount for non-individual connection consumption, but it is much lower than the design amount for individual connection consumption of 60-200 L/person/day. In order to meet the requirements of individual connection consumers, the current water supply systems should have more capacity to supply water to the consumers.
The table below shows the NRW ratios in major WSPs, which are presented in the Performance Report of Kenya’s Water Service Sector, Issue No. 4, 2011.
Record of NRW Ratios in 2010
WSP Nairobi Mombasa Kisumu Nakuru Eldoret National AverageNRW 42% 35% 50% 53% 25% 45%
Source: JICA Study Team, based on the Performance Report of Kenya’s Water Services, No. 4, 2011
The national average of 45% means quite a high level of water losses as compared to the target level of 20%. For effective water use, it is required to reduce the NRW ratio of existing water supply systems.
2.3.2 Summary of the Existing Master Plan Studies and Progress of Identified Key Projects
(1) Introduction
In 1992, JICA prepared the Study on the National Water Master Plan (NWMP (1992)). A key output was the development plan and implementation plan for water supply and sanitation facilities until the target year of 2010. However, by 1996, it had become clear that progress was too slow and this led JICA to conduct the Aftercare Study on the National Water Master Plan (Aftercare Study (1998)) with the Final Report being issued in November 1998. The aim was to update the findings of the NWMP (1992) and to make recommendations for institutional strengthening.
Both the NWMP (1992) and the Aftercare Study (1998) are key documents in the formulation of the National Water Master Plan 2030 (NWMP 2030) and have therefore been thoroughly reviewed in order to identify the data, ideas and methodologies which remain applicable today.

Final Report Current Situation of Water Supply Sectoral Report (C) Water Supply Chapter 2
Nippon Koei Co., Ltd. C - 17 The Development of the National Water Master Plan 2030
(2) NWMP (1992)
1) General
The water supply and sewerage aspects of the NWMP (1992) were based on the 41 districts in place at the time. It is evident that water supply was the prime focus of the study and that sewerage was treated as a secondary issue. The objectives of the water supply section of the NWMP (1992) were the following:
a) To clarify the situation in the water supply sector; b) To project the future domestic and industrial water demand; and c) To examine possible measures for the development of water supply in the country.
It was not the intention of the study to cover specific water supply schemes.
The population in 1990 was reported at 22,749,122, of which 3,965,118 people were located in urban areas and 18,784,004 in rural areas. The Kenya Population Census 1989 defined urban as to include “all City Councils, Municipal Councils, Town and Urban Councils, all District Headquarters and all the towns and trading centres having a minimum population of 2,000 and potential for future growth”.
The NWMP (1992) recognized the difficulty of determining the extent of water supply coverage in Kenya. In order to approximate the level of services being provided, the study referred to a demographic and health survey of 7,150 women carried out in 1989 which concluded that only 46.7% had access to a protected water source.
The main challenges facing the water sector at the time were reported to be the following:
a) Financial; b) Water supply development; and c) Operation and maintenance.
The structural adjustment of the economy taking place at the time, in combination with cost increases and higher operation and maintenance requirements led to a reduction in the levels of investment in the water sector. With the rapid rate of population growth, it was evident that the development of new water services could not keep up with the increasing water demand.
2) Water Supply
The Five-Year National Development Plan in place at the time covered the period from 1989 to 1993 and set the target of increasing the ratio of people having access to water in the urban area from 75% to 95%, and in the rural area from 26% to 50%. Taking into account the government’s sector policy, the NWMP (1992) adopted target was the “provision of safe and reliable water within a reasonable distance to all the population in the year 2010”. The study estimates of water demand (in thousand m3/day) are presented in the following table.

Current Situation of Water Supply Final Report Chapter 2 Sectoral Report (C) Water Supply
The Development of C - 18 Nippon Koei Co., Ltd. the National Water Master Plan 2030
NWMP (1992) Water Demand Estimates (Unit: thousand m3/day)
Category Sub-category Year
1990 2000 2010
Domestic Residential 867.4 1,564.7 2,575.4 Nonresidential 238.1 353.5 492.4 Subtotal 1,105.5 1,918.2 3,067.8
Livestock - 326.7 426.5 621.4 Industrial - 218.7 377.5 494.0
Total 1,650.9 2,722.2 4,183.2
Source: NWMP (1992)
The daily water production in 1988 was estimated to be only 485,000 m3.
The NWMP (1992) took the approach that the 158 identified urban town centres should be provided with “bulk” water supply schemes and that the remainder should be considered as rural. Some rural areas were to receive piped systems but the remainder were to be served by “spot” supplies such as groundwater or rainwater harvesting. The study adopted the following principles when considering urban water supply:
a) Reliance should not be placed on unregulated seasonal rivers; b) The safe yield for surface water sources is that during the ten-year drought; c) Groundwater supply is unreliable due to operation and maintenance costs and
should only be used when there is either no other source or the demand density is low; and
d) Springs are an ideal source, if still available.
A water supply development plan up to 2010 was prepared for each urban centre based on 1:50,000 topographical maps. Cost estimates were prepared for each scheme.
The NWMP (1992) considered that it was not practical to formulate definitive water supply plans specific to each rural area but instead devised an approach based on the potential water resources available. Schemes were planned on a two-stage basis as follows:
a) Stage 1 to be implemented by 2000 - Provision of water sources within walking distance i.e., within 1 km in high potential areas and within 4 km in arid or semi-arid areas; and
b) Stage 2 to be implemented by 2010 – Provision of piped water supply systems with water treatment.
The NWMP (1992) recognized that while rapid implementation of the identified schemes was necessary, resources were limited and that an efficient and effective plan should be adopted. The order of priority was developed as follows:
a) Ongoing schemes – at the time of the study there were a large number of ongoing projects that were scheduled to be completed by around 1991;
b) Urban centres in tourism areas including Nairobi, Mombasa, Malindi, Lamu, Nakuru, Kericho, Kisumu and Marsabit;
Final Report Current Situation of Water Supply Sectoral Report (C) Water Supply Chapter 2
Nippon Koei Co., Ltd. C - 19 The Development of the National Water Master Plan 2030
c) District centres with priority being given to those with the worst existing supply capacity to the water demand ratio in 2000; and
d) Other urban centres with priority being given to those with a lower cost per m3 of water.
The following key assumptions were made:
a) Unaccounted for water would be reduced to 20% by 2010; d) The government’s policy on full cost recovery would be achieved by 2000; c) The government would implement a water saving policy; and d) The country would be well-prepared for emergencies such as severe droughts.
An ambitious implementation plan was proposed covering the period up to 2010.
The proposed implementation plan for rural water supply was set to follow the two stage process described above. No priority was set for stage 1 works, although for stage 2 works, priority was given to those areas susceptible to water-borne diseases including Kwale, Mombasa, Kilifi, the Tana River and Lamu in the coastal area. Within each area, priority was given to the schemes with a lower cost per m3 of water.
(3) Aftercare Study (1998)
1) General
The Aftercare Study (1998) focused on the water supply and sewerage aspects of the NWMP (1992) and had the following key objectives:
a) To review the provisions of the NWMP (1992) and prepare a new implementation programme;
b) To make recommendations for strengthening the law and related institutional aspects; and
c) To transfer technology regarding the planning of water supply and sewerage scheme development.
The general approach taken was to divide the water sector into urban and rural schemes and to prepare development plans accordingly. Urban water supplies were defined as systems serving a centre with a projected population of more than 5,000 in 2010. Based on this, a total of 141 urban centres were covered by the study. The planning of rural water supplies was based on the administration system in place in January 1996 and hence, covered 50 districts. The study focused on the provision of sewerage facilities for a total of 40 urban centres.
For background information, the Aftercare Study (1998) referred to the “Welfare Monitoring Survey II”, which reported that 44.9% of the population had access to safe water (93.3% in urban areas and 32.5% in rural areas). The study reported that by 1994, there were 1,779 water supply systems serving Kenya, and noted that there was virtually no data available on any of the schemes and that an assessment of their performance was not possible at the time. In order to gain some idea of the present situation, the JICA Study Team conducted a survey in selected districts.

Current Situation of Water Supply Final Report Chapter 2 Sectoral Report (C) Water Supply
The Development of C - 20 Nippon Koei Co., Ltd. the National Water Master Plan 2030
The Aftercare Study (1998) provides an inventory of the water supply systems covering the 141 urban centres, although it was noted that a number of the smaller centres did not in fact have any system. The study reported that most water treatment plants adopt the conventional chemical coagulation, flocculation, sedimentation, filtration and chlorination processes. It was noted, however, that chemical dosing was frequently omitted due to insufficient budget and that water quality control was rarely practised. It was also reported that only 37 water supply schemes had sufficient capacity to provide 24-hour storage and that, as a general rule, bulk water meters were not installed.
The Aftercare Study (1998) estimated that 80.4% of the population had access to sanitation (97.6% in urban areas and 75.9% in rural areas), although the survey did not differentiate between improved sanitation and unimproved sanitation and in fact includes all possible facilities in the analysis. If the current day categorization were to be applied, then it would be evident that the percentage coverage would have been considerably less.
At the time of the study, the sewerage facilities were the responsibility of the local authorities. It was reported that 30 urban centres were served and that a total of 1.8 million people living in the urban areas were covered with a sewerage system. This is equivalent to 28% of the urban population. The 30 urban centres with sewerage were served by a total of 38 wastewater treatment plants of which eight were conventional activated sludge and 25 were waste stabilization ponds.
2) Water Supply
Bearing in mind the poor progress achieved since the preparation of the NWMP (1992), the Aftercare Study (1998) downgraded expectations and set “more moderate targets”, which can be summarised as the following:
a) Increase the assumed 90% coverage in the urban areas (1998) to 95% by 2010; b) Increase the assumed 35% coverage in the rural areas (1998) to 70% by 2010; and c) Reduce NRW to less than 30% by 2010.
In defining whether the population was considered urban or rural, the Aftercare Study (1998) took a similar approach to that adopted by the NWMP (1992) in which a centre was considered urban if:
a) A town was nominated as an urban centre; and b) A town was expected to have a population greater than 5000 by 2010.
As a result, 141 urban areas were selected and all other centres were considered rural and included in district water development schemes. The Aftercare Study (1998) did note that the 1989 census had identified 215 urban centres. However, 74 of these were too small in water supply terms to be considered urban.
The Aftercare Study (1998) estimated that the total population would reach 37.4 million by 2010, of which 11.5 million would be urban and 25.9 million rural. This was a reasonable estimate as the analysis conducted under the NWMP 2030 study estimates the actual 2010

Final Report Current Situation of Water Supply Sectoral Report (C) Water Supply Chapter 2
Nippon Koei Co., Ltd. C - 21 The Development of the National Water Master Plan 2030
population to be in the order of 38.5 million, of which 13.0 million was urban and 25.6 million rural.
The total potential water demand, in thousand m3/day, was calculated as shown in the following table.
Aftercare Study (1998) Water Demand Estimates (Unit: thousand m3/day)
Category Water Demand in 1995 Water Demand in 2010 UWS LSRWS SSRWS Total UWS LSRWS SSRWS Total
Residential 612.2 208.8 110.1 935.1 1,554.0 401.9 421.6 2,377.5 Non-residential
- Health facilities 4.6 5.0 6.4 16.0 8.9 7.1 9.4 25.4 - Schools 37.2 41.2 56.9 135.3 59.6 48.6 68.0 176.2 - Industry 142.5 26.8 31.8 201.1 383.4 60.8 55.5 499.7
Livestock 1.2 218.7 297.6 517.5 1.4 232.5 349.4 583.3 Total 801.7 500.4 502.8 1,805.0 2,007.3 750.9 903.9 3,662.0
Notes: UWS=Urban Water Supply, LSRWS=Large-Scale Rural Water Supply, SSRWS=Small-Scale Rural Water Supply Source: Aftercare Study (1998)
As shown in the table above, it was expected that the water demand would increase from 1.8 million m3/day in 1995 to almost 3.7 million m3/day in 2010. The total figure is less than that what was estimated in the NWMP (1992), although it needs to be noted that the coverage targets under the Aftercare Study (1998) were reduced.
Rehabilitation works were proposed for all of the existing urban water supply systems, and included the replacement of damaged pipes, installation of chemical dosing equipment, fitting of bulk meters, and construction of additional storage capacity. Where new works were required, surface water sources were to be the predominant form of supply with groundwater generally being used in arid and semi-arid lands (ASALs).
The Aftercare Study (1998) assumed that conventional treatment methods would be adopted and that 24-hour storage would be provided for large schemes, and 12-hour storage for small schemes. No justification was provided for this variation in approach.
Construction costs were obtained from the ongoing projects and estimates were prepared for the newly identified works. The Aftercare Study (1998) also estimated the annual operation and maintenance expenditure based on the cost to produce a cubic metre of water in Japan adjusted to suit Kenya.
As indicated above, 141 urban centres were included in the study. Nairobi and Mombasa were deleted from the scope as they were both the subject of major donor assistance in the urban water supply subsector at the time. The remaining centres were assessed, and 20 were identified for priority rehabilitation works and eight for priority expansion works. The identified urban centres are as listed in the tables below.

Current Situation of Water Supply Final Report Chapter 2 Sectoral Report (C) Water Supply
The Development of C - 22 Nippon Koei Co., Ltd. the National Water Master Plan 2030
Priority Rehabilitation Works for Urban Water Supply
01. Karuri 02. Msambweni 03. Lamu 04. Garsen 05. Hola 06. Karuri 07. Mwingi 08. Garissa 09. Rhamu 10. Bute 11. Eldas 12. Wajir 13. Ahero 14. Migori 15. Kajiado 16. Kilgotis 17. Cheptais 18. Maseno/ Luanda 19. Mbale 20. Vihiga/ Majengo
Source: Aftercare Study (1998)
Priority Expansion Works for Urban Water Supply
1. Msambweni 2. Tala and Kangundo 3. Wajir 4. Kisumu 5. Homa Bay 6. Narok 7. Luanda 8. Mbale
Source: Aftercare Study (1998)
In the case of rural water supply, the Aftercare Study (1998) stated that priority should be given to the rehabilitation of existing facilities. The study noted that it was not possible to identify what rehabilitation works were required for small-scale water supply facilities, and therefore assumed that no public investment would be required.
Works were prioritized in accordance with the percentage of the population served and the extent of water shortages during the dry season. The following six districts were selected.
Priority Districts for Rural Water Supply
1. Kilifi 2. Kwale 3. Migori 4. Kipsigis 5. Narok 6. Transmara
Source: Aftercare Study (1998)
3) Legal and Institutional
One of the objectives of the Aftercare Study (1998) was to make recommendations for strengthening the law and related institutional aspects. Following a period of detailed study, the following recommendations were made:
a) Restructure organizations related to the water supply and sewerage sectors; b) Improve personnel administration; c) Regulate water undertakers and sewerage providers; d) Amend legislation related to the water supply and sewerage sectors; e) Improve law enforcement; f) Improve the disparity between the budget and funds available; g) Improve the investment method; h) Revise tariff structures and rates in the water supply and sewerage sectors; i) Improve tariffs, billing and collection; and j) Improve operation and maintenance.
The Aftercare Study (1998) stressed that the lack of investment by the Kenyan government was a major obstacle for the implementation of the updated plan. The need for significant

Final Report Current Situation of Water Supply Sectoral Report (C) Water Supply Chapter 2
Nippon Koei Co., Ltd. C - 23 The Development of the National Water Master Plan 2030
foreign assistance was identified, but it was noted that donors were paying more attention to institutional and operational aspects as a precursor to further investment in the water sector.
According to information from the eight WSBs, the progress with the priority projects identified in the Aftercare Study (1998) are described below.
1) Urban Water Supply
Of the 20 centres selected for priority rehabilitation works to water supply systems, it was evident that works have only been carried out in Garissa and Mbale. Furthermore, of the eight centres identified for priority expansion works, progress has only been made in Kisumu and Mbale. Even in the case of Kisumu, the production capacity has only been increased to 45,500 m3/day rather than the targeted 60,750 m3/day.
2) Rural Water Supply
Six districts were given top priority for the development of rural water supply, but significant progress has only been made in Transmara, which is under the Lake Victoria South WSB.
2.3.3 Lake Victoria North Catchment Area
The current population in the LVNCA in 2010 was estimated at 6.96 million. Out of the 6.96 million, the urban population was at 1.53 million and the rural population at 5.43 million. The LVNCA has the highest population density area among six catchment areas. The population is not concentrated in a specific area and distributed over the catchment area. Based on data from the 2009 Census, the current situation of water connection in the LVNCA was estimated, as shown in the table below.
Current Situation of Water Connection (LVNCA) (Unit: households)
Type Piped by WSPs Spring/Well/ Borehole Water Vendor Stream/Lake/
Pond/Others Total
Urban 112,291 (31%)
189,805 (53%)
11,447 (3%)
45,877 (13%)
359,420 (100%)
Rural 56,315 (5%)
793,810 (70%)
4,815 (0%)
282,364 (25%)
1,137,304 (100%)
Total 168,606 (11%)
983,615 (66%)
16,262 (1%)
328,241 (22%)
1,496,724 (100%)
Source: JICA Study Team, based on Census 2009 data
The table above shows number of households of each water connection. Table 2.3.1 shows the estimated service population of each water connection, which is calculated by multiplying current population to the ratio of water connection shown in the table above.
Water provided by unregistered water vendors and water taken from streams, lakes, ponds without proper treatment are categorized as unimproved drinking water sources. Around 23% of the population get drinking water from such unimproved drinking water sources. Also, around 66% of the population get water from springs, wells or boreholes, which is the highest among six catchment areas. On the

Current Situation of Water Supply Final Report Chapter 2 Sectoral Report (C) Water Supply
The Development of C - 24 Nippon Koei Co., Ltd. the National Water Master Plan 2030
other hand, unprotected wells and springs are also categorized as unimproved drinking water sources, but the utilization ratio of unprotected ones is not known.
It was projected that the urban population would increase by 6.18 million while the rural population would decrease by 0.77 million by 2030, as shown in Section 3.2.4. Hence, the total population would come to 12.36 million in 2030, as shown in the table below.
Projected Population (LVNCA) (Unit: million persons)
Year Urban Population Rural Population Total 2010 1.53 5.43 6.97 2030 7.71 4.66 12.36
Source: JICA Study Team, based on Census 2009 data
Currently, piped water supply covers 31% of the urban population in the LVNCA, although the target coverage ratio in 2030 is 100%. It is therefore required to implement large-scale urban water supply system developments to cope with the rapid growth of the urban population and achieve the target coverage ratio of 100%.
The total capacity of piped water supply system (UWSS + LSRWSS) in LVNCA is estimated at 145,000 m3/day, which consists of 114,000 m3/day of completed systems and 31,000 m3/day of systems under construction. (Ref. Table 2.3.2) The total capacity of the UWSS is estimated at 135,000 m3/day, which consists of 104,000 m3/day of completed systems and 31,000 m3/day of systems under construction. (Ref. Table 2.3.3). The breakdowns of the water supply systems in LVNCA are shown in Tables 2.3.4, 2.3.5 and 4.3.1.
As for registered WSPs in the LVNCA, six urban WSPs and three rural WSPs carry out water supply services. According to the Performance Report of Kenya’s Water Services, No. 4, 2011 and the data from WSBs, the total capacity of piped water supply systems is 114,000 m3/day, and the total service population is 477,000. (The service population estimated by using the data of the Census 2009 is around 0.77 million as shown in Table 2.3.3. There is a difference between the two estimates.) As the estimate based on these data, the average water supply amount per person is 239 L/person/day including NRW. It is much higher than the national average of urban water supply amount, which is 65 L/person/day including NRW (36 L/person/day excluding NRW). The WSPs in the LVNCA have enough capacity for the current service population; however, the NRW ratio is quite high. Out of seven urban WSPs, five WSPs have records of more than 50% of NRW. The current situation of the WSPs in the LVNCA is shown in Table 2.3.6.
2.3.4 Lake Victoria South Catchment Area
The current population in the LVSCA in 2010 was estimated at 7.36 million. Out of the 7.36 million, the urban population was at 1.85 million, and the rural population at 5.51 million. The population is concentrated in the Kisumu and Kisii areas. Based on data from the 2009 Census, the current situation of water connection in the LVSCA was estimated, as shown in the table below.
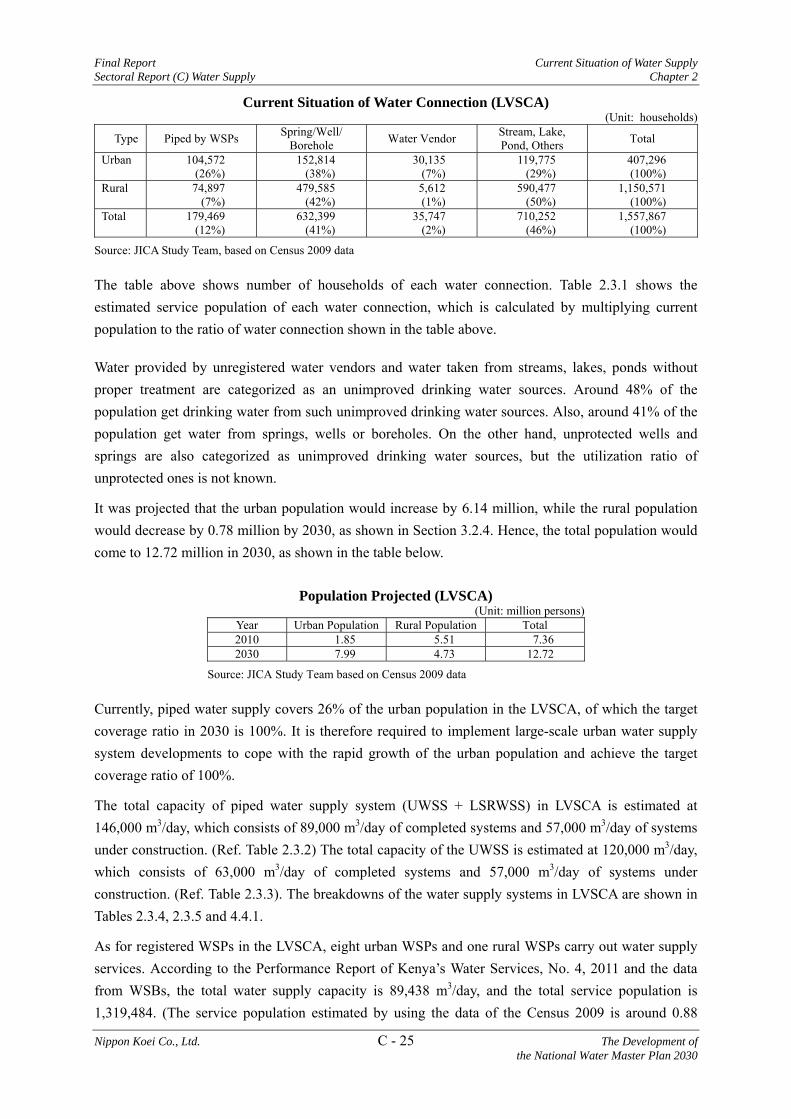
Final Report Current Situation of Water Supply Sectoral Report (C) Water Supply Chapter 2
Nippon Koei Co., Ltd. C - 25 The Development of the National Water Master Plan 2030
Current Situation of Water Connection (LVSCA) (Unit: households)
Type Piped by WSPs Spring/Well/ Borehole Water Vendor Stream, Lake,
Pond, Others Total
Urban 104,572 (26%)
152,814 (38%)
30,135 (7%)
119,775 (29%)
407,296 (100%)
Rural 74,897 (7%)
479,585 (42%)
5,612 (1%)
590,477 (50%)
1,150,571 (100%)
Total 179,469 (12%)
632,399 (41%)
35,747 (2%)
710,252 (46%)
1,557,867 (100%)
Source: JICA Study Team, based on Census 2009 data
The table above shows number of households of each water connection. Table 2.3.1 shows the estimated service population of each water connection, which is calculated by multiplying current population to the ratio of water connection shown in the table above.
Water provided by unregistered water vendors and water taken from streams, lakes, ponds without proper treatment are categorized as an unimproved drinking water sources. Around 48% of the population get drinking water from such unimproved drinking water sources. Also, around 41% of the population get water from springs, wells or boreholes. On the other hand, unprotected wells and springs are also categorized as unimproved drinking water sources, but the utilization ratio of unprotected ones is not known.
It was projected that the urban population would increase by 6.14 million, while the rural population would decrease by 0.78 million by 2030, as shown in Section 3.2.4. Hence, the total population would come to 12.72 million in 2030, as shown in the table below.
Population Projected (LVSCA) (Unit: million persons)
Year Urban Population Rural Population Total 2010 1.85 5.51 7.36 2030 7.99 4.73 12.72
Source: JICA Study Team based on Census 2009 data
Currently, piped water supply covers 26% of the urban population in the LVSCA, of which the target coverage ratio in 2030 is 100%. It is therefore required to implement large-scale urban water supply system developments to cope with the rapid growth of the urban population and achieve the target coverage ratio of 100%.
The total capacity of piped water supply system (UWSS + LSRWSS) in LVSCA is estimated at 146,000 m3/day, which consists of 89,000 m3/day of completed systems and 57,000 m3/day of systems under construction. (Ref. Table 2.3.2) The total capacity of the UWSS is estimated at 120,000 m3/day, which consists of 63,000 m3/day of completed systems and 57,000 m3/day of systems under construction. (Ref. Table 2.3.3). The breakdowns of the water supply systems in LVSCA are shown in Tables 2.3.4, 2.3.5 and 4.4.1.
As for registered WSPs in the LVSCA, eight urban WSPs and one rural WSPs carry out water supply services. According to the Performance Report of Kenya’s Water Services, No. 4, 2011 and the data from WSBs, the total water supply capacity is 89,438 m3/day, and the total service population is 1,319,484. (The service population estimated by using the data of the Census 2009 is around 0.88

Current Situation of Water Supply Final Report Chapter 2 Sectoral Report (C) Water Supply
The Development of C - 26 Nippon Koei Co., Ltd. the National Water Master Plan 2030
million as shown in Table 2.3.3. There is a difference between the two estimates.) As the estimate based on these data, the average water supply amount per person is 68 L/person/day including NRW. It is almost the same as the national average of urban water supply amount, which is 65 L/person/day including NRW (36 L/person/day excluding NRW). Also, it is almost the same as the design standard for water supply amount for non-individual connection. The WSPs in the LVSCA do not have enough capacity for individual connection consumers. High NRW ratios were recorded. Out of eight urban WSPs, three WSPs have records of more than 50% of NRW. The current situation of the WSPs in the LVSCA is shown in Table 2.3.7.
2.3.5 Rift Valley Catchment Area
The current population in the RVCA in 2010 was estimated at 4.86 million. Out of the 4.86 million, the urban population was at 1.41 million, and the rural population at 3.45 million. The population is concentrated in Nakuru area and Naivasha Area. Based on the 2009 Census data, the current situation of water connection of RVCA was estimated as shown below.
Current Situation of Water Connection (RVCA)
(Unit: households)
Type Piped by WSPs Spring/Well/ Borehole Water Vendor Stream/Lake/
Pond/Others Total
Urban 193,308 (52%)
80,577 (22%)
69,476 (19%)
27,920 (7%)
371,281 (100%)
Rural 94,777 (14%)
248,142 (37%)
23,866 (4%)
298,846 (45%)
665,631 (100%)
Total 288,085 (28%)
328,719 (32%)
93,342 (9%)
326,766 (31%)
1,036,912 (100%)
Source: JICA Study Team based on Census 2009 data
The table above shows number of households of each water connection. Table 2.3.1 shows the estimated service population of each water connection, which is calculated by multiplying current population to the ratio of water connection shown in the table above.
Water provided by unregistered water vendors and water taken from streams, lakes, ponds without proper treatment are categorized as unimproved drinking water sources. Around 40% of the population get drinking water from such unimproved drinking water sources. Also, around 31% of the population get water from springs, wells or boreholes. Unprotected wells and springs are categorized as unimproved drinking water source, but the utilization ratio of unprotected ones is not known.
It was projected that the urban population would increase by 3.08 million, while the rural population would decrease by 0.49 million by 2030, as shown in Section 3.2.4. Hence, the total population would come to 7.45 million in 2030, as shown in the table below.
Population Projected (RVCA) (Unit: million persons)
Year Urban Population Rural Population Total 2010 1.41 3.45 4.86 2030 4.49 2.96 7.45
Source: JICA Study Team based on Census 2009 data

Final Report Current Situation of Water Supply Sectoral Report (C) Water Supply Chapter 2
Nippon Koei Co., Ltd. C - 27 The Development of the National Water Master Plan 2030
Currently, the piped water supply covers 52% of the urban population in the RVCA, though the target coverage ratio in 2030 is 100%. It is therefore required to implement large-scale urban water supply system developments to cope with the rapid growth of the urban population and achieve the target coverage ratio of 100%.
The total capacity of piped water supply system (UWSS + LSRWSS) in RVCA is estimated at 136,000 m3/day, which consists of 98,000 m3/day of completed systems and 38,000 m3/day of systems under construction. (Ref. Table 2.3.2) The total capacity of the UWSS is estimated at 129,000 m3/day, which consists of 91,000 m3/day of completed systems and 38,000 m3/day of systems under construction. (Ref. Table 2.3.3). The breakdowns of the water supply systems in RVCA are shown in Table 2.3.4, 2.3.5 and 4.5.1.
As for registered WSPs in the RVCA, nine urban WSPs and five rural WSPs carry out water supply services. According to the Performance Report of Kenya’s Water Services, No. 4, 2011 and the data from WSBs, it was recorded that the total water supply capacity is 96,886 m3/day, and the total service population is 777,309. (The service population estimated by using the data of the Census 2009 is around 1.36 million as shown in Table 2.3.3. There is a difference between the two estimates.) As the estimate based on these data, it he average water supply amount per person is 125 L/person/day including NRW. It is higher than the national average of urban water supply amount, which is 65 L/person/day including NRW (36 L/person/day excluding NRW). Out of seven urban WSPs, four WSPs have records of more than 50% of NRW. The current situation of the WSPs in the RVCA is shown in Table 2.3.8.
2.3.6 Athi Catchment Area
The current population in the ACA in 2010 was estimated at 9.79 million. Out of the 9.79 million, the urban population was at 6.51 million, and the rural population at 3.28 million. The population is concentrated in the Nairobi and Mombasa areas. Based on data from the 2009 Census, the current situation of water connection in the ACA was estimated, as shown in the table below.
Current Situation of Water Connection (ACA)
(Unit: households)
Type Piped by WSPs Spring/Well/ Borehole Water Vendor Stream/Lake/
Pond/Others Total
Urban 1,150,553 (63%)
318,187 (18%)
304,906 (17%)
46,650 (3%)
1,820,296 (100%)
Rural 188,586 (28%)
223,687 (34%)
19,162 (3%)
237,075 (35%)
668,511 (100%)
Total 1,339,139 54%
541,874 22%
324,068 13%
283,725 11%
2,488,807 (100%)
Source: JICA Study Team based on Census 2009 data
The table above shows number of households of each water connection. Table 2.3.1 shows the estimated service population of each water connection, which is calculated by multiplying current population to the ratio of water connection shown in the table above.

Current Situation of Water Supply Final Report Chapter 2 Sectoral Report (C) Water Supply
The Development of C - 28 Nippon Koei Co., Ltd. the National Water Master Plan 2030
Water provided by unregistered water vendors and water taken from streams, lakes, ponds without proper treatment are categorized as unimproved drinking water sources. Around 24% of the population get drinking water from such unimproved drinking water sources. Also, around 22% of the population get water from springs, wells or boreholes. Unprotected wells and springs are categorized as unimproved drinking water sources, but the utilization ratio of unprotected ones is not known.
It was projected that the urban population would increase by 11.22 million, while the rural population would decreased by 0.47 million by 2030, as shown in Section 3.2.4. Hence, the total population would come to 20.54 million in 2030, as shown in the table below.
Population Projected (ACA) (Unit: million persons)
Year Urban Population Rural Population Total 2010 6.51 3.28 9.79 2030 17.73 2.81 20.54
Source: JICA Study Team based on Census 2009 data
Currently, piped water supply covers 63% of the urban population in the ACA, and this ratio is the highest among the six catchment areas. However, it is required to implement large-scale urban water supply system developments to cope with the rapid growth of the urban population and achieve the target coverage ratio of 100%.
The total capacity of piped water supply system (UWSS + LSRWSS) in ACA is estimated at 709,000 m3/day, which consists of 674,000 m3/day of completed systems and 35,000 m3/day of systems under construction. (Ref. Table 2.3.2) The total capacity of the UWSS is estimated at 699,000 m3/day, which consists of 664,000 m3/day of completed systems and 35,000 m3/day of systems under construction. (Ref. Table 2.3.3). The breakdowns of the water supply systems in ACA are shown in Table 2.3.4, 2.3.5 and 4.6.1.
Around 54% of the population in the catchment area are supplied with water through pipes by registered WSPs. As for Nairobi and satellite towns, according to the Performance Report of Kenya’s Water Services, No. 4, 2011 and the data from WSBs, 11 registered urban WSPs and seven registered rural WSPs manage the water supply systems to cover 2.96 million of the service population with 572,213 m3/day of water supply capacity. The NRW ratio in the area is relatively lower than the other areas. Out of the 11 urban WSPs, only two WSPs have records of more than 50% of NRW. The current situation of the WSPs in Nairobi and satellite towns is shown in Table 2.3.9.
As for Mombasa and the surrounding coastal area, according to the Performance Report of Kenya’s Water Services, No. 4, 2011 and the data from WSBs, the water supply system managed by registered WSPs covers 1.46 million of the service population. Table 2.3.10 shows six urban WSPs of which total water supply capacity is 87,520 m3/day. The NRW ratio in the area is also relatively lower than the other areas. No WSPs have records of more than 50% of NRW. The current situation of the WSPs in Mombasa and the surrounding coastal area are shown in Table 2.3.10. Also, the situation of other areas in the ACA is shown in Table 2.3.11.
Two studies: ”Feasibility Study and Master Plan for Developing New Water Sources for Nairobi and Satellite Towns” and ”Water Supply Master Plan for Mombasa and Other Towns Within the Coast

Final Report Current Situation of Water Supply Sectoral Report (C) Water Supply Chapter 2
Nippon Koei Co., Ltd. C - 29 The Development of the National Water Master Plan 2030
Province” are still under implementation by the World Bank fund. The water sources development plans proposed or studied in these studies are same as those of NWMP 2030.
2.3.7 Tana Catchment Area
The current population in the TCA in 2010 was estimated at 5.74 million. Out of the 5.74 million, the urban population was at 1.04 million, and the rural population at 4.70 million. The urban population ratio is relatively low; therefore, the population growth is relatively low as compared with the other catchment areas. Based on data from the 2009 Census, the current situation of water connection in the TCA was estimated, as shown in the table below.
Current Situation of Water Connection (TCA)
(Unit: households)
Type Piped by WSPs Spring/Well/ Borehole Water Vendor Stream/Lake/
Pond/Others Total
Urban 157,302 (58%)
44,163 (16%)
15,502 (6%)
54,700 (20%)
271,667 (100%)
Rural 314,306 (29%)
292,803 (27%)
32,568 (3%)
455,457 (42%)
1,095,134 (100%)
Total 471,608 (34%)
336,966 (25%)
48,070 (4%)
510,157 (37%)
1,366,801 (100%)
Source: JICA Study Team based on Census 2009 data
The table above shows number of households of each water connection. Table 2.3.1 shows the estimated service population of each water connection, which is calculated by multiplying current population to the ratio of water connection shown in the table above.
Water provided by unregistered water vendors and water taken from streams, lakes, ponds without proper treatment are categorized as unimproved drinking water sources. Around 41% of the population get drinking water from such unimproved drinking water sources. Also, around 25% of the population get water from springs, wells or boreholes. Unprotected wells and springs are categorized as unimproved drinking water sources, but the utilization ratio of unprotected ones is not known.
It was projected that the urban population would increase by 5.30 million while the rural population would decrease by 0.67 million by 2030, as shown in Section 3.2.4. Hence, the total population would come to 10.37 million in 2030, as shown in the table below.
Population Projected (TCA) (Unit: million persons)
Year Urban Population Rural Population Total 2010 1.04 4.70 5.74 2030 6.34 4.03 10.37
Source: JICA Study Team based on Census 2009 data
Currently, piped water supply covers 58% of the urban population in the TCA. The ratio is relatively high. Large-scale urban water supply system developments have been under implementation in order to meet the future water demand. It can be said that water supply system development is well advanced in TCA.

Current Situation of Water Supply Final Report Chapter 2 Sectoral Report (C) Water Supply
The Development of C - 30 Nippon Koei Co., Ltd. the National Water Master Plan 2030
The total capacity of piped water supply system (UWSS + LSRWSS) in TCA is estimated at 255,000 m3/day, which consists of 245,000 m3/day of completed systems and 10,000 m3/day of systems under construction. (Ref. Table 2.3.2) The total capacity of the UWSS is estimated at 106,000 m3/day, which consists of 96,000 m3/day of completed systems and 10,000 m3/day of systems under construction. (Ref. Table 2.3.3). The breakdowns of the water supply systems in TCA are shown in Table 2.3.4, 2.3.5 and 4.7.1.
Table 2.3.12 shows the current situation of 11 urban WSPs and 18 rural WSPs, of which the total water supply capacity is 232,358 m3/day. According to the Performance Report of Kenya’s Water Services, No. 4, 2011 and the data from WSBs, 11 registered urban WSPs and 18 registered rural WSPs carry out water supply services, and the total water supply capacity is 232,358 m3/day for a service population of 1.41 million. (The service population estimated by using the data of the Census 2009 is around 1.95 million as shown in Table 2.3.3. There is a difference between the two estimates.) As the estimate based on these data, the average water supply amount per person is 170 L/person/day including NRW. It is higher than the national average of urban water supply amount of 65 L/person/day including NRW (36 L/person/day excluding NRW). Out of 11 urban WSPs, four WSPs have records of more than 50% of NRW.
It should be mentioned that the water supply capacity of the rural WSPs is 130,972 m3/day, which is larger than the capacity of the urban WSPs.
2.3.8 Ewaso Ng’iro North Catchment Area
The current population in the ENNCA in 2010 was estimated at 3.82 million. Out of this, the urban population was at 0.74 million, and the rural population at 3.08 million. Based on data from the 2009 Census, the current situation of water connection in the ENNCA was estimated, as shown in the table below.
Current Situation of Water Connection (ENNCA)
(Unit: households)
Type Piped by WSPs Spring/Well/ Borehole Water Vendor Stream/Lake/
Pond/Others Total
Urban 69,641 (48%)
38,588 (26%)
18,893 (13%)
19,522 (13%)
146,644 (100%)
Rural 108,085 (20%)
241,254 (44%)
36,439 (7%)
162,083 (30%)
547,861 (100%)
Total 177,726 (26%)
279,842 (40%)
55,332 (8%)
181,605 (26%)
694,505 (100%)
Source: JICA Study Team based on Census 2009 data
The table above shows number of households of each water connection. Table 2.3.1 shows the estimated service population of each water connection, which is calculated by multiplying current population to the ratio of water connection shown in the table above.
Water provided by unregistered water vendors and water taken from streams, lakes, ponds without proper treatment are categorized as unimproved drinking water sources. Around 34% of the population get drinking water from such unimproved drinking water sources. Also, around 40% of the population

Final Report Current Situation of Water Supply Sectoral Report (C) Water Supply Chapter 2
Nippon Koei Co., Ltd. C - 31 The Development of the National Water Master Plan 2030
get water from springs, wells or boreholes. Unprotected wells and springs are also categorized as unimproved drinking water sources, but the utilization ratio of unprotected ones is not known.
It was projected that the urban population would increase by 1.02 million while the rural population would decrease by 0.43 million by 2030, as shown in Section 3.2.4. Hence, the total population would come to 4.40 million in 2030, as shown in the table below.
Population Projected (ENNCA) (Unit: million persons)
Year Urban Population Rural Population Total 2010 0.74 3.08 3.82 2030 1.76 2.64 4.40
Source: JICA Study Team based on Census 2009 data
The population growth is expected to be relatively low, due to the large proportion of arid area in ENNCA. Therefore, the scale of urban water supply system development is rather small than other catchment areas.
The total capacity of piped water supply system (UWSS + LSRWSS) in ENNCA is estimated at 39,000 m3/day, which consists of 28,000 m3/day of completed systems and 11,000 m3/day of systems under construction. (Ref. Table 2.3.2) The total capacity of the UWSS is estimated at 32,000 m3/day, which consists of 21,000 m3/day of completed systems and 11,000 m3/day of systems under construction. (Ref. Table 2.3.3). The breakdowns of the water supply systems in ENNCA are shown in Tables 2.3.4, 2.3.5 and 4.8.1.
According to the Performance Report of Kenya’s Water Services, No. 4, 2011 and the data from WSBs, the water supply system managed by the registered WSPs covers 0.49 million service population, and nine urban WSPs and three rural WSPs have a total water supply capacity of 40,500 m3/day. (The service population estimated by using the data of the Census 2009 is around 0.99 million as shown in Table 2.3.3. There is a difference between the two estimates.) As the estimate based on these data, the average water supply amount per person was estimated at 82 L/person/day including NRW. It is almost same level of the national average of urban water supply amount of 65 L/person/day including NRW (36 L/person/day excluding NRW). The NRW ratio is relatively high. Out of nine urban WSPs, four WSPs have records of more than 50% of NRW. The current situation of the WSPs in the ENNCA are shown in Table 2.3.13.
2.4 Ongoing Projects and Existing Plans
The MWI provided a copy of their internal donor matrix dated November 2009 and updated in 2010. The schemes in the matrix, particularly on the water supply and sanitation sector, are provided in Table 2.4.1. While this provides useful background information, it lacks significant technical details. Table 2.4.2 shows the existing water supply systems, Table 2.4.3 shows the list of ongoing construction projects for water supply system development, and Table 2.4.4 shows the projects proposed and planned by the WSBs.

Current Situation of Water Supply Final Report Chapter 2 Sectoral Report (C) Water Supply
The Development of C - 32 Nippon Koei Co., Ltd. the National Water Master Plan 2030
2.5 Operation and Maintenance Issues
From discussions with the WSBs, it was evident that only few WSPs are able to provide water for 24 hours per day basis. The key challenges are water availability and the high cost of power supply. Even in Tana, where water is generally more available, only three of the 24 WSPs (Nyeri, Meru and Embu which rely on gravity-fed supplies) have 24-hour water supply. It is generally recognized that the intermittent nature of system operations is contributing to water quality issues.
The WSBs reported that majority of the water supply and sewerage systems are in need of rehabilitation. There are a number of clear exceptions, such as Nyeri and Kisumu, but systems are dilapidated. Filters and chemical dosing equipment are in poor condition and the treatment plants are overloaded as more water is being forced through than desirable resulting in water quality issues.
With the increasing levels of catchment degradation, problems are being experienced due to the silting of dams and increased water turbidity. Some WSBs reported that chemical use in water treatment is increasing in order to cope with the worsening raw water quality.
As shown in Table 2.2.2, the percentage of NRW is high. However, it should be recognized that the quoted figures are only very rough estimates as:
a) There are very few production meters in place; b) There are very few bulk meters in the distribution system; c) There are insufficient customer connection meters (estimated at 40%) and many of those
that are in place do not function; and d) Many connections are rated as “flat rate” for billing purposes and the water accounting
system assumes that such connections use 10 m3 per month when in reality significantly larger volumes are used. One test recorded a usage of 87 m3 for a flat rate connection.
Most WSB managers consider that the bulk of the NRW is due to commercial losses rather than physical losses, although it was recognized that many of the pipe networks are indeed very old. It is also evident that there are a significant number of illegal connections, and in many cases, the water is being used for irrigation.
In the past, there was political pressure to expand the coverage of the water distribution systems. This means that today, there are many areas that have pipes but no water, yet it is understood that these areas are included in the statistics as being covered.
2.6 Challenges and Key Issues
(1) Low Ratio of Water Supply Development Against the Targets
It is evident that the previous targets set for future water supply and sanitation coverage have not been met. The NWMP (1992)’s adopted target was the “provision of safe and reliable water within a reasonable distance to all the population in the year 2010”, although under the Aftercare Study (1998) this was downgraded to 95% coverage in the urban areas and 70% coverage in the rural areas by the same year. The current study estimates for actual water supply coverage are still 64% in the urban areas and 38% in the rural areas (46% overall).

Final Report Current Situation of Water Supply Sectoral Report (C) Water Supply Chapter 2
Nippon Koei Co., Ltd. C - 33 The Development of the National Water Master Plan 2030
(2) Rapid Increase of Urban Population
The future national population projected for this study indicated an urban population of 46 million (68% of total), growing from 13 million (34%) in 2010. In order to achieve one of the targets, which is to have 100% coverage of the urban population with piped water supply, it is required to develop large-scale piped water supply systems for the new urban population.
(3) Insufficient Water Saving and High Level of NRW
Little mention is made of either water saving measures or the reuse of treated wastewater in the government’s strategy or sector planning documents reviewed, with discussions being limited to overall philosophy rather than detailed measures. The potential for water reuse is, however, included in the terms of reference for the recently commenced bulk water supply study for the Athi WSB under AFD and World Bank funding. It is good to note that the Athi WSB has already recognized that they have “no choice” in the matter.
The NRW levels are very high in Kenya and in many cases exceed 60%. It is very clear that priority needs to be given to leakage reduction as a precursor to obtaining high investments. Consideration needs to be given to limiting investments to those areas which have achieved a reduction in NRW to a certain threshold level.
It is good to note that water harvesting is becoming a serious consideration, and as climate change proceeds, it is essential that this potential resource is fully exploited.
(4) Need of Rehabilitation of the Existing Water Supply System
As stated in Subsection 5.2.5, the WSBs reported that majority of the water supply and sewerage systems are in need of rehabilitation. The systems have been dilapidated. Filters and chemical dosing equipment are in poor condition and the treatment plants are overloaded.
Furthermore, it is more practical and economical to maximize the use of existing facilities through rehabilitation instead of new development in order to sufficiently serve the increased demands of water supply.

Present and Future Water Demands Final Report Chapter 3 Sectoral Report (C) Water Supply
The Development of C - 34 Nippon Koei Co., Ltd. the National Water Master Plan 2030
CHAPTER 3 PRESENT AND FUTURE WATER DEMANDS
3.1 General
Chapter 3 presents the current and future situations of the population, economic indices and water demand. The current situations have been estimated, based on data from the 2009 Census and other available official data. The conditions in 2030 are projected based on Kenya Vision 2030. The projections are used for the planning conditions of the NWMP. The conditions in 2050 are projected based on official information and some assumptions by the JICA Study Team. The projections are used as reference values in the study.
(1) Population Projection
The total national population (urban and rural population) of Kenya in 2030 was projected in Kenya Vision 2030. However, Kenya Vision 2030 does not show population projections by each urban centre, district and county. These projections were carried out in the study, and were used for planning the conditions of the NWMP 2030. The total national population (urban and rural population) of Kenya in 2050 was projected by the United Nations World Urbanization Prospects (2011 version), and it is used as a reference value in the study.
(2) Economic Indices Projection
The projection of GDP was presented in Kenya Vision 2030, which was published in 2007, and in 2012, the Kenya Vision 2030 Office modified the projection of GDP growth by 2030. The projection of GDP from 2030 to 2050 was assumed by the Study Team.
(3) Water Demand Projection
The following five types of water demands were projected for 2030 and 2050:
1) Domestic Water Demand
The domestic water demand includes residential water demand, institutional water demand and commercial water demand. The residential water demand was estimated based on the projected population and the unit water demand given in the “Guidelines for Water Allocation (WRMA, 2010)1”. The institutional and commercial water demands were calculated by considering the proportion of the residential water demand.
2) Industrial Water Demand
The industrial water demand was estimated considering the proportion of the residential water demand and the economic growth rate.
1 Ref. Sectoral Report (H) 2.3.1 (7) 5).

Final Report Present and Future Water Demands Sectoral Report (C) Water Supply Chapter 3
Nippon Koei Co., Ltd. C - 35 The Development of the National Water Master Plan 2030
3) Livestock Water Demand
The livestock water demand was estimated considering the projected number of livestock units and the unit water demand given in the “Guidelines for Water Allocation (WRMA, 2010)”.
4) Wildlife Water Demand
The wildlife water demand was estimated considering the projected number of wildlife and the unit water demand.
5) Inland Fisheries Water Demand
The inland fisheries water demand was estimated considering the projected area of fish ponds and the unit water losses from evaporation and percolation.
The irrigation water demand projection is presented in Sectoral Report (E).
3.2 Population Projection
3.2.1 Base Data
The latest available information regarding population and its distribution is the 2009 Census. Thus, the study will be formulated based on such data.
Population distribution and composition is one of the most basic information required in formulating a water resources development plan. There are two main composition categories that are central to the plan. These are urban and rural population. The split is required in order to assess the service levels of water supply in both rural and urban areas as these are distinctly different in Kenya.
There are also two main distribution categories that are critical to the development of the plan: spatial distribution by administrative boundary, and spatial distribution by basin/catchment boundary. The former is required for the assessment of the present and future water demands in order to develop the water supply services plan while the latter is for calculation of water balance and water resources management plan.
Based on the 2009 Census the population data is distributed based on provinces, districts, divisions, locations, and sublocations.
(1) Administrative Distribution
Currently, planning and implementation of water supply services are facilitated through the WSBs, which include multiple districts under their area of operations and the overlap of boundaries is minimal. As such, it is considered that assessment of population data at district level is sufficient for assessment of future water demand and the development of water services plans per board. The water sector in Kenya though is undergoing further changes following the implementation of the new 2010 Constitution. The future of the WSBs is uncertain, and plans to devolve water supply services to each county are under consideration. The 2009 Census does not provide data as distributed by county, therefore the district boundaries will be used. Counties similarly with WSBs include multiple districts

Present and Future Water Demands Final Report Chapter 3 Sectoral Report (C) Water Supply
The Development of C - 36 Nippon Koei Co., Ltd. the National Water Master Plan 2030
within their boundaries, therefore a redistribution of the water demand per county will be possible in the future. Some adjustments on districts that cross over county boundaries may be required, but this are not considered as major revisions based on current information.
(2) Basin Distribution
For the water resources development plan, water demand distribution per river basin and river sub-basin is required. Domestic water demand was calculated directly in relation to population. Since neither the 2009 Census nor other sources provide basin population data, this study overlaid the sub-basin boundaries and available province, district and division boundaries. It was identified that districts were too large compared to the size of the sub-basins, therefore, the river basin domestic water demand will be estimated on the basis of the division population distribution from the 2009 Census data. The basin distribution will employ the ratio method to redistribute the division population derived water demand into the sub-basins. The methodology to be adopted is as follows.
If a division falls wholly within a sub-basin boundary, 100% of the urban and rural demands would be assigned to that sub-basin. In the case that a division crosses over two or more sub-basins, then (i) the urban demand will be allotted as a % depending on the urban spread within the sub-basin, and (ii) the rural population will be distributed proportionally to the division part area that is included in the sub-basin. Some adjustments will be required for (i) urban areas that cross sub-basin boundaries and (ii) areas that are known not to have any population.
3.2.2 Planning Horizon
In order to prepare projections, it is necessary to define the planning horizon for the study by setting the target years. In this study, the target years are dictated by various factors such as the following:
Standards and design criteria for water supply systems, Conformity with national and regional strategies and development plans, and The scope of works of this master plan.
Following a review of the above factors, it was determined that the planning horizon will be as follows:
Year 2010: This is the base year of the study. Year 2030: This is the target year for the NWMP 2030 in line with Kenya Vision 2030, and
the general practice of adopting a 20-year look-ahead for this type of studies. Year 2050: This is to allow an additional/extended 20-year planning horizon required in
assessing longer term climate change effects on the country’s water resources.
3.2.3 Population Projection
Kenya Vision 2030 presents the future population up to 2032 using the 1999 Census results as the base year. The figure below has been extracted from the Kenya Vision 2030 document and shows the projected population figures.

Final Report Present and Future Water Demands Sectoral Report (C) Water Supply Chapter 3
Nippon Koei Co., Ltd. C - 37 The Development of the National Water Master Plan 2030
19%Urban population%
26% 32% 38% 47% 56% 63% 68%
26.6
20221999
27.1
20172012
22.725.3 26.5
2007 2027
22.3
2032
20.2
2030
24.6
Urban population in millionsRural population in millions
23.1
16.9
5.4 9.012.3
38.243.4
31.7
28.2Total PopulationMillions
34.3 38.8 43.9 49.7 56.2 60.5 63.6
Urban dwellers exceed half the country’s population and overtake rural dwellers
Note: * Based on projections from 1999 National Census Source: CBS
Population Projection by Kenya Vision 2030
Comparison of the 2009 Census results and the Kenya Vision 2030 projections shows that the population projection in 2012 in Kenya Vision 2030 of 38.8 million has already been reached in 2009 (38.6 million). This indicates either an underestimation of the Kenya Vision 2030 projection or erroneous results of the latest census.
The full results of the latest census were not available at the time of this analysis but the census report highlighted some anomalous results in eight districts, wherein the data indicating a rate of increase was higher than the population dynamics (births, deaths, etc.). Age and sex profiles deviated from the norm, and significant growth was observed in household size without the accompanying growth in the number of households (refer to the 2009 Census). Eight anomalous districts were extracted and their population results were compared with results from the 1999 Census as projected to 2009, using Kenya Vision 2030’s growth rates.
Correction of Census 2009 Population Districts 2009 Census Population 1999 Census Population
Projected to 2009* Difference
Lagdera 245,123 207,966 37,157 Wajir East 224,418 145,964 78,454 Mandera (Central, East, West) 1,025,756 321,062 704,694 Turkana (Central, North, South) 855,399 564,075 291,324
Note: * Based on Kenya Vision 2030 growth rates Source: JICA Study Team, based on Census 2009
Based on the 1999 Census projected to 2009, Mandera should have a total population of 321,062 as opposed to 1,025,756. This is a difference of 704,694 people. Similarly, Turkana has a difference of 291,324, Lagdera with 37,157, and Wajir East with 78,454. The total difference is 1.112 million. This indicates that the 2009 Census population should be approximately 37.5 million (38.61 million – 1.112 million), which closes the gap with Kenya Vision 2030.

Present and Future Water Demands Final Report Chapter 3 Sectoral Report (C) Water Supply
The Development of C - 38 Nippon Koei Co., Ltd. the National Water Master Plan 2030
Following this correction, the 2009 Census population is still ahead of Kenya Vision 2030; however, it is believed that the residual difference was probably due to an underestimation of the Kenya Vision 2030 projection based on information from the MWI stating that family planning policies have not been effective in the last decade and an increase in birth rates has been observed. It is expected that the policies will be more efficient in the future and birth rates are expected to fall. Based on such information and assumptions, the study adopts the 2009 Census data as the base year, adjusted for the anomalies in eight districts, and projects this data based on the Kenya Vision 2030 growth rates presented below.
Note: Projections for Years 2010 and 2011 utilised Yearly growth rates calculated from Kenyan Vision 2030
Average Population Growth Rate in Kenya Vision 2030
Projections beyond 20 years are not available and very difficult to predict. The population of 2050 is based on the result of UN World Urbanization Prospects (2011 Revision). The proportion of urban and rural population is same as the estimate of 2030 population estimate.
The table below summarises the national population projected based on the procedure mentioned above.
Population Projection for 2030 and 2050 (Unit: million persons)
Year 2009 (Census)* 2010 2030 2050 Area No. % No. % No. % No. %
Urban 12.29 32.8 13.08 33.9 46.02 67.8 65.69 67.8 Rural 25.11 67.2 25.45 66.1 21.82 32.2 31.20 32.2 Total 37.40 100.0 38.53 100.0 67.84 100.0 96.89** 100.0
Note: *2009 Census Population adjusted for eight anomalous districts **UN World Urbanization Prospects: The 2011 Revision Source: JICA Study Team based on Kenya Vision 2030 and UN projection
3.2.4 Population Distribution Forecast
(1) General
Kenya Vision 2030 shows the forecast of the total population of Kenya; however, it does not show the population of each urban centre or district in Kenya. The study will estimate the population distribution in Kenya. It will show the urban population of each urban centre, and the rural population of each district and county.

Final Report Present and Future Water Demands Sectoral Report (C) Water Supply Chapter 3
Nippon Koei Co., Ltd. C - 39 The Development of the National Water Master Plan 2030
(2) Population Growth Rate
Based on the population projection data of Kenya Vision 2030 and the UN World Urbanization Prospects, the population growth rates of Kenya were calculated, as shown in the table below.
Population Growth Rate in Kenya Vision 2030 (Unit: million persons)
Items Population Growth Rate
2010 2030 2050 From 2010 to 2030 2030 to 2050 Urban 13.08 46.02 65.69 351.8% 142.7% Rural 25.45 21.82 31.20 85.7% 143.0% Total 38.53 67.84 96.89 176.1% 142.8%
Source: JICA Study Team based on Kenya Vision 2030 and UN projection
The population growth rate will not be uniform in each area. For the population projection, population is divided into the following three groups:
Urban population living in 137 major urban centres, which have more than 10,000 population in the 2009 Census (a list of the 137 urban centres is shown in Table 3.2.1)
Urban population living outside the 137 urban centres Rural population
The planning population growth rate between 2010 and 2030 are set as below;
1) 137 Major Urban Centres
As for Nairobi and Mombasa, the population projections and growth rates follow the reports of the “Feasibility Study and Master Plan for Developing New Water Sources for Nairobi and Satellite Towns (Draft), 2011” and the “Quarterly Management Progress Report, Coast Water Service Board, 2009”. These growth rates were set much lower than the average population growth rate of the urban population of Kenya because Nairobi and Mombasa seem to have only limited space for development.
As for the 25 developed urban centres located in the surrounding areas of Nairobi and Mombasa, a medium level of population growth rate of 6.5% was adopted. It is the same as the average population growth rate of the urban population.
As for the 16 urban centres in arid areas, a low population growth rate of 1.0% was adopted because of the hard climate conditions in arid areas.
As for Lamu, the forecast follows the existing development plan. As for other urban centres in the 137 major urban centres, a population growth rate of
8.0% was adopted because there seems to have more space for development than other urban centres.
2) Urban Population Outside the 137 Urban Centres
As for urban population outside of the major 137 urban centres, a population growth rate of 7.8% was adopted. Such rate was determined considering the adjustment of the total population projection in 2030.

Present and Future Water Demands Final Report Chapter 3 Sectoral Report (C) Water Supply
The Development of C - 40 Nippon Koei Co., Ltd. the National Water Master Plan 2030
3) Rural Population
For the overall rural population of Kenya, a uniform population growth rate of -0.9% was adopted.
The planning population growth rates between 2030 and 2050 are as shown in the table below.
Planning Population Growth Rate
Items Urban Centres/ Area Growth Rate between
2010 and 2030
Growth Rate between
2030 and 2050 Urban Population
1) Nairobi Mombasa
193.9% (3.2%/year) 281.9% (5.1%/year)
142.7% (1.7%/year)
2) 25 Developed Urban Centres 375.3% (6.5%/year) 3) 16 Urban Centres in Arid Areas 123.2% (1.0%/year) 4) Lamu (having a large-scale development plan) 5,984.6% 5) The Other 93 of the 137 Major Urban Centres 503.4% (8.0%/year) 6) Urban Population Outside the 137 Major Urban Centres
486.5% (7.8%/year)
Average 351.8% (6.2%/year)
Rural Population 83.5% (-0.9%/year) 143.0%
(1.7%/year)
National Average 176.1% (2.7%/year) 142.8% (1.7%/year)
Source: JICA Study Team based on information from MWI and WSBs
(3) Result of Population Distribution
The results of population projection (2030) of 137 Urban Centres is shown in Table 3.2.1. The population projection, 2030 by each Catchment Area is shown in Table 3.2.2, and the population projection, 2030 by each County are shown in Table 3.2.3. The summary of population projection is shown in the table below;
Population Projection by Catchment Area (unit: million persons)
Catchment Area
2010 2030 2050 Urban Rural Total Urban Rural Total Urban Rural Total
LVNCA 1.53 5.43 6.96 7.71 4.65 12.36 11.00 6.66 17.66LVSCA 1.85 5.52 7.37 7.99 4.73 12.72 11.41 6.76 18.17RVCA 1.41 3.45 4.86 4.49 2.96 7.45 6.41 4.23 10.64ACA 6.51 3.28 9.79 17.73 2.81 20.54 25.31 4.02 29.33TCA 1.04 4.69 5.73 6.34 4.03 10.37 9.05 5.76 14.81ENNCA 0.74 3.08 3.82 1.76 2.64 4.40 2.51 3.77 6.28
Total 13.08 25.45 38.53 46.02 21.82 67.84 65.69 31.20 96.89
Source: JICA Study Team (Prepared based on Tables 3.2.1 to 3.2.3.)
The population densities in Kenya in 2010 and as projected in 2030 are shown in Figures 3.2.1 and 3.2.2, respectively.

Final Report Present and Future Water Demands Sectoral Report (C) Water Supply Chapter 3
Nippon Koei Co., Ltd. C - 41 The Development of the National Water Master Plan 2030
3.3 Economic Indices Projection
3.3.1 Base Data and Current Situation
The economic indices and GDP data are required to assist with the projection of mainly industrial water demand. GDP is widely considered as a parameter directly related to industrial growth and in turn, to the increase in water demand by the industrial sector.
GDP has increased from a weak 2.9% in 2003 to 7% in 2007 indicating a remarkable recovery. On average, real GDP expanded by 5.3%. Industrial output also expanded by about 5.3% in the same period in line with GDP. Kenya Vision 2030 sets a very ambitious plan aiming to achieve a 10% GDP on an annual basis up to 2030. The sector must, however, surmount some challenges, including high fuel prices, exchange rate risks, inadequate and unreliable power supply, world economic crisis, and global and regional instability.
The 2011 Budget Outlook Paper (BOPA) provides the most updated information on the country’s current economic performance and will form the basis of the GDP projection under this study, in conjunction with the overall aim of Kenya Vision 2030 to achieve 10% GDP, if not by 2012, at least by 2030,.
3.3.2 GDP Projection
According to the BOPA, after a weak performance in 2008/09 wherein real GDP growth dropped to 2.1% from 7% in 2007, the Kenyan economy has been recovering and achieved a peak GDP of 5.1% in mid-2010. The paper expects real GDP to rebound to 2007 levels in the medium term and accelerate towards Kenya Vision 2030’s target in the later years. In line with this statement, the medium-term GDP projection given in the paper showed that GDP would increase from 3.8% in the 2009/10 fiscal year to 6.8% in 2013/14.
Considering this situation, Kenya Vision 2030 indicated a revised projection of future economic growth rate, such that the 10% GDP growth would be gradually achieved by 2016, and stay as it is until 2023, before gradually decreasing from 2024. The projected GDP growth rate is as shown in the table below.
Projected GDP Growth Rate Year % Year % Year % Year % 2010 4 2016 10 2021 10 2026 9 2011 5 2017 10 2022 10 2027 9 2012 6 2018 10 2023 10 2028 8 2013 7 2019 10 2024 9 2029 8 2014 8 2020 10 2025 9 2030 8 2015 9
Source: Kenya Vision 2030 Secretariat
It is not possible to carry out projections for the next 20 years in similar detail as above due to the lack of long-term data and unpredictable nature of relevant parameters. For this study, it was assumed that

Present and Future Water Demands Final Report Chapter 3 Sectoral Report (C) Water Supply
The Development of C - 42 Nippon Koei Co., Ltd. the National Water Master Plan 2030
following the implementation of Kenya Vision 2030, the Kenyan economy would have reached a level of relative maturity and with reference to current GDP rates of stable economies where a GDP rate of 4% per year is applied.
3.4 Domestic Water Demand
3.4.1 General
Domestic water demand is comprised of residential water demand, institutional water demand and commercial water demand. The results of the water demand projection for 2030 could be used for the purposes of conducting the water balance study for water resource development planning, and formulating water supply projects to meet the water demand in 2030. The water demand in 2050 is used for assessment of the vulnerability of water resources in the future considering the effects of climate change.
Water demand calculations basically follow the methodology set out in the MWI Design Manual for Water Supply in Kenya, October 2005. Such methodology is also given in the “Guidelines for Water Allocation (WRMA, 2010)”. The calculations were carried out using data on population projection, unit water consumption ratio, ratio of institutional/commercial water use, and NRW ratio.
3.4.2 Present Water Demand
For the calculation of water demand in 2010, the population was estimated based on the 2009 Census, and the urban and rural water consumption rates, in L/person/day, were taken from the MWI Design Manual. The water consumption rates are given in the table below.
Design Water Consumption Ratio (Unit: L/person/day)
Consumer Urban Areas Rural Areas
High-Class Housing
Medium-ClassHousing
Low-Class Housing
High Potential
Medium Potential
Low Potential
People with individual connections 250 150 75 60 50 40 People without connections - - 20 20 15 10
Source: MWI Design Manual for Water Supply in Kenya
The MWI Design Manual states that the water consumption rates include an allowance of 20% for water losses through leakage and wastage. While this figure is appropriate for the design of future systems, it is evident that current losses are much higher than this. Therefore, for the calculation of the “at source” water demand in 2010, losses of 40% have been adopted.
In line with common international practice and bearing in mind the lack of raw data, institutional demand was calculated on the basis of 10% of the residential demand for both the urban and rural scenarios. A similar approach has been taken for commercial demand, although in this case, 15% was applied for the urban scenario and 10% for the rural scenario.
In line with the targets of Kenya Vision 2030, it was assumed that 100% of the population would be served with improved supplies by 2030 and this high standard would be maintained through toward
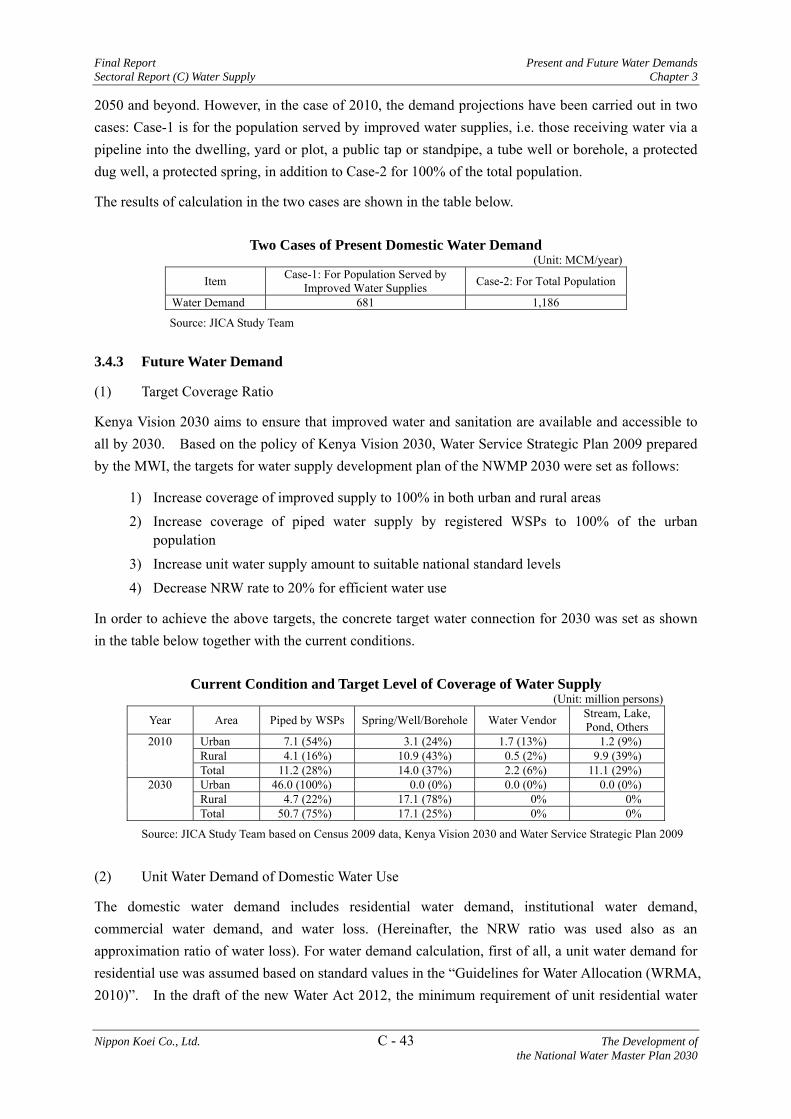
Final Report Present and Future Water Demands Sectoral Report (C) Water Supply Chapter 3
Nippon Koei Co., Ltd. C - 43 The Development of the National Water Master Plan 2030
2050 and beyond. However, in the case of 2010, the demand projections have been carried out in two cases: Case-1 is for the population served by improved water supplies, i.e. those receiving water via a pipeline into the dwelling, yard or plot, a public tap or standpipe, a tube well or borehole, a protected dug well, a protected spring, in addition to Case-2 for 100% of the total population.
The results of calculation in the two cases are shown in the table below.
Two Cases of Present Domestic Water Demand (Unit: MCM/year)
Item Case-1: For Population Served by Improved Water Supplies Case-2: For Total Population
Water Demand 681 1,186
Source: JICA Study Team
3.4.3 Future Water Demand
(1) Target Coverage Ratio
Kenya Vision 2030 aims to ensure that improved water and sanitation are available and accessible to all by 2030. Based on the policy of Kenya Vision 2030, Water Service Strategic Plan 2009 prepared by the MWI, the targets for water supply development plan of the NWMP 2030 were set as follows:
1) Increase coverage of improved supply to 100% in both urban and rural areas 2) Increase coverage of piped water supply by registered WSPs to 100% of the urban
population
3) Increase unit water supply amount to suitable national standard levels 4) Decrease NRW rate to 20% for efficient water use
In order to achieve the above targets, the concrete target water connection for 2030 was set as shown in the table below together with the current conditions.
Current Condition and Target Level of Coverage of Water Supply (Unit: million persons)
Year Area Piped by WSPs Spring/Well/Borehole Water Vendor Stream, Lake, Pond, Others
2010 Urban 7.1 (54%) 3.1 (24%) 1.7 (13%) 1.2 (9%) Rural 4.1 (16%) 10.9 (43%) 0.5 (2%) 9.9 (39%) Total 11.2 (28%) 14.0 (37%) 2.2 (6%) 11.1 (29%)
2030 Urban 46.0 (100%) 0.0 (0%) 0.0 (0%) 0.0 (0%) Rural 4.7 (22%) 17.1 (78%) 0% 0% Total 50.7 (75%) 17.1 (25%) 0% 0%
Source: JICA Study Team based on Census 2009 data, Kenya Vision 2030 and Water Service Strategic Plan 2009
(2) Unit Water Demand of Domestic Water Use
The domestic water demand includes residential water demand, institutional water demand, commercial water demand, and water loss. (Hereinafter, the NRW ratio was used also as an approximation ratio of water loss). For water demand calculation, first of all, a unit water demand for residential use was assumed based on standard values in the “Guidelines for Water Allocation (WRMA, 2010)”. In the draft of the new Water Act 2012, the minimum requirement of unit residential water

Present and Future Water Demands Final Report Chapter 3 Sectoral Report (C) Water Supply
The Development of C - 44 Nippon Koei Co., Ltd. the National Water Master Plan 2030
demand was set at 25 L/person/day, although some of the standard values are less than 25 L/person/day in the guidelines. In the water demand projection, the unit residential water demand was proposed at not less than 25 L/person/day. The table below shows the standard values and proposed unit water demands for residential use.
Standard Values and Proposed Values for Unit Residential Water Demand (Unit: L/person/day)
Category Standard Value
(including allowance for water loss)
Standard Value (excluding allowance
for water loss)
Proposed Value (excluding allowance
for water loss) Urban Population
High-Class Housing 250 200 200 Middle-Class Housing 150 120 120 Low-Class Housing Individual Connection Non-individual Connection
75
-
60 20
60 30
Rural Population
Individual connection Non-individual connection
High: 60 Medium: 50
Low: 40 High: 20
Medium: 15 Low: 10
High: 48 Medium: 40
Low: 40 High: 20
Medium: 15 Low: 10
High: 60 Medium: -
Low: 40 High: 30
Medium: - Low: 25
Note: Water loss was assumed at 20%. Source: JICA Study Team, based on the Guidelines for Water Allocation (WRMA, 2010)
Following the “Guidelines for Water Allocation (WRMA, 2010)”, the water demands were estimated for each category of water users in the urban and rural populations separately. However, there is not enough information on the percentage of future water users by category, such as high-, middle- and low-class housing, and individual and non-individual connections. The percentages of water users by category were assumed and the unit residential water demands were estimated by target area, as shown in the table below.
Assumed Unit Residential Water Demand by Target Area
Category
Unit Residential Water Demand for
Each Category(L/person/d)
Percentage of Water Users in Each Target Area
UWSS1)
UWSS2)
LSRWSS 3)
SSRWSS 4)
SSRWSS5)
Urban Population
High-Class Housing 200 6% 5% - - - Middle-Class Housing 120 50% 30% - - - Low-Class Housing Individual Connection Non-individual Connection
60 30
22% 22%
30% 35%
- -
- -
- -
Rural Population
Individual Connection High Potential Low Potential Non-individual Connection High Potential Low Potential
60 40
30 25
- -
65%
35%
20%
80%
20%
80% Estimate of Unit Residential Water Demand for Each Target Area
92 L/person/d
75 L/person/d
50 L/person/d
36 L/person/d
28 L/person/d
Note: The target areas are 1) Urban Water Supply for Nairobi, Mombasa and Kisumu, 2) Urban Water Supply, 3) Large-Scale Rural Water Supply, 4) Small-Scale Rural Water Supply, and 5) Small-Scale Rural Water Supply in Arid Area.
The percentage of water users in Target Area 1) were estimated based on the conditions of the Draft Feasibility Study and Master Plan for developing New Water Sources for Nairobi and Satellite Towns. The percentage of water users in other areas were estimated based on current situation.
Arid areas were categorized as low potential, while other areas were categorized as high potential.

Final Report Present and Future Water Demands Sectoral Report (C) Water Supply Chapter 3
Nippon Koei Co., Ltd. C - 45 The Development of the National Water Master Plan 2030
Source: JICA Study Team, based on “Guidelines for Water Allocation (WRMA, 2010)”
In addition to the unit water demand for residential use, institutional water demand, commercial water demand and NRW were determined for projection of future domestic water demand of each urban centre and area, as shown in the table below.
Proposed Unit Water Supply Amount
Target Area
(a) Unit Water Supply Amount for Residential Water
Use (L/p/d)
(b) Planning Ratio of Institutional &
Commercial Water Use
(c) NRW Ratio
(d) Unit Water Supply Amount for
Domestic Water Use (L/p/d)
1) Urban Water Supply for Nairobi, Mombasa and Kisumu 92 27% 20% 146
2) Urban Water Supply 75 27% 20% 119 3) Large-Scale Rural Water Supply 50 22% 20% 76 4) Small-Scale Rural Water Supply 36 22% 20% 55 5) Small-Scale Rural Water Supply
in Arid Area 28 20% 20% 42
Note: “Unit Water Supply Amount for Residential Water Use” is to meet “Estimate of Unit Residential Water Demand for Each Target Area”
Planning Ratio of Institutional and Commercial Water Demand is assumed, considering current situation and existing water supply development plans.
NRW ratio was used as an approximation of ratio of water loss.
“Unit Water Supply Amount for Domestic Water Use” was calculated as (d) = a x (1 + b)/(1- c) Source: JICA Study Team based on Kenya Vision 2030 and the Water Service Strategic Plan in 2009
(3) Domestic Water Demand
The results of the domestic water demand calculation are presented in the table below.
Domestic Water Demand Projected (Unit: MCM/year)
Catchment Area 2010 2030 2050 Case-1 Case-2 LVNCA 84 169 424 605 LVSCA 60 165 464 662 RVCA 59 129 264 377 ACA 223 519 941 1,344 TCA 231 146 343 490 ENNCA 25 58 125 179
Total 682 1,186 2,561 3,657
Source: JICA Study Team
As indicated in the table, the 2010 domestic water demands were estimated to be 681 MCM/year in Case-1 and 1,186 MCM/year in Case-2. Such figures have some difference with the 941 MCM/year projected in the Aftercare Study (1998). The difference seems to be reasonable because the Aftercare Study (1998) projection was based on 95% coverage in urban areas and 70% coverage in rural areas.
There is clearly a significant increase in water demand with time and this is the result of the consolidated impact of the significant increase in population, the increase in coverage to meet the aims of Kenya Vision 2030, improvements in housing standards and the increase in the number of

Present and Future Water Demands Final Report Chapter 3 Sectoral Report (C) Water Supply
The Development of C - 46 Nippon Koei Co., Ltd. the National Water Master Plan 2030
households with individual connections. The increase in the “at user” demand is higher than the increase in the “raw water” demand due to the projected decrease in water losses with time resulting from rehabilitation works and installation of new pipeline systems.
(4) Water Demand by Sub-basin
As stated above, the determination of water demands in 2010, 2030 and 2050 together with the water use in 2010 have been carried out according to the divisions defined in the 2009 Census. In order to utilize the results as input to the water balance study, it is necessary to convert the figures to be on a sub-basin basis.
This task was achieved by overlaying a map of the 204 sub-basins onto a map of the 158 census districts which also includes 137 major urban centres. There is a significant number with overlapping boundary lines between two or more sub-basins. In such cases it has been necessary to estimate the proportion of water demand in each sub-basin. For the urban water demand of the 137 major urban centres, allocation has been carried out through subjective assessment considering the locations of the key developed areas. In the case of the rural water demand, the allocation has been prorated according to area.
3.5 Industrial Water Demand
3.5.1 General
Data relevant to commercial and industrial activities were insufficient for carrying out analytical calculations of the present and projected water demand per district. A list of all major industrial firms registered in Kenya was provided by the Ministry of Industrialization; however, this was not a comprehensive list, and does not provide the exact location or the water source utilised.
Furthermore, water consumption rates of registered companies or the standards for different industry sectors were not available. Although there is a link between industry type and water use, previous studies have shown that industrial water use is strongly correlated to the type and size of operation, processes, materials and technology used and less dependent on the end product. Hence, the standard water use rates per type of industry are difficult to be allocated and sometimes misleading. The methodology for calculating the present and future industrial water demands is presented below.
3.5.2 Present Industrial Water Demand
Under this study the existing data on registered firms in Kenya was analysed to identify spatial variation of industrial activity. The number of firms per district was plotted as a % of the total number of registered firms in the country.

Final Report Present and Future Water Demands Sectoral Report (C) Water Supply Chapter 3
Nippon Koei Co., Ltd. C - 47 The Development of the National Water Master Plan 2030
Source: Ministry of Industrialization
Spatial Variation of Industrial Activity
The results indicate that 61% of the country's industrial activity is concentrated in Nairobi, followed by Mombasa (9.5%), and other major urban centres, such as Nakuru (6.1%) and Kisumu (3.8%). The majority of districts have less than 1% industrial activity.
It is safe to assume that districts with high industrial activity will have a higher industrial water usage as a % of the population water demand. Based broadly on the methodology adopted in the Aftercare Study (1998) and the industrial activity analysis, 158 districts have been designated as having high, medium, low or non-activity levels, and grouped based on the criteria as shown in the table below.
Criteria of Industrial Activity Level
Industrial Activity Criteria
(% of Firms per District)Area
High >3% 11 districts Medium 1% - 3% 16 districts Low 0% - 1% 104 districts No activity 0% 27 districts
Source: JICA Study Team
The names of districts in each industrial activity group are shown in Table 3.5.1. For each group, the following consumption rates as a percentage of urban water demand were applied in this study. It was noted that the percentages were adjusted from the Aftercare Study (1998) to account for the different approaches in the industrial activity grouping of the districts and the separation of commercial activities included under domestic.
%
District

Present and Future Water Demands Final Report Chapter 3 Sectoral Report (C) Water Supply
The Development of C - 48 Nippon Koei Co., Ltd. the National Water Master Plan 2030
Water Consumption Rate by Industrial Group Industrial Group % of Urban Water Demand
High Activity Group 25% Medium Activity Group 15% Low Activity Group 5% No Activity Group 0%
Source: JICA Study Team
The present industrial water demand was calculated by multiplying the above rates with the urban domestic water demand. The current industrial water demand was estimated at 125 MCM/year.
3.5.3 Future Industrial Water Demand
The future water demand for 2030 was projected based on the premise that industrial water usage will increase in line with the growth of urban water demand. Industrial water demand up to 2030 was calculated using the same method of present water demand calculation. The year 2050 estimates assumed that the economy will have matured sufficiently and an average GDP value of 4% was applied as mentioned before. The results of the industrial water demand calculation are as summarised in the table below.
Projected Industrial Water Demand (Unit: MCM/year)
Catchment Area 2010 2030 2050 LVNCA 6 19 42 LVSCA 10 41 90 RVCA 10 23 50 ACA 93 153 335 TCA 5 42 92 ENNCA 1 2 4
Total 125 280 613
Source: JICA Study Team
3.6 Livestock Water Demand
3.6.1 General
The 2009 Census provides livestock population data for the whole of Kenya and will be used as a basis for this projection. The data are only available at the district level, therefore, the analysis will be carried out at this level. The major water user species were identified and extracted from the 2009 Census including cattle, sheep, goats, and camels. In 2009, there were 17.5 million cattle, 17.1 million sheep, 27.7 million goats and 2.9 million camels. These are considerably larger numbers compared to the NWMP (1992) projections, indicating an increased water demand for livestock watering. Livestock development is an important part of the Kenyan economy and is central to ensuring food security.
3.6.2 Present Livestock Water Demand
There are many different forms of livestock. The livestock unit (LU) is used as a standard for the purpose of estimating water demand. According to the “Guidelines for Water Allocation (WRMA,

Final Report Present and Future Water Demands Sectoral Report (C) Water Supply Chapter 3
Nippon Koei Co., Ltd. C - 49 The Development of the National Water Master Plan 2030
2010)”, water consumption ratio is 50 L/head/day on the basis of LUs, and the following conversion factors are applied.
Livestock Unit One grade cow Equivalent to 1 Livestock Unit (LU) Three indigenous cows Equivalent to 1 Livestock Unit (LU) 15 sheep or goats Equivalent to 1 Livestock Unit (LU) Five donkeys Equivalent to 1 Livestock Unit (LU) Two camels Equivalent to 1 Livestock Unit (LU)
Source: JICA Study Team, based on Guidelines for Water Allocation (WRMA, 2010)
The livestock population per district were then converted to LUs by multiplying the number of animals with the LU conversion factor above. The census shows the number of cattle, but does not classify the numbers of grade cow and indigenous cow, respectively. As data on proportion of grade cow and indigenous cow is not available, the following proportions are adopted in this study.
Proportion of Grade Cow and Indigenous Cow Grade Cow Indigenous Cow
Non-Arid Area/ Semi Arid Area 50% 50% Arid Area 0% 100%
Source: JICA Study Team
For calculation of the livestock water demand, the number of livestock was calculated only for cattle, sheep, goat and camel, while other livestock such as poultry, donkeys, pigs, etc., were assumed negligible. The number of livestock units in 2010 was estimated at around 14.0 million. The livestock water demand is shown in the table below.
Estimated Present Livestock Water Demand
Year 2010 No. Livestock (million LU) 14.0
Livestock Water Demand (MCM/year) 255
Source: JICA Study Team
About 255 MCM of water was required in 2010 to satisfy the livestock water demand for the existing livestock population. This is considerably more than the amount of 142 MCM predicted for 2010 in the NWMP (1992), highlighting the importance of ensuring adequate water availability for this sector.
3.6.3 Future Livestock Water Demand
The growth of livestock population varies depending on the demand for meat, desire of farmer to breed livestock and government policy. A simple projection methodology was employed for this study, namely, livestock population would increase in accordance with demand on milk and meat to ensure food security as a minimum. The future demand for milk, beef, and mutton and goat meat were calculated based on standard consumption rates (kg/person/year).

Present and Future Water Demands Final Report Chapter 3 Sectoral Report (C) Water Supply
The Development of C - 50 Nippon Koei Co., Ltd. the National Water Master Plan 2030
Standard Consumption Rates of Milk, Beef, and Mutton and Goat (Unit: kg/person)
Product Urban Consumption Rural Consumption Milk * 125 45 Beef ** 12.47 6.23 Mutton and Goat ** 2.41 1.20
Source: * Kenya Dairy Master Plan 2009 ** FAO Livestock Sector Brief 2005
Current milk standard consumption data for rural and urban populations were available in the Kenya Dairy Master Plan 2009. Current consumption figures for beef or mutton and goat were not available in the MOLD. These meat consumption rates were calculated in the FAO Livestock Sector Brief 2005.
Meat Consumption Rates Product 2005 Total Consumption (1,000
tons) 2005 Population Consumption (kg/person)
Beef 294.9 31.54 million 9.35 Mutton and Goat 57 31.54 million 1.81
Source: FAO Livestock Sector Brief 2005
Consumption figures from other studies indicate a ratio of 2 for urban to rural beef consumption pattern. This provides the approximate urban consumption for beef 12.47 and 6.23 for rural, and similarly for mutton and goat 2.41 for urban and 1.2 for rural.
By applying per capita consumption rates and estimated human population for 2030, the annual growth rate of milk and beef consumption and hence, the required production were determined, as shown in the table below.
Production Projection of Milk, Beef and Mutton and Goat
Product 2009
Production (million tons)
Urban Consumption (kg/person)
Rural Consumption(kg/person)
Urban Populationin 2030
(million)
Rural Population in 2030
(million)
2030 Production
(million tons)
AverageAnnual
Growth Rate toward 2030
Milk 4.326 125 45 46.02 21.81 6. 734 2.13% Beef 0.32 12.47 6.23 46.02 21.81 0.710 3.86% Mutton and Goat
0.084 2.41 1.20 46.02 21.81 0.137 2.36%
Source: JICA Study Team based on Kenya Dairy Master Plan 2009 and FAO Livestock Sector Brief 2005
The above methodology does not account for exports or imports, but ensure food security. Until 2002, the production and consumption of milk and beef were almost equal. The government in the last decade has been establishing strategies to improve the sector and an adjustment will be made to account for the objective of Kenya Vision 2030 for the development of the livestock sector. Although the livestock subsector is currently declining and only accounts for 6% of agriculture exports and 14% of agriculture GDP, it has potential for growth. Based on Kenya Vision 2030’s goal to achieve an average growth rate of 7% across the agriculture sector, it was assumed that the implementation of Kenya Vision 2030 would have a positive impact especially on livestock exports in

Final Report Present and Future Water Demands Sectoral Report (C) Water Supply Chapter 3
Nippon Koei Co., Ltd. C - 51 The Development of the National Water Master Plan 2030
the future and the projected average growth rate can be adjusted upwards by 0.42%, which is approximately the 6% relative contribution of the livestock exports in the 7% overall agriculture growth rates (refer to Kenya Vision 2030).
The livestock population was projected using the above average yearly growth rates up to 2030. As for the projection from 2030 to 2050, it was assumed that the increasing population would put additional pressure on food security and demand for livestock. Due to the lack of any long-term available data, the growth rate from 2030 to 2050 was estimated according to population growth in this 20-year period, which is 142.8% as shown in Section 3.2.4. The average annual growth rates were adjusted as follows.
Production Growth Rate of Milk, Beef and Mutton and Goat
Product Average Annual Growth Rate 2010-2030 2030-2050
Milk 2.55% -- Beef 4.28% -- Mutton and Goat 2.78% -- Average 3.20% 1.80%
Source: JICA Study Team, based on Kenya Vision 2030
The projected livestock population was then converted to LUs and multiplied by 50 L/LU/day to calculate the water demand as explained under the present water demand. The total water demand of livestock in Kenya is summarised in the table below.
The future livestock population was projected using the above average annual growth rates up to 2030 and 2050. The projected population was then converted to LUs and multiplied by 50 L/LU/day to calculate water demand, as explained under the present livestock water demand. The projected future livestock water demands in 2030 and 2050 are summarised in the table below.
Projected Future Livestock Water Demand
Year 2030 2050 No. of Livestock (head) 27.2 39.0
Livestock Water Demand (MCM/year) 497 710
Source: JICA Study Team

Present and Future Water Demands Final Report Chapter 3 Sectoral Report (C) Water Supply
The Development of C - 52 Nippon Koei Co., Ltd. the National Water Master Plan 2030
Projected Water Demand of Livestock (Unit: MCM/year)
Catchment Area 2010 2030 2050 LVNCA 26 61 87 LVSCA 43 106 151 RVCA 70 123 175 ACA 25 59 85 TCA 34 69 99 ENNCA 57 79 113
Total 255 497 710
Source: JICA Study Team
The annual water demand of livestock in 2030 was estimated at 497 MCM compared to 2,560 MCM for domestic demand. Livestock water demand is approximately 19% of domestic water demand. This projection disregards land carrying capacity.
3.7 Wildlife Water Demand
3.7.1 General
Data relevant to wildlife populations were insufficient for carrying out analytical calculations of present and future demand per district. Following the data gathering activities exploring different available sources, it was decided that the data provided by the DRSRS would be utilised for this study as these represent the most comprehensive set of information on wildlife population. The data are a result of aerial surveys conducted from 2005 to 2011 in 11 districts across Kenya (Baringo, Garissa, Isiolo, Kajiado, Laikipia, Marsabit, Narok, Samburu, Taita, Tana River, and Turkana).
3.7.2 Present Water Demand
Water consumption for animals varies depending on the species as well as their surrounding conditions such as water availability or vegetation. Some mammals such as elephants and buffalos, require fairly large amounts of water frequently. Others such as giraffes sometimes live long without drinking water for a month if succulent vegetation is available. In order to assume the water consumption, the abovementioned species were grouped, i.e. Group A for species which require relatively much water, and Group B for those which require relatively less water.
Group A: Elephant, Zebra, Wildebeest, Kudu, Warthog, and Buffalo Group B: Giraffe, Gazelle, Gerenuk, Impala, Hartebeest, Topi, Eland, Oryx, and Ostrich
Water consumption for one LU (450 kg) is 50 L/day, and that for elephants are said to be 140-270 L/day. Generally, the actual water consumption of wildlife has not been made clear. Accordingly, water consumption of respective species was assumed as follows:
Water consumption of species is directly proportional to their average body weights. Species in Group A require water at a rate of about 50% of standard water consumption of 1
LU. Accordingly, the daily consumption was set at 5.0 L/100 kg-weight. Species in Group B require water at a rate of about 25% of standard water consumption of 1
LU. Accordingly, the daily consumption was set at 2.5 L/100 kg-weight.

Final Report Present and Future Water Demands Sectoral Report (C) Water Supply Chapter 3
Nippon Koei Co., Ltd. C - 53 The Development of the National Water Master Plan 2030
Based on the above assumptions, the daily water consumption of respective species have been estimated as presented in the tables below.
Unit Water Consumption Rates for Wildlife
Group Unit Water Consumption Remarks
No. of Animals (head)
Water Consumption(m3/day)
Group A 5 L/100 kg/day About 50% of standard water consumption of 1 LU 698,040 348,671
Group B 2.5 L/100 kg/day About 25% of standard water consumption of 1 LU 247,000 15,320
Source: JICA Study Team, based on data from DRSRS.
Based on the above estimated water consumptions and estimated numbers derived from DRSRS, the total annual wildlife water demand of major species in 2010 was estimated at 8.3 MCM (22,818 m3/day) for a total of 945,040 heads as shown below.
Estimated Daily Water Consumption by Species
Group Species No. Animals
(head)
Water Consumption
(L/100 kg)
Average Weight
Unit Water Consumption
(L/day/animal)
Water Consumption
(m3/day) A Buffalo 51,796 5 700 35 1,813 A Elephant 18,825 5 7,500 375 7,059 A Greater Kudu 390 5 195 9.75 4 A Lesser Kudu 2,709 5 75 3.75 10 A Warthog 5,187 5 65 3.25 17 A Waterbuck 2,650 5 230 11.5 30 A Wildebeest 506,494 5 425 21.25 10,763 A Zebra Burchell 108,729 5 400 20 2,175 A Zebra Grevy's 1,260 5 400 20 25 Subtotal of Group A 698,040 -- -- -- 21,896
B Bushbuck 18 2.5 60 1.5 0 B Eland 6,726 2.5 600 15 101 B Gazelle Grants 80,005 2.5 55 1.375 110 B Gazelle Thomsons 41,137 2.5 21 0.525 22 B Gerenuk 12,749 2.5 38 0.95 12 B Giraffe 18,437 2.5 1,000 25 461 B Hunters Heartebeest 214 2.5 100 2.5 1 B Impala 31,160 2.5 57 1.425 44 B Kongoni 6,319 2.5 100 2.5 16 B Oryx 8,685 2.5 250 6.25 54 B Ostrich 27,202 2.5 90 2.25 61 B Topi 14,348 2.5 110 2.75 39 Subtotal of Group B 247,000 -- -- -- 921
Grand Total 945,040 -- -- -- 22,817 Source: JICA Study Team based on data from DRSRS
3.7.3 Future Water Demand
The wildlife demand was less than 0.5% of the total water demand in 2010. Additionally, it was assumed that the water demand of wildlife will remain constant in the future as efforts are made to

Present and Future Water Demands Final Report Chapter 3 Sectoral Report (C) Water Supply
The Development of C - 54 Nippon Koei Co., Ltd. the National Water Master Plan 2030
sustain the wildlife population in Kenya so that the proportion of the wildlife demand is expected to decrease more. The water demand was projected based on the data of 11 districts and no extrapolation was made for the rest of the districts. It seems that limited national reserves and national parks are carrying the majority of wildlife in Kenya, and the demand outside of major reserves and national parks seems negligible. Considering the conditions of major national reserves and national parks, the distribution of wildlife water demand is assumed as shown below.
Estimate of Distribution of Wildlife Catchment Area LVNCA LVSCA RVCA ACA TCA ENNCA
Ratio 0% 40% 10% 30% 15% 5% Source: JICA Study Team, based on data from DRSRS
The wildlife water demand for each catchment area is shown in the table below.
Projected Wildlife Water Demand (Unit: MCM/year)
Catchment Area 2010 2030 2050 LVNCA 0.0 0.0 0.0 LVSCA 3.3 3.3 3.3 RVCA 0.8 0.8 0.8 ACA 2.5 2.5 2.5 TCA 1.2 1.2 1.2 ENNCA 0.4 0.4 0.4
Total 8.2 8.2 8.2 Source: JICA Study Team
It is assumed that wildlife will utilise only surface water, and not utilise any groundwater.
3.8 Inland Fisheries Water Demand
3.8.1 General
Fishery activities in Kenya were classified in two main categories: 1) marine fisheries, and 2) inland fisheries. The study concentrated on inland fisheries as the main user of fresh water resources.
Data on the number and area of existing and planned fishponds across the country were provided by the Ministry of Fisheries Development (MOFD) and will form the basis of the water demand projection. According to data, there were approximately 8,076 ponds in 2007. According to data in the NWMP (1992), the average area of fish ponds was estimated at around 528 m2, so that the area of fish ponds was supposed to be around 4.26 km2 in 2007.
Fish farming activities were expanded in 2009 under the Economic Stimulus Programme (ESP). The ESP was introduced through the 2009/10 budget entitled ‘Overcoming Today’s Challenges for a Better Kenya Tomorrow’, which aims to stimulate the growth of the Kenyan economy through projects in key sectors such as education, health and sanitation, food production, environment, local government, industrialisation and fisheries. Under the ESP Phase I, 200 ponds per district in 140 districts were constructed in 2010. The total number of existing constructed ponds is approximately 36,000 ponds in 2010, of which surface area was estimated at 19.01 km2.

Final Report Present and Future Water Demands Sectoral Report (C) Water Supply Chapter 3
Nippon Koei Co., Ltd. C - 55 The Development of the National Water Master Plan 2030
3.8.2 Present Water Demand
Information about the water consumption amount or rate for fish farming in Kenya are not available. Hence, several assumptions were made to estimate such water demand.
Data on the number and area of ponds as provided by the MOFD Pond depth: an average pond depth of 1 m Evaporation losses equal to 5 mm/day Percolation losses equal to 1 mm/day
Water demand for the ponds will be calculated as the amount of water required to compensate for evaporation and percolation losses. The year losses was estimated at 2.19 m/year (6 mm/day x 365 days) so that the present water demand is estimated at 41.63 MCM/year (2.19 m/year x 19.01 km2)
3.8.3 Future Water Demand
As for the 2030 and 2050 projections, it has been hard to predict how the fish ponds will increase but it was estimated that the increasing population would put additional pressure on food security and demand more food resources. Due to the lack of any long-term available data, the development of fish ponds between 2010 and 2030 were estimated according to the population growth in that period, which is 176.1% as shown in Section 3.2.4. Similarly for the development between 2030 and 2050, it was estimated according to the population growth in that period, which is 142.8% as shown in the same section. The total areas of the fish ponds were estimated, as shown in the table below.
Development of Fish Ponds (Unit: km2)
Year 2010 2030 2050 Area of Fish Pond 19.01 33.48 47.80
Source: JICA Study Team, based on data from MOFD and ESP 2009.
Based on the data of fish ponds described in the Aftercare Study (1998), the distribution of fish ponds was estimated, as shown in the table below.
Distribution of Fish Ponds in 1992 Catchment Area LVNCA LVSCA RVCA ACA TCA ENNCA
Ratio 21.3% 20.5% 10.3% 15.8% 22.4% 9.6%
Source: JICA Study Team based on Aftercare Study (1998)
A summary of the water demand for inland fisheries is presented below and details by sub-basin are shown in Table 3.8.1.

Present and Future Water Demands Final Report Chapter 3 Sectoral Report (C) Water Supply
The Development of C - 56 Nippon Koei Co., Ltd. the National Water Master Plan 2030
Projected Inland Fisheries Water Demand (Unit: MCM/year)
Catchment Area 2010 2030 2050 LVNCA 8.9 15.8 22.3 LVSCA 8.5 15.0 21.4 RVCA 4.3 7.8 10.8 ACA 6.6 11.6 16.6 TCA 9.3 16.4 23.5 ENNCA 4.0 7.0 10.0
Total 41.6 73.6 104.6
Source: JICA Study Team
It was assumed that inland fisheries will utilise only surface water, and not utilise any groundwater.
3.9 Summary of Future Water Demands
The table below shows the results of domestic, industrial, livestock, wildlife and inland fisheries water demand calculations for the present (2010), and the projections for years 2030 and 2050. The rates of increase for the periods 2010-2030 and 2030-2050 are also shown in the table.
Projected Future Water Demand (Excluding Irrigation Water Demand) (Unit: MCM/year)
Sector Year 2010
Year 2030
Rate of Increase (2010 to 2030)
Year 2050
Rate of Increase (2030 to 2050)
Domestic 1,186 2,561 216% 3,657 143% Industrial 125 280 224% 613 219% Livestock 255 497 195% 710 143% Wildlife 8 8 100% 8 100% Fisheries 42 74 174% 105 143% Total 1,616 3,420 212% 5,093 149%
Source: JICA Study Team

Final Report Water Supply Development Plan Sectoral Report (C) Water Supply Chapter 4
Nippon Koei Co., Ltd. C - 57 The Development of the National Water Master Plan 2030
CHAPTER 4 WATER SUPPLY DEVELOPMENT PLAN
4.1 General
(1) Goal of Water Service Level by 2030
Kenya Vision 2030 aims to ensure that improved water and sanitation are available and accessible to all. Based on the policy of Kenya Vision 2030, and the Water Service Strategic Plan, 2009, prepared by the MWI, the targets on water supply in Kenya by 2030 are as follows:
1) Supply safe and sufficient water by enhancing water supply capacities in both urban and rural areas.
2) Increase coverage of piped water supply by registered WSPs to 100% of the urban population.
3) Increase unit water supply amount to suitable national standard level. 4) Decrease the NRW rate to 20% for efficient water use.
The water supply development plan in the NWMP 2030 aims to meet the above targets.
(2) Coverage of Water Supply
As for the current situation, based on data from the 2009 Census, the population and ratio of water connection to each drinking water source were estimated, as shown in the table below:
Current Situation of Drinking Water Source Connection in 2010 (Unit: million persons)
Drinking Water Source/
Evaluation
Piped by WSP Spring/ Well/ Borehole Water Vendor Stream, Lake,
Pond, Others Total Improved
Source Improved and Unimproved
Unimproved Source
Unimproved Source
Urban Population 7.1 (54%)
3.1 (24%)
1.7 (13%)
1.2 (9%)
13.1 (100%)
Rural Population 4.1 (16%)
10.9 (43%)
0.5 (2%)
9.9 (39%)
25.4 (100%)
Total 11.2 (28%)
14.0 (37%)
2.2 (6%)
11.1 (29%)
38.5 (100%)
Source: JICA Study Team based on Census 2009 data
The definitions of “improved” and “unimproved” water sources were based on the JMP report as explained in Section 2.3.1. In order to achieve the goal described above, the target water connection in 2030 was set as shown in the table below.

Water Supply Development Plan Final Report Chapter 4 Sectoral Report (C) Water Supply
The Development of C - 58 Nippon Koei Co., Ltd. the National Water Master Plan 2030
Target Conditions of Drinking Water Source Connection for 2030 (Unit: million persons)
Drinking Water Source/
Evaluation
Piped by WSP Spring/ Well/ Borehole Water Vendor Stream, Lake,
Pond, Others Total Improved
Source Improved and Unimproved
Unimproved Source
Unimproved Source
Urban Population 46.0 (100%)
0.0 (0%)
0.0 (0%)
0.0 (0%)
46.0 (100%)
Rural Population 4.7 (22%)
17.1 (78%)
0.0 (0%)
0.0 (0%)
21.8 (100%)
Total 50.7 (75%)
17.1 (25%)
0.0 (0%)
0.0 (0%)
67.8 (100%)
Note: A large share of the population of Kenya is expected to have one and alternative water sources. For example, even if people are connected to piped water supply, such people would still use private wells and/or rainfall harvest tanks.
Source: JICA Study Team (Ref. Subsection 3.4.3 (1))
0
10
20
30
40
50
60
70
80
2010 2030
Serv
ice
Popu
latio
n (m
illio
n pe
rson
s)
Year
Surface Water without Treatment
Unregistered WSP
Borehole/Spring/Well
Piped Water Supply by Registered WSP
28%
37%6%
29%
75%
25%
Source: JICA Study Team (Ref. Subsection 3.4.3 (1))
Development Plan of Water Supply System
4.2 Overall Concept and Framework for Planning
Based on the basic conditions and targets aforementioned, the water supply development plan will be formulated with the following overall concept and framework:
(1) General Approach to increase the coverage of improved water supply to 100%
a) In this study, the water supply system for future development is considered as a combination of three types of water supply systems: 1) Urban Water Supply System (UWSS), which is a piped water supply system for major urban population and to be managed by a registered WSP, 2) Large-Scale Rural Water Supply System (LSRWSS), which is a piped water supply system for around 30-50 % of rural population in each catchment area with the remaining urban population, which is also to be managed by a registered WSP, and 3) Small-Scale Rural Water Supply System (SSRWSS), which consists of improved water sources for the remaining rural population and to be managed by individual, community or institution.
b) Access to unimproved water supply sources will be transferred to the above water supply system.
(2) Urban Water Supply
a) UWSS is for the following: 1) Residential water use of the urban population, 2) Commercial water use, 3) Institutional water use, and 4) Industrial water use in urban areas. It is planned to establish UWSS to cover 39.1 million urban population (2030) in 137 major urban centres,

Final Report Water Supply Development Plan Sectoral Report (C) Water Supply Chapter 4
Nippon Koei Co., Ltd. C - 59 The Development of the National Water Master Plan 2030
which have more than 10,000 population in the 2009 Census. A list of the 137 major urban centres by catchment area is provided in Table 4.2.1.
b) The allocation plan of available water sources depends on the characteristics of the target area. Regarding the source of UWSS, surface water source is to be allocated first because of its cost effectiveness. However, considering the expected shortage of surface water in the near future, utilization of groundwater is also indispensable for urban water supply. It was initially proposed to utilize groundwater for 5% of the total required amount of water source in each urban centre. The water source allocation is finalized based on the results of the water balance calculation in the water resources development plan.
c) Basically, one UWSS was planned for each urban centre. However, in case that several urban centres will depend on the same water source, one UWSS is to be formulated for a group of urban centres.
(3) Rural Water Supply (LSRWSS and SSRWSS)
a) LSRWSS and SSRWSS are considered in 47 counties. The target rural population covered by LSRWSS is to be estimated by subtracting current piped water supply population from total rural population in the rural area of districts based on Census 2009.
b) Water sources of LSRWSS are to be determined after consideration of available surface and groundwater sources in each sub-basin. For arid areas, groundwater is the only water source, if certain surface water sources are not discovered.
c) Water sources of SSRWSS are supposed to be groundwater and spring water only.
(4) Rehabilitation of Existing Water Supply System
a) In order to reduce the NRW ratio for effective water use, it was proposed to carry out immediate rehabilitation of existing water supply systems. The rehabilitation works shall include replacement of unsuitable water pipes that appear to be leaking, and installation of suitable water meters.
b) It is not easy to achieve a 20% NRW ratio in Kenya, considering that the average current NRW ratio is 45%. It is a great challenge in the water sector in Kenya. New development projects are supposed to contribute to the reduction of the average NRW ratio because new systems would keep a low NRW ratio.
(5) Required Water Supply Capacity
a) Domestic water demand was calculated based on the MWI Design Manual for Water Supply in Kenya. The minimum unit residential water demand was set at 25 L/person/day, which is more than the requirement of the MWI manual, but was proposed in the Draft Water Bill 2012 (new Water Act). The required water supply capacities were planned to meet the calculated water demand. The details are described in Section 3.4.

Water Supply Development Plan Final Report Chapter 4 Sectoral Report (C) Water Supply
The Development of C - 60 Nippon Koei Co., Ltd. the National Water Master Plan 2030
Diagram of the Water Supply System in 2030
Projected Future Domestic Water Demand in 2030 (Unit: MCM/year)
Catchment Area
Urban Water Demand Rural Water Demand
Grand Total 137 Major Urban
Centres Other Urban Total
Large-Scale Rural Water
Supply
Small-Scale Rural Water
Supply Total
LVN 276 50 326 19 82 98 424 LVS 286 75 362 25 74 102 464 RV 154 50 204 15 44 60 264 Athi 825 54 878 23 40 63 941 Tana 213 41 254 36 53 89 343 ENN 45 31 76 12 37 49 125 Total 1,800 300 2,100 130 330 461 2,561
Source: JICA Study Team
4.3 Water Supply Development Plan for Lake Victoria North Catchment Area (LVNCA)
4.3.1 Development Strategy
(1) Basic Strategy
A large percentage of the population is using groundwater and spring water in the LVNCA. In addition, the surface water resources originating from Mt. Elgon and the Cherangani Tugen Hills have been abandoned in this area. The UWSSs are planned to get surface water with priority, and the rural water supply systems are planned to use groundwater with priority.
(2) Urban Water Supply
Based on the overall concept mentioned in Section 4.2, UWSSs are planned for 32 urban centres in the LVNCA. The water supply capacity required for UWSS in the LNVCA in 2030 is 782,000 m3/day, against the current water supply capacity (including capacity under construction) of 135,000 m3/day, so that the additional capacity of 647,000 m3/day is to be developed by 2030. It is to be developed through the following three types of projects:
Urban Water Supply
(137 Urban Centres)
Large Scale Rural Water Supply
(47 Counties)
Small Scale Rural Water Supply
(47 Counties)
Piped Water Supply Service by Registered WSP 75%
Managed Wells/ Springs 25%
Service Population
58%
42%
Service Population

Final Report Water Supply Development Plan Sectoral Report (C) Water Supply Chapter 4
Nippon Koei Co., Ltd. C - 61 The Development of the National Water Master Plan 2030
1) Rehabilitation of Existing UWSS
In order to achieve a 20% NRW ratio, water meters are to be installed for all households, and old pipes of the existing UWSSs of 20 urban centres, which have 135,000 m3/day water supply capacity, are to be replaced. In addition, the rehabilitation includes replacement and repair of mechanical and electrical equipment in water treatment plants and pumping stations.
2) Expansion of UWSS
Expansion of UWSS is planned for the abovementioned 20 urban centres in order to meet the water demand in 2030. The total capacity of expansion is 556,000 m3/day.
3) Construction of new UWSS
The construction of new UWSS is planned for 12 urban centres with no UWSS. The total capacity of the new construction is 91,000 m3/day.
4) Incorporation of existing plans
According to data from WSBs, there are 12 plans of water supply development projects to cover nine UCs and surrounding areas in LVNCA, which have 45,000 m3/day of total water supply capacity (Refer to Section 2.4). These plans are to be incorporated in NWMP 2030. The planned capacity could cover only 5% of the development capacities required in 2030. Feasibility studies have been carried out for only two projects. It is required to provide F/S reports of water supply development projects, which will cover the future water demand of each UC.
(3) Rural Water Supply
Based on the overall concept mentioned in Section 4.2, the rural water supply systems were planned to be developed as LSRWSS or as SSRWSS.
1) Development of LSRWSS
The LSRWSS is proposed mainly for areas with high population density or areas with difficulties of groundwater use on a personal or community basis. The LSRWSS is to be developed for 1.78 million residents in 11 counties in the LVNCA.
2) Development of SSRWSS
SSRWSS is proposed for 4.01 million residents in 11 counties in the LVNCA. This includes construction and improvement of boreholes, wells, and springs on personal and community basis. As this type of works is to be implemented on a personal and community basis, only the water demand projection was made for SSRWSS in this study.

Water Supply Development Plan Final Report Chapter 4 Sectoral Report (C) Water Supply
The Development of C - 62 Nippon Koei Co., Ltd. the National Water Master Plan 2030
(4) Water Source
1) Water Source of Urban Water Supply
Currently, the existing urban water supply systems are mainly dependent on surface water, and only 1% of the required water depends on groundwater. However, the dependence ratio of groundwater is expected to increase because shortage of surface water is expected in the near future. The dependence ratio of groundwater was tentatively set at 5%; however, it is to be finalized by area, as based on the results of the water balance calculation described in Sectoral Report (G) Water Resources Development.
2) Water Source of Rural Water Supply
The planning conditions for the LSRWSS and SSRWSS are set as shown in the table below. The conditions are to be modified based on the results of the water balance calculation.
Planning Ration of Each Type of Rural Water Supply System (LVNCA)
Area Large-Scale Rural Water Supply System Small-Scale Rural Water Supply System (Groundwater) (Surface Water) (Groundwater)
All Area 5% 5% 90% Source: JICA Study Team assumed based on the current situation
For setting the planning conditions, the following were considered:
a) The current proportion of the LSRWSS (piped water supply) in the rural water supply system is estimated at 4%. The proportion of LSRWSS in 2030 is assumed to increase to 10% because of the future increase of population density and awareness of safe water.
b) The current dependence ratio of groundwater of the LSRWSS is estimated at 1%. Considering the shortage of surface water sources in the future, the target dependence ratio of groundwater is set at 50%. The policy promotes groundwater or spring water use as much as possible for the rural water supply system.
c) Currently, untreated surface water is being used for private and community basis; however, the use of surface water without proper treatment is planned to be decreased gradually and terminated by 2030. SSRWS is dependent on groundwater and spring water only.
4.3.2 Proposed Water Supply Development Plan
The proposed UWSS is presented in Table 4.3.1 and Figure 4.3.1, and the proposed LSRWSS and SSRWSS are in Tables 4.3.2 and 4.3.3, respectively.
The proposed water supply development plan for the LVNCA is outlined below.

Final Report Water Supply Development Plan Sectoral Report (C) Water Supply Chapter 4
Nippon Koei Co., Ltd. C - 63 The Development of the National Water Master Plan 2030
Proposed Water Supply Development Plan (LVNCA)
Type of Project Target Area Target Capacity (m3/day)
Target Population (million persons)
Urban Water Supply Rehabilitation 20 Urban Centres 135,000
6.57 Expansion 20 Urban Centres 556,000 New Construction 12 Urban Centres 91,000 Total 32 Urban Centres 782,000
Rural Water Supply LSRWSS 11 Counties 184,000 5.79 SSRWSS 11 Counties 220,000
Total 11 Counties 404,000
Source: JICA Study Team
Based on the above water supply development plan, the water supply situation in the LVNCA in 2030 would be as shown in the table below.
Water Supply Situation in 2030 (LVNCA)
Items Urban Water Supply
Large-scale Rural Water Supply
Small-scale Rural Water Supply Total
Service Population (million)
2010 0.77 4.59 5.36 2030 6.57 1.78 4.01 12.36
Water Supply Capacity (m3/day)
2010 135,000 10,000 144,000 289,000 2030 782,000 184,000 220,000 1,186,000
Operating Body Registered WSPs
Registered WSPs
Individual, Community, etc. --
Target Towns/ Areas 32UC 11 Counties --
Source: JICA Study Team (Figures for 2010 were prepared by reference to Section 2.3. Figures for 2030 were prepared based on Tables 4.3.1 to 4.3.3.)
In order to ensure water sources required for the water supply systems mentioned above, it is proposed to construct five new dams and expand one existing intra-basin water transfer system in LVNCA, as the result of the water balance study. (Ref. Sectoral Report (G), Section 4.4)
4.4 Water Supply Development Plan for Lake Victoria South Catchment Area (LVSCA)
4.4.1 Development Strategy
(1) Basic Strategy
The LVSCA is divided into three areas, Kisumu, Kisii, and the surrounding area, for UWSS planning considering the three areas’ characteristics, as shown in the table below.

Water Supply Development Plan Final Report Chapter 4 Sectoral Report (C) Water Supply
The Development of C - 64 Nippon Koei Co., Ltd. the National Water Master Plan 2030
Areal Characteristics (LVSCA)
Area Characteristics Kisumu and Surrounding Area
Out of 24 urban centres in the LVSCA, there are seven urban centres in this area. It is estimated that the population is around 40% of the total population (2030). There are many available water sources, such as surface water of rivers from the Mau Forest Complex, which is one of the Five Water Towers of Kenya, and water taken from Lake Victoria.
Kisii and Surrounding Area
There are 12 urban centres in this area. It is estimated that the population is around 30% of the total population (2030). There is no available water source from lake Victoria and the Water Tower. Gucha R. with Bunyunyu Dam is the only major water source in this area. The water source for this area may have to highly depend on groundwater sources.
Other Area Outside of the above stated areas, there are low population density areas with six urban centres. There are some available surface water sources including Lake Victoria. Basically, rural water supply systems depend on groundwater.
Source: JICA Study Team
(2) Urban Water Supply
Based on the overall concept mentioned in Section 4.2, UWSSs are planned for 25 urban centres in the LVSCA. As for six urban centres in Kisumu and its surrounding area, and seven urban centres in Kisii and its surrounding area, one water supply system is planned to cover several urban centres. The remaining 12 urban centres are planned to have independent water supply systems.
The water supply capacity required for the UWSS in the LNSCA in 2030 is 785,000 m3/day, against the current water supply capacity (including capacity under construction) of 120,000 m3/day, so that the additional capacity of 664,000 m3/day is to be developed by 2030. It is to be developed through the following three types of projects:
1) Rehabilitation of existing UWSS
In order to achieve a 20% NRW ratio, water meters are to be installed for all households, and old pipes of the existing UWSS of 21 urban centres, which have 120,000 m3/day water supply capacity, are to be replaced. In addition, the rehabilitation includes replacement and repair of mechanical and electrical equipment in water treatment plants and pumping stations.
2) Expansion of UWSS
Expansion of UWSSs is planned for the abovementioned 21 urban centres in order to meet the water demand in 2030. The total capacity of expansion is 570,000 m3/day, and it covers two cities with no UWSS.
3) Construction of new UWSS
The construction of new UWSS is planned for four urban centres with no UWSS. The total capacity of the new construction is 94,000 m3/day.
4) Incorporation of existing plans
According to data from WSBs, there are 27 plans of water supply development projects to cover 21 UCs and surrounding areas in LVSCA, which have 301,000 m3/day of total water supply capacity (Refer to Section 2.4). These plans are to be incorporated in NWMP 2030. The planned capacity could cover only 45% of the development capacities required in 2030.

Final Report Water Supply Development Plan Sectoral Report (C) Water Supply Chapter 4
Nippon Koei Co., Ltd. C - 65 The Development of the National Water Master Plan 2030
Feasibility studies have been provided for 11 projects. It is required to provide F/S reports of water supply development projects, which will cover the future water demand of each UC.
(3) Rural Water Supply
Based on the overall concept mentioned in Section 4.2, the rural water supply systems are planned to be developed as LSRWSS or as SSRWSS.
1) Development of LSRWSS
The LSRWSS is proposed mainly for areas with high population density or areas with difficulties of groundwater use on a personal or community basis. The LSRWSS is to be developed for 2.67 million residents in 14 counties in the LVSCA.
2) Development of SSRWSS
The SSRWSS is proposed for 3.79 million residents in one county in the LVSCA. This includes construction and improvement of boreholes, wells, and springs on personal and community basis. As this type of works is to be implemented on a personal and community basis, only the water demand projection was made for SSRWSS in this study.
(4) Water Source
1) Water Source of Urban Water Supply
Currently, the existing UWSSs depend on groundwater slightly at only 1% of the required water. However, the dependence ratio of groundwater is expected to increase because shortage of surface water is expected in the near future. The dependence ratio of groundwater is tentatively set at 5%; however, it is to be finalized by area, as based on results of the water balance calculation described in Sectoral Report (G) Water Resources Development.
2) Water Source of Rural Water Supply
The planning conditions for the LSRWSS and SSRWSS are set as shown in the table below. The conditions are to be modified based on the results of the water balance calculation.
Planning Ratio of Each Type of Rural Water Supply System (LVSCA)
Area Large-Scale Rural Water Supply System Small-Scale Rural Water Supply System (Groundwater) (Surface Water) (Groundwater)
Kisumu and Surrounding Area 10% 10% 80% Kishii and Surrounding Area 10% 10% 80% Other Area 10% 10% 80%
Source: JICA Study Team, assumed based on the current situation
For setting the planning conditions, the following were considered:
The current proportion of the LSRWSS (piped water supply) in the rural water supply system is estimated at 1%. The proportion of the LSRWSS in 2030 was assumed to increase to 50% because of the future increase of population density and awareness of safe water.

Water Supply Development Plan Final Report Chapter 4 Sectoral Report (C) Water Supply
The Development of C - 66 Nippon Koei Co., Ltd. the National Water Master Plan 2030
Surface water is not being used for private and community basis, and the SSRWSS is dependent on groundwater only.
4.4.2 Proposed Water Supply Development Plan
The proposed UWSS is presented in Table 4.4.1 and Figure 4.4.1, and the proposed LSRWSS and SSRWSS are in Tables 4.4.2 and 4.4.3, respectively. The proposed water supply development plan for the LVSCA is outlined below.
Proposed Water Supply Development Plan (LVSCA)
Type of Project Target Area Target Capacity (m3/day)
Target Population (million persons)
Urban Water Supply
Rehabilitation 21 Urban Centres 120,000
6.26 Expansion 21 Urban Centres 571,000 New Construction 4 Urban Centres 94,000 Total 25 Urban Centres 785,000
Rural Water Supply LSRWSS 14 Counties 277,000
6.46 SSRWSS 14 Counties 208,000 Total 14 Counties 485,000
Source: JICA Study Team
Based on the above water supply development plan, the water supply situation in the LVSCA in 2030 would be as shown in the table below.
Water Supply Situation in 2030 (LVSCA)
Items Urban Water Supply Large-scale Rural Water Supply
Small-scale Rural Water Supply Total
Service Population (million)
2010 0.88 3.02 3.902030 6.26 2.67 3.79 12.72
Water Supply Capacity (m3/day)
2010 120,000 26,000 150,000 296,0002030 785,000 277,000 208,000 1,270,000
Operating Body Registered WSPs
Registered WSPs
Individual, Community, etc.
--
Target Towns/ Areas 25 UCs 14 Counties --
Source: JICA Study Team (Figures for 2010 were prepared by reference to Section 2.3. Figures for 2030 were prepared based on Tables 4.4.1 to 4.4.3.)
In order to ensure water sources required for the water supply systems mentioned above, it is proposed to construct nine new dams in LVSCA and one new dam in LVNCA, as the result of the water balance study. (Ref. Sectoral Report (G), Section 4.5)
4.5 Water Supply Development Plan for Rift Valley Catchment Area (RVCA)
4.5.1 Development Strategy
(1) Basic Strategy
The RVCA is divided into three areas, the Nakuru central populated area, the north arid area, and the south surrounding area, for UWSS planning considering the three areas’ characteristics as shown in the table below.

Final Report Water Supply Development Plan Sectoral Report (C) Water Supply Chapter 4
Nippon Koei Co., Ltd. C - 67 The Development of the National Water Master Plan 2030
Areal Characteristics (RVCA)
Area Feature Nakuru, Naivasha and Surrounding Area (Central Area)
Out of 13 urban centres in the RVCA, there are seven urban centres in this area. It was estimated that the population is around 60% of the total population (2010). Water sources in the area seem to be insufficient for the future population; therefore, it is required to get new water sources from outside the area.
Arid Area It has a low population density area. There are three urban centres in arid areas, and groundwater is a major water source in this area.
Other Area Outside of the above stated areas, there are four urban centres, which basically depend on surface water. For future demand, a water supply development plan with groundwater use would be considered.
Source: JICA Study Team
(2) Urban Water Supply System
Based on the overall concept mentioned in Section 4.2, UWSSs are planned for 13 urban centres in the RVCA. In case that the same water resources are used among the seven urban centres in Nakuru (Nakuru, Naivasha, Gilgil, Molo, Njo ro, Eldama Ravine, Ol Kalou), one water supply system is planned to cover several urban centres. However, the UWSS in the other seven urban centres are independently planned for each urban centre.
The water supply capacity required for the UWSS in the RVCA in 2030 is 398,000 m3/day, against the current water supply capacity (including capacity under construction) of 129,000 m3/day, so that the additional capacity of 269,000 m3/day is to be developed by 2030. It is to be developed through the following three types of projects:
1) Rehabilitation of existing UWSS
In order to achieve a 20% NRW ratio, water meters are to be installed for all households, and old pipes of the existing UWSS of ten urban centres, which have 129,000 m3/day water supply capacity, are to be replaced. In addition, the rehabilitation includes replacement and repair of mechanical and electrical equipment in water treatment plants and pumping stations.
2) Expansion of UWSS
Expansion of UWSSs is planned for the abovementioned ten urban centres in order to meet the water demand in 2030. The total capacity of expansion is 254,000 m3/day.
3) Construction of new UWSS
The construction of new UWSS is planned for three urban centres with no UWSS. The total capacity of the new construction is 15,000 m3/day.
4) Incorporation of existing plans
According to data from WSBs, there are four plans of water supply development projects to cover nine UCs and surrounding areas in RVCA, which have 135,000 m3/day of total water supply capacity (Refer to Section 2.4). These plans are to be incorporated in NWMP 2030. The planned capacity could cover only 50% of the development capacities required in 2030. Feasibility studies have been carried out for only two projects. It is required to provide F/S

Water Supply Development Plan Final Report Chapter 4 Sectoral Report (C) Water Supply
The Development of C - 68 Nippon Koei Co., Ltd. the National Water Master Plan 2030
reports of water supply development projects, which will cover the future water demand of each UC.
UWSS prioritizes the use of surface water. On the other hand, there is a large-scale groundwater source in Nakuru and Naivasha, and the dependence ratio of groundwater is 46%. It is relatively high compared to other catchments. Out of Nakuru’s surrounding area, the dependence ratio of groundwater is expected to decrease in Nakuru, Naivasha, Gilgil, and Njoro with 10% of target ratio in 2030. Also, the target ratio is 5% in other areas.
(3) Rural Water Supply System
Based on the overall concept mentioned in Section 4.2, the rural water supply systems are planned to be developed as LSRWSS or as SSRWSS.
1) Development of LSRWSS
The LSRWSS is proposed mainly for the areas with high population density or areas with difficulties of groundwater use on a personal or community basis. The LSRWSS is to be developed for 1.70 million residents in 18 counties in the RVCA.
2) Development of SSRWSS
The SSRWSS is proposed for 2.40 million residents in 18 counties in the RVCA. This includes construction and improvement of boreholes, wells, and springs on personal and community basis. As this type of works is to be implemented on a personal and community basis, only the water demand projection was made for SSRWSS in this study.
(4) Water Source of Urban Water Supply
1) Water Source of Urban Water Supply
Currently, the existing UWSSs depend on groundwater for 46% of the required water from massive groundwater resources in Nakuru and Naviash. This proportion is quite higher than other areas. The dependence ratio of groundwater is tentatively set at 10% in Nakuru, Naivasha, Gilgil, and Njoro, and at 5% in other areas; however, it is to be finalized by area, based on results of the water balance calculation described in Sectoral Report (G) Water Resources Development.
2) Water Source of Rural Water Supply
The planning conditions for the LSRWSS and SSRWSS are set as shown in the table below. The conditions are to be modified based on the results of the water balance calculation.

Final Report Water Supply Development Plan Sectoral Report (C) Water Supply Chapter 4
Nippon Koei Co., Ltd. C - 69 The Development of the National Water Master Plan 2030
Planning Ratio of Each Type of Rural Water Supply System (RVCA)
Area Large-Scale Rural Water Supply System Small-Scale Rural Water Supply System(Groundwater) (Surface Water) (Groundwater)
Greater Nakuru Area 10% 10% 80% Arid Area 10% 10% 90% Other Area 10% 10% 80%
Source: JICA Study Team, assumed based on the current situation
For setting the planning conditions, the following were considered:
The current proportion of the LSRWSS (piped water supply) in the rural water supply system is estimated at 5%. The proportion of the LSRWSS in arid areas in 2030 is assumed to increase to 10% because of the future increase of population density and awareness of safe water. On the other hand, the proportion in Nakuru and other areas was assumed to increase to 20%, which is above the national average.
The current dependence ratio of groundwater of the LSRWSS was estimated at below 1% in the national average, and over 30% in the Nakuru area. Considering the shortage of surface water sources in the future, the target dependence ratio of groundwater is set at over 50% in the Nakuru area. The policy promotes groundwater or spring water use as much as possible for the rural water supply system
Currently, surface water is not being used for private and community basis. Therefore, it is supposed that the SSRWS is dependent on groundwater and spring water only.
4.5.2 Proposed Water Supply Development Plan
The proposed UWSS is presented in Table 4.5.1 and Figure 4.5.1, and the proposed LSRWSS and SSRWSS are in Tables 4.5.2 and 4.5.3, respectively. The proposed water supply development plan for the RVCA is outlined below.
Proposed Water Supply Development Plan (RVCA)
Type of Project Target Area Target Capacity (m3/day)
Target Population (million persons)
Urban Water Supply
Rehabilitation 10 Urban Centres 129,000
3.34 Expansion 10 Urban Centres 254,000 New Construction 3 Urban Centres 15,000 Total 13 Urban Centres 398,000
Rural Water Supply LSRWSS 18 Counties 178,000
4.11 SSRWSS 18 Counties 120,000 Total 18 Counties 298,000
Source: JICA Study Team
Based on the above water supply development plan, the water supply situation in the RVCA in 2030 will be as shown in the table below.

Water Supply Development Plan Final Report Chapter 4 Sectoral Report (C) Water Supply
The Development of C - 70 Nippon Koei Co., Ltd. the National Water Master Plan 2030
Water Supply Situation in 2030 (RVCA)
Items Urban Water Supply
Large-scale Rural Water Supply
Small-scale Rural Water Supply Total
Service Population (million)
2010 1.36 1.55 2.91 2030 3.34 1.70 2.41 7.45
Required Treatment Capacity (m3/day)
2010 129,000 7,000 78,000 214,000 2030 398,000 178,000 120,000 696,000
Operating Body Registered WSPs
Registered WSPs
Individual, Community, etc.
--
Target Towns/ Areas 13 UCs 18 Counties --
Source: JICA Study Team (Figures for 2010 were prepared by reference to Section 2.3. Figures for 2030 were prepared based on Tables 4.5.1 to 4.5.3.)
In order to ensure water sources required for the water supply systems mentioned above, it is proposed to construct nine new dams in RVCA and two new dams in LVSCA, as the result of the water balance study. (Ref. Sectoral Report (G), Chapter 4.6)
4.6 Water Supply Development Plan for Athi Catchment Area (ACA)
4.6.1 Development Strategy
(1) Basic Strategy
The ACA is divided into three areas, the Nairobi surrounding area, the Mombasa surrounding area, and other areas, for UWSS planning considering the characteristics of the three areas.
Areal Characteristics (ACA)
Area Feature Nairobi and Satellite Towns
This area has the highest population density area in Kenya. Out of 30 urban centres in the ACA, there are 15 urban centres with 4.46 million urban population, which is 76% of the current urban population. Thika in TCA is also covered by the water supply system of Nairobi. This area is highly dependent on water sources in the ACA.
Mombasa and Coastal Surrounding Area
There are eight urban centres with 1.28 million urban population, which is 20% of the current urban population in the ACA. Only limited surface water sources are available, and a water supply development plan consisting of spring, well field, and desalination plant should be considered.
Other Area This is outside of above area. There are seven urban centres, which are planned to prioritize the use of surface water. As for rural water supply, it was planned to prioritize the use of groundwater.
Source: JICA Study Team
(2) Urban Water Supply System
Based on the overall concept mentioned in Section 4.2, UWSSs are planned for 32 urban centres in the ACA. In case that the same water resources are used among several urban centres in 16 urban centres in Nairobi and satellite towns, nine urban centres in Mombasa and coastal surrounding area, one water supply system is planned to cover several urban centres. However, the other seven urban centres are planned to have independent water supply systems.
The water supply capacity required for the UWSS in the ACA in 2030 is 2,260,000 m3/day, against the current water supply capacity (including capacity under construction) of 699,000 m3/day, so that the additional capacity of 1,561,000 m3/day is to be developed by 2030. It is to be developed through the following three types of projects:

Final Report Water Supply Development Plan Sectoral Report (C) Water Supply Chapter 4
Nippon Koei Co., Ltd. C - 71 The Development of the National Water Master Plan 2030
1) Rehabilitation of existing UWSS
In order to achieve a 20% NRW ratio, water meters are to be installed for all households, and old pipes of the existing UWSS of 30 urban centres, which have 699,000 m3/day water supply capacity, are to be replaced. In addition, the rehabilitation includes replacement and repair of mechanical and electrical equipment in water treatment plants and pumping stations.
2) Expansion of UWSS
Expansion of UWSSs is planned for 29 of the 30 urban centres mentioned above in order to meet the water demand in 2030. The total capacity of expansion is 1,542,000 m3/day.
3) Construction of new UWSS
The construction of new UWSS is planned for two urban centres with no UWSS. The total capacity of the new construction is 19,000 m3/day.
4) Incorporation of existing plans
According to data from WSBs, there are 31 plans of water supply development projects to cover 21 UCs and surrounding areas in ACA, which have 1,215,000 m3/day of total water supply capacity (Refer to Section 2.4). These plans are to be incorporated in NWMP 2030. The planned capacity could cover only 54% of the development capacities required in 2030.
(3) Rural Water Supply System
Based on the overall concept mentioned in Section 4.2, the rural water supply systems are planned to be developed as LSRWSS or as SSRWSS.
1) Development of LSRWSS
The LSRWSS is proposed mainly for areas with high population density or areas with difficulties of groundwater use on a personal or community basis. The LSRWSS is to be developed for 2.05 million residents in ten counties in the ACA.
2) Development of SSRWSS
The SSRWSS is proposed for 2.00 million residents in ten counties in the ACA. This includes construction and improvement of boreholes, wells, and springs on personal and community basis. As this type of works is to be implemented on a personal and community basis, only the water demand projection was made for SSRWSS in this study.
(4) Water Source
1) Water Source of Urban Water Supply
Currently, the existing UWSSs depend on groundwater at 2% of the required water. The dependence ratio of groundwater is expected to become flat in the near future. Also, the dependence ratio of groundwater is tentatively set at 5% in other areas. On the other hand, the installation of desalination plant is considered in Mombasa because water supply from surface

Water Supply Development Plan Final Report Chapter 4 Sectoral Report (C) Water Supply
The Development of C - 72 Nippon Koei Co., Ltd. the National Water Master Plan 2030
water will not be satisfied with the water demand in 2030. However, it is to be finalized by area, as based on results of the water balance calculation described in Sectoral Report (G) Water Resources Development.
2) Water Source of Rural Water Supply
The planning conditions for the LSRWSS and SSRWSS are set as shown in the table below. The conditions are to be modified based on the results of the water balance calculation.
Planning Ratio of Each Type of Rural Water Supply System (ACA)
Area Large-Scale Rural Water Supply System Small-Scale Rural Water Supply System(Groundwater) (Surface Water) (Groundwater)
Nairobi 0% 40% 60% Mombasa 0% 60% 60% Other Area 10% 10% 80%
Source: JICA Study Team, assumed based on the current situation
For setting the planning conditions, the following were considered:
The current proportion of the LSRWSS (piped water supply) in the rural water supply system is estimated based on the existing system and future development plan.
The current dependence ratio of groundwater of the LSRWSS was estimated. Considering the development plan of the surface water supply system in the LSRWSS, the target dependence ratio of groundwater is set at 80% in Tana, 20% in the ACA, and 50% in other areas.
The policy promotes groundwater or spring water use as much as possible for the rural water supply system in other areas.
Currently, surface water is not being used for private and community basis, and the LSRWSS is dependent on groundwater and spring water only.
4.6.2 Proposed Water Supply Development Plan
The proposed UWSS is presented in Table 4.6.1 and Figure 4.6.1, and the proposed LSRWSS and SSRWSS are in Tables 4.6.2 and 4.6.3, respectively. The proposed water supply development plan for the ACA is outlined below.
Proposed Water Supply Development Plan (ACA)
Type of Project Target Area Target Capacity (m3/day)
Target Population (million persons)
Urban Water Supply
Rehabilitation 30 Urban Centres 699,000
17.01 Expansion 29 Urban Centres 1,542,000 New Construction 2 Urban Centres 19,000 Total 32 Urban Centres 2,260,000
Rural Water Supply LSRWSS 10 Counties 209,000
4.04 SSRWSS 10 Counties 110,000 Total 10 Counties 319,000
Note: The water supply development plan (ACA) includes Thika with 0.51 million population. Thika is located in the TCA, but Thika has been connected with the water supply system in the ACA.
Source: JICA Study Team
Based on the above water supply development plan, the water supply situation in the ACA in 2030 will be as shown in the table below.

Final Report Water Supply Development Plan Sectoral Report (C) Water Supply Chapter 4
Nippon Koei Co., Ltd. C - 73 The Development of the National Water Master Plan 2030
Water Supply Situation in 2030 (ACA)
Items Urban Water Supply
Large-scale Rural Water Supply
Small-scale Rural Water Supply Total
Service Population (million)
2010 5.29 2.15 7.44 2030 17.01 2.04 2.00 21.05
Water Supply Capacity (m3/day)
2010 699,000 100,000 108,000 907,000 2030 2,260,000 209,000 110,000 2,579,000
Operating Body Registered WSPs
Registered WSPs
Individual, Community, etc.
--
Target Towns/ Areas 32 UCs 10 Counties --
Source: JICA Study Team (Figures for 2010 were prepared by reference to Section 2.3. Figures for 2030 were prepared based on Tables 4.6.1 to 4.6.3.)
In order to ensure water sources required for the water supply systems in Nairobi and surrounding area, it is proposed to construct eight new dams in ACA, and five new dams in TCA, and expand the inter-basin water transfer system from TCA, as the result of the water balance study.
For the water supply systems in Mombasa and coastal area, it is proposed to construct three new dams in ACA and expand two existing intra-basin water transfer systems. Also, a desalination plant is necessary for Mombasa and coastal area.
For the water supply systems in other areas in ACA, it is proposed to construct four new dams in ACA. (Ref. Sectoral Report (G), Section 4.7)
4.7 Water Supply Development Plan for Tana Catchment Area (TCA)
4.7.1 Development Strategy
(1) Basic Strategy
The TCA is divided into three areas, the upper Tana, the arid area, and other areas, for UWSS planning considering the characteristics of the three areas.
Areal Characteristics (TCA)
Area Feature Tana River Upstream
Out of 19 urban centres in the TCA, there are 15 urban centres in this area. It is estimated that the population is around 60% of the total population (2030). There are many available water sources, such as surface water of rivers from Mt. Kenya. The water supply development plan in this area will be considered from the existing plan of surface water use.
Arid Area Out of three urban centres in arid areas, there are two urban centres supplied by the Tana River in this area. Groundwater is used for rural water supply system in arid areas, and surface water is also used for the water supply system in the area along the Tana River.
Other Area This is outside of the above stated areas. There are four urban centres, which are planned to prioritize the use of surface water. As for rural water supply, it is planned to prioritize the use of groundwater.
Source: JICA Study Team
(2) Urban Water Supply
Based on the overall concept mentioned in Section 4.2, UWSSs are planned for 23 urban centres in the TCA. The water supply capacity required for UWSS in the TCA in 2030 is 543,000 m3/day, against the current water supply capacity (including capacity under construction) of 106,000 m3/day, so that the

Water Supply Development Plan Final Report Chapter 4 Sectoral Report (C) Water Supply
The Development of C - 74 Nippon Koei Co., Ltd. the National Water Master Plan 2030
additional capacity of 437,000 m3/day is to be developed by 2030. It is to be developed through the following three types of projects:
1) Rehabilitation of existing UWSS
In order to achieve a 20% NRW ratio, water meters are to be installed for all households and old pipes of the existing UWSS of 15 urban centres, which have 106,000 m3/day water supply capacity, are to be replaced. In addition, the rehabilitation includes replacement and repair of mechanical and electrical equipment in water treatment plants and pumping stations.
2) Expansion of UWSS
Expansion of UWSSs is planned for 14 of the 15 urban centres mentioned above in order to meet the water demand in 2030. The total capacity of expansion is 349,000 m3/day, and it covers three cities with no UWSS.
3) Construction of new UWSS
The construction of new UWSS is planned for eight urban centres with no UWSS. The total capacity of the new construction is 88,000 m3/day.
4) Revision of existing plans
According to data from WSBs, there are 10 plans of water supply development projects to cover 18 UCs and surrounding areas in TCA, which have 880,000 m3/day of total water supply capacity. (Refer to Section 2.4) The planned capacity could cover around two times of the development capacities required in 2030. Existing plans of six water supply projects upstream of TCA seem to have excessive capacities, comparing with the water demand forecast in the Study. The required water supply capacities of the six projects are to be revised, based on the overall concept mentioned in Section 4.2.
(3) Rural Water Supply System
Based on the overall concept mentioned in Section 4.2, the rural water supply systems were planned to be developed as LSRWSS or as SSRWSS.
1) Development of LSRWSS
The LSRWSS is proposed mainly for areas with high population density or areas with difficulties of groundwater use on a personal or community basis. The LSRWSS is to be developed for 2.11 million residents in 16 counties in the TCA.
2) Development of SSRWSS
The SSRWSS is proposed for 2.72 million residents in 16 counties in the TCA. This includes construction and improvement of boreholes, wells, and springs on personal and community basis. As this type of works is to be implemented on a personal and community basis, only the water demand projection was made for SSRWSS in this study.

Final Report Water Supply Development Plan Sectoral Report (C) Water Supply Chapter 4
Nippon Koei Co., Ltd. C - 75 The Development of the National Water Master Plan 2030
(4) Water Source
1) Water Source of Urban Water Supply
The UWSSs are planned to be established for 23 urban centres. Basically, the UWSSs are planned for each urban centre independently. On the other hand, the same water resources are being used among several urban centres, and one water supply system is planned to cover 13 urban centres in the Tana upper stream site.
Currently, the existing UWSSs depend on groundwater slightly at 2% of the required water. However, the dependence ratio of groundwater is expected to increase because shortage of surface water is expected in the near future. The dependence ratio of groundwater is tentatively set at 5%. However, the dependence ratio of groundwater in arid areas is tentatively set at 100% because it has no connection to surface water. Also, it is to be finalized by area, as based on the results of the water balance calculation described in Sectoral Report (G) Water Resources Development.
2) Water Source of Rural Water Supply
The planning conditions for the LSRWSS and SSRWSS are set as shown in the table below. The conditions are to be modified based on the results of the water balance calculation.
Planning Ratio of Each Type of Rural Water Supply System (TCA)
Area Large-Scale Rural Water Supply System Small-Scale Rural Water
Supply System (Groundwater) (Surface Water) (Groundwater)
Tana 60% 0% 40% Arid Area 5% 5% 90% Other Area 10% 10% 80% Source: JICA Study Team, assumed based on the current situation
For setting the planning conditions, the following were considered:
The current proportion of the LSRWSS (piped water supply) in the rural water supply system is estimated considering the existing system and development plan.
The current dependence ratio of surface water of the LSRWSS is estimated considering the characteristics of each catchment. Therefore, it was set at 80% in the Tana upper stream area. Considering the characteristics of each catchment, the target dependence ratio of surface water was set at 80% in the Tana upper stream area. The policy promotes groundwater or spring water use as much as possible for the rural water supply system. Basically, the dependence ratio of surface water is set at 0%; however, it was set at 20% in arid areas due to the presence of the Tana River.
Currently, surface water is not being used for private and community basis, and the SSRWS is dependent on groundwater and spring water only.
4.7.2 Proposed Water Supply Development Plan
The proposed UWSS is presented in Table 4.7.1 and Figure 4.7.1, and the proposed LSRWSS and SSRWSS are in Tables 4.7.2 and 4.7.3, respectively. The proposed water supply development plan for the TCA is outlined below.

Water Supply Development Plan Final Report Chapter 4 Sectoral Report (C) Water Supply
The Development of C - 76 Nippon Koei Co., Ltd. the National Water Master Plan 2030
Proposed Water Supply Development Plan (TCA)
Type of Project Target Area Target Capacity (m3/day)
Target Population (million persons)
Urban Water Supply
Rehabilitation 15 Urban Centres 106,000
4.90 Expansion 14 Urban Centres 349,000 New Construction 8 Urban Centres 88,000 Total 23 Urban Centres 543,000
Rural Water Supply LSRWSS 16 Counties 211,000
4.96 SSRWSS 16 Counties 145,000 Total 16 Counties 356,000
Note: The water supply development plan (TCA) does not include Thika with 0.51 million population. Thika is located in the TCA, but it has been connected with the water supply system in the ACA.
Source: JICA Study Team
Based on the above water supply development plan, the water supply situation in the TCA in 2030 will be as shown in the table below.
Water Supply Situation in 2030 (TCA)
Items Urban Water Supply
Large-scale Rural Water Supply
Small-scale Rural Water Supply Total
Service Population (million)
2010 1.95 1.43 3.382030 4.90 2.24 2.72 9.86
Water Supply Capacity (m3/day)
2010 106,000 149,000 72,000 327,0002030 543,000 211,000 145,000 899,000
Operating Body Registered WSPs
Registered WSPs
Individual, Community, etc.
--
Target Towns/ Areas 23 UCs 16 Counties --
Source: JICA Study Team (Figures for 2010 were prepared by reference to Section 2.3. Figures for 2030 were prepared based on Tables 4.7.1 to 4.7.3.)
In order to ensure water sources required for the water supply systems mentioned above, it is proposed to construct four new dams and one intra-basin water transfer system and also expand two existing intra-basin water transfer systems, as the result of the water balance study. (Ref. Sectoral Report (G), Chapter 4.8).
4.8 Water Supply Development Plan for Ewaso Ng’iro North Catchment Area (ENNCA)
4.8.1 Development Strategy
(1) Basic Strategy
The ENNCA is divided into two areas, the northern arid area and the southern non-arid area, for water supply systems planning considering the characteristics of the two areas.
Areal Characteristics (ENNCA)
Area Feature Arid Area There are eight urban centres in arid areas. Both urban and rural water supply systems depend on
groundwater. Other Area This is outside the arid area. There are four urban centres, which are planned to prioritize the use of
surface water. As for rural water supply, it is planned to prioritize the use of groundwater.
Source: JICA Study Team

Final Report Water Supply Development Plan Sectoral Report (C) Water Supply Chapter 4
Nippon Koei Co., Ltd. C - 77 The Development of the National Water Master Plan 2030
(2) Urban Water Supply System
Based on the overall concept mentioned in Section 4.2, the UWSSs are planned for 12 urban centres in the ENNCA. The water supply capacity required for the UWSS in the ENNCA in 2030 is 124,000 m3/day, against the current water supply capacity (including capacity under construction) of 32,000 m3/day, so that the additional capacity of 92,000 m3/day is to be developed by 2030. It is to be developed through the following three types of projects:
1) Rehabilitation of existing UWSS
In order to achieve a 20% NRW ratio, water meters are to be installed for all households, and old pipes of the existing UWSS of six urban centres, which have 32,000 m3/day of water supply capacity, are to be replaced. In addition, the rehabilitation includes replacement and repair of mechanical and electrical equipment in water treatment plants and pumping stations.
2) Expansion of UWSS
Expansion of UWSSs is planned for the six urban centres mentioned above in order to meet the water demand in 2030. The total capacity of expansion is 61,000 m3/day.
3) Construction of new UWSS
The construction of new UWSS is planned for six urban centres with no UWSS. The total capacity of the new construction is 31,000 m3/day.
4) Incorporation of existing plans
According to data from WSBs, there are six plans of water supply development projects to cover two UCs and surrounding areas in ENNCA, which have 22,000 m3/day of total water supply capacity (Refer to Section 2.4). These plans are to be incorporated in NWMP 2030. The planned capacity could cover only 24% of the development capacities required in 2030. Feasibility studies have not been carried out for any projects. It is required to provide F/S reports of water supply development projects, which will cover the future water demand of each UC.
(3) Rural Water Supply System
Based on the overall concept mentioned in Section 4.2, the rural water supply systems are planned to be developed as LSRWSS or as SSRWSS.
1) Development of LSRWSS
The LSRWSS is proposed mainly for areas with high population density or areas with difficulties of groundwater use on a personal or community basis. The LSRWSS is to be developed for 1.16 million residents in 14 counties in the ENNCA.
2) Development of SSRWSS
The SSRWSS is proposed for 2.20 million residents in 14 counties in the ENNCA. This includes construction and improvement of boreholes, wells, and springs on personal and

Water Supply Development Plan Final Report Chapter 4 Sectoral Report (C) Water Supply
The Development of C - 78 Nippon Koei Co., Ltd. the National Water Master Plan 2030
community basis. As this type of works is to be implemented on a personal and community basis, only the water demand projection was made for SSRWSS in this study.
(4) Water Source
1) Water Source of Urban Water Supply
Currently, the existing UWSSs in arid areas depend on groundwater slightly at only 2% of the required water. However, the dependence ratio of groundwater is expected to increase, because shortage of surface water is expected in the near future. The dependence ratio of groundwater was tentatively set at 5%; however, it is to be finalized by area, as based on the results of the water balance calculation described in Sectoral Report (G) Water Resources Development.
2) Water Source of Urban Water Supply
The planning conditions for the LSRWSS and SSRWSS are set as shown in the table below. The conditions are to be modified based on the results of the water balance calculation.
Planning Ratio of Each Type of Rural Water Supply System (ENNCA)
Area Large-Scale Rural Water Supply System Small-Scale Rural Water Supply System (Groundwater) (Surface Water) (Groundwater)
Arid Area 50% 50% 90% Other Area 10% 10% 80%
Source: JICA Study Team, assumed based on the current situation
For setting the planning conditions, the following were considered:
The current proportion of the LSRWSS (piped water supply) in the rural water supply system is estimated at 5% within arid areas, and 20% outside arid areas. The proportion of the LSRWSS in 2030 is assumed to be same as the current situation.
Considering the characteristics of the catchment, the target dependence ratio of surface water was set below 50% in the ENNCA. The policy promotes groundwater or spring water use as much as possible for the rural water supply system.
Surface water is not being used for private and community basis, and the SSRWSS is dependent on groundwater only.
4.8.2 Proposed Water Supply Development Plan
The proposed UWSS is presented in Table 4.8.1 and Figure 4.8.1, and the proposed LSRWSS and SSRWSS are in Tables 4.8.2 and 4.8.3, respectively. The proposed water supply development plan for the ENNCA is outlined below.
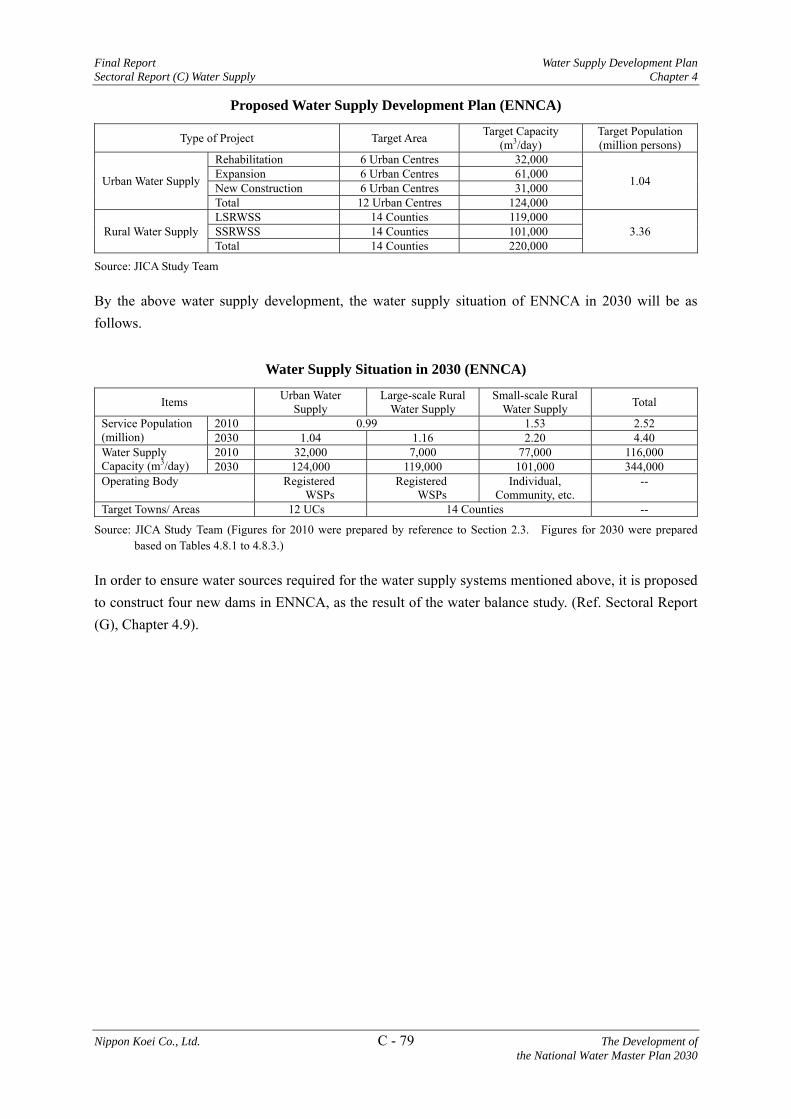
Final Report Water Supply Development Plan Sectoral Report (C) Water Supply Chapter 4
Nippon Koei Co., Ltd. C - 79 The Development of the National Water Master Plan 2030
Proposed Water Supply Development Plan (ENNCA)
Type of Project Target Area Target Capacity (m3/day)
Target Population (million persons)
Urban Water Supply
Rehabilitation 6 Urban Centres 32,000
1.04 Expansion 6 Urban Centres 61,000 New Construction 6 Urban Centres 31,000 Total 12 Urban Centres 124,000
Rural Water Supply LSRWSS 14 Counties 119,000
3.36 SSRWSS 14 Counties 101,000 Total 14 Counties 220,000
Source: JICA Study Team
By the above water supply development, the water supply situation of ENNCA in 2030 will be as follows.
Water Supply Situation in 2030 (ENNCA)
Items Urban Water Supply
Large-scale Rural Water Supply
Small-scale Rural Water Supply Total
Service Population (million)
2010 0.99 1.53 2.52 2030 1.04 1.16 2.20 4.40
Water Supply Capacity (m3/day)
2010 32,000 7,000 77,000 116,000 2030 124,000 119,000 101,000 344,000
Operating Body Registered WSPs
Registered WSPs
Individual, Community, etc.
--
Target Towns/ Areas 12 UCs 14 Counties --
Source: JICA Study Team (Figures for 2010 were prepared by reference to Section 2.3. Figures for 2030 were prepared based on Tables 4.8.1 to 4.8.3.)
In order to ensure water sources required for the water supply systems mentioned above, it is proposed to construct four new dams in ENNCA, as the result of the water balance study. (Ref. Sectoral Report (G), Chapter 4.9).

Cost Estimate Final Report Chapter 5 Sectoral Report (C) Water Supply
The Development of C - 80 Nippon Koei Co., Ltd. the National Water Master Plan 2030
CHAPTER 5 COST ESTIMATE
5.1 Basic Conditions for Cost Estimate
The project costs estimated in the study are approximate or notional figures to grasp the general financial status, and is not intended to bind the project finance arrangement in the future.
The basic conditions for the project cost estimate are as follows:
a) Project costs are updated to be the price level as of November 1, 2012;
b) Exchange rate applied is US$1.0 = KSh85.24, as of November 1, 2012;
c) Physical contingency was assumed to be 15% of the direct construction cost;
d) Cost of engineering services (detailed design and construction supervision) was assumed to be 10% of the direct construction cost;
e) Land acquisition cost was assumed at KSh100,000 per ha, when no evidence is available. (Except for dam construction, land acquisition cost was not considered because it seems negligible.)
f) The construction costs of multipurpose dams are allocated on the basis of the existing F/S, the role of the leading subsector in project implementation, and water storage volume (refer to Sectoral Report (G) Water Resources Development).
5.2 Cost Estimate
5.2.1 Project Costs (Construction Costs)
The construction costs (financial initial investment costs) for the proposed water supply projects are estimated or assumed as follows.
(1) Rehabilitation of Urban Water Supply System
The objectives of the rehabilitation are to realize a 20% NRW ratio, and to restore the functions of the existing water supply system.
The scope of the rehabilitation project is expected to include the replacement of old pipes, installation/replacement of water meters, and repair/replacement works of mechanical and electric equipment. The scope of the rehabilitation projects depends on the conditions of the existing water supply systems in urban centers. There is not enough data and information for fixing the scope. Under these conditions, it is very difficult to estimate the costs of rehabilitation projects for each urban centre. Based on the estimate of existing reports prepared by the WSBs and the Aftercare Study (1998), a unit rate of US$675/m3 of water supply capacity was applied in the cost estimates. Cost estimation was based on the replacement cost, which is 30% of the construction cost (US$2,250/m3 x 30%).
In the Aftercare Study (1998), the rehabilitation projects were proposed for the existing urban water supply systems, having a combined capacity of 391,866 m3/day. The total project cost was estimated at

Final Report Cost Estimate Sectoral Report (C) Water Supply Chapter 5
Nippon Koei Co., Ltd. C - 81 The Development of the National Water Master Plan 2030
US$44.5 million. In the Aftercare Study (1998), the unit rate of the rehabilitation project cost was estimated at US$110/m3.
(2) Expansion and New Development of Urban Water Supply System
For estimating the project costs for the expansion and new development, the project costs were divided into three types of costs: “source works and water transmission system”, “treatment works and distribution pipe networks”, and “dam and water transfer system”. The dam and water transfer system was considered additionally, only if enough water sources are not available in the surrounding area.
1) Source Works and Water Transmission System
The source works include water intake facilities, boreholes with pumps, and the transmission system. The water transmission system includes pipelines and pump stations up to the “treatment works and distribution pipe networks”.
Based on the cost estimates of existing reports prepared by the WSBs and the Aftercare Study (1998), the costs were assumed by applying a unit rate of US$375/m3 (the direct construction cost is US$300/m3) of water production.
2) Treatment Works and Distribution Pipe Networks
Based on the cost estimates of existing reports prepared by the WSBs and the Aftercare Study (1998), the costs were assumed by applying a unit rate of US$1,875/m3 (the direct construction cost is US$1,500/m3) of water production.
3) Dam and Water Transfer System
If a water source in the surrounding areas is not available so as to meet the projected water demand, the construction of a dam and/or water inter-transfer system would be required in addition to the above intake works, treatment works and distribution pipe networks. The costs of major dams and water transfer system were estimated by each dam and transfer system, based on data provided by WSPs.
In the Aftercare Study (1998), the expansion and new development projects were proposed with a total capacity of 712,000 m3/day, and the total project cost was estimated at US$1,270 million. In the Aftercare Study (1998), the unit rate of the project cost for the expansion and new development was estimated at US$1,780/m3. In the study, the total project cost was estimated at US$11,001 million for the expansion and new development of 3.72 million m3/day so that the unit rate was at US$2,957. Considering price escalation, the unit price seems reasonable as the price level in 2013. The project costs were estimated in KSh applying the exchange rate of KSh 85.24/US$.
Tables 5.2.1 to 5.2.14 show the project costs of UWSS development and LSRWSS development proposed for each catchment area. The summary of the project costs is shown below.

Cost Estimate Final Report Chapter 5 Sectoral Report (C) Water Supply
The Development of C - 82 Nippon Koei Co., Ltd. the National Water Master Plan 2030
Summary of Project Costs for UWSS and LSRWSS Projects (Unit: KSh million)
Category Total Cost
Project Cost for Each Catchment Area LVNCA LVSCA RVCA ACA TCA ENNCA
1) UWSS Rehabilitation 70,920 7,578 6,921 7,416 40,251 6,887 1,867Expansion/Development 1,018,098 136,580 152,947 93,977 490,879 122,601 21,114Sub-total 1,089,018 144,158 159,868 101,393 531,130 129,488 22,9812) LSRWSS Rehabilitation 9,087 528 1,500 384 0* 6,274 401Expansion/Development 189,761 32,553 48,280 43,464 39,543 4,450 21,472Sub-total 198,848 33,082 49,780 43,847 39,543 10,723 21,873Total 1,287,866 177,240 209,648 145,240 570,673 140,211 44,854Note: * It is assumed that rehabilitation of LSRWSS in ACA is to be carried out as a part of UWSS rehabilitation
projects. Source: JICA Study Team
5.2.2 Operation and Maintenance Costs
Operation and maintenance (O&M) costs highly depend on the design of water transmission and distribution. However, F/S reports as well as preliminary design have not been prepared for most of the proposed projects. Under the situation, it is impossible to estimate the O&M cost for each project. Based on estimates in the existing reports prepared by the WASREB and WSBs, the O&M cost can be roughly estimated by applying a unit rate of US$0.3/m3of water production.
5.2.3 Replacement Costs
Replacement costs of project facilities, such as mechanical and electric works, were assumed to be required every 15 years at an amount of 30% of the project cost.

Final Report Economic Evaluation Sectoral Report (C) Water Supply Chapter 6
Nippon Koei Co., Ltd. C - 83 The Development of the National Water Master Plan 2030
CHAPTER 6 ECONOMIC EVALUATION
6.1 Evaluation Method and Basic Conditions
The economic viability of selected projects was evaluated based on the estimated economic cost and water supply benefit. The criteria by which economic decision making are made as follows:
a) Economic Internal Rate of Return (EIRR)
b) Net Present Value (NPV)
c) Benefit and Cost Ratio (B/C Ratio)
The following assumptions were made for the economic analysis:
1) Price Level
Investment costs and O&M costs were estimated at price levels on November 1, 2012. All prices are expressed by US$ currency. The foreign exchange rate was set at KSh85.24 to US$1.00, ¥79.98 to US$1.00, and KSh110.48 to €1.00.
2) Economic Value
The prices of internationally tradable goods and services will be valued based on international border prices, which is often expressed in the World Bank’s “Commodity Prices and Price Forecast”. The prices of non-traded goods and services will be converted from their financial value to economic value by applying a standard conversion factor of 0.90 based on the facts that the ratio of taxation against the GDP in Kenya is about 11%, as well as on the fact that the conversion factors widely applied in the water sector of Kenya are mostly around 0.90.
3) Social Discount Rate
The social discount rate reflects the opportunity cost of capital to the national economy. In this study, 10% of the prevailing opportunity cost of capital in the water sector of Kenya is applied.
4) Economic Life of Projects
The economic life of water supply projects was set at 30 years. However, a part of mechanical facilities was considered at 15 years, thus it would be replaced in 15 years within the economic life.
5) Multipurpose Dams
The construction costs and annual O&M costs of multipurpose dams were allocated based on the existing F/S, the role of the leading subsector in project implementation, and the water storage volume.
The overall economic evaluation of urban domestic water supply projects for 137 urban centres was performed for each catchment area at a master plan level. Rural water supply projects were not evaluated because of the unavailability of data for planning at this preliminary stage. In addition, industrial water supply was not included in the economic evaluation due to the unpredictability of

Economic Evaluation Final Report Chapter 6 Sectoral Report (C) Water Supply
The Development of C - 84 Nippon Koei Co., Ltd. the National Water Master Plan 2030
industrial areas in the future at this preliminary stage, although the NWMP 2030 considers industrial use of water in the water demand forecast.
6.2 Economic Benefit
The economic benefits of urban water supply projects were identified as follows:
(1) Quantifiable Benefits
Cost-saving benefits, which replace the existing water supply and serve the people who are currently dependent on relatively expensive water vendor fees as compared to water tariffs in public water supply systems. The tariff, ranging from KSh2/L to KSh40/L, varies depending on the region and the season. In this study, the average tariff of one jerry can in the suburb of Nairobi (KSh4/20 L) in November 2012 was used as the base value in the economic analysis
Incremental water benefits mean increased quantity of available water for consumption through a water supply project. In other words, this increased water demand results from the availability of higher quality of water at lower cost. In order to estimate the average water demand price, the study used data from the willingness to pay surveys in Nairobi, Mombasa, and Kakamega, which were undertaken by the World Bank in 2005 (US$1.1/m3 in 2010 value). This demand price data was further adjusted to the current value, which was estimated at US$1.2/m3 in financial price.
The reduction of water loss through improved water system. Currently, around 40% of water loss was estimated. This rate can be reduced through an improved water supply system.
(2) Qualitative Benefits
Improved public health, which derives from the prevention of waterborne diseases. In particular, waterborne diseases such as diarrhea and typhoid are reported as being caused by unimproved water supply.
Among the socioeconomic impact identified in the above, 1) cost-saving benefits, and 2) incremental water benefits were selected to estimate the benefits of the overall urban water supply projects.
The construction period for urban water supply was set to three years and the benefits would be starting from the fourth year, reaching full development in five years.
6.3 Economic Cost
(1) Investment Cost
For economic evaluation, the economic investment cost was converted to its equivalent economic value in order to remove transfer payments such as taxes and subsidies. The cost of a single and multipurpose dam construction was included as described in Section 6.1. The cost for engineering services was estimated at 10% of the initial construction cost. The physical contingency cost was included in the investment cost and was set at 15% of the initial direct construction cost. The total investment costs by catchment area are summarised in the following table. The ACA would require the highest investment cost in order to respond to the increased water demand in this catchment (1,597,843 m3/day). The total economic investment cost for the proposed water supply projects was

Final Report Economic Evaluation Sectoral Report (C) Water Supply Chapter 6
Nippon Koei Co., Ltd. C - 85 The Development of the National Water Master Plan 2030
estimated at US$11,918 million. This would provide water supply services for an additional 29.7 million people by 2030.
Summary of Estimated Investment Cost and O&M Cost by Catchment Catchment
Area Additional
Water Demand 2030 (m3/day)
No. of Beneficiary
(2030)
No. of Projects
Total Financial Cost
(US$ million)
Total Economic Cost
(US$ million)
Annual Financial O&M Cost
(US$ million) LVNCA 678,010 5,638,462 32 1,580 1,488 72 LVSCA 714,638 5,710,884 24 1,768 1,669 74 RVCA 306,332 2,446,316 13 1,081 1,026 32 ACA 1,597.843 10,631,645 32 5,641 5,347 266 TCA 433,151 4,344,112 23 1,418 1,342 49
ENNCA 102,818 908,719 12 242 229 10 Total 3,832,792 29,680,139 136 11,730 11,100 502
Source: JICA Study Team
(2) Annual O&M Cost
The annual O&M cost for water supply facilities was estimated at US$0.3/m3 per day of treatment facility. Also, 0.5% of the initial construction cost was required for the annual O&M of water source facility (dam). The O&M cost is further converted to its economic value.
(3) Replacement Cost
The replacement cost is required for mechanical facilities such as pipes every 15 years and was set at 30% of the initial construction cost.
6.4 Results of Economic Evaluation
The results of economic evaluation by catchment area are summarised in the following table. Four out of the six catchments have an EIRR greater than 10%. The RVCA and the ACA were found not economically viable because of their high water transfer costs (both RVCA and ACA), desalination scheme (ACA), and high dam cost (RVCA). The TCA includes a water transfer component in the High Grand Falls, but its economic viability was still positive with an EIRR greater than 10%. In terms of economic benefits in NPV, the ACA has the largest – increasing the national economy by US$5,326 million at the present value.
Summary of Economic Evaluation Results for Urban Water Supply by Catchment (Unit: US$ million)
Catchment AreaNet Present Value (10%)
B/C EIRR Cost Benefit
LVNCA 1,745 2,278 1.31 14.0% LVSCA 1,914 2,415 1.26 13.3% RVCA 1,090 1,035 0.95 9.3% ACA 6,315 5,326 0.84 7.7% TCA 1,471 1,494 1.02 10.2%
ENNCA 263 350 1.33 14.1% Total 12,798 12,919 10.11 10.1%
Source: JICA Study Team
Implementation Programme Final Report Chapter 7 Sectoral Report (C) Water Supply
The Development of C - 86 Nippon Koei Co., Ltd. the National Water Master Plan 2030
CHAPTER 7 IMPLEMENTATION PROGRAMME
7.1 General
The implementation program for water supply projects toward 2030 was formulated to complete all of the projects in order to meet the water demand in 2030. The implementation schedule was considered in three terms: the short term (five years from 2013 to 2017), the medium term (five years from 2018 to 2022), and the long term (eight years from 2023 and 2030). The implementation schedule of the water supply development plan was considered in accordance with the water resources development plan, including the dam construction plan.
The total development capacity of the proposed projects by 2030 is 3.72 million m3/day, which is more than three times the current capacity of existing water supply systems. It is quite a huge development plan, and may have to be modified due to financial constraints.
The individual projects will have EIAs which will address all issues including land acquisition and compensation.
7.2 Prioritization Criteria for Implementation
Rehabilitation of the existing urban water supply systems has the highest priority, in order to achieve effective water use. The rehabilitation projects for 98 urban centres with water supply system are proposed to be commenced in the short term.
Basically, each water supply system is proposed to be developed in two phases by 2030 in order to avoid overdevelopment. The plan of second phase projects can be modified after completion of the first phase projects.
As for urban water supply projects for new development and expansion, prioritization of implementation was made using the following criteria:
1st Priority Projects with financing
2nd Priority Projects with detailed design completed by the WSBs
3rd Priority Projects with feasibility study completed by the WSBs
4th Priority Projects proposed by the WSBs, or proposed in the First Medium Term Plan
5th Priority Projects other than the above
Within the same ranking of project status, the following criteria will be applied for further prioritization:
• Projects with larger service population have higher priority (such as urban water supply and large-scale rural water supply projects).
• Projects which expect negative environmental impacts have lower priority.

Final Report Implementation Programme Sectoral Report (C) Water Supply Chapter 7
Nippon Koei Co., Ltd. C - 87 The Development of the National Water Master Plan 2030
• Small-scale rural water supply projects are to be implemented progressively by individuals or communities.
7.3 Implementation Schedule for Water Supply Development Toward 2030
Based on the criteria mentioned above, the implementation schedules of urban water supply projects by catchment area was prepared, as shown in Figures 7.3.1 to 7.3.6. They are summarised in the subsection hereunder.
The overall project implementation schedule is arranged so that the necessary budget for development would be balanced in the short term (2013/14 to 2017/18), the medium term (2018/19 to 2022/23), and the long term (2023/24 to 2030/31), respectively. Figures 7.3.1 to 7.3.6 show the required project costs per each term and per each catchment area.
7.4 Recommendations for Further Surveys and Studies for the NWMP 2030
In the course of projection of water demands and formulation of the water supply development plan, several assumptions had to be introduced due to lack or insufficiency of required data and information. For the further study, the following actions are recommended.
(1) Review of Population Projection of Urban Centres
The proposed water supply development plan was formulated to meet the future demand in 2030 as estimated based on the projected population. According to Kenya Vision 2030, the urban population would drastically increase to 46.02 million by 2030, which is around 3.5 times the population in 2010 (13.08 million). A concrete basis of population growth is unknown.
As the population affects the scale of the water supply system largely, it is recommended to review the urban population of urban centres based on concrete future urban development plans such as expansion of urban area, development of urban infrastructure, future land use, and future economic activity, before realization of the water supply projects.
(2) Accumulation of Basic Data for Water Demand Projection
The water demands projected in this study are for domestic, industrial, livestock, wildlife and fisheries. However, basic data for the projection were not sufficient and the projection has to be made by rough estimation.
It is recommended to accumulate basic data required for the projection of respective water demands for more accurate water demand projections. For this, the preparation of concrete development plans such as development plans for urban centres and counties, would be required.
The domestic water demand in the master plan was estimated by using unit water consumption amounts stipulated in the Design Manual of Kenya. In case of the increase of unit water consumption due to the level-up of the living standards in Kenya, it will be necessary to revise the relevant manuals and guidelines to re-estimate the domestic water demand.

Implementation Programme Final Report Chapter 7 Sectoral Report (C) Water Supply
The Development of C - 88 Nippon Koei Co., Ltd. the National Water Master Plan 2030
The future industrial water demand was estimated based on a future domestic water demand in each area. If an industrial development was planned clearly in a certain area, the industrial water demand for the area should be revised based on the development plan.
(3) Measuring of Actual Water Supply Amount
The present water supply amount for domestic use was estimated through the present water demand due to the insufficiency of data required for estimation. The Water Supply Strategic Plan 2009 mentioned that the average water meter installation rate of registered WSPs is only 86%. Furthermore, many WSPs do not accurately read the meters, and the meters are not functioning well.
It is recommended to install and manage the water meters so as to cover all population under service of WSPs since the accurate measurement of the actual water supply amount is essential for the proper water supply system development.

Tables

WSP No. of Towns Population in Service Area
Population Served
% Served No. of Connections
Production (m3 000)
NRW % No. of Staff
Very Large WSPsNairobi 6 3,203,201 2,157,826 67 401,669 154,000 40 1,918Mombasa 6 975,520 618,594 63 71,798 16,240 35 483Eldoret 1 401,456 260,512 65 42,593 15,513 52 186Nakuru 1 674,789 472,352 70 40,910 10,302 47 212Large WSPsNakuru Rural 5 441,174 202,378 46 28,921 6,405 35 118Nzoia 4 377,036 174,215 46 28,292 5,109 57 155Nyeri 1 122,203 83,408 68 19,863 5,219 39 111Mathira 2 180,000 54,000 30 19,414 3,967 61 62Othaya Mukurw 2 205,759 126,156 61 18,566 6,753 65 85Kirinyaga 5 348,000 110,106 32 18,531 1,505 86 192Western 6 448,400 131,617 29 16,364 2,170 41 100Kilifi Mariakani 11 764,090 428,161 56 16,136 4,424 39 164Murang'a South 4 299,297 91,038 30 14,932 3,368 57 62Chemosit 14 105,535 48,523 46 14,716 2,628 67 109Kisumu 1 525,313 153,083 29 14,084 6,200 62 135Kahuti 1 179,983 34,212 19 13,156 3,240 72 59Kericho 1 118,720 60,543 51 13,010 3,007 52 120Malindi 4 259,756 207,805 80 12,486 4,301 7 75Tetu Aberdare 3 103,202 69,769 68 11,819 2,473 63 56Gatamathi 2 194,111 44,954 23 11,478 3,069 79 26Nanyuki 1 83,360 50,360 60 11,364 3,832 46 83Nyahururu 9 95,000 35,564 37 10,156 2,291 57 98Kikuyu 3 112,830 38,136 34 10,047 1,859 46 37Medium WSPsGatundu 3 255,394 31,766 12 9,717 3,212 69 51Garissa 2 186,522 121,239 65 9,587 3,960 64 89Embu 1 140,000 67,549 48 9,545 3,726 57 55Naivasha 1 70,000 19,200 27 9,240 585 47 23Tavevo 3 259,772 126,114 49 8,914 3,072 91Machakos 1 161,000 10,494 7 8,485 545 41 52Imetha 7 120,872 14,160 12 8,435 3,447 81 70Murang'a 3 47,000 24,816 53 8,200 816 50 67Meru 1 105,985 53,146 50 7,537 1,926 28 70South Nyanza 5 680,000 573,020 84 7,417 2,236 39 100Ngagaka 1 64,000 26,652 42 6,698 3,500 87 39Gatanga 1 121,000 31,644 26 6,528 1,945 42 31Isiolo 1 70,000 28,310 40 6,496 1,234 38 55Ruiru Juja 2 115,376 50,765 44 6,302 816 26 40Kwale 5 174,339 67,944 39 5,979 3,189 59 71Karimenu 1 106,865 42,746 40 5,956 2,190 93 22Ngandori Mginda 4 73,000 28,170 39 5,936 5,110 77 30Gusii 7 1,600,000 300,000 19 5,743 1,210 45 147Tuuru 1 335,912 162,442 48 5,682 1,103 62 83Ngariama Njukiini 1 50,000 15,984 32 5,407 4,680 96 22Oloolaiser 3 420,000 32,528 8 5,203 1,623 40 52Small WSPsKyeni 2 68,200 11,352 17 4,591 107 40 15Kiambu 8 89,921 15,162 17 4,329 1,041 38 36Kitui 2 542,000 135,674 25 4,071 2,728 68 53Nol Turesh 2 66,667 50,000 75 4,001 3,857 64 60Eldama Ravine 1 61,986 30,211 49 3,969 1,601 80 37Mavoko 1 170,000 35,595 21 3,849 688 35 47Embe 3 60,000 8,442 14 3,257 710 80 43Lodwar 7 85,000 25,321 30 2,860 849 29 32Nithi 3 69,811 15,996 23 2,811 1,385 74 40Githunguru 2 130,067 6,072 5 2,780 92 13Kapenguria 7 92,700 7,524 8 2,595 622 42 36Lamu 2 23,500 14,774 63 2,577 540 33 26Olkalou 1 71,000 16,230 23 2,198 129 10Nyandarua North 4 40,000 5,394 13 2,189 143 27Narok 1 60,000 25,814 43 1,994 792 58 18Tarda Kiambere 1 115,000 40,000 35 1,887 320 31 24Kibwezi Mtito 1 186,000 29,120 16 1,801 465 24 29Engineer Town 1 25,000 5,454 22 1,634 214 5Makindu 1 63,178 18,996 30 1,401 726 48 21Kapsabet Nandi 1 32,500 6,417 20 1,365 209 64 14Uasin Gishu 6 61,773 8,392 14 1,350 545 48 53Iten Tambach 1 45,387 7,888 17 1,322 253 47 14Muthambi 1 22,273 9,180 41 1,299 389 40 12Ndaragwa 1 25,000 5,802 23 1,201 700 11Teso 2 47,550 7,008 15 1,091 198 7Maralal 1 40,974 5,900 14 970 500 30 23Tachasis 3 23,152 3,536 15 752 341 60 5Rumuruti 1 12,000 3,344 28 532 7 14Tia Wira 1 6,200 2,030 33 358 123 67 3Upper Chania 1 25,700 7,148 28 341 45 10Vihiga 2 8,600 784 9 206 17Kathita Kiirua 1 32,000 7,020 22 162 523 26 16Trans Nzoia 1 6,000 408 7 124 14 26 7Total 220 17,784,911 8,053,989 45 1,079,179 338,856 6,684
Table 2.2.1 Basic Data of Water Service Providers
Source: IMPACT Issue No.3
C - T - 1

WSP Drinking Water Quality
Compliance with Cl2
Standards
NRW % Water Coverage %
Sanitation Coverage %
No. Hours Supply
Staffing Collection Efficiency %
O&M Cost Coverage %
Metering Ratio (%)
Overall Ranking
Very Large WSPsNairobi 100 98 40 67 29 13 5 80 113 94 6Mombasa 58 91 35 83 88 6 10 90 114 55 22Eldoret 71 94 52 65 80 24 4 81 101 90 12Nakuru 64 100 47 70 73 16 5 92 118 89 8Large WSPsNakuru Rural 78 100 35 46 No data 7 9 90 111 18 38Nzoia 60 99 57 46 62 20 7 88 87 62 28Nyeri 100 99 39 68 87 24 6 90 143 96 1Mathira 100 100 61 30 67 20 7 78 90 39 27Othaya Mukurw 100 97 65 61 97 17 9 69 66 41 33Kirinyaga 100 99 86 32 No data 23 18 107 105 85 23Western 98 84 41 29 29 11 11 79 53 0 47Kilifi Mariakani 76 90 39 56 52 24 20 83 86 62 36Murang'a South 83 90 57 30 78 8 10 96 48 32 58Chemosit 100 90 67 46 No data 10 19 78 25 85 54Kisumu 91 94 62 29 6 18 10 84 97 96 21Kahuti 84 100 72 19 70 18 13 87 85 51 49Kericho 100 100 52 51 15 23 11 86 102 99 10Malindi 82 96 7 80 53 24 6 85 70 98 4Tetu Aberdare 44 100 63 68 100 20 7 80 107 78 14Gatamathi 95 91 79 23 81 16 5 101 91 29 25Nanyuki 100 99 46 60 98 16 7 84 81 85 7Nyahururu 73 96 57 37 65 18 10 95 108 85 18Kikuyu No data No data 46 34 70 16 5 94 70 96 29Medium WSPsGatundu No data No data 69 12 80 24 10 53 122 67 65Garissa 99 100 64 65 74 17 10 74 67 77 20Embu 100 93 57 48 92 22 6 92 135 92 3Naivasha No data No data 47 27 72 12 3 88 82 3 43Tavevo 46 100 No data 49 100 9 18 65 No data 64 66Machakos No data No data 41 7 16 No data 9 82 43 25 63Imetha 100 100 81 12 39 16 34 64 51 60 61Murang'a 96 98 50 53 96 18 9 103 80 83 5Meru 99 97 28 50 100 24 11 110 127 97 2South Nyanza 97 97 39 No data No data 18 15 95 49 80 13Ngagaka No data No data 87 42 No data 8 9 90 141 96 34Gatanga 100 100 42 26 100 6 6 70 168 54 19Isiolo 50 100 38 40 88 18 10 110 113 86 9Ruiru Juja 87 96 26 44 100 12 8 86 59 67 17Kwale 72 84 59 39 36 12 21 34 46 2 76Karimenu No data No data 93 40 94 8 6 84 81 78 55Ngandori Mginda 63 100 77 39 No data 6 6 93 131 No data 45Gusii 87 100 45 19 8 No data 26 72 34 No data 68Tuuru No data No data 62 48 4 24 22 101 94 98 42Ngariama Njukiini No data No data 96 32 No data 18 8 120 154 6 40Oloolaiser 88 100 40 8 40 9 15 78 63 78 46Small WSPsKyeni No data No data 40 17 100 5 11 89 51 29 57Kiambu 100 100 38 17 94 No data 9 92 104 80 11Kitui No data 96 68 25 No data 6 17 75 38 75 71Nol Turesh No data No data 64 75 30 24 15 66 32 29 62Eldama Ravine 100 83 80 49 74 12 19 106 No data 26 44Mavoko 100 100 35 21 No data 5 15 95 27 93 24Embe 69 47 80 14 36 7 53 101 80 44 74Lodwar 39 100 29 30 51 16 14 99 77 26 26Nithi 70 93 74 23 5 22 23 71 78 84 60Githunguru 100 100 No data 5 No data 12 13 84 104 64 39Kapenguria 32 100 42 8 67 12 34 99 38 15 52Lamu 19 No data 33 No data No data 12 16 104 84 No data 53Olkalou No data No data No data 23 50 14 6 89 45 55 59Nyandarua North 73 98 No data 13 100 19 29 51 12 78 67Narok 75 100 58 43 100 10 11 67 33 90 48Tarda Kiambere 100 98 31 35 2 12 16 123 53 59 32Kibwezi Mtito 100 100 24 16 92 24 27 88 76 0 15Engineer Town No data No data No data 22 93 8 3 78 64 13 64Makindu 100 97 48 30 70 22 16 80 57 94 16Kapsabet Nandi 75 100 64 20 No data 6 33 84 41 35 72Uasin Gishu No data No data 48 14 34 10 115 83 6 0 69Iten Tambach 100 97 47 17 91 12 14 84 No data 38 30Muthambi No data No data 40 41 No data 24 10 72 79 98 35Ndaragwa 100 No data No data 23 100 7 12 No data 0 No data 70Teso 100 99 No data 15 87 13 11 78 35 0 41Maralal 100 100 30 14 No data 6 26 81 48 99 31Tachasis No data No data 60 15 45 24 13 94 94 0 50Rumuruti No data No data No data 28 88 6 No data 83 21 0 75Tia Wira No data No data 67 33 34 16 9 93 80 0 56Upper Chania 60 67 No data 28 No data No data 30 62 51 4 77Vihiga No data No data No data 9 91 8 No data 61 5 93 73Kathita Kiirua No data No data 26 22 No data 18 99 96 159 90 37Trans Nzoia 100 88 26 7 No data 8 113 39 3 90 51
Table 2.2.2 Performance Records of Water Service Providers
Legend: Good Acceptable Not Acceptable * Indicating the degree of compliance with WSP targets from IMPACT Issue No.3.
Source: IMPACT Issue No.3
C - T - 2

Piped byWSPs
Spring/Well/Borehole Water Vendor Stream/Lake/
Pond/OthersUWS andLSRWSS SSRWSS - -
Population(million persons) 6.96 0.77 4.59 0.07 1.53
Ratio 100% 11% 66% 1% 22%Population
(million persons) 7.37 0.88 3.02 0.15 3.39
Ratio 101% 12% 41% 2% 46%Population
(million persons) 4.86 1.36 1.56 0.44 1.51
Ratio 100% 28% 32% 9% 31%Population
(million persons) 9.79 5.29 2.15 1.27 1.08
Ratio 100% 54% 22% 13% 11%Population
(million persons) 5.73 1.95 1.43 0.23 2.12
Ratio 100% 34% 25% 4% 37%Population
(million persons) 3.82 0.99 1.53 0.31 0.99
Ratio 100% 26% 40% 8% 26%Population
(million persons) 38.53 4.24 25.43 0.39 8.48
Ratio 100% 11% 66% 1% 22%Note:
Source: JICA Study Team, based on Census 2009.
RVCA
ACA
Items
Table 2.3.1 Service Population of Each Water Connection
1) The ratios and total populations are estimated based on Census 2009.2) The service population of each connection is caluculated by multiplying the tatol populations and the ratios
TCA
ENNCA
Total
TotalPopulation
(2010)
CatchmentArea
LVNCA
LVSCA
C - T - 3

(Unit: m3/day)Systems Under-
constructionUWSS LSRWSS Total UWSS
LVN 103,890 10,326 114,216 31,000 145,216LVS 63,349 26,089 89,438 57,000 146,438RVCA 91,322 6,594 97,916 37,600 135,516ACA 664,589 9,587 674,176 34,720 708,896TCA 96,026 148,972 244,998 10,000 254,998ENNCA 20,919 6,948 27,867 11,548 39,415Total 1,040,095 208,516 1,248,611 181,868 1,430,479Note: 1) Breakdown of capacities of the completed systems is shown in Table 2.3.4.2) Breakdown of capacities of the under-construction systems of UWSS is shown in Table 2.3.5.3) Capacities of the completed systems of UWSS are shown in Tables 4.3.1, 4.4.1, 4.5.1, 4.6.1, 4.7.1 and 4.8.1.4) Capacities of LSRWSS are values obtained by subtracting capacities of UWSS from total capacities.Source: JICA Study Team, based on data from WSBs
(Unit: m3/day)Catchment
Area Completed Under-construction Total
LVN 103,890 31,000 134,890LVS 63,349 57,000 120,349RVCA 91,322 37,600 128,922ACA 664,589 34,720 699,309TCA 96,026 10,000 106,026ENNCA 20,919 11,548 32,467Total 1,040,095 181,868 1,221,963Source: JICA Study Team (Ref. Table 2.3.2)
Completed Systems Ground-total
Table 2.3.2 Capacities of Existing Water Supply Systems
Table 2.3.3 Existing Urban Water Supply System
CatchmentArea
C - T - 4

Table 2.3.4 Existing Water Supply and Capacity (1/8)
Water Supply Systems Urban Centres Market Centres CountyRiver/Lake
(m3/day)Borehole(m3/day)
Dam(m3/day)
Water Source Name(s)
Chebara Eldoret Uasin Gishu 0 18,000 Chebara
Sosiani Eldoret Uasin Gishu 14,950 Sosiani
Kapsoya Eldoret Uasin Gishu 3,450 Kapsoya
Kitale Kapolet Kitale Kapolet Trans Nzoia 10 000 Kitale Kapolet
Eldoret WSC
Existing Water Supply Systems and CapacitiesWater Service ProvidersCA
Kitale, Kapolet Kitale Kapolet Trans Nzoia 10,000 Kitale, Kapolet
Kimilili, Kamtiong Kimilili Kamtiong Trans Nzoia 3,200 Kamtiong
Webuye Webuye Trans Nzoia 7,000 Webuye, Broderick Falls
Malakhisi, malaba, Kocholia Trans Nzoia
Bungoma, Matisi Bungoma Matisi Trans Nzoia 7,000 Matisi
Tindinyo Kakamega Kakamega/Busia 16,000 Tuiyobei, Nandi South Forest
Mumias Mumias Kakamega/Busia 1 680 Mumias
Nzoia WSC
Western WSC Mumias Mumias Kakamega/Busia 1,680 Mumias
Busia Mundika Busia, Nambale Kakamega/Busia 7,400 Mundika
Maseno Maseno Vihiga 2,400 Maseno
Mbale, Lunyerere Mbale Vihiga 2,200 Lunyerere
Kaimosi Kaimosi Vihiga 1,440 Kaimosi
Sosiani Sosiani Vihiga 250 Sosiani Spring
Vihiga Vihiga Vihiga 60 Vihiga Spring
Western WSC
Amatsi WSC
Vihiga Vihiga Vihiga 60 Vihiga Spring
Kapsabet Nandi WSC Kapsabet , Kabutie Kapsabet Kabutie Nandi 3,800 Kabutie
Iten/Tambach Water supply Iten Town Elgeiyo marakwet 0 1,000 Yokot dam
Tambach Town Elgeiyo marakwet 110 Tambach Springs
Uasin Gishu District Sosiani, Sigowet, Mosombor Uasin Gishu 1,299 0 0
Lugari District Lugari Trans Nzoia 164
Trans Nzoia District Kitale environs Trans Nzoia 66
Item Tambach Water ProjectLVNCA
Sidindi Malanga Yala Siaya 2,400 Yala
Sega Sega Siaya 264 Borehole No.C6154
Ugunja Ugunja Siaya 385 Borehole
Ukwala Ukwala Siaya 360 Borehole
Siaya Siaya Siaya 2,100 Abura Dam
Mauna Dam Mauna Siaya 1,200 Mauna Dam
Sibo WSC (SIBO WASCO)
Bondo Bondo Siaya 1,125 Yala River
Asembo Bay Asembo Bay Siaya 1,170 L. Victoria
South Sakwa South Sakwa-Bondo Siaya 1,700 L. Victoria
West Pokot county water supply Kapenguria West Pokot 1,680
Kapenguria environs West Pokot 230 5 Rivers
Sigor RiverKapenguria WSC
133 Kacheliba dam
75,824 1,009 37,383 114,216TOTAL
C - T - 5

Table 2.3.4 Existing Water Supply and Capacity (2/8)
Water Supply Systems Urban Centres Market Centres CountyRiver/Lake
(m3/day)Borehole(m3/day)
Dam(m3/day)
Water Source Name(s)
Existing Water Supply Systems and CapacitiesWater Service ProvidersCA
Dunga Kisumu 21,000 Victoria
Kajulu Kisumu 1,400 Kibos springs
Timbili Kericho 8,640 Timbilil
Kimugu Kericho 4 320 Kimugu
Kisumu WSC (KIWASCO)
KerichoKericho WSC (KEWASCO)
Kisumu
Kimugu Kericho 4,320 Kimugu
Ngecherok Kapsoit Kericho 720 3 No. protected Springs
Nyakach Sondu/Nyabondo/Katito Kisumu 1,440 Sondu
Muhoroni Muhoroni Kisumu 720 Muhoroni
Koru Mnara Koru Mnara Kisumu 90 Manera spring/Kipchorian stream
Kibigori Kibigori Kisumu 200 Stream
Awasi Awasi Kisumu 100 Borehole
Kericho WSC (KEWASCO)
Awasi Awasi Kisumu 100 Borehole
Tamu Tamu Kisumu 80 Bore hole
Nandi hills Nandi hills Nandi 268 Taitu Stream
Kaptumo Kaptumo Nandi 16 Kapngoriam/kaptumo stream.
Mosombor Mosombor Nandi 46 Kapngoriam/kaptumo stream.
Lessos Lessos Nandi 432 Dam
Kemeloi/Kubujoi Kemeloi/Kubujoi Kisumu 1,440 Kimendi
Nyanas WSC (NYANAS WASCO)
Kemeloi/Kubujoi Kemeloi/Kubujoi Kisumu 1,440 Kimendi
Litein Litein Bomet 12,000 Itare
Chebangang Chebangang Bomet 1,250 Kiptiget
Fort Tenan Fort -Tenan Bomet 360 Sombo
Sotik Sotik Bomet 500 Kapsonoi
Bomet Bomet Bomet 450 Nyangores
Sigowet Sigowet Bomet 50 Kipsamoi (protected )springs
LVSCA
g g p (p ) p g
Longisa Longisa Bomet 425 Amala
Chepalungu Chepalungu Bomet 520 Nyangores
Sosiot Sosiot Bomet 630 Cheboseron.
Bargeywet Bargeywet Bomet 230 Stream
Londiani Londiani Bomet 300 Masaita
Kipkelion Kipkelion Bomet 280 Kipchorian
Tililbei WSC (TILILBEI WASCO)
Sigor Sigor Bomet 425 Nyangores
Kipsitet Kipsitet Bomet 260 Stream
Chesinende Chesinende Bomet 120 Dam
Chepkemel Chepkemel BometUnderrehabilitation
Springs
Maseno kombewa Kombewa/Ojola Kisumu 1 800 MaragoliMaseno kombewa Kombewa/Ojola Kisumu 1,800 Maragoli
Kisumu rural Seme Kisumu 2,000 L. Victoria
Nyahera Nyahera/Kiboswa Kisumu 360 Orinde springs
Mkendwa Kanyakwar Mkendwa/Kiboswa Kisumu 360 Orinde springs
Gulf WSC
C - T - 6

Table 2.3.4 Existing Water Supply and Capacity (3/8)
Water Supply Systems Urban Centres Market Centres CountyRiver/Lake
(m3/day)Borehole(m3/day)
Dam(m3/day)
Water Source Name(s)
Existing Water Supply Systems and CapacitiesWater Service ProvidersCA
Kilgoris Kilgoris Narok 400 Stream
Angata Barakoi Angata Barakoi Narok 172 Protected Spring
Nkararu Nkararu Narok 38 Springs
Migori Migori Migori 1 056 3 No BoreholesMigori Migori Migori 1,056 3 No. Boreholes
Rongo Rongo Migori 320 Misadhi
Lolgorian Lolgorian Narok 60 Borehole
Kehancha Kehancha Migori 320 Orarwe
Isebania Isebania Migori 480 Ragana
Nyamira Nyamira Kisii 3,200 Eaka
Tabaka Tabaka Kisii 150 3 No Springs
Mikutra WSC (MIKUTRA WASCO)
Tabaka Tabaka Kisii 150 3 No. Springs
Ogembo Ogembo Kisii 600 Gucha,Ekerongo & Mosora spring
Keroka Keroka Kisii 600 Chiro chiro
Gesusu Gesusu Kisii 300 Protected Stream
Kisii Kisii Kisii 6,000 Gucha
Nyakomisaro Kisii Kisii 1,500 Nyakomisaro Spring
Birongo Birongo Kisii 2,400 Chiro chiro
Gusii WSC (GUSII WASCO)LVSCA
Birongo Birongo Kisii 2,400 Chiro chiro
Borabu Nyansiongo Kisii 600 Gesebei
Mbita Mbita Homa Bay 260 L. Victoria
Oyugis Oyugis Homa Bay 1,920 Awach kibuon
Kendu Bay Kendu Bay/Kosele Homa Bay 720 Awach kibuon
West Karachuonyo Adiedo/West karachuonyo Homa Bay 1,280 L. Victoria
Homa Bay Homa Bay Homa Bay 3,500 L. Victoria
South Nyanza WSC
y y y ,
Ndhiwa Ndhiwa Homa Bay 30 2 Boreholes
Nyasare Nyasare Migori Migori 300 Springs
86,400 1,266 1,772 89,438TOTAL
C - T - 7
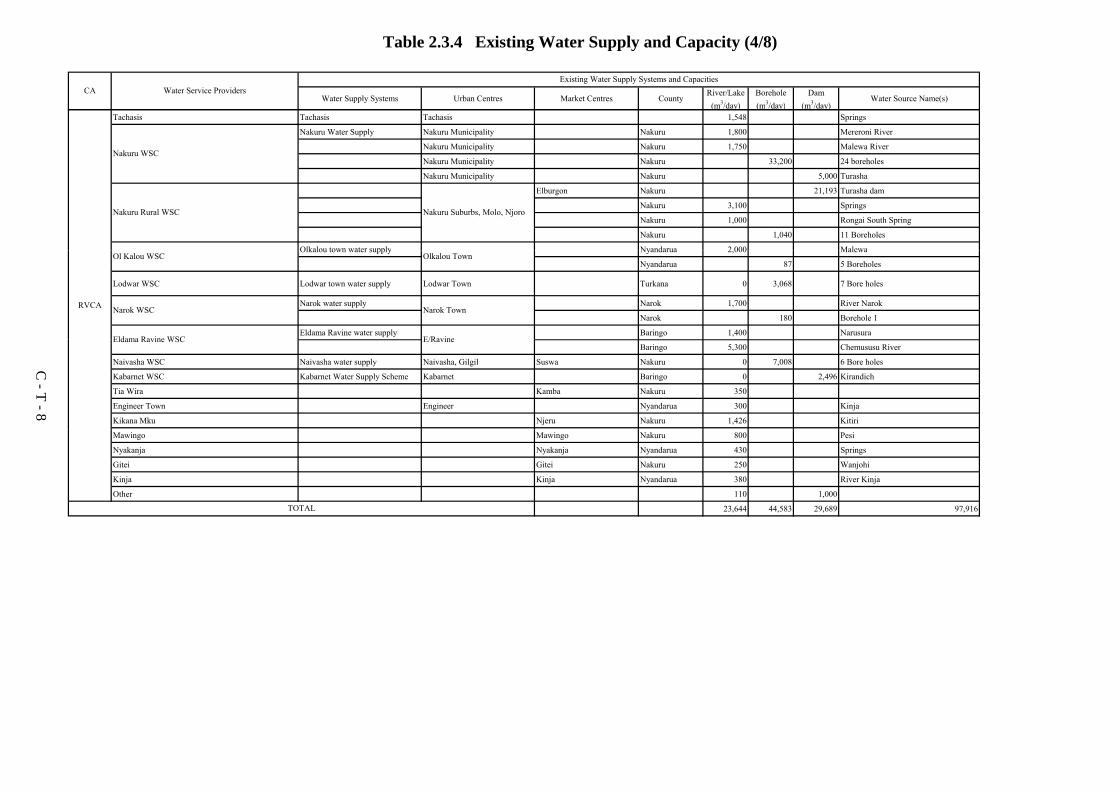
Table 2.3.4 Existing Water Supply and Capacity (4/8)
Water Supply Systems Urban Centres Market Centres CountyRiver/Lake
(m3/day)Borehole(m3/day)
Dam(m3/day)
Water Source Name(s)
Existing Water Supply Systems and CapacitiesWater Service ProvidersCA
Tachasis Tachasis Tachasis 1,548 Springs
Nakuru Water Supply Nakuru Municipality Nakuru 1,800 Mereroni River
Nakuru Municipality Nakuru 1,750 Malewa River
Nakuru Municipality Nakuru 33 200 24 boreholesNakuru WSC
Nakuru Municipality Nakuru 33,200 24 boreholes
Nakuru Municipality Nakuru 5,000 Turasha
Elburgon Nakuru 21,193 Turasha dam
Nakuru 3,100 Springs
Nakuru 1,000 Rongai South Spring
Nakuru 1,040 11 Boreholes
Olkalou town water supply Nyandarua 2 000 Malewa
Nakuru Rural WSC Nakuru Suburbs, Molo, Njoro
Olkalou town water supply Nyandarua 2,000 Malewa
Nyandarua 87 5 Boreholes
Lodwar WSC Lodwar town water supply Lodwar Town Turkana 0 3,068 7 Bore holes
Narok water supply Narok 1,700 River Narok
Narok 180 Borehole 1
Eldama Ravine water supply Baringo 1,400 Narusura
Ol Kalou WSC Olkalou Town
Narok Town
E/Ravine
RVCA Narok WSC
Eldama Ravine WSCBaringo 5,300 Chemususu River
Naivasha WSC Naivasha water supply Naivasha, Gilgil Suswa Nakuru 0 7,008 6 Bore holes
Kabarnet WSC Kabarnet Water Supply Scheme Kabarnet Baringo 0 2,496 Kirandich
Tia Wira Kamba Nakuru 350
Engineer Town Engineer Nyandarua 300 Kinja
Kikana Mku Njeru Nakuru 1,426 Kitiri
E/RavineEldama Ravine WSC
Mawingo Mawingo Nakuru 800 Pesi
Nyakanja Nyakanja Nyandarua 430 Springs
Gitei Gitei Nakuru 250 Wanjohi
Kinja Kinja Nyandarua 380 River Kinja
Other 110 1,000
23,644 44,583 29,689 97,916TOTAL
C - T - 8

Table 2.3.4 Existing Water Supply and Capacity (5/8)
Water Supply Systems Urban Centres Market Centres CountyRiver/Lake
(m3/day)Borehole(m3/day)
Dam(m3/day)
Water Source Name(s)
Existing Water Supply Systems and CapacitiesWater Service ProvidersCA
Nairobi and Sattelite Towns[Urban]
Kiambu Off takes Kiambu Riambai Kiambu 0 206
Gichocho B Water Project Ndumberi Kiambu 0 25
Kihingo Water Project Kiambu Kiambu 70Kiambu WSC
Kihingo Water Project Kiambu Kiambu 70
Thuku B/H Kiambu Kiambu 301
Ruiru Water Supply Ruiru, Juja Kiambu 1,600
Membley Water Supply Membley Kiambu 1,400
Karuri WSC Karuri Water Supply Karuri Kiambu 0 975
Thika WSC Thika Water Supply Thika Kiambu 4,400 Ruiru R.
Nairobi City Water Supply Nairobi Nairobi 0 59,000 Sasumua
Ruiru-Juja WSC
y pp y ,
Nairobi Nairobi 420,000 Thika-Chania
Nairobi Nairobi 22,000 Ruiru
Nairobi Nairobi 4,000 Kikuyu Springs
Limuru Water Supply Limuru Kiambu 0 300
Thigio Water Project Thigio Kiambu 2,000
Bathi Water Supply Kimende Kiambu 3,000
Limuru WSC
Nairobi WSC
Runana storage tank Rural Kiambu 0 1,600 Kikuyu D.
Thogoto Water Project Thogoto Kiambu 550
Thamanda and Ndum boreholes Rural Kiambu 240
Muguga Water Project Muguga Kiambu 600
Kikuyu Water Supply Scheme Kikuyu Kiambu 2,750
Ruku Water Project Rural Kiambu 72
ACA Kikuyu WSC
Karai Water Supply Scheme Karai Kiambu 4,746
Mavoko Katani, Syokimau, Lukenya,Chumvi, JKIA
Machakos 500 Mavoko Portland Dam
Machakos 220 Kinanie,
Machakos 2,201 Bulk water from Nairobi Water Co.Ongata Rongai, Kiserian, Matasianand Ngong Water Supplies
Ongata Rongai, Kiserian,Ngong and environs
Matasia Kajiado 0 2,906 19 B/HsOloolaiser WSC
Machakos WSC
Kajiado 2,935 Mbagathi river
Kajiado 241 Springs
Machakos, Mua Hills Machakos Kalumoni Machakos 0 3,373 Maruba dam
Machakos 91 Miwani & Iveti Plant A BHs
Nairobi and Sattelite Towns[Rural]
Gatundu Water Scheme Gatundu Kiambu 1,500
Nd W t S h Nd Ki b 2 000
Machakos WSC
Oloolaiser WSC
Ndarugo Water Scheme Ndarugo Kiambu 2,000
Ruabora Water Scheme Kiganjo Kiambu 1,000
Thiririka Water Scheme Kiganjo Kiambu 4,500
Karimenu 9000 Kamwangi Kiambu 6,000
Karimenu 2000 Kamwangi Kiambu 1,500Karimenu Community WSC
Gatundu South WSC
C - T - 9

Table 2.3.4 Existing Water Supply and Capacity (6/8)
Water Supply Systems Urban Centres Market Centres CountyRiver/Lake
(m3/day)Borehole(m3/day)
Dam(m3/day)
Water Source Name(s)
Existing Water Supply Systems and CapacitiesWater Service ProvidersCA
Githiga Water Project Githunguri Kiambu 3,000
Giathieko Borehole Githunguri Kiambu 120
Githunguri Boreholes Githunguri Kiambu 300
Komothai Water Supply Komothai Kiambu 3 000Komothai Water Supply Komothai Kiambu 3,000
Kiaria Boreholes Rural Kiambu 120 Kiaria B/H
Mihuko Borehole Mihugo Kiambu 120 Mihugo B/H
Kiratina Borehole Rural Kiambu 120 Kiratina B/H
Thuita Borehole Rural Kiambu 120 Thuita B/H
Gathaithi Borehole Rural Kiambu 120 Gathaithi B/H
Matimbei Water Project Rural Kiambu 1 500
Githunguri WSC
Matimbei Water Project Rural Kiambu 1,500
Kathiani WSC Kathiani W/S Kathiani town Machakos 0 362 Muooni Dam
Mumbuni, Mulima, Tawa &Mbooni W/S
Mumbuni, Mulima,Tawa,Kikima
Machakos 0 120 Kinze & Mulima dams
Machakos 2 Tawa B/HMwala, Mbiuni, Wamunyu &Kibauni
Mwala, Mbiuni, Wamunyu,Kibauni
Kajiado 662 Athi RiverMwala WSC
Mbooni WSC
Kajiado 55 Hospital & Mwala School B/Hs
Matunglu Kangundo WSC Tala, Nguluni & Kyamulendu W/S Kangundo-Tala Matungulu Machakos 0 240Ndovoini A, Kyamulendu, Nguluni,Tala & Isinga B/Hs
Mombasa and Surrounding Area
Mzima water works and pipeline Mombasa Mombasa 28,000 0 Mzima springs
Marere water supply pipeline Mombasa Mombasa 4,000 0 Marere springsSabaki/Baricho well field and
ACA
Mombasa WSC Sabaki/Baricho well field andpipeline
Mombasa Mombasa 28,800 0 Sabaki wellfield
Tiwi boreholes/Likoni Pipeline Mombasa Mombasa 2,900 Tiwi Boreholes
Malindi WSC Baricho well field and pipeline Malindi & Watamu Kilifi 11,500 Sabaki wellfield
Kiilifi Mariakani WSC Baricho well field and pipeline Kilifi Kilifi 6,400 Sabaki
Marere-Changamwe pipeline Kwale Kwale 900 Marere springs
Tiwi boreholes Ukunda/Diani Kwale 3,900Kwale WSC
Kinango Kwale 220 Umba R.
Matuga Kwale 900 mkurumuji R.
Remainning Area
Kibwezi Makindu WSC Kibwezi, Mtito Andei, Makindu Mtito Andei, Makindu Kibwezi, Kalama, Kibarani Makueni 2,951 Springs
Wote WSC Wote W/S Wote Town Council area Makueni 0 225 Mwaani B/H
N l T h L it kit k WSC N lt h W/S S lt H dLoitokitok Central, Kimana,R b M h M lili K ji d 5 258 N lt h S i
Kwale WSC
Nol Turesh Loitokitok WSC Nolturesh W/S Sultan Hamud Ramba, Marhuru, Malili,Kilome
Kajiado 5,258 Nolturesh Springs
C - T - 10

Table 2.3.4 Existing Water Supply and Capacity (7/8)
Water Supply Systems Urban Centres Market Centres CountyRiver/Lake
(m3/day)Borehole(m3/day)
Dam(m3/day)
Water Source Name(s)
Existing Water Supply Systems and CapacitiesWater Service ProvidersCA
Olkejuado WSCKajiado, Isinya & Bissil WaterSupplies
Kajiado, Isinya, Bissil Kajiado 625 Isinya 4 & Bissil 2 B/Hs.
Tavevo WSC Voi Offtakes & Mwatate w/s Voi, Wundanyi, Taita, Mwatate Taita Taveta 1,400 Mzima springsGatanga Community Water Gatanga Kiambu 5,218ACA Gatanga Community Water Project hKigio Water supply Rural Kiambu 200
Namanga W/S Kajiado 151 Oldonyorok Springs
Kajiado 365 Mashamani B/H
144,587 20,403 509,186 674,176
Lamu scheme Lamu Lamu 3,400 Shella Wells
Mokowe T.C Lamu 200 Hindi B/HolesLamu WSC
Namanga town and environsNamanga Water Users Trust
Gatanga Community Water Project
TOTAL
Hola scheme Hola Tana River 1,400 Tana R.
Ngao scheme Garsen Tana River 1,700 Tana R.
Nyeri WSC Nyeri Nyeri Municipality Nyeri 27,000 Chania
Embu WSC Embu Urban Embu Town Embu environs Embu 12,000 Rupingazi
Kerugoya Kerugoya Kirinyaga 4,061 Githioro
Sagana Sagana Kirinyaga 2,358 Ragati
Tana WSC
Ki i WSC Wang'uru Wang'uru Kirinyaga 1,199 Irrigation canal
Ndia Kerugoya/Kagumo Kirinyaga 11,834Kururu, Kahuhi, Muhuhi, Rundu,Kangaita and Rwamthambi Rivers
Karatina Urban Karatina Nyeri 2,000 Ragati
Mathira Rural Mathira constituency/rural Nyeri 15,000 Ragati, Hombe
Meru WSC Meru Urban Meru Town Meru 4,509 Kathita & Gatabora spring
Murang'a WSC Murang'a Urban Murang'a Town Murang'a 4,848 Mathioya & Kayahwe
Mathira WSC
Kirinyaga WSC
Murang a WSC Murang a Urban Murang a Town Murang a 4,848 Mathioya & Kayahwe
Othaya Mukurweini Chinga Othaya Mukurweini Nyeri 16,616Thuti,Mumwe. Kihari, Changachicha &Kihari
Kahuti Rwathia Kangema Nyeri 9,000 South Mathioya
Murang'a South Kigumo Kigumo Murang'a 9,220 Irati
Kabare Kabare Kirinyaga 4,333 Thimba
Ngariama Ngariama Kirinyaga 11,667 Mathaga, Rumindo, Kiaraganai i i
TCA
Kianyaga Kianyaga Kirinyaga 250 Thimba
Riamiatu Riamiatu Kirinyaga 1,167 Kiringa
Rukenya Rukenya Kirinyaga 300 Thimba
Nithi ChukaTown Tharaka-Nithi 2,700 Tungu
Chogoria Tharaka-Nithi 600 Kamaara (Tributary of Mara River)
Ngandori – Nginda Embu Rural Embu Rural Embu 15,000 Rupingazi
Gichugu
Nithi
Mathioya Njumbi Nyeri 6,000 South Mathioya
Gatango Kiriaini Nyeri 2,391 North Mathioya
Kyeni Kyeni Kathageri, Karurumo&Kigumo
Embu 527 Thuci & Ciangoma
Gathamati
C - T - 11

Table 2.3.4 Existing Water Supply and Capacity (8/8)
Water Supply Systems Urban Centres Market Centres CountyRiver/Lake
(m3/day)Borehole(m3/day)
Dam(m3/day)
Water Source Name(s)
Existing Water Supply Systems and CapacitiesWater Service ProvidersCA
Ngagaka Embu Rural Phase 2 Kianjokoma Embu 24,780 Thabana
Imetha Nkubu Nkubu Meru 4,100 Thingithu & Kiadegwa
Kathita Kiirua (CEFA) Kathita Kiirua Meru 1,253 Kiirua
Tetu Thegenge Tetu Nyeri 115 ZainaTetu Thegenge Tetu Nyeri 115 Zaina
Titie Titie Nyeri 1,300 Titie & Tosha
Aguthi Kinaini Nyeri 5,622 Gura
Rukanga Rukanga Rukanga Murang'a 800 Ragati
Ruiri Thau Water Association Ruiri Ruiri Meru 1,080
Ishiara Ishiara Embu 4,000 Thuci
Ena Ena Embu 2 733 EnaEmbe
TCA
Tetu Aberdaire
Ena Ena Embu 2,733 Ena
Kitui & Mutomo W/S Kitui 0 7,296 Masinga Dam
Kitui 460
Mwingi W/S Mwingi Kitui 0 1,390 Kiambere Dam
Mwingi Kitui 27Kakunike, Ukasi, Kanzui & TyaKamuthale B/Hs
Yatta WC Matuu Machakos 2 702 Yatta canal & Kyua dam
Kitui
Kiambere Mwingi WSC
TCA
Kitui WSC
Garissa WSC Garissa Garissa, Madogo Garissa 12,640 TanaGatanga Community WaterScheme
Gatanga Kiambu 5,218
Kigio Water supply Rural 200
235,121 489 9,388 244,998
Nyahururu Nyahururu Laikipia 3,832 Ewaso Narok
I ti d G ti lNyahururu WSC
Gatanga Community Water Project
TOTAL
Iguamati and Gatimu supplyproject
Mairo Inya Laikipia 720 Kamwana
Nanyuki WSC Nanyuki Laikipia 10,610
Isiolo WSC Isiolo Isiolo Isiolo 3,220 Isiolo
Mandera WSC Mandera Mandera Mandera 1,672 Daua
Maralal WSC Maralal Maralal Samburu 0 798 MaralalENNCA
Rumuruti WSC Rumuruti Rumuruti Laikipia 185 0 0
Marmanet WSC Marmanet Marmanet Laikipia 2,400 Ewaso Narok
Moyale WSC Moyale Moyale Marsabit 0 0 67 Holale, Odda BHs
Nyandarua County water supply Nyandarua County Nyandarua 260 Kirima river
Nyandarua 200 Olaimutia dam
ENNCA
Nyandarua North
Nyandarua 211 Kamwana dam
Tuuru Tuuru Laare Meru 3,692 Springs from Nyambene hills
25,871 0 1,996 27,867
Source: JICA Study Team, based on Data form WSBs
TOTAL
C - T - 12

Water Supply Schemes Urban Centres Market Centres CountyRiver/Lake(m3/day)
Borehole(m3/day)
Dam(m3/day)
Water Source Name(s)
Expansion of Chebara WaterTreatment works, Chebiemit-Chebara Water Supply and
Eldoret town. Chebiemit,Chebara Uasin Gishu 0 10,000 Chebara dam
Lessos water supply augmentationworks kesses,Lessos Uasin Gishu 600 Kesses dam
Augmentation of Kapsowar Watersupply Kapsowar town Uasin Gishu 600 Arror River
Augmentation of KapcheropWater supply Kapcherop market Uasin Gishu 600 Chepkaitit River
Rehabilitation and expansion ofKimilili water supply system Kimilili town Trans Nzoia 1,800 Kibisi River
Augmentation of Nakayonjo watersupply Chwele market Trans Nzoia 1,200 Kuywa river
Mumias water supplyaugmentation works Mumias town. Ekero Kakamega/Busi
a 15,000 Lusumu River
Construction of Lumakanda –Kipkarren water supply project Lumakanda. Kipkarren Kakamega/Busi
a 1,200 Kipkarren River
Rehabilitation of Serem andJeptulu water supply Serem and Jeptulu Vihiga 600 River Garagoli
Rehabilitation of Kaimosi watersupply
Kaimosi, Shamakhokho,Lusengeli Vihiga 600 Kaimosi dam on Garagoli River
Rehabilitation of Hamisi watersupply Hamisi town Vihiga 180 2 No protected springs at Kipchekwen
sub-locationSiaya - Bondo Water Supply Siaya,Yala, Bondo Siaya 20,000 0 0 R.Yala
Nzoia WSC
Western WSC
Amatsi WSC
Table 2.3.5 On-going Water Supply Schemes and Capacities (1/2)
CA Water Service ProvidersOn-going Water Supply Schemes and Capacities
LVNCA
Eldoret WSC
Siaya - Bondo Water Supply Siaya,Yala, Bondo Siaya 20,000 0 0 R.Yala
Asembo Bay Water Supply Ndori & Asembo Siaya 4,000 0 0 L.Victoria
45,780 0 10,600 56,380
Kisumu WSC (KIWASCO) Dunga Emergency Works Kisumu Town Kisumu 24,000 0 0 Lake VictoriaMigori Water Supply Migori Town Uriri, Oyani 15,000 0 0 R.OyaniRongo Water Supply-I Rongo Riosiri 2,000 0 0 R.MisadhiAwendo Water Supply Awendo Town 2,000 0 0 R. SareDede Water Supply Dede Centre 0 350 0 Dede BHIsebania Water Supply Isebania Town& Sirare 4,000 0 0 R.RaganaKeroka Water Supply Keroka Town 4,000 0 0 R. IchuniKegati Expansion Works Kisii Town 12,000 0 0 R.GuchaKanyadhiang Water Kanyadahiang 1,800 0 0 R.Awach-KibuonHoma Bay Water Supply Homa Bay Town 2,000 0 0 Lake Victoria
66,800 350 0 67,150
Ol Kalou WSC OlKalou Nyandarua 2,600 Malewa River
Eldama Ravine WSC Chemususu Water supply Eldama Ravine , Mogotio,parts of Rongai Baringo 0 0 35,000 Chemususu
2,600 0 35,000 37,600
RVCA
TOTAL
Migori/Narok
Gusii WSC (GUSII WASCO) Kisii
South Nyanza WSC Homa Bay
TOTAL
Sibo WSC (SIBO WASCO)
TOTAL
LVSCA
Mikutra WSC (MIKUTRA WASCO)
C - T - 13

Water Supply Schemes Urban Centres Market Centres CountyRiver/Lake(m3/day)
Borehole(m3/day)
Dam(m3/day)
Water Source Name(s)
Gatundu South WSC Theta Gatundu Ndarugo Kiambu 0 3,000 Theta
Karemenu Kamwangi,karimenu Kiambu 9,000 Karemenu
Bathi water supply Kimende Kiambu 2,000 Bathi
Ruiru Ruiru Membley Kiambu 10,000 Ruiru
Ruiru Ruiru Kiambu 1,000 Ruiru
Juja Juja Kiambu 3,000 Ndaragu
Komothai Water Expansion Githunguri Komothai.mihugo Kiambu 3,000 Gatamaiyo
Theta Water Supply Gatundu Kiambu 3,000 Theta
Mombasa WSCRehabilitation of Marerepipelines, Mzima pipelines,Baricho intake and Tiwi boreholes
Mombasa, Changamwe,Mtwapa. Kisauni,Nyali,Shanzu Mombasa 19,795 6,675 Mzima/marere springs, Tiwi
Kiilifi Mariakani WSC Rehabilitation of Baricho intake Kilfi, Mtwapa,Mariakani, Kilifi 10,000 Baricho intake
Kwale WSC Rehabilitation of Tiwi Boreholes Kwale, Ukunda,Diani,msambweni,Kinango Diani Kwale 0 1,300 Tiwi
Oloolaiser WSC Kiserian W/S Kiserian, Rongai,Ngong. Matasia Kajiado 0 15,000 The dam awaits construction of Sewersystem to be impounded
Kibwezi Makindu WSC Kibwezi Kibwezi & Mtito Andei Kalama,Kibarani Makueni 4,700 Umani Springs Phase I
Mwaani W/S Wote Makueni 0 300 Mwaani 2 & Kaiti B/Hs
Kamunyolo W/S Makueni 400 Kamunyulu dam infiltration galleries
Olkejuado WSC Kajiado W/S Kajiado,Isinya,Bissil Kajiado 0 1,000 3 B/Hs to be drilled , equiped, risingmain and reticulation lines
ACA
Karimenu Community WSC
Ruiru-Juja WSC
Githunguri WSC
Wote WSC
Table 2.3.5 On-going Water Supply Schemes and Capacities (2/2)
CA Water Service ProvidersOn-going Water Supply Schemes and Capacities
Olkejuado WSC Kajiado W/S Kajiado,Isinya,Bissil Kajiado 0 1,000 main and reticulation lines
Matunglu Kangundo WSC Matungulu W/S Phase I Tala, Nguluni,Kangundo Matunguliu,Kisukioni,Nguluni,Kandafu,komarock. Machakos 0 1,420 Ngalalya B/H
Kathiani WSC Kathiani Machakos 0 400 Desilting Muooni dam to increase thestorage capacity
62,495 10,695 21,800 94990
Murang'a WSC Murang'a Bulk Water Supply Murang'a Muranga 10,000 Irati
Kitui WSC Mutitu Water Project Mutitu Kitui 0 320 Suburface dam & infiltration galleries.10,000 0 320 10,320
Isiolo Isiolo 0 1,728 12 BHs
Rugusu system Isiolo 5,000
Kithima system Isiolo 1,800
Isiolo Isiolo 2,000Dam rehabilitation and supplyextension Marsabit 0 1,000 Holale
Odda Marsabit 20 Odda
Upper Chania Nyandarua 0
8,800 1,748 1,000 11,548Source: JICA Study Team, based on Data form WSBs
TOTAL
TOTAL
ENNCA
Isiolo WSC Isiolo
Moyale WSC Moyale
TOTAL
TCA
C - T - 14

Table 2.3.6 Water Service Providers (WSPs) (LVNCA)
WSPs Service Towns/Areas Service
Population in 2010
Capacity (m3/day)
NRW
[Urban] Eldoret WSC Eldoret 220,198 36,400 25%
Nzoia WSC Kitale, Kapolet, Kimilili, Kamtiong', Webuye, Bungoma, Matisi, Malakhisi, Malaba, Kocholia
129,798 27,200 61%
Western WSC Kakamega, Mumias, Busia, Nambale 25,080 56%Amatsi WSC Maseno, Mbale, Kaimosi, Vihiga 25,767 6,350 46%Kapsabet Nandi WSC Kapsabet 1,584 3,800 63%
Sibo WSC Yala, Sega, Ugunja, Ukwala, Siaya, Mauna, Bondo, Asembo bay, South Sakwa-Bondo
52,590 10,704 64%
Kapenguria WSC Kapenguria 18,281 2,043 56%Item Tambach Water Project Iten, Tambach 6,492 1,110 42%[Rural] Uasin Gishu District Sosiani, Sigowet, Mosombor 17,116 1,299 38%Lugari District Lugari 5,512 164 N.A.Trans Zoia District Kitale 5,046 66 25%
Total 482,384 114,216
Source: Performance Report of Kenya’s Water Services, No. 4, 2011, and data from WSBs
Table 2.3.7 Water Service Providers (WSPs) (LVSCA)
WSPs Service Towns/Areas Service
Population in 2010
Capacity (m3/day)
NRW
[Urban] Kisumu WSC Kisumu 181,512 22,400 50%Kericho WSC Kericho 98,507 13,680 46%
Gusii WSC Kisii, Nyamira, Tabaka, Ogembo, Keroka, Gesusu, Birongo, Borabu
221,439 15,350 46%
Tililbei WSC Litein, Chebang'ang', Fort Tenan, Bomet, Sotik, Londiani, Sigowet, Longisa, Chepalungu, Sosiot, Bargeywet, Kipkelion, Sigor, Kipsitet, Chesinende, Chepkemel
79,488 17,800 N.A
South Nyanza WSC Mbita, Oyugis, Seme, Nyahera, Kendu Bay, West Karachuonyo, Homa Bay, Ndhiwa
417,021 7,710 39%
Nyanas WSC Sondu, Muhoroni, Koru Mnara, Kibigori, Awasi, Tamu, Nandi Hills, Kaptumo, Mosombor, Lessos, Kubujoi
302,747 4,832 66%
Gulf WSC Kombewa, Kiboswa 6,956 4,520 59%
Mikutra WSC Kilgoris, Angata Barakoi, Nkararu, Migori, Isebania, Rongo, Lolgorian, Kehancha
11,814 2,846 60&
[Rural] NYASARE Migori N.A 300 N.A
Total 1,319,484 89,438
Source: Performance Report of Kenya’s Water Services, No. 4, 2011, and data from WSBs
C - T - 15

Table 2.3.8 Water Service Providers (WSPs) (RVCA)
WSPs Service Towns/Areas Service
Population in 2010
Capacity (m3/day)
NRW
[Urban] Nakuru WSC Nakuru 372,366 41,750 53%Nakuru Rural WSC Molo, Elburgon, Njoro, Rongai 213,476 26,333 62%Ol Kalou WSC Olkalou 10,240 2,087 30%Lodwar WSC Lodwar 28,920 3,068 66%Narok WSC Narok 12,540 1,880 45%Eldama Ravine WSC Eldama Ravine 26,013 6,700 80%Naivasha WSC Naivasha, Gilgil, Suswa 54,420 7,008 44%Kabarnet WSC Kabarnet N.A 2,496 N.A[Rural] Engineer Town Engineer 5,700 300 N.AMawingo Mawingu 10,000 800 95%Kikana Mku Njeru 28,536 1,426 51%Kinja Kinja 4,500 380 N.ATachasis Tachasis & Environs 4,106 1,548 44%Others 2,140
Total 777,309 97,916
Source: Performance Report of Kenya’s Water Services, No. 4, 2011, and data from WSBs
Table 2.3.9 Water Service Providers (WSPs) in Nairobi and Satellite Towns (ACA)
WSPs Service Towns/Areas Service
Population in 2010
Capacity (m3/day)
NRW
[Urban] Kiambu WSC Kiambu, Riambai, Ndumberi, 21,630 602 58%Ruiru-Juja WSC Ruiru, Juja, Membley 69,740 3,000 31%Karuri WSC Karuri 13,896 975 45%Thika WSC Thika
2,465,749 509,400 39%
Nairobi WSC Nairobi, Thika, Kikuyu, Ngong', Machakos, Athi River
42%
Limuru WSC Limuru, Kimende, Thigio 59,590 5,300 33%Kikuyu WSC Kikuyu, Thogoto, Muguga, Karai 32,868 10,558 54%Runda WSC Runda 13,180 - 35%
Mavoko EPZA WSC Mlolongo, Katani, Syokimau, Athi River, Lukenya, Chumvi, JKIA
47,571 2,921 37%
Oloolaiser WSC Ongata Rongai, Kiserian, Matasia, Ngong 116,025 6,082 44%Machakos WSC Machakos 13,412 3,464 48%[Rural] Gatundu South WSC Gatundu, Ndarugo 68,784 9,000 69%Karimenu Community WSC Karimenu 21,000 7,500 89%Githunguri WSC Githunguri, Komothai, Mihugo 20,844 10,020 30%Kathiani WSC Kathiani N.A 362 N.AMbooni WSC Mumbuni, Mulima, Tawa, Kikima N.A 122 N.AMwala WSC Mwala, Mbiuni, Wamunyu, Kibauni N.A 717 N.AMatunglu Kangundo WSC Kangundo, Tala, Matungulu N.A 240 N.A
Total 2,964,289 570,262 Source: Performance Report of Kenya’s Water Services, No. 4, 2011, and data from WSBs
C - T - 16

Table 2.3.10 Water Service Providers (WSPs) in Mombasa Coastal Area (ACA)
WSPs Service Towns/Areas Service
Population in 2010
Capacity (m3/day)
NRW
[Urban]
Mombasa WSC Mombasa, Changamwe, Kisauni, Mtwapa, Nyali, Shanzu
708,054 63,700 35%
Malindi WSC Malindi, Gede 186,300 11,500 25%Kilifi Mariakani WSC Kilifi, Mariakani, Kaloleni, Mtwapa 418,307 6,400 39%
Kwale WSC Kwale, Ukunda, Lunga Lunga, Msambweni, Kinango
149,344 5,920 50%
Total 1,462,005 87,520 Data Source: Performance Report of Kenya’s Water Services, No. 4, 2011, and data from WSBs
Table 2.3.11 Water Service Providers (WSPs) in Remaining Area (ACA)
WSPs Service Towns/Areas Service
Population in 2010
Capacity (m3/day)
NRW
[Urban]
Kibwezi Makindu WSC Kibwezi, Mtito Andei, Makindu, Kalama, Kibarani
38,999 2,951 40%
Wote WSC Wote 9,610 225 29%
Nol Turesh Loitokitok WSC Loitokitok Central, Kimana, Ramba, Marhuru, Sultan Hamud, Malili, Kilome
14,630 5,258 59%
Olkejuado WSC Kajiado, Isinya, Bissil 9,762 625 24%Tavevo WSC Taveta, Voi, Mwatate, Wundanyi 30,971 1,400 49%Others 5,593
Total 103,972 16,393 Data Source: Performance Report of Kenya’s Water Services, No. 4, 2011, and data from WSBs
C - T - 17

Table 2.3.12 Water Service Providers (WSPs) (TCA)
WSPs Service Towns/Areas Service
Population in 2010
Capacity (m3/day)
NRW
[Urban] Nyeri WSC Nyeri 89,582 27,000 31%Embu WSC Embu 83,865 12,000 55%
Kirinyaga WSC Kerugoya, Kutus, Wang'uru, Sagana, Kagumo,
186,478 19,452 82%
Mathira WSC Mathira 29,760 17,000 66%Meru WSC Meru 56,914 4,509 23%Murang'a WSC Murang'a 32,034 4,848 47%Kitui WSC Kitui 174,231 7,756 56%Kiambere Mwingi WSC Mwingi 57,240 1,417 35%Yatta WC Matuu 6,828 704 28%Lamu WSC Lamu, Mukowe 12,802 3,600 50%Tana WSC Garsen, Hola 3,100 N.AGarissa WSC Garissa, Madogo 124,715 12,640 58%[Rural] Gatanga Community Water Project Gatanga 36,354 5418 38%Othaya Mukurweini Othaya, Mukurweini 85,782 16,616 58%Kahuti Kangema 52,578 9,000 69%Murang'a South Kigumo, Kandara, Maragwa, Saba Saba 119,346 9,220 53%Gichugu Gichugu 29,928 17,717 74%Nithi Chogoria, Chuka, Kiriani 35,799 3,300 79%Ngandori – Nginda Manyatta, Mutunduri 49,977 15,000 26%Gathamati Njumbi, Kiriaini 38,930 8,391 72%Kyeni Kathageri, Karurumo &Kigumo 8,916 527 38%
Imetha Nkubu, Timau, Kanyakine, Tigania, Maua, Mitunguu, Mwimbi, Ruiri
52,698 4,100 74%
Muthambi 4K Muthambi 11,259 0 42%Kathita Kiirua (CEFA) Kiirua 16,788 1,253 60%Ngagaka Kianjokoma 27,504 24,780 70%Tetu Aberdaire Tetu, Kinaini, Titie 72,403 7,037 58%Rukanga Rukanga N.A 800 N.AMurugi Mukumango Mukumango 15,612 0 67%Ruiri Thau Water Association Ruiri 13,892 1,080 85%Embe Ishiara, Ena, Siakago 7,871 6,733 86%
Total 1,530,086 244,998
Source: Performance Report of Kenya’s Water Services, No. 4, 2011, and data from WSBs
C - T - 18

Table 2.3.13 Water Service Providers (WSPs) (ENNCA)
WSPs Service Towns/Areas Service
Population in 2010
Capacity (m3/day)
NRW
[Urban] Nyahururu WSC Nyahururu, Mairo Inya 46,014 4,552 57%Nanyuki WSC Nanyuki 57,252 10,610 43%Isiolo WSC Isiolo 34,168 3,220 51%Mandera WSC Mandera 13,890 1,672 52%Maralal WSC Maralal 17,328 798 47%Rumuruti WSC Rumuruti 990 185 27%Marmanet WSC Marmanet 2,400 N.AMoyale WSC Moyale 9,110 67 30%[Rural] Tuuru Laare 158,950 3,692 75%Upper Chania Njabini 7,600 0 N.ANyandarua North Nyandarua, 19,239 671 42%
Total 364,541 27,867
Source: Performance Report of Kenya’s Water Services, No. 4, 2011, and data from WSBs
C - T - 19

Table 2.4.1 Reproduction of MWI's Internal Donor Matrix (Water Supply and Sanitation) (1/7)
KES Equivalent
African Development Bank
Rift Valley Water andSanitation Project
To improve water supply and sanitation services inurban, peri-urban and rural communities within theservice area of the Rift Valley Water Services Board.The project components are : (i) Institutional Supportto Rift Valley Water Services Board (RVWSB) andNakuru Water and Sanitation Services Company(NAWASSCO); (ii) Water and SanitationImprovements in Nakuru; (iii) Water and SanitationImprovements in Small towns in Rift Valley; and (iv)Develop and implement a rural water supply andsanitation programme based on the demandresponsive approach.
RiftValley Water
ServicesBoard
Approved Service area ofRVWSB, Nakuru Dec-09 1.907 billion
Water Services BoardsSupport Project
To improve water supply and sanitation services inurban, peri-urban and rural communities within theAthi, Lake Victoria South, Northern and Tana WaterServices Boards. The project components are (i)Institutional Support; (ii) Urban Water Supply &Sanitation; (iii) Rural Water Supply and Sanitation;and (iv) Kibera Development Support
Athi,Lake Victoria
South, Northernand Tana Water
ServicesBoards.
Approved
Service Areas ofAWSB, LVSWB,
NWSB, andTWSB
Mar-12 4.712 billion
Small and medium townswater supply and wastewater managementproject
To improve the access, quality, availability andsustainability of water supply and wastewater servicesin the towns of Kitui, Siaya, Bondo, Othaya, Matuu,Kithimani, Maua and irrigation water for existingYatta irrigation schemes
Tanathi, LakeVictoria South
Tana WaterServicesBoards.
ApprovedService Areas of
TAWSB, LVSWBand TWSB
Dec 2014 7.0 billion
PIPELINE - PROGRAMMES AND PROJECTSNairobi RiversRehabilitation andRestoration program:Sewerage Improvementproject
To rehabilitate and expand sewerage servicesmanagement of Nairobi City for sustainableenvironment
Athi Waterservices Board Under Appraisal Nairobi city and
environs 3.5 billion
France (AFD)ONGOING PROGRAMMES AND PROJECTS
Kisumu Water andSanitation Project(KWSSP)
- Emergency rehabilitation / upgrading of watersystems (phase 1)- Extension of water systems (phase 2)- Rehabilitation of the Kisat wastewater treatmentplant (phase 2)- Construction of a new wastewater treatment plan(phase 2)- Capacity building to LVSWSB and KIWASCO- distribution in informal settlements
LVSWSB- Phase 1completed- Phase 2 inprogress / allstudiescompleted /retendering inprogress
Kisumu 30.06.11 2.0 billion
Nairobi Water &Sewerage EmergencyPhysical InvestmentProject (NWSEPIP)
- Rehabilitation of Sasumua Dam- Rehabilitation of Sasumua and Ngethu treatmentplants- Rehabilitation of Dandora wastewater treatmentplant- Construction of sewers and 20 ablution blocks- Rehabilitation of Mwagu system- Rehabilitation of water main lines to Nairobi
Athi WaterServices Board
- Emergencyworks onSasumua damcompleted- Rehabilitationworks onSasumua inprogress- Sanitationworks completed- Works ontreatment plantsand main lines inprogress- Studies on otherwaterinfrastructurescompleted
Nairobi 31.12.10 3.0 billion
Mombasa water andsanitation servicesimprovement program(MWSSIP)
Improvement of water and sanitation services inMombasa:- rehabilitation of Baricho system- rehabilitation of Mombasa wastewater treatmentplant- rehabilitation of Marere system- rehabilitation and extension of water and seweragedistribution network in Mombasa West mainland- TA to MOWASCO- extension of networks in informal settlements ofMombasa
CWSBAll TA,supervision andworks contractssigned, exceptthe consultingfirm for thedetailed design ofthe Mareresystem
Mombasa 31,12,14 4,0 billion
Complementary supportto the Nairobi andKisumu Water andSanitation projects
Additional fundings for KWSSP and NWSEPIP
LVSWSB andAWSB Loan agreement
signedKisumu and
Nairobi 31/12/14 5,1 billion
- PROGRAMMES AND PROJECTS
Water and sanitationprogramme in favor ofsmall and medium towns
Basket fund for financing small and medium townswater and sanitation infrastructures
WSBs
feasibility global 2015 3,0 billion
ONGOING PROGRAMMES AND PROJECTS
ImplementingAgency Geographical Area Scheduled
Completion
AmountAllocated
Programme Title Purpose Status
C - T - 20

Table 2.4.1 Reproduction of MWI's Internal Donor Matrix (Water Supply and Sanitation) (2/7)
KES Equivalent
ImplementingAgency Geographical Area Scheduled
Completion
AmountAllocated
Programme Title Purpose Status
European CommissionONGOING PROGRAMMES AND PROJECTS
AMREF Water andSanitation UmbrellaProgramme (WASUP)
Shallow wells, giant wells, boreholes, subsurfacedams, earth dams, roof attachments, VIP Latrinerefuse pits, hygiene training, capacity building
AMREF ongoing
Eastern Province:Kitui, Makueni
Rift ValleyProvince:Kajiado
Coast Province:Kilifi and Malindi
District
Sep-11 268,935,405
Safe water provision andsustainable watermanagement options inarid & semi-arid land of3 districts in the greaterMeru Region - EasternProvince - Republic ofKenya
Household rainwater harvesting, Community surfacerainwater harvesting, Expansion of Mukothima andMula piped water projects (32 km of new pipelines),Construction of VIP latrines, Training in managementof the community facilities, Hygiene and sanitationpromotion
LVIA ongoing Eastern Province:Meru region May-10 47,500,000
GOOD WATERGOVERNANCE INLAKE VICTORIASOUTH REGION
Developing a stakeholder charter, Orientationeducation and training of board members, Preparationof manuals, Development and review various strategicplans for LVSWSB and WSPs, Development andreview various plans (business-, financialmanagement-, investment plan), Valuation of assets,Training of LVSWSB and WSP staff members,Establish a research and development unit, Reductionof un-accounted for water (UFW), Improve the imageof the WSP
Lake VictoriaSouth Water
Services Boardongoing
Nyanza Province:Bondo, Homa Bay,
Gucha, Kisii,Kisumu, Kuria,
Migori, Nyamira,Nyando,
Rachuonyo, Siayaand Suba Districts
Rift ValleyProvince:
Bomet, Bureti,Kericho, Nandi
South andTransmaraDistricts
Jun-11 153,175,997
Capacity-Building forWater Service Providersin Tana Water ServicesBoard Area
Participatory capacity needs assessment for the27WSPs, Training of the 27 WSPs Board members,Training of managers, Public awareness creation,Institutional support to 27 WSPs, Sanitation andhygiene promotion, Extension of water services,Improvement of communication, Institutional supportto Tana WSB, Construction of water kiosks and VIPlatrines
TANA WATERSERVICES
BOARDongoing
Eastern Province:Meru North, Meru
Central, MeruSouth, Tharaka,Kitui, Mwingi,Mbeere, Embu,
KirinyagaCentral Province:Nyeri, Maraguaand Murang’a
Districts
Jun-11 192,336,566
Nairobi InformalSettlements Water andSanitation ImprovementProgramme
Sustainable financing mechanisms and pro-poortariffs, Situation surveys and interfacing CBOs withthe NWSC, Transaction analysis and advice,Advocacy and communication, Consumer voice andengagement with civil society, capacity building ofthe poor communities, Preliminary Design and SiteIdentification, Detailed Design and TenderDocumentation, Tendering, Evaluation and Award,Construction and Commissioning, Monitoring andEvaluation
Athi WaterServices Board ongoing
Nairobi(Informal
Settlements)Jun-13 245,454,540
Capacity-Building forRural Water ServiceProviders in NorthernKenya
Board-wide consensus building, District levelconsensus-building, Baseline studies, Clusterformation, Development of a model constitution of therural WSPs, Registration and Service ProvisionAgreement contract, Awareness creation (School-based competitions, Public posters, Local radiomessages, Public meetings), Indigenous trees project,Training, Procurement, Information andcommunication improvement
NORTHERNWATER
SERVICESBOARD
ongoing
North EasternProvince:
Garissa, Ijara,Mandera, Wajir
Eastern Province:Isiolo, Laikipia,
Marsabit, Moyale,Samburu
Jun-11 118,854,785
Improving Access toWater Supply and BasicSanitation for the UrbanPoor
Investment in water infrastructure for the urban poor:Construction and rehabilitation of expansionmeasures for water supply infrastructure/ Consultancyservices for tender document preparation andsupervision, Consultancy services for managementimprovement of the WSPs, Construction of WaterKiosks and necessary improvements to the watersupply system, Sensitization of the Communities,Implementation of measures to increase the financialviability of the WSPs , Capacity building andequipment for peri-urban units of the Water ServiceProvider; Promotion of Investment in BasicSanitation Infrastructure for the urban poor;Institutional Strengthening of the WSTF
Water ServicesTrust Fund
(WSTF)ongoing
Nationwide withinitial focus on
Western Province: Lake Victoria
North (small andmedium towns)
and subsequentlylarge towns
Dec-12 973,868,085
C - T - 21

Table 2.4.1 Reproduction of MWI's Internal Donor Matrix (Water Supply and Sanitation) (3/7)
KES Equivalent
ImplementingAgency Geographical Area Scheduled
Completion
AmountAllocated
Programme Title Purpose Status
Improved RuralDrinking Water Supplyfor ASAL MwingiDistrict, Eastern Kenya
Protection of 2 springs, 8 km pipeline extension,construction of 29 subsurface dams with shallowwells, 6 shallow wells, 1 rock catchment, 20 schoolroof catchments, 80 VIP latrines, Training on publichealth, HIV/AIDS prevention, Sanitation and Hygienetraining
German AgroAction ongoing
Eastern Province:Mwingi District,
Nuu and TseikuruDivisions
Nov-11 151,130,370
Micro-finance forcommunity managedwater projects
Identification of target communities, facilitation offinancing for water projects.
WB/The GlobalPartnership on
Output-based Aidongoing All Kenya Dec 2011 144,454,625
FINLANDONGOING PROGRAMMES AND PROJECTS
Support to WSTFTo improve water resources management and waterservices provision in poor rural communities.Capacity building of WSTF and WSBs
WSTF Implementation Countrywide August 2012
GermanyONGOING PROGRAMMES AND PROJECTS
German Technical Cooperation (GTZ)
Water Sector ReformProgram
Support to the water sector reform focusing on MWI(policy, SWAP, formalisation of WSS, cross cuttingissues like Human Rights, Pro-poor, etc.), to theWSTF pro-poor urban and basket management,WASREB pro-poor regulation with tariff negotiationsand comparative competition, WSBs and WSP forperformance improvements, WRMA for IWRM.
MWI ongoing Country wide December2010 752.70
German Development Service (DED)Water SectorDevelopmentProgramme
Support implementation of water sector reformsthrough deployment of Technical Advisors on locallevel (WSBs and WSPs; regional offices WRMA)
MWI ongoing Lake VictoriaNorth and Tana
December2012 196.86
German Financial Cooperation (KfW)Water SectorDevelopmentProgramme (WSDP)Phase I Step 1 + 2
Reduce health risks related to water-borne diseasesand the provision of adequate water supply andsanitation services to the urban population of Kitale,Webuye and Bungoma.
LVNWSB ongoing Lake VictoriaNorth WSB
July 2010(physical
completion)2895.00
Water SectorDevelopmentProgramme (WSDP)Phase II Step 1 + 2
Reduce health risks related to water-borne diseasesand the provision of adequate water supply andsanitation services to the urban population ofKakamega, Busia, Nambale
LVNWSB ongoing Lake VictoriaNorth WSB
November2010 (physical
completion)4337.87
Water SectorDevelopmentProgramme (WSDP)Phase II Step 1 + 2
Accompanying Measures to support Water ServiceProvider (Western Water Services Company WWSC) LVNWSB ongoing
Lake VictoriaNorth WSB &
WWSCJune 2011 115.80
Water Supply andSanitation for the UrbanPoor (WSTF)
Providing water supply and sanitation infrastructureinvestments through the WSTF to the urban poor inslums and informal settlements
WSTF ongoing Country wide December2011 636.90
Cooperation WSDP III -WASSIP (World Bank)
Reduce health risks related to water-borne diseasesand the provision of adequate water supply andsanitation services to the urban population in Mumias,Butere, Kimilili, Malakisi and several rural growthcentres.
LVNWSB ongoing Lake VictoriaNorth WSB 2010 173.70
C - T - 22

Table 2.4.1 Reproduction of MWI's Internal Donor Matrix (Water Supply and Sanitation) (4/7)
KES Equivalent
ImplementingAgency Geographical Area Scheduled
Completion
AmountAllocated
Programme Title Purpose Status
PIPELINE - PROGRAMMES AND PROJECTSGerman Development Service (DED)
Water SectorDevelopmentProgramme (continued)
Support implementation of water sector reformsthrough deployment of Technical Advisors on locallevel (WSBs and WSPs; regional offices WRMA), incooperation with GTZ and KfW
MWI continuous (Western Kenyaand Tana)
December2014 254.61
German Financial Cooperation (KfW)Water Supply andSanitation for the UrbanPoor, Phase II(WSTF II)
Up scaling of water supply and sanitationinfrastructure investments through the WSTF to theurban poor in slums and informal settlements.
WSTF Appraisalcompleted countrywide - 1328.4
Water SectorDevelopmentProgramme - LakeVictoria South(WSDP - LVS)
Provision of adequate water supply and sanitationservices to the urban population in one cluster ofsecondary towns
(LVSWSB) Appraisal in late2010 / early 2011
Lake VictoriaSouth / Nyanza
Province- 3653.1
Water SectorDevelopmentProgramme - LakeVictoria South(WSDP - LVS)
Accompanying Measures to support a selected WaterService Provider (yet to be specified) (LVSWSB) Appraisal in late
2010 / early 2011
Lake VictoriaSouth / Nyanza
Province- 110.7
IFADONGOING PROGRAMMES AND PROJECTS
Central Kenya Dry AreasSmallholder CommunityDevelopment Project
Improved and increased access to drinking water tothe target group throughout the project area.
Ministry ofPlanning,
National Dev &Vision 2030
Underimplementation
Central Kenya -Semi-arid districtsof Thika, Murang'a
South, Nyeri,Nyandarua and
Kirinyaga
Dec 31 2010
Southern NyanzaCommunityDevelopment Project
Sustainable access to safe domestic water andimproved environmental sanitation and hygienepractices
Ministry ofPlanning,
National Dev &Vision 2030
underimplementation
Southern Nyanzadistricts of Homabay, Kuria West,Nyatike, NyamiraNorth, Rachuonyo
North & SubaDistricts
30 Sep 2011A request byGoK for anextension ofthe projectcompletion
date has beenforwarded to
IFAD
Mount Kenya East PilotProject for NaturalResources Management
To enhance equitable and efficient water use andrationalized water abstractions . This is done throughriver basin management and community waterdevelopment.
Ministry of Waterand Irrigation
underimplementation
Central andEastern Provinces
(KirinyagaDistrict, Mara ,Imenti South,
Imenti North,MeruSouth,Meru
Central,Tharaka,Mbeere,
30 Sep 2011
Italian CooperationONGOING PROGRAMMES AND PROJECTS
Kiambere KirandichWater Project, 2ndPhase
Provide water supply to 120,000 users and sanitationin Mwingi and Kabarnet
Tanathi WSB,RV WSB Tender Mwingi and
Baringo Districts Dec 13 3,507
Kiambere KirandichWater Project 2nd Phase- TA
Provide water supply to 120,000 users and sanitationin Mwingi and Kabarnet
ItalianCooperation Ongoing Mwingi and
Baringo Districts Dec 13 55
Kisawel Self Help WaterProject
Increase water supply in rural areas throughinfrastrucutre development MWI Ongoing Nyandarua District Dec 10 33
Njabini - NgwataniroWater Supply Project
Increase water supply in rural areas throughinfrastrucutre development MWI Ongoing Nyandarua District Dec 10 34
Sigor Water SupplyProject
Increase water supply in rural areas throughinfrastrucutre development MWI Ongoing West Pokot
District Mar 11 40
Mutonga Gituma Water& Sanitation Project
Increase water supply in rural areas throughinfrastrucutre development MWI Ongoing Tharaka District Dec 10 54
Kibung'a KakimikiWater Project
Increase water supply in rural areas throughinfrastrucutre development MWI Ongoing Tharaka District Dec 10 95
Viriko/Kwa Dadu WaterProject
Increase water supply in rural areas throughinfrastrucutre development MWI Ongoing Kilifi District Dec 10 27
Kaembeni/MwaheraWater Project
Increase water supply in rural areas throughinfrastrucutre development MWI Ongoing Kilifi District Dec 10 20
Modogashe Water &Sanitation Project
Increase water supply in rural areas throughinfrastrucutre development MWI Ongoing Ladgera District Dec 10 50
Mbale Water Project Increase water supply in rural areas throughinfrastrucutre development MWI Ongoing Vihiga District Dec 10 70
Kiplombe Water Project Increase water supply in rural areas throughinfrastrucutre development MWI Ongoing Rongai District Jun-11 64
C - T - 23

Table 2.4.1 Reproduction of MWI's Internal Donor Matrix (Water Supply and Sanitation) (5/7)
KES Equivalent
ImplementingAgency Geographical Area Scheduled
Completion
AmountAllocated
Programme Title Purpose Status
Umanyi - Mitito Increase water supply in rural areas throughinfrastrucutre development MWI Ongoing Kibueri District Jun-11 120
Tigania Water supllyproject
Increase water supply in rural areas throughinfrastrucutre development MWI Ongoing Tigania East
District Jun-11 80
Nakoyocho Waterproject
Increase water supply in rural areas throughinfrastrucutre development MWI Ongoing Muguoma District Jun-11 120
Japan (JICA)ONGOING PROGRAMMES AND PROJECTS
Project forAugementation of WaterSupply in KapsabetTown
Rehabilitation and expansion of water supply system
MWI, LakeVictoria NorthWater ServicesBoard
Contracting stage Kapsabet Town October 2011 Kes.1,778,181,818
Project for Managemenof Non-Revenue Waterin Kenya
Systems and mechanisms for supervision andimplementation of measures for reducing NRW inKenya are set up and disseminated, and the capacityfor reduction of NRW is developed
MWI, WASREB,KEWI Implementation
Meru, Embu,Kapsabet andNarok Towns,Countrywide
2013 Kes.319,090,909
Revision of NationalWater Masterplan
Revision of National Water Masterplan for the year2030 including a Master Action Plan for the year2015
MWI, WRMA
DetailedPlanning SurveyStudy (tocommence inNovember 2009)
Countrywide 2012 Kes.354,545,454
Project for Improvementof Water Supply inEmbu Town andSurrounding Area
Rehabilitation and expansion of water supply system MWI, Tana WaterServices Board
Basic designongoing (fromSeptember 2009)
Embu Town andSurrounding Areas
December2012
Kes.2,327,272,000
PIPELINE - PROGRAMMES AND PROJECTSProject for Rural WaterSupply In LargerBaringo District
Increase the served population with safe and stabledrinking water supply.
MWI, RiftvalleyWater ServicesBoard
Basic design(from January2010)
Larger BaringoDistrict
Project for Rural WaterSupply (Phase II)
Increase the served population with safe and stabledrinking water supply.
MWI, TanaathiWater ServicesBoard
ImplementationReview Study(from October2009)
Larger Makueniand MachakosDistricts
Sida (Sweden)ONGOING PROGRAMMES AND PROJECTS
Support to Water Sector Reforms, WRM and RuralWSS
MWI, WRMA,WSBs, WSTF Ongoing Kenya
Water Sector Reforms MWI, WRMA,WSBs, WSTF Ongoing Kenya
Kenya Water andSanitation ProgramKWSP (Co-funded withGoK and Danida. Heredesicribing Sida part.)
Water Resources Management (incl additionalfunding for Flood and Drought Mitigation) MWI, WRMA, Ongoing Kenya. Jun-10 2,95BKShs
Rural Water Supply and Sanitation MWI, WSTF,WSBs
Ongoing Kenya
PIPELINE - PROGRAMMES AND PROJECTS"Future water sectorsupport"
Continued support to sector reforms and results forthe poor (focus areas not yet agreed)
MWI, WRMA,WSBs, WSTF
Identification Kenya 2014 1,8 BKShs
SNVONGOING PROGRAMMES AND PROJECTS
Water Services ProviderAssociation (WASPA)Strategic Plandevelopment andimplementation
Assistance to WASPA in: a)lobby/advocacy forenabling environment (sector reforms), b)facilitatingcapacity development of- and c)brokering 'bestpractice' (in socially-responsive commercialization)between its member WSPs.
WASPA draft StrategicPlan approved country-wide August 2009
C - T - 24

Table 2.4.1 Reproduction of MWI's Internal Donor Matrix (Water Supply and Sanitation) (6/7)
KES Equivalent
ImplementingAgency Geographical Area Scheduled
Completion
AmountAllocated
Programme Title Purpose Status
Socially-responsive commercialization of WSPs:1.LOWASCO (Lodwar), 2.KAWASES (Pokot),3.ERAWASCO (Eldama Ravine), 4.NAIVAWASS(Naivasha), 5.NASCO (Narok) e.g. WSTF-UPC roll-out, peformance mngmnt, clustering
WSB-DWO/PO/SO/QCA capacity (WSTF-CPC,UNICEF WaSH Programme) and collaboration withother state/non-state actors in rural water andsanitation: Turkana, Pokot, Narok.WARIS-oriented Water Point Functionality Mappingpilot PokotSocially-responsive commercialization of WSPs:6.IWASCO (Isiolo), 7.NAWASCO (Nanyuki),8.MAWASCO (Maralal), 9.GAWASCO (Garissa) e.g.WSTF-UPC roll-outWSB-DWO/PO/SO/QCA capacity (WSTF-CPC,UNICEF WaSH Programme) and collaboration withother state/non-state actors in rural water andsanitation: Isiolo, Marsabit, MoyaleSocially-responsive commercialization of WSPs:10.MAVWASCO (Mavoko), 11.Oloolaiser (Ngong,O/Rongai & Kiserian), 12.Olkejuado (Kajiado),13.Loitokitok e.g. WSTF-UPC roll-outWSB-DWO/PO/SO/QCA capacity (WSTF-CPC,UNICEF WaSH Programme) and collaboration withother state/non-state actors in rural water andsanitation: Kajiado
Training and CapacityBuilding component ofthe Lake Victoria RegionWater and SanitationInitiative (LVRWSI)
Capacity Building interventions around LocalEconomic Development (LED) in WaSH to maximisethe impact (economic benefits for the poor) of theinfrastructural investments under the Programme
LVS-WSB,WSPs, LocalAuthorities,NGOs, local
private sector
Ongoing Kisii, Homa Bay,Bondo April 2012
UN-HABITATONGOING PROGRAMMES AND PROJECTS
Kibera Water andSanitation Project
Community-based water and sanitation improvementsin Selected Areas of the Kibera Slums
Ministy ofHousing
Implementation Nairobi May 2010 116,779,350
Lake Victoria SouthSupport Programme Developing Sanitation Stratigies and Action Plans Ministry of Water
and IrrigationStudies inprogress Nyanza Province Dec 2010 75,000,000
Mirenr-Karagita Waterand Sanitation Project
Improve water and sanitation in the peri-urban areasof Navaisha Town
Rift Valley WaterServices Board Implementation Navaisha Town May 2011 13,650,000
Kibera SupportProgramme (Pre-Investement Study)
Pre-investment Study for the upsacaling of the KiberaWater and Sanitation Project - Design andSupervision for ADB Extension
Athi WaterServices Board Study in Progress 3 Villages in
Kibera, Nairobi Sept, 2011 187,500,000
Developing a Data Baseon Water Supply andSanitation in Low-Income Areas of Kenya
Provide a Data Base on water and sanitationconditions in low income areas
Water ServicesTrust Fund,Ministry of Waterand Irrigation
Implementation Countrywide Dec 2010 37,650,000
School Water, Sanitationand Hygiene Project
Improve water, sanitation and hygiene practices inurban schools
Sustainable Aid inAfricaInternational
ImplementationNyanza ProvinceKisii, Homa Bayand Bondo)
Dec 2010 23,175,000
Water SupplyImprovements forHuruma Village
Provide access to safe water for the residents ofHuruma Village
MuthaigaResidentsAssociation
Implementation Nairobi North December,2010 5,775,000
Improving healthconidtions in primaryschools
Improve standards of hygiene in a selected number ofschools in an informal settlement
Africa Populationand Healthresearch Center
Implementation
KorogchoInformalSettlement,Nairobi
Dec 2010 20,363,400
Lake Victoria RegionWater Supply andSanitation Project
Improve water supply and environmental sanitaion inthe secondary towns in the Lake Victoria Basin
Ministry of WaterandIrrigation/LakeVictoria SouthWater ServicesBoard
ImplementationNyanza ProvinceKisii, Homa Bayand Bondo)
June 2011 390,000,000
PIPELINE - PROGRAMMES AND PROJECTSLake Victoria RegionWater and SanitationProgramme - Phase 2 (tobe done in collaborationwith the EAC and theADB)
Improve water supply and environmental sanitaion inthe secondary towns in the Lake Victoria Basin
Ministry of WaterandIrrigation/LakeVictoria SouthWater ServicesBoard
ProjectFormulationStudy in Progress
Nyanza Province 1,800,000,000
varies perWSP
Capacity developmentsupport to WSPs andother WaSH actors inTanathi Water ServicesBoard area
TanathiWSPs Pending Tanathi Valley
WSB area
Capacity developmentsupport to NorthernWater Services Boardand WSPs
NorthernWSB and WSPs Ongoing Northern
WSB area June 2011
September2010
Capacity developmentsupport to Rift ValleyWater Services Boardand WSPs
Rift ValleyWSB and WSPs Ongoing Rift Valley
WSB area
C - T - 25

Table 2.4.1 Reproduction of MWI's Internal Donor Matrix (Water Supply and Sanitation) (7/7)
KES Equivalent
ImplementingAgency Geographical Area Scheduled
Completion
AmountAllocated
Programme Title Purpose Status
Lake Victoria RegionWater and SanitationProgramme - Phase 3 (inCollaboration with theEIB)
Improve water supply and sanitation in the largetowns in the Lake Victoria Basin
Ministry of WaterandIrrigation/LakeVictoria SouthWater ServicesBoard
Consultantsbeing engagedfor projectformulation study
Kisumu Town 2,250,000,000
UNICEF / Government of NetherlandsONGOING PROGRAMMES AND PROJECTS
UNICEF- Kenya WASHProgramme
Acceleration of water supply and sanitation towardsreaching Kenya's Millenium Developement Goals UNICEF Ongoing
22 districts, in 7Water ServiceBoards areasNorth Eastern
Province:Mandera, Wajir,
Garissa, Ijara:Eastern Province-
Kitui, Mwingi,Marsabit, Moyale:
Central- Kieni:Rift Valley: WestPokot, Turkana,
Kajiado: Nyanza:Kisumu, Nyando,
Siaya, Bondo,Rachuonyo:
Western: Busia:Coast- Kwale,
Tana River
2013 3.76 billion
USAIDONGOING PROGRAMMES AND PROJECTS
Sombeza Water andSanitation Project(SWASIP) Inplementedby the Aga KhanFoundation
Potable Water and Sanitation ImprovementAga Khan
Foundation(AKF)
Ongoing Kwale and Kilifidistricts (larger) Sep-10 99,055,840
Water Project Potable Water and Sanitation Improvement
World ConcernDevelopmentOrganization
(WCDO)
Ongoing Narok and Lamudistricts (larger) Oct-11 199,984,480
Mwingi WaterImprovement Project Potable Water and Sanitation Improvement
AdventistDevelopment and
Relief Agency(ADRA)
Ongoing Mwingi district(larger) Apr-11 80,835,760
Millenium WaterProgram Potable Water and Sanitation Improvement Millenium Water
Alliance Ongoing
Marsabit, Moyale,Garissa, Kibwezi,Kisumu, Butere,
Tana River
Mar-12 239,999,680
PIPELINE - PROGRAMMES AND PROJECTS
New Water Program Protable Water and Sanitation Improvement,Governance etc To be decided
strategydevelopment
underwayTo be decided 600,000,000
WorldbankONGOING PROGRAMMES AND PROJECTS
Water and SanitationService ImprovementProject
Increase access and improve water supply andsanitation services
Athi WaterServices Board,Coastal Waterservices Board,Lake VictoriaNorth Water
Services Board
Underimplementation
Service areas ofthe three WaterService Boards
June 30, 2012 12.25 billion
Source: MWI's Donor Matrix (November 2010) arranged by JICA Study Team
C - T - 26

Table 2.4.2 Urban Water Supply Projects Proposed by WSBs, 2012 (1/2)
Water Supply Schemes Urban Centres Market Centres CountyRiver/Lake
(m3/day)Borehole(m3/day)
Dam(m3/day)
Water Source Name(s)
Rehabilitation and Augmentation of Chesikaki- Cheptais-Sirisia water supply
Chesikaki- Cheptais- Sirisia Trans Nzoia 2,050 Tisi Rivers
Rehabilitation and Augmentation of Kwanza water supply Kwanza market Trans Nzoia 600 Ngéng'e dam
Rehabilitation and Augumentation of Sio Port water supply Sio Port Kakamega/Busia 1,250 Lake Victoria
Rehabilitation and Augumentation of Funyula water supply Funyula town Kakamega/Busia 560 2 No boreholes in Funyula townRehabilitation and Augumentation of Port Victoria water
lPort Victoria Kakamega/Busia 1,250 Lake Victoria
Sega-Ugunja-Ukwala WSYala, Ugunja, Ukwala, Siaya,Bondo,
Sega,Mauna,Asembo bay, Siaya 12,000 0 0 R.Nzoia
Mauna Dam Water Supply-ii Mauna Siaya 0 0 2,500 Mauna Dam
Alego-Yimbo Water Supply Alego,Yimbo Siaya 6,000 0 0 L.Kanyaboli
Usenge-Osieko W/S Usenge Osieko Siaya 4,000 0 0 L.Victoria
South Sakwa Water Supply South Sakwa Siaya 2,500 0 0 L.Victoria
29,050 560 3,100 32,710
KIWASCO Kibos Dam - Water Supply Kisumu, Kisumu 0 0 60,000 R. Kibos, R.Yala
KEWASCO Kericho Water Supply Kericho Town Kericho 14,000 0 0 R. Kimugu
Litein Water Supply Litein , Kapkatet and Sotik Bomet 8,000 0 0 R.Itare
FortTenan Water Supply Forttenan Bomet 1,200 0 0 R.Sombo
Bomet Water Supply Bomet Town Bomet 8,000 0 0 R.Nyangoress
Longisa Water Supply Longisa Bomet 4,000 0 0 R. Amala
Sosiot Water Supply Sosiot Bomet 2,000 0 0 R.Cheboseron
Londian Multi-Purpose Dam Londiani, Kipkelion. Lumbwa,Lessos Bomet 0 0 28,000 Londiani Dam (Proposed)
Sigor Water Supply Sigor Town Bomet 1,500 0 0 R.Nyangoress
Chesinende Water Supply Chesinende Bomet 0 0 500 Dam
Maseno Kombewa Maseno Kombewa, Holo Kisumu 22,000 0 0 R.Maragoli
Kisumu Rural Expansion Seme District Kisumu 2,000 0 0 L.Victoria
Magwagwa Dam Multi-Purpose Nyamira, Oyugis.Sondu,Upper Nyakach,LowerNyakach
Nandi/Kisumu 0 0 36,000 Magwagwa Dam (R. Sondu)
Koru Water SupplyKoru, Mnara, Muhoroni,Awasi,Ahero, Chemelil,Miwani
Nandi/Kisumu 0 0 42,000 Koru Dam (R.Nyando)
Nandi Dam Nandi Hills Nandi/Kisumu 0 0 12 000 Proposed Nandi Dam
LVNCA
Nzoina Water and Sanitation Company Ltd.
Western Water Services Company
SIBO WASCO
LVSCA
TILILBEI WASCO
Gulf Water Company
NYANAS WASCO
TOTAL
CatchmentArea
Water Service ProvidersPlanned Water Supply Projects and Capacities
Nandi Dam Nandi Hills Nandi/Kisumu 0 0 12,000 Proposed Nandi Dam
Lessos Water Supply Lessos Nandi/Kisumu 0 0 1,200 Lessos Dam
Kilgoris Water Supply Kilgoris Town Migori/Narok 4,000 0 0 River
Nkararu-II Water Supply Nkararu Migori/Narok 500 0 0 Nkararu Spring
Uriri Water Supply Uriri Town, Stella Migori/Narok 4,000 0 0 R.Oyani
Rongo Water Supply -II Rongo Riosiri Migori/Narok 2,000 0 0 R.Misadhi
Keroka Water Supply -II Keroka Kisii 4,000 0 0 R.Ichuni
Bonyumyu Dam Water S. Kisii, Kisii 0 0 24,000 Bonynyu Dam
Mbita Water Supply Mbita Town Homa Bay 4,000 0 0 Lake Victoria
West Karachuonyo -II WS Rural parts of Westh
Homa Bay 2,000 0 0 L.Victoria
Homa Bay Water Supply Homa Bay Town, Rodi Kopany Homa Bay 8,000 0 0 Lake Victoria
Ndhiwa Water Supply Ndhiwa Homa Bay 4,000 30 0 R.Kuja
Nyasare Kochia Water Supply Olare, Ligisa Migori 2,500 0 0 L.Victoria
97,700 30 203,700 301,430
Nakuru Water and Sanitation Company Ltd. Nakuru Long term water supply project Nakuru town Nakuru 0 0 100,000 Itare River in Mau Forest
Ol Kalou Water and Sanitation Company Ltd. Olkalou Water Supply Olkalou town Nyandarua 0 0 10,000 River Malewa
Iten Tambach Water Project Sabor - Iten Water Supply Project Iten town Elgeyo 0 0 5,000 Sabor River
Naroko Water and Sanitation Company Narok Water Supply Project Narok town and environs Narok 4,600 0 0 Engare Narok
Kabarnet Water Supply Kabarnet Water Supply Phase II Kabarnet , Kabasis, Kituro, Kabartonjo Baringo 0 0 20,000 Kirandich
4,600 0 135,000 139,600
MIKUTRA WASCO
GUSII WASCO
TOTAL
South Nyanza Water Company
TOTAL
RVCA
C - T - 27

Table 2.4.2 Urban Water Supply Projects Proposed by WSBs, 2012 (2/2)
Water Supply Schemes Urban Centres Market Centres CountyRiver/Lake
(m3/day)Borehole(m3/day)
Dam(m3/day)
Water Source Name(s)Catchment
AreaWater Service Providers
Planned Water Supply Projects and Capacities
Kiambu water supply system Kiambu 0 10,000 Kamiti River Dam
Kiambu water supply system Kiambu 10,000 Riara river Dam
Kiambu water supply system Kiambu 10,000 Riara
Theta treatment plant Gatundu 0 3,000 Theta Dam
Thirika Water Supply scheme Gatundu 10,000 Thirika Dam
Gatanga Community Water Project Gatanga Gatanga 6,000 Kiama
Kikuyu Water & Sanitation Co. Ltd Muguga water scheme Kikuyu 3,000 Ngecha
Komothai water system Ruiru 0 15,000 Dam on Komothai
Gatamaiyu 2 Ruiru 10,000 Gatamaiyu 2 Dam
Githunguri Water and sewerage Co. Ltd 4th Nairobi water supply Nairobi, Maragua 138,000 Maragua/Irati rivers
Karemeno Thika 0 100,000 Karemeno Dam
Thika 3A Thika 50,000 Thika 3A dam
Nairobi Nairobi 40,000 Deep wells
Ruiru 2 Dam Nairobi, Ruiru Githunguri 60,000 Ruiru 2 Dam
Ndarugu 2 Nairobi, Gatundu, Juja 10,000 Ndarugu Dam
Nairobi 5 Nairobi 70,000 Maragua Dam
4th Nairobi water Nairobi 138,000 Maragua/Mathioya/Irati Rivers
Nairobi 7 Nairobi 138,000 Ndarugu Dam
Mzima II project Mombasa, Voi Changamwe, 160,000 Mzima springs
Mwache dam Mombasa 200,000 Mwache river
Pemba Dam 3,000 Pemba
Mavoko Water and Sewerage Co. Mavoko W/S Machakos 15,000Mavoko Water and sewerage to be done underPPP
Machakos Water and Sewerage Ltd. Machakos W/S reticulation upgrading Machakos 0 5,000 Miwongoni dam detailed design on going
Kibwezi Makindu Water and Sanitation Company Makindu Water Supply Kibwezi & Mtito Andei Kalama,Kibarani Makueni 3,000 Umani Springs Phase II
Wote Water and Sewerage Co. Ltd. Wote W/S Wote Wote 2,000 Kaiti river infiltration galleries
Namanga W/S Namanga Kajiado 0 365 1 B/H to be drilled
Namanga Kajiado 400 Oldonyorok Springs
Mombasa Water and Sanitation Company Ltd. Mombasa
Namanga Water Users Trust
ACA
Kiambu Water and Sanitation Co. Ltd Kiambu
Gatundu South Water and Sewerage Co. LtdKiambu
KiambuRuiru-Juja Water and Sanitation Co. Ltd
KiambuThika Water and Sanitation Co. Ltd
Nairobi Water and sewerage Company Nairobi
Ol Kejuado Water and Sewerage Company Kajiado W/S Kajiado,Isinya,Bissil Kajiado 0 1,000 Dam proposed
Kayatta W/S Kayatta Machakos 0 3,000 Spring
Kabaa market & Mbiuni (Kitwamba) B/Hs Kabaa Machakos 600 Boreholes rehabilitations
Mbooni Water and Sanitation Company Mulima W/S Mbooni Makueni 0 1,000Mulima dam desilting & construction of atreatment works, 1 B/H drilling
359,400 365 855,600 1,215,365
Lamu Water and Sewerage Company Ltd. Naningi Lamu Pipeline Lamu 200,000
Nyeri Water and Sewerage Company Mt Kenya Bulk Meru, Chogoria, Chuka, Maua Meru, Taraka Nyeri 309,530 Kathita, Mutonga, Mara, Nithi, Ruguti
Kirinyaga Water and Sanitation Company Kirinyaga Bulk water supply Kerogoya Kirinyaga Kirinyaga 71,705 Thiba dam & Nyamindi, Kiringa, Ragati
Embu / Mbeere Bulk Embu Embu 77,415
Nyeri District Bulk Nyeri Nyeri 118,351
Muranga / Muranga Bulk System Muranga, Maranga 85,774
Kitui Water and Sanitation Company Kitui Water Supply Kitui Masinga, Katheka Kitui 0 9,000Masinga dam Phase II expansion of intake, T-Works & upgrade the rising mains
Kiambere Mwingi Water and Sewerage Company Mwingi Phase II W/S Mwingi Kitui 2,000 Kiambere Dam T- Works & intake worksi
Yatta Water Services Company Ltd. Yatta W/s Matuu Machakos 3,000Construction of Yatta dam, water supply andsewerage
KIPIPIRI Kipipiri Water Project Kipipiri town 3,000 0 0 River Chitohi
865,775 0 14,000 879,775
Nyahuru supply system Nyahururu Laikipia 7,822 Leshau swamp
Laikipia 3,000 Mairo-Inya BHs
Isiolo Water and Sewerage Company Isiolo Isiolo Isiolo 0 6,552 Marania
Marmanet water supply Marmanet and environs Laikipia 1,878 Leshau swamp
Laikipia 2,000 Kamwana
Laikipia 1,000 BH systems
9,700 4,000 8,552 22,252
Source: JICA Study Team based on data from WSBs
Mwala Water and Sanitation Company
ENNCA
Nyahururu Water and Sanitation Company
Marmanet Water and Sewerage Company
TOTAL
TOTAL
TCA
TOTAL
C - T - 28

Table 3.2.1 Populatio Projection of 137 Major Urban Centres (1/3)
Census 2009 Adjustment1 Nairobi 3,133,518 3,138,369 193.9% 6,085,2972 Mombasa 938,131 938,131 281.9% 2,644,5913 Kisumu 388,311 388,311 375.3% 1,457,208- Sub-total 4,459,960 4,464,811 - 10,187,096
1 Nakuru 307,990 307,990 375.3% 1,155,7892 Eldoret 289,380 294,589 375.3% 1,105,4993 Kehancha 30,109 30,109 503.4% 151,5644 Ruiru 238,858 238,858 375.3% 896,3585 Malindi 118,265 118,265 375.3% 443,8116 Naivasha 169,142 169,142 503.4% 851,4337 Kitui 109,568 109,568 503.4% 551,5478 Machakos 150,041 150,041 503.4% 755,2819 Thlka 136,917 136,917 375.3% 513,806
10 Mavoko 137,211 137,211 375.3% 514,90911 Nyeri 119,353 119,353 503.4% 600,80312 Vihiga 118,696 118,696 503.4% 597,49613 Mumias 99,987 99,987 503.4% 503,31814 Bomet 83,729 83,729 503.4% 421,47815 Kitale 106,187 106,187 503.4% 534,52816 Limuru 79,531 79,531 375.3% 298,45517 Kericho 101,808 101,808 503.4% 512,48518 Kimilili 94,927 94,927 503.4% 477,84719 Kakamega 91,768 91,768 503.4% 461,94520 Kapsabet 86,803 86,803 503.4% 436,95221 Kiambu 84,155 84,155 375.3% 315,80722 Kisii 81,801 81,801 503.4% 411,77323 Bungoma 55,867 55,867 503.4% 281,22524 Webuye 41,344 41,344 503.4% 208,11925 Busia 51,981 51,981 503.4% 261,66426 Runyenjes 19,548 19,548 503.4% 98,40127 Migori 53,100 53,100 503.4% 267,29728 Embu 60,673 60,662 503.4% 305,36229 Homa Bay 58,936 43,362 503.4% 218,27830 Lodwar 48,316 48,316 123.2% 59,54431 Meru 53,627 53,627 503.4% 269,94932 Nyahururu 36,450 36,450 503.4% 183,48333 Nanyuki 38,198 38,198 503.4% 192,28234 Maua 17,226 17,226 503.4% 86,71335 Voi 17,152 17,152 503.4% 86,34036 Siaya 22,586 12,208 503.4% 61,45237 Chuka 43,470 43,470 503.4% 218,82138 Kerugoya/Kutus 19,422 19,422 503.4% 97,76739 Muranga 28,775 28,775 503.4% 144,84940 Kabarnet 25,346 25,346 123.2% 31,23641 Karatina 8,499 8,499 503.4% 42,783
- Sub-total 3,536,742 3,515,988 - 15,628,4470
1 Ngong 107,188 107,188 375.3% 402,2422 Awasi 93,369 34,222 503.4% 172,2683 Wajir 82,800 82,800 123.2% 102,0424 Kakuma 36,875 36,875 123.2% 45,4445 Ukunda 62,529 62,529 375.3% 234,6516 Wundanyi 62,404 36,778 503.4% 185,1367 Kitengela 58,167 58,167 375.3% 218,2828 Mtwapa 48,625 48,625 375.3% 182,4749 Isiolo 45,989 45,989 503.4% 231,501
10 Juja 40,446 40,446 375.3% 151,78111 Ongata Rongai 40,178 40,178 375.3% 150,775
Population in Urban and Peri-Urban Area PopulationGrowth Ratio
Urbann Populationin 2030
City
Municipality
Other Center
Urban Centres
C - T - 29
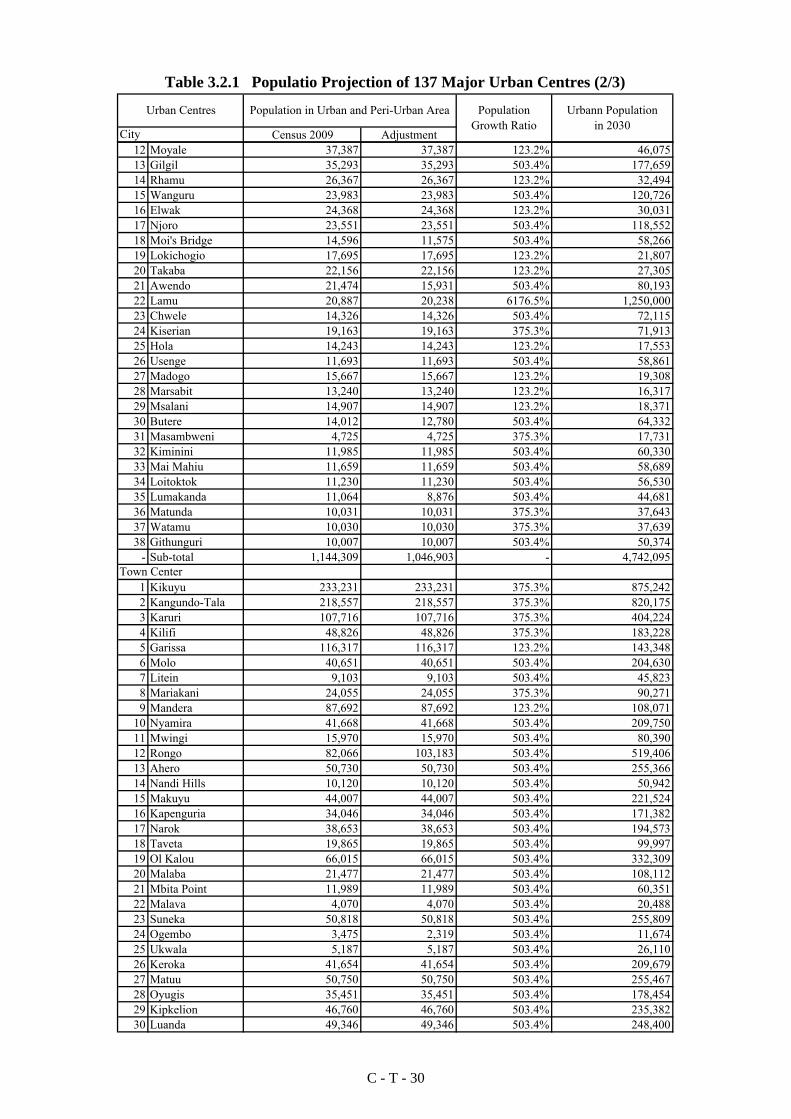
Table 3.2.1 Populatio Projection of 137 Major Urban Centres (2/3)
Census 2009 Adjustment
Population in Urban and Peri-Urban Area PopulationGrowth Ratio
Urbann Populationin 2030
City
Urban Centres
12 Moyale 37,387 37,387 123.2% 46,07513 Gilgil 35,293 35,293 503.4% 177,65914 Rhamu 26,367 26,367 123.2% 32,49415 Wanguru 23,983 23,983 503.4% 120,72616 Elwak 24,368 24,368 123.2% 30,03117 Njoro 23,551 23,551 503.4% 118,55218 Moi's Bridge 14,596 11,575 503.4% 58,26619 Lokichogio 17,695 17,695 123.2% 21,80720 Takaba 22,156 22,156 123.2% 27,30521 Awendo 21,474 15,931 503.4% 80,19322 Lamu 20,887 20,238 6176.5% 1,250,00023 Chwele 14,326 14,326 503.4% 72,11524 Kiserian 19,163 19,163 375.3% 71,91325 Hola 14,243 14,243 123.2% 17,55326 Usenge 11,693 11,693 503.4% 58,86127 Madogo 15,667 15,667 123.2% 19,30828 Marsabit 13,240 13,240 123.2% 16,31729 Msalani 14,907 14,907 123.2% 18,37130 Butere 14,012 12,780 503.4% 64,33231 Masambweni 4,725 4,725 375.3% 17,73132 Kiminini 11,985 11,985 503.4% 60,33033 Mai Mahiu 11,659 11,659 503.4% 58,68934 Loitoktok 11,230 11,230 503.4% 56,53035 Lumakanda 11,064 8,876 503.4% 44,68136 Matunda 10,031 10,031 375.3% 37,64337 Watamu 10,030 10,030 375.3% 37,63938 Githunguri 10,007 10,007 503.4% 50,374
- Sub-total 1,144,309 1,046,903 - 4,742,095
1 Kikuyu 233,231 233,231 375.3% 875,2422 Kangundo-Tala 218,557 218,557 375.3% 820,1753 Karuri 107,716 107,716 375.3% 404,2244 Kilifi 48,826 48,826 375.3% 183,2285 Garissa 116,317 116,317 123.2% 143,3486 Molo 40,651 40,651 503.4% 204,6307 Litein 9,103 9,103 503.4% 45,8238 Mariakani 24,055 24,055 375.3% 90,2719 Mandera 87,692 87,692 123.2% 108,071
10 Nyamira 41,668 41,668 503.4% 209,75011 Mwingi 15,970 15,970 503.4% 80,39012 Rongo 82,066 103,183 503.4% 519,40613 Ahero 50,730 50,730 503.4% 255,36614 Nandi Hills 10,120 10,120 503.4% 50,94215 Makuyu 44,007 44,007 503.4% 221,52416 Kapenguria 34,046 34,046 503.4% 171,38217 Narok 38,653 38,653 503.4% 194,57318 Taveta 19,865 19,865 503.4% 99,99719 Ol Kalou 66,015 66,015 503.4% 332,30920 Malaba 21,477 21,477 503.4% 108,11221 Mbita Point 11,989 11,989 503.4% 60,35122 Malava 4,070 4,070 503.4% 20,48823 Suneka 50,818 50,818 503.4% 255,80924 Ogembo 3,475 2,319 503.4% 11,67425 Ukwala 5,187 5,187 503.4% 26,11026 Keroka 41,654 41,654 503.4% 209,67927 Matuu 50,750 50,750 503.4% 255,46728 Oyugis 35,451 35,451 503.4% 178,45429 Kipkelion 46,760 46,760 503.4% 235,38230 Luanda 49,346 49,346 503.4% 248,400
Town Center
C - T - 30
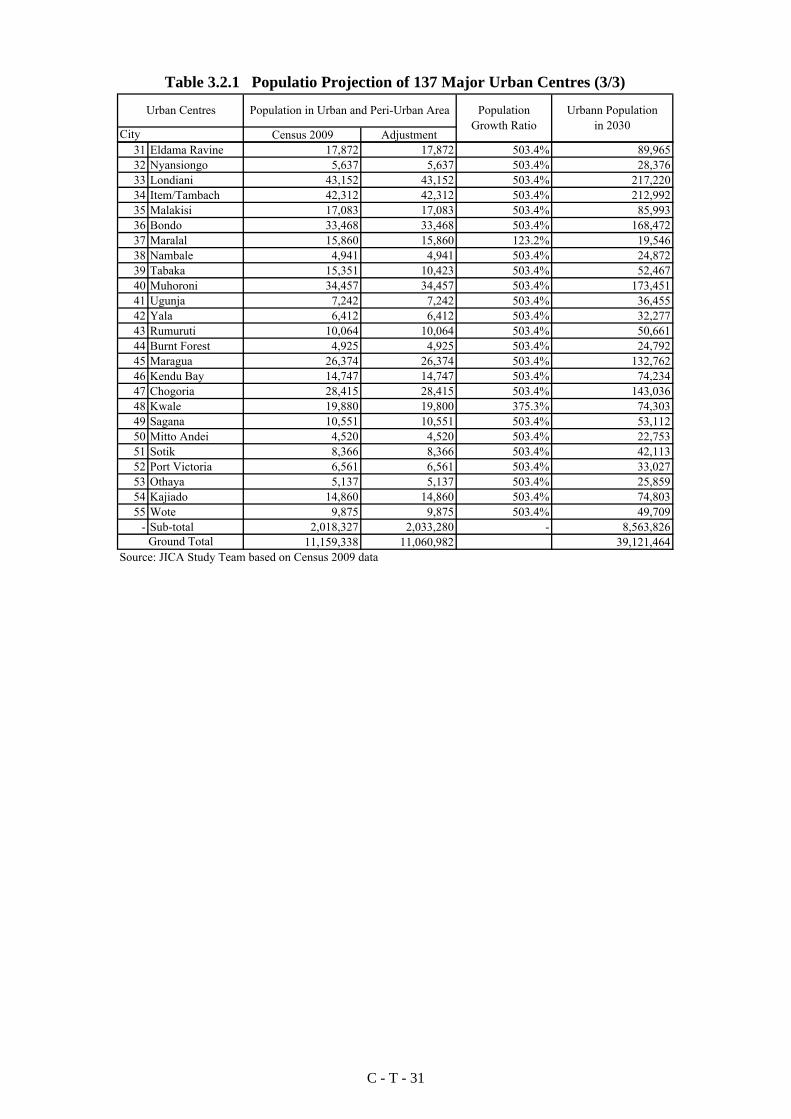
Table 3.2.1 Populatio Projection of 137 Major Urban Centres (3/3)
Census 2009 Adjustment
Population in Urban and Peri-Urban Area PopulationGrowth Ratio
Urbann Populationin 2030
City
Urban Centres
31 Eldama Ravine 17,872 17,872 503.4% 89,96532 Nyansiongo 5,637 5,637 503.4% 28,37633 Londiani 43,152 43,152 503.4% 217,22034 Item/Tambach 42,312 42,312 503.4% 212,99235 Malakisi 17,083 17,083 503.4% 85,99336 Bondo 33,468 33,468 503.4% 168,47237 Maralal 15,860 15,860 123.2% 19,54638 Nambale 4,941 4,941 503.4% 24,87239 Tabaka 15,351 10,423 503.4% 52,46740 Muhoroni 34,457 34,457 503.4% 173,45141 Ugunja 7,242 7,242 503.4% 36,45542 Yala 6,412 6,412 503.4% 32,27743 Rumuruti 10,064 10,064 503.4% 50,66144 Burnt Forest 4,925 4,925 503.4% 24,79245 Maragua 26,374 26,374 503.4% 132,76246 Kendu Bay 14,747 14,747 503.4% 74,23447 Chogoria 28,415 28,415 503.4% 143,03648 Kwale 19,880 19,800 375.3% 74,30349 Sagana 10,551 10,551 503.4% 53,11250 Mitto Andei 4,520 4,520 503.4% 22,75351 Sotik 8,366 8,366 503.4% 42,11352 Port Victoria 6,561 6,561 503.4% 33,02753 Othaya 5,137 5,137 503.4% 25,85954 Kajiado 14,860 14,860 503.4% 74,80355 Wote 9,875 9,875 503.4% 49,709
- Sub-total 2,018,327 2,033,280 - 8,563,82611,159,338 11,060,982 39,121,464
Source: JICA Study Team based on Census 2009 dataGround Total
C - T - 31

LVNCA LVSCA RVCAPopulation
in 2030Population
in 2030Population
in 20301) Urban Population 1) Urban Population 1) Urban Population
1 Eldoret 1,105,499 1 Kisumu 1,457,208 1 Nakuru 1,155,7892 Vihiga 597,496 2 Rongo 519,406 2 Naivasha 851,4333 Kitale 534,528 3 Kericho 512,485 3 Ol Kalou 332,3094 Mumias 503,318 4 Bomet 421,478 4 Molo 204,6305 Kimilili 477,847 5 Kisii 411,773 5 Narok 194,5736 Kakamega 461,945 6 Migori 267,297 6 Gilgil 177,6597 Kapsabet 436,952 7 Suneka 255,809 7 Njoro 118,5528 Bungoma 281,225 8 Ahero 255,366 8 Eldama Ravine 89,9659 Busia 261,664 9 Kipkelion 235,382 9 Lodwar 59,544
10 Luanda 248,400 10 Homa Bay 218,278 10 Mai Mahiu 58,68911 Item/Tambach 212,992 11 Londiani 217,220 11 Kakuma 45,44412 Webuye 208,119 12 Nyamira 209,750 12 Kabarnet 31,23613 Kapenguria 171,382 13 Keroka 209,679 13 Lokichogio 21,80714 Bondo 168,472 14 Oyugis 178,454 Others 1,144,26615 Siaya 61,452 15 Muhoroni 173,451 Total 4,485,89616 Yala 32,277 16 Awasi 172,268 2) Rural Population 2,961,14417 Malaba 108,112 17 Kehancha 151,564 Ground Total 7,447,04018 Malakisi 85,993 18 Awendo 80,19319 Chwele 72,115 19 Kendu Bay 74,23420 Butere 64,332 20 Mbita Point 60,35121 Kiminini 60,330 21 Tabaka 52,46722 Usenge 58,861 22 Litein 45,82323 Moi'S Bridge 58,266 23 Sotik 42,11324 Nandi Hills 50,942 24 Nyansiongo 28,37625 Lumakanda 44,681 25 Ogembo 11,67426 Matunda 37,643 Others 1,731,84327 Ugunja 36,455 Total 7,993,94228 Port Victoria 33,027 2) Rural Population 4,726,61129 Ukwala 26,110 Ground Total 12,720,55330 Nambale 24,87231 Burnt Forest 24,79232 Malava 20,488
Others 1,134,510Total 7,705,095
2) Rural Population 4,657,832Ground Total 12,362,927
ACA TCA ENNCAPopulation
in 2030Population
in 2030Population
in 20301) Urban Population 1) Urban Population 1) Urban Population
1 Nairobi 6,085,297 1 Lamu 1,250,000 1 Isiolo 231,5012 Mombasa 2,644,591 2 Nyeri 600,803 2 Nanyuki 192,2823 Ruiru 896,358 3 Kitui 551,547 3 Nyahururu 183,4834 Kikuyu 875,242 4 Thlka 513,806 4 Mandera 108,0715 Kangundo-Tala 820,175 5 Embu 305,362 5 Wajir 102,0426 Machakos 755,281 6 Meru 269,949 6 Rumuruti 50,6617 Mavoko 514,909 7 Matuu 255,467 7 Moyale 46,0758 Malindi 443,811 8 Makuyu 221,524 8 Rhamu 32,4949 Karuri 404,224 9 Chuka 218,821 9 Elwak 30,031
10 Ngong 402,242 10 Muranga 144,849 10 Takaba 27,30511 Kiambu 315,807 11 Garissa 143,348 11 Maralal 19,54612 Limuru 298,455 12 Chogoria 143,036 12 Marsabit 16,31713 Ukunda 234,651 13 Maragua 132,762 Others 720,95714 Kitengela 218,282 14 Wanguru 120,726 Total 1,760,76515 Wundanyi 185,136 15 Runyenjes 98,401 2) Rural Population 2,635,55416 Kilifi 183,228 16 Kerugoya/Kutus 97,767 Ground Total 4,396,31917 Mtwapa 182,474 17 Maua 86,71318 Juja 151,781 18 Mwingi 80,39019 Ongata Rongai 150,775 19 Sagana 53,11220 Taveta 99,997 20 Karatina 42,78321 Mariakani 90,271 21 Othaya 25,85922 Voi 86,340 22 Madogo 19,30823 Kajiado 74,803 23 Msalani 18,37124 Kwale 74,303 24 Hola 17,55325 Kiserian 71,913 Others 932,04126 Loitoktok 56,530 Total 6,344,29927 Githunguri 50,374 2) Rural Population 4,025,72428 Wote 49,709 Ground Total 10,370,02429 Watamu 37,63930 Mitto Andei 22,75331 Masambweni 17,731
Others 1,235,080Total 17,730,165
2) Rural Population 2,813,447Ground Total 20,543,611 Source: JICA Study Team, based on Census 2009 and Kenya Vision 2030
Items Items Items
Table 3.2.2 Population Projection by Catchment Area
Items Items Items
C - T - 32

Province District LVNCA LVSCA RVCA ACA TCA ENNCA TotalBungoma Bungoma 2,383 0 3 0 0 0 2,385Busia Busia 791 0 0 0 0 0 791
Kakamega 2,183 0 0 0 0 0 2,183Vihiga 1,101 92 0 0 0 0 1,193Homa Bay 0 1,382 0 0 0 0 1,382Migori 0 2,053 0 0 0 0 2,053Kisii 0 2,420 0 0 0 0 2,420Nyamira 0 452 0 0 0 0 452
Kisumu Kisumu 34 2,443 0 0 0 0 2,476Siaya Siaya 848 187 0 0 0 0 1,035Baringo Baringo 0 1 622 0 0 0 623
Kericho 0 1,444 1 0 0 0 1,446Bomet 0 1,295 0 0 0 0 1,295
Elgeyo Marakwet Elgeyo Marakwet 310 0 220 0 0 0 530Kajiado Kajiado 0 0 148 1,270 0 0 1,417Laikipia Laikipia 0 0 38 0 3 707 747Nakuru Nakuru 0 278 3,727 0 0 1 4,006Nandi Nandi 857 200 0 0 0 0 1,057Narok Narok 0 459 494 0 0 0 953Samburu Samburu 0 0 62 0 0 223 285Trans Nzoia Trans Nzoia 1,813 0 68 0 0 0 1,882Turkana Turkana 0 0 831 0 0 0 831Uasin Gishu Uasin Gishu 1,858 15 13 0 0 0 1,885West Pokot West Pokot 183 0 423 0 0 0 606Kiambu Kiambu 0 0 78 3,716 681 0 4,475Kirinyaga Kirinyaga 0 0 0 0 785 1 786Muranga Muranga 0 0 3 0 1,344 0 1,347Nyandarua Nyandarua 0 0 695 3 48 208 954Nyeri Nyeri 0 0 0 0 1,163 122 1,285
Nairobi Nairobi Nairobi 0 0 0 6,085 0 0 6,085Embu Embu 0 0 0 0 779 0 779Isiolo Isiolo 0 0 0 0 19 360 379Kitui Kitui 0 0 0 22 1,408 0 1,431
Machakos 0 0 0 2,428 430 0 2,858Makueni 0 0 0 1,161 0 0 1,161
Marsabit Marsabit 0 0 21 0 0 297 317Meru 0 0 0 0 1,255 572 1,827Tharaka-Nithi 0 0 0 0 437 0 437
Kilifi Kilifi 0 0 0 1,730 70 0 1,799Kwale Kwale 0 0 0 920 0 0 920Lamu Lamu 0 0 0 0 1,318 0 1,318Mombasa Mombasa 0 0 0 2,651 0 0 2,651Taita Taveta Taita Taveta 0 0 0 555 0 0 555Tana River Tana River 0 0 0 2 235 0 237Garissa Garissa 0 0 0 0 394 241 635Mandera Mandera 0 0 0 0 0 1,021 1,021Wajir Wajir 0 0 0 0 0 642 642
12,361 12,719 7,446 20,543 10,369 4,395 67,833
Source: JICA Study Team, based on Census 2009 and Kenya Vision 2030
Total
Nyanza
South Nyanza
Kisii
RiftValley
Kericho
Central
Eastern Machakos
Meru
Coast
NorthEastern
Table 3.2.3 Population Distribution by County and Catchment Area
Old Administration in 1992County
Population Forecast in 2030 (thousand)
WesternKakamega
C - T - 33

Table 3.5.1 Districts for Each Industrial Activity Group
Industrial Activity District
High Activity Group
Nairobi West, Nairobi East, Nairobi North, Westlands, Mombasa, Kilindini, Kisumu East, Kisumu West, Nyando, Nakuru, Nakuru North
Medium Activity Group
Nyeri North, Nyeri South, Kiambu East (Kiambaa), Kiambu West, Thika East, Thika West, Malindi, Lamu, Machakos, Eldoret West, Eldoret East, Kericho, Kakamega Central, Kakamega South, Kakamega North, Kakamega East
Low Activity Group
Nyandarua North, Nyandarua South, Kirinyaga, Muranga North, Muranga South, Kikuyu, Lari, Githunguri, Ruiru, Gatanga, Gatundu, Kwale, Kinango, Msambweni, Kilifi, Kaloleni, Taita, Taveta, Isiolo, Meru Central, Imenti North, Imenti South, Meru South, Maara, Igembe, Tigania, Tharaka, Embu, Mbeere, Kitui, Mutomo, Mwingi, Kyuso, Mwala, Yatta, Kangundo, Makueni, Mbooni, Kibwezi, Nzaui, Siaya, Bondo, Rarieda, Homabay, Suba, Rachuonyo, Migori, Rongo, Kuria East, Kuria West, Kisii Central , Kisii South, Masaba, Gucha, Gucha South, Nyamira, Manga, Borabu, West Pokot, Pokot North, Pokot Central, Trans Nzoia West, Trans Nzoia East, Kwanza, Koibatek, Wareng, Marakwet, Keiyo, Nandi North, Nandi Central, Nandi East, Nandi South, Tinderet, Laikipia North, Laikipia East, Laikipia West, Naivasha, Molo, Narok North, Narok South, Trans Mara, Kajiado Central, Loitokitok, Kipkelion, Buret, Sotik, Bomet, Kajiado North, Lugari, Vihiga, Emuhaya, Hamisi, Mumias, Butere, Bungoma South, Bungoma North, Bungoma East, Bungoma West, Mt. Elgon, Busia, Teso North, Samia, Bunyala, Teso South
Non Activity Group
Tana River, Tana Delta, Marsabit, Chalbi, Laisamis, Moyale, Garbatulla, Garissa, Lagdera, Fafi, Ijara, Wajir South, Wajirnorth, Wajir East, Wajir West, Mandera Central, Mandera East, Mandera West, Turkana Central, Turkana North, Turkana South, Samburu Central, Samburu East, Samburu North, Baringo Central, Baringo North, East Pokot
Source: JICA Study Team, based on data from MOI.
C - T - 34

No. LVNCA LVSCA RVCA ACA TCA ENNCA
1 Eldoret Kisumu Nakuru Nairobi Lamu Isiolo 2 Vihiga Rongo Naivasha Mombasa Nyeri Nanyuki 3 Kitale Kericho Ol Kalou Ruiru Kitui Nyahururu 4 Mumias Bomet Molo Kikuyu Thika Mandera5 Kimilili Kisii Narok Kangundo-Tala Embu Wajir6 Kakamega Migori Gilgil Machakos Meru Rumuruti7 Kapsabet Suneka Njoro Mavoko Matuu Moyale8 Bungoma Ahero Eldama Ravine Malindi Makuyu Rhamu9 Busia Kipkelion Lodwar Karuri Chuka Elwak
10 Luanda Homa Bay Mai Mahiu Ngong Muranga Takaba11 Item/Tambach Londiani Kakuma Kiambu Garissa Maralal12 Webuye Nyamira Kabarnet Limuru Chogoria Marsabit13 Kapenguria Keroka Lokichogio Ukunda Maragua14 Bondo Oyugis Kitengela Wanguru15 Siaya Muhoroni Wundanyi Runyenjes 16 Yala Awasi Kilifi Kerugoya/Kutus 17 Malaba Kehancha Mtwapa Maua 18 Malakisi Awendo Juja Mwingi 19 Chwele Kendu Bay Ongata Rongai Sagana20 Butere Mbita Point Taveta Karatina 21 Kiminini Tabaka Mariakani Othaya22 Usenge Litein Voi Madogo23 Moi's Bridge Sotik Kajiado Msalani24 Nandi Hills Nyansiongo Kwale Hola25 Lumakanda Ogembo Kiserian26 Matunda Loitokitok27 Ugunja Githunguri28 Port Victoria Wote29 Ukwala Watamu30 Nambale Mitto Andei31 Burnt Forest Masambweni32 Malava
Total 32 UCs 25 UCs 13 UCs 31 UCs 24 UCs 12 UCsSource: JICA Study Team based on Census 2009 data
Table 4.2.1 Target 137 Urban Centres for Urban Water Supply Development
C - T - 35

Table 4.3.1 Proposed Water Supply Development Plan for UWSS (LVNCA)
Urban Centre Service
Population in 2030
Water Demand in2030
(m3/day)
Current Capacityin 2010 (m3/day)
Under Construction
(m3/day)
Proposed Projects Rehabilitation
Works (m3/day)
Expansion Works
(m3/day)
New Construction
(m3/day) 1 Eldoret 1,105,499 131,554 36,400 11,800 48,200 83,354 0 2 Vihiga 597,496 71,102 60 0 60 71,042 0 3 Kitale 534,528 63,609 10,000 0 10,000 53,609 0 4 Mumias 503,318 59,895 1,680 15,000 16,680 43,215 0 5 Kimilili 477,847 56,864 3,200 1,800 5,000 51,864 0 6 Kakamega 461,945 54,971 16,000 0 16,000 38,971 0 7 Kapsabet 436,952 51,997 3,800 0 3,800 48,197 0 8 Bungoma 281,225 33,466 7,000 0 7,000 26,466 0 9 Busia 261,664 31,138 7,400 0 7,400 23,738 0
10 Luanda 248,400 29,560 0 0 0 0 29,560 11 Item/Tambach 212,992 25,346 1,100 0 1,100 24,246 0 12 Webuye 208,119 24,766 7,000 0 7,000 17,766 0 13 Kapenguria 171,382 20,394 1,680 0 1,680 18,714 0 14 Bondo 168,472 20,048 1,125 0 1,125 18,923 0 15 Siaya 61,452 7,313 2,100 0 2,100 5,213 0 16 Yala 32,277 3,841 2,400 0 2,400 1,441 0 17 Ugunja 36,455 4,338 385 0 385 3,953 0 18 Ukwala 26,110 3,107 360 0 360 2,747 0 19 Malaba 108,112 12,865 2,200 0 2,200 10,665 0 20 Malakisi 85,993 10,233 0 0 0 0 10,233 21 Chwele 72,115 8,582 0 1,200 1,200 7,382 0 22 Butere 64,332 7,656 0 0 0 0 7,656 23 Kiminini 60,330 7,179 0 0 0 0 7,179 24 Usenge 58,861 7,004 0 0 0 0 7,004 25 Moi's Bridge 58,266 6,934 0 0 0 0 6,934 26 Nandi Hills 50,942 6,062 0 0 0 0 6,062 27 Lumakanda 44,681 5,317 0 1,200 1,200 4,117 0 28 Matunda 37,643 4,480 0 0 0 0 4,480 29 Port Victoria 33,027 3,930 0 0 0 0 3,930 30 Nambale 24,872 2,960 0 0 0 0 2,960 31 Burnt Forest 24,792 2,950 0 0 0 0 2,950 32 Malava 20,488 2,438 0 0 0 0 2,438 Total 6,570,585 781,900 103,890 31,000 134,890 555,624 91,386
647,010
Note: The service population of piped water supply (UWSS+LSRWSS) in 2010 was estimated at 0.77 million. The service population for each urban centre in 2010 is not clear. All urban population of urban centre in 2030 was counted as service population.
Source: JICA Study Team, based on data from WSBs and Census 2009
C - T - 36

Table 4.3.2 Proposed Water Supply Development Plan for LSRWSS (LVNCA)
Item Service
Population in 2030
Water Demand in 2030 (m3/day)
Current Capacity in 2010 (m3/day)
Proposed Projects Rehabilitation
Works (m3/day)
New Construction
(m3/day) Urban Pop. 1.13 135,007
15,000 15,000 169,000 Rural Pop. 0.65 49,317Total 1.78 184,324
Note: The service population of piped water supply (UWSS+LSRWSS) in 2010 was estimated at 0.77 million.
Source: JICA Study Team, based on data from WSBs and Census 2009
Table 4.3.3 Proposed Water Supply Development Plan for SSRWSS (LVNCA)
Counties Service Population
in 2010 Service Population
in 2030 Difference
(2010-2030) Required Water Supply Amount
in 2030 (m3/day) 11 3,888,000 4,007,252 119,252 220,399
Source: JICA Study Team, based on data from Census 2009
C - T - 37

Table 4.4.1 Proposed Water Supply Development for UWSS (LVSCA)
Urban Centre Service
Population, in 2030
Water Demand in 2030 (m3/day)
Current Capacity in 2010 (m3/day)
Under Construction
(m3/day)
Proposed Projects Rehabilitation
Works (m3/day)
Expansion Works
(m3/day)
New Construction
(m3/day) Kisumu and Surrounding Area
1 Kisumu 1,457,208 212,752 22,400 24,000 46,400 166,352 0 2 Ahero 255,366 30,389 0 0 0 0 30,389 3 Awasi 172,268 20,500 100 0 100 20,400 0 4 Muhoroni 173,451 20,641 720 0 720 19,921 0 5 Kipkelion 235,382 28,010 280 0 280 27,730 0 6 Londiani 217,220 25,849 0 0 0 0 25,849 Sub-total 2,510,895 338,141 23,500 24,000 47,500 234,403 56,238
Kisii and Surrounding Area 1 Rongo 519,406 61,809 320 2,000 2,320 59,489 0 2 Kisii 411,773 49,001 7,500 12,000 19,500 29,501 0 3 Suneka 255,809 30,441 0 0 0 0 30,441 4 Keroka 209,679 24,952 600 0 600 24,352 0 5 Awendo 80,193 9,543 0 2,000 2,000 7,543 0 6 Tabaka 52,467 6,244 150 0 150 6,094 0 7 Ogembo 11,674 1,389 600 0 600 789 0 Sub-total 1,541,001 183,379 9,170 16,000 25,170 127,768 30,441
Other Area 1 Kericho 512,485 60,986 12,960 0 12,960 48,026 0 2 Bomet 421,478 50,156 450 0 450 49,706 0 3 Migori 267,297 31,808 1,056 15,000 16,056 15,752 0 4 Homa Bay 218,278 25,975 3,500 2,000 5,500 20,475 0 5 Nyamira 209,750 24,960 3,200 0 3,200 21,760 0 6 Oyugis 178,454 21,236 1,920 0 1,920 19,316 0 7 Kehancha 151,564 18,036 320 0 320 17,716 0 8 Kendu Bay 74,234 8,834 720 0 720 8,114 0 9 Mbita Point 60,351 7,182 0 0 0 0 7,182
10 Litein 45,823 5,453 5,453 0 5,453 0 0 11 Sotik 42,113 5,011 500 0 500 4,511 0 12 Nyansiongo 28,376 3,377 600 0 600 2,777 0
Sub-total 2,210,203 263,014 30,679 17,000 47,679 208,153 7,182
Total 6,262,099 784,534 63,349 57,000 120,349 570,324 93,861 664,185
Note: The service population of piped water supply (UWSS+LSRWSS) in 2010 was estimated at 0.88 million. The service population for each urban centre in 2010 is not clear. All urban population of urban centre in 2030 was counted as service population.
Source: JICA Study Team, based on data from WSBs and Census 2009
C - T - 38

Table 4.4.2 Proposed Water Supply Development Plan for LSRWSS (LVSCA)
Item Service
Population in 2030
Water Demand in 2030 (m3/day)
Current Capacity in 2010 (m3/day)
Proposed Projects Rehabilitation
Works (m3/day)
New Construction
(m3/day) Urban Pop. 1.73 206,000
26,000 26,000 251,000 Rural Pop. 0.94 71,000Total 2.67 277,000
Note: The service population of piped water supply (UWSS+LSRWSS) in 2010 was estimated at 0.88 million.
Source: JICA Study Team, based on data from WSBs and Census 2009
Table 4.4.3 Proposed Water Supply Development Plan for SSRWSS (LVSCA)
Counties Service Population
in 2010 Service Population
in 2030 Difference
(2010-2030) Required Water Supply Amount
in 2030 (m3/day) 14 2,369,000 3,788,577 1,419,577 208,372
Source: JICA Study Team, based on data from Census 2009
C - T - 39

Table 4.5.1 Proposed Water Supply Development for UWSS (RVCA)
Urban Centre Service
Population in 2030
Water Demand in 2030 (m3/day)
Current Capacity in 2010 (m3/day)
Under Construction
(m3/day)
Proposed Projects Rehabilitation
Works (m3/day)
Expansion Works
(m3/day)
New Construction
(m3/day) Greater Naluru 1 Nakuru 1,155,789 137,539
81,791 35,000 116,791 192,374 0
2 Naivasha 851,433 101,320 3 Molo 204,630 24,351 4 Gilgil 177,659 21,141 5 Njoro 118,552 14,108
6 Eldama Ravine 89,965 10,706
7 Ol Kalou 332,309 39,545 2,087 2,600 4,687 34,858 0 Sub-total 2,930,336 348,710 83,878 37,600 121,478 227,232 0 Arid Area 1 Lodwar 59,544 7,086 3,068 0 3,068 4,018 0 2 Kakuma 45,444 5,408 0 0 0 0 5,408 3 Kabarnet 31,236 3,717 2,496 0 2,496 1,221 0 4 Lokichogio 21,807 2,595 0 0 0 0 2,595
Sub-total 158,032 18,806 5,564 0 5,564 5,239 8,003 Others 1 Narok 194,573 23,154 1,880 0 1,880 21,274 0 2 Mai Mahiu 58,689 6,984 0 0 0 0 6,984
Sub-total 253,262 30,138 1,880 0 1,880 21,274 6,984 Total 3,341,630 397,654 91,322 37,600 128,922 253,745 14,987
268,732
Note: The service population of piped water supply (UWSS+LSRWSS) in 2010 was estimated at 1.36 million. The service population for each urban centre in 2010 is not clear. All urban population of urban centre in 2030 was counted as service population.
Source: JICA Study Team, based on data from WSBs and Census 2009
Table 4.5.2 Proposed Water Supply Development Plan for LSRWSS (RVCA)
Item Service
Population in 2030
Water Demand in 2030 (m3/day)
Current Capacity in 2010 (m3/day)
Proposed Projects Rehabilitation
Works (m3/day)
New Construction
(m3/day) Urban Pop. 1.14 136,000
7,000 7,000 171,000 Rural Pop. 0.56 42,000Total 1.70 178,000
Note: The service population of piped water supply (UWSS+LSRWSS) in 2010 was estimated at 1.36 million.
Source: JICA Study Team, based on data from WSBs and Census 2009
Table 4.5.3 Proposed Water Supply Development Plan for SSRWSS (RVCA)
Counties Service Population
in 2010 Service Population
in 2030 Difference
(2010-2030) Required Water Supply Amount
in 2030 (m3/day) 18 1,320,000 2,403,537 1,083,537 119,700
Source: JICA Study Team, based on data from Census 2009
C - T - 40

Table 4.6.1 Proposed Water Supply Development for UWSS (ACA)
Urban Centre Service
Population in 2030
Water Demand in 2030 (m3/day)
Current Capacity in 2010(m3/day)
Under Construction
(m3/day)
Proposed Projects Rehabilitation
Works (m3/day)
Expansion Works
(m3/day)
New Construction
(m3/day) Greater Nairobi
1 Nairobi 6,085,297 888,453
570,263 33,420 603,683 961,207 0
2 Ruiru 896,358 106,6673 Kikuyu 875,242 104,1544 Kangundo-Tala 820,175 97,6015 Mavoko 514,909 61,2746 Thika 513,806 61,1437 Karuri 404,224 48,1038 Ngong 402,242 47,8679 Kiambu 315,807 37,581
10 Limuru 298,455 35,51611 Kitengela 218,282 25,97612 Juja 151,781 18,06213 Ongata Rongai 150,775 17,94214 Kiserian 71,913 8,55815 Githunguri 50,374 5,99416 Machakos 755,281 89,878 3,373 0 3,373 86,505 0
sub-total 12,524,922 1,654,769 573,636 33,420 607,056 1,047,713 0 Mombasa Area
1 Mombasa 2,644,591 386,110
86,620 86,620 449,919 0
2 Malindi 443,811 52,814 3 Ukunda 234,651 27,924 4 Kilifi 183,228 21,804 5 Mtwapa 182,474 21,714 0 6 Mariakani 90,271 10,742 7 Kwale 74,303 8,842 8 Watamu 37,639 4,479 9 Masambweni 17,731 2,110
sub-total 3,908,701 536,539 86,620 0 86,620 449,919 0 Other Area
1 Wundanyi 185,136 22,0311,400 0 1,400 30,906 0
2 Voi 86,340 10,2743 Taveta 99,997 11,900 0 0 0 0 11,900 4 Kajiado 74,803 8,902 0 1,000 1,000 7,902 0 5 Loitoktok 56,530 6,727 0 0 0 0 6,727 6 Wote 49,709 5,915 225 300 525 5,690 0 7 Mitto Andei 22,753 2,708 2,708 0 2,708 0 0
sub-total 575,268 68,457 4,333 1,300 5,633 44,498 18,627 Grand-total 17,008,891 2,259,765 664,589 34,720 699,309 1,542,130 18,627
1,560,756
Note: Water demand in Thika, which is in Tana Catchment with 61,143 m3/day, is satisfied with water supply system of Athi Catchment. The service population of piped water supply (UWSS+LSRWSS) in 2010 was estimated at 5.29 million. The service population for each urban centre in 2010 is not clear. All urban population of urban centre in 2030 was counted as service population.
Source: JICA Study Team, based on data from WSBs and Census 2009
C - T - 41

Table 4.6.2 Proposed Water Supply Development Plan for LSRWSS (ACA)
Item Service
Population in 2030
Water Demand in 2030 (m3/day)
Current Capacity in 2010 (m3/day)
Proposed Projects Rehabilitation
Works (m3/day)
New Construction
(m3/day) Urban Pop. 1.23 137,000
37,000 37,000 155,000 Rural Pop. 0.81 62,000Total 2.04 209,000
Note: The service population of piped water supply (UWSS+LSRWSS) in 2010 was estimated at 5.29 million.
Source: JICA Study Team, based on data from WSBs and Census 2009
Table 4.6.3 Proposed Water Supply Development Plan for SSRWSS (ACA)
Counties Service Population in 2010
Service Populationin 2030
Difference (2010-2030)
Required Water Supply Amountin 2030 (m3/day)
10 1,126,000 2,001,856 875,856 110,102
Source: JICA Study Team, based on data from WSBs and Census 2009
C - T - 42

Table 4.7.1 Proposed Water Supply Development for UWSS (TCA)
Urban Centre Service
Population in 2030
Water Demand in 2030 (m3/day)
Current Capacity in 2010(m3/day)
Under Construction
(m3/day)
Proposed Projects Rehabilitation
Works (m3/day)
Expansion Works
(m3/day)
New Construction
(m3/day) Upstream of Tana Catchment
1 Nyeri 600,803 71,496 27,000 0 27,000 44,496 0 2 Embu 305,362 36,338 12,000 0 12,000 24,338 0 3 Meru 269,949 32,124 4,500 0 4,500 27,624 0 4 Chuka 218,821 26,040 2,700 0 2,700 23,340 0 5 Chogoria 143,036 17,021 600 0 600 16,421 0 6 Maua 86,713 10,319 0 0 0 0 10,319 7 Makuyu 221,524 26,361 0 0 0 0 26,361 8 Muranga 144,849 17,237 4,848 10,000 14,848 2,389 0 9 Maragua 132,762 15,799 0 0 0 0 15,799
10 Wanguru 120,726 14,366 0 0 0 0 14,366 11 Runyenjes 98,401 11,710 0 0 0 0 11,710 12 Kerugoya/Kutus 97,767 11,634 11,634 0 11,634 0 0 13 Sagana 53,112 6,320 2,358 0 2,358 3,962 0 14 Karatina 42,783 5,091 0 0 0 0 5,091 15 Othaya 25,859 3,077 3,077 0 3,077 0 0 Sub-total 2,562,468 304,934 68,717 10,000 78,717 142,570 83,646 Arid Area
1 Garissa 143,348 17,058 12,640 0 12,640 4,418 0 2 Madogo 19,308 2,298 0 0 0 0 2,298 3 Msalani 18,371 2,186 0 0 0 0 2,186 4 Hola 17,553 2,089 1,400 0 1,400 689 0
Sub-total 198,580 23,631 14,040 0 14,040 5,107 4,484 Other Area
1 Lamu 1,250,000 108,750 3,400 0 3,400 105,350 0 2 Kitui 551,547 65,634 7,750 0 7,750 57,884 0 3 Matuu 255,467 30,401 702 0 702 29,699 0 4 Mwingi 80,390 9,566 1,417 0 1,417 8,149 0
Sub-total 2,137,404 214,351 13,269 0 13,269 201,082 0 Total 4,898,453 542,916 96,026 10,000 106,026 348,759 88,130
436,889
Note: It is supplied from ACA in Thika, which is in Tana catchment with 61,143 m3/day of water demand.
The service population of piped water supply (UWSS+LSRWSS) in 2010 was estimated at 1.95 million. The service population for each urban centre in 2010 is not clear. All urban population of urban centre in 2030 was counted as service population.
Source: JICA Study Team, based on data from WSBs and Census 2009
C - T - 43

Table 4.7.2 Proposed Water Supply Development Plan for LSRWSS (TCA)
Item Service
Population in 2030
Water Demand in 2030 (m3/day)
Current Capacityin 2010 3/day)
Proposed Projects Rehabilitation
Works (m3/day)
New Construction
(m3/day) Urban Pop. 0.93 111,000
149,000 149,000 24,000 Rural Pop. 0.81 62,000Total 1.74 173,000
Note: The service population of piped water supply (UWSS+LSRWSS) in 2010 was estimated at 1.95 million.
Source: JICA Study Team, based on data from WSBs and Census 2009
Table 4.7.3 Proposed Water Supply Development Plan for SSRWSS (TCA)
Counties Service Population in 2010
Service Populationin 2030
Difference (2010-2030)
Required Water Supply Amountin 2030 (m3/day)
16 1,287,000 2,717,272 1,439,382 144,913
Source: JICA Study Team, based on data from Census 2009
C - T - 44

Table 4.8.1 Proposed Water Supply Development for UWSS (ENNCA)
Urban Centre Service
Population in 2030
Water Demand in 2030 (m3/day)
Current Capacityin 2010 (m3/day)
Under Construction
(m3/day)
Proposed Projects Rehabilitation
Works (m3/day)
Expansion Works
(m3/day)
New Construction
(m3/day) 1 Isiolo 231,501 27,549 3,220 10,528 13,748 13,801 0 2 Nanyuki 192,282 22,882 10,610 0 10,610 12,272 0 3 Nyahururu 183,483 21,835 4,552 0 4,552 17,283 0 4 Rumuruti 50,661 6,029 0 0 0 0 6,029 5 Mandera 108,071 12,860 1,672 0 1,672 11,188 0 6 Wajir 102,042 12,143 0 0 0 0 12,143 7 Moyale 46,075 5,483 67 1,020 1,087 4,396 0 8 Rhamu 32,494 3,867 0 0 0 0 3,867 9 Elwak 30,031 3,574 0 0 0 0 3,574
10 Takaba 27,305 3,249 0 0 0 0 3,249 11 Maralal 19,546 2,326 798 0 798 1,528 0 12 Marsabit 16,317 1,942 0 0 0 0 1,942 Total 1,039,808 123,737 20,919 11,548 32,467 60,467 30,803
91,270
Note: The service population of piped water supply (UWSS+LSRWSS) in 2010 was estimated at 0.99 million. The service population for each urban centre in 2010 is not clear. All urban population of urban centre in 2030 was counted as service population.
Source: JICA Study Team, based on data from WSBs and Census 2009
Table 4.8.2 Proposed Water Supply Development Plan for LSRWSS (ENNCA)
Items Service
Population in 2030
Water Demand in 2030 (m3/day)
Current Capacity in 2010 (m3/day)
Proposed Projects Rehabilitation
Works (m3/day)
New Construction
(m3/day) Urban Pop. 0.72 86,000
7,000 7,000 112,000 Rural Pop. 0.45 33,000Total 1.16 119,000
Note: The service population of piped water supply (UWSS+LSRWSS) in 2010 was estimated at 0.99 million.
Source: JICA Study Team, based on data from WSBs and Census 2009
Table 4.8.3 Proposed Water Supply Development Plan for SSRWSS (ENNCA)
Counties Service Population in 2010
Service Populationin 2030
Difference (2010-2030)
Required Water Supply Amountin 2030 (m3/day)
14 1,386,000 2,199,200 813,200 100,943
Source: JICA Study Team, based on data from Census 2009
C - T - 45

Total RehabilitationWorks
Major Dam/Major
Transmission
Intake/Mainor
TransmissionDistribution
1 Eldoret 1,105,499 131,554 48,200 83,354 18,760 2,773 2,664 13,322 7782 Vihiga 597,496 71,102 60 71,042 13,629 3 2,271 11,354 6633 Kitale 534,528 63,609 10,000 53,609 10,857 575 1,714 8,568 5004 Mumias 503,318 59,895 16,680 43,215 9,248 960 1,381 6,907 4035 Kimilili 477,847 56,864 5,000 51,864 10,235 288 1,658 8,289 4846 Kakamega 461,945 54,971 16,000 38,971 8,395 921 1,246 6,229 3647 Kapsabet 436,952 51,997 3,800 48,197 9,462 219 1,541 7,703 4508 Bungoma 281,225 33,466 7,000 26,466 5,479 403 846 4,230 2479 Busia 261,664 31,138 7,400 23,738 4,978 426 759 3,794 222
10 Luanda 248,400 29,560 0 29,560 5,669 0 945 4,724 27611 Item/Tambach 212,992 25,346 1,100 24,246 4,713 63 775 3,875 22612 Webuye 208,119 24,766 7,000 17,766 3,810 403 568 2,839 16613 Kapenguria 171,382 20,394 1,680 18,714 3,686 97 598 2,991 17514 Bondo 168,472 20,048 1,12515 Siaya 61,452 7,313 2,10016 Yala 32,277 3,841 2,40017 Ugunja 36,455 4,338 38518 Ukwala 26,110 3,107 36019 Malaba 108,112 12,865 2,200 10,665 2,172 127 341 1,705 10020 Malakisi 85,993 10,233 0 10,233 1,963 0 327 1,636 9621 Chwele 72,115 8,582 1,200 7,382 1,485 69 236 1,180 6922 Butere 64,332 7,656 0 7,656 1,468 0 245 1,224 7123 Kiminini 60,330 7,179 0 7,179 1,377 0 229 1,147 6724 Usenge 58,861 7,004 0 7,004 1,343 0 224 1,119 6525 Moi'S Bridge 58,266 6,934 0 6,934 1,330 0 222 1,108 6526 Nandi Hills 50,942 6,062 0 6,062 1,163 0 194 969 5727 Lumakanda 44,681 5,317 1,200 4,117 859 69 132 658 3828 Matunda 37,643 4,480 0 4,480 859 0 143 716 4229 Port Victoria 33,027 3,930 0 3,930 754 0 126 628 3730 Nambale 24,872 2,960 0 2,960 568 0 95 473 2831 Burnt Forest 24,792 2,950 0 2,950 566 0 94 472 2832 Malava 20,488 2,438 0 2,438 468 0 78 390 23
8,141 0 0 260 1,301 76
772 3,858 225
O&M Cost(KSh
million/year)
24,136 6,376 186
Table 5.2.1 Project Cost and O&M Cost for Urban Water Supply Development Projects (LVNCA)
Urban CentreService
Populationin 2030
WaterDemandin 2030
(m3/day)
RehabilitationWorks
(m3/day)
DevelopmentCapacity(m3/day)
Project Cost (KSh million)
Major Water Sourece WorksSiyoi 2,907 2,907 15Moi's Bridge 563 563 3Nzoia (34B) 0 0 0Kibolo 2,336 2,336 12Teremi 3,614 3,614 18Nzoia (42A) 0 0 0Transmission (to Eldret) 3,069 3,069 15
6,570,585 781,900 134,890 647,010 144,158 7,578 12,488 20,682 103,410 6,101Source: JICA Study Team #REF! #REF! #REF!
WaterD d
Total RehabilitationWorks
Major Dam/Major
Transmission
Intake/Mainor
TransmissionDistribution
1 Urban Pop. 1,134,510 135,007 9,216 125,791 24,656 528 4,021 20,106 1,1742 Rural Pop. 648,906 49,317 5,380 43,937 8,427 0 1,404 7,022 410
1,783,416 184,324 14,596 169,728 33,082 528 5,425 27,129 1,584Source: JICA Study Team
RehabilitationWorks
(m3/day)
ServicePopulation
in 2030
DevelopmentCapacity(m3/day)
Project Cost (KSh million)O&M Cost
(KShmillion/year)
Total
Total
Table 5.2.2 Project Cost and O&M Cost for LSRWSS Development Projects (LVNCA)Table 5.2.2 Project Cost and O&M Cost for LSRWSS Development Projects (LVNCA)
Item
C - T - 46

DevelopmentCapacity
Total RehabilitationWorks
Major Dam/Major
Transmission
Intake/Mainor
TransmissionDistribution
1 Klsumu 1,457,208 212,752 46,400 166,352 34,574 2,670 5,317 26,587 1,5532 Ahero 255,366 30,389 03 Awasi 172,268 20,500 1004 Muhoroni 173,451 20,641 720 19,921 3,862 41 637 3,184 1865 Kipkelion 235,382 28,010 2806 Londiani 217,220 25,849 0
Major Water Sourece WorksNandi Forest 7,126 7,126 36Nyando (Koru) 8,175 8,175 41Kibos 9,044 9,044 45
Sub-total 2,510,895 338,141 47,500 290,641 82,820 2,733 24,345 9,290 46,452 2,835
1 Rongo 519,406 61,809 2,320 59,489 11,543 133 1,902 9,508 5552 Kisii 411,773 49,001 19,500 29,501 6,780 1,122 943 4,715 2753 Suneka 255,809 30,441 0 30,441 5,838 0 973 4,865 2844 Keroka 209,679 24,952 600 24,352 4,705 35 778 3,892 2275 Awendo 80,193 9,543 2,000 7,543 1,562 115 241 1,206 706 Tabaka 52,467 6,244 150 6,094 1,177 9 195 974 577 Ogembo 11,674 1,389 600 789 186 35 25 126 7
Major Water Sourece WorksBunyunyu Dam 2,080 2,080 10
Sub-total 1,541,001 183,379 25,170 158,209 33,871 1,448 2,080 5,057 25,286 1,487
1 Kericho 512,485 60,986 12,960 48,026 9,957 746 1,535 7,676 4482 Bomet 421,478 50,156 450 49,706 9,559 26 1,589 7,944 4643 Migori 267,297 31,808 16,056 15,752 3,945 924 504 2,518 1474 Homabay 218,278 25,975 5,500 20,475 4,243 316 654 3,272 1915 Nyamira 209,750 24,960 3,200 1846 Oyugis 178,454 21,236 1,920 1107 Kehancha 151,564 18,036 320 17,716 3,416 18 566 2,831 1658 Kendu Bay 74,234 8,834 720 8,114 1,598 41 259 1,297 76
9,747 0 1,623 8,117 474
10,292 16 1,713 8,563 500
8,173 1,313 6,565 383
Kisii and Surrounding Area
Other Area
41,076
53,579
Project Cost (KSh million)O&M Cost
(KShmillion/year)
Kisumu and Surrounding Area
50,789
Table 5.2.3 Project Cost and O&M Cost for Urban Water Supply Development Projects (LVSCA)Table 5.2.3 Project Cost and O&M Cost for Urban Water Supply Development Projects (LVSCA)
Urban CentreService
Populationin 2030
WaterDemandin 2030
(m3/day)
RehabilitationWorks
(m3/day)
8 Kendu Bay 74,234 8,834 720 8,114 1,598 41 259 1,297 769 Mbita Point 60,351 7,182 0 7,182 1,377 0 230 1,148 67
10 Litein 45,823 5,453 5,453 31411 Sotik 42,113 5,011 500 2912 Nyansiongo 28,376 3,377 600 2,777 567 35 89 444 26
Sub-total 2,210,203 263,014 47,679 210,824 43,177 2,743 6,739 33,695 1,968
6,262,099 784,534 120,349 659,674 159,868 6,921 26,424 21,086 105,437 6,289Source: JICA Study Team 199,835 33,031 #REF! #REF! #REF!
Total RehabilitationWorks
Major Dam/Major
Transmission
Intake/Mainor
TransmissionDistribution
1 Other Urban Pop. 1,731,843 206,089 26,089 180,000 36,025 1,500 0 5,754 28,772 1,6802 Rural Pop. 935,056 71,064 10,150 60,914 11,684 0 0 1,947 9,737 569
Major Water Sourece WorksMagwagwa 68 68 0Katieno 0 0 0Ilooiterre 426 426 2Sand River (Naikara) 1,466 1,466 7Amala 111 111 1
2,666,899 277,154 36,239 240,915 49,780 1,500 2,071 7,701 38,508 2,259Source: JICA Study Team
0 0 0343
Project Cost (KSh million)O&M Cost
(KShmillion/year)
Total
Total
Table 5.2.4 Project Cost and O&M Cost for LSRWSS Development Projects (LVSCA)Table 5.2.4 Project Cost and O&M Cost for LSRWSS Development Projects (LVSCA)
ItemService
Populationin 2030
WaterDemandin 2030
(m3/day)
RehabilitationWorks
(m3/day)
0
DevelopmentCapacity(m3/day)
C - T - 47

Total RehabilitationWorks
Major Dam/Major
Transmission
Intake/Mainor
TransmissionDistribution
1 Nakuru 1,155,789 137,5392 Naivasha 851,433 101,3203 Molo 204,630 24,3514 Gilgil 177,659 21,1415 Njoro 118,552 14,1086 Eldama Ravine 89,965 10,7067 Ol Kalou 332,309 39,545 4,687 34,858 6,955 270 1,114 5,571 325
Major Water Sourece WorksItare 5,131 5,131 26Londiani 6,223 6,223 31Malewa 4,305 4,305 22Transmission (fromm Itale and Longiani)) 25,742 25,742 129
Sub-total 2,930,336 348,710 121,478 227,232 91,971 6,989 41,401 7,263 36,317 2,328
1 Lodwar 59,544 7,086 3,068 4,018 947 177 128 642 382 Kakuma 45,444 5,408 0 5,408 1,037 0 173 864 503 Kabarnet 31,236 3,717 2,496 1,221 378 144 39 195 114 Lokichogio 21,807 2,595 0 2,595 498 0 83 415 24
Sub-total 158,032 18,806 5,564 13,242 2,860 320 423 2,116 1240
1 Narok 194,573 23,154 1,880 21,274 4,188 108 680 3,400 199Upper Narok Dam 1,031 1,031 5
2 Mai Mahiu 58,689 6,984 0 6,984 1,340 0 223 1,116 65Sub-total 253,262 30,138 1,880 28,258 6,560 109 1,031 903 4,516 269
3,341,630 397,654 128,922 268,732 101,393 7,416 42,432 8,590 42,955 2,721Source: JICA Study Team
Major Dam/ Intake/
30,746 1,796
DevelopmentProject Cost (KSh million)
O&M Cost
Total
Table 5.2.6 Project Cost and O&M Cost for LSRWSS Development Projects (RVCA)Table 5.2.6 Project Cost and O&M Cost for LSRWSS Development Projects (RVCA)Service
WaterDemand Rehabilitation
Arid Area
Others
Greater Naluru
116,791 192,374 43,615
DevelopmentCapacity(m3/day)
Project Cost (KSh million)
6,720 6,149
O&M Cost(KSh
million/year)Urban Centre
ServicePopulation
in 2030
WaterDemandin 2030
(m3/day)
RehabilitationWorks
(m3/day)
Table 5.2.5 Project Cost and O&M Cost for Urban Water Supply Development Projects (RVCA)
Total RehabilitationWorks
Major Dam/Major
Transmission
Intake/Mainor
TransmissionDistribution
1 Other Urban Pop. 1,144,266 136,168 6,594 129,574 25,230 384 4,142 20,704 1,2092 Rural Pop. 556,753 42,313 0 42,313 8,115 0 1,353 6,763 395
Major Water Sourece WorksMurung-Sebit 0 0 0Kimwarer 1,492 1,492 7Arror 188 188 1Embobut 0 0 0Waseges 3,273 3,273 16Oletukat 1,304 1,304 7Leshota 1,202 1,202 6Oldorko 742 742 4Transmission (fromm Azuala) 2,301 2,301 12
1,701,019 178,481 6,594 171,887 43,847 384 10,502 5,494 27,467 1,645Source: JICA Study Team
Capacity(m3/day)
(KShmillion/year)
Total
Item Populationin 2030
Demandin 2030
(m3/day)
Works (m3/day)
C - T - 48

Total RehabilitationWorks
Major Dam/Major
Transmission
Intake/Mainor
TransmissionDistribution
1 Nairobi 6,085,297 888,4532 Ruiru 896,358 106,6673 Kikuyu 875,242 104,1544 Kangundo-Tala 820,175 97,6015 Mavoko 514,909 61,2746 Thlka 513,806 61,1437 Karuri 404,224 48,1038 Ngong 402,242 47,8679 Kiambu 315,807 37,581
10 Limuru 298,455 35,51611 Kitengela 218,282 25,97612 Juja 151,781 18,06213 Ongata Rongai 150,775 17,94214 Kiserian 71,913 8,55815 Githunguri 50,374 5,99416 Machakos 755,281 89,878 3,373 86,505 16,785 194 0 2,765 13,826 807
Major Water Sourece WorksUpper Athi 2,813 2,813 14Kikuyu 4,117 4,117 21Kiambaa (Ruaka) 1,961 1,961 10Ruiru-A 6,998 6,998 35Ndarugu 5,345 5,345 27Maragua 8 7,058 7,058 35Ndiara 7,058 7,058 35Chania-B 14,082 14,082 70Mbuuni 2,566 2,566 13Transmission of Norther Collectior and Others 74,244 74,244 371
sub-total 1 1,654,769 607,056 1,047,713 362,109 34,928 126,240 33,490 167,451 10,410
1 Mombasa 2,644,591 386,1102 Malindi 443,811 52,814
34,734 30,725 153,625 8,972
Mombasa Area
Greater Nairobi
603,683 961,207 219,084
DevelopmentCapacity(m3/day)
Project Cost (KSh million)O&M Cost
(KShmillion/year)
Urban CentreService
Populationin 2030
WaterDemandin 2030
(m3/day)
RehabilitationWorks
(m3/day)
Table 5.2.7 Project Cost and O&M Cost for Urban Water Supply Development Projects (ACA)
3 Ukunda 234,651 27,9244 Kilifi 183,228 21,8045 Mtwapa 182,474 21,7146 Mariakani 90,271 10,7427 Kwale 74,303 8,8428 Watamu 37,639 4,4799 Masambweni 17,731 2,110
Major Water Sourece WorksRare Dam 3,648 3,648 18Mwachi Dam 4,398 4,398 22Pemba 5,472 5,472 27Disalination Plants 0 6,342Transmission (from Mzima) 35,289 35,289 176Transmission (from Sabaki) 15,002 15,002 75
sub-total 3,908,701 536,539 92,200 444,339 155,085 4,984 63,811 14,382 71,908 10,860
1 Wundanyi 185,136 22,0312 Voi 86,340 10,2743 Taveta 99,997 11,900 0 11,900 2,282 0 380 1,902 111
Lake Chala 1,551 1,551 84 Kajiado 74,803 8,902 1,000 7,902 1,573 58 253 1,263 745 Loitoktok 56,530 6,727 0 6,727 1,290 0 215 1,075 636 Wote 49,709 5,915 525 5,390 1,064 30 172 862 507 Mitto Andei 22,753 2,708 2,951 0 170 170 0 0 0
sub-total 575,268 68,457 5,876 62,824 13,939 338 1,551 2,008 10,041 594
4,483,970 2,259,765 705,132 1,554,876 531,130 40,251 191,602 49,880 249,397 21,865Source: JICA Study Team 663,912 #REF! #REF! #REF!
4,939 288
Total
1,400 30,906 6,008 81 988
14,382 71,908 4,199
Other Area
86,620 449,919 91,274 4,984
C - T - 49

WaterDemand
Total RehabilitationWorks
Major Dam/Major
Transmission
Intake/Mainor
TransmissionDistribution
1 Other Urban Pop. 1,235,080 146,975 12,960 134,015 25,703 0 4,284 21,419 1,2512 Rural Pop. 810,576 61,604 23,800 37,804 7,250 0 1,208 6,042 353
Major Water Sourece WorksKiteta 3,009 3,009 15Thwake 2,199 2,199 11Olkishunki 1,381 1,381 7
2,045,656 208,578 36,760 171,818 39,543 0 6,589 5,492 27,462 1,637Source: JICA Study Team
DevelopmentCapacity
Total RehabilitationWorks
Major Dam/Major
Transmission
Intake/Mainor
TransmissionDistribution
Upstream of Tana Catchment1 Nyeri 600,803 71,496 27,000 2,510
14 Karatina 42,783 5,091 015 Othaya 25,859 3,077 16,6162 Embu 305,362 36,338 12,000
11 Runyenjes 98,401 11,710 03 Meru 269,949 32,124 4,5006 Maua 86,713 10,319 04 Chuka 218,821 26,040 2,7005 Chogoria 143,036 17,021 6008 Muranga 144,849 17,237 14,8489 Maragua 132,762 15,799 07 Makuyu 221,524 26,361 0
12 Kerugoya/Kutus 97,767 11,634 11,83410 Wanguru 120,726 14,366 013 Sagana 53,112 6,320 2,358
Sub-total 2,562,468 304,934 92,456 212,478 46,071 5,320 0 6,792 33,959 1,983Arid Area
1,152 5,761 336
579
690
259
190
854
817
1,152
1,213
1,271
1,424
5,761
6,064
2,897 16918,129 4,294
6,355
7,120
336
354
371
41644,549 9,398
39,761 7,816
37,943 7,536
36,048 7,604
Project Cost (KSh million)O&M Cost
(KShmillion/year)
36,048 9,423
Table 5.2.9 Project Cost and O&M Cost for Urban Water Supply Development Projects (TCA)Table 5.2.9 Project Cost and O&M Cost for Urban Water Supply Development Projects (TCA)
Urban CentreService
Populationin 2030
WaterDemandin 2030
(m3/day)
RehabilitationWorks
(m3/day)
RehabilitationWorks
(m3/day)
ServicePopulation
in 2030
O&M Cost(KSh
million/year)
Total
Table 5.2.8 Project Cost and O&M Cost for LSRWSS Development Projects (ACA)Table 5.2.8 Project Cost and O&M Cost for LSRWSS Development Projects (ACA)
ItemDevelopment
Capacity(m3/day)
Project Cost (KSh million)
d ea1 Garissa 143,348 17,058 12,640 4,418 1,575 727 141 706 412 Madogo 19,308 2,298 0 2,298 441 0 73 367 213 Msalani 18,371 2,186 0 2,186 419 0 70 349 204 Hola 17,553 2,089 1,400 689 213 81 22 110 6
Sub-total 198,580 23,631 14,040 9,591 2,647 808 0 307 1,533 90Other Area
1 Lamu 1,250,000 108,750 3,400 105,350 22,787 196 5,754 16,838 983High Grand Falls Dam 0 0Transmission (from Tana to Lamu) 26,936 26,936 135
2 Kitui 551,547 65,634 7,750 57,884 11,548 446 1,850 9,251 540Mutuni Dam 3,273 3,273 16Kitimui Dam 4,910 4,910 25Transmission (to Kitis) 1,705 1,705 9
3 Matuu 255,467 30,401 702 29,699 5,736 40 949 4,747 277Yatta Dam 1,381 1,381 7
4 Mwingi 80,390 9,566 1,417 8,149 1,645 82 260 1,302 76Transmission (to Muwangi) 852 852 4
Sub-total 2,137,404 214,351 13,269 201,082 80,772 763 39,057 8,814 32,138 2,0724,898,453 542,916 119,765 423,151 129,488 6,887 39,057 15,912 67,632 4,145
Source: JICA Study Team 434,889 161,860 #REF! #REF! #REF!
Total RehabilitationWorks
Major Dam/Major
Transmission
Intake/Mainor
TransmissionDistribution
1 Other Urban Pop. 932,041 110,913 108,972 1,941 6,646 6,274 62 310 182 Rural Pop. 810,576 61,604 40,320 21,284 4,077 0 680 3,397 199
1,742,617 172,517 149,292 23,225 10,723 6,274 742 3,707 217Source: JICA Study Team
O&M Cost(KSh
million/year)
Total
Total
Table 5.2.10 Project Cost and O&M Cost for LSRWSS Development Projects (TCA)Table 5.2.10 Project Cost and O&M Cost for LSRWSS Development Projects (TCA)
ItemService
Populationin 2030
WaterDemandin 2030
(m3/day)
RehabilitationWorks
(m3/day)
DevelopmentCapacity(m3/day)
Project Cost (KSh million)
C - T - 50

Total RehabilitationWorks
Major Dam/Major
Transmission
Intake/Mainor
TransmissionDistribution
1 Isiolo 231,501 27,549 13,748 13,801 3,438 791 0 441 2,206 129Isiolo 1,795 0 1,795 0 0 9
2 Nanyuki 192,282 22,882 10,610 12,272 2,964 610 0 392 1,961 1153 Nyahururu 183,483 21,835 4,552 17,283 3,577 262 0 552 2,762 1614 Rumuruti 50,661 6,029 0 6,029 1,156 0 0 193 964 56
Nyahururu 869 869 4Rumuruti 946 946 5
5 Mandera 108,071 12,860 1,672 11,188 2,242 96 0 358 1,788 1046 Wajir 102,042 12,143 0 12,143 2,329 0 0 388 1,941 1137 Moyale 46,075 5,483 1,087 4,396 906 63 0 141 703 418 Rhamu 32,494 3,867 0 3,867 742 0 0 124 618 369 Elwak 30,031 3,574 0 3,574 685 0 0 114 571 33
10 Takaba 27,305 3,249 0 3,249 623 0 0 104 519 3011 Maralal 19,546 2,326 798 1,528 339 46 0 49 244 1412 Marsabit 16,317 1,942 0 1,942 372 0 0 62 310 18
1,039,808 123,737 32,467 91,270 22,981 1,867 3,611 2,917 14,586 870Source: JICA Study Team
Total RehabilitationWorks
Major Dam/Major
Transmission
Intake/Mainor
TransmissionDistribution
1 Other Urban Pop. 720,957 85,794 6,948 78,846 15,527 401 2,520 12,606 7402 Rural Pop. 435,473 33,096 0 33,096 6,347 0 1,058 5,290 311
Major Water Sourece WorksKihoto 0Archers' Post 0
1,156,430 118,890 6,948 111,942 21,874 401 0 3,578 17,895 1,051Source: JICA Study Team
O&M Cost(KSh
million/year)
Total
Total
Table 5.2.12 Project Cost and O&M Cost for LSRWSS Development Projects (ENNCA)Table 5.2.12 Project Cost and O&M Cost for LSRWSS Development Projects (ENNCA)
ItemService
Populationin 2030
WaterDemandin 2030
(m3/day)
RehabilitationWorks
(m3/day)
DevelopmentCapacity(m3/day)
Project Cost (KSh million)
DevelopmentCapacity(m3/day)
Project Cost (KSh million)
O&M Cost(KSh
million/year)Urban Centre
ServicePopulation
in 2030
WaterDemandin 2030
(m3/day)
RehabilitationWorks
(m3/day)
Table 5.2.11 Project Cost and O&M Cost for Urban Water Supply Development Projects (ENNCA)
#REF! #REF! #REF!
C - T - 51

Total RehabilitationWorks
Major Dam/Major
Transmission
Intake/Mainor
TransmissionDistribution
1 LVNCA 6,570,585 781,900 134,890 647,010 144,158 7,578 12,488 20,682 103,410 6,1012 LVSCA 6,262,099 784,534 120,349 659,674 159,868 6,921 26,424 21,086 105,437 6,2893 RVCA 3,341,630 397,654 128,922 268,732 101,393 7,416 42,432 8,590 42,955 2,7214 ACA 4,483,970 2,259,765 705,132 1,554,876 531,130 40,251 191,602 49,880 249,397 21,8655 TCA 4,898,453 542,916 119,765 423,151 129,488 6,887 39,057 15,912 67,632 4,1456 ENNCA 1,039,808 123,737 32,467 91,270 22,981 1,867 3,611 2,917 14,586 870
26,596,545 4,890,506 1,241,525 3,644,713 1,089,018 70,920 315,615 119,068 583,418 41,992
Source: JICA Study Team 0 0 0 1
Total RehabilitationWorks
Major Dam/Major
Transmission
Intake/Mainor
TransmissionDistribution
1 LVNCA 1,783,416 184,324 14,596 169,728 33,082 528 0 5,425 27,129 1,5842 LVSCA 2,666,899 277,154 36,239 240,915 49,780 1,500 2,071 7,701 38,508 2,2593 RVCA 1,701,019 178,481 6,594 171,887 43,847 384 10,502 5,494 27,467 1,6454 ACA 2,045,656 208,578 36,760 171,818 39,543 0 6,589 5,492 27,462 1,6375 TCA 1,742,617 172,517 149,292 23,225 10,723 6,274 0 742 3,707 2176 ENNCA 1,156,430 118,890 6,948 111,942 21,874 401 0 3,578 17,895 1,051
11,096,037 1,139,943 250,429 889,514 198,848 9,087 19,162 28,433 142,168 8,393Source: JICA Study Team 0 0 0 0
DevelopmentCapacity(m3/day)
Project Cost (KSh million)O&M Cost
(KShmillion/year)
DevelopmentCapacity(m3/day)
Project Cost (KSh million)O&M Cost
(KShmillion/year)
Total
Total
Table 5.2.14 Project Cost and O&M Cost for Large Scale Rural Water Supply Development Projectsfor Whole of Kenya
Table 5.2.14 Project Cost and O&M Cost for Large Scale Rural Water Supply Development Projectsfor Whole of Kenya
CAService
Populationin 2030
WaterDemandin 2030
(m3/day)
RehabilitationWorks
(m3/day)
CAService
Populationin 2030
WaterDemandin 2030
(m3/day)
RehabilitationWorks
(m3/day)
able 5.2.13 Project Cost and O&M Cost for Urban Water Supply Development Projects for Whole of Kenable 5.2.13 Project Cost and O&M Cost for Urban Water Supply Development Projects for Whole of Ken
C - T - 52

Figures

C - F - 1
Allocation of the planned population of each basin in 2030 to each target city and district (Setting based on Kenya Vision 2030 & Census 2009)
Setting of Development TargetImproved water to all populationPiped water supply by registered WSPs, to all urban populationNon-revenue water (NRW) to 20%(Based on Kenya Vision 2030 & Water Service Strategic Plan)
Setting of Unit Water Supply Amount(Based on Guideline for Water Allocation)
Determination of Required Water Supply Capacity and Source of WaterUrban Water Supply:Determination of water supply capacity, intake source and intake volume (surface water, ground water) of each cityRural Water Supply (Large):Determination of required water supply capacity and intake volume (surface water, ground water) of each countyRural Water Supply (Small):Determination of required water supply capacity and intake volume (surface water, ground water) of each county
Determination of Water Supply Plan
Allocation of each water demand (Urban, Rural(Large), Rural(Small)) to surface water demand and ground water demand
Sufficiency of sources of surface water and ground water for each sub-basin
Confirmation of the following proposed projectProposal from each WSB(2012)Proposal of Aftercare Study(1998)Proposal of Kenya Vision 2030, 1st Medium Term Plan (2008-2012)
Calculation of insufficient water supply capacity by deducting the existing water supply capacity from the required water supply capacity
Determination of Required ProjectUrban Water Supply:Determination of the rehabilitation project and the development project of each cityRural Water Supply (Large):Determination of the development scale of each countyRural Water Supply (Small):Determination of the development scale of each county
NG
OK
Calculation of Water DemandUrban Water Supply:Calculation of water demand of each target cityRural Water Supply (Large):Calculation of water demand of each target districtRural Water Supply (Small):Calculation of water demand of each target district
Calculation of the water demand of surface water and ground water of each sub-basin
Determination of the surface water demand and the ground water demand of each city and district/county
Source: JICA Study Team
THE DEVELOPMENT OF THE NATIONAL WATER MASTER PLAN 2030
Figure 1.1.1 Study Flow of Water Supply Development Plan
JAPAN INTERNATIONAL COOPERATION AGENCY

C - F - 2
Source: JICA Study Team based on Information from WASREB
THE DEVELOPMENT OF THE NATIONAL WATER MASTER PLAN 2030
Figure 2.2.1 Extent of the WSBs
JAPAN INTERNATIONAL COOPERATION AGENCY
SOUTH

C - F - 3
Source: JICA Study Team based on Census 2009 data
THE DEVELOPMENT OF THE NATIONAL WATER MASTER PLAN 2030
Figure 2.3.1 Percentage of Usage of Surface Water without Treatment
JAPAN INTERNATIONAL COOPERATION AGENCY

C - F - 4
Source: JICA Study Team based on Census 2009 data
THE DEVELOPMENT OF THE NATIONAL WATER MASTER PLAN 2030
Figure 2.3.2 Percentage of Connection of Piped Water Supply
JAPAN INTERNATIONAL COOPERATION AGENCY

C - F - 5
Source: JICA Study Team based on Census 2009 data
THE DEVELOPMENT OF THE NATIONAL WATER MASTER PLAN 2030
Figure 2.3.3 Percentage of Usage of Well, Borehole and Spring (Individual basis)
JAPAN INTERNATIONAL COOPERATION AGENCY

C - F - 6
Source: JICA Study Team based on Census 2009 data
THE DEVELOPMENT OF THE NATIONAL WATER MASTER PLAN 2030
Figure 3.2.1 Population Density in 2010
JAPAN INTERNATIONAL COOPERATION AGENCY

C - F - 7
Source: JICA Study Team based on Census 2009 data and Kenya Vision 2030
THE DEVELOPMENT OF THE NATIONAL WATER MASTER PLAN 2030
Figure 3.2.2 Population Density in 2030
JAPAN INTERNATIONAL COOPERATION AGENCY

C - F - 8
Dam (Existing)
Dam (Proposed)
Water Transfer (Existing)
Water Transfer (Proposed)
Urban Water Supply Development
Sewerage Development
LEGEND OF PLANS
Source: JICA
Study Team
TH
E D
EV
EL
OPM
EN
T OF
TH
E N
ATIO
NA
L WAT
ER
MA
STE
R PL
AN
2030 Figure 4.3.1 Proposed U
rban Water Supply and
Sewerage D
evelopment Plans (LV
NC
A)
JAPA
N IN
TE
RN
ATIO
NA
L CO
OPE
RATIO
N A
GE
NC
Y

C - F - 9
Dam (Existing)
Dam (Proposed)
High Population Density Area
Water Transfer (Existing)
Water Transfer (Proposed)
Urban Water Supply Development
Sewerage Development
LEGEND OF PLANS
Source: JICA
Study Team
TH
E D
EV
EL
OPM
EN
T OF
TH
E N
ATIO
NA
L WAT
ER
MA
STE
R PL
AN
2030 Figure 4.4.1 Proposed U
rban Water Supply and
Sewerage D
evelopment Plans (LV
SCA
) JA
PAN
INT
ER
NAT
ION
AL C
OO
PER
ATION
AG
EN
CY

C - F - 10
Dam (Existing)
Dam (Proposed)
High Population Density Area
Arid Area
Water Transfer (Existing)
Water Transfer (Proposed)
Urban Water Supply Development
Sewerage Development
LEGEND OF PLANS
Source: JICA
Study Team
TH
E D
EV
EL
OPM
EN
T OF
TH
E N
ATIO
NA
L WAT
ER
MA
STE
R PL
AN
2030 Figure 4.5.1 Proposed U
rban Water Supply and
Sewerage D
evelopment Plans (R
VC
A) (1/2)
JAPA
N IN
TE
RN
ATIO
NA
L CO
OPE
RATIO
N A
GE
NC
Y

C - F - 11
Dam (Existing)
Dam (Proposed)
High Population Density Area
Arid Area
Water Transfer (Existing)
Water Transfer (Proposed)
Urban Water Supply Development
Sewerage Development
LEGEND OF PLANS
Source: JICA
Study Team
TH
E D
EV
EL
OPM
EN
T OF
TH
E N
ATIO
NA
L WAT
ER
MA
STE
R PL
AN
2030 Figure 4.5.1 Proposed U
rban Water Supply and
Sewerage D
evelopment Plans (R
VC
A) (2/2)
JAPA
N IN
TE
RN
ATIO
NA
L CO
OPE
RATIO
N A
GE
NC
Y

C - F - 12
Dam (Existing)
Dam (Proposed)
High Population Density Area
Water Transfer (Existing)
Water Transfer (Proposed)
Urban Water Supply Development
Sewerage Development
LEGEND OF PLANS
Source: JICA
Study Team
TH
E D
EV
EL
OPM
EN
T OF
TH
E N
ATIO
NA
L WAT
ER
MA
STE
R PL
AN
2030 Figure 4.6.1 Proposed U
rban Water Supply and
Sewerage D
evelopment Plans (A
CA
) JA
PAN
INT
ER
NAT
ION
AL C
OO
PER
ATION
AG
EN
CY

C - F - 13
Dam (Existing)
Dam (Proposed)
High Population Density Area
Arid Area
Water Transfer (Existing)
Water Transfer (Proposed)
Urban Water Supply Development
Sewerage Development
LEGEND OF PLANS
Source: JICA
Study Team
TH
E D
EV
EL
OPM
EN
T OF
TH
E N
ATIO
NA
L WAT
ER
MA
STE
R PL
AN
2030 Figure 4.7.1 Proposed U
rban Water Supply and
Sewerage D
evelopment Plans (T
CA
) JA
PAN
INT
ER
NAT
ION
AL C
OO
PER
ATION
AG
EN
CY

C - F - 14
Dam (Existing)
Dam (Proposed)
Arid Area
Water Transfer (Existing)
Water Transfer (Proposed)
Urban Water Supply Development
Sewerage Development
LEGEND OF PLANS
Source: JICA
Study Team
TH
E D
EV
EL
OPM
EN
T OF
TH
E N
ATIO
NA
L WAT
ER
MA
STE
R PL
AN
2030 Figure 4.8.1 Proposed U
rban Water Supply and
Sewerage D
evelopment Plans (E
NN
CA
) JA
PAN
INT
ER
NAT
ION
AL C
OO
PER
ATION
AG
EN
CY

C - F - 15
2013 2014 2015 2016 2017 2018 2019 2020 2021 2022 2023 2024 2025 2026 2027 2028 2029 2030
13/14 14/15 15/16 16/17 17/18 18/19 19/20 20/21 21/22 22/23 23/24 24/25 25/26 26/27 27/28 28/29 29/30 30/31
6.1 6.1 6.1 6.1
1.2 1.2 1.2 1.2
9.4 9.4 9.4 9.4
Teremi 7.9 7.9 7.9 7.9
9 9 9 9
9.0 9.0 9.0 9.1 9.1 9.1
1.8 1.8 1.8 4.3 4.3 4.3
3.0 3.0 3.0 2.3 2.3 2.3
5.2 5.2 5.2
3.8 3.8 3.8 14.4 14.4 14.4
0.9 0.9 0.9 2.0 2.0 2.0
4.2 4.2 4.2 9.8 9.8 9.8
18.8 18.8 18.8 43.8 43.8 43.8
16.0 16.0 16.0 37.3 37.3 37.3
12.1 12.1 12.1 28.1 28.1 28.1
9.7 9.7 9.7 22.7 22.7 22.7
4.0 4.0 4.0 9.3 9.3 9.3
8.8 8.8 8.8 20.5 20.5 20.5
10.8 10.8 10.8 25.3 25.3 25.3
11.7 11.7 11.7 27.2 27.2 27.2
6.0 6.0 6.0 13.9 13.9 13.9
1.7 1.7 1.7 3.9 3.9 3.9
5.3 5.3 5.3 12.5 12.5 12.5
6.7 6.7 6.7 15.5 15.5 15.5
2.4 2.4 2.4 5.6 5.6 5.6
2.3 2.3 2.3 5.4 5.4 5.4
1.7 1.7 1.7 4.0 4.0 4.0
1.6 1.6 1.6 3.8 3.8 3.8
4.5 4.5 4.5
3.1 3.1 3.1
3.4 3.4 3.4
2.2 2.2 2.2
2.2 2.2 2.2
1.8 1.8 1.8
17.8 17.8 17.8 17.8 17.8
647,010 219,516 34%
18.8 18.8 18.8 18.8 18.8 18.8 18.8 18.8 18.8 18.8 18.8 18.8 18.8 18.8 18.8 18.8 18.8 18.8
1,087.4
Kiboro Multipurpose Dam
253.5 337.9
Siyoi Dam
Moi's Bridge Multipurpose Dam
-
WSB, F/S
4 Moi'S Bridge
-
5 Item/Tambach
10 Kitale
11 Mumias
16
Eldoret -
9 Vihiga
-
-
WSB
6 Port Victoria WSB
Yala, Ugunja, Ukwala (3UC)
2
7
8
Kapenguria
13 Kakamega
12,000
8,141WSB
24,136
WSB, MTP
3 Usenge
12 Webuye -
MTP
7,004
6,934
24,246
3,930
WR
MA
Cat
chm
ent
No.
Nam
e of
Pro
ject
Proj
ect S
tatu
s
1 Bondo, Siaya (2 UC)WSB, MTP,
F/S
Water ResourcesDevelopment for UrbanWater Supply
Implementation Schedule
Short Term Medium Term Long Term
Capacity to be developed
(m3/day)
Tota
l
Initi
alD
evel
op.
Rat
io
-
15 Kimilili -
-
-
Bungoma -
14 Kapsabet
17 Chwele
19 Luanda -
18 Busia
-
21 Malakisi -
22 Butere -
23 Kiminini -
-
25 Lumakanda -
Nandi Hills
-
27 Nambale -
29 Malava -
28 Burnt Forest -
24
Rehabilitation for 18 UrbanCentres
20 Malaba
26 Matunda
Rural Water Supply Projects
Total Urban Water Supply Projects
2,960
2,950
2,438
10,665
4,117
7,656
18,714
83,354
71,042
53,609
43,215
17,766
38,971
48,197
51,864
26,466
7,382
10,233
4,117
4,480
7,179
6,062
4,480
7,121
8,868
3,200
3,070
2,297
2,154
6,062
2,960
2,950
2,442
4,000
6,934
5,000
1,250
5,614
21,313
11,691
14,459
16,083
15,559
7,940
2,438
30%
30%
30%
30%
50%
30%
57%
100%
21%
32%
30%
30%
100%
100%
100%
100%
100%
100%
5,330
30%
30%
30%
30%
30%
30%25,006
12,964
30%
30%
30%
30%
30%
2,215
23,738
29,560
LVN
Transmission to Eldoret
Note: As for “Project Status”, “WSB” means a project proposed by WSB, “MTP” means a flagship project proposed in the First Medium Term Plan (2008 – 2019) of Kenya Vision 2030, and “F/S” means a project proposed in completed F/S.
Source: JICA Study Team
THE DEVELOPMENT OF THE NATIONAL WATER MASTER PLAN 2030
Figure 7.3.1 Implementation Schedule of Proposed Water Supply System Development Plan (LVNCA) JAPAN INTERNATIONAL COOPERATION AGENCY

C - F - 16
2013 2014 2015 2016 2017 2018 2019 2020 2021 2022 2023 2024 2025 2026 2027 2028 2029 2030
13/14 14/15 15/16 16/17 17/18 18/19 19/20 20/21 21/22 22/23 23/24 24/25 25/26 26/27 27/28 28/29 29/30 30/31
Implementation Schedule
Short Term Medium Term Long Term
Capacity to be developed
(m3/day)
Tota
l
Initi
alDe
velo
p.
Ratio
WRM
A Ca
tchm
ent
No.
Nam
e of
Pro
ject
Proj
ect S
tatu
s
Nandi Forest Dam5.0 5.0 5.0 5.0
Kibos Dam21.1 21.1 21.1 21.1
Koru Dam 46.6 46.6 46.6 46.6
Lake Victoria
45.0 45.0 45.0 79.8 79.8 79.8
28.0 28.0 28.0 28.0 28.0 28.0 28.0 28.0 28.0 28.0
4.3 4.3 4.3 4.3
18.0 18.0 18.0 4.1 4.1 4.1
26.3 26.3 26.3 26.3 26.3 26.3 26.3 26.3 26.3 26.3 26.3
10.5 10.5 10.5 25.5 25.5 25.5
6.0 6.0 6.0 31.3 31.3 31.3
1.5 1.5 1.5 13.9 13.9 13.9
27.0 27.0 27.0 3.8 3.8 3.8
3.0 3.0 3.0 2.4 2.4 2.4
6.0 6.0 6.0 0.0 0.0 0.0
3.5 3.5 3.5 8.3 8.3 8.3
4.0 4.0 4.0 9.3 9.3 9.3
1.8 1.8 1.8 4.3 4.3 4.3
0.6 0.6 0.6 1.5 1.5 1.5
17.1 17.1 17.1 17.1 17.1
667,674 208,594 31%
0.1 0.1 0.1 0.1
Amala Dam0.9 0.9 0.9 0.9
Sande Dam15.8 15.8 15.8 15.8
Ilooiterre Dam0.8 0.8 0.8 0.8
31.1 31.1 31.1 31.1 31.1 31.1 31.1 31.1 31.1 31.1 31.1 31.1 31.1 31.1 31.1 31.1 31.1 31.1
542.2 517.2 836.0
Magwagwa Dam
Bunyunyu Dam
LVS
WSB, F/S
WSB, MTP,F/S*
Ahero, Awasi, Kipkelion,Londiani, Muhoroni (6 UC)
Kisumu and SurroundingArea
WSB, F/S*
Kisumu
2Kisii
WSB, MTP,F/S
Rongo, Suneka, Keroka,Awendo, Tabaka, Ogembo(6 Uc)
1
WSB, F/S
4 Bomet WSB, F/S
WSB, F/S*
6 Nyamira, Oyugis (2 UC) WSB, D/D
WSB, F/S
8 Litein, Sotik (2 UC) WSB, F/S
Kehancha -
-
Water Resources Development forRural Water Supply
Rural Water Supply Projects
12
Total Urban Water Supply Projects
Kisii and Surrounding Area
3 Kericho
7
9 Migori
5 Homabay
Mbita Point
Rehabilitation for 22 UrbanCentres
Kendu Bay11
Nyansiongo
10
124,289
20,475
166,352
29,501
128,708
48,026
49,706
-
WSB,D/D
41,076
7,182
8,000
15,752
17,716
8,114
2,777
2,000
36,000
4,000
8,000
4,726
5,315
2,434
833
2,000
14,000
24,000
8,000
60,000
37,287
16%
30%
56%
10%
30%
81%
2%
36%
29%
30%
30%
30%
88%
100%
Note: As for “Project Status”, “WSB” means a project proposed by WSB, “MTP” means a flagship project proposed in the First Medium Term Plan (2008 – 2019) of Kenya Vision 2030, and “F/S” means a project proposed in completed F/S.
Source: JICA Study Team
THE DEVELOPMENT OF THE NATIONAL WATER MASTER PLAN 2030
Figure 7.3.2 Implementation Schedule of Proposed Water Supply System Development Plan (LVSCA) JAPAN INTERNATIONAL COOPERATION AGENCY
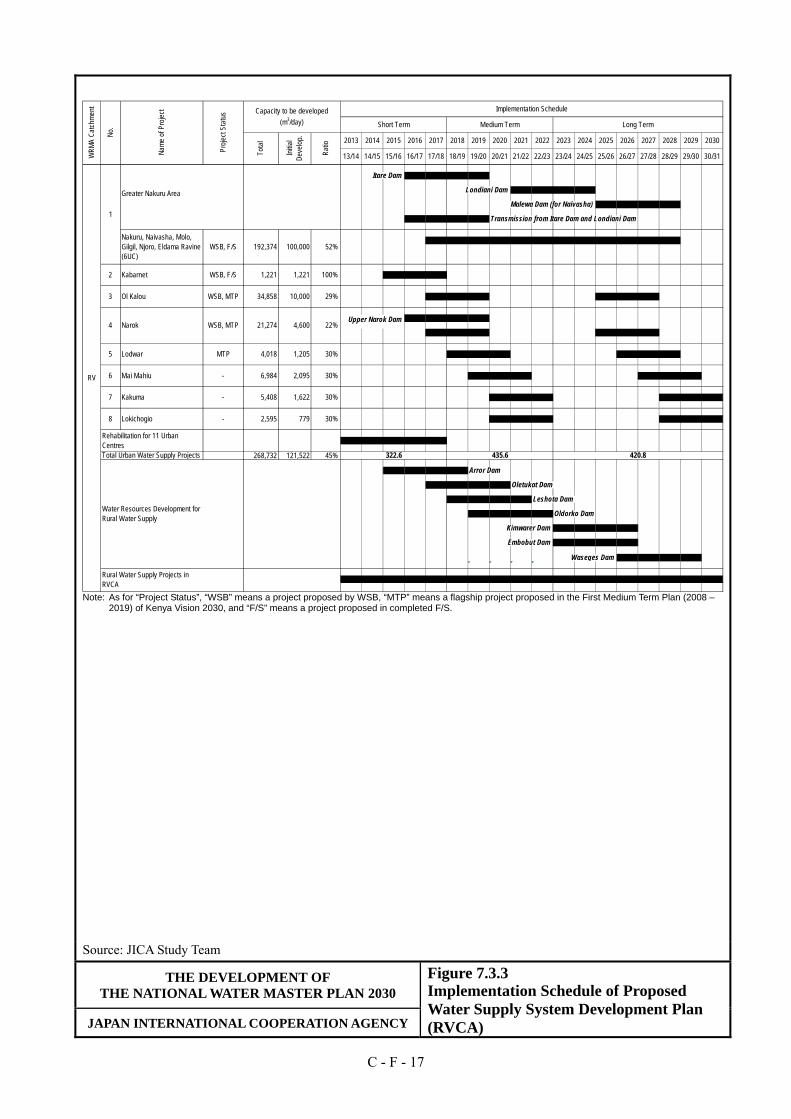
C - F - 17
2013 2014 2015 2016 2017 2018 2019 2020 2021 2022 2023 2024 2025 2026 2027 2028 2029 2030
13/14 14/15 15/16 16/17 17/18 18/19 19/20 20/21 21/22 22/23 23/24 24/25 25/26 26/27 27/28 28/29 29/30 30/31
Implementation Schedule
Short Term Medium Term Long Term
Capacity to be developed
(m3/day)
Tota
l
Initi
alDe
velo
p.
Ratio
WRM
A Ca
tchm
ent
No.
Nam
e of
Pro
ject
Proj
ect S
tatu
s
Itare Dam14.8 14.8 14.8 14.8
Londiani Dam18.0 18.0 18.0 18.0
Malewa Dam (for Naivasha)11.3 11.3 11.3 11.3
Transmission from Itare Dam and Londiani Dam75.5 75.5 75.5 75.5
36.1 36.1 36.1 36.1 36.1 36.1 36.1 36.1 36.1 36.1 36.1 36.1
0.9 0.9 0.9
7.5 7.5 7.5 18.6 18.6 18.6
2.0 2.0 2.0 2.0
3.5 3.5 3.5 12.5 12.5 12.5
0.9 0.9 0.9 2.1 2.1 2.1
1.6 1.6 1.6 3.7 3.7 3.7
1.2 1.2 1.2 2.8 2.8 2.8
0.6 0.6 0.6 1.4 1.4 1.4
17.7 17.7 17.7 17.7 17.7
268,732 121,522 45%
Arror Dam 6.3 6.3 6.3 6.3
Oletukat Dam5.9 5.9 5.9 5.9
Leshota Dam4.8 4.8 4.8 4.8
Oldorko Dam0.7 0.7 0.7 0.7
Kimwarer Dam18.7 18.7 18.7 18.7
Embobut Dam4.2 4.2 4.2 4.2
#REF! #REF! #REF! #REF!
21.7 21.7 21.7 21.7 21.7 21.7 21.7 21.7 21.7 21.7 21.7 21.7 21.7 21.7 21.7 21.7 21.7 21.7
Waseges Dam
322.6 435.6 420.8
Upper Narok Dam
RV
WSB, MTP
WSB, MTP
-
MTP
WSB, F/S
-
1
Nakuru, Naivasha, Molo,Gilgil, Njoro, Eldama Ravine(6UC)
Lodwar
Rehabilitation for 11 UrbanCentres
8 Lokichogio
Kakuma
Rural Water Supply Projects inRVCA
Total Urban Water Supply Projects
3
Water Resources Development forRural Water Supply
4 Narok
6
Greater Nakuru Area
Ol Kalou
2
7
21,274
4,018
192,374
-
Kabarnet 1,221
WSB, F/S
Mai Mahiu
5
34,858
100,000
1,221
10,000
4,600
2,095
1,622
779
6,984
5,408
2,595
52%
1,205
22%
30%
30%
30%
30%
100%
29%
Note: As for “Project Status”, “WSB” means a project proposed by WSB, “MTP” means a flagship project proposed in the First Medium Term Plan (2008 – 2019) of Kenya Vision 2030, and “F/S” means a project proposed in completed F/S.
Source: JICA Study Team
THE DEVELOPMENT OF THE NATIONAL WATER MASTER PLAN 2030
Figure 7.3.3 Implementation Schedule of Proposed Water Supply System Development Plan (RVCA) JAPAN INTERNATIONAL COOPERATION AGENCY

C - F - 18
2013 2014 2015 2016 2017 2018 2019 2020 2021 2022 2023 2024 2025 2026 2027 2028 2029 2030
13/14 14/15 15/16 16/17 17/18 18/19 19/20 20/21 21/22 22/23 23/24 24/25 25/26 26/27 27/28 28/29 29/30 30/31
Implementation Schedule
Short Term Medium Term Long Term
Capacity to be developed
(m3/day)
Tota
l
Initi
alDe
velo
p.
Ratio
WRM
A Ca
tchm
ent
No.
Nam
e of
Pro
ject
Proj
ect S
tatu
s
Ruiru - A Dam19.8 19.8 19.8 19.8
Kamiti 1 Dam17.5 17.5 17.5 17.5
7.5 7.5 7.5 7.5
7.2 7.2 7.2 7.2
Kiambaa (Ruaka) Dam3.7 3.7 3.7 3.7
5.8 5.8 5.8 5.8
Mbuuni Dam3.5 3.5 3.5 3.5
34.1 34.1 34.1 34.1
34.8 34.8 34.8 34.8
Karimenu 2 Dam15.0 15.0 15.0 15.0
Chania - B Dam50.1 50.1 50.1 50.1
Thika 3A Dam5.0 5.0 5.0 5.0
Ndiara Dam21.1 21.1 21.1 21.1
Northern Collector87.1 87.1 87.1 87.1 87.1 87.1 87.1 87.1 87.1 87.1
238.1 238.1 238.1 238.1 238.1 238.1 122.3 122.3 122.3 122.3 122.3 122.3
3.8 3.8 3.8 61.1 61.1 61.1
Rare Dam5.5 5.5 5.5 5.5
Mwachi Dam25.1 25.1 25.1 25.1
Pemba Dam9.5 9.5 9.5 9.5
44.0 44.0 44.0 44.0
Desalination Plant
103.5 103.5 103.5 103.5
136.1 136.1 136.1 136.1 136.1 136.1 32.6 32.6 32.6 32.6 32.6 32.6
0.8 0.8 0.8 5.2 5.2 5.2
1.5 1.5 1.5 2.5 2.5 2.5
4.8 4.8 4.8 11.2 11.2 11.2
Lake Chala5.3 5.3 5.3 5.3
2.7 2.7 2.7 6.2 6.2 6.2
2.2 2.2 2.2 5.0 5.0 5.0
1.5 1.5 1.5 3.5 3.5 3.5
94.4 94.4 94.4 94.4 94.4
1,560,456 1,020,860 65%
Thwake Dam2.5 2.5 2.5 2.5
Kiteta Dam7.5 7.5 7.5 7.5
Olkishunki Dam0.0 0.0 0.0 0.0
21.5 21.5 21.5 21.5 21.5 21.5 21.5 21.5 21.5 21.5 21.5 21.5 21.5 21.5 21.5 21.5 21.5 21.5
1,700.32,073.7 2,751.1
Maragua 4 Dam
Kikuyu Dam
Upper Athi Dam
Ndurugu Dam
Stony Athi Dam
449,919
Baricho System Expansion
363,000
6,399
Mzima Spring II
3,570
Athi
WSB, MTP,F/S*
961,207
WSB
-
1
2
9
8
Mombasa
Kajiado
WSB, MTP,F/S*
Ruiru, Kikuyu, Kangundd-Tala, Mavoko, Thlka,Karuri, Ngong, Kiambu,Limuru, Kitengela, Juja,Ongata Rongai, Kiserian,Githunguri (14UC)
4WSB, MTP,
F/SWote
Loitoktok
Water Resources Development forRural Water Supply
-
-
-
-
5 Wundanyi
7 Voi
6 Taveta
3
Mtwapa, Mariakani, Kwale,Malindi, Ukunda, Kilifi,Watamu, Msambweni (8UC)
Total Urban Water Supply Projects
Nairobi and Satellite Towns
Rural Water Supply Projects
Mitto Andei
Rehabilitation for 27 UrbanCentres
Nairobi
Mombasa and Coastal Area
MachakosWSB, MTP,
F/S86,505
11,900
5,390
21,331
7,902
635,000
5,000
2,872
1,000
2,000
2,018
0
30%
0%
66%
81%
13%
37%
30%
30%
30%9,574
6,727
0
6%
Note: As for “Project Status”, “WSB” means a project proposed by WSB, “MTP” means a flagship project proposed in the First Medium Term Plan (2008 – 2019) of Kenya Vision 2030, and “F/S” means a project proposed in completed F/S.
Source: JICA Study Team
THE DEVELOPMENT OF THE NATIONAL WATER MASTER PLAN 2030
Figure 7.3.4 Implementation Schedule of Proposed Water Supply System Development Plan (ACA) JAPAN INTERNATIONAL COOPERATION AGENCY

C - F - 19
2013 2014 2015 2016 2017 2018 2019 2020 2021 2022 2023 2024 2025 2026 2027 2028 2029 2030
13/14 14/15 15/16 16/17 17/18 18/19 19/20 20/21 21/22 22/23 23/24 24/25 25/26 26/27 27/28 28/29 29/30 30/31
Implementation Schedule
Short Term Medium Term Long Term
Capacity to be developed
(m3/day)
Tota
l
Initi
alDe
velo
p.
Ratio
WRM
A Ca
tchm
ent
No.
Nam
e of
Pro
ject
Proj
ect S
tatu
s
Upstream of Tana Catchment
37.2 37.2 37.2
27.0 27.0 27.0
28.5 28.5 28.5
29.8 29.8 29.8
33.4 33.4 33.4
13.6 13.6 13.6
Other Area
63.2 63.2 63.2 63.2 63.2
26.5 26.5 26.5 61.8 61.8 61.8
3.3 3.3 3.3
1.7 1.7 1.7
1.6 1.6 1.6
0.2 0.2 0.2 0.4 0.4 0.4
Mutuni Dam7.9 7.9 7.9 7.9
Kitimui Dam 7.9 7.9 7.9 7.9
Transmission to Kitui5.0 5.0 5.0 5.0
6.8 6.8 6.8 36.7 36.7 36.7
Yatta Dam 5.3 5.3 5.3 5.3
6.7 6.7 6.7 15.6 15.6 15.6
2.5 2.5 2.5 2.5
1.5 1.5 1.5 4.6 4.6 4.6
16.2 16.2 16.2 16.2 16.2
436,690 286,640 66%
7.0 7.0 7.0 7.0 7.0 7.0 7.0 7.0 7.0 7.0 7.0 7.0 7.0 7.0 7.0 7.0 7.0 7.0
39,761
18,129
49,587
36,048
44,549
18,129
49,587
36,048
Transmission to Muwangi
749.7
High Grand Fall Dam and Traansmission
309.6 462.3
Tana
WSB, F/S*,MTP
WSB, F/S
37,943
12 Makuyu
7 Maua
10 Muranga
11
9 Chogoria
Maragua
Chuka
WSB, F/S
-
WSB, F/S
WSB, F/S*,MTP
MTP
WSB, F/S
-
WSB, F/S
15 Sagana
13 Kerugoya/Kutus
14 Wanguru
1 Nyeri
MTP
3
Kitui
18 Madogo
19 Msalani
WSB, F/S
-
Lamu
6
8
WSB, F/S
Rehabilitation for 16 UrbanCentresTotal Urban Water Supply Projects
Rural Water Supply Projects
22
20
21
Hola
Matuu
16
4 Embu
23 Garissa
17 Garissa
Karatina2
5
Muranga
Othaya
Runyenjes
29,699
8,149
105,350
4,418
2,298
2,186
689
57,884
44,549
37,943
2,186
30%
25%
39,761
31,605
4,418
2,298
207
9,000
8,910
2,000
100%
30%
16%
30%
100%
100%
Meru Bulk Water Supply
Embu BulkWater Supply
Nyeri County BulkWater Supply
Muranga/ Maragua Bulk Water Supply
Tharaka Nithi Bulk Water Supply
Kirinyaga BulkWater Supply
Note: As for “Project Status”, “WSB” means a project proposed by WSB, “MTP” means a flagship project proposed in the First Medium Term Plan (2008 – 2019) of Kenya Vision 2030, and “F/S” means a project proposed in completed F/S.
Source: JICA Study Team
THE DEVELOPMENT OF THE NATIONAL WATER MASTER PLAN 2030
Figure 7.3.5 Implementation Schedule of Proposed Water Supply System Development Plan (TCA) JAPAN INTERNATIONAL COOPERATION AGENCY

C - F - 20
2013 2014 2015 2016 2017 2018 2019 2020 2021 2022 2023 2024 2025 2026 2027 2028 2029 2030
13/14 14/15 15/16 16/17 17/18 18/19 19/20 20/21 21/22 22/23 23/24 24/25 25/26 26/27 27/28 28/29 29/30 30/31
Implementation Schedule
Short Term Medium Term Long Term
Capacity to be developed
(m3/day)
Tota
l
Initi
alDe
velo
p.
Ratio
WRM
A Ca
tchm
ent
No.
Nam
e of
Pro
ject
Proj
ect S
tatu
s
Isiolo Dam 5.3 5.3 5.3 5.3
4.9 4.9 4.9 5.4 5.4 5.4
1.6 1.6 1.6 1.6
Rumuruti Dam 2.1 2.1 2.1 2.1
8.1 8.1 8.1 4.8 4.8 4.8
1.4 1.4 1.4 3.2 3.2 3.2
2.7 2.7 2.7 6.4 6.4 6.4
1.0 1.0 1.0 2.3 2.3 2.3
0.3 0.3 0.3 0.8 0.8 0.8
2.8 2.8 2.8 6.4 6.4 6.4
2.5 2.5 2.5 5.9 5.9 5.9
0.9 0.9 0.9 2.0 2.0 2.0
0.8 0.8 0.8 1.9 1.9 1.9
0.7 0.7 0.7 1.7 1.7 1.7
0.4 0.4 0.4 1.0 1.0 1.0
4.4 4.4 4.4 4.4 4.4
91,292 35,436 39%
Archers' Post Dam#REF! #REF! #REF! #REF!
13.2 13.2 13.2 13.2 13.2 13.2 13.2 13.2 13.2 13.2 13.2 13.2 13.2 13.2 13.2 13.2 13.2 13.2
54.4 74.9 134.2
Nyahururu Dam
WSB, MTP
MTP
WSP
Nanyuki
Moyale
6
Rumuruti
Maralal
8 Mandera
2 Nyahururu
Isiolo
4 Wajir
7
3
Takaba
12 Marsabit
1
MTP
MTP
-
-
-
-
Rehabilitation for 6 Urban Centres
10 Elwak -
11
-
9 Rhamu
5
ENN
Water Resources Development forRural Water Supply
Total Urban Water Supply Projects
Rural Water Supply Projects
1,528
12,272
11,188
13,801
17,283
6,029
12,143
4,416
3,867
3,574
3,249
1,942
3,682
1,325
458
6,552
10,822
3,356
30%
30%
1,160
975
1,809
583 30%
30%
30%
47%
3,643
1,072
63%
30%
30%
30%
30%
30%
Note: As for “Project Status”, “WSB” means a project proposed by WSB, “MTP” means a flagship project proposed in the First Medium Term Plan (2008 – 2019) of Kenya Vision 2030, and “F/S” means a project proposed in completed F/S.
Source: JICA Study Team
THE DEVELOPMENT OF THE NATIONAL WATER MASTER PLAN 2030
Figure 7.3.6 Implementation Schedule of Proposed Water Supply System Development Plan (ENNCA) JAPAN INTERNATIONAL COOPERATION AGENCY
Volume – IV Sectoral Report (1/3)
Sectoral Report (D) Sanitation

Final Report Sectoral Report (D) Sanitation Table of Contents
Nippon Koei Co., Ltd. D - i The Development of the National Water Master Plan 2030
THE PROJECT ON
THE DEVELOPMENT OF THE NATIONAL WATER MASTER PLAN 2030
IN THE REPUBLIC OF KENYA
FINAL REPORT
VOLUME – IV SECTORAL REPORT (1/3)
D: SANITATION
Abbreviation
Table of Contents
Page
CHAPTER 1 INTRODUCTION ................................................................................................ D-1
CHAPTER 2 CURRENT SITUATION OF SANITATION..................................................... D-2
2.1 Relevant Policies and Strategies ......................................................................................... D-2
2.2 Relevant Organizations ....................................................................................................... D-5
2.3 Current Situation ................................................................................................................. D-5
2.3.1 Overview ............................................................................................................................. D-5
2.3.2 Lake Victoria North Catchment Area ................................................................................. D-8
2.3.3 Lake Victoria South Catchment Area ................................................................................. D-9
2.3.4 Rift Valley Catchment Area ................................................................................................ D-9
2.3.5 Athi Catchment Area ......................................................................................................... D-10
2.3.6 Tana Catchment Area ........................................................................................................ D-11
2.3.7 Ewaso Ng’iro North Catchment Area ............................................................................... D-11
2.4 On-going Projects and Existing Plans ............................................................................... D-12
2.5 Operation and Maintenance Issues .................................................................................... D-12
2.6 Challenges and Key Issues ................................................................................................ D-12
CHAPTER 3 SANITATION DEVELOPMENT PLAN ......................................................... D-14
3.1 General .............................................................................................................................. D-14
3.2 Overall Concept and Framework for Planning ................................................................. D-16
3.3 Sanitation Development Plan for Lake Victoria North Catchment ................................... D-17
3.4 Sanitation Development Plan for Lake Victoria South Catchment ................................... D-18
3.5 Sanitation Development Plan for Rift Valley Catchment ................................................. D-20

Final Report Table of Contents Sectoral Report (D) Sanitation
The Development of D - ii Nippon Koei Co., Ltd. the National Water Master Plan 2030
3.6 Sanitation Development Plan for Athi Catchment ............................................................ D-21
3.7 Sanitation Development Plan for Tana Catchment ........................................................... D-23
3.8 Sanitation Development Plan for Ewaso Ng’iro North Catchment................................... D-24
CHAPTER 4 COST ESTIMATE ............................................................................................. D-26
4.1 Basic Conditions for Cost Estimate .................................................................................. D-26
4.2 Cost Estimate .................................................................................................................... D-26
4.2.1 Project Costs (Construction Costs) ................................................................................... D-26
4.2.2 Operation and Maintenance Costs ..................................................................................... D-27
4.2.3 Replacement Costs ............................................................................................................ D-27
CHAPTER 5 ECONOMIC EVALUATION ............................................................................ D-28
5.1 Evaluation Method and Basic Conditions ......................................................................... D-28
5.2 Economic Benefit .............................................................................................................. D-29
5.3 Economic Cost .................................................................................................................. D-30
5.4 Results of Economic Evaluation ....................................................................................... D-30
CHAPTER 6 IMPLEMENTATION PROGRAMME ............................................................ D-32
6.1 General .............................................................................................................................. D-32
6.2 Prioritization Criteria for Implementation ......................................................................... D-32
6.3 Implementation Schedule for Water Supply Development toward 2030 .......................... D-32
6.4 Recommendations for the further surveys and studies for NWMP2030 ........................... D-33
List of Tables
Page Table 2.3.1 Existing Sewerage Systems and Capacities .......................................................... D-T-1
Table 2.4.1 Ongoing Sewerage System and Capacity ............................................................. D-T-1
Table 2.4.2 Sewerage Projects Proposed by WSBs and First Medium Term Plan (2008-2012) of Kenya Vision 2030 ...................................................................... D-T-2
Table 3.2.1 Target 95 Urban Centres for Sewerage System Development ............................. D-T-3
Table 3.3.1 Proposed Sewerage Development Plan (LVNCA) ............................................... D-T-4
Table 3.3.2 Users and Required Units of On-Site Sanitation Facilities (LVNCA) ................. D-T-4
Table 3.4.1 Proposed Sewerage Development Plan (LVSCA) ............................................... D-T-5
Table 3.4.2 Users and Required Units of On-Site Sanitation Facilities (LVSCA) .................. D-T-5
Table 3.5.1 Proposed Sewerage Development Plan (RVCA) ................................................. D-T-6
Table 3.5.2 Users and Required Units of On-Site Sanitation Facilities (RVCA) .................... D-T-6
Table 3.6.1 Proposed Sewerage Development Plan (ACA) .................................................... D-T-7

Final Report Sectoral Report (D) Sanitation Table of Contents
Nippon Koei Co., Ltd. D - iii The Development of the National Water Master Plan 2030
Table 3.6.2 Users and Required Units of On-Site Sanitation Facilities (ACA) ...................... D-T-7
Table 3.7.1 Proposed Sewerage Development Plan (TCA) ..................................................... D-T-8
Table 3.7.2 Users and Required Units of On-Site Sanitation Facilities (TCA) ....................... D-T-8
Table 3.8.1 Proposed Sewerage Development Plan (ENNCA) ............................................... D-T-9
Table 3.8.2 Users and Required Units of On-Site Sanitation Facilities (ENNCA) ................. D-T-9
Table 4.2.1 Project Cost and O&M Cost for Sewerage Development (LVNCA) ................. D-T-10
Table 4.2.2 Project Cost and O&M Cost for Sewerage Development (LVSCA) .................. D-T-10
Table 4.2.3 Project Cost and O&M Cost for Sewerage Development (RVCA) .................... D-T-11
Table 4.2.4 Project Cost and O&M Cost for Sewerage Development (ACA) ...................... D-T-11
Table 4.2.5 Project Cost and O&M Cost for Sewerage Development (TCA) ....................... D-T-12
Table 4.2.6 Project Cost and O&M Cost for Sewerage Development (ENNCA) ................. D-T-12
Table 4.2.7 Project Cost and O&M Cost for Sewerage Development for Whole of Kenya .................................................................................................................. D-T-12
List of Figures
Page Figure 1.1.1 Study Flow for Sanitation Development Plan ...................................................... D-F-1
Figure 2.3.1 Percentage of No Wastewater Treatment ............................................................. D-F-2
Figure 2.3.2 Percentage of Sewerage Connection .................................................................... D-F-3
Figure 2.3.3 Percentage of Usage of On-site Wastewater Treatment Facility .......................... D-F-4
Figure 3.3.1 Proposed Urban Water Supply and Sewerage Development Plans (LVNCA) .............................................................................................................. D-F-5
Figure 3.4.1 Proposed Urban Water Supply and Sewerage Development Plans (LVSCA) .............................................................................................................. D-F-6
Figure 3.5.1 Proposed Urban Water Supply and Sewerage Development Plans (RVCA) (1/2)-(2/2) ............................................................................................... D-F-7
Figure 3.6.1 Proposed Urban Water Supply and Sewerage Development Plans (ACA) .......... D-F-9
Figure 3.7.1 Proposed Urban Water Supply and Sewerage Development Plans (TCA) ........ D-F-10
Figure 3.8.1 Proposed Urban Water Supply and Sewerage Development Plans (ENNCA) ............................................................................................................ D-F-11
Figure 6.3.1 Implementation Schedule of Proposed Sewerage System Development Plan (LVNCA) .................................................................................................... D-F-12
Figure 6.3.2 Implementation Schedule of Proposed Sewerage System Development Plan (LVSCA) .................................................................................................... D-F-13
Figure 6.3.3 Implementation Schedule of Proposed Sewerage System Development Plan (RVCA) ...................................................................................................... D-F-14
Figure 6.3.4 Implementation Schedule of Proposed Sewerage System Development Plan (ACA) ......................................................................................................... D-F-15

Final Report Table of Contents Sectoral Report (D) Sanitation
The Development of D - iv Nippon Koei Co., Ltd. the National Water Master Plan 2030
Figure 6.3.5 Implementation Schedule of Proposed Sewerage System Development Plan (TCA) ......................................................................................................... D-F-16
Figure 6.3.6 Implementation Schedule of Proposed Sewerage System Development Plan (ENNCA) .................................................................................................... D-F-17

Final Report Sectoral Report (D) Sanitation Abbreviations
Nippon Koei Co., Ltd. D - I The Development of the National Water Master Plan 2030
List of Abbreviations and Acronyms
ACA : Athi Catchment Area B/C : Benefit and Cost DHS : Demographic and Health Surveys EIRR : Economic Internal Rate of Return ENNCA : Ewaso Ng'iro North Catchment Area F/S : Feasibility Study JICA : Japan International Cooperation Agency JMP : Joint Monitoring Programme KIHBS : Kenya Integrated Household Budget Survey LVNCA : Lake Victoria North Catchment Area LVSCA : Lake Victoria South Catchment Area M/P Master Plan MDG : Millennium Development Goals MWI : Ministry of Water and Irrigation NPV : Net Present Value NWMP : National Water Master Plan NWRMS : National Water Resources Management Strategy NWSS : National Water Services Strategy O&M : Operation and Maintenance PPIP : Pro-Poor Implementation Plan RV : Rift Valley RVCA : Rift Valley Catchment Area TCA : Tana Catchment Area UC : Urban Centre UNICEF : United Nations Children's Fund VIP : Ventilated Improved Pit WHO : World Health Organization WSB : Water Service Board WSP : Water Service Provider WSSP : Water Sector Strategic Plan WSTF : Water Services Trust Fund WWTP : Waste Water Treatment Plant

Final Report Abbreviations Sectoral Report (D) Sanitation
The Development of D - II Nippon Koei Co., Ltd. the National Water Master Plan 2030
Abbreviations of Measures
Length mm = millimeter cm = centimeter m = meter km = kilometer
Money KSh = Kenya shilling US$ = U.S. dollar
Area ha = hectare m2 = square meter km2 = square kilometer
Energy kcal = Kilocalorie kW = kilowatt MW = megawatt kWh = kilowatt-hour GWh = gigawatt-hour
Volume L = liter m3 = cubic meter m3/s, cms = cubic meter per second CM = cubic meter MCM = million cubic meter BCM = billion cubic meter m3/d, cmd = cubic meter per day BBL = Barrel
Others % = percent o = degree ' = minute " = second °C = degree Celsius cap. = capital LU = livestock unit md = man-day mil. = million no. = number pers. = person mmho = micromho ppm = parts per million ppb = parts per billion L/p/d = litter per person per day
Weight mg = milligram g = gram kg = kilogram t = ton MT = metric ton Time s = second hr = hour d = day yr = year

NOTE 1. The National Water Master Plan 2030 was prepared based on the material and data provided from
Kenyan Government and its relevant organisations during field surveys in Kenya carried out until November 2012. The sources etc. of the material and data utilised for the study are described in the relevant part of the reports.
2. The names of ministries and related organisations of Kenyan Government are as of November 2012.
3. Information to be updated
The following information which is given in the report is needed to be updated properly:
(1) Information on the proposed development projects
The features and implementation schedules of the proposed development projects may be changed toward implementation of the project. After the subject projects were clearly featured for implementation, the project features and implementation schedules in this report should be updated.
(2) Information on the water demand
The water demand projected in this master plan should be revised when the large scale development plans, other than the projects proposed in this master plan, were formulated, as they will significantly affect to the water resources development and management.
4. Exchange rate for cost estimate
The costs of the proposed development and management plans were estimated by applying the following exchange rate as of November 1, 2012.
EXCHANGE RATE
US$1.00 = KSh 85.24 = ¥79.98 as of November 1, 2012

Final Report Introduction Sectoral Report (D)Sanitation Chapter 1
Nippon Koei Co., Ltd. D - 1 The Development of the National Water Master Plan 2030
CHAPTER 1 INTRODUCTION
The sanitation development plan is part of the National Water Master Plan 2030 (NWMP 2030). The Sectoral Report (D) presents the current situation of the sanitation sector as well as the sanitation development plan including cost estimates, economical evaluation, and implementation program. The planning conditions of the study are based on the Kenya Vision 2030, Water Service Strategic Plan, Census 2009, and other relevant official data. The study flow of the sanitation development plan is shown in Figure 1.1.1.

Current Situation of Sanitation Final Report Chapter 2 Sectoral Report (D) Sanitation
The Development of D - 2 Nippon Koei Co., Ltd. the National Water Master Plan 2030
CHAPTER 2 CURRENT SITUATION OF SANITATION
2.1 Relevant Policies and Strategies
(1) General
Over the recent years, various kinds of government strategy and policy documents have been prepared. The most important overarching documents applicable to the water supply and sanitation sector are:
a) Kenya Vision 2030; b) The National Water Services Strategy (NWSS), September 2007; c) Implementation Plan for the National Water Services Strategy, July 2008 - also known as the
Pro-Poor Implementation Plan (PPIP); d) Water Sector Strategic Plan (WSSP) 2009-14, April 2010; and e) The eight Water Service Boards (WSBs) strategic plans.
The NWMP 2030 will also need to take cognisance of the following sector-related documents:
a) Constitution of Kenya, August 2010;
b) National Water Resources Management Strategy, (NWRMS) (2007-2009), January 2007;
c) Draft Sector Investment Plan for the Water and Sanitation Sector in Kenya, January 2009;
d) Ministerial Strategic Plan 2009-2012, May 2009;
e) Water Services Strategic Plan, June 2009; f) National Climate Change Response Strategy, April 2010; and
g) National Water Harvesting and Storage Management Policy, May 2010
The key aspects of each of the above documents are summarised below.
(2) Kenya Vision 2030
The Kenya Vision 2030 sets out the overall development vision of the country from 2008 to 2030. It aims to “transform Kenya into a newly industrialised middle-income economy providing an improved quality of life to its citizens by 2030”. The Kenya Vision 2030 is based on three pillars, namely: economic, social, and political. It will be implemented through a series of successive five-year medium-term plans, the first of which covered the period from 2008 to 2012.
The popular version of Kenya Vision 2030 refers to the country’s expectation “to meet its millennium development goals (MDGs) in 2015”. The document states that some of the MDGs have already been achieved and that “Kenya Vision 2030 spells out the actions to achieve the rest.”
Among the MDGs, the goal “to halve by 2015, the proportion of people without sustainable access to safe drinking water and basic sanitation” is applicable in this section.
The long-term aim of the Kenya Vision 2030 is to ensure that improved water and sanitation are available for all. It is projected in the Kenya Vision 2030 that more than half of the population are

Final Report Current Situation of Sanitation Sectoral Report (D) Sanitation Chapter 2
Nippon Koei Co., Ltd. D - 3 The Development of the National Water Master Plan 2030
likely to be living in an urban environment by 2030. This is confirmed by the NWMP 2030 estimates.
The Kenya Vision 2030 includes the following specific target projects:
a) Rehabilitation and augmentation of the Mzima pipeline; b) Expansion of the coverage for Nairobi, Mombasa, Kisumu, Nakuru, and Kisii; c) Rehabilitation of water supplies in 26 medium-sized towns; and d) Rehabilitation and expansion of sewerage works in urban areas.
(3) National Water Services Strategy (NWSS), September 2007
The NWSS was prepared in accordance with Section 49 of the Water Act 2002. It provides a review of the water supply and sanitation situation in 2007. It recognizes that service coverage is poor and indeed has been deteriorating. Furthermore, it sets out the background of the Water Act 2002 and describes the main provisions of the law.
The stated vision of the NWSS is:
“Assured water supply, sewerage services, and basic sanitation for all Kenyans for improved health and wealth creation on an individual level and for the nation.”
The mission is:
“To realize the goals of the MDG declaration and the Kenya Vision 2030 of the Kenyan government concerning access to safe and affordable water and basic sanitation by responsive institutions within a regime of well-defined standards and regulation.”
The NWSS sets out five key goals as follows:
a) Reach at least 50% of the underserved urban population with safe and affordable water by 2015 (MDG) and thereafter, move to access for all by 2030;
b) Reach through sustainable waterborne sewage collection, treatment, and disposal systems 40% of the urban and 10% of the rural population by 2015 and total coverage in all urban centres by 2030;
c) Increase the access to safe and improved basic sanitation facilities particularly for the poor to 77.5% in the urban setting and 72.5% in the rural setting by 2015;
d) Achieve the MDGs by fast tracking affordable and sustainable access to safe water in the settlements of the urban poor; and
e) Reach at least 50% of the underserved rural population with safe and affordable water by 2015 (MDG) and thereafter, move to sustainable access for all by 2030.
In each case, the NWSS sets out the medium-term indicators for the achievements, challenges, recent developments, and strategic responses. The NWSS also provides a number of cross-cutting goals covering information systems, sector coordination, human rights and poverty alleviation, financing, gender mainstreaming, HIV/AIDS, environmental sustainability, and disaster management.

Current Situation of Sanitation Final Report Chapter 2 Sectoral Report (D) Sanitation
The Development of D - 4 Nippon Koei Co., Ltd. the National Water Master Plan 2030
(4) Implementation Plan for the National Water Services Strategy, July 2008
Also known as the Pro-Poor Implementation Plan (PPIP), this document was prepared to supplement the NWSS and specifically address the needs of the underserved population from a social standpoint. The PPIP sets out the actions to be undertaken by each of the key institutions created under the provisions of the Water Act 2002.
It should be noted that the PPIP is significantly more user-friendly and informative than the rather cumbersome NWSS. To aid in disseminating the plan to all stakeholders, it has been released in both the full and popular formats.
(5) Water Sector Strategic Plan (WSSP) 2009-14, April 2010
At the time of the review, the WSSP was still in the draft form, although by the date of the 2011 Annual Water Sector Conference, the document had been finalised and was urged to be adopted by the MWI. It is understood that the WSSP has now been approved. The vision of the Plan is as follows:
“A Kenya where water resources are protected, harnessed, and sustainably managed to ensure availability and accessibility to all for the present and future generations, thereby increasing prosperity through effective and efficient use, and a clean and healthy environment”.
The WSSP aims to meet the demand tasks and challenges through the following:
a) Increasing the knowledge among sector stakeholders of the current challenges and changes in the sector;
b) Providing policy and regulatory guidance to stakeholders, as to how the challenges should be met;
c) Providing a conducive environment for improved collaboration and coordination among stakeholders, ensuring that interventions move in the same direction, and resources are used effectively and efficiently; and
d) Providing a structure for follow-up and evaluation that covers all aspects of water development and allows its citizenry to jointly adjust their combined efforts over time, as required by circumstances.
The WSSP is based on the adoption of integrated water resources management and is guided by the Kenya Vision 2030. It provides an excellent summary of the sector as it stands today and addresses all of the key issues. The WSSP targets a sustainable and affordable access to safe water and sanitation to all, through the increased formalisation of services including low-income urban and rural areas, promotion of sustainable operation, e.g., through scheme clustering, and improved access through the works of the WSTF.
(6) WSB Strategic Plans
Copies of the eight WSB strategy plans have been collected and reviewed. Generally, the plans are vague and lacking in substance. Sanitation is poorly covered in comparison to water supply.
Through interviews conducted with the WSBs, it was clear that the plans were too ambitious and, as a result, have not been adhered to. Some WSBs indicated that their starting point, in terms of water

Final Report Current Situation of Sanitation Sectoral Report (D) Sanitation Chapter 2
Nippon Koei Co., Ltd. D - 5 The Development of the National Water Master Plan 2030
supply coverage, was not as advanced as they had been led to believe. It therefore seems that their progress has been limited and they consider this to be an unfair reflection on their performance.
Most WSBs have rewritten their plans to end in 2012 and are preparing new plans to cover the period from 2013 to 2017 in order to coincide with the Kenya Vision 2030.
2.2 Relevant Organisations
According to the Water Act 2002, the institutional arrangements for sewerage services are same as for the water supply sector. The institutional arrangements for the water supply sector are described in Section 2.2 of the Sectoral Report (C) Water Supply.
2.3 Current Situation
2.3.1 Overview
(1) Current Situation of Sanitation
At the time of the Aftercare Study (1998), it was estimated that 80% of the population of Kenya had access to sanitation (98% of the urban population and 76% of the rural population) although the figures presented did not differentiate between improved sanitation and unimproved sanitation and all possible facilities were in fact included in the analysis. It is generally recognised that sanitation lags well behind water supply and that insufficient attention has been paid to this subsector.
The MDG for sanitation is to reduce the proportion of the population without improved sanitation from 46% (in 1990) to 23% by 2015. The WHO/UNICEF Joint Monitoring Programme (JMP) report adopts the following definitions for improved and unimproved sanitation facilities:
JMP Definitions Improved Sanitation Unimproved Sanitation
Flush or pour-flush to: piped sewer system septic tank pit latrine
Ventilated improved pit (VIP) latrine Pit latrine with slab Composting toilet
Flush or pour-flush to elsewhere Pit latrine without slab/open pit Cart with small tank or drum Bucket Hanging toilet or hanging latrine Shared facilities of any type No facilities, bush or field
Source: JMP Report
The JMP report states that, in overall terms, the world is set to miss the MDG for sanitation as the currently projected figure is still 36%. Like the majority of Sub-saharan Africa, Kenya is not on target to meet the MDG for sanitation. Indeed, the JMP update indicates that Kenya is not within the 10% of the required rate to meet the target. In Sub-saharan Africa, as a whole, only 31% of the population has access to improved sanitation. While this figure is low, it should be noted that there is also a significant disparity between the urban (44%) and rural (24%) environments.
The JMP report provides the following estimates regarding the type of sanitation facility used in Kenya:

Current Situation of Sanitation Final Report Chapter 2 Sectoral Report (D) Sanitation
The Development of D - 6 Nippon Koei Co., Ltd. the National Water Master Plan 2030
JMP Estimates of Sanitation Use Facility Urban (%) Rural (%) Total (%)
Improved 27 32 31 Shared 51 18 25 Unimproved 20 32 29 Open defecation 2 18 15
Source: JMP Report
On the basis of the above total percentage figures and the JMP estimated national population of 38,765,000, it can be estimated that approximately 26,750,000 people remain without access to improved sanitation facilities in Kenya.
As with the water supply, the Census 2009 presents a good opportunity to establish the status of sanitation coverage but this has been missed as the presentation of the collected data does not allow the reader to identify the difference between the population using covered or uncovered pit latrines or the percentage of the population using shared sanitation facilities. Under MDG definitions, people using covered pit latrines and having their own facilities are counted as having improved services, while the remainder are not. The distribution of Kenya’s 8,767,954 households by province and sanitation facility is summarised in the table below.
Sanitation by Province
Province
Households (‘000)
Mai
n se
wer
Sept
ic ta
nk
Ces
spoo
l
VIP
pit
latri
ne
Pit l
atrin
e
Buc
ket
Bus
h
Oth
er
Nairobi 469.8 95.4 10.5 26.5 370.5 5.2 4.0 3.2 Central 46.5 61.2 3.2 83.6 1,025.5 1.2 3.0 0.6 Coast 42.2 57.0 5.5 39.0 403.9 4.6 177.7 1.2 Eastern 20.3 21.8 3.0 91.7 1,008.1 0.9 137.4 1.7 N Eastern 1.4 1.3 0.4 4.0 100.1 7.1 197.1 1.2 Nyanza 15.8 8.4 1.0 41.6 909.9 1.0 208.4 2.2 Rift Valley 70.4 47.9 5.2 95.5 1,470.8 2.0 443.0 2.4 Western 8.1 6.0 1.0 49.0 811.5 0.8 25.9 1.6 National 674.5 299.0 29.9 430.8 6,100.2 22.8 1,196.5 14.1
Source: Census 2009 data
On the basis that the main sewer, septic tank, cesspool, and 30% of the pit latrine facilities (VIP and other) are considered as improved sanitation, then it can be determined that 31% of the total population has access. This figure can be subdivided into 47% of the urban population and 23% of the rural population. The figures are presented on a provincial basis as follows:

Final Report Current Situation of Sanitation Sectoral Report (D) Sanitation Chapter 2
Nippon Koei Co., Ltd. D - 7 The Development of the National Water Master Plan 2030
Access to Improved Sanitation
Province Population with Improved Sanitation
Urban Rural Total No (‘000) % No (‘000) % No (‘000) %
Nairobi 2,212 70.5 0 0.0 2,212 70.5 Central 679 44.5 881 30.8 1,560 35.6 Coast 665 45.5 297 15.9 962 28.9 Eastern 450 36.7 1,158 26.1 1,607 28.4 N Eastern 99 23.1 141 7.5 240 10.4 Nyanza 447 32.2 961 23.7 1,408 25.9 Rift Valley 988 40.0 1,579 21.0 2,567 25.7 Western 288 33.9 1,017 29.2 1,305 30.1 National 5,828 46.7 6,034 23.1 11,862 30.7
Source: JICA Study Team, based on Census 2009 data
As with the water supply subsector, most of the government-prepared sector policies, strategies, development plans, and management plans provide estimates of the sanitation coverage. The Kenya Vision First Medium Term Plan 2008 to 2012 states that the national sanitation coverage was increased from 45% in 1990 to 48% in 2006. This is clearly higher than the JMP report figure, and it is assumed that a different calculation philosophy was adopted, which probably includes shared facilities.
In the NWSS estimates, the 2007 overall coverage is 50% (55% in the urban setting and 45% in the rural setting). The same figures are adopted by the WSTF in its strategic plan.
Having access to sanitation is only one aspect of the subsector, and that the safe treatment of wastewater and disposal of effluent are vitally important, especially where river flows are low. It is understood that only 5% of wastewater collected is actually treated. The Kenya Vision First Medium Term Plan 2008 to 2012 mentions that the lack of wastewater treatment is leading to high pollution levels in mainstream rivers, valley depressions, and dams.
Table 2.3.1 shows the existing sewerage systems and their capacities, which were prepared based on the data from WSBs. According to the data, sewerage systems have been developed for only 27 urban centres as follows:
Eldoret Webuye Molo Limuru Garissa Kitale Kisumu Nairobi Nyeri Isiolo Kakamega Kericho Mombasa Thika Nyahururu Kapsabet Homa Bay Machakos Embu Bungoma Nakuru Mavoko Meru Busia Naivasha Kiambu Muranga
The current situation is therefore very similar to that reported in the Aftercare Study (1998).

Current Situation of Sanitation Final Report Chapter 2 Sectoral Report (D) Sanitation
The Development of D - 8 Nippon Koei Co., Ltd. the National Water Master Plan 2030
(2) Coverage of Sanitation
Based on the Census 2009 data, the current situation of sanitation in Kenya is estimated as shown below.
Current Situation of Sanitation in 2010 (Unit: million persons)
Sanitation/ Evaluation
Sewerage Septic Tank, Pit Latrine, Cesspool
No Treatment (Bush, Others)
Total Improved Sanitation
Improved and Unimproved
Unimproved Sanitation
Urban Population 2.4 (18%)
9.2 (70%)
1.6 (12%)
13.2 (100%)
Rural Population 0.0 (0%)
20.1 (79%)
5.3 (21%)
25.4 (100%)
Total 2.4 (6%)
29.3 (76%)
6.9 (18%)
38.6 (100%)
Source: JICA Study Team based on Census 2009 data
The definition of improved and unimproved sanitation is based on the JMP report as explained in Section 2.3.1. Sewerage system has been developed in an only limited area in Kenya. Current sewerage coverage ratio is only 7%, and around 18% of the population does not use any sanitation facilities. Around 76% of the population uses on-site treatment facilities, which include unimproved sanitation such as pit latrine without slab. Figures 2.3.1, 2.3.2, and 2.3.3 show the percentages of no wastewater treatment, sewerage connection, and usage of on-site wastewater treatment facility in each district.
(3) Progress of Projects Proposed in the Aftercare Study
Of the five urban centres given priority for sewerage works, progress has only been made in Kisumu where the treatment plant has been rehabilitated. The NWMP (1992) and the Aftercare Study (1998) may not play significant role in the current planning and development of the water supply or sanitation systems.
2.3.2 Lake Victoria North Catchment Area (LVNCA)
Based on the Census 2009 data, the current situation of access to sanitation facilities in LVNCA was estimated as shown below.
Current Situation of Access to Sanitation Facilities (LVNCA) (Unit: households)
Type Sewerage Septic Tank, Pit Latrine, Cesspool No Treatment (Bush, Others) Urban 26,334
(7%) 329,509
(92%) 5,190 (1%)
Rural 1,428 (0%)
1,079,243 (95%)
60,582 (5%)
Total 27,762 (2%)
1,408,752 (94%)
65,773 (4%)
Source: JICA Study Team based on Census 2009 data

Final Report Current Situation of Sanitation Sectoral Report (D) Sanitation Chapter 2
Nippon Koei Co., Ltd. D - 9 The Development of the National Water Master Plan 2030
The table above shows number of households of each water connection. The service population of each water connection is estimated by multiplying current population to the ratio of water connection shown in the table above.
Sewerage system has been developed in limited area in LVNCA, and current sewerage coverage ratio is only 2%. There are eight small-scale wastewater treatment plants with total treatment capacity of about 21,000 m3/day. Around 94% of the population uses on-site sanitation facilities such as septic tank, etc. The on-site sanitation facilities include unimproved ones, but the ratio of the unimproved facilities is unknown. Around 4% of the population does not have any treatment facilities and uses bush for disposal.
2.3.3 Lake Victoria South Catchment Area (LVSCA)
Based on the Census 2009 data, the current situation of access to sanitation facilities in LVSCA was estimated as shown below.
Current Situation of Access to Sanitation Facilities (LVSCA) (Unit: households)
Type Sewerage Septic Tank, Pit Latrine, Cesspool No Treatment (Bush, Others) Urban 18,040
(4%) 367,893
(89%) 26,946
(7%) Rural 1,751
(0%) 926,845
(80%) 234,122
(20%) Total 19,791
(1%) 1,294,738
(82%) 261,068
(17%)
Source: JICA Study Team based on Census 2009 data
The table above shows number of households of each water connection. The service population of each water connection is estimated by multiplying current population to the ratio of water connection shown in the table above.
Sewerage system has been developed in limited area in LVSCA, and current sewerage coverage ratio is only 1%. There are four small-scale wastewater treatment plants with total treatment capacity of about 20,531 m3/day. Around 82% of the population uses on-site sanitation facilities such as septic tank, etc. The on-site sanitation facilities include unimproved ones, but the ratio of the unimproved facilities is unknown. Around 17% of the population does not have any treatment facilities and uses bush for disposal.
2.3.4 Rift Valley Catchment Area (RVCA)
Based on the Census 2009 data, the current situation of access to sanitation facilities in RVCA was estimated as shown below.

Current Situation of Sanitation Final Report Chapter 2 Sectoral Report (D) Sanitation
The Development of D - 10 Nippon Koei Co., Ltd. the National Water Master Plan 2030
Current Situation of Access to Sanitation Facilities (RVCA) (Unit: households)
Type Sewerage Septic Tank, Pit Latrine, Cesspool No Treatment (Bush, Others) Urban 36,133
(10%) 330,011
(87%) 12,690
(3%) Rural 1,412
(0%) 405,551
(59%) 279,573
(41%) Total 37,545
(4%) 735,562
(69%) 292,263
(27%)
Source: JICA Study Team based on Census 2009 data
The table above shows number of households of each water connection. The service population of each water connection is estimated by multiplying current population to the ratio of water connection shown in the table above.
Sewerage system has been developed in limited area in RVCA and the current sewerage coverage ratio is only 4%. There are four small-scale wastewater treatment plants located in Nakuru, Naivasha, and Molo with total treatment capacity of about 18,393 m3/day. Around 69% of the population uses on-site sanitation facilities such as septic tank, etc. The on-site sanitation facilities include unimproved ones, but the ratio of the unimproved facilities is unknown. Around 27% of the population does not have any treatment facilities and uses bush for disposal.
2.3.5 Athi Catchment Area (ACA)
Based on the Census 2009 data, the current situation of access to sanitation facilities in ACA was estimated as shown below.
Current Situation of Access to Sanitation Facilities (ACA) (Unit: households)
Type Sewerage Septic Tank, Pit Latrine, Cesspool No Treatment (Bush, Others) Urban 550,049
(30%) 1,252,126
(69%) 25,227
(1%) Rural 1,830
(0%) 517,232
(77%) 155,228
(23%) Total 551,879
(22%) 1,769,358
(71%) 180,455
(7%)
Source: JICA Study Team based on Census 2009 data
The table above shows number of households of each water connection. The service population of each water connection is estimated by multiplying current population to the ratio of water connection shown in the table above.
Sewerage system has been developed in limited area in ACA, and the current sewerage coverage ratio is 22%, which is the highest coverage ratio among the six catchment areas. There are eight wastewater treatment plants in six UCs around Nairobi and Mombasa with total treatment capacity of about 222,000 m3/day. Around 71% of the population uses on-site sanitation facilities such as septic tank, etc. The on-site sanitation facilities include unimproved ones, but the ratio of the unimproved facilities is unknown. Around 7% of the population does not have any treatment facilities and uses bush for disposal.

Final Report Current Situation of Sanitation Sectoral Report (D) Sanitation Chapter 2
Nippon Koei Co., Ltd. D - 11 The Development of the National Water Master Plan 2030
2.3.6 Tana Catchment Area
Based on the Census 2009 data, the current situation of access to sanitation facilities in TCA was estimated as shown below.
Current Situation of Access to Sanitation Facilities (TCA) (Unit: households)
Type Sewerage Septic Tank, Pit Latrine, Cesspool No Treatment (Bush, Others) Urban 20,304
(7%) 246,817
(90%) 7,948 (3%)
Rural 2,727 (0%)
983,265 (87%)
143,591 (13%)
Total 23,031 (2%)
1,230,082 (87%)
151,539 (11%)
Source: JICA Study Team based on Census 2009 data
The table above shows number of households of each water connection. The service population of each water connection is estimated by multiplying current population to the ratio of water connection shown in the table above.
Sewerage system has been developed in limited area in TCA, and the current sewerage coverage ratio is only 2%. There are six small-scale wastewater treatment plants in six UCs such as Thika, Nyeri, Muranga, etc. with total treatment capacity of about 32,343 m3/day. Around 87% of the population uses on-site sanitation facilities such as septic tank, etc. The on-site sanitation facilities include unimproved ones, but the ratio of the unimproved facilities is unknown. Around 11% of the population does not have any treatment facilities and uses bush for disposal.
2.3.7 Ewaso Ng’iro North Catchment Area (ENNCA)
Based on the Census 2009 data, the current situation of access to sanitation facilities in ENNCA was estimated as shown below.
Current Situation of Access Sanitation Facilities (ENNCA) (Unit: households)
Type Sewerage Septic Tank, Pit Latrine, Cesspool No Treatment (Bush, Other) Urban 13,691
(9%) 120,097
(82%) 15,340 (10%)
Rural 713 (0%)
318,692 (57%)
242,176 (43%)
Total 14,404 (2%)
438,789 (62%)
257,517 (36%)
Source: JICA Study Team based on Census 2009 data
The table above shows number of households of each water connection. The service population of each water connection is estimated by multiplying current population to the ratio of water connection shown in the table above.
Sewerage system has been developed in limited area in ENNCA, and the current sewerage coverage ratio is only 2%. There is a small-scale wastewater treatment plant in Nyahururu with total treatment capacity of about 4600 m3/day. Around 62% of the population uses on-site sanitation facilities such as septic tank, etc. The on-site sanitation facilities include unimproved ones, but the ratio of

Current Situation of Sanitation Final Report Chapter 2 Sectoral Report (D) Sanitation
The Development of D - 12 Nippon Koei Co., Ltd. the National Water Master Plan 2030
unimproved facilities is unknown. Around 36% of the population does not have any treatment facilities and uses bush for disposal.
2.4 Ongoing Projects and Existing Plans
The MWI provided copies of their internal donor matrix dated November 2009 and its 2010 updated version. The schemes in the matrix, particularly in terms of the water supply and sanitation sectors, have been included in Table 2.4.1 of the Sectoral Report (C). While this provides useful background information, it lacks significant technical details. The JICA Study Team therefore collected information of ongoing projects and new project proposals in the existing plans from each of the WSBs. Table 2.4.1 shows the list of ongoing construction projects for sewerage system development, and Table 2.4.2 shows the projects proposed and planned by the WSBs.
2.5 Operation and Maintenance Issues
Operation and maintenance of sewerage systems are carried out by WSPs under the supervision of WSBs. Performance of the water supply sector is described in the yearly report entitled the “Impact: A Performance Report of Kenya’s Water Services Sector”; however, there is no published report showing the performance of the sanitation sector.
The WSB staff recognised that there is a severe lack of data and that nobody really knows the actual condition of the sewerage systems and sanitation facilities with performance indicators, such as service population, wastewater treatment amount, and influent and effluent water quality.
The census is the only record that shows the overall condition of sanitation access in Kenya.
2.6 Challenges and Key Issues
(1) Low Coverage Ratio of the Current Sewerage System and Rapid Increase of Urban Population
The target coverage ratio of sewerage system will be 80% or 36.8 million of the urban population in 2030 although the current coverage ratio of sewerage system is only 18% which represents 2.4 million of the urban population in 2010. The service population in 2030 will be more than 15 times of the current service population. Capacity of sewerage system should be expanded rapidly up to 2030, to correspond to the increase in service population by more than 15 times.
(2) Need of Rehabilitation of the Existing Sewerage Systems
The sewerage systems with treatment capacity of 342,204 m3/day are being operated in 29 urban centres. It is difficult to know the actual performances of the sewerage systems clearly, because performance records of the sewerage systems are quite limited. It is generally believed that most of the sewerage systems were constructed before the independence year, and had been operated without proper maintenance and rehabilitation works for long years. Large scale of rehabilitation works is therefore required for the sewerage system, to keep the design capacity and national standards.

Final Report Current Situation of Sanitation Sectoral Report (D) Sanitation Chapter 2
Nippon Koei Co., Ltd. D - 13 The Development of the National Water Master Plan 2030
(3) Water Pollution in the Future
Water pollution is not a serious environmental problem in Kenya. However, the increase in future urban population will generate large amount of wastewater, and thus, will cause water pollution downstream of the urban area. From the viewpoint of water resource conservation and effective water resource use, it is highly recommended to develop a sewerage system in the urban area.
(4) Improvement Needs of Rural Sanitation
Around 6.9 million of the population still do not have access to any wastewater treatment, and this same number discharge wastewater without any treatment.
It is generally not practical and economical to plan and implement the sewerage systems in rural areas with sparse distribution of the population. Therefore, expansion and improvement of sanitation will be required in rural areas for protecting people’s health.

Sanitation Development Plan Final Report Chapter 3 Sectoral Report (D) Sanitation
The Development of D - 14 Nippon Koei Co., Ltd. the National Water Master Plan 2030
CHAPTER 3 SANITATION DEVELOPMENT PLAN
3.1 General
(1) Goal of Sanitation Service Level by 2030
The Kenya Vision 2030 states that the 2030 vision for water and sanitation is to ensure that improved water and sanitation are available to all. Based on the policy of the Kenya Vision 2030 and Water Service Strategic Plan 2009 prepared by the MWI, the targets on sanitation in Kenya by 2030 are set as follows:
a) Increase coverage of improved sanitation to 100% (Improve sanitation by sewerage system and on-site sanitation facilities);
b) Increase coverage of sewerage system to 80% for urban population; and c) Install improved on-site sanitation facilities for remaining population who are not supposed
to be covered by sewerage systems.
The sanitation development plan in the NWMP 2030 aims to meet the above target.
(2) Coverage of Sanitation
Based on the Census 2009 data, the current situation of the sanitation in Kenya is estimated as below.
Current Situation of Sanitation in 2010 (Unit: million persons)
Sanitation/ Evaluation
Sewerage Septic Tank, Pit Latrine, Cesspool
No Treatment (Bush, Others)
Total Improved Sanitation
Improved and Unimproved
Unimproved Sanitation
Urban Population 2.4 (18%)
9.2 (70%)
1.6 (12%)
13.2 (100%)
Rural Population 0.0 (0%)
20.1 (79%)
5.3 (21%)
25.4 (100%)
Total 2.4 (6%)
29.3 (76%)
6.9 (18%)
38.6 (100%)
Source: JICA Study Team based on Census 2009 data
The definition of improved and unimproved sanitation is based on the JMP report as explained in Section 2.3.1. Sewerage system has been developed in only limited area in Kenya. Current sewerage coverage ratio is only 7%, and around 18% of the population does not use any sanitation facilities. To achieve the goal, numerical targets are set for each sanitation condition as shown below.

Final Report Sanitation Development Plan Sectoral Report (D) Sanitation Chapter 3
Nippon Koei Co., Ltd. D - 15 The Development of the National Water Master Plan 2030
Target of Sanitation Condition in 2030 (Unit: million persons)
Sanitation/ Evaluation
Sewerage Septic Tank, Pit Latrine, Cesspool
No Treatment (Bush, Others)
Total Improved Sanitation
Improved and Unimproved
Unimproved Sanitation
Urban Population 36.8 (80%)
9.2 (20%)
0.0 (0%)
46.0 (100%)
Rural Population 0.0 (0%)
21.8 (100%)
0.0 (0%)
21.8 (100%)
Total 36.8 (54%)
31.0 (46%)
0.0 (0%)
67.8 (100%)
Source: JICA Study Team based on Census 2009 data and Water Service Strategic Plan 2009
The figure below shows the target of sanitation development by 2030. All residents will have access to sewerage systems or on-site wastewater treatment facilities. The service population of the sewerage system will be increased to 36.8 million from 2.4 million.
0.0
10.0
20.0
30.0
40.0
50.0
60.0
70.0
1 220302010
Sewerage
On-site Treatment
No Treatment
6 %
77 %
18 %
47 %
53 %
Source: JICA Study Team, based on Census 2009 data and Water Service Strategic Plan 2009
Development Plan of Sanitation System

Sanitation Development Plan Final Report Chapter 3 Sectoral Report (D) Sanitation
The Development of D - 16 Nippon Koei Co., Ltd. the National Water Master Plan 2030
3.2 Overall Concept and Framework for Planning
Based on the basic conditions and targets mentioned previously, the sanitation development plan will be formulated with the following overall concept and framework:
(1) Sewerage System Development
a) Sewerage system will be developed to cover 36.8 million residents by 2030, which is 80% of the urban population in Kenya. Basically, sewerage system will be developed in each urban centre.
b) For selection of target urban centres for sewerage system development, priorities are given to urban centres with the following conditions: ・ Urban centres with large population, which are supposed to generate large amount of
wastewater;
・ Urban centres which already have plans to develop sewerage system; and
・ Urban centres whose downstream has environmental problems caused by water pollution.
c) As shown in Table 3.2.1, 95 urban centres are proposed as the targets of sewerage system development.
d) For planning of sewerage system development, required wastewater treatment capacity is calculated based on the water supply amount with wastewater generation factor as shown below.
Unit Domestic Wastewater Generation Amount for Each Area
Area
Unit Water Supply Amount for Residential
Water Use
Ration of Commercial and
Institutional Water Use
Wastewater Generation
Factor
Unit Domestic Wastewater Generation
Amount 1) Nairobi, Mombasa,
and Kisumu 92 L/p/day 27% 80% 93.4 L/p/day
2) Other Urban Area 75 L/p/day 27% 80% 76.2 L/p/daySource: JICA Study Team based on MWI Design Manual
(2) Area Without Sewerage System
a) For areas with no sewerage system development, it is required to install suitable on-site wastewater treatment facilities (septic tanks) for 31.2 million population in 2030.
b) Around 17.0% of the population does not use wastewater treatment facility. Around 75.6% of the population uses on-site treatment facilities; however, the facilities include unsuitable ones which are categorised as unimproved sanitation (the percentage is not clear). Unsuitable on-site facilities shall be improved.

Final Report Sanitation Development Plan Sectoral Report (D) Sanitation Chapter 3
Nippon Koei Co., Ltd. D - 17 The Development of the National Water Master Plan 2030
3.3 Sanitation Development Plan for Lake Victoria North Catchment Area
(1) Development Strategy
Based on the overall concept described in Section 3.2, the sewerage system development is planned for the 19 UCs in LVNCA. The sewerage system development is conducted through the following three types of projects:
a) Rehabilitation of Existing Sewerage System
The rehabilitation includes repair and replacement of mechanical and electrical equipment of wastewater treatment plants (WWTPs) and pumping stations, and replacement of corrupted sewer pipes in seven UCs. This rehabilitation will be carried out for existing sewerage systems with total capacity of 21,000 m3/day.
b) Expansion of Sewerage System
In order to cover the demand in 2030, capacities of existing sewerage systems of seven UCs will be expanded. The expansion includes expansion and/or new construction of sewerage pipes, pumping stations, and WWTPs. The total capacity of expansion will be 230,000 m3/day to meet the demand in 2030.
c) Construction of New Sewerage System
There is no sewerage system in 19 UCs. New sewerage system will be constructed in these 19 UCs with total capacity of 206,000 m3/day.
d) Incorporation of existing plans
According to data from WSBs, there are five plans of sewerage development projects, which have 17,000 m3/day of total treatment capacity in LVNCA. (Refer to Table 2.4.2) These plans are to be incorporated in NWMP 2030. The planned capacity could cover only 7% of required development capacities. Two D/D and three F/S were completed for five projects. It is required to provide F/S reports of sewerage development projects, which will cover the future demand of each UC.
Outside the sewerage service area, the improved on-site treatment facilities will be available for the remaining 6.34 million residents in 2030. Currently, 6.64 million residents (94% of the entire population) are using the existing on-site treatment facilities, but unimproved facilities will be improved with new housing. Development of on-site sanitation facilities is planned for the 11 counties in LVNCA.
(2) Proposed Sanitation Development Plan
The sanitation development plan is shown in Table 3.3.1 and Figure 3.3.1, and the required unit of on-site sanitation facility is shown in Table 3.3.2. The proposed sanitation development plan for LVNCA is outlined below.

Sanitation Development Plan Final Report Chapter 3 Sectoral Report (D) Sanitation
The Development of D - 18 Nippon Koei Co., Ltd. the National Water Master Plan 2030
Proposed Sanitation Development Plan (LVNCA)
Type of Project Target Area Target Capacity (m3/day)
Target Population (million persons)
Sewerage System (Off-site Treatment)
Rehabilitation 7 UCs 21,000
6.03 Expansion 7 UCs 230,000 New Construction 12 UCs 209,000 Total 19 UCs 460,000
On-site Treatment Facilities 11 counties -- 6.33
Source: JICA Study Team
Out of the 7.71 million urban population in LVNCA, 78% is expected to be covered by the sewerage system. It is almost equal to 80% of the national target of sewerage coverage ratio. Through the above sanitation development, the sanitation situation of LVNCA in 2030 will be as follows:
Sanitation Situation in 2030 (LVNCA)
Items Sewerage System Septic Tank, etc. (On-site Treatment Facilities)
Service Population (million) 2010 0.14 6.54 2030 6.03 6.33
Required Treatment Capacity (m3/day) 2010 21,000 ----- 2030 460,000 -----
Operation Body Registered WSP Individual, Community, etc. Target Towns/ Areas 19 UCs 11 Counties
Source: JICA Study Team
3.4 Sanitation Development Plan for Lake Victoria South Catchment Area
Based on the overall planning concept and framework described in Section 3.2, sewerage system development is planned for the 19 UCs in LVSCA. The sewerage system development is conducted through the following three types of projects.
a) Rehabilitation of Existing Sewerage System
The rehabilitation includes repair and replacement of mechanical and electrical equipment of WWTPs and pumping stations, and replacement of corrupted sewer pipes in three UCs. This rehabilitation will be carried out for existing sewerage systems with total capacity of 22,000 m3/day to meet the demand in 2030.
b) Expansion of Sewerage System
In order to cover the demand in 2030, capacities of the existing sewerage systems of three UCs will be expanded. The plan includes expansion and/or new construction of sewerage pipes, pumping stations, and WWTPs. The total capacity of expanded system is 171,000 m3/day.
c) Construction of New Sewerage System
There is no sewerage system in 16 UCs. New sewerage system will be constructed in these UCs with total capacity of 291,000 m3/day.
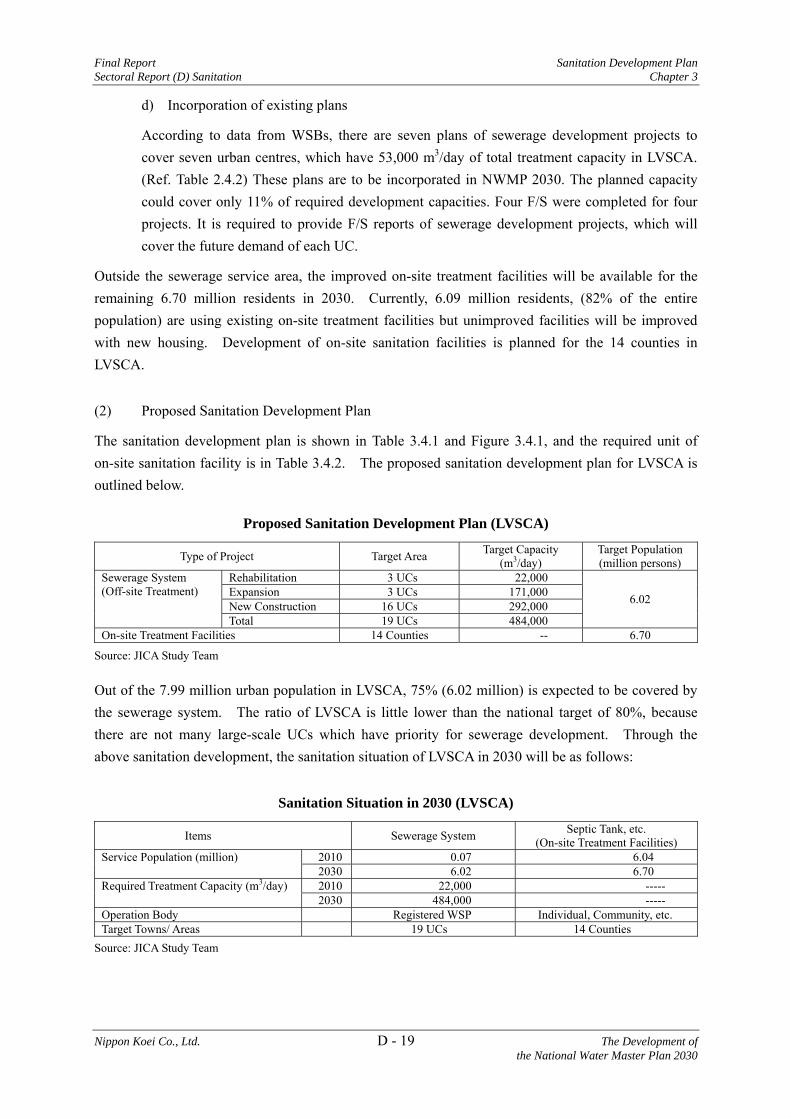
Final Report Sanitation Development Plan Sectoral Report (D) Sanitation Chapter 3
Nippon Koei Co., Ltd. D - 19 The Development of the National Water Master Plan 2030
d) Incorporation of existing plans
According to data from WSBs, there are seven plans of sewerage development projects to cover seven urban centres, which have 53,000 m3/day of total treatment capacity in LVSCA. (Ref. Table 2.4.2) These plans are to be incorporated in NWMP 2030. The planned capacity could cover only 11% of required development capacities. Four F/S were completed for four projects. It is required to provide F/S reports of sewerage development projects, which will cover the future demand of each UC.
Outside the sewerage service area, the improved on-site treatment facilities will be available for the remaining 6.70 million residents in 2030. Currently, 6.09 million residents, (82% of the entire population) are using existing on-site treatment facilities but unimproved facilities will be improved with new housing. Development of on-site sanitation facilities is planned for the 14 counties in LVSCA.
(2) Proposed Sanitation Development Plan
The sanitation development plan is shown in Table 3.4.1 and Figure 3.4.1, and the required unit of on-site sanitation facility is in Table 3.4.2. The proposed sanitation development plan for LVSCA is outlined below.
Proposed Sanitation Development Plan (LVSCA)
Type of Project Target Area Target Capacity (m3/day)
Target Population (million persons)
Sewerage System (Off-site Treatment)
Rehabilitation 3 UCs 22,000
6.02 Expansion 3 UCs 171,000 New Construction 16 UCs 292,000 Total 19 UCs 484,000
On-site Treatment Facilities 14 Counties -- 6.70
Source: JICA Study Team
Out of the 7.99 million urban population in LVSCA, 75% (6.02 million) is expected to be covered by the sewerage system. The ratio of LVSCA is little lower than the national target of 80%, because there are not many large-scale UCs which have priority for sewerage development. Through the above sanitation development, the sanitation situation of LVSCA in 2030 will be as follows:
Sanitation Situation in 2030 (LVSCA)
Items Sewerage System Septic Tank, etc. (On-site Treatment Facilities)
Service Population (million) 2010 0.07 6.04 2030 6.02 6.70
Required Treatment Capacity (m3/day) 2010 22,000 ----- 2030 484,000 -----
Operation Body Registered WSP Individual, Community, etc. Target Towns/ Areas 19 UCs 14 Counties
Source: JICA Study Team

Sanitation Development Plan Final Report Chapter 3 Sectoral Report (D) Sanitation
The Development of D - 20 Nippon Koei Co., Ltd. the National Water Master Plan 2030
3.5 Sanitation Development Plan for Rift Valley Catchment Area
(1) Development Strategy
Based on the overall planning concept and framework described in Section 3.2, sewerage system development is planned for the nine UCs in RVCA. The sewerage system development is conducted through the following three types of projects:
a) Rehabilitation of Existing Sewerage System
The rehabilitation includes repair and replacement of mechanical and electrical equipment of WWTPs and pumping stations, and replacement of corrupted sewer pipes in three UCs. This rehabilitation will be carried out for the existing sewerage systems with total capacity of 18,000 m3/day.
b) Expansion of Sewerage System
In order to cover the demand in 2030, capacities of the existing sewerage systems of three UCs will be expanded. The plan includes expansion and/or new construction of sewerage pipes, pumping stations, and WWTPs. The total capacity of expansion is 152,000 m3/day to meet the demand in 2030.
c) Construction of New Sewerage System
There is no sewerage system in seven UCs. New sewerage system will be constructed in these UCs with total capacity of 70,000 m3/day.
d) Incorporation of existing plans
According to data from WSBs, there are seven plans of sewerage development projects to cover seven urban centres, which have 106,000 m3/day of total treatment capacity. (Ref. Table 2.4.2) These plans are to be incorporated in NWMP 2030. The planned capacity could cover only 48% of required development capacities. One D/D and two F/S were completed for three projects. It is required to provide F/S reports of sewerage development projects, which will cover the future demand of each UC.
Outside the sewerage service area, the improved on-site treatment facilities will be available for the remaining 4.29 million residents in 2030. Currently, 3.38 million residents (69% of entire population) are using existing on-site treatment facilities, but unimproved facilities will be improved with new housing. Development of on-site sanitation facilities is planned for the 18 counties in RVCA.
(2) Proposed Sanitation Development Plan
The sanitation development plan is shown in Table 3.5.1 and Figure 3.5.1, and the required unit of on-site sanitation facility is in Table 3.5.2. The proposed sanitation development plan for RVCA is outlined below.

Final Report Sanitation Development Plan Sectoral Report (D) Sanitation Chapter 3
Nippon Koei Co., Ltd. D - 21 The Development of the National Water Master Plan 2030
Proposed Sanitation Development Plan (RVCA)
Type of Project Target Area Target Capacity (m3/day)
Target Population (million persons)
Sewerage System (Off-site Treatment)
Rehabilitation 3 UCs 18,000
3.16 Expansion 3 UCs 150,000 New Construction 6 UCs 72,000 Total 9 UCs 240,000
On-site Treatment Facilities 18 Counties -- 4.29
Source: JICA Study Team
Out of the 4.49 million urban population in RVCA, 70% is expected to be covered by the sewerage system. The ratio of RVCA is little lower than the national target of 80%, because there are not many large-scale UCs which have priority for sewerage development. Through the above sanitation development, the sanitation situation of RVCA in 2030 will be as follows:
Sanitation Situation in 2030 Plan (RVCA)
Items Sewerage System Septic Tank, etc. (On-site Treatment Facilities)
Service Population (million) 2010 0.19 3.35 2030 3.16 4.29
Required Treatment Capacity (m3/day) 2010 18,000 ----- 2030 240,000 -----
Operation Body Registered WSP Individual, Community, etc. Target Town/Areas 9 UCs 18 Counties
Source: JICA Study Team
3.6 Sanitation Development Plan for Athi Catchment Area
(1) Development Strategy
Based on the overall planning concept and framework described in Section 3.2, sewerage system development is planned for the 25 UCs in ACA. The sewerage system development is conducted through the following three types of projects:
a) Rehabilitation of Existing Sewerage System
The rehabilitation includes repair and replacement of mechanical and electrical equipment of WWTPs and pumping stations, and replacement of corrupted sewer pipes in six UCs. This rehabilitation will be carried out for the existing sewerage systems with a total capacity of 244,000 m3/day.
b) Expansion of Sewerage System
In order to cover the demand in 2030, capacities of the existing sewerage systems of six UCs will be expanded. This includes expansion and/or new construction of sewerage pipes, pumping stations, and WWTPs. The total capacity of expansion is 715,000 m3/day.
c) Construction of New Sewerage System
There is no sewerage system in 18 UCs. New sewerage system will be constructed in these UCs with a total capacity of 430,000 m3/day to meet the demand in 2030.

Sanitation Development Plan Final Report Chapter 3 Sectoral Report (D) Sanitation
The Development of D - 22 Nippon Koei Co., Ltd. the National Water Master Plan 2030
d) Incorporation of existing plans
According to data from WSBs, there are 15 plans of sewerage development projects, which have 396,000 m3/day of total treatment capacity. (Ref. Table 2.4.2) These plans are to be incorporated in NWMP 2030. The planned capacity could cover only 32% of required development capacities. Two D/D and six F/S were completed for eight projects. It is required to provide F/S reports of sewerage development projects, which will cover the future demand of each UC.
Outside the sewerage service area, the improved on-site treatment facilities will be available for the remaining 4.28 million residents in 2030. Currently, 6.72 million residents (71% of the entire population) are using existing on-site treatment facilities, but unimproved facilities will be improved with new housing. Development of on-site sanitation facilities is planned for the ten counties in ACA.
(2) Proposed Sanitation Development Plan
The sanitation development plan is shown in Table 3.6.1 and Figure 3.6.1, and the required unit of on-site sanitation facility is in Table 3.6.2. The proposed sanitation development plan for ACA is outlined below.
Proposed Sanitation Development Plan (ACA)
Type of Project Target Area Target Capacity (m3/day)
Target Population (million persons)
Sewerage System (Off-site Treatment)
Rehabilitation 6 UCs 244,000
16.26 Expansion 6 UCs 715,000 New Construction 19 UCs 430,000 Total 25 UCs 1,389,000
On-site Treatment Facilities 10 Counties -- 4.28
Source: JICA Study Team
Out of the 17.73 million urban population in ACA, 92% is expected to be covered by the sewerage system. The ratio of ACA is higher than the national target of 80%, because there are many large-scale UCs which have priority for sewerage development. Through the above sanitation development, the sanitation situation of ACA in 2030 will be as follows:
Sanitation Situation in 2030 (ACA)
Items Sewerage System Septic Tank, etc. (On-site Treatment Facilities)
Service Population (million) 2010 2.15 6.95 2030 16.26 4.28
Required Treatment Capacity (m3/day) 2010 244,000 ----- 2030 1,389,000 -----
Operation Body Registered WSP Individual, Community, etc. Target Towns/ Areas 25 UCs 10 Counties
Source: JICA Study Team

Final Report Sanitation Development Plan Sectoral Report (D) Sanitation Chapter 3
Nippon Koei Co., Ltd. D - 23 The Development of the National Water Master Plan 2030
3.7 Sanitation Development Plan for Tana Catchment Area
(1) Development Strategy
Based on the overall planning concept and framework described in Section 3.2, sewerage system development is planned for the 18 UCs in TCA. The sewerage system development is conducted through the following three types of projects:
a) Rehabilitation of Existing Sewerage System
The rehabilitation includes repair and replacement of mechanical and electrical equipment of WWTPs and pumping stations, and replacement of corrupted sewer pipes in four UCs. This rehabilitation will be carried out for the existing sewerage systems with a total capacity of 32,000 m3/day.
b) Expansion of Sewerage System
In order to cover the demand in 2030, capacities of existing sewerage systems of six UCs will be expanded. The plan includes expansion and/or new construction of sewerage pipes, pumping stations, and WWTPs. The total capacity of expansion is 118,000 m3/day.
c) Construction of New Sewerage System
There is no sewerage system in 12 UCs. New sewerage system will be constructed in these UCs with total capacity of 248,000 m3/day to meet the demand in 2030.
d) Incorporation of existing plans
According to data from WSBs, there are 12 plans of sewerage development projects to cover 11 urban centres, which have 98,000 m3/day of total treatment capacity. (Ref. Table 2.4.2) These plans are to be incorporated in NWMP 2030. The planned capacity could cover only 27% of required development capacities. Two D/D and eight F/S were completed for 10 projects. It is required to provide F/S reports of sewerage development projects, which will cover the future demand of each UC.
Outside the sewerage service area, the improved on-site treatment facilities will be available for the remaining 5.88 million residents in 2030. Currently, 5.08 million residents (87% of the entire population) are using existing on-site treatment facilities, but unimproved facilities are to be improved with new housing. Development of on-site sanitation facilities is planned for the 16 counties in TCA.
(2) Proposed Sanitation Development Plan
The sanitation development plan is shown in Table 3.7.1 and Figure 3.7.1, and the required unit of on-site sanitation facility is in Table 3.7.2. The proposed sanitation development plan for TCA is outlined below.

Sanitation Development Plan Final Report Chapter 3 Sectoral Report (D) Sanitation
The Development of D - 24 Nippon Koei Co., Ltd. the National Water Master Plan 2030
Proposed Sanitation Development Plan (TCA)
Type of Project Target Area Target Capacity (m3/day)
Target Population (million persons)
Sewerage System (Off-site Treatment)
Rehabilitation 6 UCs 32,000
5.24 Expansion 6 UCs 118,000 New Construction 12 UCs 248,000 Total 18 UCs 398,000
On-site Treatment Facilities 16 Counties -- 5.13
Source: JICA Study Team
Out of the 6.34 million urban population in TCA, 71% is expected to be covered by the sewerage system. The ratio of TCA is lower than the national target of 80%, because there are not many large-scale UCs which have high priority for sewerage system development. Through the above sanitation development, the sanitation situation of TCA in 2030 will be as follows:
Sanitation Situation in 2030 (TCA)
Items Sewerage System Septic Tank, etc. (On-site Treatment Facilities)
Service Population (million) 2010 0.11 4.99 2030 5.24 5.13
Required Treatment Capacity (m3/day) 2010 32,000 ----- 2030 398,000 -----
Operation Body Registered WSP Individual, Community, etc. Target Towns/ Areas 18 UCs 16 Counties
Source: JICA Study Team
3.8 Sanitation Development Plan for Ewaso Ng’iro North Catchment Area
(1) Development
Based on the overall planning concept and framework described in Section 3.2, sewerage system development is planned for the five UCs in ENNCA. The sewerage system development is conducted through the following three types of projects:
a) Rehabilitation of Existing Sewerage System
The rehabilitation includes repair and replacement of mechanical and electrical equipment of WWTPs and pumping stations, and replacement of corrupted sewer pipes in two UCs. This rehabilitation will be carried out for the existing sewerage systems with a total capacity of 5,000 m3/day.
b) Expansion of Sewerage System
In order to cover the demand in 2030, capacities of the existing sewerage systems of two UCs will be expanded. The plan includes expansion and/or new construction of sewerage pipes, pumping stations, and WWTPs. The total capacity of expansion is 27,000 m3/day.
c) Construction of New Sewerage System
There is no sewerage system in three UCs. New sewerage system will be constructed in these UCs with a total capacity of 30,000 m3/day to meet the demand in 2030.

Final Report Sanitation Development Plan Sectoral Report (D) Sanitation Chapter 3
Nippon Koei Co., Ltd. D - 25 The Development of the National Water Master Plan 2030
d) Incorporation of existing plans
According to data from WSBs, there are two plans of sewerage development projects to cover two urban centres, which have 7,000 m3/day of total treatment capacity in ENNCA. (Ref. Table 2.4.2) These plans are to be incorporated in NWMP 2030. The planned capacity could cover only 12% of required development capacities. One D/D and one F/S were completed for two projects. It is required to provide F/S reports of sewerage development projects, which will cover the future demand of each UC.
Outside the sewerage service area, the improved on-site treatment facilities will be available for the remaining 3.58 million residents in 2030. Currently, 2.40 million residents (62% of entire population) are using existing on-site treatment facilities, but unimproved facilities will be improved with new housing. Development of on-site sanitation facilities is planned for the 14 counties in ENNCA.
(2) Proposed Sanitation Development Plan
The sanitation development plan is shown in Table 3.8.1 and Figure 3.8.1, and the required unit of on-site sanitation facility is in Table 3.8.2. The proposed sanitation development plan for ENNCA is outlined below.
Proposed Sanitation Development Plan (ENNCA)
Type of Project Target Area Target Capacity (m3/day)
Target Population (million persons)
Sewerage System (Off-site Treatment)
Rehabilitation 2 UCs 5,000
0.82 Expansion 2 UCs 27,000 New Construction 3 UCs 30,000 Total 5 UCs 62,000
On-site Treatment Facilities 14 Counties -- 3.58
Source: JICA Study Team
Out of the 1.76 million urban population in ENNCA, 47% is expected to be covered by the sewerage system. The ratio of ENNCA is much lower than the national target of 80%, because there are only few large-scale urban centres which have priority for sewerage development. Currently, 36% of the population has no sanitation facilities, therefore, development of on-site treatment facilities is given higher priority than sewerage development. Through the above sanitation development, the sanitation situation of ENNCA in 2030 will be as follows:
Sanitation Situation in 2030 (ENNCA)
Items Sewerage System Septic Tank, etc. (On-site Treatment Facilities)
Service Population (million) 2010 0.07 2.37 2030 0.82 3.58
Required Treatment Capacity (m3/day) 2010 5,000 ----- 2030 62,000 -----
Operation Body Registered WSP Individual, Community, etc. Target Towns/ Area 5 UCs 14 Counties
Source: JICA Study Team

Cost Estimate Final Report Chapter 4 Sectoral Report (D) Sanitation
The Development of D - 26 Nippon Koei Co., Ltd. the National Water Master Plan 2030
CHAPTER 4 COST ESTIMATE
4.1 Basic Conditions for Cost Estimate
The project costs estimated in the study are only approximate or notional figures to grasp the general financial status, but do not bind the project finance arrangement in the future.
Basic conditions for project cost estimate are as follows:
a) Project costs were updated to correspond to the November 1, 2012 price level;
b) Exchange rate applied is US$1.0 = KSh85.24 as of November 1, 2012;
c) Physical contingency was assumed to be 15% of direct construction cost;
d) Cost of engineering services (detailed design and construction supervision) was assumed to be 10% of the direct construction cost;
e) Land acquisition cost was not considered. It was assumed that the lands are provided by the central government or local governments; and
f) The construction costs of multi-purpose dams were allocated on the basis of the existing F/S, the role of leading subsector in project implementation, and water storage volume (refer to Sectoral Report G – Water Resource Development).
4.2 Cost Estimate
4.2.1 Project Costs (Construction Costs)
The construction costs (financial initial investment costs) for the proposed sewerage projects are estimated or assumed below.
(1) Rehabilitation of Sewerage System
It is expected that the scope of the rehabilitation project will include replacement of old sewers and repair/ replacement works of mechanical and electrical equipment. The scope of the rehabilitation will depend on the conditions of each existing sewerage system, however, there is insufficient data and information to determine the project range. Under these situations, it is very difficult to estimate the cost of each rehabilitation project. Based on the estimates of existing reports prepared by WSBs and the Aftercare Study report, the unit rate of US$600/m3 of water supply capacity, which is 30% of unit project cost, was applied.
(2) Expansion and New Development of Sewerage System
For the expansion and new development of sewerage system, the project cost estimates are divided into wastewater collection system and wastewater treatment works.

Final Report Cost Estimate Sectoral Report (D) Sanitation Chapter 4
Nippon Koei Co., Ltd. D - 27 The Development of the National Water Master Plan 2030
1) Wastewater Collection System
The cost of wastewater collection system is dependent on the topographic condition of the sewerage service area. Based on the estimates of existing reports prepared by WSBs and the Aftercare Study report, the costs are assumed by applying a unit rate of US$1,250/m3 (the direct construction cost is US$1,000/m3) of wastewater treatment capacity.
2) Wastewater Treatment Works
The cost of wastewater treatment works is dependent on the treatment method to be adopted and topographic condition of the construction site. However, the treatment methods, locations, and construction site of wastewater treatment works for the 95 target urban centres have not been fixed yet. The construction site location will be determined through many discussions and negotiations to solve land acquisition problems. The treatment methods will be determined in the F/S to be carried out for each urban centre. For the cost estimate, it is assumed that waste stabilisation pond process is adopted for all wastewater treatment works.
Based on the estimates of existing reports prepared by WSBs and the Aftercare Study report, the costs are assumed by applying a unit rate of US$750/m3 (the direct construction cost is US$600/m3) of treatment capacity. The project costs were estimated in KSh applying the exchange rate of KSh 85.24/US$.
Tables 4.2.1 to 4.2.7 show the project cost estimates of sewerage system development for six catchment areas. The summary of the project costs is shown below.
Summary of Project Costs for Sewerage System Development Projects (Unit: KSh million)
Category Total Cost
Project Cost for Each Catchment Area LVNCA LVSCA RVCA ACA TCA ENNCA
Rehabilitation 17,502 1,074 1,114 941 12,482 1,655 236Expansion/Development 458,981 74,781 78,781 37,869 195,222 62,497 9,831Total 476,483 75,855 79,895 38,810 207,704 64,152 10,067Source: JICA Study Team
4.2.2 Operation and Maintenance (O&M) Costs
The O&M cost is highly dependent on electric power cost for water transmission and distribution. However, F/S reports as well as preliminary design have not been prepared for most of the proposed projects. Under this situation, it is impossible to estimate the O&M cost for each project. Based on the estimates of existing reports prepared by WASREB and WSBs, the O&M cost is roughly estimated by applying a unit rate of US$0.2/m3of treatment capacity.
4.2.3 Replacement Costs
Replacement costs of the project facilities such as mechanical and electrical works are assumed to be required every 15 years at an amount of 30% of the project cost.

Economic Evaluation Final Report Chapter 5 Sectoral Report (D) Sanitation
The Development of D - 28 Nippon Koei Co., Ltd. the National Water Master Plan 2030
CHAPTER 5 ECONOMIC EVALUATION
5.1 Evaluation Method and Basic Conditions
The economic viability of selected projects was evaluated based on the estimated economic cost and sanitation benefit. The economic decision-making criteria consist of the following:
a) Economic Internal Rate of Return (EIRR);
b) Net Present Value (NPV); and
c) Benefit and Cost Ratio (B/C Ratio).
The following assumptions were made for the economic analysis:
1) Price Level
Investment costs and O&M costs were estimated at the price level of November 1, 2012. All prices are expressed in US$ currency. Foreign exchange rate was set at KSh85.24 to US$1.00. Conversion rate was ¥79.98 to US$1.00, and KSh110.48 to €1.00.
2) Economic Value
The prices of internationally tradable goods and services will be valued on the basis of the international border prices, which is often expressed in the World Bank’s Commodity Prices and Price Forecast. The prices of non-traded goods and services will be converted from their financial value to economic value by applying a standard conversion factor of 0.90 based on the facts that the ratio of taxation against the GDP in Kenya is about 11%, as well as on the fact that the conversion factors widely applied in the water sector of Kenya are mostly around 0.90.
3) Social Discount Rate
The social discount rate reflects the opportunity cost of capital to the national economy. In this study, 10% of the prevailing opportunity cost of capital in the water sector of Kenya is applied.
4) Economic Life of Projects
The economic life of sanitation projects is set at 30 years. However, parts of the mechanical facilities have economic lives of 15 years, so they would be replaced in 15 years or within their economic lives.
5) Multi-purpose Dams
The construction costs and annual O&M costs of multi-purpose dams were allocated on the basis of the existing F/S, the role of leading subsector in project implementation, and water storage volume.
The overall economic evaluation of urban sewerage projects for the 95 urban centres was performed for each catchment at the master plan level. Rural sanitation projects were not evaluated because of the unavailability of data for planning at this preliminary stage.

Final Report Economic Evaluation Sectoral Report (D) Sanitation Chapter 5
Nippon Koei Co., Ltd. D - 29 The Development of the National Water Master Plan 2030
5.2 Economic Benefit
Economic benefits of urban sewerage projects were identified as follows:
(1) Quantifiable Benefits
Resource cost saving benefit, which is regarded as the cost saving of not having to depend on alternative sanitation facilities such as shared pit latrines and septic tanks. According to the Joint Monitoring Programme for Water and Sanitation, around 48% of the urban population relies on shared toilet, and the other 20% is dependent on other unimproved sanitary facilities and open defecation. Rapid informal settlement assessment was undertaken in the suburb of Nairobi in October 2012, in which most people in the informal settlement were reported to pay KSh5 per session for three times per day. The proposed urban sewerage projects are expected to replace the existing sanitation system as well as serve the people who are currently dependent on unimproved shared latrines. This replacement of shared latrines is considered as cost saving benefit in this study.
Affordability to pay, which is estimated as the maximum affordable value for urban communities for wastewater treatment. The household expenditure data from the Kenya Integrated Household Budget Survey (KIHBS) 2005/06 was used to estimate the affordable expenditure for the urban population. Expenditure data per adult in KIHBS is the only data extracted from the survey. From the conservative viewpoint, this study applied per adult expenditure to calculate the maximum affordable value for urban sewerage facility, i.e., expenditure of urban population more than 15 years old was estimated. The maximum affordability for urban sewerage facility was set at 1% of per adult expenditure, which is commonly considered in urban sewerage projects.
(2) Qualitative Benefits
Improved public health, which derives from the prevention of catching water-borne diseases. Several water-borne diseases are caused by poor sanitation. For instance, the Water and Sanitation Program identifies diarrhea, respiratory infection, and malaria as water-borne diseases caused by poor sanitation, whose health care costs amounted to US$51 million each year in Kenya. The rapid informal settlement assessment in Nairobi also found that malaria and cholera were often referred to as illnesses caused by wastewater. From the conservative viewpoint, the study estimated the health care and health-related productivity costs caused by malaria due to poor sanitation. The base data used for this calculation are from the Water and Sanitation Programme in Kenya and the Demographic and Health Surveys (DHS) in Kenya in 2008/09. The DHS shows that the incidence of malaria due to poor sanitation was estimated at 17% of children between 0 and 4 years old. This malaria-attributed case to poor sanitation was applied to estimate the public health costs due to poor sanitation. The prevalence of malaria for children between 0 and 4 years old was 22% (DHS 2008/09), while the malaria case for all age population in Kenya was estimated at 24.9% of the total population in 2007 (World Malaria Report 2009). From these data and conservative viewpoint, this study assumed that around 20% of the population of more than 5 years old has been inflicted with malaria every year in Kenya. Accordingly, the health care costs and working days loss costs of malaria caused by poor sanitation were calculated as a benefit of the improved sanitation through urban sewerage projects.
There are other qualitative benefits in health and environmental aspects and these benefits are often considered greater than quantifiable benefits, but due to the unavailability of data and

Economic Evaluation Final Report Chapter 5 Sectoral Report (D) Sanitation
The Development of D - 30 Nippon Koei Co., Ltd. the National Water Master Plan 2030
the difficulties of quantifying in economic terms, this study only considered the above economic benefits.
The construction period for the urban sewerage is set at three years and the benefits will start from the fourth year, reaching the full development in five years.
5.3 Economic Cost
(1) Investment Cost
For economic evaluation, the economic investment cost was converted to its equivalent economic value to remove transfer payments such as taxes and subsidies. The cost for engineering services was estimated at 10% of the initial construction cost. The physical contingency was included in the investment cost, which was set at 15% of initial direct construction cost. The total investment costs by catchment are summarised in the following table. The highest investment costs will be required in Athi catchment, in order to match the increased population in this catchment (14,427,000 beneficiaries in 2030). The total economic cost for the proposed sewerage projects was estimated at US$5,061.5 million. Note that a unit construction cost per beneficiary was estimated at US$153 at the national level.
Summary of the Estimated Investment and O&M Costs by Catchment of Urban Sewerage Projects
Catchment Area
No. of Beneficiary
No. of Projects
Unit Construction Cost
(US$ per capita)
Total Financial Cost
(US$ million)
Total Economic Cost
(US$ million)
Annual Financial O&M Cost
(US$ million) LVN 5,928,000 18 148 877.3 824.6 48.0 LVS 5,949,000 19 155 924.2 868.7 50.6 RV 2,988,000 8 149 444.2 417.6 24.3 Athi 14,427,000 25 159 2,290.3 2,152.9 125.4 Tana 5,164,000 17 142 733.2 689.2 40.1 ENN 752,000 5 153 115.4 108.4 6.3 Total 35,208,000 92 153 5,384.6 5,061.5 294.8
Source: JICA Study Team
(2) Annual Operation and Maintenance Cost
The annual O&M cost for sewerage facility was calculated by using US$0.2/m3 per day of treatment capacity and estimated as in the above table. The O&M cost was further converted to its economic value.
(3) Replacement Cost
The replacement cost is required for mechanical facilities every 15 years and set at 20% of the initial construction cost.
5.4 Results of Economic Evaluation
The results of the economic evaluation by catchment are summarised in the following table. All catchments have an EIRR greater than 10%, with the national average of EIRR of 10.9% and B/C ratio

Final Report Economic Evaluation Sectoral Report (D) Sanitation Chapter 5
Nippon Koei Co., Ltd. D - 31 The Development of the National Water Master Plan 2030
of 1.06. The proposed urban sewerage projects are expected to boost the national economy in Kenya by US$6,593 million at the present price. In terms of contribution of each economic benefit to urban sewerage projects, resource cost saving benefit consists of 91% of the total economic benefit, while the health-related benefits comprise around 1.1% of the total. The qualitative benefits such as improved public health are normally difficult to quantify and their real socioeconomic impact is likely to be underestimated. It can be said that the quantified economic benefits, in particular health-related socioeconomic benefits and environmental benefits, may be greater than the estimated quantifiable benefits. Athi catchment has the largest economic impact on the national economy, increasing it by US$2,651 million at the present value, followed by LVSCA and LVNCA.
Summary of the Economic Evaluation Results for Urban Water Supply by Catchment (Unit: US$ million)
Catchment Area Net Present Value (10%) B/C EIRR Cost Benefit LVNCA 1,010 1,106 1.09 11.3% LVSCA 1,065 1,110 1.04 10.6% RVCA 512 559 1.09 11.3% ACA 2,641 2,713 1.03 10.4% TCA 845 964 1.14 11.9%
ENNCA 130 141 1.08 11.1% Total 6,205 6,593 1.06 10.9%
Source: JICA Study Team

Implementation Programme Final Report Chapter 6 Sectoral Report (D) Sanitation
The Development of D - 32 Nippon Koei Co., Ltd. the National Water Master Plan 2030
CHAPTER 6 IMPLEMENTATION PROGRAMME
6.1 General
The implementation program for sewerage projects toward 2030 was formulated so as to complete all projects to meet the water demand in 2030. The implementation schedule was considered in three terms, namely: short term (five years from 2013 to 2017), medium term (five years from 2018 to 2022) and long term (eight years from 2023 and 2030). The implementation schedule of the water supply development plan is consistent with the water source development plan, such as dam construction plan.
The total development capacity of the proposed projects by 2030 is 2.69 million m3/day, which is more than eight times of the current capacity of existing sewerage systems. This is quite huge development plan, and needs to be modified due to financial restriction.
The individual projects will have EIAs which will address all issues including land acquisition and compensation.
6.2 Prioritisation Criteria for Implementation
The rehabilitation of existing sewerage systems has the highest priority for effective water use. Rehabilitation projects for the 27 urban centres with water supply system are proposed in the short term.
Basically, each water supply system is proposed to be developed in two phases by 2030, in order to avoid overdevelopment. The plan of 2nd phase projects could be modified, after completion of the 1st phase projects.
As for the new development and expansion sewerage projects, prioritisation for implementation is made using the following criteria:
1st Priority Projects with finance
2nd Priority Projects with detailed design completed by WSBs
3rd Priority Projects with feasibility study completed by WSBs
4th Priority Projects proposed by WSBs, or proposed in the First Medium Term Plan
5th Priority Projects other than the above
For projects with the same ranking as in the above, the following criteria will be applied for further prioritisation:
• Project with larger service population has higher priority.

Final Report Implementation Programme Sectoral Report (D) Sanitation Chapter 6
Nippon Koei Co., Ltd. D - 33 The Development of the National Water Master Plan 2030
6.3 Implementation Schedule for Water Supply Development toward 2030
Based on the criteria mentioned above, the implementation schedules of the sewerage projects were prepared as shown in Tables 6.3.1 to 6.3.6 by catchment area. These were summarised in the subsection hereunder.
The overall project implementation schedule is arranged to manage the necessary budget for development in the short term (2013/14 to 2017/18), medium term (2018/19 to 2022/23), and long term (2023/24 to 2030/31). Tables 6.3.1 to 6.3.6 show the required project costs for each term as well as by each catchment area.
6.4 Recommendations for Further Surveys and Studies for NWMP 2030
(1) Preparation of Water Pollution Map for Sewerage Development
The sewerage development target aims to increase the coverage of sewerage system to 80% of the urban population by 2030. Out of the 137 major urban centres, 95 urban centres were selected as the target. These were selected from the urban centres with large population. These urban centres with large population have huge environmental impacts in terms of generation of large volume of wastewater.
The major purpose of sewerage development is to prevent water pollution. From this viewpoint, the sewerage system should be provided so as to protect the water environment from pollution sources.
It is recommended to investigate the current situation of water environment and prepare a water pollution map for major rivers and lakes to confirm the priorities of the proposed sewerage development areas.
(2) Review of Population Projection of Urban Centres
The proposed sewerage development plans were formulated so as to treat the future wastewater to be generated by the 95 target urban centres in 2030. The wastewater generated was estimated based on the projected population of the 95 target urban centres. The Kenya Vision 2030 presents the projection of the total urban and rural populations of Kenya in 2030, however, it does not include the population projection of the urban centres. The projection for each urban centre was roughly made using the available data and information.
The priorities and required capacities of the proposed sewerage systems highly depend on the future population projection. It is recommended to review the projected urban population of the target urban centres, based on the future urban development plan, such as expansion of urban area, development of urban infrastructure, future land use, expected economic activity, etc.
(3) Confirmation on the Availability of Land for Wastewater Treatment Plant
Out of the 95 target urban centres, a feasibility study of sewerage system development has been carried out for 37 urban centres only. For the remaining 58 urban centres, the locations of wastewater treatment plants have not been determined, and it is not easy to find lands that have not

Implementation Programme Final Report Chapter 6 Sectoral Report (D) Sanitation
The Development of D - 34 Nippon Koei Co., Ltd. the National Water Master Plan 2030
been occupied or allocated in the urban areas. Therefore, land acquisition will be a key issue in the sewerage system development. For smooth realisation of the sewerage system development, it is recommended to confirm the availability of lands as early as possible based on the future land use plans of the target urban centres.
(4) Monitoring of Performance of Sewerage System
Through this study, it was revealed that the current performance of the existing sewerage systems has not been sufficiently monitored. The following data should be recorded to ensure proper formulation of the sewerage system development plan;
Number of households connected to sewerage system (ratio of sewerage connection), Influent wastewater amount to the treatment works (wastewater amount collected by sewerage
system), and
Water quality of influent and effluent wastewater to and from the treatment works.
It is recommended to monitor continuously the performance of the sewerage systems in operation as well as collect the data listed above for further study.

Tables

Sewerage Systems Town Centre Urban Centre Market Centres County Capacity (m3/day) Population ServedEldoret Water Sanitation Company Eldoret Uasin Gishu 4,800 103,760
Kitale 800 30,366Bungoma 4,500Webuye 2,700
Kakamega Sewerage Kakamega Town - Shirere Kakamega 1,500 15,962MMUST Sewerage Kakamega MMUST 1,200
Busia 3,000Kapsabet Nandi Water and Sanitation Company Ltd. Kapsabet Sewerage Kapsabet Nandi 2,500 1,500
Kisumu Sewarage Kisumu (Conventional) 6,800 47,736Nyalenda 11,000
Kericho Water and Sanitation Company Kericho Sewarage Kericho Kericho 1,500 22,500Gusii Water and Sanitation Company Kisii Sewarage Kisii Kisii n.a. 12,600South Nyanza Water and Sanitation Compay South Nyanza Sewarage Homabay Homa Bay 1,231 6,000
Nakuru Sewerage Works Old town Domestic 6,600 94,293Njoro Industrial n.a.
Nakuru Rural Water and Sanitation Company Ltd. Molo Sewerage Works Molo Town 1,260Naivasha Water and Sanitation Company Ltd. Naivasha Sewerage Works Naivasha town 933 28,620Kiambu Water and Sanitation Co. Ltd Kiambu Sewerage Kiambu Kiambu Kiambu 10,000 3,564Limuru Water and Sewarage Co. Ltd Limuru Sewerage Limuru Limuru Kiambu 10,000 4,800Thika Water and Sanitation Co. Ltd Thika Sewerage Thika Thika Kiambu 20,000 77,082
Dandora Sewerage Nairobi Nairobi Nairobi 120,000 1,241,138Kariobangi Sewerage Nairobi Nairobi 32,000
Mombasa Water and Sanitation Company Ltd. Mombasa-Changamwe Mombasa 17,100 53,872Mavoko Epza Water and Sewerage Co. Athi River, Mlolongo n,a. 32,400
Machakos-Muvuti 2, 000 12,744Mavoko (Athi River) 12,960
Nyeri Sewerage Nyeri- Kiganjo Nyeri 2,000 26,094Nyeri- ADB 6,100
Embu Water and Sanitation Company Embu Sewarage Embu Embu 682 23,400Mathira Water and Sewerage Company Karatina Sewerage Karatina Nyeri n.a. 16,882Meru Water and Sewerage Services Meru Sewerage Meru Meru 1,000 6,759Murang'a Water and Sanitation Company Murang'a Sewarage Mbiri- Murang'a Muranga 1,564 15,918Nyahururu Water and Sanitation Company Nyahururu Nyahururu Nyahururu Laikipia 2,617 25,576Nanyuki Water and Sewerage Company Nanyuki Sewerage Nanyuki Laikipia n.a. 22,242Garissa Water and Sewerage Company Garissa Garissa 1,000 5,328Isiolo Water and Sewerage Company Isiolo Isiolo sewerage Isiolo Isiolo 2,000 5,430
Source: JICA Study Team based on data from WSBs
Sewerage system Town Centre Urban Centre Market Centre County Capacity (m3/day) Population ServedNairobi Water and Sewerage Company Dandora sewerage Nairobi Nairobi 40,000
Total 40,000
Source: JICA Study Team based on data from WSBs
Western Water Service Company
Nzoia Water and Sanitation Company Ltd.
Kisumu Water and Sewerage Compay
Machakos
Trans Nzoia
Kakamega/Busia
Nakuru Water and Sanitation Company Ltd.
Kisumu
Nairobi Water and Sewerage Company
Table 2.3.1 Existing Sewerage Systems and Capacites
ENNCA
TCA
RVCA
LVSCA
LVNCA
Nakuru
CAExisting Sewerage Systems and Capacites
Water Service Providers
CA Water Service Providers
Table 2.4.1 Ongoing Sewerage System and Capacity
ACA
Nyeri Water and Sewerage Company
ACA
Ongoing Sewerage System and Capacity
Machakos Water and Sewerage Ltd.
D - T - 1

Catchment Area No. Urban Centre Project Status Projects proposed byWSBs
Flagship Project inFirst Medium Term
Plan in Kenya Vision2030
Proposed Capacity(m3/day)
Source: JICA Study Team, based on the data from WSBs and the First Medium Term Plan (2008-2012) of Kenya Vision 2030
Table 2.4.2 Sewerage Projects Proposed by WSBs and First Medium Term Plan (2008 - 2012)of Kenya Vision 2030
Proposed- -
10
F/S 3,347
4 Wajir- -
TCA
D/D 4,0001 Nyahururu 23 Isiolo
Mandera
13 Makuyu
10 Kerugoya/Kutus
12 Matuu - 16,880
Proposed-
- -
F/S 2,23511 Nyeri
Proposed
F/S 3,2702,249F/S Proposed
7 Garissa F/S8 Chogoria9 Runyenjes
1,561
5 LamuF/S 40,000
3,000F/S
-7
-
6 Chuka
10,0005,000
Thika
F/S
1 Embu
4 Meru F/S3 Kitui
D/D 6,3872 Maua 1,982D/D
-Proposed
-
Proposed
-WSBWSB
Total
Proposed
Proposed
-
- 24,064
- 57,552-
- 7,880
62,49714 Machakos 13 Kangundo-Tala
-
Kiserian
F/S 10,000
F/S 500
F/S -
8 Karuri
12 Kajiado
55,325
9 Kiambu
7 Mavoko
Ruiru
20,000-F/S 60,000F/S 20,000
Proposed
3 Kikuyu D/D
D/D1
ACA
4 Nairobi
2 Juja
15 Ukunda
6 Molo
D/D1 Kabarnet
65 Limuru
4 Naivasha RVCA
2 Nakuru 6,855
- 12,0005 7,000
2 Siaya
- 6,0007 Kericho
F/S 2,0006,000
3
6 Kisii
Homa Bay
4 Moi's Bridge5 Matunda
F/S
-
Proposed
Proposed-
--
F/S
F/S 5,000F/S
-
3,600
1,750
-
4,500
4,500
70,0002,380
LVNCA 3 Malaba
Proposed
LVSCA
1 Kisumu
4 Migori
2
D/D 3,851
- -
D/D 2,0002,471
1 Bondo
F/S
6 Kapenguria
-
7,347Total
27,972--
3 Eldama Ravine
5 Muhoroni
Bomet
F/S
-
-
-
F/S
-
Ol Kalou
7
Proposed-
ProposedProposedProposed
ENNCA
F/S
11
4,300-Proposed
97,565
3,220Narok
F/SMombasa
Ngong Proposed
Proposed
Proposed-
30,802
16,923
52,722
105,755Total
Proposed
ProposedProposedProposedProposed
396,122
40,000
7,500
--
- 5,000Proposed-
Proposed
ProposedProposed
-ProposedProposedProposed
ProposedProposedProposedProposed
Proposed
ProposedProposedProposedProposedProposed
ProposedProposed
ProposedProposedProposedProposedProposed
Proposed
ProposedProposedProposedProposedProposed
-
--
ProposedProposedProposed
-
Total
Total
ProposedProposed
--
Proposed-
-Proposed
TotalProposedProposed
Proposed-----
D - T - 2

No. LVNCA LVSCA RVCA ACA TCA ENNCA
1 Eldoret Kisumu Nakuru Nairobi Lamu Isiolo 2 Vihiga Rongo Naivasha Mombasa Nyeri Nanyuki 3 Kitale Kericho Ol Kalou Ruiru Kitui Nyahururu 4 Mumias Bomet Molo Kikuyu Thika Mandera5 Kimilili Kisii Narok Kangundo-Tala Embu Wajir6 Kakamega Migori Gilgil Machakos Meru7 Kapsabet Suneka Njoro Mavoko Matuu 8 Bungoma Ahero Eldama Ravine Malindi Makuyu 9 Busia Kipkelion Kabarnet Karuri Chuka
10 Luanda Homa Bay Ngong Muranga 11 Item/Tambach Londiani Kiambu Garissa 12 Webuye Nyamira Limuru Chogoria13 Kapenguria Keroka Ukunda Maragua14 Bondo Oyugis Kitengela Wanguru15 Siaya Muhoroni Wundanyi Runyenjes 16 Malaba Awasi Kilifi Kerugoya/Kutus 17 Malakisi Kehancha Mtwapa Maua 18 Moi's Bridge Awendo Juja Mwingi 19 Matunda Kendu Bay Ongata Rongai 20 Taveta21 Mariakani 22 Voi 23 Kajiado24 Kwale25 Kiserian
Total 19 UCs 19 UCs 9 UCs 25 UCs 18 UCs 5 UCsSource: JICA Study Team, based on Census 2009 data.
Table 3.2.1 Target 95 Urban Centres for Sewerage System Development
D - T - 3

Table 3.3.1 Proposed Sewerage Development Plan (LVNCA)
Major Urban Area Service
Population in 2030
Required Capacity in
2030 (m3/day)
Current Capacity in
2010 (m3/day)
Under Construction
(m3/day)
Proposed Projects Rehabilitation
Works (m3/day)
Expansion Works
(m3/day)
New Construction
(m3/day) 1 Eldoret 1,105,499 84,239 4,800 0 4,800 79,439 02 Vihiga 597,496 45,529 0 0 0 0 45,5293 Kitale 534,528 40,731 800 0 800 39,931 04 Mumias 503,318 38,353 0 0 0 0 38,3535 Kimilili 477,847 36,412 0 0 0 0 36,4126 Kakamega 461,945 35,200 2,700 0 2,700 32,500 07 Kapsabet 436,952 33,296 2,500 0 2,500 30,796 08 Bungoma 281,225 21,429 4,500 0 4,500 16,929 09 Busia 261,664 19,939 3,000 0 3,000 16,939 0
10 Luanda 248,400 18,928 0 0 0 0 18,92811 Item/Tambach 212,992 16,230 0 0 0 0 16,23012 Webuye 208,119 15,859 2,700 0 2,700 13,159 013 Kapenguria 171,382 13,059 0 0 0 0 13,05914 Bondo 168,472 12,838 0 0 0 0 12,83815 Malaba 108,112 8,238 0 0 0 0 8,23816 Malakisi 85,993 6,553 0 0 0 0 6,55317 Siaya 72,115 5,495 0 0 0 0 5,49518 Moi’s Bridge 58,266 4,440 0 0 0 0 4,44019 Matunda 37,643 2,868 0 0 0 0 2,868 Total 6,031,965 459,636 21,000 0 21,000 229,693 208,943
Note: Data of the service population for each urban centre in 2010 is not available. All urban population of urban centre in 2030 was counted as service population.
Source: JICA Study Team, based on data from WSBs and Census 2009
Table 3.3.2 Users and Required Units of On-Site Sanitation Facilities (LVNCA)
Counties Users
in 2010 Users
in 2030 Difference
(2010-2030)Required Units of On-site
Facilities* 11 6,540,000 6,330,000 -210,000 1,266,000
Note: * 5 users/facilities Source: JICA Study Team, based on data from Census 2009
D - T - 4

Table 3.4.1 Proposed Sewerage Development Plan (LVSCA)
Major Urban Area Service
Population in 2030
Required Capacity in
2030 (m3/day)
Current Capacity in
2010 (m3/day)
Under Construction
(m3/day)
Proposed Projects Rehabilitation
Works (m3/day)
Expansion Works
(m3/day)
New Construction
(m3/day) 1 Kisumu 1,457,208 136,103 17,800 0 0 118,303 02 Rongo 519,406 39,579 0 0 0 0 39,5793 Kericho 512,485 39,051 1,500 0 0 37,551 04 Bomet 421,478 32,117 0 0 0 0 32,1175 Kisii 411,773 31,377 0 0 0 0 31,3776 Migori 267,297 20,368 0 0 0 0 20,3687 Suneka 255,809 19,493 0 0 0 0 19,4938 Ahero 255,366 19,459 0 0 0 0 19,4599 Kipkelion 235,382 17,936 0 0 0 0 17,936
10 Homa Bay 218,278 16,633 1,231 0 0 15,402 011 Londiani 217,220 16,552 0 0 0 0 16,55212 Nyamira 209,750 15,983 0 0 0 0 15,98313 Keroka 209,679 15,978 0 0 0 0 15,97814 Oyugis 178,454 13,598 0 0 0 0 13,59815 Muhoroni 173,451 13,217 0 0 0 0 13,21716 Awasi 172,268 13,127 0 0 0 0 13,12717 Kehancha 151,564 11,549 0 0 0 0 11,54918 Awengo 80,193 6,111 0 0 0 0 6,11119 Kendu Bay 74,234 5,657 0 0 0 0 5,657 Total 6,021,294 483,887 20,531 0 0 171,256 292,101
Note: Data of the service population for each urban centre in 2010 is not available. All urban population of urban centre in 2030 was counted as service population.
Source: JICA Study Team, based on data from WSBs and Census 2009
Table 3.4.2 Users and Required Units of On-Site Sanitation Facilities (LVSCA)
Counties Users
in 2010 Users
in 2030 Difference
(2010-2030)Required Units of On-site
Facilities* 14 6,040,000 6,700,000 660,000 1,340,000
Note: * 5 users/facilities Source: JICA Study Team, based on data from Census 2009
D - T - 5

Table 3.5.1 Proposed Sewerage Development Plan (RVCA)
Major Urban Area Service
Population in 2030
Required Capacity in
2030 (m3/day)
Current Capacity in
2010 (m3/day)
Under Construction
(m3/day)
Proposed Projects Rehabilitation
Works (m3/day)
Expansion Works
(m3/day)
New Construction
(m3/day) 1 Nakuru 1,155,789 88,071 16,200 0 16,200 71,871 02 Naivasha 851,433 64,879 933 0 933 63,946 03 Ol Kalou 332,309 25,322 0 0 0 0 25,3224 Molo 204,630 15,593 1,260 0 1,260 14,333 05 Narok 194,573 14,826 0 0 0 0 14,8266 Gilgil 177,659 13,538 0 0 0 0 13,5387 Njoro 118,552 9,034 0 0 0 0 9,0348 Eldama Ravine 89,965 6,855 0 0 0 0 6,8559 Kabarnet 31,236 2,380 0 0 0 0 2,380
Total 3,156,144 240,498 18,393 0 18,393 150,150 71,955
Note: Data of the service population for each urban centre in 2010 is not available. All urban population of urban centre in 2030 was counted as service population.
Source: JICA Study Team, based on data from WSBs and Census 2009
Table 3.5.2 Users and Required Units of On-Site Sanitation Facilities (RVCA)
Counties Users
in 2010 Users
in 2030 Difference
(2010-2030)Required Units of On-site
Facilities* 18 3,350,000 4,290,000 940,000 858,000
Note: * 5 users/facilities Source: JICA Study Team, based on data from Census 2009
D - T - 6
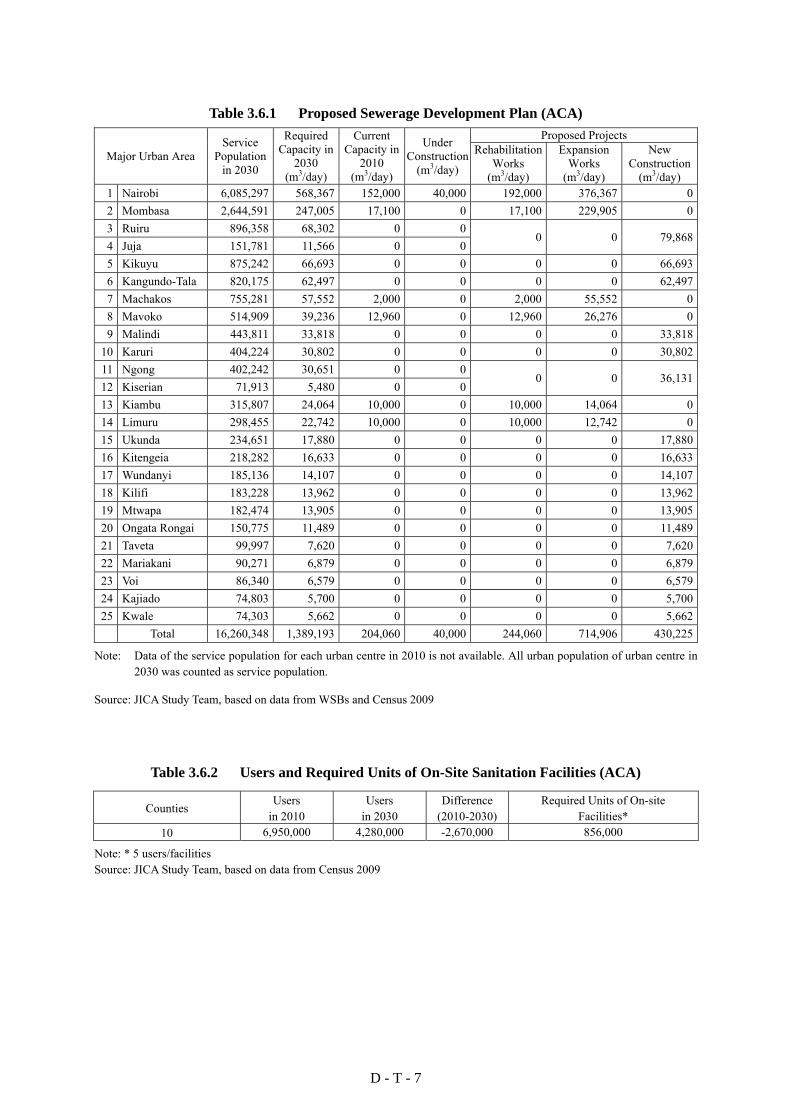
Table 3.6.1 Proposed Sewerage Development Plan (ACA)
Major Urban Area Service
Population in 2030
Required Capacity in
2030 (m3/day)
Current Capacity in
2010 (m3/day)
Under Construction
(m3/day)
Proposed Projects Rehabilitation
Works (m3/day)
Expansion Works
(m3/day)
New Construction
(m3/day) 1 Nairobi 6,085,297 568,367 152,000 40,000 192,000 376,367 02 Mombasa 2,644,591 247,005 17,100 0 17,100 229,905 03 Ruiru 896,358 68,302 0 0
0 0 79,8684 Juja 151,781 11,566 0 05 Kikuyu 875,242 66,693 0 0 0 0 66,6936 Kangundo-Tala 820,175 62,497 0 0 0 0 62,4977 Machakos 755,281 57,552 2,000 0 2,000 55,552 08 Mavoko 514,909 39,236 12,960 0 12,960 26,276 09 Malindi 443,811 33,818 0 0 0 0 33,818
10 Karuri 404,224 30,802 0 0 0 0 30,80211 Ngong 402,242 30,651 0 0
0 0 36,13112 Kiserian 71,913 5,480 0 013 Kiambu 315,807 24,064 10,000 0 10,000 14,064 014 Limuru 298,455 22,742 10,000 0 10,000 12,742 015 Ukunda 234,651 17,880 0 0 0 0 17,88016 Kitengeia 218,282 16,633 0 0 0 0 16,63317 Wundanyi 185,136 14,107 0 0 0 0 14,10718 Kilifi 183,228 13,962 0 0 0 0 13,96219 Mtwapa 182,474 13,905 0 0 0 0 13,90520 Ongata Rongai 150,775 11,489 0 0 0 0 11,48921 Taveta 99,997 7,620 0 0 0 0 7,62022 Mariakani 90,271 6,879 0 0 0 0 6,87923 Voi 86,340 6,579 0 0 0 0 6,57924 Kajiado 74,803 5,700 0 0 0 0 5,70025 Kwale 74,303 5,662 0 0 0 0 5,662 Total 16,260,348 1,389,193 204,060 40,000 244,060 714,906 430,225
Note: Data of the service population for each urban centre in 2010 is not available. All urban population of urban centre in 2030 was counted as service population.
Source: JICA Study Team, based on data from WSBs and Census 2009
Table 3.6.2 Users and Required Units of On-Site Sanitation Facilities (ACA)
Counties Users
in 2010 Users
in 2030 Difference
(2010-2030)Required Units of On-site
Facilities* 10 6,950,000 4,280,000 -2,670,000 856,000
Note: * 5 users/facilities Source: JICA Study Team, based on data from Census 2009
D - T - 7

Table 3.7.1 Proposed Sewerage Development Plan (TCA)
Major Urban Area Service
Population in 2030
Required Capacity in
2030 (m3/day)
Current Capacity in
2010 (m3/day)
Under Construction
(m3/day)
Proposed Projects Rehabilitation
Works (m3/day)
Expansion Works
(m3/day)
New Construction
(m3/day) 1 Lamu 1,250,000 95,250 0 0 0 0 95,2502 Nyeri 600,803 45,781 8,100 0 8,100 37,681 03 Kitui 551,547 42,028 0 0 0 0 42,0284 Thika 513,806 39,152 20,000 0 20,000 19,152 05 Embu 305,362 23,269 682 0 682 22,587 06 Meru 269,949 20,570 1,000 0 1,000 19,570 07 Matuu 255,467 19,467 0 0 0 0 19,4678 Makuyu 221,524 16,880 0 0 0 0 16,8809 Chuka 218,821 16,674 0 0 0 0 16,674
10 Muranga 144,849 11,037 1,561 0 1,561 9,476 011 Garissa 143,348 10,923 1,000 0 1,000 9,923 012 Chogoria 143,036 10,899 0 0 0 0 10,89913 Maragua 132,762 10,116 0 0 0 0 10,11614 Wanguru 120,726 9,199 0 0 0 0 9,19915 Runyenjes 98,401 7,498 0 0 0 0 7,49816 Kerugoya/Kutus 97,767 7,450 0 0 0 0 7,45017 Maua 86,713 6,608 0 0 0 0 6,60818 Mwingi 80,390 6,126 0 0 0 0 6,126 Total 5,235,273 398,928 32,343 0 32,343 118,389 248,195
Note: Data of the service population for each urban centre in 2010 is not available. All urban population of urban centre in 2030 was counted as service population.
Source: JICA Study Team, based on data from WSBs and Census 2009
Table 3.7.2 Users and Required Units of On-Site Sanitation Facilities (TCA)
Counties Users
in 2010 Users
in 2030 Difference
(2010-2030)Required Units of On-site
Facilities* 16 4,990,000 5,130,000 140,000 1,026,000
Note: * 5 users/facilities Source: JICA Study Team, based on data from Census 2009
D - T - 8

Table 3.8.1 Proposed Sewerage Development Plan (ENNCA)
Service
Population in 2030
Required Capacity in
2030 (m3/day)
Current Capacity in
2010 (m3/day)
Under Construction
(m3/day)
Proposed Projects Rehabilitation
Works (m3/day)
Expansion Works
(m3/day)
New Construction
(m3/day) 1 Isiolo 231,501 17,640 2,000 0 2,000 15,640 02 Nanyuki 192,282 14,652 0 0 0 0 14,6523 Nyahururu 183,483 13,981 2,617 0 2,617 11,364 04 Mandera 108,071 8,235 0 0 0 0 8,2355 Wajir 102,042 7,776 0 0 0 0 7,776
Total 817,380 62,284 4,617 0 4,617 27,004 30,663
Note: Data of the service population for each urban centre in 2010 is not available. All urban population of urban centre in 2030 was counted as service population.
Source: JICA Study Team, based on data from WSBs and Census 2009
Table 3.8.2 Users and Required Units of On-Site Sanitation Facilities (ENNCA)
Counties Users
in 2010 Users
in 2030 Difference
(2010-2030)Required Units of On-site
Facilities* 14 2,370,000 3,580,000 1,210,000 716,000
Note: * 5 users/facilities Source: JICA Study Team, based on data from Census 2009
D - T - 9
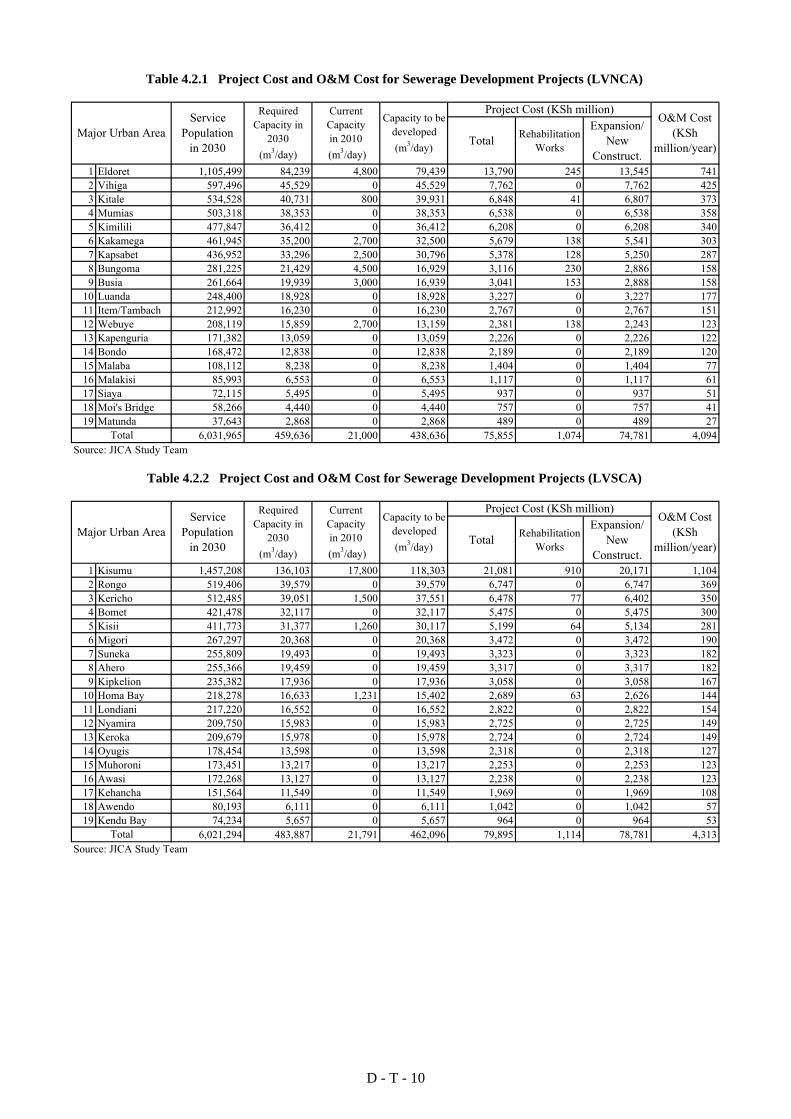
Total RehabilitationWorks
Expansion/New
Construct.1 Eldoret 1,105,499 84,239 4,800 79,439 13,790 245 13,545 7412 Vihiga 597,496 45,529 0 45,529 7,762 0 7,762 4253 Kitale 534,528 40,731 800 39,931 6,848 41 6,807 3734 Mumias 503,318 38,353 0 38,353 6,538 0 6,538 3585 Kimilili 477,847 36,412 0 36,412 6,208 0 6,208 3406 Kakamega 461,945 35,200 2,700 32,500 5,679 138 5,541 3037 Kapsabet 436,952 33,296 2,500 30,796 5,378 128 5,250 2878 Bungoma 281,225 21,429 4,500 16,929 3,116 230 2,886 1589 Busia 261,664 19,939 3,000 16,939 3,041 153 2,888 158
10 Luanda 248,400 18,928 0 18,928 3,227 0 3,227 17711 Item/Tambach 212,992 16,230 0 16,230 2,767 0 2,767 15112 Webuye 208,119 15,859 2,700 13,159 2,381 138 2,243 12313 Kapenguria 171,382 13,059 0 13,059 2,226 0 2,226 12214 Bondo 168,472 12,838 0 12,838 2,189 0 2,189 12015 Malaba 108,112 8,238 0 8,238 1,404 0 1,404 7716 Malakisi 85,993 6,553 0 6,553 1,117 0 1,117 6117 Siaya 72,115 5,495 0 5,495 937 0 937 5118 Moi's Bridge 58,266 4,440 0 4,440 757 0 757 4119 Matunda 37,643 2,868 0 2,868 489 0 489 27
6,031,965 459,636 21,000 438,636 75,855 1,074 74,781 4,094Source: JICA Study Team
Total RehabilitationWorks
Expansion/New
Construct.1 Kisumu 1,457,208 136,103 17,800 118,303 21,081 910 20,171 1,1042 Rongo 519,406 39,579 0 39,579 6,747 0 6,747 3693 Kericho 512,485 39,051 1,500 37,551 6,478 77 6,402 3504 Bomet 421,478 32,117 0 32,117 5,475 0 5,475 3005 Kisii 411,773 31,377 1,260 30,117 5,199 64 5,134 2816 Migori 267,297 20,368 0 20,368 3,472 0 3,472 1907 Suneka 255,809 19,493 0 19,493 3,323 0 3,323 1828 Ahero 255,366 19,459 0 19,459 3,317 0 3,317 1829 Kipkelion 235,382 17,936 0 17,936 3,058 0 3,058 167
10 Homa Bay 218,278 16,633 1,231 15,402 2,689 63 2,626 14411 Londiani 217,220 16,552 0 16,552 2,822 0 2,822 15412 Nyamira 209,750 15,983 0 15,983 2,725 0 2,725 14913 Keroka 209,679 15,978 0 15,978 2,724 0 2,724 14914 Oyugis 178,454 13,598 0 13,598 2,318 0 2,318 12715 Muhoroni 173,451 13,217 0 13,217 2,253 0 2,253 12316 Awasi 172,268 13,127 0 13,127 2,238 0 2,238 12317 Kehancha 151,564 11,549 0 11,549 1,969 0 1,969 10818 Awendo 80,193 6,111 0 6,111 1,042 0 1,042 5719 Kendu Bay 74,234 5,657 0 5,657 964 0 964 53
6,021,294 483,887 21,791 462,096 79,895 1,114 78,781 4,313Source: JICA Study Team
Project Cost (KSh million)O&M Cost
(KShmillion/year)
Table 4.2.1 Project Cost and O&M Cost for Sewerage Development Projects (LVNCA)
Major Urban AreaService
Populationin 2030
RequiredCapacity in
2030(m3/day)
CurrentCapacityin 2010
(m3/day)
Capacity to bedeveloped(m3/day)
Project Cost (KSh million)O&M Cost
(KShmillion/year)
Total
Table 4.2.2 Project Cost and O&M Cost for Sewerage Development Projects (LVSCA)
Major Urban AreaService
Populationin 2030
RequiredCapacity in
2030(m3/day)
CurrentCapacityin 2010
(m3/day)
Capacity to bedeveloped(m3/day)
Total
D - T - 10

Total RehabilitationWorks
Expansion/New
Construct.1 Nakuru 1,155,789 88,071 16,200 71,871 13,083 829 12,255 6712 Naivasha 851,433 64,879 933 63,946 10,951 48 10,904 5973 Ol Kalou 332,309 25,322 0 25,322 4,318 0 4,318 2364 Molo 204,630 15,593 1,260 14,333 2,508 64 2,443 1345 Narok 194,573 14,826 0 14,826 2,528 0 2,528 1386 Gilgil 177,659 13,538 0 13,538 2,308 0 2,308 1267 Njoro 118,552 9,034 0 9,034 1,540 0 1,540 848 Eldama Ravine 89,965 6,855 0 6,855 1,169 0 1,169 649 Kabarnet 31,236 2,380 0 2,380 406 0 406 22
3,156,144 240,498 18,393 222,105 38,810 941 37,869 2,073Source: JICA Study Team
Total RehabilitationWorks
Expansion/New
Construct.1 Nairobi 6,085,297 568,367 192,000 376,367 73,982 9,820 64,162 3,5132 Mombasa 2,644,591 247,005 17,100 229,905 40,069 875 39,194 2,1463 Ruiru 896,358 68,3024 Juja 151,781 11,5665 Kikuyu 875,242 66,693 0 66,693 11,370 0 11,370 6236 Kangundo-Tala 820,175 62,497 0 62,497 10,655 0 10,655 5837 Machakos 755,281 57,552 2,000 55,552 9,573 102 9,471 5198 Mavoko 514,909 39,236 12,960 26,276 5,142 663 4,480 2459 Malindi 443,811 33,818 0 33,818 5,765 0 5,765 316
10 Karuri 404,224 30,802 0 30,802 5,251 0 5,251 28711 Ngong 402,242 30,65112 Kiserian 71,913 5,48013 Kiambu 315,807 24,064 10,000 14,064 2,909 511 2,398 13114 Limuru 298,455 22,742 10,000 12,742 2,684 511 2,172 11915 Ukunda 234,651 17,880 0 17,880 3,048 0 3,048 16716 Kitengela 218,282 16,633 0 16,633 2,836 0 2,836 15517 Wundanyi 185,136 14,107 0 14,107 2,405 0 2,405 13218 Kilifi 183,228 13,962 0 13,962 2,380 0 2,380 13019 Mtwapa 182,474 13,905 0 13,905 2,370 0 2,370 13020 Ongata Rongai 150,775 11,489 0 11,489 1,959 0 1,959 10721 Taveta 99,997 7,620 0 7,620 1,299 0 1,299 7122 Mariakani 90,271 6,879 0 6,879 1,173 0 1,173 6423 Voi 86,340 6,579 0 6,579 1,122 0 1,122 6124 Kajiado 74,803 5,700 0 5,700 972 0 972 5325 Kwale 74,303 5,662 0 5,662 965 0 965 53
16,260,348 1,389,193 244,060 1,145,133 207,704 12,482 195,222 10,688Source: JICA Study Team
Capacity to bedeveloped(m3/day)
Project Cost (KSh million)O&M Cost
(KShmillion/year)
CurrentCapacityin 2010
(m3/day)
Capacity to bedeveloped(m3/day)
Project Cost (KSh million)O&M Cost
(KShmillion/year)
Table 4.2.3 Project Cost and O&M Cost for Sewerage Development Projects (RVCA)
Major Urban AreaService
Populationin 2030
RequiredCapacity in
2030(m3/day)
CurrentCapacityin 2010
(m3/day)
0 79,868
0 36,131
Total
Total
Table 4.2.4 Project Cost and O&M Cost for Sewerage Development Projects (ACA)
Major Urban AreaService
Populationin 2030
RequiredCapacity in
2030(m3/day)
13,616 0 13,616 745
6,160 0 6,160 337
D - T - 11

Total RehabilitationWorks
Expansion/New
Construct.1 Lamu 1,250,000 95,250 0 95,250 16,240 0 16,240 8892 Nyeri 600,803 45,781 8,100 37,681 6,838 414 6,424 3523 Kitui 551,547 42,028 0 42,028 7,165 0 7,165 3924 Thika 513,806 39,152 20,000 19,152 4,289 1,024 3,265 1795 Embu 305,362 23,269 682 22,587 3,885 35 3,851 2116 Meru 269,949 20,570 1,000 19,570 3,387 51 3,336 1837 Matuu 255,467 19,467 0 19,467 3,319 0 3,319 1828 Makuyu 221,524 16,880 0 16,880 2,878 0 2,878 1589 Chuka 218,821 16,674 0 16,674 2,843 0 2,843 156
10 Muranga 144,849 11,037 1,561 9,476 1,695 80 1,616 8811 Garissa 143,348 10,923 1,000 9,923 1,743 51 1,692 9312 Chogoria 143,036 10,899 0 10,899 1,858 0 1,858 10213 Maragua 132,762 10,116 0 10,116 1,725 0 1,725 9414 Wanguru 120,726 9,199 0 9,199 1,568 0 1,568 8615 Runyenjes 98,401 7,498 0 7,498 1,278 0 1,278 7016 Kerugoya/Kutus 97,767 7,450 0 7,450 1,270 0 1,270 7017 Maua 86,713 6,608 0 6,608 1,126 0 1,126 6218 Mwingi 80,390 6,126 0 6,126 1,044 0 1,044 57
5,235,273 398,928 32,343 366,585 64,152 1,655 62,497 3,422Source: JICA Study Team
Total RehabilitationWorks
Expansion/New
Construct.1 Isiolo 231,501 17,640 2,000 15,640 2,769 102 2,666 1462 Nanyuki 192,282 14,652 0 14,652 2,498 0 2,498 1373 Nyahururu 183,483 13,981 2,617 11,364 2,071 134 1,937 1064 Mandera 108,071 8,235 0 8,235 1,404 0 1,404 775 Wajir 102,042 7,776 0 7,776 1,326 0 1,326 73
817,380 62,284 4,617 57,667 10,067 236 9,831 538Source: JICA Study Team
Total RehabilitationWorks
Expansion/New
Construct.1 LVNCA 6,031,965 459,636 21,000 438,636 75,855 1,074 74,781 4,0942 LVSCA 6,021,294 483,887 21,791 462,096 79,895 1,114 78,781 4,3133 RVCA 3,156,144 240,498 18,393 222,105 38,810 941 37,869 2,0734 ACA 16,260,348 1,389,193 244,060 1,145,133 207,704 12,482 195,222 10,6885 TCA 5,235,273 398,928 32,343 366,585 64,152 1,655 62,497 3,4226 ENNCA 817,380 62,284 4,617 57,667 10,067 236 9,831 538
37,522,405 3,034,425 342,204 2,692,221 476,483 17,502 458,981 25,128Source: JICA Study Team
Table 4.2.5 Project Cost and O&M Cost for Sewerage Development Projects (TCA)
Major Urban AreaService
Populationin 2030
RequiredCapacity in
2030(m3/day)
CurrentCapacityin 2010
(m3/day)
Capacity to bedeveloped(m3/day)
Project Cost (KSh million)O&M Cost
(KShmillion/year)
Total
Table 4.2.6 Project Cost and O&M Cost for Sewerage Development Projects (ENNCA)
Major Urban AreaService
Populationin 2030
RequiredCapacity in
2030(m3/day)
CurrentCapacityin 2010
(m3/day)
Capacity to bedeveloped(m3/day)
Project Cost (KSh million)O&M Cost
(KShmillion/year)
Table 4.2.7 Project Cost and O&M Cost for Sewerage Development Projects for Whole of Kenya
Catchment AreaService
Populationin 2030
RequiredCapacity in
2030(m3/day)
CurrentCapacityin 2010
(m3/day)
Capacity to bedeveloped(m3/day)
Project Cost (KSh million)O&M Cost
(KShmillion/year)
Total
Total
D - T - 12

Figures

D - F - 1
Sewerage (Offsite-Treatment FacilitiesCalculation of target population and required sewerage treatment capacity of each target city
Onsite-Treatment Facilities)Calculation of target population and required number of the onsite-treatment facilities of each county
Confirmation of the following proposed projectProposal from each WSB(2012)Proposal of Aftercare Study(1998)Proposal of Kenya Vision 2030, 1st Medium
Term Plan (2008-2012)
Determination of Required ProjectDetermination of the rehabilitation project and the development project of each city
Allocation of the planned population of each basin in 2030 to each target city and district (Setting based on Kenya Vision 2030 & Census 2009)
Setting of Development TargetAll population will connect the improved sanitary facilities.80% of urban population will connect sewerage system
(Based on Kenya Vision 2030 & Water Service Strategic Plan)
Setting of unit wastewater generation based on water supply plan
Selection of the target cities of sewerage development based on the sizes of population and the environmental aspectsClassification of whole areas into sewerage-treatment areas and onsite-treatment areas
Calculation of required additional sewerage treatment capacity of each target city based on the capacity of the existing sewerage
Determination of Sewerage Plan
Source: JICA Study Team
THE DEVELOPMENT OF THE NATIONAL WATER MASTER PLAN 2030
Figure 1.1.1 Study Flow for Sanitation Development Plan
JAPAN INTERNATIONAL COOPERATION AGENCY

D - F - 2
Source: JICA Study Team based on Census 2009 data
THE DEVELOPMENT OF THE NATIONAL WATER MASTER PLAN 2030
Figure 2.3.1 Percentage of No Wastewater Treatment
JAPAN INTERNATIONAL COOPERATION AGENCY
Catchment Area Boundary

D - F - 3
Source: JICA Study Team based on Census 2009 data
THE DEVELOPMENT OF THE NATIONAL WATER MASTER PLAN 2030
Figure 2.3.2 Percentage of Sewerage Connection
JAPAN INTERNATIONAL COOPERATION AGENCY
Catchment Area Boundary

D - F - 4
Source: JICA Study Team based on Census 2009 data
THE DEVELOPMENT OF THE NATIONAL WATER MASTER PLAN 2030
Figure 2.3.3 Percentage of Usage of On-site Wastewater Treatment Facility
JAPAN INTERNATIONAL COOPERATION AGENCY
Catchment Area Boundary

D - F - 5
Dam (Existing)
Dam (Proposed)
Water Transfer (Existing)
Water Transfer (Proposed)
Urban Water Supply Development
Sewerage Development
LEGEND OF PLANS
Source: JICA
Study Team
TH
E D
EV
EL
OPM
EN
T OF
TH
E N
ATIO
NA
L WAT
ER
MA
STE
R PL
AN
2030 Figure 3.3.1 Proposed U
rban Water Supply and
Sewerage D
evelopment Plans (LV
NC
A)
JAPA
N IN
TE
RN
ATIO
NA
L CO
OPE
RATIO
N A
GE
NC
Y

D - F - 6
Dam (Existing)
Dam (Proposed)
High Population Density Area
Water Transfer (Existing)
Water Transfer (Proposed)
Urban Water Supply Development
Sewerage Development
LEGEND OF PLANS
Source: JICA
Study Team
TH
E D
EV
EL
OPM
EN
T OF
TH
E N
ATIO
NA
L WAT
ER
MA
STE
R PL
AN
2030 Figure 3.4.1 Proposed U
rban Water Supply and
Sewerage D
evelopment Plans (LV
SCA
) JA
PAN
INT
ER
NAT
ION
AL C
OO
PER
ATION
AG
EN
CY

D - F - 7
Dam
(E
xist
ing)
Dam
(P
rop
osed
)
Hig
h P
opul
atio
n D
ensi
ty A
rea
Arid
Are
a
Wat
er T
rans
fer
(Exi
stin
g)
Wat
er T
rans
fer
(Pro
pose
d)
Urb
an W
ate
r S
upp
ly D
evel
opm
ent
Sew
erag
e D
evel
opm
ent
LE
GE
ND
O
F P
LA
NS
Source: JICA Study Team
THE DEVELOPMENT OF THE NATIONAL WATER MASTER PLAN 2030
Figure 3.5.1 Proposed Urban Water Supply and Sewerage Development Plans (RVCA) (1/2)
JAPAN INTERNATIONAL COOPERATION AGENCY

D - F - 8
Dam
(E
xist
ing)
Dam
(P
rop
osed
)
Hig
h P
opul
atio
n D
ensi
ty A
rea
Arid
Are
a
Wat
er T
rans
fer
(Exi
stin
g)
Wat
er T
rans
fer
(Pro
pose
d)
Urb
an W
ate
r S
upp
ly D
evel
opm
ent
Sew
erag
e D
evel
opm
ent
LE
GE
ND
O
F P
LA
NS
Source: JICA Study Team
THE DEVELOPMENT OF THE NATIONAL WATER MASTER PLAN 2030
Figure 3.5.1 Proposed Urban Water Supply and Sewerage Development Plans (RVCA) (2/2)
JAPAN INTERNATIONAL COOPERATION AGENCY