SURFACE WATER SUPPLY OF THE UNITED STATES
181
DEPARTMENT OF THE INTERIOR Hubert Work, Secretary U. S. GEOLOGICAL SURVEY George Otis Smith, Director Water-Supply Paper 549 SURFACE WATER SUPPLY OF THE UNITED STATES 1922 PART IX. COLOEADO EIVEE BASIN NATHAN C. GROVER, Chief Hydraulic Engineer ROBERT FOLLANSBEE, A. B. PURTON, and ROGER C. RICE District Engineers Prepared in cooperation with THE STATES OF COLORADO, WYOMING, UTAH and ARIZONA \ 4 %, %/>- */* fi UNITED STATES GOVERNMENT FEINTING OFFICE WASHINGTON 192T
-
Upload
khangminh22 -
Category
Documents
-
view
3 -
download
0
Transcript of SURFACE WATER SUPPLY OF THE UNITED STATES

DEPARTMENT OF THE INTERIORHubert Work, Secretary
U. S. GEOLOGICAL SURVEY George Otis Smith, Director
Water-Supply Paper 549
SURFACE WATER SUPPLY OF THE UNITED STATES
1922
PART IX. COLOEADO EIVEE BASIN
NATHAN C. GROVER, Chief Hydraulic EngineerROBERT FOLLANSBEE, A. B. PURTON, and ROGER C. RICE
District Engineers
Prepared in cooperation withTHE STATES OF COLORADO, WYOMING, UTAH
and ARIZONA
\4 %, %/>- */* fi
UNITED STATESGOVERNMENT FEINTING OFFICE
WASHINGTON192T

ADDITIONAL COPIES
OF THIS PUBLICATION MAY BE PBOCUBED FEOM
THE SUPERINTENDENT OF DOCUMENTS
GOVEENMENT FEINTING OFFICE
WASHINGTON, D. C.
AT
25 CENTS PEB COPY

CONTENTS
Fog*Authorization and scope of work____________________ ____ ____ 1Definition of tenns_______________________ ___ _____ _ 2Explanation of data___________________________-___---_---_______ 3Accuracy of field data and computed results__________________._____ 4Publications..--.______________________________________________ 5Cooperation....___________________________________ ________ 9Division of work___________________________________ ____________ 9Gaging-station records.____________________________________________ 10
Colorado River basin_____________-_-________-___---___________ 10Colorado River and tributaries above Green River.___________ 10
Colorado River at Hot Sulphur Springs, Colo_____________ 10Colorado River at Glenwood Springs, Colo_____________ 12Colorado River near Palisade, Colo_________-___________ 13Colorado River near Fruita, Colo_____________________ 15Colorado River at Lees Ferry, Ariz______________________ 17Colorado.River near Topock, Ariz___ ____________________ 19Colorado River at Yuma, Ariz-___-__--__-__-___-_______ 20Fraser River near Arrow, Colo----____-_---_-----__-__ 22Williams Fork near Parshall, Colo_______________________ 24Troublesome Creek near Troublesome, Colo______________ 26Blue River at Dillon, Colo__.__________________ 27Eagle River at Redcliff, Colo__________________ 29Eagle River at Eagle, Colo___ . ______ 31Roaring Fork at Glenwood Springs, Colo____ ___________ 32Parachute Creek at Grand Valley, Colo__________________ 34Roan Creek near De Beque, Colo____________--_________ 36Taylor River at Almont, Colo____--__-_-____-_-_______ 37Gunnison River near Gunnison,CoIo.____________________ 39Gunnison River near Grand Junction, Colo_________ ____ 41East River at Almont, Colo-___-_---------------_-_---_ 43Tomichi Creek at Sargents, Colo--___-__-_-___-_-_______ 45Lake Fork at Lake City, Colo_______ ________ _______ 46Leroux Creek near Lazear, Colo____-_-_-_-__-----_______ 48Surface Creek at Cedaredge, Colo_____.________--_______ 49Uncompahgre River at Ouray, Colo_____________________ 51Uncompahgre River below Ouray, Colo _____________ 53Uncompahgre River near Colona, Colo_ ____ ___ __ 55Uncompahgre River at Montrose, Colo___________ _ _ 56Uncompahgre River near Delta, Colo _________________ 57Dolores River at Bedrock, Colo-_-_____--_-_------__-___ 58San Miguel River at Naturita, Colo_________ ______ 60
Green River basin_____________ ______________________ 61Green River near Daniel, Wyo_____--_- ______ 61Green River at Green River, Wyo _ __ _ 63Green River at Little Valley, near Green River, Utah 64East Fork at East Fork Canal, Wyo__ 66
. in

IV CONTENTS
Gaging-station records Continued. Colorado River basin Continued.
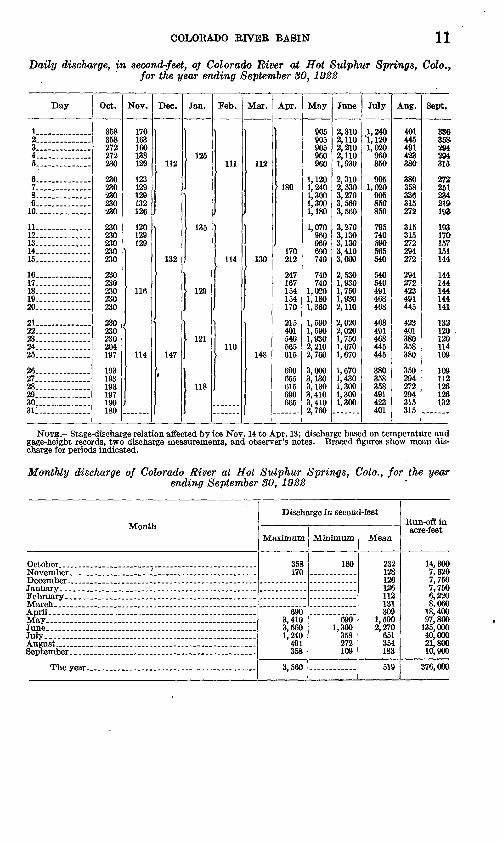
Green River basin Continued. PageEast Fork at Newfork, Wyo___________________ 67New Fork near Boulder, Wyo_________________________ 69Pine Creek at Pinedale, Wyo_________________________ 71Boulder Creek near Boulder, Wyo___-_-_--______________ 72Big Sandy Creek near Farson, Wyo_____j_______________ 74Blacks Fork near Urie, Wyo___________________________ 76Hams Fork at Diainondville, Wyo___---____--____--___- 77Little Snake River near Dixon, Wyo___________________ 79Little Snake River near Lily, Colo_-__-____--___----____ 81Savery Creek at Savery, Wyo_________________________ 81Ashley Creek near Vernal, Utah_______________________ 83Vernal Milling & Light Co.'s tailrace near Vernal, Utah____ 85North Fork of Duchesne River near Hanna, Utah_.________ 86Duchesne River near Tabiona, Utah.. .__________________ 88Duchesne River at Duchesne, Utah.____________________ 90Duchesne River at Myton, Utah________________________ 92West Fork of Duchesne River near Hanna, Utah._________ 94Wolf Creek near Hanna, Utah___._______________ _____ 95Strawberry River at Duchesne, Utah____________________ 96Red Creek near Fruitland, Utah._______________________ 98West Fork' of Lake Fork near Mountain Home, Utah_____ 100Lake Fork near Myton, Utah.._________--_-__-_--______ 101Uinta River near Neola, Utah,_________________________ 103Whiterocks Creek near Whiterocks, Utah ________________ 105Price River near Helper, Utah___.______________________ 107Huntington Creek near Huntington, Utah________________ 108Cottonwood Creek near Orangeville, Utah________________ 110Ferron Creek (upper station) near Ferron, Utah__________ 112
Little Colorado River basin___-__-_____-__-,_----_-_-------- 114Zuni River at Blackrock, N. Mex________________________ 114
Virgin River basin_________________._______________ _____ 114Virgin River at Virgin, Utah__________________________ 114Santa Clara Creek near Central, Utah.__________________ 115
Gila River basin________________________________________ 117Gila River near Solomonsville, Ariz____________________ 117Gila River near Ashurst, Ariz___________________________ 119Gila River near San Carlos, Ariz__--_-____-_-_-_________ 119Gila River at Kelvin, Ariz_________________-___________ 121Sunset Canal near Duncan, Ariz________________________ 123Cosper-Windham Canal near Duncan, Ariz ______________ 124Moddle Canal near Duncan, Ariz___________________-___ 125Brown Canal near Solomonsville, Ariz ___________________ 126Brown Canal wasteway near Solomonsville, Ariz__________ 128Michelana Canal near Solomonsville, Ariz________________ 129Fourness Canal near Solomonsville, Ariz_________________ 131'San Jose Canal near Solomonsville, Ariz_________________ 132Montezuma Canal near Solomonsville, Ariz______________ 134Union Canal near Solomonsville, Ariz___________________! 135San Simon Creek near Rodeo, N. Mex___________________ 137San Simon Creek near San Simon, Ariz__________________ 137Cave Creek near Paradise, Ariz________________________ 138

CONTENTS V
Gaging-station records Continued. Colorado River basin Continued.
Gila River basin Continued. PageCave Creek Canal near Paradise, Ariz___________________ 140East Turkey Creek at Paradise, Ariz____________________ 141Graham Canal near Safford, Ariz_______________________ 143-Smithville Canal near Thatcher, Ariz__________________ 144Dodge-Nevada,Canal near Pima, Ariz_________________ 146Curtis-Kempton Canal near Eden, Ariz__________________ 147Fort Thomas Consolidated Canal at Ashurst, Ariz_______ 149"San Pedro River near Fairbank, Ariz____________________ 15O»Santa Cruz River near Nogales, Ariz____________________ 152:Santa Cruz River at Tucson, Ariz_______________________ 154Rillito Creek near Tucson, Ariz_________________________ 155Salt River near Roosevelt, Ariz_________________________ 156North Fork of White River at Whiteriver, Ariz_________ 158White River at Fort Apache, Ariz.__:___________________ 159Tonto Creek near Roosevelt, Ariz_______________________ 161Verde River near McDowell, Ariz_______________________ 162Agua Fria River near Glendale, Ariz_____________________ 164
Barren Flat basin_____________________________________________ 165West Turkey Creek near Light, Ariz_____________________ 165
Whitewater basin_____________________________________________ 166Whitewater Draw near Rucker, Ariz_________________________ 166Whitewater Draw near Douglas, Ariz________________________ 168
Miscellaneous discharge measurements.______________________________ 170Index_______________________________________ 173
ILLUSTRATIONS
PLATE I. A, Price current meters; B, Typical gaging station._ II. Water-stage recorders; A, Au; B, Gurley; C, Stevens

SUEFACE WATER SUPPLY OF COLORADO RIVERBASIN, 1922
AUTHORIZATION AND SCOPE OF WORK
This volume is one of a series of 14 reports presenting records of .measurements of flow made on streams in the United States during the year ending September 30, 1922.
The data presented in these reports were collected by the United States Geological Survey under the following authority contained in the organic law (20 Stat. L., p. 394):
Provided, That this officer [the Director] shall have the direction of the Geo logical Survey and the classification of public lands and examination of the geological structure, mineral resources, and products of the national domain.
The work was begun in 1888 in connection with special studies relating to irrigation in the arid West. Since the fiscal year ending June 30, 1895, successive appropriation bills passed by Congress have carried the following item:
For gaging the streams and determining the water supply of the United States, and for the investigation of underground currents and artesian wells, and for the preparation of reports upon the best methods of utilizing the water resources.
Annual appropriations for the fiscal years ending June SO, 1895-1922
1895-______ ___ _ ___ . _______________ $12, 500. 0018Q^........................................... 20,000.001897 to 1900, inclusive_ _ ____ _ __ __ ___ 50, 000. 001901 to 1902, inclusive.._________________ 100, 000. 00 1903 to 1906, inclusive___________________ 200, 000. 001907.______________________________ 150, 000. 001908 to 1910, inclusive.__________________ 100, 000. 00 1911 to 1917, inclusive___ ___ __________ 150, 000. 001918_.______________________________ 175, 000. 001919______-________________________ 148, 244. 101920___-_-__.______________________________.__. 175, 000. 001921 to 1923, inclusive___________________ 180, 000. 00
\ In the execution of the work many private and State organizations
have cooperated either by furnishing data or by assisting in collecting data. Acknowledgments for cooperation of the first kind are made in connectien with the description of each station affected; coopera tion of the second kind is acknowledged on page 9.
Measurements of stream flow have been made at about 5,480 points in the United States and also at many points in Alaska and
1

2 SURFACE WATER SUPPLY, 1922, PART IX
the Hawaiian Islands. In July, 1922, 1,540 gaging stations were being maintained by the Survey and the cooperating organizations. Many miscellaneous discharge measurements were made at other points. In connection with this work data were also collected in regard to precipitation, evaporation, storage reservoirs, river profiles, and water power in many sections of the country and will be made available in water-supply papers from time to time.
DEFINITION OF TERMS
The volume of water flowing in a stream the "run-off" or "dis charge" is expressed in various terms, each of which has become associated with a certain class of work. These terms may be divided into two groups (1) those that represent a rate of flow, as second- feet, gallons per minute, miners' inches, and discharge in second-feet per square mile, and (2) those that represent' the actual quantity of water, as run-off in inches, acre-feet, and millions of cubic feet. The principal terms used in this series of reports are second-feet, second-feet per square mile, rim-off in inches, acre-feet, and millions of cubic feet. They may be defined as follows:
"Second-feet" is an abbreviation for "cubic feet per second." A second-foot is the rate of discharge of water flowing in a channel of rectangular cross section 1 foot wide and 1 foot deep at an average velocity of 1 foot per second. It is generally used as a fundamental unit from which others are computed.
"Second-feet per square mile" is the average number of cubic feet of water flowing per second from each square mile of area drained, on the assumption that the run-off is distributed uniformly both as regards time and area.
"Run-off in inches" is the depth to which an area would be cov ered if all the water flowing from it in a given period were uniformly distributed on the surface. It is used for comparing run-off with rainfall, which is usually expressed in inches.
An "acre-foot," equivalent to 43,560 cubic feet, is the quantity required to cover an acre to the depth of 1 foot. The term is com monly used in connection with storage for irrigation.
The following terms not in common use are here defined:"Stage-discharge relation," an abbreviation for the term "relation
of gage height to discharge.""Control," a term used to designate the section or sections of the
stream channel below the gage which determine the stage-discharge relation at the gage. It should be noted that the control may not be the same section or sections at all stages.
The "point of zero flow" for a gaging station is that point on the gage the gage height at which water ceases to flow over the control.

U. S. GEOLOGICAL SURVEY WATER-SUPPLY PAPER 549 PLATE 1
A. PRICE CURRENT METERS
B. TYPICAL GAGING STATION

U.
S.
GE
OL
OG
ICA
L
SU
RV
EY
WA
TE
R-S
UP
PL
Y
PA
PE
R
549
PL
AT
E
II
WA
TE
R-S
TA
GE
RE
CO
RD
ER
S
A,
Au;
B,
Gur
ley;
C,
Ste
vens

SUBFACE WATBE SUPPLY, 1922, PAB£ IX 3
EXPLANATION OF DATA
The data presented in this report cover the year beginning October 1, 1921, and ending September 30, 1922. At the beginning of January in most parts of the United States much of the precipitation in the preceding three months is stored as ground water, in the form of snow or ice, or in ponds, lakes, and swamps, and this stored water passes off in the streams during the spring break-up. At the end of September, on the other hand, the only stored water available for run-off is possibly a small quantity in the ground; therefore the run-off for the year beginning October 1 is practically all derived from precipitation within that year.
The base data collected at gaging stations ̂ consist of records of stage, measurements of discharge, and general information used to supplement the gage heights and discharge measurements in deter mining the daily flow. The records of stage are obtained either from direct readings on a staff gage or from a water-stage recorder that gives a continuous record of the fluctuations. Measurements of discharge are made with a current meter by the general methods outlined in standard textbooks on the measurement of river dis charge. (See Pis. I, II.)
From the discharge measurements rating tables are prepared that give the discharge for any stage. The application of the daily gage heights to these rating tables gives the daily discharge from which the monthly and yearly mean discharge is determined.
The data presented for each gaging station in the area covered by this report comprise a description of the station, a table giving records of discharge measurements, a table showing the daily discharge of the stream, and a table of monthly and yearly discharge and run-off.
If the base data are insufficient to determine the daily discharge, tables giving daily gage height and records of discharge measure ments are published.
The description of the station gives, in addition to statements regarding location and equipment, information in regard tb any con ditions that may affect the permanence of the stage-discharge relation, covering such subjects as the occurrence of ice, the use of the stream for log driving, shifting of control, and the cause and effect of back water. It gives also information as to diversions that decrease the flow at the gage, artificial regulation, maximum and minimum recorded stages, and the accuracy of the records.
The table of daily discharge gives, in general, the discharge in second-feet corresponding to the mean of the gage heights read each day. At stations on streams subject to sudden or rapid diurnal fluctuation the discharge obtained from the rating table and the mean daily gage height may not be the true mean discharge for the day. If such stations are equipped with water-stage recorders the
4182 27 2

4 SURFACE WATER SUPPLY, 1922, PART IX
mean daily discharge may be obtained by averaging discharge at regular intervals during the day or by use of the discharge integrator, an instrument operating on the principle of the planimeter and containing as an essential element the rating curve of the station.,
In the table of monthly discharge the column headed "Maximum" gives the mean flow for the day when the mean gage height was highest. As the gage height is the mean for the day it does not indicate correctly the stage when the water surface was at crest height and the corresponding discharge was consequently larger than given in the maximum column. Likewise, in the column headed "Minimum" the quantity given is the mean flow for the day when the mean gage height was lowest. The column headed "Mean" is the average flow in cubic feet per second during the month. On this average flow are based computations recorded in the remaining columns, which are defined on page 2.
The accuracy of stream-flow data depends primarily (1) on the permanence of the stage-discharge relation, and (2) on the accuracy of observation of stage, measurements of flow, and interpretation of records.
A paragraph in the description of the station gives information regarding the (1) permanence of the stage-discharge relation, (2) precision with which the discharge rating curve is defined, (3) refine ment of gage readings, (4) frequency of gage readings, and (5) methods of applying daily gage height to the rating table to obtain the daily discharge.
For the rating tables "well defined" indicates, in general, that the 1 rating is probably accurate within 5 per cent; "fairly well defined," within 10 per cent; "poorly defined," within 15 to 25 per cent. These notes are very general and, are based on the plotting of the individual measurements with reference to the mean rating curve.
The monthly means for any station may represent with high accu racy the quantity of water flowing past the gage, but the figures showing discharge per square mile and depth in inches may be mislead ing owing to the inclusion of large noncontributing districts in the measured drainage area, and they may also be subject to gross errors caused by lack of information concerning water diverted for irrigation or other use, or by inability to interpret the effect of artificial regula tion of the flow of the river above the station. "Second-feet per square mile" and "run-off in inches" are therefore not computed if such errors appear probable. The computations are also omitted for stations on streams draining areas in which the annual rainfall is less than 20 inches. All figures representing "second-feet per .square mile" and "run-off in inches" previously publfehed'by the survey should.be

PUBLICATIONS ' 5
used with caution because of possible inherent sources of error not known to the survey.
The table of monthly discharge gives only a general idea of the flow at the station and should not be used for other than preliminary estimates; the tables of daily discharge allow more detailed studies of the variation in flow. It should be borne in mind, also, that the observations in each succeeding year may be expected to throw new light on data previously published.
PUBLICATIONS
Investigation of water resources by the United States Geological Survey has consisted in large part of measurements of the volume of flow in streams and studies of the conditions affecting that flow, but it has comprised also investigation of such closely allied subjects as irrigation, water storage, water powers, ground waters, and quality of waters. Most of the results of these investigations have been pub lished in the series of water-supply papers, but some have appeared in the monographs, bulletins, professional papers, and annual reports.
The results of stream-flow measurements are now published an nually in 12 parts, each part covering an area whose boundaries coincide with natural drainage features as indicated below:Part I. North Atlantic slope basins.
II. South Atlantic slope and eastern Gulf of Mexico basins.III. Ohio River basin.IV. St. Lawrence River basin.V. Upper Mississippi River and Hudson Bay basins.
VI. Missouri River basin.VII. Lower Mississippi River basin.
VIII. Western Gulf of Mexico basins.I.. Colorado River basin.X. Great Basin.
XI. Pacific slope basins in California. XII. North Pacific slope basin in three parts:
A, Pacific slope basins in Washington and upper Columbia River basin.B, Snake River basin.C, Lower Columbia River basin and Pacific slope basins in Oregon.
Water-supply papers and other publications of the United States Geological Survey containing data in regard to the water resources of the United States may be obtained or consulted as indicated below:
1. Copies may be purchased at nominal cost from the Superin tendent of Documents, Government Printing Office, Washington, D. C., who will, on application, furnish lists giving prices.
2. Seta of the reports may be consulted in the libraries of the prin cipal cities in the United States.

6 SUEF\CE WATEE SUPPLY, 1922, PART IX
3. Complete sets are available for consultation in the local offices of the water-resources branch of the Geological Survey, as follows:
Boston, Mass., 2500 Customhouse.Albany, N. Y., 704 Journal Building.Trenton, N. J., Statehouse.Charlottesville, Va., care of University of Virginia.Asheville, N. C., 316 Jackson Building.Chattanooga, Tenn., 37 Municipal Building.Columbus, Ohio, Engineering Experiment Station, Ohio State University.Chicago, 111., 940 Transportation Building.Madison, Wis., care of Railroad Commission of Wisconsin.Ames, Iowa, State Highway Commission Building.Rolla, Mo., Rolla Building, School of Mines and Metallurgy.Topeka, Kans., 23 Federal Building.Helena, Mont., 45-46 Federal Building.Denver, Colo., 403 Post Office Building.Salt Lake City, Utah, 313 Federal Building.Idaho Falls, Idaho, 228 Federal Building.Boise, Idaho, Federal Building.Tacoma, Wash., 406 Federal Building.Portland, Oreg., 606 Post Office Building.San Francisco, Calif., 303 Customhouse.Los Angeles, Calif., 600 Federal Building.Tucson, Ariz., College of Law Building, University of Arizona.Austin, Tex., State Capitol.Honolulu, Hawaii, Territorial Office Building.
A list of the Geological Survey's publications may be obtained by applying to the Director, United States Geological Survey, Washing ton, D. C.
Stream-flow records have been obtained at about 5,480 points in the United States, and the data obtained have been published in the reports tabulated on page 8.
Stream-flow data in reports of the United States Geological Survey
Report
10th A, pt. 2 ...llth A, pt. 2-...12th A, pt. 2 ..13th A, pt. 3---.
B 131--.. .. -..16th A, pt. 2-.--B 140 __ ........
W 11.... ........18th A, pt. 4-...
W 15.. ..........
W 16.. ...--..
19th A, pt. 4.-..
W27 . ........
W28
20th A, pt.4--..W35to39... _
Character of data
monthly discharge (also many data covering earlier years).
Descriptions, measurements, ratings, and monthly discharge (also similar data for some earlier years).
States, eastern Mississippi River, and Missouri River above junction with Kansas.
Descriptions, measurements, and gage heights, western Mississippi River below junction of Missouri and Platte, and west ern United States.
Descriptions, measurements, ratings, and monthly discharge (also some long-time records), 1897.
Measurements, ratings, and gage heights, eastern UnitedStates, eastern Mississippi River, and Missouri River.
western United States.
Descriptions, measurements, gage heights, and ratings
Year
1884 to Sept., 1890.1884 to June 30, 1891.1884 to Dec. 31," 1892.
1888 to Dec. 31, 1893.1893 and 1894.
1895.
1896.1895 and 1896.
1897.
1897.
1897.
1898.
1898.
1898.1899.

PUBLICATIONS 7
Stream-flow data in reports of the United States Geological Survey Continued
Report
21st A, pt. 4 ___W 47 to 52 __ ...22d A, pt. 4..-..W65, 66 __ ... .W 75.... ........W82toS5_. ...W 97 to 100--.-W 124 to 135 __ .W 165 to 178 __ .W201 to214 .._W 241 to 252-...W 261 to 272 .W 281 to 292.. .W301 to 312....W 321 to 332,. -W351 to 362-,.W 381 to 394..-.W 401 to 414--.W 431 to 444. .W 451 to 464 ...W 471 to 484 _ .W 501 to 514-..W 521 to 534 .W 641 to 564... .
Character of data
__ do.. ___ .. _____ . _ ... ________ ............... -do.. ... ... ... ... do- -do.-- . . do.. .... . ... .... .... ... ... ..do.. - . do.. ... ..do.. . _ _ _ do.. do-. .... ........... ...... ... ........ .do..- ..... do..-.. .... .do..- ..do.- - . do.. .do.- ... ..do.. .- do.. .
Year
1899.1QAA
1900.1QO11901.1902.1903.1904.
1906.1907-8.1909.
1911.1912.1913.1914.1915.1916.1917.1918.1919 and 1920.1921.1922.
NOTE. No stream-flow data are given in the fifteenth and seventeenth annual reports.
The records at most of the stations discussed in these reports ex tend over a series of years, and miscellaneous measurements at many points other than regular gaging stations have been made each year. An index of the reports containing records obtained prior to 1904 has been published in Water-Supply Paper 119.
The following table gives, by years and drainage basins, the num bers of the papers on surface-water supply published from 1899 to 1920. The data for any particular station will be found in the, reports covering the years during which the station was maintained. For example, data from 1902 to 1922 for any station in the area covered by Part III are published in Water-Supply Papers 83, 98, 128, 169, 205, 243, 263, 283, 303, 323, 353, 383, 403, 433, 453, 473, 503, 523, and 543 which contained records for the Ohio River basin for those years.

Num
bers
of
wat
er-s
uppl
y pa
pers
con
tain
ing
resu
lts o
f st
ream
mea
sure
men
ts,
1899
-192
200
Yea
r
1899".
19
00
"....
1901 .
19
02
......
19
03
......
19
04
......
19
05
......
19
06
......
19
07
-8 .
1909......
19
10
......
1911.
1912......
19
13
......
1914......
19
15
......
19
16
......
19
17
......
19
18
......
19
19
-20
19
21
......
1922
...^-
.
I
Nor
th
Atl
anti
c sl
ope
basi
ns
(St.
John
R
iver
to
Yor
k R
iver
) 35
47,
»48
65,7
5 82
97
"124
, "1
25,
J>12
6 "1
65,
»166
, »1
67
"201
, »2
02,
»203
24
1 26
1 28
1 30
1 32
1 35
1 38
1 40
1 43
1 45
1 47
1 50
1 52
1 54
1
II
Sout
h A
tlan
tic
and
east
ern
Gul
f of
>
Mex
ico
(Jam
es
Riv
er t
o th
e M
issi
s
sipp
i)
'35
,36
48
65
,75
'82,
83
'97,
98
' 12
6, 1
27
f 16
7, 1
68
"203
,204 24
2 26
2 28
2 30
2 32
2 35
2 38
2 40
2 43
2 45
2 47
2 50
2 52
2 64
2
III
Ohi
o R
iver
ba
sin 36
48
, <4
9 65
,75 83
98
12
8
169
205
243
263
283
303
323
353
383
403
433
453
473
503
523
543
IV St.
Law
renc
e R
iver
'
and
Gre
at
"Lak
es '
basi
ns
36 19
65,7
5 '8
2,83
97
12
9
170
206
244
264
284
304
324
354
384
404
434
454
474
504
V
Hud
son
Bay
and
up
per
Mis
sis-
si
ppi
Riv
er
basi
ns
36
49
* 65
, 66,
75
*83,
85
*98,
99,
"100
*
128,
130 171
207
245
265
285
305
325
355
385
405
435
455
475
505
525
545
VI
Mis
sour
i R
iver
ba
sin
« 36.
37
49,
'50
66
,75 84
99
13
0,
"131 17
2
208
246
266
286
306
326
356
386
406
436
456
476
506
. 52
6 54
6
VII
Low
erM
issi
s
sipp
i R
iver
ba
sin
37
50*
65, 6
6, 7
5 *8
3,84
*
98, 9
9 *
128,
131
* 16
9, 1
73
* 20
5, 2
09 247
.267 287
307
327
357
387
407
437
457
477
507
527
547
VII
I
Wes
tern
G
ulf
of
Mex
ico
basi
n 37
50
66,7
5 84
99
132
174
210
248
268
288
308
328
358
388
408
438
458
478
508
528
548
IX
Col
orad
o R
iver
ba
sin
<*37
,38 50
66
,75 85
10
0 13
3
175,
* 1
77
211
249
269
289
309
329
359
389
409
439
459
479
509
529
549
X
Gre
at
Bas
in
38,
>39 51
66,7
5 85
100
133,
'13
4
176.
'17
7
212,
' 2
13
250,
'25
1 27
0, '
271
290
3-10
33
0 36
0 39
0 41
0 44
0 46
0 48
0 51
0 53
0 55
0
XI
Pac
ific
sl
ope
basi
ns i
n C
ali
fo
rnia
38,
'39
51
66,7
5 85
100
134
177
213
251
271
291
311
331
361
391
411
441
461
481
511
531
551
XII
N
orth
Pac
ific
slop
e ba
sins
Paci
fic
slop
e ba
sins
in
Was
hing
to
n an
d up
per
Col
umbi
a R
iver
38
51
66,7
5 85
100
135
178
214
252
272
292
312
332-
A
362-
A
392
412
442
462
482
512
532
552
Snak
e R
iver
ba
sin
38
51
66,7
5 85
100
135
178
214
252
272
292
312
332-
B
362-
B
393
413
443
463
483
513
533
553
Low
er
Col
umbi
a R
iver
and
Pa
cific
sl
ope
basi
ns
in O
rego
n 38
51
66,7
5 85
100
135
' 177
, 178
214
252
272
292
312
332-
C
362-
C
394
414
444
464
484
514
534
554
1 Rat
ing
tabl
es a
nd in
dex
to W
ater
-Sup
ply
Pape
rs 3
5-39
con
tain
ed i
n W
ater
-Sup
ply
Pape
r 39.
T
able
s of
mon
thly
dis
char
ge fo
r 189
9 in
Tw
enty
-fir
st A
nnua
l Rep
ort,
Par
t IV
. 1 J
ames
Riv
er o
nly.
«G
alla
tin R
iver
.*
Gre
en a
nd G
unni
son
rive
rs a
nd G
rand
Riv
er a
bove
junc
tion
with
Gun
niso
n.* M
ohav
e R
iver
onl
y./ K
ings
and
Ker
n ri
vers
and
sou
th P
acifi
c sl
ope
basi
ns.
»Rat
ing
tabl
es a
nd i
ndex
to W
ater
-Sup
ply
Paj
pf
47-5
2 an
d da
ta o
n pr
ecip
itatio
n,
wel
ls, a
nd ir
riga
tion
in C
alifo
rnia
and
Uta
h co
ntai
ned
in W
ater
-Sup
ply
Pape
r 52.
Tab
les
of m
onth
ly d
isch
arge
tor 1
900 i
n T
wen
ty-s
econ
d A
nim
al R
epor
t, Pa
rt I
V.
* W
issa
hick
on a
nd S
chuy
lkill
rive
rs to
Jam
es R
iver
, < S
ciof
o R
iver
.
> Lou
p an
d Pl
atte
riv
ers
near
Col
umbu
s, N
ebr.,
and
all
trib
utar
ies
belo
w j
unct
ion
with
Pla
tte.
* Tri
buta
ries
of M
issi
ssip
pi fr
om e
ast.
1 Lak
e O
ntar
io a
nd tr
ibut
arie
s to
St.
Law
renc
e R
i\cer
pro
per.
« H
udso
n B
ay o
nly.
* N
ew E
ngla
nd r
iver
s on
ly.
.
Hud
son
Riv
er t
o D
elaw
are
Riv
er,
incl
usiv
e.'
Sus
queh
anna
Riv
er to
Yad
kin
Riv
er, i
nclu
sive
.«P
latte
and
Kan
sas
river
s.'
Gre
at B
asin
in
Cal
ifor
nia
exce
pt T
ruck
ee a
nd C
arso
n R
iver
bas
ins.
Bel
ow ju
nctio
n w
ith G
ila.
< Rog
ue, U
mpq
ua, a
nd S
iletz
riv
ers
only
.

DIVISION OF WOEK 9
COOPEBATION
The work in Arizona, Utah, and Wyoming was carried on under cooperative agreement between the United States Geological Survey and the States, and special acknowledgments are due the cooperating State officials, W. S. Norveil, State water commissioner of Arizona; R. E. Caldwell, State engineer of Utah; and Frank C. Emerson; State engineer of Wyoming.
The State engineer of Colorado, A. J. McCune, paid the gage observers and furnished other assistance at four stations in Colorado.
The United States Forest Service furnished the gage-height records at eight stations and the services of a hydrographer for part of the time during the winter for work in Colorado and Wyoming.
The United States Weather Bureau paid the gage observers at the station on Colorado River near Fruita, Colo., and on Green River at Green River, Wyo.
The Office of Indian Affairs assisted in the maintenance of stations in Utah and Arizona.
On Colorado River in Arizona, the United States Bureau of Recla mation furnished financial assistance for maintaining the station near Topock. The entire cost of the installation and maintenance of the station at Lees Ferry was borne by the Southern California Edison Co.
Assistance in the collection of data was rendered by the Utah Power & Light Co., Vernal Milling & Light Co., Redlands Co., Eden Irri gation & Land Co., and C. H. Beggs.
DIVISION OF WOBK
Data for the stations in Arizona were collected and prepared for publication under the direction of Roger C. Rice and W. E. Dick- inson, district engineers, who were assisted by J. H. Gardiner, D. A. Dudley, and H. D. Empie. G. F. Holbrook assisted in the preparation of the data for publication.
Data for the stations in Wyoming and Colorado were collected and prepared for publication under the direction of Robert Follans- bee, district engineer, who was assisted by P. V. Hodges, J. B. Spiegel, M. B. Arthur, T. J. Watkins, and Miss Florence M. Hall.
Data for the stations in Utah were collected and prepared for publication under the direction of A. B. Purton, district engineer, assisted by W. E. Dickinson, R. R. Rowe, J. W. Mangan, M. T. Wilson, D. M. Corbett, and Miss Lysle Christensen.
The records were reviewed and the manuscript assembled by H. C. Troxell and J. H. Morgan.

10 SURFACE WATER SUPPLY, 1922, PART IX
GAGING-STATION RECORDS
COLORADO RIVER BASIN
COLORADO RIVER AND TRIBUTARIES ABOVE GREEN RIVEK
COLORADO RIVER AT HOT SULPHUR SPRINGS, COIO.
LOCATION. In sec. 2, T. 1 N., R. 78 W., at highway bridge near Denver & SaltLake Railway station in Hot Sulphur Springs, Grand County.
DBAINAGE ABEA. 785 square miles (revised measurement on map of Colorado,scale 1 : 500,000).
RECOBDS AVAILABLE. July 22,1904, to September 30,1909; September 23, 1910,to September 30, 1922.
GAGE. Chain gage on downstream side of bridge; read by Forest Serviceemployee. Prior to April 16, 1906, staff gage set to datum 6.07 feet lowerwas located 1,000 feet downstream.
DISCHAEGE MEASUBEMENTS. Made from bridge or by wading. CHANNEL AND CONTBOL. Bed composed of well-compacted gravel. Control
150 feet downstream; shifting at long intervals. Banks not subject tooverflow.
EXTBEMES OP DISCHABGE. Maximum stage recorded during year, 6.15 feet at8.30 a. m. June 14 (discharge, 3,790 second-feet); minimum dischargeoccurred during winter.
1904-1909; 1910-1922: Maximum stage recorded, 8.7 feet at 5 a. m.June 15, 1921 (discharge, 10,300 second-feet); minimum discharge, 63second-feet, February 15 and 25-27, 1908.
ICE. Stage-discharge relation seriously affected by ice. DIVEBSIONS. Water diverted for the irrigation of 18,000 acres from Colorado
River and tributaries above station. In addition, 12,400 acre-feet werediverted into Cache la Poudre drainage basin during 1922.
REGULATION. Diurnal fluctuation during spring of year from alternate meltingand freezing of mountain snow. No artificial regulation.
ACCTJBACY. Stage-discharge relation permanent; affected by ice during winter.Rating curve well defined. Gage read to hundredths twice daily. Dailydischarge ascertained by applying mean daily gage height to rating table.Records excellent.
Discharge measurements of Colorado River at Hot Sulphur Springs, Colo., during the year ending September 80, 1922
Date
Dec. 20
Feb. 11Apr. 25
Made by-
Hodges and McCallis- ter.. .__.__._____.____
J. C. McCallister.. _ .Follansbee and McCal
lister-..--.-. .........
Gage height
Feet «3.72«3.5
2.55
Dis charge
Sec.-ft. 140110
615
Date
May 27July 6
Made by
M. B. Arthur ..........
Gage height
Feet 5.783.32
Dis charge
Sec.-ft. 3,250
992
1 Stage-discharge relation affected by ice.
COLORADO BIVBE BASIN 11
Daily discharge, in second-feet, 0} Colorado River at Hot Sulphur Springs, Colo.f for the year ending September SO, 1922
Day
1 ......... ..2.. ............3-.-..-........4..............5..............
6..............7..............8..............9 ..... 10..............
11... ......... ..12... .___._____-13..............14 . ..... . .15...... ........
16.... ...,17..............18.. ............19..............20..... ....
21 .. ......22..............23..............24..............25..............
26..............27..............28..............29..............30..............311.... .........
Oct.
358358272272230
230230230230230
230230230230230
230230230230230
230230230204197
193193193197190180
Nov.
170163160138129
123129129132126
120129129
[ 116
114
Dec.
110 . 112
132
147
Jan.
126
135
129
121
118
Feb.
Ill
114
110
Mar.
112
130
148
Apr.
180
170212
247167154154170
215401540565615
690665615690665
May
905905905960960
1,1201,2401,3001,3001,180
1,070960960690740
740740
1,0201,1801,360
1,5901,5901,9302,2102,760
3,0003,1303,1303,4103,4102,760
June
2,3102,1102,2102,1101,930
2,3102,5303,2703,5603,560
3,2703,1303,1303,4103,000
2,5301,9301,7501,9302,110
2,0202,0201,7501,6701,670
1,6701,4301,3001,3001,300
July
1,2401,1201,020960850
9051,020905850850
795740590565540
540540491468468
468491468445445
380358358491423401
Aug.
401445491423380
380358336315272
315315272294272
294272423491445
423401380358380
350294272294315315
Sept.
33635S294294315
27225123421919»
193170157151144
144144144144141
132120120114109
109112126126132
NOTE. Stage-discharge relation affected by ice Nov. 14 to Apr. 13; discharge based on temperature and gage-height records, two discharge measurements, and observer's notes. Braced figures show mean dis charge for periods indicated.
Monthly discharge of Colorado River at Hot Sulphur Springs, Colo., for the year ending September 80, 1922
Month
July............................................... ......
September ______________ . _ ... _ . _ . ......
The year _______________________
Discharge in second-feet
Maximum
358 170
690 3,410 3,560 1,240
491 358
3,560
Minimum
180
690 1,300
358 272 109
Mean
232 128 126 126 112 131 309
1,590 2,270
651 354 183
519
Run-off in acre-feet
14,300 7,620 7,750 7,750 6,220 8,060
18,400 97,800
135, 000 40,000 21,800 10,900
376,000

12 SURFACE WATER SUPPLY, 1922, PABT IX
COLORADO BIVEE AT QLENWOOD SPRINGS, COIO.
LOCATION. In sec. 9, T. 6 S., R. 89 W., at Glenwood Springs, Garfield County. No Name Creek enters Colorado River 2 miles above station and Roaring Fork half a mile below.
DRAINAGE ABBA. 4,560 square miles (revised, measured on map of Colorado, scale, 1 : 500,000).
RECORDS AVAILABLE. January 1, 1900, to September 30, 1922; also May 12 to July 17, 1899, at point just above Roaring Fork.
GAGE. Friez water-stage recorder on right bank in front of power house installed May 17, 1910; inspected by Forest Service employee and C, H. Oberly. Prior to that date, a staff gage referred to^same datum was used.
DISCHARGE MEASUREMENTS. Made from cable beneath State Street bridge, a third of a mile below gage.
CHANNEL AND CONTROL. Bed composed of well-compacted gravel, on which silt is deposited. Control at riffle 300 feet downstream; practically per manent. Banks not subject to overflow except at extreme high stages.
EXTREMES OF DISCHARGE. Maximum stage during year from water-stage re corder, 9.3 feet at 7 a. m. June 10 (discharge, 16,100 second-feet); minimum stage, 1.9 feet at 5 p. m. January 22 (discharge, 90 second-feet).
1900-1922: Maximum stage recorded, 12.55 feet at noon June 14 and 15, 1918 (discharge, 30,100 second-feet); minimum stage, 1.6 feet at 5 p, m. February 6, 1921 (discharge, 80 second-feet).
ICE. Stage-discharge relation not affected by ice; hot water from springs keeps river open. *
DIVERSIONS. Between this station and Hot Sulphur Springs, court decrees for diversions of 48 second-feet of water from Colorado River for irrigation, and 1,250 second-feet for power. Water diverted for power is returned to river above Glenwood Springs.
REGULATION. Shoshone power plant of Colorado Power Co., 7 miles upstream, controls flow during day at low water but has insufficient pondage to control it for more than a few hours.
ACCURACY. Stage-discharge relation shifted slightly February 5. Two well defined rating tables. Operation of water-stage recorder satisfactory. Daily discharge ascertained by applying to rating tables mean daily gage height obtained by inspection of recorder graph, or for days of considerable diurnal fluctuation by averaging the bi-hourly discharge. Records excellent, except for days of missing gaige heights, for which they are fair.
Discharge measurements of Colorado River at Glenwood Springs, Colo., during the year ending September SO, 1922
Date
Jan. 24Feb. 5
Made by
T. J. Watkins...........J. B. Spiegel... __ ....
Gage height
Feet 3.402.55
Dis charge
Sec.-ft. 734300
Date
Mar. 19
Made by
T. J. Watkins.-. .......
Gage height
Feet 4.10
Dis charge
Sec.-ft. 1,550

COLOEADO RIVER BASIN 13
Daily discharge, in second-feet, of Colorado River at Glenwood Springs, Colo., for the year ending September 30,
Day
1.. .......2-...-..-....3 4............5... ........ .
6............7 .8 9............
10.. .......
11 12............13............14.. ......... .15.. ........ ..
16.... ....... .17.... ...... ..18............19 20
21............22 23 24............25............
26............27............28 __ ........29............30 31... _ ......
Oct.
1,1801,1801,1801,1801,180
1,1501,1501,1901,2501,230
1,1801,1401,1201,0801,060
1,0501,0501,0301,010
944
9521,0601,1301,0701,120
1,3201,3201,2801,2701,2201,180
Nov.
1,1401,1401,1101,1001,100
1,1201,1201,1101,090
966
912996978
1,1301,230
1,1001,0701,070
978740
9151,0501,0801,1001,100
1,0601,2001,170
936952
Dec.
1,0001,1201,050
969633
721667670803837
1,2201,3301,3701,2801,510
1,4601,2701,2501,1001,130
1,2201,1601,2301,000
865
9651,0001,070
994994988
Jan.
1,040979964
1,060920
905562528626624
681760653723760
852790931816782
677723976920969
1,1301,050
872600749626
Feb.
652665600978726
790719747761890
882858805754775
775850866890954
9941,110
962882882
906978994
Mar.
805733790790882
880738792839766
864714936867
1,000
1,2101,2501,8101,5901,480
1,3801,5401,9302,1202,240
1,9301,5901,5901,4301,3101,280
Apr.
1,2401,2201,2501,4801,870
2,1802,1801,7601,6401,640
1,5401,3701,3701,3101,260
1,2501,2801,2701,2301,170
1,1601,2601,8102,1802,380
2,5202,6002,6002,6803,020
May
3,5003,7103,8204,0304,370
5,2306,8007,4207,1106,800
5,6304,8504,3703,9203,710
3,6003,5004,1405,6006,500
7,4208,0608,0609,400
11,200
12,30014,40015,20015,70015,70015,200
June
13,50011,20010,80010,50010, 100
10,80011,90013,90015,70015,200
14,80013,90013,90014,40013,900
12,30010,50010,30010, 10010,300
10,60011,20010,8009,7509,400
8,7207,7406,5005,9105,910
July
5,9105,5004,9804,6104,490
4,3704,1403,9203,5003,600
3,7103,4003,1102,8402,600
2,4502,4602,3102,2402,180
2,1802,1802,1802,1802,050
1,9301,8101,7602,1802,6002,380
Aug.
2,1802,2402,5202,5202,180
1,9301,8701,7001,6401,580
1,5801,5701,4801,4801,380
1,4801,6401,7601,9302,050
1,9901,8701,8701,8101,760
1,7001,6401,6401,5401,5901,590
Sept.
1,6401,7601,8101,7001,700
1,5901,4801,3801,3601,300
1,2801,2901,2601,2201,180
9781,2301,1401,0401,040
1,0401,0401,010
9621,090
946927
1,0601,0801,070
NOTE. Discharge Oct. 25, Nov. 10, 11, 14, 20, 21, 23, 24,2^28, Dec. 5-10,12-20, 22, Dec. 24 to Jan. 23, Mar. 6-15, Sept. 16, 27 computed by averaging the bi-hourly discharge. No gage-height record Oct. 30,31, June 20-23, and Sept. 13,14; discharge based on comparison with flow of Colorado Kiver at Hot Sulphur Springs and Eagle Kiver at Eagle.
Monthly discharge of Colorado River at Glenwood Springs, Colo., for the year endingSeptember SO,
Month
October. __________________________
December. _________________________J&flasry. ___________________________February.. ___________________________
May.....................................................
July.................................. ..................August. . __________________________
The year.. _ . _ ......... _ . __________ .
Discharge in second-feet
Maximum
1,320 1,230 1,510 1,130 1,110 2,240 3,020
15,700 15,700 5,910 2,520 1,810
15,700
Minimum
944 740 633 528 600 714
1,160 3,500 5,910 1,760 1,380
927
528
Mean
1,140 1,060 1.060
814 844
1,230 1,720 7,460
11,200 3,090 1,800 1,250
2,720
Run-off in acre-feet
70,100 63,100 65,200 60,100 46,900 75,600
102,000 459,000 666,000 190,000 111,000 74,400
1,970,000
COLORADO RIVER NEAR PAUSADE, COIO.
LOCATION. In sec. 2, T. 11 S., R. 98 W,;, at State bridge 2 miles above Palisade, Mesa County. Nearest important .tributary, Plateau Creek, enters 6 miles above.

14 SURFACE WATER SUPPLY, 1922, PART IX
DRAINAGE AREA. 8,790 square miles (revised; measured on map of Colorado,scale 1 : 500,000).
RECORDS AVAILABLE. April 9, 1902, to September 30, 1922. GAGE. Chain gage on downstream side of bridge near midspan; read by A.
Barnhisel.DISCHARGE MEASUREMENTS. Made from bridge 2 miles below gage. CHANNEL AND CONTROL. Bed composed of gravel, silt, and scattered boulders.
Control is at rapids 300 feet downstream; practically permanent. Banksnot subject to overflow.
EXTREMES OF DISCHARGE. Maximum stage recorded during year, 21.3 feet at7 a. m. May 29 (discharge, 31,300 second-feet); minimum discharge occurred.during winter.
ICE. Stage-discharge relation affected by ice; data insufficient to warrantdetermination of discharge.
DIVERSIONS. Between Palisade and Glenwood Springs stations, the principaldiversion is the high-line canal of the Bureau of Reclamation which has acapacity of 1,425 second-feet. Of the amount diverted, power water is-returned to the river to supply a priority of 521 second-feet for the GrandValley Canal.
REGULATION. None. COOPERATION. Complete records furnished by United States Bureau of"
Reclamation.
Daily discharge, in second-feet, of Colorado River near Palisade, Colo., for the year- ending September 80, 1922
Day
1__
4-- 5---
6--. ----- -7.--
9 10--
11 12 - - 13-- 14 15--
16 17 18 19 20-
21 9923._,_ _ -24nK
Z6.. .... ............21.. ................^&.. ................9Ct
30-- 31
Oct.
1,9402,1802,1802,0001,940
1,8801,9401,8801,9402,060
2,1202,1202,0602,1202,000
2,000
2,0001,9401,880
1,9401,8801,8801,9402,060
2.1202,1202,1202,0602,0002,000
Nov.
2,0001,9401,9401,9402,000
2,0002,0001,9401,8801,880
1,9401,7001,7001,7002,060
2,0001,9001,8201,8001,760
1,6801,8801,9402,060
2,2502,320
2,060
Dec.
2,0001,9401,8801,8801,820
1,6401,4801,4201,5301,530
1,8802,0602,1802,4602,620
2,7002,1801,9402,0002,060
2,1802,2502,0601,9401,580
1 PMi «401,7001,5801,5701,570
Jan.
1,4801,5301,5801,640
1 4801,5301,3701,4201,480
1,7001 fi4ft
Mar.
1,6401,5801,5301,5301,530
1,5301,5801,5801,5301,530
1,5801,6401,6401,7001,880
2,5402,3202,4602,7002,700
9 040
2,8602,9403,0303,120
2,7802,7002,4602 OOf)
2,320
Apr.
2,1802,1202,2502,3202,390
2,4602,6262,7802,8602,780
2,7002,5402,4602,1202,060
2,1202,0002,0001,9401,880
1,9402,3203,2103,9804,700
K lAfl
5,4805,6006,210
May
7,8808,3308,7909,420
10,600
12,90016,80018,60018,20015,600
13,40011,50010,1009,4209,100
9,1009,580
11,20013,60016,400
17,80018,60019,00020,30099 fifiO
27,40028,70031,00029,90027,400
June
24,30021,90021, 20020,80019,900
21,00023,30025,80027,10027,400
26,30024,30024,50025,30024,800
23,00019,50019,00018,80019,200
IQ nnn18,00017,40016,000
14,70014,10012,90011,50011,500
July
11,00010,9009,9008,6408,180
8,1807,7407,1606,7406,600
6,8806,4705,7205,2504,700
4,5004,1804,0803,8803,580
3,480Q QQfl
3,4803,1202,860
9 f\d(\9 HO
2,6209 4fiO9 7flfl
Aug.
4,0804,0803,7803,8803,480
3,3002,7002,5402,3202,250
2,3202,2502,1802,0601 040
1,8801 9402,' 5402,7802,860
2 9402,8602,7802,7002 460
2,3209 9^0
2,1202,1802,1209 9QO
Sept.
2, 460-2,390-
2, 620-
2,3902, ISO1, 880-2,0001,940'
1,940-1, 880-2,060
1, 640-
1,5801 KQAj
1 480
1,320>
1 Q7O '1 9JMVi
1, 230
i i ptfi*
1 9ftO1 990,-
1,4201, 640»1 640'
NOTE. Figures have been changed slightly to conform to computation rules of United States Geolog ical Survey. Stage-discharge relation affected by ice Nov. 17-21 and Dec. 30 and 31; discharge determined by comparison with flow of Colorado Kiver and Eoaring Fork at Glenwood Springs.

COLORADO BIVER BASIN 15
Monthly discharge of Colorado 'River near Palisade, Colo., for the year endingSeptember 80, 192®
Mean
October ___________________________November.. ________________________DecemberMarch. _______________ . ___________April.....................................................May __ .. ________________________
June. ____________________________July......................................................
September... __ . ____ ....... _ . ____ . .........
Discharge in second-fpet
Maximum
2,180 2,320 2,700 3,120 6,880
31,000 27,400
1 11, 000 4,080 2,780
Minimum
1,880 1,680 1,420 1,530 1,880 7,880
11,500 2,460 1,880 1,150
Mean
2,010 ' 1,960
1,900 2,140 3,070
16,400 20,400 5,370 2,650 1,770
Run-off in- acre-feet
124,000 117,000 117,000 132,000 183,000
1, 010, 000 1,210,000
330,000 163,000 105,000
NOTE. Monthly means computed by engineers of the U. S. Geol. Survey.
COLORADO RIVER NEAR FRUITA, COLO.
LOCATION. In sec. 20, T. 1 N., R. 2 W., at highway bridge 1J^ miles south of Fruita, Mesa County. Nearest important tributary, Little Salt Wash, enters 1 mile below station; Gunnison River enters at Grand Junction 12 miles above.
DRAINAGE AREA. 16,800 square miles (measured on map in Hayden's atlas).HECORDS AVAILABLE. April 1, 1911, to September 30, 1922; flood records
during 1908, 1909, 1910. GAGE. Chain gage on downstream side of left span; read by L. C. Jones. Prior
to May 3, 1911, gage was vertical staff attached to center pier, datum 0.05 foot lower.
DISCHARGE MEASUREMENTS. Made from three-span highway bridge.CHANNEL AND CONTROL. Bed composed of silt and gravel which will scour out
at high stages and fill in afterwards. Control is riffle 600 feet downstream; somewhat shifting. Banks subject to overflow at stage of 14 feet.
EXTREMES OF DISCHARGE. Maximum stage recorded during year, 12.5 feet at 5 p. m. May 29 (discharge, 54,100 second-feet); minimum stage probably occurred during winter.
1908-1922: Maximum stage recorded during period, 15.2 feet June 16> 1921 (discharge, 81,000 second-feet). Weather Bureau states that highest stage known was about 18.5 feet on July 4, 1884 (discharge, estimated from extension of rating curve and levels across overflow, 125,000 second-feet). Minimum stage, 1.9 feet August 26-30, 1919 (discharge, 1,270 second-feet).
ICE. Stage-discharge relation seriously affected by ice; daily discharge not determined during winter.
DIVERSIONS. Between the Palisade station and Fruita, court decrees for diver sions of 788 second-feet from Colorado River.
^REGULATION. None.ACCURACY. Stage-discharge relation not permanent; affected by ice during
winter. Rating curve fairly well defined. Gage read to tenths twice daily. Daily discharge ascertained by applying mean daily gage height to rating table, except periods October 1 -to January 9, March 7-31, and September 1-30, when shifting-control method was used. Records good.

16 SURFACE WATER SUPPLY, 1922, PART IX
Discharge measurements .of Colorado River near Fruita, Colo., during the year ending September 80, 1922
Date
Nov. 14Apr. 6May 13
Made by
F. C. Snyder «. ... . .J. H. Baily. ..........F. C. Snyder.. __ ....
Gage height
Feet 3.985.058.14
Dis charge
Sec.-ft. 2,9305,900
16, 900
Date
July 5
Made by
J. H. Baily - ... .. _
Gage height
Feet 12.246.80
Dis charge
Sec.-ft. 41,50011,400-
»State hydrographer.
Daily discharge, in second-feet, of Colorado River near Fruita, Colo., for the year ending September 30, 1922
Day
1 2.. ....... .3_ 4..........5...
6 7 ... ..8..........9.. ........
10.. ........
11 12..........13 14..........15
16 17.. ..18... .......19..........20
21..........22.. ....... .23 24..........25
26 27..........28 29 30 31...
Oct.
2,7302,8802,8802,9602,880
2,8803,0402,8802,8803,040
3,0403,2003,2003,0403,040
2,9603,0403,0403,0403,040
3,0402,9602,8802,9603,040
3,2003,3703,3703,3703,3703,370
Nov.
3,3703,3703,200
3,3703,3703,370^ 4fin3,370
3,0403,200
3,2803,280
3,6303,3703,5403,3703,370
3,3703,5403,5403,3703,540
3,7203,7203,5403,5403,370
Dec.
3,4603,7203,7203,3703,120
2,8803,0403,0402,8802,880
2,8803,0403,2003,2003,040
3,040Q (\A(\
3,2003,1203,120
3,2803,7204,0003,8203,200
3,3703,5403,5403,3703,3703,370
Jan.
Q Q7A
Q Q7ft
3 07ft
Q KA(\
3,200
*> f\Afl
q (\A.(\
^ fUft^ run
9 4ftft
2,250
Feb.
2,200
.2,250
2,800
Mar.
9 firm
2,6602,5802,580
2,7302,5802,7302,8003,040
3,4604,5805,7004,3803,910
4,1004,2904,7606,1505,700
5,4805,2704,8604,580
4,380
Apr.
4 9CM1
3,9103,9104,6705,060
5,9206,8507,1006,3805,270
4,6704,480
3,7204,290
4,860
4,1003,9103,910
3,9105,4806,8507,8809,710
12,40012,00011,20013,300
May
19, 40020,00021, 30023,30024,000
31,40039,50042,30039,50032,200
27,20020,00017,70017,20016,600
16,20016,20021,30026,40029,600
34,90034,90035,80039,50045,200
47,10049, 10051,10053,100
49,100
June
43,20035,80033,10033,10034,000
32, 20036,70039, 50042,30041,400
41,40037,60036,70038,60037,600
34,00028,80027,20027,20026,400
26,40025,60024,00022,60022,600
21,30018,80017,70016, 60015,700
July
14,70013, 70013,30012,40011,200
9,7109,3808,4508,4508,160
7,8807,8807,1006,3806,150
5,700
5,0604,8604,670
4,6704,4804,4804,2904,290
4,2903,5403,3703,5404 480^ 860
Aug.
4 Sfift4,8605,0605,2704,670
4,4804,2903,5403,5402,880
2,8802,8802,8802,8802,880
2,3003,5403,2003,7204,290
4,6704,2904,4804,2903,720
3,5403,2003,2003,0403,2003,540
Sept.
3 {\Af\
3 ft4/V
3,370-3, 7203,370
3,2003,200q (\A.f\
2,7302,730
2,580-2,5809 4.4.A
2,4402,300
2,3002,3002,3002,3002,170
1, 9801,9801,9801,9801 860'
1,9802,1001,9801,9801,980
NOTE. Stage-discharge relation affected by ice Janl 10 to Mar. 6; discharge determined by comparison with combined flow of Colorado River near Palisade and Gunnison River near Grand Junction.
Monthly discharge of Colorado River near Fruita, Colo., for the year ending Sep tember 30, 1922
Month
October ________ . ___________ ___ . ......
February. _____
June. __ _ __ ..... . ---. ... __ ...July..........
The year _______________________
Discharge in second-feet
Maximum
3, 370 ' 3,720 4,000 3,540
6,150 16, 600 53, 100 43,200 14,700 5,270 3,720
53,100
Minimum
2,730 3,040 2,880
3,720 16, 200 15, 700 3,370 2,300 1,860
1,860
Mean
3,050 3,410 3,280 2,590 2,390 3,730 6,550
32,000 30,600 7,000 3,740 2,500
8,430
Run-off in acre-feet
188,000 203,000 202, 000 159,000 133, 000 229,000 390, 000
1,970,000 1, 820, 000
430, 000 230,000 149,000
6, 100, 000

COLORADO RIVER BASIN 17
COLORADO RIVER AT LEES FERRY, ABIZ.
LOCATION. At Lees Ferry, just above mouth of Paria River, at head of Marble Gorge and at lower end of Glen Canyon, Coconino County.
DRAINAGE AREA. Not measured.RECORDS AVAILABLE. June 13, 1921, to September 30, 1922.GAGE. Staff gage in two sections on left bank, at head of Paria riffle and east
end of the "Dugway" road; installed August 14, 1921; read by I. G. Cock- roft and W. E. Johnson, resident hydrographers of the Southern California Edison Co.
Original gage installed temporarily on May 8, 1921, on right bank near buildings-at Lees Ferry, about 400 feet upstream from the "Dugway" gage, was topped by the unusual flood of June, 1921, and damaged to such an extent that readings on it can not be reduced satisfactorily to the datum of the gage installed in its place on June 24 and known as " No. 1 gage." Stages through the crest of the flood from June 13-23 were recorded by use of stakes and referred to datum of No. 1 gage. The "Dugway" gage was read continuously and the No. 1 gage with some interruptions until June, 1922, when it was damaged by high water. Current-meter measurements were referred to both gages. The datum of the Dugway gage is 3,106.35 feet above sea level and that of the No. 1 gage is 3,102.79 feet above sea level.
DISCHARGE MEASUREMENTS. Made from cable about 1 mile upstream from Dugway gage.
CHANNEL AND CONTROL. Channel at measuring section varies in width from 350 feet at low water to 435 feet at high water. Bed is composed of sand and silt and is scoured several feet during each flood season. Control is Paria riffle; composed of gravel and boulders and has remained practically permanent during period of record.
EXTREMES OF DISCHARGE. Maximum stage during flood season of 1921 occur red June 18 and was 26.5 feet referred to Dugway gage and 30.9 feet referred to No. 1 gage (discharge from extension of rating curves, about 190,000 second-feet). Maximum stage during the flood season of 1922 occurred June 2 and was 19.9 feet referred to Dugway gage (discharge, 120,000 second- feet).
Minimum stage during period June 13, 1921, to September 30, 1922, 6.4 feet January 14 and 15, 1922 (discharge, 3,700 second-feet).
The high-water mark of the flood of 1884 at the ranch near mouth of Paria River, as identified by Jerry Johnson, is at elevation 3,137.1 feet above sea level.
ICE. Stage-discharge relation for a few days during winter of 1921-22 affected by diurnal collection of floating ice on Paria riffle.
DIVERSIONS. Water is diverted from main river and tributaries above station for irrigation of about 1,500,000 acres.
REGULATION. None.ACCURACY. Records for June 13 to September 30, 1921, are based on twice-
daily readings referred to No. 1 gage and a rating curve developed from 119 current-meter measurements made between August, 1921, and June, 1922. The measurements cover a range in stage of 12 feet and a range in discharge from 5,000 to 98,500 second-feet. The records for the year ending September 30, 1922, are based on twice-daily readings and two rating curves referred to the "Dugway gage." During the year 158 current-meter meas urements, covering a range in stage of 1& feet and a range in discharge from 3,700 to 116,000 second-feet, were referred to this gage. The low-stage measurements made after July 11, 1922, indicated a scour in the control corr/eaponding to about 0.1 foot on .gage and a new curve was drawn and

18 SURFACE WATER SUPPLY, 1922, PART IX
used for the fall and winter of 1922. Records good except those for high water of 1921 which may be subject to some error.
COOPERATION. All equipment except current meters was furnished and in stalled by the Southern California Edison Co., through H. W. Dennis, construction engineer, and the entire cost of operation was borne by that company. The Geological Survey acted in an advisory capacity, furnished the current-meter equipment, and made the studies and computations of results.
Daily discharge, in second-feet, of Colorado River at Lees Ferry, Ariz.,for the years ending September SO, 1921 and 1922
Day
1921 1 _____ ....2 ___ .......3 _ .........4 __ .........5 _ ...... ...
6.... ....... .7__... .......8 __ ........9... ....... ..
10.-...-.-....
11--.. 12 __ .........13............14.. .......15--.,. _ . -..
June
138,000150,000161, 000
July
62,70058,90055,60051,90050,500
48,20045,50041,10036,00033,200
30,80029,60029,30028,10028,500
Aug.
29,60037,00029,60026,60023,500
20,70019,40018,80017,50016,600
16,20016,60016,60014,80015,400
Sept.
23,80025,20022,50021,80021,100
20,10018,10016,200
14,200
12,80012,10011,60010,90010.000
Day
1921 16 _ .........17 _18 _ .........19-- 20.... ........
21-- 22-. _ . .... 23-- 24-- . 25--
26-- 27-- 28-- 29-- . 30--. . 31..
June
169,000175, 000181,000172, 000156, 000
137, 000119, 000106,00091, 30082,000
77,80075,20073,70075,70066,500
.July
29,30028,10032,00031,60031,200
32,00028,90029,60028,50027,700
26,60026,60027,70033,20026,20025,500
Aug.
19,40016,00020,40017,50015,600
24,50026,20040,20048,20064,100
51,90046,00035,20030,00027,70025,200
Sept.
9,6309,4408,5008,6808,150
8,1507,9807,9807,9807,640
7,8107,6407,3107,1506,830
Day
1921-22 1 ____ .2 _ .....3 ...4.. __ 5 ........
6 7; ...8 ___ 9 10
11 12 13 14.. .15
16. ..17 _ .....18 19 20 _ .....
21 22.......23 24 25 _ .. ...
26.. _ ...27.. _ ...28. ...29 __ ...30 _ . ....31........
Oct.
7,12011,8007,8307,4706,780
6,9506,9507,1206,7806,780
6,7806,7806,9507,1206,780
6,7806,4506,4506,1306,290
6,4506,1306,1306,1306,130
6,7807,1207,6507,6506,7806,450
Nov.
6,7806,7806,7806,7806,950
7,1207,3007,3007,1207,120
7,1207,1206,9506,9506,780
6,4506,4506,7806,7806,950
6,9506,9507,1206,9506,620
6,6207,1207,4707,4707,650
Dec.
7,6507,4707,4707,3007,120
7,1207,1207,4706,9506,450
5,8305,8305,5505,2805,020
5,0205, 1505,4205,9806,130
6,4507,3007,4708,0208,580
9,81010,50011,80010,7009,1808,780
Jan.
8,5808,3908,2008,580
10,000
8,9808,9808,3907,3006,620
5,2804,4303,9003,7003,700
4,1104,1104,3204,5404,540
4,9004,4304,2204,0004,110
4,4304,9004,7704,4304,4304,660
Feb.
5,1505,1505,0205,1505,280
5,0205,2805,0204,9005,020
6,45010,90010,0009,600
10,200
9,8108,3907,6507,6507,830
8,78010,20010,20010,70010,700
10,50010 0009,810
Mar.
9,6009,3909,3908,5807,650
7,3007,1206,7806,7806,620
6,2906,1306,1306,1306,290
6,78010,00016,80022,60024,500
31,20031,20024,50021,20021,900
21,20023,70024,50024,50022,20019,400
Apr.
17,20016,00014,50013,50013,000
14,00016,50017,80018,80018,100
17,80017,80018,10017,50016,800
15,70014,80014,00014,30014,000
13,50012,50013,50017,50024,900
30,70032,90036,20040,00042,000
May
42,50046,60053,20055,40055,400
61,00062,70071,70081,20086,800
85,10081, 20072,80065,50061,000
56,50054,30051,50050,40055,400
63,80070,00077,30082,30086,800
94,60099,100
106,000113,000117,000119,000
June
118,000119,000107,00095,70086,200
81,20081,20084,50088,50093,500
104,000108,000108,000102,00099,700
99,10097,40087,90079,50075,600
75,60075,00075,00072,20071,700
68,90065,50061,60057,10055,400
July
52,10048,80046,10044,00042,500
36,60034,80032,90031,20028,200
27,00025,00023,10022,40021,300
19,30018,40016,80015,40014,600
13,80013,10012,80011,90011,200
10,80010,40010,40010,1009,930
10,100
Aug.
11,90012,10012,40013,40014,900
14,10012, 40011,90011,70011,000
9,93010,6009,1208,9308,740
8,1808,1808,5508,550
11,500
11,00011,70012,40012,40019,300
17,80012,60011,00010,4009,3208,930
Sept.
8,5508,7408,740
10,80011,700
9,9308,9308,9309,1208,550
8,1807,8207,3006,9606,640
6,4806,3206,1705,7205,580
5,5805,3005,3005,1705,040
5,0404,9204,9204,7904,790

COLOEADO EIVEE BASIN 19
Monthly discharge of Colorado River at Lees Ferry, Ariz., for the years ending Sep tember SO, 1921 and 1922
Month
1921 June 13-30 __________________________July.....................................................August. .. ___________________________
1921-22 October ___________________________November... ______ . . ________ ____December ____________________________January ___________________________February. ____ . .. .. __ _ __ . _March ______________ ..........................April.....................................................May ______ .June. _________ __ ________ ___ ..July__. ..................................................August _____________________________September... _ ... .....
The year.. _____________________
Discharge in second-feet
Maximum
181,000 62,700 64,100 25,200
11,800 7,650
11,800 10,000 10,900 31,200 42,000
119,000 119, 000 52,100 19,300 11,700
119,000
Minimum
66,500 25,500 14,800 6,830
6,130 6,450 5,020 3,700 4,900 6,130
12,500 42,500 55,400 9,930 8,180 4,790
3,700
Mean
123,000 35,300 26,700 12,500
6,950 6,980 7,290 5,680 7,870
14, 700 19,500 73,500 86,500 23,400 11,400 7,070
22,600
Run-off in acre-feet
4,390,000 2,170,000 1,640,000
744,000
8,940,000
427,000 415,000 448,000 349,000 437,000 904,000
1,160,000 4,520,000 5,150,000 1,440,000
701,000 421,000
16,400,000
COLORADO RIVER NEAR TOPOCK, ARIZ.
LOCATION. In E. ^ sec. 16, T. 7 N., R. 24 E., in Mohave Canyon 1M miles below Atchison, Topeka & Santa Fe Railway bridge at Topock, Mohave County.
DBAINAGE AREA. 171,000 square miles.RECORDS AVAILABLE. February 1, 1917, to September 30, 1922.GAGE. Stevens continuous water-stage recorder on right bank at mouth of
Mohave Wash just above point where river enters a narrow section of the canyon; inspected by G. M. Bobst and D. A. Dudley. Zero of gage 424.09 feet above sea level.
DISCHARGE MEASUREMENTS. Made from cable 500 feet below gage.CHANNEL AND CONTROL. Channel straight above and below gage. Above the
gage the channel is wide and the bed of loose sand is constantly shifting. At low stages large sand bars form numerous islands between Topock and the gage. Below gage river enters a steep walled rock canyon and the channel contracts from about 800 to 400 feet. The bed in the canyon scours during floods and fills during low stages. The control is indefinite.
EXTREMES OP DISCHARGE. Maximum stage during year from water-stage recorder, 20.75 feet on June 3 (discharge, 121,000 second-feet); minimum discharge, 6,360 second-feet on September 28.
1917-1922: Maximum stage recorded, 28.2 feet at 6 a. m. June 22, 1921 (discharge, 174,000 second-feet); minimum discharge, 4,100 second-feet on January 16, 1919.
DIVERSIONS. Water is diverted from main river and tributaries above station for irrigation of about 1,500,000 acres.
ACCURACY. Stage-discharge relation not permanent. During the year 67 discharge measurements were made covering a range in discharge from 6,500 to 120,000 second-feet. Operation of water-stage recorder satisfactory during most of year. Mean daily gage heights determined by inspecting recorder graph. Daily discharge ascertained by shifting-control method. Records for October to April, fair; Miay to September, good.

20 SURFACE WATER SUPPLY, 1922, PART IX
Daily discharge, in second-feet, of Colorado River near Topock, Ariz., for the year ending September SO, 1922
Day
1.. ...... ......2... ...........3..............4..............5..............
6..............7....... . ....8..............9. ...... .......
10..............
11.......12....... ....13........... _14 _ .15.....
16..............17 _ ...........18..............19..............20..... ._..___..
-21..............2223..............24...... _ .....25..............
26..............27-... ..-.-28...... ........2930..............51..............
Oct.
10,000 9,600 9,200 9,900
12,000
14,500 9,900 8,500 8,740 8,740
8,500 9,000 8,500 8,200 8,200
7,600 8,500 9,400 9,000 8,600
9,000 8,000 8,200 8,960 8,800
9,500 10,000 8,950 8,700 9,000 9,800
Nov.
9,600 10,500 10,200 9,800 9,800
10,000 9,900
10,000 10,000 9,900
10,100 10,100 10,200 10,200 9,900
9,900 9,900 9,900 9,280 8,900
8,500 8,500 8,600 8,400 8,200
8,100 8,330 8,500 8,600 8,600
Dec.
8,600 8,700 8,700 9,000 9,000
, 9,200 9,400 9,400 9,400 9,300
9,300 9,500 9,500 9,600 9,600
9,500 9,400 9,300 9,400 9,400
9,500 11,300 19,500 19,500 17,300
13,000 11,000 10,500 9,500
10,000 14,500
Jan.
15,700 16,800 18,000 19,200 18,000
16,7QO 15,500 14,200 13,000 12,400
13,800 12,400 11,300 10,200 9,160
8,490 7,820 7,150 7,150 7,150
7,140 7,140 7,120 7,100 7,250
7,400 7,550 7,700 7,850 7,700 7,900
Feb.
8,000 8,000 7,800 7,700 7,680
7,800 7,850 7,800 7,700 8,000
8,100 11,800 10,300 9,700
13,900
19,000 17,400 17, 100 16,700 13,500
12,200 11,000 10,500 10, 700 12,000
13,000 12,500 13,000
Mar.
13,300 13,500 14,000 13,500 14,300
14,000 13,100 12,900 11,800 11,700
11,300 11,300 11,200 11,000 11,000
11,000 11,000 11,300 11,500 12,800
14,000 38,000 36,700 35,800 35,000
34,100 30,500 28,500 28,500 31,000 32,800
Apr.
33,200 29,000 19,100 18,300 17,500
17,000 17,000 17,000 17,000 20,600
22,200 23,000 22,800 21,900 22,200
23,600 23,300 22, 200 22,200 19,600
17,000 18,000 19,000 20,000 20,500
21,000 27,000 33,000 34,000 36,000
May
39,000 43,000 46,000
50,000 53,000
53,000 56,000 60,000 66,000 73,000
82,600 86,000 86,800 86,000 81,700
73,500 67,800 59,200 58,300 58,400
60,100 62,100 69,4QO 74,800 79,200
88,000 92,000 96,800
101,000 108,000 112,000
June
115,000 115,000 121,000 119,000 116, 000
.106, 000 99,500 97,000 91,200 91,800
90,700 93,400 94,000 97,200 99,300
100,000 99,700 96,000 98,000 98,000
92,000 87,000 80,000
-80,300 80,500
83,000 79,300 75,000 72,000 70,000
July
66,600 60,400 59,600 56,400 54,200
51,000 44,500 42,900 38,600 35,800
35,400 32,200 30,600 28,200 26,800
25,600 24,900 23,500 21,800 21,100
19,400 24,200 23,100 15,500 14,900
14,600 14,200 13,600 12,100 11,200 11,500
Aug.
12,100 13,900 13,000 14,600 18,800
17,800 16,000 15,100 18,000 16,800
13,600 13,000 13,000 12,500 11,000
13,000 12,600 11,000 11,400 19,500
20,000 15,600 14,800 15, 500 13,800
15,600 15,200 16,500 23,000 17,500 13,000
Sept.
11,500 11,500 13,700 11,300 11,000
11,800 11,:800 14,000 15,000 12,500
10,000 10,600 9,810 9,810 9,000
8,300 7,700 7,700 7,500 7,400
7,430 7,430 7,430 7,000 6,900
6,800 6,600 6,360 6,400 6,400
Monthly discharge of Colorado River near Topock, Ariz., for the year endingSeptember SO, 1922
Month
October __ ~ ___ ________ ___ ..............November. ......... .............. ......................
April.................................................:...May _________ _________________ .....June... __ _ ____ _ _ ..July.. -..^. ....... .....................................
September.. . _________________ _________
Discharge In second-feet
Maximum
14,. 500 10,500 19,500 19,200 19,000 38,000 36,000
112,000 121,000 66,600 23,000 15,000
121,000
Minimum
7,600 8,100 8,600 7,100 7,680
11,000 17,000 39,000 70,000 11,200 11,000 6,360
6,360
Mean
9,210 9,410
10,700 10,800 11,100 19,000 22,500 71,700 94,600 30,900 15,100 9,360
26,200
Run-off in acre-feet
566,000 560,000 658,000 664,000 616,000
1, 170, 000 1,340,000 4,410,000 5, 630, 000 1, 900, 000
928,000 557,000
19,000,000
COLORADO RIVER AT YUMA, ARIZ.
LOCATION. In NE. M NE. M sec. 35, T. 16 S., R. 22 E., San Bernardino base and meridian, 100 feet upstream from Southern Pacific Co.'s original railroad bridge at Yuma, Yuma County, and half a mile below highway bridge. Since change in channel on June 7, 1920, Gila River enters from east 5 miles upstream from this station.
DRAINAGE AREA. 242,000 square miles (measured on map compiled from best available maps of the Colorado River basin).
EECORDS AVAILABLE. April 1, 1878, to September 30, 1921. Gage heights only prior to January 1, 1902.

COLORADO EIV1E BASIN 21
GAGE. Stevehs long-distance water-stage recorder installed May 1, 1922. Sender in stilling well on left bank at same point and datum as vertical staff gage formerly used. Continuous recorder in office of Bureau of Recla mation. Sender and recorder inspected daily by D. Martinez. Zero of gage is 102.79 feet above mean sea level.
DISCHARGE MEASUREMENTS. Made from cable 1,100 feet downstream from gage.CHANNEL AND CONTROL. Bed composed of shifting sand and silt; subject to
much scour during high water. No well-defined control.EXTREMES OF DISCHARGE. Maximum mean daily discharge during year,
115,000 second-feet on June 10; minimum mean daily discharge, 4,200 second-feet on January 31.
1902-1922: Maximum mean daily discharge, 240,000 second-feet January 22, 1916; minimum mean daily discharge, 1,800 second-feet January 16, 1919.
DIVERSIONS. Water is diverted for irrigation and power from main 'river and tributaries above this station. The Yuma project of the United States Bureau of Reclamation diverts from right side of river at Laguna dam 15 miles upstream and siphons under the river at Yuma between gage and cable. Waste water from diversion returns to river on right side half a mile below cable. Imperial irrigation district diverts from river on right side 7 miles downstream from this station.
REGULATION. Flow affected at times by sluicing at Laguna dam.ACCURACY. During the year 157 discharge measurements were made at the
station; daily discharge determined by shifting-control method.CoopERATioN.^Complete records furnished by United States Bureau of Recla
mation, but data have been slightly revised to conform to computation rules used by the United States Geological Survey.
Daily discharge, in second-feet, of Colorado River at Yuma, Ariz., for the year ending September 80, 1922
Day
I ........2,..-.-......3..............4... ..5 ...........
6........ ....7..............8. ..........9........10.............
11 -..._ 12.... ..........13..--.. .......14 16 ..... ......
16.... ..17. 18 .... ..19 ...........20
21 22 23 ...........24..............25 .
26 .-,.27..... ...... ...28 29..............30 . 31 ...........
Oct.
17,300 11,800 11,100 11,000 10,900
10,200 9,500
16,000 12,000 9,700
9,200 8,900 8,600 8,800 8,500
8,200 7,600 7,300 7,000 7,100
7,100 7,500 7,200 7,900 6,300
6,500 6,600 6,700 7,400 7,100 7,000
Nov.
7,100 7,200 7,300 7,400 7,800
7,200 6,600 7,000 7,400 7,700
8,100 8,300 8,500 9,000 8,800
8,700 8,000 7,600 7,400 7,300
7,000 7,100 6,700 6,900 7,100
7,200 7,200 7,300 7,400 7,500
Dec.
7,400 7,300 7,800 7,100 7,600
7,900 7,800 7,900 7,900 7,900
.8,700 8,500 8,400 8,300 8,400
8,500 6,300 6,200 6,100 6,000
5,900 7,000 5,900
19,500 25,500
20,500 13,000 11,200 14,800 23,100 22,300
Jan.
18,000 17,000 16,400 20,000 40,600
46,800 24,000 19,000 16,600 16,100
15,700 14,100 13,900 13,300 10,500
10,500 9,400 8,300 7,000 6,400
5,700 5,500 5,700 5,500 5,200
6,000 5,900 6,500 5,000 4,600 4,200
Feb.
5,100 4,500 7,500 7,800 7,500
7,100 6,800 6,600 6,500 6,500
6,700 13,500 17,000 17,600 15,400
11,700 11,800 17,000 14,500 14,000
13,600 12,500 11,000 10,100 11,000
12,000 12,600 13,700
-------
Mar.
13,800 13,000 13,100 12,500 11,800
11,600 10,200 9,600 9,700 9,700
9,000 '8,500 7,700 7,800 7,800
7,500 7,200 8,500 9,500
24,400
19,000 16,100 23,200 28,800 31,200
35,000 30,900 27,000 26,500 26,200 26,000
Apr.
28,500 28,000 27,000 23,500 20,700
19,000 17,700 17,700 16,500 15,100
16,500 17,900 20,200 20, 700 20,500
18,500 18,300 18,700 19,100 18,000
16,800 16,000 15,500 15, 800 15,200
14,600 13,800 13,300 20,000 30,500
May
32,300 33,200 34', 100 37,000 39,000
43,700 47,000 49,900 50,000 52,200
53,500 56,fiOO 61, 300 56,000 59,400
66,000 71,300 76,000 73,000 69,000
63,000 58,200 55,000 51,100 53,000
54,800 61,000 64,000 65,000 72,000 75,100
June
83,500 91,500 97,000
100,000 104,000
107,000 109,000 112,000 114,000 115,000
107,000 98,200 88,000 84,000 87,300
92,000 100,000 105,000 110, 000 110,000
110,000 108,000 108,000 104,000 98,000
87,000 76,500 77,000 74,500 74,000
July
74,500 69,500 64,500 59,500 58,500
52,500 47,500 47,000 43,000 39,000
35,500 32,200 30,000 29,000 29,500
26,200 22,200 22,000 21,700 18,800
19,500 18,000 16,800 15,500 15,000
13,500 11,700 12,100 13,500 10,500 12,000
Aug.
10,300 9,200
11,100 11,200 11,500
12,600 13,200 12,700 12,20013,200
13,700 '13,1900 14,100 10,600 10,500
10,500 10,000 9,800 9,000 8,500
8,000 10,500 17,800 14,100 11,100
15,200 14,900 13,400 13,200 13,100 15,000
Sept.
16,700 14,800 13,800 12,500 12,100
12,500 10,700 10,300 9,000
10,100
11,500 ;,lfl,700 10,000 8,600 8,200
8,300 7,600 7,300 6,800 6,300
6,200 6,200 5,900 5,700 5,500
5,400 6,700 5,800 4,500 4,700
J "

22 SURFACE WATER SUPPLY, 1922, PART IX
Monthly discharge of Colorado River at Yuma, Ariz., for the year ending September
Month
November _ . ___ ____________ *_ ____December __________________________January
AprilMay. _ . __________________________JuneJuly.. .August .- __ ....September
- The year
Discharge in second-feet
Maximum
17,300 9,000
25,500 46,800 17,600 35,000 30,500 76,000
115,000 74,500 17,800 16,700
115, 000
Minimum
6,300 6,600 5,900 4,200 4,500 7,200
13,300 32,300 74,000 10,500 8,000 4,500
4,200
Mean
8,970 7,530
10,300 13,000 10,800 16,200 19,100 55,900 97,700 31,600 12,100 8,810
24,400
Run-off in acre-feet
552,000 448, 000 633,000 799,000 600,000 996,000
1, 140, 000 3,440,000 5,810,000 1, 940, 000
744,000 524,000
17, 600, 000
FRASER RIVER NEAR ARROW, COIO.
LOCATION. In NE. ^ sec. 4, T. 2 S., R. 75 W., a quarter of a mile from Vasquez siding on Denver & Salt Lake Railroad in Arapahoe National Forest and 13^ miles southwest of Arrow, Grand County. Nearest tributary enter* about half a mile above.
DRAINAGE AREA. 28 square miles (revised, measured on topographic map).RECORDS AVAILABLE. September 23, 1910, to September 30, 1922.GAGE. Friez water-stage recorder on left bank 300 feet upstream from old
logging road crossing at Vasquez; inspected by forest ranger. Prior to June 3, 1916, vertical staff attached to downstream side of bridge on trail to Arrow and a quarter of a mile above railroad bridge was used. During winter, readings taken from staff gage 1 mile upstream at railroad bridge.
DISCHARGE MEASUREMENTS. Made from footbridge near gage or by wadingCHANNEL AND CONTROL. Bed composed of boulders and coarse gravel; fairly
permanent. No well-defined control. Banks are not subject to overflow.EXTREMES OF DISCHARGE. Maximum stage during year from water-stage re
corder, 2.03 feet at 8 p. m. June 13 (discharge, 336 second-feet); minimum discharge occurred during winter.
1911-1922: Maximum discharge recorded, 820 second-feet at 9 p. m. June 13, 1918 (gage height, 2.9 feet); minimum discharge, 2 second-feet on March 30, 1912 (gage-height, 0.60 foot).
ICE. Stage-discharge relation affected by ice.DIVERSIONS. Court decrees for diversions of 53 second-feet across divide from
headwaters of Fraser River into headwaters of Clear Creek. During 1922, 577 acre-feet were diverted. Below station, court decrees for 74 second-feet for irrigation and 61 second-feet for placer mining and power.
REGULATION. Diurnal fluctuation during spring, caused by alternate melting and freezing of mountain snow. No artificial regulation.
ACCURACY. Stage-discharge relation practically permanent for both regular and winter stations; affected by ice. Rating curve used October 1 to October 26 and June 5 to September 30, and curve for winter station used October 27 to June 4 are both well defined. Staff gage at winter station read to quarter- tenths once daily. Operation of water-stage recorder satisfactory except for short periods. Daily discharge ascertained by applying to rating tables daily gage height or mean daily gage height determined by inspection of recorder graph. Record excellent, except for days of missing gage heights and periods affected by ice, for which they are fair.

COLORADO RIVER BASIN 23
Discharge measurements of Fraser River near Arrow, Colo., during the year endingSeptember SO, 1922
Date
Dec. 421Feb. 8July 6
Made by
-do.
»Feet »0.62«.58
.92
Dis charge
Sec.-ft.7.87.1
65
1 Made at winter station.
Daily discharge, in second-feet, of Fraser River near Arrow, Colo., for the year ending September 30, 1922
Day
l... ........2.... _ . ___ .3........ ___ .4 __ . .........5...... ........
6... ........7 ..............8. .......... ...9..............
10... ...........
11 ...........12.... ___ .....13.. .........14.... __ .. _ .15..............
16.... __ ......17.... ___ .....18 _ . ___ .....19..............20
21..............22...... ___ ...23......... _ ..24... ___ .....25.. ___ .. ....
26. _ .....27.... ..........28... ...........29.. ............30... ...........31.. ............
Oct.
1918171716
1619181816
1616161615
1414141414
1414141515
172121151517
Nov.
2321181718
2023131211
1318161513
13109810
121511159
1720231512
Dec.
1313131211
1313151210
111213107
4567
87767
777776
Jan.
676
5
6
7
Feb.
66666
87788
88876
66666
66666
666
Mar.
66666
63366
33366
66688
86336
376338
Apr.
33383
77868
83667
87666
48888
88888
May
1421211848
4854655943
3825232121
2159597192
85116169142188
208219230230188178
June
169169169160185
180200221232232
224229267252210
180166163156158
150139135131125
1151049795Q7
July
9077706967
7465605855
5250474645
4341373636
4037363534
323336373028
Aug.
3133303030
2625242423
2422222223
2324302827
3033333132
312827302926
Sept.
2526252424
2322201817
1716161616
16151514
1414141414
1313141414
NOTE. Stage-discharge relation aflected by ice Nov. 9-11,13,17-21, Dec. 9-21,23-25,29, Jan. 4 to Feb. 5, 14,19-28, Apr. 7,17; discharge based on temperature and gage-height records, two discharge measurements, and observer's notes. No gage-height record July 9-12, Aug. 13-16, and Sept. 29-30; discharge interpo- ated. Braced figures show mean discharge for periods indicated.

24 SUEFACE WATER SUPPLY, 1922, PAET IX
Monthly discharge of Fraser River near Arrow, Colo., for the year ending September0f) OU,
Month ,
November. ________________________ .
March.. -..April ...... .. ............. .......... .. .May. .TllTlfi
July..-......... .._...... _. _ . August
Discharge in second-feet
Maximum
21 23 15
8 8 8
230 267 90 33 26
267
Minimum
14 8 4
6 3 3
14 95 28 22 13
3
Mean
16..2 15.0 9.2 6.2 6.5 5.3 6.5
89.5 170 48.3 27.5 17.2
34.8
Run-off in acre-feet
%
>996 893 566 381 361 326 387
5,500 10,100 2,97ft 1,690 1,020
25, 200>
WILLIAMS FORK NEAR PARSHALL, COLO.
LOCATION. About sec. 36, T. 1 N., R. 79 W., at private bridge at Field ranch,. 4 miles above mouth of river, and 4 miles south of Parshall, Grand County.. Nearest tributary, Battle Creek, enters from west 2 miles below station.
DKAINAGE AREA. 185 square miles (measured on Forest Service atlas).RECORDS AVAILABLE. July 25, 1904, to September 30, 1922.GAGE. Bristol float type water-stage recorder at left end of bridge installed
October 18, 1919, and referred to vertical staff on downstream side of bridge- pier; inspected by F. A. Field.
DISCHARGE MEASUREMENTS. Made from two-span bridge or by wading.CHANNEL AND CONTROL. Bed composed of coarse gravel and small boulders;-
shifts. Control is gravel bar 50 feet downstream; slightly shifting at long, intervals. Water flows through small overflow channels at and above stage of 4.1 feet.
EXTREMES OF DISCHARGE. Maximum stage recorded during year, 4.2 feet at 3 a. m. June 14 (discharge, 820 second-feet); minimum discharge occurred during winter.
1904-1922: Maximum stage recorded, 6.0 feet at 9.45 a. m. June 14, 1918, (discharge, 2,520 second-feet); minimum stage, 2.1 feet on November 7,, 1919 (discharge, 15 second-feet).
ICE. Stage-discharge relation affected by ice.DIVERSIONS. Court decrees for diversions of 1,416 second-feet from Williams.
Fork, all above station. Of this amount 700 second-feet are to be diverted to the eastern slope, but this diversion has not been made.
REGULATION. Diurnal fluctuation during spring, caused by alternate melting and freezing of mountain snow.
ACCURACY. Stage-discharge relation practically permanent; affected by ice- during winter. Rating curve well defined. Operation of water-stage recorder satisfactory except period December 9 to April 18, when staff gage was read to hundredths twice daily. Daily discharge ascertained by applying to rating table mean daily gage height detenjnined by inspection of recorder graph and from two daily gage height readings. Records exceK lent except for periods affected by ice, for which they are fair.

COLORADO BIVER BASIN 25
Discharge measurements of Williams Fork near Par shall, Colo., during the year ending September 30, 1922
Date
Dec. 20
Feb. 9
Made by
ter ........ ....
Gage height
Feet
2.60 2.63
Dis charge
Sec.-ft.
614fi
Date
Apr. 25May 27July 6
Made by
.-..do.............. .
Gage height
Feet 2.903.903.43
Dis charge
Sec.-ft. 106575274
« Stage-discharge relation affected by ice.
Daily discharge, in second-feet, of Williams Fork near Par shall, Colo., for the year ending September 30, 1922
Day
1_ ..........2..............3 ... .....4.. .........5.. - ..._.
6 ..-.. ...7... ...........8--...-.. ...9..............10
11 ......12..............13. 14..............15..............
16..............17 18..............19..-. .......20
21 22 ...........23 24 26 .......
26... ...27 ..28 29 30 31
Oct.
7986868482
81951009588
8479828279
7779777779
7977778291
918893898176
Nov.
8181818182
8176718179
7969747264
6064646158
5866717177
6360697176
Dec.
7263636670
5858646566
6977716655
5147465058
5757585240
545758555554
Jan.
515045
43
32
35
Feb.
34
36
Af\
40An383836
3537374138
383937
Mar.
38
38
405161
45 50
444839
4142504545
4150646064
546054474539
Apr.
5152637477
88817171
6361524268
5454575848
6396113120115
11311195115138
May
155142167176210
300316290290240
196167152148142
132155232248280
340295346418516
564644628652660596
June
548548540472508
564628700740740
700700740740740
660644628604612
596580524524465
472430382358370
July
316285260252248
290270220206236
313192176158138
138135126113115
12011710210089
86869813210095
Aug.
128173124113109
10089847269
7469717788
8691135120113
10510410095100
827981769386
Sept.
8984827768
6666645754
5455545055
5154525151
5151505252
4852646661
NOTE. Stage-discharge relation aflected by ice Dec. 5-11,16-19, 24-26, Jan. 4 to Feb. 18, Mar. 2-7; dis charge based on temperature and gage-height record, two discharge measurements, and observer's notes. Braced figures show mean discharge for periods indicated.

26 SURFACE WATER SUPPLY, 1922, PART IX
Monthly discharge of Williams Fork near Parshall, Colo., for the year endingSeptember 30, 1922
Month
October ____________________ ..........
January ___________________________February... ________________________March. ___________________________April.....................................................
June. ___________________________July.... ..................................................August _____________________________September- ________________________
The year __________________ ........
Discharge in second-feet
Maximum
10082 77
64 138 660 740 316 173 89
740
Minimum
76 58 46
42 132 358 86 69 48
Mean
83.7 71.4 59.4 38.9 37.3 46.6 77.6
316 582 171 96.3 59.4
137
Bun-off in acre-feet
5,150 4,250 3,650 2,390 2,070 2,870 4,620
19,400 34,600 10,600 5,920 3,530
99,000
TROUBLESOME CREEK NEAR TROUBLESOME, COLO.
LOCATION. In sec. 12, T. 1 N., R. 80 W., at highway bridge 1 mile north of Troublesome, Grand County. No tributary between station and mouth, 1J^ miles below.
DRAINAGE AREA. 172 square miles (measured on base map of Colorado, scale 1: 500,000).
RECORDS AVAILABLE. April 26 to September 30, 1922. From July 22, 1904, to October 31, 1905, station maintained at practically same site.
GAGE. Vertical staff fastened to piling near downstream side of left abutment; read by A. E. Ladwig.
DISCHARGE MEASUREMENTS. Made from bridge or by wading nearby.CHANNEL AND CONTROL. Bed composed of mud and gravel, probably shifting;
control at gravel bar 75 feet downstream, which was permanent during year.
EXTREMES OP DISCHARGE. Maximum stage recorded during year, 2.70 feet at 6.30 a. m. May 26 and 27 (discharge, 350 second-feet); minimum stage, 1.28 feet at 5.30 p. m. July 20 (discharge, 1 second-foot).
ICE. Stage-discharge relation seriously affected by ice.DIVERSIONS. Court decrees for diversion of 470 second-feet from Trouble
some Creek, all above station.RE GUL ATI ON. None.ACCURACY. Stage-discharge relation practically permanent. Rating curve well
denned. Gage read to hundredths twice daily. Daily discharge ascer tained by applying mean daily gage height to rating table. Records good.
Discharge measurements of Troublesome Creek near Troublesome, Colo., during the year ending September 30, 1922
Date
Apr. 26May 27
Made by
.....do....................................................................
Gage height
Feel 2.112.611.76
Dis charge
Sec.-ft. 11630048.6

COLORADO RIVER BASIN 27-
Daily discharget in second-feet, of Troublesome Creek near Troublesome, Colo.,"for the period April 86 to September SO, 1922
Day
1 __ .....2 __ ......34 ___ .....6 ____ 11
6. . .7--..-.....8 ___ .....9..........10.
11 __ ...12. ___ ....13. __ .....14- 15 ___ .....
Apr. May
158152
.167174178
238275260260230
206186167152138
June
230214198170165
149152149146140
12811110010089
July
llll9
127
710
546
743e\
2
Aug.
2543383636
3433343433
4338343633
Sept.
3026252320
1818191816
1617161817
Day
16- 17... .......18- 19. 20-.
21..........22 _ 23- 24- 25 .
26--... ..27...... _ .28. 29 30- 31... .......
Apr.
115115118132149
May
\Af\
198226
246238260280310
335325320310290285
June
8574685344
W201915 <15
10547
18
July
221
135
2
118
191719
Aug.
m38383«
393128262fi
252319182623
Sept.
1817191616
1516161616
1615161618
Monthly discharge of Troublesome Creek near Troublesome, Colo., for the period April 26 to September SO, 1922
Month
April 26-30... ___ .. ____ ............. ........... _May. ___________________________June. __________________________JulyAugust ___________________________September _________________________
The period. ..... ___ . ____ . _ ... _ . ___ .
Discharge in second-feet
Maximum
149 335 230
19 43 30
Minimum
115 138
4 1
18 15
Mean
126 228 89.7 6.1
32.2 18.0
Run-off, in acre-feet
1,250 14,000 5,340
375 1,980 1,070
24,000
BLUE RIVER AT DHION, COLO.
LOCATION. In sec. 18, T. 5 S., R. 77 W., at highway bridge on edge of Dillon, Summit County. Nearest tributaries, Snake River and Tenmile Creek, enter a short distance below.
DRAINAGE AREA. 129 square miles (revised).RECORDS AVAILABLE. October 15, 1910, to September 30, 1922.GAGE. Gurley water-stage recorder installed April 21, 1920, referred to vertical
staff on right abutment of bridge, inspected by Forest Service ranger.DISCHARGE MEASUREMENTS. Made from bridge or by wading.CHANNEL AND CONTROL. Bed composed of compact gravel upon which lodges , debris from hydraulic dredges near Breckenridge. Control is riffle 50 feet
downstream; shifts at intervals. Banks not subject to overflow.EXTREMES OF DISCHARGE. Maximum stage during year from water-stage re
corder, 2.9 feet at 6 a. m. June 9 (discharge, 486 second-feet); minimum discharge occurred during winter.
1911-1922: Maximum stage recorded, 4.35 feet June 2, 1914 (discharge, 1,180 second-feet); minimum discharge, 14 second-feet on January 30 and February 9, 1915.
ICE. Stage-discharge relation affected by ice. 4182 27 3

28 SURFACE WATER SUPPLY, 1922, PART IX
DIVERSIONS. Court decrees for diversion of 2.3 second-feet for irrigation from Blue River above station and 63 second-feet below; also placer decrees for diversion of 118 second-feet near Breckenbridge. There is a small unad- judicated diversion froto the headwaters of the Blue, across Boreas Pass to Tarry all Creek.
REGULATION. Diurnal fluctuation during spring, caused by alternate melting and freezing of mountain snow. No artificial regulation.
ACCURACY. Stage-discharge relation practically permanent. Rating curve well defined. Operation of water-stage recorder satisfactory. Daily discharge ascertained by applying to rating table mean daily gage height obtained by inspection of recorder graph. Records excellent, except for periods of missing gage heights, for which they are fair.
Discharge measurements of Blue River at Dillon, Colo., during the year endingSeptember 30, 1922
Date
May 126
Made by
.do-.-.-.
Gage height
Feet 1.431.582.61
Dis charge
Sec.-ft. 6889
372
Date Made by Gage height
Feet 2.58i dn
Dis charge
Sec. -ft. 343
70
Daily discharge, in second-feet, of Blue River at Dillon, Colo., for the year endingSeptember 30, 1922 * ,
Day
1 ' "2... .......... .......................3 ................................'i.-.'J........ .........................5 - -
6 -- - -7........... ........................ .8... .................................9...... ..............................10 ----------- -. .
11. -_._-----------.. ,--12.......... ..................... ...i.13. _ -__ ----- _
15... -_. _----_-_
16...------------------ ----------- --17 - . ,-.18 ..................................19. -- 20 ... .... ̂ ..... .
21... ----.-- - -------22 23 ---
25 .
26-- - - _27.. - -. 28. .......... 29...-- - - - .o-j
Oct.
7776777675
7575758177
7777757271
7174716565
656563
64
636161616161
Nov.
6161616161
6161606754
5455545454
54
Apr.
4650546062
6556515049
4546464848
4949494948
5156626870
7272717683
May
91103109114127
151189195
' 186174
146131123120116
114109118146162
176204212251298
353400387396430400
June
341305305298287
320361422460443
404409417447422
374341336345345
336336320312294
284280258242245
July
239236218204201
198198182172198
206172160140136
374134127121118
118120116108103
«898103120164140
Aug.
146184209164151
138131121114111
116109104102103
103103103103104
11110810&106102
979290878691
Sept.
888&838382
81787672
7169>67676ff
656*646362:
6261<U6060
6060606061
NOTE. No gage-height record Apr. 1-7, 23, and Sept. 18-20; discharge interpolated. No record Nov. IT to Mar. 31. .

COLORADO RIVER BASIN 29"
Monthly discharge of Blue River at DUlon, Colo., for the year ending September 30,
Month
April.....................................................
July . ...-. _ .. August ____ -. .........................................
Discharge In second-feet
Maximum
SI 61 83
430 460 239 209 88
Minimum
6164 45 91
242 98 86 60
Mean
70.0 57.7 56.7
201 343 154 116 69,1
Run-off in acre-feet
4,300 1,830 3,370
12,400 29,400 9,470 7,130 4,110
EAGLE RIVEB AT EEDCLIFF, COLO.
LOCATION. In sec. 29, T. 6 S., R. 80 W., at footbridge in Redcliff, Eagle County.Nearest tributary, Turkey Creek, enter& 100 yards below station; Home- stake Creek enters 1 mile below.
DRAINAGE AREA. 74 square miles (measured on topographic map). RECORDS AVAILABLE. January 8, 1911, to September 30, 1922. GAGE. Chain gage on downstream side of footbridge; read by forest ranger.
Staff gage in same section and referred to same datum, read during highwater.
DISCHARGE MEASUREMENTS. Made from highway bridge 300 yards above,station or by wading.
CHANNEL AND CONTROL. Bed composed of boulders and is very rough. Controlshort distance below gage; shifting between narrow limits. Banks notsubject to overflow.
EXTREMES OF DISCHARGE. Maximum stage recorded during year, 2.78 feetat 6.40 p. m. May 28 (discharge, 412 second-feet); minimum stage 0.30 footon December 20, 21, and 23 (discharge, 6 second-feet).
1911-1922: Maximum stage recorded, 4.0 feet June 5, 1912 (discharge1,010 second-feet); minimum stage, 0.01 foot at 7 a. m. October 15, 1917(discharge, 1 second-foot).
ICE. Stage-discharge relation not affected by ice except for occasional shortperiods.
DIVERSIONS. Court decrees for diversion of 6 second-feet from Eagle Riverabove station, and also a decree for diversion to the Arkansas basin of18.5 second-feet from Piney Creek, a tributary. During 1922, 1,590 acre- feet were diverted.
REGULATION. Diurnal fluctuation during spring, caused by alternate meltingand freezing of mountain snow. Filling of Pando ice pond in fall reducesflow for a few days.
ACCURACY. Stage-discharge relation practically permanent; slightly affectedby ice* during winter. Rating curve well defined. Gage read to quartertenths twice daily. Daily discharge ascertained by applying mean dailygage height to rating table. Records good.
Discharge measurements of Eagle River at Redcliff, Colo., during the year endingSeptember SO,
Date
Jan. 26May 25
Made by
T. J.Watkins... ......
Gage height
Feet 0.622.47
Dis charge
Sec.-ft. 15.7
296
Date
Sept. 12
Made by Gage height
Feet 1.99.78
Dis charge-
Sec.-ft. 16116.5

30 SURFACE WATER SUPPLY, 1922, PAET IX
Daily discharge, in second-feet, of Eagle River at Redcliff, Colo., for the year endingSeptember SO, 1922
Day
1 . .... 2.... ..........3. ...... ....4..............5..............
6.. ...... ......7 8..... .........9..............10........... _
11 12..............13. ..........14 f.15.... ..........
16.. . _ ........17..............18..............19..............20..............
21......... __ .22..............23..............24..............25..............
26..............27..............28..............29..............30..............31..............
Oct.
2019191919
109101211
1819192022
2223242222
2222222322
222222222222
Nov.
2222222222
191Q192019
1919191910
191Q191919
1919191919
1910191919
Dee.
1919191719
1919101910
1010101719
161412107
676810
101912141414
Jan.
1515151515
1515151515
1515151515
1515151412
1212191219
121919121919
Feb.
1912191219
1219
1219
19
19
191*>
19
14
1512151516
1415121415
141512
Mar.
1214151519
1415121214
1515151515
1717141515
1719222222
191817161515
Apr.
1517222226
2626262626
2626262625
2626303026
3040506868
6874746880
May
110104104117110
145167158158145
15013111810592
112136145145150
150150167189286
324361400380361324
June
27224094rt224224
256256256256256
224224224224196
154154154154145
142135128123115
109104959290
July
8885787472
7270627083
6557534948
4339403838
5042383329
282631513439
Aug.
4860544001
3132272626
2724242324
"ss69534330
2730292828
242422222424
Sept.
Off
242424
9920101910
1918171716
1515151515
1515161517
1617171516
NOTE. Stage-discharge relation affected by ice Oct. 26 to Nov. 1, Nov. 15, 27, Dec. 10,17-19, and 23-31 ; discharge based on temperature and gage height records and observer's notes. No gage-height record Mar. 27-29, Apr. 13, May 13, 14, and 29; discharge interpolated.
Monthly discharge of Eagle River at Redcliff, Colo., for the year ending September80, 1922
fMonth
April.... .. ... .-..- __ .... ....
July...-.-....
Discharge in second-feet
Maximum
24 22 19 15 16 22 80
400 272 88 69 25
400
Minimum
9 19 6
£2 12 12 15 92 90 26 22 15
6
Mean
19.4 19.5 14.6 13.8 13.1 15.8 37.3
184 182 52.4 33.3. 18.0
50.4
Kun-ofl in acre-feet
1,190 1,160
898 848 728 972
2,220 11,300 10,800 3,220 2,050 1,070
36,500

COLORADO EIVBE BASIN 31EAGLE RIVER AT EAftLEy COIO.
LOCATION. In sec. 33, T. 4 S., R. 84 W., at left bank 500 feet below highway bridge at Eagle, Eagle County. Nearest tributary, Brush Creek, enters three-quarters of a mile below station.
DRAINAGE ABEA. 650 square miles (revised; measured on map of Colorado, scale 1 : 500,000).
RECOBDS AVAILABLE. January 17,1911, to September 30,1922. March 12,1905, to February 10, 1907, station was maintained short distance below mouth of Brush Creek. V
GAGE. Stevens water-stage recorder installed April 5, 1919; referred to inclined gage; inspected by Forest Service ranger.
DISCHARGE MEASUREMENTS. Made from private bridge half a mile downstream or by wading.
CHANNEL AND CONTROL. Bed composed of boulders. Control at rapids in which gage intake is located; somewhat shifting. Banks not subject to overflow.
EXTREMES OF DISCHARGE. Maximum stage during year from water-stage re corder 4.4 feet at 5 a. m. May 30 (discharge, 3,880 second-feet); minimum discharge occurred during winter.
1911-1922: Maximum discharge recorded, 6,760 second-feet June 3, 1914; minimum discharge occurred during winter.
ICE. Stage-discharge relation seriously affected by ice.DIVERSIONS. Between Eagle and Redcliff, court decrees for diversions of 80
second-feet, and below Eagle for 22 second-feet.REGULATION. Diurnal fluctuation during spring caused by alternate melting
and freezing of mountain snow. No artificial regulation.ACCURACY. Stage-discharge relation practically permanent; affected by ice dur
ing winter. Rating curve well defined. Operation of water-stage recorder satisfactory except for periods as explained in footnote to table of daily discharge. Daily discharge ascertained by applying to rating table mean daily gage height determined by inspection of recorder graph. Records excellent except for days of missing gage heights-and periods affected by ice, for which they are fair.
Discharge measurements of Eagle River at Eagle, Colo., during the year endingSeptember SO,
Date
Jan. 25A rw 90
Made by
.....do..... ............
Gage height
Feet 0.89 .901.61
Dis charge
Sec.-ft. 103238518
Date Made by
... ..do.. ..............
Gage height
Feet 3.483.231.05
Dis charge
Sec.-ft. 2,2601,900
221
Stage-discharge relation affected by ice.

32 SUEFACE WATEB SUPPLY, 1922, PART IX
Daily discharge, in second-feet, of Eagle River at Eagle, Colo., for the year endingSeptember 80, 1922
Day
1... ...... ---2 .3 - .4- ... ......5
678 ...........910
11 -12 13 14.. .....15
16 17 18 19 20
.21. 22. - ..23 24--.---....... 25
26 27 28 -.29 .30 31
Oct.
\00209209203197
194192194186183
180
170167164
159159
154149
144144
175
167170
172175172
Nov.
175170164164162
147
140137
144144147
157152147142162
140
144
147
142100
13013714.9
Dec.
142
110135
1 PkQ
1 132
134
144
142135132IDA
Jan.
10A
132
115
140
120
104
Feb.
108
110135144132
123
119121119
128
135
108
Mar.
115147
130
116
153*
386
180183186
270*>7A
255
180180154149
132
Apr.
1441521«4189223
226194
216192
172189175162175
180164154152162
177233296386
482464500428578
May
721770805848892
1,580
1,4001,170
975855784791
742
728784
1,1301,4901,540
1,8801,6001,7602,290
3,1903,4703,5703,5703,4702,930
June
2,2902,2202,3602,1402,290
2,7602,8403,4703,4703,280
3,0203,0203,0202,5202,080
1,9501,9502,1402,1402,140
2,0802,0101,7601,8201,720
1,5801,4601,2701,2801,320
July
1,2001,1101,0301,0201,000
968945848855
1,050
878763714672686
700650630630600
580552506476440
392375386470470446
Aug.
610735791679520
452404
369343332
338300274282282
286380610513470
422410392343322
300
282262291314
Sept.
364380360340321
302283264245226
223212203194189
180177177172167
162157152149149
152154154159157
NOTE. Stage-discharge relation affected by ice Nov. 17,18, Dec. 7-23, Jan. 10 to Feb. 6, Feb. 21-28, Mar. 5-17; discharge based on temperature and gage-height record and two discharge measurements. No gage height record June 12, July 17-21, and Sept. 3-9; discharge based on comparison with flow of Roaring Fork at Qlenwood Springs. Braced figures snow mean discharge for periods indicated.
Monthly discharge of Eagle River at Eagle, Colo., for the year ending September 30,
Month
October. ... _ _____ .... ____________ __ ....November.. __ ___ .. -... __ _ .. ------
January _ .... _ ........ .,. . .... ......
May. ____________________________
July... ..................................................
Discharge in second-feet
Maximum
209175
144270 578
3,570 3,470 1,200
791 380
3,570
Minimum
144 130
144 721 1,270
375 262 149
Mean
174 149 138 115 117 167 252
1,650 2,250
711 406 217
530
Run-off in acre-feet
10,700 8,870 8,480 7,070 6,500
10,300 15,000
101,000 134,000 43,700 25,000 12,900
384,000
ROARING FORK AT GIENWOOD SPRINGS, COLO.
LOCATION. In sec. 9, T. 6 S., R. 89 W., 1,500 feet above mouth of river in Glen- wood Springs, Garfield County.
DRAINAGE AREA. 1,460 square miles (revised; measured on map of Colorado, scale 1:500,000).

COLORADO RIVER BASIN 33
RECORDS AVAILABLE. April 6, 1906, to September 30, 1909; September 21,1910,to September 30, 1922.
GAGE. Gurley water-stage recorder installed October 27, 1917, referred to in clined staff on left bank 800 feet above highway bridge; inspected by UnitedStates Forest Service employee and C. H. Oberly.
DISCHARGE 'MEASUREMENTS. Made from single-span highway bridge. CHANNEL AND CONTROL. Bed composed of boulders and coarse gravel; shifting
at long intervals. No well-defined control. Banks not subject to overflow. EXTREMES OF DISCHARGE. Maximum mean daily discharge, estimated 9,000
second-feet, on May 28 and June 9; minimum discharge occurred duringwinter.
1906-1909; 1910-22: Maximum discharge, 17,600 second-feet June 14,1918, and June 14,1921; minimum discharge, 225 second-feet on December 16,1906.
ICE. Stage-discharge relation not seriously affected by ice except for shortperiods.
DIVERSIONS. Water diverted above the station for the irrigation of 8,100 acresfrom Roaring Fork and for 25,000 acres from tributaries.
REGULATION. Diurnal fluctuation during spring, caused by alternate meltingand freezing of mountain snow. No artificial regulation.
ACCTJRACY. Stage-discharge relation shifted slightly;, affected by ice. Twowell-defined rating curves used October 1 to February 28 and March 1 to
. September ,30. Operation of water-stage recorder satisfactory except forperiods as explained in footnote to table of daily discharge. Daily dischargeascertained by applying to rating tables mean daily gage height determinedby inspection of recorder graph. Records good except for periods of missinggage heights and periods when affected by ice, for which they are fair.
Discharge measurements of Roaring Fork at Glenwood Springs, Colo., during the year ending September 30,
Date
Jan. 24Feb. 4
Made by
T. J. Watkins.. .,
Gage height
Feet
".99
Dis charge
Sec.-ft. 417372
Date
Apr. 28
Made by
T. J. Watkins. ...
Gage height
Feet 0.921.96
Dis-. charge
, : f
-&&-/<.'
6091,420
« Stage-discharge relation affected by ice.
Daily discharge, in second-feet, of Roaring Fork at Glenwood Springs, Colo., for the year ending September 30, 1922 ; ...
Day
I,.... .........2-.....-. ...3 . ....4..............5 .... .
6 ,--.....7... .__.._..8-. -i......
9...:. .........10... ......
11.. .........12.. .........13 -... ..14 15.... _ .......
Oct.
6967207fU696680
680696704,fiQfi680
656'648
648
Nov.
626605591584570
570556542514500
514C1 A
514514507
Dec.
588494482440
395390400
488
488cflA500488494
Jan.
440440405380365
390
440430425
4*>ftJOK
4304.9ft
440
Feb.
375370370370Q7ft
380340528enft44.fi
410405
dnn360
Mar.
385385405427439
410
439
427
445JOQ
439JE1
501
Apr.
540603632685670
719648640678625
WO618con
603
May
2,0002,0502,3002,4202,780
3, 7804 4804,2603 OCA
3,000
9 qOA
2,0701 Qftfl1,8401.840
June
3,4003,3003,1808, HO3,120
4,7006,2007>7SOe nnft7,200
7,2007,7207,9808,5207.200
July
3,7403,5703,4003, 2103,010
2,8602,HO2, /m2,5402,700
2,4902 97fl2, MX)i Qfin1.900
Aug.
1,5901,5901,6201/4101,270
1, 1901,080
950935$30
950970960970950
Sept.
1,0301,000i,OfO1,0801,090
1,030990960960940
890870842815788

34 SUBFACE WATER SUPPJj?, 1922, PAET IX
Daily discharge, in second-feet, of Roaring Fork at Glenwood Springs, Colo., for the year ending September SO, 1922 Continued
Day
16... ...........17 18 19... ...........20
21 -------2223 2426...
26 97
28 29 , 30 31
Oct.
640626619598591
5775705705Q1
640
626626RA(\
640fiAn
Nov.
440425400430494
494482494AQA
507
500488470
488
Dec.
458385390400415
425420400*JQC
370
380At ti
435440AAf\
AA(\
Jan.
44ft430415405
r 380
390A(\(\
415425
435435A0f\
420400QQrt
Feb.
400395390405435
476A CO
390375370
380q7c
370
Mar.
540719632527561
596685744710
640
625fun575547*utn520
Apr.
632603575561603
694930
1,1601,4101,480
1,5901,5801,4901, 610 .1,760
May
1,8502,1002,6103,3503,950
4,5005,2405,8506,7007,600
8,0408,5209,0008,80)6,7003,980
June
5,8205,8205,7705,7105,660
5,6005,5105,4805,4605,580
5,2505,0204,7704,4004,050
July
1 S4O1,7101,6501,5901,590
1,5901,5401,4901,4501,400
1,350i 9on1,2701,3601,400i 4sn
Aug.:
i 9fin1,2701,2401,2501,230
1,2101,2601, 2101,1601,100
1,0601,020
9901,0401,1101,090
Sept.
779779762736719
702694686685685
685
710710702
NOTE. Stage-discharge relation affected by ice Nov. 16-19, Dec. 6-8, Dee. 18 to Feb. 6; .discharge based on temperature and gage-height record and two discharge measurements. No gage-height record May 16-30, June 3-9, 18-23, 26-30; July 2-7, 10-14, 23-28, Aug. 3, 4, and 9-11; discharge determined from com parison with flow of Eagle River at Eagle and Colorado Biver at Glenwood Springs.
Monthly discharge of Roaring Fork at Glenwood Springs, Colo., for the year endingSeptember SO, 1922
Month
December _______ '. ______ . ___ _- ___ -
March..-..- ____ _ _________ , ______ __ApriL.... ... ... v _. .......Mapi -.: - .-. .- . June. _July.... ,. August.. . . ..September-.--.---- -- - - - ,
The year..... .. ... ...
Discharge in secoQd-feet
Maximum
720 '628 588 440 528 744
1,760 9,000 9,000 3,740 1,620 1,090
9,000
Minimum
570 400 370 365 340 385 54&
1,840 3,110 1,270
930 685
340
Mean
646 510 439 416 401 523 870
4,190 5,650 2,100 Ir 160
j ,'-'834
1, 480
Run-off inacre-feet
39,700 1 30,300
27,000 25,600 22,300 32,200 51,800
258,000 336,000 129,000 71,300 49*600
1, 070, 000
PARACHUTE CREEK AT GRAND VALLEY, COLO.
LOCATION. In NW. M sec. 12, T. 7 S., R. 96 W., at Aplin ranch, half a milenorthwest of Grand Valley, Garfield County. No tributary between station
, and mouth, 1 mile below. DKAINAGE AREA. 196 square miles (measured on map of Colorado, scale
1:500,000).RECORDS AVAILABLE. -April 7, 1921, to September 30, 1922. GAGE. Vertical staff attached to side of left abutment of private bridge; read
by R. H. Aplin.DISCHABGE MEASUREMENTS. Made from single-span bridge or by wading. CHANNEL AND CONTROL. Bed composed of compact silt on shale rock. Control
at rapids 200 feet downstream; slightly shifting during high water. Banksnot subject to overflow.

COLORADO RIVER BASIN"
EXTREMES OF DISCHABGE.- Maximum stage recorded, 2.9 feet May 20 and 21 (discharge, 795 second-feet); minimum stage recorded, 0.0 during parts of July, August, and September (discharge, 6 second-feet).
1921-1922: Maximum and minimum discharge, those of 1922.ICE. Stage-discharge relation seriously affected by ice.DIVEKSIONS.: Court decrees for diversion of 71 second-feet above station.REGULATION. Diurnal fluctuation during spring due to alternate melting and
freezing of mountain snow. No artificial regulation.ACCUBACY. -Stage-discharge relation shifted slightly. Two well defined rating
curves used from October 1 to May 11 and May 12 to September 30. Gage read to half-tenths twice daily. Daily discharge ascertained by applying mean daily gage height to rating tables. Records fair. ;
Discharge measurements of Parachute Creek at Grand Valley, Colo., during the year . ending September SO, 192%.
[Made by F. C. Snyder«] . . ,
Date \
Mar. 13 __ .. ...Apr. 6 .......
height
Feet 0.25
14.70
Dis charge
Sec.-ft. 12.117.547.6
Date
May 8- __ ..
Gage height
Feet 2.601.09
Dis charge
Sec.-ft. «2714O
Date >! '
July 16 _ .. _ .Aug. 16.....-.,.
Gage height
Feet0 -1*
.06
Dis charge
See.-/*, 13.1803
»State, hydrographer. .
Daily discharge, in second-feet, of Parachute Creek at Grand Valley,, Colo., for the year ending September SO,
Day
1. _ ..... _ ...............2. .......................3-~ 4-- ............. __ ....5. .....................
6 _ . __ ...................7.- . _ . ___ ..... __ ..8-..___._ __........9. ......................10 _
11. . .....................12..... ...______ __..._ _13 _ . __ .... __ ..... _ ...14...........................IS ___ _ ... ..
M__ .... ... 17. .......................18...........................19. ................ __ ...29... .....-...-.... . .
21......... _ ...............22 _ ...... _ ...............23-.-.......... ........24 ___ ........ __ ........25 _ .. __ ...... _ .........
26. .......... ..........:..27 __ ........ _ ..... .......28 ................ ........29 ............. .........80 ....... .............31 _ . ___ ....... __ .....
Oct.
1616161616
1515151615
14IS131313
1313131313:
1415151515
15151515
. 1515
Nov.
1515151515
1515151515
-141310
13iq
13131313IQ
13iq
1313
. 13
1313131313
Mar.
2820181818
1816151515
1515152230
3947302422
26qO
qQ4739
324730283028
Apr.
262830394939'
3539f39
3737353739
282828323ft
4781100146171
197197225286318
May
352S52388406499
615700745790745
537418436382346,
382436575705795
795660575575535
455418400329296280
June
250250221.207172
155143121
< 121110
11090908080
8070706161
61RA
474736
3636363636
July
3636363636
3228282828
2725OS 4
2222
22*!121111
86666
666666
Aug.
2247362825
22221916,16
221«1611
. 814'
60,3216 6
66666
666666
Sept.
6' '6
666
66666
66666
6666«
66666
66666
4182 27-

36 SUEFACE WATEE SUPPLY, 1922, PABT IX
Monthly discharge of Parachute Creek at Grand Valley, Colo., for the year endingSeptember SO, 1922
Month
April. ........ ......................................... ..
July
Discharge in second-feet
Maximum
16 15 47
318 795 250 36 50
6
Minimum
13 13 15 26
280 36
6 6 6
Mean
14.5 13.7 26.4 83.2
514 98.9 18.8 16.5 6.0
Run-off in acre-feet
892 815
1,620 4,950
31,600 5,880 1,160 1,010
357
ROAN CREEK NEAR DE BEQUE, COLO.
LOCATION. On line between sees. 10 and 15, T. 7 S., R. 98 W., at highway bridge 11 miles north of De Beque, Mesa County. Nearest tributary, Kimball Creek, enters half a mile above.
DRAINAGE AREA. 210 square miles (measured on map of Colorado; scale 1 : 500,000).
RECORDS AVAILABLE. April 8, 1921, to September. 30, 1922.GAGE. Chain gage attached to downstream side of bridge; read by Mrs. W. L.
Hurt and J. W. Lunsford.DISCHARGE MEASUREMENTS. Made from single-span bridge or by wading;CHANNEL AND CONTROL. Bed composed of compact mud and gravel; shifting
during high water. No well-defined control. Banks not subject to overflow.EXTREMES OP DISCHARGE. Maximum stage recorded during year; 4.45 feet at
7.30 p. m. May 21 (discharge, 1,110 second-feet); minimum stage, 1.67 feet at 7.30 p. m. August 4 (discharge, 8 second-feet).
ICE. Stage-discharge relation seriously affected by ice.DIVERSIONS. Court decrees for diversion from Roan Creek of 28 second-feet
above station and 70 second-feet below, and for 62 second-feet from tribu taries entering above.
REGULATION. Diurnal fluctuation during spring from alternate melting and freezing of mountain snow. No artificial regulation.
ACCURACY. Stage-discharge relation not permanent. Four fairly well defined rating curves used October 1 to November 30, March 1 to May 16, May 17 to July 5j and July 6 to September 30. Gage read to quarter-tenths twice daily. Daily discharge ascertained by applying mean daily gage height to rating tables except for period May 5 to 16, when discharge was determined by shifting-control method and comparison with record of flow Of Parachute Creek. Records fair.
Discharge measurements of Roan Creek near De Beque, Colo., during the yearending September SO, 1922
[Made by F. C. Snyder «] '
Date
XTfiiT Q
Mar.21.- ~ .Apr. 25.-
Gage height
Feeto AK
2.633 in
Dis charge
Sec.-ft.00 Q
55168
Date
May 17. -
Gage height
Feet 3.662.940 VI
Dis charge
Sec.-ft. 686334
94
Date
July 16 Aug. 15 ~
Gage height
Feet 2.091.95
Dis charge.
Sec.-ft. 48.' I32.7
1 State hydrographer.

COLORADO RIVER BASIN 37
Daily discharge, in <$econdr-feet, of Roan Creek near De Beque, Colo., for the yearending September SO,
Day
i _ . __ . ______ ...2............................3...... ......................4................. __ ......5............................
6............... __ .... __ .7............... _ ..........8............................9..... _ ....................10..^.. ................ .... ..
11 ..................... ....12............................13............................14................. __ ......15............................
16............... ____ .....17.................. _ ......18............................19............................20..... ....... ................
21............................22................ , ... .....23............................24.... . ... ..... .......25............................
26............................27............................28. ........................29..... .......................30 .........................31 .........................
Oct.
3131282826
2624262628
3029283131
2828292828
2828283538
383333333330
NoVi
2828272626
2626262526
2624282624
2622232325
2523232426
2625232020
Mar.
2626263434
2626261926
3434426174
106172516161
8989898989
12510689747474
Apr.
7489748989
8989898989
8089747474
7474748989
89125125172172
204204244288376
May
465510510610710
910960910
1,0101,010
810710660660660
610860970970
1,080
1,0801,0801,020860860
805650650600
600550
June
454406360360315
272230189189189
189189153122122
9675585844
4451513232
3222224444
July
4458584444
4986666649
4949496649
4949362626
2636362626
262626261726
Aug.
1717171026
3636262626.
2626262626
2636362626
3649494949
493649363636
Sept,
3636496649
3636263626
2626262636
3636363636
363636363d
2626363636
Monthly discharge of Roan Creek near De Beque, Colo., for the year ending Sep tember SO, 1922
Month
October............. ____ ... ___ . ___ . ...........
March. ___________________________April......... . ..... ..-...... .-..--_...._..._.
July
Discharge in second-feet
Maximum
38 28
172 376
1,080 454
86 49 66
Minimum
24 20 19 74
465 22 17 10 26
Mean
29.7 24.9 63.0
122 785 148 42.2 32.0 35.2
Run-off in acre-feet
1,830 1,480 3,870 7,260
48,300 8,810 2,590 1,970 2,090
TAYLOR RIVER AT ALMONT, COLO.
LOCATION. In sec. 22, T. 51 N., R. 1 E., at highway bridge at Almonf, Gunnison County, 300 feet above junction of Taylor and East rivers.
DRAINAGE AREA. 440 square miles (revised; measured on map of Colorado, scale 1 : 500,000).
RECORDS AVAILABLE. June 27, 1910, to September 30, 1922.GAGE. Bristol float type water-stage recorder installed April 16, 1922, on down
stream end of center pier; inspected by J. W. Brittain.DISCHARGE MEASUREMENTS. Made from two-span bridge.CHANNEL AND CONTROL. Bed composed of small boulders and coarse gravel;
slightly shifting at long intervals. No well-defined control.

38 SURFACE WATER SUPPLY, 1922, PART IX
EXTREMES OF DISCHARGE. Maximum stage during year from water-stage re corder, 4.15 feet at 7 a. m. May 30 (discharge, 2,420 second-feet); minimum discharge occurred during winter.
1910-1922: Maximum stage recorded, 5.0 feet on June 9, 1920 (discharge, 3,760 second-feet); minimum stage, 1.2 feet several days during August) 1913 (discharge, 50 second-feet).
ICE. Stage-discharge relation affected by ice during winter.DIVERSIONS. No court decrees for diversions from Taylor River.REGULATION. None.ACCURACY. Stage-discharge relation permanent; affected by ice during winter.
Rating curve well denned. Gage read to hundredths twice daily from Oc tober 1 to April 18. Operation of water-stage recorder satisfactory April 19' to September 30. Daily discharge ascertained by applying to rating table mean daily gage height determined from two daily gage height readings or inspection of recorder graph. Records excellent except for periods affected by ice, for which they are fair.
Discharge measurements of Taylor River at Almont, Colo., during the year endingSeptember 30,
Date
Oct. 23
Feb. 1Mar. 15Apr. 16
Made by
T. J. Watkins.. ......... .do...... ......... . .do.. .do.... . ..
Gage height
Feet1 QO
«1.63«2.68
1.921.85
Dis charge
Sec.-ft. ' 187
78155158138
Date
IWair ty>July. 9
13Sept. 7
Made by
M. B. Arthur .... -do........ ..........
Gage height
Feet 3.152.642.562.04
Dis charge
Sec.-ft. 1,010
576494200
° Stage-discharge relation affected by ice.
Daily discharge, in second-feet, of Taylor River at Almont, Colo., for the yearending September 30, 1922 /
Day
1 ... ... ...2 3 4. _ ------- ...5 __ ..........
7 - - .8 ... ........»-. 10
11 12 13 14- 15
16 17 18. 19 20
21 22- 23 24 28 .
26 27 28..- .29. 30 31 -
Oct.
163163159156179
205205205205205
205205205205205
205205
185182
169169179185185
185185185185185185
Nov.
185185185185182
1791 W
148
126
116116116
116
1 ,1
104
I"*
Dec.
1 QQ
80
\ 93
*
127
Jan.
>
\ 149
1
111
153
. !
Feb.
153
140
153
159
153153153
Mar.
153153153
153
153153153
153153153153153
145137148166166
153153163153153153
Apr.
153153153179179
153169153153131
116142137148142
140145131142159
169225252298320
338,314350420503
May
565 60S673825
1,030
1,2301,2901,150
942825
762589589605648
573690906960980
1,1201,1201,2901,5601,780
2,0102,1702,1702,1702,1701,930
June
1,6301,5601,7001,7001,700
1,9302,0102,1702,1701,930
1,9301,9301,9301,8501,700
1,4901,3601,4901,4201,420
1,2901,2901,1701,1701,120
1,060960915960960
July
915825780735735
735690605565825
648565486457430
413394394394413
406387335325292
281298331387387450
Aug.
450413375350325
308266243248256
261256252281320
308394387368350
320314276276266248'
261276276276270
Sept.
270270248256234
217209205201189
186186186185185
185185175163
. 159
153153153153156
169163175179169
NOTE. Stags-discharge relation affected by ice Now 17 to Feb. 25, Mar. 4-12; discharge based on tem perature, gaga-height record, and two discharge measurements. Braced figures show mean discharge for periods indicated.

Q&L0BADO RIYEB BASIN i- 39
Monthly d/Lsehargq of Taylor River at Almontt ,Colo^,for the year ending September
Month
December __ _ _________________ ......January, __________ . ___ . _ __ ............
May _ .... __ . __ . ...................................
July..... .. . ._ ..August ___ . _____ . ___ .. _ _ . .................
Discharge in second-feet
Maximum
205185
166 503
2,170 , 2,170
915 450 270
2,170
Minimum
156
116565 915 281 243 153
Mean
189 130 98; 3
144 152 153 20ft
1,160 1*530 ' 512
305 190
398
Run-off iu acre-feet
11,600 7, 740 6,040 8,850 8,440 9,410
12,300 71,300 91,. 000 31,500 18,800 11,300
288,000
GUHNISON KIVEB NEAR GUNNISON, GOLD.
LOCATION. In sec. 3, T. 49 N., R. 1 W., at highway bridge 2 miles southwest of Gunnison, Gunnison County. Nearest tributary, Tomichi Creek, enters 1 mile below.
DRAINAGE AREA. 1,010 square miles (measured on map in Hayden's atlas).RECORDS AVAILABLE. November 27, 1910, to November 30, 1914; April 27,
1916, to September 30, 1922.GAGE. Chain gage on downstream side of bridge; datum lowered 1.00 foot
October 15, 1918; read by C. W. Chinery.DISCHARGE MEASUREMENTS. Made from single-span bridge or by wading.CHANNEL AND CONTROL. Bed composed of coarse gravel and small boulders.
Control at well-defined rapids below bridge; somewhat shifting. Banks not subject to overflow except during extreme high stages.
EXTREMES OP DISCHARGE. Maximum stage recorded during year, 4.4 feet at 7 a. m. May 30 (discharge, 5,200 second-feet); minimum discharge occurred during winter.
1910-1914; 1916-1922: Maximum discharge, 11,400 seeond-feet June 13, 1918; minimum discharge, 126 second-feet on January 2, 1919.
ICE. Stage-discharge relation seriously affected by ice.DIVERSIONS. Court decrees for diversion of 274 second-feet of water from
Gunnison River between this station and forks at Almont.REGULATION. None.ACCURACY. Stage-discharge relation not permanent; affected by ice. Two
. fairly well defined rating curves used October 1 to May 30 and May 31 to September 30. Gage read to half-tenths twice daily. Daily discharge ascertained by applying mean daily gage height to rating tables except period April 1 to May 30 when shifting-control method was used. Records good except for period affected by ice and period of shifting control for which they are fair.

40 SUBFACE WATEB SUPPLY, 1922, PART IX
Discharge measurements of Gunnison River near Gunnison, Colo., during the year ending September SO, 1922
Date
Oct. 23Dec. 9Jan. 31Mar. 36Apr. 12
Made by
T. J. Watkins. ............do.......................do... . ....,...._......do..................
Gage height
Feet i no
-1.04«2.26 1.41
1.24
Dis charge
Sec.-ft. 300188337917
346
Date
May 22
July 15Sept. 8
Made by
do M. B. Arthur _____. do -
Gage height
Feet 3.183.911.94.1.38
Dis charge
Sec.-ft. 2,7504,010
774358
Stage-discharge relation affected f>y ice.
Daily discharge, in second-feet, of Gunnison River near Gunnison, Colo., for the year ending September SO, 1922
Day
1.. .....2 . ....3.. _ .........4 5... ....
«.. .. .7.... ...8...... ........9.. .....10-- . .
11.. .12.. . .13 14 T5 .....
16 . J7 ........ .18... ..19 20
21.... .......22 23 24 26
26 27 28 29 30 31
Oct.
370370370358370
358370370370370
358322310310322
310322310370322
310310310310310
300285310310300300
Nov.
310322310300310
310300310310300
310310322310300
310
1 236
260
259
Dec.
218
235
260
Jan.
[ 285
202
265
279
Feb.
295
304
310
1 297
Mar.
262
250
225
240
267
Apr.
270270334412412
382370382382370
382352334295322
328328316328376
38852159*770820
920' 820
870973
J.200
May
1,4701,6101,6801,8402,420
2,9503,3303,1402,4202,250
1,7601,6101,6101,4701,610
1,7801,7802,6002,6002,780
2,7802,7803,1603,5503,950
4,1604,3604,5804.7804,7803,950
June
3,7503,1502,9503,3503,550
3,750S,7f.J4,3504,3503,350
3,5503,3503,5503,5503,350
' 2, 9502,7602,7602,7602,760
2,5802,5802,5802,5802,400
2,4002,2302,0601,8201,820
July
1,8201,6601,5201,3701,300
1,3001,2401,0501,0501,240
995995940788740
695740695650695
650695570532532
495460460532570570
Aug.
650740695570570
532495495460532
495460495532570
532532570570532
532532495460425
392.392360
- 360392392
Sept.
360360
425425
392360354360344
310300290280260
280255255250236
227213208208208
- 217227227222227
NOTE. Stage-discharge relation affected by ice Nov. 17 to Mar. 31; discharge based on temperature and gage-height records, three discharge measurements, and observer's notes. Braced figures show mean discharge for periods indicated. .

ff-Monthly discharge of Gunnison River near Gunnison, Colo., for the year ending
September 80, 1922 '
<Month
October _ ___ ;. __ ... ________ . _ ... . . ..
January..-...,,.. _ _
MarchApril.....................................................May... .... . -.._. _...._ .. .-..-_.-_. ..,JllTifi
JulyAugust ... - -/ -
Discharge in second-feet
Maximum
370 322
1,2004, 780 4,350 1,820
740,, 425
4,780
Minimum
300
270 1,470 ],820
460 360 208
Mean
332'283 238 268 304 250 494
2, 760 3, 020
889 508 287
805
Run-off in acre-feet
20,4Qd 16,800 14,600 16,500 16,900 15,400 29, 400
170,000 180,000 54,700 31,200 17,100
583,000
GUNNISON RIVER NEAR GRAND JUNCTION, COLO.
LOCATION. In NW. M sec. 35, T. 1 S., R. 1 W., half a mile below the Redlands Co.'s canal and 2 miles above mouth of river and Grand Junction, Mesa County; below all tributaries.
DRAIN AGE ABBA. 8,020 square miles (revised; measured on map of Colorado; scale 1 : 500,000).
RECORDS AVAILABLE. April 1, 1917, to September 30, 1922. From Optober 19, 1894, to December 21, 1895, and May 2, 1897, to September 30, 1899, sta tion maintained near mouth.
GAGE. Vertical staff at left bank a quarter of a mile below canal intake; read by employee of Redlands Co.
DISCHARGE MEASUREMENTS. Made from car and cable at gage section.CHANNEL AND CONTROL. Bed composed of compact gravel; permanent. Con
trol at rapids 500 feet downstream; practically permanent. Banks high and not subject to overflow.
EXTREMES OF DISCHARGE. Maximum stage recorded during year at fiver station, 11.3 feet at 5 p. m. May 7 (discharge, 22,000 second-feet); minimum dis charge, 8 seco ad-feet bom September 18-30.
1917-1922: Maximum stage recorded, 14.95 feet at 8 a. m. and noon May 23, 1920 (discharge, 35,300 second-feet); minimum discharge, that of September 18-30, 1922.
ICE. Stage-discharge relation affected by ice for shprt periods.DIVERSIONS. Below all diversions from Gunnison River. Most of water di
verted throug;h Redlands Canal is for pumping and is returned, to Colorado River below Gunnison fliver.
COMBINED FLOW. Combined flow of Gunnison River and Redlands power canal represents flow of Gunnison River which enters Colorado River, less about 25 second-feet which is used during irrigation season.
ACCURACY. Stage-discharge relation permanent; not affected by ice during winter. Rating curve well defined. Gage read to half-tenths twice daily. Daily discharge ascertained by applying mean daily gage height to rating table. Records excellent. ' >
COOPERATION. Daily gage-height record for station on river and complete records for power canal furnished by Redlands Co.

SURFACE WATER SUPPLY, 1922, PART IX
discharge, measurements of Gunnison River near Grand Junction, Colo., during the year ending September SO,
Date
Jan. 27Mar. 27Apr.., .76May 12
Made by
F. C. Snyder « __ . ....
J. H. Baily «... .F. C. Snyder..... ......
Gage height
Feet 2.553.403.906.98
Dis charge
Sec.-ft. 858
1,7302, 510 ,8,010
Date
Aug. 7Sept. 25
Made by
F. C. Snyder _______ do... ...................do- .. ....
Gage height
Feet 10.561.48.51
Dis charge
See.-ft. '1Q OnA
257»&
1 State hydrographer. * Estimated.
Daily discharge, in second-feet, of Gunnison River near Grand Junction, Colo., for the year ending September SO, 1Q-2&
Day
1... _ .....2...........3.... .......4...........5.. .........
6 . _ .7...........8.. .........9...........10
11 12_. r __ ......13 . 14.. _ ......15
16...... ..17 . is.....-.:.,.19...........20
21 ...... .22... _ .....23 .......24...........25 ......
26.... ___ .27.... ..28...........29-, 30 31
Oct.
370469522522522
469469 :522580522
550580580580580
580580580610610
55046946944337Q
675965
1,0601,060
965965
Nov.
1,3501,4601,4001,2501,150
1,150965
1,2501,3001,060
1,250 1,2501..2001,2001,150
1,1501,2501,280
9651,150
1,2201,2501,3501,3501,420
1,4801,5401,4601,3501,300
Dec.
1,4601,4601.3701,3501,300
1,150728983
1,0601,080
1,0601,0601,0601,0601,080
1,0601,0601,1001,1001,400
1,4301,2601,3501,2501,250
1,2501,2701,3501,3501,4001,350
Jan.
1,3001,3501,4001,4001,460
1,4001,4001,4001,3501,100
1,1201,1001,1001,060
938
830830712735712
690675623
662
750790830830814830
Feb.
83083083083083Q
830830830848875
830790750642750
' 830830875920920
9201,1001,2001,2201 260
1,3001,2001,150
Mar.
1,1001,100
966920920
920875830830875
875920
1,0101,0101,060
1,1001,1501,3001,3501,200
1,2001,1001.2501,4001,800
1, 8601,8601,7401,8001,2501,150
Apr.
1,1001,010,1,2501,3001,8QO
2,2401,6801,4001,2501,560
1,2501,010
920875790
1,1501,2001,300
838675
6752,5003,9504,1104,960
5,3206, 10Q(5,5407,490
11, 500
May
12.20012,20012,90014,20014,900
19,00021, 70020,70018,30014,200
10,3008,2607,0006,540-7,000
7,0007,740,
10,60013,50014,200
15,60014,90015,60017, 60018,300
18,30019,00019, 30019,60018, 70017,600
June
14,90012,50011,50010,90010,900
11,50012,50012,90014,50013,900
12,90011,50011,50011,90011,500
10,3008, .5308,0008, 8008,530
8,0007,4907,4907,QOO7,240
' 5, 7005,7005,1404,4404,270
July
4,9604,4404,2703,3502,780
2, SOP2,5002,500;1,6201, 510
1,5101,4001,300
550'550
495469394260260260'
260260260260
260
302347
1,0601,100
Aug.
2,5001,300
495418302
302260260
' 185119
119119110nr151
185302302302347
7121,4001,100
830560
4692211851W119iid
Sept.
11910692
106
5050505050
5060,
, 20 ' 20
20
20148
, , :S>8"
88888'
88888
Monthly discharge of Gunnison River near Grand Junction, Colo., for the year ending September SO,
Month
October.^. _ . __ ___ _.+ ...... . _ j._ ...... _ .November.. __ . _ ...... _________ : ____ ....December ________ . __ _ . ' . ' - " ... ...
February..............-..:......-..-.........:.........
April,., .. ., . ..-. _ T. r , .May:..:' ....... .I........ \ !: >- r " =' ::!''..June....-- _ . __ __________ !_._«.;. ;.(..;_, _ __ ̂ -..jniy... ........... .................:::;. .:.........August __ _____ ..September. ______ ________ .. . _ ...
Discharge in second-feet
Maximum
1,060' 1,540 i;460 1,460, 1,300 1,860
11, 500 21,700 14,900 4,960 2,500
119
21,700
Minimum
370965
; 728.< - ; 610,
642 '. -' 830
675 6,S40
, 4,270 260 119
8
8
Mean
606 1,260
1, 210 994 923
1,180 2,590,
14,400 9,730, 1,360
453 35.9
2,910
Butt-off in.acre-feet
37,30* 75,000 74,400
;;..«!, 100.51,300
H 72,600 154.000 88^00&
, 579.00O SS.eOO' 27,900 2,140
2,100,000

CCHLOR.VDO EIVEB BASIN
Combined daily discharge, in secon near Grand Junction, Colo.
d-feet, of Gunnison River and Redlands Cajkalr for the year ending September SO, 19,2% ,. ,
Day Oct. Npv. Dec. Jan. Feb. Mar. Apr. May June July Aug. Sept. :
10.
11-12..13..14..15..
16.17.18.19.20.
21.22.23.24.25.
27..28..29.. 30- 31..
860 954
1,8*0 988 992
9511,0001,0601,000
1,0101,0401,0401,0401,040
1,0401,0401,0401,0701,060
1,000919919893820
1,1201,4201,5101,5101,4201,400
1,3501,4601,5601,250,1,150
1,1501,1201,2501,3001,220
1,2501,2501,2001,2601,210
1,1901,2501,320
9651,150
1,2201,2501,3201,3501,420
1,4801,5401,4601,3501,300
1,4601,4601,3701,3501,300
1,150953
1,1001,0601,060
1,0601,0601,0601,0601,080
1,0601,0601,1001,1001,400
1,4301,2501,3501,2501,250
1,2501,270
.1,3501,3501,4001,350
1,3001,3501,4001,4001,460
1,400 1,400 1,400 1,350 ; 1,100
1,120i 1,100 1,100 1,060
675 623 610 662!
750790830830814830
830830830830830
830830830848875
830790750642750
830830875920920
1,1001,2001,2201,250
1,3001,2001,150
1,1001,100
965920920
920875830830875
875920
1,0101,0101,060
1,1001,1501,3001,3501,200
1,2001,1001,2501,4001,800
1,8601,8601,7401,9401,5101,470
1,4101,3201,5601,6202,170
2,6102,0301,7301,5801,900
1,5901,3401,2801,2501,170
1,5501,5901,6901,2301,090
1,1202,9504,4104,5605,420
5,7806,5606,9907,950
12,000
12,70012,70013,40014,70015,400
19,50022,20021,20018,80014,700
10,8008,7207,4607,0007,460
7,4808,240
11,10014,00014,700
16,10015,40016,10018,10013,800
18,80019,500
20,10019,20018,100
12,00013,00013,40015,00014,400
1&400 12,000 12,000 12,400 12,000
10,8009,0408,5109,3109,040
8,5108,0008,0007,5107,750
6,2106,2105,6704,9404,760
5,4704,9504,780,3,8403,280
3,0103,0003,0102,1302,020
2,0201.9101,8101,0601,050
1,000979894770770
770770770770770
738782822
1,5601,580
1,1901,8401,5401,270
990
909661625559559
Combined monthly discharge of G Junction, Colo., for
nnison River and Redlands Canal near Grand the year ending September SO, 1922
MonthDischarge in second-feet
Maximum Minimum Mean
Run-off in acre-feet
October __ November . December- January . February. . March..... April ... May __ .. June "August ..... September .
1,5101,5601,4601,4601,3001,940
12,00022,20015,4005,4702,980
569
820965953610642830
1,0907,0004,760
690559448
1,0701,2901,220
9231,2102,980
14,90010,2001,860
928
65,80076,80075,00061,10051,30074,400
177,000916,000;607,000114,000.,57,100,,29,300'
The year. 22,200 448 3,190 2,300,000,,
LOCATION. In sec. 22, T. 51 N., County, 100 feet above junet
DRAINAGE AREA. 295 square miRECORDS AVAILABLE. July 27,
i'" discontinued. From April 1 at this point, gage being refe
GAGE. Vertical staff on Brittaih.
EAST BtVER AT ALMONT, COIO.
1. 1 E., at highway bridge at Alm»nt, Gunnison on of East and Taylor rivers, es (measured on Forest Service atlas). 1910, to April 30, 1922, when station was,; to October 8, 1905, a station was maintained
red to different datum. ' dow,np|ream side of rjgh;t abutmentf ne^d by «T- ,W-

SURFACE WATEE SUPPLY, 1922, PART IX
DISCHARGE MEASUREMENTS. Made from two-span bridge.CHANNEL AND CONTROL. Channel composed of small boulders and coarse gravel.
Control shifting. ,EXTREMES OF DISCHARGE. Maximum stage for the period October 1, 1921, to
April 30, 1922, 1.95 feet on April 30 (discharge, 650 second-feet); minimum stage occurred during ice-affected period.
1910-1921: Maximum stage, 6.6 feet June 15, 1921 (discharge not com puted) ; minimum stage, 0.30 foot August 13, 1913 (discharge, 19 second- feet).
ICE. Stage-discharge relation affected by ice.DIVERSIONS. Court decrees for diversion of 78 second-feet from East River.REGULATION.-^None.
ACCURACY. Stage-discharge relation practically permanent; affected by ice. Rating curve well defined. Gage read to quarter-tenths twice daily. Daily discharge ascertained by applying mean daily gage-height to rating table. Records good except for period affected by ice, for which they are fair.
Discharge measurements of East River at Almont, Colo., during the year endingSeptember SO, 1922
Pate
Oct. 23Dec. 9Feb. 1
Made by
J. B. Spiegel.. ___ . _ ... ___________ .... ........T. J. Watkins. ...........................................................
height
Feet 0.88«.99
1.73
Dis charge
Sec.-ft. 995866
> Stage-discharge relation affected by ice.
Daily discharge, in second-feet, of East River at Almont, Colo., for the period October 1, 1921, to April SO,
Day
1. _ .2.... ......................................3 ............ .-.--.-._..--.-..-. ..4.............. ............................5 - _____ - __ .. _____ ......... ...
6 . ... .__. _ 7.. ....... __ ............................8,.......-....... .........................9 .. .. .. . . . V),... ........................................
11 ______ ..... _________________12...... _________ . _____ . __ ......13- ...... - . .. . 14.-...- ____ . ____________ .... .....15-.-... ____ . _________ .... .........
16 ___ - _________________ . ____ .17 ,. _18'.. _ - _____________ - ____ - ....19 A .. . _ 20
21 .-_. . ..... ........... ..._._._._.22 .23.-.-- __ - _________ . ____ . ___ ..24 ____ . ___________ . __ . _ ....25 _______ ... ___ ... _______ ....
26 _ ... __ . __________ . ........ ......27 _ - __ .... _______ ....... ..... ..28 .. ._..... . . ._29 ................. ....... .................3ft31-- . __ . _ ....... _____ . ____ . ....
Oct.
116116114112112
110 108
Ifkt100100
100100100100inn
' inn100100100inn
100100inn100100
100inninn100inninn
Nov.
10010010010098
9796949185
8483818181
8181818175
7575757575
7575757070
Dec.
58
63
66
Jan.
62
65
Feb.
64
70
65
Mar.
64
69696969
7269737577
797975757473
Apr.
7373748597
88909610094
91979190.07
9485858594
120157196242303
394380429510650
NOTE. Stage-discharge relation affected by ice Nov. 29 to Mar. 16; discharge based on temperature and gage-height records, and two discharge measurements. Braced figures show mean discharge for periods indicated.

COLORADO RIVER BASIN 45
Monthly discharge of East River at Almont, Colo., for the period October 1,to April 80, 1922
Month
March. .. __ ., _______________________April.....................................................
Discharge in second-feet
Maximum
116 100
79 650
Minimum
100 70
73
Mean
103 83.7 62.1 64.0 66.468. 4
172
Run-off in acre-feet
6,330 4,980 3,820 3,940 3,690 4,210
10,200
TOBHCHI GREEK AT SARQENTS, COIO.
LOCATION. In NW. ^ sec. 28, T. 48 N., R. 5 E., at railroad bridge three- quarters of a mile west of Sargents, Saguache County. Nearest tributary, Marshall Creek, enters a quarter of a mile above.
DRAINAGE AREA. 165 square miles (measured on map in Hayden's atlas).RECORDS AVAILABLE. May 12, 1917, to September 30, 1922, when station was
discontinued.GAGE. Stevens water-stage recorder; inspected by H. R. Aikin.DISCHARGE MEASUREMENTS. Made from highway bridge 1,000 feet downstream
or by wading near gage.CHANNEL AND CONTROL. Bed composed of gravel. Control 30 feet down,
stream at small rapids of compact gravel; fairly permanent.EXTREMES OF DISCHARGE. Maximum discharge during year 305 second-feet,
estimated, on May 28; minimum discharge occurred during winter.1917-1922: Maximum stage, 4.05 feet on June 9, 1921 (discharge, 792
second-feet); minimum discharge, 6 second-feet on December 16, 1920.ICE. Stage-discharge relation seriously affected by ice.DIVERSIONS. A few small ditches divert water for irrigation above Sargents.REGULATION. None.ACCURACY Stage-discharge relation not permanent; affected by ice. Rating
curve well defined. Operation of water-stage recorder was satisfactory except for periods indicated in footnote to table of daily discharge. Daily discharge ascertained by applying to rating tables mean daily gage height determined by inspection of recorder graph. Records good except for periods of missing gage-heights, for which they are fair.
Discharge measurements of Tomichi Creek at Sargents, Colo., during the yearending September SO, 1922
Date
Oct. 25Dec. 10
May 21
Made by
J. B. Spiegel. .........T. J. Watkins... ...........ao..^_. ...........Robert Follansbee- ..
Gage height
Feet 2.29
«2.60»3.40
3.20
Dis charge
Sec.-ft. 44.920.626.3
226
Date
July 11
Made by
M. B. Arthur ___ ...
Gage height
Feet 2.952.191.84
Dis-charge
Sec.-ft. 16344.420.0
1 Stage-discharge relation affected by ice.

SUBFACE WATER 6;U£PL¥$ -J922, PART IX
Daily discharge, in second-feet, of Tomichi Creek at Sargents, Colo., for the year ending September SO, 1922
Day
1 ........2 ___ .....34 _ .......5. ... ...
6.. .......7. .........8 9 10.'.........
ii ........12 __ .......13..........14..........15..........
Oct.
38
38
May
\ 150
194
178168151151153
June
230195200206217
220209214209198
190180171153135
July
6357545048
4745423943
4338353432
Aug.
5645393529
292826 2627
2927262726
Sept.
2222242725
2019191916
1615151515
Day
16- . 17- 18. ......19- 20
21 22. 28 :-24- 25
26 27 28 . 29 30 31. .-
Oct.
37
45
May
141155186196214231'225240243243
246250305270290270
June
129125114109100
9088909090
8371656666
July
3231333432
3335323129
262834323447
Aug.
2728252830
2832292827
232323232322
Sept.
1414141413
1313121212
1211101010
NOTE. No gage-height record May 1-10, May 26 to June 3, Aug: 80 to Sept. 5, and Sept. 13-24; discharge based on comparison ^th flow of Cottonwood Creek near Buena Vista and East Fork of Arkansas River near Leadville. .
Monthly discharge of Tomichi Creek at Sargents, Colo., for the year ending September<%nOU,
: , Month
JulyAugust ....... ......... ....... ........ .
Discharge in second-feet
Maximum
305 230
63 56
. 27
Minimum
65 26 22 10
Mean
38 201 14338.6 28.8 15.8
Run-off in acre-feet"
2,340 12,400 8, 510 2,370 1,770
940
NOTE. Mean discharge for October obtained by averaging five daily discharges.
LAKE FORK AT LAKE CITY, CO1O.
LOCATION. In see. 34, T. 44 N., R. 4 W., at private bridge one-third mile aboveHenson Creek, in Lake City, Uinsdale County.
DRAINAGE ABE A. 126 square miles (measured on topographic map). RECORDS AVAILABLE. April 21, 1918, to September 30, 1922. GAGE. Vertical staff fastened to downstream side of right abutment of bridge;
read by Eugene Otis.DISCHARGE MEASUREMENTS. Made by wading or from bridge. CHANNEL AND CONTROL. Bed of stream composed of coarse gravel well com
pacted. Control at small rapids 250 feet downstream; shifting during . extreme high water.
EXTREMES OF DISCHARGE. Maximum stage recorded, 2.62 feet at 7 a. m. and6 p. m. June 8 and 7 a. m. June 11 (discharge, 1,000 second-feet); minimumdischarge occurred, during winder.
1918-1922: Maximum discharge recorded, 1,560 second-feet on. June 12and 15, 1921; minimum stage, 0.57 foot on March 20, 1919 (discharge,10 second-feet).
ICE. Stage-discharge relation seriously affected by ice. DIVERSIONS. Practically none which do not return to stream above station.
Court decrees for diversion of 22 second-feet below station.

: RIVER BASIN .'ifrREGULATION. -Flow regulated by Lake San Cristobal, located 4 miles upstream;
area 1 square mile. During low water, operation of power plant located 1 mile upstream, may influence discharge slightly.
ACCUEACT. Stage-discharge relation not permanent; affected by ice. Three fairly well-defined rating curves used October 1 to January 3, March 26 to August 31, and September 1-30. I Gage read to hundredths twice daily. Daily discharge ascertained by applying mean daily gage height to rating tables except periods March 26 to April 13 and July 26 to August 31, when shifting- control method was used.
Discharge measurements of Lake Fork at Lake City, Calo., during the year endingSeptember SO, 1922
Date
Oct. 22Apr. 18
Made by
T. J. Watkins ..........
Gage height
IFeet 1.07.86
2.58
Dis charge
Sec.-ft. 32.626.7
946
Date
July 19
Made by
M. B. Arthur.. .............do.................
Gage height
Feet 1.58.76
Dis charge
16125.8
Daily discharge, in second-feet, Qf Lake Fork at Lake City, Colo., for the year endingSeptember SO,
Day
l ..............2 ..............3. _ . .........4 ..............5. _ .. __ . ...
6..............7 ______ . ...8..............9 __ ..;. .....
10..............
11. .............12. __ ...... ...13... _ ........14. _ ....... ...15. ...........
16. ____ ......17........ ......18..............19........... ...20-.. .......
21.. ........ ....2223............!.24........ ......25......... .....
26... _ .. ......27..............28..... _ ......29 ..............30... _ .... ....31..............
Oct.
5049474747
4749474542
4242404040
3837373785
3533333537
353633322724
Nov.
2525302525
2525252525
2525232221
2117202423
2221212221
2223212121
Dec.
2123232323
2525252530
3130292422
2124262621
1613132122
231817181614
Jan.
141414
1
14
1f! 12
1
14
Feb.
12
14
13
Mar.
1 1S
15
151514151518
Apr.
1919223544
6675645438
2930312522
212127.3440
8458.811
105132
125114108114132
May
162180208220249
368482474382307
240197193167170
174170212276290
318,334368442535
657679690703755755
Jane
613474442526646
755807
1.000970970
970940955970910
7947557*1768781
768755703679613
591591591571535
July
535518474450434
434396329302285
267244228212204
190174160154150
154144140130120
118114114114114128
Aug.
154154137125123
1141101089393
*193' 91
89101
9991919191
8981797168.
626058605858
Sept.
6060606258
4841383027
2222222222
2222242320
2025444444
4130272424
NOTE. Stage-discharge relation affected by ice Jan. 4 to Mar. 25; discharge based on temperature and gage-height records and observer's notes. Braced figures show mean discharge for periods indicated.

48,, SUBFACE WATER SUPPLY, 1922, PABT IX
Monthly discharge of Lake Fork at Lake City,- Golo., for the year ending SeptemberSO, 1922
Month
October __________________________November.. . ____________ _ .................December. ________________________ ._January __________________________February _______ __________________March... __________________________April _______________________________May.....................................................June. ____________________________July......................................................August ... _________ . _____________September. _________________________
The year. ______________ \ .............
Discharge in second-feet
Maximum
60 30 31
132 755
1,000 535 154
62
1,000'
Minimum
24 17 13
19 162 442 114 58 26
Mean
39.3 23.0 22.2 13.7 13.2 14.J. 58.0
366 741 243 93.0 34.3
139
Run-off in acre-feet
2,420 1,370 1,360
;842 /733 867
3,:450 22,500 44,100 14,900 5,720 2,040
100,000
1EROUX CREEK NEAR IAZEAE, COLO.
LOCATION. In sec. 33, T. 13 S., R. 93 W., at highway bridge, 8 miles north of Lazear, Delta County. No important tributary within several miles.
DRAINAGE AREA. 52 square miles (measured on Forest Service atlas).RECORDS AVAILABLE. May 15, 1917, to September'30, 1922.GAGE. Stevens water-stage recorder, referred to vertical staff fastened to face
on left bridge abutment; inspected by G. H. Henderson.DISCHARGE MEASUREMENTS. Made from single-span bridge or by wading.CHANNEL AND CONTROL.: Bed composed of gravel and boulders; very rough.
Control 50 feet downstream; shifts during high water.EXTREMES OF DISCHARGE. Maximum stage during year from water-stage re
corder, 3.85 feet at 6.30 p. m. May 27 (discharge, 1,360 second-feet); mini mum stage, creek practically dry during winter.
1917-1922: Maximum discharge, 1,420 second-feet June 17, 1917, and May 29, 1921; minimum stage, creek practically dry during winter.
ICE. No data. Practically entire flow of stream is stored in reservoirs during winter,
DIVERSIONS. Court decrees for diversion of 55 second-feet above station, of which 33 second-feet are for diversion out of the drainage basin. Adjudi cated decrees for 290 second-feet, below station.
REGULATION. Diurnal fluctuation during spring caused by alternate melting and freezing of mountain snow. Flow in nonirrigating season stored in reservoirs on headwaters. Decrees for such storage amount to 606 acre-feet.
COOPERATION. Complete records furnished by State engineer.

COLOKADO klVER BASIN
Daily discharge, in second-feet, of Leroitx Creek near Lazear, Colo., for the yearending September SO,
Day
1 . . __ ..2....... _ ..... _ ....« ... .-,_ -A
5 ___ . .
6...... ...... ___ . .7............-...... -8........ __ . _ ....................9....................................10 _ ._., _
11......... ._ . 12 __ ...............................13.... _ 14... _ ........ ............... _ ....15 . ............ ...............
16....................................17... ..............................18....................................19 ^ . 20.... ........ .-.__..._.-..._..-.-... .
21-.... .-..-............. ......2223... _ . _ .._ 24..... ......... ........... ......25. . . .. .
26.... ........ _ .. _ _..:__. ..........27 . 28 ......... ......... __ ...... ...29... . __ 30 31 ........ ..................
Oct.
4.78.65.03.53.3
3.53.53.32.82.6
3.54.43.33.33.3
3.23.02.92.92.9
2.92.92.83.04.4
4.43.73.22.83.04.4
Nov.
4.54.43.03.03.0
3.03.03.03.03.0
3.03.03.01.21.2
3.02.02.02.02.0
2.02.02.02.d2.0
2.02.02.02.02.0
Apr.
1212111011
3067
105144163
144119144173318
May
318376441464664
799638488283196
119898498105
127222376397441
397537744856717
717856744789600612
June
537537512562562
537488488441346
251236251236163
135127135127119
112105989282
7573747789
July
7463443942
3541404345
4740383332
3640403838
4037322725
233029383327
Aug.
2116129.28.8
81010?:?8 ,
118162121
2122141617
1614141414
7,77.14.8101212
Sept.
1112132522
148.05.612.04.0
1.21.21.6.8.8
.8
.61.11.0.7
.7
.6
.6
.5
.5
.5
.5,4,.3.7
Monthly discharge o1 Leroitsc Creek near Lazear, Colo., for the year ending September
Month
October __________________________
April 16-30 _ .....................
July... .............. ................................
September _________________________
Discharge in second-feet
Maximum
8.6 4.5
856 562
74 22 25
Minimum
2.6 1.2
84 73 23 4.8 .3
Mean
3.58 2.51
97.5 464 256 38.4 13 4.72
Run-off in acre-feet
220 149
2,900 28,500 15,200 2,360
799 281
SURFACE CREEK AT CEDAREDGE, COIO.
LOCATION. About sec. 29, T. 13 S., R. 94 W., at Cedaredge, Delta County. Nearest tributary, Mill Creek, enters 4 miles above.
DRAINAGE AKEA. 43 square miles (measured on Forest Service atlas).RECORDS AVAILABLE. May 16, 1917. to September 30, 1922.GAGE. Stevens water-stage recorder referred to vertical staff fastened to con
crete abutment of footbridge 400 feet upstream from highway bridge in Cedaredge; inspected by J. C. Rock. :
DISCHARGE MEASUREMENTS. Made from footbridge at gage section.CHANNEL AND CONTROL. Bed composed of small boulders filled in behind
control which is old concrete weir, located 12 feet downstream. At high stages water flows through overflow channel which may shift somewhat.

50 SURFACE WATER SUPPLY, 1922, PART IX
EXTREMES OP DISCHARGE. Maximum discharge during year 660 second-feet at midnight May 5; minimum discharge during winter when creek was prac tically dry.
1917-1922: Maximum stage, 1.8 feet at 7 a. m. May 24, 1920 (discharge, 715 second-feet); minimum stage during winter is practically zero.
ICE. No data. Flow very small as most of it is stored during winter.DIVERSIONS. Adjudicated decrees for diversion of 142 second-feet above station,
., of which 67 second-feet are for diversion out of the drainage basin. Adjudi cated decrees for 272 second-feet, below station.
REGULATION. Alternate melting and freezing of snow in mountains caused diurnal fluctuation during spring of year. Adjudicated decrees for storage of 8,140 acre-feet on headwaters. The storage and release of this water changes the natural flow.
COOPERATION. Complete records furnished by State engineer.
Daily discharge, in second-feet, of Surface Creek at Cedar edge, Colo., for the yearending September 30, 1922
Day
I... .........-.- ...-........2._.___._..__...__________.____..___.3. ____ . __ . __ . _ . _ .. __ ....4. ____ ... __ .. _______ . __5............................ ___ ..
6.......... __ . _ ....... ... . .7___..__._,._...___. _____. .........8.. . __ .... ......9_. __._.___.__________.._.. ... ... .10....................................
11_. .. __ . ... _ ....... .12.......... ....... ...... ... . .13.....................................14.. ___._ ..... ... ̂. . .15.......................... ..... . .
16....................................17....................................18....................................19 . ..... . ....... ......20....................................
21 ........... . .22 ..... . ....... ......23................................ .24 ..... ....... ... ...25 . ................... ..........
36....................................27....................................28....................................29____.._.____. .......................30....................................31....................................
Oct.
1112108.410
11118.47.25.2
6.24.65.27.218
32.22.62.63 ft
3.03.49 9.5.6
.61.01.01.0.6.6
Nov.
0.6.61.01.41.8
.6
.51,01.42 2
2.21.0.6.6.6
.6
.61.42.2O A
1.21.0.7.4.3
.2
.2
.2
.2
.2
Apr.
6282106166
May
182300330400450
540520400240150
10072727272
84130210220230
270290320310310
340320290290290280
Jane
245245240240270
2§6270270230180
160160140114100
7777687777
7777777777
6860666688
July
7774686088
flO68656060
6243357758
4137505745
4537271618
353027238.86.7
Aug.
1027222923
2320171726
2027343534
5146373833
3227222222
404226263937
Sept.
2632202525
2522211817
1715139.4
. 9.4
8.37.25.65.06.7
1115301814
1414151412
Monthly discharge of Surf ace Creek at Cedaredge, Colo., for the year ending September
Month
October ___________________________
July.. .............. .....................................
September..... ___ . __________________
Discharge in second-feet
Maximum
18 3.0
540 290 88 51 32
Minimum
0.5 .2
72 60 6.7
10 5
Mean
5.24 .95
261 142 47.3 29.2 15.8
Run-ofl in acre-feet
322 56.5
16,000 8,450 2,910 1,800
940

COLORADO -BtVBB BASIN 51
1 UNCOMPAHGBE EIVBE AT OUR AT, COIO.
LOCATION. River: In sec. 31, T. 44 N., R. 7 W., in box canyon a short distance upstream from highway bridge half a mile south of Ouray, Ouray County. Nearest tributary, Canyon Creek, enters 150 feet below; nearest tributary above is Bear Creek.
Power-house flume: In tailrace of power-house flume in Ouray about 100 feet upstream from entrance to river. Water diverted from Uncom- pahgre River above river station.
DRAINAGE AREA. 44 square miles (measured on topographic map).RECORDS AVAILABLE. January 25, 1911, to September 30, 1922, for river sta
tion and February 25, 1916, to September 30, 1922, for power-house flume. From January 7 to March 17, 1908, records were kept at dam of Ouray Electric Light & Power Co., 1 mile south of present station.
GAGE. River: Stevens water-stage recorder referred to vertical staff attached to rock cliff at left side of stream 150 feet above mouth of Canyon Creek: inspected by F. A. Rice.
Power-house flume: Vertical staff fastened to side of wooden flume juet below power house.
DISCHARGE MEASUREMENTS. River: Made from footbridge at gage or by wading.
Flume: Made from footbridge just below gage.CHANNEL AND CONTROL. River: Bed composed of small boulders. Control short
distance downstream, shifting at intervals; station is in box canyon with Mgh vertical walls.
Flume: Control is plank nailed across bottom of flume at lower end.EXTREMES OF DISCHARGE. River: Maximum stage during year from water-
stage recorder, 3.6 feet at 10 p. m. June 13 (discharge, 840 second-feet); minimum stage, 0.28 foot at 10 a. m. December 25 (discharge, 0.5 second- foot) .
1911-1922: Maximum stage recorded, 6.0 feet at 8 a. m, October 5, 1911 (discharge, 1,980 second-feet); minimum discharge, no flow February 2, 3, and 29, 1912.
ICE. Stage-discharge relation not affected by ice, as warm springs keep streamy open.
DIVERSIONS. No diversion above station other than pipe line whose flow is included in these records.
REGULATION. Diurnal fluctuation during spring from alternate melting and freezing of mountain snow.
ACCURACY. River: Stage-discharge relation practically permanent. Rating curve fairly well defined. Operation of water-stage recorder satisfactory except for periods as explained in footnote to table of daily discharge. Daily discharge ascertained by applying to rating table mean daily gage- height determined by inspection of recorder graph. Records good.
Flume: Daily discharge from December 1 to April 30; July 22 to 28; and August 22 to September 13, determined from study of river charts and one daily gage height. Records good. Daily discharge for remainder of year obtained by applying poorly defined rating table to daily gage height. Records fair. Records of combined discharge or river and flume good except those for October and November, which are only .fair, as the quantity diverted by the flume during the period is a large percentage of the total discharge.

52 SURFACE WATER SUPPLY, 1922, PART IX
Discharge measurements of Uncompahgre River at Our ay, Colo., during the year ending September 80, 1922
Date
Oct. 14Feb. 26July 16
Made by
T. J. Watkins. do . ...M. B. Arthur.- ___ . ______________________________
Gage height
Feet 0.82.48
1.46
Dis charge
Sec.-ft. 25.411.3
106
Discharge measurements of power-house flume at Ouray, Colo., during the year ending September SO, 1922
Date
Feb. 26
Made by Gage height
Feet 1.101.05
Dis charge
Sec.-ft. 3.5
4.5
' Estimated.
Combined daily discharge, in second-feet, of Uncompahgre River and power-house flume at Ouray, Colo., for the year ending September 30, 1922
Day
1 ___ . .......2-..... .....3 .... .4 .,. ...5 ........
6-- , .7 _ . ____ 8-, .... 9 10 _____ ......
11 ....12.. ............13 14. __ ..... 15 _ ......
16 ......17 18 .19 _ ...........20
21. __ .........22... ...........23 .24 .25
26 27_. i .-28 29.. ...... ...30 .. 31
Oct.
2928262728
2929282726
2627272625
2626252525
2524242822
242323323421
Nov.
2124232422
1818181818
1818161212
10M121314
1414141314
1312141216
Dec.
2123152221
2222202019
2023232322
2217212222
2121201621
212120202020
Jan.
1720201813
1519161415
1414141417
1416222021
1928272520
202019181615
Feb.
1516161718
1618181918
1718161615
1718171516
161515
15
151516
Mar.
1613151517
1515181715
1616161719
' 1724231619
2128282222
23991Q
1910
18
Apr.
1919213429
2220192021
2021182124
2420202335
6284O7
9997
95101oo114
May
165179201207289
380346274189131
9975109114115
100129182222240
237232300371413
4234fifi475486458477
June
230201224282391
475514611615575
514559607571461
444469514
s 521486
465475475427357
363371297276300
July
360279273273246
227209199175160
151147140129124
11690999995
8273767664
667168SO
. 8283
Aug.
7656605451
5351504852
- 4956496447
5969906555
4950404440
383838363640
Sept.
4033333433
3532393334
3835312828
2828282828
2728282726
2628292626
NOTE, No gage-height record for river Nov. 17-20, Jan. 22-27, Feb. 2-3; discharge interpolated.

COLORADO RIVER BASIN
Combined monthly discharge of Uncompahgre River and power-house flume at Ouray, Colo., for the year ending September SO,
Month
October _____________ _ ........................November ____ .. ______ ___ .....
February. ...............................................March.. _______________________ __ ..April...... ................................. _.....__.__.,_May ____________ ____ ___ __ . ..June.. __________ ... .July..... __ .............. ...... . .... _,.. : .
September- ________________________
The year ... _ _____________ ... ...
Discharge in second-feet
Maximum
34 24 23 28 19 28
158 486 615 360 90 40
615
Minimum
21 10 15 13 15 13 18 75
201 64 36 26
10
Mean
26.3 15.8 20.7 18. 1 16.4 18.7 48.5
261 436 143 52.0 30.5
90.6
Run-off inacre-feet
1,620 940
1,270 1,110
911 1,150 2,890
16,000 25,900 8,790 3.200 1,810
65,600
UNCOMPAHGRE RIVER BELOW OURAY, COLO.
LOCATION. In sec. 30, T. 44 N., R. 7 W., near lowest bridge in Ouray, Ouray County, a third of a mile below railroad station. Below all tributaries in Ouray.
DRAINAGE AREA. 76 square miles (measured on topographic map).RECORDS AVAILABLE. May 12, 1913, to September 30, 1922.GAGE. Gurley water-stage recorder installed March 28, 1917, referred to ver
tical staff attached to rock cliff 500 feet above bridge, used since March 22, 1916j inspected by F. A. Rice. Original gage, vertical staff attached to downstream side of right bridge abutment, was used prior to March 22, 1916.
DISCHARGE MEASUREMENTS. Made from single-span bridge or by wading.CHANNEL AND CONTROL. Bed composed of coarse gravel and small boulders.
Control is broken rock ledge 50 feet downstream on which mill tailings are alternately deposited and scoured out. Banks not subject to over flow except at extreme high-water stage of 6.5 feet.
EXTREMES OP DISCHARGE. Maximum stage during year from water-stage re corder, 4.8 feet at 10 a. m. June 8 (discharge, 1,450 second-feet); minimum stage, 1.44 feet at 8 a. m. March 18 (discharge, 10 second-feet).
1913-1922: Maximum discharge, 2,530 second-feet at 1 a. m. June 14, 1918; minimum discharge, 10 second-feet on February 5 and 6, 1915, and March 18, 1922.
ICE. Stage-discharge relation not affected by ice; warm springs keep river open.
DIVERSIONS. All diversions returned to river above station except one of 5.2 second-feet from Oak Creek.
REGULATION. Diurnal fluctuation during spring caused by alternate melting and freezing of mountain snow. No artificial regulation.
ACCURACY. Stage-discharge relation not permanent. Two fairly well defined rating curves used October 1 to April 19 and April 20 to September 30. Operation of water-stage recorder satisfactory. Daily discharge ascertained by applying to rating tables mean daily gage height determined by inspec tion of recorder graph. Records good.

54 SURFACE WATEE SUPPLY, 1922, PART IX
Discharge measurements of Uncompahgre River below Ouray, Colo., during the year ending September SO, 1922
Date
Oct. 14Feb. 26
Made by
T. J. Watkins.. ___ ......do..
Gage height
Feet 1.861.653.75
Dis charge
Sec.-ft. 44.723.9
837
Date
June 12July 16
Made by- Gage height
Feet 4.242.56
Dis charge
Sec.-ft. 1,100
219
Daily discharge, in second-feet, of Uncompahgre River below Ouray, Colo., for the year ending September SO, 1922
Day
1 .. __ .....2 _____ .. ....3..............3... _ ........5.......... ....
6..... _ ......7..............8..............9.. ............
10..............
11 ...........12..............13..... _ ... ...14..... _ ......15..............
16..............17......... _ ..18... -. . .19...... _ .....20..............
21.. _ .........22...... __ ....23..............24........ _ ...25 ____ .......
26... ...........27..............28.. .........29 _______ .30..............31-. .......
Oct.
6560535050
4949535048
4849484843
4342424040
3938374645
595246566458
Nov.
5n48444443
4242403635
3636423837
333327324fl
46424(18942
3638404039
Dec.
3835323540
4038374036
3840424040
37on
3Q
3837
3635303036
353636343636
Jan.
qe
3534OQ
9fi
394240sa36
3490
302626
2526242425
28ao383628
272828272626
Feb.
07
28282826
2627272624
26
232422
2323232627
2824252525
252323
Mar.
2322252626
2122232222
2324242731
2528162632
3643453735
373430292828
Apr.
2828365653
4039404236
3636353740
3833351Q
66
111116
132132
138126134175226
May
261296310320507
640.520448363267
223218223223223
216273375403435
458462561645670
720720705690690610
June
502466494561655
720824
1,0301,090
944
824884
1,0301,060
854
854854
1,0901,000
974
932980968836720
731748
655635715
July
705585561538512
471427423407367
359352341302264
244218216218213
213' 196
186175164
1$7157157186175186
Aug.
184166155151146
149140132124132
153140140134130
140161
,168136126
1201031009688
838084868878
Sept.
8178767568
6361fifi5756
5454495151
48484747«
4545434243
4846464343
NOTE. No gage-height record Jan. 8-13 and July 14; discharge interpolated. Shifting-eontrol method used Apr. 20 to May 1 and May 19 to July 1.
Monthly discharge of Uncompahgre River below Ouray, Colo., for the year endingSeptember 30, 1922
Month
October..... ________________________
January.. ... _ . .....................................February.. _____ ____________________
April..... .......... ________ --_ ..... ...May.. _ __ ... __________ ________
July.............. ...................................
September.-. ________________________
The year. _______________________
Discharge in second-feet
Maximum
65 50 42 42 28 45
226 720
1, 090 705 184 81
1,090
Minimum
37 27 29 2422 16 28
216 466 157 78 42
16
Mean
48.7 39.3 36.5 31.0 25.1 28.1 73.6
441 818 312 126 53.8
170
Run-ofi inacre-feet
2,990 2,340 2,240 1,910 1,390 1,730 4,380
27,100 48,700 19,200 7,750 3,200
123,000

COLORADO RIVER BASIN 55v UWCOMPAHGRE RIVER NEAR COIOHA, COIO.
LOCATION. In sec. 5, T. 46 N., R. 8 W., just below highway bridge 4 miles south of Qolpna, Ouray County. Nearest tributary, Billy Creek, enters 13^ miles downstream.
DRAINAGE ABBA. i03 square miles (measured on topographic map).RECORDS AVAILABLE. April 26, 1903, to June 10, 1906, April 6, 1917, to Sep
tember 30, 1922.GAGE. Friez water-stage recorder located a short distance below highway
bridge; installed June, 1921. Original gage was vertical staff half a mile east of Colona and used until station was washed out June 11, 1921.
DISCHARGE MEASUREMENTS. Made from highway bridge.CHANNEL AND CONTROL. Shifts during high water.EXTREMES OF DISCHARGE. Maximum stage during year from water-stage re
corder, 3.21 feet at 3.30 a. m. June 14 (discharge, 1,610 second-feet); mini mum discharge occurred during winter. *
ICE. Station discontinued during winter.DIVERSIONS. Only a few small diversions above station.COOPERATION. Records of daily discharge furnished by United States Bureau of
Reclamation.
Daily discharge, in second-feet, of Uncompahgre River near Colona, Colo., for the year ending September 80, 192%
Day
l.. ...... .. __ . _____ .... _ .... __ ...2........... _____ .. _ . _____ . ___ ...3............. _ . _____ . ___ ............4............. ___ . _ . _ ..:. .....5. _______ . _ . _______ . __ ...... __ .
6......... ___ ............ ____ .... __ ..7....... _____ . ___ ..... ___ . .. ____8............. ___ . ___ .. ___ .... ___ _.^-. ..........................................10.. ........... _____ ..... __ .............
11.... _______________ ... .............12.. _ ...... ___ ........ _______ . ____ .13...... __ ... __ .... ___ ......... _ .....14............................................15........... ___ . _____ ... __ ............
16.. _ ...... _ . _ ... ___ ............. .....17 _ ......... __ . ___ .. ______ .... ......18............ __ . _ ..... ____ .... __ ....19............................................20.... .....................................
21............................................22.. _ .... __ . ___ . ____ . ___ .. ___ ..^.. ..........................................24....... _ . ___ ....... ___ .... __ .. _ ...25........ __ . ____ . _ ............... _ ..
26.......... _____ .... ___ ........ _ .....27.... ..._......._.... ...........__.....__..28 __ . _ . ____ . __________ .. __ . ...29............................................30.. ..... ...--.......-..-.-...-. ...,-.-...-31.... .....................................
Oct.
122140124120110
108120115115110
108110108108105
105105101999T
979795101120
110122110131140140
Apr.
102120132165182
134120120128112
112120108100127
147115112121162
285392382408395
443402445543703
May
680623676673752
975910852755653
558538560587560
524570700733755
792748835900925
9751,0601,0701,0401,020900
June
739660670738827
895970
1,3501,3401,320
1,2801,3801,4401,5001,360
1,3201,2801,3601,410If 400
1,3401,3801,3301,3001,200
1,1401,1601,1001,0401,070
July
1,2001,1201,040997930
889840790765732
707635600555512
502477423408404
410400366316292
270275317370377385
Aug.
415419385370340
330320300281285
330295312315306
312345665410340
321297276274245
242219197197200186
Sept.
183176175176166
162154146144137
130120114114112
112108105102100
9592959286
8591868181
NOTE. Quantities changed slightly to conform to computation rules used by U. 8. Geol. Survey.

56
Monthly discharge of Uncompahgre River near Colona, Colo., for the year endingSeptember 30, 1922
Month
May..... ............
July...
Discharge in second-feet
Maximum
140 703
1,070 1,600 1,200
565 183
Minimum
95 100 524 660 270 186 81
Mean
113 231 771
1,180 , 590
311 121
Eun-off in acre-feet
6,950 13,700 47, 400 70,200 36,300 19,100 7,200
NOTE. Monthly means computed by engineers of the TJ. S. Geol. Survey.
TJNCOMPAHGRE RIVER AT MONTROSE, COLO.
LOCATION. In sec. 31, T. 49 N., R. 9 W., at highway bridge one-fourth mile west of Montrose, Montrose County. Nearest important tributary, Happy Canyon Creek, enters about 2 miles below.
DRAINAGE AREA. 565 square miles.RECORDS AVAILABLE. April 22, 1903, to September 30, 1922.GAGE. Vertical staff attached to bridge; read by L. R. Alien.DISCHARGE MEASUREMENTS. Made from bridge.CHANNEL AND CONTROL. Bed composed of sand and gravel; shifts occasionally.EXTREMES OF DISCHARGE. No data.ICE. Although ice forms along banks during winter, river is not frozen over.
Observations, however, are discontinued.DIVERSIONS. Uncompahgre River is so over-appropriated that the United States
Bureau of Reclamation has constructed a turmel and canal to divert 1,300 second-feet from Gunnison River into the Uncompahgre basin above Uncompahgre.
COOPERATION. Daily discharge furnished by United States Bureau of Recla mation.
Daily discharge, in second-feet, of Uncompahgre River at Montrose, Colo*, for the year ending September '30, 19%2
Day
1.. ............ ....L.... .................. _ a.-... 4-.. ___ _
7--.-. . . _ _ . __ .. ____ .....8---- . :.- 9..... . _ ...
10------
12--- 13---- - 14
10---- 17----- - :1C
19.- - 20
21 ' - - -22 . _ _ 23...-.. --- .-.--.2425.--- .
Oct.
5050788282
130130130130140
230230208208190
190
115115115
11512512513096
Apr.
1818181818
12121318
105
105105105105105
320300320320425
470520520520338
May
868640675640682
1,080500705582448
357280400400357
357338675825850
875900950
1,2301,080
June
1,000800490640823
9921,0801,6301,2801,040
1,1401,1401,1801,440
992
1,0001,0401,0601,0801,120
950905
1,040960820
July
692610561680712
585588590598602
561542490520500
510520438438452
496470470413438
Aug.
118125548520520
470470460490480
500500510520500
533585838730635
542542520530480
Sept.
320320320320350
350350264247191
178159
14O128126
126126787272
7272727255

COLORADO EWER BASIN 57
Daily discharge, in second-feet, of Uncompahgre River at Montrose, Goto., for the year ending September SO, 1922 Continued
Day
26 27..-.-. ............28..-.. , ......... ..... ... ..........29.. ......... ........... ............,...... 3fl31-----
Oct.
969090404040
Apr.
338. 318
422682830
May
9951,1801,2301,2301,2001,150
June
665627796648890
July
460460460460118118
Aug.
43$35835812564
191
Sept.
5555
111111145
NOTE. Quantities changed slightly to conform to computation rules used by II. S. Geol. Survey. No record Nov. 1 to Mar. 31.
Monthly discharge of Uncompahgre River at Montrose, Colo., for the year endingSeptember 30, 1922
Month
October. ___ ______ __ ... _ ____ __ .. __ ..
July.... .
Discharge in second-feet
Maximum
230 830
1,230 1,630
712 838 350
Minimum
40 12
280 490 118 54 55
Mean
122247 764 976 502 458 168
Kun-off in acre-feet
7,500 14,700 47,000 58,100 30,900 28,200 10,000
NOTE. Monthly means computed by engineers of the U. S. Geol. Survey.
UNCOMPAHGRE BITER NEAR DELTA, COLO.
LOCATION. In T. 15 S,, on line between Rs. 95 and 96 W., at highway bridge 2 miles south of Delta, Delta County. No tributaries below station and none for several miles above. *
DRAINAGE AREA. 1,110 square miles (revised; measured on map of Colorado, scale 1 : 500,000).
RECORDS AVAILABLE. April 29, 1903, to September 30, 1922.GAGE. Vertical staff; read by Miss Eva Helmick.DISCHARGE MEASUREMENTS. Made from bridge.CHANNEL AND CONTROL. Bed composed of silt and gravel. Control shifts at
intervals. Banks are not subject to overflow.EXTREMES OP DISCHARGE. Maximum stage recorded, 4.30 feet at 7.30 a. m.
May 6 (discharge, 1,450 second-feet); minimum stage, 0.85 foot at 7.30 p. m. July 14 (discharge, 20 second-feet).
ICE. Although ice forms along banks and slush ice frequently occurs stage- discharge relation is probably not materially affected thereby; observations, however, are discontinued during winter.
DIVERSIONS. Ditches above station divert normal flow during irrigation season; records represent largely return seepage water.
REGULATION. None.COOPERATION. Daily discharge furnished by United States Bureau of Reclama
tion.

58 STJKFACE WATEP, SUPPLY, 1922, PAET IX
Daily discharge, in second-feet, of Uncompahgre River near Delta Colo., for the year ending September SO,
Day
I... ... . . ....-.. .... ....2._._-......__......._.._____.....____......_.3 ..... -.-..__ -.... -..... -....._4 ....5 _ ... _______________________
6. _ .. _____________ . _________7.. _ ... ______________________ ..8... .......__.. ....___.._.__._....._.9... --.._.._--.-.__ -_..... .......-......10.. . ....... .......... ............
11.. ............. ..-. ....-.. ...-.....12.. .....................................13 .-... ............. .........-......14 _____________________ ..... ....15.. _ .... ____________________ ..
16. _ .- .. .. . ........... ........17.. _ ..................................18.. .... ...... ...... ... ... .... ..19... ............ ..........................20 .......................................
2122.. _ ...23.... ..... __ -..-.. ............. ...24....-..._.._._.._.__._.______.______...._._.25 _____________________ . .........
26............................................27 _ ............. ............................28. ____________________ .... .....2930 ________________ .... ____ . ....31... ......-. ..........-.......-....:
Oct.
203200200191182
201250203246235
240246235235250
213175192157161
136150132132150
150128132132185203
Apr.
583635118120
854041212160
130126103103103
4947424872
11628028016091
280251208220220
May
930585
1,050500552
1,1801,100955775475
296162125182243
215212320380540
775647320393475
395593770747572325
June
222123117121121
150472930785615
343355355555420
335190493536560,
562402630562472
332422332392412
July
2883342263946
747779176170
15330612330
118139132161153
130129116277153
176226118122123101
Aug.
Ill202152168158
175168147150152
181168175198188
198170419443472
355342311342280
230176207192187152
Sept.
161163180165200
172175178155155
160198188132178
201180225210155
171178
188188
155207188165165
NOTE. Quantities changed slightly to conform to computation rales used by U. S. Geol. Survey. No record Nov. 1 to Mar. 31.
Monthly discharge of Uncompahgre River near Delta, Colo,, for the year endingSeptember SO,
Month
April.....................................................
July........... ........................................
September ...............................................
Discharge in second-feet
Maximum
250 280
1,180 930
. 334 472 225
Minimum
128 35
125 117 23
111 132
Meai}
189 128 542 411 135 225 178
Run-off in acre-feet
11,600 7,620
33,300 24,500 8,300
13,800 10,600
NOTE. Monthly means computed by engineers of the U. S. Geol. Survey.
DOIORES EIVEE AT BEDROCK, C010.
LOCATION. In sec. 17, T. 47 N., R. 18 W., at highway bridge at Bedrock, Mont- rose County. Nearest perennial tributary, West Paradox Creek, enters below station.
DRAINAGE AREA. 1,910 square miles (measured on Colorado Geological Survey map, scale 1:500,000).
RECORDS AVAILABLE. April 26, 1918, to September 30, 1922, when station was discontinued.
GAGE. Chain gage attached to upstream side of bridge; read by G. S. Ayres.DISCHARGE MEASUREMENTS. Made from single-span bridge or by wading.

OOLOEAIK) RIVER BASIN-
CHANNEL AND CONTROL. ^ed of stream composed of compact sand and silt, which shifts. Control at bend of river 500 feet downstream; shifts during high water..
ICE. Ice forms complete cc|>ver; records discontinued during winter.EXTREMES OP DISCHARGE. Maximum stage recorded during year, 8.3 feet at
5.30 p. m. May 1 ((jlischarge, 5,460 second-feet); minimum discharge, 4 second-feet during pa^t of August and September.
1918-1922: Maximum and minimum discharge, those of the year ending September 30, 1922. j
DIVERSIONS. Water is diverted from Dolores River and tributaries above sta tion for the irrigation (j>f 25,500 acres, of which 20,000 acres are in Monte- zuma Valley. The M^ntezuma Valley Irrigation Co. has an adjudicated decree for diversion of [1,300 second-feet.
REGULATION. None.COOPERATION. Complete rjecords furnished by State engineer.
Daily disc in second-feet, of Dolores River at Bedrock, Colo., for the year ending September 30, 1922
Day
1 ______________2 ____________ . ........3.. _ ...........-.... ..-4. ..........................5. ______________ ...
6... _____ . ___ .........7.--... ..................8. _____________ . ...9 _ .-_ .. .............-10 ..................... ...
11. ........................12 ...........................13 _____________ .....14 _______ . ____ .......15... ____ . __ ...........
16 ........................17 .......................18. ...... ................19... ........................20
21 ...........................22 ____________ . ........23.--.-.......-.-.-..........24. ___________ . ........25 ___ . .....................
26 _____ - ..................27 .......-. .-.._..-..._28- ...................2930 ________ .... .........31. ......... ............
Oct.
21151101916
1110888
8898
109999
9999
41
151513131010
))1)!}
J511^11>,11
I>.>,j>!
>,J>:>:)
27,9R2f>
Nov.
102102114114102
102102102102102
10281818162
7262818162
72544632114
8110210210281
Dec.
8181818181
8181818181
8181818181
8181818181
8181818181
818181818181
Mar.
10593938899
9988888893
93
May
5,3905,2505,1104,8304,760
4,9005,0405,1804,9704,340
2,8102,7003,3604,8304 fiQrt
3,5503,0503,2903,8803,880
3,8803,9403,6203,9404,270
4,1404,0004,0704,2003,7403,550
June
3,1702,3301,9301,5501,630
2,0303,0501,7502,7602,810
3,0502,4302,4302,4802,590
2,0301,7101,4701,7101,590
1,6301,4701,2301,3301,260
1,110840740715621
July
442442382307228
179141119119119
112105622525
3232252532
5425191919
131619163928
Aug.
3225165054
5036252525
1613161613
1616161613
4667461913
13138444
Septi
134444
44444
44664
44444
44444
44444
4182 27-

60 SURFACE WATER SUPPLY, 1922, PART IX
Monthly discharge of Dolores River at Bedrock, Colo., for the year ending Sep tember 80, 1922
Month
October _____________________________
March 1-11... _ .. ................ _ .................May. ____________________________
July ..................................................
Discharge in second-feet
Maximum
410 114
105 5,390 3,170
442 67 13
Minimum
20 32
88 2,700
621 13 4 4
Mean
111 86.5 81 93.4
4,170 1,850
104 23.4 4.43
Run-ofl in acre-feet
6,82tt 5,15fr 4,980 2,040
256,000 110,000
6,400' 1,440
264
SAN MIGUEI RIVER AT NATTJRITA, COLO.
LOCATION. In T. 46 N., on line between Us. 15 and 16 west, at highway bridgein Naturita, Montrose County. Nearest tributary, Basin Creek, entershalf a mile downstream
DRAINAGE AREA. 1,080 square miles (measured on map of Colorado, scale1:500,000).
RECORDS AVAILABLE. April 26, 1918, to September 30, 1922. GAGE. Chain gage fastened to upstream side of bridge; read by Mrs. A. R..
Pay son.DISCHARGE MEASUREMENTS. Made from single-span bridge or by wading. CHANNEL AND CONTROL. Bed rough; composed of coarse gravel and smal^
boulders. Control at rapids 300 feet downstream; shifts during high water.. EXTREMES OP DISCHARGE. Maximum stage recorded during year, 4.85 feet at
8 a. m. May 8 (discharge, 2,760 second-feet); minimum discharge, 44second-feet on January 6.
1918-1922: Maximum stage from high-water mark during night of May 4^1921 (discharge, 6,000 second-feet); minimum stage recorded, 0.05 footon August 31, 1918 (discharge, 38 second-feet).
ICE. Stage-discharge relation slightly affected by ice. DIVERSIONS. Court decrees for diversion of 102 second-feet from San Migue
River, of which approximately 84 second-feet are above station. REGULATION. Diurnal fluctuation during spring from alternate melting and
freezing of mountain snow. COOPEEATION. Complete records furnished by State engineer.
Daily discharge, in second-feet, of San Miguel River at Naturita, Colo., for the? year ending September 30, 1922
Day
1... __ ... __2_... _ .......3_...-..-. _.4. ________5..............
6..............7..............8..............9.... _ .......10-. .-...-..
Oct.
10913211610997
102102102102102
Nov.
132132132124124
140132124116116
Dec.
11609
889292
9297848492
Jan.
9470
8611950
4446465350
Feb.
6060706060
606080
100140
Mar.
5350587972
7262626772
Apr.
148182251374487
336251283318195
May
2,5402,2602,1602,0102,210
2,4802,5902,1601,8601,620
June
1,4001,2001,1201,2401,240
1,2801,2801,7601,8101.670
July
975872742742680
621593512487462
Aug.
621355300266222
148138148159128
Sept.
868686
10286
7262626262:

COLORADO RIVER BASIN 61
Daily discharge, in second-feet, of San Miguel River at Naturita, Colo., for the year ending September SO, 1922 Continued
Day
11.... . _12..............13..............14..............15..............
16.. ............17..............18..............19.. ............20.... ..........
21..............22..............23..............24..............25..............
26..............27..............28..............29..............30... ...........31. .............
Oct.
102102116116124
124124116116124
132116116124148
140124116132132132
Nov.
10292888892
92929284102
102116116109116
109102102116116
Dec.
132102109132132
11697102132132
116140124116116
102116124148159132
Jan.
6250in5050
5050505060
6060606060
606060606060
Feb.
150. 130
130130130
125125120120120
1201191198679
625858
Mar.
8662727286
72159182138148
138195300300266
266266182148148138
Apr.
208266208182251
336222195182318
7111,0801,5401,6701,540
1,6701,9602,0602,2102,540
May
1,3201,4001,4401,4901,320
1,0401,1201,4401,5801,540
1,8101,7601,8101,9602,160
1,9601,9602,0601,8601,9101,720
-June
1,6701,6701,6701,6701,400
1,3201,2001,2401,3201,320
1,2401,2401,2401,2001,080
1,010975872806
1,010
July
374374336336336
266251266236236
236251236195182
170182195208236266
Aug.
v 159148138138138
148208336300208
182159138138119
867979868686
Sept.
5353535353
53534646531. 5046464646
5053535353-
Monthly discharge of San Miguel River at Naturita, Colo., for the year endingSeptember SO, 1922
Month
October _____________________________
February.. ___________________________March. _____________________________
June.. ____________________________ ...July.....................................................August _____________________________
The year ..........................................
Discharge in second-feet
Maximum
148 140 159 119 150 300
2,540 2,590 1,810
975 621 102
2,590
Minimum
97 84 84 44 58 50
148 1,040
806 170
79 46
44
Mean
118 110 113 59.6 97.5
131 739
1,820 1,310
389 182 59.3
429
Kun-off in acre-feet
7,260 6, 550 6,950 3,660 5,410 8,060
44,000 112,000 78,000 23,900 11, 203 3,530
311,000
GREEN RIVER BASIN
GREEN RIVER NEAR DANIEL, WYO.
LOCATION. Near line between Tps. 32 and 33 N., R. 110 W., at highway bridge6 miles southeast of Daniel, Sublette County. No large tributary withinseveral miles.
DRAINAGE AREA. 932 square miles (measured on map of Wyoming issued byUnited States Geological Survey; scale 1:500,000).
RECORDS AVAILABLE. April 1, 1915, to September 30, 1922. State engineermaintained station at this point during 1913 and 1914.
GAGE. Chain gage on downstream side of bridge; read by Mrs. A. P. Sommers. DISCHARGE MEASUREMENTS. Made from two-span bridge or by wading. CHANNEL AND CONTROL. Bed composed of coarse gravel and small boulders.
Control 100 feet downstream at small rapids; shifts slightly. Banks arehigh and not subject to overflow.

62 SURFACE WATEB SUPPLY, 1922, PART IX
EXTREMES OP DISCHARGE. Maximum stage recorded during year, 5.1 feet at 4.30 p. m. June 15 (discharge, 4,010 second-feet); minimum discharge occurred during winter.
1915-1922: Maximum stage recorded, 7.0 feet at 10 a. m. June 16, 1918 (discharge, 8,750 second-feet); minimum discharge occurred during winter.
ICE. Stage-discharge relation seriously affected by ice; observations discon tinued during winter.
DIVERSIONS. Adjudicated diversions for irrigation of 18,000 acres above station,REGULATION. None, except natural regulation of Green River lakes.ACCURACY. Stage-discharge relation shifted slightly during winter. Two fairly
well defined rating curves used October 1 to November 19 and-April 24 to September 30. Gage read to quarter-tenths once daily. Daily discharge ascertained by applying daily gage height to rating tables. Records fair except for periods of missing gage heights, for which they are poor.
Discharge measurements of Green River near Daniel, Wyo., during the year endingSeptember 30, 1922
[Made by M. B. Arthur]
Date
May 10..-..- ___ --.-- __ -. ___ - ___ ... _ . _ . __ ...-. ___ . __ .. __ .June 20 _____________________________________________
Gage height
Feel 3.684.672.22
Dis charge
Sec.-ft. 1,7403,130
283
Daily discharge, in second-feet, of Green River near Daniel, Wyo., for the year endingSeptember 30, 1922
Day
2 3 .................................4 5.
6 7 .................................8 . .-.-.....-.... ............9.. . .. ...... ................
10
11 .: . 12 13 14 15. .... ....................... ..
16 17 18 19 20
21 22- .23.. ..............................24 25
26 97'2829 30 31 ,
Oct.
385375365355
327318309309
300300300300300
91 Q21991 Q219
91 Q
21991 Q91 Q
21991 Q91 Q91Q219213
Nov.
213207201195190
185180175175185
190195207219219
201195195195
Apr.
653528
618498707707662
May
626810964
1,6201,680
2,1703,0002,1701,6301,760
1,4901,2501,2501,2501,360
1,8602,4503,0502,7702,430
2,4302,5102,5802,7502,840
2,9303,0002,5602,1002,1002,100
June
2,3802,3802,3802,3802,530
2,7002,8703,1403,3103,610
3,8203,6103,7003,9104,010
3,8003,5703,3703,1803,090
3,0003,0903,1803,0903,000
2,9102,8202,7402,6502,560
July
2,480
2,000
1,150
840
920820
772772725725725725
Aug.
680725820820870
870820772680680
680725725725820
820870870920
1,030
1,0801,0301,030
975820
772725680680680635
Sept.
635635635
635
635635635635680
470
f o/U
I
278
260
NOTE. Shifting-control method used Apr. 24 to June 16. No gage-height record July 2-23, Sept. 11-24; and 26-30; discharge based on comparison with flow of New Fork near Boulder and Green River a* <Green River. Braced figures show mean discharge for periods indicated. No record Nov. 20 to Apr. 23.

COLORADO BIVEB BASIN Dd
Monthly discharge of Green River near Daniel, Wyo., for the year ending September
Month
April24-30. - .- -. . .-
3uly......... .............................................
Discharge in second-feet
Maximum
385 219 707
3,050 4,010
1,080
Minimum
213 175 528 626
2,380 725 635
Mean
272 1% 625
2,050 3,090 1,240
807 470
Run-off in acre-feet
16, 70ft 7,380 8,680
126,000 184,000 76,200 49,60028,ooa
GREEN RIVER AT 6REEN RIVER, WYO.
LOCATION. In sec. 22, T. 18 N., R. 107 W., at Union Pacific Railroad pumping station, 100 feet below railroad bridge at Green River, Sweetwater County. No tributary within several miles.
DKAINAGE AKEA. 7,670 square miles (measured on- map of United States Geologi cal Survey, scale 1:500,000).
RECORDS AVAILABLE. May 2, 1895, to October 31, 1906; March 1, 1915, to September 30, 1922.
GAGE. Chain gage on left bank at pumping station; read by Miss Alyce. Graver. From March 1, 1915, to September 28, 1920, gage one-third of a mile down stream. Gage used from 1895 to 1906 was vertical staff on submerged cribbing near present location. No determined relation between gages.
DISCHARGE MEASUREMENTS. Made from two-span highway bridge.CHANNEL AND CONTROL. Bed composed of small boulders. Control of well
compacted small boulders 400 feet downstream; fairly permanent.EXTREMES OF DISCHARGE. Maximum stage recorded during year, 5.85 feet at
8 a. m. June 12 (discharge, 13,300 second-feet); minimum discharge occurred during winter.
1895-1906; 1915-1922: Maximum stage recorded, 12.3 feet at 5 p. m. June 19, 1918 (discharge, 22,200 second-feet); minimum discharge recorded, 160 second-feet, November 17, 1898.
I.CE. Stage-discharge relation seriously affected by ice.DIVERSIONS. Prior to July 1, 1921, adjudicated diversions of 223 second-feet
between this station and the station near Daniel.REGULATION. None.ACCURACY. Stage-discharge relation shifted slightly. Rating curve fairly well
defined. Gage read to tenths twice daily. Daily discharge ascertained by applying mean daily- gage height to rating table except period July 19 to August 31, when shifting-control method was used. Records good.
Discharge measurements of Green River at Green River, Wyo., during the year endingSeptember SO, 1922
[Made by M. B. Arthur]
Date
May 2 _____________________________________________15..... ....... . ....... .. -.-.......-. ....... .... .. .
June 17... __ .. ____ . ____ .. ____________________________July 29.............................................................................
Gage height
Feet 3.543.215.70
- 2.74
Dis charge
Sec.-ft. 4,2202,900
12, 4002,030

64 SURFACE WATER SUPPLY, 1922, PART IX
Daily discharge, in second-feet, of Green River at Green River, Wyo., for the year ending September SO, 1922
Day
1 .... - ......2...........................3.. .........................4...........................5...........................
6..... ... . . ..7........................ .8...........................9...........................10...........................
11--..-. ....... . ..12..........-........... .13............ ...............14....... ..........._15-..-... .................
16..........................17...-.... ................18................. ..... .19.............. .............20......... ............. ..
21.................... .......22....... ......... .......23............... ............24............ ...............25..................... ...
26........ ...... .............27...........................28... ......... ..............29. ..........................30................. ..........31........ ...... .............
Oct.
770770770770770
770770770770770
770770770770770
770770770770770
730690690690690
690690690690690690
Nov.
690690770730770
770770770770770
770770770770770
770770770770770
770770730690690
690690620620620
Mar.
3, 1103,3803,650
3,3803,1102,8502,7202,600
2,4802,4802,2502,2502,1401,930
Apr.
1,5601,4702,6001,320
950
1,3201,3201,2503,3802,360
1,1801,060
950810950
1,060770730950
1,120
1,5601,4701,7401,9302,360
2,8503,5104,0904,0903,940
May
4,0904,0903,5103,7904,090
4,5605,8105,8106,0005,620
4,7303,9403.5103,1102,980
3,2403,2403,5104,7305,440
6,1906,1906,5806,5806,970
7,7608,1608,9808,1608,1608,160
June
8,5708,5708,5708,5708,570
8,98011,10011,10011,60012,100
13,00013,00012, 60012,10012,100
12,10012, 60011,60011,10011,100
11,10011, 10011, 10011, 10011,100
11, 10011,10011,10010,70010, 200
July
9,8208,5707,7607,3606,190
5,0804,7303,9403,5103,240
3,2403,1102,9802,9802,980
2,9802,9802,6002,3902,270
1,9701,9701,9901,9902,010
2,0102,1402,1402,0501,9501,850
Aug.
1,8301,8301,8301,8301,830
1,8301,8301,8301,8301,740
1,7401,5601,6401,7401,740
2,1401,9301,9301,9302,030
2,0302,0302,0302,0302,030
2,0302,0301,9301,7401,6401,640
Sept.
1,5601,5601,5601,5601,560
1,4701,4001,4001,4001,400
1,4001,3201,1801,0601,000
1,000950950950950
950950900850770
770770770770770
Monthly discharge of Green River at Green River, Wyo., for the year ending September30, 1922
Month .
October.. __________________ __ ..........November.. ____________ ' ____________March 18-31.............................................
June. ________________________ ..........July.....................................................August _____________________________
Discharge in second-feet
Maximum
770 770
3,650 4,090 8,980
13,000 9,820 2,140 1,560
Minimum
690 620
1,930 730
2,980 8,570 1,850 1,560
770
Mean
743 . 736 2,740 1,820 5,410
11,000 3,570 1,860 1,130
Run-off in acre-feet
45,700 43,800 76,100
108,000 333,000 655,000 220,000 114,000 67,200
GREEN RIVER AT LITTLE VALLEY, NEAR GREEN RIVER, UTAH
LOCATION. In sec. 4, T. 22 S., R. 16 E., 1 mile above old Little Valley ferry and 6 miles downstream from Green River, Emery County. San Rafael River enters Green River 16 miles downstream in see. 25, T. 23 S., R. 16 E.
DRAINAGE AREA. 41,000 square miles (measured in 1915, on best available maps of Colorado River basin).
RECORDS AVAILABLE. December 18, 1910, to September 30, 1922. Records obtained at Green River (known also as Elgin or Blake) from 1894 to 1899 and 1905 to 1911 give practically the same flow.
GAGE. Stevens continuous water-stage recorder on left bank 1 mile above old ferry; inspected by A. I. Anderson.

COLORADO RIVER BASIN 65
DISCHARGE MEASUREMENTS. Made from car on old ferry cable.CHANNEL AND CONTROL. Bed composed of gravel and sand. Fairly permanent
gravel riffle two-thirds of a mile below gage. Banks high and not subject to overflow.
EXTREMES OF DISCHARGE. Maximum stage during year, 10.80 feet at 1 p. m. June 12 (discharge, 46,200 second-feet); minimum discharge, 955 second- feet (estimated mean for the day) on January 9.
1894-1899; 1905-1922: Maximum discharge recorded, 68,800 second-feet, May 29, 1897; minimum stage recorded, 0.95 foot December 1, 1919 (discharge, 510 second-feet).
ICE. Stage-discharge relation affected by ice nearly every winter.DIVERSIONS. Station is below practically all diversions from Green River.REGULATION. None.ACCURACY. Stage-discharge relation changed slightly November 19 to Decem
ber 6; no ice effect apparent this year. Rating curves well defined between 1,500 and 50,000 second-feet. Operation of water-stage recorder satisfactory except January 8 to February 16, April 17 and 18, May 24-26, May 30 to June 8, June 22 to July 31, and August 25 and September 9; when staff was read. Daily discharge ascertained by applying mean daily gage height or daily reading to rating table. Records good.
COOPERATION. Since December 16, 1917, station has been maintained in cooper ation with Utah Power & Light Co., which made most of the discharge measurements.
Discharge measurements of Green River at Little Valley, near Green River, Utah, during the year ending September SO, 1922
Date
Nov. 17Dec. 8Feb. 16May 16
18
Made by
E. O. Thornm* _R. R. Rowe ______
-do -do
Gage height
Feet 1.421.211.396.326.31
Dis charge
Sec. -ft. 2,4902,3002,310
21,10019,500
Date
11July 11
13
Made by
E. G. Thorum __ __ do do do
Gage height
Feet 9.82
10.624.143.79
Dis charge
Sec.-ft. 39,20046, 3008,6208,390
a Engineer of Utah Power & Light Co.
Daily discharge, in second-feet, of Green River at Little Valley, near Green River, Utah, for the year ending September 80, 1922
Day
1 ____2 _____3 _____4 _____5 .........
6 .........7 _......_.8 .........9 .........
10 __ .....
11 .........12 _..._.._.13 .........14 __ . ....15 .........
16 _____ .17 .........18 .__.._...19 _...._...20 _____ .
Oct.
2,280
2,2302 2002,180
2,2202,2202,3102,5902,590
2,5002,4502,4202,430
2,4502,4002,3502,3202.290
Nov.
2,2802,3902,5002,5002,500
2,5002,4502,4202,3702,350
2,3702,3702,3402,320
2,3702,4702,4802,5002.470
Dec.
2,6902,6202,6002 KAA
2,450
2,4502,420
2,1001 KAf\
1 qeft
1,2901,5001,780
1 9801 9401 PU.fi
1,5401.610
Jan.
2,500
2,5802,5002,280
2,2802,0801,690
9551,060
1 2601,3701,4101,6901,740
2,0801,7401 Qfift1,5401.450
Feb.
1,9001,8001,9001,8001,850
2,0802,210
1,8501,850
2,2102,3503,0103,2003,200
2,3502 91 ft
2,0802,0802.140
Mar.
2,740
2,210
2,280
9 3*V*
2 KAfl
2,5002,500
3,010
3,2004,1807,050
17,60019.000
Apr.
6,0605,5305,270
5,140
5,1405,790
6,7607,360
7,5107,0506,9006,3305,790
5,270A QCft
4,7004,4104.290
May
11,500
14,00014 80015,300
16,00017, 600
22,50029,000
31,000
28,400
21 700
on qnn
9O Qfifi9fi 3ftfl91 4.HO
23.900
June
45,600
43,200
38,60039,000
4*> OAA
45,20045, 80044,600
41,600
QQ OAA
35,100$4. OAA
35.100
July
21, 70020,00018,40016,80015,800
14, 30013,20011,80010,800
8,8508,0007,5106,760
6,470
5,7905,2704.900
Aug.
4,0604,9003,8304 0604,180
4,0603,6103,6103,4003,400
3,7203 4.no3,3003,3003,100
3,4003 OAA
9 Q9O9 Q9fi
3.400
Sept.
4,6504,2904,1804 0603^940
3,9403,9403,8303,5203,200
3,1003,0102,9202,7402 660
2,580
2 4.9H
2,3502.280

66 SURFACE WATER SUPPLY, 1922, PART IX
Daily discharge, in second-feet, of Green River at Little Valley, near Green River, Utah, for the year ending September 30, 1922 Continued
Day
21 _____
23 _____24 _____25
26.. 27 _____28 29 _____30 _____31
Oct.
2,2402,2302,2202,5402,760
2,2802,2902,3102,2602,2402,220
Nov.
2,4002,4002,4502,4202,570
2,5202,6002,7102,7802,760
Dec.
2,0302,2802,8803,1003,360
2,9702,4102,2202,1102,2902,460
Jan.
1,5401,7401 fiin1,4501,450
1,5401,6401,540i fiQfl1,8001,590
Feb.
2,2802,920O QOft
3,0103,200
3,400.3,7203,500
Mar.
12,50010,6009,790
10,20019 ftfWI
12,50011,1009,5908,0007,2006,610
Apr.
4,2904 900
4,2904,5305,020
6,3307,6708,8509,590
10,600
May
27,90031,00033,000
»6, 700
40,40042,00042,60043,40044,000
June
36,30035,70035,70035,40033,000 30,70028,70026,40025,00023,100
July
4,6504,1803,9403,8303,940 3,9403,8303,8304,0604,0604,060
Aug.
4,5305,6608,6805,5305,090 4,6504,0603,8303,9404,1804,290
Sept.
2,2102,1402,1402,0802,020 2,0201,9601,9601,9601,960
NOTE. Braced figures show estimated mean discharge for period indicated.
Monthly discharge of Green River at Little Valley, near Green River, Utah, for the year ending September 80, 1922
Month
October __________________________ .
July. ___ ... __ .- .... __ _
Discharge in second-feet
Maximum
2,760 2,780 3,360 2,580 3,720
19,000 10,600 44,000 45,800 21, 700 8,680 4,650
45,800
Minimum
2,180 2,280 1,260
955 1,800 2,210 4,290
11,500 23,100 3,830 2,920 1,960
955
Mean
2,350 2,460 2,180 1,750 2,470 6,420 6,050
26,800 37,400 8,600 4,070 2,890
8,630
Run-off in acre-feet
144,000 146,000 134,000 108,000 137,000 395,000 360,000
1,650,000 2, 230, 000
529,000 250,000 172,000
6, 250, 000
EAST FORE AT EAST FORE CANAL, WTO.
LOCATION. In sec. 10, T. 31 N., R. 106 W., 300 feet above intake of East Fork Canal, 18 miles southeast of Boulder, Sublette County. Nearest tributary, Canal Creek, enters just below.
DRAINAGE AREA. 106 square miles (measured on base map of Wyoming, scale 1 : 500,000).
RECORDS AVAILABLE. During irrigation seasons of 1916, 1917, 1921, and 1922.GAGE. Vertical staff on left bank; read by Robert Hawkins.DISCHARGE MEASUREMENTS. Made from cable near gage or by wading.CHANNEL AND CONTROL. Bed composed of small boulders; control 100 feet
downstream, apparently permanent.EXTREMES OF DISCHARGE. Maximum stage recorded during irrigation season,
4.3 feet at 10 a. m. June 10 (discharge, 1,180 second-feet); minimum stage, 0.75 foot on September 30 (discharge, 4 second-feet).
1916, 1917, 1921, and 1922: Maximum stage, 4.6 feet June 23 and 25, 1917 (discharge, 1,400 second-feet); minimum stage, that of 1922.
ICE. No data, as records are discontinued during winter.DIVERSIONS. Prior to July 1, 1921, there were adjudicated diversions of 26
second-feet above station.REGULATION. Flow regulated to small extent by many small lakes at head
waters.

COLORADO RIVER BASIN 67
ACCURACY. Stage-discharge relation practically permanent. Rating curve well defined below 1,000 second-feet. Gage read to half-tenths once daily. Daily discharge ascertained by applying daily gage height to rating table. Records good except during high water, when the mean daily gage height based on one reading may be considerably in error. For this period records considered fair.
Discharge measurements of East Fork at East Fork Canal, Wyo., during the yearending September 80, 1922
[Made by M. B. Arthur)
Date
June 21 _________________________________ .. _ ... Sept. 28. __ .... ____ ... ___ ... ___ . ___ ...... _____ ...... .........
Gage height
Feet 3.79.80
Dis charge
Sec.-ft. 828
5.0
Daily discharge, in second-feet, of East Fork at East Fork Canal, Wyo,, for theirrigation season of 1922
Day
I.... ...2........... ....3... ............4......... __ ..5. ___ .........
6...............7....... __ . ...8---.. __ ......9 . ...........10..............
11. _______ ..12 ...............13 ------14...... __ . ....15... .. ..........
June
655710770835
1,040
1,110970
1,1101,0401,180
655770900868835
July
285285255242230
242270230205180
168115979797
Aug.
5151515151
4438322727
3851389773
Sept.
2218121515
151212108
158878
Day
16. _ . _ .......17. ____ ........18....... ........19..... _20---- -
21... 22........ _ ....23...... .........24..... _____ ..25.. ___ . _ ...
26...... .........27...... .........28 ...... ......29...... ____ ..30 31....... ........
June
900835900770770
868835682550500
435398398330285
July
11597
1069797
9797898181
736558515851
Aug.
5144383232
3844322727
181818151818
Sept.
88
1066
76665
56554
Monthly discharge of East Fork at East Fork Canal, Wyo., for the irrigation seasonof 1922 *.
Month
July........ ..... ... . . ............
September... __ .. ___ . _________________
The period. . ..... .......
Discharge in second-feet
Maximum
1,180 285 97 22
Minimum
285 51 15 4
Mean
763 139 38.4 9.3
Run-off in acre-feet
45,400 8,550 2,360
553
56,900
EAST FORE AT NEWFORK, WYO.
LOCATION. About sec. 33, T. 32 N., R. 108 W., at highway bridge a quarter of a mile south of Newfork, Sublette County. No tributaries between sta tion and mouth, 1 mile below.
DRAINAGE AREA. 348 square miles (measured on map of Wyoming, scale 1 : 500,000).
4182 27 6

68 SURFACE WATBE SUPPLY, 1922, PAET IX
RECORDS AVAILABLE. April 1, 1905, to October 31, 1906; May 11, 1915, to September 30, 1922.
GAGE. Vertical staff on downstream side of left abutment; read by J. W. Glaze. Gage a quarter of a mile upstream used during 1905; gage used during 1906 located at bridge and referred to datum 0.27 foot higher than present gage.
DISCHARGE MEASUREMENTS. Made from two-span highway bridge or by wading.CHANNEL AND CONTROL. Bed composed of sand and gravel. Control 100 feet
downstream at gravel bar which is slightly shifting. Banks subject to overflow at stage of 6 feet.
EXTREMES OF DISCHARGE. Maximum stage recorded, 6.1 feet at 7 a. m. June 10 (discharge, 2,460 second-feet); minimum discharge occurred during winter.
1915-1922: Maximum discharge 2,940 second-feet on June 19, 1917; minimum discharge, 25 second-feet at 6 p. m. April 4, 1920.
ICE. Stage-discharge relation seriously affected by ice; observations discon tinued.
DIVERSIONS. Prior to July 1, 1921, adjudicated diversions of 141 second-feet above station.
REGULATION Flow regulated to small extent by many small lakes at headwaters.ACCURACY. Stage-discharge relation practically permanent. Rating curve well
defined. Gage read to hundredths twice daily. Daily discharge ascertained by applying mean daily gage height to rating table. Records excellent.
Discharge measurements of East Fork at Newfork, Wyo., during the year endingSeptember 30, 1922
[Made by M. B. Arthur]
Date
May8 ____ ... _ ... ____ ... _ .... ________ - _ - - -
%Feet
2.294.021.17
Dis charge
See.-ft. 27293447.8
Daily discharge, in second-feet, of East Fork at Newfork, Wyo., for the year endingSeptember 30, 1922
Day
12................. ___ ............3 . .. . _.. 4................ __ ................5... ... _ ....... __ -
6... __ ..................... __ ...7... __ .. _ - _._ .-. ..-8 -. .- . - 9....................................10. ... ... ....................
11. _ ..... ___ .....................12 ....................................13 14..... _ ............................15 . _. .
16. .17.-.-........... ...... ............18. _ - . -.-.-19....................................20 .
Oct.
4949494848
4848484848
4848484848
4848484848
Nov.
4848484848
4848484848
4848484848
4949494949
Apr.
4949485151
5248485051
4948484647
4646464646
May
211226348402348
259242276259226
195160138136130
128172259402456
June
1,5401,4001,5401,7501,900
2,0602,1402,2202,3002,380
1,7501,6101,5401,4001,470
1,0701,0101,1901,1901,070
July
226184172149160
149138128114111
9892868176
7276808185
Aug.
6566706665
6461616265
6464688471
7168666470
Sept.
7170686972
7169666258
5654545»51
5151515151

COLORADO RIVER BASIN 69
Daily discharge, in secondtfeet, of East Fork at Newfork, Wyo., for the year ending September 30, 1922 Continued
\ Day
21.... _ ...... ___ .. __ ............22................ __ ...... __ ......23....................................24............. _ . ... . ..... ...25....................................
26................... __ .. _ .... ...27.................. __ ..............28....................................29....... _ ..... ..........30... .................................31. _ . _ .......... ___ . _ .. __ ..
Oct.
4848485251
514949494848
Nov.
4949494848
4949515252
Apr.
4648556572
86102128149198
May
512607685950
1,260
1,6801,6101,4701,7501,8201,750
June
1,070900810685568
512456402366312
July
9084858581
767170686565
Aug.
7071696868
686869696869
Sept.
5151515151
5151515151
Monthly discharge of East Fork at Newfork, Wyo., for the year ending September0n 1 oat® OU, I &aa
Month
October ___________________________November... __________________________
June... ___ . ______________________July... __ ......... _ ......... ......... _ .. . ..August __________________________ __September __________________________
Discharge in second-feet
Maximum
52 52
198 1,820 2,380
226 84 72
Minimum
48 48 46
128 312
65 61 51
Mean
48.5 48.7 63.8
615 1,290
103 67.5 56.9
Run-oft in acre-feet
2,980 2,900 3,800
37,800 76,800 6,330 4,150 3,390
NEW FORK NEAR BOULDER, WYO.
LOCATION. About sec. 8, T. 32 N., R. 108 W., at highway bridge 1 mile west of Boulder, Sublette County. Nearest tributary, Boulder Creek, enters one-eighth of a mile below.
DRAINAGE AREA. 578 square miles (measured on map of Wyoming, scale 1:500,000).
RECORDS AVAILABLE. May 11, 1915, to September 30, 1922.GAGE. Vertical staff on downstream side of left abutment; read by Martin
Brandt.DISCHARGE MEASUREMENTS. Made from two-span bridge or by wading.CHANNEL AND CONTROL. Bed composed of sand and gravel underlain by slate;
somewhat shifting. No well-defined control. At high water there are two overflow channels, one around right end of bridge and other from New Fork to Boulder Creek.
EXTREMES OP DISCHARGE. Maximum stage recorded during year, 6.2 feet from 5.30 a. m. June 23 to 7 a. m. June 24 (discharge, 3,420 second-feet); minimum discharge occurred during winter.
1915-1922: Maximum stage recorded, 8.7 feet at 6 a. m. June 17, 1918 (discharge, 12,300 second-feet); minimum discharge of 42 second-feet oc curred from December 15-17, 1915.
ICE. Stages-discharge relation seriously affected by ice; observations discon tinued.
DIVERSIONS. Prior to July 1, 1921, adjudicated diversions of 191 second-feet above station.
REGULATION. None.

70 SURFACE WATER SUPPLY, 1922, PART IX
ACCURACY. Stage-discharge relation practically permanent. Rating curve fairly well denned. Gage read to quarter-tenths twice daily. Daily dis charge ascertained by applying mean daily gage height to rating table. Records good. '
Discharge measurements of New Fork near Boulder, Wyo., during the year endingSeptember 80, 1922
[Made by M. B. Arthur]
Date Gage height
Feet 3.266.05
Dis charge
Sec.-ft. 586
3,fl40
Daily discharge, in second-feet, of New Fork near Boulder, Wyo., for the year endingSeptember 80, 1922
Day
l _______ . _ .... _ . _ .... ...2....................................3 . .. .4....... ____ . _ . ________ . ...5__.......... -. -.. .--.._._.....
6 .7... __ . .. _ . ....8., .....« _. . .............10........... .........................
11 __ ........ _________ .. .....12........ ............................13... ...... 14... ........ _ ... .15......................... _ .... .
16..- _.-..._._._._...__17 .... __ .....18............................ ....19....................................20 . ... .........
21............................ . .. .22....................................23. ...................24........................... . .. .25. ..............................
26. ..............................27. .........................28 ..............................29 ...................... . .30 31. ..............................
Oct.
118113109
104
100100969692
9288848480
848484
8484
848496
100104
928484848496
Nov.
9292888888
8884.
888484
8477707077
80
Apr.
199
127137i<sa169181
19499 4
298Q-IQ
400
May
422400605
1,0801,080
1,080550578550495
4454004454004f¥l
400379400445470
605730
795865
9351,1601,0801,1601,2401,420
June
1,4201,6001,6001,7001,900
2,2102,4302,5402,7702,890
2,8902,8902,8903,0103,130
3,1303,0102,8903,0103,130
3,1303,2703,4203,2703,130
2,8902,7702,5402,4302,320
July
2,2102,1002,0001,8001,700
1,6001,5001,4201,2401,160
1,0801,010
935795665
665605578665665
635665665730665
635605550495495795
Aug.
445422422422422
400400400400400
400400400470470
445422445445470
470445445445422
400379358358358358
Sept.
358358338338338
338338318318318
318318318338338
338318318298279
279260260242201
194194194194188

COLORADO RIVER BASIN 71
Monthly discharge of New Fork near Boulder, Wyo., for the year ending SeptemberOf) OU,
Month
October ___________________________
April 20-30.. ____.._-.-___._...-_.__..-.--.___ ...____
July......................................................August _____________________________
Discharge in second-feet
Maximum
118 92
400 1,420 3,420 2,210
470 358
Minimum
80 67
122 379
1,420 495 358 188
Mean
92.8 82.1
212 704
2,670 1,010
417 292
Run-off in acre-feet
5r 710 2,930 4,630
43,300 159,000 62,100 25,600 17,400
PINE CREEK AT PINEDAIE, WYO.
LOCATION. In sec. 4, T. 33 N., R. 109 W., at highway bridge at Pinedale,Sublette County. No large tributary between station and mouth, 3 milesbelow.
DRAINAGE AREA. 128 square miles (measured on United States GeologicalSurvey map, scale 1:500,000).
RECORDS AVAILABLE. May 8, 1915, to September 30, 1922. GAGE. Vertical staff on downstream side of bridge pier; read by D. C. Carson.
Prior to August 17, 1917, vertical staff a quarter of a mile downstream onleft bank; no determined relation between gages.
DISCHARGE MEASUREMENTS. Made frofla two-span bridge or by wading. CHANNEL AND CONTROL. Bed composed of gravel. Control at rapids just below
gage; somewhat shifting. Banks subject to overflow at extremely high water. EXTREMES OF DISCHARGE. Maximum stage recorded during year, 4.0 feet June
22-24 (discharge, 1,500 second-feet); minimum discharge occurred duringwinter.
1915-1922: Maximum stage, 5.0 feet at 8 a. m. and 5 p. m., June 17, 1918(discharge, 2,310 second-feet); minimum discharge, occurred during winter,
ICE. Stage-discharge relation somewhat affected by ice. DIVERSIONS. Prior to July 1, 1921, adjudicated diversions of 73 second-feet
above Pinedale and 4 second-feet below. REGULATION. Flow regulated by Fremont Lake, which has an area of
approximately 8 square miles and drains 110 square miles. ACCURACY. Stage-discharge relation not permanent. Rating curve fairly well
defined. Gage read to hundredths twice daily. Daily discharge ascertainedby applying mean daily gage height to rating table except periods April 21to May 18 and May 28 to September 30 when shifting-control method was-used. Records fair.
Discharge measurements of Pine Creek at Pinedale, Wyo., during the year endinySeptember SO, 1922
[Made by M. B. Arthur]
Date
May 9..... __________________________________ . ________June 20 _____________________________________________Sept. 25. _ . _ .. _ . ___ __ . _________ . ___ ...... ___ .. _ .......
Gage height
Feet 1.373.601.38
Dis charge
Sec.-ft.
&&

72 SURFACE WATER SUPPLY, 1922, PART IX
Daily discharge, in second-feet, of Pine Creek at Pinedale, Wyo., for the year endingSeptember 30, 1922
Day
I... ....... ....................2....................................3....................................4... _ _ _5....................................
6....................................T............ ........................8....................................9....................................10 . . .-. .
11 ......................... ........12....................................13 _ __ _ _ ....14. ___________________.._. ____.__.__15....................................
16..... ...............................17.. ..................................IS....................................19............. __ ...................20...... . . .......
21..... - . _-.- 22........ ..... .................23........-.... _..._^.... ................................25... ...................... ........ T ..
26 .. .... ..................27...... _ . . 28.............................. ..29 ...... ...... . . .. 30.. ........ ..-. ............31............ .........................
Oct.
2420181818
1717171615
1414131311
1110887
668
108
876666
Nov.
66555
55555
55544
44
Apr.
1717171717
1717171717
May
1818183335
4246617380
7878757580
788298
118152
183190198234285
320365365393423471
June
534534554623658
714819924980
1,050
1,1201,1801,2501,2501,230
1,2301,2301,2201,2201,290
1,4301,5001,5001,5001,430
1,3601,3601,2901,2201,150
July
1,0901,050
.1,020952882
882812812742672
602534502471411
411411411404397
389381373365340
315295270270266266
Aug.
262230218198186
183172158155146
149131131162165
169186183239248
248226218202190
183180169162155155
Sept.
176166162162210
239244239234230
222214202190183
165155149137125
8569635955
5957555448
NOTE. No gage-height record July 19-23; discharge interpolated.
Monthly discharge of Pine Creek at Pinedale, Wyo., for the year ending September30, 1922
Month
October ___________________________November 1-17. ______________________April 21-30 . ... .................................May _______________________________June... _____________________________July ....... ........August- ____________________________September.. _ ... __ . __________________
Discharge in second-feet
Maximum
24 6
17 471
1,500 1,090
262 244
Minimum
6 4
17 18
534 266 131 48
Mean
11.8 4.9
17 154
1,110 548 186 147
Run-off in acre-feet
726 165 337
9,470 66,000 33,700 11,400 8,750
BOULDER CREEK NEAR BOULDER, WYO.
LOCATION. In sec. 4, T. 32 N., R. 108 W., at Sandlin ranch, 2 miles northwestof Boulder, Sublette County. No tributary between station and mouth2 miles below.
DRAINAGE AREA. 112 square miles (measured on United States GeologicalSurvey map; scale 1:500,000).
RECORDS AVAILABLE. April 23, 1904, to October 31, 1906; May 10, 1915, toSeptember 30, 1922.
OAGE. Chain gage installed May 19, 1920, 50 feet upstream from vertical staffused prior to that date and referred to same datum; read by Mrs. M. M.Sandlin. Gage used 1904-1906 was located a short distance upstream.

COLORADO RIVER BASIN 73
DISCHARGE MEASUREMENTS. Made by wading or from bridge 1% miles down stream during high water.
CHANNEL AND CONTROL. Bed composed of gravel; deep pool at gage. Control150 feet downstream at rapids which shift slightly at intervals. Banks arehigh and not subject to overflow.
EXTREMES OP DISCHARGE. Maximum stage recorded during year, 5.8 feet onJune 10 (discharge, 2,340 second-feet); minimum stage, probably occurredduring winter.
1904-1906; 1915-1922: Maximum stage recorded, 6.8 feet on June 14,1918 (discharge, 3,240 second-feet); minimum discharge, 0.9 second-footon August 31, 1915.
ICE. Stage-discharge relation seriously affected by ice. DIVERSIONS. Prior to July 1, 1921, adjudicated diversions of 83 second-feet
above station. REGULATION. Natural regulation by Boulder Lake. Low-water discharge
affected by irrigation above station. ACCURACY. Stage-discharge relation permanent. Rating curve well defined
below 2,400 second-feet. Gage read to hundredths twice daily. Dailydischarge ascertained by applying mean daily gage height to rating table.Records good.
Discharge measurements of Boulder Creek near Boulder, Wyo., during the year ending September 30, 1922
[Made by M. B. Arthur]
Date
May8. ____________ . ________________________ _. _ Sept. 26... ___ ._._.-.--_- . __ . __ . ___ ..... ____ . ___ . __ ...
Gage, height
Feet 1.91 .66
Dis charge
Sec.-ft. 146 "6
0 Estimated.
Daily discharge, in second-feet, of Boulder Creek near Boulder, Wyo., for the yearending September 80, 1922
Day
1..... ______________________2.... .. . ____ _ . . . . .3.... _________________________4 __ . ...5 . _________________________
6....... ______ ... ... __ . __ ..... _ .7.. __________________________8..... ________________________9..... ________________________
10.... _________________________
11..... ________________________12.... _________________________13.14..... __________________________15
16....r. ____________ . __ ........ ....17....!! ___ . _________ .. _ ...18 .....19 .. ________________________20-... _____ ..... _________ ... ___ ..
Oct.
88777
77777
77777
77777
Nov.
77776
66666
66666
66
May
38496881
103
115122134151143
132126113108101
927992
143
245
June
1,1401,1401,2801,4201,700
1,9301,9302,0102,1802,340
2,0901,9301,9301,9302 090
1,8501,7001,9302,0102.090
July
675625580535495
495455395335284
226187124134134
143164164154154
Aug.
6867626058
5451494744
4041414858
6062626054
Sept.
2928272623
2219181515
1513121211
1110999

74 SURFACE WATER' SUPPLY, 1922, PART IX
Daily discharge, in second-feet, of Boulder Creek near Boulder, Wyo., for the year ending September SO, 1922 Continued
Day
21..... _______________________22..... __________________________23 .. ___ _ . _____ ....... _ __ _...24..... __________________________25 ......_..._. _ .......... _______ .....
26..... ________ .. ___ I ___ . ____ .....27.. __________________________28. __________________ ____29 . __________________________30. . __ .......... __ ... ____ . _____ .31 - __ . ____ . ____ . _ . _ . _____ .
Oct.
77788
876677
Apr.
29
May
307375443553741
goo972960960
1,0801,210
June
2,0902,1802,0101,7001,420
1,2101,1401,020
900785
July
154154143134120
1109986787667
Aug.
5046535250
«04641383532
Sept.
898r7
7777T
Monthly discharge of Boulder Creek near Boulder, Wyo., for the year ending Sep tember SO, 1922
Month
November 1-17 _______________________
July _____________________________August _____________________________
Discharge in second-feet
Maximum
8 7
1,210 2,340
675 68 29
Minimum
6 6
38 785 67 32
7
Mean
7.1 6.2
346 1,700
248 50.9 13.6
Run-ofl in acre-feet
437 20£
21,300 101,000 15,200 3,130
809>
BIG SANDY CREEK NEAR FARSON, WYO.
LOCATION. In sec. 18, T. 27 N., R. 106 W., three-quarters of a mile below Ten Trees and 18 miles north of Farson, Sweetwater County. No tributary within several miles.
DRAINAGE ABBA. 322 square miles (measured on United States Geological Survey map; scale, 1 : 500,000).
RBCOKDS AVAILABLE. May 10, 1915, to September 30, 1917; April 28, 1921, to September 30, 1922.
GAGE. Stevens eight-day water-stage recorder at left bank, half a mile above head gate of Eden Canal, installed May 1, 1921, and referred to datum of staff gage used from 1915 to 1917; inspected by employee of Eden Land & Irrigation Co.
DISCHAEGE MEASUREMENTS. Made from cable 100 feet upstream from gage or by wading.
CHANNEL AND CONTROL. Bed composed of well-compacted sand; control 150 feet downstream, fairly permanent. Banks are overflowed at stage of 3.7" feet.
EXTREMES OF DISCHARGE. Maximum stage during year from water-stage re corder, 4.8 feet from 2 to 7 a. m. June 9 (discharge, 766 second-feet); minimum stage 1.10 feet at noon September 24 (discharge, 4 second-feet).
1915-1917; 1921-1922: Maximum discharge recorded, 1,160 second-feet on .June 26, 1917; minimum discharge that of September 24, 1922.
ICE. Stage-discharge seriously affected by ice.DIVERSIONS. Prior to July 1, 1921, adjudicated diversions of 43 second-feet
above station and 4 second-feet below.REGULATION. None.

COLORADO BIVEE BASIN-
ACCURACY. Stage-discharge relation shifted slightly. Two fairly well defined rating curves used October 1 to June 11 and June 12 to September 30. Operation of water-stage recorder satisfactory. Daily discharge ascertained by applying to rating tables mean daily gage heights obtained by inspection of recorder graph. Records good.
Discharge measurements of Big Sandy Creek near Parson, Wyo., during the year ending September 30, 1922
[Made by M. B. Arthur]""
Date
July SI.............................................................................
height
Feet 2.354.051.92
Dis charge
Sec.-ft. 12864544.1
Daily discharge, in second-feet, of Big Sandy Creek near Parson, Wyo., for the year ending September 30, 1922
Day
I...... __ . __________ . _ ....... ...2. ____________________________3... _______ ....... __ ........ ___ . ....4......... _________ .. ___ ........... ...5. ...........................................
6........ ______________ . __ .. __ ...7..... _ ... __ .......... __ ......... _ ...8...... ___ . ___ . ___ ............. _ .....9...................... _ ...................10............................................
11...... __ .... __________ ... _ .......12.. _ . _____ . ___ . __________ . .....13...... ____ ......... ____ . __ . ____ ..14..... _____ . _ ... ___ .......... .......15...... ___ .... __ . ______ . _ .... _ ...
,16-.-. ____ ... _______ .... _ ..........17............................................18.... ........................ .............19.... _____ .... _ ................... ....20...... _ .... _ .. __ ............... __ ...
21-...-.... _ .... ____ .. .................22...... _______ . _ .... __ ...............23............................................24....... ......... ____ ....... ........25.. ..-....................................
26-...-..-..... _ .... __ .............. ......27...... ___ ........ ___ . __ .........28. _ --. ___ . ___ .. _ ...................29..... ____ .......... _ . ........... .30 ........................................31............... _ ... ___ ..................
Oct.
1214162225
2626252626
2626262626
252525
- 2626
2627262525
263132353432
Nov.
3234343132
31
May
128122117113109
10599938789
7978118196268
340392419608594
581594540554594594
June
554486514568622
662676704738710
704556556556556
556488488542542
542529542502448
Af\Q
394380380354
July
326300274254241
236234217203185
171150134116105
103105105103100
9696969491
827572615446
Aug.
4242424146
4642403433
2828378967
7782796459
5352504741
353125181514
Sept.
1314151514
1112121110
981076
65566
66'4
f «
66667

76 SURFACE WATER SUPPLY, 1922, PART IX
Monthly discharge of Big Sandy Creek near Parson, Wyo., for the year endingSeptember 30, 1922
Month
November 1-6 ___ ______ ........................May 6-31- -. ......................... ............June... ____ _ ................................Jqly. .................................................August ....... ..... . ....-....................
Discharge in second-feet
Maximum
35 34
608 738 326 89 15
Minimum
12 3178
354 46 144
Mean
25.6 32.3
293 542 146 45.1 8.4
Run-off in acre-feet
1,570 384
15,100 32,300 8,980 2,770
500
BLACKS FORK NEAR URIE, WYO.
LOCATION. In sec. 23, T. 16 N., R. 115 W., at highway bridge, 4 miles north west of Urie, Uinta County. No tributary within 10 miles.
DRAINAGE AREA. 261 square miles (measured on United States Geological Survey map; scale 1 : 500,000).
RECORDS AVAILABLE. August 21, 1913, to September 30, 1922.GAGE. Vertical staff on downstream side of center pier; read by Miss Myrtle
Anderson.DISCHARGE MEASUREMENTS. Made from two-span bridge or by wading.CHANNEL AND CONTROL. Bed composed of well-compacted gravel. Control
is small rapids just below bridge; shift slightly at long intervals. Right bank high and not subject to overflow; left bank is overflowed at stage of about 3 feet.
EXTREMES OF DISCHARGE. Maximum stage recorded during year, 3.95 feet at 8.30 a. m. May 26 (discharge, 1,690 second-feet); minimum discharge, 6 second-feet for several days in October and September.
1913-1922: Maximum stage recorded, 4.72 feet at 7 p. m. June 19 and 9 a. m. June 20, 1917 (discharge, 2,680 second-feet); minimum discharge 1 second-foot September 17-22, 1916.
ICE. Stage-discharge relation seriously affected by ice.DIVERSIONS. Prior to July 1, 1921, adjudicated diversions of 636 second-feet
above station, and 4 second-feet below.REGULATION. None.ACCURACY. Stage-discharge relation not permanent. Rating curve well defined.
Gage read to hundredths twice daily. Daily discharge ascertained by applying mean daily gage height to rating table except for periods April 19 to June 5 and July 6 to September 30, for which shifting-control method was used. Records good.
Discharge measurements of Blacks Fork near Urie, Wyo., during the year endingSeptember 30, 1922
[Made by M. B. Arthur]
Date
Sept. 30.. ............................................... _ . .. ........
Gage height
Feet 1.85.62
Dis charge
Sec.-ft. 23710.6

COLORADO EIVEE BASIF 77
Daily discharge, in second-feet, of Blacks Fork near Urie, Wyo., for the yearSeptember 30,
Day
1....... ..... ___ . _____ ......2 ....................................3..... ... .............. ........ ......4.. ............ ___ .................5............. ___ . __ .. ___ .....
6............... _ ..... __ .........7. ......... __ ............ __ . __ .8....................................9.............. .....................
10... .-..... . .......
11.. __ ....... ___ . _ ... ___ ......12...................... __ ..........13.. ........ -.-...-...- _ ..... ....14..................... ___ .........15...................... ____ .......
16........................ _____ ...17.............. __ ..................18.............................. _ ...19........... _ ......... ____ ......20....................... . _ -.
21 ___ . ..............................22................ .............. .....23........... __ . -. __ -24........ ___ ... __ . . ........25............... _ ..................
26.............- ....1...27............................. __ ...28....... .........................29................... __ .. _ . __ ...30........... ___ . ___ .. __ . ....31............. ..... ___ .... _ ...
Oct.
1313866
66688
813131313
1318181818
2224242418
202218181815
Nov.
1313131313
1313131313
1313131313
Apr.
58546060
175256221221233
266280280242183
May
18019&224221269
269369415369288
221192178178192
392662440602602
560450614766
1,130
1,480844844
1,140982387
June
857857668728668
740680590
1,010838
680620620620455
360740505620560
650650590405380
360340330315310
July
300230245280186
8468534646
403020108
79967
1513151513
101324101010
Aug.
1416251611
877711
8781212
88888
88888
7887913
Sept.
id141199
99999
1010101010
77666
66766
666137
NOTE. No gage-height record June 25-30 and July 9-15; discharge based on comparison with flow of Hams Fork at Diamondville. No record Nov. 16 to Apr. 16.
Monthly discharge of Blacks Fork near Urie, Wyo., for the year ending September30, 1922
Month
November 1-15 ____ ______ ......................April 17-30... ____ _____________________
June... _________________________July........... .... ______ ...... __ .-..-....-....August . _ .. _ _ ._ September ________________________
Discharge in second-feet
Maximum
24 13
280 1,480 1,010
300 25 19
Minimum
6 13 54
178 310
7 7 6
Mean
14.5 13.0
185 505 592 59.1 9.7 8.6
Kun-off in acre-feet
892 387
5,140 31,000 35,200 3,630
596 512
HAMS FORK AT DIAMONDVILLE, WYO.
LOCATION. .In SW. M sec. 24, T. 21 N., R. 116 W., at highway bridge at Dia mondville, Lincoln County. Nearest tributary, Willow Creek, enters 4 miles upstream.
DRAINAGE AREA. 386 square miles (revised; measured on United States Geological Survey map, scale 1:500,000).
RECORDS AVAILABLE. October 1, 1918, to September 30, 1922. From May 1 to September 30, 1918, station maintained at Kemmerer 2 miles upstream; records at two points comparable.
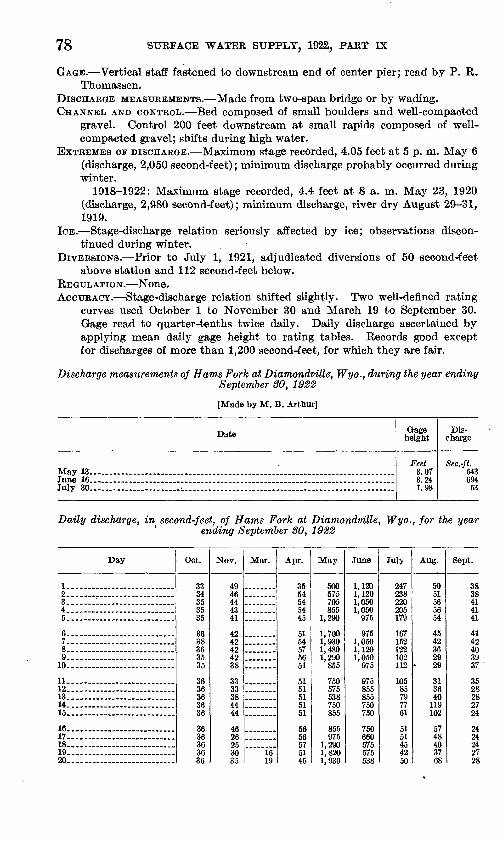
78 SURFACE WATER SUPPLY, 1922, PAET IX
GAGE. Vertical staff fastened to downstream end of center pier; read by P. R. Thomassen.
DISCHARGE MEASUREMENTS. Made from two-span bridge or by wading.CHANNEL AND CONTKOL. Bed composed of small boulders and well-compacted
gravel. Control 200 feet downstream at small rapids composed of well- compacted gravel; shifts during high water.
EXTREMES OF DISCHARGE. Maximum stage recorded, 4.05 feet at 5 p. m. May 6 (discharge, 2,050 second-feet); minimum discharge probably occurred during winter.
1918-1922: Maximum stage recorded, 4.4 feet at 8 a. m. May 23, 1920 (discharge, 2,980 second-feet); minimum discharge, river dry August 29-31, 1919.
ICE. Stage-discharge relation seriously affected by ice; observations discon tinued during winter.
DIVERSIONS. Prior to July 1, 1921, adjudicated diversions of 50 second-fe"et above station and 112 second-feet below.
REGULATION. None.ACCURACY. Stage-discharge relation shifted slightly. Two well-defined rating
curves used October 1 to November 30 and March 19 to September 30. Gage read to quarter-tenths twice daily. Daily discharge ascertained by applying mean daily gage height to rating tables. Records good except for discharges of more than 1,200 second-feet, for which they are fair.
Discharge measurements of Hams Fork at Diamondville, Wyo., during the year endingSeptember 30, 1922
[Made by M. B. Arthur]
Date
May 13 __ ____ ............ __ .....June 16 ________________________________________July 30. __ .............. ___ ............. ____ ... __ .
Gage height
Feet 3.073.241.98
Dis charge
Sec.-fl. 543694
53
Daily discharge, in second-feet, of Hams Fork at Diamondville, Wyo., for the year ending September 30, 1922
Day
1.... ___ ............. _ .2- ............... _ ........3.... _ '_.........._...._._.4........................ ...5....- ...................
6. ____ ... __ ............7...... _ ......... _ ... ...8.... .......... ..........9...................... _ ..10--- -..-.. .
11....-... . __ ..... _ ..12.--. - 13... _ . .... ..........14... __ ....................16.... ..... ............
16..... ...................17.... .. ___ ...........IS... 19. _ ...... ...... ....... ....20.... ..................
Oct.
3334353535
3638363535
3636363636
3636363636
Nov.
4946444341
424249
4238
3333384444
AR
26OK
3035
Mar.
1619
Apr.
3554545445
515457Kft
51
5151515151eft
56575145
May
500575705855
1,290
1,7001,9301,4801,290
855
750575538750855
855975
1 9Qrt
1,8201.930
June
1,1201,1201,0501,050
975
9751,0501,1201,050
975
97585585575ft7W>
17 EA
660575575538
July
247238220205179
167152122102112
10585797761
Kl51454250
Aug.
5051565654
4542362929
313640
119102
5748403768
Sept.
3838414141
4142403937
3528282724
94
24242728

COLORADO BIVER BASIN 79
Daily discharge, in second-feet, of Hams Fork at Diamondville, Wyo., for the year ending September SO, 1922 Continued
Day
21. ....... _ ... _ ... _ . ...22........ ___ ..............2324...........................1&. ..................... ... ..
26............ _ ... __ .....27............ ___ .........28...........................29...........................30.... _ ... _ ..............31.... ......,. _
Oct.
36384266
705552464449
Nov.
4143332325
2934374139
Mar.
2236C7
10536
505040323232
Apr.
5794
126152193
256290315370500
May
1,8201,7001 AQfl
1,4801,480
1,5901,5901,4801,1201,1201,120
June
500468A*2K
402370
315315270270260
July
54561Q7957
615659565751
Aug.
6157
1377550
424032363642
Sept.
2525252525
2426313531
NOTE. Stage-discharge relation affected by ice Nov. 18-20,23,25,26,28; discharge interpolated. Shifting- control method used Sept. 1-30. No record Dec. 1 to Mar. 18.
Monthly discharge of Hams Fork at Diamondvitte, Wyo., for the year ending Sep tember SO, 1922
Month
October ___________________________
March 19-31-- ._ _ .... ......
May __ __ ___ .. ____ ....June. ______________________________July.......................... ...........................August.September. ______ . _________________
Discharge in second-feet
Maximum
70 49
105 500
1,930 1,120
247 137 42
Minimum
33 23 16 35
500 260 42 29 24
Mean
40.2 , 37.6 > 40.5
113 1,210
712 97.9 52.7 31.3
Run-off in acre-feet
2,470 2,240 1,040 6,720
74,400 42,400 6,020 3,240 1,860
LITTLE SNAKE BIVER NEAR DIXON, WYO.
LOCATION. In sec-, 6, T. 12 N., R. 90 W., at highway bridge 1 mile west ofDixon, Carbon County. No important tributary within several miles.
DRAINAGE ABEA. 1,060 square miles (measured on United States GeologicalSurvey map; scale, 1:500,000).
RECORDS AVAILABLE. May 27, 1910, to September 30, 1922. GAGE. Chain gage on upstream side of bridge; read by Mrs. J. E. Herold. CHANNEL AND CONTROL. Shifting during high water. EXTREMES OF DISCHARGE. Maximum gage height recorded, 7.2 feet at noon
May 27 (discharge, 5,860 second-feet); minimum stage recorded, 0.65 footfrom August 5-8 (discharge, 22 second-feet).
1910-1922: Maximum mean daily stage recorded, 8.3 feet on May 23,1920 (discharge, 8,960 second-feet); minimum stage recorded, 0.2 l foot onAugust 6, 1911 (discharge, 5 second-feet).
DIVERSIONS. Prior to July 1, 1921, adjudicated diversion above station of 68second-feet in Wyoming and 33 second-feet in Colorado; below station,68 second-feet in Wyoming and 54 second-feet in Colorado.
REGULATION. None. COOPERATION. Complete records furnished by State engineer of Colorado.

80 SUEFACE WATEE SUPPLY, 1922, PAET IX
Discharge measurements of Little Snake River near Dixon, Wyo., during the year ending September 30, 1922
[Made by B. T. Chase]
Elate
May 27... ________________________________________Aug. 12 __________________________________________
Gage height
Feet 7.00.75
Dis charge
Sec.-ft. 5,560
28.6
Daily discharge, in second-feet, of Little Snake River near Dixon, Wyo., for the year ending September SO, 1922
Day
1. _______________2. _________________3. ________________4.. _______ _ ...5. _ _ __ ...
6. ________________7. ________________8. ________________9- _______________10.-- . -......-...-
11. ________________12. ____________ . ....13......... __________ _ ..14. ________________15. ________________
16. ________________17- .. .. __ ...... __ .18. ________________19. ________________20- _________________
21 __________________22.. _________________________23-.- ___ -___ _ 24. _________________25- _________________
26- .. 27 __________________28. _________________29. _________________30.- __ . __31 ______.__..__...._...____
Oct.
4638414651
87136136156162
169146115100
79
5454545451
3838383846
4646515454K_l
Nov.
KA
54>!<t
5454
5454463838
38
515864KA
7074646470
6464707064
54545458fi-t
Mar.
780780810307
2883382332185>n4ISM
Apr.
184196254299444
490318326318310
274274233218204
190184196176233
299435694810810
1,0101,0101,1701,4201,700
May
1,8201,6002,0002,0602,490
2,8103,6303,6302,8102,250
2,7401,4201,3401,5101,700
2,0602,6803,4904,0604,440
4,6604,2104,0604,3604,580
4,8105,1104,6604,8104,5103,770
June
3,2803,0702,9402,9402,940
2,8802,8103,0702,9402,940
2,7402,6202,3102,0001,650
1,3401,2901,2101,2501,210
1,010978842722588
467379318288274
July
233176162140140
108103806464
6464646157
5050484040
3531282828
282626242424
Aug.
2424242322
2222222324
2424242424
24242425
108
10368454033
272626262626
Sept.
2828282828
2828282826
2626262424
24. 24
242424
2424242424
2424242434
NOTE. No record Dec. 1 to Mar. 21.
Monthly discharge of Little Snake River near Dixon, Wyo., for the year endingSeptember SO, 1922
Month
March 22-31..- ________________________
May. ______________________________
July... ___ . _
Discharge in second-feet
Maximum
169 74
810 1,700 5,110 3,280
233 108 34
Minimum
38 38
184 184
1,340 274
24 22 24
Mean
73.5, 57.8 41.4
489 3,230 1,780
68.1 32.3 25.8
Run-off in acre-feet
4,520 3,440 8,210
29,100 199, 000 106,000
4,190 1,990 1,540

COLORADO RIVER BASIN 81
LITTLE SNAKE RIVER NEAR LILT, COLO.
LOCATION. In sec. 20, T. 7 N., R. 98 W., at highway bridge near mouth of canyon 6 miles above Lily, Moffat County. No tributary between station and mouth of river at Lily.
DRAINAGE AREA. Not measured.RECORDS AVAILABLE. May 1 to September 30, 1922.GAGE. Remodeled Bristol.DISCHARGE MEASUREMENTS. Made from bridge and by wading.CHANNEL AND CONTROL. Fairly permanent.DIVERSIONS. Adjudicated diversions for irrigation of 28,700 acres between
Dixon and Lily stations.REGULATION. NoneCOOPERATION. Complete records furnished by State engineer.
Daily discharge, in second-feet, of Little Snake River near Lily, Colo., for the year ending September SO, 1922
Day
1 ____ . ...2 _____ . ...3. _ -.__.__.4 _____ . ...5 _____ . ...
6. ____ .. ... 7 _______
9 ____________10 _____ ____
11 _____ .. _12 _____ __13 ____ .. ___14 _____ ____15 .. .......
May
2,4002,4002,4000 Ann
2,450
2,960 3,560
4,400 3,980
2,4502,9602,1602,0202,300
June
3,9803,7703,5603,3503,350
3,560 3,3503,150 3,350 3,350
3,5603,1502,9602,7802,450
July
306236206180156
134 134114 114 114
11411496
11480
Aug.
4052405252
525252 46 46
4646524040
Sept.
2020202019
18 17
19 20
1918172023
Day
16. __ _ 17 ._. .18 _-_ 19 20 - __ ..
21 ____________ 22 ____________23. _ .__- __24 ____________ 25 __.____ __
26. ___________27__. _____ .28 ___ _______29 ____________30 - __31
May
2,4502,4503,5603,9804,400
4,840 5,360 4,4003,980 4,400
4,8405,3605,6505,0905,3604,840
June
2,1601,7401,6101,4801,360
1,250 1,080 1,010
940 870
800664544438346
July
9696968080
80 66 6666 66
666666524040
Aug.
4646282828
114 96 5252 40
282020202020
Sept. '
2628262422
20 19 1817 16
1514161717
Monthly discharge of Little Snake River near Lily, Colo., for the year ending Sep tember SO, 1922
Month
July.... __ _____ ______ _______August
Discharge in second-feet
Maximum
5,650 3,980
306 114 28
Minimum
2,020 346 40 2014
Mean
3,680 2,200
108 44.1 19.4
Run-off in acre-feet
226,000 131,000
6,640 2,710 1,150
368,000
SAVERY CREEK AT SAVERY, WYO.
LOCATION. About in sec. 8, T. 12 N., R. 89 W., half a mile east of Savery, Carbon County. No tributary between station and mouth, l^_j miles below.
DRAINAGE AREA. 354 square miles (measured on United States Geological Survey map, scale 1:500,000).
RECORDS AVAILABLE. May 1, 1915, to September 30, 1916; April 5, 1918, to September 30, 1922, when station was discontinued.
GAGE. Vertical staff; read by Marie Kilgore.

82 SURFACE WATER SUPPLY, 1922, PART IX
EXTREMES OP DISCHARGE. Maximum stage recorded during year, 4.5 feet at 6.30 p. m. May 7 (discharge, 1,090 second-feet); minimum stage recorded 0.8 foot on several days during October and August (discharge, 9 second- feet).
1915-1916; 1918-1922: Maximum stage recorded, 5.7 feet on May 19, 21, 22, 1920 (discharge, 1,770 second-feet); no flow July 6 to September 3, 1915, August 5, 6, 9-31, and September 1-14, 1918.
DIVERSIONS. Prior to July 1, 1921, adjudicated diversions of 64 second-feet from Savery Creek, and 13 second-feet from tributaries entering above.
REGULATION. None.COOPERATION. Complete records furnished by State engineer of Colorado.
Discharge measurements of Savery Creek at Savery, Wyo., during the year endingSeptember SO, 1922
[Made by B. T. Chase]
Date
May 27. _ _. .. __ ...................... ___ ._ . _ . ___ .....Aug. II..............................................................................
Gage height
Feet 3.88.95
Dis charge
Sec.-ft. 80815.0
Daily discharge, in second-feet, of Savery Creek at Savery, Wyo., for the year endingSeptember SO, 1922
Day
1... _ .. .... ^.. .........................3.. ......... ................4........ _ .. _ ...........5.. ....... _ . __ ..........
6... ...._--.-.....- ...7.............. __ .........^.. .........................9...........................10--
11...........................12-.-..-.-...-.......-.......13.. ....... ___ .... 14...........................15...........................
16.. . _ ..... ... _ ....17..... ...................18.... ........ ..........19.... ...20... ...................... ..
21........... __ ...........22.... .......................23..... ... _ .............24.............. _ ..........25............. _ ...........
26..- ....................27-..--.-.... ___ .........28.. ...... ...................29...........................30........ ...................31..... ___ . _ ..... ........
Oct.
1818181813
1313131313
139999
99242432
4040404040
404040404040
Nov.
4040404040
4040403232
3232324050
3232323232
3232323232
323232
x 3232
Mar.
472472
472580490472472
472418346124124124
Apr.
12462124124124
142175220220220
2201241249262
124124124124124
124142152220472
472472472472472
May
616616671768854
854900994
. 994900
994854854768768
810728728709690
690728728748728
690728690690690690
June
508508508508508
400400400400400
400400400328292
256188188188175
162162928476
7676767676
July
7676766962
6262626250
4540363232
3228282824
2428282418
181818131313
Aug.
1818131616
13991313
13131199
9991313
1313131313
135050505050
Sept.
5050505050
5050404040
1818181818
1818181824
2424242424
2424244040
NOTE. No record Dec. 1 to Mar. 18.

COLORADO EIVER BASIN 83
Monthly discharge of Savery Creek at Savery, Wyo., for the year ending September
Month
October ___________________________November __________________________March 19-31.... _ . ____________________April _______________________________
June... _____________________________July......................................................
September. _________________________
Discharge in second-feet
Maximum
40 50
580 472 994 508
76 50 50
Minimum
9 32
124 62
616 76 13 9
18
Mean
23.8 35.0
388 208 770 277 38.6 18.5 30.9
Run-off in acre-feet
1,460 2,080 9,990
12,400 47,300 16,500 2,370 1,140 1,840
ASHIEY CREEK NEAR VERNAL, UTAH
LOCATION. In sec. 1, T. 3 S., R. 20 E., three-quarters of a mile above heading of power canal of Vernal Milling & Light Co., 4 miles above mouth of Dry Fork, and 12 miles northwest of Vernal, Uinta County.
DRAINAGE AREA. 101 square miles (measured on topographic map).RECORDS AVAILABLE. June 6, 1914, to September 30, 1922. From October 8,
1911, to June 5, 1914, fragmentary records were obtained at power plant. Records are also available for a point below mouth of Dry Fork from March 15, 1900, to December 31, 1904.
GAGE. Stevens continuous water-stage recorder on left bank three-quarters of a mile above heading of power canal; inspected by Adam Erickson and William Thomas.
DISCHARGE MEASUREMENTS. Made from cable or by wading.CHANNEL AND CONTROL. Bed steep and rough; composed of gravel and cobbles
and subject to change during high water. No well-defined control.EXTREMES OF DISCHARGE. Maximum stage recorded during year, 8.67 feet at
7 p. m. June 8 (discharge, about 1,700 second-feet); minimum stage re corded, 4.38 feet March 2-13, 20-23, (discharge, 35 second-feet).
1911-1922: Maximum discharge, 2,050 second-feet at 9 p. m. May 29, 1921; minimum discharge, 26 second-feet, February 7, 1920.
ICE. None.DIVERSIONS. None above station.REGULATION. None.ACCURACY. Stage-discharge relation changed during high water. Rating curve
used October 1 to May 19 well defined below 300 second-feet; extended above. Rating curve used June 12 to September 30 fairly well defined below 700 second-feet. Water-stage recorder operated satisfactorily except as indi cated in footnote to daily-discharge table. Daily discharge determined by applying to rating table mean daily gage height determined from recorder graph. Shifting-control method used during high water. Discharge for periods of no gage heights interpolated, or estimated from hydrographic comparison with record for Whiterocks Creek. Records for low water, good; for high water, fair.

84 SURFACE WATER SUPPLY, 1922, PART IX
Discharge measurements of Ashley Creek neaf Vernal, Utah, during the year endingSeptember 30, 1922
Date
Oct. 7Jan. 23
Made by
. .do .......... ..do-.. ...
Gage height
Feet 4.744.437.55
Dis charge
Sec.-ft. 91.041.2i A°.o
Date
Sept. 5
Made by
W. E. Dickinson ___A. B. Purton ______
Gage height
Feet 7.966.35
Dis charge
Sec.-ft. 700107
Daily discharge, in second-feet, of Ashley Creek near Vernal, Utah, for the year end ing September 30, 1922
Day
1 ________2 __________3 _____ . ....4 _____._____...5 _________
6 _____ . __7 ....______..._8 __ . _.....___9 ..______..____
10 ...._...______
11 ___ __12 ___________13 ..._______....14 ..________._._15 .._.__________
16 _________17 .. ...._._18. _......._____19_ ____ . _____20 .....______
21 _________22 _________23 _._____.......24_ _.......__.__25
26 27 ___ ________28 29 ..__..._______30 ___ _ 31 ______....__..
Oct.
8888888888
on90908888
8585858381
8179787674
7270706970
696969697070
Nov.
7070fiQ
6967
6765646260
5959595958
5958565354
5656565656
5654535352
Dec.
5050EA
5049
4949494949
' 4949494947
4745454646
4747474646
4645454545AK
Jan.
4545414444
44AV
4343JQ
42
4242
4242424242
4141414140
4040403939*>Q
Feb.
30
3800
OQ
00
Qft
°.ft
38Qft«>o
38383838
383800
00
38
3838373737
373736
Mar.
OB35353535QG
3535QE
QE
OK
35353636
3637363635
3535353840
4040403837V7
Apr.
37373707
4ft
4040404040
4040383838
383838QQ
38
4042454750
5456596574
May
798392
101203
305470460322250
213213203228246
285445770770750
750
870
9881,0401,1101,0401,020
June
1,0601,0701,0801,1101,120
1,1601,2601,4101,4801,280
1,130974882822762
702756840804768
750696620525470
425387354335339
July
299263242233225
208198185175168
158151145143151
140134132
. 128126
128£26
128122-
118114118112109107
Aug.
120116116116114
112116111112116
112134114128112
109105103
105
107111107105107
130114111116109105
Sept.
Ill105103
107
107102969595
9593939191
9088888886
8484909395
9390888686
NOTE. No gage heights Jan. 21, 22, 24-26, 28-31, Feb. 1, 2, 4-9, May 20-26; discharge estimated. Braced figures show estimated mean discharge for period indicated.
Monthly discharge of Ashley Creek near Vernal, Utah, for the year ending September
Month
April... __ ___________________________
July... _ __ __
September. _ ____________________
Discharge in second-feet
Maximum
90 70 50 45 39 40 74
1,110 1,480
299 134 111
1,480
Minimum
69 52 45 39 36 35 37 79
335 107 103
84
35
Mean
79.4 59.5 47.4 41.9 37.8 36.2 43.5
541 ,846
159 113 93.9
175
Bun-ofl in ' acre-feet
4,880 3,540 2,910 2,580 2,100 2,230 2,590
33,300 50,300 9,780 6,950 5,590
127,000

COLORADO RIVER BASIN 85
VERNAL MULING & LIGHT CO.'S TAILRACE NEAR VERNAL, UTAH
LOCATION. In NW. ^ sec. 18, T. 3 S., R. 21 E., at power plant of Vernal Milling & Light Co., 10 miles northwest of Vernal, Uinta County.
RECOKDS AVAILABLE. May 3 to September 30, 1917, and March 18, 1920, to September 30, 1922.
GAGE. Indicating gage in office of power plant, actuated by float in stilling well in tailrace beneath plant; read by employees of power company.
DISCHAKGE MEASTJKEMENTS. Made by wading.CHANNEL AND CONTKOL. Channel straight for 50 feet below gage. Banks
high; one channel at all stages. Bed composed of gravel and cobbles; fairly permanent.
ICE. None.ACCTJKACY. Stage-discharge relation changed between January 24 and June 5.
Rating curves well defined between 15 and 35 second-feet. Gage read to hundredths hourly. Daily discharge ascertained by applying mean daily gage height to rating table except for days when plant was not operating continuously; for which days hourly discharge was used. Shifting-control method used from January 1 to May 31. Discharge February 19 estimated from kilowatt-hour output of plant. Records good, except period of shifting control, which is fair.
COOPEKATION. Gage-height record furnished by Vernal Milling & Light Co.
Discharge measurements of Vernal Milling & Light Co.'s tailrace near Vernal, Utah, during the year ending September 30, 1922
Date
Oct. 8Jan. 24June 4
Made by
. .do....
. .do.... .. __ .....
Gage height
Feet 4.704.584.51
Dis charge
Sec.-ft. 28.823.817.8
Date
Sept. 5
Made by
1v. E. Dickinson ____A. B. Purton _____
Gage height
Feet 4.884.77
Dis charge
Sec.-ft. 31.526.7
Daily discharge, in second-feet, of Vernal Milling & Light Co.'s tailrace near Vernal, Utah, for the year ending September 80, 1922
Day
1 _______ .2 ___ . ........3 ___ .. . .4 _________5 ..__._.._____.
6 ___ .7 ..__......__8 __ . . ...9 ____ . .....10 ..............
11 ....._._.._..12 ..............13.. . ........14 ___ . __ ...15 ___ _ ...
16 17 ___ __ .18 ______________19 _________20 ___ . _____
21 __.__._....._.22 _______ .23. _......__._24 _ . ._....__..25 _________
Oct.
2722262727
2627272326
2726272727
2324242525
2525232727
Nov.
2727272727
1827282627
2427232727
2728262824
2928272428
Dec.
2927282328
2828272828
2427262626
2627242828
2928282824
Jan.
2324272727
2525232525
2425252423
2527272525
2523252525
Feb.
2626252523
2624262626
2723252525
2626251726
2625252626
Mar.
1725252621
2325232323
2220222224
2425252125
2523222222
Apr.
2113212223
2222222021
2121202120
1920202020
2020122020
May
2022212122
2117202222
2122231820
2120211621
1621212223
June
2423221923
23211900
011782
101277
10
13100811
July
2520222021
2526172023
2526242424
2023242424
2423192023
Aug.
1523232323
1922232023
2322131721
2020202119
208122021
Sept.
2222192022
2222222318
2222232323
2119192222
2322231921

86 SURFACE WATER SUPPLY, 1922, PART IX
Daily discharge, in second-feet, of Vernal Milling & Light Co.'s tailrace near Vernal, Utah, for the year ending September SO, 1922 Continued
Day
26. _____ ....27 _ . __ . _ .2829 ______________30 ______________31 _____ . _ .
Oct.
272627271697
Nov.
2723282927
Dec.
24282797
2827
Jan.
26262600
2726
Feb.
222626
Mar.
142122212122
Apr.
2122222212
May
242318232024
June
122
172125
July
232324231919
Aug.
221920211823
Sept.
2121212223
Monthly discharge of Vernal Milling & Light Co.'s tailrace near Vernal, Utah, for the year ending September 80, 1922
Month
October _____ _ _______________________________________November. -.
January _February.. __________________ _____________MarchApril. . _ __
June..July
The year.
Discharge in second-feet
Maximum
27 29 29 27 27 26 23
* 24 25 26 23 23
29
Minimum
16 18 23 23 17 17 12 16 0
17 8
18
0
Mean
25.5 26.4 26.9 25.1 25.0 22.5 20.0 20.8 12.2 22.5 19.8 21.5
22.4
Run-off in acre-feet
1,570 1,570 1,650 1,540 1,390 1,380 1,190 1,280
726 1,380 1,220 1,280
16,200
NORTH FORK OF DUCHESNE RIVER NEAR HANNA, UTAH
LOCATION. In NW. }£ NE. ^ sec. 35, T. 2 N., R. 9 W., Uinta special base and meridian, 250 feet below Hades Creek, 6 miles above confluence with West Fork, and 10 miles northwest of Hanna, Duchesne County.
DRAINAGE AREA. 75 square miles (measured on topographic map).RECORDS AVAILABLE. August 16, 1921, to September 30, 1922.GAGE. Vertical enamel staff on left bank 10 feet downstream from cable; read
by V. R. Savage.DISCHARGE MEASUREMENTS. Made from cable or by wading.CHANNEL AND CONTROL. Channel straight for half a mile above gage; makes
sharp turn to left 50 feet below gage. One channel at all stages. Bed of gravel and small boulders. Right bank high. Left bank lower but prob ably not subject to overflow. Well defined riffle control immediately below gage; permanent. Stage of zero flow 0.8 foot as determined October 1, 1921.
EXTREMES OP DISCHARGE. Maximum stage recorded, 4.65 feet at 8 p. m. June 8 and 9 (discharge, 1,490 second-feet); minimum stage not recorded.
ICE. Stream probably freezes over at times each winter.DIVERSIONS. None.REGULATION. None.ACCURACY. Stage-discharge relation permanent, except as affected by ice.
Rating curve well defined below 1,000 second-feet; extended above. Gage read to hundredths once or twice daily except as stated in footnote to daily- discharge table. Daily discharge determined by applying mean daily gage height to rating table. Discharge for periods of missing gage height estimated or interpolated. Records for periods of gage-height record good; others fair.

COLOKADO RIVER BASIN 87
Discharge measurements of North Fork of Duchesne River near Hanna, Utah, during the year ending September SO, 1922
Date
Oct. 1Jan. 12Sept. 14
Made by
W. E. Dickinson ______________ . __________ . ..............do . . . ,..-_ ...............A. B. Purton. ________ . ______________________ . .....
Gage
Feet 0.83".96
.77
Dis charge
Sec.-ft. 34.517.730.7
° Stage-discharge relation affected by ice. N
Daily discharge, in second-feet, of North Fork of Dulchesne River near Hanna, Utah, for the year ending September SO, 1922
Day
1 __ . __ .....2.. . ...........3..............4...... ........5..............
6..............7..............8.._ ...... ..9.......... __
10.. ........... .
11 ...........12..............13..............14.. ...... ......15..............
16..............17..............18..............19.......... __20..............
21..............22..............23..............24..............25..............
26......... _ ..27..............28..............29..............30... ........31.... __ .. __
Oct.
3534333332
3233323131
31313131
. 31
2928282827
27262639
26
262626
Nov.
25
2524232324
23
23
%
Dec.
Au
24
20
22
,
2323
Jan.
23
M
18
20
Feb.
20
Mar.
22
Apr.
2424262524
2626;252626
2624262526
12526264348
3950656850
SOen5252
120
May
101140149124154
140149132108101
94101128149176
225297431446423
412466607739836
836787806855831895
June
915925925
1,0701,160
1,3201,3601,4201,4901,410
1,1301,1901,080
875682
635975777
1,0801,130
1,1301,1301,030
635518
500458419479382
July
285257
277
297'288279279279
279278277276275
274275276277277
238
Aug.
200200200195192
189186186
146
105103
10199
I 90
807978
I,656565
Sept.
1 -0t 56|
48
4543413939
3534323029
2827272727
2626262626
2630312928
NOTE. No gage heights Oct. 2-4,21,25-28,30,31, Nov. 1-5,12-30, Dec. 1-9,12-29, Jan. 2-11,13-31, Feb. 1 to Apr. 1, July 3-10, 12, 14, 17-20, 22, 23, 26-31, Aug. 1, 2,5, 6, 9-13, 15, 16, 18-21, 23, 25-28, Sept. 1-4, 7, 12, 13, and 15. Braced figures show estimated mean discharge for periods indicated.

88 SURFACE WATER SUPPLY, 1922, PAET IX
Monthly discharge of North Fork of Duchesne River near Hanna, Utah, for the year ending September 30, 1922
Month
October _____________________________November.. __________ .. __ _ ._ . ._
February..-, ________________________
May _________________ ____ . _ . , _ _
July... ... ... .. . . ...August ________ _____________________September __ _ _________ ____ .. .........
Discharge in second-feet
Maximum
39
120 895
1,490
290
1,490
Minimum
26
24 94
382
65 26
Mean
29.7 23.5 22.1 20.0 20.0 22.0 40.1
382 941 270 121 35.0
161
Run-off in acre-feet
1,830 1,400 1,360 1,230 1,110 1,350 2,390
23,500 56,000 16, 600 7,440 2,080
116,000
DUCHESNE RIVER NEAR TABIONA, UTAH
LOCATION. In SW. M sec. 17, T. 2 S., R. 6 W., Uinta special base and meridian, at highway bridge 8 miles southeast of Tabiona, Duchesne County, and 5% miles above Rock Creek.
DRAINAGE AREA. 352 square miles.RECORDS AVAILABLE. January 16, 1919, to September 30, 1922.GAGE. Stevens steel tape gage on downstream side of bridge; installed March
8, 1920; read by Lyman Duke.DISCHARGE MEASUREMENTS. Made by wading or from bridge.CHANNEL AND CONTROL. Channel composed of gravel and sand. Left bank
high and not subject to overflow. Right bank is overflowed at extreme high stage allowing water to pass around bridge. Gravel riffle 100 feet below gage forms control.
EXTREMES OF DISCHARGE. Maximum stajge (from high-water mark) 14.4 feet about June 9 (discharge estimated, 2,350 second-feet); minimum discharge occurred during ice period.
1919-1922: Maximum discharge, about 2,500 second-feet on June 13, 1921 (uncertain because gage readings for that time are doubtful and river was over right bank); minimum discharge probably less than 70 second-feet in January, 1919, when river was frozen over.
ICE. River freezes over each winter.DIVERSIONS. Some small diversions for irrigation above station.REGULATION. None.ACCURACY. Stage-discharge relation changed during high water May 25 to
June 14. Rating curves fairly well defined. Gage read to hundredths once daily except May 25 to June 14 when tape gage was broken. Daily dis charge ascertained by applying daily gage height to rating tables, except for periods of ice effect January 8 to February 18, February 28, March 1-3, and 5-10, which were estimated from one measurement, observer's notes, temperature records, and comparison with flow of Duchesne River at Du chesne. Discharge for period May 25 to June 14 estimated from comparison with flow of Duchesne River at Duchesne. Records good.

COLOKADO BIVEK, BASIN 89
Discharge measurements of Duchesne River near Tabiona, Utah, during the year ending September 30, 1922
Date
Oct. 1Jan. 10
Made by
.....do..,.. __ ....
Oage height
Feet 9.72
«9.9
Dis charge
Sec.-ft. 172141
Date
Sept. 13
Made by- Gage height
Feet 13.09.94
Dis charge
Sec.-ft. 1,410
162
° Stage-discharge relation affected by ice.
Daily discharge, in second-feet, of Duchesne River near Tabiona, Utah, for the year ending September 30, 1922
Day
1 2 3
6.. . .......... .7 8 .....9 .... ... ....10
11 12 13 14..... .........15 . ___ . __ -
16- __ 17.... ...... ....18 19 20
21 22. 23 24 35
26- 27 28 . 29 30 31
Oct.
180182179175167
164160157148148,
146142144144140
140144142140
142142149171177
153157153155153153
Nov.
163151155153
153153153151151
149149148149146
146146144142
142140139139
142142142142140
Dec.
140142142142140
140142144142142
140137
133130
128126132135142
146142139135132
133133
128128126
Jan.
126132125118115
115110
\ 105
11
80
Feb.
100
115115
113115115115115
115115110
Mar.
I 110
116
110
115118115115118
115115116115113
113115
116
121125
121125123
Apr.
l4l125121
125
118120116115113
115
110113118
126108121126137
21119021394jfl
251275
278273
May
2802983784fl9
469
657785820702581
493434one
448465
5457KO
1,0001,1201 040
1,0301,0301,1701 ^fl
2,000
June
2,200
2,300
11, 860.
1,410
1,3101,1201,1201,2001,220
1,2801,2501,1801,1701,120
1,030879
. OC1
874833
July
824792760688593
539511471456433
422366349332307
292280272307
286310286244228
222252269228212199
Aug.
222233225917
207
2041941Q71Q9
220
209IRQ
173
168
171202197207OKO
230209192187182
175244255233238236
Sept.
209944233
220
202192182180175
175171IfUl
168171
171160155149143
141137135133133
153164
141137
NOTE. Braced figures show estimated mean discharge for periods indicated.
Monthly discharge of Duchesne River near Tabiona, Utah, for the year endingSeptember 30, 1922
Month
November.. ________ _______________
April... _-.....-...... ................................
July... . .
September-- _ .
The year _ ______ - .. . .......
Discharge in second-feet
Maximum
182 155 146 132
125 288
824 255 244
Minimum
140 139 126
108 280 833 199 166 133
Mean
154 146 136 92.3
105 115 159 988
1,580 388 207 170
354
Run-off in acre-feet
9,470 8,690 8,360 5,680 5,830 7,070 9,460
60,800 94,000 23,900 12,700 10,100
256,000

90 SUEPACE WATER SUPPLY, 1922, PART IX
DUCHESNE RIVER AT DUCHESNE, UTAH
LOCATION. In NE. J4 NW. M sec. 1, T. 4 S., R. 5 W., Uinta special base and meridian, at Seventh Street Bridge in Duchesne, Duchesne County, a mile above mouth of Strawberry River.
DRAINAGE AREA. 660 square miles.RECORDS AVAILABLE. December 3, 1917, to September 30, 1922.GAGE. Chain gage on downstream handrail of bridge near right bank; read
by E. S. Winslow.DISCHARGE MEASUREMENTS. Made from bridge or by wading.CHANNEL AND CONTROL. Channel straight for 100 feet above and several
hundred feet below gage. Bed composed of gravel and cobbles. Head of a long heavy gravel riffle is a short distance below gage. Banks are low but not subject to overflow. Stage of zero flow at gage height 2.6 feet as deter mined August 4 and 18, 1921.
EXTREMES OF DISCHARGE. Maximum stage recorded during year, 8.65 feet at noon June 10 (discharge, 4,420 second-feet); minimum discharge probably less than 160 second-feet in latter part of January when stage-discharge relation was affected by ice.
1918-1922: Maximum discharge, that of June 10,1922; minimum discharge, 53 second-feet July 29 and August 23-27, 1919.
ICE. Stream freezes every winter.DIVERSIONS. Below all diversions above mouth of Strawberry River; numerous
diversions above and below station.REGULATION. None except by diversion.ACCURACY. Stage-discharge relation changed during high water about June 13;
affected by ice January 8 to March 20. Rating curves poorly defined. Gage read to half-tenths or hundredths once a day. Daily discharge ascertained by applying daily gage height to rating table except for period of ice effect which was estimated from temperature records, observer's notes, and hydrographic study of flow at this station in conjunction with that of Duchesne River at Myton, Strawberry River at Duchesne, and Lake Fork near Myton. Discharge interpolated for October 1. Records for low and high stages fair; those for medium stages may be poor.
Discharge measurements of Duchesne River at Duchesne, Utah, during the year ending September 80, 1922
Date
Oct. 2
17
Made by
W. E. Dickinson .... ... ..do ... ... ... do .
Gage height
Feet 4.37
"4.45»4.47
Dis charge
Sec.-ft. 258 191166
Date
Jan. 25
Sept. 7
Made by
W. E. Dickinson ___ ..do................A. B. Purton ______
Gage height
Feet "4.50
8.555.34
Dis charge
Sec.-ft. 155
4,020296
1 Stage-discharge relation affected by ice.

COLORADO RIVER BASIN
Daily discharge, in second-feet, of Duchesne River at Duchesne, Utah, for the year ending September 30,
Day
1... _____2. _____ .... .3 .. ____ ..4. _ - __ .5
6. ____ .....
8 9. ... ... .10
11 .... .12. 13 14 15
16 17 . __ ..18 . __ ..19 20
21 22 _____ ..23 24.. .........25
26 27. ____ . _ ..28.. 9030 31 _ . .. ..
Oct.
250251245245254
245245245236236
236230230230239
239245245245245
239239239272260
275272275275266269
Nov.
269266260260242
242242242242242
245245245245248
248245245245254
254254254245245
245245245245245
Dec.
248248224224230
224224224224254
260260254254254
254215230245275
284290290290290
275284284284275290
Jan.
290290284284275
260230
200
160
Feb.
-
200
230
Mar.
225
245260260245260
260260245230230224
Apr.
236230236242310
290266275266275
266245260275260
260275275230254
275290310350395
420450515515550
May
560515670870
1,140
1,6701,7702,1202,2301,870
1,6201,6201,4703,5201,570
1,6201,8202,2302,5602,560
2,4502,6202,6203,1803,600
3,9003,7803,8403,9604,0203,960
June
4,0904,0903,9604,1604,280
4,2804,2204,2204,1604,420
4,1603,8403,9604,0903,560
3,1703,3003,3003,8803,880
3,7203,6603,3303,0402,840
2,5202,2802,1002,1602,040
July
1,8601,6201,4401,4401,320
3,2603,2101,160990880
825825770670670
620620570525720
570570720570525
52540048044n400440
Aug.
480570440400400
400400365365365
330330330365330
330270270270300
365365400400330
300270365400400440
Sept.
400365300400365
344270270270245
245245220220200
200200200200200
200200,180180180
200200200270245
NOTE. Braced figures show estimated mean discharge for periods indicated.
Monthly discharge of Duchesne River at Duchesne, Utah, for the year ending Septem ber Qfl 1Q99Ovl OU, J.&&&
Month
October ________ ...............................November..... ____ .. ______ ........ ......
JftntiftryFebruary _________________________
April..... .. ... .......
July.. _ . -. ..
Discharge in second-feet
Maximum
275 269 290 290
260 550
4,020 4,420 1,860
570 400
4,420
Minimum
230 242 215
230 515
2,040 400 270 180
Mean
249 248 257 196 209 233 310
2,260 3,560
827 366 247
747
Run-off in acre-feet
15,300 14,800 15,800 12,300 11,600 14,300 18,400
139,000 212,000 50,800 22,500 14,700
541,000
4182 27-

92 SURFACE WATER SUPPLY, 1922, PART IX
DUCHESHE RIVER AT MYTON, UTAH
LOCATION. In NW. ^4, sec. 25, T. 3 S., R. 2 W., Uinta special base and meridian, at highway bridge at Myton, Duchesne County, 3 miles below mouth of Lake Fork and 15 miles above mouth of Uinta River.
DKAINAGE AKEA. 2,750 square miles (measured on topographic map).RECOKDS AVAILABLE. October 26, 1899, to November 30, 1910, and July 26,
1911, to September 30, 1922.GAGE. Chain gage on upstream rail near left end of steel highway bridge;
installed August 6, 1910; read by Owen Smith and A. K. Draper.DISCHAKGE MEASUREMENTS. Made from highway bridge or by wading.CHANNEL AND CONTROL. Stream bed composed of coarse gravel; banks com
paratively low but not likely to be overflowed, although they are subject to erosion during high water. Gravel riffle 200 feet below gage forms fairly permanent control.
EXTKEMES OP DISCHAKGE. Maximum stage recorded during year, 7.94 feet at 8 a. m. June 10 (discharge, from extension of rating curve, 12,800 second- feet) ; minimum discharge, 282 second-feet October 12.
1899-1922: Maximum stage recorded, that of June 10, 1922; minimum stage recorded, 0.75 foot at 8.30 p; m. August 23 and 8 a. m. August 24, 1919 (discharge, 8 second-feet).
ICE. Stage-discharge relation seriously affected by ice every winter.DIVEKSIONS. Much of the low-water flow of the river and its tributaries is
diverted for irrigation above station. In [Strawberry Valley, 50,000 to 75,000 acre-feet is diverted to the Great Basin.
REGULATION. Annual run-off is affected by storage in the United States Bureau of Reclamation reservoir on Strawberry River, one of the main tributaries.
ACCUKACT. Stage-discharge relation below 1,500 second-feet changed during high water in June and July; affected by ice January 8 to March 21. Rating curves well defined below 8,000 second-feet and extended above. Gage read to half-tenths from October 1 to February 20, and to hundredths from January 21 to September 30. Daily discharge ascertained by applying daily,gage height to rating tables except for period of ice effect when dis charge was estimated from observer's notes, recorded gage heights, weather records, and hydrographic comparison with other Duchesne River stations, and as noted in footnote to daily-discharge table. Records below 8,000 second-feet good; above that stage and estimated amounts fair.
COOPEKATION. One discharge measurement furnished by water commissioner, Uinta Basin.
Discharge measurements of Duchesne River at Myton, Utah, during the year endingSeptember SO,
Date
Oet. 510
Jan. 19
Made by
-W,-E,-Diekiason __.....do. .-.............-..do... ............C. C. Jacob ».... ___
s&Feet 1.982.04
2.503.83
Dis charge
See.-ft. 342378380
1,970
Date
12Sept. 9
Made by Gage height
Feet
6. 676.801.99
Dis charge
Sec.-ft.
6,4707,560
456
« Stage-discharge relation affected by ice.* Water commissioner, Uinta Basin.« Engineer, U, S. Bureau of Indian Affairs.

COLORADO EIVER BASIN 93
Daily discharge, in second-feet, of Duchesne River at Myton, Utah, for the yearending September SO, 1922
Day
I...... .... .2...... ........3. 4 ...... ..5.... __
6 - .... 7......... .....S- ...... . 9..............10
11 . .12 _ ......13 .......... .14... ........15 ...........
16.......... .17. .. _ ....18..............19.......... ....20
21........... ...22..............23..............24 ..............25 __ ..........
26... ... ........27 28... _ ... .....29. ____ . _ ..30 31... ...........
Oct.
304329354354295
354354354365376
304282304304329
354354304304329
354372392410578
410410410410410410
Nov.
410410410344329
329329329329329
320312304329354
329304304304354
354410329329354
486441329382382
Dec.
410441472441441
441441441456472
472472472472472
506540540540540
655655695472540
615615615596578KAfl
Jan.
540540472472472
410
O«JV
380
Of U
Feb.
425
Mar.
1,0601,040
924
766608631513555615
Apr.
548606663562788
806663606548570
623562441520540
452365460388506
466600703806865
1,1301,2001,2301,2801,260
May
1,2401,3201,4601,5901,960
2,7303,2703,7304,2603,270
2,6202,1602,2602,3002,350
2,5202,9103,7304,6404,700
4,7604,8305,2305,7406,160
6,5807,0406,8806,7106,6406,580
June
6,8606,6907,0007,1807,350
7,8308,0608,2408,6808,770
8,1807,1507,2807,2806,270
5,8505,6406,2806,9106,800
6,8906,8406,2305,2104,170
3,9403,4303,1403,4203,120
July
2,4102,2602,1101,6801,700
1,5101,5801,3001,070
960
896896834771771
722672603659744
634696758704698
628566628578578578
Aug.
62l'
1,150771,698634
603578524512530
536416473530495
460466466477628
778640
1,060672659
628698634566578717
»
Sept. *
840738728717738
691603.528454452
449416460472384
379400422379369
379353374400395
328389353460369
NOTE. Stage-discharge relation affected by ice Jan. 7 to Mar. 22; braced figures show estimated mean discharge for periods indicated. No gage height record; discharge estimated Oct. 2, 9,15, 22, 23, Nov. 11, 12, 16, Dec. 9, 18, 19, 25, 29, Mar. 26, Apr. 2, 8, 16, 23, 30, May 3, 21, 28, 30, June 4,18, July 2, 13, 16, 22, 30, Aug. 13,15, 20, Sept. 3, 8,10, and 17.
Monthly discharge of Duchesne River at Myton, Utah, for the year ending September
Month
October ____________________ s. _____November. _________________________December __________________________January __ . ________________________February... ________________________March. _____________________________April.... __ . __ . ___ . _______________ . ...May. __________________ : _________June _____________________________July......................................................August ...................................................September. _________________________
Discharge in second-feet
Maximum
578 486 695 540
1,280 7,040 8,770 2,410 1,150
840
8,770
Minimum
282 304 410
365 1,240 3,120
566 416 328
282
Mean
360 352 518 400 425 660 692
3,940 6,360 1,010
619 481
1,320
Run-off in acre-feet
22,100 20,900 31,900- 24,600' 23,60a 40,600- 41,200-
242,000' 378,000 62,100 38,100 28,600
954,000

94 SURFACE WATER SUPPLY, 1922, PART IX
WEST FORK OF DUCHESNE RIVER NEAR HANNA, UTAH
LOCATION. Near east line in SE. ]4= sec. 27, T. 1 N., R. 9 W., Uinta special base and meridian, a quarter of a mile above Wolf Creek, 3 miles above con fluence with. North Fork, and 6 miles northwest of Hanna, Duchesne County.
DRAINAGE AREA. 54 square miles.RECORDS AVAILABLE. August 16, 1921, to March 31, 1922.GAGE.' Vertical enamel staff on left bank; read by J. T. Murdock.DISCHARGE MEASUREMENTS. Made by wading.CHANNEL AND CONTROL. Channel straight for 200 feet above and below gage.
One channel at all stages. Bed of gravel and cobbles. Left bank high. Right bank may be overflowed during extremely high water. Cobble riffle control immediately below gage. Stage of zero flow at gage height 0.4 foot determined September 29, 1921.
EXTREMES OP DISCHARGE. Maximum stage for year did not occur during period of records. Minimum stage recorded, 0.74 foot March 5-31 (discharge, 18 second-feet).
ICE. Stream usually freezes over at times each winter.DIVERSIONS. None.RE GTJL ATI ON. None.ACCURACY. Stage-discharge relation permanent throughout period. Rating
curve well denned. Gage read to hundredths once daily. Daily discharge determined by applying daily gage height to rating table. Records good.
Discharge measurements of West Fork of Duchesne River near Hanna, Utah, during the year ending September SO, 192%
Date
Jan. 12Sept. 14
Made by
W. E. Dickins'on _ . ____________ , ____________ . .....
Qage height
Feet 0.80.73
Dis charge
Sec.-ft. 22.025.4
Daily discharge, in second-feet, of West Fork of Duchesne River near Hanna, Utah, for the period, October 1, 1921, to March 31,
iDay
1 .......
4..-. .-.5 __ ... _ .
6 __ ....... 7 .......
B .. 10
11 .......12 __ .......13 __14 __ . .....15 __ ... _ .
Oct.
2727272525
25 25
25 25
2525252525
Nov.
2222212121
21 2191
21 21
2121212121
Dec.
2121212121
21 2191
2121
2121222222
Jan.
2222222222
22 22 992222
2222222222
Feb.
2424242424
24 24 2424 24
2424242424
Mar.
2020202018
18 181ft
18 18
1818181818
Day
16 __ ......17 __ ... 18 ___ .....19 __ .......20
21.......... 22 ___ .... 23 _ .......24 _ .......25 .......
26 _ . __ ..27 28 29 __ . __ .30 - 31
Oct.
2525252525
25 25 2728 27
272625242423
Nov.
2121212121
21 21 2121 21
2121212121
Dec.
2222222222
22 22 222222
222222222222
Jan.
2222222222
22 22 2222 22
222222222424
Feb.
2422222221
21 21 2121 21
202020
Mar.
1818181818
18 18 1818 18
181818181818

COLORADp RIVER BASIN 95
Monthly discharge of West Fork of Duchesne River near Hanna, Utah, for the period October 1, 1921, to March 31, 1922
Month
November.. ____________ _ __________._--._ _ ... _
January.. ____________________________
March. ______ ___ __ __ _ ______ _ __ __ _ ____
Discharge in second-feet
Maximum
28 22 22 24 24 20
Minimum
23 2121 22 20 18
Mean
25.4 21.1 21.6 22.1 22.7 18.3
Kun-off in acre-feet
1,560 1,260 1,330 1,360 1,260 1,180»
7,90ft
WOLF GREEK NEAR HANNA, UTAH
LOCATION. Near west line in SW. H sec. 26, T. 1 N., R. 9 W., Uinta special base and meridian, 600 feet above mouth and 6 miles northwest of Hanna, Duchesne County.
DRAINAGE ABBA. 19 square miles.RECORDS AVAILABLE. August 16, 1921, to March 31, 1922.GAGE. Vertical enamel staff on left bank; read by J. T. Murdock.DISCHARGE MEASUREMENTS. Made by wading or from bridge 150 feet
downstream.CHANNEL AND CONTROL. Channel winding. Bed composed of sand and
cobbles. Banks heavily covered with willows which trail in water. Natu ral open place on left bank at gage and riffle. Trailing willows on right bank cut away at this place. One channel at all stages. Banks may be over flowed during possible sudden floods. Cobble riffle control 10 feet below gage. Stage of zero flow at gage height, 0.0 foot determined September 29, 1921.
EXTREMES OF DISCHARGE. Extremes of year do not occur during period of record.
ICE. Seldom forms at this station.DIVERSIONS. Small ditches divert water for use at Murdock ranch.REGULATION. None.ACCURACY. Stage-discharge relation permanent during period. Rating curve
well defined. Gage read to hundredths once daily. Daily discharge determined by applying daily gage height to rating table; except for periods of ice effect, January 1-11 and January 29 to February 9, when discharge was estimated. Record good.
Discharge measurements of Wolf Creek near Hanna, Utah, during the year endingSeptember 30, 1922
Pate
Jan. 12Sept. 14
Made by
A. B. Purton..... ______ _ ____________ ____ __ _____ _ _-_-_--_.____
Gage height
Feet 0.921.02
Dis charge
Sec.-ft. 8.7
13.4

SURFACE WAOnlE :SUiPELY, 1922, PART IX
Daily discharge, in second-feet, of Wolf Creek near Hanna, Utah, for the period October 1, 1921, to March 31, 1922
Day
1... ...... .2__3_ ......4........5. ........
6... _______7... .......
10...... .
11 _ .......12..13..........14..........15.... ......
Oct.
1313121313
131219
19
1212121212
Nov.
1111111111
1110 101011
1010101010
Dec.
1010101010
1010 101010
1010101010
Jan.
99Q
99
9Q
Q
99
Feb.
88888
8
8
8888
Mar.
88
88
88
8888
Day
16..........17--.-. .10
10
20--........
21..........
23- ........24..........25__. .......
26..........97
28- 9Q
30. 31.
Oct.
1211111111
11 11111211
11
11111111
Nov.
1010101010
10 10101010
1010101010
Dec.
1010101010
10 10101010
9
999
Jan.
Q
9988
8
888
88888Q8
Feb.
88888
8
888
888
Mar.
88888
8
888
888899
Monthly discharge of Wolf Creek near Hanna, Utah, for the period October 1, 1921,to March 31, 1922
MonthDischarge in second-feet
Maximum
13 11 10 98 9
13
Minimum
11 10 98 8 8
8
Mean
11.7 10.2 9.8 8.6 8.0 .8.1
9.42
Run-off in acre-feet
719 607 603 529 444 498
3,400
STRAWBERRY RIVER AT DUCHESNE, UTAH
LOCATION. In SW. % NE. % sec. 2, T. 4 S., R. 5 W., Uinta special base and meridian, at Winslow ranch, three-fourths of a mile west of post office at Duchesne, Duchesne County, three-fourths of a mile above mouth of Indian Canyon Creek, a small tributary entering from south, and 1M miles above confluence of Strawberry and Duchesne rivers.
DRAINAGE AREA. 1,040 square miles (measured on topographic maps).RECORDS AVAILABLE. June 10, 1908, to November 30, 1910; March 16, 1914, to
September 30, 1922.GAGE. Vertical staff on downstream side of right abutment of bridge washed
out June 5, 1922; replaced by enamel vertical staff June 13, 1922, lowering datum 2.70 feet; read by E. S. Winslow.
DISCHARGE MEASUREMENTS. Made from cable just below bridge or by wading.CHANNEL AND CONTROL. Channel straight for several hundred feet above and
below gage. Bed of sand and fine gravel. Natural channel about 50 feet wide is constricted at bridge to 36 feet. Banks comparatively low, covered with underbrush; left bank subject to overflow at very high stages. Gravel riffle 200 feet below gage; fairly permanent.
EXTREMES OP DISCHARGE. Maximum stage recorded during year, 7.70 feet on May 27 (discharge, 3,230 sesond-feet); minimum discharge estimated, 50 second-feet on January 7.
1908-1922: Maximum discharge, that of May 27; minimum discharge, 30 second-feet, November 20, 1914. Records obtained prior to 1914 incom plete.
ICE. Stage-discharge relation affected by ice every winter.

COLORADO RIVER BASIN 97
DIVERSIONS. 50,000 to 75,000 acre-feet of water from Strawberry Valley reservoir (capacity, 250,000 acre-feet) about 40 miles above station, is diverted annually by means of a tunnel to Spanish Fork drainage basin. Some water is also diverted from upper end of Strawberry Valley to basin of Provo River.
REGULATION. Since 1912 flow of river has been affected by operation of Straw berry Valley reservoir.
ACCURACY. Stage-discharge relation changed slightly about June 12; affected by ice January 4 to March 23. Rating curves well defined below 500 second- feet; extended above. Gage read to hundredths twice daily, except June 6-12 when the gage-height was estimated. Daily discharge ascertained by applying mean daily gage height to rating tables except for period when stage-discharge relation was affected by ice. For this period, discharge estimated from temperature records, observer's notes, three meter measure ments, and hydrographic comparison with other Duchesne River stations. Records good.
Discharge measurements of Strawberry River at Duchesne, Utah, during the year ending September SO, 1922
Date
Oct. 2Jan. 16
1725
Made by
. __ do...... _____ ..
.....do..................
.....do ...............
Gage height
Feet 2.37
«3.06"2.94"3.28
Dis charge
Sec.-ft. 12093.480.277.5
Date
21
Made by
.....do..................A. B. Purton ...........
Gage height
. Feet »8.15
7.094.88
Dis charge
^.Sec.-ft. 1470876158
0 Stage-discharge relation affected by ice. b Datum lowered 2.70 feet.
Daily discharge, in second-feet, of Strawberry River at Duchesne, Utah, for the year ending September SO, 1922
Day
1. .............2 ..............3 __ . __ . ...4... __ .. .....5... ____ ....
6 ________ .7..............8..............9..............10..............
11... _____ ..12. ___ .... _ .13..............14... ___ ......15 ___ ........
16..... ___ . ...17..... _ .. _ .18..............19. _ . __ . ...20
21. _____ ....22- .... ...23...... ___ ...24 ___ ........25 __ .... ___ .
26. _ ... ___ .27. ..........28....... .......29 _ ...........30 _____ . .....31 r.. __ ______
Oct.
124127127127127
129131129131127
129127129131129
129133131133131
127127131135197
137137133135135133
Nov.
133. 131
129131127
124124124120120
116116116116116
116116116118122
124126127124120
116116116114120
Dec.
120120116118120
116114105100100
120133139137139
1358078
107137
145171174133137
133137139137135135
Jan.
135135126120110
855060
> 80
9380
68
77
85
Feb.
90
110
Mar.
130
250
335268
234226188148146152
Apr.
160176192225256
223169180171171
169165156150154
146139141154158
174207289299325
352380423453460
May
498585626738
1,000
1,3601,6401,8701,9401,660
1,2701,0901,0501,1501,210
1,2601,5001,8102,1202,340
2,2802,3002,3602,4202,480
2,7603,2302,8202,7402,7102,560
June
2,4202,4402,2601,9401,780
1,6701,6001,6001,5301,460
1,4601,3301,3701,4001,340
1,2601,2001,1201,040970
905840800758718
690610590610598
July
583572538468414
375360354331331
309298290276271
251251251239256
276256281251246
232227331246223227
Aug.
450730527298256
227223209205205
205205184194194
184180169317271
246256527256223
188184184194205209
Sept.
303216184184184
180174165162156
156156156156156
156156151148148
148148148148148
148148156281162

98 SURFACE WATER SUPPLY, 1922; PART IX
Monthly discharge of Strawberry River at Duchesne, Utah, for the year endingSeptember 80, 1922
Month
October ___________________________November... ............................................December __________________________
February... __________________________March. _____________________________April _______________________________May _____________________________ __.June. ______________________________July ...................................................
The year. ..........................................
Discharge in second-feet
Maximum
197 133 174 135
460 3,230 2,440
583 730 303
3,230
Minimum
124 114
78 50
139 498 590 223 169 148
50
Mean
133 121 126 84.4 99.3
202 227
1,790 1,280
317 261 169
402
Run-off in acre-feet
8,180 7,200 7,750 5,190 5,510
12,400 13,500
110,000 76,200 19,500 16,000 10, 100
292,000
RED CREEK NEAR FRUIT!AND, UTAH
LOCATION. In SE. ^ sec. 21, T. 3 S., R. 8 W., TJinta special base and meridian, 400 feet above State highway crossing at Murdock ranch, 1^ miles above confluence, with Currant Creek, and 4 miles southeast of Fruitland, Duchesne County.
DRAINAGE AREA. 89 square miles.RECORDS AVAILABLE. November 23, 1917, to September 30, 1922, when
station was discontinued.GAGE. Vertical enamel staff on left bank 200 feet east of ranch house and 400
feet upstream from road bridge; read by members of Murdock family.DISCHARGE MEASUREMENTS. Made by wading.CHANNEL AND CONTROL. One channel at all stages. Banks subject to over
flow at extremely high water. Left bank overgrown with willows. Right bank sloping meadow. Stream bed composed of silt and sand.
EXTREMES OF DISCHARGE. Maximum discharge during year occurred in sudden flood on August 22; quantity not determined.. Minimum stage, 3.53 feet on March 3 (discharge, 1 second-foot).
1918-1922: Sudden floods of high discharge occur nearly every summer; quantity not determined. Creek practically dry a part of each summer.
ICE. Stream freezes over every winter.DIVERSIONS. Below all diversions from Red Creek.REGULATION. None except by diversion.ACCURACY. Stage-discharge relation changed May 17-26 and again on August
22; affected by ice December 1 to February 11. Rating curve well defined. Gage read to half-tenths, occasionally to hundredths, once a day except as stated in footnote to daily-discharge table. Shifting-control method used May 17 to September 30. Daily discharge ascertained by applying daily gage height to rating table. Discharge August 22, when water was over gage, and other periods of missing gage heights interpolated or estimated from elevation of high-water mark and observer's notes. Records fair.

COLORADO RIVER BASIN 99
Discharge measurements of Red Creek near Fruitland, Utah, during the yearending September SO, 1922
Date
Oct. 12Jan. 14
Made by
do
Gage height
Feet 4.05
«4.39
Dis charge
Sec.-ft. 14.18.2
Date Made by
W. E. Dickinson ___A. B. Purton. _____
Gage
Feet 4.223.96
Dis charge
Sec.-ft. 30.114.6
» Stage-discharge relation affected by ice.
Daily discharge, in second-feet, of Red Creek near Fruitland, Utah, for the year ending September SO, 1922
Day
1 __ . ____ .2 ... 3... ........4 _____ ......5... ___ . .....
6 ..... ... ...7... ... ........8.... .... ...9 ... ........10 .... .......
11 12... .... .......13 14 .15... ... ........
16 17 18... ...........19 20
21....... .......22..............23...... ........24......... .25 ... ........
26 ....... .27... ...........28 .........29.. ........30 31... ...........
Oct.
1414141414
1414141414
1414141414
1414141414
1414141414
141414141310
Nov.
1010101010
1011
. 111213
1313131313
1314141414
1414141414
1414141414
Dec.
11
Jan.
8
Feb.
.
6
555
55567
99753
222
Mar.
21
43
22222
22222
34566
740422824
201612789
Apr.
91099
11
1319221312
97777
764707176
6433281920
2424222628
May
2419222270
1121141187564
5048373335
48126153125118
118129120161177
193179131131127123
June
118112112112113
1171231068876
7162535456
5248484745
4336
30
July
2522202220
1818203232
1212121010
10108810
14151277
77
191513
Aug.
3343332424
67227
24
1976715
1967
2419
19200241715
16194843
. 5343
Sept.
3824191917
1615151515
1613151614
1514141314
2424152414
2415143315
NOTE. No gage heights Nov. 27 to Dec. 3, Dec. 23,24, Jan. 11-13, Mar. 26-28, June 14,23-30, and Aug. 22. Braced figures show estimated mean discharge for periods indicated.
Monthly discharge of Red Creek near Fruitland, Utah, for the year ending SeptemberSO, 1922
Month
October _ . _____ -.. ....-. .....................
January ________ ______ __ ____ ....February ___ .-......... ..............................March. ..................................................
July... . .......... ........ ........... .......
The year _______________________
Discharge in second-feet
Maximum
14
42 76
193 123 32
38
Minimum
10 10
2 1 7
19
7 6
13
Mean
13.8 12.7 11.0 8.0 5.5 8.6
24.7 96.8 64.4 14.8 27.4 18,0
25.6
Run-off in acre-feet
848 756 676 492 305 529
1,470 5,950 3,830
910 1,680 1,070
18,500
4182 27-

100 SURFACE WATER SUPPLY, 1922, PART IX
WEST FORE OF LAKE FORK NEAR MOUNTAIN HOME, UTAH
LOCATION. In SE. J^ sec. 18, T. 2 N., R. 5 W., Uinta special base and meridian, a quarter of a mile below Moon Lake and 13 miles northwest of Mountain Home, Duchesne County.
DRAINAGE AREA. 108 square miles (measured on topographic map).RECORDS AVAILABLE. September 18, 1921, to September 30, 1922.GAGE. Stevens continuous water-stage recorder on right bank; attended by
engineers of Office of Indian Affairs and United States Geological Survey.DISCHARGE MEASUREMENTS. Made from cable or by wading.CHANNEL AND CONTROL. Channel steep and rough. Bed composed of boulders
and gravel. Right bank high; left bank low. One channel at all stages. Rock riffle control 25 feet below gage; practically permanent. Point of zero flow, gage height 1.1 feet, determined October 11, 1921.
EXTREMES OP DISCHARGE. Maximum stage during year, 3.47 feet at 1 p. m. June 21 (discharge, 1,910 second-feet); minimum stage not recorded.
DIVERSIONS. None above station.REGULATION. Flow affected by storage and release of water from Brown Duck
Lake reservoir.ACCURACY. Stage-discharge relation permanent. Rating curve well defined.
Water-stage recorder operated satisfactorily, except July 2-9. Daily dis charge ascertained by applying to rating table mean daily gage height determined from recorder graph except for July 2-9 when discharge was estimated. Records good.
Discharge measurements of West Fork of Lake Fork near Mountain Home, Utah, during the year ending September 80,
Date
Oct. 11June 10
Made by
Dickinson and Preece ".
Gage height
FeetA AQ
3.25
Dis charge
Sec.-ft. 60 1
1,670
Date
Sept. 12
Made by
Purton and Jacob ». ....
Gage height
Feet 1.38.67
Dis charge
Sec.-ft. 27978.6
1 Engineer, Office of Indian Affairs. »"Water commissioner, Uinta Basin.
Daily discharge, in second-feet, of West Fork of Lake Fork near Mountain Home, Utah, for the period September 18, 1921, to September 30, 1922
Day
1.. ......... .................. _ .2 ___ . _ .... __ ...................3..... -_ .... ...___...._..__.4.. ..................................5 ......................
6.... .............................7... ._- .... .......................8 __ ...............................9 -.-.-... .. .......10 . . ._..
11 -.- ..--_-..--..... _ 12 13.................. ..................14....................................15....................................
16....................................17....................................18 ........ _... .19....................................20 ................. .........
21 . 22........ ........ ....................23................. ...............24....................................25
Sept.
96Qfi94
on88858076
Oct.
6161616161
62CAfAfA62
6061616161
60KQ
59
57
5756566566
Nov.
5958565656
6555535151
5149484949
May June
1,0901,1901,3101,5501,690
1,8001,6201 3301,6201,680
1,5201,4201,4701,4401,140
1,1101,2301,4301,5401,600
1,6701,5701,3501,100
960
July
660
450
275
254232222212236
260268268268275
271264282268246
Aug.
209229222306190
170166163159170
156138141151141
129120116113120
127151154141127
Sept.
138134127131141
13412011110196
9287848079
7776747373
7069686665

COLORADO RIVER BASIN 101
Daily discharge, in second-feet, of West Fork of Lake Fork near Mountain Home, SS Utah, for the period September 18, 1921, to September SO, 1922 Continued J^
Day
26 ... ....... - .- . \. ... .. .27........ -.._.......__......._.-_....28-......-...-.-. ....................29 .. -... . 30 .- - .... _.... -. -SI................... .................
Sept.
7369686461
Oct.
6161vj585859
Nov. May
880952
1,010
June
880816765880730
July
229222229215203200
Aug.
116113109129131134
Sept.
666873767a
NOTE. Braced figures show mean discharge for period indicated.
Monthly discharge of West Fork of Lake Fork near Mountain Home, Utah, for the year ending September SO, 1922
Month
June. _ __ ___________ ... _____ ____July
Discharge in second-feet
Maximum
66 59
1,800 660 229 141
Minimum
56 48
730 200 109 65
Mean
60.4 53.1
1, 3iO 312 150 90.7
Run-off in acre-feet
3,710 1,580
78,000 19,200 9,220 5,400
LAKE FORE NEAR MYTON, UTAH
LOCATION. In sec. 21, T. 3 S., R. 2 W., Uinta special base and meridian, 100 yards below highway bridge, half a mile above confluence of Lake Fork with Duchesne River, and 3^4 miles northwest of Mytori, Duchesne County.
DRAINAGE AREA. 468 square miles (measured on topographic maps).RECORDS AVAILABLE. July 3, 1900, to December 31, 1903; June 13, 1907, to
November 30, 1910; July 26, 1911, to September 30, 1922.GAGE. Stevens continuous water-stage recorder on right bank; inspected by
O. K. Draper.DISCHARGE MEASUREMENTS. Made from cable or by wading.CHANNEL AND CONTROL. Channel fairly straight for several hundred feet above
and below gage. Banks high and not subject to overflow. Bed composed of silt and gravel. Gravel riffle about 300 feet below gage; fairly permanent. Point of zero flow, gage height 0.2 foot; determined July 29, 1922.
EXTREMES OP DISCHARGE. Maximum discharge, 3,110 second-feet at 9 a. m. June 21 (gage height, 7.56 feet); minimum stage, 0.85 foot, 1 to 4 p. m. October 19 (discharge, 8 second-feet).
1900-1903; 1907-1922: Maximum stage recorded, 9.4 feet, June 22 and 23, 1917 (discharge, 4,350 second-feet); minimum discharge July 24, 1916, probably zero.
ICE. Stage-discharge relation seriously affected by ice every winter.DIVERSIONS. No diversions below station; several canals of the Office of
Indian Affairs and some privately-owned canals divert water above for irrigation. Some return water from irrigation enters a short distance above station.
REGULATION. Flow affected by irrigation diversions above.ACCURACY. Stage-discharge relation changed slightly at numerous times; prob
ably affected by ice December 6 to March 22. Rating curves well defined. Water-stage recorder operated satisfactorily except as stated in footnote to daily-discharge table. Daily discharge ascertained by applying mean daily gage height to rating tables. Shifting-control method used August 13-20.

102 SURFACE WATER SUPPLY, 1922, PART IX
Discharge for periods of missing gage height and ice effect, estimated from observer's notes, temperature records, one measurement, and by comparison with records for all Duchesne River stations. Records good except those for winter, which are fair.
Discharge measurements of Lake Fork near Myton, Utah, during the year endingSeptember 30, 1922
Date
Oct. 4 Jan. 18
June 212
Made by
Dickinson and Charles*.
Dickinson and Draper.Dickinson and Preece »_
Gage height
Feet 1.26
"2.862.684.966.51
Dis charge
Sec.-ft. 23.4
2431,2802,240
Date
June 2127
Made by
Dickinson and Preece..
.... .do.... ..
Gage height
Feet 7.54 4.311.281.40
Dis charge
Sec.-ft. 3,100 1,030
34.937.3
» Stage-discharge relation affected by ice. * Engineer, Office of Indian Affairs. « Water commissioner, Uinta Basin.
Daily discharge, in second-feet, of Lake Fork near Myton, Utah, for theSeptember 30, 1922
Day
l _ . ___ ....1. ...... ...... .3.. ... 4.. ..... .
6... . _ ....7........ ...8 '.9 .... 10 -
11 .12......... ..13 14 _______ ...15
16 17..............18.. ...... ......19..............20
21...... _22. __ .........23 24........ ...25. .............
26. 27..............28........ ...29.... ..........30 _ ....31 ...... .
Oct.
2020181916
1927262723
2122181716
171611913
1414141624
2422252925
Nov.
2222181715
1218212118
1919202428
32333645114
10492868190
9079605649
Dec.
5457665360
Jan.
128
100
Feb.
130
Mar.
162
166173155139139149
Apr.
155149149148177
151122121126102
122106103106118
104103919398
114122132137146
158170160160144
May
142149170185226
271285342378342
280285271236202
181224271342338
326329398476594
765800790915
1,0201,080
June
1,1701,2301,4401,6402,040
2,3202,5202,8502,8802,820
2,5002,1202,2902,1801.600
1,3401,4401,8902,3702,420
2,6002,6002,1601,5301,290
1,140948840870700
July
600500395350334
303271205150100
5025264142
3836222639
402532' 44
44
363029342829
Aug.
3743433527
3028191514
2124242218
1718172637
3843878251
35404362
6678
Sept.
9865606887
9165573732
3330262220
1414181915
16161513
. 13
1620202420
NOTE. No gage heights Dec. 9,11-16,18-23, 25-30, Jan. 1-17, 19-31, Feb. 1 to Mar. 24, June 30 to July 2, and July 9-11. Braced figures show estimated mean discharge for periods indicated.

COLORADO BIVER BASIN 103
Monthly discharge of Lake Fork near Myton, Utah, for the year ending Septemberso, wn
Month
October _____________________ . ______
April......... _ .. ._..-. _ . __ . _
July.............. ...... ....... .-....... _..... ........
Discharge In second-feet
Maximum
29 114
177 1,080 2,880
60087 98
2,880
Minimum
9 12 64
91 142 700 22 14 13
9
Mean
19.5 44.7 89.0
115 130 143 130 407
1,858 127 36.8 34.8
259
Run-off in acre-feet
1,200 2,660 5,470 7,070 7,220 8,790 7,740
25,000 111,000
7,810 2,260 2,070
188,000
UINTA BIVER NEAR NEOLA, UTAH
LOCATION. In SE. M sec - 26, T. 2 N., R. 2 W., Uinta special base and meridian, 800 feet above tailrace of Uinta Power & Light Co.'s plant (Pole Creek unit), 1^4 miles above mouth of Pole Creek, and 9 miles north of Neola, Duchesne County.
DKAINAGE AREA. 181 square miles.RECORDS AVAILABLE. July 30 to December 31, 1921; April 1 to June 7; and
September 11 to 30, 1922.GAGE. Stevens continuous water-stage recorder on left bank removed June -20,
1922. Vertical staff installed to new datum on September 11, 1922; inspected by Jed Timothy and J. J. Johnson.
DISCHAKGE MEASUREMENTS. Made by wading or from cable. Cable destroyed by high water in June. Measuring conditions exceptionally bad at cable on account of rough channel.
CHANNEL AND CONTROL. Channel steep and rough. Bed composed of boulders and gravel. Banks fairly high and probably not subject to overflow unless channel changes, which may readily occur during high water. Gage height of zero flow, 0.25 foot determined August 2, 1921.
EXTREMES OF DISCHARGE. Not determined.ICE. River freezes over every winter.DIVERSIONS. None above station.REGULATION. None.ACCURACY. Stage-discharge relation changed during high water; affected by
ice December 17-27. Rating curves fairly well defined for low watery- poorly defined for high water. Water-stage recorder operated satisfactorily October 1 to December 16 and April 4 to June 7. Staff gage read to hundredths' once daily December 29-31 and September 11-30 except as stated in footnote to daily-discharge table. Daily discharge ascertained by applying to rating tables mean daily gage height as determined from recorder graph or staff gage readings. Discharge for ice-affected period estimated from observer's notes and temperature charts. Discharge for other periods of missing gage height interpolated. Records fair, except for discharges over 600 second-feet which may be poor.

104 SURFACE WATER SUPPLY, 1922, PAET IX
Discharge measurements of Uinta River near Neola, Utah, during the year endingSeptember SO,
Date
Oct. 3Jan. 21June 7
Made by
W. E. Dicklnson ___. __ do __________
do.
Gage height
Feet 1.71
1.923.70
Dis charge
Sec.-ft. 15263.8
1,960
Date
Sept. 11
Made by Gage height
Feet 5.051.26
Dis charge
Sec.-ft. 385202
« Stage-discharge relation affected by ice. * Water commissioner, Uinta Basin. « Engineer, Office of Indian Affairs.
Daily discharge, in second-feet, of Uinta River near Neola, Utah, for the year ending September SO, 1922
Day
1- ........ _ .. ______ ............ _2 __3 . .......... _ ............................4. ........ ___ . ___ .. ___ .............5- ........ ___ . _ ................... ...
6 ......... ____ .... _ . _ . __ . _ ... ...7. ..... _ ..... _ . _ . _ .. ___ ..8 __ ..... ____ . _ .. _ .... _ . _ .........9. ..... __ .. _ ........... _ ...10 ............ _ .. __ ......... _ .........
11- ..... _____ ........ _ . _ .............12 .....13 ... _____ . _ . ____ . _ ... __ ..14 ............ ___ ..... __ .... ___ .....15 __________________ ___ . .
16 - ........................................17 ...... _______ ... ___ . ___ ..... .....18........ ___ .......... .19 __ ........... _ . _________ .... ....20........ _ . __ __i _____ ..............
2122 __ .. ______________________ ...239425 ..........................,............
26-27 ________ ... ...28 __ .... _ .... ___ . ______ . __ . .......29. .........................................3031 ...
Oct.
154151151151149
156158151149147
145143143141141
138138138136136
134134134156145
134136128134
128
Nov.
-W126122122
120120117117117
11711>5
117113113
113109109113115
113111113109111
109107107107106
Dec.
107111107120141
149138165251257
209145109109107
106
| 100
103
99
Apr.
,I 90
90101
9290928990
8686888886
8888898889
98106115117122
128124126132138
May
147154
194236
283331354290234
209194189189191
201251339404368
339377435
609
706750840990
1,0001,000
June
960990
1,1301,2201,450
2,0002,380
Sept.
201198196185185
182180180175170
166161161161161
166168171171171
NOTE. No gage height record Dec. 27,28, Jan. 1 to Mar. 31, Apr. 1-3, June 8 to Sept. 10, Sept. 12, le, 20, and 27. Braced figures show estimated mean discharge for periods indicated.
Monthly discharge of Uinta River near Neola, Utah, for the year ending SeptemberSO, 1922
Month
November
May. . ......
Discharge in second-feet
Maximum
158 128 257 138
1,000 2,380
201
Minimum
128 106 99 86
147 960 161
Mean
142 115 124 99.9
403 1,450
175
Run -off in acre-feet
8,730 6,840 7,620 5,940
24,800 20,000 7,000

COLORADO EIVEB BASIN 105WHITEROCKS CREEK NEAR WHITEROCKS, UTAH
LOCATION. In sec. 18, T. 2 N., R. 1 E., Uinta special base and meridian, 8 miles north of Whiterocks, Uinta County. United States Whiterocks Canal diverts from left side and Farm Creek Canal from right side 2 miles below station.
DRAINAGE AREA. 118 square miles.RECORDS AVAILABLE. August 1, 1921, to November 18, 1921, and May 1 to
September 30, 1922, at present site. November 8, 1917, to June 2, 1921, at a point about 2 miles downstream, below diversion of United States White- rocks Canal and above Farm Creek Canal. 1889 to 1904 and 1907 to 1910 somewhere near present site. Records are comparable.
GAGE. Stevens continuous water-stage recorder on left bank; installed August 4, 1921; inspected by J. F. Wilkin.
DISCHARGE MEASUREMENTS. Made by wading or from cable a quarter of a mile above gage.
CHANNEL AND CONTROL. Narrow canyon. Stream bed is steep and rough; com posed of boulders and gravel. Channel is subject to change during high water.
EXTREMES OF DISCHARGE. Maximum stage during year, 5.40 feet at 9 p. m. June 20 and 7 p. m. June 21 (discharge, 2,750 second-feet); minimum stage not determined.
1918-1922: Maximum stage that of June 20 and 21; minimum discharge not determined.
ICE. Stream freezes over each winter.DIVERSIONS. None.REGULATION. None.ACCURACY. Stage-discharge relation changed for low water, during extreme
stage on June 21 and again on September 10 when rocks were removed from control. Rating curves well defined between 50 and 200 second-feet, fairly well defined between 200 and 2,000 second-feet. Operation of water-stage recorder satisfactory except as stated in footnote to daily-discharge table. Daily discharge ascertained by applying to rating table mean daily gage height determined from recorder graph. Shifting-control method used August 30 to September 9. Daily discharge interpolated October 7 and 8. For periods of missing gage-height, discharge estimated by comparison with Uinta River near Neola and Ashley Creek near Vernal. Records fair.
Discharge measurements of Whiterocks Creek near Whiterocks, Utah, during the year ending September SO,
Date
Oct. 9
Made by
"W. E. Dickinson. ....... . do.......... ........ - do....... . ...... .
Gage height
Feet 1.00
4.07
Dis charge
Sec.-ft. 85.200 7
1,470
Date
Aug. 28Sept. 10
Made by
W. E. Dickinson ____
Gage height
Feet 4.312.011.81
Dis charge
Sec.-ft. 1,690
206116
' Stage-discharge relation affected by ice. » Engineer, Office of Indian Affairs.

106 SURFACE WATER SUPPLY, 1922, PART IX
Daily discharge, in second-feet, of Whiterocks Creek near Whiterocks, Utah, for the year ending September SO,
Day
1 ____ .. ... _ ...... __ . ___ ..2 ___ ... _ ...3 __ ......4 ___________________________5 _____ _____
6 ___ . ..7 _____ ..... _ ............ _ ....... __ .8 ____ ....... ..............................9 .
10 _____ -... .-....-...-.._._
11 ___ ........................ __ ..........12............................................13 ___ ... .. .........-...-..... _ ....14 ___ ......................................15 ___ ............... __ . ................
16. .-. . -..-._.--.-.__.._.17 ___ ............ ............... _ ........18 ___ . .. .....-............19 20 . .
21 __ ......... .... ....22 ___ . ... ........ ...............2324 ___ . . .. ..-. .......25 ____
26...-.- .... ..... ........27.. _ ............. ..........................28 _____ .. .... . .. .....29 ____ ..... .. . ?n31
Oct.
898888
10299
9290878582
8080807877
7777757372
7170718588
818170787275
Nov.
7370726969
6865616262
6259625759
605140
May
1 150
I175
315410305240345
450480450470
650
810900
1,0201,0601,030
June
1,1001,1601,2301,350i idn
1,6101,8602,2002,2002,130
1,6801,5201,3001,020
11,000
1,7702,1002,000
2,2001,4101,2601,100
800
580
July
530485460455435
440405380360335
305295280275270
270265255240235
235230250225225
230240230235250250
Aug.
270280270230210
200191184177180
191188177177191
174164.158155155
180152167184200
200205215230220210
Sept.
195177167164174
158143128122116
116116113113110
108108105105102
100100100100
98.
98100100100100
NOTE. No gage-heights Oct. 7,8, May 1-4,15-26, June 15-17, and 25-29. mean discharge for periods indicated.
Braced figures show estimated
Monthly discharge of Whiterocks Creek near Whiterocks, Utah, for the year endingSeptember SO, 1922
Month
October ___ . . _ ____ . ...... .
July . .. ............................
September __ .... ___ . . _
Discharge in second-feet
Maximum
102 73
1,0602,200
530 280 195
Minimum
70 40
580 225 152 98
Mean
81.1 62.3
544 1,380
309 196 121
Run-off in acre-feet
4,990 2,230
33,400 82,100 19,000 12,100 7,200

COLORADO RIVER BASIN 107PRICE RIVER NEAR HELPER, UTAH
LOCATION. In SE. ^ sec. 36, T. 13 S., R, 9 E., at highway bridge, three-fourths of a mile above diversion dam of Price River Irrigation Co., 2 miles south of-Helper, Carbon County, and 3 miles below Spring Creek.
DRAINAGE AREA. 530 square miles (measured on topographic map).RECORDS AVAILABLE. February 21, 1904, to September 30, 1922.GAGE. Vertical staff on left bank, installed July 16, -1907. May 29, 1922,
station moved downstream a quarter of a mile to highway bridge and chain gage installed at new datum; read by D. S. Rowley.
DISCHARGE MEASUREMENTS. Made from highway bridge or by wading.CHANNEL AND CONTROL. Bed of stream composed of gravel and sand. A riffle
immediately below ford shifts occasionally during floods. Control at new site is a riffle of gravel and cobbles.
EXTREMES OF DISCHARGE. Maximum stage recorded during year, 4.50 feet at 7 a. m. May 20 (discharge, 3,100 second-feet); minimum discharge probably about 35 second-feet in February when stage-discharge relation was affected by ice.
1904-1922: Summer floods occur nearly every year and may exceed any recorded stage. Maximum stage recorded for which discharge was determinjed, 8.43 feet at 9 p. m. June 25, 1917, determined by leveling from hub set at high-water mark (discharge determined from extension of rating curve, 8,500 second-feet). Minimum discharge, 4 second-feet during December, 1905, and January, 1906.
ICE. Stage-discharge relation affected by ice for short periods nearly every winter.
DIVERSIONS. Practically none.REGULATION. Practically none.ACCURACY. Stage-discharge relation changed slightly for low water during
winter; affected by ice November 16-23, December 6-16, 24-25, and Janu ary 1 to March 10. Rating curves fairly well defined. Gages read to hun- dredths once a day with occasional omissions anji twice daily during periods of rapidly changing stage. Daily discharge ascertained by applying daily gage height to rating tables. Discharge for period of ice-effect estimated from three meter measurements, temperature records, and observer's notes. Discharge interpolated or estimated from observer's notes for days when no gage heights were obtained and for days of small floods. Records fair.
Discharge measurements of Price River near Helper, Utah, during the year endingSeptember SO, 1922
Date
Dec. 66
Jan. 27
Made by
R. R. Bowe .... ... .do..................W. E. Dickinson .......
Gage height
Feet "0.89".76".89
Dis charge
Sec.-ft. 41.540.240.6
Date
Mar. 16May 25
Made by
W. E. Dickinson ............do. ..............A. B. Purton ...........
Gage height
Feet 0.703.857.20
Dis- charge
Sec.-ft. 55.4
2,25056.4
1 Stage-discharge relation aflected by ice.

108 SURFACE WATER SUPPLY, 1922, PART IX
Daily discharge, in second-feet, of Price River near Helper, Utah, for the year endingSeptember 30,
Day
1 23..... . ...4 __ 5 _ .. _ ......
6...... ....... .7 ... 8...._ 9.. ........... .10_
11... ...........12 13 _ . _ .......14..............15.... ....... ...
16.. ........... .17..... ......18. 19..............20_
21 _ ...........22..............23 24..............25.... __ ......
26.... ..........27 28..............29..............30 31 . _ ....
Oct.
6057575754
6062635757
5654545451
5454545451
5148517373
636057575757
Nov.
5454525154
5151544851
4848485447
45
5151
4545485148
Dec.
6357374537
40
tv
37404560
9684484545
485448484851
Jan.
40
Feb.
38
Mar.
. 38
3939704765
6582625565
7699122158124
11210897998280
Apr.
8399
131169239
187164141117112
10891919191
87838787
104
165225275298360
421660578688762
May
730778778
1,1401,300
1,4901,5701,6601,4501,170
908908
1,120980
1,090
1,1702,0002,0702,2503,100
1,9401,9002,0102,2902,310
2,3102,1301,9702,1202,0802,000
June
1,9401,8901,7801,7001,540
1,4901,3801,3201,1901,110
978942834748620
572540484432373
350309290263246
223201195212272
July
254224195175156
150150134118128
1181091009685
8381787878
7880818178
747470015092100
Aug.
13415014511498
81786610080
7470666959
, 545861125105
100781568171
615856125150225
Sept.
1751506985100
6459544949
4639393937
3737373737
3737373737
3742424244
NOTE. Braced figures show estimated mean discharge for periods indicated. No gage-height record Oct. 7, Dec. 16, Jan. 16,18, 20, 22, 24, 30, Feb. 28, Apr. 7, 21, 25, July 2, Aug. 12,17,25, and Sept. 13; dis charge estimated.
Monthly discharge of Price River near Helper, Utah, for the year ending September
Month
October... ... ________________________
February _ . ............................................
April.. . MayJune __ _ _JulyAugust _ .. __ . ......................................
The year. ______ ______________
Discharge in second-feet
Maximum
86 54
158 762
3,100 1,940
254 225 115
3,100
Minimum
48
83 730 19574 54 37
Mean
57.0 48.8 47.fi 40.0 38.0 68.6
226 1,640
814 135 95.1 45.4
272
Run-off in acre-feet
3,500 2,900 2,930 2,460 2,110 4,220
13,400 101,000 48,400 8,300 5,850 3,240
198,000
HUNTINGTON CREEK NEAR HUNTINGTON, UTAH
LOCATION. In SE. ^i sec. 6, T. 17 S., R. 8 E., at Cunha ranch 7 miles northwest of Huntington, Emery County. Below all main tributaries except Fish Creek.
DRAINAGE ABBA. 188 square miles (measured on United States Forest Service map, 1920).

COLORADO RIVER BASIN 109
RECORDS AVAILABLE. May 3, 1909, to September 30, 1922, fragmentary.GAGE. Stevens continuous water stage recorder on right bank installed Sep
tember 11, 1917; inspected by Joseph Cunha.DISCHARGE MEASUREMENTS. Made by wading or from bridge at gage.CHANNEL AND CONTROL. Bed composed of gravel and sand. Control of coarse
gravel shifts occasionally during high stages.EXTREMES OF DISCHARGE. Maximum stage for year, 5.29 feet at 11 p. m. May
25 (discharge, 1,340 second-feet); minimum stage not determined.1909-1922: Maximum discharge, 1,340 second-feet at 9.30 p. m. May 25,
1920, and at 11 p. m. May 25, 1922; minimum discharge, 12 second-feet March 20-23, 1912.
ICE. Stage-discharge relation seriously affected by ice.DIVERSIONS. Several small ditches divert from tributaries above station.REGULATION. Small storage reservoir above station regulates flow to a slight
extent.ACCURACY. Stage-discharge relation slightly changed for low water during May;
affected by ice November 17 to March 30. Rating curves well defined. Outside staff gage was read about once a week to hundredths, during periods when operation of the recorder was unsatisfactory. Daily discharge ascer tained by applying to rating table mean daily gage height determined from recorder graph or weekly readings. Daily discharge good; estimated periods fair.
Discharge measurements of Huntington Creek near Huntington, Utah, during the year ending September SO, 1922
Date
Dec. 7
May 26
M**- .
_ ..do .. __ ... __
Gage height
Feet "2.22"2.65
4.67
Dis charge
Sec.-ft. 39.744.8
924
0 Stage-discharge relation affectedbyiee.
Daily discharge, in second-feet, of -Huntington Creek near Huntington, Utah, for the year ending September SO, 1922
Day
1. ...... _ ....
3..............4.... __ ......5 ...........
6. ___ . __ .7..............8. __ ...... ...9. ____ ......
10 __ ...... _
11...... _ . _ .12 _____ ......13--.-...-...-..14..............15 . __ ......
16 ____ . _ 17..... ...-..18 19.. ______ .20
Oct.
65707274
.. 74
70706464
- 62
6262626262
6059595959
Nov.
5858585656
5858535454
5359605959
5844
| 45
Dec.
40
Jan.
45
Feb.
45
Mar.
45
Apr.
5053566060
82100
} QA UU
585450
50
5864
May
188196216222282
381442438348295
250250260280300
1 380.
462
June
918874852858858
858841802759697
619578587540500
470485484Oirx
July
234210193181174
170163193198193
188184179177174
172170168168168
Aug.
,
| 170
1
142
1*0
Sept.
1161R
I 56
57565453
5352505049
4948484848

110
Daily
SURFACE WATER SUPPLY, 1922, PART IX
, in second-feet, of Huntington Creek near Huntington, Utah, for the year ending September 80, 1922 Continued
Day
21..............22..............23..............24..............25..............
26. ..........27... ........28..............29..............30 ..........31... ........
Oct.
5958607458
58
Nov.
45
Dec.
40
Jan.
45
Feb.
45
Mar.
4550fin82
65
50
Apr.
72828791
100
106114130141168
May
553667771892
1,010
1,040929958994
1,000976
June
,
I 394
I304
273256250285285
July
163161157152148
146152
! 156
159
Aug.
125
849453766262
Sept.
4740494243
4250573530
NOTE No gage-height record Oct. 26-31, Nov. 1,18-21, 23-27, 29, 30,Dec. 1-6, 8-12,14-18, 20-28, 30, 31, Jan. 1, 2, 4-9, 11-18, 20-25, 27-31, Feb. 1, 2, 4-8, 10-17, 19-24, 26-28, Mar. 1, 3-6, 8-13, 15, 17-23, 25-30, Apr. 8-10,14-18, May 11-19, June 14-17,19-24, July 28-30. Aug. 1-5, 7-12,14-25, Sept. 3-6, 29, and 30; discharge estimated. Braced figures show estimated mean discharge fof periods indicated, based on hydrographic comparison with Cottonwood Creek near OrangeviDe.
Monthly discharge of Huntington Creek near Huntington, Utah, for the year end ing September 30, 1922
Month
October ___________________________
December _________________ . .............January _______________________ ___February...... ___ .... ___ .. . _ . . _ .........
April............................ .........................MayJune. _____ _________ . _ . _ . . .....July.....................................................August. ........ .........................................September. _________________________
The year... _ . __ . ..............................
Discharge in second-feet
Maximum
74 60
168 1,040
918 234
116
1,040
Minimum
188 250 146
30
30
Mtean
62.8 51.3 40 45 45 50.9 77.5
520 553 173 123 51.8
150
Run-off in acre-feet
3,860 3,050 2,460 2,770 2,500 3,130 4,610
32,000 32,900 10,600 7,560 3,080
109,000
COTTONWOOD CREEK NEAR OEANGEVILLE, UTAH
LOCATION. In SW. }& sec. 10, T. 18 S., R. 7 E., at Johnson ranch, 5 milesnorthwest of Orangeville, Emery County.
DRAINAGE AREA. 200 square miles (measured on United States Forest Servicemap, 1920).
RECORDS AVAILABLE. May 1, 1909, to September 30, 1922. GAGE. Stevens continuous water-stage recorder installed August 11, 1921, on
left bank near ranch house; inspected by George Sitterud. DISCHARGE MEASUREMENTS. Made from cable 500 feet downstream or by
wading. CHANNEL AND CONTROL. Bed rough; shifting. Banks fairly high but have
been overflowed by sudden floods, to which the stream is subject. Controlcomposed of gravel and sand.
EXTREMES OP DISCHARGE, Maximum stage during year, 9.1 feet about 10 p. m.August 22 (discharge by extending curve, 2,500 second-feet); minimumdischarge probably less1 than 20 second-feet in winter.
1909-1922: Maximum discharge, that of August 22; minimum dischargerecorded, 5 second-feet, September 21, 1910.

COLORADO RIVER BASIN 111
ICE. Stage-discharge relation affected by ice.DIVERSIONS. Two .or three small ditches divert water above station but all
main ditches take out below.REGULATION. None.ACCURACY. Stage-discharge relation changed during high water on August 22;
affected by ice November 18 to March 6. Rating curves fairly well defined below 800 second-feet and extended above. Water-stage recorder operated successfully except as indicated in footnote to daily-discharge table. Daily discharge ascertained by applying mean daily gage height to rating table. Discharge for ice-affected periods estimated from observer's notes,weather records, and two discharge measurements. Discharge for other periods of missing gage heights interpolated or estimated by comparison with flow of Ferron Creek. Records fair.
Discharge measurements of Cottonwood Creek near Orangeville, Utah, during the year ending September 30, 1922
Date
Dec. 7
Made by- Gage height
Feet "3.13"4.28
Dis charge
Sec.-ft. 20.828.8
Date
May 27
Made by Oage height
Feet 5.702.62
Dis charge
Sec.-ft. 82047.3
Stage-discharge relation affected by ice.
Daily discharge, in second-feet, of Cottonwood Creek near Orangeville, Utah, for the year ending September 30, 1922
Day
1 . -2..............a..... ......4..............5
6. ...... .......7..............8..............a... -10
11. . 12..............13..............14 _____ .. 15..............
16..............17..............18.. 19..............20........ ......
21 ..22..............23..............24..............25........ ......
26....... .......27........ ......28..............29..............30. .31
Oct.
6360595858
5978595858
5858585755
5555555556
5757607150
454945CO
5452
Nov.
5252515152
5252504950
4Q50505051
5446
in
39
39
1 38
Dec.
35
Jan.
30
Feb.
35
Mar.
50
47
50
56
60
5846454242
Apr.
47KQ
646558
46Cft
585057
5655565447
41
72
104
1231OK
165200209
May
195186198223276
276292316340340
270200210225246
274346400455510
490470
I 665
860900940
1,090
June
990920965
1,0301,100
1,0801,0801,000585920
880840860808708
688716712704692
680640604574550
518494506574556
July
474440408388379
367355343317300
281268256246238
231226223228228
216214OftO
198
1939A4.
211200243223
Aug.
326317233214202
198188184182182
173167176182167
165186180233289
2464Qn1006253
5151476262110
Sept.
14169554945
4340383736
3635323231
2928303030
3030292930
3030323029
NOTE. Only weekly readings obtained during period of ice-effect. Monthly discharge for December, January, and February estimated. No gage heights March 1-5, 7-12, 14-20, 22-26, Apr. 17-24, May l, 8-14,18,19, 23-26, Sept. 8 and 9. Braced figures show estimated mean discharge for periods indicated.
112 SURFACE WATER SUPPLY, 1922, PART IX
Monthly discharge of Cotfonwood Creek near Orangeville, Utah, for the year endingSeptember 30, 1922
Month
October _______________ . ... .....November.. ____________ ___ . . .........December __________________________January ..................................................February. _____ ____________ _ .........March. ..................................................April............................... . . . ........
July.... ..................................................August __ ... _________________________September- _________________ . . .........
The year _________________________
Discharge in second-feet
Maximum
78 54
209 1,090 1,100
474 490 141
1,100
Minimum
45
42
186 494 193
47 28
Mean
56.945.7 35 30 35 51.2 78.8
457 779 275 177 38.8
172
Run-off in acre-feet
3,500 2,720 2,150 1,840 1,940 3,150 4,690
28,100 46,400 16,900 10, 900 2,310
125,00*
FERRON CREEK (UPPER STATION) NEAR FERRON, UTAH
LOCATION. Close to line between sec. 1 and 2, T. 20 S., R. 6 E., a quarter of a mile below house at Peterson ranch, 1J^ miles above grist mill, and 5 miles northwest of Ferron, Emery County.
DRAINAGE AREA. 140 square miles (measured on United States Forest Service map, 1920).
RECORDS AVAILABLE. May 6, 1911, to September 30, 1922.GAGE. Inclined staff on right bank; installed September 23, 1911; read by
Joseph Peterson. Datum lowered 1.00 foot September 4, 1919.DISCHARGE MEASUREMENTS. Made by wading or from cable 15 feet upstream
from gage.CHANNEL AND CONTROL. Banks high and not subject to overflow. Bed com
posed of sand and gravel. Current swift and has tendency to cut channel deeper. Stage of zero flow at gage height 0.5 foot determined August 12, 1921.
EXTREMES OF DISCHARGE. Maximum stage recorded during year, 6.00 feet at 8 p. m. August 22 (discharge, 1,110 second-feet); minimum stage not determined.
1911-1922: Maximum stage recorded, 10.0 feet at 3 p. m. July 25, 192D (discharge, probably 2,000 second-feet); minimum discharge, 1 second-foot March 22 and 23, 1912.
ICE. Stage-discharge relation seriously affected by ice.DIVERSIONS. Above all diversions except a small ditch for the Peterson ranch.REGULATION. None.ACCURACY. Stage-discharge relation changed for low water, during high water
in May or June; affected by ice November 15-27 and December 6 to March 23. Rating curves fairly well defined below 400 second-feet and extended above. Gage read to hundredths once or twice daily except as stated in footnote to daily-discharge table. Daily discharge ascertained by applying mean daily gage height to rating table except for days of large fluctuation and periods when stage-discharge relation was affected by ice. For the latter periods discharge was estimated from two measurements, observer's notes, recorded gage heights, and weather records. Discharge interpolated for days when gage was not read. Records fair.

COLOEADO RIVER BASIN 113
Discharge measurements of Perron Creek (upper station) near Perron, Utah, during the year ending September SO, 1922
Date
Dec. 6
Made by
R. R. Rowe _ . .......
Gage height
Feet "0.56"1.38
Dis charge
Sec.-ft. 17.57.8
Date
May 27
Made by Gage height
Feet 3.28.45
Dis charge
Sec.-ft. 40132.2
0 Stage-discharge relation affected by ice.
Daily discharge, in second-feet, of Perron Creek (upper station)near Perron, Utah, for the year ending September SO, 1922
Day
I.. ------- _ .2 ...........3 . ... ..... 4..............5 .... ... -
6 ...........7... ...........8- ... .... -9 ... ... ... ..10 ^
11 -----------12 -.13... 14.. _ .. _ ...-15.... ..........
16.. __ ........17 18 19 20.... ...... _
21 22 23 ..24 ..25
26. .27 -.28 29 30 31
Oct.
9797
2797on
QA
30252525
OK
272700
9Q
29OC
282929
29on
2828OQ
2197
28292827
Nov.
26
23OK
on
00
99
221ft
1Q
2021201ft
18
25279Q
Dec.
on
97
25OK
91
10
15
20
Jan.
10
8888
Feb.
20
Mar.
25
3236
252425292127
Apr.
2724232522
202021
20
2322212020
2219222323
38
506386
9595105110130
May
110131245OCA
380
3744102971 ̂ 9Q<;
100118138200194
243270254352291
272417496604641
531517614572641580
June
>us545654fi7QfiQ9
R4.fi
630
574
501417338321311
342342332291281
258212218196171
157144140131171
July
121
998484
8075726863
6256565650
5450494848
4747444344
424165414155
Aug.
5547504242
414040Aft40
3938603936
3438345040
5070373636
333232333255
Sept.
4n55353532
3130312930
2928282928
2828272728
2828272727
2727272626
NOTE. No gage heights and discharge estimated Oct. 1, 3, 5, 7, 9, 14, 24, 30, Nov. 1, 2, 7, 10, 13,16,17, 24, 26, Dec. 2, 14, 16, 18, 20-25, 28-30, Jan. 1, 3, 10, 18, Feb. 15, 21, Mar. 10, 13, 21, Sept. 17, 19, 21, and 24. Braced figures show estimated mean discharge for periods indicated.
Monthly discharge of Perron Creek (upper station) near Perron, Utah, for the year ending September SO, 1922
Month
July......... __ .........................................
September.. _____ ... __ ___ ___ .
Discharge in second-feet
Maximum
84 29 29
130 641 692 121 70 55
692
Minimum
21
19 95
131 41 32 26
Mean
29.3 20.8 18.6 9.7
20 25.6 42.3
339 382 61.0 41.6 29.9
85.1
Run-off in acre-feet
1,800 1,240 1,140
596 1,110 1,570 2,520
20,800 22,700 3,750 2,560 1,780
61,600

114 SURFACE WATER SUPPLY, 1922, PART IX
LITTLE COLORADO RIVER BASIN
ZUNI RIVER AT BIACEROCE, N. MEX.
LOCATION. At reservoir on Zuni Indian Reservation at Blackrock, McKinley County. Rio de Los Nutrias, nearest large tributary, enters from north about 4 miles above.
DRAINAGE AREA. About 660 square miles.RECORDS AVAILABLE. Yearly flow July 1, 1903, to June 30, 1905; July 1, 1908,
to June 30, 1910. Monthly flow October 1, 1910, to September 30, 1922. Record since July 1, 1908, shows inflow into reservoir.
METHOD OF COLLECTING DATA. From July 1, 1903, to June 30, 1905, records were obtained by the ordinary stream-gaging methods. Reservoir com pleted in 1908. Record beginning July 1, 1908, obtained by means of gage in reservoir and capacity curve for reservoir, quantity of water released from the reservoir during the periods of inflow being taken into consideration.
EXTREMES OF DISCHARGE. Channel dry greater part of the year below point where it leaves mountains, but stream is subject to sudden floods of con siderable volume and usually of short duration.
DIVERSIONS. Reservoir at Ramah, about 18 miles above station, capacity of which is given as 4,240 acre-feet, is used to irrigate about 1,150 acres in T. 11 N., R. 16 W. There are other small ponds or reservoirs' in drainage area.
COOPERATION. Record furnished by the Office of Indian Affairs, through H. F. Robinson, supervising engineer, Albuquerque, N. Mex.
Monthly discharge of Zuni River at Blackrock, N. Mex., for the year ending Sep tember 30, 1922
Month
January .............
Run-ofl in acre-feet
0
00
339
Month S
April..... ...........
July.....
Run-ofl inacre-teet
6186189
0210
Month Run-ofl inacre-feet
1,110286
2,320
VIRGIN RIVER BASIN
VIRGIN RIVER AT VIRGIN, UTAH.
LOCATION. In NW. M sec. 27, or NE. M sec. 28, T. 41 S., R. 12 W., a few hundred feet above point where river enters a steep, narrow gorge and three-quarters of a mile west of Virgin, Washington County. Station replaces one maintained prior to February, 1915, half a mile above Virgin and gives practically the same record of flow.
DRAINAGE AREA. 1,010 square miles (measured on topographic map).RECORDS AVAILABLE. April 18, 1909, to September 30, 1922.GAGE. Chain gage on right bank near lower end of sandstone* bluff; installed
February 1, 1915; read by Lawrence Earl.DISCHARGE MEASUREMENTS. Made by wading or from highway bridge 7 miles
below gage.CHANNEL AND CONTROL. Bed consists of sand and gravel. Right bank high;
left bank low and is overflowed. One channel at all stages. Principal control is a gravel bar a short distance below gage; shifting.

COLORADO RIVER BASIN 115
EXTREMES OF DISCHARGE. Not determined for current year.1909-1918: Maximum stage recorded, 11.6 feet at upper station October
27, 1912 (discharge estimated, 12,000 second-feet). Flood of August 31, 1909, probably equaled or exceeded this flow. Minimum discharge, 24 second-feet, July 1, 2, 4, and 5, 1909.
ICE. Stage-discharge relation not affected by ice.DIVERSIONS. Above all important diversions.REGULATION. None.ACCURACY. Stage-discharge relation variable. Gage read to hundredths four
or five times a week. Occasional floods of short duration occurred which do not appear in recorded gage heights. Rating curves not sufficiently well defined to warrant publication of daily discharge. Monthly discharge is believed to be accurate enough for general studies.
Discharge measurements of Virgin River at Virgin, Utah, during the year endingSeptember SO, 1922
Date
May 27
Made by- Gage height
Feet 2.763.85
Dis charge
Sec.-ft. 127
1,190
Monthly discharge of Virgin River at Virgin, Utah, for the year ending September30, 1922
MonthDischarge in second- feet, mean
225214
331345
Run-ofl in acre-feet
13,80012, 70032, 30020,40019,200
MonthDischarge in second- feet, mean
435638
1,380455
Run-ofl in acre-feet
26,70038,00084,80027, 100
NOTE. Records for July, August, and September are not given because of uncertainty of results.
SANTA CLARA CREEK NEAR CENTRAL, UTAH
LOCATION. In sec. 11, T. 39 S., R. 16 W., just above bridge at R. H. Hunt ranch, 1 mile southeast of Central, Washington County, on road to Pine Valley. Hunt's spring, which has fairly constant discharge of about 3 second-feet, enters 40 feet below gage.
DRAINAGE AREA. 84 square miles (measured on topographic maps).RECORDS AVAILABLE. April 21, 1909, to September 30, 1922.GAGE. Vertical enamel staff nailed to cottonwood tree on left bank about 50
feet above bridge; read by Mrs. R. H. Hunt. Datum of gage was raised 0.45 foot on January 20, 1910, 2.00 feet on February 22, 1916, and lowered 1.00 foot on August 12, 1918.
DISCHARGE MEASUREMENTS. Made by wading or from footbridge at gage.CHANNEL AND CONTROL, Stream bed consists of gravel and sand. Banks
fairly high but may be overflowed at extreme stage; one channel at all stages. A riffle formed by small boulders 40 feet below gage is fairly permanent.
EXTREMES OF DISCHARGE. Maximum stage recorded during year, 4.5 feet at 12.30 p. m. on December 21 (discharge by extending rating, 900 second- feet); Minimum discharge, 6 second-feet January 19-20.

116 SURFACE WATER SUPPLY, 1922, PART IX
1909-1922: Maximum stage recorded 5.00 feet at 11 a. m. October 6,1916 (discharge, 1,450 second-feet); minimum stage, 0.82 foot January 8, 1920 (discharge, 4 second-feet).
ICE. Stage-discharge relation seldom affected by ice.DIVERSIONS. The New Castle Reclamation Co. have a reservoir on Grass
Valley Creek that has a capacity of 23,000 acre-feet. Water is diverted into this reservoir from Santa Clara Creek above town of Pine Valley and released into tunnel through rim of the Great Basin for irrigation of lands outside the Colorado River basin. Central Canal diverts water about 2 miles above station for irrigation of lands near Central. This canal has been measured when it was carrying 16 second-feet.
REGULATION. Mow affected by the diversions and storage above.ACCURACY. Stage-discharge relation for low water changed December 21.
Rating curves fairly well defined below 200 second-feet and extended above. Gage read to hundredths once daily with frequent omissions of one to two days. Daily discharge ascertained by applying daily gage height to rating table, or by interpolating discharge for days when gage was not read. Rec ords fair, except for very high water, which may be poor.
Discharge measurements of Santa Clara Creek near Central, Utah, during' the year ending September 30, 1922
Date
Nov. 5May 26
Made by
W. E.Dickinson __ __ - _ -. _ __ ----- __ - ______A. B. Purton ___ - ______ - ____ ---------- _ ---- __ - ____ --
Gage height
Feel 1.082.37
Dis charge
Sec.-ft. 14.3
201
Daily discharge, in second-feet, of Santa Clara Creek near Central, Utah, for the year ending September 30, 1922
Day
1. __ . ........2.-.-- .........3.. ...... ...4
6 ~7..-.. ... ...8 __ -..-.9 _ ..10
11 ___ ...- _ .12 13-. 14 15
16 17.. 18 - 1Q20 .
21 2223 . 24 25
26 27 28 29 30 31 -
Oct.
1212121212
1212121212
1212121212
1212121212
1313223219
18171616
15
Nov.
1414141414
1414141313
12
121912
1912191212
12121212
11
11
Dec.
11
11
11
11
11
111010109
99
111214
400133704438
26202820in
20
Jan.
1522851562820
1099211Q16
1414
14
14
1066
1912
1919
10
-to
1 Q1319.10
Feb.
1212121313
1312H
182112
3018
1313
13261Q1614
14131111
191314
Mar.
1618131210
81213109
1010131435
6338133353
66251335345
4543
- 36302828
Apr.
2626264236
3030323046
3230282825
2220Oq
2524
2343
6066
7177809393
May
9797104112129
140152162112101
9080879093
112133i <\l167162
157157177182228
2041671621601 ^7
June
154162157162167
157157148138125
116104938793
9393079287
8787838377
7674716663
July
6055504545
4340383836
3432309726
2626252630
28282827OK
232300
26 2423
Aug.
3228252423
2323232626
2626262525
2525252626
2626262626
2625OK
25OK
25
Sept.
2526252626
2625242320
2020191919
2019101918
1818181818
1818181818

COLORADO RIVER BASIN 117
Monthly discharge of Santa Clara Creek near Central, Utah, for the year endingSeptember 80, 1922
Month
July......... .........................................
Discharge in second-feet
Maximum
32 14
400 285 182 133 93
228 167 60 32 26
400
Minimum
12 11 9 6
11 8
20 80 63
. 23 23 18
6
Mean
14.1 12.4 33.4 31.9 240 30.2 41.4
138 108 32.6 25.5 20.6
42.8
Kun-offin acre-feet
867 738
2,050 1,960 1,330 1,860 2,460 8,480 6,430 2,000 1,570 1,230
31,000
GILA RIVER BASIN
GIIA RIVER NEAR SOIOMONSVIIIE, ARIZ.
LOCATION. In NE. ^ sec. 31, T. 6 S., R. 28 E., 1 mile below intake of Brown Canal and 10 miles east of Solomonsville, Graham County. San Francisco River enters from right 10 miles upstream.
DRAINAGE AREA. 7,910 square miles (measured on topographic maps).RECORDS AVAILABLE. April 21, 1914, to September 30, 1922.GAGE. Stevens continuous water-stage recorder on left bank, directly opposite
J. W. Earven ranch; inspected by J. W. Earven.DISCHARGE MEASUREMENTS. Made from cable at gage or by wading.CHANNEL AND CONTROL. Bed composed of gravel, sand, and silt. Banks well
defined. Control formed by gravel riffle below gage.EXTREMES OF DISCHARGE. Maximum stage during year from water-stage re
corder, 3.6 feet at 2 a. m. August 15 (discharge, 3,780 second-feet); minimum stage, 1.0 foot June 17-19 (discharge, 42 second-feet).
1914-1922: Maximum stage determined from floodmarks on gage, 14.0 feet January 19, 1916 (discharge, about 100,000 second-feet from extension of rating curve); minimum discharge that of June 17-19, 1922.
DIVERSIONS. Station is above diversions for irrigation in Safford Valley, except Brown Canal which diverts 1 mile above station for irrigating 820 acres. Brown Canal wasteway returns some water to river below this station. About 14,000 acres are irrigated from Gila River and tributaries above Safford Valley.
ACCURACY. Stage-discharge relation fairly permanent between rises. Twenty- eight measurements made during year define rating curves as follows: October 1 to December 23, well defined above 140 second-feet; December 24 to January 16, fairly well defined; January 17 to February 14 shifting- control method used; February 15 to April 3, well defined; April 4 to July 8, well defined; July 9 to August 15, fairly well defined; August 16 to September 30, well defined below 150 second-feet. Water-stage recorder checked on days when measurements were made, and at other times by J. W. Earven. Operation of recorder satisfactory throughout year except for period June1-6. Staff gage readings used June 1 and 6. Discharge interpolated June2-5. Daily discharge ascertained by applying mean daily gage height to rating tables. Records good.

118 SURFACE WATER SUPPLY, 1922, PART IX
Discharge measurements of Gila River near Solomonsville, Ariz., during the year ending September SO, 1922
Date
Oct. 114
Nov. 215
Dec. 115
Jan. 116
Feb. 115
Mar. 115
Apr. 1219
Made by
H. D. Empiet ____ ..do........ ..............do.......................do........ ...............do ....................do......... ._._.____.....do.......... ...... .....-do.......................do.......................do...................-do......................-do.......................do.... ... ..... -do....... ,
Gage height
Feet 1.641.241.261.28
1.371.401.431.401.411.401.431.521.38
Dis charge
Sec.-ft. 282154165178207206203225188184181189206151
Date
*
1120
619
July 11522
1015
Sept. 213
Made by
H. D. Empie ... ... do ..... do .... ...... do... . .... .... -do... ..... do ... ... ... ......do ...... ... ..do _ - . Gardiner and Empie- H. D. Empie.. ... .... do... ... . . ............... do ....... .....do ......... ... .. do
Gage height
Feet 1.321.281.181.141.05.1.021.211.111.131.281.422.981.251.26
Dis charge
Sec.-ft. 13010378665143957990
127174
2,480108114
Daily discharge,in second-feet, of Gila River near Solomonsville, Ariz., for the year ending September SO, 1922
Day
1 ..........2. _____ . ....3 .... 4. ___ . __ ..5 ,r . ........
6 7 8 . 9 10
11 12 13 14 15-
16 17 18 ... ........19 20
21 22 23 24 25
26 '...27 28 29 30 O-f
Oct.
265242242220220
200200180180180
162
14.E
14.E
145 tAK
145
128I A K
tAK
145
180180180180162
Nov.
162
162162
162162
162162
1621621fi9
180
180180180162162
180180180180180
180180180180180
Dec.
200200200200200
220242
220220
2202202202009 nn
220200200200200
200200onn
205
205OftK
205
205OftK
Jan.
OftE
315
288288
288
2882882889fifl009
225
200200
200200oftfl
200170
170170170192109190
Feb.
188182182182182
160160160155
155178178
175175
154
1541 *A.1 *U
154
1541 >U
154
Mar.
175
175
175175
154164
154175
175
175154154
175
175154154154175
202202175175175
Apr.
175175260325291
291291257257228
228200200176176
176153153153134
134134134134134
134134134134114
May
114114134114114
11411411411498
9898989883
8383717171
8383837171
7171717159n
June
7167635854
5050505060
5050505050
5042424250
6050505059
59S39898163
July
8383717159
5998
257240149
149115909090
79100797979
100797079
213
115100100909090
Aug.
458302168149
130115115335168
149130662564
1,720
605554780
1,140910
662503413302210
18616314416310790
Sept.
90107124107107
163163124210335
18612410710790
9090107107210
163268268186163
12412410710790

COLORADO EIVBE BASIN 119
Monthly discharge of Gila River near Solomonsville, Ariz., for the year endingSeptember SO, 1922
Month
April ___ ___________________________
July-----.... ...... .. .. .... ...............
The year ___________ .. __________
Discharge in second-feet
Maximum
265 180 242 375 188 202 325 134 153 257
1,720 335
1,720
Minimum
128 162 200 170 154 154 114
59 42 70 90 90
42
Mean
175 170 209 234 164 171 187 90.4 59.6
105 401 145
176
Run-off in acre-feet
10,800 10,100 12,900 14,400 9,110
10,500 11,100 5,560 3,550 6,460
24,700 8,630
128,000
GILA RIVER NEAR ASHURST, ARIZ.
LOCATION. In sec. 30, T. 5 S., R. 24 E., below all canal headings in Safford Valley and 1J^ miles east of Ashurst, Graham County.
DRAINAGE AREA. 10,900 square miles (measured on topographic maps).RECORDS AVAILABLE. December 24, 1920, to September 30, 1922. Discharge
measurements only.DISCHARGE MEASUREMENTS. Made by wading near road crossing.DIVERSIONS. About 38,000 acres are irrigated by Gila River and tributaries
above this station. Water for about 24,000 acres diverted by Safford Valley canals.
REGULATION. Flow varies considerably with amount of water diverted by canals of Safford Valley.
ACCURACY. No gage heights are obtained at this station; discharge measure ments only are made. Records give outflow from Safford Valley, belowall diversions.f
Discharge measurements of Gila River at Ashurst, Ariz., during the period December 24, 1920, to September 80, 1922
[Made by H. D. Empie]
Date
1920 Dec. 24 ___ ... _____
1921Jan. 17 .. __ ......Feb. 19....... ....Mar. 1... ___ .. ...
May3 ..............
Discharge
Sec.-ft. 91
1028.76.25.24.22.7
Date
1921 July 2.... ...........
Oct. 30 ... __ ....Nov. 3.. __ . __ ..
1922Jan. 4 ...............Feb. 2.... __ . ....
Discharge
Sec.-ft. 1.5
2316.43.8
105
14662
Date
1922
July3 ..
Sept. 4 _ . __ ......
Discharge
Sec.-ft. 3.44.13.82.41.7
2543.5
QUA RIVER If EAR SAN CABLOS, ARIZJ
LOCATION. In T. 3 S., R. 18 E., unsurveyed, 1 mile above San Carlos dam site, on San Carlos Indian Reservation, and 6 miles west of San Carlos, Gila County. San Carlos River enters from right 8 miles upstream.
DRAINAGE AREA. 12,900 square miles (measured on topographic maps).

120 SURFACE WATER SUPPLY, 1922, PART IX
RECORDS AVAILABLE. April 29, 1914, to September 30, ,1922, at present site. July 11, 1899, to November 27,1905, at point half a mile south of San Carlos, and below San Carlos River. August 17, 1910, to February 5, 1911, at point just below Arizona Eastern Railroad bridge, and half a mile above San Carlos River.
GAGE. Stevens continuous water-stage recorder on left bank; inspected by Tecora Ketchayan and Harvey Ford.
DISCHARGE MEASTTREMENTS. Made from cable a mile above gage, from crossing cable at gage, or by wading.
CHANNEL AND CONTROL. Bed composed^of sand, gravel, and boulders. Banks not subject to overflow. Boulder riffle just below gage. At low stages, gravel bar is formed on* left bank around point of rock at gage location,, necessitating the maintenance of a ditch from channel to gage well. This low-water condition develops a changeable control, and frequent inspection of well and ditch, and frequent measurements are required to determine stage-discharge relation.
EXTREMES OF DISCHARGE. Maximum stage during year from water-stage recorder, 4.1 feet on August 21 (discharge, 1,150 second-feet); minimum discharge, 0.6 second-foot July 12.
1914-1922: Maximum stage, 25.5 feet, January 20, 1916 (discharge, from extension of rating curve, about 92,000 second-feet); minimum stage, dry June 28 to July 1, 1919.
DIVERSIONS. About 38,000 acres are irrigated from Gila River and tributaries above this station.
ACCURACY. Stage-discharge relation changed on account of changes in ditch to gage during low water, and changes in gravel bar about gage at other stages. Standard rating curve fairly well defined between 1,000 and 14,000 second- feet; poorly defined above. Below 1,000 second-feet, several rating curves covering different periods of time, dependent upon changes in ditch and control, and discharge measurements, have been used. Water-stage recorder checked weekly or semiweekly. Operation of water-stage recorder was reasonably satisfactory .except when influenced by poor channel conditions at low water as indicated in footnote to daily-discharge table. Daily discharge ascer tained by applying mean daily gage height to rating table except as indi cated in footnote to table of daily discharge. Shifting-control method used January 19-28. Records fair.
Discharge measurements of Gila River near San Carlos, Ariz., during the yearending September SO, 1922
[Made by J. H. Qardiner]
Date
Oct. 6.......25......
Nov. 17......22 __ .
Jan. 7. _8 .....
Gage height
Feet 1.211.201.201.282.332 22
Dis charge
Sec.-ft. 55525468
450356
Date
Feb. 24.......25.- -
Mar.29 _ ...
15.. -
Qage height
Feet 1.431.501.301.341.231.17
Dis charge
Sec.-ft. 796655534026
Date
July 12. r ... .28 ..-
Aug. 21 ..Sept. 7-. ....
16...--
height
Feet 1.191.00(«)4.101.59.95
Dis charge
Sec.-ft. 250.40
621,150
209.3
No water at gage. Heavy bar cuts off channel.

COLORADO RIVER BASIN 121
Daily discharge, in second-feet, of Gila River near San Carles, Ariz., for the year ending September SO, 1922
Day
1.. .... ... ..2..... .........3 . .4. ________5. ...... ....
6..............7.. ........... .8. ........... ..9.... ......... .10-.--.... ......
11 _______ .12.... ......... .13....... ...... .14.... ... .......15
16 17 18 19 20.
21 22 23
25
26. 27 28. 29 30 31
Oct.
5555555555
5555555555
5555555555
5555554646
46464655
\ 55
555555555555
Nov.
5555555555
555555
, 5555
5555555555
5555555555
6065656565
6565656565
Dec.
7177779090
119119119119119
125130135130130
125119119119119
1151101009090
100153104104104104
Jan.
112127607745467
467408389370354
324309294294294
324324295253215
215204192192183
15211910510497127
Feb.
119119119119119
119119112112112
10490908484
8484908484
8484848065
585858
Mar.
5858585859
5353535953
5365656565
6572787885
7253474753
655953535353
Apr.
535365124116
8565655947
5953474747
4747474747
4741414141
414141
, 3530
May
3021303030
3030252520
2015151510
10101055
55555
555555
June
55555
55555
55555
55555
55556
65555
July
55554
44333
2230.61.4
306090100250
1501003060
500
300100626262
424
Aug.
3872401275016
253838
350
730730
1,150
100
Sept.
I"12
1620161610
82081216
11
11
18181818IS
NOTE. Braced figures show mean discharge for periods indicated for which no records are available, estimated by comparison with flow at other stations in basin. Staff readings used Oct. 1, 6,8,15,18, 21;. Dec. 6,10,13, 20, 24, 27; Feb. 25; Aug. 5,8,19, and Sept. 5; ditch to recorder well out of order. Discharges interpolated or estimated Oct. 2-5, 7, 12-14, 16, 17, 19-21, 23, 24; Dec. 4, 5, 7-9, 11, 12, 14-19, 21-23, 25, 26, 28-30; Feb. 17, 23, 24; July 16-30; Aug. 6, 7, and Sept. 28-30 by comparison with records for other stations in basin; record lost on these dates because ditch was out of order. . Gage heights May 8-19 believed affected by ditch maintenance and discharges have been estimated.
Monthly discharge of Gila River near San Carlos, Ariz., for the year ending Sep tember SO, 1922
Month
November- .. ____ T ________________ _
February.. _________________________March.. ___________________________April... . . .May. ____________________________
July . .. .... .
Discharge in second-feet
Maximum
55 65
153 745 119 85
124 30
6 500
1,150
1.150
Minimum
46 55 71 97 58 47 30
5 5 .6
16
.6
Mean
53.5 58.2
i 111 279 93.5mo54.0 14.2 5.1
?a4259
18.5
91.0
Run-off in acre-feet
3,290 3,460 6,820
17,200 5,190 3,690 3,210
873 303
4,820 15,900 1,100
65,900
GELA RIVER AT KELVIN, ARIZ.
LOCATION. In sec. 12, T. 4 S., R. 13 E., 1,000 feet below mouth of Mineral Creek, 15 miles below mouth of San Pedro River, a quarter of a mile below concrete highway bridge, 25 miles above Florence, and 1 mile west of Kelvin, Final County.
DKAINAGE AREA. 18,100 square miles (measured on topographic maps and Greenidge map of Sonora).

122 SURFACE WATER SUPPLY, 1922, PART IX
RECORDS AVAILABLE. January 26, 1911, to September 30, 1922.GAGE. Stevens continuous water-stage recorder on left bank.DISCHARGE MEASUREMENTS. Made from highway bridge a quarter of a mile
above gage or by wading. CHANNEL AND CONTROL. Bed composed of sand, gravel, and silt; continually
shifting. Banks well defined. Gravel riffle 300 feet below gage. EXTREMES OP DISCHARGE. Maximum st^,ge during year from water-stage
recorder, 4.25 feet at 3.30 p. m. August 22 (discharge, 2,360 second-feet);minimum stage, 1.7 feet, June 9-27, and June 29 to July 3 (discharge, 4.5second-feet).
1911-1922: Maximum stage recorded, 19.5 feet about noon, January 20,1916, determined from floodmarks (discharge, from extension of rating curve,about 132,000 second-feet, revised); no flow on June 29 to July 11, 1913.
DIVERSIONS. Station is above diversions for Florence-Casa Grande Valley.About 38,000 acres irrigated from Gila River above this station. Acreageirrigated from San Pedro River not known.
ACCURACY. Stage-discharge relation continually changing. Standard ratingcurve fairly well defined below 30,000 second-feet; poorly defined above.Rating curves for short periods between rises used. Water-stage recorderchecked weekly during year by observer. Operation of water-stage recordersatisfactory except for periods indicated in footnote to daily-dischargetable. Daily discharge ascertained by applying mean daily gage height torating tables except as indicated in footnote to table of daily discharge.Shifting-control method used October 25 to November 22 and January 10to March 26. Records good.
Discharge measurements of Gila River at Kelvin, Ariz., during the year endingSeptember SO, 1922
Date
Oct. 7 24
Nov. 1623
9Feb. 22
26Mar. 27
12
Made by-
John H. Gardiner _____ _-__-do-_._ ____ . _____
do- do . ____ ______
do_____ do ___ ________
do. do .
_____ do __ _._ . ..do __
Gage height
Feet 2.17 2 122 172.283.55
2.459 4.9
2.399 *\n2.29
Dis charge
Sec.~ft. 91 7870
1171,040
360160103112
91
Date
May 7 22
July 1129
Aug. 11182229
Sept. 51730
Made by-
John H. Gardiner ______ .do _ ...
-do _____ _____ ... .do ___ . __ ._____ do ______ . .do. . _ . .do .....do ______ . __ . do __ __._ __ _____... ..do . . _______ do _________
Gage height
Feet 2.02 1.862.102.583.473.254.352.332.301 Q-l
1.94
Dis charge
Sec.-ft. 37 1646
267995709
2,3401121012117
Daily discharge, in second-feet, of Gila River at Kelvin, Ariz., for the year endingSeptember SO, 1922
Day
1 ______2 __._._._3__.__......4 ______ .5 _ . ____ .
6___ __ ._7_-_._______.8___ __ _ _9__.._._..._.10 __ . ___
11_ _._.....12_._ __..._13_._._ ____14___.________15____.__._.__
Oct.
19815012211097
979797136122
11097970786
Nov.
7979797979
7474747474
6868686666
Dec.
150
150165165
180198198198198
198198198215215
Jan.
198515832
1,150580
440440380353320
3203202909on290
Feb.
300260260260260
260260260240220
220205205185185
Mar.
10088788080
8080808394
94106120150134
Apr.
8282178178198
198157140122108
10894948576
May
4848404040
4032323130
2827262524
June
88888
8884.54.5
4.54.54.54.54.5
July
4.54.54.588
883215794
4848404040
Aug.
580505440440440
440440440505580
1,390622302255440
Sept.
565677118102
102102118375
4952401125840

COLORADO RIVER BASIN 123
DaUy discharge, in second-feet, of Gila River at Kelvin, Ariz., for the year ending September 30, 1W2 Continued
Day
16 . ..17............18.. .... ......19............20............
21. . 22... 23 24.. ........ ..25 _ .........
26 .. 27............28. ...29. . 30............31. ........
Oct.
8686868675
7575757586
949494838379
Nov.
6679827477
8093122122122
122122122150165
Dee.
215198180180180
180198198198180
198198198198198198
Jan.
290320320320320
275275255255255
235235235235235375
Feb.
165165165150150
165176177148122
98100100
Mar.
120120167152124
152152ua126126
126122108948282
Apr.
665748'4858
5848484848
4048484848
May
2221212116
1616161616
161616111111
June
4.54.54.54.54.5
4.54.54.54.54.5
4.54.5164.54.5
Jute
485848140122
412198944869
1,080665440278162505
Aug.
8701,000712
1,310935
9351,390695450375
22816815011810277
Sept.
2621201918
1716161616
30601126621
NOTE. Staff readings used Dec. 30, Jan. 4, 26, Feb. 12, July 24, Sept. 22, 30, due to clock stopping or mud in well. Discharge estimated or interpolated Dec. 27-29, Dec. 31 to Jan. 3, Apr. 14-17, May 8-16, Sept. 18-21,23-27,29,31; from field observations and by comparison with records for other stations in basin.
Monthly discharge of Gila River at Kelvin, Ariz., for the year ending SeptemberSO,
Month
AprD.... __ _ _ _ _ __ _ _____ May _______ '. ____ ___ _______ __
July _____________________________
The year _______________ . ______
Discharge in second-feet
Maximum
198 165 215
1,150 300 167 198 48 16
1,080 1,390
695
1,390
Minimum
75 66
150 235 98 78 40 11 4.5 4.5
77 16
4.5
Mean
98.2 90.0
189 360 195 111 88.6 24.9 5.82
158 559 107
166
Run-off in acre-feet
6,040 5,360
11,600 22,100 10,800 6,820 5,270 1,530
346 9,720
34,400 6,370
120,000
SUNSET CANAL NEAR DUNCAN, ARIZ.
LOCATION. In NW. ^ sec. 17, T. 19 S., R. 20 W. New Mexico principal merid ian, in New Mexico, 1^ miles below intake, 9 miles east of Arizona-New Mexico State line, and 14 miles east of Duncan, Greenlee County.
RECORDS AVAILABLE. October 1, 1914, to September 30, 1915; July 15, 1922, to September 30, 1922.
GAGE. Vertical staff on right bank at Brook ranch; read by G. S. Hayes.DISCHARGE MEASUREMENTS. Made from footbridge at gage.CHANNEL AND CONTROL. Bed composed of silt. Banks vertical. No well-
defined control.DIVERSIONS. About 35 acres irrigated above station.ACCURACY. Stage-discharge relation continually changing. Standard rating
curve well defined. Gage read to hundredths twice a day. Daily discharge ascertained by applying mean daily gage height to rating table. Shifting- control method used for entire year. Records good.
Canal diverts water from right side of Gila River in NW. % sec. 20, T. 19 S. R. 20 W. New Mexico principal meridian, for irrigating 1,800 acres near Virden.
4182 27 9

124 SURFACE WATER SUPPLY, 1922, PART IX
Discharge measurements of Sunset Canal near Duncan, Ariz., during the year ending September SO,
Date
July 1518
Made by
t
Gage height
Feet 1.-761.34
Dis charge
Sec.-ft. 31.524.2
Date
11
Made by
J. H. Gardiner ____.....do __ .. __ ......
Gage height
Feet 1.981.95
Dis charge-
Sec.-ft. 34.fr39. &
Daily discharge, in second-feet, of Sunset Canal near Duncan, Ariz., for the period July 15 to September SO,
Day
2. .....3.. ... .
5
6
8. .....9 ... ...10
July Aug.
245
122733
3129Oft
ID
37
Sept.
89
241815
2429322738
Day
11.........12 to
14 15
16 17.. 1Q
1Q20
July
29
3023OQ1Q
12
Aug.
"28
28434732
1311122123
Sept.
325552
015333840
Day
21 22 23 24 25
26 27 28 29 30 31
July
3721
1323
351813101010
Aug.
15. 18
152232
322827221714
Sept.
3843474744
4239393*36
Monthly discharge oj Sunset Canal near Duncan, Ariz., for the period July 15 to-September SO, 1922
Month
July 15-31 _____ . _____ . ________ . ........August ___ _________ _______ .. __ ...September. ______ ___ _________ ___
The period _____________ __ ......._.
Discharge in second-feet
Maximum
3747 47
47
Minimum
10 5 0
0
Mean
19.9 24.0 27.1
24.3
Run-off to acre-feet
671 l,48(r 1,610.
3,760-
COSPER-WINDHAM CANAL NEAR DUNCAN, ARIZ.
LOCATION. In NW. H sec. 11, T. 19 S., R. 21 W. New Mexico principal meri dian, in New Mexico, half a mile below intake, 4 miles east of Arizona-New Mexico State line, and 9 miles east of Duncan, Greenlee County.
RECORDS AVAILABLE. October 1,1914, to September 30, 1915; July 18, 1922, to September 30, 1922.
GAGE. Vertical staff on left bank at Foster ranch; read by W. F. Foster.DISCHARGE MEASUREMENTS. Made from footbridge at gage.CHANNEL AND CONTROL. Bed composed of silt. Banks vertical. No well-
defined control.DIVERSIONS. None.ACCURACY. Stage-discharge relation fairly permanent for period. Rating curve
fairly well defined. Gage read twice a day to nearest hundredth. Daily discharge ascertained by applying mean daily gage height to rating table.. Discharge interpolated for August 12. Records fair.
Canal diverts water from right side of Gila River in SW. % sec. 11, T. 19 S., R. 21 W. New Mexico principal meridian, for irrigating 800 acres near Virden.

COLORADO EIVEE BASIN 125
The following discharge measurement was made by J. H. Gardiner: July 17, 1922: Gage height, 0.72 foot; discharge, 1.6 second-feet.
Daily discharge, in second-feet, of Cosper-Windham Canal near Duncan, Ariz., for the period July 18 to September $0,
Day
1
3_
5..... .
e. _ ....7. 8. .....9... ....
JO ......
July Aug.
149
10
10
3246
Sept.
3822
36
00
Day
11 12. 13- .14 15 ..
16 17 -to
19. . 20
July
2
2
Aug.
2
700
000
5
Sept.
86888
8877
11
Day
21 22 23
25.
26 27 ' 28 29 30 31
July
1062
11
101
112
Aug.
4A442
213232
Sept.
1010787
810
987
Monthly discharge of Cosper-Windham Canal near Duncan, Ariz., for the period July 18 to Septembr 80,
Month
July 18-31 ______ . _____ . _ . __ .......
The period ___ _________ __ ____
Discharge in second-feet
Maximum
11 14 10
14
Minimum
1 0 0
0
Mean
3.7 4.3 6.3
5.0
Run-off in acre-feet
103 264377
744
MODDIE CANAL NEAR DUNCAN, ARIZ.
LOCATION. In NW. M sec. 10, T. 19 S., R. 21 W. New Mexico principal meridian, in New Mexico, half a mile below intake, 4 miles east of Arizona-New Mexico State line, and 9 miles east of Duncan, Greenlee County.
RECORDS AVAILABLE. October 1, 1914, to September 30, 1915; July 17, 1922, to September 30, 1922.
GAGE. Vertical staff on left bank; read by W. W. Lloyd.DISCHARGE MEASUREMENTS. Made from footbridge at gage.CHANNEL AND CONTROL. Bed composed of silt. Banks vertical. No well-
defined control.DIVERSIONS. None.ACCURACY. Stage-discharge relation continually changing. Standard rating
curve fairly well defined. Gage read to hundredths twice a day. Daily discharge ascertained by applying mean daily gage height to rating table. Shifting-control method used for entire year. Records fair.
Canal diverts water from left side of Gila River in NW. M sec. 11, T. 19 S., R. 21 W. New Mexico principal meridian, for irrigating 2,200 acres near Franklin..

126 SURFACE WATER SUPPLY, 1922, PART IX
Discharge measurements of Moddle Canal near Duncan, Ariz., during the year ending September SO, 1922
[Made by J. H. Qardiner]
Date
July 17....... . _. _ _ _. . ._ _
Gage height
Feet 0.561.12
Discharge
Sec.-ft. 0.575.8
Daily discharge, in second-feet, of Moddle Canal near Duncan, Ariz., for the period July 17 to September 30, 1922
Day
1 ____ .2 3 -4 5
6 7 8 9 10
July Aug.
24453919
7.6
3.02.43.63.6
24
Sept.
3.64.86.44 13.5
9 n
7.08.0R 9Q A
Day
11 .12 ..13 .14
16 17. ...1010OA
July
0.5.5.9.5
Aug.
2.81.2
28455.4
5.4474743
7 0
Sept.
0000
13
33165130
Day
21 22 23 24 25
26 27 28 29. 30 31
July
1.7.4.4.4
4.7
3.4.4.7.3.3.3
Aug.
2249504125
19158.44.34.33.6
Sept.
242416137.2
181717139.4
Monthly discharge of Moddle Canal near Duncan, Ariz., for the period July 17 toSeptember 80, 1922
Month
July 17-31..... __ ..... ________ . __ . ______August... ______________________ . _ September- _______ , _________________
Discharge in second-feet
Maximum
4.7 50 51
51
Minimum
0.3 1.2
0
0
Mean
1.03 20.6 13.1
13.8
Rua-off in acre-feet
31 1,270
780
2,080
BROWN CANAL NEAR SOLOMONSVIILE, ARIZ.
LOCATION. In SE. ^ SE. M sec. 30, T. 6 S., R. 28 E., near Earven ranch, aquarter of a mile below intake, and 10 miles east of Solomonsville, GrahamCounty.
RECORDS AVAILABLE. June 1, 1914, to September 30, 1915; December 20,1920to September 30, 1922.
GAGE. Vertical enamel staff on right bank 10 feet below head gate; read byJ. W. Earven.
DISCHARGE MEASUREMENTS. Made by wading. CHANNEL AND CONTROL. Bed composed of silt. Banks not subject to overflow.
Control affected by periodic deposits from wash on right bank just belowgage.
DIVERSIONS. No diversions above gage.

COLOKADO KI7ER BASlN 127
ACCUBACY. Stage-discharge relation not permanent. Rating curves fairly well defined. Gage read to nearest two-hundredths twice a day. Daily dis charge ascertained by applying mean daily gage height to rating table. Records fair.
Canal diverts water from right side of Gila River in SE. M sec. 30, T. 6 S.,R. 28 E., for irrigating about 820 acres east of Solomonsville.
Discharge measurements of Brown Canal near Solomonsville, Ariz., during the year ending September SO, 1922
Date
Oct. 1Nov. 2Dec. 1Jan. 1Feb. 1Mar. 1Apr 12
Made by
.... -do.......... _..._..-
... ..do....... .......... .
.....do..................
.....do. ..............
.. ...do.......... .......
Gage
Feet 4.905.085.154.855.105.105.10
Dis charge
Sec.-ft. a n
14.714.49.4
13.513.215.9
Date
May 2
July 115
Aug. 1Sept, 1
Made by
... ..do........ ........ ..
.....do..................
.....do..................
.... -do...... ...,
Gage
Feet 5.074.904.805.025.264.985.18
Dis charge
Sec.-ft. 13.611.59.99.1
15.29.5
13.2
Daily discharge, in second-feet, of Brown Canal .near Solomonsville, Ariz,, for the year ending September SO, 1922
Day
1 _____ .2..............3....... ....4 ___ ........5..............
6 .............7.. ............8..............9.... .......10...:..........
11 ...........12 .............13 ... .1*.. ...... ......15 ........... .
16..............17_. .._..._.....18..............19..............20 . .. .........
21 .............22..............23... ...........24..............25..............
26..............27..............,28..............29..............30..............31..............
Oct.
9891111
1211111211
1313131*14
1414141312
1212121214
141414141414
Nov.
1414141414
1414141414
1416161513
1615151515
1515151515
1413131515
Dec.
1414131310
8881012
1212121212
1313131313
1313131313
1313)1199
Jan.
99999
99999
99989
99999
99121414
141414141414
Feb.
1414141414
1414141414
1414141414
1414141414
. 1414141414
141413
Mar.
1414141414
14H141414
100000
314141414
1414141414
141413131311
Apr.
1313161718
1818181717
1716131414
1515141414
1414121212
1212121212
May
1212121212
1212121212
1110101010
1010101010
1010101010
101010101010
June
1010101010
1010101010
1010101010
1010101010
1010101010
10123910
July
99999
1113141315
1818161611
1010121011
1212101314
121212121213
Aug.
1611101010
1010101112
121218188
30000
00287
899768
Sept.
1312141414
1414151510
888'8
8
888810
1010101010
108777

128 SURFACE WATER SUPPLY, 1922, PART IX
Monthly discharge of Brown Canal near Solomonsville, Ariz., for the year endingSeptember SO, 1922
Month
October ___________________________December.. _______ _________ ..............January ..................................................February _ ___ _____ __ .. _ . .............
July ...... ..................... ........................
Discharge in second-feet
Maximum
14 16 14 14 14 14 18 12 12 18 18 15
18
Minimum
8 13 8 9
13 0
12 10
3 9 0 7
0
Mean
12.4 14.5 11, 7 10.4 14.0 11.6 14.5 10.7 9.8
12.2 7.9
10.2
11.6
Run-off in acre-feet
762 863 7*9 640 778 713 863 658 583 750 486 607
8,420
BROWN CANAL WASTEWAY NEAR SOLOMONSVHLE, ARIZ.
LOCATION. In SE. ^ NE. ^ sec. 31, T. 6 S., R. 28 E., near Earven ranch and 10 miles east of Solomonsville, Graham County.
RECORDS AVAILABLE. December 20, 1920, to September 30, 1922.GAGE. Vertical enamel staff on right bank 200 feet below waste gate; read by
J. W. Earven.DISCHARGE MEASUREMENTS. Made by wading.CHANNEL AND CONTROL. Bed composed of silt. Channel straight. Banks not
subject to overflow.DIVERSIONS. None.ACCURACY. Stage-discharge relation not permanent. Rating curves fairly well
defined. Gage read to nearest two-hundredths twice a day. Daily dis charge ascertained by applying mean daily gage height to rating table. Shifting-control method used October 2 to November 1. Records fair.
Wasteway returns water from Brown Canal to Gila River half a mile below station, "Gila River near Solomonsville."
Discharge measurements df Brown Canal wasteway near Solomonsville, Ariz., during the year ending September SO,
Date
Nov. 2Dec. 1
Feb. 1IVt&T 1Apr. 12
Made by
.. do.................. do . . .. do... . .....do . ................ ..do... ... ....... ..
Gage height
Feet 5.205.365.424.995.28K ATI
4 98
Dis charge
Sec.-ft.
7.67.23.55.8 8.03.5
Date
Apr. 19May 2June 1July 1
22 Aug. 1
Made by
J. H. Gardiner-... .....H. D. Empie.-. ______ do ....................... do. ............Gardiner and Empie ... H. D. Empie. .. ....
Gage height
Feet 5.065.005.225.10
- 5.03 5.205.15
Dis charge
Sec.-ft. 4.23.25.23.93.5 4.S5.5

COLORADO RIVER BASIN 129
Daily discharge, in second-feet, of Brown Canal wasteway near Solomonsville, Ariz,, for the year ending September SO, 1922
Day
1 __ ..... .....2 ..........3 _ .. ...4.... ..........5.. ......
« .... .......7 _ ..... __ ..8 ___ ........9. . . _ ..
10 ...........
11 ..............12.. .........13 . __ ...14 _ ...........15 .........
16 17... _ ....i ...18 19.. ....... 20.. .........
21 _ ... __ . ...22.. .....23 24 _ ..... ___ .25...... ........
26.. ...27. .-..28 ......29 30 31... .......
Oct.
66776
65665
56677
77744
46-677
665544
Nov.
88775
54556
67765
6677
( 7
88888
88888
Dec.
88887
6668
10
1010101010
1010101010
1010101010
1010103
103
Jan.
10003
33333
33333
33443
34566
766666
Feb.
66666
66666
66666
66666
66666
666
Mar.
76666
66666
50000
14444
44445
555455
Apr.
55684
44444
43345
43333
33333
33333
May
33333
33333
44444
44445
55555
555555
June
66666
66666
66666
66666
66666
68158
July
44444
46541
00004
44533
33335
333333
Aug.
46666
66666
55788
20000
00000
000001
Sept.
44433
32226
44444
44443
33322
22222
Monthly discharge of Brown Canal wasteway near Solomonsville, Ariz., for the yearending September SO,
Month
October __________________________November.. ______ ...........
January ________________________ .....February. ............................March. __ _______________ . .....
May _ _________ .. .June. ________ ... ............July. ....... .._.._. . _.._. _... August September _________________________
The year ... ... ..... ......... ......
Discharge in second-feet
Maximum
7 8
10 7 6 7 8 5 8 6 8 6
10
Minimum
4 4 3 0 6 0 3 3 1 0 0 2
0
Mean
5.8 6.8 8.8 3.6 6.0 4.3 3.8 4.1 6.6 3.2 3.0 3.2
4.9
Run-off in acre-feet
357 405 541 221 333 264 226 252 393 197 184 190
3,570
MICHEIANA CANAL NEAR SOLOMONSVILLE, ARIZ.
LOCATION. In NE. J4 SW. M sec. 3, T. 7 S., R. 27 E., at Moody ranch, a quarterof a mile below head gate and 6 miles northeast of Solomonsville, GrahamCounty.
RECORDS AVAILABLE. October 1, 1914, to September 30, 1915; December 21,1920, to September 30, 1922.
GAGE. Vertical'staff on*right-bank 30 feet below wagon bridge; read by EdwinMoody.

130 SURFACE WATER SUPPLY, 1922, PART IX
DISCHARGE MEASUREMENTS. Made by wading.CHANNEL AND CONTROL. Bed composed of silt. Banks vertical. No well-
defined control.DIVERSIONS. None.ACCURACY. Stage-discharge relation not permanent. Standard rating curve
fairly well defined. Gage read twice a day to hundredths. Daily discharge ascertained by applying mean daily gage height to rating tables. Shifting- control method used for entire year. Records fair.
Canal diverts water from right side of Gila River in the SW. }>i sec. 31, T. 7 13., R. 28 E., for irrigating about 450 acres near Solomonsville.
Discharge measurements of Michelana Canal near Solomonsville, Ariz,, during the year ending September SO, 1922
Date
Oct. 1Nov. 2Dec. 1Jan. 2Feb. 1Mar. 1Apr. 12
19May 2
1926
Made by
.....do _____ ... . ... .do ... ..do.. ....................do.. ..............-.-do.--.....-. ....... ..do--.. .... ..
H. D. Empie.--... ....
do ...
Gage height
Feet 4.704.604 on4.784.90,4.304.224 V)4.36
4.13
Dis- charge
Sec.-ft. 6.56.07.56.47.3
7.3H o9.16.64.4
Date
5
2127
July 11391
Aug. 1
9
Made by
do- ..... ........ .. do ... .......... do.. ..... do . ...... do do ...... do ..... do.. ... ... .......... . do.. ....... ...... do
Qage height
Feet 4.104.134.003.854.154.144.934.104.434.384.32
Dis charge
See.-ft. 3.54.32.61.54.04.12.63.77.16.45.3
Daily discharge, in second-feet, of Michelana Canal near Solomonsville, Ariz., for the year ending September SO,
Day
1...... ........2. _ ..,.3 _ .......4. 5. ..... .....
6.. __ .....7 . _ ....8. .....9, . ........10. ...... ....
11. 1218M ...15. ......
16. 17 18 .19. 20
21...... ........22... ....23. 24. ..26. ..
26 27. 28. 9Q
30 . _31
Get.
665566 :
6
66
66677
7655'5
57
7
9
10101010109
Nov.
9778
810g
10
10
655
655
5
555
5
47777
Dec.
77776
66666
66665
55855
577
7
787778
Jan.
8777
76666
66665
5
5
5
56666
776
6
Feb.
555
5
5
552
00000
00005
1010101010
101111
Mar.
1111111210
8888
88888
8889g
9e988
888
87
Apr.
77799
99988
87788
99
101010
1088
1013
131313iq
11
May
98777
89999
99999
99775
56"
655
345444
June
4-4454
34433
22222
22222
23333
444
3
July
«444
44544
43454
35444
44356
544457
Aug.
65655
54578
68887
66788
88677
654666
Sept.
65336
66663
33334
55554
44444
43333

COLORADO MTEB BASIN4
Monthly discharge of Michelana Canal near SolomonsviUe, Ariz., for th&yearenebmgSeptember 30,
Month
October ________ . __________________
January ________ . __________________
April.. __ . ___________ . .........................May - .-... .- ..-.... ....- ..-..........
July-- August _ - ________________________
Discharge in second-feet
Maximum
10 10 8 8
11 12 13 9 5 7 8 6
13
Minimum
5 5 5 5 0 7 74:
2 34:
3
0
Mean
619- 6.7 6.4 6.1 4.8 8.6 9.3 6.9 3.0 4.3 6.4 4.2
6.1
Run-off in acre-feet
424 399 394 375 267 529 563 424 179 264 394 250
4,450
FOURNESS CANAL NEAR SOIOMOKSVHIE, ARIZ.
LOCATION. rn SE. J^ SE. J^ sec. 35, T. 6 S., R. 27 E., three-quarters of a mile below intake and 8 miles east of Solomonsville, Graham County.
RECOKDS AVAILABLE. October 1, 1914, to September 30, 1915; December 2% 1920, to September 30, 1922.
GAGE. Vertical staff on right bank 300 feet below waste gate; read by David Jurado.
DISCHARGE MEASUREMENTS. Made by wading at gage.CHANNEL AND CONTROL. Bed composed of silt. Channel small and uniform
in cross section. No well-defined control.DIVERSIONS. No diversions above gage.ACCURACY. Stage-discharge relation not permanent. Rating curves fairly well
defined. Gage read to half-tenths twice a day. Daily discharge ascer tained by applying mean daily gage height to rating table. Records fair.
Canal diverts water from left side of Gila River in NE. 27 E., for irrigating about 260 acres near Solomonsville.
sec. 1, T. 7 S., R.
Discharge measurements of Fourness Canal near Solomonsville, Ariz., during the year ending September 30, 1922
Date
Oct. 1Dec. 1
Feb. 1Mar. 1Apr. 19
Made by-
El. D. Empie ...........
..do.... . -do..... ..... ... ... - do...... . ......
Gage height
Feet 5.10
4.655.055.164.63
Dis charge
See.-ft. 4.63.9.98
3.94.44.4
Date
July 5
Made by
do...... .... . ... ..do....... ... . do....... ........
Gage height
Feet 4.304.304.554.824.28
Dis charge
Sec.-ft. 0.66.48
ae, 5.5
.42
4182 27- -10

132 SURFACE WATER SUPPLY, 1922, PART IX
Daily discharge, in second-feet, of Fourness Canal near Solomonsville, Ariz., for the year ending September SO,
Day
1 ___ ........2 ___ -....-.-3 ... ........4... _ ... .....5-.... ......
6... _ ........7.. __ ....8-. . ........9. __ .........
10..............
11 ..............12 .... .......13....... .......14 _ ...........15 .
16 ...........17 . 18 ....... ...19 __ ...20 .........
21.... ...... .22. .............28 24 . -25 .
2627 28... __ .. .29 30 31. ........
Oct.
3.04.52.02.09 n
2.02.02.02.02.0
1.51.52.52.52.5
2.53.03.03.03.0
3.03.02.02.02.0
2.03.03.03.03.03.0
Nov.
2.52.500.8
1.51.52.52.02.0
2.02.02.02.02.0
2.53.03.03.03.0
3.02.52.52.52.5
2.52.52.53.03.0
Dec.
3.02.52.52.52.5
2.52.52.52.51.5
1.51.51.51.5
2.02.02.52.52.5
2.52.52.5o n9 n
o n2.02.09 n.6
1.0
Jan.
1.01.01.000
09 n2.02.0o ft
o n2.00 A
o n2 ft
2.09 n2.0o n2.0
2.02.51.000
02.02.02.02.53.0
Feb.
3.53.52.000
0001.02.5
2.52.52.52.53.0
3.03.03.03.03.0
2.52.52.5i n3.0
3.03.03.0
Mar.
3.54.04.04.04.0
4.02.59 n2.01.5
1.51.51.51.51.5
1.51.53.03.54.0
4.04.04.03.03.0
3.03.03.03.03.03.0
Apr.
3.03.03.03.0i n
3.03.0000
00005.0
5.05.04.54.03.5
3.53.53.03.03.0
2.01.51.0.5.6
May
0.6.6.6.6.6
.6
.6
.6
.6
.6
.6
.6
.5
.5
.5
.5
.5
.5
.5
.5
.5
.5
.5
.5
.5
.5
.5
.5
June
0.5.4.4.4.5
.5
.5
.5
.5
.5
.5
.5
.5
.5
.5
.5
.5
.5
.4
.4
.5
.5
.6
.5
.51.01.500
July
1.53.02.02.02.0
2.53.54.05.06.5
6.56.52.02.01.5
1.54.04.03.02.5
2.02.02.02.01.5
1.51.51.51.54.04.0
Aug.
3.53.02.02.02.0
9 n2.03.04.03.0
3.04.02.000
0.7
1.51.51.5
1.01.01.01.0.9
.9
.9
.7
.7
.5
.5
Sept.
0.6.5.»
1.01.0
1.01.01.01.01.0
000.7
1.0
1.01.01.000
1.02.01.6l.fr1.5
1.52.02.02.02.0
Monthly discharge of Fourness Canal near Solomonsville, Ariz., for the year endingSeptember SO, 1922
Month
December __ .
April __ ....May... ............... ........ .......... ........ ...June.July .........
Discharge in second-feet
Maximum
4.5 3 3 3 3.5 4 5 .6
1.5 6.5 4 2
6.5
Minimum
. 1.5 0 .6
0 0 1.5 0 .5
0 1.5 0 0
0
Mean
2.50 2.21 2.08 1.66 2.25 2.85 2.32 .56 .50
2.87 1.61 1.02
1.86
Run-off in. acre-feet
164 132 12ft 95
125 175 13S 34 30
176 99 61
1,350
SAN JOSE CANAL NEAR SOLOMONSVHLE, ARIZ.S
LOCATION. In NW. M NE. % sec. 10, T. 7 S., R. 27 E., near Curtis ranch,2 miles below intake, and 4 miles east of Solomonsville, Graham County.
RECORDS AVAILABLE. April 1, 1914, to September 30,1915; December 21, 1920,to September 30, 1922.
GAGE. Stevens continuous water-stage recorder installed April 13, 1922, 50 feetabove concrete drop, 200 feet below waste gate, and 2 miles below heading;inspected by H. D. Empie. Prior to installation of recorder, vertical staffat same location and datum; read by Gonzalo Palma.

COLORADO RIVER BASIN 133
DISCHARGE MEASUREMENTS. Made by wading or from footbridge at gage.CHANNEL AND CONTROL. Wide uniform section, well-defined banks. Control
is formed by concrete drop 50 feet below gage.DIVERSIONS. One diversion above gage, irrigating 90 acres.ACCURACY. Stage-discharge relation permanent. Rating curve well defined.
Staff gage read to hund^edths twice a day until April 13. Operation of water-stage recorder satisfactory April 13 to September 30. Daily discharge ascertained by applying mean daily gage height to rating table. Records good.
Canal diverts water from left side of Gila River in the SW. J^ sec. 36, T. 6 S*. R. 27 E., for irrigating 3,000 acres near Solomonsville and Safford.
Discharge measurements of San Jose Canal near Solomonsville, Ariz., during the yearending September 30, 1922
Date
Oct. 1Nov. 2Dec. 1Jan. 2Feb. 1Mar. 1
31Apr. 13
20
Made by
H. D. Empie.. ____
..... do.. do .-..-do... ...... ...... -do.. ... ....
3. H. Gardiner ____ .
Gage height
Feet 0.94.64.62.64.64.66.66.64.62
Dis charge
Sec.-ft. 76.633.041.143.042.935.045.342.640.4
Date
May 4
July 124
Aug. 1Sept. 1
1430
Made by
H.D.Empie ......
do -J.H. Qardiner....... ...H. D. Empie-- _____
Gage height
Feet 0.50.43.50.48.52.48.54.45
Dis charge
Sec.-ft. 29.624.330.728.632. ,027.1.33.624; 6
Daily discharge, in second-feet, of San Jose Canal near Solomonsville, Ariz., for the year ending September SO, 1922
Day
1. ..........2. __ ,. ___ .3. __ .. .,.4. __ ........5. .... .....
6. _ ...7 __ .........8.... . .9 ....... .,10
11 12 13 14 . ...15. ..
16. 17 ......18. ....19 _ ......20.. ..
21 .......... .22 _ ......23.... ..........24 . 25..... _ ......
26 .......27 28 __ .. _ .....29. _ ..........30 __ ..........31 .......
Oct.
7762606260
5242434442
3832323433
3333343333
3231333434
343537363836
Nov.
3534333233
'3332333333
3333333333
3333343334
3334343434
3636394040
Dec.
4242424242
4446464645
4645444442
4242403943
4645424244
424446444243
Jan.
4443454947
4949404242
4644444342
4344434343
4341434244
444343434343
Feb.
4443434343
4242486558
4545464950
5052525353
5452484745
444036
Mar.
3737313536
3735363434
3234283535
3434333334
3739363735
353545454545
Apr.
4545464964
6556656565
6665544343
3843434336
3030292828
3030292928
May
2425323131
3030303030
3028251926
2626262525
2525252625
182525252525
June
2525252523
2018181018
1718181717
1718181514
1510161617
1819223142
July
3130252725
2730283239
3432303029
2228312929
2728272844
393428223028
Aug.
3352766040
3430807457
3533493845
140
344742
4549567973
645965452626
Sept.
2827343330
3639.303042
3447373129
3029302835
3542473933
3129282829

134 SURFACE WATER SUPPLY, 1922, PART IX
Monthly discharge of San Jose Canal near Solomonsville, Ariz., for the year endingSeptember SO, 1922
Month
November _________________________
March __ ... _____________________AprQ.... ........ .........................................May _______________________________
July......................................................
September _____________________ ........
Theyear... _ .... _ .... _ . _____ . _____ .
Discharge in second-feet
Maximum
77 40 46 49 65 45 66 32 42 44 79 47
79
Minimum
31 32 39 40 36 28 28 18 10 22
0 27
0
Mean
40.6 34.1 43.4 43.8 47.6 36.1 44.3 26.4 19.4 29.8 45.5 33.3
37.0
Run-off ia acre-feet
2,500 2,030 2,870 2,690 2,640 2,220 2,640 1,620 1,180 1.S30 2,800 1,980
26,800
MONTEZUMA CANAL NEAR SOLOMONSVILLE, ARIZ.
LOCATION. In SE. ^ NW. % sec. 17, T. 7 S., R. 27 E., 1 mile below intake and 2 miles east of Solomonsville, Graham County.
RECORDS AVAILABLE. April 1, 1914, to September 30, 1915; December 29, 1920, to September 30, 1922.
GAGE. Stevens continuous water-stage recorder installed June 26, 1922, on left bank -200 feet below waste gate; inspected by H. D. Empie. Prior to June 26, 1922, staff gage 1 mile below waste gate; read by Frank Carrasco.
DISCHARGE MEASUREMENTS. Made by wading or from footbridge at gage.CHANNEL AND CONTROL. Bed composed of silt; banks vertical. No well-defined
control.DIVERSIONS. None.ACCURACY. Stage-discharge relation not permanent. Rating curves fairly well
defined. Gage read to half-tenths twice a day until June 26. Operation of water-stage recorder satisfactory June 26 to September 30. Daily dis charge ascertained by applying mean daily gage height to rating table. Shifting-control method used for several short periods prior to June 26. Records fair.
Canal diverts water from left side of Gila River in NE. % sec. 17, T. 7 S.,R. 27 E., for irrigating 3,750 acres near Solomonsville and Safford.
Discharge measurements of Montezuma^Canal near Solomonsville, Ariz., during the year
Date
Oct. 52123
Nov. 1Dec. 2
Feb. 326
Mar. 31623
Apr. 14202124
May 8Apr. 28«
Made by
__ .do ......................do..... ... ... .... ..i. do . ........-do..... . ........ ..do.. -.....--..... .do-. .................do.. ..... ........... .do.. .:. ........ .do.. ...... .......... .do.. ... ..... ...._ .do- ...
.. do ....
H. D. Empie.. ____ .
Gage height
Feet 6.336,375.936.105.886.506.256.076.156.306.006.606.255.77K 79
f\ 4-S
8.969.148.93
Dis charge
Sec.-ft. 45.442.933.737.9
47.748.744.949.547.644.970.9KQ 9
37.937.228.432.836.729.4
Date
May 1215
1315
July 27
1010
23
813
142026
Made by
.....do..
... ..do ..do- do . - ..... do ..... do- ... .....do - _
.... .do- .... . .do .....do. _ ......
Gage height
Feet 8.808.808.728.728.608.608.749.248.608.62
. 8.809.948.76
10.168.618.868.989.02
Dis charge
Sec.-ft. 27.227.425.8
> 25.4" 22.9
25.028.945.223.924.830.668.529.277.525.232.635.239.1
' Beginning on this date, measurements made at new station, 1 mile below intake.

COLOBADO BIVEB BASIN J35
Daily discharge, in second-feet, of Montezuma Canal near Solomonsville, Ariz,, for the year ending September 80, 1922
Day
1 _______2 3 . .^.. ............f>. r ... ....... r .
6.... ..........7-T . ....8
10
11 ,-12 13 14 ..............16
16 17. ..........18..... ........ .19 20.. ...... ...
21... .. .........22 23 ..24 26
26 27 28 29 38 31
Oct.
5054494744
4448484847
4547434244
4242464545
3940424646
403939393942
Nov.
3939424239
3939424239
3936393942
3935373535
3539393937
3939403939
Dec.
3933343638
3841383838
3838384040
3636363638
4040363636
343434343437
Jan.
3741414138
3838424245
42 40
404444
4444424447
4747474848
' 484949464949
Feb.
5054554862
6656.524648
6666565649
4143414949
4444494949
695551
Mar.
6147474650
6248484843
4747474546
4446524749
5452534949
525454625452
Apr.
6262585858
5664606258
5862627777
7766665965
4140404349
3632363234
May
2929262623
2426262626
2626262624
2626232326
2624242626
262626242929
June
2824262626
2624232324
2424232323
2323232323
2223232323
2629292932
July
2626262423
2324822824
3228262624
2426222326
2623232445
343128242624
Aug.
3150685234
2828285440
3431736464
0081113
2330327171
695244322826
Sept.'
2428293228
2934242642
4449363131
2929312935
40>47524430.
332»282826
Monthly discharge of Montezuma Canal near Solomonsville, Ariz., for the year ' ending September SO, 1922
Month
April .. _
July.. ... ........ ... ...... .... ..... ..........
The year ...........................................
Discharge in second-feet
Maximum
54 42 41 49 69 54 77 29 32 45 73 62
77
Minimum
39 35 33 37 41 43 32 23 22 22
0 24
0
Mean
44.2 38.7 36.9 43.9 50.6 49.1 54.3 25.8 24.7 26.5 38.0 33.4
38.8
Run-off inacre-feet
2,720 2,300 2,270 2,700 2,800 3,020 3,230 1,590 1,470 1,630 2,340 1,990
28,100
UNION CANAL NEAR SOLOMONSVILLE, ARIZ.
LOCATION. In SE. M NE. M sec. 14, T. 7 S., R. 26 E., 1% miles below intakeand 1J^ miles northwest of Solomonsville, Graham County.
RECORDS AVAILABLE. April 1, 1914, to September 30, 1915; January 1, 1921,to September 30, 1922.
GAGE. Stevens continuous water-stage recorder installed June 11, 1922, on leftbank 1,300 feet below waste gate; inspected by H. D. Empie. Prior to June11, 1922; staff on right bank; read by M. R. Nanez.
DISCHARGE MEASUREMENTS. Made by wading or from footbridge at gage.

136 SURFACE WATER SUPPLY, 1922, PART IX
CHANNEL AND CONTROL. Bed composed of silt and sand; banks vertical. Nowell-defined control.
Di v BRSIONS. None. ACCURACY. Stage-discharge relation not permanent. Rating curves fairly well
defined. Gage read twice a day to nearest two-hundredths until June 11.Operation of water-stage recorder satisfactory June 11 to September 30.Daily discharge ascertained by applying mean daily gage height to ratingtables. Shifting-control method used for several short periods. Recordsfair.
Canal diverts water from left side of Gila River in the NW. % sec. 18, T. 7 S., R. 27 E., for irrigating 5,975 acres near Safford and Thaicher.
Discharge measurements of Union Canal near Solomonsville, Ariz., during the year ending September 80,
Date
Oct. 526
Nov. 126
Dec. 2Jan. 5Feb. 3
26Mar. 7Apr. 11
20May 1
9192231
Made by
H. D. Empie. _____.....do.......................do.......................do ....................do............. . .......do-.. .....do ............... .do . .__ .do. ___ -. ......do... .......... ....J. H. Qardiner ____H. D. Empie ___ ____ do _________.....do............ ......do . ...................do. _ ...
Gage height
Feet 2.652.382.562.84
1.723 19
2.333.152.942.02O id.2.061.361.381 04
Dis charge
Sec.-ft. 63.055.9ATI a72.0
34.8OA *>
54.495.7
48.062.948.222.923.214 0
Date
91230
82427
Aug. 18
17Sept. 1
51430
Made by
H. D. Empie ______
.....dO -.
.....do. ..............
.....do .. ......
.....do ...............
.....do .........,..
.....do .............. .do .....do ...............
.....do ..............
s&Feet 0.72.85.75
1.751.762.241 O7
2. IS3.641.123.651.621.691.881.56
Dis charge
Sec.-ft. 6.0
f A O
6.532.035.748.519.148.9
11115.8
12328.929.741.924.6
Daily discharge, in second-feet, of Union Canal near Solomonsville, Ariz,, for the year ending September SO,
Day
1 _______2 _____ - __3 __ ... ....4 ___ . .......5. _ . __ - ....
6-.-.- .- -T. .............8 _ .. .........9. ___ .... ....10..... ......11 . .....12 . 13. 14. ___ ..... ...15... . ...16 -17 ___18 19 ___ - _ -20 21 - .22 ....23 __ ...24 -25 ___ ......26 _ ... ...27...... ........28 9Q30 0-f
Oct.
85757371696769656958606163606056565246
46
5256565669737373696760
Nov.
636165616163636163636363634632424440304263636361606196928396
Dec.
1161018888926158830290928381797977757575796765636571717371676965
Jan.
65636160342727333332484847'444454636363626157555785878684888691
Feb.
939596938984898686120644570818179757171656166626262586574
Mar.
879590
. 9396968680767468705853808068646674
1021091048492959884757471
Apr.
70707814011912913797888491656075746864615456576569676163676765
. 65
May
6362605955595757484544434644393431222224242424242420212020179.2
June
6.88.05.53.56.85.56.84.55.55.55.55.56.84.54.55.56.84.54.54.54.55.59.28.0101313352748
July
39302721201438729649525134343227402418143042262188494636283026
Aug.
581215839382824186054567313111911712212111877
10184725032171159.2
334633
Sept.
334347403240523740675458
-464440293240478172849652443736282527

COLORADO BJ¥ER BASIN 137
Monthly discharge of Union Canal near Solomonsvitte, Ariz., for the year ending
Month
October __________________________November _________________________
January-. ........... ................. ....................February __________________________
April. ____________________________
June ____________________________July........... ...................-. ...................August. __________________________
The year. ______ ... ..........................
Discharge in second-feet
Maximum
85 96
116 91
120 109 140 63 48 96
131 96
140
Minimum
46 32 58 27 45 53 54 9.2 3.5
14 5
25
3.5
Mean
63.4 61.2 77.8 58.3 76.5 82.0 77.5 36.8 9.47
37.2 62.1 46.8
57.4
Run-off in acre-feet
3,900 3,640 4,780 3,580 4,250 5,040 4,610 2,260
564 2,290 3,820 2,780
41,500
SAN SIMON CREEK NEAR RODEO, N. HEX.
LOCATION. In SE. ^ sec. 6, T. 27 S., R. 21 E., 10 miles north, of Rodeo,Hidalgo County, N. Mex.
DRAINAGE AREA. 454 square miles (measured on topographic maps). RECORDS AVAILABLE. March 25, 1920, to September 30, 1922. GAGE. Vertical staff in midstream; read by A. J. Love. DISCHARGE MEASUREMENTS. Made by wading near gage. CHANNEL AND CONTROL. Uniform channel 300 feet wide, covered with sacaton
grass and small mesquite. EXTREMES OF DISCHARGE. Trace of water only on August 8. Dry during
remainder of year.1920-1922: Maximum daily mean discharge, 1,340 second-feet July 25,
1921. Creek dry during greater part of each year. DIVERSIONS. None. REGULATION. None.ACCURACY. Stream dry during year except on August 8. Records good. COOPERATION. Records furnished by University of Arizona, Prof. G. E. P.
Smith, irrigation engineer:
SAN SIMON CREEK NEAR SAN SIMON, ARIZ.
LOCATION. In SW. H sec. 29, T. 13 S., R. 31 E., 1 mile east of San Simon, Cochise County.
DRAINAGE AREA. 938 square miles (measured on topographic maps).RECORDS AVAILABLE. August 1, 1919, to September 30, 1922.GAGE. Vertical enamel staff fastened to bridge, low-water section on right pier,
high-water section on left pier; read by Ed Gentner.DISCHARGE MEASUREMENTS. Made from bridge or by wading near gage.CHANNEL AND CONTROL. Bed composed of gravel, scouring to heavy clay at
high water. Low-water control is a gravel bar 50 feet below gage. High- water control formed by right angle turn to right 400 feet below station.
EXTREMES OF DISCHARGE. Maximum mean daily discharge for year, 680 second- feet on August 10; minimum discharge, zero flow greater part of year.
1919-1922: Maximum mean daily discharge, 1,070 second-feet on July 25, 1921; minimum discharge, zero flow greater part of each year.
DIVERSIONS. None.REGULATION. None.

138 SUBFACE WATER SUPPLY, J922, PART IX
ACCURACY. Stage-discharge relation fairly permanent. Standard rating curve fairly well defined. Gage read to tenths once a day or oftener during floods. Daily discharge ascertained from discharge hydrographs prepared from discharge determined by applying each gage reading to rating table. Records fair.
COOPERATION. Records furnished by University of Arizona, Prof. G. E. P. Smith, irrigation engineer.
Daily discharge, in second-feet, of San Simon Creek near San Simon, Ariz., for the year ending September SO, 1922
Date
Oct. 8 Mar.25 -June 11 _______
12..... ......26-.:.. 27..... ......
July 26...... . _ .
Discharge
ocfl
2035
id*.15
34045
Date
July 31 -Aug. 1.. ... ... .
9 . 10-- 12 13 _ ...........U. ............
Discharge
5080
15068010106
Date
Aug. IS... 16.- . __ ,17 ......18 19......
Discharge
157
15390
4<»
NOTE. Stream dry on days for which no discharge is given.
Monthly discharge of San Simon Creek near San Simon, Ariz., for the yearSeptember SO, 1922
Month
October .._..... ..........................................March. ___________________________
July.---... ..August...
The year _______________________
Discharge in second-feet
Maximum
250 20
340 50
680
680
Minimum
0 0 0 0 0
0
Mean
8.06 .64
17.8 3.06
45.4
6.32
Run-off in acre-feet
496 39
1,060 188
2,790
4,570
CAVE CREEK NEAR PARADISE, ARIZ.
LOCATION. In SW. H SE. J£ sec. 34, T. 17 S., R. 31 E., at Portal ranger station, 8 miles by road southeast of Paradise, Cochise County.
DRAINAGE AREA. 39 square miles (measured on topographic maps).RECORDS AVAILABLE. August 5, 1919, to September 30, 1922.GAGE. Vertical enamel staff on right bank 100 feet from ranger station; read
by Mrs. Alice H. Scholefield.DISCHARGE MEASUREMENTS. Made by wading near gage.CHANNEL AND CONTROL. Channel composed of gravel and boulders. Channel
fairly straight and uniform in cross section.EXTREMES OF DISCHARGE. Maximum stage recorded during year, 1.80 feet on
August 16 (discharge, 110 second-feet); dry during part of year.1919-1922: Maximum stage recorded, 5.30 feet August 7, 1921 (dis
charge, 3,360 second-feet); dry during a part of each year.DIVERSIONS. Cave Creek Canal diverts water from left side 700 feet above sta
tion,. Records of this canal are published in this report. Another canal diverts water above this station to irrigate about 7J^ acres.
REGULATION. None.

COLORADO RIVER BASIXT 139
ACCURACY. Stage-discharge relation fairly permanent* Bating curve fairly well defined. Gage read to two-hundredths once a day and oftener during floods. Daily discharge ascertained by applying mean daily gage height to rating table. Discharge hydrographs used during periods of flood. Records fair.
COOPERATION. Records furnished by University of Arizona, Professor G. E. P. Smith, irrigation engineer.
Discharge measurements of Cave Creek near Paradise, Ariz., during the year endingSeptember 80, 1922
[Made by H. C. Schwalen]
Date
Oct. 12..... _________ .13...
Gage height
Feel 0.73.72
Dis charge
Sec.-ft. 0.36.34
Date
Dec. 15. ____________Mar. 19.. ____________
Gage height
Feet 0.74.70
Dis charge
Sec.-ft. 0.36.26
Daily discharge, in second-feet, of Cave Creek near Paradise, Ariz., for the year ending September 80, 1922
Day
1 _______2 _ . ___ .....3..............4..............5 __ ..........
6..............7.. __ ........8........ _ ...9... ____ ....
10 __ ..........
11 ______ ...12..............13 __ ....... _14..............15
16..............17........ __ ..18 ........ 19..............20 .
21 __ ..........22 ____ .. ....23..............24 _______ ..25... _ . ___ ..
26 ___ . .......27 ______ . ...28..............29..............30-... . -..31..... __ ....
Oct.
0.5.5
.5
.5
.5
.5
.5
.5
.5
.5
.5
.5
Nov.
0.5.5.5.5.5
.5
.5
.5
.5
.5
.5
.5
.5
.5
.6
.5
.5
.5
.5
.5
.5
.51.01.0.5
.5
.5
.51.01.0
Dec.
1.01.51.51.51.5
9 n3.03.03.03.0
3.03.03.03.0.5
.5
.5
.5
.5
.5
.5
Jan.
0.5.5
1.0
.5
.5
.5
.5
.5
.5
.5
.5
.5
.5
.5
.5
Feb.
0.5
Mar.
0.5.5.5.5.5
.5
.5
.5
.5
.5
.5
.5
.5
.5
.5
.5
.5
.6
.5
.5
.5
.5
Apr.
0.5.5.5.5.5
.5
.5
.5
.5
.5
.5
.5
.5
.5
.5
.5
.5
.5
.5
.5
1.01.01.01.01.0
1.01.01.01.01.0
May
1.01.01.01.01.0
1.01.01.01.01.0
1.01.01.01.01.9
1.01.01.01.01.0
1.01.01.0.5.5
.5
.5
.5
.5
.5
June
0.5
July
3.5
Aug.
1.54.58.0
110.091.091.061.061.0
4.04.01.01.01.0
1.0
Sept.
1.0
NOTE. Trace only on days for which no discharge is given, except on June 10 to July 7, July 9 to Aug. 12, Aug. 27 to Sept. 7-30, when the stream was dry.

140 SURFACE WATEE SUPPLY, 1022, PART IX
Monthly discharge of Cave Creek near Paradise, Ariz., for the year ending September30, 1922
Month
November... ________________ . _______December __________________________January _____________________________February... ________________ . ........March.. ____________________ ___ . ......April.....................................................May .....................................................June ___________________________July....................................... ...........August ___________________________September. ..............................................
The year ...........................................
Discharge in second-feet
Maximum
0.5 1 3 1 .5 .5
1 1 .5
3.5 110
1
110
Minimum
«T. 0.5 T. T. T. T. .5
' .5 0 0 0 0
0
Mean
0.19 .57
1.18 .42 .02 .39 .67 .87 .02 .11
14.2 .03
1.58
Run-off in acre-feet
12 34 73 26
1 24 40 53
1 7
873 2
1,150
1 Trace of water only.
CAVE CREEK CANAL NEAR PARADISE, ARIZ.
LOCATION. In SW. ^ SE. % sec. 34, T. 17 S., R. 31 E., at Portal ranger station of United States Forest Service, 750 feet below head of canal, and 8 miles by road southeast of Paradise, Cochise County.
RECORDS AVAILABLE. October 14, 1919, to September 30, 1922.GAGE. Vertical staff on left bank; read by Mrs. Alice H. Scholefield.DISCHARGE MEASUREMENTS. Made by wading near gage.CHANNEL AND CONTROL. Earth section. Bed composed of small graveLDIVERSIONS. Above all diversions from canal.ACCURACY. Stage-discharge relation continually changing. Rating curve
poorly defined. Gage read to half-tenths once a day. Daily discharge ascertained by applying daily gage height to rating table. Records poor.
COOPERATION. Records furnished by University of Arizona, Prof. G. E. P. Smith, irrigation engineer.
Canal diverts water from left bank of Cave Creek in SE. ^ SW. ^ sec. 34, T. 17 S., R. 31 E., for irrigating 113 acres near Portal ranger station. When sufficient water is available, 176 additional acres are irrigated. A part of the water for this additional acreage is diverted from Cave Creek, below gaging station on Cave Creek, to Cave Creek Canal through a secondary carrier known as Portal-Reay ditch. Water carried by Portal-Reay ditch does not pass gaging station on Cave Creek Canal.
Discharge measurements of Cave Creek Canal near Paradise, Ariz., during the year ending September 30, 1922
fMade by H. C. Schwalen]
Date
Oct. 12..............................................................................Dec. 15 ___________ ___ ____ . ..................................Mar. 19.. _____ 1 __ ......... ___ ... . _ .... ___ ... _ . ..................
Gage height
Feet 1.301.37
7.31
Dis charge
Sec.-ft. 0.78.79.50
1 New gage datum.

COLORADO RIVER BASIN 141
Daily discharge, in second-feet, of Cave Creek Canal near Paradise, Ariz., for the year ending September SO, 1922
Day
1 ........2. 3 ___ .....4 __ .......5 __ .......
6 ______ .7...... __ .8- .......9...........
10. .......
11 .......12...........13 __ .......14. .......15 ______
16 17 .......18 .18 1.-20 __
21 __ ... ...22 23 ........24 __ ......25 ........
26 .......27 .......28. .......29 ......30 __ .. __ .31 .......
Oct.
1.6.9
1.61.2.9
2 71.61.61.61.6
1.6.9.9.9.9
.9
.9
.9
.5
.9
.7
.5
.5
.9
.9
.9
.9
.6
.6
.6
.6
Nov.
0.4.4.4.4.4
.4
.4
.4
.6
.6
.6
.6
.5
.3
.2
.2
.2
.2
.2
.2
.2
.2
.2
.2
.3
.3
.3
.5
.7
.7
Dec.
0.7.7.1.7
1.0
1.01.01.01.01.0
1.01.01.01.01.0
1.01.01.01.01.0
1.0.7.7.7.7
.7
.7
.7
.7
.7
.7
Jan.
0.71.01.0.5.7
.7
.7
.7
.71.0
1.01.01.01.01.0
1.01.0.7.7.7
.7
.7
.7
.7
.7
.7
.7
.7
.7
.7
.7
Feb.
0.7.7.7.7.7
.7
.7
.7
.7
.7
.7
.7
.5
.5
.5
.5
.5
.5
.1
.1
.1
.3
.3
.3
.3
.3
.5
Mar.
0.5.5.5.5.5
.5
.5
.5
.5
.5
.51.01.0.5.5
.5
.5
.5
.5
.5
.5
.5
.51.3
1.31.41.41.41.31.3
Apr.
1.31.31.81.81.8
1.31.81.81.31.3
1.31.31.31.31.3
1.81.81.81.81.8
1.81.81.81.8
1.8
1.81.31.81.81.8
May
1.81.81.01.01.0
1.01.01.01.01.0
1.0.7.7.7.7
.7
.7
.5
.5
.5
.1
.1
July
1.5
Aug.
1.81.8
1.81.81.82.9.9
2.92.91.81.81.4
1.41.01.01.01.01.8
Sept.
1.8.7
1.81.81.8
4.33.62.62.62. 6
2.62.62.61.81.8
1.81.01.01.01.0
1.01.31.0.7.7
.7
.7
.7
.7
.7
NOTE. Canal dry on days for which no discharge is given.
Monthly discharge of Cave Creek Canal near Paradise, Ariz., for the year endingSeptember 30, 1922
Month
December- _________________________
March.. .................................................April.. ___ . ... ...May .....................................................July __ ......... , __ ... _ . . . _ . . .August ...................................................September.. .............................................
The year ...........................................
Discharge in second-feet
Maximum
2.7 .7
1.0 1.0.7
1.4 1.8 1.8 1.5 2.9 4.3
4.3
Minimum
0.5 .2 .7 .5 .1 .5
1.3 0 0 0 .7
0
Mean
1.04 .37 .86 .79 .51 .72
1.62 .60 .05 .99
1.63
.77
Run-off inacre-feet
64 22 53 49 28 44 96 37
3 61 97
554
EAST TURKEY CREEK AT PARADISE, ARIZ.
LOCATION. In SW. M sec. 19, T. 17 S., R. 31 E., at Paradise, Cochise County. DRAINAGE AREA. 8 square miles (measured on topographic map).
RECORDS AVAILABLE. August 4, 1919, to September 30, 1922. GAGE. Vertical enamel staff on right bank 300 feet downstream from post
office; read by John Hancock.' DISCHARGE MEASUREMENTS. Made by wading near gage.

142 SURFACE WATER 6UPPLY, 1922, PART IX
CHANNEL AND CONTROL. Bed composed of boulders and gravel. Control formed by concrete wall extending at an angle across channel. Channel fairly uniform in cross section.
EXTREMES OP DISCHARGE. Maximum mean daily discharge for year, 18 second- feet August 19; creek dry during periods of year.
1919-1922: Maximum mean daily discharge, 170 second-feet August 18,. 1921; minimum discharge, dry for periods of each year.
DIVERSIONS. Several small diversions above station, most of water returns to creek above station.
ACCURACY. Stage-discharge relation fairly permanent. Rating curve poorly defined. Gage read to nearest two-hundredths twice a week and oftener during floods. Daily discharge ascertained by applying gage heights to rating table, and interpolating for days when gage was not read. Records fair.
COOPERATION. Records furnished by University of Arizona, Prof. G. E. P, Smith, irrigation engineer.
Discharge measurements of East Turkey Creek at Paradise, Ariz., during the yearSeptember SO, 1922
[Made by H. C. Schwalen]
Date
Dec. 15... ____ . ___ ... . ___ ___ . __ ..... Mar. 3 __ . _______________________________________
SBFeet
0.00.18
Dis charge
Sec.-ft, 0.14.42
Daily discharge, in second-feet, of East Turkey Creek at Paradise, Ariz., for the year ending September 30, 1922
Date
14. 15- 16 17.. . is
Discharge
0^5.5.5.5.5.5
Date
Mar. 19.. ...........20---.------.91
22...... .......23 ------24 --
Discharge
0.5.5.5.5.5.5
Date
Mar.25. Julys.. Aug 19
20- Sept. 1 -
5
Discharge
0.&2
1821.5.5
NOTE. Trace only Oct. 1 to June 2, except for the period Mar. 13-25. Dry June 3 to Sept. 30, except for July 8, Aug. 19, and 20, and Sept. 1 and 5.
Monthly discharge of East Turkey Creek at Paradise, Ariz., for the year ending1September 30, 1922
Month
March. ___________________July . .August __________________________ ..September _________________________ .
Discharge in second-feet
Maximum
0.5 2
18 1.5
Minimum
o T
0 0 0
Mean
0.21 .06 .65 .05
Run-off inacre-feet
1* 4
40 $
Trace.

COLORADO EIVEE BASIN
GRAHAM CAHAI WEAR SAFFORD, ARIZ.
143
LOCATION. In NE. ^ SW. ^ sec. 5, T. 7 S., R. 26 E., near Hatfield ranch, a mile below intake, and 2 miles north of Safford, Graham County.
RECOBDS AVAILABLE. October 1, 1914, to September 30, 1915; December 30, 1920, to September 30, 1922.
GAGE. Vertical staff on left bank 600 feet below waste gate* read by J. M. Hatfield.
DISCHABGE MEASUBEMENTS. Made by wading or from footbridge at gage.CHANNEL AND CONTBOL. Bed composed of silt; frequently covered by deposits,
of sand; shifting. No well-defined control.DIVEBSIONS. One diversion just above gage; irrigates 52 acres.ACCUBACY. Stage-discharge relation not permanent. Standard rating curve
well defined. Gage read to hundredths twice daily. Daily discharge ascer tained by applying mean daily gage height to rating table. Shifting-control method used for entire year. Records good.
Canal diverts water from right side of Gila River in the NW. J^ sec. 9, T. 7 S., R. 26 E., for irrigating 2,577 acres near Safford.
Discharge measurements of Graham Canal near Safford, Ariz., during the year ending September SO, 1922
Date
Oct 3Nov. l
30
Feb. 3Mar. 3Apr. 14
21May 1
7
Made by
.do ..do do. . .do ... ..do... ... ... ... ...
..do.. ...
Oage height
Feet 5.425.465.345.585.265.285.105.505.004.754.65
Dis charge
Sec.-ft. 35.245.636.046.401 436.925.345.426.4
9.9
Date
July 27
24
2831
Sept. 5182527
Made by
..do ... - ... - ..do
do .do ..do ..do ..do ....
Oage height
Feet 4.654.674.534.554.855.204.854.854.884.954.90
D.is- charge
Sec.-ft 10.510.75.99.19.9
24.37.67.64.7
11.08.2
Daily discharge, in second-feet, of Graham Canal near Safford, Ariz., for the year ending September SO, 1922
Day
1 ... .... ....2 3. __ .........4 ...... ....5 .
6 7 ...........8....... ....9..... ......10 .. .........
11 12 13 14........ .15
16 ..17 18 ...........19 20 ...
Oct.
tn4339on
37
34oo
345841
OK
35353434
3n29292725
Nov.
454244
44
4449
394240
4648485050
5352555865
Dec.
304350
48
5845383834
- 3845454f>45
4342424242
Jan.
454545en
50
4747474747
4755562736
3838384040
Feb.
3333311A.22
2630323428
2638272932
3231262428
Mar.
3133313337
3331453830
3234364238
3838383839
Apr.
253030
54
6062464ft35
31
27202422
2225252730
May
2625242324
2624242323
2323212121
2019171715
June
11125129
78-888
96176
89869
July
12109
7
97172618
1187107
88777
Aug.
12541888
796
2125
2317413741
1926303834
Sept,
61615124
9312023
- 21
00003
74277

144
Daily di
SURFACE WATER SUPPLY, 1922, PAET IX
, in second-feet, of Graham Canal near Safford, Ariz., for the year ending September SO, 1922 Continued
Day
21. ____ ......22.. __ . _ . 23 24 25
26 27 28 29 30 31 _ ........
Oct.
26313232Qfi
454546464644
Nov.
57«ifi544407
2927353941
Dec.
4240424752
455045454545
Jan.
40404038IS
010
97
333535
Feb.
3032362528
252533
Mar.
3929262525
272727252525
Apr.
4540302825
2427262626
May
1516161414
141414121212
June
88888
99161215
July
799817
36274510910
Aug.
> 2830221624
31242313116
Sept.
104191211
10312&
Monthly discharge of Graham Canal near Safford, Ariz., for the year ending Septem ber SO, 1922
Month
October ___________ . _ .... . . _ . . ..
December _________________________ .January ____ . _________ . ......................February.... ________ .. __________ . .....
April.....................................................May __________________ _ . ....
July.......... August... __ ... ______________________
Discharge in second-feet
Maximum
58 65 58 55 38 45 62 26 16 45 54 31
65
Minimum
25 35 30
, 0 22 25 20 12
5 7 6 0
0
Mean
37.2 45.8 43.9 38.8 29.3 32.7 33.1 19.1 9.1
12.5 22.6 8.8
27.8
Run-off in acre-feet
2,29O 2,730 2,700 2,390 1,630 2,010 1,970 1,170
542 769
1,390 524
20,100
SMITHVIIIE CANAL NEAR THATCHER, ARIZ.
LOCATION. In NW. % sec. 35, T. 6 S., R. 25 E., three-quarters of a mile below intake and 1^4 miles north of Thatcher, Graham County.
RECORDS AVAILABLE. October 1, 1914, to September 30, 1915; December 23, 1920, to September 30, 1922.
GAGE. Vertical enamel section on left bank 300 feet below waste gate; read by Patricia Vasquez.
DISCHARGE MEASUREMENTS. Made from footbridge at gage.CHANNEL AND CONTROL. UnifoBm section;, banks,vertical. No well-defined
control.DIVERSIONS. None.ACCURACY. Stage-discharge relation not permanent. Standard rating curve
well defined. Gage read to hundredths twice a day. Daily discharge "ascertained by applying mean daily gage height to rating table; shifting- control method used for entire year. Records good.
Canal diverts water from left side of Gila River in the NE. ^ sec. 35. T. 6 S., R. 25 E., for irrigating 1,760 acres near Pima.

COLORADO RIVER, BASIN 145
Discharge measurements of Smithville Canal near Thatcher, Ariz., during the year ending September SO, 1922
Date
Oct. 3Nov. 1Dec. 2Jan. 4Feb. 2Mar. 2
18May 1
19
Made by
.....do..................
.-do.......................do.......................do..................
Gage height
Feet 6.206.326.686.406.485.866.155.605.805.49
Dis charge
Sec.-ft. 31.430.948.742.842.823.131.615.821.514.1
Date
1218
July 21224
9Sept. 4
18
Made by
__ .do _________.....do.......................do.......................do...... ___ . ....J. H. Gardiner _____
__ .do _________.....do... ....................do... .____.____.__..
Gage height
Feet 5.205.145.205.155.425.026.756.645. 825.43
Dis charge
See.-ft. 8.26.37.57.6
11.85.5
46.941.623.411.2
Daily discharge, in second-feet, of Smithville Canal near Thatcher, Ariz., for the year ending September 80, 1922
Day
1 _______2.......... __3.......... ....4..............5.. _ .........
6... . ..........7 __ ..........8... __ .......9..............10.. ............
11 12 . 13 14..............15 _ ...........
16 17 18..... .........19.. _ .........20..............
21..............22 _ ...........23..............24..............25..............
26..............27..............28..............29. _ ... .......30..............31..............
Oct.
3936302832
3131163226
29211760
2529181512
1312101113
342328303333
Nov.
3029272835
4047514951
4532223136
3536374240
3141303235
3126273030
Dec.
5149494853
5356565352
4747444742
36424140
4138373821
0014303130
Jan.
3333334040
3536363842
4242424242
4240394141
4141383835
34343436.3640
Feb.
4340403939
in40373131
3341353030
27232426
30333023QK
4Q1624
Mar.
2117242621
829273030
3527263526
2435292729
2924262423
232121242018
Apr.
1 18183330
2736302324
2421212324
2624161620
1617171618
1616162018
May
1818181616
1616151514
1412131212
1310131212
1011101010
101010
8
June
881089
108887
7791611
76797
871067
61113277
July
97666
6612An18
810
108
67777
677714
1Q
876136
Aug.
5522456
5544
61
412364465
387
214053
3114406
161816161012
Sept.
1221201714
1225131953
4054241716
1211991017*
102414
77767

146 SURFACE WATEB SUPPLY, 1922, PART IX
Monthly discharge of Smithville Canal near Thatcher, Ariz., for the year endingSeptember 30, 1922
Month
November. _________________________December __________________________
February.. _________________________March.. ________ __ __ . .... . . ........April. . .... _ . _____________________May _______________________________June... ___________________________July......................................................
Discharge in second-feet
Maximum
39 51 56 42 49 35 36 18 27 40 65 54
65
Minimum
0 22 0
33 16
8 16
8 6 6 0 6
0
Mean
23.0 35.2 39.6 38.3 32.9 25.1 21.3 12.7 9.1 9.3
20.5 17.2
23.6
Run-off in acre-feet
1,410 2,090 2,430 2,360 1,830 1,540 1,270
781 542 572
1,260 1,020
17,100
DODGE-NEVADA CANAL NEAR PIMA, ARIZ.
LOCATION. In NW. }£ SE. }£ sec. 18, T. 6 S., R. 25 E., a mile below intake and 1J^ miles north of Pima, Graham County.
RECOBDS AVAILABLE. December 31, 1920, to September 30, 1922.GAGE. Vertical staff on right bank, half a mile below waste gate, and 200 feet
upstream from siphon at county highway crossing; read by W. W. Crockett.DISCHARGE MEASUREMENTS. Made by wading at gage.CHANNEL AND CONTROL. Bed composed of silt; banks vertical; shifting.
Control affected by siphon 200 feet below gage.DIVERSIONS. One diversion above gage; irrigates 14J^ acres.ACCURACY. Stage-discharge relation not permanent. Rating curves well
defined. Gage read to nearest two-hundredths twice a day. Daily dis charge ascertained by applying mean daily gage height to rating tables. Records good.
Canal diverts water from left side of Gila River in the NW. M sec. 20, T. 6 S., .R. 25 E., for irrigating 1,250 acres near Pima.
Discharge measurements of Dodge-Nevada Canal near Pima, Ariz., during the year ending September SO, 1922
Date
Oct. ' 3Nov. 3Dec. 3
Feb. 2
Apr. 15
Made by
H. D. Empie . ___ .
..do.......................do... .................de... .................do.......................do..... ..........
Gage
Feet 1.841 QC
2.912 1R
1.481.58
Dis charge
Sec.-ft. 11.117.425.027.999 R
16.521.7
Date
Apr. 18"IWa-rr O
July 3Aug. i 2
Made by
-....do-.. ..... ... -do. ... ... .....-.-.do.. . . ..
Gage
Feet 1.461.311.14.90
2.661.04
Dis charge
Sec.-ft. 19.113.99.74.6
32.76.7
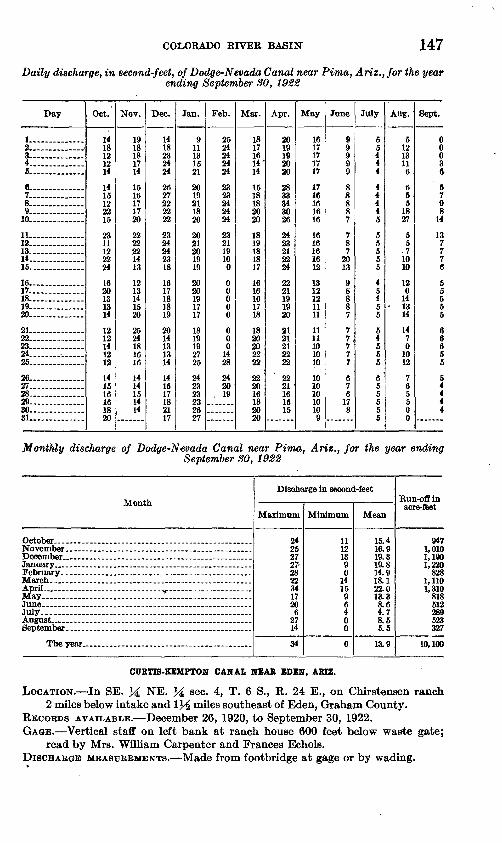
COLORADO EIVEE BASIN 147
Daily discharge, in second-feet, of Dodge-Nevada Canal near Pima, Ariz,, for the yearending September 80, 1922
Day
1 __ ..... __2........ ......3 ..4..............5. ... ____
6.......... ....7..............8... ...... _ ..9..............10
11 12 .........13... ...........14... ...........15
16. ........17..............18 ..........19..............20
21 .......22... ..... ......23... ...........24... ........25 .
26 .......27....... .......28 ..........29 .........30 31.. __ ........
Oct.
141819
1214
141519
2215
23111299
24
1620131314
19
121419
12
14151616IB
20
Nov.
1918181714
1516171720
2222221413
1213141520OK
24181616
1414151414
Dec.
1418232424
2627222222
2324242318
1617181810
2014131314
141517182117
Jan.
911131521
2019211820
2091
201010
202010
1717
18191997
25
242323232627
Feb.
2524242424
2323242424
232119100
00000
000
1428
2420
, 19
Mar.
18171614'14
1518182020
1819181817
1616161718
1820202222
222016182020
Apr.
2019192020
28.33043026
2400
219924
2221191920
91
21212222
2221161515
May
1617171717
1716161616
1616161612
1312121111
1111101010
1010101010
Q9
June
99999
88887
787
2013
98887
77777
676
178
July
55444
44445
5
555
45455
54555
655555
Aug.
51213116
655
1827
55
71010
120
14 13
14
1470
1012
765$00
Sept.
00036
5798
14
137776
55555
66655
54444
Monthly discharge of Dodge-Nevada Canal near Pima, Ariz., for the yearSeptember SO, 1922
Month
November... ________________________
$ay- .-. . .. . .......July.....................................................
Discharge in second-feet
Maximum
24 25 27 27- 28 22 34 17 20
6 27 14
34
Minimum
11 12 13 9 0
14 15 9 6
0 0
0
Mean
15.4 16.9 19.3 19.8 14.9 18.1 22.0 13.3 8.6 4.7 8.5 5.5
13.9
Kun-ofl in acre-f&et
947 1,010 1,190 1,220
828 1,110 1,310
818 512 289 523 327
10,100
CURTIS-KEMPTON CANAI HEAR EDEN, ARIZ.
LOCATION. In SE. M NE. M sec. 4, T. 6 S., R. 24 E., on Chirstensen ranch 2 miles below intake and 1^ miles southeast of Eden, Graham County.
RECORDS AVAILABLE. December 26, 1920, to September 30, 1922.GAGE. Vertical staff on left bank at ranch house 600 feet below waste gate;
read by Mrs. William Carpenter and Frances Echols.DISCHARGE MEASUREMENTS. Made from footbridge at gage or by wading.

148 SURFACE WATER SUPPLY, 1922, PART IX
CHANNEL AND CONTROL. Bed composed of silt, banks vertical; shifting. Con trol affected by two checks just below gage.
DIVERSIONS. Three diversions above gage; irrigates 87 acres.ACCURACY. Stage-discharge relation not permanent. Rating curves well
defined. Gage read to half -tenths twice a day. Daily discharge ascertained by applying mean daily gage height to rating tables. Records good.
Canal diverts water from right side of Gila River in the NW. 6 S., R. 24 E., for irrigating 1,650 acres near Eden.
see. 12, T.
Discharge measurements of Curtis-Kempton Canal near Eden, Ariz., during the year ending September SO, 1922
Date
Oct. 3Nov. 3Dec. 3
Feb. 2
Apr. 1518
May 3
Made by
H. D. Empie ........
..... do.... - ......
... -do...... ...... . .do...... ........... ......do.... ............ .do..-. ...........
H. D. Empie __ . ......
Gage height
Feet 4.92
5. IS5.205.104.68
4.674.40
DIs-charge
Sec.-ft. 21.114 4O1 Q
29 726 719.2
21.617.3
Date
July 3
25
1123
Made by
do
. __ do ..................
.....do..... . ... ..do....~
Gage height
Feet 4.184.031 Ql
4.545.254.815.244.72
Dis charge
aee.-ft. 9.17.3
23.34.6
42. ^21.438.717.2
Daily discharge, in second-feet, of Curtis-Kempton Canal near Eden, Ariz., for the year ending September 30, 1922
Day
1 __ . .........2 .......3 ... ....4 .... ..... .5., ............
6 7 .... 8 9. ... .......10-
11 . ...12 13 14.. ......15
16 17 18. _ ..........19 20 . ....... ...
21. 22-..... ..23 24. 25
26 .......27 28...... . ,29 30 31 ,
Oct.
2524201712
1413153223
oo
17231919
232497
11
1414151921
161918232323
Nov.
2221131520
Oft
25232117
10142125OQ
1623282325
252328Ofi
28
3131on
26
Dec.
252632onon
9723252530
2518202526
2727272731
323030on
32
01
9725on
32oo
Jan.
31312897
25
2597303130
9797979701
31262322
2630330«
34
Q4.04,
34343636
Feb.
3228272825
2526262512
00000
00233025
2430252323
14
20
Mar.
2119191919
9119192024
9725212323
2722202123
15112317.17
171718171717
Apr.
1912172121
1922242125
1716152710
1419191920
1918191919
9120121717
May
1719171616
141414149
1113141214
1111101010
1010121010
9910999
June
99889
216666
6669
661164
66666
6767
July
976
6
6671519
109776
66666
66444
76666
Aug.
6192197
766
1737
2825254043
2810184338
2510620
000000
Sept.
1231191814
1415141423
2613121010
12101099
9101855
86676

COLORADO BIVEE BASIN 149
Monthly discharge of Curtis-Kempton Canal near Eden, Ariz., for the year endingSeptember SO, 1922
, Month
April...-... ....... .. ............................
July....................................................
Discharge in second-feet
Maximum
32 33 32 36 32 27 27 19 21 19 43 31
43
Minimum
7 13 18 2! 0
11 10 9 4 4 0 5
0
Mean
18.5 23.5 27.6 29.6 18.1 19.9 18.6 12.0 7.2 7.0
15.4 12.5
17.5
Run-off in acre-feet
1,140 1,400 1,700 1,820 1,010 1,220 1,110
738 428 430 947 744
12,700
FORT THOMAS CONSOLIDATED CANAL AT ASHURST, ARIZ.
LOCATION. In the NE. M SE. M sec. 30, T. 5 S., R. 24 E., 2 miles below intake, half a mile east of State highway, and 1 mile southeast of Ashurst, Graham County.
HECORDS AVAILABLE. December 26, 1920, to September 30, 1922.GAGE. Vertical staif on right bank half a mile below waste gate; read by Tom
Hundley.DISCHARGE MEASUREMENTS. Made from footbridge at gage.CHANNEL AND CONTROL. Bed consists of silt and frequently covered by moss;
shifting.DIVERSIONS. None.ACCURACY. Stage-discharge relation not permanent. Rating curves well
defined. Gage read to half-tenths twice a day. Daily discharge ascertained by applying mean daily gage height to rating tables. Records good.
Canal diverts water from left side of Gila River in the NW. M sec. 4, T. 6 S., H. 24 E., for irrigating 2,236 acres near Fort Thomas.
Discharge measurements of Fort Thomas Consolidated Canal at Ashurst, Ariz., during the year ending September 80, 1922
Date
Oct. 3Nov. 3 Jeb. 2Mar. 2Apr. 18
19May 3
Made'by
do., .....do ... .... ..... ........do .... ..
H. D. Empie ____.....do-..... . .
aFeet
. 9.058.90 9.308.658.678.758.52
, D.is- charge
Sec.-ft. 3127 40.51814.517.312
Date
July 3 25
Sept. 411
*
Made by
_ ..do ....
do...
Gage height
Feet 8.658.03 a 769.718.159.79
Dis charge
Sec.-ft.9.74.2
11.229.36.4
60.5

150 SURFACE WATER SUPPLY, 1922, PART IX
Daily discharge, in second-feet, of Fort Thomas Consolidated Canal at Askur&t, Ariz., for the year ending September SO, 1922
Day
\.. ............2. _ ..........3 4..... _ ......5
6 7.... _ .......8... ...........9..............10.. ... ......
11 . 12 13.... ..........14. .. ........15 .
16..............17... ...........18...... ........19. .........20 -
21... ....... ....22..............23...... ........24..............25 .........
26 27..............28 _ .. __ ....29..............30...- _31. ........
Oct.
3231312721
1718173936
2317181834
1813211815
1312131320
171821262632
Nov.
3136262726
2934313132
3127263432
2626232626
2931312626
120000
Dec.
00000
00000
00000
036435050
4650465054
555454525250
Jan.
50250030
615250Kf\
d«
50505048in
5048485050
485050463Q
373634323632
Feb.
3936393936
3936373632
3126313936
3231263629
3229322629
292923
Mar.
2317201310
101791514
1823181817
1715172314
IS23201717
171717171420
Apr.
1519161115
1316201919
2219191516
1616161513
11.2111213
1113131111
May
81010810
8111086
1112111111
108888
77788
88
11131313
June
1315121547
54444
444117
64444
44222
581794
July
64222
2481514
7442
. 4
42447
99101417
171212101214
Aug.
143232139
400015
6001
43
522066563
372623100
000161317
Sept.
49977
1445
2055
5515774
\ 41 4
442
44844
44222
Monthly discharge of Fort Thomas Consolidated Canal at Ashurst, Ariz., for the year ending September SO, 1922
Month
October __ . _________________ . __ . .....
February... ________________________
April.......... ...........................................
July .... ..... ........ ......... .........................August... ................................................September.. ___ . ..................................
Discharge in second-feet
Maximum
39 36 55 61 39 23 22 13 47 15 65 55
65
Minimum
12 0 0 0
23 9
11 6 2 2 0 2
0
Mean
21.8 24.5 23.9 41.9 32.3 16.9 14.9 9.4 7.7 7.6
16.7 8.9
18.8
Run-off in acre-feet
1,340 1,460 1,470 2,580 1,790 1,040
887 ' 578
458 467
1,030 530
13,600
SAN PEDRO RIVER NEAR FAIRBANK, ARIZ.
LOCATION. In T. 20 S., R. 21 E., unsurveyed, on old Spanish grant at ranch house of Boquillas Land & Cattle Co., 1^£ miles south of Fairbank, Cochise County, and 4 miles below Charleston dam site.
DRAINAGE ABEA. 1,300 square miles (measured on topographic maps and Greenidge map of Sonora, Mex.).
.RECOBDS AVAILABLE. September 28, 1912, to September 30, 1922. January 27, 1904, to August 31, 1906, and October 8, 1910, to November 15, 1911, for a station at Charleston; November 15, 1911, to September 28, 1912, for station at diversion dam of Boquillas Land & Cattle Co.

COLORADO BITER BASIN 151
GAGE. Vertical and inclined staff on right bank just upstream from ford leading to ranch house; read by A. H. Zachau.
DISCHARGE MEASUREMENTS. Made from cable 600 feet downstream from gage or by wading.
CHANNEL AND CONTROL. Bed composed of sand and gravel; shifting. Banks high and steep, channel fairly straight with considerable fall. At low stages channel bears away from gage, and a ditch has to be maintained from gage to river. No well-defined control.
EXTREMES OF DISCHARGE. Maximum stage recorded during year, 13.2 feet at 8 a. m. August 10 (discharge, 3,380 second-feet); minimum stage, 9.1 feet May 18-23 (discharge, 1 second-foot).
1912-1922: Maximum stage recorded, 26 feet, present datum, at 5 p. m. December 22,1915 (discharge not determined); minimum discharge, 1 second- foot June 13-14, September 26-28, 1918, June 23-30, 1919, and April 29, May 18-23, 1922.
DIVERSIONS. Boquillas Land & Cattle Co., diverts at a dam a mile above station for irrigation. Total area irrigated not known.
ACCURACY. Stage-discharge relation not permanent. Rating curves well de fined except for discharge above 2,000 second-feet. Gage read to hun- dredths once a day and oftener during flood periods. Daily discharge ascertained by applying mean daily gage height to rating table. Shifting- control method used January 7 to March 13 and May 4 to June 13. Records fair.
Discharge measurements of San Pedro River near Fairbank, Ariz., during the year ending September 30,
Date
Dec. 2Mar. 13
29
Made by
..do.. ............. do
Gage height
Feet 9.259.349.059.55
Dis charge
Sec.-ft. 1282.2
39.6
Date
July 31
Sept. 28
Made by
H. C. Schwalen. ___
.... .do...
Gage height
Feet 10.389.309.25
Dis charge
Sec.-ft. 27714.42.7
Daily discharge, in second-feet, of San Pedro River near Fairbank, Ariz., for the year ending September 30,
Day
I...... ........2-... .........3 _.4.. ............5.. ............
6..............7..............8 9..............10..............
11... ...........12 ...........13... ...........14..............15 ...........
16 17........ ...18..............19 ...........20 __ ..........
Oct.
1814141818
1834181411
1111888
88888
Nov.
88888
814141414
1414141414
1414141414
Dec.
1111141818
1818182323
2318181814
1411
1111
Jan.
1414141818
2318181814
1414141414
1414131010
Feb.
1111111111
11111177
1010131313
10131Q
1311
Mar.
88777
77777
7891014
1414106
10
Apr.
141066
6666
63.53.53.5
3.53.5
66
May
3.56644
24444
72222
22rii
June
22333
33333
3322.52.5
2.54444
July
1814141411
1,77065013816863
4723232323
1858014168223
Aug.
42055281414
1414
985186
1,900
223635516863
138401866340
Sept,
20373
33528510
5457373
1,64070
3530303024
2419301919

152 SURFACE WATER SUPPLY, 1922, PART IX
Daily discharge, in second-feet, of San Pedro River near Fairbank, Ariz., for the year ending September SO, 1922 Continued
Day
21..............22..............2324..............26..............
26..............27..............28..............29..............30.............31.. .... ._...___
Oct.
88888
888888
Nov.
1411111111
1111111111
Dec.
14141414
1414141414
Jan.
1313101313
131313111114
Feb.
111088
1188
Mar.
14106610
61014101010
Apr.
63.53.53.53.5
3.56613.5
May
11166
666663
June
4444
41534023
July
474028168203
4202439683108895
Aug.
10863
2668347
342823231818
Sept.
1919
J 1414L"
'"t 6
6-66-6-
Monthly discharge of San Pedro River near Fairbank, Ariz., for the year endingSeptember SO, 1922
Month
October _ .....-.-..--...--...-.-..--. _ . __ ... _ .....November.. _____________________
March.. _________ . __ ___ ... _____ __ .
May _______________ . ___ __ . ________
July........... .-......-.-...-...-.....--..... .....August _ ... _____ -. __ .. ________ . __ . __September..- ____ -.. ___ .-.._ __ . _ ...... _ ..
Theyear _ . _ _ _. _ __ . . _ __ . .
Discharge in second-feet
Maximum
3414 23 23 13 14 14 7
153 1,770 1,900 1,640
1,900
Minimum
8 8
11 10
7 6 1 1 2.5
11 14 6
1
Mean
11.3 11.9 15.3 14.1 10.5 9.0 5.32 3.60
10.) 204 174 131
50.4
Run-off in. acre-feet
695. 70S. 941 86T 583. 553sir221 601
12,500- 10, 7007,80ft
36,50ft
SANTA CRUZ RIVER NEAR NOG ALES, ARIZ.
LOCATION. In sec. 36; T. 23 S., R. 14 E., at city of Nogales pumping plant,7 miles northeast of Nogales, Santa Cruz County.
DRAINAGE AREA. Not measured.RECORDS AVAILABLE. April 28, 1921, to June 30, 1922, when station was dis
continued. March 22 to November 30,1907, and April 1,1909, to September30, 1920; fragmentary.
GAGE. Painted on vertical pier of highway bridge. One gage to each pierdesignated A, B, and C, from left to right bank; read by O. R. Harrington.For description of previous gages used at this station, see Water-SupplyPaper 479, page 157.
DISCHARGE MEASUREMENTS. Made by wading or from highway bridge at gage. CHANNEL AND CONTROL. Bed composed of sand and gravel which is constantly
shifting. Channel is wide and shallow with low banks. No well-definedcontrol.
EXTREMES OF DISCHARGE. "Maximum stage for period, 5.6 feet at 5 p. m. June27 (discharge, 86 second-feet); dry for numerous periods.
1921-1922: Maximum stage, 8.3 feet at 6 p. m. August 9, 1921 (discharge,,2,600 second-feet); channel usually dry during long periods of each year.
DIVERSIONS. Water is diverted above station for irrigation of about 140 acres. ACCURACY. Stage-discharge relation continually changing. Standard rating.
curve fairly well defined. Staff gage read twice a day to half-tenths. Dailydischarge ascertained by applying mean daily gage height to rating tables..Shifting-control method used January 3 to February 22. Records fair.

COLORADO EIVEE BASIN 153
Discharge measurements o/ Santa Cruz River near Nogales, Ariz., during the year ending September SO, 1922
Date
Dec. l2
Jan. 2
Made by
J. H. Gardiner ____.....do ..___.__.....__E. C. Eice.............
Gage height
Feet 5.105.135.14
Dis charge
Sec.-ft. 10.0n11
Date
Feb. 22Mar. 14
Made by
B. C. Rice.............i. H. Gardiner ____
Gage height
Feet 5.125.15
Dis charge
See.-/*. 7.5
10
Daily discharge, in second-feet, of Santa Cruz River near Nogales, Ariz., for the year ending September SO, 1922
Day
1 ____________ .... _ . _ ...2....................................3.. _______ . _ . __ ............4 __ __.... ._.._...._......_._..._5....................................
6..... __ .... _ . __ ..............7 _ ........ _____ . __ ..........8.. ___________ ... ___ . _ ....9 _ . ____ ..... _____ ...... .10 __ .. __ .... __ ....... _ ......
11.. _ . _____ . _ ............ _ ..12... _ .... _____ . ___ ...... _ ..13 ___ .... _____ ... __ ........ .14....................................15. __ . _ ................. _ ......
16.... _ ........ _______ .........17................. _ . _____ ......18....................................19........ __ .... ____ ....... __ .20............ __ . __ . ..........
21...... _ .... _ .... .......... _22 __ . _ ..... ___ ..... ___ .. _ ..23 _______ ... __ . _______ ...24 _ ...... __ . ___ . __ ...........25.............. ___ . ___ ..........
26....-..... . .-. .............27....................................2829.......... ___________ .........30....................................31...... _ .. _ ....... ____ .. __ .
Oct.
1714141717
1410101010
105101010
105
. 101010
5551010
101014141410
Nov.
107.5107.57.5
7.55555
5551010
107.57.57.510
. 10551010
1010101417
Dec.
1717107.510
17171717%
1717141414
1010107.510
1010141014
10101010147.5
Jan.
7.514222727
1616122716
161212912
129161616
2216161616
161616161620
Feb.
1611H118
88888
85558
85555
814141414
777
*"
Mar.
74.524.54.5
4.54.522.2
4.519147
77
10.577
74.521414
147772
Apr.
774.52
June
437
NOTE. Stream dry on days for which no discharge is given.
Monthly discharge of Santa Cruz River near Nogales, Ariz., for the year endingSeptember 30, 1922
Month
October. __________ _ .. ______ __ .
February.. _________________________
April ___ ...... _____ ...... __ ...................."June. ____________________________
The period ______________________
Discharge in second-feet
Maximum
17 17 17 27 16 19
7 43
Minimum
5 5 7.5 7.5 5 0 0 0
Mean
10.6 8.28
12.6 16.1 8.6 6.36 .68
1.7
Run-off in acre-feet
652 493 775 990 478 391 40
101
3,920

154 SURFACE WATER SUPPLY, 1922, PART IX
SANTA CRUZ RIVER AT TTTCSON, AKIZ.
LOCATION. In sec. 14, T. 14 S., R. 13 E., at Congress Street Bridge at Tucson, Pima County, 7 miles above Rillito Creek.
DRAINAGE AREA. 2,260 square miles (measured on topographic maps and Greenidge maps of Sonora, Mex.).
RECORDS AVAILABLE. October 15, 1905, to September 30, 1922.GAGE. Staff gages painted on, downstream side of each bridge abutment; read
by J. O. Kenny.DISCHARGE MEASUREMENTS. Made from bridge or by wading.CHANNEL AND CONTROL. Bed composed of sand; channel wide and shallow.
Control shifts badly at all stages.EXTREMES OF DISCHARGE. Maximum discharge during year, 2,000 second-feet
about 11 p. m. July 20; river dry most of time.1905-1922: Maximum stage recorded, 9.8 feet December 24, 1914 (dis
charge, about 9,000 second-feet); river dry most of each year at this point.DIVERSIONS. Diversions above station for irrigation; amounts unknown.REGULATION. None. *ACCURACY. Stage-discharge relation not permanent. Rating curves poorly
denned. Gage read to tenths several times a day during periods of flow. Daily discharge ascertained from discharge hydrographs prepared from discharge determined by applying each gage reading to rating table. Rec ords fair.
COOPERATION. Records furnished by University of Arizona, Professor G. E. P. Smith, irrigation engineer.
Discharge measurements of Santa Cruz River at Tuscan, Ariz., during the yea* ending September 80, 1922
Date
July 718182126
Made by
Cbde and Schwalen ....H. C. Schwalen ........
Gage height
Feet 4.525.424.084.404.95
Dis charge
Sec.-ft. ' 165
66416079
400
Date
July 2731
16
Made by
W. E. Code ... ..... .. ....do-.... ...........
Gage height
Feet 4.605.734.985.524.38
Dis charge
Sec.-ft. 32
1,010260502
18
Daily discharge, in second-feet, of Santa Cruz River at Tuscan, Ariz., for the year ending September 80,
Day
1 _ . __ . _ ...2 ___ ..........3 _ ...... _ ...4 ______5 - _
6 -....... .7 8 ____ . ___ .9... _ .........10-
11-- 12 __ ............13- 14 _ . .. .15 __ ..... .--..
Jan.
1010101010
99999
88888
July
554
154
Aug.
35
220
301070
250180
Sept.
180
200
40
Day
16 __17- 18 1920--. _______ -
21 ______ - __ .22 __ 23 __ . __24 __ ....... 25
26-- _ 27-- 28 __ ..... ___29- 3001
Jan.
77776
66655
432111
July
20
2555
290
3102
1
40030
25630
Aug.
38045018030
5
5340590
5
Sept.
15
NOTE. Stream reported dry on days of no record.

COLORADO RIVER BASIN 155
Monthly discharge of Santa Cruz River at Tucson, Ariz., for the year ending Sep tember 30, 192%
Month
July.................. _.___._.___._.___..__._.__.. _ ..August ______________________________September- _____ ___ __ .. ___ _ .... .....
Discharge in second-feet
Maximum
10 630 590 200
630
Minimum
1 0 0 0
0
Mean
6.7 66.0
' 89.7 14.5
15.0
Run-off inacre-feet
412 4,060 5,520
863
10,900
NOTE. Monthly discharge computed by engineer of U. S. Geol. Survey from daily discharge furnished by University of Arizona, G. E, P. Smith, irrigation engineer.
RILLITO CREEK NEAR TUCSON, ARIZ.
LOCATION. In sec. 23, T. 13 S., R. 13 E., at highway bridge on Oracle road, 4 miles above confluence with Santa Cruz River and 4 miles north of Tucson» Pima County.
DRAINAGE AREA. 897 square miles (measured on topographic maps).RECORDS AVAILABLE. January 12, 1911, to September 30, 1922; fragmentary,GAGE. Staff gages painted on downstream side of several bridge piers, set to
same datum; read by Morgan Mason.DISCHARGE MEASUREMENTS. Made from bridge or by wading.CHANNEL AND CONTROL. Bed composed of sand which is constantly shifting.
Control not well defined.EXTREMES OP DISCHARGE. Maximum discharge during year, 3,250 second-feet"
during night of August 9-10; dry greater part of year.1911-1922: Maximum stage occurred December 23, 1914 (discharge
greater than 16,000 second-feet); dry greater part of each year.DIVERSIONS. Flood water is diverted for irrigation above station; amount
unknown.REGULATION. None.ACCURACY. Stage-discharge relation continually changing. Rating curves-
poorly defined. Gage read to tenths several times a day during periods of flow. Daily discharge ascertained from discharge hydrographs prepared from discharge determined by applying each gage reading to rating table~ Records fair.
COOPERATION. Records furnished by University of Arizona, Prof. G. E. P, Smith, irrigation engineer.
Discharge measurements of Rillito Creek near Tucson, Ariz., during the year ending:September SO,
Date
Jan. 34
July 19
Made by
W. E. Code ____ . _.....do ....................do......... . ...
Gage height
Feet 4.183.673.40
Dis charge
Sec.-ft. 94.08.44.0
Date
16
Made by
W. E. Code.... ........
Gage height
Feet 3.42
4.75
Dis charge
Sec.-ft. 34.011.
316
4182 27- -11

156
Daily
SURFACE WATER SUPPLY, 1922, PART IX
, in second-feet, of Rillito Creek near Tucson, Ariz., for the year ending September 30, 1922
Day
1 2 _ -----3-, ... ...4 .. -- 6. ..........
6 ....... .7- . ...8-. .... ..9 ........
10
11 . 12 13- .14 - -_15 .. .
Oct.
5
4
Jan.
651141
June July
45
Aug.
2
26075
Sept.
300
Day
16 17 18 19 - 20 - -
22 23
25
26 27 -------28 29 30 31-
Oct. Jan. June
18
35
July
56
4
5
16
Aug.
1820
2501
6310
Sept.
NOTE. Stream dry on days for which no discharge is given.
Monthly discharge of Rillito Creek near Tucson, Ariz., for the year ending September 30, 1922
(
Month
October. .. _ .. .January _ _ . _ _ . ------- . _June.... _July .-.- - .August. __ . __ -_ __ _ ... , . ...September..
The year _ _ . __ . . . . .. ... .....
Discharge in second-feet
Maximum
5 65 35 45
310 300
300
Minimum
0 0 0 0 0 0
0
Mean
0.3 3.8 1.8 3.4
30.4 10
4.2
Run-off in acre-feet
18 234 105 209
1,870 595
3,030
SAIT EIVEK NEAR ROOSEVEIT, ARIZ.
LOCATION. At site of former diversion dam for power canal, 10 miles above upper end of Roosevelt reservoir and 20 miles east of Roosevelt, Gila County.
DRAINAGE AREA. 4,222 square miles (measured by United States Bureau of Reclamation).
RECORDS AVAILABLE. October 1, 1913, to September 30, 1922 (including all water diverted for the development of power but not flow of Tonto Creek); February 7, 1901, to December 9, 1907, at site of Roosevelt dam (including flow of Tonto Creek).
1910-1913: Discharge at Roosevelt dam computed from records of flow into and out of the reservoir (representing natural flow of Salt River, includ ing Tonto Creek and water diverted for the development of power).
GAGE. Principal gage is vertical staff on left bank, bolted to concrete wall at head of canal. Temporary gages are used from time to time on account of channel shifting away from main gage.
DISCHARGE MEASUREMENTS. Made from cable at dam site or by wading near dam site. Prior to January 19, 1916, when dam was destroyed by flood, low-water measurements were made by wading below dam. Above wading stage discharge was determined from elevation of water surface in reservoir taking into account known outflow and computed inflow from other sources besides Salt River.

COLORADO RIVER BASIN 157
CHANNEL AND CONTROL. Shifting sand and gravel. Prior to its destruction by flood on January 19, 1916, dam formed a permanent control.
EXTREMES OF DISCHARGE. Maximum stage reported during 'year, 9.0 feet March 17 (discharge, 16,500 second-feet); minimum stage, 2.95 feet Septem ber 29 and 30 (discharge, 205 second-feet).
1913-1922: Maximum mean daily discharge, 79,200 second-feet January 15, 1916; minimum discharge, 152 second-feet September 25, 1918, and July 4, 1921.
DIVERSIONS. None of importance.REGULATION. None.ACCURACY. Discharge measurements are made nearly every day when discharge
is less than about 3,000 second-feet, and results should be excellent. For flow greater than 3,000 second-feet there are no facilities for making discharge measurements. Discharge determined from extension of rating curve and study of reservoir contents.
COOPERATION. Daily-discharge records furnished by Salt River Valley Water Users' Association.
Daily discharge, in second-feet, of Salt River near Roosevelt, Ariz., for the year ending September 30, 1922
Day
1 _______2. .............3 _______ 4 ..............5 ..............
6 _.....__.7 _ 8... ...... .....« - - 10 -
11 _____12 _________13 14 ..............15 ___
16- _.-._.-.._..17 _. .18 19 ..._......____20 .. .._._
21 _ __22 ____ ...__.23. .............24 ..............25 ..............
26 _____ __27 _ _ __28 __ 29. __30 31 ______ ...
Oct.
350406362376362
336310313284280
300296293293283
277277275274272
270270270270331
384477384362355320
Nov.
269256246240240
232230230223223
223223223223223
229240250260247
25522724094.A
247
250250265272322
Dec.
270252245254252
254247254274242
251251251266258
258268250260246
232258402608410
320458535 '516522482
Jan.
473410'540
4,6001,880
1,000790652602542
524449408366344
295325295295298
336320298288285
285285291287282298
Feb.
1,580545545369356
342308323
1,6302,610
2,8202,8501,5601,3801,000
810700698700775
8621,0501,120950862
875775755
Mar.
750700675542512
500550542538522
505518569565535
5828,6609,3804,4003,850
2,9002,2502,420
2,750
2,4002,3002,4009 _lfifi
2,2001,860
Apr.
1,8601,9102,2503,3203,500
2.3QO2,5202,1201,7801,600
1,6401,4501,4001,4001,400
1,6001,7001,6301,5201,550
1,4501,5801,8802,3002,200
2,3002,1001,8001,7201,560
May
1,5601,5201,4601,3301,250
1,1901,1601,1401,0801,060
1,0601,040990942865
835726720730726
705690695688670
611
598590670560
June
548535520552508
488476448442432
380372370364355
348340304297285
26826525894fi292
298330388480488
July
438348320282275
257240247240238
244234230238228
225225332260393
453365280256
374
678
344332
Aug.
528870412288274
252243209240284
524428362312425
925545835568
1,060
712572512758548
510500435390378342
Sept.
268325300268250
24224494n250240
235236230230268
241278250227220
288255252260235
225222211205205

158 SURFACE WATER SUPPLY, 1922, PART IX
Monthly discharge of Salt River near Roosevelt, Ariz., for the year ending September
Month
October.. __ _ ______ ___ __ ____November.. ____ ___ ___ ___ __ .....
January.. __ _ ______ .. _ _ . .. .....February... ___ i. ___ ____ _ .. __ ...
April May.. . __ _ ________ _ _ _ .........June. __ . _ _______ ___ _ _ _____July... ......-. .......-..............._ ...... .August ___ _ _______ .. _ .. _ .. _ ..September- __ ____ _ ___ _ _ ._ __ _
The year _________ ___ ____ .......__.
Discharge in second-feet
Maximum
477 322 608
4,600 2,850 9,380 3,600 1,560
648 855
1,060 325
9,380
Minimum
270 223 232 282 308 500
1,400 560 246 225 209 205
205
Mean
320 243 318 592
1,040 1,990 1,910
919 389 330 492 247
731
Run-off in acre-feet
19,700 14,500 19,600 36,400 57,800
122,000 114,000 56,500 23,100 20,300 30,300 14,700
529,000
NORTH FORK OF WHITE RIVER AT WHITERIVER, ARIZ.
LOCATION. At power plant half a mile from Fprt Apache Indian School at Whiteriver, Navajo County, 2^ miles above junction of north and east forks of White River.
DRAINAGE AREA. Not measured.RECORDS AVAILABLE. October 1, 1916, to June 30, 1922, when station was dis
continued. Record fragmentary.GAGE. Inclined and vertical staff on right bank 140 feet below tailrace of
power plant; read by Chester Gatewood.DISCHARGE MEASUREMENTS. Made by wading or from highway bridge.CHANNEL AND CONTROL. Bed composed of sand and gravel; shifts during high
water. Control is gravel and boulders.EXTREMES OF DISCHARGE. Maximum stage recorded during period, 4.8 feet at
6.15 a. m. April 24 (discharge, 1,120 second-feet); minimum discharge, 35 second-feet, December 4 and 5.
1916-1922: Maximum stage recorded, 7 feet during February, 1920 (discharge not determined); minimum discharge, 10 second-feet June 22 and 27, 1921.
ICE. Stage-discharge relation probably not seriously affected by ice.DIVERSIONS. Water diverted for development of power and returned to river
above gage.REGULATION. Slight fluctuation may occasionally be caused by operation of
power plant just above gage.ACCURACY. Stage-discharge relation fairly permanent. Rating curves poorly
defined. Gage read to quarter-tenths twice daily. Daily discharge ascer tained by applying mean daily gage height to rating table. Records fair.
Discharge measurements of North Fork of White River at Whiteriver, Ariz., during the year ending September 30, 1922
[Made by J. H. Gardiner]
Date
20..
Gage height
Feet9 Q1
3.05
Dis charge
Sec.-ft. 30e;n
Date
4...... . ..............
Gage height
Feet 4.084.08
Dis charge
Sec.-ft. 442441

COLORADO RIVER BASIN 159
Daily discharge, in second-feet, of North Fork of White River at Whiteriver, Ariz., for the -period October 1, 1921, to June 80, 1922
Day
1 _______________2.. ________________3 ________________4 __________________5.... ______________
6- _________________7 ________ __ ........8 _______________9- __ . _____________10 . ______________
11 . ______ . _______12.. __ .....................13 __ .. _____ _ .......14. ________________15... _______________
16 ..- __ ..... .. 17. _________________18 __ ._______ _ _.___.__19.... ______________20. --. -
21.... _____________ __22... ________________23.. .. . . ... .24... __________ . ........25 .- __ _-_--._
26 _ _27.... ________ .........28 _______________29 _________ , ........30.. . . _-_ __- . _31. _______________
Oct.
8575855555
5555555565
6575757575
6565656565
5555558596
757575756565
Nov.
6565656555
5555555555
5555555565
6555654555
6575657565
6555656555
Dec.
5565453535
6555454555
6555555565
5545555555
555565
55
6512085857585
Jan.
7596657575
7585657575
7555555555
5555756565
6555555555
555555556555*
Feb.
5555555555
555555120290
175175395162120
148148162530192
192162148-148148
148148120
Mar.
1209696120120
12010812096120
120120120108162
175455250250250
250340395455340
395495455425425425
Apr.
455455570570610
455395368340270
340315340340425
495425395395455
530610790838838
790610530530530
May
495455425395395
395395395368368
315290250250250
270270290290290
270250250250230
230230210210210192
June
192175175162148
14814813413455
1201201089696
, 8585858575
7575859696
10896969685
Monthly discharge of North Fork of White River at Whiteriver, Ariz., for the period October 1, 1921, to June 30, 1922
Month
December ___ __ _________ ____ ._ _
Discharge in second-feet
Maximum
96 75
120 96
530 455 838 495 192
Minimum
55 45 35 55 55 96
270 192
55
Mean
67.9 60.3 59.7 64.4
152 243 500 303 111
Run-off in acre-feet
4,180 3,590 3,670 3,960 8,440
14,900 29,800 18,600 6,600
93,700
WHITE RIVEK AT FORT APACHE, ARIZ.
LOCATION. At highway bridge on Fort Apache Military Reservation, half a mile below junction of North and East forks, at Fort Apache, Navajo County.
DBAINAGE AREA. Not measured.RECORDS AVAILABLE. June 1, 1921, to June 30, 1922, when station was dis
continued. October 23, 1912, to September 30, 1920. Records fragmentary.GAGE. Vertical and inclined staff fastened to downstream encl of left abutment
of bridge; installed June 6, 1921; read by George Bond and Jesse Palmer. For previous gages see Water-Supply Paper 479.

160 SUKFACE WATER SUPPLY, 1922, PAKT IX
DISCHARGE MEASUREMENTS. Made from highway bridge or by wading.CHANNEL AND CONTROL. Bed composed of sand and gravel with gravel riffle.
Control frequently shifts during high water. Left bank subject to overflow during extreme high stages.
EXTREMES OP DISCHARGE. Maximum stage recorded during period, 2.86 feet at 6 p. m. April 26 (discharge, 640 second-feet); minimum stage, 1.5 feet 4 p. m. December 4 (discharge, 50 second-feet).
1912-1922: Records incomplete, maximum discharge not determined. Minimum discharge of 25 second-feet occurred on November 3 and 4, 1915.
DIVERSIONS. Small quantity of water diverted for irrigation by Indians several miles above station; amount not known.
REGULATION. None.ACCURACY. Stage-discharge relation not permanent. Rating curves poorly de
fined. Gage read to hundredths twice a day. Daily discharge ascertained by applying mean daily gage height to rating table. Records poor.
Discharge measurements of White River at Fort Apache, Ariz., during the year ending September SO, 1922
[Made by J. H. Gardiner]
Date
Nov. 19 . .. . 20..
Gage height
Feet 1.521.64
Dis charge
Sec.-ft. 4068
Date
May 3.! ......................Z. ......................
Gage height
Feet 2.742.70
Dis charge
Sec.-ft. 522495
Daily discharge, in second-feet, of White River at Fort Apache, Ariz., for the period October I,*l921,to June 20, 1922
Day
1 ..... 2... . ._ .3.... 4.. ... 5... _ . . .
6... 7................ .........8............................9... ... .... ... ..... ...
10... _ ........ .....
11 12....... .....................13........... ..............14............................15............................
16......-...-..... .....-...17 .... . . _ ..18.. ......-... ........19 20.... .... .......
21...... ............. .........2223.................. .......24 .. .......................25
26..... _ ....................27 28. .. _ 29...... ..... JL -30 .11
Oct.
120135122110100
100100100100100
9090909090
9090909080
808080122122
11010090909090
Nov.
9080808080
8080808080
8080808080
8080806070
8080808080
8080808080
Dec.
8080805060
9080706060
8080807080
8050708070
7080806070
100240150122110110
Jan.
10013515010090
909010010090
8060707070
7090909090
7070707090
707070708090
Feb.
7070707070
707090135235
200200165165135
165165182200218
235200182165182
165165150
Mar.
135100122135150
110150122100150
135135135110165
200500330258280
330380330470380
440470470440440440
Apr.
470470580580630
500440380380330
330355380355410
470440380380440
500580580630630
580580540540540
May
500
!410380410380
410380355380355
355380355380380
380355380330330
330355330305280330
June
330305305280258
218218182200182
182150135150135
122110110100100
100100110110110
135150150135122

COLORADO BIVEE BASIN 161
Monthly discharge of White River at Fort Apache, Ariz., for the period October 11921, to June SO, 1922
Month
May _____________________________
Discharge in second-feet
Maximum
135 90
240 150 235 500 630
330
Minimum
80 60 50 70 70
100 330 280 100
Mean
97.8 79.3 85.2 85.0
150 262 480 388 166
i
Run-off in acre-feet
6,010 4,720 5,240 5,230 8,330
16,100 28,600 23,900 9,880
108,000
TONTO CREEK NEAR ROOSEVELT, ARIZ.
LOCATION. In sec. 14, T. 6 N., R. 10 E., 6 miles above upper end of Rooseveltreservoir and 15 miles northwest of Roosevelt, Gila County.
DKAINAGE ABE A. 1,004 square miles (measured by United States Bureau ofReclamation).
RECOKDS AVAILABLE. October 1, 1913, to September 30, 1922. GAGE. Vertical staff on right bank. Site of gage is changed from time to time
owing to shifting control. DISCHAKGE MEASTJKEMENTS. Made by wading at low stages and by slope
method at high stages. CHANNEL AND CONTKOL. Bed composed of boulders and gravel; banks well
defined. Control shifts at high stages.EXTKEMES OF DISCHAKGE. Maximum discharge during year, 10,000 second-
feet, March 17; minimum mean daily discharge, 5 second-feet, July 15-20. 1913-1922: Maximum mean daily discharge, 15,800 second-feet, January
19,1916; minimum discharge, 1 second-foot, parts of September and October,1918, and June and July, 1921.
DIVEKSIONS. None of importance. Entire flow is discharged into Rooseveltreservoir.
REGULATION. None. ACCUKACY. Discharge measurements made as often as appears necessary to
determine changes in stage-discharge relation. Records for high stagesbased on extension of rating curves and study of contents of Rooseveltreservoir.
COOPEKATION. Records of daily discharge furnished by Salt River Valley WaterUsers'Association.
Daily discharge, in second-feet, of Tonto Creek near Roosevelt, Ariz., for the year ending September 80, 1922
Day
1 ________2 _________3 ..........4 ______________5 __ ____ _____
6 . . _______7 _______ __8 ___________9 ___________
10 _ ___________
Oct.
14125873636
2525222218
Nov.
1818181818
1818181814
Dec.
3026262018
2020261618
Jan.
250178300
3,0001,820
700490OQn
325380
Feb.
1,500476460330330
275290
2,3603,400
Mar.
304300290275260
140130130115115
Apr.
290270350400360
360330300330330
May
1151021028585
72626558
115
June
2020202020
12108
1413
July
1512998
88777
Aug.
700143552035
221010
77
Sept.
77888
777
2610

162
Daily
SURFACE WATER SUPPLY, 1922, PART IX
, in second-feet, of Tonto Creek near Roosevelt, Ariz., for the year ending September 80, 1922 Continued
Day
11 _______12 ______ ..13 _ _____14 ___ ___15 ________
16 __17 _ ______18 .._.. 19 _______20 __ - ____
21 ______22 ______ .23 24 . __ - _25 ________
28 ________27 ________28 ______ 29 ______30 _______ -31- __
Oct.
1811111111
11111111
118832130
685032302620
Nov.
1414
1414
1414141418
18.18181818
1818181818
Dec.
1818151615
1515151515
1515322626
322,200
775380274262
Jan.
325350Qlft
9on153
130ion
88ftft
8583505040
4030303020
960
Feb.
1,6801,4001 000615540
470qcn
300300QftA
350390400385365
335325
Mar.
100130160175220
3406,0005,0003,0003,000
I OKft
1,2501,0901,0201 nnn
Qfifl900870680630
1,860
Apr.
275240
182165
165
165150
165165
165
165150130130130
May
230148130130130
115100857562
5045403533
303625252520
June
131212107
710101010
106666
66564018
July
76665
55555
68667
'230
790.145
552056
Aug.
2038455536
3025258576
5149403630
2622161288
Sept.
87779
10121088
8421812'14
1412121010
Monthly discharge of Tonto Creek near Roosevelt, Ariz., for the year ending SeptemberSO,1922
Month
April _ _May _______ . . __ _______________
July.... ________ ____________________August __ _____ _ _ _ _ _ .... ____
The year. _ __ _______ _ _ ____________
Discharge in second -feet
Maximum
130 18
2,200 3,000 3,400 6,000
400 230
56 790 700 42
6,000
Minimum
8 14 15 20
275 100 130 20
6 5 7 7
5
Mean
30.4 16.7
142 362 700
1,030 224 78.4 13.9 47.5 56.2 11.1
224
Run-off in acre-feet
1,870 994
8,730 22,300 38,900 63,300 13,300 4,820
827 2,920 3,460
660
162,000
VERDE RIVER NEAR McDOWELL, ARIZ.
LOCATION. At dam site on Salt River Indian Reservation, three-quarters of amile above junction with Salt River and 5J^ miles below McDowell, Mari-copa County.
DRAINAGE AREA. 6,000 square miles (furnished by United States Bureau ofReclamation).
RECORDS AVAILABLE. August 14 to September 30, 1889; April 20, 1897, toNovember 11, 1899; January 1, 1901, to April 19, 1902; July 23-26, 1902;January 1, 1903, to September 30, 1922.
GAGE. Painted on granite rocks on right bank. DISCHARGE MEASUREMENTS. Made from cable at gage or by wading. Since
November, 1913, measurements have been made regularly three or fourtimes a week by a resident hydrographer.
CHANNEL AND CONTROL. Bed composed of sand; shifting.

COLORADO RIVER BASIN 163
EXTREMES OF DISCHARGE. Maximum mean daily discharge during year, 21,800 second-feet, January 4; minimum mean daily discharge, 120 second-feet, June 24 and 25.
1897-1922: Maximum mean daily discharge, 61,500 second-feet, Novem ber 27, 1905; minimum mean daily discharge, 32 second-feet, July 19 and 20, 1904.
DIVERSIONS. Water is diverted 5 miles above station for use on Indian reser vation.
COOPERATION. Daily discharge record furnished by Salt River Valley Water Users' Association.
Daily discharge, in second-feet, of Verde River near McDowell, Ariz., for the year ending September 30, 1922
Day
1__ . ....2. .........S.. ........4....... ...5.
6..........7.. .....8.. ........9.. ..10
11.. ....12 13... ...14..........15..........
16. 17..........18.. ....19..........20. ......
21..........22..........23..........24..........25..........
26..........27..........2829..........30..........31..........
Oct.
202330812
1,1001,560
947713548486394
344330300275268
265256250242242
239233230227389
483491446385360360
Nov.
290290273297293
289284283288294
289291290287282
277291291292291
288280288292293
285287288282291
Dec.
291297288285282
277282289286289
292302284288289
286282280279284
287292319338482
5741,540
15,40011,4005,2402,940
Jan.
1,9801,510
20,20021,8008,800
4,5003,0802,5001,7201,470
1,2701,110975922795
686556543500460
432418411393407
397397374360365
1,090
Feb.
3,6901,7401,2801,100842
749698726
1,8803,320
9,08012,2007,8804,2403,240
2,5001,8301,4301 4202,670
2,7502,6202,5101,8501,400
1,2201,0601,060
Mar.
1,1101,040915680680
602602660662655
608560600645672
8589.-02017,8009 1 VI6,650
5,6505,0504 5004,2704,080
4,7204,5804,3504,1603,4602,660
Apr.
2,6002,2502,0001,6921,720
2,0002,0501,7801,3801,260
1,1601,160900965912
825735666760678
608543498442453
445452426383365
May
332332320301298
283280265241264
314316316315297
294294281256247
235215200174176
190190190190174171
June
171171166166166
166160155155155
155155155148145
148148150150138
128125125120120
125172230277338
July
270248240215
.180
152147206208173
173145164137129
133127168177154
134160203364298
234209285415330287
Aug.
660562450368320
295270252222232
338356281258255
264238295366282
295320404504420
355318318285275255
Sept.
262290335316370
354320336340293
287216261252235
206190176174205
198185175185178
180152152196178
Monthly discharge of Verde River near McDowell, Ariz., for the year ending Sep tember 30,
Month
October ... ____ ..... _______ . ...............November. ..............................................
January ..................................................February. ...............................................March. ..................................................April.... .................................................May .............................................
July... __ ............... _. ..
September. ..............................................
Discharge in second-feet
Maximum
1,560 297
15,400 21,800 12,200 17,800 2,600
332 338 415 660 370
21,800
Minimum
202 273 277 360 698 560 365 171 120 127 222 152
120
Mean
442 288
1,440 2,590 2,750 3,280 1,070
256 163 209 333 240
1,080
Run-off in acre-feet
27,200 17,100 88,500
159,000 153,000 202,000 63,700 15, 700 9,700
12,900 20,500 14,300
784,000

164 SUEPACE WATER SUPPLY, 1922, PART IX
AGUA FRIA RIVER NEAR GLENDALE, ARIZ.
LOCATION. In sec. 28, T. 6 N., R. 1 E., at uncompleted masonry diversion dam of Beardsley. irrigation project at Camp Dyer, 4 miles below mouth of Castle Creek and 22 miles northwest of Glendale, Maricopa County.
DRAINAGE AREA. 1,420 square miles (measured on topographic map).RECORDS AVAILABLE. November 10, 1910, to September 30, 1922.GAGE. Staff gage fastened to damaged stilling well on right bank at upstream
face of dam; read by Will Benson.DISCHARGE MEASUREMENTS. Made from cable about one-third of a mile below
gage or by wading.CHANNEL AND CONTROL. Channel composed of gravel and shifting sand. Prin
cipal control is formed by unfinished part of masonry diversion dam and ledge on which it is built. This dam has a large gap or opening near right bank through which low and medium flow passes; a scour gate opening, 4 feet by 7^ feet, in the base near the left bank through -which flow from left channel passes at higher stages, and another gap or opening near left bank that carries flow at still higher stages. At extreme high stages stream, flows over entire broad crest of dam which is at elevation 28.2 feet on gage. Sand fills in and scours out of the crevices in the right gap of dam continually with each rise in the river. Stage-discharge relation, therefore, is not permanent.
EXTREMES OF DISCHARGE. Maximum stage recorded during year, 29.2 feet at noon September 2; minimum stage, 2.4 feet September 27.
1910-1922: Maximum stage, 33 feet November 27, 1919. determined from floodmarks (discharge, about 105,000 second-feet); minimum discharge 0.(> second-foot September 24-26, 1919. No record of discharge since Septem ber 30, 1919.
DIVERSIONS. Water is diverted above gage for irrigating two or three small ranches; amount not known.
ACCURACY. Stage-discharge relation variable. Not enough discharge measure ments were made to define rating. Gage read to hundredths twice a day. Daily discharge not determined. Gage-height record good.
COOPERATION. Gage-height record furnished by Robert O. Beardsley.
Discharge measurements of Agua Fria River near Glendale, Ariz., during the year ending September SO, 1922
Date
Nov. 1818
Dec. 1029.
Jan. 4
Made by
. .do..................
Code and Leatherman. R. C. Rice ______ .
Gage height
Feet 3.50<! 5O
3.614.58 5.85
Dis charge
Sec.-fl. 121214
271 1,960
Date
22May 19 July 3
Made by
R. C. Rice. ..... ....... .-do. . ......do......... .....:Rice and Dudley __ . R. C. Rice... _____ .
Gage height
Feet 4.044.395.503.81 3.64
Dis charge
Sec.-ft. 120105503
19 2.6

BARREN FLAT BASIN 165
Daily gage height, in feet, of Agua Fria River near Glendale, Ariz., for the year ending September 30, 1922
Day
1 __ ..........2..............3 ...........4..............5..-----.---...
6... ...........7... ...........8..............9 ...........10..............
11 ...........12.............13 ...14..............15..............
16..............17.. .........18 ...........19 ..20......... .
21.............22..............23 24... ...........25..............
26..............27..............28...... ........29.. ............SO...... .....31. ..
Oct.
10.25.454.754.44.25
4.14.03.953.93.85
3.83.83.83.83.75
3.753.753.753.753.7
3.753.73.653.653.9
3.73.653.653.653.53.5
Nov.
3.53.53.53.53.45
3.453.453.453.53.5
3.53.53.53.53.5
3.5
3.53.53.5
3.553.553.553.553.55
3.553.53.53.553.55
Dec.
3.553.553.553.53.5
3.63.553.63.553.5
3.53.53.53.5
3.5
3.53.53.5
3.53.64.13.953.85
5.856.75.354.54.23.95
Jan.
3.759.9
12.86.15.25
4.94.6
4.44.25
4.14.054.0
3.85
3.83.753.7
3.65
3.553.55
3.53.53.53.53.58.7
Feb.
5.35.04.74.5
4.54.455.37.46.95
6.355.45.5K EC
5.3
5.25.05
.5.34.94 9
4 9K nc
5.04 Q
4 OK
4.84.75
Mar.
4.74.64.554.54.45
4.44.34.34.254.25
4.24.44.84.7d Q
5.257.76 Of.
7.15.5
c o
5.55.35.4
5.35.25.1c n4.95A QC
Apr.
4.94.854.854.84.75
4.754.74.74.654.6
4.554.54.44.44.3.
4.25
4.154 1 %
4.15
4.14.14.1
4.054.05A ftK
4.0
May
4.03.953.95
3.95"i Q
39"i Q
3.853.95
4 ftc
4.03.953 Q
3.853.853.83.83.8
3.753.753.753.75
3.753.753.73.73.73.7
June
3.73.73.73.73.7
3.73.73.653.653.65
3.653.653.65
3.63.63.63.63.6
3.6
3.63.6o 7
4.03.853.753.73.65
July
3.653.653.653.65
3.65
3.653.653.65
3.65
3.63.63.6
4.03.854.050 O
4.14 03.83.753.65
3.655.54.13 0
3.73.65
Aug.
5.44.74.33.553.85
3.83.753.83.84.0
3.84.44.44.13.9
3.853.954.554.64.45
4.754.25.74.64.15
3.854.154.13.83.753.75
Sept.
6.212.856.54.053.5
7.13.453.02.92.8
2.752.72.72 72.65
2.62.552.52.52.45
2.452.62.52.52.45
2.452.42.92.852.45
BARREN FLAT BASIN
WEST TURKEY CREEK. NEAR LIGHT, ARIZ.
LOCATION. In SW. % sec. 17, T. 18 S., R. 29 E., at Sanders ranch, 2*4 miles south and 9J^ miles east of Light, Cochise County.
DRAINAGE AREA. 19 square miles (measured on topographic map).RECORDS AVAILABLE. July 30, 1919, to September 30, 1922.GAGE. Vertical enamel staff on right bank directly north of Sanders ranch;
read by Sybil Sanders.DISCHARGE MEASUREMENTS. Measurements made by wading near gage.CHANNEL AND CONTROL. Low-water control 20 feet below gage, high-water
control 100 feet below gage. Banks high, not subject to overflow.EXTREMES OF DISCHARGE. Maximum stage recorded during year, 2.0 feet August
14 (discharge, 48 second-feet); dry July 10-27, 31, August 1-8, and Sep tember 12-30.
1919-1922: Maximum mean daily discharge, 990 second-feet on July 31; 1921; dry at numerous times.
DIVERSIONS. Minor diversions above and below station.ACCURACY. Stage-discharge relation fairly permanent. Rating curve fairly
well defined between zero and 30 second-feet. Gage read once a day to nearest two-hundredths and oftener during periods of flood. Daily dis charge ascertained by applying daily gage height to rating table, and by hydrograph for flood periods. Records fair.
COOPERATION. Records furnished by University of Arizona, Prof. G. E. P. Smith, irrigation engineer.

166 SURFACE WATEE SUPPLY, 1922, PAET IX
Daily discharge, in second-feet, of West Turkey Creek near Light, Ariz., for the year ending September SO, 1922
Day
1 . _ ..........2 ...................
^5 .
6 . __ ......7.... ....... ...........8 .... ... ......9... ......... ..........10
11....... _ ............12. ..13 14...... .............15 .............
16... ... . .....17...... ... __ ....18 .19 ...20
21.... ..................22.......... .........23 24......................25 . .
26 .........27... ...... .............28...... .............29......................30...... _ ............31
Oct.
0.5.5.5.5.5
1.01.0.5.5.5
.5
.5
.5
.5
.5
.5
.5
.5
.5
.5
.5
.5
.5
.5
.5
Nov.
0.5.5.5.5.5
.5
.5
.5
.5
.5
.5
.5
.5
.5
.5
.5
.5
.5
.5
.5
.5
.5
.5
.5
.5
.5
.5
.5
.5
Dec.
0.5.5.5.5.5
.5
.5
.5
.5
.5
.5
.5
.5
.5
.5
.5
.5
.5
.5
.5
.5
.5
.5
.5
.5
.5
.5 .5
.5
.5
Jan.
0.5.5.5
1.01.0
1.01.01.01.01.0
1.01.0.5.5.5
.5
.5
.5
.5
.5
.5
.5
.5
.5
.5
.5
.5
.5
.5
.5
.5
Feb.
0.5.5.5.5.5
.5
.5
.5
.5
.5
.5
.5
.5
.5
.5
Mar.
0.5.5.5.5.5
.5
.5
.5
.5
.5
.5
.5
.5
.5
.512
222222
Apr.
22222
22222
111
.5
.5
.5
.5
.5
.5
.5
.5
.5
.5
.5
.5
.5
May
0.5.5.5.5
July
0.5.5
Aug.
415
222
1817
11555
11
115332
.5
.5
.5
.5
.5
.5
Sept.
0.5.5.5.5
3.0
2.02.0.5.5.5
.5
NOTE. Trace only on days for which no discharge is given, except July 10-26, 31, Aug. 1-8, and Sept. 12-30, when stream was dry.
Monthly discharge of West Turkey Creek near Light, Ariz., for the year endingSeptember SO, 1922
Month
October _________________________November.. _________________ .. ...........December.. ..............................................
February _________________________
April.... .. ......... .................................May ________________ ..........
July.....................................................
September ...............................................
The year ______________________
Discharge in second-feet
Maximum Minimum
1.0 .5 .5
1 .5
2 2 .5 T.
1 18
3
18
0.5 .5 .5 .5 T. .5 .5 T. T.
0 0 0
0
Mean
0.43 .5 .5 .65 .30 .76 .98 .06 T. .03
4.0 .37
.72
Run-off in acre-feet
26 30 31 40 17 47 58 4
T. 2
246 22
523
NOTE. T.=Trace of water.
WHITEWATEB BASIN
WHITEWATER DRAW NEAR RUCKER, ARIZ.
LOCATION. In sec. 29, T. 19 S., R. 29 E., at Heyne ranch, 6 miles east of Rucker,Cochise County.
DRAINAGE AREA. 40 square miles (measured on topographic map). RECORDS AVAILABLE. August 7, 1919, to September 30, 1922.

WHITEWATER BASIN 167
GAGE. Vertical enamel staff fastened to tree on left bank; read by F. W. IjEeyne.DISCHARGE MEASUREMENTS. Made from cable 100 feet below gage or by
wading.CHANNEL AND CONTROL. Channel composed of boulders, gravel, and bedrock,
with pronounced drop 300 feet below gage. Channel fairly straight and fairly uniform in cross section.
EXTREMES OP DISCHARGE. Maximum mean daily discharge for year, 76 second- feet on August 10; minimum discharge, dry July 1-25.
1919-1922: Maximum, mean daily discharge, 1,240 second-feet November 23, 1919; minimum discharge, dry August 1-12, 1920, and July 1-25, 1922.
DIVERSIONS. Minor diversions above and below station.ACCURACY. Stage-discharge relation fairly permanent. Rating curve fairly
well defined between zero and 200 second-feet. Gage read once a day to nearest two-hundredths. Daily discharge ascertained by applying daily gage height to rating table. Records fair.
COOPERATION. Records furnished by University of Arizona, Prof. G. E. P. Smith, irrigation engineer.
Discharge measurements of Whitewater Draw near Rucker, Ariz., during the year ending September SO, 1922
[Made by J. H. Gardiner]
Date
Dec. 7 _________________ .. ______ . ______________ . .......Mar. 11 _______ . ____ . _ . ______ . ______ . __ . _________
Gage height
Feet 0.72.70
Dis charge
Sec.-ft. 0.42.30
Daily discharge, in second-feet, of Whitewater Draw near Rucker, Ariz., for the year ending September SO, 1922
Day
1 ......... ...... .2...... ....... ......3.. ..............4 . __ ...........5 . .............. .
6........ .......... .7... ............ .8 ....9.. ....... ....... ...10
11..... . .............12 -.13 14.... _____ ......15 . _ .
16..... ..... .........17 18 ....... .......19...... _ ..........20- _ .....
21 .........22... ............. ...23 ........ ........24... ............. ...9";
26. 27 28 ........ ....29 ...... ..........30 31
Oct.
22211
11111
11111
.5
.5
.5
.5
.5
.5
.5
.5
.5
.5
Nov.
0.5.5.5.5.5
.5
.5
.5
.5
.5
.5
.5
.5
.5
..5.5
.5
.5
.5
.5
.5
.5
.5
.5
.5
Dec.
0.5.5.5.5.5
.5
.5
.5
.5
.5
.5
.5
.5
.5
.5
.5
.5
.5
.5
.5
.5
.5
.5
.5
.5
.5
Jan.
0.5.5.5
11
11111
11111
11111
111
111111
Feb.
11111
11111
11111
.5
.5
.5
.5
.5
.5
.5
.5
.5
.5
.5
Mar.
0.5.5.5.5.5
.5
.5
.5
.5
.5
.5
.5
.5
.5
.5
.5
.5
.5
.5
.5
.5
.5
.5
.5
.5
.5
.5
.5
.5
Apr.
0.5.5.5.5.5
.5
.5
.5
.5
.5
.5
.5
.5
.51
1111
11
2
22111
May
11111
.5
.5
.5
.5
.5
.5
.5
.5
.5
.5
Aug.
66
76
1989
2816
119765
43332
221111
Sept.
11111
76456
53222
21111
11111
11111
NOTE. Trace only where no discharge is given, except July 1-25, when stream was dry.

168 SURFACE WATER SUPPLY, 1&22, PART IX
Monthly discharge of Whitewater Draw near Rucker, Ariz., for the year ending' September 30, 1922
Month
February.... _________ . ______ , ... . ..........
April.. -- - . .
July..-... ............................................
Discharge in second-feet
Maximum
2.5 .5
1 1 .5
2 1 T. T.
n7
76
Minimum
0.5 .5 .5 .5 .5 .5 .5 T. T.
0 T.
1
0
Mean
0.85 .50 .50 .95 .77 .50 .86 .32 T. T.
7.39 2.10
1.2
Run-off in acre-feet
52 30 31 58 43 31 51 20 T. T.
454 124
894
NOTE. T.=Trace of water only.
WHITEWATER DRAW NEAR DOUGLAS, ARIZ.
LOCATION. In see. 10, T. 24 S., R. 27 E., opposite city pumping plant, a quarterof a mile above highway and El Paso & Southwestern Railroad bridges, 1mile above electric railway bridge, and 1J4 miles west of Douglas, CochiseCounty.
DRAINAGE AREA. Not measured. RECORDS AVAILABLE. February 16, 1916, to April 30, 1922, when station was
discontinued. Records were obtained August 24 to October 10, 1911, atelectric railway bridge; July 21, 1912, to February 15, 1916, at highwaybridge.
GAGE. Vertical and inclined staff on right bank opposite city pumping plant;read by Mrs. J. Harris and W. W. Coons. '
DISCHARGE MEASUREMENTS. Made from cable near gage or by wading. CHANNEL AND CONTROL.' Bed composed of sand and gravel; shifting. Slag
dumped into channel below gage causes backwater at gage during low waterand scours out at high water.
EXTREMES OP DISCHARGE. Maximum stage recorded during year, 4.7 feet,October 5 and 12; minimum discharge less than 0.5 second-foot for longperiods.
1911-1922: Maximum stage recorded, 14.5 feet about 8 p. m. July 28,1919 (estimated discharge, 4,050 second-feet). Stream dry or carries lessthan 0.5 second-foot the greater part of each year.
DIVERSIONS. Some flood water is diverted above station for irrigation; quantityunknown.
ACCURACY. Stage-discharge relation not permanent. Not enough dischargemeasurements were made to define rating. Gage read to half-tenths once aday. Daily discharge not determined. Gage-height record good.
Discharge measurements of Whitewater Draw near Douglas, Ariz., during the yearending September 80, 1922
[Made by J. H. Qardiner]
Date
Dec. 6 - . Mar. 12...---.--.--.-. _ .... _ .......... _ --- -- ... - _ ..
Gage height
Feet 3.653.70
Dis charge
Sec.-ft. 0.19.25

WHITEWATER BASIN 169
Daily gage height, in feet, of Whitewater Draw at Douglas, Ariz., for the period October 1, 1921, to April 30, 1922
Day
I.... 2 3..- -.4 5 .
6. 7 . .8 .......................................9 ..........................................10
11.. 12......................... .................13. . .....14.. ........................................15 .
16 17....... 18-.. ........19 20 -. ........
21 ..........................................22 .......................................23-.. 24. ....... .......................... ......25... ..........................................
26 . ........27... .......................................28.... .............................. . . .29. .....................................30 ......................................31 . ...
Oct.
3.753.75
3.754.7
4.54 45
3.93.6
3.54.73.65
3.65
3.63.63.63.63.65
3.63.63.63.63.6
3.63.63.63.63.653.6
Nov.
3.63.63.653.653.65
3.653.653.73.653.7
3.653.653.653.65
3.653.63.63.63.6
3.63.653.653.653.65
3.63.63.63.73.7
Dec.
3.653.7
3.653.7
3.65
3.653.653.65
3.653.653.73.73.65
3.653.653.73.73.65
3.65
3.73.73.7
3.653.63.63.63.6
Jan.
3.653.73.73.653.65
3.65
3.653.653.7
3.73.653.653.653.65
3.653.653.73.653.65
3.65
3.653.653.65
3.653.73.73.653.653.7
Feb.
3.73.653.653.653.65
3.65
3.653.73.7
3.73.653.653.653.65
3.653.653.653.653.65
3.653.653.653.653.65
3.653.653.65
Mar.
3.653.73.73.73.7
3.73.653.653.73.7
3.73.73.653.653.7
3.73.73.73.73.65
3.73.73.73.73.7
3.73.73.73.73.73.7
Apr.
3.73.73.73.73.7
3.73.73.73.73.7
3.73.73.653.73.65
3.73.73.73.73.7
3.73.73.73.653.65
3.63.63.63.63.7

170 SUEFACE WATEK SUPPLY, 1922, PART IX
MISCELLANEOUS DISCHARGE MEASUREMENTS
In addition to the records of stream flow obtained at gaging sta tions and reported in the preceding pages, measurements of flow were made at a number of other points, as shown by the following table:
Miscellaneous discharge measurements in Colorado River drainage basin during- the year ending September 30, 1922
Date
May 2424
Oct. 16
Jan. 23
Jan. 24
12
Oct. 14
Jan. 15
Sept. 8Dec. 5
Jan. 29Mar. 15Dec. 5
5
7
Jan. 28Nov. 3
May 25
May 25
25
Stream
Co.'s tailrace.
do .....-do.... ..................do... ..............
. ....do.... .............
.....do ..............
Huntington Creek .....
-do- .
... .-do ... .......... .
Tributary to or divert ing from
.....do ..... ..... ... -
.....do--.. ..... ....
chesne River.
-do-. do-. ... ..do---....... ... ...
.... .do.-- ..... .
. -do................
.... -do--. . ....
San Rafael River ______
.... -do.---..... ..... ..
-...do--- -
... .do.. ... ...
Locality
At mouth, near Eagle, Colo
In sec. 34, T. 125, R. 97 W.,near Whitewater, Colo.
In sec. 1, T. 3 S., R. 20 E., immediately above Ashley Spring and 12 miles north west of Vernal, Uinta County, Utah.
In sec. 1, T. 3 S., R. 20 E., atits confluence with Ashley Creek, Utah.
In sec. 18, T.3S., R.21E.,atpower plant of Vernal Mill ing & Light Co., 10 miles northwest of Vernal, Uinta County, Utah.
In SE. M see. 26, T. 2 N., R.9 W., at mouth, 10 miles northwest of Hanna, Du- chesne County, Utah.
In sec. 22, T.3 S., R. 9 W., one-half mile below Deep Creek near Fruitland, Utah.
.....do.-
.... .do-- ..... .. do---- In SW. V*. sec. 26, T. 11 S.,
R. 8 E., 1 mile south of Colton, Utah.
.. do.--... .... ...
.... .do--- . In NW. M sec. 26, T. 11 S.,
R. 8 E., half a mile south-
In NW. H sec. 26, T. 11 S.,R. 8 E., quarter of a mile
In see. 33, T. 18 S., R. 9 E., at former gaging station "Huntington Creek near Castledale, Utah," 6 miles east of Castledale..'
do -In sec. 4, T. 41 S., R.7 W.,
at upper bridge at Order- ville, Kane County, Utah
In sec. 1, T. 17 S., R. 68 E.,at bridge on Arrowhead Trail, 1\i miles northeast of St. Thomas, Nev.
In sec. 11, T. 39 S., R. 16 W.,enters Santa Clara Creek 40 feet below gaging sta tion "Santa Clara Creek near Central, Utah.
In sec. 3, T. 39 N., R. 16 W.,near head of canal near Mesquite, Nev.
In sec. 29, T. 39 N., R. 16 W.,at head of canal half a mile south of Mesquite, Nev.
Gage height
Feet
0.78
2.37
2.283.883.06
3.28
5.33
4.94
Dis charge
Sec.-ft. 1792431.9
10.7
50
36.4
5.5
48
40.320053.324.8
23.125.245.2
8.8
14.2
3720
2,160
2.8
32.3
21.5-

MISCELLANEOUS DISCHARGE MEASUREMENTS 171
Miscellaneous discharge measurements in Colorado River drainage basin during the year ending September SO, 1922 -Continued
Date
July 4
5
3
Apr. 24
July 18
Apr. 26
July 19
Apr. 2424
July 18
Apr. 24
2525
July 17Anr 94
2525
252626
July 28
Dec. 3July 31Aug. 1
5Apr. 11Feb. 22
Apr. 23
23
Stream
do .
.....do ......
D-ila T?ivor
.. .do......... ........
.....do ....... ......
... ..do ..............
..... do. __ .... __
Sunset Canal _ _ ..
. __ do. _____ .. _ .__ .do. ... .....
nal.
Shriver ditch ........... do.
Black-McOlesky Canal.
Creek.
.... .do ... ... .
.....do ............ .
Ditch No. 1--.. .......
.... .do.. .... .....
Tributary to or divert ing from
Virgin Eiver ____ .
do
. _ .do. ___ .... __ .
... -do- ...... .. do . . _ .do __ !... ___ .
.....do __ . ____ ..
.. do... .... .... .. do. do. ... -. do.. ........ ..
__ do. ___ . ..... ....... do .... .... .-....do- ..... ... ...__ do _ .... ..do ... ..... .... ..do.-.. ......
... ..do.. .... .... .
.....do. _.............. do -do- ...... ..... ..do-
. __ do.... ............ ..do- ...... .... . do .. _ do. _______ .
Santa Cruz River .....
Rillito Creek.. ........
. __ do ___ ....
Locality
In SE. Msec. 15,T.14S.,R.65 E., at former gaging sta tion "Muddy Kiver near Moapa, Nev."
In NE. M sec. 2,T. 15 S.,R.66 E., at former gaging sta tion "Muddy River at Weiser ranch, near Moapa, Nev."
In sec. 13, T. 17 S., R. 68 E., at former gaging station, "Muddy River near St. Thomas, Nev."
Ariz. . do....... ...............__ .do _ ............ -...
Sheldon, Ariz.
York, Ariz.
--...do.. ... ...... . . _ .do ___ . __ . __ do _ .... __ ... do-
. _ .do. __ .. __ .__ .do _ ...... .. ... ....... -do... ... ..... ... -do.. .... .... ... ... __ do __ .do _ . _ ... .. . .....
. __ do.. ___ . _ ...
.do.--... ... ... .At San Carlos, Ariz .........
man, Ariz.
..... do... ... ... .... .....__ do.. _____ ....... do.. ... ... ....Near Feldman, Ariz ___At highway bridge, 7 miles
northeast of Nogales, Ariz. Near mouth, near Tucson,
Ariz. .....do... ....... ............
Gage height
Feet 1.16
........
5.807.106.105.85
Dis charge
Sec.-jt. 42.3
20
3
48
2649
1
10
3612.41.54.8
13
1.82.61.27.71.86.7
8.36.23.4
40.9
7.449137.510.82.61.1
7.1
7.3
4182 27- -12

INDEX
A Page Accuracy of data and results, degrees of ___ 4-6 Acre-foot, definition of... . ______ 2 Agua Fria River near Qlendale, Ariz__.. 164-165 Almont, Colo., East River at________ 43-45
Taylor River at._____________ 37-39 Appropriations, record of.__._______ 1 Arizona, cooperation by. __j______.. 9 Arrow, Colo., Fraser River near._____.. 22-24 Ashley Creek near Vernal, Utah_. __ 83-S4,170 Asbley Spring, Utah, discharge measurement
of............ -_. ..-. .--. 170Ashurst, Ariz., Fort Thomas Consolidated
Canal at.....___..._..._ 149-150Gfla River near...________....._ 119
Au water-stage recorder, plate showing___ 3
B
Barren Flat basin, Ariz., gaging-station rec ord in_____________ 165-166
Bedrock, Colo., Dolores River at______ 58-60 Beggs, C. H., cooperation by_.____... 9 Big Sandy Creek near Farson, Wyo___... 74-76 Black-McClesky Canal near Duncan, Ariz.. 171 Blackrock, N. Mex., Zuni River at_____ 114 Blacks Fork near Urie, Wyo_________ 76-77 Blue River at Dillon, Colo..________ 27-29 Boulder Creek near Boulder, Wyo_.__ 72-74 Boulder, Wyo., New Fork near_____... 69-71 Brown Canal near Solomonsville, Ariz.... 126-128 Brown Canal wastewaynear Solomonsville,
Ariz..___.____._____ 128-129 Brush Creek near Eagle, Colo.. . __... 170 Bunkerville Canal at Mesquite, Nev ____ 170
Castledale, Utah, Huntington Creek near... 170 Cave Creek near Paradise, Ariz______ 138-140 Cave Creek Canal near Paradise, Ariz__ 140-141 Cedaredge, Colo., Surface Creek at.. 49-50 Central, Utah, Hunts Spring near_..___ 170
Santa Clara Creek near.________ 115-117 Colmonero Canal near Duncan, Ariz..___ 171 Colona, Colo., Uncompahgre River near__ 65-56 Colorado, cooperation by__________ 9 Colorado River and tributaries above Green
River, gaging-station records on. 10-61Colorado River at Qlenwood Springs, Colo.. 12-13
at Hot Sulphur Springs, Colo_..__ 10-11at Lees Ferry, Ariz_..._.______ 17-19at Yuma, Ariz_ ____________ 20-22near Fruita, Colo_____________ 15-16near Palisade, Colo_.__.______ 13-15near Topock, Ariz__._________ 19-20
Colton, Utah, Fish Creek at_________ 170Price River at........____.____.. 170White River at.......................... 170
PageComputations, results of, accuracy of____ 4-6 Control, definition of.... . _.--_.__ .. 2 Cooperation, record of_____._.____ 9 Cosper-Wilson Canal near Duncan, Ariz.... 171 Cosper-Windham Canal near Duncan, Ariz.. 124-
125,171Cottonwood Creek near Orangeville, Utah. 110-112 Currant Creek near Fruitland,Utah .. 170 Current meters, Price, plate showing ___ 2 Curtis-Kempton Canal near Eden, Ariz_. 147-149
DDaniel, Wyo., Green River near__.__.. 61-63Data, accuracy of_ . 4-5
explanation of.--.... . 3-4De Beque, Colo., Roan Creek near. . 36-37 Delta, Colo., Uncompahgre River near 57-58 Diamondville, Wyo., Hams Fork at_... 77-79 Dickinson, W. E., work of_________ - 9 Dillon, Colo., Blue River at 27-29Ditch No. 1 near Nogales, Ariz. .... 171Dixon, Wyo., Little Snake River near. '. 79-80 Dodge-Nevada Canal near Pima, Ariz..... 146-147Dolores River at Bedrock, Colo. __.__ 58-60 Douglas, Ariz., Whitewater Draw near_. 168-169 Dripping Springs Creek above Winkleman,
Ariz 171Duehesne River at Duchesne, Utah. 90-91
at Myton, Utah___....___..... 92-93near Tabiona, Utah.. 88-89 North Fork of, near Hanna, Utah.. .. 86-88 West Fork of, near Hanna, Utah 94-95
Duchesne, Utah, Strawberry River at . 96-98 Duncan, Ariz., Black-McClesky Canal near. 171
Colmonero Canal near. 171 Cosper-Wilson Canal near. 171 Cosper-Windham Canal near.. 124-125,171 Moddle Canal near.. 125-126,171 Shriver ditch near. . 171 Sunset Canal near. _ _- 123-124,171 Valley Canal near. . 171
E
Eagle, Colo., Brush Creek near.. 170 Eagle River at Eagle, Colo__ . 31-32
at Redcliff, Colo.. 29-30 East Fork at East Fork Canal, Wyo..._.. 66-67
at Newfork, Wyo. 67-69 East Fork Canal, Wyo., East Fork at ... 66-67 East River at Almont, Colo... 43-45 East Turkey Creek at Paradise, Ariz. 141-142 Eden, Ariz., Curtis-Kempton Canal near.. 147-149 Eden Irrigation & Land Co., cooperation by. 9
Fairbank, Ariz., San Pedro River near.... 150-152 Farson, Wyo., Big Sandy Creek near .. 74-7S
173

174 INDEX
PageFeldman, Ariz., Puseh ditch near..... _ 171 Ferron Creek (upper station) near Ferron,
Utah........___..._____ 112-113Fish Creek at Colton, Utah......___..... 170Follansbee, Robert, and assistants, work of.. 9 Foit Apache, Ariz., White River at-___ 159-161 Fort Thomas Consolidated Canal at Ashurst,
Ariz..........-..........- 149-150Fourness Canal near Solomonsville, Ariz.. 131-132 Fraser River near Arrow, Colo ... 22-24Fruita, Colo., Colorado River near... .... 15-16Fruitland, Utah, Currant Creek near __ 170
Red Creek near..._________...
GGaging station, typical, plate showing _. 2 Gila River at Kelvin, Ariz................. 121-123
at Sheldon, Ariz______________ 171 at York, Ariz______'_________ 171 near Ashurst, Ariz_____________ 119 near San Carlos, Ariz________ 119-121 near Solomonsville, Ariz__ ______ 117-119
Gila River basin, Ariz.-N. Mex., gaging-station records in_____.... 117-16S
Glendale, Ariz., Agua Fria River near__. 164-165Glenwood Springs, Colo., Colorado River at. 12-13
Roaring Fork at______________ 32-34Graham Canal near Saflord, Ariz.__.... 143-144Grand Junction, Colo., Gunnison River near. 41-43Grand Valley, Colo., Parachute Creek at__ 34-36Green River at Green River, Wyo______ 63-64
at Little Valley, near Green River, Utah. 64-66near Daniel, Wyo ____________ 61-63
Green River basin, Wyo.-Utah-Colo., gaging-station records in________ 61-113
Gunnison River near Grand Junction, Colo . 41-43near Gunnison, Colo..._________ 39-41
Gurley water-stage recorder, plate showing.. 3Gypsum Creek at Gypsum, Colo______ 170
HHades Canyon Creek near Hanna, Utah .. 170Hams Fork at Diamondville, Wyo. _____ 77-79Hanna, Utah, Hades Canyon Creek near__ 170
North Fork of Duchesne River near__ 86-88West Fork of Duchesne River near___ 94-95Wolf Creek near______. ______ 95-96
Helper, Utah, Price River near______ 107-108Hereford, Ari»., San Pedro River at.____ 171Holbrook, G. F., work of..1 __________ 9Hot Sulphur Springs, Colo., Colorado River
at............................_ 10-11Huntington Creek near Castledale, Utah__ 170
near Huntington, Utah_____.._ 108-110Hunts Spring near Central, Utah______ 170
Kannah Creek near Whitewater, Colo..__ 170 Kelvin, Ariz., Gila River at. ________ 121-123
Lake City, Colo., Lake Fork at........__ 46-48Lake Fork at Lake City, Colo_______. 46-48
near Myton, Utah___________ 101-103 West Fork of, near Mountain Home,
Utah______________ 100-101
PageLazear, Colo., Leroux Creek near 48-49 Lees Ferry, Ariz., Colorado River at 17-19 Leroux Creek near Lazear, Colo...... . 48-49Light, Ariz., West Turkey Creek near__v 165-166 Lily, Colo., Little Snake River near.. _. 81 Little Colorado River.basin, N. Mex., gaging-
station record in 114Little Snake River near Dixon, Wyo. 79-80
near Lily, Colo..._...._____._ 81
M McDowell, Ariz., Verde River near.... . 162-163Mesquite C anal near Mesquite, Nev. 170 Mesquite, Nev., Bunkerville Canal at 170 Michelana Canal near Solomonsville, Ariz. 129-131 Moapa, Nev., Muddy River near 171 Moddle Canal near Duncan, Ariz 125-126,171 Montezuma Canal near Solomonsville,
Ariz .. . 134-135Montrose, Colo., Uncompahgre River at 56-57 Morgan, J. H., work of 9 Mountain Home, Utah, West Fork of Lake
Fork near.. 100-101 Muddy River near Moapa, Nev... 171
near St. Thomas, Nev 171 Myton, Utah, Duchesne River at.. - 92-93
Lake Fork near._ 101-103
NNaturita, Colo., San Miguel River at. 60-61 Neola, Utah, Uinta River near.. . 103-104 New Fork near Boulder, Wyo 69-71 Newfork, Wyo., East Fork at 67-69 Nogales, Ariz., ditch No. 1 near 171
Santa Cruz River near.. 152-153
OOrangeville, Utah, Cottonwood Creek
near_______________ 110-112Orderville, Utah, Virgin River at... .. 170Ouray, Colo., Uncompahgre River at 51-53
Uncompahgre River below 53-54
Palisade, Colo., Colorado River near. 13-15Parachute Creek at Grand Valley, Colo.. 34-36Paradise, Ariz., Cave Creek near_ 138-140
Cave Creek Canal near_ . 140-141East Turkey Creek at__ .. 141-142.
Parshall, Colo., Williams Fork near 24-26Pima, Ariz., Dodge-Nevada Canal near... 146-147Pine Creek at Pinedale, Wyo- 71-72Pinedale, Wyo., Pine Creek at 71-72Price current meters, plate showing 2Price River at Colton, Utah. 170
near Helper, Utah..........._. 107-108Publications, information concerning 5-8
obtaining or consulting of. 5-6on stream flow, list of 6-7
Purton, A. B., and assistants, work of 9Pusch ditch near Feldman, Ariz 171
RRed Creek near Fruitland, Utah..... 98-«9 Redcliff, Colo., Eagle Eiver at... 29-30 Eedlands Co., cooperation by 9 Eice, Roger C., work of 9

INDEX 175Page
Eillito Creek near Tucson, Ariz 156-156 Roan Creek near DeBeque, Colo ___ 36-37 Bearing Fork at Qlenwood Springs, Colo__ 32-34 Rodeo, N. Mex., San Simon Creek near 137
l Roosevelt, Ariz., Salt River near __ 156-158 Tonto Creek near_._____.__ 161rl62
Rueker, Ariz., Whitewater Draw near.__ 166-168 Run-off in inches, definition of 2
Sabino Creek near Tucson, Ariz..... ..... 171Safford, Ariz., Graham Canal near __ 143-144 St. Thomas, Nev., Muddy River near___ 171 Salt River near Roosevelt, Ariz 156-158 San Carlos, Ariz., Qila River near .... 119-121San Carlos River at San Carlos, Ariz.... 171San Jose Canal near Solomonsville, Ariz... 132-134San Miguel River at Naturita, Colo..___ 60-61San Pedro River at Hereford, Ariz...___ 171
near Fairbank, Ariz__________ 150-152San Simon Creek near Rodeo, N. Mex 137
near San Simon, Ariz ,. 137-138Santa Clara Creek near Central, Utah.. 115-117Santa Cruz River at Tucson, Ariz....__ 154-155
near Nogales, Ariz________.__ 152-153 Sargents, Colo., Tomichi Creek at_____ 45-46 Savery Creek at Savery, Wyo 81-83 Second-feet, definition of. ... .. 2 Second-feet per square mile, definition of 2 Sheldon, Ariz., QDa River at ...... 171Shriver ditch near Duncan, Ariz.. __.. 171Smithville Canal near Thatcher, Ariz 144-146Solomonsville, Ariz., Brown Canal near... 126-128
Brown Canal wasteway near.....__ 128-129Fourness Canal near. 131-132 GUa River near_ . . 117-119 Michelana Canal near....... _.. 129-131Montezuma Canal near_._ __ 134-135 San Jose Canal near __________ 132-134 Union Canal near___________ 135-137
Southern California Edison Co., cooperationby............................... 9
Stage-discharge relation, definition of . 2 Stevens water-stage recorder, plate showing 3 Strawberry River at Duchesne, Utah........ 96-98Sunset Canal near Duncan, Ariz__ 123-124,171 Surface Creek at Cedaredge, Colo_-___ 49-50
T
Tabiona, Utah, Duchesne River near......Taylor River at Almont, Colo. . 37-39 Terms, definition of_____________ 2 Thatcher, Ariz., Smithville Canal near__ 144-146 Tomichi Creek at Sargents, Colo 45-46 Tonto Creek near Roosevelt, Ariz . 161-162 Topock, Ariz., Colorado River near_____ 19-20 Troublesome Creek near Troublesome, Colo. 26-27 Troxell, H. C., work of . . . 9 Tucson, Ariz., Rillito Creek near_..__ 155-156
Sabino Creek near......____.__.. 171Santa Cruz River at.. __..__ 154-155
U Page Uinta River near Neola, Utah._____ 103-104 Uncompahgre River at Montrose, Colo.. . 56-57
at Ouray, Colo _____ 51-53 below Ouray, Colo.._ _____ 53-54 near Colona, Colo.-___..._____ 55-56 near Delta, Colo_.___________ 57-58
Union Canal near Solomonsville, Ariz__ 135-137 United States Bureau of Reclamation, coop
eration by .. . 9 United States Forest Service, cooperation by. 9 United States Office of Indian Affairs, coop
eration by.._i ..._ .. 9 United States Weather Bureau, cooperation
by...______________ 9 Urie, Wyo., Blacks Fork near . 76-77 Utah, cooperation by 9 Utah Power & Light Co., cooperation by 9
VValley Canal near Dunean, Ariz... 171 Verde River near McDowell, Ariz,__ 162-163 Vernal Milling & Light Co., cooperation by.. 9 Vernal Milling & Light Co.'s tailrace near
Vernal, Utah________ 85-86,170 Vernal, Utah, Ashley Creek near 83-84,170
Vernal Milling & Light Co.'s tailracenear 170
Virgin River at OrderviUe, Utah____... 170at Virgin, Utah .................... 114-115
Virgin River basin, Utah, gaging-station rec ords in_____________ 114-117
WWater-stage recorders, plate showing _ 3 West Turkey Creek near Light, Ariz 165-166 White River at Colton, Utah 170
at Fort Apache, Ariz.. , 159-161 North Fork of, at Whiteriver, Ariz 158-159
Whiterocks Creek near Whiterocks, Utah.. 105-106 Whitewater basin, Ariz., gaging-station rec
ords in.-..___..._ 166-169 Whitewater, Colo., Kannah Creek near. 170 Whitewater Draw near Douglas, Ariz 168-169
near Rueker, Ariz____ . 166-168 Wffliams Fork near Parshall, Colo_.. . 24-26 Winkleman, Ariz., Dripping Springs Creek
above______...._ 171Wolf Creek near Hanna, Utah 95-96Work, authorization of . 1
division of_..._____ .... 9scope of____ .. . 1-2
Wyoming, cooperation by. 9
York, Ariz., Gila River at... 171 York Canal at York, Ariz... 171 York Cattle Co.'s ditch at York, Ariz 171 Yuma, Ariz., Colorado River at 20-22
Zero flow, point of, definition of 2 Zuni River at Blackrock, N. Mex 114
o