DATA COLLECTION SURVEY ON WATER SUPPLY AND ...
290
4R JR 21-041 ISLAMIC REPUBLIC OF PAKISTAN DATA COLLECTION SURVEY ON WATER SUPPLY AND SEWERAGE SECTOR OF PAKISTAN FINAL REPORT DECEMBER 2021 JAPAN INTERNATIONAL COOPERATION AGENCY(JICA) NIHON SUIDO CONSULTANTS CO., LTD. JAPAN TECHNO CO., LTD. YOKOHAMA WATER CO., LTD.
-
Upload
khangminh22 -
Category
Documents
-
view
0 -
download
0
Transcript of DATA COLLECTION SURVEY ON WATER SUPPLY AND ...

4R JR
21-041
ISLAMIC REPUBLIC OF PAKISTAN
DATA COLLECTION SURVEY ON WATER SUPPLY AND SEWERAGE SECTOR
OF PAKISTAN
FINAL REPORT
DECEMBER 2021
JAPAN INTERNATIONAL COOPERATION AGENCY(JICA)
NIHON SUIDO CONSULTANTS CO., LTD. JAPAN TECHNO CO., LTD.
YOKOHAMA WATER CO., LTD.

The Data Collection Survey on Water Supply and Sewerage Sector of Pakistan Final Report
i
DATA COLLECTION SURVEY ON WATER SUPPLY AND SEWERAGE SECTOR OF PAKISTAN
FINAL REPORT
Table of Contents
Outline of the Survey ..................................................................................................................................... 1-1 1.1 Basic Information of the Survey ................................................................................................................................ 1-1
1.1.1 Background of the Survey .................................................................................................................................. 1-1 1.1.2 Objectives of the Survey ..................................................................................................................................... 1-2 1.1.3 Composition of the Survey Team ....................................................................................................................... 1-2 1.1.4 Survey Schedules ................................................................................................................................................ 1-2 1.1.5 Survey Area and Counter Part Organizations .................................................................................................... 1-3 1.1.6 Current Status and Issues of the Survey Area Based on Existing Research .................................................... 1-5 1.1.7 Analysis of Related Materials /Information and Necessary Data Collection ................................................... 1-7
Overview of the Water, Sewerage and Drainage Sectors of the Central Government, Sindh Province, Punjab Province and KP Province of Pakistan ........................................................................................................... 2-1
2.1 Policies, Regulations and Plans pertaining to the Water, Sewerage and Drainage Sector ...................................... 2-1 2.1.1 Federal Government ............................................................................................................................................ 2-1 2.1.2 Punjab Province ................................................................................................................................................... 2-8 2.1.3 KP Province ....................................................................................................................................................... 2-12 2.1.4 Sindh Province ................................................................................................................................................... 2-15
2.2 Administrative Organization for Water Supply and Sewerage Sector ................................................................... 2-17 2.2.1 Federal Government .......................................................................................................................................... 2-17 2.2.2 Punjab Province ................................................................................................................................................. 2-17 2.2.3 KP Province ....................................................................................................................................................... 2-22 2.2.4 Sindh Province ................................................................................................................................................... 2-24
2.3 Financial Status of Water, Sewerage and Drainage Utilities in the Water and Sewage Sector ............................ 2-27 2.3.1 Financial status of the Central Government of Pakistan ................................................................................. 2-27 2.3.2 Financial Status of Sindh Province ................................................................................................................... 2-27 2.3.3 Financial Status of Punjab Province ................................................................................................................. 2-29 2.3.4 Financial Status of KP Province ....................................................................................................................... 2-30
2.4 Environmental and Water Quality Standards in the Water and Sewage Sector .................................................... 2-33 2.4.1 Drinking Water Quality Standards ................................................................................................................... 2-33 2.4.2 Discharge Water Quality Standards .................................................................................................................. 2-34
Current Status of Sewerage and Drainage in Multan, Punjab Province ..................................................... 3-1
The Data Collection Survey on Water Supply and Sewerage Sector of Pakistan Final Report
ii
3.1 Multan's Socio-economic Status, Geographical Characteristics, Vital Statistics, Industry..................................... 3-1 3.1.1 Geographic Features ............................................................................................................................................ 3-1 3.1.2 Climate ................................................................................................................................................................. 3-2 3.1.3 Socio-economic and Industrial Situations .......................................................................................................... 3-3 3.1.4 Demographic ....................................................................................................................................................... 3-3
3.2 Organizational Structure of WASA Multan .............................................................................................................. 3-4 3.3 WASA Multan's Fee Structure and Financial Status ................................................................................................. 3-5
3.3.1 WASA Multan Fee Structure .............................................................................................................................. 3-5 3.3.2 WASA Multan's financial situation .................................................................................................................. 3-11
3.4 Current Status of Sewerage and Drainage Facilities in WASA Multan ................................................................ 3-12 3.4.1 Sewerage System .............................................................................................................................................. 3-12 3.4.2 Sewer System .................................................................................................................................................... 3-13 3.4.3 Drainage System................................................................................................................................................ 3-16 3.4.4 Pumping Station ................................................................................................................................................ 3-17 3.4.5 Sewage Treatment Plant .................................................................................................................................... 3-19
3.5 Management and Operation of sewerage and drainage facilities of WASA Multan ............................................ 3-20 3.5.1 Management of Sewer pipes ............................................................................................................................ 3-20 3.5.2 Management of Pumping Stations and Sullage Carriers ................................................................................ 3-25 3.5.3 Sewer pipes/Sullage Carrier Management Equipment ................................................................................... 3-34 3.5.4 Environmental and Social Considerations Regarding Cooperation Components of Multan ....................... 3-38 3.5.5 Sewerage Issues of Multan ............................................................................................................................... 3-39
3.6 Current status of WASA Multan's business operations ........................................................................................... 3-42 3.7 WASA Multan Sewerage Master Plan(M/P) .......................................................................................................... 3-44
3.7.1 Summary of WASA Multan M/P(Sewerage Edition) .............................................................................. 3-44 3.7.2 Summary of WASA Multan M/P(Rainwater Drainage Edition) ............................................................. 3-47
3.8 Other Donor’s Project in Multan .............................................................................................................................. 3-49 3.9 Request of WASA Multan ........................................................................................................................................ 3-50
CURRENT STATUS OF WATER SUPPLY IN HARIPUR, KP PROVINCE ....................................... 4-1 4.1 Socio-Economic Status, Geographical Characteristics, Demography, and Industries of Haripur ......................... 4-1
4.1.1 Natural Geographical Features ........................................................................................................................... 4-1 4.1.2 Climate in Haripur ............................................................................................................................................... 4-2 4.1.3 Major Water Resources of Haripur District ...................................................................................................... 4-3 4.1.4 Socioeconomic and Industrial Conditions ......................................................................................................... 4-3 4.1.5 Population Movements ....................................................................................................................................... 4-4 4.1.6 Afghan Refugee Camp ........................................................................................................................................ 4-4
4.2 Organizational Structure of Water Utilities in Haripur ............................................................................................. 4-4 4.2.1 Division of Roles between PHED and TMA .................................................................................................... 4-4 4.2.2 PHED’s Organizational Structure....................................................................................................................... 4-5

The Data Collection Survey on Water Supply and Sewerage Sector of Pakistan Final Report
iii
4.2.3 TMA's Organizational Structure and Personnel ................................................................................................ 4-7 4.2.4 Organizational Roles and Responsibilities ......................................................................................................... 4-8
4.3 Tariff System and Financial Status of Water Utilities in Haripur ............................................................................. 4-9 4.3.1 Financial Status of the PHED Haripur ............................................................................................................... 4-9 4.3.2 Tariff System of the TMA ................................................................................................................................. 4-11
4.4 Current Status of Water Supply Facilities in Haripur .............................................................................................. 4-13 4.4.1 Water Facilities in Urban Area .......................................................................................................................... 4-13 4.4.2 Water Supply Facilities in Rural Area .............................................................................................................. 4-16
4.5 Current Status of Water Utility Operations in Haripur............................................................................................ 4-22 4.5.1 Management Organization ............................................................................................................................... 4-22 4.5.2 Current Status of Water Supply Rate and its Issues ......................................................................................... 4-24 4.5.3 Current Status of Water Supply Time and its Challenges ............................................................................... 4-25 4.5.4 Current Status of Water Supply Volume and its Issues ................................................................................... 4-25 4.5.5 Current Status of Water Quality and its Issues ................................................................................................. 4-25 4.5.6 Current Status of Non-revenue Water Ratio and its Issues ............................................................................. 4-27
4.6 Plan for Improvement of Water Supply Facilities in Haripur................................................................................. 4-27 4.6.1 Water Supply and Sanitation Master Plan ........................................................................................................ 4-27
4.7 Survey of Existing Water Sources in Haripur ......................................................................................................... 4-28 4.7.1 Survey on Water Quantity, Quality, and Seasonal Variation of Shah Maqsood Spring ................................ 4-28 4.7.2 Water Quantity, Quality, and Seasonal Variation Study of Chapra Dam under Construction ...................... 4-30 4.7.3 Water Quality Survey at Other Potential Water Source Sites ......................................................................... 4-33 4.7.4 Water Quality Survey of Water Supply Facilities around Haripur ................................................................. 4-37
4.8 Proposed Projects by Phed ....................................................................................................................................... 4-37 4.9 Trends of Other Donors in Haripur .......................................................................................................................... 4-40 4.10 Necessity of sewage treatment facilities ................................................................................................................ 4-48 4.11 Request of PHED Haripur ...................................................................................................................................... 4-48
4.11.1 Request of PHED Haripur .............................................................................................................................. 4-48 4.11.2 Comparison on Potential Water Sources and Environmental and social consideration .............................. 4-49
Current Status of Water Supply and Sewerage Sector in Karachi, Sindh PROVINCE ............................ 5-1 5.1 Organizational Structure of KWSB ........................................................................................................................... 5-1 5.2 Tariff System and Financial Status of KWSB ........................................................................................................... 5-8
5.2.1 The KWSB's Water and Sewer Rate System..................................................................................................... 5-8 5.2.2 Financial Condition of KWSB ......................................................................................................................... 5-10 5.2.3 KWSB Funding Flow and Project Approval Procedures ............................................................................... 5-12
5.3 Current Status of Water and Sewage Facilities in Karachi City ............................................................................. 5-12 5.3.1 Current Status of Water Facilities in Karachi City ........................................................................................... 5-12 5.3.2 Current Status of Sewerage Facilities in Karachi City .................................................................................... 5-14
5.4 Issues of KWSB Business Management ................................................................................................................. 5-16

The Data Collection Survey on Water Supply and Sewerage Sector of Pakistan Final Report
iv
5.5 Karachi Water Supply and Sewerage Master Plan and Progress of Facility Development Based on It ............. 5-20 5.5.1 Karachi Water Supply and Sewerage M/P....................................................................................................... 5-20 5.5.2 Karachi Water Supply and Sewerage Services Improvement Project (KWSSIP) ........................................ 5-23 5.5.3 Main Water Supply Facilities Development Project(KⅣ Project) .......................................................... 5-25 5.5.4 Main Sewerage Facilities Development Project(SⅢ Project) ................................................................. 5-26 5.5.5 Other Ongoing Projects ..................................................................................................................................... 5-27 5.5.6 WB / AIIB Project ............................................................................................................................................. 5-29 5.5.7 PPP Initiatives in Karachi .................................................................................................................................. 5-30 5.5.8 Summary of Water and Wastewater Facility Improvement Projects ............................................................. 5-31
5.6 Points to be Noted for the Development of Water Supply and Sewerage Sector in Karachi ............................... 5-31 5.6.1 Status of Response to the Proposals in the M/P ............................................................................................... 5-32 5.6.2 Current Status and Direction of Operational Improvements .......................................................................... 5-32 5.6.3 Current Status of Facility Development and its Direction .............................................................................. 5-32 5.6.4 Evaluation of Past ODA Loan Projects ............................................................................................................ 5-32 5.6.5 Evaluation of the Project ................................................................................................................................... 5-33
EXISTING DRAINAGE SYSTEM AND URBAN ENVIRONMENT OF LAHORE, PUNJAB ..... 6-1 6.1 Current Status of WASA Lahore's Organizational Structure and Business Operations ......................................... 6-1 6.2 Current Status of Sewerage and Rainwater Drainage in Lahore ............................................................................. 6-2
6.2.1 Sewerage and Drainage System in Lahore ........................................................................................................ 6-2 6.2.2 Sewer pipe and Pump Facilities.......................................................................................................................... 6-2 6.2.3 Rainwater Drains and Pump Facilities ............................................................................................................... 6-9
6.3 Issues of Drains in Lahore ........................................................................................................................................ 6-17 6.3.1 Occurrence of Ponding during Wet Weather ................................................................................................... 6-17 6.3.2 Other Issues ........................................................................................................................................................ 6-21 6.3.3 Progress of the Implementation of Drainage Master Plan .............................................................................. 6-25
6.4 Analysis of the Issues of Drains in Lahore .............................................................................................................. 6-26 6.4.1 Factor Analysis of Issues by Analyzing Existing Information ........................................................................ 6-26 6.4.2 Causes for Ponding and Study for Solutions ................................................................................................... 6-29 6.4.3 Environmental and Social Consideration......................................................................................................... 6-32
6.5 Sewerage Master Plan of Lahore ............................................................................................................................. 6-33 6.5.1 Outline of Sewerage Master Plan ..................................................................................................................... 6-33 6.5.2 Outline of Drainage Master Plan ...................................................................................................................... 6-35
6.6 Trends of Other Donors in Lahore ........................................................................................................................... 6-39 6.7 Request of WASA Lahore ........................................................................................................................................ 6-40
SURVEY AND SEMINAR ON FINANCE FOR WASA FAISALABAD, PUNJAB .......................... 7-1 7.1 Current Status of WASA Faisalabad's Business Operations .................................................................................... 7-1
7.1.1 WASA Faisalabad's Undertaking to Improve its Management ........................................................................ 7-1 7.1.2 WASA Faisalabad Tariff Structure ..................................................................................................................... 7-5

The Data Collection Survey on Water Supply and Sewerage Sector of Pakistan Final Report
v
7.1.3 Financial Status of WASA Faisalabad .............................................................................................................. 7-10 7.2 Capacity of WASA Faisalabad Staff in Financial Management ............................................................................ 7-13
7.2.1 Objectives of Capability Assessment in Financial Management ................................................................... 7-13 7.2.2 Methodology for the Financial Capability Assessment .................................................................................. 7-13 7.2.3 Financial Capability Assessment ...................................................................................................................... 7-14
7.3 Conducting Financial Seminars ............................................................................................................................... 7-18 7.4 Other Donors in Faisalabad ...................................................................................................................................... 7-18
RECOMMENDATIONS FOR FUTURE COOPERATION IN THE WATER SUPPLY, SEWERAGE AND DRAINAGE SECTORS IN THE TARGET CITIES .................................................................................... 8-1
8.1 Basic Concept.............................................................................................................................................................. 8-1 8.2 Recommendations for Future Cooperation in Multan .............................................................................................. 8-2
8.2.1 Issues of Sewage and drainage Sector in Multan .............................................................................................. 8-2 8.2.2 Countermeasures against Issues in Multan ........................................................................................................ 8-3 8.2.3 Equipment Needed for O&M Improvement in Multan .................................................................................... 8-3 8.2.4 Effectiveness Indicators and Baseline/Target Values for Support .................................................................... 8-6 8.2.5 Necessary Responsibilities of the Multan Side .................................................................................................. 8-8 8.2.6 Countermeasures against Other Issues ............................................................................................................... 8-8
8.3 Water Supply Sector in Haripur ............................................................................................................................... 8-11 8.3.1 Outline of the Request from the PHED (Facility Development Plan) ........................................................... 8-11 8.3.2 Survey Results of the study of Water Sources ................................................................................................. 8-12 8.3.3 Necessity of Additional Research on Water Sources ...................................................................................... 8-14 8.3.4 Points to be Noted.............................................................................................................................................. 8-14
8.4 Measures for Improvement of Rainwater Management of Lahore ....................................................................... 8-15 8.4.1 Lahore M / P ...................................................................................................................................................... 8-15 8.4.2 Necessity for Factor Analysis of Ponding Focusing on Road Surfaces ......................................................... 8-17 8.4.3 Direction of Improvement of Rainwater Management ................................................................................... 8-19 8.4.4 Implementation Procedures of Improvement Measures and Relationship with Master Plan ...................... 8-23 8.4.5 Role-Sharing with Other Donors ...................................................................................................................... 8-23
8.5 Utilization of Japanese Technology ......................................................................................................................... 8-24 【Appendix】 (Chapter 1)
1.1 Record of Meeting 1.2 Questionnaire Multan 1.3 Questionnaire Haripur 1.4 Questionnaire Karachi 1.5 Questionnaire Lahore
(Chapter 2)

The Data Collection Survey on Water Supply and Sewerage Sector of Pakistan Final Report
vi
2.1 List of laws and policies (Chapter 3)
3.1 Vol-I O&M Manual Water Supply 3.2 Vol-II O&M Manual Sewerage, Drainage and Sewage Treatment 3.3 Vol-III Implementation Plan & Organizational Design WASA MLT (12-06-2017) 3.4 Existing and proposed WWTP Presentation 3.5 Consultancy Services for Master Planning of Water Supply, Sewerage and Drainage System of WASA Multan Final Master Plan Report 3.6 Technical Data of the existing pump stations, Multan WASA 3.7 Pre flood Arrangements 15-05-2019 Monsoon 3.8 Daily Desilting Report 02-12-2019 to update 3.9 WASA MULTAN (MDA) TARIFF 3.10 WASA MULTAN REVENUE
(Chapter 4) 4.1 Brief Presentation on Public Health Engg Division Haripur 4.2 KFW project details 4.3 KP Annual Development Programme 2017, 2018 4.4 KP Annual Development Programme 2019, 2020 4.5 Haripur_Economic, Financial and Policy Data
(Chapter 5) 5.1 KW&SB Presentation,19-12-18-converted 5.2 KW&SB Financial Data
(Chapter 6) 6.1 IMPROVEMENT PLAN OF MULTAN ROAD PUMPING STATION, LWASA 6.2 AIIB Projects 6.3 Sewerage Improvement Plan of Gulberg, Garden Town, Faisal Town, Kattar Band & Ferozepur Road areas 26.11.2019 6.4 Preparation of Master Plan for Water Supply, Sewerage and Drainage System for Lahore 2040 6.5 WASA Monsoon 22-6-2011 6.6 Newspaper Articles of Lahore Flooding 6.7 Cumulative Report Maximum Rainfall 2020-2021 6.8 DETAIL OF MACHINERY IN WASA LAHORE
(Chapter 7) 7.1 Document of WASA Faisalabad Gazette 7.2 Document of WASA Faisalabad Maintenance 7.3 Questionnaire Financial Management of WASA Faisalabad 7.4 Discussion Paper WASA Faisalabad 7.5 WASA Faisalabad Seminar_Presentation

The Data Collection Survey on Water Supply and Sewerage Sector of Pakistan Final Report
vii
7.6 WASA Faisalabad Seminar_Results
The Data Collection Survey on Water Supply and Sewerage Sector of Pakistan Final Report
viii
Table Contents Table 1.1-1 Objectives of the Survey in the Target Cities .......................................................................................... 1-2 Table 1.1-2 Composition of Survey Team .................................................................................................................. 1-2 Table 1.1-3 Schedule for the First Field Survey .......................................................................................................... 1-3 Table 1.1-4 Schedule for the Second Field Survey ..................................................................................................... 1-3 Table 1.1-5 Counter Part Organizations under the Survey ......................................................................................... 1-4 Table 1.1-6 Meetings .................................................................................................................................................... 1-4 Table 1.1-7 Common Issues of the Country ............................................................................................................... 1-5 Table 1.1-8 Current Status pertaining to the Water, Sewerage and Drainage Sectors at the Targeted Cities .......... 1-6 Table 1.1-9 JICA’s Major Cooperation in Water, Sewerage and Drainage Sector ................................................... 1-7 Table 1.1-10 Major Cooperation Projects of Other Donors in the field of Water, Sanitation and Drainage Sector in
Pakistan (Since 2000) ........................................................................................................................................ 1-10 Table 2.1-1 Relevant Laws of the Federal and the 3 Provincial Governments ......................................................... 2-1 Table 2.1-2 Policies of the Federal and 3 Provinces Relevant to Water and Sewerage ............................................ 2-2 Table 2.2-1 Comparison of administrative structure between the 2013 Act and the 2019 Act .............................. 2-19 Table 2.2-2 Administration Hierarchy in The KP Province ..................................................................................... 2-22 Table 2.2-3 Area and population of Districts under the Karachi Division .............................................................. 2-26 Table 2.3-1 Budget of WASH Sector(Per Capita USD・and Total Investment(USD millions) .................... 2-27 Table 2.3-2 Composition of Revenue Source in Sindh Province ............................................................................ 2-28 Table 2.3-3 Water Supply and Sewerage Projects of Sindh Provincial Government ............................................. 2-28 Table 2.3-4 Current Revenue Expenditure ................................................................................................................ 2-28 Table 2.3-5 Budget (Revenue Prospect) of KP Provincial Government ................................................................. 2-31 Table 2.3-6 Outcome/Output indicators defined under the PHED's medium-term financial plan ........................ 2-31 Table 2.3-7 Medium-Term Development Plan pertaining to Water Supply and Sanitation Sector in the KP Province
............................................................................................................................................................................. 2-32 Table 2.3-8 Priority Projects in the Medium-Term Development Plan ................................................................... 2-33 Table 2.4-1 National Drinking Water Quality Standard (NSDWQ) ....................................................................... 2-33 Table 2.4-2 National Environmental Quality Standards for Urban and Liquid Industrial Wastewater (NEQS)1,2
(2000) .................................................................................................................................................................. 2-34 Table 3.1-1 Monthly Fluctuations in Temperature and Precipitation in Multan ....................................................... 3-3 Table 3.2-1 Capacity and Vacancy of WASA Multan(As of Dec.7. 2019) ............................................................ 3-5 Table 3.3-1 Tariff Structure for the Water and Sewerage of WASA Multan ............................................................. 3-6 Table 3.3-2 Comparison of Current and Proposed Revised Rates ............................................................................ 3-6 Table 3.3-3 Trends in Fee Collection ........................................................................................................................... 3-8 Table 3.3-4 Maintenance Budget: Income ................................................................................................................ 3-11 Table 3.3-5 Operation and Maintenance Budget: Expenditure................................................................................ 3-11 Table 3.4-1 Types and Length of Sewer .................................................................................................................... 3-14 Table 3.4-2 Laid Year of Sewer and Sullage Carrier of WASA Multan .................................................................. 3-15
The Data Collection Survey on Water Supply and Sewerage Sector of Pakistan Final Report
ix
Table 3.4-3 Summary of Sewage Treatment Plant ................................................................................................... 3-19 Table 3.4-4 Water Quality Plan of Sewage Treatment Plant .................................................................................... 3-19 Table 3.4-5 Current Treatment Status of Sewage Treatment Plant .......................................................................... 3-19 Table 3.5-1 Equipment for Each Pipe Management Office/ Branch ....................................................................... 3-21 Table 3.5-2 Current Status and Findings of Disposal Station .................................................................................. 3-25 Table 3.5-3 Overview of Existing Disposal Station (DS) ........................................................................................ 3-28 Table 3.5-4 Pump type and inoperable number at the time of WASA Multan M / P survey and this survey ....... 3-30 Table 3.5-5 Planned flow rate and pump capacity of disposal station (WASA Multan M / P and at the time of this
survey) ................................................................................................................................................................ 3-30 Table 3.5-6 Current Status of Disposal stations and Improvement Measures ........................................................ 3-32 Table 3.5-7 Sewer pipe Management Equipment Owned by WASA Multan ........................................................ 3-35 Table 3.5-8 Expected Effects and Points to be Noted from the Perspective of Environmental and Social
Consideration (Multan) ..................................................................................................................................... 3-39 Table 3.7-1 List of Sewage Treatment Plant Specifications ..................................................................................... 3-47 Table 3.8-1 Summary of the ADB Project ................................................................................................................ 3-49 Table 3.9-1 Requested Equipment List of WASA Multan ....................................................................................... 3-50 Table 3.9-2 Requested Equipment List of WASA Multan(Item 3. Detailed list of Specifications of Pumps with
Motors, Valves & Pipes) ................................................................................................................................. 3-51 Table 4.2-1 Sanctioned Strength and Status of the PHED Haripur ........................................................................... 4-6 Table 4.2-2 Organization of TMA Haripur and its Staff Numbers ............................................................................ 4-7 Table 4.2-3 Roles and Responsibilities of Office Staff by Position ........................................................................... 4-8 Table 4.2-4 Quantity of Water Supply and Sanitation Facilities under PHED Jurisdiction ..................................... 4-9 Table 4.3-1 PHED Haripur Expenditure (Budget) ..................................................................................................... 4-9 Table 4.3-2 PHED Haripur Expenditure (Breakdown) ............................................................................................ 4-10 Table 4.3-3 Water Tariff Collection in PHED Haripur ............................................................................................. 4-10 Table 4.3-4 Monthly Household Expenditure per Capita by Region ...................................................................... 4-11 Table 4.3-5 Haripur TMA Water Charges and Collection Rates ............................................................................. 4-11 Table 4.3-6 Revenue of Haripur TMA ...................................................................................................................... 4-12 Table 4.3-7 Expenditure on Water Sector in Haripur TMA ..................................................................................... 4-12 Table 4.4-1 List of Tube Wells Managed by TMA ................................................................................................... 4-13 Table 4.4-2 Current status of water supply facilities in rural areas .......................................................................... 4-17 Table 4.6-1 Summary of Master Plan for Water Supply and Sanitation ................................................................. 4-27 Table 4.7-1 Results of Water Quality Measurement Test of Shah Maqsood Spring .............................................. 4-29 Table 4.7-2 Simple Water Quality Test Results of Shah Maqsood Springs ............................................................ 4-29 Table 4.7-3 Chapra Dam Summary ........................................................................................................................... 4-30 Table 4.7-4 Results of Water Quality Measurement Tests for Chapra Dam ........................................................... 4-31 Table 4.7-5 Results of Simple Water Quality Tests Capra Dams ............................................................................ 4-32 Table 4.7-6 Simple Water Quality Test Results for Haro River ............................................................................... 4-33

The Data Collection Survey on Water Supply and Sewerage Sector of Pakistan Final Report
x
Table 4.7-7 Results of Simple Water Quality Test for Dor River ............................................................................ 4-33 Table 4.7-8 Results of Water Source Water Quality Survey in Abbottabad and Mansella .................................... 4-37 Table 4.8-1 Summary of water supply facility development plan in Haripur ......................................................... 4-37 Table 4.9-1 KfW Project Summary for Water Distribution Network Improvement in Haripur City ................... 4-40 Table 4.9-2 Project Summary of the Construction of Water Supply Facility in Abbottabad Financed by ADB .. 4-42 Table 4.9-3 Project Summary for the Construction of Water Supply Facility in Havelian City Supported by Korea
............................................................................................................................................................................. 4-46 Table 4.11-1 Comparison of Water Source Candidate in Haripur (Urban water supply) ...................................... 4-50 Table 4.11-2 Comparison of Water Source Candidate in Haripur (Rural Water Supply) ...................................... 4-50 Table 4.11-3 Expected Benefits and Environmental and Social Considerations (Haripur) ................................... 4-51 Table 5.1-1 Seniority List of the KWSB ..................................................................................................................... 5-2 Table 5.1-2 Vacancy/Excess status of the KWSB posts (as of September 2021) ..................................................... 5-3 Table 5.2-1 Rate Structure for Water Supply and Sewerage/Drainage of the KWSB (As of July 2021) ............... 5-8 Table 5.2-2 Rate Schedule for Water and Sewer and Drainage in KWSB ............................................................... 5-9 Table 5.2-3 Financial Status of the KWSB .............................................................................................................. 5-11 Table 5.3-1 Overview of Karachi's Water Supply .................................................................................................... 5-13 Table 5.3-2 Water Facilities in Karachi City (partially approximate number) ........................................................ 5-14 Table 5.3-3 Sewage Amount and Treatment Amount in Karachi City.................................................................... 5-15 Table 5.3-4 Sewerage Facilities in Karachi City ...................................................................................................... 5-15 Table 5.4-1 Issues on Water Supply Service in Karachi City and Countermeasures ............................................. 5-16 Table 5.4-2 Reasons for Water Loss and Water Leakage and Necessary Measures for NRW .............................. 5-17 Table 5.4-3 Human Resource Development Issues and Necessary Measures ....................................................... 5-19 Table 5.4-4 Self-Evaluation of Operational Management of KWSB .......................................................................... 5-19 Table 5.5-1 Long-term Facility Development of Bulk Water Supply System ........................................................ 5-20 Table 5.5-2 Long Term Facility Development Plan for Retail Water Supply System ............................................ 5-20 Table 5.5-3 New Facility Construction plan ............................................................................................................. 5-21 Table 5.5-4 Existing Facility Rehabilitation Plan ..................................................................................................... 5-22 Table 5.5-5 Priority Project List ................................................................................................................................. 5-22 Table 5.5-6 List of SOP of KWSSIP ......................................................................................................................... 5-24 Table 5.5-7 Outline of SⅢ Project............................................................................................................................. 5-26 Table 5.5-8 Contents of Phase 1................................................................................................................................. 5-29 Table 5.5-9 Contents of Phase 2................................................................................................................................. 5-30 Table 5.6-1 Outline of the ODA Loan Project .......................................................................................................... 5-33 Table 5.6-2 Evaluation Result of ODA Loan Project ............................................................................................... 5-33 Table 6.2-1 Summary of Existing Sewerage Facilities in Sewage Treatment Area ................................................. 6-2 Table 6.2-2 List of Sewer pipes .................................................................................................................................... 6-4 Table 6.2-3 Current Status and Findings of Disposal Stations (DSs) ........................................................................ 6-5 Table 6.2-4 Overview of Existing Major Disposal Station (DS) .............................................................................. 6-7
The Data Collection Survey on Water Supply and Sewerage Sector of Pakistan Final Report
xi
Table 6.2-5 Summary of Existing Drainage Facilities................................................................................................ 6-9 Table 6.2-6 Major Existing Drains in Lahore ........................................................................................................... 6-11 Table 6.2-7 Current Status and Findings of Drainage Pump Stations (DPSs) ........................................................ 6-14 Table 6.2-8 Overview of Existing Drainage Pump Station (DPS) ....................................................................... 6-16 Table 6.3-1 Changes over time in the total number of ponding at 22 monitoring locations .................................. 6-18 Table 6.3-2 Monitoring Data of Heavy Rain in Lakshimi Chowk .......................................................................... 6-19 Table 6.3-3 Over Time Changes in the Number of Ponding by Monitoring Data in Lakshimi Chowk ............... 6-19 Table 6.3-4 Over Time Changes in the Number of Ponding by Monitoring Data in Lowrence Road ................. 6-21 Table 6.4-1 Summary and Classification of Issues in the Current state of Drains .................................................. 6-27 Table 6.4-2 Environmental and Social Consideration Aspects (Lahore) ................................................................ 6-32 Table 6.6-1 WASA Lahore Facility Construction Project that Each Donor is Planning to Finance ...................... 6-40 Table 6.7-1 Request of Equipment of O&M from WASA Lahore ......................................................................... 6-41 Table 7.1-1 WASA-F Tariff Structure for Water Supply, Sewerage and Drainage .................................................. 7-6 Table 7.1-2 WASA-F’s water, Sewerage and Drainage Tariffs.................................................................................. 7-7 Table 7.1-3 Proposed Water and Sewer Rate Revisions............................................................................................. 7-9 Table 7.1-4 WASA Faisalabad Water and Sewerage Charges and Collection Rates ............................................ 7-10 Table 7.1-5 Revenue Trends in the Operating Budget (in PKR million) ................................................................ 7-11 Table 7.1-6 Trends of Expenditure in Operating Budget (in PKR million) ............................................................ 7-12 Table 7.1-7 Annual Electricity Consumption and Electricity Rates for Major Facilities ....................................... 7-13 Table 7.2-1 List of Financial Capability Survey Interviewees ................................................................................. 7-14 Table 7.2-2 Results of Questionnaire-Based Interviews Survey.............................................................................. 7-15 Table 7.2-3 Responses by Questionnaire .................................................................................................................. 7-16 Table 7.2-4 Results of the Literature Review, Interview, and Field Survey ............................................................ 7-17 Table 7.4-1 Actual and Planned Assistance to WASA Faisalabad .......................................................................... 7-18 Table 7.4-2 Framework and Content of Technical Assistance Planned by AfD ..................................................... 7-19 Table 8.1-1 Major Issues and Example of Countermeasures in the Five Target Cities in Pakistan ......................... 8-1 Table 8.2-1 Issues of sewerage and drainage sector in Multan .................................................................................. 8-2 Table 8.2-2 Countermeasures for the issues in the sewage and drainage sector of Multan ..................................... 8-3 Table 8.2-3 Consideration on Equipment Required for Support - Feasibility and Quantity Justification (Request and
Suggestion) ........................................................................................................................................................... 8-4 Table 8.2-4 Indicators and Baseline/Target Values Corresponding to Expected Support ........................................ 8-6
Figure Contents
Figure 1.1-1 Survey Area ............................................................................................................................................. 1-4 Figure 1.1-2 Schematic Diagram of Japan's Recent Support on the Water Sector in Pakistan ................................ 1-9 Figure 2.2-1 Organization chart of HUD & PHED in Punjab Province ................................................................. 2-18 Figure 2.2-2 Divisions and Location of Metropolitan Corporations in Punjab Province ...................................... 2-19 Figure 2.2-3 Lahore District Administration ............................................................................................................. 2-20
The Data Collection Survey on Water Supply and Sewerage Sector of Pakistan Final Report
xii
Figure 2.2-4 Multan District Administration............................................................................................................. 2-21 Figure 2.2-5 Faisalabad District Administration ....................................................................................................... 2-21 Figure 2.2-6 Organization Chart of The PHED in The KP Province ...................................................................... 2-23 Figure 2.2-7 Division Map of KP Province ............................................................................................................. 2-24 Figure 2.2-8 District Block Map of the Sindh Province (Karachi Division is shown in red) ................................ 2-25 Figure 2.2-9 Districts and Cantonments under the Karachi Division ...................................................................... 2-25 Figure 3.1-1 Topographic Map of Multan................................................................................................................... 3-1 Figure 3.1-2 Town Composition of Multan District and Administrative Area of Multan Development Authority
(MDA) .................................................................................................................................................................. 3-2 Figure 3.1-3 Monthly Fluctuations in Temperature and Precipitation in Multan ..................................................... 3-3 Figure 3.2-1 WASA Multan Organizational Chart ..................................................................................................... 3-4 Figure 3.3-1 Change of Recovery(2016~2019(Half a year)) ........................................................................ 3-9 Figure 3.3-2 Improvement Trends in Water Supply and Drainage Tariff Collection Amount .............................. 3-10 Figure 3.4-1 Sewerage Area Map .............................................................................................................................. 3-12 Figure 3.4-2 Sullage Carrier to STP .......................................................................................................................... 3-14 Figure 3.4-3 Current Situation of Multan Old Town ................................................................................................ 3-16 Figure 3.4-4 Roadside Drains .................................................................................................................................... 3-17 Figure 3.4-5 Location and Target Area of Each Disposal Station ............................................................................ 3-17 Figure 3.4-6 Location Map of Existing Sewage Disposal Station (Ds), Lift Station (Ls) and Sewage Treatment Plant
............................................................................................................................................................................. 3-18 Figure 3.4-7 Existing Sewage Treatment Plant......................................................................................................... 3-20 Figure 3.5-1 Management Organization of Sewage Pipes and Pumping Stations ................................................. 3-20 Figure 3.5-2 Structure of Each Branch and System of Human Power Group ........................................................ 3-21 Figure 3.5-3 Response in Sewage Flood Complaint Area ....................................................................................... 3-23 Figure 3.5-4 Overflow of Sewer in Multan Old Town ............................................................................................. 3-24 Figure 3.5-5 Ponding Problematic Areas Multan City ............................................................................................. 3-24 Figure 3.5-6 Overflow from Manhole in Rainy Weather ......................................................................................... 3-25 Figure 3.5-7 Photos of Disposal Station .................................................................................................................... 3-27 Figure 3.5-8 Management Status of Open Drains/ Cunetts in Undeveloped Sewer pipe Areas ........................... 3-34 Figure 3.5-9 Equipment Owned by Pumping Station Office .................................................................................. 3-36 Figure 3.5-10 Equipment of Sewer pipe management office .................................................................................. 3-37 Figure 3.5-11 Jetting machine with Severe Damage ................................................................................................ 3-38 Figure 3.5-12 Image of Sewerage and Drainage System of Multan ....................................................................... 3-40 Figure 3.7-1 Sewer pump stations and Sewer treatment plants (plan) .................................................................... 3-45 Figure 3.7-2 Location of Sullage Carrier (Plan) .................................................................................................... 3-46 Figure 3.7-3 Rainwater Drainage System Plan ......................................................................................................... 3-48 Figure 3.8-1 Summary of the ADB Project .............................................................................................................. 3-49 Figure 4.1-1 Topography of Haripur District .............................................................................................................. 4-1

The Data Collection Survey on Water Supply and Sewerage Sector of Pakistan Final Report
xiii
Figure 4.1-2 Administrative division map of Haripur district .................................................................................... 4-2 Figure 4.1-3 Temperature and Rainfall in Haripur ..................................................................................................... 4-3 Figure 4.2-1 PHED Abbottabad District (Hazara District) Organization Chart (Haripur in the red lines chain) ... 4-6 Figure 4.4-1 Status of TMA controlled tube wells ................................................................................................... 4-15 Figure 4.4-2 Tube wells positions managed by TMA .............................................................................................. 4-16 Figure 4.4-3 Status of Tube Wells in Rural Water Supply........................................................................................ 4-21 Figure 4.4-4 Proposed Scheme of Rural Water Supply and Village Locations ...................................................... 4-22 Figure 4.5-1 Piping Layout Plan for Haripur City Water Transmission and Distribution Pipeline ....................... 4-23 Figure 4.5-2 Example of Tube Well Column Map (Mirapur village) ..................................................................... 4-24 Figure 4.5-3 Example of Water Distribution Pipe Plan (Kahal Village) ................................................................. 4-24 Figure 4.5-4 Water Pipes Crossing Roadside Ditches and Valves in The Drainage ............................................... 4-26 Figure 4.7-1 Shah Maqsood Spring Point ................................................................................................................. 4-28 Figure 4.7-2 Status of water quality and water volume measurement .................................................................... 4-30 Figure 4.7-3 Variation in Water Volume at Chapra Dam ......................................................................................... 4-32 Figure 4.7-4 Haro River Area .................................................................................................................................... 4-33 Figure 4.7-5 Dor River Area ...................................................................................................................................... 4-34 Figure 4.7-6 Water Flow Rate of Dor River.............................................................................................................. 4-35 Figure 4.8-1Existing Tube Well Layout and Planned Transmission Pipeline Route for the Urban Water Supply
System ................................................................................................................................................................ 4-39 Figure 4.8-2 Dam and Village Locations and Transmission Pipeline Routes for the Rural Water Supply Systems 4-
40 Figure 4.9-1 Layout of Water Intake Facilities, Low Water Pipeline and Water Treatment Plants ....................... 4-43 Figure 4.9-2 Layout of the Choona Water Treatment Plant Water Treatment Plant Supported with ADB .......... 4-44 Figure 4.9-3 Layout of the Rapid Filtration Facility to be Constructed with Support from ADB ......................... 4-44 Figure 4.9-4 Facility Layout of the Water Supply Facility Construction Project in Havelian City Supported by Korea
............................................................................................................................................................................. 4-47 Figure 4.10-1 SOKA River and Dumping Location in Mirupur Suburb ................................................................ 4-48 Figure 5.1-1 Organogram of the KWSB ..................................................................................................................... 5-1 Figure 5.2-1 Development Project Pre-Screening Process by Pakistani Government - Overseas Donors .......... 5-12 Figure 5.3-1 Main Water Facilities in Karachi City .................................................................................................. 5-13 Figure 5.3-2 Areas with Excess or Deficiency of Water Supply in Karachi ........................................................... 5-14 Figure 5.3-3 Overview of Karachi's Sewage Treatment Districts ........................................................................... 5-15 Figure 5.5-1 Location Map of KIV Phase 1.............................................................................................................. 5-25 Figure 5.5-2 Facility Layout for S III Project ............................................................................................................ 5-27 Figure 5.5-3 Bulk Water Supply System in Karachi City ........................................................................................ 5-28 Figure 6.1-1 Organizational Chart of WASA Lahore ................................................................................................. 6-1 Figure 6.2-1 WASA Lahore’s Jurisdictions and Sewerage Districts ......................................................................... 6-3 Figure 6.2-2 Deteriorated Reinforced Concrete Pipe ................................................................................................. 6-5

The Data Collection Survey on Water Supply and Sewerage Sector of Pakistan Final Report
xiv
Figure 6.2-3 WASA Lahore’s Jurisdictions and Drainage Districts ........................................................................ 6-10 Figure 6.2-4 Conditions of Primary and Secondary Drains. .................................................................................... 6-12 Figure 6.2-5 Discharge of Untreated Sewage from DSs to Main Drains ................................................................ 6-13 Figure 6.2-6 Waste Cleaning at Drainage Facilities .................................................................................................. 6-14 Figure 6.2-7 Photos of existing Drainage Pump Stations ........................................................................................ 6-16 Figure 6.3-1 Ponding Locations................................................................................................................................. 6-18 Figure 6.3-2 Photo of Ponding Location ................................................................................................................... 6-19 Figure 6.3-3 Grating Lid and Porous Manhole Cover ............................................................................................. 6-20 Figure 6.3-4 Situation during Dry Weather and Ponding at Lawrence Road ......................................................... 6-20 Figure 6.3-5 Retarding Basin Near the Ponding Location at Lawrence Road ....................................................... 6-21 Figure 6.3-6 Discharge of Sewage to Drains ............................................................................................................ 6-22 Figure 6.3-7 Situation of Solid Wastes Dumping to the Drains ............................................................................... 6-23 Figure 6.3-8 Solid Wastes Dumping Sites at Primary Drains .................................................................................. 6-23 Figure 6.3-9 Drains Having Difficulty of Cleaning Work ....................................................................................... 6-24 Figure 6.3-10 Current Situation of Illegal Occupation Area .................................................................................... 6-25 Figure 6.4-1 Correlation between Drainage Issues and Solutions ........................................................................... 6-27 Figure 6.4-2 Sewage and Rainwater Drainage System in Lahore ........................................................................... 6-30 Figure 6.5-1 Location of Disposal Station&Sewage Treatment Plant and Specifications .................................... 6-34 Figure 6.5-2 Location of Principle Drains in the Suburbs 1/3 ................................................................................. 6-36 Figure 6.5-3 Location of Principle Drains in the Suburbs 2/3 ................................................................................. 6-37 Figure 6.5-4 Location of Principle Drains in the Suburbs 3/3 ................................................................................. 6-38 Figure 6.6-1 Projects of Other Donors ...................................................................................................................... 6-39 Figure 7.1-1 WASA Faisalabad's Management Improvement Initiatives ................................................................. 7-2 Figure 7.1-2 WASA Faisalabad Water and Sewerage Bill Collection System ......................................................... 7-4 Figure 7.1-3 GIS Water and Wastewater Facility Information .................................................................................. 7-5 Figure 8.2-1 Current Status of Sewer pipe Management and Necessary Equipment .............................................. 8-4
The Data Collection Survey on Water Supply and Sewerage Sector of Pakistan Final Report
xv
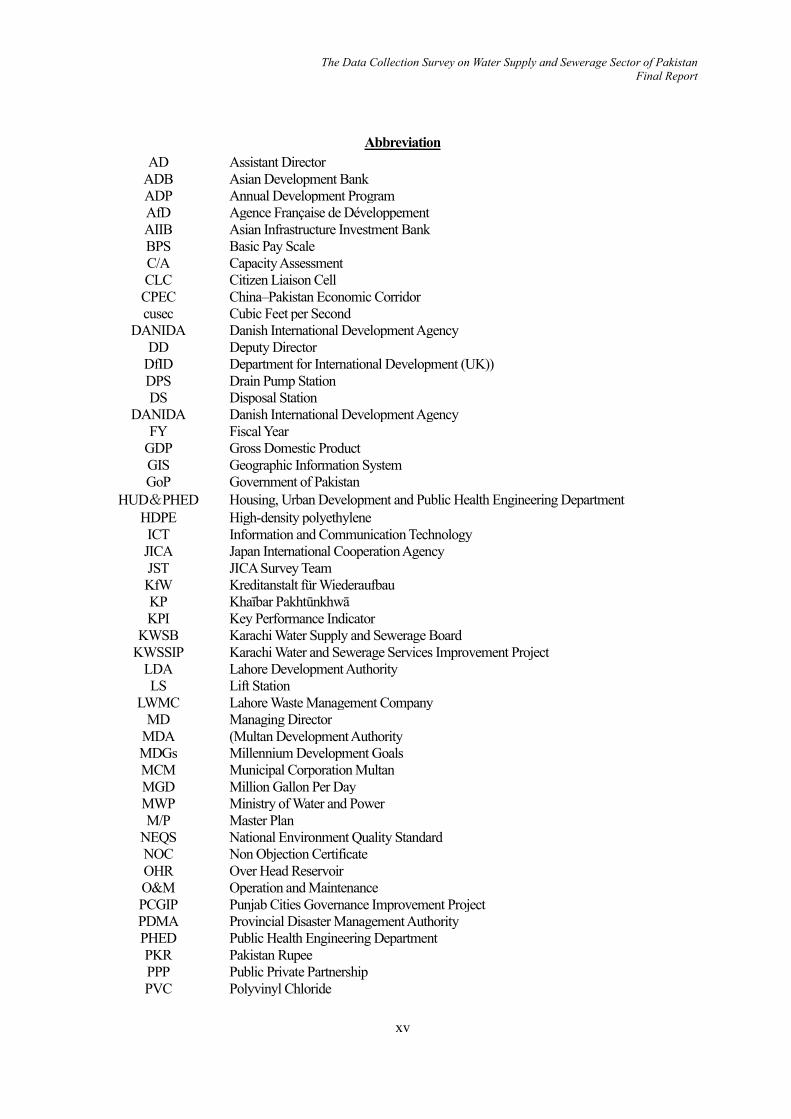
Abbreviation AD Assistant Director
ADB Asian Development Bank ADP Annual Development Program AfD Agence Française de Développement AIIB Asian Infrastructure Investment Bank BPS Basic Pay Scale C/A Capacity Assessment CLC Citizen Liaison Cell CPEC China–Pakistan Economic Corridor cusec Cubic Feet per Second
DANIDA Danish International Development Agency DD Deputy Director
DfID Department for International Development (UK)) DPS Drain Pump Station DS Disposal Station
DANIDA Danish International Development Agency FY Fiscal Year
GDP Gross Domestic Product GIS Geographic Information System GoP Government of Pakistan
HUD&PHED Housing, Urban Development and Public Health Engineering Department HDPE High-density polyethylene ICT Information and Communication Technology JICA Japan International Cooperation Agency JST JICA Survey Team KfW Kreditanstalt für Wiederaufbau KP Khaībar Pakhtūnkhwā KPI Key Performance Indicator
KWSB Karachi Water Supply and Sewerage Board KWSSIP Karachi Water and Sewerage Services Improvement Project
LDA Lahore Development Authority LS Lift Station
LWMC Lahore Waste Management Company MD Managing Director
MDA (Multan Development Authority MDGs Millennium Development Goals MCM Municipal Corporation Multan MGD Million Gallon Per Day MWP Ministry of Water and Power M/P Master Plan
NEQS National Environment Quality Standard NOC Non Objection Certificate OHR Over Head Reservoir O&M Operation and Maintenance PCGIP Punjab Cities Governance Improvement Project PDMA Provincial Disaster Management Authority PHED Public Health Engineering Department PKR Pakistan Rupee PPP Public Private Partnership PVC Polyvinyl Chloride
The Data Collection Survey on Water Supply and Sewerage Sector of Pakistan Final Report
xvi
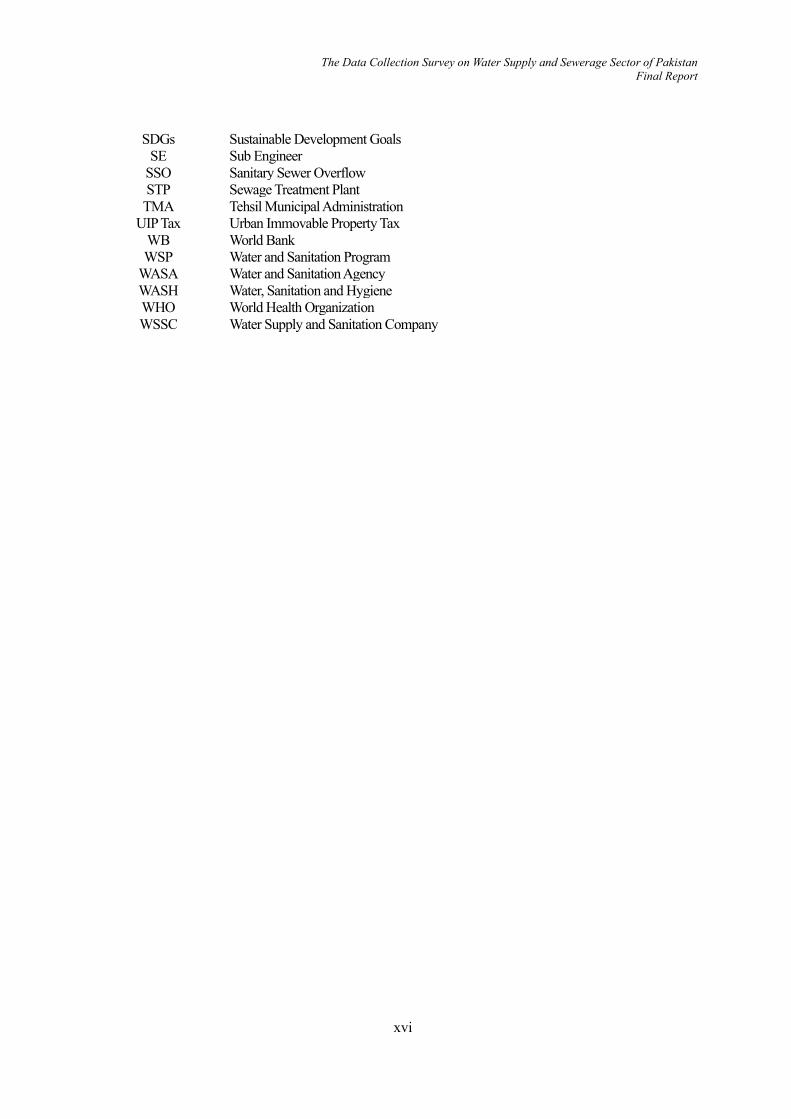
SDGs Sustainable Development Goals SE Sub Engineer
SSO Sanitary Sewer Overflow STP Sewage Treatment Plant
TMA Tehsil Municipal Administration UIP Tax Urban Immovable Property Tax
WB World Bank WSP Water and Sanitation Program
WASA Water and Sanitation Agency WASH Water, Sanitation and Hygiene WHO World Health Organization WSSC Water Supply and Sanitation Company
The Data Collection Survey on Water Supply and Sewerage Sector of Pakistan Final Report
1-1
OUTLINE OF THE SURVEY
1.1 BASIC INFORMATION OF THE SURVEY
1.1.1 Background of the Survey
The Islamic Republic of Pakistan (hereinafter referred to as “Pakistan”) has a population of 207 million (2017). As of 2020, 90% of the population has access to safe or basic water. However, two-thirds of the population that do not have access to safe or basic water live in Rural Areas. This indicates the existence of a large gap between urban areas and rural areas pertaining to water access. Even in urban areas where the rate of access to safe or basic water is high, water demand cannot be met due to the rapid population growth and water leakages caused by aging of existing facilities. 24-hour water supply is yet to be realized. As a result of water level lowering due to over-pumping and the effects of salinization, many cities plan to shift their water sources from groundwater to surface water in future, but specific time frame has not been decided and river water rights that serve as sources of surface water are not secured. In addition, most of the supplied water is not properly treated. It is just being disinfected, and distributed. Even where the water is treated, it is mixed with untreated water at the reservoir, or sewage is mixed in the aged transmission pipe network.
Regarding the financial aspect, since water services are not adequately provided, water tariff has to be kept low. Also, volume charge is not applied for the water tariff system. Thus, the water utilities depend on the subsidies from the Provincial and Federal Governments for its facility investment costs and maintenance and operation costs.
Meanwhile, sewerage facilities and sewage treatment plants of the scale that are required nationwide are not developed, and most industrial wastewater and domestic wastewater are discharged untreated, resulting in chronic unsanitary conditions in the cities. Soil pollution is also a concern since the sewage that has flowed into the rainwater drain flows into the agricultural irrigation canal. Even in the areas where sewerage facilities are developed, significant amount of sediment, garbage and waste, food residues etc. are dumped into the sewage pipes, which causes frequent pipe clogging.
In order to improve the above situation, the Government of Pakistan undertook a series of measures. The Ministry of Environment established the National Sanitation Policy in 2006, with the policy goal of achieving 100% dissemination of sanitation facilities by 2025. The Ministry of Climate Change issued the National Drinking Water Policy in 2009 with the goal of providing safe and sustainable drinking water access to all citizens by 2025. "Vision 2025" which is the medium-to-long-term growth strategy approved by the Government of Pakistan in 2014 sets a target that all citizens should have access to clean drinking water by 2025, which is similar to the National Drinking Water Policy.
The Ministry of Water Resources established the "National Water Policy" in 2018, which addressed the policy of capacity building of water related agencies in the field of agricultural irrigation, climate change, rainwater drainage, sanitation, urban water supply, hydropower, disaster response, information management, financial sustainability, etc. and the basic policy for the Provincial Governments to plan the water resource management and its development. Under this policy, the central government allocates

The Data Collection Survey on Water Supply and Sewerage Sector of Pakistan Final Report
1-2
10% of the national public development budget to the water sector, and this is targeted to be increased up to 20% by 2030. 1.1.2 Objectives of the Survey
Under this Survey, targeted with following 5 cities shown in Table 1.1-1 future issues mainly in the water and sewerage field are sorted out and directions for the future cooperation of the Japan International Cooperation Agency (hereinafter referred to as “JICA”) is considered
Table 1.1-1 Objectives of the Survey in the Target Cities
Target Cities Objectives of the Survey Multan, Punjab Province Collect and analyze information in the sewerage and drainage fields, and propose
cooperation related to provision of equipment in the sewerage and drainage fields. Khyber Pakhtunkhwa(KP)Province, Haripur
Collect and analyze information in the water supply field and propose cooperation for facility development in the water supply field.
Sindh Province, Karachi Collect and analyze information in the water and sewage field and sort out the issues. Lahore, Punjab Province Collect and analyze information on the maintenance of drains (especially the handling
of dumped waste) and sort out issues. Faisalabad, Punjab Province Collect and analyze information on the financial status of water utilities and conduct
financial seminars. Source: JICA Survey Team (hereinafter referred to as JST)
1.1.3 Composition of the Survey Team
Following Table 1.1-2 shows the Composition of the Survey Team.
Table 1.1-2 Composition of Survey Team Role Name Company
Team Leader/Sewerage Plan 1 Takashi DAIRAKU Nihon Suido Consultants Co., Ltd. Co-Team Leader/ Sewerage
plan2 Yuichiro KONNO Nihon Suido Consultants Co., Ltd.
Water Supply Plan Masatoshi IWAMOTO Japan Techno Co., Ltd. Urban Drainage Koji MIYAUCHI Japan Techno Co., Ltd. Organization/ System Kozo HAYASHISHITA Yokohama Water Co., Ltd. Operation Masayuki NAGAMOCHI Nihon Suido Consultants Co., Ltd. Mechanical and Facility Plan Hiroki FUJIWARA Nihon Suido Consultants Co., Ltd. Finance Evaluation1 Naoki MORI Japan Techno Co., Ltd. Finance Evaluation 2 Yakuro INOUE Japan Techno Co., Ltd. Environmental and Social Considerations
Koji KIMURA Japan Techno Co., Ltd.
Source: JST
1.1.4 Survey Schedules
The first and second survey schedule is presented in Table 1.1-3 and Table 1.1-4 respectively.

The Data Collection Survey on Water Supply and Sewerage Sector of Pakistan Final Report
1-3
Table 1.1-3 Schedule for the First Field Survey
Source: JST
Table 1.1-4 Schedule for the Second Field Survey
Source: JST
1.1.5 Survey Area and Counter Part Organizations
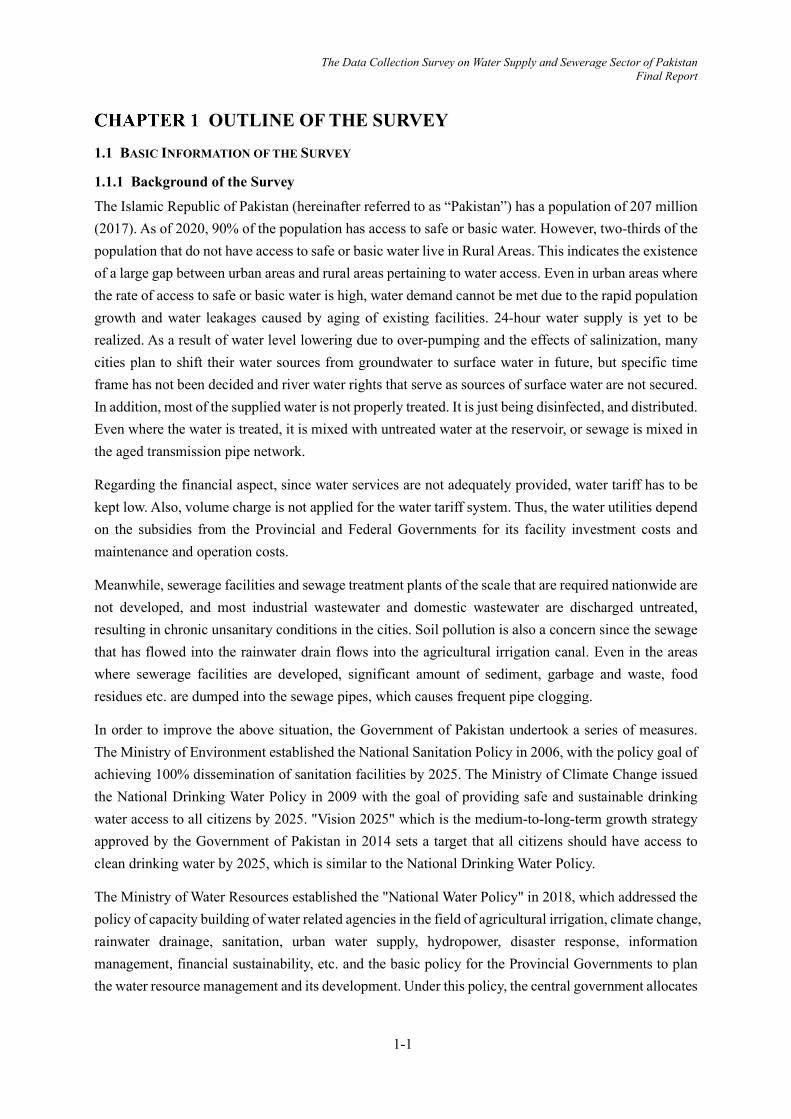
(1) Survey Area The Survey areas consist of five (5) cities of Pakistan; namely Multan in Punjab Province, Haripur in KP Province, Karachi in Sindh Province, Lahore in Punjab Province and Faisalabad in Punjab Province. The background for city selection is being described in section 1.1.7.
Dairaku Konno Iwamoto Miyauchi Hayashishita Nagamochi Fujiwara Inoue Kimura
2019/11/25 Mon Islamabad Islamabad Islamabad Lahore Islamabad Lahore Lahore2019/11/26 Tue Islamabad Islamabad Islamabad Lahore Islamabad Lahore Lahore2019/11/27 Wed Islamabad Islamabad Islamabad Lahore Islamabad Lahore Lahore2019/11/28 Thu Lahore Lahore Islamabad Lahore Islamabad Lahore Lahore2019/11/29 Fri Lahore Lahore Haripur Lahore Haripur Lahore Lahore2019/11/30 Sat Lahore Lahore Haripur Lahore Haripur Lahore Lahore2019/12/1 Sun Lahore Lahore Haripur Lahore Haripur Lahore Lahore Lahore2019/12/2 Mon Lahore Lahore Haripur Lahore Lahore Lahore Lahore Lahore2019/12/3 Tue Lahore Lahore Haripur Lahore Lahore Lahore Lahore Haripur2019/12/4 Wed Lahore Lahore Haripur Lahore Lahore Lahore Lahore Haripur2019/12/5 Thu Lahore Lahore Haripur Lahore Lahore Lahore Lahore Haripur2019/12/6 Fri Multan Multan Haripur Multan Multan Multan Multan Haripur2019/12/7 Sat Multan Multan Haripur Multan Multan Multan Multan Haripur2019/12/8 Sun Multan Multan Haripur Multan Multan Multan Multan Haripur2019/12/9 Mon Multan Multan Haripur Multan Multan Multan Multan Islamabad Haripur
2019/12/10 Tue Multan Multan Haripur Multan Multan Multan Multan Haripur Haripur2019/12/11 Wed Multan Multan Haripur Multan Multan Multan Multan Haripur Haripur2019/12/12 Thu Multan Multan Haripur Multan Multan Multan Multan Haripur Haripur2019/12/13 Fri Faisalabad Faisalabad Haripur Multan Multan Multan Multan Faisalabad Haripur2019/12/14 Sat Faisalabad Faisalabad Haripur Multan Lahore Multan Multan Faisalabad Haripur2019/12/15 Sun Faisalabad Faisalabad Haripur Multan Japan Faisalabad Multan Faisalabad Haripur2019/12/16 Mon Faisalabad Faisalabad Haripur Multan Haripur Multan Faisalabad Faisalabad2019/12/17 Tue Faisalabad Faisalabad Haripur Multan Haripur Multan Faisalabad Multan2019/12/18 Wed Faisalabad Faisalabad Haripur Multan Haripur Multan Faisalabad Multan2019/12/19 Thu Islamabad Islamabad Islamabad Multan Haripur Multan Faisalabad Multan2019/12/20 Fri Islamabad Islamabad Islamabad Multan Islamabad Multan Multan Multan2019/12/21 Sat Japan Japan Japan Multan Japan Multan Multan Multan2019/12/22 Sun Lahore Lahore Multan Lahore2019/12/23 Mon Lahore Lahore Multan Lahore2019/12/24 Tue Lahore Japan Multan Japan2019/12/25 Wed Lahore Lahore2019/12/26 Thu Lahore Lahore2019/12/27 Fri Lahore Lahore2019/12/28 Sat Lahore Lahore2019/12/29 Sun Lahore Lahore2019/12/30 Mon Japan Japan2019/12/31 Tue
JICA Survey Team(JST)
Iwamoto2021/3/23 Tue Japan
2021/3/24 Wed Dubai
2021/3/25 Thu Islamabad
2021/3/26 Fri Islamabad
2021/3/27 Sat Islamabad
2021/3/28 Sun Haripur
2021/3/29 Mon Haripur
2021/3/30 Tue Haripur
2021/3/31 Wed Haripur
2021/4/1 Thu Haripur
2021/4/2 Fri Haripur
2021/4/3 Sat Haripur
2021/4/4 Sun Haripur
2021/4/5 Mon Haripur
2021/4/6 Tue Haripur
2021/4/7 Wed Haripur
2021/4/8 Thu Islamabad
2021/4/9 Fri Islamabad
2021/4/10 Sat Islamabad
2021/4/11 Sun Islamabad
2021/4/12 Mon Islamabad
2021/4/13 Tue Japan
JICA Survey Team(JST)
The Data Collection Survey on Water Supply and Sewerage Sector of Pakistan Final Report
1-4
Source: JST based on a United Nation map
Figure 1.1-1 Survey Area
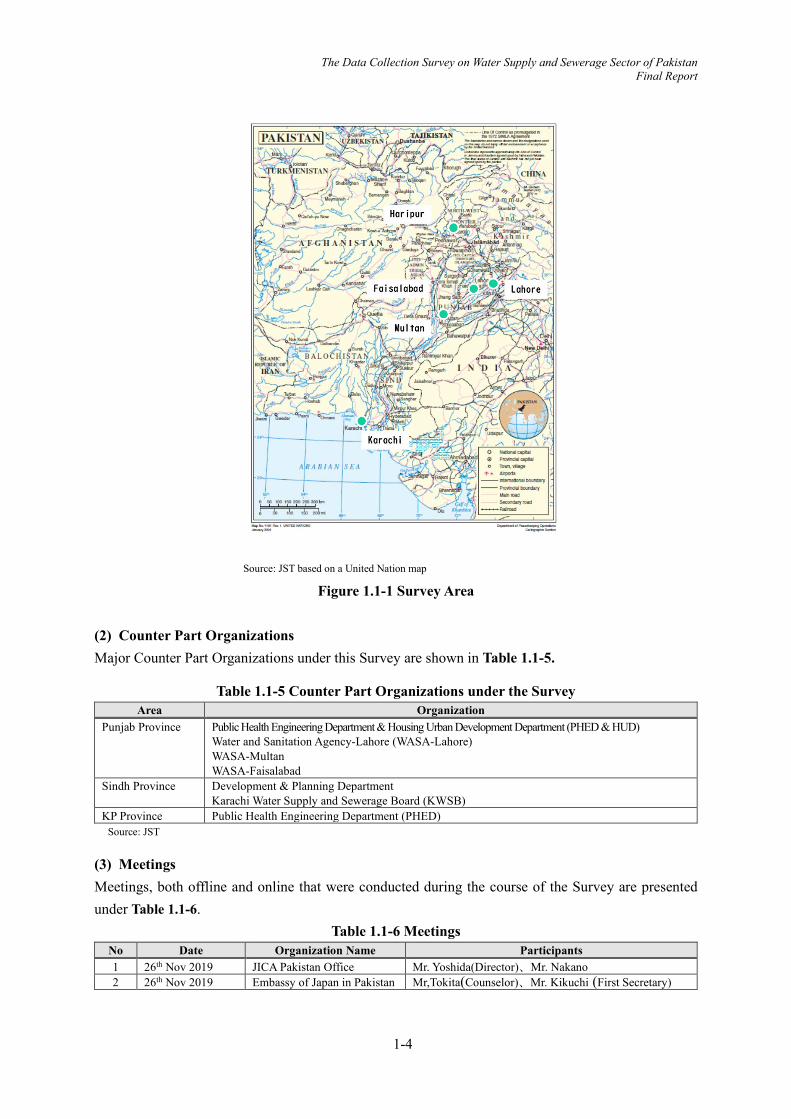
(2) Counter Part Organizations Major Counter Part Organizations under this Survey are shown in Table 1.1-5.
Table 1.1-5 Counter Part Organizations under the Survey Area Organization
Punjab Province Public Health Engineering Department & Housing Urban Development Department (PHED & HUD) Water and Sanitation Agency-Lahore (WASA-Lahore) WASA-Multan WASA-Faisalabad
Sindh Province Development & Planning Department Karachi Water Supply and Sewerage Board (KWSB)
KP Province Public Health Engineering Department (PHED) Source: JST
(3) Meetings Meetings, both offline and online that were conducted during the course of the Survey are presented under Table 1.1-6.
Table 1.1-6 Meetings No Date Organization Name Participants 1 26th Nov 2019 JICA Pakistan Office Mr. Yoshida(Director)、Mr. Nakano 2 26th Nov 2019 Embassy of Japan in Pakistan Mr,Tokita(Counselor)、Mr. Kikuchi (First Secretary)

The Data Collection Survey on Water Supply and Sewerage Sector of Pakistan Final Report
1-5
No Date Organization Name Participants 3 26th Nov 2019 WASA Lahore Mr. Syed Zahid Aziz(Managing Director) 4 27th Nov 2019 PHED Haripur Mr. Shahid Mehmood(Executive Engineer) 5 27th Nov 2019 WASA Lahore Mr. Muhammad Yousaf(Executive Engineer) 6 28th Nov 2019 WASA Lahore Mr. Syed Zahid Aziz(Managing Director)
7 29th Nov 2019 DESCON Lahore Mr. Muhammad Imran Khan Cheema(Head Business Development)
8 29th Nov 2019 PHED Punjab Mr. Salman Yusuf(Additional Secretary(Tech)) 9 29th Nov 2019 P&D Punjab Mr. Muhammad Abid Bodla(Ph.D. Civil Engineer) 10 30th Nov 2019 WASA Lahore Ms. Sumaira Iftikhar(Deputy Director) 11 2nd Dec 2019 WASA Multan Mr. Rao Muhammad Qasim(Managing Director) 12 11th Dec 2019 WASA Multan Mr. Muhammad Waqas Mehmood(Deputy Director) 13 11th Dec 2019 WASA Multan Mr. Asif Francis(Assistant Director) 14 14th Dec 2019 WASA Faisalabad Mr. Shoaib Rashid(Director Administration) 15 16th Dec 2019 WASA Faisalabad Mr. Faqir Muhammad Chaudhry(Managing Director) 16 17th Dec 2019 WASA Faisalabad Mr. Johnson Gill(Director Revenue Domestic) 17 18th Dec 2019 Faisalabad City Mr. Ishrat Ali(Commissioner) 18 19th Dec 2019 AFD Islamabad Mr. Ahsan Imtiaz Paracha(Project Manager) 19 19th Dec 2019 DANIDA Islamabad Ms. Bente Schiller(Deputy Head of Mission)
20 20th Dec 2019 ADB Islamabad Mr. Syed Umar Ali Shah(Senior Project Officer, Pakistan Resident Mission)
21 20th Dec 2019 JICA Pakistan Office Mr. Yoshida (Director)、Mr. Nakano 22 20th Dec 2019 Embassy of Japan in Pakistan Mr,Tokita(Counselor)、Mr. Kikuchi (First Secretary) 23 4th Mar 2020 ADB Islamabad Mr. Mian S. Shafi(Project Manager) 24 4th Sep 2021 WASA Lahore(Online) Mr. Ghufran(Deputy Managing Director(O&M)) 25 9th Sep 2021 KWSB Karachi(Online) Mr. Ayub Shaikh(Senior Engineer)
26 25th Sep 2021 WASA Faisalabad(Online Financial Semminar) Mr. Jabbar Anwar Chaudhry(Managing Director)
Source: JST
1.1.6 Current Status and Issues of the Survey Area Based on Existing Research
(1) Common Issues of the Country As shown in Table 1.1-7 , following 3 items can be mentioned as common issues: (1) Rapid population growth, (2) Decrease in water resource, and (3) Vulnerability to natural disasters (climate change). In order to address these issues, it is important to develop appropriate water and sewage systems.
Table 1.1-7 Common Issues of the Country Issues Current Situation
① Rapid Population Growth
・Population growth rate is 2%, population: 212 million (current) ⇒ 300 million or more (2040) ・Increase in urban population: Approximately 78 million (currently 36.6% of the total population) ⇒ 139 million (2040)
② Reduction of Water Resources
・Excessive use of surface water and groundwater ⇒ Decrease in surface water, lower groundwater level, salinization ・Water pollution caused by bacteria and heavy metals
③ Vulnerability to Natural Disaster (Climate Change)
・ Temperature rise: +1.4~+3.7℃ by 2060 ⇒ Higher than the world average, especially in the southern and coastal areas ・ Urban Areas are vulnerable to heat waves, precipitation, floods, and sea level rise
Source: JST
(2) Current Status and Issues pertaining to the Water, Sewerage and Drainage Sector at the Targeted Cities Based on The Existing Research Table 1.1-8 shows the current status and issues pertaining to the water, sewerage and drainage sectors at the targeted cities. Under this survey, after investigating the existing issues, we have proposed mitigation measures in Multan, Haripur and Lahore.

The Data Collection Survey on Water Supply and Sewerage Sector of Pakistan Final Report
1-6
Table 1.1-8 Current Status pertaining to the Water, Sewerage and Drainage Sectors at the Targeted Cities
Current Status of Water, Sewerage and Drainage Sectors Multan, Punjab Province
Garbage and waste dumped on the road is flowing down into sewer pipes and drains. There is also direct dumping into drains. The garbage reduces the flow capacity, which causes sewer overflow.
Cleaning work is performed using a jetting machine and a suction machine. However, since each of them are used separately, the effect of the cleaning work is inferior to that of the general work method under which both machines work in tandem.
Sediment is being removed manually by using a winch machine. Labors enter the manhole and physically remove sludge and garbage. Safety management is an issue.
One-fifth to one-third of WASA staff are sewage cleaners, and labor cost burden is heavy. Most of the pumps in the drainage pump stations are of vertical axis type, but the shaft cores are not
exposed, and the life of the equipment is short. Pumps, control panels, transformers and other facilities /equipment at pumping stations are aging.
Lahore, Punjab Province
Difference in the level of drain development between the regions In the developed area including the old city area in northern Lahore, facility development was
completed. However, maintenance is not sufficiently performed. As for the new development area in the Central and Southwest region of Lahore, development works are in progress but still insufficient.
Inundation damage caused by the decline in flow capacity due to the aging of sewage / drainage pumping stations
Decline in flow capacity due to illegal dumping in drains and deterioration of surrounding sanitary environment
Lack of continuous implementation of drainage cleaning and public awareness to prevent waste dumping
Undeveloped main drain Faisalabad, Punjab Province
<Service level> 2 hours x 3 times water supply per day, low water pressure, Mixing of sewage into water pipes due to
inadequate pump pressure Use of groundwater due to the low water supply service level <Facility use> Existence of many non-operated facilities due to breakdowns, high non-revenue water rate:
Approximately 50% <Organizational management> A large number of posts are vacant, while executives hold concurrent positions due to lack of budget <Finance> Low charge collection rate, large number of receivables, low charge level (based on the area of the
house) Business operation relying on state subsidies and lack of independence.
Haripur, KP Province
Water is supplied for only 1-2 hours in a day The basic unit of water supply is very low with an average of 45L /person/day. Water pollution problem
- Waste discharged from the Hattar Industrial Estate may cause kidney and other diseases (Haripur Province's view)
- Low-quality galvanized steel pipes which are used as water supply pipes in the Dingi village may be one of the major causes for kidney damage (Haripur prefecture's view)
Lack of policies, guidelines and regulations pertaining to water resources and sector development plan Lack of reliable sector baseline data Lack of residents' involvement in planning, implementation and maintenance Low awareness on the importance of hygiene in the efficiency of water services Inadequate public health services Absence of water quality monitoring and management system Lack of direct accountability about the services provided and the costs Insufficient capacity on asset management technology for proper maintenance and repair of aging
water facilities in government agencies and communities Absence of training centers and programs in water sanitation sector
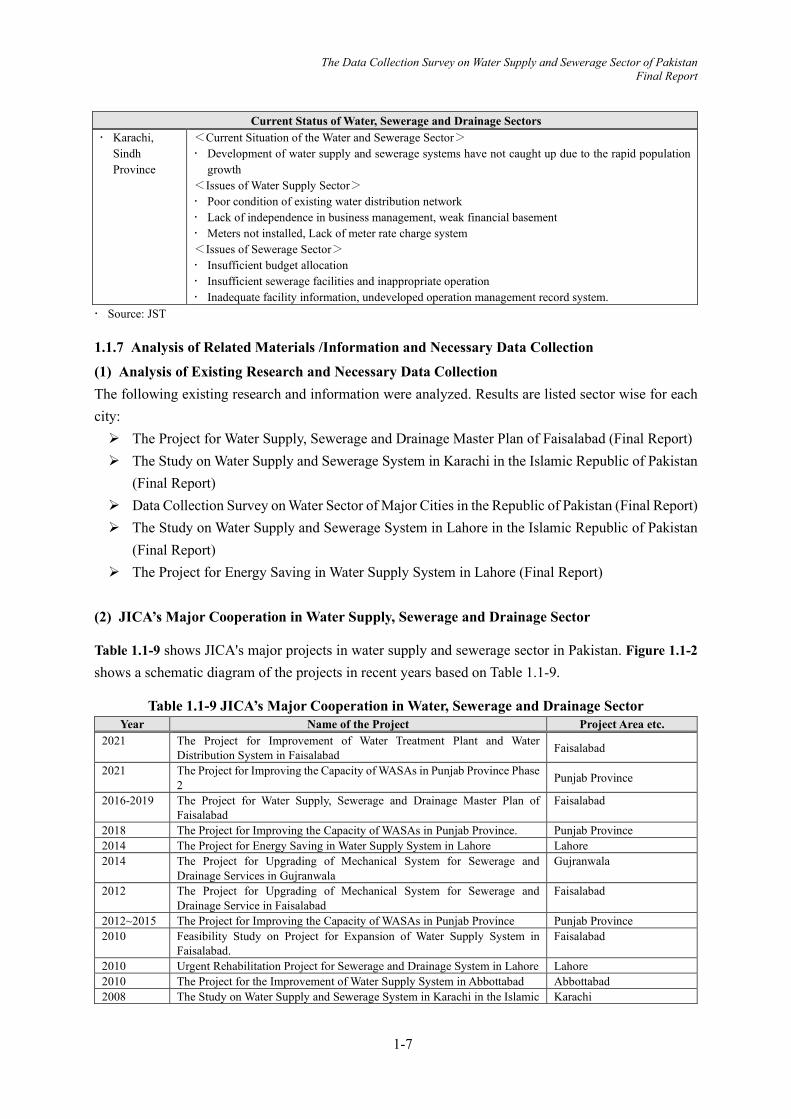
The Data Collection Survey on Water Supply and Sewerage Sector of Pakistan Final Report
1-7
Current Status of Water, Sewerage and Drainage Sectors Karachi,
Sindh Province
<Current Situation of the Water and Sewerage Sector> Development of water supply and sewerage systems have not caught up due to the rapid population
growth <Issues of Water Supply Sector> Poor condition of existing water distribution network Lack of independence in business management, weak financial basement Meters not installed, Lack of meter rate charge system <Issues of Sewerage Sector> Insufficient budget allocation Insufficient sewerage facilities and inappropriate operation Inadequate facility information, undeveloped operation management record system.
Source: JST
1.1.7 Analysis of Related Materials /Information and Necessary Data Collection
(1) Analysis of Existing Research and Necessary Data Collection The following existing research and information were analyzed. Results are listed sector wise for each city: The Project for Water Supply, Sewerage and Drainage Master Plan of Faisalabad (Final Report) The Study on Water Supply and Sewerage System in Karachi in the Islamic Republic of Pakistan
(Final Report) Data Collection Survey on Water Sector of Major Cities in the Republic of Pakistan (Final Report) The Study on Water Supply and Sewerage System in Lahore in the Islamic Republic of Pakistan
(Final Report) The Project for Energy Saving in Water Supply System in Lahore (Final Report)
(2) JICA’s Major Cooperation in Water Supply, Sewerage and Drainage Sector
Table 1.1-9 shows JICA's major projects in water supply and sewerage sector in Pakistan. Figure 1.1-2 shows a schematic diagram of the projects in recent years based on Table 1.1-9.
Table 1.1-9 JICA’s Major Cooperation in Water, Sewerage and Drainage Sector Year Name of the Project Project Area etc.
2021 The Project for Improvement of Water Treatment Plant and Water Distribution System in Faisalabad Faisalabad
2021 The Project for Improving the Capacity of WASAs in Punjab Province Phase 2 Punjab Province
2016-2019 The Project for Water Supply, Sewerage and Drainage Master Plan of Faisalabad
Faisalabad
2018 The Project for Improving the Capacity of WASAs in Punjab Province. Punjab Province 2014 The Project for Energy Saving in Water Supply System in Lahore Lahore 2014 The Project for Upgrading of Mechanical System for Sewerage and
Drainage Services in Gujranwala Gujranwala
2012 The Project for Upgrading of Mechanical System for Sewerage and Drainage Service in Faisalabad
Faisalabad
2012~2015 The Project for Improving the Capacity of WASAs in Punjab Province Punjab Province 2010 Feasibility Study on Project for Expansion of Water Supply System in
Faisalabad. Faisalabad
2010 Urgent Rehabilitation Project for Sewerage and Drainage System in Lahore Lahore 2010 The Project for the Improvement of Water Supply System in Abbottabad Abbottabad 2008 The Study on Water Supply and Sewerage System in Karachi in the Islamic Karachi
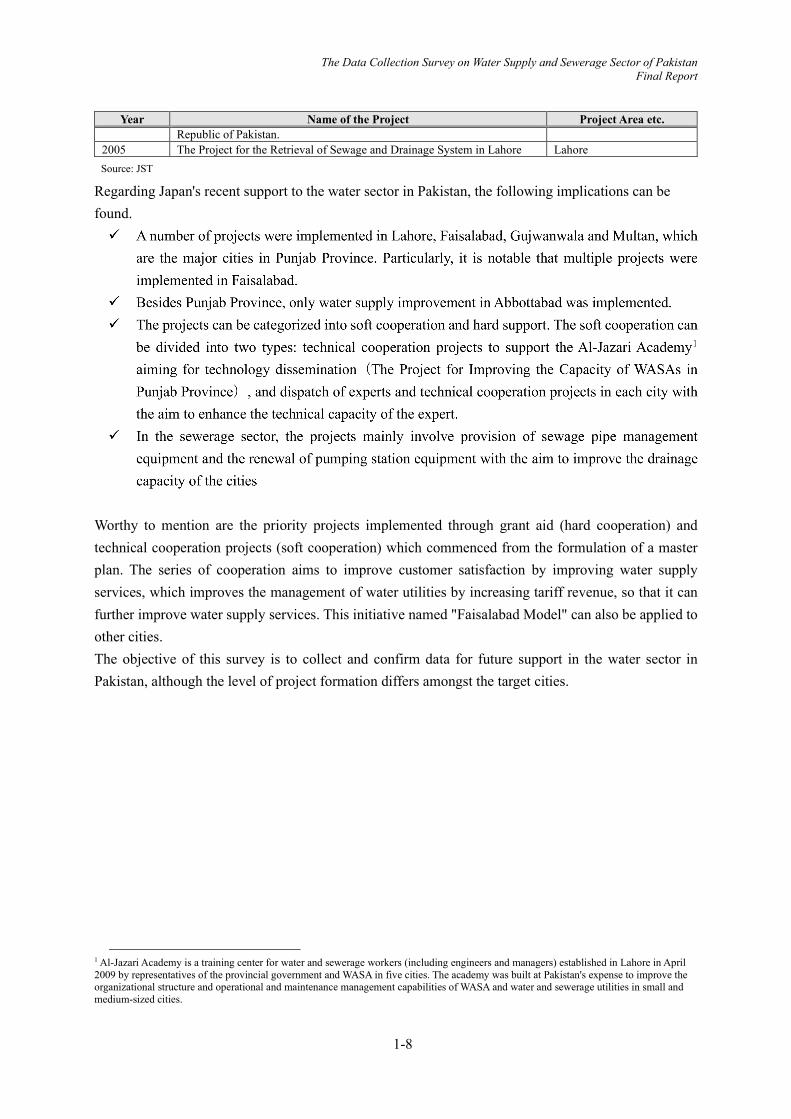
The Data Collection Survey on Water Supply and Sewerage Sector of Pakistan Final Report
1-8
Year Name of the Project Project Area etc. Republic of Pakistan.
2005 The Project for the Retrieval of Sewage and Drainage System in Lahore Lahore Source: JST
Regarding Japan's recent support to the water sector in Pakistan, the following implications can be found.
Worthy to mention are the priority projects implemented through grant aid (hard cooperation) and technical cooperation projects (soft cooperation) which commenced from the formulation of a master plan. The series of cooperation aims to improve customer satisfaction by improving water supply services, which improves the management of water utilities by increasing tariff revenue, so that it can further improve water supply services. This initiative named "Faisalabad Model" can also be applied to other cities. The objective of this survey is to collect and confirm data for future support in the water sector in Pakistan, although the level of project formation differs amongst the target cities.
1 Al-Jazari Academy is a training center for water and sewerage workers (including engineers and managers) established in Lahore in April 2009 by representatives of the provincial government and WASA in five cities. The academy was built at Pakistan's expense to improve the organizational structure and operational and maintenance management capabilities of WASA and water and sewerage utilities in small and medium-sized cities.

The Data Collection Survey on Water Supply and Sewerage Sector of Pakistan Final Report
1-9
Source: Edited by JST based on JICA’s Materials
Figure 1.1-2 Schematic Diagram of Japan's Recent Support on the Water Sector in Pakistan
Based on the big picture of Japan’s cooperation in water and sewerage sector in Pakistan, the background for selecting the targeted five cities under this survey are as follows; Multan, Punjab: Multan has been experiencing serious ponding problems. (1) There is a high
possibility that technology and knowhow from Japan, which has been accumulated mainly by the cooperation of providing sewage and drainage equipment in large cities in Punjab, can be utilized; (2) the poverty rate in southern Pakistan is higher in comparison with the north. There is a particular high need to improve the lives of residents by resolving the existing ponding problems; and (3) Multan is a target city of the “Punjab Water Supply and Sewerage Management Capacity Enhancement Project Phase 2”. If cooperation in Multan is to be implemented, synergy effects between the projects can be expected.
Haripur, KP: Japan's assistance has been carried out mainly in Punjab, the largest province in Pakistan with about half of the country's population. However, considering the expansion of the initiative "Faisalabad Model" to other provinces in the future, Haripur, KP is one of the potential target areas, and Haripur, located in the vicinity of Abbottabad can be utilized.
Karachi, Sindh Province: As it has been more than decade since Japan’s last project in Karachi, the largest city in Sindh Province, the latest information pertaining to water and sewerage sector has not been updated. Therefore, it was decided to collect latest information of the sector in Karachi.

The Data Collection Survey on Water Supply and Sewerage Sector of Pakistan Final Report
1-10
Lahore, Punjab: Ponding is frequently occurring in Lahore due to rainwater inflow into the sewage pipes and sedimentation in the drains. The potential cooperation to address this issue would align with the trend of Japan’s cooperation to improve drainage capacity mainly in Punjab, which means that Japan’s accumulated knowledge can be utilized. Thus, the city was selected for this study in order to investigate the details of the existing situation and issues related to drains and ponding.
Faisalabad, Punjab: The initiative "Faisalabad Model" to establish a good cycle for improving water supply is under the process in Faisalabad as described above. As a part of the initiative, "Faisalabad Water Utility Management Improvement Project" is proposed to be launched during the second half of FY2021 to strengthen the management capacity of WASA Faisalabad. As a preliminary study of the project, Faisalabad was selected in order to check the financial status of WASA Faisalabad and to conduct a financial seminar to grasp of WASA staffs’ depth of understanding about business management and finance.
(3) Outline of similar surveys and related projects by other donors Table 1.1-10 shows the major cooperation projects of other donors in water, sewerage and drainage sectors since 2000 in Pakistan.
Table 1.1-10 Major Cooperation Projects of Other Donors in the field of Water, Sanitation and Drainage Sector in Pakistan (Since 2000)
Country/ Donor Year Target Sector Remarks (including major projects and plans)
Asian Development Bank/ ADB
2010-2011 Water/ Sewerage Pre-Feasibility Study for Urban Transport and Industrial Wastewater Management in Faisalabad
2009-2018 Water/ Sewerage Sindh Cities Improvement Investment Program 2005-2009 Sewerage /Drainage Rawalpindi Environmental Improvement 2003-2009 Water/ Sewerage Southern Punjab Basic Urban Services Project
2002-2007 Water Punjab Community Water Supply and Sanitation Sector Project
World Bank/ WB
2019-2031 Water/ Sewerage Karachi Water and Sewerage Services Improvement Project (KWSSIP) Cofinancing with W B
2015 Water Faisalabad Peri-Urban Structure Plan, 2012-2016 Water Punjab Cities Governance Improvement Project
2006-2017 Water/ Sewerage Water and Sanitation Program (WSP), including
“Benchmarking for Performance Improvement in Urban Utilities”, “Pakistan Water Operators’ Partnership”
Agence Française de
Développement、 /AFD)
2019 Water Capacity Building Project for Performance Improvement of Faisalabad WASA
2019 Water Faisalabad City Water Resources Expansion Project phaseⅡ
2010-2016 Water Faisalabad City Water Resources Expansion Project
Danish International Development
Agency/ DANIDA
2021 Sewerage Lahore Karter Bund Wastewater Treatment Plant Project
2018 Sewerage Faisalabad Wastewater Treatment Plant Project
Asian Infrastructure
Investment Bank、/AIIB)
Plan Water/ Sewerage Lahore Water and Wastewater Management Project
2019-2031 Water/ Sewerage Karachi Water and Sewerage Services Improvement Project
(KWSSIP) Cofinancing with W B
Source: JST

The Data Collection Survey on Water Supply and Sewerage Sector of Pakistan Final Report
2-1
OVERVIEW OF THE WATER, SEWERAGE AND DRAINAGE SECTORS OF THE CENTRAL GOVERNMENT, SINDH PROVINCE, PUNJAB PROVINCE AND KP PROVINCE OF PAKISTAN
2.1 POLICIES, REGULATIONS AND PLANS PERTAINING TO THE WATER, SEWERAGE AND
DRAINAGE SECTOR
2.1.1 Federal Government
(1) Laws and Regulations In Pakistan, many authorities are delegated from the federal administration to the provincial government due to the existence of "diarchy" system (the system that divide the functions of government into central and provincial), which was introduced under the Indian Government Act of 1921 during the period of the British rule. The Government of India Act, 1935, enacted by the British Parliament, specified the division of duties between the central and provincial governments, and has one item in the Provincial Legislative List “Water, that is to say, water supply, irrigation and canals, drainage and embankment, water storage and water power”.
For this reason, each province enacted laws relating to water and sewerage. However, some of the laws enacted by the British Parliament before independence were succeeded as the provincial laws although they were partly amended later on. Table 2.1-1 shows the legal structure of the federal and the three provincial governments. Khyber Pakhtunkhwa is described as KP.
Table 2.1-1 Relevant Laws of the Federal and the 3 Provincial Governments Federal Punjab KP Sindh
Canal and Drainage Act, 1873 Punjab Canal and Drainage Act, 1873
KP Canal and Drainage Act, 1873
Bombay Irrigation Act, 1879 Sindh Irrigation Act, 1879
Indus River System Authority Act, 1992
Punjab Irrigation and Drainage Authority Act, 1997
KP Irrigation and Drainage Authority Act, 1997
Sindh Irrigation and Drainage Authority Act, 1997 (abolished)
Sindh Water Management Ordinance, 2002
Pakistan Environmental Protection Act, 1997
Punjab Environmental Protection Act, 1997
KP Environmental Protection Act, 2014
Sindh Environmental Protection Act, 2014
Punjab Water Act, 2019 Source: JST
Indus River System Authority Act, 1992 By this act the Indus River System Authority (IRSA) was established as an external bureau of the Federal Ministry of Water Resources based on the Four-provincial Agreement on Water Intake from the Indus River (Water Apportion Accord 1991). The act also stipulates arrangements for operating the agreement. The main contents of this act are as follows.

The Data Collection Survey on Water Supply and Sewerage Sector of Pakistan Final Report
2-2
Summarize the issues for establishing rules regarding the use of surface water between the provinces
Review of water source use as necessary Regulation and coordination of Water and Power Development Authority (WPDA) activities Prioritization between the provinces
Pakistan Environmental Protection Act, 1997
This act stipulates increased power and responsibility of the Pakistan Environmental Protection Agency, which was established by the Pakistan Environmental Protection Ordinance ,1983, the predecessor of this act, such as:
Undertake all necessary measures for the implementation of the national environmental policies Provide guidelines for the protection and conservation of species, habitats, and biodiversity in
general, and for the conservation of renewable and non-renewable resource Ensure enforcement of the National Environmental Quality Standards Establish standards for the quality of the ambient air, water and land Take measures to promote research and the development of science and technology which may
contribute to the prevention of pollution, protection of the environment, and sustainable development
Summon and enforce attendance of any person and require him/her to supply any information or document needed for the conduct of any enquiry or investigation into any environmental issue
Environmental impact assessment, the power to delegate to the Provincial Government or any local council or local authority in the province and the establishment of provincial environmental protection agency are also stipulated under this act.
(2) Policy Table 2.1-2 shows the federal and the provincial policies relevant to water and sewerage.
Table 2.1-2 Policies of the Federal and 3 Provinces Relevant to Water and Sewerage Federal Punjab KP Sindh
National Drinking Water Policy, 2009 Punjab Urban Water Supply
and Sanitation Policy, 2007)
Khyber Pakhtunkhwa Drinking Water Policy, 2015
Sindh Drinking Water Policy, 2017
National Sanitation Policy, 2006 Sindh Sanitation Policy, 2017 Pakistan Approach to Total
Sanitation, 2011 (PATS)
National Environmental Policy 2005
Punjab Environmental Policy 2015
National Water Policy of Pakistan, 2018
National Climate Change Policy, 2012
Punjab Climate Change Policy, 2017*
*The draft of the Punjab Climate Change Policy, 2017 is available on the internet but approval is not confirmed.
Source: JST
National Drinking Water Policy, 2009 The policy was enacted in 2009 by the Ministry of Environment (at that time) with the aim to provide

The Data Collection Survey on Water Supply and Sewerage Sector of Pakistan Final Report
2-3
safe and sustainable drinking water to all people in Pakistan by 2025. It describes the current situation and its analysis, goals, plan, policies, and implementation.
The policy include the responsibility of the federal, provincial and local governments to secure financial resources for the development of new water supply facilities and rehabilitation of existing facilities to achieve the goal, water source conservation, and the introduction of locally adapted sustainable technology and maintenance systems , community participation and delegation of authority, awareness-raising activities for residents (water saving and hygiene education), strengthening of operational management capacity of water supply utilities, promotion of public-private partnership (PPP), etc. However, it has not yet reached the stage of formulating a concrete Action Plan and setting up of annual goals.
National Sanitation Policy, 2006 The policy was established by the Ministry of Environment (at that time) in 2006 with the aim of disseminating sufficient sanitation facilities to improve the quality of life and environment necessary for the healthy living. The policy aims to achieve Open Defecation Free (ODF) by promoting the use of toilets in residences and businesses and proper disposal of urine as well as to halve the percentage of people who cannot continuously use sanitary facilities by 2015 to meet the Millennium Development Goals (MDGs) of the United Nations (UN) and to make it up to 100% by 2025. The major policies are as follows;
Develop plans that can be implemented by utilizing existing resources, avoiding foreign borrowing, and developing the capacity of public institutions and communities.
Understand and support the role of communities, NGOs and other formal and informal sectors in improving sanitation.
Develop and introduce affordable and easy-to-use technologies that are adapted to local conditions.
Adopt comport-sharing2 and total sanitation3 models in all public programs to ensure financial sustainability and the involvement of communities and private organizations in development and subsequent maintenance.
Promote integrated sanitation programs in coordination with urban and regional planning, health, environment, housing, and education. In addition, the following scenarios for policy implementation have been identified. In urban areas or high-density rural settlements provision of flush latrine and/or pour flush latrines in homes (or privately shared) connected to an underground sewage system terminating in a sewage treatment facility to be ensured.
2 A project implemented in Pakistan mainly in the rural water supply and sanitation sector, in which communities, private donors, NGOs, and government agencies bring their own resources and activities (components). Source: Component-Sharing: Up-Scaling Demand-Responsive Approaches in Rural Water Supply and Sanitation Sector in Pakistan, WSP-SA https://www.wsp.org/sites/wsp/files/publications/sa_component.pd 3 Communities as a whole work to improve sanitation and be involved in eradicating open defecation. Source: Eiri Sugita, https://core.ac.uk/download/pdf/288461371.pdf

The Data Collection Survey on Water Supply and Sewerage Sector of Pakistan Final Report
2-4
In unserved urban areas and low-density rural settlements provision of ventilated pit privies/pour flush latrines connected to a septic tank4 linked to a wastewater disposal and/or collection system to be ensured.
Minimum sewage treatment facilities will be of biological treatment and retention time will be calculated so that the effluent produced will be as per the National Environmental Quality Standard (NEQS) notified under the Pakistan Environment Protection Act, 1997. The effluent from the low-cost treatment plants in the rural areas will be used for the agricultural purposes.
Master plan for treatment of municipal and industrial wastewater in urban and rural areas will be devised and implemented.
As policy measures, 15 themes were introduced: the major ones being: Financing by the Government: Financing from the Federal government will be a part of overall
allocation through public sector development plan. The provincial and local governments will make similar allocations through their annual development plans for achieving the MDG.
The Component Sharing Models5 will be adopted for all the government schemes in the urban areas and villages having over 1,000 population. Sewage and wastewater treatment facilities will be provided by developers for large schemes where local government developed disposal are not available.
Effluent Quality Monitoring: Provincial Environmental Protection Agencies will be responsible for monitoring the industrial and municipal effluents in accordance with the NEQS.
Pakistan Approach to Total Sanitation, 2011 (PATS) One of the objectives of the National Sanitation Policy is to promote Community Led Total Sanitation (CLTS) model and other approaches for the creation of an open defecation free (ODF) environment. The CLTS core group was requested by the Ministry of Environment to propose a country specific strategy to achieve “Total Sanitation”
In terms of the Pakistan’s approach for total sanitation, School Led Total Sanitation, Component Sharing, Sanitation Marketing and Disaster Response were introduced as well as CLTS.
National Environmental Policy 2005 The Ministry of Environment (then) adopted this policy to provide an overarching framework for addressing the environmental issues facing Pakistan, particularly freshwater bodies and coastal waters, air pollution, lack of proper waste management, deforestation, loss of biodiversity, desertification, natural disaster, and climate change. It also gives direction for addressing the cross sectorial issues as well as the underlying causes of environmental degradation and meeting international obligations. The goal is to protect, conserve and restore Pakistan’s environment in order to improve the quality of life of its citizens through sustainable development. It outlines the objectives to achieve the goal as
4 One of the domestic wastewater treatment facilities and is also called a decomposition tank. It is a system that collects flushed wastewater from toilets, separates it into solid and liquid, decomposes it by anaerobic microorganisms, and allows it to overflow from the top or percolate underground. The removal rate of biochemical oxygen demand (BOD), an indicator of water pollution, is said to be as high as 50%. The most significant difference between this system and the septic tanks that are widely used in Japan is that it does not have an aeration function 5 Projects implemented by communities, NGOs and government organizations bringing and sharing resources and components in the field of
water supply and sanitation source: Component-Sharing: Up-Scaling Demand-Responsive Approaches in Rural Water Supply and Sanitation Sector in Pakistan, WSP-SA https://www.wsp.org/sites/wsp/files/publications/sa_component.pd

The Data Collection Survey on Water Supply and Sewerage Sector of Pakistan Final Report
2-5
follows:
Conservation, restoration, and efficient management of environmental resources. Integration of environmental considerations in policy making and planning processes. Capacity development of government agencies and other stakeholder at all levels for better
environmental management. Meeting international obligations effectively in line with the national aspirations. Creation of demand for environment through mass awareness and community mobilization.
According to these objectives, sectorial guidelines were established. As for water supply and management, 13 actions are described such as development of legal and policy framework for promotion of safe drinking water, increase of coverage for water supply and water treatment facilities and establishment of water quality monitoring and surveillance system. As waste management, 18 actions are described such as strict enforcement of the National Environmental Quality Standard and Self-Monitoring and Reporting System, make installation of wastewater treatment plants an integral part of all sewerage systems and devise and implement the National Sanitation Policy. However, no numerical targets were identified.
National Water Policy of Pakistan, 2018 i. Background The following is described in the preamble of this policy. The snow-clad peaks of mountain ranges in the North continuously recharge the system. The descending snowmelt and monsoon waters flow into the country’s Indus River System and its tributaries. Irrigated agriculture is the backbone of the country’s economy and consumes around 95% of the nation’s water resources. The balance is used for domestic and industrial requirements. With rapidly growing population, the country is heading towards a situation of water shortage and by corollary, a threat to food insecurity. Per capita surface water availability has declined from 5,260 m3 per year in 1951 to around 1,000 cubic meters. This quantity is further expected to drop to about 860 m3 by 2025, thereby transitioning from a “water stressed” to a “water scarce” country. (The minimum water requirement to avoid food and health implications is 1,000 m3 per capita per year.) The changing and unpredictable precipitation patterns may have serious consequences, including flash floods in the north and increasingly prolonged droughts in the south. The objective of the National Water Policy is to take recognizance of the emergency water crisis and provide overall policy framework and guideline for a comprehensive plan of action.
ii Objectives of the Policy The National Water Policy lays down the broad policy framework and set of principles for water security on the basis of which the Provincial Government can formulate their respective Master Plans and projects for water conservation, development and management. Thirty-three (33) objectives were identified such as:
Promoting sustainable consumption and production patterns throughout the water sector from exploitation to utilization

The Data Collection Survey on Water Supply and Sewerage Sector of Pakistan Final Report
2-6
Augmentation of the available water resources of the country through judicious and equitable utilization via reservoirs, conservation, and efficient use
Improving availability, reliability, and quality of freshwater resources to meet critical municipal, agricultural, energy, security and environmental needs.
Improving urban water management by increasing system efficiency and reducing non-revenue water through adequate investments to address drinking water demand, sewage disposal, handling of wastewater and industrial effluents
Promoting behavioral change to reduce wastage of water by raising public awareness through media campaigns and incorporating water conservation lessons in syllabi/curricula at primary, secondary and tertiary levels
Improving watershed management through extensive soil conservation, catchment area treatment, preservation of forests and increasing forest cover
Flood management to mitigate floods and minimize their damages iii. Strategic Priorities and Planning Principles Several strategic initiatives were identified to be taken up at the Federal and the Provincial levels. These includes:
Conservation and Efficiency Storage Leveraging Technology such as sea water utilization and water recycling Renewable Energy Integrated Water Resource Management Comprehensive Regulatory Framework
The process of planning, development, and management of water resources at the Federal and the Provincial level will be guided by the following set of principles:
Equity and participatory decision-making Water is a strategic resource and access to affordable and safe drinking water is a fundamental
human right of all citizens. Efficiency and conservation will be promoted at all levels. Environmental Sustainability must be ensured. Practicability and Innovation will be encouraged and ensured.
In response to the 18th revision of the Pakistan National Constitution, which strengthened the responsibilities of the provincial governments, the provincial governments developed the Detailed Plan for (a) water pricing6, (b) drinking water, (c) water quality, (d) water treatment, considering the National Environment Policy (2005), the National Sanitation Policy (2006), the National Drinking Water Policy (2006) and the Agricultural Policy in general.
iv. Urban Water Management Among several issues, the urban water management includes the following:
6 A long-term billing system to promote the efficient use of scarce water resources

The Data Collection Survey on Water Supply and Sewerage Sector of Pakistan Final Report
2-7
Urban water management will be elementally integrated into the overall water management of the country
System losses in urban areas are a major issue which can be attributed to lower rates of recovery Non-revenue water in urban hubs requires a coordinated effort. The Public Health Engineering
Department and WASAs will be encouraged to devise coordinated strategies under the Provincial Action Plans.
Industrial units and municipal entities will be required to treat effluents and hazardous discharge before disposal.
At present, less than 1% of total wastewater in the country is being treated before disposal. Treatment will be promoted at the centralized level at first and will be decentralized in due course of time.
Drinking water supply will be aimed to provide safe, affordable and sustainable supply of water to every citizen of Pakistan.
v. Investment Requirements The share for water sector in the Public Sector Development Programme (PSDP) under the federal budget fluctuated between the years 2000 and 2018 with the highest of 18% during 2006-2007 and minimum of 3.7% or Rs. 36.75 billion during 2017-18. On the contrary, water sector provincial development expenditure increased from Rs. 45.58 billion in 2012-2013 to R.105.58 billion. However, the total allocation of Rs.145 billion (sic) which is the combined federal and provincial development budget for 2017-18 is totally inadequate. The National Water Policy recognizes the need to ensure that water sector receives at least 10 % of the Federal PSDP allocation in 2018-19, gradually increasing to 20% by 2030. The Provincial Government may also increase their development expenditure for this sector.
National Climate Change Policy, 2012 The Policy was established in 2012 by the Ministry of Environment (at that time). It provides for addressing the issues that Pakistan faces or will face in future due to the changing climate. The vulnerabilities of various sectors to climate change were highlighted and appropriate adaptation measures spelled out. These cover policy measures to address issues in various sectors such as water, agriculture, forestry, coastal areas, biodiversity and other vulnerable ecosystems. Furthermore, appropriate measures relating to disaster preparedness, capacity building, institutional strengthening; technology transfer; introduction of the climate change issue in higher education curricula; ensuring environmental compliance through Initial Environmental Examinations (IEE) and Environmental Impact Assessments (EIA) in the development process; addressing the issue of deforestation and illegal trade in timber; promoting Clean Development Mechanisms (CDM); and raising Pakistan’s stance regarding climate change at various international forums, were also incorporated as important components of the policy. The policy thus provides a comprehensive framework for the development of Action Plans for national efforts on adaptation and mitigation.
Regarding water resources, following are described. Water resources are inextricably linked with climate; this is why the projected climate change has serious implications for Pakistan’s water resources.
The Data Collection Survey on Water Supply and Sewerage Sector of Pakistan Final Report
2-8
Freshwater resources in Pakistan are based on melting of snow and glaciers and monsoon rains, both are highly sensitive to climate change. Country specific climate change projections strongly suggest the following future trends in Pakistan: Decrease in glacier volume and snow cover leading to alterations in the seasonal flow pattern
of the Indus River System (IRS).
Increased annual flows for a few decades followed by decline in flows in subsequent years;
Increase in the formation and outburst of glacial lakes.
Higher frequency and intensity of extreme climate events coupled with irregular monsoon rains causing frequent floods and droughts; and
Greater demand on water due to higher evaporation rates at elevated temperatures.
Policy Measures To address the impact of climate change on water resources and to enhance water security, the Government of Pakistan, in collaboration with relevant entities shall take the following measures: Water Storage and Infrastructure Water Conservation Strategies Integrated Water Resource Management Legislative Framework Enhancing Capacity Awareness Raising
No numerical targets or concrete measures to achieve the targets are shown.
2.1.2 Punjab Province
(1) Laws and Regulations Punjab Canal and Drainage Act, 1873
As mentioned in 2.1.1, the administration regarding “water” was delegated to the provincial government after “The Government of India Act, 1935” was enacted. However, the law related to the use of water is based on the Canal and Drainage Act, 1873, which was enacted in 1873 under the period of British rule. It was succeeded as a provincial legislation and amended multiple times afterwards. The same applies to the Khyber Pakhtunkhwa Province and the Sindh Province.
The basic concept is that the state government is in a position to use and manage the land for public purposes such as irrigation, navigation and drainage. The followings are mainly stipulated in the Act. Definition of canal
Surface water and river-bed water from natural sources such as rivers and lakes are to be used by the state government.
The Data Collection Survey on Water Supply and Sewerage Sector of Pakistan Final Report
2-9
Construction and maintenance of canals, navigation of canals, rights and responsibilities of landowners over canals, and setting of charges for water abstraction from canals.
Removal of obstacles to drainage. Compensation for damages caused by legal actions
This act was amended in 2015 as follows:
The Provincial Government may plan and implement a scheme for development, rehabilitation, or improvement of a canal.
A portion of the costs associated with the above may be imposed on the water users. A person who has not paid the water usage fee may be excluded from the water supply.
Punjab Irrigation and Drainage Authority Act, 1997 In response to the establishment of the Federal Indus River System Authority Act (1992) and the Indus River System Authority (IRSA) as an external agency of the Federal Ministry of Water Resources, the act is to establish the Punjab Irrigation and Drainage Authority (PIDA). It aims for realizing a long-term sustainable irrigation and drainage system through economical and effective operation management, and participation of beneficiaries in its operation and maintenance. Regarding the authority and responsibilities, the exercise of authority specified under the (Punjab) Canal and Drainage Act, 1873 mentioned above, and management based on the Water Apportion Accord, 1991 are addressed.
Punjab Environmental Protection Act, 1997 The act is based on the Federal Government's Pakistan Environmental Protection Act. Until the 2012 amendment, this federal law was in operation. By the amendment, the name of the law changed to Punjab, and the wording in the text was corrected to be consistent with the Punjab provincial agencies as a provincial law. The purpose of this act which is " to provide for the protection, conservation, rehabilitation and improvement of the environment, prevention and control of pollution, promotion of sustainable development, and for matters connected therewith and incidental thereto” remains the same. The Punjab Environmental Protection Council comprises of provincial executives to (a) co-ordinate and supervise enforcement of the provisions of the Act; (b) approve comprehensive national environmental policies and ensure their implementation within the framework of a national conservation strategy as may be approved by the Government from time to time; (c) approve the Punjab Environmental Quality Standards; (d) provide guidelines for the protection and conservation of species, habitats, and biodiversity in general, and for the conservation of renewable and non-renewable resources; (e) coordinate integration of the principles and concerns of sustainable development into national development plans and policies; and (f) consider the Punjab Environment Report and give appropriate directions thereon.
The Punjab Government further establishes the Punjab Environmental Protection Agency to implement functions such as to prepare or revise and establish the Punjab Environmental Quality Standards with approval of the Punjab Environmental Protection Council. The Provincial Sustainable Development Fund is to be established for the purpose such as providing financial assistance to the projects designed

The Data Collection Survey on Water Supply and Sewerage Sector of Pakistan Final Report
2-10
for the protection, conservation, rehabilitation and improvement of the environment, the prevention and control of pollution, the sustainable development of resources and for research in any specified aspect of environment.
In addition, there are provisions regarding the Initial Environmental Examination (IEE) and Environmental Impact Assessment (EIA) for the projects that are expected to have a negative impact on the environment.
Punjab Water Act, 2019 The Government of Punjab enacted the Punjab Water Act 2019 in December 2019 to address the challenges associated with groundwater and drinking water. The objective of the Act is to ensure sustainable user benefits through centralized monitoring/control of water resources management including all public and private water and sewerage services under the authority of the "Punjab State Water Resources Board". For this purpose, "The Punjab Water Resources Commission" is established with the following functions;
To secure, redistribute or augment the water resources of Punjab. Allocate water resources for domestic, agricultural, ecological, industrial and other purposes in
different parts of Punjab. Ensure the proper use of water resources in Punjab. The Government shall also establish a
"Punjab Water Services Regulatory Authority", which shall be empowered to; Ensure that water and sewerage utilities perform their duties and conduct their operations in
accordance with this law. Approve the tariff revision set by the water and sewerage utilities.
This Commission may designate private companies, municipalities and statutory bodies as water and sewerage utilities for any area. It is stipulated that the designated water and sewerage utilities shall develop and maintain an efficient and economical water supply system within their area and ensure the proper business, in specific, maintain and extend water mains and other pipes, including industrial facilities. In addition, the main impacts of this law on the operations of each WASA are as follows. It is also possible that WASA may be reorganized into other operational forms under the framework of this law.
At present, WASA is supervised and operated as a sub-organization of the HUD&PHED department, but under the Act, all WASA will be regulated by the Punjab Water Services Regulatory Authority as a statutory body or company of service providers. The statutory body/company may be separated into a separate organization/company as a service provider for sewerage and water services.
WASA shall apply to the Water Services Regulatory Authority for revision of tariff. WASA shall ensure that the service levels/indicators set by the regulator are met.
As of now, the Punjab State Water Resources Board has been established, but the Punjab Water Services Regulatory Authority has not been established. The impact of this law on the future operations of WASA is significant, as it paves the way for WASA to be transformed into an independent entity.
The Data Collection Survey on Water Supply and Sewerage Sector of Pakistan Final Report
2-11
(2) Policy Punjab Urban Water Supply and Sanitation Policy, 2007
This policy follows the National Drinking Water Policy and National Sanitation Policy mentioned above and was enacted by the Punjab government in 2007. It sets policy goals and measures for urban water supply and sanitation. The Water Supply Policy states that in order to achieve “safe water supply, as well as sustainable development that conserves the environment and water as the property of mankind taking into account appropriate water intake", the following measures are to be implemented. As with the National Drinking Water Policy, the government is yet to formulate a specific action plan and set annual targets.
Community Participation Social and Environmental Considerations Capacity Building: Strengthening the management capacity of the organization is essential for
effective and efficient functioning of the organization. Human resource development is achieved through training on service and appropriate deployment of organizations and institutions.
Promotion of Public Private Partnership (PPP) Environmental, Health and Hygiene Education Monitoring and evaluation: During the project implementation period, monitoring and
evaluation of organizational operations will be conducted using benchmarking indicators (water supply performance indicators).
The Punjab Environmental Policy,2015 This policy is the equivalent to the National Environmental Policy, 2015. It provides an overarching framework for addressing the environmental issues facing Punjab, particularly pollution of freshwater bodies, air pollution, lack of proper waste management, deforestation, loss of biodiversity, desertification, water logging, natural disasters, and climate change. It also provides broad guidelines to the Provincial and Local Governments for addressing environmental concerns related to them and ensuring effective management, restoration, enhancement of environmental resources and ensuring their sustainable use.
As the key environmental challenge that the Punjab Province faces relate to environmental degradation, it concludes as a result of unsustainable use of its natural resources for economic growth and development. The urban areas of all the cities of Punjab especially Lahore, Multan, Faisalabad, Sheikhupura, Gujranwala, Rawalpindi and Sialkot are facing problems pertaining to uncontrolled urbanization, haphazard industrialization, deterioration of air, surface and ground water quality, improper disposal of the municipal and industrial wastes. As a strategy and action, it stresses on revisiting legislative framework. It introduces sectorial guidelines amongst which actions relating to the water and sewerage are as follows:
Water Utility of WASA and administrative unit of TMAs should develop wastewater treatment plants and achieve the effluent standard.
Greening of the city through rainwater harvesting.

The Data Collection Survey on Water Supply and Sewerage Sector of Pakistan Final Report
2-12
Establishment of the Punjab Water Resources and Wastewater Regulatory Authority 7 and restrict the use of unregulated water by regulating the overall use of groundwater and installing water meters, both public and private.
Punjab Climate Change Policy, 2017
This policy proposes measures which address Punjab specific climate change impacts and is in line with the National Climate Change Policy, 2012. One of the policy objectives mentions “Integrate climate compatible development paradigm through climate resilient, low carbon, and water-energy-food nexus related measures into key relevant sector’s policies, strategies, and plan”.
Under climate change measures, 16 sectors are listed. Out of these, seven sectors namely Water Resources, Agriculture, Livestock, Forestry, Land and Vulnerable Ecosystem, Biodiversity, and Disaster Preparedness are identified as priority sectors, measures are introduced while indicating the relationship with SDGs.
2.1.3 KP Province
(1) Laws and Regulations The Khyber Pakhtunkhwa (KP) Province was renamed from the North West Frontier Province under the 18th constitutional amendment in 2010, and the name of the provincial law has been changed since then. However, the Khyber Pakhtunkhwa is used for all the laws and regulations in this section including ones before the rename.
Khyber Pakhtunkhwa Canal and Drainage Act, 1873 The Canal and Drainage Act enacted in 1873 during the British rule was taken over under the provincial government law. The structure and content of the law is similar to that as described in 2.1.2.
In 2015, it was amended8 to include the followings under “Offences to the Act”: Throwing of garbage and polythene bags in the Canal to block it. water flow. Encroaching on the side areas of the Canal. Diverting sewerage lines towards the Canal.
Khyber Pakhtunkhwa Irrigation and Drainage Authority Act, 1997
Similar to the law in Punjab, in response to the establishment of the Federal Indus River System Authority Act (1992) and the Indus River System Authority (IRSA) as an external agency of the Federal Ministry of Water Resources, the act aimed at establishment of the Khyber Pakhtunkhwa Irrigation and Drainage Authority. The structure of the law is different from that of Punjab, but the provisions are generally the same.
Khyber Pakhtunkhwa Environmental Protection Act, 2014 It is similar to the law in Punjab in that it is based on the Federal Government's Pakistan Environmental Protection Act, 1997. The 1997 federal act was applied until this law was enacted as a KP provincial
7 The relationship with the Punjab Water Services Regulatory Authority mentioned in “the Punjab Water Act, 2019” section is unclear. 8 The amended act is called Khyber Pakhtunkhwa Canal and Drainage (Amendment) Act, 2015.
The Data Collection Survey on Water Supply and Sewerage Sector of Pakistan Final Report
2-13
law in 2014. Its preamble “It is expedient to provide for the protection, conservation, rehabilitation and improvement of the environment, monitoring, prevention and control of pollution, and promotion of sustainable development” is the same as in the federal act.
The content and structure of the law is basically the same as that of Punjab, but the members of the Khyber Pakhtunkhwa Environmental Protection Council are composed of provincial executives, Chairman of the Board of Education and one of the vice chancellors as representative of all the universities in the Province In addition to the functions such as law enforcement monitoring, comprehensive environmental policy approval and enforcement, and approval of the Khyber Pakhtunkhwa Environmental Quality Standard, it also stipulates “promotion of Eco-tourism initiatives, establishment of alpine and other type Botanical Gardens in suitable locations and development of a comprehensive Land Zonation strategy to save the agriculture and forest land”.
The establishment of the Khyber Pakhtunkhwa Environmental Protection Agency is positioned as the implementing agency of the law, whose function is equivalent to that of the Punjab province. The Khyber Pakhtunkhwa Environmental Improvement Fund is to facilitate establishment activities/operations of the agency designed for the protection, conservation, rehabilitation and improvement of the environment, the prevention and control of pollution, and the sustainable development of resources.
(2) Policy Khyber Pakhtunkhwa Drinking Water Policy, 2015
The Government of Khyber Pakhtunkhwa (GoKP) formulated this policy to provide vison and strategic framework for fulfilling responsibility towards ensuring availability of adequate quantity of potable water to the entire population adopting the basic principles of the National Drinking Water Policy 2009 and the National Environment Policy 2005 mentioned above.
i. Present Situation The predominant source of drinking water in Khyber Pakhtunkhwa Province is groundwater. However, due to persistent withdrawal and dwindling re-charge processes, the groundwater is depleting rapidly at many places. Surface water sources are most available in the northern districts of the province; however, unrestrained contamination and increasing use for irrigation pose major threats to the safety and availability of surface water for drinking purposes.
ii. Goal The overall goal of this policy is to streamline the sector and ensure that the entire population of the Khyber Pakhtunkhwa has access to adequate quantity of potable water at affordable cost through equitable, efficient and sustainable services by 2025.
iii. Objectives Fourteen (14) objectives are introduced, these include:

The Data Collection Survey on Water Supply and Sewerage Sector of Pakistan Final Report
2-14
Enhance the drinking water supply coverage in the province, thereby contributing to the government’s commitment towards achievement of the relevant Millennium Development Goals (MDGs) and Sustainable Development Goals (SDGs) targets
Introduce reforms in the drinking water supply sector encompassing regulatory, institutional, economic, monitoring and accountability aspect
Allocate at least 10% of provincial ADP (Annual Development Program) for the achievement of the goal objectives of the policy
iv. Policy Principle Nine principles are introduced, these include: Water allocation for drinking purpose9 shall have priority over other uses Delegation of responsibilities and resources to the respective authorities/agencies/corporations
for enabling them to discharge their assigned functions Tariffs for drinking water services shall be set up so as to recover at least O&M costs for service
provision.
v. Policy Approaches Institutional framework: demarcation and coordination of roles among the Provincial
Government, District Government, Water and Sanitation Authority, Public Sector Water Service Providers, Private Sector/Providers, KP Environmental Protection Agency, Community/Beneficiaries and Development Partners
Starting FY 2015-16, at least 10% of the total provincial ADP will be allocated to the drinking water sector.
Master Planning regarding new drinking water supply systems and rehabilitation and upgrading of existing systems to be adopted
Legislation of the Drinking Water Act, the Water and Sanitation Regulatory Authority Act and the Water and Sanitation Companies Act
Promote private entrepreneurship and public-private partnership for enhancing provision and O&M of drinking water supply systems, resource mobilization and capacity development.
Performance-based awards for water utilities Protection and conservation of water resources Water quality monitoring and surveillance framework shall be established Capacity development for water utilities
vi. Policy Guidelines Knowledgebase for decision making (leveraging ICT sector) Cost-effective and appropriate technological options to suit local conditions and socio-cultural
practices will be used. Planning, designing, construction, monitoring and operation and maintenance for various categories of water supply schemes shall be under adequate Standard Operating Procedures (SOP).
Mass information, education and communication campaigns shall be developed and implemented to promote water safety, water conservation and safe hygiene practices.
In addition to the above, R&D and emergency response and preparedness are introduced.
9 Drinking water referring to here intend to water used for domestic purposes, such as drinking, cooking, and sanitation.
The Data Collection Survey on Water Supply and Sewerage Sector of Pakistan Final Report
2-15
With regard to sanitation, the Khyber Pakhtunkhwa Sanitation Policy was proposed, but the same is yet to be approved. 2.1.4 Sindh Province
(1) Laws and Regulations Sindh Irrigation Act, 1879
As water-related law in the Sindh Province, another British act, the “Sind10 Irrigation Act, 1879” was succeeded as the provincial act. Although the name is different, the structure and the content are the same as that of the Canal and Drainage Act of Punjab or KP. The following amendments were made in 2012. sub-section (1) Notwithstanding any grant or lease by any authority or any judgment or decree
of any court in favor of any person, the land of all the natural or artificial depression courses meant for discharge of flood or rain waters shall stand resumed to Government and shall be exclusively used for such purpose.
sub-section (2) Any person in possession of Government land mentioned in sub-section (1), shall vacate such land within seven days of the commencement of this Act.
sub-section (3) Whoever fails to vacate the land as required under subsection (2), shall be punished with imprisonment which may extend to ten years and shall also be liable to fines which may extend to rupees one million: Provided that the offence punishable under this subsection shall be non-bailable
Sindh Irrigation and Drainage Authority Act, 1997
Similar to the laws in Punjab and KP, in response to the establishment of the Federal Indus River System Authority Act (1992) and the Indus River System Authority (IRSA) as an external agency of the Federal Ministry of Water Resources, the act aimed to establish the Sindh Irrigation and Drainage Authority. The structure of the law is different from that of Punjab, but the provisions are generally the same. This act was repealed followed by the enactment of the below-mentioned Sindh Water Management Ordinance, 2002.
Sindh Water Management Ordinance, 2002 In addition to the Sindh Irrigation and Drainage Authority (SIDA) mentioned above, the comprehensive law that includes the Area Water Board (AWB), the Farmers' Organization (FO), and the Watercourse Associations (WA) which are state governmental organizations related to water was enacted in 2002 and transitioned.
Sindh Environmental Protection Act,2014 This Act was the federal act applied in the Sindh Province until 2014 when provincial act was enacted. The preamble is same as that of the Punjab or the KP acts. Regarding the constituents of the Sindh Environmental Protection Council, two members of the Provincial Assembly of Sindh amongst the eleven members of the Standing Committee on Environment nominated by the Speaker are added as the
10 Spelling before 18th amendment of the Constitution. It was Bombay Irrigation Act when enacted in 1879.
The Data Collection Survey on Water Supply and Sewerage Sector of Pakistan Final Report
2-16
high officials of the provincial government. The name of fund to provide financial assistance to projects designed for the protection, conservation, rehabilitation and improvement of the environment, the prevention and control of pollution, the sustainable development of resources and for research in any specified aspect of the environment is the Sindh Sustainable Development Fund. (2) Policies
Sindh Drinking Water Policy, 2017 It was established by the Public Health Engineering & Rural Development Department in Sindh and is based on the principle of being consistent with the SDGs and the National Drinking Water Policy (2009) mentioned above. The ultimate goal is to improve the quality of life of Sindh citizens by reducing morbidity and mortality caused by water-borne diseases through provision of safely managed and potable drinking water to the entire population. To this end, 15 objectives are introduced, such as:
Introduce legislative measures regulations to create enabled framework for safely management of water supply, regulation of water usage, extraction, treatment, transportation, and distribution.
Ensure that all drinking water resources and supply system are protected with community involvement.
Enhance the coverage of safely managed supply of water in the province to achieve the Sustainable Development Goals (SDGs) targets of universal access.
Ensure that all drinking water supply systems are designed and constructed with the national drinking water standards and all municipal discharges comply with the National Environment Quality Standards (NEQS).
Increase public awareness about water borne and water related diseases (including Polio), nutrition and hygiene, and enhance the role of communities for household water treatment/storage, water safety and conservation, and safe hygiene practices.
Institutionalize Water, Sanitation and Hygiene (WASH) in schools and introduce changes in curriculum to incorporate health, nutrition, and hygiene. Improve safe water and sanitation practices amongst school children.
Sindh Sanitation Policy, 2017
The policy was established by the Public Health Engineering & Rural Development Department of Sindh. The vision is "to provide better sanitation service and to make sure that the entire population of Sindh has access to safely managed sanitation services and sanitation environment that is also nutrition sensitive hygiene” Five targets are listed as follows:
To eradicate open defecation from the Sindh Province by 2025, while 70 villages in 13 high priority districts to achieve the status of open defecation free (ODF) by 2020.
That 100% households in the Sindh have access to and use sanitary latrines by 2025, while 70% of households in rural high priority districts to achieve this by 2020.
To strengthen and implement liquid waste management with sewer lines and covered/improved drains with 85% coverage in urban areas and 60% coverage in rural areas.
The Data Collection Survey on Water Supply and Sewerage Sector of Pakistan Final Report
2-17
To create and develop wastewater treatment mechanisms to cover 75% of urban areas and 40% of rural areas by 2025.
To implement solid waste management with 100% coverage in urban areas and 60% coverage of rural areas by 2025.
Thirteen (13) items are listed as action guidelines. The main guidelines are as follows:
The policy aligns itself with the goals and targets of the SDGs for sanitation. The sanitation policy adheres itself to the pursuit of total sanitation as outlined under the
Pakistan’s Approach to Total Sanitation (PATS). Institutionalize the component sharing model set out in the National Sanitation Policy (2006). This Sindh Sanitation Policy reiterates the Pakistan Approach to Total Sanitation (PATS) and
places emphasis on ODF.
2.2 ADMINISTRATIVE ORGANIZATION FOR WATER SUPPLY AND SEWERAGE SECTOR
2.2.1 Federal Government
In Pakistan, the responsibility of the provincial government was strengthened under the 18th amendment of the Constitution in April 2010. However, as mentioned in 2.1.1 above, since the division of duties of central and the provincial governments were defined in the Government of India Act, 1935., the provincial government has long been in charge of the water and sewage sector. The federal government provides the basic framework and the provincial government take concrete measures.
The ministries related to "water" in the federal government are the Ministry of Climate Change and the Ministry of Water Resources. The Ministry of Climate Change has been renamed from the Ministry of Environment at the time of reorganization of ministries in August 2017. The ministry is in charge of provision of safe water supply, expanding water supply operations, maintenance of existing water supply systems, saving water, improving water quality, water purification technology, and water supply business management. During the reorganization of ministries as mentioned above, the Power Department was separated from the Ministry of Water and Power and renamed as the Ministry of Water Resources. The ministry is in charge of water resource management and coordinates with provinces regarding irrigation, hydropower and Indus River intake.
2.2.2 Punjab Province
(1) Provincial Government The Punjab provincial government has 40 departments11, of which the Housing, Urban Development & Public Health Engineering Department (HUD&PHED) is responsible for the water and sewage sector. On the Punjab Province website, the HUD & PHED HUD is in a position to supervise PHED and the Water Supply and Sanitation Agency (WASA), the water and sewage agencies of the five cities described below. It states that the HUB&PHED is in charge of approving water and sewage tariff of WASA, hiring staff, and rendering compensation of operational deficiencies.
11 Some, like the Board of Revenue, do not include the department in the organization name. https://punjab.gov.pk/provincialdepartments
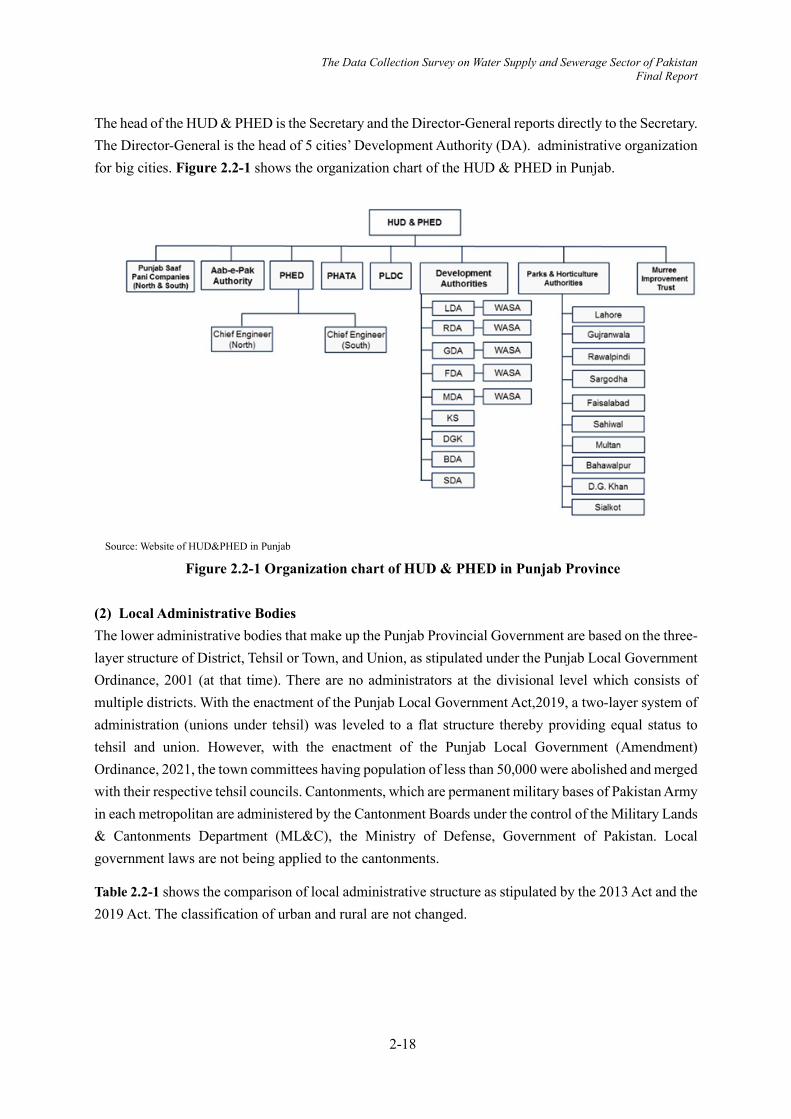
The Data Collection Survey on Water Supply and Sewerage Sector of Pakistan Final Report
2-18
The head of the HUD & PHED is the Secretary and the Director-General reports directly to the Secretary. The Director-General is the head of 5 cities’ Development Authority (DA). administrative organization for big cities. Figure 2.2-1 shows the organization chart of the HUD & PHED in Punjab.
Source: Website of HUD&PHED in Punjab
Figure 2.2-1 Organization chart of HUD & PHED in Punjab Province (2) Local Administrative Bodies The lower administrative bodies that make up the Punjab Provincial Government are based on the three-layer structure of District, Tehsil or Town, and Union, as stipulated under the Punjab Local Government Ordinance, 2001 (at that time). There are no administrators at the divisional level which consists of multiple districts. With the enactment of the Punjab Local Government Act,2019, a two-layer system of administration (unions under tehsil) was leveled to a flat structure thereby providing equal status to tehsil and union. However, with the enactment of the Punjab Local Government (Amendment) Ordinance, 2021, the town committees having population of less than 50,000 were abolished and merged with their respective tehsil councils. Cantonments, which are permanent military bases of Pakistan Army in each metropolitan are administered by the Cantonment Boards under the control of the Military Lands & Cantonments Department (ML&C), the Ministry of Defense, Government of Pakistan. Local government laws are not being applied to the cantonments.
Table 2.2-1 shows the comparison of local administrative structure as stipulated by the 2013 Act and the 2019 Act. The classification of urban and rural are not changed.

The Data Collection Survey on Water Supply and Sewerage Sector of Pakistan Final Report
2-19
Table 2.2-1 Comparison of administrative structure between the 2013 Act and the 2019 Act 2013 Act 2019 Act
classification requirement classification requirements
urban
Metropolitan Corporation Lahore only Metropolitan Corporation one for every division
Municipal Corporation having a population of more than 500,000
Municipal Corporation having a population of more than 250,000
Municipal Committee having a population between 30,000 and 500,000
Municipal Committee* having a population between 75,000 and 250,000
Town Committee having a population of more than 20,000**
rural District Council Tehsil Council
*The area comprising the city which houses a Tehsil headquarters, unless it qualifies to be classified as a Municipal Corporation, shall be a Municipal Committee whether or not its population is less than seventy-five thousand. ** The requirement was changed to “more than or equal to 50,000 by the enactment of 2021 amendment.
Source: JST
As for metropolitan corporations, Lahore was the sole Metropolitan Corporation, but with the enactment of 2019 Act, all of the nine divisional capitals attained the status of Metropolitan Corporations. Figure 2.2-2 shows the divisions and the location of metropolitan corporations.
Source: JST
Figure 2.2-2 Divisions and Location of Metropolitan Corporations in Punjab Province

The Data Collection Survey on Water Supply and Sewerage Sector of Pakistan Final Report
2-20
Thus, all of the target cities under this survey are metropolitan corporations. Figure 2.2-3,Figure 2.2-4 and Figure 2.2-5 show the metropolitan corporations and other local administrative bodies (except for Lahore) in Lahore, Multan and Faisalabad, respectively. These maps are processed on the maps published12 by the Local Government & Community Development Department (LGCD) of the Punjab Provincial Government based on the enactment of the 2019 Act. As for Lahore, although the LGCD shows the tehsil boundary, the Metropolitan Corporation Lahore is the sole official administrative body as mentioned above.
Source: JST processed on LGCD -published map
12https://lgcd.punjab.gov.pk/node/605#overlay-context=node/606
Figure 2.2-3 Lahore District Administration
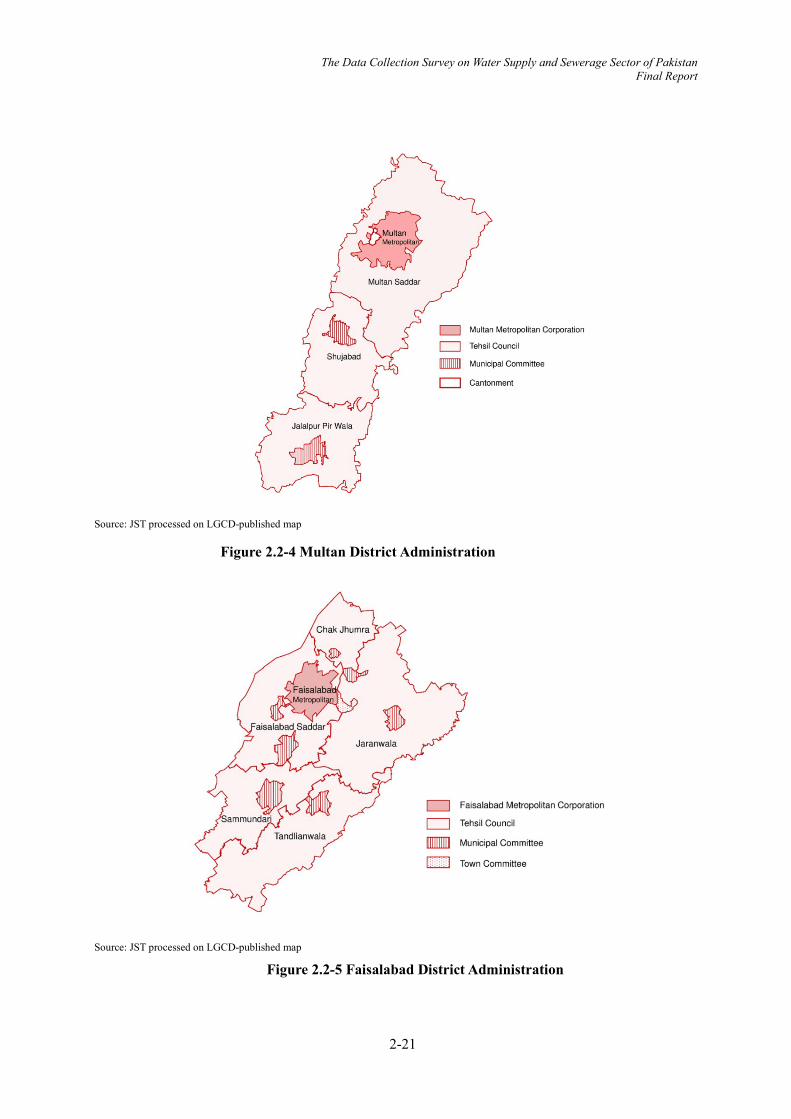
The Data Collection Survey on Water Supply and Sewerage Sector of Pakistan Final Report
2-21
Source: JST processed on LGCD-published map
Source: JST processed on LGCD-published map
Figure 2.2-4 Multan District Administration
Figure 2.2-5 Faisalabad District Administration

The Data Collection Survey on Water Supply and Sewerage Sector of Pakistan Final Report
2-22
(3) Development Authorities and WASA In Punjab Province, Development Authorities (DAs) are established in the metropolitan areas. Among all DAs, the Lahore Development Authority (LDA) was established prior to the others by the enactment and enforcement of the Lahore Development Authority Act, 1975. DAs of the other four cities were established by the Punjab Development of Cities Act, 1976. Under the provisions of this Act, urban issues such as water supply, sewerage, waste disposal. are positioned as DA's affairs. The Act also stipulates that the Director-General appointed by the provincial government is head of business execution under the command of the provincial government. In the metropolitan areas, the Water and Sanitation Agency (WASA) is responsible for the water, sewerage and drainage sectors of the DA, each of which is a part of the DA. The scope of business of WASA is the same as that of the DA's administrative districts. The head of WASA is the Managing Director (MD), and as mentioned above, reports directly to the Director General, who is the head of the DA. The details about WASA are mentioned in the succeeding chapter.
2.2.3 KP Province
The KP provincial administration is based on the Khyber Pakhtunkhwa Local Government Act, 2013. The governing body has a three-layer structure. Table 2.2-2 shows the administration hierarchy in the KP Province.
Table 2.2-2 Administration Hierarchy in The KP Province high middle low
District Tehsil/Town urban rural City District Government (only District Peshawar)
Town Municipal Administration Neighborhood Council Village Council
District Government Tehsil Municipal Administration
Source: JST
There are a total of 34 District Governments directly under the province with the Town/Tehsil Municipal Administration (TMAs) under it. The TMAs consist of the Neighborhood Council (NC) in urban areas and the Village Council (VC) in rural areas. Peshawar, the capital of the Province, is designated as the City District and has the City District Government. The Town Municipal Administration is placed below the City District Government.
The law stipulates that the TMA will provide urban services such as water supply, sanitation and sewerage. Although it is not positioned as an administrative organization, there are seven divisions in the province where multiple districts are gathered, and the Division Capital, the capital of the county, is the administrative center of each division.
On the other hand, the Khyber Pakhtunkhwa Rural Area Drinking Water Supply Scheme Act, 1985 is effective in the KP Province, and the provincial government implements water supply in the areas defined as villages under the above-mentioned Local Government Act with the Public Health Engineering Department (PHED) of the Provincial Government taking charge of it. This law also stipulates basic water supply matters in the area, that is, prohibition of illegal connections and vandalism,
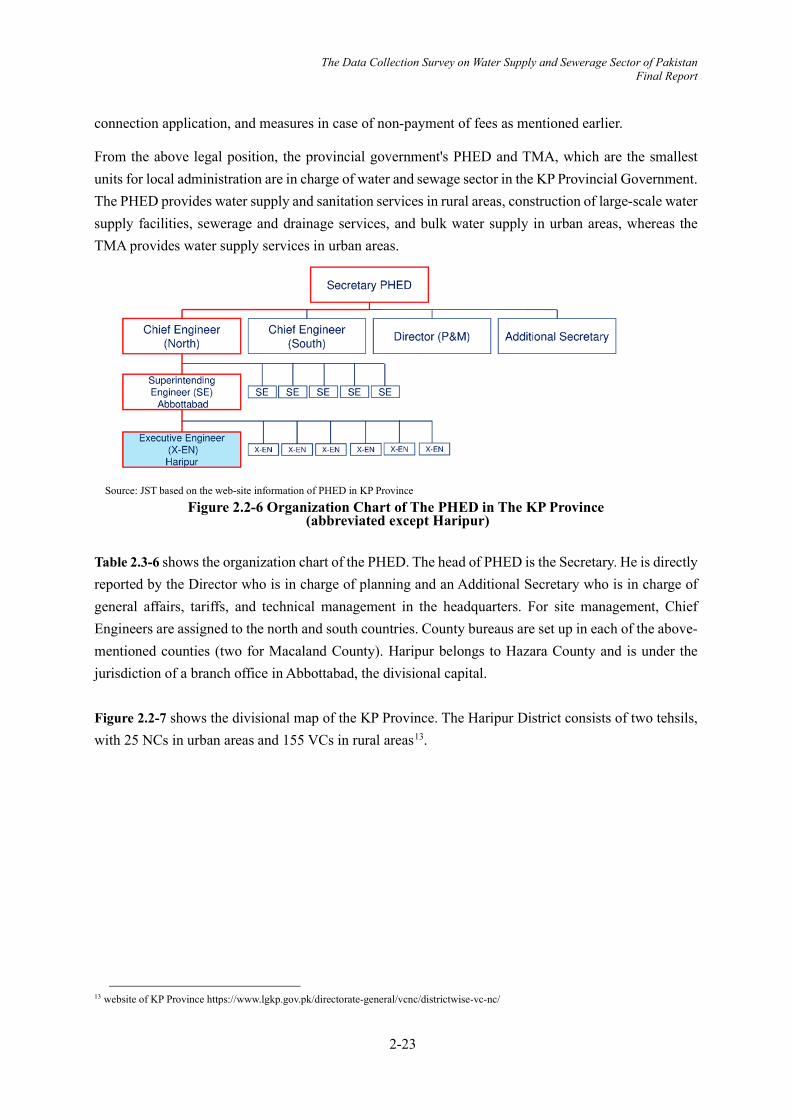
The Data Collection Survey on Water Supply and Sewerage Sector of Pakistan Final Report
2-23
connection application, and measures in case of non-payment of fees as mentioned earlier.
From the above legal position, the provincial government's PHED and TMA, which are the smallest units for local administration are in charge of water and sewage sector in the KP Provincial Government. The PHED provides water supply and sanitation services in rural areas, construction of large-scale water supply facilities, sewerage and drainage services, and bulk water supply in urban areas, whereas the TMA provides water supply services in urban areas.
Source: JST based on the web-site information of PHED in KP Province
Figure 2.2-6 Organization Chart of The PHED in The KP Province (abbreviated except Haripur)
Table 2.3-6 shows the organization chart of the PHED. The head of PHED is the Secretary. He is directly reported by the Director who is in charge of planning and an Additional Secretary who is in charge of general affairs, tariffs, and technical management in the headquarters. For site management, Chief Engineers are assigned to the north and south countries. County bureaus are set up in each of the above-mentioned counties (two for Macaland County). Haripur belongs to Hazara County and is under the jurisdiction of a branch office in Abbottabad, the divisional capital. Figure 2.2-7 shows the divisional map of the KP Province. The Haripur District consists of two tehsils, with 25 NCs in urban areas and 155 VCs in rural areas13.
13 website of KP Province https://www.lgkp.gov.pk/directorate-general/vcnc/districtwise-vc-nc/

The Data Collection Survey on Water Supply and Sewerage Sector of Pakistan Final Report
2-24
Source: JST
Figure 2.2-7 Division Map of KP Province (Hazara Division shown in green also shows the district boundary)
2.2.4 Sindh Province
The Sindh administration is based on the Sindh Local Government Act, 2013 (SLGA). There are 29 Districts in the Sindh province, of which 6 Districts make up the Karachi Division, which is treated differently under the Act as the provincial capital. Figure 2.2-8 shows the district block map of the Sindh Province. Under the Act, the Metropolitan Corporation, the District Municipal Corporation, the Municipal Corporation, the Municipal Committee, the Town Committee, and the Union Committee are the administrative organizations for district urban areas. However, military land under the jurisdiction of the Cantonment Board is not covered.

The Data Collection Survey on Water Supply and Sewerage Sector of Pakistan Final Report
2-25
Source: JST
Figure 2.2-8 District Block Map of the Sindh Province (Karachi Division is shown in red)
As an organization of city administration, the law stipulates that the Karachi Metropolitan Corporation (KMC) should be set up for the Karachi Division and the District Municipal Corporation (DMC) should be set up in each district of Karachi. The head of the KMC is the mayor, and the head of the DMC is the Chairman. Figure 2.2-9 shows the divisions and Cantonments under the Karachi Division.
Source: https://en.wikipedia.org/wiki/List_of_Union_Councils_of_Karachi
Figure 2.2-9 Districts and Cantonments under the Karachi Division Table 2.2-3 shows the population and area under the Karachi Division according to the population census conducted by the Pakistan Bureau of Statistics in 2017. The population in the Karachi Metropolitan area is 16 million as of 2017, an increase of 60% from less than 10 million in 1998.
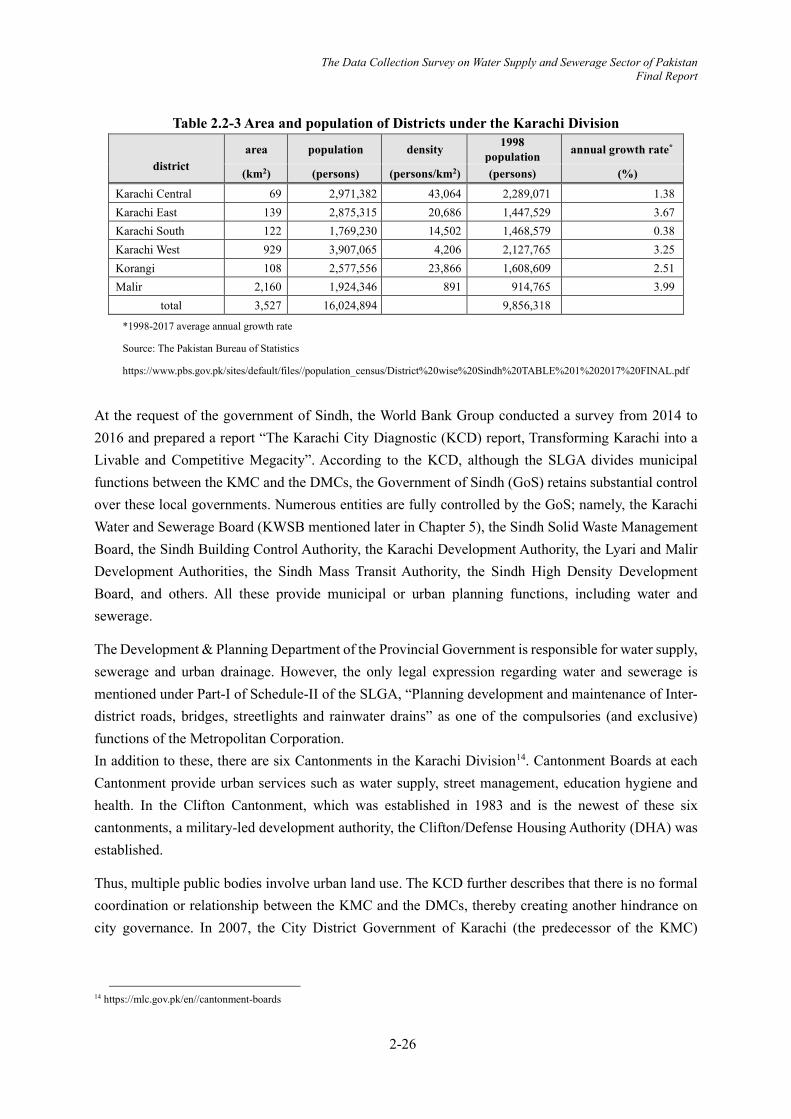
The Data Collection Survey on Water Supply and Sewerage Sector of Pakistan Final Report
2-26
Table 2.2-3 Area and population of Districts under the Karachi Division
district
area population density 1998 population annual growth rate*
(km2) (persons) (persons/km2) (persons) (%)
Karachi Central 69 2,971,382 43,064 2,289,071 1.38 Karachi East 139 2,875,315 20,686 1,447,529 3.67 Karachi South 122 1,769,230 14,502 1,468,579 0.38 Karachi West 929 3,907,065 4,206 2,127,765 3.25 Korangi 108 2,577,556 23,866 1,608,609 2.51 Malir 2,160 1,924,346 891 914,765 3.99
total 3,527 16,024,894 9,856,318
*1998-2017 average annual growth rate
Source: The Pakistan Bureau of Statistics
https://www.pbs.gov.pk/sites/default/files//population_census/District%20wise%20Sindh%20TABLE%201%202017%20FINAL.pdf
At the request of the government of Sindh, the World Bank Group conducted a survey from 2014 to 2016 and prepared a report “The Karachi City Diagnostic (KCD) report, Transforming Karachi into a Livable and Competitive Megacity”. According to the KCD, although the SLGA divides municipal functions between the KMC and the DMCs, the Government of Sindh (GoS) retains substantial control over these local governments. Numerous entities are fully controlled by the GoS; namely, the Karachi Water and Sewerage Board (KWSB mentioned later in Chapter 5), the Sindh Solid Waste Management Board, the Sindh Building Control Authority, the Karachi Development Authority, the Lyari and Malir Development Authorities, the Sindh Mass Transit Authority, the Sindh High Density Development Board, and others. All these provide municipal or urban planning functions, including water and sewerage.
The Development & Planning Department of the Provincial Government is responsible for water supply, sewerage and urban drainage. However, the only legal expression regarding water and sewerage is mentioned under Part-I of Schedule-II of the SLGA, “Planning development and maintenance of Inter-district roads, bridges, streetlights and rainwater drains” as one of the compulsories (and exclusive) functions of the Metropolitan Corporation. In addition to these, there are six Cantonments in the Karachi Division14. Cantonment Boards at each Cantonment provide urban services such as water supply, street management, education hygiene and health. In the Clifton Cantonment, which was established in 1983 and is the newest of these six cantonments, a military-led development authority, the Clifton/Defense Housing Authority (DHA) was established.
Thus, multiple public bodies involve urban land use. The KCD further describes that there is no formal coordination or relationship between the KMC and the DMCs, thereby creating another hindrance on city governance. In 2007, the City District Government of Karachi (the predecessor of the KMC)
14 https://mlc.gov.pk/en//cantonment-boards

The Data Collection Survey on Water Supply and Sewerage Sector of Pakistan Final Report
2-27
formulated the Karachi Strategic Development Plan (KSDP 2020)15 and approved it through a resolution passed by the city council. However, it is yet to be approved by the GoS. 2.3 FINANCIAL STATUS OF WATER, SEWERAGE AND DRAINAGE UTILITIES IN THE WATER AND
SEWAGE SECTOR
2.3.1 Financial status of the Central Government of Pakistan
Under the federal government of Pakistan, the Ministry of Climate Change (former Ministry of Environment), as the ministry responsible for the water and sewage sector, is involved in drafting the national policies and guidelines. The finances for the water and sewage sector often relies on foreign loan projects and provincial government budgets. The federal government distributes national tax revenues to each province in a lump sum manner and the distributed revenues are allocated to water, sewerage, and sanitation at the discretion of the province.
Investment in the WASH sector in Pakistan is reported to have increased from 63 billion Pakistan Rupees (PKR) (2016) to 101 billion PKR (2018). The following table shows the investment in the WASH sector. The per capita investment amount is 5 USD, and the ratio (0.37%) of the gross domestic product (GDP) is lower than that of Sri Lanka and Nepal.
Table 2.3-1 Budget of WASH Sector(Per Capita USD・and Total Investment(USD millions) USD per capita USD millions % per DGP
Pakistan 5 (2018) 973 (2018) 0.37(2017) Sri Lanka 18 (2018) 382 (2018) n.a.
Nepal 12 (2019) 346 (2019) 2.34(2019) Bangladesh 5 (2017) 800 (2017) 0.46 (2017)
In Pakistan, provincial budgets for WASH rose from 63 billion to 101 billion Pakistani rupees (US$ 645 million to US$ 954(973 is correct) million) from fiscal year 2016 to fiscal year 2018. Source:National Systems to Support Drinking Water, Sanitation and Hygiene: Global Status Report 2019_WHO
2.3.2 Financial Status of Sindh Province
The revenues of the Sindh province are shown in Table 2.3-2. 66% of total revenue comes from the federal subsidies (national tax distributions). The remaining consists of 22% from its own financial resources, 5% from loans, 5% from overseas ODA support and public sector development projects (Development Receipt: Foreign Project Assistance and PSDP). PSDP are invested in country-led projects such as energy, transportation and communications, water resources, education, and health.
15 Land-use plan, water supply, sewerage and solid waste master plan forecasting the population of Karachi in 2020 as 27,550 sources: The study on water supply and sewerage system in Karachi….(JICA,2008)

The Data Collection Survey on Water Supply and Sewerage Sector of Pakistan Final Report
2-28
Table 2.3-2 Composition of Revenue Source in Sindh Province (PKR. in million)
Description Budget
Estimates 2017-18
Revised Estimates 2017-18
Budget Estimates
2018-19 Amount Rate (%)
Total Provincial Consolidated Fund 954,516 903,953 100.0 1,045,868 General Revenue Receipts 826,934 795,724 88.0 908,167 Federal Transfers 627,307 598,761 66.2 665,085 Provincial Taxes 185,621 181,033 20.0 223,267 Provincial Non-Tax 14,006 15,929 1.8 19,814 Current Capital Receipts 57,514 60,227 6.7 75,789
Loan and Advances 11,014 13,727 1.5 15,789 Bank Borrowings 46,500 46,500 5.1 60,000
Development Receipts 70,068 48,002 5.3 61,911 Foreign Project Assistance and PSDP 70,068 48,002 61,911
Source:Budget Analysis 2018-2019_Finance Department Gov. of Sindh
As access to clean water is a top priority for Sindh provincial government, the Current Revenue Expenditure (CRE) allocation in water supply sector was increased to PKR 9.84 billion from the previous year (2017-2018). Important projects identified under the 2018/2019 budget are as follows
Table 2.3-3 Water Supply and Sewerage Projects of Sindh Provincial Government
Project Project Cost
(2018/2019 Budget)
Greater Karachi Water Supply Scheme (K-IV) 4.2 billion PKR Greater Karachi Sewerage Plan (S-III) 3.0billion PKR Source: JST
Table 2.3-4 Current Revenue Expenditure
(PKR. in million)
2017-18 2018-19 Percent of
BE RE BE CRE Increase General Public Services 188,544 203,736 224,051 29 19 Executive & Legislative Organs, Financial &
Fiscal Affairs 118,482 136,256 148,837
Transfers 66,000 63,491 71,000 General Services 4,062 3,989 4,214 Public Order and Safety Affairs 102,443 102,883 113,758 15 11 Law Courts 10,838 10,822 11,996 Police 86,237 86,338 96,282 Fire Protection 10 9 10 Prison Administration & Operation 3,943 3,689 4,042 Administration of Public Order 1,415 2,025 1,428 Economic Affairs 88,247 99,512 100,798 13 14 General Economic, Commercial & Labour
Affairs 2,286 2,403 2,522
Agriculture, Food, Irrigation, Forestry & Fishing 64,441 73,716 76,483
Agriculture 14,224 13,446 17,326 Irrigation 16,170 13,271 17,993 Land Reclamation 4,294 2,497 4,751 Forestry 2,023 2,090 2,292

The Data Collection Survey on Water Supply and Sewerage Sector of Pakistan Final Report
2-29
2017-18 2018-19 Percent of
BE RE BE CRE Increase Food 11,514 13,850 10,200 Fuel and Energy 16,216 28,562 23,921 Mining and Manufacturing 2,375 3,062 739 Manufacturing 300 300 300 Mining 2,075 2,762 439 Construction and Transport 18,618 19,576 19,928 Other Industries 527 755 1,127 Environment Protection 909 757 1,044 0.1 15 Rural/Urban 420 367 420 Pollution Abatement 222 285 433 Administration of Environment Protection 267 105 191 Housing and Community Amenities 4,560 5,140 9,844 1 14 Community Development 2,968 2,568 3,018 Water Supply 1,592 2,572 6,826 Health 85,304 87,539 99,537 13 17 Hospital Services 63,141 61,686 70,930 Public Health Services 2,286 3,686 6,843 Health Administration 19,877 22,167 21,764 Recreational, Culture and Religion 8,331 10,650 9,710 1.2 16 Recreational and Sporting Services 2,587 2,877 2,610 Broadcasting and Publishing 411 417 495 Religious Affairs 5,334 7,355 6,605 Education Affairs and Services 178,658 165,117 205,020 26.5 15 Pre & Primary Education Affairs and
Services
118,807 112,802 141,320
Tertiary Education and Services 26,450 29,000 33,443 Subsidiary Services to Education 1,325 1,160 1,452 Education Affairs Not Elsewhere Defined 32,076 22,154 28,805 Social Protection 9,477 9,838 9,472 1.2 0 Administration 865 849 880 Others 8,612 8,989 8,592 Total Current Revenue Expenditure
666,474 685,174 773,237 100 16
Source:Budget Analysis 2018-2019_Finance Department Gov. of Sindh
2.3.3 Financial Status of Punjab Province
The Punjab Province relies on the federal government's Federal Divisible Pool share for 80% of its revenue. The remaining 20% is province-specific tax and non-tax revenue and asset revenue (as per the Finance Dep., Punjab Gov.).
The provincial government of Punjab has requested its departments to set up the Punjab Revenue Authority, Board of Revenue and Excise and Taxation Department to secure new sources of revenue through taxes or tax exemption in order to meet the critical development budgetary demands.
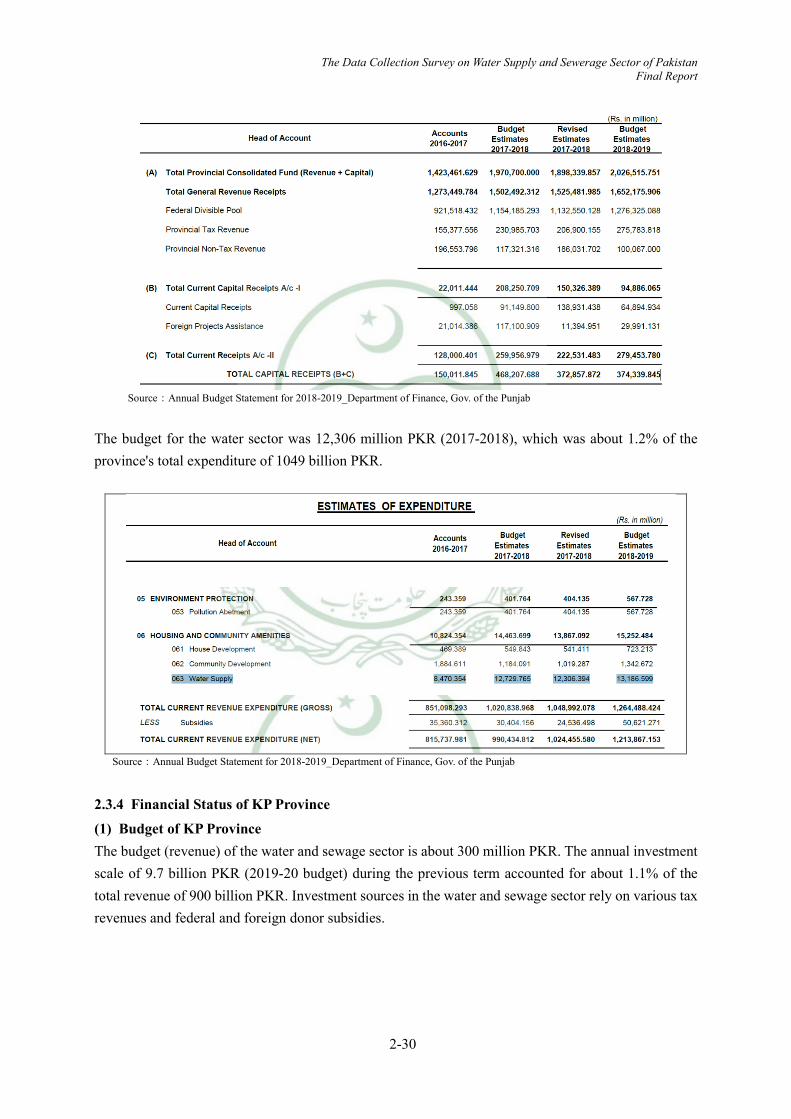
The Data Collection Survey on Water Supply and Sewerage Sector of Pakistan Final Report
2-30
Source:Annual Budget Statement for 2018-2019_Department of Finance, Gov. of the Punjab
The budget for the water sector was 12,306 million PKR (2017-2018), which was about 1.2% of the province's total expenditure of 1049 billion PKR.
Source:Annual Budget Statement for 2018-2019_Department of Finance, Gov. of the Punjab
2.3.4 Financial Status of KP Province
(1) Budget of KP Province The budget (revenue) of the water and sewage sector is about 300 million PKR. The annual investment scale of 9.7 billion PKR (2019-20 budget) during the previous term accounted for about 1.1% of the total revenue of 900 billion PKR. Investment sources in the water and sewage sector rely on various tax revenues and federal and foreign donor subsidies.

The Data Collection Survey on Water Supply and Sewerage Sector of Pakistan Final Report
2-31
Table 2.3-5 Budget (Revenue Prospect) of KP Provincial Government
S.No DEPARTMENT NAME Budget
Estimates 2018-19
Revised Estimates
2018-19
Budget Estimates
2019-20 10. Public Health Department 400,000,000 300,000,000 304,680,000 40 Public Health 400,000,000 300,000,000 304,680,000
TOTAL REVENUE RECEIPTS(Provincial budget including tax revenue) 532,635,331,000 495,355,262,000 793,340,455,000
GRAND TOTAL (Includes federal and overseas donor’s subsidies) 648,000,000,000 587,409,559,000 900,000,000,000
Source:Estimates of Receipts for 2019-20_ Government of Khyber Pakhtunkhwa
(2) OBB System From the Medium-term Development Plan (2010), the output-based medium-term development plan was introduced as a complementary budget method to the conventional budget / development method.
OBB (Output Based Budgeting) aims to improve the efficiency of public spending by setting goals for the public sector and linking them to the fiscal budget. It was institutionalized to clearly define outcomes and outputs and enhance the traditional item-accumulating budget system. It improves the policy decision and measurement of Key Performance Indicators (KPIs) and is utilized as an index to evaluate the results of the previous year and provide feedback to the budget committee.
Table 2.3-6 Outcome/Output indicators defined under the PHED's medium-term financial plan
Outcome(s) Output(s)
2018-19 Medium Term
Targets 2021-22
Target Progress
1. Improved health outcome due to sustainable supply of clean drinking water and safe sanitation practices 1.1 Sanitation services improved
1.1.1 Area covered through street pavement under sanitation schemes. 100 195 150
1.1.2 Drained/ Sewerage system installed M2 240,000 M2 468,000 M2 360,000 1.1.3 Percentage of population provided sanitation
services M 60,000 M 117,000 M 60,000 1.1.4 Percentage of Population provided sanitation
services 1% 1.8% 1.5% 1.2 Access to adequate quantity of safe water provided
1.2.1 Percentage coverage of villages provided water supply schemes. 300 270 300
1.2.2 Percentage of beneficiaries provided safe drinking water 100% 90% 100%
1.2.3 Number of waters solarization schemes completed 3.48% 3.13% 3.48%
1.2.4 Number of waters solarization schemes completed 50 Nos. 30 Nos. 100 Nos.
1.3 Existing infrastructure rehabilitated / repaired
1.3.1 Number of existing Water Supply Schemes rehabilitated 100% 95% 100%
1.3.2 Number of leakages repaired in existing Water supply Schemes. 100 % 80 % 100%
1.4 Water quality testing labs and equipment across the Province operationalized
1.4.1 Number of water samples examined 3,500 Nos. 3,000 Nos. 5,000 Nos. 1.4.2 percentage of water storage reservoirs cleaned
& disinfected
100% 90% 100%

The Data Collection Survey on Water Supply and Sewerage Sector of Pakistan Final Report
2-32
Outcome(s) Output(s)
2018-19 Medium Term
Targets 2021-22
Target Progress
2. Improved governance 2.1 Enhanced revenue collection and efficient/effective administrative services
2.1.1 Revenues on account of water charges collected 100% 60% 100%
2.1.2 Revenue target achieved 100% 60% 100% 2.1.3 Reduction in illegal connections 30% 10% 60%
Source:Medium Term Budget Estimates for Service Delivery 2019-22_Finance Department of Government Khyber Pakhtunkhwa
(3) PHED(Provincial Government)Medium-Term Development Plan The PHED planned a total of 9.7 billion PKR (2019-20 budget), which comprised of 4.2 billion PKR for water expansion, 300 million PKR for rehabilitation and repair of existing facilities, and 5 billion PKR for labor costs etc. Priority projects in the water sector include rehabilitation of existing facilities, projects by various donors, development of solar power, and Master planning for expansion plans.
Table 2.3-7 Medium-Term Development Plan pertaining to Water Supply and Sanitation Sector
in the KP Province PKR in million
Outcome(s) / Output(s) BE 2016-17 BE 2017-18
FBE 2018-19
FBE 2019-20
1. Improved health outcome due to sustainable supply of clean drinking water and safe sanitation practices
4,135.009 5,149.104 4,288.157 4,683.603
1.1 Sanitation services improved 107.903 152.367 126.891 138.592 Development/Capital 107.903 152.367 126.891 138.592 1.2 Access to adequate quantity of safe water
provided 3,144.106 4,652.292 3,874.414 4,231.705
Development/Capital 3,144.106 4,652.292 3,874.414 4,231.705 1.3 Existing infrastructure
rehabilitated/repaired 880.000 339.445 282.689 308.758
Development/Capital 880.000 339.445 282.689 308.758 1.4 Water quality testing labs and equipment
across the Province operationalized - - - -
1.5 Awareness campaigns for rural population on
- health hygiene practices - conservation and protection of potable water
for preservation of water - NBCC strategy conducted
3.000 5.000 4.164 4.548
Development/Capital 3.000 5.000 4.164 4.548 2. Improved governance 282.886 4,434.783 4,696.451 4,992.864 2.1 Enhanced revenue collection and
efficient/effective administrative services 282.886 4,434.783 4,696.451 4,992.864
Salary 194.797 2,882.540 2,929.253 2,977.385 Non-Salary 73.089 1,541.243 1,758.038 2,005.474 Development/Capital 15.000 11.000 9.161 10.006 Grand Total 4,417.895 9,583.887 8,984.608 9,676.467 BE: Budget Estimated FBE: Future Budget Estimated NBCC: National Board for Certified Counselors
Source:Medium Term Budget Estimates for Service Delivery 2017-18 to 2019-20_Finance Department of Government Khyber Pakhtunkhwa
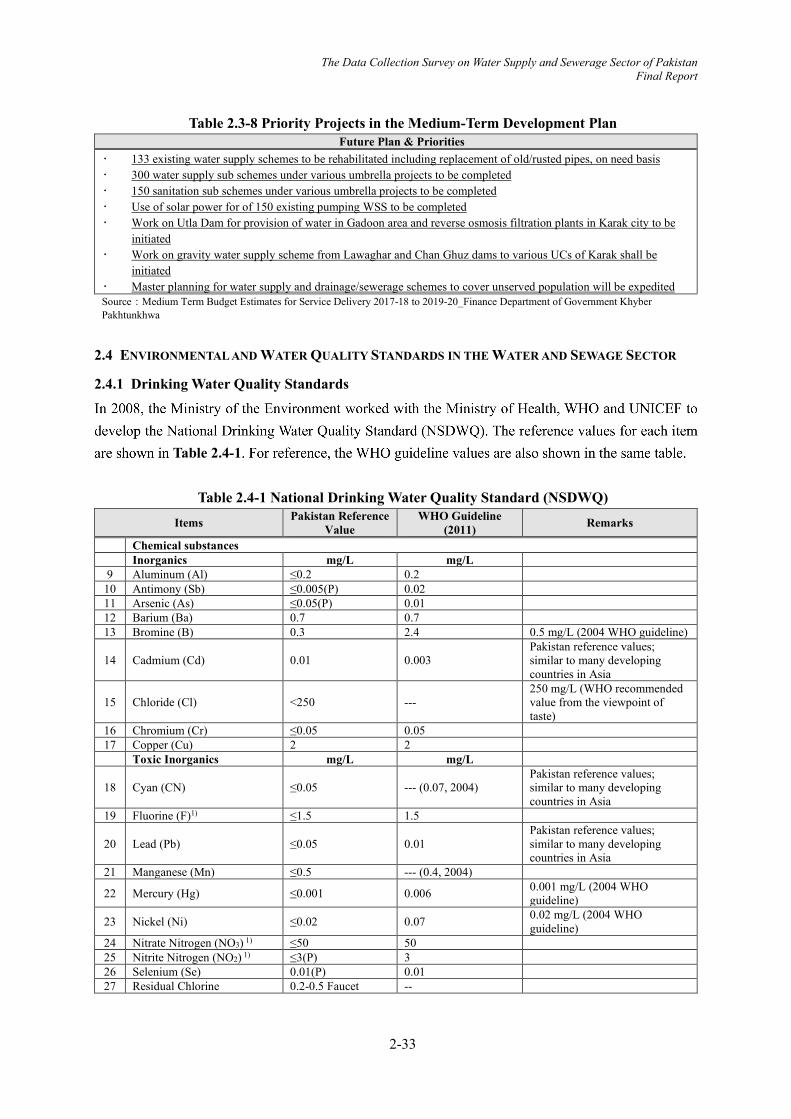
The Data Collection Survey on Water Supply and Sewerage Sector of Pakistan Final Report
2-33
Table 2.3-8 Priority Projects in the Medium-Term Development Plan Future Plan & Priorities
133 existing water supply schemes to be rehabilitated including replacement of old/rusted pipes, on need basis 300 water supply sub schemes under various umbrella projects to be completed 150 sanitation sub schemes under various umbrella projects to be completed Use of solar power for of 150 existing pumping WSS to be completed Work on Utla Dam for provision of water in Gadoon area and reverse osmosis filtration plants in Karak city to be
initiated Work on gravity water supply scheme from Lawaghar and Chan Ghuz dams to various UCs of Karak shall be
initiated Master planning for water supply and drainage/sewerage schemes to cover unserved population will be expedited Source:Medium Term Budget Estimates for Service Delivery 2017-18 to 2019-20_Finance Department of Government Khyber Pakhtunkhwa
2.4 ENVIRONMENTAL AND WATER QUALITY STANDARDS IN THE WATER AND SEWAGE SECTOR
2.4.1 Drinking Water Quality Standards
Table 2.4-1
Table 2.4-1 National Drinking Water Quality Standard (NSDWQ)
Items Pakistan Reference Value
WHO Guideline (2011) Remarks
Chemical substances Inorganics mg/L mg/L
9 Aluminum (Al) ≤0.2 0.2 10 Antimony (Sb) ≤0.005(P) 0.02 11 Arsenic (As) ≤0.05(P) 0.01 12 Barium (Ba) 0.7 0.7 13 Bromine (B) 0.3 2.4 0.5 mg/L (2004 WHO guideline)
14 Cadmium (Cd) 0.01 0.003 Pakistan reference values; similar to many developing countries in Asia
15 Chloride (Cl) <250 --- 250 mg/L (WHO recommended value from the viewpoint of taste)
16 Chromium (Cr) ≤0.05 0.05 17 Copper (Cu) 2 2
Toxic Inorganics mg/L mg/L
18 Cyan (CN) ≤0.05 --- (0.07, 2004) Pakistan reference values; similar to many developing countries in Asia
19 Fluorine (F)1) ≤1.5 1.5
20 Lead (Pb) ≤0.05 0.01 Pakistan reference values; similar to many developing countries in Asia
21 Manganese (Mn) ≤0.5 --- (0.4, 2004)
22 Mercury (Hg) ≤0.001 0.006 0.001 mg/L (2004 WHO guideline)
23 Nickel (Ni) ≤0.02 0.07 0.02 mg/L (2004 WHO guideline)
24 Nitrate Nitrogen (NO3) 1) ≤50 50 25 Nitrite Nitrogen (NO2) 1) ≤3(P) 3 26 Selenium (Se) 0.01(P) 0.01 27 Residual Chlorine 0.2-0.5 Faucet --

The Data Collection Survey on Water Supply and Sewerage Sector of Pakistan Final Report
2-34
Items Pakistan Reference Value
WHO Guideline (2011) Remarks
0.5-1.5 Water Purification Plant
28 Zinc (Zn) 5.0 ---(Levels above 3 mg / L are unacceptable to users)
Pakistan reference values; similar to many developing countries in Asia
Organic
29 Pesticides mg/L
PSQCA No. 4639-2004, Page No. 4 Table No. 3 Serial No. 20- 58
Pakistan standard specifications for bottled water
30 Phenol Compounds (as phenol) mg/L ≤0.002
31 Polynuclear Aromatic Hydrocarbons (as PAH) g/L 0.01 (by GC/MS
method)
Radioactive Substance 32 Alpha Rays Bq/L 0.1 0.5 33 Beta Rays Bq/L 1 1
2.4.2 Discharge Water Quality Standards
The Ministry of the Environment established the National Environmental Quality Standards (NEQS) for urban and liquid industrial wastewater in 1993 and revised the same in 2000. Table 2.4-2 shows the revised Environmental Quality Standards (NEQS).
Table 2.4-2 National Environmental Quality Standards for Urban and Liquid Industrial Wastewater (NEQS)1,2 (2000)
No. Parameter Reference Value
Discharge to Rivers and Lakes
Inflow to Wastewater Treatment Plant3
Discharge to Ocean4
1 Increased Temperature 5 =<3˚C =<3˚C =<3˚C 2 pH 6-9 6-9 6-9 3 Biochemical Oxygen Demand (BOD) 6, mg/L 80 250 807 4 Chemical Oxygen Demand (COD) , mg/L 150 400 400 5 Total Suspended Solids (TSS), mg/L 200 400 200 6 Total Dissolved Solids (TDS), mg/L 3,500 3,500 3,500 7 Oil, mg/L 10 10 10 8 Phenol Compounds (as phenol) , mg/L 0.1 0.3 0.3 9 Chloride (as Cl-), mg/L 1,000 1,000 SC8
10 Fluorine (as F-), mg/L 10 10 10 11 Total Cyanide (as CN-), mg/L 1.0 1.0 1.0 12 Anionic Surfactant (as MBAS)9, mg/L 20 20 20 13 Sulfate (SO4) , mg/L 600 1,000 SC8 14 Sulfide (S-), mg/L 1.0 1.0 1.0 15 Ammonia (NH3), mg/L 40 40 40 16 Pesticides 10, mg/L 0.15 0.15 0.15 17 Cadmium (Cd) 11, mg/L 0.1 0.1 0.1
18 Chromium (Trivalent and Hexavalent Chromium), mg/L
1.0 1.0 1.0
19 Copper (Cu) 4, mg/L 1.0 1.0 1.0 20 Lead (Pb) 4, mg/L 0.5 0.5 0.5 21 Mercury (Hg) 4, mg/L 0.01 0.01 0.01 22 selenium (Se) 4, mg/L 0.5 0.5 0.5 23 Nickel (Ni) 4, mg/L 1.0 1.0 1.0 24 Silver (Ag) 4, mg/L 1.0 1.0 1.0 25 All Toxic Metals, mg/L 2.0 2.0 2.0 26 zinc (Zn) , mg/L 5.0 5.0 5.0

The Data Collection Survey on Water Supply and Sewerage Sector of Pakistan Final Report
2-35
No. Parameter Reference Value
Discharge to Rivers and Lakes
Inflow to Wastewater Treatment Plant3
Discharge to Ocean4
27 Arsenic (As) 4, mg/L 1.0 1.0 1.0 28 Barium (Ba) 4, mg/L 1.5 1.5 1.5 29 Iron (Fe) , mg/L 8.0 8.0 8.0 30 Manganese (Mn) , mg/L 1.5 1.5 1.5 31 Boron (B) 4, mg/L 6.0 6.0 6.0 32 Chlorine, mg/L 1.0 1.0 1.0
1. Diluting wastewater with fresh water to adjust to NEQS standards before discharge into the environment is not permitted 2. The concentration of pollutants in the water used is deducted from the concentration of wastewater in the calculation of NEQS compliance. 3. Applies only if sewage treatment is performed and BOD = 80 mg / L is achieved by the sewage treatment system 4. The condition is that the discharge point is not on the coast and not within 10 miles of the mangrove and other important estuaries. 5. Drainage must not cause a temperature rise of more than 3 ° C at the edge of the zone where the first mixing and dilution takes place in the receiving body. If no zone is defined, use 100m from the discharge point. 6. The minimum dilution ratio for wastewater is assumed to be 1:10, but lower ratios result in stricter criteria being determined by the Federal Environmental Protection Agency. 1:10 dilution means, for example, that at least 10 cubic meters of water must be present in a body of water that receives 1 cubic meter of treated wastewater to dilute the wastewater. 7. The value for industry is 200 mg / L. 8. Emission concentration below seabed concentration (SC). 9. Methylene blue active substance: Assuming that the surfactant is a biodegradable substance. 10. Pesticides include herbicides, fungicides and pesticides. 11. However, the total emission of toxic metals shall not exceed the level stated in No. 25. 12. Source: National environmental standards.


The Data Collection Survey on Water Supply and Sewerage Sector of Pakistan Final Report
3-1
CURRENT STATUS OF SEWERAGE AND DRAINAGE IN MULTAN, PUNJAB PROVINCE
3.1 MULTAN'S SOCIO-ECONOMIC STATUS, GEOGRAPHICAL CHARACTERISTICS, VITAL
STATISTICS, INDUSTRY
3.1.1 Geographic Features
Multan is the central city of the southern Punjab Province, extending east of the Chenab River and located roughly in the center of Pakistan. The administrative area of the Multan Development Authority (MDA), which corresponds to the city area, is 584 km2, and the altitude is around 129 m (423 ft).
Source: Topographic-map.com, Dashed line is MDA area
Figure 3.1-1 Topographic Map of Multan
Multan was designated as a City District in 2005, and the District has been reorganized into six Towns. Some of these towns are MDA administrative areas. Figure 3.1-2 shows the Town composition of the Multan District and the administrative districts of the MDA. According to WASA Multan officials, the characteristic of Multan is a flat cup-shaped terrain where natural drainage is difficult, as neither sewage nor rainwater can be drained without a pump. The topographic map shows that there is a small hill in the center of the city area, whereas the surrounding area is flat, and there are places where natural drainage is difficult due to complex depressions and undulations. Since the flat terrain around the city is suitable for agriculture, citrus and mango plantations are spread out.
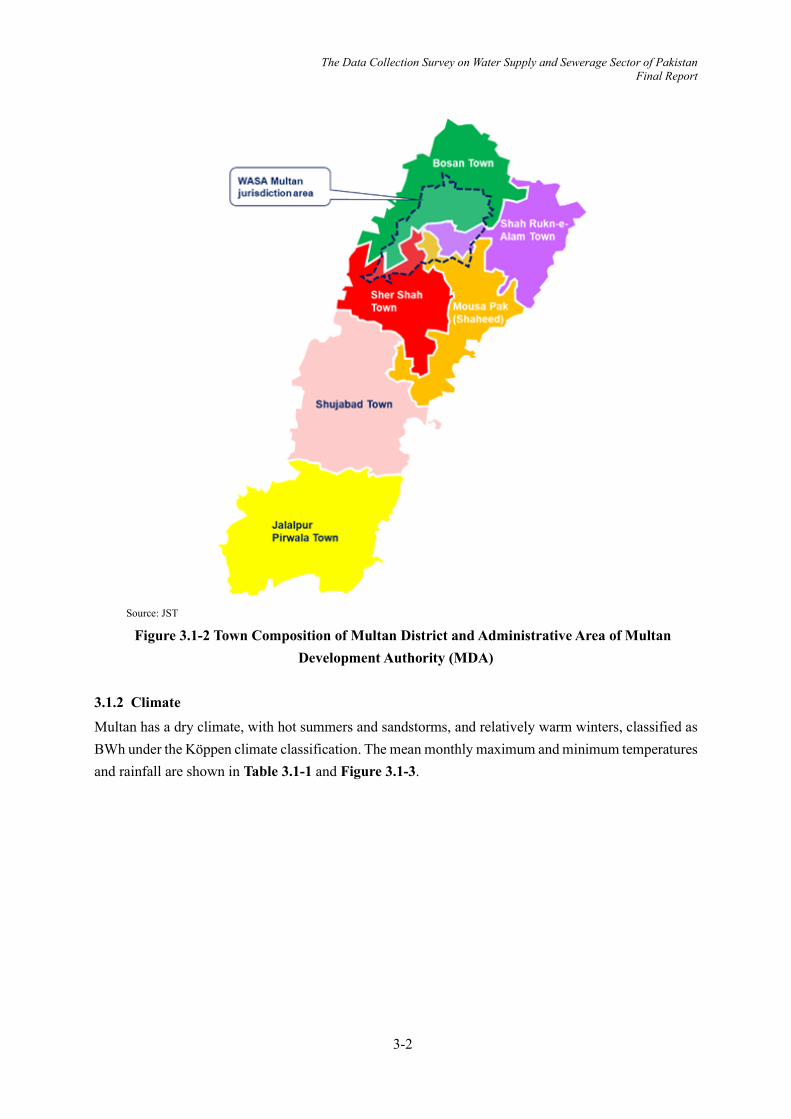
The Data Collection Survey on Water Supply and Sewerage Sector of Pakistan Final Report
3-2
Source: JST
Figure 3.1-2 Town Composition of Multan District and Administrative Area of Multan Development Authority (MDA)
3.1.2 Climate
Multan has a dry climate, with hot summers and sandstorms, and relatively warm winters, classified as BWh under the Köppen climate classification. The mean monthly maximum and minimum temperatures and rainfall are shown in Table 3.1-1 and Figure 3.1-3.

The Data Collection Survey on Water Supply and Sewerage Sector of Pakistan Final Report
3-3
Table 3.1-1 Monthly Fluctuations in Temperature and Precipitation in Multan
Month Mean Daily Minimum Temperature (°C)
Mean Daily Maximum Temperature (°C)
Mean Total Rainfall (mm)
Jan 5.4 20.5 7.8 Feb 8.4 23.5 15.5 Mar 14.1 28.8 18.5 Apr 19.9 35.9 14.3 May 25.3 41.0 12.2 Jun 28.7 42.1 13.4 Jul 28.9 39.1 49.6
Aug 28.0 37.5 41.8 Sep 25.1 36.7 24.8 Oct 18.6 34.1 5.8 Nov 11.8 28.6 1.4 Dec 6.7 22.9 5.9
Source: World Weather Information Service (Multan) (worldweather.wmo.int/em/home)
Source:World Weather Information Service(Multan) (worldweather.wmo.int/em/home)
Figure 3.1-3 Monthly Fluctuations in Temperature and Precipitation in Multan
The annual rainfall of Multan is about 200 mm.
3.1.3 Socio-economic and Industrial Situations
Multan, which is one of the oldest cities in South Asia along with Mohenjo-daro and Harappa, is now developing as a central city in southern Punjab Province with a well-developed transportation network. Agriculture is a major industry in the region and is famous for producing fruit trees such as mango and citrus fruits, as well as producing wheat, cotton and sugar cane. Multan is also famous for producing pottery, carpets, leather and stone crafts. In addition, the textile industry, which is the main manufacturing industry in Pakistan, and fertilizer production using natural gas produced in the neighborhood are also carried out.
3.1.4 Demographic
According to the 2017 census, the population of Multan was 2,258,570, an increase of 1.66 times from that of the previous survey conducted in 1998, which was 1,381,478. The population growth is higher

The Data Collection Survey on Water Supply and Sewerage Sector of Pakistan Final Report
3-4
than that of Pakistan (1.57 times growth since the last survey) and Punjab Province (1.49 times growth since the last survey). The population of Multan City is 1,826,546 in urban areas and 432,024 in rural areas.
3.2 ORGANIZATIONAL STRUCTURE OF WASA MULTAN
In the five cities designated as the City District of Punjab Province, the Development Authorities, which are the Provincial government agencies, were established. WASA, which handles water and sewage services, is positioned within it. WASA Multan was established in 1992 as an organization responsible for the water and sewage division of the MDA. The head of the organization is the Managing Director (MD). Under him, there are Deputy Managing Directors (DMDs) for the administrative department and the technical department .The administrative department consists of three departments-Administration, Finance, and Recovery- and the technical department consists of two departments-Engineering and Works. The organization chart is shown in Figure 3.2-1.
The Director Works, who is in charge of maintenance of the technical department, specializes in the maintenance of sewerage, and the Deputy Director (DD) under the Director Engineering is in charge of the water supply department. It is inferred that such a system is established since the predecessor of WASA Multan was a sewerage utility. However, it is desirable that the water supply business should be operated, and the maintenance of facilities should be systematically carried out under an independent Director.
It should be noted that this organizational chart does not show the linkages of organizational names such as bureaus / departments / sections but shows the duties of executive staff such as MD / DMD / Director and their connections.
Source:WASA Multan, Edited by JST
Figure 3.2-1 WASA Multan Organizational Chart

The Data Collection Survey on Water Supply and Sewerage Sector of Pakistan Final Report
3-5
Under the Director Works, the central, northern, and southern sewer pipe management offices are headed by a Deputy Director (DD) each, who are in charge of managing the sewer pipes. Regarding the management of pumping stations and Sullage Carriers, one DD is in charge of 15 Disposal Stations, 10 Lift Stations and Sullage Carrier under the Director Works. Regarding the tariff collection、two DDs under the Director Recovery share the district and are responsible for the collection, and under him , the Assistant Director (AD) and other tariff collection professions are assigned.
Table 3.2-1 shows the capacity and vacancy status of WASA Multan's staff, which is derived by classifying positions into three categories according to their salary grade (BPS). As on December 7, 2019, there are 549 posts that are vacant, accounting for about 28% of the total. In addition, the vacancy rate is higher in middle and upper positions than in lower positions.
Table 3.2-1 Capacity and Vacancy of WASA Multan(As of Dec.7. 2019)
BPS Capacity Vacancy
1-10 1,599 386 11-16 315 133 More than 17 72 30
Total 1,986 549 Source:WASA Multan、Edited by JST
3.3 WASA MULTAN'S FEE STRUCTURE AND FINANCIAL STATUS
3.3.1 WASA Multan Fee Structure
(1) Water and sewage rate system The tariff structure for water and sewerage under WASA Multan is shown in Table 3.3-1 and the contrast between the current and pending revised tariffs are shown in "(2) Current and proposed revised tariffs". For water and sewage charges, a flat-rate system based on size of premises is adopted for calculating domestic/residential charges. For commercial and industrial uses, a flat rate system is adopted based on the diameter of the water pipes (water supply) and the type of business, taking into account the amount of usage. A registration system (registration and renewal fees), similar to that of Japan's designated contractor registration system, has been established for the water and sewage drainage system operators. In addition, there exemptions are set out for the MDA/WASA employees, pensioners and widows, and the disabled. The draft tariff revision adopts a provision to introduce a metered system for water charges. In addition, for private housing and urban development projects, the Recovery Regulations (WASA Multan)-2016 (No. 670/MD/WASA) specifies that WASA Multan shall levy the following supervision fee on developers for installation of water and sewerage facilities: Connection fee for Water Supply, Sewerage and for supervision of development works at the rate
of PKR 40,000 per acre. No Objection Certificate (NOC) to allow development works by depositing the connection fee.
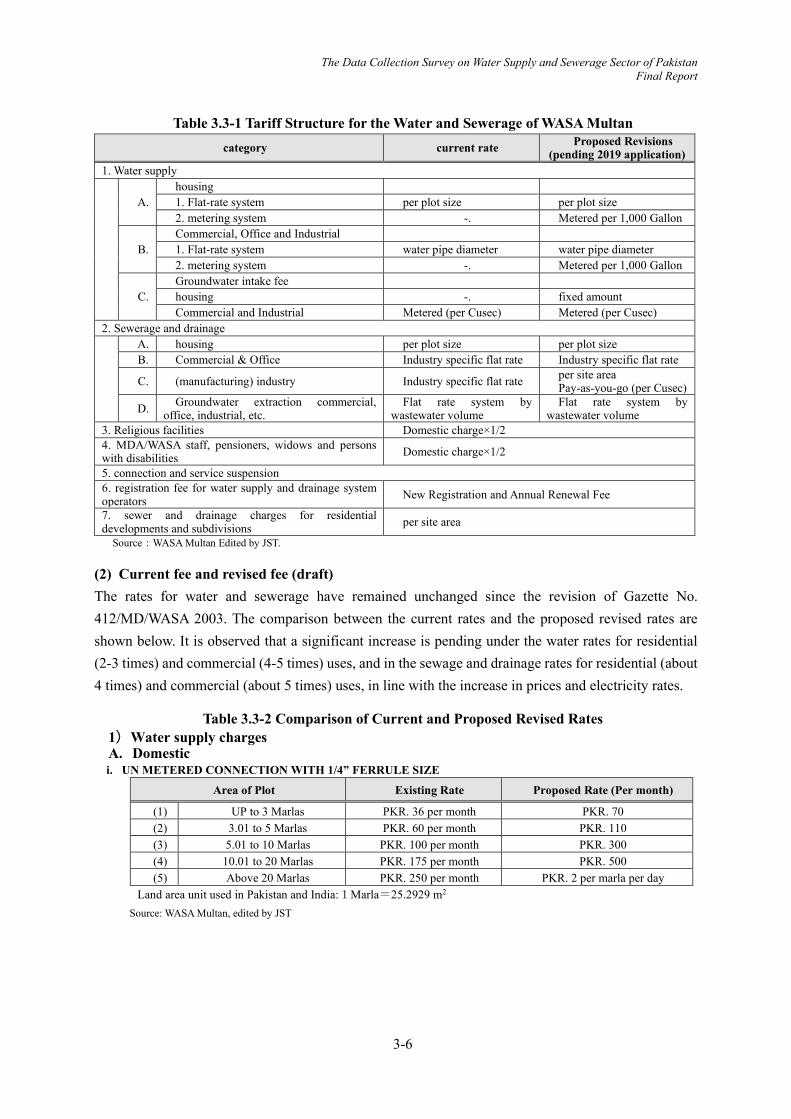
The Data Collection Survey on Water Supply and Sewerage Sector of Pakistan Final Report
3-6
Table 3.3-1 Tariff Structure for the Water and Sewerage of WASA Multan category current rate Proposed Revisions
(pending 2019 application) 1. Water supply
A. housing 1. Flat-rate system per plot size per plot size 2. metering system -. Metered per 1,000 Gallon
B. Commercial, Office and Industrial 1. Flat-rate system water pipe diameter water pipe diameter 2. metering system -. Metered per 1,000 Gallon
C. Groundwater intake fee housing -. fixed amount Commercial and Industrial Metered (per Cusec) Metered (per Cusec)
2. Sewerage and drainage
A. housing per plot size per plot size B. Commercial & Office Industry specific flat rate Industry specific flat rate
C. (manufacturing) industry Industry specific flat rate per site area Pay-as-you-go (per Cusec)
D. Groundwater extraction commercial, office, industrial, etc.
Flat rate system by wastewater volume
Flat rate system by wastewater volume
3. Religious facilities Domestic charge×1/2 4. MDA/WASA staff, pensioners, widows and persons with disabilities Domestic charge×1/2
5. connection and service suspension 6. registration fee for water supply and drainage system operators New Registration and Annual Renewal Fee
7. sewer and drainage charges for residential developments and subdivisions per site area
Source:WASA Multan Edited by JST.
(2) Current fee and revised fee (draft) The rates for water and sewerage have remained unchanged since the revision of Gazette No. 412/MD/WASA 2003. The comparison between the current rates and the proposed revised rates are shown below. It is observed that a significant increase is pending under the water rates for residential (2-3 times) and commercial (4-5 times) uses, and in the sewage and drainage rates for residential (about 4 times) and commercial (about 5 times) uses, in line with the increase in prices and electricity rates.
Table 3.3-2 Comparison of Current and Proposed Revised Rates 1)Water supply charges A. Domestic i. UN METERED CONNECTION WITH 1/4” FERRULE SIZE
Area of Plot Existing Rate Proposed Rate (Per month)
(1) UP to 3 Marlas PKR. 36 per month PKR. 70 (2) 3.01 to 5 Marlas PKR. 60 per month PKR. 110 (3) 5.01 to 10 Marlas PKR. 100 per month PKR. 300 (4) 10.01 to 20 Marlas PKR. 175 per month PKR. 500 (5) Above 20 Marlas PKR. 250 per month PKR. 2 per marla per day
Land area unit used in Pakistan and India:1Marla=25.2929 m2 Source: WASA Multan, edited by JST
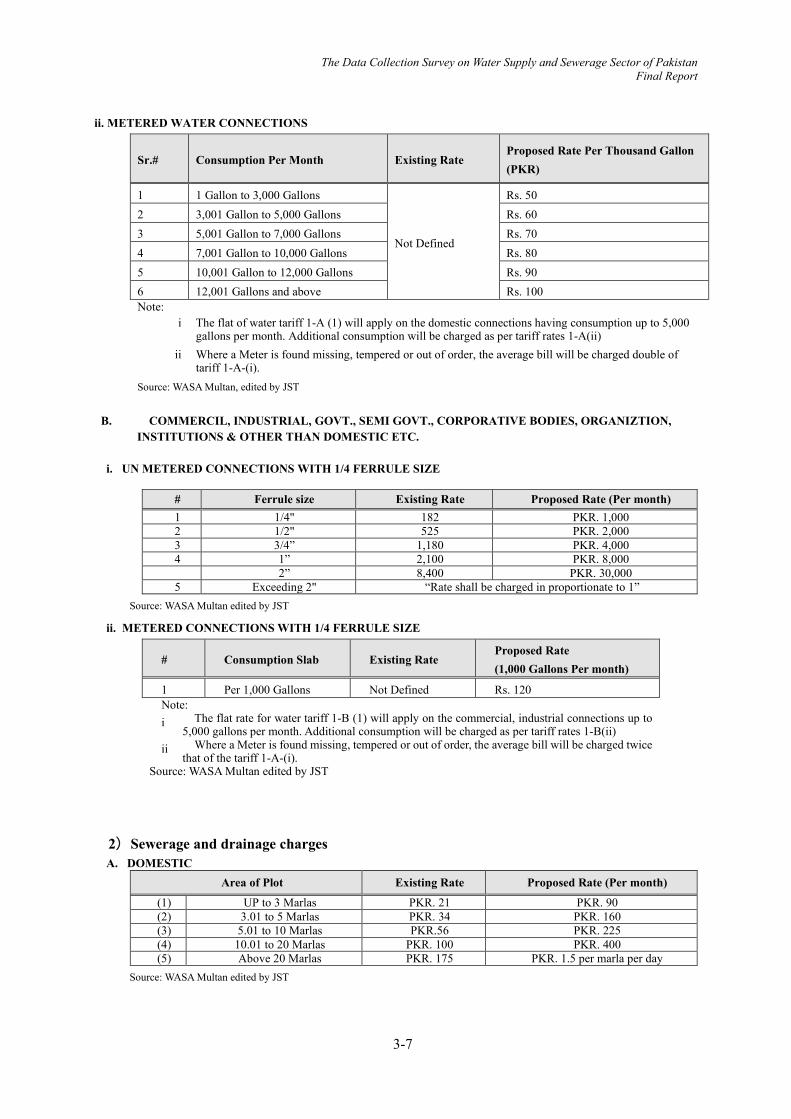
The Data Collection Survey on Water Supply and Sewerage Sector of Pakistan Final Report
3-7
ii. METERED WATER CONNECTIONS
Sr.# Consumption Per Month Existing Rate Proposed Rate Per Thousand Gallon (PKR)
1 1 Gallon to 3,000 Gallons
Not Defined
Rs. 50 2 3,001 Gallon to 5,000 Gallons Rs. 60 3 5,001 Gallon to 7,000 Gallons Rs. 70 4 7,001 Gallon to 10,000 Gallons Rs. 80 5 10,001 Gallon to 12,000 Gallons Rs. 90 6 12,001 Gallons and above Rs. 100 Note:
i The flat of water tariff 1-A (1) will apply on the domestic connections having consumption up to 5,000 gallons per month. Additional consumption will be charged as per tariff rates 1-A(ii)
ii Where a Meter is found missing, tempered or out of order, the average bill will be charged double of tariff 1-A-(i).
Source: WASA Multan, edited by JST
B. COMMERCIL, INDUSTRIAL, GOVT., SEMI GOVT., CORPORATIVE BODIES, ORGANIZTION, INSTITUTIONS & OTHER THAN DOMESTIC ETC.
i. UN METERED CONNECTIONS WITH 1/4 FERRULE SIZE
# Ferrule size Existing Rate Proposed Rate (Per month) 1 1/4" 182 PKR. 1,000 2 1/2" 525 PKR. 2,000 3 3/4” 1,180 PKR. 4,000 4 1” 2,100 PKR. 8,000 2” 8,400 PKR. 30,000
5 Exceeding 2" “Rate shall be charged in proportionate to 1” Source: WASA Multan edited by JST
ii. METERED CONNECTIONS WITH 1/4 FERRULE SIZE
# Consumption Slab Existing Rate Proposed Rate (1,000 Gallons Per month)
1 Per 1,000 Gallons Not Defined Rs. 120 Note: i The flat rate for water tariff 1-B (1) will apply on the commercial, industrial connections up to
5,000 gallons per month. Additional consumption will be charged as per tariff rates 1-B(ii) ii Where a Meter is found missing, tempered or out of order, the average bill will be charged twice
that of the tariff 1-A-(i). Source: WASA Multan edited by JST
2)Sewerage and drainage charges A. DOMESTIC
Area of Plot Existing Rate Proposed Rate (Per month)
(1) UP to 3 Marlas PKR. 21 PKR. 90 (2) 3.01 to 5 Marlas PKR. 34 PKR. 160 (3) 5.01 to 10 Marlas PKR.56 PKR. 225 (4) 10.01 to 20 Marlas PKR. 100 PKR. 400 (5) Above 20 Marlas PKR. 175 PKR. 1.5 per marla per day
Source: WASA Multan edited by JST

The Data Collection Survey on Water Supply and Sewerage Sector of Pakistan Final Report
3-8
B. COMMERCIL, GOVT., SEMI GOVT., CORPORATIVE BODIES, ORGANIZTION, INSTITUTIONS
ETC OTHER THAN DOMESTIC ETC.
# Category Existing Rate Proposed Rate (Per month) 1 I PKR. 175 PKR. 1,000 2 II PKR. 280 PKR. 1,500 3 III PKR. 420 PKR. 2,500 4 IV PKR. 700 PKR. 5,000
Source: WASA Multan edited by JST
(3) Change in Fee Revenue The trend in fee collection is shown below, with a low collection rate of 44.5% to 48.0%, which is slowly but surely improving.
The fee collection rate is low at 40%. Past unpaid fees have been collected in excess of the amount of fees collected for the relevant year.
The total of the amount collected for the current year and past unpaid bills is almost equal to and accounts for about 100% of the amount assessed for the current year. It can be inferred that the burden of past unpaid bills is large.
Table 3.3-3 Trends in Fee Collection (PKR)
Fiscal Year
Current Billing
Current Recovery
Arrear Recovery
Total Recovery
Collection rate (%)
Arrear-Current
Recovery Rate (%)
Recovery Rate
(%)
(1) (2) (3) (4) = (2) +(3) (5) = (2)/ (1)
(6) = (3)/ (2)
(7) = (4)/ (1)
2016-17 287,937,417 132,343,170 149,756,446 282,099,616 46.0 113.2 98.0 2017-18 353,468,948 157,389,989 167,224,035 325,651,298 44.5 106.2 92.1 2018-19 419,799,277 201,693,902 216,235,740 422,491,474 48.0 107.2 100.6 2019-20 251,746,110 115,552,138 89,761,282 217,840,233 45.9 77.7 86.5
Source:WASA Multan

The Data Collection Survey on Water Supply and Sewerage Sector of Pakistan Final Report
3-9
Source: WASA Multan, edited by JST
Figure 3.3-1 Change of Recovery(2016~2019(Half a year))
With regard to the amount of fees collected, the following improvements have been made since the establishment of WASA in 1992:
The amount of fees collected has been growing at a constant rate since the establishment of
WASA Multan in 1992. With two rate changes, rates have shown rapid growth. As of 2019, an application for revised rates is pending with the Punjab government. In the past,
fee increases had been postponed due to considerations for the poor. The issues to be addressed are the tariff regime (levy system of financial resources) that takes poor populace under account and the tariff system for price rise.

The Data Collection Survey on Water Supply and Sewerage Sector of Pakistan Final Report
3-10
Source: WASA Multan, edited by JST
Figure 3.3-2 Improvement Trends in Water Supply and Drainage Tariff Collection Amount

The Data Collection Survey on Water Supply and Sewerage Sector of Pakistan Final Report
3-11
3.3.2 WASA Multan's financial situation
Water and sewerage fee revenue is a major source of income along with subsidies and the Urban Immovable Property Tax (UIP Tax), and the collection rate has been improving every year. However, the ratio of labor cost and electricity charge is prominent in the O&M cost, and the income from water and sewage charges is about 60-70% of the labor cost, which is not enough to cover the O&M cost. For this reason, it relies on other tax sources such as subsidies from the state government and UIP tax. In addition, the WB's Punjab Cities Governance Improvement Project (PCGIP), a project to support maintenance and management capacity improvement, is a promising source of funding, but its sustainability after the completion of the project is a concern due to the limited duration of the project.
Table 3.3-4 Maintenance Budget: Income Million PKR
Actual 2017-18 Actual 2018-19 Estimates 2019-20
TARIFF RECEIPTS 328.220 429.447 530.000 Subsidy from Government 369.996 368.700 369.930 UIP Tax Share 152.545 232.983 260.000
Monsoon Grant 0.000 30.000 30.000
PCGIP 137.679 0.000 0.000
OTHER RECEIPTS 78.871 50.182 59.565 Total 1,067.311 1,111.312 1,249.495 Tariff Receipts / Total (%) 30.8 38.6 42.4 Source:WASA Multan , edited by JST
Table 3.3-5 Operation and Maintenance Budget: Expenditure
Million PKR
Actual 2017-18 Actual 2018-19 Estimates 2019-20
PAY AND PENSION 544.322 607.912 864.600
Electricity Charges 266.105 262.897 500.000
WATER SUPPLY DIVISION 64.613 24.462 57.691
DISPOSAL STATION DIVISION 161.092 108.501 145.100
OTHER OPERATING EXPEND. 49.358 47.796 119.043
Closing Balance 39.751 97.749 -339.190
Total 1,125.241 1,149.317 1,347.244
Percentage of labor costs (%) 48.4 52.9 64.2
Percentage of Electricity Charges (%) 23.6 22.9 37.1
Source: WASA Multan , edited by JST
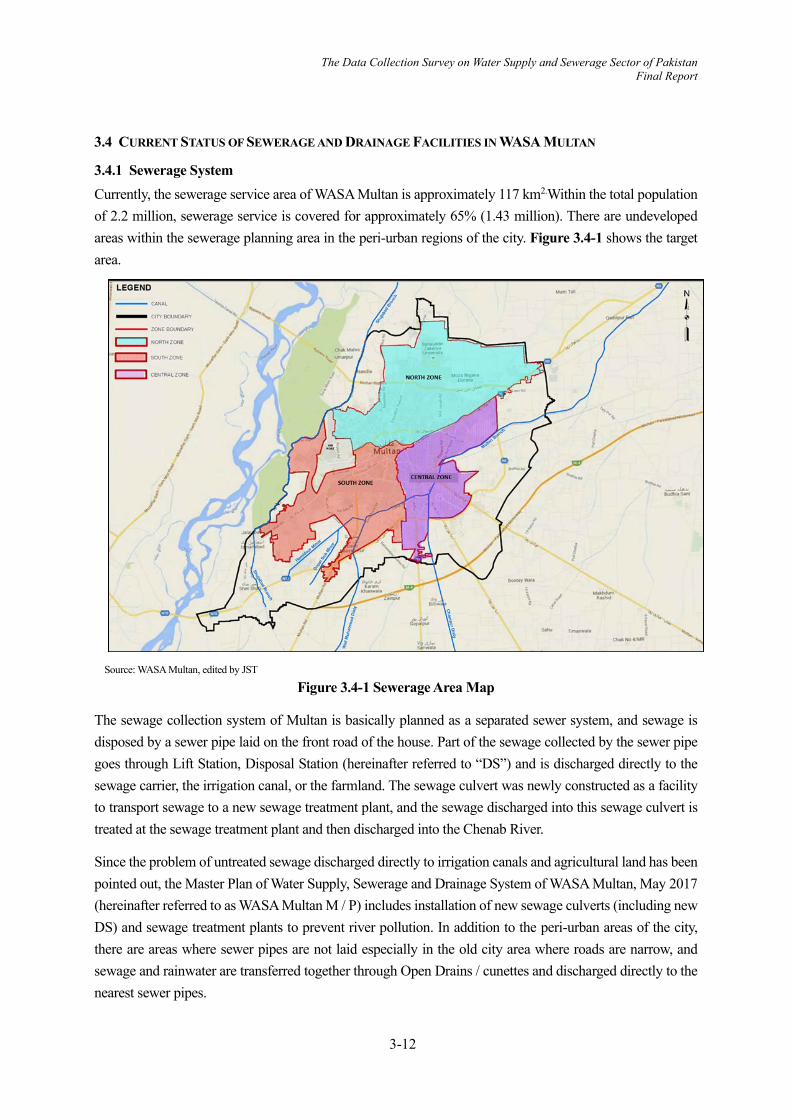
The Data Collection Survey on Water Supply and Sewerage Sector of Pakistan Final Report
3-12
3.4 CURRENT STATUS OF SEWERAGE AND DRAINAGE FACILITIES IN WASA MULTAN
3.4.1 Sewerage System Currently, the sewerage service area of WASA Multan is approximately 117 km2.Within the total population of 2.2 million, sewerage service is covered for approximately 65% (1.43 million). There are undeveloped areas within the sewerage planning area in the peri-urban regions of the city. Figure 3.4-1 shows the target area.
Source: WASA Multan, edited by JST
Figure 3.4-1 Sewerage Area Map
The sewage collection system of Multan is basically planned as a separated sewer system, and sewage is disposed by a sewer pipe laid on the front road of the house. Part of the sewage collected by the sewer pipe goes through Lift Station, Disposal Station (hereinafter referred to “DS”) and is discharged directly to the sewage carrier, the irrigation canal, or the farmland. The sewage culvert was newly constructed as a facility to transport sewage to a new sewage treatment plant, and the sewage discharged into this sewage culvert is treated at the sewage treatment plant and then discharged into the Chenab River.
Since the problem of untreated sewage discharged directly to irrigation canals and agricultural land has been pointed out, the Master Plan of Water Supply, Sewerage and Drainage System of WASA Multan, May 2017 (hereinafter referred to as WASA Multan M / P) includes installation of new sewage culverts (including new DS) and sewage treatment plants to prevent river pollution. In addition to the peri-urban areas of the city, there are areas where sewer pipes are not laid especially in the old city area where roads are narrow, and sewage and rainwater are transferred together through Open Drains / cunettes and discharged directly to the nearest sewer pipes.

The Data Collection Survey on Water Supply and Sewerage Sector of Pakistan Final Report
3-13
Regarding the disposal of rainwater, roadside drains were constructed along some relatively large roads and rainwater is removed separately from sewage, but the discharge (connection) destination is a sewer pipe or an irrigation canal. Meanwhile, where the roads that do not have roadside drains, which account for the majority, rainwater from the house and on the road is discharged directly into the sewer pipe. In the latter case, since rainwater is connected to the sewer pipe, which is planned as a separate sewer system, overflow easily occurs due to its insufficient capacity. However, the amount of rainfall in Multan is less than that in Lahore and Faisalabad in the same Punjab province, so the scale of flood damage is not as serious in comparison to the two cities.
As described above, in Multan sewerage and drainage system, as well as sewer pipes, drain and treatment plant, have issues, as sewage, rainwater, and irrigation water are partially mixed and construction of the treatment facility has just started.
3.4.2 Sewer System (1) Sullage Carrier At WASA Multan, there are two systems namely the Northern Sullage Carrier (NSC) and the Surai Miani Sullage Carrier (SMSC), which were constructed and completed with the support of ADB in 2017 as Sullage Carriers to convey sewage to sewage treatment plants. The sewage is pumped by three sewage pumping plants at Inner Bypass DS, Khan Village DS and Chungi No. 9 DS and flows into the Sewage Treatment Plant (hereinafter “STP”) which is an oxidation pond sewage treatment plant constructed with the support of ADB. The treated sewage is discharged into the Chenab River, about 2 km west, through an open-drained channel.
The NSC is a mortar-finished brick open-channel structure with RC lids on most sections. Management inspection ports are installed every 50 feet (about 15 m). On the other hand, SMSC has the same structure as NSC, but it has no lid and is an open channel.
NSC SMSC

The Data Collection Survey on Water Supply and Sewerage Sector of Pakistan Final Report
3-14
Cleaning work for NSC's inverted siphon Confluence of NSC and SMSC
Source: JST
Figure 3.4-2 Sullage Carrier to STP The NSC runs down the northwestern part of the city along the Multan Bypass Road, crossing the Shujabad canal and there are canal roads on both sides of it. For this reason, floating garbage and waste are likely to accumulate in this area. Cleaning work is carried out twice a year before the rainy season (usually around June to September) and during the rainy season (the photo in Figure 3.4-2 is the demonstration for JST).
Both NSC and SMSC are Sullage Carriers through which sewage flows and the amount of floating garbage and waste are overwhelmingly smaller than that of Lahore, which will be described later. This is mainly because both sullage carriers are open in the suburbs, garbage and waste are removed by the DS before it is released into the sewage drainage canal, and there is little dust that originally flows into the DS (there are no large open-channel sullage carrier in the city area except for the gutter that also serves as rainwater).
(2) Sewer Pipes Table 3.4-1 shows the lengths of sewer pipes by trunk line (Trunk Sewer), sub main line (Sub main) and branch line (Lateral Sewers). The minimum pipe diameter is 9 inches (about 23 cm) and the maximum diameter is 72 inches (about 1.8 m).
Table 3.4-1 Types and Length of Sewer Types Material Length(m)
Trunk Sewer (Diameter:24” – 72”) Reinforced Concrete Pipe 226,880 Sub main and Lateral Sewers(Diameter:9” – 21”) Reinforced Concrete Pipe 1,556,201
Total 1,783,081 Note: The data of WASA Multan M / P created in 2016, thus there is a slight difference from the current status
Source: WASA Multan M/P
Trunk Sewer is buried 15 to 30 feet (4.5 to 9.0 m) underground. The minimum earth cover is 3-4 feet (0.9-1.2 m). The recognized problem is that the groundwater pollution is caused by leakage of sewage due to blockage of sewer pipes. In addition, the capacity of Trunk Sewer and Sub main sewer pipes are insufficient due to an increase in the amount of sewage.
Lateral Sewers are 9 to 21 inches (23 to 53 cm) in diameter. The minimum pipe diameter of 9 inches (about
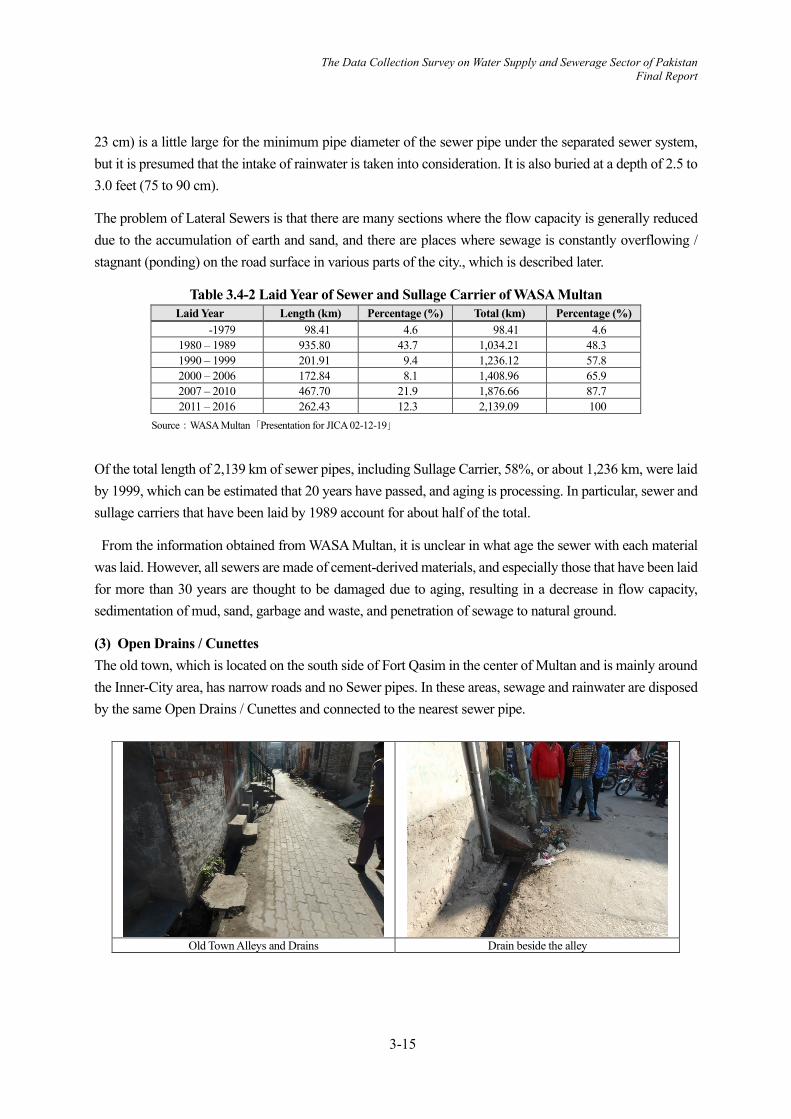
The Data Collection Survey on Water Supply and Sewerage Sector of Pakistan Final Report
3-15
23 cm) is a little large for the minimum pipe diameter of the sewer pipe under the separated sewer system, but it is presumed that the intake of rainwater is taken into consideration. It is also buried at a depth of 2.5 to 3.0 feet (75 to 90 cm).
The problem of Lateral Sewers is that there are many sections where the flow capacity is generally reduced due to the accumulation of earth and sand, and there are places where sewage is constantly overflowing / stagnant (ponding) on the road surface in various parts of the city., which is described later.
Table 3.4-2 Laid Year of Sewer and Sullage Carrier of WASA Multan Laid Year Length (km) Percentage (%) Total (km) Percentage (%)
-1979 98.41 4.6 98.41 4.6 1980 – 1989 935.80 43.7 1,034.21 48.3 1990 – 1999 201.91 9.4 1,236.12 57.8 2000 – 2006 172.84 8.1 1,408.96 65.9 2007 – 2010 467.70 21.9 1,876.66 87.7 2011 – 2016 262.43 12.3 2,139.09 100
Source:WASA Multan「Presentation for JICA 02-12-19」
Of the total length of 2,139 km of sewer pipes, including Sullage Carrier, 58%, or about 1,236 km, were laid by 1999, which can be estimated that 20 years have passed, and aging is processing. In particular, sewer and sullage carriers that have been laid by 1989 account for about half of the total.
From the information obtained from WASA Multan, it is unclear in what age the sewer with each material was laid. However, all sewers are made of cement-derived materials, and especially those that have been laid for more than 30 years are thought to be damaged due to aging, resulting in a decrease in flow capacity, sedimentation of mud, sand, garbage and waste, and penetration of sewage to natural ground.
(3) Open Drains / Cunettes The old town, which is located on the south side of Fort Qasim in the center of Multan and is mainly around the Inner-City area, has narrow roads and no Sewer pipes. In these areas, sewage and rainwater are disposed by the same Open Drains / Cunettes and connected to the nearest sewer pipe.
Old Town Alleys and Drains Drain beside the alley

The Data Collection Survey on Water Supply and Sewerage Sector of Pakistan Final Report
3-16
inside the textile factory: Livestock / garbage/waste and
drainage pits Dye drainage
Source: JST Figure 3.4-3 Current Situation of Multan Old Town
As shown in Figure 3.4-3, narrow alleys have developed in the old city area, and houses, shops, and town factories are mixed. There is a drainon the side of the alley, and household wastewater, sewage, factory drainage, and garbage flow into it. In this way, sewage including factory effluent, livestock manure and garbage of various sizes flow in. During the rainy season, all effluent including rainwater flows from the Open drains/Cunettes into the sewer pipes downstream of it, which in turn clog the sewer pipes by garbage and waste. 3.4.3 Drainage System (1) Rainwater Drains Unlike other big cities in Punjab, Multan has some roadside drains as described in the next section. However, it doesn’t have systematic rainwater drains and rainwater pipes, which are dedicated facilities for rainwater drainage. This may be because of the fact that the amount of rainfall is less than in other cities. The rainwater basically flows into sewer pipes, agricultural canals and agricultural lands, but other than that, it is flooded in depressions, lowlands, and roads. In other cities, sewage collected by sewer pipes are often discharged from a disposal station to a rainwater drain, but since there are no rainwater drain in Multan, the discharge destination is often an irrigation canal. (2) Roadside Drains Roadside Drains are constructed along some relatively large roads within the area provided with sewage works. Since the area is only about 70 km, most roads have no roadside drains and no rainwater drainage facilities. Roadside drains are constructed and maintained by the Municipal Corporation Multan (hereinafter referred to as “MCM”) instead of WASA Multan, but they are poorly managed and are often damaged, resulting in significant accumulation of garbage, waste and sediment. It is usually constructed under the road and / or along the side of the road, and it terminates with a sewer pipe or an irrigation canal.

The Data Collection Survey on Water Supply and Sewerage Sector of Pakistan Final Report
3-17
Under the sidewalk drain (underdrain) inlet Drain (underdrain) inlet with a cracked sidewalk
Source:WASA Multan M/P Figure 3.4-4 Roadside Drains
3.4.4 Pumping Station Sewage in Multan is collected by sewer pipes and is discharged from 15 Disposal Stations (DSs) to Sullage Carrier, Irrigation Canal and Agricultural land. The location and target area of each DS are shown in Figure 3.4-5. In addition, 10 Lift Stations (LS) are installed as needed. The location map of DS and LS is shown in Figure 3.4-6.
Source: WASA Multan M/P
Figure 3.4-5 Location and Target Area of Each Disposal Station

The Data Collection Survey on Water Supply and Sewerage Sector of Pakistan Final Report
3-18
Source:: Master Plan of Water Supply, Sewerage and Drainage System of WASA Multan, May 2017, WASA Multan
Figure 3.4-6 Location Map of Existing Sewage Disposal Station (Ds), Lift Station (Ls) and Sewage Treatment Plant

The Data Collection Survey on Water Supply and Sewerage Sector of Pakistan Final Report
3-19
3.4.5 Sewage Treatment Plant The sewage treatment plant constructed with ADB financing is in operation since 2017. The existing sewage treatment plant was constructed with a treatment capacity of 223,339 m3 / day, a stabilization pound method (anaerobic pond + facultative pond) (2007-2012). As a sewage transportation facility to the sewage treatment plant, a Sullage Carrier with an extension of about 11 km was constructed mainly by renovating the existing drains. The sewage discharged by the three Disposal Stations to the existing sullage carriers are collected and treated.
Table 3.4-3 Summary of Sewage Treatment Plant Processing method Stabilization pond (anaerobic pond + facultative pond)
method Planned capacity 59MGD/day(268,219㎥/day)
Residence time Anaerobic pond 1 day Facultative anaerobic pond
5.12 days
Site Area 184 Acres
Planned service population 1,086,275 (Year 2040) Construction Cost 902 million PK rupees (including land acquisition cost 260
million PKR) . Except for the following 4DS ・Chungi No.9※* The name will be changed to Zakriya
Town L / S in the future. ・Bosan Road ・Inner Bypass ・Suraj Miani
Commencement year of Construction 2007 Completion year of Construction 2010
Source: WASA Multan M/P
Table 3.4-4 Water Quality Plan of Sewage Treatment Plant Water Quality Items Before
Treatment (mg/l) After Treatment
(mg/l) Efficiency (%)
Biological Oxygen Demand (BOD) 250 60 76 Chemical Oxygen Demand (COD) 450 150 67 Total Suspended Solids (TSS) 300 30 88 Source: WASA Multan M/P
WASA Multan does not carry out regular water quality inspections before and after treatment at the sewage treatment plant, but at present, according to the inspection results conducted in March 2019 (refer Table 3.4-5) and visual inspection of treated water, it can be inferred that the treatment is done under good conditions.
Table 3.4-5 Current Treatment Status of Sewage Treatment Plant
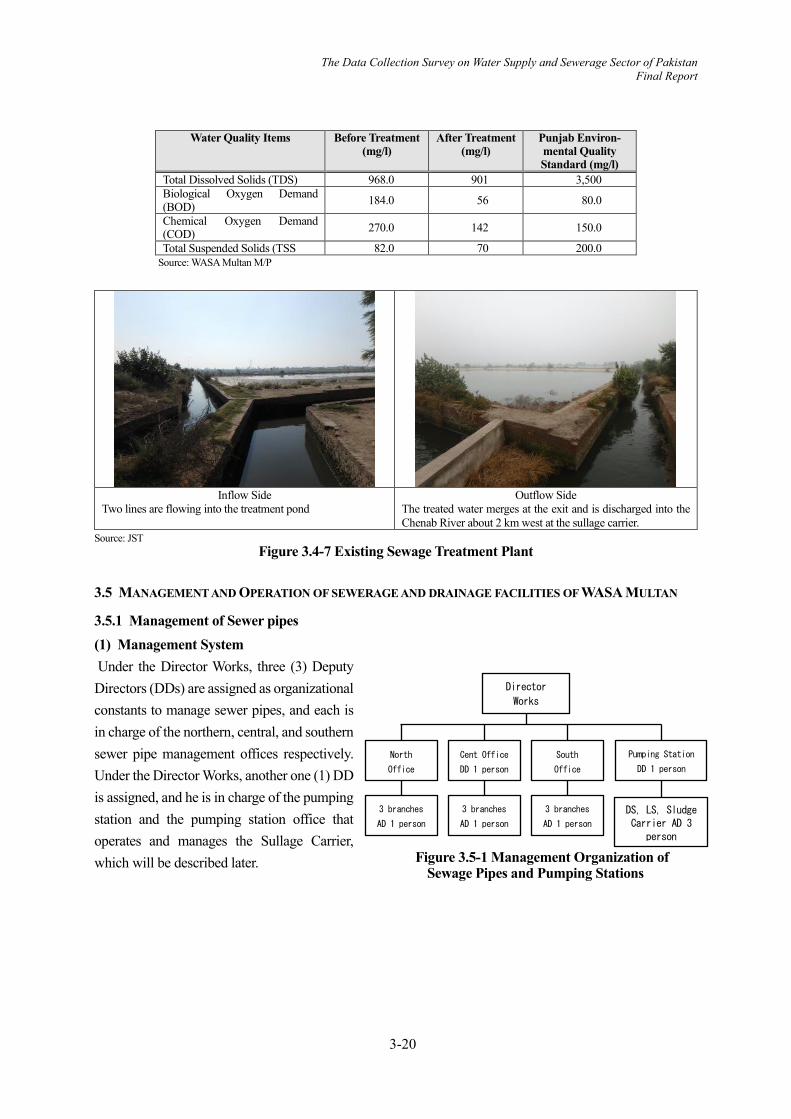
The Data Collection Survey on Water Supply and Sewerage Sector of Pakistan Final Report
3-20
Water Quality Items Before Treatment (mg/l)
After Treatment (mg/l)
Punjab Environ-mental Quality Standard (mg/l)
Total Dissolved Solids (TDS) 968.0 901 3,500 Biological Oxygen Demand (BOD) 184.0 56 80.0
Chemical Oxygen Demand (COD) 270.0 142 150.0
Total Suspended Solids (TSS 82.0 70 200.0 Source: WASA Multan M/P
Inflow Side
Two lines are flowing into the treatment pond Outflow Side
The treated water merges at the exit and is discharged into the Chenab River about 2 km west at the sullage carrier.
Source: JST Figure 3.4-7 Existing Sewage Treatment Plant
3.5 MANAGEMENT AND OPERATION OF SEWERAGE AND DRAINAGE FACILITIES OF WASA MULTAN
3.5.1 Management of Sewer pipes (1) Management System Under the Director Works, three (3) Deputy Directors (DDs) are assigned as organizational constants to manage sewer pipes, and each is in charge of the northern, central, and southern sewer pipe management offices respectively. Under the Director Works, another one (1) DD is assigned, and he is in charge of the pumping station and the pumping station office that operates and manages the Sullage Carrier, which will be described later.
North
Office
Cent Office
DD 1 person
South
Office
Pumping Station
DD 1 person
Director
Works
3 branches
AD 1 person
3 branches
AD 1 person
3 branches
AD 1 person
Figure 3.5-1 Management Organization of Sewage Pipes and Pumping Stations
DS, LS, Sludge Carrier AD 3
person

The Data Collection Survey on Water Supply and Sewerage Sector of Pakistan Final Report
3-21
The three (3) sewer pipe management offices have three (3) Assistant Directors (ADs) under each DD, and each AD manages the sewer pipes within the jurisdiction of the Subdivision in charge. Figure 3.5-1 shows the management organization chart of the sewer pipes and the pumping station. In addition, three (3) Sub Engineers (SEs) or Senior Sub Engineers (SSEs) are assigned under each AD, and 3 human-powered cleaning teams with five (5) members per group are placed under each SE / SSE. The entire office has 81 groups with 405 people.
Figure 3.5-2 shows the Structure of each branch and man-power team, Table 3.5-1 shows the arrangement of jetting machines and suction machines, which are sewer pipe cleaning equipment, at each office and branch office. One or more of both equipment are installed at each branch. In addition, each jetting machine / suction machine has a driver and 3 or 4 workers.
Table 3.5-1 Equipment for Each Pipe Management Office/ Branch
Pipe management office
Branch Pipe Cleaning Equipment
Jetting machine Suction machine
North Galgasht Colony 1 2 Eid Gah 1 1 Suraj Miani 1 1
Middle New Multan 1 1 Mumtazabad 1 1 Qasim Pur Colony 1 1
South Hassan Perwana 3 2 Garden Town 1 1 Wilayyatabad 1 1
Total 11 11 Source:WASA Multan "Pre-flood Arrangement (May 2019)" , edited by JST Note: According to the interview in the field survey in December 2019, 12 Flushers (2 of them failed) and 12 Suckers (1 of them failed).
(2) Current Status of Management of Sewer Pipes The management method of the sewer pipes in Multan is a corrective method in response to complaints received from citizens such as flooding of sewage. No preventive management is performed. A mechanical group using a jetting machine / suction machine and a human-powered group using a bamboo pole are deployed in nine subdivisions, which are subordinate organizations of three (3) sewer pipe management offices. The human-powered team consists of five Sewer men, and 81 such teams are in charge of each small area.
Whenever the call center attached to WASA headquarters receives any complaints from citizens / users, the human powered team which is in charge of the area heads to the site and first carries out the work using a bamboo pole. One bamboo pole is about 2 to 3 m long, and two such poles are connected by wire. Since the
Each Branch
AD 1 person
SE or
SSE1 person
SE or
SSE1 person
Manning
Cleaner
3 units × 5
Manning
Cleaner
3 units × 5
Manning
Cleaner
3 units × 5
SE or
SSE1 person
Figure 3.5-2 Structure of Each Branch and System of Human Power Group

The Data Collection Survey on Water Supply and Sewerage Sector of Pakistan Final Report
3-22
work is performed from the above-ground part of the manhole, it can only reach 4 to 6 m from the mouth of the sewer pipe. The mechanical team is dispatched in case the problems such as clogging are not resolved by the human powered team. The operation of the mechanical team is to insert a hose with a nozzle of a jetting machine from the manhole where the water is overflowing and thereby perform the cleaning work.
When the water level in the manhole has decreased, the first step of the operation is done. Then the hose of the suction machine is inserted into the same manhole to further decrease the water level and the operation is completed. At this point, the water level is above the mouth of the sewer pipe. Therefore, the condition of the pipe could not be confirmed. and materials that cause clogging such as garbage or waste are not removed, so to speak, "work to improve the passage of water" is performed. It is said that the garbage and waste in the manhole are removed by the human power team at night / dawn when the water level drops due to the decrease in the amount of sewage.
As described above, even when a jetting machine is used, the work is not performed for the purpose of completely removing the sediments in the sewer pipe. As a result, the solid matter that has flowed down is easily trapped in the sewer pipe and is accumulated, thereby repeatedly causing clogging at the same place.
There is no statistical data on the frequency with which the mechanical team is dispatched, but according to the experience of the site manager, about 50% of the complaints are resolved by them. When garbage, waste, earth and sand are accumulated on the entire sewer pipe, the newly flowing solid matter is easily captured / accumulated near the upstream pipe opening. These are then removed physically by the human team. Therefore, it can be inferred that there are some cases wherein operation of the bamboo pole near the upstream pipe opening can “improve the water passage”.
Bamboo pole operation Connecting Bamboo Poles

The Data Collection Survey on Water Supply and Sewerage Sector of Pakistan Final Report
3-23
Operation by Suction Operation by Jetting machine Vehicle(left vehicle)
Source: JST
Figure 3.5-3 Response in Sewage Flood Complaint Area
(3) Overflow and ponding of sewer pipes in fine weather In Multan, there are places where sewage is constantly overflowing. JST has inspected the site and confirmed the situation with WASA Multan. (Refer to Figure 3.5-4) It is said that the problem cannot be solved by normal maintenance work using a jetting machine, etc., and drainage pumps and suction machines are used. In addition, as shown in Figure 3.5-5, trouble-occurring places are distributed at various parts of the city, and in some cases, the places are spread over a wide area.
In WASA Multan M / P, problems are attributed to inadequate planning, insufficient capacity of sewer pipes and clogging of Trunk Sewer. However, if the capacity is insufficient, the clogging problem is resolved at nighttime when the amount of sewage decreases. Therefore, lacking capacity is not the main cause. Basically, it is assumed that the clogged sewer pipes sometimes cannot be solved by using jetting machine. This indicates that sewer pipes are clogging to the extent that this machine cannot handle it, or the pipe material is destroyed, and sediment has fallen into the pipe.
It is necessary to investigate the cause of these problems and take adequate countermeasures. It is proposed to drain the sewage in the sewer pipe and then check the current situation by a sewer survey TV camera or the like. Since WASA Multan does not have a sewer survey TV camera, new procurement is required.
In addition to sewer survey TV cameras, it is necessary to procure equipment such as water stop plugs that stop backflow from downstream and inflow of sewage from other sewer pipes, as well as to gain the know-how of survey procedures and methods. The sewer survey TV camera is not required to be a self-propelled robot TV camera that can conduct a detailed survey. It can be a simple camera (tube mouth camera) or a push-in type (insertion type) TV camera that can be easily inserted in the manhole as they are easy to operate, have fewer failures, and their specs are enough to achieve the current purpose of confirmation.

The Data Collection Survey on Water Supply and Sewerage Sector of Pakistan Final Report
3-24
Overflow of Sewer Work from the manhole
Source: JST
Figure 3.5-4 Overflow of Sewer in Multan Old Town
Source: WASA Multan M/P
Figure 3.5-5 Ponding Problematic Areas Multan City
(4) Overflow and Ponding of Sewer Pipes in Rainy Weather Compared to other cities in Punjab such as Lahore, Multan has less annual and intense rainfall. Therefore, it is often thought that problems such as overflow which are usually encountered during rainy weather are not significant. However, compared to other cities, there is no trunk sewer that connects to rivers, and roadside drains and rainwater pipes are connected to sewer pipes, showing that the development of

The Data Collection Survey on Water Supply and Sewerage Sector of Pakistan Final Report
3-25
rainwater drainage facilities are far behind.
In addition, when roadside drains and the like are not constructed, rainwater is conveyed to the sewer pipes as in other cities. As a result of this, during rainy weather water overflows from manholes and disposal stations. As this survey was conducted during the dry season, the current situation could not be studied. However, it was confirmed during the interview survey and the description in WASA Multan M / P Report. Figure 3.5-6 is the photo of the overflow from the manhole during rainy weather.
According to the photo in Figure 3.5-6, it seems that overflow continues even after rainfall stops. It is speculated that the clogging of the sewer pipes and the accumulation of sediment/garbage which are the major causes of sewage ponding during fine weather, also causes overflow and ponding during rainy weather. Similar to sewage ponding, proper maintenance of sewer pipes are also necessary to prevent overflow during rainy weather.
Overflow from manhole in rainy weather Overflow from manhole in rainy weather Source:WASA Multan M/P
Figure 3.5-6 Overflow from Manhole in Rainy Weather
3.5.2 Management of Pumping Stations and Sullage Carriers (1) Management System As shown in Figure 3.5-1 in the previous section, one (1) DD is assigned under the Director Works to manage the pumping stations and sullage carrier and is in charge of fifteen (15) DS, ten (10) LS and Two (2) lines of sullage carrier of NSC and SMSC. Three (3) ADs are assigned under the DD. Each pumping station has three shifts, and each shift has three to five people performing pump operation, screen cleaning, etc. In the present scenario, DD is vacant, but sufficient nos. of ADs are present. At the pumping station, the operation of each pump is recorded, and equipment repair is mainly outsourced.
(2) Current Status of the Management of Pumping Stations The current status and findings of Disposal Station (DS) are shown in Table 3.5-2. The summary of the site survey and interview results of DS are shown in Table 3.5-3.
Table 3.5-2 Current Status and Findings of Disposal Station

The Data Collection Survey on Water Supply and Sewerage Sector of Pakistan Final Report
3-26
Current Status Findings 1 General:
・Of the 15 DSs, the following five DSs were put into operation in 1980s. Since then, pumps and other equipment were replaced, but the facilities are aging in particular, and many pumps are out of order or not functioning. D-1:Chungi No.9 (The rehabilitation work will be implemented from 2020 year by the ADP of the Government of Punjab) D-2:Old Shujabad (New No.2 pump facility started operation in 2018, and is available for the time being) D-3:Kiri Jamandan(Six vertical pumps were added in 2005, but two of them are not functioning, other pumps have many failures)
D-6:Suraj Miani (Four out of six vertical pumps renewed in 2006 are not functioning) D-7:Vehari Road (Seven out of nine vertical pumps renewed in 2005 are not functioning) ・The funding source for the construction work of the existing DS is ADB at two DSs, and the remaining by the Government of Punjab.
・Renewal of pumps and other equipment, and rehabilitation of structure of D-3, D-6 and D-7 are urgently needed. ・The standard service life of pump and electric panel is about 15 years.
2 Screen Facility: ・Except for three small DSs, 11 DSs have manual rake screens, but the screen pit of all DS is deep (5 to 9m), and manual cleaning is dangerous. ・The latest D-12 New Shah Shams DS (2019) are equipped with a mechanical screen and has good operation performance.
・It is recommended that mechanical screen is provided.
3 Pump Facility: ・ There are following three main types of existing pumps, some of which are submersible pumps (S). a. Vertical axis pump (V): Many failures due to defect of the intermediate bearing, shaft runout, etc. b. Horizontal pump (H): Many failures due to coupling center misalignment. c. Dry-pit type submersible pump (Cooling Jacket, SC): Most of the pumps installed after 2006 are of this type, and the operation is good at present. ・ Electric motor: Supply voltage fluctuates greatly, causing damage.
・Originally, vertical axis pump (vortex mixed flow) have many proven results for sewage, and is robust and reliable .While replacing the pump, it is important to carefully consider the pump type.
4 Electrical Equipment: ・Some of the control panels and generators have reached the standard useful life (approximately 15 years), and are aging.
・In case of renewal of the pump, the electrical equipment is also replaced at the same time, in principle.
5 Power Situation: ・The situation differs depending on the power receiving system at each Disposal Station. a. Single line power receiving: There is a daily power failure, one to several hours / day during the dry season, and sometimes all throughout the day during the rainy season. b. Dual line power receiving: Very few power failures during the dry season. During the rainy season, sometimes both lines go out. ・ -The supply voltage fluctuates greatly.
・Enhancement of generator facility is indispensable to ensure operation of the Disposal Station to prevent floods. ・ Equipment such as voltage stabilizer is required.
6 Operation and Maintenance Situation: ・All pumps are manually operated on site. There is no monitoring and control system. ・Operation and maintenance system: 3 shifts / day, 3-5 staffs / shift implements pump operation and screen cleaning works. Pump operation record is maintained. -Equipment repair: WASA does not have its own workshop and repair work is mainly outsourced.
Source: JST

The Data Collection Survey on Water Supply and Sewerage Sector of Pakistan Final Report
3-27
・Deep screen pit, dangerous manual work (D-1)
・Mechanical screen, good in operation(D-12)
・Vertical pump(V) motor, aging / many failure(D-6)
・Vertical pump / intermediate bearing, misalignment.(D-3)
・Horizontal pump (H), failure (D-4)
・Dry pit submersible pump(SC), (D-12)
・Pump control panel, aging, (D-6)
・Generator, aging (D-6)
Source:JST
Figure 3.5-7 Photos of Disposal Station

The Data Collection Survey on Water Supply and Sewerage Sector of Pakistan Final Report
3-28
Table 3.5-3 Overview of Existing Disposal Station (DS)
No. Name of DS
Operation starts year /
(renewal year)
Pump type*1
No. of pump / Capacity
Total pump
capacities(m3/mi
n)
Current status / issues nos x Cfs (m3/min)
D-1 Chungi No.9 1982 (2006)
V V V V
5 x 20 (34.0) 2 x 12 (20.4) 3 x 10 (17.0) 2 x 5 (8.5)
164 (279)
・ Screen pit is deep and dangerous work. Odor problem occurs because it is located in the city. ・ Three pumps are not functioning, other pumps also have many failures, defect with the pump shaft. Aging equipment and structure. ・ Improvement / renewal work by the ADP is planned (2020).
D-2 Old Shujabad No.1:
V
6 x 15 (25.5) 3 x 10 (17.0)
145 (246)
・Screen pit is deep and dangerous work. ・No.1:Two pumps are not functioning, other pumps also have many failures, and defect with the pump shaft. Aging equipment and structure. ・No.2:Good operational condition of the dry pit type submersible pumps (SC).
1980(2008) No.2: 2018
SC
D-3 Kirri Jamandan
(Old) (1984) (New)
2005(2009)
V V V S
2 x 15 (25.5) 2 x 10 (17.0) 2 x 5 (8.5) 1 x 15 (25.5)
75 (127)
・ (Old) facility was abandoned, V pump was renewed in 2005. ・ Screen pit is deep and dangerous work. ・ Two V pumps are not functioning, other pumps have many failures, and defect with the pump shaft Aging equipment and structure, and water leaks from the pump body / force main piping. ・ One submersible pump was installed in the pump pit as an alternative to the V pump (2018).
D-4 Sameejabad 2012 (ADB)
H H H H
2 x 20 (34.0) 3 x 15 (25.5) 1 x 10 (17.0) 1 x 5 (8.5)
100 (170)
・Screen pit is deep and dangerous work. ・Two pumps are not functioning and are under repair, other pumps have many failures、 Bearing damage due to misalignment. ・Motor damage due to large voltage fluctuation.
D-5 Khan Village Northern Bypass (Bosan Road)
2009 (ADB)
H H
6 x 15 (25.5) 4 x 20 (34.0)
170 (289)
・Screen pit is deep and dangerous work. ・Two pumps are not functioning. Three pumps were relocated to the other DS having insufficient capacity.
D-6 Suraj Miani 1983 (2006)
V SC
6 x 15 (25.5) 3 x 15 (25.5)
135 (229)
・Screen pit is deep and dangerous work. ・V pump: 3 units are not functioning, other pumps have many failures, and defect with the pump shaft Aging equipment and structure. ・SC pump : one unit is not functioning, other pumps are in good operation.
D-7 Vehari Road No.1:1983 (2005)
No.2:2017
V
SC
No.1: 9 x 15 (25.5) No.2: 5 x 15(25.5)
210 (357)
・Screen pit is deep and dangerous work. ・No.1: V pump: 7 unit are not functioning, other pumps have many failures, and defect with the pump shaft. Aging equipment and structure. ・No.2: operational condition of the dry pit type submersible pumps (SC). ・Insufficient capacity of Generator
D-8 Garden Town 2013 SC SC
2 x 10 (17.0) 2 x 5 (8.5)
30 (51.0)
・Facility condition is good、good operational condition of the dry pit type submersible pump (SC). ・Increase in transformer capacity is required.

The Data Collection Survey on Water Supply and Sewerage Sector of Pakistan Final Report
3-29
No. Name of DS
Operation starts year /
(renewal year)
Pump type*1
No. of pump / Capacity
Total pump
capacities(m3/mi
n)
Current status / issues nos x Cfs (m3/min)
D-9 Muzaffarabad Jhakar Pur
(New) 2006(2012)
SC SC
2 x 10 (17.0) 2 x 5 (8.5)
30 (51.0)
・Old facility (1994) was abandoned. ・Facility condition is good、good operational condition of the dry pit type submersible pump(SC).
D-10 Qasim Bela 2012 SC SC
2 x 10 (17.0) 2 x 5 (8.5)
30 (51.0)
・Facility condition is good、good operation al condition of the dry pit type submersible pump(SC). ・Increase in transformer capacity is required
D-11 Under Pass 2008 S S
2 x 2 (3.4) 2 x 1 (1.7)
6 (10.2)
・For drainage in the Under Pass area. Operate only during rainfall. ・Pump being operated by generator due to non-available of commercial power supply D-12 New Shah
Shams 2019 SC
SC SC SC
4 x 20 (34.0) 4 x 15 (25.5) 3 x 10 (17.0) 3 x 5 (8.5)
185 (314)
・Although the screen pit is 9.0m deep, good operation with mechanical screen (rope type) installed. ・Good operational condition of the dry pit type
D-13 Inner Bypass 2018 SC 2 x 5 (8.5) 1 x 10 (17.0) 1 x 2 (3.4)
22 (37.4)
・Screen pit is deep and dangerous work. ・Good operational condition of the dry pit type submersible pump(SC). ・The generator is out of order.
D-14 Paeran Ghaib 2002(2008) H H
1 x 2 (3.4) 1 x 3 (5.1)
5 (8.5)
・One H pump is not functioning、aging equipment and structure. ・Without generator.
D-15 Basti Langrial 2002 H 1 x 2 (3.4) 2 (3.4)
・Engine driving pump is aging. ・Old pump room was abandoned.
Note: *1 V: Vertical Pump, H: Horizontal Pump, S: Submersible Pump, SC: Submersible Pump (Cooling Jacket, dry pit type)
Source: WASA Multan, JST
(3) Current Status and Evaluation of Capacity Maintenance and Renewal of Disposal stations Current Status of Capacity Maintenance and Renewal of Disposal station
The current status of the disposal station (at the time of the field survey on December 2019) is as described so far, but the current status is also described in WASA Multan M / P report (2014-2015 survey). Comparing the two, the number of pumps that cannot be operated due to the type of pump or failure was significantly different in 5 years.
Based on WASA Multan M / P report and the results of this survey, Table 3.5-4 summarizes the total number of pumps for each type of disposal station and the number of pumps that cannot be operated due to failure. The findings obtained are summarized below.
There is no significant change in the number of vertical pumps and horizontal pumps. The number of Submersible Pump (Cooling Jacket) have increased significantly from 11 to 44. By
that amount, the total number of pumps has increased (from 76 to 108). Most of the non-operable pumps due to a failure are vertical pumps. The number of non-operable vertical pumps at the time of formulating WASA Multan M / P have
increased significantly from 7 to 17.
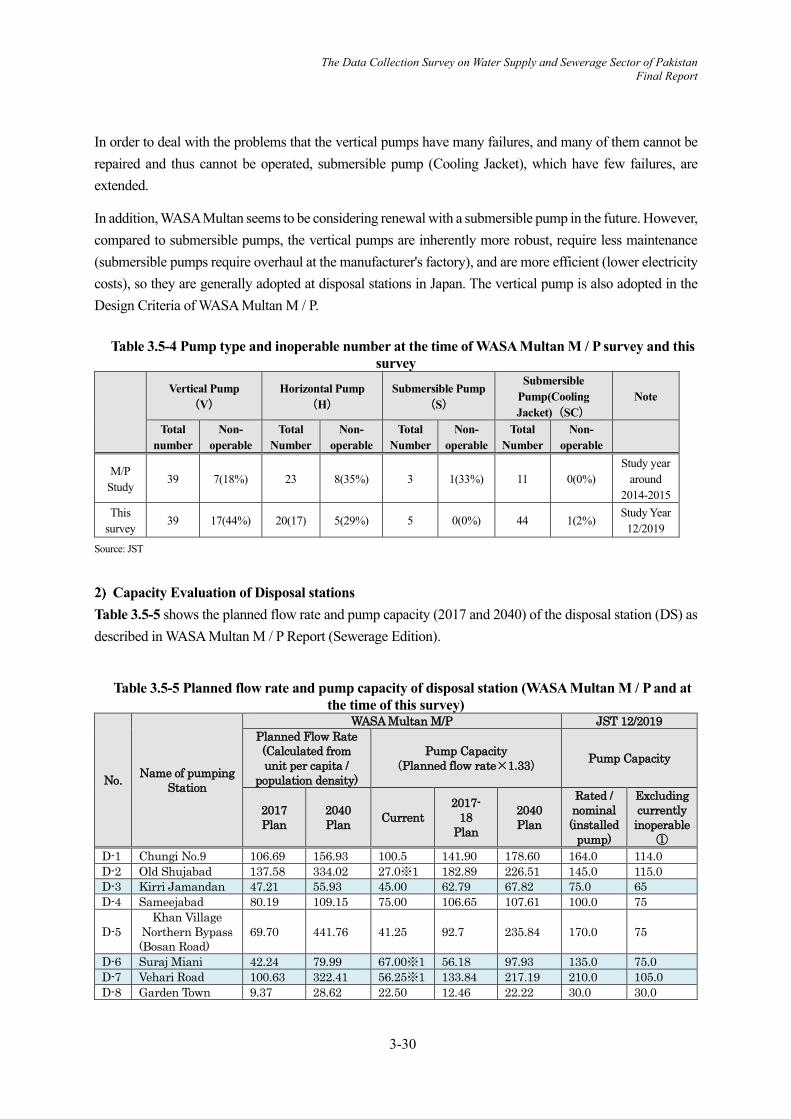
The Data Collection Survey on Water Supply and Sewerage Sector of Pakistan Final Report
3-30
In order to deal with the problems that the vertical pumps have many failures, and many of them cannot be repaired and thus cannot be operated, submersible pump (Cooling Jacket), which have few failures, are extended.
In addition, WASA Multan seems to be considering renewal with a submersible pump in the future. However, compared to submersible pumps, the vertical pumps are inherently more robust, require less maintenance (submersible pumps require overhaul at the manufacturer's factory), and are more efficient (lower electricity costs), so they are generally adopted at disposal stations in Japan. The vertical pump is also adopted in the Design Criteria of WASA Multan M / P.
Table 3.5-4 Pump type and inoperable number at the time of WASA Multan M / P survey and this survey
Vertical Pump (V)
Horizontal Pump (H)
Submersible Pump(S)
Submersible Pump(Cooling Jacket)(SC)
Note
Total number
Non-operable
Total Number
Non-operable
Total Number
Non-operable
Total Number
Non-operable
M/P Study
39 7(18%) 23 8(35%) 3 1(33%) 11 0(0%) Study year
around 2014-2015
This survey
39 17(44%) 20(17) 5(29%) 5 0(0%) 44 1(2%) Study Year
12/2019 Source: JST
Capacity Evaluation of Disposal stations
Table 3.5-5 shows the planned flow rate and pump capacity (2017 and 2040) of the disposal station (DS) as described in WASA Multan M / P Report (Sewerage Edition).
Table 3.5-5 Planned flow rate and pump capacity of disposal station (WASA Multan M / P and at the time of this survey)
No. Name of pumping Station
WASA Multan M/P JST 12/2019 Planned Flow Rate (Calculated from unit per capita /
population density)
Pump Capacity (Planned flow rate×1.33) Pump Capacity
2017 Plan
2040 Plan Current
2017- 18
Plan
2040 Plan
Rated / nominal (installed
pump)
Excluding currently
inoperable①
D-1 Chungi No.9 106.69 156.93 100.5 141.90 178.60 164.0 114.0 D-2 Old Shujabad 137.58 334.02 27.0※1 182.89 226.51 145.0 115.0 D-3 Kirri Jamandan 47.21 55.93 45.00 62.79 67.82 75.0 65 D-4 Sameejabad 80.19 109.15 75.00 106.65 107.61 100.0 75
D-5 Khan Village
Northern Bypass (Bosan Road)
69.70 441.76 41.25 92.7 235.84 170.0 75
D-6 Suraj Miani 42.24 79.99 67.00※1 56.18 97.93 135.0 75.0 D-7 Vehari Road 100.63 322.41 56.25※1 133.84 217.19 210.0 105.0 D-8 Garden Town 9.37 28.62 22.50 12.46 22.22 30.0 30.0

The Data Collection Survey on Water Supply and Sewerage Sector of Pakistan Final Report
3-31
No. Name of pumping Station
WASA Multan M/P JST 12/2019 Planned Flow Rate (Calculated from unit per capita /
population density)
Pump Capacity (Planned flow rate×1.33) Pump Capacity
2017 Plan
2040 Plan Current
2017- 18
Plan
2040 Plan
Rated / nominal (installed
pump)
Excluding currently
inoperable①
D-9 Muzaffarabad 25.99 45.90 8.25 34.56 41.06 30.0 30.0 D-10 Qasim Bela 14.00 21.50 33.75※1 18.62 25.36 30.0 30.0
D-11 Under Pass 6.0 6.0
D-12 New Shah Shams 185.0 185.0
D-13 Inner Bypass 22.0 22.0
D-14 Paeran Ghaib 2.26 5.13 0.75 3.00 4.56 5.0 3.0
D-15 Basti Langrial 2.0 2.0
計 635.86 1,601.34 477.25 845.59 1,224.7 1,304.0 (1,089.0)
932.0 (717.0)
Note: Blue shading is a pumping station requested to be renewed by WASA Multan, and pink shading is Pumping station under construction during the formulation of WASA Multan M / P and is not listed in WASA Multan M / P due to non-operation, small scale, for the rainwater, etc.
here, Planned flow rate of WASA Multan M / P: Calculated for target year 2040 and current 2017 by adding commercial demand, rainwater 33%, etc. to the basin population and unit per capita (85 gallons / man-day) of each pumping station Required pump capacity of WASA Multan M / P: Planned flow rate plus 33% margin (spare machine) Source: JST
The capacity of the disposal station as a whole will be evaluated from the total value in 2017 (current situation). While this survey covered 15 locations, WASA Multan M / P report describes 12 locations under construction at that time, excluding rainwater and small-scale facilities, thus comparisons are made targeting 12 possible locations.
M / P: Compared to the planned flow rate of 636cfs and required capacity of 846cfs (636 x 1.33) in 2017, the total capacity of the installed pumps is 1,089cfs. Excluding pumps that are out of order and cannot be operated, the current pump capacity (total column of ① in Table 3.5-5) is 717cfs, which does not meet the required capacity. D-7 pumping station as an example for each pumping station can be analyzed as follows. M / P: The planned flow rate in 2017 is 101cfs and the required capacity is 133cfs, while the current survey result shows that the current pump capacity ① is 105cfs. The current pump capacity is almost equal to that of the planned flow rate, but the required capacity is not met. Relatively new pumping stations and pumping stations where the expansion of submersible pumps is progressing may meet the required capacity. However, generally speaking, like No.7 Pumping Station, there are many cases where the pump capacity that can be operated is equivalent to the planned flow rate and does
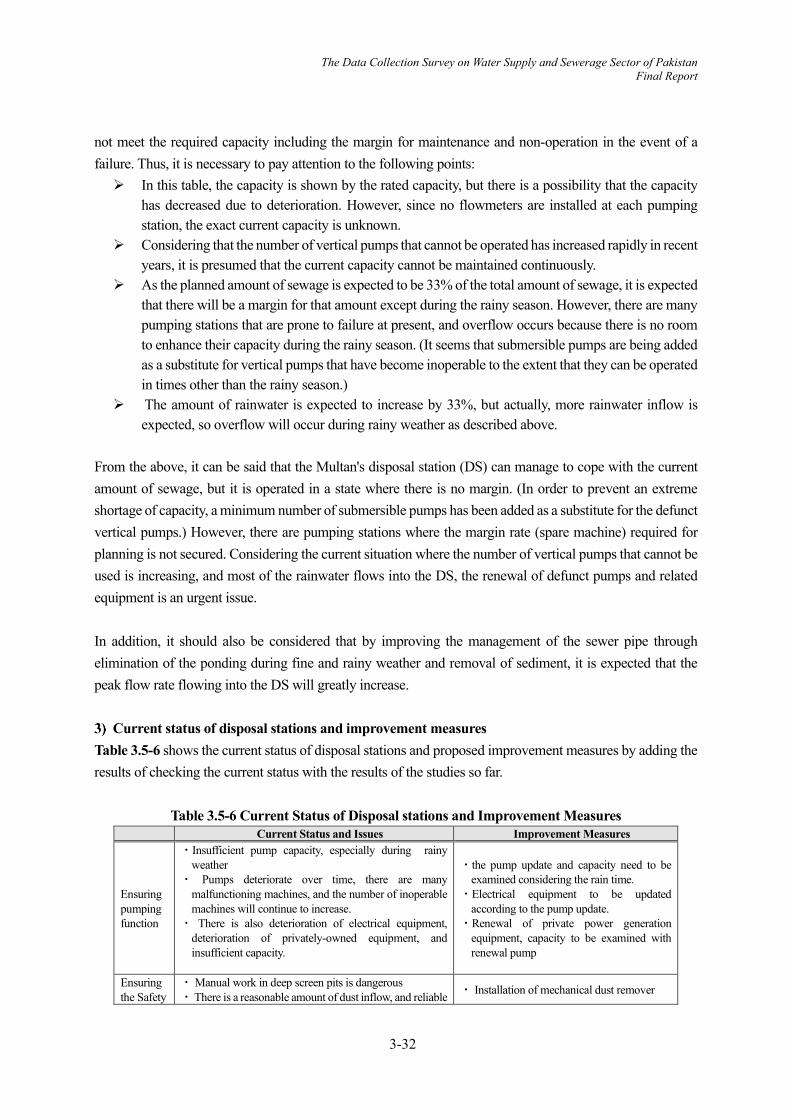
The Data Collection Survey on Water Supply and Sewerage Sector of Pakistan Final Report
3-32
not meet the required capacity including the margin for maintenance and non-operation in the event of a failure. Thus, it is necessary to pay attention to the following points: In this table, the capacity is shown by the rated capacity, but there is a possibility that the capacity
has decreased due to deterioration. However, since no flowmeters are installed at each pumping station, the exact current capacity is unknown.
Considering that the number of vertical pumps that cannot be operated has increased rapidly in recent years, it is presumed that the current capacity cannot be maintained continuously.
As the planned amount of sewage is expected to be 33% of the total amount of sewage, it is expected that there will be a margin for that amount except during the rainy season. However, there are many pumping stations that are prone to failure at present, and overflow occurs because there is no room to enhance their capacity during the rainy season. (It seems that submersible pumps are being added as a substitute for vertical pumps that have become inoperable to the extent that they can be operated in times other than the rainy season.)
The amount of rainwater is expected to increase by 33%, but actually, more rainwater inflow is expected, so overflow will occur during rainy weather as described above.
From the above, it can be said that the Multan's disposal station (DS) can manage to cope with the current amount of sewage, but it is operated in a state where there is no margin. (In order to prevent an extreme shortage of capacity, a minimum number of submersible pumps has been added as a substitute for the defunct vertical pumps.) However, there are pumping stations where the margin rate (spare machine) required for planning is not secured. Considering the current situation where the number of vertical pumps that cannot be used is increasing, and most of the rainwater flows into the DS, the renewal of defunct pumps and related equipment is an urgent issue.
In addition, it should also be considered that by improving the management of the sewer pipe through elimination of the ponding during fine and rainy weather and removal of sediment, it is expected that the peak flow rate flowing into the DS will greatly increase.
Current status of disposal stations and improvement measures Table 3.5-6 shows the current status of disposal stations and proposed improvement measures by adding the results of checking the current status with the results of the studies so far.
Table 3.5-6 Current Status of Disposal stations and Improvement Measures Current Status and Issues Improvement Measures
Ensuring pumping function
・Insufficient pump capacity, especially during rainy weather
・ Pumps deteriorate over time, there are many malfunctioning machines, and the number of inoperable machines will continue to increase.
・ There is also deterioration of electrical equipment, deterioration of privately-owned equipment, and insufficient capacity.
・the pump update and capacity need to be examined considering the rain time.
・Electrical equipment to be updated according to the pump update.
・Renewal of private power generation equipment, capacity to be examined with renewal pump
Ensuring the Safety
・ Manual work in deep screen pits is dangerous ・ There is a reasonable amount of dust inflow, and reliable ・ Installation of mechanical dust remover

The Data Collection Survey on Water Supply and Sewerage Sector of Pakistan Final Report
3-33
Current Status and Issues Improvement Measures dust removal is important to protect the pump.
Efficiency and energy saving
・ Pump operation is manually implemented at the site, and there is a handwritten operation record.
・ Proper pump operation that matches the amount of inflow water is not performed, which is one of the causes of upstream ponding.
・Install a water level gauge, flow meter, etc. and implement an effective pump operation method that matches the amount of inflow water.
・ Consider introducing a model that saves energy when updating the pump
(Example: In the case of 20cfs pump, Submersible Pump (Cooling Jacket) motor: 150kW, in the case of Japanese vertical axis pump: 132kW)
O&M ・ Although there is a pump operation record, preventive
maintenance pump operation rotation is insufficient. ・ Insufficient regular inspection and maintenance
・ Install an operation time meter on each pump to carry out effective operation rotation.
・ Implement operation management guidance with soft components
Source: JST
(4) Current Status of Management of Drains Management of Sullage Carrier
Sullage Carrier (NSC and SMSC) are managed by WASA's pumping station office, mainly for cleaning when the flow rate increases during the rainy season and is systematically implemented before the rainy season. As the name implies, the pumping station office is the department that manages the disposal station. However, branch line sewer pipes which are directly connected to daily citizens' lives are maintained by the Sewer pipe Maintenance Office that has sub-divisions distributed throughout the city. Meanwhile, the pumping station office manages the 2 specific locations of Sullage Carrier of NSC and SMSC. Cleaning work is carried out by the excavation machine (backhoe, etc.) owned by the office.
Apart from the regular cleaning of the general area, special cleaning are performed on the upstream side of the inverted siphon area where garbage and waste tend to collect. The NSC runs down the northwestern part of the city along the Multan Bypass Road, crossing the Shujabad canal and with canal roads along both of its sides. For this reason, floating garbage and waste tend to accumulate in the area, and cleaning work is carried out twice a year once before the rainy season (usually around June to September) and the other during the rainy season.
Both NSC and SMSC are Sullage Carrier through which sewage flows, but the amount of floating garbage and waste is overwhelmingly small in comparison to that of Lahore, which will be described later. This is because the section where both the sullage carriers are open channels are within the suburbs where garbage and waste are removed by the DS before sewage is released into the drainage canal, thus ensuring very little garbage and waste inflows into the DS (There are no large open sewage sullage carriers in the city area except for the open drains/cunetttes for both sewage and rainwater in the old city area.).
Management of Roadside Drain The management of the Roadside Drains are under the jurisdiction of the Municipal Corporation Multan (MCM), and not WASA Multan. In case the connection (discharge) destination of the roadside drain is a

The Data Collection Survey on Water Supply and Sewerage Sector of Pakistan Final Report
3-34
sewer pipe managed by WASA Multan, 1/2 of general sewer connection fee is collected. However, these roadside drains are subsidiary facilities of the road, and since their maintenance is with the MCM, they are not managed by WASA. In addition, following interactions with WASA, it is inferred that the management of roadside drains by the MCM are rarely implemented.
Management of Open Drains/Cunetts in the City Center The Open Drain / Cunetts in the old city area have the function of removing sewage and rainwater in areas where sewer pipes are not laid. As shown in the photograph in Figure 3.5-8, they are prone to be clogged due to a large amount of garbage and waste. For this reason, WASA Multan is temporally cleaning the necessary areas in response to the received complaints and planned cleaning are not conducted. These open drains/ cunetts are managed by the subdivisions in each of the three sewer pipe management offices.
Garbage and waste removed by cleaning are conveyed to the disposal site by the MWMC (Multan Waste Management Company) at a later date (3 to 5 days after cleaning according to the interaction with the concerned officials). Before that, they are stored at the site to remove moisture. The same procedure is being followed by WASA Faisalabad.
Stored Garbage and waste eliminated from the open drains/
cunetts Correspondence of flooding point by drainage pump set
The trace of flood can be seen. Source: JST
Figure 3.5-8 Management Status of Open Drains/ Cunetts in Undeveloped Sewer pipe Areas
3.5.3 Sewer pipes/Sullage Carrier Management Equipment Table 3.5-7 shows the sewer pipe and sullage carrier management equipment owned by WASA Multan as of December 2019.
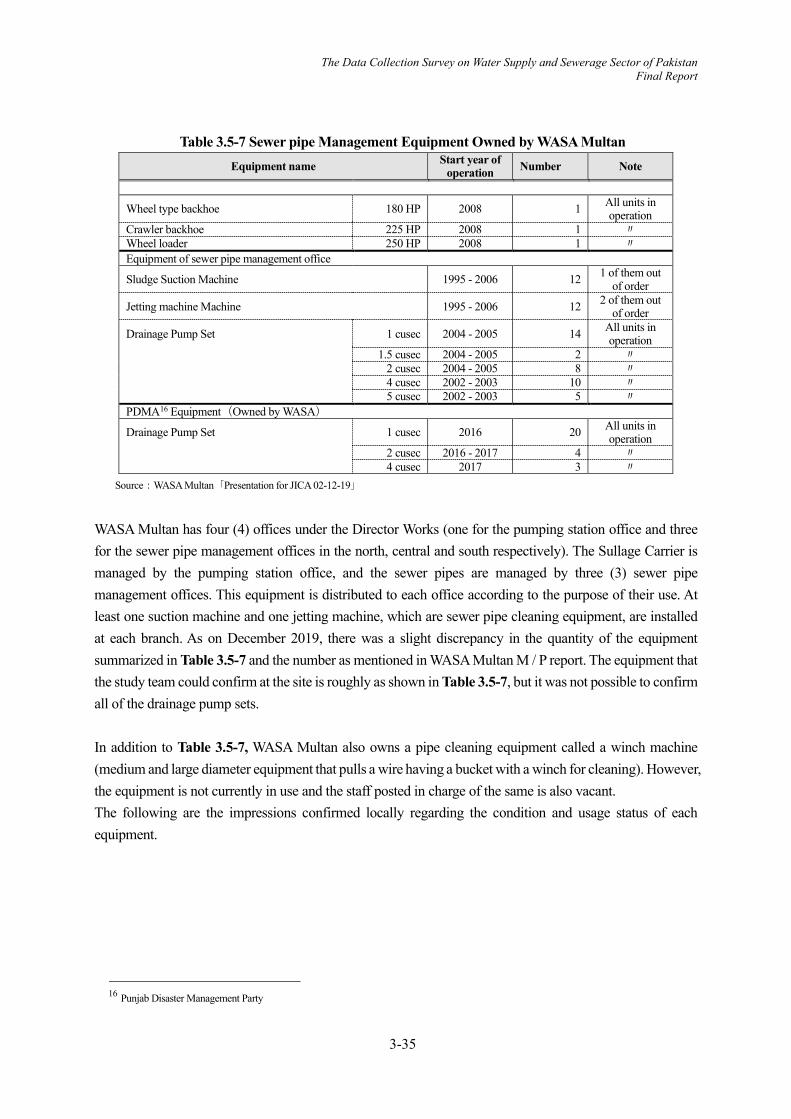
The Data Collection Survey on Water Supply and Sewerage Sector of Pakistan Final Report
3-35
Table 3.5-7 Sewer pipe Management Equipment Owned by WASA Multan Equipment name Start year of
operation Number Note
Wheel type backhoe 180 HP 2008 1 All units in operation
Crawler backhoe 225 HP 2008 1 〃 Wheel loader 250 HP 2008 1 〃 Equipment of sewer pipe management office
Sludge Suction Machine 1995 - 2006 12 1 of them out of order
Jetting machine Machine 1995 - 2006 12 2 of them out of order
Drainage Pump Set 1 cusec 2004 - 2005 14 All units in operation
1.5 cusec 2004 - 2005 2 〃 2 cusec 2004 - 2005 8 〃 4 cusec 2002 - 2003 10 〃 5 cusec 2002 - 2003 5 〃 PDMA16 Equipment(Owned by WASA)
Drainage Pump Set 1 cusec 2016 20 All units in operation
2 cusec 2016 - 2017 4 〃 4 cusec 2017 3 〃
Source:WASA Multan「Presentation for JICA 02-12-19」
WASA Multan has four (4) offices under the Director Works (one for the pumping station office and three for the sewer pipe management offices in the north, central and south respectively). The Sullage Carrier is managed by the pumping station office, and the sewer pipes are managed by three (3) sewer pipe management offices. This equipment is distributed to each office according to the purpose of their use. At least one suction machine and one jetting machine, which are sewer pipe cleaning equipment, are installed at each branch. As on December 2019, there was a slight discrepancy in the quantity of the equipment summarized in Table 3.5-7 and the number as mentioned in WASA Multan M / P report. The equipment that the study team could confirm at the site is roughly as shown in Table 3.5-7, but it was not possible to confirm all of the drainage pump sets. In addition to Table 3.5-7, WASA Multan also owns a pipe cleaning equipment called a winch machine (medium and large diameter equipment that pulls a wire having a bucket with a winch for cleaning). However, the equipment is not currently in use and the staff posted in charge of the same is also vacant. The following are the impressions confirmed locally regarding the condition and usage status of each equipment.
16 Punjab Disaster Management Party

The Data Collection Survey on Water Supply and Sewerage Sector of Pakistan Final Report
3-36
(1) Equipment owned by pumping station office
Wheel type backhoe Crawler backhoe
Wheel loader Source: JST
Figure 3.5-9 Equipment Owned by Pumping Station Office
These excavators are mainly used to remove floating garbage and waste and sludge accumulated in sullage carriers. Their operation started in 2008, and it has already been over 10 years, but they seem to be in good operational condition. They are usually stored in Farooq Pura LS, one of the Lift stations in the city, and it is presumed that the reasons for their good working conditions is because of the existence of a roof as shown in the photo and that they are not used quite often as mentioned above. In particular, the crawler backhoe lacks mobility because it requires a trailer to move due to its characteristics and cannot be used in narrow areas. It is considered that it is not used except for the large-scale construction work carried out by WASA Multan. In addition, although the wheel type loader is suitable for surface earthwork, it is not suitable for cleaning the sullage carriers. Thus, the frequency of its use is quite low.
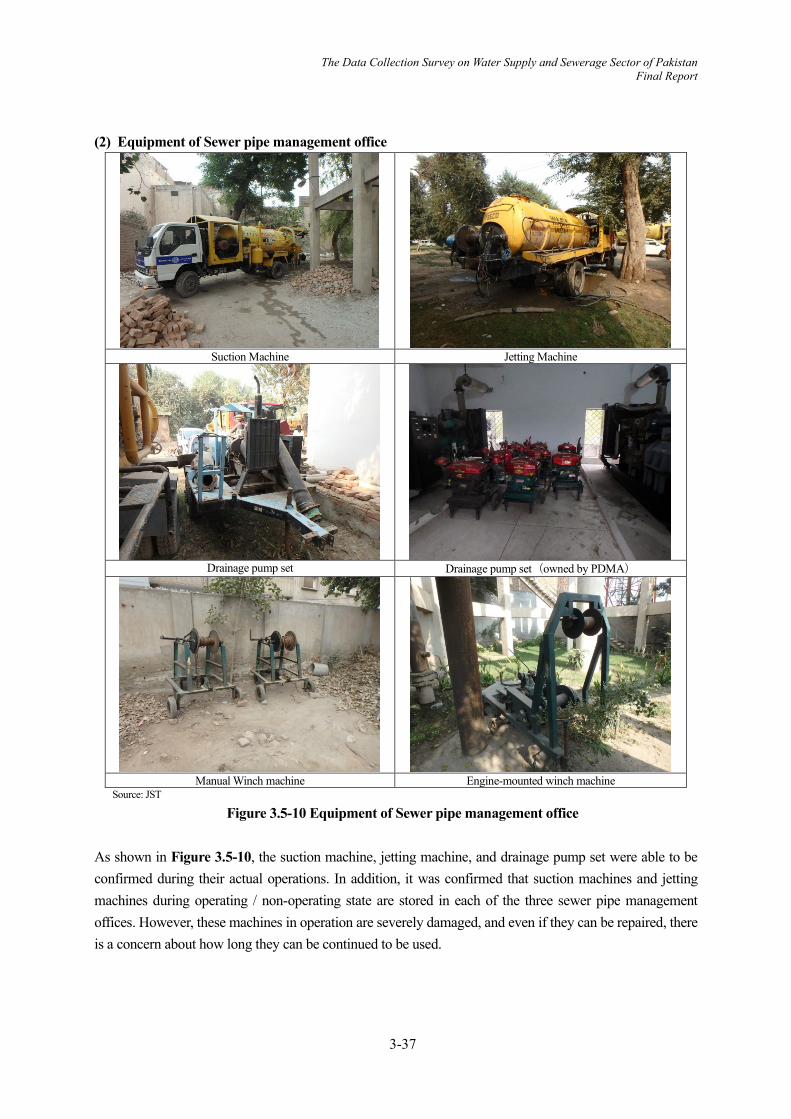
The Data Collection Survey on Water Supply and Sewerage Sector of Pakistan Final Report
3-37
(2) Equipment of Sewer pipe management office
Suction Machine Jetting Machine
Drainage pump set Drainage pump set(owned by PDMA)
Manual Winch machine Engine-mounted winch machine
Source: JST Figure 3.5-10 Equipment of Sewer pipe management office
As shown in Figure 3.5-10, the suction machine, jetting machine, and drainage pump set were able to be confirmed during their actual operations. In addition, it was confirmed that suction machines and jetting machines during operating / non-operating state are stored in each of the three sewer pipe management offices. However, these machines in operation are severely damaged, and even if they can be repaired, there is a concern about how long they can be continued to be used.

The Data Collection Survey on Water Supply and Sewerage Sector of Pakistan Final Report
3-38
The hose reel is broken. Moreover, since the damaged high-pressure hose is cut from the tip and used, the length of the high-pressure hose is shortened.
Leakage of wash water
Source: JST
Figure 3.5-11 Jetting machine with Severe Damage
The drainage pump sets owned by WASA Multan are distributed in branch offices and DS and LS in addition to each sewer pipe management offices. They are used for daily sewage flood drainage and monsoon rainwater drainage. It was confirmed that the DS and LS which JST had inspected had a certain number of non-operating drainage pump sets that are not included in Table 3.5-7.
On the other hand, the drainage pump set of the Provincial Disaster Management Authority (PDMA) is for fresh water and is used only for rainwater drainage during the monsoon period. Therefore, it cannot be used during sewage flooding.
As for the winch machine, although it is stored in each DS and LS like the drainage pump set, there are some which are clearly in a state of disposal, and JST could not confirm the actual operational site during the study.
3.5.4 Environmental and Social Considerations Regarding Cooperation Components of Multan As a potential component of cooperation to the Multan
Providing equipment such as jetting machines Pumping station equipment update (Suraj Miani DS / Vehari Road DS (Kiri Jamandan DS))
are important components of the study Table 3.5-8 summarizes the expected effects and points to be noted based on the current situation, when assuming a cooperative project above.

The Data Collection Survey on Water Supply and Sewerage Sector of Pakistan Final Report
3-39
Table 3.5-8 Expected Effects and Points to be Noted from the Perspective of Environmental and Social Consideration (Multan)
Category Points to be noted from the perspective of environmental and social consideration Pollution Control Diesel exhaust from donor generators (for power outages) and jetting machines, etc. ?
Contamination of irrigation water due to sewage discharge ‐ Sewage overflow reduction P Work efficiency improvement by mechanization of screen repair and garbage/waste removal of Pumping station
P
Reuse and recycling of aging equipment parts (no disposal planned) ‐ Reduction of the amount of garbage/waste spilled into the water environment (reduction of the load on the living environment) (Boova pur disposal site)
P
Improvement of soil pollution by reducing sewage leakage P Reduction of noise and vibration by renewal of aging equipment P Improvement of odor problem by reducing sewage leakage P
Natural Environment
Nature reserves and wildlife habitats in the target area: non-existent ‐ Impact on water conditions such as natural rivers, topographical and geological alterations: unpredictable
‐
Social Environment
New acquisition of business land and relocation of residents: unpredictable ‐ Impact on cultural properties (many in the city): unpredictable ‐ Improving the occupational health environment by mechanizing garbage/waste removal and cleaning
P
Ethnic diversity is recognized in the target area, but there is no uneven distribution of lifestyles ‐ Poor people-squatting, but business impact is not expected ‐ The site area required for the renewal work of the target pumping station is sufficient, and it is not necessary to secure a workspace outside the site.
‐
Other infrastructure, organization, uneven distribution of benefits, impact on local economy ? Other Reduce number of times of workers entering to the dangerous areas by mechanization P
Improvement of the safety of working environment due to the improvement of the aging equipment (underground of pump room, etc.) that is currently considered dangerous
P
Emission reduction by saving energy due to the renewal of aging equipment P 【Impact】P: Positive, N: Negative, -: No change, ?: To be checked if necessary
Source: JST 3.5.5 Sewerage Issues of Multan (1) Sewerage and Drainage System (Collection System) and Issues of Multan According to the information collected, the sewerage and drainage systems served by WASA Multan have characteristics such as rainwater connections to sewers, inadequate rainwater drainage facilities, untreated sewage discharge into irrigation canals, sewage flooding during fine weather etc. Here, based on the collected information, especially focusing on the sewage and rainwater collection system, its characteristics are to be analyzed and issues to be extracted. Figure 3.5-12 shows the sewage and drainage system of Multan. The mechanism of the sewage and drainage system of Multan as shown in the above-mentioned figure, are listed below. The generated sewage is connected to a sewer pipe. Sewer is transmitted from the disposal station
(DS), part of it is transmitted via Sullage Carrier, and treated at the sewage treatment plant (STP).
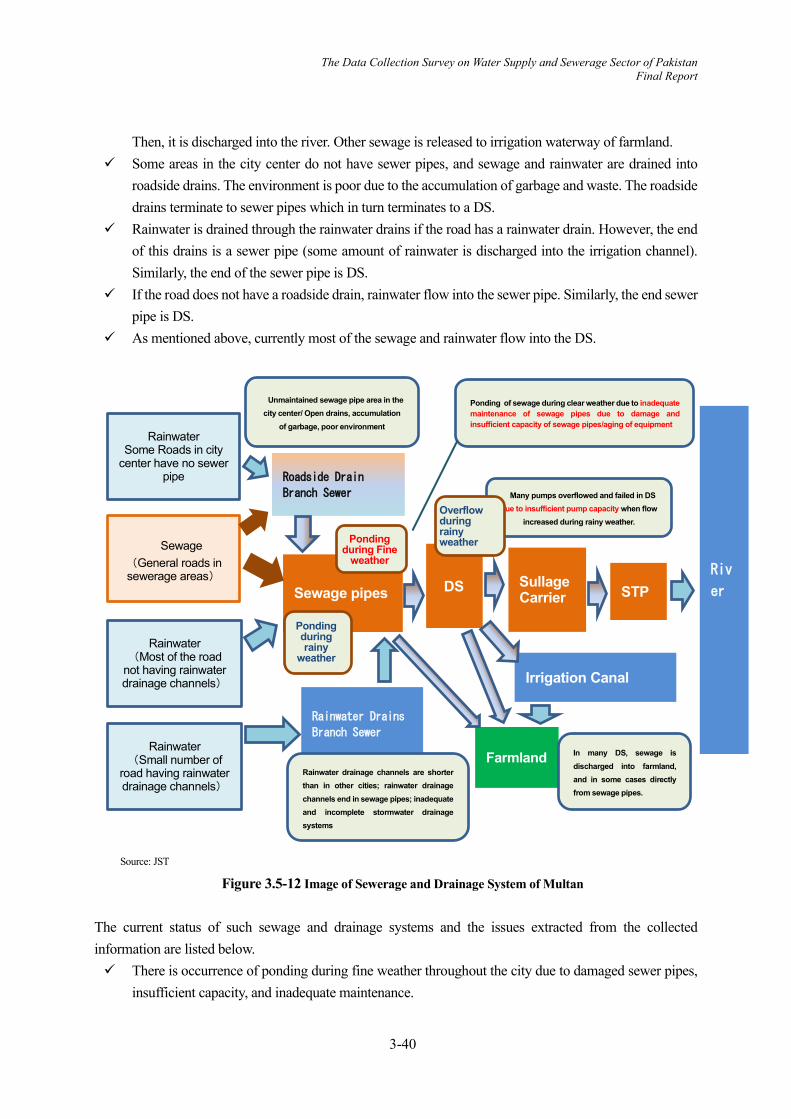
The Data Collection Survey on Water Supply and Sewerage Sector of Pakistan Final Report
3-40
Then, it is discharged into the river. Other sewage is released to irrigation waterway of farmland. Some areas in the city center do not have sewer pipes, and sewage and rainwater are drained into
roadside drains. The environment is poor due to the accumulation of garbage and waste. The roadside drains terminate to sewer pipes which in turn terminates to a DS.
Rainwater is drained through the rainwater drains if the road has a rainwater drain. However, the end of this drains is a sewer pipe (some amount of rainwater is discharged into the irrigation channel). Similarly, the end of the sewer pipe is DS.
If the road does not have a roadside drain, rainwater flow into the sewer pipe. Similarly, the end sewer pipe is DS.
As mentioned above, currently most of the sewage and rainwater flow into the DS.
Source: JST
Figure 3.5-12 Image of Sewerage and Drainage System of Multan The current status of such sewage and drainage systems and the issues extracted from the collected information are listed below. There is occurrence of ponding during fine weather throughout the city due to damaged sewer pipes,
insufficient capacity, and inadequate maintenance.
Rainwater Some Roads in city
center have no sewer pipe
Rainwater (Small number of
road having rainwater drainage channels)
Irrigation Canal
Rainwater Drains
Branch Sewer
Sewage pipes
Rainwater (Most of the road
not having rainwater drainage channels)
Sewage (General roads in sewerage areas)
DS
Unmaintained sewage pipe area in the city center/ Open drains, accumulation
of garbage, poor environment
Riv
er SullageCarrier STP
Farmland
Ponding of sewage during clear weather due to inadequate maintenance of sewage pipes due to damage and insufficient capacity of sewage pipes/aging of equipment
Many pumps overflowed and failed in DS due to insufficient pump capacity when flow
increased during rainy weather.
Ponding during Fine
weather
Rainwater drainage channels are shorter than in other cities; rainwater drainage channels end in sewage pipes; inadequate and incomplete stormwater drainage systems
Roadside Drain
Branch Sewer
In many DS, sewage is discharged into farmland, and in some cases directly from sewage pipes.
Ponding during rainy
weather
Overflow during rainy weather

The Data Collection Survey on Water Supply and Sewerage Sector of Pakistan Final Report
3-41
Except for the sewage discharged into the Sullage Carrier that flows into the new sewage treatment plant, sewage is discharged from the disposal station (DS) to the irrigation canal / agricultural land. (There are no main drains in Multan that connect to rivers such as in Lahore and Faisalabad.)
There are no main rainwater drains leading to rivers, there are few rainwater drainage facilities such as roadside drains and rainwater pipes, and rainwater is generally drained to sewer pipes. In addition, the end of the flow such as a roadside drain is a sewer pipes, and there are sewage / rainwater Ponding during rainy weather due to insufficient capacities and management of the sewer pipe for the amount of rainwater and decrease in capacity due to sedimentation and garbage/waste.
Many pumps are out of order at disposal stations. (It is judged that there are many failures in the vertical pump and there are problems with the specifications and accuracy of the installation work.)
There is a disposal station (DS) where overflow occurs due to insufficient pump capacity during rainy weather.
(2) Key Issues Described in WASA Multan M / P Report
In WASA Multan M/P Report, following 9 items are described as Key Issues of Sewerage System.
A. Sewage Ponding/Problematic Areas) B. Untreated Sewage Disposal into Canals and Chenab River C. Un-served area of Sewerage Service D. Rehabilitation of existing disposal stations E. Canals are used as sullage carriers) F. Areas having no Final Disposal)、Release to agricultural land G. Manual operation of pumps H. Other Key Issues
a. Insufficient capacity of the facility b. Insufficient capacity during rainy weather due to rainwater connection to sewer pipes
and SSO (Sanitary Sewer Overflow) c. Aging facilities d. Clogging due to sediment accumulation in sewer pipes / open channels e. Insufficient capacity due to unplanned sewer pipe connection f. Necessity of DS relocation due to progress of urbanization g. Pump not working due to lack of maintenance h. Stopping of existing DS i. Corrosion / damage to the crown of the main sewer pipes
I. Equipment & Machinery These issues can be broadly divided into items related to planned facility maintenance and items related to facility maintenance / renewal and operation management as shown below. Items related to planned facility maintenance are listed below. 〔Issues related to planned facility maintenance〕
B Discharge of sewage to irrigation canals, etc. C Undeveloped area of sewerage system

The Data Collection Survey on Water Supply and Sewerage Sector of Pakistan Final Report
3-42
E Use of irrigation canals as a sewage drain (sewage discharge facility) F Release to areas and farmlands where there are no final disposal destination G Manual operation of pumping station (related to rehabilitation renewal of some facilities) H Other issues
a. Insufficient capacity of the facilities b. SSO Insufficient capacity during rainy weather due to rainwater connection to the sewer pipe and
SSO f. Necessity of DS relocation due to progress of urbanization g. Stopping of existing DS
Issues related to these planned facility developments can be resolved by undertaking a steady facility development based on WASA Multan M / P.
The items classified as issues related to facility maintenance / renewal and operation management are listed below. [Issues related to facility maintenance / renewal and operation management]
A. Overflow of sewage D. Renewal of existing disposal station H. Other important issues c. Aging facilities d. Clogging Blockage due to sediment accumulation in sewer pipes / open channels e. Insufficient capacity due to unplanned sewer pipe connections (related to some plans) g. Pumps not working due to lack of maintenance i. Corrosion / damage to the crown of the main sewer pipes
I. Equipment & Machinery The issues pointed out in this section (1) are mostly included in the issues identified in WASA Multan M / P Report. In this report, we focused on the issues related to facility maintenance / renewal and operation management among the issues faced by the sewage and drainage projects in Multan. Regarding the issues "g. pump not working due to lack of maintenance” as listed in WASA Multan M / P, the main cause is judged to be the poor specifications and insufficient installation accuracy according to the results of this survey.
3.6 CURRENT STATUS OF WASA MULTAN'S BUSINESS OPERATIONS
In order to assess the business operations of WASA Multan, in Utility Basic Checklist (UBC), which is based on the basic checklist for water utilities in the “Handbook for Capacity Assessment for Urban Water Sectors and Water Systems in Developing Countries” items of sewerage were added, distributed and asked for the answers.
The Data Collection Survey on Water Supply and Sewerage Sector of Pakistan Final Report
3-43
Although it is not a sufficient assessment since the contents of the answers have not been confirmed by interviews, based on the collected answers and information on other materials, the status of WASA Multan's business operation can be assessed roughly as follows
As a medium- to long-term plan, WASA Multan M / P with the target year of 2040 was prepared in 2017. Regular reviews have not been done, but details are unknown.
The water supply range is 55% of the population, and the water supply time is 2 hours each during the morning, noon, and evening.
Dissemination of Sewerage Service is 65% of the population, and the treatment rate of generated sewage at sewage treatment plants is 25%.
Regarding the water supply facilities, there are 20 Over Head Reservoir, but they are not used. Water is supplied directly from 102 nos. of deep wells (Tube Well). More than 80% of water pipes are asbestos cement pipes, and 70% of them have aged as they were constructed 25 years or more.
Regarding the sewerage facilities, some pumping station structures need to be repaired, and pumps are also aging. About 60% of sewer pipes are more than 30 years old
Regarding the O & M facility, there are manuals such as Standard Operating Procedures (SOP) created during the formulation of WASA Multan M / P for both water and sewerage, but it is unknown whether they are used in the field.
Drawings of water pipes, sewer pipes and facilities have been digitized during WASA Multan M / P formulation, but since the GIS system has not been introduced, WASA Multan staff cannot utilize them.
No water meters are installed, and water pressure are not measured at the faucets. The non-revenue water rate is 28.8%. Regular water quality measurement details are not known.
Regarding the O&M of sewer pipes, the main work is responding to complaints such as overflow of sewage due to the clogging. However, since the water level in the pipe is always high, it seems that the cause of clogging has hardly been investigated.
Although there are problems with aging and breakdown of pipe cleaning equipment such as jetting machines and suction machines, more than one pipe cleaning equipment are owned by each of the nine (9) branches of the sewer pipe management office.
Although the quality of treated sewage water is not regularly measured, it is said that regular monitoring of large-scale business establishments is implemented.
The appropriation rate based on water and sewage charges are about 30% of the maintenance cost. There are valid rules regarding personnel and salary, and staff training is also conducted. Although complaints from users have been dealt with, grievance records are not compiled. Public relations for reducing non-revenue water, saving water, and collecting fee are conducted.
Regarding the organizational structure of WASA Multan, the vacancy rate of the Deputy Director (DD) position, which is the key to the organizational management, is high, and it is often the case that the direct subordinate Assistant Director (AD) is acting as a substitute or concurrently serving as DD. Furthermore, there are vacancies in AD position itself, and the influence is affecting to the lower ranks. For this reason, situation such as lower staff taking over the work of upper staff while his treatment remains unchanged occurs in the multiple positions, which puts a heavy load on the AD level in particular. Improvement of this situation is desired in order to carry out the work stably.

The Data Collection Survey on Water Supply and Sewerage Sector of Pakistan Final Report
3-44
Meanwhile, although WASA Multan organization has some points to be improved, such as the DD vacancy rate and the water supply sector not being independent, the current maintenance system and technical level are not inferior to that in other major cities in Punjab, and there was an impression that lower management had a good grasp of the site, probably due to the compact organization size. In addition, there are some points that WASA Multan seemed to be more advanced than other cities such as the preparation of the Standard Operating Procedures Manual (SOP) for maintenance and management, aiming to optimize and improve the efficiency of on-site work. 3.7 WASA MULTAN SEWERAGE MASTER PLAN(M/P)
3.7.1 Summary of WASA Multan M/P(Sewerage Edition) WASA Multan created a Sewerage M / P in 2017. This M / P has a target year of 2040 and has set a target of 100% sewerage dissemination by 2028. The sewage collection method is based on the separate system, but it allows rainwater to be connected to the sewer pipe where there are no roadside drains. The collection facility is basically a natural flow, but a pumping point is provided depending on the topographical conditions. The collection area is divided into four areas for each planned sewage treatment plant, and a new disposal station is installed to collect sewage. One of the four planned sewage treatment plants is an existing sewage treatment plant, and expansion of this facility is being planned. The treatment method of the sewage treatment plant is the pound method, and the treated water is discharged into the Chenab River. Figure 3.7-1 shows the location map of the disposal station and sewage treatment plant including the existing one planned under the M / P.
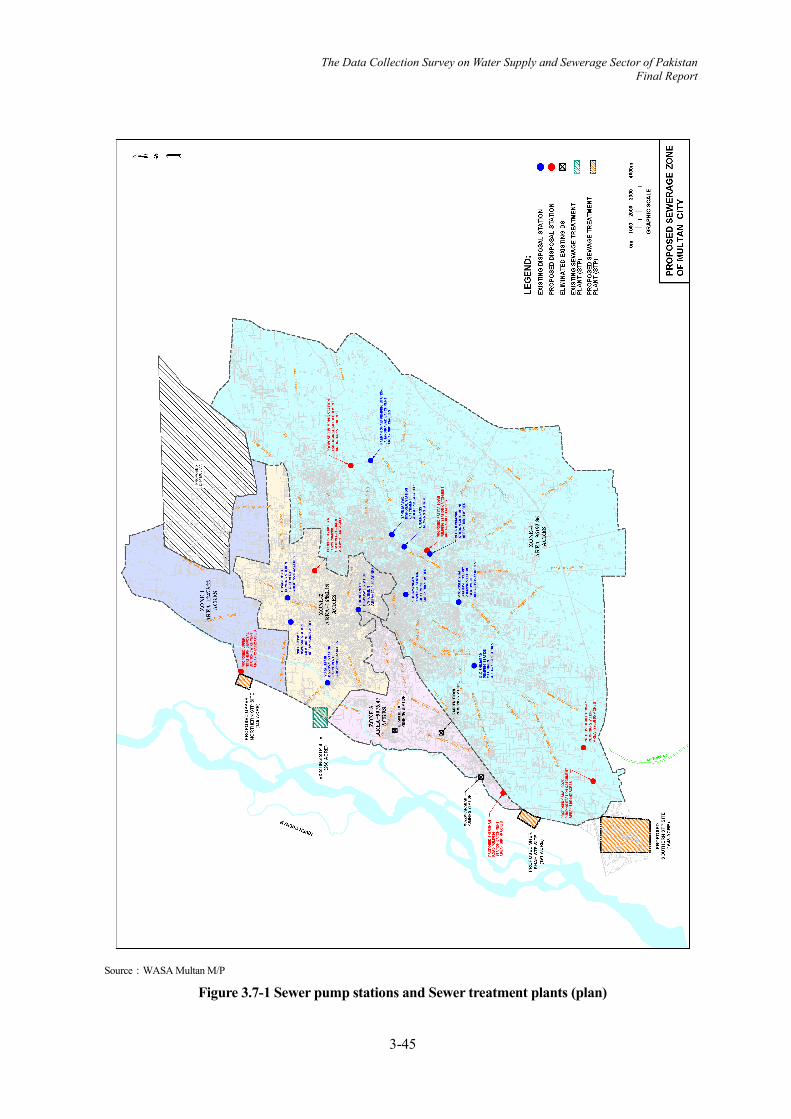
The Data Collection Survey on Water Supply and Sewerage Sector of Pakistan Final Report
3-45
Source:WASA Multan M/P
Figure 3.7-1 Sewer pump stations and Sewer treatment plants (plan)

The Data Collection Survey on Water Supply and Sewerage Sector of Pakistan Final Report
3-46
The Sullage Carrier is a sewage culvert that serves as the main line. Figure 3.7-2 shows the location of the Sullage Carrier, including the existing ones.
Source: WASA Multan M/P
Figure 3.7-2 Location of Sullage Carrier (Plan)

The Data Collection Survey on Water Supply and Sewerage Sector of Pakistan Final Report
3-47
The sewage treatment plant is a core facility, and the target year for sewage treatment is set to 2032. The following is a list of specifications for sewage treatment plants, including the existing one.
Table 3.7-1 List of Sewage Treatment Plant Specifications Sr. No. Parameter/Components Unit STP - 01 STP – 02
(Existing) STP - 03 STP – 04 (ADB Fund)
1 Design Average Flow Cusec 42 77 62 587
MGD 22.65 41.5 33.5 316
2 Anaerobic Ponds (APs)
i Numbers No 10 18 16 140
ii Top Length of each Pond m 86 86 85 103
iii Top Width of each Pond m 60 64 63 59
iv Total Height of each Pond m 3.25 3.25 3.25 3.25
3 Facultative Ponds (FPs)
i Numbers
In Parallel No 10 16 16 140
In Series No 3 3 3 3
ii Top Length of one Pond in Series m 136 124 113 136
iii Top Width of one Pond in Series m 58 65 64 58
iv Total Height of each Pond m 2.5 2.5 2.5 2.5
Source: WASA Multan M/P
3.7.2 Summary of WASA Multan M/P(Rainwater Drainage Edition) WASA Multan created a M / P for rainwater drainage in 2017. This M / P has a target year of 2040. Multan's rainwater drainage system has only roadside drains for rainwater drainage on some roads. If the roads does not have any drains, rainwater is conveyed through sewer pipes. Furthermore, the end of the roadside drain is also a sewer pipe or an irrigation canal, which can be said that the system is incomplete at present. This M / P aims to construct a drastic rainwater drainage system which involve construction of drains which end to DS, irrigation canals and rivers, proposing the construction of 240 rainwater drains with a length of 200m to 2500m.
Based on natural flow, the structure of the facility is basically brickwork, and the minimum cross-sectional dimension of the facility is 0.6m x 0.3m. Figure 3.7-3 shows the rainwater drainage system plan.

The Data Collection Survey on Water Supply and Sewerage Sector of Pakistan Final Report
3-48
Source: WASA Multan M/P
Figure 3.7-3 Rainwater Drainage System Plan
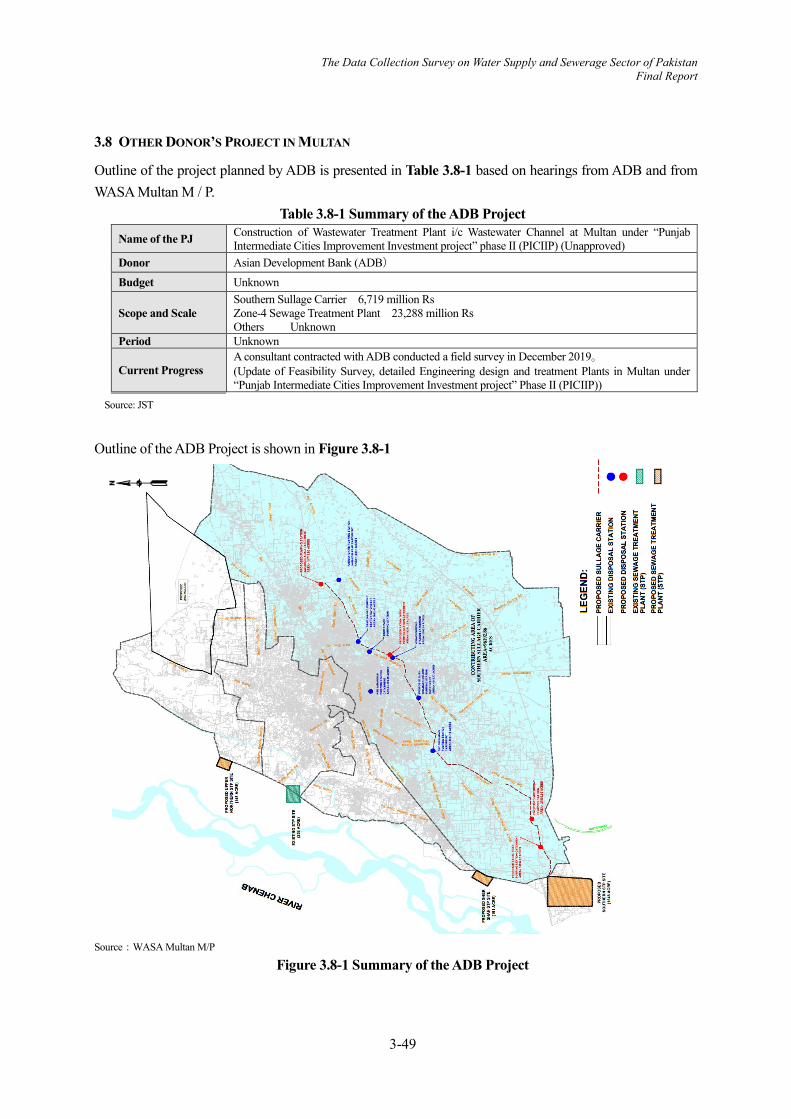
The Data Collection Survey on Water Supply and Sewerage Sector of Pakistan Final Report
3-49
3.8 OTHER DONOR’S PROJECT IN MULTAN
Outline of the project planned by ADB is presented in Table 3.8-1 based on hearings from ADB and from WASA Multan M / P.
Table 3.8-1 Summary of the ADB Project Name of the PJ Construction of Wastewater Treatment Plant i/c Wastewater Channel at Multan under “Punjab
Intermediate Cities Improvement Investment project” phase II (PICIIP) (Unapproved) Donor Asian Development Bank (ADB) Budget Unknown
Scope and Scale Southern Sullage Carrier 6,719 million Rs Zone-4 Sewage Treatment Plant 23,288 million Rs Others Unknown
Period Unknown
Current Progress A consultant contracted with ADB conducted a field survey in December 2019。 (Update of Feasibility Survey, detailed Engineering design and treatment Plants in Multan under “Punjab Intermediate Cities Improvement Investment project” Phase II (PICIIP))
Source: JST
Outline of the ADB Project is shown in Figure 3.8-1
Source:WASA Multan M/P
Figure 3.8-1 Summary of the ADB Project

The Data Collection Survey on Water Supply and Sewerage Sector of Pakistan Final Report
3-50
3.9 REQUEST OF WASA MULTAN
The following is the list of equipment as requested by WASA Multan.
Table 3.9-1 Requested Equipment List of WASA Multan
Equipment Specification Purpose Qty. Tentative Unit
Cost (Million Rs)
Amount (Million Rs) Remarks
1 Suction Machines Tank Capacity more than 4cub.meter Sewer Cleaning 27 20 540.000
Pipe cleaning equipment
(Self-propelled)
2 Jetting Machines Tank Capacity more than 4cub.meter Sewer Cleaning 27 18 486.00
Pipe cleaning equipment
(Self-propelled)
3 Pumps with Motors, Valves & Pipes
More than 10 cusec (Mechanical Seal Type) Sewage Pumping 23 70 1610.000
Pumping station related
equipment
4 Auto Priming Dewatering Pumps Sets More than 5 cusec For Dewatering 10 8 80.000
Self-priming drainage
equipment
5 Dragline (clamshell) Wheel Type Main Drain Cleaning 2 23.50 47.00 Excavation machine
6 Wheel Excavator (Backhoe) Main Drain Cleaning 2 20 40.000 Excavation
machine
7 Dump Truck 4 ton Carry silt to dump site 4 5 20.000 Transport
Vehicle
8 Truck Crane 10 ton O&M 2 14 28.000 Lifting Equipment
9 Skid Mounted flushing units 1000 Gallon 12 10 120.000
Pipe cleaning equipment (Tractor)
10 Lifter (Heavy Duty) Heavy Duty Loading & un-loading of pumps & motors
3 3.5 10.500 Loading and unloading equipment
11 Auto Priming Dewatering Pumps Sets Up to 05 cusec Sewage Pumping 16 7 112.000
Self-priming drainage
equipment
12 Water Testing Lab Mobile Cab Sampling & Testing 2 5 10.000
Water Quality Analysis Vehicle
13 Single cabin vehicle shifting of Material and equipment 05 3.5 17.500 Vehicle
14 Pneumatic Plugs for sewer line 12" & 18" i/d Plugging of sewer 35 0.65 23.00 Pipe cleaning
equipment Total : Equipment (No. 1.2.4.5.6.7.8.9.10.11.12.13.14) 1,534
Total : Pumping Station Facilities (No. 3) 1,610
Source:WASA Multan(Partially added by JST)
Detailed list of specifications for item “3.Pumps with Motors, Valves & Pipes” from the above list is shown as follows.

The Data Collection Survey on Water Supply and Sewerage Sector of Pakistan Final Report
3-51
Table 3.9-2 Requested Equipment List of WASA Multan(Item 3. Detailed list of Specifications of Pumps with Motors, Valves & Pipes)
S.# Locality Requirements Quantity Reason
1. Disposal Station Vehari Road
Replacement of existing 15 cusecs vertical life expired pumps with 20 cusecs submersible close couple with cooling jacket dry well installation including suction and delivery pipes with allied accessories 2 sluice valves and 1 non-return valve for each pump.
Replacement of existing 15 cusecs
vertical life expired pumps with 15 cusecs submersible close couple with cooling jacket dry well installation including suction and delivery pipes with allied accessories 2 sluice valves and 1 non-return valve for each pump.
Replacement/Rehabilitation of
existing electric equipment’s like M.C.C, Electrical cables, Change over etc.
Replacement of existing Generator
sets 300 KVA & 250 KVA with 725 KVA.
Rehabilitation of civil structures (screening chamber, wet wells, dry well)
Replacement of existing manual screen with mechanical screen.
Pumps = 06 Nos Suction: 06(No)x355mm(i/d)x15m (length) Sluice valve= 12Nos Non return valve =06Nos
Pumps = 03 Nos Suction: 2(No)x355mm(i/d) x15m(length) Sluice valve= 06Nos Non return valve =03Nos
1 Job
1 No
1 Job
3 Nos
• The pumps have almost expired their designed life (installed in 2004-05), operation & maintenance cost is at a very high side.
• O&M cost of vertical pumps is higher than the close coupled submersible pumps.
• Installed in 2004-05, not energy efficient and near to expiry of their life.
• Installed in 1986 & 2002 respectively and they are life expired.
• Structure was originally constructed in 1986 and rehabilitated in 2004.
• Manual cleaning of screens is
very dangerous.
2. Disposal Station Kiri Jamdan
Replacement of existing 15 cusecs submersible life expired pump with 20 cusecs submersible close couple with cooling jacket dry well installation including suction and delivery pipes with allied accessories 2 sluice valves and 1 non-return valve.
Replacement of existing 5 cusecs
vertical pumps near to life expiry with 10 cusecs submersible close couple with cooling jacket dry well installation including suction and delivery pipes with allied accessories 2 sluice valves and 1 non-return valve for each pump.
Replacement/Rehabilitation of
existing electric equipment’s like
Pumps = 03 Nos Suction: 03(No)x355mm(i/d) x15m(length) Sluice valve= 06Nos Non return valve =03Nos
Pumps = 2 Nos Suction: 2(No)x305mm(i/d) x15m(length) Sluice valve= 04Nos Non return valve =02Nos
1 Job
• The pump has almost expired their designed life (installed in 2004-05), operation & maintenance cost is at a very high side.
• The pumps have almost near
to expiry of their life operation and maintenance cost is at a very high side.
• Population density increased and incoming sewage also increased.
• Installed in 2004-05, not
energy efficient and near to expiry of their life.

The Data Collection Survey on Water Supply and Sewerage Sector of Pakistan Final Report
3-52
S.# Locality Requirements Quantity Reason
M.C.C, Electrical cables, Change over etc.
Replacement of existing manual
screen with mechanical screen.
1 Nos
• Manual cleaning of screens is very dangerous.
3. Disposal
Station Suraj Miani
Replacement of existing 15 cusec vertical life expired pumps with 20 cusec submersible close couple with cooling jacket dry well installation including suction and delivery pipes with allied accessories 2 sluice valves and 1 non-return valve for each pump.
Replacement/Rehabilitation of existing electrical equipment’s like M.C.C, HT, Change over etc.
Replacement of existing leaked GRP force main with HDPE/Ductile Iron Pipe 1000mm inner dia.
Replacement of existing Generator sets 500 KVA with 635 KVA
Rehabilitation of existing civil structures (screening chamber, wet wells, dry well)
Replacement of existing manual screen with mechanical screen.
09 Nos
1 Job
3x400m
2 Nos
1 Job
2 Nos
• The pumps have almost expired their designed life (Installed in 2005-06), operation & maintenance cost is at a very high side.
• O&M cost of vertical pumps is higher than the close coupled submersible pumps.
• Catchment area is increased from 2670 acre to 3029 acres i.e., capacity of pumps increased from 15 cusec to 20 cusec.
• Installed in 2005-06 and near to expiry of their life
• Damaged and leaked at various locations
• Installed in 2005-06 and near
to expiry of their life, capacity will be enhanced after installation of pumps with higher capacity
• Structure was originally constructed in 1978 and rehabilitated in 2005-06
• Manual cleaning of screens is very dangerous.
Source:WASA Multan(Partially added by JST)

The Data Collection Survey on Water Supply and Sewerage Sector of Pakistan Final Report
4-1
CURRENT STATUS OF WATER SUPPLY IN HARIPUR, KP PROVINCE 4.1 SOCIO-ECONOMIC STATUS, GEOGRAPHICAL CHARACTERISTICS, DEMOGRAPHY, AND
INDUSTRIES OF HARIPUR
4.1.1 Natural Geographical Features The Haripur District is part of the Hazara region of the Khyber Pakhtunkhawa (KP) province and its main city, Haripur, is located 65 km to the north of the capital city Islamabad and 35 km south of Abbottabad. Haripur became a district in 1991 from the Teshil in the Abbottabad district. The following figure presents the topographical map of the Haripur district. The area circled in red is Haripur city and the black line is the approximate border of the district. Haripur city is located at an altitude of about 610 m above sea level, with the Tarbera Dam in the north, the Magara Hills between Islamabad in the south, and the Dor River flowing from east to west through the center of the city. The area of the Haripur district is 1725 km2.
Source:Topographic-maps.com
Figure 4.1-1 Topography of Haripur District
The figure below shows the administrative division map of the Haripur district. The yellow line is the boundary of the tehsil and there are three tehsils in the Haripur district, namely Haripur, Khanpur and Ghazi. Haripur city area is included in the central Haripur Tehsil.
Tabera Dam
Makara Hills
Haripur
Dor River

The Data Collection Survey on Water Supply and Sewerage Sector of Pakistan Final Report
4-2
Source: from KP Province website
Figure 4.1-2 Administrative division map of Haripur district
4.1.2 Climate in Haripur The hottest month of the year is June with an average temperature of 32 °C while January has the lowest average temperature of 10.1 °C. The annual maximum and minimum temperatures are 40°C and 3° C respectively. Monthly rainfall is highest in August (244 mm) and lowest in November (31 mm).

The Data Collection Survey on Water Supply and Sewerage Sector of Pakistan Final Report
4-3
Source:weather.com
Figure 4.1-3 Temperature and Rainfall in Haripur
4.1.3 Major Water Resources of Haripur District 17 The Haripur district covers an area of 1902 km2, which is 2.56% of the total area of the KP province and is located in the hilly plains at an average altitude of 520 m above sea level. It occupies an important geographical position as it is known as the gateway to the Hazara and the Khyber-Pakhtunkhwa regions and is adjacent to the capital city Islamabad. The region is rich in natural resources and has special significance due to the presence of two important reservoirs, namely the Tarbera Dam and the Khanpur Dam. The major rivers passing through this region are the Dor, the Haro and the mighty Indus. There are also many rivers flowing from the surrounding hills.
The Tarbera Dam is an earth fill dam on the Indus River in the KP province. It is the largest earth fill dam in the world in terms of its structural volume. It forms the Tarbera Reservoir, with a surface area of about 250 square kilometers.
The Khanpur Dam is a dam on the Haro River near the Potohar Plateau and the Khanpur village in the Khyber Pakhtunkhwa. The reservoir, Khanpur Lake, supplies drinking water to Islamabad and Rawalpindi and irrigation water to many agricultural and industrial areas around the city. In Haripur, both surface water and groundwater are important for natural environment, drinking water and irrigation. The groundwater and surface water in this region are abundant in terms of water quantity. Although the main source of water in Haripur is a mixture of groundwater and surface water, the local people use dug wells, shallow wells and springs for drinking and other purposes.
4.1.4 Socioeconomic and Industrial Conditions Based on the percentage of GDP in the KP province (2014-2015), wholesale and retail trade (22%), livestock and poultry (16%), manufacturing (10%) and transport and communication (10%) are significant. The agricultural products with a relatively large share of production in the country are maize (18.87%), barley (18.03%) and tobacco (70%). As for livestock, cattle (14.2%) and goats (11.9%) are the main livestock. On the other hand, a large share of industrial production in the country is also produced by minerals, such as cement (29.49%), tobacco (36.15%), silica sand (20.15%), marble (57.71%) and gypsum (25.72%).
17 Master Plan of Water. Supply and Sanitation for District Haripur (2018), Public Health Engineering Department KP

The Data Collection Survey on Water Supply and Sewerage Sector of Pakistan Final Report
4-4
In the Haripur district, the Hattar Industrial Estate is located in the its southern part and contributes to the local industry. The Hattar Industrial Estate produces food and beverages, textiles, tableware, paper printing, cement, publishing, chemicals, rubber, carpet, and leather products, but there are some problems regarding soil and groundwater pollution.
4.1.5 Population Movements According to the census carried out in 2017, the population of the Haripur district is 1,003,000. This comprise of 899,000 in rural areas and 104,000 in urban areas as specified in the Master Plan. The Master Plan assumes that the future population of the rural areas will be 1,153,000 by 2030, based on an annual population growth rate of 1.93%. 4.1.6 Afghan Refugee Camp The Haripur district has three camps, namely Padhana, Panian-I and Panian-II, located along the lakeshore area of Tarbera dam northwest to the city. The total population of the refugee camps is estimated to be 65,662 as of 2019. The wells for water supply in the camp were constructed by the PHED but are being maintained by the private sector. It is remote and not at all related to the planned urban and rural water supply schemes in the region. 4.2 ORGANIZATIONAL STRUCTURE OF WATER UTILITIES IN HARIPUR
4.2.1 Division of Roles between PHED and TMA As mentioned in 2.2.3 above, water supply and sanitation functions are performed by the Provincial Government and the Tehsil/Town Municipal Administration (TMA). In general, the Public Health Engineering Department of Government (PHED) and the TMA takes the charge of water supply and sanitation in the rural areas and water supply in the urban areas respectively. However, according to the questionnaire answered by the PHED official, the actual practices are as follows:
1) Water supply & sewerage works are executed by the PHE Departments in rural areas and small-scale projects in the urban area are carried out by the Tehsil Municipal Administrations. However, large scale projects are entrusted to the PHED in urban areas as well. These projects are funded by the Provincial Government under the Annual Development Programme (ADP).
2) The Urban Development Wing of the Planning & Development Department mostly deals with the policies, strategies, and legal framework for the urban development while infrastructure development is carried out by the other Nation Building Departments.
3) In Haripur, house plans are approved by the TMA Haripur. They have enforced regulations for building construction. However, for project implementation, only administrative approval from the concerned forum is needed.
4) the Deputy Commissioner, being the Land Revenue Collector has the power to acquire the required land for public purpose.
5) The Public Health Engineering Department has its own technical standards for water supply.

The Data Collection Survey on Water Supply and Sewerage Sector of Pakistan Final Report
4-5
In capital cities of the seven divisions including the provincial capital Peshawar, Water Supply and Sanitation Services Companies (WSSC) are established under the Provincial Government in 2017 to merge the function of the PHED and the TMA to provide services such as drinking water supply and sewerage and drainage management in urban centers. However, there are no plans to expand the WSSC outside the divisional headquarters like Haripur. 4.2.2 PHED’s Organizational Structure The administrative head is the Secretary appointed by the Provincial Government. Figure 4.2- 1 shows the organogram of the PHED headquarter. Yellow-highlighted are the posts which Haripur belongs to.
Source: The PHED Haripur
In terms of water supply and sanitation, the whole area of the province is divided into two; namely, north and south. The Hazara Division where Haripur District is located belongs to the North. The Superintending Engineer of BPS-18 stationed at Abbottabad manages the six branches such as Haripur and Abbottabad. The administrative head of the Haripur branch is the Executive Engineer (X-EN) of BPS-18. Figure 4.2-1 shows the organogram of the Abbottabad Circle of PHED. Blue-highlighted portion indicates the X-EN in Haripur District. The PHED Haripur was established as a branch of the PHED Abbottabad in 1972 and became independent in 1994 consisting of two branches, Haripur and Ghazi.
Figure 4.2- 1 Organogram of PHED Headquarters

The Data Collection Survey on Water Supply and Sewerage Sector of Pakistan Final Report
4-6
Source: PHED Haripur
Figure 4.2-1 PHED Abbottabad District (Hazara District) Organization Chart (Haripur in the red lines chain)
Table 4.2-1 shows the strength and working/vacant status of the PHED Haripur.
Table 4.2-1 Sanctioned Strength and Status of the PHED Haripur No. Designation BPS Sanctioned
Strength Working Vacancy
A 1 Executive Engineer 18 1 1 0 2 Subdivision Officer 17 2 2 0 3 Head Clerk 16 1 1 0 4 Assistant Social Mobilizer 16 1 1 0 5 Divisional Account Officer 16 1 1 0 Sub Total (Officer) 6 6 0 6 Senior Clerk 14 3 3 0 7 Stenographer 14 1 0 1 8 Division Head Draftsman 13 1 1 1 9 Draftsman 12 1 1 1 10 Sub Engineer 12 6 4 2 11 Junior Clerk 11 10 8 2 12 Accounts Clerk 10 2 2 0 13 Tracer 7 1 0 1 14 Driver 6 3 1 2
15 Post man who delivers letters, applications one office to other offices 3 2 2 0
16 Watchman 3 2 2 0 17 Office Boy 3 1 1 0 18 Office Boy 3 5 4 1 19 Sweeper 3 2 2 0 Sub Total (Officials) 40 31 9 Total (Office Based) 46 37 9

The Data Collection Survey on Water Supply and Sewerage Sector of Pakistan Final Report
4-7
No. Designation BPS Sanctioned Strength Working Vacancy
B Field Staff (Operational Staff) 1 Pipe Fitter 6 1 0 1 2 Pump Operator 6 87 87 0 3 Labor in charge 4 3 3 0 4 Watchman 3 64 64 0 5 Operator-Valve man 3 15 15 0 6 Operator-Watchman 3 150 120 30 7 Valve man 3 73 73 0 8 Valve man-Watchman 3 20 14 6 Sub Total (Field staffs) 413 376 37 Grand Total 459 413 46
Source: PHED Haripur
The number of staff assigned to the tube-well water supply facility as field workers (operators, valve operators, and security guards) is 413, out of which there are 37 vacancies. Although it seems that the responsibilities of operators, valve operators, and security guards are divided, the actual situation is that pump operation is limited to turning on and off on the pump control panel, and valve operation is limited to switching multiple valves in the distribution pipes. The total number of water supply and sanitation facilities managed by the PHED is 307, and multiple personnel are assigned to each facility, so a vacancy of about 37 personnel is not considered to be a problem for daily operation.
4.2.3 TMA's Organizational Structure and Personnel The organizational structure of the TMA is shown in the Table below. The total number of staff are shown for the various divisions except for the water supply division.
Table 4.2-2 Organization of TMA Haripur and its Staff Numbers No Name of Post BPS No of Staff Tehsil Nazim
TOTAL 5 Tehsil Naib Nazim
TOTAL 5 Administration
TOTAL 23 Finance Branch
TOTAL 17 Infrastructure &Services Branch
TOTAL 42 Regulation Branch
TOTAL 39 Water Supply Branch 1 Electric Supervisor 14 1 2 Water supply Supervisor (Vacant) 09 1 3 Water supply Inspector 08 1 4 Head Fitter 07 1 5 Pipe Fitter 06/04 3 6 Tube well operator 04 68 7 Valve Man 04 16 8 Plumber 04 6 9 Drains cleaner 03 2 10 Night watchman 03 1
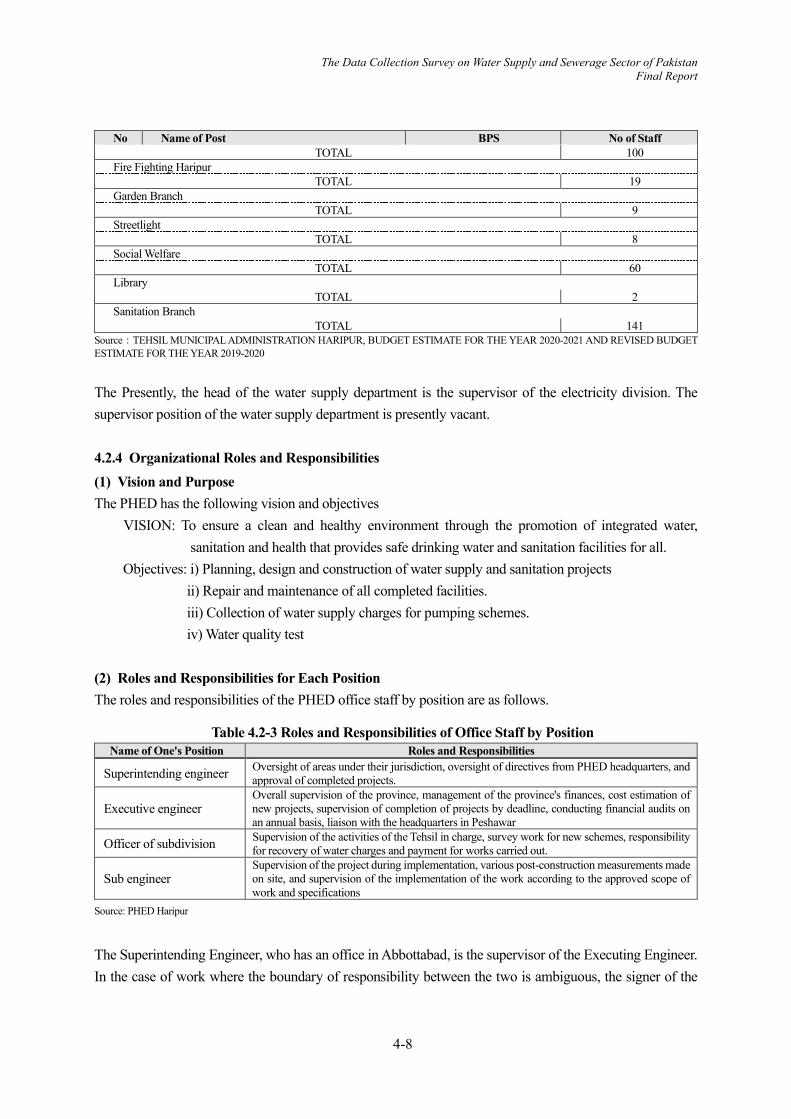
The Data Collection Survey on Water Supply and Sewerage Sector of Pakistan Final Report
4-8
No Name of Post BPS No of Staff TOTAL 100
Fire Fighting Haripur TOTAL 19
Garden Branch TOTAL 9
Streetlight TOTAL 8
Social Welfare TOTAL 60
Library TOTAL 2
Sanitation Branch TOTAL 141
Source:TEHSIL MUNICIPAL ADMINISTRATION HARIPUR, BUDGET ESTIMATE FOR THE YEAR 2020-2021 AND REVISED BUDGET ESTIMATE FOR THE YEAR 2019-2020
The Presently, the head of the water supply department is the supervisor of the electricity division. The supervisor position of the water supply department is presently vacant.
4.2.4 Organizational Roles and Responsibilities (1) Vision and Purpose The PHED has the following vision and objectives
VISION: To ensure a clean and healthy environment through the promotion of integrated water, sanitation and health that provides safe drinking water and sanitation facilities for all.
Objectives: i) Planning, design and construction of water supply and sanitation projects ii) Repair and maintenance of all completed facilities. iii) Collection of water supply charges for pumping schemes. iv) Water quality test
(2) Roles and Responsibilities for Each Position The roles and responsibilities of the PHED office staff by position are as follows.
Table 4.2-3 Roles and Responsibilities of Office Staff by Position Name of One's Position Roles and Responsibilities
Superintending engineer Oversight of areas under their jurisdiction, oversight of directives from PHED headquarters, and approval of completed projects.
Executive engineer Overall supervision of the province, management of the province's finances, cost estimation of new projects, supervision of completion of projects by deadline, conducting financial audits on an annual basis, liaison with the headquarters in Peshawar
Officer of subdivision Supervision of the activities of the Tehsil in charge, survey work for new schemes, responsibility for recovery of water charges and payment for works carried out.
Sub engineer Supervision of the project during implementation, various post-construction measurements made on site, and supervision of the implementation of the work according to the approved scope of work and specifications
Source: PHED Haripur
The Superintending Engineer, who has an office in Abbottabad, is the supervisor of the Executing Engineer. In the case of work where the boundary of responsibility between the two is ambiguous, the signer of the

The Data Collection Survey on Water Supply and Sewerage Sector of Pakistan Final Report
4-9
documents is being checked on a case-by-case basis. With respect to new projects, the survey is handled by the Officer of the subdivision and the construction supervision is being handled by the sub engineer.
(3) Administrative Facility The total nos. of water supply and sanitation schemes managed by the PHED are 307 schemes, which are shown in the table below.
Table 4.2-4 Quantity of Water Supply and Sanitation Facilities under PHED Jurisdiction Type of facility quantity
Tube well water supply facilities 250
Gravity Water Supply Facilities 53
sanitary facilities four
Source: PHED Haripur
On the other hand, there may be more than one tube well within a scheme, but amongst the 250 schemes, there are 259 tube wells that are in operation and 15 tube wells that have been abandoned. The reason for abandonment is mainly due to low water levels in the tube wells. 4.3 TARIFF SYSTEM AND FINANCIAL STATUS OF WATER UTILITIES IN HARIPUR
4.3.1 Financial Status of the PHED Haripur The following table shows the expenditure on maintenance, construction works and personnel costs of the PHED Haripur. In comparison with the amount of water tariffs collected, the financial management status is sustained by the subsidies received from the general account of the national and provincial governments. The budget scale of the utility during the past three years shows an increasing trend at an average of 1.09 points.
Financial resources: Own financial resources (water rate revenue) account for approximately 6% of operating
expenses, and approximately 10% of maintenance and management costs (excluding personnel costs).
Main source of funding: subsidies from federal and provincial governments, and grants and loans from international donors
Three-year increase/decrease of the budget: 1.09% growth rate with decrease of costs for construction works and increase of maintenance costs.
Table 4.3-1 PHED Haripur Expenditure (Budget)
S. No. Year Salary Budget Non-Salary
Budget Development
Budget
total growth rate Amount
(PKR) one 2016-17 103,658,290 345,063,765 161,549,000 610,271,055 -. two 2017-18 120,550,400 340,192,643 152,280,000 613,023,043 1.00 three 2018-19 127,492,270 470,541,032 123,188,000 721,221,302 1.17 Three-year rate 0.181 0.594 0.225 1.00 1.09
Source:: Public Health Engineering Division Haripur PHED_KP Province Gov.

The Data Collection Survey on Water Supply and Sewerage Sector of Pakistan Final Report
4-10
Table 4.3-2 PHED Haripur Expenditure (Breakdown)
S. No. Object Heads Item of expenditure
Progressive Total 2018-19
Execution at the end of June 2019
Share Percentage (%)
one A011 Total Salary Pay 77,840,875 25.6 two A012- Total Regular Allowances 49,652,260 16.3 three A03-Operating Expensive 136,723,051 44.9 four A05-Grants / Subsides 600,000. 0.2 A04- Encashment of L.P.R. 1,777,594 0.6 five A06-Transfers 0 0.0 six A09-Physical Assessments 614,930 0.2 seven A13-Repair & Machinery 37,207,524 12.2 total 304,416,234 100.0
Source:Consolidated Reconciliation Statements of (Pay and Allowances) for the Month 06/2019 In Respect of Public Health Engineer: Division Haripur (HR-7018 Haripur)
The water tariff is set at a fixed rate of 120 PKR/month per household connection, and in addition to the conventional payment at the payment counter, the PHED is improving the tariff collection system by encouraging the use of automatic bank account deductions. The share of paid amounts for water tariff in the total household expenditure is estimated at about 0.4% for an average household and about 1% for a low-income household, assuming a family size of 6 persons/household; thus, it can be said that water services are provided at an affordable cost, as per the policy of the KP Province.
Water tariff billing is calculated by multiplying the number of household connections by a fixed charge of PKR 120 / month for 12 months. In 2019-20, 46,276 households were connected, and PKR 66,637,440 (46,276 x 120 x 12) were billed, while tariff revenue declined due to the outbreak of COVID-19. However, the one in 2020-21 is expected to be higher than the last year.
Table 4.3-3 Water Tariff Collection in PHED Haripur
S. No.
counter for years (following a
number in the hito-futa-mi
counting system)
Total number of households
Collection target amount
amount billed or claimed
actual amount collected
one 2016-17 42,108 21,946,000 60,635,520 38,642,615 two 2017-18 43,489 30,800,000 62,624,160 39,847,305 three 2018-19 45,241 44,432,000 65,147,040 40,839,303 four 2019-20 46,276 30,000,000 66,637,440 36,131,000
water rates (charges)
120 PKR per household per month, levied quarterly (360 PKR for 3 months) Fee notification: electronic, bank account debit
Annual Targets. In 2016-17 and 2017-18, the target amount was significantly achieved; in 2018-19, the target amount was not achieved; the January fee collection is delayed due to the impact of the quarterly notification. Exceeded KP's 2016-17 OBB (output-based) target performance of 70%.
Amount collected per year.
Annual fee collections are growing at 2.8% (two-year average).
Source: PHED_KP Province Gov.
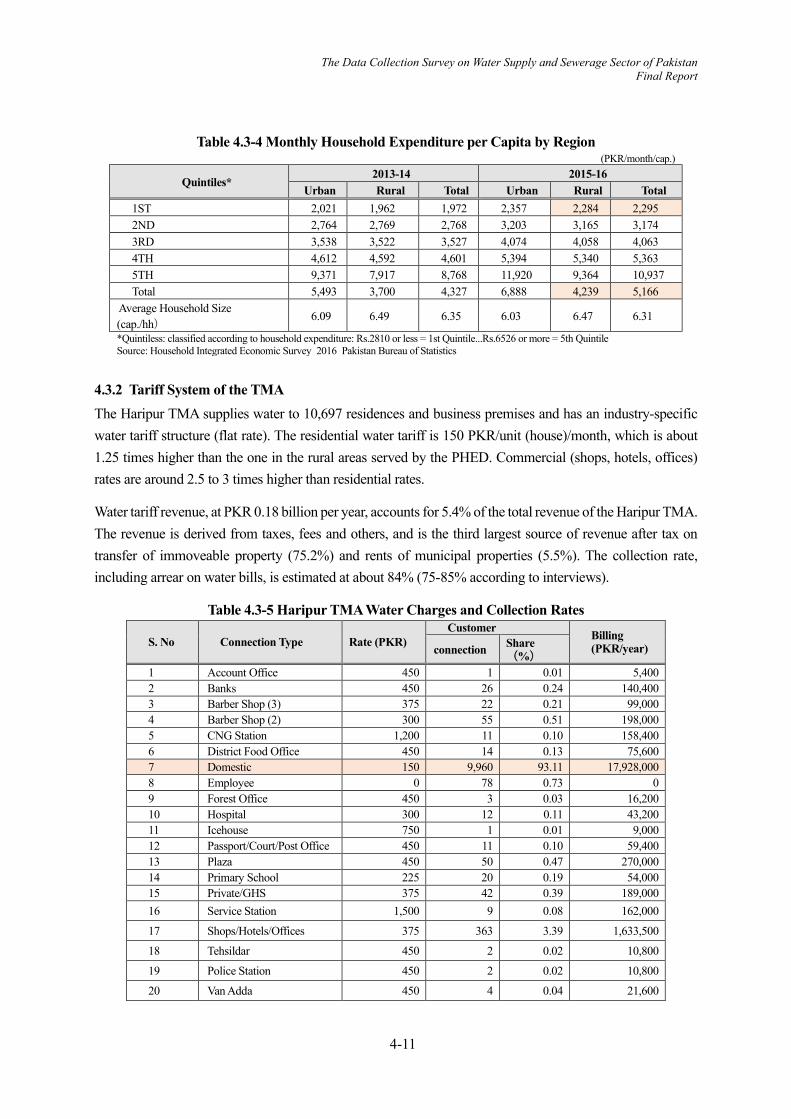
The Data Collection Survey on Water Supply and Sewerage Sector of Pakistan Final Report
4-11
Table 4.3-4 Monthly Household Expenditure per Capita by Region (PKR/month/cap.)
Quintiles* 2013-14 2015-16
Urban Rural Total Urban Rural Total 1ST 2,021 1,962 1,972 2,357 2,284 2,295 2ND 2,764 2,769 2,768 3,203 3,165 3,174 3RD 3,538 3,522 3,527 4,074 4,058 4,063 4TH 4,612 4,592 4,601 5,394 5,340 5,363 5TH 9,371 7,917 8,768 11,920 9,364 10,937 Total 5,493 3,700 4,327 6,888 4,239 5,166
Average Household Size (cap./hh)
6.09 6.49 6.35 6.03 6.47 6.31
*Quintiless: classified according to household expenditure: Rs.2810 or less = 1st Quintile...Rs.6526 or more = 5th Quintile Source: Household Integrated Economic Survey_2016_Pakistan Bureau of Statistics
4.3.2 Tariff System of the TMA The Haripur TMA supplies water to 10,697 residences and business premises and has an industry-specific water tariff structure (flat rate). The residential water tariff is 150 PKR/unit (house)/month, which is about 1.25 times higher than the one in the rural areas served by the PHED. Commercial (shops, hotels, offices) rates are around 2.5 to 3 times higher than residential rates.
Water tariff revenue, at PKR 0.18 billion per year, accounts for 5.4% of the total revenue of the Haripur TMA. The revenue is derived from taxes, fees and others, and is the third largest source of revenue after tax on transfer of immoveable property (75.2%) and rents of municipal properties (5.5%). The collection rate, including arrear on water bills, is estimated at about 84% (75-85% according to interviews).
Table 4.3-5 Haripur TMA Water Charges and Collection Rates
S. No Connection Type Rate (PKR) Customer Billing
(PKR/year) connection Share(%)
1 Account Office 450 1 0.01 5,400 2 Banks 450 26 0.24 140,400 3 Barber Shop (3) 375 22 0.21 99,000 4 Barber Shop (2) 300 55 0.51 198,000 5 CNG Station 1,200 11 0.10 158,400 6 District Food Office 450 14 0.13 75,600 7 Domestic 150 9,960 93.11 17,928,000 8 Employee 0 78 0.73 0 9 Forest Office 450 3 0.03 16,200 10 Hospital 300 12 0.11 43,200 11 Icehouse 750 1 0.01 9,000 12 Passport/Court/Post Office 450 11 0.10 59,400 13 Plaza 450 50 0.47 270,000 14 Primary School 225 20 0.19 54,000 15 Private/GHS 375 42 0.39 189,000 16 Service Station 1,500 9 0.08 162,000
17 Shops/Hotels/Offices 375 363 3.39 1,633,500
18 Tehsildar 450 2 0.02 10,800
19 Police Station 450 2 0.02 10,800
20 Van Adda 450 4 0.04 21,600
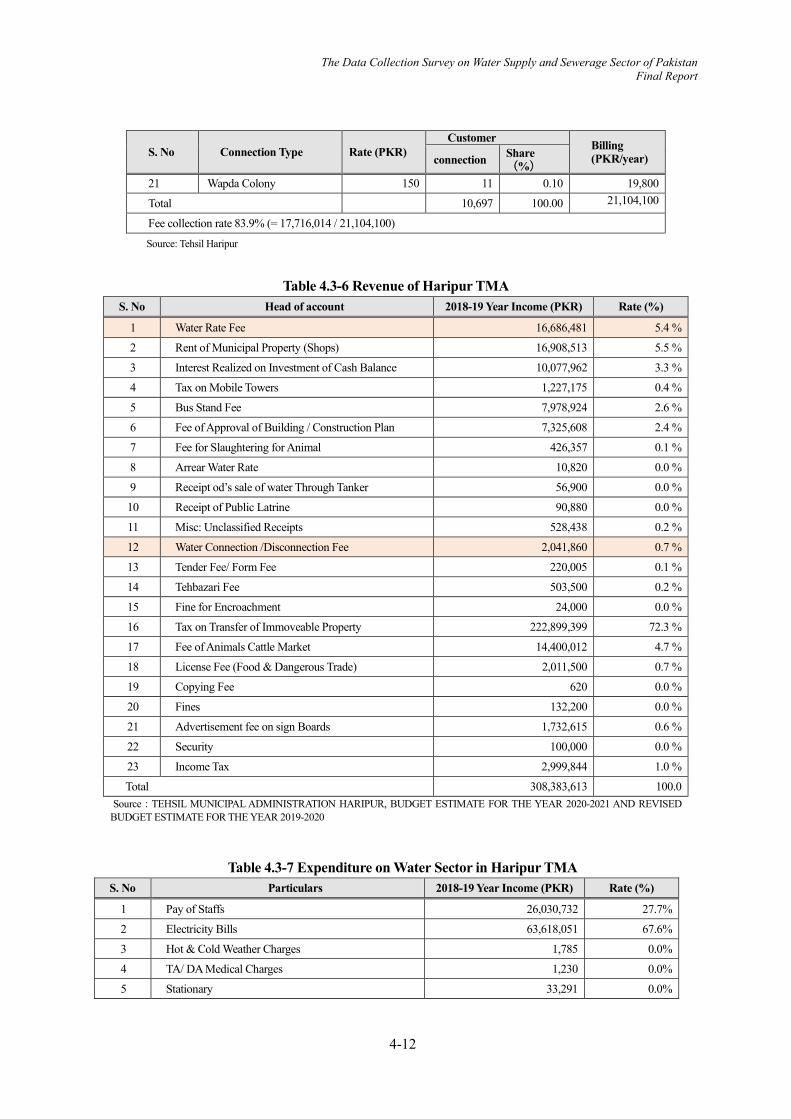
The Data Collection Survey on Water Supply and Sewerage Sector of Pakistan Final Report
4-12
S. No Connection Type Rate (PKR) Customer Billing
(PKR/year) connection Share(%)
21 Wapda Colony 150 11 0.10 19,800
Total 10,697 100.00 21,104,100
Fee collection rate 83.9% (= 17,716,014 / 21,104,100)
Source: Tehsil Haripur
Table 4.3-6 Revenue of Haripur TMA
S. No Head of account 2018-19 Year Income (PKR) Rate (%)
1 Water Rate Fee 16,686,481 5.4 %
2 Rent of Municipal Property (Shops) 16,908,513 5.5 %
3 Interest Realized on Investment of Cash Balance 10,077,962 3.3 %
4 Tax on Mobile Towers 1,227,175 0.4 %
5 Bus Stand Fee 7,978,924 2.6 %
6 Fee of Approval of Building / Construction Plan 7,325,608 2.4 %
7 Fee for Slaughtering for Animal 426,357 0.1 %
8 Arrear Water Rate 10,820 0.0 %
9 Receipt od’s sale of water Through Tanker 56,900 0.0 %
10 Receipt of Public Latrine 90,880 0.0 %
11 Misc: Unclassified Receipts 528,438 0.2 %
12 Water Connection /Disconnection Fee 2,041,860 0.7 %
13 Tender Fee/ Form Fee 220,005 0.1 %
14 Tehbazari Fee 503,500 0.2 %
15 Fine for Encroachment 24,000 0.0 %
16 Tax on Transfer of Immoveable Property 222,899,399 72.3 %
17 Fee of Animals Cattle Market 14,400,012 4.7 %
18 License Fee (Food & Dangerous Trade) 2,011,500 0.7 %
19 Copying Fee 620 0.0 %
20 Fines 132,200 0.0 %
21 Advertisement fee on sign Boards 1,732,615 0.6 %
22 Security 100,000 0.0 %
23 Income Tax 2,999,844 1.0 %
Total 308,383,613 100.0 Source:TEHSIL MUNICIPAL ADMINISTRATION HARIPUR, BUDGET ESTIMATE FOR THE YEAR 2020-2021 AND REVISED
BUDGET ESTIMATE FOR THE YEAR 2019-2020
Table 4.3-7 Expenditure on Water Sector in Haripur TMA S. No Particulars 2018-19 Year Income (PKR) Rate (%)
1 Pay of Staffs 26,030,732 27.7%
2 Electricity Bills 63,618,051 67.6%
3 Hot & Cold Weather Charges 1,785 0.0%
4 TA/ DA Medical Charges 1,230 0.0%
5 Stationary 33,291 0.0%

The Data Collection Survey on Water Supply and Sewerage Sector of Pakistan Final Report
4-13
S. No Particulars 2018-19 Year Income (PKR) Rate (%)
6 Repair & Maintenance & Purchase of Tube Well Motors Installation of New Pipeline 4,395,826 4.7%
TOTAL 94,080,915 Source:TEHSIL MUNICIPAL ADMINISTRATION HARIPUR, BUDGET ESTIMATE FOR THE YEAR 2020-2021 AND REVISED BUDGET
ESTIMATE FOR THE YEAR 2019-2020
Estimating the annual income and expenditure of the water supply related sections, the expenditure amounts to 94,080,915 (PKR) against an income of 16,686,481 (PKR). The annual deficit amounts to 77,394,434 (PKR) and the revenue income covers only 17.7% of the expenditure. Electricity accounts for 67.6% or about two-thirds of the total expenditure. In recent years, a sharp rise in the unit price of electricity has become a problem, and there is an urgent need to reduce electricity consumption.
4.4 CURRENT STATUS OF WATER SUPPLY FACILITIES IN HARIPUR
Both urban and rural water supply facilities use tube wells as their water source. There are two methods: water pumped up from a tube well by a submersible motor pump is distributed directly to each household, and water is stored once in an elevated tank and distributed by gravity. In this section, we will divide the water supply facilities into those in urban and rural areas.
4.4.1 Water Facilities in Urban Area The water supply facilities in the city of Haripur are based on the system of pumping up groundwater using tube wells, storing it once in an elevated tank, and distributing the same from there by gravity. However, since there are no drawings pertaining to the piping layout of the existing facilities, it is possible that some of the water is distributed directly by submersible motor pumps, but neither the TMA or the PHED has an accurate grasp of this system.
There are 31 tube wells operating as water supply facilities managed by the TMA. The list of facilities are shown in the table below. Out of these, 5 problematic sites were inspected. 3 sites could not operate due to the low water level and the water supply was stopped. Therefore, new tube wells were drilled at No. 15 and No. 17 sites.
Table 4.4-1 List of Tube Wells Managed by TMA No Site Name GPS coordinates Operation/Stop Findings (sites visited)
1 Mohallah Session House 33°59'44.00''N 72°56'32.00'''E Operation -.
2 Mohallah Tanki (Chungi No.4)
33°59'37.00''N 72°56'59.00'''E Operation -.
3 Mohallah Awan Colony 33°59'45.00''N 72°56'45.00'''E Operation -.
4 Mohallah Akber Aban Ger khan rodd
33°59'37.89''N 72°56'31.46'''E Operation -.
5 Mohallah Al-Hamra GT road 33°59'40.00''N 72°56'24.00'''E Operation -.
6 Mohallah Ramzani Circular torad
33°59'54.72''N 72°56'10.42'''E Operation -.
7 Mohallah Feroz-pura No.1 Circular road
34°00'00.8 "N, 72°56'09.9 "E Operation
Tube well depth was 380 ft (115.8 m), and static water level was reduced from 100 ft (30.5 m) to 170 ft (51.8 m)
8 Mohallah Feroz-pura No.2 34°00'1.49'''N Operation -.

The Data Collection Survey on Water Supply and Sewerage Sector of Pakistan Final Report
4-14
No Site Name GPS coordinates Operation/Stop Findings (sites visited) Circular road 72°56'13.51'''E
9 Mohallah Fort road 34°00'8.35''N 72°56'22.04'''E Operation -.
10 Mohallah Asif Abad (Darband Adda)
34°00'12.7 "N 72°56'04.6 "E Operation
The depth of the tube well is 400 ft (121.9 m), the static water level has decreased from 160 ft (48.8 m) to 180 ft (54.9 m), and the pumping rate has decreased from 32m3 / hr to 18m3 / hr after construction.
11 Mohallah Babu (St No.8) Daeband Adda
34°00'17.89 "N, 72°55'53.27 "E Operation -.
12 Mohallah Dheri road 34°00'28.45 "N, 72°56'19.93 "E Operation -.
13 Mohallah Khoo 34°00'4.55 "N, 72°55'51.63 "E Operation -.
14 Mohallah Model City Dheendah road
33°59'56.62 "n, 72°55'23.93 "E Operation -.
15 Mohallah Zafar Park GT road 33°59'44 "N, 72°55'51 "E Stop
The first tube well dried up and a second tube well was drilled in 2012, but the water quality was so poor that it was not used. The third tube well is being drilled.
16 Mohallah Chaman Park GT road
33°59'41.95 "n, 72°56'1.32 "E Operation -.
17 Mohallah Saddar Bazar Khanpur road
33°59'36.5 "N, 72°55'57.2 "E Stop
- Pump installation depth decreased from 180 ft (54.9 m) to 340 ft (103.6 m) and stopped. - A new tube well is being drilled nearby.
18 Mohallah Eid Gah No.1 Khanpur road
33°59'19.4 "N, 72°55'40.68 "E Operation -.
19 Mohallah Eid Gah No.2 Khanpur road
33°59'11.78 "n, 72°55'41.44 "E Operation -.
20 Mohallah Afzal Abad (Central Jail)
33°58'46.72 "n, 72°55'22.66 "E Operation -.
21 Mohallah Alam Abad (Back TIP Housing Society)
33°58'14.01 "n, 72°56'6.00 "E Operation -.
22 Mohallah Noor Colony No.4 (Kachi rd)
33°58'5.6 "N, 72°54'52.02 "E Operation -.
23 Mohallah Noor Colony No.3 (Kachi rd)
33°57'57.78 "N, 72°55'0.12 "E Operation -.
24 Mohallah Noor Colony No.1 (Kachi rd)
33°58'16.48 "n, 72°55'11.64 "E Operation -.
25 Mohallah Noor Colony No.2 (Kachi rd)
33°58'16.02 "n, 72°54'52.82 "E Operation -.
26 Mohallah Roshan Amad 33°58'41.3 "n, 72°55'40.00 "E Operation -.
27 Mohallah Aziz Colony (Central Hail Chowk)
33°58'40.83 "n, 72°55'24.68 "E Operation -.
28 Mohallah Pir Colony 33°59'1.45 "N, 72°55'3.55 "E Operation -.
29 Mohallah Pathan Colony 33°59'8.87 "N, 72°54'53.35 "E Operation -.
30 Mohallah Nasim Town Kangara road
33°58'56.54 "n, 72°54'17.76 "E Operation -.
31 Mohallah Malik pura Tensil road
33°59'51 "N, 72°56'25.1 "E Stop
- Pumping rate dropped from 88 to 40 m3/ hr, and then to 5 m3/ hr six months ago, and use stopped. - Water is supplied from a nearby tube well.
Source: JST
Out of 31 wells in Haripur, 6 wells are being newly constructed because bacteria were detected in the tube wells due to contamination from the ground surface. The aquifers of these six wells were changed from the existing wells, but a barrier layer of 50 feet (about 15 meters) using cement or other material was added to the surface layer to prevent contamination of the tube wells from the ground surface during drilling.
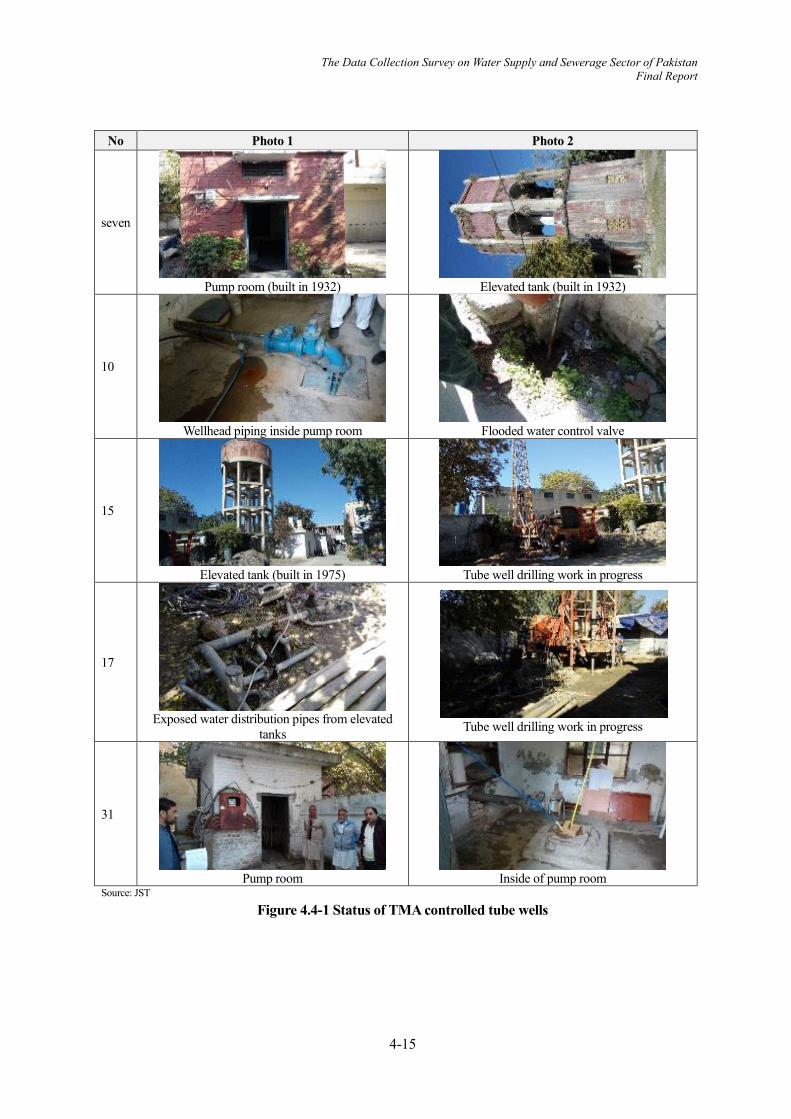
The Data Collection Survey on Water Supply and Sewerage Sector of Pakistan Final Report
4-15
No Photo 1 Photo 2
seven
Pump room (built in 1932)
Elevated tank (built in 1932)
10
Wellhead piping inside pump room
Flooded water control valve
15
Elevated tank (built in 1975)
Tube well drilling work in progress
17
Exposed water distribution pipes from elevated
tanks
Tube well drilling work in progress
31
Pump room
Inside of pump room
Source: JST
Figure 4.4-1 Status of TMA controlled tube wells
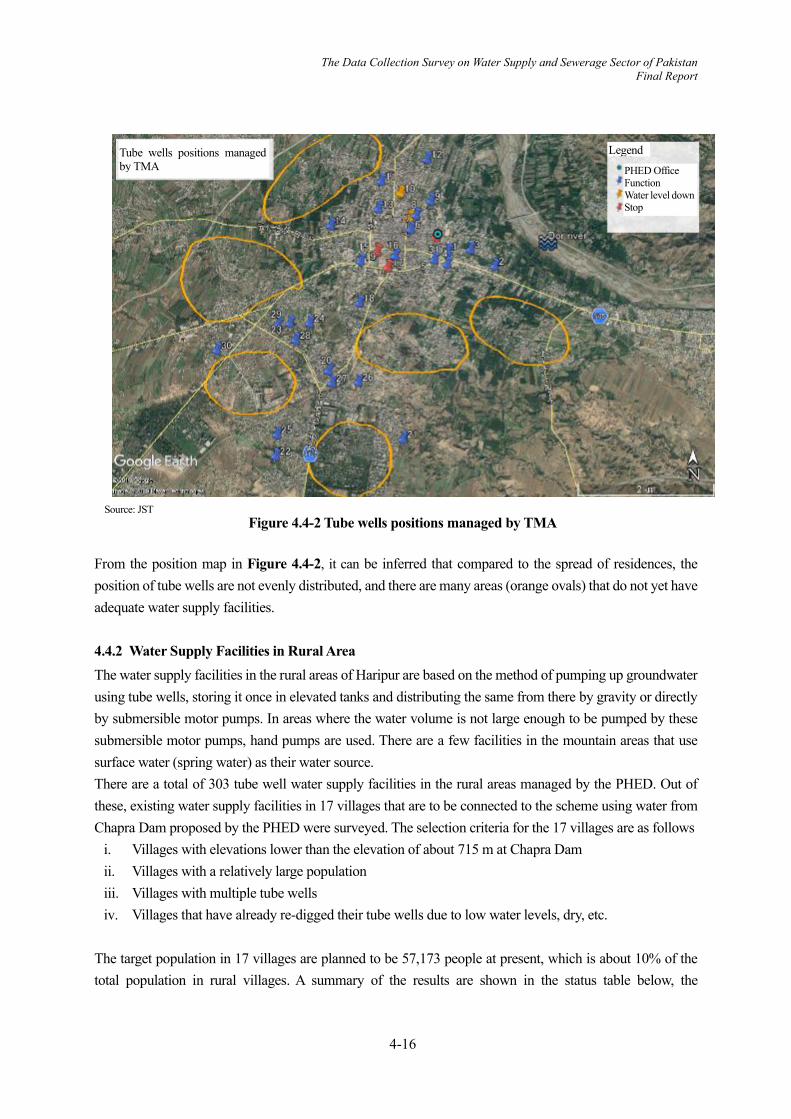
The Data Collection Survey on Water Supply and Sewerage Sector of Pakistan Final Report
4-16
Source: JST
Figure 4.4-2 Tube wells positions managed by TMA
From the position map in Figure 4.4-2, it can be inferred that compared to the spread of residences, the position of tube wells are not evenly distributed, and there are many areas (orange ovals) that do not yet have adequate water supply facilities.
4.4.2 Water Supply Facilities in Rural Area The water supply facilities in the rural areas of Haripur are based on the method of pumping up groundwater using tube wells, storing it once in elevated tanks and distributing the same from there by gravity or directly by submersible motor pumps. In areas where the water volume is not large enough to be pumped by these submersible motor pumps, hand pumps are used. There are a few facilities in the mountain areas that use surface water (spring water) as their water source. There are a total of 303 tube well water supply facilities in the rural areas managed by the PHED. Out of these, existing water supply facilities in 17 villages that are to be connected to the scheme using water from Chapra Dam proposed by the PHED were surveyed. The selection criteria for the 17 villages are as follows
i. Villages with elevations lower than the elevation of about 715 m at Chapra Dam ii. Villages with a relatively large population iii. Villages with multiple tube wells iv. Villages that have already re-digged their tube wells due to low water levels, dry, etc.
The target population in 17 villages are planned to be 57,173 people at present, which is about 10% of the total population in rural villages. A summary of the results are shown in the status table below, the
Tube wells positions managed by TMA
Legend
PHED Office Function Water level down Stop

The Data Collection Survey on Water Supply and Sewerage Sector of Pakistan Final Report
4-17
photographs in Figure 4.4-3 and the village location map in Figure 4.4-4. Table 4.4-2 Current status of water supply facilities in rural areas
No Site Name GPS coordinates Population Operation/
Stop
Year of pump
installation
Pump operation
time Findings (sites visited)
L2 Serai Saleh 33°58'45.9 "N, 72°59'15.4 "E
18,560 Operation Old 1994/ New 2017 8 hours.
- There are two tube wells, one old and one new, and their depths are increased from 300 ft (91.4 m) to 400 ft (121.9 m). The static water level is also lowered from 90 to 140 ft (42.7 m). The old tube well is not currently being used. - The pumping rate of the
new tube well is 12 m3/ hr.
L5 Kamel Pur 33°56'13.4 "N, 72°59'25.5 "E
1,360 Stop Old 2008/ New 2019 -.
- The old tube well had a water flow of 8 m3/ hr at first, but it was abandoned when the water flow became low. The depth of the old tube well is 250 ft (76.2 m) and 400 ft (121.9 m) in the new tube well. - For new tube well, the
pump rooms have not constructed yet.
L6 Pind Jamal Khan
33°56'01.7 "N, 72°59'50.6 "E
1,914 Operation 2016 10-13 hours
Tube well depth is 296 ft (90.2 m), static water level is 190 ft (57.9 m), and pumping rate is 10 m3/ hr
L8 Kahal Bala 33°56'07.4 "N, 72°58'20.5 "E
4,210
Operation 1990. 8 hours.
The depth of the tube well is 426 ft (129.8 m), the static water level is 160 ft (48.8 m), and the pumping rate was 20 m3/ hr immediately after construction, but is now 14 m3/ hr, which becomes low.
L18 Kahal Payin
33°56'10.3 "N, 72°57'53.6 "E
Operation 2016 4 hours.
- The depth of the tube well is 440 ft (134.1 m), the static water level is 165 ft (50.3 m), and the pumping rate is 22 m3/hr. - Only about 100
households are connected to this tube well.
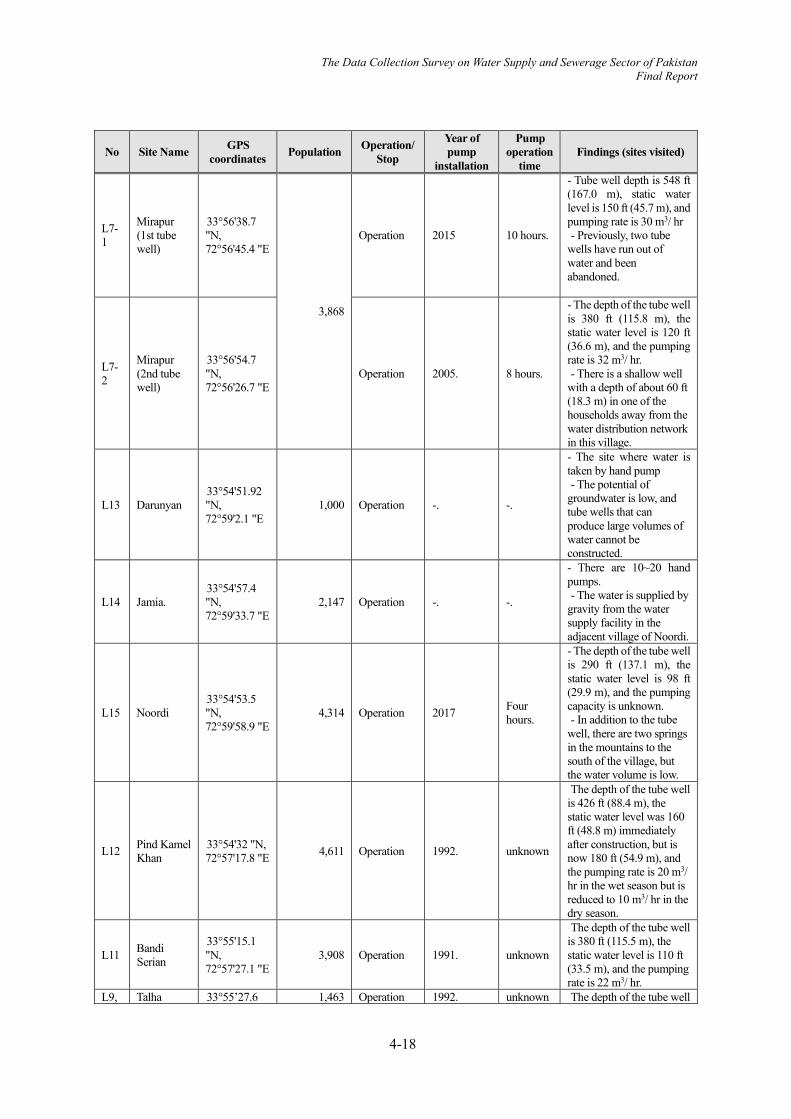
The Data Collection Survey on Water Supply and Sewerage Sector of Pakistan Final Report
4-18
No Site Name GPS coordinates Population Operation/
Stop
Year of pump
installation
Pump operation
time Findings (sites visited)
L7-1
Mirapur (1st tube well)
33°56'38.7 "N, 72°56'45.4 "E
3,868
Operation 2015 10 hours.
- Tube well depth is 548 ft (167.0 m), static water level is 150 ft (45.7 m), and pumping rate is 30 m3/ hr - Previously, two tube
wells have run out of water and been abandoned.
L7-2
Mirapur (2nd tube well)
33°56'54.7 "N, 72°56'26.7 "E
Operation 2005. 8 hours.
- The depth of the tube well is 380 ft (115.8 m), the static water level is 120 ft (36.6 m), and the pumping rate is 32 m3/ hr. - There is a shallow well
with a depth of about 60 ft (18.3 m) in one of the households away from the water distribution network in this village.
L13 Darunyan 33°54'51.92 "N, 72°59'2.1 "E
1,000 Operation -. -.
- The site where water is taken by hand pump - The potential of
groundwater is low, and tube wells that can produce large volumes of water cannot be constructed.
L14 Jamia. 33°54'57.4 "N, 72°59'33.7 "E
2,147 Operation -. -.
- There are 10~20 hand pumps. - The water is supplied by
gravity from the water supply facility in the adjacent village of Noordi.
L15 Noordi 33°54'53.5 "N, 72°59'58.9 "E
4,314 Operation 2017 Four hours.
- The depth of the tube well is 290 ft (137.1 m), the static water level is 98 ft (29.9 m), and the pumping capacity is unknown. - In addition to the tube
well, there are two springs in the mountains to the south of the village, but the water volume is low.
L12 Pind Kamel Khan
33°54'32 "N, 72°57'17.8 "E 4,611 Operation 1992. unknown
The depth of the tube well is 426 ft (88.4 m), the static water level was 160 ft (48.8 m) immediately after construction, but is now 180 ft (54.9 m), and the pumping rate is 20 m3/ hr in the wet season but is reduced to 10 m3/ hr in the dry season.
L11 Bandi Serian
33°55'15.1 "N, 72°57'27.1 "E
3,908 Operation 1991. unknown
The depth of the tube well is 380 ft (115.5 m), the static water level is 110 ft (33.5 m), and the pumping rate is 22 m3/ hr.
L9, Talha 33°55’27.6 1,463 Operation 1992. unknown The depth of the tube well
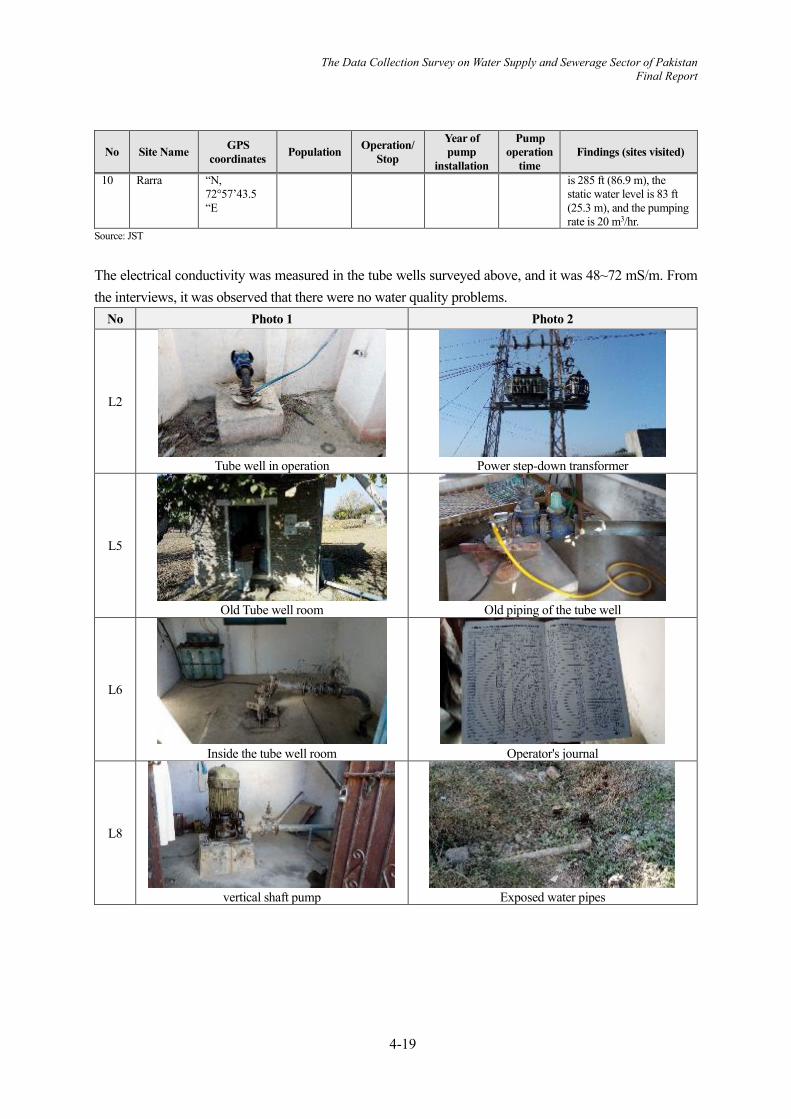
The Data Collection Survey on Water Supply and Sewerage Sector of Pakistan Final Report
4-19
No Site Name GPS coordinates Population Operation/
Stop
Year of pump
installation
Pump operation
time Findings (sites visited)
10 Rarra “N, 72°57’43.5 “E
is 285 ft (86.9 m), the static water level is 83 ft (25.3 m), and the pumping rate is 20 m3/hr.
Source: JST
The electrical conductivity was measured in the tube wells surveyed above, and it was 48~72 mS/m. From the interviews, it was observed that there were no water quality problems.
No Photo 1 Photo 2
L2
Tube well in operation
Power step-down transformer
L5
Old Tube well room
Old piping of the tube well
L6
Inside the tube well room
Operator's journal
L8
vertical shaft pump
Exposed water pipes

The Data Collection Survey on Water Supply and Sewerage Sector of Pakistan Final Report
4-20
No Photo 1 Photo 2
L18
Tube well room
Water storage tank installed in the upper part of the
house
L7-1
Two abandoned tube wells
Control panel of submersible motor pump
L7-2
Water pipes for housing connection
Shallow well
L13
Tube well with installed submersible motor pump
Bridge near the village
L15
Exposed piping from a spring

The Data Collection Survey on Water Supply and Sewerage Sector of Pakistan Final Report
4-21
No Photo 1 Photo 2
L16
Paved roads in the neighborhood
L12
Control panel of the submersible motor pump
Plumbing from tube well shed
L11
Tube well piping
Leaking valve
L9, 10
Tube well piping
Control panel of the submersible motor pump
Source: JST Figure 4.4-3 Status of Tube Wells in Rural Water Supply
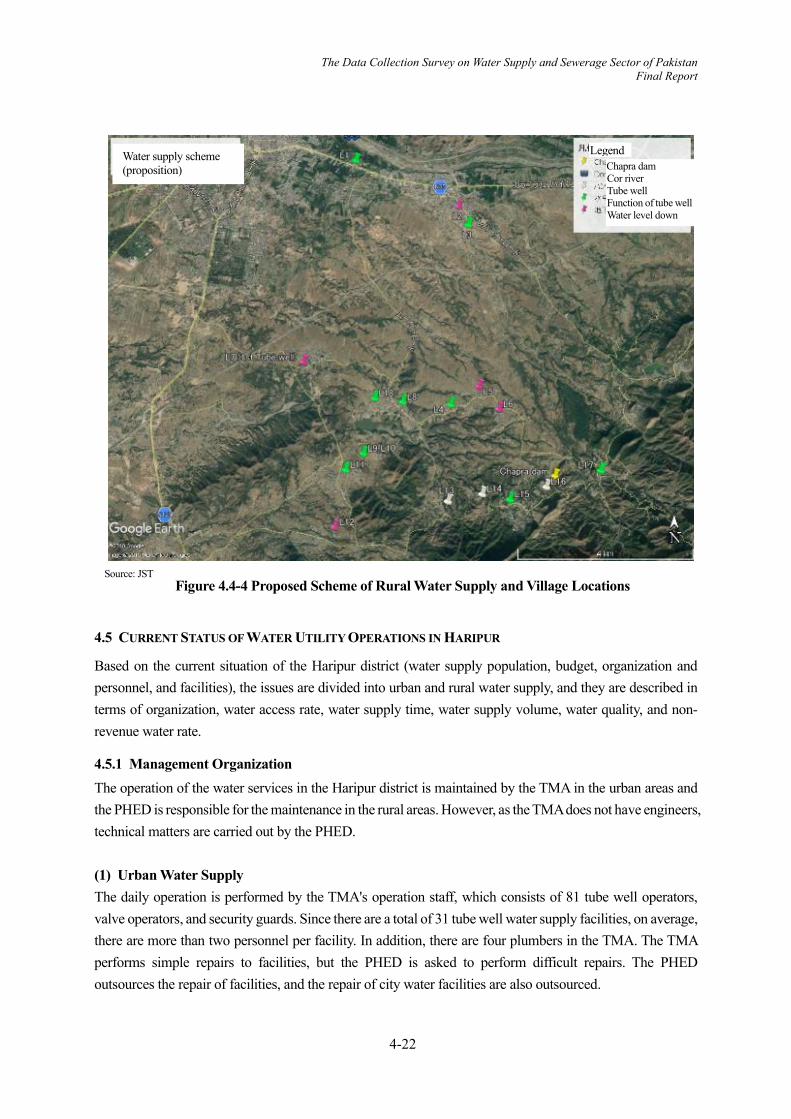
The Data Collection Survey on Water Supply and Sewerage Sector of Pakistan Final Report
4-22
Source: JST
Figure 4.4-4 Proposed Scheme of Rural Water Supply and Village Locations
4.5 CURRENT STATUS OF WATER UTILITY OPERATIONS IN HARIPUR
Based on the current situation of the Haripur district (water supply population, budget, organization and personnel, and facilities), the issues are divided into urban and rural water supply, and they are described in terms of organization, water access rate, water supply time, water supply volume, water quality, and non-revenue water rate.
4.5.1 Management Organization The operation of the water services in the Haripur district is maintained by the TMA in the urban areas and the PHED is responsible for the maintenance in the rural areas. However, as the TMA does not have engineers, technical matters are carried out by the PHED.
(1) Urban Water Supply The daily operation is performed by the TMA's operation staff, which consists of 81 tube well operators, valve operators, and security guards. Since there are a total of 31 tube well water supply facilities, on average, there are more than two personnel per facility. In addition, there are four plumbers in the TMA. The TMA performs simple repairs to facilities, but the PHED is asked to perform difficult repairs. The PHED outsources the repair of facilities, and the repair of city water facilities are also outsourced.
Legend Chapra dam Cor river Tube well Function of tube well Water level down
Water supply scheme (proposition)
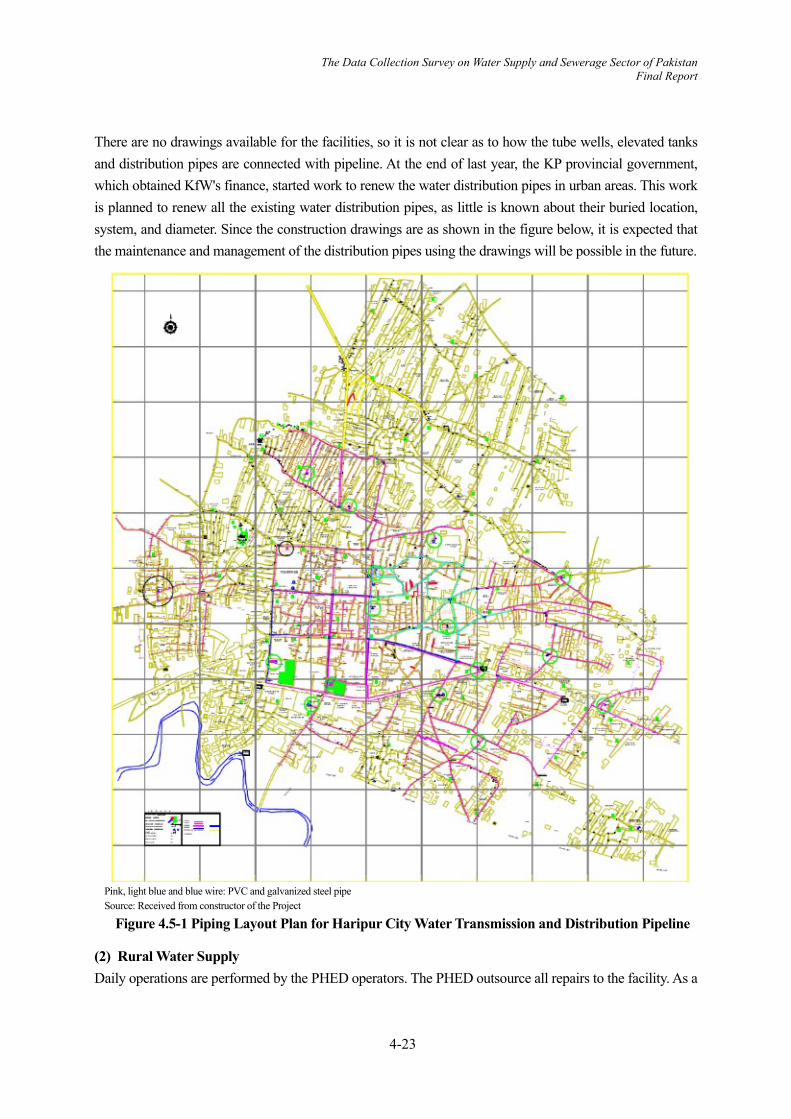
The Data Collection Survey on Water Supply and Sewerage Sector of Pakistan Final Report
4-23
There are no drawings available for the facilities, so it is not clear as to how the tube wells, elevated tanks and distribution pipes are connected with pipeline. At the end of last year, the KP provincial government, which obtained KfW's finance, started work to renew the water distribution pipes in urban areas. This work is planned to renew all the existing water distribution pipes, as little is known about their buried location, system, and diameter. Since the construction drawings are as shown in the figure below, it is expected that the maintenance and management of the distribution pipes using the drawings will be possible in the future.
Pink, light blue and blue wire: PVC and galvanized steel pipe Source: Received from constructor of the Project
Figure 4.5-1 Piping Layout Plan for Haripur City Water Transmission and Distribution Pipeline
(2) Rural Water Supply Daily operations are performed by the PHED operators. The PHED outsource all repairs to the facility. As a

The Data Collection Survey on Water Supply and Sewerage Sector of Pakistan Final Report
4-24
result, the PHED does not have a maintenance and repair station.
As for the drawings and documents of the water supply facilities, the tube well column diagram and the distribution pipe layout diagram were confirmed. Examples of these are shown in the figure below. In case of tube wells, it is possible to change the installation depth of submersible motor pumps or consider the structure of new tube well if the water level drops or there is a need for re-drilling. In addition, since the plan of the water distribution pipes is available, it is possible to expand the piping network.
Source:PHED_KP Province Gov. Figure 4.5-2 Example of Tube Well Column
Map (Mirapur village)
Source:PHED_KP Province Gov. Figure 4.5-3 Example of Water Distribution
Pipe Plan (Kahal Village)
4.5.2 Current Status of Water Supply Rate and its Issues (1) Urban Water Supply The TMA explains that the water supply rate is about 90%, but there is no evidence. The area indicated by the orange line in Figure 4.4-2 lack water supply facilities, but the exact situation is not known due to the non-availability of drawings. However, the KfW project has started to improve the pipeline network, so it is expected to increase the water supply rate after the works are completed. (2) Rural Water Supply The water supply rate of 71.7% in 2019 increased to 77.6% in 2020. Since the water supply rate is calculated by dividing the number of households having water pipe connections to the no. of total households, even if the water supply time and volume decreases, the supply rate increases as long as the connections are made. On the other hand, the Master Plan states that as of 2017, 34.47% of the rural village population were not

The Data Collection Survey on Water Supply and Sewerage Sector of Pakistan Final Report
4-25
supplied with water. Therefore, the water supply rate is considered to be around 65~70%.
4.5.3 Current Status of Water Supply Time and its Challenges The water supply time is as short as 1~2 hours/day in both urban and rural areas. This is due to the fact that the water distribution system uses valves to switch between different areas of the system and distribute the limited amount of water equally. In order to cope with this, each household is equipped with a water storage tank and uses the amount of water that can be stored during 1~2 hours of supply. It is desirable to extend the water supply time because if the water supply time is extended, the water storage tank in each household will no longer be needed and the hygiene problem of using the water storage tank will be eliminated.
4.5.4 Current Status of Water Supply Volume and its Issues (1) Urban Water Supply According to the information from the PHED, the current water supply intensity (Per-capita Consumption for Domestic Use) averages about 45 liters/person/day. However, the calculation of the water supply intensity based on the pumping volume and pump operation time during the operation of the two units resulted in approximately 27 liters/person/day, which may indicate that the water supply intensity has decreased. The exact water supply intensity needs to be calculated from the pumping volume and operation time for each tube well and the exact population. The Master Plan does not include a target water supply intensity for the future, but the PHED plans for a water supply intensity of 113~136 liters /person/day for urban and rural water supply.
(2) Rural Water Supply According to the information received from the PHED, the current water supply intensity is about 45 liters /person/day on average; calculated from the survey results for the two water supply systems, it is 47.5~52.2 liters /person/day, and the average of about 45 liters /person/day is considered reasonable. This also applies to urban water supply, but the water level of tube wells that are the source of water supply is on a downward trend during recent years, and there have been cases where tube wells with even deeper depths were dug when the water volume had extremely reduced or when the static water level had dropped extremely low. If the use of groundwater continues at this rate, the number of tube wells abandoned from areas that do not receive recharge from rivers will increase, and the possibility of groundwater depletion cannot be ruled out. In order to understand the current status of groundwater and the potential for future pumping, a hydrogeological investigation should be conducted. The Master Plan does not include an assessment of groundwater resources, but it states that options for using surface water should be considered first in future planning.
4.5.5 Current Status of Water Quality and its Issues (1) Urban Water Supply The TMA has commissioned the University of Abbottabad to carry out water quality testing. The water quality test items are odor, taste, color, pH, electrical conductivity, total hardness in terms of calcium carbonate, evaporation residue, calcium, magnesium, sodium, potassium, general bacteria and coliform
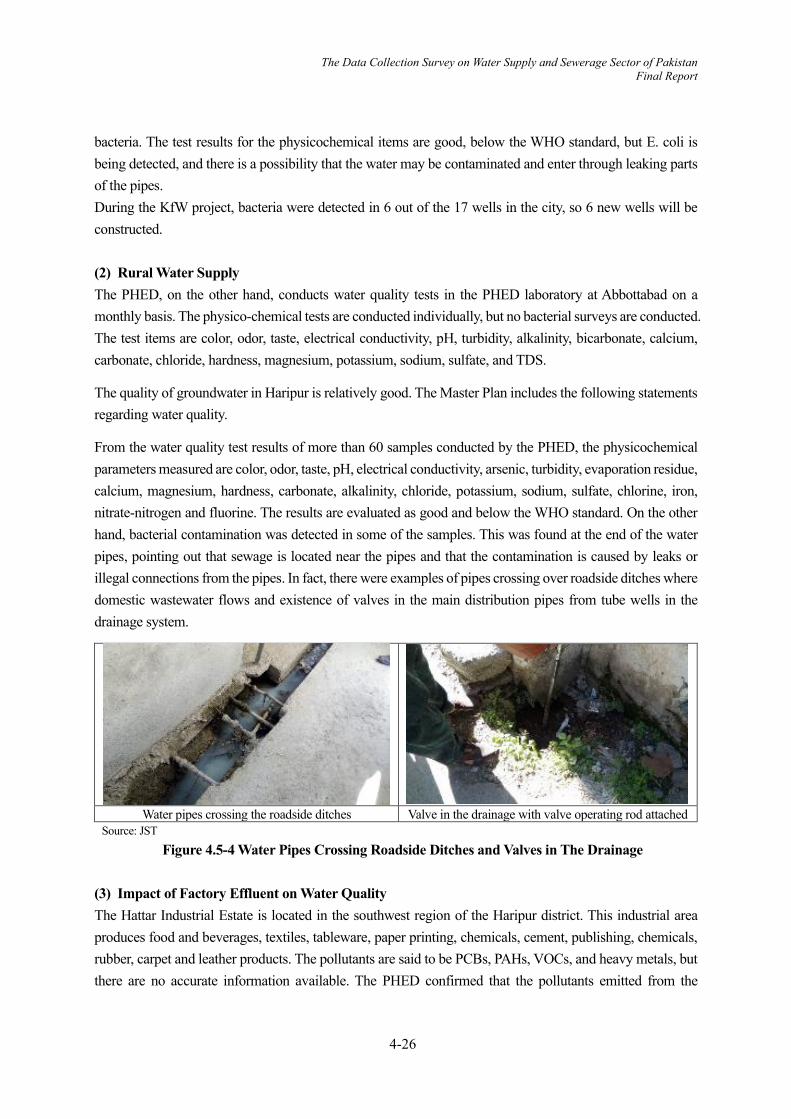
The Data Collection Survey on Water Supply and Sewerage Sector of Pakistan Final Report
4-26
bacteria. The test results for the physicochemical items are good, below the WHO standard, but E. coli is being detected, and there is a possibility that the water may be contaminated and enter through leaking parts of the pipes. During the KfW project, bacteria were detected in 6 out of the 17 wells in the city, so 6 new wells will be constructed.
(2) Rural Water Supply The PHED, on the other hand, conducts water quality tests in the PHED laboratory at Abbottabad on a monthly basis. The physico-chemical tests are conducted individually, but no bacterial surveys are conducted. The test items are color, odor, taste, electrical conductivity, pH, turbidity, alkalinity, bicarbonate, calcium, carbonate, chloride, hardness, magnesium, potassium, sodium, sulfate, and TDS.
The quality of groundwater in Haripur is relatively good. The Master Plan includes the following statements regarding water quality.
From the water quality test results of more than 60 samples conducted by the PHED, the physicochemical parameters measured are color, odor, taste, pH, electrical conductivity, arsenic, turbidity, evaporation residue, calcium, magnesium, hardness, carbonate, alkalinity, chloride, potassium, sodium, sulfate, chlorine, iron, nitrate-nitrogen and fluorine. The results are evaluated as good and below the WHO standard. On the other hand, bacterial contamination was detected in some of the samples. This was found at the end of the water pipes, pointing out that sewage is located near the pipes and that the contamination is caused by leaks or illegal connections from the pipes. In fact, there were examples of pipes crossing over roadside ditches where domestic wastewater flows and existence of valves in the main distribution pipes from tube wells in the drainage system.
Water pipes crossing the roadside ditches Valve in the drainage with valve operating rod attached
Source: JST
Figure 4.5-4 Water Pipes Crossing Roadside Ditches and Valves in The Drainage (3) Impact of Factory Effluent on Water Quality The Hattar Industrial Estate is located in the southwest region of the Haripur district. This industrial area produces food and beverages, textiles, tableware, paper printing, chemicals, cement, publishing, chemicals, rubber, carpet and leather products. The pollutants are said to be PCBs, PAHs, VOCs, and heavy metals, but there are no accurate information available. The PHED confirmed that the pollutants emitted from the

The Data Collection Survey on Water Supply and Sewerage Sector of Pakistan Final Report
4-27
industrial estate have infiltrated the shallow wells in the Dingi village, which is adjacent to the industrial estate, causing health problems for the residents. The PHED is not involved in the water supply to this village but has applied to the provincial government for a budget to upgrade the pipes and submersible motor pumps. As tube wells are available, it is expected that the problem will be solved once the pipes and submersible motor pump are repaired.
4.5.6 Current Status of Non-revenue Water Ratio and its Issues The answers to the questionnaire to the PHED states that the non-revenue water rate is 10~20%, but the non-revenue water rate has not been measured for either urban or rural water supply. The calculation of non-revenue water is based on the estimated amount of water delivered - the amount of water used by a standard household x the number of households, and the actual amount may be higher. In addition, there are no bulk meters in the distribution mains, and water meters are not installed in each household, so it is not possible to ascertain the exact amount. In the future, it is necessary to promote the installation of these meters for the effective use of limited groundwater.
4.6 PLAN FOR IMPROVEMENT OF WATER SUPPLY FACILITIES IN HARIPUR
4.6.1 Water Supply and Sanitation Master Plan The provincial government prepared a master plan for water supply and sanitation for each province in 2018. This master plan has a target year of 2030 to provide 100% water supply coverage. A summary of the plan is given in the table below.
Table 4.6-1 Summary of Master Plan for Water Supply and Sanitation Volume 1 Contents Chapter 1: Introduction (background, objectives, target areas, TOR, work implementation methods,
etc.) Chapter 2: Topographical Features of Haripur District Chapter 3: Geographical Analysis Chapter 4: Water Resources and Water Quality Characteristics of Haripur Chapter 5: Current Situation Analysis Chapter 6: Water Supply Facility Improvement Plan Chapter 7: Sanitation Service Plan Chapter 8: Cost Analysis and Investment Planning
Target year 2030 Target water supply 25 gallons (117 liters)/person-day *Not listed in the report, but based on interviews with PHED Target water supply rate
66.5% in 2018 to 100% by 2030.
Standard water supply facilities
Conventional facility with a submersible motor pump installed in a tube well
Standard sanitation facilities
While implementing CLTS, standard wastewater treatment facilities consisting of gutters and ponds are to be provided to 200~800 households in 21 selected sites, but the plan is not clear.
Total investment PKR 1.9 billion present value equivalent at 10% interest rate by 2018-2030 (annual present value of PKR 1.6 billion, in Japanese Yen)
Volume 2 Contents Attachment 1: TOR, Attachment 2: Data Collection Sheet, Attachment 3: Water Supply Scheme List, Attachment 4: Water Quality Test Report, Attachment 5: Rehabilitation Scheme List, Attachment 6: Extension Scheme List, Attachment 7: New Scheme List, Attachment 8: Sanitation Scheme Worksheet, Sanitation Scheme Site List, Sanitation Scheme Village Elevation Map
Source: Water Supply and Sanitation Master Plan for Khyber Pakhtunkhwa 2018 Dist: Haripur
Standard water supply facilities are planned with facilities using tube wells, but it is stated in the report that

The Data Collection Survey on Water Supply and Sewerage Sector of Pakistan Final Report
4-28
facilities using surface water should also be considered. However, no specific plan is described.
4.7 SURVEY OF EXISTING WATER SOURCES IN HARIPUR
A survey of the potential and existing water sources around the Haripur district was carried out in relation to the project proposed by the PHED.
4.7.1 Survey on Water Quantity, Quality, and Seasonal Variation of Shah Maqsood Spring In Shah Maqsood, there are springs at various points. We found three springs within a radius of 5 to 10 meters. We measured the volume and quality of water at the points marked with red circles in the open concrete channel shown below, which has the largest volume of water.
In general, springs are the outflow of stratified water or fissure water onto the ground, and although the quality of the water is good, it may be affected by precipitation, so a thorough investigation is necessary.
It is not clear whether the spring water at the study site is subsoil water from the Dor River or water from the aquifer on the eastern side of the mountain. It was explained to the PHED that the water quantity and quality of the spring water fluctuate throughout the year and that continuous measurement is important for the planning of water supply facilities. However, the PHED does not have any continuous measurement data of water quantity and quality, so we measured them during the two field surveys under this survey. On the other hand, it has been confirmed to the PHED that there are no users downstream of the Shah Maqsood springs.
Source: JST
Figure 4.7-1 Shah Maqsood Spring Point
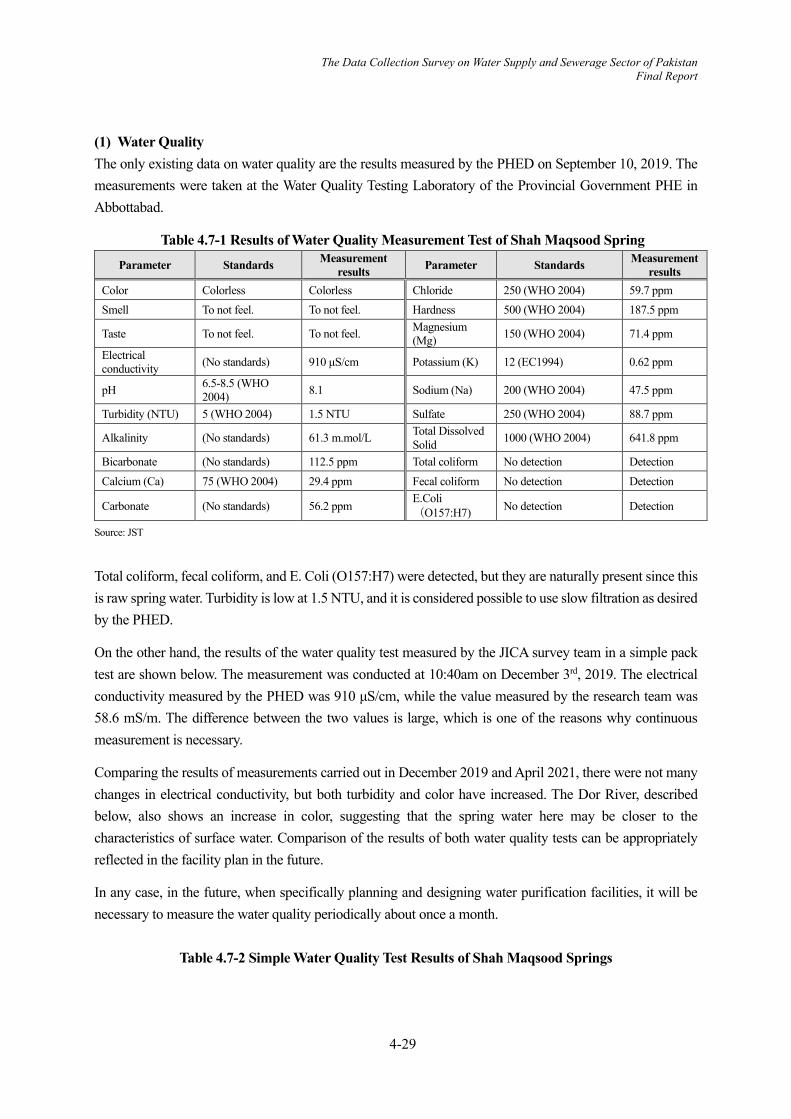
The Data Collection Survey on Water Supply and Sewerage Sector of Pakistan Final Report
4-29
(1) Water Quality The only existing data on water quality are the results measured by the PHED on September 10, 2019. The measurements were taken at the Water Quality Testing Laboratory of the Provincial Government PHE in Abbottabad.
Table 4.7-1 Results of Water Quality Measurement Test of Shah Maqsood Spring Parameter Standards Measurement
results Parameter Standards Measurement results
Color Colorless Colorless Chloride 250 (WHO 2004) 59.7 ppm Smell To not feel. To not feel. Hardness 500 (WHO 2004) 187.5 ppm
Taste To not feel. To not feel. Magnesium (Mg) 150 (WHO 2004) 71.4 ppm
Electrical conductivity (No standards) 910 μS/cm Potassium (K) 12 (EC1994) 0.62 ppm
pH 6.5-8.5 (WHO 2004) 8.1 Sodium (Na) 200 (WHO 2004) 47.5 ppm
Turbidity (NTU) 5 (WHO 2004) 1.5 NTU Sulfate 250 (WHO 2004) 88.7 ppm
Alkalinity (No standards) 61.3 m.mol/L Total Dissolved Solid 1000 (WHO 2004) 641.8 ppm
Bicarbonate (No standards) 112.5 ppm Total coliform No detection Detection Calcium (Ca) 75 (WHO 2004) 29.4 ppm Fecal coliform No detection Detection
Carbonate (No standards) 56.2 ppm E.Coli(O157:H7) No detection Detection
Source: JST
Total coliform, fecal coliform, and E. Coli (O157:H7) were detected, but they are naturally present since this is raw spring water. Turbidity is low at 1.5 NTU, and it is considered possible to use slow filtration as desired by the PHED.
On the other hand, the results of the water quality test measured by the JICA survey team in a simple pack test are shown below. The measurement was conducted at 10:40am on December 3rd, 2019. The electrical conductivity measured by the PHED was 910 μS/cm, while the value measured by the research team was 58.6 mS/m. The difference between the two values is large, which is one of the reasons why continuous measurement is necessary.
Comparing the results of measurements carried out in December 2019 and April 2021, there were not many changes in electrical conductivity, but both turbidity and color have increased. The Dor River, described below, also shows an increase in color, suggesting that the spring water here may be closer to the characteristics of surface water. Comparison of the results of both water quality tests can be appropriately reflected in the facility plan in the future.
In any case, in the future, when specifically planning and designing water purification facilities, it will be necessary to measure the water quality periodically about once a month.
Table 4.7-2 Simple Water Quality Test Results of Shah Maqsood Springs

The Data Collection Survey on Water Supply and Sewerage Sector of Pakistan Final Report
4-30
Parameter WHO standards Unit Measurement results
(Dec 3, 2019) measurement results
(April 1, 2021) Turbidity 5 NTU degree 1.4 3.6 Color degree 15 TCU degree 1.0 7.0 Iron 0.3 mg/l mg/l Less than 0.2 Less than 0.2 Manganese (Mn) 0.4 mg/l mg/l Less than 0.5 Less than 0.5 Ammonia nitrogen -. mg/l Less than 0.2 Less than 0.2 Nitrite-nitrogen 3 mg/l mg/l less than 5 less than 5 Nitrate-nitrogen 5 0 mg/l mg/l 15 20 Electrical conductivity -. mS/m 58.6 59.5 Source: JST
(2) Volume of Water The volume of water flowing in a concrete channel at one of the Shah Maqsood springs was measured. Simply the surface flow velocity was calculated as the mean flow velocity.
The measurement was conducted at around 3:30 p.m. on December 4, 2019, and the measured flow rate was 261.7 m3/h. As described below, this water flow rate cannot meet the daily water supply requirement for urban areas, so it is necessary to add water from other springs or continue using existing tube wells to meet the planned water supply volume.
Since the volume of water in the springs are likely to fluctuate seasonally and even on a daily basis, periodic measurements are necessary for planning and design of the facility.
Pack test water quality measurement status Status of water volume measurement in open channel
Source: JST Figure 4.7-2 Status of water quality and water volume measurement
4.7.2 Water Quantity, Quality, and Seasonal Variation Study of Chapra Dam under Construction (1) Dam Outline
Table 4.7-3 Chapra Dam Summary Dam application Irrigation Client KP Provincial Irrigation Department (100% provincial government budget) Construction Site Near Chapra village, Haripur district Water storage capacity 597 acre-feet (about 736,000 tons) Maximum water level of the dam 2450 ft (746 m) Amount of water required for irrigation 697 m3/h Schedule for completion June 2020

The Data Collection Survey on Water Supply and Sewerage Sector of Pakistan Final Report
4-31
Topographic map of the dam Plan view of dam structure
Source: JST
The Chapra Dam is currently under construction for irrigation use and was scheduled to be completed by June 2020, but as of April 2021, its construction is still going on. The quality and quantity of water in the river at the site of the dam will be surveyed before being stored.
(2) Water quality As with the Shah Maqsood spring water, the only existing data on water quality are the results measured by the PHED on September 10, 2019. The measurements were taken at the Water Quality Testing Laboratory of the provincial government's PHE in Abbottabad. The water was taken from the river upstream of the dam under construction.
Table 4.7-4 Results of Water Quality Measurement Tests for Chapra Dam Parameter Standards Measurement
results Parameter Standards Measurement results
Color Colorless Colorless Chloride 250 (who 2004) 74.6 ppm Smell To not feel. To not feel. Hardness 500 (who 2004) 175 ppm Taste To not feel. To not feel. Magnesium (Mg) 150 (who 2004) 64.8 ppm Electrical conductivity Without 885 μs/cm Potassium (K) 12 (EC 1994) 0.8 ppm
pH 6.5-8.5 (WHO 2004) 7.9 Sodium (Na) 200 (WHO 2004) 37.4 ppm
Turbidity (NTU) 5 (WHO 2004) 1.2 NTU Sulfate 250 (WHO 2004) 65.2 ppm
Alkalinity Without 34.7 m.mol/l Total Dissolved Solid 1000 (who 2004) 616 ppm
Bicarbonate Without 48.3 ppm Total coliform No detection Detection Calcium (Ca) 75 (WHO 2004) 37.4 ppm Fecal coliform No detection Detection Carbonate Without 46.8 ppm E.Coli(O157:H7) No detection Detection Source: JST
Total coliform, fecal coliform, and E. Coli (O157:H7) were detected, but these are naturally present since this is untreated surface water. Turbidity is low at 1.2 NTU, and it is considered possible to use slow filtration as desired by the PHED.
On the other hand, the results of the water quality test measured by the JICA survey team in a simple pack test are shown below. The measurement was conducted at 2:00pm on December 3, 2019. The electrical conductivity measured by the PHED was 885 μS/cm, while the value measured by the research team was

The Data Collection Survey on Water Supply and Sewerage Sector of Pakistan Final Report
4-32
42.5 mS/m, which is almost twice as much as that of the PHED, and this is one of the reasons why continuous measurement is necessary. In any case, in the future, when specifically planning and designing water purification facilities, it will be necessary to measure the water quality periodically for about once a month.
Table 4.7-5 Results of Simple Water Quality Tests Capra Dams
Parameter Who standards Unit Measurement
results Turbidity 5 NTU degree 0.9 Color degree 15 TCU degree 0.5 Iron 0.3 mg/l mg/l Less than 0.2 Manganese (Mn) 0.4 mg/l mg/l Less than 0.5 Ammonia nitrogen -. mg/l Less than 0.2 Nitrite-nitrogen 3 mg/l mg/l Less than 5 Nitrate-nitrogen 5 0 mg/l mg/l 2.0 Electrical conductivity -. mS/m 42.5
Source: JST
(3) Volume of water
The quantity of water was obtained from the Irrigation Department in Haripur, using measured data on the quality of water in the river at the site of the dam before storage. According to the data, it was measured daily during August ~ October 2019 and ranged from 8 to 18 cusec (800 ~ 1,800 m3/h) over a period of three months, when excluding large variations in water quantity due to heavy rainfall. The variation in these water volumes is shown in the figure below. During the past three months, the minimum water volume is 800 m3/h. Since this is the only data available at present, it is necessary to continuously measure the water volume for at least several years, taking seasonal variations into account, in order to plan the water supply.
On t the other hand, the amount of water required by the Irrigation Department is 6.97 cusec (= 677 m3/h) as obtained from interviews.
Source: KP Provincial Irrigation Department
Figure 4.7-3 Variation in Water Volume at Chapra Dam
01,0002,0003,0004,0005,0006,0007,0008,0009,000
2019年8月1日 2019年9月1日 2019年10月1日
Chapra Dam water volume
2019.8.1 2019.9.1 2019.10.1

The Data Collection Survey on Water Supply and Sewerage Sector of Pakistan Final Report
4-33
4.7.3 Water Quality Survey at Other Potential Water Source Sites (1) Haro River
The Haro River is located about 36 km southeast of Haripur city by car and has the Khanpur Dam. The water quality was measured on December 4, 2019 and the result are as follows: Turbidity is 20 degrees, which is high due to the existence of quarries in the river.
Table 4.7-6 Simple Water Quality Test Results for Haro River Parameter Who standards Unit Measurement results
Turbidity 5 NTU degree 20 Color degree 15 TCU degree 3.0 Iron 0.3 mg/l mg/l Less than 0.2 Manganese (Mn) 0.4 mg/l mg/l Less than 0.5 Ammonia nitrogen -. mg/l Less than 0.2 Nitrite-nitrogen 3 mg/l mg/l Less than 5 Nitrate-nitrogen 5 0 mg/l mg/l 1.5 Electrical conductivity -. mS/m 48.4 Source: JST
The water quality of the Haro River is fine, like the water from the Shah Maqsood spring and the surface water from the Chapra Dam, but it poses more challenges than other water sources because it is far from the city (about 36 km) and passes through a mountainous area, thereby making the cost of pipeline construction very expensive.
Haro River Water quality measurement sampling points Mountainous area on the way to Haro River
Source: JST
Figure 4.7-4 Haro River Area
(2) Dor River The Dor River flows from east to northwest of Haripur city where Abbottabad city is located and empties into the Tarbera dam. The water quality was measured as follows.
Table 4.7-7 Results of Simple Water Quality Test for Dor River Parameter WHO standards Unit Measurement results
(Dec. 12, 2019) Measurement results
(Mar. 30, 2021) Turbidity 5 NTU degree 20 20
Color degree 15 TCU degree 8.5 14
Iron 0.3 mg/l mg/l Less than 0.2 Less than 0.2
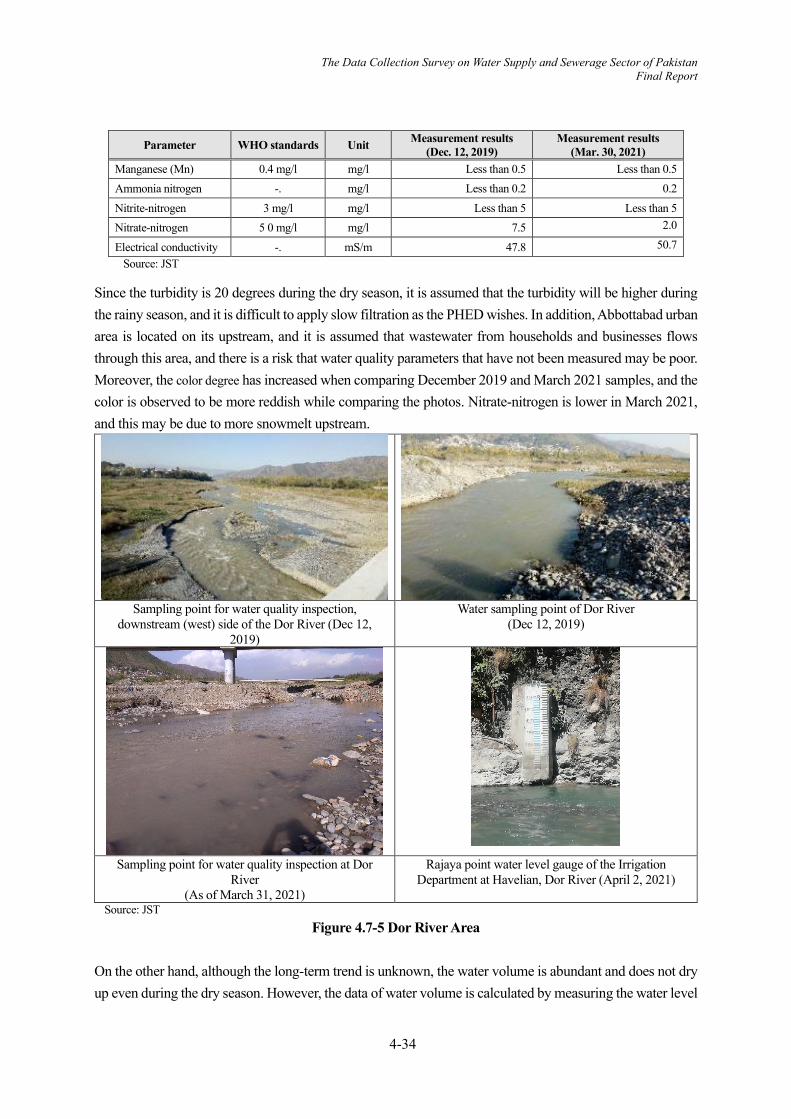
The Data Collection Survey on Water Supply and Sewerage Sector of Pakistan Final Report
4-34
Parameter WHO standards Unit Measurement results (Dec. 12, 2019)
Measurement results (Mar. 30, 2021)
Manganese (Mn) 0.4 mg/l mg/l Less than 0.5 Less than 0.5 Ammonia nitrogen -. mg/l Less than 0.2 0.2 Nitrite-nitrogen 3 mg/l mg/l Less than 5 Less than 5 Nitrate-nitrogen 5 0 mg/l mg/l 7.5 2.0
Electrical conductivity -. mS/m 47.8 50.7 Source: JST
Since the turbidity is 20 degrees during the dry season, it is assumed that the turbidity will be higher during the rainy season, and it is difficult to apply slow filtration as the PHED wishes. In addition, Abbottabad urban area is located on its upstream, and it is assumed that wastewater from households and businesses flows through this area, and there is a risk that water quality parameters that have not been measured may be poor. Moreover, the color degree has increased when comparing December 2019 and March 2021 samples, and the color is observed to be more reddish while comparing the photos. Nitrate-nitrogen is lower in March 2021, and this may be due to more snowmelt upstream.
Sampling point for water quality inspection,
downstream (west) side of the Dor River (Dec 12, 2019)
Water sampling point of Dor River (Dec 12, 2019)
Sampling point for water quality inspection at Dor River
(As of March 31, 2021)
Rajaya point water level gauge of the Irrigation Department at Havelian, Dor River (April 2, 2021)
Source: JST Figure 4.7-5 Dor River Area
On the other hand, although the long-term trend is unknown, the water volume is abundant and does not dry up even during the dry season. However, the data of water volume is calculated by measuring the water level

The Data Collection Survey on Water Supply and Sewerage Sector of Pakistan Final Report
4-35
by the Irrigation Department in Abbottabad. The graph below is based on the data of flow rate calculated from the water level of the water level gauge at the Rajaya point in Havelian city, Dor River.
Source: Prepared by JST from water level data from Irrigation Department of Abbottabad
Figure 4.7-6 Water Flow Rate of Dor River
Data prior to 2014 have values less than 100 liter/sec and are considered to be unreliable. These reasons are as follows.
- The lower end of the water level gauge is missing due to aging, so the water level cannot be read accurately. - The Haripur PHED have repeatedly asked the Irrigation Department in Abbottabad as to how to
calculate the water volume, but they have not received a clear answer. However, it should be noted that the water level gauges are not intended to measure the flow rate. It was originally intended that the Irrigation Department in Abbottabad would brief the Irrigation Department headquarters in Peshawar about the possibility of flooding in the river. Since the purpose of the project was not originally to measure water flow, it is highly likely that the exact water flow will not be indicated in the future.
However, due to the recent requirement of the water flow rate of the Dor River by the JICA survey team and also due to the plan to construct new water supply facilities in the Havelian by South Korea, accurate measurement of the water flow rate of the Dor River has become important and the PHED of Haripur believes that the reliability of the water flow rate data will increase from 2020.
After 2014, there were variations in the same month from year to year, but we can grasp the trend of a loose M-type, with relatively high-water flow in March when rainfall increases, the highest flow in the year in July and August after the rainy season, and a decrease from the end of the year to the beginning of the year. The absolute value of the water volume is questionable, but if 200 liter/sec is taken as the minimum value, for example, it is 17,280 m3/day. Table 4.8-1meets the current population at 10,342 m3/day. However, it should
0200400600800
1,0001,2001,4001,600
J A N F E B M A R A P R M A Y J U N J U L Y A U G S E P O C T N O V D E C
Water f low rate o f Dor River
2020 2019 2018 2017 2016 20152014 2013 2012 2011 2010 2009
liter/sec

The Data Collection Survey on Water Supply and Sewerage Sector of Pakistan Final Report
4-36
be noted that the absolute value is questionable and that if water supply facilities are constructed upstream of Haripur in the cities of Havelian and Abbottabad using the Dor River and its upstream as a source of water, the water volume may become insufficient.
<Colum> Review about Water volume data of the Dor River prepared by the Irrigation Department of Abbottabad Background of the review: Since the Irrigation Department of Abbottabad has not provided the basis for calculating the water volume of the Dor River, it is estimated by using the Manning's formula.
(1) Water level (height) and calculated water volume at Rajaya on February 6, 2021, for the Irrigation Department. It is calculated to be 139 Cs (=3.93 m3/sec) at 1.3 feet (=0.396 m).
(2) River width It shall be about 9 meters from the site visit.
(3) Flow velocity, planned high water volume Determine the flow velocity by using the Manning's equation. Manning's formula: V=R2/3×√I÷n (R=A÷S, V: Average velocity (m/s), R: Radial depth (m), I: water surface gradient, n: Manning's roughness coefficient, A: water surface cross-sectional area (m2), S: moist edge (length of the section in contact with the water in the cross-section of the stream (m)) R=9.0×0.396÷9.7925=0.3642 Hydraulic gradient from Google Earth, I = (966-956) m / 2023 m = 0.0049
Roughness coefficients are assumed to be n = 0.03 (neat cross-sectional channel). The average flow velocity is V = 0.36422/3 x √0.0049 / 0.04 = 1.195 m/s. Therefore, the water volume is calculated as Q = V*A = 1.195 x 9.0 x 0.396 = 4.26 m3/s. 4) Comparison with the Irrigation Department data There is a 7.7% difference between the Irrigation Department's data of 3.93 m3/sec and the above calculated result of 4.26 m3/s. On the other hand, when the water volume was compared with other water level data of the same month, the difference was enlarged as shown in the table below.
Water level Irrigation Department
Water Quantity Estimates of the research team
Difference
1.3 (= 0.396 m) 139 Cs (=3.93 m3/sec) 4.26 m3/sec - 7.7 % of the total 1.4 (= 0.427 m) 178 Cs (=5.04 m3/sec) 4.80 m3/sec 5.0 %. 1.5 (= 0.457 m) 220 Cs (=6.23 m3/sec) 5.36 m3/sec 16.2 % of the total
Judging from the above, although the water level data from the Irrigation Department cannot be used as a reference because the lower end of the water level gauge is damaged and it does not represent the absolute water level, the water level data can be used as a reference for water level calculation.
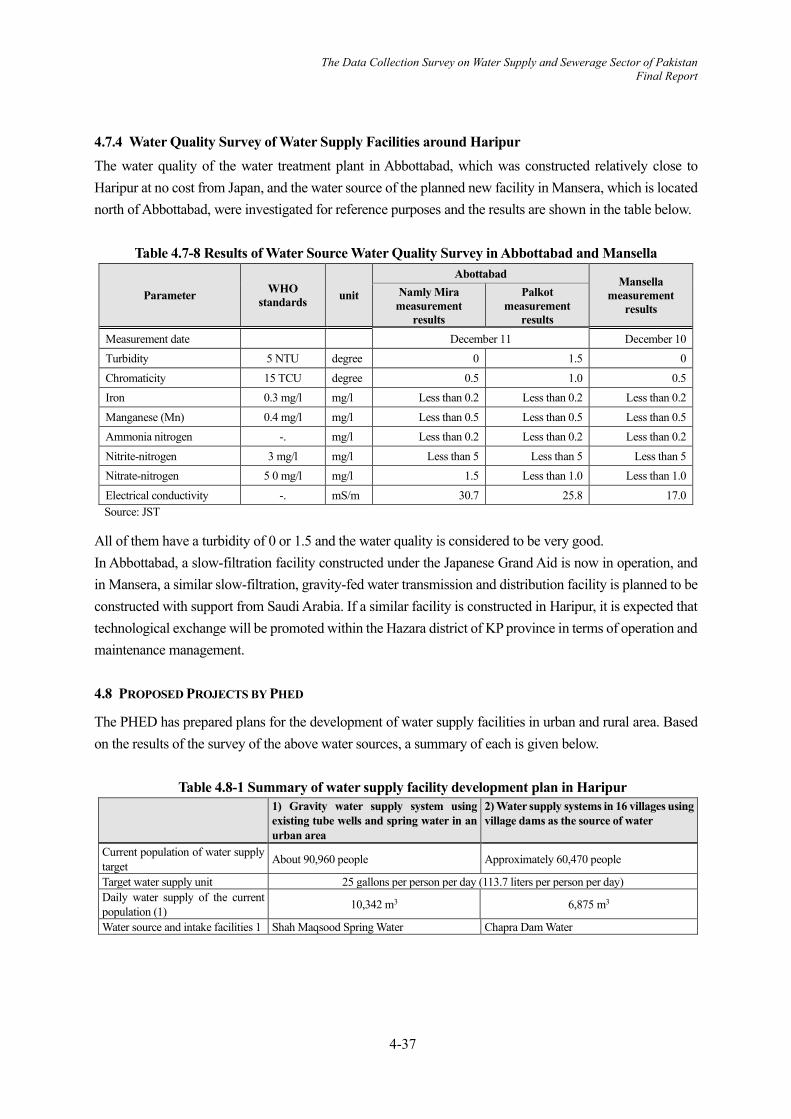
The Data Collection Survey on Water Supply and Sewerage Sector of Pakistan Final Report
4-37
4.7.4 Water Quality Survey of Water Supply Facilities around Haripur The water quality of the water treatment plant in Abbottabad, which was constructed relatively close to Haripur at no cost from Japan, and the water source of the planned new facility in Mansera, which is located north of Abbottabad, were investigated for reference purposes and the results are shown in the table below.
Table 4.7-8 Results of Water Source Water Quality Survey in Abbottabad and Mansella
Parameter WHO standards unit
Abottabad Mansella measurement
results Namly Mira
measurement results
Palkot measurement
results Measurement date December 11 December 10 Turbidity 5 NTU degree 0 1.5 0 Chromaticity 15 TCU degree 0.5 1.0 0.5 Iron 0.3 mg/l mg/l Less than 0.2 Less than 0.2 Less than 0.2 Manganese (Mn) 0.4 mg/l mg/l Less than 0.5 Less than 0.5 Less than 0.5 Ammonia nitrogen -. mg/l Less than 0.2 Less than 0.2 Less than 0.2 Nitrite-nitrogen 3 mg/l mg/l Less than 5 Less than 5 Less than 5 Nitrate-nitrogen 5 0 mg/l mg/l 1.5 Less than 1.0 Less than 1.0 Electrical conductivity -. mS/m 30.7 25.8 17.0 Source: JST
All of them have a turbidity of 0 or 1.5 and the water quality is considered to be very good. In Abbottabad, a slow-filtration facility constructed under the Japanese Grand Aid is now in operation, and in Mansera, a similar slow-filtration, gravity-fed water transmission and distribution facility is planned to be constructed with support from Saudi Arabia. If a similar facility is constructed in Haripur, it is expected that technological exchange will be promoted within the Hazara district of KP province in terms of operation and maintenance management.
4.8 PROPOSED PROJECTS BY PHED
The PHED has prepared plans for the development of water supply facilities in urban and rural area. Based on the results of the survey of the above water sources, a summary of each is given below.
Table 4.8-1 Summary of water supply facility development plan in Haripur 1) Gravity water supply system using
existing tube wells and spring water in an urban area
2) Water supply systems in 16 villages using village dams as the source of water
Current population of water supply target About 90,960 people Approximately 60,470 people
Target water supply unit 25 gallons per person per day (113.7 liters per person per day) Daily water supply of the current population (1) 10,342 m3 6,875 m3
Water source and intake facilities 1 Shah Maqsood Spring Water Chapra Dam Water

The Data Collection Survey on Water Supply and Sewerage Sector of Pakistan Final Report
4-38
1) Gravity water supply system using existing tube wells and spring water in an urban area
2) Water supply systems in 16 villages using village dams as the source of water
Water source and intake facilities 2 Existing multiple tube well facilities (number of tube wells to meet the daily water supply: target daily water supply volume - the volume of water produced from the spring of Shah Maqsood)
Existing multiple tube well facilities (number of tube wells to meet the daily water supply: target daily water supply volume - produced water volume from Chapra Dam water)
Water pipe from the water intake point to the water treatment plant
Less than about 1 km long (There is a vacant land for a water treatment plant near the Shah Maqsood spring)
About 1~3 km long (The site of water treatment plant has not yet been determined, but it is thought that it could be built around the dam.)
Amount treated at water treatment plants (2)
= 261 m3/h = 6,264 m3/day = 123 m3/h = 2,952 m3/day
Fulfillment rate (②÷①) 60.5 % 42.9 % Water purification plant site The proposed site is a vacant lot on the side
of the Shah Maqsood spring. undecided
Water pipes from the water treatment plant to each distribution reservoir
8 km long 25 km long
Source: Modified by JST from PHED information
The water volume of the water treatment plant in the above table was set by considering the following.
It was assumed to be 261 m3/h based on the measured flow rate of Shah Maqsood spring for the urban water supply.
Water intake rights for water supply from the Chapra Dam for the rural water supply were yet to be negotiated. The minimum water volume measured by the Irrigation Department, once a day from September to November 2019, was 8 cusec (= 800 m3/h). On the other hand, the volume of water required by the Irrigation Department is 6.97 cusec (= 677 m3/h) obtained from the interviews, and the rest is 123 m3/h. Therefore, 286 m3/h, which satisfies the daily water supply of 6,875 m3 for rural water supply, cannot meet the demand. If the water from Chapra Dam is used in the rural water supply scheme, the existing tube wells will continue to be used.
In this case, the sufficiency ratio of new water sources (spring water and dam water) to the daily water supply of the current population is calculated to be 60.5 % for urban areas using spring water and 42.9 % for rural areas using dam water.
To address this issue, in urban areas, it would be possible to look for the possibility of using other springs other than those in Shah Maqsood, as they were found in abundance in the surrounding area. Alternatively, rapid filtration could be used as a method of water intake from the Dor River. On the other hand, no other suitable water source has been identified for the water supply in rural areas, so it is necessary to study the measures to be taken.
The following two figures show the water source points, the routes of transmission and distribution pipelines, and existing tube wells for the water system in the table above.

The Data Collection Survey on Water Supply and Sewerage Sector of Pakistan Final Report
4-39
Source: JST
Figure 4.8-1Existing Tube Well Layout and Planned Transmission Pipeline Route for the Urban Water Supply System
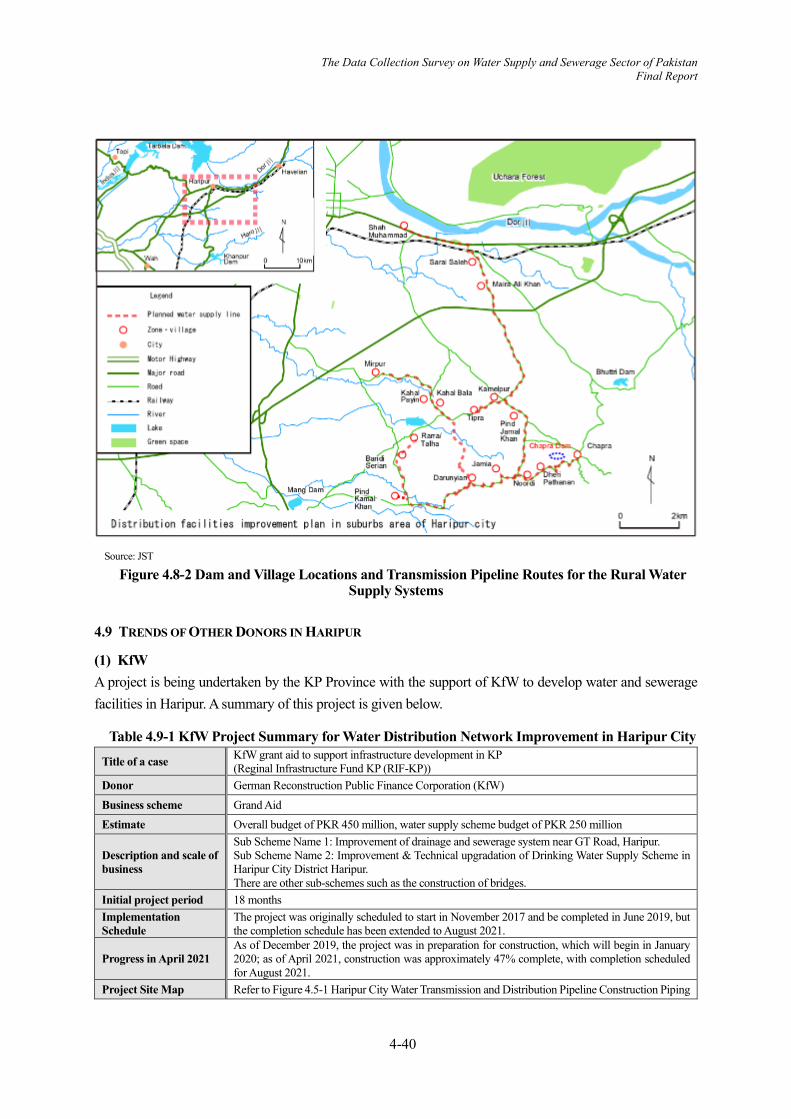
The Data Collection Survey on Water Supply and Sewerage Sector of Pakistan Final Report
4-40
Source: JST
Figure 4.8-2 Dam and Village Locations and Transmission Pipeline Routes for the Rural Water Supply Systems
4.9 TRENDS OF OTHER DONORS IN HARIPUR
(1) KfW A project is being undertaken by the KP Province with the support of KfW to develop water and sewerage facilities in Haripur. A summary of this project is given below.
Table 4.9-1 KfW Project Summary for Water Distribution Network Improvement in Haripur City Title of a case KfW grant aid to support infrastructure development in KP
(Reginal Infrastructure Fund KP (RIF-KP)) Donor German Reconstruction Public Finance Corporation (KfW) Business scheme Grand Aid Estimate Overall budget of PKR 450 million, water supply scheme budget of PKR 250 million
Description and scale of business
Sub Scheme Name 1: Improvement of drainage and sewerage system near GT Road, Haripur. Sub Scheme Name 2: Improvement & Technical upgradation of Drinking Water Supply Scheme in Haripur City District Haripur. There are other sub-schemes such as the construction of bridges.
Initial project period 18 months Implementation Schedule
The project was originally scheduled to start in November 2017 and be completed in June 2019, but the completion schedule has been extended to August 2021.
Progress in April 2021 As of December 2019, the project was in preparation for construction, which will begin in January 2020; as of April 2021, construction was approximately 47% complete, with completion scheduled for August 2021.
Project Site Map Refer to Figure 4.5-1 Haripur City Water Transmission and Distribution Pipeline Construction Piping
The Data Collection Survey on Water Supply and Sewerage Sector of Pakistan Final Report
4-41
Layout Plan.
Project Objectives for Sub-Scheme 2
- Install a well-planned water pipe network throughout the city. - Renovate facilities in all areas that will reach the end of their design life by 2037. - Removing old and disused asbestos pipes, galvanized steel pipes, PVC pipes and various other types of pipes.
Sub-scheme 2 construction details and costs
1) Well construction 2) Pump room 3) Water transmission and distribution pipe (HDPE pipe) 4) Pump equipment 5) Maintenance and repair of existing water storage tank 6) Construction supervision fee 7) Reserve funds 8) Publicity expenses 9) Price increase
Sub-scheme 2 construction details and costs
Other information on sub-scheme 2
- There are 17 tube wells in use, and E. coli has been detected in 7 of them. - The planned population for water supply in 2037 is 86,368, assuming a population growth rate of 3%. - The annual maintenance cost after completion of the project is 2% of the construction cost, which is PKR 4.0 million.
Source: JST
Implementation structure: KfW and the KP provincial government had agreed on a contract between KfW and a local consultant (AiD Corporation) for design and construction supervision. The construction company is a local company, and the bidding was divided into 6 lots by area. The bidding was completed, and contract signed. KfW staff used to come to the site once every two months to supervise the Project, but due to COVID-19, this is presently being conducted through video conference. If the water transmission and distribution pipes are constructed under this water supply project, it is expected that the water transmission and distribution pipe network will be maintainable. If a water treatment plant using surface water is constructed, the water supply volume will increase, and if a system for proper maintenance and management is established, it will be possible to operate a facility with a low non-revenue water rate and relatively good water quality compared to large cities such as Karachi and Faisalabad, where it is difficult to improve the non-revenue water rate due to non-availability of data pertaining to burial of existing water pipes. The water quality is relatively good. In case of the water treatment plant construction project, JICA could promote the project in cooperation with KfW.
Features One of the features of the construction is that all existing pipes are planned not to be used after the completion of the work, and all new water pipes from the distribution pipes from the elevated tanks in the city to the water supply pipes connecting to each household will be installed. Once the water supply pipes have been laid to all households, the switchover from the old distribution and water supply pipes will be carried out sequentially. This method is adopted because it is difficult to grasp the existing pipes, but it is easier to explain to residents and easier to understand than switching to new distribution and water supply pipes for each part. The policy of the project is to excavate the relatively wide roads and bury the pipes during the daytime, and to excavate the narrow roads and bury the pipes at night.
The Data Collection Survey on Water Supply and Sewerage Sector of Pakistan Final Report
4-42
Additional Works Out of 31 wells in Haripur city, 6 tube wells were found to have bacteria due to contamination from the surface and these tube wells are being newly constructed under this project.
(2) Saudi Arabia General Information of the Project
Project Title: Review of Feasibility study and detailed design for Construction of gravity flow water supply scheme at Mansehra.
Client: PHED Mansehra, KP Province Implementing agency: PHED Mansehra, KP Province Finance: Saudi Arabian Development Fund Project description: Construction of a water treatment plant using the Siran River as a source of water
in the highlands of the city, and construction of a gravity-flow water distribution system. Status of Implementation
The project is currently at the stage of completing the basic design and a review study is planned to review this basic design. Currently, no progress has been made in selecting a consultant due to Covid-19. However, this project is planned to adopt slow filtration and gravity distribution as the water treatment method, which is similar to the water treatment facility that the govt. of Japan supported in Abbottabad.
(3) ADB
ADB has a plan to construct a new water treatment plant next to the slow-filtration water treatment plant constructed by Japan in Abbottabad. The outline of this water supply facility are as follows.
Table 4.9-2 Project Summary of the Construction of Water Supply Facility in Abbottabad
Financed by ADB KCPIP-04: Key points for extension of JICA gravity water supply scheme Scope - New water intake facility
- 600 mm diameter, 17 km of raw water pipeline - Construction of a new water treatment plant with a capacity of 300 liters per second adjacent to the existing Choona water treatment plant - Transmission of treated water to the city - 16 new distribution points and a new, well-designed distribution network with individual house connections and water meter connections
Cost (billion PKR)
- Total 69.7 - Lot 1: Water treatment plant: 11.4 - Lot 2: Distribution network, intake facilities and conduits: 58.4
Effect - Increase in water storage capacity: 1.7 to 4.1 million gallons - Completely new water distribution network of 193 km - House connections to increase from 15,000 to 36,000 - Volume of treated water to be added: 6.85 million gallons per day
Innovation Rapid filtration technology, water volume measurement, solar energy, SCADA
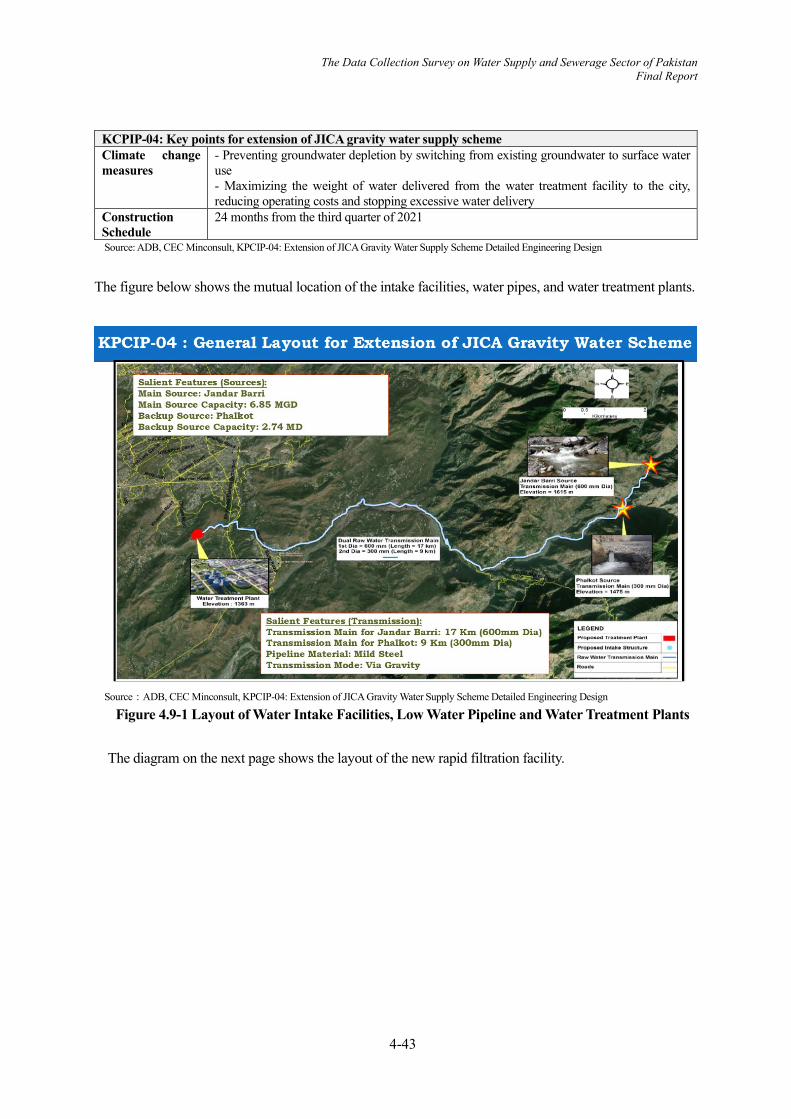
The Data Collection Survey on Water Supply and Sewerage Sector of Pakistan Final Report
4-43
KCPIP-04: Key points for extension of JICA gravity water supply scheme Climate change measures
- Preventing groundwater depletion by switching from existing groundwater to surface water use - Maximizing the weight of water delivered from the water treatment facility to the city, reducing operating costs and stopping excessive water delivery
Construction Schedule
24 months from the third quarter of 2021
Source: ADB, CEC Minconsult, KPCIP-04: Extension of JICA Gravity Water Supply Scheme Detailed Engineering Design
The figure below shows the mutual location of the intake facilities, water pipes, and water treatment plants.
Source:ADB, CEC Minconsult, KPCIP-04: Extension of JICA Gravity Water Supply Scheme Detailed Engineering Design
Figure 4.9-1 Layout of Water Intake Facilities, Low Water Pipeline and Water Treatment Plants The diagram on the next page shows the layout of the new rapid filtration facility.
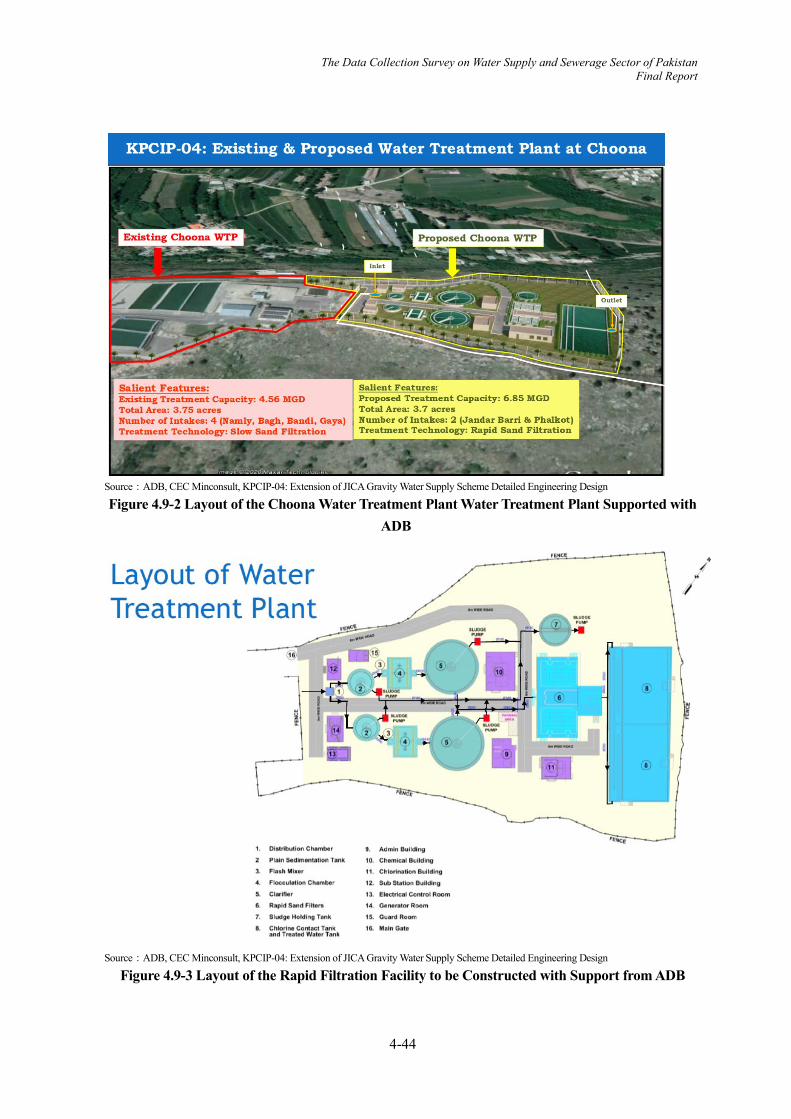
The Data Collection Survey on Water Supply and Sewerage Sector of Pakistan Final Report
4-44
Source:ADB, CEC Minconsult, KPCIP-04: Extension of JICA Gravity Water Supply Scheme Detailed Engineering Design
Figure 4.9-2 Layout of the Choona Water Treatment Plant Water Treatment Plant Supported with ADB
Source:ADB, CEC Minconsult, KPCIP-04: Extension of JICA Gravity Water Supply Scheme Detailed Engineering Design
Figure 4.9-3 Layout of the Rapid Filtration Facility to be Constructed with Support from ADB
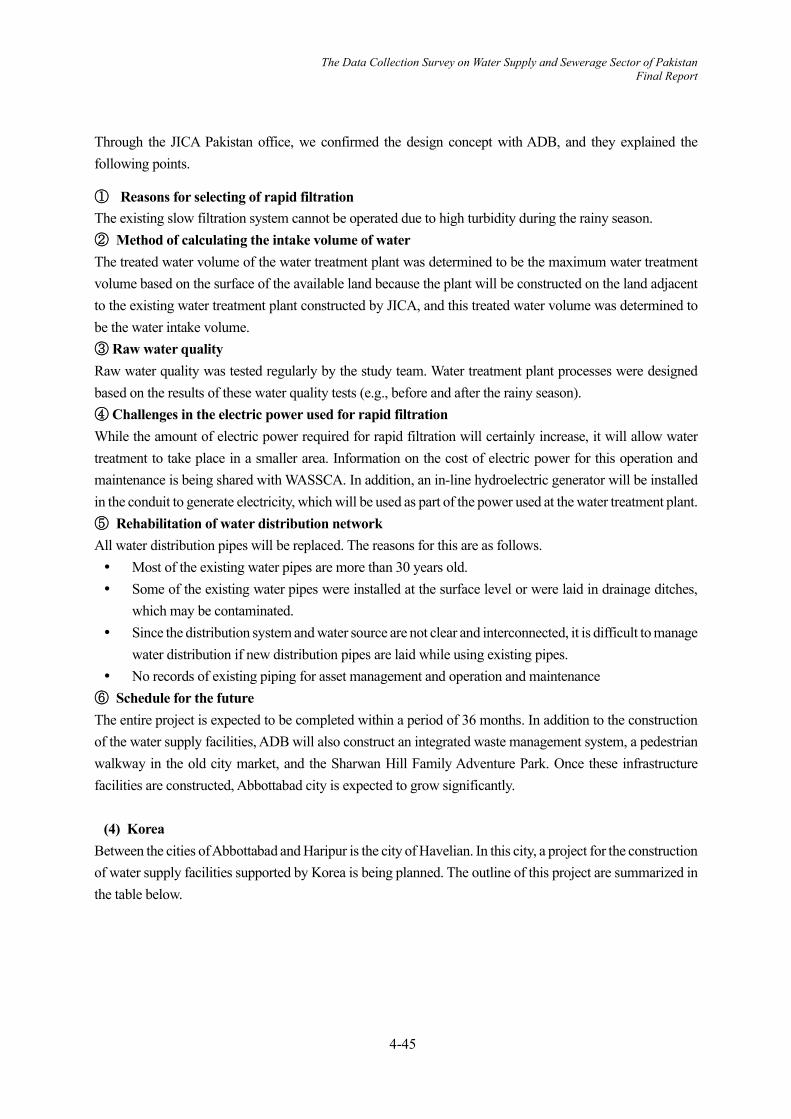
The Data Collection Survey on Water Supply and Sewerage Sector of Pakistan Final Report
4-45
Through the JICA Pakistan office, we confirmed the design concept with ADB, and they explained the following points.
① Reasons for selecting of rapid filtration The existing slow filtration system cannot be operated due to high turbidity during the rainy season. ② Method of calculating the intake volume of water The treated water volume of the water treatment plant was determined to be the maximum water treatment volume based on the surface of the available land because the plant will be constructed on the land adjacent to the existing water treatment plant constructed by JICA, and this treated water volume was determined to be the water intake volume. ③ Raw water quality Raw water quality was tested regularly by the study team. Water treatment plant processes were designed based on the results of these water quality tests (e.g., before and after the rainy season). ④ Challenges in the electric power used for rapid filtration While the amount of electric power required for rapid filtration will certainly increase, it will allow water treatment to take place in a smaller area. Information on the cost of electric power for this operation and maintenance is being shared with WASSCA. In addition, an in-line hydroelectric generator will be installed in the conduit to generate electricity, which will be used as part of the power used at the water treatment plant. ⑤ Rehabilitation of water distribution network All water distribution pipes will be replaced. The reasons for this are as follows. Most of the existing water pipes are more than 30 years old. Some of the existing water pipes were installed at the surface level or were laid in drainage ditches,
which may be contaminated. Since the distribution system and water source are not clear and interconnected, it is difficult to manage
water distribution if new distribution pipes are laid while using existing pipes. No records of existing piping for asset management and operation and maintenance
⑥ Schedule for the future The entire project is expected to be completed within a period of 36 months. In addition to the construction of the water supply facilities, ADB will also construct an integrated waste management system, a pedestrian walkway in the old city market, and the Sharwan Hill Family Adventure Park. Once these infrastructure facilities are constructed, Abbottabad city is expected to grow significantly.
(4) Korea
Between the cities of Abbottabad and Haripur is the city of Havelian. In this city, a project for the construction of water supply facilities supported by Korea is being planned. The outline of this project are summarized in the table below.

The Data Collection Survey on Water Supply and Sewerage Sector of Pakistan Final Report
4-46
Table 4.9-3 Project Summary for the Construction of Water Supply Facility in Havelian City Supported by Korea
Project title Gravity Based Safe Drinking Water Supply System in Havelian, Abbottabad, Khyber Pakhtunkhwa, Pakistan
Project Overall Objective
To improve the quality of life of people of Havelian by reducing incidence of death and illness caused by water-borne diseases through ensuring provision of adequate quantity of safe drinking water to the entire population at an affordable cost and in an equitable, efficient and sustainable manner
Partner country country Pakistan
working group PHED, KP.
Beneficiary Direct: 47,000 people in the Havelian region (88,000 people in the future)
Project duration 2021-2026
Schedule
April - May 2021 Finalize project plan June-August 2021 Selection of Korean contractor for project management September 2021 - March 2022 Conduct basic research April 2022 - June 2022 Select local design firm July 2022 - June 2023 Implementation Design June 2023 - June 2025 Construction
Overall project cost (including counterpart country cost)
KOICA USD 12.0 Millions
Partner Public Health Engineering Department Khyber Pakhtunkhwa (PHED KP) and local villagers
Project area Havelian District
Component
OUTPUT Contents estimate
OUTPUT 1 Water purification system design drawings (10,300 m3/day) 0.83 M USD
OUTPUT 2 Water purification system (intaking/purification plant, conduct/distribution pipe) 8.71 M USD
OUTPUT 3 Improved water distribution pipe 1.65 M USD
OUTPUT 4 Enhanced capacity of Pakistani workforce for operating water purification plant 0.5 M USD
OUTPUT 5 Established equipment for water purification plant 0.15 M USD
OUTPUT 6 Consulting for law and policy on water meter system 0.10 M USD
OUTPUT 7 Groundwater survey and conservation research 0.06 M USD
Total amount 12.0 M USD
Source: Survey team's summary of responses to inquiries from JICA Pakistan Office to KOICA officials

The Data Collection Survey on Water Supply and Sewerage Sector of Pakistan Final Report
4-47
Source: Survey team's processing of responses to inquiries from JICA Pakistan Office to KOICA staff.
Figure 4.9-4 Facility Layout of the Water Supply Facility Construction Project in Havelian City Supported by Korea
The following are the information for the project plan which was obtained from KOICA through JICA Pakistan office. The water purification system is planned to be slow filtration, because the quality of raw water is good,
and the operation cost is cheaper than rapid filtration. However, the details will be decided after the contractor (assumed to be a consultant) is selected.
The amount of water to be withdrawn is judged to be sufficient to supply the planned amount of 10,300 m3/day based on the local Dor River, but the exact amount of water will be measured after the contractor is selected.
As for the water quality, the water quality laboratory of the Pakistan Council of Research in Water Resources (PCRWR) was asked to analyze the water quality. In addition, a Korean expert measured nitric acid with a portable test kit, according to the report.
The construction of this Korean-supported water supply facility is located upstream of the Dor River in Haripur and is planned to take water from the Dor River, so it is necessary to note the progress of the project as it is closely related to the water supply facility planned for Haripur.

The Data Collection Survey on Water Supply and Sewerage Sector of Pakistan Final Report
4-48
4.10 NECESSITY OF SEWAGE TREATMENT FACILITIES
Although the project will increase the water supply, the PHED confirmed that there is no need for a sewage treatment facility at this time because their priority is to develop water supply facilities. This is also the case for surrounding cities such as Abbottabad, Mancehra and Havelian. Furthermore, wastewater from households, including kitchen and shower wastewater, flows from the road gutters into the SOKA River in the south of the city, and there is a river that percolates underground. The permeability of the ground is so good that it just flows there and percolates into the underground. Each household has a septic tank for toilets, and this sludge is pumped up and disposed of on the outskirts of Mirupur village in the southern part of Haripur by the TMA or private sludge collection vehicles when contacted. As there are no major problems with this method of disposal, the PHED believes that it is not necessary at present to develop sewerage facilities, although it may be necessary to consider it if the population increases further in the future.
SOKA River Dumping site on the outskirts of Mirupur village
Source: JST
Figure 4.10-1 SOKA River and Dumping Location in Mirupur Suburb
4.11 REQUEST OF PHED HARIPUR
4.11.1 Request of PHED Haripur There is a proposal for a rapid filtration water treatment facility using the Dor River, but because of the high turbidity of the river, the PHED prefers two water source facilities that also uses the less turbid water from Shah Masqood Springs. For this purpose, the PHED understands that it is important to regularly measure the volume and quality of water from the Dor River and Shah Masqood Spring. On the other hand, it was explained that all the water quality parameters that need to be measured for planning such a facility cannot be met by the equipment of the PHED Water Quality Laboratory, Abbottabad. It was promised that for the time being, the items that could not be measured at the water quality laboratory would continue to be measured by a simple portable test (pack test) left by the JICA survey team.
The Shah Masqood Springs are likely to be subterranean water from the Dor River in the north. Therefore, it is unlikely that the volume of water will suddenly decrease, or the quality of water will change, as is the case with springs from underground aquifers, and it is likely that the water quality will show the same trends as that in the Dor River.
On the other hand, the PHED expressed its intention to install the V-notch by itself to measure the water

The Data Collection Survey on Water Supply and Sewerage Sector of Pakistan Final Report
4-49
quantity periodically throughout the year in order to make the best use of the Shah Masqood Springs, but they would like JICA to propose the detailed location and water collection method.
4.11.2 Comparison on Potential Water Sources and Environmental and social consideration A comparison on the potential water sources were carried out.
A-1 Urban water supply 1 - Shar Maqsood Springs Positive-1 Water quality is relatively good Positive-2 Water source is relatively close to the water supply area Positive - 3 Water can be supplied by gravity from the water source to the water supply area Negative-1 Insufficient water quantity A-2 Urban water supply 2 - Dor River Positive-1 Water source is relatively close to the water supply area Positive-2 Water can be supplied by gravity from the water source to the water supply area Positive-3 Water volume is relatively large Negative-1 Poor water quality (Abbottabad, Havelian and other urban areas are located upstream) Negative-2 Improvement of power consumption (high turbidity, pre-treatment facilities are required) A-3 Urban water supply 3 - Halo River Positive-1 Water quality is relatively good Positive-2 Water volume is relatively large Negative-1 Construction of a dam or intake weir is required, which would have a significant environmental impact. Negative-2 Water source is far from the water supply area, long distance micro tunneling is required, and the cost is enormous A-4 Urban Water Supply 4 – Tube wells around Tarbela Dam Positive Not confirmed (not investigated due to PHED's wishes) Negative-1 The seasonal variation of groundwater level is large, and the possibility of stable supply is low. Negative-2 Water cannot be supplied by gravity from the source to the water supply area (pumping required). A-5 Rural Water Supply 1 - Chapra Dam Positive -1 Water quality is relatively good (before flooding) Positive-2 Water can be supplied by gravity from the water source to most of water supply area Negative-1 Uncertainty about the scheduled completion date Negative-2 Elevations in some of the areas to be served are higher than Chapra Dam and need to be pumped up at one of the locations

The Data Collection Survey on Water Supply and Sewerage Sector of Pakistan Final Report
4-50
Negative-3 It’s difficult to predict water quality after flooding of Dam A-6 Local Water Supply 2 - New tube well (tube well) Positive-1 Water quality is relatively good Positive-2 Water source is close to the water supply area Negative-1 Increased power consumption due to the need to pump up Negative-2 There is a concern about the depletion of water resources (the prospect of stable supply is poor) The above situation is summarized in Table 4.11-1 and Table 4.11-2
Table 4.11-1 Comparison of Water Source Candidate in Haripur (Urban water supply) Shar Maqsood Spring Dor River Halo River
Water quality + Pollution source upstream. + Volume of water -. + + Distance + + -(Distant) Water supply system + + ? (Further investigation required) Electricity consumption -. -(Pretreatment required) -. Expense -. -. -- - (enormous) Environmental impact -. -. -(water intake facility required) Assess Recommended Moderate Not recommended Source: JST
Table 4.11-2 Comparison of Water Source Candidate in Haripur (Rural Water Supply)
Chapra Dam Additional tube well Water quality + / ? (No prediction of water quality after flooding) + Volume of water + -- (Insufficient) Distance + + + Water supply system -. + Electricity consumption -. - (Pumping Pump) Expense - (Water transmission facilities and pumping stations) - (Well and water transmission facilities) Environmental impact - (Water Transmission Facilities) - (Groundwater depletion) Assess Moderate Not recommended
Source: JST
In light of this situation, and based on the feasibility and PHED's intentions, we have identified the following as possible water source candidates
Shar Maqsood Spring and Dor River for urban water supply Chapra Dam for rural water supply
Table 4.11-3 below summarizes the expected effects and points to consider, organized based on the current situation, when assuming a project with the following candidates.
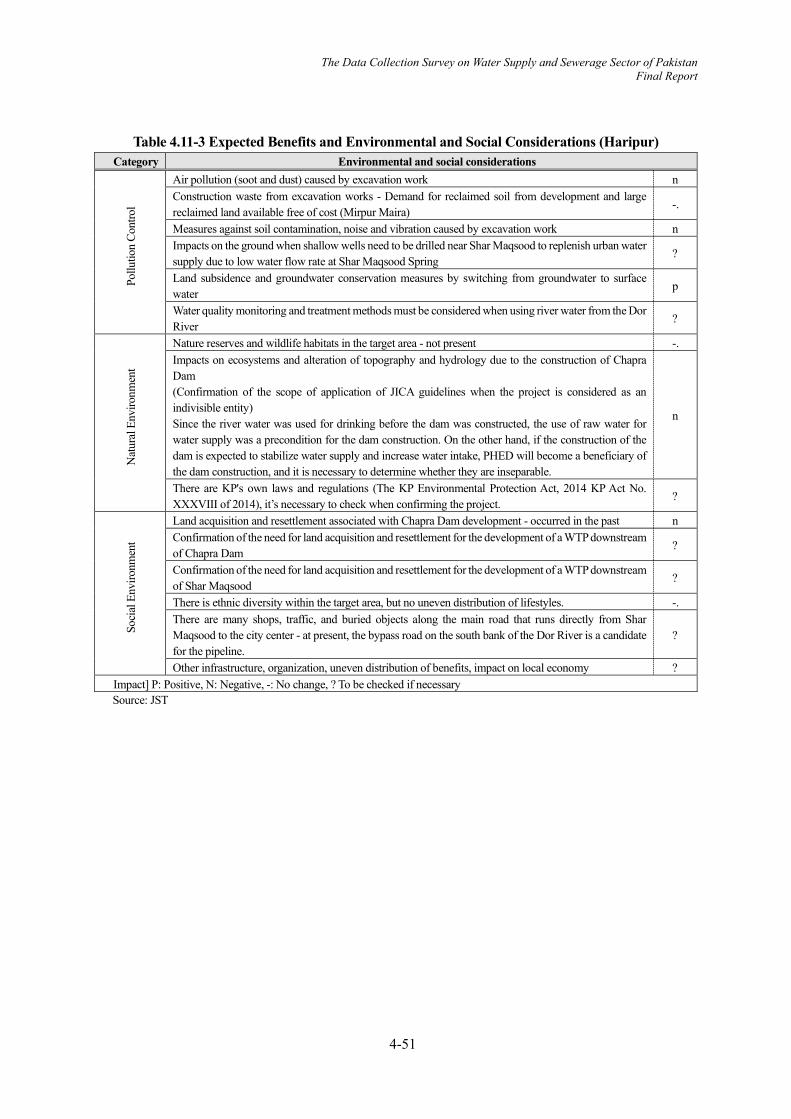
The Data Collection Survey on Water Supply and Sewerage Sector of Pakistan Final Report
4-51
Table 4.11-3 Expected Benefits and Environmental and Social Considerations (Haripur) Category Environmental and social considerations
Pollu
tion
Cont
rol
Air pollution (soot and dust) caused by excavation work n Construction waste from excavation works - Demand for reclaimed soil from development and large reclaimed land available free of cost (Mirpur Maira)
-.
Measures against soil contamination, noise and vibration caused by excavation work n Impacts on the ground when shallow wells need to be drilled near Shar Maqsood to replenish urban water supply due to low water flow rate at Shar Maqsood Spring
?
Land subsidence and groundwater conservation measures by switching from groundwater to surface water
p
Water quality monitoring and treatment methods must be considered when using river water from the Dor River
?
Nat
ural
Env
ironm
ent
Nature reserves and wildlife habitats in the target area - not present -. Impacts on ecosystems and alteration of topography and hydrology due to the construction of Chapra Dam (Confirmation of the scope of application of JICA guidelines when the project is considered as an indivisible entity) Since the river water was used for drinking before the dam was constructed, the use of raw water for water supply was a precondition for the dam construction. On the other hand, if the construction of the dam is expected to stabilize water supply and increase water intake, PHED will become a beneficiary of the dam construction, and it is necessary to determine whether they are inseparable.
n
There are KP's own laws and regulations (The KP Environmental Protection Act, 2014 KP Act No. XXXVIII of 2014), it’s necessary to check when confirming the project.
?
Soci
al E
nviro
nmen
t
Land acquisition and resettlement associated with Chapra Dam development - occurred in the past n Confirmation of the need for land acquisition and resettlement for the development of a WTP downstream of Chapra Dam
?
Confirmation of the need for land acquisition and resettlement for the development of a WTP downstream of Shar Maqsood
?
There is ethnic diversity within the target area, but no uneven distribution of lifestyles. -. There are many shops, traffic, and buried objects along the main road that runs directly from Shar Maqsood to the city center - at present, the bypass road on the south bank of the Dor River is a candidate for the pipeline.
?
Other infrastructure, organization, uneven distribution of benefits, impact on local economy ? Impact] P: Positive, N: Negative, -: No change, ? To be checked if necessary Source: JST

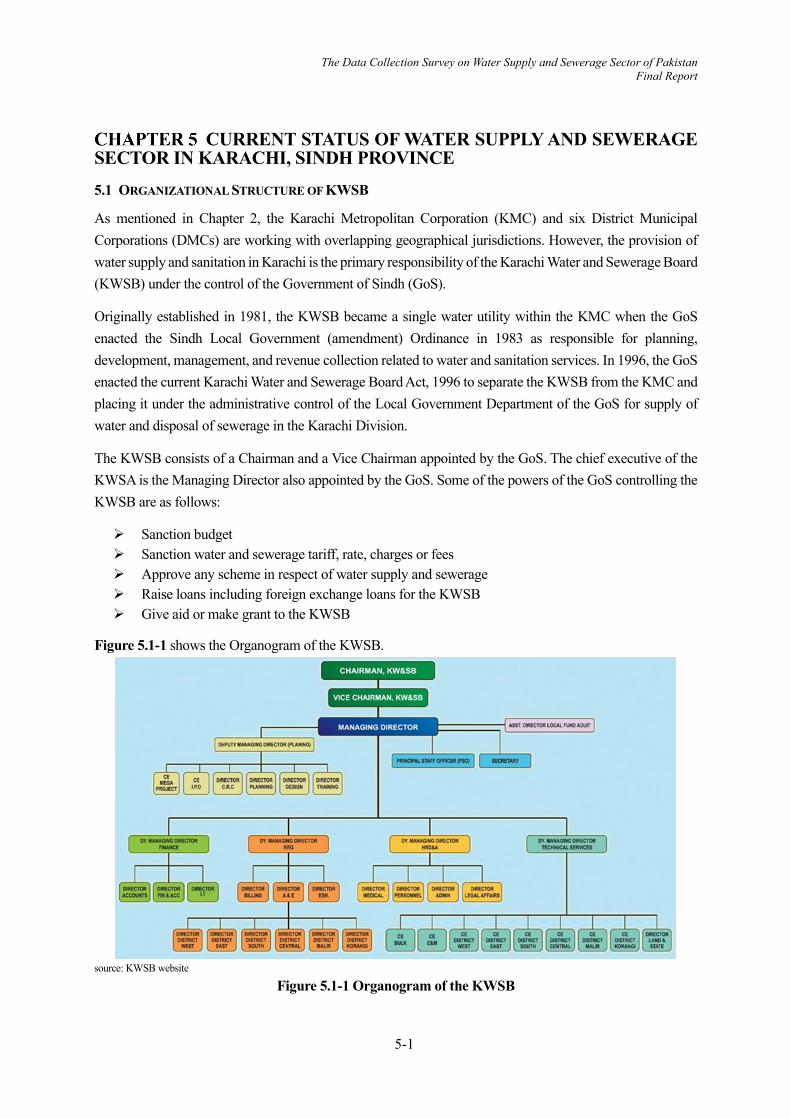
5-1
The Data Collection Survey on Water Supply and Sewerage Sector of Pakistan Final Report
CURRENT STATUS OF WATER SUPPLY AND SEWERAGE SECTOR IN KARACHI, SINDH PROVINCE 5.1 ORGANIZATIONAL STRUCTURE OF KWSB
As mentioned in Chapter 2, the Karachi Metropolitan Corporation (KMC) and six District Municipal Corporations (DMCs) are working with overlapping geographical jurisdictions. However, the provision of water supply and sanitation in Karachi is the primary responsibility of the Karachi Water and Sewerage Board (KWSB) under the control of the Government of Sindh (GoS).
Originally established in 1981, the KWSB became a single water utility within the KMC when the GoS enacted the Sindh Local Government (amendment) Ordinance in 1983 as responsible for planning, development, management, and revenue collection related to water and sanitation services. In 1996, the GoS enacted the current Karachi Water and Sewerage Board Act, 1996 to separate the KWSB from the KMC and placing it under the administrative control of the Local Government Department of the GoS for supply of water and disposal of sewerage in the Karachi Division.
The KWSB consists of a Chairman and a Vice Chairman appointed by the GoS. The chief executive of the KWSA is the Managing Director also appointed by the GoS. Some of the powers of the GoS controlling the KWSB are as follows:
Sanction budget Sanction water and sewerage tariff, rate, charges or fees Approve any scheme in respect of water supply and sewerage Raise loans including foreign exchange loans for the KWSB Give aid or make grant to the KWSB
Figure 5.1-1 shows the Organogram of the KWSB.
source: KWSB website
Figure 5.1-1 Organogram of the KWSB

5-2
The Data Collection Survey on Water Supply and Sewerage Sector of Pakistan Final Report
Table 5.1-1 shows the seniority list of KWSB.
Table 5.1-1 Seniority List of the KWSB
Table 5.1-2 shows the vacancy/excess status of post designations as of September 2021. Out of 5,934 posts, 1,824 are vacant.

5-3
The Data Collection Survey on Water Supply and Sewerage Sector of Pakistan Final Report
Table 5.1-2 Vacancy/Excess status of the KWSB posts (as of September 2021)
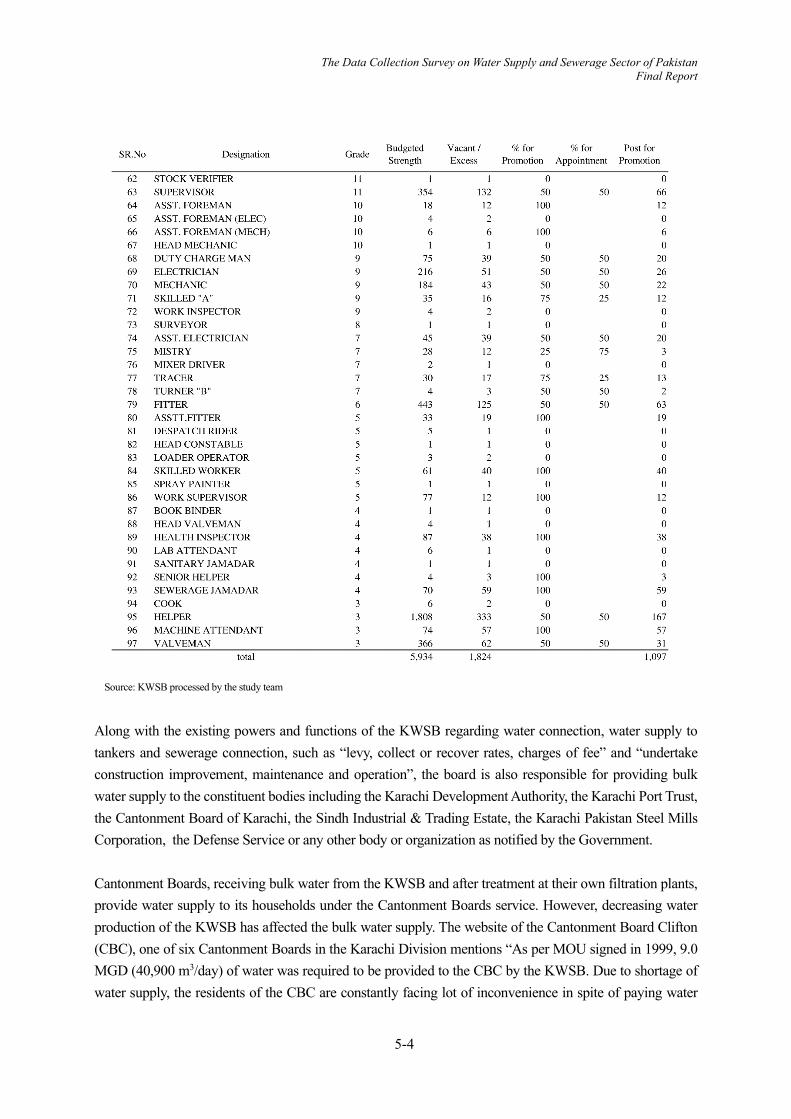
5-4
The Data Collection Survey on Water Supply and Sewerage Sector of Pakistan Final Report
Source: KWSB processed by the study team
Along with the existing powers and functions of the KWSB regarding water connection, water supply to tankers and sewerage connection, such as “levy, collect or recover rates, charges of fee” and “undertake construction improvement, maintenance and operation”, the board is also responsible for providing bulk water supply to the constituent bodies including the Karachi Development Authority, the Karachi Port Trust, the Cantonment Board of Karachi, the Sindh Industrial & Trading Estate, the Karachi Pakistan Steel Mills Corporation, the Defense Service or any other body or organization as notified by the Government. Cantonment Boards, receiving bulk water from the KWSB and after treatment at their own filtration plants, provide water supply to its households under the Cantonment Boards service. However, decreasing water production of the KWSB has affected the bulk water supply. The website of the Cantonment Board Clifton (CBC), one of six Cantonment Boards in the Karachi Division mentions “As per MOU signed in 1999, 9.0 MGD (40,900 m3/day) of water was required to be provided to the CBC by the KWSB. Due to shortage of water supply, the residents of the CBC are constantly facing lot of inconvenience in spite of paying water

5-5
The Data Collection Survey on Water Supply and Sewerage Sector of Pakistan Final Report
taxes more than any part of the city. Average supply during last 5 years was 5-6 MGD (22,700 – 27,300 m3/day)” 18 The Karachi City Diagnostic As mentioned in Chapter 2, the government of Sindh requested the World Bank Group to analyze the competitiveness of Karachi and provide advice in improving the livability to compile the Karachi City Diagnostic (KCD) report, “Transforming Karachi into a Livable and Competitive Megacity”. Regarding the management of the KWSB, the following are described. To this end, the World Bank conducted a set of rapid assessments from 2014 to 2016. The following are quoted from the KCD.19 Policy and Institutional Framework Neither the province nor the city has a formal policy for the WSS sector. In the absence of such a framework, fiscal support to the Karachi Water and Sewerage Board (KWSB) has been on an ad hoc basis and often aimed at addressing its immediate financial difficulties rather than funding longer-term goals or transformation. A provincial drinking water policy is, however, under preparation. The 2008 JICA-funded study of the water supply and sewerage system in Karachi remains the most recent overview of infrastructure needs and planning for the city’s WSS sector but limited planned interventions have been undertaken.
The KWSB currently has about 13,500 employees and had an estimated budget of US$222 million for 2014–15. However, de facto, the KWSB enjoys only a very limited autonomy. Key functions—including approval of budgets, regulations, and tariffs, hiring and postings, and provision or facilitation of locally mobilized funds or foreign loans or grants—lie within the purview of the provincial government. Additionally, the KWSB relies directly on subsidies from the provincial government and is fully dependent on provincial and federal funds for debt servicing and infrastructure expansion to meet its growing needs and to close the service deficit gap. In 2014, it received a US$50 million subsidy towards payment of electricity bills to the Karachi Electric. The current payable debts of the KWSB to the Karachi Electric are around US$320 million. Sector Structure and Assets Ownership Water supply is a significant challenge facing Karachi, with only 55 percent of water requirements being currently met. Per design, Karachi receives an inflow of 650 million gallons per day (MGD) (2,955,000 m3/day), mainly from two sources: the Indus River to the east of the city and the Hub Dam, a large water-storage reservoir constructed in 1981 on the Hub River, which flows to the west of the city. The Hub reservoir was not able to supply water for several years during the late 1990s and early 2000sas the dam’s catchment area was dry during the monsoon season. As per the World Health Organization’s standard of providing 55 gallons (250 L) per capita per day, Karachi’s current water needs are estimated at 1,200 MGD (5,455,000 m3/day). This translates into a shortfall of more than 550 MGD (2,500,000 m3/day). According to the KSDP 2020 estimates, the need is expected to reach 1,400 MGD (6,365,000 m3/day) by 2020.
Non-piped systems, including private water tankers, are abundant and form the major source of domestic
18 http://www.cbc.gov.pk/en///water-supply 19 The figures used in this section are quoted from KCD surveyed between 2014-2016. The latest figures may differ from these.

5-6
The Data Collection Survey on Water Supply and Sewerage Sector of Pakistan Final Report
water supply in Karachi, particularly in informal settlements. The KWSB has 24 hydrants licensed to private parties, of which 10 are operational and the remaining closed as per a recent Supreme Court Order. The construction of illegal hydrants are widespread. In an effort to control illegal water tapping, the KWSB introduced amendments to discourage illegal hydrants and has dismantled 948 illegal hydrants since 2009. In 2015, 10 KWSB hydrants were metered. However, only three metered hydrants are currently in operation. Access and Quality of Service Water supply in Karachi is highly irregular and inequitable. Data shows that access to improved water sources has declined during the past 10 years, slipping from 90 percent coverage of the population in 2006–07 to 86 percent in 2014–15. Further, rationing of water supply is widespread in most places, particularly in poor neighborhoods. More than 50 percent of Karachi’s population live in informal settlements, and most of them face severe shortages of water and a lack of proper sewerage systems (ADB 2007). Water availability often ranges from two hours every two days to four hours per day at very low pressure. Due to the lack of alternatives—as groundwater is brackish and the KWSB is the only service provider—many households also rely on vendors that supply water through commercial tankers at high prices, especially during the summer months.
A large amount of water does not reach users. The water distribution system in Karachi is, on average, about 40–45 years old, with many corroded pipes that disrupt effective transmission. It is estimated—in the absence of bulk and domestic metering—that nonrevenue water (NRW) is 35 percent (192 MGD (873,000 m3/day)), which includes both physical and commercial losses (leakages and large-scale, unauthorized diversion or thefts). Sewerage More than 6 million population of Karachi have no access to public sewerage service. Sewerage network coverage is estimated at 60 percent and faces complex challenges of inadequate sewer trunk mains, malfunctioning pumping facilities, and insufficient wastewater treatment capacity.
The amount of raw sewage discharged into the sea each day is 475 MGD. The sewerage network of the city has had very little maintenance since the 1960s (ADB 2007), and the three existing wastewater treatment plants are dysfunctional. Additionally, separation of municipal wastewater from industrial effluent is not a common practice. Two of the biggest industrial estates in Pakistan, both located in Karachi, have no effluent treatment plants, and the waste—containing hazardous materials, heavy metals, oil, and so on—are discharged directly into the rivers and the already polluted harbor (Worldwide Fund for Nature 2007). Efficiency and Sustainability The existing water and sanitation systems in Karachi underperform on most international standards for efficient and sustainable service delivery. The operational inefficiencies of the KWSB—including revenue under collection, distribution losses, and labor inefficiencies—cost the province millions of dollars every year.
5-7
The Data Collection Survey on Water Supply and Sewerage Sector of Pakistan Final Report
The KWSB has a computerized monthly billing cycle. On an average, it generates PRs 850 million (US$8.5 million) per month, while it collects PRs 550 million (US$5.5 million) per month, which puts collection efficiency at around 65 percent, far below the best practice of 100 percent. Average distribution and transmission losses in Karachi are 35 percent, which is far above the norm of 20 percent.
Poor billing and collection efficiency and the nature of the tariff structure also inhibit efforts to bridge the receipts-expenditure gap. Only 30 percent, or 300,000 out of a total 1.1 million customers, are presently being billed. The revenue collection decreased from 61 percent to 59 percent during the past five years. It is estimated that less than half of the registered 1.04 million consumers pay their monthly water bills. The total outstanding arrears are estimated at US$460 million (US$179 million for retail and US$281 million for bulk) and continues to accumulate. Government institutions and utilities are among the largest defaulters, owing the equivalent of US$350 million to the KWSB.
In Karachi, retail-level water supply is not metered, and consumers are billed on flat rates based on size of plots. Only 25 percent of the industrial or commercial customers have metered supply, with the remainder billed on connection size. Domestic connections are not metered, and tariffs are thus based on property size and not on volumetric consumption. The average water tariff is low, at US$0.13 per cubic meter, which creates a disincentive for any form of water savings (table 3.4). Additionally, there are no charges for sewerage services.
Additionally, the KWSB suffers from overstaffing and labor inefficiency. It has around 13,500 employees, or 6.5 employees per 1,000 connections, more than twice the norm of 2.0 employees per 1,000 connections frequently used as the international benchmark in developing countries. Along with electricity charges, salaries and benefits (establishment cost) represent about 92 percent of the total expenditures of the KWSB. This situation leaves very little fiscal space for the board to invest and carry out regular operation and maintenance of its assets. The board management very often has to choose among paying salaries, buying fuel, or purchasing spare parts. Investment Trends and Future Needs Over the past 10 years (2005-2014), capital expenditures in the water and sanitation sector totaled over US$65 million. The vast majority of this investment was undertaken with the support of the provincial and the federal governments. The amount of investment is decreasing since 2008. The investment level is insufficient to close the current gap in terms of access and quality and in keeping pace with the growing demand and service targets.
Additionally, the actual investment amount is far from the estimated investment requirements for water supply to ensure universal access to safe and affordable drinking water by 2030, which is one of the Sustainable Development Goals. In 2007, the JICA WSS Master Plan for Karachi estimated the total investment needs for the WSS at US$2.6 billion.
Karachi’s water and sewerage crisis are foremost a governance and institutional one. Without a viable governance framework that clearly delineates the appropriate roles and responsibilities of relevant

5-8
The Data Collection Survey on Water Supply and Sewerage Sector of Pakistan Final Report
stakeholders in policy making, service delivery, and regulation, the long-term effects of technical, financial, or internal management changes cannot be secured. 5.2 TARIFF SYSTEM AND FINANCIAL STATUS OF KWSB
5.2.1 The KWSB's Water and Sewer Rate System (1) Water and sewerage rate structure The tariff structure for water supply and sewerage/drainage of the KWSB is shown in Table 5.2-1 and the fee schedule is shown in Table 5.2-2. The tariffs are set out for each for water supply and sewerage and drainage sector, and by each residential, commercial and industrial category of residential, commercial and industrial. Water rates are set at a fixed rate as well as metered rates, while sewerage and drainage rates are set at as a fixed percentage of the water bill. The flat rate is set by and out according to the size of the premises. Water and sewage charges are revised annually at an annual rate of about 8-9%, mainly due to rising prices.
Table 5.2-1 Rate Structure for Water Supply and Sewerage/Drainage of the KWSB (As of July 2021) category Fee Classification and Concept
. Water Supply
Domestic
Plots (Residential) Flat Rate Set for each plot size category (16 categories)
For two or more floors, 50% of the flat rate per floor is added Metered Rs. 219 per 1,000 Gallons
Flats Flat rate Set for each site area category (13categories) Metered Rs. 219 per 1,000 Gallons
Commercial, Office and Public Facility
Offices Flat rate Same rates as Tariff of Domestic Flat depends on covered area
basis (Square feet) Metered Rs. 219 per 1,000 Gallons
Shops Flat rate Rs. 171 per store per month
Dhobi Ghats, Restaurants, Agricultures, Block Thallas, Cattle ponds, Hammams
Flat rate Twice rate of Tariff of Domestic house depends upon size of plot (Square yard)
Metered Rs. 372 per 1,000 Gallons
Commercial, High-rise buildings, Housing projects, Hotel
Flat rate Twice rate of Tariff of Domestic house depends upon size of plot (Square yard)
Metered Rs. 372 per 1,000 Gallons
Cooperative societies Flat rate Same as Bulk Domestic Rates
Metered Rs.21 per 1000 Gallons
Universities, schools, clinics and hospitals
Flat rate Double the residential (detached house) flat rate Set for each site area category (13 categories)
Metered Rs. 222 per 1,000 Gallons 2. Sewerage and drainage
Residence
Plots (Residential) Flat rate Set for each plot size category (16 categories) 75% of the flat rate per floor for buildings with two or more floors
Metered 25% of water charges
Flats Flat rate Set for each site area category (13 categories)
Metered 25% of water bill Commercial, office and public facilities 25% of water charges
Source: The Sindh Government Gazzette, September 17, 2015
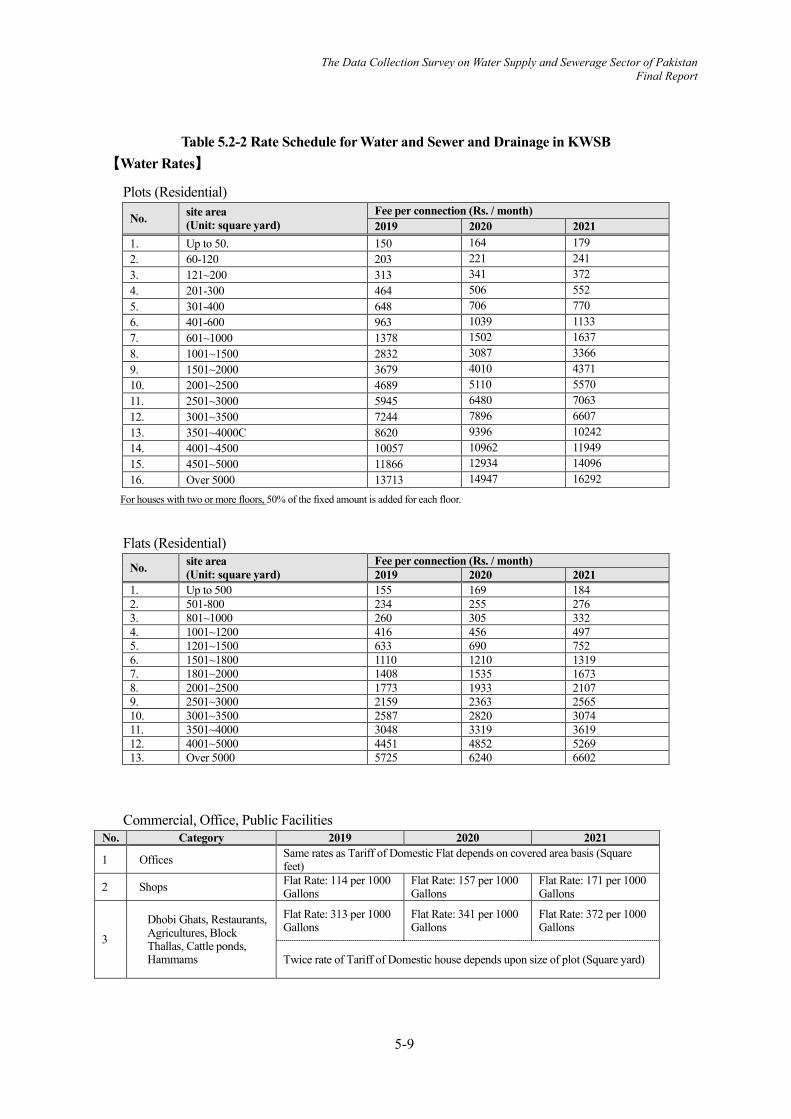
5-9
The Data Collection Survey on Water Supply and Sewerage Sector of Pakistan Final Report
Table 5.2-2 Rate Schedule for Water and Sewer and Drainage in KWSB 【Water Rates】
Plots (Residential)
No. site area (Unit: square yard)
Fee per connection (Rs. / month) 2019 2020 2021
1. Up to 50. 150 164 179 2. 60-120 203 221 241 3. 121~200 313 341 372 4. 201-300 464 506 552 5. 301-400 648 706 770 6. 401-600 963 1039 1133 7. 601~1000 1378 1502 1637 8. 1001~1500 2832 3087 3366 9. 1501~2000 3679 4010 4371 10. 2001~2500 4689 5110 5570 11. 2501~3000 5945 6480 7063 12. 3001~3500 7244 7896 6607 13. 3501~4000C 8620 9396 10242 14. 4001~4500 10057 10962 11949 15. 4501~5000 11866 12934 14096 16. Over 5000 13713 14947 16292
For houses with two or more floors, 50% of the fixed amount is added for each floor.
Flats (Residential) No. site area
(Unit: square yard) Fee per connection (Rs. / month) 2019 2020 2021
1. Up to 500 155 169 184 2. 501-800 234 255 276 3. 801~1000 260 305 332 4. 1001~1200 416 456 497 5. 1201~1500 633 690 752 6. 1501~1800 1110 1210 1319 7. 1801~2000 1408 1535 1673 8. 2001~2500 1773 1933 2107 9. 2501~3000 2159 2363 2565 10. 3001~3500 2587 2820 3074 11. 3501~4000 3048 3319 3619 12. 4001~5000 4451 4852 5269 13. Over 5000 5725 6240 6602
Commercial, Office, Public Facilities No. Category 2019 2020 2021
1 Offices Same rates as Tariff of Domestic Flat depends on covered area basis (Square feet)
2 Shops Flat Rate: 114 per 1000 Gallons
Flat Rate: 157 per 1000 Gallons
Flat Rate: 171 per 1000 Gallons
3
Dhobi Ghats, Restaurants, Agricultures, Block Thallas, Cattle ponds, Hammams
Flat Rate: 313 per 1000 Gallons
Flat Rate: 341 per 1000 Gallons
Flat Rate: 372 per 1000 Gallons
Twice rate of Tariff of Domestic house depends upon size of plot (Square yard)
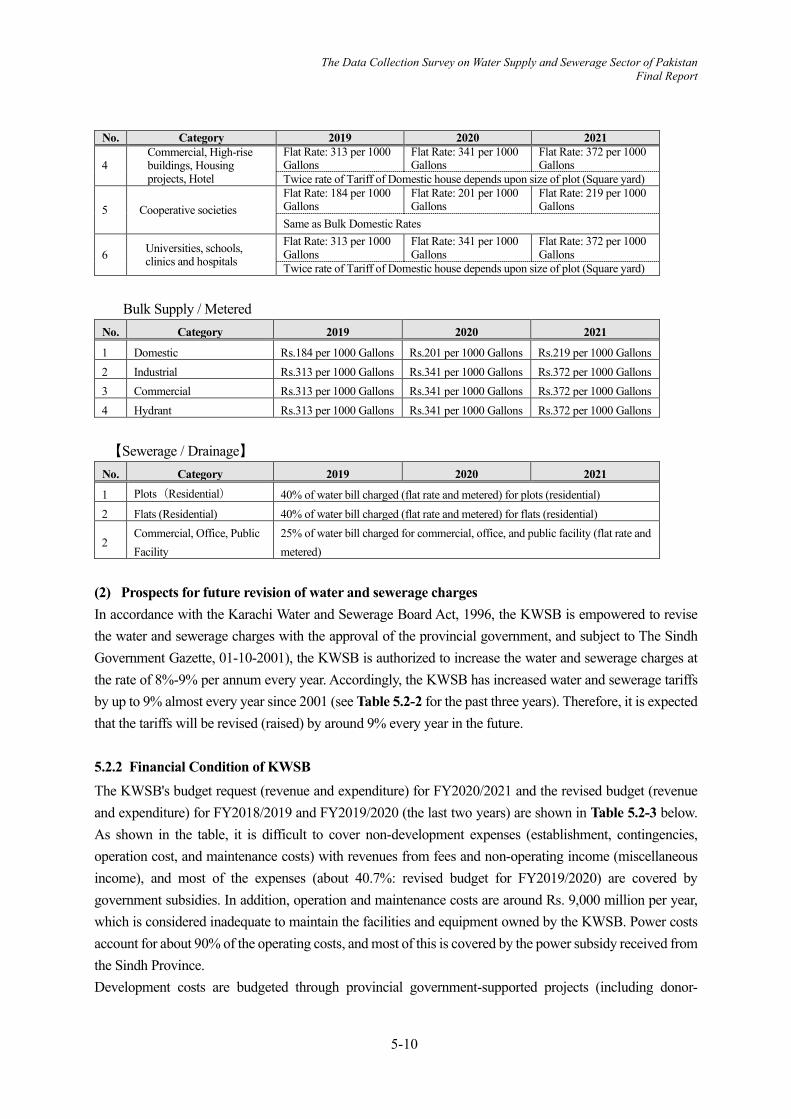
5-10
The Data Collection Survey on Water Supply and Sewerage Sector of Pakistan Final Report
No. Category 2019 2020 2021
4 Commercial, High-rise buildings, Housing projects, Hotel
Flat Rate: 313 per 1000 Gallons
Flat Rate: 341 per 1000 Gallons
Flat Rate: 372 per 1000 Gallons
Twice rate of Tariff of Domestic house depends upon size of plot (Square yard)
5 Cooperative societies Flat Rate: 184 per 1000 Gallons
Flat Rate: 201 per 1000 Gallons
Flat Rate: 219 per 1000 Gallons
Same as Bulk Domestic Rates
6 Universities, schools, clinics and hospitals
Flat Rate: 313 per 1000 Gallons
Flat Rate: 341 per 1000 Gallons
Flat Rate: 372 per 1000 Gallons
Twice rate of Tariff of Domestic house depends upon size of plot (Square yard)
Bulk Supply / Metered No. Category 2019 2020 2021
1 Domestic Rs.184 per 1000 Gallons Rs.201 per 1000 Gallons Rs.219 per 1000 Gallons 2 Industrial Rs.313 per 1000 Gallons Rs.341 per 1000 Gallons Rs.372 per 1000 Gallons 3 Commercial Rs.313 per 1000 Gallons Rs.341 per 1000 Gallons Rs.372 per 1000 Gallons 4 Hydrant Rs.313 per 1000 Gallons Rs.341 per 1000 Gallons Rs.372 per 1000 Gallons 【Sewerage / Drainage】
No. Category 2019 2020 2021
1 Plots(Residential) 40% of water bill charged (flat rate and metered) for plots (residential) 2 Flats (Residential) 40% of water bill charged (flat rate and metered) for flats (residential)
2 Commercial, Office, Public Facility
25% of water bill charged for commercial, office, and public facility (flat rate and metered)
(2) Prospects for future revision of water and sewerage charges In accordance with the Karachi Water and Sewerage Board Act, 1996, the KWSB is empowered to revise the water and sewerage charges with the approval of the provincial government, and subject to The Sindh Government Gazette, 01-10-2001), the KWSB is authorized to increase the water and sewerage charges at the rate of 8%-9% per annum every year. Accordingly, the KWSB has increased water and sewerage tariffs by up to 9% almost every year since 2001 (see Table 5.2-2 for the past three years). Therefore, it is expected that the tariffs will be revised (raised) by around 9% every year in the future. 5.2.2 Financial Condition of KWSB The KWSB's budget request (revenue and expenditure) for FY2020/2021 and the revised budget (revenue and expenditure) for FY2018/2019 and FY2019/2020 (the last two years) are shown in Table 5.2-3 below. As shown in the table, it is difficult to cover non-development expenses (establishment, contingencies, operation cost, and maintenance costs) with revenues from fees and non-operating income (miscellaneous income), and most of the expenses (about 40.7%: revised budget for FY2019/2020) are covered by government subsidies. In addition, operation and maintenance costs are around Rs. 9,000 million per year, which is considered inadequate to maintain the facilities and equipment owned by the KWSB. Power costs account for about 90% of the operating costs, and most of this is covered by the power subsidy received from the Sindh Province. Development costs are budgeted through provincial government-supported projects (including donor-

5-11
The Data Collection Survey on Water Supply and Sewerage Sector of Pakistan Final Report
supported projects), and there are no development projects funded by the KWSB's own resources.
Table 5.2-3 Financial Status of the KWSB (Unit: million Rs.)
Particulars 2018/2019 Revised
2019/2020 Revised
2020/2021 Proposed
1 Receipts 40744.090 21117.993 33947.410 1) Revenue income, etc. 9015.00 10660.000 12505.000 Water Charges (Retail & Bulk) 7940.000 9400.000 10825.000 Sewerage Arrears (Retail & Bulk) 75.000 60.000 80.000 Others 1000.000 1200.000 1600.000 2) Government subsidy 7511.812 7320.301 7686.764
Arrears Receivable from (Government of Sindh,
Government of Pakistan) 911.812 260.364 686.764
Subsidy from Govt. of Sindh for Payment of
Electricity charges 6600.000 6200.000 7000.000
Grant in Aid from Govt. of Sindh 859.937 0.000 3) Government Aided 24317.278 3137.692 13725.646 State Government Support Projects (K-III) 856.700 State Government Support Project (K-IV) 15898.500 200.000 2857.000 Greater Karachi Sewage Project (S-III) 1724.196 11250.000 3000.000
Consolidated Effluent Treatment Plant Improvement
(CETP) 0.000 0.000 5000.000
ADP Business 5837.882 1687.692 2868.646 2 Expenditure 40744.090 21117.993 33917.410 1) Establishment 6244.836 6828.839 7627.413 2) Contingencies 654.986 887.336 973.546 3) Repair & Maintenance (Operational Cost) 6947.368 6731.390 7693.075 Electricity Charges 6500.000 6200.000 7000.000 Others 447.368 531.390 693.075 4) Repair & Maintenance 1573.015 2676.722 2454.564 5) Development Works 1006.607 856.014 1443.166 6) Government Aided 24317.278 3137.692 13725.646 State Government Support Projects (K-III) 856.700 State Government Support Project (K-IV) 15898.500 200.000 2857.000 Greater Karachi Sewage Project (S-III) 1724.196 1250.000 3000.000
Consolidated Effluent Treatment Plant Improvement
(CETP) 0.000 0.000 5000.000
ADP Business 5837.882 1687.692 2868.646 Source: The KWSB, 2019

5-12
The Data Collection Survey on Water Supply and Sewerage Sector of Pakistan Final Report
5.2.3 KWSB Funding Flow and Project Approval Procedures (1) Fund flow by borrowing from donors20 The fund flow in case of borrowing from a donor is described below based on the case of the KASSIP project about to be implemented under WB / AIIB financing. WB and AIIB will be responsible for 40% of the total project cost, and the provincial government will
be responsible for the remaining 20%. The lessee is the Federal Government of Pakistan, the Implementing Entity is the Government of
Sindh, and the Executing Agency is the KWSB. There are no sublease from the Federal Government to the Provincial Government or the KWSB.
Regarding the flow of funds, the loan money from WB and AIIB will be transferred to the account of the National Bank of Pakistan and released to the Executing Agency (EA: KWSB) who has opened a separate designated account (DA) at this bank.
Payments are made for advance payments and piecework payments. (2) Procedures for project approval within the Government of Pakistan The procedure within the Pakistani government generally differs depending on the amount of the project cost, but in the case of overseas donor projects, it is the same as in the procedure for projects having cost of 10 billion PKR or more. It is reviewed / approved by the process as shown in Figure 5.2-1.
5.3 CURRENT STATUS OF WATER AND SEWAGE FACILITIES IN KARACHI CITY
5.3.1 Current Status of Water Facilities in Karachi City The Karachi City Water Supply System supplies approximately 650 MGD of water to Karachi citizens by means of bulk supply from the Indus River (Kinjhar Lake) and the Hub Dam and wells as shown in Figure 5.3 1. However, currently the water supply capacity is far below the water demand and NRW rate is up to 35%, which results in the shortage of water supply in many areas of the city. In response to this, the KIV project (described later) is being implemented to substantially increase the bulk supply from the Kinjhar
20 Project Document of the Asian Infrastructure Investment Bank, Karachi Water and Sewerage Services Improvement Project, 2019
Source: JST
EAD: Economic Affairs Division) ECNEC: Executive Committee of National Economic Council CDWP: Central Development Working Party PDWP: Provincial Development Working Party PCⅠ: Plan of project other than survey, PCⅡ: Plan of survey project
Approval by PDWP/CDWP
Approval by ECNEC
Over 10 billion PKR and overseas donor
projects
Approval of PC-Ⅰ& PC-Ⅱ
Formal request to each
donor By EAD
Selection of requested projects by the Planning and Development Bureau of the
Ministry of Planning and Development
Figure 5.2-1 Development Project Pre-Screening Process by Pakistani Government - Overseas Donors
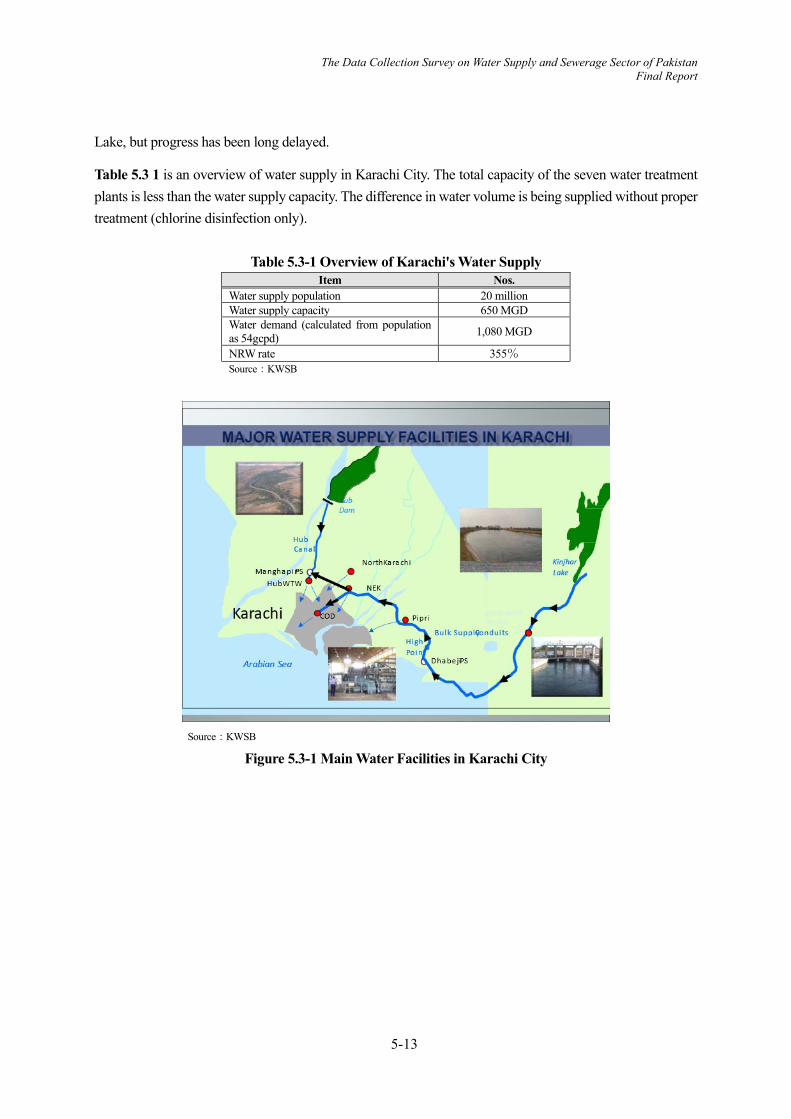
5-13
The Data Collection Survey on Water Supply and Sewerage Sector of Pakistan Final Report
Lake, but progress has been long delayed.
Table 5.3 1 is an overview of water supply in Karachi City. The total capacity of the seven water treatment plants is less than the water supply capacity. The difference in water volume is being supplied without proper treatment (chlorine disinfection only).
Table 5.3-1 Overview of Karachi's Water Supply
Item Nos. Water supply population 20 million Water supply capacity 650 MGD Water demand (calculated from population as 54gcpd) 1,080 MGD
NRW rate 355% Source:KWSB
Source:KWSB
Figure 5.3-1 Main Water Facilities in Karachi City
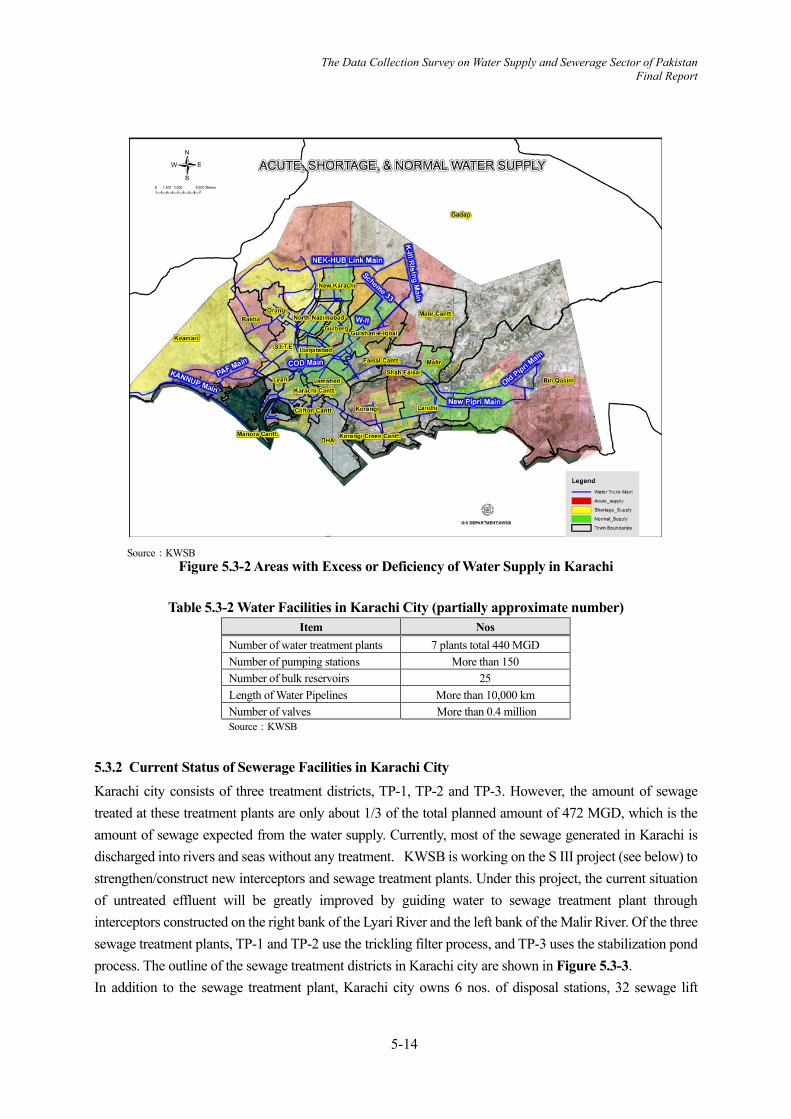
5-14
The Data Collection Survey on Water Supply and Sewerage Sector of Pakistan Final Report
Source:KWSB
Figure 5.3-2 Areas with Excess or Deficiency of Water Supply in Karachi
Table 5.3-2 Water Facilities in Karachi City (partially approximate number) Item Nos
Number of water treatment plants 7 plants total 440 MGD Number of pumping stations More than 150 Number of bulk reservoirs 25 Length of Water Pipelines More than 10,000 km Number of valves More than 0.4 million Source:KWSB
5.3.2 Current Status of Sewerage Facilities in Karachi City Karachi city consists of three treatment districts, TP-1, TP-2 and TP-3. However, the amount of sewage treated at these treatment plants are only about 1/3 of the total planned amount of 472 MGD, which is the amount of sewage expected from the water supply. Currently, most of the sewage generated in Karachi is discharged into rivers and seas without any treatment. KWSB is working on the S III project (see below) to strengthen/construct new interceptors and sewage treatment plants. Under this project, the current situation of untreated effluent will be greatly improved by guiding water to sewage treatment plant through interceptors constructed on the right bank of the Lyari River and the left bank of the Malir River. Of the three sewage treatment plants, TP-1 and TP-2 use the trickling filter process, and TP-3 uses the stabilization pond process. The outline of the sewage treatment districts in Karachi city are shown in Figure 5.3-3. In addition to the sewage treatment plant, Karachi city owns 6 nos. of disposal stations, 32 sewage lift

5-15
The Data Collection Survey on Water Supply and Sewerage Sector of Pakistan Final Report
pumping stations, 5,670 km of sewer pipes, and 250,000 manholes as sewage transmission facilities. Since the amount of sewage actually flowing in is smaller than the amount of sewage expected from the treatment district of each sewage treatment plant, it is presumed that the sewer pipes are damaged or clogged21. The city owns 23 nos. of jetting machines and suction machines as equipment for cleaning sewer pipes, but they are aging, and the number of machines are insufficient. However, they will be increased by the KWSSIP as described later.
Source:Karachi M/P Report
Figure 5.3-3 Overview of Karachi's Sewage Treatment Districts
Table 5.3-3 Sewage Amount and Treatment Amount in Karachi City Items Sewage Amount
Sewage generated in City(70% of water supplied) 472 Optimum design capacity of Sewage Treatment plants 150 Quantity of Sewage Treated 50 Shortfall in Sewage Treatment capacity 322 Source:KWSB
Table 5.3-4 Sewerage Facilities in Karachi City Facilities/ Equipment Nos
Number of sewage treatment plants 3 Number of major disposal stations 6 Number of lift station 32 Total length of sewers 5,670 km Total number of manholes 250,000 Number of Sewer Cleaning Machines: Suction Machines / Jetting Machines 23 each
21 The study on water supply and sewerage system in Karachi Final Report, 2008
Sewage Treatment Plant Sewerage Catchment Area Sewerage Catchment Area

5-16
The Data Collection Survey on Water Supply and Sewerage Sector of Pakistan Final Report
5.4 ISSUES OF KWSB BUSINESS MANAGEMENT
(1) Business Management Issues and Requirements for Improvement as Pointed out in M / P Report The Study Report on Water Supply and Sewerage System in Karachi (hereinafter referred to as the Karachi M/P Report), pointed out that the major issue of water supply services in Karachi city is the low level of KWSB’s water supply service. Since it fails in securing the necessary amount and quality of water, residents have a strong dissatisfaction and their willingness to pay for water service remains low. Four requirements are shown for providing stable water supply services, all of which require replacement of aging water distribution/supply facilities and securing of necessary water sources. The financial resources required for these improvements cannot be secured due to low revenue collection rates, resulting in a vicious cycle. (See Table 5.4-1.)
Table 5.4-1 Issues on Water Supply Service in Karachi City and Countermeasures Issues on Water Supply Service in Karachi City Requirements for Providing Good Water Supply Service
There are many old pipes in the current water distribution network, the pipe diameter is insufficient, and the water leakage rate and non-revenue water rate are far beyond the permissible limits. In most parts of the urban areas, residents are obliged to spend
money on ground level water tanks, suction/booster pumps, roof-top storage tanks, and water filters, and water must be boiled prior to drinking. Many households cannot obtain the sufficient amount of
water to meet the basic needs and are compelled to use secondary sources of water such as shallow wells or tanker supplies. In the light of the poor water supply situation, many residents
have a very negative impression of KW&SB and the service it provides and are therefore reluctant to pay water charges
Sufficient water supply to meet demand (no need to rely on shallow wells or tanker water supply).
Safe water suitable for drinking is supplied (no need to use filtration equipment or boiling).
Water is supplied with sufficient pressure (no need to use suction / booster pumps or rooftop tanks).
By continuously supplying water for 24 hours and keeping the inside of the water pipe under pressure at all times, pollution and excessive air mixing are avoided (no need to use an underground tank).
Source:Karachi M/P Report
(2) Organizational and Institutional Reform Proposed under the Karachi M / P Report In the Karachi M/P report, one of the operational problems is that the KWSB, despite its apparently independent form of organization, has always been subjected to various political interferences in the conduct of its business, as analyzed below. Local governments have legitimate roles in the shaping of policies for water and sanitation sector in the
region, including the adjustment of tariffs. The source of the problem is that KWSB is expected to act both as the local governments’ agent in
developing and delivering these policies and as the operator of services with managerial and technical functions.
To address this problem, it is proposed that policy and representative functions should be separated from the operation of services.
As a concrete proposal, the report proposes that the Karachi city be divided into three independent retail
service zones and responsibilities for providing retail services be transferred from KWSB to newly
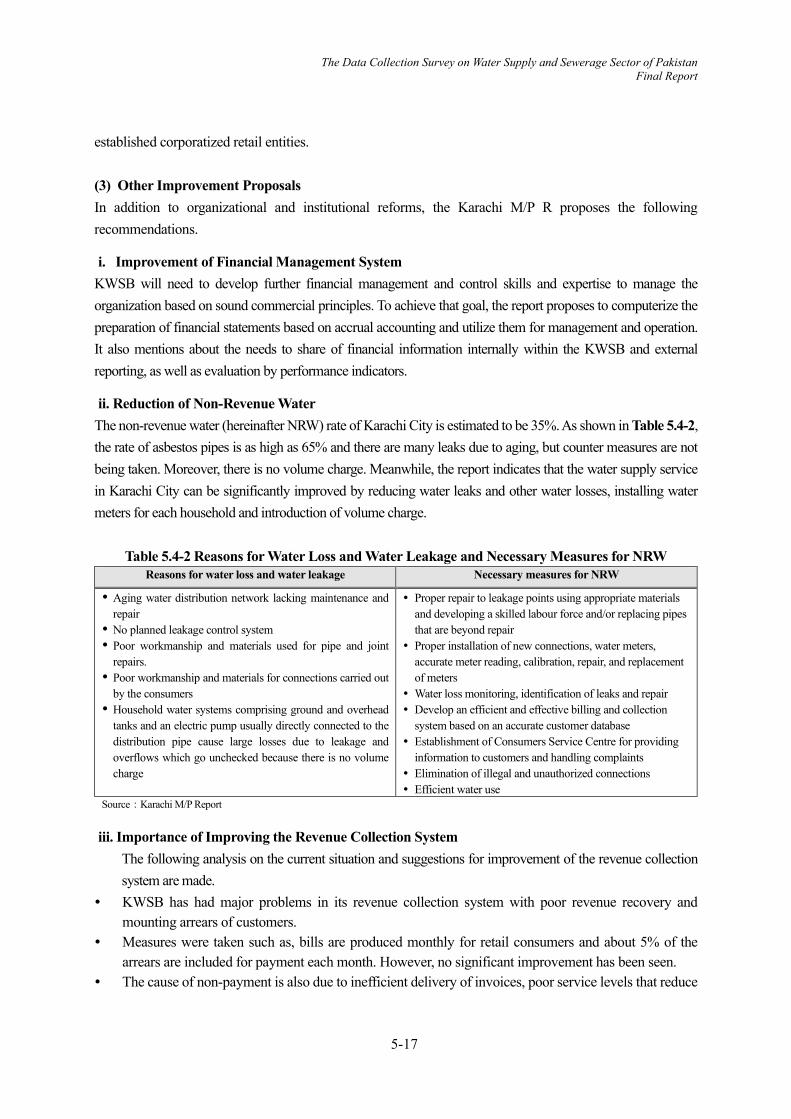
5-17
The Data Collection Survey on Water Supply and Sewerage Sector of Pakistan Final Report
established corporatized retail entities.
(3) Other Improvement Proposals In addition to organizational and institutional reforms, the Karachi M/P R proposes the following recommendations.
i. Improvement of Financial Management System KWSB will need to develop further financial management and control skills and expertise to manage the organization based on sound commercial principles. To achieve that goal, the report proposes to computerize the preparation of financial statements based on accrual accounting and utilize them for management and operation. It also mentions about the needs to share of financial information internally within the KWSB and external reporting, as well as evaluation by performance indicators.
ii. Reduction of Non-Revenue Water The non-revenue water (hereinafter NRW) rate of Karachi City is estimated to be 35%. As shown in Table 5.4-2, the rate of asbestos pipes is as high as 65% and there are many leaks due to aging, but counter measures are not being taken. Moreover, there is no volume charge. Meanwhile, the report indicates that the water supply service in Karachi City can be significantly improved by reducing water leaks and other water losses, installing water meters for each household and introduction of volume charge.
Table 5.4-2 Reasons for Water Loss and Water Leakage and Necessary Measures for NRW
Reasons for water loss and water leakage Necessary measures for NRW
Aging water distribution network lacking maintenance and repair No planned leakage control system Poor workmanship and materials used for pipe and joint
repairs. Poor workmanship and materials for connections carried out
by the consumers Household water systems comprising ground and overhead
tanks and an electric pump usually directly connected to the distribution pipe cause large losses due to leakage and overflows which go unchecked because there is no volume charge
Proper repair to leakage points using appropriate materials and developing a skilled labour force and/or replacing pipes that are beyond repair
Proper installation of new connections, water meters, accurate meter reading, calibration, repair, and replacement of meters
Water loss monitoring, identification of leaks and repair Develop an efficient and effective billing and collection
system based on an accurate customer database Establishment of Consumers Service Centre for providing
information to customers and handling complaints Elimination of illegal and unauthorized connections Efficient water use
Source:Karachi M/P Report iii. Importance of Improving the Revenue Collection System
The following analysis on the current situation and suggestions for improvement of the revenue collection system are made.
KWSB has had major problems in its revenue collection system with poor revenue recovery and mounting arrears of customers.
Measures were taken such as, bills are produced monthly for retail consumers and about 5% of the arrears are included for payment each month. However, no significant improvement has been seen.
The cause of non-payment is also due to inefficient delivery of invoices, poor service levels that reduce

5-18
The Data Collection Survey on Water Supply and Sewerage Sector of Pakistan Final Report
customers' willingness to pay, poor connection, etc. Improvements are needed on these fronts. The payment system through mobile phones, credit cards are already introduced, which improves user
convenience but does not lead to an improvement in collection rate. iv. Sustainable Management of Facility Information Using GIS
The following analysis of the current situation and proposals are made for sustainable management of facility information using GIS.
Water and wastewater utilities are increasingly adopting GIS to perform day-to-day operation, maintenance, data management and customer service. Utilities can also use GIS for demand analysis, facility expansion planning, and network design based on hydraulic modelling and infrastructure management.
GIS applications for asset/facility management is the most important and basic requirement pertaining to the GIS development for KWSB and GIS development should be tailored to meet the needs.
In the survey, information is being collected and digitized, and hardware/software and personnel are needed to build a system that utilizes the information.
v. Improvement of Customer Service
The following analysis on the current situation and suggestions for improvement of customer service are being made. Providing good customer service can increase residents' willingness to pay, increase the rate of revenue
collection, and thereby ensure financial sustainability. For the improvement of customer service, a clear customer mandate describing the levels of services to
be provided and the responsibilities of customers to pay bills, settle arrears and to comply with regulations with respect to water connections etc. are needed. Complaint handling must be carried out by a dedicated, trained team.
Customers should be able to obtain basic information about tariff collection and facility operation via internet.
Maximizing the use of customer feedback to monitor actual performance will help to improve operations in the future.
vi. Human Resource Development
Table 5.4-3 shows the issues pertaining to human resource development and the necessary measures. KWSB has a seniority-based lifetime employment system, does not have a clear human resource development goal, or "human resource development plan," and does not conduct performance and competency evaluations for each staff member. Therefore, currently the motivation of the staff does not increase. In response to this, the report doesn’t suggest any systematic proposals, but it pointed out the needs to clarify the target values / targets of organizations and individuals and develop human resources development plan including performance evaluation of each staff member and monitoring of training effect.
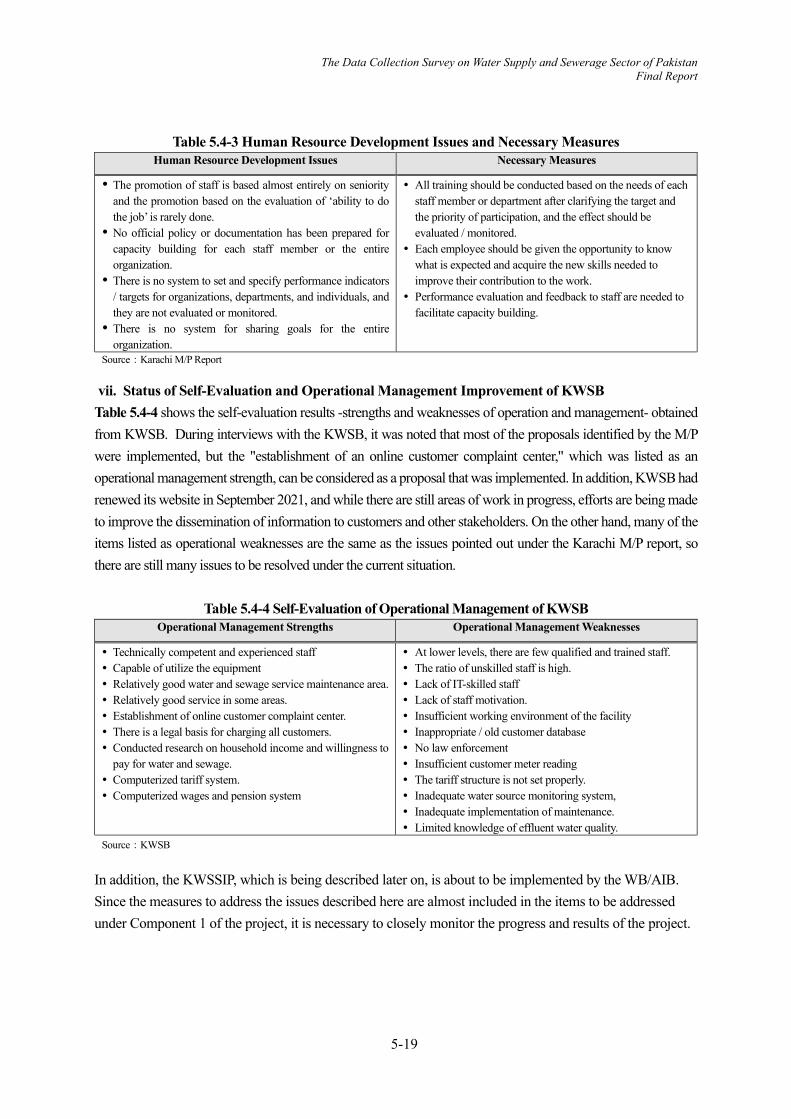
5-19
The Data Collection Survey on Water Supply and Sewerage Sector of Pakistan Final Report
Table 5.4-3 Human Resource Development Issues and Necessary Measures Human Resource Development Issues Necessary Measures
The promotion of staff is based almost entirely on seniority and the promotion based on the evaluation of ‘ability to do the job’ is rarely done. No official policy or documentation has been prepared for
capacity building for each staff member or the entire organization. There is no system to set and specify performance indicators
/ targets for organizations, departments, and individuals, and they are not evaluated or monitored. There is no system for sharing goals for the entire
organization.
All training should be conducted based on the needs of each staff member or department after clarifying the target and the priority of participation, and the effect should be evaluated / monitored.
Each employee should be given the opportunity to know what is expected and acquire the new skills needed to improve their contribution to the work.
Performance evaluation and feedback to staff are needed to facilitate capacity building.
Source:Karachi M/P Report
vii. Status of Self-Evaluation and Operational Management Improvement of KWSB Table 5.4-4 shows the self-evaluation results -strengths and weaknesses of operation and management- obtained from KWSB. During interviews with the KWSB, it was noted that most of the proposals identified by the M/P were implemented, but the "establishment of an online customer complaint center," which was listed as an operational management strength, can be considered as a proposal that was implemented. In addition, KWSB had renewed its website in September 2021, and while there are still areas of work in progress, efforts are being made to improve the dissemination of information to customers and other stakeholders. On the other hand, many of the items listed as operational weaknesses are the same as the issues pointed out under the Karachi M/P report, so there are still many issues to be resolved under the current situation.
Table 5.4-4 Self-Evaluation of Operational Management of KWSB
Operational Management Strengths Operational Management Weaknesses
Technically competent and experienced staff Capable of utilize the equipment Relatively good water and sewage service maintenance area. Relatively good service in some areas. Establishment of online customer complaint center. There is a legal basis for charging all customers. Conducted research on household income and willingness to
pay for water and sewage. Computerized tariff system. Computerized wages and pension system
At lower levels, there are few qualified and trained staff. The ratio of unskilled staff is high. Lack of IT-skilled staff Lack of staff motivation. Insufficient working environment of the facility Inappropriate / old customer database No law enforcement Insufficient customer meter reading The tariff structure is not set properly. Inadequate water source monitoring system, Inadequate implementation of maintenance. Limited knowledge of effluent water quality.
Source:KWSB
In addition, the KWSSIP, which is being described later on, is about to be implemented by the WB/AIB. Since the measures to address the issues described here are almost included in the items to be addressed under Component 1 of the project, it is necessary to closely monitor the progress and results of the project.
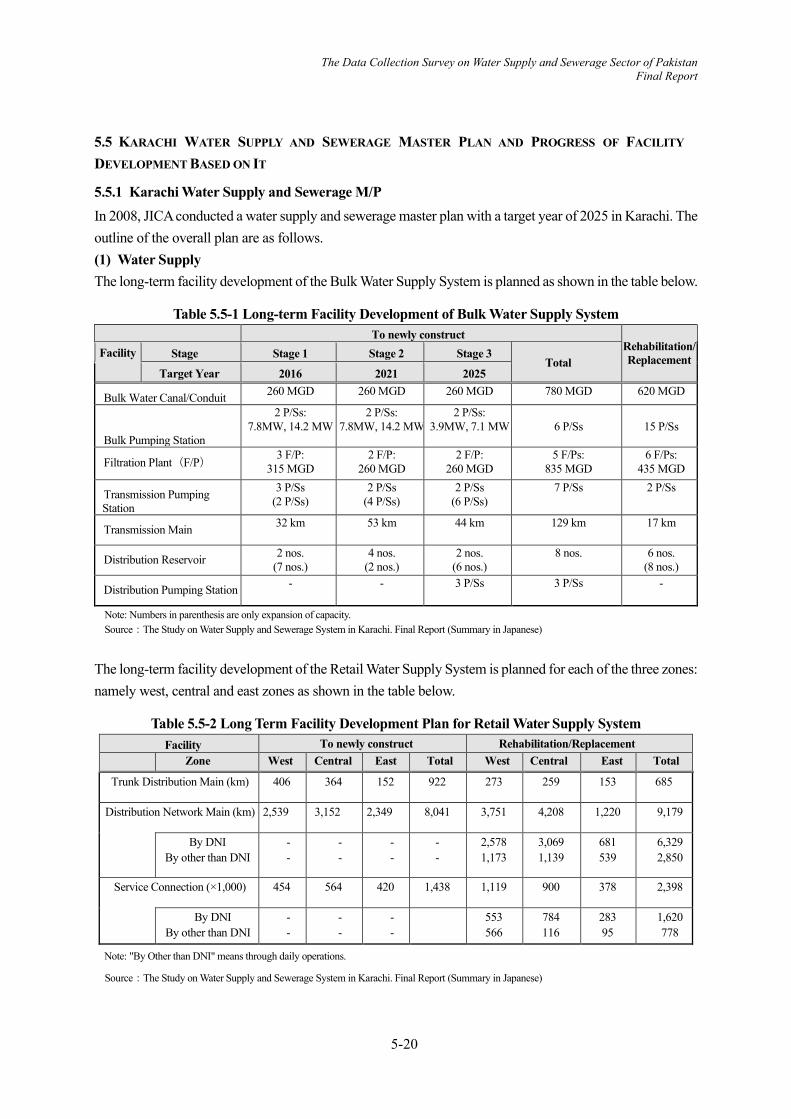
5-20
The Data Collection Survey on Water Supply and Sewerage Sector of Pakistan Final Report
5.5 KARACHI WATER SUPPLY AND SEWERAGE MASTER PLAN AND PROGRESS OF FACILITY
DEVELOPMENT BASED ON IT
5.5.1 Karachi Water Supply and Sewerage M/P In 2008, JICA conducted a water supply and sewerage master plan with a target year of 2025 in Karachi. The outline of the overall plan are as follows. (1) Water Supply The long-term facility development of the Bulk Water Supply System is planned as shown in the table below.
Table 5.5-1 Long-term Facility Development of Bulk Water Supply System To newly construct
Rehabilitation/ Replacement Facility Stage Stage 1 Stage 2 Stage 3
Total Target Year 2016 2021 2025
Bulk Water Canal/Conduit 260 MGD 260 MGD 260 MGD 780 MGD 620 MGD
Bulk Pumping Station
2 P/Ss: 7.8MW, 14.2 MW
2 P/Ss: 7.8MW, 14.2 MW
2 P/Ss: 3.9MW, 7.1 MW
6 P/Ss
15 P/Ss
Filtration Plant(F/P) 3 F/P: 315 MGD
2 F/P: 260 MGD
2 F/P: 260 MGD
5 F/Ps: 835 MGD
6 F/Ps: 435 MGD
Transmission Pumping Station
3 P/Ss (2 P/Ss)
2 P/Ss (4 P/Ss)
2 P/Ss (6 P/Ss)
7 P/Ss 2 P/Ss
Transmission Main 32 km 53 km 44 km 129 km 17 km
Distribution Reservoir 2 nos. (7 nos.)
4 nos. (2 nos.)
2 nos. (6 nos.)
8 nos. 6 nos. (8 nos.)
Distribution Pumping Station - - 3 P/Ss 3 P/Ss -
Note: Numbers in parenthesis are only expansion of capacity. Source:The Study on Water Supply and Sewerage System in Karachi. Final Report (Summary in Japanese)
The long-term facility development of the Retail Water Supply System is planned for each of the three zones: namely west, central and east zones as shown in the table below.
Table 5.5-2 Long Term Facility Development Plan for Retail Water Supply System Facility To newly construct Rehabilitation/Replacement
Zone West Central East Total West Central East Total
Trunk Distribution Main (km) 406 364 152 922 273 259 153 685
Distribution Network Main (km) 2,539 3,152 2,349 8,041 3,751 4,208 1,220 9,179
By DNI By other than DNI
- -
- -
- -
- -
2,578 1,173
3,069 1,139
681 539
6,329 2,850
Service Connection (×1,000) 454 564 420 1,438 1,119 900 378 2,398
By DNI By other than DNI
- -
- -
- -
553 566
784 116
283 95
1,620 778
Note: "By Other than DNI" means through daily operations.
Source:The Study on Water Supply and Sewerage System in Karachi. Final Report (Summary in Japanese)
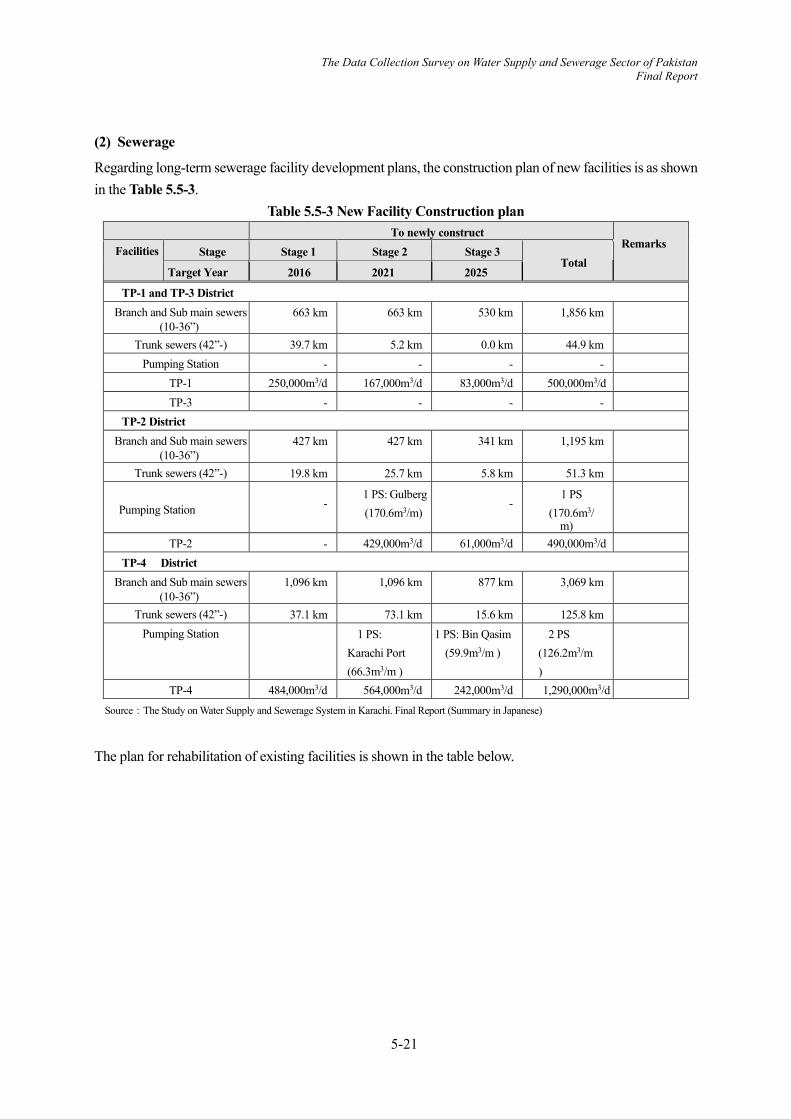
5-21
The Data Collection Survey on Water Supply and Sewerage Sector of Pakistan Final Report
(2) Sewerage
Regarding long-term sewerage facility development plans, the construction plan of new facilities is as shown in the Table 5.5-3.
Table 5.5-3 New Facility Construction plan To newly construct
Remarks Facilities Stage Stage 1 Stage 2 Stage 3 Total
Target Year 2016 2021 2025
TP-1 and TP-3 District Branch and Sub main sewers
(10-36”) 663 km 663 km 530 km 1,856 km
Trunk sewers (42”-) 39.7 km 5.2 km 0.0 km 44.9 km
Pumping Station - - - -
TP-1 250,000m3/d 167,000m3/d 83,000m3/d 500,000m3/d
TP-3 - - - -
TP-2 District Branch and Sub main sewers
(10-36”) 427 km 427 km 341 km 1,195 km
Trunk sewers (42”-) 19.8 km 25.7 km 5.8 km 51.3 km
Pumping Station
-
1 PS: Gulberg (170.6m3/m)
-
1 PS (170.6m3/
m)
TP-2 - 429,000m3/d 61,000m3/d 490,000m3/d
TP-4 District Branch and Sub main sewers
(10-36”) 1,096 km 1,096 km 877 km 3,069 km
Trunk sewers (42”-) 37.1 km 73.1 km 15.6 km 125.8 km
Pumping Station 1 PS: Karachi Port (66.3m3/m )
1 PS: Bin Qasim (59.9m3/m )
2 PS (126.2m3/m)
TP-4 484,000m3/d 564,000m3/d 242,000m3/d 1,290,000m3/d
Source:The Study on Water Supply and Sewerage System in Karachi. Final Report (Summary in Japanese)
The plan for rehabilitation of existing facilities is shown in the table below.

5-22
The Data Collection Survey on Water Supply and Sewerage Sector of Pakistan Final Report
Table 5.5-4 Existing Facility Rehabilitation Plan To newly construct
Remarks Facilities Stage Stage 1 Stage 2 Stage 3
Total Target Year 2016 2021 2025
TP-1 and TP-3 District Branch and Sub main sewers (10-36”) 232 km 61 km 9 km 302 km
Pumping station
-
2 PS:
Jamila /
Chakiwara
(157.9m3/m)
-
2 PS
(157.9m3/m)
TP-1 110,000m3/d - - - Mechanical and electrical equipment
TP-3 245,000m3/d - - - Pumping facility
TP-2 District Branch and Sub main sewers (10-36”) 54 km 133 km 7 km 194 km
Pumping station
-
1 PS:
Clifton(107.7m3/
m)
1 PS
(107.7m3/
m)
TP-2 - 110,000m3/d
TP-4 District Branch and Sub main sewers (10-36”) - 440 km 14 km 454 km
Pumping station
1 PS:
Korangi
(289m3/m)
1 PS
(289m3/m)
Source:The Study on Water Supply and Sewerage System in Karachi. Final Report (Summary in Japanese)
A summary of the priority projects are as follows.
Table 5.5-5 Priority Project List Sector Contents of Development
Water Supply
・ Renewal of existing water distribution branch (total length about 1,000km) ・ Rehabilitation or renewal of existing water supply pipes (total of about 230,000 water supply devices) ・ Installation of water meters for existing water supply equipment (total of about 230,000 locations) ・ Renewal of the existing main water distribution main of about 50km required for water distribution ・ Installation of a new water distribution main of about 26km required for water distribution ・ Installation of 17 flow meters ・ Expansion of NEK Old reservoir (136,400 m3)
Sewerage
Rehabilitation of existing branch sewer and new installation of branch sewer to collect all generated sewage in the target year Installation of new sub main sewers and trunk sewers Rehabilitation of 2 sewage treatment plants, TP-1 and TP-3 The SIII project implements some of the above a. and b.
Source:Excerpt from The Study on Water Supply and Sewerage System in Karachi. Final Report (Summary in Japanese)
5-23
The Data Collection Survey on Water Supply and Sewerage Sector of Pakistan Final Report
5.5.2 Karachi Water Supply and Sewerage Services Improvement Project (KWSSIP)22 (1) Outline of KWSSIP Karachi Water Supply and Sewerage Services Improvement Project (KWSSIP) is a major strategic investment plan for the improvement of water supply and sewerage infrastructure in Karachi which was developed through a discussion among relevant stakeholders, WB, technical experts, and consultants to bring about reforms in the institutional and operational system. Implementation of this project will improve access to safe water and sanitation services in Karachi and increase KWSB's financial and operational performance. To achieve this goal, KWSSIP provides three main components:
i. Component 1:Reform of Institutional and Operational Systems In order to enhance the capacity and improve the operation of the KWSB, the following initiatives will be undertaken under this component. Institutional Reform Institutional reform and capacity development in human resource development Communication strategy and capacity development Construction of a rational tariff system and management of revenue collection Implementation of non-revenue water (NRW) measures Social Sector Policy and Karachi Abadi Plan
ii. Component 2:Facility Development to Ensure Sustainable Water Supply and Sewerage The following items have been selected for facility development in under the KWSSIP. Water network rehabilitation Sewer network rehabilitation Rehabilitation and replacement of safe water supply in the informal settlements Improvement of energy efficiency Procurement of sewer cleaning machines such as high-pressure jetting machines and suction machines.
iii. Component 3: Improving Operational Management This component will support operational management and cost reduction, and will include the following initiatives. Preparing bids for the implementation of SOP-1 and proposed future projects Update KWSB Master Plan Specific Safeguards Documents Implementation of energy audit Review of PPP options Survey for groundwater protection
22 Excerpt from KWSB website
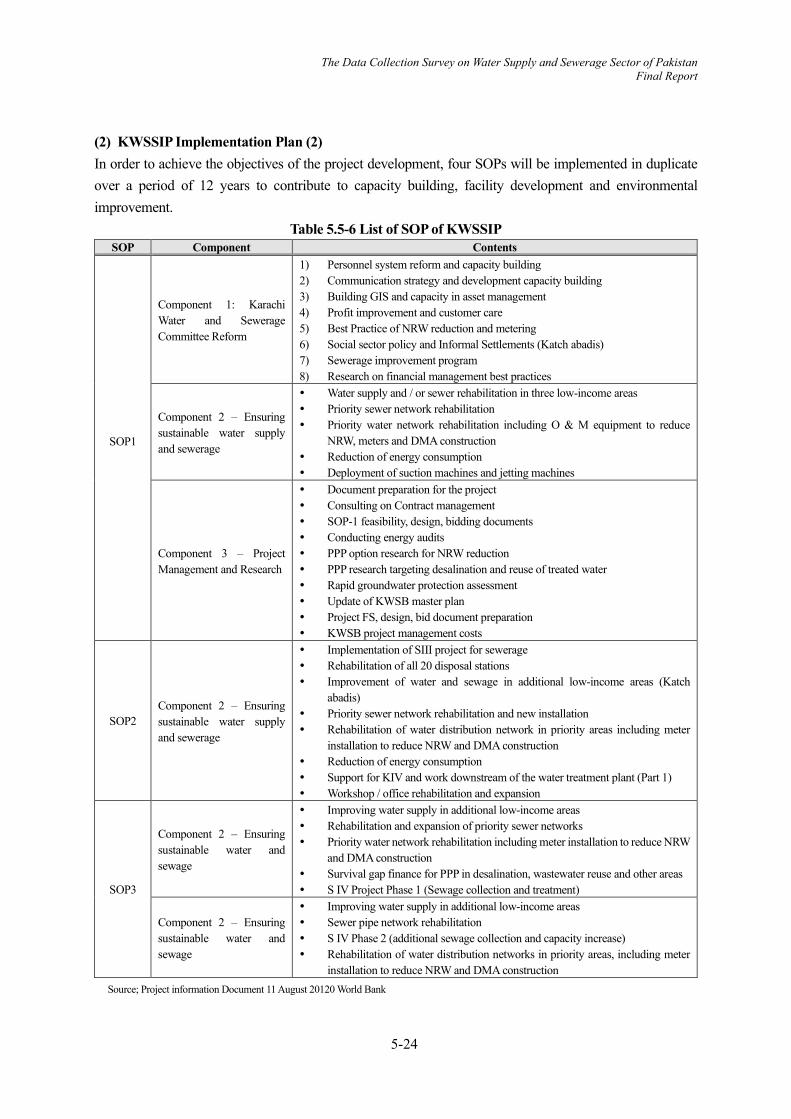
5-24
The Data Collection Survey on Water Supply and Sewerage Sector of Pakistan Final Report
(2) KWSSIP Implementation Plan (2) In order to achieve the objectives of the project development, four SOPs will be implemented in duplicate over a period of 12 years to contribute to capacity building, facility development and environmental improvement.
Table 5.5-6 List of SOP of KWSSIP SOP Component Contents
SOP1
Component 1: Karachi Water and Sewerage Committee Reform
1) Personnel system reform and capacity building 2) Communication strategy and development capacity building 3) Building GIS and capacity in asset management 4) Profit improvement and customer care 5) Best Practice of NRW reduction and metering 6) Social sector policy and Informal Settlements (Katch abadis) 7) Sewerage improvement program 8) Research on financial management best practices
Component 2 – Ensuring sustainable water supply and sewerage
Water supply and / or sewer rehabilitation in three low-income areas Priority sewer network rehabilitation Priority water network rehabilitation including O & M equipment to reduce
NRW, meters and DMA construction Reduction of energy consumption Deployment of suction machines and jetting machines
Component 3 – Project Management and Research
Document preparation for the project Consulting on Contract management SOP-1 feasibility, design, bidding documents Conducting energy audits PPP option research for NRW reduction PPP research targeting desalination and reuse of treated water Rapid groundwater protection assessment Update of KWSB master plan Project FS, design, bid document preparation KWSB project management costs
SOP2 Component 2 – Ensuring sustainable water supply and sewerage
Implementation of SIII project for sewerage Rehabilitation of all 20 disposal stations Improvement of water and sewage in additional low-income areas (Katch
abadis) Priority sewer network rehabilitation and new installation Rehabilitation of water distribution network in priority areas including meter
installation to reduce NRW and DMA construction Reduction of energy consumption Support for KIV and work downstream of the water treatment plant (Part 1) Workshop / office rehabilitation and expansion
SOP3
Component 2 – Ensuring sustainable water and sewage
Improving water supply in additional low-income areas Rehabilitation and expansion of priority sewer networks Priority water network rehabilitation including meter installation to reduce NRW
and DMA construction Survival gap finance for PPP in desalination, wastewater reuse and other areas S IV Project Phase 1 (Sewage collection and treatment)
Component 2 – Ensuring sustainable water and sewage
Improving water supply in additional low-income areas Sewer pipe network rehabilitation S IV Phase 2 (additional sewage collection and capacity increase) Rehabilitation of water distribution networks in priority areas, including meter
installation to reduce NRW and DMA construction Source; Project information Document 11 August 20120 World Bank
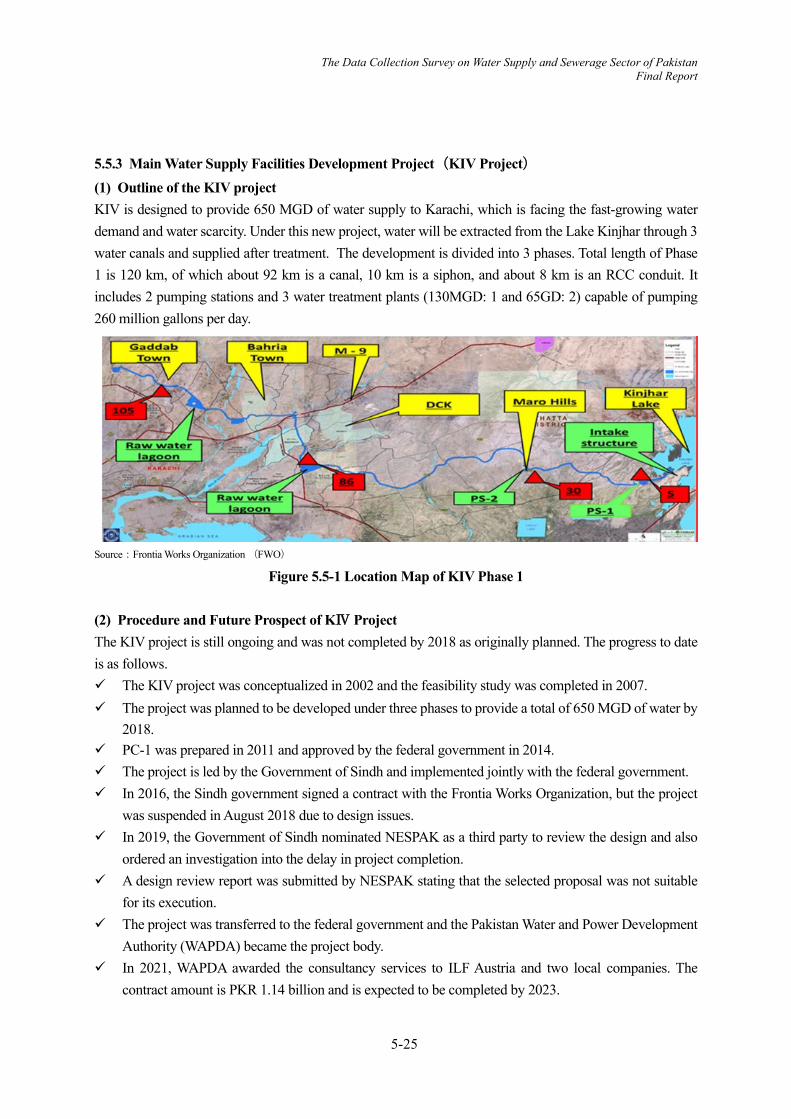
5-25
The Data Collection Survey on Water Supply and Sewerage Sector of Pakistan Final Report
5.5.3 Main Water Supply Facilities Development Project(KⅣ Project) (1) Outline of the KIV project KIV is designed to provide 650 MGD of water supply to Karachi, which is facing the fast-growing water demand and water scarcity. Under this new project, water will be extracted from the Lake Kinjhar through 3 water canals and supplied after treatment. The development is divided into 3 phases. Total length of Phase 1 is 120 km, of which about 92 km is a canal, 10 km is a siphon, and about 8 km is an RCC conduit. It includes 2 pumping stations and 3 water treatment plants (130MGD: 1 and 65GD: 2) capable of pumping 260 million gallons per day.
Source:Frontia Works Organization (FWO)
Figure 5.5-1 Location Map of KIV Phase 1
(2) Procedure and Future Prospect of KⅣ Project The KIV project is still ongoing and was not completed by 2018 as originally planned. The progress to date is as follows. The KIV project was conceptualized in 2002 and the feasibility study was completed in 2007. The project was planned to be developed under three phases to provide a total of 650 MGD of water by
2018. PC-1 was prepared in 2011 and approved by the federal government in 2014. The project is led by the Government of Sindh and implemented jointly with the federal government. In 2016, the Sindh government signed a contract with the Frontia Works Organization, but the project
was suspended in August 2018 due to design issues. In 2019, the Government of Sindh nominated NESPAK as a third party to review the design and also
ordered an investigation into the delay in project completion. A design review report was submitted by NESPAK stating that the selected proposal was not suitable
for its execution. The project was transferred to the federal government and the Pakistan Water and Power Development
Authority (WAPDA) became the project body. In 2021, WAPDA awarded the consultancy services to ILF Austria and two local companies. The
contract amount is PKR 1.14 billion and is expected to be completed by 2023.

5-26
The Data Collection Survey on Water Supply and Sewerage Sector of Pakistan Final Report
This project was severely delayed due to problems in the design of the water conduit. The revised budget amount (Phase 1) has also increased from the original PKR 25.5 billion to PKR 150 billion, suggesting not only technical but also budgetary problems. Presently, the project is transferred to the federal government, and consulting service is awarded to an Austrian consulting company, which has stated that the project will be completed by 2023. Therefore, the technical and budgetary problems are expected to be improved, and the project is expected to be continued and completed. It is necessary to monitor the progress of the project.
5.5.4 Main Sewerage Facilities Development Project(SⅢ Project) The SIII project aims to improve the environmental and sanitary conditions in Karachi through an integrated system of sewage collection, treatment and disposal. The outline of the facilities to be constructed and renewed is shown in the table below.
Table 5.5-7 Outline of SⅢ Project Facility/ Equipment Location /Name Length /Capacity
Interceptor (reinforced concrete) Installed along the Lyari River 33.320km Installed along the Malir River 22.741km
Renewal and expansion of existing sewage treatment plants
STP-Ⅰ 100 MGD (Existing 51 MGD) STP-Ⅲ 180 MGD (Existing 54 MGD)
New Construction of Sewage Treatment Plant STP-Ⅳ (at Korangi) 180 MGD
Source:KWSB
5-27
The Data Collection Survey on Water Supply and Sewerage Sector of Pakistan Final Report
Figure 5.5-2 Facility Layout for S III Project As on 2016, the implementation design was completed and the rehabilitation work for TP I and TP III and the construction of the interceptors along the Lyari River that flows into TP III had commenced. The present unfinished portion is planned to be implemented under Phase 2 of the WB / AIIB project. 5.5.5 Other Ongoing Projects Other facility development projects that are being carried out by KWSB are as follows. In water supply, renewal and new construction project pertaining to facilities related to bulk supply are being carried out. Although the sewerage project is not directly implemented by KWSB, the joint treatment facility at the leather factory has a large volume of treated water and is expected to make a significant contribution for improving the water environment. The study for reuse of treated water is also related to the scarcity of water sources in Karachi.
(1) Project to Upgrade the Dhabeji Pumping Station Dhabeji Pumping Station is an extremely important facility as it is a booster relay pumping station located in the middle of the bulk water supply project that brings raw water from the Kinijhar Lake to Karachi city. It was commissioned in 1959, and its functions have deteriorated due to aging. Four pumps with a capacity of 25 MGD each are being planned to be upgraded under the state government budget, and the progress rate is 80% as on August 2021.
(2) Restoration of Lake Haleji and Construction of Haleji Water Pipes As a measure to strengthen the bulk water supply project, the restoration of Haleji Lake and the construction of an open channel and reinforced concrete pipe conduit to the Gharo pumping station was announced in February 2020 and preparations are underway. The project cost is 6 billion PKR, which is the budget of the state government. (See Figure 5.5-3)

5-28
The Data Collection Survey on Water Supply and Sewerage Sector of Pakistan Final Report
Figure 5.5-3 Bulk Water Supply System in Karachi City
(3) Combined Effluent Treatment Plant for Leather Factories23 In Karachi, there are many leathers (tanning) factories, and their untreated wastewater is polluting the water areas. In response to this, the Directorate of Industries of Sindh Province, with the cooperation of KWSB, is gradually setting up a combined effluent treatment plant (CETP). The CETP installed in the Korangi Industrial Park, where 150 leather factories are located, has a treatment capacity of 42,000 m3 / day and uses the UASB method (Up flow Anaerobic Sludge Blanket). The total project cost is 490 million PKR. Since this treatment method is a technology developed in the Netherlands, it is also supported by the Dutch government. In January 2020, it was announced that five CETPs will be constructed at a project cost of KPR 18.1 billion.
(4) Reuse of Treated Sewage Karachi is suffering from a shortage of water sources, and the reuse of treated sewage water has been considered and implemented in some areas。As of 2008, TP-3 treated sewage water is being reused at Pakistan Steel Works. TP-3 sends 4,500 m3 / day of treated water to the nearby Pakistan Air Force (PAF) site for gardening purposes. The treated water itself is free, but all necessary costs are borne by the PAF. There are other cases where treated water from the plant's treatment facilities is provided to adjacent golf courses, etc. for a fee. 24
The KWSSIP, which is currently underway, is studying the reuse of treated sewage water as a PPP project.
23 Pakistan Tanners Association及び KWSB資料 24The Study on Water Supply and Sewerage System in Karachi Final Report, Jul 2008
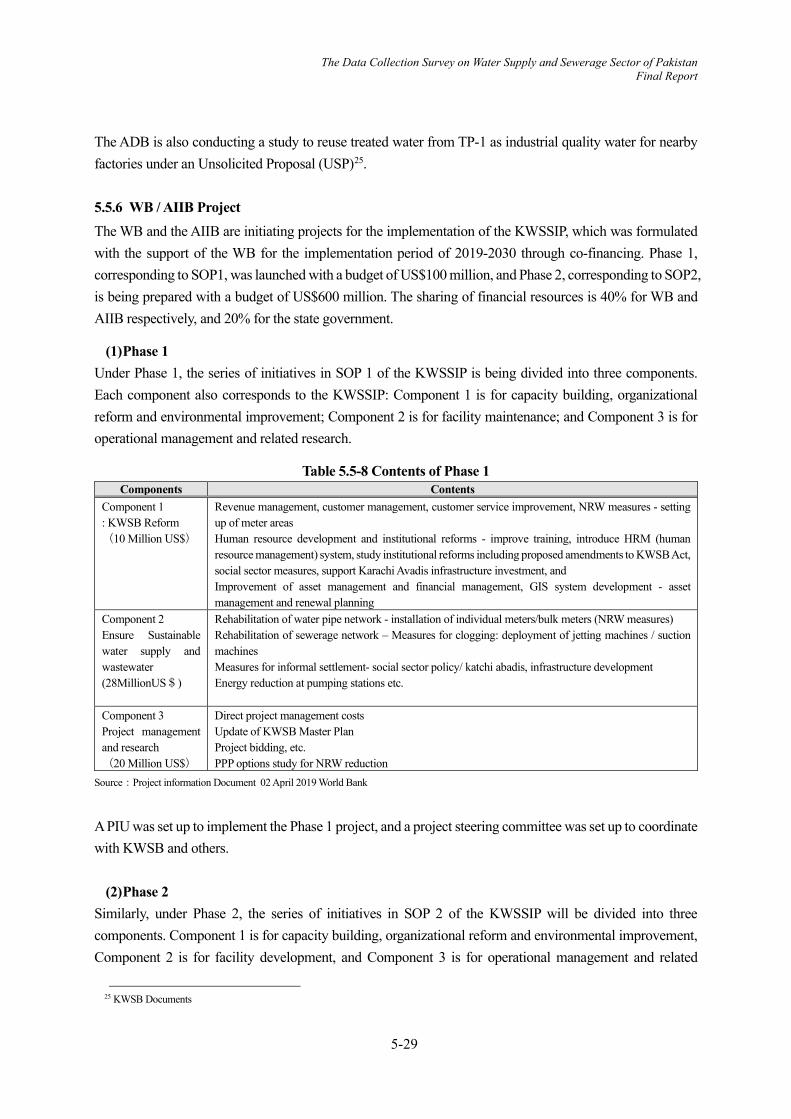
5-29
The Data Collection Survey on Water Supply and Sewerage Sector of Pakistan Final Report
The ADB is also conducting a study to reuse treated water from TP-1 as industrial quality water for nearby factories under an Unsolicited Proposal (USP)25.
5.5.6 WB / AIIB Project The WB and the AIIB are initiating projects for the implementation of the KWSSIP, which was formulated with the support of the WB for the implementation period of 2019-2030 through co-financing. Phase 1, corresponding to SOP1, was launched with a budget of US$100 million, and Phase 2, corresponding to SOP2, is being prepared with a budget of US$600 million. The sharing of financial resources is 40% for WB and AIIB respectively, and 20% for the state government.
(1) Phase 1 Under Phase 1, the series of initiatives in SOP 1 of the KWSSIP is being divided into three components. Each component also corresponds to the KWSSIP: Component 1 is for capacity building, organizational reform and environmental improvement; Component 2 is for facility maintenance; and Component 3 is for operational management and related research.
Table 5.5-8 Contents of Phase 1 Components Contents
Component 1 : KWSB Reform (10 Million US$)
Revenue management, customer management, customer service improvement, NRW measures - setting up of meter areas Human resource development and institutional reforms - improve training, introduce HRM (human resource management) system, study institutional reforms including proposed amendments to KWSB Act, social sector measures, support Karachi Avadis infrastructure investment, and Improvement of asset management and financial management, GIS system development - asset management and renewal planning
Component 2 Ensure Sustainable water supply and wastewater (28MillionUS$)
Rehabilitation of water pipe network - installation of individual meters/bulk meters (NRW measures) Rehabilitation of sewerage network – Measures for clogging: deployment of jetting machines / suction machines Measures for informal settlement- social sector policy/ katchi abadis, infrastructure development Energy reduction at pumping stations etc.
Component 3 Project management and research (20 Million US$)
Direct project management costs Update of KWSB Master Plan Project bidding, etc. PPP options study for NRW reduction
Source:Project information Document 02 April 2019 World Bank
A PIU was set up to implement the Phase 1 project, and a project steering committee was set up to coordinate with KWSB and others.
(2) Phase 2 Similarly, under Phase 2, the series of initiatives in SOP 2 of the KWSSIP will be divided into three components. Component 1 is for capacity building, organizational reform and environmental improvement, Component 2 is for facility development, and Component 3 is for operational management and related
25 KWSB Documents

5-30
The Data Collection Survey on Water Supply and Sewerage Sector of Pakistan Final Report
research. An overview of these components is provided in Table 5.5-9.
Table 5.5-9 Contents of Phase 2 Component Contents
Component1 KWSB Reform (20 Million US$)
Implementation of institutional reforms, including implementation of the proposed amendments to the KWSB Law Effective progress management and reporting system Meter installation/bulk connection, tariff collection and customer management as per SOP1 NRW measures - expansion of SOP1 initiatives Human resource management initiatives – improvement of training, upgraded HRM system Asset management and financial management, GIS improvements Facility renewal, climate change response Preparation and development of water safety plan Monitor water conservation and promote public awareness PPP research - reuse of treated water, private investment in NRW measures
Component 2 Ensure sustainable water supply and sewerage (560 Million US$)
Additional bulk water supply options - consider investing in bulk water supply at six locations Implementation of Sewerage S-III Project Phase 2 (US$150 million) Water and sewerage improvements in additional low-income areas Rehabilitation of sewerage network in priority areas, augmentation and rehabilitation of disposal stations Rehabilitation of water pipeline network in priority areas, installation of meters and construction of DMA, NRW measures, additional chlorine injection Reduction of energy consumption - implementation of energy audit results in SOP1 KIV supplementation - connecting government funded KIV water treatment plant to water pipeline network, rehabilitation of existing facilities, construction of water treatment plant
Component 3 Project Management and Study (20 Million US$)
Cost for project management and preparation for future projects
Source:Project information Document 11 August 20120 World Bank
5.5.7 PPP Initiatives in Karachi Regarding PPPs and private sector participation in the water sector in Karachi, the Public-Private Infrastructure Advisory Facility (PPIAF) is conducting research in collaboration with the WB, as described below, and the KWSSIP is being implemented mainly by the WB/AIB.
(1) Study of PPIAF According to PPIAF's annual report, 26 , PPIAF is focusing on Karachi's water sector in Pakistan and conducting a study for PPP implementation in conjunction with the formulation and approval of the KWSSIP, a co-financing program between WB and AIIB. The study is to enhance raw water supply, cost implications, and private sector participation in water source development so that PPP implementation and private sector participation in treated water reuse and NRW measures will be promoted. The study aimed at enhancing raw water supply, determination of cost implications, and private sector participation in water source development so that PPP implementation and private sector participation in treated water reuse and NRW measures will be promoted. The study also seeks to preserve the water environment through investment in sewage treatment with reuse while prioritizing the use of surface water from the existing Indus River, as well
26 ANNUAL REPORT PPIAF, 2020

5-31
The Data Collection Survey on Water Supply and Sewerage Sector of Pakistan Final Report
as proper NRW management. Furthermore, it is proposed that the PPIAF will support the institutional and legal development of the project to enable the private sector to participate and carry out the project, in close coordination with the technical assistance for the KWSSIP project. The above was approved in July 2018.
(2) KWSSIP Project by WB/AIIB The NRW measures and reuse of treated water will be implemented under Phase 1 and Phase 2 of the KWSSIP project being implemented and prepared by WB/AIIB. In addition, preparations will be made to reform the legal system, which is likely to include reforms corresponding to PPP.
(3) Karachi Water Canal Project by IFC27 According to IFC's ASPI (Summary of Advisory Services Project Information), the following advisory services projects are presently underway. Project Description: IFC will provide advice to the KWSB to facilitate private sector participation for the rehabilitation of the Karachi Water Supply Canal (KWSC). The project includes a canal, a pumping station, and a water treatment plant, among others, as well as the implementation of an international competitive bidding (ICB) process to select a private developer to design, build, finance, and maintain KWSC. Project implementation period: April 2020-March 2022
(4) Research on reuse of treated sewage water by ADB According to the KWSB, ADB is conducting an unsolicited proposal-level study on the production of industrial grade water for nearby factories by recycling treated water from the existing sewage treatment plant STP-1. It is assumed that the implementation will be through PPP.
5.5.8 Summary of Water and Wastewater Facility Improvement Projects KIV project, which aims to drastically solve the water supply shortage caused by population growth, and the SⅢ project, which aims to prevent water pollution and improve the urban environment, are both based on the Water Supply and Sewerage Master Plan. Both projects are delayed due to technical problems and the huge investment is required. Under these circumstances, the financial burden on the state governments is reduced by transferring the KIV project to the federal government, and by implementing the other water supply facility development and the SIII project through co-financing from WB and AIIB. 5.6 POINTS TO BE NOTED FOR THE DEVELOPMENT OF WATER SUPPLY AND SEWERAGE SECTOR IN
KARACHI
For the development of the water supply and sewerage sector in Karachi, it is necessary to understand the current status of the improvement measures proposed in the M/P formulated in 2008 and the progress of facility development. It is also important to confirm the contents of the newly formulated KWSSIP and co-financing projects of WB and AIIB which is implementing KWSSIP. The following is an outline of the project and the results of the evaluation and monitoring of water supply improvement projects implemented with ODA loans in the past as a reference.
27 International Finance Corporation: An organization of the WB Group that provides investment support and technical assistance to developing
countries by private companies.

5-32
The Data Collection Survey on Water Supply and Sewerage Sector of Pakistan Final Report
5.6.1 Status of Response to the Proposals in the M/P In the M/P report, as part of organizational and institutional reforms, a proposal was made to establish three new retail service companies and transfer responsibility for service provision, but this has not been realized. As for other operational improvements, it proposes to improve the financial system, reduce NRW, improve the revenue collection system, GIS-based facility management, customer service and develop human resources. However, although some improvements have been made, such as the establishment of an online customer information center and the renewal of the website, there are still many issues that need to be resolved under the current situation.
5.6.2 Current Status and Direction of Operational Improvements The newly formulated KWSSIP consists of three components, which will be implemented sequentially in the projects initiated by the WB/AIIB. Component 1 aims at institutional and operational reforms and will address institutional reforms, human resource development, tariff system/tariff collection, NRW and social sector measures. Component 3 is aimed at improving operational management, energy reduction, and updating the master plan. Institutional reform also includes amendments to the KWSB law. In this way KWSSIP include legal amendment and update of the masterplan, proposed content of the M/P is almost covered, and operational improvement is focused on Phase 1 of the WB/AIIB Project, the room for new technical cooperation and other support in the area of operational improvement is considered to be small.
5.6.3 Current Status of Facility Development and its Direction In terms of facility development, the KIV project for water supply and the SIII project for sewerage are lagging behind in progress, but the KIV project has been transferred from the state government to the federal government and is on track for continued implementation. As for the S III project, the remaining projects are to be implemented under the KWSSIP. Component 2 of the KWSSIP is mainly focused on facilities development. Phase 1 includes rehabilitation of existing facilities and deployment of NRW control and sewer pipe management equipment. In Phase 2, the project will develop related facilities for the S III and K IV projects, rehabilitate the disposal station/sewer network, and construct DMAs and install meters for water supply. From an overview of the facility developments planned under the KWSSIP, it can be inferred that the plan is to implement the projects with the highest priority within the set financial resources. Therefore, there is a possibility of implementing new projects for facility development, including the development proposed in the M/P.
5.6.4 Evaluation of Past ODA Loan Projects28 In Karachi, a project to upgrade/renew/expand the water treatment plant and pumping station, completed in 2006, is underway. This section reviews the ex-post evaluation and ex-post monitoring results and identifies the KWSB operational issues related to the development projects.
28 Based on "Karachi Water Supply Improvement Project Evaluation Report" (2008) and "Karachi Water Supply Improvement Project
Monitoring Results Table" (2013).

5-33
The Data Collection Survey on Water Supply and Sewerage Sector of Pakistan Final Report
Table 5.6-1 Outline of the ODA Loan Project Project Name Karachi Water Supply Improvement Project Amount of ODA loan approved / amount executed
10.3 billion yen / 5.8 billion yen
Signing of Exchange of Notes and Loan Agreement
Nov. 1994 / Nov. 1994
Date of Loan Completion Aug. 2006
Contents of the Project
Pipri Water Treatment Plant Expansion
Expansion of facilities with a capacity of 114,000 m3/day
Hub water purification plant improvement
Add 455,000 m3 /day water purification facility
Mango Pill Pumping Station Upgrade
Renewal of pump stations at 478,000 m3/day
Source:Karachi Water Supply Improvement Project Evaluation Report
5.6.5 Evaluation of the Project Of the five DAT evaluation items, the sustainability was given a rating of C because of the lack of financial sustainability and the low continuity of the project, and the overall evaluation result was also given a rating of C.
Table 5.6-2 Evaluation Result of ODA Loan Project Items Rating Contents of the Evaluation
Relevance a The implementation of the project is well aligned with development needs and policies, both at the time of planning and evaluation. Therefore, the relevance is high.
Efficiency b Although the project period was significantly longer than planned, the project cost was lower than planned. Therefore, efficiency is judged to be moderate.
Effectiveness a The implementation of the project has generally resulted in effects as planned. Therefore, the effectiveness is high.
Impact This project is mainly an expansion of the existing KWSB facility. But since the project site is located in a rural area far from the city center, there was no need to acquire land or relocate residents. Therefore, construction work had little impact on the surrounding natural environment.
Sustainability c
The sustainability of the project is poorly evaluated due to the financial problems of the implementing agency. The lack of budget has affected the maintenance and management of the project in various ways, such as the purchase of chemicals, generator fuel, and replacement parts. Therefore, the sustainability of the project is of great concern.
Overall Evaluation
C
Conclusion The relevance and effectiveness of this project are high, and the efficiency is moderate, but there are concerns about the sustainability of the project. Therefore, the overall evaluation of this project is generally high.
Source:"Karachi Water Supply Improvement Project Evaluation Report" (2008)
Monitoring Result <Issues> According to the report, with no subsidy from the city government to cover the necessary expenses due to unrevised and unpaid tariffs, the city is restricting its expenditure up to the water revenue. As a result, there are large arrears in electricity bills, and the power supply was cut off in 2013.
<Response/Future action plan> Possible measures such as installing meters for large users, introducing metered water supply, improving the
5-34
The Data Collection Survey on Water Supply and Sewerage Sector of Pakistan Final Report
collection rate, and revising tariffs are taken. However, in order to achieve a drastic solution, it is necessary for the government of Sindh and Karachi to make a decision to set appropriate water rates and allocate subsidies. As a future course of action, these proposals will be provided to the higher authorities and consider supporting the efforts of the implementing agencies to improve their finances through technical cooperation and other means.
<Lessons Learnt> In order to realize the benefits of cooperation, it is important to simultaneously promote infrastructure development and operation and maintenance management systems. In addition, as pointed out in the evaluation as a recommendation to the implementing agency, the sustainability of the project, especially its financial sustainability, needs to be fully considered not only at the time of project formation, but also in the future, including the allocation of government subsidies and the prospect of increase in water rates. Moreover, in order to ensure long-term sustainability, consultations should be held with higher-level organizations from the time of project formation on organizational system improvements that will lead to service improvements, and if necessary, consideration should be given to obtaining commitments for organizational system improvements.
As mentioned above, support for facility development has a certain effect, but in order to maximize the effect, it is necessary to strengthen the financial structure to ensure the necessary management and repair costs.
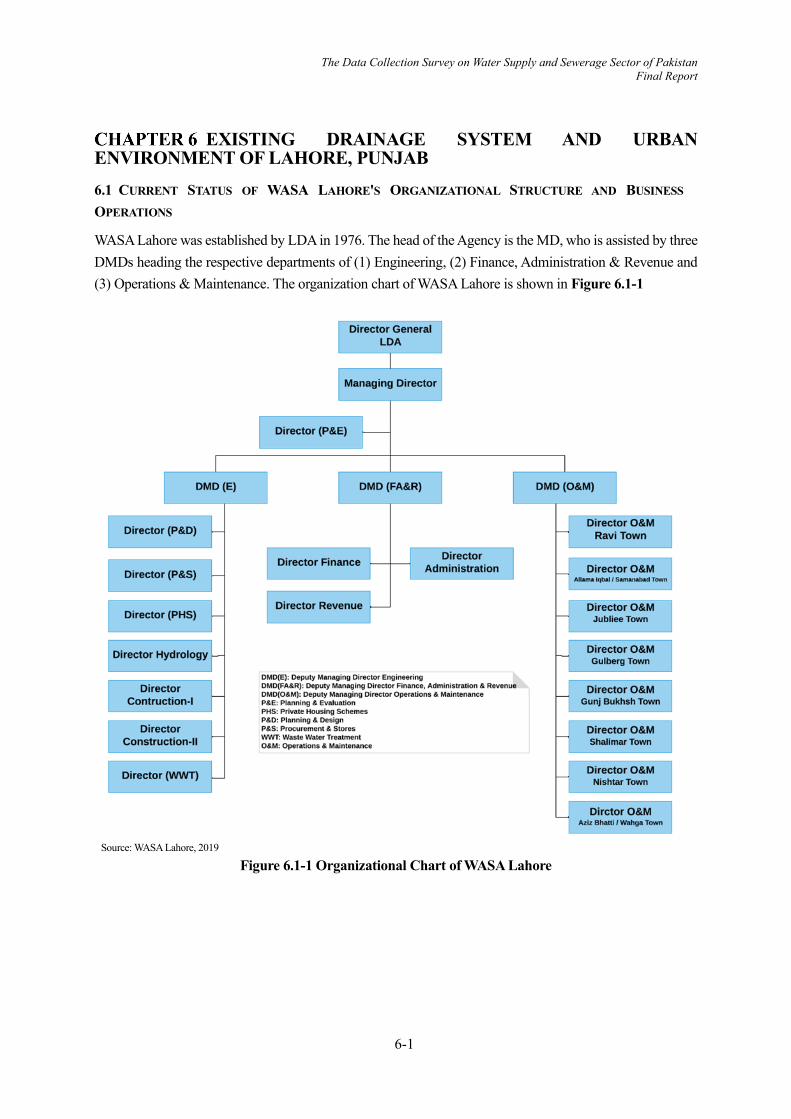
6-1
The Data Collection Survey on Water Supply and Sewerage Sector of Pakistan Final Report
EXISTING DRAINAGE SYSTEM AND URBAN ENVIRONMENT OF LAHORE, PUNJAB 6.1 CURRENT STATUS OF WASA LAHORE'S ORGANIZATIONAL STRUCTURE AND BUSINESS
OPERATIONS
WASA Lahore was established by LDA in 1976. The head of the Agency is the MD, who is assisted by three DMDs heading the respective departments of (1) Engineering, (2) Finance, Administration & Revenue and (3) Operations & Maintenance. The organization chart of WASA Lahore is shown in Figure 6.1-1
Source: WASA Lahore, 2019
Figure 6.1-1 Organizational Chart of WASA Lahore

6-2
The Data Collection Survey on Water Supply and Sewerage Sector of Pakistan Final Report
6.2 CURRENT STATUS OF SEWERAGE AND RAINWATER DRAINAGE IN LAHORE
6.2.1 Sewerage and Drainage System in Lahore The sewerage system in Lahore is basically a separate sewer system, where is sewage collected by about 3,800 km of sewer pipes (848 km of trunk/semi-trunk lines and 2,950 km of branch lines) and is discharged untreated from 14 DSs into primary drains or rivers. In addition, 93 lift stations were installed in the above sewer pipe system. On the other hand, as for the drainage system, roadside ditches are constructed along relatively large roads and rainwater is discharged through tertiary/secondary drains to primary drains and into rivers. There are four Drain Pump Stations (DPSs) in the discharge area, which are operated when the river water level becomes high. However, there are many roads where roadside ditches are not constructed, and at such roads, rainwater from houses flows directly into the sewer pipes. Thus, in principle, the discharge system is a separate system, but it is characterized by the inseparable functioning of the sewerage system and the drainage system, where rainwater flows into the sewer pipe in the upstream area and sewage is discharged into the primary drain in the downstream area.
A summary of the existing sewerage facilities in each treatment area are shown in Table 6.2-1.
Table 6.2-1 Summary of Existing Sewerage Facilities in Sewage Treatment Area Sewage
Treatment District
Number of Pump Stations Sewer pipeline Length (km)
Disposal Station (DS) Lifting Station (LS)
Shahdara 1 9 244 Mehmood Booti 1 6 518 Khokhar Road 2 11 522 Central 6 43 1,313 South 3 8 996 South East 1 16 205
Total 14 93 3,798
Source: WASA Lahore, 2019
6.2.2 Sewer pipe and Pump Facilities (1) Sewer pipe Facilities The sewerage area currently under the jurisdiction of WASA Lahore is divided into six treatment districts Figure 6.2-1 shows WASA Lahore’s jurisdictional areas and sewage treatment districts.
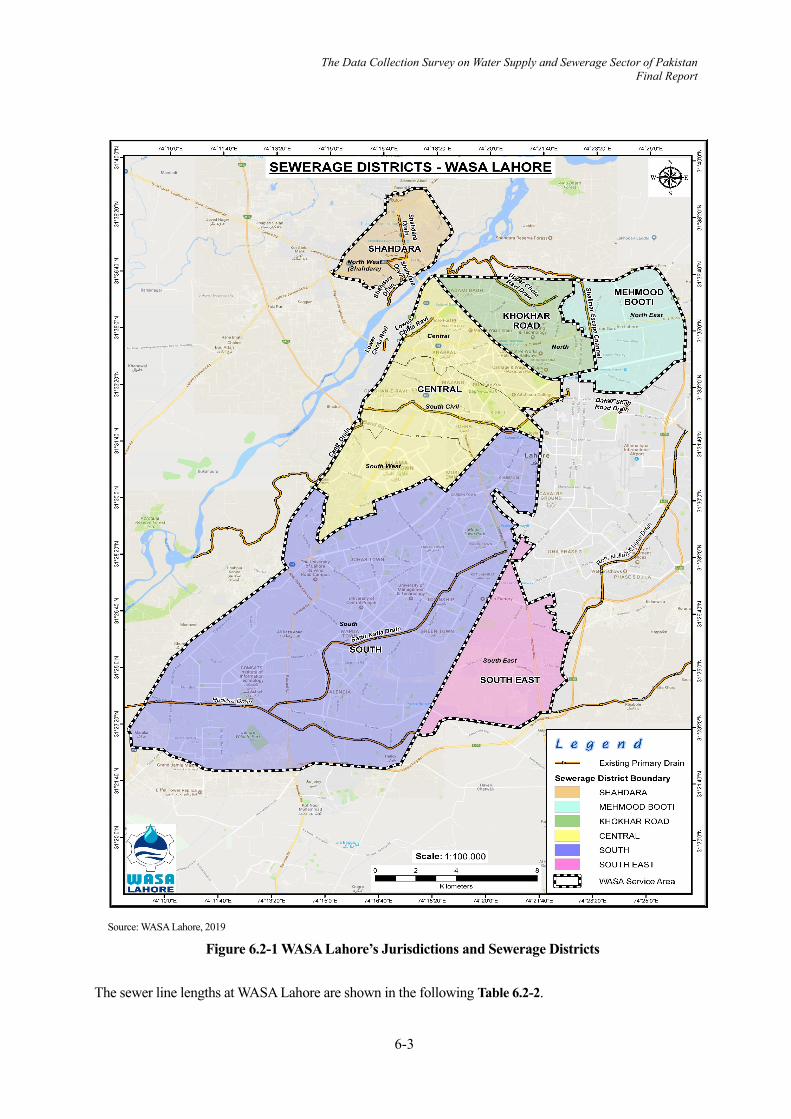
6-3
The Data Collection Survey on Water Supply and Sewerage Sector of Pakistan Final Report
Source: WASA Lahore, 2019
Figure 6.2-1 WASA Lahore’s Jurisdictions and Sewerage Districts
The sewer line lengths at WASA Lahore are shown in the following Table 6.2-2.

6-4
The Data Collection Survey on Water Supply and Sewerage Sector of Pakistan Final Report
Table 6.2-2 List of Sewer pipes
Drainage Treatment District
Target Area
Length (km) Pipe Material Breakdown (%)
Trunk Line
Semi-trunk Line
Branch Line Total29
Reinforced
Concrete Pipe
Brick Others
North West
Shahdara Farrukhabad 34.71 32.75 176.08 243.55 100 0 0
North East
Tajpura Shadipura Fateh Garh Baghbanpura
40.62 69.01 408.77 518.40 100 0 0
North
Shadbagh. Misri Shah Data Nagar Gujjar Pura Mughalpura Baghbanpura Mustafa Abad
63.54 72.55 385.41 521.50 98.32 1.68 0
Central
City Anarkali Ravi Road Shimla Hill Mustafa Abad
58.19 41.48 253.57 353.24 92.17 7.06 0.77
South Civil
Ichhra Mozang Gulberg Dholanwal. Samanabad Krishan Nagar Gulshan-e-Ravi
44.15 51.90 409.41 505.45 96.81 3.19 0
South West
Ichhra Sabzazar. Dholanwal. Samanabad Mustafa Town Allama Iqbal Town
39.03 56.98 358.00 454.01 100 0 0
South
Gulberg Township Johar Town Jubilee Town LDA Avenue-I Garden Town Mustafa town
96.50 97.73 801.99 996.22 99.45 0.55 0
South East
Kahna Township Green Town Industrial Area
17.12 31.97 156.19 205.28 100 0 0
Total 393.86 454.37 2,949.41 3,797.65 Source: 'Existing Sewerage Lines Analysis', WASA Lahore.
Of the approximately 3,800 km of sewer pipes, the oldest were laid as far back as the 1950s, and the majority were laid by 2000. More than 90% of the pipes are made of cement-derived materials. Of the cement-derived
29 The total may not necessarily match due to rounding.

6-5
The Data Collection Survey on Water Supply and Sewerage Sector of Pakistan Final Report
materials, reinforced concrete pipes have a longer service life, but their chemical resistance is inferior to that of plastic piping materials. As a result, old sewer pipes are deteriorating, resulting in reduced flow capacity, sedimentation of mud, sand and debris, as well as interior surface damage and pipe top failure due to generation of corrosive gases. There is also a concern that sewage may infiltrate into the natural ground.
Source: WASA Monsoon 22-6-2011.ppt
Figure 6.2-2 Deteriorated Reinforced Concrete Pipe (2) Disposal Station Overview and the site survey / interview results of Disposal Stations (DSs) are show in Table 6.2-3 and Table 6.2-4. The current status and findings of DSs are as follows.
Table 6.2-3 Current Status and Findings of Disposal Stations (DSs) Current Status Findings 1 General:
・Pumps and other equipment, including the D-4 Old Outfall-1 DS which has been in service since the 1940s and is the oldest in WASA, has been renewed and expanded with funding from the GoP and the Donors in a timely manner. Currently, although some equipment is under repair, almost all DSs are functioning. ・Since the 2000s, expansion and construction of some facilities have been carried out mainly by the GoP funding in order to cope with the increase in generated sewage due to population growth. On the other hand, there is a shortage of existing pump capacity mainly in populated area. In particular, D-9 Multan Road DS is required to double its capacity because of the shortage of existing capacity.
・Based on the Master Plan prepared by WASA in 2018, it is urgent to develop facilities from high priority area.
2 Screen Facility: ・Automatic screen or mechanical screen is installed in six DSs, and they operate well. Other DSs are equipped with manual rake screen, but each DS has a medium- to large-scale capacity and many trashes, so it is required for mechanization. ・The screen spacing is 50 mm or more, but rubbish passing through the screen is deposited in the pump pit. That is the cause of the pump blockage failure.
-To protect the pump, it is recommended to equip fine automatic screen or mechanical screen with spacing of about 20 mm.
3 Pump Facility: ・Most of the existing pump type is vertical-axis pump (V) or horizontal-axis pump (H), which have been inspected and repaired at appropriate times, and generally satisfy the functions. ・All pumps at D-14 LDA Avenue DS are submersible pump type (S, pump pit), but screen spacing is not appropriate. It takes time to check the lifting of pumps due to passing rubbish. In case of overhaul or breakdown, it will be handled at the manufacturer's factory (in Pakistan) and take several months.
-When selecting pump type for renewal / expansion, it is important to carefully consider the pump type including the screen equipment and inspection / repair work.
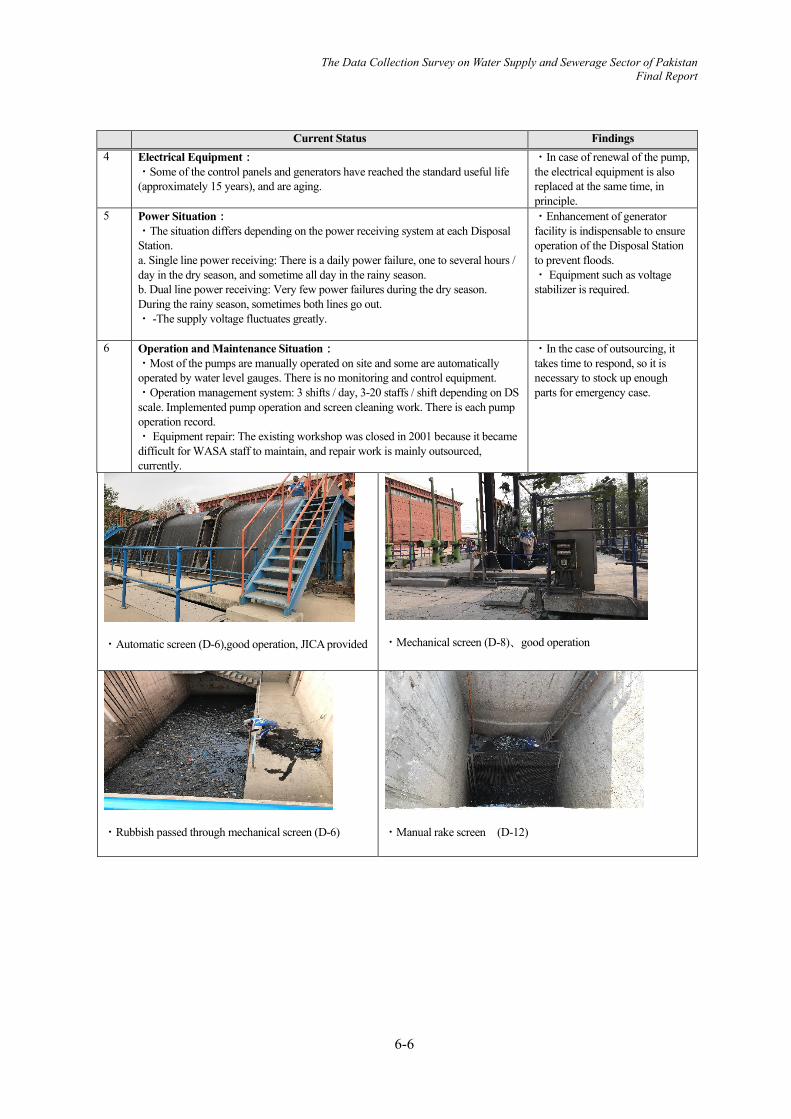
6-6
The Data Collection Survey on Water Supply and Sewerage Sector of Pakistan Final Report
Current Status Findings 4 Electrical Equipment:
・Some of the control panels and generators have reached the standard useful life (approximately 15 years), and are aging.
・In case of renewal of the pump, the electrical equipment is also replaced at the same time, in principle.
5 Power Situation: ・The situation differs depending on the power receiving system at each Disposal Station. a. Single line power receiving: There is a daily power failure, one to several hours / day in the dry season, and sometime all day in the rainy season. b. Dual line power receiving: Very few power failures during the dry season. During the rainy season, sometimes both lines go out. ・ -The supply voltage fluctuates greatly.
・Enhancement of generator facility is indispensable to ensure operation of the Disposal Station to prevent floods. ・ Equipment such as voltage stabilizer is required.
6 Operation and Maintenance Situation: ・Most of the pumps are manually operated on site and some are automatically operated by water level gauges. There is no monitoring and control equipment. ・Operation management system: 3 shifts / day, 3-20 staffs / shift depending on DS scale. Implemented pump operation and screen cleaning work. There is each pump operation record. ・ Equipment repair: The existing workshop was closed in 2001 because it became difficult for WASA staff to maintain, and repair work is mainly outsourced, currently.
・In the case of outsourcing, it takes time to respond, so it is necessary to stock up enough parts for emergency case.
・Automatic screen (D-6),good operation, JICA provided
・Mechanical screen (D-8)、good operation
・Rubbish passed through mechanical screen (D-6)
・Manual rake screen (D-12)
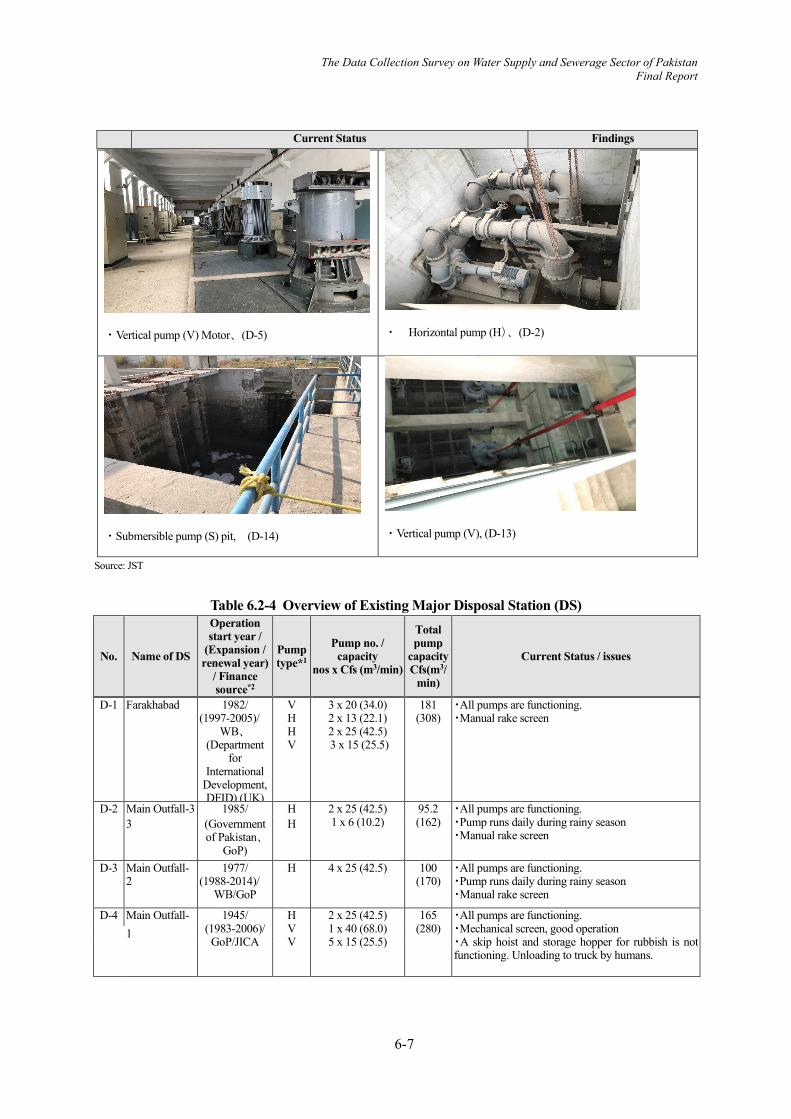
6-7
The Data Collection Survey on Water Supply and Sewerage Sector of Pakistan Final Report
Current Status Findings
・Vertical pump (V) Motor、(D-5)
・ Horizontal pump (H)、(D-2)
・Submersible pump (S) pit, (D-14)
・Vertical pump (V), (D-13)
Source: JST
Table 6.2-4 Overview of Existing Major Disposal Station (DS)
No. Name of DS
Operation start year /
(Expansion / renewal year)
/ Finance source*2
Pump type*1
Pump no. / capacity
nos x Cfs (m3/min)
Total pump
capacity Cfs(m3/
min)
Current Status / issues
D-1 Farakhabad 1982/ (1997-2005)/
WB、 (Department
for International
Development, DFID) (UK)
V H H V
3 x 20 (34.0) 2 x 13 (22.1) 2 x 25 (42.5) 3 x 15 (25.5)
181 (308)
・All pumps are functioning. ・Manual rake screen
D-2 Main Outfall-3 1985/
H
2 x 25 (42.5) 1 x 6 (10.2)
95.2 (162)
・All pumps are functioning. ・Pump runs daily during rainy season ・Manual rake screen
3 (Government of Pakistan、
GoP)
H
D-3 Main Outfall- 2
1977/ (1988-2014)/
WB/GoP
H
4 x 25 (42.5)
100 (170)
・All pumps are functioning. ・Pump runs daily during rainy season ・Manual rake screen
D-4 Main Outfall- 1945/ (1983-2006)/
GoP/JICA
H V V
2 x 25 (42.5) 1 x 40 (68.0) 5 x 15 (25.5)
165 (280)
・All pumps are functioning. ・Mechanical screen, good operation ・A skip hoist and storage hopper for rubbish is not functioning. Unloading to truck by humans.
1

6-8
The Data Collection Survey on Water Supply and Sewerage Sector of Pakistan Final Report
No. Name of DS
Operation start year /
(Expansion / renewal year)
/ Finance source*2
Pump type*1
Pump no. / capacity
nos x Cfs (m3/min)
Total pump
capacity Cfs(m3/
min)
Current Status / issues
D-5 Gulshan-E-Ravi
1992/ (2000-2006)/
WB/JICA
H H
14 x 40 (68.0)
560 (952)
・Largest DS in WASA. ・All pumps are functioning. ・ Although mechanical screen operation is good, rubbish passing through the screen flows into the pump pit. ・Electrical water level gauge installed, double line power receiving.
D-6 Shad Bagh 1982/ (2006-2014)/ WB/DFID
/JICA
V
6 x 40 (68.0)
240 (408)
・All pumps are functioning. ・ Although automatic screen (spacing 50 mm) operation is good, rubbish passing through the screen flows into the pump pit. ・Electrical water level gauge installed, double line power receiving.
D-7 Khokhar Road 1997/
(2014) WB/DFID
/JICA
V
5 x 56 (95.2)
280 (476)
・One pump under repair, other pumps are functioning ・ Although automatic screen (spacing 50 mm) operation is good, rubbish passing through the screen flows into the pump pit. ・Electrical water level gauge installed, double line power receiving.
D-8 Mehmood Booti
1997/ (2004)/
WB/DFID
V
4 x 56 (95.2)
224 (381)
・All pumps are functioning. ・ Although automatic screen (spacing 50 mm) operation is good, rubbish passing through the screen flows into the pump pit. ・Double line power receiving.
D-9 Multan Road 1982/ (2006-2012)/
WB/JICA
V 6 x 40 (68.0)
240 (408)
・All pumps are functioning. ・Some pump operation panels under renewal construction. ・No screen
D-10 Bhatti Gate 2000/ GoP
V 4 x 25 (42.5)
100 (170)
・One pump is not functioning, other all pumps are functioning, aging. ・Manual rake screen
D-11 LMP Block 1985/ (1990-2000)/
GoP
H V V
2 x 25 (42.5) 3 x 20 (34.0) 1 x 15 (25.5)
125 (212)
・All pumps are functioning, aging ・Manual rake screen
D-12 Nishtar Colony
1992/ (1996-2006)/
GoP
H H H V
3 x 15 (25.5) 2 x 25 (42.5) 2 x 13 (22.1) 1 x 10 (17.0)
131 (223)
・One pump is not functioning, other all pumps are functioning, aging. ・Manual rake screen
D-13 Shukat Khanam
2019/ GoP
V 10 x 25 (42.5)
250 (425)
・Latest DS in WASA、all pumps are functioning. ・Mechanical screen ・Administration building under construction
D-14 LDA Avenue-1
2015/ GoP
S S
8 x 15 (25.5) 1 x 4 (6.8)
124 (211)
・Two pumps under repair in manufacturer's factory (several months are required). ・Because screen spacing is large, the pump is blocked by passing rubbish, and mechanical fine screen is required. ・Double-line power receiving
Note: *1 V: Vertical Pump, H: Horizontal Pump, S: Submersible Pump (pump pit), SC: Submersible Pump (Cooling Jacket, dry pit) *2 GoP: Govt. of Punjab, WB:World Bank, DFID: Department for International Development(UK), JICA: Japan International Cooperation Agency Source: WASA Lahore, JST, 2019
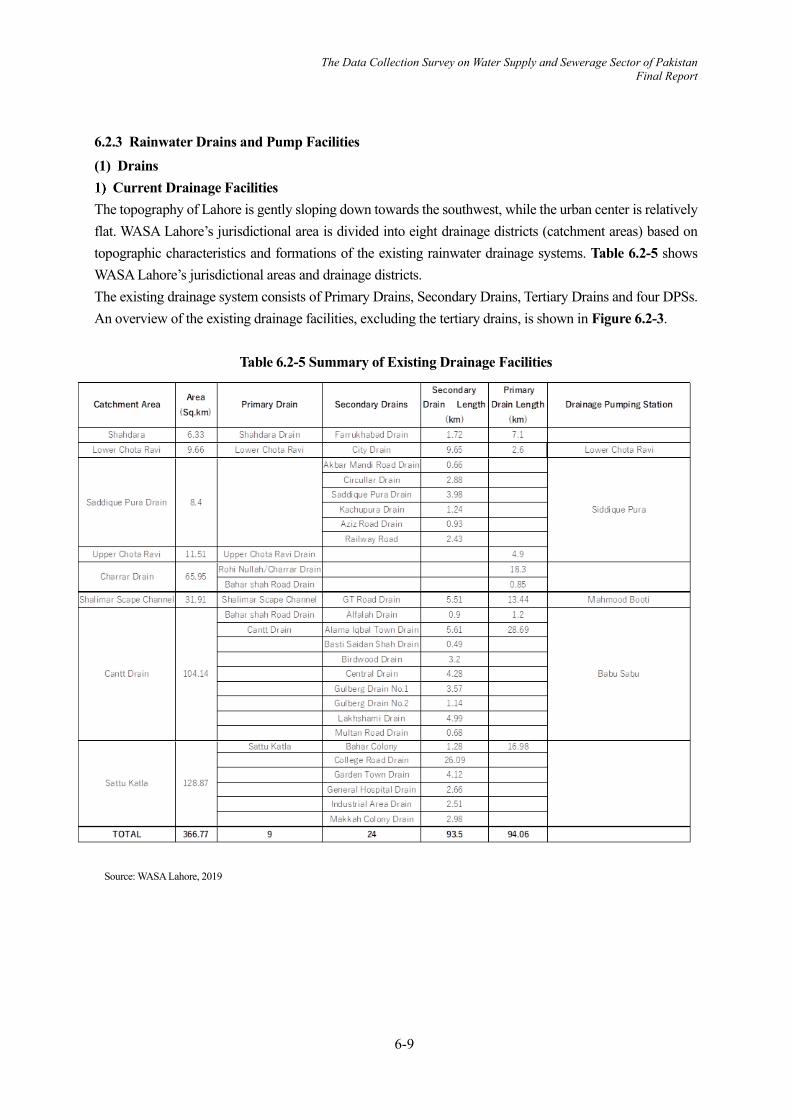
6-9
The Data Collection Survey on Water Supply and Sewerage Sector of Pakistan Final Report
6.2.3 Rainwater Drains and Pump Facilities (1) Drains
Current Drainage Facilities The topography of Lahore is gently sloping down towards the southwest, while the urban center is relatively flat. WASA Lahore’s jurisdictional area is divided into eight drainage districts (catchment areas) based on topographic characteristics and formations of the existing rainwater drainage systems. Table 6.2-5 shows WASA Lahore’s jurisdictional areas and drainage districts. The existing drainage system consists of Primary Drains, Secondary Drains, Tertiary Drains and four DPSs. An overview of the existing drainage facilities, excluding the tertiary drains, is shown in Figure 6.2-3.
Table 6.2-5 Summary of Existing Drainage Facilities
Source: WASA Lahore, 2019

6-10
The Data Collection Survey on Water Supply and Sewerage Sector of Pakistan Final Report
Source: WASA Lahore, 2019
Figure 6.2-3 WASA Lahore’s Jurisdictions and Drainage Districts
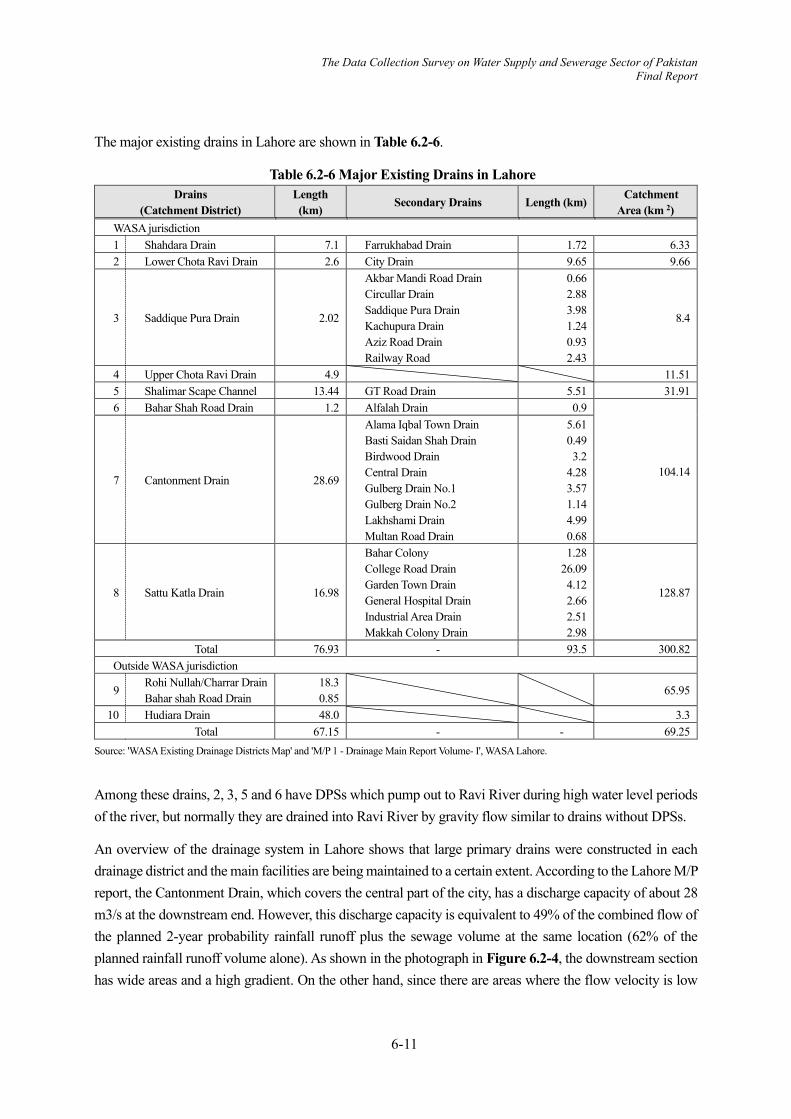
6-11
The Data Collection Survey on Water Supply and Sewerage Sector of Pakistan Final Report
The major existing drains in Lahore are shown in Table 6.2-6.
Table 6.2-6 Major Existing Drains in Lahore Drains
(Catchment District) Length (km)
Secondary Drains Length (km) Catchment
Area (km 2) WASA jurisdiction 1 Shahdara Drain 7.1 Farrukhabad Drain 1.72 6.33 2 Lower Chota Ravi Drain 2.6 City Drain 9.65 9.66
3 Saddique Pura Drain 2.02
Akbar Mandi Road Drain Circullar Drain Saddique Pura Drain Kachupura Drain Aziz Road Drain Railway Road
0.66 2.88 3.98 1.24 0.93 2.43
8.4
4 Upper Chota Ravi Drain 4.9 11.51 5 Shalimar Scape Channel 13.44 GT Road Drain 5.51 31.91 6 Bahar Shah Road Drain 1.2 Alfalah Drain 0.9
104.14 7 Cantonment Drain 28.69
Alama Iqbal Town Drain Basti Saidan Shah Drain Birdwood Drain Central Drain Gulberg Drain No.1 Gulberg Drain No.2 Lakhshami Drain Multan Road Drain
5.61 0.49 3.2
4.28 3.57 1.14 4.99 0.68
8 Sattu Katla Drain 16.98
Bahar Colony College Road Drain Garden Town Drain General Hospital Drain Industrial Area Drain Makkah Colony Drain
1.28 26.09 4.12 2.66 2.51 2.98
128.87
Total 76.93 - 93.5 300.82 Outside WASA jurisdiction
9 Rohi Nullah/Charrar Drain Bahar shah Road Drain
18.3 0.85
65.95
10 Hudiara Drain 48.0 3.3 Total 67.15 - - 69.25
Source: 'WASA Existing Drainage Districts Map' and 'M/P 1 - Drainage Main Report Volume- I', WASA Lahore.
Among these drains, 2, 3, 5 and 6 have DPSs which pump out to Ravi River during high water level periods of the river, but normally they are drained into Ravi River by gravity flow similar to drains without DPSs.
An overview of the drainage system in Lahore shows that large primary drains were constructed in each drainage district and the main facilities are being maintained to a certain extent. According to the Lahore M/P report, the Cantonment Drain, which covers the central part of the city, has a discharge capacity of about 28 m3/s at the downstream end. However, this discharge capacity is equivalent to 49% of the combined flow of the planned 2-year probability rainfall runoff plus the sewage volume at the same location (62% of the planned rainfall runoff volume alone). As shown in the photograph in Figure 6.2-4, the downstream section has wide areas and a high gradient. On the other hand, since there are areas where the flow velocity is low

6-12
The Data Collection Survey on Water Supply and Sewerage Sector of Pakistan Final Report
due to the low gradient, the difference in height between the adjacent road surface and the small water surface, and construction of parapet walls to secure capacity, locations can be found where ponding are likely to occur at high water levels.
Taking the example of the Central Drain (see Figure 6.2-3), a tributary of the Cantonment Drain which drains into the city center, the capacity of the secondary trunk drain is equivalent to 55% to 88% of similar flows. It should be noted that although the current analysis indicates that the capacity is insufficient for the planned water flow, it is unlikely that a shortage of capacity during periods of heavy rainfall is the cause of prolonged and persistent ponding at these catchments.
Upstream Area of Cantonment Drain DPS Upstream of Cantonment Drain and Birdwood Drain Confluence
Parapet Wall to Secure Capacity for Cantonment Drain Confluence of Cantonment Drain with Central Drain
Central Drain Central Drain
Source: Lahore M/P Figure 6.2-4 Conditions of Primary and Secondary Drains.
In Lahore, as shown in Figure 6.2-6, untreated sewage from all DSs is discharged into primary drains and

6-13
The Data Collection Survey on Water Supply and Sewerage Sector of Pakistan Final Report
rainwater drains are used as sewage conveyance facilities. This results in deterioration of the environment in the vicinity of those channels, accumulation of wastes and also reduction of drainage capacity due to sewage runoff. Lahore M/P proposed construction of an interceptor pipe and sewage treatment plant to discontinue the discharge of untreated sewage from DSs to primary drains and discharge the same into the river after treatment.
Discharge from Nishter Colony (Main) DS Discharge from Multan Road DS Source: JICA survey team
Figure 6.2-5 Discharge of Untreated Sewage from DSs to Main Drains
Operation and Maintenance of Drainage Facilities In Lahore, ponding occurs in various parts of the city during the rainy season. Therefore, rainfall records, depths and durations of ponding at these points are monitored and a management plan is drawn up every year for the purpose of removing solid wastes from the drainage facilities, mainly during the rainy season. The work is carried out by eight regional offices under the Deputy Managing Director along with daily cleaning work.
At Lower Chota Ravi DPS located downstream of Lower Chota Ravi Drain, labourers must work immersed in sewage
Drain cleaning work under the road bridge by manual labour Photographed on April 22, 2011
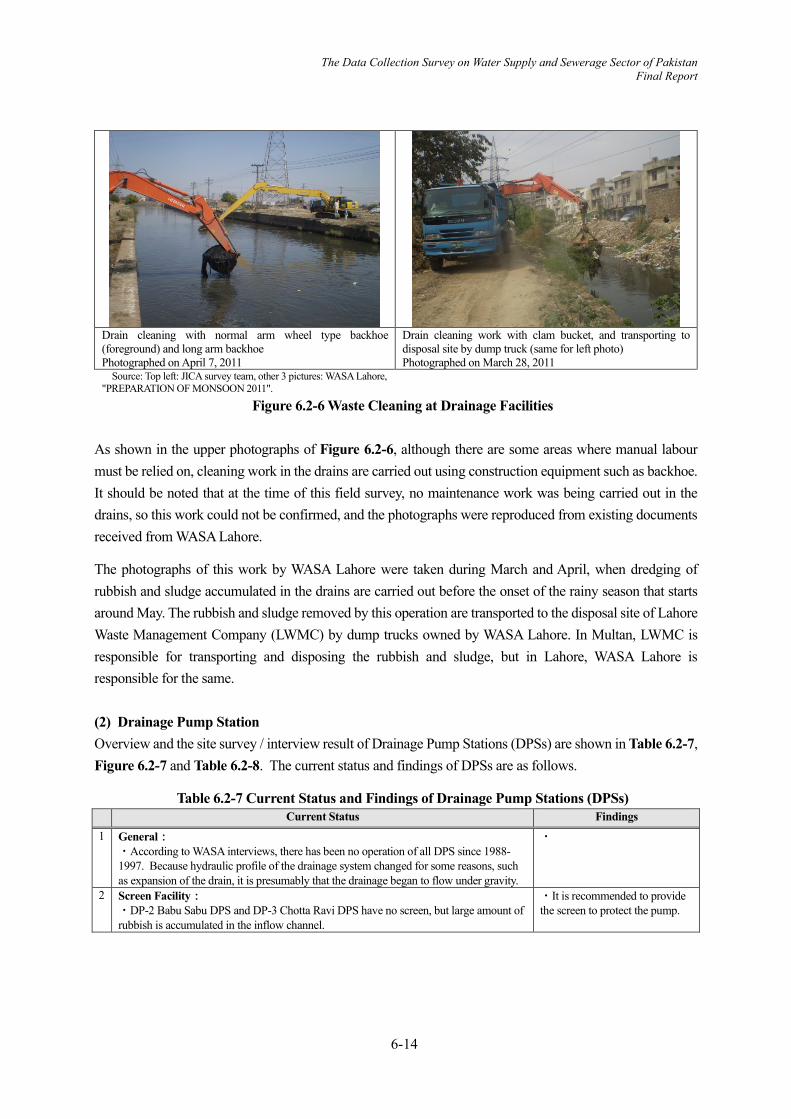
6-14
The Data Collection Survey on Water Supply and Sewerage Sector of Pakistan Final Report
Drain cleaning with normal arm wheel type backhoe (foreground) and long arm backhoe Photographed on April 7, 2011
Drain cleaning work with clam bucket, and transporting to disposal site by dump truck (same for left photo) Photographed on March 28, 2011
Source: Top left: JICA survey team, other 3 pictures: WASA Lahore, "PREPARATION OF MONSOON 2011".
Figure 6.2-6 Waste Cleaning at Drainage Facilities
As shown in the upper photographs of Figure 6.2-6, although there are some areas where manual labour must be relied on, cleaning work in the drains are carried out using construction equipment such as backhoe. It should be noted that at the time of this field survey, no maintenance work was being carried out in the drains, so this work could not be confirmed, and the photographs were reproduced from existing documents received from WASA Lahore.
The photographs of this work by WASA Lahore were taken during March and April, when dredging of rubbish and sludge accumulated in the drains are carried out before the onset of the rainy season that starts around May. The rubbish and sludge removed by this operation are transported to the disposal site of Lahore Waste Management Company (LWMC) by dump trucks owned by WASA Lahore. In Multan, LWMC is responsible for transporting and disposing the rubbish and sludge, but in Lahore, WASA Lahore is responsible for the same.
(2) Drainage Pump Station Overview and the site survey / interview result of Drainage Pump Stations (DPSs) are shown in Table 6.2-7, Figure 6.2-7 and Table 6.2-8. The current status and findings of DPSs are as follows.
Table 6.2-7 Current Status and Findings of Drainage Pump Stations (DPSs) Current Status Findings 1 General:
・According to WASA interviews, there has been no operation of all DPS since 1988-1997. Because hydraulic profile of the drainage system changed for some reasons, such as expansion of the drain, it is presumably that the drainage began to flow under gravity.
・
2 Screen Facility: ・DP-2 Babu Sabu DPS and DP-3 Chotta Ravi DPS have no screen, but large amount of rubbish is accumulated in the inflow channel.
・It is recommended to provide the screen to protect the pump.

6-15
The Data Collection Survey on Water Supply and Sewerage Sector of Pakistan Final Report
Current Status Findings 3 Pump Facility:
・The pump drive system is electric motor or engine. ・All pumps have exceeded the standard equipment useful life (approximately 15 years), but WASA has been performing maintenance operations, and all pumps are functioning for now.
・It is important to continue periodic maintenance operation.
4 Electrical Equipment: ・The control panels and generator facilities have exceeded the standard equipment useful life (generally 15 years) and are aging.
・In case of renewal of the pump, the electrical equipment is also replacement at the same time, in principle.
5 Power Situation: ・The situation differs depending on the power receiving system at each DPS. a. Single line power receiving: There is a daily power failure, one to several hours / day in the dry season, and sometime all day in the rainy season. b. Dual line power receiving: Very few power failures during the dry season. During the rainy season, sometimes both lines go out. ・The supply voltage fluctuates greatly.
・Enhancement of generator facility is indispensable to ensure operation of the DPS to prevent floods. ・ Equipment such as voltage stabilizer is required.
6 Operation and Maintenance Situation: ・Most of the pumps are manually operated on site. There is no monitoring and control equipment. ・Operation management system: 3 shifts / day. Implemented pump operation and screen cleaning work. ・ Equipment repair: The existing workshop was closed in 2001 because it became difficult for WASA staff to maintain, and repair work is mainly outsourced, currently.
・Enhancement of generator facility is indispensable to ensure operation of the Disposal Station to prevent floods. ・ Equipment such as voltage stabilizer is required.
・DP-1 Mehmood Booti DPS(1)
・DP-1 Mehmood Booti DPS (2)
・DP-2 Babu Sabu DPS (1)
・DP-2 Babu Sabu DPS(2)

6-16
The Data Collection Survey on Water Supply and Sewerage Sector of Pakistan Final Report
Current Status Findings
・DP-3 Chotta Ravi DPS (1)
・DP-3 Chotta Ravi DPS (2)
・DP-4 Siddique Pura DPS (1)
・DP-4 Siddique Pura DPS (2) Source: JST
Figure 6.2-7 Photos of existing Drainage Pump Stations
Table 6.2-8 Overview of Existing Drainage Pump Station (DPS)
No.
Name of DPS
Operation start year
/(expansion / renewal year)
/ finance source*2
Pump type*1
Pump no. / capacity
Total pump
capacity Cfs(m3/
min)
Current status / issues nos x Cfs (m3/min)
DP-1 Mehmood Booti
1978/ (1986, 2008 relocation)/GoP
H
4 x 25 (42.5)
100 (170)
・ Because rainwater is drained by gravity, pump operation is not required since 1993. ・ Inspection / repair of pump and electric equipment is necessary for operation ・ Manual rake screen ・ Large amount of rubbish accumulated in gravity drains ・ Dual-line power receiving
DP-2 Babu Sabu 1978/
H
7 x 25 (42.5)
175 (297)
・2 engine-driven pumps + 5 motor-driven pumps ・Because rainwater is drained by gravity, pump operation is not required since 1997. ・Periodic maintenance operation is carried out. ・No screen ・Large amount of rubbish accumulated in suction channel. ・Single-line power receiving
(1985-2001)/ WB/GoP

6-17
The Data Collection Survey on Water Supply and Sewerage Sector of Pakistan Final Report
No.
Name of DPS
Operation start year
/(expansion / renewal year)
/ finance source*2
Pump type*1
Pump no. / capacity
Total pump
capacity Cfs(m3/
min)
Current status / issues nos x Cfs (m3/min)
DP-3 Chotta Ravi
1967/ (1990)/
WB/GoP
H H
5 x 16 (27.2) 1 x 25 (42.5)
105 (178)
・2 engine-driven pumps+4 motor-driven pumps ・Because rainwater is drained by gravity, pump operation is not required since 1998. ・Periodic maintenance operation is carried out. ・No screen ・Large amount of rubbish accumulated in suction channel. ・Single-line power receiving
DP-4 Siddique Pura 1997/ WB
V
3 x 71 (121)
213 (362)
・All pumps are engine-driven. ・Because rainwater is drained by gravity, pump operation is not required since 1997. ・Periodic maintenance operation is carried out. ・Mechanical screen (out of order) ・Large amount of rubbish accumulated in suction channel.
Note: *1 V: Vertical Pump, H: Horizontal Pump, S: Submersible Pump, SC: Submersible Pump (Cooling Jacket, dry pit) *2 GoP: Govt. of Punjab, WB:World Bank, DFID: Department for International Development(UK), JICA: Japan International Cooperation Agency
Source:: WASA Lahore, JST
6.3 ISSUES OF DRAINS IN LAHORE
6.3.1 Occurrence of Ponding during Wet Weather (1) Current status of ponding during wet weather in Lahore One of the major issues with the drainage system in Lahore is the occurrence of ponding in urban areas. WASA Lahore identified 74 sore locations of ponding during a January 2009 survey. In these areas, rainwater ponding occurred in lowlands and depressions during heavy and long-lasting rains, and it took a long time to drain in some cases.
According to the WASA Lahore M / P report, as of 2015, 28 out of 51 locations included under the identified 74 sore locations had reduced ponding time due to implementation of countermeasures. Table 6.3-1 shows the ponding areas and the areas that were alleviated as of 2015. At this point, countermeasures were under consideration for the remaining 23 locations out of the above mentioned 51 locations. The area shown in Figure 6.3-1 is the Cantonment Drain basin, which is one of the primary drains, and is located in the center of Lahore city. In addition, the 23 locations of concern lie in the basin of the Central Drain, which is a secondary drain, and its vicinity areas. It can be seen that there are many ponding areas in the city center, and that countermeasure projects are also being concentrated.
WASA Lahore monitors (records and collects data) whenever a ponding event occurs at any sore location. There are 22 monitoring locations (almost corresponding to the 23 locations mentioned above), and the recorded data include date, duration and total rainfall, ponding depth, and duration.
Under this survey, monitoring data for four years from 2016 to 2019 were obtained, and in September 2021, data from 2020 up to the time of acquisition were also obtained. Table 6.3-1 shows the secular change in the number of ponding. It cannot be said unconditionally because the ponding situation differs depending on the
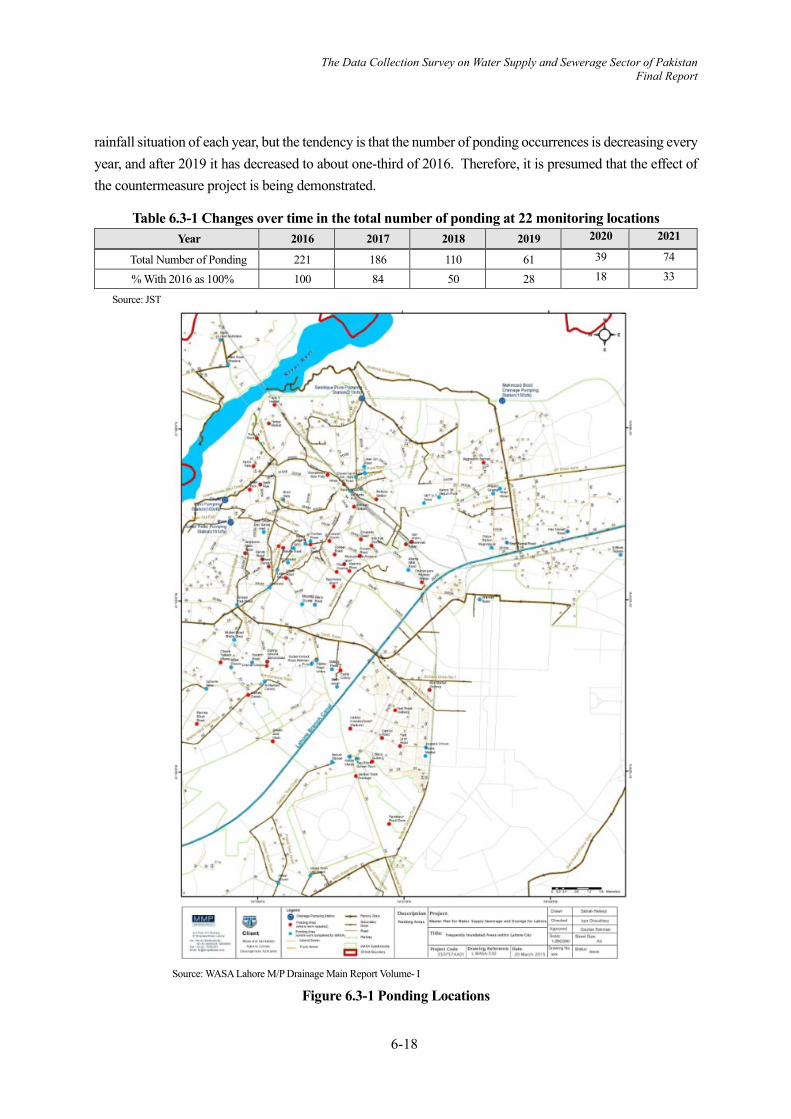
6-18
The Data Collection Survey on Water Supply and Sewerage Sector of Pakistan Final Report
rainfall situation of each year, but the tendency is that the number of ponding occurrences is decreasing every year, and after 2019 it has decreased to about one-third of 2016. Therefore, it is presumed that the effect of the countermeasure project is being demonstrated.
Table 6.3-1 Changes over time in the total number of ponding at 22 monitoring locations Year 2016 2017 2018 2019 2020 2021
Total Number of Ponding 221 186 110 61 39 74
% With 2016 as 100% 100 84 50 28 18 33
Source: JST
Source: WASA Lahore M/P Drainage Main Report Volume- I
Figure 6.3-1 Ponding Locations

6-19
The Data Collection Survey on Water Supply and Sewerage Sector of Pakistan Final Report
However, most of the 22 monitoring locations had incidence of ponding since 2019. Therefore, it can be said that ponding is not entirely eliminated, but the number of occurrences and their degree of occurrence is reduced.
(2) Field survey and existing information of typical ponding areas 2 typical ponding locations were surveyed. i. Lakshimi Chowk According to the photo provided by WASA Lahore, it can be seen that the intersection was ponded extensively.
Source: WASA Lahore and JST
Figure 6.3-2 Photo of Ponding Location
Table 6.3-2 presents the monitoring data during heavy rainfall in Lakshimi Chowk. During heavy rainfall on July 16, 2019, the ponding depth reached a maximum of about 1 m, and it took nearly 7 hours to drain.
Table 6.3-2 Monitoring Data of Heavy Rain in Lakshimi Chowk Date of rain Duration time of rain Rainfall amount Ponding depth Time to solve
2018/7/3 677min 250mm 26inch 275min 2019/7/16 840min 283mm 43inch 405min
Source: JST
On the other hand, according to the monitoring data, the number of occurrence of ponding at Lakshimi Chowk has decreased significantly since 2016. Although countermeasures were implemented and thereby resulting in improvement of ponding situation, it seems that it cannot be dealt with during heavy rains.
Table 6.3-3 Over Time Changes in the Number of Ponding by Monitoring Data in Lakshimi Chowk Lakshimi Chowk(2016~2019)
Year 2016 2017 2018 2019 Total ponding times 12 9 2 2
Source: JST
Lakshmi Chowk during dry weather Inflow of rainwater from elevated roads may also have an effect
Ponded Lakshmi Chowk Sucker Truck is working There is a secondary drain, Central Drain, near by

6-20
The Data Collection Survey on Water Supply and Sewerage Sector of Pakistan Final Report
In order to promote drainage of rainwater into the drains, measures are taken such as making the lid of the inlet connected to the road gutter as a grating lid and the manhole cover of the sewer pipe porous. The sewer pipe is not an effective ponding solution because it is full during heavy rains, the number of manholes is not many, and the cross-sectional area of the holes are small.
As in the photo on the left, there are many places where the grating lid is used.
Manhole cover made porous so that rainwater can flow into the sewer pipe
Source: JST
Figure 6.3-3 Grating Lid and Porous Manhole Cover ii. Lawrence Road At the Lawrence Road, as shown in the photo below on the right, ponding along the road causes traffic issues. As seen in the photo below on the left taken during the dry weather, a roadside drain is constructed under the sidewalk, but the intake is blocked. In addition, the height of the sidewalk where the roadside drain is constructed is higher than that of the residential land on the opposite side, and it is considered that it is not functioning.
Situation in dry weather at Lawrence Road Roadside drain is installed under the sidewalk
Ponding at Lawrence Road The truck seems to work for measures of flooding
出典:WASA Lahore , JST
Figure 6.3-4 Situation during Dry Weather and Ponding at Lawrence Road
As shown in Table 6.3-4, the number of ponding has decreased since 2016 at this location.

6-21
The Data Collection Survey on Water Supply and Sewerage Sector of Pakistan Final Report
Table 6.3-4 Over Time Changes in the Number of Ponding by Monitoring Data in Lowrence Road
Lowrence Road(2016~2019) Year 2016 2017 2018 2019
Total ponding time 17 17 5 4 Source: JST
In addition, the ponding rainwater of Lawrence Road is drained to the retarding basin in Jinnah Park by a pump set. See the photo in Figure 6.3-5.
Last year's drainage work record posted inside the drainage team tent set up at the ponding point
The ponding rainwater of Lawrence Road is drained to the retarding basin in Jinnah Park by a pump set.
Source: JST Figure 6.3-5 Retarding Basin Near the Ponding Location at Lawrence Road
The area near the northwest entrance of the Jinnah Park in the center of Lahore is also a location for ponding during the rainy season. Next to the park entrance, the WASA has set up a tent for drainage work, and last year's work record was posted on the board. The accumulated rainwater at this location is drained by a drainage pump set to a retarding basin in the Jinnah Park, about 300 m east in a straight line.
6.3.2 Other Issues (1) Discharge of untreated sewage to the rainwater drain from other than Disposal Station (DS) Most of the rainwater drains are located in urban areas, except near the downstream areas of the Hudiara Drain in the southern part of Lahore. The drains are open channels without lids except for some sections. In urban areas, in addition to the sewage collected to the DS by sewer pipes being discharged from the DS, the wastewater from surrounding houses and shops are directly flowing in the drains. As a result, the rainwater drains are used as a sewage channel. The discharge destination of all rainwater drains is the Ravi River.
The covered area of the upper reaches of the Central Drain, which has the central part of Lahore within the basin, was surveyed. In this Drain, visually from the opening part, although it smelled bad, it was not possible to observe the floating matters. Since all other drains are open channels, garbage is dumped, and when combined with sewage, a foul odor is generated. This also serves as a breeding ground for flies and mosquitoes. Therefore, this is an area of concern as unsanitary environment exists right next to the citizens. In addition, as shown in the photograph in Figure 6.3-6, dumped garbage and sludge from rainwater/sewage

6-22
The Data Collection Survey on Water Supply and Sewerage Sector of Pakistan Final Report
are accumulated, thereby, the effective cross section of the drains are reduced, that is, the flow capacity is reduced.
Sewage discharged to Sattu Katla Drain from LMP DS
Sewage discharged directly from the house adjacent to the drain. There is a sewer pipe under the blue door in the center of the photo
Source: JST Figure 6.3-6 Discharge of Sewage to Drains
(2) Dumping of Solid Waste Compared with other cities, the rainwater drains in Lahore have an extremely large amount of accumulated solid waste. The rainwater drains are originally a facility for rainwater, but since sewage from DS and others are discharged, there is a flow rate during dry weather. As a result, most of the solid wastes flow downstream. However, many of them accumulates without flowing down, which is the situation shown in Figure 6.3-7. Regarding the dumping of solid wastes into the drains, the JICA study team has confirmed dumping of unnecessary foodstuffs from open-air dealers, dumping of livestock manure and dumping of household wastes from the houses adjacent to the drains as shown in Figure 6.3-7. As shown in Figure 6.3-8, solid wastes are dumped into the primary drains in many places.
It seems that the dumping of solid wastes into the drains are not done solely by the citizens. As a special note regarding the dumping of garbage, the following was stated as the answer to the questionnaire submitted to the WASA Lahore. The problem is that a private company that has a contract with the Lahore Waste Management Company dumps the collected garbage into the drains. In addition, during the site visit under this survey, it was confirmed that the garbage collected by the vehicles were dumped into the drains. Figure 6.3-7 shows the accumulation of solid wastes in the drain and the situation of a large amount of garbage, which is presumed to be collected garbage, in places where vehicles can easily access.

6-23
The Data Collection Survey on Water Supply and Sewerage Sector of Pakistan Final Report
Figure 6.3-7 Situation of Solid Wastes Dumping to the Drains
Source: M/P of WASA Lahore
Figure 6.3-8 Solid Wastes Dumping Sites at Primary Drains
A large number of solid wastes that fills the drain Solid wastes that seem to be collected garbage in a plastic bag
Dumping solid wastes near the bridge with good vehicle access Dumping unnecessary foodstuffs from street vendors along the
drain Source: JST

6-24
The Data Collection Survey on Water Supply and Sewerage Sector of Pakistan Final Report
According to interviews with WASA Lahore staff, WASA Lahore conveys about half of the solid wastes that are being brought into the solid waste disposal site each year. If the collected garbage are no longer dumped into the drains the cleaning work by WASA Lahore will be significantly reduced. It can be said that the problem of dumping solid wastes into the drains are not only for public awareness, but also for the way of waste administration.
(3) Difficulty of cleaning work There are places in the city which face difficulty in cleaning the drains due to non-accessibility of construction machinery and manual workers. Such places include drains that are covered with trees in the parks, those having build-up areas and houses along both of its banks and are constructed at medians of the main road, as shown in the photo in Figure 6.3-6. It is difficult to implement regular cleaning works in such places and wastes and sludge that naturally flow down during wet weather are removed on the downstream side. Under such cases, non-flowing wastes and sludge accumulates, and it is necessary to improve access or procure equipment with a small or long arm suitable for such places for removing the accumulated waste and sludge.
Part of a drain in Jinnah Park that is difficult to access from both sides Solid wastes remain piled up
Inefficient cleaning work due to the median strip of the main road and the steel cover. There is a lot of solid wastes inside
Source: JST Figure 6.3-9 Drains Having Difficulty of Cleaning Work
(4) Illegal occupation Before the field survey, it was recognized that illegal occupation refers to stalls, huts, tents, etc. that hinder the maintenance of existing drains. However, it was not confirmed whether or not there were any parts that would interfere with maintenance at all the sites that were interviewed and inspected under WASA Lahore, except for the places where motorcycles were parked on the lid of the Central Drain. Central Drain's bike parking is also easy to move and does not interfere with maintenance work. Based on that, as a result of confirming whether there is a state of illegal occupation of WASA Lahore again, and if so, what kind of situation it is, illegal occupation is an area / community that LDA does not approve as a place of residence. Since it is not approved as a place of residence by the LDA, it is outside the jurisdiction of WASA Lahore, and illegal immigrants and refugees from the northern and western parts of Pakistan and Afghanistan live in it. After confirming safety, on-site confirmation was carried out. Current situation of illegal occupation is shown in Figure 6.3-10.

6-25
The Data Collection Survey on Water Supply and Sewerage Sector of Pakistan Final Report
Situation of a road of illegal occupation area Situation of a road of illegal occupation area
Grey water from household Grey water from household Source: JST
Figure 6.3-10 Current Situation of Illegal Occupation Area
The area is located on the left riverbed bank of the Ravi River, which is sandwiched between the left bank of the Ravi River and the west side of the Ring Road that goes around the outside of Lahore city. The roads and drains in the photo are maintained by the local community but they are of poor quality. In addition, due to the illegal occupation but the presence of residents, the minimum necessary infrastructure, such as electricity by WAPDA and water supply by WASA Lahore, are being serviced.
Due to the large number of residents, the riverbed, and the water supply but the sewerage system is not maintained, drainage from households is stagnant and the roads are flooded even during dry season.
In this way, all sewage including factory effluent, livestock manure, large and small trash, and rainwater in the rainy season flows from the open drain into the sewer pipe downstream. As a result, the sewer pipe downstream are blocked and the sewage overflows, and even in mid-December, when there are no rains, the situation shown in the photograph occurs.
6.3.3 Progress of the Implementation of Drainage Master Plan WASA Lahore has commenced drain and rainwater storage tank construction projects amongst the projects identified in the drainage master plan with the budget from the provincial government. However, while the overall planned budget is 16.9 billion PKR, sufficient progress has not been obtained due to restrictions on

6-26
The Data Collection Survey on Water Supply and Sewerage Sector of Pakistan Final Report
the budget scale. In addition, construction of the trunk sewer to guide the sewage to the sewage treatment plant that is currently being discharged to the drains has commenced under AIIB loan finance. The WASAL says that this project will also contribute to flood control by expanding the flow capacity of drains.
(1) Construction of drains Regarding construction of secondary and tertiary drains, the Haji Camp Drain project is on-going.
Project name: Storm Water Drainage System from Haji Camp to River Ravi via Laxmi Chowk, Macleod Road, Nabha Road, Chauburji and Sham Nagar, Lahore
Budget: 31billion PKR by Gov. of Punjab Basin Area: 575 Acre、 Design Consultant: NESPAK (Local consultant)
Progress: 6.7km out of 10km completed Structure: Cast-in-place and precast concrete box culverts
(2) Construction of storage facilities One of the rainwater storage facilities planned in the drainage master plan was completed and other projects have commenced their construction.
Constructed facility: Lawrence Road underground storage tank Start to construct facility: Sheranwala Gate and Kashmir Road underground storage tanks
6.4 ANALYSIS OF THE ISSUES OF DRAINS IN LAHORE
6.4.1 Factor Analysis of Issues by Analyzing Existing Information (1) Extraction of issues by analyzing existing information The preparatory study on the Lahore water supply, sewerage and drainage improvement project (2010) (hereinafter referred to as the "Lahore Preparatory Study (2010)") conducted a detailed survey for each rainwater drain and listed their problems. Under this survey, by analyzing the contents described in the report of the study by the method of factor analysis, issues, their factors and their correlations were clarified, and effective countermeasures were considered. When the issues described for each drain are summarized according to similar contents, they can be classified into two categories: problems as a result of ponding and problems that cause such issues as insufficient facilities. Table 6.4-1 shows the issues under each of the two categories and the corresponding drain name.

6-27
The Data Collection Survey on Water Supply and Sewerage Sector of Pakistan Final Report
Table 6.4-1 Summary and Classification of Issues in the Current state of Drains Current Issues Corresponding Drain
Causal Issues
Discharge of untreated sewage from sewerage system
Mehmood Booti、Central
Inflow of sewage from houses and shops Shadara、Mehmood Booti、Chotta Ravi
Discharge of untreated sewage from the factory Sattu Katla Drain
The drainage system is not yet developed due to the remarkable progress of urbanization.
Sattu Katla Drain
House shops line up facing the drains and it is difficult to bring in equipment.
Chotta Ravi、Central
Dumping of garbage and wastes Shadara、Central、Sattu Katla Drain
Resulting Issues
Poor environment due to accumulation of garbage, waste, sludge, etc.
Shadara、Chotta Ravi、Central、Sattu Katla Drain
Reduction of cross-section Chotta Ravi、Central、Sattu Katla Drain
Full water even in the dry season Shadara、Mehmood Booti、Central
Interfering with rainwater drainage during rainy season or occurrence of ponding
Chotta Ravi、Central
Source: JST
(2) Factor analysis of the extracted issues The resulting issues are important for assessing the degree of impact on citizen life, but the causal issues are important for devising solutions. Firstly, factors causing the resulting issues were analyzed, and then solutions to eliminate the factors were considered. Figure 6.4-1 shows the results of the examination of the correlation including the solution, that is, results of factor analysis using the correlation diagram. The examination procedure starts with the resulting issue, confirms the issue that is the cause, and finally considers the solution. The arrows in the figure indicate the order in which the issues are solved by remedial measures.
Source: JST Figure 6.4-1 Correlation between Drainage Issues and Solutions
Resulting Issues
② Management ・Organization ・Equipment ・Cooperation between government
Lack of drains, insufficient capacity, connected sewers
Discharge/inflow of sewage
Dumping of solid wastes
Insufficient maintenance / equipment
① Const. of facilities
・Implementation of M/P ・Construction of sewers ・Construction of drains
③ Solid waste administration
➃Citizen enlightenment /
Solutions Causal Issues
Ponding in rainy season
Full water even in the dry season
Cross-section reduction due to accumulation of garbage, waste and sludge, poor
Poor environment due to sewage discharge / inflow
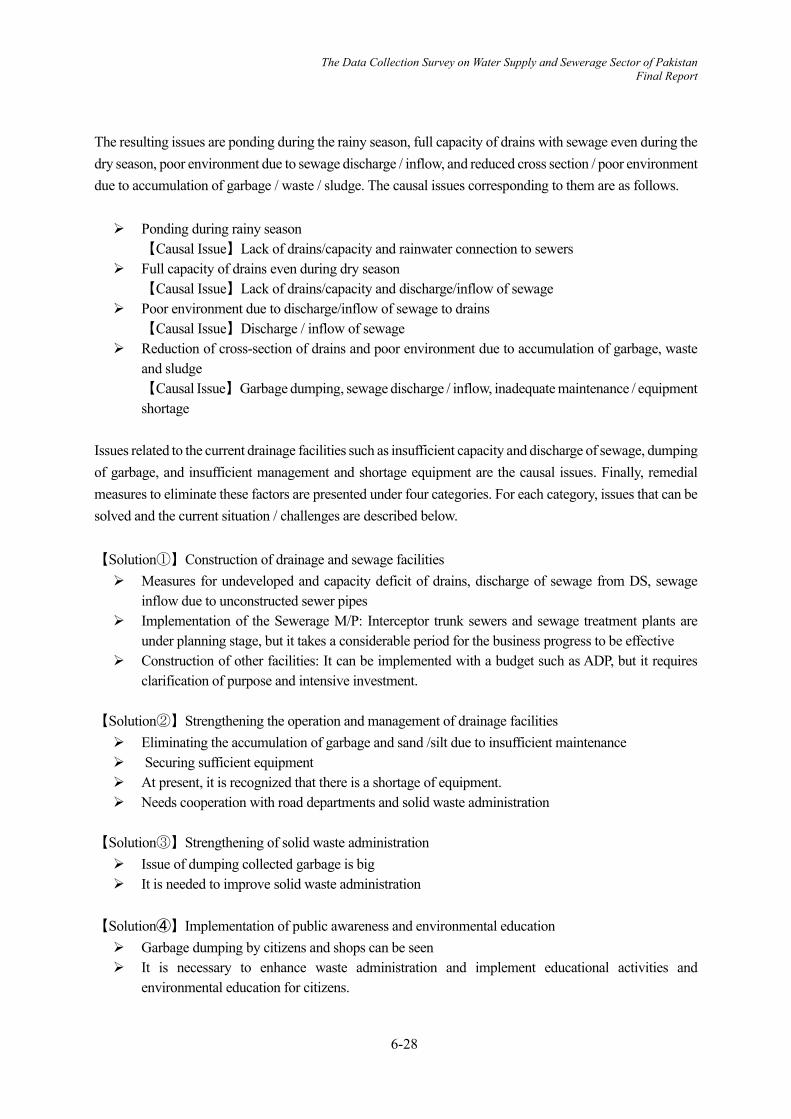
6-28
The Data Collection Survey on Water Supply and Sewerage Sector of Pakistan Final Report
The resulting issues are ponding during the rainy season, full capacity of drains with sewage even during the dry season, poor environment due to sewage discharge / inflow, and reduced cross section / poor environment due to accumulation of garbage / waste / sludge. The causal issues corresponding to them are as follows.
Ponding during rainy season
【Causal Issue】Lack of drains/capacity and rainwater connection to sewers Full capacity of drains even during dry season
【Causal Issue】Lack of drains/capacity and discharge/inflow of sewage Poor environment due to discharge/inflow of sewage to drains
【Causal Issue】Discharge / inflow of sewage Reduction of cross-section of drains and poor environment due to accumulation of garbage, waste
and sludge 【Causal Issue】Garbage dumping, sewage discharge / inflow, inadequate maintenance / equipment shortage
Issues related to the current drainage facilities such as insufficient capacity and discharge of sewage, dumping of garbage, and insufficient management and shortage equipment are the causal issues. Finally, remedial measures to eliminate these factors are presented under four categories. For each category, issues that can be solved and the current situation / challenges are described below. 【Solution①】Construction of drainage and sewage facilities Measures for undeveloped and capacity deficit of drains, discharge of sewage from DS, sewage
inflow due to unconstructed sewer pipes Implementation of the Sewerage M/P: Interceptor trunk sewers and sewage treatment plants are
under planning stage, but it takes a considerable period for the business progress to be effective Construction of other facilities: It can be implemented with a budget such as ADP, but it requires
clarification of purpose and intensive investment.
【Solution②】Strengthening the operation and management of drainage facilities Eliminating the accumulation of garbage and sand /silt due to insufficient maintenance Securing sufficient equipment At present, it is recognized that there is a shortage of equipment. Needs cooperation with road departments and solid waste administration
【Solution③】Strengthening of solid waste administration Issue of dumping collected garbage is big It is needed to improve solid waste administration
【Solution➃】Implementation of public awareness and environmental education Garbage dumping by citizens and shops can be seen It is necessary to enhance waste administration and implement educational activities and
environmental education for citizens.

6-29
The Data Collection Survey on Water Supply and Sewerage Sector of Pakistan Final Report
6.4.2 Causes for Ponding and Study for Solutions Here, among the issues extracted in 6.4-1, the causes and solutions are examined by focusing on the ponding during rainy weather. As for the current state of rainwater drainage in Lahore, primary drains are constructed except in some areas, and four rainwater discharge pumping stations that can forcibly discharge rainwater at high water levels in rivers are installed at the discharge points from the primary drains to rivers. However, these pumping stations are not being operated and rainwater is drained to rivers by natural flow from the primary drains. On the other hand, when it rains intensively or when heavy rain continues for a long time, there are places where rainwater is ponded over a wide area and in various parts of the city, which create serious problems.
As a result of analyzing the causes of ponding in Lahore through the Lahore Preparatory Study 2010, the WASA Lahore M / P, and under this on-site survey, the following four causes are summarized.
1) There are no rainwater drains (even primary drains in some areas) in the vicinity, or the capacity of the drains are insufficient.
2) Many roads do not have roadside drains, so connect the houses and road rainwater drainage to the sewer pipe. 3) Occurrence of ponding due to lack of facilities for taking rainwater into the drains 4) Drains are blocked by garbage and sand / silt.
Among these causes, 1), 3) and 4) are described in the reports of the Lahore Preparatory Study 2010 and the WASA Lahore M / P, and the solutions are shown, but cause no 2) is not described clearly nor the position of it as a sewage / drainage system is shown. The causes of each ponding are outlined below.
There are no drains in the vicinity or capacity of the drains are insufficient In some newly developed areas, there is a wide range of ponding due to the absence of drains (in some cases, primary drains), and in the city center ponding occur because the drains are inadequate or incapacitated. As a countermeasure, first of all, the construction of drains can be mentioned. The WASA Lahore M/P (Rainwater Drain Edition) shows countermeasures for each basin and ponding area and includes not only the construction of drains but also the construction of storage and infiltration facilities. When these construction projects are implemented, a large part of the ponding issue in Lahore will be resolved, but there are many locations where projects need to be implemented, so it is necessary to determine priorities and secure financial resources for implementation.
Connection of rainwater to sewer pipes Rainwater is flowing into sewer pipes that are planned and designed as sewer pipes. Many roads do not have storm sewers or roadside drains to receive rainwater from houses and roads. Basically, it is presumed that these factors may cause frequent ponding during heavy rains in rainy weather. Figure 6.4-2 shows a schematic representation of Lahore's sewage and drainage system.
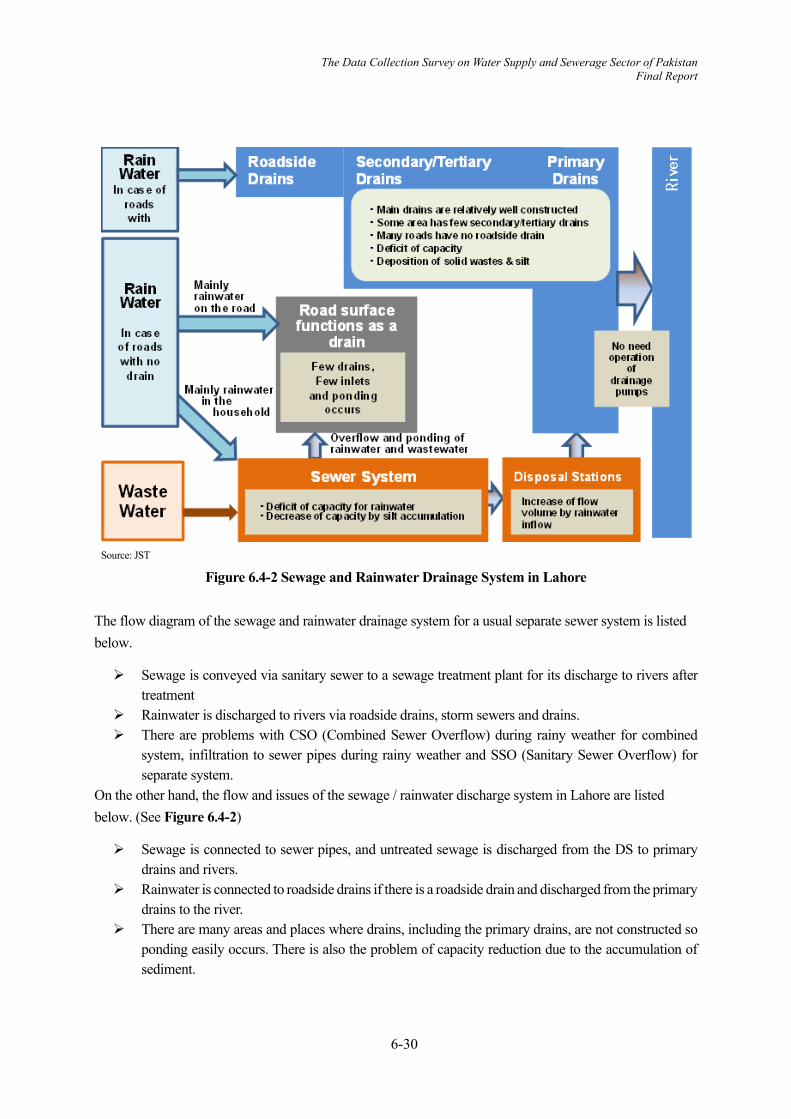
6-30
The Data Collection Survey on Water Supply and Sewerage Sector of Pakistan Final Report
Source: JST
Figure 6.4-2 Sewage and Rainwater Drainage System in Lahore
The flow diagram of the sewage and rainwater drainage system for a usual separate sewer system is listed below.
Sewage is conveyed via sanitary sewer to a sewage treatment plant for its discharge to rivers after treatment
Rainwater is discharged to rivers via roadside drains, storm sewers and drains. There are problems with CSO (Combined Sewer Overflow) during rainy weather for combined
system, infiltration to sewer pipes during rainy weather and SSO (Sanitary Sewer Overflow) for separate system.
On the other hand, the flow and issues of the sewage / rainwater discharge system in Lahore are listed below. (See Figure 6.4-2)
Sewage is connected to sewer pipes, and untreated sewage is discharged from the DS to primary drains and rivers.
Rainwater is connected to roadside drains if there is a roadside drain and discharged from the primary drains to the river.
There are many areas and places where drains, including the primary drains, are not constructed so ponding easily occurs. There is also the problem of capacity reduction due to the accumulation of sediment.
6-31
The Data Collection Survey on Water Supply and Sewerage Sector of Pakistan Final Report
If there are no roadside drains, rainwater is connected to the sewer pipe. In this case, the capacity of sewer pipe will be insufficient for the rainwater amount. In addition, sediment is often accumulated and easily overflows.
Overflowing rainwater flows down the road according to the terrain / gradient and forms ponding at the depression.
As described above, when rainwater flows into a sewer pipe (basically planned based on the amount of sewage), the planned amount of rainwater (the amount of rainwater during heavy rain) is extremely large compared to the amount of sewage. Therefore, the capacity of the sewer pipe becomes insufficient except during light rainfall. As a countermeasure, it is possible to install rainwater drains / roadside drains that connects to the primary drains or the secondary / tertiary drains on the road. However, construction of new rainwater drains / roadside drains would be very costly and time consuming. Therefore, the following measures are effective.
Measures to taken sequentially from the ponded area, and the current drains improved. In addition, allow rainwater to flow down the road and reduce the extension of drain construction. Prioritize measures for ponding areas, connect to drains that have already been constructed, and
develop pump facilities and storage / infiltration facilities as necessary.
However, regarding the flow of rainwater on the road, it is necessary to pay attention to the contents described in the next section 3).
Ponding due to lack of facilities for taking rainwater to drains In Lahore, rainwater often flows down the road, but the rainwater sometime has nowhere to go and is accumulated in depressions and lowlands. As mentioned above, the construction of drains as other storage / infiltration facilities will be a countermeasure for this issue. However, it is not possible to install drains / roadside drains during a short period of time, so the overflow of rainwater on the roads would continue.
On the other hand, when observing the road in Lahore, it is rarely found except for the roadside drains that takes in rainwater flowing down the road and flows it into the drains. It is speculated that the lack of facilities installed for this purpose is one of the causes for the long-term ponding as observed in various parts of the city. It is thought that the improvement of these facilities will reduce the ponding for a particularly long time.
Blockage of drains due to garbage and soil / silt According to existing information and results obtained from drains survey, it has been confirmed that there are many drains where garbage and sediments are being accumulated and are stagnant, and that the flow section is greatly reduced on some locations. The decrease in the flow section impairs the flow capacity of the drain and causes the occurrence of ponding. However, in these drains, in general, during heavy rainfall, ponding occurs only during the time when the flow rate exceeds the reduced flow capacity, and the ponding disappears after the rainfall intensity is reduced. The ponding that is a problem in Lahore has continued for a long time even after the end of rainfall, and it is considered that the blockage of the drain is not the main cause of the occurrence of ponding.
Next, measures to prevent the inflow of wastes and soil / silt from the drains are examined. It has been confirmed that the covered drains have extremely less garbage than the open channel drains. Covered drains
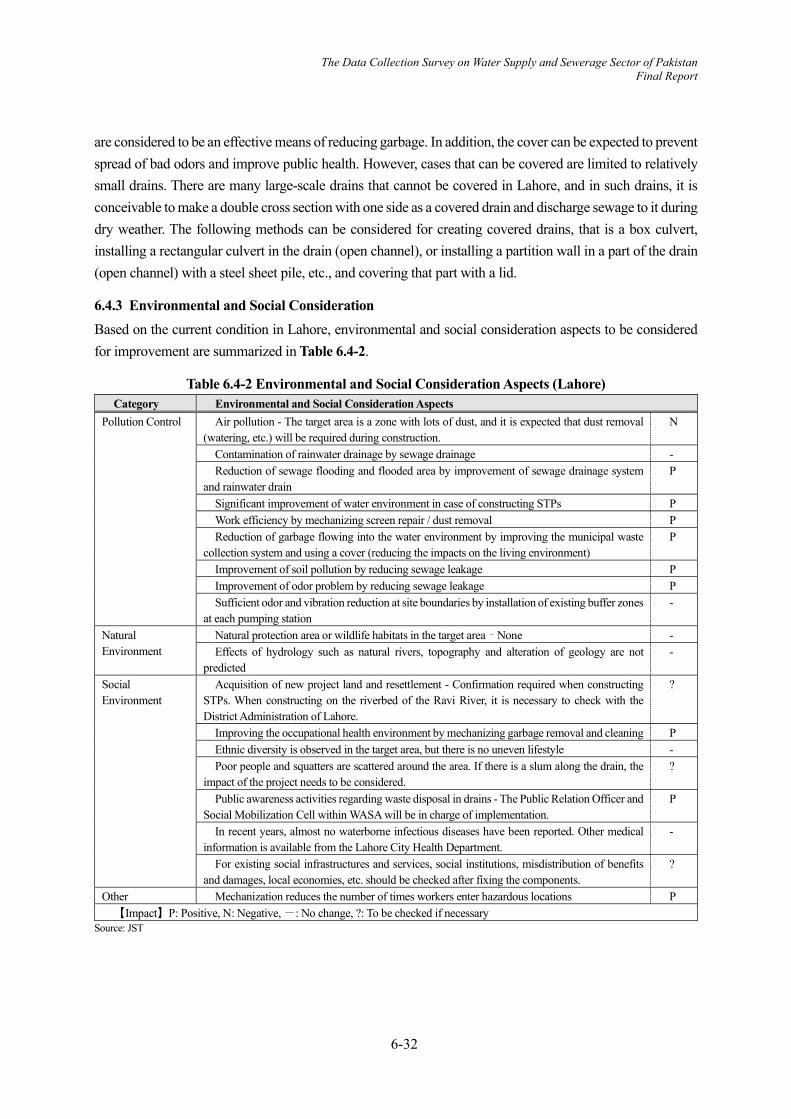
6-32
The Data Collection Survey on Water Supply and Sewerage Sector of Pakistan Final Report
are considered to be an effective means of reducing garbage. In addition, the cover can be expected to prevent spread of bad odors and improve public health. However, cases that can be covered are limited to relatively small drains. There are many large-scale drains that cannot be covered in Lahore, and in such drains, it is conceivable to make a double cross section with one side as a covered drain and discharge sewage to it during dry weather. The following methods can be considered for creating covered drains, that is a box culvert, installing a rectangular culvert in the drain (open channel), or installing a partition wall in a part of the drain (open channel) with a steel sheet pile, etc., and covering that part with a lid.
6.4.3 Environmental and Social Consideration Based on the current condition in Lahore, environmental and social consideration aspects to be considered for improvement are summarized in Table 6.4-2.
Table 6.4-2 Environmental and Social Consideration Aspects (Lahore) Category Environmental and Social Consideration Aspects
Pollution Control Air pollution - The target area is a zone with lots of dust, and it is expected that dust removal (watering, etc.) will be required during construction.
N
Contamination of rainwater drainage by sewage drainage ‐ Reduction of sewage flooding and flooded area by improvement of sewage drainage system
and rainwater drain P
Significant improvement of water environment in case of constructing STPs P Work efficiency by mechanizing screen repair / dust removal P Reduction of garbage flowing into the water environment by improving the municipal waste
collection system and using a cover (reducing the impacts on the living environment) P
Improvement of soil pollution by reducing sewage leakage P Improvement of odor problem by reducing sewage leakage P Sufficient odor and vibration reduction at site boundaries by installation of existing buffer zones
at each pumping station ‐
Natural Environment
Natural protection area or wildlife habitats in the target area‐None ‐ Effects of hydrology such as natural rivers, topography and alteration of geology are not
predicted ‐
Social Environment
Acquisition of new project land and resettlement - Confirmation required when constructing STPs. When constructing on the riverbed of the Ravi River, it is necessary to check with the District Administration of Lahore.
?
Improving the occupational health environment by mechanizing garbage removal and cleaning P Ethnic diversity is observed in the target area, but there is no uneven lifestyle ‐ Poor people and squatters are scattered around the area. If there is a slum along the drain, the
impact of the project needs to be considered. ?
Public awareness activities regarding waste disposal in drains - The Public Relation Officer and Social Mobilization Cell within WASA will be in charge of implementation.
P
In recent years, almost no waterborne infectious diseases have been reported. Other medical information is available from the Lahore City Health Department.
‐
For existing social infrastructures and services, social institutions, misdistribution of benefits and damages, local economies, etc. should be checked after fixing the components.
?
Other Mechanization reduces the number of times workers enter hazardous locations P 【Impact】P: Positive, N: Negative, -: No change, ?: To be checked if necessary
Source: JST

6-33
The Data Collection Survey on Water Supply and Sewerage Sector of Pakistan Final Report
6.5 SEWERAGE MASTER PLAN OF LAHORE
6.5.1 Outline of Sewerage Master Plan WASA Lahore created a sewerage master plan in 2018. This master plan has a target year of 2040. The sewage collection method is based on the separate system, but it allows rainwater to be connected to the sewer pipe where there are no roadside drains. As a general rule, the collection system is by gravity flow, but depending on the topographical conditions, pumping stations are provided. The service area is divided into 6 areas for each planned sewage treatment plant, and new disposal stations are installed to collect sewage. The treatment method of the sewage treatment plant will be the Chemically Enhanced Primary Treatment Method, and the treated water will be discharged into rivers or irrigation canals. The locations of the disposal stations, the sewage treatment plants, and the specification list of the sewage treatment plant are shown in Figure 6.5-1.
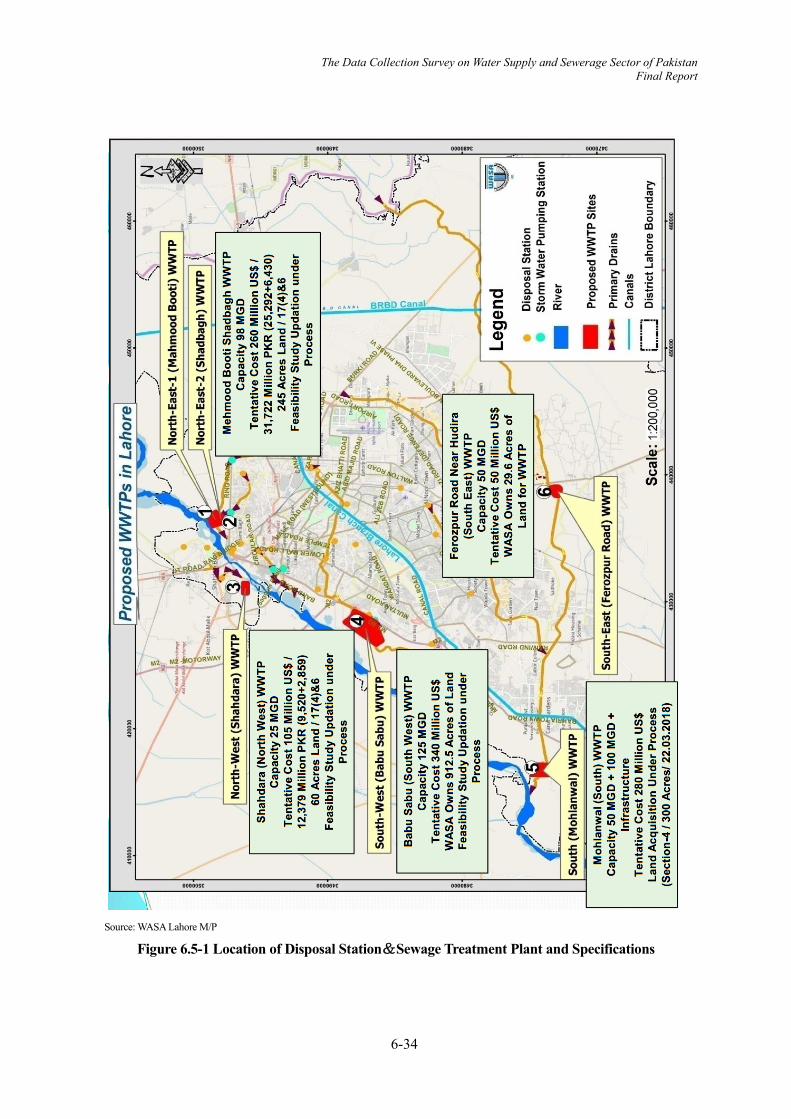
6-34
The Data Collection Survey on Water Supply and Sewerage Sector of Pakistan Final Report
Source: WASA Lahore M/P
Figure 6.5-1 Location of Disposal Station&Sewage Treatment Plant and Specifications

6-35
The Data Collection Survey on Water Supply and Sewerage Sector of Pakistan Final Report
6.5.2 Outline of Drainage Master Plan WASA Lahore created a master plan for the rainwater drainage system in 2018. This master plan has a target year of 2040. Of the drainage maintenance areas under the WASA Lahore, the improvement of ponding damage in the city center is mainly planned by the construction of infiltration / storage facilities and drains divided into 10 areas. On the other hand, the suburbs of the same maintenance area are planned to be divided into 9 areas to construct drains and pumping stations. The location map of the drains in the suburbs, which is the largest of the above plans, is shown. The location map of the principal drains planned to be constructed in the suburbs, which is the largest of the above plans, is shown in Figure 6.5-2,Figure 6.5-3 and Figure 6.5-4.
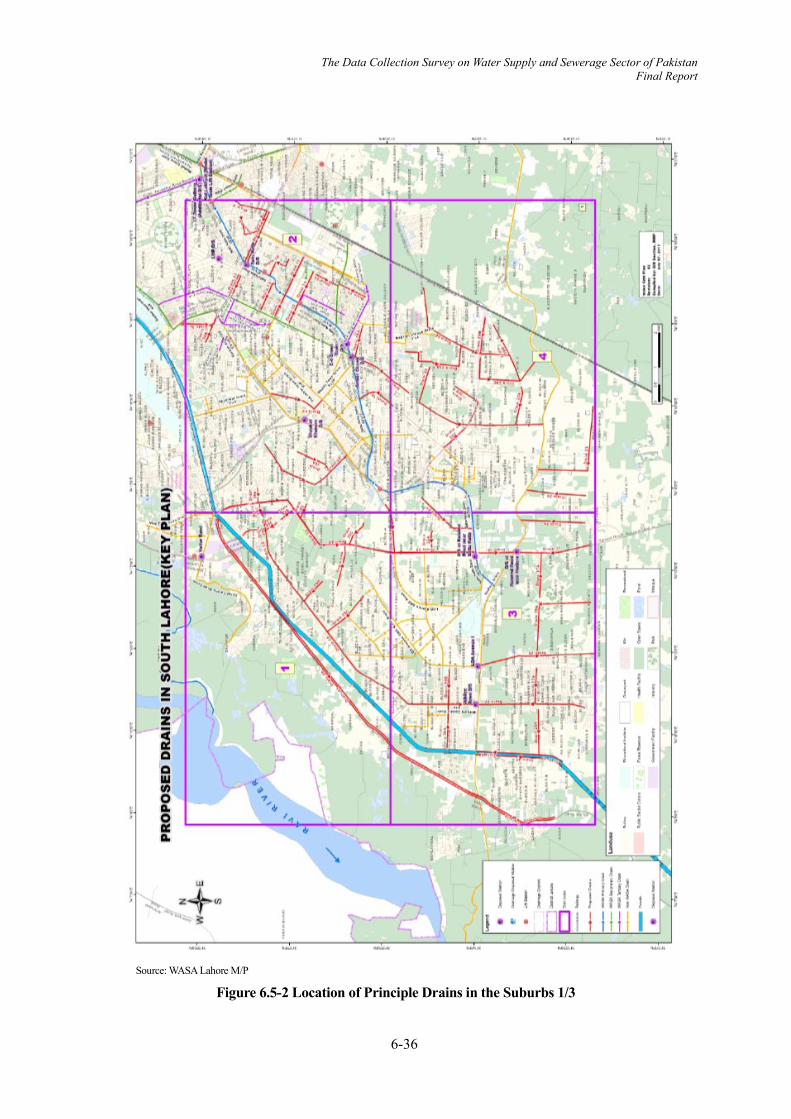
6-36
The Data Collection Survey on Water Supply and Sewerage Sector of Pakistan Final Report
Source: WASA Lahore M/P
Figure 6.5-2 Location of Principle Drains in the Suburbs 1/3

6-37
The Data Collection Survey on Water Supply and Sewerage Sector of Pakistan Final Report
Source: WASA Lahore M/P
Figure 6.5-3 Location of Principle Drains in the Suburbs 2/3

6-38
The Data Collection Survey on Water Supply and Sewerage Sector of Pakistan Final Report
Source: WASA Lahore M/P
Figure 6.5-4 Location of Principle Drains in the Suburbs 3/3
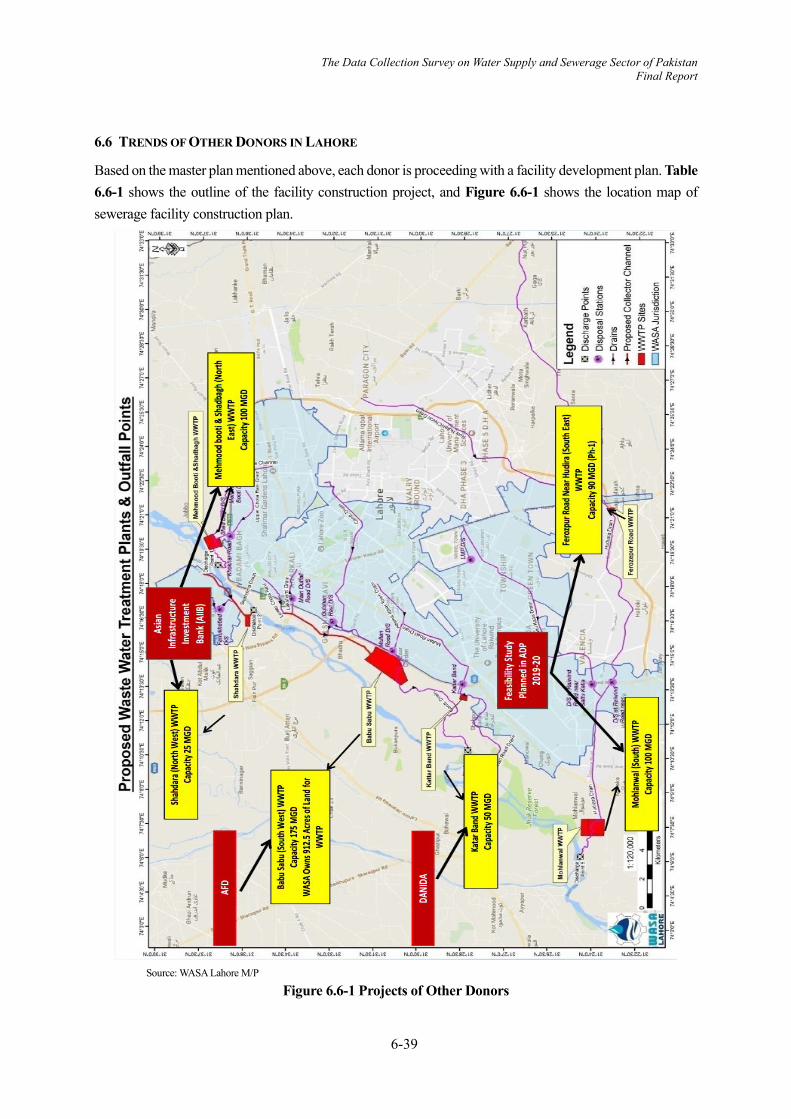
6-39
The Data Collection Survey on Water Supply and Sewerage Sector of Pakistan Final Report
6.6 TRENDS OF OTHER DONORS IN LAHORE
Based on the master plan mentioned above, each donor is proceeding with a facility development plan. Table 6.6-1 shows the outline of the facility construction project, and Figure 6.6-1 shows the location map of sewerage facility construction plan.
Source: WASA Lahore M/P
Figure 6.6-1 Projects of Other Donors
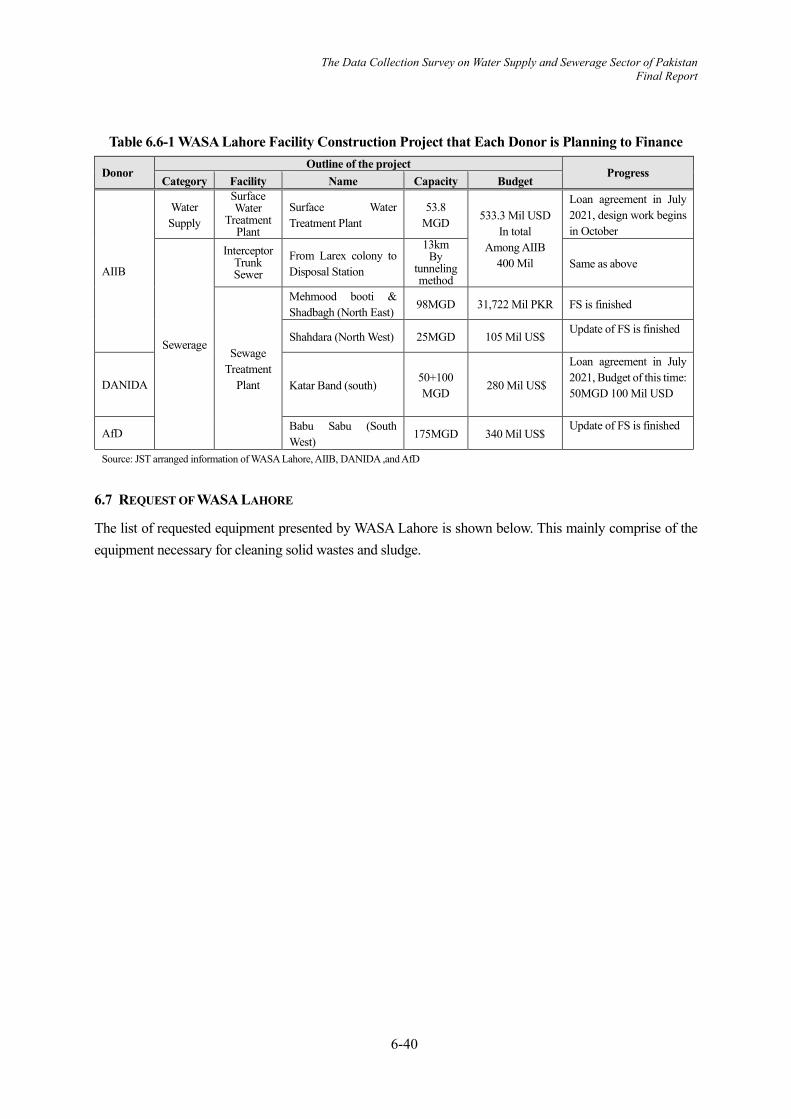
6-40
The Data Collection Survey on Water Supply and Sewerage Sector of Pakistan Final Report
Table 6.6-1 WASA Lahore Facility Construction Project that Each Donor is Planning to Finance
6.7 REQUEST OF WASA LAHORE
The list of requested equipment presented by WASA Lahore is shown below. This mainly comprise of the equipment necessary for cleaning solid wastes and sludge.
Donor Outline of the project
Progress Category Facility Name Capacity Budget
AIIB
Water Supply
Surface Water
Treatment Plant
Surface Water Treatment Plant
53.8 MGD 533.3 Mil USD
In total Among AIIB
400 Mil
Loan agreement in July 2021, design work begins in October
Sewerage
Interceptor Trunk Sewer
From Larex colony to Disposal Station
13km By
tunneling method
Same as above
Sewage Treatment
Plant
Mehmood booti & Shadbagh (North East)
98MGD 31,722 Mil PKR FS is finished
Shahdara (North West) 25MGD 105 Mil US$ Update of FS is finished
DANIDA Katar Band (south) 50+100 MGD
280 Mil US$
Loan agreement in July 2021, Budget of this time: 50MGD 100 Mil USD
AfD Babu Sabu (South West)
175MGD 340 Mil US$ Update of FS is finished
Source: JST arranged information of WASA Lahore, AIIB, DANIDA ,and AfD

6-41
The Data Collection Survey on Water Supply and Sewerage Sector of Pakistan Final Report
Table 6.7-1 Request of Equipment of O&M from WASA Lahore
Source: WASA Lahore “Demand of machinery to JICA”
Other requests: Reinforcement of the capacity pumping station During the first survey, there was an offer to support a project to double the capacity of the existing Multan Road Disposal Station from 240 cusec to 480 cusec. This project will contribute to address ponding issues in the area, including enhancement of the diameter of the inflow pipe to the pumping station and improving the trunk sewer pipe.
Sr. No Descrition Total ExistingNeeds
replacement
Additionalrequirement
due to increasein
infrastructure
QtyRequire
dMain Specifications Justification
2 2 8 10Capacity' 155 L/sec. (@20m
head),solid passing size 77mm , SSimpeller
79 35 5 40Capacity '90 L/sec. (@20m head)
solid passing size 50mm,SS impeller
2 Wheel Excavators Large 8 4 6 10Digging reach-9.75 metersBucket Capacity 1.5 Ton
For cleanig of drains.Existing excavatorsare old and need replacement.Existingquantity is not adequate with work load
3Excavators Floating (For working
under the bridges)0 0 5 5
Boom length 4-6 MBucket Capacity 1.5 Ton
For Cleaning of Under Bridges ofdrains.No existing arrangement of
cleaning drains under the bridges exceptmanual cleaning
11 Very Old (Model
1977)2 3 Digging reach 20-22 M
For Cleaning of Primary drains.Onedragline only which has passed its life
0 0 2 2 Digging reach 12-15 MFor Cleaning of Wetwells of Disposal
pump Stations
5 Large Suction Unit 34 10 0 10
Min. vacuum pressure -93Kpa atsealing temperature of 150 C.
Suction rate 20 m3/min.Tank capacity 7m3
For main sewer lines.Old machines needreplacement
6 Small Suction Unit 3 3 0 5Min. vacuum pressure -93Kpa
Suction rate 20 m3/min
for Narrow Streets.No arrangement forsmall streets
7 Jetting Unit heavy 36 10 0 10High pressure pump discharge
capacity minimum 200 l/min at 200bar. Tank capacity 8 m3
For removal of sewer blockage at mainroads.Old machines need replacement
8 Jetting Unit small 3 3 2 5High pressure pump discharge
capacity minimum 120 l/min at 190bar. Tank capacity3000 liters
For removal of sewer blockage in narrowStreets.No arrangement for small streets
9 Mini Excavators 0 0 5 5
Digging reach up to 5.5 MBucket capacity 1000 Kg
Engine Power minimum 20 KWFor cleaning of Small Drains.No mini
excavator available in WASA
10 Front End Loader 2 2 3 5 Shovel capacity1.9 m3Loading of garbage on dump trucks.Onlyone loader available procured by JICA in
2005Dump Truck 45 20 0 20 8 ton capacity with tipping angle of
50-60 degree drop tailgate type 20 old trucks need replacement
11Pick Up Truck for Monitoring &
Silt Transportation in Streets.0 0 5 5 --
For use in small streets for transportationof garbage removed from small drains and
sewers
Fully Automatic Auto-Prime SolidHandling Dewatering Sets
1
To clear storm water ponding and to givetemporary relief to public in case of
damage to any sewer line.35 Existing setsneed replacement.Existing quantity is not
adequate with work load
Wheel mounted Draglineexcavator
4


7-1
The Data Collection Survey on Water Supply and Sewerage Sector of Pakistan Final Report
SURVEY AND SEMINAR ON FINANCE FOR WASA FAISALABAD, PUNJAB 7.1 CURRENT STATUS OF WASA FAISALABAD'S BUSINESS OPERATIONS
7.1.1 WASA Faisalabad's Undertaking to Improve its Management WASA Faisalabad has undertaken to improve its management by thoroughly classifying operations, legal basis, assigned personnel, revenues and expenses (systematization, breakdowns, and coding), analyzing each expense item, drafting improvement targets, and implementing and monitoring them. In particular, it attaches great importance to resource management planning and crisis/risk management such as disasters and is promoting the strengthening of administrative capacity and improvement of public services by categorizing the following seven indicators: public procurement, flow of funds in administrative organizations, tax and fee collection system, coordination of facility planning and provision of services in border areas, information disclosure, and accountability.
DLI 1 Resource Planning
Three-Year Integrated Rolling plans for Development and Asset Management implemented by each CDG for area within its ‘city’ boundary.
Develop a three-year integrated role plan and review operations with respect to development planning and asset management, which had not been coordinated previously.
DLI 2 Procurement
Good procurement performance practices are set up at CDGs through implementation of the Provincial procurement rules.
Review inconsistencies between public procurement laws and practices and accumulate best practices in public procurement.
DLI 3 Intergovernmental Finance System
Reporting of flow of funds to CDG and city entities, at the CDG level
Report on the flow of funds between city administrative departments and WASA.
DLI 4 Revenue Collection System
Improvements in Own Source Revenue (OSR) Collection Systems. Improve the self-financing collection system.
DLI 5 Boundary Alignment
Boundary of “city” area adopted by each city and its entities as their planning and service area.
Integrate water and wastewater planning and services in the boundary areas of the city and WASA project areas
DLI 6 Public Disclosure and Access to Information
Public disclosure and Access to Information mechanism implemented.
Implement public relations and information access methods.
DLI 7 Accountability Effective and transparent feedback and grievance redress mechanisms implemented.
Implement an efficient and transparent feedback mechanism for resolving the complaints.
DLI: Disbursement linked Indicators ( CDGs: City District Governments
7 DLIs(Disbursement Linked Indicators)
Source:Punjab Cities Governance Improvement Project
In WASA Faisalabad, the responsibilities and costs of each operation and staff are clarified by the heads of the Administration, Finance, and Business Planning departments, and linked to the improvement of practices such as facility information, customer information, and complaint handling using GIS information. The results of these activities are reflected in the management plan.
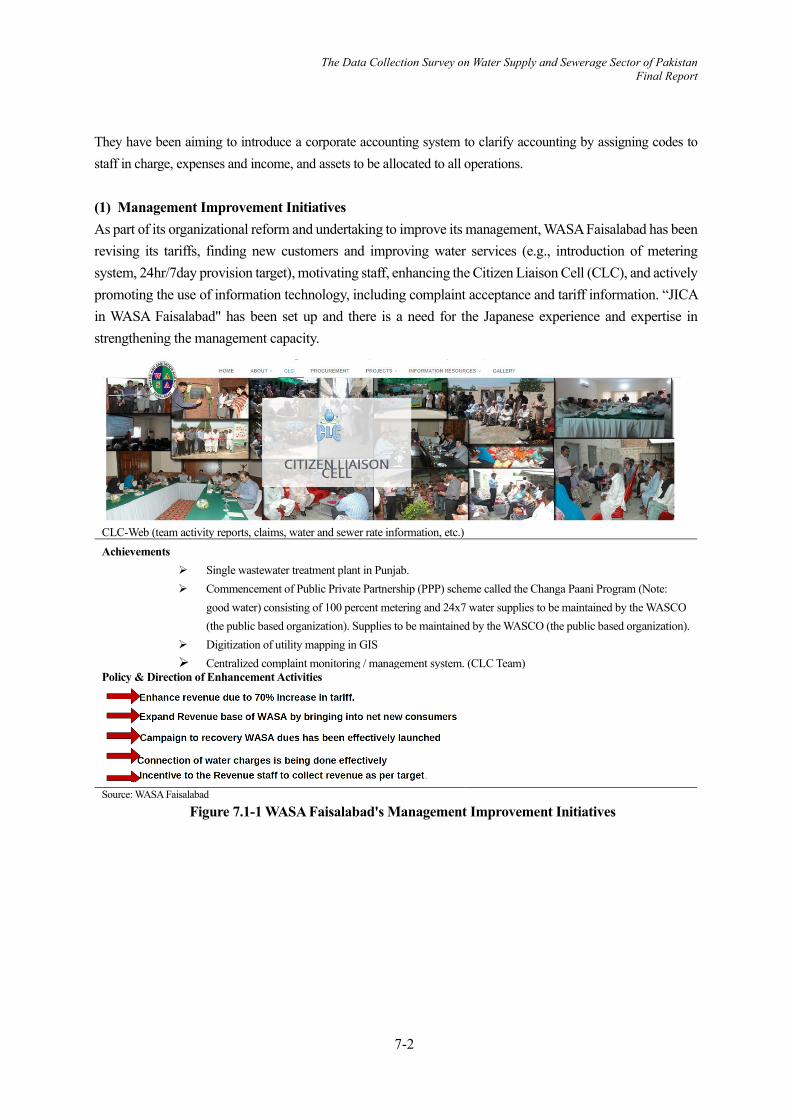
7-2
The Data Collection Survey on Water Supply and Sewerage Sector of Pakistan Final Report
They have been aiming to introduce a corporate accounting system to clarify accounting by assigning codes to staff in charge, expenses and income, and assets to be allocated to all operations. (1) Management Improvement Initiatives As part of its organizational reform and undertaking to improve its management, WASA Faisalabad has been revising its tariffs, finding new customers and improving water services (e.g., introduction of metering system, 24hr/7day provision target), motivating staff, enhancing the Citizen Liaison Cell (CLC), and actively promoting the use of information technology, including complaint acceptance and tariff information. “JICA in WASA Faisalabad" has been set up and there is a need for the Japanese experience and expertise in strengthening the management capacity.
CLC-Web (team activity reports, claims, water and sewer rate information, etc.) Achievements
Single wastewater treatment plant in Punjab. Commencement of Public Private Partnership (PPP) scheme called the Changa Paani Program (Note:
good water) consisting of 100 percent metering and 24x7 water supplies to be maintained by the WASCO (the public based organization). Supplies to be maintained by the WASCO (the public based organization).
Digitization of utility mapping in GIS Centralized complaint monitoring / management system. (CLC Team)
Policy & Direction of Enhancement Activities
Source: WASA Faisalabad
Figure 7.1-1 WASA Faisalabad's Management Improvement Initiatives
7-3
The Data Collection Survey on Water Supply and Sewerage Sector of Pakistan Final Report
(2) Implementation status of meter charge billing and collection (24hr/days) Pilot project
WASA Faisalabad embarked on a pilot project with the support of the Yokohama City Waterworks Bureau.
Introduction procedure: two steps First step: explain how to improve the quality of water supply services. Second step: introduce a meter charge system. ① Installment of 585 meters: from September 2018 ② Installment of 450 Meters: from January 2019
Meter reading system: 3 persons x 2 teams x 3 to 4 days/month (directly managed by the fee collection team) Meter reading: manually recorded on a statement and entered into the fee management system. Fee management system: Developed by WASA Faisalabad Claims information (developed by the Punjab IT Bureau (PITB)): Separated system is developed Facility information: needs for improved management, rehabilitation, etc., are identified. Information is donor-specific, and records are kept on paper-basis.
Effects of Metered Rate System Water supply service quality (water supply time 5-6hr/24hr ⇒ 16hr/24hr, pressurized water and
hygienic) is improved. The water-saving effect has improved, and the system is well received by the residents. Example of fee payment: 240m3/month (7-8 households) metered and 2,289 PKR. (water and
sewage fee) paid
Future developments pertaining to metering system and fee collection The service area will be expanded sequentially. Expansion of the bank transfer system: about 20-30% in 2017 and 50% in 2019 at present Promotion of automation meter reading (tele-metering). Use of Japan's support as an opportunity to
expand, using own financial resources. The Deputy Director in charge received training in Yokohama (2017) and is highly motivated.
Introduction of water metering system in stages and improvement of its efficiency (improve quality of water services, technical support, outsourcing of meter reading)

7-4
The Data Collection Survey on Water Supply and Sewerage Sector of Pakistan Final Report
Water and sewage fee collection system
Water and Sewage Fee Schedule IT for fee payment system Source: WASA Faisalabad
Figure 7.1-2 WASA Faisalabad Water and Sewerage Bill Collection System
(3) Status of GIS and Facility Inventory System Development Development and maintenance status of GIS data Facility inventory data (planning and design specifications, etc.) were accumulated (in data
accumulation stage). It is reaching the stage in which the data can be utilized as facility information statistics.
The system by which completion drawing is automatically updated in the GIS database is yet to be completed.
Data updates in GIS database are being performed to incorporate facility information from monitoring activities.
Utilization of GIS data There is no strategy prepared for utilizing facility inventory information intended to supervise
construction of water and sewage facilities, facilitate construction occupancy consultations, and regulate connection permits.

7-5
The Data Collection Survey on Water Supply and Sewerage Sector of Pakistan Final Report
It has yet to utilize facility information data such as repair and rehabilitation history, cost data, and determination of the degree of deterioration as the basis for its mid-term management plan (at the stage of data accumulation). No request for technical support and introduction of Japanese know-how was presented by WASA Faisalabad.
Provisions Concerning Facility Inventory Ledger There is no provision under the Punjab Gazette No. 552/MD/WASA/2015 "Sewerage and Drainage
Faisalabad Regulation -2105" regarding the design and operation of the system for "coordinating and maintaining public sewerage ledgers" as stipulated in the Sewerage Act and Sewerage Ordinance of Japan. Moreover, no standards are provided for the management of sewerage facilities under the Faisalabad Regulation -2105.
It imposes an obligation to connect to the sewerage system, but the regulation is not designed to disclose information on sewerage facilities and to exercise the duties and powers of the sewerage system manager.
Support to manage sewerage system in each international donors' construction project has not been provided. The national and provincial budgets have not been assessed for their importance.
GIS data monitoring window The system classifies and accumulates data in a systematic manner. There is a lack of information
to be used for occupancy and facility management, such as location information and separation from public and private boundaries.
Missing facility inventory information is observed.
water pipe
sewer pipe
Source: WASA Faisalabad Figure 7.1-3 GIS Water and Wastewater Facility Information
7.1.2 WASA Faisalabad Tariff Structure (1) Water and sewage tariff system The tariff structure for water supply and sewerage/drainage for WASA-F is shown in Table 7.1-1 and the tariff table is shown in
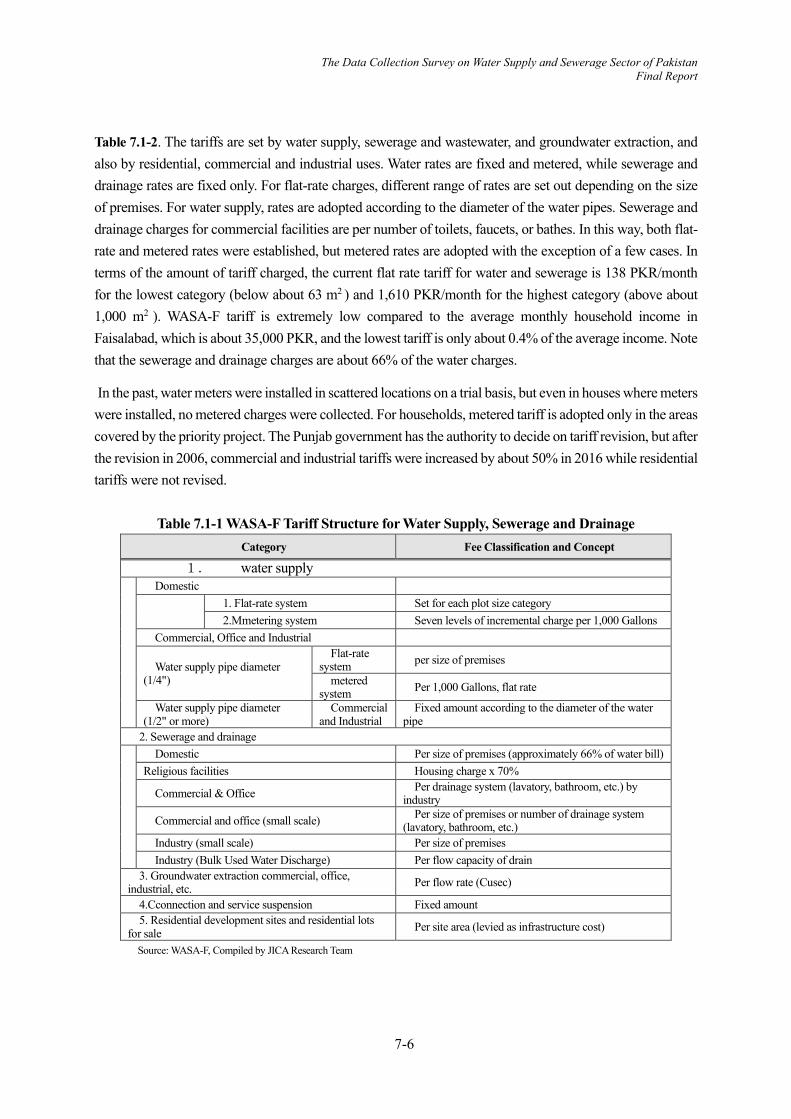
7-6
The Data Collection Survey on Water Supply and Sewerage Sector of Pakistan Final Report
Table 7.1-2. The tariffs are set by water supply, sewerage and wastewater, and groundwater extraction, and also by residential, commercial and industrial uses. Water rates are fixed and metered, while sewerage and drainage rates are fixed only. For flat-rate charges, different range of rates are set out depending on the size of premises. For water supply, rates are adopted according to the diameter of the water pipes. Sewerage and drainage charges for commercial facilities are per number of toilets, faucets, or bathes. In this way, both flat-rate and metered rates were established, but metered rates are adopted with the exception of a few cases. In terms of the amount of tariff charged, the current flat rate tariff for water and sewerage is 138 PKR/month for the lowest category (below about 63 m2 ) and 1,610 PKR/month for the highest category (above about 1,000 m2 ). WASA-F tariff is extremely low compared to the average monthly household income in Faisalabad, which is about 35,000 PKR, and the lowest tariff is only about 0.4% of the average income. Note that the sewerage and drainage charges are about 66% of the water charges.
In the past, water meters were installed in scattered locations on a trial basis, but even in houses where meters were installed, no metered charges were collected. For households, metered tariff is adopted only in the areas covered by the priority project. The Punjab government has the authority to decide on tariff revision, but after the revision in 2006, commercial and industrial tariffs were increased by about 50% in 2016 while residential tariffs were not revised.
Table 7.1-1 WASA-F Tariff Structure for Water Supply, Sewerage and Drainage
Category Fee Classification and Concept
1. water supply
Domestic
1. Flat-rate system Set for each plot size category 2.Mmetering system Seven levels of incremental charge per 1,000 Gallons
Commercial, Office and Industrial
Water supply pipe diameter (1/4")
Flat-rate system per size of premises
metered system Per 1,000 Gallons, flat rate
Water supply pipe diameter (1/2" or more)
Commercial and Industrial
Fixed amount according to the diameter of the water pipe
2. Sewerage and drainage
Domestic Per size of premises (approximately 66% of water bill) Religious facilities Housing charge x 70%
Commercial & Office Per drainage system (lavatory, bathroom, etc.) by industry
Commercial and office (small scale) Per size of premises or number of drainage system (lavatory, bathroom, etc.)
Industry (small scale) Per size of premises Industry (Bulk Used Water Discharge) Per flow capacity of drain
3. Groundwater extraction commercial, office, industrial, etc. Per flow rate (Cusec)
4.Cconnection and service suspension Fixed amount 5. Residential development sites and residential lots
for sale Per site area (levied as infrastructure cost)
Source: WASA-F, Compiled by JICA Research Team
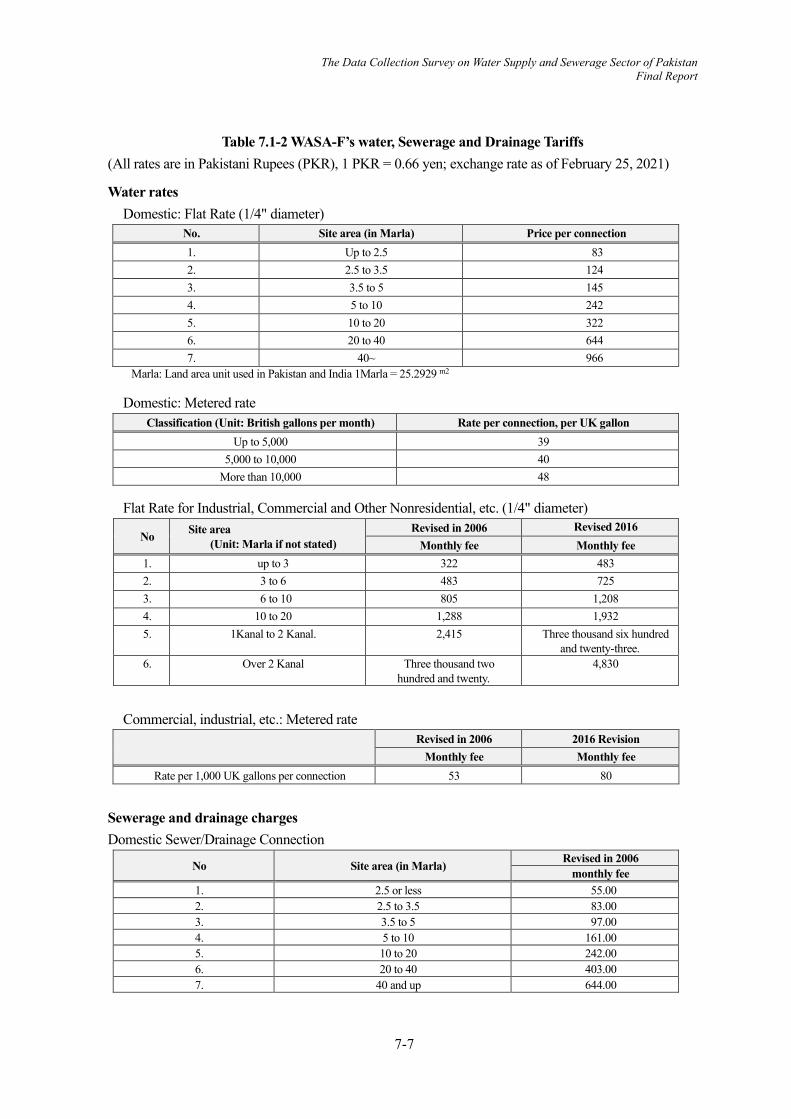
7-7
The Data Collection Survey on Water Supply and Sewerage Sector of Pakistan Final Report
Table 7.1-2 WASA-F’s water, Sewerage and Drainage Tariffs (All rates are in Pakistani Rupees (PKR), 1 PKR = 0.66 yen; exchange rate as of February 25, 2021)
Water rates Domestic: Flat Rate (1/4" diameter)
No. Site area (in Marla) Price per connection 1. Up to 2.5 83 2. 2.5 to 3.5 124 3. 3.5 to 5 145 4. 5 to 10 242 5. 10 to 20 322 6. 20 to 40 644 7. 40~ 966
Marla: Land area unit used in Pakistan and India 1Marla = 25.2929 m2
Domestic: Metered rate Classification (Unit: British gallons per month) Rate per connection, per UK gallon
Up to 5,000 39 5,000 to 10,000 40
More than 10,000 48
Flat Rate for Industrial, Commercial and Other Nonresidential, etc. (1/4" diameter)
No Site area (Unit: Marla if not stated)
Revised in 2006 Revised 2016 Monthly fee Monthly fee
1. up to 3 322 483 2. 3 to 6 483 725 3. 6 to 10 805 1,208 4. 10 to 20 1,288 1,932 5. 1Kanal to 2 Kanal. 2,415 Three thousand six hundred
and twenty-three. 6. Over 2 Kanal Three thousand two
hundred and twenty. 4,830
Commercial, industrial, etc.: Metered rate
Revised in 2006 2016 Revision
Monthly fee Monthly fee Rate per 1,000 UK gallons per connection 53 80
Sewerage and drainage charges Domestic Sewer/Drainage Connection
No Site area (in Marla) Revised in 2006 monthly fee
1. 2.5 or less 55.00 2. 2.5 to 3.5 83.00 3. 3.5 to 5 97.00 4. 5 to 10 161.00 5. 10 to 20 242.00 6. 20 to 40 403.00 7. 40 and up 644.00
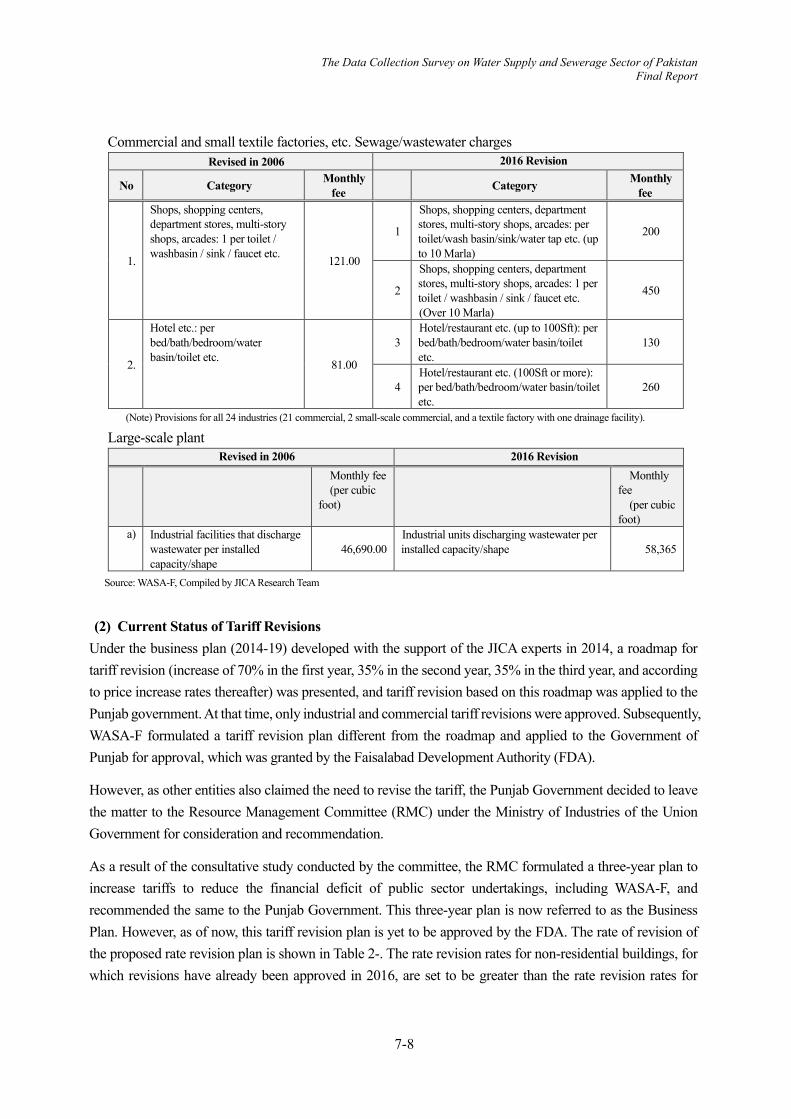
7-8
The Data Collection Survey on Water Supply and Sewerage Sector of Pakistan Final Report
Commercial and small textile factories, etc. Sewage/wastewater charges Revised in 2006 2016 Revision
No Category Monthly fee
Category Monthly fee
1.
Shops, shopping centers, department stores, multi-story shops, arcades: 1 per toilet / washbasin / sink / faucet etc.
121.00
1
Shops, shopping centers, department stores, multi-story shops, arcades: per toilet/wash basin/sink/water tap etc. (up to 10 Marla)
200
2
Shops, shopping centers, department stores, multi-story shops, arcades: 1 per toilet / washbasin / sink / faucet etc. (Over 10 Marla)
450
2.
Hotel etc.: per bed/bath/bedroom/water basin/toilet etc.
81.00
3 Hotel/restaurant etc. (up to 100Sft): per bed/bath/bedroom/water basin/toilet etc.
130
4 Hotel/restaurant etc. (100Sft or more): per bed/bath/bedroom/water basin/toilet etc.
260
(Note) Provisions for all 24 industries (21 commercial, 2 small-scale commercial, and a textile factory with one drainage facility).
Large-scale plant Revised in 2006 2016 Revision
Monthly fee (per cubic
foot)
Monthly fee
(per cubic foot)
a) Industrial facilities that discharge wastewater per installed capacity/shape
46,690.00 Industrial units discharging wastewater per installed capacity/shape
58,365
Source: WASA-F, Compiled by JICA Research Team
(2) Current Status of Tariff Revisions Under the business plan (2014-19) developed with the support of the JICA experts in 2014, a roadmap for tariff revision (increase of 70% in the first year, 35% in the second year, 35% in the third year, and according to price increase rates thereafter) was presented, and tariff revision based on this roadmap was applied to the Punjab government. At that time, only industrial and commercial tariff revisions were approved. Subsequently, WASA-F formulated a tariff revision plan different from the roadmap and applied to the Government of Punjab for approval, which was granted by the Faisalabad Development Authority (FDA).
However, as other entities also claimed the need to revise the tariff, the Punjab Government decided to leave the matter to the Resource Management Committee (RMC) under the Ministry of Industries of the Union Government for consideration and recommendation.
As a result of the consultative study conducted by the committee, the RMC formulated a three-year plan to increase tariffs to reduce the financial deficit of public sector undertakings, including WASA-F, and recommended the same to the Punjab Government. This three-year plan is now referred to as the Business Plan. However, as of now, this tariff revision plan is yet to be approved by the FDA. The rate of revision of the proposed rate revision plan is shown in Table 2-. The rate revision rates for non-residential buildings, for which revisions have already been approved in 2016, are set to be greater than the rate revision rates for
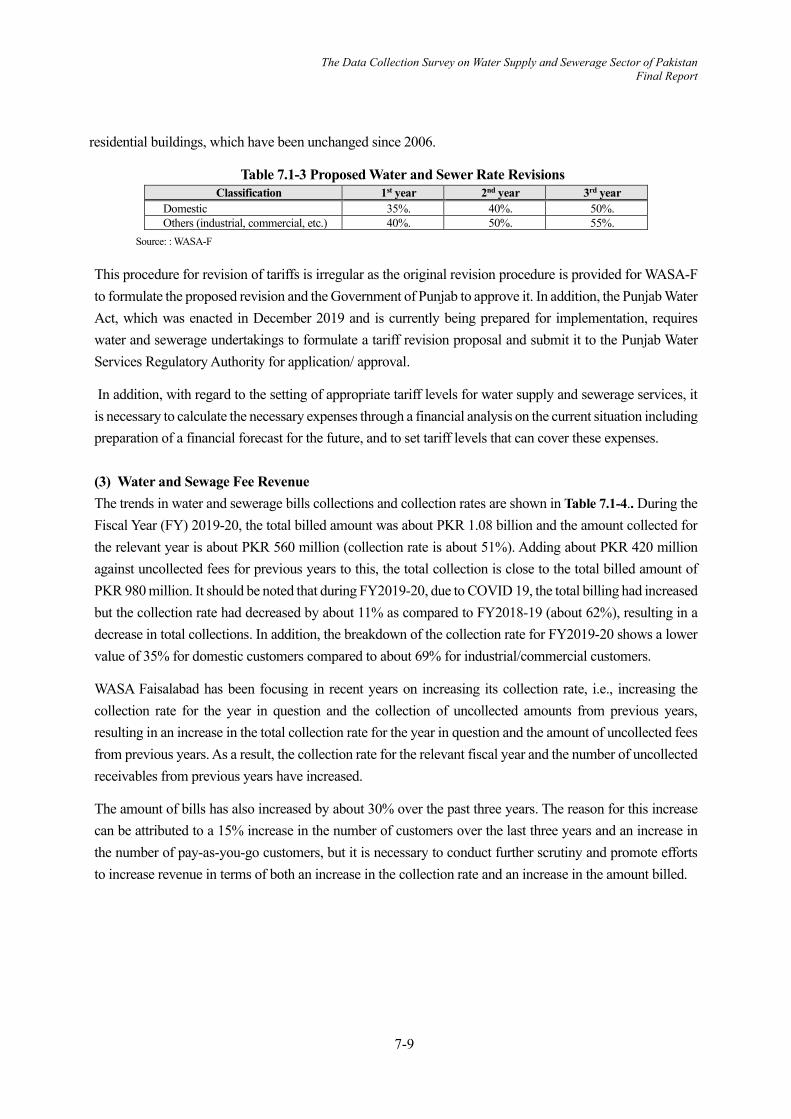
7-9
The Data Collection Survey on Water Supply and Sewerage Sector of Pakistan Final Report
residential buildings, which have been unchanged since 2006.
Table 7.1-3 Proposed Water and Sewer Rate Revisions Classification 1st year 2nd year 3rd year
Domestic 35%. 40%. 50%. Others (industrial, commercial, etc.) 40%. 50%. 55%.
Source: : WASA-F
This procedure for revision of tariffs is irregular as the original revision procedure is provided for WASA-F to formulate the proposed revision and the Government of Punjab to approve it. In addition, the Punjab Water Act, which was enacted in December 2019 and is currently being prepared for implementation, requires water and sewerage undertakings to formulate a tariff revision proposal and submit it to the Punjab Water Services Regulatory Authority for application/ approval.
In addition, with regard to the setting of appropriate tariff levels for water supply and sewerage services, it is necessary to calculate the necessary expenses through a financial analysis on the current situation including preparation of a financial forecast for the future, and to set tariff levels that can cover these expenses.
(3) Water and Sewage Fee Revenue The trends in water and sewerage bills collections and collection rates are shown in Table 7.1-4.. During the Fiscal Year (FY) 2019-20, the total billed amount was about PKR 1.08 billion and the amount collected for the relevant year is about PKR 560 million (collection rate is about 51%). Adding about PKR 420 million against uncollected fees for previous years to this, the total collection is close to the total billed amount of PKR 980 million. It should be noted that during FY2019-20, due to COVID 19, the total billing had increased but the collection rate had decreased by about 11% as compared to FY2018-19 (about 62%), resulting in a decrease in total collections. In addition, the breakdown of the collection rate for FY2019-20 shows a lower value of 35% for domestic customers compared to about 69% for industrial/commercial customers.
WASA Faisalabad has been focusing in recent years on increasing its collection rate, i.e., increasing the collection rate for the year in question and the collection of uncollected amounts from previous years, resulting in an increase in the total collection rate for the year in question and the amount of uncollected fees from previous years. As a result, the collection rate for the relevant fiscal year and the number of uncollected receivables from previous years have increased.
The amount of bills has also increased by about 30% over the past three years. The reason for this increase can be attributed to a 15% increase in the number of customers over the last three years and an increase in the number of pay-as-you-go customers, but it is necessary to conduct further scrutiny and promote efforts to increase revenue in terms of both an increase in the collection rate and an increase in the amount billed.
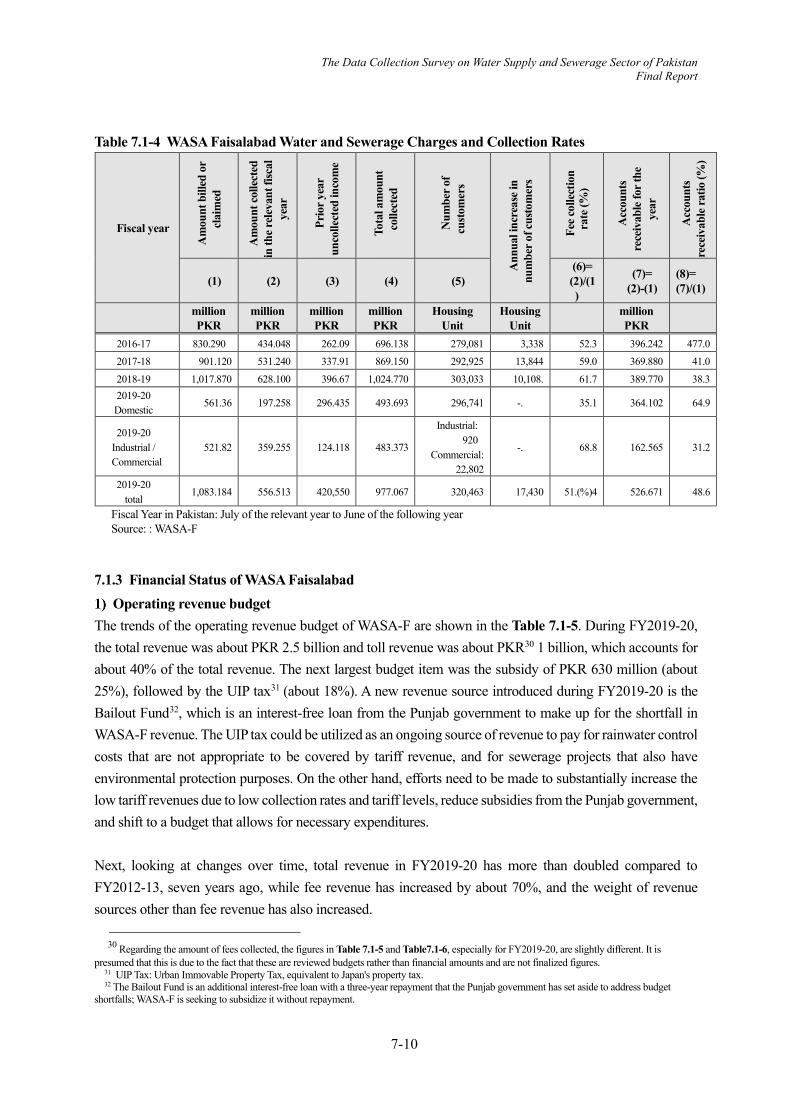
7-10
The Data Collection Survey on Water Supply and Sewerage Sector of Pakistan Final Report
Table 7.1-4 WASA Faisalabad Water and Sewerage Charges and Collection Rates
Fiscal year
Am
ount
bill
ed o
r cl
aim
ed
Am
ount
colle
cted
in
the r
elev
ant f
iscal
ye
ar
Prio
r yea
r un
colle
cted
inco
me
Tota
l am
ount
co
llect
ed
Num
ber o
f cu
stom
ers
Ann
ual i
ncre
ase i
n nu
mbe
r of c
usto
mer
s
Fee c
olle
ctio
n ra
te (%
)
Acc
ount
s re
ceiv
able
for t
he
year
Acc
ount
s re
ceiv
able
ratio
(%)
(1) (2) (3) (4) (5) (6)= (2)/(1)
(7)= (2)-(1)
(8)= (7)/(1)
million PKR
million PKR
million PKR
million PKR
Housing Unit
Housing Unit
million PKR
2016-17 830.290 434.048 262.09 696.138 279,081 3,338 52.3 396.242 477.0 2017-18 901.120 531.240 337.91 869.150 292,925 13,844 59.0 369.880 41.0
2018-19 1,017.870 628.100 396.67 1,024.770 303,033 10,108. 61.7 389.770 38.3 2019-20 Domestic
561.36 197.258 296.435 493.693 296,741 -. 35.1 364.102 64.9
2019-20 Industrial / Commercial
521.82 359.255 124.118 483.373
Industrial: 920
Commercial: 22,802
-. 68.8 162.565 31.2
2019-20 total
1,083.184 556.513 420,550 977.067 320,463 17,430 51.(%)4 526.671 48.6
Fiscal Year in Pakistan: July of the relevant year to June of the following year Source: : WASA-F
7.1.3 Financial Status of WASA Faisalabad Operating revenue budget
The trends of the operating revenue budget of WASA-F are shown in the Table 7.1-5. During FY2019-20, the total revenue was about PKR 2.5 billion and toll revenue was about PKR30 1 billion, which accounts for about 40% of the total revenue. The next largest budget item was the subsidy of PKR 630 million (about 25%), followed by the UIP tax31 (about 18%). A new revenue source introduced during FY2019-20 is the Bailout Fund32, which is an interest-free loan from the Punjab government to make up for the shortfall in WASA-F revenue. The UIP tax could be utilized as an ongoing source of revenue to pay for rainwater control costs that are not appropriate to be covered by tariff revenue, and for sewerage projects that also have environmental protection purposes. On the other hand, efforts need to be made to substantially increase the low tariff revenues due to low collection rates and tariff levels, reduce subsidies from the Punjab government, and shift to a budget that allows for necessary expenditures. Next, looking at changes over time, total revenue in FY2019-20 has more than doubled compared to FY2012-13, seven years ago, while fee revenue has increased by about 70%, and the weight of revenue sources other than fee revenue has also increased.
30 Regarding the amount of fees collected, the figures in Table 7.1-5 and Table7.1-6, especially for FY2019-20, are slightly different. It is
presumed that this is due to the fact that these are reviewed budgets rather than financial amounts and are not finalized figures. 31 UIP Tax: Urban Immovable Property Tax, equivalent to Japan's property tax. 32 The Bailout Fund is an additional interest-free loan with a three-year repayment that the Punjab government has set aside to address budget
shortfalls; WASA-F is seeking to subsidize it without repayment.

7-11
The Data Collection Survey on Water Supply and Sewerage Sector of Pakistan Final Report
For FY2019-20, other income (about PKR 64.0 million) consisted of about PKR 34.5 million in fees for reviewing water and sewerage facilities in residential developments and PKR 14.9 million in fees for use of OHR rooftops (mainly for installation of telecom and other facilities), both of which accounted for 77% of total other income. The other major components were PKR 5.5 million in tender registration fees and PKR 4.1 million in miscellaneous income from bottled water sales, fines and sale of small assets. Housing development review fees account for a large proportion of the total revenue, but in most cases, WASA-F does not provide water supply but secures groundwater as its own water source. It is necessary not only to get temporary income from the review fee but also to increase the supply capacity of the housing development in the area that WASA-F is supposed to develop under the M/P and to supply the water by WASA-F as much as possible to ensure stable management as a sustainable source of income.
Table 7.1-5 Revenue Trends in the Operating Budget (in PKR million)
Fiscal year RB 2012-13 RB 2016-17 RB 2017-18 RB 2018-
19 RB 2019-20 percentage
Initial balance (75.459) 3.700 (48.788) 0.000 0.000
Water and sewage fee income
608.550 695.195 873.408 1,024.077 1,031.142 40.8
UIP tax allocation 223.976 354.286 469.134 427.385 449.929 17.8
Grants 33and PCGIP 34 0.000 711.379 1,022.129 921.880 631.180 25.0
Bailout Funds 0.000 0.000 0.000 0.000 350.000 13.9
Other income 395.309 88.130 103.573 119.025 64.018 2.5
Total 1,152.376 1,852.690 2,419.456 2,492.367 2,526.269 100
RB: Revised Budget (Implementation Based Review) Grants: State Government grants to cover budget shortfalls and monsoon inundation costs; PCGIP:
World Bank's Punjab City Governance Improvement Project grant for five cities. WASA-F was a target city until FY2018-19 but not thereafter.
Source: : WASA-F
Expenditure in the operating budget
Table 7.1-6 shows the trends in the WASA-F's operating budget expenditure; it is noteworthy that the total expenditure income for FY2019-20 is about PKR 3.2 billion, which is about PKR 0.7 billion more than the total income. In terms of expenditure, personnel expenses were the highest at around PKR 1.4 billion, accounting for 42% of the total expenditure. The second largest expenditure was electricity at about PKR 1 billion, accounting for about 32%. The maintenance and management expenditure are low at about 3.9%, suggesting that the budget for maintenance and management cannot be secured due to the mandatory personnel and power costs.
Looking at the trends of expenditure budget over time, total expenditure in during FY2019-20 is 2.4 times higher than the one in during FY2012-13. In the same year comparison, labor and power costs were 2.4 times
33 Grants from State Government to meet budgetary shortfalls and monsoon season inundation costs 34 PCGIP: Grant assistance by the World Bank under the Punjab City Governance Improvement Project for five cities; WASA-F eligible until
FY2018-19, not eligible thereafter.
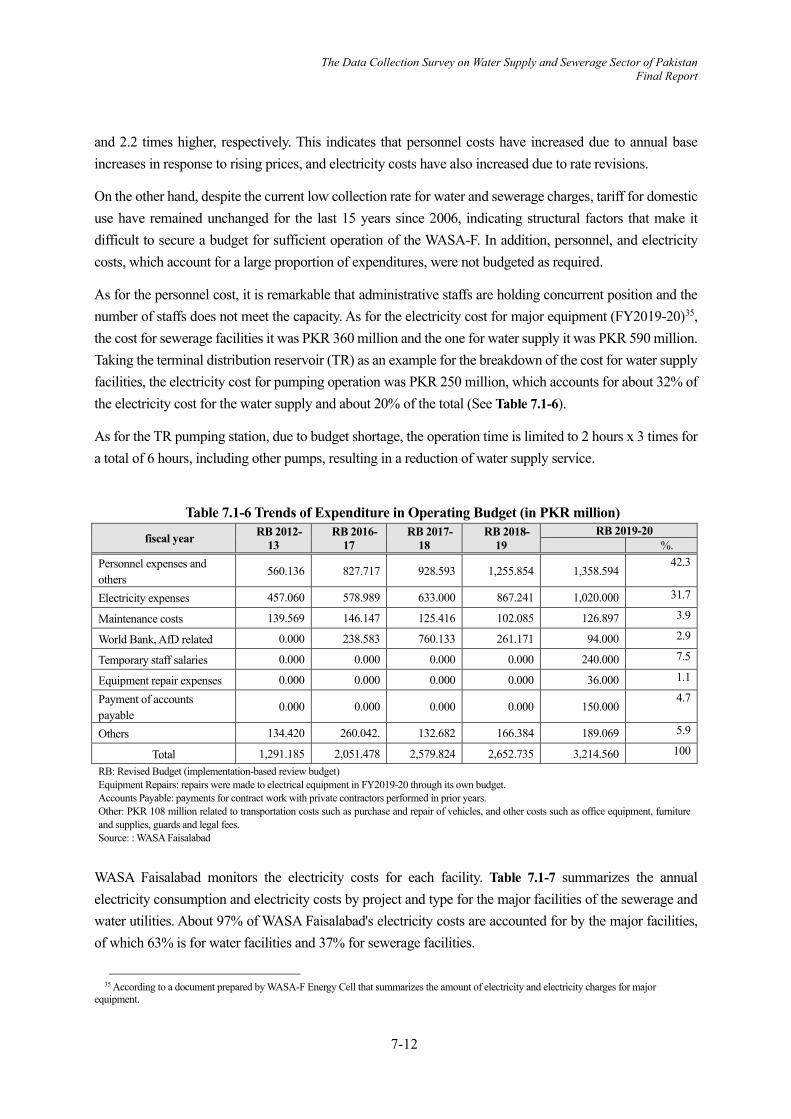
7-12
The Data Collection Survey on Water Supply and Sewerage Sector of Pakistan Final Report
and 2.2 times higher, respectively. This indicates that personnel costs have increased due to annual base increases in response to rising prices, and electricity costs have also increased due to rate revisions.
On the other hand, despite the current low collection rate for water and sewerage charges, tariff for domestic use have remained unchanged for the last 15 years since 2006, indicating structural factors that make it difficult to secure a budget for sufficient operation of the WASA-F. In addition, personnel, and electricity costs, which account for a large proportion of expenditures, were not budgeted as required.
As for the personnel cost, it is remarkable that administrative staffs are holding concurrent position and the number of staffs does not meet the capacity. As for the electricity cost for major equipment (FY2019-20)35, the cost for sewerage facilities it was PKR 360 million and the one for water supply it was PKR 590 million. Taking the terminal distribution reservoir (TR) as an example for the breakdown of the cost for water supply facilities, the electricity cost for pumping operation was PKR 250 million, which accounts for about 32% of the electricity cost for the water supply and about 20% of the total (See Table 7.1-6).
As for the TR pumping station, due to budget shortage, the operation time is limited to 2 hours x 3 times for a total of 6 hours, including other pumps, resulting in a reduction of water supply service.
Table 7.1-6 Trends of Expenditure in Operating Budget (in PKR million)
fiscal year RB 2012-13
RB 2016-17
RB 2017-18
RB 2018-19
RB 2019-20 %.
Personnel expenses and others
560.136 827.717 928.593 1,255.854 1,358.594 42.3
Electricity expenses 457.060 578.989 633.000 867.241 1,020.000 31.7
Maintenance costs 139.569 146.147 125.416 102.085 126.897 3.9
World Bank, AfD related 0.000 238.583 760.133 261.171 94.000 2.9
Temporary staff salaries 0.000 0.000 0.000 0.000 240.000 7.5
Equipment repair expenses 0.000 0.000 0.000 0.000 36.000 1.1
Payment of accounts payable
0.000 0.000 0.000 0.000 150.000 4.7
Others 134.420 260.042. 132.682 166.384 189.069 5.9
Total 1,291.185 2,051.478 2,579.824 2,652.735 3,214.560 100
RB: Revised Budget (implementation-based review budget) Equipment Repairs: repairs were made to electrical equipment in FY2019-20 through its own budget. Accounts Payable: payments for contract work with private contractors performed in prior years. Other: PKR 108 million related to transportation costs such as purchase and repair of vehicles, and other costs such as office equipment, furniture and supplies, guards and legal fees. Source: : WASA Faisalabad
WASA Faisalabad monitors the electricity costs for each facility. Table 7.1-7 summarizes the annual electricity consumption and electricity costs by project and type for the major facilities of the sewerage and water utilities. About 97% of WASA Faisalabad's electricity costs are accounted for by the major facilities, of which 63% is for water facilities and 37% for sewerage facilities.
35 According to a document prepared by WASA-F Energy Cell that summarizes the amount of electricity and electricity charges for major
equipment.

7-13
The Data Collection Survey on Water Supply and Sewerage Sector of Pakistan Final Report
Table 7.1-7 Annual Electricity Consumption and Electricity Rates for Major Facilities
Facility / Type Number of locations
Consumption (Million Kwh)
Charges (Million PKR)
Percentage
Sewerage
Eastern District Pumping Station 38 locations 6.1 157 15.8
Western District Pumping Station 63 locations 8.1 206 20.8
Total 14.2 363 36.6
Water supply
Well pump eighty-seven (used in legal documents) 9.8 250 25.2
Pressure pump station 2 locations, 6 units 5.0 128 12.9 Terminal water distribution pond pumping station 1 location, 8 units 7.9 200 20.2
Other pumping stations 3 locations, 11 cars 2.0 five 5.1 Total 24.7 629 63.4
Total amount 38.9 992 100.0 The JICA survey team organized the data for each facility prepared by WASA-F Energy Cell (DD in charge of electricity placed to check the energy consumption). The values shown as monthly averages were converted to annual values. Source: WASA Faisalabad
7.2 CAPACITY OF WASA FAISALABAD STAFF IN FINANCIAL MANAGEMENT
7.2.1 Objectives of Capability Assessment in Financial Management The Master Plan identifies the following financial and accounting issues for WASA Faisalabad
WASA Faisalabad does not use accrual accounting but uses modified cash basis accounting as the accounting method prescribed by the Government of Punjab.
The financial statements comprise only the income statement; no balance sheet or cash flow statement is being prepared.
The accounts of WASA Faisalabad are included in the general accounts of the Government of Punjab and there are some unknowns when it is treated as a standalone water and sewerage project.
Internal and external audits are inadequate as financial procedures for public utilities and governance awareness is immature.
The purpose of this survey is to collect relevant information and analyze the financial status of WASA Faisalabad, and to understand the knowledge level of WASA Faisalabad staff on financial matters through conducting financial seminars. Considering the fact that the master plan recommends that water supply and sewerage systems are to be accounted for separately and that they are to be independently financed, the survey was conducted based on the proposal made by the consultant team regarding the method to confirm the level of knowledge.
7.2.2 Methodology for the Financial Capability Assessment (1) Questionnaire survey The descriptive questionnaires were prepared. The questions in the questionnaire were further subdivided from ones indicated under the JICA’s Capacity Assessment Handbook, and also addressed on the contents and significance of the works in depth, for example, addressing about the meaning of separation of water and sewage accounting. The survey was conducted through the following process:

7-14
The Data Collection Survey on Water Supply and Sewerage Sector of Pakistan Final Report
Ask the financial officer to fill out the questionnaire. Based on the pre-written questionnaire, interviews and discussions with finance staff were conducted.
The following are examples of questions being asked.
Do you prepare an annual financial report? If not, what are your plans for the future? Are you computerizing your accounting operations? Are you separating the water and sewage accounting? If not, what are your plans for the future? Is
there any impact from computerization? What do you think the separation of water and sewerage accounting is for? To what extent is the computerization of accounting being carried out? For example, how do you
obtain information on expenditures in each division and office? What role does financial improvement play in building an independent business entity
(2) Two-step interview survey The survey was conducted using the following two-step method in order to confirm the intention and method of the survey, to understand the financial management situation of WASA Faisalabad, and to recognize the further direction for improved financial management as well as to build consensus on the purpose of the seminar scheduled for March 2020.
Step 1: Briefing (purpose of the survey, explanation of the questionnaire, WASA's financial situation) Step 2: Confirmation of the questionnaire
(3) Person subject to investigation Five (5) interviewee subjects to the survey were nominated: the person in charge of management and finance (Director) and the person in charge of operations (Deputy Director of Finance Department). Director Revenue Domestic was responsible for IT system establishment (as previous position).
In order to obtain a collective view as an organization, an organizational assessment (supervised by the Deputy Director of the Finance Department) was conducted by five staff members as follows:
Table 7.2-1 List of Financial Capability Survey Interviewees Designation Interviewee Post
Deputy Director Finance Abdul Raout Butt General Manager, Deputy General Manager, Finance Department (responsible)
Deputy Managing Director (Eng.) Adnan Risar Khan Deputy chief engineer Director Administration Shoaib Rasheed General Manager, General Affairs and Planning Director Revenue Industry & Commerce
Shahryaar Revenue collection (residential/general public)
Director Revenue Domestic Johnson Haroon Gill Revenue collection (commercial and industrial) Source: JST
7.2.3 Financial Capability Assessment The results of the survey on financial capability assessment are described below. (1) Results of questionnaire-based survey The results of the interviews with senior officials in charge of financial management (deputy managers, general managers, and deputy department heads) are shown below.
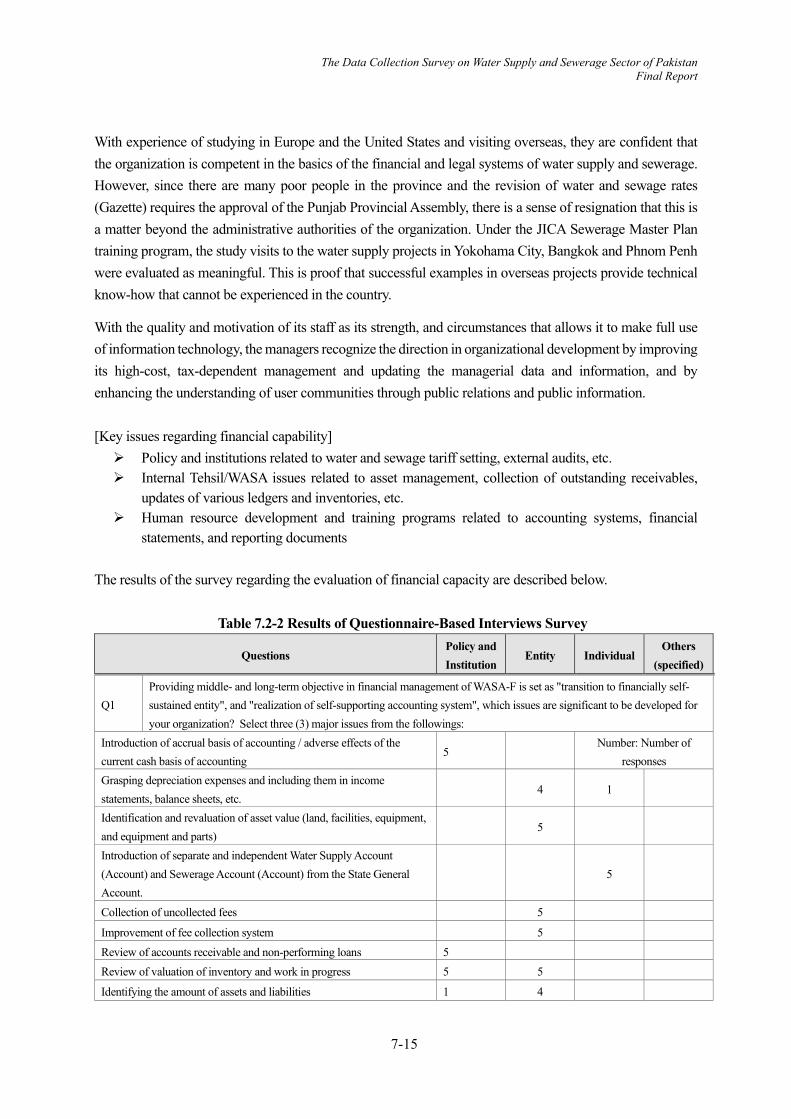
7-15
The Data Collection Survey on Water Supply and Sewerage Sector of Pakistan Final Report
With experience of studying in Europe and the United States and visiting overseas, they are confident that the organization is competent in the basics of the financial and legal systems of water supply and sewerage. However, since there are many poor people in the province and the revision of water and sewage rates (Gazette) requires the approval of the Punjab Provincial Assembly, there is a sense of resignation that this is a matter beyond the administrative authorities of the organization. Under the JICA Sewerage Master Plan training program, the study visits to the water supply projects in Yokohama City, Bangkok and Phnom Penh were evaluated as meaningful. This is proof that successful examples in overseas projects provide technical know-how that cannot be experienced in the country.
With the quality and motivation of its staff as its strength, and circumstances that allows it to make full use of information technology, the managers recognize the direction in organizational development by improving its high-cost, tax-dependent management and updating the managerial data and information, and by enhancing the understanding of user communities through public relations and public information. [Key issues regarding financial capability] Policy and institutions related to water and sewage tariff setting, external audits, etc. Internal Tehsil/WASA issues related to asset management, collection of outstanding receivables,
updates of various ledgers and inventories, etc. Human resource development and training programs related to accounting systems, financial
statements, and reporting documents
The results of the survey regarding the evaluation of financial capacity are described below.
Table 7.2-2 Results of Questionnaire-Based Interviews Survey
Questions Policy and Institution
Entity Individual Others
(specified)
Q1 Providing middle- and long-term objective in financial management of WASA-F is set as "transition to financially self-sustained entity", and "realization of self-supporting accounting system", which issues are significant to be developed for your organization? Select three (3) major issues from the followings:
Introduction of accrual basis of accounting / adverse effects of the current cash basis of accounting
5 Number: Number of responses
Grasping depreciation expenses and including them in income statements, balance sheets, etc.
4 1
Identification and revaluation of asset value (land, facilities, equipment, and equipment and parts)
5
Introduction of separate and independent Water Supply Account (Account) and Sewerage Account (Account) from the State General Account.
5
Collection of uncollected fees 5
Improvement of fee collection system 5
Review of accounts receivable and non-performing loans 5
Review of valuation of inventory and work in progress 5 5
Identifying the amount of assets and liabilities 1 4
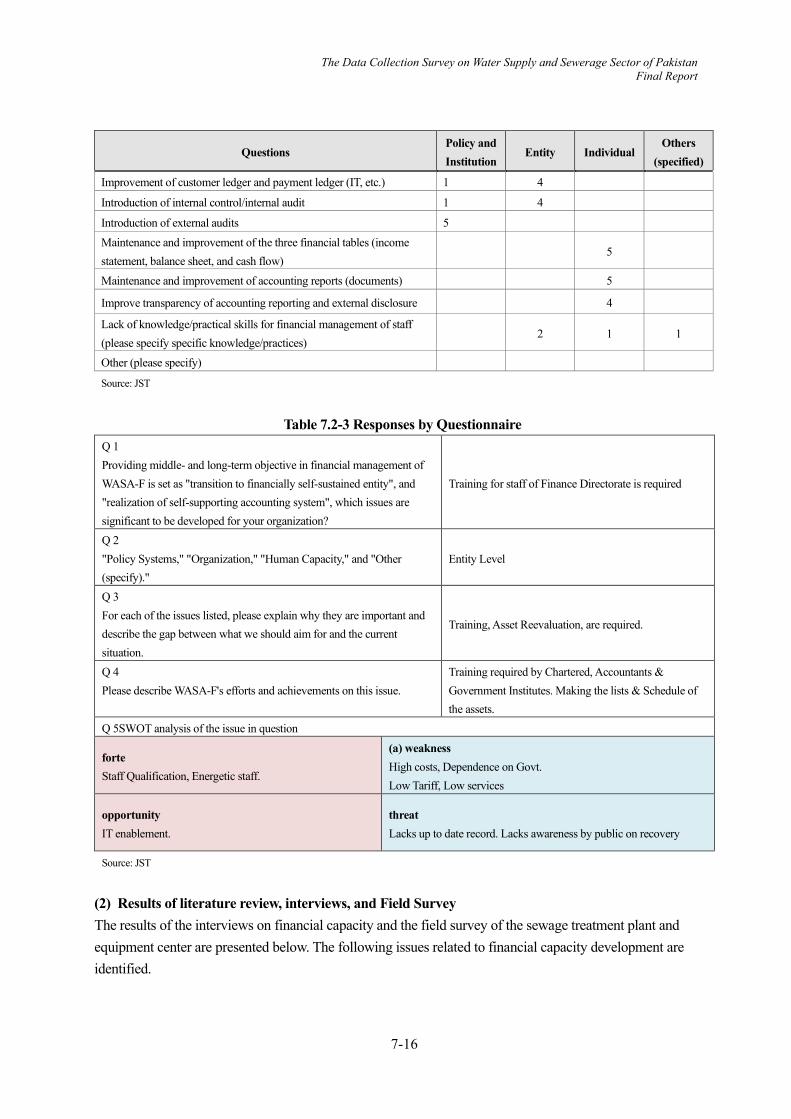
7-16
The Data Collection Survey on Water Supply and Sewerage Sector of Pakistan Final Report
Questions Policy and Institution
Entity Individual Others
(specified)
Improvement of customer ledger and payment ledger (IT, etc.) 1 4
Introduction of internal control/internal audit 1 4
Introduction of external audits 5
Maintenance and improvement of the three financial tables (income statement, balance sheet, and cash flow)
5
Maintenance and improvement of accounting reports (documents) 5
Improve transparency of accounting reporting and external disclosure 4
Lack of knowledge/practical skills for financial management of staff (please specify specific knowledge/practices)
2 1 1
Other (please specify)
Source: JST
Table 7.2-3 Responses by Questionnaire
Q 1 Providing middle- and long-term objective in financial management of WASA-F is set as "transition to financially self-sustained entity", and "realization of self-supporting accounting system", which issues are significant to be developed for your organization?
Training for staff of Finance Directorate is required
Q 2 "Policy Systems," "Organization," "Human Capacity," and "Other (specify)."
Entity Level
Q 3 For each of the issues listed, please explain why they are important and describe the gap between what we should aim for and the current situation.
Training, Asset Reevaluation, are required.
Q 4 Please describe WASA-F's efforts and achievements on this issue.
Training required by Chartered, Accountants & Government Institutes. Making the lists & Schedule of the assets.
Q 5SWOT analysis of the issue in question
forte Staff Qualification, Energetic staff.
(a) weakness High costs, Dependence on Govt. Low Tariff, Low services
opportunity IT enablement.
threat Lacks up to date record. Lacks awareness by public on recovery
Source: JST
(2) Results of literature review, interviews, and Field Survey The results of the interviews on financial capacity and the field survey of the sewage treatment plant and equipment center are presented below. The following issues related to financial capacity development are identified.

7-17
The Data Collection Survey on Water Supply and Sewerage Sector of Pakistan Final Report
Table 7.2-4 Results of the Literature Review, Interview, and Field Survey Literature Review Field Survey
Do you prepare an annual financial report? If not, what are your plans for the future?
Budget Estimates & Revised reports are prepared, and liquidation reports are conducted.
Budget Estimates & Revised report (3 years) was obtained.
Do you computerize your accounting operations?
Budget Estimates & Revised reports allow you to itemize, budget, close, and analyze over time.
The need for human resource development was emphasized in the hearings.
Have you separated the water and sewer utility accounts? If not, what are your plans for the future? Will there be any impact from computerization?
Expenses are segregated for each department and responsible operations. Common expenses (personnel and agency costs) are not segregated. Dedicated water and sewer service operations can be separated.
The case of Manila Waterworks (Maynilad) regarding the tariff system and the mechanism of tariff revision is presented, which suggest the important issues for establishment of independent management in consideration of the poor, and it is presented the main points is the separation of water supply and sewerage project accounting.
What do you believe the separation of the water and sewer accounts is for?
Metering system is not in place, and there are insufficient efforts to ensure burden equity, water conservation and O&M cost reduction.
Key points were presented on fairness in sharing the financial burden, water conservation, reduction of investment in water source development and tariff system.
To what extent is the accounting computerized? For example, how do you obtain information on expenditures in each division or office?
Confirmed the activities and motivation of the Citizen Liaison Cell (CLC).
Check the CLC office server and monitor for customer information and fee collection operations; registration and payment are available from the web page.
What role does financial improvement play in building an independent entity?
Budget Estimates & Revised report and water and sewer rates (Gazette) were analyzed to identify issues for independent entity solutions.
The state legislature's approval of rate changes and electricity prices are barriers, forcing the company to rely on subsidies to manage its finances.
The training at Phnom Penh Waterworks has helped us understand the need for a self-sustaining entity.
There is a need for a forum to discuss foreign experiences and examples of initiatives.
Maintenance and management practices, quality of water and sewage services, resident explanation (public relations and public information)
Analyze WASA newsletter for CLC activities.
Hearing from Japanese experts on issues related to sewage treatment and factory wastewater countermeasures
Understand the case of the advanced city in Japan (Yokohama City). Pilot project of water meter is under trial.
Maintenance and repair of pipe-cleaning equipment, water quality control of sewage treatment, and industrial effluent control, the field survey confirmed the lack of funding and engineers for water and sewage services.
Source: JST

7-18
The Data Collection Survey on Water Supply and Sewerage Sector of Pakistan Final Report
7.3 CONDUCTING FINANCIAL SEMINARS
A seminar on the basic financial management of water utilities was held for WASA-F management executives as follows.
Seminar Title: Seminar for the Management Improvement of WASA Faisalabad Date & Time: September 25, 2021, 10:00-13:00 (Pakistan time), 14:00-16:00 (Japan time) Venue: Online Meeting (WASA-F conference room in Faisalabad)
Participants
Pakistani side (WASA-F): Managing Director, Deputy Managing Director, Director Water Distribution Management/Project Manager, Director Administration, Director Finance, Director Planning & Design, Director Water Resource, Deputy Director (I&C, Finance, CRC, WDM, Revenue, GIS, IT) Japanese side (JICA Study Team): Team Leader / Sewerage Plan I, Deputy Team Leader / Sewerage Plan II, Finance Evaluation, Operation
Contents
1) Opening remarks (WASA-F President) 2) Overview of public enterprise finance and accounting (Finance Evaluation)
• Issues for Improvement in WASA-F Finances • Overview of public enterprise finance and accounting (its advantages and principles) • Financial Statements Required for the Introduction of Public Sector Finance and Accounting
3) Water and Sewerage Business Financial Improvements and Performance Indicators (Operations) • Issues and Management Strategies for the Japan's Public Corporations (Water Utilities) • Establish and monitor key performance indicators (KPIs) • Action plan development and performance management • Considerations in Practice
4) "Faisalabad Water Utility Management Improvement Project" (Operations Manager) 5) Questions and answers 6) Closing remarks (Chief Operating Officer)
7.4 OTHER DONORS IN FAISALABAD
Table 7.4-1 shows the results of assistance provided by other donors in Faisalabad. In addition to Japan, World Bank and AfD/French government have continued to provide financial aid to render technical assistance, operational improvement and construction of water treatment plants. AfD has also continued to provide assistance for construction of water treatment plants and DANIDA has started construction of sewage treatment plants. The technical assistance planned by AfD for Lahore and Faisalabad is described in detail in under the next section.
Table 7.4-1 Actual and Planned Assistance to WASA Faisalabad
Year of implementation Institution Project title Amount Assistance
Modality outline
2010 ~ 2016
French government
Extension of Water Resource of Faisalabad City
51 billion PKR Loan
Construction of water purification plant, well pump and provision of water meters for improvement of water supply services in Faisalabad.
2012 ~ 2019 World Bank Punjab Cities Governance
Improvement Project 1.9 billion PKR Loan
Support for building administrative capacity in the five major cities of Panjab. In urban water supply sector, repair and maintenance of equipment for operation and maintenance and support for GIS-based pipe network drawing.
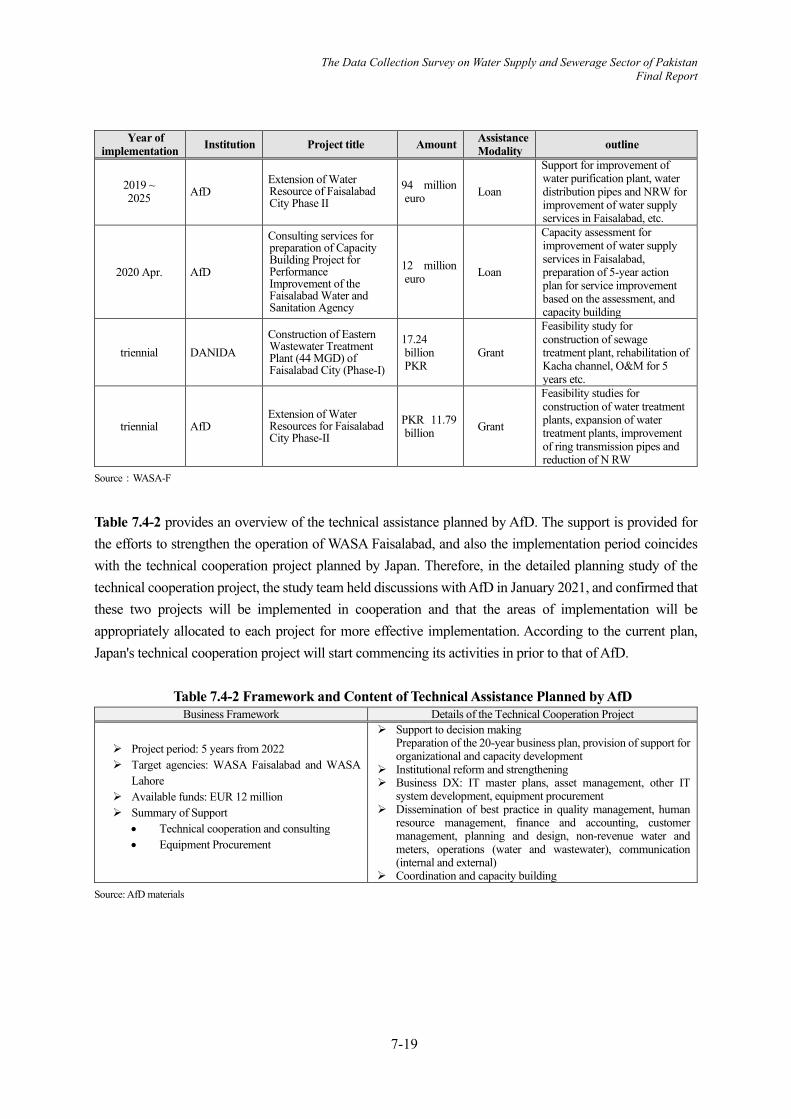
7-19
The Data Collection Survey on Water Supply and Sewerage Sector of Pakistan Final Report
Year of implementation Institution Project title Amount Assistance
Modality outline
2019 ~ 2025 AfD
Extension of Water Resource of Faisalabad City Phase II
94 million euro Loan
Support for improvement of water purification plant, water distribution pipes and NRW for improvement of water supply services in Faisalabad, etc.
2020 Apr. AfD
Consulting services for preparation of Capacity Building Project for Performance Improvement of the Faisalabad Water and Sanitation Agency
12 million euro Loan
Capacity assessment for improvement of water supply services in Faisalabad, preparation of 5-year action plan for service improvement based on the assessment, and capacity building
triennial DANIDA Construction of Eastern Wastewater Treatment Plant (44 MGD) of Faisalabad City (Phase-I)
17.24 billion PKR
Grant
Feasibility study for construction of sewage treatment plant, rehabilitation of Kacha channel, O&M for 5 years etc.
triennial AfD Extension of Water Resources for Faisalabad City Phase-II
PKR 11.79 billion Grant
Feasibility studies for construction of water treatment plants, expansion of water treatment plants, improvement of ring transmission pipes and reduction of N RW
Source:WASA-F
Table 7.4-2 provides an overview of the technical assistance planned by AfD. The support is provided for the efforts to strengthen the operation of WASA Faisalabad, and also the implementation period coincides with the technical cooperation project planned by Japan. Therefore, in the detailed planning study of the technical cooperation project, the study team held discussions with AfD in January 2021, and confirmed that these two projects will be implemented in cooperation and that the areas of implementation will be appropriately allocated to each project for more effective implementation. According to the current plan, Japan's technical cooperation project will start commencing its activities in prior to that of AfD.
Table 7.4-2 Framework and Content of Technical Assistance Planned by AfD
Business Framework Details of the Technical Cooperation Project
Project period: 5 years from 2022 Target agencies: WASA Faisalabad and WASA
Lahore Available funds: EUR 12 million Summary of Support
• Technical cooperation and consulting • Equipment Procurement
Support to decision making Preparation of the 20-year business plan, provision of support for organizational and capacity development
Institutional reform and strengthening Business DX: IT master plans, asset management, other IT
system development, equipment procurement Dissemination of best practice in quality management, human
resource management, finance and accounting, customer management, planning and design, non-revenue water and meters, operations (water and wastewater), communication (internal and external)
Coordination and capacity building Source: AfD materials

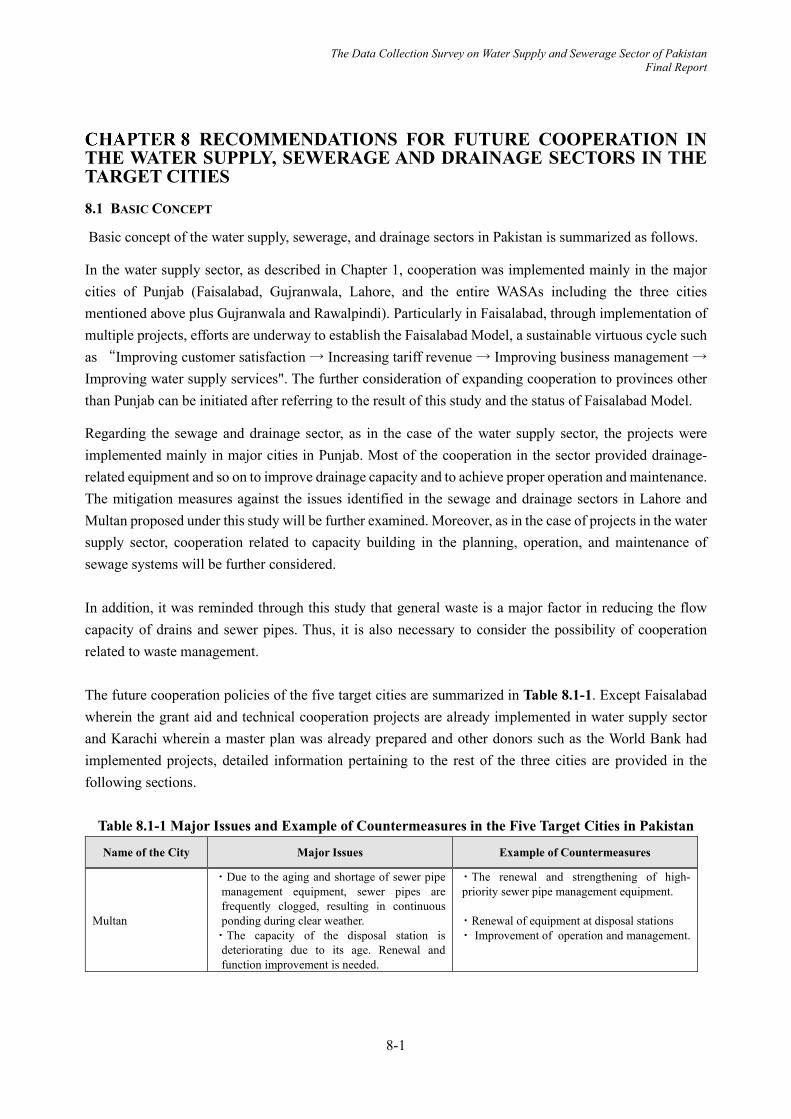
The Data Collection Survey on Water Supply and Sewerage Sector of Pakistan Final Report
8-1
RECOMMENDATIONS FOR FUTURE COOPERATION IN THE WATER SUPPLY, SEWERAGE AND DRAINAGE SECTORS IN THE TARGET CITIES 8.1 BASIC CONCEPT
Basic concept of the water supply, sewerage, and drainage sectors in Pakistan is summarized as follows.
In the water supply sector, as described in Chapter 1, cooperation was implemented mainly in the major cities of Punjab (Faisalabad, Gujranwala, Lahore, and the entire WASAs including the three cities mentioned above plus Gujranwala and Rawalpindi). Particularly in Faisalabad, through implementation of multiple projects, efforts are underway to establish the Faisalabad Model, a sustainable virtuous cycle such as “Improving customer satisfaction → Increasing tariff revenue → Improving business management → Improving water supply services". The further consideration of expanding cooperation to provinces other than Punjab can be initiated after referring to the result of this study and the status of Faisalabad Model.
Regarding the sewage and drainage sector, as in the case of the water supply sector, the projects were implemented mainly in major cities in Punjab. Most of the cooperation in the sector provided drainage-related equipment and so on to improve drainage capacity and to achieve proper operation and maintenance. The mitigation measures against the issues identified in the sewage and drainage sectors in Lahore and Multan proposed under this study will be further examined. Moreover, as in the case of projects in the water supply sector, cooperation related to capacity building in the planning, operation, and maintenance of sewage systems will be further considered. In addition, it was reminded through this study that general waste is a major factor in reducing the flow capacity of drains and sewer pipes. Thus, it is also necessary to consider the possibility of cooperation related to waste management. The future cooperation policies of the five target cities are summarized in Table 8.1-1. Except Faisalabad wherein the grant aid and technical cooperation projects are already implemented in water supply sector and Karachi wherein a master plan was already prepared and other donors such as the World Bank had implemented projects, detailed information pertaining to the rest of the three cities are provided in the following sections.
Table 8.1-1 Major Issues and Example of Countermeasures in the Five Target Cities in Pakistan
Name of the City Major Issues Example of Countermeasures
Multan
・Due to the aging and shortage of sewer pipe management equipment, sewer pipes are frequently clogged, resulting in continuous ponding during clear weather.
・The capacity of the disposal station is deteriorating due to its age. Renewal and function improvement is needed.
・The renewal and strengthening of high-priority sewer pipe management equipment. ・Renewal of equipment at disposal stations ・ Improvement of operation and management.
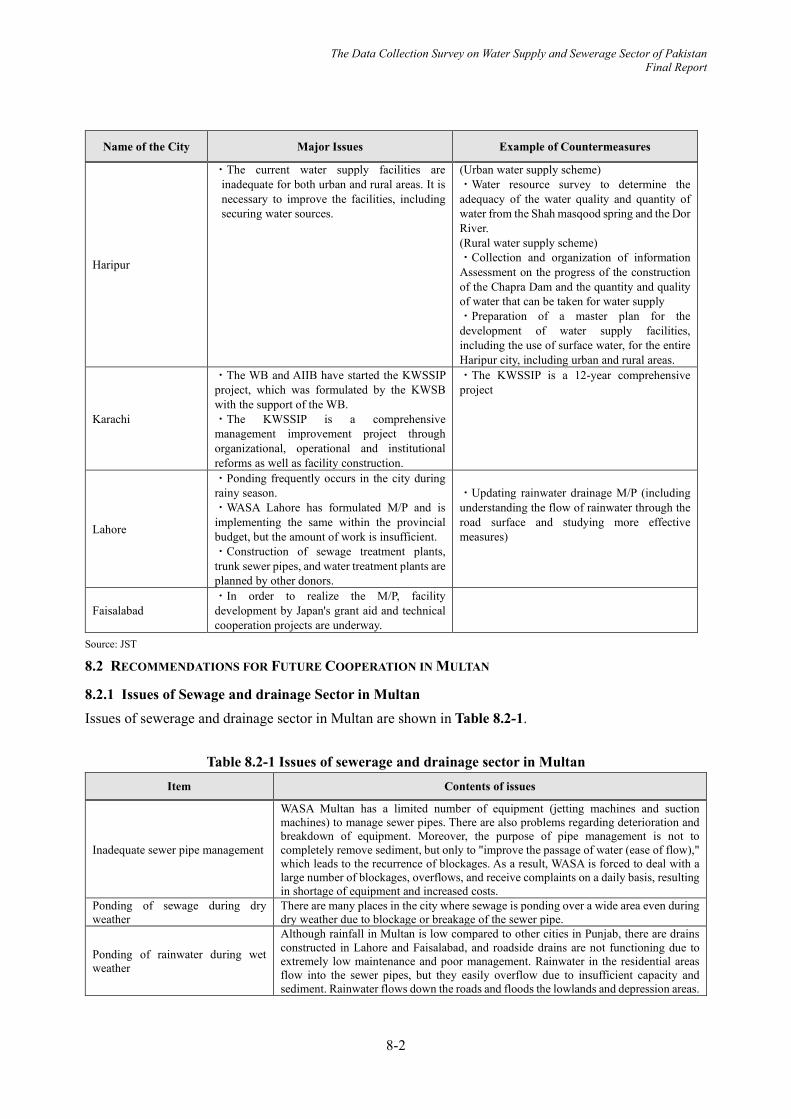
The Data Collection Survey on Water Supply and Sewerage Sector of Pakistan Final Report
8-2
Name of the City Major Issues Example of Countermeasures
Haripur
・The current water supply facilities are inadequate for both urban and rural areas. It is necessary to improve the facilities, including securing water sources.
(Urban water supply scheme) ・Water resource survey to determine the adequacy of the water quality and quantity of water from the Shah masqood spring and the Dor River. (Rural water supply scheme) ・Collection and organization of information Assessment on the progress of the construction of the Chapra Dam and the quantity and quality of water that can be taken for water supply ・Preparation of a master plan for the development of water supply facilities, including the use of surface water, for the entire Haripur city, including urban and rural areas.
Karachi
・The WB and AIIB have started the KWSSIP project, which was formulated by the KWSB with the support of the WB. ・The KWSSIP is a comprehensive management improvement project through organizational, operational and institutional reforms as well as facility construction.
・The KWSSIP is a 12-year comprehensive project
Lahore
・Ponding frequently occurs in the city during rainy season. ・WASA Lahore has formulated M/P and is implementing the same within the provincial budget, but the amount of work is insufficient. ・Construction of sewage treatment plants, trunk sewer pipes, and water treatment plants are planned by other donors.
・Updating rainwater drainage M/P (including understanding the flow of rainwater through the road surface and studying more effective measures)
Faisalabad ・In order to realize the M/P, facility development by Japan's grant aid and technical cooperation projects are underway.
Source: JST
8.2 RECOMMENDATIONS FOR FUTURE COOPERATION IN MULTAN
8.2.1 Issues of Sewage and drainage Sector in Multan Issues of sewerage and drainage sector in Multan are shown in Table 8.2-1.
Table 8.2-1 Issues of sewerage and drainage sector in Multan Item Contents of issues
Inadequate sewer pipe management
WASA Multan has a limited number of equipment (jetting machines and suction machines) to manage sewer pipes. There are also problems regarding deterioration and breakdown of equipment. Moreover, the purpose of pipe management is not to completely remove sediment, but only to "improve the passage of water (ease of flow)," which leads to the recurrence of blockages. As a result, WASA is forced to deal with a large number of blockages, overflows, and receive complaints on a daily basis, resulting in shortage of equipment and increased costs.
Ponding of sewage during dry weather
There are many places in the city where sewage is ponding over a wide area even during dry weather due to blockage or breakage of the sewer pipe.
Ponding of rainwater during wet weather
Although rainfall in Multan is low compared to other cities in Punjab, there are drains constructed in Lahore and Faisalabad, and roadside drains are not functioning due to extremely low maintenance and poor management. Rainwater in the residential areas flow into the sewer pipes, but they easily overflow due to insufficient capacity and sediment. Rainwater flows down the roads and floods the lowlands and depression areas.
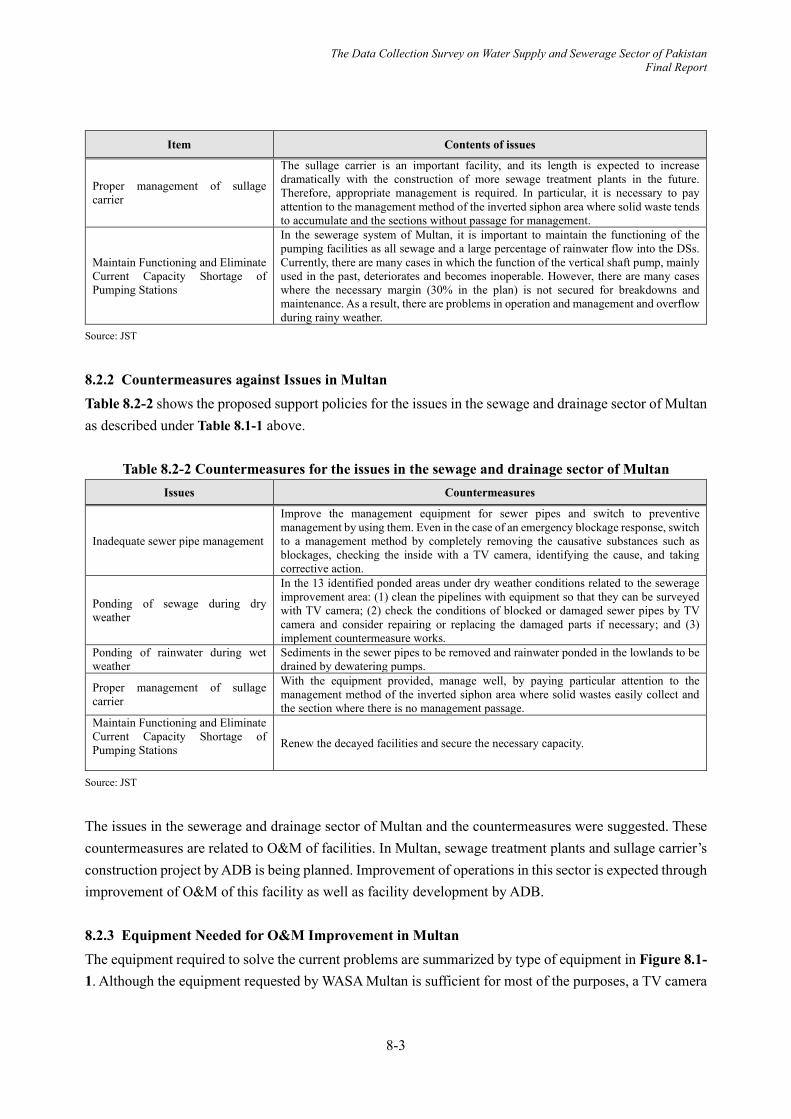
The Data Collection Survey on Water Supply and Sewerage Sector of Pakistan Final Report
8-3
Item Contents of issues
Proper management of sullage carrier
The sullage carrier is an important facility, and its length is expected to increase dramatically with the construction of more sewage treatment plants in the future. Therefore, appropriate management is required. In particular, it is necessary to pay attention to the management method of the inverted siphon area where solid waste tends to accumulate and the sections without passage for management.
Maintain Functioning and Eliminate Current Capacity Shortage of Pumping Stations
In the sewerage system of Multan, it is important to maintain the functioning of the pumping facilities as all sewage and a large percentage of rainwater flow into the DSs. Currently, there are many cases in which the function of the vertical shaft pump, mainly used in the past, deteriorates and becomes inoperable. However, there are many cases where the necessary margin (30% in the plan) is not secured for breakdowns and maintenance. As a result, there are problems in operation and management and overflow during rainy weather.
Source: JST
8.2.2 Countermeasures against Issues in Multan Table 8.2-2 shows the proposed support policies for the issues in the sewage and drainage sector of Multan as described under Table 8.1-1 above.
Table 8.2-2 Countermeasures for the issues in the sewage and drainage sector of Multan Issues Countermeasures
Inadequate sewer pipe management
Improve the management equipment for sewer pipes and switch to preventive management by using them. Even in the case of an emergency blockage response, switch to a management method by completely removing the causative substances such as blockages, checking the inside with a TV camera, identifying the cause, and taking corrective action.
Ponding of sewage during dry weather
In the 13 identified ponded areas under dry weather conditions related to the sewerage improvement area: (1) clean the pipelines with equipment so that they can be surveyed with TV camera; (2) check the conditions of blocked or damaged sewer pipes by TV camera and consider repairing or replacing the damaged parts if necessary; and (3) implement countermeasure works.
Ponding of rainwater during wet weather
Sediments in the sewer pipes to be removed and rainwater ponded in the lowlands to be drained by dewatering pumps.
Proper management of sullage carrier
With the equipment provided, manage well, by paying particular attention to the management method of the inverted siphon area where solid wastes easily collect and the section where there is no management passage.
Maintain Functioning and Eliminate Current Capacity Shortage of Pumping Stations
Renew the decayed facilities and secure the necessary capacity.
Source: JST
The issues in the sewerage and drainage sector of Multan and the countermeasures were suggested. These countermeasures are related to O&M of facilities. In Multan, sewage treatment plants and sullage carrier’s construction project by ADB is being planned. Improvement of operations in this sector is expected through improvement of O&M of this facility as well as facility development by ADB. 8.2.3 Equipment Needed for O&M Improvement in Multan The equipment required to solve the current problems are summarized by type of equipment in Figure 8.1-1. Although the equipment requested by WASA Multan is sufficient for most of the purposes, a TV camera

The Data Collection Survey on Water Supply and Sewerage Sector of Pakistan Final Report
8-4
for sewer pipe survey is needed with a view to change the sewer pipe management method.
Source: JST
Figure 8.2-1 Current Status of Sewer pipe Management and Necessary Equipment
Next, the feasibility of the required equipment and the required quantities were examined based on the required support/equipment previously considered and the equipment requested by WASA Multan. The results are shown in Table 8.2-3.
Table 8.2-3 Consideration on Equipment Required for Support - Feasibility and Quantity
Justification (Request and Suggestion) Name of Equipment
Specifi cations
Quantity Upper: Suggestion Lower: Request
Feasibility (Necessity) Quantity Justification
Sewer pipe cleaning (cleaning and suction equipment)
Jetting Machine 4m3 tank 18 units (27 units)
Ponding caused by blocked sewer pipes is a frequent problem, and similar equipment is already in use for the purpose of eliminating it. The existing equipment, which has exceeded its useful life, will be replaced and the number of vehicles will be increased for preventive management.
Currently, at least one unit is deployed in each of the nine Sub-Divisions in response to complaints of blockages and other problems. Two units need to be set in each office, one to deal with complaints (emergencies) and the other to deal with ponded areas during clear weather and for systematic preventive management.
2. Drainage channel cleaning
3. Drainage equipment
1. Sewerage pipe cleaning,
Survey and diagnostic equipment
Current Status Project Support: Procurement Equipment
Poor drainage and overflow due to reduced flow capacity caused by sewerage pipe blockage
Sewerage pipe cleaning equipment: ・Jetting machine ・Small pipe cleaning machine ・Suction machine ・Truck crane
Prolonged sewage ponding during clear weather due to inability to investigate the cause of blocked sewerage pipes
Sewerage pipe survey and diagnosis equipment: ・TV camera (insert type) ・TV camera (telescopic type) ・Water stop plug
Reduction in flow capacity due to accumulated sludge in drainage channels
Drainage channel cleaning equipment: ・Backhoe ・Clamshell ・Dump truck ・Suction machine
Ponding of roads and low-lying areas due to inadequate drainage and overflow of sewerage pipes during wet weather
Sewage ponding due to lack of sewer discharge points, and sewage overflow and ponding due to blocked sewer pipes
Storm water drainage equipment ・Dewatering pump (for rain water) ・Truck crane ・Suction machine
Sewage drainage equipment ・Dewatering pump (for sewage), ・Truck crane ・Suction machine
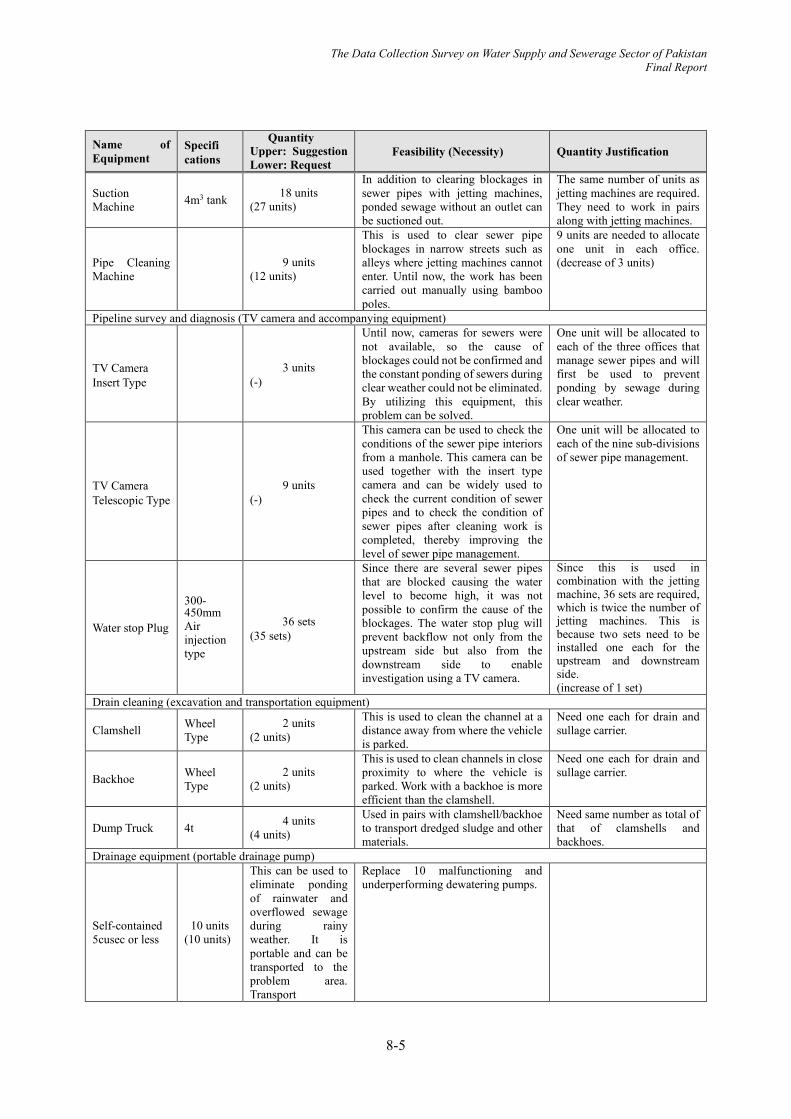
The Data Collection Survey on Water Supply and Sewerage Sector of Pakistan Final Report
8-5
Name of Equipment
Specifi cations
Quantity Upper: Suggestion Lower: Request
Feasibility (Necessity) Quantity Justification
Suction Machine 4m3 tank 18 units
(27 units)
In addition to clearing blockages in sewer pipes with jetting machines, ponded sewage without an outlet can be suctioned out.
The same number of units as jetting machines are required. They need to work in pairs along with jetting machines.
Pipe Cleaning Machine 9 units
(12 units)
This is used to clear sewer pipe blockages in narrow streets such as alleys where jetting machines cannot enter. Until now, the work has been carried out manually using bamboo poles.
9 units are needed to allocate one unit in each office. (decrease of 3 units)
Pipeline survey and diagnosis (TV camera and accompanying equipment)
TV Camera Insert Type
3 units (-)
Until now, cameras for sewers were not available, so the cause of blockages could not be confirmed and the constant ponding of sewers during clear weather could not be eliminated. By utilizing this equipment, this problem can be solved.
One unit will be allocated to each of the three offices that manage sewer pipes and will first be used to prevent ponding by sewage during clear weather.
TV Camera Telescopic Type
9 units (-)
This camera can be used to check the conditions of the sewer pipe interiors from a manhole. This camera can be used together with the insert type camera and can be widely used to check the current condition of sewer pipes and to check the condition of sewer pipes after cleaning work is completed, thereby improving the level of sewer pipe management.
One unit will be allocated to each of the nine sub-divisions of sewer pipe management.
Water stop Plug
300-450mm Air injection type
36 sets (35 sets)
Since there are several sewer pipes that are blocked causing the water level to become high, it was not possible to confirm the cause of the blockages. The water stop plug will prevent backflow not only from the upstream side but also from the downstream side to enable investigation using a TV camera.
Since this is used in combination with the jetting machine, 36 sets are required, which is twice the number of jetting machines. This is because two sets need to be installed one each for the upstream and downstream side. (increase of 1 set)
Drain cleaning (excavation and transportation equipment)
Clamshell Wheel Type
2 units (2 units)
This is used to clean the channel at a distance away from where the vehicle is parked.
Need one each for drain and sullage carrier.
Backhoe Wheel Type
2 units (2 units)
This is used to clean channels in close proximity to where the vehicle is parked. Work with a backhoe is more efficient than the clamshell.
Need one each for drain and sullage carrier.
Dump Truck 4t 4 units (4 units)
Used in pairs with clamshell/backhoe to transport dredged sludge and other materials.
Need same number as total of that of clamshells and backhoes.
Drainage equipment (portable drainage pump)
Self-contained 5cusec or less
10 units (10 units)
This can be used to eliminate ponding of rainwater and overflowed sewage during rainy weather. It is portable and can be transported to the problem area. Transport
Replace 10 malfunctioning and underperforming dewatering pumps.
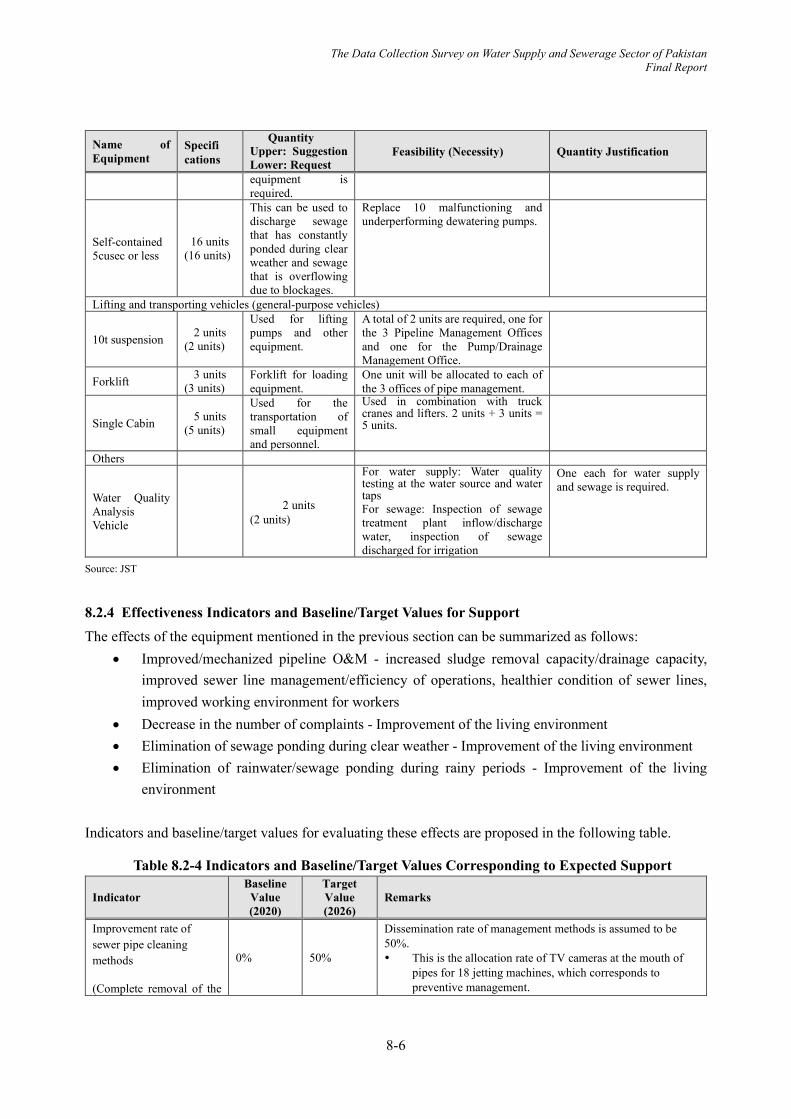
The Data Collection Survey on Water Supply and Sewerage Sector of Pakistan Final Report
8-6
Name of Equipment
Specifi cations
Quantity Upper: Suggestion Lower: Request
Feasibility (Necessity) Quantity Justification
equipment is required.
Self-contained 5cusec or less
16 units (16 units)
This can be used to discharge sewage that has constantly ponded during clear weather and sewage that is overflowing due to blockages.
Replace 10 malfunctioning and underperforming dewatering pumps.
Lifting and transporting vehicles (general-purpose vehicles)
10t suspension 2 units (2 units)
Used for lifting pumps and other equipment.
A total of 2 units are required, one for the 3 Pipeline Management Offices and one for the Pump/Drainage Management Office.
Forklift 3 units (3 units)
Forklift for loading equipment.
One unit will be allocated to each of the 3 offices of pipe management.
Single Cabin 5 units (5 units)
Used for the transportation of small equipment and personnel.
Used in combination with truck cranes and lifters. 2 units + 3 units = 5 units.
Others
Water Quality Analysis Vehicle
2 units (2 units)
For water supply: Water quality testing at the water source and water taps For sewage: Inspection of sewage treatment plant inflow/discharge water, inspection of sewage discharged for irrigation
One each for water supply and sewage is required.
Source: JST
8.2.4 Effectiveness Indicators and Baseline/Target Values for Support The effects of the equipment mentioned in the previous section can be summarized as follows:
• Improved/mechanized pipeline O&M - increased sludge removal capacity/drainage capacity, improved sewer line management/efficiency of operations, healthier condition of sewer lines, improved working environment for workers
• Decrease in the number of complaints - Improvement of the living environment • Elimination of sewage ponding during clear weather - Improvement of the living environment • Elimination of rainwater/sewage ponding during rainy periods - Improvement of the living
environment Indicators and baseline/target values for evaluating these effects are proposed in the following table.
Table 8.2-4 Indicators and Baseline/Target Values Corresponding to Expected Support
Indicator Baseline
Value (2020)
Target Value (2026)
Remarks
Improvement rate of sewer pipe cleaning methods (Complete removal of the
0% 50%
Dissemination rate of management methods is assumed to be 50%. This is the allocation rate of TV cameras at the mouth of
pipes for 18 jetting machines, which corresponds to preventive management.
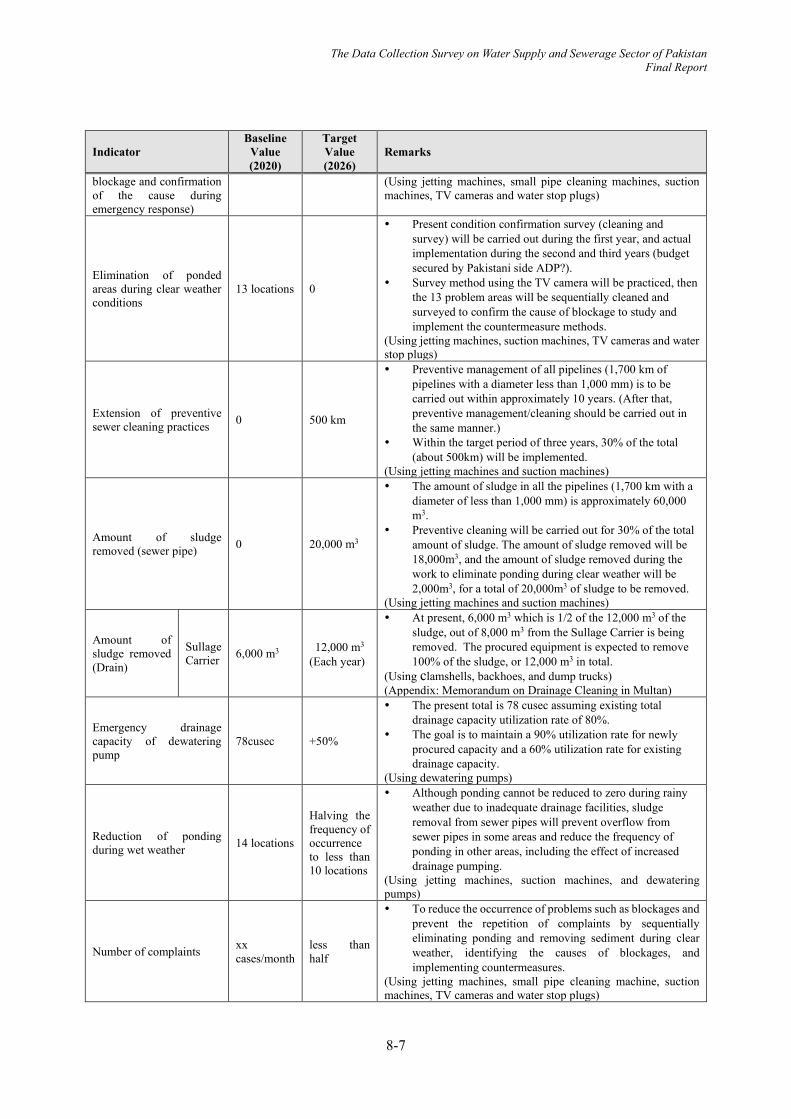
The Data Collection Survey on Water Supply and Sewerage Sector of Pakistan Final Report
8-7
Indicator Baseline
Value (2020)
Target Value (2026)
Remarks
blockage and confirmation of the cause during emergency response)
(Using jetting machines, small pipe cleaning machines, suction machines, TV cameras and water stop plugs)
Elimination of ponded areas during clear weather conditions
13 locations 0
Present condition confirmation survey (cleaning and survey) will be carried out during the first year, and actual implementation during the second and third years (budget secured by Pakistani side ADP?).
Survey method using the TV camera will be practiced, then the 13 problem areas will be sequentially cleaned and surveyed to confirm the cause of blockage to study and implement the countermeasure methods.
(Using jetting machines, suction machines, TV cameras and water stop plugs)
Extension of preventive sewer cleaning practices 0 500 km
Preventive management of all pipelines (1,700 km of pipelines with a diameter less than 1,000 mm) is to be carried out within approximately 10 years. (After that, preventive management/cleaning should be carried out in the same manner.)
Within the target period of three years, 30% of the total (about 500km) will be implemented.
(Using jetting machines and suction machines)
Amount of sludge removed (sewer pipe) 0 20,000 m3
The amount of sludge in all the pipelines (1,700 km with a diameter of less than 1,000 mm) is approximately 60,000 m3.
Preventive cleaning will be carried out for 30% of the total amount of sludge. The amount of sludge removed will be 18,000m3, and the amount of sludge removed during the work to eliminate ponding during clear weather will be 2,000m3, for a total of 20,000m3 of sludge to be removed.
(Using jetting machines and suction machines)
Amount of sludge removed (Drain)
Sullage Carrier 6,000 m3 12,000 m3
(Each year)
At present, 6,000 m3 which is 1/2 of the 12,000 m3 of the sludge, out of 8,000 m3 from the Sullage Carrier is being removed. The procured equipment is expected to remove 100% of the sludge, or 12,000 m3 in total.
(Using clamshells, backhoes, and dump trucks) (Appendix: Memorandum on Drainage Cleaning in Multan)
Emergency drainage capacity of dewatering pump
78cusec +50%
The present total is 78 cusec assuming existing total drainage capacity utilization rate of 80%.
The goal is to maintain a 90% utilization rate for newly procured capacity and a 60% utilization rate for existing drainage capacity.
(Using dewatering pumps)
Reduction of ponding during wet weather 14 locations
Halving the frequency of occurrence to less than 10 locations
Although ponding cannot be reduced to zero during rainy weather due to inadequate drainage facilities, sludge removal from sewer pipes will prevent overflow from sewer pipes in some areas and reduce the frequency of ponding in other areas, including the effect of increased drainage pumping.
(Using jetting machines, suction machines, and dewatering pumps)
Number of complaints xx cases/month
less than half
To reduce the occurrence of problems such as blockages and prevent the repetition of complaints by sequentially eliminating ponding and removing sediment during clear weather, identifying the causes of blockages, and implementing countermeasures.
(Using jetting machines, small pipe cleaning machine, suction machines, TV cameras and water stop plugs)
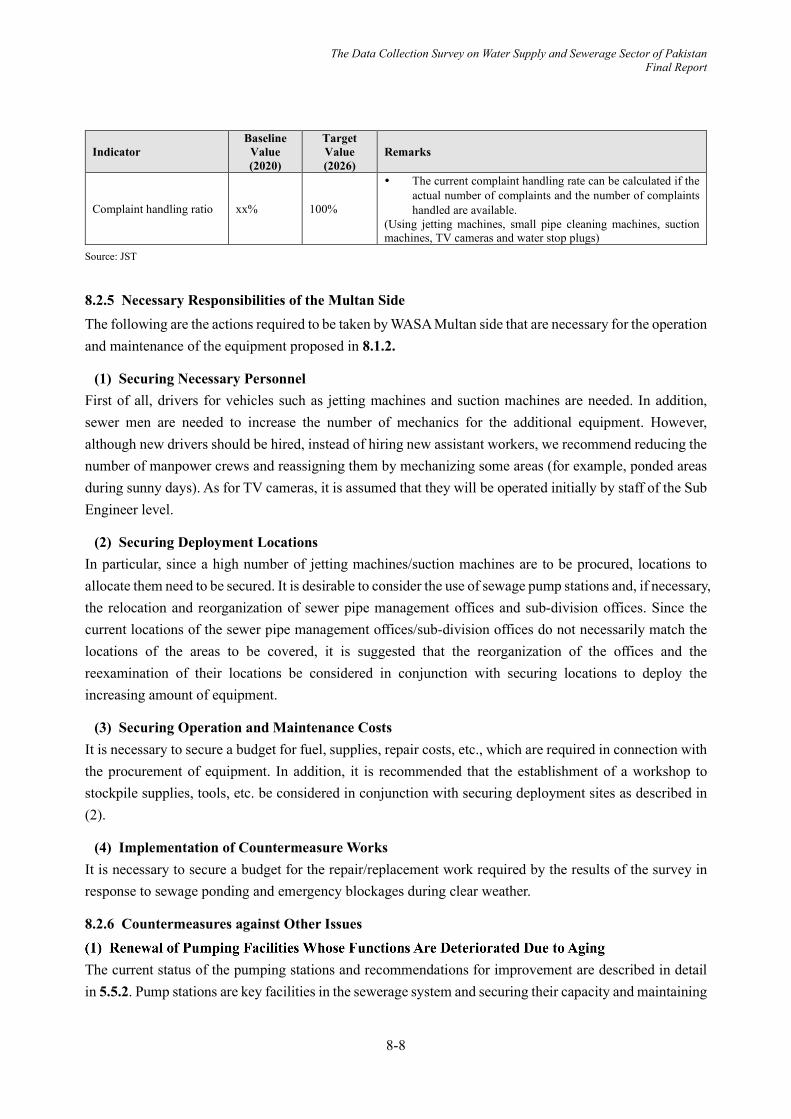
The Data Collection Survey on Water Supply and Sewerage Sector of Pakistan Final Report
8-8
Indicator Baseline
Value (2020)
Target Value (2026)
Remarks
Complaint handling ratio xx% 100%
The current complaint handling rate can be calculated if the actual number of complaints and the number of complaints handled are available.
(Using jetting machines, small pipe cleaning machines, suction machines, TV cameras and water stop plugs)
Source: JST
8.2.5 Necessary Responsibilities of the Multan Side The following are the actions required to be taken by WASA Multan side that are necessary for the operation and maintenance of the equipment proposed in 8.1.2.
(1) Securing Necessary Personnel First of all, drivers for vehicles such as jetting machines and suction machines are needed. In addition, sewer men are needed to increase the number of mechanics for the additional equipment. However, although new drivers should be hired, instead of hiring new assistant workers, we recommend reducing the number of manpower crews and reassigning them by mechanizing some areas (for example, ponded areas during sunny days). As for TV cameras, it is assumed that they will be operated initially by staff of the Sub Engineer level.
(2) Securing Deployment Locations In particular, since a high number of jetting machines/suction machines are to be procured, locations to allocate them need to be secured. It is desirable to consider the use of sewage pump stations and, if necessary, the relocation and reorganization of sewer pipe management offices and sub-division offices. Since the current locations of the sewer pipe management offices/sub-division offices do not necessarily match the locations of the areas to be covered, it is suggested that the reorganization of the offices and the reexamination of their locations be considered in conjunction with securing locations to deploy the increasing amount of equipment.
(3) Securing Operation and Maintenance Costs It is necessary to secure a budget for fuel, supplies, repair costs, etc., which are required in connection with the procurement of equipment. In addition, it is recommended that the establishment of a workshop to stockpile supplies, tools, etc. be considered in conjunction with securing deployment sites as described in (2).
(4) Implementation of Countermeasure Works It is necessary to secure a budget for the repair/replacement work required by the results of the survey in response to sewage ponding and emergency blockages during clear weather.
8.2.6 Countermeasures against Other Issues
The current status of the pumping stations and recommendations for improvement are described in detail in 5.5.2. Pump stations are key facilities in the sewerage system and securing their capacity and maintaining

The Data Collection Survey on Water Supply and Sewerage Sector of Pakistan Final Report
8-9
their functions are critical for proper operation and management. Renewal of pumps and other equipment at the pumping stations are required by WASA Multan and is also considered a high priority under this survey. The following is a list of the current issues of the pumping stations.
In order to solve these issues, it is desirable to replace the equipment with vertical-shaft pumps, starting from the pumping stations with the highest priority. This can be expected to have the following effects
Based on the current issues and the expected effects, we propose the replacement of pumping station equipment with high priority. Firstly, a more detailed survey to grasp the status and issues of the equipment is recommended.
(2) Management Issues and Countermeasures Under this survey, maintenance of sewer pipes by renewal and strengthening the management equipment is given high priority. However, maintenance of equipment alone cannot solve the issues. Improvement of sewer pipe management must be implemented in combination to achieve sufficient effects. The issues of management are as follows

The Data Collection Survey on Water Supply and Sewerage Sector of Pakistan Final Report
8-10
It is necessary to change the work method to a method that completely removes the sediment in the sewer pipes, but this is difficult to implement under the current situation where many sewer pipes are half-clogged. Even if a soft component is implemented in conjunction with a project to provide equipment, generally a short period of instruction often ends up with explanations and demonstrations of how to use the provided equipment. It is difficult to develop and learn how to use the equipment in a way that actually fits the local situation.
WASA Multan has put together a standard operating procedure (SOP) for O&M work in conjunction with the development of the master plan. The contents of the SOP were reviewed under this survey. The SOP describe how to manage sewer pipes under normal conditions in developed countries, but do not describe work methods that are appropriate for the current situation in Multan. It is necessary to develop O&M methods that are appropriate for the current situation in Multan, and to formulate these methods as SOP documents so that they can be incorporated into actual operations. In addition, the "Punjab Water Supply and Sewerage Management Capacity Enhancement Project Phase 2" targeting the five WASA in Punjab Province was launched, and its activities include the improvement of sewerage management capacity, so collaboration with this project is desirable.
(3) Support for More Comprehensive Operational Improvements WASA Multan does not have the equipment, software, or personnel to use GIS systems, nor does it have a volumetric charge system, and accounting software. WASA Multan is in need of support not only for sewer pipe management but also for overall operation and management methods, so it is possible to implement soft support for overall operation and management methods.
Meanwhile, WASA Faisalabad has installed all these IT systems. By collaborating with the Faisalabad Water Supply Business Management Improvement Project, the results of the Faisalabad project can be rolled out to Multan. Similarly, WASA Multan's water quality testing laboratory is very poor compared to that of WASA Lahore, WASA Faisalabad, etc., and a water quality testing vehicle is included in the WASA Multan’s equipment request. As part of the operational improvement, technical cooperation including water quality testing equipment and dispatch of experts would be effective.
As mentioned above, WASA Multan is lacking in operational and management assets and human resources compared to other WASAs, and support for its improvement is in line with the provincial development policy of southern Punjab region.
(4) Cooperation with Other Donors and Role-Sharing in Future Support The projects implemented by other donors in the water sector in Multan are the Punjab Cities Governance Improvement Project (2012-2016) implemented by WB to improve the management of Multan and four
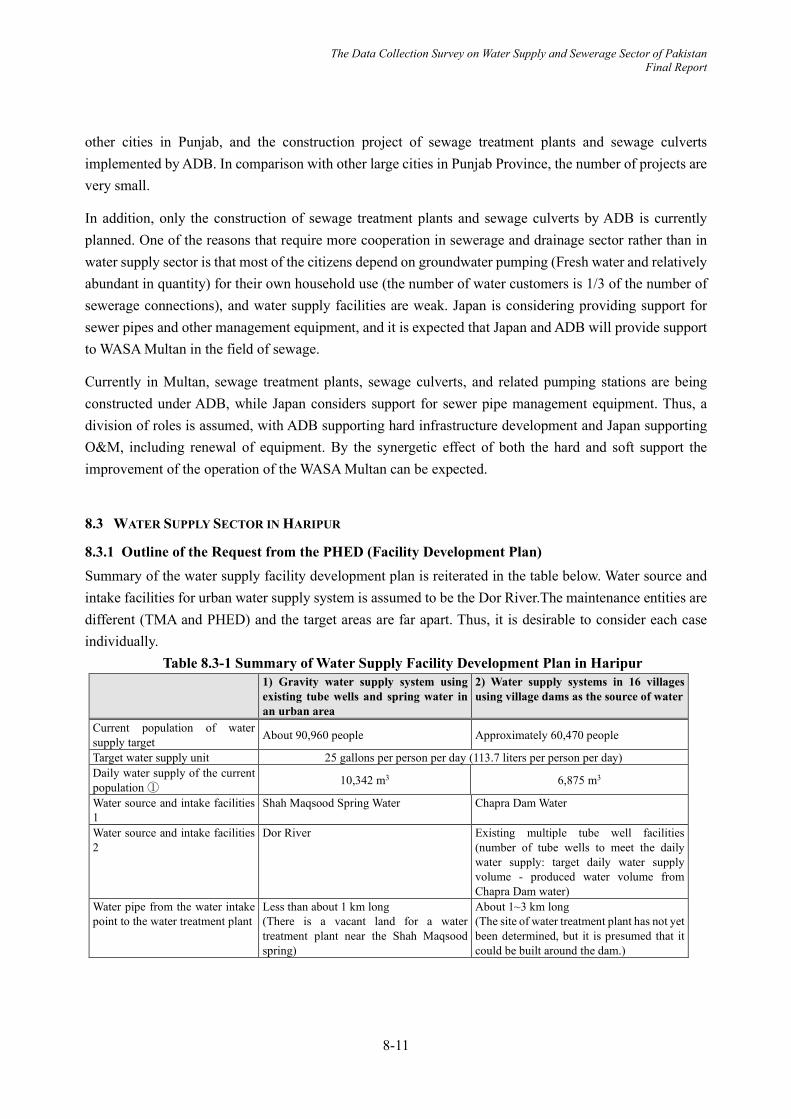
The Data Collection Survey on Water Supply and Sewerage Sector of Pakistan Final Report
8-11
other cities in Punjab, and the construction project of sewage treatment plants and sewage culverts implemented by ADB. In comparison with other large cities in Punjab Province, the number of projects are very small.
In addition, only the construction of sewage treatment plants and sewage culverts by ADB is currently planned. One of the reasons that require more cooperation in sewerage and drainage sector rather than in water supply sector is that most of the citizens depend on groundwater pumping (Fresh water and relatively abundant in quantity) for their own household use (the number of water customers is 1/3 of the number of sewerage connections), and water supply facilities are weak. Japan is considering providing support for sewer pipes and other management equipment, and it is expected that Japan and ADB will provide support to WASA Multan in the field of sewage.
Currently in Multan, sewage treatment plants, sewage culverts, and related pumping stations are being constructed under ADB, while Japan considers support for sewer pipe management equipment. Thus, a division of roles is assumed, with ADB supporting hard infrastructure development and Japan supporting O&M, including renewal of equipment. By the synergetic effect of both the hard and soft support the improvement of the operation of the WASA Multan can be expected.
8.3 WATER SUPPLY SECTOR IN HARIPUR
8.3.1 Outline of the Request from the PHED (Facility Development Plan) Summary of the water supply facility development plan is reiterated in the table below. Water source and intake facilities for urban water supply system is assumed to be the Dor River.The maintenance entities are different (TMA and PHED) and the target areas are far apart. Thus, it is desirable to consider each case individually.
Table 8.3-1 Summary of Water Supply Facility Development Plan in Haripur 1) Gravity water supply system using
existing tube wells and spring water in an urban area
2) Water supply systems in 16 villages using village dams as the source of water
Current population of water supply target About 90,960 people Approximately 60,470 people
Target water supply unit 25 gallons per person per day (113.7 liters per person per day) Daily water supply of the current population ① 10,342 m3 6,875 m3
Water source and intake facilities 1
Shah Maqsood Spring Water Chapra Dam Water
Water source and intake facilities 2
Dor River Existing multiple tube well facilities (number of tube wells to meet the daily water supply: target daily water supply volume - produced water volume from Chapra Dam water)
Water pipe from the water intake point to the water treatment plant
Less than about 1 km long (There is a vacant land for a water treatment plant near the Shah Maqsood spring)
About 1~3 km long (The site of water treatment plant has not yet been determined, but it is presumed that it could be built around the dam.)

The Data Collection Survey on Water Supply and Sewerage Sector of Pakistan Final Report
8-12
1) Gravity water supply system using existing tube wells and spring water in an urban area
2) Water supply systems in 16 villages using village dams as the source of water
Volume treated at water treatment plants②
= 261 m3/h = 6,264 m3/day = 123 m3/h = 2,952 m3/day
Fulfillment rate (②÷①) 60.5 % 42.9 % Water treatment plant site The proposed site is a vacant lot on the side
of the Shah Maqsood spring. undecided
Water pipes from the water treatment plant to each distribution reservoir
Length 8 km Length 25 km
Source: Modified by JST from PHED information
For both systems, it is desirable to use the gravity flow method for transmission and distribution of water as much as possible, and to consider a method for avoiding the use of pumps from the view of heavy burden of electricity costs. As for the urban water supply, the elevation of the Shah Masqood Spring and the Dor River is higher than the elevation of the city, so the water can be pumped to the elevated tank in the city by gravity. As for rural water supply, since the dam will be constructed in the highest area, if the location of water treatment plant is properly considered, it is possible to distribute water to most of the target villages by the gravity.
Comparing the efficiency of urban water supply to rural water supply, the project efficiency of urban water supply is relatively high. The construction of water pipes in the urban area with support of KfW will be completed in August 2021, so it is expected that leakage will become low. Meanwhile, water supply facilities in rural areas are less effective than those in urban areas due to the high cost of construction of water pipes in mountainous areas and the smaller beneficiary population compared to urban areas.
8.3.2 Survey Results of the study of Water Sources (1) Survey results of water source for urban water supply As for the new water sources to be developed, the above table assumes a combination use of Shah Maqsood spring water and Dor River for urban water supply, which is likely to meet the water supply plan. This is because the volume of water from the spring is not sufficient to meet the entire water supply plan, and it is also expected to fluctuate seasonally and annually. The advantages and disadvantages of these two water sources are summarized in the table below. As for the water treatment method, considering the risks of the two water sources (decrease in the volume of water from the spring, decrease in the volume of water from the Dor River, and deterioration of water quality), it is reasonable to adopt rapid filtration. On the other hand, if the Shah Masqood Spring and the Dor River are used together, it can meet the planned water supply amount and the use of existing tube wells will become unnecessary.
Table 8.3-2Comparison of Water Sources for Urban Water Supply Dor River Shah masqood spring water
Water volume
The water volume is bigger than the spring, as shown in the figure below. However, as the water supply facilities in Abbottabad and Havelian, which are located upstream, shall take water from the same
This spring can be considered to be a subterranean flow of the Dor River due to its topography; although the volume of water is lower than that of the River. However, the volume of water is stable as no other projects are expected
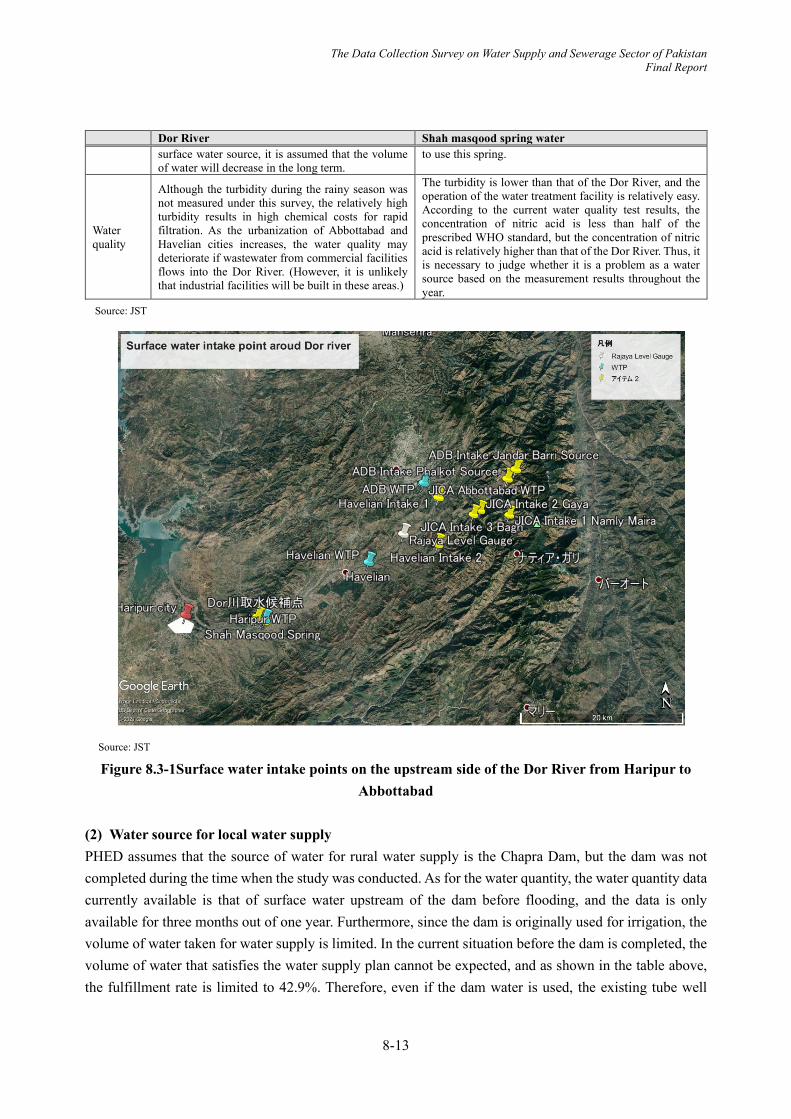
The Data Collection Survey on Water Supply and Sewerage Sector of Pakistan Final Report
8-13
Dor River Shah masqood spring water surface water source, it is assumed that the volume of water will decrease in the long term.
to use this spring.
Water quality
Although the turbidity during the rainy season was not measured under this survey, the relatively high turbidity results in high chemical costs for rapid filtration. As the urbanization of Abbottabad and Havelian cities increases, the water quality may deteriorate if wastewater from commercial facilities flows into the Dor River. (However, it is unlikely that industrial facilities will be built in these areas.)
The turbidity is lower than that of the Dor River, and the operation of the water treatment facility is relatively easy. According to the current water quality test results, the concentration of nitric acid is less than half of the prescribed WHO standard, but the concentration of nitric acid is relatively higher than that of the Dor River. Thus, it is necessary to judge whether it is a problem as a water source based on the measurement results throughout the year.
Source: JST
Source: JST
Figure 8.3-1Surface water intake points on the upstream side of the Dor River from Haripur to Abbottabad
(2) Water source for local water supply PHED assumes that the source of water for rural water supply is the Chapra Dam, but the dam was not completed during the time when the study was conducted. As for the water quantity, the water quantity data currently available is that of surface water upstream of the dam before flooding, and the data is only available for three months out of one year. Furthermore, since the dam is originally used for irrigation, the volume of water taken for water supply is limited. In the current situation before the dam is completed, the volume of water that satisfies the water supply plan cannot be expected, and as shown in the table above, the fulfillment rate is limited to 42.9%. Therefore, even if the dam water is used, the existing tube well
The Data Collection Survey on Water Supply and Sewerage Sector of Pakistan Final Report
8-14
facilities need to be used in combination. On the other hand, the water quality data currently available are for the surface water upstream of the dam before flooding and not after flooding.
8.3.3 Necessity of Additional Research on Water Sources (1) Additional Study of Water Sources for Urban Water Supply The geological and groundwater resources of the entire Haripur area need to be studied to understand the water resources of the entire region. Especially, it is necessary to obtain the data of water quantity and quality of Shah Masqood Spring and Dor River for at least about one year prior to planning of the facility. Under this survey, it is important to understand whether the Shah Masqood spring water is submerged in the Dor River or not. Therefore, detailed planning survey is needed to evaluate the sources of both the Dor River and the Shah Masqood Spring for about one year and to develop a plan for facility development using these surface waters. During this survey, it is desirable to check the progress of ongoing ADB and Korean projects and reflect the volume of water available from the Dor River in the facility plan by reflecting the water volumes taken in these projects.
(2) Additional Study of Water Sources for Rural Water Supply The Chapra Dam is assumed to be the water source for rural water supply, but the dam has not been completed and there is no adequate data on the quantity and quality of water for water supply plan. Therefore, before the dam is completed, the volume of water that can be taken for water supply has to be confirmed with the Irrigation Department in Abbottabad. On the other hand, as for water quality, it is necessary to continuously measure the stored water quality for one year after the completion of the dam construction, and to study the water treatment method based on the results.
8.3.4 Points to be Noted (1) Necessity of a Long-Term Plan for Water Supply Facilities Using Surface Water As mentioned earlier, PHED only has a master plan with groundwater, and it is desirable to prepare a long-term plan with the surface water. However, when we asked to the Haripur PHED, the response obtained was that such a budget would be difficult to secure. JST believes that it is becoming difficult to operate and maintain water supply facilities that rely on tube wells due to the decline in groundwater levels and increased expenditure on electricity. If the volume of water supplied by tube wells decreases, residents will be forced to rely on unsanitary water, so it is desirable to implement the project as soon as possible. Therefore, it is recommended that a master plan using surface water be developed as soon as possible.
(2) Importance of Support for the Operation and Maintenance If rapid filtration is to be adopted as the water treatment system, improvement of its maintenance and management capacity is required., as KP Province has no experience about rapid filtration system in this area.
There is currently a fixed charge per household, but the collection rate is relatively high, and a metering system could be applied by gradually increasing the amount paid per month. In urban areas, if the facilities are equipped with gravity-type water transmission and distribution, the cost of electricity can be reduced,

The Data Collection Survey on Water Supply and Sewerage Sector of Pakistan Final Report
8-15
and the current operating deficit of the TMA's water services will also be reduced. Improving the operation and maintenance of the rapid filtration and implementation of the metering system will ensure the sustainability of the water services.
(3) Collaboration with Other Developing Partners' Projects As for the Haripur urban area, the KfW project is rehabilitating the water distribution network, and it is assumed that the new pipes will reduce leakages. Considering synergistic effect with the KfW project, if water supply facilities are newly constructed, it is expected that the water supply volume will increase more, and the water supply facilities will become more efficient. If the water supply facilities become more efficient, the financial sustainability of the water supply management will be improved. Since 24-hour water supply is expected to be possible after the project implementation, it is considered to be an appropriate timing to shift to a metering system.
With regard to the Korean water facility development project, which is being planned to take water from the Dor River in Havelian City, it is possible to collaborate on having the Irrigation Department in Abbottabad to properly measure the water level and adequately gasp the water flow rate of the Dor River.
From these linkages, it would be possible to make an impact in the field of water and sanitation over a wide area of KP province. 8.4 MEASURES FOR IMPROVEMENT OF RAINWATER MANAGEMENT OF LAHORE
In Lahore, rainwater flooding (Ponding) during heavy rains has a great impact on the lives of citizens at many locations in the city. As a countermeasure, a M / P (Master Plan for Water Supply, Sewerage and Drainage System for Lahore) for rainwater drainage was prepared, and the implementation of the plan is presently under progress. On the other hand, implementation of the overall plan requires a large amount of investment and time. It also for proposes the development of rainwater storage and infiltration facilities.
Under this survey, in particular, the problems in the upstream part, which are not often mentioned in the Lahore M / P, are extracted, and methods for alleviating the rainwater ponding problems other than the development of core facilities were examined.
8.4.1 Lahore M / P Lahore M / P describes the current state of ponding as "rainfall runoff flows toward relatively depressed areas along the road and rapidly forms Ponding”. The stored water is eventually drained to WASA sewer system. However, due to the limited capacity of sewers and covered drains, it takes a long time to discharge ponded rainwater. In addition, it is said that flooding (Ponding) during rainy weather is formed for the following reasons.
a. Insufficient capacity of sewer pipe / drains b. Sludge accumulation in sewer pipes / drains c. Absence of drain / sewer d. There are no rainwater inlets
The Data Collection Survey on Water Supply and Sewerage Sector of Pakistan Final Report
8-16
e. Depression in a specific location f. Topographic changes in the city
Regarding the explanation of the current situation of ponding and the reasons listed above, the five items b. to f. are reasonable because they are consistent with the results of this survey. "a. Insufficient capacity of sewer pipes / drains" is agreed because rainwater is not expected to be transmitted through sewer pipes. Regarding the lack of capacity of the drains, it should be noted here that there is a room for reconsideration as it cannot be explained that the ponding continues for a long time in case the capacity shortage is the main cause of the ponding. Based on this analysis of the current situation, Lahore M / P shows the following basic ideas.
a. Existing facilities related to the ponding area are recommended to be kept clean and properly maintained. Also, the provision of emergency camps at very important places during the monsoon season should be actively considered.
b. The ponding area cannot be eliminated because it is formed by the slope of the road in the area where it gathers in a specific place.
c. Offline storage is not possible in densely populated areas. However, such storage facilities are advantageous if they are installed in an open area such as a park and connected to a ponding area.
d. For mitigation of ponding in the city, it is proposed to establish new drains and in line storage pond in addition to the infiltration well in the park. The measures proposed in the master plan are explained in detail in the report.
Based on these basic ideas, the following two facility construction are shown as strategies for ponding mitigation measures.
a. Mitigation of urban flooding with offline storage and infiltration wells b. Mitigation of urban flooding by constructing new rainwater drains
Under the Lahore M / P report, measures by storage / infiltration will be considered first, and if that is difficult, construction of a new drain will be considered. On the premise of insufficient capacity of primary drains, etc., it is difficult to improve their capacity in terms of cost, construction, implementation period, etc. Therefore, the Lahore M / P does not include the redevelopment of the primary drains, and new construction of secondary and tertiary drains are planned mainly in areas where there are no drainage facilities.
In response to this, the following considerations are also needed. a. It is understandable as a planning method that the lack of capacity was the cause of the overflow
by comparing the planned runoff volume and the current capacity. However, the judgement that the lack of capacity is the main cause of ponding has a room for further consideration, considering the continuation of ponding for a long time.
b. It is necessary to verify whether the calculated flow rate (the peak flow rate of the hydrograph showing the change in flow rate) is flowing into drains. Considering the current situation that

The Data Collection Survey on Water Supply and Sewerage Sector of Pakistan Final Report
8-17
rainwater is connected to sewer pipes, overflowing rainwater flows down the road surface, and they are ponded on the road surface. It is estimated that a considerable delay phenomenon occurs in the flowing down process. It is considered that this phenomenon causes the change of hydrograph flowing into the main channel, and the peak flow rate may be lower than the planned (calculated) flow rate.
c. There are no influences of river water due to the height difference between the flooded area and the discharged river water level (there is a height difference of more than 10 m between the city center where there are many ponding areas and the discharged river water level), and there should be a problem of ponding inside the levee. In the case of flooding inside levee, the flooding occurs only while the capacity of the rainwater drainage facility is exceeded, and it does not become a long-term flooding, which is different from the phenomenon that occurs. Therefore, it is necessary to find out the reason why the ponding continues for a long time.
d. It should be noted that other cities in Punjab likewise use roads as rainwater drains as in Lahore. It is necessary to verify the flow of rainwater (changes in the flow path and flow rate) until the rainwater reaches the drains and confirm whether facilities are in place to allow rainwater on the road to flow into the rainwater drains.
e. Regarding the capacity improvement of drains and the construction of storage / infiltration facilities due to lack of capacity, the capacity improvement of facilities will lead to the improvement of flood safety. Therefore, their steady implementation is needed. In addition, it is necessary to construct drains /roadside drains in the undeveloped areas steadily.
f. In parallel with this, or as a measure to be taken immediately, it is necessary to grasp the condition of rainwater flowing down on the road and let it flow into the drains or roadside drains.
The main cause for current long-time lasting ponding is not the insufficient capacity of rainwater drains. Other causes need to be considered. In Lahore M/P, rainwater flowing on the road surface is not considered sufficiently. It is necessary to verify the condition of rainwater flowing on the road surface and the facility to be taken into the drains, considering the uninstalled roadside drains, the connection of rainwater to the sewer pipes, and the use of road surface as a rainwater drainage facility.
The method of checking the capacity of the primary drains, which are the core facilities, and evaluation of the existing facilities is an appropriate method for planning. Furthermore, when the construction of the rainwater drainage facility in the upstream part is completed, a facility of that scale is required. Therefore, it is added that it does not deny the facility construction including the storage / infiltration facility corresponding to the planned flow rate.
Another important point is that the Lahore M / P report describes the cooperation between the construction work of the Orange Line subway and the flood control work being promoted by LDA. Specifically, it is said that drains will be constructed in line with the subway construction. Since this project will eliminate some ponding areas in the city center, measures for those areas are not included in the Lahore M / P measures project. 8.4.2 Necessity for Factor Analysis of Ponding Focusing on Road Surfaces Considering the fact that pondings continue for a long term and that their occurrence near the primary drains are

The Data Collection Survey on Water Supply and Sewerage Sector of Pakistan Final Report
8-18
very rare, it is necessary to assume the cause of pondings other than that of capacity of primary drains. In particular, the study focused on the issues caused by the usage of road surface as a rainwater drainage facility.
a. Since there are few roads with roadside drains, "road-drains" that use roads as rainwater drainage occur in large areas depending on the location.
b. In Lahore, there are very few facilities that convey rainwater flowing on the roads (including rainwater mixed with sewage that overflows from sewer pipes) into drains. In addition, there are few inlets to the roadside drains. The drains have only sealed lids for maintenance. Intakes to the rainwater drains are only equipped with sealing lids for managing the channels. As a result, the evaluation is similar to that of "There are few rainwater inlets" as pointed out by Lahore M / P.
c. If all roads have roadside drains, rainwater are treated by regular inlets, through holes of the manhole covers, or cross gutters with grating lids. However, in the case of Lahore, it is necessary to assume a considerably large amount of rainwater because there are areas where roadside drains and secondary and tertiary drains are not installed over a wide area. In other words, it is necessary to imagine that the big amount of rainwater that cannot be treated by a few inlets flows down the road, and to consider the facility that corresponds to that amount of rainwater.
d. Highways are often constructed at a higher level and general roads at a lower level. There is a high possibility that the rainwater flowing on the road surface may be dammed up. This is also mentioned in the Lahore M / P.
e. It is necessary to calculate not only the amount of rainwater runoff for checking the capacity of the drains, but also the amount of rainwater flowing on the road by using hydraulic formula or the simulation model. What is calculated is how the amount of water increases as the rainwater flows down the road surface and reaches the vicinity of the drains, or whether the rainwater is ponded without a drain nearby.
To summarize the above, there are many places in Lahore where a large amount of rainwater flows down the road, but there is lack of facilities to deal with the rainwater on the roads. In other words, when evaluating a rainwater drainage system, the capacity evaluation of the core facilities examined in the Lahore M / P creation work is not sufficient. It is necessary to check how much rainwater that has fallen on the residential and road area will eventually flow down on the road, and whether there are facilities that allow rainwater to flow smoothly into the drains. "Few rainwater inlets" which were pointed out in the Lahore M / P report is a very important and serious point, and it is speculated that it may be one of the major factors which causes ponding to occur in Lahore during rainy weather and continue for a long time. From another point of view, it is speculated that the drains, which are currently regarded as rainwater drains, were initially constructed as water distribution / drains. And this is one factor of ponding. It is probable that the water is divided / distributed from the irrigation canal and it functions mainly as water distribution canal in the upstream part and as a drainage canal in the downstream part. It is speculated that this may have a negative effect on the rainwater drainage function.

The Data Collection Survey on Water Supply and Sewerage Sector of Pakistan Final Report
8-19
The grounds for the estimation are that there are several drains starting from the vicinity of the irrigation canal, that there are drains that are close at the upstream, that drains are formulated as the network (similar to water distribution system of water works. A network-like structure is effective for this, but a tree-like structure is sufficient for drainage.), and that some drains are not installed in the lowest region on the terrain. In that case, drains are installed at a slightly higher position, making it difficult to convey rainwater. In addition, it is speculated that the function as a rainwater drain may be inferior due to structural reasons such as insufficient function of conveying rainwater. It is presumed that this does not apply to all drains, but to drains that are tributaries of the Cantonment Drain, which were built in the old days at the city center and have many ponding areas. For this reason, the rainwater that has flowed down on the road due to the road gradient and the terrain cannot flow in drains promptly even if it flows down to the vicinity of them. As a result, the area is ponded for a long time and cannot be taken into the drains without the help of a drainage pump. As described above, in addition to the fact that there are very few facilities that take rainwater flowing through the road into the drains, there is also a problem with the function of the drains itself, which is presumed to be causing the current long-term ponding.
8.4.3 Direction of Improvement of Rainwater Management (1) Basic Concept
a. Based on the implementation of Lahore M / P, supplementary countermeasures will be considered. Specifically, countermeasures which supplement the promotion of the construction / improvement of drainage system including storage / infiltration facilities currently being implemented / planned, and thereby enhance the project effect will be considered.
b. In Lahore, not only the rainwater drains but also the sewer system and the road surface each function as a rainwater drainage facility. In order to make the best use of their abilities / functions, it is inspected to utilize these three facilities in an integrated manner. That is, the existing drains and sewers will be joined to maximize the capacity of each other's facilities. In addition, this integrated utilization shall be applied only during rainy weather, and complete separation of each function shall be performed during dry weather.
c. Since there are few roadside drains and the road surface is also used as a rainwater drain, installation of the facilities that effectively takes rainwater flowing on the road surface into the drains will be considered. Since it is necessary to consider not only the rainwater flowing in the drains but also the rainwater flowing in the sewer network and on the road surface, the utilization of simulation model that can integrate and analyze all of them will be considered.
(2) Outline of Improvement Measures (draft) The basic concept and outline of improvement measures are shown in Figure 8.4-1.
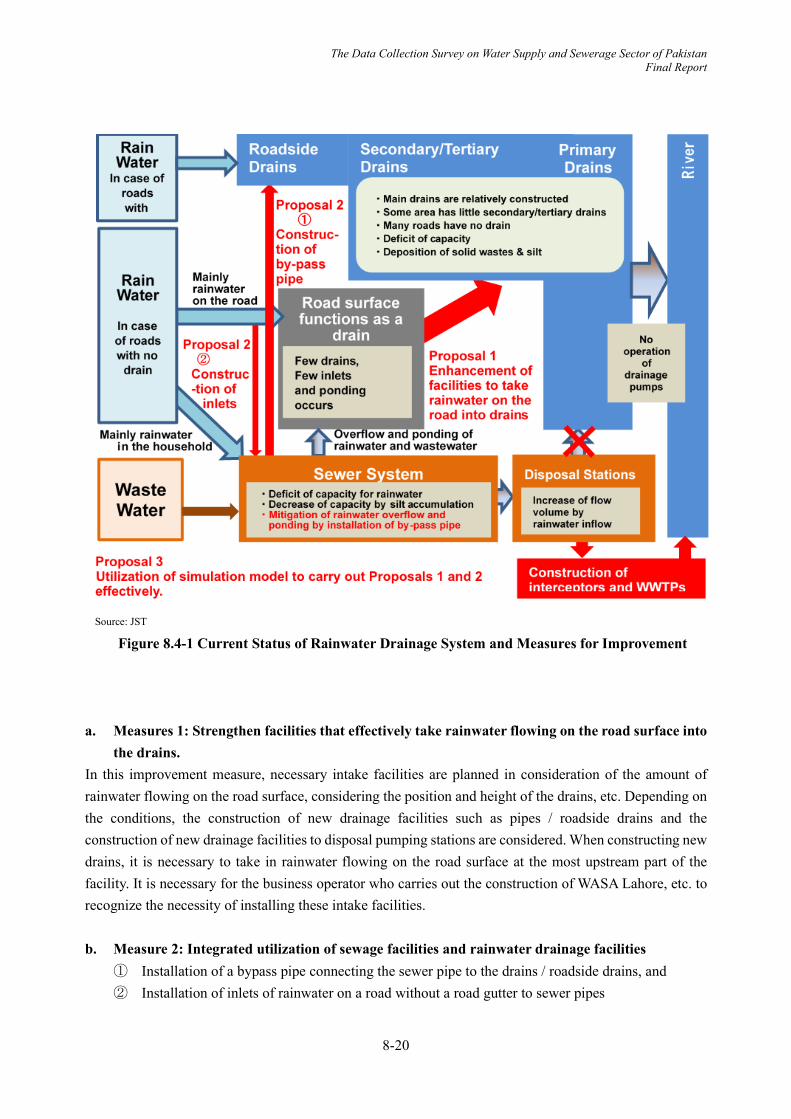
The Data Collection Survey on Water Supply and Sewerage Sector of Pakistan Final Report
8-20
Source: JST
Figure 8.4-1 Current Status of Rainwater Drainage System and Measures for Improvement
a. Measures 1: Strengthen facilities that effectively take rainwater flowing on the road surface into
the drains. In this improvement measure, necessary intake facilities are planned in consideration of the amount of rainwater flowing on the road surface, considering the position and height of the drains, etc. Depending on the conditions, the construction of new drainage facilities such as pipes / roadside drains and the construction of new drainage facilities to disposal pumping stations are considered. When constructing new drains, it is necessary to take in rainwater flowing on the road surface at the most upstream part of the facility. It is necessary for the business operator who carries out the construction of WASA Lahore, etc. to recognize the necessity of installing these intake facilities. b. Measure 2: Integrated utilization of sewage facilities and rainwater drainage facilities
① Installation of a bypass pipe connecting the sewer pipe to the drains / roadside drains, and ② Installation of inlets of rainwater on a road without a road gutter to sewer pipes

The Data Collection Survey on Water Supply and Sewerage Sector of Pakistan Final Report
8-21
Measure 2① is related to the integrated utilization of sewer system and drains / roadside drains, and by reducing the overflow of sewage to the road surface due to insufficient capacity of sewer pipes during rainy weather, it is possible to protect the sanitary environment of the city. According to Measure 2 ② , inlets are installed on the road without a roadside drain to take in rainwater within the allowable range of the sewer pipe capacity, reduce the flow of rainwater on the road surface during light rainfall, and shorten ponding time. c. Measure 3: Utilization of simulation model to implement improvement measure 1 and 2
effectively Improvement measures 1 and 2 can be effectively implemented by simulating the changes of the flow of rainwater and sewage during rainy weather, to confirm the occurrence status & causes of overflow and ponding and to establish countermeasures. Specifically, since the road surface plays an important role as a rainwater drainage facility, a model that matches the current situation of Lahore is required to be established by combining a sewer system model and a surface flow model.
By effectively combining improvement measures 1, 2 and 3 and implementing them in parallel with the implementation of the Lahore M / P plan, it is possible to implement countermeasures for ponding during rainy weather, which can obtain higher effects more quickly. In addition, the more accurate simulation model can scrutinize the validity of the Lahore M / P facility plan and, in some cases, recommendation for change to those that can be expected to have higher effects can also be expected. (3) Specific Project Image Related to Improvement Measures i. Installation of inlet facilities to drains Figure 8.4-2 shows an example of a facility plan that takes in rainwater that has flowed on the road surface in case without facilities such as roadside drains near the starting point of the new drain. If the area without roadside drain is large, a large amount of rainwater will flow down, so multiple facilities of sufficient scale as shown in the figure are required. It is necessary to install appropriate facilities in consideration of the expected amount of rainwater and road gradient. In Faisalabad, although a drain was newly constructed as a countermeasure for ponding, there were cases where the ponding was not resolved because the facilities for taking in rainwater on the road surface were not sufficiently installed. It is presumed that the necessity of installing
Source: JST
Figure 8.4-2 Inlet facility of rainwater on the surface of the road to the drain

The Data Collection Survey on Water Supply and Sewerage Sector of Pakistan Final Report
8-22
such a rainwater intake facility is not recognized in each city of Pakistan or Punjab, so it is important to inform the necessity.
ii. Integrated utilization of sewage facilities and rainwater drainage facilities – Installation of by-pass pipe Bypass pipes are installed to the existing or new roadside drains from the sewer pipes that are full due to the rainwater connection. By integrating the rainwater drainage facility and the sewage facility, the following will be realized.
By implementing this method, the overflow of sewer pipes during rainy weather can be reduced, and the amount of rainwater collected at ponding areas can be reduced.
Reduces sewage overflow and improves urban sanitation A system that can smoothly collect and drain sewage and rainwater can be realized by integrating
the sewage facility and the rainwater drainage facility as one. By implementing this method, the effect of installing rainwater storage / infiltration facilities near
the ponding area, which is a measure as described in Lahore M / P to eliminate the ponding areas, can be further enhanced.
This is an effective method when the roadside drains are already installed or when there is an installation plan.
This method can shorten the extension of roadside drain. The capacity of the facility can be effectively utilized.
Specifically, it is assumed that the connection is near the starting point of the roadside drain as shown in Fig. 8.4-3, but in the case of the existing roadside drains, connection can be done other than the starting point by checking the overflow status of the sewer pipe and other situation. The connection from the sanitary sewer pipe to the drainage facility is carried out in each city in the United States as a measure against overflow of the sewer pipe due to infiltration, that is, a measure against SSO (Sanitary Sewer Overflow). Regarding the integrated utilization of sewerage facilities and rainwater drainage facilities, it is proposed to install inlets on a road without roadside drains and to connect it to a sewer pipe. By this measure, road surface water will be drained promptly during light rainfall and it will prevent long-term ponding of rainwater in the depression and can alleviate problems in terms of living environment and hygiene. These two facilities will have functions of a rainwater inlet and a rainwater separate chamber of the combined sewage system and will result in the
Source: JST
Figure 8.4-3 Example of by-pass pipe from sewer to drain

The Data Collection Survey on Water Supply and Sewerage Sector of Pakistan Final Report
8-23
creation of combined system only upstream in Lahore.
iii. Integrated simulation model of surface flow and sewerage system Figure 8.4-4 shows an image of a simulation model that integrates the surface flow and the sewer network. This model is based on the assumption of overflow from the sewer pipe and intake of rainwater on the road surface into the sewer pipe. In the case of Lahore, it is a more complicated structure in which drains, the sewer pipe, and the road surface have a rainwater drainage function. Therefore, by utilizing such a model and knowing the amount of water flowing through the three facilities with high accuracy, it is possible to grasp the current situation and select an optimal solution. In particular, the scale and structure of the rainwater intake facility under Improvement Measure 1 can be accurately determined, and the effectiveness of the bypass pipe function under Improvement Measure 2 can be confirmed. 8.4.4 Implementation Procedures of Improvement Measures and Relationship with Master Plan The improvement measures include usage of the latest simulation models focusing on the rainwater that has flowed on the road surface and studying more effective countermeasures. However, since there are no cases where roads are used as rainwater drains in Japan or in other developed countries, the adequate knowledge has not been obtained for reviewing the master plan. Therefore, currently the measures are to supplement the master plan so that it can be implemented more efficiently and effectively. The following procedures are being considered for implementing the proposed content. A pilot area is set up, and a simulation model is built based on detailed information on facilities and
topography. Compare the calculation results with the present status and check whether the calculation results can
explain the present status. The model will be calibrated so that it can be explained. Focus on the management of rainwater flow on the road and consider the necessary measures. Compare with the measures in the master plan and consider what needs to be modified. Set up multiple pilot areas to generalize the best response and what needs to be modified in the
master plan.
8.4.5 Role-Sharing with Other Donors In Lahore, all the collected sewage is discharged without treatment from the disposal station to the river by the rainwater drain that runs through the city, causing deterioration of the urban and water environment. In
Source: Annual Report Japan Institute of Wastewater Engineering and Technology 2015
Figure 8.4-4 Concept of simulation model

The Data Collection Survey on Water Supply and Sewerage Sector of Pakistan Final Report
8-24
order to improve this situation, WASA Lahore is going to start the construction of a sewage treatment plant and trunk sewers connected to it based on the master plan. AIB, DANIDA, and AFD are planning to construct sewage treatment plants, and AIB is about to start construction of trunk sewers. AIIB is also planning to build a water treatment plant to treat river water as part of its efforts to secure new water sources, which is a challenge in the water supply business. In this way, a number of international donors are about to launch big projects in the sewerage and water supply sector, and WASA Lahore is currently focusing on the smooth implementation of these projects. Meanwhile, in the field of rainwater drainage, a master plan has been formulated to improve the present situation of continuous ponding during rainy season, and based on the master plan, construction of rainwater drains and storage facilities has been started. However, as for rainwater drainage, it is being carried out within the scope of the state budget, and the role can be shared with the efforts of these other donors.
8.5 UTILIZATION OF JAPANESE TECHNOLOGY
Those that seemed to have an advantage in utilizing Japanese technology in Pakistan were picked up. The contents, merits, and points to be noted of the technology were examined and considered based on the results of the survey. The results are shown in Table 8.5-1. At present, it is difficult to show applicable technologies with clear superiority, but it is important to propose applicable technologies while promoting the support by Japan.
Table 8.5-1 Example of Japanese technologies with advantage studied in this survey and results Field Name Contents Merits Point to be noted Consideration
Water works
Pump Large, high-efficiency pump used for water intake, water supply and distribution
・ Energy saving due to high efficiency. Excellent durability if there is high quality equipment with sufficient quality control
・ unique technology such as water hammer prevention measures by flywheel and diagonal flow type pump on the vertical axis can be adopted.
・Training for O&M is required.
・It is necessary to ensure equipment maintenance, inspection, repair, etc.
・Since the electricity charges for water and sewage pumps are high in each city, energy audits are conducted and efforts are being made to reduce them.
・The explanation of advantages of them from the concept of life cycle cost is effective.
Prestressed concrete (PC) tank
Large cylindrical reservoir 1) Assembling the top plate by the dome method 2) Side wall and bottom fixing method
・Large ground-based reservoir can be constructed economically and robustly
・ Skill and know-how are required for construction. Japan has a large number of achievements
・ Since maintenance of internal corrosion protection is not required, water leakage from the bottom of the side wall, which has a high risk of water leakage, can be prevented.
・It is necessary to improve the technical capabilities of local contractors.
・Standardization of capacity and design is required.
・It is necessary to explain the merit of having a long service life time and little maintenance from the viewpoint of life cycle cost in spite of expensive initial cost.
Water meter including plastic
Water meter including using plastic material for water supply
・ It is relatively cheaper than the European products distributed in Pakistan. (In case of metal meters)
・ There is a case where
・Confirmation of conformity with Pakistani standards is required.
・ From the perspective of anti-theft, there is a possibility that the introduction of plastic meters will proceed.
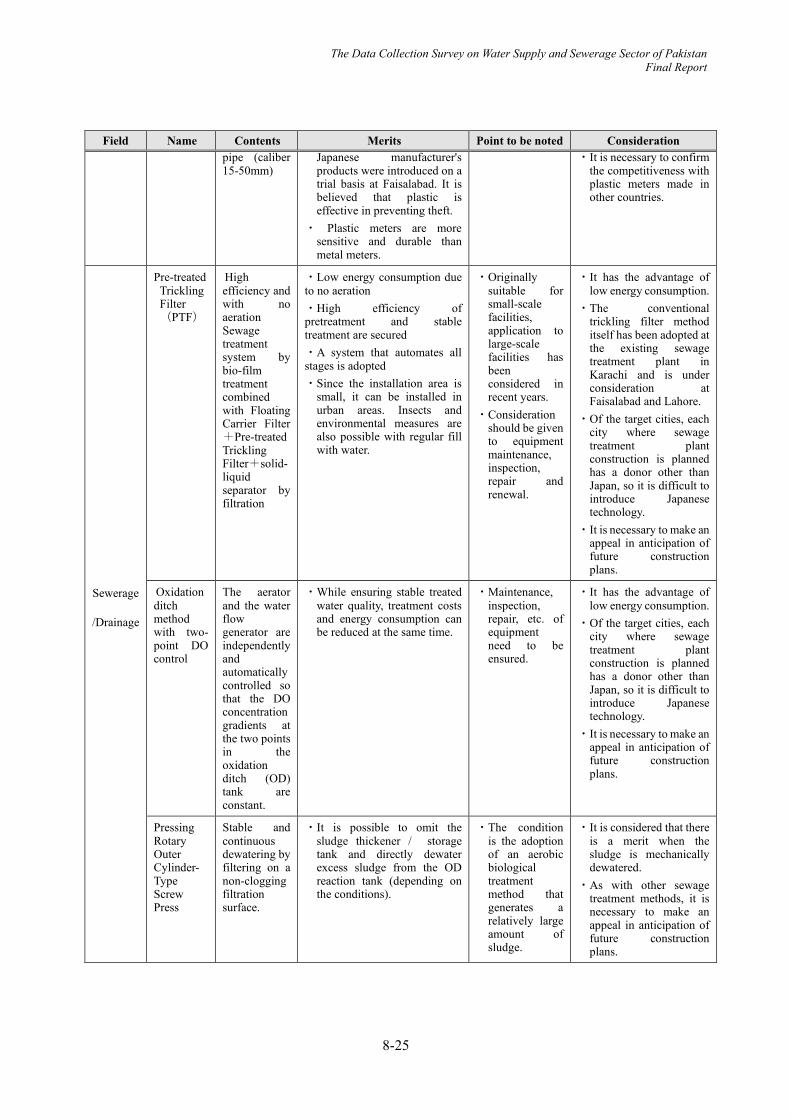
The Data Collection Survey on Water Supply and Sewerage Sector of Pakistan Final Report
8-25
Field Name Contents Merits Point to be noted Consideration pipe (caliber 15-50mm)
Japanese manufacturer's products were introduced on a trial basis at Faisalabad. It is believed that plastic is effective in preventing theft.
・ Plastic meters are more sensitive and durable than metal meters.
・It is necessary to confirm the competitiveness with plastic meters made in other countries.
Sewerage
/Drainage
Pre-treated Trickling Filter(PTF)
High efficiency and with no aeration Sewage treatment system by bio-film treatment combined with Floating Carrier Filter+Pre-treated Trickling Filter+solid-liquid separator by filtration
・Low energy consumption due to no aeration ・High efficiency of pretreatment and stable treatment are secured ・A system that automates all stages is adopted ・Since the installation area is
small, it can be installed in urban areas. Insects and environmental measures are also possible with regular fill with water.
・Originally suitable for small-scale facilities, application to large-scale facilities has been considered in recent years.
・Consideration should be given to equipment maintenance, inspection, repair and renewal.
・It has the advantage of low energy consumption.
・The conventional trickling filter method itself has been adopted at the existing sewage treatment plant in Karachi and is under consideration at Faisalabad and Lahore.
・Of the target cities, each city where sewage treatment plant construction is planned has a donor other than Japan, so it is difficult to introduce Japanese technology.
・It is necessary to make an appeal in anticipation of future construction plans.
Oxidation ditch method with two-point DO control
The aerator and the water flow generator are independently and automatically controlled so that the DO concentration gradients at the two points in the oxidation ditch (OD) tank are constant.
・While ensuring stable treated water quality, treatment costs and energy consumption can be reduced at the same time.
・Maintenance, inspection, repair, etc. of equipment need to be ensured.
・It has the advantage of low energy consumption.
・Of the target cities, each city where sewage treatment plant construction is planned has a donor other than Japan, so it is difficult to introduce Japanese technology.
・It is necessary to make an appeal in anticipation of future construction plans.
Pressing Rotary Outer Cylinder-Type Screw Press
Stable and continuous dewatering by filtering on a non-clogging filtration surface.
・It is possible to omit the sludge thickener / storage tank and directly dewater excess sludge from the OD reaction tank (depending on the conditions).
・The condition is the adoption of an aerobic biological treatment method that generates a relatively large amount of sludge.
・It is considered that there is a merit when the sludge is mechanically dewatered.
・As with other sewage treatment methods, it is necessary to make an appeal in anticipation of future construction plans.
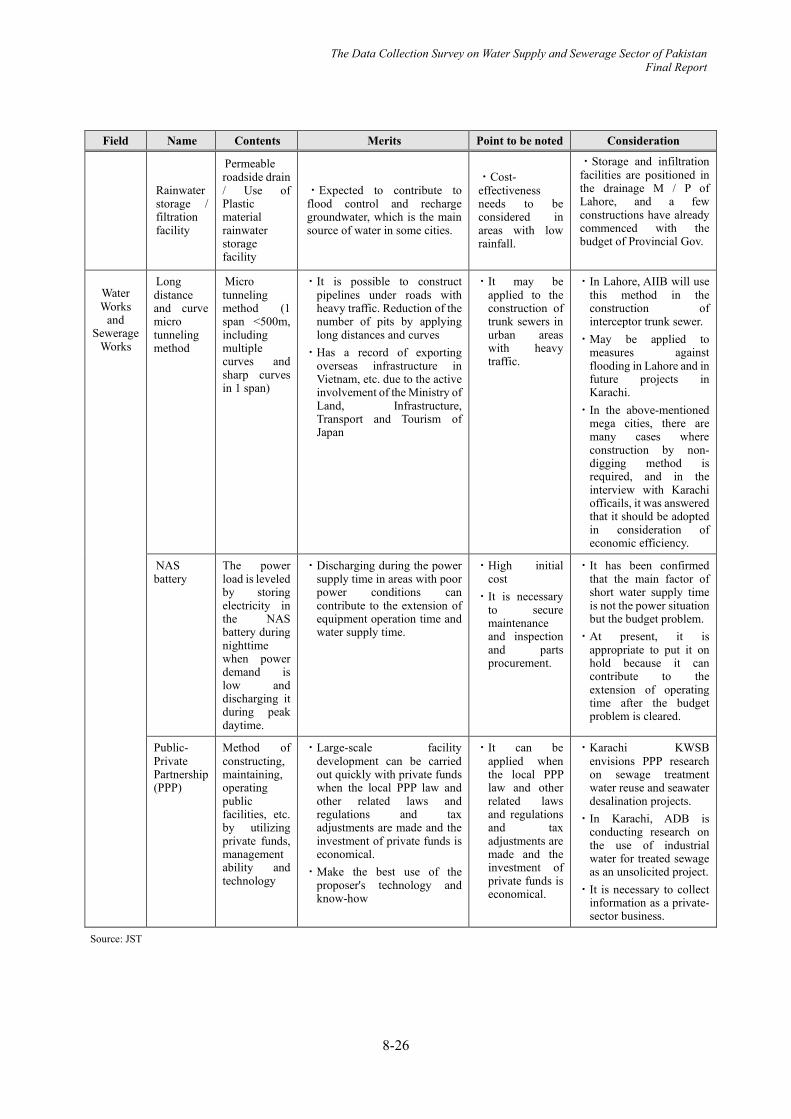
The Data Collection Survey on Water Supply and Sewerage Sector of Pakistan Final Report
8-26
Field Name Contents Merits Point to be noted Consideration
Rainwater storage / filtration facility
Permeable roadside drain / Use of Plastic material rainwater storage facility
・Expected to contribute to flood control and recharge groundwater, which is the main source of water in some cities.
・Cost-effectiveness needs to be considered in areas with low rainfall.
・Storage and infiltration facilities are positioned in the drainage M / P of Lahore, and a few constructions have already commenced with the budget of Provincial Gov.
Water Works
and Sewerage
Works
Long distance and curve micro tunneling method
Micro tunneling method (1 span <500m, including multiple curves and sharp curves in 1 span)
・It is possible to construct pipelines under roads with heavy traffic. Reduction of the number of pits by applying long distances and curves
・Has a record of exporting overseas infrastructure in Vietnam, etc. due to the active involvement of the Ministry of Land, Infrastructure, Transport and Tourism of Japan
・It may be applied to the construction of trunk sewers in urban areas with heavy traffic.
・In Lahore, AIIB will use this method in the construction of interceptor trunk sewer.
・May be applied to measures against flooding in Lahore and in future projects in Karachi.
・In the above-mentioned mega cities, there are many cases where construction by non-digging method is required, and in the interview with Karachi officails, it was answered that it should be adopted in consideration of economic efficiency.
NAS battery
The power load is leveled by storing electricity in the NAS battery during nighttime when power demand is low and discharging it during peak daytime.
・Discharging during the power supply time in areas with poor power conditions can contribute to the extension of equipment operation time and water supply time.
・High initial cost
・It is necessary to secure maintenance and inspection and parts procurement.
・It has been confirmed that the main factor of short water supply time is not the power situation but the budget problem.
・At present, it is appropriate to put it on hold because it can contribute to the extension of operating time after the budget problem is cleared.
Public-Private Partnership (PPP)
Method of constructing, maintaining, operating public facilities, etc. by utilizing private funds, management ability and technology
・Large-scale facility development can be carried out quickly with private funds when the local PPP law and other related laws and regulations and tax adjustments are made and the investment of private funds is economical.
・Make the best use of the proposer's technology and know-how
・It can be applied when the local PPP law and other related laws and regulations and tax adjustments are made and the investment of private funds is economical.
・Karachi KWSB envisions PPP research on sewage treatment water reuse and seawater desalination projects.
・In Karachi, ADB is conducting research on the use of industrial water for treated sewage as an unsolicited project.
・It is necessary to collect information as a private-sector business.
Source: JST