DYNAMIC GROUND WATER RESOURCES OF MADHYA ...
175
DYNAMIC GROUND WATER RESOURCES OF MADHYA PRADESH (As on March, 2020) CENTRAL GROUND WATER BOARD GROUND WATER SURVEY North Central Region Water Resources Department Ministry of Jal Shakti Government of Madhya Pradesh Government of India BHOPAL MARCH 2020
-
Upload
khangminh22 -
Category
Documents
-
view
3 -
download
0
Transcript of DYNAMIC GROUND WATER RESOURCES OF MADHYA ...

DYNAMIC GROUND WATER RESOURCES
OF
MADHYA PRADESH (As on March, 2020)
CENTRAL GROUND WATER BOARD GROUND WATER SURVEY North Central Region Water Resources Department Ministry of Jal Shakti Government of Madhya Pradesh
Government of India BHOPAL
MARCH 2020

DYNAMIC GROUND WATER RESOURCES
OF
MADHYA PRADESH
(As on March, 2020)
CENTRAL GROUND WATER BOARD GROUND WATER SURVEY North Central Region Water Resources Department Ministry of Jal Shakti Government of Madhya Pradesh
Government of India BHOPAL
MARCH 2020


Dynamic Ground Water Resource of Madhya Pradesh -
i
DYNAMIC GROUND WATER RESOURCES OF MADHYA PRADESH, 2020
AT A GLANCE
1. Total Annual Ground Water Recharge (BCM) : 36.16
2. Annual Extractable Ground Water Resource (BCM) : 33.38
3. Annual Ground Water Extraction (BCM) : 18.97
4. Stage of Ground Water Extraction (%) : 56.82
CATEGORISATION OF ASSESSMENT UNITS
(Blocks/ Urban Areas)
Annual Extractable
Ground Water Assessment Units Resource
Sl. Category
No.
Number % in MCM %
1 Safe 233 73.5 % 24254.07 72.66 %
2 Semi-Critical 50 15.77 % 5021.66 15.04 %
3 Critical 8 2.52 % 754.83 2.26 %
4 Over-Exploited 26 8.20 % 3349.83 10.04%
5 Saline 0 0 % 0 0 %
Total 317
33383.40

Dynamic Ground Water Resource of Madhya Pradesh -
ii
C O N T E N T S
CHAPTER TITLE PAGE NO MESSAGES
FOREWORD
PREFACE
AT A GLANCE
EXECUTIVE SUMMARY
CHAPTER-1
1.0 Introduction 1
1.1 Previous Assessments 1
1.2 Re-assessment of Ground Water Resources,2020 3
1.3 Constitution of State Level Committee for Ground Water Resource
Estimation 3
1.4 Proceedings of Resource Estimation 4
CHAPTER-2
2.0 Ground Water Resources Estimation Methodology 6
2.1 Ground Water Assessment of Unconfined Aquifer 6
2.2 Norms to be Used in the Assessment 20
2.4 INDIA-GROUNDWATERRESOURCEESTIMATIONSYSTEM (IN-
GRES) 30
CHAPTER-3
3.0 Background 31
3.1 Rainfall 33
3.2 Physiography 37
3.3 Geomorphology 39
3.4 Land use Land cover 39
3.5 Drainage and Basins 40
3.6 Hydrogeological units and Aquifer Parameters 42
3.7 Ground Water Level Scenario 49
3.8 Hydrochemistry of Groundwater 57

Dynamic Ground Water Resource of Madhya Pradesh -
iii
CHAPTER-4
4.0 Computation of Ground Water Resource 66
4.1 Assessment units 66
4.2 Ground Water Resource of Madhya Pradesh 68
4.3 Ground Water Extraction for all Uses (Domestic, Irrigation, Industrial) 78
4.4 Stage of Ground Water Extraction 83
4.5 Categorization of Assessment Units 83
4.6 Ground Water Available for future Use 83
4.7 Comparison of Resource of 2016-17 with Base Year 2019-20 88
CHAPTER-5
5.0 Ground Water Level Scenario in the Country 92
CHAPTER-6
6.0 Conclusions 111
6.1 Inference from Ground Water Resource Assessment 113
6.2 Recommendations 114
A P P E N D I C E S
A
Government resolution on constitution of Central Level Expert
Group (CLEG) for overall re-assessment of ground water resources
of the country, 2020
114
B Constitution of State Level Committee (as in 2020) 119
C Minutes of First SLC meeting 122
D Minutes of Second SLC meeting and Approval of GW Resource
assessment by the State Level Committee 125
E Minutes of the First meetings of the Central Level Expert Group for
overall re- assessment of ground water resources of country, 2020 128
F Minutes of the Second meetings of the Central Level Expert Group for
overall re- assessment of ground water resources of country, 2020 133
G Approval letter from Ministry 138
H INDIA- GROUNDWATER RESOURCE ESTIMATION SYSTEM (IN-GRES) 140
A N N E X U R E S
IV A Assessment Unit Wise Geographical areas, hilly area, command area,
non-command area and Recharge worthy area
IV B Assessment Unit Wise monsoon and non-monsoon Rainfall recharge
IV C Assessment Unit Wise Other Sources Recharge
IV D Assessment Unit Wise Groundwater Extraction for all uses
IV E List of Safe, Semi-Critical, Critical and Over Exploited Assessment units

Dynamic Ground Water Resource of Madhya Pradesh -
iv
F I G U R E S
3.1 Administrative Map/ Assessment units of Madhya Pradesh 32
3.2 Rainfall Distribution - SW Monsoon 2019, Madhya Pradesh 36
3.3 Annual Normal Rainfall Map, Madhya Pradesh 37
3.4 Physiography Map, Madhya Pradesh 38
3.5 Geomorphology, Madhya Pradesh 39
3.6 Land use Land Cover, Madhya Pradesh 40
3.7 Basins and Major Rivers, Madhya Pradesh 42
3.8 Principal aquifer system, Madhya Pradesh 43
3.9 Hydrogeology Map, Madhya Pradesh 48
3.10 Location of Groundwater Monitoring Wells, Madhya Pradesh 49
3.11 Pre monsoon Water level (May-2019), Madhya Pradesh 50
3.12 Post monsoon Water level (Nov-2019), Madhya Pradesh 51
3.13 Annual Water Level Fluctuation (May 2018- May 2019), Madhya
Pradesh 52
3.14 Annual Water Level Fluctuation (Nov 2018- Nov 2019), Madhya Pradesh 53
3.15 Seasonal Water Level Fluctuation (May 2019- Nov 2019), Madhya
Pradesh 54
3.16 Pre-monsoon Water Level Trend, Madhya Pradesh 56
3.17 Post-monsoon Water Level Trend, Madhya Pradesh 57
3.18 National Hydrographic Station for Groundwater Collection, Madhya
Pradesh 58
3.19 Electrical Conductivity in shallow aquifer, Madhya Pradesh 59
3.20 Fluoride Concentration in shallow aquifer, Madhya Pradesh 61
3.21 Nitrate Concentration in shallow aquifer, Madhya Pradesh 62
4.1 Ground Water Resources and Extraction Scenario, Madhya Pradesh, 2020 71
4.2 Annual Groundwater Recharge per unit area, Madhya Pradesh 78
4.3 Total Groundwater Extraction per unit area, Madhya Pradesh 79
4.4 Categorisation of Assessment units in Madhya Pradesh 84
4.5 Categorisation of Assessment units 84
T A B L E S
1.1
1.1 Ground water Resources assessment 2009 to 2020 2
1.2 Categorization of assessment units from 2009 to 2020 2
2.1 Methods of Estimation of Recharge from different sources 13
2.2 Norms Recommended for Specific Yield 21
2.3 Norms Recommended for Rainfall Infiltration Factor 24
2.4 Norms Recommended for Recharge due to Canals 27
2.5 Norms Recommended for Recharge from Irrigation 28
3.1 District-wise seasonal and annual Rainfall (mm) - Year 2019 33
3.2 District wise monthly Rainfall-Year-2019 34
3.3 District wise Normal Annual Rainfall-Year-2019 36

Dynamic Ground Water Resource of Madhya Pradesh -
v
3.4 Hydrogeological Units, their Potential and Groundwater Scenario,
Madhya Pradesh 44
3.5 Frequency distribution of electrical conductivity in phreatic aquifer
range 59
3.6 Frequency Distribution of Fluoride in Phreatic Aquifer 60
3.7 Frequency distribution of Nitrate in shallow aquifer 62
3.8 Frequency distribution of Total Hardness in shallow aquifer 63
3.9 Quality of Water on the basis of SAR values 63
3.10 Number of wells falling in different RSC ranges 64
3.11
Table showing maximum and minimum values and values exceeding
desirable and permissible limit for drinking use of different
parameters 65
4.1 District wise Area Details, Madhya Pradesh 67
4.2 District wise Recharge, Madhya Pradesh 72
4.3 District wise Recharge from other source components, Madhya
Pradesh 75
4.4 District -wise Ground Water Draft for Various Uses and Stage of
Ground Water Extraction 80
4.5 Category wise Annual Extractable Ground Water Resource 85
4.6 Comparison Of Categorization of Improved and Deteriorated
Assessment Units (2020 And 2017) 89
4.7 District -wise comparison of resource between 2016-17 and 2019-20 89
RFEERENCES 159
ABBREVIATIONS 162

Dynamic Ground Water Resource of Madhya Pradesh -
vi
E X E C U T I V E S U M M A R Y
Dynamic Ground Water Resources Assessment is carried out at periodical
intervals jointly by Central Ground Water Board, North Central Region, Bhopal and
Ground Water Survey, Water Resource Department, Govt. of Madhya Pradesh under the
guidance of State Level Committee and under the overall supervision of Central Level
Expert Group. Such joint exercises have been taken up earlier in 1980, 1995, 2004, 2009,
2011, 2013 and 2017.
The assessment involves computation of Dynamic Ground Water Resources or
Annual Extractable Ground Water Resource, total Current Annual Ground Water
Extraction (utilization) and the percentage of utilization with respect to annual
extractable resources (Stage of Ground Water Extraction). The assessment units (Blocks/
Urban areas) are categorized based on Stage of Ground Water Extraction, which are then
validated with long-term water level trends. The assessment prior to that of year 2017
were carried out following Ground Water Estimation Committee (GEC) 97
Methodology, whereas 2017 as well as the present assessment are based on norms and
guidelines of the GEC 2015 Methodology.
The main source of replenishable ground water resources is recharge from
rainfall, which contributes to nearly 77 % of the total annual ground water recharge. A
major part of the state receives rainfall mainly during SW Monsoon season spread over
the months of mid-June to September. Over 99 % of the annual rainfall is received in the
four rainy months for June to September only thereby leading to large variations on
temporal scale.
Type of rock formations and their storage and transmission characteristics have
a significant influence on ground water recharge. Ground water occurrence in the Hard
rock formations which are occupying nearly 80% of the total geographical area of the
state, are forming poor aquifers. Porous formations such as the alluvial formations in the
Bhind (Chambal basin), Hoshangabad and Narsimhapur districts (Narmada basin) and also
in Sheopur, Morena, Datia, Chhatarpur, Jabalpur, Katni, Khandwa, Burhanpur, Raisen, Sidhi
and Balaghat districts and along rivers in some other districts on the other hand generally
have high specific yields and are good repositories of ground water.

Dynamic Ground Water Resource of Madhya Pradesh -
vii
In the present assessment, the total annual ground water recharge has been
assessed as 36.16 bcm. Keeping an allocation for natural discharge, the annual extractable
ground water resource works out as 33.38 bcm. The total annual ground water extraction
(as in 2020) has been assessed as 18.97 bcm. The average stage of ground water
extraction for the state as a whole works out to be about 56.82%. The extraction of
ground water for various uses in different parts of the state is not uniform. Out of the
total 317 assessment units (Blocks/ Urban areas) in the state, 26 units (8.20 %) have
been categorized as ‘Over-Exploited’ indicating Ground Water extraction exceeding the
total Annual Extractable Resources. A total of 8 (2.52 %) assessment units have been
categorized as ‘Critical’, where the stage of ground water extraction is between 90-100
% of annual extractable resources available. There are 50 ’Semi-Critical’ units (15.77%),
where the stage of ground water extraction is between 70 % and 90 % and 233 (73.51%)
assessment units have been categorized as ‘Safe ‘, where the stage of Ground water
extraction is less than 70 %. Out of 33383.40 mcm of total Annual Extractable Resources
of the state, 3349.83 (10.04 %) are under ‘Over-Exploited’, 754.83 mcm (2.26 %) are
under ‘Critical’, 5021.66 mcm (15.04 %) are under ’Semi-Critical’, 24254.07 mcm
(72.66 %) are under ‘Safe’ category assessment units.
In comparison to 2017 assessment, the total numbers of assessment units in the
state have increased from 313 to 317 as the four urban areas of the state namely Bhopal,
Indore, Gwalior and Jabalpur are added in this year assessment. The total annual ground
water recharge has decreased from 36.42 to 36.16 bcm. The changes are attributed
mainly to changes in recharge from ‘Other Sources’. Accordingly, the annual extractable
resource of Ground Water Resource Assessment, 2020 on comparison Ground Water
Resource Assessment, 2017 shows a decrease from 34.47 to 33.38 bcm. The ground water
extraction has marginally increased from 18.88 to 18.97 bcm and the changes are
attributed mainly to due to increase in the abstraction structures and increase in
population. The overall stage of groundwater extraction has increased from 54.76 % to
56.82 %.
Almost all over-exploited assessment units falling in western part of Madhya
Pradesh, which is known as “MALWA AREA” where ground water extraction has
increased many folds during past decades. District wise analysis of data of annual
extractable resource and annual ground water extraction indicate that four districts namely

Dynamic Ground Water Resource of Madhya Pradesh -
viii
Indore, Mandsaur, Ratlam & Shajapur are districts where stage of ground water extraction
is more than 100% as a whole.

Dynamic Ground Water Resource of Madhya Pradesh -
1
CHAPTER-1
1.0 INTRODUCTION
Water is a fundamental resource for life. Sustainable development and efficient
management of this scarce resource has become a challenge in Madhya Pradesh. Increasing
population, growing urbanization and rapid industrialization combined with the need for raising
agricultural production generates competing demands for water. Ground water has steadily
emerged as the backbone of Madhya Pradesh’s agriculture and drinking water security. Ground
water is an annually replenishable resource but its availability is non- uniform in space and time.
Ground water available in the zone of water level fluctuation is replenished annually with rainfall
being the dominant contributor. Hence, the sustainable utilization of ground water resources
demands a realistic quantitative assessment of ground water availability in this zone based on
reasonably valid scientific principles.
Agriculture is the main stay of the people of Madhya Pradesh. Water is essential for
irrigation purposes, but its indiscriminate use can lead not only to shortages, but also to the
deterioration of crop yields and soils. The impact of over extraction on dynamic resources of
ground water resources is noticed in many places in Madhya Pradesh especially in western part
called Malwa region. In these areas depletion of water levels, drying of wells and ground water
quality problems are reported. The State has varied hydrogeological characteristics due to which
ground water potential varies from place to place. Increasing urbanization and growing
dependence on ground water for irrigation in the state has called for judicious and planned uses of
ground water resources.
The dynamic ground water refers to the quantity of ground water available in the zone of
water level fluctuation, which is active recharge zone and replenished annually. In addition to the
dynamic ground water resource, there exists a limited ground water reservoir in the deeper zones
below the active recharge zone and in the confined aquifers in Madhya Pradesh. The ground water
exploitation primarily confines in the shallow aquifer. The sustainability of shallow aquifers plays
an important role for the development of ground water structures. The sustainable development of
ground water resources, therefore, warrants precise quantitative assessment of dynamic ground
water resources based on the reasonably valid scientific principles.
1.1 PREVIOUS ASSESSMENTS
Ground Water Resources Estimation of the country was done for the first time in the year
1979. A committee known as Ground Water Exploitation Committee was constituted by
Agriculture Refinance and Development Corporation (ARDC) of Government of India Based on

Dynamic Ground Water Resource of Madhya Pradesh - 2020
2
the methodology and norms recommended by the above committee ground water resources were
assessed. Subsequently, necessity was felt to refine the methodologies and the “Ground Water
Estimation Committee (GEC)” headed by the Chairman, CGWB came into existence. Based on
the detailed Surveys and Studies carried out by the different Regions and Projects of CGWB, the
committee recommended the revised methodology in 1984 (GEC- 84) for estimation of ground
water resources.
Again in year 1997, Ground Water Estimation Committee revised its methodology and
suggested the modified methodology for computation of ground water resource estimation, which
was refined on the basis of studies of State Government agencies and CGWB. Based on GEC
1997, the dynamic ground water resources of Madhya Pradesh have been estimated for the state
considering 2004, 2009, 2011 and 2013 as base years. The methodology underwent
comprehensive revisions again in 2015 and a revised methodology, namely GEC 2015
methodology has been prescribed for ground water assessment. This methodology is being
followed for assessment carried out from 2017 onwards. Salient details of status of ground water
resources and categorization of assessment units in 2004, 2009, 2011, 2013, 2017 and 2020 are
shown in Table 1.1 and Table1.2 respectively.
Table.1.0: Ground water Resources assessment 2009 to 2020
Sl.
No.
Ground Water Resources
Assessment 2009 2011 2013 2017 2020
1 Annual Ground Water Recharge (BCM) 33.95 35.04 35.98 36.42 36.16
2 Annual Extractable Ground Water
Resource (BCM) 32.25 33.29 34.16 34.47 33.38
3 Annual Ground Water Extraction for
Irrigation, Domestic & Industrial uses (BCM) 17.99 18.83 19.36 18.88 18.97
4 Stage of Ground Water Extraction (%) 55.7 57 56.68 54.76 56.82
Table.1.1: Categorization of assessment units from 2009 to 2020
Sl.
No.
Categorization of
Assessment units 2009 2011 2013 2017 2020
1 Total Assessed units 313 313 313 313 317
2 Safe 224 218 228 240 233
3 Semi-critical 61 67 58 44 50

Dynamic Ground Water Resource of Madhya Pradesh - 2020
3
Sl.
No.
Categorization of
Assessment units 2009 2011 2013 2017 2020
4 Critical 04 04 02 07 08
5 Over-Exploited 24 24 25 22 26
6 Saline 00 00 00 00 00
1.2 RE-ASSESSMENT OF GROUND WATER RESOURCES, 2020
The assessment of Ground water resources is carried out to determine the prevailing status of
ground water resources in the state. It also helps assess the impact of the on-going ground water
management practices on the groundwater resources. In 2020, Department of Water Resources,
River Development & Ganga Rejuvenation, Ministry of Jal Shakti constituted a Central Level
Expert Group (CLEG) for over-all supervision of the re-assessment of ground water resources in
the entire country as in 2020. The terms of reference of the committee include supervision of
assessment of annual replenish able ground water resources and the status of utilization for
reference year 2020. A copy of the Government Resolution is in Appendix A.
Ground water resources assessment for reference year 2020 in Madhya Pradesh have been
carried out jointly by Central Ground Water Board (CGWB), North Central Region, Bhopal in
association with Ground Water Survey, Water Resources Department, Government of M.P. under
the supervision of State Level Committee (Appendix B), with technical guidance from Central
Level Expert Group. The assessment carried out was approved by the State Level Committee
(Appendix D). Based on the assessments the Report titled “Dynamic Ground Water Resources of
Madhya Pradesh-2020” has been compiled. The report briefly describes salient features of
previous assessments, ground water estimation methodology, rainfall distribution, physiography,
geomorphology, land use land cover, drainage and basins hydrogeology, aquifer systems of
Madhya Pradesh, ground water level and ground water quality scenario, and various components
of the ground water resource assessment, 2020 in detail.
The report was reviewed and deliberated upon during the meeting of CLEG held on
31.03.2021, and was approved as mentioned in Appendix E.
1.3 CONSTITUTION OF STATE LEVEL COMMITTEE FOR GROUND
WATERRESOURCE ESTIMATION
The reassessment of dynamic ground water resources of Madhya Pradesh for the base year
2019-20, has been presently estimated. A State Level Technical Committee was constituted for
Re-Estimation of Ground Water Resources of Madhya Pradesh under the Chairmanship of the
Additional Chief Secretary, Water Resources Department, Government of M.P. vide Memo No.

Dynamic Ground Water Resource of Madhya Pradesh - 2020
4
F-15/21/2016/Minor/31/1244 dated 23.09.2020 for the assessment 2019-20 (Appendix B). The
structure of Committee was with following nominees of different departments:
1. Additional Chief Secretary,
Water Resources Department, Government of M.P. - Chairman
2. Commissioner, Urban Development and Housing Department - Member
3. Engineer -in - Chief, Water Resources Department - Member
4. Engineer -in - Chief, Public Health Engineering Department - Member
5. Engineers -in - Chief, RES - Member
6. Director, Agriculture, Government of M.P. - Member
7. Director, Industries, Government of M.P. - Member
8. General Manager, NABARD, Bhopal - Member
9. Director, Rajeev Gandhi Watershed Mission, Government of M.P. - Member
10. Chief Engineer, BODHI, Water Resources Department - Member
11. Superintending Geo Hydrologist, GWSC, Circle Bhopal - Member
12. Resource Scientist, State GW Data Centre, Bhopal - Member
13. Regional Director, CGWB, NCR, Bhopal - Member Secretary
1.4 PROCEEDINGS OF THE RESOURCE ESTIMATION
First State level meeting was held on 04.12.2020 under the Chairmanship of Sh. S N
Mishra, Additional Chief Secretary, Water Resources Department, Govt. of Madhya Pradesh. In
the meeting Sh. M. S. Sonkusare, Head of office, CGWB, NCR, Bhopal explained the planning of
assessment of Dynamic Groundwater Resource of Madhya Pradesh (As on March' 2020). It was
decided in the meeting that all data will be provided by all the line departments by 31st January,
2021 and all attempts will be made to complete the Dynamic Groundwater resource estimation by
the end of February 2021. The minutes of the meeting and the list of participants is enclosed as
Appendix C.
Thereafter, the Groundwater resource estimation work was taken up jointly by CGWB,
NCR, Bhopal and State Groundwater Survey, WRD under the supervision of Sh. G P Soni, Chief
Engineer, BODHI, Water Resource Department and Sh. P.K. Jain, Regional Director, CGWB,
NCR, Bhopal. For the first time exercise was done through IN-GRES (India-Groundwater
Resource Estimation System), a software solution developed by CGWB in collaboration with IIT-
Hyderabad for the purpose of Resource Estimation Automation. Virtual as well as hands on
training programs were conducted by CGWB showcasing INGRES features, data upload, trigger
computations and approve the results. Sh. Chitta Ranjan Biswal, Scientist 'B', CGWB, NCR,
Dynamic Ground Water Resource of Madhya Pradesh - 2020
5
Bhopal provided necessary guidance for computation of Groundwater Resource works and
reconciliation of the entire exercises. Dr. Jitendra Jain, Superintending Engineer and Sh. Bijendra
Baghel, Scientific Officer from Ground Water Survey, Water Resource Department coordinated
and monitored the progress of the works done by officers of Ground Water Survey. The data
uploaded in INGRES software by Officers of State Ground Water Survey were checked, validated
and discrepancies noticed were corrected under the direction of Sh. Chitta Ranjan Biswal, Scientist
'B', CGWB, NCR, Bhopal.
Second State level meeting was held virtually on 07.04.2021 under the Chairmanship of
Sh. S N Mishra, Additional Chief Secretary, Water Resources Department, Govt. of Madhya
Pradesh. Sh. Chitta Ranjan Biswal, Scientist 'B', CGWB, NCR, Bhopal presented the gist on
Dynamic Ground Water Resource Assessment (As on March' 2020). The resources were discussed
thoroughly by the members of the committee and after discussion the Dynamic Ground Water
Resource of Madhya Pradesh as on March’ 2020 was approved. The minutes of the meeting and
the list of participants is enclosed as Appendix D.
After approval from the state level committee the Dynamic Groundwater Resource got
approved from the competent authority, Ministry of Jal Shakti, Govt. of India on 15.06.2020.
(Appendix G). After approval from the Ministry Dynamic Groundwater Resource of Madhya
Pradesh (As on March' 2020) was prepared by Sh. Chitta Ranjan Biswal, Scientist 'B', CGWB,
NCR, Bhopal under the guidance of Sh. P K Jain, Regional Director, CGWB, NCR, Bhopal.

Dynamic Ground Water Resource of Madhya Pradesh - 2020
6
CHAPTER-2
2.0 GROUND WATER RESOURCE ESTIMATION METHODOLOGY
Ground water resource as in 2020 have been estimated following the guidelines mentioned
in the GEC 2015 methodology using appropriate assumptions depending on data availability. The
principal attributes of GEC 2015 methodology are given below:
The methodology recommends aquifer wise ground water resource assessment of both the
Groundwater resources components, i.e., Replenish able ground water resources or Dynamic
Ground Water Resources and In-storage Resources or Static Resources. Wherever the aquifer
geometry has not been firmly established for the unconfined aquifer, the in-storage ground water
resources have to be assessed in the alluvial areas down to the depth of bed rock or 300 m,
whichever is less. In case of hard rock aquifers, the depth of assessment would be limited to 100
m. In case of confined aquifers, if it is known that groundwater extraction is being done from this
aquifer, the dynamic as well as in-storage resources are to be estimated. If it is firmly established
that there is no ground water extraction from this confined aquifer, then only in-storage resources
of that aquifer has to be estimated. Until aquifer geometry is established on appropriate scale, the
existing practice of using watershed in hard rock areas and blocks/mandals/ firkas in soft rock
areas may be continued.
It is also pertinent to add that as it is advisable to restrict the groundwater development as
far as possible to annual replenish able resources, the categorization also takes into account the
relation between the annual replenishment and groundwater development. An area devoid of
ground water potential may not be considered for development and may remain safe whereas an
area with good groundwater potential may be developed and may become over exploited over a
period of time. Thus, water augmentation efforts can be successful in such areas, where the
groundwater potential is high and there is scope for augmentation.
2.1 GROUND WATER ASSESSMENT OF UNCONFINED AQUIFER
Though the assessment of ground water resources includes assessment of dynamic and in-
storage resources, the development planning should mainly focus on dynamic resource as it gets
replenished on an annual basis. Changes in static or in-storage resources normally reflect long-
term impacts of ground water mining. Such resources may not be replenishable annually and may
be allowed to be extracted only during exigencies with proper planning for augmentation in the
succeeding excess rainfall years.

Dynamic Ground Water Resource of Madhya Pradesh - 2020
7
2.1.1 Assessment of Annually Replenish able or Dynamic Ground Water
Resources The methodology for ground water resources estimation is based on the principle of
water balance as given below –
𝐼𝑛𝑓𝑙𝑜w − 𝑂𝑢𝑡𝑓𝑙𝑜w = 𝐶ℎ𝑎𝑛𝑔𝑒 i𝑛 𝑆𝑡𝑜𝑟𝑎𝑔𝑒 (𝑜𝑓 𝑎𝑛 𝑎q𝑢i𝑓𝑒𝑟) .................................. (1)
Equation (1) can be further elaborated as –
∆𝑆 = 𝘙𝘙𝐹 + 𝘙𝑆𝑇𝘙 + 𝘙𝐶 + 𝘙𝑆W𝐼 + 𝘙𝐺W𝐼 + 𝘙𝑇𝑃 + 𝘙W𝐶𝑆 ± 𝑉𝐹 ± 𝐿𝐹 − 𝐺𝐸 − 𝑇 − 𝐸 − 𝐵 ............. (2)
Where,
ΔS - Change in storage
RRF –Rainfall Recharge
RSTR - Recharge from stream channels
RC - Recharge from canals
RSWI - Recharge from surface water irrigation
RGWI - Recharge from ground water irrigation
RTP - Recharge from Tanks & Ponds
RWCS - Recharge from water conservation structures
VF - Vertical flow across the aquifer system
LF - Lateral flow along the aquifer system (through flow)
GE - Ground Water Extraction
T -Transpiration
E – Evaporation
B - Base flow
It is preferred that all the components of water balance equation should be estimated in an
assessment unit. Due to lack of data for all the components in most of the assessment units, it is
proposed that at present the water budget may be restricted to the major components only, taking
into consideration certain reasonable assumptions. The estimation is to be carried out using
lumped parameter estimation approach keeping in mind that data from many more sources if
available may be used for refining the assessment.
2.1.2 Rainfall Recharge
It is recommended that ground water recharge should be estimated on ground water level
fluctuation and specific yield approach since this method takes into account the response of ground
water levels to ground water input and output components. This, however, requires adequately
spaced representative water level measurement for a sufficiently long period. It is proposed that

Dynamic Ground Water Resource of Madhya Pradesh - 2020
8
there should be at least three spatially well distributed observation wells in the assessment unit, or
one observation well per 100 sq. Km. Water level data should also be available for a minimum
period of 5 years (preferably 10years), along with corresponding rainfall data. Regarding
frequency of water level data, two water level readings, during pre and post monsoon seasons, are
the minimum requirement. It would be ideal to have monthly water level measurements to record
the peak rise and maximum fall in the ground water levels. In units or subareas where adequate
data on ground water level fluctuations are not available as specified above, ground water recharge
may be estimated using rainfall infiltration factor method only. The rainfall recharge during non-
monsoon season may be estimated using rainfall infiltration factor method only.
2.1.2.1 Ground Water Level Fluctuation Method
The ground water level fluctuation method is to be used for assessment of rainfall recharge in
the monsoon season. The ground water balance equation in non-command areas is given by
∆𝑆 = 𝘙𝘙𝐹 + 𝘙𝑆𝑇𝘙 + 𝘙𝑆W𝐼 + 𝘙𝐺W𝐼 + 𝘙𝑇𝑃 + 𝘙W𝐶𝑆 ± 𝑉𝐹 ± 𝐿𝐹 − 𝐺𝐸 − 𝑇 − 𝐸 − 𝐵 ............................. (3)
Where,
ΔS - Change is storage
RRF - Rainfall recharge
RSTR - Recharge from stream channels
RSWI - Recharge from surface water irrigation
RGWI-Recharge from ground water irrigation
RTP - Recharge from Tanks & Ponds
RWCS - Recharge from water conservation structures
VF - Vertical flow across the aquifer system
LF - Lateral flow along the aquifer system (through flow)
GE - Ground water extraction
T-Transpiration
E - Evaporation
B - Base flow
Whereas the water balance equation in command area will have another term i.e., Recharge
due to canals (RC) and the equation will be as follows:
∆𝑆 = 𝘙𝘙𝐹 + 𝘙𝑆𝑇𝘙 + 𝘙𝐶 + 𝘙𝑆W𝐼 + 𝘙𝐺W𝐼 + 𝘙𝑇𝑃 + 𝘙W𝐶𝑆 ± 𝑉𝐹 ± 𝐿𝐹 − 𝐺𝐸 − 𝑇 − 𝐸 − 𝐵 .................... (4)
A couple of important observations in the context of water level measurement must be
followed. It is important to bear in mind that while estimating the quantum of ground water

Dynamic Ground Water Resource of Madhya Pradesh - 2020
9
extraction, the depth from which ground water is being extracted should be considered. One should
consider only the draft from the same aquifer for which the resource is being estimated.
The change in storage can be estimated using the following equation:
∆𝑆 = ∆ℎ × 𝐴 × 𝑆𝑌 … … … … … … … … … … … … … … … … . (5)
Where,
ΔS - Change is storage
Δh - rise in water level in the monsoon season
A - Area for computation of recharge
SY - Specific Yield
Substituting the expression in equation (5) for storage increase ΔS in terms of water level
fluctuation and specific yield, the equations (3) & (4) becomes (6) & (7) for non-command and
command sub- units,
𝑹𝑹 = ∆𝒉 × 𝑨 × 𝑺𝒀 − 𝑹𝑺𝑻𝑹 − 𝑹𝑺𝑾𝑰 − 𝑹𝑮𝑾𝑰 − 𝑹 𝑻𝑷 − 𝑹𝑾𝑪𝑺 ± 𝑽𝑭 ± 𝑳𝑭 + 𝑮𝑬 + 𝑻 + 𝑬 + 𝑩 … … … … (𝟔)
𝑹𝑹 = ∆𝒉 × 𝑨 × 𝑺𝒀 − 𝑹𝑺𝑻𝑹 − 𝑹𝑺𝑾𝑰 − 𝑹 𝑪 − 𝑹 𝑻𝑷 − 𝑹𝑾𝑪𝑺 ± 𝑽𝑭 ± 𝑳𝑭 + 𝑮𝑬 + 𝑻 + 𝑬 + 𝑩 … … … … (𝟕)
Where base flow/ recharge to/from streams have not been estimated, the same is assumed
to be zero. The rainfall recharge obtained by using equation (6) and (7) provides the recharge in
any particular monsoon season for the associated monsoon season rainfall. This estimate is to be
normalized for the normal monsoon season rainfall as per the procedure indicated below.
2.1.2.2 Normalization of Rainfall Recharge
Let Ri be the rainfall recharge and ri be the associated rainfall. The subscript “i” takes
values 1 to N where N is the number of years for which data is available. This should be at least
5. The rainfall recharge, Ri is obtained as per equation (6) & equation (7) depending on the sub-
unit for which the normalization is being done.
After the pairs of data on Ri and ri have been obtained as described above, a normalization
procedure is to be carried out for obtaining the rainfall recharge corresponding to the normal
monsoon season rainfall. Let r(normal) be the normal monsoon season rainfall obtained as the
average of recent 30 to 50 years of monsoon season rainfall. Two methods are possible for the
normalization procedure. The first method is based on a linear relationship between recharge and
rainfall of the form
𝘙 = 𝑎𝑟 … … … … … … … … …… … … … … … … … . . … … … . (8)

Dynamic Ground Water Resource of Madhya Pradesh - 2020
10
` Where,
R =Rainfall recharge during monsoon season
r = Monsoon season rainfall
a = a constant
The computational procedure to be followed in the first method is as given below:
𝑅𝑅𝐹(𝑁𝑜𝑟𝑚𝑎𝑙) = ∑ [𝑅𝑖
𝑟 (𝑁𝑜𝑟𝑚𝑎𝑙)𝑟𝑖
]𝑁𝑖=1
𝑁… … … … … … … … … … … … (9)
Where,
RRF (normal) - Normalized Rainfall Recharge in the monsoon season,
Ri - Rainfall Recharge in the monsoon season for the ith year
r(normal) - Normal monsoon season rainfall,
ri - Rainfall in the monsoon season for the ith year,
N - No. of years for which data is available.
The second method is also based on a linear relation between recharge and rainfall.
However, this linear relationship is of the form,
𝘙𝘙𝐹(𝑛𝑜𝑟𝑚𝑎𝑙) = 𝑎 × 𝑟(𝑛𝑜𝑟𝑚𝑎𝑙) + 𝑏 … … … … … … … … … … … … … … … … … … … … . . (10)
Where,
RRF(normal) - Normalized Rainfall Recharge in the monsoon season
r(normal) - Normal monsoon season rainfall
a and b - constants.
The two constants ‘a’ and ‘b’ in the above equation are obtained through a linear
regression analysis. The computational procedure to be followed in the second method is as given
below:
𝑎 = 𝑁𝑆4 − 𝑆1𝑆2
𝑁𝑆3 − 𝑆12 … … … … … … … … … … … … … … … … . . … ( 11 )
𝑏 = 𝑆2 − 𝑎𝑆1
𝑁… … … … … … … … … … … … … … … … … … (12)
Where,
𝑆1 = ∑ 𝑟 𝑖𝑁𝑖=1 , 𝑆2 = ∑ 𝑟 𝑖
𝑁𝑖=1 , 𝑆3 = ∑ 𝑟2𝑖
𝑁𝑖=1 , 𝑆4 = ∑ 𝑅1𝑟𝑖
𝑁𝑖=1
2.1.2.3 Rainfall Infiltration Factor Method

Dynamic Ground Water Resource of Madhya Pradesh - 2020
11
The rainfall recharge estimation based on Water level fluctuation method reflects actual
field conditions since it takes into account the response of ground water level. However, the
ground water extraction estimation included in the computation of rainfall recharge using water
level fluctuation approach is often subject to uncertainties. Therefore, it is recommended to
compare the rainfall recharge obtained from water level fluctuation approach with that estimated
using rainfall infiltration factor method. Recharge from rainfall is estimated by using the following
relationship –
𝘙𝘙𝐹 = 𝘙𝐹𝐼𝐹 × 𝐴 ×R−a
1000 … … … … … … … … … … … … … … … … 1 3
Where,
A - Area in hectares
RRF - Rainfall recharge in ham
RFIF - Rainfall Infiltration Factor
R - Rainfall in mm
a - Minimum threshold value above which rainfall induces ground Water recharge in mm
The threshold limit of minimum and maximum rainfall event which can induce recharge
to the aquifer is to be considered while estimating ground water recharge using rainfall infiltration
factor method. The minimum threshold limit is in accordance with the relation shown in equation
(13) and the maximum threshold limit is based on the premise that after a certain limit, the rate of
storm rain is too high to contribute to infiltration and they will only contribute to surface runoff.
It is suggested that 10% of Normal annual rainfall may be taken as minimum rainfall threshold
and 3000 mm as maximum rainfall limit. While computing the rainfall recharge, 10% of the
normal annual rainfall is to be deducted from the monsoon rainfall and balance rainfall would be
considered for computation of rainfall recharge. The same recharge factor may be used for both
monsoon and non-monsoon rainfall, with the condition that the recharge due to non-monsoon
rainfall may be taken as zero, if the normal rainfall during the non-monsoon season is less than
10% of normal annual rainfall. In using the method based on the specified norms, recharge due to
both monsoon and non-monsoon rainfall may be estimated for normal rainfall, based on recent 30
to 50 years of data.

Dynamic Ground Water Resource of Madhya Pradesh - 2020
12
2.1.2.4 Percent Deviation
After computing the rainfall recharge for normal monsoon season rainfall using the
ground water level fluctuation method and rainfall infiltration factor method these two estimates
have to be compared with each other. A term, Percent Deviation (PD) which is the difference
between the two expressed as a percentage of the later is computed as
𝑃𝐷 = 𝖱𝖱(normal,wtfm)– 𝖱𝖱F(normal,rif m)
𝖱𝖱F(normal,rif m) × 100 … … … … … … … … … … … . (14)
Where,
RRF (normal, wlfm) = Rainfall recharge for normal monsoon season rainfall estimated by
the ground water level fluctuation method
RRF (normal, rifm) = Rainfall recharge for normal monsoon season rainfall estimated by
the rainfall infiltration factor method
The rainfall recharge for normal monsoon season rainfall is finally adopted as per the
criteria given below:
• If PD is greater than or equal to -20%, and less than or equal to +20%, RRF (normal)
is taken as the value estimated by the ground water level fluctuation method.
• If PD is less than -20%, RRF (normal) is taken as equal to 0.8 times the value estimated
by the rainfall infiltration factor method.
• If PD is greater than +20%, RRF (normal) is taken as equal to 1.2 times the value
estimated by the rainfall infiltration factor method.
2.1.3 Recharge from Other Sources
Recharge from other sources constitutes recharges from canals, surface water irrigation,
ground water irrigation, tanks & ponds and water conservation structures in command areas where
as in non-command areas it constitutes the recharge due to surface water irrigation, ground water
irrigation, tanks & ponds and water conservation structures. The methods of estimation of recharge
from different sources are as follows.
Table.2.1: Methods of estimation of recharge from different sources
Sl. No. Source Estimation Formula Parameters
1
Recharge from
𝑅𝐶 = W𝐴 × 𝑆𝐹 × 𝐷𝑎𝑦𝑠
RC = Recharge from Canals WA = Wetted Area
SF = Seepage Factor
Days = Number of Canal Running Days

Dynamic Ground Water Resource of Madhya Pradesh - 2020
13
Sl. No. Source Estimation Formula Parameters
Canals
2
Recharge from
Surface Water
Irrigation
𝑅𝑆𝖶𝐼 = 𝐴𝐷 × 𝐷𝑎𝑦𝑠 × 𝑅𝐹𝐹
RSWI = Recharge due to applied surface water
irrigation
AD = Average Discharge
Days = Number of days’ water is discharged to the
Fields
RFF = Return Flow Factor
3
Recharge from
Ground Water
Irrigation
𝑅𝐺𝖶𝐼 = 𝐺𝐸𝐼𝑅𝑅 × 𝑅𝐹𝐹
RGWI = Recharge due to applied ground water
irrigation
GEIRR = Ground Water Extraction for Irrigation
RFF = Return Flow Factor
4
Recharge due to
Tanks & Ponds
𝑅𝑇𝑃 = 𝐴W𝑆𝐴 × 𝑁 × 𝑅𝐹
RTP = Recharge due to Tanks & Ponds
AWSA = Average Water Spread Area
N = Number of days Water is available in the
Tank/Pond
RF = Recharge Factor
5
Recharge due to
Water
Conservation
Structures
𝑅𝖶𝐶𝑆 = 𝐺𝑆 × 𝑅𝐹
RWCS = Recharge due to Water Conservation
Structures
GS = Gross Storage = Storage Capacity multiplied
by number of fillings.
RF = Recharge Factor
2.1.4 Evaporation and Transpiration
Evaporation can be estimated for the aquifer in the assessment unit if water levels in the
aquifer are within the capillary zone. It is recommended to compute the evaporation through field
studies. If field studies are not possible, for areas with water levels within 1.0mbgl, evaporation
can be estimated using the evaporation rates available for other adjoining areas. If depth to water
level is more than 1.0mbgl, the evaporation losses from the aquifer should be taken as zero.
Transpiration through vegetation can be estimated if water levels in the aquifer are within
the maximum root zone of the local vegetation. It is recommended to compute the transpiration
through field studies. Even though it varies from place to place depending on type of soil

Dynamic Ground Water Resource of Madhya Pradesh - 2020
14
&vegetation, in the absence of field studies the following estimation can be followed. If water
levels are within 3.5m bgl, transpiration can be estimated using the transpiration rates available
for other areas. If it is greater than 3.5m bgl, the transpiration should be taken as zero.
For estimating evapotranspiration, field tools like Lysimeters can be used to estimate
actual evapotranspiration. Usually agricultural universities and IMD carry out lysimeter
experiments and archive the evapotranspiration data. Remote sensing based techniques like
SEBAL (Surface Energy Balance Algorithm for Land) can be used for estimation of actual
evapotranspiration. Assessing offices may apply available lysimeter data or other techniques for
estimation of evapotranspiration. In case where such data is not available, evapotranspiration
losses can be empirically estimated from PET data provided by IMD.
2.1.5 Recharge During Monsoon Season
The sum of normalized monsoon rainfall recharge and the recharge from other sources and
lateral and vertical flows into & out of the sub unit and stream inflows & outflows during
monsoon season is the total recharge/ accumulation during monsoon season for the sub unit.
Similarly, this is to be computed for all the sub units available in the assessment unit.
2.1.6 Recharge During Non-Monsoon Season
The rainfall recharge during non-monsoon season is estimated using rainfall infiltration
factor Method only when the non-monsoon season rainfall is more than 10% of normal annual
rainfall. The sum of non-monsoon rainfall recharge and the recharge from other sources and lateral
and vertical flows into & out of the sub unit and stream inflows & outflows during non-monsoon
season is the total recharge/ accumulation during non-monsoon season for the sub unit. Similarly,
this is to be computed for all the sub units available in the assessment unit.
2.1.7 Total Annual Ground Water Recharge
The sum of the recharge/ accumulations during monsoon and non-monsoon seasons is the
total annual ground water recharge/ accumulations for the sub unit. Similarly, this is to be
computed for all the sub units available in the assessment unit.
2.1.8 Annual Extractable Ground Water Resource (EGR)
The Annual Extractable Ground Water Resource (EGR) is computed by deducting the
Total Annual Natural Discharge from Total Annual Ground Water Recharge.
The ground water base flow contribution limited to the ecological flow of the river should
be determined which will be deducted from Annual Ground Water Recharge to determine Annual
Extractable Ground Water Resources (EGR). The ecological flows of the rivers are to be
determined in consultation with Central Water Commission and other concerned river basin

Dynamic Ground Water Resource of Madhya Pradesh - 2020
15
agencies. In case base flow contribution to the ecological flow of rivers is not determined then
following assumption is to be followed.
In the water level fluctuation method, a significant portion of base flow is already
accounted for by taking the post monsoon water level one month after the end of rainfall. The base
flow in the remaining non-monsoon period is likely to be small, especially in hard rock areas. In
the assessment units, where river stage data are not available and neither the detailed data for
quantitative assessment of the natural discharge are available, present practice (GEC 1997) of
allocation of unaccountable natural discharges to 5% or 10% of annual recharge may be retained.
If the rainfall recharge is assessed using water level fluctuation method this will be 5% of the
annual recharge and if it is assessed using rainfall infiltration factor method, it will be 10% of the
annual recharge. The balance will account for Annual Extractable Ground Water Resources
(EGR).
2.1.9 Estimation of Ground Water Extraction
Ground water draft or extraction is to be assessed as follows.
GEALL = GEI𝖱𝖱 + GEDO + GEIND … … … … … … … … … … … … … … … … (15)
Where,
GEALL = Ground water extraction for all uses
GEIRR = Ground water extraction for irrigation
GEDOM = Ground water extraction for domestic uses
GEIND = Ground water extraction for industrial uses
2.1.9.1 Ground Water Extraction for Irrigation (GEIRR)
The methods for estimation of ground water extraction are as follows.
Unit Draft Method: – In this method, season-wise unit draft of each type of well in an assessment
unit is estimated. The unit draft of different types (eg. Dug well, dug cum bore well, shallow tube
well, deep tube well, bore well etc.) Is multiplied with the number of wells of that particular type
to obtain season-wise ground water extraction by that particular structure.
Crop Water Requirement Method: – For each crop, the season-wise net irrigation water
requirement is determined. This is then multiplied with the area irrigated by ground water
abstraction structures. The database on crop area is obtained from Revenue records in Tehsil
office, Agriculture Census and also by using Remote Sensing techniques.

Dynamic Ground Water Resource of Madhya Pradesh - 2020
16
Power Consumption Method: –Ground water extraction for unit power consumption (electric) is
determined. Extraction per unit power consumption is then multiplied with number of units of
power consumed for agricultural pump sets to obtain total ground water extraction for irrigation.
2.1.9.2 Ground Water Extraction for Domestic Use (GEDOM)
There are several methods for estimation of extraction for domestic use(GEDOM). Some
of the commonly adopted methods are described here.
Unit Draft Method: – In this method, unit draft of each type of well is multiplied by the number
of wells used for domestic purpose to obtain the domestic ground water extraction.
Consumptive Use Method: – In this method, population is multiplied with per capita consumption
usually expressed in litre per capita per day (lpcd). It can be expressed using following equation.
GDO= 𝑃𝑜𝑝𝑢𝑙𝑎𝑡i𝑜𝑛 × 𝐶𝑜𝑛𝑠𝑢𝑚𝑝𝑡i𝑣𝑒 𝘙𝑒q𝑢i𝑟𝑒𝑚𝑒𝑛𝑡 × 𝐿𝑔……………… (16)
Where,
Lg = Fractional Load on Ground Water for Domestic Water Supply.
The Load on Ground water can be obtained from the Information based on Civic water supply
agencies in urban areas.
2.1.9.3 Ground Water Extraction for Industrial Use (GEIND)
The commonly adopted methods for estimating the extraction for industrial use are as
below:
Unit Draft Method: - In this method, unit draft of each type of well is multiplied by the number
of wells used for industrial purpose to obtain the industrial ground water extraction.
Consumptive Use Pattern Method: – In this method, water consumption of different industrial
units is determined. Numbers of Industrial units which are dependent on ground water are
multiplied with unit water consumption to obtain ground water extraction for industrial use.
𝐺𝐸𝐼𝑁𝐷 = 𝑁𝑢𝑚𝑏𝑒𝑟 𝑜𝑓 𝐼𝑛𝑑𝑢𝑠𝑡𝑟i𝑎𝑙 𝑈𝑛i𝑡𝑠 × 𝑈𝑛i𝑡 W𝑎𝑡𝑒𝑟 𝐶𝑜𝑛𝑠𝑢𝑚𝑝𝑡i𝑜𝑛 × 𝐿𝑔 ....................... (17)
Where,
Lg = Fractional load on ground water for industrial water supply.
The load on ground water for industrial water supply can be obtained from water supply agencies
in the Industrial belt.

Dynamic Ground Water Resource of Madhya Pradesh - 2020
17
Ground water extraction obtained from different methods need to be compared and based
on field checks, the seemingly best value may be adopted. At times, ground water extraction
obtained by different methods may vary widely. In such cases, the value matching the field
situation should be considered. The storage depletion during a season, where other recharges
are negligible can be taken as ground water extraction during that particular period.
2.1.10 Stage of Ground Water Extraction
The stage of ground water extraction is defined by.
Stage of GW E𝗑traction = E𝗑isting Gross GW E𝗑traction for all Uses
Annual E𝗑tractable GW 𝖱esources × 100 … … … (18)
The existing gross ground water extraction for all uses refers to the total of existing gross
ground water extraction for irrigation and all other purposes. The stage of ground water
extraction should be obtained separately for command areas, non-command areas and poor
ground water quality areas.
2.1.11 Validation of Stage of Ground Water Extraction
The assessment based on the stage of ground water extraction has inherent uncertainties.
In view of this, it is desirable to validate the ‘Stage of Ground Water Extraction’ with long term
trend of ground water levels.
Long term Water Level trends are prepared for a minimum period of 10 years for both pre-
monsoon and post-monsoon period. If the ground water resource assessment and the trend of long
term water levels contradict each other, this anomalous situation requires a review of the ground
water resource computation, as well as the reliability of water level data. The mismatch conditions
are enumerated below.
SOGWE Ground Water Level Trend Remarks
≤ 70% Significant decline in trend
monsoon and post-monsoon
in both pre- Not acceptable and needs
reassessment
> 100% No significant decline in both pre-monsoon and
post-monsoon long term trend
Not acceptable and needs
reassessment
2.1.12 Categorization of Assessment Unit
As emphasized in the National Water Policy, 2012, a convergence of Quantity and Quality
of ground water resources is required while assessing the ground water status in an assessment
unit. Therefore, it is recommended to separate estimation of resources where water quality is
beyond permissible limits for the parameter salinity.

Dynamic Ground Water Resource of Madhya Pradesh - 2020
18
The categorization based on status of ground water quantity is defined by Stage of Ground Water
Extraction as given below:
Stage of Ground Water Extraction Category
≤ 70% Safe
> 70% and ≤90% Semi-critical
> 90% and ≤100% Critical
> 100% Over Exploited
2.1.13 Allocation of Ground Water Resource for Utilization
The Annual Extractable Ground Water Resources are to be apportioned between domestic,
industrial and irrigation uses. Among these, as per the National Water Policy, requirement for
domestic water supply is to be accorded priority. This requirement has to be based on population
as projected to the year 2025, per capita requirement of water for domestic use, and relative load
on ground water for urban and rural water supply. In situations where adequate data is not available
to make this estimate, the following empirical relation is recommended.
𝐴𝑙𝑙𝑜𝑐 = 22 × 𝑁 × 𝐿𝑔 𝑚𝑚 𝑝𝑒𝑟 𝑦𝑒𝑎𝑟 … … … … … … … … . … … … … … … … . (19)
Where,
Alloc = Allocation for domestic water requirement
N = population density in the unit in thousands per sq. km.
Lg = fractional load on ground water for domestic water supply (≤ 1.0)
In deriving equation (19), it is assumed that the requirement of water for domestic use is
60 lpd per head. The equation can be suitably modified in case per capita requirement is different.
If by chance, the estimation of projected allocation for future domestic needs is less than the current
domestic extraction due to any reason, the allocation must be equal to the present day extraction.
It can never be less than the present day extraction as it is unrealistic.
2.1.13 Net Annual Ground Water Availability for Future Use
The water available for future use is obtained by deducting the allocation for domestic use
and current extraction for Irrigation and Industrial uses from the Annual Extractable Ground Water
Recharge. The resulting ground water potential is termed as the net annual ground water
availability for future use. The Net annual ground water availability for future use should be

Dynamic Ground Water Resource of Madhya Pradesh - 2020
19
calculated separately for non-command areas and command areas. As per the recommendations
of the R&D Advisory committee, the ground water available for future use can never be negative.
If it becomes negative, the future allocation of Domestic needs can be reduced to current extraction
for domestic use. Even then if it is still negative, then the ground water available for future uses
will be zero.
2.1.14 Ground Water Assessment Urban Areas
The Assessment of Ground Water Resources in urban areas is similar to that of rural areas.
Because of the availability of draft data and slightly different infiltration process and recharge due
to other sources, the following few points are to be considered.
• Even though the data on existing ground water abstraction structures are available,
accuracy is somewhat doubtful and individuals cannot even enumerate the well census in
urban areas. Hence it is recommended to use the difference of the actual demand and the
supply by surface water sources as the withdrawal from the ground water resources.
• The urban areas are sometimes concrete jungles and rainfall infiltration is not equal to that
of rural areas unless and until special measures are taken in the construction of roads and
pavements. Hence, it is proposed to use 30% of the rainfall infiltration factor proposed for
urban areas as an adhoc arrangement till field studies in these areas are done and
documented field studies are available.
• Because of the water supply schemes, there are many pipelines available in the urban areas
and the seepages from these channels or pipes are huge in some areas. Hence this
component is also to be included in the other resources and the recharge may be estimated.
The percent losses may be collected from the individual water supply agencies, 50% of
which can be taken as recharge to the ground water system.
• In the urban areas in India, normally, there is no separate channels either open or sub
surface for the drainage and flash floods. These channels also recharge to some extent the
ground water reservoir. As on today, there is no documented field study to assess the
recharge. The seepages from the sewerages, which normally contaminate the ground water
resources with nitrate also contribute to the quantity of resources and hence same percent
as in the case of water supply pipes may be taken as norm for the recharge on the quantity
of sewerage when there is sub surface drainage system. If estimated flash flood data is
available, the same percent can be used on the quantum of flash floods to estimate the
recharge from the flash floods. Even when the drainage system is open channels, till further
documented field studies are done same procedure may be followed.

Dynamic Ground Water Resource of Madhya Pradesh - 2020
20
• It is proposed to have a separate ground water assessment for urban areas with population
more than 10 lakhs.
• Wherever, the pre monsoon and post monsoon water levels are above mean sea level the
dynamic component of the estimation will be same as other areas.
• If both these water levels are below sea level, the dynamic component should be taken as
zero.
• Wherever, the post monsoon water table is above sea level and pre monsoon water table is
below sea level the pre monsoon water table should be taken as at sea level and fluctuation
is to be computed.
• The static or in storage resources are to be restricted to the minimum of 40 times the pre
monsoon water table or the bottom of the aquifer.
2.2 NORMS TO BE USED IN THE ASSESSMENT
The committee recommends that the state agencies should be encouraged to conduct field
studies and use these computed norms in the assessment. For conducting field studies, it is
recommended to follow the field-tested procedures for computing the norms. There is the
possibility of error creeping in at various levels in the field study and hence the committee is of
the opinion to give a maximum and minimum values for all the norms used in the estimation. The
committee can foresee the handicap of the state agencies which are not able to compute the norms
by their own field study. In such cases, it suggests an average of the range of norms to be used as
the recommended value for the norm.
2.2.1 Specific Yield
Recently under Aquifer Mapping Project, Central Ground Water Board has classified all
the aquifers into 16 Principal Aquifers which in turn were divided into 42 Major Aquifers. Hence,
it is required to assign Specific Yield values to all these aquifer units. The values recommended
in the Table 2.1 may be followed in the future assessments. The Major aquifer map can be
obtained from Regional offices of Central Ground Water Board.
The recommended Specific Yield values are to be used for assessment, unless sufficient
data based on field studies are available to justify the minimum, maximum or other intermediate
values. The Norms suggested below are nothing but the redistribution of norms suggested by
GEC-1997 methodology and hence people are encouraged to conduct field studies and strengthen
the Norms database.

Dynamic Ground Water Resource of Madhya Pradesh - 2020
21
Table.2.2: Norms Recommended for Specific Yield
Sl.
No.
Principal
Aquifer
Major Aquifers
Age Recommended
(%)
Minimum
(%)
Maximum
(%) Code Name
1
Alluvium
AL01
Younger Alluvium
(Clay/Silt/Sand/ Calcareous
concretions)
Quaternary
10
8
12
2 Alluvium AL02 Pebble / Gravel/ Bazada/
Kandi Quaternary 16 12 20
3
Alluvium
AL03
Older Alluvium
(Silt/Sand/Gravel/Lithomargic
clay)
Quaternary
6
4
8
4 Alluvium AL04 Aeolian Alluvium (Silt/ Sand) Quaternary 16 12 20
5 Alluvium AL05 Coastal Alluvium
(Sand/Silt/Clay) Quaternary 10 8 12
6 Alluvium AL06 Valley Fills Quaternary 16 12 20
7 Alluvium AL07 Glacial Deposits Quaternary 16 12 20
8 Laterite LT01 Laterite / Ferruginous
concretions Quaternary 2.5 2 3
9
Basalt
BS01
Basic Rocks (Basalt) -
Weathered, Vesicular or
Jointed
Mesozoic to
Cenozoic
2
1
3
10 Basalt BS01 Basic Rocks (Basalt) - Massive
Poorly Jointed
Mesozoic to
Cenozoic 0.35 0.2 0.5
11 Basalt BS02 Ultra Basic - Weathered,
Vesicular or Jointed
Mesozoic to
Cenozoic 2 1 3
12 Basalt BS02 Ultra Basic - Massive Poorly
Jointed
Mesozoic to
Cenozoic 0.35 0.2 0.5
13
Sandstone
ST01
Sandstone/Conglomerate
Upper
Palaeozoic to
Cenozoic
3
1
5
14
Sandstone
ST02
Sandstone with Shale
Upper
Palaeozoic to
Cenozoic
3
1
5
15
Sandstone
ST03
Sandstone with shale/ coal
beds
Upper
Palaeozoic to
Cenozoic
3
1
5
16
Sandstone
ST04
Sandstone with Clay
Upper
Palaeozoic to
Cenozoic
3
1
5
17 Sandstone ST05 Sandstone/Conglomerate Proterozoic to
Cenozoic 3 1 5
18 Sandstone ST06 Sandstone with Shale Proterozoic to
Cenozoic 3 1 5
19
Shale
SH01
Shale with limestone
Upper
Palaeozoic to
Cenozoic
1.5
1
2
20
Shale
SH02
Shale with Sandstone
Upper
Palaeozoic to
Cenozoic
1.5
1
2
21
Shale
SH03
Shale, limestone and
sandstone
Upper
Palaeozoic to
Cenozoic
1.5
1
2
22
Shale
SH04
Shale
Upper
Palaeozoic to
Cenozoic
1.5
1
2
23 Shale SH05 Shale/Shale with Sandstone Proterozoic to Cenozoic
1.5 1 2

Dynamic Ground Water Resource of Madhya Pradesh - 2020
22
Sl.
No.
Principal
Aquifer
Major Aquifers
Age Recommended
(%)
Minimum
(%)
Maximum
(%) Code Name
24 Shale SH06 Shale with Limestone Proterozoic to
Cenozoic 1.5 1 2
25 Limestone LS01 Miliolitic Limestone Quarternary 2 1 3
26 Limestone LS01 Karstified Miliolitic Limestone Quarternary 10 5 15
27
Limestone
LS02
Limestone / Dolomite
Upper
Palaeozoic to
Cenozoic
2
1
3
28
Limestone
LS02
Karstified Limestone /
Dolomite
Upper
Palaeozoic to
Cenozoic
10
5
15
29 Limestone LS03 Limestone/Dolomite Proterozoic 2 1 3
30 Limestone LS03 Karstified
Limestone/Dolomite Proterozoic 10 5 15
31 Limestone LS04 Limestone with Shale Proterozoic 2 1 3
32 Limestone LS04 Karstified Limestone with
Shale Proterozoic 10 5 15
33 Limestone LS05 Marble Azoic to
Proterozoic 2 1 3
34 Limestone LS05 Karstified Marble Azoic to
Proterozoic 10 5 15
35
Granite
GR01
Acidic Rocks (Granite,Syenite,
Rhyolite etc.) - Weathered ,
Jointed
Mesozoic to
Cenozoic
1.5
1
2
36
Granite
GR01
Acidic Rocks (Granite,Syenite,
Rhyolite etc.)-Massive or
Poorly Fractured
Mesozoic to
Cenozoic
0.35
0.2
0.5
37
Granite
GR02
Acidic Rocks (Pegmatite,
Granite, Syenite, Rhyolite
etc.) - Weathered, Jointed
Proterozoic to
Cenozoic
3
2
4
38
Granite
GR02
Acidic Rocks (Pegmatite,
Granite, Syenite, Rhyolite
etc.) - Massive, Poorly
Fractured
Proterozoic to
Cenozoic
0.35
0.2
0.5
39 Schist SC01 Schist - Weathered, Jointed Azoic to
Proterozoic 1.5 1 2
40 Schist SC01 Schist - Massive, Poorly
Fractured
Azoic to
Proterozoic 0.35 0.2 0.5
41 Schist SC02 Phyllite Azoic to
Proterozoic 1.5 1 2
42 Schist SC03 Slate Azoic to
Proterozoic 1.5 1 2
43 Quartzite QZ01 Quartzite - Weathered,
Jointed
Proterozoic to
Cenozoic 1.5 1 2
44 Quartzite QZ01 Quartzite - Massive, Poorly
Fractured
Proterozoic to
Cenozoic 0.3 0.2 0.4
45 Quartzite QZ02 Quartzite - Weathered,
Jointed
Azoic to
Proterozoic 1.5 1 2
46 Quartzite QZ02 Quartzite- Massive, Poorly
Fractured
Azoic to
Proterozoic 0.3 0.2 0.4
47 Charnockite CK01 Charnockite - Weathered,
Jointed Azoic 3 2 4
48 Charnockite CK01 Charnockite - Massive, Poorly
Fractured Azoic 0.3 0.2 0.4
49 Khondalite KH01 Khondalites, Granulites - Weathered, Jointed
Azoic 1.5 1 2

Dynamic Ground Water Resource of Madhya Pradesh - 2020
23
Sl.
No.
Principal
Aquifer
Major Aquifers
Age Recommended
(%)
Minimum
(%)
Maximum
(%) Code Name
50 Khondalite KH01 Khondalites, Granulites -
Mssive, Poorly Fractured Azoic 0.3 0.2 0.4
51
Banded
Gneissic
Complex
BG01
Banded Gneissic Complex -
Weathered, Jointed
Azoic
1.5
1
2
52
Banded
Gneissic
Complex
BG01
Banded Gneissic Complex -
Massive, Poorly Fractured
Azoic
0.3
0.2
0.4
53
Gneiss
GN01
Undifferentiated
metasedimentaries/
Undifferentiated
metamorphic - Weathered,
Jointed
Azoic to
Proterozoic
1.5
1
2
54
Gneiss
GN01
Undifferentiated
metasedimentaries/
Undifferentiated
metamorphic - Massive,
Poorly Fractured
Azoic to
Proterozoic
0.3
0.2
0.4
55 Gneiss GN02 Gneiss -Weathered, Jointed Azoic to
Proterozoic 3 2 4
56 Gneiss GN02 Gneiss-Massive, Poorly
Fractured
Azoic to
Proterozoic 0.3 0.2 0.4
57 Gneiss GN03 Migmatitic Gneiss -
Weathered, Jointed Azoic 1.5 1 2
58 Gneiss GN03 Migmatitic Gneiss - Massive,
Poorly Fractured Azoic 0.3 0.2 0.4
59
Intrusive
IN01
Basic Rocks (Dolerite,
Anorthosite etc.) -
Weathered, Jointed
Proterozoic to
Cenozoic
2
1
3
60
Intrusive
IN01
Basic Rocks (Dolerite,
Anorthosite etc.) - Massive,
Poorly Fractured
Proterozoic to
Cenozoic
0.35
0.2
0.5
61
Intrusive
IN02
Ultrabasics (Epidiorite,
Granophyre etc.) -
Weathered, Jointed
Proterozoic to
Cenozoic
2
1
3
62
Intrusive
IN02
Ultrabasics (Epidiorite,
Granophyre etc.) - Massive,
Poorly Fractured
Proterozoic to
Cenozoic
0.35
0.2
0.5
2.2.2 Rainfall Infiltration Factor It is recommended that to assign Rainfall Infiltration Factor values to all the aquifer units
recently classified by the Central Ground Water Board. The values recommended in Table 2.2
may be followed in the future assessments. The recommended Rainfall Infiltration Factor values
are to be used for assessment, unless sufficient data based on field studies are available to justify
the minimum, maximum or other intermediate values.
An additional 2% of rainfall recharge factor may be used in such areas or parts of
the areas where watershed development with associated soil conservation measures are
implemented. This additional factor is subjective and is separate from the contribution due
to the water conservation structures such as check dams, nalla bunds, percolation tanks etc.

Dynamic Ground Water Resource of Madhya Pradesh - 2020
24
The norms for the estimation of recharge due to these structures are provided separately.
This additional factor of 2% is at this stage, only provisional, and will need revision based
on pilot studies.
The Norms suggested below are nothing but the redistribution of norms suggested
by GEC-1997 methodology and hence people are encouraged to conduct field studies and
strengthen the Norms database.
Table.2.3: Norms Recommended for Rainfall Infiltration Factor
Sl.
No.
Principal
Aquifer
Major Aquifers
Age Recommended
(%)
Minimum
(%)
Maximum
(%) Code Name
1
Alluvium
AL01
Younger Alluvium
(Clay/Silt/Sand/ Calcareous
concretions)
Quaternary
22
20
24
2 Alluvium AL02 Pebble / Gravel/ Bazada/
Kandi Quaternary 22 20 24
3
Alluvium
AL03
Older Alluvium
(Silt/Sand/Gravel/Lithomargic
clay)
Quaternary
22
20
24
4 Alluvium AL04 Aeolian Alluvium (Silt/ Sand) Quaternary 22 20 24
5 Alluvium AL05 Coastal Alluvium
(Sand/Silt/Clay) -East Coast Quaternary 16 14 18
5 Alluvium AL05 Coastal Alluvium
(Sand/Silt/Clay) - West Coast Quaternary 10 8 12
6 Alluvium AL06 Valley Fills Quaternary 22 20 24
7 Alluvium AL07 Glacial Deposits Quaternary 22 20 24
8 Laterite LT01 Laterite / Ferruginous
concretions Quaternary 7 6 8
9 Basalt BS01 Basic Rocks (Basalt) -
Vesicular or Jointed
Mesozoic to
Cenozoic 13 12 14
9 Basalt BS01 Basic Rocks (Basalt) -
Weathered
Mesozoic to
Cenozoic 7 6 8
10 Basalt BS01 Basic Rocks (Basalt) - Massive
Poorly Jointed
Mesozoic to
Cenozoic 2 1 3
11 Basalt BS02 Ultra Basic - Vesicular or
Jointed
Mesozoic to
Cenozoic 13 12 14
11 Basalt BS02 Ultra Basic - Weathered Mesozoic to
Cenozoic 7 6 8
12 Basalt BS02 Ultra Basic - Massive Poorly
Jointed
Mesozoic to
Cenozoic 2 1 3
13 Sandstone ST01 Sandstone/Conglomerate Upper Palaeozoic
to Cenozoic 12 10 14
14 Sandstone ST02 Sandstone with Shale Upper Palaeozoic
to Cenozoic 12 10 14
15 Sandstone ST03 Sandstone with shale/ coal
beds
Upper Palaeozoic
to Cenozoic 12 10 14
16 Sandstone ST04 Sandstone with Clay Upper Palaeozoic
to Cenozoic 12 10 14
17 Sandstone ST05 Sandstone/Conglomerate Proterozoic to
Cenozoic 6 5 7
18 Sandstone ST06 Sandstone with Shale Proterozoic to
Cenozoic 6 5 7

Dynamic Ground Water Resource of Madhya Pradesh - 2020
25
Sl.
No.
Principal
Aquifer
Major Aquifers
Age Recommended
(%)
Minimum
(%)
Maximum
(%) Code Name
19 Shale SH01 Shale with limestone Upper Palaeozoic
to Cenozoic 4 3 5
20 Shale SH02 Shale with Sandstone Upper Palaeozoic
to Cenozoic 4 3 5
21 Shale SH03 Shale, limestone and
sandstone
Upper Palaeozoic
to Cenozoic 4 3 5
22 Shale SH04 Shale Upper Palaeozoic
to Cenozoic 4 3 5
23 Shale SH05 Shale/Shale with Sandstone Proterozoic to
Cenozoic 4 3 5
24 Shale SH06 Shale with Limestone Proterozoic to
Cenozoic 4 3 5
25 Limestone LS01 Miliolitic Limestone Quarternary 6 5 7
27 Limestone LS02 Limestone / Dolomite Upper Palaeozoic
to Cenozoic 6 5 7
29 Limestone LS03 Limestone/Dolomite Proterozoic 6 5 7
31 Limestone LS04 Limestone with Shale Proterozoic 6 5 7
33 Limestone LS05 Marble Azoic to
Proterozoic 6 5 7
35
Granite
GR01
Acidic Rocks (Granite,Syenite,
Rhyolite etc.) - Weathered ,
Jointed
Mesozoic to
Cenozoic
7
5
9
36
Granite
GR01
Acidic Rocks (Granite,Syenite,
Rhyolite etc.)-Massive or
Poorly Fractured
Mesozoic to
Cenozoic
2
1
3
37
Granite
GR02
Acidic Rocks (Pegmatite,
Granite, Syenite, Rhyolite
etc.) - Weathered, Jointed
Proterozoic to
Cenozoic
11
10
12
38
Granite
GR02
Acidic Rocks (Pegmatite,
Granite, Syenite, Rhyolite
etc.) - Massive, Poorly
Fractured
Proterozoic to
Cenozoic
2
1
3
39 Schist SC01 Schist - Weathered, Jointed Azoic to
Proterozoic 7 5 9
40 Schist SC01 Schist - Massive, Poorly
Fractured
Azoic to
Proterozoic 2 1 3
41 Schist SC02 Phyllite Azoic to
Proterozoic 4 3 5
42 Schist SC03 Slate Azoic to
Proterozoic 4 3 5
43 Quartzite QZ01 Quartzite - Weathered,
Jointed
Proterozoic to
Cenozoic 6 5 7
44 Quartzite QZ01 Quartzite - Massive, Poorly
Fractured
Proterozoic to
Cenozoic 2 1 3
45 Quartzite QZ02 Quartzite - Weathered,
Jointed
Azoic to
Proterozoic 6 5 7
46 Quartzite QZ02 Quartzite- Massive, Poorly
Fractured
Azoic to
Proterozoic 2 1 3
47 Charnockite CK01 Charnockite - Weathered,
Jointed Azoic 5 4 6
48 Charnockite CK01 Charnockite - Massive, Poorly
Fractured Azoic 2 1 3
49 Khondalite KH01 Khondalites, Granulites -
Weathered, Jointed Azoic 7 5 9

Dynamic Ground Water Resource of Madhya Pradesh - 2020
26
Sl.
No.
Principal
Aquifer
Major Aquifers
Age Recommended
(%)
Minimum
(%)
Maximum
(%) Code Name
50 Khondalite KH01 Khondalites, Granulites -
Mssive, Poorly Fractured Azoic 2 1 3
51
Banded
Gneissic
Complex
BG01
Banded Gneissic Complex -
Weathered, Jointed
Azoic
7
5
9
52
Banded
Gneissic
Complex
BG01
Banded Gneissic Complex -
Massive, Poorly Fractured
Azoic
2
1
3
53
Gneiss
GN01
Undifferentiated
metasedimentaries/
Undifferentiated
metamorphic - Weathered,
Jointed
Azoic to
Proterozoic
7
5
9
54
Gneiss
GN01
Undifferentiated
metasedimentaries/
Undifferentiated
metamorphic - Massive,
Poorly Fractured
Azoic to
Proterozoic
2
1
3
55 Gneiss GN02 Gneiss -Weathered, Jointed Azoic to
Proterozoic 11 10 12
56 Gneiss GN02 Gneiss-Massive, Poorly
Fractured
Azoic to
Proterozoic 2 1 3
57 Gneiss GN03 Migmatitic Gneiss -
Weathered, Jointed Azoic 7 5 9
58 Gneiss GN03 Migmatitic Gneiss - Massive,
Poorly Fractured Azoic 2 1 3
59
Intrusive
IN01
Basic Rocks (Dolerite,
Anorthosite etc.) -
Weathered, Jointed
Proterozoic to
Cenozoic
7
6
8
60
Intrusive
IN01
Basic Rocks (Dolerite,
Anorthosite etc.) - Massive,
Poorly Fractured
Proterozoic to
Cenozoic
2
1
3
61
Intrusive
IN02
Ulrta Basics (Epidiorite,
Granophyre etc.) -
Weathered, Jointed
Proterozoic to
Cenozoic
7
6
8
62
Intrusive
IN02
Ulrta Basics (Epidiorite,
Granophyre etc.) - Massive,
Poorly Fractured
Proterozoic to
Cenozoic
2
1
3
2.2.3 Norms for Canal Recharge
Unlike other norms, the Recharge factor for calculating recharge due to canals is given in
two units viz. ham/million m2 of wetted area/day and cumecs per million m2 of wetted area. As all
other norms are in ham, the committee recommends the norm in ham/million m2 of wetted area
for computing the recharge due to canals.
There is a wide variation in the values of the recharge norms proposed by GEC 1997.The
Canal seepage norm is approximately 150 times the other recharge norms. In the absence of any
field studies to refine the norms it is decided by the committee to continue with the same norms.
The committee strongly recommends that each state agency must conduct one filed study at least
one in each district before completing the first assessment using this methodology. The committee

Dynamic Ground Water Resource of Madhya Pradesh - 2020
27
also suggests a recommended value and minimum and maximum values as in the case of other
norms. Where specific results are available from case studies in some states, the adhoc norms are
to be replaced by norms evolved from these results.
The Norms suggested in Table.2.3 below are nothing but the rationalization and
redistribution of norms suggested by GEC-1997 methodology and hence people are encouraged to
conduct field studies and strengthen the Norms database.
Table.2.4: Norms Recommended for Recharge due to Canals
Formation
Canal Seepage factor (ham/day/million
square meters of wetted area)
Recommended Minimum Maximum
Unlined canals in normal soils with
some clay content along with sand 17.5 15 20
Unlined canals in sandy soil with some
silt content 27.5 25 30
Lined canals in normal soils with some
clay content along with sand 3.5 3 4
Lined canals in sandy soil with some
silt content 5.5 5 6
All canals in hard rock area 3.5 3 4
2.2.4 Norms for Recharge Due to Irrigation
The Norms Suggested by GEC-1997 gives for only three ranges of water levels and it
creates a problem in the boundary conditions. For instance, as a result of the variation in water
level from 24.9 to 25.1m bgl in the adjoining blocks, change occurs in the return flow from
irrigation in the range of 10% to 15%. Hence to reduce the discrepancy it is recommended to have
linear relationship of the norms in between 10m bgl water level and 25m bgl water level. It is
proposed to have the same norm of 10m bgl zone for all the water levels less than 10m. Similarly,
the norm recommended for 25m may be used for the water levels more than 25m as well. The
Recommended Norms are presented in Table 2.4.
For surface water, the recharge is to be estimated based on water released at the outlet. For
ground water, the recharge is to be estimated based on gross draft. Where continuous supply is
used instead of rotational supply, an additional recharge of 5% of application may be used. Where
specific results are available from case studies in some states, the adhoc norms are to be replaced
by norms evolved from these results.

Dynamic Ground Water Resource of Madhya Pradesh - 2020
28
Table.2.5: Norms Recommended for Recharge from Irrigation
DTW
m bgl
Ground Water Surface Water
Paddy Non-paddy Paddy Non-paddy
≤ 10 45.0 25.0 50.0 30.0
11 43.3 23.7 48.3 28.7
12 40.4 22.1 45.1 26.8
13 37.7 20.6 42.1 25.0
14 35.2 19.2 39.3 23.3
15 32.9 17.9 36.7 21.7
16 30.7 16.7 34.3 20.3
17 28.7 15.6 32.0 18.9
18 26.8 14.6 29.9 17.6
19 25.0 13.6 27.9 16.4
20 23.3 12.7 26.0 15.3
21 21.7 11.9 24.3 14.3
22 20.3 11.1 22.7 13.3
23 18.9 10.4 21.2 12.4
24 17.6 9.7 19.8 11.6
≥ 25 20.0 5.0 25.0 10.0
2.2.5 Norms for Recharge due to Tanks & Ponds
As the data on the field studies for computing recharge from Tanks & Ponds are very
limited, it is recommended to follow the same norm as followed in GEC 1997 in future assessments
also. Hence the norm recommended by GEC-2015 for Seepage from Tanks & Ponds is 1.4 mm /
day.
2.2.6 Norms for Recharge due to Water Conservation Structures
Even though the data on the field studies for computing recharge from Water Conservation
Structures are very limited, it is recommended that the Recharge from the water conservation
structures is 40% of the Gross Storage based on the field studies by Non-Government
Organizations. Hence, the norm recommended by GEC-2015 for the seepage from Water
Conservation Structures is 40% of gross storage during a year which means 20% during monsoon
season and 20% during non- monsoon Season.
2.2.7 Norm for Per Capita Requirement
As the option is given to use the actual requirement for domestic needs, the Requirement
Norm recommended by the committee is 60 lpcd for domestic needs. This can be modified if the
actual requirement is known.

Dynamic Ground Water Resource of Madhya Pradesh - 2020
29
2.2.8 Norm for Natural Discharges
The Discharge Norm used in computing Unaccounted Natural Discharge is 5% if water
table fluctuation method is used or 10% if rainfall infiltration factor method is used for assessing
the Rainfall recharge. This committee recommends to compute the base flow for each assessment
unit. Wherever, there is no assessment of base flow, earlier norms recommended by GEC 1997 i.e.
5% or 10% of the Total Annual Ground Water Recharge as the Natural Discharges may be
continued.
2.2.9 Unit Draft
GEC-1997 methodology recommends to use well census method for computing the ground
water draft. The norm used for computing ground water draft is the unit draft. The unit draft can
be computed by field studies. This method involves selecting representative abstraction structure
and calculating the discharge from that particular type of structure and collecting the
information on how many hours of pumping is being done in various seasons and number of such
days during each season. The Unit Draft during a particular season can be computed using the
following equation:
𝑈𝑛i𝑡 𝐷𝑟𝑎𝑓𝑡 = 𝐷i𝑠𝑐ℎ𝑎𝑟𝑔𝑒 i𝑛 𝑚3⁄ℎ𝑟 × 𝑁𝑜. 𝑜𝑓 𝑝𝑢𝑚𝑝i𝑛𝑔 ℎ𝑜𝑢𝑟𝑠 i𝑛 𝑎 𝑑𝑎𝑦 × 𝑁𝑜. 𝑜𝑓 𝑑𝑎𝑦𝑠 … … (29)
One basic drawback in the methodology of computing unit draft is that there is no
normalization procedure for the same. As per GEC-1997 guidelines, the recharge from rainfall is
normalized for a normal rainfall. It means that even though the resources are estimated in a surplus
rainfall year or in a deficit rainfall year, the assessment is normalised for a normal rainfall which
is required for planning. For recharge from other sources, average figures/ values are taken. If the
average figures are not available for any reason, 60% of the design figures are taken. This
procedure is very much essential as the planning should be for average resources rather than for
the recharge due to excess rainfall or deficit rainfall. But the procedure that is being followed for
computing unit draft does not have any normalization procedure. Normally, if the year in which
one collects the draft data in the field is an excess rainfall year, the abstraction from ground water
will be less. Similarly, if the year of the computation of unit draft is a drought year the unit draft
will be high. Hence, there is a requirement to devise a methodology that can be used for the
normalization of unit draft figures. The following are the two simple techniques, which can be
followed. If the unit draft values for one rainfall cycle are available for at least 10 years second
method shown in equation 31 is to be followed or else the first method shown in equation 30 may
be used.
𝑁𝑜𝑟𝑚𝑎𝑙i𝑠𝑒𝑑 𝑈𝑛i𝑡 𝐷𝑟𝑎𝑓𝑡 = Unit Draft × 𝖱ainfall for the year
Normal 𝖱ainfall …………….(30)

Dynamic Ground Water Resource of Madhya Pradesh - 2020
30
Normalised Unit Draft =−𝑏 ∑ Unit Drafti
𝑛𝑖=1
𝑁𝑢𝑚𝑏𝑒𝑟 𝑜𝑓 𝑌𝑒𝑎𝑟𝑠… … … … … … … … … … . (31)
Although GEC-1997 methodology recommends a default value for the unit drafts, each State is
using its own values, generally after conducting field studies, even though without a
documentation. Hence, it is felt that this norm may be computed by the state agency, which is
going to assess the norms before commencement of the assessment. But it is strongly
recommended that the field studies should be documented and submitted along with the results of
the assessment.
2.3 INDIA -GROUNDWATER RESOURCE ESTIMATION SYSTEM (IN-GRES)
“INDIA-GROUNDWATER RESOURCE ESTIMATION SYSTEM (IN-GRES) is a
Software/Web-based Application developed by CGWB in collaboration with IIT-Hyderabad. It
will provide common and standardized platform for Ground Water Resource Estimation for the
entire country and its pan- India operationalization (Central and State Governments). The system
will take ‘Data Input’ through Excel as well as Forms, compute various ground water components
(recharge, extraction etc.) and classify assessment units into appropriate categories (safe, semi-
critical, critical and over-exploited). The Software uses GEC 2015 Methodology for estimation
and calculation of Groundwater resources. It allows for unique and homogeneous representation
of groundwater fluxes as well as categories for all the assessment units (AU) of the country.
URL of IN-GRES http://ingres.iith.ac.in
The detailed description about IN-GRES Software is given in Appendix-H.

Dynamic Ground Water Resource of Madhya Pradesh - 2020
31
CHAPTER-3
3.0 BACKGROUND
Madhya Pradesh is located in the central part of India or metaphorically, the heart of India.
The State of Madhya Pradesh is a land-locked State, bordered on the west by Gujarat, on the
northwest by Rajasthan, on the northeast by Uttar Pradesh, on the east by Chhattisgarh, and on the
south by Maharashtra (Fig 3.1). It has a geographical area of 3,08,252 Sq. km. and is situated
between north latitudes 21° 04' and 26° 54' and east longitudes 74° 00' and 82° 50'. There are 52
districts and 313 Community Development blocks in Madhya Pradesh. The population of state as
per census 2011 is 7.27 crores with a population density of 236 persons per sq.km area. Out of
total population, 72.37% is rural. The important urban areas in the State are Bhopal, Indore,
Jabalpur, and Gwalior.
Madhya Pradesh comprises several linguistically and culturally distinct regions, of which
the major regions are:
• Malwa - A plateau region in the northwest of the state, north of the Vindhya Range, with
its distinct language and culture. Indore is the major city of the region, while Ujjain is a
town of historical importance. Bhopal, the capital city, lies on the extension of Malwa
Region and on the edge of Bundelkhand region.
• Nimar (Nemar): The western portion of the Narmada River valley, lying south of the
Vindhyas in the southwest portion of the state. This region comprises Khandwa, Khargone,
Burhanpur and Barwani districts.
• Bundelkhand: A region of rolling hills and fertile valleys in the northern part of the state,
which slopes down toward the Indo-Gangetic plain to the north. Gwalior is an historic
center of the region. This region encompasses Datia, Sagar, Damoh, Panna, Chhatarpur
and Tikamgarh Districts.
• Chambal: The north-western region. A mountainous region rich in red, soft, and fragile
sandstone. The climate is harsh, and the area is known for murderous pirates who were
active in hundreds in the late 1900s. This region comprises Sheopur, Morena and Bhind
districts.
• Baghelkhand: A hilly region in the northeast of the state, which includes the eastern end
of the Vindhya Range. Satna, Rewa and Sidhi districts lie in this Region.

Dynamic Ground Water Resource of Madhya Pradesh - 2020
32
• Mahakoshal (Mahakaushal): The southeastern portion of the state, which includes the
eastern end of the Narmada river valley and the eastern Satpuras. Jabalpur is the most
important city in the region. Katni and Jabalpur districts lie in this Region.
• Central Vindhya and Satpura region: Occupy most of the central Narmada river valley.
Hoshangabad, Harda, Narsinghpur districts lie in this Region.
Fig 3.1: Administrative Map/ Assessment units of Madhya Pradesh
Central Ground Water Board (CGWB), North Central Region, Bhopal in association with Ground
Water Survey Department, Water Resources Department, Government of M.P. has assessed
dynamic ground water resources of Madhya Pradesh in 317 assessment units (313 blocks and 4
urban areas i.e. Bhopal, Indore, Jabalpur, Gwalior) (Fig-3.1) according to the methodology
recommended by the Ground Water Estimation Committee constituted by Government of India
(GEC 2015). The Present report quantifies the dynamic ground water resources of Madhya
Pradesh State for the base year 2019-20.

Dynamic Ground Water Resource of Madhya Pradesh - 2020
33
3.1 RAINFALL OF MADHYA PRADESH
Madhya Pradesh experiences a tropical climate with wide variation in temperature. There are four
seasons during the year. The summer season from March to Mid-June, the monsoon season from
Mid-June to September, the post monsoon season in October-November, and the winter season
from December to February, May is the hottest month, while January is the coldest.
Rainfall is the main source of recharge to ground water which contributes to nearly 77 % of
the total annual ground water recharge, so rainfall pattern has an important impact on groundwater
levels in the phreatic aquifer. A major part of the country receives rainfall mainly during SW
Monsoon season spread over the months of June to September. Over 99 % of the annual rainfall is
received in the four rainy months for June to September. August is the wettest month.
The district wise seasonal and annual rainfall observed during the year 2019 for the districts is
given in Table 3.1. The district-wise observed monthly rainfall is given in Table 3.2. Annually,
the Mandsaur District received the highest rainfall of 2144.5 mm where as Datia District received
the lowest rainfall of 787.2 mm.
Table.3.1: District-wise seasonal and annual Rainfall (mm) - Year 2019 (Source: IMD)
Sl No. Districts Winter Pre-
Monsoon
SW-
Monsoon
Post-
Monsoon Annual
1 Agar-Malwa 0 12 1855 62.2 1929.2
2 Alirajpur 0 2.9 1394.5 123.5 1520.9
3 Anuppur 44.1 60.1 1342.3 29.2 1475.7
4 Ashoknagar 15.8 10.8 1366.5 63.5 1456.5
5 Balaghat 46.6 18.3 1284.1 29.2 1378.2
6 Barwani 0 0.1 1138.2 62.4 1200.7
7 Betul 0.5 10.2 1250.9 127.3 1388.9
8 Bhind 31.8 7.4 734.2 19.8 793.1
9 Bhopal 0.4 15.2 1756.5 154.8 1926.9
10 Burhanpur 0 3.3 1206.3 127.2 1336.7
11 Chhatarpur 12.2 16.4 1205.1 62.3 1295.9
12 Chhindwara 29.5 25 1275.3 84.9 1414.7
13 Damoh 4 5.5 1489 35 1533.5
14 Datia 29.7 14.8 719.9 22.7 787.2
15 Dewas 0 1.2 1465.2 39.7 1506
16 Dhar 0.3 5.7 1217.2 68 1291.1
17 Dindori 17.2 24.8 1453.4 114.7 1610.1

Dynamic Ground Water Resource of Madhya Pradesh - 2020
34
Sl No. Districts Winter Pre-
Monsoon
SW-
Monsoon
Post-
Monsoon Annual
18 Guna 7.1 16.8 1557.2 35.4 1616.5
19 Gwalior 34.8 25.1 823 12 894.9
20 Harda 10.5 13.7 1591.5 101.9 1717.6
21 Hoshangabad 7.4 45.9 1934.1 88.5 2075.9
22 Indore 2.5 0.9 1434.6 63.6 1501.5
23 Jabalpur 12.5 20.5 1587 39.4 1659.3
24 Jhabua 1.8 2.4 1424.7 120.4 1549.3
25 Katni 25 41.8 1283 66.4 1416.2
26 Khandwa 0 0 1311.3 90.8 1402.1
27 Khargone 0 0 1016.5 47.3 1063.7
28 Mandla 29.1 31.2 1747.2 67 1874.5
29 Mandsaur 1.2 41.3 2018.6 83.5 2144.5
30 Morena 42.3 24.8 731.1 38.9 837
31 Narsinghpur 0.2 8.6 1719.4 14.4 1742.6
32 Neemuch 3 19.7 1711.7 70 1804.4
33 Panna 4.3 0 1115.5 81.6 1201.3
34 Raisen 6.2 8.8 1863.2 61 1939.2
35 Rajgarh 0 8.4 1631 85.6 1725
36 Ratlam 0 16.9 1563.5 80.7 1661
37 Rewa 37.8 35.1 1199.2 71 1343.2
38 Sagar 0.7 17 1519.9 19.5 1557.2
39 Satna 33.9 29.7 903 24.1 990.6
40 Sehore 3.2 10 1774.4 55.2 1842.8
41 Seoni 22.2 20.3 1474.7 90.9 1608.1
42 Shahdol 15 38 869 55 977
43 Shajapur 0 6 1712.9 88.1 1807
44 Sheopur 13.6 22.5 849.2 25 910.3
45 Shivpuri 12.8 23.4 895 44.4 975.5
46 Sidhi 22.2 26.2 916 96.4 1060.8
47 Singrauli 26.4 66.3 1211.3 91 1395
48 Tikamgarh 4.5 14.5 1053 108.7 1180.7
49 Ujjain 4 11.8 1477.3 90.1 1583.2
50 Umaria 18.9 28.2 1334.2 31.3 1412.6
51 Vidisha 1.6 17.8 1603.8 47 1670.2

Dynamic Ground Water Resource of Madhya Pradesh -
34
Table.3.2: District wise monthly Rainfall-Year-2019 (Source: IMD)
DISTRICTS JAN FEB MAR APR MAY JUN JUL AUG SEP OCT NOV DEC
Agar-Malwa 0 0 0 12 0 69.6 314.4 688.4 782.6 60.2 2 0
Alirajpur 0 0 0 2.9 0 84 338.1 686.4 286 83.4 40.1 0
Anuppur 27.5 16.5 42.6 8.6 8.9 123 324.6 447.2 447.6 20.1 0 9.2
Ashoknagar 0 15.8 0.8 10 0 38.5 345.8 566 416.3 58.8 4.3 0.5
Balaghat 28.6 18 17.9 0.4 0 35.1 353.6 447.1 448.4 20.4 1.5 7.3
Barwani 0 0 0 0.1 0.1 60.9 309.1 458.1 310.1 57 5.3 0
Betul 0 0.5 0.3 9.9 0 90.1 372.9 487.2 300.7 115.6 3.3 8.3
Bhind 0 31.8 0 1.5 5.9 66.3 263 210.7 194.3 12.2 7.6 0
Bhopal 0 0.4 0 14.2 1 101.1 641.9 493.2 520.3 132.6 0.6 21.6
Burhanpur 0 0 0 1.8 1.5 109.3 347.7 441.9 307.4 85.6 40.2 1.4
Chhatarpur 2.6 9.5 1.3 11.6 3.4 47.5 264.7 476 416.9 38.8 0 23.5
Chhindwara 23.5 6 14.3 10.7 0 63.6 219.1 454.5 538.2 61.2 1.7 22
Damoh 1.5 2.5 1 4 0.5 56.5 453 543 436.5 21.5 0 13.5
Datia 0.7 29 0 7.7 7.2 52.7 301.3 155.4 210.6 15.1 0 7.7
Dewas 0 0 0 1.2 0 69 393.8 417.8 584.5 38.5 1.2 0
Dhar 0 0.3 0 5.7 0 105.4 302.5 461.3 348 63.6 4.3 0.1
Dindori 7 10.2 19.6 5.2 0 119.6 453.8 416.2 463.8 85 0 29.7
Guna 1 6.1 0.3 16.1 0.4 32 324.5 730 470.8 30.9 3.5 1
Gwalior 2.2 32.6 1.3 9.7 14.2 61.8 249.1 210.7 301.5 9.6 0.4 2.1
Harda 0 10.5 13.2 0.5 0 42.4 446.3 410.3 692.6 67.8 26.7 7.4
Hoshangabad 3.5 3.9 30.3 12.3 3.3 52.7 505.8 771.5 604.1 67.4 2.9 18.2
Indore 0 2.5 0 0.5 0.4 120.7 387.8 400.3 525.8 50.4 13.1 0
Jabalpur 3.1 9.4 3.1 17.1 0.3 64.5 393.5 734.3 394.8 24.7 0 14.7
Jhabua 0 1.8 0 2.4 0 143.1 302.9 598.7 379.9 103.1 15.9 1.3
Katni 12 13 28.6 13.2 0 102.8 278 313.6 588.6 13.6 0 52.8
Khandwa 0 0 0 0 0 100.6 436.7 378 396 70.5 15 5.3
Khargone 0 0 0 0 0 48.8 293.9 393.8 280 46.2 1 0
Mandla 18.7 10.3 25.6 5.6 0 83.4 493.6 559.8 610.5 53.2 0 13.8
Mandsaur 0 1.2 0 41.3 0 84.2 455.3 891 588.1 75.1 8.4 0
Morena 25 17.4 0.6 16.5 7.7 79.8 235.2 227.3 188.8 18.7 10.6 9.7
Narsinghpur 0 0.2 0.6 8 0 82.6 442 581 613.8 1.8 3.2 9.4
Neemuch 0 3 0.3 19.3 0 116.9 379.5 674.6 540.7 47.3 21 1.7
Panna 2.2 2.1 0 0 0 30.7 277.4 439 368.5 57 0 24.6

Dynamic Ground Water Resource of Madhya Pradesh - 2020
35
DISTRICTS JAN FEB MAR APR MAY JUN JUL AUG SEP OCT NOV DEC
Raisen 0 6.2 0 6.8 2.1 71.6 475.9 667.3 648.4 29 12 20
Rajgarh 0 0 0 8.4 0 80.2 349.8 638.9 562.1 65.2 18.2 2.3
Ratlam 0 0 0 15.5 1.3 179.3 453.2 480.1 450.8 79.3 0.3 1
Rewa 25.2 12.6 23.2 10.3 1.6 29.3 355.7 426.4 387.8 55.4 0 15.6
Sagar 0 0.7 0 15.3 1.7 70.4 334 612.8 502.6 6.1 2.6 10.8
Satna 11.3 22.6 11.8 6.2 11.7 51.1 301.1 350.3 200.4 8.5 0 15.6
Sehore 0 3.2 3.2 0 6.8 92.8 564.5 493.7 623.4 46.6 0.6 8
Seoni 19.7 2.5 15.7 3.6 1.1 72.2 333.5 422.6 646.5 71.5 0 19.4
Shahdol 7 8 18 20 0 38 243 347 241 26 0 29
Shajapur 0 0 0 6 0 71.5 520.2 527 594.2 76.6 11.5 0
Sheopur 3.5 10.1 0 22.5 0 76.7 355 294.2 123.4 19.5 0 5.5
Shivpuri 1.3 11.5 0.3 21 2.1 50.1 319.3 271.6 254 36.6 6.5 1.3
Sidhi 17.4 4.8 22.6 3.6 0 9.4 201.6 328 377 35.4 0 61
Singrauli 13.4 13 37.1 21.8 7.4 68.8 334.5 407.7 400.3 33.8 0 57.2
Tikamgarh 0 4.5 0 2.5 12 21.5 339 405.5 287 93 0 15.7
Ujjain 0 4 0 8.6 3.2 132 330.9 517.2 497.2 69.2 20.8 0.1
Umaria 4.6 14.3 11.8 16.4 0 52.3 503 402.4 376.5 10.8 0 20.5
Vidisha 0 1.6 0 17.5 0.3 33 345.1 689.3 536.3 32.1 7.5 7.4

Dynamic Ground Water Resource of Madhya Pradesh - 2020
36
Fig. 3.2: Rainfall Distribution - SW Monsoon 2019, Madhya Pradesh
Daily observed rainfall distributions for Madhya Pradesh along with their daily rainfall normal
have been depicted in Fig 3.2. The normal annual rainfall for Madhya Pradesh is 1088 mm.
The variation in normal annual rainfall is between 742.5 mm and 1471.6 mm. The rainfall
decreases as we move from East to West and south to North. The highest normal annual rainfall
occurs in Balaghat district (1471.6 mm) followed by Mandla, Annupur and Dindori districts,
which are in southern and south eastern parts of State whereas lowest normal annual rainfall is
recorded in 742.5 mm in Barwani district in the western part of Madhya Pradesh. The Normal
annual rainfall map of Madhya Pradesh in shown in the
Table.3.3: District wise Normal Annual Rainfall-Year-2019
S.No District
Normal
Annual
Rainfall
(mm)
S.No District Normal Annual
Rainfall (mm)
1 Agar Malwa 1036.1 27 Khargone 950.3
2 Alirajpur 912.8 28 Mandla 1427.7
3 Anuppur 1423.6 29 Mandsaur 753.7
4 Ashoknagar 926 30 Morena 753
5 Balaghat 1471.6 31 Narsinghpur 1191
6 Barwani 742.5 32 Neemuch 854.9
7 Betul 1145.55 33 Panna 1183
8 Bhind 951 34 Raisen 1207.3
9 Bhopal 1126.65 35 Rajgarh 972
10 Burhanpur 883.8 36 Ratlam 992.85
11 Chhatarpur 1092.7 37 Rewa 1141.5
12 Chhindwara 1139.25 38 Sagar 1205
13 Damoh 1176 39 Satna 1075.5
14 Datia 963.8 40 Sehore 1067.5
15 Dewas 1069 41 Seoni 1322

Dynamic Ground Water Resource of Madhya Pradesh - 2020
37
S.No District
Normal
Annual
Rainfall
(mm)
S.No District Normal Annual
Rainfall (mm)
16 Dhar 856.5 42 Shahdol 1131.4
17 Dindori 1376.3 43 Shajapur 1036.1
18 Guna 1082 44 Sheopur 799.2
19 Gwalior 870 45 Shivpuri 994.9
20 Harda 1374 46 Sidhi 1154
21 Hoshangabad 1324.5 47 Singrauli 1120.2
22 Indore 976.8 48 Tikamgarh 943.6
23 Jabalpur 1279.45 49 Ujjain 861.5
24 Jhabua 865.4 50 Umaria 1242
25 Katni 1171.4 51 Vidisha 1135.3
26 Khandwa 951.65
Fig.3.3: Annual Normal Rainfall Map, Madhya Pradesh
3.2 PHYSIOGRAPHY
The State exhibits six distinct physiographic units as follows:
▪ The Malwa Plateau
▪ The Satpura Range

Dynamic Ground Water Resource of Madhya Pradesh - 2020
38
▪ The Vindhyan Range
▪ The Mahakoshal Range
▪ The Bundelkhand Region and
▪ The River valleys.
Fig.3.4: Physiography Map, Madhya Pradesh
The Malwa Plateau marks the northern span of the Deccan Plateau and this region forms
a part of the vast Deccan Plateau of Central India. The hill ranges run across the plateau. The
Satpura Range located in the southern part of the State is E-W trending. It has an average
elevation of 600 m amsl and highest elevation of 1350 m amsl. The Vindhyan range occupies
in the northern and central part of the region and has ENE-WSW trend. The Mahakoshal Range
also has a similar trend. The Vindhyan Range extends into the Malwa Plateau and Bundelkhand
Region. The Vindhyan Range and Mahakoshal Range are separated from the Satpura Range
by the Narmada River and vast tract of its basin area. The river valleys, other than the Narmada
alluvial plain and Chambal alluvial plain, are very limited and form narrow belts along the
rivers. Dhupgarh in Pachmarhi is on 1350 m amsl which is the highest elevation point in the
state. The Physiography map of Madhya Pradesh is shown in the Fig 3.4.

Dynamic Ground Water Resource of Madhya Pradesh - 2020
39
3.3 GEOMORPHOLOGY
Major part of the state is occupied by pediment pediplain complex, dissected plateaus and
dissected hills and valleys. Pediment Pediplain complex is the major landform covering about
180762 km2 (nearly 59%), presently mostly in the western and northeastern side sparcely
distributed in all other sides. The other major landform observed is moderate dissected plateau
covering about 43709 km2 (14.2%), highly dissected plateau in 11090 km2 (3.5%), low
dissected plateau in 8520 km2 (2.8%), moderately dissected hills and valleys in 22012 km2
(7.35%), low dissected hills and valleys in 6363 km2 (2%). Dissected hills and valleys, flood
plain and alluvial plain landforms are occupied very small part of the state. The geomorphology
map of Madhya Pradesh is shown in the Fig 3.5.
Fig.3.5: Geomorphology, Madhya Pradesh
3.4 LAND USE LAND COVER
Agriculture and forest are the prominent land use aspects in the state and forms 55 % and
28 % of total area respectively followed by the shrub land and water bodies. The spatial
distribution of land use is presented in Fig 3.6. (as per Land Use Land cover data, NASA,
USA).

Dynamic Ground Water Resource of Madhya Pradesh - 2020
40
Fig3.6: Land use Land Cover, Madhya Pradesh
3.5 DRAINAGE AND BASINS
Madhya Pradesh State represents great river basins and the watershed of a number of
rivers. Catchments of many rivers of India lie in Madhya Pradesh. There are six river basins in
Madhya Pradesh namely 1. Ganga Basin (1.1 Yamuna sub basin - Chambal sub-sub basin,
Kunwari sindh sub-sub basin, Jamni sub-sub basin, Betwa sub-sub basin, Dhasan sub-sub
basin, Ken sub-sub basin, Paisuni and Baidhan sub sub basin 1.2 Tons sub basin, 1.3 Sone sub
basin), 2. Narmada Basin, 3. Godavari Basin, 4. Tapti Basin, 5. Mahi Basin and 6. Mahanadi
Basin. The basins of Madhya Pradesh are shown in the Fig 3.7. As Madhya Pradesh is located
in the center of India, most of the rivers are interstate rivers. The rivers namely, Chambal,
Sindh, Betwa, Ken flows northward and meet with Yamuna, whereas the Sone River falls
directly into Ganga. Narmada, Tapti and Mahi Rivers flow westward and meet Arabian Sea
whereas Wainganga and Pench Rivers meet Godavari in the south. The Narmada (originating
from Amarkantak) and Tapti (originating from Multai in Betul District) Rivers and their basins
divide the state in two, with the northern part draining largely into the Ganga basin and the
southern part into the Godavari and Mahanadi systems. The Vindhyas form the southern

Dynamic Ground Water Resource of Madhya Pradesh - 2020
41
boundary of the Ganga basin, with the western part of the Ganga basin draining into the
Yamuna and the eastern part directly into the Ganga itself. All the rivers, which drain into the
Ganga, flow from south to north, with the Chambal, Kshipra, Kalisindh, Parbati, Kuno, Sind,
Betwa, Dhasan and Ken Rivers being the main tributaries of the Yamuna. The land drained by
these rivers is agriculturally rich, with the natural vegetation largely consisting of grass and dry
deciduous forest types. The eastern part of the Ganga basin consists of the Son, the Tons and
the Rihand Rivers, with the Son being the major tributary. This is also the junction point of the
Satpura and the Vindhya Ranges, with the Maikal and Kaimur Hills being the fulcrum. The
forests here are much richer than the thorn forests of the northwestern part of Madhya Pradesh.
The Son River is of great significance in that it is the largest tributary going into the Ganga on
the south bank and arising out of the hills of Madhya Pradesh rather than from the Himalayas.
This river and its tributaries contribute the bulk of the monsoon flow into Ganga, because the
north bank tributaries are all snow fed. The major tributary of the Ganga, the Son River, arises
in one of the most important watersheds in India, the Maikal hills around Amarkantak. Three
of the great rivers of India, Narmada, Mahanadi and Son, are given birth to by these hills. This
is also one of the few ranges in the state having a north south configuration. The Mahanadi
itself, together with its tributaries such as Hasdeo, Mand and Kharun flows southeast into
Chhattisgarh and converts that state into a green rice bowl. The upper Mahanadi catchment
contains some of the finest forests in the state, ranging from mixed deciduous to teak, bamboo
and sal. Just as the Mahanadi flows east from the Maikal hills and the Son flows north, the
mighty Narmada charts a westerly course from these very hills. The Narmada flows through a
rift valley, with the Vindhyas marching along its northern bank and the Satpuras along the
southern. Its tributaries include Banjar, Tawa, Machna, Denwa and Sonbhardra Rivers. Taken
in combination with its parallel sister river, the Tapti, which also flows through a rift valley,
the Narmada - Tapti systems carry and enormous volume of water and provide drainage for
almost a quarter of the land area of Madhya Pradesh.
The Satpuras, in the Gawligarh and Mahadeo hills, also contain a watershed, which is
south facing. The Indrawati, Wainganga, Wardha, Pench, Kanhan and Penganga Rivers,
discharge an enormous volume of water into the Godavari system. The Godavari is the lifeline
of Andhra Pradesh, but the water which feeds it is a gift of the central India watershed.

Dynamic Ground Water Resource of Madhya Pradesh - 2020
42
Fig.3.7: Basins and Major Rivers, Madhya Pradesh
3.6 HYDROGEOLOGICAL UNITS AND AQUIFER PARAMETERS
The State of Madhya Pradesh has varied hydrogeological characteristics due to which
ground water potential differs from place to place. The area is underlain by various geological
formations ranging in age from the Archaean to the Recent. Hard rock areas cover more than
80% of total land area of the State. These hard-rock areas show wide variations and
complexities in nature and composition of rocks, geological structures, geomorphological set
up and hydro meteorological conditions. The crystalline rocks of Archaean age like granite,
gneiss, granulites, schist, quartzite and granitoids occupy about 14.7% of geographical area of
the State. The basaltic rocks of Deccan lava flows are the predominant formations and occupy
nearly 44.5% of total geographical area. The consolidated sedimentary rocks of Vindhyan
Super Group and Mahakoshal (Cuddapah) Super Group of Proterozoic age occupy about 19.1%
of total geographical area and the semi consolidated (Gondwana Formation) occupies about
6.7%. Recent unconsolidated alluvial sediments occupy about 14.4% of total geographical area.
The Principal aquifer system of Madhya Pradesh is shown in the Fig 3.8. The Hydrogeological
units of the state and their potential is described in Table 3.4 and shown in Fig 3.9

Dynamic Ground Water Resource of Madhya Pradesh - 2020
43
Fig.3.8: Principal aquifer system, Madhya Pradesh

Dynamic Ground Water Resource of Madhya Pradesh - 2020
44
Table.3.4: Hydro geological Units, their Potential and Groundwater Scenario, Madhya Pradesh
Geological Age Group Rock Formation
Surface
Exposure
Area
(Approx.)
Occurrence and Hydrogeological Characters.
Pleistocene
to
Recent
Alluvial plains (older
and Newer
Alluvium)
Unconsolidated clays
and silts, gravels and
sands
of different mix.
Lenses of Peat and
organic matter
carbonate and
siliceous concretions
(Kankars)
38,000
Sq.Km.
Occur widespread in Bhind (Chambal basin), Hoshangabad and Narsimhapur
districts (Narmada basin) and also in Sheopur, Morena, Datia, Chhatarpur,
Jabalpur, Katni, Khandwa, Burhanpur, Raisen, Sidhi and Balaghat districts
and along rivers in some other districts. Form very potential ground water
reservoirs with a thick sequence of sandy aquifers down to great depths (>300
m.bgl). The aquifers are unconfined, semi-confined (leaky confined) or
confined.
Cretaceous
to
Eocene
Deccan Trap
Basalts
1,43,300
Sq.Km.
Occupy the Malwa plateau covering Nimuch, Mandsaur, Indore, Dhar,
Ratlam, Shajapur, Sagar, Rajgarh, Sehore, Badwani, Khargone, Khandwa and
Burhanpur districts and parts of Jhabua, Raisen, Guna, Ashoknagar, Vidisha,
Bhopal, Sehore, Betul, Jabalpur, Katni, Hoshangabad, Harda, Narsimhapur,
Chhindwara, Seoni, Dindori, Mandla, Shahdol and Anuppur districts.
Bagh and Lameta
Groups
Sandstones cherty
limestone
8,500
Sq.Km.
Infra Trappean formation of Bagh&Lametas occurs in Dhar, Jhabua& Jabalpur
districts and small patches in Sagar, Hoshangabad and Narsimhapur districts.
Weathered, Fractured and vesicular basaltic layers of Traps, inter-trappeans
and infratrappeans form productive unconfined hallow aquifers and leaky
confined/confined deeper aquifers and yield upto 5 lips. (Infra trappeans are
less productive). Sp.Yield 1 to 4% Hydraulic conductivity 5-15 m/day.
Palaezoic
to
Cretaceous
Gondwana super
Group. Jabalpur,
Mahadeva, Panchet,
Raniganj, Barakars
and Talchir Groups
Boulder beds Sand-
stones, shales, clays,
limestone, coal
seams
28,000
Sq.Km.
Occur in Betul, Chhindwara, Narsimhapur, Hoshangabad, Jabalpur, Katni,
Sidhi, Umaria, Shahdol and Anuppur districts. Possess moderate primary
porosity. Groundwater occurs under phreatic as well as semi-confined to
confined conditions. Free flowing conditions with free flow discharge of 150
to 200 lpm have been recorded in North-eastern part of Jabalpur district.
Vindhyan Super
Group. Bhander,
Occur in Gwalior, Morena, Sheopur, Shivpuri, Guna, Ashoknagar, Rewa,
Panna, Satna, Jabalpur, Katni, Damoh, Sagar, Chhatarpur, Raisen, Bhopal,
Vidisha, Nimuch, Mandsaur and Dewas districts. Generally, devoid of any

Dynamic Ground Water Resource of Madhya Pradesh - 2020
45
Geological Age Group Rock Formation
Surface
Exposure
Area
(Approx.)
Occurrence and Hydrogeological Characters.
Precambrian
(Proteozoic)
Rewa, Kaimur and
Semri Groups.
Mahakoshal
(Cuddaph) Super
Group
Bijawar and Gwalior
Groups.
Shales, Sandstones
and limestones
58,700
Sq.Km.
primary porosity. Weathering and denudation, structurally weak planes and
fractures impart porosity and permeability in the rock mass. Solution cavities
(Cavernous) in carbonate rocks, at places give rise to large groundwater
storage/circulation. Sp. Yield value of unconfined aquifer is generally low
(0.2% to 3%). Hydraulic conductivity varies widely depending upon fracture
incidence
(2 to 10 m/day.)
Archaeans
Older
MetamorphicsSausar,
Sakoli and Chilpi
Groups.
&Bundelkhand
Granites.
Granitoid gneisses,
schists, gneisses,
quartzites and
granites
31,500
Sq.Km.
Occur in Seoni, Balaghat, Shahdol, Anuppur, Mandla, Dindori, Sidhi, Rewa,
Panna, Datia, Tikamgarh, Gwalior, Chhatarpur, Jabalpur, Katni, Jhabua and
Shivpuri districts, as also parts of Chhindwara, Harda, Hoshangabad,
Narsimhapur and Dewas districts. Do not posses primary porosity.
Weathering, fracturing, jointing impart secondary porosity. Groundwater
mostly occurs under phreatic conditions and at some places also under
confined/semi confined conditions.

Dynamic Ground Water Resource of Madhya Pradesh - 2020
46
3.6.1 Archaeans
Archaeans comprise old metamorphic, granites, gneisses and schist. They are hard and
compact formations with low primary permeability, forming poor aquifers. Ground water occurs
in these only in the weathered mantle and underlying fractured zone. Dug wells in this formation
have depths of 5-30 m with water levels between 3-17 m bgl. Where thickness of aquifer is
considerable. Specific capacity ranges from 20-200 lpm/m of draw down. Hydraulic conductivity
is generally less than 1 m/d and specific yield less than 3%. The yield of open wells ranges between
40-135 m3/d.
3.6.2 Vindhyans
These are composed of sandstone, shale and limestone. The sandstone and shale are hard and
compact and form poor aquifers. Ground water occurs in these in the weathered mantle and
fractured zone. The limestone is different in its hydrogeological properties having large solution
cavities, which give rise to immense secondary permeability. The wells in limestone formations
yield 100-500 m3/day for 3m draw down. Specific capacity ranges from 100-300 lpm/m of draw
down, hydraulic conductivity varies between 5-15 m/d and specific yield ranges from 1-3 % in
good karstic zones.
3.6.3 Gondwana
The Gondwanas are sedimentary formations rich in granular zones and form good aquifers.
They support both dugwells and tubewells, capable of yielding 100-500 m3/d for the drawdown of
6-10 m. the specific capacity ranges between 75-250 lpm/m of drawdown, hydraulic conductivity
varies between 10-25 m/d and specific yield is from 1-3 %.
3.6.4 Infra Trappeans
The Bagh and Lameta beds and Nimar sandstone are also sedimentary formations but have
a limited extent and poor to moderate permeability. The limestone and calcareous clays when
karstified form productive aquifers. The corralling limestone, the marls and nodular limestone are
hard and compact having poor permeability. The Nimar sandstone has intergranular porosity,
joints, fracture, bedding planes, which give moderate scope for ground water movement. The depth
of wells varies from 3 to 13 m and depth to water level between 2 to 12 m bgl.
3.6.5 Deccan Traps
These form the most important aquifers in the region. Being the most extensive. The
weathered, fractured, jointed and vesicular units of basalts form moderate to good aquifers. These
formations have highly variable yields ranging from 10 to 750 m3/d. Dug wells range in depth
from 4 to 20 m with water levels varying between 2 and 14 m bgl. The specific capacity ranges
from 50 to 150 lpm/m of drawdown, hydraulic conductivity varies between 5 and 15 m/d and the
specific yield is 1-3%. The Deccan Traps formations can be tapped by dug well, dug-cum-bore

Dynamic Ground Water Resource of Madhya Pradesh - 2020
47
and bore wells. It is observed that the yield increases by 5-10 times when 10-15 m bores wells
extending down to the lower vesicular and bore well are drilled at the base of dug wells. Yields of
400-600 m3/d can be obtained in this way. In some areas the control of doleritic dykes on
occurrence of ground water is observed. Wells located on the upstream side of these dykes produce
yields. Also wells located on tectonic lineaments gave better yields.
3.6.6 Alluvium
It consists of unconsolidated gravel, sand, silt, clay in various proportions and has primary
inter-granular porosity and permeability. Hence it is the most promising formation for ground
water development. The thickness of alluvium varies from 10 to 318 m with aquifer thickness
from 10 to 160 m being more in the Ganga basin than in the Narmada basin. The depth to water
ranges from 5 to 30 m bgl. The transmissivity is high in the Ganga basin being upto 3000 m2/d. In
the Narmada basin transmissivity ranges between 83-283 m2/d. the yields vary from 30 to 50 m3/hr
for shallow wells and 30-200 m3/hr for deep wells in the Ganga basin. In the Narmada basin the
yields are of the order of 15-30 m3/hr in the phreatic zone and 70-200 m3/hr in the deeper zone. In
the Waingangā sub basin, the wells yield 60-600 m3/d. In the Tapi basin, the yields are 25-95 m3/d.

Dynamic Ground Water Resource of Madhya Pradesh - 2020
48
Fig.3.9: Hydrogeology Map, Madhya Pradesh

Dynamic Ground Water Resource of Madhya Pradesh - 2020
49
3.7 GROUND WATER LEVELS SCENARIO
3.7.1 Depth to Water Level
Groundwater level refers to underground surface below which the ground is wholly saturated
with water. The upper surface of the zone of saturation is the water table. In case of wells
penetrating confined aquifers, the water level represents the pressure or piezometric head at the
point. The configuration of the water table depends upon topography, geology, climate water
yielding and water bearing of rocks in the zones of aeration and saturation which control ground
water recharge.
During the water year 2019-20, the existing monitoring wells (Fig 3.10) were monitored four
times, i.e., during May 2019, August 2019, November 2019 and January 2020. With the field data,
maps were prepared for visual interpretation of the behaviors of the ground water levels. Depth to
ground water levels were demarcated into various zones in the ranges of less than 2 m, 2-5 m, 5-
10 m, 10-20 m, 20-40 m and more than 40 m. The description of the depth to water levels during
pre-monsoon (May) and post monsoon (November) monitoring seasons is as follows:
Fig.3.10: Location of Groundwater Monitoring Wells, Madhya Pradesh
3.7.1.1 Depth to Water Level: Pre-Monsoon (May- 2019)
Depth to Water levels ranges from 0.72 in Jhoteshwar monitoring station, Narsinghpur
district to 37 m bgl in Lalpura monitoring station of Neemuch district of Madhya Pradesh. Very
shallow water levels up to 2 m bgl are very few. Only 0.58% of wells in Madhya Pradesh State
fall in this category. About 13.40% of wells spreading all over Madhya Pradesh State has recorded

Dynamic Ground Water Resource of Madhya Pradesh - 2020
50
a water level in depth range of 2-5 m bgl. Depth to water levels ranging 5-10 m bgl is spread in
most parts of the State. About 48.10% of wells fall under this category. Deeper ground water levels
ranging 10-20 m bgl are seen mostly in northern western parts of the state and in isolated patches
in the northern and southern parts of the state. About 35.79 % of wells in the State fall in this
category. Ground water levels of more the 20 m bgl are found in about 2.13 % of the wells and
occur mainly in are seen mostly in northern western parts of the state and in isolated patches in the
northern and southern parts of the state. The depth to water level map of Madhya Pradesh State
for May 2019 is shown in Fig 3.11.
Fig 3.11: Pre monsoon Water level (May-2019), Madhya Pradesh
3.7.2 Depth to Water Level: Post-Monsoon (November-2019)
Depth to Water levels ranges from ground level to 32.35 m bgl in Madhya Pradesh state.
During this year the state has received excess rainfall and many of the districts are in rainfall large
excess category. Very shallow water levels up to 2 m bgl are seen in many districts as patches.
About 25.37 % of monitoring wells recorded water level less than 2 m bgl category. About 44.91%
of monitoring wells spreading all over Madhya Pradesh state has recorded a water level in the
depth range of 2-5 m bgl. Depth to water levels ranging 5-10 m bgl is noticed in about 23.14% of
wells. Deeper ground water levels ranging 10-20 m bgl are seen in about 5.60% of wells in the
state. Ground water levels of more than 20 m are found in about 0.98% of the wells and are seen

Dynamic Ground Water Resource of Madhya Pradesh - 2020
51
in of the state. The depth to water level map of Madhya Pradesh State for November 2019 is shown
in Fig 3.12.
Fig.3.12: Post monsoon Water level (Nov-2019), Madhya Pradesh
3.7.3 Water Level Fluctuation
Ground water is a dynamic system. The ground water level or head is subject to change
both due to natural and manmade causes. The zones of aeration and saturation play important roles
in ground water recharge and ground water level fluctuation. Groundwater level is an important
indicator for the recharge of the aquifer, groundwater abstraction and the discharge from the
aquifer to surface waters and to some extent groundwater quantity. Groundwater level can vary
significantly over time and seasons. Decline in groundwater levels can occur as a result of natural
climatic conditions (low rainfall), changes in land use, or as a result of over abstraction. Rise in
groundwater levels can occur as a result of natural climatic conditions (heavy rainfall), changes in
land use, or as a result of artificial recharge to groundwater by rainwater harvesting.
Water level fluctuations were analysed and maps were prepared after every water level
measurement comparing the current water levels with that of the same season of the previous year,
preceding season, pre-monsoon season and the decadal seasonal mean. These fluctuations were
carefully examined to observe the ground water situation with respect to time.
3.7.4 Annual Water Level Fluctuation
3.7.4.1 Water level Fluctuation (May-2018 to May-2019)

Dynamic Ground Water Resource of Madhya Pradesh - 2020
52
The ground water levels of monitoring wells during May 2019 were compared with those
of May 2018 to decipher the changes that took place in the ground water regime. In Madhya
Pradesh, 52% of the wells show a rise and the rest 48% wells show a decline in water levels. About
24.19 % of the wells show a rise in water level up to 2 m spreading in patches in many parts of the
state. About 11.06 % of the wells show a rise in water level between 2 to 4 m and, 16.73% of the
wells shows rise more than 4 m. The rise in water level in the range of 2-4 m and more than 4 m
are mainly found in districts towards the eastern and northern parts of the state.
About 18.66 % of the wells show a decline in water level up to 2 m and covering almost
all district of the state. About 12.48 % of the wells show a decline in water level between 2 to 4
m and occur in sporadic patches of the state. About 16.88 % of the wells shows decline more
than 4 m. In general, this year there is a rise in water level in the state as compared to last year.
The annual water level fluctuation map (May 2018-May 2019) is shown in the Fig 3.13.
Fig.3.13: Annual Water Level Fluctuation (May 2018- May 2019), Madhya Pradesh
3.7.4.2 Water level Fluctuation (November 2018 to November 2019)
About 87.90 % of wells show rise and 12.09 % decline in water levels in November 2019
compared to those in November 2018. The state has received excess rainfall during the month of
September and October and many districts are in large excess category which leads to rise in water
level all over the state. About 37.53 % of wells in Madhya Pradesh state, shows rise in water levels

Dynamic Ground Water Resource of Madhya Pradesh - 2020
53
up to 2 m and seen almost all part of the state. Rise of 2-4 m has occurred in 25.86 % of wells.
About 24.5% of wells shows rise in water levels more than 4 m and most prominently seen as
patches in the westernmost part of the state.
Decline in water levels up to 2 m are seen in about 9.56 % of wells. Decline in water level
between 2-4 m is observed in 1.36 % of wells of the state. Decline in water level more than 4 m is
observed by 1.15 % monitoring wells located in Balaghat, Narsingpur, Hoshangabad, Chhindwara,
Gwalior, Bind, Morena Districts and in many other districts in small pockets. The annual water
level fluctuation map (November 2018-November 2019) is shown in the Fig 3.14.
Fig.3.14: Annual Water Level Fluctuation (Nov 2018- Nov 2019), Madhya Pradesh
3.7.4.3 Seasonal Water Level Fluctuations (May-2019 to November-2019)
Water levels have shown a general rise in 96.23 % of the wells. Such a rise is a normal
phenomenon in the hydrological cycle since the monsoon rainfall forms the sole source of natural
recharge to ground water regime in the state. The state has received excess rainfall during the
month of September and October and many of the districts fall in large excess category. Rise in
the order of 0 to 2 m bgl is seen in 17.67 % of wells of the state. About 29.13% of the wells have
shown a rise of 2-4 m bgl and are seen in almost all parts of the state except the northern and
southeastern part of the state. Significant rise of more than 4 m bgl is found in 49.42 % of wells
that is, in entire parts of the state except the northern parts of the state.

Dynamic Ground Water Resource of Madhya Pradesh - 2020
54
About 3.77% of the wells in Madhya Pradesh state show a marginal decline in water level
up to 2 m bgl. Decline in water level between 2-4 m bgl is observed in 0.33 % of wells and mostly
in the northern and southeastern part of the state. About 0.16 % wells shows a decline in water
level more than 4 m bgl and are seen in northern and southeastern part of the state. The seasonal
water level fluctuation map (May 2019-November 2019) is shown in the Fig 3.15.
Fig.3.15: Seasonal Water Level Fluctuation (May 2019- Nov 2019), Madhya Pradesh
3.7.4 Long-Term Ground Water Level Trend
Groundwater is replenished from precipitation and from surface water, but the rate of
abstraction (withdrawal by humans) may exceed the rate of natural recharge, leading to reduction
of the resource indicated by declining trend of water level. Rising trend in groundwater levels can
occur as a result of natural climatic conditions (heavy rainfall), changes in land use, construction
of pond or reservoir or as a result of artificial recharge to groundwater by rainwater harvesting.
The trend analysis of depth to ground water levels (time series analysis) using the data
from the hydrograph network stations for the past one decade 2010-19 was carried out using the
least square method. Based on this analysis, maps are prepared demarcating various zones of rising
and declining trends for the decade 2010-19.

Dynamic Ground Water Resource of Madhya Pradesh - 2020
55
3.7.4.1 Ground water Level Trend Pre-Monsoon (May 2010 to May 2019)
Ground water levels trend map of pre-monsoon period (May 2010 to May 2019) in Madhya
Pradesh state has been depicted in Fig 24. The Map shows that there is a general declining trend
up to 0.10 m/year of ground water levels during the past decade in the almost all the districts of
the State. The rising trend more than 0.20 m/year has been observed only in Sheopur district.
Declining trend at a rate up to (-0.10 m/year) is observed in a small pocket mainly in central and
southern parts of the state and declining trend at a rate (-0.10 to -0.20 m/year) has been observed
mainly in Damoh, Narsinghpur, Chhindwara, Indore, Dhar, Ratlam and Raisen District of the state.
The declining trend at a higher rate (>0.2m/year) has seen in Dhar, Chhindwara, Bind, Morena,
Guna and Ratlam Districts of the state. The declining trend of pre-monsoon water levels reflects
the ground water developmental activities in an area, whereas the rising trend indicates that either
the developmental activities have reduced, or that, recharge due to sources other than the rainfall,
such as applied irrigation has increased. Around 52.2% of monitoring wells are showing declining
water levels trend while 47.8 % monitoring wells are showing rising ground water level trend.
Fig 3.16: Pre-monsoon Water Level Trend, Madhya Pradesh

Dynamic Ground Water Resource of Madhya Pradesh - 2020
56
3.7.4.2 Ground water Level Trend Post-Monsoon (November 2010 to November
2019)
Ground water levels trend map of post-monsoon period (Nov 2010 to Nov 2019) in
Madhya Pradesh state has been depicted in Fig 25. The Map shows that there is a general declining
trend up to 0.10 m/year of ground water levels during the past decade in almost all the districts of
the state. Declining trend at a rate (-0.10 to -0.20 m/year) has been observed mainly in Rajgarh,
Vidisha, Betul, Sheopur Districts of the state. Rising trend at a rate 0.10 m/year is observed in
northeastern parts of the state. Declining trend at a rate 0.10 to 0.20 m/yearhas been observed in
Chhindwara (part), Narsingpur(part), Damoh (part), Panna (part), Sheopur (part) & Datia (part)
Districts of the state. Declining trend at a rate (0.10 to 0.20 m/year) has been observed in Vidisha,
Rajgarh and Betul Districts.The declining trend in post-monsoon water levels suggests that a part
of the aquifer is being dewatered every year, due either to deficient rainfall or to developmental
activities. The rising post-monsoon trend, on the other hand, shows that additional water is being
stored in the aquifer due to either increased rainfall or to seepage through applied irrigation.
Fig.3.17: Post-monsoon Water Level Trend, Madhya Pradesh

Dynamic Ground Water Resource of Madhya Pradesh - 2020
57
3.8 HYDROCHEMISTRY OF GROUNDWATER (2019-20)
Water samples were collected from 1194 Ground Water Monitoring Wells during May 2019
and monitored for chemical quality of ground water (phreatic aquifer) and their location is given
in Fig 3.18. Detailed analysis of the chemical samples was carried out parameters namely: pH,
Electrical Conductivity (EC), Carbonate, Bi-carbonate, Chloride, Fluoride, Nitrate, Sulphate,
Phosphate, Total hardness, Calcium, Magnesium, Sodium and Potassium.
Fig.3.18: National Hydrographic Station for Groundwater Collection
3.8.1 Salinity
The salinity of water is represented by electrical conductivity. Electrical conductivity is a
numerical expression of the ability of water to conduct an electric current. It depends on the total
concentration of the ionized substances dissolved in water and the temperature at which the
measurement is made. Electrical conductivity increases by about 2% per degree Celsius rise in
temperature. The mobility of the dissolved ions, their valencies and their concentration affect
conductivity. As electrical conductivity is an index of salinity in water, high electrical conductivity
means high salinity. High salinity not only imparts bad taste to drinking water but such water is
not suitable for irrigation purposes as it leads to deposition of salt content in the soil and affects
the fertility of soil in the absence of adequate soil management practices.

Dynamic Ground Water Resource of Madhya Pradesh - 2020
58
The water having electrical conductivity up to 1000 µS/cm at 25°C may be considered
fresh & suitable for drinking purpose. The Ground water quality of Madhya Pradesh is generally
good as 58.71% wells have electrical conductivity below 1000 µS/cm at 25°C. The salinity tolerant
crop may be grown in the area where electrical conductivity is more than 2000 µS/cm 25°C.
The chemical quality of ground water of Madhya Pradesh is generally good as the perusal
of the frequency distribution of electrical conductivity in phreatic aquifer. Table 3.5 shows that
86.85% wells fall in the range of 0-1500 µS/cm at 25°C and only 1.01% wells have electrical
conductivity more than 3000 µS/cm at 25°C.
Table.3.5: Frequency distribution of electrical conductivity in phreatic aquifer range
EC Range (µS/cm at 25°C) No. of Samples %
0-1500 1037 86.85
1501-3000 145 12.14
>3001 12 1.01
Fig.3.19: Electrical Conductivity in shallow aquifer, Madhya Pradesh

Dynamic Ground Water Resource of Madhya Pradesh - 2020
59
The distribution of major ions indicates that in Madhya Pradesh in ground water with low
to medium salinity (EC 1000 µs/cm) bicarbonate is the predominant anion but there is
conspicuous increase in Chloride, Sulphate and Nitrate ion concentration with increase in salinity
which indicates that the leaching of minerals of these constituents or human activity is contributing
towards salinity in ground water of the area. Generally, the ground water in Madhya Pradesh is
alkaline earth bicarbonate type. In Madhya Pradesh, the electrical conductivity of water in shallow
aquifer occurs more than 3000 µs/cm at 25°C in Agar Malwa, Alirajpur, Bhind, Indore, Neemuch,
Ratlam, Sagar and Sehore districts. The distribution of Electrical Conductivity in Madhya Pradesh
is given in the Fig 3.19.
3.8.2 Fluoride
Generally, fluoride is present in low concentration in natural water. The presence of
fluoride in ground water is very important from health point of view for human consumption as in
low concentration; it prevents dental caries (up to 1.0 mg/l). However, the high concentration of
fluoride above the permissible limit of 1.5 mg/l in drinking water (IS: 10500 Drinking water
standards) is harmful for human consumption as it causes mottling of teeth and skeletal fluorosis.
Its accumulation leads not only to high skeletal concentration, but also has crippling ill effects.
In Madhya Pradesh fluoride rich water in shallow aquifer occurs in Alirajpur, Anuppur,
Bhind, Chhindwara, Datia, Dewas, Dhar, Dindori, Harda, Jabalpur, Mandla, Neemuch, Raisen,
Rajgarh, Ratlam, Singrauli, Tikamgarh, Ujjain and Umaria districts. The distribution of fluoride
in the State is shown in Fig 28. Flouride analysis reveals that there is no specific trend observed
for distribution of Fluoride in the State. The maximum fluoride concentration has been observed
at Fatta (4.00 mg/l) of Alirajpur district. The frequency distribution of Fluoride is given in the
Table 3.6 shows that in 89.61% (1070 nos.) wells Fluoride concentration is within the desirable
limit of 1.0 mg/l where as 3.18% (38 nos.) wells show Fluoride concentration above the maximum
permissible limit of 1.5 mg/l.
Table.3.6: Frequency Distribution of Fluoride in Phreatic Aquifer
Fluoride Conc. Range (mg/l) No. of Samples %
0-1 1070 89.61
1-1.5 86 7.20
>1.5 38 3.18

Dynamic Ground Water Resource of Madhya Pradesh - 2020
60
Fig.3.20: Fluoride Concentration in shallow aquifer, Madhya Pradesh
3.8.3 Nitrate
Undesirable changes in the natural quality of ground water due to anthropogenic activities of
man are a matter of great concern. The contribution of atmospheric and geological sources for
Nitrate in ground water is small in comparison to the sources related to pollution as a result of
activities of man. Sewage and animal waste contain considerable amount of Nitrate and its
discharge on land & subsequent leaching by rainfall causes enrichment of Nitrate in ground water.
Similarly, agricultural sources such as excessive use of fertilizers, irrigation with wastewaters,
legumes and farm yard wastes contribute nitrate to ground water.
Concentration of nitrate in excess of 45mg/l in water is harmful for human consumption,
particularly for infants as it may cause blue baby disease. The highest desirable and maximum
permissible limit of nitrate is 45mg/l (IS: 10500 Drinking water standards). The locations of wells
in Madhya Pradesh, where concentration of nitrate ion was more than 45mg/l in ground water are
shown in Fig 29. Perusal of frequency distribution of nitrate in ground water reveals that 69.18%
(826 nos.) wells have nitrate concentration within the permissible limit of 45mg/l while 30.82%
(368 nos.) well water contain nitrate in excess of 45 mg/l (Table 3.7).

Dynamic Ground Water Resource of Madhya Pradesh - 2020
61
Table.3.7: Frequency distribution of Nitrate in shallow aquifer
Nitrate Conc. Range (mg/l) No. of Samples %
0-45 826 69.18
46-100 282 23.62
>100 86 7.20
Fig.3.21: Nitrate Concentration in shallow aquifer, Madhya Pradesh
In Madhya Pradesh, nitrate concentration in shallow aquifer occurs in Agar Malwa,
Alirajpur, Anuppur, Ashok Nagar, Balaghat, Barwani, Betul, Bhind, Bhopal, Burhanpur,
Chhatarpur, Chhindwara, Damoh, Datia, Dewas, Dhar, Dindori, Gwalior, Harda, Hoshangabad,
Indore, Jabalpur, Jhabua, Katni, Khandwa, Khargone, Mandla, Mandsaur, Morena, Narsinghpur,
Neemuch, Panna, Raisen, Rajgarh, Ratlam, Rewa, Sagar, Satna, Sehore, Seoni, Shahdol, Shajapur,
Sheopur, Shivpuri, Sidhi, Singrauli, Tikamgarh, Ujjain, Umaria and Vidisha districts. The
distribution of nitrate concentration in the State is shown in Fig 29. Very high nitrate concentration
of 458 mg/l was found in the ground water sample from Palar of Damoh district.
3.8.4 Total Hardness
Hardness is mainly caused by the presence of Calcium and Magnesium Bicarbonate,
Sulphate and Chloride ions. As per Bureau of Indian Standard IS:10500: 2012 (Drinking water),
the desirable limit of total hardness is 200 mg/l and permissible limit is 600 mg/l. Total Hardness

Dynamic Ground Water Resource of Madhya Pradesh - 2020
62
in the shallow ground water in Madhya Pradesh ranges between 10 to 1480 mg/l (1480 mg/l in
Sanwer, Indore district). Most of the waters are calcium bicarbonate type attributing to temporary
hardness of water. Permanent hardness of water caused by Calcium and Magnesium, Sulphate and
Chloride can be removed by ion exchange.
Table.3.8: Frequency distribution of Total Hardness in shallow aquifer
Total Hardness Range (mg/l) No. of Samples %
<200 246 20.60
200-600 863 72.28
>600 85 7.12
The study of Total Hardness in ground water reveals that 85 nos. (7.12%) of well waters
contain hardness more than the permissible limit of 600 mg/l and 863 nos. (72.28%) of well waters
has total hardness above the desirable limit of 200 mg/l but below the permissible limit of 600
mg/l (Table 3.8).
3.8.5 Suitability for Irrigation
The crop productivity depends on the quality of the water used for irrigation. Water
suitability for irrigation needs to be evaluated on the basis of hazards it can create in the soil,
affecting yield & quality of crops. The potential hazards to crop growth are salinity, sodicity,
alkalinity and toxicity.
3.8.6 Sodium absorption Ratio
Sodium Adsorption Ratio (SAR) is an estimate of the degree to which Sodium will be
absorbed by soil from water. Sodium in irrigation, waters adversely affects soil structure and
permissibility by replacing Ca and Mg ions.
𝑆𝐴𝑅 =𝑁𝑎+
√𝐶𝑎++ + 𝑀𝑔++
2
Where: Na+, Ca+2 and Mg+2 is expressed in meq/l
Table.3.9: Quality of Water on the basis of SAR values
S.No. Range of
SAR No. of Sample
% of
Samples Quality of Water
1. <10 1184 99.16 Low Sodium hazard good quality
2. 10-18 9 0.75 Medium Sodium hazard medium quality
3. 18-26 1 0.08 High Sodium hazard bad quality
4. >26 0 0 Very High Sodium hazard very bad
quality

Dynamic Ground Water Resource of Madhya Pradesh - 2020
63
Table 3.9 shows that the quality of water samples as per SAR is good as 99.16% (1184 nos.) wells
have SAR value below 10.
3.8.7 Residual Sodium Carbonate
Residual Sodium Carbonate (RSC): Equals the sum of bicarbonate and Carbonate ion
concentration minus the sum of Calcium & Magnesium ions, when all the ions are expressed in
meq/l.
𝑅𝑆𝐶 = (𝐶𝑂3− − + 𝐻𝐶𝑂3
−) − (𝐶𝑎++ + 𝑀𝑔+ +)
According to Eaton (1950) and USSL (1954), irrigation waters containing residual sodium
carbonate (RSC) above 2.5 meq/l are not suitable for irrigation purpose. Water containing 1.25 to
2.5 meq/l of RSC is marginally suitable & those containing less than 1.25 meq/l of RSC are safe.
The water quality of Madhya Pradesh has been evaluated on the basis of RSC in Table 3.10.
Table.3.10: Number of wells falling in different RSC ranges
S.No. RSC Range in meq/l No. of wells % of wells Suitability
1. < 1.25 1081 90.54 Suitable
2. 1.25 – 2.5 56 4.69 Marginally suitable
3. >2.5 57 4.77 Unsuitable
Nearly 95.23% (1137 Nos.) of dug well waters of Madhya Pradesh were found to have
RSC values below 2.5meq/l, which infers that the water is free from alkalinity hazards. However,
4.17% (49 Nos.) of wells have RSC more than 2.5 meq/l. Excessive use of these high RSC waters
for irrigation can adversely affect fertility of the soil in the area by making it alkaline, resulting at
times in hardening of the soil due to deposition of sodium carbonate. For safe use of such waters
gypsum requirement for different soils needs to be evaluated.
Maximum and minimum values and values exceeding desirable and permissible limit for drinking
use of different parameters is shown in the Table 3.11.

Dynamic Ground Water Resource of Madhya Pradesh - 2020
64
Table3.11: Showing maximum and minimum values and values exceeding desirable and permissible limit for drinking use of different parameters
p
H
T
H
C
a
Mg Na K CO3 HCO3 C
l
SO4 NO3 F E
C
m
g/
l
µS/cm at 25°C
Range of
values (Min.)
6.48 20 4 1 4 0.1 0 25 5 0 1 0.01 Minimum 138
Range of
values (Max.)
8.43 1480 421 206 610 165 32 1197 1151 1100 458 4.00 Maximum 4875
IS:10500 drinking
water
(desirable
limit)
6.5- 8.5
200 75 30
Bicarbonate alkalinity
200
250 200 45 1 Range of
EC
% of samples
IS: 10500 drinking
water
(permissibl
e limit)
6.5- 8.5
600 200 100 600 1000 400 45 1.5 <1500 86.85
% samples exceeding
desirable
limit
Nil 72.28 42.80 38.53 78.73 7.12 0.92 30.82 7.20 1501- 3000
12.14
% samples exceeding
permissible
limit
Nil 7.12 3.26 1.17 3.93 0.17 0.25 30.82 3.18 >3000 1.01

Dynamic Ground Water Resource of Madhya Pradesh - 2020
65
CHAPTER-4
4.0 COMPUTATION OF GROUND WATER RESOURCE
The Dynamic ground water resources (as in 2020) of Madhya Pradesh have been assessed
jointly by Central Ground Water Board, North Central Region, Bhopal and Ground Water Survey,
Water Resource Department, Govt. Of Madhya Pradesh under the supervision of the State Level
Committee. The dynamic ground water resources are also known as Annual Ground Water
Recharge, since it gets recharged every year from rainfall and other sources (secondary sources)
such as applied irrigation water, surface water bodies, water conservation structures, etc.
Methodology adopted for the assessment has been outlined in Chapter 2 of this report. This section
provides a summary of the Ground Water Resources Assessment 2020 (GWRA-2020) made for
the state. Data of rainfall, ground water structures, canal, tanks ponds etc. are collected of five
years from 2015 to 2019. The water level data are used from 2010 to 2019.
4.1 ASSESSMENT UNITS
In the earlier assessment years, the resource was estimated for all 313 administrative blocks
as the assessment units. In the assessment year 2019-20, four urban areas of Madhya Pradesh
namely Bhopal, Indore, Gwalior and Jabalpur were added to estimate separately. The ground water
resources have been computed for all 317 assessment units (313 administrative blocks and 4 urban
areas) of Madhya Pradesh.
The following sub-units are taken into account for the computation of various figures in the
methodology and have been considered as given below: -
4.1.1 Hilly Area
This sub-unit comprises of all portions of ground water assessment unit which have slopes
greater than 20%. This sub-unit is characterized by more runoff and less ground water recharge,
and hence has been excluded for ground water recharge computation.
4.1.2 Poor Ground Water Quality Area
There is no clear cut demarcated area of poor quality in the State for computation of ground
water resources. Apart from this, statistical data of ground water structure is also not available.
Hence this unit has not been considered for resource estimation.
4.1.3 Command and Non-Command Area
In the methodology, it is recommended that dynamic ground water resources estimation
should be carried out for command area and non-command area separately. This has been
followed. For computation of ground water resources of command area only medium and major
command areas have been considered.

Dynamic Ground Water Resource of Madhya Pradesh - 2020
66
Block-wise total geographical areas, hilly area, command area, non-command area and area
worthy for ground recharge are given in Annexure IVA, whereas district-wise geographical areas,
hilly area, command area, non-command area and area worthy for ground recharge are shown in
Table 4.1
Table.4.1: District wise Area Details
District
Total Geographical Area (Hectare)
Recharge Worthy Area
Hilly
Area Total
Command area
Non-
command
area
Total
Alirajpur 0 305440 305440 26400 331840
Agar 11375 240201 251576 20617 272193
Anupur 0 294200 294200 78200 372400
Ashoknagar 20650 441594 462244 5150 467394
Balaghat 101503 790290 891793 31107 922900
Badwani 66689 300142 366831 175369 542200
Bhind 179891 266009 445900 0 445900
Bhopal 0 264800 264800 12437 277237
Betul 29248 827202 856450 147850 1004300
Burhanpur 11289 245761 257050 66250 323300
Chhatarpur 116640 673794 790434 78302 868736
Chhindwara 12476 872301 884777 296723 1181500
Datia 132097 134103 266200 2900 269100
Damoh 57667 416952 474619 255981 730600
Dewas 18544 558538 577082 125002 702084
Dhar 149070 663570 812640 2660 815300
Dindori 0 456000 456000 116500 572500
Guna 37209 580305 617514 21486 639000
Gwalior 131133 297167 428300 28100 456400
Harda 79150 190940 270090 62910 333000
Hoshangabad 253623 304729 558352 112048 670400
Indore 5376 376521 381897 7903 389800
Jabalpur 80876 362992 443868 78225 522093
Jhabua 17018 294235 311253 34747 346000
Katni 33404 433244 466648 22752 489400
Khargone 172061 484836 656897 146103 803000
Khandwa 92560 488886 581446 171004 752450
Mandla 31070 542920 573990 180410 754400
Mandsaur 0 499048 499048 54470 553518
Morena 224789 213700 438489 60400 498889
Neemuch 0 375744 375744 44300 420044

Dynamic Ground Water Resource of Madhya Pradesh - 2020
67
District
Total Geographical Area (Hectare)
Recharge Worthy Area
Hilly
Area Total
Command area
Non-
command
area
Total
Narsinghpur 50569 428531 479100 34200 513300
Panna 32712 629763 662475 52375 713500
Raisen 58600 602340 660940 185700 846640
Rajgarh 0 615498 615498 0 615498
Ratlam 8614 452986 461600 24500 486100
Rewa 75446 517470 592916 38444 631360
Satna 47108 624998 672106 78128 750234
Sagar 47073 878345 925418 99782 1025200
Sehore 95559 368413 463972 193828 657800
Seoni 71956 733064 805020 70780 875800
Shahdol 5047 492753 497800 86300 584100
Shajapur 0 339617 339617 7708 347325
Sheopur 71150 462330 533480 127120 660600
Shivpuri 69421 907628 977049 50751 1027800
Sidhi 48890 311515 360405 124995 485400
Singrauli 6602 444658 451260 115940 567200
Tikamgarh 39692 448408 488100 16700 504800
Umaria 0 421900 421900 32000 453900
Ujjain 0 593933 593933 19090 613023
Vidisha 76287 594483 670770 66330 737100
State Total 2870134 24064797 26934931 3889627 30824558
4.2 GROUND WATER RESOURCES OF MADHYA PRADESH Groundwater resources of Madhya Pradesh State have been computed according to
Methodology and norms described in Chapter-2. The assessment wise details have been provided
in Annexure (IV B to IV H). The Salient features of the computations are given below.
4.2.1 Recharge from Rainfall
Recharge from rainfall has been computed separately for monsoon and non-monsoon periods
as well as for command and non-command areas. Recharge from rainfall is mainly a function of
geographical area of the district, normal monsoon rainfall and lithology of the area.
The recharge from rainfall during monsoon season has been computed using mainly Water
Level Fluctuation Method, whereas recharge from rainfall during non-monsoon period has been
computed using Rainfall Infiltration Factor Method. Details of the block-wise monsoon and non-

Dynamic Ground Water Resource of Madhya Pradesh - 2020
68
monsoon Rainfall recharge have been given in Annexure IV B. District-wise recharge from
rainfall is given in Table-4.2.
Non-monsoon rainfall recharge is taken into account in Annupur, Balaghat, Burhanpur,
Chhindwara, Dindori, Mandla, Rewa, Satna, Seoni, Shahdol, Sidhi and Umaria districts, where
non monsoon rainfall is more than 10% of the total annual rainfall. Total recharge from rainfall in
the State is of the order of 2787259.71 ham (27.87 bcm) which is approximately 76.75% of the
total annual ground water recharge (Fig 4.1) with Hoshangabad district having the highest
recharge of 129279.3 ham and Alirajpur district has minimum recharge of the order of 19981.86
ham.
4.2.2 Recharge from Other Sources
Total Recharge to ground water has several components, rainfall being the major one. The
other component include seepage from canals, return flow from surface water irrigation, return
flow from ground water irrigation, seepage from Tanks and Ponds etc. for command area. For
non–command area seepage from canals and return flow from surface water irrigation is not
applicable. Assessment wise recharge from other sources has been given in Annexure IV B.
District- wise recharge from other sources is given Table 4.2. Component of recharge from other
sources is highest in Hoshangabad district (77814.08 ham) followed by Khargone district
(50420.74 ham) where maximum canal irrigation facility is available. Lowest value of recharge
from other source is recorded in Dindori (641.44 ham) and Anuppur (1565.94 ham) being tribal
districts where use of ground water as well surface water for irrigation purpose is very low. Total
recharge from rainfall is 2787259.71 ham (27.87 bcm) whereas from other sources is 828873.53
ham (8.29 bcm). Assessment wise recharge from canals, surface water irrigation, ground water
irrigation, seepage from Tanks and Ponds, water conservation structures and pipelines has been
given in Annexure IV C. District- wise recharge from canals, surface water irrigation, ground
water irrigation, seepage from Tanks and Ponds, water conservation structures and pipelines is
given Table 4.3.
4.2.3 Recharge from All Sources
The overall contribution of rainfall (both monsoon & non-monsoon) recharge to state’s
total annual ground water recharge is 77 % and the share of recharge from ‘Other sources’ viz.
canal seepage, return flow from irrigation, recharge from tanks, ponds and water conservation
structures taken together is 23 % (Fig 4.1). Total replenishable ground water resources including
rainfall recharge and recharge from other sources have been computed on assessment- wise and
by adding up assessment wise figures of the respective districts which is presented in Annexure

Dynamic Ground Water Resource of Madhya Pradesh - 2020
69
IV B and Table-4.2. Total annual recharge from all sources in the State is of the order of
3616133.15 ham, (36.16 bcm), with Hoshangabad district having the highest recharge of
207093.39 ham and Alirajpur district has minimum recharge of the order of 23103.53 ham.
Volumetric estimates are dependent on the areal extent of the assessment units. In order to compare
the ground water resource of different assessment units, the volumetric estimates of annual ground
water recharge have been converted to depth units (m) by dividing the annual ground water
recharge by the area of the respective assessment units (km2). Spatial variation in annual ground
water recharge (m) is shown in Fig 4.2.
4.2.4 Unaccounted Natural Discharge and Annual Extractable Ground Water Resource
The total annual ground water recharge of the area is the sum of monsoon and non-
monsoon recharge. An allowance of 5% of total annual ground water recharge has been kept for
natural discharge in the non-monsoon season, recharge is considered of WLF method is employed
to compute rainfall recharge during monsoon season otherwise 10%. The balance ground water
available accounts for existing net ground water availability for various uses and potential for
future development. Assessment wise unaccounted natural discharge and Annual Extractable
Ground Water Resource is given in Annexure IV B whereas district wise unaccounted natural
discharge and Annual Extractable Ground Water Resource is given in Table 4.2. Total
unaccounted natural discharge in the State is of the order of 278093.45 ham (2.78 bcm) with
Hoshangabad district having the highest discharge of 12074.2 ham and Jhabua with lowest of
1703.56 ham. The total natural discharge in the state is about 8% of the total annual Groundwater
recharge (Fig 4.1). The Annual Extractable Ground Water Resource in the state is 3338039.67
ham (33.38 bcm) with Hoshangabad district having the highest Annual Extractable Ground Water
Resource of 195019.19 ham and Alirajpur with lowest of 21327.31 ham. The Annual Extractable
Ground Water Resource in the state which is 92% of the total annual Groundwater recharge (Fig
4.1)

Dynamic Ground Water Resource of Madhya Pradesh - 2020
70
Fig.4.1: Ground Water Resources and Extraction Scenario, Madhya Pradesh, 2020
76.75 %
4.43 %
0.33 % 18.49 %
Recharge from Rainfall-Monsoon
Season
Recharge from Other Sources-
Monsoon Season
Recharge from Rainfall-Non
Monsoon Season
Recharge from Other Sources-
Non Monsoon Season
8%
92%
Total Natural Discharges
Annual Extractable Ground Water Resource
91%
9%
Extraction for Irrigation
Extraction for Domestic and
Industrial Use

Dynamic Ground Water Resource of Madhya Pradesh -
71
Table.4.2: District wise Recharge, Madhya Pradesh
S.
No. District
Monsoon Season Non-monsoon Season
Total Annual
Ground Water
Recharge (Ham)
Total
Natural
discharges
(Ham)
Annual
Extractable
Ground Water
Resource (Ham)
Recharge from
rainfall (Ham)
Recharge
from other
sources
(Ham)
Recharge
from rainfall
(Ham)
Recharge
from other
sources
(Ham)
1 Agar Malwa 33138.64 2590.2 0 9681.3 45410.14 4382.3 41027.84
2 Alirajpur 19981.86 1058.6 0 2063.07 23103.53 1776.22 21327.31
3 Anuppur 36011.33 319.95 2853.65 1245.99 40430.92 2695.93 37734.99
4 Ashoknagar 28905.41 2075.65 0 7824.77 38805.83 3103.98 35701.85
5 Balaghat 81686.5 1957.93 290.51 2791.18 86726.12 8672.64 78053.48
6 Barwani 34944.34 3415.72 0 18550.63 56910.69 5165.15 51745.54
7 Betul 102040.17 3612.4 0 16046.71 121699.28 8221.47 113477.81
8 Bhind 80922.82 1574.22 0 15453.78 97950.82 9204.22 88746.59
9 Bhopal 30342.01 2622.81 0 6942.84 39907.66 3042.37 36865.29
10 Burhanpur 30054.26 2541.78 264.63 7412.93 40273.6 2929.68 37343.92
11 Chhatarpur 65844.51 4269.32 0 16628.35 86742.18 6288.59 80453.59
12 Chhindwara 87803.07 3866.38 600.33 12436.85 104706.63 5919.69 98786.94
13 Damoh 31619.92 2050.39 0 9173.22 42843.53 3545.25 39298.28
14 Datia 36352.9 730.38 0 6722.3 43805.58 3037.44 40768.14
15 Dewas 66496.05 4935.92 0 15466.15 86898.12 6096.06 80802.06
16 Dhar 84490.43 7124.47 0 22699.4 114314.3 9401.24 104913.07
17 Dindori 40499.2 141.01 301.21 500.43 41441.85 2604.84 38837.01
18 Guna 60581.42 4283.83 0 14725.3 79590.55 4324.69 75265.86
19 Gwalior 53338.95 8182.71 0 18809.43 80331.09 6641.99 73689.1
20 Harda 33125.19 2883.56 0 15865.43 51874.18 5187.43 46686.75
21 Hoshangabad 129279.31 11449.3 0 66364.78 207093.39 12074.2 195019.19
22 Indore 37119.3 7338.55 0 15632.8 60090.65 5476.51 54614.14
23 Jabalpur 51628.17 3265.54 0 8922.5 63816.21 4819 58997.21
24 Jhabua 21206.45 1494.72 0 5236.23 27937.4 1703.56 26233.84

Dynamic Ground Water Resource of Madhya Pradesh - 2020
72
S.
No. District
Monsoon Season Non-monsoon Season
Total Annual
Ground Water
Recharge (Ham)
Total
Natural
discharges
(Ham)
Annual
Extractable
Ground Water
Resource (Ham)
Recharge from
rainfall (Ham)
Recharge
from other
sources
(Ham)
Recharge
from rainfall
(Ham)
Recharge
from other
sources
(Ham)
25 Katni 33856.39 1363.44 0 4594.03 39813.86 3136.6 36677.26
26 Khandwa 56167.03 4407.81 0 37510.11 98084.95 8047.93 90037.02
27 Khargone 63404.27 5658.22 0 44762.52 113825.01 7863.59 105961.41
28 Mandla 56699.37 871.29 1095.53 4003.84 62670.03 3425.88 59244.15
29 Mandsaur 47803.06 4507.38 0 14756.06 67066.5 6706.65 60359.85
30 Morena 47301.71 1017.7 0 20826.71 69146.12 5361.48 63784.63
31 Narsinghpur 102628.63 3571.16 0 15637.83 121837.62 8296.36 113541.26
32 Neemuch 29881.06 4282.92 0 8391.84 42555.82 4255.57 38300.25
33 Panna 57402.37 1283.65 0 6047.5 64733.52 6473.35 58260.17
34 Raisen 76289.29 3279.07 0 9587.61 89155.97 7206.76 81949.21
35 Rajgarh 65411.49 3848.31 0 13198.21 82458.01 4954.26 77503.75
36 Ratlam 54572.43 7036.13 0 22822.5 84431.06 8108.4 76322.66
37 Rewa 42008.7 1835.61 273.82 8259.36 52377.49 4009.86 48367.63
38 Sagar 91071.07 3614.96 0 14072.96 108758.99 8828.73 99930.26
39 Satna 51079.31 2498.19 1006.14 10349 64932.64 5640.78 59291.86
40 Sehore 54332.97 3470.08 0 11992.9 69795.95 4608.14 65187.81
41 Seoni 62350.77 1951.24 2242.88 5957.79 72502.68 4252.85 68249.83
42 Shahdol 45582.48 368.6 1595.85 1329.18 48876.11 4887.61 43988.5
43 Shajapur 42405.42 3246.09 0 11150.46 56801.97 3551.76 53250.21
44 Sheopur 35918.59 963.24 0 19248.01 56129.84 4957.24 51172.6
45 Shivpuri 62089.34 3662.39 0 14689.65 80441.38 5712.34 74729.04
46 Sidhi 47076.52 795.32 667.28 2711.05 51250.17 3756.37 47493.79
47 Singrauli 33344.8 790.04 0 2636.16 36771 2717.35 34053.65
48 Tikamgarh 47166.79 3180.52 0 11632.9 61980.21 5618.82 56361.39
49 Ujjain 73764.02 5627.8 0 20805.98 100197.8 8396.96 91800.84

Dynamic Ground Water Resource of Madhya Pradesh - 2020
73
S.
No. District
Monsoon Season Non-monsoon Season
Total Annual
Ground Water
Recharge (Ham)
Total
Natural
discharges
(Ham)
Annual
Extractable
Ground Water
Resource (Ham)
Recharge from
rainfall (Ham)
Recharge
from other
sources
(Ham)
Recharge
from rainfall
(Ham)
Recharge
from other
sources
(Ham)
50 Umaria 42947.39 559.13 811.73 1768.1 46086.35 4608.62 41477.73
51 Vidisha 75288.67 2711.94 0 12747.24 90747.85 6394.74 84353.11
Total(Ham) 2775256.2 160187.57 12003.56 668685.87 3616133.15 278093.45 3338039.67
Total(BCM) 27.753 1.602 0.12 6.687 36.161 2.781 33.38

Dynamic Ground Water Resource of Madhya Pradesh - 2020
74
Table 4.3: District wise Recharge from other source components
S.No District
Recharge
from Canals
(in Ham)
Recharge
from Surface
Water
Irrigation (in
Ham)
Recharge
from Ground
Water
Irrigation (in
Ham)
Recharge
Due to
Tanks and
Ponds (in
Ham)
Recharge due to
Water
Conservation
Structures (in
Ham)
Recharge
Due to
Pipelines (in
Ham)
Total
Recharge from
Other Sources
(in Ham )
1 Agar Malwa 822.45 575.21 9510.33 884.71 478.8 0 12271.5
2 Alirajpur 0 0 1576.64 486.63 1058.408 0 3121.678
3 Anuppur 0 0 1509.74 47.8 8.4 0 1565.94
4 Ashoknagar 1065.65 2912.64 5170.39 404.34 347.4 0 9900.42
5 Balaghat 601.11 563.69 2683.92 306.21 594.18 0 4749.11
6 Barwani 1067.34 9536.29 8041.96 1402.6 1918.182 0 21966.372
7 Betul 2579.49 3097.02 11786.88 1899.26 296.46 0 19659.11
8 Bhind 6027.16 5897.31 5011.63 37.3 54.6 0 17028
9 Bhopal 0 0 5859.22 957.57 279.644 2469.225 9565.659
10 Burhanpur 89.15 1383.85 5072.76 634.35 2774.604 0 9954.714
11 Chhatarpur 3858.06 2191.32 12708.11 2039.58 100.596 0 20897.666
12 Chhindwara 323.43 1196.14 13287.86 782.47 713.34 0 16303.24
13 Damoh 1403.38 3311.6 4860.83 1568.61 79.2 0 11223.62
14 Datia 1081.84 3177.9 2980.92 26.34 185.68 0 7452.68
15 Dewas 351.1 884.88 15138.68 452.5 3574.92 0 20402.08
16 Dhar 3624.05 2498.58 19212.62 2826.52 1662.14 0 29823.91
17 Dindori 0 0 594.4 0 47.04 0 641.44
18 Guna 2153.48 3640.06 11821.66 1066.35 327.55 0 19009.1
19 Gwalior 4984.5 15623.83 4488.97 1165.43 72.42 657 26992.15
20 Harda 7578.09 7456.05 3603.8 53.03 58.02 0 18748.99
21 Hoshangabad 47900.87 20157.26 9583.56 122.46 49.92 0 77814.07
22 Indore 53.17 224.85 14795 1518.02 6380.32 0 22971.36
23 Jabalpur 291.37 2915.4 7073 326.86 1033.92 547.5 12188.05

Dynamic Ground Water Resource of Madhya Pradesh - 2020
75
S.No District
Recharge
from Canals
(in Ham)
Recharge
from Surface
Water
Irrigation (in
Ham)
Recharge
from Ground
Water
Irrigation (in
Ham)
Recharge
Due to
Tanks and
Ponds (in
Ham)
Recharge due to
Water
Conservation
Structures (in
Ham)
Recharge
Due to
Pipelines (in
Ham)
Total
Recharge from
Other Sources
(in Ham )
24 Jhabua 138.7 2064.42 2585.97 1266.34 675.504 0 6730.934
25 Katni 818.99 1162.49 3344.73 523.27 108 0 5957.48
26 Khandwa 1306.54 24904.72 10005.09 3336.37 2365.188 0 41917.908
27 Khargone 3702.27 28246.99 10358.47 3290.52 4822.496 0 50420.746
28 Mandla 1789.44 588.06 1727.04 706.37 64.224 0 4875.134
29 Mandsaur 0 0 15359.41 463.63 3440.4 0 19263.44
30 Morena 13914.63 3795.66 3661.65 389.19 83.28 0 21844.41
31 Narsinghpur 1390.29 585 17184.98 5.22 43.5 0 19208.99
32 Neemuch 0 0 8374.27 3574.49 726 0 12674.76
33 Panna 678.79 1828.76 3888.25 870.13 65.22 0 7331.15
34 Raisen 320.25 91.09 9704.18 2412.93 338.22 0 12866.67
35 Rajgarh 0 0 15386.64 735.88 924 0 17046.52
36 Ratlam 162.87 19.44 25879.92 773.6 3022.8 0 29858.63
37 Rewa 3212.94 934.91 5480.83 367.35 98.94 0 10094.97
38 Sagar 889.62 1061.16 14222.49 1363.95 150.69 0 17687.91
39 Satna 362.68 3960.65 8308.49 136.41 78.96 0 12847.19
40 Sehore 1116 3124.33 9645.1 1504.37 73.2 0 15463
41 Seoni 1013.96 237.6 5435.39 1184.4 37.68 0 7909.03
42 Shahdol 310.94 0 1211.11 149.56 26.16 0 1697.77
43 Shajapur 0 0 13519.96 571.79 304.8 0 14396.55
44 Sheopur 12744.8 3259.29 3650.51 395.05 161.6 0 20211.25
45 Shivpuri 1760.69 2851.83 12023.37 1351.98 364.18 0 18352.05
46 Sidhi 848.13 0 2116.92 275.52 265.8 0 3506.37
47 Singrauli 102.14 0 2697.44 356.86 269.76 0 3426.2

Dynamic Ground Water Resource of Madhya Pradesh - 2020
76
S.No District
Recharge
from Canals
(in Ham)
Recharge
from Surface
Water
Irrigation (in
Ham)
Recharge
from Ground
Water
Irrigation (in
Ham)
Recharge
Due to
Tanks and
Ponds (in
Ham)
Recharge due to
Water
Conservation
Structures (in
Ham)
Recharge
Due to
Pipelines (in
Ham)
Total
Recharge from
Other Sources
(in Ham )
48 Tikamgarh 1269.5 2109.89 9187.41 2169.1 77.52 0 14813.42
49 Ujjain 0 0 23047.85 2355.37 1030.56 0 26433.78
50 Umaria 0 0 2147.83 162.6 16.8 0 2327.23
51 Vidisha 2182.2 687.27 12081.65 421.02 87.038 0 15459.178
District Total (Ham) 135892.1 168757.44 428609.8 50122.21 41818.264 3673.725 828873.529
District Total (bcm) 1.36 1.69 4.29 0.50 0.42 0.04 8.29

Dynamic Ground Water Resource of Madhya Pradesh - 2020
77
Fig.4.2: Annual Groundwater Recharge per unit area, Madhya Pradesh
4.3 GROUND WATER EXTRACTION FOR ALL USES (DOMESTIC, IRRIGATION
AND INDUSTRIAL)
Ground water extraction for various uses has been calculated separately for command and
non-command areas. Details of assessment-wise groundwater extraction for various uses are given
in Annexure – IV D. District-wise ground water extraction figures are also compiled and given
in Table 4.4
Total extraction of ground water for all uses in state is calculated as 1896752.9 ham (18.97
bcm). From the Table 4.4, it is seen that maximum ground water extraction for all uses is
107741.87 ham in Ratlam district and minimum extraction of ground water for all uses is 4131.95
ham in Dindori district. Comparison of ground water extraction for various uses reveals that
extraction for irrigation accounts for more than 91% of total ground water extraction, whereas
extraction for domestic & industrial supply accounts for meager 9% of the total ground water
extraction in the state. (Fig 4.1). Volumetric estimates are dependent on the areal extent of the
assessment units. In order to compare the total ground water extraction of different assessment
units, the volumetric estimates of total ground water extraction have been converted to depth units

Dynamic Ground Water Resource of Madhya Pradesh - 2020
78
(m) by dividing the total ground water extraction by the area of the respective assessment units
(km2). Spatial variation in total extraction (m) is shown in Fig 4.3.
Fig.4.3: Total Groundwater Extraction per unit area, Madhya Pradesh

Dynamic Ground Water Resource of Madhya Pradesh - 2020
79
Table.4.4: District -wise Ground Water Extraction for Various Uses and Stage of Ground Water Development
S
N District
Existing
Gross
Ground
Water
Extraction
for
Irrigation
(Ham)
Existing
Gross
Ground
Water
Extraction
for
Industrial
Water
Supply
(Ham)
Existing
Gross
Ground
Water
Extraction
for
Domestic
Water
Supply
(Ham)
Existing
Gross
Ground
Water
Extraction
for All Uses
(Ham)
Annual GW
Allocation for
Domestic Use
as on 2025
(Ham)
Net Ground
Water
Availability for
Future use
(Ham)
Stage of
Ground
Water
Extraction
(% )
1 Agar Malwa 38041.29 0 1593.66 39634.97 1766.32 4711.45 96.61
2 Alirajpur 6306.57 0 2189.07 8495.65 2548.66 12472.07 39.83
3 Anuppur 6038.97 0 1512.23 7551.2 1623.03 30072.99 20.01
4 Ashoknagar 20681.54 0 1746.69 22428.24 1927.85 13092.45 62.82
5 Balaghat 12464.29 0 3597.17 16061.44 3889.78 61699.41 20.58
6 Barwani 33147.22 0 3491.24 36638.47 3939.54 19221.59 70.81
7 Betul 46816.25 0 3753.32 50569.58 4105.82 62555.74 44.56
8 Bhind 25344.54 0 3414.4 28758.94 3758.17 59643.88 32.41
9 Bhopal 23436.86 0 3579.55 27016.42+9 4087.34 9341.08 73.28
10 Burhanpur 22112.22 0 1469.58 23581.82 1665.18 13566.5 63.15
11 Chhatarpur 50832.41 0 2952.35 53784.73 3323.15 26298.06 66.85
12 Chhindwara 53283.55 0 5792.71 59076.21 6149.52 39353.93 59.8
13 Damoh 19443.36 0 2988.54 22431.87 3295.52 16559.44 57.08
14 Datia 12664.84 0 1678.34 14343.2 1894.54 26208.75 35.18
15 Dewas 60554.71 25.35 4104.7 64684.74 4579.59 16963.5 80.05
16 Dhar 77390.91 0 5739.37 83130.27 6648.4 32426.91 79.24
17 Dindori 2377.6 0 1754.34 4131.95 1986.42 34472.98 10.64

Dynamic Ground Water Resource of Madhya Pradesh - 2020
80
S
N District
Existing
Gross
Ground
Water
Extraction
for
Irrigation
(Ham)
Existing
Gross
Ground
Water
Extraction
for
Industrial
Water
Supply
(Ham)
Existing
Gross
Ground
Water
Extraction
for
Domestic
Water
Supply
(Ham)
Existing
Gross
Ground
Water
Extraction
for All Uses
(Ham)
Annual GW
Allocation for
Domestic Use
as on 2025
(Ham)
Net Ground
Water
Availability for
Future use
(Ham)
Stage of
Ground
Water
Extraction
(% )
18 Guna 47286.67 0 2408.17 49694.84 2715.98 25263.21 66.03
19 Gwalior 17955.82 0 3756.7 21712.52 4376.51 51729.54 29.47
20 Harda 14704.63 0 1183.32 15887.95 1330.85 30651.27 34.03
21 Hoshangabad 39144.71 0 2168.49 41313.17 2355.8 153518.7 21.18
22 Indore 59179.95 1471.4 8146.08 68797.42 10002.61 2539.19 125.97
23 Jabalpur 25507.4 6.48 3536.67 29050.55 3956.94 29689.42 49.24
24 Jhabua 10246.94 0 2993.56 13240.51 3548.42 12438.46 50.47
25 Katni 13378.93 0 2624.73 16003.69 2973.79 20324.5 43.63
26 Khandwa 40020.29 45.92 2881.48 42947.69 3243.92 46726.88 47.7
27 Khargone 41433.83 0 4293.5 45727.33 4743.84 59783.75 43.15
28 Mandla 6908.22 0 2425.78 9334 2690.49 49645.45 15.76
29 Mandsaur 61437.69 0 3311.25 64748.93 3604.9 2412.5 107.27
30 Morena 19819.3 0 5581.4 25400.69 6348.42 37719.42 39.82
31 Narsinghpur 70217.32 0 2263.17 72480.48 2452.96 40870.98 63.84
32 Neemuch 33497.06 0 1893.07 35390.12 2063.71 3215.25 92.4
33 Panna 15444.08 0 2363.99 17808.08 2635.57 40180.52 30.57
34 Raisen 39617.81 650 3227.11 43494.9 3646.89 38034.53 53.08
35 Rajgarh 61546.56 0 3873.19 65419.73 4534.9 11422.31 84.41
36 Ratlam 103519.66 208 4014.22 107741.87 6066.1 1491.06 141.17

Dynamic Ground Water Resource of Madhya Pradesh - 2020
81
S
N District
Existing
Gross
Ground
Water
Extraction
for
Irrigation
(Ham)
Existing
Gross
Ground
Water
Extraction
for
Industrial
Water
Supply
(Ham)
Existing
Gross
Ground
Water
Extraction
for
Domestic
Water
Supply
(Ham)
Existing
Gross
Ground
Water
Extraction
for All Uses
(Ham)
Annual GW
Allocation for
Domestic Use
as on 2025
(Ham)
Net Ground
Water
Availability for
Future use
(Ham)
Stage of
Ground
Water
Extraction
(% )
37 Rewa 21032.59 173.74 5346.46 26552.8 6185.05 20976.23 54.9
38 Sagar 56586.75 0 3645.88 60232.63 4089.76 39253.76 60.27
39 Satna 33693.62 0 4544.75 38238.38 5077.31 23649.88 64.49
40 Sehore 38035.12 0 2365.6 40400.72 2605.78 24992.51 61.98
41 Seoni 22485.01 0 3136.8 25621.81 3485.41 42279.41 37.54
42 Shahdol 4944.24 0 2157.66 7101.91 2384.54 36659.72 16.14
43 Shajapur 54079.84 0 2098.73 56178.57 2288.53 2798.52 105.5
44 Sheopur 17631.34 0 1719.3 19350.64 1968.51 31572.74 37.81
45 Shivpuri 48093.48 0 4394.96 52488.42 5022.47 21613.11 70.24
46 Sidhi 8506.79 0 2518.87 11025.68 2894.9 36092.08 23.21
47 Singrauli 10858.41 0 2174.35 13032.75 2568.08 20627.17 38.27
48 Tikamgarh 36393.46 0 3841.62 40235.06 5083.16 14884.79 71.39
49 Ujjain 92923.58 28.84 3517.88 96470.3 3859.19 9505.3 105.09
50 Umaria 8591.38 0 1480.99 10072.37 1714.96 31171.39 24.28
51 Vidisha 47660.09 0 3576.55 51236.64 4027.89 32665.13 60.74
Total(Ham) 1733319.68 2609.73 160823.56 1896752.9 183736.97 1525059.41 56.82
Total(BCM) 17.333 0.026 1.608 18.968 1.837 15.251 56.82

Dynamic Ground Water Resource of Madhya Pradesh - 2020
82
4.4 STAGE OF GROUND WATER EXTRACTION
The overall stage of groundwater extraction in the state is 56.82 %. The stage of ground
water extraction is very high in the districts of Indore, Mandsaur, Ratlam and Shajapur where it
is more than 100%, which implies that in these districts the annual ground water consumption is
more than annual extractable ground water resources. In the districts of Ashoknagar, Barwani,
Bhopal, Burhanpur, Chhatarpur, Dewas, Dhar, Guna, Narsinghpur, Rajgarh, Sagar, Satna,
Sehore, Shivpuri, Tikamgarh and Vidisha the stage of ground water Extraction is between 60-
90%. Agar and Neemuch districts have stage of ground water extraction between 90 to 100 %.
In rest of the districts, the stage of ground water extraction is below 60 %. The Ratlam (141.17%),
Indore (125.97%), Mandsaur (107.27%), Shajapur (105.5%) and Ujjain (105.09%) districts
reached at highest ground water extraction and Dindori with 10.64% is lowest stage of extraction
district in state.
4.5 CATEGORIZATION OF ASSESSMENT UNITS
The distributions of various categorized assessment units are shown in the Fig 4.4. 233
blocks are falling under safe category, 50 blocks are falling in semi-critical category, 8 blocks of
in critical category, and 26 blocks of the state are categorized as over-exploited. List of safe,
semi-critical, critical and over-exploited area is given in Annexure IV E and in Annexure IV
D. Almost all over-exploited blocks are falling in western part of Madhya Pradesh, which is
known as “MALWA AREA” where ground water extraction has increased many folds during
past decades.
The percentage of Over-exploited, Critical and Semi-critical administrative units are
approximately 27% of the total units in the state (Fig. 4.5). Out of 33380.40 mcm of Total Annual
Extractable Resources of the state, 3349.83 mcm (10.04 %) are under ‘Over-Exploited’, 754.83
mcm (2.26 %) are under ‘Critical’, 5021.66 mcm (15.04 %) are under ’Semi-Critical’, 24254.07
mcm (72.66 %) are under ‘Safe’ category assessment units. District-wise details are given in
Table 4.5.
4.6 GROUND WATER AVAILABLE FOR FUTURE USE
Assessment wise, data of Ground Water Available for future use is given in Annexure-IV
D and district wise are shown in Table 4.4. From Table 4.4, it is seen that in Madhya Pradesh
1525059.41 ham (15.25 bcm) ground water is estimated to be available for future use.

Dynamic Ground Water Resource of Madhya Pradesh - 2020
83
Figure.4.4: Categorisation of Assessment units in Madhya Pradesh
Figure.4.5: Categorisation of Assessment units
73%
16%
3%
8%Safe
Semi-critical
Critical
Over-exploited

Dynamic Ground Water Resource of Madhya Pradesh - 2020
84
Table.4.5: Category wise Annual Extractable Ground Water Resource
S.No District
Total Annual
Extractable
Ground Water
Resource of
Assessed Units
(in mcm)
Safe Semi-Critical Critical Over-Exploited
Annual
Extractable
Ground
Water
Resource
(in mcm)
%
Annual
Extractable
Ground
Water
Resource
(in mcm)
%
Annual
Extractable
Ground
Water
Resource
(in mcm)
%
Annual
Extractable
Ground
Water
Resource
(in mcm)
%
1 Agar Malwa 410.28 111.64 27.21 106.19 25.88 - - 192.46 46.91
2 Alirajpur 213.27 213.27 100.00 - - - - - -
3 Anuppur 377.35 377.35 100.00 - - - - - -
4 Ashoknagar 357.02 283.47 79.40 73.55 20.60 - - - -
5 Balaghat 780.53 780.53 100.00 - - - - - -
6 Barwani 517.46 354.96 68.60 103.68 20.04 - - 58.81 11.36
7 Betul 1134.78 823.52 72.57 311.26 27.43 - - - -
8 Bhind 887.47 887.47 100.00 - - - - - -
9 Bhopal 368.65 206.30 55.96 162.35 44.04 - - - -
10 Burhanpur 373.44 373.44 100.00 - - - - - -
11 Chhatarpur 804.54 438.95 54.56 365.58 45.44 - - - -
12 Chhindwara 987.87 671.36 67.96 218.60 22.13 97.91 9.91 - -
13 Damoh 392.98 338.45 86.12 54.53 13.88 - - - -
14 Datia 407.68 407.68 100.00 - - - - - -
15 Dewas 808.02 427.58 52.92 114.76 14.20 - - 265.68 32.88
16 Dhar 1049.13 623.22 59.40 - - 76.18 7.26 349.73 33.34
17 Dindori 388.37 388.37 100.00 - - - - - -
18 Guna 752.66 752.66 100.00 - - - - - -
19 Gwalior 736.89 712.21 96.65 24.68 3.35 - - - -
20 Harda 466.87 466.87 100.00 - - - - - -
21 Hoshangabad 1950.19 1749.06 89.69 201.14 10.31 - - - -
22 Indore 546.14 - - 107.28 19.64 - - 438.86 80.36
23 Jabalpur 589.97 582.55 98.74 - - 7.42 1.26 - -

Dynamic Ground Water Resource of Madhya Pradesh - 2020
85
S.No District
Total Annual
Extractable
Ground Water
Resource of
Assessed Units
(in mcm)
Safe Semi-Critical Critical Over-Exploited
Annual
Extractable
Ground
Water
Resource
(in mcm)
%
Annual
Extractable
Ground
Water
Resource
(in mcm)
%
Annual
Extractable
Ground
Water
Resource
(in mcm)
%
Annual
Extractable
Ground
Water
Resource
(in mcm)
%
24 Jhabua 262.34 238.59 90.95 23.75 9.05 - - - -
25 Katni 366.77 366.77 100.00 - - - - - -
26 Khandwa 900.37 781.31 86.78 119.06 13.22 - - - -
27 Khargone 1059.61 998.02 94.19 61.60 5.81 - - - -
28 Mandla 592.44 592.44 100.00 - - - - - -
29 Mandsaur 603.60 - - 136.36 22.59 161.97 26.83 305.27 50.57
30 Morena 637.85 637.85 100.00 - - - - - -
31 Narsinghpur 1135.41 931.36 82.03 204.05 17.97 - - - -
32 Neemuch 383.00 - - 139.58 36.44 - - 243.42 63.56
33 Panna 582.60 582.60 100.00 - - - - - -
34 Raisen 819.49 725.29 88.51 94.20 11.49 - - - -
35 Rajgarh 775.04 149.65 19.31 330.79 42.68 294.60 38.01 - -
36 Ratlam 763.23 - - 103.28 13.53 - - 659.94 86.47
37 Rewa 483.68 449.39 92.91 34.29 7.09 - - - -
38 Sagar 999.30 999.30 100.00 - - - - - -
39 Satna 592.92 382.62 64.53 210.30 35.47 - - - -
40 Sehore 651.88 535.13 82.09 - - 116.75 17.91 - -
41 Seoni 682.50 682.50 100.00 - - - - - -
42 Shahdol 439.89 439.89 100.00 - - - - - -
43 Shajapur 532.50 - - 129.10 24.24 - - 403.40 75.76
44 Sheopur 511.73 511.73 100.00 - - - - - -
45 Shivpuri 747.29 300.26 40.18 447.04 59.82 - - - -
46 Sidhi 474.94 474.94 100.00 - - - - - -
47 Singrauli 340.54 340.54 100.00 - - - - - -

Dynamic Ground Water Resource of Madhya Pradesh - 2020
86
S.No District
Total Annual
Extractable
Ground Water
Resource of
Assessed Units
(in mcm)
Safe Semi-Critical Critical Over-Exploited
Annual
Extractable
Ground
Water
Resource
(in mcm)
%
Annual
Extractable
Ground
Water
Resource
(in mcm)
%
Annual
Extractable
Ground
Water
Resource
(in mcm)
%
Annual
Extractable
Ground
Water
Resource
(in mcm)
%
48 Tikamgarh 563.61 101.62 18.03 461.99 81.97 - - - -
49 Ujjain 918.01 - - 485.74 52.91 - - 432.26 47.09
50 Umaria 414.78 414.78 100.00 - - - - - -
51 Vidisha 843.53 646.61 76.66 196.92 23.34 - - - -
Total States 33380.40 24254.07 72.66 5021.66 15.04 754.83 2.26 3349.83 10.04

Dynamic Ground Water Resource of Madhya Pradesh - 2020
87
4.7 COMPARISON OF RESOURCE OF 2016-17 WITH BASE YEAR 2019-20
The total assessment units in the year 2016-17 was 313 (all the blocks), but in the year 2019-20
four urban areas namely Bhopal, Indore, Jabalpur and Gwalior are added separately for estimation. So in
the year 2019-20 the resource is estimated for total 317 assessment units (313 blocks and 4 urban areas).
The annual extractable resource in the state computed in 2016-17 was 3447359 ham (34.47 bcm)
which is almost same as compared to current data of 3338039.67 ham (33.38 bcm). In general, the reasons
for slight changes are attributed to decrease in recharge from other sources.
The total groundwater extraction in the state for the year 2016-17 was 1887866 ham (18.88 bcm),
but in the year 2019-20 total groundwater extraction is slightly increased to 1896753 ham (18.97 bcm)
due to the revision of well census data and population.
The stage of ground water extraction has reached to 56.82% as compared to 54.76% in assessment
year 2016-17. In the assessment year-2016-17, 240 blocks falling in safe category has decreased to 233
in 2019-20, 44 blocks falling in semi-critical category has increased to 50 in 2019-20, 07 blocks falling
in Critical category has increased to 08 in 2019-20 whereas blocks under over-exploited category has 22
in the year 2016-17 reached to 26 in the assessment year 2019-20.
The ground water resources of the individual block /assessment unit show wide variation in the
resource available and stage of ground water extraction. In Madhya Pradesh, the high ground water
extraction concentrates mainly in the western (Malwa Region) and part of Bagkhelkhand Region of the
State. The other part of the state has very low extraction of ground water. Twelve districts in the state
have stage of extraction between 60% and 90 %, whereas two districts have stage of ground water
extraction between 90 to 100 %. The Indore (116.63%), Mandsaur (103.22%), Ratlam (126.63%) and
Shajapur (102.52%) districts reached at highest ground water extraction and Anuppur with 7.87% of
extraction is lowest stage of extraction district in state. The overall stage of extraction of Madhya Pradesh
in ground water point of view is 56.82 %.
The assessment units improved or deteriorated from 2017 to 2020 assessment are given in Table
4.6. For comparison of ground water resources data computed using GEC’2015 analysis of district wise
figures is made for year 2016-17 and 2019-20, which is given in Table 4.7.

Dynamic Ground Water Resource of Madhya Pradesh - 2020
88
Table.4.6: Comparison of Categorization of Improved and Deteriorated Assessment Units (2020 And 2017)
S.
No
Name of
District
Name of
Assessment
Unit
Stage of
Ground
Water
Extraction
(%) in
2017
Categorization
in 2017
Stage of
Ground
Water
Extraction
(%) in
2020
Categorization
in 2020
Improved Assessment Units
1 Raisen Sanchi 73.15 Semi-Critical 63.49 Safe
2 Damoh Batiyagarh 73.37 Semi-Critical 65.34 Safe
3 Sagar Banda 70.38 Semi-Critical 57.92 Safe
Deteriorated Assessment Units
4 Sehore Ashta 77.36 Semi-Critical 99.67 Critical
5 Hoshangabad Bankhedi 68.56 Safe 72.96 Semi-Critical
6 Narsinghpur Narsinghpur 67.48 Safe 74.25 Semi-Critical
7 Chhindwara Chhindwara 88.5 Semi-Critical 96.55 Critical
8 Chhindwara Mohkhed 67.73 Safe 70.83 Semi-Critical
9 Neemuch Jawad 96.1 Critical 100.3 Over-Exploited
10 Neemuch Neemuch 94.64 Critical 102.25 Over-Exploited
11 Ashoknagar Ishagarh 67.06 Safe 77.74 Semi-Critical
12 Shajapur Kalapipal 97.33 Critical 108.83 Over-Exploited
13 Jhabua Jhabua 67.74 Safe 77.13 Semi-Critical
14 Shivpuri Kolaras 69.56 Safe 78.97 Semi-Critical
15 Rewa Mauganj 65.62 Safe 72 Semi-Critical
16 Vidisha Gyraspur 67.58 Safe 71.96 Semi-Critical
17 Vidisha Kurwai 69.26 Safe 71.06 Semi-Critical
18 Dhar Tirla 87.6 Semi-Critical 94.44 Critical
19 Chhatarpur Bijawar 66.91 Safe 76.28 Semi-Critical
Table.4.7: District -wise comparison of resource between 2016-17 and 2019-20
S.
No. District
Annual Extractable
Groundwater
Resource (ham)
Total Ground Water
Extraction (ham)
Stage of Ground
Water Extraction (%)
2016-17 2019-20 2016-17 2019-20 2016-17 2019-20
1 Agar Malwa 42166.88 41027.84 39149.51 39634.97 92.84 96.61
2 Alirajpur 18279.15 21327.31 8227.54 8495.65 45.01 39.83
3 Anuppur 34549.47 37734.99 2754.3 7551.2 7.97 20.01
4 Ashoknagar 39821.99 35701.85 21865.91 22428.24 54.91 62.82
5 Balaghat 89518.11 78053.48 15288.99 16061.44 17.08 20.58
6 Barwani 70775.53 51745.54 38993.26 36638.47 55.09 70.81
7 Betul 119671.8 113477.8 68986.65 50569.58 57.65 44.56
8 Bhind 72318.86 88746.59 26026.74 28758.94 35.99 32.41

Dynamic Ground Water Resource of Madhya Pradesh - 2020
89
S.
No. District
Annual Extractable
Groundwater
Resource (ham)
Total Ground Water
Extraction (ham)
Stage of Ground
Water Extraction (%)
2016-17 2019-20 2016-17 2019-20 2016-17 2019-20
9 Bhopal 37001 36865.29 25955 27016.42 70.15 73.28
10 Burhanpur 36013.37 37343.92 24202.6 23581.82 67.2 63.15
11 Chhatarpur 98493.03 80453.59 60773.92 53784.73 61.7 66.85
12 Chhindwara 113351.8 98786.94 62575 59076.21 55.2 59.8
13 Damoh 38283.47 39298.28 22279.32 22431.87 58.2 57.08
14 Datia 34747.76 40768.14 13955.1 14343.2 40.16 35.18
15 Dewas 78745.17 80802.06 66325.6 64684.74 84.23 80.05
16 Dhar 113217.6 104913.1 77988.57 83130.27 68.88 79.24
17 Dindori 36408.05 38837.01 3709 4131.95 10.19 10.64
18 Guna 83413.77 75265.86 46124.79 49694.84 55.3 66.03
19 Gwalior 74837 73689.1 22348.18 21712.52 29.86 29.47
20 Harda 48132 46686.75 14902 15887.95 30.96 34.03
21 Hoshangabad 186782 195019.2 41680 41313.17 22.31 21.18
22 Indore 54997 54614.14 64140.6 68797.42 116.63 125.97
23 Jabalpur 66823 58997.21 28380 29050.55 42.47 49.24
24 Jhabua 22230.96 26233.84 12722.26 13240.51 57.23 50.47
25 Katni 35385 36677.26 16464 16003.69 46.53 43.63
26 Khandwa 101065.5 90037.02 43364.22 42947.69 42.01 47.7
27 Khargone 126703.9 105961.4 46185.25 45727.33 36.45 43.15
28 Mandla 49909.92 59244.15 8867.3 9334 17.77 15.76
29 Mandsaur 58367.69 60359.85 60244.7 64748.93 103.22 107.27
30 Morena 68113.96 63784.63 24224 25400.69 35.56 39.82
31 Narsinghpur 117630.2 113541.3 74501.75 72480.48 63.34 63.84
32 Neemuch 40882.44 38300.25 35748.54 35390.12 87.44 92.4
33 Panna 44965.39 58260.17 16410.86 17808.08 36.5 30.57
34 Raisen 84863.65 81949.21 44396.28 43494.9 52.31 53.08
35 Rajgarh 84511.21 77503.75 70539.68 65419.73 83.47 84.41
36 Ratlam 80882.77 76322.66 102423.2 107741.9 126.63 141.17
37 Rewa 59043.14 48367.63 26582.62 26552.8 45.02 54.9
38 Sagar 103446.3 99930.26 60315.75 60232.63 58.31 60.27
39 Satna 61419.25 59291.86 41860.17 38238.38 68.15 64.49
40 Sehore 70844.86 65187.81 43865.18 40400.72 61.92 61.98
41 Seoni 74391.7 68249.83 28669 25621.81 38.54 37.54
42 Shahdol 52728.41 43988.5 4763 7101.91 9.03 16.14
43 Shajapur 55658.04 53250.21 57061.03 56178.57 102.52 105.5
44 Sheopur 48321.65 51172.6 17376.34 19350.64 35.96 37.81
45 Shivpuri 73451.36 74729.04 50831.63 52488.42 69.2 70.24
46 Sidhi 32259.48 47493.79 9464 11025.68 29.34 23.21
47 Singrauli 37232.04 34053.65 10472.9 13032.75 28.13 38.27

Dynamic Ground Water Resource of Madhya Pradesh - 2020
90
S.
No. District
Annual Extractable
Groundwater
Resource (ham)
Total Ground Water
Extraction (ham)
Stage of Ground
Water Extraction (%)
2016-17 2019-20 2016-17 2019-20 2016-17 2019-20
48 Tikamgarh 51286.71 56361.39 37413.48 40235.06 72.95 71.39
49 Ujjain 90065.7 91800.84 88575.88 96470.3 98.35 105.09
50 Umaria 44810.56 41477.73 5425.8 10072.37 12.11 24.28
51 Vidisha 88556.95 84353.11 52464.67 51236.64 59.24 60.74
TOTAL (ham) 3447359 3338040 1887866 1896753 54.76 56.82
TOTAL (bcm) 34.47 33.38 18.87 18.97 54.76 56.82

Dynamic Ground Water Resource of Madhya Pradesh - 2020
91
CHAPTER-5
5.0 DISTRICT WISE GROUND WATER SCENARIO
The ground water conditions, its availability and utilization scenario and categorization of
assessment units in different states are discussed in the previous chapter. District wise summaries are
given below.
5.1 ALIRAJPUR
Alirajpur district is underlain by Archaean Granite-gneisses, phyllite Basaltic lava flows of Deccan
trap and Bagh Bed. Dynamic Ground water resources of the district have been estimated for base year-
2019-20, on block wise basis. Out of 334900 ha of geographical area, 305400 ha (91%) is ground water
recharge worthy area and 29500 ha (9%) is hilly area. There are six number of assessment units (block)
in the district which fall under non-command category, there are no major irrigation projects in the
district, and medium irrigation project for irrigation. All blocks of the district are categorized as safe
blocks, and highest stage of ground water development is computed as 68.77 % for Bhabra Block. The
annual extractable groundwater resource in the district is 21327.31 ham and total ground water extraction
for all uses is 8495.65 ham, making stage of ground water development 39.83% (45.01% in 2016-17) as
a whole for district. After making allocation for future domestic supply for year 2025, balance available
ground water for future use would be 12472.07 ham.
5.2 AGAR
Agar district is underlain by mainly Basaltic lava flows of Deccan trap. Dynamic ground water
resources of the district have been estimated for base year -2019-20 on block-wise basis. Out of 270243
ha of geographical area, 251576 ha (93%) is ground water recharge worthy area and 18667 ha (7%) is
hilly area. There are four number of assessment units (block) in the district out of which Barod (Semi
Critical in 2016-17) block falls under Semi Critical category and Nalkhera (Over Exploited in 2016-17)
& Susner (Over Exploited in 2016-17) fall in over exploited category. The highest stage of ground water
development is computed as 126.05 % in Nalkhera block. The annual extractable groundwater resource
in the district is 42167 ham and net ground water extraction for all uses is 39634.97 ham, making stage
of ground water development 96.61% (92.84% in 2016-17) as a whole for district. After making
allocation for future domestic supply for year 2025, balance available ground water for future use would
be 4711.45 ham.
5.3 ANUPPUR
Anuppur district is underlain by Archaean Granite-gneisses, Gondwanas sandstone-clays,
Lametas and Deccan trap basalts. Dynamic ground water resources of Anuppur district have been

Dynamic Ground Water Resource of Madhya Pradesh - 2020
92
estimated for base year -2019-20, on block- wise basis. Out of 372400 ha of geographical area, 294200
ha (79%) is ground water recharge worthy area and 78,200 ha (21%) is hilly area. There are four number
of assessment units (block) in the district which fall under non-command sub-unit, as there are no major
& medium irrigation projects in the district. All blocks of the district are categorized as safe blocks, and
highest stage of ground water development is computed as 33% for Jaitahri Block. The annual extractable
groundwater resource in the district is 37734.99 ham and ground water extraction for all uses is 7551.2
ham, making stage of ground water development 20.01% (7.97 % in 2019-20) as a whole for district.
After making allocation for future domestic for year 2025, balance available ground water for future use
would be 30072.99 ham.
5.4 ASHOKNAGAR
Ashoknagar district is underlain by Deccan trap basalts, Vindhyan sandstone and Archaean
granite-gneisses. Dynamic Ground water resources of the district have been estimated for base year -
2019-20, on block- wise basis. Out of 4,67,394 ha of geographical area, 4, 62,244 (98%) ha is ground
water recharge worthy area and 5,150 (2%) is hilly area. There are four numbers of assessment units
(block) in the district having command area (4.46 %) and non-command area (95.54%). Out of 4 blocks
of the district, 3 blocks are categorized as safe and Ishagarh block fall under semi-critical category (Safe
in 2016-17). Highest stage of ground water extraction, is computed as 77.74% (67.06% in 2016-17) in
Ishagarh block. The annual extractable resource in the district is 35701.85 ham and gross ground water
extraction for all uses is 22428.24 ham, making stage of ground water extraction 62.82% (54.91 % in
2016-17) as a whole for district. After making allocation for future domestic supply for year 2025,
balance available ground water for future use would be 13092.45 ham.
5.5 BALAGHAT
Balaghat district is underlain by Archaean Granite, gneisses and phyllites. Dynamic Ground
water resources of the district have been estimated for base year -2019-20, on block wise basis. Out of
922900 ha of geographical area, 891793 ha (97 %) is ground water recharge worthy area and 31107 ha
(3%) is hilly area. There are ten numbers of assessment units (block) in the district which fall under
command (11%) and non-command (89%) sub units. All blocks of the district are categorized as safe
blocks, and highest stage of ground water development is computed as 52.57% (35.30% in 2016-17) for
Khairilangi Block. The annual extractable ground water resource in the district is 78053.48 ham and
ground water extraction for all uses is 16061.44 ham, making stage of ground water extraction 20.58%
(17.08% in 2016-17) as a whole for district. After making allocation for future domestic supply for year
2025, balance available ground water for future use would be 61699.41 ham.

Dynamic Ground Water Resource of Madhya Pradesh - 2020
93
5.6 BARWANI
Barwani district is underlain by, Basaltic lava flows of Deccan trap. Dynamic ground water
resources of the district have been estimated for base year-2019-20, on block-wise basis. Out of 5,42,200
ha of geographical area, 3,66,831 (68%) ha is ground water recharge worthy area and 1,75,369 ha (32%)
is hilly area. There are seven number of assessment units (block) in the district which fall under command
and non-command sub-unit. Barwani, Niwali, Pati, Thikari and Sendhwa blocks of the district are
categorized as safe blocks, Rajpur as semi critical, and Pansemal as over exploited with highest stage of
ground water development which is computed as 143.60% (100.03% in 2016-17). The annual extractable
ground water resource in the district is 51745.54 ham and ground water extraction for all uses is 36638.47
ham, making stage of ground water extraction 70.81% (55.09% in 2016-17) as a whole for district. After
making allocation for future domestic supply for year 2025, balance available ground water for future
use would be 19221.59 ham.
5.7 BETUL
Betul district is underlain by Archaeans Granite-gneisses, Gondwanas sandstone-clays, Lametas
and Deccan trap basalts. Dynamic ground water resources of the district have been estimated for base
year -2019-20, on block-wise basis. Out of 10,04,300 ha of geographical area, 8,56,450 ha (85%) is
ground water recharge worthy area and 1,47,850 ha (15%) is hilly area. There are ten numbers of
assessment units (block) in the district which fall under command (3.41 %) and non-command (96.59%)
sub units. All blocks of the district are categorized as safe blocks except Betul and Multa block. Betul
block having highest stage of ground water extraction which is computed as 44.56% (79.10% in 2016-
17) and categorized as Semi Critical. The annual extractable ground water resource in the district is
113477.81 ham and ground water extraction for all uses is 50569.58 ham, making stage of ground water
development 46.56% (57.65% in 2016-17) as a whole for district. After making allocation for future
domestic supply for year 2025, balance available ground water for future use would be 62555.74 ham.
5.8 BHIND
Bhind district is characterized by alluvial formation,Vindhyan Formation, and Gwalior Series. Dynamic
Ground water resources of the district have been estimated for base year -2019-20, on block-wise basis.
Out of 4,45,900 ha of geographical area, 445900 ha (100%) is ground water recharge worthy area. There
are six numbers of assessment units (block) in the district which fall under command (40%) and non-
command (60%) sub units. All blocks of the district are categorized as safe blocks, and highest stage of
ground water development is computed as 35.82%(45.63% in 2016-17) for Ater Block. The annual
extractable ground water resource in the district 88746.59 ham and ground water extraction for all uses
is 28758.94 ham, making stage of ground water development 32.41% (35.99% in 2016-17) as a whole

Dynamic Ground Water Resource of Madhya Pradesh - 2020
94
for district. After making allocation for future domestic supply for year 2025, balance available ground
water for future use would be 59643.88 ham.
5.9 BHOPAL
Bhopal district is underlain by Deccan trap basalts and Vindhyan sandstone. Dynamic ground
water resources of the district have been estimated for base year -2019-20, on block wise basis. Out of 2,
77,237 ha of geographical area, 2, 64,800 ha (96%) is ground water recharge worthy area and 12,437 ha
(4%) is hilly area. There are three number of assessment units (two blocks and one urban area) in the
district which fall under non-command sub unit. The assessment of Bhopal Urban area done this year
separately. Berasia block of the district is categorized as safe block (same in 2016-17) and the Phanda
block and Bhopal Urban area fall under Semi-critical category. Highest stage of ground water extraction
is computed as 79.46% for Bhopal Urban. The annual extractable ground water resource in the district is
36865.29 ham and ground water extraction for all uses is 27016.42 ham, making stage of Ground water
extraction 73.28% (70.15% in 2016-17) as a whole for district. After making allocation for future
domestic supply for year 2025, balance available ground water for future use would be 9341.08 ham.
5.10 BURHANPUR
Burhanpur district is underlain by, Basaltic lava flows of Deccan trap and Tapi alluvium.
Dynamic Ground water resources of the district have been estimated for base year -2019-20, on block-
wise basis. Out of 3,23,300 ha of geographical area, 2,57,050 ha (80%) is ground water recharge worthy
area and 66,250 ha (20%) is hilly area. There are two number of assessment units (block) in the district
which fall under command (4%) and non-command (96%) sub units. Both the blocks of the district are
categorized as safe blocks with highest stage of ground water development is computed as 68.56% for
Burhanpur block. The annual extractable ground water resource in the district is 37343.92 ham and
ground water etraction for all uses is 23581.82 ham, making stage of ground water extraction 63.15%
(67.20% in 2016-17) as a whole for district. After making allocation for future domestic supply for year
2025, balance available ground water for future use would be 13566.5 ham.
5.11 CHHATARPUR
About 65% of the district is occupied by Bundelkhand granite in northern & north central part
with a thin soil cover. The exposure of Bijawars triangular in shape and constitute about 15% of the south
eastern part of the district. Dynamic ground water resources of the district have been estimated for base
year -2019-20 on block-wise basis. Out of 861549 ha of geographical area, 790434 ha (92%) is ground
water recharge worthy area and 71115 ha (8%) is hilly area. There are eight number of assessment units
(block) in the district which fall under non-command (86%) and command (14%) sub units.
Badamalhara, Gaurihar, Loundi and Rajnagar blocks are in safe. Buxwaha, Chhatarpur, Nowgaon and

Dynamic Ground Water Resource of Madhya Pradesh - 2020
95
Bijawar (Safe in 2016-17) are under semi critical. Highest stage of ground water development is
computed as 87.33 % for Buxwaha Block. annual extractable ground water resource in the district
80453.59 ham and ground water extraction for all uses is 53784.73 ham, making stage of ground water
extraction 66.85% (61.70% in 2016-17) as a whole for district. After making allocation for future
domestic supply for year 2025, balance available ground water for future use would be 26298.06 ham.
5.12 CHHINDWARA
Chhindwara district is underlain by Deccan trap basalts, Archaean granite-gneisses and
Gondwanas sandstone-clays. Dynamic ground water resources of the district have been estimated for
base year -2019-20 on block-wise basis. Out of 1176024 ha of geographical area, 879301 ha (75%) is
ground water recharge worthy area and 296723 ha (25%) is hilly area. There are eleven number of
assessment units (block) in the district which fall under non-command (99 %) and command (1 %
Morkhed and Sauser) sub units. Amarwara, Bichhua, Chourai, Harrai, Jamai, Sausar, Parasia and Tamia
blocks of the district are categorized as safe blocks, Mohkhed (safe in 2016-17), Pandurna (Same in
2016-17) are as semi critical, Chhindwada (Semi-critical in 2016-17) is categorized as critical. Highest
stage of ground water extraction is computed as 96.55 (88.50%in 2016-17) for Chhindwara block. The
annual extractable ground water resource in the district is 98786.94 ham and ground water extraction for
all uses is 59076.21 ham, making stage of ground water extraction 59.80% (55.20% in 2016-17) as a
whole for district. After making allocation for future domestic supply for year 2025, balance available
ground water for future use would be 39353.93 ham.
5.13 DAMOH
Damoh district is underlain mainly by Vindhyan Shale, Limestone and Sandstone. Dynamic
ground water resources of the district have been estimated for base year -2019-20 on block-wise basis.
Out of 730600 ha of geographical area, 474619 ha (65%) is ground water recharge worthy area and
255981 ha (35%) is hilly area. There are seven number of assessment units (block) in the district which
fall under non-command (88 %) and command (12% ) sub units. Damoh, Hatta, Jabera, Patera,
Tedukheda, Batiyagarh (Semi-critical in 2016-17) blocks of the district are categorized as safe blocks,
and Pathariya as semi critical (same in 2016-17). The highest stage of ground water extration is computed
as 81.20% (81.83% in 2016-17) in Pathariya block. The annual extractable ground water resource in the
district is 39298.28 ham and ground water extraction for all uses is 22431.87 ham, making stage of
ground water development 57.08% (58.20 % in 2012/13) as a whole for district. After making allocation
for future domestic supply for year 2025, balance available ground water for future use would be
16559.44 ham.

Dynamic Ground Water Resource of Madhya Pradesh - 2020
96
5.14 DATIA
Datia district is characterized by alluvial formation, Bundelkhand Granite gneiss, and Gwalior
Series Dynamic ground water resources of the district have been estimated for base year -2019-20 on
block-wise basis. Out of 269100 ha of geographical area, 266200 ha (99%) is ground water recharge
worthy area and 2900 (1%) is hilly area. There are three numbers of assessment units (block) in the
district which fall under command (49%) and non-command (51%) sub units. All blocks of the district
are categorized as safe blocks with highest stage of ground water development of 48.16 % in Datia block.
The annual extractable ground water resource in the district 40768.14 ham and ground water extraction
for all uses is 14343.2 ham, making stage of ground water extraction 35.18% (40.16 % in 2016-17) as a
whole for district. After making allocation for future domestic and industrial supply for year 2025,
balance available ground water for future irrigation would be 26208.75 ham.
5.15 DEWAS
Dewas district is underlain by Deccan trap basalts, Archaeans granite-gneisses and Vindhyan
sandstone. Dynamic ground water resources of the district have been estimated for base year -2019-20
on block-wise basis. Out 718744 ha of geographical area, 577082 ha (79 %) is ground water recharge
worthy area and 141662 ha (21%) is hilly area. There are six number of assessment units (block) in the
district which fall under non-command (97 %) and command (3% Bagli and Kannod) sub units. Bagli,
Kannod and Tonkkhurd blocks of the district are categorized as safe blocks. Kategaon block of the district
is categorized as semi critical block (same in 2016-17), Dewas and Sonkatch (same in 2016-17) blocks
as over exploited with highest stage of ground water development of 104.83% in Dewas block. The
annual extractable ground water resource in the district is 80802.06 ham and ground water extraction for
all uses is 64684.74 ham, making stage of ground water development 80.05% (84.23% in 2016-17) as a
whole for district. After making allocation for future domestic supply for year 2025, balance available
ground water for future use would be 16963.5 ham.
5.16 DHAR
Dhar district is underlain by mainly Basaltic lava flows of Deccan trap. Dynamic ground water
resources of the district have been estimated for base year -2019-20 on block-wise basis. Out of 815300
ha of geographical area, 812640 ha (almost 100%) is ground water recharge worthy area and 2660 ha
(less than 1%) is hilly area. There are thirteen number of assessment units (block) in the district which
fall under non-command (82 %) and command (18 %) sub units. Bagh, Dahi, Dharampuri, Gondwana,
Kukshi, Manawar, Nisarpur, Sardarpur and Umraban blocks of the district are categorized as safe blocks.
Tirla are categorized as critical (semi critical in 2016-17) and Badnawar, Dhar and Nalchha are
categorized as over exploited (same in 2016-17) with highest stage of ground water development is

Dynamic Ground Water Resource of Madhya Pradesh - 2020
97
computed as 155.40 % in Dhar block. annual extractable ground water resource in the district is
104913.07 ham and ground water extraction for all uses is 83130.27 ham, making stage of ground water
development 79.24% (68.88 % in 2012/13) as a whole for district. After making allocation for future
domestic supply for year 2025, balance available ground water for future use would be 32426.91 ham.
5.17 DINDORI
Dindori district is underlain by Deccan trap basalts. Dynamic ground water resources of the district
have been estimated for base year -2019-20 on block-wise basis. Out of 612800 ha of geographical area,
4,96,300 ha (81%) is ground water recharge worthy area and 1,16,500 ha (19%) is hilly area. There are
seven number of assessment units (block) in the district which fall under non-command sub units. All
blocks of the district are categorized as safe blocks, and highest stage of ground water development is
computed as 16.10% for Shahpura Block. The annual extractable ground water resource in the district is
38837.01 ham and Ground Water extraction for all uses is 4131.95 ham, making stage of ground water
extraction 10.64%(10.19 % in 2012/13) as a whole for district. After making allocation for future
domestic supply for year 2025, balance available ground water for future use would be 34472.98 ham.
5.18 GUNA
Guna district is underlain by Deccan trap basalts, Vindhyan sandstone and laterites. Dynamic
ground water resources of the district have been estimated for base year-2019-20 on block-wise basis.
Out of 6,39,000 ha of geographical area, 6,17,514 ha (97%) is ground water recharge worthy area and
21,486 ha (3%) is hilly area. There are five number of assessment units in the district which fall under
non-command (94%) and command (6%) units. Presently all the blocks of the district are categorized as
safe blocks. The highest stage of ground water development is computed as 69.90% (63.43% in 2016-
17) in Guna block. The annual extractable ground water resource in the district is 75265.86 ham and
ground water extraction for all uses is 49694.84 ham, making stage of ground water extraction 66.03%
(55.30% in 2016-17) as a whole for district. After making allocation for future domestic supply for year
2025, balance available ground water for future use would be 25263.21 ham.
5.19 GWALIOR
Gwalior district is characterized by Gwalior Series, Bundelkhand granite gneiss, Vindhyan
sandstone and alluvial formations. Dynamic ground water resources of the district have been estimated
for base year -2019-20 on block-wise basis. Out of 4,75,660 ha of geographical area, 4,47,560 ha (94%)
is ground water recharge worthy area and 28,100 ha (6%) is hilly area. In the district there are total five
number of assessment units (four blocks and one urban area), out of which three numbers of assessment
units (Bhitarwar, Dabra and Ghatigaon) in the district fall under command (30%) and all five assessment

Dynamic Ground Water Resource of Madhya Pradesh - 2020
98
units (Bhitarwar, Dabra, Ghatigaon and Morar) fall under non-command (70%) sub units. The assessment
of Gwalior_Urban area done this year separetaely. All assessment units of the district are categorized as
safe blocks except the Gwalior_Urban area which comes under semi critical category with highest stage
of ground water extraction of 85.47%. The annual extractable ground water resource in the district is
75265.86 ham and ground water extraction for all uses is 21712.52 ham, making stage of ground water
extraction 29.47 % (29.86% in 2016-17) as a whole for district. After making allocation for future
domestic supply for year 2025, balance available ground water for future use would be 51729.54 ham.
5.20 HARDA
Harda district is characterized by alluvial formations and Deccan trap basaltic lava flow.
Dynamic ground water resources of the district have been estimated for base year -2019-20 on block-
wise basis. Out of 3,33,000 ha of geographical area, 2,70,090 ha (81%) is ground water recharge worthy
area and 62,910 ha (19%) is hilly area. There are three numbers of assessment units in the district which
fall under command (29%) and non-command (71%) categories sub units. All blocks of the district are
categorized as safe blocks, with highest stage of ground water development of 51.30% in Harda block.
The annual extractable ground water resource in the district 46686.75 ham and ground water extraction
for all uses is 15887.95 ham, making Stage of Ground water extraction 34.03% (30.96% in 2016-17) as
a whole for district. After making allocation for future domestic supply for year 2025, balance available
ground water for future use would be 30651.27 ham.
5.21 HOSHANGABAD
Hoshangabad district is characterized by alluvial formations, Gondwana, Archaean and Deccan
trap basaltic lava flow. Dynamic ground water resources of the district have been estimated for base year
-2019-20 on block-wise basis. Out of 6,65,453 ha of geographical area, 5,58,352 ha (83%) is ground
water recharge worthy area and 1,07,101 ha (17%) is hilly area. There are seven number of assessment
units in the district which fall under command (45%) and non-command (55%) sub units. All blocks of
the district are categorized as safe blocks, except Bankhedi, which is categorized as semi-critical (safe in
2016-17) with the highest stage of ground water extraction of 72.96%(68.56% in 2016-17). The annual
extractable ground water resource in the district 195019.19 ham and ground water extraction for all uses
is 41313.17 ham, making stage of ground water extraction 21.18% (22.31% in 2016-17) as a whole for
district. After making allocation for future domestic supply for year 2025, balance available ground water
for future use would be 153518.7 ham.
5.22 INDORE
Indore district is underlain by mainly Basaltic lava flows of Deccan trap. Dynamic ground water
resources of the district have been estimated for base year -2019-20 on block-wise basis. Out of 3,89,800

Dynamic Ground Water Resource of Madhya Pradesh - 2020
99
ha of geographical area, 3,81,897 ha (98%) is ground water recharge worthy area and 7,903 ha (2%) is
hilly area. There are five number of assessment units (Depalpur, Indore, Mhow, Sanwer and
Indore_Urban) in the district which fall under non-command (99 %) and command (1% Mhow and
Depalpur) sub units. The assessment of Indore_Urban done separately this year. Mhow block of the
district is categorized as semi critical (same in 2016-17) and Depalpur, Indore and Sanwer as over
exploited (same in 2019-20) and the Indore_Urban also categorized as over exploited. The command sub
units of Depalpur and Mhow blocks are safe. The highest sage of ground water extraction is computed
as 176.55% in Indore block. The annual extractable ground water resource in the district is 54614.14 ham
and ground water extraction for all uses is 68797.42 ham, making stage of ground water extraction 125.67
% (116.63 % in 2019-20) as a whole for district. After making allocation for future domestic supply for
year 2025, balance available ground water for future use would be 2539.19 ham.
5.23 JABALPUR
Jabalpur district is underlain by Alluvium, Archaean granite, Basaltic lava flows of Deccan trap
Bijawar and Vindhyan sandstone. Dynamic ground water resources of the district have been estimated
for base year -2019-20 on block-wise basis. Out of 5,45,365 ha of geographical area, 4,50,538 ha (83%)
is ground water recharge worthy area and 94,827 ha (17%) is hilly area. There are eight number of
assessment units (seven blocks and one urban area) in the district which fall under non-command (82%-
Kundam and Majholi) and command (18%) sub units. All the assessment units are categorized as safe
except the Jabalpur_Urban area, which assessed first time this year and is categorized as critical. The
highest stage of ground water extraction is computed as 90.66% in Jabalpur_Urban. The annual
extractable ground water resource in the district is 58997.21 ham and ground water extraction for all uses
is 28380 ham, making stage of ground water development 49.24% (42.47% in 2016-17) as a whole for
district. After making allocation for future domestic supply for year 2025, balance available ground water
for future use would be 29689.42 ham.
5.24 JHABUA
Jhabua district is underlain by Archaeans granite-gneisses, phyllite and Basaltic lava flows of
Deccan trap. Dynamic ground water resources of the district have been estimated for base year -2019-
20 on block-wise basis. Out of 344300 ha of geographical area, 311200 ha (90%) is ground water
recharge worthy area and 33100 ha (10%) is hilly area. There are six number of assessment units (block)
in the district which fall under non-command (95%) & command (5%) (Petlawad) categories. All blocks
of the district are categorized as safe blocks, except Jhabua, which is categorized as semi critical (safe in
2016-17) and highest stage of ground water development is computed as 77.13% (67.74% in 2016-17)

Dynamic Ground Water Resource of Madhya Pradesh - 2020
100
for Jhabua Block. The annual extractable ground water resource in the district is 26233.84 ham and
ground water extraction for all uses is 13240.51 ham, making stage of ground water extraction 50.47%
(57.23% in 2016-17) as a whole for district. After making allocation for future domestic supply for year
2025, balance available ground water for future use would be 12438.46 ham.
5.25 KATNI
Katni district is underlain by Vindhyan sandstone, Bijawar Alluvium and Basaltic lava flows of
Deccan trap and. Dynamic ground water resources of the district have been estimated for base year -
2019-20 on block-wise basis. Out of 489400 ha of geographical area, 466648 ha (95 %) is ground water
recharge worthy area and 22752 ha (5%) is hilly area. There are six number of assessment units (block)
in the district which fall under non-command (93 %) and command (7 %) sub units. All the blocks of the
district are categorized as safe. Highest stage of ground water extractoion is computed as 62.95% (60.72
% in 2016-17) for Vijayraghogarh. The annual extractable ground water resource in the district is
36677.26 ham and ground Water extraction for all uses is 16003.69 ham, making stage of ground water
extraction 43.63 % (46.53 % in 2016-17) as a whole for district. After making allocation for future
domestic supply for year 2025, balance available ground water for future use would be 20324.5 ham.
5.26 KHANDWA
Khandwa district is underlain by mainly Basaltic lava flows of Deccan trap. Dynamic ground
water resources of the district have been estimated for base year -2019-20 on block-wise basis. Out of
751550 ha of geographical area, 581446 ha (77%) is ground water recharge worthy area and 170104 ha
(23%) is hilly area. There are seven number of assessment units (block) in the district which fall under
non-command (85%) and command (15%, Chhegaon Makhan, Khandwa, Punasa and Pandhana) sub
units. All the blocks except, Chhegaon Makhan are categorized as safe. Chhegaon Makhan block of the
district is categorized as semi critical (semi critical in 2016-17). The highest stage of ground water
development is computed as 82.96%(78.89% IN 2016-17) in Chhegaon Makhan. The annual extractable
ground water resource in the district is 90037.02 ham and ground water extraction for all uses is 42947.69
ham, making Stage of Ground water extraction 47.70% (42.91% in 2016-17) as a whole for district. After
making allocation for future domestic supply for year 2025, balance available ground water for future
use would be 46726.88 ham.
5.27 KHARGONE
Khargone district is underlain by mainly Basaltic lava flows of Deccan trap. Dynamic ground
water resources of the district have been estimated for base year -2019-20 on block-wise basis. Out of
803000 ha of geographical area, 656897 ha (82 %) is ground water recharge worthy area and 146103 ha
(18 %) is hilly area. There are nine number of assessment units (block) in the district which fall under

Dynamic Ground Water Resource of Madhya Pradesh - 2020
101
non-command (74%) and command (26%) sub units. All the blocks are categorized as safe except
Khargone. Khargone block of the district are categorized as semi-critical (same in 2016-17). The highest
stage of ground water extraction is computed as 76.53 % in Khargone. The annual extractable ground
water resource in the district is 105961.41 ham and ground water extraction for all uses is 45727.33 ham,
making stage of ground water extraction 43.15% (36.45% in 2016-17) as a whole for district. After
making allocation for future domestic supply for year 2025, balance available ground water for future
use would be 59783.75 ham.
5.28 MANDLA
Mandla district is underlain by Basaltic lava flows of Deccan trap. Dynamic ground water
resources of the district have been estimated for base year -2019-20 on block-wise basis. Out of 877100
ha of geographical area, 726910 ha (83%) is ground water recharge worthy area and 150190 ha (17%) is
hilly area. There are nine number of assessment units (block) in the district which fall under non-
command (95 %) and command (5 %- Bichhiya, Mandla and Nainpur) sub units. All blocks of the district
are categorized as safe blocks, and highest stage of ground water extraction is computed as 47.78 %(
55.01% in 2016-17) for Mohgaon Block. The annual extractable ground water resource in the district is
59244.15 ham and ground water extraction for all uses is 9334 ham, making Stage of Ground water
extraction 15.76 % (17.77 % in 2016-17) as a whole for district. After making allocation for future
domestic supply for year 2025, balance available ground water for future use would be 49645.45 ham.
5.29 MANDSAUR
Mandsaur district is underlain by mainly Basaltic lava flows of Deccan trap. Dynamic ground
water resources of the district have been estimated for base year -2019-20 on block-wise basis. Out of
552330 ha of geographical area, 499047 ha (90%) is ground water recharge worthy area and 53283 ha
(10 %) is hilly area. There are five number of assessment units (block) in the district which fall under
non-command. Garoth block of the district are categorized as semi critical (same in 2016-17), Malhargarh
and Bhanpra block of the district are categorized as critical (same in 2016-17), Mandsaur and Sitamua
(same in 2016-17) as over exploited. The highest stage of ground water extraction is computed as
135.16% in Sitamau block. The annual extractable ground water resource in the district is 60359.85 ham
and ground water extraction for all uses is 64748.93 ham, making stage of ground water extraction 107.27
% (103.22 % in 2016-17) as a whole for district. After making allocation for future domestic supply for
year 2025, balance available ground water for future use would be 2412.5 ham.
5.30 MORENA
Morena district is characterized by alluvial formation,Vindhyan Formation and Gwalior Series.
Dynamic ground water resources of the district have been estimated for base year -2019-20 on block-

Dynamic Ground Water Resource of Madhya Pradesh - 2020
102
wise basis. Out of 496889 ha of geographical area, 438489 ha (88 %) is ground water recharge worthy
area and 58400 ha (12%) is hilly area. There are seven numbers of assessment units (block) in the district
which fall under command (51 %) and non-command (49 %) sub units. All the seven blocks- ambah,
Jaura, Kailaras ,Morena, Pahadgarh, Porsa and Sabalgarh blocks are safe. The highest stage of ground
water extraction is computed as 59.93% in Ambah block. The annual extractable ground water resource
in the district 63784.63 ham and ground water extraction for all uses is 25400.69 ham, making stage of
ground water extraction 39.82% (35.56% in 2016-17) as a whole for district. After making allocation for
future domestic supply for year 2025, balance available ground water for future use would be 37719.42
ham.
5.31 NARSINGHPUR
Narsinghpur district is underlain by Alluvium, Gondwana sandstone, Bijawar and Basaltic lava
flows of Deccan trap. Dynamic ground water resources of the district have been estimated for base year
-2019-20 on block-wise basis. Out of 513300 ha of geographical area, 479100 ha (89%) is ground water
recharge worthy area and 34200 ha (11%) is hilly area. There are six number of assessment units (block)
in the district which fall under non-command (90%) and command (10%) sub units. Except Narsinghpur
block, which is categorized as semi critical (safe in 2016-17), all other blocks are categorized as Safe.
The highest stage of ground water extraction is computed 74.25 %( 69.74 % in 2016-17) in Narsinghpur
block. The annual extractable ground water resource in the district is 113541.26 ham and Ground Water
extraction for all uses is 72480.48 ham, making stage of ground water extraction 63.84% (63.34 % in
2016-17) as a whole for district. After making allocation for future domestic for year 2025, balance
available ground water for future use would be 40870.98 ham.
5.32 NEEMUCH
Neemuch district is underlain by mainly Basaltic lava flows of Deccan trap. Dynamic ground
water resources of the district have been estimated for base year -2019-20 on block-wise basis. Out of 4,
20,044 ha of geographical area, 3,75,744 ha (89%) is ground water recharge worthy area and 44,300 ha
(11 %) is hilly area. There are three number of assessment units (block) in the district which fall under
non-command. Jawad block (critical in 2016-17) of the district is categorized as over exploited. Neemuch
(critical in 2016-17) is ver exploited and Manasa (same in 2016-17) as semi critical. The highest stage of
ground water extraction is computed as 102.25% in Neemuch block. The annual extractable ground water
resource in the district is 38300.25 ham and ground water extraction for all uses is 35390.12 ham, making
stage of ground water extraction 92.40 % (87.44 % in 2016-17) as a whole for district. After making

Dynamic Ground Water Resource of Madhya Pradesh - 2020
103
allocation for future domestic supply for year 2025, balance available ground water for future use would
be 3215.25 ham.
5.33 PANNA
Panna district is underlain by Vindhyan Shale, Limestone and Sandstone and Alluvium. Dynamic
ground water resources of the district have been estimated for base year -2019-20 on block-wise basis.
Out of 7,13,500 ha of geographical area, 6,82,425 ha (96%) is ground water recharge worthy area and
31,025 ha (4 %) is hilly area. There are five number of assessment units (block) in the district which fall
under non-command (95 %) and command (5 % Panna) sub units. All the blocks of the district are
categorized as safe blocks. The highest stage of ground water extraction is computed as 42.30% (61.96%
in 2016-17) in Ajaygarh block. The annual extractable ground water resource in the district 58260.17
ham and ground water extraction for all uses is 17808.08 ham, making stage of ground water extraction
30.57% (36.50 % in 2016-17) as a whole for district. After making allocation for future domestic supply
for year 2025, balance available ground water for future use would be 38034.53 ham.
5.34 RAISEN
Raisen district is underlain by Basaltic lava flows of Deccan trap Vindhyan Sandstone and
Alluvium. Dynamic Ground water resource estimation of the district has been computed for Base Year-
2019-20, on block wise basis. Out of 8,46,539 ha of geographical area, 6,60,939 (78%) ha is ground
water recharge worthy area and 1,85,600 (22 %) is hilly area. There are seven number of assessment
units (block) in the district which fall under non-command (92%) and command (8%- Badi) sub units.
All blocks of the district are categorized as safe except Obedullaganj which fall in semi critical category.
The highest stage of ground water extraction is computed as 71.62 % in Obedullaganj block. The annual
extractable ground water resource in the district 81949.21 ham and ground water extraction for all uses
is 43494.9 ham, making stage of ground water extraction 53.08% (52.31% in 2016-17) as a whole for
district. After making allocation for future domestic supply for year 2025, balance available ground water
for future use would be 38034.53 ham.
5.35 RAJGARH
Rajgarh district is underlain by mainly Basaltic lava flows of Deccan trap. Dynamic ground water
resources of the district have been estimated for base year -2019-20 on block-wise basis. Out of 6,15,498
ha of geographical area, 6,15,498 ha (100 %) is ground water recharge worthy area. There are six number
of assessment units (block) in the district which fall under non-command. Biora, Khilchipur and Zeerapur
blocks of the district are categorized as semi critical (same in 2016-17), Narsinghgarh and Sarangpur
blocks of the district are categorized as critical (semi critical in 2016-17), Rajgarh categorized as safe
(same in 2016-17). The highest stage of ground water extraction is computed as 98.18% (95.39 % in

Dynamic Ground Water Resource of Madhya Pradesh - 2020
104
2016-17) in Sarangpur block. The annual extractable ground water resource in the district is 77503.75
ham and ground water extraction for all uses is 65419.73 ham, making stage of ground water extraction
84.41 % (83.47% in 2016-17) as a whole for district. After making allocation for future domestic supply
for year 2025, balance available ground water for future use would be 13335.61 ham.
5.36 RATLAM
Ratlam district is underlain by Basaltic lava flows of Deccan trap. Dynamic ground water
resources of the district have been estimated for base year -2019-20 on block-wise basis. Out of 4, 86,100
ha of geographical area, 4, 61,600 ha (95 %) is ground water recharge worthy area and 24,500 ha (5 %)
is hilly area. There are seven number of assessment units (block) in the district which fall under non-
command (98 %) and command (2% Bajna block) sub units. Alote, Jaora, Piploda and Ratlam blocks of
the district are categorized as over exploited (same as in 2016-17), Sailana and Bajna as semi critical
(same as in 2016-17). The highest stage of ground water extraction is computed as 167.50 % in Jaora
block. The annual extractable ground water resource in the district 76322.66 ham and ground water
extraction for all uses is 107741.87 ham, making stage of ground water extraction 141.47% (126.63 %
in 2016-17) as a whole for district. After making allocation for future domestic supply for year 2025,
balance available ground water for future use would be 1491.06 ham.
5.37 REWA
Rewa district is underlain by Vindhyan Shale, Limestone and Sandstone and Alluvium. Dynamic
ground water resources of the district have been estimated for base year -2019-20 on block-wise basis.
Out of 628736 ha of geographical area, 591136 ha (93%) is ground water recharge worthy area and 37600
ha (7%) hilly area. All blocks, of the district are categorized as safe, except Mauganj which is categorized
as semi critical (safe in 2016-17). The highest stage of ground water extraction is computed as 72% in
Mauganj block. The annual extractable ground water resource in the district is 48367.63 ham and ground
water extraction for all uses is 26552.8 ham, making stage of ground water extraction 54.90% (45.02%
in 2016-17) as a whole for district. After making allocation for future domestic supply for year 2025,
balance available ground water for futureuse would be 20976.23 ham.
5.38 SAGAR
Sagar district is underlain by Basaltic lava flows of Deccan trap Vindhyan Sandstone and
Alluvium. Dynamic ground water resources of the district have been estimated for base year -2019-20
on block-wise basis. Out of 1,025,200 ha of geographical area, 925418 ha (90 %) is ground water
recharge worthy area and 99782 ha (10 %) is hilly area. There are eleven number of assessment units
(block) in the district which fall under non-command (95 %) and command (5 %) sub units. All the blocks
are categorized as safe. Banda block of the district is categorized as safe which was categorized as semi

Dynamic Ground Water Resource of Madhya Pradesh - 2020
105
critical in 2016-17. The highest stage of ground water extraction is computed as 69.82% in Bina block.
The annual extractable ground water resource in the district 99930.26 ham and ground water extraction
for all uses is 60232.63 ham, making stage of ground water extraction 60.27% (58.31 % in 2016-17) as
a whole for district. After making allocation for future domestic supply for year 2025, balance available
ground water for future use would be 39253.76 ham.
5.39 SATNA
Satna district is underlain by Vindhyan Shale, Limestone and Sandstone and Alluvium. Dynamic
ground water resources of the district have been estimated for base year -2016/17 on block-wise basis.
Out of 752016 ha of geographical area, 672106 ha (89%) is ground water recharge worthy area and
779910 ha (11%) hilly area. There are nine number of assessment units (block) in the district which fall
under non-command & command (Amarpatan, Nagod, Rampur baghelon, Sohawal, Uchehra blocks).
Amarpatan, Majhgawan, Nagod, Ramnagar and Unchehra blocks of the district are categorized as safe
(safe in 2016-17). Maihar, Rampur Baghelon and Sohawal blocks (same in 2016-17) as semi critical.
The highest stage of ground water development is computed as 89.21% in Rampur Baghelon. The annual
extractable ground water resource in the district is 59291.86 ham and ground water extraction for all uses
is 38238.38 ham, making stage of ground water development 64.49% (68.15% in 2012/13) as a whole
for district. After making allocation for future domestic supply for year 2025, balance available ground
water for future use would be 23649.88 ham.
5.40 SEHORE
Sehore district is underlain by Basaltic lava flows of Deccan trap, Vindhyan Sandstone and
Alluvium. Dynamic ground water resources of the district have been estimated for base year -2019-20
on block-wise basis. Out of 656544 ha of geographical area, 462716 ha (70%) is ground water recharge
worthy area and 193828ha (30%) is hilly area. There are five number of assessment units (block) in the
district which fall under non-command (80%) and command (20% Ashta, Budhni, Ichawar,
Nasrullahganj & Sehore) sub units. Ashta block of the district are categorized as critical (semi critical in
2016-17) and rest of the blocks are safe. The highest stage of ground water development is computed as
99.37% (77.36% in 2016-17) Ashta block. The annual extractable ground water resource in the district
65187.81 ham and ground water extraction for all uses is 40400.72 ham, making stage of ground water
extraction 61.98% (61.92% in 2016-17) as a whole for district. After making allocation for future
domestic supply for year 2025, balance available ground water for future use would be 24992.51 ham.
5.41 SEONI
Seoni district is underlain by Deccan trap basalts and Archaeans granite-gneisses. Dynamic
ground water resources of the district have been estimated for base year -2019-20 on block-wise basis.

Dynamic Ground Water Resource of Madhya Pradesh - 2020
106
Out of 8,75,800 ha of geographical area, 8,05,020 ha (92%) is ground water recharge worthy area and
70,780 ha (8 %) is hilly area. There are eight number of assessment units (block) in the district which
fall under non-command (91%) and command (9% Barghat, Dhanora, Keolari and Seoni) sub units. All
the blocks of the district are categorized as safe blocks. Chhapara is with highest stage of ground water
development is computed as 57.10% (66.15% in 2016-17). The annual extractable ground water resource
in the district is 68249.83 ham and ground water extraction for all uses is 25621.81 ham, making stage
of ground water extraction 37.54 % (38.54% in 2016-17) as a whole for district. After making allocation
for future domestic supply for year 2025, balance available ground water for future use would be
42279.41 ham.
5.42 SHAHDOL
Shahdol district is underlain by Archaeans granite-gneisses, Gondwanas sandstone-clays,
Lametas and Deccan trap basalts. Dynamic ground water resources of the district have been estimated
for base year -2019/20 on block-wise basis. Out of 5, 84,100 ha of geographical area, 4, 97,800 ha (85%)
is ground water recharge worthy area and 86,300 ha (15%) is hilly area. There are five number of
assessment units (block) in the district which fall under non-command & command (Beohari) category.
All blocks of the district are categorized as safe blocks, and highest stage of ground water extraction is
computed as 22.39 % for Sohagpur Block. The annual extractable ground water resource in the district
is 56801.97 ham and ground water extraction for all uses is 7101.91 ham, making stage of ground water
extraction 16.14% as a whole for district. After making allocation for future domestic supply for year
2025, balance available ground water for future use would be 43988.5 ham.
5.43 SHAJAPUR
Shajapur district is underlain by mainly Basaltic lava flows of Deccan trap. Dynamic ground
water resources of the district have been estimated for base year -2019/20 on block-wise basis. Out of
3,44,325 ha of geographical area, 3,39,617 ha (98%) is ground water recharge worthy area and 4,708 ha
(2%) is hilly area. There are four number of assessment units (blocks) in the district which fall under
non-command. Mohan Berodia (same in 2016/17) and Shujalpur block (same in 2016/17) and Kalapipal
unit are categorized as over-exploited, whereas Shajapur unit is categorized as semi-critical of the district.
The highest stage of ground water extraction is computed as 126.34% in Mohan Berodia block. The
annual extractable ground water availability in the district is 56801.97 ham and ground water extraction
for all uses is 56178.57 ham, making stage of ground water extraction 105.50% (102.52% in 2016/17) as
a whole for district. After making allocation for future domestic supply for year 2025, balance available
ground water for future use would be 53250.21 ham.

Dynamic Ground Water Resource of Madhya Pradesh - 2020
107
5.44 SHEOPUR
Sheopur district is underlain by Vindhyan Sandstone and Alluvium. Dynamic ground water
resources of the district have been estimated for base year -2019/20 on block-wise basis. Out of 6,60,600
ha of geographical area, 5,33,480 ha (81%) is ground water recharge worthy area and 1,27,120 ha (19%)
is hilly area. There are three number of assessment units (blocks) in the district which fall under non-
command (87%) and two (Sheopur and Vijaypur) under command (13%) sub units. All blocks of the
district are categorized as safe. The highest stage of ground water extraction is computed as 68.96% in
Vijaypur block. The annual extractable ground water availability in the district 51172.6 ham and ground
water extraction for all uses is 19350.64 ham, making stage of ground water extraction 37.81% (35.96 %
in 2016/17) as a whole for district. After making allocation for future domestic supply for year 2025,
balance available ground water for future use would be 53250.21 ham.
5.45 SHIVPURI
Shivpuri district is underlain by Budelkhand granite, Basaltic lava flows of Deccan trap Vindhyan
Sandstone and Alluvium. Dynamic ground water resources of the district have been estimated for base
year -2019/20 on block-wise basis. Out of 10,27,800 ha of geographical area, 9,77,049 ha (95%) is
ground water recharge worthy area and 50,751 ha (5%) is hilly area. There are eight number of assessment
units (block) in the district which fall under non-command (93%) and seven also under command (7%)
sub units. Karera, Shivpuri and Pohri blocks are categorized as safe whereas Badarwas, Khaniyadhana,
Kolaras, Narwar and Pichor blocks of the district are categorized as semi critical. The highest stage of
ground water extraction is computed as 83.82% in Khaniyadhana block. The annual extractable ground
water availability in the district 74729.04 ham and ground water extraction for all uses is 52488.42 ham,
making stage of ground water extraction 70.24 % (69.2% in 2016/17) as a whole for district. After making
allocation for future domestic supply for year 2025, balance available ground water for future use would
be 21613.11 ham.
5.46 SIDHI
Sidhi district is underlain by Vindhyan limestone sandstone, Archaean granite Gondwana
sandstone and Alluvium Dynamic ground water resources of the district have been estimated for base
year-2019/20 on block-wise basis. Out of 4,85,380 ha of geographical area, 3,60,385 ha (74%) is ground
water recharge worthy area and 1,24,995 ha (26%) is hilly area. There are five number of assessment
units (block) in the district which fall under non-command (87%) and three under command (13%) sub
units. All blocks of the district are categorized as safe. The highest stage of ground water development
is computed as 43.56% in Sidhi block. The annual extractable ground water availability in the district
47493.79 ham and ground water extraction for all uses is 11025.68 ham, making stage of ground water

Dynamic Ground Water Resource of Madhya Pradesh - 2020
108
extraction 23.21% (29.34% in 2016/17) as a whole for district. After making allocation for future
domestic supply for year 2025, balance available ground water for future use would be 36092.08 ham.
5.47 SINGRAULI
Singrauli district is underlain by Archaean granite and Gondwana sandstone. Dynamic ground
water resources of the district have been estimated for base year -2019/20 on block-wise basis. Out of
5,67,200 ha of geographical area, 4,51,260 ha (80%) is ground water recharge worthy area and 1,15,940
ha (20%) is hilly area. There are three number of assessment units (block) in the district which fall under
non-command (86%) and two under command (14% -Deosar, Waidhan) sub units. All the blocks of the
district are categorized as safe. The highest stage of ground water extration is computed as 32.02% in
Chitrangi block. The annual extractable water availability in the district 56361.39 ham and ground water
extraction for all uses is 13032.75 ham, making stage of ground water extraction 38.27% (28.13% in
2016/17) as a whole for district. After making allocation for future domestic supply for year 2025,
balance available ground water for future use would be 20627.17 ham.
5.48 TIKAMGARH
Tikamgarh district is occupied by Bundelkhand granite with a thin soil cover. Dynamic ground
water resources of the district have been estimated for base year-2019/20 on block-wise basis. Out of
5,04,864 ha of geographical area 4,88,164 ha (97%) is ground water recharge worthy area and 16,700 ha
(3%) is hilly area. There are six number of assessment units (blocks) in the district which fall under non-
command (92%) and command (8%) sub units. All blocks of the district in command and non-command
area are categorized as semi critical except Prathivipur which fall in safe category. Highest stage of
ground water extraction is computed as 81.26% for Jatara block. The annual extractable ground water
availability in the district 56361.39 ham and ground water extraction for all uses is 40235.06 ham, making
stage of ground water extraction 71.39% (72.95% in 2016/17) as a whole for district. After making
allocation for future domestic supply for year 2025, balance available ground water for future use would
be 14884.79 ham.
5.49 UJJAIN
Ujjain district is underlain by mainly Basaltic lava flows of Deccan trap. Dynamic ground water
resources of the district have been estimated for base year-2019/20 on block-wise basis. Out of 6,13,023
ha of geographical area, 5,93,933 ha (97%) is ground water recharge worthy area and 19,090 ha (3%) is
hilly area. There are six number of assessment units (blocks) in the district which fall under non-
command (100 %). Mahidpur, Tarana and Khachrod blocks of the district are categorized as semi critical.
Badnagar, Ghatia and Ujjain blocks are categorized as over exploited. The highest stage of ground water

Dynamic Ground Water Resource of Madhya Pradesh - 2020
109
extraction is computed as 142.70% in Ujjain block. The annual extractable ground water resource in the
district is 91800.84 ham and ground water extraction for all uses is 96470.3 ham, making stage of ground
water extraction 105.09% (98.35% in 2019/20) as a whole for district. After making allocation for future
domestic supply for year 2025, balance available ground water for future use would be 9505.3 ham.
5.50 UMARIA
Umaria district is underlain by Gondwana sandstone, Archaeans granite-gneisses, -clays, Lametas
and Deccan trap basalts. Dynamic ground water resources of the district have been estimated for base
year-2019/20 on block-wise basis. Out of 4,53,900 ha of geographical area, 4,21,900 ha (93%) is ground
water recharge worthy area and 32,000 ha (7%) is hilly area. There are three number of assessment units
(blocks) in the district which fall under non-command category. All blocks of the district are categorized
as safe blocks, and highest stage of ground water extraction is computed as 31.48% for Karkeli Block.
The annual extractable ground water resource in the district is 41477.73 ham and ground water extraction
for all uses is 10072.37 ham, making stage of ground water extraction 24.28% (12.11% in 2019/20) as a
whole for district. After making allocation for future domestic supply for year 2025, balance available
ground water for future irrigation use be 31171.39 ham.
5.51 VIDISHA
Vidisha district is underlain by Basaltic lava flows of Deccan trap and Vindhyan Sandstone.
Dynamic ground water resources of the district have been estimated for base year-2019/20 on block-wise
basis Out of 7,37,100 ha of geographical area, 6,80,770 ha (92%) is ground water recharge worthy area
and 56,330 ha (8%) is hilly area. There are seven number of assessment units (block) in the district which
fall under non-command (89%) and command (11%) sub units. Five blocks of the district are under safe
category whereas two blocks are falling in Semi-Critical Category. The highest stage of ground water
extraction is computed as 71.964 % in Gyraspur block. The annual extractable ground water resource in
the district 84353.11 ham and ground water extraction for all uses is 51236.64 ham, making stage of
ground water extraction 60.74% (59.24% in 2016/17) as a whole for district. After making allocation for
future domestic supply for year 2025, balance available ground water for future use would be 32665.13
ham.

Dynamic Ground Water Resource of Madhya Pradesh - 2020
110
CHAPTER 6
6.0 CONCLUSIONS
• Total Annual Ground Water Recharge in the state (2020) has been assessed as 36.16 billion cubic
meters (bcm). Ground water resources are replenished through rainfall and other sources like
return flow from irrigation, canal seepage, recharge from water bodies, water conservation
structures etc. The main source of annual ground water recharge is rainfall, which contributes
nearly 77% of the Total Annual Ground Water Recharge.
• The Total Annual Extractable Ground Water Resource of the country has been assessed as 33.38
billion cubic meters (bcm), after keeping a provision for natural discharge.
• The Annual Ground Water Extraction of the state (2020) is 18.97 billion cubic meters (bcm), the
largest user being irrigation sector.
• The Stage of ground water extraction for the entire state, which is the percentage of ground
water extraction with respect to Annual Extractable Ground Water Recharge, has been computed
as 56.82 %. The extraction pattern of ground water is not uniform across the state, resulting in
ground water stressed conditions in some parts of the state while in some other areas; ground
water extraction has been sub- optimal.
• Out of the total 317 assessment units (Blocks/ Urban areas) in the state, 26 units (8.20 %) have
been categorized as ‘Over- Exploited’, 8 units (2.52 %) have been categorized as ‘Critical’, 50
units (15.77 %) have been categorized as ’Semi-Critical’ and 233 units (73.51 %) have been
categorized as ‘Safe.’
• Out of 33383.40 mcm of total Annual Extractable Resources of the state, 3349.83 (10.04 %) are
under ‘Over-Exploited’, 754.83 mcm (2.26 %) are under ‘Critical’, 5021.66 mcm (15.04 %) are
under ’Semi-Critical’, 24254.07 mcm (72.66 %) are under ‘Safe’ category assessment units.
• Almost all over-exploited assessment units falling in western part of Madhya Pradesh, which is
known as “MALWA AREA” where ground water extraction has increased many folds during
past decades.
• The total Annual Ground Water Recharge for the entire state, as in 2020 has decreased by 0.26
bcm as compared to the last assessment (2017). The total Annual Extractable GW Resources has
also decreased by 1.09 bcm. The Annual Ground Water Extraction for irrigation, domestic and
Industrial uses increased by 0.09 bcm during this period. These variations are attributed mainly

Dynamic Ground Water Resource of Madhya Pradesh - 2020
111
to refinement of parameters, refinement in well census and population data, and changing ground
water regime.
• It is also pertinent to add that as it is advisable to restrict the ground water extraction as far as
possible to annual replenishable resources, the categorization also reflects the relation between
the annual replenishment and ground water extraction. An area with low groundwater potential
may not be considered for ground water extraction and may remain safe and an area with good
ground water potential may be heavily used for ground water extraction and may become over
exploited over a period of time. Thus, water augmentation efforts can be successful in such areas,
where the groundwater potential is high and there is scope for augmentation.
• GEC-2015 methodology has been developed for prevalent Indian conditions, on the basis of
terrain characteristics and data availability. INDIA-GROUNDWATER RESOURCE
ESTIMATION SYSTEM (IN- GRES) is a Software/Web-based Application developed by
CGWB in collaboration with IIT-Hyderabad for assessment of ground water resources using GEC
2015 Methodology. Constraints in data availability have been overcome through realistic
assumptions based on experience in the state.
• A conscious effort is required on the parts of the State/ Central agencies to acquire the requisite
realistic data to map the changing groundwater scenario in the state.
6.1 INFERENCES FROM GROUND WATER RESOURCE ASSESSMENT
An analysis of assessment results leads us to the following inferences as the way forward in the
assessment of Ground water resources.
6.1.1 Water balance Studies
Ground water is one of the several components of the Hydrologic Cycle, other important
components being rainfall, surface water, soil moisture and evapotranspiration. Holistic water resources
management interventions require proper understanding of the interactions between the different
components of the hydrosphere. Studies for determining the Base flow and lateral flow components in
the Water Balance equation need to be taken up to bring more accuracy to the Ground Water Resources
Assessment.
6.1.2 Aquifer Charactersation and Parameter Estimation
One of the key elements that determine the accuracy of ground water resources assessment is the
realistic estimation of the recharge and discharge parameters. It is recommended that more experimental
studies be taken up for refining the norms of RIF, return flow from irrigation based on soil types and

Dynamic Ground Water Resource of Madhya Pradesh - 2020
112
agro-climatic zone, recharge from water conservation and water bodies and more field studies for
evaluation of specific yield values as well as its variation with depth.
6.1.3 Case Studies Linking Assessment with Management
It is recommended to take up case studies in various assessment units wherein quantitative
evaluation of the ground water management interventions and consequent changes in the assessment
results could be analysed. Such studies would help bring out the efficacy of various management
interventions on the ground water regime.
6.1.4 Temporal availability of Ground Water Resources
Even though the GEC 2015 methodology advocates season-wise resource assessment, the estimation
of recharge during monsoon and non-monsoon seasons may not be sufficient. Temporal variations in
groundwater availability, particularly in hard rock terrain are not reflected in present practices. Hence,
the assessment of temporal availability of ground water resources on the basis of available water
columns can be attempted by considering the water levels measured frequently using Digital Water
Level Recorders (DWLRs).
6.1.5 Creation of Database for Ground Water Resources Assessment and its Regular Updating
GEC 2015 has devised the data structure of all the data elements (like water level, rainfall etc.)
and norms (like Specific Yield, Rainfall Infiltration Factor etc.) with its name, type of data and its
precision. The templates (excel sheets) for data collection/compilation for assessment through IN-
GRES using GEC 2015 has also been devised. However, major challenges are lack of dedicated
manpower as well as presence of State GW/Nodal Departments (in majority of States) at District level
for understanding/analysis of data/information to be collected/compiled from different State
Departments (like Agriculture, Irrigation, Water Supply, Industries, Water Conservation etc.). Of
particular importance in this regard are data/information related to recharge from water bodies, water
conservation/harvesting structures, return flow from applied irrigation and details of ground water
extraction structures in use for irrigation, domestic and industrial purpose. These need to be
collected/compiled and regularly updated at district/block level so that more realistic assessment of
ground water resources could be accomplished.
6.1.6 Aquifer- Stream Interactions
Additional studies on aquifer-stream interactions are required to understand the contribution of
ground water to streams and the requirement of environmental flows for sustainability of water resources
and surrounding ecosystem.\

Dynamic Ground Water Resource of Madhya Pradesh - 2020
113
6.1.7 Ground Water Modelling and Predictive Simulation
Besides the assessment of the dynamic ground water resources using norms prescribed in GEC 2015
methodology through automation, the concept of Ground water modelling must be included where
predictive simulation can also be done. This would give an idea of the future availability of Ground water
resources with respect to the changing climate and extraction patterns.
6.2 RECCOMENDATIONS
The dependency on groundwater has increased many folds during the recent years and the
groundwater extraction for irrigation, domestic and industries have resulted in lowering of water levels,
long-term water level declining trend and even drying up of wells. The best option lies in improving the
recharge component in any well-defined administrative or natural boundary (Block/ Water shed) by an
integrated scientific approach with people participatory program. Such program also needs to include
cost effective structures and best practices possible without deteriorating the existing surface and ground
water resources in terms of quantity and quality. In order to regulate the groundwater extraction, Central
Ground Water Board in association with Ground Water Survey, Water Resource Department has
computed Dynamic Groundwater Resources and categorized blocks as Over Exploited, Critical, Semi
Critical and Safe.
Hence, there is an urgent need to implement artificial recharge schemes to augment ground water so that
artificial recharge would be a part of Sustainable Management of ground water. The guidelines which
can be used in the formulation of scheme proposal can be enumerated as follows.
Criteria for selection of priority area
1. Area characterized by significant declining post monsoon long term water level trend
2. Area characterized by deeper post monsoon water level.
3. The area having high stage of groundwater extraction & categorized as Over Exploited, Critical
ground water assessment units.
4. The aquifer under stress needs to be considered for artificial recharge & priority to be given for
recharging at the recharge area of the confined aquifer, viz., crystalline-sedimentary contacts,
palaeo-channels, beach terraces, upstream side of fractures/lineaments.

Dynamic Ground Water Resource of Madhya Pradesh - 2020
114
Appendix-A
Government Resolution on constitution of
Central Level Expert Group
for overall re-assessment of
Ground Water Resources of the country, 2020

Dynamic Ground Water Resource of Madhya Pradesh - 2020
115

Dynamic Ground Water Resource of Madhya Pradesh - 2020
116

Dynamic Ground Water Resource of Madhya Pradesh - 2020
117

Dynamic Ground Water Resource of Madhya Pradesh - 2020
118

Dynamic Ground Water Resource of Madhya Pradesh - 2020
119
Appendix-B
Constitution of State Level Committee
(as in 2020)

Dynamic Ground Water Resource of Madhya Pradesh - 2020
120

Dynamic Ground Water Resource of Madhya Pradesh - 2020
121

Dynamic Ground Water Resource of Madhya Pradesh - 2020
122
Appendix-C
Minutes of First SCL meeting
(as in 2020)

Dynamic Ground Water Resource of Madhya Pradesh - 2020
123

Dynamic Ground Water Resource of Madhya Pradesh - 2020
124

Dynamic Ground Water Resource of Madhya Pradesh - 2020
125
Appendix-D
Minutes of Second SCL meeting
and approval of Resource from SLC
(as in 2020)

Dynamic Ground Water Resource of Madhya Pradesh - 2020
126

Dynamic Ground Water Resource of Madhya Pradesh - 2020
127

Dynamic Ground Water Resource of Madhya Pradesh - 2020
128
Appendix-E
First Minutes of the meeting of the Central Level Expert Group for
overall re- assessment of
Ground water resources of country, 2020

Dynamic Ground Water Resource of Madhya Pradesh - 2020
129
Minutes of 1st Meeting of Central Level Expert Group for Re-assessment of Ground Water Resources
of India as in 2020
Date: 19.01.2021
The 1st meeting of the Central Level Expert Group (CLEG) for re-assessment of the Ground
Water Resources of India as in 2020 was held through Video Conferencing on 19.01.2021 at 10.30 Hrs. Shri
G. C. Pati, Chairman, Central Ground Water Board & CLEG chaired the meeting. The list of participants is
annexed.
Dr P. Nandakumaran, Member (South), CGWB & Member Secretary, CLEG, welcomed all the
Members of Central Level Expert Group and participants. He briefed the participants on the Ground
Water Resource Assessment process and roles and responsibilities of CLEG and State Level Committees
(SLCs) for ensuring timely completion the whole process by the end of March, 2021. The Chairman, in his
opening remarks, emphasized the need for timely completion of GWRA-2020 by using the Web based
application ‘’INDIA-GROUNDWATER RESOURCE ESTIMATION SYSTEM (IN-GRES)’’developed by
CGWB in association with IIT-Hyderabad.
A presentation on ‘Status of various activities related to Ground Water Resource Assessment-
2020’ was made by Dr. Ratikanta Nayak, Scientist-D, CGWB, CHQ, Faridabad. It was followed by
Presentation by Prof K. B. V.N. Phanidra, Dept. of Civil Engg., IIT-Hyderabad on ‘’INDIA-
GROUNDWATER RESOURCE ESTIMATION SYSTEM (IN-GRES)’’. The presentations were
followed by detailed discussions on various aspects of the resource assessment.
Important action points emerged from the discussions are listed below:
Minor refinements in ‘IN-GRES’ suggested by Members based on the online and physical trainings
shall be incorporated in the software. (Action: CGWB & IIT, Hyderabad)
1. Feasibility of incorporating a provision in the software for computation of distributed values
of water level fluctuation over the assessment unit through interpolation of water level fluctuation in the
individual observation points-may be explored during future refinement to overcome the shortcomings
of using arithmetic average as is in practice at present.
(Action: CGWB & IIT, Hyderabad)
2. Request of some of the members to have login credentials of the IN-GRES software to have hands-on
experience and to suggest improvements shall be considered after firming up the software and data entry by

Dynamic Ground Water Resource of Madhya Pradesh - 2020
130
States. (Action: CGWB & IIT, Hyderabad)
3. Possibility to aggregating groundwater availability at basin level, as is being done in the case of
surface water resources may be considered in future.
(Action: CGWB & IIT, Hyderabad) Possibility of considering block level data availability in Tamil Nadu
(Firkas of Tamil Nadu within a block can be arithmetically added and block level assessment be made and
included in the report) could be considered to bring in uniformity.(Action: CGWB & IIT, Hyderabad)
The following decisions were taken during the meeting: -
1. The whole process of Re-assessment of Ground Water Resources of the country as in 2020 will
be carried out through ‘ INDIA-GROUNDWATER RESOURCE ESTIMATION SYSTEM (IN-GRES)’.
2. The States (Punjab, Madhya Pradesh, West Bengal, Rajasthan, Uttar Pradesh) where re-
organization /changes in number and boundary of assessment units have taken place (2020 as compared
to 2017) shall provide the shape file of assessment unit boundaries without further delay. State
Groundwater/Nodal Departments are requested to provide the shape file for commencement of data upload for the
States in ‘IN-GRES’.
3. Data collection/compilation of GW Extraction (for domestic, irrigation and industrial uses)
and Recharge from ‘Others Sources’ (canal seepage, return flow from SW/GW irrigation, tanks/ponds, water
conservation structures) for majority of States have not been completed. State Groundwater/Nodal
Departments are requested to expedite data collection in this regard, as these data are available exclusively with
State Departments.
4. Progress of work to be monitored on a regular basis by States/Regional offices of CGWB as well
as the Working Group at CGWB, CHQ, Faridabad to ensure completion of re-assessment of ground
water resources of the State and approval by State Level Committees by the end of February, 2021.
The meeting ended with thanks to the Chair.

Dynamic Ground Water Resource of Madhya Pradesh - 2020
131
List of participants of the 1st meeting of Central Level Expert Group (CLEG) on 19.01.2021
S.No Participants 1. Shri. G. C. Pati, Chairman, Central Ground Water Board 2. Dr. P. Nandakumaran, Member (South), Central Ground Water Board 3. Shri. Sunil Kumar, Member (CGWA), Central Ground Water Board 4. Shri. Sanjay Marwah, Member (HQ), Central Ground Water Board 5. Shri. G. L. Meena, Member (N&W), Central Ground Water Board 6. Shri S.K. Tripathi, DDG & RMH-IV, Southern Region, Geological Survey of India 7. Dr. Anupma Sharma, Scientist 'F', National Institute of Hydrology, Roorkee 8. Dr. Pulak Guhathakurta, Scientist F & Head, Climate Research Division, IMD, Pune 9. Shri Sunil Kumar, Director, Basin Planning-1, Directorate, Basin Planning Management
Organization, Central Water Commission 10. Smt. Soumya P Kumar, Director, MI-Stat.Wing, D/o Water Resources, RD & GR, M/o Jal
Shakti
11. Shri A. Murlidharan , Deputy Adviser (PHE), Department of Drinking Water Supply & Sanitation, Ministry of Jal Shakti
12. Shri. B Rath, Technical Expert (WM), NRAA, Ministry of Agriculture & Farmer Welfare 13. Shri. Sekhar M, Professor, Department of Civil Engg., Indian Institute of Science (IISc),
Bangalore 14. Shri. K B V N Phanindra, Professor, Department of Civil Engg., Indian Institute of
Technology-Hyderabad 15. C. Mruthyunjaya Swamy, K.E.S, Secretary to Government, Minor Irrigation & Ground
Water Development Department, Govt of Karnataka 16. Shri V S Patel, Managing Director, Gujarat Water Resources Development Corporation
Ltd., Gandhinagar, Gujarat 17. Er. Debashish Roy, Engineer in Chief & Ex-Officio Secretary, Water Resources Investigation
Department, Government of West Bengal 18. Dr. Pandith Madhnure, Director, Ground Water Department , Govt. of Telengana
19. Shri. Gopal Sharma, Superintending Hydrogeologist, Ground Water Department, Government of Rajasthan
20. Shri. B.B Singla, Superintending Engineer, Ground Water Management Circle , S.A.S Nagar, Government of Punjab
21. Er. S.Raja, Deputy Director, Officer of the Chief Engineer, State Ground and Surface Water Resources Data Centre, Govt. of Tamil Nadu
22. Shri. N. Srinivasu, Deputy Director, Ground Water & Water Audit Department, Govt. of Andhra Pradesh
23. Dr. Vijay Pakmode, Deputy Director, GSDA, Pune, Govt. of Maharastra 24. Dr. Bijendra Baghel, GW Data Center, WRD, Bhopal, Government of Madhya Pradesh
25. Shri Awdhesh Kumar, Executive Engineer, Ground Water Department, Uttar Pradesh
26. Shri. Pankaj Mahala, Hydrologist, Ambala, Government of Haryana 27. Shri.Paul Prabhakar, Regional Director, CGWB, SECR, Chennai 28. Shri.V.Kunhambu, Regional Director, CGWB, SWR, Bangalore 29. Dr.S.K.Samanta, Regional Director, CGWB, ER, Kolkata 30. Dr.P.K.Jain, Regional Director, CGWB, CR, Nagpur 31. Er. Hirak Dey, Director, State Water Investigation Directorate, West Bengal 32. Shri. P. Jyoti Kumar, Deputy Director, Ground Water Department, Telengana
S.No Participants
33. Dr. R C Jain, Advisor (GW), Gujarat Water Resources Development Corporation Ltd.,
Gandhinagar, Gujarat

Dynamic Ground Water Resource of Madhya Pradesh - 2020
132
34. Shri. Mahavir, TA, Office of Hydrologist, Karnal, Government of Haryana 35. Dr. Poonam Sharma, Scientist-D, CGWB, CHQ, Faridabad 36. Shri. A. K. Madhukar, Scientist-D, CGWB, CHQ, Faridabad 37. Shri. Anurag Khanna, Scientist-D, CGWB, CHQ, Faridabad 38. Shri. M. K. Sharma, Scientist-D, CGWB, WR, Jaipur 39. Dr. Ratikanta Nayak, Scientist-D, CGWB, CHQ, Faridabad 40. Dr. Ranjan Ray , Scientist-D,CGWB, CHQ, Faridabad 41. Dr. S. Subramanian, Scientist-D, CGWB, SECR, Chennai 42. Smt. Sandhya Yadav, Scientist-D, CGWB, ER, Kolkata 43. Shri. M.L.Angurala, Scientist-D, CGWB, NWHR, Jammu 44. Shri. Sanjeev Mehrota, Scientist-D, CGWB, WCR, Ahmedabad
45. Shri. A. V. S. S. Anand, Scientist-D, CGWB, Rajiv Gandhi National Ground Water Training
& Research Institute, Raipur 46. Shri. D. Venkateshwar, Scientist-D, CGWB, CR, , Nagpur 47. Dr. M. Senthil Kumar, Scientist-C, CGWB, CHQ, Faridabad 48. Smt. Rumi Mukherjee, Scientist-C, CGWB, CHQ, Faridabad 49. Shri. Chittaranjan Biswal, Scientist-B, CGWB, NCR, Bhopal 50. Miss. Subhra Satapathy, Scientist-B, CGWB, CHQ, Faridabad 51. Rayees Ahmad Pir, Assistant Hydrogeologist, CGWB, NWHR, Jammu 52. Shri. Yogesh Bhandari, Vassar Labs, Hyderabad 53. Shri. Nikhilesh Kumar, Vassar Labs, Hyderabad 54. Smt. Baljinder Kaur, Vassar Labs, Hyderabad

Dynamic Ground Water Resource of Madhya Pradesh - 2020
133
Appendix-F
Second Minutes of the meeting of the Central Level Expert Group for
overall re- assessment of
Ground water resources of country, 2020

Dynamic Ground Water Resource of Madhya Pradesh - 2020
134
Minutes of 2nd Meeting of Central Level Expert Group for Re-assessment of Ground Water
Resources of India for 2020 (held through Video Conferencing)
Date: 31.03.2021
The 2nd meeting of the Central Level Expert Group (CLEG) for re-assessment of the Ground
Water Resources of India for 2020 was held under the Chairmanship of Shri G.C. Pati, Chairman, Central
Ground Water Board (CGWB) through Video Conferencing on 31.03.2021 at 10.30Hrs. The list of participants
is attached (Annexure).Dr P. Nandakumaran, Member (South), CGWB & Member Secretary, CLEG,
welcomed all the Members of Central Level Expert Group and participants. He briefed the participants
about the Ground Water Resource Assessment 2020 and requested Chairman, CGWB to address the
participants. Chairman, Central Ground Water Board, congratulated all Officers of State GW/Nodal
Departments, Regional offices of CGWB and IIT Hyderabad for their sincere efforts for completion of GW
Resource Assessment for 2020 through web based application ‘’INDIA-GROUNDWATER RESOURCE
ESTIMATION SYSTEM (IN-GRES)’’. He also appreciated the CLEG members for their valuable inputs
which have helped in the realistic assessment of ground water resources in the country. He also intimated the
members about the directions of the DoWR, RD & GR, Ministry of Jal Shakti regarding the need to
complete the assessment and to publish the report without further delay. He then requested the Member
Secretary to take up the Agenda items:
Agenda 2.1: Confirmation of Minutes of 1st CLEG Meeting & Action Taken on Decisions:
As no comments were received from any of the members, minutes of the 1st meeting of CLEG held
on 19.01.2021 were confirmed.
Dr P. Nandakumaran, Member Secretary, CLEG mentioned that various actions for
improvements in the IN-GRES software, as discussed during the previous meeting have been initiated in
consultation with IIT Hyderabad and that all such improvements will be carried out over the next couple of
years in a phased manner.
Agenda 2.2: Status of Ground Water Resource Assessment 2020:
A brief presentation on status of ‘Ground Water Resource Assessment-2020 (GWRA- 2020)’ as
in 2020 was made by Dr. Ratikanta Nayak, Scientist-D, CGWB, CHQ, Faridabad. It was informed that
all the States/UTs (except Telangana, Tamil Nadu and West Bengal) have already assessed their ground
water resources jointly with CGWB. State Level Committees (SLCs) of 28 States/UTs have approved
the GW Resource Assessment for their respective States/UTs.

Dynamic Ground Water Resource of Madhya Pradesh - 2020
135
Salient features of the national scenario of dynamic ground water resources of India, based on the
outputs of assessment as in 2020 in respect of 33 States and outputs of assessment as in 2017 in respect
of Tamil Nadu, Telangana and West Bengal were presented and discussed. The members appreciated
the work done by CGWB, State Departments and IIT Hyderabad and expressed their agreement with the
whole process of assessment.
The presentations were followed by detailed discussions, during which the following requests
were made
1. State GW/Nodal Department of Telangana and Tamil Nadu requested for 15 days more time
for completing GWRA-2020.
2. State GW/Nodal Department of West Bengal requested for 3 months more time for completing
GWRA-2020.
The following decisions were taken during the meeting after the discussions: -
1. In view of the fact that incorporation of ground water resources Tamil Nadu, Telangana and
West Bengal as in 2020 are not considered to cause any significant change in the national scenario,
members of CLEG gave their consent/approval for the results of GWRA-2020 as finalized, subject to
incorporation of final results of the remaining States/UTs.
2. The national report on Dynamic GW Resources of India, 2020 will be prepared by CGWB based
on the assessment carried out jointly by State GW/Nodal departments and CGWB.
3. It was decided by the CLEG that 15 days time will be given to the three States (Telangana, Tamil
Nadu and West Bengal) to submit their assessment results as in 2020 (with the approval of State Level
Committee) so that the assessment results for 2020 can be included in national compilation report. In case
data in respect of these States are not made available by the prescribed date, CGWB may proceed with
finalization and publication of the national report by incorporating results of the previous assessment results
for these States.
4. It was also decided to request the States for which assessment is yet to be approved by their
respective SLCs to get the same approved at the earliest and latest by 15.04.2021 positively.
The meeting ended with thanks to the Chair.

Dynamic Ground Water Resource of Madhya Pradesh - 2020
136
List of participants of the 2nd meeting of Central Level Expert Group (CLEG) on 31.03.2021
S.No Participants 1. Shri. G. C. Pati, Chairman, Central Ground Water Board 2. Dr. P. Nandakumaran, Member (South), Central Ground Water Board 3. Shri. Sunil Kumar, Member (CGWA), Central Ground Water Board 4. Shri. Sanjay Marwaha, Member (HQ), Central Ground Water Board 5. Shri. G. L. Meena, Member (N&W), Central Ground Water Board
6. Shri. Rohit Kumar, Joint Secretary, Ministry of Rural development(MGNREGS), Govt. of India
7. Ms. Veditha Reddy, IAS, Secretary (PWD), Andaman & Nicobar Administration
8. Shri. C. Mruthyunjaya Swamy, K.E.S, Secretary to Government, Minor Irrigation &
Ground Water Development Department, Govt. of Karnataka 9. Shri. Suren Karkidholi, PCE-cum-Secretary, Water Resource Department, Govt. of Sikkim
10. Shri S.K. Tripathi, DDG & RMH-IV, Southern Region, Geological Survey of India 11. Dr. Pulak Guhathakurta, Scientist F & Head, Climate Research Division, IMD, Pune 12. Dr. Anupma Sharma, Scientist 'F', National Institute of Hydrology, Roorkee
13. Dr. Sekhar M, Professor, Department of Civil Engg., Indian Institute of Science (IISc),
Bangalore
14. Dr.B.R.Chahar, Professor, Department of Civil Engineering, Indian Institute of
Technology -Delhi
15. Dr. Mallinath Kalshetti, IAS , Director, Ground Water Survey and Development Agency
(GSDA), Govt. of Maharashtra
16. Dr. K B V N Phanindra, Associate Professor, Department of Civil Engg., Indian Institute of
Technology-Hyderabad
17. Shri Sunil Kumar, Director, Basin Planning-1, Directorate, Basin Planning Management
Organization, Central Water Commission
18. Smt. Soumya P Kumar, Director, MI-Stat. Wing, D/o Water Resources, RD & GR, M/o Jal
Shakti, Govt. of India 19. Shri. B Rath, Technical Expert (WM), NRAA, Ministry of Agriculture & Farmer Welfare 20. Shri.Avinash Mishra, Joint Advisor (WR&LR), NITI Aayog, New Delhi
21. Shri. V S Patel, Managing Director, Gujarat Water Resources Development Corporation
Ltd., Gandhinagar, Govt. of Gujarat 22. Dr. Pandith Madhnure, Director, Ground Water Department , Govt. of Telangana
23. Shri. A Varaprasad Rao, Director, State Ground Water & Water Audit Department,
Govt. of Andhra Pradesh 24. Er. Hirak Dey, Director, State Water Investigation Directorate, Govt. of West Bengal
25. Shri. Narinder Kumar Garg, Chief Engineer, Ground Water Cum Project Co-ordination-
NHP, Department of Water Resources, Govt. of Punjab
26. Shri Gopal Prasad Sharma, Superintending Hydrogeologist, Ground Water Department,
Government of Rajasthan, Jaipur. 27. Dr. Bijendra Baghel, GW Data Center, WRD, Bhopal, Government of Madhya Pradesh
28. Shri. Rakesh Ku. Gupta, Chief Hydrogeolgist, Office of Hydrologist, Karnal, Government of
Haryana
29. Dr. R C Jain, Advisor (GW), Gujarat Water Resources Development Corporation Ltd.,
Gandhinagar, Govt. of Gujarat
30. Shri. B. S. Nirola, Additional Chief Engineer, Water Resource Department, Govt. of
Sikkim 31. Dr. S. Raja, Executive Engineer, SG&SWRDC, Govt. of Tamil Nadu 32. Shri. P. Jyoti Kumar, Deputy Director, Ground Water Department, Govt. of Telangana
33. Shri. N. Srinivasu, Deputy Director, Ground Water & Water Audit Department, Govt. of Andhra Pradesh

Dynamic Ground Water Resource of Madhya Pradesh - 2020
137
34. Ms. Debatri Bagchi, Sr. Geologist, State Water Investigation Directorate, Govt. of West Bengal
35. Shri. S. S. Timsina, SE, Water Resource Department, Govt. of Sikkim 36. Ms. A. Lahiri, Geologist, State Water Investigation Directorate, Govt. of West Bengal 37. Shri. S. Haldar, EE, State Water Investigation Directorate, Govt. of West Bengal
38. Shri. R. K. Banshiwal, Senior Hydrogeologist, (DSPC), Ground Water Department, Jodhpur.
39. Shri. Arun Kumar, EE, APWD, Andaman & Nicobar Administration 40. Shri. Mahavir, TA, Office of Hydrologist, Karnal, Government of Haryana 41. Shri. Paul Prabhakar, Regional Director, CGWB, SECR, Chennai 42. Shri. Anand Kumar Agrawal, Regional Director, CGWB, MER, Patna 43. Shri. V. Kunhambu, Regional Director, CGWB, SWR, Bangalore 44. Dr. S .K. Samanta, Regional Director, CGWB, ER, Kolkata 45. Dr .P. K. Jain, Regional Director, CGWB, CR, Nagpur 46. Shri. Sanjeev Mehrota, Scientist-D & HOO, CGWB, WCR, Ahmedabad 47. Dr. Poonam Sharma, Scientist-D, CGWB, CHQ, Faridabad 48. Shri. Rana Chatarjee, Scientist-D & HOO, CGWB, SUO, Delhi 49. Shri.Pramod Kr.Tripathi, Scientist-D & HOO, CGWB, NR, Lucknow 50. Dr. Prabir Ku.Naik, Scientist-D, CGWA, Delhi 51. Dr. Ratikanta Nayak, Scientist-D, CGWB, CHQ, Faridabad 52. Shri. Prashant Rai, Scientist-D, CGWB, UR, Dehradun 53. Dr. Ranjan Ray , Scientist-D,CGWB, CHQ, Faridabad 54. Smt. Sandhya Yadav, Scientist-D, CGWB, ER, Kolkata 55. Shri. M.L.Angurala, Scientist-D, CGWB, NWHR, Jammu
56. Dr. A. V. S. S. Anand, Scientist-D, CGWB, Rajiv Gandhi National Ground Water Training
& Research Institute, Raipur 57. Dr. M. Senthil Kumar, Scientist-C, CGWB, CHQ, Faridabad 58. Smt. Rumi Mukherjee, Scientist-C, CGWB, CHQ, Faridabad 59. Smt. Rani.V.R, Scientist-C, CGWB, KR, Kerala 60. Shri. Biswarup Mohapatra, Scientist-C, CGWB, WCR, Ahmedabad 61. Shri. Vipin Mallick, Scientist-B, CGWB, NHR, Dharamsala 62. Shri. Uddesya Kumar, Scientist-B, CGWB,NCCR, Raipur 63. Miss. Chandreyee Dey, Scientist-B, CGWB, UR, Dehradun 64. Shri. Chittaranjan Biswal, Scientist-B, CGWB, NCR, Bhopal 65. Miss. Subhra Satapathy, Scientist-B, CGWB, CHQ, Faridabad 66. Shri.A.K.Sinha, Assistant Geophysicist, CGWB, ER, Kolkata 67. Dr. Fakhre Alam, AHG, CGWB, MER, Patna 68. Shri. Yogesh Bhandari, Vassar Labs, Hyderabad

Dynamic Ground Water Resource of Madhya Pradesh - 2020
138
Appendix-G
Approval Letter of Dynamic Ground Water Resource -2020
By Ministry

Dynamic Ground Water Resource of Madhya Pradesh - 2020
139

Dynamic Ground Water Resource of Madhya Pradesh - 2020
140
Appendix-H
IN-GRES (INDIA GROUND WATER RESOURCE ESTIMATION SYSTEM)
URL: https://ingres.iith.ac.in
A. Objectives of IN-GRES
• IN-GRES allows for unique and homogeneous representation of groundwater fluxes as well
as categories for all the assessment units (AU) of the country.
• The visibility dashboards and System allows user to view data in both MIS (tabular) as well
as GIS (map) formats, and to download reports.
• Removes the hurdles associated with manual data entry, computations, representation, report
generation, approvals, and visualization
• Improves accuracy, efficiency and minimizes time in groundwater (GW) resource
computation.
• Helps the district / state level GW scientists in effective planning and management of GW
resources of their region, and draw regulations on GW withdrawals.
• Create awareness among the public through access, visualize, and compare the status of
GW resources to the level of a mandal/district
Figure 1: Overview of Ground Water Resource Estimation Platform – GEC 2015
B. Modules
IN-GRES is divided into 3 modules namely: Input, Computation and Output.
1. Input module– Input Module refers to the Data Entry module at an Assessment
Unit (AU) level. Data Input is done via 2 methods i.e.
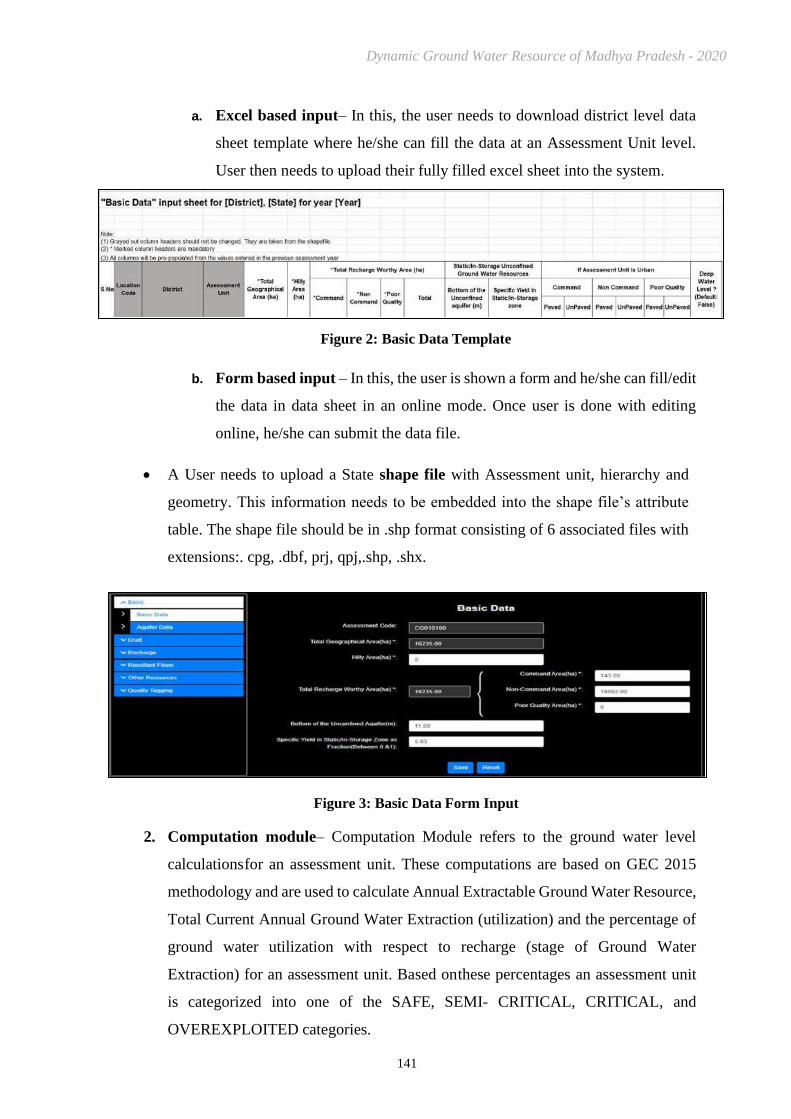
Dynamic Ground Water Resource of Madhya Pradesh - 2020
141
a. Excel based input– In this, the user needs to download district level data
sheet template where he/she can fill the data at an Assessment Unit level.
User then needs to upload their fully filled excel sheet into the system.
Figure 2: Basic Data Template
b. Form based input – In this, the user is shown a form and he/she can fill/edit
the data in data sheet in an online mode. Once user is done with editing
online, he/she can submit the data file.
• A User needs to upload a State shape file with Assessment unit, hierarchy and
geometry. This information needs to be embedded into the shape file’s attribute
table. The shape file should be in .shp format consisting of 6 associated files with
extensions:. cpg, .dbf, prj, qpj,.shp, .shx.
Figure 3: Basic Data Form Input
2. Computation module– Computation Module refers to the ground water level
calculations for an assessment unit. These computations are based on GEC 2015
methodology and are used to calculate Annual Extractable Ground Water Resource,
Total Current Annual Ground Water Extraction (utilization) and the percentage of
ground water utilization with respect to recharge (stage of Ground Water
Extraction) for an assessment unit. Based on these percentages an assessment unit
is categorized into one of the SAFE, SEMI- CRITICAL, CRITICAL, and
OVEREXPLOITED categories.

Dynamic Ground Water Resource of Madhya Pradesh - 2020
142
3. Output module - Once categorized, the results are shown in two views:
a. MIS Dashboard – MIS dashboard shows the results of the assessment for
the entire India, and also for each state State in a tabular form. The MIS
dashboard shows all type of recharges, extractions, inflows and outflows
computed for both monsoon and non-monsoon periods of the year and then
reflect the overall stage of extraction at the selected Geo-Zoom Level. User
can see the calculations for each component by drilling down to the
Assessment Unit level.
Figure 4: MIS View
b. GIS Dashboard– GIS dashboard shows the data in Web Geo-Server format,
implemented in interactive GIS platform allowing user to all GEC related
information in the map itself. GIS view represents the data on India map and color
codes each District/Assessment unit based on the categorization.

Dynamic Ground Water Resource of Madhya Pradesh - 2020
143
Figure 5: GIS View
C. Excel Download and Upload Templates
To compute data in IN-GRES, 11 excel templates are provided for the user to fill and submit
the data in the system for an Assessment Unit. These include:
i. Basic Data File (with 2 internal sub-sheets)
Figure 6: Basic Data Template
Figure 7: Aquifer Data Template

Dynamic Ground Water Resource of Madhya Pradesh - 2020
144
ii. Rainfall Data File (with 5 internal sub-sheets)
Figure 8: Rainfall – Assessment Unit Data Template
Figure 9: Rainfall – Rain Gauge Data Template
Figure 10: Rainfall – IMD Grid Data Template
Figure 11: Rainfall – Time Series Data Template

Dynamic Ground Water Resource of Madhya Pradesh - 2020
145
Figure 12: Rainfall – Threshold Data Template
iii. Ground Water Well Data File (with 3 internal sub-sheets)
Figure 13: Ground Water Well – Assessment Unit Data Template
Figure 14: Ground Water Well – Well Level Data Template
Figure 15: Ground Water Well – Time Series Data Template

Dynamic Ground Water Resource of Madhya Pradesh - 2020
146
iv. Recharge Data File (with 6 internal sub-sheets)
Figure 16: Recharge – Surface Water Irrigation – Canal Outlet Template
Figure 17: Recharge – Surface Water Irrigation– Crop Water Requirement Template
Figure 18: Recharge – Canal Seepage Template

Dynamic Ground Water Resource of Madhya Pradesh - 2020
147
Figure 19: Recharge – Tanks and Ponds Template
Figure 20: Recharge – Water Conservation Structure Template
Figure 21: Recharge – Ground Water Irrigation Template

Dynamic Ground Water Resource of Madhya Pradesh - 2020
148
v. Draft Data File (with 6 internal sub-sheets)
Figure 22: Draft – Domestic Unit Draft Template
Figure 23: Draft – Domestic Consumptive Use Template
Figure 24: Draft – Irrigation Unit Draft Template

Dynamic Ground Water Resource of Madhya Pradesh - 2020
149
Figure 25: Draft – Irrigation Power Consumption Template
Figure 26: Draft – Industrial Unit Draft Template
Figure 27: Draft – Industrial Consumptive Use Template

Dynamic Ground Water Resource of Madhya Pradesh - 2020
150
vi. Inflow and Outflow Data File (with 8 internal sub-sheets)
Figure 28: Environmental Flows – Base Flow Template
Figure 29: Environmental Flows – Base Flow Template
Figure 30: Environmental Flows – Vertical Inter Aquifer Flow Template
Figure 31: Environmental Flows – Lateral Aquifer Flow Template

Dynamic Ground Water Resource of Madhya Pradesh - 2020
151
Figure 32: Environmental Flows – Evapotranspiration Template
Figure 33: Environmental Flows –Evaporation Template
Figure 34: Environmental Flows – Transpiration Tem
Figure 35: Environmental Flows – Stream Channels Template

Dynamic Ground Water Resource of Madhya Pradesh - 2020
152
vii. Additional Potential Resources Data File (with 3 internal sub-sheets)
Figure 36: Additional Potential Resources – Shallow Water Area Template
Figure 37: Additional Potential Resources – Flood Prone Area Template
Figure 38: Additional Potential Resources – Spring Discharge Template
viii. Resources of Confined and Semi-Confined Aquifer Data File (with 2
internal sub-sheets)

Dynamic Ground Water Resource of Madhya Pradesh - 2020
153
Figure 39: Resources of Confined and Semi-Confined Aquifer – Confined Aquifer Template
Figure 40: Resources of Confined and Semi-Confined Aquifer – Semi-Confined Aquifer
Template
ix. Urban Area Resource – Pipelines and Sewages (with 1 internal sub-sheet)
Figure 41: Urban Area Resource –Pipelines & Sewage Template
x. Unconfined Dynamic Aquifer Other Details (with 1 internal sub-sheet)
Figure 42: Unconfined Dynamic Aquifer Other Details Template
xi. Coastal Areas (with 1 internal sub-sheet)
Figure 43: Coastal Areas Template

Dynamic Ground Water Resource of Madhya Pradesh - 2020
154
xii. Water Depletion Zones (with 1 internal sub-sheet)
Figure 44: Water Depletion Zones Template
D. Approval Levels
The data is uploaded at the root Level by the District/State Level Experts. After data entry, the
datasets are TRIGGERED and sent for approval by Higher Authorities. There are 6 stages of
approvals in IN-GRES. The hierarchies of data approvals are shown in Fig 45.

Dynamic Ground Water Resource of Madhya Pradesh - 2020
155
Fig 45: Approval Levels

Dynamic Ground Water Resource of Madhya Pradesh - 2020
E. Report and Annexure
The download option in MIS View allows the user to download reports in 6 formats:
Central Level Report option allows user to download the state-wise district level data for an
assessment year, computation type and view.
State Report option allows user to download the Assessment Unit-wise data for the selected state
for an assessment year, computation type and view.
Annexure 1 – State-wise Resources
Annexure 2 – District-wise Resources
Annexure 3 – Categorization
Annexure 4 – List of Categorization
Custom Report - Custom reports allow user to generate report for a specific assessment unit
which fall under a certain criterion. User has an option to define ranges for Recharge Worthy Area,
Annual Rainfall, Ground Water Recharge, Ground Water Extraction and Stage of Extraction. User
also has an option to choose to download the report for a specific Category.
Note: -The above 4 Annexures are as per standard CGWB formats.
F. Other System Features-
1. Live Ground Water Dashboard
Live Ground Water Dashboard shows the live Change in Ground Water Storage for a specific
assessment unit. The live ground water level is fetched from the India WRIS website via an API.
Change in Ground Water Storage can be expressed as follows:
ΔS = A * (Pre – Current) * SY
Where,
ΔS = Change in Ground Water Storage
A = Area of Water Depletion Zones
Pre = Pre - monsoon Ground water level
Current = Current Ground water level
SY = Specific Yield
2. Map comparison
Map comparison allows user to compare the Ground water estimation done for two years. The GIS
view shows the categorization at an assessment unit level. The MIS View table will show the data
for year 1, year 2 and also the percentage difference in the value between these two years.

Dynamic Ground Water Resource of Madhya Pradesh - 2020
157
Fig 46: Map Comparison
3. Heat Maps
Allows to visualize geospatial view of the output data based on different parameters which
include:
• Categorization for future Ground Water development
• Annual Normal Rainfall
• Annual Ground water recharge
• Annual Ground water extraction
• Aquifer
4. Computational Popup
Provide an overview of the summary of the computations.

Dynamic Ground Water Resource of Madhya Pradesh - 2020
158
Fig 47: Computation Popup
5. Map Download
Provision to download Map.

Dynamic Ground Water Resource of Madhya Pradesh - 2020
159
A B B R E V I A T I O N S
bcm Billion Cubic Meter
C Command
CGWB Central Ground Water Board
CLEG Central Level Expert Group for overall reassessment of ground
water resource of the country
cm Centimeter
DOWR, RD & GR Department of Water Resources, River Development &
Ganga Rejuvenation, Ministry of Jal Shakti, Govt. of India
GEC-1984 Ground Water Estimation Committee, 1984
GEC-1997 Ground Water Resources Estimation Committee, 1997
GWRA- 2015 Ground Water Resources Estimation Committee, 2015
GWS Ground Water Survey
ham Hectare meter
IMD India Meteorological Department
LPA Long Period Average
lps Litres per second
m Meter
m bgl Meter below ground level
mcm Million cubic Meter
m ham Million hectare meter
mm Millimeter
NABARD National Bank for Agricultural and Rural Development
NC Non Command
NCR North Central Region
Sq. m Square Meter
WRD Water Resource Department

Dynamic Ground Water Resource of Madhya Pradesh - 2020
160
Inspiration
Sh. R N Mishra,
Additional Chief Secretary, Water Resource Department, Govt. of Madhya Pradesh
Sh. G C Pati,
Chairman, Central Groundwater Board
Guidance
Sh. M S Dabar,
Engineer in Chief, Water Resource Department
Sh. G P Soni,
Chief Engineer, (BODHI), Water Resource Department
Sh P K Jain,
Regional Director, CGWB, NCR, Bhopal
Dr. Seraj Khan,
Retd. Scientist, CGWB
Principal Contributor
Sh. Chitta Ranjan Biswal
Scientist-B, CGWB, NCR, Bhopal
Contributors:
Central Ground Water Board, North Central Region, Bhopal
Sh. Vishal Wagh, Young Professional
Sh. Kamlesh Birla, Young Professional
All Young Professionals of CGWB, NCR, Bhopal
State Groundwater Survey, Water Resource Department
Dr.Jitendra Jain,
Superintending Geohydrologist
Sh Bijendra Baghel,
Scientific Officer
GWALIOR DIVISION
Sh. Pradeep Mishra, Senior Geohydrologist
Sh. Alok Kulshresth, Assistant Geohydrologist
Sh. Vishnu Varshney, Assistant Geohydrologist
Sh. Bharat Jain, Assistant Geohydrologist

Dynamic Ground Water Resource of Madhya Pradesh - 2020
161
JABALPUR, BALAGHAT AND REWA DIVISION
Sh. R. K Gohe, Senior Geohydrologist
Dr. U.B.S. Prihar, Senior Geohydrologist
Sh. Deepesh Kumar Shourie, Assistant Geohydrologist
Dr. S K Patel, Assistant Geophysicist
Sh. D.K. Shukla, Assistant Geohydrologist
KHANDWA DIVISION
Sh. Safdar Hussain Safdari, Senior Geohydrologist
Sh. Sanjay Mahajan, Assistant Geohydrologist
Sh. Pankaj Chouhan, Assistant Geohydrologist,
Sh. Shrikant Wate, Sub Engineer
Sh. S K Deokata, Sub Engineer
Sh. J P Dehariya, Sub Engineer
Sh. Shankalal Ladhe, Sub Engineer
SAGAR DIVISION
Sh. R K Sahu, Senior Geohydrologist
Sh. R K Rajak, Assistant Geohydrologist
Sh. Vikas Pimpalkar, Assistant Geohydrologist
Sh.Satish Namdev, Assistant Geophysicist
Sh. Arvind Kumar Shrivastava, Sub Engineer
Sh. Kulwant Singh, Sub Engineer
Sh. O P Tiwari, Sub Engineer
Sh. Amar Singh Rajput, Sub Engineer
Sh. Manish Badkur, Sub Engineer
UJJAIN DIVISION
Sh. Sudhir Kumar Sharma, Senior Geo Hydrologist
Sh. Dinesh Dhanotia, Sub Engineer
Sh Prakash Choudhary, Geophysicist
Sh. Anand Gehlot, Sub Engineer

Dynamic Ground Water Resource of Madhya Pradesh - 2020
162
R E F E R E N C E S
1 Dynamic Ground Water Resources of Madhya Pradesh (2009), CGWB ,NCR, Govt
Of India and GWS, WRD, Govt. of MP
2 Dynamic Ground Water Resources of Madhya Pradesh (2011), CGWB ,NCR, Govt
Of India and GWS, WRD, Govt. of MP
3 Dynamic Ground Water Resources of Madhya Pradesh (2013), CGWB ,NCR, Govt
Of India and GWS, WRD, Govt. of MP
4 Dynamic Ground Water Resources of Madhya Pradesh (2017), CGWB ,NCR, Govt
Of India and GWS, WRD, Govt. of MP
5 National Compilation on Dynamic Ground Water Resource of India (2020), CGWB,
Govt. of India
6 Ground Water Year Book(2019-20), Madhya Pradesh, CGWB, NCR, Govt. of India
7 Rainfall Statistics of India (2019), India Meteorological Department, Govt. of India

Dynamic Ground Water Resource of Madhya Pradesh - 2020
CENTRAL GROUND WATER BOARD
North Central Region, Bhopal
Government of India
&
GROUND WATER SURVEY
Water Resources Department
Government of Madhya Pradesh