Water resources of Shoalhaven valley report
186
WATER RESOURCES OF THE SHOALHAVEN •VALLEY SURVEY OF THIRTY N. S.W. RIVER VALLEYS REPORT N 9 8 - OCTOBER 1967
-
Upload
khangminh22 -
Category
Documents
-
view
0 -
download
0
Transcript of Water resources of Shoalhaven valley report

WATER RESOURCES OF THE
SHOALHAVEN •VALLEY
SURVEY OF THIRTY N. S.W. RIVER VALLEYS
REPORT N 9 8 - OCTOBER 1967

WATER RESOURCES OF THE SHOALHAVEN 4IVER VALLEY
PREFACE
BY THE HON. JACK G. BEALE, M.E. , A . S . T . C . Mech. Eng.,
M . I . E . A u s t . , M.ASCE., M.A.S.M.E. , M . A . S . A . E . , M.L.A.
MINISTER FOR CONSERVATION
NEW SOUTH WALES
I n accordance w i t h t h e p o l i c y o f t h e New South Wales Liberal-Country
P a r t y Government announced p r i o r t o t h e May, 1965 S t a t e E l e c t i o n s , I
d i r e c t e d t h e Water C o n s e r v a t i o n and I r r i g a t i o n Commission o f New South
Wales t o undertake a comprehensive v a l l e y survey o f t h e S t a t e ' s water
r e s o u r c e s a s a p r e r e q u i s i t e t o t h e f o r m u l a t i o n o f a ba lanced and soundly-
based programme o f w a t e r conservation.
The survey w i l l be t h e l a r g e s t and most comprehensive s tudy of
w a t e r r e s o u r c e s e v e r undertaken i n A u s t r a l i a . I t w i l l embrace thirty
major r i v e r v a l l e y s o f t h e S t a t e and w i l l c o v e r a l l t h e main aspects
o f t h e i r phys iography , c l i m a t e and w a t e r r e s o u r c e s - b o t h s u r f a c e and
underground - t o g e t h e r w i t h a r e v i e w o f c u r r e n t and p o s s i b l e f u t u r e water
requirements.
As i t w i l l be some t ime b e f o r e t h e whole survey can b e completed,
s e p a r a t e r e p o r t s a r e b e i n g i s s u e d f o r t h e i n d i v i d u a l r i v e r valleys.
T h i s r e p o r t on t h e Water Resources o f t h e Shoalhaven R i v e r V a l l e y i s the
e i g h t h r e p o r t t o be completed.
JACK G. BEALE. M.L.A.
October , 1967.
WATER RESOURCES OF THE SHOALHAVEN RIVER VALLEY
SECTION, -.,
T ' 2
1
3
• 4.
5
6 7
8
9
10
Ii 1 12
13
14
15 16
APPENDICES
Appendix 1
Appendix 2 - Appendix 3
Appendix 4
Appendix 5
Appendix 6
Appendix 7
Appendix 8
Appendix 9
Appendix 10
Appendix 11
Appendix 12
Appendix 13
Appendix 14
Appendix 15
Appendix 16
Appendix 17
Appendix 18
Appendix 19
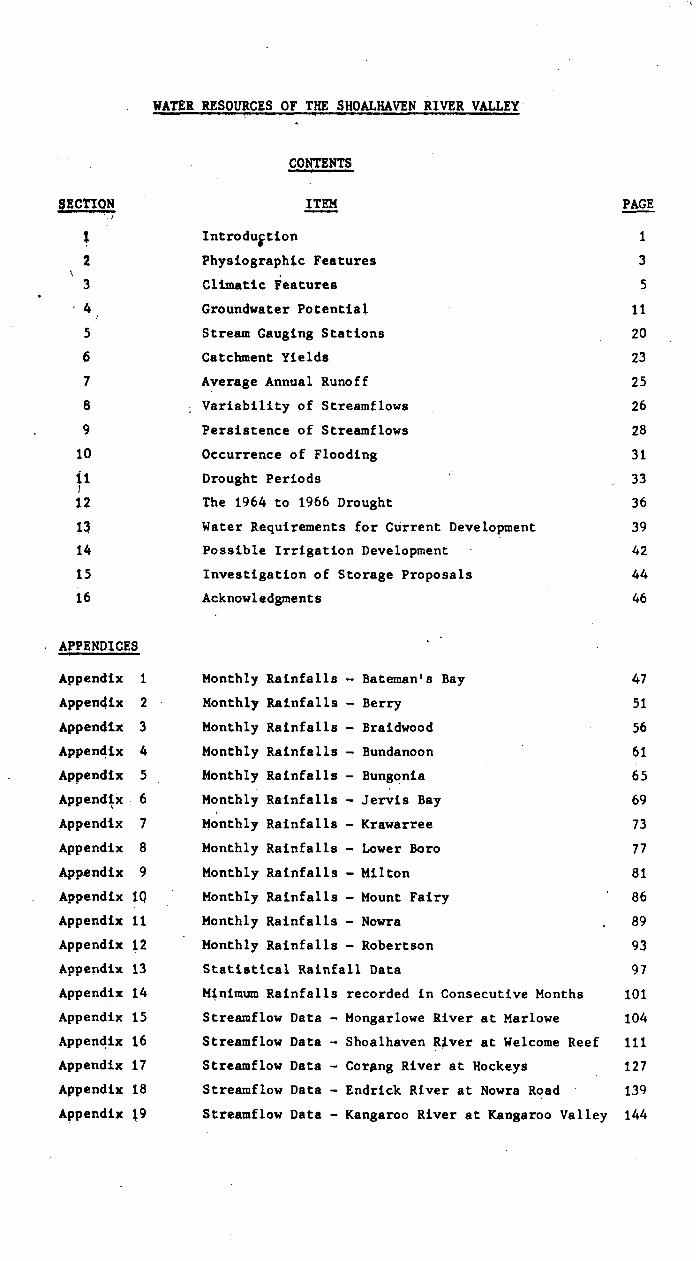
CONTENTS
PAGE ITEM
Introduition
P h y s i o g r a p h i c Features
C l i m a t i c Features
1
3
5
Groundwater Potential 11
Stream Gauging Stations 20
Catchment Yields 23
Average Annual Runoff 25
V a r i a b i l i t y o f Streamflows 26
P e r s i s t e n c e o f Streamflows 28
Occurrence o f Flooding 31
Drought Periods 33
The 1964 t o 1966 Drought 36
Water Requirements f o r Current Development 39
P o s s i b l e I r r i g a t i o n Development 42
I n v e s t i g a t i o n o f S t o r a g e Proposals 44
Acknowledgments 46
Monthly R a i n f a l l s - Bateman's Bay 47
Monthly R a i n f a l l s - Berry 51
Monthly R a i n f a l l s - Braidwood 56
Monthly R a i n f a l l s - Bundanoon 61
Monthly R a i n f a l l s - Bungonia 65
Monthly R a i n f a l l s - J e r v i s Bay 69
Monthly R a i n f a l l s - Krawarree 73
Monthly R a i n f a l l s - Lower Boro 77
Monthly R a i n f a l l s - Milton 81
Monthly R a i n f a l l s - Mount Fairy 86
Monthly R a i n f a l l s - Nowra . 89
' Monthly R a i n f a l l s - Robertson 93
S t a t i s t i c a l R a i n f a l l Data 97
Minimum R a i n f a l l s recorded i n C o n s e c u t i v e Months 101
Streamflow Data - Mongarlowe R i v e r a t Marlowe 104
Streamf low Data - Shoalhaven R i v e r a t Welcome Reef 111
Streamf low Data - Coring R i v e r a t Hockeys 127
Streamf low Data - Endrick R i v e r a t Nowra Road 139
Streamflow Data - Kangaroo R i v e r a t Kangaroo Valley 144
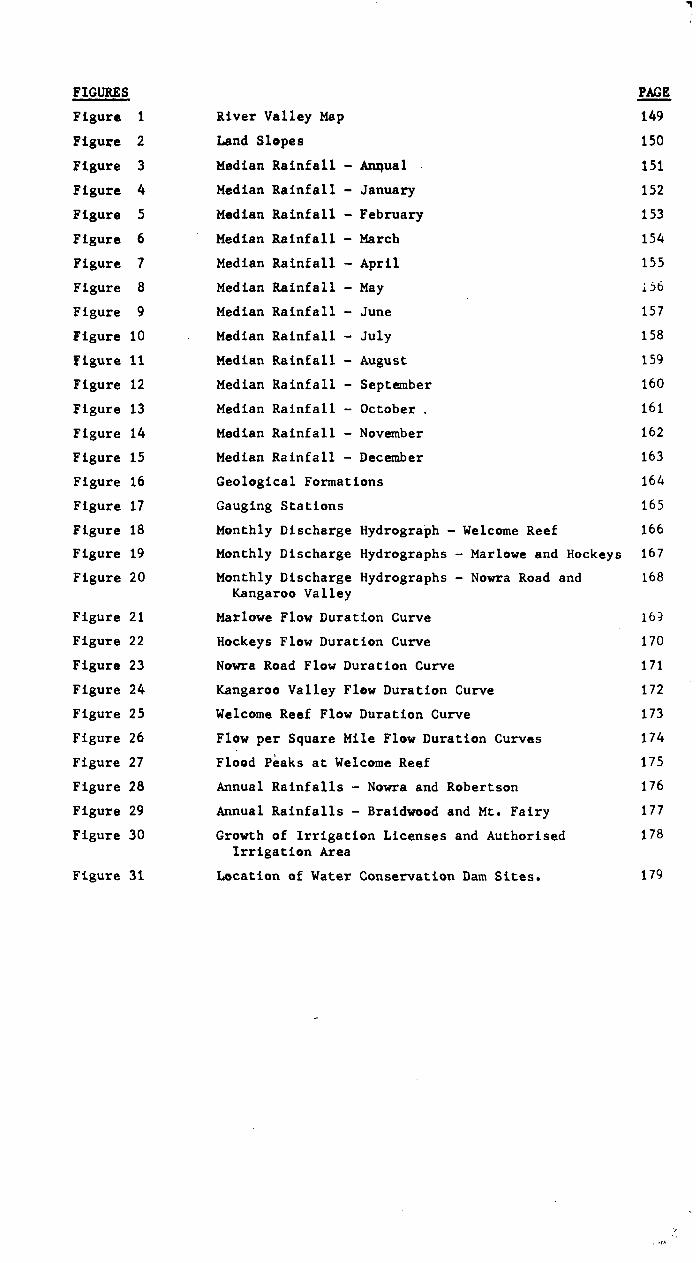
FIGURES PAGE
F i g u r e 1 R i v e r V a l l e y Map 149
F i g u r e 2 Land S l o p e s 150
F i g u r e 3 Median R a i n f a l l - Annual 151
F i g u r e 4 Median R a i n f a l l - January 152
F i g u r e 5 Median R a i n f a l l - February 153
F i g u r e 6 Median R a i n f a l l - March 154
F i g u r e 7 Median R a i n f a l l - A p r i l 155
F i g u r e 8 Median R a i n f a l l - May i56
F i g u r e 9 Median R a i n f a l l - June 157
F i g u r e 10 Median R a i n f a l l - J u l y 158
F i g u r e 11 Median R a i n f a l l - August 159
F i g u r e 12 Median R a i n f a l l - September 160
F i g u r e 13 Median R a i n f a l l - October . 161
F i g u r e 14 Median R a i n f a l l - November 162
F i g u r e 15 Median R a i n f a l l - December 163
F i g u r e 16 G e o l o g i c a l Formations 164
F i g u r e 17 Gauging S t a t i o n s 165
F i g u r e 18 Monthly D i s c h a r g e Hydrograph - Welcome R e e f 166
F i g u r e 19 Monthly D i s c h a r g e Hydrographs - Marlowe and Hockeys 167
F i g u r e 20 Monthly D i s c h a r g e Hydrographs - Nowra Road and 168 Kangaroo Valley
F i g u r e 21 Marlowe Flow D u r a t i o n Curve 163
F i g u r e 22 Hockeys Flow Durat ion Curve 170
F i g u r e 23 Nowra Road Flow Durat ion Curve 171
F i g u r e 2 4 Kangaroo V a l l e y Flow Durat ion Curve 172
F i g u r e 25 Welcome Reef Flow Durat ion Curve 173
F i g u r e 26 Flow p e r Square M i l e Flow Durat ion Curves 174
F i g u r e 27 F lood Peaks a t Welcome R e e f 175
F i g u r e 28 Annual R a i n f a l l s - Nowra and Robertson 176
F i g u r e 29 Annual R a i n f a l l s - Braidwood and Mt. F a i r y 177
F i g u r e 30 Growth o f I r r i g a t i o n L i c e n s e s and Author i sed 178 I r r i g a t i o n Area
F i g u r e 31 L o c a t i o n o f Water C o n s e r v a t i o n Dam S i t e s . 179

WATER RESOURCES OF THE SHOALHAVEN RIVER VALLEY
1 . INTRODUCTION.
Man i s dependent on r e l i a b l e and adequate w a t e r s u p p l i e s , n o t o n l y for
a g r i c u l t u r a l and i n d u s t r i a l deve lopment , but f o r h i s v e r y existence.
About t h r e e q u a r t e r s o f t h e E a r t h ' s s u r f a c e i s permanently covered by
w a t e r i n t h e oceans and p o l a r i c e c a p s , t h e remaining q u a r t e r compri s ing the
land m a s s e s . The t o t a l volume o f w a t e r on Ear th , i n a l l i t s forms, has been
e s t i m a t e d t o be about 320 m i l l i o n c u b i c m i l e s . However, i t i s d i f f i c u l t to
a d e q u a t e l y r e l a t e t h e magnitude o f t h i s volume t o o t h e r n a t u r a l resources,
p a r t i c u l a r l y when i t i s c o n s i d e r e d t h a t one c u b i c m i l e i s e q u i v a l e n t t o about
a m i l l i o n m i l l i o n gallons.
Obv ious ly t h e u s e f u l n e s s o f t h i s r e s o u r c e i s most l i m i t e d a s about 97.2
p e r c e n t i s i n t h e oceans and a f u r t h e r 2 p e r c e n t i s h e l d i n t h e p o l a r icecaps.
I n a d d i t i o n , a s underground w a t e r compr i se s o v e r 9 9 . 5 p e r c e n t o f t h e remaining
0 . 8 p e r c e n t , t h e amount o f f r e s h w a t e r c o n t a i n e d i n l a k e s and streams
approximates t o o n l y 0 . 0 0 4 p e r c e n t o f t h e t o t a l volume o f water on Earth.
I n an e f f o r t t o e n s u r e t h a t adequate w a t e r s u p p l i e s would be available,
e a r l y c i v i l i z a t i o n s e s t a b l i s h e d t h e i r v i l l a g e s near major r i v e r s and, mainly
because o f t h e l i m i t e d amounts o f w a t e r needed, s u p p l i e s were g e n e r a l l y adequate
However t h e w a t e r requ irements o f modern c i v i l i z a t i o n s a r e o f such magnitudes
t h a t i t i s normal ly n o t p o s s i b l e t o s a t i s f y major i n d u s t r i a l or l a r g e area
i r r i g a t i o n demands i n t h e absence o f l a r g e w a t e r c o n s e r v a t i o n dams on the
streams.
Modern s o c i e t y makes huge demands on w a t e r s u p p l i e s f o r domestic,
i n d u s t r i a l and a g r i c u l t u r a l p u r p o s e s . I n t h e p r o d u c t i o n o f a ton o f paper
a b o u t . 6 0 t o n s o f w a t e r a r e used; a ton o f s t e e l r e q u i r e s about 300 t o n s of
water and a ton o f food r e q u i r e s about 1 , 0 0 0 t o n s o f water.
Annual water requirements o f c rops a r e u s u a l l y o f t h e order o f two to
t h r e e f e e t depth and dur ing a drought p e r i o d i t i s n e c e s s a r y t o prov ide a
major p r o p o r t i o n o f t h i s requirement by i r r i g a t i o n . The r e l a t i v e magnitude of
t h i s demand can be a s s e s s e d when i t i s r e a l i s e d t h a t a depth o f t h r e e f e e t over
an a r e a o f o n l y one a c r e i s e q u i v a l e n t t o o v e r 8 0 0 , 0 0 0 gallons.

-2—
The g r o s s w a t e r r e s o u r c e s o f any country a r e u s u a l l y c o n s i d e r e d t o be the
t o t a l amount o f p r e c i p i t a t i o n , comprised o f r a i n f a l l o r snow, which f a l l s on
t h e l a n d . The s u r f a c e w a t e r r e s o u r c e s a r e u s u a l l y regarded a s t h e amounts of
w a t e r i n r i v e r s and lakes.
I n comparison w i t h a l l o f t h e o t h e r c o n t i n e n t s , A u s t r a l i a h a s t h e least
a v e r a g e annual p r e c i p i t a t i o n , t h e average r a i n f a l l b e i n g o n l y about lA feet
whereas A f r i c a , A s i a , Europe and North America a l l r e c e i v e about 2 f e e t and
South America r e c e i v e s an a v e r a g e o f a lmos t 4 feet.
However, when l o s s e s , due t o t h e n a t u r a l p r o c e s s e s o f evaporation,
t r a n s p i r a t i o n and s e e p a g e a r e deducted from t h e average r a i n f a l l s o f the
c o n t i n e n t s , t h e r e s i d u a l s , o r s u r f a c e water r e s o u r c e s , show t h a t Australia
h a s a comparat ive r u n o f f much l e s s than i n d i c a t e d by t h e average rainfalls.
The average annual s u r f a c e w a t e r r e s o u r c e s o f t h e A u s t r a l i a n mainland have
been a s s e s s e d a t about 240 m i l l i o n a c r e f e e t which i s e q u i v a l e n t t o a depth
o f l e s s than 2 i n c h e s o v e r t h e c o n t i n e n t a l a r e a . In comparison, r u n o f f s for
t h e o t h e r c o n t i n e n t s a r e about 7 i n c h e s i n A f r i c a , 9 i n c h e s in A s i a and Europe,
11 i n c h e s i n North America and about 19 i n c h e s i n South America.
Due t o t h e r e l a t i v e l y f l a t topography o f t h e A u s t r a l i a n c o n t i n e n t , there
a r e no a r e a s t h a t a r e permanently covered by snow and a s a r e s u l t , streamflows
i n A u s t r a l i a a r e l a r g e l y dependent upon t h e o c c u r r e n c e o f r u n o f f producing
s t o r m s . A u s t r a l i a n s treams t h e r e f o r e tend t o e x h i b i t g r e a t e r v a r i a b i l i t y in
f l o w than t h o s e o f o t h e r continents.
The extreme v a r i a b i l i t y o f f l o w s i n t h e m a j o r i t y o f A u s t r a l i a n streams
and t h e pro longed d u r a t i o n o f s e v e r e droughts makes i t i m p e r a t i v e t h a t water
c o n s e r v a t i o n dams be c o n s t r u c t e d i f a s s u r e d w a t e r s u p p l i e s a r e t o be maintained
o v e r t h e f u l l p e r i o d o f each drought.
The s u r f a c e w a t e r r e s o u r c e s o f t h e Shoalhaven R i v e r V a l l e y have been
a s s e s s e d a s a v e r a g i n g about 1 , 4 6 0 , 0 0 0 a c r e f e e t p e r annum. As t h e average
annual r a i n f a l l o v e r t h e v a l l e y i s 35 i n c h e s , t h e s u r f a c e water r e s o u r c e s are
e q u i v a l e n t t o a r u n o f f o f about 28 percent..
On a square m i l e b a s i s , t h e s u r f a c e water r e s o u r c e s o f t h e Shoaihaven
R i v e r V a l l e y a r e about l h t i m e s t h e average f o r c o a s t a l b a s i n s i n New South
Wales and o v e r f i v e t i m e s t h e average f o r t h e t o t a l area o f t h e State.

-3-
2 . PHYSIOGRAP111C FEATURES.
The e x t e n t o f t h e Shoalhaven R i v e r V a l l e y , a s adopted f o r t h e purposes of
t h i s r e p o r t , i s shown a t F i g u r e 1; t h e t o t a l a r e a o f t h e v a l l e y i s about
2 , 8 2 0 square miles.
The headwaters o f t h e Shoalhaven R i v e r r i s e i n t h e extreme s o u t h o f the
v a l l e y i n mountainous country i n t h e v i c i n i t y o f t h e Euranbene and Bald
Mountains , t h e l a t t e r b e i n g o v e r 4 , 8 0 0 f e e t i n e l e v a t i o n . The r i v e r flows
a l m o s t due n o r t h t o n e a r Majors Creek, b e i n g j o i n e d on t h e l e f t bank by
J i n d e n and J e r r a b a t t g u l l a Creeks b o t h o f which r i s e i n rugged country to
t h e w e s t o f t h e Shoalhaven R i v e r . N o t a b l e peaks i n t h e J e r r a b a t t g u l l a Creek
catchment a r e The Bald Peak and Mount Cowangerong, b o t h o f which a r e about
4 , 5 0 0 f e e t i n elevation.
Below Majors Creek t h e Shoalhaven R i v e r sweeps g e n e r a l l y t o t h e north-
e a s t and i s j o i n e d by Jembaicumbene and Gi l lamatong Creeks on t h e r i g h t bank
and Reedy and Boro Creeks on t h e l e f t bank. The town o f Braidwood i s located
on Gi l l amatong Creek about f i v e m i l e s upstream o f t h e Shoalhaven R i v e r Junction.
The w e s t e r n boundary o f t h e Shoalhaven R i v e r V a l l e y i s formed by the
Great D i v i d i n g Range and w h i l s t s t e e p land s l o p e s p r e v a i l a l o n g t h e boundary
t o t h e s o u t h - w e s t o f Braidwood, t h e d i v i d e i n t h e s e c t i o n from Mount F a i r y to
n e a r Goulburn i s c h a r a c t e r i s e d by r e l a t i v e l y f l a t s l o p e s and i s ill-defined.
About s i x t e e n m i l e s t o t h e n o r t h o f Braidwood t h e Shoalhaven R i v e r is
j o i n e d by a major t r i b u t a r y , t h e Mongarlowe R i v e r , which r i s e s near Sugarloaf
Mountain i n t h e Budawang Range. The Mongarlowe R i v e r t r a v e l s a d i s t a n c e of
about twenty f i v e m i l e s i n a n o r t h e r l y d i r e c t i o n and p a s s e s through Monga and
Mongarlowe b e f o r e t u r n i n g t o t h e n o r t h - w e s t and j o i n i n g t h e Shoalhaven River
about s i x t e e n m i l e s n o r t h o f Braidwood. The catchment o f t h e Mongarlowe River
i s comprised o f mountainous topography i n t h e upper s e c t i o n s a l o n g t h e eastern
boundary, and u n d u l a t i n g t o h i l l y land forms i n t h e lower s e c t i o n n e a r the
Shoalhaven River.
The Corang R i v e r r i s e s i n t h e Budawang Range i n t h e v i c i n i t y o f The Peak
( e l e v a t i o n 2 , 8 0 0 f e e t ) and j o i n s t h e Shoalhaven R i v e r about t h r e e m i l e s west
o f N e r r i g a . Below N e r r i g a , t h e Shoalhaven R i v e r i s j o i n e d on t h e r i g h t bank
by a n o t h e r major t r i b u t a r y , t h e Endrick R i v e r , which r i s e s i n t h e Budawang
Range i n mountainous t e r r a i n and f e a t u r e s a number o f w a t e r f a l l s i n its
c o u r s e t o t h e main r i v e r valley.

-4-
Above Welcome R e e f t h e Shoalhaven R i v e r p a s s e s through generally
u n d u l a t i n g c o u n t r y ; however , from Welcome R e e f where t h e r i v e r e n t e r s a
narrow g o r g e t o a p o i n t about f o u r m i l e s w e s t o f Nowra, i t t r a v e l s through
mountainous country.
Nerrimunga Creek , a l e f t bank t r i b u t a r y o f t h e Shoalhaven R i v e r , r i s e s in
h i l l y c o u n t r y t o t h e e a s t o f Lake B a t h u r s t and e n t e r s a s t e e p s i d e d gorge
b e f o r e j o i n i n g t h e Shoalhaven R i v e r about f i v e m i l e s downstream o f t h e Endrick
R i v e r . Bungonia Creek commences i n h i l l y t o s t e e p t e r r a i n about t e n m i l e s east
o f Goulburn and p a s s e s through Bungonia b e f o r e e n t e r i n g a canyon which extends
a l m o s t t o t h e j u n c t i o n o f t h e c r e e k and t h e Shoalhaven R i v e r . Barbers Creek
r i s e s i n u n d u l a t i n g c o u n t r y n e a r T a l l o n g and, i n s i m i l a r f a s h i o n t o Bungonia
Creek , e n t e r s a s t e e p g o r g e b e f o r e j o i n i n g t h e Shoalhaven R i v e r about one mile
downstream o f t h e Bungonia Creek junction.
The s o u t h e r n t r i b u t a r i e s o f t h e Shoalhaven R i v e r downstream o f t h e Endrick
R i v e r d r a i n a l a r g e p l a t e a u a r e a bounded by t h e Turpent ine Range on t h e south-
e a s t . The m a j o r i t y o f d e f i n e d s t reams i n t h i s a r e a commence on t h e relatively
f l a t p l a t e a u and f a l l o v e r t h e escarpment edge i n t o s t e e p s i d e d v a l l e y s . The
f o u r main s t reams i n t h i s a r e a a r e Ettrema, Bundundah, Danjera and Yarramunmun
Creeks a l l o f which d r a i n i n t o Yalwal Creek which j o i n s t h e Shoalhaven River
about t w e l v e m i l e s w e s t o f Nowra.
The remain ing major t r i b u t a r y o f t h e Shoalhaven R i v e r i s t h e Kangaroo
R i v e r , t h e upper t r i b u t a r i e s o f which r i s e i n t h e Robertson - Moss V a l e plateau.
T h i s r i v e r t r a v e l s g e n e r a l l y i n a w e s t e r l y d i r e c t i o n o v e r a d i s t a n c e o f about
t h i r t y m i l e s b e f o r e j o i n i n g t h e Shoalhaven R i v e r some twenty m i l e s upstream of
Nowra. W h i l s t t h e Kangaroo R i v e r t r a v e r s e s rugged mountainous t e r r a i n and
w a t e r f a l l s f o r , p a r t s o f i t s l e n g t h , t h e r e a r e l i m i t e d a r e a s o f a l l u v i a l flats
which a r e u s e d f o r d a i r y i n g . About .two m i l e s upstream o f t h e Kangaroo -
Shoalhaven R i v e r j u n c t i o n t h e Kangaroo R i v e r i s j o i n e d by Bundanoon Creek on its
r i g h t bank. T h i s c r e e k commences i n u n d u l a t i n g c o u n t r y n e a r Bundanoon and, in
common w i t h t h e s t reams i n t h i s a r e a , drops r a p i d l y i n t o a s t e e p s i d e d valley
i n i t s l o w e r reaches.
About t e n m i l e s upstream o f Nowra t h e Shoalhaven R i v e r emerges o n t o a plain
and from B u r n e r t o t h e mouth f l o w s through i n c r e a s i n g l y wide a l l u v i a l flats.
The a l l u v i a l f l a t s e x t e n d northwards up t h e v a l l e y o f Broughton Creek t o the
town o f Berry and southwards t o t h e v i c i n i t y o f J e r v i s Bay.

-5—
I n t h e lower Shoalhaven V a l l e y d a i r y i n g i s t h e p r i n c i p a l agricultural
i n d u s t r y ; t h e d a i r y i n g a r e a e x t e n d i n g from t h e upper r e a c h e s o f Broughton Creek
o v e r t h e a l l u v i a l f l a t s south—east o f Nowra. The main secondary agricultural
i n d u s t r y i n t h i s s e c t i o n o f t h e v a l l e y i s t h e growing o f f o d d e r , such a s maize,
l u c e r n e and oats.
Land u s e i n t h e u p p e r S h o a l h a v e n V a l l e y i s m a i n l y c o n f i n e d t o t h e grazing
o f s h e e p f o r wool a n d , where s u i t a b l e a r e a s o c c u r , f o r t h e p r o d u c t i o n o f fat
l ambs . I n some m i n o r a r e a s o f t h e u p p e r v a l l e y c a t t l e g r a z i n g i s the
p r e d o m i n a n t industry.
Many s e c t i o n s o f t h e v a l l e y , p a r t i c u l a r l y i n t h e d i s s e c t e d p l a t e a u area
w e s t o f Nowra a r e u n i n h a b i t e d and l a r g e l y u n u s e d f o r a n y t y p e o f agricultural
pursuit.
Land s l o p e s i n t h e S h o a l h a v e n R i v e r V a l l e y a r e shown a t F i g u r e 2 . The
f l a t a r e a s i n t h e v a l l e y , w i t h s l o p e s l e s s t h a n 3 d e g r e e s , a r e v e r y limited
a n d c o m p r i s e o n l y 8 p e r c e n t o f t h e t o t a l v a l l e y a r e a . U n d u l a t i n g t o hilly
l a n d f o r m s , w i t h s l o p e s b e t w e e n a b o u t 3 a n d 8 d e g r e e s , p r e d o m i n a t e a n d occur
o v e r n e a r l y h a l f o f t h e v a l l e y ( 4 4 p e r c e n t o f t h e t o t a l a r e a ) . H i l l y t o steep
a r e a s ( s l o p e s b e t w e e n 8 d e g r e e s a n d 15 d e g r e e s ) make up a f u r t h e r 17 p e r c e n t of
t h e v a l l e y w h i l e t h e r e m a i n i n g 31 p e r c e n t i s c o m p r i s e d o f m o u n t a i n o u s sections
w i t h s l o p e s g r e a t e r t h a n 15 degrees.
3 . CLIMATIC FEATURES.
Rainfall.
The d i s t r i b u t i o n o f r a i n f a l l o v e r t h e S h o a l h a v e n R i v e r V a l l e y i s controlled
t o a l a r g e e x t e n t by o r o g r a p h i c e f f e c t s , r a i n f a l l i n g e n e r a l i n c r e a s i n g with
i n c r e a s i n g e l e v a t i o n . Annual m e d i a n r a i n f a l l s o f t h e o r d e r o f 60 i n c h e s are
f ound o v e r t h e h i g h g r o u n d w h i c h forms t h e h e a d w a t e r s o f t h e Kangaroo R i v e r in
t h e v i c i n i t y o f R o b e r t s o n . (The m e d i a n i s t h a t r a i n f a l l e q u a l l e d o r exceeded
o n f i f t y p e r c e n t o f occasions).
A n o t h e r h i g h r a i n f a l l a r e a e x i s t s o v e r t h e r a n g e whIch s e p a r a t e s the
v a l l e y s o f t h e C l y d e a n d u p p e r S h o a l h a v e n R i v e r s , t h e a n n u a l m e d i a n rainfall
r e a c h i n g a maximum o f a b o u t 50 i n c h e s o v e r t h e h i g h e r , s l o p e s e a s t o f Braidwood.
To t h e w e s t o f t h i s h i g h r a i n f a l l a r e a a marked r a i n shadow e x i s t s , annual
m e d i a n r a i n f a l l s d e c r e a s i n g t o l e s s t h a n 25 i n c h e s . Along t h e c o a s t a l plain
t h e a n n u a l m e d i a n r a i n f a l l v a r i e s b e t w e e n a b o u t 35 a n d 45 inches.

-6—
The d i s t r i b u t i o n o f annual median r a i n f a l l o v e r t h e catchment i s shown at
F i g u r e 3 w h i l s t t h e d i s t r i b u t i o n o f month ly median r a i n f a l l s a r e shown at
F i g u r e s 4 t o 15 inclusive.
I n g e n e r a l , t h e s p a t i a l d i s t r i b u t i o n o f monthly r a i n f a l l throughout the
a r e a i s s i m i l a r t o t h e annual r a i n f a l l d i s t r i b u t i o n . Al though t h e r e g i o n lies
i n l a t i t u d e s i n which t h e d i s t r i b u t i o n o f r a i n f a l l throughout t h e y e a r would be
e x p e c t e d t o b e un i form, i n g e n e r a l h i g h e r monthly r a i n f a l l i s e x p e r i e n c e d in
t h e months December t o A p r i l when about 5 0 p e r c e n t o f t h e annual amount is
r e c e i v e d . I n t h e p e r i o d August t o November i n c l u s i v e o n l y about 25 p e r c e n t of
t h e annual amount i s g e n e r a l l y received.
The A u s t r a l i a n A l p s s h e l t e r t h e r e g i o n from most s o u t h t o w e s t airstreams
which a r e t h e predominant r a i n produc ing a i r s t r e a m s o v e r s o u t h e r n New South
Wales i n t h e w i n t e r and s p r i n g months . May, June and J u l y each r e c e i v e about
8 p e r c e n t o f t h e annual r a i n f a l l w h i l e August i s t h e d r i e s t month on t h e average
r e c e i v i n g about 5 p e r c e n t o f t h e annual rainfall.
I n August median r a i n f a l l s v a r y from about 2 t o 2 i n c h e s o v e r t h e higher
r a i n f a l l a r e a s t o l e s s t h a n 1 i n c h i n t h e r a i n shadow areas.
The w e t t e s t month v a r i e s from s t a t i o n t o s t a t i o n i n t h e v a l l e y but occurs
i n one o f t h e months from January t o A p r i l i n c l u s i v e . The w e t t e s t month median
v a l u e s v a r y from 3k t o 43/4 i n c h e s o v e r t h e h i g h r a i n f a l l a r e a s t o l e s s than 2
i n c h e s o v e r t h e r a i n shadow area.
Monthly and annual r a i n f a l l s r ecorded a t Bateman's Bay, B e r r y , Braidwood,
Bundanoon, Bungonia , J e r v i s Bay, Krawarree, Lower Boro , M i l t o n , Mount Fairy,
Nowra and Robert son a r e g i v e n i n Appendices 1 t o 12 respectively.
Very heavy Storm r a i n f a l l s may o c c u r o v e r t h e v a l l e y when an active
d e p r e s s i o n i s c e n t r e d o f f t h e New South Wales c o a s t j u s t n o r t h o f t h e valley.
Storms o f t h i s t y p e a f f e c t t h e a r e a on an a v e r a g e o f about t w i c e a y e a r and
t h e y may o c c u r i n any month o f t h e y e a r . The h i g h e s t f a l l s on r e c o r d f o r a
2 4 hour p e r i o d end ing 9 a . m . a r e 2 0 . 8 3 i n c h e s on 13th January 1911 and 20.05 S-30m",
i n c h e s on 14 th February 1898 a t Brogers Creek.
Monthly t o t a l s o f more than 20 i n c h e s have been recorded a t a l l stations
e x c e p t t h o s e l y i n g i n t h e r a i n shadow a l o n g t h e upper v a l l e y . I n t h i s area
h i g h e s t monthly t o t a l s v a r y from 13 t o 17 i n c h e s . N o t a b l y h i g h monthly totals
a r e 4 7 . 4 i n c h e s a t A r a l u e n , j u s t o u t s i d e t h e boundary o f t h e v a l l e y and 42.5
i n c h e s a t Robertson which were recorded i n May 1925 and May 1943 respectively.

-7-
The t a b l e s a t Appendix 13 show on a monthly and annual b a s i s f o r Bateman's
Bay, B e r r y , Braidwood Bundanoon, Bungonia , J e r v i s Bay, Krawarree, Lower Boro,
M i l t o n , Mount F a i r y , Nowra and Robertson t h e f o l l o w i n g data:
( 1 ) The maximum and minimum r a i n f a l l t o t a l s on record.
( 2 ) The 1 0 t h , 3 0 t h , 5 0 t h , 7 0 t h and 9 0 t h percentiles.
(A r a i n f a l l o b s e r v a t i o n l e s s than t h e 10 th p e r c e n t i l e value
can b e e x p e c t e d o n c e e v e r y t e n y e a r s on t h e a v e r a g e . Similarly, •
a r a i n f a l l o b s e r v a t i o n l e s s t h a n t h e 7 0 t h p e r c e n t i l e can be
e x p e c t e d i n s e v e n y e a r e o u t o f t e n o r a l t e r n a t i v e l y a rainfall
o b s e r v a t i o n g r e a t e r than t h e 7 0 t h p e r c e n t i l e can be e x p e c t e d on
an a v e r a g e o f t h r e e y e a r s i n ten).
Minimum r a i n f a l l s recorded a t Bateman's Bay, B e r r y , Braidwood, Bundanoon,
J e r v i s Bay and Nowra a r e shown i n t h e table ' s a t Appendix 1 4 . The tables
i n d i c a t e t h e minimum c u m u l a t i v e r a i n f a l l commencing i n any month o f t h e year
and c o n t i n u i n g f o r up t o 12 months , which have occurred a t t h e s e stations.
Al though v e r y low r a i n f a l l t o t a l s have been recorded f o r a f e w consecutive
months , pro longed dry s p e l l s a r e i n f r e q u e n t , p a r t i c u l a r l y on t h e c o a s t and over
t h e h i g h e r r a i n f a l l a r e a s . Except f o r t h e rainshadow a r e a , a t l e a s t 7k inches
a r e r e c e i v e d on 9 0 p e r c e n t o f o c c a s i o n s i n any c o n s e c u t i v e s i x month period.
The c o r r e s p o n d i n g f i g u r e f o r any c o n s e c u t i v e 12 month p e r i o d i s 17k inches.
Temperature.
The temperature reg ime o f t h e v a l l e y i s r e a s o n a b l y w e l l r e c o r d e d . The
a v e r a g e monthly and y e a r l y t empera tures f o r a v a i l a b l e s t a t i o n s a r e l i s t e d in
T a b l e s 1 t o 4 a s follows:
T a b l e s 1 and 2 J e r v i s Bay and Wollongong r e s p e c t i v e l y , which may be taken
a s r e p r e s e n t a t i v e o f t h e immediate c o a s t a l a r e a o f t h e valley.
T a b l e 3 Nowra which i s r e p r e s e n t a t i v e o f l o c a t i o n s on t h e c o a s t a l plain
i n l a n d from t h e sea.
Tab le 4 Braidwood, r e p r e s e n t a t i v e o f t h e a r e a s o f t h e v a l l e y about 2,500
f e e t above s e a level,

-8-
TABLE 1
JERVIS BAY ( E l e v a t i o n 257 F e e t )
Average Temperature ( ° F ) Based on 29 Years o f Record
Month Jan. Feb. Mar. Apr. May June July Aug. Sept. Oct. _ Nov. Dec. Year
Average Maximum
74.5 75.0 73.3 68.8 64.4 60.2 58.9 61.0 64.3 67.7 70.2 73.0 67.6
Average Minimum 63.0 64.0 62.7 58.5 53.8 50.5 48.6 49.5 52.2 55.3 58.3 61.3 56.5
Average Daily 68.8 69.5 68.0 63.6 59.1
i 55.4 53.8 55.2 58.3 61.5 64.3 67.1 62,0
H i g h e s t on Record 1 0 9 . 0 Lowest .,,, on Record 3 8 . 0 - -
TABLE 2
WOLLONGONG ( E l e v a t i o n 33 f e e t )
Average Temperature ( ° F ) Based on 30 Years o f Record
Month Jan. Feb. Mar. Apr. May June July Aug.]
Sept. Oct. Nov. Dec. Year
Average Maximum
78.4 78.4 76.3 72.1 67.1 62.5 61.7 64.1 68.4 71.8 74.3 76.7 71.0
Average Minimum 62.6 63.1 60.9 56.4 51.9 48.3 47.1 47.7 50.7 54.1 57.3 60.8 55.1
Average Daily 70.5 70.8 68.6 64.3 59.5 55.4 54.3 55.9 59.5 63.0 65.8 68.7 63.0
H i g h e s t on Record 115 .2 Lowest on Record 33.6
TABLE 3
NOWRA ( E l e v a t i o n 50 f e e t )
Average TemRerature ( ° F ) Based on 16 Years o f Record
Month ,
Jan. Feb. Mar. Apr. May June July Aug. Sept. Oct. Nov. Dec. Year
Average Maximum
81.3 81.1 78.3 73.0 67..1 62.4 61.9 65.2 70.1 74.9 77.2 79.6 72.7
Average Minimum
60.5 61.8 58.7 53.4 49.9 47.0 45.3 45.5 48.9 52.0 54.7 58.7 ,
53.0
Average Daily 70.9 71.5 68.5 63.2 58.5 54.7 53.6 55.3 59.3 63.5 65.9 69.1
, 62.8
H i g h e s t on Record 1 1 0 . 0 Lowest on Record 3 1 . 5 - , :-- _

-9-
TABLE 4
BRAIDWOOP ( E l e v a t i o n 2 , 5 0 0 f e e t ) ,
Average Temperature ( o F ) Based on 30 Years o f Record
Mouth Jan. Feb. Mar. Apr. -.-
May June July Aug. Sept. Oct. Nov. Dec. Year
Average Maximum 78.5 78.3 73.2 65.3 58.2 52.8 52.0 54.9 60.8 66.8 71.9 76.3
. 65.8
Average Minimum
51.6 51.5 48.6 42.7 36.0 31.8 30.6 32.4 36.4 41.0 44.9 48.8 41.4
Average Daily 65.1 64.9 60.9 54.0 47.1 42.3 41.3 43.7 48.6 53.9 58.4'62.5
_ 53.6
, - - _ H i g h e s t on Record 1 0 5 . 0 Lowest on Record 14.5-
During t h e months October t o March, warm weather i s e x p e r i e n c e d with
a v e r a g e maxima v a r y i n g from t h e mid s e v e n t i e s t o t h e low e i g h t i e s o v e r the
l ower p a r t s o f t h e v a l l e y away from t h e c o a s t . Somewhat c o o l e r conditions
o c c u r o v e r t h e h i g h e r p a r t s o f t h e v a l l e y and a l s o on t h e c o a s t where sea
b r e e z e s t e n d t o reduce maximum t e m p e r a t u r e s . Days a r e m i l d t o c o o l f o r the
remainder o f t h e y e a r e x c e p t o v e r t h e more e l e v a t e d a r e a s dur ing t h e winter
months where days a r e r a t h e r cold.
O c c a s i o n a l l y v e r y h o t days a r e e x p e r i e n c e d i n summer when dry north
w e s t e r l y winds b low from C e n t r a l A u s t r a l i a . Wollongong h a s e x p e r i e n c e d an
extreme temperature o f 115°F. On t h e a v e r a g e , t emperatures above 100°F are
recorded about t w i c e per y e a r on t h e c o a s t . A g r e a t e r f requency o f occurrence
would b e e x p e c t e d o v e r low l e v e l a r e a s inland.
On t h e c o a s t average minima a r e about 10°F t o 15°F c o o l e r than
c o r r e s p o n d i n g maxima. I n l a n d , however, r a n g e s o f 20°F o r more may o c c u r . In
w i n t e r on o c c a s i o n s o f c l e a r s k i e s and l i g h t winds v e r y low overnight
t empera tures o c c u r p a r t i c u l a r l y a t t h e h i g h e r s t a t i o n s o f t h e r e g i o n . At
Braidwood, an extreme minimum temperature o f 14 .5 °F h a s been recorded.
Frost.
F r o s t i n c i d e n c e i n c r e a s e s from a lmos t n i l on t h e c o a s t t o more than 90
d a y s p e r y e a r o v e r t h e h i g h e r p a r t s o f t h e h i n t e r l a n d where f r o s t s can occur
a t any t i m e o f t h e y e a r . Severe f r o s t s , however, a r e u s u a l l y c o n f i n e d t o the
months A p r i l t o October i n c l u s i v e i n t h e h i g h e s t a r e a s w i t h t h e season
becoming s h o r t e r a t lower elevations.

-10-
Sunshine.
E s t i m a t e s o f t h e average number o f hours o f b r i g h t s u n s h i n e per day in
each month f o r t h e v a l l e y a r e shown i n Table 5 . These e s t i m a t e s a r e based on
Cloud amount observations.
TABLE 5
Es t imated Average D a i l y Durat ion o f B r i g h t Sunshine (Hours)
. Jan. Feb. Mar. Apr. May June July Aug. Sept. Oct. Nov. Dec.
, Year
8.1 7.8 7,1 6.7 6.1 5.8 6.5 6.9 7.7 8.0 8,3 8.2 7,3
Evaporation.
E s t i m a t e s o f t h e a v e r a g e monthly and annual e v a p o r a t i o n from an Australian
s tandard sunken tank a r e shown i n Table 6 t o g e t h e r w i t h e s t i m a t e s o f the
s tandard d e v i a t i o n s . These e s t i m a t e s a r e based on r a d i a t i o n , a i r temperature
and humid i ty considerations.
TABLE 6
Es t imated Average Monthly and Annual Evaporat ion ( I n c h e s )
Month Jan. Feb. Mar. Apr. May June July Aug. Sept. Oct. Nov. Dec. Year
Evapor- • ation
5.5 4.2 3.8 2.6 1.8 1.4 1.6 1.6 2.4 3.5 5.1 5.5 39.0
Standard Deviation
0.9 0.9 0.7 0.4 0.4 0.3 0.3 0.3 0.4 0.5 0.7 0.8 3.0
Wind.
Strong winds and s q u a l l s o c c u r o v e r t h e r e g i o n from t ime t o t ime in
a s s o c i a t i o n w i t h m e t e o r o l o g i c a l c o n d i t i o n s a s follows:
1 . E a s t e r l y t o s o u t h e r l y winds w i t h mean s p e e d s o f up t o 50 miles
per hour and g u s t s up t o 70 m i l e s p e r hour o r more may occur on
t h e c o a s t when a deep d e p r e s s i o n i s l o c a t e d j u s t o f f t h e southern
New South Wales o r e a s t e r n V i c t o r i a n coast.
2 . Strong n o r t h t o n o r t h - w e s t winds w i t h mean wind s p e e d s o f t h e order
o f 50 m i l e s per hour w i t h g u s t s on o c c a s i o n s r e a c h i n g 70 m i l e s per
hour have been recorded a t Por t Kembla a s t h e p r e s s u r e gradient
t i g h t e n s ahead o f an approaching s o u t h e r l y change . S i m i l a r winds
would be e x p e c t e d t o o c c u r o v e r t h e Shoalhaven V a l l e y particularly
on t h e coast.

-11-
3 . The h i g h e s t wind g u s t s on record i n t h e v a l l e y a r e a s s o c i a t e d with
s e v e r e l o c a l s q u a l l s such a s thunderstorms o r f r o n t a l squalls.
T a b l e 7 g i v e s t h e extreme wind g u s t l i k e l y t o b e experienced
i n t h e v a l l e y f o r v a r i o u s r e t u r n periods.
TABLE 7
Es t imated Extreme Wind Gusts t o be Expected for Given Return Periods.
Return P e r i o d (Years) 10 20 • 50 100
Extreme Wind Gust Equalled o r Exceeded ( M i l e s Per Hour) 85 90 100 105
4 . GROUNDWATER POTENTIAL.
L i k e many o f t h e c o a s t a l r i v e r s o f New South Wales t h e catchment o f the
Shoalhaven R i v e r p r o v i d e s c o n v i n c i n g e v i d e n c e o f e a r t h movements i n Tertiary
t ime which r a i s e d most o f t h e v a l l e y s e v e r a l thousand feet.
The g r e a t e r p a r t o f t h e v a l l e y compr i se s p o r t i o n o f t h e Southern
T a b l e l a n d s ; t h e o r i g i n a l g r a d i e n t s , and t o some e x t e n t t h e mature form of
t h e v a l l e y s o f t h e main stream and many o f i t s t r i b u t a r i e s , a r e still
ma in ta ined upstream o f a s e r i e s o f w a t e r f a l l s , by which t h e s treams leave
t h e p l a t e a u . A f t e r p l u n g i n g i n t o deep g o r g e s t h e y f l o w through rugged
c o u n t r y b e f o r e t h e main v a l l e y opens o u t and r i v e r f l a t s o f relatively
r e c e n t a g e appear on t h e i n s i d e o f t h e entrenched meanders.
In t h e v i c i n i t y o f Nowra t h e broad a l l u v i a l p l a i n s commence and
c o n t i n u e a lmos t t o t h e s e a , where t h e r e a r e r a i s e d beaches and wind blown
sands a l o n g t h e coastline.
The g e o l o g i c a l map a t F i g u r e 16 shows t h e a r e a t o be geologically
complex, p a r t i c u l a r l y i n t h e southern and w e s t e r n p a r t s , where a considerable
v a r i e t y o f o l d e r P a l a e o z o i c s t r a t a ( O r d o v i c i a n , S i l u r i a n and Devonian) occur,
i n c l u d i n g greywackes , s l a t e s , q u a r t z i t e s , s a n d s t o n e s , s h a l e s , siltstones,
l i m e s t o n e s and in terbedded v o l c a n i c s . These a n c i e n t rocks have been
s t r o n g l y f o l d e d and f a u l t e d , and invaded by g r a n i t e s and allied
i n t r u s i o n s b e l i e v e d t o be o f Devonian and Carboni ferous age.

•
-12-
The n o r t h e r n and e a s t e r n p a r t s o f t h e v a l l e y a r e u n d e r l a i n b y more recent
s t r a t a which comprise t h e s o u t h e r n s e c t i o n o f t h e Sydney B a s i n . These./Permian_ ,
and Mesozo ic s t r a t a i n c l u d e m a i n l y s h a l e s , s a n d s t o n e s and c o n g l o m e r a t e s with
some contemporaneous v o l c a n i c rocks.
T h e r e a r e r e m n a n t s o f T e r t i a r y r i v e r d e p o s i t s o n t h e T a b l e l a n d , some of
which a r e capped b y b a s a l t o f L a t e T e r t i a r y a g e . P l e i s t o c e n e and Recent
a l l u v i a o c c u r i n some o f t h e u p l a n d v a l l e y s and f l a n k t h e S h o a l h a v e n River
i n i t s l o w e r r e a c h e s . T h e r e a r e sand b e d s on t h e n o r t h s i d e o f t h e mouth of
t h e S h o a l h a v e n R i v e r w h i c h e x t e n d some m i l e s t o t h e n o r t h b e h i n d Seven Mile
Beach.
D i s c u s s i o n o f t h e g r o u n d w a t e r p o t e n t i a l o f t h i s v a l l e y i s f a c i l i t a t e d if
t h r e e m a i n s u b d i v i s i o n s , b a s e d o n t h e mode o f o c c u r r e n c e o f t h e w a t e r and the
n a t u r e o f t h e s t r a t a i n w h i c h i t i s s t o r e d , a r e u s e d ; v i z . J o i n t e d Rocks,
w h i c h a l t h o u g h t h e m s e l v e s i m p e r v i o u s , may c o n t a i n w a t e r i n t h e partings,
f r a c t u r e s , b e d d i n g p l a n e s , j o i n t s y s t e m s e t c ; P o r o u s R o c k s , u s u a l l y sandstones,
w h i c h may c o n t a i n w a t e r i n o p e n i n g s b e t w e e n cemented sand g r a i n s ; and
U n c o n s o l i d a t e d D e p o s i t s , i n w h i c h w a t e r may b e s t o r e d i n t h e p o r e s p a c e s in
s a n d s a n d / o r g r a v e l s a s s o c i a t e d w i t h a l l u v i a l m a t e r i a l , o r i n a c c u m u l a t i o n s of
a e o l i a n a n d b e a c h s a n d s n e a r t h e coast.
I n t h e S h o a l h a v e n R i v e r V a l l e y , g r o u n d w a t e r i s u t i l i z e d m a i n l y f o r watering
s t o c k , w h i l s t i r r i g a t i o n f rom t h i s s o u r c e i s t h e e x c e p t i o n r a t h e r t h a n t h e rule.
R e c o r d s o f b o r e s i n t h e v a l l e y a r e r e l a t i v e l y few, b u t a r e s u f f i c i e n t t o indicate
t h a t t h e g e n e r a l g r o u n d w a t e r p o t e n t i a l o f t h e a r e a f o r s t o c k w a t e r i n g facilities
i s good b u t t h a t t h e p o t e n t i a l f o r i r r i g a t i o n i s poor.
J o i n t e d Rocks.
W i t h t h e e x c e p t i o n o f t h o s e p a r t s o f t h e v a l l e y u n d e r l a i n by t h e Hawkesbury
S a n d s t o n e and t h e a l l u v i a l and b e a c h s a n d d e p o s i t s , t h e S h o a l h a v e n River
c a t c h m e n t i s u n d e r l a i n by s t r a t a i n w h i c h t h e g r o u n d w a t e r i s c o n t a i n e d in
c r a c k s , f i s s u r e s , p a r t i n g s a n d j o i n t s i n t h e r o c k s . I n c l u d e d i n t h i s g r o u p are
a v a r i e t y o f m e t a m o r p h i c r o c k s , i n d u r a t e d s e d i m e n t a r y s t r a t a a n d p l u t o n i c and
v o l c a n i c i g n e o u s r o c k s . The w a t e r b e a r i n g p o t e n t i a l o f t h i s g r o u p varies
c o n s i d e r a b l y , t h e outcome o f b o r i n g f o r w a t e r d e p e n d i n g on many factors

i n c l u d i n g t h e r o c k t y p e , t h e d e g r e e o f w e a t h e r i n g and j o i n t i n g , t h e relative
e l e v a t i o n and r e l i e f a t t h e b o r e s i t e , t h e amount and d i s t r i b u t i o n o f the
r a i n f a l l , and t h e a b i l i t y o f t h e r a i n t o p e r c o l a t e t h r o u g h t h e s o i l s w h i c h have
b e e n p r o d u c e d b y t h e l o c a l environment.
The o l d e s t s t r a t a i n t h i s g r o u p a r e o f O r d o v i c i a n a g e (more t h a n 400
m i l l i o n y e a r s o l d ) w h i c h i n c l u d e m a i n l y g r e y w a c k e , . c h e r t , s l a t e , quartzite,
s a n d s t o n e and l i m e s t o n e . D i p s v a r y o v e r a w i d e r a n g e , b u t t h e s t r i k e is
u s u a l l y n o r t h - n o r t h - w e s t . F a u l t i n g i s common a n d t h e r e i s a t e n d e n c y f o r the
h a r d e r , more r e s i s t a n t s t r a t a ( g r e y w a c k e , c h e r t and q u a r t z i t e i n particular)
t o b e h e a v i l y f r a c t u r e d . I t i s i n t h e s e r o c k s t h a t c o n d i t i o n s f a v o u r a b l e to
t h e o c c u r r e n c e o f g r o u n d w a t e r a r e t o b e e x p e c t e d , a l t h o u g h l e s s competent
s t r a t a s u c h a s s l a t e s may a l s o y i e l d u s e f u l s u p p l i e s o f water.
B o r e s i n t h e s e s t r a t a , l o c a t e d a t f a v o u r a b l e s i t e s , c a n u s u a l l y b e relied
on t o y i e l d u s e f u l s u p p l i e s o f s t o c k w a t e r . Y i e l d s o f 300 t o 400 g a l l o n s per
h o u r a r e l i k e l y and i n some i n s t a n c e s ( a l t h o u g h none h a v e b e e n r e c o r d e d in
t h i s v a l l e y ) s u p p l i e s g r e a t l y e x c e e d i n g 1 , 0 0 0 g a l l o n s p e r h o u r h a v e been
o b t a i n e d f r o m s u c h strata.
The s a l i n i t y o f t h e w a t e r s v a r i e s , i t b e i n g u s u a l f o r h i g h e r yielding
b o r e s t o p r o d u c e b e t t e r q u a l i t y w a t e r . T o t a l s a l i n i t i e s r a n g e f rom a b o u t 50 to
300 p a r t s p e r h u n d r e d t h o u s a n d , w i t h t h e sodium c h l o r i d e c o n t e n t r a n g i n g up to
200 p a r t s p e r h u n d r e d t h o u s a n d . The w a t e r s a r e f a i r l y h a r d , and e v e n where
t h e T o t a l S a l i n i t y i s low, s o f t e n i n g i s u s u a l l y r e q u i r e d t o make t h e water
s u i t a b l e f o r d o m e s t i c use.
Most f a i l u r e s i n t h e s e s t r a t a c a n b e a t t r i b u t e d t o e i t h e r p o o r s i t e s or
f a i l u r e t o b o r e d e e p enough i n t o t h e somet imes r a t h e r h a r d strata.
The S i l u r i a n s t r a t a o u t c r o p i n s e v e r a l m e r i d i o n a l l y d i s p o s e d z o n e s i n the
w e s t e r n p a r t o f t h e v a l l e y . They i n c l u d e s l a t e s , p h y l l i t e s and limestones
c o m p r i s i n g a s e q u e n c e o f m e t a m o r p h i c r o c k s a n d a s e r i e s o f v o l c a n i c rocks.
O v e r l y i n g them and t h e o l d e r O r d o v i c i a n t h e r e a r e a number o f f o r m a t i o n s of
Upper Devon ian a g e w h i c h i n c l u d e s i m i l a r r o c k s e q u e n c e s t o t h e Silurian;
v o l c a n i c r o c k s a r e i n t e r b e d d e d w i t h s e d i m e n t a r y b e d s , wh ich h a v e b e e n less
metamorphosed t h a n t h e o l d e r s t r a t a and a r e b e s t d e s c r i b e d a s meta-sediments.

-14- However b o t h sys tems o f r o c k s have l o s t any o r i g i n a l p o r o s i t y they may
have p o s s e s s e d ( e x c e p t t h e l i m e s t o n e s which i n some a r e a s e . g . n e a r Bungonia,
a r e c a v e r n o u s ) , and hence t h e y a r e i n c l u d e d w i t h t h e j o i n t e d rocks.
The outcome o f b o r i n g i n t h e s e s t r a t a i s e s s e n t i a l l y t h e same a s i n the
Ordov ic ian r o c k s where u s e f u l s t o c k s u p p l i e s a r e normal ly o b t a i n a b l e at
s e l e c t e d s i t e s , w i t h o c c a s i o n a l y i e l d s i n e x c e s s o f 1 , 0 0 0 g a l l o n s p e r hour of
"good' q u a l i t y w a t e r . The s a l i n i t y l i m i t s a l s o a r e e s s e n t i a l l y t h e same,
a l t h o u g h " s a l t y " s p r i n g s which have been observed i s s u i n g from some small
o u t c r o p s o f Devonian s t r a t a n o r t h o f Bungonia ( t h e o u t c r o p s a r e t o o s m a l l to
appear on t h e map) s u g g e s t t h a t i n t h e Devonian s h a l e s t h e r e i s a higher
s a l i n e c o n t e n t i n t h e c o n t a i n e d groundwater than i s t h e c a s e i n t h e harder
strata.
Permian r o c k s u n d e r l i e most o f t h e e a s t e r n p a r t o f t h e Shoalhaven River
V a l l e y . Once a g a i n t h e sequence c o n t a i n s sedimentary and v o l c a n i c rocks
i n c l u d i n g c o n g l o m e r a t e s , s a n d s t o n e s , s i l t s t o n e s , s h a l e s , t u f f s , l a v a s , cherts
and c o a l seams. The sed iments have been indurated and a r e l a r g e l y impervious
e x c e p t f o r j o i n t s , p a r t i n g s and o t h e r secondary openings.
The Megalong Conglomerate which o u t c r o p s o v e r e x t e n s i v e a r e a s t o t h e west
and s o u t h o f Nowra c o n t a i n s c o n g l o m e r a t e s , s a n d s t o n e s and s i l t s t o n e s which have
been l i t t l e p r o s p e c t e d f o r groundwater i n t h i s v a l l e y . However t h e occasional
b o r e i n t h i s and nearby catchments s u g g e s t s t h a t u s e f u l s u p p l i e s o f f a i r to
good q u a l i t y groundwater can be e x p e c t e d from b o r e s from 50 t o 200 f e e t deep.
The o v e r l y i n g Berry Formation which i n c l u d e s a l a r g e p r o p o r t i o n o f shales
and s i l t s t o n e s h a s n o t proved a r e l i a b l e w a t e r - b e a r i n g f o r m a t i o n , supplies
r a n g i n g from l e s s than 100 g a l l o n s per hour t o a s much a s 3 , 0 0 0 g a l l o n s per
hour b e i n g r e c o r d e d . The few a n a l y s e s a v a i l a b l e show t h e s a l i n i t y of
groundwater from t h e Berry s h a l e s t o be q u i t e low, a T o t a l S a l i n e c o n t e n t less
than 100 p a r t s p e r hundred thousand b e i n g u s u a l . A bore i n t h e township of
Berry which p e n e t r a t e d 85 f e e t o f s h a l e y i e l d e d 600 g a l l o n s p e r hour f o r a
drawdown o f o n l y 8 f e e t o f t h e a v a i l a b l e 74 f e e t . The a n a l y s i s o f w a t e r from
t h i s b o r e shows a T o t a l S a l i n i t y o f 32 p a r t s p e r hundred thousand, Alkalinity
( a s Sodium Carbonate) 18 p a r t s p e r hundred thousand, Hardness ( a s Calcium
Carbonate) 10 p a r t s p e r hundred thousand and pH 6.6.

-15-
The Gerringong V o l c a n i c s , which i n c l u d e some t h i c k , w e l l j o i n t e d tuffaceous
s a n d s t o n e s have produced some s u r p r i s i n g l y h i g h y i e l d s . A number o f b o r e s less
than 100 f e e t deep l o c a t e d i n t h e v i c i n i t y o f Gerringong y i e l d s u p p l i e s w e l l in
e x c e s s o f 1 , 0 0 0 g a l l o n s p e r hour , one bore b e i n g equipped t o produce 6,000
g a l l o n s p e r hour f o r i r r i g a t i o n . Water from t h i s bore h a s a T o t a l Saline
c o n t e n t o f 144 p a r t s p e r hundred thousand, a Hardness o f 80 p a r t s per hundred
thousand and a pH o f 6.8.
An u n u s u a l l y h i g h y i e l d i n g bore i n t h i s sequence i s l o c a t e d o n l y a few
m i l e s w e s t o f Gerr ingong . I t encountered h e a v i l y j o i n t e d t u f f a c e o u s sandstones
a t 166 f e e t from which a l a r g e f l o w o f about 4 0 , 0 0 0 g a l l o n s per hour was
o b t a i n e d . The d r i l l e r who c o n s t r u c t e d t h i s bore r e p o r t e d t h a t b l o c k s of
s a n d s t o n e o f h o u s e b r i c k s i z e were brought t o t h e s u r f a c e by t h e g r e a t velocity
o f t h e w a t e r . An a n a l y s i s o f t h i s w a t e r shows: T o t a l S a l i n i t y 6 1 . 9 p a r t s per
hundred thousand; Hardness ( a s Calcium Carbonate) 3 0 . 8 p a r t s p e r hundred
thousand and pH 7 . 7 . The c o n s i d e r a b l e head o f w a t e r encountered i n t h i s bore
probably r e s u l t s from an i n t a k e i n t h e h i g h e r country t o t h e west.
The I l l a w a r r a Coal Measures a r e much more important f o r t h e i r c o a l content
than f o r t h e i r groundwater p o t e n t i a l . As f a r a s i s known t h e r e a r e no b o r e s in
t h i s v a l l e y producing w a t e r from t h e s e s t r a t a , but i t i s known t h a t t h e y normally
y i e l d b r a c k i s h w a t e r i n o t h e r p a r t s o f t h e Sydney Basin.
The g r a n i t e s , which form t h e backbone o f t h e Great D i v i d i n g Range some
4 , 0 0 0 f e e t h i g h i n t h e s o u t h - w e s t e r n p a r t o f t h e v a l l e y , and a l s o o u t c r o p over
c o n s i d e r a b l e a r e a s n e a r Braidwood and Bungonia, a r e e x p e c t e d t o be u s e f u l water
b e a r e r s o n l y where t h e y a r e d e e p l y weathered . However t h e r e a r e no r e c o r d s of
b o r e s i n them, a l t h o u g h i t i s known t h a t s p r i n g s a r e f a i r l y common i n the
general v i c i n i t y o f Braidwood.
A w e l l twenty two f e e t d e e p , l o c a t e d near Majors Creek y i e l d e d 100 gallons
p e r hour from t h e weathered g r a n i t e and i t i s c o n s i d e r e d t h a t r e l a t i v e l y small
s u p p l i e s s u i t a b l e f o r s t o c k w a t e r i n g should be o b t a i n a b l e from b o r e s on
s a t i s f a c t o r y s i t e s . I n a r e a s o f h i g h r e l i e f , such a s a r e found n e a r the
w e s t e r n d i v i d e , t h e depth o f w e a t h e r i n g i s u n l i k e l y t o be s u f f i c i e n t t o provide
wor thwhi l e s u p p l i e s o f groundwater and t h e l i m i t e d amount o f j o i n t i n g found in
g r a n i t e s s u g g e s t s t h a t b o r i n g i n them would b e s p e c u l a t i v e . Some s m a l l but
v a l u a b l e s u p p l i e s a r e o b t a i n e d from s p r i n g s , which a r e f a i r l y common.

-16-
B a s a l t s o f T e r t i a r y a g e form some s m a l l c a p p i n g s i n rough country east
o f Lower Boro, b u t t h e major o u t c r o p s a r e c o n f i n e d t o t h e a r e a forming the
d i v i d e e a s t from R o b e r t s o n . I t i s i n t h e l a r g e r o u t c r o p s o f b a s a l t t h a t the
b e s t groundwater p r o s p e c t s a r e expected.
Bores a t good s i t e s can b e e x p e c t e d t o y i e l d s u p p l i e s s u i t a b l e f o r stock
w a t e r i n g and, a f t e r s o f t e n i n g , f o r d o m e s t i c u s e . Recorded y i e l d s range from
200 t o 1 , 0 0 0 g a l l o n s p e r hour and i n most i n s t a n c e s t h e w a t e r has proved
s u i t a b l e f o r garden u s e . The a n a l y s i s o f a w a t e r sample from a bore o f depth
80 f e e t i n b a s a l t i n t h e v i c i n i t y o f t h e headwaterso f Bundanoon Creek shows a
T o t a l S a l i n e c o n t e n t o f 4 0 . 9 p a r t s per hundred thousand, A l k a l i ( a s Sodium
Carbonate) 1 4 . 3 p a r t s p e r hundred thousand, Hardness ( a s Calcium Carbonate)
10 p a r t s p e r hundred thousand and pH 4.4.
Porous Rocks.
The T r i a s s i c s t r a t a which comprise p a r t o f t h e southern end o f t h e Sydney
B a s i n c o n t a i n t h e o n l y r o c k s i n t h i s group from which u s e f u l s u p p l i e s of
groundwater a r e obtained.
Of them, t h e Lower T r i a s s i c Narrabeen group which c o n s i s t s o f clayey
s a n d s t o n e s , s i l t s and s h a l e s , have o n l y a s m a l l a r e a o f o u t c r o p , t h e main
e x p o s u r e s b e i n g a l o n g t h e f l a n k s o f t h e Moss V a l e - Robertson p l a t e a u . The
s t r a t a a r e r e l a t i v e l y imperv ious and i n t h i s a r e a have no s i g n i f i c a n t ground-
w a t e r potential.
The o v e r l y i n g Hawkesbury S a n d s t o n e s , which a r e w e l l exposed i n t h e vertical
c l i f f s f l a n k i n g t h e v a l l e y s o f Bundanoon Creek and t h e Kangaroo R i v e r , underlie
most o f t h e p l a t e a u occupy ing t h e n o r t h e r n edge o f t h e Shoalhaven R i v e r Valley
and o u t c r o p o v e r much o f i t . Cappings o f t h e Wianamatta group o b s c u r e them in
t h e more e l e v a t e d p a r t s and t h e r e a r e a l s o some e x t e n s i v e a r e a s o f b a s a l t near
Robert son and Moss Vale.
The Hawkesbury Sandstones have a maximum t h i c k n e s s o f about 800 f e e t but
u s u a l l y t h e y c o n t a i n o n l y a few r e l a t i v e l y t h i n porous z o n e s . However i n this
s o u t h e r n p a r t o f t h e Sydney B a s i n t h e z o n e s a r e t h i c k e r and more persistent
than elsewhere.
Most b o r e s c o n s t r u c t e d e n t i r e l y i n t h e s e s a n d s t o n e s y i e l d s u p p l i e s o f the
o r d e r o f 800 t o 1 , 0 0 0 g a l l o n s p e r hour o f w a t e r w i t h a s a l i n i t y l e s s than 10
p a r t s p e r hundred thousand. A number o f a q u i f e r s a r e encountered , t h e y i e l d from
e a c h s u c c e s s i v e l y deeper a q u i f e r u s u a l l y b e i n g g r e a t e r than t h e one above.

-17-
A bore n e a r F i t z r o y F a l l s i s t y p i c a l o f t h e c o n d i t i o n s i n t h i s sandstone
f o r m a t i o n . S t r a t a p e n e t r a t e d a r e s a n d s t o n e s o f v a r i o u s c o l o u r s , w h i t e , yellow
and p a l e g r e y b e i n g t h e most common. A q u i f e r s occurred a t 27 - 30 feet,
101 - 108 f e e t and 167 - 182 f e e t , t h e r e s p e c t i v e s u p p l i e s b e i n g 2 0 , 180 and
630 g a l l o n s p e r hour; a t 630 g a l l o n s per hour o n l y one t h i r d o f t h e available
drawdown was u t i l i z e d , i n d i c a t i n g t h a t a supply o f about 1 , 2 0 0 g a l l o n s per hour
c o u l d be obtained.
A p a r t i a l a n a l y s i s o f t h e w a t e r from t h i s bore gave : T o t a l S a l i n i t y of
6 . 4 p a r t s per hundred thousand; C h l o r i d e ( a s Sodium C h l o r i d e 2 p a r t s per
hundred thousand and pH 5 . 8 . The low s a l i n i t y and somewhat a c i d pH a r e typical
o f t h e w a t e r s from t h e Hawkesbury Sandstone where t h e y a r e n o t i n f l u e n c e d by
t h e o v e r l y i n g Wianamatta group which c o n s i s t s e s s e n t i a l l y o f s h a l e s with
o c c a s i o n a l t h i n beds o f sandstone.
As i s t h e c a s e e l s e w h e r e i n t h e Sydney B a s i n , t h e Wianamatta group almost
i n v a r i a b l y y i e l d s s a l i n e w a t e r s which a r e u s u a l l y s u i t a b l e o n l y f o r s t o c k , and
a r e r a r e l y s u i t a b l e f o r w a t e r i n g even v e r y s a l t t o l e r a n t p l a n t l i f e . The saline
w a t e r from t h e s h a l e s i s b e l i e v e d t o be r e s p o n s i b l e f o r t h e poorer than usual
q u a l i t y o f t h e w a t e r i n t h e upper a q u i f e c s o f Hawkesbury Sandstone where they
underl ie and a r e c l o s e t o s h a l e o u t c r o p s . I n c a s e s where b o r e s p e n e t r a t e an
a p p r e c i a b l e t h i c k n e s s o f t h e Wianamatta S h a l e s i t may be n e c e s s a r y t o cement
o f f t h e s h a l l o w e r a q u i f e r s i n order t o p r e v e n t c o n t a m i n a t i o n o f t h e better
q u a l i t y water which can u s u a l l y be o b t a i n e d by b o r i n g s e v e r a l hundred f e e t into
t h e Hawkesbury Sandstones.
U n c o n s o l i d a t e d Material.
There a r e two d i s t i n c t g e n e r a t i o n s o f a l l u v i u m i n t h e Southern Tablelands,
t h e f i r s t b e i n g probably o f T e r t i a r y a g e w h i l s t t h e second i s b e l i e v e d t o have
been d e p o s i t e d d u r i n g t h e P l e i s t o c e n e period.
The a c t u a l b a s e o f t h e T e r t i a r y a l l u v i u m i s o f t e n a s much a s 100 feet
above t h e p r e s e n t stream b e d s , t h e s e c l a y s , sands and g r a v e l s hav ing been built
up by a n c e s t r a l s treams p r i o r t o t h e u p l i f t o f t h e t a b l e l a n d s . Occasionally
t h e s e a n c i e n t g r a v e l s have been s i l i c i f i e d i n t o " s i l c r e t e " , p o s s i b l y due to
c o n t a c t metamorphism by b a s a l t s which have s i n c e been removed by erosion.

-18-
Because o f t h e i r e l e v a t i o n t h e sands and g r a v e l s i n t h e T e r t i a r y a l l u v i u m a r e of
l i t t l e o r no importance a s a s o u r c e o f groundwater.
The d i s t r i b u t i o n o f t h e P l e i s t o c e n e (and p o s s i b l y more r e c e n t ) alluvium
on t h e T a b l e l a n d s s u g g e s t s t h a t t h e r e h a s been some l a t e o r p o s t Tertiary
movement a l o n g some o f t h e numerous f a u l t s . The g e o l o g i c a l map ( F i g u r e 16)
shows some e x t e n s i v e a r e a s o f a l l u v i u m i n t h e v a l l e y o f t h e main stream t o the
n o r t h and w e s t o f Braidwood and a l s o i n some o f t h e t r i b u t a r y valleys.
As f a r a s i s known no b o r e s have been c o n s t r u c t e d i n t h e s e a r e a s , but
a d j a c e n t catchments i n d i c a t e t h e r e may be o v e r 200 f e e t o f a l l u v i a l material
w i t h some t h i n b u t e x t e n s i v e b e d s o f sand and g r a v e l beneath t h e l a r g e r flats.
Large y i e l d s a r e n o t a n t i c i p a t e d but s u p p l i e s o f s e v e r a l thousand g a l l o n s per
hour o f good q u a l i t y w a t e r appear p o s s i b l e i n some a r e a s . I t i s b e l i e v e d that
t h e more r e c e n t a l l u v i u m on t h e s m a l l e r t r i b u t a r i e s i s n o t more than 30 o r 40
f e e t t h i c k , but i s seems l i k e l y t h a t s u i t a b l y s i t e d w e l l s o r b o r e s would yield
u s e f u l s u p p l i e s o f s t o c k w a t e r and perhaps l i m i t e d i r r i g a t i o n supplies.
A f t e r t h e main r i v e r l e a v e s t h e p l a t e a u i t f l o w s through a deep g o r g e , and
t h e r e i s no a l l u v i a l development o f any consequence u n t i l t h e v a l l e y slowly
b e g i n s t o open o u t downstream o f i t s c o n f l u e n c e w i t h t h e Kangaroo R i v e r . Here
some narrow f l a t s o c c u r on t h e i n s i d e o f t h e en trenched meanders . These
i s o l a t e d f l a t s a r e b e l i e v e d t o be o f f l u v i a t i l e o r i g i n , and i t i s considered
t h a t t h e r e would be l i t t l e d i f f i c u l t y i n o b t a i n i n g s u p p l i e s f o r s t o c k purposes
from e i t h e r b o r e s o r w e l l s a t d e p t h s between 20 and 50 feet.
For some 10 o r 12 m i l e s upstream o f Nowra t h e r i v e r i s t i d a l and the
a l l u v i u m i s o f e s t u a r i n e o r i g i n , hav ing been d e p o s i t e d i n a b r a c k i s h o r salt
w a t e r env ironment . There, i s a c o n s i d e r a b l e t h i c k n e s s o f t h i s u s u a l l y dark
c o l o u r e d , s i l t y and muddy a l l u v i u m . T e s t b o r i n g c a r r i e d o u t by t h e Metropolitan
Water Sewerage and Drainage Board a t t h e downstream end o f Long Reach ( a few
m i l e s upstream o f Nowra) encountered 180 f e e t o f mud, s i l t and sand without
r e a c h i n g bedrock , and s e i s m i c s u r v e y s i n d i c a t e a maximum t h i c k n e s s o f t h e order
o f 300 f e e t o f s a l t w a t e r charged s e d i m e n t s . In t h e v i c i n i t y o f Nowra the
r i v e r l e a v e s i t s c o n f i n e d v a l l e y and f l o w s a c r o s s an e x t e n s i v e a l l u v i a l plain
which i s u n d e r l a i n by d e l t a i c d e p o s i t s , c h i e f l y b l a c k sands s i l t s and muds with
o c c a s i o n a l bands o f m a t e r i a l c o n t a i n i n g s h e l l s o f marine o r i g i n . Much o f the
a r e a i s low l y i n g and swampy.

-19-
As i s t h e c a s e e l s e w h e r e a l o n g t h e c o a s t , most o f t h e groundwater stored
i n t h i s a l l u v i u m i s e i t h e r b r a c k i s h o r s a l t y , and t h e o c c a s i o n a l supply o f good
q u a l i t y w a t e r i s t h e r e s u l t o f e s p e c i a l l y f a v o u r a b l e c o n d i t i o n s , such a s may be
found i n t h e l e v e e s o r i n a r e a s where sands occur a t , o r v e r y c l o s e t o , the
s u r f a c e . I n b o t h c a s e s d i r e c t i n f i l t r a t i o n o f l o c a l r a i n f a l l forms a l e n s of
f r e s h w a t e r which d i s p l a c e s t h e b r a c k i s h o r s a l i n e w a t e r and virtually"floats"
on t h e more d e n s e , s a l t y w a t e r . I n such c o n d i t i o n s good q u a l i t y w a t e r rarely
e x t e n d s be low 20 - 25 f e e t from t h e s u r f a c e , a f t e r which any bore o r w e l l is
l i k e l y t o e n c o u n t e r b r a c k i s h o r s a l t y water.
The l e v e e s o f f e r t h e b e s t p r o s p e c t s f o r u s e f u l s u p p l i e s o f groundwater,
and w e l l s o r s p e a r p o i n t s l o c a t e d on them u s u a l l y produce w a t e r s u i t a b l e for
s t o c k , d o m e s t i c and garden u s e , a l t h o u g h t h e y i e l d s a r e v e r y v a r i a b l e , ranging
from a f e w hundred t o more than one thousand g a l l o n s p e r hour.
Away from t h e l e v e e s t h e r e i s a f a i r l y r a p i d d e t e r i o r a t i o n i n t h e water
q u a l i t y s o t h a t s h a l l o w s u p p l i e s a r e u s u a l l y s u i t a b l e o n l y f o r s t o c k watering.
During dry p e r i o d s t h e w a t e r t a b l e may f a l l s e v e r a l f e e t and t h e r e i s o f t e n a
c o r r e s p o n d i n g i n c r e a s e i n t h e s a l i n i t y o f t h e s h a l l o w groundwater . However
r u n o f f from t h e s i d e s l o p e s w i l l sometimes r e s u l t i n t h e o c c u r r e n c e o f localized
z o n e s o f good q u a l i t y w a t e r . Such a zone o c c u r s on t h e n o r t h s i d e o f the
Shoalhaven R i v e r i n an a r e a n e a r Meroo, which i s l o c a t e d towards t h e edge of
t h e a l l u v i a l p l a i n between Nowra and Berry.
There i s a c o n s i d e r a b l e development o f a l l u v i a l f l a t s on Broughton Creek,
and upstream o f Berry t h e w a t e r t a b l e i s known t o b e s h a l l o w , and t h e quality
o f t h e w a t e r g o o d . Al though t h e r e a r e no r e c o r d s o f w e l l s i n t h i s alluvium
b e i n g used t o s u p p l y w a t e r f o r i r r i g a t i o n i t seems l i k e l y t h a t s u f f i c i e n t water
c o u l d be o b t a i n e d f o r t h i s purpose from s u i t a b l e w e l l s . Downstream o f Berry,
where t h e Broughton Creek f l a t s merge w i t h t h o s e o f t h e Shoalhaven R i v e r , the
environment a t t h e t ime o f d e p o s i t i o u was e s t u a r i n e , and hence t h e prospects
o f o b t a i n i n g good q u a l i t y w a t e r a r e b e l i e v e d t o b e s i m i l a r t o t h o s e on the
main f l a t s , c h i e f l y b r a c k i s h t o s a l i n e w a t e r w i t h o c c a s i o n a l l e n s e s of
b e t t e r q u a l i t y water).
To t h e n o r t h o f t h e mouth o f t h e Shoalhaven R i v e r t h e r e i s an extensive
a r e a o f a e o l i a n and beach sands which runs p a r a l l e l t o Seven M i l e Beach f o r a
w i d t h o f about t h r e e q u a r t e r s o f a m i l e . Behind t h e beach t h e r e a r e low lying
swampy a r e a s which c o n t a i n accumula t ions o f decayed v e g e t a b l e m a t t e r . This

-20-
environment i s t y p i c a l o f t h e c o n d i t i O n s under which t h e sands have accumulated,
and i s r e s p o u s i b l e f o r p e a t y and a c i d groundwater which i s o f t e n encountered
i n a r e a s o f beach sands.
U t i l i z a t i o n o f t h e w a t e r from t h e s e sands i s c o n f i n e d t o camping grounds,
caravan parks and o c c a s i o n a l d o m e s t i c s u p p l i e s which a r e u s u a l l y o b t a i n e d from
s p e a r p o i n t s n o t more than 15 f e e t d e e p . I t i s probable t h a t s u p p l i e s suitable
f o r i r r i g a t i o n c o u l d be o b t a i n e d from b o r e s o r b a t t e r i e s o f s p e a r p o i n t s i n these
s a n d s , b u t t h e poor s o i l s which o c c u r i n t h e beach sand a r e a s a r e l i k e l y to
r e s t r i c t t h i s t y p e o f development.
Although t h e r e a r e probably two o r t h r e e square m i l e s o f t h e s e sand beds
which would y i e l d w a t e r o f low s a l i n i t y s u i t a b l e f o r town o r i n d u s t r i a l water
s u p p l i e s , t h e e l o n g a t e d shape o f t h e a r e a would make l a r g e s c a l e e x t r a c t i o n of
w a t e r from t h e a r e a q u i t e c o s t l y . I f t h i s were p r a c t i c a b l e , i t may w e l l be
p o s s i b l e t o o b t a i n s e v e r a l m i l l i o n g a l l o n s p e r day o f w a t e r ( p o s s i b l y requiring
t r e a t m e n t by a e r a t i o n and l i m e d o s i n g ) from t h i s source.
5 . STREAM GAUGING STATIONS.
Streamflow o r i g i n a t e s i n t h e p r e c i p i t a t i o n o f a tmospher ic m o i s t u r e which
i s m a i n l y evaporated from t h e o c e a n s and i s c a r r i e d o v e r t h e land masses by
w e a t h e r s y s t e m s . Runoff i s g e n e r a l l y r e c o g n i s e d t o be t h a t component of
p r e c i p i t a t i o n which appears a s f l o w i n s treams a f t e r e v a p o r a t i o n , transpiration
and deep s e e p a g e l o s s e s have been satisfied.
I n most a r e a s o f New South Wales r a i n f a l l r e c o r d s have been o b t a i n e d for
r e l a t i v e l y long p e r i o d s o f t i m e . T h e r e f o r e , i t c o u l d be e x p e c t e d t h a t if
s a t i s f a c t o r y e s t i m a t e s were a b l e t o be made o f l o s s e s due t o evaporation,
t r a n s p i r a t i o n and deep seepage t h e remainder o f t h e p r e c i p i t a t i o n , o r runoff,
c o u l d b e r e l i a b l y a s s e s s e d . However, d e s p i t e i n t e n s i v e r e s e a r c h , no suitable
method h a s y e t been formulated o f r e l a t i n g r u n o f f and r a i n f a l l f o r any catchment
t o a s a t i s f a c t o r y d e g r e e o f accuracy i n t h e a b s e n c e o r any s tream flow
information.
I n w a t e r r e s o u r c e s and o t h e r h y d r o l o g i c i n v e s t i g a t i o n s i t i s therefore
e s s e n t i a l t o have b a s i c s t reamf low d a t a a v a i l a b l e i n o r d e r t o e n a b l e satisfactory
r e s u l t s and c o n c l u s i o n s t o ke o b t a i n e d . In a d d i t i o n i t i s most d e s i r a b l e that
t h e s e s treamf low r e c o r d s c o v e r a s l o n g a . p e r i o d a s possible.

-21-
Two b a s i c s t e p s a r e i n v o l v e d i n s t reamf low measurement, t h e f i r s t being
t h e measurement o f r i v e r l e v e l , o r gauge h e i g h t , i n r e l a t i o n t o a constant
datum and t h e second b e i n g t h e c o r r e l a t i o n o f measured h e i g h t w i t h stream
discharge.
R i v e r h e i g h t s a r e normal ly o b t a i n e d by v i s u a l o b s e r v a t i o n o f t h e l e v e l of
t h e w a t e r s u r f a c e on a graduated s c a l e , o r s t a f f g a u g e , which i s i n s t a l l e d on
t h e r i v e r bank o r on b r i d g e p i e r s . However t h e s e measurements o n l y indicate
t h e w a t e r l e v e l a t t h e t ime o f o b s e r v a t i o n and t h e r e f o r e i t i s d e s i r a b l e to
r e c o r d t h e c o n t i n u o u s v a r i a t i o n o f r i v e r l e v e l s between t h e t i m e s o f actual
r e a d i n g s . T h i s may be e f f e c t e d by means o f a c o n t i n u o u s g r a p h i c a l o r digital
r e c o r d which i s produced by a f l o a t o r p r e s s u r e a c t u a t e d recorder.
Measurements o f s tream d i s c h a r g e a r e made by u s e o f a c u r r e n t m e t e r to
measure f l o w v e l o c i t i e s , and survey methods t o measure t h e a r e a o f effective
f l o w . The combinat ion o f f l o w v e l o c i t i e s , i n f e e t p e r s econd , and effective
a r e a s , i n square f e e t , g i v e s t h e d i s c h a r g e o f t h e s tream i n c u b i c f e e t per
second o r cusecs.
R e l a t i o n s a r e e s t a b l i s h e d , by means o f g r a p h s , between gauge h e i g h t s and
c o r r e s p o n d i n g d i s c h a r g e s b a s e d on a l l s t reamf low measurements a t t h e gauging
s t a t i o n and, i n s t a b l e c h a n n e l s , t h e s e , r e l a t i o n s t e n d t o remain relatively
c o n s t a n t . The r e l a t i o n s h i p s a r e employed t o e s t i m a t e s tream d i s c h a r g e s for
p e r i o d s when .gauge h e i g h t s , b u t n o t measured f l o w s , a r e a v a i l a b l e f o r the
s t a t i o n . I t i s t h e r e f o r e p o s s i b l e t o d e r i v e c o n t i n u o u s s t reamf low r e c o r d s at
any s t a t i o n u s i n g gauge h e i g h t d a t a and t h e gauge h e i g h t - d i s c h a r g e relationship.
Stream d i s c h a r g e s a r e normal ly g i v e n i n terms o f c u s e c s , one c u s e c flowing
f o r t w e l v e hours b e i n g a p p r o x i m a t e l y e q u a l t o one a c r e f o o t o r t h e volume of
w a t e r which would c o v e r an a r e a o f one a c r e t o a 4 e p t h o f one f o o t . An
a d d i t i o n a l u n i t which i s f r e q u e n t l y used 14:catchment y i e l d s t u d i e s i s inches
d e p t h o v e r t h e t o t a l catchment area.
The i n s t a l l a t i o n o f s tream gaug ing s t a t i o n s i n t h e Shoalhaven R i v e r Valley
commenced w i t h t h e e r e c t i o n o f a s t a t i o n a t Welcome Reef i n 1909 . Additional
s t a t i o n s were i n s t a l l e d on t h e Shoalhaven g i v e r a t Warn i i n 1914 and on both
t h e Corang and Mopgerlowe R i v e r s a t Hockeys and Charleyong r e s p e c t i v e l y i n 1924.

-22-
A t p r e s e n t t h e r e a r e e i g h t s t r e a m g a u g i n g s t a t i o n s i n t h e v a l l e y w h i c h are
o p e r a t e d by t h e W a t e r C , n s e r v a t i o n a n d I r r i g a t i o n Commission. I n a d d i t i o n the
M e t r o p o l i t a n W a t e r Sewerage a n d D r a i n a g e Board i s c u r r e n t l y o p e r a t i n g seven
p e r m a n e n t a n d s i x t e m p o r a r y g a u g i n g s t a t i o n s b u t o n l y l i m i t e d p e r i o d s o f records
a r e a v a i l a b l e f o r t h e s e stations.
Due t o t h e s h o r t p e r i o d s o f r e c o r d a v a i l a b l e f o r t h e B o a r d ' s s t r e a m gauging
s t a t i o n s f l o w s t a t i s t i c s r e p r e s e n t o n l y a s m a l l s amp le o f f l o w r e g i m e s and
t h e r e f o r e a r e u n l i k e l y t o b e i n d i c a t i v e o f l o n g t e r m f l o w c o n d i t i o n s . Details
o f s t a t i s t i c s f o r t h e B o a r d ' s s t r e a m g a u g i n g s t a t i o n s have t h e r e f o r e n o t been
i n c l u d e d i n t h e t a b l e s o f f l o w s t a t i s t i c s g i v e n l a t e r i n t h i s report.
The c u r r e n t g a u g i n g s t a t i o n s a r e s i t u a t e d so a s t o m e a s u r e t h e r u n o f f from
a b o u t n i n e t y p e r c e n t o f t h e S h o a l h a v e n R i v e r V a l l e y . The d e n s i t y o f permanent
s t r e a m f l o w s t a t i o n s i n t h e S h o a l h a v e n R i v e r V a l l e y o f a b o u t f i v e s t a t i o n s per
thousand square m i l e s , i s s l i g h t l y more than t h e d e n s i t y f o r C o a s t a l New South
Wales and i s s u b s t a n t i a l l y g r e a t e r than t h e New South W a l e s a n d Australian
a v e r a g e s o f 2 . 2 s t a t i o n s and 0 . 5 s t a t i o n s respectively.
Some d i f f i c u l t i e s have been e x p e r i e n c e d i n m a i n t a i n i n g contiMmuli operation
o f s tream g a u g i n g s t a t i o n s i n t h e v a l l e y . These d i f f i c u l t i e s stem from the
s p a r s e d i s t r i b u t i o n o f populaFion o v e r t t l e v a l l e y p a r W u l a T l y Jn tbq flagged,
r e l a t i v e l y i n a c c e s s i b l e , I r e a s o f 4 1 0 r u n o f f . As a r e s u l t , s e v e n stream
RauRtng s t a t i o n s , i n s t a l l e d a t v a r t p u s t i m e s from 1924, have had -t hf
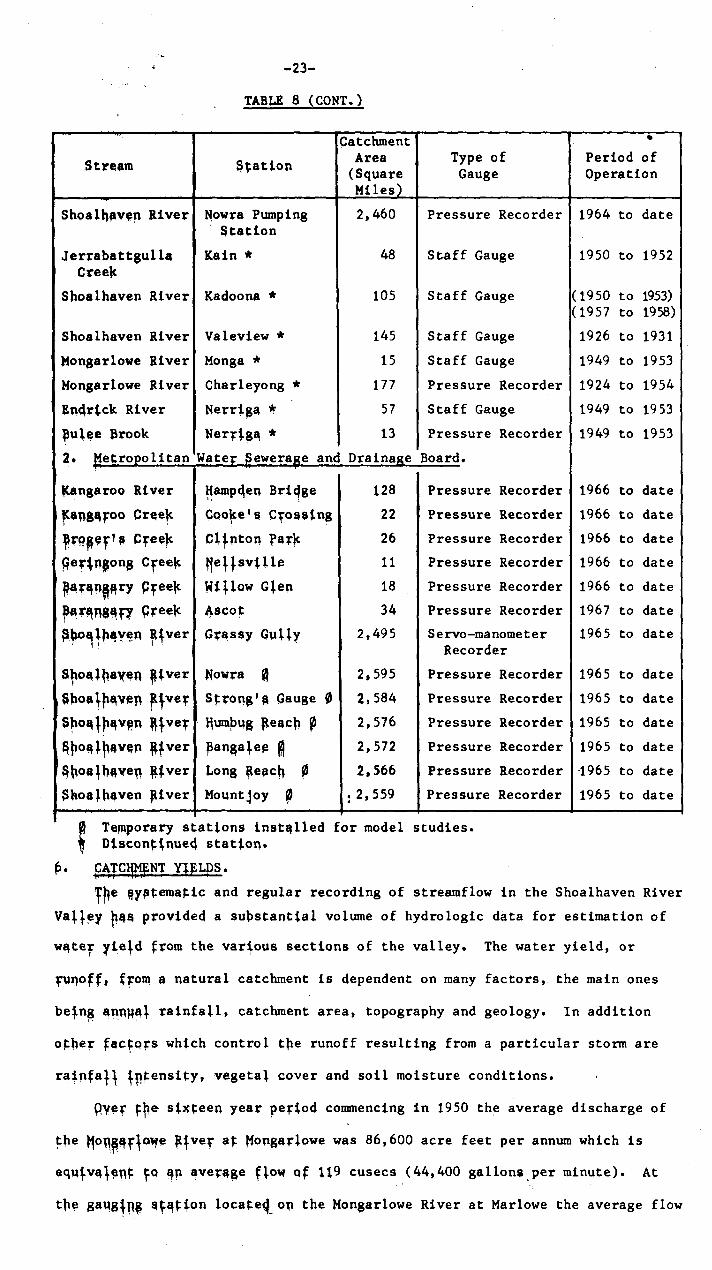
d i s c o n t i n u e d , due m a i n l y t o o n 8 v O 1 . a P t 4 t y o f gauge rea4ers.
he l o c a t i o n s o f e x i s t i n g and d i l c o n t i n g e g gauging s t a t i o n s i n Ole
Shoalhaven R i v e r V a l l e y I r e showp 1 . n F i g p r e 17 and r e l e v a n t o p e r a t i o n a l details
o f each s t a t i o n a r e g i v e n i n Table 8.
T A I f f 8.
Stream Station
papomenF 4real
(Square Hiles),
Type of Gauge
P e r i o d of Operation
T. Water Conse .
a t i o n an Irrigation Commis, ion
1949 t o date
1945 t o date
1924 t o date
1953 t o date
1954 t o date
1914 t o date
1909 t o date
Nongarlowe River
Mongerlowe River
Corang River
liclrick River
P m g a r o o River
Shoalhaven River
Shoalhaven River
Mongarlowe
tiarlowe
Hockeys
Nowra Road
Kangaroo Valley
Warn t
Welcome Reef
, 50
175
62
81
93
500
1,070
S t a f f Gauge
f l o a t Recorder
p r e s s u r e Recorder
f l o a t RecOrder
S t a f f Gauge
S t a f f Gauge
pressure-Recorder
-23—
TABLE 8 (CONT.)
Stream Station
Catchment Area
(Square Miles)
Type of Gauge
P e r i o d of Operation
Shoalhaven River Nowra Pumping 2,460 P r e s s u r e Recorder 1964 t o date Station
Jerrabattgulla Kain * 48 S t a f f Gauge 1950 t o 1952 Creek
Shoalhaven River Kadoona * 105 S t a f f Gauge (1950 t o 1953) (1957 t o 1958)
Shoalhaven River V a l e v i e w * 145 S t a f f Gauge 1926 t o 1931
Mongarlowe River Monga * 15 S t a f f Gauge 1949 t o 1953
Mongarlowe River Charleyong * 177 P r e s s u r e Recorder 1924 t o 1954
En4r1ck River N e r r i g a * 57 S t a f f Gauge 1949 t o 1953
E u l e e Brook Nerr tga * 13 P r e s s u r e Recorder 1949 t o 1953
2 . retropolitan Water peweraoe and Drainage Board.
Kangaroo River amp4en Brilge 128 P r e s s u r e Recorder 1966 t o date
Kang4roo Creek Cooise's Crossing 22 P r e s s u r e Recorder 1966 t o date
141400f1S Creek C l i n t o n Park 26 P r e s s u r e Recorder 1966 t o date
G e r t n e n g Creek Nellsvtlle 11 P r e s s u r e Recorder 1966 t o date
Eav ingery peelc Wi l low Glen 18 P r e s s u r e Recorder 1966 t o date
! w l i n s , T y creel( Ascot 34 P r e s s u r e Recorder 1967 t o date
44011J4yen Etver Grassy 2,495 Servo—manometer 1965 t o date Recorder
Shoalhayen Etver N o w a 0 2,595 P r e s s u r e Recorder 1965 t o date
Shoaplaven Elver S t r o n g l a Gauge 0 2,584 P r e s s u r e Recorder 1965 t o date rShoalhaven Elver ' 1111014$ E W h 0 2,576 P r e s s u r e Recorder 1965 t o date
Shoe /haven Efver Eantia/e0 0 2,572 P r e s s u r e Recorder 1965 t o date
Shoalhalrep River Long each 0 2,566 P r e s s u r e Recorder 1965 t o date
Shoa lheven River Mountloy 0 :2,559 P r e s s u r e Recorder 1965 t o date
;Temporary s t a t i o n s i n s t a l l e d f o r model studies. D t s c o n t t n u e 4 station.
0 . CATCTIENT YIELDS.
The s y s t e m a t i c and r e g u l a r r e c o r d i n g o f s t r e a m f low i n t h e Shoalhaven River
V a l l Y t!aa prov ided a s u b s t a n t t a l volume o f h y d r o l o g i c data f o r e s t i m a t i o n of
w a t e r y t e l d from t h e v a r t o u s s e c t i o n s o f t h e v a l l e y . The w a t e r y i e l d , or
f U n o f f s from a n a t u r a l catchment i s dependent on many f a c t o r s , , t h e main ones
b e i n g a p n w o r a i n f a l l , catchment a r e a , topography and g e o l o g y . I n addition
o t h e t f a c t o r s which c o n t r o l t h e r u n o f f r e s u l t i n g from a p a r t i c u l a r storm are
r a i n f a l l 1 p t e n s i t y , v e g e t a l c o v e r and s o i l m o i s t u r e conditions.
Over t h e s i x t e e n y e a r p e r i o d commencing i n 1950 t h e average d i s c h a r g e of
t h e l ionparlolfe R i v e r a t Mongarlowe was 8 6 , 6 0 0 a c r e f e e t p e r annum which is
e q u l v a l e n t e n a v e r a g e f / o w o f 119 c u s e c s ( 4 4 , 4 0 0 g a l l o n s p e r m i n u t e ) . At
t h e gaustpE s W i o n 1 . o c a t e 4 o h t h e Mongarlowe R i v e r a t Marlowe t h e average flow

-24—
o v e r a twenty one y e a r p e r i o d has been 1 7 3 , 0 0 0 a c r e f e e t p e r annum (237 cusecs).
However, t h i s l a t t e r s t a t i o n measures r u n o f f from a catchment area o f more than
t h r e e t i m e s t h a t above Mongarlowe, and t h e r e f o r e t h e s e y i e l d s a r e consistent
w i t h h y d r o l o g i c principles.
At t h e Corang R i v e r a t Hockeys t h e average annual f l o w o v e r a f o r t y two
y e a r p e r i o d was 5 8 , 1 0 0 a c r e f e e t ( 8 0 c u s e c s ) o r about 3 0 , 0 0 0 g a l l o n s p e r minute.
Over t h e p e r i o d o f a v a i l a b l e r e c o r d o f t h i r t e e n y e a r s t h e d i s c h a r g e o f the
Endrick R i v e r a t Nowra Road has been about 1 0 5 , 0 0 0 a c r e f e e t p e r annum (143
c u s e c s ) o r about 5 4 , 0 0 0 g a l l o n s p e r minute.
Records o f s t r e a m f l o w f o r t h e Kangaroo R i v e r a t Kangaroo V a l l e y indicate
t h a t t h e average annual r u n o f f a t t h i s s t a t i o n o v e r a n i n e y e a r p e r i o d was
2 2 7 , 0 0 0 a c r e f e e t ( 3 1 0 c u s e c s o r 1 1 6 , 0 0 0 g a l l o n s p e r minute.
Over a t h i r t y two y e a r p e r i o d t h e f l o w o f t h e Shoalhaven R i v e r a t Warni
was 1 7 1 , 0 0 0 a c r e f e e t p e r annum ( 2 3 4 c u s e c s ) . At Welcome Reef on the
Shoalhaven R i v e r t h e average d i s c h a r g e o v e r a f i f t y two y e a r p e r i o d o f record
was 4 6 7 , 0 0 0 a c r e f e e t p e r annum ( 6 4 0 cusecs).
For comparat ive purposes t h e y i e l d s a t v a r i o u s s t reamf low s t a t i o n s , over
t h e r e s p e c t i v e p e r i o d s o f a v a i l a b l e r e c o r d s a r e g i v e n i n Table 9 . D e t a i l s of
monthly maximum, minimum and mean f l o w s f o r t h e gauging s t a t i o n s l o c a t e d on the
Mongarlowe R i v e r a t Marlowe, t h e Shoalhaven R i v e r a t Welcome R e e f , t h e Corang
R i v e r a t Hockeys, t h e Endrick R i v e r a t Nowra Road and t h e Kangaroo R i v e r at
Kangaroo V a l l e y a r e g i v e n i n Appendices 15 t o 19 inclusive.
TABLE 9.
Stream Station Yeiars of Cmplete ltecords
Average Annual Y i e l d Over Period o f Complete Years o f Record
Acre Feet P e r Annum Cusecs ,
G a l l o n s Per Minute
Mongarlowe River Mongarlowe 17 84,000 115 43,000
Mongarlowe River Marlowe 21 173,000 237 89,000
Corang River Hockeys 42 58,100 80 30,000
Endrick River Nowra Road 13 105,000 143 54,000
Kangaroo River Kangaroo 9 227,000 '310 116,000 Valley .
Shoalhaven River Warn i 32 171,000 234 88,000
Shoalhaven River Welcome 52 • 467,000 640 240,000 -Reef
_ _ _

-25-
7 . AVERAGE ANNUAL RUNOFF.
Based on t h e s t reamf low r e c o r d s a v a i l a b l e f o r t h e Shoalhaven R i v e r at
Welcome R e e f , o v e r t h e p e r i o d from 1909 t o d a t e , e s t i m a t e s have been prepared
o f t h e l o n g term average annual r u n o f f s o f s e l e c t e d sub—catchments i n the
Shoalhaven R i v e r Valley.
These e s t i m a t e s i n d i c a t e t h a t t h e average annual s u r f a c e w a t e r resources
o f t h e Shoalhaven R i v e r V a l l e y a r e o f t h e o r d e r o f 1 , 4 6 0 , 0 0 0 a c r e feet
( 3 9 6 , 0 0 0 m i l l i o n g a l l o n s ) which i s e q u i v a l e n t t o a c o n t i n u o u s r a t e o f 750,000
g a l l o n s p e r m i n u t e . On a square m i l e o f catchment a r e a b a s i s t h i s r u n o f f is
more than one t h i r d g r e a t e r than t h e average f o r c o a s t a l b a s i n s i n New South
Wales and o v e r f i v e t i m e s t h e average f o r t h e State.
I n t h e f o l l o w i n g Table 10 t h e e s t i m a t e d l o n g term average annual runoff
o f t h e Shoalhaven R i v e r V a l l e y i s compared w i t h t h e c o r r e s p o n d i n g r u n o f f s for
t h e Hawkesbury and Bega Valleys.
TABLE 10.
Basin
Catchment Area in Square Miles
Es t imated Long Term Average Annual Runoff
Acre Feet p e r Annum
Acre F e e t per Annum per square mile
Percentage Runoff
Shoalhaven Valley
Hawkesbury Valley
Bega Valley
1 , 2,820 k
8,390
740
1,460,000
1,850,000
400,000
520
220 ' 540
28%
11%
277.
A p r e v i o u s e s t i m a t e o f t h e l o n g t e r m a v e r a g e a n n u a l r u n o f f f o r the
S h o a l h a v e n R i v e r V a l l e y was g i v e n i n t h e 1963 p u b l i c a t i o n "Review of
A u s t r a l i a ' s W a t e r R e s o u r c e s " a s 1 , 2 3 0 , 0 0 0 a c r e f e e t p e r annum. T h i s estimate
was b a s e d o n p e r i o d s o f r e c o r d s o f 46 y e a r s a t Welcome R e e f a s compared with
t h e 52 y e a r s now available.
The a v e r a g e a n n u a l r u n o f f o f t h e S h o a l h a v e n R i v e r V a l l e y i s equivalent
t o a b o u t 28 p e r c e n t o f t h e a n n u a l r a i n f a l l o v e r t h e v a l l e y a n d , when compared
w i t h o t h e r a d j a c e n t v a l l e y s , t h i s p e r c e n t a g e i s c o m p a r a t i v e l y high.

-26—
However, t h e h i g h e s t i m a t e d r u n o f f o f t h e Shoalhaven R i v e r V a l l e y is
a t t r i b u t a b l e t o t h e h i g h y i e l d i n g a r e a s i n t h e n o r t h o f t h e v a l l e y where
c o n s i s t e n t l y h i g h r a i n f a l l s occur.
The p e r c e n t a g e r u n o f f f o r t h e a d j a c e n t Hawkesbury R i v e r V a l l e y , (given
i n T a b l e 1 0 ) , o f 11 p e r c e n t appears t o be r e l a t i v e l y low when compared with
t h e Shoalhaven R i v e r V a l l e y . However, t h e r u n o f f from a catchment tends
t o d e c r e a s e w i t h i n c r e a s e i n a r e a and a s t h e Hawkesbury R i v e r catchment is
about t h r e e t i m e s t h a t o f t h e Shoalhaven R i v e r t h e p e r c e n t a g e r u n o f f s are
compatible.
8 . VARIABILITY OF STREAMFLOWS.
W h i l s t average annual d i s c h a r g e s a r e commonly used f o r t h e comparison
o f l o n g term y i e l d s from a catchment t h e y do n o t i n d i c a t e t h e v a r i a b i l i t y of
f l o w s from y e a r t o y e a r . The v a r i a b i l i t y o f annual f l o w s from a catchment is
o f utmost importance i n t h e p l a n n i n g o f w a t e r r e s o u r c e s p r o j e c t s ; t h e greater
t h e v a r i a b i l i t y , t h e more d i f f i c u l t i t i s t o e c o n o m i c a l l y u t i l i s e t h e available
s u r f a c e w a t e r r e s o u r c e s o f a valley.
I n common w i t h t h e m a j o r i t y o f o t h e r s treams i n New South Wales the
s treams i n t h e Shoalhaven R i v e r V a l l e y e x h i b i t a h i g h d e g r e e o f variability.
An i n d i c a t i o n o f t h e v a r i a b i l i t y o f s t reamf lows a t s e l e c t e d s t a t i o n s i n the
v a l l e y i s g i v e n i n T a b l e 1 1 . T h i s t a b l e i n d i c a t e s t h e maximum, minimum and
mean d i s c h a r g e s recorded a t t h e s t a t i o n s o v e r t h e p e r i o d s o f a v a i l a b l e records.

-27—
TABLE 11
Stream Sta4on 12er4od of Computed 1tecor4s
Recorded Discharge
Maximum Minimum Mean
Mongarlowe Marlowe August 1945 to 4 7 , 2 0 0 cusecs 2 cusecs 237 cusecs M.ver June 1967 (17,700,000
g.p.m.) ( 7 5 0 g.p.m.) (89,000
g.p.m.)
Corang Hockeys September 1924 3 4 , 7 0 0 cusecs 0 80 cusecs 4ver
Endrick Nowra
t o June 1967
J u l y 1953 to
(13,000,000 g.p.m.)
2 8 , 0 0 0 .cusecs 0
(30,000 g.p.m.)
, 143 cusecs
River Road June 1967 (10,500,000 g . p . m . )
(54,000 g.p.m.)
Kangaroo Kangaroo . J u l y 1954. to 8 1 , 0 0 0 cusecs 0 . 7 cusecs 310 cusecs River Valley. June 1267
. .' (30,300,000
. g.p.m.)
( 2 6 0 g.p.m.) (116,000 g.p.m.)
Shoalhaven Welcome June 1909 to 3 1 3 , 0 0 0 cusecs 0 640 cusecs .River Reef. June 1967 (117,000,000
g.p.m.) .
(240,000 g.p.m.)
A v a i l a b l e s t r e a m f l o w r e c o r d s i n d i c a t e t h a t t h e r e i s a h i g h degree of
v a r i a b i l i t y i n t h e annual w a t e r r e s o u r c e s o f t h e Shoalhaven R i v e r V a l l e y . On
t h e Shoalhaven R i v e r a t Welcome Reef t h e maximum annual d i s c h a r g e o c c u r r e d in
1950 and was n e a r l y two m i l l i o n a c r e f e e t o r o v e r f o u r t i m e s t h e average annual
d i s c h a r g e . As t h e minimum annual d i s c h a r g e a t t h i s l o c a t i o n was about 38,000
a c r e f e e t , t h e r a t i o o f maximum annual t o minimum annual f l o w was i n e x c e s s of
f i f t y t o one.
The maximum monthly f l o w 'ecorded a t Welcome Reef. was n e a r l y 9 0 0 , 0 0 0 acre
f e e t i n May 1925 which i s e q u i v a l e n t t o more than twenty t i m e s t h e average
monthly f l o w . During t h e month o f January 1919, no f l o w was recorded a t this
s t a t i o n f o r t h e e n t i r e month.
On h o t t h e Corang R i v e r a t Hockeys and t h e Mongarlowe R i v e r a t Marlowe
t h e maximum recorded annual d i s c h a r g e was about 2.1/2 t i m e s t h e mean annual flow.
The minimum annual f l o w s a t t h e s e s t a t i o n s were o n l y about 10 p e r c e n t o f the
mean.
The recorded maximum and minimum annual d i s c h a r g e s o f t h e Kangaroo River
a t Kangaroo V a l l e y were about doub le , and one q u a r t e r r e s p e c t i v e l y o f t h e mean
flow.
The monthly v a r i a t i o n s i n s t r e a m f l o w s a l w a y s e x h i b i t a g r e a t e r variability
than annual d i s c r . d , o s , t h e maxiAum monthly f l o w s a t Nowra Road, Marlowe and
Hockeys b e i n g s e v e n , t e n and twenty t h r e e t i m e s t h e r e s p e c t i v e mean monthly
flows.

-28-
His tograms o f monthly s t r e a m f l o w s recorded a t t h e s tream gaug ing stations
a t Welcome R e e f , Marlowe, Hockeys, Nowra Road and Kangaroo V a l l e y a r e shown in
F i g u r e s 18 t o 2 0 i n c l u s i v e ; t h e s e F i g u r e s i l l u s t r a t e t h e h i g h d e g r e e of
v a r i a p i l i t y o f s t r e a m f l o w s i n t h e v a l l e y . Furthermore exam/Ration o f Figures
18 t o 2 0 i n d i c a t e s t h a t no apparent p e r i o d i c t rend o c c u r s i n runoff.
The mean monthly r a i n f a l l s i n t h e v a l l e y a r e r e l a t i v e l y uniformly
d i s t r i b u t e d throughout t h e y e a r . The mean monthly r a i n f a l l a t Braidwood varies
from about 21/2 i n c h e s i n t h e summer months from December t o March i n c l u s i v e to
about 2 i n c h e s i n t h e months from J u l y t o September. A s i m i l a r p a t t e r n in
a v e r a g e monthly r a i n f a l l s a l s o o c c u r s a t Nowra, however, a s t h e average annual
r a i n f a l l a t Nowra i s about 11/2 t i m e s t h a t recorded a t Braidwood, t h e average
monthly r a i n f a l l s a r e s u b s t a n t i a l l y g r e a t e r , t h e maximum b e i n g n e a r l y four
i n c h e s i n t h e summer months and about 21/2 i n c h e s i n t h e w i n t e r months.
9 . rERSISTENCE OF STREAMFLOWS.
Flows i n t h e m a j o r i t y o f s treams i n t h e Shoalhaven R i v e r V a l l e y tend to
c o n t i n u e f o r s i g n i f i c a n t p e r i o d s o f t ime a f t e r t h e c e s s a t i o n o f r a i n f a l l . The
c o n c l u s i o n which may b e drawn from t h i s i s t h a t c o n t r i b u t i o n s t o s treamf low
from groundwater a r e r e l a t i v e l y h i g h and o f extended duration.
A procedure commonly employed t o e n a b l e comparison o f s treamf low
p e r s i s t e n c e t o b e made between s t a t i o n s i s t h e p r e p a r a t i o n o f graphs showing
f l o w d u r a t i o n c u r v e s . These c u r v e s i n d i c a t e t h e cumula t ive p e r c e n t a g e s of
t i m e t h a t d i s c h a r g e s have v a r i e d from t h e minimum f l o w , which i n many instances
i s z e r o , up t o t h e maximum d i s c h a r g e o r any o t h e r s e l e c t e d f l o w . Flow duration
c u r v e s a r e c o n s t r u c t e d t o show t h e p e r c e n t a g e s o f t ime t h a t f l o w s were equal
t o o r g r e a t e r than ( o r a l t e r n a t i v e l y equa l t o o r l e s s than) any selected
d i s c h a r g e . The f l o w d u r a t i o n c u r v e s and d a t a g i v e n i n t h i s r e p o r t correspond
t o t h e p e r c e n t a g e s o f t ime t h a t f l o w s were e q u a l t o o r g r e a t e r than any
s e l e c t e d flow.
The f l o w d u r a t i o n curve o f t h e Mongarlowe R i v e r a t Marlowe i s g i v e n at
F i g u r e 21 and t h e f r e q u e n c i e s o f f l o w a t t h i s s t a t i o n a r e g i v e n i n the
f o l l o w i n g T a b l e 12.

-29—
TABLE 12.
P e r c e n t a g e o f Time Flow Equalled
o r Exceeded
Corresponding Flows
Cusecs G a l l o n s Per
Minute
10 385 144,000
30 114 42,700
50 50 18,700
70 22 8,200
90 8 .3,000
95 5 1,900
100 2 700
The d u r a t i o n curve o f d i s c h a r g e f o r t h e Corang R i v e r a t Hockeys i s shown
a t F i g u r e 22 and t h e f l o w f r e q u e n c y s t a t i s t i c s f o r t h i s s t a t i o n a r e g i v e n in
t h e f o l l o w i n g Table 13.
TABLE 13.
P e r c e n t a g e o f Time Flow Equalled
i o r Exceeded
Corresponding Flows
Cusecs G a l l o n s Per
Minute
10 90 33,700
30 22 8,200
50 10 1 3,700
70 3 i 1,100
90 1 400 r 95 0.5 200
97 0 0
100 0 0
The f l o w d u r a t i o n c u r v e f o r t h e Endrick R i v e r a t Nowra Road i s appended
a t F i g u r e 23 and f l o w f requency d a t a c o r r e s p o n d i n g t o t h e curve are g i v e n in
t h e f o l l o w i n g Table 14.
TABLE 14.
P e r c e n t a g e o f Time Flow Equalled
• o r Exceeded
Corresponding Flows
Cusecs G a l l o n s Per minntp
10 185 e
69,300 30 49 18,300 50 24 9,000 7g 8 3,000
90 2 700
95 1 400
100 0 0

-31)-
At f t g u r e 2 4 t h e f l o w d u r a t i o n c u r v e f o r t h e Kangaroo R i v e r a t Kangaroo
V a l l e y 1.41 ebown an4 f l o w d a t a c o r r e s p o n d i n g t o t h e c u r v e m e g i v e n i n the
f o l l o w i n g T a b l e 1.5.
TABLE 15.
P e r c e n t a g e o f Time f l o w Equalled
o r Exceeded
. Corresponding Flows
Cusecs G a l l o n s Per
Minute
10 ,
500 187,000
30 122 45,700
50 74 27,700
70 40 15,000
90 11 4,100
95 5 1,900
98 2 700
100 .
0.7 3 0 0 _
The f l o w d u r a t i o n c u r v e f o r t h e Shoalhaven R i v e r a t Welcome Reef is
appended a t F i g u r e 25 and t h e f l o w f r e q u e n c y s t a t i s t i c s f o r t h i s s t a t i o n are
g i v e n i n t h e f o l l o w i n g Table 16.
TABLE 16.
P e r c e n t a g e o f Time Flow Equalled
o r Exceeded
Corresponding Flows
Cusecs G a l l o n s Per
Minute .
10 900 337,000
30 265 99,000
50 131 49,000
70 70 26,200
90 30 11,200
95 17 6,400
100 0 • 0
WIli lst t h e f l o w d u r a t i o n c u r v e s shown a t F i g u r e s 21 t o 25 i n d i c a t e the
f r e q u e n c y o f v a r i o u s f l o w s a t t h e p a r t i c u l a r s t a t i o n s t h e y do n o t permit a
comparlson t o h e made o f t h e r e l a t i v e f l o w d u r a t i o n c h a r a c t e r i s t i c s o f the
v a r f o u s sup-catchments i n t h e valley.
To e n a b l e t h e s e comparisons t o be made, t h e f l o w d u r a t i o n c u r v e s f o r the
f l v e s t a t i o n s have been r e p l o t t e d i n t h e form o f d u r a t i o n c u r v e s o f f l o w per
square Tulle o f catchment a r e a and a r e shown a t F i g u r e 26.

'11—
The curves sbown A c j i , g u r e ; k 4 u 4 g 4 t e ' t h a t , o f t h e f i v e s e l e c t e d stations
t h e Kangaroo R i v e r ap Fanparpo V s / l e y exhib i ts by f a r t h e h i g h e s t persistence
o f f l o w . The h i g h r u n o f f - r e c o r d e d a t t h i s s t a t i o n i s a t t r i b u t e d t o t h e high
a v e r a g e annual r a i n f a l l _ n f n e a r l y _ s i x t y . i n c h e s o v e r t h e catchment and the
r e l a t i v e l y s t e e p topography o f t h e Kangaroo Valley.
The d u r a t i o n c u r v e s o f f l o w p e r square m i l e f o r t h e Endrick R i v e r at
Nowra Road and t h e Mongarlowe R i v e r a t Marlowe a r e v e r y s i m i l a r . T h i s result
i s t o be e x p e c t e d a s t h e catchments a r e l o c a t e d i n r e l a t i v e l y c l o s e proximity
t o each o t h e r and have g e n e r a l l y s i m i l a r topography.
The catchment o f t h e Corang R i v e r a t Hockeys i s s i t u a t e d between the
Endrick and Mongarlowe R t v e r catchments and c o u l d t h e r e f o r e be e x p e c t e d to
p r o v i d e s i m i l a r f l o w p e r s i s t e n c e c h a r a c t e r i s t i c s p e r u n i t a r e a o f catchment.
However a s i n d i c a t e d a t F i g u r e 26 f l o w f r e q u e n c i e s o f t h e Corang R i v e r at
Hockeys a r e s u b s t a n t i a l l y be low t h o s e o f t h e o t h e r a d j o i n i n g c a t c h m e n t s . This
d i f f e r e n c e i n f l o w c h a r a c t e r i s t i c s i s a t t r i b u t a b l e t o t h e d i f f e r e n t p e r i o d s of
r e c o r d a v a i l a b l e f o r t h e t h r e e s t a t i o n s , t h e f l o w f r e q u e n c i e s f o r t h e Corang
R i v e r a t Hockeys b e i n g based on 42 y e a r s o f r e c o r d , whereas t h e frequencies
f o r t h e Endrick R i v e r a t Nowra Road and t h e Mongarlowe R i v e r a t Marlowe are
b a s e d op 13 y e a r s and 21 y e a r s respectively.
The d u r a t i o n curve o f d i s c h a r g e f o r t h e Shoalhaven R i v e r a t Welcome Reef •
i s s u b s t a n t i a l l y be low t h o s e o f a l l t h e o t h e r s e l e c t e d s t a t i o n s . However as
t h e catchment a r e a above Welcome R e e f i s more than s i x t i m e s g r e a t e r than any
o f t h e opher catchments s t u d i e d and a s y i e l d s normal ly d e c r e a s e a s the
catchment a r e a i n c r e a s e s , t h i s r e s u l t i s t o be expected.
1 0 . OCCURRENCE OF FLOODTNG.
Major f l o o d s a r e p o t o f f r e q u e n t o c c u r r e n c e i n t h e Shoalhaven R i v e r Valley.
Upstream o f Nowra t h e r e a r e no major c e n t r e s o f p o p u l a t i o n l o c a t e d on the
Shoalhaven Ttiever and any f l o o d i n g which has occurred i n towns i n t h e upper
Shoalhaven V a l l e y i s due t o l o c a l i s e d runoff.

-12-
F l o o d i n g o f t h e low l y i n g a r e a s near Nowra has occurred a s a r e s u l t of
l o c a l heavy r a i n f a l l i n a s s o c i a t i o n w i t h minor f l o o d s i n t h e Shoalhaven River.
However, medium and major f l o o d s a t Nowra a r e m a i n l y due t o f l o o d r u n o f f s from
t h e upper Shoalhaven R i v e r catchment . Below Nowra f l o o d h e i g h t s a r e influenced
by t h e t i m i n g o f t h e f l o o d hydrograph i n r e l a t i o n t o t i d a l behaviour.
The d i s t r i b u t i o n and magni tudes o f f l o o d h e i g h t s g r e a t e r than f i f t e e n feet
( e q u i v a l e n t t o a d i s c h a r g e o f about 2 2 , 0 0 0 c u s e c s ) , which have been recorded for
t h e Shoalhaven R i v e r a t Welcome Reef o v e r t h e p e r i o d from 1909 t o 1966, are
i n d i c a t e d a t F i g u r e 2 7 . The h i g h e s t recorded f l o o d a t t h i s l o c a t i o n occurred
i n May, 1925 when t h e r i v e r reached a maximum gauge h e i g h t o f 55 f e e t 6 inches.
The e s t i m a t e d c o r r e s p o n d i n g peak d i s c h a r g e a t t h i s s t a t i o n was 3 1 3 , 0 0 0 cusecs
which i s e q u i v a l e n t t o a r u n o f f o f n e a r l y 300 c u s e c s p e r square mile.
No r e c o r d s a r e a v a i l a b l e f o r t h e May, 1925 f l o o d f o r t h e gauging stations'
a t Nowra Road, Marlowe o r Kangaroo V a l l e y . The e s t i m a t e d maximum d i s c h a r g e of
t h e C o r a n e R i v e r a t Hockeys dur ing t h i s f l o o d was about 1 7 , 0 0 0 c u s e c s which is
o n l y t h e f o u r t h h i g h e s t f l o o d recorded a t t h i s l o c a t i o n s i n c e 1924.
The second h i g h e s t f l o o d recorded a t Welcome Reef o c c u r r e d i n October , 1959
when a peak h e i g h t o f 42 f e e t 2 i n c h e s was r e c o r d e d . The e s t i m a t e d discharge
o f 1 6 4 , 0 0 0 c u s e c s correspond ing t o t h i s h e i g h t i s l i t t l e more than h a l f o f the
maximum May, 1925 d i s c h a r g e . Maximum d i s c h a r g e s recorded during t h e October,
1959 f l o o d a t o t h e r gauging s t a t i o n s i n t h e v a l l e y were o f major magnitudes.
At t h e s t a t i o n s l o c a t e d on t h e Mongarlowe R i v e r a t Marlowe and t h e Kangaroo
R i v e r a t Kangaroo V a l l e y t h e October , 1959 f l o o d was t h e h i g h e s t recorded over
t h e p e r i o d s o f a v a i l a b l e records.
D e t a i l s o f t h e e i g h t h i g h e s t f l o o d s recorded f o r t h e Shoalhaven River at
Welcome Reef from 1909 t o 1966 a r e given i n t h e f o l l o w i n g Table 17.
TABLE 17.
Month Maximum Flood Height
Es t imated Maximum Flow (Cusecs)
• May 1925 55 f t . 6 ins. 313,000
October 1959 42 f t . 2 ins. 164,000
October 1.916 40 f t . 0 ins. 130,000 A p r i l 1945 37 f t . 0 ins. 124,000
May 1943 31 f t . I ins. 85,000
June 1952 30 f t . 1 ins. 78,500
J u l y 1959 30 f t . 0 ins. 78,000
J u l y 1922 29 f t . 0 ins. 72,000

-33—
Because o f t h e 4amage which has been o c c a s i o n e d by p a s t f l o o d s , the
Shoalhaven S h i r e Counc i l i s a t p r e s e n t under tak ing a programme o f works (with
80 p e r c e n t o f t h e f i n a n c e b e i n g prov ided by t h e Commonwealth and State
Governments i n equa l s h a r e s ) , d e s i g n e d t o reduce i n f l o w o f f l o o d w a t e r s t o low
l y i n g land and t o improve d r a i n a g e o f f l o o d w a t e r s dur ing t h e f a l l i n g s t a g e s of
a f l o o d . The works comprise a sys tem o f low l e v e e s , d r a i n s and f l o o d g a t e s in
t h e f l o o d l i a b l e a r e a s downstream o f Nowra.
11 . DROUGHT PERIODS.
There does n o t appear t o be any s p e c i f i c d e f i n i t i o n o f t h e term "drought".
G e n e r a l l y i t i s c o n s i d e r e d t o be an ex tended p e r i o d o f low r a i n f a l l a t any
l o c a t i o n . However t h e c r i t e r i a used i n a s s e s s i n g i f an a r e a i s under drought
c o n d i t i o n s v a r y w i t h g e o g r a p h i c a l l o c a t i o n , average r a i n f a l l and normal crop
r e q u i r e m e n t s . For example a c o n t i n u o u s p e r i o d o f t w e l v e months w i t h low
r a i n f a l l s may be c o n s i d e r e d t o be a drought on a c o a s t a l catchment whereas
such r a i n f a l l s may be c o n s i d e r e d t o b e normal on an i n l a n d catchment.
I n g e n e r a l an a r e a i s c o n s i d e r e d t o be under drought c o n d i t i o n s when
t h e s o i l m o i s t u r e i s i n s u f f i c i e n t f o r t h e requirements o f t h e r a j o r i t y of
c rops dur ing t h e growing s e a s o n o r when w a t e r s h o r t a g e s f o r d o m e s t i c , industrial
o r m u n i c i p a l purposes a r e e x p e r i e n c e d . A prime i n d i c a t o r , o f drought conditions
i s a d i m i n i s h e d o r exhaus ted r a t e o f streamflow.
Graphs showing a v e r a g e annual r a i n f a l l s a t Robertson and Nowra and at
Mount F a i r y and Braidwood a r e g i v e n a t F i g u r e s 28 and 29 r e s p e c t i v e l y . These
graphs i n d i c a t e t h a t t h e l o w e s t c a l e n d a r y e a r r a i n f a l l s a t Braidwood and Nowra
were 1 5 . 4 7 i n c h e s and 2 0 . 6 2 i n c h e s i n 1944 and 1895 r e s p e c t i v e l y . I n addition
t h e graphs show t h a t t h e l o n g e s t p e r i o d o f below average r a i n f a l l a t the
m a j o r i t y o f t h e s t a t i o n s appeared t o o c c u r from about 1901 t o 1911 and this
would seem t o be t h e most c r i t i c a l drought p e r i o d f o r t h e Shoalhaven Valley
s i n c e r e c o r d s commenced i n 1887 a t Braiduood.
However, a second p e r i o d o f low r a i n f a l l occurred from about 1935 t o 1944
and t h i s p e r i o d was a lmost a s s e v e r e p a r t i c u l a r l y i n c o a s t a l s e c t i o n s o f the
v a l l e y . As i n d i c a t e d a t F i g u r e s 28 and 29 o t h e r s h o r t e r p e r i o d s of

34
be low average r a i n f a l l have o c c u r r e d but t h e s e have been a l l e v i a t e d somewhat
by above a v e r a g e r a i n f a l l s dur ing p r e c e d i n g o r f o l l o w i n g years.
A f e a t u r e o f t h e annual r a i n f a l l graphs i s t h e r e l a t i v e r e l i a b i l i t y of
r a i n f a l l a t Robertson ( F i g u r e 2 8 ) . I n a d d i t i o n t o t h e h i g h average rainfall
o f n e a r l y 6 4 i n c h e s , y e a r s o f be low a v e r a g e r a i n f a l l do n o t ex tend for
s i g n i f i c a n t p e r i o d s , t h e l o n g e s t p e r i o d o f be low average r a i n f a l l b e i n g only
about s i x y e a r s (1905 - 1 9 1 0 ) . However, dur ing t h i s s i x y e a r p e r i o d the
a v e r a g e r a i n f a l l was about 45 i n c h e s which was s o d i s t r i b u t e d dur ing the
p e r i o d t o be adequate f o r most a g r i c u l t u r a l purposes.
S i n c e t h e commencement o f r e g u l a r r e c o r d i n g o f s treamf lows o f the
Mongarlowe R i v e r a t Marlowe i n 1945 t h e minimum t w e l v e monthly f l o w occurred
from October , 1964 t o September, 1965 and was 1 6 , 4 0 0 a c r e f e e t . T h i s flow
c o r r e s p o n d s t o o n l y 9 p e r c e n t o f t h e average annual d i s c h a r g e a t t h i s station.
At t h e gaug ing s t a t i o n l o c a t e d on t h e Corang R i v e r a t Hockeys t h e minimum
f l o w dur ing a t w e l v e month p e r i o d was o n l y 3 , 1 0 0 a c r e f e e t (from March, 1941
t o February, 1942) o r 5 p e r c e n t o f t h e average annual f l o w recorded a t this
l o c a t i o n s i n c e 1924.
The minimum t w e l v e monthly d i s c h a r g e o f t h e Endrick R i v e r a t Nowra Road
s i n c e 1953 was about 7 , 1 0 0 a c r e f e e t from October , 1964 t o September, 1965.
T h i s d i s c h a r g e corresponds t o about 7 p e r c e n t o f t h e average annual flow.
The gaug ing s t a t i o n l o c a t e d on t h e Kangaroo R i v e r a t Kangaroo V a l l e y was
e s t a b l i s h e d i n J u l y , 1954 and s i n c e t h a t d a t e t h e minimum t w e l v e monthly flow
was about 24,-000 a c r e f e e t from September, 1064 t o August , 1965. As the
a v e r a g e annual f l o w a t t h i s s t a t i o n i s o f t h e order o f 2 3 0 , 0 0 0 a c r e f e e t the
minimum t w e l v e monthly f l o w corresponds t o about 11 p e r c e n t o f t h e average.
Over t h e p e r i o d o f a v a i l a b l e r e c o r d s from 1909 f o r t h e Shoalhaven River
a t Welcome Reef t h e l o w e s t f l o w o v e r any p e r i o d o f t w e l v e s u c c e s s i v e months
h a s been 3 7 , 1 0 0 a c r e f e e t from December 1939 t o November 1940 a s compared
w i t h t h e f l o w o f 8 5 , 5 0 0 a c r e f e e t from February 1965 t o January 1966 . These
f l o w s a r e e q u i v a l e n t t o o n l y 8 p e r c e n t and 18 p e r c e n t r e s p e c t i v e l y o f t h e aver-
a g e annual flow.
The minimum t w e l v e monthly f l o w s a t s e l e c t e d s t a t i o n s i n t h e Shoalhaven
R i v e r V a l l e y and t h e i r p e r c e n t a g e s o f t h e r e s p e c t i v e a v e r a g e annual f l o w s at
t h e s t a t i o n s a r e g i v e n i n t h e f o l l o w i n g Table 18.

-35-
TABLE 18.
Stream. Station
Minimum Twelve Monthly Flow
Period Acre Feet Percentage of Mean Annual
Flow
Mongarlowe River
Marlowe Oct . 1964 to S e p t . 1965
4
16,400 97.
Corang River Hockeys March;: 1941 t o F e t . 1942
3,100 57.
Endrick River Nowra Road O c t . 1964 to S e p t . 1965
7,100 77.
Kangaroo River
Kangaroo Valley S e p t . 1964 t o Aug. 1965
24,000 11%
Shoalhaven River
Welcome Reef Dec . 1939 to Nov. 1940
37,100 87.
As p r e v i o u s l y i n d i c a t e d , s t reamf lows i n t h e Shoalhaven R i v e r V a l l e y are
r e l a t i v e l y p e r s i s t e n t . An i n d i c a t i o n o f t h i s p e r s i s t e n c y can be o b t a i n e d by
c o n s i d e r a t i o n o f p e r i o d s o f z e r o f l o w , i f any , recorded a t each gaug ing station.
Over t h e p e r i o d o f a v a i l a b l e r e c o r d s f o r t h e Shoalhaven R i v e r a t Welcome
R e e f from 1909 t o d a t e t h e r e have been s e v e r a l p e r i o d s o f z e r o f l o w , t h e most
pro longed b e i n g o f 76 days d u r a t i o n from December, 1918 t o February, 1919.
However t h e t o t a l p e r c e n t a g e o f t ime dur ing which no f l o w h a s occurred a t this
s t a t i o n i s l e s s than one percent.
The l o n g e s t p e r i o d o f z e r o ,f low e x p e i i e n c e d on t h e Corang R i v e r a t Hockeys
s i n c e 1924 was 97 days from November, 1928 t o February, 1929. At t h i s station 4,
t h e t o t a l p e r c e n t a g e o f t i m e d u r i n g which no f l o w has occurred i s about 31/2
percent.
The s t a t i o n on t h e Endrick R i v e r p t Nowra Road was e s t a b l i s h e d i n July,
1953 and s i n c e t h a t d a t e t h e r e have been o n l y f o u r t e e n days o f z e r o f l o w which
c o r r e s p o n d s t o o n l y about 0 . 3 p e r c e n t o f t h e t o t a l time.
At t h e s t a t i o n s l o c a t e d on t h e Mongarlowe R i v e r a t Marlowe and on the
Kangaroo R i v e r a t Kangaroo V a l l e y t h e r e have been no p e r i o d s o f z e r o flow
o v e r t h e t o t a l p e r i o d s o f record.
The minimum t h i r t y day and s i x t y day volumes o f f l o w which have been
recorded a t t h e f i v e s e l e c t e d s t a t i o n s a r e shown i n t h e f o l l o w i n g Table 19.

-36-
TABLE 19
Stream Station
Minimum Recorded Flow (Acre Feet)
T h i r t y Days S i x t y Days
Mongarlowe River Marlowe 195 452 (Dec . 1954 to (Dec . 1954 to
Jan. 1955) Jan. 1955)
Corang River Hockeys 0 0 (Nov. 1928 to (Nov. 1928 to Feb . 1929) Feb. 1929)
Endrick River Nowra Road 11 77 (March t o April (Feb . t o April
1965) 1965)
Kangaroo River Kangaroo Valley 63 213 (March t o April (Feb . t o April
1965) 1965)
Shoalhaven River Welcome Reef 0 0 (Dec . 1918 to (Dec . 1918 to
Feb. 1919) Feb. 1919) I
As i n d i c a t e d i n Table 19 t h e minimum t h i r t y and s i x t y day volumes recorded
on t h e Endrick R i v e r a t Nowra Road and t h e Kangaroo R i v e r a t Kangaroo Valley
occurred d u r i n g 1965. However t h e s e s t a t i o n s were n o t e s t a b l i s h e d u n t i l 1953
and 1954 r e s p e c t i v e l y and t h e r e f o r e t h e r e c o r d s do n o t c o v e r e a r l i e r critical
drought periods.
1 2 . THE 1964-1966 DROUGHT.
From l a t e 1964 t o e a r l y 1966 a p e r i o d o f e x t r e m e l y low r a i n f a l l was
e x p e r i e n c e d i n t h e Shoalhaven R i v e r V a l l e y . At Nowra t h e t w e l v e monthly
r a i n f a l l from October , 1964 t o September, 1965 i n c l u s i v e was 2 1 . 9 0 inches
which i s about 43 p e r c e n t g r e a t e r than t h e minimum r a i n f a l l o v e r a twelve
month p e r i o d recorded a t t h i s l o c a t i o n s i n c e 1896.
The minimum t w e l v e monthly r a i n f a l l a t Braidwood during t h e 1964-1966
drought was 1 4 . 2 3 i n c h e s from September, 1964 t o August , 1965, t h i s rainfall
b e i n g about 33 p e r c e n t g r e a t e r than t h e minimum t w e l v e monthly rainfall
recorded o v e r a p e r i o d o f 80 years.
The recorded monthly r a i n f a l l s a t Braidwood, Robertson and Nowra over
t h e p e r i o d from J u l y , 1964 t o June, 1967 a r e shown i n Table 20.

-37-
TABLE 20
Month R a ' a f a l l (Points)
Braidwood Robertson Nowra
J u l y 1964 201 84 46 .. A u g u s t 1964 291 282 216
S e p t e m b e r 1964 174 200 146
O c t o b e r 1964 399 378 300
November 1964 153 276 148
December 1964 253 174 256
J a n u a r y 1965 7 113 154
F e b r u a r y 1965 53 121 65
March 1965 1 44 6
A p r i l 1965 44 521 336
May 1965 31 213 216
J u n e 1965 154 422 279
J u l y 1965 86 484 292
Augus t 1965 68 78 45
S e p t e m b e r 1965 279 354 93
O c t o b e r 1965 603 1,273 765
November 1965 62 127 70
December 1965 276 487 386
J a n u a r y 1966 81 145 84
F e b r u a r y 1966 374 846 313
March 1966 146 898 298
A p r i l 1966 13 124 39
May 1966 91 61 29
J u n e 1966 335 1,044 626
J u l y 1966 118 142 106
Augus t 1966 152 282 133
S e p t e m b e r 1966 261 427 215
O c t o b e r 1966 393 585 451
November 1966 598 2,101 857
December 1966 746 449 345
J a n u a r y 1967 321 793 588
F e b r u a r y 1967 44 300 161
March 1967 159 772 257
A p r i l 1967 26 135 91
May 1967 106 153 83
J u n e 1967 158 1,365 535
Totals O c t o b e r 1964 t o September 1965 1,528 3,178 2,190
Totals J u l y 1964 t o J u n e 1967 7,257 16,253 9,030

-38-
C r i t i c a l l y low f l o w s o f e x t e n d e d d u r a t i o n w e r e e x p e r i e n c e d i n s t r e a m s in
t h e S h o a l h a v e n R i v e r V a l l e y d u r i n g t h e y e a r s 1964 t o 1966, The minimum twelve
m o n t h l y f l o w s r e c o r d e d a t t h e s t a t i o n s a t Marlowe, Hockeys , Nowra Road,
Kangaroo V a l l e y and Welcome R e e f a r e shown i n t h e f o l l o w i n g T a b l e 21,
TABLE 21,
Stream
i
Station
Minimum Twelve Month ly F low During 1964-66 Drought
Period A c r e Feet P e r c e n t a g e of Mean Annua l Flow
Mongarlowe River
Marlowe O c t . 1964 to S e p t . 1965
16,400 9%
Corang River
Hockeys Dec . 1964 to Nov. 1965
3,200 57.
Endrick River
Nowra Road O c t . 1964 to S e p t . 1965
7,100 77.
Kangaroo River
Kangaroo Valley
S e p t . 1964 to Aug. 1965
24,000 117.
Shoalhaven River
Welcome Reef F e b . 1965 to J a n . 1966.
85,500 18%
Compar i son o f t h e t w e l v e m o n t h l y d i s c h a r g e s shown i n t h e foregoing
T a b l e 21 w i t h t h e minimum t w e l v e m o n t h l y f l o w s g i v e n i n T a b l e 18 i n S e c t i o n 11
shows t h a t o v e r a t w e l v e month p e r i o d t h e d i s c h a r g e s r e c o r d e d a t Marlowe, Nowra
Road a n d Kangaroo V a l l e y d u r i n g t h e 1964-1966 d r o u g h t w e r e t h e l o w e s t recorded
s i n c e commencement o f r e c o r d s a t t h e s e locations.
I n a d d i t i o n t h e minimum 1964-1966 d r o u g h t p e r i o d d i s c h a r g e o v e r twelve
m o n t h s a t Hockeys was a b o u t 3 , 2 0 0 a c r e f e e t o r o n l y a b o u t 100 a c r e f e e t greater
t h a n t h e minimum r e c o r d e d a t t h i s l o c a t i o n s i n c e 1924. However t h e minimum
t w e l v e m o n t h l y f l o w o f t h e S h o a l h a v e n R i v e r a t Welcome R e e f d u r i n g t h e 1964-1966
d r o u g h t was more t h a n d o u b l e t h e minimum f l o w o f 3 7 , 0 0 0 a c r e f e e t r e c o r d e d during
t h e y e a r s 1939-1940.
A l l s t r e a m s i n t h e v a l l e y e x p e r i e n c e d e x t r e m e l y low o r z e r o f l o w s during
t h e 1964-1966 d r o u g h t p e r i o d . A s c h e d u l e o f t h e minimum t h i r t y d a y and sixty
d a y d i s c h a r g e s a t Mar lowe, Hockeys , Nowra Road, Kangaroo V a l l e y and Welcome
R e e f i s g i v e n i n T a b l e 22.

-39—
TABLE 22.
Stream
-
Station
Min imum T o t a l F l o w During 1 9 6 4 — 1966 ( A c r e Feet)
T h i r t y Days S i x t y Days
M o n g a r l o w e River
C o r a n g River
E n d r i c k River
K a n g a r o o River
S h o a l h a v e n River
Marlowe
Hockeys
N o w r a Road
K a n g a r o o Valley
W e l c o m e Reef
250
0
11
63
1,750
1,080
3
77
213
4,500
C o m p a r i s o n o f T a b l e 22 w i t h T a b l e 19 g i v e n i n S e c t i o n 11 s h o w s that,
w i t h t h e e x c e p t i o n o f t h e s t a t i o n a t W e l c o m e R e e f , m i n i m u m t h i r t y a n d sixty
d a y f l o w s d u r i n g t h e 1 9 6 4 - 1 9 6 6 d r o u g h t , e i t h e r e q u a l l e d o r a p p r o a c h e d the
m i n i m u m c o r r e s p o n d i n g d i s c h a r g e s r e c o r d e d a t a l l t h e stations.
T h e 1 9 6 4 - 1 9 6 6 d r o u g h t c o n d i t i o n s w e r e a l l e v i a t e d b y t h e o c c u r r e n c e of
a b o v e a v e r a g e r a i n f a l l s i n O c t o b e r , 1 9 6 5 w h e n o v e r s i x , s e v e n a n d t w e l v e inches
w e r e r e c o r d e d a t B r a i d w o o d , Nowra a n d R o b e r t s o n r e s p e c t i v e l y . A d d i t i o n a l above
a v e r a g e r a i n f a l l s o c c u r r e d i n D e c e m b e r , 1 9 6 5 a n d F e b r u a r y , 1 9 6 6 a n d r e s u l t e d in
a p p r e c i a b l . e i n c r e a s e s i n f l o w s i n a l l s t r e a m s i n t h e valley.
S i n c e F e b r u a r y , 1 9 6 6 , r a i n f a l l i n t h e S h o a l h a v e n V a l l e y h a s b e e n adequate
f o r m o s t a g r i c u l t u r a l p u r p o s e s . D e t a i l s o f r e c e n t s t r e a m f l o w measurements
o b t a i n e d a t t h e g a u g i n g s t a t i o n s l o c a t e d a t M a r l o w e , H o c k e y s , Nowra Road,
K a n g a r o o V a l l e y a n d W e l c o m e R e e f a r e g i v e n i n t h e f o l l o w i n g T a b l e 23.
TABLE 23.
Stream Station D a t e of Measurement
M e a s u r e d Flow (Cusecs)
M o n g a r l o w e River Marlowe 29.5.1967 18
C o r a n g River Hockeys 29.5.1967 3
E n d r i c k River N o w r a Road 29.5.1967 5
K a n g a r o o River K a n g a r o o Valley 1.6.1967 23
S h o a l h a v e n River W e l c o m e Reef 29.5.1967 79
1 3 . WATER REQUIREMENTS FOR CURRENT DEVELOPMENT.
I n t e n s i v e d a i r y i n g i n t h e c o a s t a l s e c t i o n o f t h e v a l l e y a n d t h e grazing
o f s h e e p f o r w o o l a n d m u t t o n i n t h e i n l a n d s e c t i o n s a r e t h e m a i n rural
a c t i v i t i e s i n t h e S h o a l h a v e n R i v e r V a l l e y ; s e c o n d a r y r u r a l a c t i v i t i e s are
t h e g r o w i n g o f f o d d e r a n d t h e g r a z i n g o f c a t t l e . C u r r e n t l y t h e biggest
i n d u s t r i a l u s e i s b y t h e W i g g i n s T e a p e S h o a l h a v e n P a p e r M i l l w h i c h h a s a daily
w a t e r r e q u i r e m e n t o f a b o u t 311 m i l l i o n gallons.

-40—
The a r e a a u t h o r i s e d f o r i r r i g a t i o n under t h e Water Act has increased
from 333 a c r e s a t J u n e , 1945 t o about 3 , 1 0 0 a c r e s a t June , 1967 and t h e total
number o f i r r i g a t i o n l i c e n s e s h a s i n c r e a s e d from 18 i n 1945 t o 118 i n 1967.
The a r e a p r e s e n t l y a u t h o r i s e d f o r i r r i g a t i o n i s b y f k r t h e g r e a t e s t area
l i c e n s e d i n t h e Shoalhaven R i v e r V a l l e y , b e i n g some 600 a c r e s above t h e next 4
h i g h e s t l i c e n s e d area o f 2 , 5 0 0 a c r e s i n 1959 . The v a r i a t i o n i n t h e total
number o f i r r i g a t i o n l i c e n s e s and correspond ing a r e a s o v e r t h e p e r i o d from
J u n e , 1945 t o June , 1967 i s shown a t F igure 30.
The average a r e a p e r l i c e n s e has remained r e l a t i v e l y c o n s t a n t a t about
20 a c r e s s i n c e 1945, and a t June , 1967 was 27 a c r e s p e r license.
W h i l s t t h e r e a r e no major w a t e r c o n s e r v a t i o n o r f l o o d m i t i g a t i o n storages
c o n s t r u c t e d i n t h e Shoalhaven R i v e r V a l l e y t h e r e a r e a number o f minor
s t o r a g e s c o n s t r u c t e d f o r town w a t e r supp'y purposes.
The Wingecarr ibee S h i r e Counc i l has c o n s t r u c t e d a c o n c r e t e a r c h dam of
maximum h e i g h t 100 f e e t o v e r Bundanoon Creek. T h i s s t o r a g e , which was
comple ted i n 1959, has a maximum c a p a c i t y o f 450 m i l l i o n g a l l o n s ( 1 , 6 5 0 acre
f e e t ) and p r o v i d e s w a t e r s u p p l i e s t o Moss V a l e , Bundanoon, E x e t e r , Berrima
and S u t t o n Forest.
The Shoalhaven S h i r e Counc i l has c o n s t r u c t e d two minor dams f o r water
s u p p l y purposes i n t h e c o a s t a l s e c t i o n o f t h e v a l l e y . The l a r g e s t o f these
s t o r a g e s , which i s l o c a t e d on F l a t Rock Creek, r e t a i n s a maximum s t o r a g e volume
o f 140 m i l l i o n g a l l o n s ( 5 1 5 a c r e f e e t ) . The o t h e r s t o r a g e i s t h e Cambewarra
Dam w i t h a maximum c a p a c i t y o f about 9 m i l l i o n g a l l o n s ( 3 3 a c r e feet).
, I n a d d i t i o n t h e Shoalhaven S h i r e Counc i l pumps w a t e r from t h e Shoalhaven
R i v e r a t B u r n e r f o r domes t i c and i n d u s t r i a l p u r p o s e s , t h e maximum pumping
r a t e b e i n g 7 , 3 0 0 g a l l o n s p e r m i n u t e . The Shoalhaven S h i r e Counci l proposes to
c o n s t r u c t a s t o r a g e o f c a p a c i t y 2 , 3 0 0 m i l l i o n g a l l o n s ( 8 , 5 0 0 a c r e f e e t ) on
Danjera Creek n e a r Yalwal f o r w a t e r supp ly purposes.
Water supp ly f o r t h e town o f Braidwood i s o b t a i n e d by pumping a t a rate
o f 200 g a l l o n s p e r minute from t h e Shoalhaven R i v e r a t a p o i n t about 41/2 miles
w e s t o f t h e town. The town o f Kangaroo V a l l e y has been s i m i l a r l y prov ided with
w a t e r s u p p l i e s by pumping from t h e Kangaroo R i v e r ( t h e works b e i n g completed in
October 1956) a t a maximum r a t e o f 500 g a l l o n s p e r minute.

-41-
The e s t i m a t e d maximum requirements i n t h e Shoalhaven R i v e r V a l l e y under
p r e s e n t c o n d i t i o n s f o r i r r i g a t i o n under l i c e n s e , w a t e r supply and riparian
u s a g e ( n o t i n c l u d i n g t r a n s m i s s i o n l o s s e s ) a r e g i v e n i n Table 24.
TABLE 24.
Requirement -
Cusecs Acre Feet p e r Annum
I r r i g a t i o n under l i c e n s e (3,140 a c r e s a t 2 f e e t p e r 8 month season)
13 9,500
Town, commercial and s t o c k water supplies
48 35,000
R i p a r i a n usage 51 37,200
Totals 112 81,700 _
As i n d i c a t e d i n Table 2 4 t h e r e i s a l i m i t e d demand f o r i r r i g a t i o n i n the
Shoalhaven R i v e r V a l l e y , t h e i r r i g a t i o n demand r e p r e s e n t i n g o n l y about nine
p e r c e n t o f t h e e s t i m a t e d maximum t o t a l demand e x c l u s i v e o f transmission
losses.
The a r e a s a u t h o r i s e d f o r i r r i g a t i o n on t h e Shoalhaven R i v e r and its
t r i b u t a r i e s a t 3 0 t h June , 1967 and t h e e s t i m a t e d t o t a l demands f o r each
t r i b u t a r y and s e l e c t e d s e c t i o n s o f t h e Shoalhaven R i v e r ( i n c l u d i n g town and
i n d u s t r i a l w a t e r s u p p l i e s and r i p a r i a n usage but e x c l u d i n g t r a n s m i s s i o n losses)
a r e shown i n Table 25.

-42-
TABLE 25.
Stream
Area Authorised f o r I r r i g a t i o n at 3 0 t h J u n e , 1967
(Acres)
T o t a l Demand
Cusecs Acre Feet p e r Annum
Brundee Swamp 20 0.5 370
F l a t Rock Creek - 1.5 1,100
B a r r i n g e l l a Creek 17 0.2 140
Broughton Creek 432 3.8 2,800
Bomaderry Creek 70 2.5 1,800
Bugong Creek 60 0.5 370
Kangaroo River 1,718 16.6 12,100
Joarima Creek - 0.8 580
Bugonia Creek 8 1.2 880
Shoalhaven R i v e r below 55 46.3 33,800 Endrick River
Endrick River - 4.0 2,900
Bindee Brook 21 0.4 290
Mongarlowe River 75 4.7 3,400
Shoalhaven R i v e r between - 1.6 1,200 Mongarlowe and Endrick Rivers
Corang River 20 1.4 1,000
Bombay and Gi l lamatong Creeks 47 1.4 1,000
Jembaicumbene Creek 15 0.5 370
Shoalhaven R i v e r below 575 21.1 15,400 Jembaicumbene Creek to Mongarlowe River
Shoalhaven R i v e r above 10 3.0 2,200 Jembaicumbene Creek
- Totals 3443 112.0 81,700
The f o r e g o i n g r e q u i r e m e n s g i v e n i n Table 25 o n o t i n c l u d e any allowance
f o r t r a n s m i s s i o n l o s s e s 4ue t o e v a p o r a t i o n from t h e stream s u r f a c e and
s e e p a g e i n t o t h e bed and banks o f each c h a n n e l . These l o s s e s , which can be of
s u b s t a n t i a l magni tudes p a r t i c u l a r l y dur ing drought p e r i o d s , a r e r e l a t e d t o flow
l e v e l s i n t h e s tream c h a n n e l s and groundwater c o n d i t i o n s and t h e r e f o r e can be
e x p e c t e d t o vary w i d e l y depending on a n t e c e d e n t m e t e o r o l o g i c a l conditions.
14 . POSSIBLE IRRIGATION DEVELOPMENT.
P r o v i s i o n o f an a s s u r e d w a t e r supply would e n a b l e t h e p r e s e n t production
o f v e g e t a b l e s , p a s t u r e and fodder c r o p s t o be i n c r e a s e d by more intensive
irrigation.

-43-
The a r e a s which appear s u i t a b l e f o r i r r i g a t i o n h a v e been determined with
t h e a s s i s t a n c e o f a e r i a l photographs . The e x t e n t o f a r e a s a s s e s s e d as
s u i t a b l e f o r i r r i g a t i o n i s summarised i n T a b l e 26 below:-
TABLE 26
Name o f Stream A s s e s s e d Area Suitable f o r i r r i g a t i o n (Acres)
Shoalhaven Rivers
. Above Jemimicumbene Creek confluence
J u n c t i o u Jembaicumbene Creek t o junction MOngarPowe River
• . , J u n c t i o n MOD8 a r l o w e R i v e r t o junction Ithdrick River
• J u n c t i o n Endrick R i v e r t o l i m i t o f tidal influence
, L i m i t ' o f t i d a l i n f l u e n c e t o Nowra
Below Nowra
T r i b u t a r i e s o f Shoalhaven River:
Crookhaven Creek Jembaicumbene Creek and tributaries Bombay Creek and tributaries G i l l e m a t e n g Creek Durran Durra Creek and tributaries Reedy Creek and tributaries Bore Creek and tributaries !fangarlowe Wor' Corang R i v e r and tributaries Kangaroo R i v e r and tributaries Bomaderry c r e e k and tributaries Breughton Creek and tributaries Remaining tributaries
3.300
1,950
100
50
1,400
4.500
1,500 3,700
800 2,400 1,100 2,300 1,500
800 600
3,400 700
4,600 5,300
TOTAL 40,000
A f a c t o r which c o u l d govern t h e e x t e n t and r a t e o f i r r i g a t i o n development
i s t h e u n f a v o u r a b l e d i s t r i b u t i o n o f s u i t a b l e and i r r i g a b l e a r e a s . Of the
t o t a l a r e a o f 4 0 , 0 0 0 a c r e s a s s e s s e d a s b e i n g s u i t a b l e f o r irrigation,
a p p r o x i m a t e l y 6 , 0 0 0 a c r e s l i e w i t h i n t h e t i d a l i n f l u e n c e which e x t e n d s 30
m i l e s upstream from t h e c o a s t t o B u r n e r . E f f e c t i v e development o f irrigation
i n t h i s a r e a would be dependent upon t h e p r o v i s i o n o f a f r e s h w a t e r supp ly by
c o n s t r u c t i o n o f b a r r a g e s on t h e lower r i v e r o r by conveyance o f w a t e r t o the
i r r i g a b l e a r e a s by pipeline.
Due t o t h e n a t u r e o f t h e main r i v e r channe l c o n s t r u c t i o n o f a barrage on
t h e r i v e r proper would b e e x t r e m e l y c o s t l y and would i n t r o d u c e f l o o d drainage
and n a v i g a t i o n a l difficulties.
C o n s i d e r a b l e a r e a s on t h e Shoalhaven R i v e r be low Nowra and on Broughton
and Crookhaven Creeks a r e f l o o d l i a b l e . Because o f t h e n a t u r e o f t h e drainage

-44—
p a t t e r n w i t h i n t h e S h o a l h a v e n C a t c h m e n t , a s i g n i f i c a n t p r o p o r t i o n o f t h e areas
s u i t a b l e f o r i r r i g a t i o n l i e o n s m a l l e r s t r e a m s which command o n l y m i n o r catch—
m e n t s p o s s e s s i n g l i m i t e d s t r e a m f l o w potential.
15. INVESTIGATION OF STORAGE PROPOSALS.
When c o n s i d e r a t i o n was i n i t i a l l y g i v e n t o t h e c o n s t r u c t i o n o f a major
s t o r a g e dam on t h e Shoalhaven R i v e r i t was e n v i s a g e d a s a multi-purpose
p r o j e c t i n c l u d i n g n o t o n l y t h e p r o v i s i o n o f w a t e r f o r i r r i g a t i o n but a l s o for
t h e town o f Nowra and o t h e r c e n t r e s o f populat iOn. I n a d d i t i o n t h e r e also
e x i s t s .a c o n s i d e r a b l e p o t e n t i a l f o r h y d r o - e l e c t r i c power generation.
T h i s s i t u a t i o n l e d t o t h e c o n s t i t u t i o n o f t h e Shoalhaven R i v e r Water
Supply I n v e s t i g a t i o n Committee i n 1947 f o r t h e purpose o f i n v e s t i g a t i n g and
r e p o r t i n g upon p r o p o s a l s f o r t h e u t i l i s a t i o n o f w a t e r from t h e Shoalhaven Riven
2 The Committee recommendel t h a t t h e then f i v e l o c a l C o u n c i l s i n the
SpoaIhayep Area shou ld c o n s i d e r a d i s t r i c t w a t e r supply scheme w i t h the
Shoalhavep R i v e r a s t h e main s o u r c e o f s u p p l y . Such a scheme w Ø approved by
t h e Shoalhaven S h i r e ' C o u n c t l s h o r t l y a f t e r i t s i n a u g u r a t i o n i n 1948.
T h i s Committee, l u r i n g t h e p e r i o d 1947-52 , gave c o n s i d e r a t i o n t o a scheme
i n v o l v i n g t h e c o n s t r u c t i o n o f a s t o r a g e 4am a t D e v i l ' s Bridge ( o r alternatively
Welcome R e e f ) , s u p s i l i a r y s t o r a g e s on t h e EndricAhand Corang .Rivers , a tunnel
19 m i l e s i n l e n g t h t o t h e head o f Conjo la Creek t 9 g e t h e r w i t h t h e necessary
b a l a n c i n g s t o r a g e , p r e s s u r e p i p e s t o power s ta t ton ' s and g r a v i t a t i o n mains to
s e r v i c e r e s e r v o t r s . The scheme a l s o e n v i s a g e d t h e r e t i c u l a t i o n o f w a t e r to
h y d r o - e l e c t r t c g e n e r a t i n g s a t i o n s and t o towns and farms on t h e c o a s t a l strip
between Ktama a n l Ulladulla.
The Commtttee, i n i t s i n v e s t i g a t i o n s , p a i d regard t o t h e expected
economics o f h y d r o - e l e c t r i c power g e n e r a t i o n t o g e t h e r w i t h t h e l i k e l y revenue
from w a t e r i n t h e Local Government a r e a s o f Nowra, Cambewarra, U l l a d u l l a , Clyde,
Berry , Broughton V a l e , Gerrtngong, Kiama, Jamberoo, S h e l l h a r b o u r , North
I l l a w a r r a and Wollongong. (These a r e a s l a t e r became t h e Shoalhaven Shire,
Ktama and S h e l l h a r b o u r M u n i c i p a l i t i e s and t h e C i t y o f Grea ter Wollongong).
I n a d d i t i o n t h e Committee c a r r i e d o u t an economic survey o f t h e a r e a and
as a consequence conc luded t h a t w i t h some i r r i g a t i o n on each farm and a
dependable s t o c k w a t e r s u p p l y , an a p p r e c i a b l e i n c r e a s e i n p r o d u c t i o n and a
s t a b i l i s a t i o n o f t h e d a i r y i n d u s t r y might be expected.

-45-
Al though c o n s i d e r a t i o n was g i v e n a t t h e t ime t o t h e p o s s i b i l i t y of
s h a r i n g t h e c o s t o f s t o r a g e w i t h t h e M e t r o p o l i t a n Water Sewerage and Drainage
Board, t h e Board d i d n o t have any immediate need f o r w a t e r from t h e Shoalhaven
R i v e r . However by 1960 t h e Board found i t n e c e s s a r y t o c o n s i d e r t h e means by
which t h e demand o f t h e r a p i d l y growing I l l a w a r r a D i s t r i c t c o u l d be supplemented
and, h a v i n g conc luded t h a t t h e Shoalhaven V a l l e y was t h e o b v i o u s f u t u r e source
o f s u p p l y , a sked t h e Government t o reconvene t h e Committee. T h i s was done in
September 1960.
I n October , 1963 t h e Committee submi t t ed i t s r e p o r t t o t h e M i n i s t e r for
C o n s e r v a t i o n c o n c l u d i n g amongst o t h e r t h i n g s t h a t , prov ided adequate water
s u p p l i e s were r e s e r v e d f o r s t o c k and l i c e n s e d i r r i g a t i o n p u r p o s e s , t h e aspect
o f g r e a t e s t importance i n t h e development o f t h e s u r f a c e w a t e r r e s o u r c e s of
t h e Shoalhaven V a l l e y i s t h e p r o v i s i o n o f s u p p l i e s t o meet t h e p r e s e n t and
f u t u r e d o m e s t i c and i n d u s t r i a l needs o f t h e v a l l e y and t h e r a p i d l y expanding
I l l a w a r r a D p i t 4 c t . Broa44y he Committee recommended t h a t t h e Metropolitan
Water Sewerage and Orainage Hoard shou ld be p e r m i t t e d t o d i v e r t some water
sub. lect po s u i t a b l e p r o v i s i o n b e i n g made for:
( a ) s t o c k and domes t i c w a t e r supplies;
( 0 ) town w a t e r s u p p l i e s o t h e r than t h o s e i n t h e Shoalhaven Shire;
( c ) a r e a s i r r i g a t e d from pumps l i c e n s e d under P a r t I I o f t h e Water Act;
( d ) s p e c i a l requ irements o f t h e Shoalhaven S h i r e due t o a contractual
o b l i g a t i o n t o a paper mill.
I n r e s p e c t oF t h e requirements o f t h e M e t r o p o l i t a n Water Sewerage and
Drainage Board, t h e I n v e s t i g a t i n g Committee concerned i t s e l f p r i m a r i l y w i t h the
South Coast a r e a on t h e b a s i s t h a t t h e Board's a l l o c a t i o n o f w a t e r from the
Shoalhaven V a l l e y t o meet i t s requirements i n t h e Sydney M e t r o p o l i t a n Area would
be s u b s e q u e n t l y recommended hy a f u t u r e Committee. The Board ' s investigations
have conf irmed t h a t t h e i n c r e a s i n g m e t r o p o l i t a n requ irements c o u l d necessitate
s u b s t a n t i a l u t i l i s a t i o n o f w a t e r from t h e Shoalhaven River.
The Commission's l o n g term programme e n v i s a g e s c o n s t r u c t i o n o f storages
f o r i r r i g a t i o n and domes t i c and s t o c k purposes a t an e s t i m a t e d c o s t o f $12
m i l l i o n on t h e upper Shoalhaven and Hndrick R i v e r s ( t h e approximate locations
o f t h e s e and o t h e r dam s i t e s p r e v i o u s l y c o n s i d e r e d a r e i n d i c a t e d a t F i g u r e 31).

-46-
S e l e c t i o n o f t h e a c t u a l s t o r a g e s i t e s h a s n o t y e t b e e n m a d e b y the
C o m m i s s i o n . B e f o r e t h i s i s p o s s i b l e , a t h o r o u g h e x a m i n a t i o n o f t h e river
v a l l e y w i l l b e e s s e n t i a l f o l l o w e d b y d e t a i l e d i n v e s t i g a t i o n o f potential
s t o r a g e sites.
T h e M e t r o p o l i t a n W a t e r S e w e r a g e a n d D r a i n a g e B o a r d ( u t i l i s i n g t h e services
o f t h e Snowy M o u n t a i n s H y d r o - E l e c t r i c A u t h o r i t y ) i s i n v e s t i g a t i n g p r o p o s a l s for
a u g m e n t a t i o n o f t h e B o a r d ' s w h o l e s t o r a g e a n d d i s t r i b u t i o n s y s t e m s o a s to
p r o v i d e f o r d o m e s t i c a n d i n d u s t r i a l s u p p l i e s f o r i t s S o u t h C o a s t a n d Sydney
M e t r o p o l i t a n A r e a s . T h e s e i n v e s t i g a t i o n s a r e b e i n g u n d e r t a k e n i n r e s p e c t of
p r o p o s a l s b o t h i n t h e B o a r d ' s a r e a o f o p e r a t i o n s a n d i n t h e S h o a l h a v e n Valley.
I n A u g u s t , 1 9 6 6 t h e P r e m i e r a p p r o v e d t h e c o n s t i t u t i o n o f t h e Shoalhaven
R i v e r W a t e r S u p p l y S t a n d i n g C o m m i t t e e t o c o m p r i s e r e p r e s e n t a t i v e s o f t h e Water
C o n s e r v a t i o n a n d T r r i g a t i o n C o m m i s s i o n ( a s C h a i r m a n a n d C o n v e n o r ) , Department
o f P u b l i c W o r k s , M e t r o p o l i t a n W a t e r S e w e r a g e a n d D r a i n a g e B o a r d a n d Electricity
C o m m i s s i o n f o r t h e p u r p o s e o f r e v i e w i n g f r o m t i m e t o t i m e t h e m a n n e r i n which
t h e w a t e r r e s o u r c e s o f h e S h o a l h a v e n R i v e r s h o u l d b e u t i l i s e d i n t h e best
i n t e r e s t s o f t h e S t a t e . T h i s C o m m i t t e e w o u l d c o n s i d e r a n y p r o p o s a l s f o r t h e use
o f S h o a l h a v e n w a t e r s r e f e r r e d b y t h e M i n i s t e r f o r C o n s e r v a t i o n , i n c l u d i n g those
a r i s i n g f r o m c u r r e n t i n v e s t i g a t i o n s b y t h e M e t r o p o l i t a n W a t e r S e w e r a g e and
P r a i n a g e Board.
1 6 . ACKNOWLEDGMENT.
T h e W a t e r C o n s e r v a t i o n a n d I r r i g a t i o n C o m m i s s i o n g r a t e f u l l y acknowledges
t h e a s s i s t a n c e p r o v i d e d b y t h e D i r e c t o r , B u r e a u o f M e t e o r o l o g y , i n supplying
t h e s e c t i o n o n C l i m a t i c f e a t u r e s , t h e R a i n f a l l S t a t i s t i c a l D a t a a n d t h e Median
R a i n f a l l Maps f o r i n c l u s i o n i n t h i s r e p o r t , t h e New S o u t h W a l e s D e p a r t m e n t of
P u b l i c W o r k s i n p r o v i d i n g d e t a i l s o f t h e v a r i o u s t o w n w a t e r s u p p l y s c h e m e s and
t h e M e t r o p o l i t a n W a t e r S e w e r a g e a n d D r a i n a g e B o a r d i n s u p p l y i n g d e t a i l s of
s t r e a m g a u g i n g s t a t i o n s a n d i n f o r m a t i o n c o n c e r n i n g i n v e s t i g a t i o n o f storage
proposals.

Year -a
Jan. Feb. 14ar. Apr. May June July Aug. Sept. O c t . _
-Nov. —
Dec. Year
1895 NO RECORDS 40 73
1896 244 448 343 12 4S9 1061 77 239 78 111 259 191 3502
1897 414 186 52 354 348 681 73 441 257 199 42 329 3376
1898 85 1134 86 78 379 603 67 360 103 260 25 68 3448
1899 445 14 111 573 275 932 248 996 _ 390 490 -271 66 4511
1900 330 165' 269 478 1421 -717 748 70 .221 21 535 265 - 5240
1901 279 72 273- -146 35 106 147 1139 251 158 116 64 2786
1902 264 46 173 70 138 91 600 -262 -127 291 104 913 3079
1903 65 63 95 47 168 188 411 223 797 196 226 692 3171
1904 243 90 256 705 172 33 1309 55 53 113 62 105 3196
1905 216 266 139 360 178 -213 61 60 33 336 30 267 2159
1906 143 99 1175. 53 175 13 30 578 310 176 123 99 ' 2974
1907 431 181 304 253 76 720 26 46 32 45 179 107 2400
1908 104 : 616 86 604 123 60 75 697 80 128 162 15 2750
1909 243 733 45 17 28 579 378 76 92 183 71 431 2876
1910 1582 47 344 82 24 175 361 37 152 298 270 352 3924
1911 1376 179 422 30 489 98 326 283 262 53 228 185 3931
1912 133 570 861 27 252 315 964 47 45 80 320 71 3686
SOIZSIIVIS

Year Jan. Feb. Mar. Apr. .4ay June ...._
July Aug. _
Sept. Oct. Nov. Dec. ,
Year ...
1913 49 43 411 -894 1767 1600 118 12 303 171 65 93 5526
1914 75 32 4.686 557 224 155 659 .35 804 229 ' 300 .
583 5359
1919 413 128 76 428 175 304 211 56 459 92 99 355 2796
1916 385 350 611 395 105 86 353 145 871 1247 461 533 5542
1917 103 254 670 590 -475 19.4 40 70 324 160 570 217 3869
1918 916 400 97 471 80 - 32 746 147 115 73 248 62 3387
1919 79 1564 195 187 .
849 18 72 158 170 149. 388 471 4300
.1920 1485 129 350 113 85 91 192 102 206 88 275 1606 4722
1921 .237 570 265 661 570 • 340 145 45 257 141 105 1106 4442
1922 823 421 50 205 106 249 1263 119 489 352 49 188 4314
1923 220 123 .439 207 20 350 147 156 675 276 203 464 2935
1924 245 269 349 420 159 201 535 96 128 129 564 615 3710
1925 535 405 261 102 3749 585 102 76 23 110 280 68 6296
1926 376 48 677 348 266 339 17.1 54 178 100 2 265 2824
1427 235 53 174 1312 358 29 110 42 381 275 436 81 3486
1928 171 782 1027 206 . 194 .679 280 80 28 74 49 179 3749
1929 84 1885 265 540 310 15 107 892 136 536 669 291 5730
1930 185 59 300 202 875 852 103 43 71 550 98 457 3795
SOLISIIVIS

-49- A p p e n d i x 1 S h e e t 3
BATEMAN'S BAY RAINFALL STATISTICS (Points)
{4
1 S
..4
3 en N el
CA 1.4
0 if.;
N v-I
en Q
in v-I 41,
CO en In
0 cl
0 co
Cr7s
ig 1 1
en c9i
i'2
3,. co tz.i.
0 cc,I.:
in .,91
,
• ,„) r., ere in N CO N. p. en '4erg N ic..4 0 N. I....4. I:41.., et, • Q N In en 4 In in •-I •-I 4 •4 ••••
In In N N in
(04
N 1
, 0 N. 2 VI CO g St lc?) CO N. 1-'1 2 7-1 kg cy.-4 N. riz ocg c:t.'
z (4 in in N 4 .-4 .4 r4 4 .-4 0 in %43 In N •-•
• 11 ai in t-4 .0 r-- cri 0 9 •-• ch 4 CO 4 0 0 4 in .-1 u v44.oin0r-0coN%0NN0com6nco ia q
• iJ
In In • es, cii
'2
In
.
In io N
1:21
N
Nc91%,
$0 10 N
•
v-4
ocg
NI
M N 3
en S N 0 N. N 3 z.4.1 ir-n-
P.. N. • 4 le) N vi N .4 •4 N 4 In N
C I `
4 N. ire
0' in In4
10 I..I")en
N. I")
N. N. 0
. •-i
N. 0 In
%0 .4;:, 0
N N. N
N •-•
N. N. N
0 .-4 N •..?
N. co r'I
.-I N
4 0 .-4
In in 4
In .-e
0.. In N 10 co in a' co co v-/ N. N N ...1 N In 0 0 l'.-- •-• * tog A 5 ...24 f,..14 CO.0 P,...4 ,C:4I 4 %0 4 I-I C.?4 741 N
In 1.1
V CO e-I N cn 0 In In 4 in 4 ..1 CO .-4 N CO co% t•N en 0 (NI in o EN In O't CO ../. P.. N ‘0 .7 CO -9 In .4 CO N 0 Cl in 03 en N N. v-i co Na Crl In
1,
lei 2 c‘e: el '0
171 It)
1,-Al N. egii CO 0 in (1:::: 3 in N. ,irs;) .--• CO A 4:4 N In in v..I "4 c..• v-4 11-1 N %0 N. ..4 •-i in
I-I
• $4 NI CO N. N in Oi 43 in en N. •-• 0% •-4 Cn in co in in I
N. M
0 %0
g I 0. v-I v-4 -4v2
N. 3 .0 cv) 4
co .n -4N
co C') N N
In 6.1
0'. N
.-I •-I
• F.4 4 O. 0% 0% in in In c4 in at in re) CO -I - oi in In p- as in in In 0 .4 %0 0% 0 0 •-• •-i .0 .--1 N. ..4 cr. %,0 •-• r N N. In N N WO CO N CO N CO 1-4 •-t •-•
• .0 a .-i 0 0 co in N ‘0 in v.I '0 ON co a% 4 4 •-I 43 • en •-• r... In v.I .o 4 In v.4 CO 0% 0 In N. in 4 i
4. .. -. .4 0. 4 In 4 .-1 in en 4 N 3 ..c. e
_
• I:I %41 4 0 0 N .-I v-I ‘,0 NI 4 c". '.0 ,-4 N N. N In N. 4 6:41 ... .0
CO Cel N
N en
in N
en cn
in Cl
4 .0.
o N
.7 in N. N
N .4
CO In
1:7% N
in in 0
N .-I
,
k .-4 cel A A 14 vt ft-) 3 41 / N. / 41)
tezle er:i ,c,i1 ecp,1 z4! :
cri 0% 0% 0% 0% 0% 0% 0% 0% 0% M 0' 0% 0% 0% 0% 0% 0% >4 v4 v.4 v.I v.4 v1 v.I V-I 1.4 1-4 1..1 •••1 v-.I .-I v-I .-I .-I v-I v•I

Year Jan. Feb. . Apr. May June July Aug. Sept. Oct. Nov. Dec. Year
1949 524 -319 338 142 402 1218 233 86 195 202 489 176 4544
1950 656 490 1333 983 728 787 751 185 296 478 181 180 7048
1951 596 492 25 31 261 1321 146 346 945 395 124 55 4737
1952 105 106 651 1477 266 1507 317 619 113 740 543 452 6896
1953 2207 109 78 108 1510 7 36 127 88 288 61 135 2754
1954 :301 948 40 34 8 97 112 14 63 289 178 238 2322
1955 "342 1059 247 112 954 172 117 71 132 227 203 285 3921
1956 165 1132 1269 194 749 1003 467 120 150 595 222 142 6208
1957 22 502 124 13 2 374 824 481 48 16 55 365 2826
1958 701 391 401 131 32 897 137 127 120 130 31 239 3337
1959 433 485 787 247 52 421 674 156 123 1494 618 243 5733
1960 314 116 670 146 176 104 491 101 495 302 187 959 4061
1961 341 362 1171 90 45 367 641 678 409 356 1392 1060 6912
1962 551 472 309 122 213 0 122 252 706 195 158 528 3628
1963 303 270 593 1022 1736 667 568 226 451 86 279 884 7085
1964 60 168 203 1190 196 718 43 399 77 153 437 318 3962
1965 65 89 53 236 278 231 184 40 159 841 100 272 2548
1966- 192 339 173 36 N.R. 817 NO RECORDS
Avg
SINVH31Yq

-51-- A p p e n d i x 2 S h e e t 1
BERRY RAINFALL STATISTICS (Points)
0%
•
0
U)
0-)
• 14
• i4
U)
CO N 4,1
4
N
m 0
3 N
3 a%
CO
00 N e0
4 %0 N N 0% /-4 CO CO en .0 4 en N N
0 •%1 0 0% 4 %0
4 en N
N In N CM N N N N N 0'
01 %0 4 0 0 In •••4 t42 ..4• r%4 40
0
N N
01
4
0 '0
.0
N en a% 4
0 •4 in
%0 a% a) In
0
v-4 .0
in op .0 0%
Cn
4
CO 1`.• (NI 4
in 4
4
in N.-.
in
0% 0 03
43
N
0 In
Is. 4 -I
0
°I
In en
N 0%
00
3
at .0 C.)
N •-4 c0
in
in N. v-4
C %0 en
.0
a) en en
in 0
cf,
a• '0 in
0 N
v-4 4
In co
N
c0 v-4
rn 4 en
N
C•1
I-4 N.
3
•-4 v-4
CM 4
Crl
%0
N
4 04;% .54o eci; 6 8 rn) • 0 in cv cs1 i n N CO f's An f en 4 • N esi
0% i n 4 N 43 i n a . 0 . 0 ,(;) 0 4N 4 4 N c0 e l as / . 0 0 , c0
▪ 9 *-4 1-4 a% in co
N. 1-4 CM IN 43 ON 0% ' n 4
• ao .3% ea i n 4 0 4 0 . 0 CM 0 N cr 4 % C . N 0 N / %0 4 0 0 r,-; 3 I n Q ‘ f l •
: 41 1? "4. en in
1.• N 14 C4 0 1.4 c0 4 0 N N ap N. 0 0 N. U) a% C:4 2 e..04 i n co
••4 a% ri
I n 0 03 .0
3 co en 1'4 p ra
1̀... 0% en 019 %C.4
0% i n en a% N 0 a ) a% N C%1 0% 0 0 •-4 •-1 •-4 •-1 Cn CO
N N %-4 1"4 4 ri r4
• v.-4 03 N 0 0 4 . 0 3 ,D en Cs! 0 a. • ‘33 5 'A 03 c.ri 2 Fi A 2 %0
▪ c0 N. ...I 0
03 a% ▪ N 1-4 N • 1 v1 •
N. en 4 i n co N . 0 03 0 . 0 i n ce a% i n co in I n 4 N N 01 In
v-4 I n N
c0 0 0 en 14 Cn N. N • en ' "
4 v-4 at a. 00 in In
741 tv.. 4-4 C042.
N N 0% •••1
F4 4.
•-1 a ) 0 .0 C') i n ps. ne ce0 •-• N *0
T4
CM
03 . 0 0% N N 4 N en 0 0 .0 %0 N. 4 ON cr% N. 1••••• CO •-! CM I-4 1-4 1.4 Cn 43
1-4
In 1'4 en 0% c0 Cs,1 Cs1 0 0 0% 0% en esi N 0 4 if) N. 4 012 0 Cl o Cn r".• /-4
1-4 •-1
$4 4 >4
U) o (:). 0 N en 4 i n . 0 • c0 0 . 0 v-4 C•1 en 4 00 c0 00 0% 0% 0% 0% O. ON 0 . 0 0 CI% 0 0 0 0 0 03 CO CO 03 03 03 03 a ) 03 03 e0 a ) e0 0% 0% 0% CYN o% 4,-4 4-4 v”I v.4 v4 • •-4 e4 •-4 •-4 v-4 v-4 vo4

-52— A p p e n d i x 2 S h e e t 2
BERRY RAINFALL STATISTICS (Points)
1.4
>4
0% rl (.1
N N 1••• N
411 40% 1".• N
CO NA
In in
0% 10
3 co v-4 N Col
N C°1 0%
en %0 P..
4 0%
in %0
op N 0% In
in N 0
1-4 %0 411
N v-1 4 441
Cel vt CO
Col 1-4 in
• C.) %or en ce% 4 0 N 4:0 0% N CNI 0 03 (41 4-4 in N 0 N 0 co in 0% •-4 CO 4 P.. .-1 0 v.-4 0% I... In 0% 4 N
•-4 v-4 v-4
N •-4 4 •-4
%ea N v-I
4 in in 00 N
co rs 0% 4 in Col N
in N 4 03 0 CO
v4 co CO v4
rs. 03 in
en 0%
In 'NA
cv en
N In
cn %co v-4
N in en
v-4 4 en
in en N
4 e•-• •-1
in
• 4 o% 4 op 4 1-- 4 in cn 4.-403inNlino%
0 T-4 N
-4 0%
N %0 v-4
4 4 3 0% in
'.0 v4 in v-4 4 •-4 v-I
Inc in
• N In 0% es. lo 0 co a% r•-• .0 r•-• 4 4 cr) 00 rl %co . rl g-4 en 0 co co co 0 4 in C11
ch) N •-4 N N 00ci r•-• %0 rl N 4 4 in
00 csi In v-e 0 en en 4-4 N N N v-4 P. %0 0 OD r•-• 00 *0 en
1••• en N.N
04 1 03 sr)
o% 1-1
in en CI
N v-1
a% e-4
en 1-1
a% ci% 4 %a
en 4 N N
e-4 g %,:st N 0%
4 In 0% 141 -00
C.1 In
CO N
C%4 in .0 in en .4 a% In rl
.-e 00 03 C°1 0
N N N co
.-4
v-I 0 %a 4 v44
4 %.0 4 N
N CO
N 0%
0% 10
in PI
a% 0
4 00
N 3 0 v-4 a% 4
10 N N In N N I-4 N
In N *-4 CO r4 0% I's. 1r) c0 0 In 0 0% %0 I.. 0 2 Co) In N C N %0 0 .0 en •-4 4 in 4 in 0% 4°1 N Col 0% N
•-1 •-•
v-4 N 0 0 .-4 v-4 01 0 0 4 c) N 4 oP in P. 0% •-4 v-4 0% 0 C° Cel Cy) 1-4
."2, 3 in N N v4 in in 1-4
01 re
• 14 c.24 a% in co 0 N0.0 04 0% In4 N In 3 0% 0% en 4 N In in .0 a% N a% 0% Col v-4 o% 4 N N co 0% en en in en N %-1 4 .4
• Os csi %CP in v-4 00 in I-. v-4 00 Cf/ %0 00 %.0 0 (%1 N
in 4 9-4
en v4 OD N N %0
N 0% en C*1
as en
In 4 en 4 a%
v4 v-4
N N 4
%0
Cs1 N v-1 1%. CV 03 4 o • N OD %(:) N 0 Col 411 csa N %a a% 03 4 %0 N %0 03 OD %0 %0 4 4-4 0% v-4 N N C%1 OD 0 N 0% v-4 0 Cr% 03
14 es
In %0 0
0% 0 • • - 1 - 4 •-1 N •-4 v4
4 •-4
in v-4
se v-4 •-4
op v-I
0% •-1
0 N
•-• N
N N
)4 0% 0% 0%
v-4 0% ,4,1
0% 14
0% 144
0% vvl
0% 1-1
0% r4
0% 1-4
0% 1-4
0% v-4
0% v-4
0% v-4
0% v-4
0% v4
0% v-4
0% v-4

-53- Appendix 2 Sheet 3
BERRY RAINFALL S T A T I S T I C S (Points)
W 0 O >4
%0 v-I en
k
r•-• CV N.
0 N. in
in in
.4 in en 1
en 0 g
eq N. 0%
en 0% en
%.0 %.0 Co
in •-•
5:. in 4 in
1,.. .-4 o
•-'d CY, e.2.
4 •••4 e.:;)
in 0%
L7.41 a% CV
ciAi -I 0% f..;!
a% 4 c., en
• 0 w CI
> o Z
,-, (NI 4
co 4 0.1
co .., 4
co 0% el
N. (NI cv
.-4
0% 4
N. a% en
0% enCo
en in N
en in
N •-4 N
o a%
.0 Cn N
o 4 en
in CO 0
.-•
0% 4 •--I
cy% •-4 N.
%0 4 4
en en N
in 0% N
o a% 4
CD
(NI co
N.
o en
h. ON cv
%I)
en 4,
N. N. •-•
.4 in .13
in 4
0 in en
.0 in in
in 4
0
N- CV
en in
r1 c0 •-.4
en co N.
%JD
1.) CO a% .0 N. cNi a% 4 a% in 0 esi 4 N. 4 .0 .0 vo •-1 C.) 4 in In %Co 0% CO N 0% N. in 0 0% 0% 0 CV el 0 4:0
0 Cn •-i CV CO Cn CV .-4 in •..4 4 •-4 43 N. in
• 4-1 a% en ai en csi in .-4 0 d a% Co 4 en en N en .4 1,-. M NO %Omen 4 .4 en .-4c0c0.-icOs.040 Mint's' ill Z. N rsi cl en 0 Co esi in en I-4 •-I NI ...t 1 ••••1
• W
4 N. 4 0%, •-/
el CO
•-I CO en .4
en N. .../ N.
N. .--1 v-4
in .-I
.--1 CO CV
CO CO 0 %0
%0 •-•
CV 43
CO r") N1
N. NI CO
0 Co cs1
CO en
.-I
›.. .-i en ‘p 04 .0 in N. in CV Cn %0 %0 %0 N. 0% ap N. ..-1 r-4 An 0 h. 0% CO %0 en co en en N CV %0 •-1 0% 0% •-i in 3 N. -..? 4 vz• ci "4 0 4 40 N. •-I ll •-•1 1••4 CV In •-4
CV N. N. 0% in N. CO •••4 •-4 0% CO %0 N. in -4 .0 a% V) CD 0 in eD N. in .,0 co N •V en 00 .0 so in •-•1 .--1 csi -4 in 0 I'",
P.%
in
0
N
cr%
0 •-•
csi
tvl
0
•V
In
en ri
in
.-1
in
ko •-4
en
.-I
.0 in
CV
00
N.
.0
4
.-(
en
0%
CV 1-4
vo in %.0
N
•-4 0 '0 •'4 N. in 4 0 4 4 c r 1 cs1 0 0.0NN.0300 X
, i so en
N %0 col .-4 '.0 4
1 en N in 4 ..., N 4* N v-i
i4 Co co in (NI o .0 .-4 N. Ni .0 in 4 .0 N. .-i Co .0 cNi q. ...i 2 a,. ,.; Co *-4
.4 . 3 z., .11 .01 (Ns., N 0%
N
rt.; CO en
' 543 COZ ••4 en
%.0 •-I •-I ON •-4 CO 4 N. N. 4 r•-• 4 -4 0. co .-4 4 •-I 0 ..-4 %-4 CO en CO w-i 0 %0 N en in NI ON C4 C4 C4 en
, N k.0 N CO N 0
.4 4 .0 10 .0 in en 4 0% 0
.4 N en •••I
• o 0 44
o .u.4. -4 Cog
en $
o3 N.
0 0
.4 0 0
as en 0 N N
CO
cv •-I
N .-t en
N %0 en
e4 .0
CT 1-4
N. •--I
CO 0
N.
In c"
N
Cr .43 m
4,
..0 en
4 4 in
.0 ••-I
• 0 in co Co N en 4 en N en as en .4 N co 4 •-4 .0 4 et co .-i .0 0% en CV In •-4 in CD •-4 N. ON 4 .-t co en 4 *st Cn 0% c‘i .0 en N .4 .4 o
.4 a en 4 en in 4 N
,
w C0% Q (I, 'cf.; g cr:, CC 'N34 gl g .0 .-- 41 CC 4 P cl 'A A cr., °A ,T, ..<7.4 t
7-I 0% •-I a% '1-4 Cr. v-1
Cr, 'IV ce% v.4 oN 1-4 en e-I
0% 1-I
0% 1.-1
0' v-I
0% v-4
0% ..-I
0% •-I
0% 1-4
CT 1-.1
as 1-1
0% ...I

Year Jan. Feb. Mar. Apr. May June July -Aug. _Sept. _Oct. Nov. Dec.. Year
1941 557 369 66 241 140 174 70 248 -337 270 175 70 2737
1942 76 235 575 .239 144 217 125 -87 47 766 898 188 3597
1943 139 /29 _261 130 3099 120 43 -633 • -449 692 698 191 6684
1944 249 102 76 406 811 161 _ 203 -388 98 130 55 135 2814
1945 -476 351 .242 1397 420 _938 172 46 28 169 169 222 4630 td
1946 174 551 319 1035 182 518 0 7 110 164 367 85 3712
1947 264 646 171 637 168 299 -40 317 53 .230 525 1030 4380
1948 1120 554 -324 142 1161 953 101 58 190 127 123 379 5232 • 0 4 1949 666 563 981 138 734 1258 /31 176 476 147 522 210 .6093
• 1950 1069 1111 1720 1472 1165 _2242 1098 194 494 834 478 234 12111
cn 1951 1009 842 446 18 535 1707 408 245 1003 188 31 214 6646 •-i
1-1 co
1952 258 267 753 1638 278, 1520 319 1589 34 936 250 450 8492
1953 346 305 525 108 2004 17 191 244 166 518 190 115 4729
1954 831 1177 82 106 193 327 294 .209 .193 -440 412 377 4641
1955 710 1312 431. 323 1045 359 82 96 85 175 386 652 5656 cn Ox• .. 40
0 40 1956 358 2006 1191 336 1193 837 286 268 146 654 173 98 7546 0 0
rt p.
1957. 212 511 267 - 17 9 164 766 526 75 110 79 400 3136
1958 404 1783 1062 860 49 702 189 311 257 171 119 558 6465
1959 628 1286 1687 196 55 362 632 164 397 2802 484 171 8864

-55- Appendix 2 S h e e t 5
BERRY RAINFALL STATISTICS ( P o i n t s ) •
14 •-4 , 0 o . t•-• i I , O . cr, . 0 en a% co cv cy. in O.
ON in co .1 4
A
0
4.) O.
0-3
A
14
A
.0
4 0 ul
0 N .-s .42 in
0 4 14
0 N 0 •-• o
N Is- O c 0 e••• p 0 a% en 4 r4
0 . i n 0 N "-• co CV O's n el in • -4 - 4 • -4 v-4 0
cNi a a% n 4 I n 0 0 in in CV r•-• 4 CV r 's e l CV I N en in in
cn e n a . 0 . . 0 CV • - i e n en •-4 4 0 cs, 4 ' an c 0 r , .-1 (NI
ON CO 0 ' ,D c0 0 4 • - I 4 • - I 4 I n 0
N cs1
4 4 Oti cr. m in • C•I
4 i n as 4 ON In csi co 40 en en co a% •-4
r l CV I N Ps. I N i n cn N ••1 .-• r n a, a, •-• in
▪ • - I t v l in 0 . 0 4 in cn co n o ▪ 0 %Cr 0 CNI e n CV • - I 4
• - I •-I
'.0 0 N 43 I'. kr)
fs4 •-4 •-f
•-4 h. Cr) )0 CV CV cr) in in
4 c> ,C) o 0 N Cr) Cr) c 0 i n 4 4
4 gD 4 CT en In co a . LB') NI n
Cs! CO 0 N as 4 • 4 0 , •-4 C s CV 0 0 co I n cn oo cNi csi
o • CV i n s 0 r•-• 40 . 0 . 0 . 0 . 0 . 0 ,D
0 , cf, 0 , Cr, " Os cf. grk • •4 •-I

Year Jan. - Feb. Mar. Apr. May June J u l y Aug. Sept. Oct. Nov. Dec. Year
. ,
1887 NO 1RECORDS 480
1888 170 -80 170 0 55 24 9 2 23 177 110 50 776 1727
1889 247 106 17 195 558 146 63 172 -200 190 401 .
44 2339
1890 122 741 769 37 103 349 194 82 , 190 235 242 143 3427
1891 NO _RECORDS
1892 :357 _226 455 200 205 55 9 0 195 1174 524 144 173 3798
1893 395 138 115 646 149 379 1 3 7 82 16 392 228 174 ,2851
1894 N.R. 288 694 345 59 319 2 118 139 195 10 213
1895 654 161 45 45 69 9 1 131 144 104 16 166 1547
1896 176 350 210 • 59 1122 684 11 200 27 68 248 38 2693
1897 343 80 50 107 145 463 104 327 212 195 46 201 2273
1898 65 1274 34 17 172 392 51 448 52 242 5 33 2785
1899 102 32 53 301 87 374 413 766 169 178 373 54 2902
1900 183 159 307 398 735 317 655 113 124 20 482 155 3648
.1901 232 27 138 101 8 63 63 695 102 299 165 40 1933
1902 165 0 150 24 31 69 223 154 123 272 87 761 ,2059
1903 92 102 173 105 80 133 403 114 356 317 53 345 2273
1904 218 267 100 402 141 25 497 23 75 193 68 - 225 2234

-57- Appendix 3 S h e e t 2
BRAIDWOOD RAINFALL STATISTICS (Points)
/
N 'eV •-1 v-I N v-4 N
a)
N • m 4 In 4 0 .40 v-I v-I
0.
N N
in ot 4 N
0 0% a, N
4) in 42 N
0 •-i In
in in N In
4 9-4 In N
in CO ap .er
4 0 In
in ON o
4 In .0 CNC
%0 .0
0 .0 N
OD r•-•
v-I
In
N
In in In
N 0 In
Cr) in csi
0 CV v-I
a, 4 4
k0
ON i n Cr) ON • CNI I n f•••• . 0 4 0 . US I n CO i n ON
v-I CV In
. 0 4 a . a . i n 0 0 In g NO CO N OD
v-I t .̀4 • v-I
r•-•
'0N
ON fs. •-4 0 •-I
en
a. 0 In ‘.0 Cs!
N v-I v-I
i n en I n CY, 0% 4 v-I an I n r)
Cr) CT 0 a% 4 0 0 N CV
CO VD v OD ON In 0 i n ‘ 0 i n '.0 csi
. 0 a , 4 . 0 Ln 4 ON ON 4 • O •CO N v-I CV
a s I n I n r - N CO N • CT, CV CO 0 ‘ ,0 I n 0 In I n 4)1 .91 a . 4 i n aa en i n c0 Ln
C ri (NI in 4 N v-I v-I •-1 CV
N co co . 0 i n c r I n •-I N . 0 4 0 I n ki) I n CV CV CV N p i i n 4 4 In c0 v-I N i n ON CV %0 0 CD
I n 9 •-I •-1 • •-I •-I •-1 •-I
op a, a, 4 N $ In v.4 4 •-I V;) N • i n .0 .-4 e n i n
ON- 0 1 CV 1 1 CO CV ON i n c v I n I n c•,1 In
css I n csi CV
NO CO OD CO NO ON N
C•4
In 0 VD I n Is, N e l 0 4 i n •-I CV in CV CV 4 . 0 cn . 0 I n cv 4 C‘i I n o's v-1 p l Cr) v-I CN/ •-I
I n N N 0 cr o 0 I n N In In co v-I
I n 4 csi CV •-I I n in In . 0 CO OD 4 CP CV i n Is.
I n 4
. 0 v o I n r-- In a% 0 s o cv co I n 4 4 i v 0 0 i n In N . 0 4 co i n i n co r - c r r - In o N es) N oo
• CV •
v-I CV v-4 •-I 1-4 01
N i a , CO N CV •-I I n 4 VD 0 CO 4 es4 co a ) •-4 ' 0 Cr) ON *-1 N 0 4 ex) . 0 0 a . 0 e-- ▪ In co •-I çN st) •-I •-4 CV CV
o I n eN1 I n 4 . 0 0 4 c v 0 . 0 N I n co cNi cp, i n in , 0 %.0 In 00 In N 0 c0 In c•J es-
• - i 4 4 r ) I n CV CV
In 0 I n i n In es) In 0 04 (NI i n In a% (NI In L • r) r•-• r's 0 0 Os 0 I n CV ON I n ON in
v-I I n v.4 v-I OD v-I v.4 I n • c4
I n ,.‘P h op a, 0 •-.1 CV I n ....1 Ln %.0 h op (7, 0 .--1 N 0 0 0 0 0 v-I v-I •-I •-I •-I v-I •-I v--I v-I •-I CV CV CV CT a , a , a , a , ON ON a s ON a% 0 , ON ON Crs Os C s Cis Ces •-I g-1 9-1 ,-.1 •-I v-I v-I v.1 ....1 •-I • - i ..-4 •.-I (-I •-I •-I •-I .8-I
•

-58- Appendix 3 S h e e t 3
BRAIDWOCIp RAINFALL STATISTICS (Points)
. 4 N ep 03 I n i n N I n c 0 i n re I n N i n 0 N v0 4' N re i n sO * 0 a I n 0 0 N N s0 i n co a% 4 r e 4 v0 N 0 r4 r 4 N c0 c0 e•-• co N Csi 4 N N N N N i n N N 4 N N N N N
e0 0 i n sO * 0 a . i n re I n 0 0 is. ea I n en sO 4 Iss Is- 0% i n I n Os 4-4 0% Is. CO CO i n 0 .43. /-4 4 IN N i n N r 4 v-4 Csi N i n en i n -et i n • in
I n co .1;v, CO CP. N r4 " fl4.
I n e-s I n N s0 0 Cs1 CO M i n i n 4 0 N 0 r•••• i n v-I i n v0 P'- i n in N i n 4 N N v-4
ese i n c 0 CO i n I n N N 0 i n Cr, 0 . 0 a 4 a sO I n sO CO N . 4 03 v-i v0
v-4 :3 I in I in
re m r4 r4
• 0% 0% .4 94
N 0 0 i n 4 . 0 4 -4 • Csi Os 0 N Csi N
C • r)
esi 4r4
f l „-; 3 .7; 4. i n , - 4 a s N a% en ese !i i n I n ea, N s O Cr) 4 N• %0 0 en re r e i n 4 Cs' v-4 M r•-• in
N • i n vX) c0 sla 4 vO 4 v-i 4 r - i n i n in 1*-• N 4 N i n co i n N N as csi co • so co as N C4 N r4 r4 N N N so
01" cy.̀n ,csJ 4 V I ti
c0 sO rq,
i n ese c0 i n s0 0% Os 1-4 Cr) i n ' 4 1 : ) , 3 i n o set
"R. 1`1 6
N I n 4 i n 4 Os i n . 0 0 a% N 0 . so 1.--• N 4 0 in i n I n qpi 4fl r . i n i n 4 i n i n co as csi N. M I n N . 0 i n csi r i v-4 ir4
' I 4 y 4 0 4 I n 4 o a% sO • 4 ' 4 i n .-• i n %0 0 Co
• N CSI in
i n i n i n 4 co i n 0 co r - 4 rs. i n sO 0 Os in c0 c0 re as 0 0 a 0 0 sO e•-• C cse 4-4 N .4* v-4 4 N N N vn4 "-I 4 N
4 i n c0 v-4 Os Os i n I n %0 N 0 en i n r•-• c0 c0 4 r - I n N I n rsi
1-4 0% 00 4-4 a% I n CO r4 sO 0% 4-1 N 03 N M v-4 • N v-4 4-4
3 sID 4 4 0 rs N %/a CO 9-4 9-1 C*4 r's i n i n i n i n N
i n ' 4 i n sio N co a o v-4 C•1 i n I n r*- ca cl̀ 0 N N N N N N N i n M i n i n i n i n i n i n i n in as as as as os (.7% a . a os as as a% as as
• ?-1 11-1 • v-I • v-I 1.4 *-4 v-I r-I ir-4 1-4 4-1 1-4

-59-- A p p e n d i x 3 S h e e t 4
BRAIDWOOD RAINFALL STATISTICS (Points)
.-4 so 0 CO 4 0 n co
3 .0 v., CO CO " a i n 0 ep I n • - / en i n as 0 co
N • - i t'n N N N
0
• 4.1
0
—•
•
N CO • 4 • - I NO 0 NO i s 4 co a s i n s o •-4 • - • V I CO N
• - I N ••4 N •••4 I n Cr) •-4
%0 F) F)•-• in 4 0 •-•
n n •-•
so in 0 •-.1 N in in o
In •-I •-I
0% . 0 In i n . 0 CO co 0 co 4 N 4 •-4 csi
4 en N 0 0 i n co as N
4 . C*4 0% Os v 4 CO 0% i n i n as i n es 4 a . i n cs. v.43 • en en i n en * 0 0% N 0 % 0 1 M 4 0 N en en
4 col c• N 1 4 4 I N v4 I n N 9-4
• •-1 es i n • - i co 0 4 N C*1 i n 0 • 411. Cel • - I N •••1
co csi N N i n in I s 0 N • N .0
•-s N
N . 0 i n as i n as v 4 Ps N N Csi
a% CO N • - I 1 4 N • . 4 4 a . • N
•wl
r i i n 0% 0 • - • Ifl
m CO 1"-- as
v-4 N 4
4. "4 in 0 4 .-4 N 0 I4 v-4 N
0 N 4 ••• en a
0 4 4 ri N sO 0
•.•
CO %0 0% 0%
o . 0 • - I N Cis as co 3 I N ON CO * 0 N
1-1 N es1
0 4 N NO 4 en 0% es CO N v-I N cs• 4
•.4 • • • I •-I
0 i n a s as en . 0 CO in as •-• Ce) CO CD N I4 •-• • CV v4
c.4 co •-•1 • 0 I s 4 co so N . . 0 0 N
i n in
0 N 4 0 N CO N 1 4 * 0 v 4 * 0 0% i n * 0 in •.4 csi
" A A •p% •'‘, • N 4.
1-4 i n 0 i n 9-4 0 n CO 44' co N i4-1 0% a% 1••• N CO r i Cel e s CO I S I n N cs4 0 NO I n i n 4
• 4
• - I N 0 4 . $n i n i n v 4 v-4 CO
4 a s i n n N Q 4 . N CO * n Csi 0% 0% r** v.-. 4 n • P s 4 . CO aet 0 i n i n 4 y4 4 en I N N
144 ese v4 0% en • - I • v.1
4 0 0 i n esi • - • Le') 0 co 4 0 v4 4 as N I n 0 co I n i n a s 4 en N
en• 4 ••-• 0 (NI 4 .0 csi 4 •-4 0% I n en 0 •-4 v-4
4 a , cn N CO 0 N v-i 4 a . CO m co m ' . 0 c o as 4 Is- 1.4 Cr) •-4 • - I CO CO 4 • - I ▪ N 03 v-4 i n co
• 11-4 • I n • - I • - i i n 4 CO v4 e%I
0 0 0 • - I • - I I s i s p 4, n n 4 • n as co a s CO i n i n N i n 0 co i n • - • i n csi co
4 I n i n csi i n i n N N •-4 Cr)
• - I N C.;) I ,S. 4 - CO .04. 0 " " Cr) 4 i n . 0 N co 4 4 I n i n i n i n i n I n i n i n In 0% 0% 0 , 0 , 0% 0% 0 , 0 , 0 , 0% 0% 0% 0% 0% 0% a s 0% 0%
• • • • • • v.4 • • I 1-4 v-i v-4 • • - • v l v4

Year Jan. Feb. Mar. Apr. .May June July Aug. Sept. Oct. Nov. Dec. Year -
1959 276 479 461 261 _25 -662 564 63 141 1110 738 244 5024
1960 356 88 227 87 201 49 553 74 477 221 232 820 3385
1961 279 358 573 97 34 _250 497 388 286 385 634 556 4337
1962 599 464 170 59 _185 2 211 193 569 154 113 535 3254
1963 377 321 449 545 162 223 252 166 342 129 148 291 3605
1964 58 77 137 495 138 291 201 291 174 399 153 253 2667
1965 7 53 1 44 31 154 86 68 279 603 62 276 1664
1966 81 374 146 13 91 335 118 152 261 393 598 746 3308
1967 321 44 159 26 106 158

Appendix 4
. S h e e t I
BUNDANOON P.O. RIMNFALL STATISTICS (Points)
14
0.4
In a. en
csI en in en
N en en 4
en N. 4 c'
in 0 0 en
In vz ch N
0 in 0 en
4 42 0 en
4 ars 4
4 in in
csi 0 ao en
.0 N. 4
N 4 4 in
4 0 en
•-• ,r4 Cr) in
en. in rs en
encr, %Co inCIN en
•
in
• N CO Cr) Cr) 4) l•-• 0% CO en o N In 0 cs cr. '0 4 0 1.1 N 43 CO in o 4:1• io en in 0 en CO in 4 in 4-1 r4 ,0 Is- CV r4 as en en cv
0 a, cn
4 4
0 N
,0 0
csi 0
•-.4 •-•
en in
co 4
as in
In a.
o Ne
N en
o 0
0 v-4
en en
co 0
o 4 en
en N rl ese ese N •-4 4 in 4 •-i CNA
• 4.1 I's CO *0 0% in 0 4 so cn co 0 N 0 en 0 el 0 o
io co en 4 a% en N 4 N cy% No co vo r-- in N. 0 en in Cr) N N N CV I-4 en 4 N
•-i •-i •-i N
• 1.1 %o en I-4 v-I en 0 co CV In 0 4 0 ts4 4 in .0 a. co en N en 0 co in 0 0 0 4 4 cr. en en
en 1-1 rl CV N en v-0 in N 4 in en
•
00 O
•-i 0 4 •
N. se, Cn
v-4 4
in 4 in
O csi cs4
o en en v-I
0 en v-4
4 cv CV
N co v-4
ON as
Cn CNI 1-4
a% en
4 a0 N
csi 0, v-4
. in in
4, CO %es .-i
as en r-i
0 0 cv rl
Cn .-4 4
•-I 0 v-e ri
Is. ci,
in . N
VD
o a, en
o *-4 en
o en
en co In
as in r4
o en cv co N In in o co co 0 as en
1-4 VD N
es. in ,o
4 4 W
OD 4 en in co en cv
v-4 en
4 csi
a% 4 in 0 cv 4 0 CV a 0 0 0 en o a as N v-4
N Cs4
),0 0 N
in ' en
ce% •-4
N 4 en
0 4
v-I 4 v-4
se, csi
e() en
CR) CO %ID *0
14 co in Co es. 0 N in 0 in 0 0 in ci (NJ 0 0 0 4 en . 4 4 0 $23 O 4 4 CV CV in cv N N en CV v-4 r4 CV en in o en cv
14 as
0%
CV
r*"." a% v-4
0, co. CV
0 N r4
en CI 0 v-4
v-4 0 Is.
0 in
0 in
CO N ,0
in o CO
en a% in
o %0 o 4
C`.1 4
o rs- v-4
in a, •-•1
co In
,o in
• en in 0 N 0 0 0 CO v-I Cn C '.0 r"•- ‘C) Cr)
...I N en
N re
N In v-4 co
in en
en o 4 4
o co en
co en
CY, 4 VA
N
N CV CV VD VD CV • v-4 v-4 os 4 o 0 0 w 0 0 •-4 VD ON N
VD v-4
.0 CV
•-•4 CV
CO 4.4 en
4 v-I
a, v-4
in CO
it's 4 eV
go v-I
co v-I
w v-4
0 CV
4 N VD
4 r4 v-I
CO
14 cs1 cn r•••• CO 0 Cs.1 4,1 COas IPJ 0 0 0 0 0 0 0 0 v-I v-4 •-4 v-4 v-4 •-4 v-4 v-4 v-4 v-4
Cr% Os v4 v-4 v-4 v-4 w4 v-4 •-4 v-4 v-4 v-I v-4 1-1 v-4 v-4 v-4

Year Jan. Feb. Mar. Apr. May June July Aug. Sept. Oct. Nov. Dec. Year
020 878 163 247 145 19 125 175 395 135 166 279 1923 4650
1921 .
517 316 434 970 . 1131 137 1038 162 267 137 176 788 6073
1922 1488 407 63 283 173 171 1584 142 404 306 19 266 5306
.. 1923 305 63 79 672 47 619 636 268 330 268 171 244 3702
1924 374 150 429 621 412 259 281 62 3-13 166 489 293 3849
1925 658 552 285 164 1914 1059 87 152 40 103 396 68 5478
1926 199 111 819 594 588 /95 592 126 184 30 30 351 3919 ,
1927 418 146 134 1628 346 140 48 22 .
253 278 534 115 4062
1928 216 877 377 505 168 930 656 152 73 ' 146 65 89 4254
1929 134 1631 427 201 281 148 230 434 432 462 669 244 5293
1930 144 257 373 191 503 1276 246 149 48 352 146 781 4466
1931 166 282 408 1129 374 128 603 19 525 214 309 386 4543
1932 44 283 726 383 194 82 353 374 1052 94 276 234 4095
1933 607 16 293 603 450 230 632 13 338 261 613 567 4623
1934 608 1720 327 629 233 653 557 409 467 238 359 612 6812
1935 550 558 217 274 125 200 171 35 215 444 184 520 3493
1936 505 748 422 351 253 335 143 132 106 110 18 563 3686
1937 295 319 632 62 63 983 161 316 151 325 342 374 4023

-63- A p p e n d i x 4 S h e e t 3
BUNDANOON P . O . RAINFALL STATISTICS (Points)
csi cc) I . 01 ••.1 0 •••1 i n a , co a kio r-4 i n csi N 0 n
6 esi m * 0 0 CO *0 i n a cn N n 0 CNA i n V-4 v-1 4 CO 1-4 r4 0 ON 0 . P.. CO 0 4 a a%
4 f l n csi 4 i • r 1r) i n co r•-• N s, cn
0
•-4
• 14
co i n 14 C41 CO •-4 0 . 0 4 i n • i n CO r••• Col co i n 04 ▪ N 4 0 4 0 0
• i n as 01 v.) a 4 i n 0.
1-4 •-4 N In •-4 •-4 i n 1-4 •-4 4
c n 4 •-• 0 CO 0 a 0 04 4 i n 4 r - CO N
3 f,:) o i n co n 4 . *0 4 0 so i n i n 01 cn co n M 1-4 CO 04 •-1 4 4 cn 4 r • - 4 4 cn
In 0 en M 14 Cr) 0 , 0 , CO 04 1-1 i n 04 i n 4 04 Cn v-i a . CO 0 . 4 4 i n co o 04 0 , 4:4 i n 4 0 •-4 csi i n co N Cr) 04 * 0 4 •-• 1-4 •-4 1-4 CV In CA i n csi 4 v-4
•-•1
i . 0 i n co 04 0 . CO ON CO •--4 1-4 0 0 r--- CV a , co 4 i n v.4 0 CO i n co i n •-i co r-- . 0 0 In 4 04 r - c•-•
. i n . N ,ID I-1 •-4 . 4 css 0 04 04 .-1
C'.) i n •-4 A) CO N 01 M CT •-1 0 a , 14 4 • 0 . 0 cn 0 Crl VD i n "-I I n 1.4 Ci‘ CT . 0 4 '.0 as N 0 oN cNi 0 •-i c‘i cv 4 cv cv •-4 Cr) 1"-- •-I v-4 •-4 1-4 1-4
. 0 0 i n co i n i n • - I ON 4 0 as co in r - a r n i n in CT. h en i n . i n ‘ ‘ ) cn co 01 0 4 CO c•-• r - 14 I.-- . * 0 04
• - I • 4 •-4 •-4 •-4 I's. CV 1-4 N .-4 •-1
o co as (NI co rn ko 4 a i n i n cn . 0 a so so .-• v-4 Cy) ce) N 0 VD 0 . i n o a , o re) i n vl
v-4 .4-1 1-4 . CO 4 • - I 1 ' - i n cn
• 04 01
co 4 CO 0 v-4 • r - c‘i r- Cn Csi CV) en N i n 14 0
rsi c‘i v-1 CO co i n i n 0 04 CV •-4 •-4
1.. N en 0 • - I CO 01 4 04 . 0 i n Cn CV) CO 0 %Co 0 in Cr 04 Cr en r - O'S Os 4:0 CO CO cn i n 0 •-i 0 i n i n r- Cn 01 4 v-4 •-4 1-4 0 CO i n •-I •-4 • VD 0 14 .4-4
••4 •-4
•-4 * 0 1••••• . 0 i n i n -ct co i•-• 0 •-4 0 0 •-•4 •-4 co i n CO CO 0 r-- t--- i n a . 0 4 0 co •-i as n . 0 0 0 4 •-4 14 4 v-I v-4 v-I cNi CO CV) CV) i n 04 •-1 in
v-4 v-4 v-4
Cn N. v-i 0 i n 0 •-i r - 0 ' ON 0 I", 4 a% CO ' 0 0 •-I N 1,-1 4 CO 1-4 N.. NO r*-- •--I •-4 0 4 co re) r - No CT CV) CV) v-4 04 04 1-1 4 i n c:r 4 4 r - i n CV CA •--4 CV
•--I •-1
N 4 CO 0 .-1 04 In cn v.) o co crs r- •-4 CV i n i n 01 . 0 cc) 01 kla_ 4 . 0 4 . 0 i n CO 4 CO 4 en c'. 4 v-1 •-4 • co i n i n co cn i n in
CO CT 0 1-4 CA c0) 4 i n . 0 r•-• CO ON 0 .-4 CA 01 --d" In M cn 4 4 4 4 4 4 4 4 4 s t i n i n i n i n i n in O S O S O S O S O s O S O S O S O s O s O S O S O s O S O S O S CT ON •-4 •-4 •-4 v-4 •-I v-4 ••-4 Ir4 v-I •-I 14 •-4 •-4 14 1-4 •-•1 •-I •-I

-64- A p p e n d i x 4 S h e e t 4
BUNDANOON P . O . RAINFALL STATISTICS (Points)
$. CIS 0 >4
in N. NO r....
In In *0 in
r- 4 N. In
cn N CT .0
iNi 4 Is- In
0 en in n
4 0 in so
0 0 en n
cr. 0 o en
4 NO .-4 en
en CV ..e) in
0 •-I in ON CD Cr) CNS CO in 0 in ‘o W co co n en N. cn a. a. N in 4 A en n ty 0
v-I 0
e-4 cr. n cse en en
0 Z
40 3
.. g N.,134
cri eV cf,c2, CN
8 .-1
or.3.. in
4.4 e4
in '0.
in .
• 4J in ..-i in .-4 r- a% in CO 1"-- *0 C:IN o 4 N 4 0 as cr 4 co N 0 N 0 .0 .-e N co
••4 4 c.4 (NI es! 4 •-I In
4.1 c0 in 0 In •-4 r•-• ON 0 In as en M 0 in so ..1 .0 4 c0 e0 .0 es4 en 0 v-i •-i ci el cv .0 /... •-I pl, CV
U4.
• 00 CT N CO 4 4 .0 .-I 4 eD cse in 0 44 N
in ee:1 In
co re
In •-4
N.
•-I 0
IN •.4 cr, C•4 v-I CO
ON
•-4 4 en
•-•
›, ' LC ri 1's I-I Or ; :34 CC, .: in41 PI g 8 2 0 cl in 4 %ID I-- en 4 cn 4 ,-) 1
1 4
.7. i
4 A
iNi V
o 2.
N 7,1 .-4 "21
:::: a inv-I
st
cio r4 ,C2i ei
Zi, in
Cr:I JD
..* Nt .--i %o 0 .4 c4 .-i ...t CN In •-I 0 ea X
et
a% 4
In N 4 I a% r-- p •-•
4 In
el •-I
4 N. en •-I
W a.
4 4
in 4
c0 C•4
N •-I
0 I.•
Cr, 0%
0 4
co
.-4 .0
(NI in co
a% 0
st N
'4 M In in •-4 N In *0 CO NT •-• •-I -
• 14 al Z
0 4
9-4 •-I
Ise.
.-4 4,4 e•-• in *0
*0
0 co l'•••
*0 in N
1-4 ..-• •-I
In 0 N
co
C:1% C44 4.4
en CO in
0
CV .0
CA •-I 0
ND In
• .0 w a, (0)
Pi
as f If .
r- •-4
v:, 11 o i n esi
e7 4 in rc f• : .-e .2
In
r;1 N
N 4
ir7, cp
g
4 0 , In N 4 in 4 .-e cy. •-1 h In 0 In
N .0
••-I N
In DO
4 oo
in .0
0 In
in •-I
n 4
in .-4
.-I •-I
.0 .%.
•-I
1...
W ea
'.0 in
h. in
'co in
cr, in
0 ,42
v-I *0
CSI .0
in *0
4 *0
in N0
'.0 N0
n NO
W
>4 0*
1.4 a,
•.4 a,
•-I a,
•-• a,
•-I a,
v-4 a,
•-4 a,
,-4 a,
•.• a,
•-I a,
•-I 0
•-4

- Year Jan. Feb. -Mar. Apr. May June
. *July _Aug. Sept. Oct. Nov. Dec.
— Year
NO 1883 RECORDS 37 144 -463 43.1 • 68 26 15 168 212 111 13
.. 1884 82 .-44, -41 A54 106 323 406 .50 156 307 102 8 1979
188;'-.601029 49 133 185 43 237 196 28 57 56 224 388 2625 ,
1886 195 21 ' . 73 181 71 85 245 ..328 51 319 202 510 2281
0.4 1887 775 382 266 310 153 319 147 331 176 141 343 639 4082
1888 29 335 121 18 81 62 15 61 171 25 9 - 803 1730
1889 214 160 18 280 .332 183 116 193 _152 136 381 390 _2367 ,
1890 .176 • ,,
676 732 36 153 396 283 118 163 315 282 71 3401
1891 628 140 55 505 152 1595 134 233 349 174 285 130 4380
1892 504 70 761 114 131 .
61 127 213 -774 398 119 227 3499
1893 506 215 474 476 271 318 160 92 -79 266 345 186 3388
, 1894 656 343 -427'. 233 62 245 57 .
111 "237 179 100 246 3296
1895 580 141 . 22 42 78 55 56 174 142 -48 41 195 1574
1896 200 305 .326 74 236 . 479 36 162 39 162 412 143 2574 -...
1897 199 2 53 .200 139 495 212 291 261 _126 34 272Y 2284
1898 183 614 31 40 133 167 169 380 87 130 25 102 • 2261
1899 63 23 51 182 106 381 223 656 178 .86 338 80 2467
1900 191 84 320 308 675 288 653 118 211 55 462 146 3511

-66- !
Sheet 2
BUNGONIA (INVRRARY PARK) RAINFALL_ STATISTICS . " • (Points)
• -,
>4,
4 4-4 4 4 N 0 4 4 v.4 N.
g 14 ' 0 6- 3 § cA e.. en N 0 ••4 en
N 41 N . I n Qv C4 • - 1 CD 4 •-• CA e . 0% N 1.4 N N No N , N N 4.4 e.4 en 4'4 N Cs1
9031 3 tlel 3 ••4 .0 In N N Cl N N
1.1
• .
0
• 4.1
.0 In
t•
4-3
.0 •
144
fe,1 0 00 A fro' 00 CJ▪ I
4 InN
r1% 3 i,11 0 in t•1 •••1
•-1 4 0 r. 0 C l id) C l 14 N C l r / t.. N
5 ACl ••4 1.4 4 •-1
N N I n 4 in C l . 0 I n so 4 I n v-4
0 N N 0 1 CO 0 N 0 1 I n 00
•-4 it)
0 . 0 4-4 CO 0
n . 01.-1 i ce cr% F.T r i F*4 . :
•-4 c9inrIP
r.
. 0 0 44 4-4 N ."4 N 0 4 •-1 N 4 M
I n cf. i n 4 •4 0 2 I n 0 0 0 N • N v-4 ••4
ev• 0 . 0 4-4 In N i n Cl 00 N
.-• N 14
04 in 3 C l cA
N CI Cr1 N
N C I 4 in O 0 0 0 0 0 O 0% M 01 0% 01 >4 •-I • 4 •-4 •-I •-4
N ••• 0 N Cl
a a 4.4 N N g NCONO co 1•4 .1
fit IN N 1.4 Cl 411
N 0 •.4 In 4 0 04 in o • In••4 In N ork C l co Cei
N 4•4 Cl.'.in
•
•-1 co co in N Cl CO 0 0% Cl %0 111 4 N. 4
14 •-• N •••1 N N
0 N %.0 Cl N i n co Cl o 4 in M In N N 01 4-4 N 01 Cl 4 -4 •-1 •-4 •-4
14 01 %0 Cl ••4 0 Cl Cl 00 4 03 rs 0
• 4 o3 CC N
in v-4
tn N
0% Cl 0 4.4 Cl N C%1 0% Ln co c4 N $0 40 •-1 Cl ,4-1 el 0 k0 0 4 '1 Cl
, pi rl 1
" 4 In N
ctg;g1Plclit:i Cl II 00 Cl 0 0 0 N N %0 cn 4
"4 .4
N N.. 4 0 ch v-I In N N 4.1 SO 02 1-4 N •-4 N 00 Cl 4 4 4-4 14 •-4 •-1 •-1 in
01 In Cl •-4 01 Cl Cl 0 *0 •-4 C.. as 44 N N. 0 0. op i n 4:0 cs4 00 4 el .r Cl ei 4 Q. Cr1 N
N %0 0% CO N 01 v4 4**1 CO N •-4 Cl 4 in
4 N. 4
4-4 0 v-4
4-4 nj
i n 0 4 0 n1
Cl 0 n4 Os CI 0% 4 0 0 40 ‘0 in Cl 4-4 4-4 CO C%1 CO 4 0 .-4
N N Cl p.. N v-1
%o •-• 00 a 0 r•iNen 4 in .0 0 0 0 0 .-4 •-4 v-I •-4 •-1 14*. 01 0% 01 01 01 0% 0% 0% 0% 01 0 v-1 v-1 •••4 •-1 •-1 •4 •-1 1-4 •-4 v4
g41
n g;.41 41 1'4
I n 4 e l r1
o 4 N 0 Cs4 N
4 ) 0 N Cl
N 01 .0
•••1 Cl c%i •-4
01 01 N. oo
PS 4:1 00 0% •-1 eri
i n 00
N
N. co •4
0% OS •.4 •-4

-67- Appendix 5 Sheet 3
• BUNGONIA (INVERARY PARK) RAINFALL STATISTICS
(Pointe)
>4
en 4 00• 0 ex) N 0 i n c0 0 In 0 a% r••• T.% on 4 N N N N N IV
$: A
.X; 0 r44
•
N i n 444
r 9 A 4
N 444 V*4
. 4 0 on en c0 GO 0% a ce •-4 OD ,0
v4 91 4
4%4 i n I n i n i n op I n i n •n Fi N r-4 t-4
i n co v-4 •-4
i n 4 cnIn
It, a% co
in 0 4 14-.. e•••• 4
‘4, c0
v-4 0
c0 1-4 00 v4
o 1•••• N 19- %0
in 0.
c 0 0 1••• on a% c0 4 m O N Os I n v4 r4 • In co .4 r . v-4 I n N i n e.1 14
n . - 4 N 4 0 % 0 en a ' 0 ' c > N
•-4 V4 V
N 0 4 0 i n o•-• N i n in
i n i n 4
co i n 9-1 9-4 0% N . 0 on r•••• 0% r - in
•-1 In
coro_ r - 4 co en 0
• as is. 0 co 1.4 .14
cr, I n in 0 4 • op 9-1 i n in
v-I
4 on on N c0 N N i n 0 r•- •-4 Cr)
N .c. In4
n (s1 CO sO on
N 4••4 N I n %a 0c0 %0 0 c 0 N N 0c0 N . v-4 CO on op on N 1,1 eV . 4 I n N N
4 co , 4 on %.0.-4 c0 co 4 N 0 N v i •-1 • v4 r ) on in
ri c0 c0 i n . 0 on v-1 CO . 4 N h r ‘ l $.4 •-4 •-4
sO •-4 4 en fs. s o CO cp v-4 4 4 4 co 0. v4 v l N
4 N I n N v-4 0% I n Cr) Cs4 v-4 0 , 0,
gi '44 44
N In N
91 el
a 0 •• N on .0 •-1 •-4 co a% 4
on Cyl
n •-• 4 0 :01 .4) ( ' I N CO
1-4
a% %o a . c0 •-•1 In i n r - r . in •-4 ('1
N N o•-• co N I n C O 42 N C O I n r4 in on 0 , I n • on on a% 4 I n 0 , 0 N s-4 VD
eV I n i v N T4 .••••
N 0 0 •.-4 N CO • - • Cr) 4 N i n i n co i n i n on i n op i n p•-. 1•••• I n n I n c%8 4 V i c o en 0 I n *0 co CsI in
• 4 N N tri - • N e•4 .••• 4 IN N in
4 0 i n n co r•-• 4 on on co 4 •-4 4 i n 0 co a% e%4 .-• GO I n N 0 a% 14- a . 4 as i n a% on a 0 i n 00
N Cs1 v.4 v-4 V i 9 cn v-1 i n .••• N in
0 i n I T CV i n i n N 4 a% en n 4 n %o 0 a% co a% co 0% n i n ‘ 0 •r4 I n i n i n .-1 r . on i n a% so N i n 4 n v-4 v-I 9-1 14 r 4 r-1 %0 4 en vi
•-1
0% i n N 0 Os O4 . 0 I n 4 CNI N Os 0 r - a 0 .•-• .••• I n go;)) glen 00 N 4 4 c0 N 4 4 . 4 4 0 0
94 v-I i n r•••••
I n 4 I n ..4
cy. ez. .-1 N i n 4 I n r-• c0 0% 0 .-• N I n 4 on 0 1,- v-i N N N N I n I n i n en I n I n i n in a a% a a a% a% 0 . a . a cr a . a . as a cr a a a% 9.4 •-4 mr4 9.4 •-4 v4 v-I •-4 v-I •-4 41-1 v-4 v-4 . 4 •-1 •-4

-68-- Appendix 5
A
S h e e t 4
BUpONIA (INVERARY TARR) RAINFALL STATISTICS .(Points)
14 24° :IP% .7 7 F.; g 54't .2) 2 N CO r e 0 0 1. too 14 PI 14 Vi. «4 #4 Of on r4 is) 4-4
•
CO 0 4 V I 4) 0 0 0 1 14 in P. 0 12 '4) 7•1: .7)% • 0 101 On vo v 4 V i i n WO 14
itp2 0 •-I 4 0% . 1 CO %::24
I I • - I 4,4 Vi
Ps CO on in 0 • 4
I.al' 2 F r4
• 4 Vi • in 4 in 2, 3 g. 4 ▪ r4
o . 4 i s 0 on co 4.4 4 0 0 Ot 14 0 czk I•••• in in CP el P4 4 . 4 4 1-4 N IV
2 CO ifl A A 4 3 sO V i 4 on la
• n
. 1 0 .... CO 14.1 g v0 C O N O 0 •••
''' T. CO C O v l 1,3 . 4 on '0 on iv ir-- r 4 Nin
. 4 P I 0 1 5 .0 i n %0 0 CO 0 1 4 r•
. I
•.4 co 1,•••• trlo 7 s %0 f••• P•••• • 4 I N N on in rs1 0 ' 0 ` . . 0" 3 g r4 '4) o (3% 0
• in ao co P. so .0 4 0 r•-, 0 N CO 4 P I • - I VD 04 N 4-4 i n r 4 CO CO t 4 1,:••••_ in P4 on oi Sn 0 ' 1111 ••4 IC/ N
Ps ••1 4 CO 0 0% tr1 c" ▪ 4.4 Os ' in co 0 Ii.4 ) P. 4 P4 41 0 ' . 4 N P I Ps CO 0 0 ' 4') I s Ps
. o n 9-1 so
. • , 14 0 4 0 4 N ••4 •-4 i n co cz CP . 4 0 , • r n • 4
1 11̂ o-• P I I I I Ps 1,1 g . 4 4 9 CO in .-• 4 .0 Vi or. fr4 1.4 • fro 4 •-4 on, sr
• So • ' CO
7-1 . 4 0 4 P.. . 4 4 4 N 1.• '•;. 3 5 Os •-4 s•:44 P I e n * I f a ' % C I 4 0 4 ••4 n I C I • - I ' •-I
•-I
I.
" I CO I n 4 I n r• IP I n i n ••4 4
P4 P4 IN
•
o I n i n 4 4 I s 4.4 N in a r% on in4 r‘s1 3 COCO •n • . 4 '47 3 IT:
V i a .0 V i 0 . CO 1r4 CO a ' I s P I Ps on 0 O l e 41 P I Ps P I • %0 0 ' I s 0 CO
F.1 ei 9 4 . 4 4 on On In 4 4 P on ri on IN
14 CO 7 Tri 3 .4.1 s 7 7. 0 .4 4,4 on 4 in 0 ri lel V i in in in in in coi co, 0, 0 0 Ok 0% 0% 0 . 0 , 0 , 0 " 0 ' 0 " O N CA
1.4 . 4 ••4 0.1 • - I ••4 9-4 yr4 •••1 1.4 1.4 • • I 1.4 1 4 . 4 •-I

Year Jan. Feb. Mar. Apr. May June July Aug. Sept. Oct. Nov. Dec. -
t Year
1899 NO RECORDS 657 1341 282 784 348 215
1900 314 181 761 1652 1685 756 1186 134 601 38 851 147 8306
1901 319 152 552 1240 135 305 697 1371 309 348 153 0 5581
1902 385 208 681 213 268 255 807 809 90 632 136 611 5095
1903 94 439 260 135 1062 205 726 931 351 318 248 680 5449
1904 348 490 579 1004 209 93 935 1.50 .
477 282 38 _111 -4716
1905 151 173 228 484 753 461 94 185 115 457 121 496 3718
, 1906 96 76 718 178 170 133 _22 —444 291 132 118 153 -.2531
1907 509 164 240 279 304 927 .
139 105 92 55 325 117 3256
1907 165 738 222 390 283 221 683 . 7-44 313 191 99 160 4209
1909 290 .
798 83 55 214 475 348 215 365 159 52 540 3594
1910 458 86 548 90 151 245 477 155 152 281 .
316 510 3469
1911 1266 165 777 145 372 83 511 690 171 108 324 318 4930
1912 176 404 476 210 530 532 994 172 91 51 207 172 4015
1913 59 70 410 466 1516 926 173 19 460 409 111 53 4672
1914 149 75 2253 283 547 247 1051 309 526 219 434 862 6955
1915 392 165 379 1062 343 567 604 139 325 219 15 435 4645
1916 124 320 415 410 236 283 421 177 841 1086 544 874 5731
SDIZSIIVIS

-70- Appendix 6 S h e e t 2
JERVIS BAY RAINFALL STATISTICS (Pointe)
• 4
•
04 0
00
a 0
0
In In CO
en
CO N. N in
p 4 4
In in .-4 4
•-1
N. 0 4
4
at en en
as
%AD en
0 co en %o en N ••4 N N
o en en Cr) c0
N 4
a) 4 4 4 0 CO CO ch 0 •O
C%4 •-4 4
•-4 4
,e4 csi gn
N
• " 4 •-4
0 0 . 0% csi CO CO 0 CO a% 0 %.0 0 4 CO R 3 in %C. N en CV CO en in i n m en co
en en csi cqi In en 0 ••-4 en
csi 4 cse 0 4 4 en in en en
4 .0 4 .0 tn 0 .0 4 0% N. • N % , 0 • N. en 4 1-1 4 •-4 en en
e n csi es, • - I . 4 CO in en In 4 . 0 i n 4 4 CO
N. CO O. %D 0 r••••• 4 I n • - I N . I n • - I s.co 4 . - i In N • -4 N •-1 e n cn —4 es, c4 in
0% N . CO go., 8 4 N 0 4 en 0 co o in en 0'co • 0 •-1 e n .0 I , • - • CO 4 CO s o csi 4 a . en NO en in en in en .-4 N • - I I n 4 • - I In
. 0 0 . a NI Cr) N 4 N . . 0 0 I n •-1 •-1 - v-4 0 •••1 Cn CO CO 0 CO •-1 N • i n %0 CO 0% csi CO %0 • at en • -4 • • - I N i n 4 N • Cr) N I n %/0
Ne in at (-4 en • -4 0 s O 4 . 0 e n N.-... N. en ' - 4 4
441 o en -711 en 0 . 4 CO Cr, 0% 0% N . 1 , . C ' ) N . %0 in .0
0% N CV en N. 0 en e4 0.1 .-e I n e%1 csj e q csi i n N- - 4 •-1
co .4 0 a In CO 4 ...4 i n %.0 CO CV 0 4 i n N J csi N. CO s o i n 0% 0% 0 0 0 . 0 csi 4 N . in 0 0 4 Cn •-1 in .-• 4 N 4:1 en CO in en 0 • - I %10 Cr) I - I • - I en
I - I v-I
CO • - I en at N. co N. Cn 0 in en 4 N. en en . 0 4 0% N CO 4 o o en co N o s 4 0 0 •-•1
en e.1 In i n •-1 O 0 N os en en N N In
• 0 0 en N. en N. co 0 a) N. 4 en co 1-1 1 4 . 4 0
11- ••et 4 4 0 0 •-4 0 in 4 I 0% a 0 - o co %a• • en N N N en 4 i n • 4 N . in in 4 4 4n cn
0 %o co N en N. %0 0% Cs1 CO 0% Cs4 in 4 N C•4 in N. N. %a 0 N .44 4 s o CO 4 . 0 0
C•4 4-1 4 in N e n In en 01 N 0 N N . 4 4 c • I cN1
N. . 0 4 0 0% 0 en a% N. CO esi a N. en Ne a% a a N. to CO N. so i n . . 4 e n 4 NA 0 en at 0 a) a% a) 4 NA 4 0 cs. %0 C V N CV e-4 . 0 4 r 4 • - I •-1 CO
• 1 •••1
tp 0 in c ( ) •-4 N N 0 en vo o os en es- en 4n •-1 N 4 0 0 •-4
4 4 4 e n ' e l l CC c.t 3 3 • • - 4 CO
CV CV h . 4 •-1 .-1
>4
N CO a s 0 •-1 N e n N t I n s o N CO a s 0 • 1 N Cn 1-1 •-1 N N CV CV CV CV CV CV CV CV C n e n e n C n en 0% 0% 0% 0% 0% 0% 0% 0% 0% a% a% a% CT CP, CP. CM 0 ' CI% •ff •1 • -1 •-1 •-1 •-1 •••1 •-1 •-1 • -1 •-1 ••1 •-1 •-1 •-1 •-1

-71— A p p e n d i x 6 S h e e t 3
JERVIS BAY RAINFALL STATISTICS ( P o i n t s )
.
14 as •
h . . 4 4 4 c n 4 W I N N I a , •-•4 I n a% In V:D N 0 0 I n 4 c o r•-. i n a% c o N . 4 4 ,c1
N . ' 4 cn c:3 ch in a% . 0 • - 4 C o 4 i n 0 en e n
egg 3 e n i n e 4 e n c r i 4 c s i e n <NJ 4 i n e n c o v o N.
0
0. •
as
> as z
• 14 0.
14 as
- tie
as
e n a% 4 o 4 c r i iNe e n N . N . N . e n I n c o c o c o a%
3 0 N c o e n N e n ' 0 a % 4 c e i NN
N • - f 0 1 en %00 csi • - I • - I Cr)
a% o a.% 4 04 CO ch vD
i n N
N In 0% co N
a% I n 4 h i i n 4 i n 4 e n a% a% O I n i c z 3 c.4 0% 0 a l en i n I n N
N . . . I n I n N i n 4 I (.4
I n N I n N N I n CA 0 4 h i . 0 0 I n e-I i n e y 4 I n I n N N N I VD I n o N 0 N
r n N 4 N . • - 1 N I n P I CA
N 0 0 seD i n 0 4 e q 0 a% e n i n 4 4 4 o N. N J CA N e n In
(-4 in 0 c., .-4 so N. I n . 0% •••4 4 0% . - i . 0 c o i n e n 0% N . 01
. 4 4 c o r 3 I n 4 ,r)
O I n c o e n i n C o N . 0-% 4 4 N . s o I n I n a%
N N e n 4 4 4 %."4 N
N. N.
N. 4
%-e a%
N. e•I
Co N CO
c•I 0 4
eNe in CO
4
%0 0% C..0.4 0 CO 0 N.0 a. .-I so o o In e-4
4 .--i ,,--e In In r-- .-.1
k0 4 en 4 In in co a% a% Co 4 N.
N VD C.4
o I n N . N . 0 • - 1 "-I N •••4 N . 0% 0% 0 Co %0 0 iv,
3 4 ' . 4 co N c o c o • -1 N N N . CO 4 CO
C i • - i N I n AO 4 i n c o I n 4 •-•4 • - • ••••4
4 ' a% tNe c o %.0 N ' 0 <-4 I n i n Os CsI I n N N. I n I n vo ( - 4 I n i n CO a% i n I n 4 N r ` s . 1 0 4 i n 0 N in I n e s t N 4 i n •••• N CO %C. v i 4 i n 4 c 0 r-.
0% v-I . I n •--1 0% In % o 4 • - I I n o (NI c o I n a% C C 0 • -o e n c o N . 4 I n CO Cn
I n v-I VD I n ip.4 4 I n % o 01 • - I •-•
c o 0 0 % c s i c o c s i 4 c s i N I n o c s . c o c v r- r - . o I n %o C o 4 c s i I n 0 . 0 i n i n I n 0 . c o i n 4 N 4 ) N J e n —I 4 N I-4 Cr) I - I • -4 Cr) c:IN 4 In
0 % NO CO i n 0% I n I n v o a% cs% I n • - I en en r-- N . 0 N • 4 1-4 N CO 4 * c 0 4 4 N %0
4 e n c l h i i n CNA N I n N . In
N (Ns c o c n . - 1 , 0 0 1 ( N i / 1 0 3 m m 0 0 0 4 4 Os ka 0 0 . i n c-4 a , , o c o (NI %o . 0 I n N 4 so I n e n 4 N i n s o 4 .-4
In NO N . CO O S 0 C.:11 3 tg Co o N 0 N I n I n I n I n 4 4 4 4 4 i n i n in
Os 0% Os 0% 0% 0% Os 0% 0% CA O S a S O S CPS 0% 0% 0 % 0% . - 4 v-S w-1 1.4 • -4 4-4 I-4

-72- Appendix 6 S h e e t 4
JERVIS BAY RAINFALL STATISTICS (Points)
14 1 m Nenc00
Os
Fel
in
as
r
as
in
in
N Os 43$ t
c" 1•% 0
! I •
4 1-400in e•
A$
co *4 50
a% 400 %13
1... .-14-1 0%
4 0
In
4 in
st) 03
en 0 in 4
co 0 en
4 N
IN in
Jan.
Feb.
Mar.
Apr.
May
June
July
-
Aug.
Sept.
Oct.
Nov.
_Dec. 1/411 in rr$ en 4 %/0 0% r•%. 03 0 4 4 4 $ en 03 w4 4 111 at 1%. t's en CV 0 In WO gri %.7 kin V.1 CV Vr) Cr) h h 00 kb Cl CV ffi
0 00
.04 •N
Vr) 00 N
1-4 ch Cs1
cri k0 r4
.4 C0 i.4
In a)
4 e% N
0 1,- N
h N v:3
4 CO •••4
1.0 %/0 4-4
cc 0% 4
co 0 I-I
g P.T.
N N
0 en
0% %0
4 0
4 en
en 1.4
In CV
as 4
a:,
.-4 N
in 0 03
in
03 as
in N 0 4 4 ,M 4:0 CV 94 00 CV N N in h. %0 P4
q3 4 0 0 s In 0 co in in co as in N 0 en as as a. 0 ,f) ..4 cp 4 in r. CV ..4 co 11 CV ,..4 1.4 'el 4 '.0 in in CV CV CV •-•I
0, ON in
V3 CV 4
N N
0 Co) CV
CO ON in
4
I v•I
co
,
4 in co
4- r-- 0
in VD N
. 43 CO ,0
C V In C*4
4 ,-I .4
co so 4
4,4
CO 00 in in co co .-1 CV CV ..4 N CV •--I 0 ON CV
sO ••4
4 .7 h 4 v - i N
0 CV CO N
In 4
'.0
".• r's .r.4
in CO
,i) 0, v-4
CT CNI i
Tr-4
In CIN
,r1 0 in in
•••4 4
t's s.0
'.0 es.'
.-I in
0, os
Li", .--1 CV '.0 In
'.0 VD
4 in
4 in
in .4
In so oo .-1 cr. 13. N. In '.0
..-4 I's r") I.-- 4
c" in 4 N in 4 co in 0 en In a en as en .--4 esi in VD CV N in CV '.0 C4 CO in CO CV V3 •-I .-I as in 4 csi N r-- 0 in In .-I CV •-I •-4 1-4
co in NO en en in co a. 00 r•-• NO in In ,--1 4 N 0 In a. .--i 0 co co enst 0 as r-- 00 CV ,r-1 CV ..-I e-1 CV 4 In 0 .--i VD •-•1
/-4 •..4 •-I
U) in in en co eq CV N 03 In ••4 0 CO C:h N in os CIN CV 0 0 In N CV 9-1 0 •-I 4 .-4 in '.0 in CV
vl .-4 03 N
111 N •-4
CV •-4 0
To-4 CV N CV
•4 so
CV eD
•-•4 in
in .0
si) cis
0 oo
'.0 in
r•-• en
C. 1 in
0, in
CT N in co
4 in
in in
1--- a)
•-I 0
. - , N 0
T 4 in ,4:3
. - 4 sO CV in in in •-I VD
c. 3 CV 8 CV .:_i Os
cic;),
CV
CV .-1
In
in
in
1..4,
in
cgs,
CV
.ciiisl
N '.0
.08)
in
t;lii
CV
tN
CV
r.......,
4
14 en 4 In %0 1•••• CO 0, 0 ,.4 CV en 4 in .o r--
o in in Ul In in In in s.r) '.0 ,0 '.0 %ID '.0 '.0 '.0 w ON CT 0, Os 0, 0, 0, 0, Os CT 0, 0, ON 0, 0,
>4 v..4 .-I w.1 .-4 •-4 9-4 v-4 •-I •-I gr-I •-I •-I •--4 ,--1 1-4
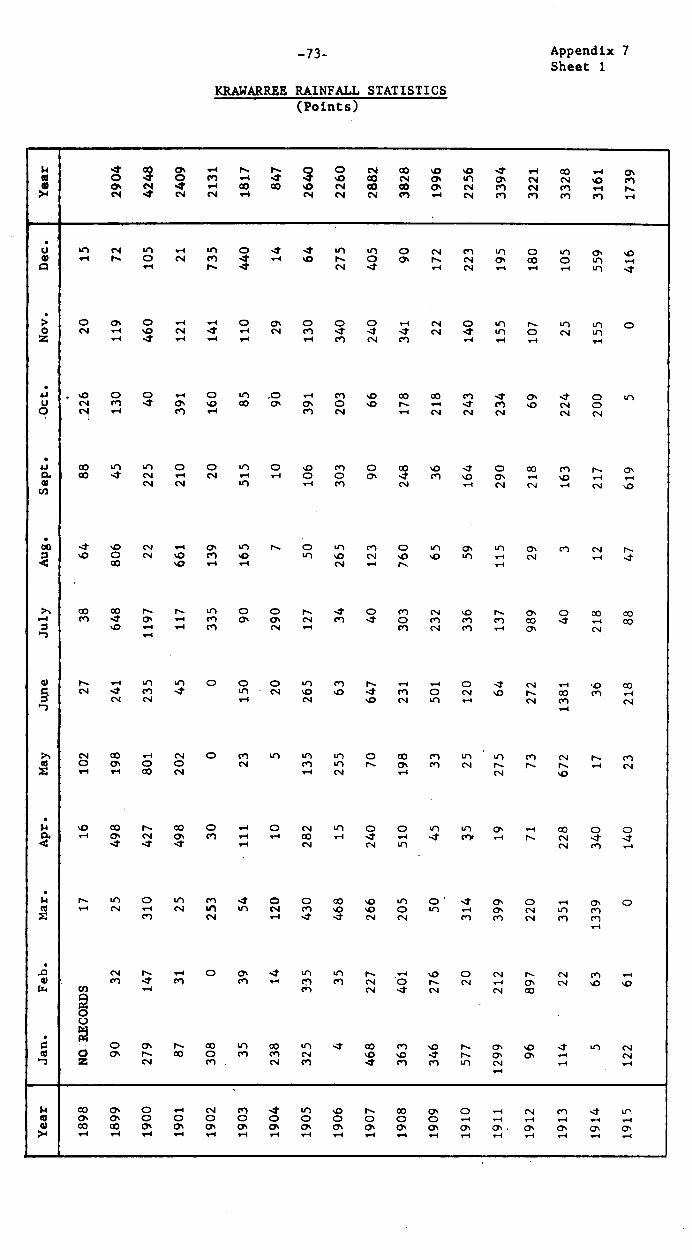
-73- A p p e n d i x 7 S h e e t 1
KRAWARREE RAINFALL STATISTICS (Points)
%Ct, CO 01%
N N 4 N
N . o 0 N CO NO . 0 4 co •••4 Cf% e n •••4 4 4 . 0 CO N i n N %la in .-1 co co NO N CO CO N i n N i n 1-4 N. N N N i n v-4 N i n i n i n in
a)
P.%
al
ea
• 14
• .0
I n N i n • 1 i n 0 4 4 i n i n o N en i n o i n o% ‘o •.4 P.. 0 N i n 4 %0 N . 0 0% N 0 ' CO 0 i n •-.1 N • - I in
0 0% 0 •-4 •-4 0 0% 0 0 0 I-4 N 0 i n i n i n o •-4 N CNI i n 4 4 s t N 4 i n o N in •-4 4 • - I •-• i n N i n e-4 •- I •-4 •-4
. o 0 o i n r o i n . 0 CO CO i n 4 0% 4 0 trl N en 4 o% %o co os o . - i 4 i n N o •-4 Cr) •-4 i n N
CO i n i n 0 0 I n 0 s o i n o c o Le, 4 o CO CO 4 N N o o 4 i n m NO •-4 •-I N i n •-4 i n N •-4 N N •-4
4 NO 0% i n N . 0 i n i n 0 i n in 0 N NO i n %0 i n NO N CO %0 .-L •-4 N •-4 1-4
CO CO N . N . i n 0 0 h . 4 0 V ) N r-- 0% 0 CO co i n 4 1.4 0 N N M 4 0 i n m e ) CO 4 . - i co N • 4 i n N i n •-4
•-4
i n i n 0 0 0 i n i n •-4 CD 4 N •-4 CO N 4 i n 4 i n • h i . 0 .1z) 4 i n o N .13 N . CO i n 1.4 C%1 N • - I N . 0 N i n •-4 •-4
CO •-4 N 0 i n i n i n i n 0 c o i n i n i n i n N cy. 0 0 cse i n N 1-4 •-4 CO N •-4 N •-4 N .0
%o% co N . CO 0 •-4 0 N i n 0 0 i n i n 0% •-4 CO 0 0 •- I Cy• N a% i n • - I •-4 CO •-4 4 M t .-1 N . N 4 4 4 4 4 N i n N
N . i n 0 i n i n 4 0 0 CO . 0 i n 0 sa* 0% 0 ON 0 v-4 N I n i n N i n . 0 . 0 0 i n N 411 in
- 4 4 N
N N . •-4 0 0% 4 i n i n N . ..-4 %0 0 N e . N i n .-4 i n ...t i n i n .-4 i n i n h i 0 N . N - 4 0 . N . 0 .0 Cl) %-i M N 4 N N CO
2 0 c)
0 0% N . c o i n c o i n 4 CO i n %D N . 0% . 0 4 i n N 0 O . h . CO C c. 1 c n N . 0 . 0 -4' N . 0 0 . ...-4 N Z N i n N i n 4 i n i n i n N . - i ..-i ..-1
CO 0% 0 •-4 N i n 4 N . CO 0% 4 in 0% 0 0 0 0 0 0 0 0 1-4 1-4 e-4 •-I CO CO 0% 0% 0% 0 . 0% as • v - 1 •-4 •-4 • - I •-4 •-4 • - I • - I •-4 1-4 •-4 •-4 •-4 •-I

- 7 4-- Appendix 7 S h e e t 2 •
KRAWAREE RAINFALL STATISTICS
NO' g qm co on N N
N In •-I 0% 4 en 4 e
• N &fl I . . . 0 . 0 4 r, CO 1.• 1%. N N I n a t co as 0 v4 CO
N N
•
•
0
$4 0.
0. co4 ,1/41 co I n C O N . o o
. cc, c, N N N %0 Fe) %-i N e l •.-4
I n co N i n N CO 0 •-4 i n CO CD N •-4 as 0 ' i n 0 0 , "
4 e l 4 CO v-4 N
,1? 4 t c4 tv• N N .0
N 0
A In •-4
. 0 0% 0% 0 0 I n I n i n 0% CD
. 0 4 CO co •.4 •-4 •-4 C%1
%0 N 0 N i n i n o In cs. (."1 0 4 0 N
N N .-4 .0 -`4
• 0 N . •-4 I n i n •-4 •-4 N r ' N •-4
C CO . 0 csi 4 N MI N N N 4 0 No 4
N N N
. 0 Ln o •-4 r•-• . 0 0 a , In 0% •-4 i n i n N , r 4
3 •-• .-1 UI
•-I 0 . 0 CO N Ce) ,r4 0 C*4 Cr) Cfl %/0 CO ,n 0% 0 e l 0 0 . 0 0 4 i n co i n N. NI NI co 4 •-1 •-4 I n •-4 •-4 •-4 v-4 qr-4
0 0 0 0 %0 %0 csi cf) CO CO N 4 0 i n •-4 N evi sC) CO %0 N
•-4 v-4 N N N •-4 9 •-I N N CO
0
N N c r . i.... 0 P-. N c 0 0 0 M
N 0% -.1* 4 0 I - - N N N 4 NI re i n i n N. . 4 o i re) 0 NO P.. Ul CO
C.") cf ) r s 2 N •-•1 Cel Cr) •-4 N
4 Q I n N CO n i n 0 0 0% N 4 en co i n o N -1
f v ) •-• •-.1 •-I •-4
. 0 0 .D 0 N 0 0 4 . 0 c•I a% N a% a% •-4 •-I N •-4
o C.1 . 0 v-4 Cr) 0% CO N o en 4 co
<NI
4 %Co -4 0% N.
N •-4 In
4 CO
0 0 N N W 4 N. o 0 0 0 N. 0 CO N cy% I n co so i n e l e - • cr,
N I n N I n N e l r•-•
CO 4 0 o it) .0 a, 4 co i n •-4 I'vs 0 •-4 rav r's CO N Cel 4 i n cv I n I n N. i n en Ne en i n CO 1,1 I n •.4 N N 4 •-•4
43 4) >4
so N. CO 0 o Ne en 4 i n t o N co 0% 0 N en •-4 ,e4 •-4 •-4 C*4 N N N N e l cet 0% 0% 0% 0% 0% 0% 0 ' 0% 0% 0% 0% 0% 0% 0% 0% 0% 0% a% •-4 1-4 v.4 1.4 1.-4 •-4 4-4 •-4 •-4 •-4 •-e •-4

Year Jan. Feb. Mar. Apr. May June July Aug. Sept. Oct. Nov. Dec. Year
1934 1228 938 150 316 178 627 1047 379 133 370 461 237 6064
1935 287 330 95 599 19 104 57 29 253 602 161 318 2854
1936 335 446 577 149 111 439 179 146 39 51 40 373 2885
1937 359 81 670 95 55 165 64 250 178 .
374 216 351 • 2858
1938 298 43 100 108 196 93 87 883 140 319 258 17 2542
1939 331 111 552 484 31 87 3 404 28 189 206 103 2529
1940 176 68 0 575 102 58 14 46 497 18 126 429 2103
1941 671 395 185 53 145 39 10 71 209 137 140 100 2155
1942 107 122 563 33 267 158 117 51 62 456 581 167 2684
1943 .288 120 157 188 898 30 28 205 208 377 474 438 3411
1944 125 60 178 148 1102 8 200 54 18 133 50 224 2300
1945 360 318 40 745 47 553 52 111 60 258 223 244 3011
1946 258 323 213 202 93 478 42 30 80 140 506 26 2391
1947 23 991 159 140 83 103 38 150 73 81 442 • 641 2924
1948 652 557 95 138 836 616 7 21 64 303 130 287 3706
1949 227 346 942 77 383 684 69 23 282 283 279 46 3641
1950 372 -543 1300 413 360 462 334 83 120 606 264 179 5036
1951 667 909 100 46 139 874 55 355 375 338 83 143 4084
cn 0-3
•-i cn
cn

-76- Appendix 7 Sheet 4
rRAWAREE RAINFALL STATISTICS (Pqnts)
14 Cd 0 Po
03 0 4-4 in
4 h 1.1 sy
0 csi CT ro
C•1 h In in
CO 0 N. in
h 0 cn cs1
0 m I-- csi
vr, 0 in in
••4 so a, re)
0 n n in
4 0 03 cn
in n 4-4 4
in 0 ri in
in .7 cr,
0 r-i cri so CV Cr) CV N. N N. 00 N. Cr) ‘0 CV 41 .-I 4 0 NO 4 in a iio ,44 CV ON CO 0 4 CI n ..4 554 In Cr) (r) 4-4 ON k0 Is. 4 tti in
> O
Cr) NI
sO Ml
O ..-4
(NI 4
a) tNi
0 4 as
in 00 0
ON •-I
a, CV
in •-4
N 4 CO
cn N- OD
Z in 0) 4-4 r4 4.4 %.0 CV in •-4 NI CV 554 .
• 1.1 ND US r.) CO CD CO •-4 4 in 4 N. • - 4 as in U in seo 0 in -.7 .-4 co 4 4 4 in in 0 in ...1 in cn 1-4 •0
v-I CV 4 5-4 .-4 in in
/..s in 144 0 4 N. .-o co •0 0 in Cr) 0 CV NI 0. Cr) N. CO in •10 ,0 ,0 CO 4 CV • in in co in 6) ••-• T-I •-4 4 4 CO CV v-I CV M
• CIO c0 0 N. in CO .-4 4 N. CV CV 0 .-4 in .1 0 .4
0 4
m .-+
,0 (7, 4 cNo Cr)
a. •-4
n N. in in
Cr) CV
0 CNI
a, 4
n
in In 4 CO 0 00 as CV •-i N. 03 0 •-4 in .....4 0
0 (NJ
.4-4 •43 Cr) 0 4
•-4 N.
ln 14-1
0, in
.4) CT,
in VD
4 •-4
N. CV
(NI •-i
on '"')
w in .7 •-4 •-I CO In CV Cr) CV CV 0 •-1 CV 4 in Z If) •-4 in .:"- N. a:o •-I N. •-i 0 in Cr) 0 P s",
P's 03
CV e-1
4 CT
CO in
•-1
0 4 Cr)
6 v-i
in as
ty
0
4
N. Cr)
%0
Cr) ..-o
N crs
CV
1-4 cn
in .-I
Cr)
Cr) .-I
•-I
0, in
.-i
111 csi
Cr)
•-i '.0
Z .-4 co in c0 •-I •-4 .0 •-4
W N. CO N. CO 01 CO 0 .-4 CO 00 CV •0 N. .-I VD to. 4 a,
Lin in in in
,.0 oo in
•-I CV •-I
N. CV
h- in ,4-1
4 on in
o N
C) .-I
e-I
1-4 CO
v-I 4 as
co Cr) N.
cr in CV
CV 01
N. ....t
4 N
0, In
(7, -..I •-i
Cr) •C) on
4 04
if) ,--1
CO •0
X 4 Cr) o's •-4 •-I in 4 co ,,-4 4 4 CV
XI to
v0 •-4
vo Cr)
4 N.
vo N.
4 •-4
•-1 N
.o CT
cy, •0
co N.
.o
...t cr c0
in co
co 4
o s0
co •0
44 .-i in 4::1 in N. 1-4 CV in in •O CV 01
• 0 to 1-1
0, ..0 04
0 in 01
ON Cr) CV
N. N. •-I
N. .0 N.
•-i I-4
0 ‘0 4
CV in Cr)
Cr) CV CV
e-i CO s-4
N. in in
CV N. in
4 Cr)
0, -..1. CO csi ..-1
1
I-o to
cso in
in in
-.I in
in It)
vD In
N. in
c0 In
0, In
0 VD
.-I •0
c•.I •ID
Cr) sr)
4 ,0
on ,0
•C) •0
W ON ON 0, 0, ON ON ON ON Cm as as 0, ON a, a >4 •-1 5-4 I-1 5.51 55.1 5-1 5-1 5-1 5-1 •-1 .r-1 5-1 5-1 5-1 •-1
#

Year Jan. Feb. Mar. Apr. May June July Aug. Sept. Oct. Nov. Dec. Year
1903 43 132 121 118 50 83 252 94 454 262 50 308 1967
1904 198 140 48 276 224 33 285 -44 98 125 60 185 1716
1905 260 145 98 195 174 193 80 40 49 235 32 175 1676
1906 33 55 548 72 96 94 46 250 214 ,..-* 239 173 121 1941
1907 309 277 80 194 30 405 37 30 83 32 304 85 1866
1908 50 293 41 170 143 - 50 58 421 165 109 209 11 1720
1909 336 648 57 79 NO RECORDS
1910 NO RECORDS 212 169 228 380
1911 579 69 218 0 318 133 187 97 89 98 128 134 2050
1912 52 235 322 ,61 18 164 422 171 129 52 90 230 1946
1913 51 43 278 211 635 342 88 42 64 187 24 192 2157
1914 24 38 802 134 73 51 228 12 173 57 238 472 2302 1
1915 192 82 176 71 108 252 91 86 509 96 0 111 1774
1916 97 117 96 383 63 152 288 191 362 415 352 225' 2741
1917 93 148 148 56 79 . 157 167 210 230 196 358 206 2048
1918 525 211 49 117 52 47 207 180 29 64 171 13 1665 , ,
1919 0 417 103 222 186 38 32 167 82 146 150 409 1952 _ 1
1920 489 e 113 315 151 14 120 208 182 116 151 158 568 2585
_ I,
0110q
113/10'1

-78- A p p e n d i x 8 S h e e t 2
LOWER a m p RAINFALL STATISTICS (Points)
>4
•
9 1.
4.4
00 0 44
if;
I .0
ri4
A
43 0
v-4 N in CO 1.41
N en r4
0 v4 el
0% 01 4, 44
CO In 0% v4
0 ew. v4 e4
1,2 N P.wwe
0 4 v4
vw4 40
In 0
•••4 N v4
.4 0% N 0 el 4 e. N. cri WI 4 in .4 csi 4 .4
v4 in C*44 4 In
0 0% I4 4 00 en h. csi 4.4 0 fl 4) •.0 N In
e4 v4 v4 c".4 v-4
• in N N .-4
h . 4 40 co en en (NI 4) f̀%. 4 CO 0% 2
3 03 e l 01 N. 0 N wv4 iv) N N
0% 0 v-4 In i n en N • csi
4 Crl 4 ' N 03 0 e ) 4 .01 . 0 . 4 i n i n co Ok I n rn s0 N N . 4 N C.4 Cr) 4.4
0 03 0 CO N CO h . r - N cfl 4 csi v-4 0 N 4 4
N N N 4 v4 v-4
4 Cy) v-4 4 cn cy% co i n N ifi e4 0% 0 -3' 0% 0% 0% CO 0% In Cr) I-1 C%1 4 c%. - 4 in
Cr) 0% v-I Cr) • I n v-4 o i n 4 0% e . h CO cq • N v4 an 4 i n o i n • e4 04 0
v-4 wr-4 v-4 Cv) v-4 • N •-4
%0 0% co c%i . 0 co co i n i n 0% 0% w 4 : 1 1 Q I n N o% cr. cy. N i n . 4 v-4 v-4 Ims • r.. . 0 en . 4 N. • csi
v-4 C44 v-4 i n csi csi N • 0 N
N 3 'if;
g • 4 • e l 4.-4 ' - - 4 0 % en v-4 I n ▪ i n o% I n rs.. co co en rs. ts.
C%4 v-4 •-0 v-4 44-4 V-4 Ce) •-4
i n • co N o o N co • co 0. ▪ csi co o
4 • • co I n . 4 csi In . 4 v4 0 ) I n N Cri N
N. CO
CD I n Ln • CO
C%4 v-4 v-I
i n I n M I n 0 0% N o% i n I n 0 e l 0 I n 0 es e l i n P . co 0% rs. e • i n . 0 es r•••• e l 0 i n c l k0 CO in
N v4 e l el v4
4 N N
N Ps. 4 4:0 i n co • csi 0 co 0 co N I-1 C̀wwl swt en o .cr i n I n N I's 0 i n 0% o • e l es i n e4
e4 v-4 e4 v4 Cr) Cr) C4 4 i n v-4 in
N. 40 v-4 I n i n 0 I n N -5?) COo3 0 %o o N i n o % 0 c.4 %0 rs- I n
co▪ i n rn rs.
. 4 i n v4 i n N " 00
i n v-4 4 0 2 3 ' 0 -1 A .̀1,3 co . 0 1 18 N In 4 0 v-4 Cs1 i n •-1 4 a . cn Cl N i n v4
• 0 i n i n i n 4 n1
4 .0:?4 k0 0 N e l 0 N- 0% N. 4 N • ' 0 i n .0 co i n co 0% 3 . 4 N i n I-4 h . i n I n CO •-4 4 v-4 v-4 . 4 C r ) Cr) en en e l N
0 >4
. 4 (NI : e t -4. i n kis r•-• CO os 0 . 4 cso i n 4 i n r - co os N N N ewl N e4 i n i n en i n Cr) Cr) i n i n i n in a . a . tr. 0 . cr. 01 0% 0% 0% 0% 0% 0% 0% 0% cr, cs% v4 v-4 v-4 . 4 vw4 v-4 vv4 v4 vw4 v-4 wv4 v-I v-4 v4 1-4 wv-4 v-4 •-•

Year Jan. Feb. Mar. Apr. May June July _Aug. Sept. Oct. -Noy. Abac. Year
' 1940 140 14 5 546 141 13 _26 44 . 240 83 97 -242 1591
1941 572 .336 45 60 149 119 20 • 127 303 97 122 -44 1994
. 1942
. 40 221 144 22 • 269 287 120. 106 91 217 369 75 1961.
1943 170 17 72 199 899 42 56 250 263 285 335 __236 2842 '
1944 95 35 91 126 -293 20 101 51 11 94 78 129 1124
1945 _351 217 62 .
887 54 305 ii5 99 30 143 128 1-06 2567
1946 288 188 .127 171 .46 320 - 30 2 3 . 77 90 303 169 1832
• 1947 19 -463 182 224 -49 91 122 .137 155 BO 289 620 2551
1948 -446 473 . 151 103 .
579 _353 41 24 120 124 28 247 2689
1949 - 90 218 296 33 189 446 170 28 146 301 460 106 2683
.1930 452 -467 -934 436 -488 _353 426 64 121 711 _316 109 4877
1951 -378 363 12 31 85 642 134 343 310 285 53 14 2670
1952 116 _55 299 312 242 - 376 . 157 '345 146 - -464 358 504 3774
1953 186 56 57 42 640 .
40 52 94 134 204 200 156 1861
1954 83 412 8 50 29 71 93 71 104 310 377 61 1669
1955 210 582 363 91 644 131 80 252 61 144 347 227 3132
1956 234 563 787 263 • .. 348 765 318 156 138 318 44 28 3962
1957 47 138 169 55 18 188 454 218 28 30 44 246 1635
• —

-80— A p p e n d i x 8 S h e e t 4
LOWER BORO RAINFALL S T A T I S T I C S (Points)
a) as a) .4 cv CV 0 4 C l 0 1 (N4 0 cn cnir in in CV h 4 ON NI CV 4 n 4 Cs.1 C11 CV /-4
•
• .0
• 4-1
as a) >4
I
aN en 0 co co 4 cm 4 in ▪ C11 0 1 0 CV • 0 as tv ) h . in in cn CV CV 4
• -1 V D a) 0 4 0 in in 4 f l ,a0 4 n L o L o i n LAD as 4 • -1 Lf") • . 1 CV
so co • -1 4-4 CV rs. U 4c4 U n 0 0 r•-• N 4 4 Cn • es) o c%1 4 CV •••4 CV 1 n Z
•-1
a) Lo 0 as r•-• CV 0 CV 4 cr, co 0 co 0 VD CV
v.4 r ) 4 c•4
N . LI-) cet CV VD 4 4 . 0 CV co 4 o o so in 4 as aN •-1 1-1 I n CV " 1-4
C r-- 4 cs-) o •-4 a s a s Ce) Cr) V a CV ON CV 4 (n C v.4 r ) C•1
1-1 a) a) N a) 4 r•-• Ifl CV 0 . 4 I n •-1 4 CV a) a) 4 .o Cs4 CV
•-4 i f ) 0 CV VD 0 C'") a) r-- II") • - • h 4 . 0 0 CV 1-1 Cr) . - 1 v-4
CV 4 0 CO CV CT •-1 1.•••• Or., I1 a s •••1 N O N •-1 N • - / VD / - 1 Cr) •-1 v.4 e l VD
oN ▪ Crl .0 •-1
• CV in
Csi ir-I (N4
4 a , 0 N 0 0 a) r-4 4 a , 0 N 0 a in r 4 C.') C n CV cn
No 4 . 0 i n co In 4 •-1 /-1 v-▪ I 4 4 •-1
CO CT 0 • -1 rs-) 4 i n . 0 t•-• • u 1 s o s o s o s 0 .0
C ' a s as a s ON ON O N O N O N ON
1-4 1-1 e - I v-I

Year Jan. Feb. Mar. Apr. May June July, Aug. Sept. Oct. Nov. Dec. ,111
Year
1877 185 156 '763 356 945 67 581 17 726 645 176 225 44342
1878 28 1578 114 234 67 156 365 361 444 33 459 *325 4164
1879 756 666 371 89 1284 277 95 597 1510 255 330 290 6520
1880 127 585 984 1060 104 3 4 504 25 274 339 551 96 4683
1881 549 328 247 122 610 2 0 4 153 ' 74 232 1124 277 200 4120
1882 118 51 .
427 1312 229 490 46 257 51 1141. 469 315 4906
1883 396 912 96 1013 . 1565 45 39 43 329 286 100 143 4967 '31
1884
1885
194
603
85
67
218
148
954
201
316
104
468 744
535 563
24
86
108
64
368
134
351
248
82
455
3912
3208
0 rt 03 r- r.
U3
cc,
0-3 1886 399 112 149 431 26 140 260 250 81 536 295 341 3020
1887 675 545 268 1086 512 840 282 479 461 201 '• 724 1051 7124 C3 Ci)
1888 227 238 104 13 79 203 10 169 ' 173 258 ' 134 1192 2800
1889 572 229 252 18.9 881 112 791 298 346 164 484 183 4501
1890 219 1235 2516 200 373 803 1098 105 249 250 245 197 7490
•0 1891) 1898) NO RECORDS m
m rt 0. •-•
1899 214 48 2 7 4 . 549 365 1616 548 1082 238 460 427 141 5962
1900 363 489 434 428 1240 677 959 218 255 45 877 270 6255
1901 210 115 328 250 0 233 344 1028 321 217 70 16 3132
1902 601 101 171 110 315 137 681 397 90 704 176 605 4088

-82- A p p e n d i x 9 S h e e t 2
MILTON RAINFALL STATISTICS (Pol.nts)
14 1 >4
N
. Nei% N
N gl:
cr,
cr 42.
in
N
2 N
4:0
.j, A
0 ::.:).
en
N iip 4
.-4 03
N err,1
0
gp, 4
ON
oyii, in
v-I 4 0 03 N N In 2 cl cr .s.1 cc; r,) 2 ..:t q
. h i n 4 i n 4
_
Jan.
Feb.
Mar.
Apr.
May
June
July
Aug.
Sept.
Oct.
Nov.
Dec.
_
_
(4 r in 4 N .4 CT 0 ,i 41;1 4 •-• 43 03 I-4 ct. lel 4
h 4 VI Fri
N ri
0 ri
N wp 3 i
In tl
t0 o . . 0 4 0 o ph f cis a'.r.,
1513 47) r pi . 4 .4P .4
v, 1*-4 4 Of -3 rc , ri. 2 N 2 v-i 8 •-4 1 14) si, 0
4 N en
0 .74 I n C r l N i n in %o *g• cn n N , 1 h- c i N IN
I '
0 .0 ,.0 .0 ,r4 4 0 co .-• in .-i N oN a , n n a ..t ly,?4 mi.- 1, in tif:1 c...1.-1 0
in v-4 CO In ..7 ,..54 cn .1:).4 co 0 004
Csi
0 N. ON 441 0 N .-4 .4 .-I in N r - cr 4 00 c0 so in • I
0
In
C. 1 '-1C
r--
in
%c)
0 Cl
cv
.0
in
Ov
. - i
), c...-.
in
ic!* 4
a
vffi
-4
in
*4
g
in.
c0 0 a ' N i n N a) I-- .-4 NO .1' N N N
I n n i n csi •-4 ••-I 0 v-4 in
in .it as in
..ct N 0
as r-I
N in In
r-- •-1 . 441 fn .-I CI •-i . 0 Cf. ••1 v i CI i-s .-4 •-I 91
0 in in 0 r- .0 in c0 in in -.1 as NO as N co i n .1 in in 4 in N in in .0 I-4 .-• r-.. i n i n .-1 . 1 r-. r-- N in 4
I-4 ri r) in .0 4
v-4 v-I a ) 4 en No r-I N
v-4
0 4:11
in en
in in
.-i in
-4 c 4-
N NO
in .1•
.0 c0 4 r... in 0 0 ._, i 0 h. „I cf., N i n - I ...t 4 . in in 4 h " N0 .-I -et n
V-i v-4 NI v-I r i
v-4
,.
CO N v-4 In er) CO in v-I N 4 •-I 0 •-I . 0 0 . 0 CO .0 v-i - CO 4 CO Csi .it 0 CNA 4 in in oN N 4 N r - i n r- N •-• in N rn .-4 r) ifi in 4* en .-4 i n r - N
•-4
0 .0
,
4 4* 0 In in a\ v0 N in 0 o0 .-i cvc co 0 N U) 1-1 Q in c0 4 .c. in .-• 0 .0 1::: 4 ..ct . 0 as 0 T-1
in
v-4 i-i
c0
4
in I--
. N
N
%a:,
in
.-.
0:1
.-1
ON in
in
4
aN
in
-V 03 . T 0 en i n i-i ..-i
0 c0 a ) r - 0 i n in .0 .0 0 in i-i 0 in CIN os In co co 0 i n cr. 0 co r--• .--i in N oN In ...1 ! „cr cn co In . 0 r i h N •-4 sr) N
v-I !
O's in in In cr .0 0 c0 cr% N a) N r,- N c0 or 0 in 0 op. a) in c) in .0 in in 4 c0 h . i n cy‘ NO I-- i n r- wi N in vi N CO in
"! v-i Fs' in 1-4 4 4 4 a,
v-4
I v-I
3 rl 1:, in 2 v-i 2 4 or; fil c.2 4 .21 ....1 g or; v-4 %ig, c:.1 2 f .,' :2 r. --- i °4 cc V v-1 $41 N i n os r-- .4 N
14 in .4 in .0 is- 03 Cr, 0 ..-1 N in 4 i n . 0 h CO CT 0 0 0 0 0 0 0 0 0 v-i v-4 v-4 .-4 wl v-4 v-I v-4 .--1 .-I N 41 cr% cr, ON 0 0. as a* a, i:T a, a‘ a , a , a a a , a , a, >4 I-4 v-4 v-4 v-4 9-4 v-4 v-4 v-4 v-4 v-4 , v-I v-I .-4 v-4 v-I •-•4 .-4 v-4

-83- A p p e n d i x 9 S h e e t 3.
MILTON RAINFALL STATISTICS (Points)
1•1 CO " - I CO 4 i n 0 r`..
9114 fr1 4 4 P+
1 si
in O N 0% A , i n 0 Op •-1 CO CO . 0 ..1* Cs1 0% i n 4 ceivi IN !d.j.') g
• 13
OD
CV i CO 04 CO 1n 4 • - / \ o C•1 0 op en n Cr) C 4 0 .o 4 a.. a% N CO • 1 i n en co h n 4 0 N a . . 0 r-- i n csi i n 4 • -4 Cc) • - I CNI • - I * -1 M i n 4 i n i n •-/
i n cs. co co 0 0 N a , v.4 4 0 i n •-4 \ ( ' 1 in S n 0 4 * h oo 4 VD ON 0 C•1 0 cD i n •-1 in in CS1 4 4 4 i n in
v0 i n CO Is• N i CO OD ON h . C•1 4 CNI •-1 0 0 0 i n N cs, en 0 • r - r s CN1 VP Cs! 0 co en N i n ' 0 co in • - I 4 • - I .-• 4 C•1 Cs1 i n i n 4 4 r-
r - MI a% 0 csi 4 in N. 4 a . i n 4 i n o i n op Csi i n 0 CO . 0 4 •-• 4 r - r - 4 n o C \ r•-• CO 4 Csi 0 i n . 4 rP1 4 N
•-1 OD 4 op i n i n as es- CO • - I 0 co 0 4 i n 0 en op i n i n C•4 • JD %.0 op v:* 00 N 4 i n 4 4 0 in
C•1 v4 • - I I n CO
i n c.1 i n 0 C•1 en .-• ns %/0 • - I i n 4 oo CV Col ON c.4 M 4 4 4 i n co 4 * a , 4 n i n 0 4 .0 •-1 Cr) CV. •-1 VD i n i n r - 1-4 v-1
•-1
o v-1 1-1 \ ‘ : / i n 0 et) i n cr, VD N VD i n 4 sO 0 0 0 0 4 . 0 ese 0 . 0 4 i n I n N . 0 r-- a% 4 in CN1 •-1 i n 4 ' 0 4 \C I • - I •-1 CS1 M 4 CV
•-I
4 • - / CV i n i n i n .-e i n co 0 , 0 ON CN1 CO CO 0 s0 / 03 cse ('4Cr)
h• I n 4 •-1 Csi cse a , 0 0 0 , N a ) i n v-4 4 C̀.1 CO 4 4 t y i n 4 • - / •-I in
VP •-4 cip op i n n n 0 , 4 4 i n i n i n i n 00 esi i n as 4:0 •-1 0 0 4 %ID •••1 CO 0 i n i n co 4 4 a% i n 0 n as 4 ..o r-- 1-.. v-I 4 i n 0 a , i n 4 rg 4 i n •-• •-/
CV •-•
00 N 0 i n 4 CC CO csi a, C*4 0 0 crs in
i n •-1 ('.1 i n en 0 .-e C%1 3 CV i n ese 1-4 v - I •-I
•-• i n i n i n 0 r s 0 op i n 4 N i n csi C.1 1̂ , 0 CO ON CN1 00 Sri N as CV CO 1*-- v-1 0 a ) i n as
s0 I f l csi cse M I-1 i n csi Cr) •-4 i n 4 CV Cs1 1-,
0 i n i n .•••1 Cr) OD I n 0 03 i n ne i n 4 4 0 0 N a , i n CV 00 CO 4 0 . •-1 N CV O. VD co cse IN i n 0 , 4 i n i n Cr) iN h 0 , i n 4 4 4
1-1
›"1
T-e essi i n 4 en 0 A s CO 0% 0 •-1 i n 4 i n VP r*-- OD Cs1 C.1 Cs1 Csi C.1 Cs.1 CNA CNA i n i n i n i n i n i n i n i n in cr• 0% 0% CA CA 0% CA 0% 0% a , 0% 0% 0% Os Os Os Os Os • - I v - I • -1 • - I 1/-1 • - I • -4 1-1 • - I • - I • - I • - I • - I •-•

-84— Appendix 9 S h e e t 4
MILTON RAINFALL STATISTICS (Points)
0 CY% N 4 CO N e‘r in N I n o N 0 . I - 4 I n N O s I n In o N 0 0 1 r 1 N C O N4 en en 4 4 N N co I n en en
1.1
•
• 11 LI
.1 (F.
tr,
•
(LI
In
In N
lcsA CO N
Csi •-4 N ill
4 O. .-e o co • 0% 4 %0
Cr) r••• 19
q'N
• 1
0 in 4 in 0. 0 in n r! f"
h 4 4 v - I 0 4 , O s cn I n n 4 rio • N O s N 0 - •ri
re a l / 4.1 N r i Csi •-4
.-e cr3 I n 4 r 4() ,r4 03
• •4 Cr) 0 CV N co 4 ri r4
Cr) 4 ; ) i n 4 i n . 0 In CO Csa 0 0 0 In
• I n I - 4 Cssi es1 4-4
•
N 0% Cr I n vzi 4 cn co sO I n h. . 0 4 0 I n r •-4 In
41-4
N .c;is g cr. Fis. m so 0 CO CNA a • h . in 4,-4 t f r ) CO CO 0 . 4 0 r•-• l'•••
i f ) I n i n V-1 4 cn • cse '1
N CO C T N 4 r-- o n i n Os o I n 4 I n • - 4 N n lfl Cl N rse i n i n cse I n co
I n I n e.4 . 0 I t v-i .-1
4 i n v..- In 0 e n • N ( 7 , N In I n 4 . 0 CO so , 0 en r-- N .-• sO • -4 4.4 .4-1 i n N 4 v-4 N v-4 in
•-i
I n 4 • 4 cn I n 0 i n as N I n N 0 co N o 4 in as as c4 so n 4 o i n ▪ N N •-4 1-4 N I-4
•-4 Cg r s Cr) N 4 i n f'd gr.. I n cv • -4 • • -4 v-4 •-4
N i n Os n 4 (.4 !;;-, 2 CO 74 I n a . n co 4 ON I n N I N u l 4 in %C)
c v CO4
I n r-- i n %0 s 0 i n N 4-4 0 4-4 1-1 v-4
O s cr, 4 en -7/1 I n I n
r - 0 I n I N 0 Cr) Cr) v-4 en co co C n CO ON 0 0 0 • -1 N i n N 4 4 en * 0 4 • N 4 i n ,A) CO csi N 1.4 N N
• -1 •-4
1,--4 0 0 CO Vsi ON NO 4 i n 4-4 NO CO •-4 CV CO r•-• V-- CO O s N N I . - i n i n 4 0 . - i i n • - 4 i n 0% en a , v-4 4 0, 0 4-1 N N •-1 • - ) Is-- O s •-.1 v•-) I n I n 4-4 • - 4 I 4-4 •-4
I n Os co I n n 0 0 i n I n N n co 0 CO N 0 In 4 i n ch 50 I n cr 4 0% cV 4 i n n co i n 4
I n N • - i Co) i n F l r•-• , 0 v - I 0 c9 • 3 •-4 1-4 v.4
CO CO Cr) 4-4 4-4 N 4 N sO m I n i n 43 O s 50 i n a n • I n • N %Ip CN • I n I n I n N v-4 C n v-4 I n I n s4-4 V I N . v l Cr) 4 0 0 N •Cr
1-1 •-4
Os o i n 4 i n v;$ h CO a% 0 4-4 i n Lc') .0 I n 4 i t 4 4 4 4 4 4 4 i n I n i n i n i n i n in
a i 0 . 0 . as 0 , 0 0 ' as as as as a as a a a 1-4 1-4 1-4 I - 4 1-4 v-4 14--4 • - 4 • v-4 V.4 1-4 • -4 1-4 1-1 1-4 vs-4 4-4

-85— A p p e n d i x 9 S h e e t 5
MILTON RAINFALL STATISTICS (joints)
I n 0 N I n I n 0 0 op in •-I •-4 I n N I n . 0 •-4 0 N 4 i n i n n 4 a% N in
>4 I n i n n 4 at> 4 n en
11) 9
N 0 fi 1•1 p o0. N 4 0
N inrco g q ' p ft) 4
I n 4 co %,c) 0 i n 4 o. o cO 0 o% 00 N . 0 . 0 n - In
N •-1
• i cr, o N o P.. 0 4 N • 0 UInNInInInN
• cc) Cr) Cr) v-i
• 4.1 N 03 N •-1 •-•1 N en 0 v-'1 n .-e N tfl•-1
•-4 tri ' 11 4t30 •-1 In
• 00 I", 03 . 0 0 0 CO •-I Op i n eZ i n i n cr, er 4 a , i n C° • •-•1 N C t s i n m
% 0 C . 4 i n e4 I n o i n 4 N i n co n 4
N 4 I n in .-4 I n op
•1
a . co n I n o o o N 0 1"-- CO •-4 • h I n co es! O es, co i n 4 m 4$. 0 . i n n In
o 4 i n co (.4 ko cr. al I n 00 4 i n N 4-4 .0
N •r4 1-4
•-4 0 co cp csi 11 co r•-. co In 0 . . 4 co . 4 4 CO r•-• N 1.4 1-1 % •-I
I n 4 •-1 I n en in 1-4 1-4
co n . o N 4 cy, I n n
2 n . 0 cr. 4 n 0 co n o v4 4 . 0 4-4 r4 N I n csi 1-1 1.-1 ••-1 1-1
• . 0 00 N N I n v i I n CO 0 N Cr) Cr)
Cr, CO I n •-1 00 Is-• Cr) 4 4 . 0 co 4 4.4 N i n 4
4 In N 03 Os r•-• Cr) CO CT 4 i n No 43 o% 0 4 N 0 I n N i n i n 4 in
4 4 i n N n
$4
>4
N co o 4 e4 i n 4 i n N. en i n I n 0 0 . 0 VD VD ND 43 NO as as a , a% a ▪ a as a , a a • 4 •••I •••• v.4 •-4 •-I •-I 4 •••I •-I "-I

, Year Jan. Feb. Mar. Apr. May June July Aug. Sept. Oct. Nov. Dec.
_ Year
, • 1899 NO RECORDS 18 381 32
1900 217 84 341 460 847 287 526 162 204 19 551 281 3979
1901 257 23 225 156 35 133 91 391 193 283 245 31 2063
1902 109 19 184 12 8 118 89 92 82 - 180 83 679 1655
1903 68 245 204 276 91 174 360 .84 532 435 • 119 284 2872
1904 269 270 41 221 123 69 268 ' 76 97 267 102 146 1949
1905 t87 187 106 184 182 350 170 .
82 82 _ 250 64 145 1989
1906 16 116 426 138 157 227 90 319 296 316 243 163 2507
1907 371 76 90 115 32 281 66 88 113 53 256 130 1671
1908 ', 108 295 11 265 207 86 150 400 193 34 256 61 2066
1909 262 542 77 98 51 ,418 .248 191 80 159 44 178 2348
1910 553 145 315 35 28 165 196 39 259 214 219 322 2490 •
1911 622 126 329 7 369 206 271 118 278 85 298 144 2853
1912 • 68 175 463 17 13 181 507 214 228 114 107 97 2184
1913 86 103 366 190 686 313 82 125 105 227 ,21 261 2565
1914 95 42 715 199 71 80 299 14 139 104 154 505 _2417
1915 267 135 229 159 156 422 •237 190 537 204 10 239 2785
1916 127 158 241 517 93 330 337 252 390 540 408 261 3654

or.. . . . N a l • r u • Apt., J tfflb jury Aug. sept. Oct. lov. Dec. Year
1917 415 367 54 116 160 230 183 343 • 300 367 404 226 3165
1918 425 222 81 187 117 143 359 304 56 127 128 16 2165
1919 24 154 107 147 340 81 98 165 92 135 151 507 2001
1920 485 124 338 94 23 182 245 262 165 186 208 594 2906
1921 285 268 157 379 526 291 155 130 140 202 150 345 3028
1922 306 211 65 270 91 177 1085 121 255 96 51 249 2977 i—s
1923
1924
219
129
12
344
68
33
46
179
124
94
505
139
316
163
128
204
352
230
318
182
253
538
335
206
2676
2441 rt FI P:61 CO •••4
1925 206 249 86 60 1593 569 186 258 97 173 198 12 3687
cn 1926 61 48 423 294 351 230 167 202 140 75 23 129 2143
1927 520 40 82 76 216 33 66 170 155 365 521 93 2337 I-1 c-) 1928 98 681 438 226 85 275 165 96 75 115 55 67 2376 cn
1929 's 0 490 321 178 95 66 69 563 117 125 387 267 2678
1930 27 67 49 228 195 383 216 151 104 435 81 373 2309 C/3
VI 1931 102 110 300 377 598 383 190 110 392 213 183 212 3170 mm
rt a.
1932 10 55 461 211 138 163 197 225 137 101 229 168 2095 •-•
1933 407 6 101 271 156 130 318 18 308 157 NO RECORDS
1934)_ 1945) NO RECORDS
1946 433 257 136 252 63 243 168 67 72 87 296 88 2162

Year Jan. 'Feb. -Mar. Apr. May -June July Aug. Sept. Oct. Nov. Dec. Year
1947 0 252 95 156 61 130 234 1112 214 91 271 728 2384
1948 602 424 50 201 719 229 11 57 107 152 43 375 2972
1949 172 238 425 28 515 536 212 28 .260 218 411 121 3164
1950 305 350 1068 525 249 437 87 80 374 373 115 528( 4691 •
1951 329 238 0 78 146 564 223 254 309 387 130 78 2736
1952 116 118 347 556 153 622 116 98 210 462 120 452 -3370
1953 201 45 90 80 596 122 107 99 154 75 _253 115 1937
. . 1934. 65 386 0 33 26 45 70 50 51 293 405 88 1512
1955 . 184 399 293 115 562 /17 154 439 37 100 424 376 3300
1956 285 437 777 .
656 341 787 ,280 298 149. 336 104 53 4503
1957 45 103 118 65 35 18.0 361 338 0 40 54 338 1677
1958 393 284 150 115 135 268 312 169 208 263 108 252 2657
1959 173 421 590 442 40 1054 412 120 145 895 676 50 5018
1960 201 89 232 100 285 36 477 86 483 258 181 698 3126
1961 146 215 729 199 21 .
176. 418 215 119 342 '912 423 3915
1962 504 272 118 180 212 17 211 307 502 220 101 539 3183
1963 337 458 224 342 341 303 313 198 308 156 154 343 3477
1964 171 37 155 703 127 159 336 196 241 512 148 239 3024

Year Jan. Fab... Mar. Apr . May —June _July -
Aug. —Sept.
_
-act. -
'Nov. Dozy : Year
1896
1897
1898
1899
1900
1901
1902
1903
1904
1905
1906
1907
1908
1909
1910
1911
1912
1913
398.
587
59
154
273
440
136
190
186
123
385
160
112
710
2021
67
44 ''
98
929
- 2
48
136
49
147
418
126
117
56
923
551
24
265
412
64 •
- 49
67
.111
-443
322
126
148
308
103
946
,303
81
0
472
478
582
701 -
NO RECORDS
757 337
56 533
- 4 0 9 - -191
2 8 5 1718
290 25
2.5 76
176 __* 300
- 9 3 6 107
511 478
17 137
216 415
120 • 194
0 167
92 149
106 411 . 217 316
6 0 4 • 1509
1147
510
-_ 668
-697
124
69
181
.0 --
466
0
760
8
551
119
21
354
-1105
292
147
362
810
297
420
403
1850
37
3
11
259
281
727
376
1091
138
195
207
368
1 3 5 1 .
70
639
438
329
68
40
689
. _21
1327
169
0
372 .
74
26
...
•
30
415
-77
199
. 227
' 308
'79
525
170
-86
128
19
67
77
126
.194
50
151
•
'
_316
100
-275
425
- 62
. 283
'555
315
'370
-283
194
5
78
183
197
.121
143
-3.46.
• :--420
29
0
277
827
.109
..186
-136
.48
-109
13.8
179
92
201
215
. 162
300
72
'
240
451,. . -
3 6 4 -
47
78
.33
-542 .
358. - .,. 14
374 ..
105
129
.25
.581
532
274
. 37 ,
58
4480
_3913
4101
5439
'2839
3005
.3354
4479
.2999
'2597
2499
2834 ,
2700
33114
4801
3643
4808
..

I
—90— Appendix 11 S h e e t 2
NOWRA P.O. RAINFALL STATISTICS (Points)
1.4
304
• r i • co 0 .0 0. 4 4 In 0 4 0 A ov,3 ' • 41 4 c%
N CO . 0 9-4 4 co .0 . 0 0 In ON CO h 4 in in n "-I in o In CO in co s O h O s 0 en In en In in N e n in 4 4 4
• •
0
0
• cs3
PIN 9-1
at.
N ( I CO V D i n
CO • CO 1•••• co in 0 0 eciri N • a% 4 I n 0 CO ON V I 4 CNI I n C 4 P s P . . in 94 CV I n I - I 1-1 0 in
•
. 0 en en 0 . 0 3 co as 4 4 0% 0% CO 4 0 •-1 N CO 0 . CO h h en er N •
.141 CO 4 In 0 • - 4 N • -4 • -4 - • en
en o c4 0 4 • •4 ON CO C T . 0 N 42 a% In • 4) N o In in eNi cie o 4 CO cr% .0 %0 en 0 a% •-1 Cl% N • -4 I n P 1 1-1 in • 14 14 .-4 1-1 en •• 9-1
cse ••• •1
4 in c%1 csi 4 Cr, CP, .0 q-4 4 en p en 4 (NI in as n I n c v . 0 o co 0 C V 4 0 , ? A N • - i 1 4 in 4 . I - 4 •,-4 CV CO
In 4 N r•-• en in 4 0 C V i n O s 0 en 0 Cf. - in en in • -1 1:1% ts4 0 O s C 4 r••• • - 1 C T 0 r••• r s O s CO • - 4 • - • • -1 • -4 v-1 csi
0 CO CV 0 0 0 CV I n 0 I n CO CO 4 csi . 0 .0 4 r-- eNi P.- en o ••• o • -4 I n in in in in in .0 co • • 4 1*••• CO I n V;) I n • 4 • -4 • - 4 I n re 4 I n C•sl
• - t • V-4
• P •••• csi in 0 en cr in 0 0% a s s i r CO . 0 i n r s •
C V 1-4 t O CO P I • - I 0 en 0 co in co in Pi O s • -4 Cs1 r 4 I n CN1 0 C I v-I
en cv CO a% CO CO 0 vi ' 0 ‘c• N c4 en 4 CO o -dr e•i in In CO In 9 0 C V I n 4 ' 4 ' v.1 CO h Crt CO i n N N • 4 1 4 r••• i n • 4 in in en csi en 4 en
0 in • co , 0 I n 1-1 0 r ' s I n ai • r•-• N 4 ' ) i n CO 4 qp4
C•4 In In en • -1 0 , in in No c-4
• en 4 en en en In cr 4 ç n rs. "-I i n i n e n N • -4 in
at in n n in co cr n 4 co in . 0 . 4 4 1-4 CO 0 0 o en al in (-4 co o In a n in n v-i en co n
co en 4 c.r .4 •-• N •-• CV i n C V . 0 CM 1-4 In •-4
in 4 ' en 0 4 In a. N csi In c4 as o csi N n CV 0 . 0 ‘ a 0 csa r•-•• r•••• In mo i n CV in in 0 N 4 I n CV in In n • - 4 I-4
. 0 4 .0
N i • C e t . 7 1 : 1 - - . 4 4 (NI in in co io in a% 4 • - 1 GO 91-4
ON in in co Pr •-1 CO i n i - I in P in N CV CO CV in ese
4 in .0 r•-• CO o v-i eNi en 4 in .0 N co as 0 •
•-1 • -4 4.4 • •4 1-4 • 4 CM N • CV CV CV CV CV CV CV in in • O s O s a , a% a , 0% 0% a% 0% a% a , 0 , 0 , a , 0% • -4 • -1
• 1-1 I - 4 • - I to4 ▪ 1-1 • 4 1-1 • -4 e 4 1-4 • -4 • -1 • -1 11-4 •-4

-91— Appendix 11 S h e e t 3
NOWRA P.O. RAINFALL STATISTICS (Pointe)
• •J 0
•
PP)
•
c0 c0 ce 4 4 0 ••• CO C•1 4 cel 0 4 tO ••• en 4 0 N c0 02 co in e0 Ps ye en aN re 43 03 oe 04 ere 4 0 en 03 Ps 0 en e0 N 4 oe PI re p on 01 en m N Cs4 N N 4 04 en ce4 en en 4
101414 LI g it? 7 3 fA :2 r. 0 re en re en eel en re *0 ofe 4 0 N 4.5 in
PI p 4 4 ••4 4 v.4 CV r4 %0 ce4 er4
CNi N 0 •-i 0 I s - P - 0 P co f s 1 r . 5 etli
in en4 Cs1 01 0% en co Ps •-e 0 0 4 1••• MP- N 00 en
IN •-1 4.4 v.4 1-1 %0 4 v-1
0. 03 0 4 N co co en N CO 0 %0 0 N 0 0 r,
00 In en N si) s0 v-4 v-4 •-e in 2 4126- v.1 04 9-1 Cr)
op 0 CO sO 0 en 0 op In 4 in
N %0 h. c0 cp In
v-1
In 0 •-1 C;1% %0 co 0 •-1 er.4 1", •-1 4 0 4 en 4 re CO
cse en c:• •-• • ce) 4-1 2 v-1 0 0% i n v-i en 0 , 1.4 i n • N v.4 •-4 •-•
o oe t o en In N 0% N %0 N m 4 •••4 M e n to esi co %0 N en N In 4 ci Cr) v-4 •-1 •-1
•-1
54 ,ss. 0. 4 *0 IN •-4 r•-• csa oe cre 0 0 0 en 0% 0% e l 0 %0 %0 CO v.4 In N es1 %0
Cel en In •-4 er4 er-4 •-1 Csi
en co e0 ye In etc en to 4 P- 4 co 0 ••• cet cs4 Ifl In 4 In *0 0% 40 v-1 Cr) N . 0 4 co co N Ors 4 In
•••1 r••• ('4 si) v-I •-1 N In In v-I 00 v.• •-•1
so 0 • cr) ess ace , 0 ece re 4 en en 0% 00 •-e 4 at CO 0 i n 0% 00 In 4 co op ▪ 4 0 N N 0 a% esi v-4 en en Co) er4 v-1 w 4 r 's •-• etc eo in
0 •-1 in •-e co eti .-4 oe In 0 r ) 4 %0 cn %o .-4 4 N •-s c:rs 0. co %0 oe in 04 1,- Os en CO CO 4 in ot 0 0 4 en ere er) v-1 er-1 in 4 eel v-1 en c4 In 4 •-•
•-I •-•
in t o c%1 %0 e•1 4 in N 0 in •-• C N 4 ete N P- In %0 ••4 In in to • eel c-4 I n v-1 N CO In %0 04 In 4.4 v-1 v-1 IN. 4 v-I N In v4 v-1 I-1 • %0
. 0 est op 4 • 0 in P- co es- i n Ps I`, N •-1 •-1 en v-1 a. In cv 03 C4, in en i n 1 . 4 ere N 4 • v-1 IN i n in es1
I-1
4 : 2 N • - 4 %.0 N in oe
0% CO i n 04 -0 1-4 0 In cte 0 1-4 In v-1 %0 01 04 en •et 0% 0 N v-I %0 Os 0% 0% 0% 0 c%1
N N •-4 4 •-1 • en V-0 Os 4
C4 en 4 In e0 P-- co 4 I n t0 ti. 2 44. en en en en en en en en -Tr 4-4 re 4 4 -0 4 4
0% 0% 0% 0% 0% 0% 0% 0% 0% 0 ' 0% 0% 0% 0% 0% 0% 0% 0% v-I erl v-1 v.1 •-1 v-1 er4 v-1 v-1 v-1 11-1 v-1 v-1 v-1 v-1 4-1 v-1 v-1

Year Jan. , Feb. Mar. Apr. May June July Aug. Sept. Oct. Nov. Dec. Year
1950 844 835 1039 799 1037 1949 765 155 213 682 385 147 8850
1951 632 937 241 16 327 1700 438 201 966 136 38 56 5688
1952 317 144 627 1318 147 1090 343 1200 18 672 240 343 6459
1953 159 269 241 125 1040 0 145 130 149 290 101 133 2782
1954 438 968 43 47 116 98 182 139 244 315 370 195 3155
1955 540 836 237 202 896 282 46 63 77 167 313 399 4058
1956 292 1971 1056 346 689 638 259 234 .
120 585 213 27 6430
1957 164 447 120 12 10 241 828 391 59 28 106 344 2750
1958\ 342 1450 642 575 45 694 216 168 142 116 50 423 4863
1959 471 671 1148 229 57 370 560 117 198 2600 306 .
266 6993
1960 317 238 594 161 329 295 421 302 348 450 241 746 4442
1961 208 327 1149 191 44 318 392 920 195 318 2290 956 7308
1962 868 490 212 261 725 3 95 364 547 206 49 762 , •4582
1963 693 292 1092 1239 706 545 227 569 257 208 144 934 6906
1964 125 39 301 953 119 1050 46 216 146 300 148 256 3699
1965 154 65 6 336 216 279 292 45 93 765 70 385 ' 2706
1966 102 582 298 39 29 626 106 133 215 451 857 345 3783
1967 588 161 257 91 90 497 F-4

Year Jan. Feb. Mar. Apr. May June July Aug. Sept. Oct. Nov. Dec. Year
1890 695 2074 2782 602 425 1229 1171 145 352 222 698 236 10631
1891 720 211 420 984 .
135 1934 257 305 424 171 351 181 6093
1892 540 324 2207 1193 252 42 495 1025 1373 933 382 317 9083
1893 .
1290 258 2394 304 96 1303 388 86 224 315 331- 232 7221
1894 796 535 2724 703 93 386 239 242 512 184 .
60 308 6682
1895 2326 970 541 302 170 89 85 386 461 107 178 268 5883
1896 120 810 592 36 560 1489 115 177 41 324 588 235 5087
1897 296 192 96 887 725 1317 1.030 357 424 148 100 825 6397
1898 775 1285 217 110 877 872 400 753 248 363 15 192 6107
1899 97 38 445 •485 -296 1331 1089 2784 196 455 392 118 7726
1900 399 313 755 446 1744 1402 2375 117 315 57 821 141 8885
1901 408 185 524 491 97 228 515 1043 278 270 178 32 4249
1902 385 41 189 240 130 79 937 278 137 1595 251 1407 5669
1903 141 78 379 308 408 453 491 588 940 493 329 804 5412
1904 283 528 ' 467 1221 189 25 3185 140 346 370 86 133 6973
1905 242 423 216 1020 403 397 129 98 149 416 118 861 4472
1906 261 171 1063 52 550 35 28 1248 255 340 332 198 4533
1907 835 85 535 50 608 969 50 55 60 23 274 1% 3740

Year ' Jan. Feb. Mar. Apr. May June July Aug. Sept. Oct. Nov. Dec. Year
.,_ 1908 283 1618 113 226 310 119 349 1450 191 248 218 104 5229
1909 290 667 97 42 191 828 318 140 452 221 88 861 4195
1910 ' 912 108 825 272 176 215 1589 30 195 369 168 886 5745 ROBERTSON
P.O.
RAINFALL
STATISTICS
(Points)
1911 2720 999 .
694 828 520 731 647 631 240 136 .
422 193 8761
1912 185 736 669 331 591 663 1684 321 118 87 316 125 5826
1913 172 121 698 715 2078 2069 399 0 198 184 142 226 7002
1914 142 171 NO RECORDS
1915 NO RECORDS 283 86 0 608
1916 352 553 319 412 342 162 485 307 811 2064 703 - 665 7175
1917 393 372 279 1068 115 328 78 24 846 139 732 312 4686
1918 1580 N.R. 133 NO RECORDS 66 NO RECORDS
1919 NO RECORDS
1920 , . NO RECORDS
1921 NO RECORDS
1922 1282 633 103 318 224 152 2317 335 724 252 12 265 6617
1923 237 111 127 721 70 681 1176 558 277 349 161 288 4756
1924 445 280 577 973 496 274 512 143 268 192 425 523 5108
1925 953 657 338 150 2927 1500 55 327 116 110 394 156 7683
1926 359 33 _
948 759 726 633 777 124 258 65 0 _
694 5376
sio

-95- Appendix 12 S h e e t 3 '
•
ROBERTSON P.O. RAINFALL STATISTICS (Points)
LI :
>4
in •-iin se)
.0
,
In so .0
N.. in c 0
. p....
4 0 N1,-
in
in cnO in
co in 4
%0 in.ONNN-et ‘0 *0
0
N O.
*0
Cf1 4
0
N 4
1-4
0 N
0 F',4 .0
in
N0 4
.0
In
1.-- 4 v-4 In
•-4 4 v-4 I--
cn 0% In
c0
co %C? 4, In
in %.0 N V:,
A e
• . U •-• 4 4 In In OD N in co a. .-4 -.in In 0 In •-i cr, N. .-I 0 4 9-1 CV In In cr. In as In a csi csi esi co 0 •-• In •-I %0
CI C11 1-4 1-1 1-4 v-4
4 v..4 4:4 v-4 v-1 in in 4 0, .-4 CNI in v.4 N
;
0 Z
N c0 .0
ao in
r-- in %0
N in v-i
v-4 .0 In
In
N . CNI
N.
csi .0
vl 4
4
In C•4
co w N N
0 N v4
N in
In a. 0
csi cse 0
N 4 0 0 •-i
.0 VD
in 0 * 1 In
0 4 csi
• 1.1 4 N •-• 4 ,r4 cr. v-1 v-I N In •-4 0 ON 0 CT N v-I 0 4- U v..4 Min N %0 r•-• 4 est co N N cy. in 0 v-4 CV t•-• 0% 0
0 4 v-I N 1-1
in •-1 VI N in 4 .-4 v-4 cn 1-1 In 4 N in v-4
• 4.4 in In r-- csi as In •-i in .0 4 c4 0 0 a 4 c.1 In N Is. Ci. 0% •-4 4 In a' c-1 as cc) a co v-1 in as • Inel ...,t v-4 N. ,4
A •
c., 14, in in •-4 in N. In v-4 v-4 4 in 4 W • -4
W 0 4
4 wi Q
1.4
ca v-i co
In r•-•
in v-4
N. in • el
In •-I 1
in .-4
4 N. In
cj v-4 r- csi
N
ceg 4
co I-- %,A0
.-e Ina;
co a%
,L2 , in •1:41
D*. 4 4 4 in 4 In 4 •-i in c0 a 0 In •-i as c0 cr. el N. 4-1 0
v-4 I-4
NID 0%
N. cs1
0 C4
CNI VI •-4
Cr) In
In 0,
CO r••• v-i
14 C.4
N. v-4
C1, CNI . N
v-4 .0 v-4 in N. N.
N 4 co
In 4::.
en
W 0 In 4 a. v-4
In 0,
N. CO
9-1 0
In 4
CO 0
..-1 0
CO
as N.
in. v-I in
in in
.0 CO
0 N
4 CO a% ,4-4
•-4 CO
0 N
4 so
0 in
v-4 4"-- 44-4
v..4 in v-1
v.4 N .0 v.4 in N v4
CA v-I In v-4 *C1 ,r1
t.. in N 4 m N in 4 NI co • N. ko 0 , ce) 0 co in csi OD ciO M a, In '
co csi
0 In 4. In ‘D 4'
(.4
In .4.
N. r... .0
in s-i
N. In
N. v-4 4 in
csi co 4.-4
OD v-I
N v-I in N
4 0. 0
.-4 .0 in
I
i•s CL c0 0% •-i
in as c0
os 0.
r- v-4 1-4 CO In 4 .0
co 4 •-1
4 -4
csi 4 as In as I n sk 4 40 •-i 4
,0 co
0 in
0 co
0
.0 4 cis fsi in .0 C..I In v-4
N 0 1-4
CO In %0 C,./ in .0 in In v-4 in 4 .4
CI
2 N N ,v,
CO 0% .4
r- c4
cn 0 In 4
CT v-i in
VI l',.
in
0 0 .0
v-4 4 cn
0
in cri
v-4 C')N C') N
v-4
in I-4
in In •-•
v-i CO 4 v.-1
CO v-4 cr. 0
•-i
v-4 0 0 N
v-4 as v-4
.0 in I-I
a0 I-- v-I
• CO .0 v-4 4 0 %Co Ce) Cr% C•1 t's %0 v-i a% r.... o% .0 .0 in in N. vo
, W 1... N. 42 ics in 4 in .I' .0 4 oo •-i •-i in co cc) 00 a% 4 44 vl ..4 4 v.4 v-4 In 0 in .0 4 %0 In In v-4 I-4 N IN
1 .0 N icg c n
v - 4 c0 In ty 0, 0 C.4 os in as ct;), 0
.5)., 4 2.
0 co In
co . ,2
.0 ,g
in '4
in 2
r•-• C11 0 le::-.4 N N cn Cr .... .1
I
14 N CO CY, 0 • N cn 4 in .0 N co a% 0 •-• N In 4 in 10 (NI c4 c4 In C') . In In el In In In in In 4 4 4 4 4 4 4 as a% 0% as a% a% a% a% ce% cr, a% CT a, Cr% a, CT 0% CT, CY% >4 •-4 v-4 1-1 v-4 v-4 v-I v-4 v-4 v-I v-4 v-4 v-4 4-4 v-4 v-I v-1 v-I v-I v-1

Year Jan. Feb. Mar. Apr. May June July Aug. Sept. Oct. Nov. Dec. Year
1946 211 502 287 1580 149 788 57 17 132 176 509 78 4486
1947 190 1300 205 715 172 203 76 326 62 202 429 1378 5258
1948 1114 312 180 182 1279 1253 94 34 309 171 92 434 '1+54
1949 1044 653 1160 182 948 2488 224 192 444 298 632 220 8485
1950 1022 931 1880 1409 1221 2716 965 208 323 799 544 207 12225
1951 1909 1377 457 20 540 2522 574 363 1159 252 34 174 9381
1952 288 356 753 1484 286 1664 1370 1979 45 1027 346 569 10167
1953 412 429 396 100 1862 17 201 170 273 286 248 163 4557
1954 696 1515 176 101 123 151 377 229 301 567 542 290 5068
1955 607 909 411 477 1912 358 128 72 161 281 430 902 6648
1956 522 3242 2072 148 1049 1071 409 318 183 875 58 162 10109
1957 237 1122 212 22 6 453 899 735 24 77 128 330 4245
1958 624 1185 918 535 53 660 284 210 275 254 171 448 5617
1959 1239 814 1528 230 158 592 1060 216 259 2607 529 317 9 - f0
1960 415 377 496 203 624 527 945 327 520 751 266 1787 7238
1961 465 520 1531 738 136 591 371 1479 514 1046 2858 2062 12311
1962 1010 1132 313 658 1181 8 540 805 814 341 164 950 7916
1963 828 480 2133 1515 1269 840 438 1162 750 293 322 1467 11497
1964 272 316 562 1775 190 2736 84 282 200 378 276 174 7245
1965 113 121 44 521 213 422 484 78 354 1273 127 487 42:v7
1966 145 846 898 124 61 1044 142 282 427 585 2101 449 7104
1967 800 300 772 135 153 1366
' 0 ' d
NO51113E1011
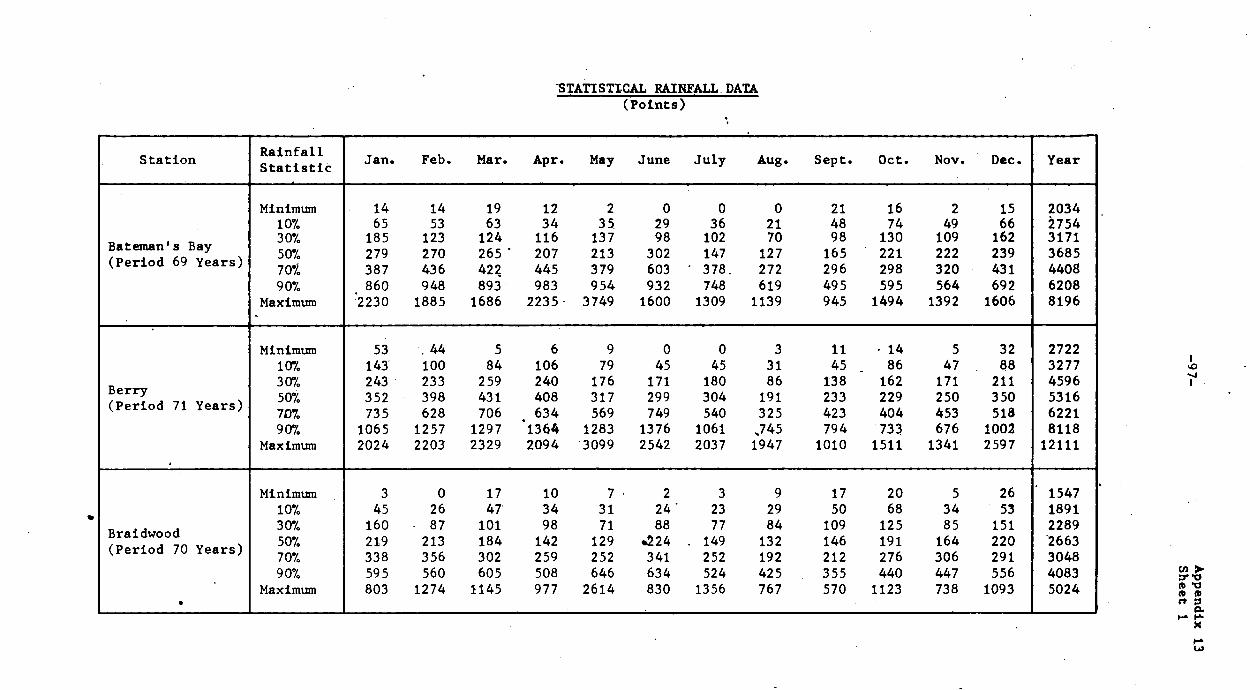
-STATISTICAL RAINFALL DATA (Points)
Station Rainfall Statistic Jan. Feb. Mar. Apr. May June July Aug. Sept. Oct. Nov. Dec. Year
Bateman's Bay ( P e r i o d 69 Years)
Minimum 100/. 300/. 50% 70% 907.
Maximum
14 65
185 279 387
. 860
2230
14 53
123 270 436 948
1885
19 63
124 265 422. 893
1686
12 34
116 207 445 983
2235-
2 35
137 213 379 954
3749
0 29 98
302 603 932
1600
0 36
102 147
' 378. 748
1309
0 21 70
127 272 619
1139
21 48 98
165 296 495 945
16 74
130 221 298 595
1494
2 49
109 222 320 564
1392
15 66
162 239 431 692
1606
2034 2754 3171 3685 4408 6208 8196
•
Berry ( P e r i o d 71 Years)
Minimum 107. 307. 50% 7137, 907.
Maximum
53 143 243 352 735
1065 2024
.44 100 233 398 628
1257 2203
5 84
259 431 706
1297 2329
6 106 240 408 634
1364 2094
9 79
176 317 569
1283 3099
0 45
171 299 749
1376 2542
0 45
180 304 540
1061 2037
3 31 86
191 325
,745 1947
11 45
_ 138 233 423 794
1010
• 14 86
162 229 404 733
1511
5 47
171 250 453 676
1341
32 88
211 350 518
1002 2597
2722 3277 4596 5316 6221 8118
12111
Braidwood ' ( P e r i o d 70 Years)
. I
Minimum 10% 30% 50% 707. 9070
Maximum
3 45
160 219 338 595 803
0 26 87
213 356 560
1274
17 47
101 184 302 605
1145
10 34 98
142 259 508 977
7 31 71
129 252 646
2614
• 2 24' 88
6224 341 634 830
3 23 77
. 149 252 524
1356
9 29 84
132 192 425 767
17 50
109 146 212 355 570
20 68
125 191 276 440
1123
5 34 85
164 306 447 738
26 53
151 220 291 556
1093
' 1547 1891 2289 /663 3048 4083 5024
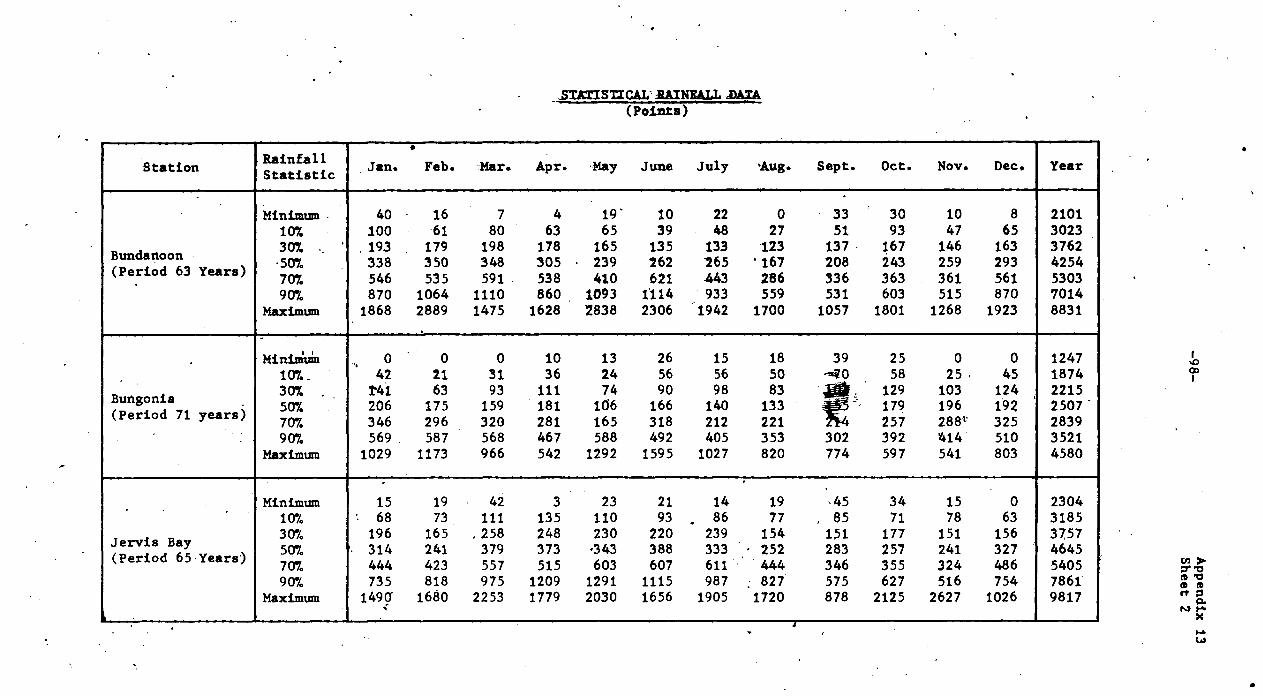
_STATISTICAL' _RAINFALL JATA (Points)
Station - ... ,Rainfall
Statistic Jan. 4.
Feb. Mar. . Apr. 'May June July Aug. Sept. Oct. Nov. Dec. Year
• • Minimum- 40 - 16 7 4 19 10 22 0 33 30 10 8 2101
10% 100 61 80 63 65 39 48 27 51 93 47 65 3023
Bundanoon ( P e r i o d 63 Years)
30% -. ' .50% 707.
. 193 338 546
179 350 535
198 348 591 .
178 3 0 5 • 538
165 239 410
135 262 621
133 265 443
123 '167
286
137. 208 336
167 243 363
146 259 361
163 293 561
3762 4254 5303
90% 870 1064 1110 8 6 0 .
1093 1114 .
933 559 531 603 515 870 7014 Maximum 1868 2889 1475 1628 2838 2306 1942 1700 1057 1801 1268 1923 8831
• 4
• MiniUM
. o o o 10 13 26 15 18 39 25 0 0 1247
• 107._ 42 21 31 36 24 56 56 50 -40 58 25. 45 1874
Bungonia .
307. . 507
T41 206
63 175
93 159
111 *181
74 106
90 166
98 140
83 133 *
ati, VP'.
129 179
103 196
124 . 192
2215 2507
( P e r i o d 71 years) 70% 346 296 320 281 165 318 212 221 214 257 2881' 325 2839 90% 569. 587 568 467 588 492 405 353 302 392 414 510 3521
Maximum 1029 1173 966 542 1292 1595 1027 820 774 597 541 803 4580
• ' . •
Minimum 15 19 42 3 23 21 14 19 '45 34 15 0 2304 10% 68 73 111 135 110 93
. 86 77 , 85 71 78 63 3185
J e r v i s Bay ( P e r i o d 65 'Years)
30% 507 707.
196 '. 314
444
165 241 423
.258 379 557
248 373 515
230 .343 603
220 388 607
239 333 611
• 154 252 444
151 283 346
177 257 355
151 241 324
156 327 486
3757 4645 5405
90% 735 818 975 1209 1291 1115 987 : 827 575 627 516 754 7861 Maximum 1490
: 1680 2253 1779 2030 1656 1905 1720 878 2125 2627 1026 9817
I

.STATISTICAL RAINFALL DATA (Points)
Station
-. Rainfall Statistic Jan. Feb. Mar.
. Apr. May June July Aug. Sept. Oct. Nov. - Dec.
. Year
Minimum 0 0 0 10 0 0 3 0 10 5 0 14 847 107. 22 21 33 32 11 18 27 19 35 59 27 45 1986 307. 150 77 139 88 48 80 64 51 77 136 124 135 2400
Krawarree 50% 283 268 199 149 125 173 119 94 166 203 184 226 2870
. ( P e r i o d 6 4 Years) 70% 368 368 412 328 244 274 225 198 224 282 295 397 3545
90% 660 741 708 586 819 657 688 480 469 418 515 605 4923 Maximum 1299 1330 1339 745 2700 1381 1901 883 853 1684 1529 917 6064
• Minimum 0 6 5 0 14 13 20 0 11 30 0 0 1124
10% 27 18 41 44 31 38 34 29 30 61 31 28 1676 307. 93 69 80 103 65 83 80 69 89 110 90 121 -1946
Lower Boro 50% 185 192 151 170 108 157 134 118 129 187 171 188 2225 ( P e r i o d 59 Years) 70%. 351 294 260 224 242 285 208 218 • 189 262 289 252 2585
_ 977. 489 473 548 418 579. 482 399 302 310 415 424 504 3695
. Maxtmum 712 656 934 887 1695 765 929 619 509 1008 560 790 4877
, Minimum 26 29 20 11 0 . 0 0 0 22 31 0 16 2099
10% 99 72 114 80 67 43 39 25 59 85 ' 98 96 3075 30% 211 166 211 207 195 140 147 76 131 168 187 182. 4127
Milton 50% 356 341 323 419 332 •
297 260 192 225 268 287 306 4703 ( P e r i o d 8 0 Years) 70% 490 518 648 643 539 595 502 310 345 394 418 470 5505
907 • 921 1183 1190 1124 1280 1244 928 655 636 745 623 918 7341 Maximum 2040 2577 2516 2117 3743 1920 1678 1435 1680 2639 1970 1699 12018

STATISTICAL RAINFALL DATA (Points)
Station _
Rainfall Statistic Jan. Feb. Mar. Apr. May June July Aug. Sept. Oct. Nov. Dec. Year
Minimum 0 12 0 7 8 17 11 14 0 19 10 12 1512 107. 25 41 43 34 27 67 74 60 73 75 47 55 1941 307. 107 109 90 113 90 157 155 99 112 124 108 130 2296
Mount Fairy 50% 194 199 194 179 142 222 204 163 160 203 167 239 2666 ( P e r i o d 52 Years) 70% 287 270 330 230 253 304 282 216 255 284 256 338 3038
907. 498 " 433 552 500 597 556 416 341 456 435 492 536 3847 Maximum 622 681 1068 703 1593 1054 1085 563 574 895 912 728 5018
Minimum 10 2 0 0 0 0 0 0 0 5 0 8 2062 10% 65 37 53 48 46 16 44 23 50 73 29 36 2671 30% 159 139 160 164 141 118 130 73 111 138 107 137 3271
Nowra 50% 290 267 256 285 273 263 259 157 ' 190 202 181 250 3776 ( P e r i o d 67 Years) 70% 432 455 476 443 413 535 399 232 254 313 294 440 4541
90% 830 943 965 904 1038 1093 788 689 529 592 483 716 6436 • Maximum 2021 1971 1.899 1539 2512 1949 1850 1379 966 2600 2290 1787 8850
Minimum 13 19 • 18 20 6 8 28 0 13 23 0 23 3147 10% 141 78 127 86 97 55 76 24 60 87 58 114 4249 30% 283 258 313 272 188 198 205 140 191 .184 171 193 5204
Robertson 50% 445 468 467 491 403 527 383 278 277 286 276 288 6265 ( P e r i o d 69 Years) 70% 696 667 698 721 595 969 • 647 386 461 378 425 559 7221
90% 1114 1474 2001 1460 1279 1751 1324 1162 814 1046 698 1133 9760 Maximum 2720 3242 2782
. 2998 4252 2736 3185 2784 1523 2607 2858 2062 12311
ario m mm rt o 0.
%
•-•

MINIMUM RAINFALL RECORDED IN PERIODS OF UP TO TWELVE MONTHS COMMENCING IN THE MONTH INDICATED
Station Number of
Months
Jan. Feb. Mar. Apr. May June July Aug. Sept. Oct. Nov. Dec.
v—I
tv)
111
r•-•
00
C:rs
0
Csa
e—I
•-1
- 14 14 19 12 2 0 0 0 ' 21 16 2 15 92 80 56 15 105 43 22 77 64 71 93 104
223 205 82 .
139 199 83 *96 123 119 280 233 163 270 373 179; 251 211 258 149 231 330 386 252 338
. 438 518
. 291 265 294. 432 328 388
. 414 456 363 617
Bateman's Bay 626 779 305 328 583 523 435 494 608 623 733 755
. 1037 958 368 617 761 730 539 655 726 891 871 846 1162 - 1222 657 795 999 1043 889
. 1009 1142 1029 962 1281
1526 1356 835 1033 1321 1242 1232 1369 1280 1120 1393 1293 1646 1556. ' 1673 1375 1420 1571 1706 1547 1371 1713 1549 • 1631 1762 1912 1415 1780 1837 2065 1843 1760 1766 1773 1693 1777 2034 2073 1919 2185 2378 2073 2028 1821 1826 1806 2029 1893
1 53 44 5 6 9 . 0 0 3 11
4I
14 5' 32 2 215 178 18 26 77 7 7 50 33 ' 106 122 146 3 427 ' 425 210
, 160 114 256 62 64 224 320 294 317
' 4 583 459 385 167 440 476 76 255 367 444 410 493 5 663 506 534 566 620 • 760 311 398 489 653 671
•
947 Berry 6 855 731 659 859 928 805 410 520 861 892 , 1115 1114
7 . 943 910 1112 1216 034 1170 697 913 1174 1263 1287 1278 8 1068 1365 1341 1288 1465 1440 1138 1258 1330 1455 1451 1527 9 1521 1531 1381 1518 1580 1675 1850 1849 1522 2001 1710 1565
10 1750 1632 1811 1809 1815 2075 2303 2355 2216 2126 1748 1815 • 11 19§0 2180 1887 1951 2281 2412 2459 2446 2391 2213 1990 2053
12 2722 2256 2122 2360 2519 2633 2480 2453 2570 2260 2236 2519
•-• 0

MINIMUM RAINFALL RECORDED IN PERIODS OF UP TO TWELVE MONTHS COMMENCING IN THE MONTH INDICATED.
Station Number
of Months
Jan. Feb. Mar. Apr. May June July Aug. Sept. Oct. Nov. Dec.
, 1 3 0 17 10 7 2 3 9 17 20 5 26 2 51 44 51 41 65 12 43 46 78 71 38 52 3 187 161 95 123 81 118 126 170 166 239 • 99 167 4 322 193 155 126 202 . 147 209 230 285 267 172 220 5 347 274 171 249 318 272 321 368 313 414 225 379
Braidwood 6 7
439 632
332 463
266 382
365 505
460 476
331 497
487 554
396 677
466 519
467 629
430 437
400 479
8 816 607 550 521 642 749 745 887 815 661 644 702
. '9 939 711 566 687 818 951 1018 921 822 943 867 856 10 1211 727 732 863 1114 1248 1172 928 1045 1166 1021 979 11 1298 893 908 1213 1378 1368 1228 1196 1268 1.120 L144 1251 12 1547 1069 1258 1423 1437 1621 1496 1526 1422 1443 1416 1338
•-I
cv cn 4 w) mo N co cr 0 .—I CV
v-I
v-I
v-I
40 16 7 4 19 10 22 0 33 30 10 8 128 48 54 74 100 89 33 127 123 60 71 114 222 348 214 289 305 210 151 167 223 235 265 328 415 564 418 420 452 356 201 366 323 417 448 441 755 699 511 651 700 626 412 525 507 618 604 662
1036 791 727 859 828 752 588 659 658 984 915 822 Bundanoon 1251 993 935 1102 1066 852 729 884 1135 1009 1075 1300
1331 1215 1178 1253 1186 1112 1145 1337 1159 1169 1463 1335 1615 1458 1329 1316 1237 1327 1589 . 1685 1319 1809 1498 1386 1904 1609 1392 1367 1452 1801 1731 ' 1885 1892 1878 1549 1663
. 1970 1672 ' 1443 1582 2040 2294 1922 1936 2060 1929 1783. 1952 2101 1723 1638 2362 2502 2461 1970 2104 2171 2149 2072 2018
I-• 0

MINIMUM RAINFALL RECORDED IN-PERIODS OF-UPIO TWELVEMONTHS COMMENCING _IN-THE:MONTH INDICATED'
.
Station
_ Number
of 'Months
• Jan. Feb. Mar. Apr. May June
. July Aug. Sept. Oct. Nov. Dec.
• 1 15 19 42 3 23 21 14 19 45 - 34 15 0 2 111 61 111 26 142 155 33 138 139 75 149 23 3 154 372 134 193 325 450 180 252 240 274 187 236 4 465 530 301 503 581 777 391 487 435 289 388 278 5 602 697 892 824 901 835 709 644 503 559 490 589
• ' J e r v i s Bay 6
• 7 769
1211 '1083 1174
1155 1495
1144 1226
983 1197
.
1104 1293
772 935
• 689 822
650 1060
812 1123
801 914
745 912
8 1267 1514 1540 1440 1463. 1552 1176 1232 1373 1475 1081 1335
• 9 1607 1559 1809 1641 1664 1793 1331 1698 1717 1685 1547 1391
10 1652 1828 2192 2037 1905 1936 1971 1947 1884 1869 1603 1731 11 1921 2211 2389 2278 2060 2247 2240 2114 2119 1925 1943 1776 12 2304 2734 2630 2433 2443 2599 2589 2500 2175 2265 1988 2045
1 10 2 0 0 0 0 0 0 0 5 0 8 2 61 29 0 22 59 3 7 40 24 86 62 55 3 124 200 142 110 140 166 51 45 189 195 206 145 4 510 276 296 157 304 343 56 224 262 307 241. 198 5 710 345 434" 439 547 616 235 353 374 577 340 673
N owra 6 7
785 903
503 697
625 869
680 862
801 831
736 829
364 524
480 712
638 830
640 '858
780 858
749 818
8 931 996 1051 999 1055 1074 892 987 925 1025 927 949 9 1382 1120 1247 1384 1160 1111 1088 1462 1092 1210 1091 977
10 1446 1316 1695 1489 1197 1121 1563 1545 1514 1391 1119 1428 11 1625 1958 1705 1526 1207 1596 1646 1671 1581 1419 1570 1492 12 2062 1968 1882 1536 1682 1679 1772 1738 1609 1790 '. 1634 1671
_

-104— A p p e n d i x 15 • S h e e t 1
MONGARLOWE RIVER AT MARLOWE.
LOCATION:
PERIOD OF ESTABLISHMENT: A u g u s t 1 9 4 5 t o date.
COMPLETE YEARS OF COMPUTED RECORDS: 21
ZERO OF GAUGE: R . L . 4 5 . 0 4 Assumed Datum.
CATCHMENT AREA: 1 7 5 S q u a r e Miles.
CONTROL: Rock Bar.
L a t i t u d e 3 5 ° 1 6 ' L o n g i t u d e 149°55'
EQUIPMENT: A u t o m a t i c R e c o r d e r ( F l o a t T y p e ) installed J a n u a r y 1954. S t a f f G a u g e , r a n g e 0 t o 3 0 feet.
CURRENT METER OBSERVATIONS: ( a ) Number o b t a i n e d 131
( b ) Maximum observation i n cusecs : 2,928
( c ) Minimum observation i n c u s e c s 3.2
MAXIMUM ESTIMATED DISCHARGE DURING PERIOD OF RECORDS: 4 7 , 2 0 0 cusecs.
MEAN DAILY DISCHARGE FOR 21 YEARS: 2 3 7 cusecs.
MEAN ANNUAL DISCHARGE FOR 21 YEARS: 1 7 3 , 0 0 0 a c r e feet.

-105- Appendix 15 S h e e t 2
IONGARLOIE RIVET( AT MARLOWE • ',••i", •
Year 1945 Year 1946 , .
Month D i s c h a r g e
. i n Cusecs ,.
Discharge f o r Month A c r e Feet
-
-Month *
Discharge i n Cusees
Discharge. f o r Month Acre Feet Max. Min. 7. Mean
— Max. Min. Mean
: „ Jan. .• 00 00 .00 -Jan. 242 4 24 1 , 4 6 0 •
Feb. 00 00 0.0 00 Feb... 30 6 12 700',
Mar. 00 00 00 00 Mar. 15 '10 11 672'
. , Apr.' .0. 00 00 0* Apr. 383 10 45 2,688
May ... .. .. .. May • 30 15 20 1,224
June , .
•• •• •• •• June , 970 '15 104 6,230
July.. •
A I 7 .. ,7 • ..
•
July 75 15 11 2,050 .„,T1., ,.:;..
Aug! . 4..
pi pt ,'., 4. 120744 Aug. 15 .10 11. -,71.,
1” Sept. 10 ' 6 8 472:
,... Oct. 50 15 ,
1494 Oct. 10 3 0 / 4 8 .
• 4 '; Nov. 269 '1. .29
• ::-;'' '1,224 Nov. 99 3 23 ' 1,386
‘ ' t .•
• i ;W
Dec, 15 "0 ,
11' 1$
676 Dec. 26.613.816 . -• . , , w-•
Tclt: A
•• °,!. li .. .Total 00 .00 •
_
00 18,842
Year 194? Year 1948
.4.101.
Feb.
Mar.
Apr.
NAT
June
July
Aug.
Sept.
Oct.
Nov.
Dec.
6
8660
191
167
40
30
21
80
64
13
80
692
2
2
30
21
21
21
15
12
10
6
6
21
5„
471 fH 5?
p 20
24
17
25
22
9
13
167
' 320
.'26,422 1; 3024
2,94 1,016
1,442
1,074
1,558
1,304
. 572
806
10,024
an.
Feb.
Mar.
Apr.
May
June
. July
Aug.
Sept.
Oct.
Nov.
Dec.
1070
No
No
No
No
No
No
No
No
No
No
No
80
Records
Records
Records
Records
Records
Records
Records
Records
Records
Records
Records
214 13,240
3,920*
2,640*
1,660*
68,300*
17,600*
2,040*
1,190*
710*
580*
470*
320* . ,
Total -
.. .. .. 51,656 Total .. ... .. 112,670*
* Estimated.

-106- Appendix 15 S h e e t 3
MONGARLGWE RIVER AT MARLOWE
Year 1949 Year 1950
Month Discharge. i n Cusecs
Discharge f o r Month Acre Feet
-
Month
_ Discharge i n Cusecs
Discharge f o r Month Acre Feet - Max. Min. Mean
,
Max.] - Mean
Jan.
Feb.
Mar.
Apr.
May
June
July
Aug.
Sept.
Oct. Nov.
Dec.
418
No
No
No
No
No
No
No
No
No .‘
No
No
10
Records
Records
Records
Records
Records
Records
Records
Records
Records
Recoids,
Records
79 4,860,
• 480*
13,000*
630*
25,400*
107,900*
.20,750*
6,660*
4,690*
3,500*
4,640*
1,800*
Jan.
Feb.
:Mar.
Apr.
May
June
July
Aug.
Sept.
Oct.
Nov.
, Dec.
No
No
No
No
No
No
.No
No ' .
No
No
No
No
Records
Records
Records
Records
Records
Records
Records
Records
Records
Records
Records
Records
' 7,930*
37,200*
69,600*
95,000*.
47,500*
78,400*
41,500*
12,600*
5,170*
26,000*
7,280*
2,340*
Total ' .. .. .. 194,310* Total •• • • • •. 430,520*
Year 1951 Year 1952
I I ,. Jan. No Records 31,000* Jan. 50 10 20 1,244
Feb. No Records 34,000* Feb. 15 10 12 668
Mar. No Records 8,350* Mar. 1880 10 10.4 6,446
Apr. 80 40 51 3,056 Apr. 7500 30 431 25,854
May 50 15 37 2,306 May 920 99 208 12,892
June 18000 18 1224 73,438 June 25000 64 1408 84,472
July 1425 99 287 17,820 July 8500 151 635 39,406
Aug. 1020 ' 64 152 9,398 Aug. 10700 225 1317 81,660
Sept. 9200 50 478 28,696 Sept. 225 47 133 8,008
Oct. 3280 64 294 18,214 Oct. 1120 30 152 9,450 ,
Nov. 120 40 59 3,560 Nov. 1645 92 239 14,362
Dec. 64 21 40 2,464 Dec. 613 110 224 13,876 ,
Total .. .. .. 232,264* T o t a l A .. .. .. 298,338
* Estimated.

-107- Appendix 15 S h e e t 4
MONGARLOWE RIVER AT MARLOWE
Year 1953 Year 1954
Month Discharge i n Cusecs
Discharge f o r Month Acre Feet
Month Discharge i n Cusecs
Discharge f o r Month Acre Feet Max. Min. Mean Max. Min. Mean
Jan. 1220 75 197 12,234 Jan. 35 7 17 1,038
Feb. 277 92 137 .
7,674 Feb. 13500 19. 397 22,216
Mar. 130 60 81 5,048 Mar. 200 36 80 4,934
Apr. 69 35 50 3,010 Apr. 37 21 29 1,768
May 11000 35 881 54,624 May 27 16 20 1,246
June 225 60 115 6,920 June 30 13 16 970
July 75 47 60 3,718 July 27% 13 16 980
Aug. 110 35 51 3,090 Aug. 16 9 12 738
Sept. 35 26 28 1,686 ,Sept. 15 9 10 612
Oct. 75 7 .32 1,976 ' Oct. No Records 320*
Nov. 47 19 -25 1,476 Nov. No Records 260*
Dec. 26 4 11 712 Dec. 4.4 3 3.6 224
Total .. .. .. 102,168 Total .. .. .. 35,306*
Year 1955 Year 1956
Jan. 3.41 3.41
3.4 210 Jan. 148 8 19 1,160
Feb. No Records 8,000* Feb. 20700 13 1271 73,730
Mar. 6050 69 304 18,838 Mar. 13500 277 1064 65,988
Apr. 11900 27 143 8,558 Apr. 1120 106 244 14,668
May 14900 91 733 45,424 May 5800 106 436 27,010
June 332 73 149 8,910 June 12300 126 1014 60,814
* , July 106 52 64 3,940 July 10100 172 507 31,412
Aug. 64 27 42 2,592 Aug. 362 78 139 8,644
Sept. 38 21 26 1,554 Sept. 116 52 69 4,122
Oct. 137 16 28 1,706 Oct.: 2000 52 203 12,592
Nov. 106 9 -
15 904 Nov. 69 32 50 2,972
Dec. 27 9 13 ''776 Dec. 30 17 24 1,486
Total .. .. .. 101,412* Total .. .. .. 304,598
. . * Estimated.

-108- Appendix 15 S h e e t 5
MONGARLOWE RIVER AT MARLOWE
Year 1957 Year 1958
Month
•
Discharge i n Cusecs
Discharge f o r Month Acre Feet
Month Discharge i n Cusecs
Discharge f o r Month Acre Feet Max. Min. Mean Max. Min. Mean
Jan. 16 11 13 832 Jan. 390 6 34 • 2,132
Feb. 426 , 9 38 2,110 Feb. 10000 30 517 28,966
Mar. 38 16 23 1,442 Mar. 1210 47 169 10,476
Apr. 23 10 16 950 Apr. 47 25 34 2,022
May 10 5 8 490 May 35 25 30 1,860
June No Records 2,300* June 20500 20 485 29,082
July 112qp 29 515 31,920 July 7760 54 241 14,972
Aug. 3795 46 347 21,518 Aug. 137 35 52 3,228
Sept. 390 47 120 7,184 Sept. 47 30 36 2,166
Oct. 47 30 34 2,138 Oct. 74 20 35 2,182
Nov. 30 12 23 1,376 Nov. 20 12 15 888
Dec. 92 7 13 788 Dec. 164 12 25 . 1,564. ,
Total .. .. .. 73,048* .
Total .. .. .. 9 9 , 5 3 8 '
Year 1959 Year 1960
,Jan. 238 16 60 3,724 Jan. 455 30 67 4,138
Feb. 1450 40 145 8,130 Feb. 54 25 32. 1,856
Mar. 3540 72 306 18,950 Mar. 692 25 106 6,594
Apr. 4420 72 298 17,884 Apr. 207 40 62 3,744
May 63 40 48 2,986 May 222 35 49 3,014
June 17300 30 719 43,128 June 54 25 37 2,204
July 35100 103 1288 79,884 July 23600 25 1041 64,540
Aug. 277 82 141 8,740 Aug. 192 63 100 6,222
Sept. 82 40 64 3,848 Sept. 1054 51 202 12,138
Oct. 47206 40 2313 143,408 Oct. 278 61 104 6,470
Nov. 7120 254 655 39,300 Nov. 72 39 51 3,082
Dec. 546 72 172 10,686 Dec. 13200 38 691. 42,872
Total .. .. .. 380,668 Total .. .. .. -156,874
Estimated.

-109- Appendix 15 S h e e t 6
IONGARLOWE RIVER AT MARLOWE
Year 1961 T
Year'1962
Month Discufre i n Cpascs-
Discharge f o r Month
, Acre Feet ; Month
14sOarpo iiCCUsecs
Discharge f o r Month Acre Feet tpix. ' Mip.:. Mean f: lie xlpn Mean
. .. Jan. 1695 59 ' '174 1 0 , 8 0 6 ' Jan.
1 5600 219 563 34,914
Feb. 80 '46 57 3,180. Feb. 13400 .'.
131 691 38,694
Mar. 17900 49 894 55,418 Mar. 1270 .121 260 16,138
, .. Apr. 453 80 .183 10,960 Apr. 228 76 113 6,796
May 91 49 60 3,720 May 1210 61 141 • 8,758
June 2870 51 282 16,916 June 91 50 65 3,922 ,
July 4942 41 463 28,698 July 1018 50 121 . 7,528
Aug. 5500 101 501 31,090 Aug. 429 . 60 131 8,148
Sept. 1192 161 355 21,298: Sept. 12100 60 905 54,312
Oct. 7160 89 370 22,966 Oct. 253 80 136 8,438
Nov. 36800 78 1609 96,520 Nov. 152 49 71 4 , 3 3 8 .
Dec. 9072. 243 706 43,744 ' Dec. 1520 46 198 12,266
Total i. .. .. 345,316 Total .. .. .. 204,252
Year 1963 Year 1964
, v Jan. 775 60 191 ' 6,244 Jan. 99 37 58 3,590
.... Feb. 900 57 157 8,790
, Feb. 48 . 22 30 1,766
Mar. 7280 57 549 .34,050 Mar. 211 22 36 2,254
Apr. 35700 85 1018 62,306 Apr. 3388 26 342 20,530
May 16200 288 904 56,080 May 181 65 110 6,852
June 5500 ' 197 472 28,352 June 5680 60 380 22,790
July 4000 152 454 28,140 July 90 65 78 4,826
Aug. 2660 90 176 10,938 Aug. 1390 46 126 7,818
Sept. 9200 67 459 27,534 Sept. 192 41 65 3,890
Oct. 601 80 176 10,910 ' Oct. 922 31 59 3,682
Nov. 501 63 103 6,206 Nov. 302 27 65 3,918
Dec. 2241 53 421 26,104 Dec. 85 20 29 1,830
Total .. .. .. 305,654 .„
Total .. .. .. 83,746 A

-110— Appendix 15 S h e e t 7
MONGARLOWE RIVER AT MARLOWE
Year 1965 Year 1966
Month Discharge i n Cusecs
Discharge f o r Month Acre Feet
Month , Discharge
i n Cusecs Discharge f o r Month Acre Feet Max. Min. Mean Max. Min. Mean
Jan. 23 14 18 1,118 Jan. 16 8 11 700
Feb. 16 10 13 752 Feb. 259 7 32 1,802
Mar. 11 7 8 516 Mar. 42 15 23 1,448
Apr. 16 6 10 588 Apr. 15 9 11 686
May 11 8 9 560 May 13 9 11 .656
June 27 7 10 606 June 1048 10 117 7,020
July 51 10 16 977 July 51 22 28 1,765
Aug. 12 9 11 664 Aug. 216 18 22 1,355
Sept. 69 8 19 1,154 Sept. 378 34 950 5,703
Oct. 2461 7 181 11,200 Oct. 326 31 55 3,382
Nov. 89 18 34 2,034 Nov. 14950 32 797 47,796
Dec. 73 14 27 1,658 Dec. 2510 57 157 9,724 ,
Total .. .. .. 21,827 Total .. .. .. 82,037
Year 1967
Jan. 206 29 54 3,352
Feb. 135 31 47 2,630
Mar. 260 40 70 4,322
Apr. 61 24 35 2,128
May 46 20 25 1,575
June 253 18 81 4,864
July
Aug.
Sept.
Oct.
Nov.
Dec.
Total ,

-111—
SHOALHAVEN RIVER AT WELCOME REEF
LOCATION:
PERIOD OF ESTABLISHMENT:
COMPLETE YEARS OF COMPUTED RECORDS: '
ZERO OF GAUGE:
CATCHMENT AREA:
CONTROL:. ,
A p p e n d i x 16 S h e e t 1
L a t i t u d e 3 5 ° 1 0 ' L o n g i t u d e 150°00'
J u n e , 1 9 0 9 t o date.
52,
1 0 0 . 1 0 Assumed Datum.
1 , 0 7 0 S q u a r e Miles.
' R o c k Bar.
EQUIPMENT: A u t o m a t i c R e c o r d e r ( p r e s s u r e type) i n s t a l l e d November 1955 S t a f f g a u g e , . r a n g e 0 to• 5 0 feet.
CURRENT METER OBSERVATIONS: ( 4 ) Number o b t a i n e d 195
. - ( b ) Maximum observation i n C p s e c ! : 2,615
MAXIMUM E S M A T E D , D I S C H O G E DUaING-PEKI015 OF RECORDS:
• , !
MEAN 'DAILY DISCHARGE. FO 52 .yuks1
MEAN ANNUAL DISCHARGE FOR,
• 521EARS4..
REMARKS:
) Minimum-observation in. c u s e c s 0.03
' 3 1 3 , 0 0 0 cusecs:
:64O,cusecs.
4 6 7 , 0 0 0 a c r e feet.
P e r i o d s o f m i s s i n g r e c o r d s c o m p u t e d b y . c o r r e l a t i o n w i t h S h o a l h a v e n R i v e r at
1.1arti a n d M c n g a r l o w e R i v e r a t Charlyong.
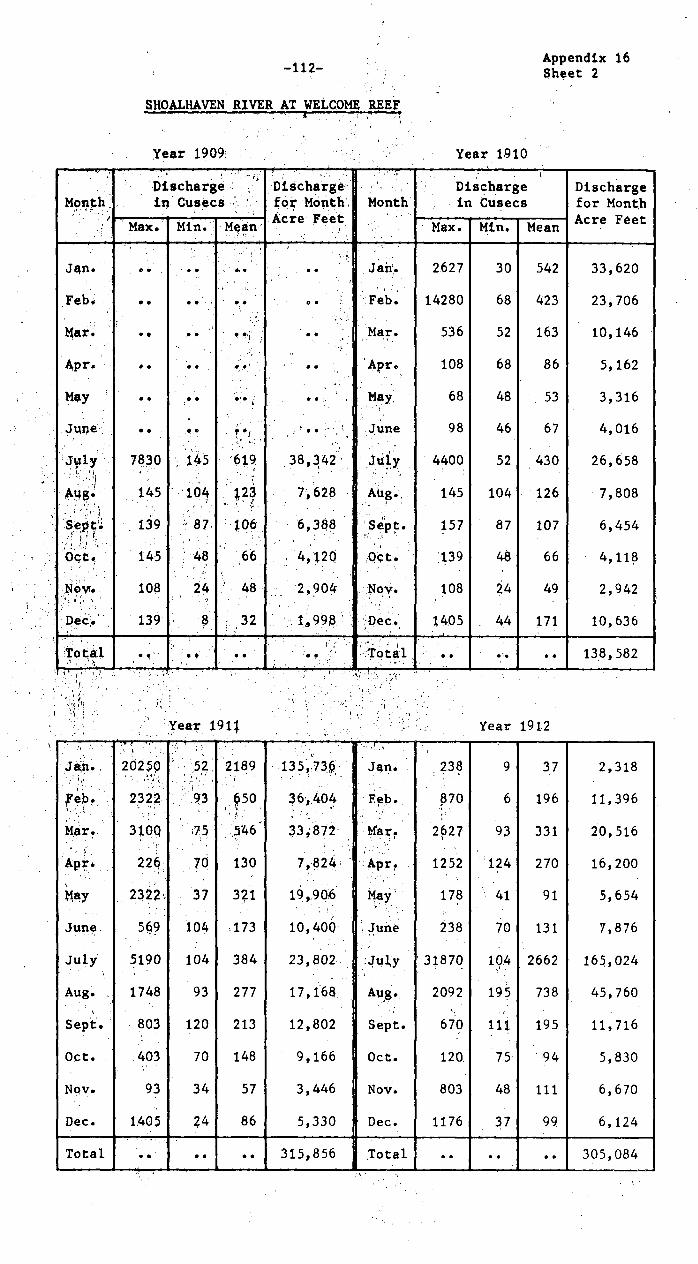
-112- Appendix 16 S h e e t 2
SHOALHAVEN RIVER AT WELCOME RgEE, .4 r
Year 1909 Year 1910
Month: ' IA
D i s c h a r g e - '
i n Cuseos :": ' • .
D i s c h a r g e .- f o r Month', Acre Feet'
• •
Month Discharge i n Cueecs
Discharge f o r Month Acre Feet , Max. Min, Mean! Max. Min. Mean
Jan. . .. ... ••
, , Jan, 2627 30 542 33,620
.Feb. .. ..., ... .• -Feb: 14280 68 423 23,706
Mar. .. ,. , . . :Mar. 536 52 163 10,146
Apr.
, May
••
..
••
• ..
,
,
.
. . '
:Apr.
May,
108
68
68
48
86
53
5,162
3,316
J-04e.l. .. .. , iii . . June 98 46 67 4,016
'Aily 7.410 ';-.445 619 .38,142. .JUlly 4400 52 .430 26,658
p4g, , .
1
145 '.'104. , . ,
123 ... ..y .
7,628 Atig,. ! .
145 104 126 7,808
$...g,Fit'% :•)'-'
•,„ ;, ,,. .
119 ::'87. ' 100 • 0,300 Sept . , :.
157 87 107 6,454
Oct. . 145 48 ':66 ,4,120 Oct. 139 48 66 4,118
... No. 108 24 48 2,904 ..:Noy. _
108 24 49 2,942
, ' D e c . • . 139 8 32 ,1,99V ::-Dec.,, 1405 44 171 10,636
0 , Total
.. .. ..
_ .
_
.1.0t41
,• - • e. !4 .. 13.8,582
Year 1912
JO., - •
,
:)!_ Mar. •
Apr..
"14)T
June.
July
Aug.
Sept.
Oct.
Nov.
Dec.
20250 . . •,.
r..
2.322, , 310q
226i
2322
509
5190
1748
. 803
403
93
1405
' 52: ,
93
75. ..70
37
104
104
93
120
70
34
74
2189 •
i050
..40.
130
371
173
384
277
213
148
57
86
135r730, . . . •
10,404
334872:
7,-.824
19,900
10,4*
23,802
17,168
12,802
9,166
3,446
5,330
.3"41•
Feb.
Z4.4;,
H , A 0 r • .
May
June
:July
Aug.,
Sept.
Oct.
Nov.
Dec.
230f,1
870
4027
1752
178
238
'31870
2092
670
120.
803
1176
9
6
93
:124
41
70
104
195
111
75
48
37
37
196
331
270
91
131
2662
738
195
94
111
99
2,318
11,396
20,516
16,200
5,654
7,876
165,024
45,760
11,716
5,830
6,670
6,124
Total .
.. .
.. 315,856 :Total .. .. .. 305,084

•
-143-
SHOALHAVEN: RIVER AT WELCOME REEF
Year 1913 Year 1914
Appendix 16 S h e e t 3
Month
A ,
' Discharge i n Cuseca
-
Discharge fOr Month
. • ., A c r e Feet . Month, . ,
, Di4harge
in.'cupeca '
Discharge f o r Month Acre Feet Max. Min. Mean Max. Min. - • Mean
Jan. 139. 48 79 -4,.918 ',Jan.-. 93 ,37 54 3,372
, Feb. . 66 0 '13 r ,-,1/24 Feb. 37 16 '24 1,336
Mar. 1252 15 141 8,722 Mar. 42200 5 3069 190,300
‘A#r. 306 61 115i. .1,9Q4 .Apr. 2289 306 759 45,534 (
May '44700 ;93 _2185. 135,474 May, 736 171 328 20,314
s41Fie : 59000 :536 4821 289,492 'June ,803 116 173 10,386
JulT. 6480 403 1034 125,892 ':July 10200. 244' .1105 68,512
-., Aug. 1023 178 486-- 30,136 Aug. . 348 116 ' 187 11,610
•Sept. -186 120 .142 .8,536 Sept. 1551. 481 454 27,228
, Oct. , 536 98 186. 11,.52 Oct. : .946 111 255 15,836
Nov!. 12.? 56 Y86_ .5 1.80 Nov. -'6,70. 151, .164 15,848
)Dec, 1013, 30 121 ' '7,520 Dec. 15600 93 626 38,842 t T
TC4g1' ...,, .. ,. .635,150 Total ..:, .. .. 449,118
A - Y e a r 1916,
J a n . -H.
Feb, ,
'1Mar. .
Apr . ''
May. :
June, , July
Aug..
Sept.
Oct.:'
Nov. .
Dec.
50.50,:'
- 1319
• 111'_•
306,
120.
, 4900
9.46
536
13900
: 670
87
238'
2:13?
61
30
93
81
v -.75
93
104
70
91
41
30
834
89
48
194
97
543.
245
177 .
1689
226.
, 62
59
51.„7,44
4,984
3,002.
11,670
6,030
32,610
, • 15,192
10,.994
. 101,360
13,986
3,744
3,682
J a n . : , Feb.
Mgr .
, Apr.
May
June
July
Aug.
\Sept.
Oct.
Nov.
Dec.
736
2398
, 1787
3600
164
214
1710
3600
22700
130000
803
8070
87
- 52
151
129
56
54
54
104
. . 93
375
186
164
, 154
192
641'
562 , , 91
122
188
395
806
10839
366
875
' 9,560
11,148
39,726
33,752
5,636
7,320
11,662
24,496
48,356
672,012
21,944
54,250
Total .. ,, .. 258,998 , Total .. .
.. .. 939,862

-114-
SHOALHAVEN RIVER AT WELCOME REEF '
Year 1917 Year 1918
Appendix 16 S h e e t 4
Month Discharge i n Cusecs
- Discharge f o r Month Acre Feet
Month Discharge i n Cusecs
Discharge f o r Month Acre Feet Max. Min.. Mean Max. Min. _ . Mean
Jan. 270 75 127 7,866 Jan. 4000 30 604 37,464
Feb. 736 111 225 12,616 Feb. 8550 164 1274 71074
, Mar. 736 87 176 10,928 Mar. 1405 81 253 15,734
Apr. 536 52 101 6,086 Apr. 151 70 92 5,538
May 803 56 197 12,184 May 93 37 61 3,770
June 120 56 95 5,676 June 34 ,
15 22 1,336
July 70 30 45 2,784 July 3300 11 417 25,850
Aug. 120 52 87 5,386 Aug. 946 214 484 30,032
Sept. 348 66 139 8,350 Sept. 195 66 113 6,766
Oct. 2016 75 523 32,440 Oct. 66 34 48 2,974
Nov. 10200 44 454 27,244 Nov. 120 19 41 2,482
Dec. 1023 51 285 17,686 Dec. 13 0 2 124
Tbtal .. .. .. 149,246 Total .. .. .. 203,444
Year 1919 Year 1920
Jan. 0 0 0 0 Jan. 15400 238 2616 162,196
Feb. 12600 0 820 45,954 Feb. 2474 139 858 49,746
Mar. 4698. 66 241 14,920 Mar. 1405 111 358 22,216
Apr. 670 61 224 13,438 Apr. 151 75 107 6,416
May 1100 34 160 9,928 May 81 66 74 4,622
June 403 120 183 11,006 June 81 56 66 3,970
July 120 58 87 5,384 July 803 61, 159 9,888
Aug. 139 48 69 4,290 Aug. 238 75 .
' 115 7,178
Sept. 238 98 -.147 8,844 Sept. 870 70 137 8,220 2
Oct. 93 24 49 2,928 Oct. 803 44 112 6,970
Nov. 37 22 29 1,742 Nov. 75 24 40 2,428
Dec. 1481 48 406 25,192 Dec. 28600 37 2176 134,890
Total .. .. .. 143,626 Total .. .. .. 418,740

-115-- Appendix 16 S h e e t 5
SHOALHAVEN RTVER AT WELCOME REEF - . „
Year 1921 Year 1922
Month Discharge. i n Cusecs
Discharge f o r Month Acre Feet
Month iDischarge. in.Cusecs
Discharge for. Month Acre Feet
Max. ,Min. Mein Max.. Min. Mean - ,
Jan. 946 120, :451 28,100 Jan. 2110,0 L9,5 2110 130,820
Feb. 1710. . 75 426 23,888 Feb. 946 87 236 13,216
Mar. 1863 151 .571 35,436 Mar. 946 81 201 12,462
Apr. 12400 111 1488' 89,316 Apr.. 139 •: 30 54 3,242
,May 2780 87, 1131 - /0,168 .
May 178 75 104 6,496 t'
June 10200 214. ,1342 80,552 June 238 98 153 9,200
July 1405 195 581 36,036 July 72000 98 8423 522,244
,Augil id 603 151 314 19,476 Aug. 6150 429 1323 82,036
Sept. 238 ' 93 151 9,060 Sept. 3200 164 966 57,974
Oct. 120 56 77 4,790 Oct. 946 139 302 18,728
Nov. 87 ,48' 54 3,470 Nov, 270 70 132 7,940
Dec. 4000 37 504 31,262 Dec. 306 56 111 6,90
Total .. .. .. 431,554 1
Total .. ' .. .. 87112810',
Year 1923 Year 1924
. ' I --
Jan. 803 24 . 91 5„638 ' Jan. 93 24 46 2,042
Feb. 56 16 32 1,802 Feb. 536 34 114 6,628
Mar. 19 11, 14 870' Mar. 52 11 25 1,562
Apr. • 22 6 • ' 13 812- Apr. • 178 24 . 78 4,654
May 48 19 , . 34 2 , 1 0 0 • May 75! 44 56 3,468'
Arne 611 30- '78 4 , 6 6 6 ' ,June • 93 42 61 3,662
. . , • i,
July'. .1176 93 .30 22,924 J u l y .
1405. 48 165 10,206
Aug. 1328 48 249 15,416 Aug. .1.20,, 56 86 5,316
Sept. 7320 34 988 59,306 Sept. - 56, 34 45 2,688
Oct. 238 66 94:. 5,826 Oct. 139 19 49 3014'
Nov. 803 70 211; 12,666 NOy. No Records 9,100*
Dec. ' 93 22 51. 3,210 Dec. 946 56 157 9,744
'Total .. ' .. .. 1.35,236 Total .. .. .. 62,884* A
*. Estimated.

-116-
SHOALHAVEN RIVER AT WELCOME REEF
Year 1925- Year 1926
Appendix 16 S h e e t 6
Month Discharge i n Cusecs
Discharge f o r Month Acre Feet
Month Discharge i n Cusecs
Discharge f o r Month Acre Feet Max. ' M i n . I . Mean Max. Min. Mean
Jan. No Records ' 17,300* Jan. 360 45 138 8,570
Feb. 946 98 357 20,014 Feb. 40 14 23 1,268
Mar. 151 52 89 5,494 Mar. 1030 15 184 11,436
Apr. 61 34 49 2,954 Apr. 896 82 241 14,444
May 313000 23 1408 893,314 May 896 60 198 12,236
June 16880 560 2516 150,854 June 1470 162 411 24,658
July 1910 342 828 51,356 July 1150 134 243 15,060
Aug. No Records 26,700* Aug. 970 99 180 11,148
Sept. 336 168 247 14,842 Sept. 203 60 87 5,218
Oct. 203 108 136 8,418 Oct. 108 32 59 3,632
Nov. 414 90 203 12,164 Nov. 32 10 18 1,110
Dec. 220 47 71 4,430 Dec. 27 8 15 926
Total .. .. .. 1,207,840* Total .. .. .. 109,706 * *
Year 1927 Year 1928 , I i
Jan. 970 40 126 7,838 Jan. No Records 2,700*
Feb. 90 14 25 1,388 Feb. 15600 40 1427 82,800
14Eir. , 34 12 19 1,182 Mar. 2100 82 530 32,860
Apr. 9300 11 606 36,376 Apr. 3100 129 442 26,546
May 1150 99 249 15,426 May 150 90 118 7,350
June 94 70 81 4,842 June 3300 82 654 39,238
July 90 50 63 3,894 July 353 54 229 14,178
Aug. 60 40 48 3,006 Aug. 126 32 137 8,494
Sept. 134 32 47 2,814 Sept. 72 42 56 3,372
Oct. 324 50 109 6,730 Oct. 50 20 39 2,402
Nov. 427 50 124 7,458 Nov. 20 0 7 406
Dec. 174 45 70 4,362 Dec. 18 - 6 7 478
Total .. .. .. 95,316 Total .. .. .. 220,824* L
* Estimated.

Appendix 16 • S h e e t ?
SHOALHAVIN ItTyvt AT WfLCOMR REEF
y e a r 1929 Year 1930
. Month
V • Discharge
i n Cuses Discharge f o r Month Acre Feet
Month
_ Discharge i n Cusecs
1
Discharge f o r Month Acre Feet Max. Min. Mean . Max. - Min. - Mean
-
Jan. 5 • 1 3 168 Jan. 197 40 66 4,082
Feb. No Records 129,000* Feb. 246 26 63 .
3,536
Mar. 6871 1971 342 21,232 Mar. 77 17 38 2,352
Apr. No Records 96,000* Apr. 77 17 37 2,224
May 197 126 153 .9,490 May No Records 21,000*
June 131 84 100 6,024. June 6320 6 56 1038 62,274
July 93 62 77 4006 JUly 822 143 389 24,148
Aug. No Records 57,000* Aug. 246 77 118 7,340.
Sept. No Records 17,700* Sept. 98 59 81 4,848
Oct. ,
No Records 33,000*. Oct. 323 42 136 8,466
Nov. 1845 131 402 24,146 Nov. 155 36 82 4,930
Dec. 323 50 105 6,530 iDec. 155 36 68 4,238
Total .. .. .. 405,096* Total .. .. .. 149,438*
Year 31 Year 1932
. w , 4
Jan. 70 .13 37 2,288 Jan. 36 6 17 1,078
Feb. 14 0 8 ' 462., Feb. .
32 6 17 062
Mar. 88 4 35 7,176 Mar. 1030 14 256 15,866
Apr. 5050 23 433 26,004 Apr. 569 77 184 11,060
May 12800 121 864 53,600 May 168 29 65 4,014
June 10200 264 1529 91,724 June 346 66 102 6,120
July 3200 112 675 41,868_ July 346 50 117 7,250 ,
Aug. 370 93 167 10,380 Aug. 3600 112 493 30,576
Sept. 450 112 208 12,524 Sept. 2390 102 585 35,102
Oct. 155 77 .114 7,084 Oct. 370 121 245 15,224
Nov. 346 47 131. 7,864 Nov. 370 77 137 8,238
Dec. 155- 40 79 4,914 Dec. 93 40 63 3,922 •
Total. .. .. .4, 260,888 Total .. .. .. 139,432
* Estimated.

- 1 1 8 -
SHOALHAVEN RIVER AT WELCOME REEF
Year 1933 Year 1934
Appendix 16 S h e e t 8
Month
1
Discharge i n Cusecs
Discharge f o r Month Acre Feet
Month Discharge i n Cusecs
Discharge f o r Month Acre Feet Max. Min. Mean
i Max. Min. Mean
. - Jan. 748 0 142 8,782 Jan. 55600 155 3212 199,136
Feb. 121 29 58 3,246 Feb. 55600 323 4332 242,584
Mar. 62 17 26 1,596 Mar. 1380 306 624 38,696
Apr. 748 45 136 8,170 Apr. 12800 284 1000 60,026
May 284 26 88 5,462 May 730 177 334 20,700
June 131 70 96 5,772 June 22500 357 2345 140,686
July 687 84 215 13,334 July 32300 264 3304 204,852
Aug. 370 77 154 9,584 Aug. 23200 575 2877 178,360
Sept. 450 56 104 6,236 Sept. 1900 246 626 37,588
Oct. 1530 62 310 19,228 Oct. 7300 228 700 43,396
Nov. 1230 45 229 13,762 Nov. 3800 210 545 32,692
Dec. 1230 264 424 26,286 Dec. 1800 193 448 27,810
Total .. .. .. 121,458 Total .. .. .. 1,226,526
Year 1935 Year 1936
_ I I Jan. 950 193 418 25,908 1 Jan. No Records 14,400*
Feb. 2700 78 516 28,904 ; Feb. 246 88 154 8,942
Mar. 264 122 191 11,846 Mar. 3100 162 698 43,280
Apr. 2700 122 586 35,154 Apr. 575 162 278 16,708
May 284 148 200 12,394 May 210 122 146 9,078
June 264 135 174 10,420 June 13500 122 844 50,674
July 177 122 147 9,100 July 13500 122 913 56,632
, Aug. 148 88 117 7,280 Aug. 4000 210. 543 33,694
Sept. 730 98 196 11,792 Sept. 451 69 201 12,070
Oct. 2400 65 421 26,104 Oct. 122 69 87 5,388
Nov. 489 148 246 14,788 Nov. 78 24 50 3,004
Dec. 1300 78 206 12,792 Dec. 1540 19 202 12,548
Total .. .. .. 206,482 Total .. .. .. 266,418* A
* Estimated.

-119- Appendix 16 S h e e t 9
SHOALHAVEN RIVER AT WELCOME REEF
Year 1937' Year 1938
-
Mbpth Discharge i n Cusecs
Discharge f o r Month Acre Feet
e
. Month
Discharge i n Cusecs
'
Discharge f o r Month Acre Feet Max. Min. Mean Max. Min. Mean
V 4
Jan. 575 46 194 12,012 Jan. 2700 66 433 26,842
cek. 730 46 104 5,804 Feb. . 1600 82 290 16,252
Mar. 4600 57 575 35,638 Mir. 414 60 140 '8,686
Apr. 270 99 146 8,768 Apr. llt 50 77 4,620
May 118 74 93 5 , 7 8 8 . May 1150 45 120 7,428
June 288. 90 153 9,170 June. 253 50 105 6,318
July 174 90 130 8,060 July No Records 5,800*
Aug. 970 66 .210 • 13,024 Aug. No Records 113,000*
Sept. 2190 118 317 19,426 Sept. No Records 24,900*
Oct. .387 118 201 12,482 Oct. No Records 20,000*
Nov. ,
1150 129 362 21,720 Nov. No Records 12,300*
Dec. 623 55 177 11,976 Dec. 368 42 115 7,144
Total 163,468 _
Total .. .. .. 2'53,290*
Year 1939 Year 1940
Jan.
Feb.
Mat.
Apt.
425
160
1900
6600
35
28
28
320
86
77
477
1689
5,316
4,314
29,546
101,324.
Jan.
Feb. .
Mar.
. Apr.
168
16
6
730
14
4
§!
4
63
11
6
124
3,884
654
372
7,436
May 575 193 289 17,912 May 168 50 89 5,494
June 177 98 135 8,090 June 50 42 47 2,832
July 451 78 148 9,178 July 46. 33 38 2,384
Aug. 2800 78 615 38,104 Aug. 39 22 34 .
2,086
Sept.. 344 87 146 9,028 Sept. 410 23 63 3,784
Ott. 650 97 217 13,454 Oct. 260 21 • 80 .
4,980
Nov. 114 58 88 5,252 Noy. No Records 900*
Dec. 58 14 37 2,304 Dec. No Records 2,900*
Total .. .. .. 243,822 Total .. . .. .. 37;706*
* Estimated.

-120- Appendix 16 S h e e t 10
BROALHAVEN LIVER. AT WfLCOM$ M g r
Year 1941 Year 1942
Month
r Discharge i n Cusecs
Discharge f o r Month Acre Feet
Month
-
Discharge I n Cusecs
Discharge f o r Month Acre Feet Max. iMin. 'Mean, Max. Min. Mean
Jan. .
No Records 33,000* Jan. 0.6 0 0.1 6
Feb. 8600 112 706 39,524 Feb. 135 0 44 1,328
Mar. 155 58 94 5,824 Mar. 7300 1 476 29,506
Apr. 94 42 57 3,422 Apr. 625 52 127 7,600
May 106 46 59 3,650 May 283 42 83 5,172
June 58 46 55 3,298 June 950 55 187 11,218
July 54 39 44 2,708 July 410 58 119 7,394
Aug. 58 29 41 2,544 Aug. 58 41 50 3,098
Sept. 730 42 121 7,238 Sept. 58 27 39 2,344
Oct. 73 20 38 2,332 Oct. 17900 21 1157 71,754
Nov. 46 9 21 1,220 Nov. • No Records- .12,000*
Dec. 9 0 3 183 Dec. . 489 85 225 13,946
Total .. .. .. 1 0 4 , 9 4 3 * Q
Total .. . .
.. .. 2 2 5 , 3 6 6 1r
Year 1943 Year 1944
Jan. 530 66 187 11,610 Jan. 265 85 120 7,424
Feb. 58 37 45 2,514 Feb. 104 44 64 3,712
ear. 37 24 31 1,938 Mar. 140 37 60 3,580
Apr. 211 24 48 2,880 Apr. 85 12 49 2,968
May 86000 27 5423 336,216 May .., 1
19400 37 1312 81,352
June 975 190 436 26,168 June..- 780 188 337 20,244
J u l y % 190 91 125 7,724 July 1450 104 237 14,682
Aug. 780 91 276 17,100 A u g ; ' 111 85 96 5,948
Sept. 1200 150 436 26,154 S e p t . • 85 55 67 4,026
Oct. 6200 150 1045 64,790 Oct. 66 33 50 3,070
Nov. 2760 265 732 43,946 Nov. 37 13 21 1,266
Dec. 1535 265 631 39,136 Dec. 131 4 25 1,576
Total_ .. .. .. 5 8 0 , 1 7 6 . i
Total .. .. .. 149,848
* Estimated.

-121- Appendix 16 S h e e t 11
SHOALHAVEN RIVER AT WELCOME REEF
Year 1945 Year 1946
Month , Discharge i n Cusecs
Discharge f o r Month Acre Peet
Month Discharge i n Cusecs
'
Discharge f o r Month Acre Feet Max. Min.- Mean :Max. Min.' iliaii
Jan. 165 0 37 2,870 Jan. 491 11 53 3,304
Feb. 975 18 99 5,554 Feb. 85 17 46 2,548
Mar. 91 12 25 1,562 Mar. 48 25 35 2,172
Apr. 124qpo 21 15195 311,702 Apr. 270 31 87 5,196
May No .Recbrds 11,000* May. 92 45 64 3,964
June 36300 80 2690 161,380 June No Records 27,000*
July 510 172 ' 281 17,422 July 975 66 146 9,082
Aug. 432 130 211 13,088 Aug. 66 44 54 3,366
Sept. ..
136 85 107 6,390 Sept. 44 28 37 2,198
Oct,. 205 60 90 5,604 Oct. 44 .23 32 1,990
Nov. 352 50 97 5,818 Nov. No Records 11,000*
Dec. 55 25 41 2,536 Dec. 73 18 40 2,468
Total .. .. .. 544,926* Total .. .. ..
1
74,288* _
Year 1947 Year 1948
Jan. 32 4 14 862 Jan. 7620 150 1180 73,180
Feb. 14500 0 1258 70,430 Feb. 3260 111 587 34,022
Mar. 780 51 122 7,540 Mar. 835 89 181 11,210
Apr. 104 44 67 3,994 Apr. 87 70 73 • 4,372
,May 66 44 57 3,518 May 68000 70 3061 189,762
June 97 44 60 3,588 June 8200 144 1728 103,694
July 49 39 44 2,760 July 725 144 344 21,316
Aug. 515 39 74 4,600 Aug. 138 97 112 7,284
Sept. 165 31 64 3,830 Sept. 104 64 86 5,140
Oct. 35 15 .27 1,664 Oct. 123 48 69 4,290
Nov. 85 15 40 2,386 Nov. 60 37 47 2,870
Dec. 9800 41 1022 61,300 ,Dec. 37 24 28 1,740
Total .. .. .. 166,472 Total .. .. .. 458,880
* Estimated.

-122- Appendix 16 S h e e t 12
SHOALHAVEN RIVER, AT WELCOME REEF
Year 1949 Year 1950
Month Discharge i n Cusecs
Discharge f o r Month Acre Feet
Month Discharge i n Cusecs
Discharge f o r Month Acre Feet Max. Min. Mean Max.
. Min. Mean
Jan. No Records Jan. 3810 33 626 _
38,828
Feb. No Records Feb. 3670 80 1000 56,022
Mar. No Records Mar. 45500 165 5517 342,054
Apr. No Records Apr. 45500 671 5589 335,342
May No Records May 22200 575 4913 304,620
June 36500 15 7073 424,360 June 18140 835 4699 281,958
July 2640 364 1220 75,656 July 13420 671 3451 213,976
Aug. 566 108 215 13,304 Aug. 2300 671 986 61,154
Sept. 671 104 198 11,860 Sept. 671 246 456 27,356
Oct. 960 118 330 20,472 Oct. 25000 223 2759 171,062
Nov. 4230 85 657 39,448 Nov. 9800 417 1126 67,582
Dec. 671 70 173 10,746 Dec. 417 148 249 15,420
Total .. _
•• _
•• _
.. Total .. .. .. 1,915,374
Year 1951 Year 1952
Jan. 4230 136 966 59,870 Jan. 148 60 85 5,260
Feb. 25200 223 3778 211,586 Feb. 108 60 66 -3,946
Mar. 2000 270 575 35,654 Mar. 1450 50 255 15,788
Apr. '270 148 227 13,590 Apr. 11000 55 2465 147,888
May 148 136 139 • 8,600 May 3395 725 1509 93,582
June 40200 136 5262 315,724 June 78500 295 7297 437,846
July 2410 671 1402 86,924 July 17100 781 1944 120,506
Aug. 8200 531 2078 128,828 Aug. 37000 638 5674 351,808
Sept. 40200 322 3349 200,918 Sept. 685 396 529 31,724
Oct. 1625 453 1001 62,080 Oct. 9600 299 1530 94,886
Nov. 453 270 353 .
21,204 Nov. 9600 329 2360 141,612
Dec. 246 78 167 10,364, Dec. 2880 781 1337 82,870
Total .. .. ,
S. 1,155,342 Total .. - .. 1527,716
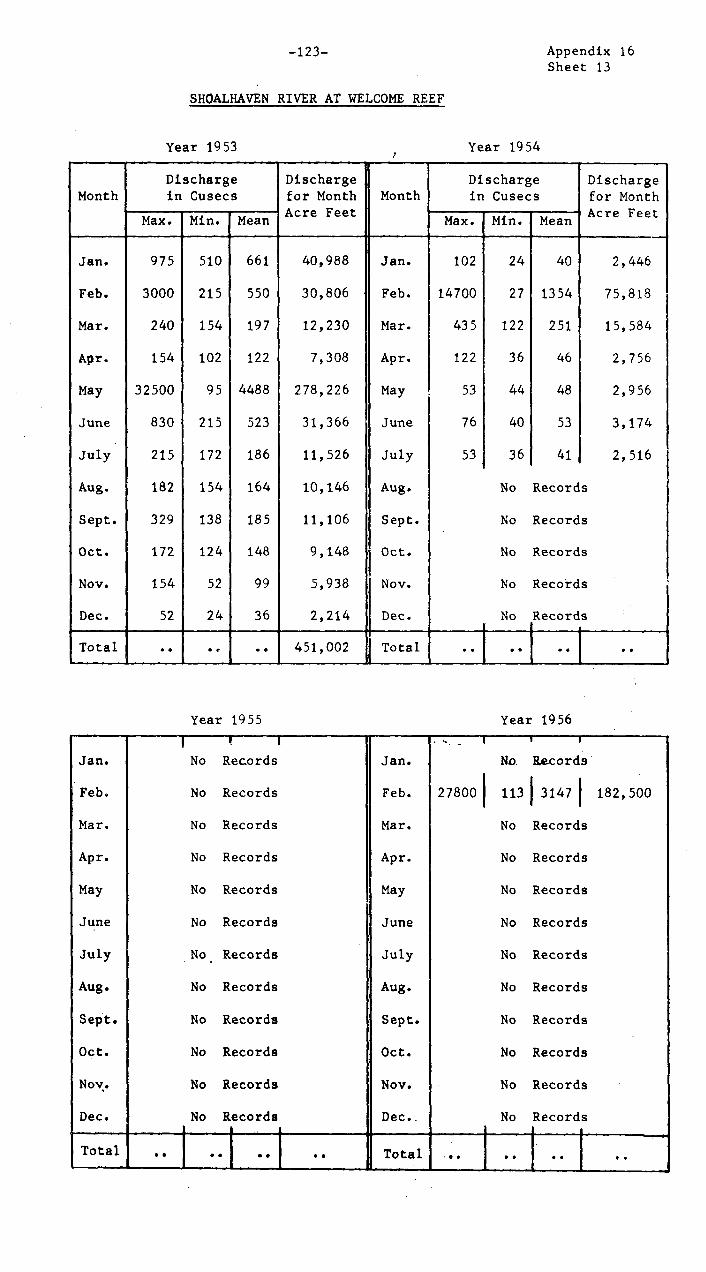
-123- A p p e n d i x 16 S h e e t 13
SHOALHAVEN RIVER AT WELCOME REEF
Y e a r 1953 Y e a r 1954
Month Discharge i n Cusecs
Discharge f o r Month A c r e Feet
Month Discharge i n Cusecs
Discharge f o r Month A c r e Feet Max. Min. Mean Max. Min. Mean
A
Jan. 975 510 661 40,988 Jan. 102 24 40 2,446
Feb. 3000 215 550 30,806 Feb. 14700 27 1354 75,818
Mar. 240 154 197 12,230 Mar. 435 122 251 15,584
Apr. 154 102 122 7,308 Apr. 122 36 46 2,756
May 32500 95 4488 278,226 May 53 44 48 2,956
June 830 215 523 31,366 June 76 40 53 3,174
July 215 172 186 11,526 July 53 36 41 2,516
Aug. 182 154 164 10,146 Aug. No Records
Sept. 329 138 185 11,106 Sept. No Records
Oct. 172 124 148 9,148 Oct. No Records
Nov. 154 52 99 5,938 Nov. No Records
Dec. 52 24 36 2,214 Dec. No Records
Total .. .. .. 451,002 I Total ••
1
••
I
••
1
• •
Y e a r 1955 Y e a r 1956
I ! ! . , _ T l I
Jan. No Records Jan. No Records
Feb. No Records Feb. 278001 1131 31471
182,500
Mar. No Records Mar. No Records
Apr. No Records Apr. No Records
May No Records May No Records
June No Records June No Records
July N o . Records July No Records
Aug. No Records Aug. No Records
Sept. No Records Sept. No Records
Oct. No Records Oct. No Records
Nov.. No Records Nov. No Records
Dec. No Records Dec. No Records
T o t a l _ • •
1
• •
1
• •
I
• • Total • • • • • • • •
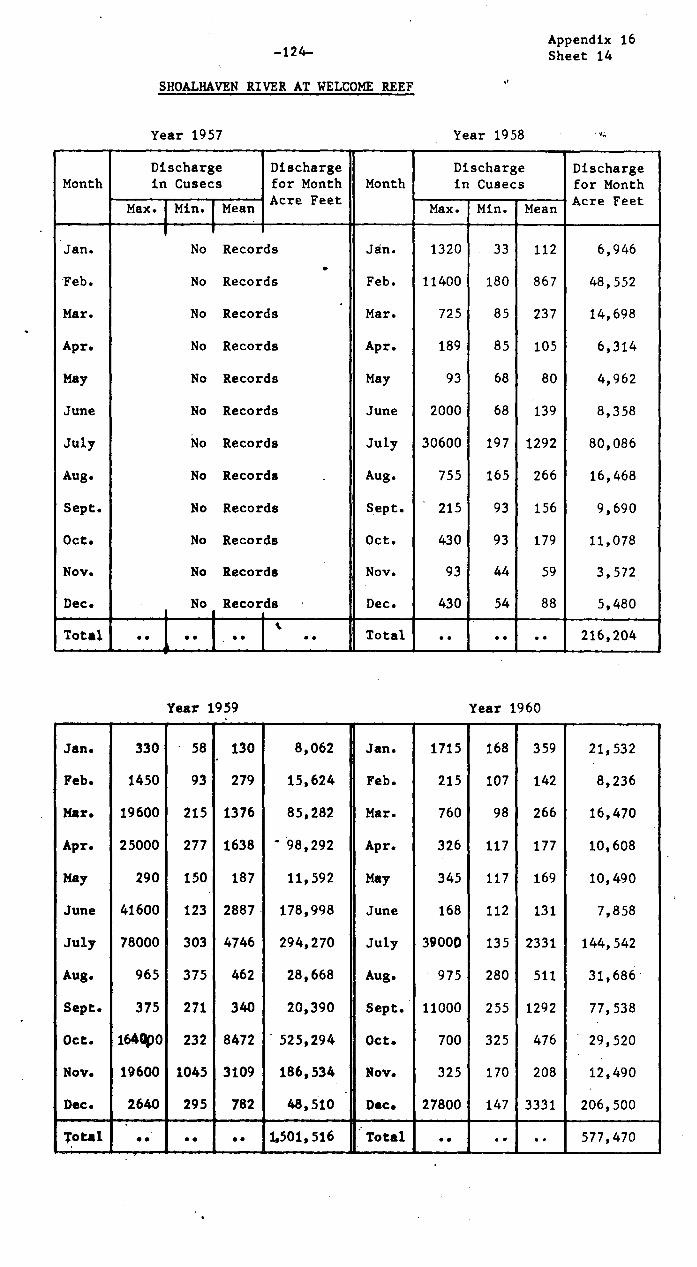
-124-- Appendix 16 S h e e t 14
SHOALHAVEN RIVER AT WELCOME REEF
Year 1957 Year 1958
Month
1 Discharge i n Cusecs
Discharge f o r Month Acre Feet
.
Month
, Discharge i n Cusecs
Discharge f o r Month Acre Feet Max. I Min. I Mean Max. Min. Mean
Jan. No Records Jan. 1320 33 112 6,946
. Feb. No Records Feb. 11400 180 867 48,552
Mar. No Records Mar. 725 85 237 14,698
Apr. No Records Apr. 189 85 105 6,314
May No Records May 93 68 80 4,962
June No Records June 2000 68 139 8,358
July No Records July 30600 197 1292 80,086
Aug. No Records Aug. 755 165 266 16,468
Sept. No Records Sept. ' 215 93 156 9,690
Oct. No Records Oct. 430 93 179 11,078
Nov. No Records Nov. 93 44 59 3,572
Dec. No Records Dec. 430 54 88 5,480
Total .• •• •• %
.. Total .. .. .. 216,204
Year 1959 Year 1960
Jan. 330 58 130 8 , 0 6 2 ' Jan. 1715 168 359 21,532
Feb. 1450 93 279 15,624 Feb. 215 107 142 8,236
Mar. 19600 215 1376 85,282 Mar. 760 98 266 16,470
Apr. 25000 277 1638 ' 98,292 Apr. 326 117 177 10,608
May 290 150 187 11,592 May 345 117 169 10,490
June 41600 123 2887 178,998 June 168 112 131 7,858
July 78000 303 4746 294,270 July 39000 135 2331 144,542
Aug. 965 375 462 28,668 Aug. 975 280 511 31,686
Sept. 375 271 340 20,390 Sept. 11000 255 1292 77,538
Oct. 1640100 232 8472 ' 525,294 Oct. 700 325 476 29,520
Nov. 19600 1045 3109 186,534 Nov. 325 170 208 12,490
Dec. 2640 295 782 48,510 Dace 27800 147 3331 206,500 I.
Total .. _
.. 4.. 1001,516 Total .. .. .. 577,470

-125- Appendix 16 S h e e t 15
SHOALHAVEN RIVER AT WELCOME REEF
Year 1961 Year 1962
Month Discharge i n Cusecs
- Discharge f o r Month Acre Feet
Month Discharge i n Cusecs
,Acre Mean
Discharge f o r Month
Feet - Max. Min. Mean Max. Min. .
Jan. 3810 205 686 42,522 Jan. 12300 720 1937 120,110
Feb. 195 178 186 10,412 Feb. 17700 560 2419 135,444
Mar. 35600 195 3291 204,018 Mar. 2760 435 783 48,560
Apr. 1450 390 629 37,748 Apr. 620 255. 384 23,010
May 390 215 281 17,414 May 1535 214 363 22,500
June 3130 215 601 36,052 June 283 168 201 12,030
July 20030 295 2315 143,560 July 1045 160 310 19,200
Aug. 18970 375 1892 117,290 Aug. 1715 183 455 28,190
Sept. 11660 620 1674 100,428 Sept. 48500 168 3615 216,900
Oct. 9800 325 1303 80,778 Oct. 885 251 486 30,110
Nov. 41900 370 5159 309,514 Nov. 520 161 264 15,860
Dec. 17100 1012 3387 209,974 Dec. 3395 161 865 53,624
Total .. .. .. 1,309,710 Total .. .. ‘.. 725,538 I .
Year 1963 Year 1964
Jan. .1953 260 531 32,936 Jan. 318 134 206 12,768
Feb. 2300 281 663 37,136 Feb. 147 83 114 6,596
Mar. 9400 270 1302 80,714 Mar. 292 83 126 .7,784
Apr. 49800 318 2608 156,460 Apr. 7430 83 1185 71,100
May 30600 1290 4277 265,170 May 520 195 302 18,708
June 11880 730 1817 109,040 June i 22200 230 1617 97,000
July 14500 640 2309 143,160 t July 2000 376 731 45,316
Aug. 8200 410 774 47,970 Aug. 7070 212. 733 45,440 1
Sept. 19600 270 1985 119,108 Sept. 780 346. 467 28,040
Oct. 2300 298 713 44,188 Oct. 2300 230 404 25,074
Nov. 1210 230 .396 23,744 i Nov. 2200 162 494 -29,642
Dec.
[
7070 195 1339 83,000 Dec. 346 122 168 10,386
Total .. .. .. 1,142,626 Total .. .. .. 397,854

-126- Appendix 16 S h e e t 16
SHOALHAVEN RIVER AT WELCOME REEF
Y e a r 1965 Y e a r 1966
Month Discharge i n Cusecs
Discharge f o r Month A c r e Feet
Month Discharge i n Cusecs
Discharge f o r Month A c r e Feet Max. Min. Mean Max. Min., Mean
Jan. 110 58 74 4,558 Jan. 80 38 52 3,230
Feb. 66 48 58 3,228 Feb. 364 42 103 5,740
Mar. 44 29 33 2,060 Mar. 143 51 92 5,696
Apr. 64 34 43 2,602 Apr. 63 51 53 3,196
May 58 48 49 3,040 May 63 48 53 3,282
June 106 44 57 3,420 June 1170 51 270 16,210
July 133 53 79 4,884 July 200 76 107 6,654
Aug. 100 48 71 4,388 Aug. 300 64 112 6,936
Sept. 220 48 110 6,618 Sept. 2640 122 401 24,056
Oct. 2300 40 503 31,232 Oct. 975 110 274 17,018
Nov. 440 48 146 8,770 Nov. 53000 101 4338 260,264
Dec. 660 48 191 11,862 Dec. 4090 230 624 38,688
Total .. .. .. 86,662 Total .. .. .. 390,970 , a
Y e a r 1967
Jan. 590 190 268 16,596
Feb. 590 110 165 9,232
Mar. 355 82 137 8,514
Apr. 110 65 85 5,118
May 110 59 75 4,664
June 280 71 161 9,666
July
Aug.
Sept.
Oct.
Nov.
Dec. - -
Total

-127— A p p e n d i x 17 S h e e t 1
CORANG RIVER AT HOCKEYS
LOCATION:
PERIOD OF ESTABLISHMENT: S e p t e m b e r 1 9 2 4 t o date.
COMPLETE YEARS OF COMPUTED RECORDS: 42
ZERO OF GAUGE: R . L . 1 7 8 0 . 2 3 W a t e r C o n s e r v a t i o n Datum.
CATCHMENT AREA: 6 2 S q u a r e Miles.
CONTROL: R o c k Bar.
L a t i t u d e 3 5 ° 0 9 ' L o n g i t u d e 150002'
EQUIPMENT: A u t o m a t i c R e c o r d e r ( P r e s s u r e type) i n s t a l l e d A u g u s t , 1926. S t a f f G a u g e , r a n g e 0 t o 25 feet.
CURRENT METER OBSERVATIONS: ( a ) N u m b e r o b t a i n e d 261
( b ) Maximum observation i n c u s e c s : 1,700
( c ) Min imum observation i n c u s e c s 0
MAXIMUM ESTIMATED DISCHARGE DURING PERIOD OF RECORDS: 3 4 , 7 0 0 cusecs
MEAN DAILY DISCHARGE FOR 4 2 YEARS: 8 0 cusecs.
MEAN ANNUAL DISCHARGE FOR 4 2 YEARS: 5 8 , 1 0 0 a c r e feet

-138-- Appendix 17 S h e e t 12
CORANG RIVER AT HOCKEYS
Y e a r 1964 Y e a r 1965 t
Month Discharge i n Cusecs
Discharge f o r Month A c r e Feet
Month Discharge i n Cusecs
Discharge f o r Month A c r e Feet Max. Min. Mean Max. Min. Mean
Jan. 10 2.6 5.3 ..
329 Jan. 5.5 0.7 2.1 128
Feb. 4.7 0.7 1.8 106 Feb. 0.7 0.1 0.4 22
Mar. 52 0.8 6.2 386 Mar. .05 0 0.01 0.6
Apr. 3410 1 160 9,618 Apr. 0.15 0 0.05 3
May 121 10 33 2,062 May 0.6 0.1 0.3 16
June 8685 12 394 23,640 June 4 0.2 0.5 32
July 44 13 11 1,244 July 54 0.7 6.3 390
Aug. 460 7.2 30 1,832 Aug. 4 1 2.2 135
Sept. 22 8.1 13 770 Sept. 44 1 8 468
Oct. 440 4 17 1,046 Oct. 2920 0.8 136 8,444
Nov. 260 4 26 1,584 Nov. 34 4.7 11 686
Dec. 82 1.8 7.6 472 Dec. 28 4 12 764
Total .. .. .. 43,089 Total *- .. -- 11,089
Y e a r 1966 Y e a r 1967
Jan. 5.4 1.3 2.5 154 Jan. 44 4.3 31 1,952
Feb. 1305 1.3 59 3,328 Feb. 44 6 12 689
Mar. 101 7 17 1,046 Mar. . 183 6 25 1,561
Apr. 8.1 1.4 3.3 198 Apr. 39 3.7 9.4 566
May 1.8 0.8 1.2 77 May 34 2.5 4.8 300
June 1117 1 86 5,188 June 432 1.6 58 3,508
July 10 1.3 6.2 384 July
Aug. 49 4.3 6.7 418 Aug.
Sept. 440 10 40 2,406 Sept.
Oct. 380 9 37 2,304 Oct.
Nov. 2120 16 147 8,828 Nov. .
Dec. 800 9 78 4,810 Dec.
Total .. .. .. 29,141 Total

-129-
CORANG RIVER AT HOCKEYS
Y e a r 1928
Appendix 17 S h e e t 3
Y e a r 1929
Month Discharge i n Cusecs
Discharge f o r Month A c r e Feet
Month Discharge i n Cusecs
Discharge f o r Month A c r e Feet Max. Min. Mean Max. Min. Mean
Jan. 2 0.8 1.3 80 Jan. 0 0 0 0
Feb. 824 0.6 131 8,100 Feb. 2805 0 261 14,632
Mar. 3035 6 137 8,500 Mar. 242 9 35 2,200
Apr. 526 14 71 4,250 Apr. 574 6 51 3,054
May 16 4 9 546 May 60 6 17 1,082
June 2170 5 225 13,512 June 22 6 23 1,388
July 292 24 73 4,568 July 35 4 8 522
Aug. 94 13 33 2,058 Aug. 5790 9 198 12,356
Sept. 13 5 9 560 Sept. 305 17 46 2,754
Oct. 5 0 5 310 Oct. 1410 6 67 4,150
Nov. 2 0 0.2 12 Nov. 193 11 38 2,302
Dec. 0 0 0 0 Dec. . 11 4 7 460
Total .. .. .. 42,496 Total .. .. .. 44,900
Y e a r 1930 Y e a r 1931
- Jan. 7 1 2 144 Jan. 30 1 6 376
Feb. 22 1 5 288 Feb. 2 0.5 1 58
Mar. 96 1 12 796 Mar. 93 0.5 14 852
Apr. 44 3 9 554 Apr. 4310 3 271 16,254
May 3280 5 144 8 , 9 2 8 ' May 13300 18 173 10,702
June 7060 26 352 21,104 June 89 18 40 2,416
July 365 16 55 3,438 July 2860 15 140 8,654
Aug. 16 7 10 638 ' Aug. 15 5 9 554
Sept. 7 3 5 316 Sept. 553 5 50 3,024
Oct. 39 3 7 444 Oct. 42 4 10 596
Nov. 5 1 2 112 Nov. 9 2 5 274
Dec. 106 1 12 742 1 Dec. 42 2 12 720
Total .. .. .. 3 7 , 5 0 4 1 Total .. .. .. 44,480

-130-
CORANG RIVER AT HOCKEYS
Y e a r 1932 Y e a r 1933
Appendix 17 S h e e t 4
Month Discharge i n Cusecs
D i s c h a r g e , f o r Month
A c r e Feet
..
Month Discharge i n Cusecs
Discharge f o r Month A c r e Feet Max. Min. Mean Max. Min. Mean
Jan. 1.5 0 0.1 9 Jan. 210 0 22 1,380
Feb. 39 0 4 228 Feb. 36 1.5 8 458
Mar. 710 0 27 1,686 Mar. 105 0 7.3 454
Apr. 42 5 13 806 Apr.- 590 7.6 63 3,788
May 160 2 13 826 May 770 5 65 4,042
June 9 2 6 340 June 260 18 42 2,514 I
July 226 2 30 1,852 July 870 18 81 5,000
Aug. 420 12 56 3,486 Aug. 57 12 24 1,480 1
Sept. 553 9 162 9,704 Sept. 356 5 36 2,168
Oct. 48 9 20 1,264 Oct. 630 5 49 3,020
Nov. 48 3 14 820 Nov. 790 2 42 2,526
Dec. 7 2 3 208 1 Dec. 128 9 27 1,696
Total .. .. .. 21,229 Total .. .. .. 28,526 -
Y e a r 1434 Y e a r 1935
Jan. 4610 5 107 6,648 Jan. 356 15 50 3,106
Feb. 6240 9 455 25,502 Feb. 226 9 61 3,442
Mar. 180 12 35 2,170 Mar. 74 6 21 1,314
Apr. 9160 19 239 14,378 Apr. 330 5 42 2,496
May 420 23 45 2,800 May 19 5 10 638
June 3760 31 223 13,378 June 202 5 24 1,424
July 1750 19 208, 12,894 July 12 5 8 498
Aug. 6535 42 236 14,606 Aug. 6 2 3 210
Sept. 89 11 34 2,068 Sept. 70 2 AO 586
Oct. 139 7 17 1,018 Oct. 1620 1 65 4,082
Nov. 117 3 11 658 Nov. 62 3 11 698
Dec. 370 9 41 2 , 5 3 8 . Dec. 800 4 35 2,172
Total .. .. .. 98,658 Total '.. .. .. 20,666 h

-131- Appendix 17 S h e e t 5'
CORANG RIVER AT HOCKEYS
Year 1936 Year 1937
Month Month Discharge i n Cusecs
Discharge f o r Month Acre Feet
Month Discharge i n Cusecs
Discharge f o r Month Acre Feet Max. Min. Mean Max. Min. Mean
Jan. 235 4 25 1,560 ' Jan. 166 3 26 1,624
Feb. 168 3 15 874 Feb. 290 3 18 830
Mar. 3760 10 176 10,884 Mar. 1620 10 90 5,608
Apr. 300 13 35 2,114 Apr. 10 3 6 340
May 70 6 13 802 May 3 2 2.4 146
June 8780 8 103 6,182 June 1140 2 98 5,878
July 55 16 25 1,578 Jury 134 10 32 1,986
Aug. 55 8 14 • 886 Aug. 780 8 48 2,950
Sept. 16 4 8 488 Sept. 117 8 27 1,636
Oct. 4 1 3 158 Oct. 54 8 18 1,098
Nov. . 2 0.2 1 61 ..
Nov. 315 16 64 3,826
Dec. 195 0 20 1,240 Dec. 48 3 11 698
Total .. .. .. 26,827 Total ... .. .. 26,620 . I
Year 1938 Year 1939
Jan. 820 1 44 2,720 Jan. 89 0 10 630
Feb. 480 4 45 2,532 Feb. 15 0.5 2 150
Mar. 24 4 8 494 Mar. 1700 0.5 328 20,358
Apr. 134 3 13 780 Apr. 2725 16 135 8,098
May 250 3 16 996 May 1140 13 94 5,846
June 16 4 6 356 June 20 3 9 576
July 6 3 3.2 .
202 .July 13 4 7 436
Aug. 10700 3 342 21,122 Aug. 37 4 10 618
Sept. 54 9 26 1,344' Sept. 3490 2 58 3,468
Oct. 8495 5 118 12,082 Oct. 134 13 38 2,378
Nov. 48 11 21 1,242 Nov. 20 8 14 826
Dec. 12 1 3 176 Dec. :8 0.5 3 180 ,
Total 4 .. A .. . .
J 44,046 Total 7. ..
A .. 43,564
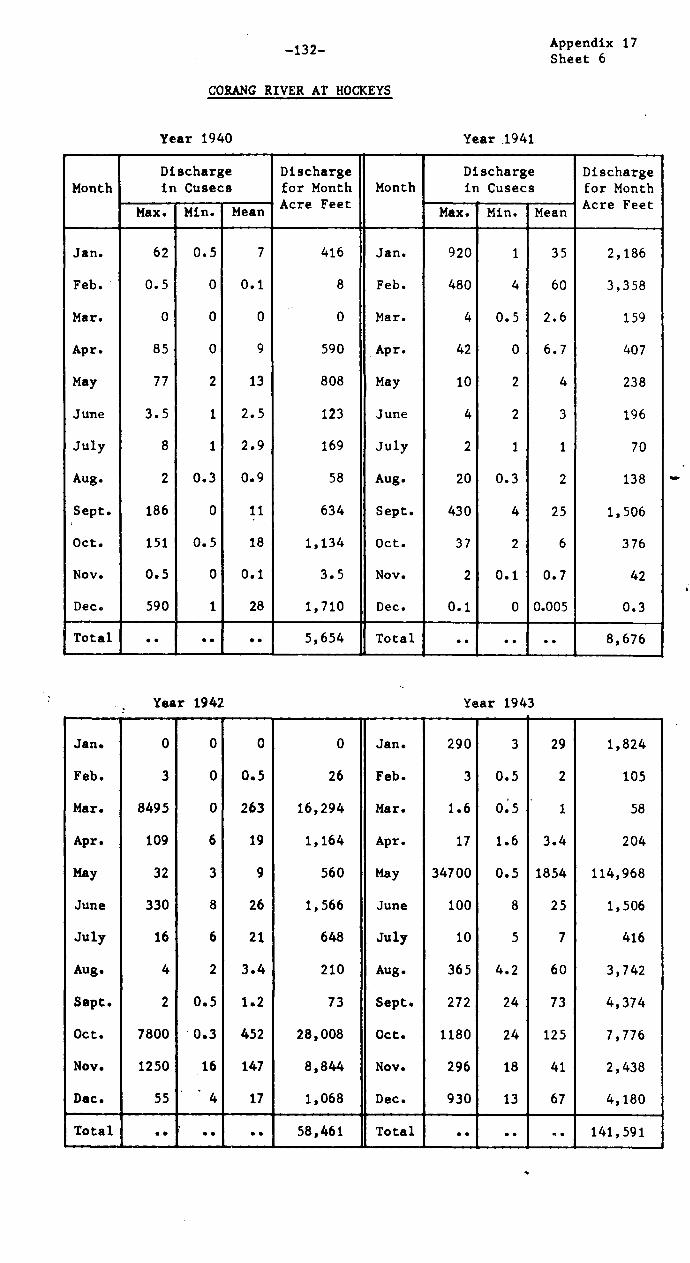
-132-
CORANG RIVER AT HOCKEYS
Year 1940 Year .1941
Appendix 17 S h e e t 6
Month Discharge i n Cusecs
Discharge f o r Month Acre Feet
Month
.
Discharge i n Cusecs
Discharge f o r Month Acre Feet Max. Min. Mean Max. Min. Mean
Jan. 62 0.5 7 416 Jan. 920 1 35 2,186
Feb. 0.5 0 0.1 8 Feb. 480 4 60 3,358
Mar. 0 0 0 0 Mar. 4 0.5 2.6 159
Apr. 85 0 9 590 Apr. 42 0 6.7 407
May 77 2 13 808 May 10 2 4 238
June 3.5 1 2.5 123 June 4 2 3 196
July 8 1 2.9 169 July 2 1 1 70
Aug. 2 0.3 0.9 58 Aug. 20 0.3 2 138
Sept. 186 0 11 634 Sept. 430 4 25 1,506
Oct. 151 0.5 18 1,134 Oct. 37 2 6 376
Nov. 0.5 0 0.1 3.5 Nov. 2 0.1 0.7 42
Dec. 590 1 28 1,710 Dec. 0.1 0 0.005 0.3
Total .. .. .. 5,654 Total .. .. .. 8,676
Year 1942 Year 1943
Jan. 0 0 0 0 Jan. 290 3 29 1,824
Feb. 3 0 0.5 26 Feb. 3 0.5 2 105
Mar. 8495 0 263 16,294 Mar. 1.6 0.5 ' 1 58
Apr. 109 6 19 1,164 Apr. 17 1.6 3.4 204
May 32 3 9 560 May 34700 0.5 1854 114,968
June 330 8 26 1,566 June 100 8 25 1,506
July 16 6 21 648 ' July 10 5 7 416
Aug. 4 2 3.4 210 Aug. 365 4.2 60 3,742
Sept. 2 0.5 1.2 73 Sept. 272 24 73 4,374
Oct. 7800 0.3 452 28,008 Oct. 1180 24 125 7,776
Nov. 1250 16 147 8,844 Nov. 296 18 41 2,438
Dec. 55 * 4 17 1,068 Dec. 930 13 67 4,180
Total .. ' .. .. 58,461 Total .. .. .. 141,591 _

-133-
CORANG RIVER AT HOCKEYS
Y e a r 1944 Y e a r 1945
A p p e n d i x 17 S h e e t 7
Month
Discharge i n Cusecs
Discharge f o r Month A c r e Feet
Month
Discharge i n Cusecs
Discharge f o r Month A c r e Feet Max. Min. Mean Max. Min. Mean
Jan. 13 2 4 258 Jan. 234 0 12 768
Feb. 2 0.1 0.7 42 Feb. 138 0.5 10 612
Mar. 0.1 0 0.04 2.6 Mar. 6 0.3 1.8 112
Apr. 1.5 0 0.3 18 Apr. 24800 1.5 602 36,152
May 4075 0.3 152 9,424 May 49 8 14 842
June 36 13 18 1,078 June 11700 8 691 40,266
July 59 12 20 1,222 July 24 16 18 1,144
Aug. 66 8 13 826 Aug. 18 5-5 10 602
Sept. 8 3 5 280 Sept. 4 2 3 180
Oct. 3 0.4 1 78 Oct. 3 2 2 130
Nov. 0.4 0.1 0.2 12 Nov. 260 1.5 12 736
Dec. 0 0 0 0 Dec. 2.5 1 1 92
Total 13.241 Total 81,636
Y e a r 1946 Y e a r 1947
Jan. 65 0.5 2 144 Jan, 1 0 0.1 5.6
Feb. 65 0.5 14 777 Feb. 5320 0 165 9,258
Mar. 9 1 2 125 Mar. 65 2.5 9 538
Apr. 1155 1 73 4,378 Apr. 800 2 63 3,788
May 138 10 22 1,326 May 25 3 8 480
June 4410 10 120 7,224 June 440 5.5 31 1,852
July 35 6 13 798 July 5.5 3.5 5 300
Aug. 6 2 3 222 Aug. '247 2,5 15 916
Sept. 2.5 1.5 2 114 Sept. 16 3 7 408
Oct. 2 0.3 1 . 68 Oct. 3 1.5 2 142
Nov. 183 0.3 13 790 Nov. 13 1.5 3 172
Dec. 3.5 0,4 1.5 96 Dec. 4120 2 151 9,394
Total 16,062 Total .. 27,254

-134-
CORANG RIVER AT HOCKEYS
A p p e n d i x 17 S h e e t 8
Y e a r 1948 Y e a r 1949
Month Discharge i n Cusecs
Discharge f o r Month A c r e Feet
Month Discharge i n u u s e c s
Discharge f o r Month A c r e Feet Max. Min. Mean Max. Min. Mean
Jan. 1881 8 157 9,450 Jan. 1605 3 81 5,046
Feb. 25 8 10 606 Feb. 13 2.5 7 366
Mar. 65 6 16 996 Mar. 1780 8 243 15,088
Apr. 10 4 5 308 Apr. 20 6 10 588
May 5705 6 176 10,936 May 3280 6 146 9,074
June 1080 8 125 7,482 June 4975 25 458 27,512
July 58 10 21 1.292 July 98 13 37 2,292
Aug. 8 6 7 428 Aug. 52 10 22 1,382
Sept. 4 3 4 232 Sept. 234 20 57 3,454
Oct. 4 2 3 166 Oct. 35 8 13 828
Nov. 2 0.5 1 74 Nov. 234 4 28 1,702
Dec. 81 0.2 3 176 Dec. 40 4 11 700
Total 00 32,146 Total .. f0 ms 68,032
Y e a r 1950 Y e a r 1951
Jan.
Feb.
Mar.
Apr.
3280
1080
1305
2025
2
13
16
13
74
177
371
258
4,574
9,890
23,016
15,476
Jan.
Feb,
Mar.
Apr.
5100
669
81
6
4
10
6.
2.5
456
256
17
4
28,260
14,316
1,076
236
May 580 8 110 6,814 May 3 2 5 3 166
June 3580 138 861 51,640 June 16500 2 1034 62,016
July No Records 7,900 July 1055 8 101 6,274
Aug. 145 27 47 2,908 Aug, 244 20 50 3,124
Sept. 160 13 30 1,828 Sept. 16500 8 404 24,266
Oct. 5085 8 221 13,722 Oct., 1755 13 99 6,162
Nov. 171 15 32 1,852 Nov. 13 3 6 356
Dec. 30 4 10 642 Dec. 3 1.5 2 130
Total GO 00 OM 140,262 Total .. .. ' I I 146,382 ._....i
* Estimated

-135-
CORANG RIVER AT HOCKEYS
Y e a r 1952 Y e a r 1953
A p p e n d i x 17 S h e e t 9
Month Discharge i n Cusecs
Discharge f o r Month A c r e Feet
Month Discharge i n Cusecs
Discharge f o r Month A c r e Feet Max. Min. Mean Max. Min. Mean
Jan. 3 0.3 1 72 Jan. 780 25 63 3,932
Feb. 8 0.1 1 79 Feb. 149 10 31 1,724
Mar. 3653 2 100 6,234 Mar. 35 8 18 1,142
Apr. 7750 10 262 15,722 Apr. 10 2.5 51 306
May 1505 25 113 6,992 May 6800 2.5 612 37,968
June 14300 13 459 27,546 June 46 10 19 1,124
July 8500 13 276 17,152 July 10 4 8 480
Aug. 5460 25 657 40,712 Aug. 6 4 4.3 266
Sept. 30 8 16 982 Sept. 3 2.5 2.8 168
Oct. 840 6 63 3,916 Oct. 16 2.5 4.7 294
Nov. 1780 6 176 10,588 Nov. 3 1 2.1 126
Dec. 171 20 62 3,858 Dec. 2 0 0.5 29
Total .. .. ., 133,853 Total •• • • 47,559
Y e a r 1954 Y e a r 1955
4, Jan. 7.8 0.1 0.9 54 Jan. 175 0.1 16 976
Feb, 6310 0.3 191 10,688 Feb. 4810 3.5 225 12,600
Mar. 40 25 9.3 576 Mar. 1630 20 144 8,956
Apr. 2.5 1.5 1.8 110 Apr. 6240 3.5 75 4,492
May 1.5 1 1.1 68 May 6460 13 299 18,566
June 5 1.5 2.2 129 June 395 20 62 3,746
July 25 1.2 4.9 306 July 73 10 17 1,028
Aug. 3.5 1.5 2 124 Aug. 16 7 11 670
Sept. 5 1 1.5 91 Sept. 7 3.5 5.3 316
Oct. 106 0.5 8.6 433 Oct. 7 3,5 5,2 321
Nov. 135 1.7 20 1,196 Nov. 33 0.3 3.1 186
Dec. 1.5 0.5 1 64 Dec. 73 0.5 4.2 262
Total OS on so 13,839 Total •• 0 • C. 52,119 1

-136-
CORANG RIVER AT HOCKEYS
Appendix 17 S h e e t 10
Yea r 1956 Year 1957
I
Month Discharge i n Cusecs
Discharge f o r Month A c r e Feet
Month Discharge i n Cusecs
Discharge f o r Month Acre Feet Max. Min. Mean Max. Min. Mean
Jan. 125 1.5 12 750 Jan. 8.5 0.4 3.6 222
Feb. 11500 5 747 43,352 Feb. 818 0.1 63 3,544
Mar. 5835 40 755 46,834 Mar. 48 5 11 668
Apr. 486 13 64 3,848 Apr. 13 1.5 3 180
May 5085 16 176 10,914 May 1 0.4 0.6 38
June 7450 25 429 25,720 June 2010 0.5 69 4,168
July 6610 35 178 11,048 July 9065 13 236 14,646
Aug. 185 16 57 3,506 Aug. 1960 12 178 11,014
Sept. 16 7 13 792 Sept. 101 9 26 1,580
Oct. 4265 16 139 8,648 Oct. 8.1 1.8 4.3 265
Nov. 10 2.5 6 375 Nov,. 2.6 0.2 1.3 76
Dec. 3.5 0.4 2.1 129 Dec. 0.5 0 0.1 6 p.
Total •• •• .. 155,916 Total •• • • .. 36,407
Yea r 1958 Year 1959
Jan. 195 0.6 9.4 585 Jan. 440 2.6 51 3,165
Feb. 10700 9 348 19,482 Feb. 2470 12 116 6,488
Mar. 2690 7.2 187 11,600 Mar. 2840 26 161 10,010
Apr. 91 7.2 16 940 Apr. 3850 15 143 8,608
May 16.5 4 9 556 May 15 7.2 10 650
June 10400 4 228 13,674 June 7060 5.5 279 16,768
July 3940 16 104 6,478 July 13600 22 407 25,288
Aug. 24 5.5 11 676 Aug. 67 20 29 1,822
Sept. 12 6.3 8 496 Sept. 101 15 25 1,492
Oct. 39 5.5 12 742 Oct. 13900 12 681 42,194
Nov. 12 0.8 2.1 124 Nov. 1380 34 150 8,982
Dec. 172 1.8 13 796 Dec. 365 9 49 3,016
Total •• •• .. 56,149 Total • • • • .. 128,483 , .

-137-
CORANG RIVER AT HOCKEYS
Y e a r 1960 Y e a r 1961
A p p e n d i x 17 S h e e t 11
Month Discharge i n Cusecs
Discharge f o r Month A c r e Feet
Month Discharge i n Cusecs
Discharge f o r Month A c r e Feet Max. Min. Mean Max. Min. Mean
Jan, 34 2.6 15 909 Jan. 480 8 31 1,938
Feb. 44 4 9.3 542 Feb, 12 5 7.4 413
Mar. 640 7.2 51 3,142 Mar. 11000 13 474 29,418
Apr. 121 6.4 20 1,225 Apr. 74 15 27 1,626
May 440 4 22 1,370 May 67 10 13 800
June 60 10 17 1,026 June 2155 10 129 7,730
July 7210 8 236 14,652 July 3670 20 166 10,266
Aug. 101 12 28 1,766 Aug. 3940 15 328 20,312
Sept. 440 11 67 4,040 Sept. 560 26 94 5,608
Oct. 201 11 33 2,048 Oct. 2690 12 130 8,090
Nov. 41 8 14 824 Nov. 6685 9 362 21,740
Dec. 9360 9 329 20,382 Dec. 2610 22 252 15,610
Total •• •• 51,926 Total 0 • • • .. 123,551
Y e a r 1962 Y e a r 1963
Jan. 3040 26 176 10,896 Jan. 74 12 22 1,336
Feb. 9065 20 278 15,516 Feb. 2155 18 120 6,700
Mar. 1030 22 85 5,266 Mar. 4075 15 254 15,760
Apr. 720 15 64 3,846 Apr. 20600 15 326 19,562
May 3200 15 146 9,046 May 4865 44 264 16,356
June 25 10 15 872 June 3080 34 162 9,700
July 660 8 54 3,346 July 2505 30 147 9,088
Aug. 350 11 59 3,634 Aug. 2025 15 61 3,796
Sept. 4660 15 352 21,108 Sept. 5900 10 258 15,474
Oct. 67 13 26 1,632 Oct. 178 15 45 2,766
Nov. 44 4 12 732 Nov. 247 12 33 2,004
Dec. 2190 5.5 140 8,676 Dec. 3160 8.1 167 10,372
Total •. 0. .. 84,570 Total •• •• .. 112,914 , , .

-138- Appendix 17 S h e e t 12
CORANG RIVER AT HOCKEYS
Y e a r 1964 Y e a r 1965
Month Discharge i n Cusecs
Discharge f o r Month A c r e Feet
,
Month Discharge i n Cusecs
, Discharge f o r Month A c r e Feet Max. Min. Mean Max. Min. Mean
Jan. 10 2.6 5.3 329 Jan. 5.5 0.7 2.1 128
Feb. 4.7 0.7 1.8 106 Feb. 0.7 0.1 0.4 22
Mar. 52 0.8 6.2 386 Mar. .05 0 0.01 0.6
Apr. 3410 1 160 9,618 Apr. 0.15 0 0.05 3
May 121 10 33 2,062 May 0.6 0.1 0.3 16
June 8685 12 394 23,640 June 4 0.2 0.5 32
July 44 13 11 1,244 July 54 0.7 6.3 390
Aug. 460 7.2 30 1,832 Aug. 4 1 2.2 135
Sept. 22 8.1 13 770 Sept. 44 1 8 468
Oct. 440 4 17 1,046 Oct. 2920 0.8 136 8,444
Nov. 260 4 26 1,584 Nov. 34 4.7 11 686
Dec. 82 1.8 7.6 472 Dec. 28 4 12 764
Total .. .. .. 43,089 Total .. .. .. 11,089
Y e a r 1966 Year 1967
Jan. 5.4 1.3 2.5 154 Jan. 44 4.3 31 1,952
Feb. 1305 1.3 59 3,328 Feb. 44 6 12 689
Mar. 101 7 17 1,046 Mar. , 183 6 25 1,561
Apr. 8.1 1.4 3.3 198 Apr. 39 3.7 9.4 566
May 1.8 0.8 1.2 77 May 34 2.5 4.8 300
June 1117 1 86 5,188 June 432 1.6 58 3,508
July 10 1.3 6.2 384 July
Aug. 49 4.3 6.7 418 Aug.
Sept. 440 10 40 2,406 Sept.
Oct. 380 9 37 2,304 Oct.
Nov. 2120 16 147 8,828 Nov. .
Dec. 800 9 78 4,810 Dec.
Total .. .. .. 29,141 Total _

-139-- A p p e n d i x 18 S h e e t 1
ENDRICK RIVER AT NOWRA ROAD
LOCATION:
PERIOD OF ESTABLISHMENT: J u l y , 1 9 5 3 t o date.
COMPLETE YEARS OF COMPUTED RECORDS: 13
ZERO OF GAUGE: R . L . 1 7 4 7 . 8 8 W a t e r C o n s e r v a t i o n Datum.
CATCHMENT AREA: 81 S q u a r e Miles.
CONTROL: C o n c r e t e Causeway.
L a t i t u d e 3 5 ° 0 5 ' L o n g i t u d e 150007'
EQUIPMENT: A u t o m a t i c R e c o r d e r ( F l o a t Type) i n s t a l l e d N o v e m b e r 1953. S t a f f G a u g e , r a n g e 0 t o 2 0 feet.
CURRENT METER OBSERVATIONS:
MAXIMUM ESTIMATED DISCHARGE DURING PERIOD OF RECORDS:
MEAN DAILY DISCHARGE FOR 13 YEARS:
MEAN ANNUAL DISCHARGE FOR 13 YEARS:
( a ) Number o b t a i n e d 125
( b ) Maximum observation i n c u s e c s : 2,836
( c ) Minimum observation i n c u s e c s 0
2 8 , 0 0 0 cusecs.
1 4 3 cusecs.
1 0 5 , 0 0 0 a c r e feet.

-140-
ENDRICK RIVER AT NOWRA ROAD.
Y e a r 1953 Y e a r 1954
Appendix 18 S h e e t 2
Month Discharge i n Cusecs
Discharge f o r Month A c r e Feet
Month Discharge i n Cusecs
Discharge f o r Month A c r e Feet Max. Min. Mean Max. Min. Mean
Jan. 00 00 0. 00 Jan. 2.9 0.5 1.6 98
, Feb. • • • • • • • • Feb. 11000 1.4 269 15,039
Mar. 00 00 •• •• Mar. 63 2.9 11 706
Apr. .. .. .. .. Apr. 2.9 2.3 2.7 164
May .. • • • • • • May 2.9 1.7 2.2 139
June • • • • • • • • June 13 2.3 3.5 212
July 0. .. .. • • July 39 2 8.2 502
Aug. .. 00 00 .0 Aug. 38 2.6 7.1 442
Sept. 00 OS .0 00 Sept. 7.6 1.9 3.2 191
Oct. • • • • • • • • Oct. 212 1.0 11 652
Nov. • • • • • • • • Nov. 242 1.7 20 1,224
Dec. 5.7 0.5 1.2 74 Dec. 1 1 1 62
Total 00 00 • • .0 Total • • .. • • 19,431
Y e a r 1955 Y e a r 1956
Jan. 105 0 7.8 486 Jan. 265 3.7 23 1,418
Feb. 6900 8.4 237 13,266 Feb. 19200 ; 12 965 55,964
Mar. 1980 27 162 10,072 Mar. 7875 59 621 38,506
Apr. 11000 5.7 96 5,742 Apr. 389 28 68 4,076
May 11500 10 491 30,454 May 8400 47 270 16,740
June 2050 37 135 8,114 June 13200 37 677 40,606
July 215 30 41 2,570 July 12600 44 309 19,144
Aug. 85 10 26 1,596 Aug. 841 22 85 5,300
Sept. 17 4.5 7.9 472 Sept. 203 18 40 2,408
Oct. 10 2.3 5.4 334 Oct. 6715 22 183 11,350
Nov. 44 0.8 3.4 206 Nov. 28 6.2 11 684 b
Dec. 215 1.5 17 1,052 Dec. 7 1.0 4.2 258 1
Total .. .. .. 74,364 ' Total .. .. .. 196,454 6 .

-141-
ENDRICK RIVER AT NOWRA ROAD
Y e a r 1957 Y e a r 1958
A p p e n d i x 18 S h e e t 3
Month Discharge i n Cusecs
Discharge f o r Month A c r e Feet
Month Discharge i n C u s e c s
,
Discharge f o r Month A c r e Feet
Max. Min. Mean Max. 'Min. Mean
Jan. 10 1 5.7 352 Jan. 203 0.5 10 616
Feb. 4780 3.8 97 5,442 Feb. 8550 12 441 24,712
Mar. 50 7 14 846 Mar. 2860 9 152 9,454
Apr. 10 3 4.7 284 Apr. 244 9 26 1,556
May 4.5 3.4 3.8 238 May 19 6 9.7 604
June 3255 4.5 73 4,364 ' June 16500 6 367 22,050
July 12800 7 345 21,382 July 7430 24 165 10,256
Aug. 3520 24 257 15,906 Aug. 155 15 25 1,558'
Sept. 178 15 50 3,012 Sept. 37 11 18 1,050
Oct. 15 5 8.2 508 Oct. 56 6.5 15 936
Nov. 20 0.8 4.2 249 Nov. 37 2 3.9 234
Dec. 2 0.8 0.4 32 Dec. 142 3 19 1,154
Total .. .. .. 52,615 Total .. .. .. 74,180
Y e a r 1959 Y e a r 1960
Jan. 470 4, 76 4,694 Jan. 142 8.7 26 1,656
Feb. 2750 15 113 6,356 Feb. 51 6.8 14 836
Mar. 9730 26 317 19,658 Mar. 1200 8.7 67 4,160
Apr. 5255 22 203 12,208 Apr. 129 11 23 1,380
May 22 11 14 832 May 1980 11 70 4,364
June 12600 8 395 23,684 June 675 17 49 2,966
July 27300 32 638 39,578 July 13000 22 318 19,722
Aug. 1200 37 91 5,612 Aug. 1155 17 66 4,088
Sept. 76 22 39 2,366 Sept. 1460 12 162 9,692
Oct. 27700 16 1031 63,912 Oct. 1460 22 85 5,290
Nov. 1580 59 227 13,634 Nov. 44 17 28 1,708
Dec. 350 26 74 4,610 .... Dec. 13700 17 513 31,818
Total .. .. .. 197,144 a " Total ..
, .. .. I
87,680

-142- A p p e n d i x 18 S h e e t 4
ENDRICK .RIVER AT NOWRA ROAD
Y e a r 1961 Y e a r 1962
Month Discharge i n Cusecs
Discharge f o r Month A c r e Feet
Month Discharge i n Cusecs
Discharge f o r Month A c r e Feet
Max. Min. Mean Max. Min. Mean
Jan. 815 14 76 4,726 Jan. 4920 54 266 16,502
Feb. 168 14 21 1,148 Feb. 11500 31 327 18,304
Mar. 21400 14 786 48,730 Mar. 2820 29 93 5,738
Apr. 360 31 63 3,772 Apr. 1042 26 88 5,282
May 104 21 27 1,656 May 2407 23 154 9,526
June 2905 23 201 12,032 June 45 18 28 1,664
July 6840 48 271 16,806 July 1065 17 74 4,574
Aug. 6590 44 485 30,052 Aug. 855 18 108 6,692
Sept. 2905 44 219 13,150 Sept. 5865 17 381 22,836
Oct. 4500 26 206 12,792 Oct. 180 20 41 2,554
Nov. 11300 25 557 33,404 Nov. 76 8 19 1,122
Dec. 5903 48 436 27,532 Dec. 3295 8 182 11,304
Total .. .. .. 205,800 Total .. .. .. 106,092
Y e a r 1963 Y e a r 1964
Jan. 710 18 73 2,408 Jan. 25 6.8 14 852
Feb. 2500 22 128 7,188 Feb. 8.8 3.2 5.5 318
Mar. 7235 15 369 22,872 Mar. 200 4.6 22 1,342
Apr. 28000 34 485 29,116 Apr. 8550 4.6 365 21,877
May 5370 41 352 21,814 May 196 22 44 2,738
June 6590 56 273 16,394 June 11200 20 675 40,526
July 4000 44 286 17,750 July 61 20 33 2,058
Aug. 6900 24 140 8,684 Aug. 1020 9.1 56 3,490
Sept. 10400 22 369 22,130 Sept. 30 9.2 18 1,074
Oct. 563 26 81 5,030 Oct. 569 6.8 21 1,300
Nov. 4215 17.5 37 2,230 Nov. 515 4.6 30 1,780
Dec. 4890 12.7 267 16,540 Dec. 76 2.0 8.1 500 i
Total .. .. .. 172,156 Total .. .
.. .. 77,855 a .

-143-
ENDRICK RIVER AT NOWRA ROAD
Y e a r 1965 Y e a r 1966
A p p e n d i x 18 S h e e t 5
Month
Discharge i n Cusecs
Discharge f o r Month A c r e Feet
Month
Discharge i n Cusecs
Discharge f o r Month A c r e Feet
Max. Min. Mean Max. Min. Mean
Jan. 4 1 2.1 132 Jan. 3 0.6 1.5 932
Feb. 1.8 1.0 1.11 76 Feb. 2640 0.9 80 4,500
Mar. 0.8 0.1 0.4 24 Mar. 805 7.5 35 2,164
Apr. 4 0 1.2 73 Apr. 13 3.5 5.4 324
May 4.6 1.4 1.8 113 May 10 3.1 4.2 260
June 11 1.4 3 180 June 3664 4.2 224 13,418
July 395 2.8 29 1,814 July 210 13 27 1,684
Aug. 13 2.9 5.4 335 Aug. 3187 12 46 2,832
Sept. 94 2.2 13 797 Sept. 1065 16 79 4,738
Oct. 3430 1.5 235 14,558 Oct. 385 15 53 3,307
Nov. 37 2.8 9.7 584 Nov. 15820 21 569 34,148
Dec. 1532 3 62 3,842 Dec. 668 23 67 4,183
Total .. •• 22,528 Total •• • • 72,490
Y e a r 1967
Jan. 2442 12 82 5,107
Feb. 101 9.5 21 1,176
Mar. 413 8.3 34 2,084
Apr. 77 5.3 14 824
May 14 3.7 5.8 357
June 1896 4.8 152 9100
July
Aug.
Sept.
Oct.
Nov.
Dec.
- Total
_

-144- A p p e n d i x 10 S h e e t 1
KANGAROO RIVER AT KANGAROO VALLEY
LOCATION:
PERIOD OF ESTABLISHMENT: J u l y , 1 9 5 4 t o date.
COMPLETE YEARS OF COMPUTED RECORDS: 9.
ZERO OF GAUGE: R . L . 3 8 . 3 1 A s s u m e d Datum.
CATCHMENT AREA: 9 3 S q u a r e Miles.
CONTROL: R o c k Bar.
EQUIPMENT: S t a f f g a u g e , r a n g e 0 t o 50 feet.
CURRENT METER OBSERVATIONS: ( a ) Number o b t a i n e d 102
MAXIMUM ESTIMATED DISCHARGE DURING PERIOD OF RECORDS:
MEAN DAILY DISCHARGE FOR 9 YEARS:
MEAN ANNUAL DISCHARGE FOR 9 YEARS:
L a t i t u d e 3 4 ° 4 4 ' L o n g i t u d e 150031'
( b ) Maximum observation i n c u s e c s : 15,120
( c ) Minimum observation i n c u s e c s 0.8
8 1 , 0 0 0 cusecs.
3 1 0 cusecs.
2 2 7 , 0 0 0 a c r e feet.

-145— A p p e n d i x 19 S h e e t 2
KANGAROO RIVER AT KANGAROO VALLEY
Y e a r 1954 Y e a r 1955
Month Discharge i n Cusecs
Discharge f o r Month A c r e Feet
Month Discharge i n Cusecs
Discharge f o r Month A c r e Feet
Max. Min. Mean Max. 4
Min. Mean
Jan. • • • • , • • • • Jan. 580 5.3 53 3,270
Feb. ( .. 00 0 • 00 Feb. 10340 35 726 40,674
'Mar. .. .. •• .. Mar. 1330 98 312 19,348
Apr. 00 00 00 04 Apr. 195 66 91 5,474
May •• •• • • • • May 48400 82 1066 66,100
June •• • • • • • • June 890 82 187 11,224
July .. 04 00 00 July 107 52 77 4,794
.. Aug. 154 13 42 2,630 Aug. 52 19 39 2,396
Sept. 144 13 25 1,486 Sept. 52 19 35 2,098
Oct. 605 7.5 81 5,032 Oct. 30 6.2 13 786
Nov. 680 25 191 11,470 Nov. 580 3 59 3,550
Dec. 57 13 29 - 1,790 Dec. 1055 52 366 22,662
Total .. 00 00 .... 00 Total .. .. .. 182,376
Y e a r 1956 Y e a r 1957
) 1 1 Jan. No Records Jan. 10 1.1 3.5 219
. L Feb. Noi Records Feb. 7060 1.8 1232 68,964
Mar. 8500 195 1826 113,210 Mar., 64 39 52 3,210
Apr. 3600 ,
255 1293 80,140 Apr.. 39 15 22 1,298
May 36600 135 1537 95,308 May 15 1.8 10 600
June 36600 39 1.271 76,236 June No Records
'July 890 96 291" ',-181036 July No Records
. ' Aug. 244 39 117 6,998 , Aug. No Records
• Sept., 64 /1 • 38 • 2,312 Sept. No Records
Oct. 8260 21 450 27,918 Oct. No Records 0
, Nov. 51 21 39 2,192 Nov. 21 2.4 10 590 / 'Dec. 39 4.8 22 1,408 Dec. 8.2 1 2 126
, y Total.. .. .. • • Total .. 00 00 00
A . _

-146-
KANGAROO RIVER AT KANGAROO VALLEY
Y e a r 1958 Y e a r 1959
Appendix 19 S h e e t 3
Month Discharge i n Cusecs
Discharge f o r Month A c r e Feet
Month
.
Discharge i n Cusecs
Discharge f o r Month A c r e Feet ,Max. Min. Mean Max. Min. Mean
Jan. 171 9 24 1,506 Jan. 2320 8 117 19,652
Feb. 7060 37 538 30,134 Feb. 47000 54 753 42,160
Mar. 11620 57 707 43,848 Mar. No Records
Apr. 1110 53 223 13,372 Apr. No Records
May 140 34 68 4,216, May 145 47 64 3,980
June 11380 31 257 15,436 June 2200 33 192 11,492
July 5700 57 240 14,856 July 46700 72 936 58,014
Aug. 135 35 54 3,348 Aug. 605 78 137 8,478
Sept. 135 30 40 2,402 Sept. 680 64 135 8,112
Oct. 72 15 32 1,984 Oct. 81000 58 2236 138,602
Nov. 15 5.2 8.3 500 Nov. 1495 135 454 27,214
Dec. 125 8 29 1,794 Dec. 135 39 90 5,610
Total .. .. .. 133,396 Total .. .. .. ..
Y e a r 1960 Y e a r 1961
Jan. 308 33 87 5,410 Jan. 1840 64 192 11,876
Feb. 440 21 64 3,696 Feb. 323 52 89 4,060
Mar. 630 52 158 9,804 Mar. 40?00 39 1071 64,270
Apr. 142 37 73 4,354 Apr. 730 90 201 12,072
May 1055 26. 133 8,270 May 144 66 .90 5,558
June 3200 52 193 11,506 June 1440 74 257 15,396
July 10020 78 710 44,036 July 2110 78 184 11,416
Aug. 945 64 153 9,492 Aug. 10420 66 792 49,094
Sept. 705 64 222 13,330 Sept. 1960 110 294 17,622
Oct. 1900 42 252 15,628 Oct. 1440 64 160 9,896
Nov. 177 52 87 5,206 Nov. 50000 42 2247 134,808
Dec. 14900 52.41105 68,530 Dec. 16200 ' 144 1167 72,358 li
Total .. A . .
I . . e 199,262 Total .
.. 409,326

-147- Appendix 19 S h e e t 4
KANGAROO RIVER AT KANGAROO VALLEY
Y e a r 1962 Y e a r 1963
Month Discharge i n Cusecs
Discharge f o r Month A c r e Feet
Month Discharge i n Cusecs
Discharge f o r Month A c r e Feet Max. Min. Mean Max. Min. Mean
. - Jan. 7910 142 572 35,448 Jan. 1605 64 184 11,426
Feb. 11860 115 896 50,174 Feb. 233 39 83 4,660
Mar. 310 90 180 11,164 Mar. 42000 30 19$8 118,656
Apr. 1220 82 266 15,938 Apr. 75000 116 1758 105,458
May 16600 82 583 36,158 May 3750 195 788 48,880
June 149 66 95 5,672 June 4150 149 437 26,226
July 630 55 181 11,224 July 1780 115 296 18,380
Aug. 1900 55 303 18,816 Aug. 13180 50 631 . 39,114
Sept. 3100 66 481 29,824 Sept. 3700 64 493 29,602
Oct. 214 59 99 6,168 Oct. 290 66 133 8,218
Nov. 134 29 53 3,154 Nov. 144 116 128 7,664
Dec. 1660 24 208 12,920 Dec. 8340 98 926 57,436
Total .. .. .. 236,660 Total .. .. .. 475,720
Y e a r 1964 Y e a r 1965
Jan. 154 43 78 4,860 Jan. 11 3 6.8 420
Feb. 52 29 40 2,340 Feb. 4.5 2 3 161
Mar. 2260 29 155 9,616 Mar. 1.6 1 1.3 76
Apr. 4050 29 683 41,008 Apr. 135 0.7 38 2,294
May 154 66 104 6,444 May 62 7.3 13 786
June 47000 66 1989 119,318 June 244 4.4 34 2,052
July 130 43 70 4,328 July 1550 17 131 8,102
Aug. 83 25 36 2,246 Aug. 35 17 27 1,662
Sept. 34 25 31 1,892 Sept. 54 15 34 2,058
Oct. 25 11 17 1,040 Oct. 5000 7 547 33,916
Nov. 480 11 39 2,318 Nov. 135 25 55 3,306
Dec. 47 4 11 668 Dec. 835 52 145 8,990
Total .
.. .. A
.. 196,078 Total .. 4 ' ' A .. 63,823 ,

-148-
KANGAROO RIVER AT KANGAROO VALLEY
Y e a r 1966 Y e a r 1967
A p p e n d i x 19 S h e e t 5
Month Discharge i n Cusecs
Discharge f o r Month A c r e Feet
Month Discharge i n Cusecs
Discharge f o r Month A c r e Feet
Max. Min. Mean Max. Min. Mean
Jan. 54 7 23 1,436 Jan. 2750 19 291 18,052
Feb. 2960 7 358 20,032 Feb. 290 82 112 6,264
Mar. 3150 21 298 18,470 Mar. 2560 64 425 26,370
Apr. 94 30 49 2,948 Apr. 80 39 48 2,902
• May 35 14 21 1,328 May 39 21 28 1,756
June 1768 14 266 15,986 June 3850 21 401 24,070
July 72 39 46 2,872 July
Aug. 323 14 48 2,950 Aug.
Sept. 156 21 76 4,538 Sept.
Oct. 80 21 36 2,260 Oct.
Nov. 16000 39 972 58,320 Nov.
Dec. 1720 52 194 12,058 Dec.
Total .. 143,198 Total

.•.• , 4 NUN SOUTH
*ALES
311.
SHOALHAVIN BASIN
VICTONIA
COULBURN
—6•
Lake Bathurst
• MOUNT FAIRY
LD .i. Z
NiS.
41)
. MT COW 6ER0N6
7 1 41
1. BALD
MOUNTAIN
/)
TONEY
47.
lir
(442,,,e2,0
BRAIDWOOD
MAJOR
50. 149
IP MOSS VALE
NGONIA
SUNOANOON
x CURROCKBILLY ^I` MOUNTAIN •
MONGARLOWE i
.. 4.- rq
4 ( Isfiri A
.\ .S
SUGARLOAF ...:'
youNTAIN ••2`
ULLADULLA
BATEMANS BAY
FIGURE I
ROBERTSON
JERVIS BAY
c5
EURANBENE MOUNTAIN NEW SOUTH WALES
WATER CONSERVATION & IRRIGATION COMMISSION
KIAMA
Sli QM-11AV g.N pivE.R VALLV SCALE
.,Lcs 5 4 5 2 I 0 IN
LS NILES
35.
36.
50.30

ITC
LEGEND
150 FIGURE 2
Mostly Flat Slopes less than 3 degrees
Undulating t o Hilly Slopes greater than 3 degrees but l e u than B degrees
Hilly t o S t e e p • • • • • 0 , 0
Slopes greater than S d e g r e e s but less than 15 degrees
Rugged or Mountainous Slopes greater than 15 degrees
COULBURN
A I ...7. Nil
A P I S ..1, Asen-rsairr , AI A K & M r .001
Allir.m.00.1111111 et, I N M a •
-4111111P"ora.11011. A U a l - 4 1 . 1 6 6 . l n . -- :11'
* v . ' . • , , I 1 r , i . , . . - , . . • . A M I V W / M M I N S M I P i . 4 . : / d 0111.
- . . . . M M o d N I M M I N . . . . a e f f • M a i . r M M = . 1 . • : i . O l V A ; 7 . 0 • M a l • —
mmommErearta AndI,O.AF ( w i a s e Amrar ow iftibi •1 = NN .
A V . . < 1 0 O M I N I I M M Ilr,4,10 ANN_._--1111hk,...LA 0 a • —Al - 410111, .0,-,dallil - . . i - oweltreAmi %cm
^.00 ‘ 1 1 1 1 1 . 0 . - . 4 . 1 7 , - - . 6 7 . 1 - 1 = w a . 0
s e .11e.N,M, 11:̀41 "e---.._-..-AIN.--ram , uliNbilligablallit As :t./14AMINIIMI 4111111MMIIII WI a 1 r..- a l i , . a••- . . - . 4 . g o r - 0 / 1 0 0 1 h * A c . W I l a r i 0 0 1 0 " A
emir ________
_IIIIIi11111.111 ib 6...amooLgw• .....ThdPmr.noinmitimwdr-o.!0. •-•• a m i l i l i l l i e V ' .* ‘ " • • • 6111.11.11.1, " A " ' V I .o.m. - - - • • • I o m m u m n o m m t - 2 - - q i n a r Air 0,-,1%.,........10011111w,., , ,m; , - - , , , ib --%.......e...., ommi 0 i i ; . . . - . 4 r . v M r ' MN.
a...,,-,....--='•••••--,A1Vari %. . . . . '" , • • N . 1 1 L . . . . . . . . r w i l v i m s , 7 • 1 1 4 1 , m m , 1 1 . . . , 4641/1' wwwir., / = • •••••■61.04.....••••••'°' att... . .4011111111.0..
" li
oxirrig a •...................... p.„--.. appiiiiiamen....,...4...._.........._..-. ,.... . efilli1111/11/Ims..•-,,a or /BR s a m E N N E . - - - --- .0-
a 1111111111"a 1...L.,•414.1"."4"11.,m‘miewmarms246:11116:14.4 h -mumiffilliw . )4001P
It M i . •
I I I M M I l l MUM I I I M I " W M m a m m y
I N IIM • IIMMIS
= l a p 111AIMMI,
I N E M / M E M O . M i l l i e 7 — 8=ftwarailielegp--
-411"1"11111•6'hais mzirrallarr4;11.7.71011101; iiwAilligi gm.P=1-amitillid cas.lirimirrvilzmaw.vamscommA•1 • aisa....,
a m i t i o n i m m LP IMMOIMI I I I I I I I I . oi
• • • , . . . i o r wm.... Au. .....1 M I N a I I I M ' I M - . _ If
I L L . V r a l k • I P m i . , - . 6 . . . a i m _Pere. INN_ rimsommem ;yr
. . . m r . „ 7 , 1 1 7 4 6 , a . . 4 , . . „ , , , z , = , .,.,„,„„ — ....,,..s... M I O N I M M O I O N
= M I L . C M I I P y~s~,Arsanw
-Neweireffiff= MINE&
A m m o 1,
, 1 1 1 r 1 1 m
i m m i m i l o w . I N O W • l l i t \ IpittrffF 41111111WW ammommrims.Ami...
• • • . ri••• M I N O M I M I INII/iliffw
I M M I N I L M I •-••••••• ` V M D , MN
'•••A•NEOI. -yew
=kJ
BATEMA BAY
KIAMA
ERVIS BAY
NEW SOUTH WALES
WATER CONSERVATION & IRRIGATION COMMISSION
06'1*
SHOALHAVpi RIVER VALLEY
D SLOPES SCALE
5 M,LES 5 4 3 2 I 0 IS MILES
35•
36*
50* , 5 0 30

I50.
151 150.30'
FIGURE 3
MOUNT FAIRY
—k....
. . ,/.---'
,
%.: McARJEOERKS
, .
Le(LOWER
AR A LU EN •
i BETTOWYND
*KRA ARREE
30"
3
PENROSE
I/
35° 40" 45"
MILTON•
BATEMANS BAY
40"
ROBERTSON
45"
JAMBER00 • KIAMA •
5,,
(KOKHAVEN HEADS
JERVIS BAY
NEW SOUTH •WALES
WATER CONSERVATION & IRRIGATION COMMISSION
SHOALHAVEN tIVER VALLEY ANNUAL MEDIAN RAINFALL
SCALE • ' sd,LEs0 • 3 2 1 0 0 1 0 13 MILES
33!
34.
ISO 130•50'

1.'52 130.30'
FIGURE 4
MOUNT FAIRY
MAJORS CREEK •
LOWER BORO
BRAIDWOOD
ARALUEN 0
BE.TTOWYND
KRAWARREE
BUNGONIA
3.0"
3.0"
P NROSE
BATEMANS
ROBERTSON
KANGAROO VALLEY
BERRY•
JAMBER00 0./ KIAMA •
CROOKHAVEN HEADS
JERVIS BAY
BUNDANOON
BAY
NEW SOUTH WALES
WATER CONSERVATION a IRRIGATION COMMISSION
SHOALHAVEN , RIVER VALLEY JANUARY MEDIAN RAINFALL
SCALE • • muss 3 4 3 2 1 0 S 10 • I3ILII
• .5
130430'

133 150•30.
FIGURE 5
2-0°
• MOUNT FAIRY
,
ARALUEN
BETTOWYND
2.5
3.0"
21"
SUNGONIA
PENROSE
OBERTSON
3.0'
JAMBER00 •
IAMA •
3•0' CROOKHAVEN trWEADS
JERVIS BAY
'BATEMANS BAY
NEW SOUTH WALES
WATER CONSERVATION & IRRIGATION COMMISSION
SHOALHAVEN RIVER VALLEY FEBRUARY MEDIAN RAINFALL
SCALE MILCS 7 • 3 5 I ? 1 .„7...10 IS MILES
310
311.

134 190230'
FIGURE 6
LOW ER BORO
BRA I DWOOD
AR ALUEN •
BE TTOWYND
KR AWARR EE
BUNGONIA
2.0"
2.5"
2.0"
PENROSE
BAT EMANS BAY
3.0" ma
ROBERTS .N
C-F-200K HAV EN HEADS
JERVIS BAY
NEW SOUTH WALES WATER CONSERVATION & IRRIGATION COMMISSION
SHOALHAVEN RIVER VALLEY MARCH MEDIAN RAINFALL
SCALE I M E S 5 • 1 2 1 0 5 10 15 MILES
100•50'

155 1$0•30*
FIGURE 7
./BUNGONIA
.FAIRY l i L O W
ER SORO MOUNT s
i•—
//
•
MAJORS, CZ) CREEK
AR ALUEN •
BETTOWYND
•04AWARREE
PENROSE
" " 2.5"
IVDANOON
MILTON•
3.5-
30' BATEMANS BAY
\ 5'
•
•o" 3.5"
ROBERTSON
KANGAROO VALI.EY.
ER-Y•
JAMBER00
KI MA •
OOK HAVE N HEADS
JERVIS BAY
NEW SOUTH WALES WATER CONSERVATION & IRRIGATION COMMISSION
SHOALHAVEN RIVER VALLEY APRIL MEDIAN RAINFA4
SCALE WiLtS • 3 2 I 0 S 10 IS MU.
35!
34.
130•30*

136 FIGURE 8
MOUNT FAIRY LLOWER BORO
BRAID 00
AR ALU EN •
BET TOW YND
1.5"
11"
IA
PENROSE
2.5"
KANGAROO VALLEY
BERRY•
•NOW RA
BAT E M NS BAY
2.5u 4 c°
ILTO N•
2.0° NEW SOUTH WALES
3.d
JISEROO • IAMA
CROOK H AV EN HEADS
JERVIS BAY
WATER CONSERVATION & IRRIGATION COMMISSION
SHOALHAVEN RIVER VALLEY MAY MEDIAN RAINFALL
SCALE 10 IS Win
SS*
36*
ISO. /
150'30'

1 3 7 11040'
FIGURE 9
MOUNT 'N \ FAIRY LOWER OR
AR ALUE •
BETTOWYND
KR AWARREE
2.0#
B UN DA NOON 4 1 - 1 1 w i r N ROSE
Nmoi.5
NGONIA
21"
ROBERTS
BAT EMANS BAY
3.0.*
21"
3-d MBER00
• IAMA •
OOK HAVEN HEADS
JERVIS BAY
NEW SOUTH WALES WATER CONSERVATION & IRRIGATION COMMISSION
SHOALHAVEN RIVER VALLEY JUNE MEDIAN RAINFALL
SCALE MILES 4 3 1 I 0 S o . _ 0 IS ii.0.13
36.
ISO. 110.30'

mos 158 IKON'
FIGURE" 10
-1143-UNGONIA
BRA I D OOD •
MAJORS (Z, CREEK
BE TTOW YN D
4,
• 1.5"
2.13'
1•5"
BAT EMANS BAY
JAM BER00 0, KIAMA •
C ROOK HAV EN HEADS
JERVIS BAY
ROBERTSON
2-511
2.0"
NEW SOUTH WALES WATER CONSERVATION & IRRIGATION COMMISSION
SHOALHAVEN RIVER VALLEY JULY MEDIAN RAINFALL
SCALE wits 1 4 . = • • = i m m i m i L 7 . , 3 I IS IMES
150.30*
311.

1•5"
MOUNT FAIRY
MAJORS CREEK
BRAID WOOD
AR ALUEN I.
TOWYND
REE
1.0"
139
PENROSE BUNDANOON
BATEMANS BAY
OBERTSON
acr
1.5" c
FIGURE 11
JAMBER00 • KIAMA •
CROOK HAV EN HEADS
JERVIS BAY
NEW SOUTH WALES WATER CONSERVATION & IRRIGATION COMMISSION
SHOALHAVEN, RIVER VALLEY AUGUST MEDIAN RAINFALL
SCALE somas s • 3 t 1 0 5 10 IS WILES
2°5°
311.
130.30'

ISO. 160
150430'
FIGURE 12
S MOUNT FAIRY
;
MAJORS CREEK •
• •-••••-_,./-/y
...111/E1UNGONIA
LOWER 80110
BRA IDWOOD
BETTOWYND
OcKRAWAR EE
PENROSE
MILTON•
2-0"
BATEMANS BAY
ROBERTSON
JAMEIER00 • 14 AMA
• 215 OOK HAVEN..
EADS
JERVIS BAY
NEW SOUTH WALES
WATER CONSERVATION ft IRRIGATION COMMISSION
SHO4HAVEN RIVER VALLEY SEPTEMBER MEDIAN RAINFALL
SCALE MILES 5 4 3 I I 0 5 10 IS MILES
5. 35.
34.
ISO. 150•10°

161 1101S0.
FIGURE 13
2-01
1 MAJORS CREEK
L.
/ L O W E R BORO
ARALUEN •
BETTOWYND
4111(KRAWARREE
1
.11)BUNGONIA
2.0"
PENROSE BUNDANO N
ROBERTSON
KANGAROO VALLEY
BERRY•
•NOWRA
JAM BEROO
MAMA
C.1,700K HAVEN
L ( W E AD S
JERVIS BAY
oe
BATEMANS BAY
47'
.5.
N E W S O U T H WALES
W A T E R CONSERVATION a IRRIGATION COMMISSION
SHOALHAVEN RIVER VALLEY OCTOBER MEDIAN RAINFALI_
SCALE anus 5 4 3 2 I 0 3 _ 0 IC MILES
33.
ISO. 130430'

162 130.30.
FIGURE 14
BETTOWYND
20
JAM BERO • KIAM
ClOOKHAVEN HEADS
2.5° JERVIS BAY."...
BATEMANS BAY
NEW SOUTH WALES WATER CONSERVATION 4 IRRIGATION COMMISSION
SHOALHAVP4 FUVF.F( VAI.LEY NovgmpER higpiAti RAINFAI.t.
SCALE toll.t$ 5 4 3 2 1 0 5 10 . • IS MILES
1=911=1.1.11MOMi
3II.

006 163
130030.
FIGURE 15
BUNGONIA
MOUNT FAIRY
BRAIDWOOD
AR ALUEN 0
BETTOWYND
KRAWARREE
2'
PENROSE
OBERTSON
31:1'
243u (•'"
JAMBER00 ‘11
MIA N A •
CItOOK HAVEN HEADS
JERVIS BAY
• BATEMANS BAY
NEW SOUTH WALES
WATER CONSERVATION & IRRIGATION COMMISSION
SHOAWAVEN RIVER vALj_y DECE413ER MEDIAN RA!NFAI.I.
SCALE MILLS ; 4 3 I I 0 ? $p IS MILES
150•341*

Lf—CLLILD
W i a n d o o t t o liverpoe C,OUP Ssb.qoap
lASSIC
Volcanic,
S h o a t wilrh game sanceel iono beds
Sam:Iacono w e l t e o n , snot* Honet •OorY M a s c o t , easoesteme
t i o t r a b o e n I I I I S a n d s t o n e . ' a c e t o n e , clainetone C r o u p shoto o n e tuttbreoces etqystone
C o a l Alasennes cher+, C O . ! a n d toneistieto snow, i l l a r e a r r a r i S h o l e , a f l o a t . . . . c a n g l e m e r a t e , fr.rf,
Formation
alegalong Congloneencee
(IRIAN
VOVICIAN
Coesienows VoIcanace
Mennimenola
IGNEOUS
++
E
•
MIMI
bm•-4'
inn
t rach je t ic t o f f e n d latiVe
S i l t e t a n e , ettant oast eandeitene
Quar ts oandotetee, ' a c e t o n e e n s COMIVOWIRO•
Sol i te c o n e l o a • r a t e , siliceous semestans, shade Itenestatte Janes...O. caste 0100 catwlentionerte & d o l e % , r e a m , . e r a o d a , Ka*, b e s e t stensistome • aseignemendo
Secants a c i d NOICPIPI.C.
S l a t e , ' A y a l a . • leoetttanie
C t a i n l e • sittekttY
Batiod
Rhyohle
e t t e r o s o , *Aide
164
1100aRTOOM
FIGURE 16
0 co
NEW SOUTH SOUTH WALES WATER CONSERVATION AND IRRIGATION COMMISSION
SHOALHAVEN RIVER VALLEY GEOLOGICAL FORMATIONS
ceict•

163 FIGURE 17
Staff Gauges_
LEGEND
Automatic Recorders Pressure Type Float Type
Discontinued Stations_
GOULBURN
WELCOME PEE'
x.„
g.1
WARP
RAID WOO
ALEVIEW
KADOONA
WILLOW GLEN
HAMPDEN BRIDGE
/SCOT
COOKE'S CROSSING
NELLSVILLE
CLINTON PARK
KAN0A10°
K A N G A P O O / '> _lief
VALLEY r' .5!̀ . /
41̀. / (OA
NOWRA PuMPIN TATION
MODEL STUDIES
STATIONS
0
NOWRA ROAD
NERNIGA Brook
MONGARLOWE
ONCA
ULLAOULLA
BATEMAN!) BAY
N E W SOUTH WALES
J E R V IS
BA V
W A T E R CONSERVATION a IRRIGATION COMMISSION
SHOALHAVEN RIVER VALLEY GAUGING STATIONS
3 0 t h . J U N E 111611
SCALE I I ILCS 5 • 3 I I 0 5 10 IS WiLCS
t . 3 1 1 . -100
li•
o. 1 5 0 . 30

166
500,000
400,000
300,000
200,000
100,000
0
1500,000
400,000
300,000
200,000
100,000
0
1p 72,000
L
1909 1910 1911 1912 1913 1914 1915 1916 1917 1918 1919 1920 1921 1922 1923 1
1928 1929 1930 1931 1932 19 3 3 1934 1935 1936 1937 1938 1939 1940 1941 1942
500,000.
400,000
300,000
200,000
100,000
i I w
1947 1948 1949 1950 1951 1952
f' r - NO RECORDS N 0 RECORDS I roil 1953 1954 19 55 1956 19 57 195 8 1959 1960 1961
HYDROGRAPH OF MONTHLY DISCHARGES FOR SHOALHAVEN RIVER

FIGURE 18 V e93, 00
g24 1925 1926 1027
3 1944 1945 1946
500,000
400,000
300,000
200,000
100,000
0
500,000
400,000
300,000
200,000
100,000
0
DISCHARGE
>- 500000
400 ,000 z
0
3 0 0 , 0 0 0 2
62 1963 1964 1965 1966
200,000
100,000
0
AT WELCOME REEF
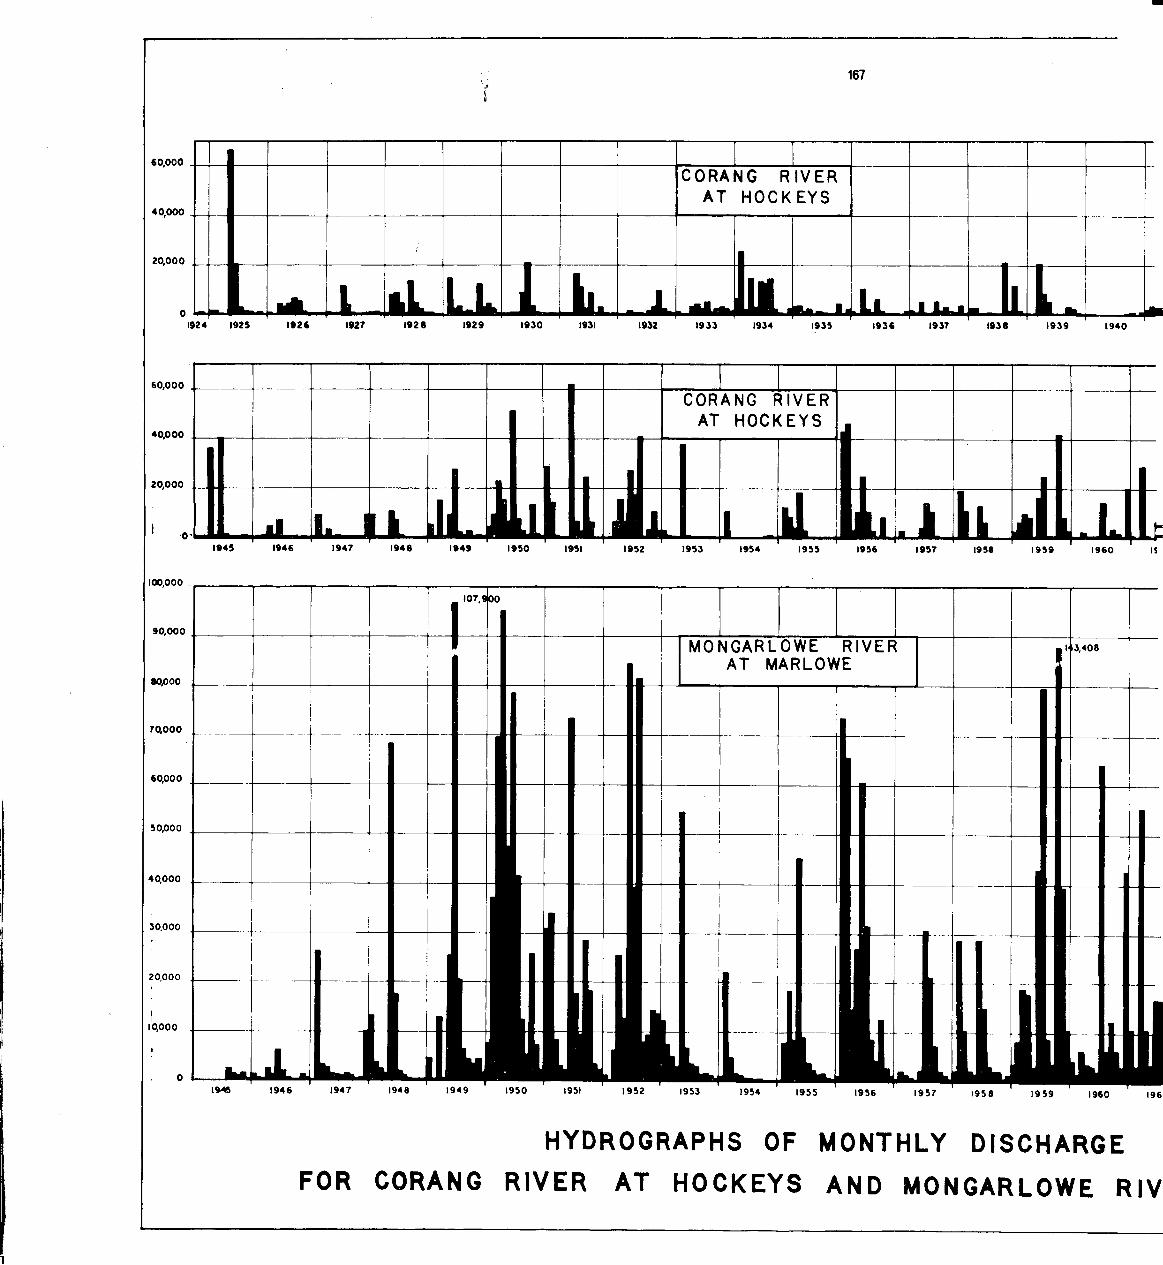
167 i ,
60,000
40,000
CORANG AT
RIVER HOCK EYS
20,000
0 1924 1925 9261 1927 9281 1929 1930 1931 1932 19 33 1934 1935 1936 1937 193 8 1939 1940
60,000
40,000
CORANG AT HOCK
RIVER EYS
20,000
1 _ a_ 1k L ...., _ a
.111
1945
100,000
1946 1947 194 8 1949 1950 1951 1952 1953 1954 195 5 1956 195? 19 58 1959 1960 I S
90,000
107,900
80,000
MONGARLOWE AT MARLOWE
RIVER I 3,408
70,000 _
1
60,000
50,000
40,000
30,000 4-- .
I 1
20,000 1 r 10,000
I I , . I
1 . I i I 1 1 1945 9461 194
FOR
7 194 8
CORANG
I 949 1950
RIVER HYDROGRAPHS
1951 1952
AT
1953
HOCKEYS
1954
OF
195 5
MONTHLY AND
19 56 1957
MONGARLOWE
9581
DISCHARGE
1 959 1960
RIV
196

FIGURE 19
1 114,968
,9 41 1942 _Ai 1943 944
60,000
40,000
20,000
0
1962
1962
1963
1963
1964
1964
1965
1 965
196 6
3966
Lu 60,000 W
40,000 Lu
20,000 C.)
0
104000 LLI
90,000 CC
X
84000 0 cn
70,000 CI
60,000 >..;
X
59000
0
40,000 M
30,000
20,000
0,000
1ER AT MARLOWE

80,000
60,000
40,000
20,000
1953
120,000
100,000
80,000
60,000
40,000
20,000
1954 1955 1956 1957 1958 1959
ENDRICK RIVER AT NOWRA ROAD
1960 1961 1962 1963
KANGAROO RIVER AT KANGAROO VALLEY
138,600 134800 ,
I
I
. J. ..._._..., 8 ' w m• 0
0
hi—i 0 w et
0 w ct 0 z wk.'
cc 0 0 z 0
, 1 1 .
, .
1954 19 55 1956 19 57 1958 1959 1960 19 61 1962 196 3 1 I
HYDROGRAPHS OF MONTHLY DISCHARGE FOR AT NOWRA ROAD AND KANGAROO RIVER AT K

FIGURE 20
1964 1965 1966
80,000
40,000
20 ,000 ta)
1•10
Uri
0
I2Q000 <
X
100,000 0
cn 80,000
13
>-
60,000
40,000
0
20,000 2
0 64 1965 19 66
ENDRICK RIVER .NGAROO VALLEY
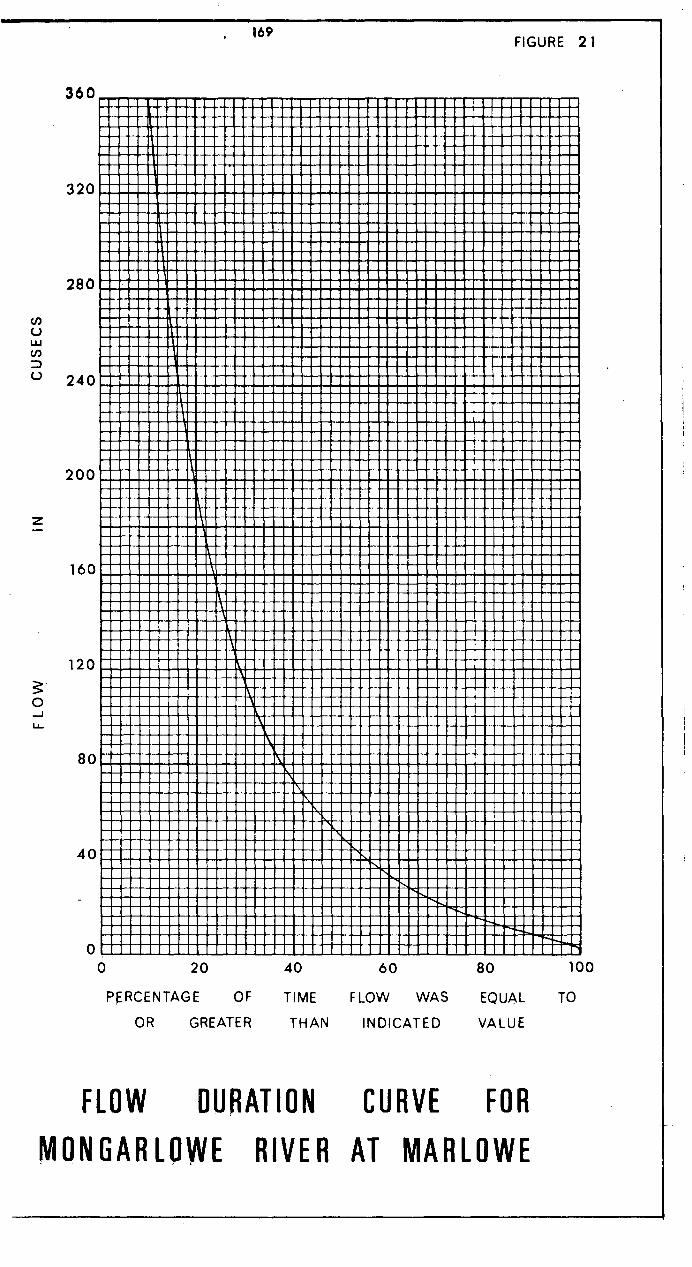
169 FIGURE 21
360
320
280
200
160
120
0 -J U-
80
40
unimigumms • WOOMMOOMMOMOSINIMMOMMOMMEMOMMMEMMOMM O M E M E A M M M O S I I IITOMMINIMMIMMOMMOMOMMMOMMMIOMMEMOMMO M M O M M I N I M M O M I O mmagem•mgmegmmumgmgmaimummummimm ammaimmimon• n MemmOMMIUMMIMMOMMEMMOMMEMMOMMEMO m m u m m o m m g m i r MOMEMOmEMMUMMIN0mMEMEEMMEMMEMMEMN MMINIMMIIMMEm WIMMOMMEMMOMMINIOMMINIMMEMMEMMOMMINOMMEMM MINIMMIMMOMM•EVOMMIROMOMOMMEMOMOMMOMMIMMINIMMOMMOMME MMOMMIWOMMO E E O INIMMOOMMOMMIUMMIOMMEMMOMOMMOMMOMMO
MESI IMMOMMO MOMMEMOMMIIMMOMMOMOMMOMMEMOOMMMOMMOMMIM EMOMMEMOMMIUMOMMEMMEMMOrnmismummommommommimmummm ONWOMOMMOIMMEMMOMMEMOMEMMEMEMENOMMOMMEMOMMEMMINI M E M I M M O MOMMOMMOMMEMOMMEMMUMMOMMEMEMEMMOOMMIIMM
I • Implappmeg • • • • • • • • • • • • • • • • • • • • • • • • • • • Es mpg UMMOMMOMMOMMEMMEMORMOMMUUMMOMMERMOMMMOOMMEm
MMOM UMW
I I MIllimmummOMMEMOMMONOMMMOOMOMMMOMMIMMI M M I MOMmel I I I W O O M M O M O M M E M M E M M O M M O M M E M M O M M O M O M M MUM OUMNIEWIMOMMUMOMMOMMIMOMMMOMMIIMMIMMUOMIIMMOMMINOM M E M E M O M M O M M I N I M M E M M E M O M M O M M O O M M E M O M M M O O OMMIIMMEM m i l i M m E M I M O M E M O M M O M M O O M M E M E E M M O M M E M M M O M M E I OMMOMMIOM mainmasts Nam mummassmaussmemmessms m m =ammo
1 • • • • • • • • • • 011•MOMMEMMOOMMOMOOMMOW1•In••••••••• mgmmommiummemammmammommgmearampams ommommem momommusimmummonsmmonmmoommo momm•smainmanommam• mosemsmisnmmimmammmssummumme mmummammipmmiumm I I I M M I I M M I M M O M M O M M O I M M U M M O M M O M I M M O M O M E M E N I M M O MMEM MOMMOOMMEMMINOMMEMOMMMEMOMM M E OM W M OmmE111 Ill•MMOM
um •Ills m • mom m 1 I 911.1161 Iii•91 m illiIIIIIII i LW
iiiiliiuiisi mommum immommummummom • mum mommmommommomm Emmummommiummummommemmommmo mommommEmmommummum miammommemamsminnitimmommmomman nammumummonsmmis i MENIOMOIMEMOMMOMMEMOMEMMEMMEMMRMOMOMMIOMME 110111.0000MM MOMMEMOMIS IMEMI IMEMO M O M 111100EMEMMIIIIMEMMIIMMEMMINIM INIMMEMII IMMEMIIMMOM M E 1110 IIMMEMEMMIOMMEMMEMEMMINEMOIM
1 E M M U M O M O M M U M M I I M MEMOOMMUM MOOMMOMMEMMOMOMMEMEMME IIMMOMMIONMEOM S E M M E M • MMOMMMOMM MO WM=
MOMMMOMMOOMME ROMMOMMOM M E T MEM MOM MEIMMIIMOMMM O M M E M M M O M M O M M E M O M M M O M O M M M 0 MMOMMEMMEMME§MMIIMME M O M M O M M M O M M O M W O O M M M E M M I MO 0011MMOKOMMEM§§MEMOMMI M E
MEMOMMOMMEMEMMOMMOMMETINIMEMOMMOOMMEMENIMMMOEM
M N • MOMMOMM MEMOMMEMOMM MMINIMEMEMOMEMMOMEMMOINIMM
..4 b'•
• mum m o m mmommommummism mummummommemm N g
I U u I I I u u u I I I u I u I U u u I I I I U I I I u U u u u I u I I U l i ! ! I u I b . mmmommommommommommsnmssamommomommrnmimmum
0 20
PERCENTAGE OF
OR GREATER
40 60
TIME FLOW WAS
THAN INDICATED
80
EQUAL TO
VALUE
FLOW DURATION CURVE FOR MONGARLOWE RIVER AT MARLOWE
100

170 FIGURE 22
0
U-
360
320
280
200
160
120
80
40
MEMMEMEMMOMMOMMOMMEMM M E M MMEMMOMMUMMINIMEMOMM IIMMOMMMOMMOMMOMMOMMOMMINIMOMMOMMMEMOMOMOMMMOMMI MMEMMOOMMOMMOMMOEMMMOMOMMOMOMMOOMMOMMOMMOMOMMMOMMII MOOMMOMMENOMOMMMOEMOMMMOMMOMMEMEMOMMEMMOMMEMEMMEM sommummolm•mplimmEMMOMMEMOMMINIMMENNIMMOMMMOMMEMO MEMOMOMMIE0 IMMEMOMMOMMOMMEMOMMOTOMOMMIMOMMOMMO MMOIMMOMM MEMOMEMEMEMMOMMMEMMEM OMMUMEMMEMMEEM OMMINIMME iii • mu I milIMMINIMMOMMOMME MMOMOMMEME OEM
SEM I E E E = MESIMMEMO IMMEMMEMMUMEMOM M I • II WO MMOMmilmel l mmOmuMEMMINIEMOMMEMOMMOMMEMMOMMOMMIMMOMO minimilmOMMII.MOMMOMMOMMEMOMMOMOMMWOMMOMMIMMOMM=
11 MOS m MallummilOmMERMEMMINIMMEMOMMUIMMEMOMEMOMMEMEM
M MOMmommOMMOMMEMMINIMMOMMEMOMMOMOOMMOMMOMME • II • MMEMOMMOOMOMMEMEMEMMOOM MOO=
1 n 1 1 1 1 1 1 1 1 1 MOMMEMOMMOMMEMOMMEMMOOMMEmm
MMOI IMMEM OMIIMMOMMEMMOMMOMMEMOMMEOMMOMOM AIN MEMEMEEEMEEEEMEEEMEEEEE
Min 1 11111 11111111111111111111111 Ili 111.1111 11111 I ! I I I •1111111111111111111
1 E M T MEMEMEMEMEMEEMEME MIME 111 1
I I I 1111111111111 1 .11111.
. . . . . . . . . . ...I..
I& mum: I I I I . I 111111 1 I I I I I I I I I LAI M E M O MOOMME M • M MOM OM•MO ME OM ••iiuu•uuuuiuuuuuuuuuiu•uuusu•uuuuus •
I M O = g • • mgmel 1 • I A N mem is m m m EE ME EEM
MIE PEEM
• ME EMMO E E • U M W = M EMI 1111:111111111:
IIMIAUMMOOMMO M E M M O M E M E M M E M M • m u M M M E M M O M • • ••MEM MMEHMEMMEMOMMEMMEMOMINIMMOOMMEMOMEMMOMMINOMMOMMMOOMM MEMMEMEMOMMINIM • M I N = ONMEMMEMMEMMEMMMUMMINIMMI
MEMEEMEM MO • M E M O M O M OMOMMO
IIIMMEHMEMM MOIMM MOM gm mmmgmmiummommommgmmemmg g minsmommEgimmommommummommumgmlimmummommosommom MMURIMMOOMMEMMEMOMMIMEMMEMOMMINIMMEMMMMOMMMOMMMEMM MMEMMOMMOMMMMOMMEMOMMOMMMOMMEMEMMOOMMOMMMOMMOMMOMM EMMUMMEMMOOMMOOMMOMMINIMMEMMEMOOMMEMOMMINOMOMMEMMEM MMOMMVOMMMOMOMMOMM MOM MEMEMMOMOMEMMIIMMOMMEMOMEM
WOMMIIMM MOOMMOM = O M MEMMIIMME MOOMMEMMMOMMOOMMEMIM
mimmumWommummumm mummem mmommummommum mom
mummemmism
M O M = MOIMMEMOSOPOOMMOIMMEMOMMEMMOMMOMMMOMM MOM MMOOm U r n
MMEMMOMMOM IIMMOMMOMOMMEMM 0
0 20
PERCENTAGE OF
OR GREATER
40 60
TIME FLOW WAS
THAN INDICATED
80
EQUAL TO
VALUE
FLOW DURATION CURVE FOR CORANG RIVER AT HOCKEYS
100

171 FIGURE 23
180
160
140
100
80
60
0 MOON•MMEIMMEMEMNOMONOMMEMMOMOMMINOMMEMMEMEMOMMEMMO MEMMEMMEMEMEMOMOWOMIMMOM MIMMOMMOOMMINIMMOM • MEM
4 0
M I M I I M M O u ME ommmlommmImim • mmommoimm • MINISMAMMINIMMOMMIMM M O M IMMO M MEMMOMMEMMIN MOO= I I M M I M U M M O M O M M I I I I M M O M = MOMINOMOMMIOMMOOMMEMEMEM OMMOMMIMMEM = M U • M M I N I M M O O M MEMMEMEMMEMEM • • • • • • M m E f f i MEMMEMIONEMMOIMMIN MINISMOMOMMOMM S O M O M M O T E I I • OMMOOMMOMMIIMMOMMTOMMEMOMEMOMER MEMOMIIIMM f I IM•IMOMMOMMMOMMEMOMO IMMUSOMMOMMEMM MMOMMWMO•• MMOMMINIMMEMMOMMEM EMEM MOMMINIMMIIM
oommommimgsmouggomemmommmommommomm mommomm noon = m o m mmommommmmloommoommommmommommommormom m o m = Egg mgommommm• mmolglimommommmomommmommummommmmmommmemmomismoomm
mommimmmommolmomommommournmmommommommemgmmommom H IIMEMMUMMINIMMEMMEMOMMOMMOMMOMOMMIMMEMMO 11 MOMMOMMOMMEMOOMMINIMOMMMOMM MOM=
I IAN maiiiiiiiiiiiiiiiiiiiiiiiiiiiiii I I 1111"441111111119191111111' 11111111 II I I, IIIIIIIIIIIIIIIIIIIIIIIIIIIII 411111 • 1111 IIIMMEMEMMOMMEMO • • MEM O
I I •011 M•M I 1 I I I . OMOMMOMM • II I
I I M I I I I I M S I M M O M I M M E M ME 1 1 1 1 4 1 1 1 1 I I I
M E M M I L M E M M I E M M I
M I +MN
V I I I " 1 1 i l 01111111111111111111111.11111111
• • I • • MEMO
• I =ME
MOMMEMMOM I M E I ME ME OMMOMMO M E M O = =MEM I I I M E M M E M E M I E MEMMEMMEMMOMEMEMEMEMMIMMEMMUMMEM M I M S I M A M M I ME • = O M INIMMOMMM MONO=
..uuurn••iu•u•urn IIMMIUMMEM M E M MEMOMMEMMOMME M • • M E M OM MEMMOMMEMMEMEM
MMUMMMMIIMMOMMMEMMOIMMOMMMOMMENOWIMMOOM MEMOMMOMM M I M E W M ME ME MEMOMMMEMOMMIMM MMOMMIROMMEM M E M • W • MO W O M E N • 111 MMEMMOMO
= i m p mom m i m u m s 0 0 1 • M E M O mommIlmmommmommo mom T o m • Llsommomms ommimmommumommimmogmmummo mom•• ms m m•suommommom mommimmommummomommommmEgom sommmi moymmiummom mmomommommom mommomoommmo
20
0
a. MEMMOMOMMOMM MMOMMOMMOWIMM = E M M E N = M O OM
auulunhuuulnhlllullulHllh:ululullHlluuulullu MMINIMMOMIMEMMOMMEMEMOMME MEMMOgOMMEMMINIMMOMMEMEM
mons immommummommommmommiammommommemmm mommommomminsmimmummummulgsmommommom - 4 4 4 1 1 M
is- 0 20
PERCENTAGE OF
OR GREATER
40 60 80
TIME FLOW WAS EQUAL TO
THAN INDICATED VALUE
100
FLOW DURATION CURVE FOR ENDRICK RIVER AT NOWRA ROAD

172 FIGURE 24
900
800
700
600 uJ
500
z 400
300
0
200
100
.111111 mill 'Ili mulp.olk• ... .•.. .. .. .. mum• 11111111111111111111111
I +IIIIII1.1111111111111111111111111111
1 .111111111111111.1111111111 .1111111111111111111111111111 MOMMOOMO MEMOOMMOMMEM • OEM
U . 1 M I R A E M I I pli
11111111111111111111111 OM-M- 11 MIME I I I I I I I I I I I I I I I I I I I I I I I I 11111
1 I I I I I I I I I I I 1 I I I . 1 ' IMO
' 111111111111111 ' 1 UMW
i l l 11
OMMIN 1
1
11 1111111111 I I I III
• • I I • • 'II"' plimm limos mum •••••mm• pm pm I•mom
I
s o m s Nom MIIIMMON111 1 1 1 1 1 1 1 1 1
1 1 1 1
11111111111111111111111111!!!I!I!
1 1 1 1 1 1 1 1
M
11111111111111111111116111111111111
I N 1 M
1 1 1 1 1 1 1 1 1 4 1 1 .
1 1 1 11119.11.11111"111 I • M 1
1411111
I
Mill k 11111 111111111.1 1111111:1111411:11! 111111 II I I I IT iill Ili! *ill il hill iiii .. • .. I.. mi. .1 . . ............ .... moimmp mom 1 1 IIIIIIAMmig 1
1111.11 almilliiiiiiiiIIIIIIII I
11111111 r, I I m u m I v mu
M i l l i 1 11 IIIIIIIIIIIIIIIII
m u m mil mom mom•me•m v•mom • • • um pm m I I I I m m o • • • m• mum 11111 II 101111 IIII Iloilo IIIIIIIIIIIIIII 1 milm I I 1 a s s o m m. p op mom m• mumppomm • •
i• on =Ism•m 1 M i l IIIIINImmil iiiiiiii Mill I
I I 11111011111111 III 111111111111111111
lb-miam m imm mm imm
I I
1111111111111111111111 /11111181811.11 millial
• • mom mi no U moompsommomm pm. mom Imo m u m m o m • M ME OEM maINO gme Mill
j
t 1
0 20 80
PERCENTAGE OF TIME FLOW WAS EQUAL TO
OR GREATER THAN INDICATED VALUE
40 60 100
FLOW DURATION CURVE FUR KANG4K10 RIVER AT KANGAROO VALLEY

900
173 FIGURE 25
800
700
(f) 600
c.)
500
— 400
300
U- 200
100
SUNNI M r s & •mm I °W11191 mml MIIIII: 111114.01 1111011 IMIIIIIIIIIIIIIIIIIIIIIIIIIIII 11111111 • SOMA M I MN ONOMMON mIN SO MINI 1IN m NM miliNEMONNO. 0 MIMI 111111 1111111111111111111111111111 dill
MOMS IE SOMI REMIIIROMENOMEMEMMEMEMIEMMEMON11... 1 . . I: I l l i Ilemid
IIIIIIIIIIIIIIIIIIEIIIIIIMI A I 11111
II MEMMIENEMENNEMEM MONSOON NOM I I : INOMMOMINOMMOISION MEMNON'S IMO I . INNINIMMONONNOMMINMENIENONMONs SS 111111114 1111111111111111111111111111... MM MIAMI I I I a l l i i i i i i i i i i i i i i l l i i i
INI
ME
111111i
1111111111 M 1 111111111111111111111 MITA I 111E117 I I I
I II 11101111
I I I
1 I l i I MI I
11
l u l l " j
II 11 1111111111
111111 I
1. 11
NMENNEEMEETINE MONNENNEINIM I MON ROBISON MENNE 1111111111111111 111111111111111111111111111111111
I ..........11 . . . =mom . . . . . . EMOMEMENNIMEMN MEEMMEMENOR El NM MMEMMOMM NONE•MUM EMEMEENNE MIME MEMENEENNORMOMME NOMMOMMOINEMEINNENNEMOMMIN MONO :11111111111VIIIIIIIIIIIIIIIIIIIIIIIIIIIIIIIIIIIIIII MINIMUMS MUM NENE M VINEINS MENNE ME MEMO NOMMONNOMOMON MO MONEMOMMENI MOOMMENOMMONONNON NOMMONOMMOMMHONOMMONNOMMOSIMM NOMMIIMMOMMOMMONME MOMEMENSIMENOWENNIMMENNEMMEN Il INEEMMEMONENMENNEIME MMOMMOOMMOMOSINOMMOOMMIIIM IS MIIIMIIMMONINOMMEMO IMMEMENNIMMiNVONNOMENNO V I EE OM ESOMMIIMMNION 111111111111141111111111 1 1 I I 11 111111111111
I
UNIONISM NEM, MENNEN MEMO MIE MOMENVEMOMMOOmm MEMENENNINOMMMUNINMENENNIN • II MONNOMMONNOMINNOMME 111111111111111N1111111111 I 1E1111111111111111111 I
. . . . . . . . . . . . . . . " . . . . . . . 1..m.. . . ............ . . . . . . . . . . . . . . .w. mum.. .1..§........m....... .............m..R1 . . . . . . . 1 gmEgLoggimplimmlimml 11111111111111111121111111 r i 1 I I 11 .................m......m. mmilimil milli .........1 ...N....g..... 1 . . 1................. ............m.......0....1 • . . ....1............1 m m o m m u m m o m m u m m g m a m m mimmommimmimmummommom mingsmomminimmommommom onimmompsmommommummain mlumMOMMOmmommummilOOMOmmommommimOMMOSOMomm m m i n i g m m i n n e r n m m o m m i n u m 0 W m g m o m m i m i l ROMMINOMme
umpummuniuniiddsompi minim li ...........................„.......... .......... ..... ............................. MOM= IMMO NOMMOSOMMONMENNOMMENNOMONINVIONNEOMMENNOMMINEINSON MOMMEEMONSENNEMENINEMONMSONMEMEONONIMMONOMMOMMO INSOMMMEMEMINIMMONNEMENOMMOMMIONEMMEMIIMIUMNEMENEME mmiumminommummummummimmumgmmummummasimmomm mimmummomommummmaimmommoimmommumisminsm immmemommommummummummom mossimmumummommomms mommimmomm m u m m u m mimmommumm m o m mime
.. 0 20
PERCENTAGE OF
OR GREATER
4 0 60
TIME • FLOW WAS EQUAL TO
THAN INDICATED VALUE
80 100
FlpW DURATION CURVE FOR SHCIALIHAM RIVER AT WELCOME REEF

174 FIGURE 26
4 . 5 mommoommommemmum mmemmemmmemmummoommommommgmmomm mommummummmommemommommunimmegmemmommemmemmommmmom memmommommmommmmumgmmommommmommempmgmmommmmommomm mummimmmmimmogimmemmmmmemmmommmommommummempmmommm mommommom Emma gmmummommommemmemmommmemmommommemmom IIIIMMOAMOM MIMMO EMMOOMOMMOMMIIIMOOMMEMOMMOMIIMMOMMOIMME MEMIIMSEM MMEMIOMMIIMMOSOMOMMMOMMOMMOMOMOMMOMMOOMM I M O MEM 011 EMINIEMOMMEMMEMMIUMMOOmmINIMMOMMIIMMOMME
4.0
3.5
ce
• limOMMMEEMMOSMINIMMEMMINIMOMMIIMMMOMMMOOMMOOMMOOMMO • i l i u m uuuaii•aauu•a•su•m•uauuuuuumumuusmmumau•uuumu
• I I•I N I M B I OM MO MOMMIIMEMOMMOMMEMMEMMOMMOMOSIII 11111111MME MI m EM M E O W MEMMEMMOMMOMMEMMOM IIIMMEMM
111111p11 I OM MU MEM OH mm11111 ME
W M II
OMMEMOOMMIMMO110111 EMMONS MMOMMOMMEMOMEMOMMOMMIIMmln IMMO=
OffilIMMOMMMEMMOMONIMMOM um • Ern= OM MOMMOMMEMM OM •
mime. wommill • • I 1 11 I 11111.113 3 I m o m , 11
111.1 11 al m
i iiiIIIIIIII II I I 1 II IIIIIIII 1••._•• 1 T o _ JIIIIII i n • elm • • • mim•••• 11011.11:10 I
1 1 MOMIMMIIM MOMMIMM
0 pm • • m • mom ui I I I
• • IIIi ,a • U.. 11 • um.
A MEM111211111 A p 11 p mmm nommil im n g mmmommommommom 2 mEMOMAMMMIPMEm Ms 111111MMINIMMIIIMMUM m MOMMIIMMIIMMOMMO
2•0 UII•1IIIIIUUUUUUUIUUU!dI•IIUIIUIUUUUUIUIUIIIUIUUU•I MMAIMMIMMITAMMOMME MORFUMUTITO/MOMMOOMMOMMOMMMINIMM
1
0 0.5
0
1 A M1111111111141WIMMI r M O M O M M O 0 II MOW•MOMOMMEMMEMEM 11111111MIMMEMIVEMOM A EMOMMEMEIMUMBINNEMMMEMMOMOMMIIIMME 11111311111111=1111=111211 MOMMURrimimn TNOMMIIMMOMMOMMIIMMEM 011110UOIMMOOMMMAMM•MMINIMONMIIMMI•IIIMMOMOMMEMMEMOMMOMO
11111
I MOILIMIWAO 111,1611111§11 MIIIIRMIIINWIFOUGPMFOOMMEMMOMMEMO MMOMMMIV 1W/MEMEM • MIPMMEM
MOM?T 011111I SOMMOMMEMM
IIMMEW I I y r M N p' U M 1111 • OM EM MO=
ti i m mummsrim am mAimmismairlimp-a wrmomprommums m m o m m a m i mgmmm gm Iggmppmmememmommmmomp mgmmimmm mmmimmmammummwAmpg mmia4p/17RWIEHTENRMIlm MI•IIMOOMM O M M I N V I I I I M E M M I I 2 O M m i
M O O M I M I I M M O M 1 OMMMOROONIMMEMEM
IIIMMHOMEMIIIMMWMMOMMOMIMINIMOIMMEMM MMIIMEMEMMINIMMEMO MMIIIIII IMMORMEEMEMOMMINEMEMEMOMMOM MOMMOMMOMMEMMEMM MMENEHOMMIIRMOIMOMMINVIMMOMUMNFIVICAMMIIMEMEMMOIMOMM IIIMMOMIIMMOVMMOMMOMEIMOMOIIMMIMIUMMOMMEMM 1IuIIHTOT I ' r
: I
I I : M I I I M I N I A L I A M M I L I U O M M O M E M O M M E M IMMO
M O M M W M U M M I M M E M E M W M O I N O M M E M I M M U M M O M • MEM. 1 1 8 1 1 1 1 1 1 1 1 1 1 1 , 1 1 1 1 1 1 1 6 1 1 1 1 1 1 1 1 1 1 1 1 1 . 1 1 1 1 1 1 1 1 1 1
!I
• um•ma•w m u m IIIMEMENOMM MO =MEM I I I I I1I I I I I I INm N g . 6 flhIHhIIIIIIIII MEM MOMMENMMOOMMMOLZIOMMOMM MOMMOMINNOMMMOOMMOMMOMM MEMOMMOMIMMEMPIIIMOM167.11111111MMOMOMMOIMIKOMMIUMMOMMOMO MOMMEMMEMMEUMWIIMEMOW7.4110MMOMMOMEMENSMIBMOMMOMMIIM IIMMEMINIIMEMMOMIONEOWPOMMEMOMMEMEMIIMOMMECOMMMEMMOMM M O W N I I M M I Z N I l b r I I I I I I I I 1 1 1 1 1 1 1 0 1 1 M 1 1 1 1 1 1 b : I I I I I M M E IIIII
111 . . . 4 i -114. u m . . m - U . . m o m = m m e m ammo mm . . , t _ -_ - -_ .
_ ___...ea...4 0 20
PERCENTAGE OF OR GREATER
40 60 80
TIME FLOW WAS EQUAL TO THAN INDICATED VALUE
FLOW DURATION CURVES FOO SHOALHAVEN VALLEY
100
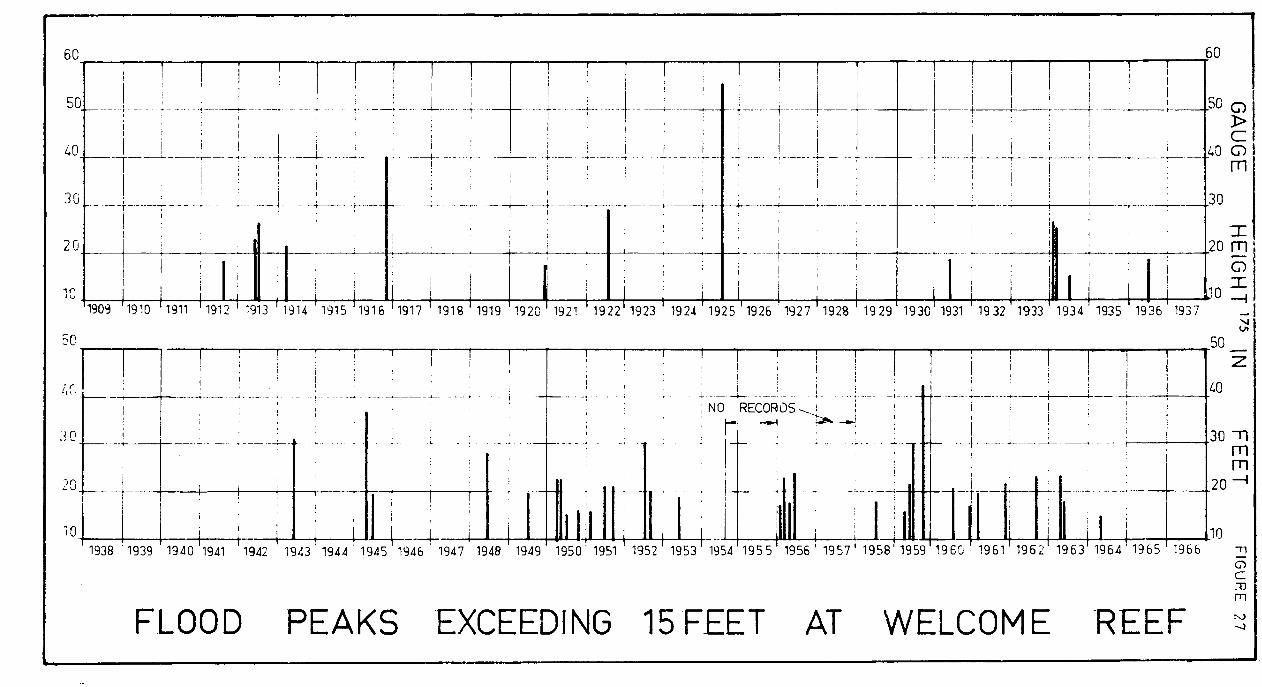
60 60
50 50
40
3
20
4-
1909 1910 1911 1912 1913
Be
--f-
30
20 71
00 914 1915 191 6
11917
1918 1919 1920 1921 19 22 19 23 19 24 192 5 19 26 1927 1928 19 29 19 30 1931 19 32 1933 1934 1935 1936 193 7
50
3 C.' 1
10
H H
f I I I I
11 1 I ?f,3
1938 1939 1940 1941 1942 1943 194 4 1945 1946 194 7 1948 1949 195 0 1951
1
; NO RECORDS ,
II 1952 1953 1954 1955 1956' 1957 1958 1959 1960 1961 1962 1963 1964 1965 1966 -n
FLOOD PEAKS EXCEEDING 15 FEET AT WELCOME REEF
30 71 Frl
20
10

176 FIGURE 28
0 0 0 0 co 0 — C‘l CO Ch 01 Ch — — — —
80
60
40
20
0 I')
0 an 0)
Average Annual Rainfall= 39-679
NOWRA 0 0 0 0 0 cv el mt in co cn cn cp cn cn
—
110
60 Ui
4 0 z
20 Z
00 z(-)
uJ
80
60<
ANNUAL RAINFALLS AT
ROBERTSON AND NOWRA
RAINFALL
40
20
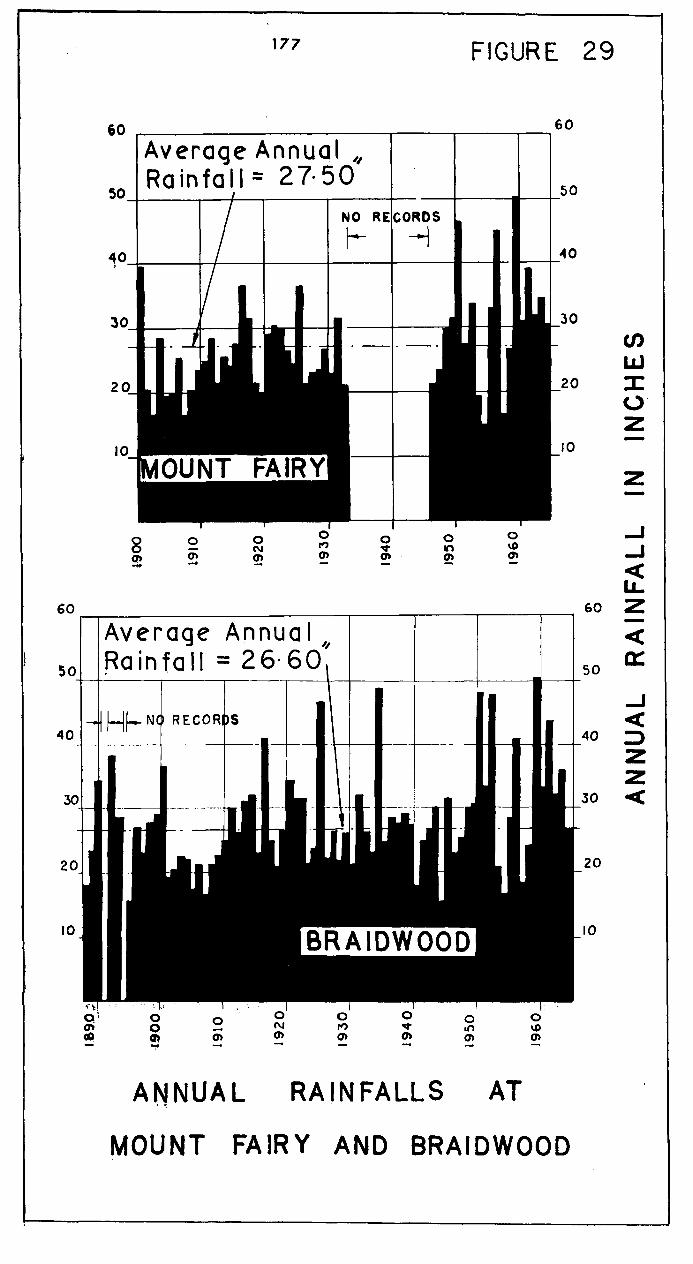
177 FIGURE 29
60
40
30
20
10
60
50
10
30
20
10
Average Annual „ Rainfall = 27.50
OUNT FAIRY
0
0 cft
0 CJ
0
0
0 In
In
ANNUAL RAINFALLS AT
60
50
40
30
20
10
MOUNT FAIRY AND BRAIDWOOD
IMI11•111
dct 6 0 Z
50
40
30 <
20
10

178 FIGURE 30
160
140— —L
120
(J) LiJ
IL 0 80
40-
20
-4-
• 1 - -r- - r - t ; I
—
NUMBER OF LICENSES SHOWN
TOTAL LICENSED AREA SHOWN
Ln If, 0/ 01
-t-
a.)
3200
(f)
ix
2800 <4
-240U
-2000ix Fr
Lu (r) —1200 Z
—800
Lu 4ct
CC
SHOALHAVEN RIVER VALLEY
400
0
AREA AUTHORISED FOR IRRIGATION AND
TOTAL NUMBER OF LICENSES AT 30 ' JUNE FOR EACH YEAR INDICATED

104 179 so.30
FIGURE 31
BURRIER
DEVILS BRIDGE 1 DAM SITE
WELCOME REEF PAM SITE
BRAIDWOOD
UPPER SHOALHAVEN DAM SITE
ENDRICK RIVER DAM SITE
O") c-)
ULLADULLA
NEW SOUTH WALES
WATER CONSERVATION & IRRIGATION COMMISSION
K A M A e
oCi47
SHOALHAVEN RIVER VALLEY WATER CONSERVATION DAM SITES
SCALE emus3 4 3 2 1 0 5 0 15 ICUS
t i n t N E C IIIMINII=Ole
i50°30