Untitled - State Water Resources Control Board
301
-
Upload
khangminh22 -
Category
Documents
-
view
0 -
download
0
Transcript of Untitled - State Water Resources Control Board

This report is printed with soybean inks on recycled paper certified to contain by weight not less than 10% postconsumer waste
and 40% secondary waste.
Report Authors
Michael W. Monroe-Technical Program Manager, San Francisco Estuary Project Judy Kelly-Environmental Scientist, San Francisco Bay Regional Water Quality Control Board
Nina Lisowski-Report Design
Sun Francisco Estuary Project Shfl
Amy Zimpfer, Director Liz Blair Marcia Brockbank Rachel Dagovitz Craig Denisoff Mark Flachsbart Paul Jones Judy Kelly Tim Vendlinski Billie Yarbrough Sam Ziegler
Association of Bay Area Governmerats Manugement
Revan Tranter, Executive Director
Gary Binger, Planning Director Taras Bursztynsky, Technical DirectionlEnvironmental Management
Technical Advice a d Assistance
Much of the information in this report is based on the San Francisco Estuary Project's technical documents. The authors of these documents were instrumental in compiling and analvzing data and in describing the technical asuects of the management issues.
Judy Kelly wrote the draft of Chapter 9, with input from Mike Carlin, Tom Mumley, and other staff of the San Francisco Bay Regional Water Quality Control Board.
Staff of the Association of Bay Area Governments assisted in gathering data and in preparing the.draft report for review. Emy Meiorin was extraordinarily helpful in
The California Academy of Sciences, East Bay Regional Park District, and Bruce Herbold provided various line drawings. Orj
Roger Myers. Special thanks for permission to include the drawing on page 27 to Malcolm Margolin, Michael Harney, and Heyday Books, Berkeley. Many others, especially Bob Walker, generously made available their collections of photographs.
Several members of the SFEP Technical Advisorv Committee were esueciallv helpful in
A draft of this report was submitted for review to the participants of the San Francisco -
Estuary Project. Comments by the following reviewers helped clarify the issues and added greatly to the accuracy of the final report:
Jim Arthur, Doug Ball and Ken Lentz, U.S. Bureau of Reclamation; Chuck Batts, Bay Area Dischargers Association; George Baurnli, State Water Contractors; Mary Bergen and Diana Jacobs, State Lands Commission; Randy Brown and Ed Winkler, Department of Water Resources; Michael Carlin and Tom Mumley, S.F. Bay Regional Water Quality Control Board; John Cashman, U.C. San Francisco; Steve Cochrane, Hayward Shoreline Interpretive Center; Andy Cohen; Joe Damas, East Bay Municipal Utility District; Richard Denton and Greg Gartrell, Contra Costa Water District; Bill DuBois, California Farm Bureau Federation; Arthur Feinstein, Golden Gate Audubon Society; Wolfgang Fuhs, Department of Health Services; Sally H e m and Jim Shanks, M&T Staten Ranch; Totton Heffelfinger, Sierra Club; Bruce Herbold and Alan Jassby, U.C. Davis; Perry Herrgesell, Department of Fish and Game; Ron Hudson, U.S. Navy; Roger James, Santa Clara Valley Water District; Dave Jones, San Francisco Clean Water Program; Mike Josselyn, Romberg Tiburon Centers; Marshall Lee, State Department of Food and Agriculture; Ed Long, National Oceanographic and Atmospheric Administration; John Malamut, Bay Planning Coalition; Steve McAdam, Bay Conservation and Development Commission; Jim McKevitt, U.S. Fish and Wildlife Service; Chris Mobley, National Marine Fisheries Service; Peter Morse, Sacramento County; Joe O'Connor, Aquatic Habitat Institute; Emily Renzel, City of Palo Alto; Barbara S a h a n , Marin Audubon Society; Larry Schemel, U.S. Geological Survey; Larry Soenen, Soil Conservation Service; Ted Smith, Citizen at Large; Leo Winternitz, State Water Resources Control Board; Arliss Ungar, League of Women Voters of the Bay Area; and Elizabeth Willcie. Joyce Nutall provided editorial comments.
Special thanks to Nina Lisowski, who, as with many other SFEP products, did an exceptional job on the design and layout of the final report. Nina's skill, patience, and optimism were of immeasurable value in getting this report to press.
This report was prepared as part of a cooperative effort between the Environmental Protection Agency and the Association of Bay Area Governments. It does not reflect the views of any individual agencies or organizations. The conclusions presented, and any errors that remain, are those of the authors.
For the participants and staff of the San Francisco Estuary Project who have worked so diligently in the effort to restore and maintain
the estuary's physical, chemical, and biological integrity.
vii
San Francisco Estuary Project Committees I Sponsoring Agency Committee
Daniel McGovern John C. Wise Environmental Protection Agency, Region 9 Environmental Protection Agency, Region 9
W. Don Maughan State Water Resources Control Board
Eliseo Samaniego State Water Resources Control Board
Pamela Lloyd Marion Otsea Sun Francisco Bay Regional Water Quality Control Board Sun Francisco Bay Regional Water Quality Control Board
Clifford C. Wisdom Karl Longley I Central Valley Regional Water Quality Control Board Central Valley Regional Water Quality Control Board
Management Committee
Floyd Anders Robert (Bob) Bury Pacific Coast Federation of Fishermen's Associations Vice-Mayor of Redwood City
Ed Anton State Water Resources Control Board
Supervisor A1 Aramburu Marin County
James Baetge State Water Resources Control Board
Supervisor George L. Barber Sun Joaquin County
Connie Barker Association of California Water Agencies
James R. Bybee National Marine Fisheries Service
Pete Chadwick California Department of Fish and Game
Daniel Chapin California Waterfowl Association
James C. Conwell U.S. Bureau of Reclamtion
Councilmember Rosemary Corbin Contra Costa Cities
Loretta Barsamian William H. Crooks Environmental Protection Agency, Region 9 Central Valley Regional Water Quality Control Board
Chuck Batts Bay Area Dischargers Association
John Beuttler United Anglers of California
Frank ~il leci California Waterfowl Association
Walter Bishop Bay Area Dischargers Association
Chuck Curry Sun Mateo Council of Mayors
Ralph Dradson California Striped Bass Association
William DuBois California Farm Bureau Foundation
Theodore R. Durst U.S. A m y Corp of Engineers
Jeffry Blanchfield Elva Edger Bay Conservation & Development Commission League of Women Voters, bay ~ r e a
Dan Boatwright, Jr. The Hoffman Company
Randall Brown Califonia Department of Water Resources
Arthur Feinstein Golden Gate Audubon Society
Mayor David A. Fleming, Vacaville Association of Bay Area Governments

viii
Management Committee (corzt'd)
Kassandra Fletcher Building Industry Association of Northern California
John Fraser Association of California Water Agencies
Wolfgang Fuhs CalifoPnia Department of Health Services
Audrey Goins Bay Area Council
George Gomes California Farm Bureau
Zeke Grader Pacific Coast Federation of Fisherman's Associations
Mayor Dick Green, Belrnont Sun Mateo Council of Mayors
Peter Grenell California State Coastal Conservancy
Lori Griggs Committee for Water Policy Consensus
Robert Gromm Delta Advisory Planning Council
Ken Guziak Sacramento Metropolitan Chamber of Commerce
Allen Hackett Sacramento Metropolitan Chamber of Commerce
Nori Hall The Shorelands
James Haussener Northern California Marine Parks and Harbors Association
Neil Havlik Solano County Farmlands and Open Space Foundation
Sally H e m e Delta Agricultural Interests
Totton Heffelfmger Sierra Club, Sun Francisco Bay Chapter
John Henderson Bay Planning Coalition
Henry M. Hirata Sun Joaquin County
Susan Hoffman U.S. Bureau of Reclamation
Reed Holderman California State Coastal Conservancy
Marc Holrnes Save Sun Francisco Bay Association
Roger James Santa Clara Valley Water District (BASMAA)
Paul E. Jepperson Central Valley Regional Water Quality Control Board
Lt. Colonel Larry Jinkins U.S. Army Corps of Engineers
Ellen Johnck Bay Planning Coalition
Jerry Johns State Water Resources Control Board
Greg Karras Citizens for a Better Environment
Larry Kolb Sun Francisco Bay Regional Water Quality Control Board
Michael A. Krone Bay Area League of Industrial Associations
Councilmember Bobbi Landers Contra Costa Cities
Kenneth Lentz U.S. Bureau of Reclamation
Donald Lollock Department of Fish and Game
Leonard Long Pacific Interclub Yachting AssociationlRecreatioaal Boaters of California
John Malamut Bay Planning Coalition
Steve McAdarn S.F. Bay Conservation and Development Commission
Jackie McCort Sierra Club, Sun Francisco Bay Chapter
James U. McDaniel California Department of Water Resources
James J. McKevitt U.S. Fish and Wildlife Service
Sunne Wright McPeak Committee for Water Policy Consensus
Emy Chan Meiorin Association of Bay Area Governments
Commander Lee Michlin Naval Facilities Engineering Command
Chris Mobley National Marine Fisheries Service
Management Committee (cont'd)
Richard Morat . U.S. Fish & Wildlife Service
Jim Sequeira City of Sacramento
Tom Mumley Harry Seraydarian San Francisco Bay Regional Water Quality Control Board Environmental Protection Agency, Region 9
Barry Nelson James Shanks .Tnvp .Tnn Frnnrisrn Rav Association Delta Farm Interests I Richard Oba Jay R. Sorensen I United Anglers of California California Striped Bass Assocation
Alan Pendleton Herbert Stone S.F. Bay Conservation and Development Commission Bay Area League of Industrial Associations
Walter Pettit State Water Resources Control Board
Ray Thompson Sacramento Metropolitan Chamber of Commerce
Michele Pla' San Francisco Clean Water Program
Lt. Commander Scott Tieman U.S. Coast Guard
Robert G. Potter California Department of Water Resources
Arliss Ungar League of Women Voters, Bay Area
Alan Ramo Herbert W. Von Colditz Citizens for a Better Environment Pacific Interclub Yachting AssociationfRecreational
Boaters of California Liza Riddle California State Coastal Conservancy Henry Voss
California Department of Food and Agriculture Steve Ritchie San Francisco Bay Regional Water Qlkality Control Board
Captain Thomas H. Robinson U.S. Coast Guard
Peter A. Rogers California Department of Health Services
Mayor Anne Rudin City of Sacramento
Shelley Sack BASMAA, Alameda County
Barbara Salzman Marin Audubon Society
Tom Wakeman U.S. Army Corps of Engineers
Supervisor Doris Ward Board of Supervisors, City and County of San Francisco
Mary-Ann Warmerdam California Farm Bureau Federation
Pete Williams Bay Area Council
Councilmember Terri Williamson City of Pleasant Hill, Contra Costa Cities
A. J . Yates California Department of Food and Agriculture
Public Advisory Committee
K. C. Bishop Pacific Industrial Business Association
Philip Bowles Bowles Farming
William Boland Betty Brickson California Marine Affairs and Navigation Conference Water Education Foundation
William Booth California State Grange
Ken Burger East Bay Regional Park District
Roberta Borgonova Supervisor Edward Campbell San Francisco Planning and Urban Research Association Alameda County
Pub@ Advisory Committee (cont'd)
Hal Candee Natural Resources Defense Council
Supervisor Ernie Carpenter Sonorna County
Steve Cochrane Hayward Shoreline Interpretive Center
Supervisor Illa Collin Sacramento County
Betty Croly Alameda County Planning Department
Supervisor George DeMars Yolo County
George Dupray California State Grange
Larry Edginton Plumbers and Steamfiners Union, Local 467
Supervisor Anna G. Eshoo Sun Mateo County
Douglas Fraleigh Sacramento County
Bill Gardner California Natural Resources Federation
Ernie Goitein Peninsula Conservation Center Foundation
Diane Kelly California Association of Port Authorities
Luana Kiger Soil Conservation Service
Rodney Kilcoyne Council of Bay Area Resource Conservation Districts
Councilmember Liz Kniss City of Palo Alto
Clifford Koster California Association ofResource Conservation Districts
Robert Langner California Marine and N~vigation Conference
Mem Levin San Mateo County
Beth Levine Golden State Wildlife Federation
Margaret Lewis Citizens Committee to Complete the Refuge
Kathy Mannion Western Growers Association
John McMahon Operating Engineers. Local #3
Frances McTamaney Sun Francisco Bay National Wildlife Refuge
Betty Harris Judith Moorad California Association of Resource Conservation Districts Western Oil and Gas Association
Jim Haussener Trish Mulvey Northern California Marine and Harbors Association Citizens Committee to Complete the Refuge
Bruce Heyer Ocean Alliance
Debbie Mytels Peninsula Conservation Center Foundation
Nancy Hornor Golden Gate National Recreation Area
Richard L. Hubbard California Natural Resources Federation
Thomas Hunter Plumbers and Steamfitters Union, Local 467
Richard Izrnirian Federation of Fly Fishers
Councilmember Linda J. Jeffrey City of Dublin
Doug Nadeu Golden Gate National Recreation Area
Mayor Marilyn O'Rourke Cit>, of Benicia
Elizabeth Patterson State L~nds Commission
Robert Rabb San Francisco Planning and Urban Research Association
Elbert Reed Council of Bay Area Resource Conservation Districts
Public Advisory Committee (cont'd)
Councilmember Emily Renzel
Y City of Palo Alto
Ted Smith Citizen At Lurge
A. L. Riley Golden State Wildlife Federation
John Steiner San Francisco Bay National Wildlife Refuge
Thomas Rinn State Water Contractors
Supervisor Jan Stewart Solano County
I Jane Rogers M. K. Veloz San Francisco Foundation Northern California M brine Association
Gene Roh City of West Sacramento
Martin Vitz East Bay Regional Park Districl
Suzanne Royce Charles Warren
1 Dolphin Swim and Boating Club State Lands Commissic
Patrick Ryan Port of Oakland
Sandy Waterhouse Solano County
Art Santos Jeremy West Plumbers and SteamJitters Union, Local 467 Dolphin Swim and Boanng ~ l u o
Sharon Whaley San Jose Water Compc
Rita Schmidt-Sudman Water Education Foundation
David Wheeler David Schuster Northern California Marine Association State Water Contractors
Steven Sharpe Sonoma County
Scott Yo0 Sun Jose Chamber of Commerce
1 Kevin Shea East Bay Regional Park District
Technical Advisory Committee
Susan Anderson Shelley Clarke San Francisco Bay Regional Water Quality Control Board US. Environmental Protection Agency, Region 9
William Angeloni U.S. Armv Corns o f Enaineers
Andrew Cohen University of California
James Arthur U.S. Bureau of Reclamation
Patrick Cotter U.S. Environmental Protection Agency, Region 9
Donald Crosby University of California, Berkeley
Doug Ball U.S. Bureau of Reclamation
Richard Denton Contra Costa Water District
Randall Brown California Department of Water Resources
Michael Carlin Wolfgang Fuhs San Francisco Bay Regional Water Quality Control Board California D e p a m n t of Health Services
John Cashman University of California, Sun Francisco
Greg Gartrell Contra Costa Water District
Dustin Chivers California Academy of Sciences
Terrence Gosliner California Academy of Sciences
xii
--
Technical Advisory Committee (cont'd)
Andy Gunther Joe O'Comor Aquatic Habitat Institute Aquatic Habitat Institute
John Harte Steve Obrebski University of California. Berkeley San Francisco State University, Romberg Tiburon Center
Tom Harvey Gary Page U.S. Fish and Wildlife Service Point Reyes Bird Observatory
Perry Herrgesell David Peterson California Department of Fish and Game U.S. Geological Survey
Michael Herz Gerald Pollock The Baykeeper California Department of Health Services
James Hollibaugh Tom Powell San Francisco State University, Romberg Tiburon Centers University of California, Davis
Roger Hothem Robert Riseborough U.S. Fish & Wildlife Service University of California, Santa Cruz
Michael Josselyn Michael Rugg San Francisco State University, Romberg Tiburon Centers California Department of Fish and Game
Jeff Koseff Larry Scheme1 Stanford University U.S. Geological Survey
Marshall Lee Steve Schwarzbach California Department of Food and Agriculture U.S. Fish & Wildlife Service
Robb Leidy Larry Smith U.S. Environmental Protection Agency, Region 9 U.S. Geological Survey
Samuel Luoma Robert Spies U.S. Geological Survey Lawrence Livermore National Laboratory
Bruce MacFarlane Tom Tamblyn National Marine Fisheries Service State Water Resources Control Board
Richard McMillan Tom Wakeman
Brian Melzian U.S. Army Corps of Engineers
U.S. Environmental Protection Agency, Region 9 Jeanette Whipple
Steve Monismith National Marine Fisheries Service
Stanford University Ed Winkler
Richard Morat California Department of Water Resources
U.S. Fish & Wildlife Service Leo Wintemitz
Tom Mumley State Water Resources Control Board
San Francisco Bay Regional Water Quality Control Board David Young
Frederic Nichols U.S. Environmental Protection Agency
U.S. Geological Survey
Preface
During the pastfifty years, United States coasts have uiuiergone an astonishing tran$onnation. Once regions of clean water and biological resources in seemingly endless abundance, today coastal bays, sounds, and rivers exhibit m y signs of stress. These signs, such as diminished natural habitats, declining populations ofjish and wild& , and contaminated water and sediments, are widespread and reflect the way in which coastal waters and their watersheds have been developed and managed. Un1essfutUp.e development and management of these areas are improved, these signs of stress will likely become even m e severe and widespread.
In the spring of 1986, the Regional Administrator of the U.S. Environmental Protection Agency's (EPA) oflce in San Francisco recognized a need to give more attention to the many environmental problems of San Francisco Bay and the Sacramento-San Joaquin Delta. Elected oflcials, along with representatives of industry, agriculture, environmental groups, user organizations, and government agencies were called together to begin addressing these problems. ln an @art then known as the Bay-Delta Project, the Brst steps were taken toward the ulti- mate goal of developing a plan that would seek to resolve the most important problems facing the BaylDelta estuary.
In 1987, recognizing the national scope in problems of coastal water quality and living resources, the United States Congress amended the federal Clean Water Act. Section 320 of the Act (Appendix 1) established the National Estuary Program. Administered by the Environmental Protection Agency, the National Estuary Program provides $60 million in federal funding over a five-year period for developing comprehensive plans to address the environmental problems facing the Nation's most signBcant bays, sounds, and harbors.
As provided by Section 320 of the Clean Water Act, the Governor of California nominated San Francisco Bay and the Sacramento-San Joaquin Delta for inclusion in the National Estuary Program. In response, the Administrator of EPA fonnally convened a Management Conference of the San Francisco Estuary Project in April, 1988. This Conference included the original members of the Bay-Delta Project and carried forward the &ort they began. It is one of 17 inanagemt conferences currently supported by the Natoml Estuary Program.
The San Francisco Estuary Project Management Conference comprises four committees. These committees and their respective responsibilities are the Sponsor- ing Agency Committee-overall policy guidance; Management Committee--project direction, planning, and budget decisions; Public Advisory Committevublic outreach and education; and Technical Advisory Committedechnical accuracy and feasibility of products and recommendations.
The San Francisco Estuary Project has until November, 1992 to develop a Comprehensive Conservation and Management Plan for the BaylDelta estuary.
xiv State of the Estuary
The plan will identify the actions necessary to restore and maintain the estuary's chemical, physical, and biological integrity.
During the process of developing a Comprehensive Conservation and Manage- ment Plan, Estuary Project participants will seek to achieve several goals:
I. Develop a comprehensive understanding of environmental and public health values attributable to the Bay and Delta and how these values interact with social and economic factors.
2. Achieve efective, united, and ongoing management of the Bay and Delta.
3. Develop a Comprehensive Conservation and Management Plan to restore and maintain the chemical, physical, and biological integrity of the Bay and Delta. The plan shall restore and maintain adequate water quality and a balanced indigenous population of shel@sh,fish, and wildlife. It also shall restore and maintain recreational activities and assure that the beneficial uses of the Bay and Delta are protected.
4. Recommend priority corrective actions and compliance schedules addressing point and aon-point sources of pollution. These recommendations will include short- and long-term components based on the best scientijic infor- mation available.
During the first year of the Estuary Project, Management Conference members identifiedfive key management issues which they believe the Comprehensive Conservation and Management Plan must address if the Project's goals are to be reached. The management issues are described in Chapter 1 of this report. Subsequently, Management Conference members formed several subcommittees to begin exploring the technical and regulatory aspects of the issues. Subcom- mittee members are listed in Appendix 2.
To summarize information on the management issues and their causes and to lay the groundwork for addressing the issues, the Estuary Project has prepared several technical reports. Subcommittee members designed the scopes of these reports and reviewed numerous drafts; as a result, the reports, to a large extent, reflect the interests and concerns of the subcornittee members. Some reports have been completed and others will be finished later this year.
The Estuary Project's Comprehensive Conservation and Management Plan is scheduled to be completed by November, 1992. Prior to that date, a dr@ plan will be presented to the public for review and comment. The fiaal plan will be submitted to the Governor and the EPA Administrator for approval. Once signed, the plan should begin to be implemented imdiately by local, state, and federal agencies. EPA and the State of California will monitor plan implementation and the resulting environmental improvements. If the plan's objectives are not being met, or if the plan needs strengthening, the Management Conference may be reconvened to take appropriate action. In this way, the Estuary Project Management Conference may continue to seek improvements for the estuary well into the future.
This report describes the existing state of the BaylDelta estuary and hav the estuary is influenced by local and regional activities. It is based primarily on the Estuary Project's technical reports. It begins with an introduction on the impor- tance of estuaries and compares management issues in the Bay and Delta to those of other estuaries in the National Estuary Program. The subsequent chapters describe some of the BaylDelta estuary's physical characteristics; its development
and uses by humans; and the status and trends of its habitats, fish, and wildlife. There also are chapters on wetlands, freshwater flows, pollutants, and dredging and waterway mod@cation. A chapter on research and monitoring reviews efforts to develop better technical information and uaderstanding of the estuary and its processes. A brieffinal chapter presents some general conclusions and reinforces the need for Esmry Project participants to develop comprehensive and integrated actions to address the Jive management issues.
As part of implementing the Comprehensive Conservation and Management Plan, this report will be updated biennially. Future State of the Estuary reports will evaluate the effectiveness of the Comprehensive Conservation and Manage- ment Plan and will identiJj, any additional actions needed to meet its goals.
Finally, a note on the units of measurement used in this report: This report is based on many documents, some using metric units and others using U.S. customary units. The particular units used vary according to the topic; for ex- ample, information on dredging is most commonly presented in U.S. customary units, while pollutant data is usually expressed in metric units. To make the information in this report understandable to non-scientists and to avoid exten- sive data conversions, U.S. customary units are used as much as possible. In instances where metric units are displayed, the reader may wish to refer to the conversion table on the inside of the back cover.
Preface xu
Contents
Credits 2ii
San Francisco Estuary Project Committees vu
Preface ~ U Z
List of Figures x x ~ ~
List of Tables xn,
Summary s-I
1 Introduction I
Values of Estuaries I
Threats to Estuaries 2
Consequences of Change in the BaylDelta EstuayThe Five Management Issues 2
Decline of Biologkd Resources Intem@ed Land Use Freshwater Diversion and Altered Flow Reginse Increased PoUutants Increased Dredging and Waterway Modfiation Interrelated Aspects of the Five Management Issues
Management of the Estuary 7
Local Government Regbnal Government State Government Federal Government
Boundaries of the San Francisco Estuary Project Study Area 9
2 An Overview of the BayIDelta Estuary's Physical characteristics zz
Evolution of the Estuary 12
The Estuary Today 13
C h a & WaterQua@ Tides Hydrology Sediments
&orunary 24
xvii

xviii State of the Estuary
3 Development and Uses of the BayIDelta Estuary 25
Findings 25
Important Periods of Development 26 The Estuary's Native American Inhabitants Spaniards andthe Missions Early Settlement The Gold Rush and Hydriaulic Mining The Rise of Agriculture, Land Reclamation, and Flood Control The Rise of Manufacturing Post War Urbanization
Trends in Population and Land Use 32
The Future
Indicators of Economic Development 36
Estuary-Dependent Economic Activities
Summary 42
4 The BayIDelta Estuary's Biological Resources 43
Findings 43
Life in the Estuary 45
The Estuary's Habitats and Biological Communities 46
The Estuary's Aquatic Resources 58
Phytoplankton Zooplankton Benthos Fish
The Estuary's Wildlife Resources 76 Historic Wildlife Conditions Early Causes of Historic Wildlife Declines Current Trends in the Distribution and Abundance of Wildlife Threatened and Endangered Species and Species with Declining Populations Current Factors Meeting Wildlife Populations The Future of Wildlife in the Estuary Basin
Summary 91
5 Wetlands 93
Findings 93
The Estuary's Wetlands 94
Wetland Values 95
Wetland Distribution 100
Wetland Loss and Conversion 101
Impacts of Wetland Loss 104
Future Trends 105
Wetland Acquisition, Restoration, and Enhancement
S u m r y 110

Contents xir
6 Freshwater Diversion and Altered Flow Regime zzz
Findings 111
Origin of the Estuary's Fresh Water 113
Variable Precipitatiodey to the Estuary's Flows 113
Flows into the Estuary Under Natural Conditions 226
Water Project Development 118
Early Developments Federal Central Valley Project State Water Project Other Projects
Water Development Facilities-Reservoirs and Diversions 122
Storage Reservoirs Diversions
Uses of Fresh Water Divertedfrom the Estuary's Tributaries and the Delta 127
The Estuary's Altered Flow Regime 129
Annual Delta Olltflow Seasonal Delta Olltflow
Effects of Diversion and Flow Alterations 132
Salinity Pollutants Primary Productivity and Organic Carbon Znfm Entrainment Reverse Flows Water Transparency Fishery Resources
The Future 144
Local Agency Projects State Water Project Completion Cemtral Valley Project Meeting Environmental Needs and Future Water Demand Water Quality Standards for the Estuary
Summary 149
7 Pollutants 151
Findings 151
What are Pollutants? 152
Measurement of Pollutants Kinds of Pollutants
The Behavior of Pollutants in the Estuary 156
PhysicalCharacteristics Environmental Conditions Transformalion Bioaccumulatlon
Pollutants in the EstuarqLA Chronicle of Change 158
Current Status of Pollutants in the Estuary 162
Pollutants of Concern Sources of the Estuary's Pollutants
Pollutant Loads to the Estuary 172
Pollutant Distribution in the Estuary 174
Pollutants in Water Pollutants in Sediments Pollutants in Biota Pollutant Trends in Sediments and Biota
Pollutant Effects in the Estuary 178
Toxicity of Sun Francisco Bay Ambient Water Tonicity of Municipal and Industrial Efluents Toxicity of Urban Runoff Toxicity of Nonurban Runoff Toxicity of Sediments Biological Indicators of Sublethal Pollutant Effects Pollutant Effects on Driraking Water-THMs
What Does the Future Hold? 188
Summary 190
nr State of the Estuary
8 Dredging and Waterway Modification 191
Findings 191
The Need for Dredging 193
Sedimentation
Kinds of Dredges 193
Who Dredges? 194
The Location of Dredging Projects 195
Army Corps of Engineers U.S. Navy Ports and Reheries Local Districts Commercial Marinas Sand Mining
Amounts of Material Dredged 198
Disposal Sites 198
Disposal Quantities 199
The Fate of Dredged Material Disposed in San Francisco Bay 200
Effects of Dredging and Dredged Material Disposal 202
Burial of the Benthic Community Increased Suspended Sediment Concentrations Dredged Material as a Source of PohWznts
Impact of Dredged Material Disposal on Angler Success 205
Limits on Disposal 207
Quality of Dredged Material 208
Projections of Future Dredging 210
Quantities of Material to be Dredged
Planning for the F u t u r d Long-Tern Management Strategy For Dredged Material Disposal 210
Waterway Modification 212
Flood Control Projects Sea Level Rise
9 Monitoring and Research 217
Findings 217
Definitions and Distinctions 218
How Monitoring and Research Information is Used 219
Monitoring and Research Programs in the BaylDelta Estuary 220
Pollutants Biological Resources and Flows Academic Involvemerst in Research and Monitoring
Efforts to Develop a Regional Monitoring Program 227
The Estuary Project's Regional Monitoring Strategy 228
Summary 231
~ ~~
Contents nri
1 0 A Comprehensive Approach to Addressing the Management Issues 233
Are More Studies Needed Before a Comprehensive Plan Can be Developed to Address the Management Issues? 234
Vision for the Future 234
Appendix 1 237 Section 320, Clean Water Act, As Amended
Appendix 2 241 Sun Francisco Estuary Project Subcommittees
Glossary 245
References 255
Conversion Table inside back cover
xxiv State of the Estuary
Sacramento and Sun Joaquin Basin Water Year Class.@cations 117 Major Features of the State Water Project and Central Valley Project 121 Reservoir Storage Capacity, Sacramento-San Joaquin River Basins, 1850-1990 124 Freshwater Depletions Upstream of the Delta, 18804990 126 Historic Delta Exports, 1940-1 990 127 Acreage of Major Crops Irrigated with Central Valley Project Water, 1988 128 Acreage of Major Crops Irrigated with State Water Project Water, 1987 128 Uses of Water Delivered by the Central Valley Project and State Water Project, 1985 129 Reduction in Delta Outflow Caused by Upstream Diversions, In-Delta Uses, and Delta Exports, 1921 -1990 131 Sacramento River Flow at Bend Bridge near Red Bluff, 1892-1988 131 Seasonal Delta Outflow under Unimpaired Conditions and Present Level of Development 133 Water Circulation in the Sacramento-San Joaquin Delta as Influenced by Flows and Exports 138 Reverse Flow in the Lower San Joaquin River, 1955-1988 139 Generalized Transport and Fates of Pollutants in a Typical Estuary 157 Effectiveness of Primary and Secondary Treatment 160 Flow and Pollutant Loadingsfrom Municipal Dischargers in the San Francisco Bay Region, 1955 to 1985 161 BOD, Suspended Solids, Oil & Grease, Chromium andzinc Loadingsfrom Bay Area Rejimries, 1961 to 1984 161 Municipal Dischargers and Mean Discharge Volumes to the BaylDelta Estuary, 19844986 165 Industrial Facilities and Mean Discharge Volumes to the BaylDelta Estuary, 1984-1986 166 Floatable Debris Found in San Francisco and Oakland Harbor Areas, 1989 171 Combined Loadings of Selected Pollutants by Source to the BaylDelta Estuary (Arsenic, Cadmium, Chromium, Copper, Lead, and Zinc) 173 Bay Area Sites Exhibiting Elevated Pollutant Concentrations in Sediments or Biota 177 Army Corps of Engineers Major Navigation Projects in the BaylDelta Estuary 195 Naval Facilities Dredging Sites, 1975-1985 196 Aquatic Dredged Material Disposal Sites in San Framisco Bay 199 Annual Sediment Volumes Releasedfrom Corps and Navy Projects, 1975-1990 200 Disposal of Dredged Material at Estuary Disposal Sites, 198687 201 Phases of Transport During Open Water Disposal of Dredged Material 202 Frequency Distribution of Dredged Material Disposal at Alcatraz Disposal Site, January 1984-December 1987 207 Projected Total Dredging in the BaylDelta Estuary, 1995-2045 210 How Monitoring Programs Aid Resource Management 219 Cost Estimates for Monitoring Activities in the BaylDelta Estuary, 199011991 222 Organization of the Interagency Ecological Studies Program 224 Estimated Interagency Ecological Studies Program Funding by Program Element, FY 1990191 225 Strategy for Developing a Regional Monitoring Program 229
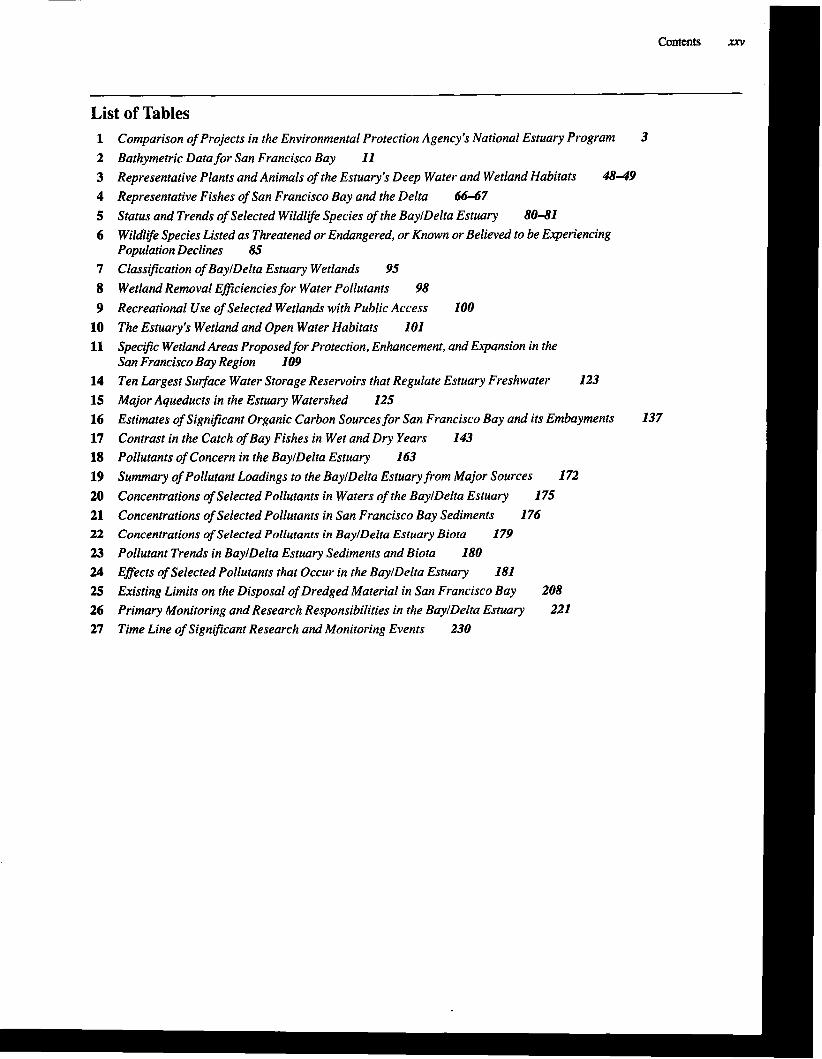
List of Tables 1 1 Comparison of Projects in the Environmental Protection Agency's National Estuary Program 3
2 Bathymetric Data for San Francisco Bay 11 3 Representative Plants and Animals of the Estuary's Deep Water and Wetland Habitats 4849
4 Representative Fishes of Sun Francisco Bay and the Delta 66-67
5 Status and Trends o f Selected Wildlife Svecies of the BavlDelta Estuaiv 80-81
Classification of BaylDelta Estuary Wetlands 95
Wetland Removal Eflciencies for Water Pollutants 98
Recreational Use of Selected Wetlands with Public Access 100
The Estuary's Wetland and Open Water Habitats 101 Specific Wetland Areas Proposed for Protection, Enhancement, and Expansion in the Sun Francisco Bay Region 109 Ten Largest Surface Water Storage Reservoirs that Regulate Estuary Freshwater 123
Major Aqueducts in the Estuary Watershed 125 Estimates of Significant Organic Carbon Sources for Sun Francisco Bay and its Embayments 137
Contrast in the Catch of Bay Fishes in Wet and Dry Years 143 Pollutants of Concern in the BaylDelta Estuary 163 Summary of Pollutant Loadings to the BaylDelta Estuary porn Major Sources 172
Concentrations of Selected Pollutants in Waters of the BaylDelta Estuary 175
Concentrations of Selected Pollutants in San Francisco Bay Sediments 176 Concentrations of Selected Pollutants in BaylDelta Estuary Biota 179
Pollutant Trends in BaylDelta Estuary Sediments and Biota 180 Effects of Selected Pollutants that Occur in the BaylDelta Estuary 181 Existing Limits on the Disposal of Dredged Material in Sun Francisco Bay 208
Primary Monitoring and Research Responsibilities in the BaylDelta E s t q 221
Time Line of Significant Research and Monitoring Events 230

Summary
Under the authoriry of the federal Clean Water Act, the Son Francisco Estuary Project is tasked with preparing a plan to restore andprotect the integrity of the Sun Francisco BaylSacramento-San Joaquin Delta estuury. This plan, referred to as a Comprehensive Conservation and Management Plan, is scheduled to be completed by November, 1992, and will culminate a six-year eflort by elected oficials and more than one hundred representatives of industry, agriculture, environmental and user organizations, and government agencies. The plan will begin to be implemented after receiving concurrence of the Governor and ap- proval by the Administrator of the Environmental Protection Agency.
Shortly after the Estuary Project began, Project participants identifiedflve management issues which they believe the plan must address. These issues are:
Intensified Land Use Decline of Biological Resources Freshwater Diversion and Altered Flow Regime
Increased Pollutants Increased Dredging and Waterway Modification
To help characterize the management issues and to lay the groundwork for achieving a consensus on ways to address them, the Estuary Project has prepared several technical reports. These reports sumrnurize what is known (and what is not known) about the technical aspects of the management issues, including their scope and impacts on the estuary, historical trends, and current status. They also describe how the management issues may @ect the estuary in the foreseeable fiture.
This State of the Estuary report distills information in the Estuary Project's technical reports as well as in other relevant documents. It describes the techni- cal aspects of the management issues in a way that is intended to be comprehen- sible to a general, non-technical audience. The report's purpose is to provide an objective assessment of the current state of the BaylDelta estuary and to assist Project participants in understanding the management issues. It will also serve as a tool to educate the public about the estmry and its problems.
What is the San Francisco BayISacramento-San Joaquin Delta Estuary and Why is it Important?
Estuaries are coastal areas where freshwater runoff from the land mixes with ocean water. The BayPe1t.a estuary is the largest estuary on the west coasts of North and South America. It comprises the 1,153-square-mile Sacramento-San Joaquin Delta
--
S-2 State of the Estuary
and the 478-square-mile San Francisco Bay and receives runoff from some 40 percent of California's land area. Because of its highly dynamic and complex environmental conditions, the estuary supports an extraordinarily diverse and productive ecosystem. It also supports many important economic activities including commercial and sport fishing, shipping, industry, agriculture, recre- ation, and tourism.
Of the estuary's many uses, one of the most critical is the use of fresh water for municipal, industrial, and agricultural purposes. Some two-thirds of California's 30 million people obtain their drinking water from the estuary's fresh water supply, and industry and agriculture rely heavily on the estuary's fresh water to meet their water needs.
Although the estuary has been described as the major estuary in the United States most modified by human activity, it remains an invaluable natural re- source of local, national, and international significance. It is, however, beset with several problems.
Intensified Land Use
Until the mid-1800s, the estuary's waters and biological resources were essen- tially undisturbed by human development. Following the influx of gold seekers in the 1850s, human activities began to change the estuary in major ways. Hydraulic mining carried more than one billion cubic yards of silt and gravel from the Sierra Nevada into the Delta and the embayments of San Francisco Bay. Land reclamation in the Delta and along the edge of the Bay converted more than 750 square miles of tidal marsh into agriculture and other uses. Farming and ranching altered large expanses of upland vegetation.
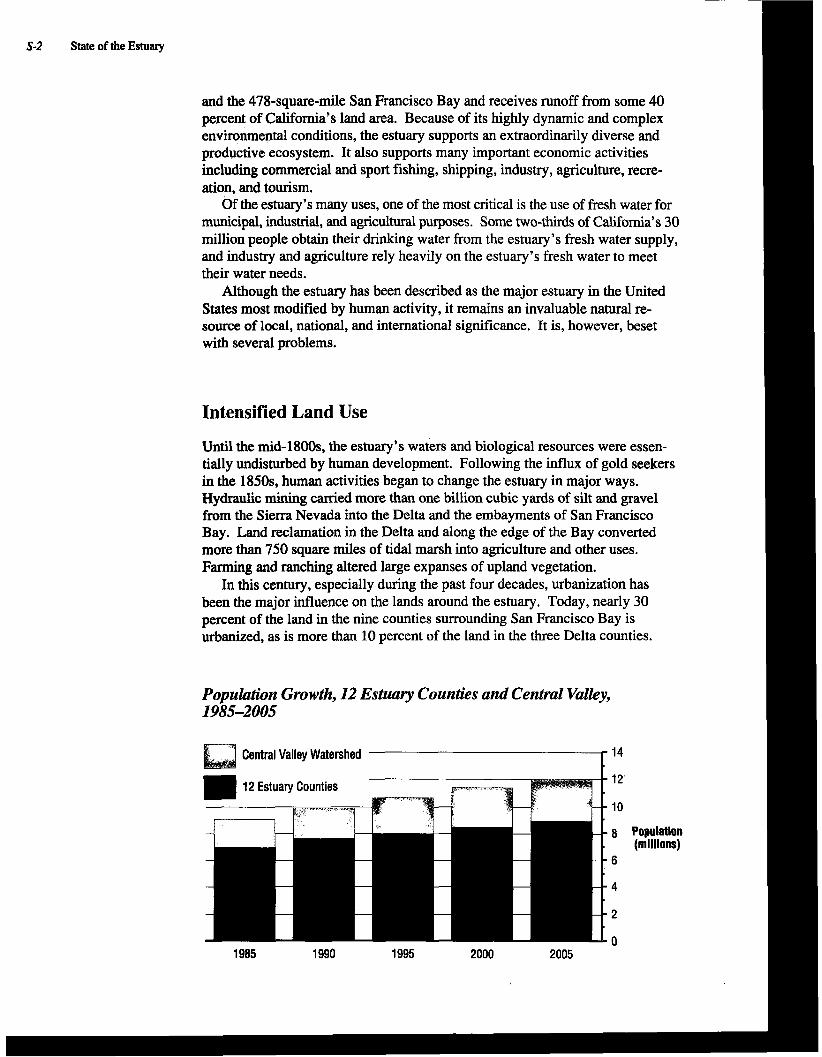
In this century, especially during the past four decades, urbanization has been the major influence on the lands around the estuary. Today, nearly 30 percent of the land in the nine counties surrounding San Francisco Bay is urbanized, as is more than 10 percent of the land in the three Delta counties.
Population Growth, 12 Eshcary Counties and Central Valley, 1985-2005
Central Valley Watershed 14
12
10
8 Population (mllllons)
6
1; 1985 1990 1995 2000 2005

The increase in urban land area around the estuary reflects the growth of the human population. There are now more than 7 3 million individuals living in the 12 estuary counties, making the region the fourth most populous metropoli- tan area in the United States. With more than two million additional people living in the Central Valley portion of the estuary's watershed, about one-third of California's population now lives on lands that drain into the Delta and Bay. The number of people living within the estuary's entire watershed is projected to increase to 12 million by 2005. Estuary counties in which the expected popula- tion growth will be greatest are San Joaquin, Solano, and Sacramento.
Population growth is expected to result in the loss of productive agricultural land and, to a lesser extent, range and forest lands. Between 1990 and 2005, some 275 square miles of additional land will be urbanized in the 12 estuary counties. In the remainder of the estuary's Central Valley watershed, urban land use is projected to increase by about 450 square miles during the same time period. These changes will reduce the acreage of valuable farmland, wetlands, and riparian areas, and will also increase pollutant loadings to the estuary.
Decline of Biological Resources
The estuary's biological resources-its habitats, aquatic organisms, and wild- life-have undergone major changes since the Gold Rush. These changes include habitat degradation and conversion, population declines and the extirpa- tion of many native species, and the introduction of hundreds of species of plants and animals. Although the estuarine ecosystem remains diverse and productive, it is highly modified.
In the past 140 years, shoaling caused by hydraulic mining debris and the diking and filling of tidal marshes have decreased the surface area of San Francisco Bay by 37 percent to its present area of 478 square miles at high tide. More than one-half million acres of the estuary's historic tidal wetlands have been converted to farms, salt ponds, and urban uses. Less than 45,000 acres of the estuary's historic tidal marshes remain intact, a reduction of 92 percent. Non-tidal wetlands have been converted to farms and other uses, and many of the riparian forests have been removed by flood control projects and urban development. More than one-half of the natural upland habitats in the estuary basin have been converted to urban uses.
The estuary's communities of aquatic resources-its phytoplankton, zoop- lankton, bottom-dwellers, and fish-have undergone extensive change. More than 100 species of aquatic invertebrates including clams, oysters, and worms have been introduced in the past century; today, most of the large invertebrates in the Bay's shallows are introduced species. Likewise, most of the more than 50 fish species that occur in the Delta are non-natives.
Much of the estuary's productivity is dependent upon the growth of phyto- plankton, small floating plants which transform sunlight into food. Since the early 1970s, and especially since the 1976-77 drought, phytoplankton abun- dance generally has declined in the estuary's northern reach. Populations of zooplankton that feed on phytoplankton also have declined in the northern reach and are now at levels much lower than in the 1970s. The causes of these changes are not well understood but are thought to include, at a minimum, reduced freshwater flows and a recently introduced Asian clam.
Summary s-3
I
I
I
I
I I
I1 ' I I
' I I
I I I Al
I I
' 1
1 1
I
~ I
I ' I . I ~'

S 4 State of the Estuary
The recent arrival of the clam, Potamcorbula amurensis, has made it difficult for scientists to understand the causes of alterations of the phytoplankton and zooplankton communities. Unintentionally introduced into the estuary in cargo ship ballast water, the clam was first discovered in the Carquinez Strait area in 1986, following a winter of unusually high river flow. Since then, during five years of low flows, it has spread throughout Suisun and San Pablo bays and, to a lesser extent, into portions of San Francisco Bay. Growing at densities as high as 25,000 individuals per square meter, the clam population is able to consume vast quantities of phytoplankton. By greatly reducing the availability of phytoplankton to other organisms, the clam may be causing a major shift in the makeup of the aquatic ecosystem in the northern portion of the estuary.
Several of the estuary's fish species have undergone changes in population levels in recent years. Although some species have increased in numbers, including the commercially important Pacific herring and many of the native non-game fishes that inhabit South Bay, others have declined. Species with declining populations and which are receiving the greatest attention are Chinook salmon, striped bass, and Delta smelt.
The estuary's salmon stocks have dropped markedly since the turn of the century, when an annual average of some 850,000 fish returned to Central Valley streams to spawn. By the early 1950s, following the construction of Shasta Dam on the Sacramento River and Friant Dam on the San Joaquin River, runs had dropped to about 400,000 fish. The construction of Friant Dam completely destroyed the upper San Joaquin River stock of mostly spring run salmon. Numerous smaller dams are also responsible for the declining salmon populations. Today, an annual average of about 285,000 salmon spawn in the estuary watershed; most of these are fall-run fish which spawn in the Sacra- mento River drainage. Some of the factors responsible for the decline in salmon populations include reduced spawning habitat, inadequate stream spawning flows, intermittant poor water quality, reduced spawning gravels of suitable size, increased mortality induced by high stream temperatures, and losses of young fish to water diversions. The upper Sacramento River winter run has declined to such an extent that it has been listed as a federal threatened species and a state endangered species. The annual commercial ocean catch of about 400,000 salmon has remained fairly stable, maintained in part by five hatcheries which produce a total of more than 30 million fingerlings and yearlings each year. The natural reproduction of salmon in streams is now inadequate to sustain the commercial and sport fisheries.
Striped bass, introduced into the estuary in the 1880s, supported a large commercial fishery until the 1930s. Since then, it has been a prized sport fish. By the early 1970s, striper fishing had declined and by the early 1980s, the population was was about one-third of its early 1960s level. Today, the number of adult striped bass is at the lowest level of this century, with fewer than one million adults present. Potential causes of the decline are many and include Delta water diversions, reduced Delta outflows, reverse flows, low San Joaquin River flows, pollutants, wetland filling, and others. Losses to Delta water diversions seem to be a very important factor in the decline. Additional losses occur in the 1,800 unscreened siphons and pumps of Delta farms.
The Delta smelt is another species that has received much attention in recent years. Although the smelt has no commercial or sport value, it is one of the few remaining native species found in the upper reaches of the estuary. Once com- mon, its numbers have dropped precipitously since the early 1980s. Because it
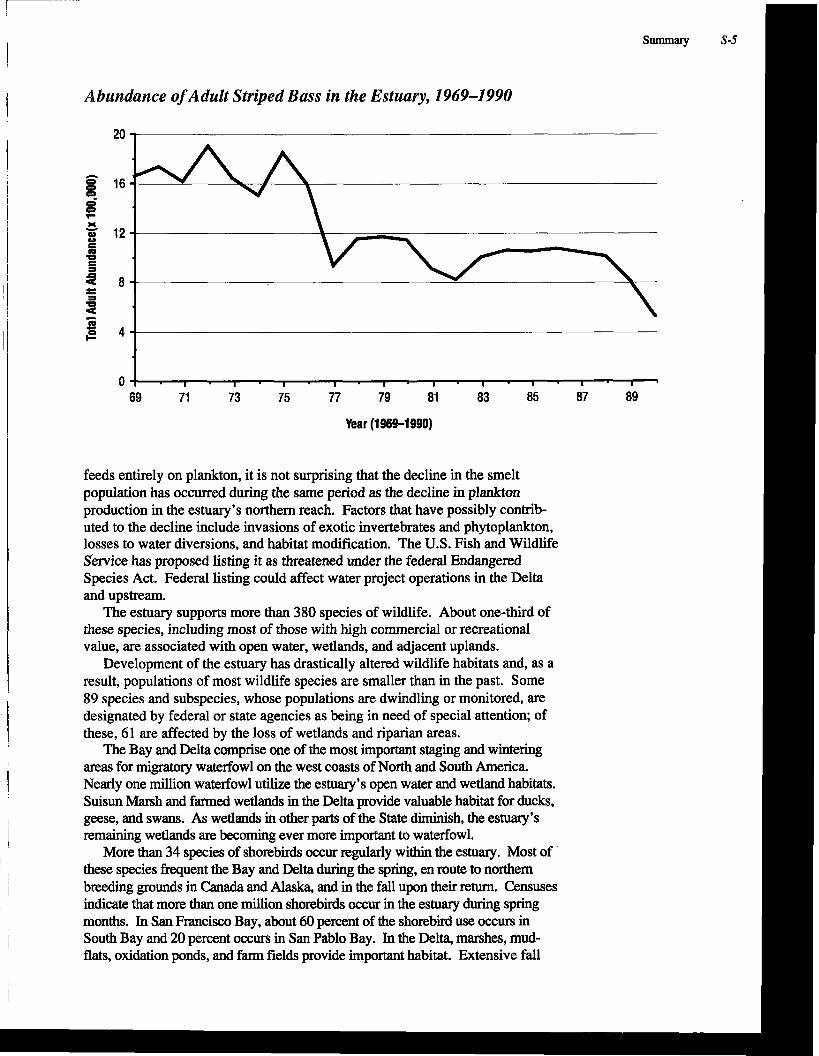
Abundance of Adult Striped Bass in the Estuary, 1969-1990
feeds entirely on plankton, it is not surprising that the decline in the smelt population has occurred during the same period as the decline in plankton production in the estuary's northern reach. Factors that have possibly contrib- uted to the decline include invasions of exotic invertebrates and phytoplankton, losses to water diversions, and habitat modification. The U.S. Fish and Wildlife Service has proposed listing it as threatened under the federal Endangered Species Act. Federal listing could affect water project operations in the Delta and upstream.
The estuary supports more than 380 species of wildlife. About one-third of these species, including most of those with high commercial or recreational value, are associated with open water, wetlands, and adjacent uplands.
Development of the estuary has drastically altered wildlife habitats and, as a result, populations of most wildlife species are smaller than in the past. Some 89 species and subspecies, whose populations are dwindling or monitored, are designated by federal or state agencies as being in need of special attention; of these, 61 are affected by the loss of wetlands and riparian areas.
The Bay and Delta comprise one of the most important staging and wintering areas for migratory waterfowl on the west coasts of North and South America. Nearly one million waterfowl utilize the estuary's open water and wetland habitats. Suisun Marsh and farmed wetlands in the Delta provide valuable habitat for ducks, geese, and swans. As wetlands in other parts of the State diminish, the estuary's remaining wetlands are becoming ever more important to waterfowl.
More than 34 species of shorebirds occur regularly within the estuary. Most of these species frequent the Bay and Delta during the spring, en route to northern breeding grounds in Canada and Alaska, and in the fall upon their return. Censuses indicate that more than one million shorebirds occur in the estuary during spring months. In San Francisco Bay, about 60 percent of the shorebird use occurs in South Bay and 20 percent occurs in San Pablo Bay. In the Delta, marshes, mud- flats, oxidation ponds, and farm fields provide important habitat. Extensive fall
1- Summary S-5
! I
I
I
I
I 1

S-6 State of the Estuary
and spring flooding of plowed Delta fields can result in large concentrations of shorebirds. Reflecting the importance of the estuary to shorebirds, in 1990, the San Francisco-San Pablo Bay system was recognized as a site of hemispheric impor- tance by the Western Hemisphere Shorebird Reserve Network. Only three other areas on the west coasts of the Americas have received such high recognition.
Populations of many of the estuary's wildlife species have increased in recent years. In the last five years, the breeding population of the double- crested cormorant, a bird which nests on bridges and other man-made structures, increased to more t h k 1,100 pairs. The breeding population of the western gull has also grown, and in 1981, California gulls established a nesting population in the Bay that still flourishes. Through immigration from other areas, the Ameri- can peregrine falcon, an endangered species, has increased ten-fold in the Bay area during the past 20 years; however, none of the few pairs nesting locally has reproduced successfully.
Since the 1980s, there has been a substantial increase in the red fox popula- tion, especially on the eastern shoreline of South Bay. The fox, introduced to California from the Midwest in the early 1900s, is an efficient predator that has adapted to urbanized areas and now poses a severe threat to ground-nesting birds, waterfowl, and shorebirds in the estuary. The U.S. Fish and Wildlife Service recently proposed a plan to reduce the threat of fox predation on nesting birds at the San Francisco Bay National Wildlife Refuge.
Although populations of some species have increased in recent years, populations of other species have declined. The endangered California clapper rail, estimated at 1,500 individuals in the mid-1980s, has dropped to 300-500 individuals. The South Bay nesting population of the Caspian tern has declined from more than 1,000 individuals in 197 1 to about 200 individuals in 1990. Predation by red fox and other introduced predators, as well as habitat changes, are noted causes of these declines. The successful nesting of the least tern, also an endangered species, is subject to predation and human disturbance as well.
Habitat availability for the salt marsh harvest mouse, a state and federal endan- gered species, has declined markedly in the past 20 years. While about 6,000 acres of habitat remain available to the northern subspecies in Suisun Bay, only about
California Clapper Rail Counts in South Bay, 1972-1990
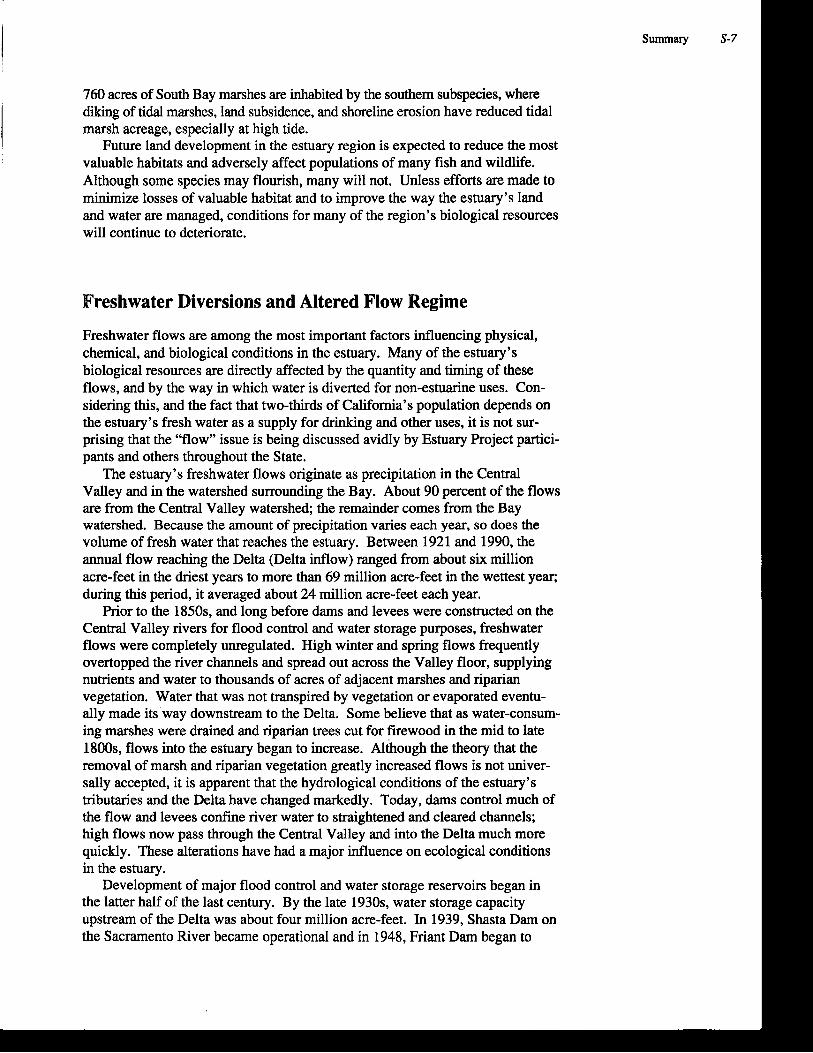
760 acres of South Bay marshes are inhabited by the southern subspecies, where diking of tidal marshes, land subsidence, and shoreline erosion have reduced tidal marsh acreage, especially at high tide.
Future land development in the estuary region is expected to reduce the most valuable habitats and adversely affect populations of many fish and wildlife. Although some species may flourish, many will not. Unless efforts are made to minimize losses of valuable habitat and to improve the way the estuary's land and water are managed, conditions for many of the region's biological resources will continue to deteriorate.
Freshwater Diversions and Altered Flow Regime
Freshwater flows are among the most important factors influencing physical, chemical, and biological conditions in the estuary. Many of the estuary's biological resources are directly affected by the quantity and timing of these flows, and by the way in which water is diverted for non-estuarine uses. Con- sidering this, and the fact that two-thirds of California's population depends on the estuary's fresh water as a supply for drinking and other uses, it is not sur- prising that the "flow" issue is being discussed avidly by Estuary Project partici- pants and others throughout the State.
The estuary's freshwater flows originate as precipitation in the Central Valley and in the watershed surrounding the Bay. About 90 percent of the flows are from the Central Valley watershed; the remainder comes from the Bay watershed. Because the amount of precipitation varies each year, so does the volume of fresh water that reaches the estuary. Between 1921 and 1990, the annual flow reaching the Delta (Delta inflow) ranged from about six million acre-feet in the driest years to more than 69 million acre-feet in the wettest year; during this period, it averaged about 24 million acre-feet each year.
Prior to the 1850s, and long before dams and levees were constructed on the Central Valley rivers for flood control and water storage purposes, freshwater flows were completely unregulated. High winter and spring flows frequently overtopped the river channels and spread out across the Valley floor, supplying nutrients and water to thousands of acres of adjacent marshes and riparian vegetation. Water that was not transpired by vegetation or evaporated eventu- ally made its way downstream to the Delta. Some believe that as water-consum- ing marshes were drained and riparian trees cut for firewood in the mid to late 1800s, flows into the estuary began to increase. Although the theory that the removal of marsh and riparian vegetation greatly increased flows is not univer- sally accepted, it is apparent that the hydrological conditions of the estuary's tributaries and the Delta have changed markedly. Today, dams control much of the flow and levees confine river water to straightened and cleared channels; high flows now pass through the Central Valley and into the Delta much more quickly. These alterations have had a major influence on ecological conditions in the estuary.
Development of major flood control and water storage reservoirs began in the latter half of the last century. By the late 1930s, water storage capacity upstream of the Delta was about four million acre-feet. In 1939, Shasta Dam on the Sacramento River became operational and in 1948, Friant Dam began to
Summary S-7

S-8 State of the Estuary
store San Joaquin River water. Today, there are more than 100 reservoirs in the Central Valley watershed, each with a storage capacity of at least 50,000 acre- feet. Together they can store some 27 million acre-feet of water, about three million acre-feet more than the long-term average annual flow of fresh water into the Delta.
Diversions from the estuary's tributaries began in the mining regions of the northern Sierra in the mid-1850s as miners diverted flows for hydraulic mining operations. At about the same time, farmers began to divert water from streams on the Valley floor. The volume of water diverted upstream of the Delta has grown steadily ever since. At the 1990 level of development, upstream diver- sions deplete the volume of water reaching the estuary by more than nine million acre-feet. This water is used for agricultural, municipal, and industrial uses in the Central Valley and in the Bay area. Within the Delta, about one million acre-feet of water is consumed each year, mostly.to irrigate crops in the rich Delta soils.
Since the 1940s, when the federal Central Valley Project began diverting water into the Contra Costa Canal, the export of fresh water from the Delta has increased steadily. In 195 1, the federal Delta-Mendota Canal began to export Delta water southward into the San Joaquin Valley, mostly to farms. In 1968, the State Water Project Delta pumping facility began exporting Delta water into the California Aqueduct, a system that conveys water southward into the San Joaquin Valley and to southern California. By 1990, the combined average annual volume of water exported by these three Delta diversions had increased to nearly six million acre-feet.
At the current level of development, upstream diversions, in-Delta uses, and Delta exports reduce flows to San Francisco Bay by more than 15 million acre- feet, a reduction of more than 50 percent of the average annual flow. About 85 percent of the fresh water exported from the Delta goes to farms and the remain- der is used for municipal and industrial uses in the Bay area, the Central Valley, and southern California.
Given the trend of increased diversions from the estuary's tributaries and the Delta, it is surprising that average annual Delta outflow seems to have changed little
Reduction in Delta O u m w Caused by Upstream Diversions, In-Delta Uses, and Delta Exports, 1921-1990
100
C 80
0 - 5 " 60 B s - S 40 I=
20
0 20 25 30 35 40 45 50 55 60 65 70 75 80 85 90
Year (1921-1990)

during the past 70 years. The suspected causes of this include increasing precipita- tion in the Central Valley watershed and land use changes that increase runoff.
Although the average annual volume of water flowing into the estuary each year appears to have remained more or less unchanged since the 1920s, water 4
development has altered seasonal flow patterns substantially. The storage of water during winter and spring months for release later in the year greatly re- duces flows during April, May, and June, and may increase them slightly during the late summer and early fall. At the 1990 level of development, Delta outflow during spring and early summer is about one-third of what it would be without water storage and diversions. The reduction of spring and early summer flows, in conjunction with changes in flow patterns within the Delta caused by the state and federal water projects, are associated with the decline of salmon, striped bass, and other species.
Water development is far from complete in the estuary watershed and in other parts of the State. To complete the State Water Project, water planners are currently evaluating ways to increase average annual Delta exports by more than one million acre-feet and, at the same time, to reduce some of the existing prob- lems associated with Delta diversions. In addition to increasing the export rdte at the State's Delta pumping facility, planners are considering modifying Delta channels and constructing water storage facilities elsewhere. The federal government also is planning to increase its water deliveries from estuary tribu- taries and is currently evaluating the environmental impacts of various develop- ment alternatives.
Given the expected increase in water demand by California's growing popula- tion in the coming decades, there will be growing pressure to develop and divert more of the estuary's freshwater supply. Some believe that the demand for fresh water can be met by implementing stringent water conservation measures and by changing the way water is priced and marketed. Others believe it can be met only by constructing new canals and reservoirs. Considering the technical, social, economic, and political complexities of water development, it is likely that Californians will meet future water needs through a combination of conservation measures, new physical facilities, and major changes in water policy.
Increased Pollutants
Pollutants are substances that adversely affect the physical, chemical, and biological properties of the environment. Some pollutants occur naturally and have been components of natural ecosystems for millions of years. Others are synthetic and have been introduced into the environment only recently.
There are four kinds of pollutants in the estuary: inorganic chemicals, organic chemicals, biological materials, and suspended sediments and other particles. The most important inorganic chemicals are the trace elements and compounds of phosphorus and nitrogen. The trace elements in the estuary for which there is most concern are arsenic, cadmium, chromium, copper, lead, mercury, nickel, selenium, silver, and zinc. Phosphorus and nitrogen are nutrients necessary for plant growth but, at high concentrations, they may cause excessive growth of aquatic vegetation.
Organic chemicals of greatest concern are synthetic substances including plastics, pesticides, fertilizers, solvents, and pharmaceuticals. PCBs and pesti- cides such as DDT and Malathion are inorganics that may adversely affect estuary organisms. Most biological pollutants (bacteria and viruses) that are
S-10 State of the Estuary
harmful to human health enter the estuary in untreated sewage, recreational boat discharge, and runoff from farms, feedlots, and urban areas. Eroding soil and decomposing plant and animal wastes are sources of sediment and other par- ticles which may degrade the estuary's water quality.
The kinds of pollutants considered to adversely affect the estuary have changed markedly over the years. Until the 1940s, most pollutant problems, at least the most obvious ones, were caused by untreated industrial and sewage wastes. After the Second World War, as industry and agriculture thrived and as more people moved into the watershed, increased use of synthetic organic com- pounds began to pose new, and often more subtle, threats.
Pollutants enter the estuary from many sources and each source contributes a unique mixture of chemicals. These sources include more than 50 municipal wastewater treatment plants, more than 65 industrial facilities, urban runoff, rural runoff, rivers, dredging and dredged material disposal, and others.
Beginning in the 1950s, some publically-owned wastewater treatment plants began primary treatment of municipal effluent; this consists of screening, sedi- ment removal, sludge digestion, and disinfection. In the mid-1960s, secondary treatment began; this treatment further removes sediment and chemicals. The expenditure of more than three billion dollars on enhanced treatment in the 1960s and 1970s led to major improvements of municipal and industrial effluent and of Bay water quality. For example, between 1955 and 1985, even as the volume of municipal discharges increased from 250 to 550 million gallons per day, improved treatment reduced biochemical oxygen demand by about 80 percent and loadings of suspended solids by about 75 percent.
In the late 1970s, advances in pretreatment programs also reduced the load of toxic pollutants entering the estuary from municipal wastewater treatment plants. Pretreatment programs aim to remove toxic pollutants at their sources rather than at municipal treatment plants. This reduces the volume of pollutants to be treated at the treatment plants and may help them operate more effectively.
The treatment of wastewater discharged directly from industrial facilities into the estuary also has improved. Loads of pollutants from the biggest class of industrial dischargers-oil refineries-have declined dramatically since the early 1960s. For example, in 1961, refineries discharged about two tons of chromium and zinc into the Bay each day; by 1984, daily discharge was about 25 pounds. Additional reductions in industrial loadings have been made through pollution prevention and source reduction.
The quantity of conventional pollutants entering the estuary from municipal and industrial sources has been reduced markedly during the past 40 years. As a result, the most obvious symptoms of poor water quality-odors, algal blooms, and low oxygen levels-have been eliminated throughout most of the estuary. Pollutants that continue to be of major concern are the trace elements, organo- chlorines and other synthetic pesticides, and petrochemical hydrocarbons.
Preliminary estimates indicate that rural and urban runoff provide the great- est quantities of most trace elements to the estuary. Urban runoff is the major source of oil and grease. Municipal and industrial effluent contribute sizable loads of cadmium, mercury, and silver. Agricultural lands contribute large quantities of pesticides.
Pollutants have been detected in the estuary's water, sediments, and organ- isms. Although the concentrations of most pollutants surveyed in water are low, copper, lead, mercury, and nickel have exceeded state water quality objectives established to protect beneficial uses of the estuary's waters.
Summary s-I1
Compared to background levels attributable to natural sources or to coastal reference concentrations, pollutant concentrations in sediments are slightly elevated in nearly all parts of the estuary. Concentrations are highest in harbors, harbor entrances, industrial waterways, and marinas. Trace elements with the highest concentrations in sediments are copper, lead, chromium, and zinc. Areas with particularly high concentrations of these pollutants include Islais Creek, Alameda Naval Air Station, Channel Creek, Mare Island Strait, and Hunters Point Naval Shipyard. There currently are no standards for pollutant concentrations in sediments.
Pollutants in the estuary's water and sediments may ultimately find their way into its animals. Filter feeders such as clams and oysters ingest pollutants in the water as they feed on plankton; snails and worms take in pollutants as they graze on the organic matter in sediments. Animals, including humans, that consume these organisms (or organisms that consume them) also ingest the pollutants they contain. As organisms consume contaminated prey, pollutant concentrations in their tissues may increase. Concentrations of ten trace elements, DDT, and PCB sampled in the estuary's mussels, clams, fish, and birds are either significantly elevated (compared to samples collected elsewhere in the State) or exceed the State Maximum Allow- able Residue Level or the Median International Standard. Concentrations of pollutants in aquatic animals are greatest in organisms inhabiting harbors, harbor entrances, marinas, and industrial waterways.
Even though pollutant loads for many trace elements from municipal and industrial effluent sources have decreased in recent decades, concentrations of most pollutants in the estuary's sediments and animals do not indicate a similar trend. Based upon available data from repeated analyses of sediments, sedi- ment cores, mussels and other animals, few reductions in pollutant concentra- tions have been demonstrated.
Pollutants that enter the estuary may have a wide range of effects on organ- isms ranging from very subtle physiological changes to death. While it is fairly easy to measure concentrations of pollutants in water, sediments, and animal tissue, it often is extremely difficult to determine the overall effect of a pollutant on individual animals. Even more difficult to determine are pollutant effects on populations of a single species or on the entire aquatic community. During the past five years, laboratory bioassays (some of which must be considered as prelirni- nary) have indicated that, at times, the Bay's ambient water, some municipal and industrial effluent, and some urban and rural runoff are toxic to test organisms. Tests of starry flounder and striped bass chromosomes, tissue, and enzymes have indicated localized pollutant effects. PCBs appear to be reducing reproductive success in starry flounder in the eastern portion of Central Bay, and PCBs and DDE in black-crowned night heron eggs have been correlated with decreased embryo size and eggshell thickness, respectively.
One pollutant-related issue of concern, especially to agencies which provide public drinking water from the Delta, is that of disinfection by-products. These by- products form when organic materials in water react with water disinfectants such as chlorine or ozone. Drainage from Delta farms is the main source of organic materials in Delta water that contribute to the formation of disinfection by-products. Regulatory agencies may soon lower the acceptable level of disinfection by- products in drinking water, requiring drinking water purveyors to change to more expensive disinfection processes in order to minimize by-product formation.
The future loading of pollutants to the estuary will be determined by the number of people living in the watershed, land use patterns, the use and disposal
-
S-12 State of the Estuary
of pollutant-containing products, industrial processes, and treatment technolo- gies. In the absence of additional control measures or more widespread and effective pollution prevention, loads from municipal effluent will rise as the population discharging to municipal treatment plants increases. With some 725 square miles of rural land in the watershed projected to be urbanized by 2005, pollutant loading from urban runoff is expected to increase substantially. And unless there are substantial changes in farming practices, agriculture will I
continue to contribute large loads of toxic pesticides.
Dredging and Waterway Modification
Dredging in the estuary has been an issue of concern for many decades. Although nearly everyone agrees dredging is necessary to enable safe navigation of commer- cial, military, and recreational vessels, there are many views regarding the environ- mental impacts of dredging and how dredging should be managed.
Dredging is the systematic excavation of bottom sediments. The primary reason for dredging is to ensure that water depths in navigation channels, turning basins, docking slips, and marinas are deep enough for vessels to maneuver safely. Be- cause rivers carry an average of more than six million cubic yards of sediment into the estuary each year, and as many as 286 million cubic yards of sediments in the shallows are resuspended by currents and waves, dredged areas require periodic maintenance dredging.
Most of the dredging in the estuary is undertaken by the U.S. Army Corps of Engineers. The first Corps project in the Bay was the San Francisco Harbor Project, authorized by Congress in 1868. By 1987, the Corps had responsibility for 19 navigation projects in the Bay and Delta. The U.S. Navy dredges to maintain design depths at eight facilities in the estuary. The 15,major ports and refineries are also dredged periodically. Flood control districts dredge to maintain channel capacities where tributaries enter the Bay, and reclamation districts dredge periodi- cally as part of levee maintenance. Additional dredging occurs at many of the 223 commercial marinas in the Bay and Delta and at commercial sand mining sites in the Bay. Between 1975 and 1985, the Corps and Navy together dredged an annual average of about 4.9 million cubic yards of material. In 1986 and 1987, these agencies dredged an annual average of 7.3 million cubic yards. An unspecified, but smaller quantity of material was dredged by other entities.
Prior to 1972, dredged material was disposed at more than two dozen sites in the estuary. In the early 1970s, environmental considerations led the Corps to desig- nate six sites in the Bay acceptable for dredged material disposal. Since 1975, the Corps has limited the aquatic disposal of nearly all dredged material to just three sites-adjacent to Alcatraz Island, in San Pablo Bay, and in Carquinez Strait.
The Alcatraz Island site is the major disposal site in the Bay, and in recent years the proportion of dredged material disposed there has increased considerably. From 1975 to 1984, an average annual volume of less than two million cubic yards of material was disposed at the site; during 1985-1987, the average annual volume increased to five million cubic yards. In 1986 and 1987, about 65 percent of all dredged material disposed in the Bay was at the Alcatraz Island site.
When the Corps designated in-Bay disposal sites in the early 1970s, it selected sites from which currents would disperse disposed dredged material. By 1982,
however, it was discovered that the Alcatraz Island site had accumulated enough material to pose a hazard to navigation. By 1986, the Corps removed 183,000 cubic yards from the Alcatraz mound. This event stimulated discussion regard- ing disposal practices and the fate and effects of disposed material.
When material is disposed at the in-Bay sites, nearly all of it drops immediately to the bottom. The most dense portion forms a mound and the finer particles spread out and settle. The material is then moved by diffusion and currents in a direction determined largely by the direction and strength of bottom currents. Although the ultimate fate of dredged material disposed in the estuary is unknown, finer material is relatively well dispersed compared to denser materials, especially those from clamshell operations. Based on studies conducted in the past 15 years, most of the dredged material disposed at the three in-Bay sites likely remains in the Bay.
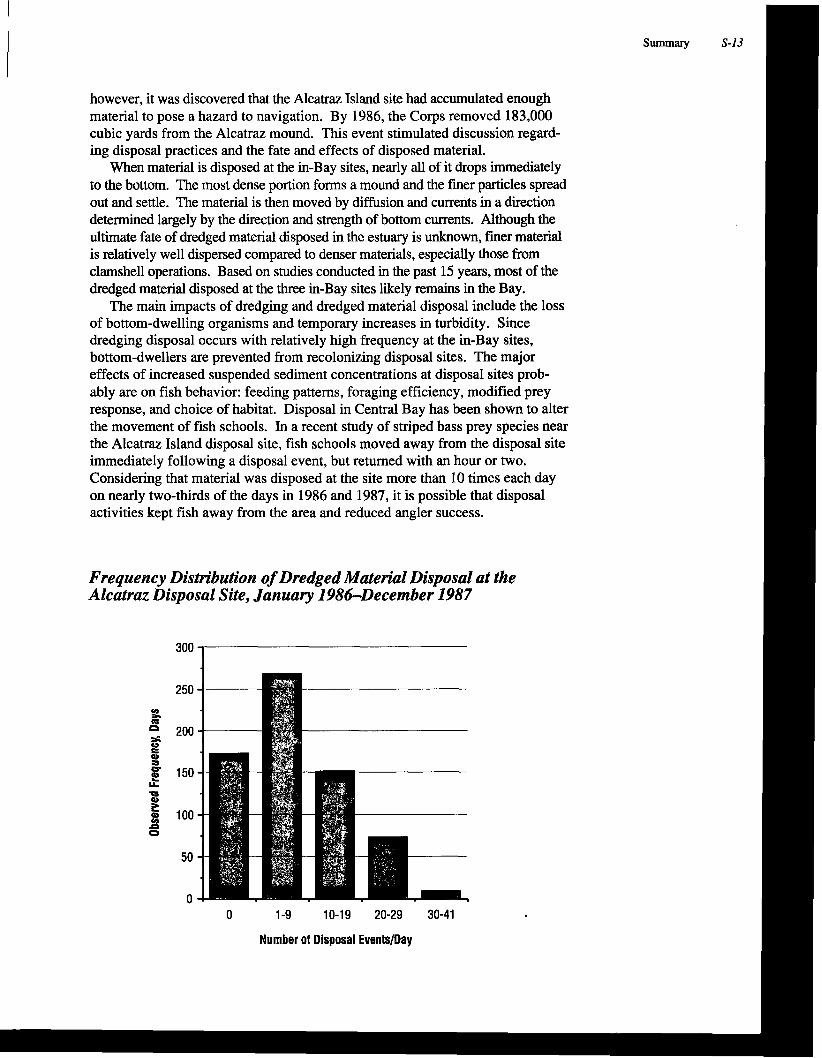
The main impacts of dredging and dredged material disposal include the loss of bottom-dwelling organisms and temporary increases in turbidity. Since dredging disposal occurs with relatively high frequency at the in-Bay sites, bottom-dwellers are prevented from recolonizing disposal sites. The major effects of increased suspended sediment concentrations at disposal sites prob- ably are on fish behavior: feeding patterns, foraging efficiency, modified prey response, and choice of habitat. Disposal in Central Bay has been shown to alter the movement of fish schools. In a recent study of striped bass prey species near the Alcatraz Island disposal site, fish schools moved away from the disposal site immediately following a disposal event, but returned with an hour or two. Considering that material was disposed at the site more than 10 times each day on nearly two-thirds of the days in 1986 and 1987, it is possible that disposal activities kept fish away from the area and reduced angler success.
Frequency Distribution of Dredged Material Disposal at the Alcatraz Disposal Site, January 1986-December 1987
0 1-9 10-19 20-29 30-41
Number of Disposal Eventsmay
Summary S-13

S-14 State of the Estuary
Current projections indicate that, between 1995 and 2045, about eight million cubic yards of material will be dredged annually in the estuary. This includes new projects, maintenance of existing projects, and permitted projects. Additional dredging will occur in the Delta to maintain channels, ports, and levees.
In response to the Alcatraz mounding problem and other concerns about dredging impacts on the Bay's water quality and biological resources, a joint effort is underway to prepare a plan for better managing dredging activities. Active participants in this effort to develop a long-term management strategy include the Corps, Enviionmental Protection Agency, Bay Conservation and Development Commission, San Francisco Bay Regional Water Quality Control Board, and dredging and environmental interests. The plan is scheduled to be completed by 1995 and will specify where dredged material may be disposed in the ocean, in the Bay, and at upland sites.
There are some 50 major federally sponsored flood control projects in the estuary watershed. These projects have vastly altered the character of the estuary's streams and shorelines through channel straightening and deepening, removal of riparian vegetation, channel lining, and construction of levees and dams. Although flood control projects provide important benefits, they also adversely affect habitat conditions for many species of fish and wildlife. Some recently constructed projects have used alternative techniques to reduce flood threat while preserving high habitat values.
Global warming is expected to cause a simcant rise in sea level in the coming years. Although scientists do not agree on the precise extent to which the seas will rise, the estuary will likely undergo many changes as intertidal habitats become subtidal and as tides begin to inundate higher areas. Subsiding lands adjacent to the estuary will be most severely affected. To minimize the adverse impacts of sea level rise on the estuary's most valuable habitats and shoreline economic activities, government agencies need to begin developing policies that anticipate a marked change in future sea level.
Need for a Comprehensive Monitoring and Research Program
Over the years, scientists have developed a substantial body of knowledge about the estuary and how it functions. For some issues, the current technical under- standing is fairly sophisticated; however, there are many aspects of each of the management issues for which understanding is still quite rudimentary. To in- crease our understanding of the estuary so that policy decisions can be based on a better technical footing will require the development of a long-term, regional monitoring program and the support of additional basic research.
Estuary Project participants currently are developing a regional program that will seek to assist ongoing efforts for achieving a more comprehensive focus for monitoring and research. The program will build upon, rather than duplicate, the efforts of universities and local, state, and federal agencies. It will include components on pollutants, fish and wildlife populations and habitats, hydrody- namics, and freshwater outflows. The progrzpn, to be implemented as a compo- nent of the Comprehensive Conservation and Management Plan, will also enable a periodic assessment of the plan's effectiveness.
Comprehensive Approach to Addressing the Issues
Several conclusions emerge from the preceding sections. First, the Estuary Project's five management issues comprise a wide range of environmental prob- lems in the estuary. Although some of the problems are more systemic and serious than others, they all ultimately affect the estuary's biological resources and water quality.
Second, while some aspects of the management issues have improved in recent decades, others have become worse. The most notable improvements in- clude declining rate of wetland loss, reduced pollutant loads of municipal and industrial sources, and improved regulation of dredging. Urban expansion, how- ever, continues to deplete the stock of valuable upland wildlife habitats, wet- lands, and riparian areas, and to increase loadings of many point and non-point pollutants. Population growth fuels the increasing demand for fresh water. Water development projects continue to influence the estuary's primary produc- tivity and habitat quality and to adversely affect populations of valuable com- mercial and sport fish and other species.
Finally, it is apparent that the management issues are interrelated, linked in a web of interacting chemical, physical, and biological processes. Understanding this is critical to developing effective actions to address the issues. It makes little sense, for example, to try to lower the pollutant related impacts of dredging without also reducing the quantities of pollutants that find their way into sedi- ments in effluent and runoff. Similarly, it would be unwise for public entities to spend large sums of funds to protect a particular wetland and then to allow incompatible land uses on adjacent uplands.
Given the interrelated nature of the Estuary Project's management issues, a more coordinated approach is needed among the entities addressing them. Devel- oping this approach will be one of the main challenges for the Estuary Project as it prepares its Comprehensive Conservation and Management Plan in the coming year.
Summary S-IS
Introduction
k estuary is deJimd as a partially enclosed body of water where fresh water of a stream or river meets tidal ocean water. Estmries exist in many shapes and sizes, ffom the vast areas at the mouths of the Nile and Amazon rivers, to the narrow inlets along the steep, green coastline of the Pacific Northwest. As transition zones between marine andfresh waters, estuaries are m n g the richest and most productive eco- system, their diverse natural habitats suppomng a wide array of biological resources.
For millennia, estuaries have been sites of intensive human settlement. It is no
1 coincidence that many of the world's great civilizations have thrived in estuarine regions, for this is where there is access to ocean trade, abundantfpeshwater and marine fisheries, as well as fertile soils andfpesh water. These features embled the advent of large-scale irrigated agriculture thousands of years ago and, more recently, encouraged the growth of large urban and industrial centers. Given the extent of development in their watersheds, it is not surprising that estuaries exhibit many environmental problems.
Values of Estuaries
Estuaries are valuable in many ways. From a biological perspective, they pro- vide important habitat for hundreds of species of plants and animals. As spawn- ing, nursery, and feeding grounds, they are invaluable to fish and shellfish. Their waters provide comdors for anadromous fish, such as salmon and steel- head trout, that migrate upstream to spawn. Worldwide, some two-thirds of all harvested fish spend time in estuaries. In the United States, estuaries support fisheries valued at more than $19 billion annually (USEPA, 1990a).
Estuaries support many kinds of natural habitats, wetlands being among the most valuable. Wetland habitats are used by shorebirds, migratory waterfowl, and other animals. Wetlands are home to many threatened or endangered species, reflecting the extent to which they have been degraded or converted to other uses. Extraordinary in its ability to convert sunlight and nutrients into plant matter, an acre of estuarine wetland can produce more than 12 tons of organic material annually. This rate of production is exceeded in natural ecosystems only by tropical rainforests. Wetlands also reduce flood damage, improve water quality, and stabilize shorelines and streambanks.
In addition to their habitat values, estuaries provide for many diverse human needs. They supply water for municipalities, industry, and agriculture; support commercial and sport fisheries; and encourage tourism and recreation. They also are important sites of manufacturing and shipping. In a less tangible way, estuaries are prized for their aesthetic qualities.
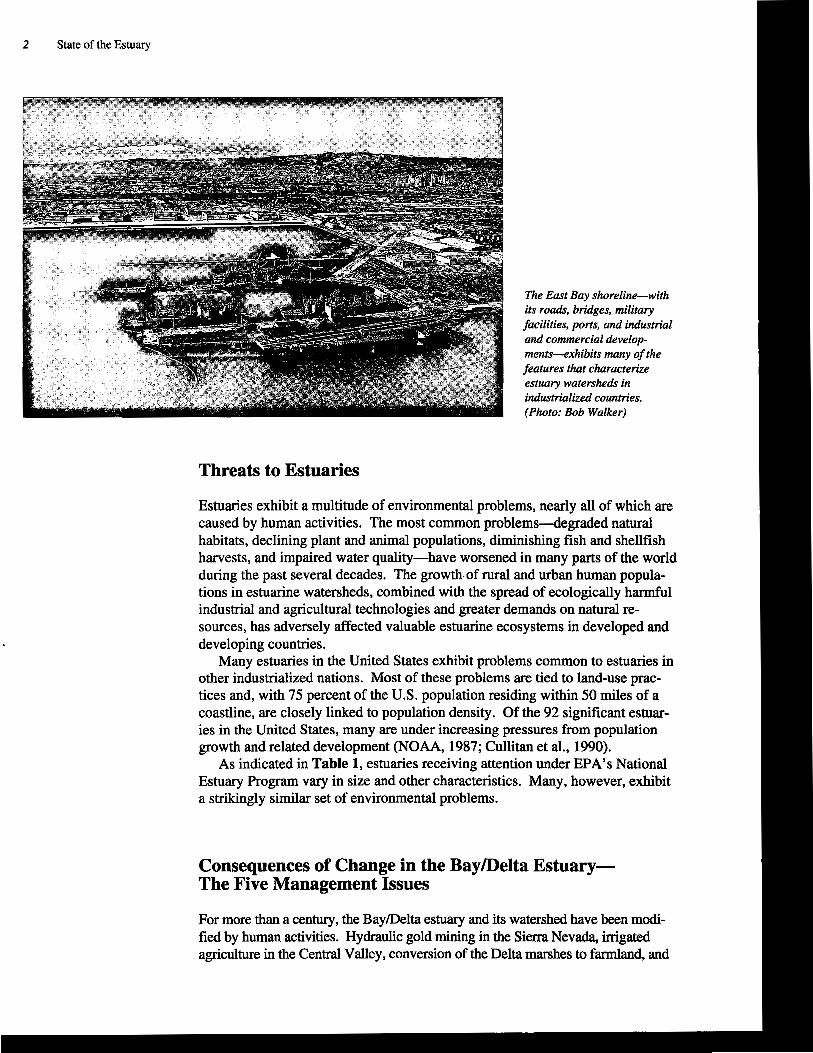
2 State of the Estuary
The East Bay shoreline-with its roads, bridges, military facilities, ports, and industrial and c o m r c i a l develop- ments-exhibits many of the features that characterize estuary watersheds in industrialized countries. (Photo: Bob Walker)
Threats to Estuaries
Estuaries exhibit a multitude of environmental problems, nearly all of which are caused by human activities. The most common problems--degraded natural habitats, declining plant and animal populations, diminishing fish and shellfish harvests, and impaired water quality-have worsened in many parts of the world during the past several decades. The growth of rural and urban human popula- tions in estuarine watersheds, combined with the spread of ecologically harmful industrial and agricultural technologies and greater demands on natural re- sources, has adversely affected valuable estuarine ecosystems in developed and developing countries.
Many estuaries in the United States exhibit problems common to estuaries in other industrialized nations. Most of these problems are tied to land-use prac- tices and, with 75 percent of the U.S. population residing within 50 miles of a coastline, are closely linked to population density. Of the 92 significant estuar- ies in the United States, many are under increasing pressures from population growth and related development (NOAA, 1987; Cullitan et al., 1990).
As indicated in Table 1, estuaries receiving attention under EPA's National Estuary Program vary in size and other characteristics. Many, however, exhibit a strikingly similar set of environmental problems.
Consequences of Change in the Bay/Delta Estuary- The Five Management Issues
For more than a century, the BayDelta estuary and its watershed have been modi- fied by human activities. Hydraulic gold mining in the Sierra Nevada, irrigated agriculture in the Central Valley, conversion of the Delta marshes to farmland, and
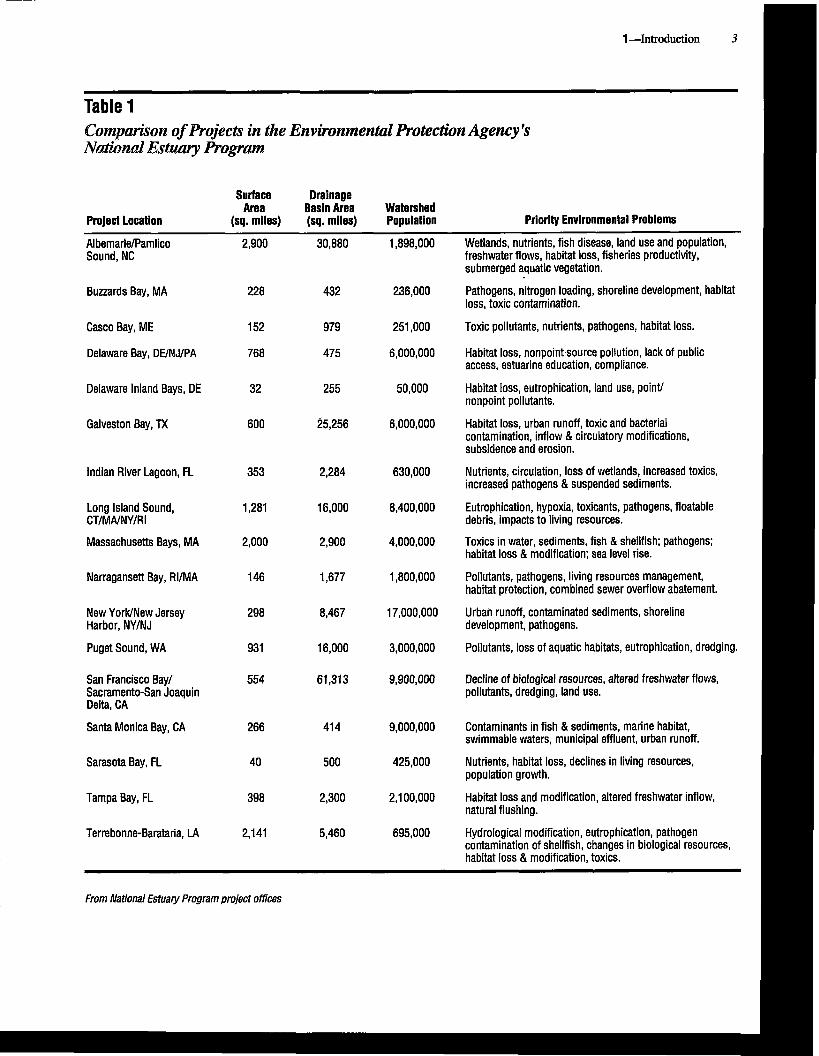
Table 1 Comparison of Projects in the Environmental Protection Agency's N h d Eshwy Program
Surface Drainage Area Basin Area Watershed
Project Location (sq. miles) (sq. miles) Population Priority Environmental Problems
Al bemarlelPamlico Sound, NC
Wetlands, nutrients, fish disease, land use and population, freshwater flows, habitat loss, fisheries productivity, submerged aquatic vegetation.
Pathogens, nitrogen loading, shoreline development, habitat loss, toxic contamination.
Buzzards Bay, MA
Toxic pollutants, nutrients, pathogens, habitat loss. Casco Bay, ME
Delaware Bay, DVNJIPA Habitat loss, nonpointsource pollution, lack of public access, estuarine education, compliance.
Delaware Inland Bays, DE Habitat loss, eutrophication, land use, point/ nonpoint pollutants.
Habitat loss, urban runoff, toxic and bacterial contamination, inflow & circulatory modifications, subsidence and erosion.
Galveston Bay, TX
Nutrients, circulation, loss of wetlands, increased toxics, increased pathogens & suspended sediments.
Indian River Lagoon, FL
Eutrophication, hypoxia, toxicants, pathogens, floatable debris, impacts to living resources.
Long Island Sound, CT/MA/NY/RI
Massachusetts Bays, MA Toxics in water, sediments, fish & shellfish; pathogens; habitat loss & modification; sea level rise.
Narragansett Bay, RIIMA Pollutants, pathogens, living resources management, habitat protection, combined sewer overflow abatement.
Urban runoff, contaminated sediments, shoreline development, pathogens.
New YorklNew Jersey Harbor, NY/NJ
Pollutants, loss of aquatic habitats, eutrophication, dredging. Puget Sound, WA
San Francisco Bay/ Sacramento-San Joaquin Delta, CA
Decline of biological resources, altered freshwater flows, pollutants, dredging, land use.
Contaminants in fish & sediments, marine habitat, swimmable waters, municipal effluent, urban runoff.
Santa Monica Bay, CA
Sarasota Bay, FL Nutrients, habitat loss, declines in living resources, population growth.
Tampa Bay, FL Habitat loss and modification, altered freshwater inflow, natural flushing.
Terrebonne-Barataria, LA Hydrological modification, eutrophication, pathogen contamination of shellfish, changes in b i ~ l ~ g i ~ a l resources, habitat loss & modification, toxics.
From National Estuary Program project offices
4 State of the Estuary
the filling of the Bay shoreline for urban uses have vastly changed the estuary's character. These changes, combined with the effects of nearly ten million humans currently inhabiting the watershed, have taken a high toll on the estuary's water quality and biological resources.
Estuary Project Management Conference participants have identified five man- agement issues that they believe must be addressed in order to restore and maintain the estuary's chemical, physical, and biological integrity: decline of biological re- sources, intensitled land use, freshwater diversion and altered flow regime, in- pollutants, and increased dredging and waterway modification.
Decline of Biological Resources
Human activities have greatly diminished or altered the estuary's biological resources-its vegetation, fish, and wildlife. Wetlands and the animals depen- dent on them have been particularly affected. Only a fraction of the estuary's original (1850) tidal wetlands are intact; and the tidal wetlands that remain are threatened by pollutants, altered freshwater flows, conversion to other uses, and the spread of urban development. Non-tidal wetlands are threatened by many of the same factors. Communities of benthic, or bottom-dwelling, organisms are undergoing phenomenal changes. Populations of many fish species have de- clined to their lowest levels, and the number of fish and wildlife species needing special protection is increasing. Measures are urgently needed to restore the estuary's biological resources to levels that are self-sustaining and adequate to support commercial and recreational activities.
Intensified Land Use Vast changes in land use have accompanied the increase in the' region's human population. Thousands of acres of native habitat around the estuary and far upstream have been converted to agriculture, silviculture, grazing, and urban and suburban uses. Many of the activities associated with these land uses contribute to habitat loss and degradation and to increased pollutant loads. Of particular concern are the effects of leapfrog development of nual lands, loss of open space, and polluting activities in existing urban and suburban areas. Man- agement actions must be developed and implemented to lessen the adverse effects of land use on the estuary.
Freshwater Diversion and Altered Flow Regime
Water storage and diversions for flood control, agriculture, and municipal and industrial uses have altered patterns of freshwater inflow to the estuary. In recent years, an average of more than one-half of San Francisco Bay's fresh- water supply from the Sacramento and San Joaquin river systems has been diverted. The seasonal flow regime has been highly modified. Water diversion and altered flow regime are implicated in a range of changes in the estuary including altered circulation patterns, declining populations of many aquatic resources, increases in seasonal salinity concentrations, and the fate and effect of pollutants. .Management measures must be implemented to ensure that the many uses of the estuary's fresh water occur without unacceptable adverse impacts to its biological resources.
I I Increased Pollutants 1 Despite the expenditure of large sums on pollution control in the 1960s and 1970s,
the estuary continues to be subjected to considerable pollutant loads. Sources of 1 these pollutants are municipal and industrial discharges and urban and rural runoff.
Concentrations of many pollutants are elevated in the'estuary's water, sediment,
! and biota, and are generally highest at dozens of harbors, harbor entrances, indus- trial waterways, and marinas. Although many species of fish and wildlife exhibit adverse effects of pollutants, the effects at the individual or population level are not well understood. Actions are needed to reduce pollutant loads to levels that ensure protection of all of the estuary's many uses.
Increased Dredging and Waterway Modification Many of the estuary's waterways have been modified for navigation, water export, and flood control purposes. Modification features include navigation and water transport ~hannels,~flood control levees, and armored streambanks and shorelines. The construction and maintenance of these features have affected the estuary's flow patterns, fate and effects of pollutants, and fish and wildlife habitats. Actions must be taken to ensure that projects are designed, constructed, and maintained in ways that minimize adverse impacts and, where possible, enhance the estuary's water quality, biological resources, and uses.
lnterreluted Aspects of the Five Management Issues All five management issues are interrelated, even though they have been described, and are often addressed, separately. The issues are linked through physical, chemi- cal, and biological processes. For example, the discharge of pollutants from point and nonpoint sources influences the distribution and concentration of pollutants in sediments; pollutants in sediments affect disposal options for dredged material; disposal may affect fish behavior, which, in turn, may influence the feeding success of some species of birds and predatory fish. As an example of the linkage between flows and biological resources, the timing and volume of fresh water entering the estuary affect water temperature, circulation patterns, availability of phytoplankton and zooplankton, and ultimately the survival of the young of many fish species. Inappropriate land uses may result in wetland losses which, in turn, increase flooding frequencies and rates of sedimentation, alter the fate of pollutants in nonpoint runoff, and reduce available wildlife habitat. There are many connections like these among the management issues, reminding one of a basic tenet of ecology: everythmg is connected to everything else.
Among the five management issues, land use is the single issue that most affects the others. The use of land for a particular purpose-highways, housing, open space,, agriculture, or industry4etennines the kinds of activities that occur and the resulting environmental impacts. As shown in Figure 1, land use affects the estuary's biological resources by influencing pollutant loads, demand for fresh water, dredging and waterway modification needs, and development pressure on habitats.
In a survey conducted for the Estuary Project, the most frequently noted perceived cause of the estuary's problems was "the lack of dealing with the system as a whole" (Tetra Tech, 1987). Given the linkage among the manage- ment issues, many believe that the issues must be addressed in an integrated
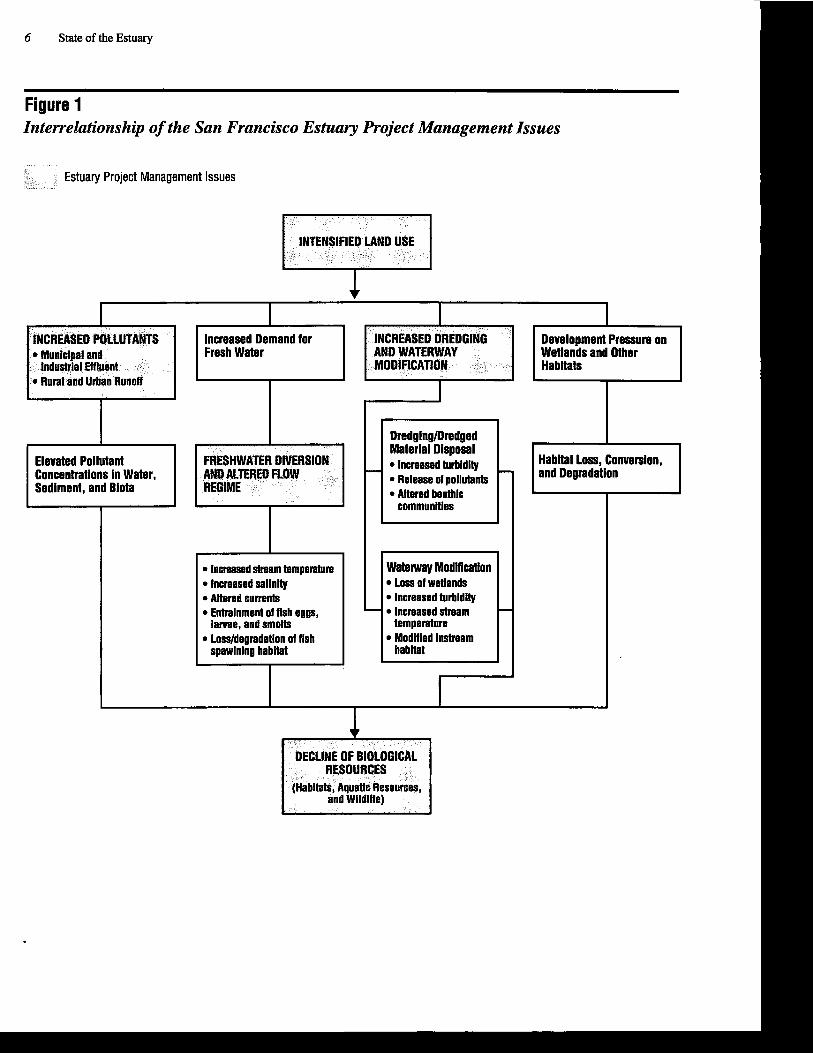
fashion, rather than individually. The creation and implementation of an effective Management Plan will require an extraordinary amount of communica- tion and coordination, especially among government agencies. .
Management of the Estuary
This report seeks to s u m m a the current state of the Estuary Project's five man- agement issues. It is not intended to provide an in-depth description of the regula- tory and management activities of government agencies. However, even a brief overview of agency roles can help one to understand who regulates what, and to place the management issues in a regulatory framework.
The following sections describe the roles of local, regional, state, and federal agencies in managing activities in and around the estuary. The descriptions are cursory and do not attempt to cover the entire range of each agency's responsibili- ties. A more thorough description and analysis of these responsibilities will be provided in the Estuary Project's report on the programs and activities of regulatory and management agencies.
Local Government
Local government comprises more than 100 cities, 12 counties, and scores of commissions, special purpose agencies, and districts. The primary way in which cities and counties affect the estuary is through the regulation of land use. Cities and counties adopt general plans that specify the location and density of various kinds of development. Although the plans also include elements for protecting important natural resources and for designating open space, only a few cities and counties have specific ordinances to protect the estuary and its streams and wetlands (Blanchfield et al., 1991).
Another kind of local entity that plays an important role in determining land use is the Local Agency Formation Commission (LAFCO). The 12 county LAFCOs set the limits on where urban expansion may occur. By influencing urban expansion, LAFCOs indirectly affect habitat conditions, the quantity and kinds of pollutants reaching the estuary, and also the demand for fresh water for municipal and industrial growth.
Special districts provide community services that are financed by charging fees to customers and/or by taxing landowners within their boundaries. Some of these districts, especially those established for mosquito abatement, flood con- trol, and water supply (including irrigation) are responsible for activities that may adversely affect environmental conditions in the estuary; however, special districts also can be helpful in protecting and managing the estuary's natural resources. Examples of special districts are the reclamation districts that main- tain Delta levees; the Suisun Resource Conservation District, which manages lands in Suisun Marsh; and the East Bay Regional Park District, which owns and manages wetlands and other valuable habitats..
Regional Government
There is no single regional agency that has jurisdiction over the entire estuary basin. There are, however, three planning bodies responsible for preparing advi- sory plans for regional land use. These are the Association of Bay Area
8 State of the Estuary
Governments, the Sacramento Area Regional Planning Council of Governments, and the San Joaquin Council of Governments. These bodies also provide an important service to the region through the development and dissemination of information on a variety of environmental issues such as air quality, water conservation, and hazardous waste management.
State Government There are many state agencies whose regulatory and management actions directly affect the estuary:
State Water Resources Control Board (SWRCB) regulates diversion of fresh water and assures adequate water quality to protect the estuary's beneficial uses.
Central Valley (CVRWQCB) and San Francisco Bay (SFBRWQCB) Regional Water Quality Control Boards develop and administer regional water quality plans and regulate the discharge of pollutants.
San Francisco Bay Conservation and Development Commission (BCDC) develops and implements a plan for the conservation and development of San Francisco Bay waters and the regulation of shoreline development.
Department of Fish and Game @FG) manages the commercial and sport harvest of fish and wildlife, manages wildlife habitat, comments on the biological impacts of proposed federal and state projects, and provides for the scientific and educational use of fish and wildlife.
Department of Water Resources @WR) develops and manages the state's water supplies, primarily through the operation of the State Water Project, and provides flood control protection.
State Lands Commission (SLC) manages all ungranted sovereign tidelands and submerged lands, including the beds of navigable rivers, lakes, streams, bays and estuaries, and coastal waters subject to the public trust doctrine.
State Coastal Conservancy (SCC) conserves and enhances coastal natural resources and enhances access to them.
State Reclamation Board (SRB) participates with federal interests in the construction of flood control levees and channels, ensures maintenance of these features, and regulates activities that would have an impact on them.
State Department of Food and Agriculture @FA) is designated the lead state agency for regulating pesticide use on private and public lands and is respon- sible for protecting the environment from harmful pesticide use.
Federal Government
The federal government is active in regulating activities that may affect interests beyond the state scope. The main agencies and their roles follow:
Army Corps of Engineers (USACE) constructs and maintains flood control and navigation projects, regulates activities that affect the navigability of waterways, and regulates the disposal of dredged and fill material in waters of the United States including adjacent or contiguous wetlands.
Coast Guard (USCG) provides aids to navigation, regulates construction and operation of bridges, maintains boating safety through search and rescue and other programs, and controls accidental spills by requiring contingency cleanup plans.
1-Introduction 9
Environmental Protection Agency (USEPA) regulates, directly and through oversight of programs delegated to the state, water quality, air quality, and the use and disposal of hazardous substances.
Bureau of Reclamation (USBR) develops water supplies for many uses, but primarily for agriculture, and ensures delivery of water through operation of the federal Central Valley Project.
Fish and Wildlife Service (USFWS) plans and manages federal wildlife refuges, evaluates biological impacts of federally funded or permitted water development projects, and provides recommendations for minimizing project impacts and enhancing fish and wildlife resources.
National Marine Fisheries Service (NMFS) has primary federal responsibility for the conservation, management, and development of living marine resources and for the protection of certain marine mammals and endangered species.
Soil Conservation Service (SCS) assists farmers in implementing practices to reduce soil erosion and protect wetlands.
Given the multitude of agencies at work around the estuary, and their differ- ent and often opposing missions, it is no wonder that regulatory programs are sometimes perceived as an impediment to effective management. One of the challenges to improving conditions in the estuary will be to ensure that all agen- cies, regardless of their mandates, from the local through the federal level, are working toward a set of common goals and objectives.
Boundaries of the San Francisco Estuary Project Study Area
For purposes of the San Francisco Estuary Project, the BayDelta estuary is defined as the waters of San Francisco Bay and the Sacramento-San Joaquin Delta. The Estuary Project's primary study area, referred to in this report as the "estuary basin," includes the four major embayments of the San Francisco Bay system and their immediate watersheds, and lands and waters of the Sacramento- San Joaquin Delta, as delineated by Section 12220 of the State Water Code (Figure 2). This area comprises portions of the twelve estuary counties: Alameda, Contra Costa, Marin, Napa, Sacramento, San Francisco, San Joaquin, San Mateo, Santa Clara, Solano, Sonoma, and Yolo.
Under the authority of Section 320 of the Clean Water Act (Appendix I), San Francisco Estuary Project participants are to identify the causes of the Bay/ Delta estuary's environmental problems and to develop a plan to address them. In doing this, they are to assess activities in and around the estuary that contrib- ute to the problems, as well as activities within a larger "estuarine zone." As defined in Section 320 of the Clean Water Act, the estuarine zone extends to the upstream reach of tidal influence or the historical limit of anadromous fish runs, whichever is greater. The estuarine zone of the BayDelta estuary extends well into the upper reaches of streams in the Central Valley watershed where fish such as salmon and steelhead trout spawned in the past. Accordingly, San Francisco Estuary Project participants are assessing activities affecting condi- tions in Central Valley streams and rivers tributary to the estuary and will take this information into account when developing the Comprehensive Conservation and Management Plan.

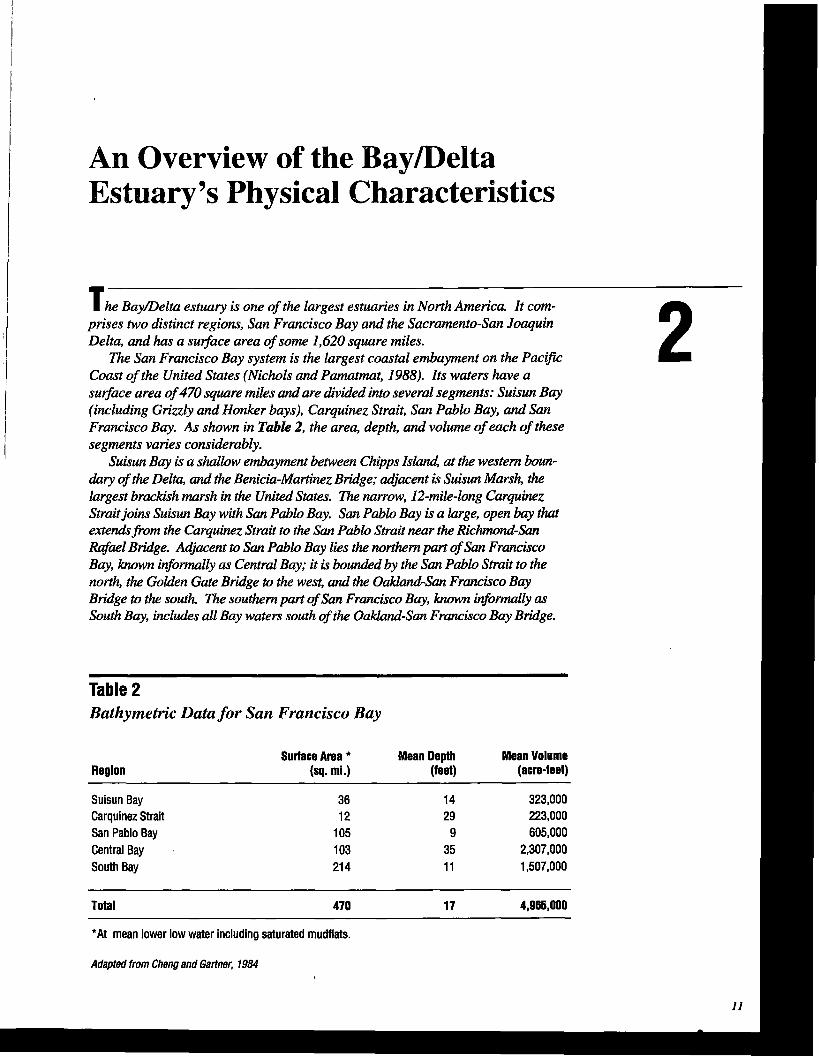
An Overview of the BayJDelta Estuary's Physical Characteristics
T h e Bay/Delta estuary is one of the largest estuaries in North America. It com- prises two distinct regions, Sun Francisco Bay and the Sacramento-Sun Joaquin
n Delta, and has a sudace area of some 1,620 square miles.
The Sun Francisco Bay system is the largest coastal embayment on the Pacific Coast of the United States (Nichols and Pamatmat, 1988). Its waters have a surjace area of 470 square miles and are divided into several segments: Suism Bay (including Grizzly and Honker bays), Carquinez Strait, Sun Pablo Bay, and Sun Francisco Bay. As shown in Table 2, the area, depth, and volume of each of these segments varies considerably.
Suisun Bay is a shllow epnbayment between Chipps I S M at the western boun- dary of the Delta, and the Benicia-Martinez Bridge; adjacent is Suisun Marsh, the largest brackish marsh in the United States. The mrrow, 12-mile-long Carquinez Strait joins Suisun Bay with Sun Pablo Bay. Sun Pablo Bay is a large, open bay that extends from the Carauinez Strait to the Sun Pablo Strait near the Richmond-Sun Rafael Bridge. Adjacent to Sun Pablo Bay lies the northern part of Sun Francisco Bay, known informally as Central Bay; it is bounded by the Sun Pablo Strait to the north, the Golden Gate Bridge to the west, and the Oaklapld-Sun Francisco Bay Bridge to the south. The southern part of Sun Francisco Bay, known informally as South Bay, includes all Bay waters south of the ~~~Sun Francisco Bay Bridge.
Table 2 Bathymetric Data for San Francisco Bay
Surface Area * Mean Depth Mean Volume Region (84 mi.) (feet) (acre-feet)
Suisun Bay 36 14 323,000 Carquinez Strait 12 29 223,000 San Pablo Bay 105 9 605,000 Central Bay . 103 35 2,307,000 South Bay 21 4 11 1,507,000
Total 470 17 4,965,000
*At mean lower low water including saturated mudflats.
Adapted from Cheng and Gartner, 1984
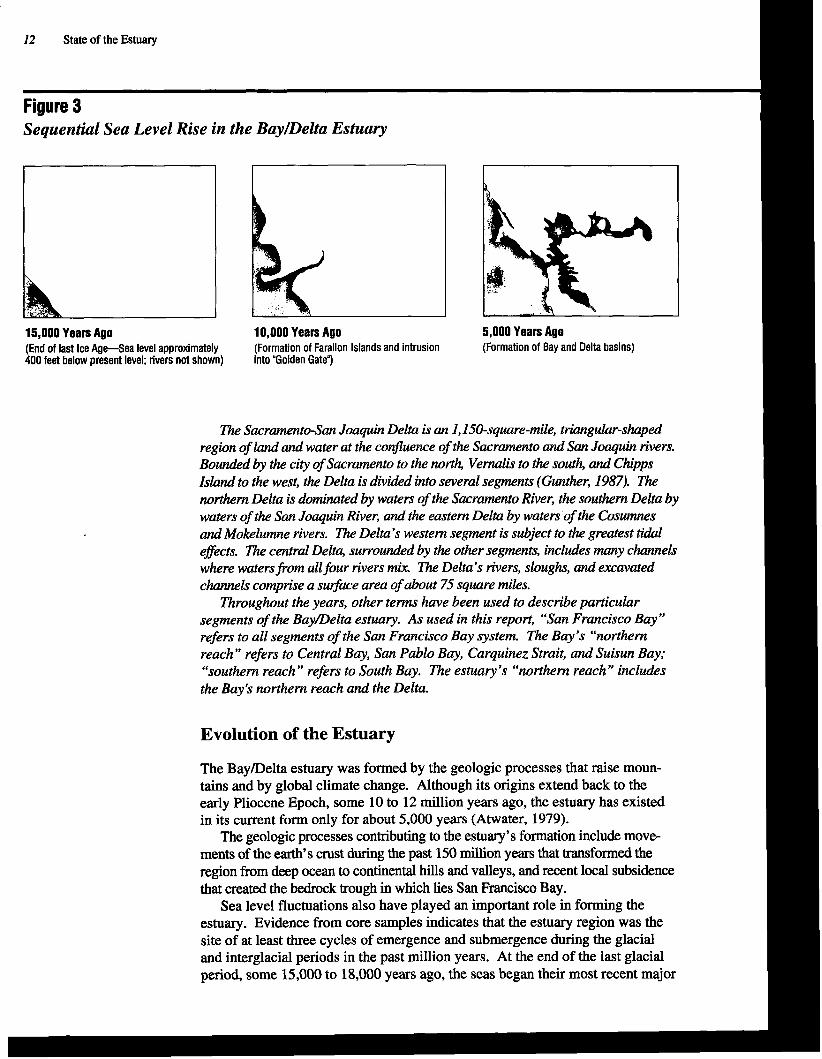
-
12 State of the Estuary
Figure 3 Sequential Sea Level Rise in the Bay/Delta Estuaiy
15,000 Years Ago 10,000 Years Ago 5,000 Years Ago (End of last Ice A ~ e S e a level approximately (Formation of Farallon Islands and intrusion (Formation of Bay and Delta basins) 400 feet below present level; rivers not shown) into "olden Gate")
The Sacramento-San Joaquin Delta is an 1,150-square-mile, tPiangular-shaped region of land and water at the conJluence of the Sacramento and San Joaquin rivers. Bounded by the city of Sacramento to the north, Vemlis to the south, and Chipps Island to the west, the Delta is divided into several segments (Gunther, 1987). The northern Delta is dominated by waters of the Sacramento River, the southern Delta by waters of the San Joaquin River, and the eastern Delta by waters of the Cosumnes and Mokelumne rivers. The Delta's western segment is subject to the greatest tidal gects. The central Delta, surrounded by the other segments, includes many channels where waters from all four rivers mix The Delta's rivers, sloughs, and excavated channels comprise a sup3'me area of about 75 square miles.
Throughout the years, other terms have been used to describe particular segments of the Bay/Delta estuary. As used in this report, "San Francisco Bay" refers to all segments of the San Francisco Bay system. The Bay's "northern reach" refers to Central Bay, Sun Pablo Bay, Carquinez Strait, and Suisun Bay; "southern reach" refers to South Bay. The estuary's "northern reach" includes the Bay's northern reach and the Delta.
Evolution of the Estuary
The BayIDelta estuary was formed by the geologic processes that raise moun- tains and by global climate change. Although its origins extend back to the early Pliocene Epoch, some 10 to 12 million years ago, the estuary has existed in its current form only for about 5,000 years (Atwater, 1979).
The geologic processes contributing to the estuary's formation include move- ments of the earth's crust during the past 150 million years that transformed the region from deep ocean to continental hills and valleys, and recent local subsidence that created the bedrock trough in which lies San Francisco Bay.
Sea level fluctuations also have played an important role in forming the estuary. Evidence from core samples indicates that the estuary region was the site of at least three cycles of emergence and submergence during the glacial and interglacial periods in the past million years. At the end of the last glacial period, some 15,000 to 18,000 years ago, the seas began their most recent major
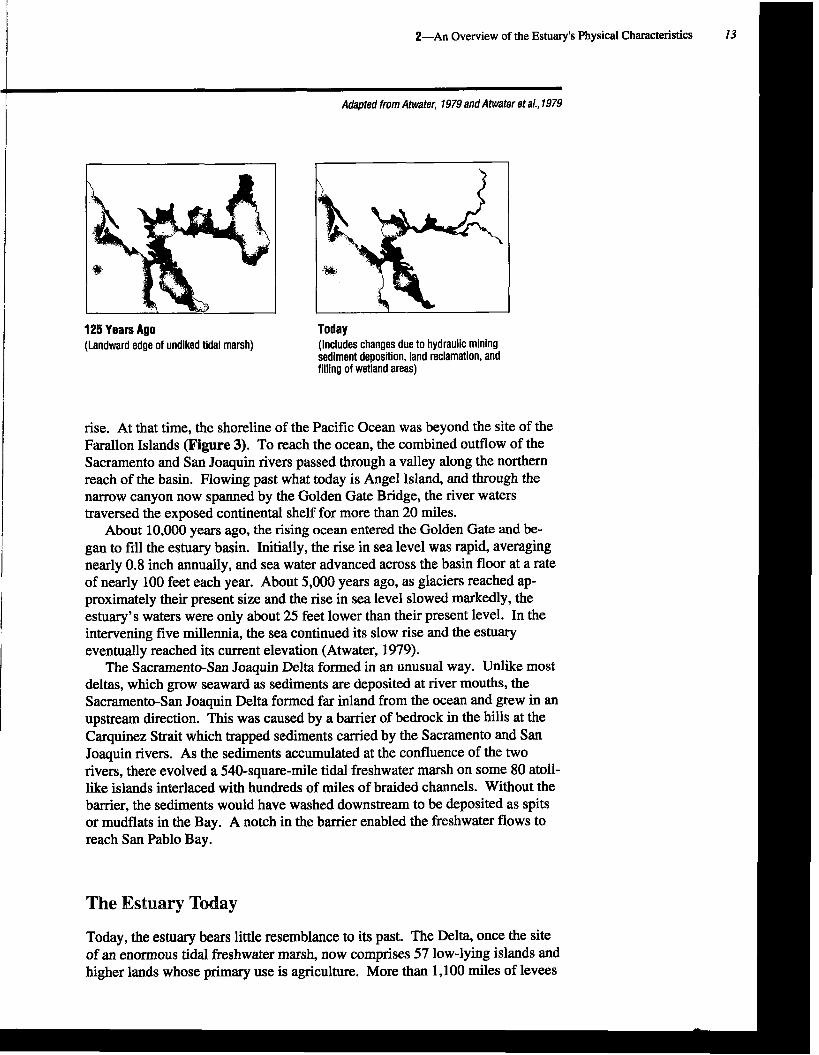
7-
I 2-An Overview of the Estuary's Physical Characteristics 13
Adapted from Atwater, 1979 and Atwater et a/., 1979
125 Years Ago Today (Landward edge of undiked tidal marsh) (Includes changes due to hydraulic mining
sediment deposition, land reclamation, and filling of wetland areas)
rise. At that time, the shoreline of the Pacific Ocean was beyond the site of the Farallon Islands (Figure 3). To reach the ocean, the combined outflow of the Sacramento and San Joaquin rivers passed through a valley along the northern reach of the basin. Flowing past what today is Angel Island, and through the narrow canyon now spanned by the Golden Gate Bridge, the river waters traversed the exposed continental shelf for more than 20 miles.
About 10,000 years ago, the rising ocean entered the Golden Gate and be- gan to fill the estuary basin. Initially, the rise in sea level was rapid, averaging nearly 0.8 inch annually, and sea water advanced across the basin floor at a rate of nearly 100 feet each year. About 5,000 years ago, as glaciers reached ap- proximately their present size and the rise in sea level slowed markedly, the estuary's waters were only about 25 feet lower than their present level. In the intervening five millennia, the sea continued its slow rise and the estuary eventually reached its current elevation (Atwater, 1979).
The Sacramento-San Joaquin Delta formed in an unusual way. Unlike most deltas, which grow seaward as sediments are deposited at river mouths, the Sacramento-San Joaquin Delta formed far inland from the ocean and grew in an upstream direction. This was caused by a barrier of bedrock in the hills at the Carquinez Strait which trapped sediments carried by the Sacramento and San Joaquin rivers. As the sediments accumulated at the confluence of the two rivers, there evolved a 540-square-mile tidal freshwater marsh on some 80 atoll- like islands interlaced with hundreds of miles of braided channels. Without the barrier, the sediments would have washed downstream to be deposited as spits or mudflats in the Bay. A notch in the barrier enabled the freshwater flows to reach San Pablo Bay.
The Estuary Today
Today, the estuary bears little resemblance to its past. The Delta, once the site of an enormous tidal freshwater marsh, now comprises 57 low-lying islands and higher lands whose primary use is agriculture. More than 1,100 miles of levees
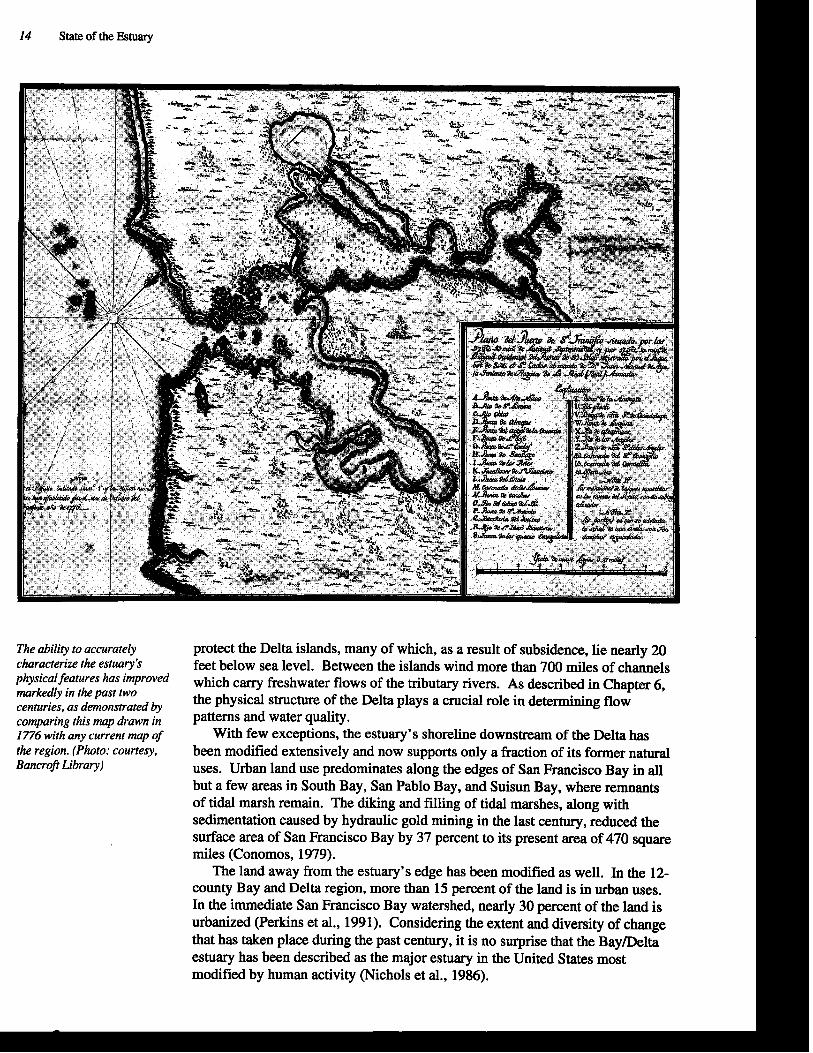
14 State of the Estuary
The ability to accurately protect the Delta islands, many of which, as a result of subsidence, lie nearly 20 characterize the estuary's feet below sea level. Between the islands wind more than 700 miles of channels physicalfeatures jmprwed which carry freshwater flows of the tributary rivers. As described in Chapter 6, markedly in the past two centuries, as demonstrated by the physical structure of the Delta plays a crucial role in determining flow
comparing this map d m in patterns and water qualitye 1776 with any current map of With few exceptions, the estuary's shoreline downstream of the Delta has the region. (Photo: courtesy, been modified extensively and now supports only a fraction of its former natural Bancrofr Library) uses. Urban land use predominates along the edges of San Francisco Bay in all
but a few areas in South Bay, San Pablo Bay, and Suisun Bay, where remnants of tidal marsh remain. The diking and filling of tidal marshes, along with sedimentation caused by hydraulic gold mining in the last century, reduced the surface area of San Francisco Bay by 37 percent to its present area of 470 square miles (Conomos, 1979).
The land away from the estuary's edge has been modified as well. In the 12- county Bay and Delta region, more than 15 percent of the land is in urban uses. In the immediate San Francisco Bay watershed, nearly 30 percent of the land is urbanized (Perkins et al., 1991). Considering the extent and diversity of change that has taken place during the past century, it is no surprise that the BayIDelta estuary has been described as the major estuary in the United States most modified by human activity (Nichols et al., 1986).
2-An Overview of the Estuary's Physical Characteristics 15
Climate
Climate plays an important role in determining the environmental conditions in and around the estuary. The amount and timing of precipitation, air tempera- ture, and wind patterns influence freshwater inflow, salinity, and currents.
Similar to the rest of coastal California, the estuary region has a Mediterra- nean climate. The climate is characterized by cool, wet winters (November- April) and warm, dry summers (May-October).
Precipitation in the estuary's watershed occurs mostly as rainfall, except in the higher reaches of the Sierra Nevada where snowfall is common. In any year, the amount of precipitation in different parts of the watershed varies greatly. The wettest areas usually receive about 60 inches of rain, six times as much as the driest areas. More importantly, the amount and timing of precipitation varies widely from year to year, strongly influencing patterns of freshwater flow, habitat conditions, and hydrology.
Air temperatures in the Bay area reflect essentially a maritime climate, with mean monthly temperatures ranging from 50" F to 60" F. Areas farther inland have much higher average temperatures during the summer (80" F) and lower average temperatures during the winter (43" F) (Conornos, 1979).
Winds, a particularly important influence on Bay circulation and the resuspen- sion of sediments, vary throughout the year. During the summer, strong westerly winds develop during the afternoon as warm air in the Central Valley rises and cool air from the Pacific Ocean moves inland. These winds are especially strong at gaps in the Coastal Range. During winter storms, the strongest winds are from the southeast and east.
Water Quality
Water quality is an extremely important component of the estuarine environ- ment because it influences the distribution and abundance of estuarine organ- isms and affects many other beneficial uses. The estuary's water quality- salinity, temperature, nutrients, and dissolved oxygen-varies greatly from one segment to another and can change markedly with the seasons.
Salinity Salinity is a measure of the total salt content of water. The common unit of salinity measurement is concentration, usually expressed as parts per thousand (ppt). Salinity also may be expressed as the concentration of total dissolved solids or as specific electrical conductance. Most salinity measurements in na- tural waters range from near zero ppt in fresh water, to around two ppt in brackish water, to about 33 ppt in ocean water.
The salinity of water entering the estuary varies greatly. The Sacramento River and eastside streams flowing into the Delta are low in salts, with salinity averaging less than 0.1 ppt. San Joaquin River water is more saline than these tributaries and, since the 1930s, its average salinity has increased from less than 0.2 ppt to about 0.4 ppt, primarily as a result of increased agricultural drainage (SWRCB, 1991).
The salinity of the estuary's northern reach varies considerably and increases along a gradient from the Delta to Central Bay. At the mouth of the Sacramento River, for example, the mean annual salinity is slightly less than 2 ppt; in Suisun Bay it is about 7 ppt; and at the Presidio in Central Bay it is about 30 ppt (Fox et al., 1991). In the southern reach, salinities remain at near-ocean concentrations during much of the year.
16 State of the Estuary
Seasonal changes in the salinity distribution within the estuary are controlled mainly by the exchange of ocean and Bay water, and by river inflow. River inflow has the greater influence on salinity distributieh throughout most of the estuary because inflow varies widely, while ocean salinities vary relatively little. In winter, high flows of fresh water from the Delta lower the salinity throughout the estuary's northern reach. High Delta flows also intrude into South Bay, lowering salinity there for extended periods (Conomos, 1979).
During the summer, when freshwater inflow is low, saline water from the Bay intrudes into the Delta. The inland limit of salinity intrusion varies greatly from year to year. Salinity of one ppt has extended upstream of Rio Vista several times in this century. During the summer, high evaporation rates may cause salinity in South Bay to exceed that of ocean water.
As described in Chapter 6, water storage and diversions also influence the salinity of the estuary's waters. Since the 1920s, water development has played an increasingly important role in determining salinity concentrations in many segments of the estuary.
Temperature The temperature of the estuary's waters varies geographically and seasonally. During summer, water in the northern reach of San Francisco Bay is usually warmer than the ocean water, due to atmospheric heating and the inflow of relatively warm river water. In winter, the Bay's waters are usually cooler than the ocean. South Bay, with its small volume of freshwater inflow, has water temperatures intermediate between the ocean and river temperatures (NOAA, 1985). Water temperatures in San Francisco Bay range from about 50" F to 68O F; in the Delta, they range from about 57" F to 75" F (Conomos, 1979). Throughout the estuary, water temperatures tend to be highest in shallow, still areas.
Water temperature influences the timing of aquatic species development and biological productivity, in general. It is particularly important in determin- ing the survival of fish eggs, larvae, and juveniles in the estuary's streams and rivers and in the Delta. The temperature of these waters is strongly affected by ambient air temperature, the temperature of water released from reservoirs, river flow rates, and strearnside vegetation. The effect of reservoir release temperatures on aquatic resources is most pronounced in river segments up- stream of the Delta.
Nutrients Nutrients are essential for the growth and reproduction of estuarine plants and animals. They enable the growth of single-celled plants known as phytoplankton, and the growth of benthic algae, part of the base of the aquatic food web. Without nutrients, there would be neither plants in the estuary's waters, nor the animals they sustain. Too great a supply of nutrients, however, may cause excessive plant growth and, as the plants decompose, oxygen depletion and odors. This condition, known as eutrophication, was a frequent occurrence in parts of San Francisco Bay before municipalities improved the treatment of sewage effluent.
The estuary's main nutrients are nitrogen (in the form of nitrate and am- monium), phosphate, and silicate. These compounds are supplied by several sources including river inflow, ocean water, sewage treatment plants, runoff, wetlands, and atmospheric fallout (rain and dust). Bacterial decomposition of organic matter in the water column and on the bottom increases the availability
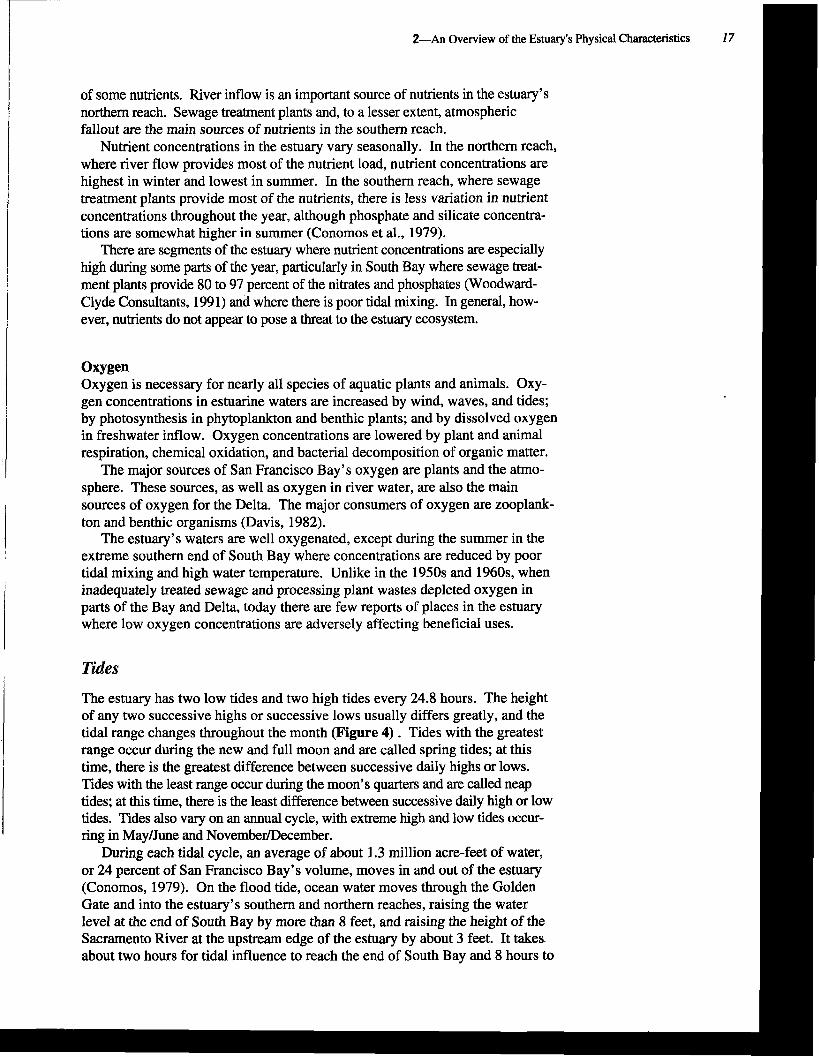
2-An Overview of the Estuary's Physical Characteristics 17
of some nutrients. River inflow is an important source of nutrients in the estuary's northern reach. Sewage treatment plants and, to a lesser extent, atmospheric fallout are the maiq sources of nutrients in the southern reach.
Nutrient concentrations in the estuary vary seasonally. In the northern reach, where river flow provides most of the nutrient load, nutrient concentrations are highest in winter and lowest in summer. In the southern reach, where sewage treatment plants provide most of the nutrients, there is less variation in nutrient concentrations throughout the year, although phosphate and silicate concentra- tions are somewhat higher in summer (Conomos et al., 1979).
There are segments of the estuary where nutrient concentrations are especially high during some parts of the year, particularly in South Bay where sewage treat- ment plants provide 80 to 97 percent of the nitrates and phosphates (Woodward- Clyde Consultants, 1991) and where there is poor tidal mixing. In general, how- ever, nutrients do not appear to pose a threat to the estuary ecosystem.
owgen Oxygen is necessary for nearly all species of aquatic plants and animals. Oxy- gen concentrations in estuarine waters are increased by wind, waves, and tides; by photosynthesis in phytoplankton and benthic plants; and by dissolved oxygen in freshwater inflow. Oxygen concentrations are lowered by plant and animal respiration, chemical oxidation, and bacterial decomposition of organic matter.
, The major sources of San Francisco Bay's oxygen are plants and the atmo- sphere. These sources, as well as oxygen in river water, are also the main sources of oxygen for the Delta. The major consumers of oxygen are zooplank- ton and benthic organisms (Davis, 1982).
The estuary's waters are well oxygenated, except during the summer in the extreme southern end of South Bay where concentrations are reduced by poor tidal mixing and high water temperature. Unlike in the 1950s and 1960s, when inadequately treated sewage and processing plant wastes depleted oxygen in parts of the Bay and Delta, today there are few reports of places in the estuary where low oxygen concentrations are adversely affecting beneficial uses.
Tides
The estuary has two low tides and two high tides every 24.8 hours. The height of any two successive highs or successive lows usually differs greatly, and the tidal range changes throughout the month (Figure 4) . Tides with the greatest range occur during the new and full moon and are called spring tides; at this
I time, there is the greatest difference between successive daily highs or lows. Tides with the least range occur during the moon's quarters and are called neap tides; at this time, there is the least difference between successive daily high or low tides. Tides also vary on an annual cycle, with extreme high and low tides occur- ring in MayIJune and NovemberIDecember.
During each tidal cycle, an average of about 1.3 million acre-feet of water, or 24 percent of San Francisco Bay's volume, moves in and out of the estuary (Conomos, 1979). On the flood tide, ocean water moves through the Golden Gate and into the estuary's southern and northern reaches, raising the water level at the end of South Bay by more than 8 feet, and raising the height of the Sacramento River at the upstream edge of the estuary by about 3 feet. It takes. about two hours for tidal influence to reach the end of South Bay and 8 hours to
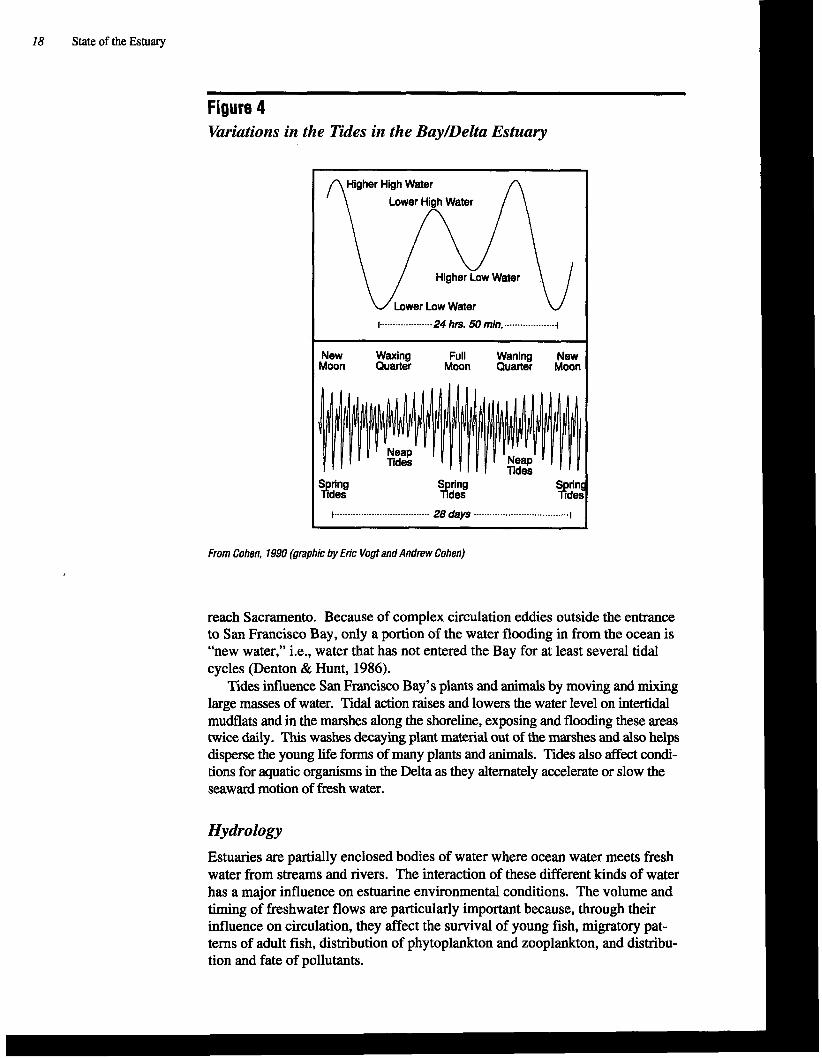
18 State of the Estuary
Figure 4 Variations in the Tides in the Bay/Delta Estuary
Higher High Water
Lower High Water
Lower Low Water I .................... 24 hs. 50 mi". .................... 1
New Waxing Full Waning New Moon Quatter Moon Quarter Moon
S ring #des
S ring #des
S rin $det
t .................................... 28 deys .................................... ,
From Cohen, 1990 (graphic by Eric Vogt and Andrew Cohen)
reach Sacramento. Because of complex circulation eddies outside the entrance to San Francisco Bay, only a portion of the water flooding in from the ocean is "new water," i.e., water that has not entered the Bay for at least several tidal cycles (Denton & Hunt, 1986).
Tides influence San Francisco Bay's plants and animals by moving and mixing large masses of water. Tidal action raises and lowers the water level on intertidal mudflats and in the marshes along the shoreline, exposing and flooding these areas twice daily. This washes decaying plant material out of the marshes and also helps disperse the young life forms of many plants and animals. Tides also affect condi- tions for aquatic organisms in the Delta as they alternately accelerate or slow the seaward motion of fresh water.
Hydrology
Estuaries are partially enclosed bodies of water where ocean water meets fresh water from streams and rivers. The interaction of these different kinds of water has a major influence on estuarine environmental conditions. The volume and timing of freshwater flows are particularly important because, through their influence on circulation, they affect the survival of young fish, migratory pat- terns of adult fish, distribution of phytoplankton and zooplankton, and distribu- tion and fate of pollutants.

2-An Overview of the Estuary's Physical Characteristics 19
Sources of the Estuary's Fresh Water The estuary receives 90 percent of its fresh water from streams and rivers of the Central Valley and from the Trinity River drainage and about 10 percent from tributaries and other sources surrounding San Francisco Bay. Of the flows entering the estuary from the Central Valley, the Sacramento River (including imports from the Trinity River drainage) accounts for 80 percent, the San Joaquin River 15 percent, and smaller streams the remainder ( F i e 5). In the Bay's immediate watershed, most of the k h water is provided by fewer than a dozen tributaries.
Industrial, residential, and minor agricultural sources also contribute treated water of varying quality to the estuary. In South Bay, the volume of these flows during summer actually exceeds the amount of natural freshwater inflow from the adjacent watershed (Conomos, 1979).
Circulation in the Northern Reach Fresh water flowing from the Delta usually meets salt water from the ocean in the vicinity of Suisun Bay. Because fresh water is less dense than salt water, when they meet, fresh water tends to flow over the surface of the salt water before the two are partially mixed by much stronger tidal currents and winds. This separation of fresh and salt water results in a vertical salinity gradient that may occur in an area ex- tending several miles in length and which is most prominent when Delta outflow is high. When outflow is low, the waters are well-mixed, with only a small salinity gradient from the surface to the bottom (Conomos, 1979).
The downstream flow of the freshwater surface layer induces an upstream flow of saltier water along the bottom in a pattern known as gravitational circulation (Smith, 1987). The most landward zone of gravitational circulation, where bottom ebb and flood currents are nearly equal, is called the null zone (Arthur and Ball, 1980).
The location of the null zone is influenced mainly by Delta outflow. A moder- ate Delta outflow of about 10,000 cfs (cubic feet per second) positions the null
Figure 5 Annual Freshwater Inflow to the Estuary (Million Acre-Feet)
1901 -1 979 average
San Francisco Bay Basin Streams, 2.7 Sacramento
her Central Valley Rivers, 1.3
San Joaquin River, 3.4
From data in DWR, 1987a
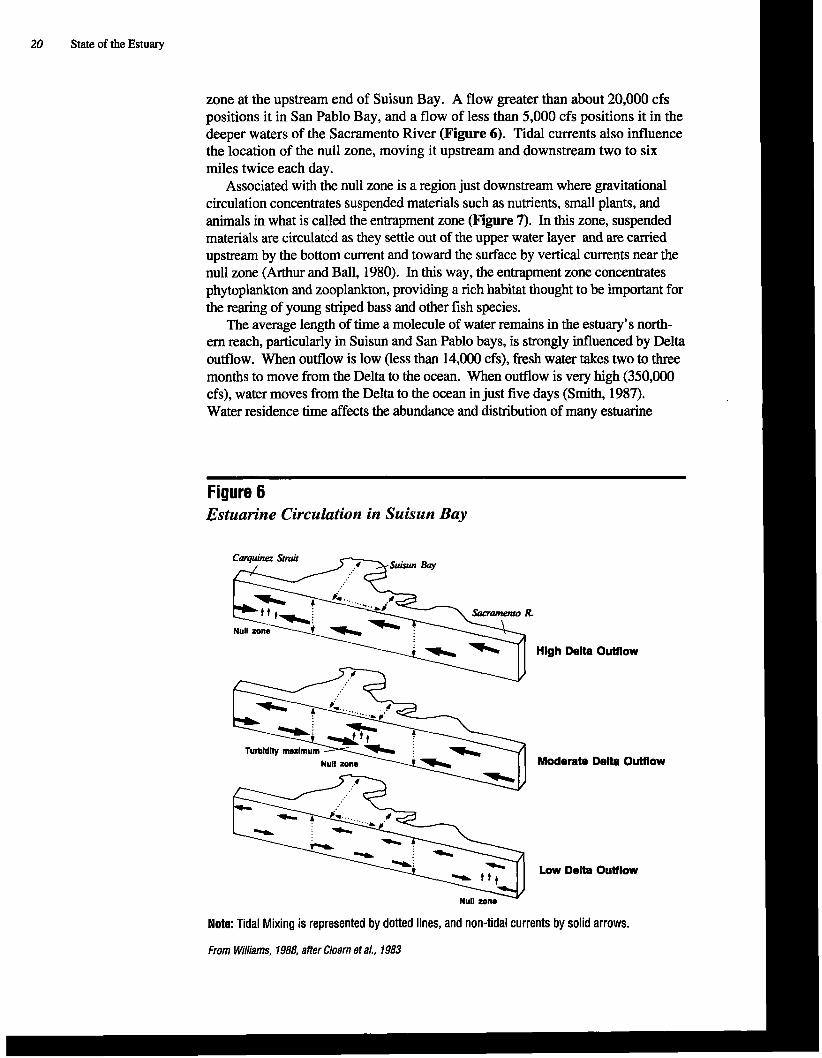
20 State of the Estuary
zone at the upstream end of Suisun Bay. A flow greater than about 20,000 cfs positions it in San Pablo Bay, and a flow of less than 5,000 cfs positions it in the deeper waters of the Sacramento River (Figure 6). Tidal currents also influence the location of the null zone, moving it upstream and downstream two to six miles twice each day.
Associated with the null zone is a region just downstream where gravitational circulation concentrates suspended materials such as nutrients, small plants, and animals in what is called the entrapment zone (Figure 7). In this zone, suspended materials are circulated as they settle out of the upper water layer and are camed upstream by the bottom current and toward the surface by vertical currents near the null zone (Arthur and Ball, 1980). In this way, the entrapment zone concentrates phytoplankton and zooplankton, providing a rich habitat thought to be important for the rearing of young striped bass and other fish species.
The average length of time a molecule of water remains in the estuary's north- ern reach, particularly in Suisun and San Pablo bays, is strongly influenced by Delta outflow. When outflow is low (less than 14,000 cfs), fresh water takes two to three months to move from the Delta to the ocean. When outflow is very high (350,000 cfs), water moves from the Delta to the ocean in just five days (Smith, 1987). Water residence time affects the abundance and distribution of many estuarine
Figure 6 Estuarine Circulation in Suisun Bay
Moderate Delta Outflow
Low Delta Outflow
Note: Tidal Mixing is represented by dotted lines, and non-tidal currents by solid arrows.
From Williams, 1988, after Cloern et al., 1983
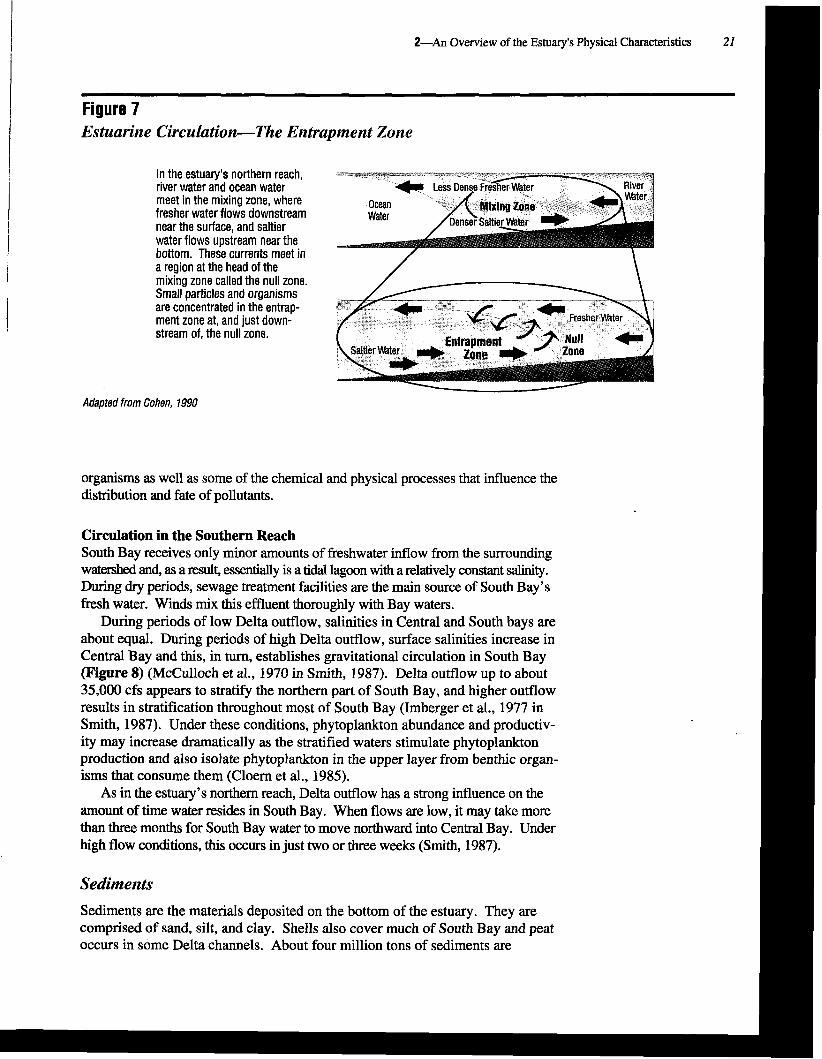
Figure 7 Estuarine Circulation-The Entrapment Zone
. .-.". I near the surface, and saltier / ~enser sante~
i are concentrated in the entrap- ment zone at, and just down- stream of, the null zone.
Adapted from Cohen, 1990
organisms as well as some of the chemical and physical processes that influence the distribution and fate of pollutants.
Circulation in the Southern Reach South Bay receives only minor amounts of freshwater inflow from the surrounding watenhed and, as a result, essentially is a tidal lagoon with a relatively constant dhity. During dry periods, sewage treatment facilities are the main source of South Bay's fresh water. Winds mix this effluent thoroughly with Bay waters.
During periods of low Delta outflow, salinities in Central and South bays are about equal. During periods of high Delta outflow, surface salinities increase in Central Bay and this, in turn, establishes gravitational circulation in South Bay (Figure 8) (McCulloch et al., 1970 in Smith, 1987). Delta outflow up to about 35,000 cfs appears to stratify the northern part of South Bay, and higher outflow results in stratification throughout most of South Bay (Imberger et al., 1977 in Smith, 1987). Under these conditions, phytoplankton abundance and productiv- ity may increase dramatically as the stratified waters stimulate phytoplankton production and also isolate phytoplankton in the upper layer from benthic organ- isms that consume them (Cloern et al., 1985).
As in the estuary's northern reach, Delta outflow has a strong influence on the amount of time water resides in South Bay. When flows are low, it may take more than three months for South Bay water to move northward into Central Bay. Under high flow conditions, this occurs in just two or three weeks (Smith, 1987).
Sediments
Sediments are the materials deposited on the bottom of the estuary. They are comprised of sand, silt, and clay. Shells also cover much of South Bay and peat occurs in some Delta channels. About four million tons of sediments are
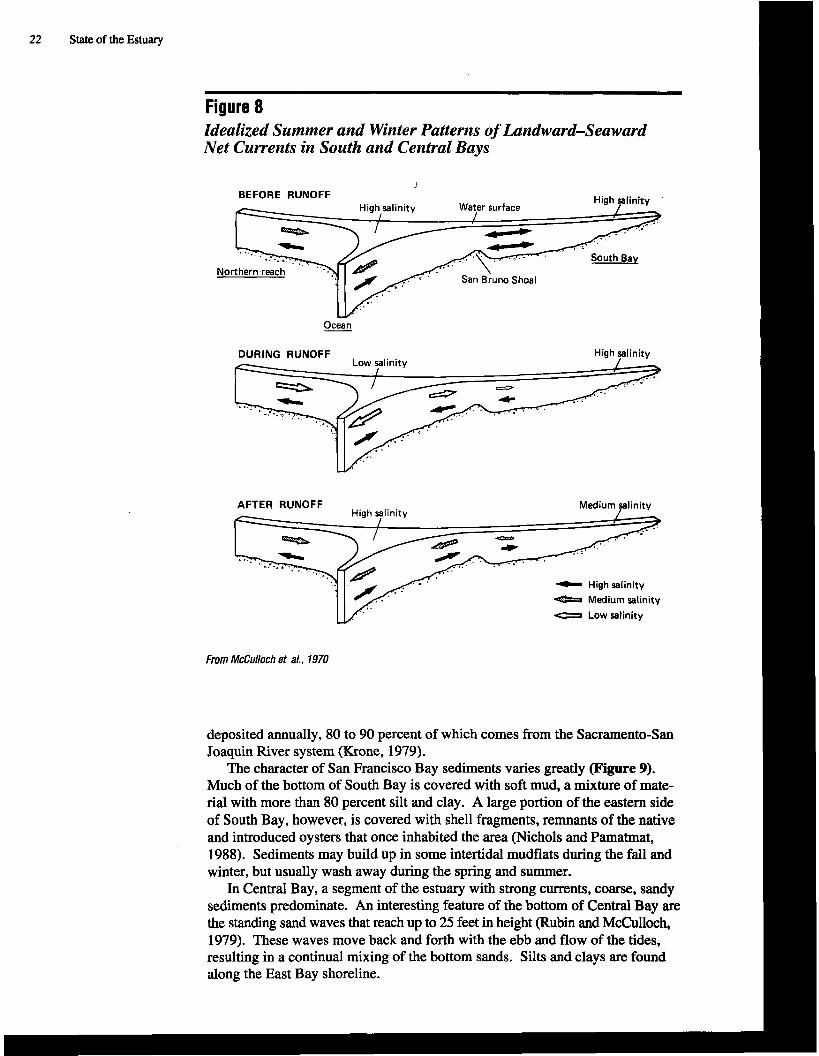
22 State of the Estuary
Figure 8 Idealized Summer and Winter Patterns of Landward-Seaward Net Currents in South and Central Bays
I
BEFORE RUNOFF
Northern reach ' y 1 r, /" \ San Bruno Shoal I
DURING RUNOFF . .. . High salinity 1
AFTER RUNOFF ... . .. . Medium wlinity
High salinity Medium salinity - Low salinity
From McCulloch et a/., 1970
deposited annually, 80 to 90 percent of which comes from the Sacramento-San Joaquin River system (Krone, 1979).
The character of San Francisco Bay sediments varies greatly (Figure 9). Much of the bottom of South Bay is covered with soft mud, a mixture of mate- rial with more than 80 percent silt and clay. A large portion of the eastern side of South Bay, however, is covered with shell fragments, remnants of the native and introduced oysters that once inhabited the area (Nichols and Pamatmat, 1988). Sediments may build up in some intertidal mudflats during the fall and winter, but usually wash away during the spring and summer.
In Central Bay, a segment of the estuary with strong currents, coarse, sandy sediments predominate. An interesting feature of the bottom of Central Bay are the standing sand waves that reach up to 25 feet in height (Rubin and McCulloch, 1979). These waves move back and forth with the ebb and flow of the tides, resulting in a continual mixing of the bottom sands. Silts and clays are found along the East Bay shoreline.
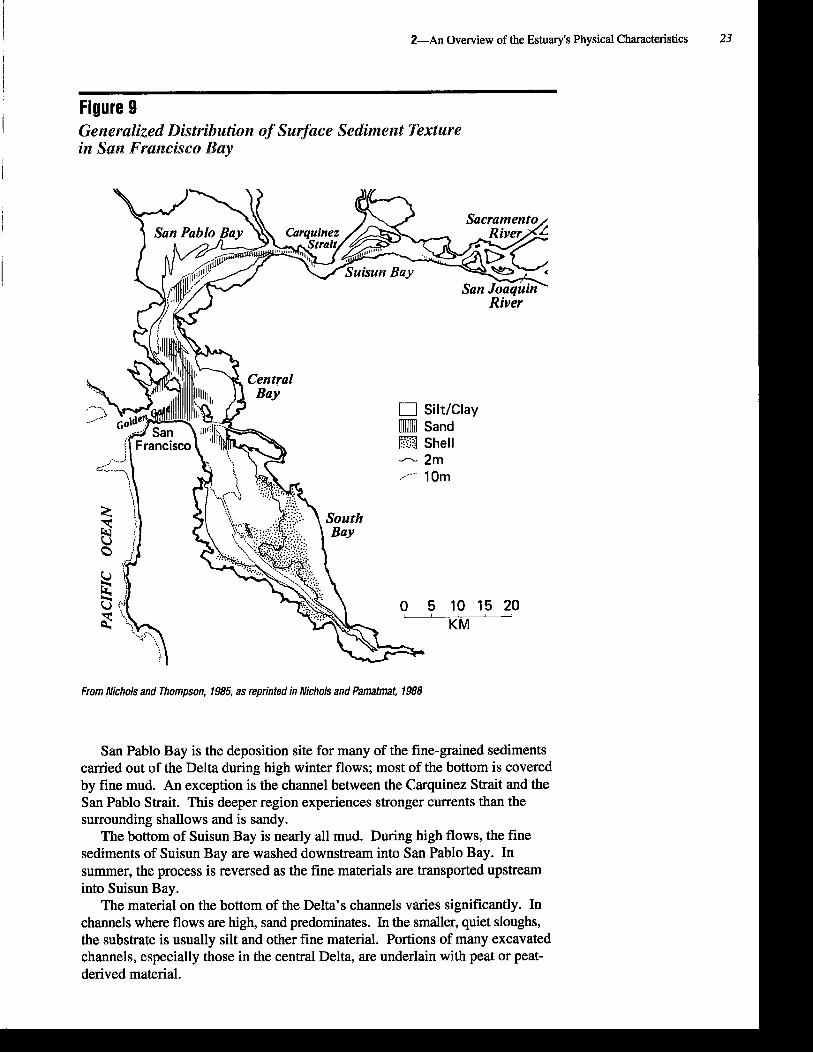
2-An Overview of the Estuary's Physical Characteristics 23
Figure 9 Generalized Distribution of Surface Sediment Texture in San Francisco Bay
17 SiltIClay jlllil Sand
Shell -- 2m ,----. 1 Om
From Nichols and Thompson, 1985, as reprinted in Nichols and Pamatmat, 1988
San Pablo Bay is the deposition site for many of the fine-grained sediments carried out of the Delta during high winter flows; most of the bottom is covered by fine mud. An exception is the channel between the Carquinez Strait and the San Pablo Strait. This deeper region experiences stronger currents than the surrounding shallows and is sandy.
The bottom of Suisun Bay is nearly all mud. During high flows, the fine sediments of Suisun Bay are washed downstream into San Pablo Bay. In summer, the process is reversed as the fine materials are transported upstream into Suisun Bay.
The material on the bottom of the Delta's channels varies significantly. In channels where flows are high, sand predominates. In the smaller, quiet sloughs, the substrate is usually silt and other fine material. Portions of many excavated channels, especially those in the central Delta, are underlain with peat or peat- derived material.
24 State of the Estuary
Summary
The BayDelta estuary evolved over many millennia as rising sea level inundated a coastal valley to form San Francisco Bay and as sediments from the Sierran and Coastal mountain ranges accumulated to create the SacramentoISan Joaquin Delta. Throughout this long period, natural processes governed the nature and pace of the estuary's evolution. During the past 140 years, however, human activities have far surpassed natural processes as the primary force of change in the estuary and its watershed.
Although the estuary is vastly different in many respects from its prehistoric condition, physical factors-climate, water quality, hydrology, and sediments- continue to form the foundation of the estuarine ecosystem. In a sense, they define the very nature of the ecosystem, as precipitation, winds, water temperature, salinity patterns, interactions of fresh and salt water, currents, and variation in substrate influence the distribution and abundance of the estuary's plants and animals.
The following chapters describe the many ways in which Californians have come to rely on the estuary's ecosystem. They also describe how human activities have compromised and continue to threaten this ecosystem.
Development and Uses of the Bay/Belta Estuary
T h e BayLDelta estuary region sustained human populations for thousands of years. Until the middle of the last century, human activities caused few sign$cant impacts to the estuary's water quality and biological resources. Since the Gold Rush, however, the unprecedented growth of urban areas, industry, and large- scale agriculture has placed ever-increasing stresses on the estuary ecosystem. In spite of this, the estuary continues to support many important regional and state-wide economic activities. This chapter traces the i m m e population growth and changes in land use that have occurred in the estuary watershed since the re- gion was inhabited by Native AmePicans, and it describes the impacts of those changes. It also describes some of the major economic activities dependent on, or associated with, the estuary.
Much of the informution in this chapter comes fPom the Estuary Project 5 Status and Trends Report on Land Use and Population (Perkins et al., 1991) and the report entitled, Effects of Land Use Change and Intensification on the San Francisco Estuary (BlanchPeld et al., 1991).
During the process of characterizing human development and uses in the estuary, the following points have emerged:
1. Before 1848, human impacts on the estuary's water quality and its ability to sustain biological resources were minimal.
2. Hydraulic gold mining caused the first major human-induced alteration of the estuary. By the early 1900s, more than one billion cubic yards of mining debris had silted in hundreds of miles of streams and raised the bottom of parts of San Francisco Bay by as much as three feet. Although the debris worsened flooding and impeded navigation, some of the accreted sediment enabled the spread of tidal marshes in the Bay.
3. By the turn of this century, levee construction in the Delta and along the bayshore had enabled the conversion of more than half of the estuary's tidal wetlands to farmland and other uses. Conversion of shoreline wetlands to urban uses has continued to the present time, although at a slower rate during the past few decades.
4. Water development in the Central Valley for flood control, irrigation, and other purposes has altered the timing and volume of flows entering the estuary, and has adversely affected habitat, fish, and wildlife.
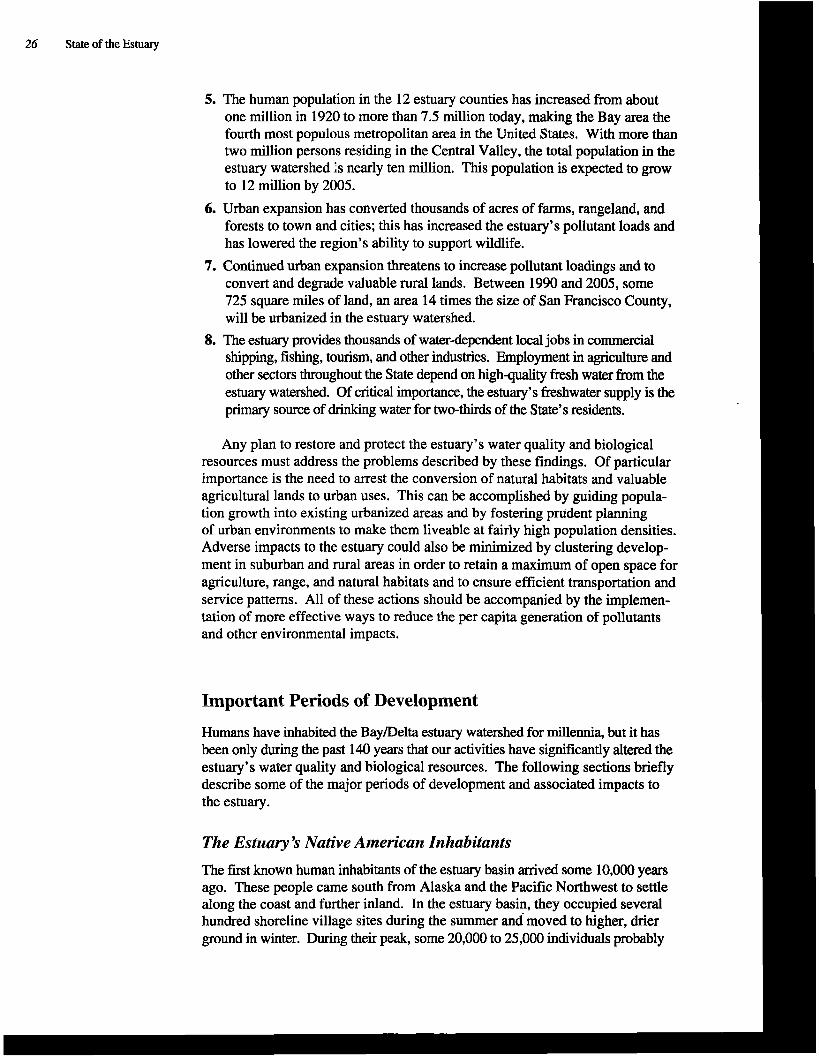
26 State of the Estuary
5. The human population in the 12 estuary counties has increased from about one million in 1920 to more than 7.5 million today, making the Bay area the fourth most populous metropolitan area in the United States. With more than two million persons residing in the Central Valley, the total population in the estuary watershed Is nearly ten million. This population is expected to grow to 12 million by 2005.
6. Urban expansion has converted thousands of acres of farms, rangeland, and forests to town and cities; this has increased the estuary's pollutant loads and has lowered the region's ability to support wildlife.
7. Continued urban expansion threatens to increase pollutant loadings and to convert and degrade valuable rural lands. Between 1990 and 2005, some 725 square miles of land, an area 14 times the size of San Francisco County, will be urbanized in the estuary watershed.
8. The estuary provides thousands of water-dependent local jobs in commercial shipping, fishing, tourism, and other industries. Employment in agriculture and other sectors throughout the State depend on high-quality fresh water from the estuary watershed. Of critical importance, the estuary's freshwater supply is the primary source of drinking water for two-thirds of the State's residents.
Any plan to restore and protect the estuary's water quality and biological resources must address the problems described by these findings. Of particular importance is the need to arrest the conversion of natural habitats and valuable agricultural lands to urban uses. This can be accomplished by guiding popula- tion growth into existing urbanized areas and by fostering prudent planning of urban environments to make them liveable at fairly high population densities. Adverse impacts to the estuary could also be minimized by clustering develop- ment in suburban and rural areas in order to retain a maximum of open space for agriculture, range, and natural habitats and to ensure efficient transportation and service patterns. All of these actions should be accompanied by the implemen- tation of more effective ways to reduce the per capita generation of pollutants and other environmental impacts.
Important Periods of Development
Humans have inhabited the Baymelt. estuary watershed for millennia, but it has been only during the past 140 years that our activities have significantly altered the estuary's water quality and biological resources. The following sections briefly describe some of the major periods of development and associated impacts to the estuary.
The Estuary's Native American Inhabitants
The first known human inhabitants of the estuary basin arrived some 10,000 years ago. These people came south from Alaska and the Pacific Northwest to settle along the coast and further inland. In the estuary basin, they occupied several hundred shoreline village sites during the summer and moved to higher, drier ground in winter. During their peak, some 20,000 to 25,000 individuals probably
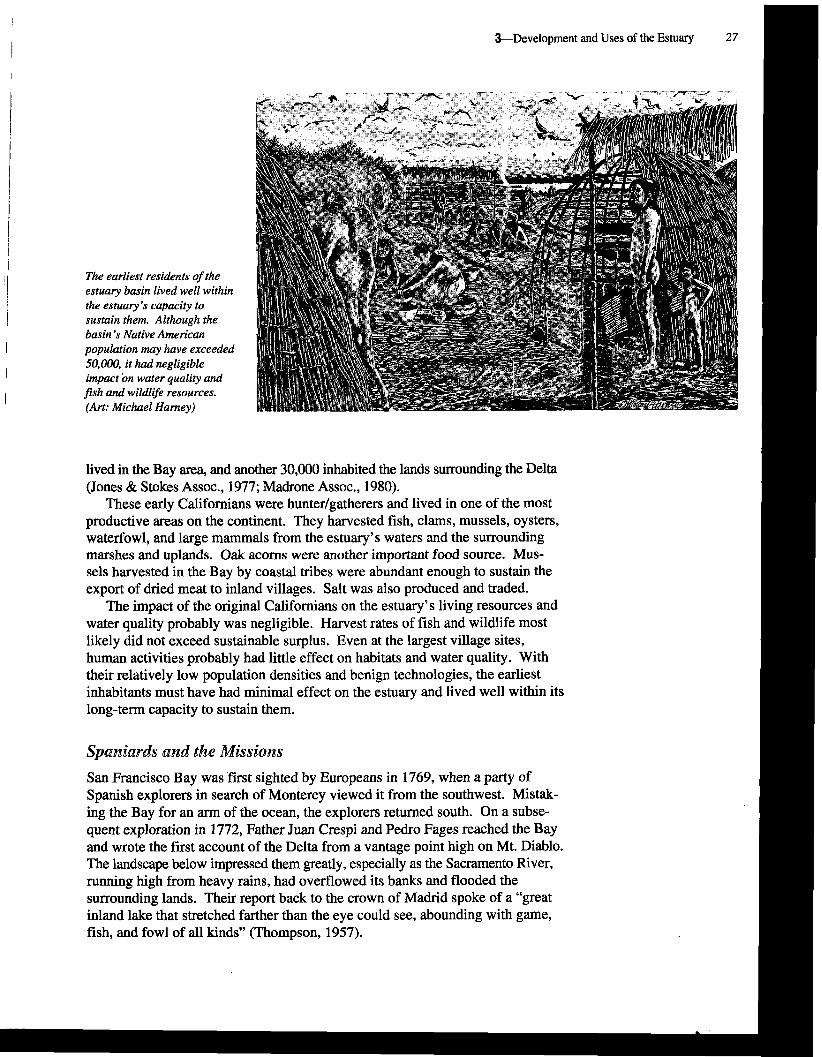
The earliest residents of the estuary basin lived well within
basin's Native American population may have exceeded
lived in the Bay area, and another 30,000 inhabited the lands surrounding the Delta (Jones & Stokes Assoc., 1977; Madrone Assoc., 1980).
These early Californians were hunterlgatherers and lived in one of the most productive areas on the continent. They harvested fish, clams, mussels, oysters, waterfowl, and large mammals from the estuary's waters and the surrounding marshes and uplands. Oak acorns were another important food source. Mus- sels harvested in the Bay by coastal tribes were abundant enough to sustain the export of dried meat to inland villages. Salt was also produced and traded.
The impact of the original Californians on the estuary's living resources and water quality probably was negligible. Harvest rates of fish and wildlife most likely did not exceed sustainable surplus. Even at the largest village sites, human activities probably had little effect on habitats and water quality. With their relatively low population densities and benign technologies, the earliest inhabitants must have had minimal effect on the estuary and lived well within its long-term capacity to sustain them.
Spaniards and the Missions
San Francisco Bay was first sighted by Europeans in 1769, when a party of Spanish explorers in search of Monterey viewed it from the southwest. Mistak- ing the Bay for an arm of the ocean, the explorers returned south. On a subse- quent exploration in 1772, Father Juan Crespi and Pedro Fages reached the Bay and wrote the first account of the Delta from a vantage point high on Mt. Diablo. The landscape below impressed them greatly, especially as the Sacramento River, running high from heavy rains, had overflowed its banks and flooded the surrounding lands. Their report back to the crown of Madrid spoke of a "great inland lake that stretched farther than the eye could see, abounding with game, fish, and fowl of all kinds" (Thompson, 1957).
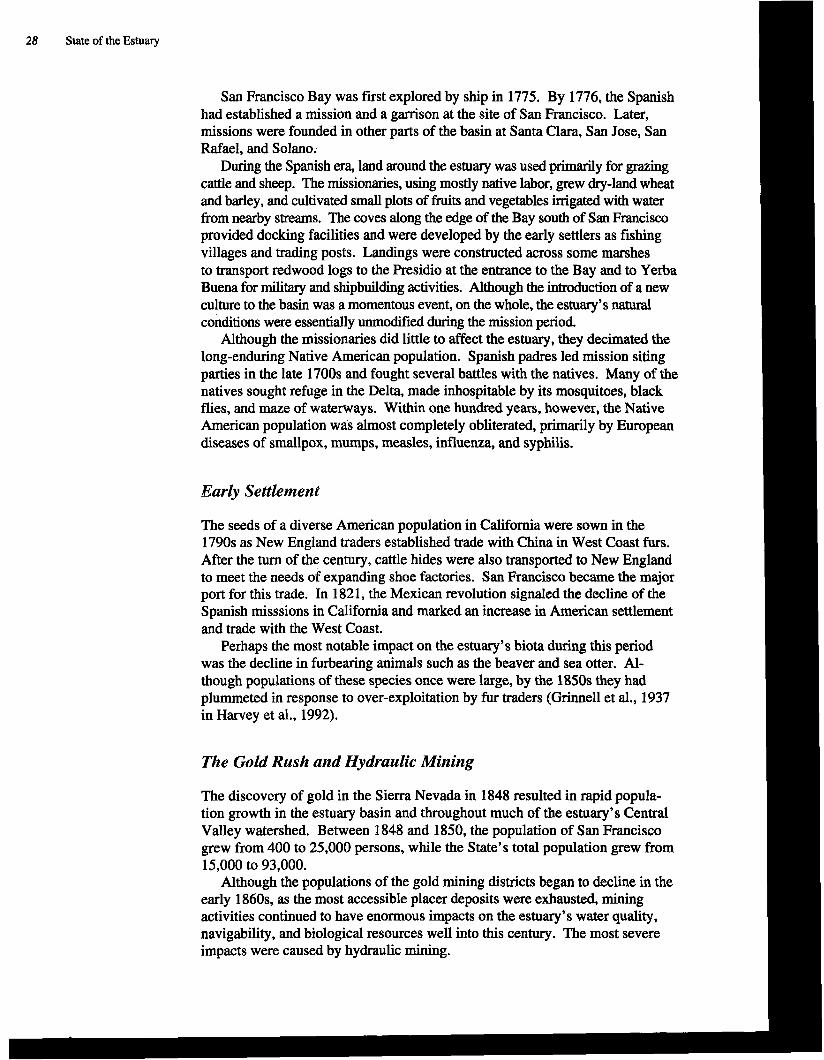
28 State of the Estuary
San Francisco Bay was first explored by ship in 1775. By 1776, the Spanish had established a mission and a garrison at the site of San Francisco. Later, missions were founded in other parts of the basin at Santa Clara, San Jose, San Rafael, and Solano.
During the Spanish era, land around the estuary was used primarily for grazing cattle and sheep. The missionaries, using mostly native labor, grew dry-land wheat and barley, and cultivated small plots of fruits and vegetables irrigated with water from nearby streams. The coves along the edge of the Bay south of San Francisco provided docking facilities and were developed by the early settlers as fishing villages and trading posts. Landings were constructed across some marshes to transport redwood logs to the Presidio at the entrance to the Bay and to Yerba Buena for military and shipbuilding activities. Although the introduction of a new culture to the basin was a momentous event, on the whole, the estuary's natural conditions were essentially unmodified during the mission period.
Although the missionaries did little to affect the estuary, they decimated the long-enduring Native American population. Spanish padres led mission siting parties in the late 1700s and fought several battles with the natives. Many of the natives sought refuge in the Delta, made inhospitable by its mosquitoes, black flies, and maze of waterways. Within one hundred years, however, the Native American population wai almost completely obliterated, primarily by European diseases of smallpox, mumps, measles, influenza, and syphilis.
Early Settlement
The seeds of a diverse American population in California were sown in the 1790s as New England traders established trade with China in West Coast furs. After the turn of the century, cattle hides were also transported to New England to meet the needs of expanding shoe factories. San Francisco became the major port for this trade. In 1821, the Mexican revolution signaled the decline of the Spanish misssions in California and marked an increase in American settlement and trade with the West Coast.
Perhaps the most notable impact on the estuary's biota during this period was the decline in furbearing animals such as the beaver and sea otter. Al- though populations of these species once were large, by the 1850s they had plummeted in response to over-exploitation by fur traders (Grimell et al., 1937 in Harvey et al., 1992).
The Gold Rush and Hydraulic Mining
The discovery of gold in the Sierra Nevada in 1848 resulted in rapid popula- tion growth in the estuary basin and throughout much of the estuary's Central Valley watershed. Between 1848 and 1850, the population of San Francisco grew from 400 to 25,000 persons, while the State's total population grew from 15,000 to 93,000.
Although the populations of the gold mining districts began to decline in the early 1860s, as the most accessible placer deposits were exhausted, mining activities continued to have enormous impacts on the estuary's water quality, navigability, and biological resources well into this century. The most severe impacts were caused by hydraulic mining.
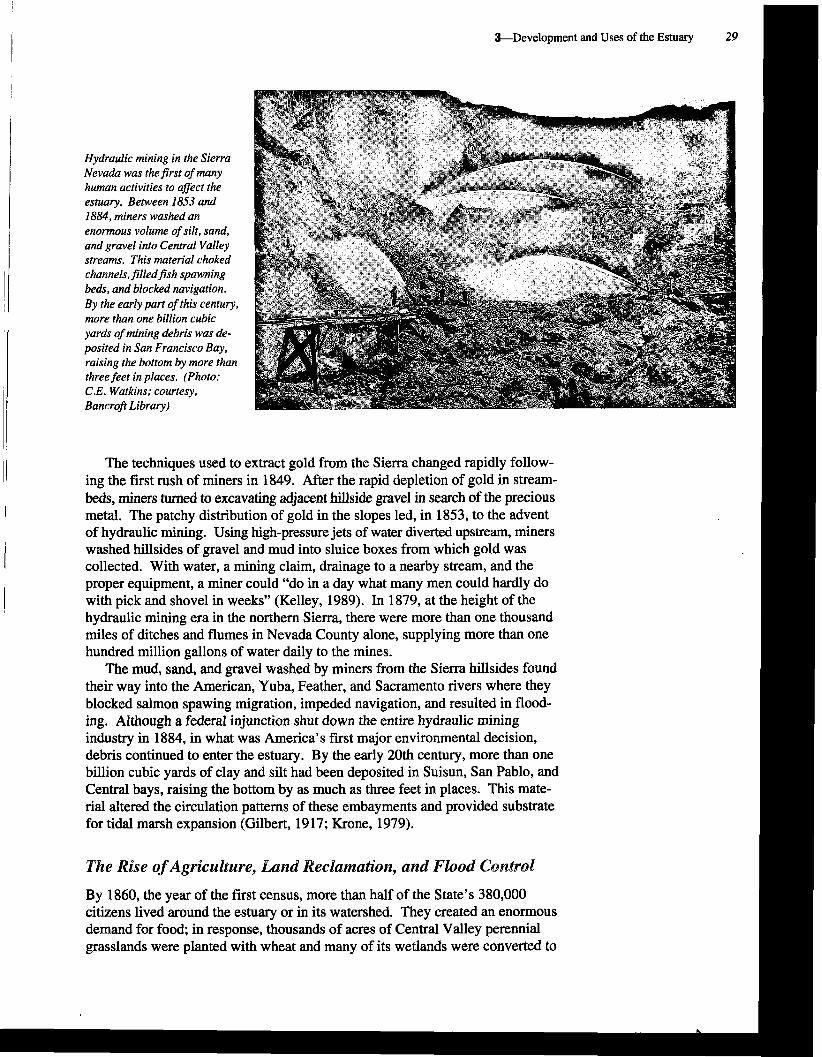
Hydraulic mining in the Sierra
estuary. Between 1853 and 1884, miners washed an enormous volume of silt, sand, and gravel into Central Valley streams. This material choked channels, jiiledfish spawning beds, and blocked navigation. By the early part of this century, B$3 more than one billion cubic
raising the bottom by more than
Bancrofi Library)
The techniques used to extract gold from the Sierra changed rapidly follow- ing the first rush of miners in 1849. After the rapid depletion of gold in stream- beds, miners turned to excavating adjacent hillside gravel in search of the precious metal. The patchy distribution of gold in the slopes led, in 1853, to the advent of hydraulic mining. Using high-pressure jets of water diverted upstream, miners washed hillsides of gravel and mud into sluice boxes from which gold was collected. With water, a mining claim, drainage to a nearby stream, and the proper equipment, a miner could "do in a day what many men could hardly do with pick and shovel in weeks" (Kelley, 1989). In 1879, at the height of the hydraulic mining era in the northern Sierra, there were more than one thousand miles of ditches and flumes in Nevada County alone, supplying more than one hundred million gallons of water daily to the mines.
The mud, sand, and gravel washed by miners from the Sierra hillsides found their way into the American, Yuba, Feather, and Sacramento rivers where they blocked salmon spawing migration, impeded navigation, and resulted in flood- ing. Although a federal injunction shut down the entire hydraulic mining industry in 1884, in what was America's first major environmental decision, debris continued to enter the estuary. By the early 20th century, more than one billion cubic yards of clay and silt had been deposited in Suisun, San Pablo, and Central bays, raising the bottom by as much as three feet in places. This mate- rial altered the circulation patterns of these embayments and provided substrate for tidal marsh expansion (Gilbert, 1917; Krone, 1979).
The Rise ofAgriculture, Eand Reclamation, and Flood Coaakod
By 1860, the year of the first census, more than half of the State's 380,000 citizens lived around the estuary or in its watershed. They created an enormous demand for food; in response, thousands of acres of Central Valley perennial grasslands were planted with wheat and many of its wetlands were converted to

30 State of the Estuary
farmland. Rich wetland soils in the Delta and adjacent to the Central Valley's rivers were especially prized for their ability to raise crops.
The conversion of wetlands to farms was encouraged by passage of the federal Arkansas Act of 1850, which gave to the states all of the unsold federal land within their borders that was swamp and overflowed. Congress made this offer subject to one condition: that the states use the funds from the sale of these lands to ensure that the lands be drained, reclaimed, and put to productive agriculture. Of the more than two million acres of California land eventually designated as swamp and overflowed lands, about one-half million acres were in the Delta, nearly 550,000 acres were in the Sacramento Valley, and additional acreage abounded in the San Joaquin Valley. Subsequent State legislation, particularly the Green Act of 1868, encouraged the conversion of these wetlands into large agricultural holdings (Kelley, 1989).
The draining and reclamation of Delta marshes for farming purposes began on Merritt Island in 1853. At first, the low-lying Delta lands were protected from seasonal flooding by small levees constructed using mules and "Fresno scrapers" and by hand. By the 1870s, sidedraft dredges took over the arduous task of levee construction and maintenance (Thompson & Dutra, 1983). Thirty years later, more than one-half of the Delta, some 250,000 acres, had been converted to farm land.
Upstream of the Delta, farmers were faced with annual flooding made worse by streambeds clogged with mining debris. To prevent the inundation of thousands of acres of drained wetlands and adjacent uplands, they began con- structing low levees in an effort to confine riverflow. The first levee in the Sacramento Valley was constructed along the Feather River near Yuba City in 1867. It failed, as did many of the succeeding levees constructed by levee districts in the ensuing decades. It was not until 1917 that Congress authorized construction of the Sacramento River Flood Control Project, and another 25 years passed before this project would regularly protect Valley farms and cities from floods (USACE, 1987; Kelley, 1989).
The developments of the last century were not without adverse environmen- tal impacts. Burning, drainage, and piecemeal flood control were carried out on hundreds of thousands of acres in the estuary watershed. This degraded and converted natural habitats and lowered habitat values for fish, migratory water- fowl, and other wildlife. The large flood control and reclamation projects altered flow patterns in the estuary and its tributaries. At the same time, the overharvest of many species of fish and wildlife led to the eventual collapse of several commercial fisheries and to population declines of furbearing mammals. By the turn of the century, water quality problems of low oxygen levels and bacterial contamination near sewage outfalls in San Francisco Bay began to be reported (Skinner, 1962).
The Rise of Manufacturing
The early 1900s was a period of growth and diversification as the towns around the estuary broadened their economic bases. These changes were facilitated by the expansion of rail and automobile transportation. Between 1920 and 1939, Albany, Daly City, El Cerrito, Hayward, Piedmont, Redwood City, San Leandro, and San Mateo all doubled in size (Vance, 1964 in Perkins et al., 1991). Cities in the Central Valley also grew, but at a slower rate.
I 3-Development and Uses of the Estuary 31
Much of the urban growth along the fringes of the Bay was fueled by the expansion of the industrial and manufacturing sectors. From the Carquinez Strait downstream, towns along the shoreline developed into industrial, food processing,
I
and shipping centers for regional products. Attendant with this expansion was an increase in pollutants discharged to the estuary by canneries, manufacturing industries, and municipalities. In addition, thousands of acres of valuable wet- lands were filled to provide land for industry, transportation, and other urban
i uses. By the 1930s, some 62 square miles of salt ponds had replaced half of South Bay's tidal wetlands (Ver Planck, 1958).
From the 1900s through the 1940s, further economic growth and diversifi- cation resulted from the construction of private and public water development projects in the estuary watershed. The purposes of these projects included electrical generation; flood control; and water for municipal, industrial, and agri- cultural uses. The Mokelumne Aqueduct began delivering water from the Mokelumne River drainage to the East Bay in 1929, and the Hetch Hetchy Aque-
I duct began transfers of water from the Tuolumne River to San Francisco in 1935. The federal Central Valley Project, with dams on the Sacramento and San Joaquin rivers, begain providing water in the early 1940s. The main features
I I of the Sacramento River Flood Control Project were completed in the mid-1940s. The construction of dams on nearly all of the estuary tributary rivers in the
Central Valley prevented salmon and steelhead trout from reaching thousands of miles of habitat and reduced the recruitment of spawning gravel to the remaining available reaches. Water project operations began to prevent significant volumes of fresh water from reaching the estuary and to alter the timing of flows.
' 1 Post War Urbanization
The Second World War brought about an era of even greater growth and
' I change. The entry of the United States into the war stimulated manufacturing 1 1 and industry around the estuary. The war effort attracted thousands of workers
to military and industrial facilities for ship-building, aircraft deployment, equip-
' I ment maintenance and repair, and military supply. During this period of expanding heavy industry, there was an increase in the estuary's loadings of toxic industrial pollutants, especially solvents and trace elements.
I After the war, much of the labor force remained in the Bay area, attracted by its mild climate, scenic beauty, and the likelihood of permanent work. The growing population, which had tripled from pre-war numbers to 4.5 million, generated a housing construction boom, numerous public works projects, and I ! industrial and commercial expansion. Although the Delta retained its rural charac- ter during this period, large-scale residential and commercial development began ~ 1 to replace small farms and pasture on the flat lands adjacent to San Francisco Bay. The construction of highways and freeways and associated leapfrog suburban development became a major feature of the landscape. Much of this develop-
I 1: ment converted or degraded important habitats, particularly tidal wetlands, and increased the loading of pollutants in urban runoff (Davis et al., 1991; Meiorin et al., 1991).
' 1 Loadings of agricultural pollutants grew enormously during this period as farmers applied new formulations of synthetic organic pesticides to lands through- out the estuary watershed. In addition, some of the soil brought under cultivation
~ with federal and state water on the west side of the San Joaquin Valley had high
I
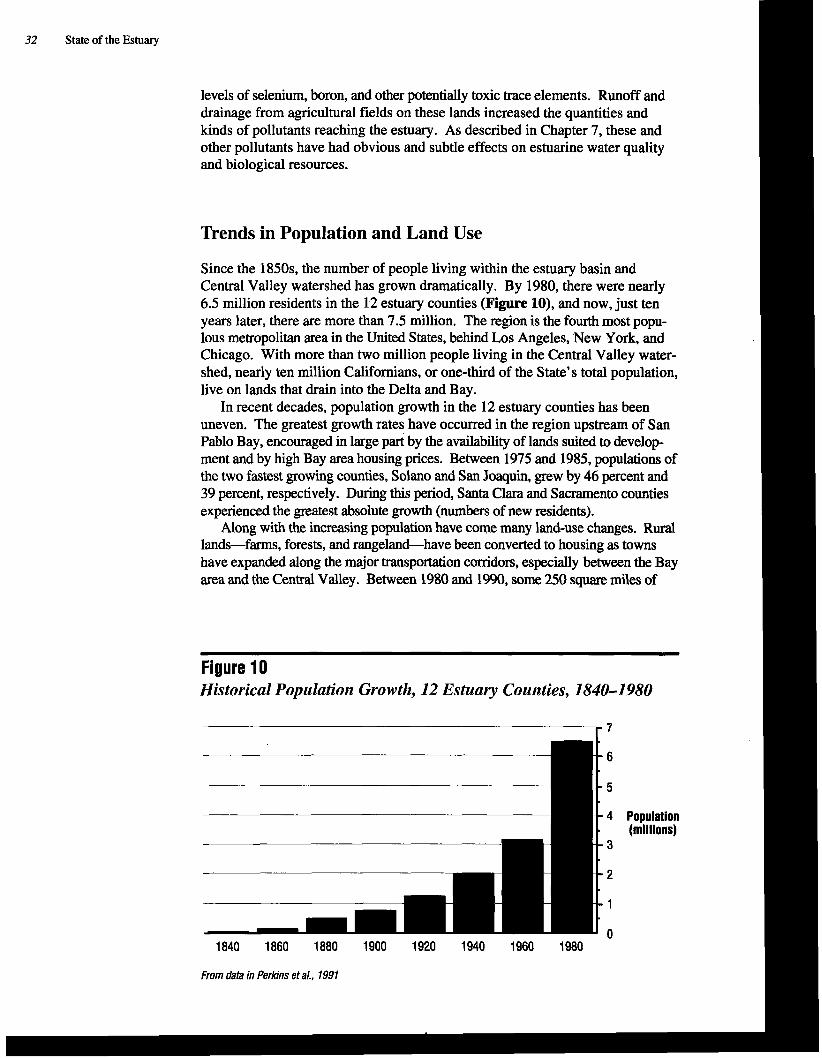
32 State of the Estuary
levels of selenium, boron, and other potentially toxic trace elements. Runoff and drainage from agricultural fields on these lands increased the quantities and kinds of pollutants reaching the estuary. As described in Chapter 7, these and other pollutants have had obvious and subtle effects on estuarine water quality and biological resources.
Trends in Population and Land Use
Since the 1850s, the number of people living within the estuary basin and Central Valley watershed has grown dramatically. By 1980, there were nearly 6.5 million residents in the 12 estuary counties (Figure lo), and now, just ten years later, there are more than 7.5 million. The region is the fourth most popu- lous metropolitan area in the United States, behind Los Angeles, New York, and Chicago. With more than two million people living in the Central Valley water- shed, nearly ten million Californians, or one-third of the State's total population, live on lands that drain into the Delta and Bay.
In recent decades, population growth in the 12 estuary counties has been uneven. The greatest growth rates have occurred in the region upstream of San Pablo Bay, encouraged in large part by the availability of lands suited to develop- ment and by high Bay area housing prices. Between 1975 and 1985, populations of the two fastest growing counties, Solano and San Joaquin, grew by 46 percent and 39 percent, respectively. During this period, Santa Clara and Sacramento counties experienced the greatest absolute growth (numbers of new residents).
Along with the increasing population have come many land-use changes. Rural lands-farms, forests, and rangeland-have been converted to housing as towns have expanded along the major transportation corridors, especially between the Bay area and the Central Valley. Between 1980 and 1990, some 250 square miles of
Figure 10 Historical Population Growth, 12 Estuary Counties, 1840-1 980
1840 1860 1880 1900 1920 1940 1960 1980
From data in Perkins et ab, 1991
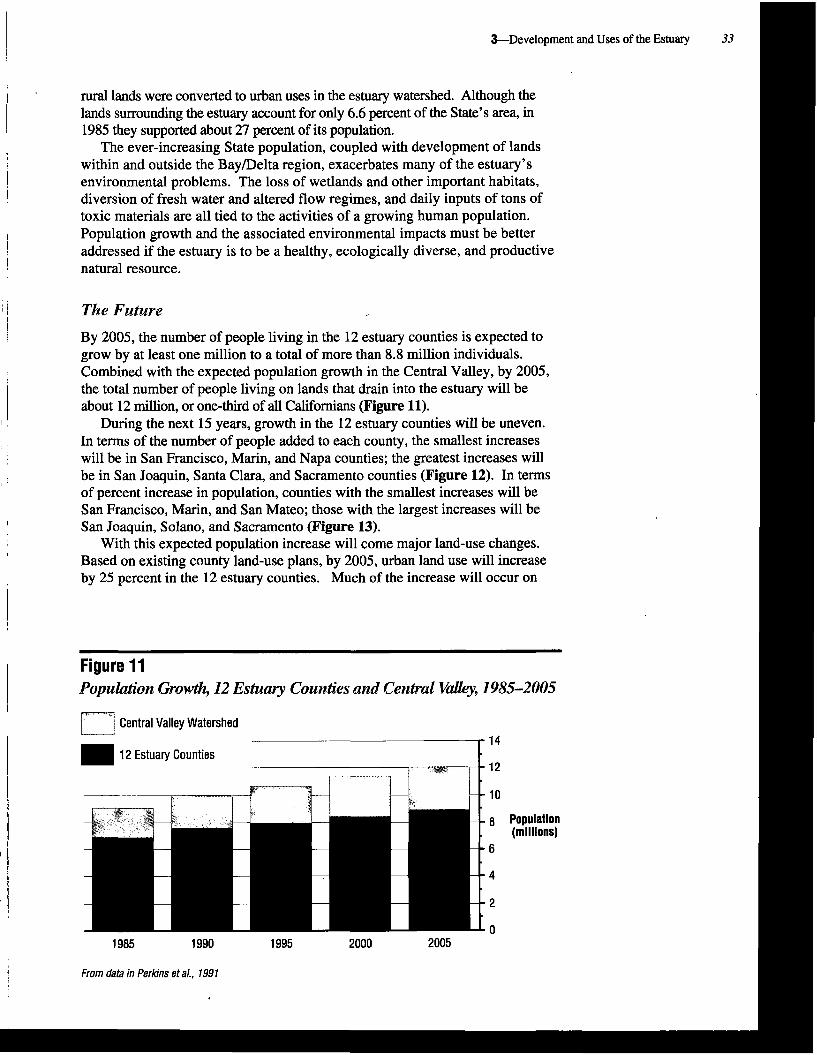
rural lands were converted to urban uses in the estuary watershed. Although the lands surrounding the estuary account for only 6.6 percent of the State's area, in 1985 they supported about 27 percent of its population.
The ever-increasing State population, coupled with development of lands within and outside the BayIDelta region, exacerbates many of the estuary's environmental problems. The loss of wetlands and other important habitats, diversion of fresh water and altered flow regimes, and daily inputs of tons of toxic materials are all tied to the activities of a growing human population. Population growth and the associated environmental impacts must be better addressed if the estuary is to be a healthy, ecologically diverse, and productive natural resource.
I The Future
I I By 2005, the number of people living in the 12 estuary counties is expected to grow by at least one million to a total of more than 8.8 million individuals. Combined with the expected population growth in the Central Valley, by 2005, the total number of people living on lands that drain into the estuary will be
I about 12 million, or one-third of all Californians (Figure 11).
During the next 15 years, growth in the 12 estuary counties will be uneven. In terms of the number of people added to each county, the smallest increases will be in San Francisco, Marin, and Napa counties; the greatest increases will 1 be in San Joaquin, Santa Clara, and Sacramento counties (Figure 12). In terms of percent increase in population, counties with the smallest increases will be San Francisco, Marin, and San Mateo; those with the largest increases will be San Joaquin, Solano, and Sacramento (Figure 13).
With this expected population increase will come major land-use changes. I Based on existing county land-use plans, by 2005, urban land use will increase
by 25 percent in the 12 estuary counties. Much of the increase will occur on
Figure 11 Bopuktktisn Growth, 12 E s h q Counties and Cenf a1 Valley, 1985-2005
I
Central Vallev Watershed
12 Estuary Counties
1985 1990 1995 2000 2005
From data in Psrkins et a/., 1991
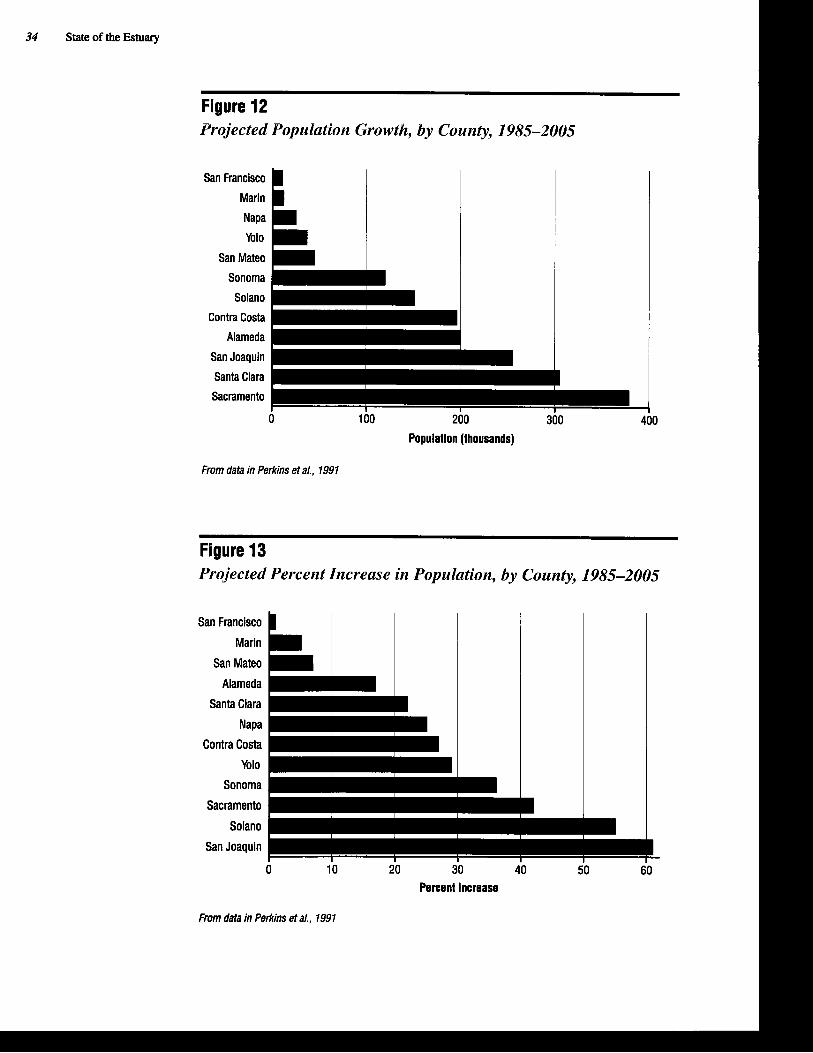
34 State of the Estuary
Figure 12 Projected Population Growth, by County, 1985-2005
San Francisco
Marin
Napa
Yolo
San Mateo
Sonoma
Solano
Contra Costa
Alameda 1-1 San Joaquin
I
Santa Clara I I I
Sacramento i
0 100 200 3i)o 4b0
Populatlon (thousands)
From data in Perkins etal., 1991
Figure 13 Projected Percent Increase in Population, by County, 1985-2005
San Francisco
Marin
San Mateo
Alameda
Santa Clara
Napa
Contra Costa
Yolo
Sonoma
Sacramento
Solano
San Joaquin
0 10 20 30 40 50 60 Percent Increase
From data in Perkins etal., 1991
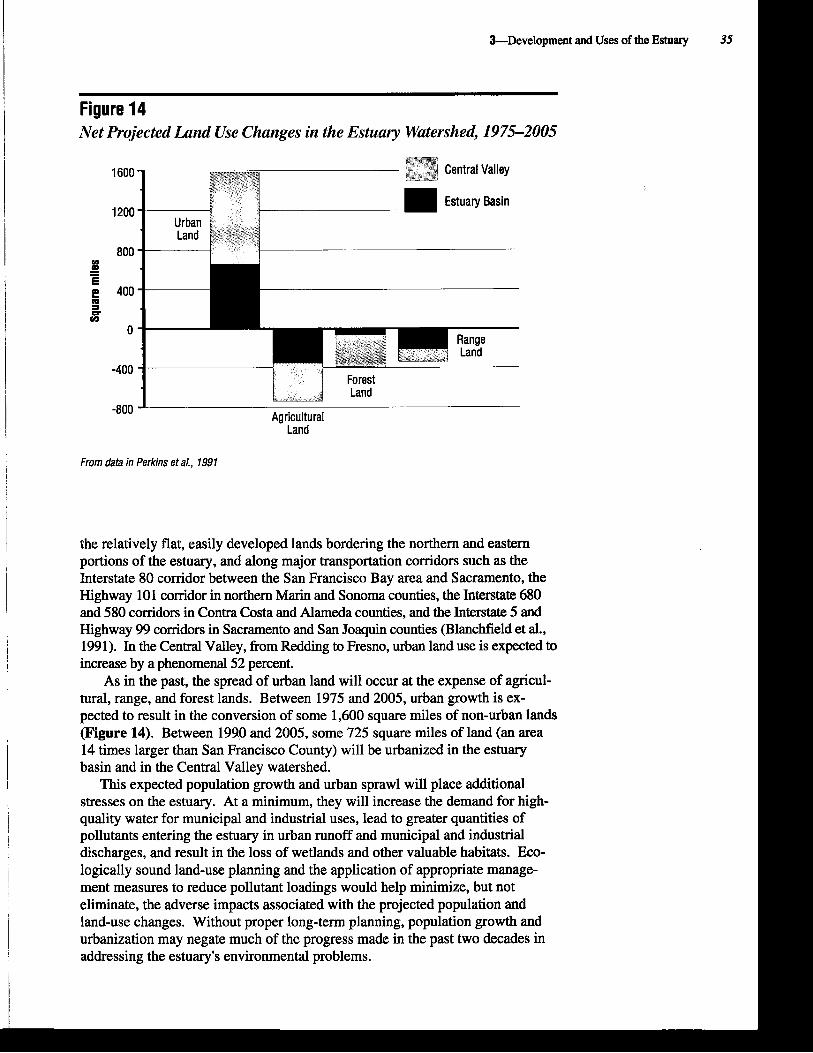
and Uses of the
Figure 14 Net Projected Land Use Changes in the Estuary Watershed, 1975-2005
Central Valley
Estuary Basin
1 1 , .I$ Land -800 ' Agricultural
Land
From data in Perkins eta/., 1991
1 the relatively flat, easily developed lands bordering the northern and eastern portions of the estuary, and along major transportation corridors such as the
1 Interstate 80 corridor between the San Francisco Bay area and Sacramento, the Highway 101 corridor in northern Marin and Sonoma counties, the Interstate 680 and 580 comdors in Contra Costa and Alameda counties, and the Interstate 5 and Highway 99 corridors in Sacramento and San Joaquin counties (Blanchfield et al.,
I 1991). In the Central Valley, from Redding to Fresno, urban land use is expected to increase by a phenomenal 52 percent.
As in the past, the spread of urban land will occur at the expense of agricul- tural, range, and forest lands. Between 1975 and 2005, urban growth is ex- pected to result in the conversion of some 1,600 square miles of non-urban lands (Figure 14). Between 1940 and 2005, some 725 square miles of land (an area 14 times larger than San Francisco County) will be urbanized in the estuary basin and in-the Central Valley watershed.
This expected population growth and urban sprawl will place additional stresses on the estuary. At a minimum, they will increase the demand for high- quality water for municipal and industrial uses, lead to greater quantities of pollutants entering the estuary in urban runoff and municipal and industrial discharges, and result in the loss of wetlands and other valuable habitats. Eco- logically sound land-use planning and the application of appropriate manage- ment measures to reduce pollutant loadings would help minimize, but not eliminate, the adverse impacts associated with the projected population and land-use changes. Without proper long-term planning, population growth and urbanization may negate much of the progress made in the past two decades in addressing the estuarv's environmental ~roblems.
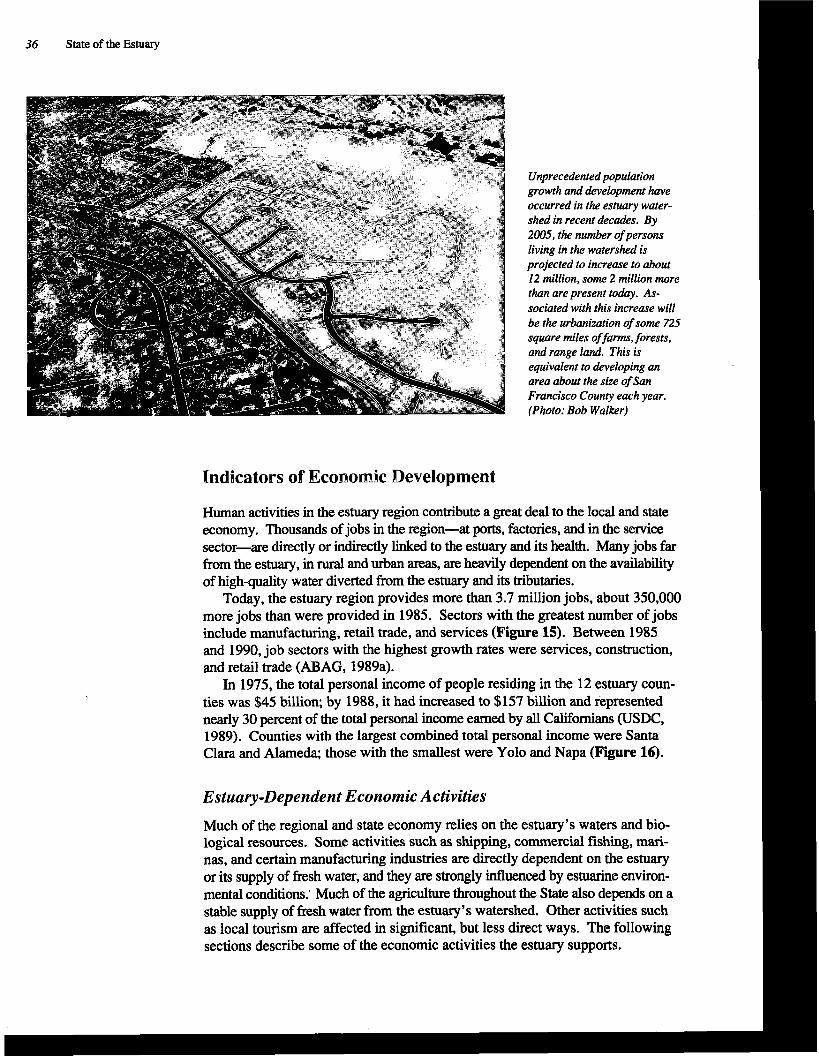
36 State of the Estuary
Unprecedented population growth and development b e occurred in the estuary water- shed in recent decades. By 2005, the number of persons living in the watershed is projected to increase to about 12 million, some 2 million more than are present today. As- sociated with this increase will be the urbanization of some 725 square miles of farms, forests, and range land. This is equivalent to developing an area about the size of Sun Francisco County each year. (Photo: Bob Walker) I
Indicators of Economic Development I Human activities in the estuary region contribute a great deal to the local and state economy. Thousands of jobs in the region-at ports, factories, and in the service sector-are directly or indirectly linked to the estuary and its health. Many jobs far from the estuary, in rural and urban areas, are heavily dependent on the availabiity of high-quality water diverted from the estuary and its tributaries.
Today, the estuary region provides more than 3.7 million jobs, about 350,000 more jobs than were provided in 1985. Sectors with the greatest number of jobs include manufacturing, retail trade, and services (Figure 15). Between 1985 and 1990, job sectors with the highest growth rates were services, construction, and retail trade (ABAG, 1989a).
In 1975, the total personal income of people residing in the 12 estuary coun- ties was $45 billion; by 1988, it had increased to $157 billion and represented nearly 30 percent of the total personal income earned by all Californians ( U S E , 1989). Counties with the largest combined total personal income were Santa Clara and Alarneda; those with the smallest were Yolo and Napa (Figure 16).
Estuary-Dependent Economic Activities
Much of the regional and state economy relies on the estuary's waters and bio- logical resources. Some activities such as shipping, commercial fishing, mari- nas, and certain manufacturing industries are directly dependent on the estuary or its supply of fresh water, and they are strongly influenced by estuarine environ- mental conditions.' Much of the agriculture throughout the State also depends on a stable supply of fresh water from the estuary's watershed. Other activities such as local tourism are affected in significant, but less direct ways. The following sections describe some of the economic activities the estuary supports.
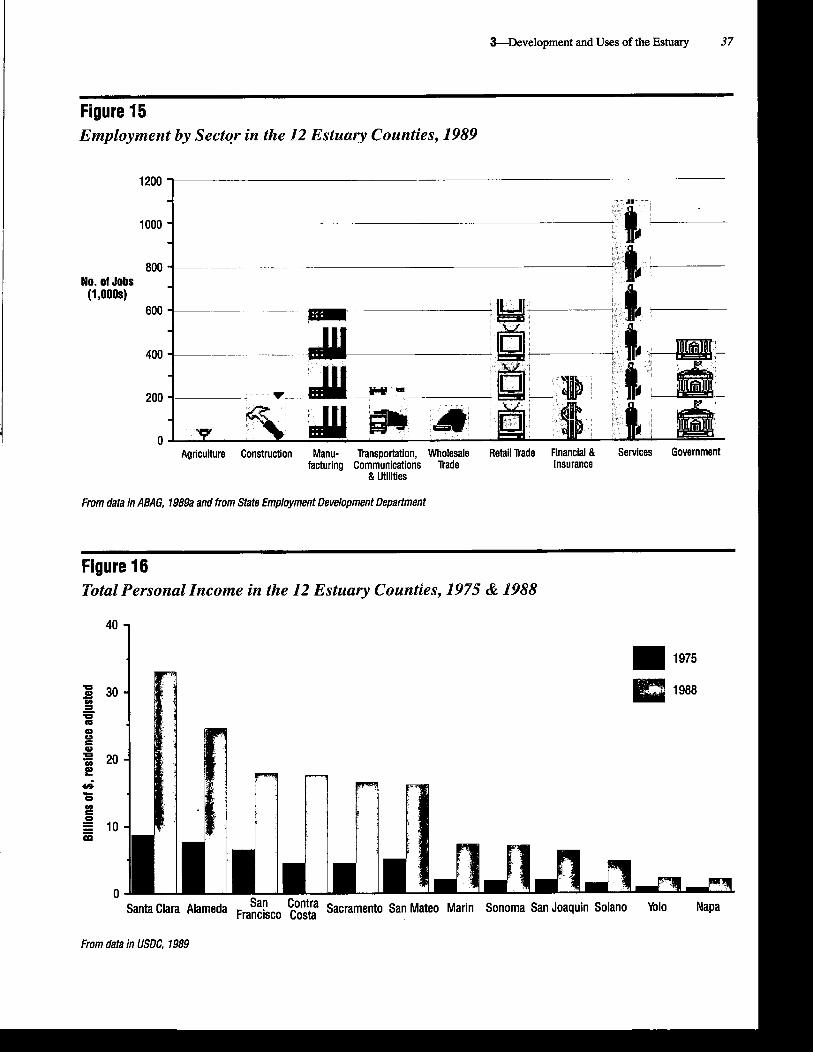
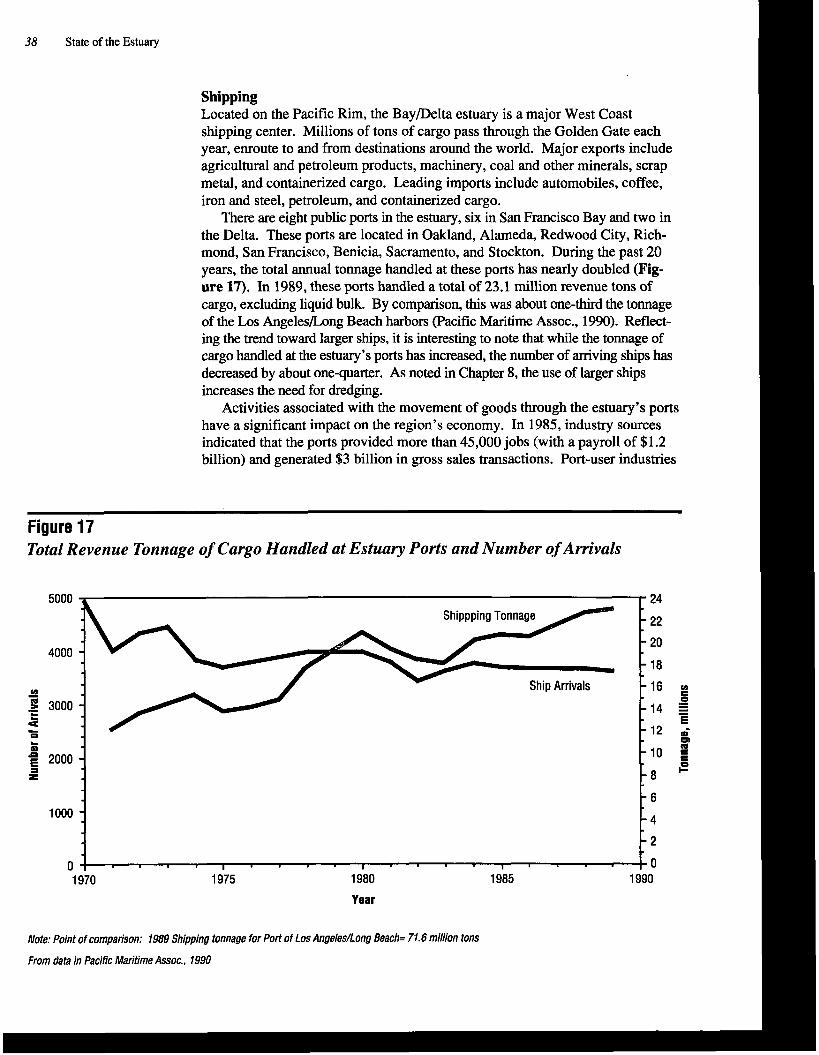
38 State of the Estuary
Shipping Located on the Pacific Rim, the BayDelta estuary is a major West Coast shipping center. Millions of tons of cargo pass through the Golden Gate each year, enroute to and from destinations around the world. Major exports include agricultural and petroleum products, machinery, coal and other minerals, scrap metal, and containerized cargo. Leading imports include automobiles, coffee, iron and steel, petroleum, and containerized cargo.
There are eight public ports in the estuary, six in San Francisco Bay and two in the Delta. These ports are located in Oakland, Alarneda, Redwood City, Rich- mond, San Francisco, Benicia, Sacramento, and Stockton. During the past 20 years, the total annual tonnage handled at these ports has nearly doubled (Fig- ure 17). In 1989, these ports handled a total of 23.1 million revenue tons of cargo, excluding liquid bulk. By comparison, this was about one-third the tonnage of the Los Angelesbng Beach harbors (Pacific Maritime Assoc., 1990). Reflect- ing the trend toward larger ships, it is interesting to note that while the tonnage of cargo handled at the estuary's ports has increased, the number of amving ships has decreased by about one-quarter. As noted in Chapter 8, the use of larger ships increases the need for dredging.
Activities associated with the movement of goods through the estuary's ports have a significant impact on the region's economy. In 1985, industry sources indicated that the ports provided more than 45,000 jobs (with a payroll of $1.2 billion) and generated $3 billion in gross sales transactions. Port-user industries
Figure 17 Total Revenue Tonnage of Cargo Handled at Estuary Ports and Number of Arrivals
Year
Note: Point of comparison: 1989 Shipping tonnage for Port of Los Angeles/Long Beach= 71.6 million tons
From data in Pacific Maritime Assoc., 1990
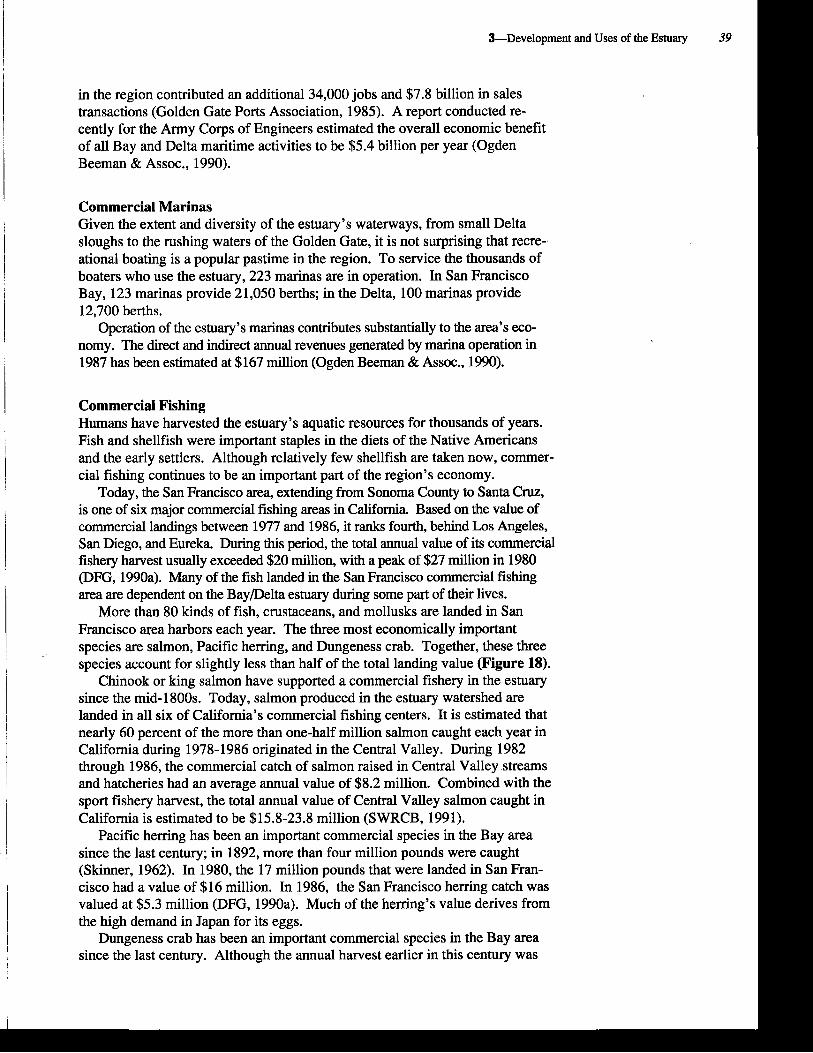
3--Development and Uses of the Estuary 39
I
in the region contributed an additional 34,000 jobs and $7.8 billion in sales transactions (Golden Gate Ports Association, 1985). A report conducted re- cently for the Army Corps of Engineers estimated the overall economic benefit of all Bay and Delta maritime activities to be $5.4 billion per year (Ogden Beeman & Assoc., 1990).
Commercial Marinas
I
Given the extent and diversity of the estuary's waterways, from small Delta sloughs to the rushing waters of the Golden Gate, it is not surprising that recre- ational boating is a popular pastime in the region. To service the thousands of boaters who use the estuary, 223 marinas are in operation. In San Francisco Bay, 123 marinas provide 21,050 berths; in the Delta, 100 marinas provide 12,700 berths.
Operation of the estuary's marinas contributes substantially to the area's eco- nomy. The direct and indirect annual revenues generated by marina operation in 1987 has been estimated at $167 million (Ogden Beeman & Assoc., 1990).
I Commercial Fishing Humans have harvested the estuary's aquatic resources for thousands of years.
' i Fish and shellfish were important staples in the diets of the Native Americans and the early settlers. Although relatively few shellfish are taken now, commer-
I cia1 fishing continues to be an important part of the region's economy. Today, the San Francisco area, extending from Sonoma County to Santa Cruz,
is one of six major commercial fishing areas in California. Based on the value of commercial landings between 1977 and 1986, it ranks fourth, behind Los Angeles, San Diego, and Eureka. During this period, the total annual value of its commercial fishery harvest usually exceeded $20 million, with a peak of $27 million in 1980 (DFG, 1990a). Many of the fish landed in the San Francisco commercial fishing area are dependent on the BayPelta estuary during some part of their lives.
More than 80 kinds of fish, crustaceans, and mollusks are landed in San Francisco area harbors each year. The three most economically important species are salmon, Pacific herring, and Dungeness crab. Together, these three
i species account for slightly less than half of the total landing value (Figure 18). Chinook or king salmon have supported a commercial fishery in the estuary
since the mid- 1800s. Today, salmon produced in the estuary watershed are I landed in all six of California's commercial fishing centers. It is estimated that 1 nearly 60 percent of the more than one-half million salmon caught each year in
California during 1978-1986 originated in the Central Valley. During 1982 through 1986, the commercial catch of salmon raised in Central Valley streams and hatcheries had an average annual value of $8.2 million. Combined with the
I sport fishery harvest, the total annual value of Central Valley salmon caught in California is estimated to be $15.8-23.8 million (SWRCB, 1991).
Pacific herring has been an important commercial species in the Bay area since the last century; in 1892, more than four million pounds were caught
, (Skinner, 1962). In 1980, the 17 million pounds that were landed in San Fran- cisco had a value of $16 million. In 1986, the San Francisco herring catch was valued at $5.3 million (DFG, 1990a). Much of the herring's value derives from the high demand in Japan for its eggs.
I Dungeness crab has been an important commercial species in the Bay area since the last century. Although the annual harvest earlier in this century was
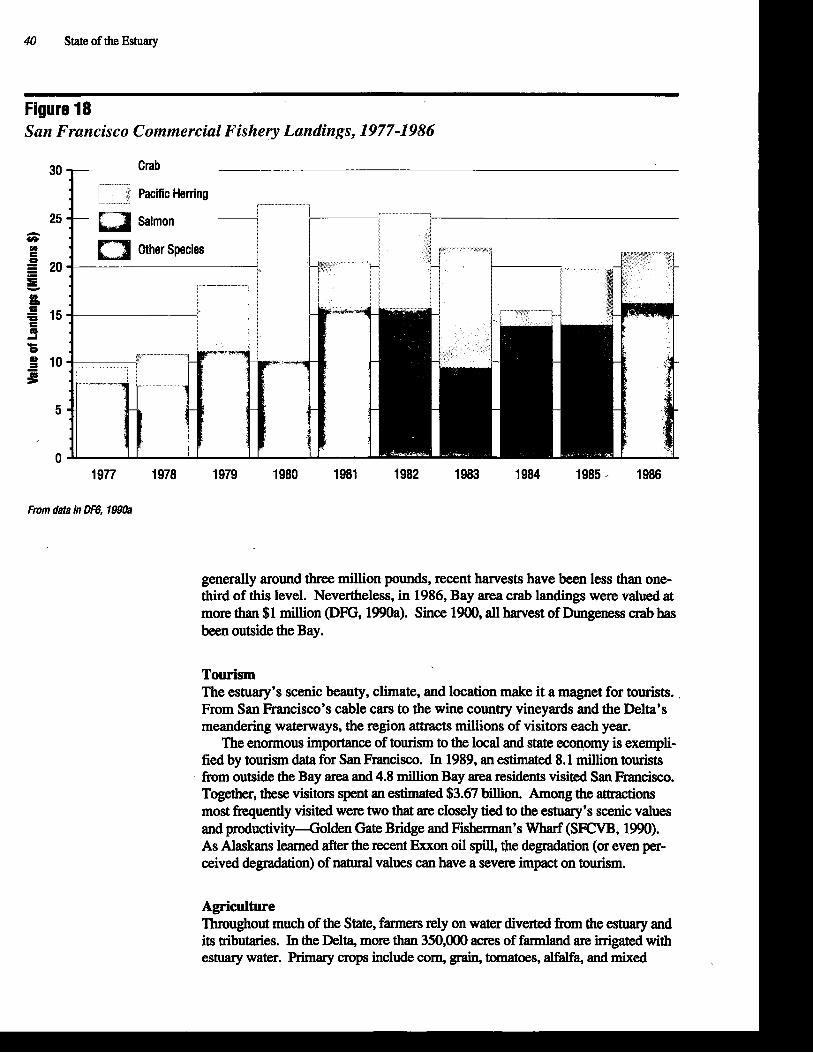
40 State of the Estuary
Figure 18 Seen Francisco Commercial Fishery Landings, 1977-1986
From data in DF6, 1990a
generally around three million pounds, recent harvests have been less than one- third of this level. Nevertheless, in 1986, Bay area crab landings were valued at more than $1 million (DFG, 1990a). Since 1900, all harvest of Dungeness crab has been outside the Bay.
Tourism The estuary's scenic beauty, climate, and location make it a magnet for tourists. , From San Francisco's cable cars to the wine country vineyards and the Delta's meandering waterways, the region attracts millions of visitors each year.
The enormous importance of tourism to the local and state economy is exempli- fied by tourism data for San Francisco. In 1989, an estimated 8.1 million tourists from outside the Bay area and 4.8 million Bay area residents visited San Francisco. Together, these visitors spent an estimated $3.67 billion. Among the amactions most frequently visited were two that are closely tied to the estuary's scenic values and productivity4lden Gate Bridge and Fisherman's Wharf (SFCVB, 1990). As Alaskans leamed after the recent Exxon oil spill, @e dejpdation (or even per- ceived degradation) of natural values can have a severe impact on tourism.
Agriculture Throughout much of the State, farmers rely on water diverted from the estuary and its tributaries. In the Delta, more than 350,000 acres of fa~nland are irrigated with estuary water. Primary crops include corn, grain, tomatoes, alfalfa, and mixed
pasture; other important crops are sugar beets, deciduous trees, and safflower. In I
In other of the Central Valley and as far away as southern California, the federal Central Valley Project or State Water Project provide water from the estuary and its tributaries to many farms and ranches. The main area of agricultural use of this exported water is the San Joaquin Valley, where three counties-Fresno, Kern, and Tulare-ranked first, second, and third, respectively, in the nation in
I included cotton, grapes, rice, and alfalfa. In 1988, crops grown with CVP water I
Joaquin Valley and other areas. Major crops included cotton, almonds, alfalfa, and grapes. In 1987, crops grown with SWP water had a gross value of $509 million (DWR, 1988a). Additional information regarding agricultural produc- tion is presented in Chapter 6.
Municipal and Industrial Uses Water diverted from the estuary and its tributaries helps meet municipal and industrial water needs throughout the State. Some 20 million Californians rely on the estuary's freshwater supply as the primary source of their drinking water. Industry also depends on the estuary's freshwater supply for process and cooling operations at refineries, canneries, m d manufacturing facilities.
Salt production is perhaps the most visible industrial activity in the estuary.
I in South Bay. In these shallow ponds, most of which were once tidal marsh, I
42 State of the Estuary
Bay water is slowly evaporated to produce salt. In recent years, approximately 1.3 million tons of salt have been produced annually (L. Johnson, pers. comm.).
The quality of water diverted from the estuary and its tributaries for agricultur- al, municipal, and industrial uses is of utmost concern to water suppliers and users. Salinity, turbidity, organic materials, and trace elements all influence water uses and treatment requirements. These water quality issues are described in Chapter 7.
Summary
The Baypelta estuary has been home to humans for thousands of years. With a vast increase in population have come land-use changes and enormous pressures on the estuary's waters and biological resources.
The major adverse alterations to the estuary began with the discovery of gold in the mid-1800s. During the subsequent decades of hydraulic mining and even after its ban, enormous quantities of debris entered the estuary and its tibutar- ies, blocking navigation, exacerbating flooding, and altering conditions for fish and wildlife. The conversion of more than one-half million acres of Delta and bayshore marshes to farming and other uses reduced the estuary's capacity to support vast numbers of economically important biological resources. The ex- pansion of agriculture throughout the Central Valley, as well as the storage and diversion of fresh water for flood control, irrigation, and other uses, also adversely affected habitat conditions for scores of species of fish and wildlife. Urbanhation and industrial expansion in the estuary basin and Central Valley watershed has led to high loadings of many kinds of pollutants.
The estuary region continues to support a robust and broad-based economy, with many sectors directly dependent on estuarine water quality and habitat con- ditions. Economies in other regions in the State also depend on the reliable delivery of fresh water from the estuary and its tibutaries.
Given the State's current population and land-use projections, it is apparent that the estuary will face even greater stresses in the coming decades unless Californians improve their management of pollutants and fresh water supplies, and better protect estuarine habitats, especially wetlands. Also, in the face of expected urban expansion, there is a pressing need to conserve the region's re- maining upland habitats-forests, range, and productive agricultural lands. Above all, steps must be taken to ensure that continued population growth occurs within the region's capacity to sustain a healthy estuary and an accept- able quality of life for the people living here.
The BayIDelta Estuary's Biological Resources
T h e BayDelta estuary is home to hundreds of species of plants and animals that A live in its waters and on its shores and adjacent uplands. From microscopic
The estuary's biological resources, or biota, have strongly infuenced human activities within the basin for thousands of years. Without the incredible abundance offish, shelIfish, and wildlife, there would have been few settlements of Native Ameri- cans around the Bay or the Delta If not for beaver and mink,&r traders might not have explored the Delta m a r s h W and pushed on to the ends of the Central Valley. Without the ficks of watep-fowl and large herds of elk, deer, and antelope, the early settlers of Sun Francisco would have dined on a much simpler diet.
H m helopmnt of the estuary basin rmd Cenb-al Valley watershed ~ Q S greatly altered natural habitats. Even so, the region's plants and animals continue to influ- ence human activities and are of inestimable value and attraction. From a c o m r -
enrich our lives. In addition to its values to humans, the estuary's biota has its own intatansic worth as a part of the natural web of life.
This chapter describes the plants and animals that comprise the biological component of the estuarine ecosystem. It explains how the composition of the bi- ota has changed during the past century and notes the causes of some of the more
reports on wetlands and other habitats (Meiorin et al., 1991), wildlife (Harvey et al., 1992), and aquatic resources (Herbold et al., 1992). It also draws on other pertinent references.
1. During the past 140 years, many of the habitats in the estuary basin have been I
and more than one-half of the native upland habitats have been urbanized. These habitat changes have adversely affected the region's ability to support fish and wildlife resources.

44 State of the Estuary
2. Since the mid-1970s, phytoplankton abundance has declined in the estuary's northern reach. The causes of this phenomenon are unknown, but may in- clude inadequate freshwater flows in most years (due to drought conditions and increased exports), and, since 1987, the establishment of large numbers of the introduced clam Potamocorbula amurensis in Suisun Bay. In addition, the composition of the phytoplankton community has changed.
3. Since the mid-1970s, zooplankton abundance has been low in the estuary's northern reach. In addition, there have been changes in the composition of the zooplankton community. Taken together, these factors may have reduced the availability of food for the young of several species of fish.
4. In the estuary's northern reach, the community of bottomdwelling organisms is undergoing a rapid change as a result of the recent establishment of the clam Potamocorbula amurensis. This clam is displacing other benthic species and may have far reaching effects on fish and wildlife populations.
5. The number of Chinook salmon returning to spawn in the estuary's tributaries has declined by nearly 70 percent, compared to early 1900 levels. In the San Joaquin River, salmon runs have dropped by 90 percent. In the Sacramento River, the winter run has been designated a federal threatened and state endan- gered species. Although salmon continue to support valuable commercial and sport fisheries, today, many of the fish are produced in hatcheries.
6. The striped bass population is at its lowest level since this species was intro- duced into the estuary more than one hundred years ago. The population of adult striped bass has declined to about one-half million, less than 20 percent of the number that occurred in the early 1960s. The number of young fish, as indi- cated by the Striped Bass Index, is at an all-time low. Delta water diversions, pollutants, and habitat alteration are suspected causes of the decline.
7. Since the early 1980s, the number of Delta smelt, a once-abundant native species of the Delta and Suisun Bay, has declined to low levels. Completely dependent on zooplankton for food, this species has been severely affected by low plankton production in the past several years. In September 1991, the U.S. Fish and Wildlife Service proposed listing this species as threatened under the federal Endangered Species Act.
8. Many species of plants and animals have been intentionally or unintention- ally introduced into the estuary and they have altered the community compo- sition significantly. Unintentional introductions of benthic organisms now occur at a rate of about one per year. Several introduced wildlife predators threaten endangered bird species. Most introductions compound the difficul- ties of managing the estuary.
9. The estuary is one of the most important staging and wintering areas for mi- gratory waterfowl and shorebird populations on the west coasts of North and South America. Nearly one million waterfowl and one million shorebirds utilize the estuary's openwater and wetland habitats. As waterfowl habitat has dwindled in other parts of the State, the estuary has become increasingly important for maintaining bird populations.
10. The major factors threatening wildlife in the estuary basin are habitat loss and degradation, disease, predation by introduced predators, and pollution. Two- thirds of the 89 species of resident wildlife currently in decline or mxiving special attention from the state or federal governments are dependent on wetlands.
L
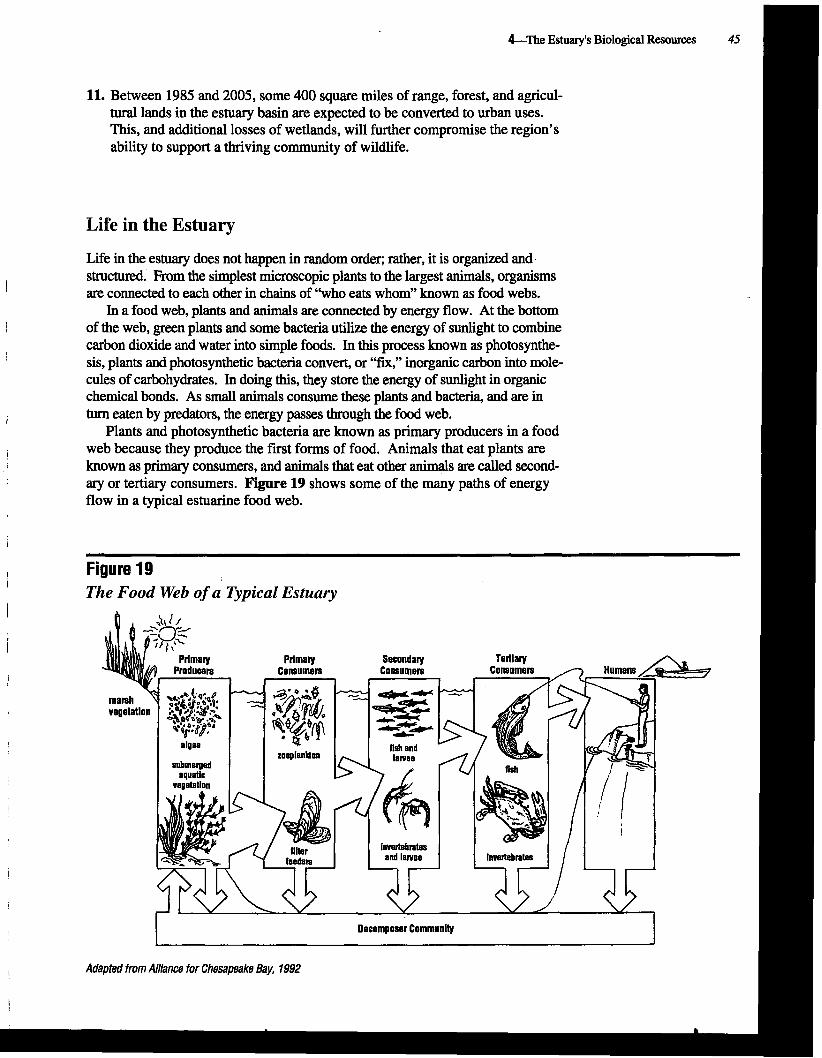
11. Between 1985 and 2005. some 400 sauare miles of range. forest. and amicul- turd lands in the estuary basin are expected to be converted to urban uses. This, and additional losses of wetlands, will further compromise the region's ability tc 3 support a thriv community of 1 wildlife.
Life in the Estuary
Life in the estuary does not h a ~ ~ e n in random order: rather, it is or~anized and.
I structured. From the simplest microscopic plants to the largest animals, organisms are connected to each other in chains of "who eats whom" known as food webs.
In a food web, plants and animals are connected by energy flow. At the bottom 1 of the web, meen ~lants and some bacteria utilize the enerev of sunlight to combine
carbon dioxide and water into simple foods. In this process known as photosynthe- 1 sis, plants and photosynthetic bacteria convert, or "fix," inorganic carbon into mole-
cules of carbohydrates. In doing this, they store the energy of sunlight in organic chemical bonds. As small animals consume these plants and bacteria, and are in
1 turn eaten by predators, the energy passes through the food web. Plants and photosynthetic bacteria are known as primary producers in a food
I web because they produce the first forms of food. Animals that eat plants are known as primary consumers, and animals that eat other animals are called second-
! ary or tertiary consumers. Figure 19 shows some of the many paths of energy flow in a typical estuarine food web.
h
I Fig I
Thc rre 19 Food Web of a Typ !1 Estuary
Primary D.".l..u-
Primary consumers
Secondary Consumers
Tertiary Consumers
I Decomposer Community I I
I Adapted from Alliance for Chesapeake Bay, 1992
1,
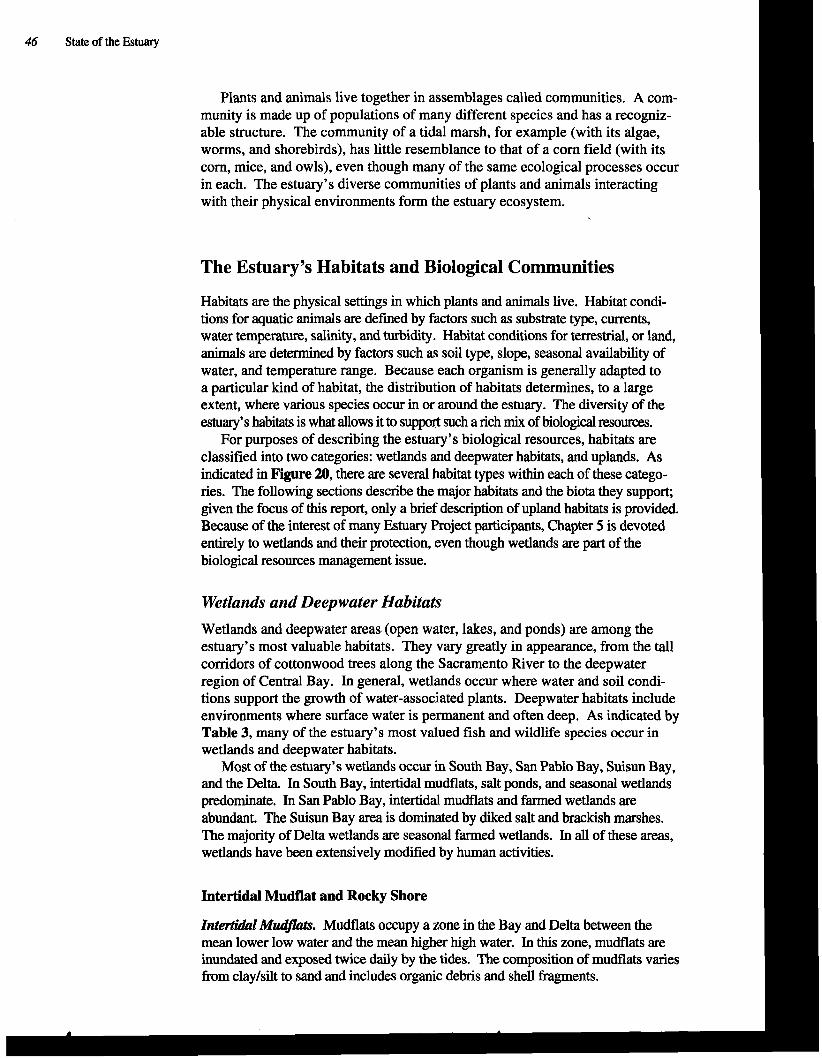
46 State of the Estuary
Plants and animals live together in assemblages called communities. A com- munity is made up of populations of many different species and has a recogniz- able structure. The community of a tidal marsh, for example (with its algae, worms, and shorebirds), has little resemblance to that of a corn field (with its corn, mice, and owls), even though many of the same ecological processes occur in each. The estuary's diverse communities of plants and animals interacting with their physical environments form the estuary ecosystem.
The Estuary's Habitats and Biological Communities
Habitats are the physical settings in which plants and animals live. Habitat condi- tions for aquatic animals are d e f d by factors such as substrate type, currents, water temperature, salinity, and turbidity. Habitat conditions for terrestrial, or land, animals are determined by factors such as soil type, slope, seasonal availability of water, and temperature range. Because each organism is generally adapted to a particular kind of habitat, the distribution of habitats determines, to a large extent, where various species occur in or around the estuary. The diversity of the estuary's habitats is what allows it to support such a rich mix of biological resources.
For purposes of describing the estuary's biological resources, habitats are classified into two categories: wetlands and deepwater habitats, and uplands. As indicated in Figure 20, there are several habitat types within each of these catego- ries. The following sections describe the major habitats and the biota they support; given the focus of this report, only a brief description of upland habitats is provided. Because of the interest of many Estuary Project participants, Chapter 5 is devoted entirely to wetlands and their protection, even though wetlands are part of the biological resources management issue.
Wetlands and Deepwater Habitats
Wetlands and deepwater areas (open water, lakes, and ponds) are among the estuary's most valuable habitats. They vary greatly in appearance, from the tall corridors of cottonwood trees along the Sacramento River to the deepwater region of Central Bay. In general, wetlands occur where water and soil condi- tions support the growth of water-associated plants. Deepwater habitats include environments where surface water is permanent and often deep. As indicated by Table 3, many of the estuary's most valued fish and wildlife species occur in wetlands and deepwater habitats.
Most of the estuary's wetlands occur in South Bay, San Pablo Bay, Suisun Bay, and the Delta. In South Bay, intertidal mudflats, salt ponds, and seasonal wetlands predominate. In San Pablo Bay, intertidal mudflats and farmed wetlands are abundant. The Suisun Bay area is dominated by diked salt and brackish marshes. The majority of Delta wetlands are seasonal farmed wetlands. In all of these areas, wetlands have been extensively modified by human activities.
Intertidal Mudflat and Rocky Shore
Znte& M u d ! . Mudflats occupy a zone in the Bay and Delta between the mean lower low water and the mean higher high water. In this zone, mudflats are inundated and exposed twice daily by the tides. The composition of mudflats varies from claylsilt to sand and includes organic debris and shell fragments.
1
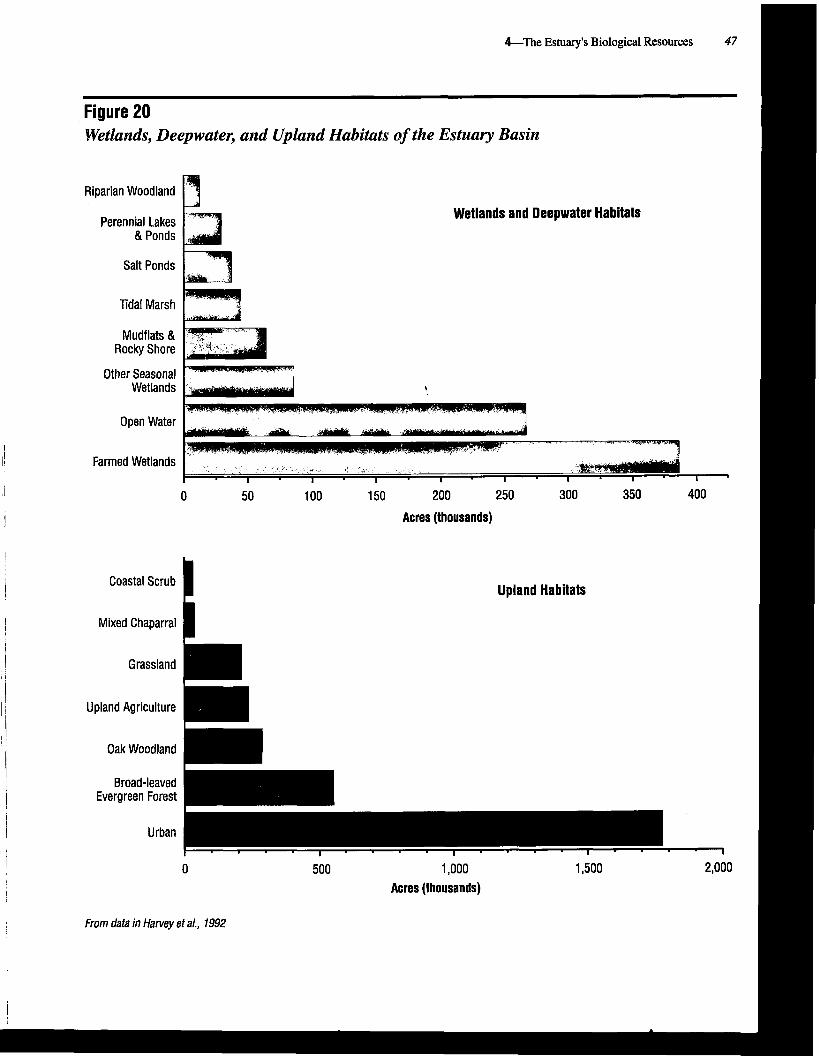
Wetlands and Deepwater Habitats
Upland Habitats
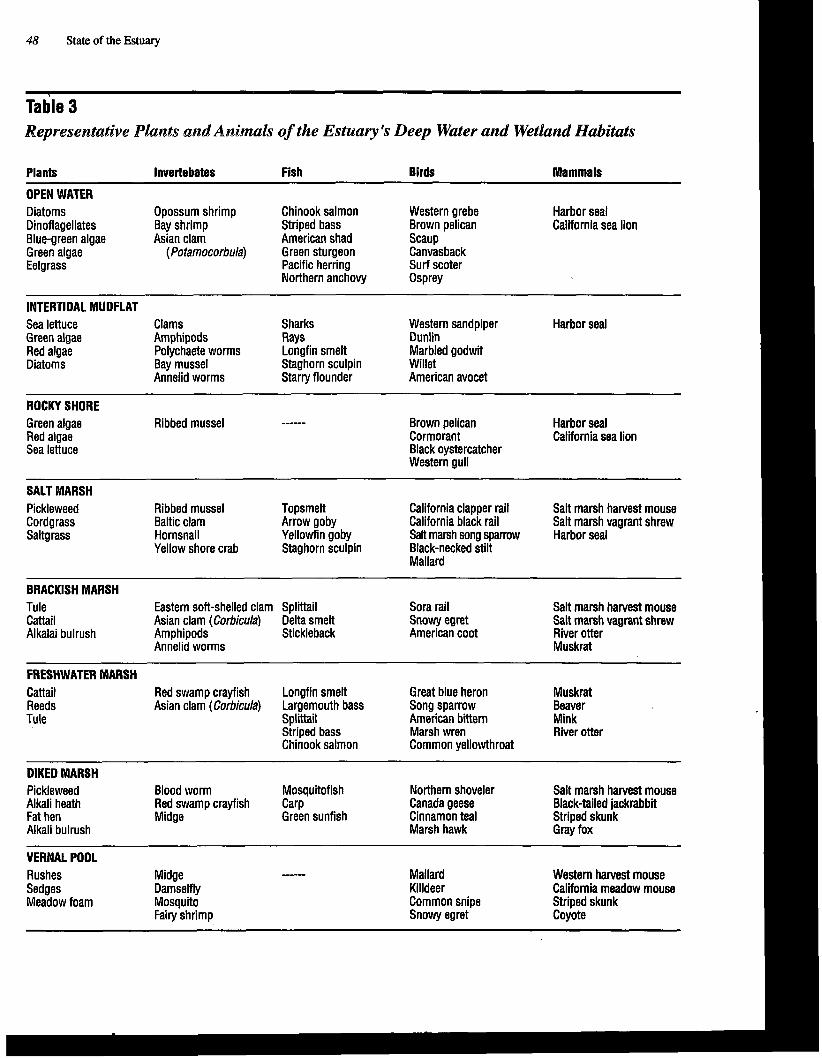
48 State of the Estuary
~al;le 3 Represelat~tive Plants and Animals of the Estuary's Deep Water and Wetland Habitats
Plants lnvertebates Fish Birds Mammals
OPEN WATER Diatoms Opossum shrimp Chinook salmon Western grebe Harbor seal Dinoflagellates Bay shrimp Striped bass Brown pelican California sea lion Blue-green algae Asian clam American shad Scaup Green algae (Potamocorbula) Green sturgeon Canvasback Eelgrass Pacific herring Surf scoter
Northern anchovy Osprey
INTERTIDAL M UDFLAT Sea lettuce Clams Sharks Western sandpiper Harbor seal Green algae Amphipods Rays Dunlin Red algae Polychaete worms Longfin smelt Marbled godwit Diatoms Bay mussel Staghorn sculpin Willet
Annelid worms Starry flounder American avocet
ROCKY SHORE Green algae Ribbed mussel ------ Brown pelican Harbor seal Red algae Cormorant California sea lion Sea lettuce Black oystercatcher
Western gull
SALT MARSH Pickleweed Ribbed mussel Topsmelt California clapper rail Salt marsh harvest mouse Cordgrass Baltic clam Arrow goby California black rail Salt marsh vagrant shrew Saltgrass Hornsnail Yellowfin goby Salt marsh song sparrow Harbor seal
Yellow shore crab Staghorn sculpin Black-necked stilt Mallard
BRACKISH MARSH Tule Eastern soft-shelled clam Splittail Sora rail Salt marsh harvest mouse Cattail Asian clam (Corbicula) Delta smelt Snowy egret Salt marsh vagrant shrew Alkalai bulrush Amphipods Stickleback American coot River otter
Annelid worms Muskrat
FRESHWATER MARSH Cattail Reeds Tule
Red swamp crayfish Longfin smelt Asian clam (Corbicula) Largemouth bass
Splittail Striped bass Chinook salmon
Great blue heron Song sparrow American bittern Marsh wren Common yellowthroat
Muskrat Beaver Mink River otter
DIKED MARSH Pickleweed Alkali heath Fat hen Alkali bulrush
Blood worm Mosquitofish Red swamp crayfish Carp Midge Green sunfish
Northern shoveler Canada geese Cinnamon teal Marsh hawk
Salt marsh harvest mouse Black-tailed jackrabbit Striped skunk Gray fox
VERNAL POOL Rushes Sedges Meadow foam
Midge ------ Damselfly Mosquito Fairy shrimp
Mallard Western harvest mouse Killdeer California meadow mouse Common snipe Striped skunk Snowy egret Coyote
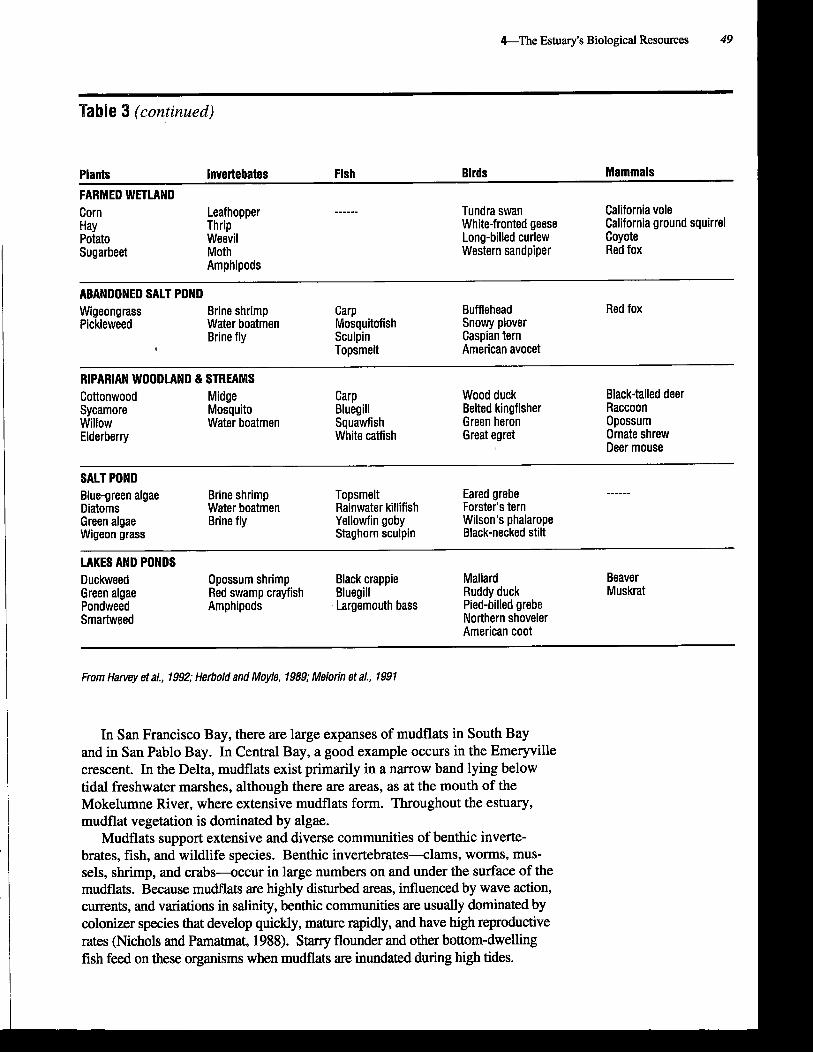
&The Estuary's Biological Resources 49
Table 3 (continued)
Plants lnvertebates Fish Birds Mammals
FARMED WETLAND Tundra swan California vole White-fronted geese California ground squirrel Long-billed curlew Western sandpiper
ABANDONED SALT POND
American avocet
RIPARIAN WOODLAND & STREAMS Black-tailed deer
White catfish Deer mouse
Staghorn sculpin Black-necked stilt
LAKES AND PONDS
American coot
From Harvey et al., 1992; Herbold and Moyle, 1989; Meiorin eta/., 1991
In San Francisco Bay, there are large expanses of mudflats in South Bay and in San Pablo Bay. In Central Bay, a good example occurs in the Emeryville crescent. In the Delta, mudflats exist primarily in a narrow band lying below tidal freshwater marshes, although there are areas, as at the mouth of the Mokelumne River, where extensive mudflats form. Throughout the estuary, mudflat vegetation is dominated by algae.
Mudflats support extensive and diverse communities of benthic inverte- brates, fish, and wildlife species. Benthic invertebrates-clams, worms, mus- sels, shrimp, and crabs--occur in large numbers on and under the surface of the mudflats. Because mudflats are highly disturbed areas, influenced by wave action, currents, and variations in salinity, benthic communities are usually dominated by colonizer species that develop quickly, mature rapidly, and have high reproductive rates (Nichols and Pamatmat, 1988). Starry flounder and other bottom-dwelling fish feed on these organisms when mudflats are inundated during high tides.
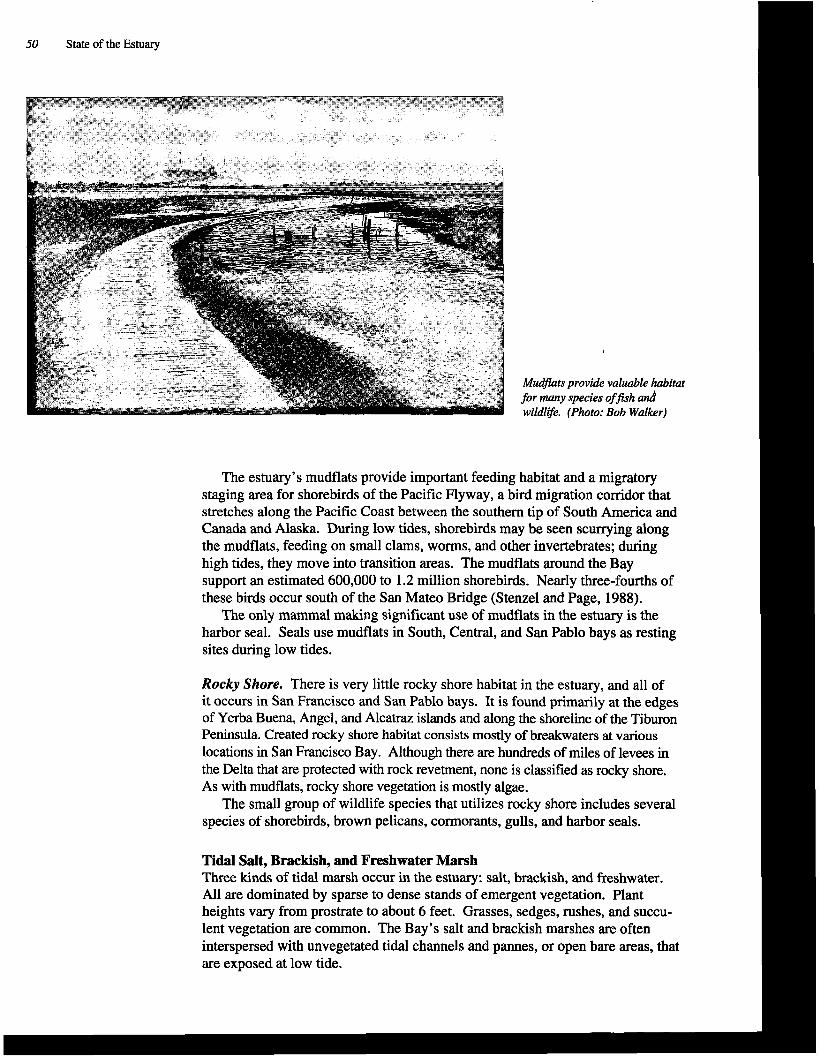
50 State of the Estuary
The estuary's mudflats provide important feeding habitat and a migratory staging area for shorebirds of the Pacific Flyway, a bird migration corridor that stretches along the Pacific Coast between the southern tip of South America and Canada and Alaska. During low tides, shorebirds may be seen scurrying along the mudflats, feeding on small clams, worms, and other invertebrates; during high tides, they move into transition areas. The mudflats around the Bay support an estimated 600,000 to 1.2 million shorebirds. Nearly three-fourths of these birds occur south of the San Mateo Bridge (Stenzel and Page, 1988).
The only mammal making significant use of mudflats in the estuary is the harbor seal. Seals use mudflats in South, Central, and San Pablo bays as resting sites during low tides.
Rocky Shore. There is very little rocky shore habitat in the estuary, and all of it occurs in San Francisco and San Pablo bays. It is found primarily at the edges of Yerba Buena, Angel, and Alcatraz islands and along the shoreline of the Tiburon Peninsula. Created rocky shore habitat consists mostly of breakwaters at various locations in San Francisco Bay. Although there are hundreds of miles of levees in the Delta that are protected with rock revetment, none is classified as rocky shore. As with mudflats, rocky shore vegetation is mostly algae.
The small group of wildlife species that utilizes rocky shore includes several species of shorebirds, brown pelicans, cormorants, gulls, and harbor seals.
Tidal Salt, Brackish, and Freshwater Marsh Three kinds of tidal marsh occur in the estuary: salt, brackish, and freshwater. All are dominated by sparse to dense stands of emergent vegetation. Plant heights vary from prostrate to about 6 feet. Grasses, sedges, rushes, and succu- lent vegetation are common. The Bay's salt and brackish marshes are often interspersed with unvegetated tidal channels and pannes, or open bare areas, that are exposed at low tide.
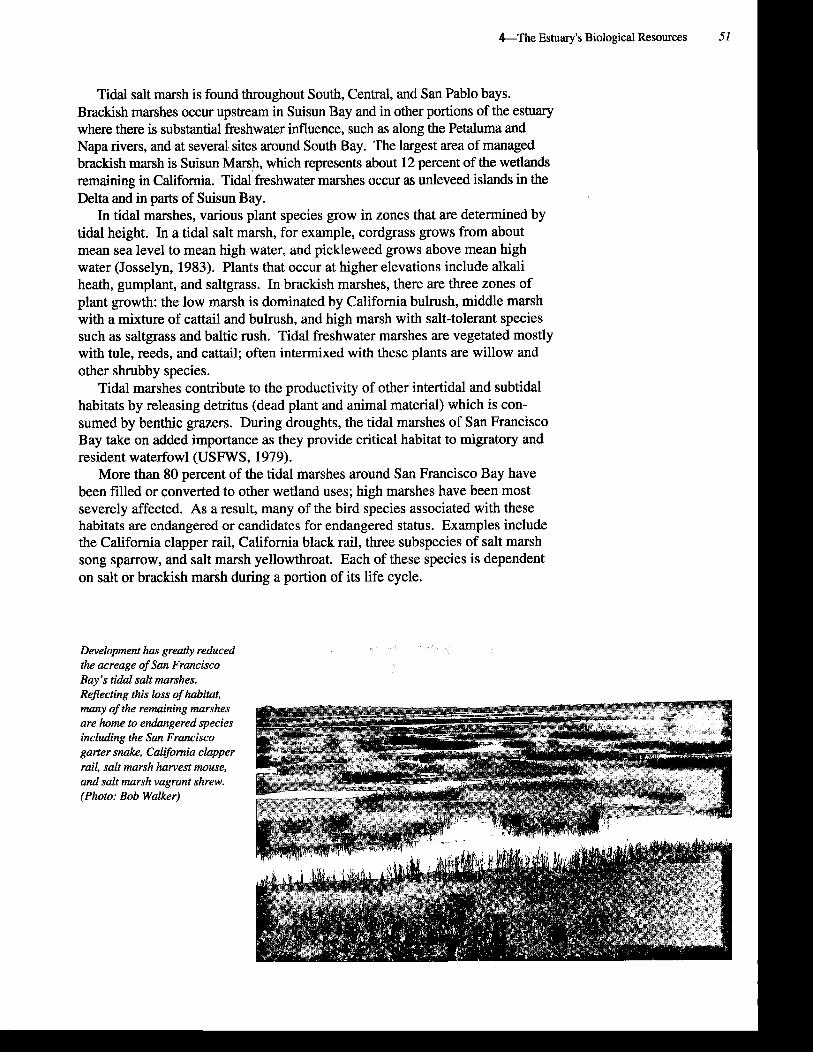
Tidal salt marsh is found throughout South, Central, and San Pablo bays. Brackish marshes occur upstream in Suisun Bay and in other portions of the estuary where there is substantial freshwater influence, such as along the Petaluma and Napa rivers, and at several sites around South Bay. The largest area of managed brackish marsh is Suisun Marsh, which represents about 12 percent of the wetlands remaining in California. Tidal freshwater marshes occur as unleveed islands in the Delta and in parts of Suisun Bay.
In tidal marshes, various plant species grow in zones that are determined by tidal height. In a tidal salt marsh, for example, cordgrass grows from about mean sea level to mean high water, and pickleweed grows above mean high water (Josselyn, 1983). Plants that occur at higher elevations include alkali heath, gumplant, and saltgrass. In brackish marshes, there are three zones of plant growth: the low marsh is dominated by California bulrush, middle marsh with a mixture of cattail and bulrush, and high marsh with salt-tolerant species such as saltgrass and baltic rush. Tidal freshwater marshes are vegetated mostly with tule, reeds, and cattail; often intermixed with these plants are willow and other shrubby species.
Tidal marshes contribute to the productivity of other intertidal and subtidal habitats by releasing detritus (dead plant and animal material) which is con- sumed by benthic grazers. During droughts, the tidal marshes of San Francisco Bay take on added importance as they provide critical habitat to migratory and resident waterfowl (USFWS, 1979).
More than 80 percent of the tidal marshes around San Francisco Bay have been filled or converted to other wetland uses; high marshes have been most severely affected. As a result, many of the bird species associated with these habitats are endangered or candidates for endangered status. Examples include the California clapper rail, California black rail, three subspecies of salt marsh song sparrow, and salt marsh yellowthroat. Each of these species is dependent on salt or brackish marsh during a portion of its life cycle.
Devebpment has greatly reduced I the acreage of Sun Francisco 1 Bay's ti& s i t marshes. Reflecting this loss of habitat, -- I many are h
of the 7me to
remaining lr endangered
tarshes species
including the Sun Francisco garter snake, California clapper rail, salt marsh harvest mouse, and salt marsh vanrant shrew. " (Photo: Bob Walker)
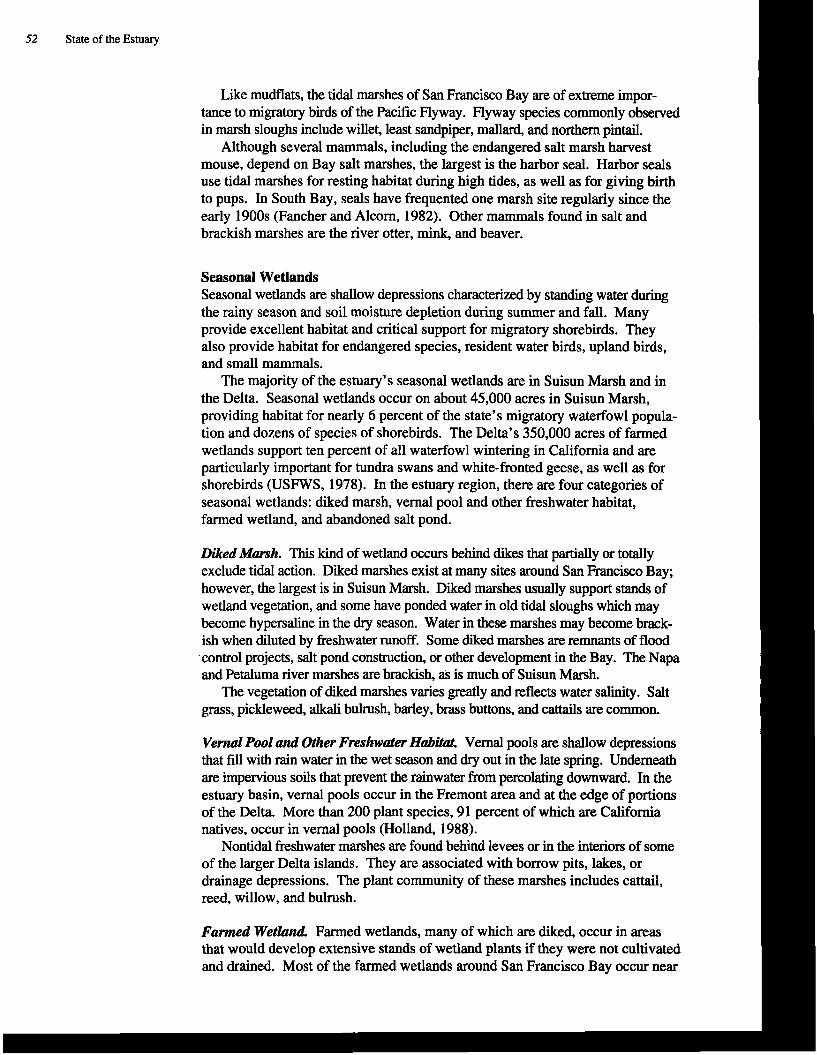
, 52 State of the Estuary
Like mudflats, the tidal marshes of San Francisco Bay are of extreme impor- tance to migratory birds of the Pacific Flyway. Flyway species commonly observed in marsh sloughs include willet, least sandpiper, mallard, and northern pintail.
Although several mammals, including the endangered salt marsh harvest mouse, depend on Bay salt marshes, the largest is the harbor seal. Harbor seals use tidal marshes for resting habitat during high tides, as well as for giving birth to pups. In South Bay, seals have frequented one marsh site regularly since the early 1900s (Fancher and Alcorn, 1982). Other mammals found in salt and brackish marshes are the river otter, mink, and beaver.
Seasonal Wetlands Seasonal wetlands are shallow depressions characterized by standing water during the rainy season and soil moisture depletion during summer and fall. Many provide excellent habitat and critical support for migratory shorebirds. They also provide habitat for endangered species, resident water birds, upland birds, and small mammals.
The majority of the estuary's seasonal wetlands are in Suisun Marsh and in the Delta. Seasonal wetlands occur on about 45,000 acres in Suisun Marsh, providing habitat for nearly 6 percent of the state's migratory waterfowl popula- tion and dozens of species of shorebirds. The Delta's 350,000 acres of farmed wetlands support ten percent of all waterfowl wintering in California and are particularly important for tundra swans and white-fronted geese, as well as for shorebirds (USFWS, 1978). In the estuary region, there are four categories of seasonal wetlands: diked marsh, vernal pool and other freshwater habitat, farmed wetland, and abandoned salt pond.
Diked Marsh. This kind of wetland occurs behind dikes that partially or totally exclude tidal action. Diked marshes exist at many sites around San Francisco Bay; however, the largest is in Suisun Marsh. Diked marshes usually support stands of wetland vegetation, and some have ponded water in old tidal sloughs which may become hypersaline in the dry season. Water in these marshes may become brack- ish when diluted by freshwater runoff. Some diked marshes are remnants of flood .control projects, salt pond construction, or other development in the Bay. The Napa and Petaluma river marshes are brackish, ds is much of Suisun Marsh.
The vegetation of diked marshes varies greatly and reflects water salinity. Salt grass, pickleweed, alkali bulrush, barley, brass buttons, and cattails are common.
V e d Pool and Other Freshwater Ha.& Vernal pools are shallow depressions that ffi with rain water in the wet season and dry out in the late spring. Underneath are impervious soils that prevent the rainwater from percolating downward. In the estuary basin, vernal pools occur in the Fremont area and at the edge of portions of the Delta. More than 200 plant species, 91 percent of which are California natives, occur in vernal pools (Holland, 1988).
Nontidal freshwater marshes are found behind levees or in the interiors of some of the larger Delta islands. They are associated with borrow pits, lakes, or drainage depressions. The plant community of these marshes includes cattail, reed, willow, and bulrush.
Fanned W e t l a d Farmed wetlands, many of which are diked, occur in areas that would develop extensive stands of wetland plants if they were not cultivated and drained. Most of the farmed wetlands around San Francisco Bay occur near
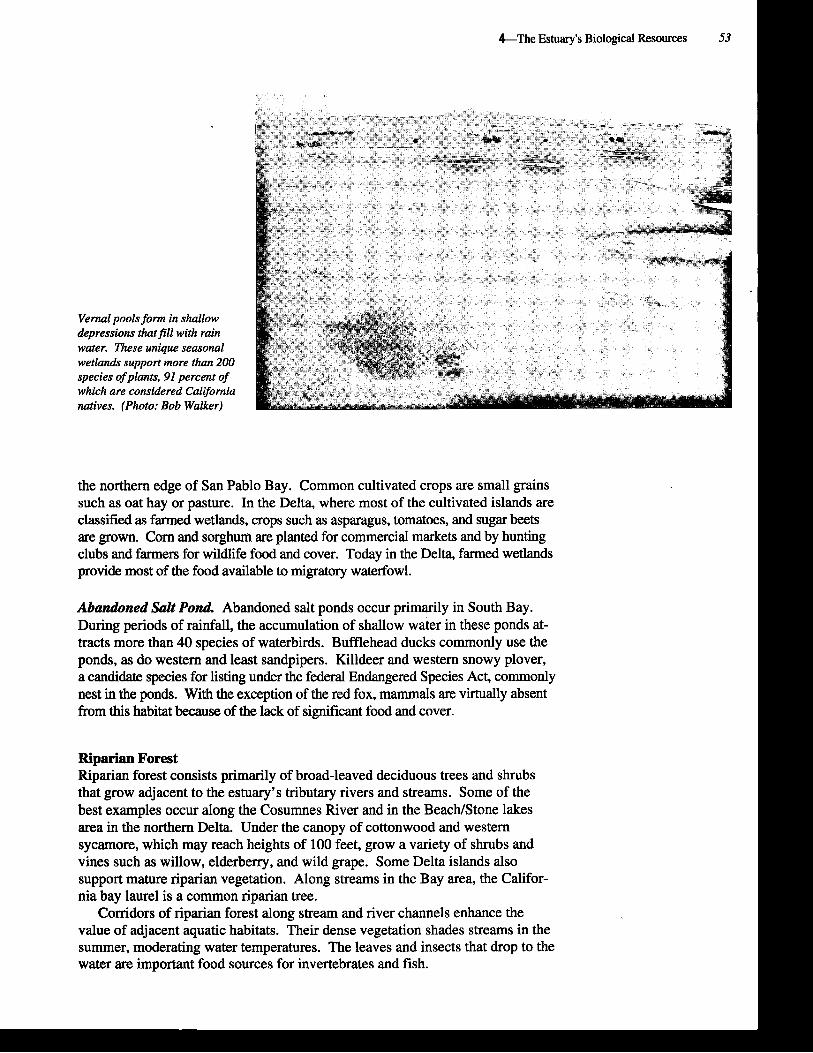
V e m l pools form in shallow
wetlands support more thm 200
natives. (Photo: Bob Walker) I
the northern edge of San Pablo Bay. Common cultivated crops are small grains such as oat hay or pasture. In the Delta, where most of the cultivated islands are classified as farmed wetlands, crops such as asparagus, tomatoes, and sugar beets are grown. Corn and sorghum are planted for commercial markets and by hunting clubs and farmers for wildlife food and cover. Today in the Delta, farmed wetlands provide most of the food available to migratory waterfowl.
Abandoned SaZt P o d Abandoned salt ponds occur primarily in South Bay. During periods of rainfall, the accumulation of shallow water in these ponds at- tracts more than 40 species of waterbirds. Bufflehead ducks commonly use the ponds, as do western and least sandpipers. Killdeer and western snowy plover, a candidate species for listing under the federal Endangered Species Act, commonly nest in the ponds. With the exception of the red fox, mammals are virtually absent from this habitat because of the lack of significant food and cover.
Riparian Forest Riparian forest consists primarily of broad-leaved deciduous trees and shrubs that grow adjacent to the estuary's tributary rivers and streams. Some of the best examples occur along the Cosurnnes River and in the BeachIStone lakes area in the northern Delta. Under the canopy of cottonwood and western sycamore, which may reach heights of 100 feet, grow a variety of shrubs and vines such as willow, elderberry, and wild grape. Some Delta islands also support mature riparian vegetation. Along streams in the Bay area, the Califor- nia bay laurel is a common riparian tree.
Conidors of riparian forest along stream and river channels enhance the value of adjacent aquatic habitats. Their dense vegetation shades streams in the summer, moderating water temperatures. The leaves and insects that drop to the water are important food sources for invertebrates and fish.
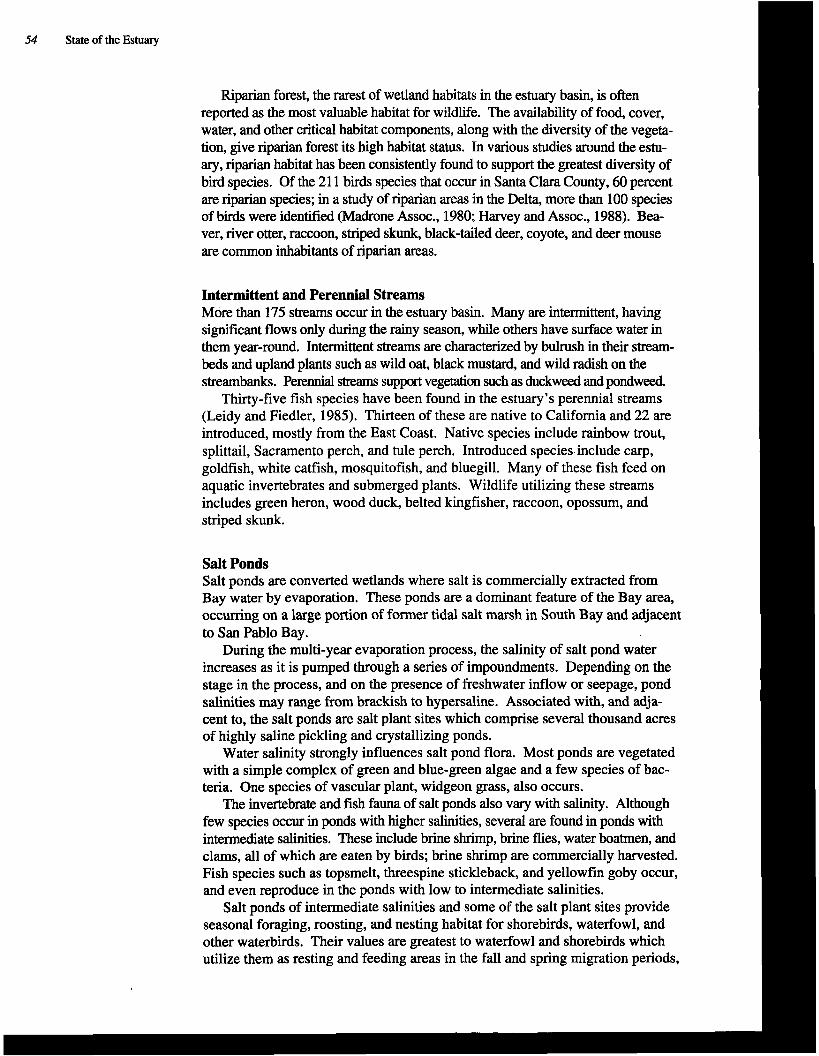
54 State of the Estuary
Riparian forest, the rarest of wetland habitats in the estuary basin, is often reported as the most valuable habitat for wildlife. The availability of food, cover, water, and other critical habitat components, along with the diversity of the vegeta- tion, give riparian forest its high habitat status. In various studies around the estu- ary, riparian habitat has been consistently found to support the greatest diversity of b i d species. Of the 21 1 b i d species that occur in Santa Clara County, 60 percent are riparian species; in a study of riparian areas in the Delta, more than 100 species of birds were identified (Madrone Assoc., 1980; Harvey and Assoc., 1988). Bea- ver, river otter, raccoon, striped skunk, black-tailed deer, coyote, and deer mouse are common inhabitants of riparian areas.
Intermittent and Perennial Streams More than 175 streams occur in the estuary basin. Many are intermittent, having significant flows only during the rainy season, while others have surface water in them year-round. Intermittent streams are characterized by bulrush in their stream- beds and upland plants such as wild oat, black mustard, and wild radish on the streambanks. Perennial streams support vegetation such as duckweed and pondweed.
Thirty-five fish species have been found in the estuary's perennial streams (Leidy and Fiedler, 1985). Thirteen of these are native to California and 22 are introduced, mostly from the East Coast. Native species include rainbow trout, splittail, Sacramento perch, and tule perch. Introduced species include carp, goldfish, white catfish, mosquitofish, and bluegill. Many of these fish feed on aquatic invertebrates and submerged plants. Wildlife utilizing these streams includes green heron, wood duck, belted kingfisher, raccoon, opossum, and striped skunk.
Salt Ponds Salt ponds are converted wetlands where salt is commercially extracted from Bay water by evaporation. These ponds are a dominant feature of the Bay area, occumng on a large portion of former tidal salt marsh in South Bay and adjacent to San Pablo Bay.
During the multi-year evaporation process, the salinity of salt pond water increases as it is pumped through a series of impoundments. Depending on the stage in the process, and on the presence of freshwater inflow or seepage, pond salinities may range from brackish to hypersaline. Associated with, and adja- cent to, the salt ponds are salt plant sites which comprise several thousand acres of highly saline pickling and crystallizing ponds.
Water salinity strongly influences salt pond flora. Most ponds are vegetated with a simple complex of green and blue-green algae and a few species of bac- teria. One species of vascular plant, widgeon grass, also occurs.
The invertebrate and fish fauna of salt ponds also vary with salinity. Although few species occur in ponds with higher salinities, several are found in ponds with intermediate salinities. These include brine shrimp, brine flies, water boatmen, and clams, all of which are eaten by birds; brine shrimp are commercially harvested. Fish species such as topsmelt, threespine stickleback, and yellowfin goby occur, and even reproduce in the ponds with low to intermediate salinities.
Salt ponds of intermediate salinities and some of the salt plant sites provide seasonal foraging, roosting, and nesting habitat for shorebirds, waterfowl, and other waterbirds. Their values are greatest to waterfowl and shorebirds which utilize them as resting and feeding areas in the fall and spring migration periods,
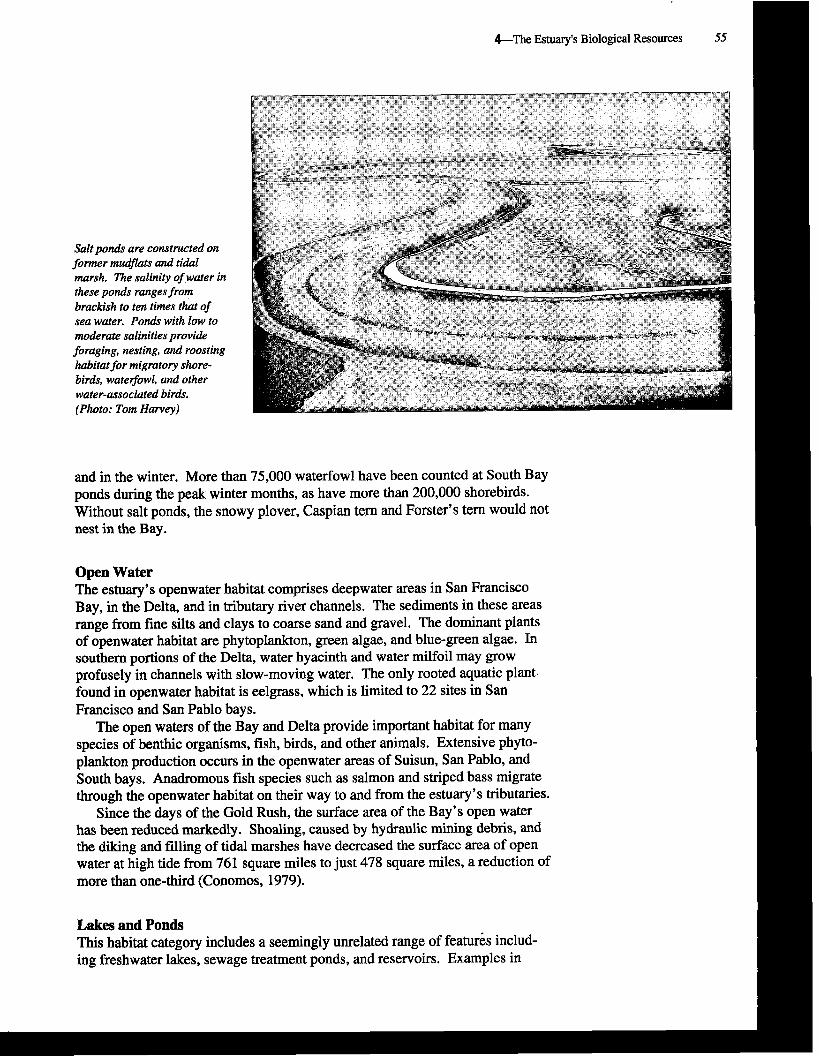
&The Estuary's Biological Resources 55
Salt ponds are constructed on former mudflats and tidal marsh. The salinity of water in these ponds ranges from I brackish to ten times that of sea water. Ponds with low to moderate salinities provide foraging, nesting, and roosting habitat for migratory shore- birds, waterjowl, and other water-associated birds. (Photo: Tom Harvey) I
and in the winter. More than 75,000 waterfowl have been counted at South Bay ponds during the peak winter months, as have more than 200,000 shorebirds. Without salt ponds, the snowy plover, Caspian tern and Forster's tern would not nest in the Bay.
Open Water The estuary's openwater habitat comprises deepwater areas in San Francisco Bay, in the Delta, and in tributary river channels. The sediments in these areas range from fine silts and clays to coarse sand and gravel. The dominant plants of openwater habitat are phytoplankton, green algae, and blue-green algae. In southern portions of the Delta, water hyacinth and water milfoil may grow profusely in channels with slow-moving water. The only rooted aquatic plant found in openwater habitat is eelgrass, which is limited to 22 sites in San Francisco and San Pablo bays.
The open waters of the Bay and Delta provide important habitat for many species of benthic organisms, fish, birds, and other animals. Extensive phyto- plankton production occurs in the openwater areas of Suisun, San Pablo, and South bays. Anadromous fish species such as salmon and striped bass migrate through the openwater habitat on their way to and from the estuary's tributaries.
Since the days of the Gold Rush, the surface area of the Bay's open water has been reduced markedly. Shoaling, caused by hydraulic mining debris, and the diking and filling of tidal marshes have decreased the surface area of open water at high tide from 761 square miles to just 478 square miles, a reduction of more than one-third (Conomos, 1979).
Lakes and Ponds This habitat category includes a seemingly unrelated range of features includ- ing freshwater lakes, sewage treatment ponds, and reservoirs. Examples in

56 State of the Estuary
the Delta are the Beach and Stone lakes, Sacramento County regional sanitation ponds, Stockton sewage treatment ponds, Franks Tract, and Clifton Court Forebay. In the Bay area, included are such sites as Spinnaker Lagoon in San Rafael, the Alameda Creek quarry ponds in Fremont, and municipal water supply reservoirs.
The plant communities of lakes and ponds around the estuary vary widely. In general, they are dominated by aquatic vegetation, including floating, sub- merged and emergent species. Duckweed, pondweed, and cattail are common.
Many Delta lakes support diverse invertebrate communities of opossum shrimp, crayfish, and amphipods; however, most artificial lakes and ponds in the estuary basin probably support simpler invertebrate communities. Warmwater fish species are common.
Probably the most valuable freshwater lakes in the estuary basin are the Beach and Stone lakes near Sacramento. These lakes, with diverse stands of marsh and adjacent riparian vegetation, support large numbers of waterfowl and an egret rookery. Of the artificial lakes and ponds, wastewater treatment ponds prob- ably have the greatest potential for valuable wildlife habitat. Studies show that ponds in the Delta and Bay area are used during the winter by many species of waterfowl, shorebirds, and other waterbirds (Madrone Assoc., 1980).
Transition Areas
Wetlands often give way to uplands within a gradual transition area. Along a gradient away from the wetlands, soils become drier, wetland plants fewer, and plants adapted to drier soil more numerous. Depending on the soil type, slope, and hydrological conditions, the width of a transition area may vary from a few feet to several hundred feet. Common transition area plant communities include wetland species such as gumplant, and grassland species such as wild radish, .
curly dock, and grasses. Larger shrubs such as coyote brush, black mustard, fennel, and star thistle are common in transition areas.
Transition areas are ecologically important parts of the estuary ecosystem. They may provide temporary refuge for many species of tidal wetland-associated wildlife, especially during periods of high tides or storms. They also may pro- vide foraging habitat or meet some other needs of wildlife associated with wetlands. Two endangered species, the California clapper rail and salt marsh harvest mouse, frequently utilize transition areas. Other wildlife commonly associated with wetlandlupland transition areas include gopher snake, mourning dove, meadowlark, killdeer, striped skunk, and ground squirrel.
UplamH Habitats
Uplands are the generally well-drained areas that comprise the majority of the lands in the estuary region. There are many kinds of upland habitats, from the grasslands along the estuary's edge to the evergreen redwood forests on the wetter slopes. All are of value to the region's wildlife by providing nesting, foraging, and other habitat. Agricultural land is especially important to many species of raptors and wintering shorebirds, geese, swans, and cranes. Uplands may influence the quality of adjacent wetlands, especially when they buffer them from human disturbance.
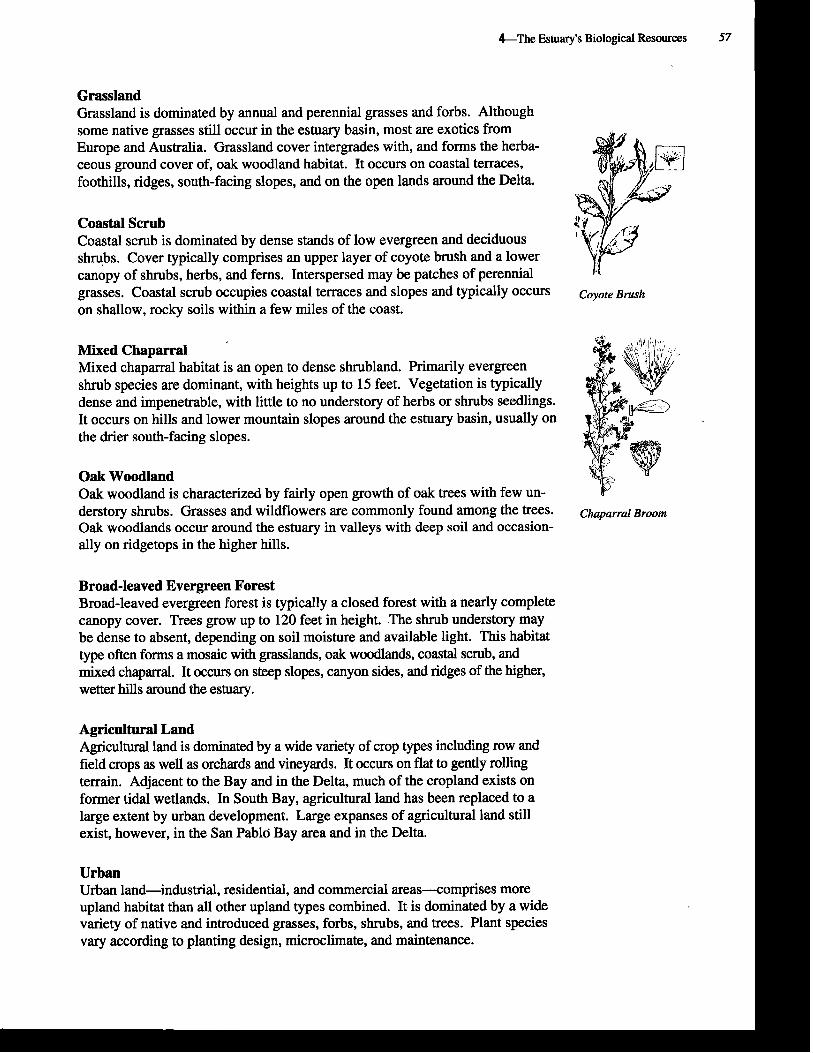
&The Estuary's Biological Resources
Grassland Grassland is dominated by annual and perennial grasses and forbs. Although some native grasses still occur in the estuary basin, most are exotics from Europe and Australia. Grassland cover intergrades with, and forms the herba- ceous ground cover of, oak woodland habitat. It occurs on coastal terraces, foothills, ridges, south-facing slopes, and on the open lands around the Delta.
Coastal Scrub Coastal scrub is dominated by dense stands of low evergreen and deciduous shrups. Cover typically comprises an upper layer of coyote brush and a lower canopy of shrubs, herbs, and ferns. Interspersed may be patches of perennial grasses. Coastal scrub occupies coastal terraces and slopes and typically occurs coyote ~~~~h on shallow, rocky soils within a few miles of the coast.
Mixed Chaparral Mixed chaparral habitat is an open to dense shrubland. Primarily evergreen shrub species are dominant, with heights up to 15 feet. Vegetation is typically dense and impenetrable, with little to no understory of herbs or shrubs seedlings. It occurs on hills and lower mountain slopes around the estuary basin, usually on the drier south-facing slopes.
Oak Woodland Oak woodland is characterized by fairly open growth of oak trees with few un- derstory shrubs. Grasses and wildflowers are commonly found among the trees. ckparral Broom Oak woodlands occur around the estuary in valleys with deep soil and occasion- ally on ridgetops in the higher hills.
Broad-leaved Evergreen Forest Broad-leaved evergreen forest is typically a closed forest with a nearly complete canopy cover. Trees grow up to 120 feet in height. The shrub understory may be dense to absent, depending on soil moisture and available light. This habitat type often forms a mosaic with grasslands, oak woodlands, coastal scrub, and mixed chaparral. It occurs on steep slopes, canyon sides, and ridges of the higher, wetter hills around the estuary.
Agricultural Land Agricultural land is dominated by a wide variety of crop types including row and field crops as well as orchards and vineyards. It occurs on flat to gently rolling terrain. Adjacent to the Bay and in the Delta, much of the cropland exists on former tidal wetlands. In South Bay, agricultural land has been replaced to a large extent by urban development. Large expanses of agricultural land still exist, however, in the San Pablo Bay area and in the Delta.
Urban Urban land-industrial, residential, and commercial areas-comprises more upland habitat than all other upland types combined. It is dominated by a wide variety of native and introduced grasses, forbs, shrubs, and trees. Plant species vary according to planting design, microclimate, and maintenance.
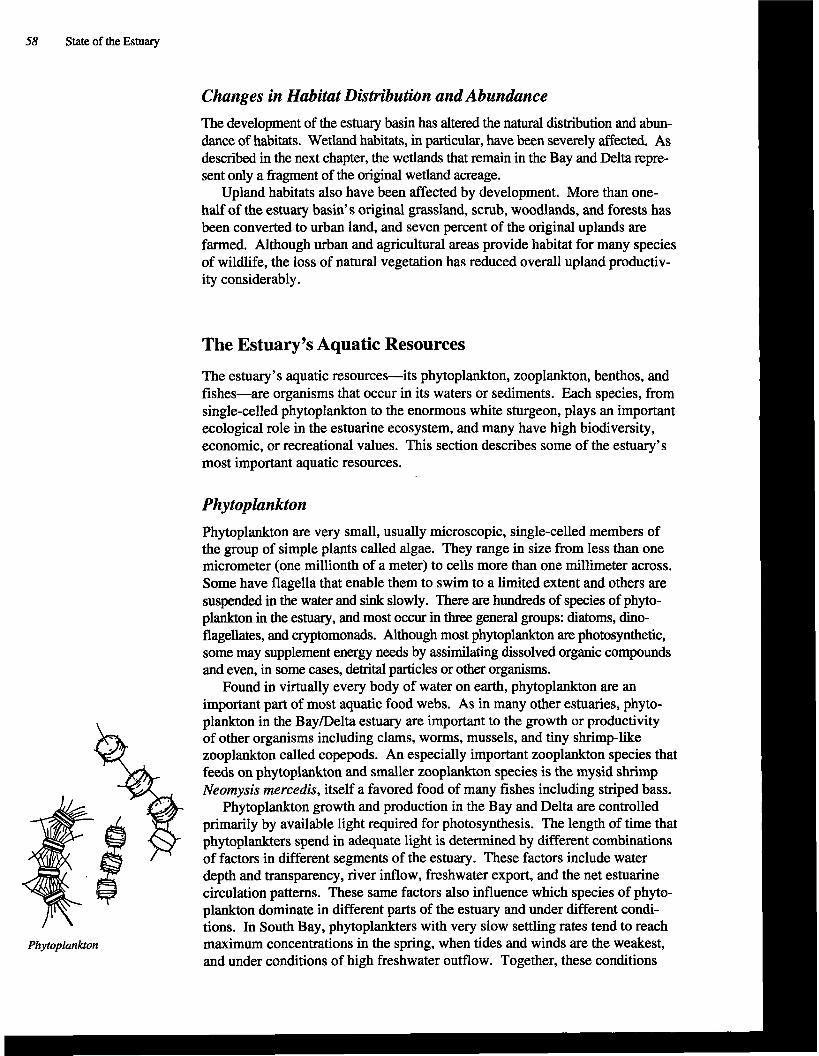
58 State of the Estuary
Changes in Habitat Distributi~n and Abundance
The development of the estuary basin has altered the natural distribution and abun- dance of habitats. Wetland habitats, in particular, have been severely affected. As described in the next chapter, the wetlands that remain in the Bay and Delta repre- sent only a fragment of the original wetland acreage.
Upland habitats also have been affected by development. More than one- half of the estuary basin's original grassland, scrub, woodlands, and forests has been converted to urban land, and seven percent of the original uplands are farmed. Although urban and agricultural areas provide habitat for many species of wildlife, the loss of natural vegetation has reduced overall upland productiv- ity considerably.
The Estuary's Aquatic Resources
The estuary's aquatic resources-its phytoplankton, zooplankton, benthos, and fishes-are organisms that occur in its waters or sediments. Each species, from single-celled phytoplankton to the enormous white sturgeon, plays an important ecological role in the estuarine ecosystem, and many have high biodiversity, economic, or recreational values. This section describes some of the estuary's most important aquatic resources.
Phytoplankton
Phytoplankton are very small, usually microscopic, single-celled members of the group of simple plants called algae. They range in size from less than one micrometer (one millionth of a meter) to cells more than one millimeter across. Some have flagella that enable them to swim to a limited extent and others are suspended in the water and sink slowly. There are hundreds of species of phyto- plankton in the estuary, and most occur in three general groups: diatoms, dino- flagellates, and cryptomonads. Although most phytoplankton are photosynthetic, some may supplement energy needs by assimilating dissolved organic compounds and even, in some cases, detrital particles or other organisms.
Found in virtually every body of water on earth, phytoplankton are an important part of most aquatic food webs. As in many other estuaries, phyto- plankton in the BayDelta estuary are important to the growth or productivity of other organisms including clams, worms, mussels, and tiny shrimp-like zooplankton called copepods. An especially important zooplankton species that feeds on phytoplankton and smaller zooplankton species is the mysid shrimp Neomysis mercedis, itself a favored food of many fishes including striped bass.
Phytoplankton growth and production in the Bay and Delta are controlled primarily by available light required for photosynthesis. The length of time that phytoplankters spend in adequate light is determined by different combinations of factors in different segments of the estuary. These factors include water depth and transparency, river inflow, freshwater export, and the net estuarine circulation patterns. These same factors also influence which species of phyto- plankton dominate in different parts of the estuary and under different condi- tions. In South Bay, phytoplankters with very slow settling rates tend to reach
Phytoplankton maximum concentrations in the spring, when tides and winds are the weakest, and under conditions of high freshwater outflow. Together, these conditions
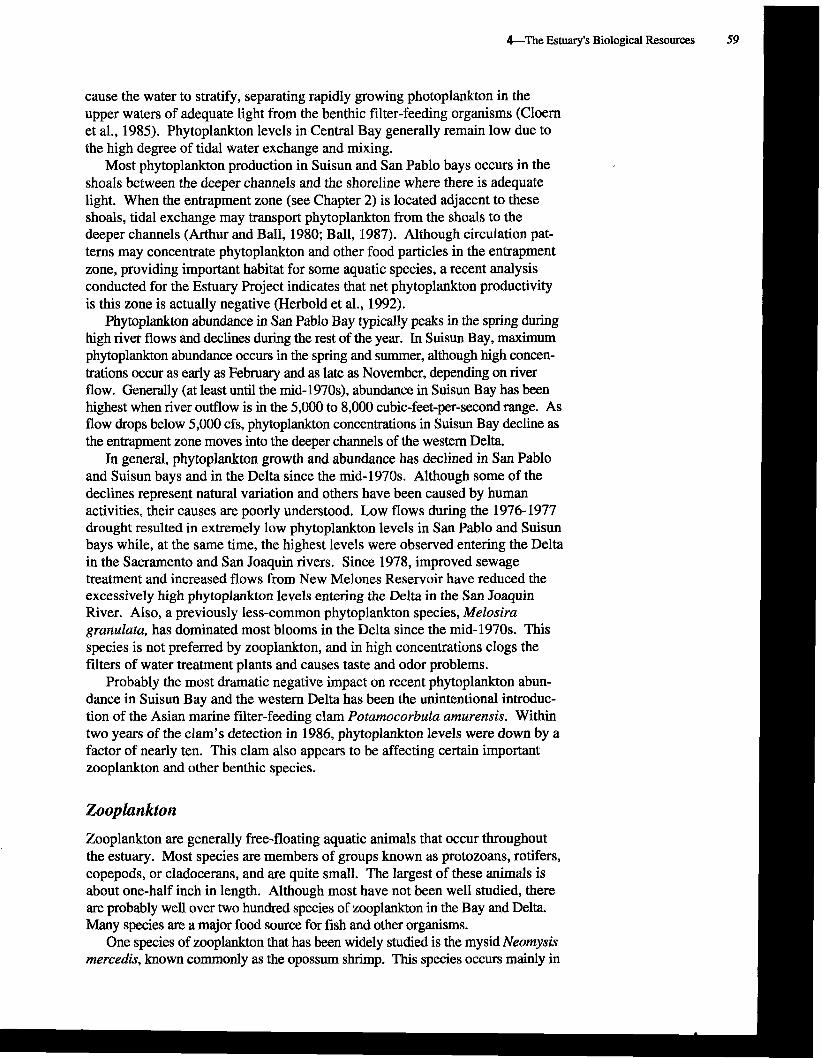
L T h e Estuary's Biological Resources 59
cause the water to stratify, separating rapidly growing photoplankton in the upper waters of adequate light from the benthic filter-feeding organisms (Cloern et al., 1985). Phytoplankton levels in Central Bay generally remain low due to the high degree of tidal water exchange and mixing.
Most phytoplankton production in Suisun and San Pablo bays occurs in the shoals between the deeper channels and the shoreline where there is adequate light. When the entrapment zone (see Chapter 2) is located adjacent to these shoals, tidal exchange may transport phytoplankton from the shoals to the deeper channels (Arthur and Ball, 1980; Ball, 1987). Although circulation pat- terns may concentrate phytoplankton and other food particles in the entrapment zone, providing important habitat for some aquatic species, a recent analysis conducted for the Estuary Project indicates that net phytoplankton productivity is this zone is actually negative (Herbold et al., 1992).
Phytoplankton abundance in San Pablo Bay typically peaks in the spring during high river flows and declines during the rest of the year. In Suisun Bay, maximum phytoplankton abundance occurs in the spring and summer, although high concen- trations occur as early as February and as late as November, depending on river flow. Generally (at least until the mid-1970s), abundance in Suisun Bay has been highest when river outflow is in the 5,000 to 8,000 cubic-feet-per-second range. As flow drops below 5,000 cfs, phytoplankton concentrations in Suisun Bay decline as the entrapment zone moves into the deeper channels of the western Delta.
In general, phytoplankton growth and abundance has declined in San Pablo and Suisun bays and in the Delta since the mid-1970s. Although some of the declines represent natural variation and others have been caused by human activities, their causes are poorly understood. Low flows during the 1976-1977 drought resulted in extremely low phytoplankton levels in San Pablo and Suisun bays while, at the same time, the highest levels were observed entering the Delta in the Sacramento and San Joaquin rivers. Since 1978, improved sewage treatment and increased flows from New Melones Reservoir have reduced the excessively high phytoplankton levels entering the Delta in the San Joaquin River. Also, a previously less-common phytoplankton species, Melosira granulata, has dominated most blooms in the Delta since the mid-1970s. This species is not preferred by zooplankton, and in high concentrations clogs the filters of water treatment plants and causes taste and odor problems.
Probably the most dramatic negative impact on recent phytoplankton abun- dance in Suisun Bay and the western Delta has been the unintentional introduc- tion of the Asian marine filter-feeding clam Potamocorbula amurensis. Within two years of the clam's detection in 1986, phytoplankton levels were down by a factor of nearly ten. This clam also appears to be affecting certain important zooplankton and other benthic species.
Zooplankton
Zooplankton are generally free-floating aquatic animals that occur throughout the estuary. Most species are members of groups known as protozoans, rotifers, copepods, or cladocerans, and are quite small. The largest of these animals is about one-half inch in length. Although most have not been well studied, there are probably well over two hundred species of zooplankton in the Bay and Delta. Many species are a major food source for fish and other organisms.
One species of zooplankton that has been widely studied is the mysid Neomysis mercedis, known commonly as the opossum shrimp. This species occurs mainly in
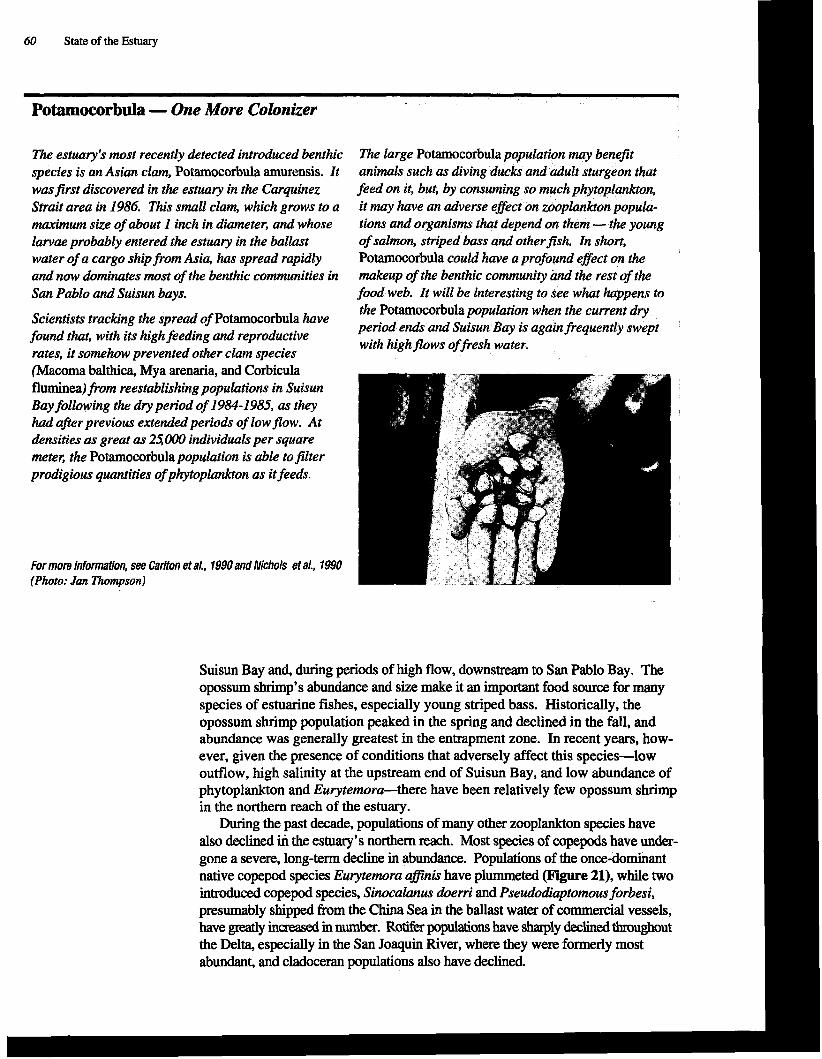
60 State of the Estuary
Potamocorbula - One More Colonizer
The estuary's most recently detected introduced benthic species is an Asian clam, Potamocorbula amu~ensis. It wasfirst discovered in the estuary in the Carquinez Strait area in 1986. This small clam, which grows to a maximum size of about I inch in diameter, and whose larvae probably entered the estuary in the ballast water of a cargo ship from Asia, has spread rapidly and now dommEnates most of the benthic communities in San Pablo and Suisun bays.
Scientists tracking the spread of Potamocorbula have found that, with its high feeding and reproductive rates, it somehow prevented other clam species (Macoma balthica, Mya arenaria, and Corbicula fluminea)fPom reestablishing populations in Suisun Bay following the dry period of 1984-1985, as they had after previous extended periods of low flow. At densities as great as 25,000 individuuls per square meter, the Potamocorbula population is able to filter prodigious quantities of phytoplankton as it feeds.
For more information, see Carlton et a/., 1990 and Nichols et a/., 1990 (Photo: Jan Thompson)
The large Potamocorbula population may benefit animals such as diving ducks and adult sturgeon that feed on it, but, by consuming so much phytoplankton, it may have an adverse eflect on zooplankton popula- tiom and organism that depend on them - the young of salmon, striped bass and other fish. In short, Potamocorbula could have a profound egect on the makeup of the benthic community hPul the rest of the food web. It will be interesting to see what happens to the Potamocorbula population when the current dry period ends and Suisun Bay is again frequently swept with high flows offresh water.
Suisun Bay and, during periods of high flow, downstream to San Pablo Bay. The opossum shrimp's abundance and size make it an important food source for many species of estuarine fishes, especially young striped bass. Historically, the opossum shrimp population peaked in the spring and declined in the fall, and abundance was generally greatest in the entrapment zone. In recent years, how- ever, given the presence of conditions that adversely afFect this species-low outflow, high salinity at the upstream end of Suisun Bay, and low abundance of phytoplankton and Eurytemora-there have been relatively few opossum shrimp in the northern reach of the estuary.
During the past decade, populations of many other zooplankton species have also declined iti the estuary's northern reach. Most species of copepods have under- gone a severe, long-term decline in abundance. Populations of the once-dominant native copepod species Eurytemora afinis have plummeted @gum 21), while two introduced copepod species, Sinocalanus doerri and Pseudodiaptomous forbesi, presumably shipped from the China Sea in the ballast water of commercial vessels, have greatly increased in number. Rotifer populations have shsapy declined throughout the Delta, especially in the San Joaquin River, where they were formerly most abundant, and cladoceran populations also have declined.
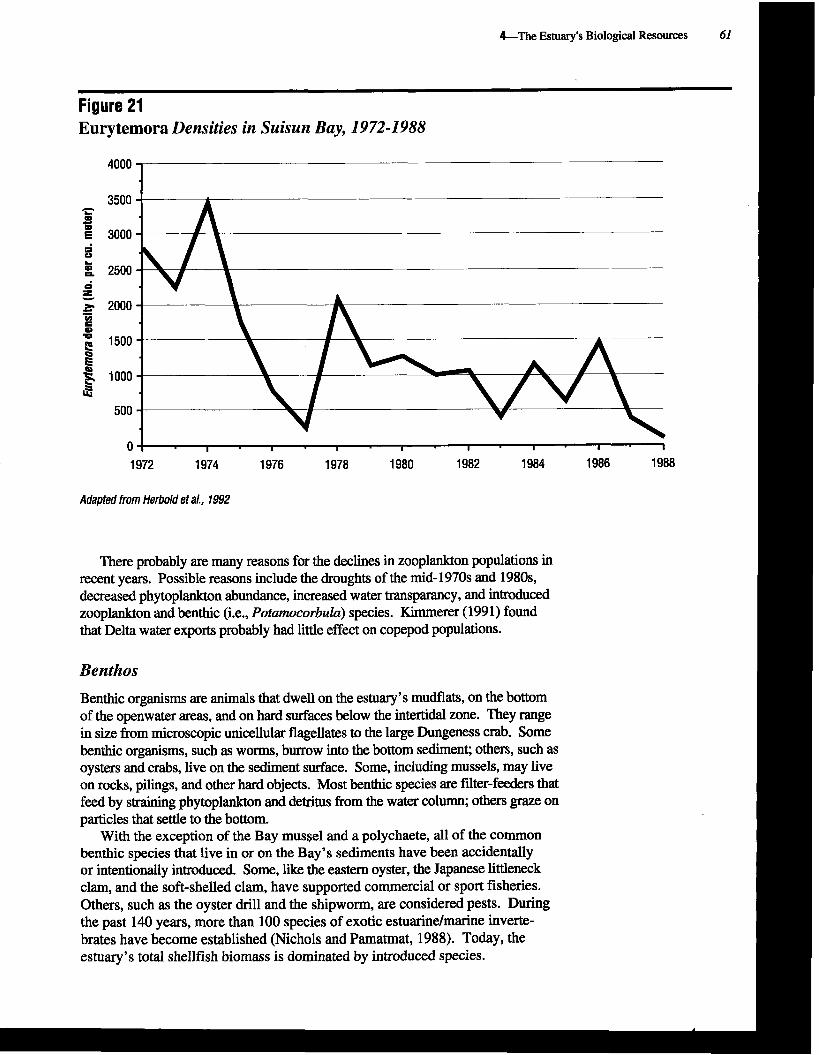
L T h e Estuary's Biological Resources 61 1
Eurvtemora Densities in Suisun Bav. 6972-1988 I
decreased phytoplankton abundance, increasedbater transP-cy, and introduced zooplankton and benthic (i.e., Potamocorbula) species. Kimmerer (1991) found that Delta water exports probably had little effect on copepod populations.
Benthic organisms are animals that dwell on the estuary's mudflats, on the bottom of the ownwater areas. and on hard surfaces below the intertidal zone. They range
oysters and crabs, live on the sediment surface. Some, including mussels, may live on rocks, pilings, and other hard objects. Most benthic species are filter-feeders that feed by straining phytoplankton and detritus from the water column; others graze on particles that settle to the bottom.
With the exception of the Bay mussel and a polychaete, all of the common benthic species that live in or on the Bay's sediments have been accidentally or intentionally introduced. Some, like the eastern oyster, the Japanese littleneck clam, and the soft-shelled clam, have supported commercial or sport fisheries. Others, such as the oyster drill and the shipworm, are considered pests. During the Dast 140 years, more than 100 species of exotic estuarinelmarine inverte-
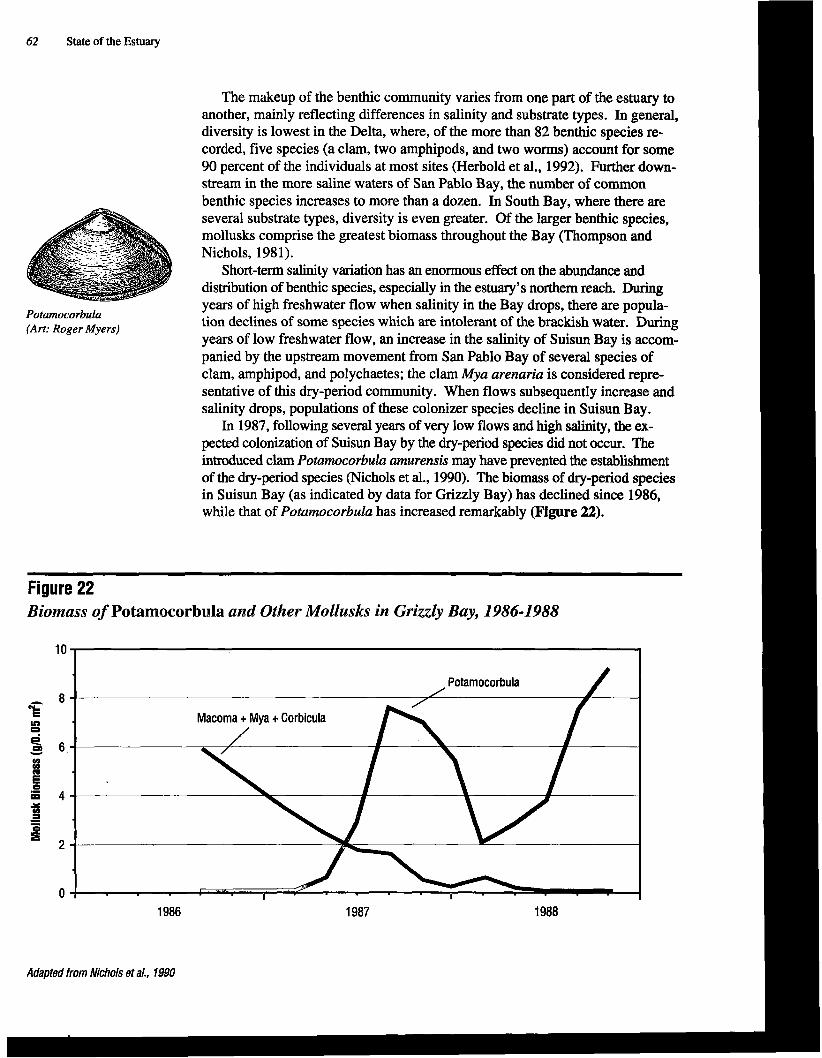
62 State of the Estuary
The makeup of the benthic community varies from one part of the estuary to another, mainly reflecting differences in salinity and substrate types. In general, diversity is lowest in the Delta, where, of the more than 82 benthic species re- corded, five species (a clam, two amphipods, and two worms) account for some 90 percent of the individuals at most sites (Herbold et al., 1992). Further down- stream in the more saline waters of San Pablo Bay, the number of common benthic species increases to more than a dozen. In South Bay, where there are several substrate types, diversity is even greater. Of the larger benthic species, mollusks comprise the greatest biomass throughout the Bay (Thompson and Nichols, 198 1).
Short-term salinity variation has an enormous effect on the abundance and distribution of benthic species, especially in the estuary's northern reach. During years of high freshwater flow when salinity in the Bay drops, there are popula-
Potamocorbula (Art: Roger Myers) tion declines of some species which are intolerant of the brackish water. During
years of low freshwater flow, an increase in the salinity of Suisun Bay is accom- panied by the upstream movement from San Pablo Bay of several species of clam, amphipod, and polychaetes; the clam Mya arenaria is considered repre- sentative of this dry-period community. When flows subsequently increase and salinity drops, populations of these colonizer species decline in Suisun Bay.
In 1987, following several years of very low flows and high salinity, the ex- pected colonization of Suisun Bay by the dry-period species did not occur. The introduced clam Potamocorbula amurensis may have prevented the establishment of the dry-period species (Nichols et al., 1990). The biomass of dry-period species in Suisun Bay (as indicated by data for Grizzly Bay) has declined since 1986, while that of Potamocorbula has increased remarkably (Figure 22).
Figure 22 Biomass of Botamocorbula and Other Mollusks in Grizzly Bay, 1986-1988
1986
Adapted from Nichols eta/., 1990
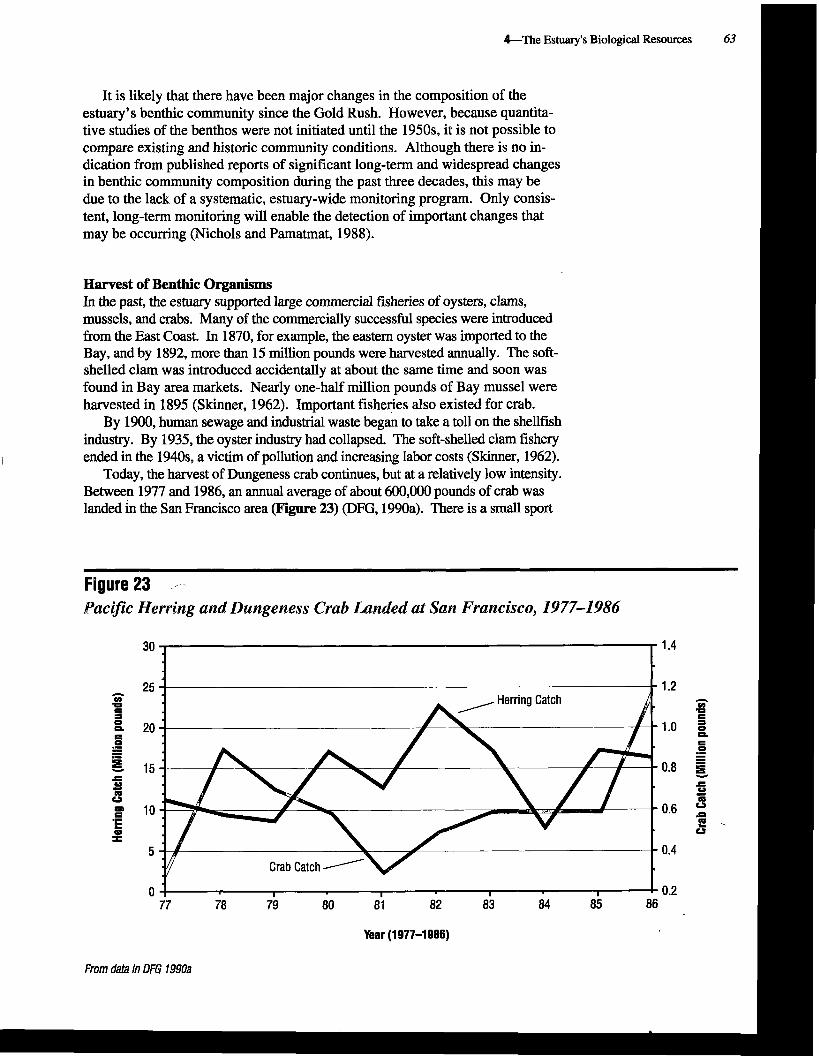
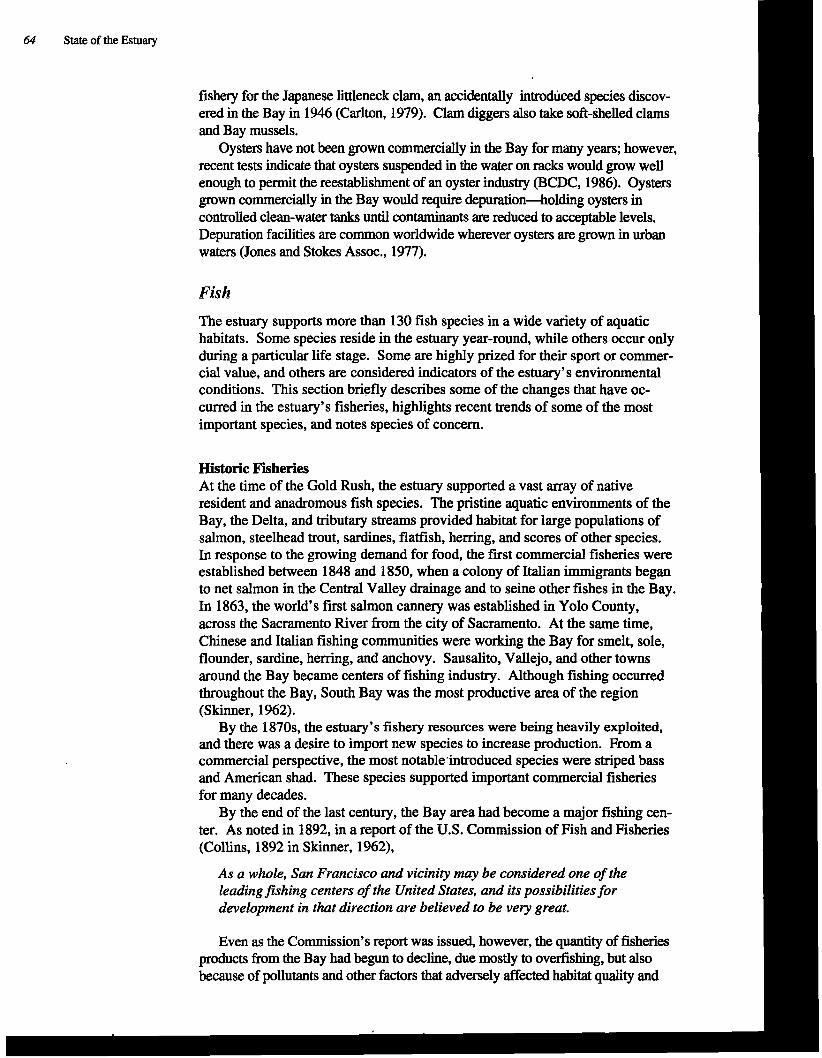
64 State of the Estuary
fishery for the Japanese littleneck clam, an accidentally introduced species discov- ered in the Bay in 1946 (Carlton, 1979). Clam diggers also take soft-shelled clams and Bay mussels.
Oysters have not been grown commercially in the Bay for many years; however, recent tests indicate that oysters suspended in the water on racks would grow well enough to permit the reestablishment of an oyster industry (BCDC, 1986). Oysters grown commercially in the Bay would require depuration-holding oysters in controlled clean-water tanks until contaminants are reduced to acceptable levels. Depuration facilities are common worldwide wherever oysters are grown in urban waters (Jones and Stokes Assoc., 1977).
Fish
The estuary supports more than 130 fish species in a wide variety of aquatic habitats. Some species reside in the estuary year-round, while others occur only during a particular life stage. Some are highly prized for their sport or commer- cial value, and others are considered indicators of the estuary's environmental conditions. This section briefly describes some of the changes that have oc- curred in the estuary's fisheries, highlights recent trends of some of the most important species, and notes species of concern.
Historic Fisheries At the time of the Gold Rush, the estuary supported a vast array of native resident and anadromous fish species. The pristine aquatic environments of the Bay, the Delta, and tributary streams provided habitat for large populations of salmon, steelhead trout, sardines, flatfish, herring, and scores of other species. In response to the growing demand for food, the first commercial fisheries were established between 1848 and 1850, when a colony of Italian immigrants began to net salmon in the Central Valley drainage and to seine other fishes in the Bay. In 1863, the world's first salmon cannery was established in Yolo County, across the Sacramento River from the city of Sacramento. At the same time, Chinese and Italian fishing communities were working the Bay for smelt, sole, flounder, sardine, herring, and anchovy. Sausalito, Vallejo, and other towns around the Bay became centers of fishing industry. Although fishing occurred throughout the Bay, South Bay was the most productive area of the region (Skinner, 1962).
By the 1870s, the estuary's fishery resources were being heavily exploited, and there was a desire to import new species to increase production. From a commercial perspective, the most notable,introduced species were striped bass and American shad. These species supported important commercial fisheries for many decades.
By the end of the last century, the Bay area had become a major fishing ten- ter. As noted in 1892, in a report of the U.S. Commission of Fish and Fisheries (Collins, 1892 in Skinner, 1962),
As a whole, Sun Francisco and vicinity m a y be considered one of the leadingfishing centers of the United States, and its possibilities for development in that direction are believed to be very great.
Even as the Commission's report was issued, however, the quantity of fisheries products from the Bay had begun to decline, due mostly to overfishing, but also because of pollutants and other factors that adversely affected habitat quality and
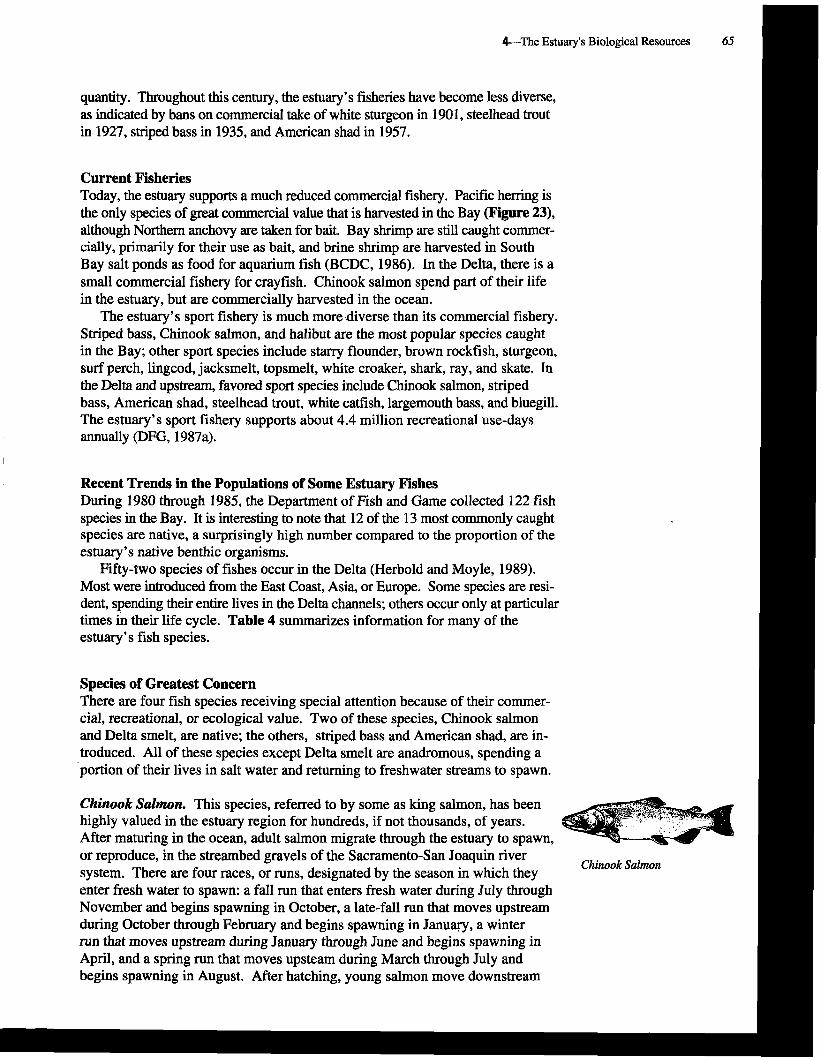
&--The Estuary's Biological Resources 65
quantity. Throughout this century, the estuary's fisheries have become less diverse, as indicated by bans on commercial take of white sturgeon in 1901, steelhead trout in 1927, striped bass in 1935, and American shad in 1957.
Current Fisheries Today, the estuary supports a much reduced commercial fishery. Pacific herring is the only species of great commercial value that is harvested in the Bay (Figure 23), although Northern anchovy are taken for bait. Bay shrimp are still caught commer- cially, primarily for their use as bait, and brine shrimp are harvested in South Bay salt ponds as food for aquarium fish (BCDC, 1986). In the Delta, there is a small commercial fishery for crayfish. Chinook salmon spend part of their life in the estuary, but are commercially harvested in the ocean.
The estuary's sport fishery is much more \diverse than its commercial fishery. Striped bass, Chinook salmon, and halibut are the most popular species caught in the Bay; other sport species include starry flounder, brown rockfish, sturgeon, surf perch, lingcod, jacksmelt, topsmelt, white croaker, shark, ray, and skate. In the Delta and upstream, favored sport species include Chinook salmon, striped bass, American shad, steelhead trout, white catfish, largemouth bass, and bluegill. The estuary's sport fishery supports about 4.4 million recreational use-days annually (DFG, 1987a).
I
Recent Trends in the Populations of Some Estuary Fishes During 1980 through 1985, the Department of Fish and Game collected 122 fish species in the Bay. It is interesting to note that 12 of the 13 most commonly caught species are native, a surprisingly high number compared to the proportion of the estuary's native benthic organisms.
Fifty-two species of fishes occur in the Delta (Herbold and Moyle, 1989). Most were introduced from the East Coast, Asia, or Europe. Some species are resi- dent, spending their entire lives in the Delta channels; others occur only at particular times in their life cycle. Table 4 summarizes information for many of the estuary's fish species.
Species of Greatest Concern There are four fish species receiving special attention because of their comrner- cial, recreational, or ecological value. Two of these species, Chinook salmon and Delta smelt, are native; the others, striped bass and American shad, are in- troduced. All of these species except Delta smelt are anadromous, spending a portion of their lives in salt water and returning to freshwater streams to spawn.
Chinook Salmon. This species, referred to by some as king salmon, has been highly valued in the estuary region for hundreds, if not thousands, of years. After maturing in the ocean, adult salmon migrate through the estuary to spawn, or reproduce, in the streambed gravels of the Sacramento-San Joaquin river
Chinook Salmon system. There are four races, or runs, designated by the season in which they enter fresh water to spawn: a fall run that enters fresh water during July through November and begins spawning in October, a late-fall run that moves upstream during October through February and begins spawning in Januw, a winter run that moves upstream during January through June and begins spawning in April, and a spring run that moves upstearn during March through July and begins spawning in August. After hatching, young salmon move downstream
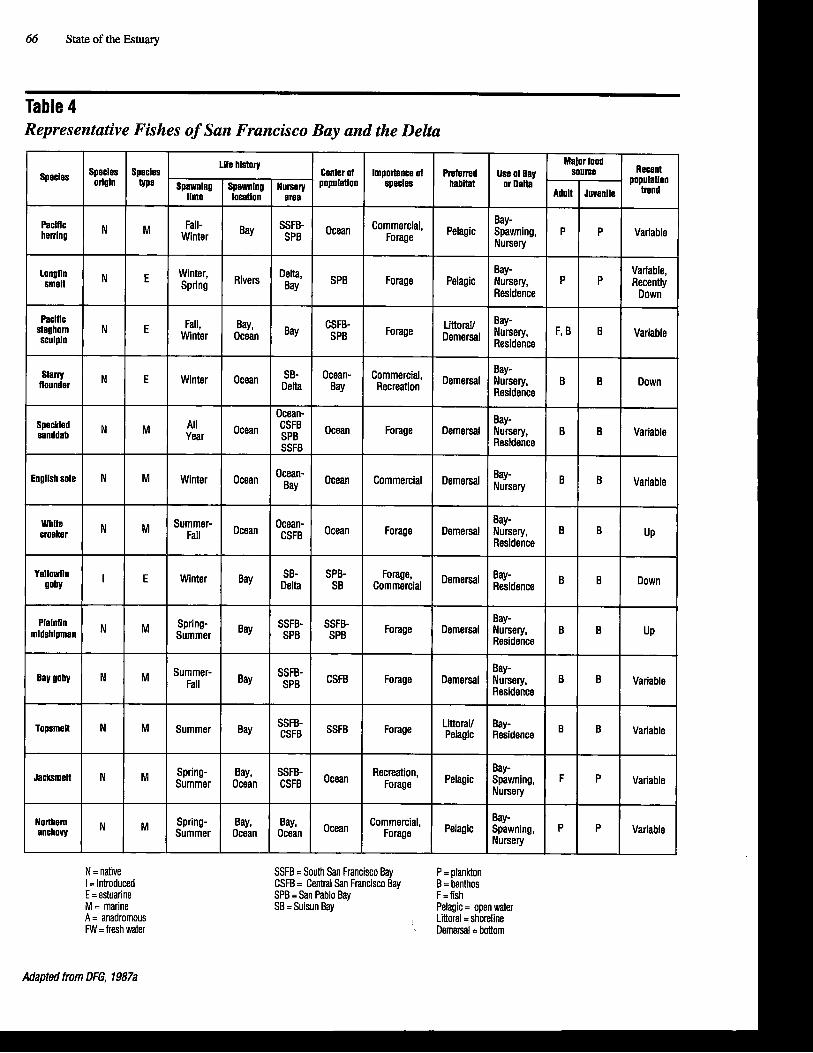
Species
Paclflc herring
Longfin smelt
Paclfic staghorn sculpin
&w flounder
Speckled sanddab
Engllsh sole
whlta croaker
Yehvl in goby
66 State of the Estuary
Table 4
Species Origin
N
N
N
N
N
I
Representative Fishes
N = native I =Introduced CSFB = Central San Francisco Bay B = benthos E = estuarine SPB = San Pablo Bay F=fish M = marine SB = Suisun Bay Pelagic = open water A = anadromous , Littoral =shoreline FW =fresh water Demersal =bottom
Adapted from DFG, 1987a
Specles
E
M
M
of San Francisco
SSFB =
Bag goby
Topsmelt
Jacksmelt
Northern anchovy
Bay and
South San Francisco
Spring- Summer
Summer- Fall
Summer
Spring- Summer
Spring- summer
N
N
N
,,,
SSFB- SPB
CSFB
SSFB
Ocean
Ocean
Spmlng Hme
r
Winter, Spring
Fall, Winter
Winter
Winter
Summer- Fall
Winter
M
M
Center of POPulflon
Ocean
SPB
CSFB- SPB
Ocean- Bay
ocean
Ocean
Ocean
SPB- SB
the Delta
Bay
Bay
Bay
Bay
Bay, Ocean
Bay, ocean
P = plankton
Forage
Forage
Forage
Rez,"F* Commercial,
F~~~~
SSFB- SPB
------- SSFB- SPB
SSFB- CSFB
Bay, ocean
Ufs hlstory
Spming loeatlon
Rivers
Bay, Ocean
Ocean
ocean
Ocean
Ocean
Bay
Importance of specla
Commercial, Forage
Forage
0
Forage
Commercial
Forage
Forage, Commercial
~ u r s e v area
SSFB- SPB
Delta, Bay
Bay
::& Ocean-
i!LB SSFB
Ocean- Bay
Ocean- CSFB
SB- Delta
Demersal
Demersal
LittoraV Pelagic
Pelagic
Pelagic
Preferred habitat
Pelagic
Pelagic
L ioraV
Dememl
Demersal
Damersal
Demersal
~~~~~l
Bay- Nursery, Residence
Bay- Nursery, Residence
Bay- Residence
Bay- Spawning. Nursery
Bay- Spawning, Nursery
Use of Bay or Delta
Bay- Spawning, Nursery
Bay- Nursery, Residence
Bay-
; ; Bay- Nursery, Residence
Bay- Nursery, Residence
Bay-
Bay- Nursery, Residence
Bay- Residence
UP B
Recent population
Variable
Variable, Recently
Down
Variable
Down
Variable
Variable
UP
Down
B
Major
Adult
P
P
F,
B
B
B
B
food source
Juvenile
P
P
B
B
B
B
B
B
B
B
P
B
B
P
P
Variable
Variable
Variable
Variable
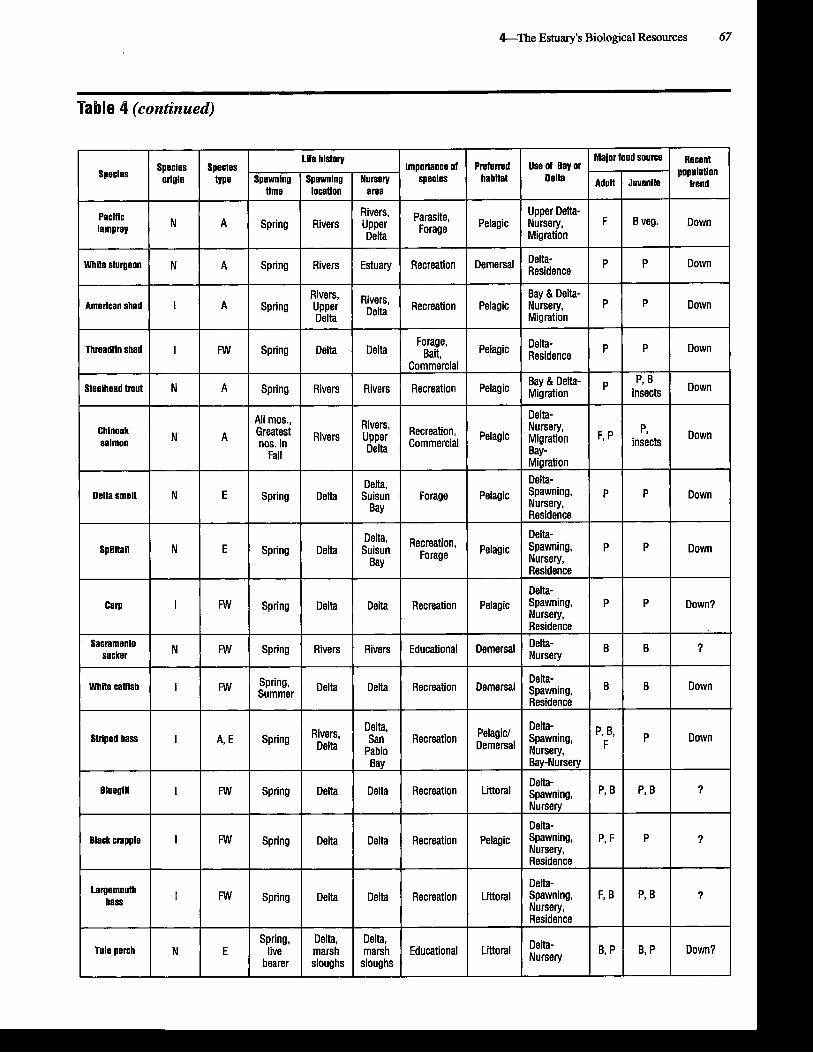
~ i f e history Major food s o u m ~ e w n t Species Specles importance of Preferred Use of Bay or
Species origin type Spawning Spawning Nursery species habltat populauon
Adult Juvenile trend time location area
Pacific Upper Delta- N Parasite. Pelagic Nursery, lamprey A Spring Rivers Upper F B veg. Down Forage
Delta Migration
Whlte sturgeon N A Spring Rivers Estuary Recreation Demersal P P Down Delta- Residence
Rivers, Rivers, Bay & Delta- American shad I A Spring Upper Recreation Pelagic Nursery, P P Down
Delta Delta Migration
Forage, Threadfin shad I FW Spring Delta Delta Bait, Pelagic i$&nce P P Down
Commercial
Stealhead trout N A Spring Rivers Rivers Recreation Pelagic Bay & Delta- Migration
P, B insects
All mos., Delta- Chinook Rivers' Recreation, Nursery, N P, A Rivers Upper Pelagic Migration h P Down Commercial salmon
Fall Delta Bay-
- - -~ Migration
Delta, Delta- Delta smelt N E Spring Delta Suisun Forage Pelagic p P Down
Bay Nursery, Residence
Delta- Splittail N
Delta* Recreation. Pelagic Spawning, p E Spring Delta Suisun P Down Forage
Bay Nursery, Residence
Delta- Carp I FW Spring Delta Delta Recreation Pelagic Spawning$ p P Down?
Nursery, Residence
Sacramento N sucker Rivers Rivers Educational Demersal B B ?
-- --- WhiB catfish
Delta- I FW Spring* Delta Delta Recreation Demersal spawning, B B Down Summer
Residence
Delta, Delta- Striped bass I A, E Spring San Recreation Spawning, '' B' P
F Down
Delta Pablo Nursery, Bay Bay-Nursery
Bluegill Delta-
I FW Spring Delta Delta Recreatlon Littoral spawning, P, B P, B ? Nursery
Delta- Black crappie I Spring Delta Delta Recreation Pelagic Spawning, p, F p ?
Nursery, Residence
Largemouth Delta-
bass I FW Spring Delta Delta Recreation Li iowl Spawning, F, B P, B 7 Nursery, Residence
Spring, Delta, Delta, Tuie perch N E live marsh marsh Educational L ioral ;;E;ry B, P B, P
Down? bearer sloughs sloughs
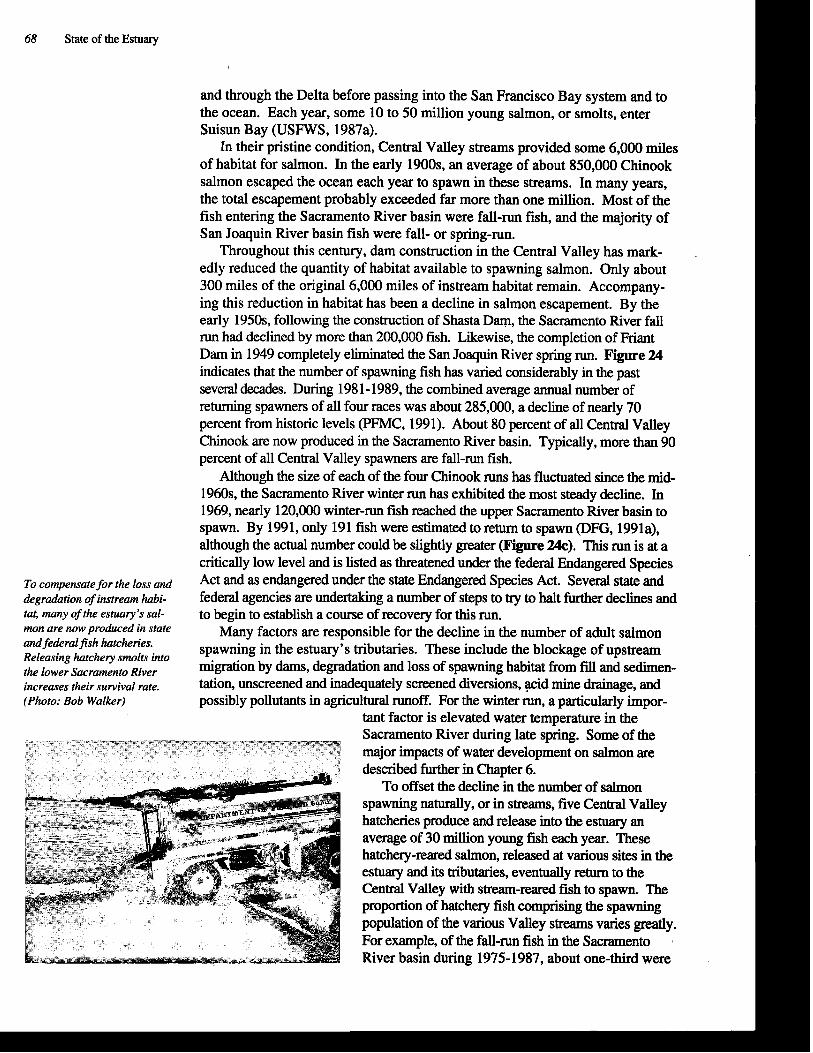
68 State of the Estuary
and through the Delta before passing into the San Francisco Bay system and to the ocean. Each year, some 10 to 50 million young salmon, or smolts, enter Suisun Bay (USFWS, 1987a).
In their pristine condition, Central Valley streams provided some 6,000 miles of habitat for salmon. In the early 1900s, an average of about 850,000 Chinook salmon escaped the ocean each year to spawn in these streams. In many years, the total escapement probably exceeded far more than one million. Most of the fish entering the Sacramento River basin were fall-run fish, and the majority of San Joaquin River basin fish were fall- or spring-run.
Throughout this century, dam construction in the Central Valley has mark- . edly reduced the quantity of habitat available to spawning salmon. Only about 300 miles of the original 6,000 miles of instream habitat remain. Accompany- ing this reduction in habitat has been a decline in salmon escapement. By the early 1950s, following the construction of Shasta Dam, the Sacramento River fall run had declined by more than 200,000 fish. Likewise, the completion of Friant Dam in 1949 completely eliminated the San Joaquin River spring run. Figure 24 indicates that the number of spawning fish has varied considerably in the past several decades. During 198 1-1989, the combined average annual number of returning spawners of all four races was about 285,000, a decline of nearly 70 percent from historic levels (PFMC, 1991). About 80 percent of all Central Valley Chinook are now produced in the Sacramento River basin. Typically, more than 90 percent of all Central Valley spawners are fall-run fish.
Although the size of each of the four Chinook runs has fluctuated since the mid- 1960s. the Sacramento River winter run has exhibited the most steadv decline. In 1969, nearly 120,000 winter-run fish reached the upper Sacramento River basin to spawn. By 1991, only 191 fish were estimated to return to spawn (DFG, 1991a), although the actual number could be slightly greater (Figure 24c). This run is at a critically low level and is listed as threatened under the federal Endangered Species
To for the loss and Act and as endangered under the state Endangered Species Act. Several state and degradation of instream habi- federal agencies are undertaking a number of steps to try to halt further declines and tat, maay of the estuary's sal- to begin to establish a course of recovery for this run. mon are now produced in state Many factors are responsible for the decline in the number of adult salmon a d federal fish hatcheries. spawning in the estuary's tributaries. These include the blockage of upstream Releasing hatchery smolts into the lower Sacrmnto River migration by dams, degradation and loss of spawning habitat from fill and sedimen- increases their survival rate. tation, unscreened and inadequately screened diversions, p id mine drainage, and (Photo: Bob Walker) possibly pollutants in agricultural runoff. For the winter run, a particularly impor-
tant factor is elevated water temperature in the Sacramento River during late spring. Some of the major impacts of water development on salmon are described further in Chapter 6.
To offset the decline in the number of salmon spawning naturally, or in streams, five Central Valley hatcheries produce and release into the estuary an average of 30 million young fish each year. These hatchery-reared salmon, released at various sites in the estuary and its tributaries, eventually return to the Central Valley with stream-reared fish to spawn. The proportion of hatchery fish comprising the spawning population of the various v d e j SG v&es greaiY. For example, of the fall-run fish in the Sacramento River basin during 1975-1987, about one-third were
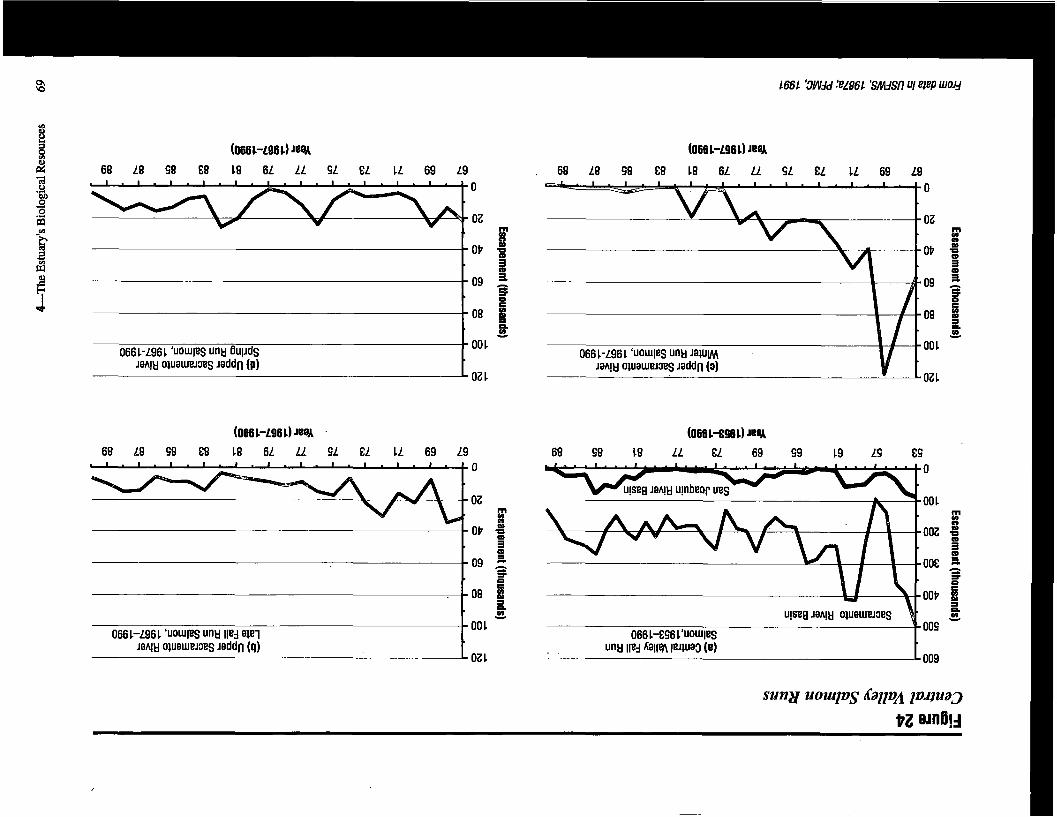
a -09 5
e 0
08 I 2: w
066 1-L96 1 'uouleS Untl E ~ M ~ S 00 1
JaA!U oluatllw3eg ~ e d d n (p) oz 1
(0661-~961) Je# . (0661-€S61) JeaX 68 L8 98 E8 18 6L LL 9L EL 1L 69 L9 68 98 18 LL EL 69 99 19 LS E9
0 0
oz 00 1
t R OP = 002 1 ;O
3 (D ii
09 5 3
ooe 5 0 3
0
08 I OOP I t P - U)
00 1 w
009
02 1 009
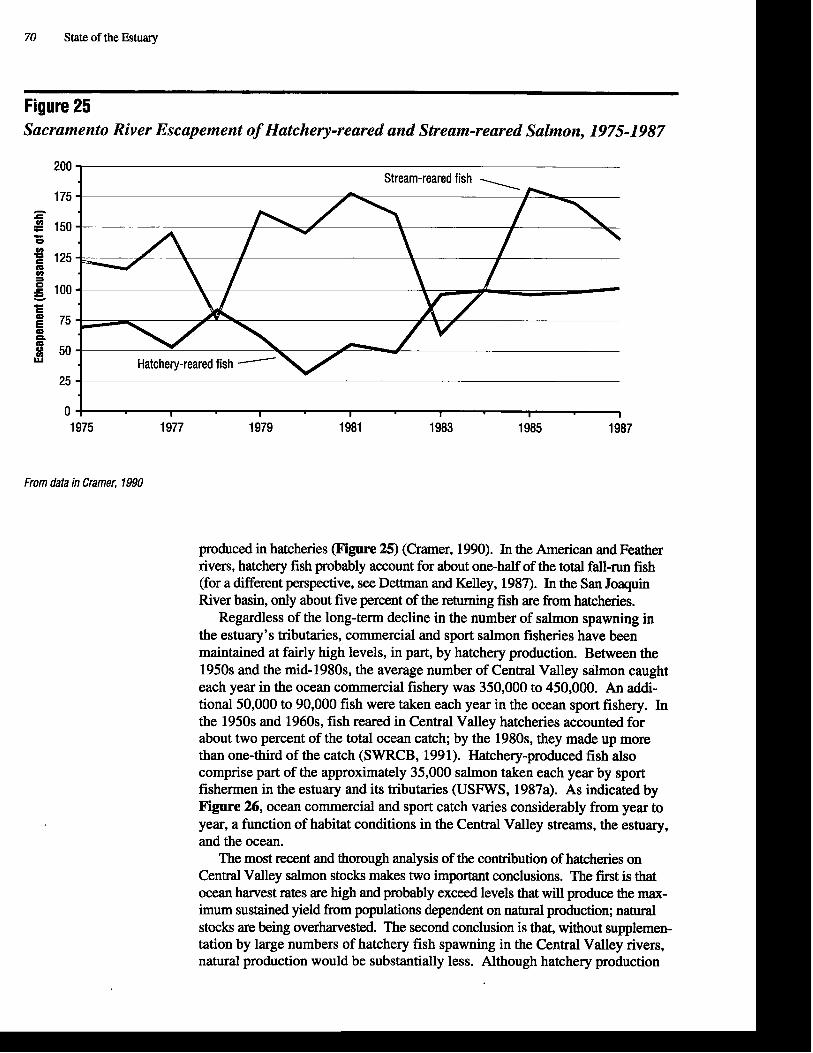
70 State of the Estuary
Figure 25 Sacramento River Escapement of Hatchery-reared and Stream-reared Salmon, 1975-1987
From data in Cramer, 1990
produced in hatcheries F i e 25) (Cramer, 1990). In the American and Feather rivers, hatchery fish probably account for about one-half of the total fall-run fish (for a different perspective, see Dettrnan and Kelley, 1987). In the San Joaquin River basin, only about five percent of the returning fish are from hatcheries.
Regardless of the long-term decline in the number of salmon spawning in the estuary's tributaries, commercial and sport salmon fisheries have been maintained at fairly high levels, in part, by hatchery production. Between the 1950s and the mid- 1980s, the average number of Central Valley salmon caught each year in the ocean commercial fishery was 350,000 to 450,000. An addi- tional 50,000 to 90,000 fish were taken each year in the ocean sport fishery. In the 1950s and 1960s, fish reared in Central Valley hatcheries accounted for about two percent of the total ocean catch; by the 1980s, they made up more than one-third of the catch (SWRCB, 1991). Hatchery-produced fish also comprise part of the approximately 35,000 salmon taken each year by sport fishermen in the estuary and its tributaries (USFWS, 1987a). As indicated by Figure 26, ocean commercial and sport catch varies considerably from year to year, a function of habitat conditions in the Central Valley streams, the estuary, and the ocean.
The most recent and thorough analysis of the contribution of hatcheries on Central Valley salmon stocks makes two important conclusions. The first is that ocean harvest rates are high and probably exceed levels that will produce the max- imum sustained yield from populations dependent on natural production; natural stocks are being overharvested. The second conclusion is that, without supplemen- tation by large numbers of hatchery fish spawning in the Central Valley rivers, natural production would be substantially less. Although hatchery production
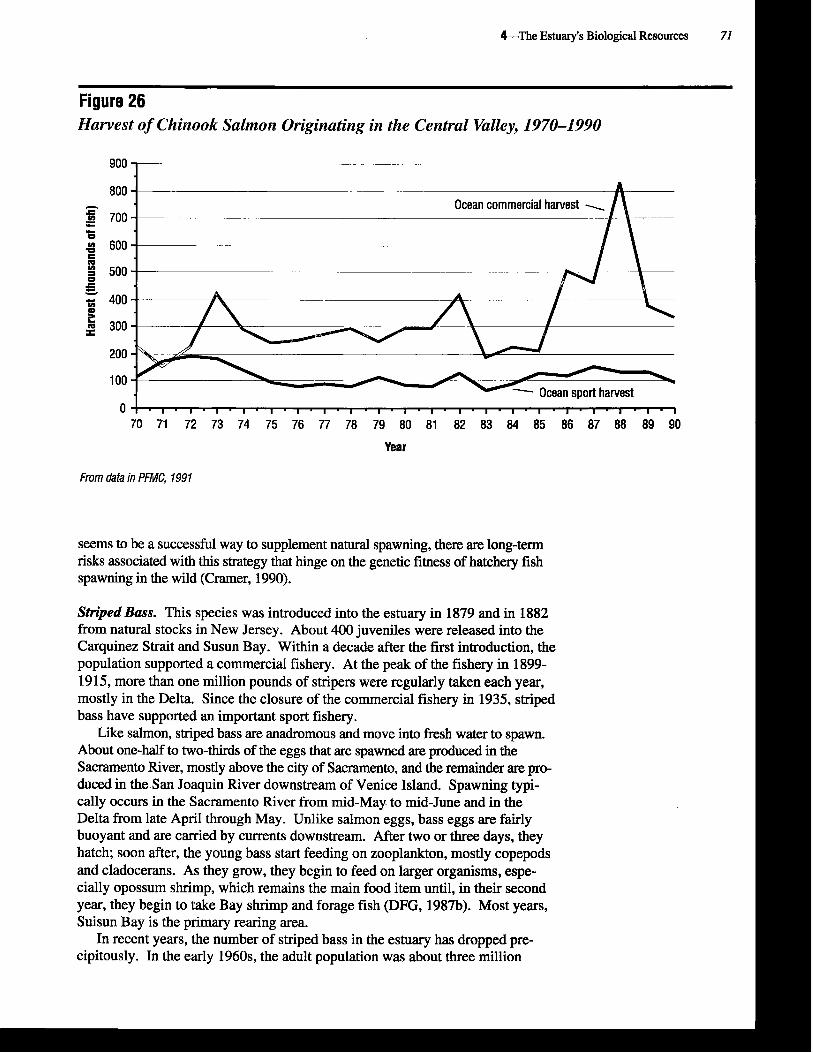
&-The Estuary's Biological Resources 71 I
Figure 26 Harvest of Chinook Salmon Originating in &he Central Valley, 1970-1990
-- Ocean sport harvest
70 71 72 73 74 75 76 77 78 79 80 81 82 83 84 85 86 87 88 89 90 I Year
From data in PFMC, 1991
seems to be a successful way to supplement natural spawning, there are long-term risks associated with this strategy that hinge on the genetic fitness of hatchery fish spawning in the wild (Cramer, 1990).
Striped Bass. This species was introduced into the estuary in 1879 and in 1882 from natural stocks in New Jersey. About 400 juveniles were released into the Carquinez Strait and Susun Bay. Within a decade after the first introduction, the population supported a commercial fishery. At the peak of the fishery in 1899- 1915, more than one million pounds of stripers were regularly taken each year, mostly in the Delta. Since the closure of the commercial fishery in 1935, striped bass have supported an important sport fishery.
Like salmon, striped bass are anadromous and move into fresh water to spawn. About one-half to two-thirds of the eggs that are spawned are produced in the Sacramento River, mostly above the city of Sacramento, and the remainder are pro- duced in the San Joaquin River downstream of Venice Island. Spawning typi- cally occurs in the Sacramento River from mid-May to mid-June and in the Delta from late April through May. Unlike salmon eggs, bass eggs are fairly buoyant and are carried by currents downstream. After two or three days, they hatch; soon after, the young bass start feeding on zooplankton, mostly copepods and cladocerans. As they grow, they begin to feed on larger organisms, espe- cially opossum shrimp, which remains the main food item until, in their second year, they begin to take Bay shrimp and forage fish (DFG, 1987b). Most years, Suisun Bay is the primary rearing area.
In recent years, the number of striped bass in the estuary has dropped pre- cipitously. In the early 1960s, the adult population was about three million
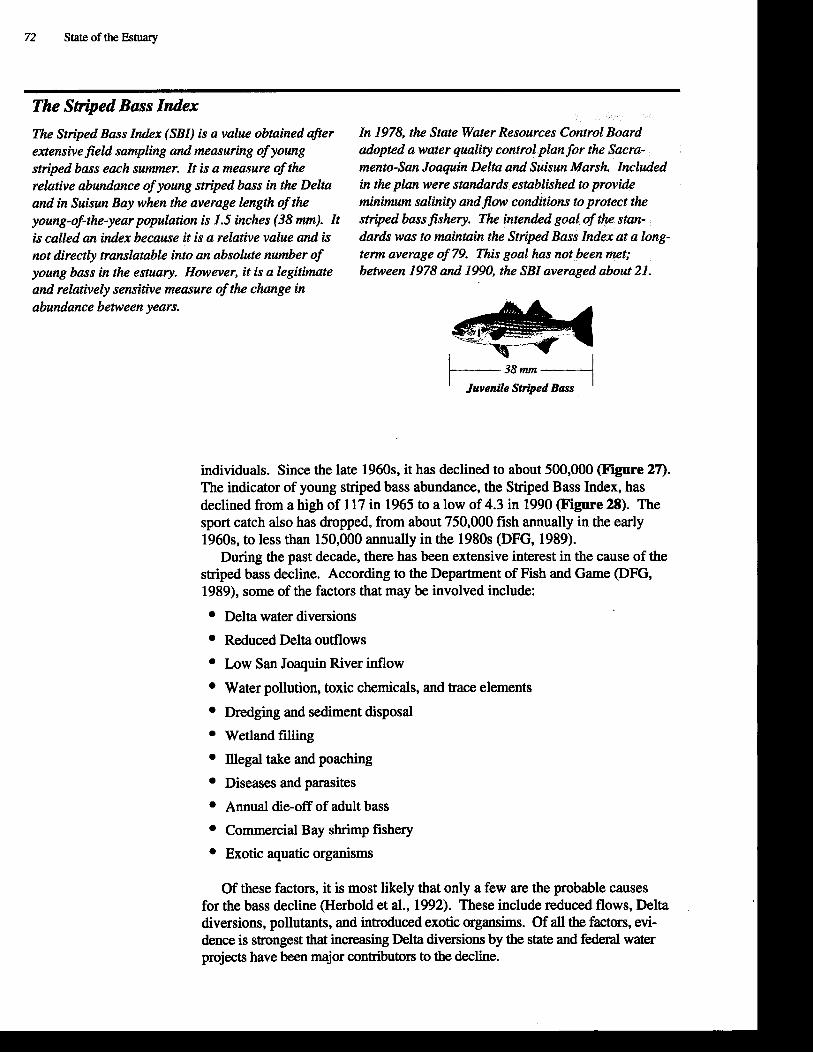
72 State of the Estuary
The Striped Bass Zrzdex
The Striped Bass Index (SBI) is a vahe obtained afer extensive field sampling and measuring of young striped bass each s m r . It is a measure of the relative abundance of young striped bass in the Delta and in Suisun Bay when the average length of the young-of-the-year population is 1.5 inches (38 mm). It is called an index because it is a relative value and is not directly translatable into an absolute number of young bass in the estuary. However, it is a legitimate and relatively semPISltive measure of the change in abundance between years.
In 1978, the State Water Resources Control Board adopted a water quulity control plan for the Sacra- mento-San Joaquin Delta and Suisun Marsh Included in the plan were standards established to provide m i n i m salinity and flow conditions to protect the m p e d bassfishery. The intended goal of the stan- dards was to maintain the Striped Bass Zndex at a long- term average of 79. This goal has not been met; between 1978 and 1990, the SBI averaged about 21.
38 mm
Juvenile Striped Bass
individuals. Since the late 1960s, it has declined to about 500,000 (Figure 27). The indicator of young striped bass abundance, the Striped Bass Index, has declined from a high of 117 in 1965 to a low of 4.3 in 1990 (Figure 28). The sport catch also has dropped, from about 750,000 fish annually in the early 1960s, to less than 150,000 annually in the 1980s (DFG, 1989).
During the past decade, there has been extensive interest in the cause of the striped bass decline. According to the Department of Fish and Game (DFG, 1989), some of the factors that may be involved include:
Delta water diversions
Reduced Delta outflows
Low San Joaquin River inflow
Water pollution, toxic chemicals, and trace elements
Dredging and sediment disposal
Wetland filling
Illegal take and poaching
Diseases and parasites Annual die-off of adult bass
Commercial Bay shrimp fishery
Exotic aquatic organisms
Of these factors, it is most likely that only a few are the probable causes for the bass decline (Herbold et al., 1992). These include reduced flows, Delta diversions, pollutants, and introduced exotic organsims. Of all the factors, evi- dence is strongest that increasing Delta diversions by the state and federal water projects have been major contributors to the decline.
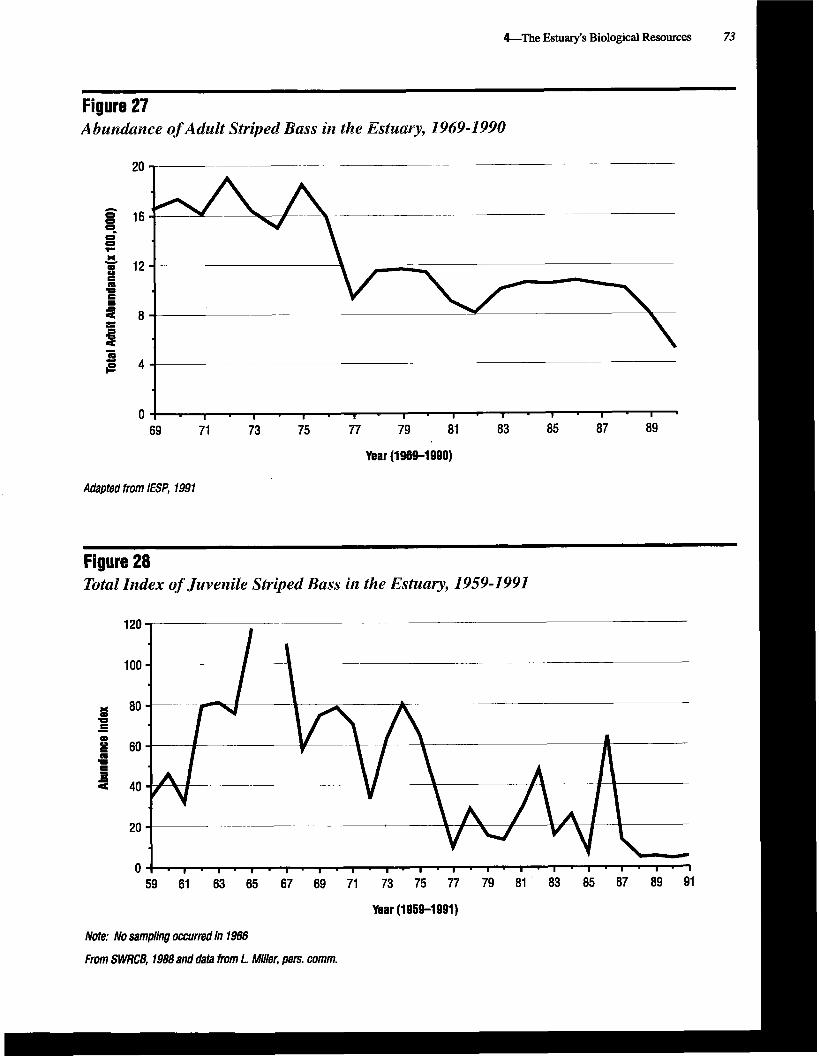

74 State of the Estuary
The striped bass became a premier commercial and sport fish shortly after it was released into the estuary. Although commercial harvest was halted in the 1930s, primarily a result of over- fishing, sport anglers continue to seek stripers. Some of the largest fish are taken in the swift currents at the Golden Gate. (Photo: courtesy, Abe Cuanang and Ed Ow)
American Shad is an anadromous species from the East Coast that was intro- duced into the estuary's tributaries in 187 1. Within eight years, it supported a commercial fishery. From 1900 until 1945, annual harvest frequently exceeded one million pounds. After 1945, the population declined, and in 1957, the State
~merican Shad banned the commercial fishery in order to protect sport use and other fisheries (Skinner, 1962). The current adult population is estimated to be about three mil- lion individuals, about one-third to two-thirds its size in the early decades of this cenhiry (DFG, 1987~).
Today, a popular shad fishery exists in the Sacramento, San Joaquin, American, Feather, and Yuba rivers, and in the Delta. Surveys in the late 1970s indicate that between 35,000 and 55,000 angler days were spent in catching 79,000 to 140,000 shad (DFG, 1987~).
Shad historically spawned throughout much of the lower reaches of the Sacramento and San Joaquin rivers. Today, the San Joaquin River no longer sup- ports significant spawning activity. The major nursery areas are in the Feather River downsteam of the Yuba River, the lower American River, the Sacramento River upstream of the American River, and the north Delta. Shad spawn in open water from May to June, and fertilized eggs sink and drift with the current until hatch- ing after four to six days. Upstream of the Delta, young shad feed primarily on terrestrial insects. When river flows are high, more young shad are carried into the Delta where they feed on zooplankton, including opossum shrimp.
There are many factors which may have contributed to the decline of the shad population. These include elevated water temperatures in the spawning and nursery
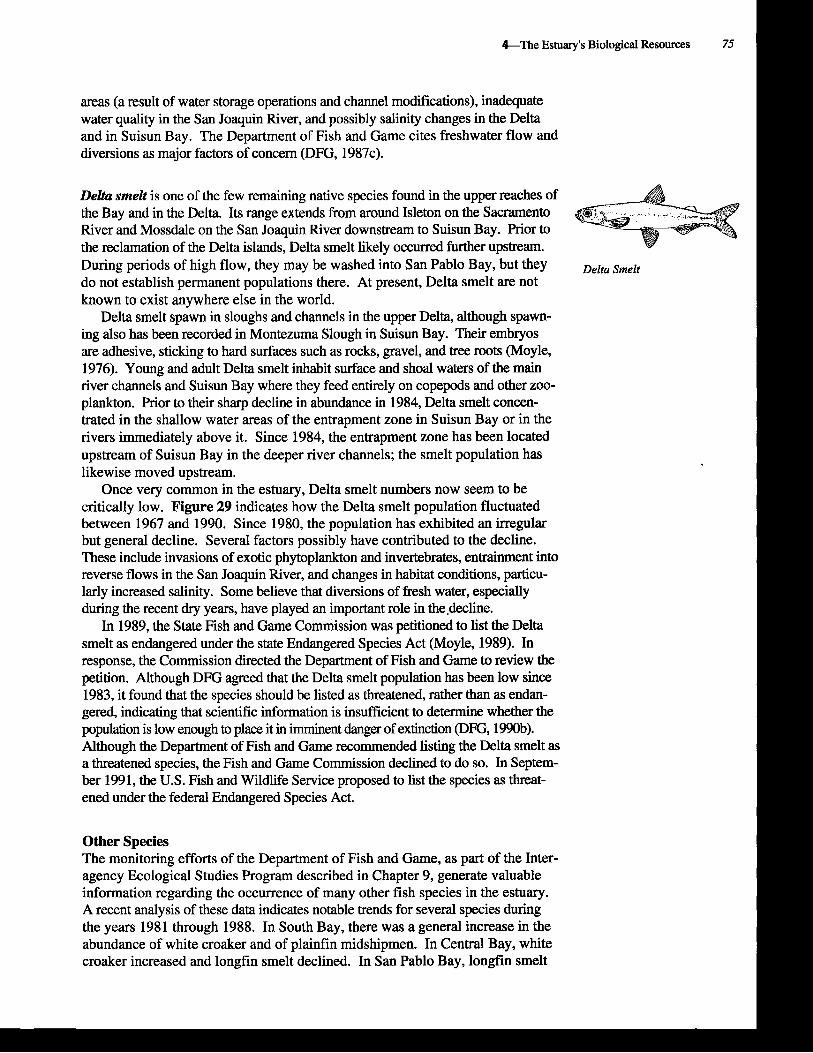
&The Estuary's Biological Resources 75
areas (a result of water storage operations and channel modifications), inadequate water quality in the San Joaquin River, and possibly salinity changes in the Delta and in Suisun Bay. The Department of Fish and Game cites freshwater flow and diversions as major factors of concern (DFG, 1987~).
Delta smelt is one of the few remaining native species found in the upper reaches of the Bay and in the Delta. Its range extends from around Isleton on the Sacramento River and Mossdale on the San Joaquin River downstream to Suisun Bay. Prior to the reclamation of the Delta islands, Delta smelt likely occurred further upstream. During periods of high flow, they may be washed into San Pablo Bay, but they Delta Smelt do not establish permanent populations there. At present, Delta smelt are not known to exist anywhere else in the world.
Delta smelt spawn in sloughs and channels in the upper Delta, although spawn- ing also has been recorded in Montezuma Slough in Suisun Bay. Their embryos are adhesive, sticking to hard surfaces such as rocks, gravel, and tree roots (Moyle, 1976). Young and adult Delta smelt inhabit surface and shoal waters of the main river channels and Suisun Bay where they feed entirely on copepods and other zoo- plankton. Prior to their sharp decline in abundance in 1984, Delta smelt concen- trated in the shallow water areas of the entrapment zone in Suisun Bay or in the rivers immediately above it. Since 1984, the entrapment zone has been located upstream of Suisun Bay in the deeper river channels; the smelt population has likewise moved upstream.
Once very common in the estuary, Delta smelt numbers now seem to be critically low. Figure 29 indicates how the Delta smelt population fluctuated between 1967 and 1990. Since 1980, the population has exhibited an irregular but general decline. Several factors possibly have contributed to the decline. These include invasions of exotic phytoplankton and invertebrates, entrainment into reverse flows in the San Joaquin River, and changes in habitat conditions, particu- larly increased salinity. Some believe that diversions of fresh water, especially during the recent dry years, have played an important role in the ,decline.
In 1989, the State Fish and Game Commission was petitioned to list the Delta smelt as endangered under the state Endangered Species Act (Moyle, 1989). In response, the Commission directed the Department of Fish and Game to review the petition. Although DFG agreed that the Delta smelt population has been low since 1983, it found that the species should be listed as threatened, rather than as endan- gered, indicating that scientific information is insufficient to determine whether the population is low enough to place it in imminent danger of extinction (DFG, 1990b). Although the Department of Fish and Game recommended listing the Delta smelt as a threatened species, the Fish and Game Commission declined to do so. In Septem- ber 1991, the U.S. Fish and Wildlife Service proposed to list the species as threat- ened under the federal Endangered Species Act.
Other Species The monitoring efforts of the Department of Fish and Game, as part of the Inter- agency Ecological Studies Program described in Chapter 9, generate valuable information regarding the occurrence of many other fish species in the estuary. A recent analysis of these data indicates notable trends for several species during the years 1981 through 1988. In South Bay, there was a general increase in the abundance of white croaker and of plainfin midshipmen. In Central Bay, white croaker increased and longfin smelt declined. In San Pablo Bay, longfin smelt
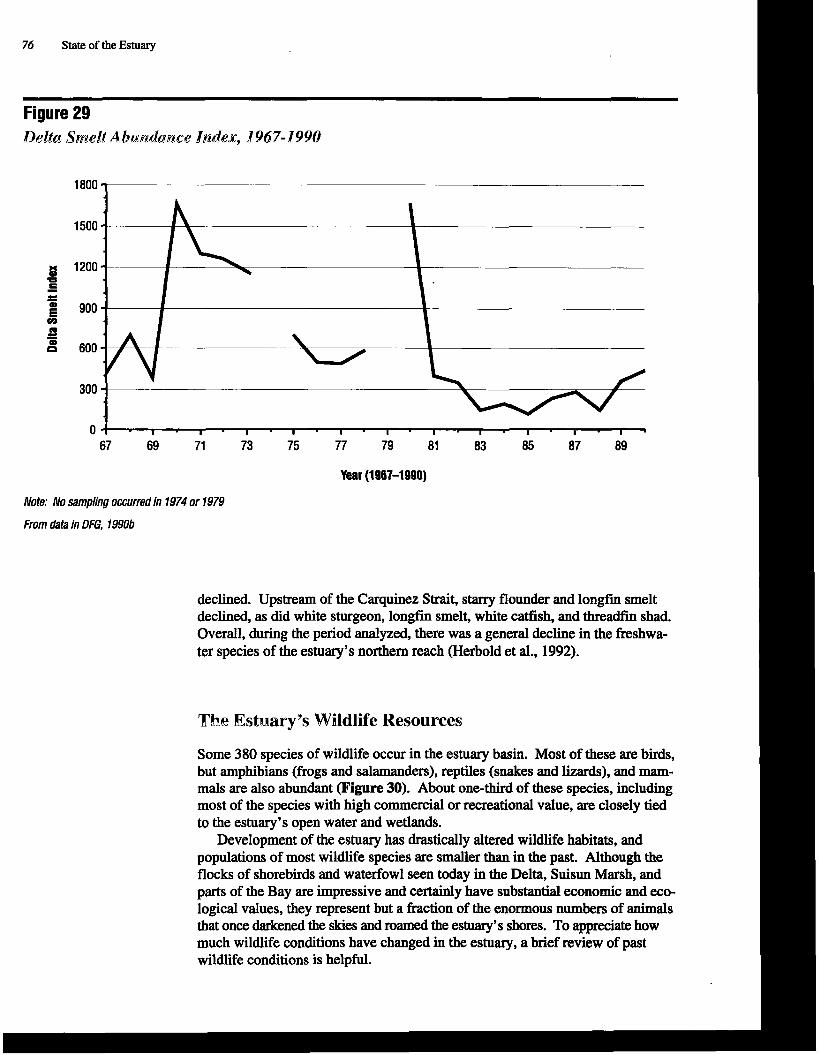
76 State of the Estuary
Figure 29 Delta Smelt Abundance Index, 1967-d99Q
Year (1967-1990)
Note: No sampling occurred in 1974 or 1979
From data in DFG, 1990b
declined. Upstream of the Carquinez Strait, starry flounder and longfin smelt declined, as did white sturgeon, longfin smelt, white catfish, and threadfin shad. Overall, during the period analyzed, there was a general decline in the freshwa- ter species of the estuary's northern reach (Herbold et al., 1992).
The Estaaary9s Wildlife Resources
Some 380 species of wildlife occur in the estuary basin. Most of these are birds, but amphibians (frogs and salamanders), reptiles (snakes and lizards), and mam- mals are also abundant (Figure 30). About one-third of these species, including most of the species with high commercial or recreational value, are closely tied to the estuary's open water and wetlands.
Development of the estuary has drastically altered wildlife habitats, and populations of most wildlife species are smaller than in the past. Although the flocks of shorebirds and waterfowl seen today in the Delta, Suisun Marsh, and parts of the Bay are impressive and certainly have substantial economic and eco- logical values, they represent but a fraction of the enormous numbers of animals that once darkened the skies and roamed the estuary's shores. To appreciate how much wildlife conditions have changed in the estuary, a brief review of past wildlife conditions is helpful.
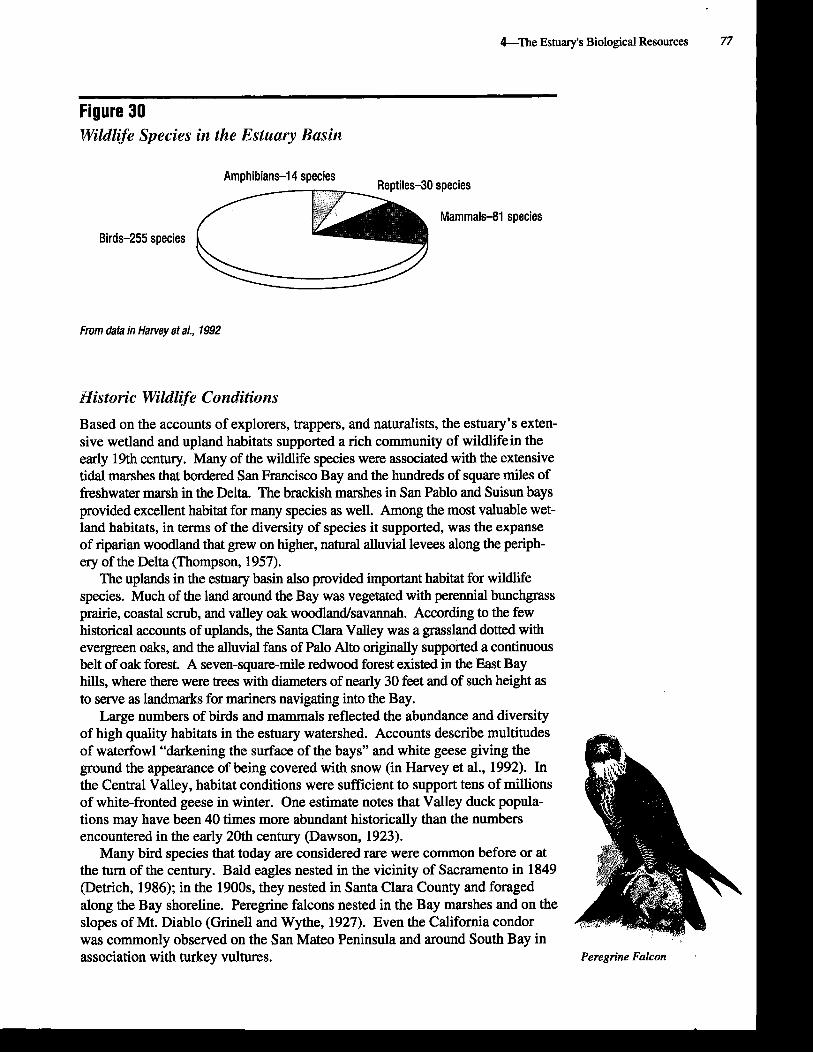
y's Biological Resources 77
-- - --
Figure 30 Wildlife Species in the Estuary Basin
From data in Harvey et a/., 1992
Historic Wildlife Conditions
Based on the accounts of explorers, trappers, and naturalists, the estuary's exten- sive wetland and upland habitats supported a rich community of wildlifein the early 19th century. Many of the wildlife species were associated with the extensive tidal marshes that bordered San Francisco Bay and the hundreds of square miles of freshwater marsh in the Delta. The brackish marshes in San Pablo and Suisun bays provided excellent habitat for many species as well. Among the most valuable wet- land habitats, in terms of the diversity of species it supported, was the expanse of riparian woodland that grew on higher, natural alluvial levees along the periph- ery of the Delta (Thompson, 1957).
The uplands in the estuary basin also provided important habitat for wildlife species. Much of the land around the Bay was vegetated with perennial bunchgrass prairie, coastal scrub, and valley oak woodlandlsavannah. According to the few historical accounts of uplands, the Santa Clara Valley was a grassland dotted with evergreen oaks, and the alluvial fans of Palo Alto originally supported a continuous belt of oak forest. A seven-square-mile redwood forest existed in the East Bay hills, where there were trees with diameters of nearly 30 feet and of such height as to serve as landmarks for mariners navigating into the Bay.
Large numbers of birds and mammals reflected the abundance and diversity of high quality habitats in the estuary watershed. Accounts describe multitudes of waterfowl "darkening the surface of the bays" and white geese giving the ground the appearance of being covered with snow (in Harvey et al., 1992). In the Central Valley, habitat conditions were sufficient to support tens of millions of white-fronted geese in winter. One estimate notes that Valley duck popula- tions may have been 40 times more abundant historically than the numbers encountered in the early 20th century (Dawson, 1923).
Many bird species that today are considered rare were common before or at the turn of the century. Bald eagles nested in the vicinity of Sacramento in 1849 (Detrich, 1986); in the 1900s, they nested in Santa Clara County and foraged along the Bay shoreline. Peregrine falcons nested in the Bay marshes and on the slopes of Mt. Diablo (Grinell and Wythe, 1927). Even the California condor was commonly observed on the San Mateo Peninsula and around South Bay in association with turkey vultures. Peregrine Falcon
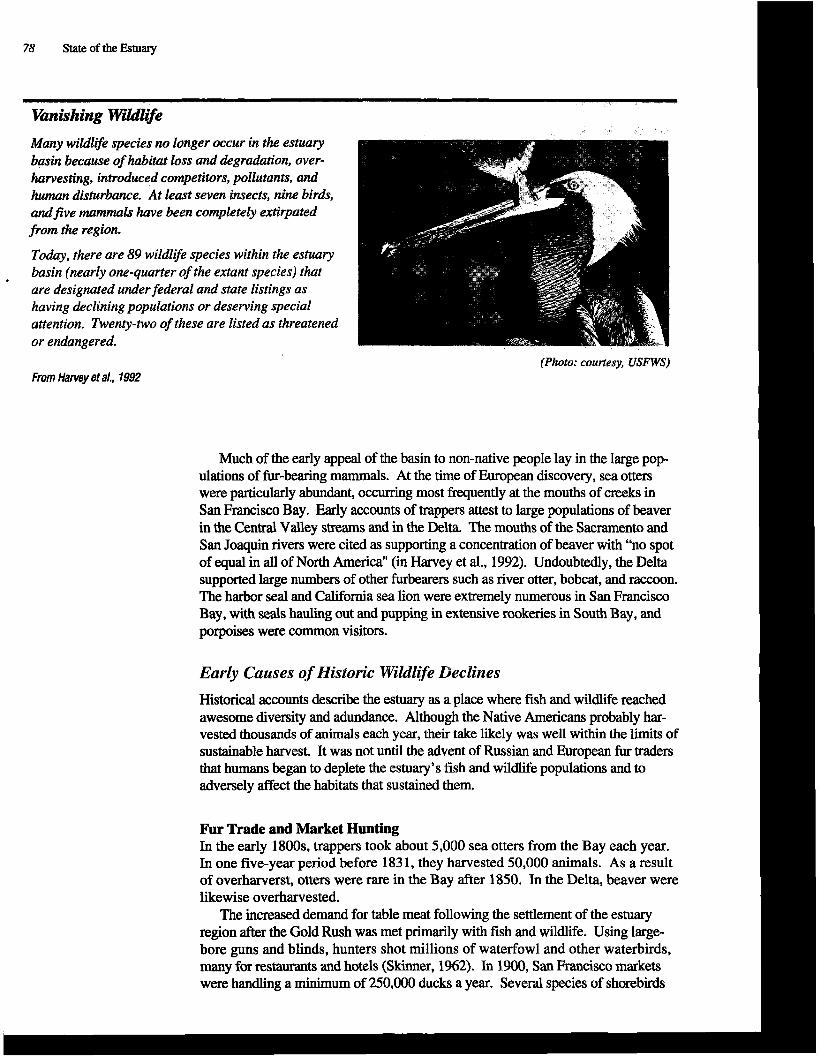
78 State of the Estuary
Many wildlife species no longer occur in the estuary basin because of habitat loss and degradation, over- harvesting, introduced competitors, pollutants, and human disturbance. At least seven insects, nime birds, andjive m a m l s have been coprzpletely extirpated from the region.
Today, there are 89 wildlife species within the estuary basin (nearly one-quarter of the extant species) that are designated under federal and state listings as having declining populations or deserving special attention. Twenty-two of these are listed as threatened or endangered.
(Photo: courtesy, USFWS) From Harvey eta/., 1992
Much of the early appeal of the basin to non-native people lay in the large pop- ulations of fur-bearhg mammals. At the time of European discovery, sea otters were particularly abundant, occurring most frequently at the mouths of creeks in San Francisco Bay. Early accounts of trappers attest to large populations of beaver in the Central Valley streams and in the Delta. The mouths of the Sacramento and San Joaquin rivers were cited as supporting a concentration of beaver with "no spot of equal in all of North America" (in Harvey et al., 1992). Undoubtedly, the Delta supported large numbers of other furbearers such as river otter, bobcat, and raccoon. The harbor seal and California sea lion were extremely numerous in San Francisco Bay, with seals hauling out and pupping in extensive rookeries in South Bay, and porpoises were common visitors.
Early Causes of Historic Wildlife Declines
Historical accounts describe the estuary as a place where fish and wildlife reached awesome diversity and adundance. Although the Native Americans probably har- vested thousands of animals each year, their take likely was well within the limits of sustainable harvest. It was not until the advent of Russian and European fur traders that humans began to deplete the estuary's fish and wildlife populations and to adversely affect the habitats that sustained them.
Fur Trade and Market Hunting In the early 1800s, trappers took about 5,000 sea otters from the Bay each year. In one five-year period before 183 1, they harvested 50,000 animals. As a result of overharverst, otters were rare in the Bay after 1850. In the Delta, beaver were likewise overharvested.
The increased demand for table meat following the settlement of the estuary region after the Gold Rush was met primarily with fish and wildlife. Using large- bore guns and blinds, hunters shot millions of waterfowl and other waterbirds, many for restaurants and hotels (Skinner, 1962). In 1900, San Francisco markets were handling a minimum of 250,000 ducks a year. Several species of shorebirds
&The Estuary's Biological Resources 79
also were taken for market including American plovers, willets, curlews, and many other species. By the late 1800s, market hunting had begun to severely affect populations of some waterfowl and shorebirds.
Habitat Loss and Alteration The Gold Rush of 1849 and subsequent settlement of the estuary region acceler- ated habitat alteration and loss. The silt washed into streams by Sierra hydraulic . gold mining smothered hundreds of miles of anadromous fish spawning habitat, ultimately reducing fish populations and decreasing the amount of food avail- able to the estuarine wildlife dependent on them.
Land reclamation had an enormous adverse effect on the most productive wild- life habitats. In the Delta, between 1860 and 1930,320,000 acres of tidal freshwa- ter marsh were converted to farms. This eliminated nearly all of the tidal freshwater marsh and riparian habitat and reduced populations of many landbirds, waterbirds, raptors, mammals, and other animals that utilize these habitats.
In South Bay, San Pablo Bay, and Suisun Bay, tidal salt marshes were diked to form salt ponds and farms. By the 1930s, more than 62 square miles, or 83 percent, of the original tidal salt marshes had been converted to salt ponds (Josselyn, 1983). This greatly impacted salt-marsh-dependent species such as rails, song spar- rows, harvest mice, and shrews, and contributed to the eventual need to list them as threatened or endangered species, or to provide other special status designations. At the same time, however, the conversion of salt marsh into salt ponds resulted in increased use of the Bay by some waterbirds including the eared grebe, American white pelican, terns, and others.
Development also modified uplands. Farms were established in grasslands and oak savannahs. A major loss of valuable habitat occurred in the 1850s when the cutting of oak woodland began. Initially, oaks were cut for use as fuel, but in the mid-20th century they were removed to improve range conditions for cattle. Removal of these important trees reduced habitat for some birds that fed and nested in them, but it also benefitted species adapted to grasslands-ground squirrel, mule deer, horned lark, mourning dove, and others.
Other Causes of Population Changes In addition to overharvest and habitat loss, several other factors have adversely affected the estuary's wildlife. These include the application of persistent pesticides, withdraw1 of ground water for agriculture, poisoning of predators, and the introduction of non-native species of plants and animals. Many of these factors continue to affect wildlife species today.
Current Trends in the Distribution and Abundance of Wildlife
Considering the large number of wildlife species in the estuary basin, it is far beyond the scope of this report to provide an in-depth description of the status and trends of each one. However, information regarding some representative species is presented in Table 5. Additional information for some wildlife groups is also presented below.
Waterfowl For many years, the U.S. Fish and Wildlife Service and the California Depart- ment of Fish and Game have conducted cooperative midwinter surveys of the estuary's waterfowl. These surveys develop indices of the relative abundance of
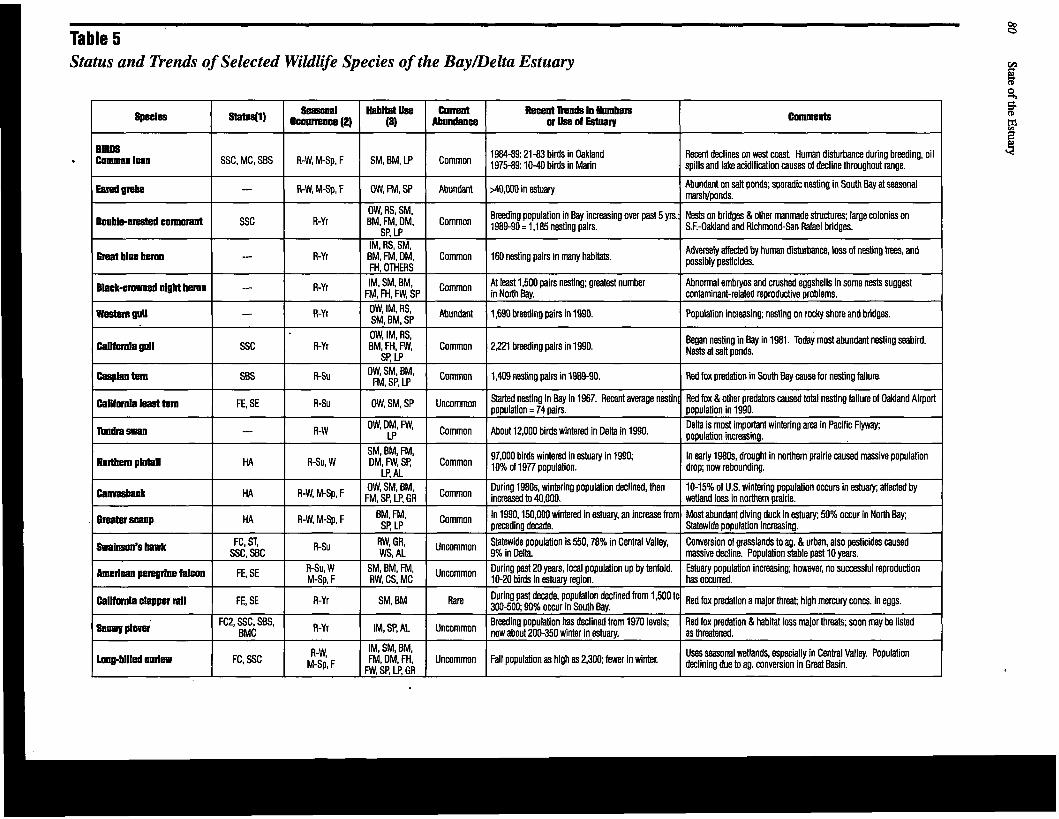
Table 5 Status and Trends of Selected Wildlife Species of the Bay/Delta Estuary
specla SBaPonal HabRatb Cmrent Recent Trends in Mmbm -" OCEWB~~CB (2) (9) Abuadanw orUseofEstnary C 0 ~ o t S
BIRDS Common loon 1984-89: 21-83 birds in Oakland SSC, MC, SBS R-W, M-Sp, F SM, BM, LP Common 1975-89: birds in
Recent declines on west coast. Human disturbance during breeding, oil spills and lake acidification causes of decline throughout range.
mw- - R-W, M-Sp, F OW, FM, SP Abundant d0,000 in estuary Abundant on salt ponds; sporadic nesting in South Bay at seasonal marshlponds.
OW, RS, SM, Dosble-emsted muorant SSC R-Yr Breeding population in Bay increasing over past 5 yrs.; Nests on bridges & other manmade structures; large colonies on
FM1 DM, Common 1989-90 = 1,185 nesting pairs. SP, LP S.F.-Oakland and Richmond-San Rafael bridges.
IM, RS. SM, Pleat blue hama - R-Yr BM, FM, DM, Common 160 nesting pairs in many habitats. Adversely affected by human disturbance, loss of nesting tm, and
FH, OTHERS possibly pesticides.
Black-cmmd nlgbt hem - IM, SM, BM, Common At least 1,500 pairs nesting; greatest number Abnormal embryos and crushed eggshells in some nests suggest R-yr FM, FH. FW, SP in North Bay. contaminant-related reproductive problems.
Bestem !g~ll - RYr OW* I", Abundant 1,690 breeding pairs in 1990. SM, BM, SP Population increasing; nesting on rocky shore and bridges.
OW, IM, RS, Galllomla gull SSC R-Yr BM, FH, FW, Common 2,221 breeding pairs in 1990. Began nesting in Bay in 1981. Today most abundant nesting seabird.
SP, LP Nests at salt ponds.
Q=Ilhm SBS RSu Oris$,? Common 1,409 nesting pairs in 1989-90. Red fox predation in South Bay cause for nesting failure.
CalMOrnla least t e ~ ~ FE, SE R-SU OW, SM, SP Uncommon Started nesting in Bay in 1967. Recent average nestin[ Red fox & other predators caused total nesting failure of Oakland Airport population = 74 pairs. population in 1990.
mndra ssaa - R-W Common About 12,000 birds wintered in Delta in 1990. OW' DM' M! Delta is most important wintering area in Paclfic Flyway; LP population increasing.
SM, BM, FM, Lrtbm p l ~ l HA R-SU, W
97,000 birds wintered in estuary in 1990; In early 1980s, drought in northern prairie caused massive population OM, M! SP, 10% of 1977 population. LP, AL drop; now rebounding.
canmdd~ HA OW, SM, EM, During 19&, wintering population declined, then 1&15% of U.S. wintering population occurs in estuary; affected by R-W, M-Sp9 FM, SP, LP, GR increased to 40,000. wetland loss In northern prairie.
W s C a n P HA R-N M-Sp, , Common In 1990,150,000 wintered in estuary, an increase from Most abundant diiing duck in 50% occur in North Bey. preceding decade. Statewide population increasing.
Swlnson's harslr FC, ST, R-SU RW, GR, Uncommon Spwide population is 550,78% in Central Valley, Conversion of grasslands to ag. 8 urban, also pesticides caused SSC. SBC WS, A 1 9% ln Delta. massive decline. Population stable past 10 years.
Amerlcea perenline falcon FE, SE A-Su, W SM, BM, FM, During past20 years, loml population up by tenfold. Estuary population increasing; however, no successful reproduction M-Sp, F RW, CS, MC 10-20 birds in estuary region. has occurred.
Calftornla clapper tall FE, SE R-Yr SM, BM Rare ~ $ - \ ~ ~ , ~ ~ i / ~ $ ~ ~ ~ l i n e d l"Om Red fox predation a major threat high mercury ma. in eg..
snmgpl- FC2, SSC, SBS, R-Yr Breeding population has declined from 1970 levels; Red fox predation & habitat loss major threats; soon may be listed
BMC IMs SP, AL Uncommon now about 200-350 winter in estuary. as threatened.
R-w, IM, SM, BM, Loopbilled cmlm FC, SSC FM, DM, M. Uncommon Fall population as high as 2,300; fewer in winter.
Uses seasonal wetlands, especially in Central Valley. Population declining due to ag. conversion in Great Basin, M-Sp' W, SP, LP, GR

"Pa b k 5 (continued)
-a'' ltebftatllse Cotmot Abmdanm Recent Trends In RnmbeR mi' ocamnm (2) (31 o r l l s e o f ~ Comnteats
IM, RS, SM, m m sandplr - R-W, M-Sp, F BM, FM, FH, Abundant 475,000-700,000 in Bay during spring. Most abundant shorebird in estuary.
FW, SP, LP, AL
IM, SM, BM, Black-necked stllt - R-SU, W FM. DM, FH, Common
8,000-12,000 in Bay during fall; mostly in The increasing South Bay breeding population is threatened by
M! SP, LP South Bay salt ponds. introduced predators.
Alameda song spaAaslr FC2, SSC R-Yr SM Rare Habitat stable, except at Coyote Creek Conversion of South Bay salt marshes has greatly reduced available habitat
Mwlored blaclrblrd FC2. SSC R-Yr BM, FM, FH, Common
Steep population decline throughout range. Nests in freshwater marsh; Central Valley population declined nearly FW, LP, GR, AL Several colonies in Fremont eliminated during 1930-1980.
in past decade. WLlYllllWS Salt marsh mnd81jng FC1, SSC R-Yr SM. DM Rare conversion occurring. One of the most endangered species in the estuary basin.
Stable, except where marsh erosion &
shm
Saltmarabhawestmo~ R, SE R-Y r SM, BM, DM Rare Great seasonal and annual population Only 760 acres of diked habitat available in South Bay; 6,000 acres fluctuations. of tidal marsh in North Bay. Vulnerable to floodinglgenetic isolation.
Harbor seal - R-Yr OW, IM, RS, Common Population stable at about 300-500; more than Recent study detected PCB and DDT in tissue. SM, BM 350 used two South Bay haulout sites in 1990.
SM, BM, FM, Radtor FC2. ST, IN R-Yr FN, GR, CS, increasing since arrival in Bay Area Major predator on bayshore nesting birds, especially rails and terns.
MC, AL in early 1980s.
AMPHIIIIAUS & REPTILES Galitomla tlger FC2, SSC R-Y r FM, FH, WS Uncommon Populations small, isolated and declining. Loss of vernal pools is a major cause of population decline. salamaoder
BM, FM, DM, FH, RW, LP, GR, Uncommon
May be extirpated from the Delta Still occurs at a few locations Galitomla red-legged frog FC2, SSC R-Yr Populations small, isolated and declining. in Bay Area.
BF
efaatnatbrsaske FC2, ST R-Yr FH, LP, GR, WS Uncommon Populations small, isolated and declining. pesticides, cause for decline. Loss of sloughs & marshes in Central Valley & Delta, possibly
Saa F m b u garter snake R, SE R-Yr SM, LP Rare Populations small, isolated but stable Loss of major prey, the red-legged frog, due to habitat conversion during past decade. and introduced bullfrog.
Westem pond turtle FC FM, DM, FH, Uncommon Population greatly reduced, but Loss of riparian vegetation and natural shorelines in Delta FW, RW, LP, GR probably stable. cause of decline.
(1) Key to Stabs Listings: SSC: Calif. Dept. of Fish 8 Game species of special concern A: Federal Endangered SBS: U. S. Fish 8 Wildlife Service sensltii bird species FE Federai Threatened HA: t!arvestal species SE: Slab Endangered MC: Federal management concern ST: State Threatened FC: Candidate for Federal
threatened lendangered listing
(2) Seasonal Omrence: (3) Wetland Habitats: R-Flesident OW-open water H i g r a n t IMntertidal mudflat Sp-Spring RS-rocky shore Su-Summer SMsalt marsh F-Fall BM-brackish marsh W-Wim FMfreshmarsh .
DMdiked marsh
F m e r freshwater Upland Habitats: habitat GL-grassland NY-farmed wetlands Al-agricultural land RW-riparian woodland UR-urban land SP-salt pond CS-eoastal scrub LP-lakes &ponds BF-broad-leaved forest
M C m i chapanal W h a k woodland
From data in Harvey et a/., 1992
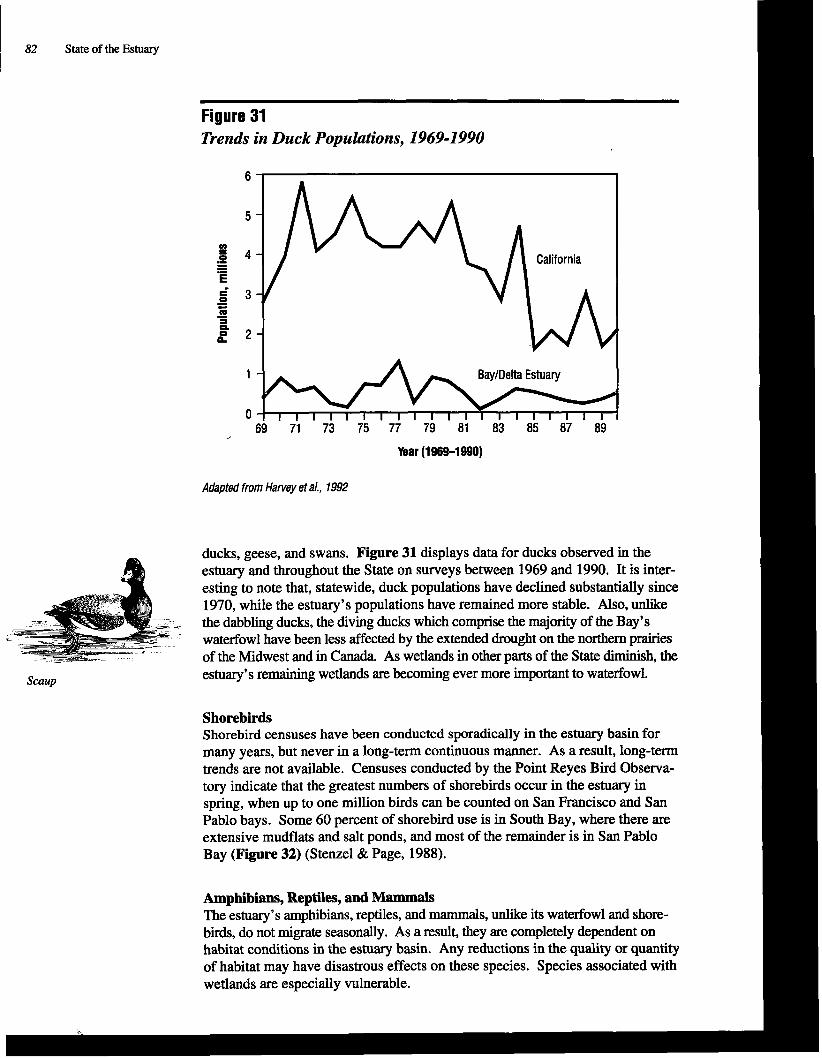
82 State of the Estuary
- ----- - - -
Trends in Duck Populations, 1969-1990
Year (1969-1 990)
Adapted from Harvey et a/., 1992
ducks, geese, and swans. Figure 31 displays data for ducks observed in the estuary and throughout the State on surveys between 1969 and 1990. It is inter- esting to note that, statewide, duck populations have declined substantially since
- - -
- - -- - --- - - - waterfowl have been less affected by the extended drought on the northern prairies -- -mn--. ------- - - of the Midwest and in Canada. As wetlands in other parts of the State diminish, the
Scaup estuary's remaining wetlands are becoming ever more important to waterfowl.
Shorebirds Shorebird censuses have been conducted sporadically in the estuary basin for many years, but never in a long-term continuous manner. As a result, long-term trends are not available. Censuses conducted by the Point Reyes Bird Observa- tory indicate that the greatest numbers of shorebirds occur in the estuary in spring, when up to one million birds can be counted on San Francisco and San Pablo bays. Some 60 percent of shorebird use is in South Bay, where there are extensive mudflats and salt ponds, and most of the remainder is in San Pablo Bay (Figure 32) (Stenzel & Page, 1988).
Amphibians, Reptiles, and Mammals The estuary's amphibians, reptiles, and mammals, unlike its waterfowl and shore- birds, do not migrate seasonally. As a result, they are completely dependent on habitat conditions in the estuary basin. Any reductions in the quality or quantity of habitat may have disastrous effects on these species. Species associated with wetlands are especially vulnerable.
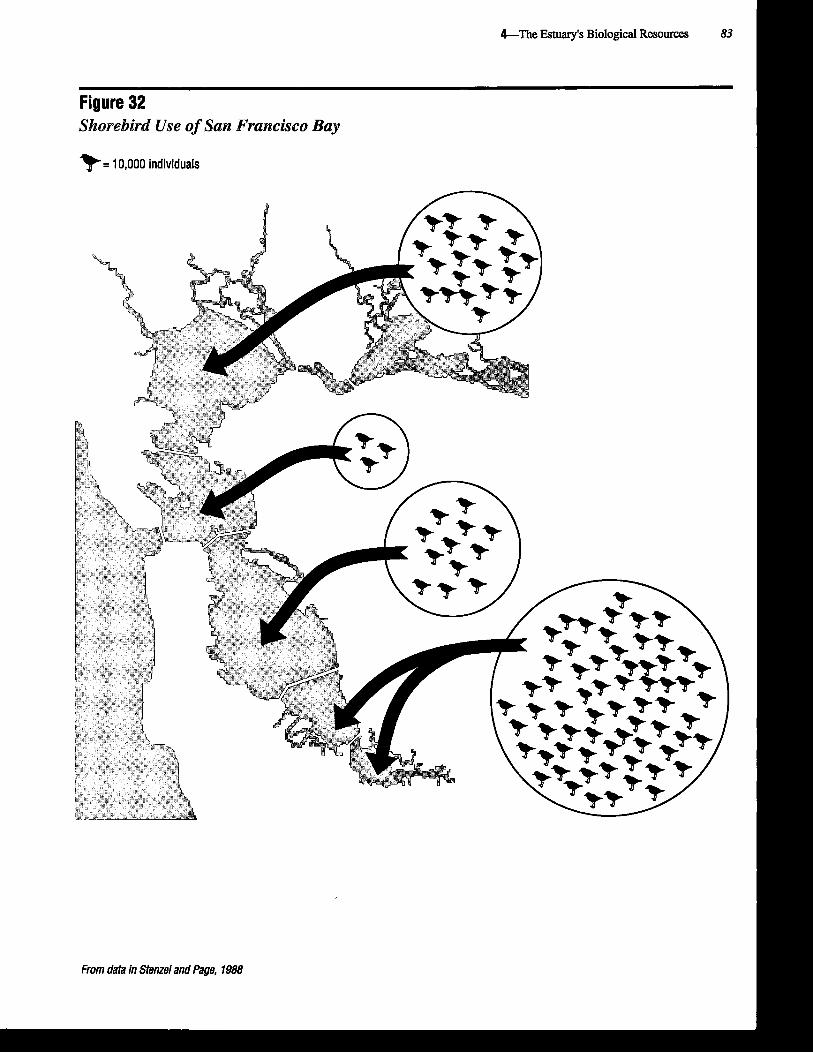
4--The Estuary's Biological Resources 83
Figure 32 Shorebird Use of San Francisco Bay
b = 1 0,000 individuals
I
I I
From data in S t and P a 1988
84 State of the Estuary
Threatened and Endangered Species and Species with Declining Populations
There are 22 wildlife species that occur the estuary basin which are listed as threatened or endangered by the state and federal governments. According to the California Fish and Game Code (Sec. 2062), to meet the state Endangered Species Act's definition of "endangered," a species must be
a native species or subspecies;
a bud, mammal, fish, amphibian, reptile, or plant;
in serious danger of becoming extinct throughout all, or a signrficant portion, of its range;
affected by loss of habitat, change in habitat, overexploitation, predation, competition, or disease.
A "threatened" species is a species which is "likely to become an endangered species in the foreseeable fufure" in the absence of the special protection provided by the Act (Cal. Fish and Game Code Sec. 2067). Federal definitions of the terms "endangered" and ''hxitened" are essentially the same as the state definitions.
There are 67 other species that occur in the estuary basin and which are con- sidered as candidates for federal listing or as state species of special concern. Of the basin's 89 listed, candidate, or special concern species, 61 have been adversely affected by wetland conversion and 32 are known or believed to be experiencing declining populations. Of the species experiencing declines, all but a few are associated with wetlands (Table 6).
Current Factors Aflecting Wildlife Populations
There are many factors responsible for recent changes in the estuary's wildlife populations. These include habitat loss and degradation, hunting, disease, predation, pollutants, competition, and human disturbance. The relative impor- tance of each factor for a particular species varies, but, taken together, they represent the major determinants of wildlife abundance and distribution.
Habitat Loss and Degradation The quantity and quality of wildlife habitat is one of the most important factors determining the size and health of wildlife populations. In recent years, habitat conditions within the estuary basin have changed drastically. Intensified farming practices have lowered the availability of food and cover for many wildlife species. The degradation and conversion of seasonal wetlands around the Bay have reduced the region's capacity to support shorebirds and waterfowl, as well as several endangered species. The loss of riparian habitat has reduced populations of several species of ducks and riparian-dependent songbirds. The remaining tidal marshes, fkagmented and confined by adjacent levees, are unable to provide adequate habitat during high tides. Increased erosion and sewage treatment plant effluent are reducing the capacity of tidal marshes to support wildlife. The conversion of upland habitat, especially range and farmlands, to urban uses has reduced the populations of many birds and mammals by eliminating buffer areas, increasing human disturbance, and subjecting wildlife to feral predators.
Changes in habitat conditions outside the estuary basin also have affected populations of waterfowl that winter here. During the past two decades, thousands
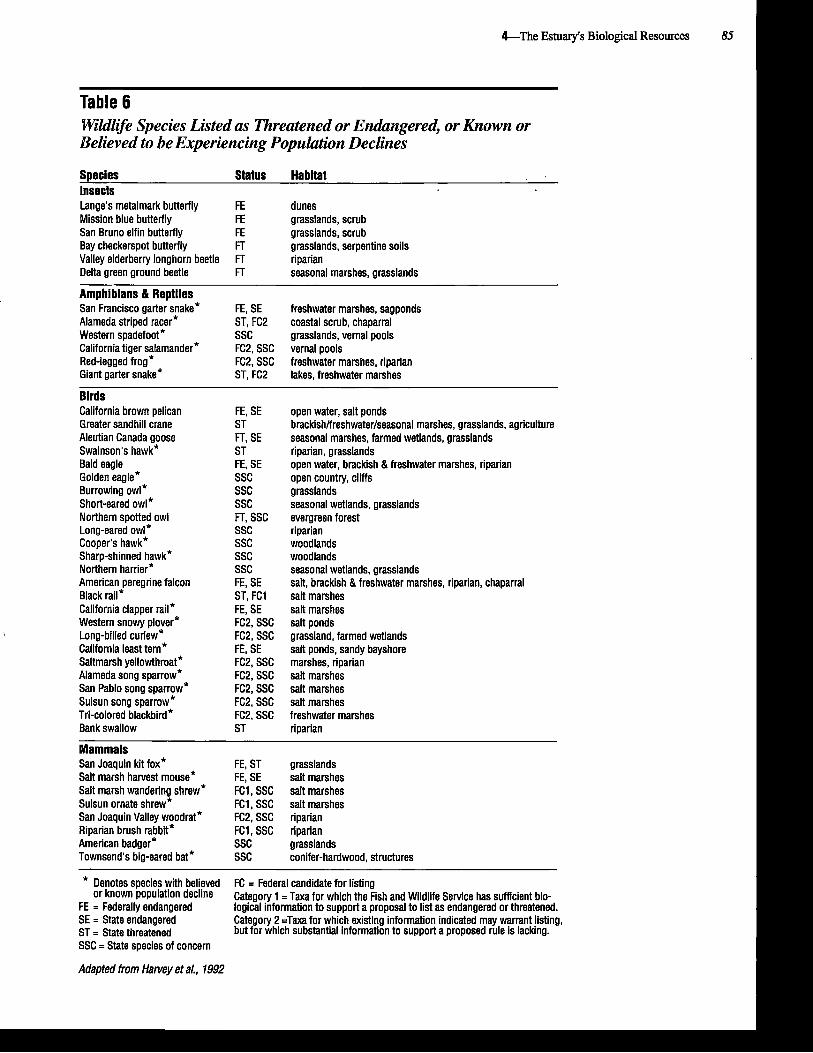
&The Estuary's Biological Resources 85
Table 6 Wildlife Species Listed as Threatened or Endangered; or Known or Believed to be Experiencing Population Declines
Species Insects Lange's metalmark butterfly Mission blue butterfly San Bruno elfin butterfly Bay checkerspot butterfly Valley elderberry longhorn beetle Delta green ground beetle
Amphibians & Reptiles San Francisco garter snake* Alameda striped racer* Western spadefoot* California tiger salamander* Red-legged frog* Giant garter snake*
Birds California brown pelican Greater sandhill crane Aleutian Canada goose Swainson's hawk* Bald eagle Golden eagle* Burrowing owl* Short-eared owl* Northern spotted owl Long-eared owl* Cooper's hawk* Sharp-shinned hawk* Northern harrier* American peregrine falcon Black rail* California clapper rail* Western snowy plover* Long-billed curlew* California least tern* Saltmarsh yellowthroat* Alameda song sparrow* San Pablo song sparrow* Suisun song sparrow* Tri-colored blackbird* Bank swallow
Status Habitat
FE dunes FE grasslands, scrub FE grasslands, scrub FT grasslands, serpentine soils FT riparian FT seasonal marshes, grasslands
FE, SE freshwater marshes, sagponds ST, FC2 coastal scrub, chaparral SSC grasslands, vernal pools FC2, SSC vernal pools FC2, SSC freshwater marshes, riparian ST, FC2 lakes, freshwater marshes
FE, SE ST FT, SE ST FE, SE SSC SSC SSC FT, SSC SSC SSC SSC SSC FE, SE ST, FC1 FE, SE FC2, SSC FC2, SSC FE, SE FC2, SSC FC2, SSC FC2, SSC FC2, SSC FC2, SSC ST
open water, salt ponds brackish/freshwater/seasonal marshes, grasslands, agriculture seasonal marshes, farmed wetlands, grasslands riparian, grasslands open water, brackish & freshwater marshes, riparian open country, cliffs grasslands seasonal wetlands, grasslands evergreen forest riparian woodlands woodlands seasonal wetlands, grasslands salt, brackish & freshwater marshes, riparian, chaparral salt marshes salt marshes salt ponds grassland, farmed wetlands salt ponds, sandy bayshore marshes, riparian salt marshes salt marshes salt marshes freshwater marshes riparian
Mammals San Joaquin kit fox* Salt marsh harvest mouse* Salt marsh wandering shrew* Suisun ornate shrew* San Joaquin Valley woodrat* Riparian brush rabbit* American badger* Townsend's big-eared bat*
* Denotes species with believed or known populat~on decl~ne
FE = Federally endangered
FE, ST grasslands FE, SE salt marshes FC1, SSC salt marshes FC1, SSC salt marshes FC2, SSC riparian FC1, SSC riparian SSC grasslands SSC conifer-hardwood, structures
FC = Federal candidate for listing Category 1 = Taxa for which the Fish and Wildlife Service has sufficient blo- logical information to support a proposal to list as endangered or threatened.
SE = State endangered Category 2 =Taxa for which existing information indicated may warrant listing, ST = State threatened but for which substantial information to support a proposed rule is lacking. SSC = State species of concern
Adapted from Harvey et a/., 1992
i 86 State of the Estuary
of seasonal wetlands in the waterfowl breeding areas of the north-central United States and south-central Canada, an area that produces about 50 percent of the ducks in North America, have been converted to agricultural uses. As a result, and in conjunction with a drought that began in 1979 and extended into 1988, ,
waterfowl production has plummeted. Lowered production reduces the number of birds that winter in the estuary.
Hunting Hunting is a si&icant cause of death of many wildlife groups, including waterfowl. Nationwide, it has been estimated that hunting accounts for about one-half of all annual waterfowl losses (Bellrose, 1980). Although the number of waterfowl shot in California has decreased recently, reflecting the overall decline in waterfowl populations, substantial numbers still are taken in the estuary. During 1971-1980, an annual average of some 22,784 ducks were shot in eleven of the estuary counties (Carney et al., 1983).
Although hunters may take substantial numbers of wildlife, state and federal hunting programs are managed for sustained harvests. Without the support of hunters, hunting organizations, and government hunting programs, there would be much less high-quality habitat remaining for waterfowl and other species in the estuary basin and in other parts of the State.
Disease Disease is a major cause of death among waterfowl wintering in the Delta, San Francisco Bay, and throughout the State. The effects of disease are compounded as populations concentrate in increasingly small habitat areas. Overcrowding, poor habitat quality, and adverse weather may contribute to the spread of diseases such as avian cholera and botulism.
The Bay and Delta represent two of the four areas in the State considered focal points of avian cholera. In 1948, the disease spread from South Bay to the Delta where it killed 40,000 waterfowl. In 1984,200 eared grebes died of cholera during a small outbreak on a South Bay salt pond. It has been suggested that the gradual expansion in the range of cholera outbreaks during the past 35 years may reflect interactions among the disease, habitat deterioration, and increasing pollution from chlorinated pesticides (McLandress, 1983).
Predation The effect of predation on wildlife populations is usually most pronounced during the breeding season and on populations already reduced in numbers and existing in poor habitat. In the major waterfowl nesting grounds in the northern plains, as well as in the estuary basin, high rates of predation by skunks, ravens, and other animals on nesting waterfowl have accompanied intensified agricul- tural practices and other changes in land use that eliminate prime nesting habitat. Agricultural intensification in the Delta and Suisun Marsh have reduced the nesting habitat for many waterfowl species.
Much of the predation on birds that nest in the estuary's marshes is caused by introduced species including the Norway rat, opossum, and red fox. Since the 1980s, there has been a huge increase in the red fox population in the Bay region. The fox, a subspecies introduced from the Midwest at the end of the 19th century and not the native subspecies of the Sierra Nevada, is an efficient
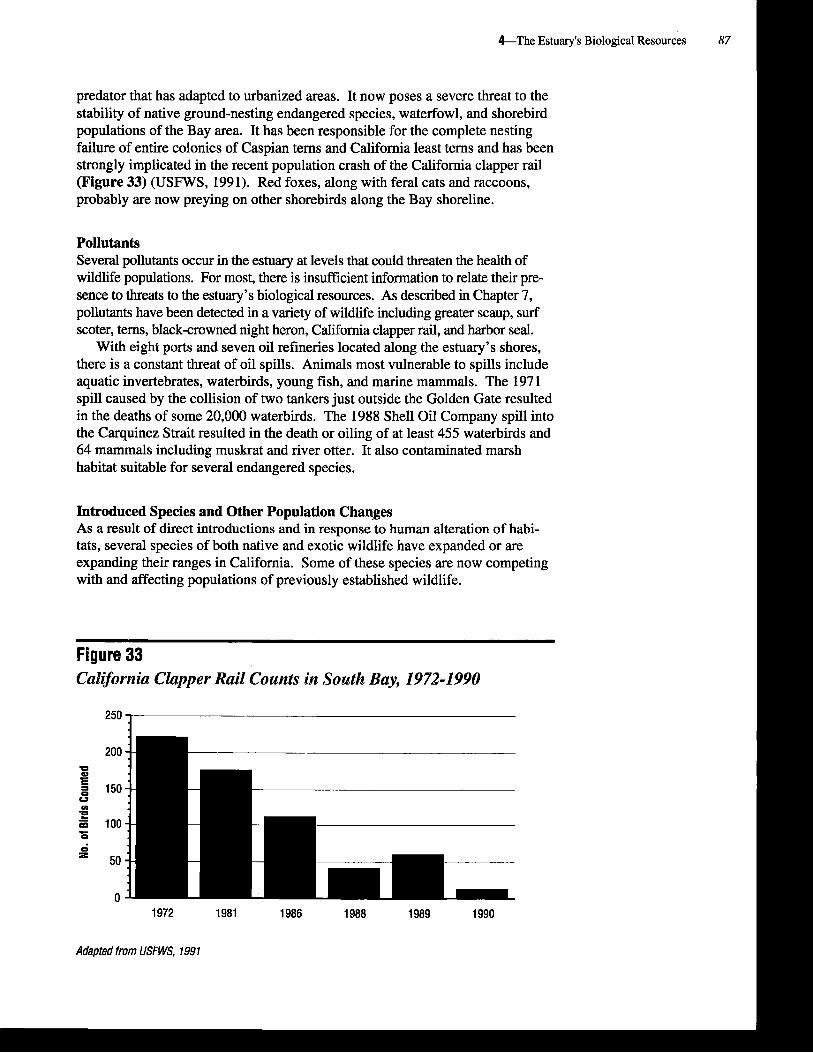
&The Estuary's Biological Resources 87
predator that has adapted to urbanized areas. It now poses a severe threat to the stability of native ground-nesting endangered species, waterfowl, and shorebird populations of the Bay area. It has been responsible for the complete nesting failure of entire colonies of Caspian terns and California least terns and has been strongly implicated in the recent population crash of the California clapper rail (Figure 33) (USFWS, 1991). Red foxes, along with feral cats and raccoons, probably are now preying on other shorebirds along the Bay shoreline.
Pollutants Several pollutants occur in the estuary at levels that could threaten the health of wildlife populations. For most, there is insufficient information to relate their pre- sence to threats to the estuary's biological resources. As described in Chapter 7, pollutants have been detected in a variety of wildlife including greater scaup, surf scoter, terns, black-crowned night heron, California clapper rail, and harbor seal.
With eight ports and seven oil refineries located along the estuary's shores, there is a constant threat of oil spills. Animals most vulnerable to spills include aquatic invertebrates, waterbirds, young fish, and marine mammals. The 1971 spill caused by the collision of two tankers just outside the Golden Gate resulted in the deaths of some 20,000 waterbirds. The 1988 Shell Oil Company spill into the Carquinez Strait resulted in the death or oiling of at least 455 waterbirds and 64 mammals including muskrat and river otter. It also contaminated marsh habitat suitable for several endangered species.
Introduced Species and Other Population Changes As a result of direct introductions and in response to human alteration of habi-
I tats, several species of both native and exotic wildlife have expanded or are expanding their ranges in California. Some of these species are now competing with and affecting populations of previously established wildlife.
Figure 33 Califsmia Clapper Rail Counts in South Bay, 1972-1990
I
1972 1981 1986 1988 1989 1990
Adapted from USNVS, 1991
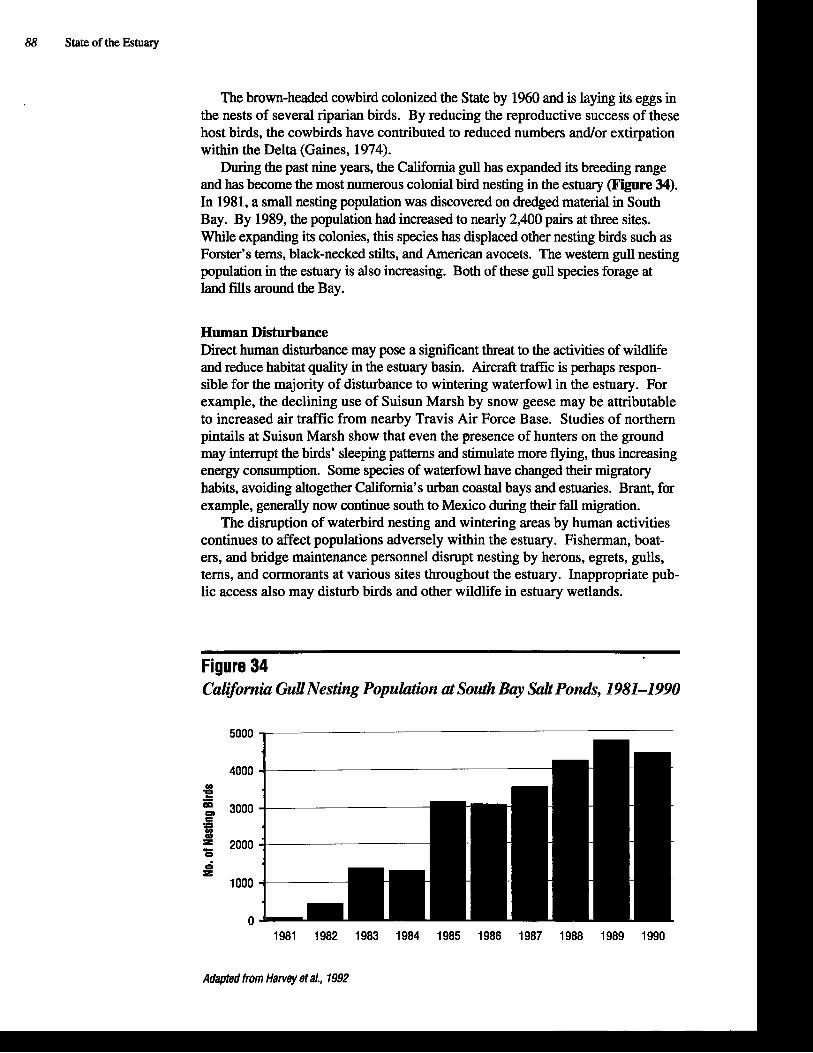
88 State of the Estuary
The brown-headed cowbird colonized the State by 1960 and is laying its eggs in the nests of several riparian birds. By reducing the reproductive success of these host birds, the cowbirds have contributed to reduced numbers andlor extirpation within the Delta (Gaines, 1974).
During the past nine years, the California gull has expanded its breeding range and has become the most numerous colonial bird nesting in the estuary ( F i e 34). In 1981, a small nesting population was discovered on dredged material in South Bay. By 1989, the population had increased to nearly 2,400 pairs at three sites. While expanding its colonies, this species has displaced other nesting birds such as Forster's term, black-necked stilts, and American avocets. The western gull nesting population in the estuary is also increasing. Both of these gull species forage at land fills around the Bay.
Human Disturbance Direct human disturbance may pose a sigmficant threat to the activities of wildlife and reduce habitat quality in the estuary basin. Aircraft traffic is perhaps respon- sible for the majority of disturbance to wintering waterfowl in the estuary. For example, the declining use of Suisun Marsh by snow geese may be attributable to increased air traffic from nearby Travis Air Force Base. Studies of northern pintails at Suisun Marsh show that even the presence of hunters on the ground may intempt the birds' sleeping patterns and stimulate more flying, thus increasing energy consumption. Some species of waterfowl have changed their migratory habits, avoiding altogether California's urban coastal bays and estuaries. Brant, for example, generally now continue south to Mexico during their fall migration.
The disruption of waterbird nesting and wintering areas by human activities continues to affect populations adversely within the estuary. Fisherman, boat- ers, and bridge maintenance personnel disrupt nesting by herons, egrets, gulls, terns, and cormorants at various sites throughout the estuary. Inappropriate pub- lic access also may disturb birds and other wildlife in estuary wetlands.
Figure 34 California G d Nesting Population at South Bay S d Ponds, 1981-1990
1981 1982 1983 1984 1985 1986 1987 1988 1989 1990
Adapted from Harvey et a/., 1992

&The Estuary's Biological Resources 89 I
Freeways, coinmercial and ipldUstrir and mar
a1 facilities, i~las are tht
housing, I main
causes of habitat loss and I degradation along the Bay
1 shoreline. (Photo: Bob Walker)
1 The Future of Wildli$e in the Estuary Basin
Based on current trends and projections of land use and other human activities, the future for wildlife within the estuary basin is not bright. Although some species, especially those associated with urban areas, may increase their numbers, most wildlife populations are likely to decline further. Some endangered species may become extinct. The factors that will be responsible for these changes are primarily human-induced and include habitat loss, alteration, and degradation.
Habitat Loss
Urban Growth. According to Estuary Project projections, urban land use in the estuary basin is expected to increase by about 400 square miles, an area nearly as large as San Mateo County, between 1985 and 2005 (Perkins et al., 1991). This will require the conversion of range, forest, and agricultural lands and will ad- versely affect the wildlife species associated with these habitats. Over a longer period, tens of thousands of acres of wetlands and stream corridors also could be adversely affected by development (Blanchfield et al., 1991). Such habitat losses would substantially.reduce the region's capacity to support waterfowl, shorebirds, and many species of mammals.
Delta Levee Maintenance. Recent state legislation increases the financial assis- tance to Delta reclamation districts to maintain levees. Although the legislation
90 State of the Estuary
includes provisions to mitigate adverse environmental impacts of levee mainte- nance, it is not expected that habitat losses will be completely offset. As a result, most Delta levees will continue to provide habitat of only minimal wildlife value.
Shoreline Erosion. The bayward margins of tidal marshes have been eroding at a rapid rate. Annual erosion rates of 3-16 feet have been reported for some shore- lines in South Bay (Atwater et d., 1979). In North Bay, erosion rates are lower, as represented by a rate of 1.0-2.9 feet per year for several marshes in Marin County (Philip Williams & Assoc., 1989). Influencing the erosion rates are a rise in sea level, subsidence, and an introduced benthic isopod (Sphaeroma quoyanu) that bur- rows into mud banks, undercutting pickleweed. Similar or increased erosion rates are expected to continue. The resulting habitat loss will adversely affect several species of marsh wildlife, many of which are already in decline.
Sea Level Rise. As global warming continues, a result of the accumulation of greenhouse gases in the atmosphere, sea level could rise by 1.6 to 4.9 feet by the mid-22nd century, based on a midpoint temperature increase of 5.4 O F (Califor- nia Energy Commission, 1989). This would raise water levels throughout the estuary. It would convert large portions of existing mudflats to subtidal habitat and would convert existing tidal marshes to mudflats. The loss of tidal marshes could result in the extinction of the California clapper rail, black rail, salt marsh vagrant shrew, Suisun ornate shrew, Suisun song sparrow, and salt marsh song sparrow. Habitat changes also would seriously reduce populations of other species found in tidal marshes, including the harbor seal. Other wetlands such as diked seasonal salt marshes, salt ponds, and riparian vegetation could be permanently inundated. A one foot rise in sea level could double the average number of floods of Delta islands and lead to massive losses of wildlife habitat (Logan, 1990).
Habitat Alteration
Askn Clam Invasion. As noted previously, the recent establishment of the clam Potamocorbula amurensis in the estuary threatens to alter the composition of the benthic community and to affect food web relationships. By out-competing other benthic invertebrates that currently serve as prey items for waterfowl and other waterbirds, this clam may reduce the availability of food for many bird species. By establishing high densities in the northern reach of the Bay, Potamocorbula may reduce the amount of biomass in the water column, adversely affecting fish-eating birds such as the western grebe, brown pelican, and others. Wildlife species that feed on the clam, such as scaup and surf scoter, could benefit from the dense populations of this bivalve.
Tidal Salt Marsh Conversion. The San JoseISanta Clara municipal sewage treatment plant currently discharges an average of 120 million gallons of efflu- ent each day. Over the past couple of decades, this has converted salt marsh to brackish marsh. If the plant increases its flow by 25 percent, as planned, ad- ditional marsh conversion will occur, with adverse impacts to the many species dependent on salt marsh.
Habitat Degradation Many of the estuary's habitats that remain intact are expected to be degraded by pollutants and introduced predators and plants. As described in Chapter 7,

&The Estuary's Biological Resources 91
photographed on a levee I adjacent to Mowry Slough in South Bay during a survey of California Clapper rails. (Photo: Kevin Foerster) 1
pollutants that are of greatest concern are the toxic trace elements and persistent organic chemicals.
Unless actions are taken to control the red fox and introduced rats, losses of salt marsh wildlife species and ground nesting seabirds and shorebirds will con- tinue, especially in South Bay. The U.S. Fish and Wildlife Service has proposed that a control program be implemented for the red fox and other predators on the San Francisco Bay National Wildlife Refuge (USFWS, 1991).
Two non-native species of cordgrass-smooth cordgrass and Chilean cordgrass- were recently introduced into San Francisco Bay. Smooth cordgrass is replacing native cordgrass, especially in lower tidal areas, and Chilean cordgrass is displacing pickleweed. If these species are allowed to spread, they may reduce the acreage of mudflats and pickleweed marsh. In doing so, they would reduce habitat for shore- birds and species dependent on pickleweed. Conversely, both species of cordgrass might provide better high tide cover for California clapper rails and black rails. They also might contribute greater amounts of detritus to the estuarine food web and prove more resistant to shoreline erosion.
Summary
The BayDelta estuary has sustained a diverse community of biological resources for millennia. Even today, in the midst of a region becoming increasingly urban- ized, it continues to support hundreds of species of plants, fish, and wildlife. All of these species play a role in the food web of the estuarine basin. They also provide many tangible and intangible benefits including jobs, recreation, open space, and aesthetic values. Although some fish and wildlife species are thriving, especially those associated with urban areas, many are in decline. The most pervasive causes of these declines are habitat loss, alteration, and degradation.
92 State of the Estuary
The estuary's habitats, the base of support for all of its fish and wildlife communities, have been severely affected by development during the past cen- tury. Aquatic habitats have been altered by water supply, navigation, and flood control projects. Most of the historic tidal marshes have been converted to other uses. More than one-half of the estuary basin's historical uplands are now towns and cities.
As a result of habitat change and other human-induced causes, the estuary's ability to support a diverse ecosystem with large populations of economically im- portant species has declined. The sheash industry is gone, as are the commercial striped bass and shad fisheries. Naturally reproducing populations of important recreational fish, such as Chinook salmon and striped bass, have been in decline for decades. The commercial salmon industry now depends on fish hatcheries for much of its catch. Eighty-nine wildlife species whose populations are dwindling or monitored are designated by federal or state agencies as being in need of special protection; about two-thirds of these species are associated with wetlands.
Future development of the estuary basin is expected to continue to reduce valuable habitat and to diminish fish and wildlife populations. The growing human population, expansion of urban lands, and other activities are expected to further re- duce the habitat base and directly affect many species of fish and wildlife. Although some species will flourish, many will not. Unless some substantial changes are made in the way the estuary's land and water are managed, conditions for many of the region's biological resources will continue to deteriorate.
Wetlands
As transition areas be&een the water and the land, they provide important habitat 1 for hundreds of species offish and wildlife. They also provide many benefits to the human inhabitants of the region. More than any other habitat type, wetlands have been adversely afected by development in the estuary basin and in the Central Valley watershed.
This chapter expands on the previous one by describing the unique values and functions of wetlands. It traces some of the factors responsible for past changes in wetland distribution and also projects future trends. It describes the extent to which wetlands are protected, as well as some of the @forts underway to enhance wetland values around the estuary. This chapter is based primarily on the Estu- ary Project's Status and Trends Report on Wetlands and Related Habitats in the San Francisco Estuary (Meiorin et al., 1991).
During the process of characterizing the estuary's wetlands, the following points have emerged:
1. Wetlands are one of the estuary's most important natural assets. They provide habitat for many fish and wildlife species and benefits associated with flood control, groundwater recharge, shoreline stabilization, open space, and water quality maintenance.
2. Since 1850, more than one-half million aces of the estuary's wetlands have been modified. In the Delta, 97 percent of the original tidal wetlands have been converted to farmland or other uses. In San Francisco Bay, 82 percent of the original tidal wetlands have been filled or converted to other wetland types. Losses of riparian, seasonal, and other wetland types also have been extensive.
3. Wetland losses have reduced the estuary's capacity to support large numbers of fish and wildlife and to provide other wetland-associated benefits. Of the 32 species of wildlife whose populations are currently known to be declining in the estuary basin, 23 are associated primarily with wetlands.
I 4. Although wetland degradation and conversion have slowed substantially since the early 1970s, wetland losses continue.
5. Based on expected patterns of urban expansion, seasonal and riparian wet- lands are the most threatened wetland types.

94 State of the Estuary
6. Projected urban expansion in the estuary basin could adversely affect at least 3,500 acres of wetlands and 10,000 acres of stream corridor. Mitigation could offset some of the losses.
7. More than 121,000 acres of the estuary's wetlands (about 19 percent) are currently protected in parks, refuges, and preserves.
8. Many public and private entities are seeking to protect additional wetland
tool for conserving wetlands well into the next centurv. I
Wetlands are transitional lands that occur between terrestrial and aquatic systems where the water table is usually at or near the surface, or the land is covered by shallow water. According to the most comprehensive and widely used wetland classification system, developed by Cowardin et al. (1979) for the U.S. Fish and Wildlife Service, wetlands have one or more of the following attributes: (1) at least periodically, the land supports mostly water-adapted (2) the sub- strate is mostly undrained, waterlogged soil, (3) the substrate is nonsoil and is saturated with water or covered by shallow water at some time during the grow- ing season of each year. This definition is broad enough to cover a wide array of very different kinds of wetlands.
According to the Cowardin classification system, there are five major systems of wetlands: marine, estuarine, riverine, lacustrine (from Latin, for lake), and palus- trine (from Latin, for marsh). As displayed in Table 7, wetlands of the BayPelta estuary occur in each of these categories except marine. The various kinds of wetlands and their associated communities are described at the beginning of the preceding chapter.
Although most of the Delta It is important to note that, while the Cowardii system is commonly used to marshes have been "reclaimed," classify wetlands, it is not by itself sufficient to define wetlands for regulatory the region's diverse array of purposes. Public agencies involved in the regulation of activities affecting channels, freshwater marsh, wetlands utilize more specific wetland definitions. One of the most problematic riparian forest, and farmed
-1 wetlands provides aspects of wetlands regulation during the past decade has been the use of different
hnhitnt fnr mnnv wetland definitions by various agencies. For example, the Environmental Protec-
-. ~ - -
The Fish and Wildlife Service definition, however.
beaches, and sand bars). In 1989, the Army Corps of Engineers, Environ-
mental Protection Agency, Fish and Wildlife Service, and Soil Conservation Service adopted a "Federal
dures to identify and delineate wetlands for redatory purposes, even though the agencies may continue to
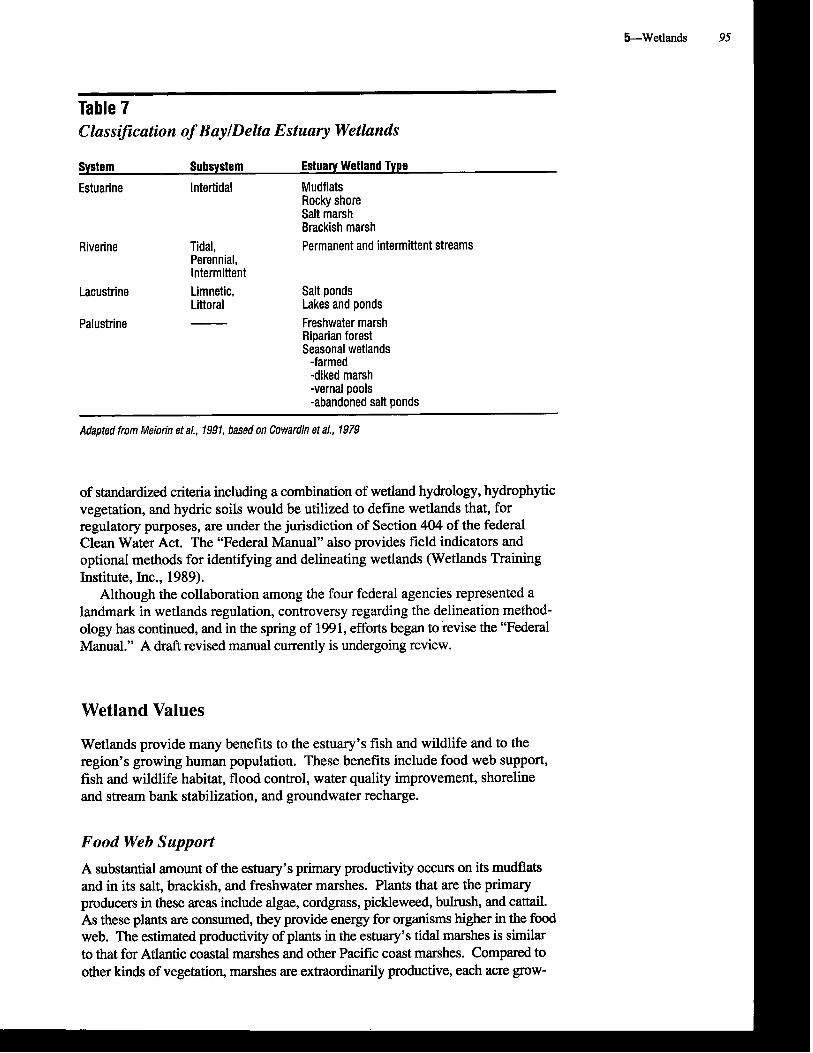
Table 7 Classification of BaylDelta Estuary Wetlands
System Subsystem Estuary Wetland Type
Estuarine Intertidal Mudflats Rocky shore Salt marsh Brackish marsh
Riverine Tidal, Permanent and intermittent streams Perennial, Intermittent
Lacustrine Limnetic, Salt ponds Littoral Lakes and ponds
Palustrine Freshwater marsh Riparian forest Seasonal wetlands
-farmed -diked marsh -vernal pools -abandoned salt ponds
Adapted from Meiorin et a/., 1991, based on Cowardin et al., 1979
of standardized criteria including a combination of wetland hydrology, hydrophytic vegetation, and hydric soils would be utilized to define wetlands that, for regulatory purposes, are under the jurisdiction of Section 404 of the federal Clean Water Act. The "Federal Manual" also provides field indicators and optional methods for identifying and delineating wetlands (Wetlands Training Institute, Inc., 1989).
Although the collaboration among the four federal agencies represented a landmark in wetlands regulation, controversy regarding the delineation method- ology has continued, and in the spring of 199 1, efforts began to revise the "Federal Manual." A draft revised manual currently is undergoing review.
Wetland Values
Wetlands provide many benefits to the estuary's fish and wildlife and to the region's growing human population. These benefits include food web support, fish and wildlife habitat, flood control, water quality improvement, shoreline and stream bank stabilization, and groundwater recharge.
Food Web Support
A substantial amount of the estuary's primary productivity occurs on its mudflats and in its salt, brackish, and freshwater marshes. Plants that are the primary producers in these areas include algae, cordgrass, pickleweed, bulrush, and cattail. As these plants are consumed, they provide energy for organisms higher in the food web. The estimated productivity of plants in the estuary's tidal marshes is similar to that for Atlantic coastal marshes and other Pacific coast marshes. Compared to other kinds of vegetation, marshes are extraordinarily productive, each acre grow-
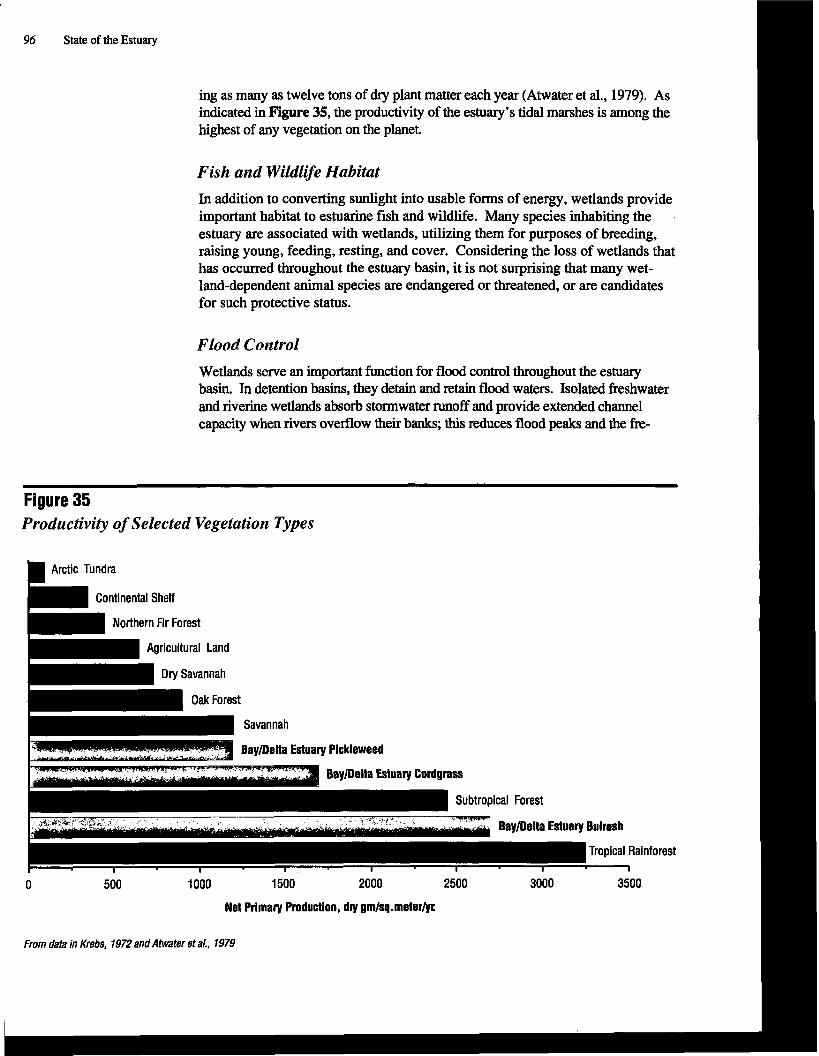
' 96 State of the Estuary
ing as many as twelve tons of dry plant matter each year (Atwater et al., 1979). As indicated in Fie 35, the productivity of the estuary's tidal marshes is among the
Fish and Wildlife Habitat I
important habitat to estuarine fish and wildlife. Many species inhabiting the .
estuary are associated with wetlands, utilizing them for purposes of breeding, raising young, feeding, resting, and cover. Considering the loss of wetlands that has occurred throughout the estuary basin, it is not surprising that many wet- land-dependent animal species are endangered or threatened, or are candidates
Flood Control
Wetlands serve an important function for flood control throughout the estuary basin. In detention basins, they detain and retain flood waters. Isolated freshwater and riverine wetlands absorb stormwater runoff and provide extended channel
Productivity of Selected Vegetation Types
1 Arctic Tundra I Continental Shelf I
Northern Fir Forest I
Savannah
0 500 1000 1500 2000 2500 3000 3500
Net Primary Production, dw gmlsq.meteriyr
From data in Krebs, 1972 and Atwater et a/., 1979
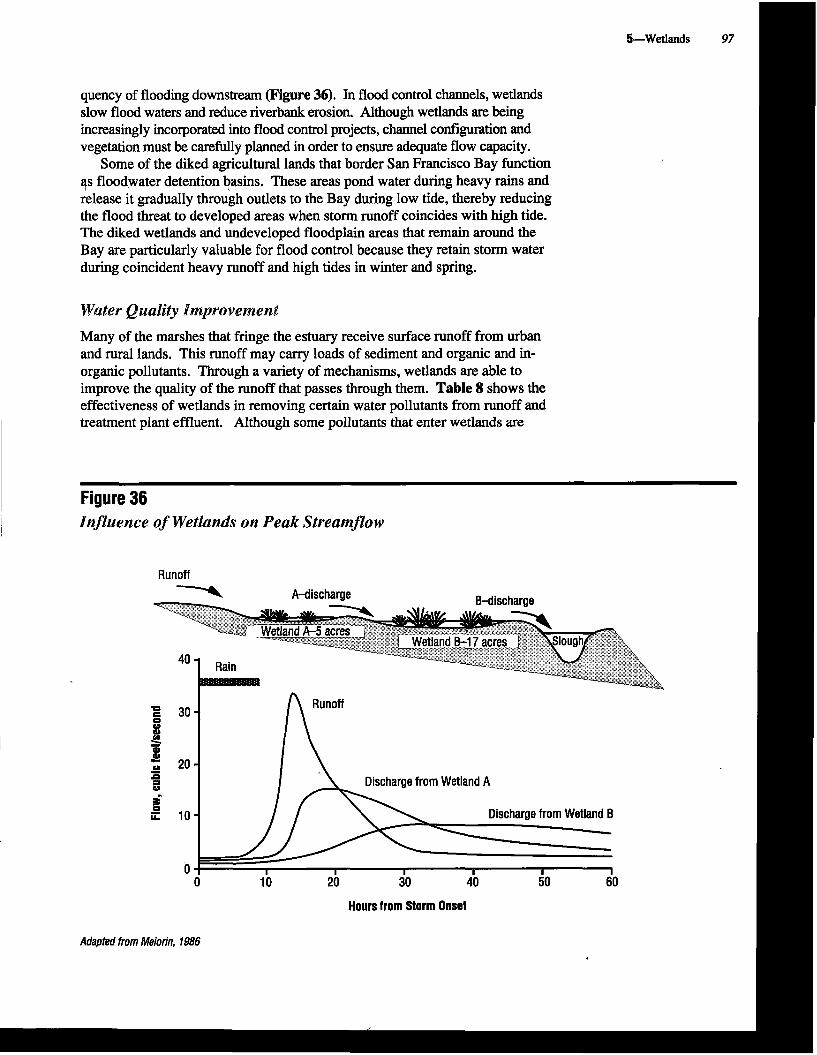
quency of flooding downstream (Figure 36). In flood control channels, wetlands slow flood waters and reduce riverbank erosion. Although wetlands are being increasingly incorporated into flood control projects, channel configuration and vegetation must be carefully planned in order to ensure adequate flow capacity.
Some of the diked agricultural lands that border San Francisco Bay function qs floodwater detention basins. These areas pond water during heavy rains and release it gradually through outlets to the Bay during low tide, thereby reducing the flood threat to developed areas when storm runoff coincides with high tide. The diked wetlands and undeveloped floodplain areas that remain around the Bay are particularly valuable for flood control because they retain storm water during coincident heavy runoff and high tides in winter and spring.
W61:ter Quality Improvemen&
Many of the marshes that fringe the estuary receive surface runoff from urban and rural lands. This runoff may carry loads of sediment and organic and in- organic pollutants. Through a variety of mechanisms, wetlands are able to improve the quality of the runoff that passes through them. Table 8 shows the effectiveness of wetlands in removing certain water pollutants from runoff and treatment plant effluent. Although some pollutants that enter wetlands are
Figure 36 Bnfauence of Wetlands on Peak Streamflow
Runoff 7 A-discharge
Adapted from
Hours from Storm Onsrt
Meiorin, 1986

98 State of the Estuary
Table 8 Wetland Removal EfJZciencies for Water Pollutants (Percent)
Water Source Applied to Wetlands
Primary-treated Secondary-treated Sewage sewage Urban runoff lconstructed (Natural
Pollutant
Total Solids Dissolved Solids Suspended Solids BOD5 COD Nitrogen (as N) Phosphorus (as P) Heavy Metals
wetlands) Natural wetlands Constructed wetlands - 40 - 75 - - 5 - 20 - - 29 - 90 0 - 92
59 - 90 70 - 96 37 - 92 50 - 90 50 - 80 - 30 - 98 40 - 97 60 - 86 20 - 90 10 -97 77 - 97 - 20 - 100 23 - 94
wetlands)
Adapted from Chan et a/., 1981
transformed into relatively harmless forms and are retained in the sediments, others may enter the food web and adversely affect biota.
Sediment removal is one of the most obvious effects that wetlands have on inflowing water. As water flows through a marsh, it slows and the suspended sediment drops out. The rate at which this occurs is related to the density of the marsh vegetation, water velocity, and sediment size.
During recent years, wetlands have been constructed for the purpose of treating storm water and domestic waste water. This treatment utilizes the processes of sedimentation, filtration, and biological uptake, and c& remove a substantial pro- portion of pollutants. Typically, these constructed wetlands cover less than ten acres and support few kinds of vegetation; however, larger projects have been built, and they aim to provide multiple-use objectives including habitat creation.
Although wetlands can treat storm water and waste water, acting as a sink for sediments and some chemical pollutants, the degree to which the fish and wildlife using these wetlands are exposed to pollutants is not well understood. As was learned at the Kesterson National Wildlife Refuge in the early 1980s-where many shorebirds, ducks, and other wildlife exhibited toxic effects of selenium- an attractive marsh does not necessarily provide safe habitat (BISF, 1985). Until the effects of pollutant discharges into wetlands are better understood, the use of wetlands to treat runoff or wastewater should be pursued with utmost caution.
Shoreline Stabilization and Bank Protection
Stream runoff, tidal water movement, and wave action can erode and destroy un- protected shorelines. Vegetated wetlands reduce erosion by absorbing and damping wave energy, binding the shore with roots, and encouraging the deposition of suspended sediment. Using wetland vegetation to reduce shoreline erosion has
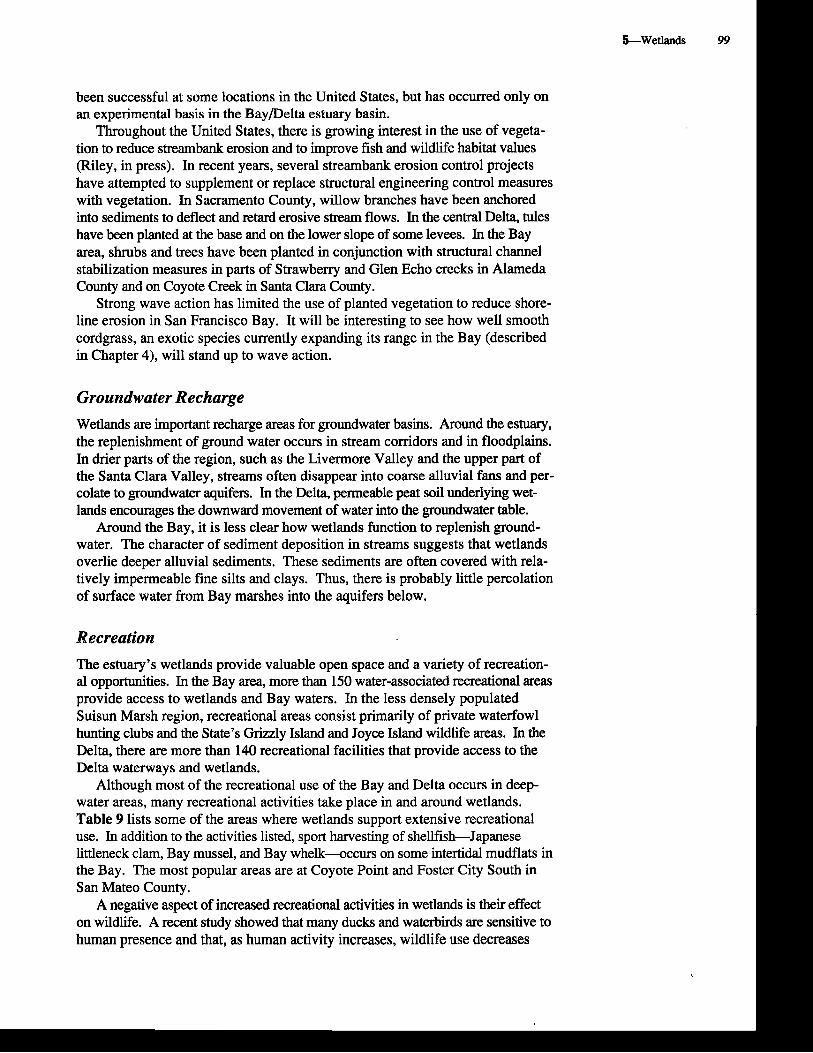
been successful at some locations in the United States, but has occurred only on an experimental basis in the BayPelta estuary basin.
Throughout the United States, there is growing interest in the use of vegeta- tion to reduce streambank erosion and to improve fish and wildlife habitat values (Riley, in press). In recent years, several streambank erosion control projects have attempted to supplement or replace structural engineering control measures with vegetation. In Sacramento County, willow branches have been anchored into sediments to deflect and retard erosive stream flows. In the central Delta, tules have been planted at the base and on the lower slope of some levees. In the Bay area, shrubs and trees have been planted in conjunction with structural channel stabilization measures in parts of Strawberry and Glen Echo creeks in Alameda County and on Coyote Creek in Santa Clara County.
Strong wave action has limited the use of planted vegetation to reduce shore- line erosion in San Francisco Bay. It will be interesting to see how well smooth cordgrass, an exotic species currently expanding its range in the Bay (described in Chapter 4), will stand up to wave action.
Groundwater Recharge Wetlands are important recharge areas for groundwater basins. Around the estuary, the replenishment of ground water occurs in stream corridors and in floodplains. In drier parts of the region, such as the Livermore Valley and the upper part of the Santa Clara Valley, streams often disappear into coarse alluvial fans and per- colate to groundwater aquifers. In the Delta, permeable peat soil underlying wet- lands encourages the downward movement of water into the groundwater table.
Around the Bay, it is less clear how wetlands function to replenish ground- water. The character of sediment deposition in streams suggests that wetlands overlie deeper alluvial sediments. These sediments are often covered with rela- tively impermeable fine silts and clays. Thus, there is probably little percolation of surface water from Bay marshes into the aquifers below.
W ecreation
The estuary's wetlands provide valuable open space and a variety of recreation- al opportunities. In the Bay area, more than 150 water-associated recreational areas provide access to wetlands and Bay waters. In the less densely populated Suisun Marsh region, recreational areas consist primarily of private waterfowl hunting clubs and the State's Grizzly Island and Joyce Island wildlife areas. In the Delta, there are more than 140 recreational facilities that provide access to the Delta waterways and wetlands.
Although most of the recreational use of the Bay and Delta occurs in deep- water areas, many recreational activities take place in and around wetlands. Table 9 lists some of the areas where wetlands support extensive recreational use. In addition to the activities listed, sport harvesting of shellfish-Japanese littleneck clam, Bay mussel, and Bay whelk-occurs on some intertidal mudflats in the Bay. The most popular areas are at Coyote Point and Foster City South in San Mateo County.
A negative aspect of increased recreational activities in wetlands is their effect on wildlife. A recent study showed that many ducks and waterbirds are sensitive to human presence and that, as human activity increases, wildlife use decreases
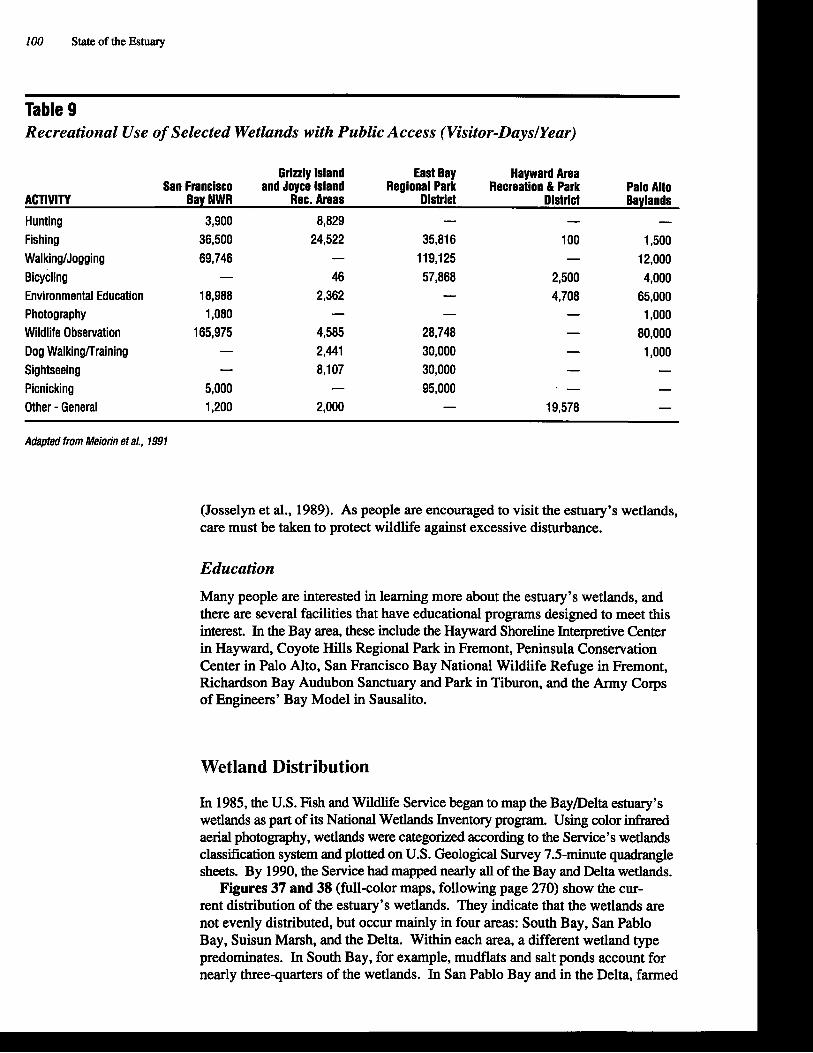
100 State of the Estuary
Table 9 Recreational Use of Selected Wetlands with Public Access (Visitor-Dayslyear)
Grizzly Island East Bay Hayward Area San Francisco and Joyce Island Regional Park Recreation & Park Palo Alto
ACTIVITY Bay NWR Rec. Areas Dlstrlct District Baylands
Hunting 3,900 8,829 - - - Fishing 36,500 24,522 35,816 100 1,500 WalkingJJogging 69,746 - 119,125 - 12,000 Bicycling - 46 57,868 2,500 4,000 Environmental Education 18,988 2,362 - 4,708 65,000 Photography 1,080 - - - 1,000 Wildlife Observation 165,975 4,585 28,748 - 80,000 Dog Walkingnraining - 2,441 30,000 - 1,000 Sightseeing - 8,107 30,000 - - Picnicking 5,000 - 95,000 . - - Other - General 1,200 2,000 - 19,578 -
Adapted from Meiorin eta/., 1991
(Josselyn et al., 1989). As people are encouraged to visit the estuary's wetlands, care must be taken to protect wildlife against excessive disturbance.
Education
Many people are interested in learning more about the estuary's wetlands, and there are several facilities that have educational programs designed to meet this interest. In the Bay area, these include the Hayward Shoreline Interpretive Center in Hayward, Coyote Hills Regional Park in Fremont, Peninsula Conservation Center in Palo Alto, San Francisco Bay National Wildlife Refuge in Fremont, Richardson Bay Audubon Sanctuary and Park in Tiburon, and the Army Corps of Engineers' Bay Model in Sausalito.
Wetland Distribution
In 1985, the U.S. Fish and Wildlife Service began to map the Baypelta estuary's wetlands as part of its National Wetlands Inventory program. Using color infrared aerial photography, wetlands were categorized according to the Service's wetlands classification system and plotted on U.S. Geological Survey 7.5-minute quadrangle sheets. By 1990, the Service had mapped nearly all of the Bay and Delta wetlands.
Figures 37 and 38 (full-color maps, following page 270) show the cur- rent distribution of the estuary's wetlands. They indicate that the wetlands are not evenly distributed, but occur mainly in four areas: South Bay, San Pablo Bay, Suisun Marsh, and the Delta. Within each area, a different wetland type predominates. In South Bay, for example, mudflats and salt ponds account for nearly three-quarters of the wetlands. In San Pablo Bay and in the Delta, farmed

wetlands are most common. In Suisun Marsh, two-thirds of the wetlands are diked. Table 10 summarizes wetland acreages in the estuary basin.
Wetland Loss and Conversion
Looking at the estuary from our homes, offices, and automobiles, it is difficult to imagine the extent to which its wetlands have been lost or modified. Much of San Francisco's financial district was once a tidal marsh; in the late 1800s, land specula- tors sold lots in the marsh even before it was filled. The waterfronts of Berkeley and Oakland, as well as the Delta's farmland, also were developed on marshes. Throughout the estuary basin, human activities have destroyed or modified valuable wetlands. The wetlands that remain, as rich and productive as they are, represent only a remnant of what once was an unimaginably vast resource (Figure 39).
The loss of the estuary's wetlands began shortly after California became a state. Losses were greatest in the Delta, where land reclamation drained thou- sands of acres of freshwater marshes. By 1900, levees isolated more than 90 percent of the Delta's wetlands from tidal influence. By 1930, with reclamation essentially complete, 320,000 acres of the Delta's historic 345,000 acres of tidal marshes were converted to farmland (USACE, 1979; Atwater, 1982). By 1985, only about 8,200 acres of tidal marshes remained in the Delta, as did just a remnant of the thousands of acres of riparian forest that had bordered the Delta's tribu- tary watercourses.
During the past 140 years, the Bay area also has experienced extensive wetland conversion and losses. The major activities responsible for most of these changes have been farming, salt production, and urbanization. The diking and draining of tidal wetlands adjacent to the Bay for farming purposes began after the Gold Rush. Today, most of the agriculture in the Bay area occurs on these diked historic baylands.
Table 10 The Estuary's Wetland and Open Water Habitats (acres)
S. F. Bay* Suisun Bay Delta Total
Mudflats & Rocky Shore 57,776 5,994 322 64,092 Tidal Marshes 25,466 10,682 8,223 44,371 Seasonal Wetlands
-Farmed Wetlands 27,344 8,064 350,347 385,755 -Other Seasonal Wetlands 21,150 47,482 16,502 85,134
Riparian Forests 2,322 403 9,788 12,513 Salt Ponds 36,603 27 54 36,684
TOTAL WETLANDS 170,661 72,652 385,236 628,549 Perennial Lakes & Ponds 13,361 3,526 12,482 29,369 Open Water 192,109 28,247 45,802 266,158
Total Wetlands & Open Water 376,131 104,425 443,520 924,076
'includes SouthICentral Bay & San Pablo Bay
Adapted from Meiorin et al., 1991

102 State of the Estuary
Figure 39 Historic Changes in Tidal Marshes of San Francisco Bay and Delta
The commercial production of salt in the Bay began in the late 1850s. By the turn of the century, extensive wetland areas were diked off to produce salt in evaporation ponds. By the 1930s, more than one-half of South Bay's historic tidal wetlands had been converted to salt ponds and associated facilities. In the early 1950s, nearly 11,000 additional acres of once-tidal diked wetlands adja- cent to San Pablo Bay were put into production. Today, there are 36,630 acres of salt ponds in the San Francisco Bay system. Although salt ponds provide excellent habitat for some species, their capability to support a highly diverse biota is lower than the tidal marshes they replaced.
From Williams, 1988, after Nichols et al., 1986
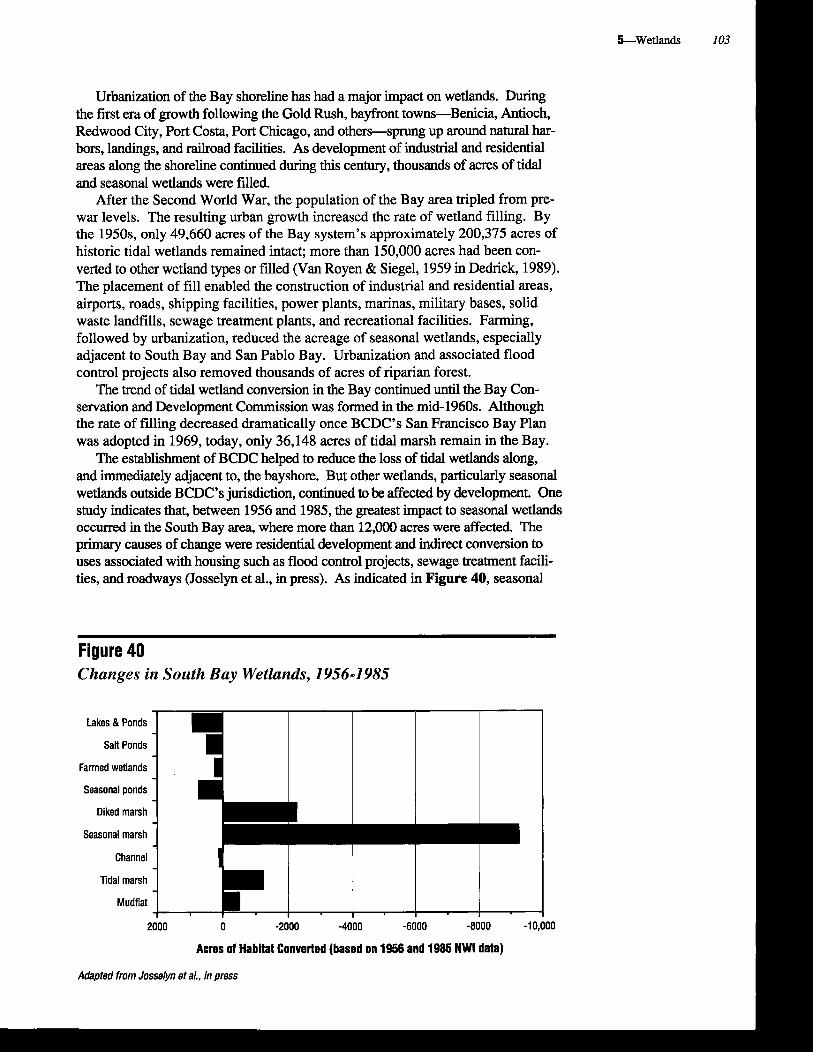
L W e t l a n d s 103
Urbanization of the Bay shoreline has had a major impact on wetlands. During the first era of growth following the Gold Rush, bayfront towns-Benicia, Antioch, Redwood City, Port Costa, Port Chicago, and others-sprung up around natural har- bors, landings, and railroad facilities. As development of industrial and residential areas along the shoreline continued during this century, thousands of acres of tidal and seasonal wetlands were filled.
After the Second World War, the population of the Bay area tripled from pre- war levels. The resulting urban growth increased the rate of wetland filling. By the 1950s, only 49,660 acres of the Bay system's approximately 200,375 acres of historic tidal wetlands remained intact; more than 150,000 acres had been con- verted to other wetland types or filled (Van Royen & Siegel, 1959 in Dedrick, 1989). The placement of fill enabled the construction of industrial and residential areas, airports, roads, shipping facilities, power plants, marinas, military bases, solid waste landfills, sewage treatment plants, and recreational facilities. Farming, followed by urbanization, reduced the acreage of seasonal wetlands, especially adjacent to South Bay and San Pablo Bay. Urbanization and associated flood control projects also removed thousands of acres of riparian forest.
The trend of tidal wetland conversion in the Bay continued until the Bay Con- servation and Development Commission was formed in the mid-1960s. Although the rate of filling decreased dramatically once BCDC's San Francisco Bay Plan was adopted in 1969, today, only 36,148 acres of tidal marsh remain in the Bay.
The establishment of BCDC helped to reduce the loss of tidal wetlands along, and immediately adjacent to, the bayshore. But other wetlands, particularly seasonal wetlands outside BCDC's jurisdiction, continued to be affected by development. One study indicates that, between 1956 and 1985, the greatest impact to seasonal wetlands occurred in the South Bay area, where more than 12,000 acres were affected. The primary causes of change were residential development and indirect conversion to uses associated with housing such as flood control projects, sewage treatment facili- ties, and roadways (Josselyn et al., in press). As indicated in Figure 40, seasonal
Figure 40 Changes in South Bay Wetlands, 1956-1985
Lakes & Ponds
Salt Ponds
Farmed wetlands
Seasonal ponds
Diked marsh
Seasonal marsh
Channel
Tidal marsh
Mudflat
2000 0 -2000 -4000 -6000 -8000 -1 0,000
Acres of Habitat Converted (based on 1956 and 1985 NWI data)
Adapted from Josselyn eta/., in press
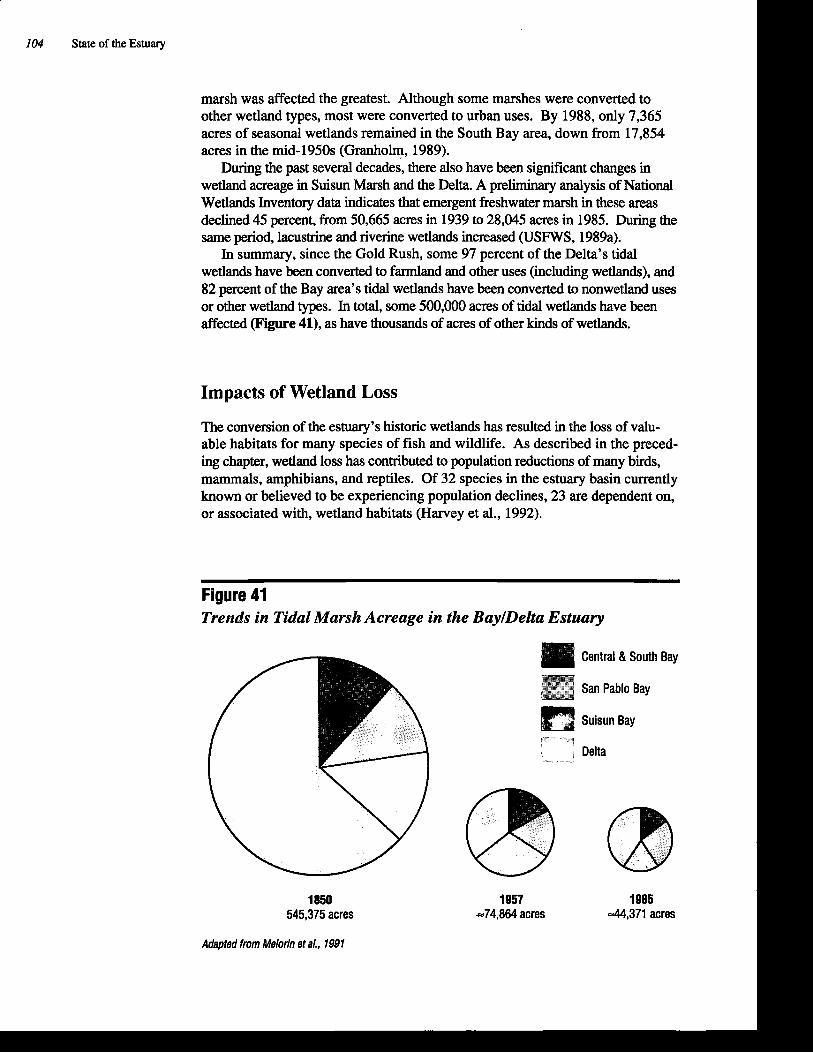
1 104 State of the Estuary
marsh was affected the greatest. Although some marshes were converted to other wetland types, most were converted to urban uses. By 1988, only 7,365 acres of seasonal wetlands remained in the South Bay area, down from 17,854 acres in the mid- 1950s (Granhoh, 1989).
During the past several decades, there also have been significant changes in wetland acreage in Suisun Marsh and the Delta. A prehmmry analysis of National Wetlands Inventory data indicates that emergent freshwater marsh in these areas declined 45 percent, from 50,665 acres in 1939 to 28,045 acres in 1985. During the same period, lacustrine and riverine wetlands increased (USFWS, 1989a).
In summary, since the Gold Rush, some 97 percent of the Delta's tidal wetlands have been converted to farmland and other uses (including wetlands), and 82 percent of the Bay area's tidal wetlands have been converted to nonwetland uses or other wetland types. In total, some 500,000 acres of tidal wetlands have been affected ( F i e 41), as have thousands of acres of other kinds of wetlands.
Impacts of Wetland Loss
The conversion of the estuary's historic wetlands has resulted in the loss of valu- able habitats for many species of fish and wildlife. As described in the preced- ing chapter, wetland loss has contributed to population reductions of many birds, mammals, amphibians, and reptiles. Of 32 species in the estuary basin currently known or believed to be experiencing population declines, 23 are dependent on, or associated with, wetland habitats (Harvey et al., 1992).
Figure 41 Trends in Tidal Marsh Acreage in the BaylDelta Estuary
1850 545,375 acres
Central 81 South Bay
I--- 7 , Delta 1 -
1957 1985 -74,864 acres 4 , 3 7 1 acres
Adapted from Meiorin et aL, 1991
The loss of wetlands affects the estuary in other ways. It diminishes the amount of energy available to the estuarine food web, decreases wetland-related flood control and water quality improvement benefits, and reduces open space. Wetland loss also lowers the estuary's scenic values.
During the past three decades, wetland losses have slowed considerably, but they have not stopped. Given current development plans, future losses may be expected, primarily as a result of urban expansion.
As indicated in Chapter 3, urban expansion is projected to continue through- out the estuary basin well into the next century. Although most of it will occur upstream of Carquinez Strait, there will be considerable development around much of San Francisco Bay as well. Based on proposals for highways, airports, and residential housing, and on the long-term general plans of local govern- ments, substantial future wetland degradation and alteration will likely occur.
High way Projects
Highway construction has filled hundreds of acres of wetlands along the edge of the Bay. The Bay Conservation and Development Commission anticipates that highway construction could place fill on an additional 362 acres of wetlands in its jurisdiction during the next 25 years (BCDC, 1989). The proposed widening of Highway 37 near the edge of San Pablo Bay and the construction of Route 61 in South Bay (parallel to 1-880) are the two projects with the greatest potential for wet- land impacts. A South Bay crossing also would result in wetland loss. In addition, many small roadway extensions and realignments will affect small wetlands.
Airports
Several Bay area airports have begun, or are planning, to expand their facilities. Some of this expansion will require placement of fill in wetlands. The largest wetland-related expansion would occur at the Oakland International Airport. The Oakland Board of Port Commissioners (the airport is part of the Port), currently updating the Airport Master Plan, is evaluating options for runway expansion and other facility construction. Depending on the final option selected, expansion would impact 58 to 135 acres of wetland. In addition, up to 387 acres of Bay could be filled. An Environmental Impact Statement will be issued for any proposed project (L. Meyer, pers. cornm.). Impacts associated with such a project would be in addition to those resulting from the construction of a distribution center that was permitted in 1986, but not built because of legal challenge.
In 1989, Marin County adopted the Gnoss Field Master Plan. The plan includes the expansion of an existing runway at Gnoss Field and also the con- struction of a new runway. These projects could result in the loss of at least 40 acres of salt marsh.
San Francisco International Airport is planning to construct a new interna- tional terminal, parking lots, and other facilities on existing land within the airport boundaries. This would not require filling wetlands. In response to local
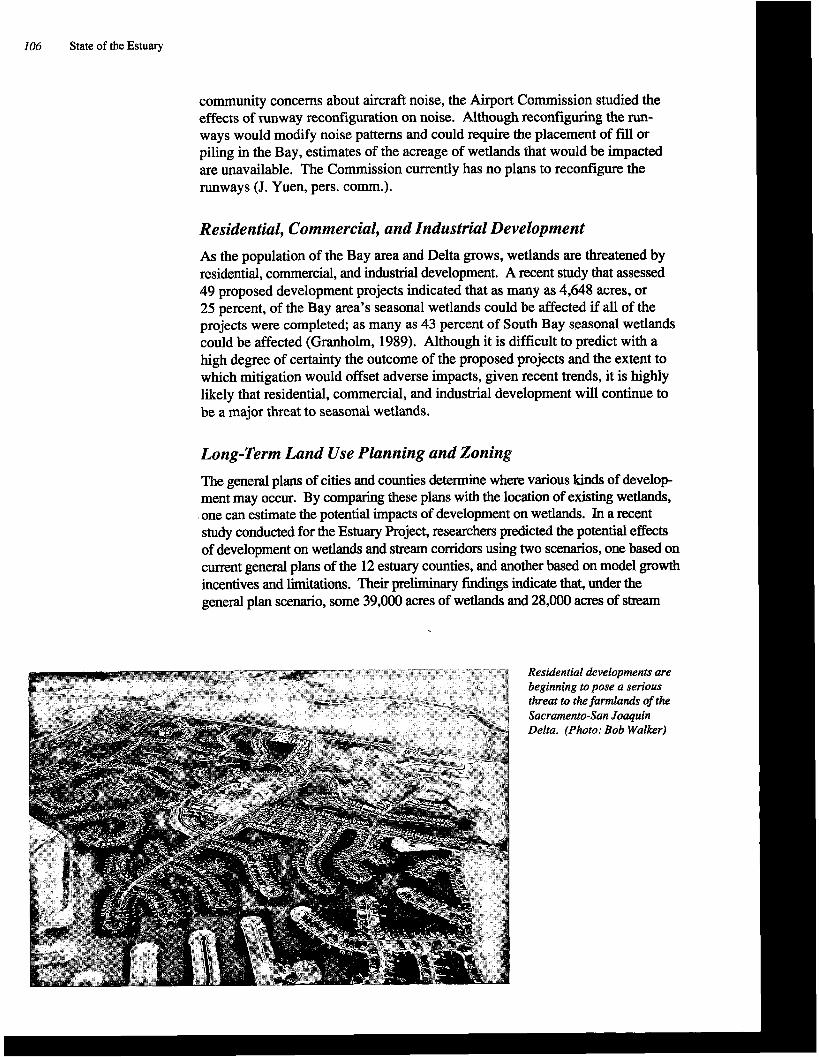
community concerns about aircraft noise, the Airport Commission studied the effects of runway reconfiguration on noise. Although reconfiguring the run- ways would modify noise patterns and could require the placement of fill or piling in the Bay, estimates of the acreage of wetlands that would be impacted are unavailable. The Commission currently has no plans to reconfigure the runways (J. Yuen, pers. comm.).
Residential, Commercial, and Zndustrial Development
As the population of the Bay area and Delta grows, wetlands are threatened by residential, commercial, and industrial development. A recent study that assessed 49 proposed development projects indicated that as many as 4,648 acres, or 25 percent, of the Bay area's seasonal wetlands could be affected if all of the projects were completed; as many as 43 percent of South Bay seasonal wetlands could be affected (Granholm, 1989). Although it is difficult to predict with a high degree of certainty the outcome of the proposed projects and the extent to which mitigation would offset adverse impacts, given recent trends, it is highly likely that residential, commercial, and industrial development will continue to
The general plans of cities and counties determine where various kinds of develop- ment may occur. By comparing these plans with the location of existing wetlands, one can estimate the potential impacts of development on wetlands. In a recent study conducted for the Estuary Project, researchers predicted the potential effects of development on wetlands and stream corridors using two scenarios, one based on current general plans of the 12 estuary counties, and another based on model growth incentives and limitations. Their prelirmnary findings indicate that, under the general dan scenario, some 39,000 acres of wetlands and 28,000 acres of stream
Residential datelo~ments are I
Sacramento-San Joaquin Delta. (Photo: Bob Walker)

corridor could eventually be affected by development. Although developers would be required to compensate for unavoidable adverse impacts, thus reducing actual losses, it is important to understand that this is the direction in which current land- use plans are headed. Based on a more realistic scenario incorporating model growth incentives and limitations, development could impact about 3,500 acres of wetlands and 10,000 acres of stream corridor (Blanchfield et al., 1991).
Although the study did not attempt to predict exactly where wetland losses would occur, it identified several areas of particular concern: farmed wetlands in the Delta and in North Bay; and diked vegetated wetlands in Suisun Bay, on the west side of San Pablo Bay, and in the greater Santa ClaraISan Jose area. Areas with the highest potential for impacts to stream corridors include Sacramento, Hayward, Dublin, Livermore Valley, San Jose, Concord, and Fairfield. The researchers also noted that, while these areas may have the highest potential to be affected by development, virtually every watershed in the estuary basin has wetlands and stream corridors that will be lost as development continues.
Protected Wetlands
There are many acres of wetlands in the estuary basin protected by government and private entities. Most of these wetlands are in parks, recreational areas, wildlife refuges, and preserves. According to the U.S. Fish and Wildlife Service, in 1989, there were 62,740 acres of wetlands and openwater habitats protected in San Francisco and Sati Pablo bays (USFWS, 1989b). Today, as a result of recent public acquisitions, more than 66,440 acres of wetlands are protected in these areas. In Suisun Bay, more than 55,000 acres of tidal and seasonal marshes are protected under the Suisun Marsh Protection Plan. In the Delta, valuable wetlands are protected in county and state parks, recreational areas, wildlife management areas, and private preserves. In total, at least 121,440 acres of wetlands are protected within the estuary basin.
Wetland Acquisition, Restoration, and Enhancement
Seeking to protect additional wetlands and to improve habitat values, several public and private entities are stepping up their programs of wetlands acquisition, restoration, and enhancement. Although the specific goals, strategies, and activ- ities of each of these entities differ somewhat, their overall aim is to ensure the permanent protection of the estuary's most valuable wetlands and to enhance wetland habitat values. Representative entities involved in this effort include:
East Bay Regional Park District
Hayward Area Recreation and Park District
Solano County Farmlands and Open Space Foundation
Suisun Marsh Conservation District
California Department of Fish and Game
California Department of Parks and Recreation
State Coastal Conservancy
State Lands Commission
National Park Service
U.S. Fish and Wildlife Service

108 State of the Estuary
Audubon Society
California Waterfowl Association
Ducks Unlimited
The Nature Conservancy
Trust for Public Land
Examples of local involvement in wetlands acquisition and enhancement in- clude activities by the East Bay Regional Park District, which is improving wet- lands in several shoreline parks and acquiring additional areas. The Hayward Area Recreation and Park District has restored tidal action to former salt ponds north of the San Mateo Bridge and is seeking to further improve habitat values there. In the Suisun Marsh area, the Solano County Farmlands and Open Space Founda- tion recently opened its first acquisition, Rush Ranch, to the public. This 2,070- acre site, previously a cattle ranch, is adjacent to Suisun Slough and supports about 1,200 acres of wetlands (N. Havlik, pers. comm.). There, as throughout the rest of Suisun Marsh, the Suisun Marsh Conservation District will be involved in enhancing habitat values.
Exemplifying the State's intent to increase the acreage of permanently protected wetlands, the California Department of Fish and Game, as mandated by Senate Concurrent Resolution 28, is required to develop a plan to protect, preserve, restore, acquire, and manage wetlands in order to increase the State's wetlands by 50 percent by the year 2000. To help meet this goal, DFG has acquired some 1,500 acres in the Napa marsh and additional acreage in the Petaluma marsh; wetland restoration and enhancement efforts are ongoing and additional acquisi- tions are planned (J, Swanson, pers. comm.). In Suisun Marsh, DFG recently acquired 525 acres and is currently improving habitat values there, as well as on the other portions of wetlands it manages in the marsh. In the Delta, DFG has established the Woodbridge Ecological Area and is managing the 400-acre site to maximize habitat values for waterfowl and other migratory waterbirds.
Other state efforts to acquire and enhance wetlands include the West Delta Water Management Program, in which the Department of Water Resources plans to purchase the 10,000-acre Sherman Island in the western Delta and, among other objectives, maximize its wildlife habitat values (DWR, 1988b). The Department of Parks and Recreation is pursuing acquisition and enhancement at several sites throughout the estuary basin. The State Coastal Conservancy has been instrumental in many of the most important wetland acquisition and enhancement projects in the Bay, including Rush and Cullinan ranches. (In 1988, the Estuary Project helped the Coastal Conservancy fund several wetlands projects.) The State Lands Commis- sion recently stepped up its efforts to protect the Delta's valuable resources, includ- ing wetlands (CSLC, 1991).
At the federal level, the U.S. Fish and Wildlife Service has prepared a Concept Plan for Wate~owl Habitat Protection in Sun Francisco Bay (USFWS, 1989b). The plan identifies important wetland areas and proposes their protec- tion, enhancement, and expansion. These areas, listed in Table 11, include many kinds of wetlands and total 51,291 acres in North Bay and 22,398 acres in South Bay. The Concept Plan suggests that these and other important wetland areas be preserved and enhanced by the Fish and Wildlife Service, California Department of Fish and Game, and private conservation organizations. A similar plan, developed earlier for the Central Valley, identifies lands in the Delta that should receive special protection (USFWS, 1978).
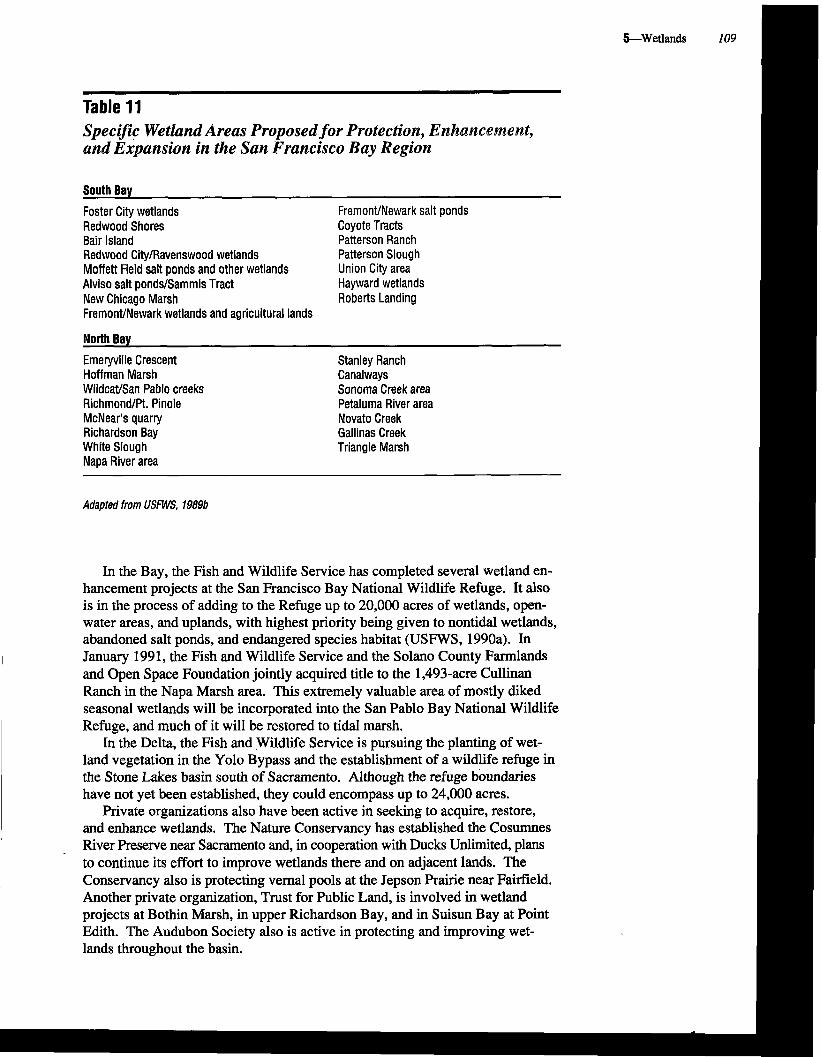
Table 11 Specific Wetland Areas Proposed for Protection, Enhancement, and Expansion in the San Francisco Bay Region
South Bay
Foster City wetlands Fremonff Newark salt ponds Redwood Shores Coyote Tracts Bair Island Patterson Ranch Redwood CityIRavenswood wetlands Patterson Slough Moffett Field salt ponds and other wetlands Union City area Alviso salt ponds1Samrnis Tract Hayward wetlands New Chicago Marsh Roberts Landing FrernontINewark wetlands and agricultural lands
North Bay
Erneryville Crescent Stanley Ranch Hoffman Marsh Canalways WildcaffSan Pablo creeks Sonorna Creek area RichmondIPt. Pinole Petalurna River area McNear's quarry Novato Creek Richardson Bay Gallinas Creek White Slough Triangle Marsh Napa River area
Adapted from USFWS, 1989b
In the Bay, the Fish and Wildlife Service has completed several wetland en- hancement projects at the San Francisco Bay National Wildlife Refuge. It also is in the process of adding to the Refuge up to 20,000 acres of wetlands, open- water areas, and uplands, with highest priority being given to nontidal wetlands, abandoned salt ponds, and endangered species habitat (USFWS, 1990a). In January 1991, the Fish and Wildlife Service and the Solano County Farmlands and Open Space Foundation jointly acquired title to the 1,493-acre Cullinan Ranch in the Napa Marsh area. This extremely valuable area of mostly diked seasonal wetlands will be incorporated into the San Pablo Bay National Wildlife Refuge, and much of it will be restored to tidal marsh.
In the Delta, the Fish and Wildlife Service is pursuing the planting of wet- land vegetation in the Yolo Bypass and the establishment of a wildlife refuge in the Stone Lakes basin south of Sacramento. Although the refuge boundaries have not yet been established, they could encompass up to 24,000 acres.
Private organizations also have been active in seeking to acquire, restore, and enhance wetlands. The Nature Conservancy has established the Cosumnes River Preserve near Sacramento and, in cooperation with Ducks Unlimited, plans to continue its effort to improve wetlands there and on adjacent lands. The Conservancy also is protecting vernal pools at the Jepson Prairie near Fairfield. Another private organization, Trust for Public Land, is involved in wetland projects at Bothin Marsh, in upper Richardson Bay, and in Suisun Bay at Point Edith. The Audubon Society also is active in protecting and improving wet- lands throughout the basin.
110 State of the Estuary
Public and private programs are crucial to the protection and improvement of the estuary's wetlands. The extent to which existing and future programs are successful will depend to a large extent on public sentiment and the entities' abilities to secure adequate funding for acquisition and management. Successful programs also will depend on open communication and close cooperation with neighboring land owners, local planners, regulatory agencies and elected officials.
Summary
Wetlands are one of the estuary's most valuable assets. They provide many benefits including food-web support, habitat for fish and wildlife, flood protec- tion, water quality improvement, and erosion control. They also provide valu- able open space and a variety of recreational opportunities.
Human development of the estuary basin has resulted in the loss or conver- sion of more than 500,000 acres of tidal wetlands. In the Delta, 97 percent of the 345,000 acres of historic freshwater wetlands have been converted to other uses, mostly farms. In the Bay area, 82 percent of the approximately 200,000 acres of historic tidal salt and brackish wetlands have been converted to other wetland types, particularly salt ponds, and to non-wetland uses. Development also has adversely affected non-tidal wetlands, particularly riparian forest and seasonal wetlands. Although wetland loss has slowed substantially since the early 1970s, it continues.
The major human-induced threats to the Bay's remaining wetlands in@ude highway construction, airport expansion, and other shoreline development. Away from the immediate Bay margin, residential, commercial, and industrial devel- opment (including associated flood control and transportation projects) threaten seasonal wetlands and riparian corridors. On rural lands, particularly in the counties experiencing high growth rates, wetlands face urban expansion.
Although many of the estuary's wetlands have been adversely affected by de- velopment, a sizable acreage is now protected in parks, refuges, and preserves. In the Bay and Delta, more than 121,000 acres of wetlands curzently are safeguarded by public and private entities through ownership, leases, and easements. This represents about 19 percent of the estuary's remaining wetlands. Efforts to place in public ownership wetlands threatened with development will likely occur throughout the basin during the next few decades.
Given the importance of wetlands and the extent to which they have been lost or modified, it is imperative that local, state, and federal entities develop policies and programs to protect and enhance the estuary's remaining wetlands and to increase wetland acreage and diversity throughout the region.
Freshwater Diversion and Altered Flow Regime
Fresh water has played an especia~y crucial role in the settlement and develop- ment of the western United States. In the basically arid climate that characterizes much of the West, water has a pervasive influence on human life. Its availability afSects the locations of cities and industries, agricultural patterns, and even recre- ational opportunities. In short, flesh water determines where people live, work, and play. It also is a key factor in maintaining many of the most productive ecosys- tems, including that of the BaylDelta estuary.
In California, water resources development has been an economic and highly political issue ever since the first farms and towns were established more than 140 years ago. During the past decade, as both the demand for water and an awareness of the ejjiects of water resources development have grown, the debate over how best to manage flesh water has been especially lively. With the State currently facing a sixth consecutive year of water shortage, many Californians have a heightened apprecia- tion of water resources. Many also recognize a need to improve local, state, and federal water policies in order to b a r baEance the competing uses m e s h wwater.
About 70 percent of the State's available water supply is carried by northern California rivers and streams. Some 80 percent of the present demand for water is in the Sun Joaquin Valley and south of the Tehachapi Mountains. As the link between most of the State's water supply and most of its demand, the BaylDelta estuary has been adversely afected in many ways by water development.
This chapter traces water resource development in the Central Valley water- shed and describes how this development has altered the timing and volume of the estuary's freshwater flows. It also describes the impacts of those alterations on the estuary's water quality and biological resources. Unlike most of the other chapters in this report, this one is not based on a single technical document pre- pared by the Estuary Project. Instead, it draws on reports submitted in 1987 to the State Water Resources Control Board during the first phase of the Water Quality1 Water Rights Proceeding on the Sun Francisco BaylSacramento-Sun Joaquin Delta, and on other pem'nent sources.
During the process of characterizing the freshwater flow issue, the following points have emerged:
1. Fresh water strongly influences environmental conditions in the estuary. It also supports many other uses including water for agriculture, municipalities, and industry. Some 20 million Californians, or two-thirds of the State's population, rely on the estuary's freshwater supply as a primary source of drinking water.
112 State of the Estuary
2. Ninety percent of the estuary's fresh water originates in the Central Valley watershed. The Sacramento River provides about 80 percent of this flow, and the San Joaquin River and other streams contribute the remainder.
3. The total annual volume of fresh water reaching the estuary is highly vari- able, primarily a result of variable precipitation patterns. During the past 70 years, annual inflow has ranged from more than 50 million acre-feet (MAF) to less than eight MAF and has averaged about 24 MAF.
4. Beginning in the 1850s' flood control projects and storage and diversions for agriculture began to influence the timing and volume of the estuary's fresh- water flows. By the late 1970s, diversions for a variety of purposes reduced the annual volume of water entering San Francisco Bay by more than one- half in some years.
5. Reservoirs in the Central Valley are capable of storing about 27 MAF of fresh water. This is some three MAF more than the estuary's average annual inflow since the 1920s.
6. At the current level of development, more than 16 MAF of fresh water are diverted from the estuary's supply. Of this volume, more than 9 MAF are diverted upstream of the Delta, and about 7 MAF are diverted from the Delta for local use and export.
7. Water storage and diversions are operated by private entities, local munici- palities, and the federal and state governments. The federal Central Valley Project and the State Water Project are by far the two largest diverters, together removing nearly 10 MAF of water from the estuary's freshwater supply. Eighty-five percent of this water is used by agriculture, and 15 percent goes to municipal, industrial, and other uses.
8. Water storage and diversions affect the seasonal flow of fresh water into the estuary. At the present level of development, they reduce flow into the Bay in al l seasons except late summer and early fall. The effects of diversions and storage on seasonal flow are greatest in the spring.
9. Diversions and altered flow regime affect the estuary's circulation and water quality, habitat conditions for wildlife, production and abundance of phyto- plankton, and the survival of eggs and young of many fish species including salmon, striped bass, and others. The effects of diversions and altered flow regime are greatest during dry and critically dry years.
10. Construction of local water development projects and the completion of the State Water Project are expected to increase annual diversions from the estuary's water supply by at least 1.1 MAl?. Additional local projects, State Water Project intermittent Delta exports, and the ultimate operations of the federal Central Valley Project could increase future diversions even further.
11. The current drought, existing environmental problems in the estuary and its tributaries, and planned water projects have led many Californians to take a more active interest in water issues. With environmental groups, urban water suppliers, and farmers seeking ways to improve existing water management, and the State Water Resources Control Board and federal Environmental Protection Agency anticipating regulatory actions, the next few years may bring significant changes in statewide water policy.
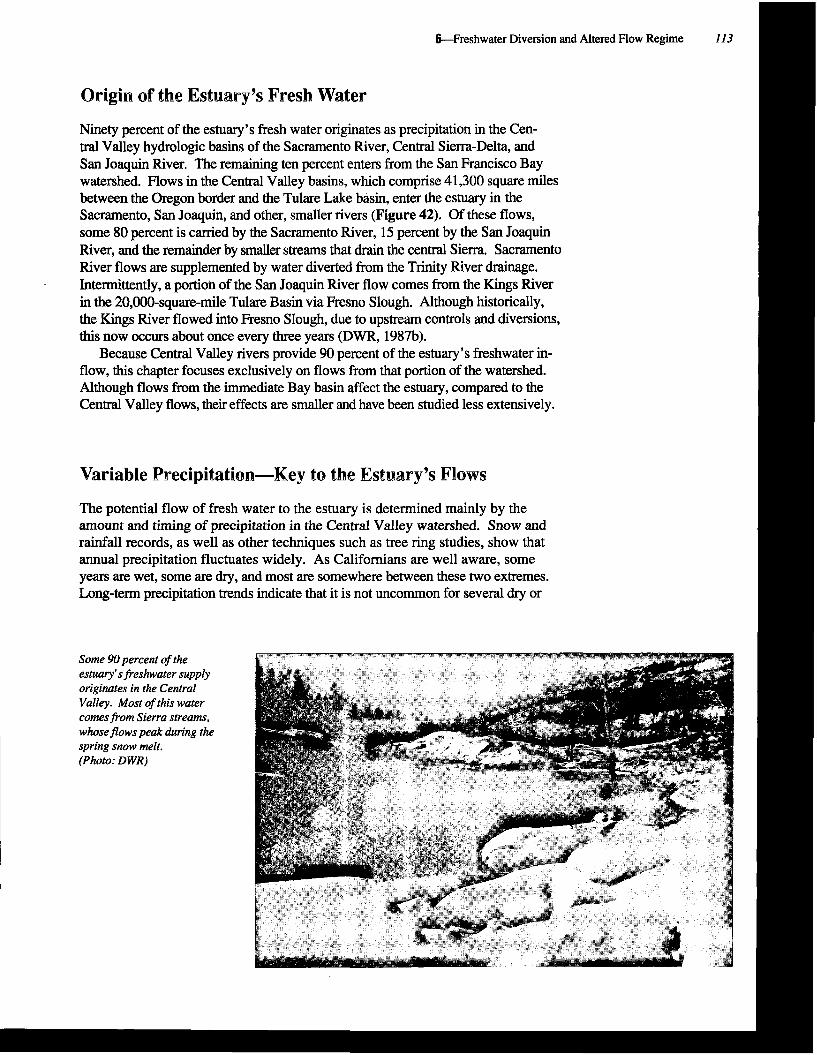
Origin of the Estuary's Fresh Water
Ninety percent of the estuary's fresh water originates as precipitation in the Cen- tral Valley hydrologic basins of the Sacramento River, Central Sierra-Delta, and San Joaquin River. The remaining ten percent enters from the San Francisco Bay watershed. Flows in the Central Valley basins, which comprise 41,300 square miles between the Oregon border and the Tulare Lake basin, enter the estuary in the Sacramento, San Joaquin, and other, smaller rivers (Figure 42). Of these flows, some 80 percent is carried by the Sacramento River, 15 percent by the San Joaquin River, and the remainder by smaller streams that drain the central Sierra. Sacramento River flows are supplemented by water diverted from the Trinity River drainage. Intermittently, a portion of the San Joaquin River flow comes from the Kings River in the 20,000-square-mile Tulare Basin via Fresno Slough. Although historically, the Kings River flowed into Fresno Slough, due to upstream controls and diversions, this now occurs about once every three years @WR, 1987b).
Because Central Valley rivers provide 90 percent of the estuary's freshwater in- flow, this chapter focuses exclusively on flows from that portion of the watershed. Although flows from the immediate Bay basin affect the estuary, compared to the Central Valley flows, their effects are smaller and have been studied less extensively.
Variable Precipitation-Key to the Estuary's Flows
The potential flow of fresh water to the estuary is determined mainly by the amount and timing of precipitation in the Central Valley watershed. Snow and rainfall records, as well as other techniques such as tree ring studies, show that annual precipitation fluctuates widely. As Californians are well aware, some years are wet, some are dry, and most are somewhere between these two extremes. Long-term precipitation trends indicate that it is not uncommon for several dry or
6--Freshwater Diversion and Altered Flow Regime 113
Some 90 percent of the estuary'sfreshwater supply originates in the Central Valley. Most of this water comes from Sierra streams, whoseflows peak during the spring snow melt. (Photo: DWR)
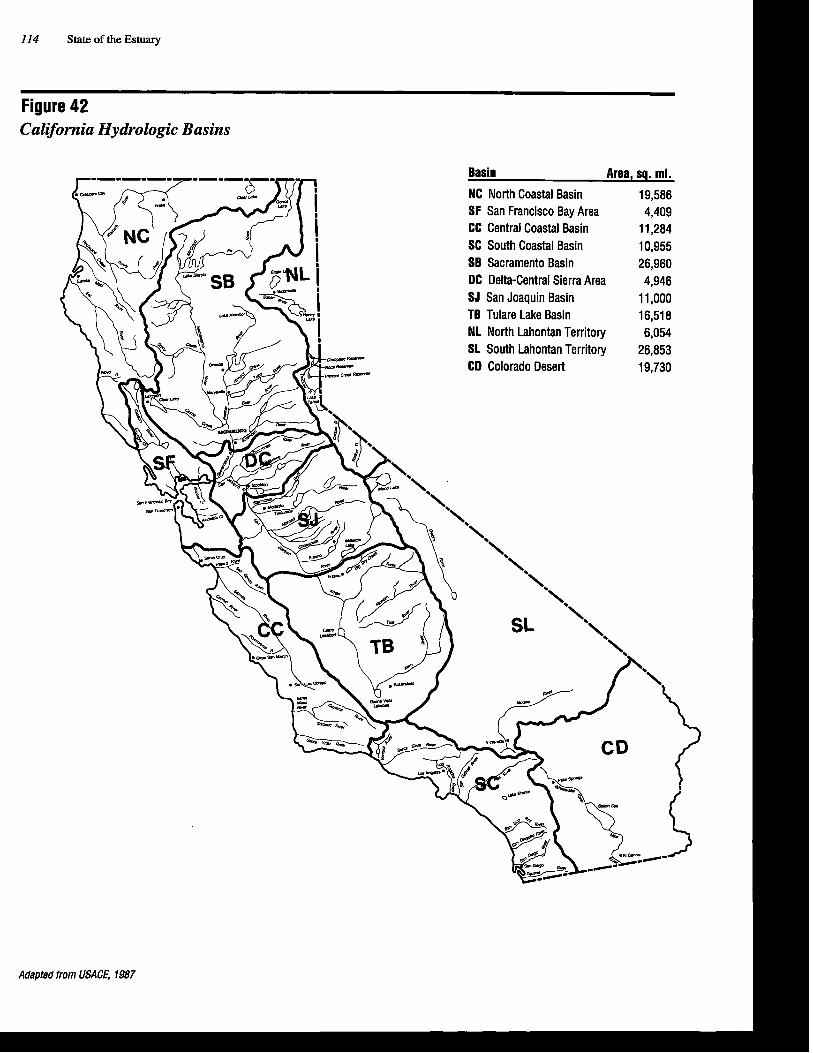
Basin Area, sq. mi.
NC North Coastal Basin 19,586 SF San Francisco Bay Area 4,409 CC Central Coastal Basin 11,284 SC South Coastal Basin 10,955 SB Sacramento Basin 26,960 DC Delta-Central Sierra Area 4,946 SJ San Joaquin Basin 11,000 TB Tulare Lake Basin 16,518 NL North Lahontan Territory 6,054 SL South Lahontan Territory 26,853 CD Colorado Desert 19,730
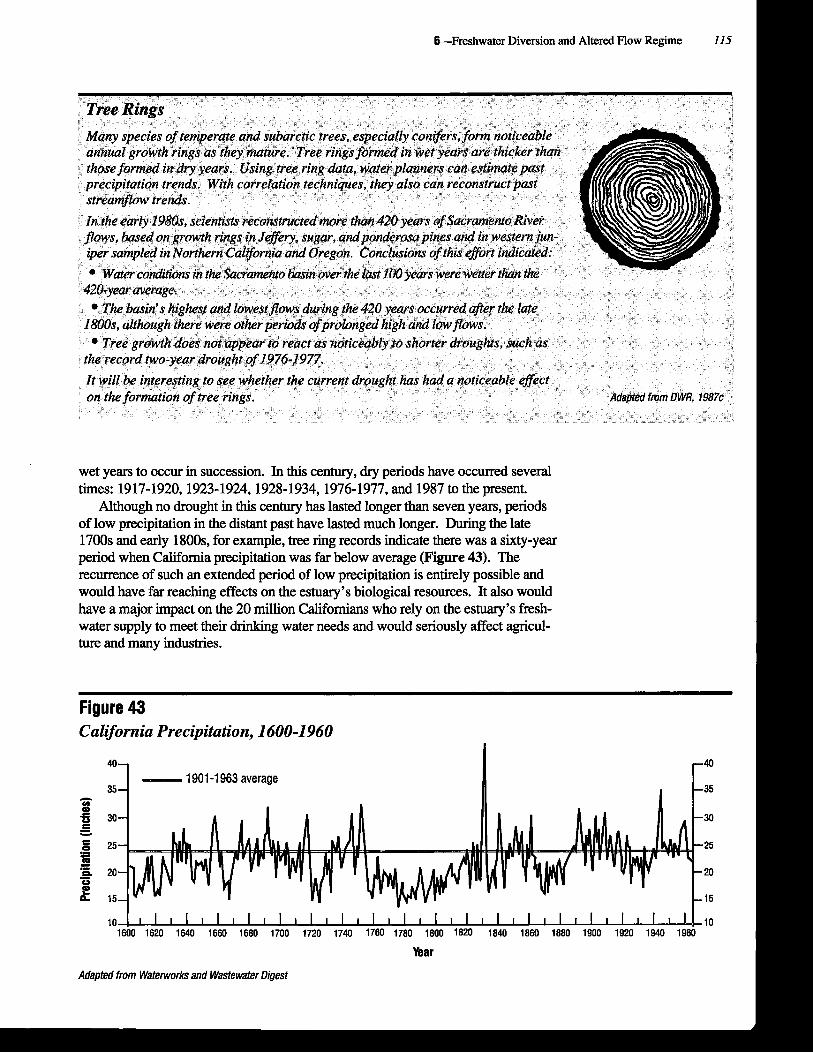
&Freshwater Diversion and Altered Flow Regime 115
wet years to occur in succession. In this century, dry periods have occurred several times: 19 17-1920,1923-1924,1928-1934,1976- 1977, and 1987 to the present.
Although no drought in this century has lasted longer than seven years, periods of low precipitation in the distant past have lasted much longer. During the late 1700s and early 1800s, for example, tree ring records indicate there was a sixty-year
I period when California precipitation was far below average ( F i e 43). The recurrence of such an extended period of low precipitation is entirely possible and would have far reaching effects on the estuary's biological resources. It also would
I have a major impact on the 20 million Californians who rely on the estuary's fresh- I water supply to meet their drinking water needs and would seriously affect agricul-
ture and many industries.
Figure 43 California Precipitation, 1600-1960
40 40 - 1901 -1 963 average 35 35
c. V) aa s u 30 C
30 - - s 25 - 25 L. rn L - n 20 - 20 U E
15 15
10 10 1600 1620 1640 1660 1680 1700 1720 1740 1760 1780 1800 1820 1840 1860 1880 1900 1920 1940 1960
Year
Adapted from Waterworks and Wastewater Digest
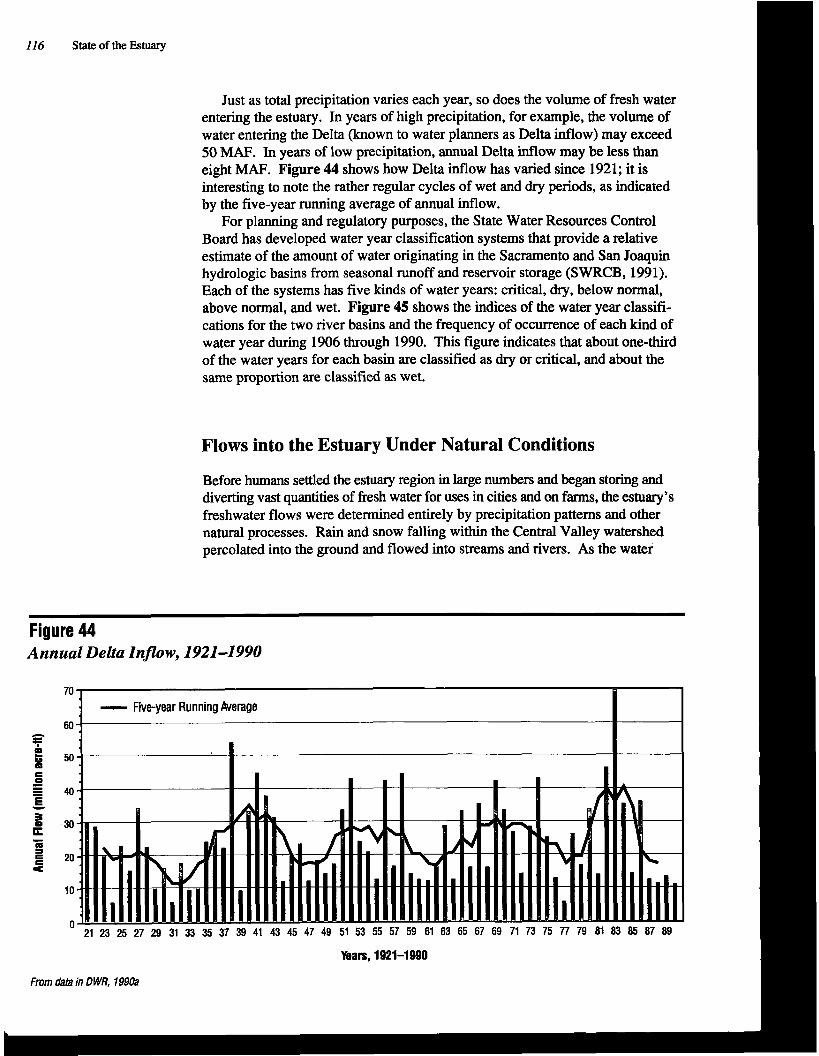
11 6 State of the Estuary
Just as total precipitation varies each year, so does the volume of fresh water entering the estuary. In years of high precipitation, for example, the volume of water entering the Delta (known to water planners as Delta inflow) may exceed 50 MAF. In years of low precipitation, annual Delta inflow may be less than eight MAF. Figure 44 shows how Delta inflow has varied since 1921; it is interesting to note the rather regular cycles of wet and dry periods, as indicated by the five-year running average of annual inflow.
For planning and regulatory purposes, the State Water Resources Control Board has developed water year classification systems that provide a relative estimate of the amount of water originating in the Sacramento and San Joaquin hydrologic basins from seasonal runoff and reservoir storage (SWRCB, 1991). Each of the systems has five kinds of water years: critical, dry, below normal, above normal, and wet. Figure 45 shows the indices of the water year classifi- cations for the two river basins and the frequency of occurrence of each kind of water year during 1906 through 1990. This figure indicates that about one-third of the water years for each basin are classified as dry or critical, and about the same proportion are classified as wet.
Flows into the Estuary Under Natural Conditions
Before humans settled the estuary region in large numbers and began storing and diverting vast quantities of fresh water for uses in cities and on farms, the estuary's freshwater flows were determined entirely by precipitation patterns and other natural processes. Rain and snow falling within the Central Valley watershed percolated into the ground and flowed into streams and rivers. As the water
Figure 44 Annual Delta Inflow, 1921-1990
70
60 c. z : 50 E 0 - - = 40 E - 3 0 30 - Y - m 3
3 20
10
0 21 23 25 27 29 31 33 35 37 39 41 43 45 47 49 51 53 55 57 59 61 63 65 67 69 71 73 75 77 79 81 83 85 87 89
Years, 1921-1990
From data in D WR, 1990a
I

&Freshwater Diversion and Altered How Regime
Figure 45 Sacramento and San Joaquin Basin Water Year Classifcations
Sacramento Basin
9.2 Above
normal 7.8
Below normal
6.5
5.4 Criiical
lndex Million Ac-fl Occurrence of Water Year Types, 1906-1990
San Joaquin Basin
3.3 Above
normal 2.8
Below normal
2.2
1.8 Criiical
lndex Million Ac-fl Occurrence of Water Year Types, 19061990
Adapted from SWRCB, 1991 and San Joaquin River Operations Model
reached the Valley floor, peak flows overtopped the natural riverbank levees and spread out across the landscape into vast stands of tules and other wetland vegeta- tion. Some of the water that flowed into these wetlands was transpired or evapo- rated; the remainder eventually reentered the rivers and flowed into the Delta and the Bay. The conversion of Central Valley marshes to farmland and the associated construction of flood control levees vastly altered the hydrologic characteristics of the drainage (Fox et al., 1990).
Under natural conditions in an average year, flows increased in late fall as rains swelled streams and rivers. They continued to increase throughout the winter and peaked in the spring when warm temperatures melted the Sierra snowpack. After the spring snow melt, flows declined to low levels until the fall. Many of the
I18 State of the Estuary
How Water is Measured Quantities andflav rates of large volumes of water, as Francisco Bay is about five million acre-feet, or that in streams, rivers, and lakes, are measured in special the volume offresh water exportedfrom the Delta in units. The U.S. customary unit most commonly used to each of the past several years has been between five describe water quantity is the acre-foot, An acre-foot and six MAF. is the volume of water it takes to cover one acre to a depth of 12 inches, or about 326,000 gallons. One acre-foot often is described as the volume offiesh water used by a household offive in a year, although the actual volume consumed varies considerably, depending on location and water conservation pmc- tices. One thousand acre-feet is abbreviated one TAF and one million acre-feet tk one MAF. To put one MAF
Water flow is most commonly measured as cubic feet per second. Because the volume of a cubic foot is equal to about 75 gallons, a flow of one cubic foot per second (cfs) wouldfill a sixty-gallon bathtub in about eight seconds. During winter, the average freshwater flow fiom the Delta to the Bay is about 35,000 cfs; during summer, it averages about 14,000 cfs.
into perspective, remember that the volume of Sun
estuary's native species of fish and other aquatic and wildlife resources are adapted to an ecosystem characterized by this high seasonal variation in freshwater flows.
One of the most important aspects of the natural flow pattern was the large volume of water that entered the estuary in the winter and spring. These flows repelled sea salts from the Delta, ensuring appropriate water quality for fresh- water wetlands. They washed nutrients into estuarine waters, encouraging growth of the microscopic plants and animals at the bottom of the food web. They also enabled fish to migrate, spawn, and rear successfully.
No one knows for certain the total volume of fresh water that entered the estuary in an average year under natural conditions. Some believe that annual Delta inflow was much lower than it has been since the early part of this century, in part because of the extensive stands of marsh and riparian vegetation that trans- pired large volumes of water; as the trees were cut and marshes drained in the late 1800s, flows to the estuary increased (SWC, 1987). Although this theory is not universally accepted, it certainly has stimulated discussions regarding the role of flows in determining estuarine productivity. In this regard, it is impor- tant to note that the seasonal distribution of flows plays a much greater role in determining estuarine biological productivity than does the total annual volume.
Although there is no way to know how much fresh water entered the estuary in the distant past, based on precipitation records, maps of native vegetation, and hydrologic models, the average annual volume possibly ranged between 19 and 29 MAF (DWR, 1987b; SWC, 1987).
Water Project Development
Early Developments
The estuary's freshwater flows began to be modified shortly after the Gold Rush, as miners in the northern Sierra diverted streams to supply the giant water cannons used in hydraulic mining. By 1867, there were more than 300 systems operating a total of some 6,000 miles of mining flumes and pipelines and storing nearly
I ~
&-Freshwater Diversion and Altered Flow Regime 119
150,000 acre-feet of water. Most of the water diverted for mining purposes was returned to streams, albeit carrying large quantities of sediment. Some systems also supplied water for the irrigation of nearby farms (DPW, 1931).
As agriculture took root in the Central Valley, farmers began diverting signifi- cant volumes of water from streams and rivers to irrigate crops. The first major agricultural irrigation ditch in the San Joaquin Valley was constructed in 1852 along the Merced River (DPW, 1931). North of the Delta, the first major irrigation work was a ditch constructed in 1856 on Cache Creek near the town of Woodland; by the early 1870s, it served some 15,000 acres of Capay Valley farmland (Pisani, 1984).
Following the drought of 1864 and the subsequent influx of farmers, other irrigation projects were constructed during the irrigation boom of the 1870s and 1880s. By 1878, there were some 200,000 acres of irrigated land in the State, much of it in the Central Valley. By 1890, more than one million acres were under irrigation.
The drought of 1898, in combination with high land and machinery prices, drove many of the Valley's dry-land wheat farmers out of business. It also rein- forced the advantages of irrigated agriculture in an essentially semi-arid region. In 1898, the U.S. Geological Survey and the U.S. Reclamation Service began to
I identify potential water storage sites in the Central Valley watershed.
The expansion of irrigated agriculture in the Central Valley continued well into this century. By 1929, more than 1.2 million acres of Valley lands, excluding the Delta, were irrigated with water diverted directly from the Sacramento and San Joaquin river systems upstream of the Delta (DPW, 193 1). The massive storage and diversions of water for these lands, in conjunction with droughts in 19 17- 1920
Naiwak, Historic, and Unimpaired Flows-What's the Dinereme? During the past few years, as more and more people have become active in Bay/ Delta water issues, there has been much confusion regarding the tern 'yow." Although this term mag, seem pretty obvious, there are actukllly three kinds offow and it is important to difSerentiate them.
NaturalfEows are the flows that occurred in the estuary and its tributary w courses at the time of the first Spanish explorations of California, i.e., b Gold Rush. Since natural flows were not measured, no one knows what they were.
HistoricfZows are the flows that actually occurred over the historic hydrological period and were measured at various locations in the Central Valley usingflow measuring devices. These flows reflect upstream impoundments, diversions, and runoff under the upstream storage and channel configurations that existed at the time of measuremeat.
Unimpairedflows are neither natural nor historic flows. They are hypothetical flows that would occur in the estuary and its tributaries in the absence of up- stream impoundments and diversions of rainfall or snowmelt rune#, but in the presence of existing channel configurations, both upstream and in the Delta.
represent potential, but unrealized flows to the estuary. nning tool.
120 State of the Estuary
A traveler's observations of the dry lands in the San Joaquin Valley in 1899:
66 T h e plains are given up to desolation. Eight or ten years ago large crops of
wheat were raised on this la nd... and farm houses built on nearly every quarter section. ..But not a spear of anything green grows on the place this year. .,.The houses of former inhabitants are empty, the doors swing open or shut with the wind. Drifting sand is piled to the top of many fences. The windmills, with their broken arms, swing idly in the breeze. Like a veritable city of the dead, vacant residences on every side greet the traveler by horse team as he pursues his weary way across these seemingly endless plains."
Source: Pisani, 19M
and 1923-1924, resulted in saltwater incursion problems in large portions of the Delta and water and power shortages in rural and urban areas (Means, 1928). These events greatly increased litigation over water rights and spurred interest in the de- velopment of a coordinated state plan to manage surface water more effectively.
In 1933, during the fourth year of a six-year drought, the Governor signed legislation enabling the State to issue bonds for implementation of the State Water Plan. The plan called for the construction of reservoirs and canals in the northern part of the State. Voters in San Francisco approved the bonds by a margin of two to one; in Sacramento County by nine to one; in Shasta County by eighteen to one; and in Tulare County by twenty to one. Los Angeles County rejected the plan two to one (Pisani, 1984). Due to depressed financial markets, the bonds were never put on sale; instead, the State requested federal involve- ment in implementing the plan. Congress authorized the Reclamation Bureau to begin constructing the project, which was modified slightly and renamed the Central Valley Project.
Federal Central Valley Project
The Central Valley Project (CVP) is the largest water development project in the world, with a service area nearly 400 miles long and 45 miles wide. It is a multi-purpose project authorized by Congress to improve navigation, regulate river flows, reclaim arid and semi-arid lands, control floods, and enhance fish and wildlife. Other project benefits include electrical generation and recre- ational opportunities. The CVP is operated by the U.S. Bureau of Reclamation.
Major CVP features are shown in Figure 46. These facilities primarily re- gulate, store, or divert flows of the Trinity, Sacramento, American, Stanislaus, and San Joaquin rivers, all of which are tributary (by way of a diversion tunnel for the Trinity) to the BayPelta estuary. The CVP pumps water from the Delta and exports it to the San Joaquin Valley via the Delta-Mendota and San Luis canals, to Santa Clara and San Benito counties via the San Felipe facilities, and to Contra Costa County via the Contra Costa Canal. The CVP also diverts and delivers water upstream from the Delta with facilities that include the Tehama- Colusa, Corning, and Folsom South canals. Water is delivered from Millerton Lake via the Madera and Friant-Kern canals (DWR, 1990~).
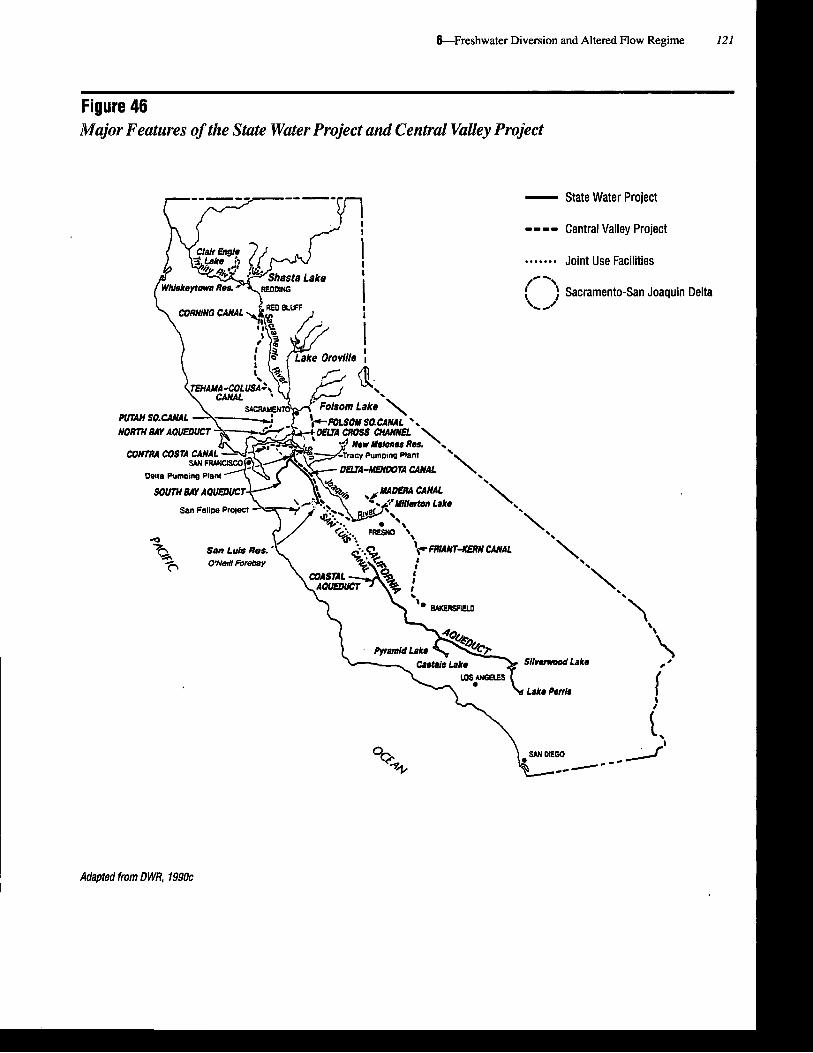
&Freshwater Diversion and Altered Flow Regime 121 I
Figure 46 Major Features of the State Water Project and Central Valley Project
I --- Shasta Lake
keyt to own Re& REODING i
- State Water Project
- - - - Central Valley Project
.-....- Joint Use Facilities
/- -\ \ Sacramento-San Joaquin Delta . I
Wta Purnnmg Plain UCUI-In W I A L ' .
SOUTH EAY AOUWUCT '\ "\
San Luis Res. ' "\. I
O'NmI! Forebay
la LWO '\
Adapted from D WR, 1990~
Sllvenmxi Lake #' I
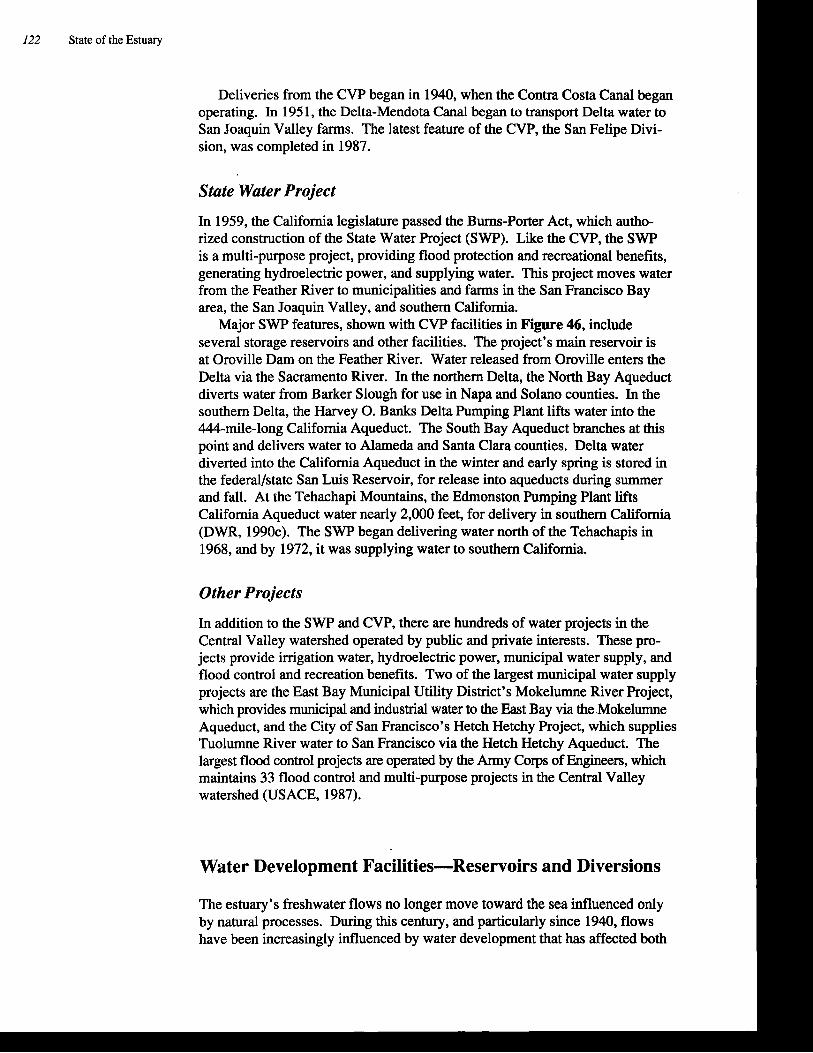
122 State of the Estuary
Deliveries from the CVP began in 1940, when the Contra Costa Canal began operating. In 1951, the Delta-Mendota Canal began to transport Delta water to San Joaquin Valley farms. The latest feature of the CVP, the San Felipe Divi- sion, was completed in 1987.
State Water Project
In 1959, the California legislature passed the Burns-Porter Act, which autho- rized construction of the State Water Project (SWP). Like the CVP, the SWP is a multi-purpose project, providing flood protection and recreational benefits, generating hydroelectric power, and supplying water. This project moves water from the Feather River to municipalities and farms in the San Francisco Bay area, the San Joaquin Valley, and southern California.
Major SWP features, shown with CVP facilities in Figure 46, include several storage reservoirs and other facilities. The project's main reservoir is at Oroville Dam on the Feather River. Water released from Oroville enters the Delta via the Sacramento River. In the northern Delta, the North Bay Aqueduct diverts water from Barker Slough for use in Napa and Solano counties. In the southern Delta, the Harvey 0. Banks Delta Pumping Plant lifts water into the 444-mile-long California Aqueduct. The South Bay Aqueduct branches at this point and delivers water to Alameda and Santa Clara counties. Delta water diverted into the California Aqueduct in the winter and early spring is stored in the federdstate San Luis Reservoir, for release into aqueducts during summer and fall. At the Tehachapi Mountains, the Edmonston Pumping Plant lifts California Aqueduct water nearly 2,000 feet, for delivery in southern California (DWR, 1990~). The SWP began delivering water north of the Tehachapis in 1968, and by 1972, it was supplying water to southern California.
Other Projects
In addition to the SWP and CVP, there are hundreds of water projects in the Central Valley watershed operated by public and private interests. These pro- jects provide irrigation water, hydroelectric power, municipal water supply, and flood control and recreation benefits. Two of the largest municipal water supply projects are the East Bay Municipal Utility District's Mokelumne River Project, which provides municipal and industrial water to the East Bay via the Mokelumne Aqueduct, and the City of San Francisco's Hetch Hetchy Project, which supplies Tuolumne River water to San Francisco via the Hetch Hetchy Aqueduct. The largest flood control projects are operated by the Army Corps of Engineers, which maintains 33 flood control and multi-purpose projects in the Central Valley watershed (USACE, 1987).
Water Development Facilities-Reservoirs and Diversions
The estuary's freshwater flows no longer move toward the sea influenced only by natural processes. During this century, and particularly since 1940, flows have been increasingly influenced by water development that has affected both

the timing and volume of fresh water that enters the Delta and San Francisco Bay. Storage reservoirs and diversions are the two development features that most affect flows.
Storage Reservoirs &I.$
With the exception of the Cosumnes River, large f p
multi-purpose reservoirs have been constructed on all of the Central Valley's major rivers. More than 100 reservoirs each have a storage capacity of at least 50,000 acre-feet, and the ten largest each store more - than one MAF (Table 14). Together, Valley reser- voirs can store about 27 MAF (Figure 47).
I about 60 percent of the State's average annual runoff and more than the entire Dams on the estuary's hibu-
average annual historic Delta 1921-1990 inflow of nearly 24 MAF (DWR, taries, such as Folsom Dam on
1987a and 1990a). the American tant features lnjtuuu CUI
Central Valley reservoirs are operated primarily for flood control in the winter and water stomge projet
I and for capturing the spring snowmelt runoff to be released in the summer for ~ l ~ h ~ ~ ~ h they provide nL,, agriculture. Although the timing of flow releases varies from reServ0ir to reservoir, us@l benefits to society, dams I
are one of th spoasible for estuary's a m (Photo: Bob 1
Ten Lamest Surface Water Storage Reservoirs that Regulate I
Shasta 29,500 4,552,000 USBR 1945 Pine Flat 5,970 1,000,000 USCE 1954 Folsom 11,450 1,010,000 USBR 1956 Berryessa 20,700 1,602,000 USBR 1957 Clair Englel 16,400 2,448,000 USBR 1962 San Luis 12,700 2,039,000 DWRJUSBR 1967 McClure 7,130 1,026,000 MID 1967 Oroville 15,800 3,538,000 DWR 1968 New Don Pedro 12,960 2,030,000 TID-MID 1971 New Melones 12,500 2,400,000 USCE 1979
Although located in North Coast basin, 900,000 acre-feet are transferred to Sacramento Basin.
*DWR=California Department of Water Resources MID=Modesto lrrigation District TID=Turlock lrrigation District USBR=U.S. Bureau of Reclamation USCE=U.S. Army Corps of Engineers
Adapted from D WR, 1987c
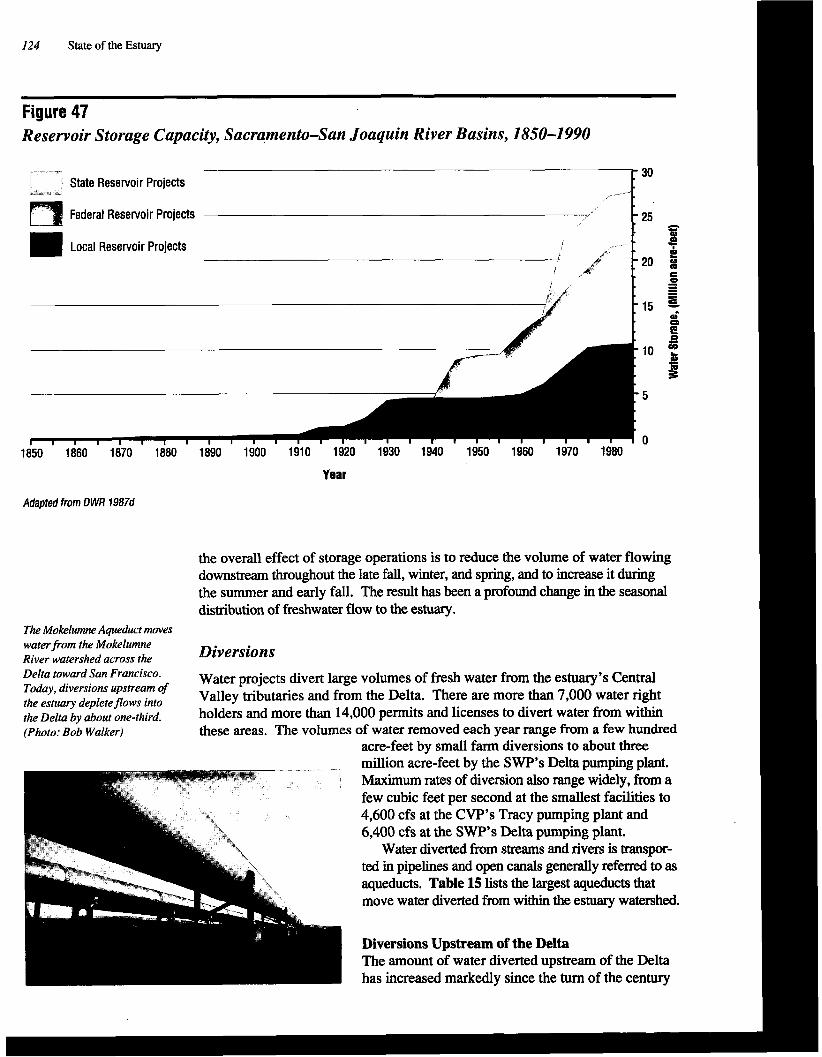
124 State of the Estuary
Figure 47 Reservoir Storage Capacity, Sacramento-San Joaquin River Basins, 1850-1990
r-7 State Reservoir Projects 30
4 .-
Federal Reservoir Projects
Local Reservoir Projects i
/ A* r' ,&
20 t C 0
Year
Adapted from D WR 1987d
the overall effect of storage operations is to reduce the volume of water flowing downstream throughout the late fall, winter, and spring, and to increase it during the summer and early fall. The result has been a profound change in the seasonal distribution of freshwater flow to the estuary.
The Mokelww Aqueduct moves I waterfrom the Mokelumne River watershed across the Diversions
Francisco. Water projects divert large volumes of fresh water from the estuary's Central Today, diversions upstream of the estuary depleteflows into Valley tributaries and from the Delta. There are more than 7,000 water right the Delta bv about one-third. holders and more than 14,000 permits and licenses to divert water from within (Photo: Bob Walker) these areas. The volumes of water removed each year range from a few hundred
acre-feet by small farm diversions to about three million acre-feet by the SWP's Delta pumping plant. Maximum rates of diversion also range widely, from a few cubic feet per second at the smallest facilities to 4,600 cfs at the CVP's Tracy pumping plant and 6,400 cfs at the SWP's Delta pumping plant.
Water diverted from streams and rivers is trampor- ted in pipelines and open canals generally referred to as
\\ aqueducts. Table 15 lists the largest aqueducts that move water diverted from within the estuary watershed. I Diversions Upstream of the Delta The amount of water diverted upstream of the Delta has increased markedly since the turn of the century
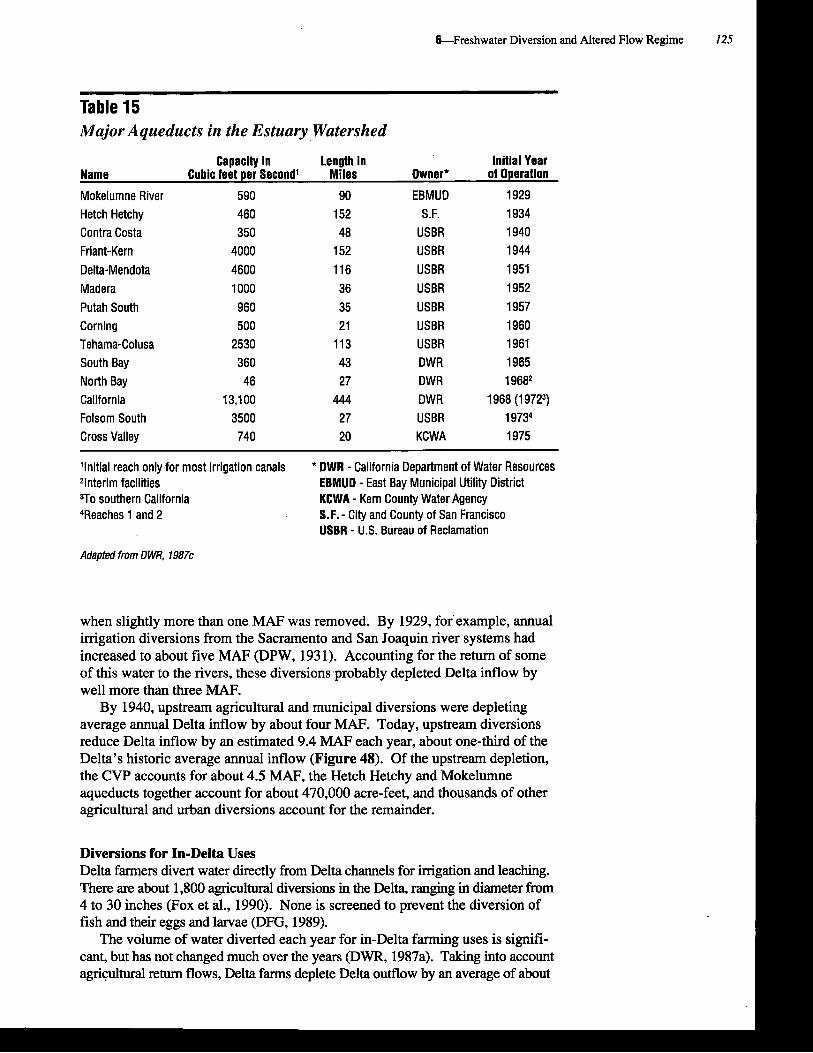
&Freshwater Diversion and Altered Flow Regime 125 I
Major Aqueducts in the Estuary Watershed I Caoacitv in Lenoth in Initial Year 1
Mokelumne River 590 90 EBMUD 1929 Hetch Hetchy 460 152 S.F. 1934 Contra Costa 350 48 USBR 1940
Friant-Kern 4000 152 USBR 1944
Delta-Mendota 4600 116 USBR 1951
Madera 1000 36 USBR 1952
Putah South 960 35 USBR 1957
Corning 500 21 USBR 1960 Tehama-Colusa 2530 113 USBR 1961
South Bay 360 43 DWR 1965
North Bay 46 27 DWR 1 9682
California 13,100 444 DWR 1968 (1 9723) Folsom South 3500 27 USBR 1 9734 Cross Valley 740 20 KCWA 1975
'Initial reach only for most irrigation canals * DWR - California Department of Water Resources 21nterim facilities EBMUD - East Bay Municipal Utility District T o southern California KCWA - Kern County Water Agency 4Reaches 1 and 2 . S.F.- City and County of San Francisco
USBR - U.S. Bureau of Reclamation
Adapted from DWR, 1987~
when slightly more than one MAF was removed. By 1929, for example, annual irrigation diversions from the Sacramento and San Joaquin river systems had increased to about five MAF (DPW, 193 1). Accounting for the return of some of this water to the rivers, these diversions probably depleted Delta inflow by well more than three MAF.
By 1940, upstream agricultural and municipal diversions were depleting average annual Delta inflow by about four MAF. Today, upstream diversions reduce Delta inflow by an estimated 9.4 MAF each year, about one-third of the Delta's historic average annual inflow (Figure 48). Of the upstream depletion, the CVP accounts for about 4.5 MAF, the Hetch Hetchy and Mokelumne aqueducts together account for about 470,000 acre-feet, and thousands of other agricultural and urban diversions account for the remainder.
Diversions for In-Delta Uses Delta farmers divert water directly from Delta channels for irrigation and leaching. There are about 1,800 agricultural diversions in the Delta, ranging in diameter from 4 to 30 inches (Fox et al., 1990). None is screened to prevent the diversion of fish and their eggs and larvae (DFG, 1989).
The volume of water diverted each year for in-Delta farming uses is signifi- cant, but has not changed much over the years (DWR, 1987a). Taking into account agricultural return flows, Delta farms deplete Delta outflow by an average of about

126 State of the Estuary
-
Freshwater Depletions Upstream of the Delta (MAF), 1880-1990
1880 1890 1900 1910 1920 1930 1940 1950 1960 1970 1980 1990
Year I
960,000 acre-feet each year. During the summer, when irrigation of Delta farm- land is at a peak, the combined diversions for Delta farms may exceed 4,000 cfs (DWR, 1990a). This is about the same rate at which the CVP removes water I Exports i f fresh water from the Delta began in 1940, when the CVP's Contra
~h~ State water projectpumping Costa Canal began providing fresh water to municipalities and industries in
'acn year. ~ u c pumps - ,,. ,,, ..,ter into the 440-mile- 1990a). This is about ten percent of the average volume diverted for in-Delta lnno rnlifnrnin Anuodr~rt amicultural use, and about two percent of the combined diversions to the Delta- I
moves water 117 miles south, where it replaces the natural flows in the San Joaquin River diverted by the CVP's Madera and Friant-Kern canals. As this re- placement water flows downstream toward the Delta, it is removed from the river channel for irrigation. The
about 700,000 acre-feet in the 1950s to mor;than 2.8 I

Clifton Court Forebay in the southern Delta, the Harvey 0. Banks Delta Pumping Plant lifts water into the California Aqueduct. Since this pumping plant began operation in 1968, annual SWP Delta diversions have increased steadily, reaching a peak in 1989 of more than three MAF. As indicated in Figure 49, annual federal and state exports from the Delta now total nearly six MAF.
Uses of Fresh Water Diverted from the Estuary's Tributaries and the Delta
Water diverted from the estuary's tributaries in the Central Valley and from the Delta is used to meet a large proportion of the state's water demand. In 1985, for example, water diverted from these areas accounted for 48 percent of the state's total net water use of some 34 MAF and 5 1 percent of its total water supply (DWR, 1988a). As described in Chapter 3, this diverted water is used primarily for agricultural, municipal, and industrial purposes. It also is used for fish and wildlife habitat, recreation, and other purposes.
Most of the water diverted upstream of the Delta is used by agriculture. Thousands of diversions remove water from Central Valley streams for farming operations. Water is also taken for municipal and industrial uses in Central Valley

128 State of the Estuary
urban areas as well as in the Bay area. Of the CVP water diverted upstream of the Delta in 1988,85 percent went to farms, 8 percent was used for municipal and industrial purposes, and the remaining 7 percent was used for several other purposes including fish and wildlife habitat (USDI, 1988).
Within the Delta, almost all water use is for agriculture. Farmers irrigate about three-fourths (5 15,000 acres) of the Delta with water from adjacent chan- nels. The most important crops produced with this water include corn, grain, tomatoes, alfalfa, pasture, sugar beets, safflower, and asparagus (SWRCB, 1991).
Both the CVP and the SWP export water from the Delta for a variety of uses. Of the three MAF of water exported from the Delta by the CVP in 1988,82 percent of the volume delivered went to agriculture, 14 percent to municipal and industrial uses, and the remainder to other uses. In 1988, the CVP delivered Delta water to about 2.1 million acres of farmland in the Central Valley, and to lands in Contra Costa, San Benito and Santa Clara counties (USDI, 1988). Figure 50 shows the acreage of the major crops grown with CVP water.
The State Water Project also delivers substantial volumes of water from the Delta for agricultural and urban uses. Compared to the CVP, the SWP delivers a larger proportion of its water to municipal and industrial users. For example, of the 2.7 MAF of Delta water delivered by the SWP in 1985,1.3 MAF (48 percent) was used to grow crops on 445,000 acres in the San Joaquin Valley and in other areas, 1.0 MAF (37 percent) was used for municipal and industrial purposes, and 0.4 MAF (15 percent) was used for other purposes (SWRCB, 1991). F i e 51 indicates the
Figure 50 Figure 51 Acreage of Ma~or Crops Pmgated with Acreage of Major Crops Irrigated with Central Valley Project W~ter, 6988 State Water Project Water, 1987
Suga (2.62%) \ Safflower, 10,752 ac (2.79%)
-Wheat, 17,714 ac (4.60%)
r Beets, 46,505 ac (2.17%) Barley, 10,107 2 Melons, 53,441 ac (2.50%)
Citrus, 101,155 ac (4.73%)
Cotton 179,588 ac
46.62%
istachios, 19,558 ac (5.08%)
Total Irrigated land = 2,140,427 acres Total lrrlgated land = 385,235 acres
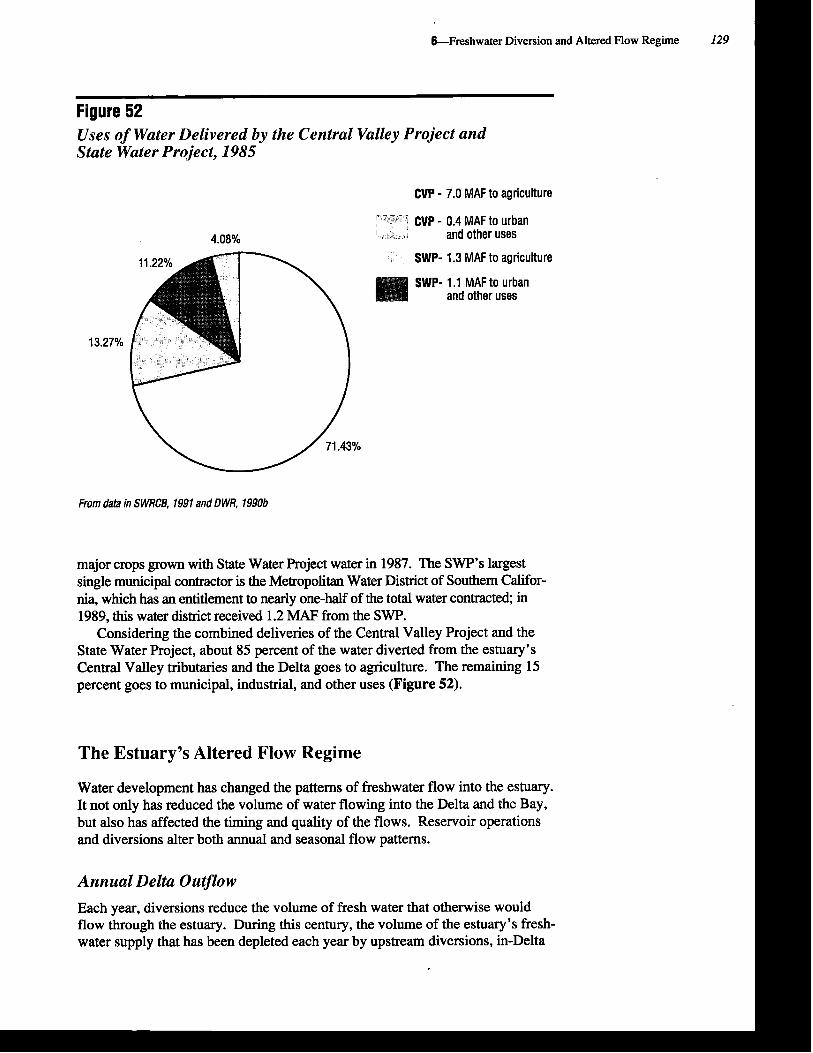
&Freshwater Diversion and Altered Flow Regime 129
Figure 52 Uses of Water Delivered by the Central Valley Project and State Water Project, 1985
CVP - 7.0 MAF to agriculture
CVP - 0.4 MAF to urban 4.08% and other uses
SWP- 1.3 MAF to agriculture
SWP- 1 .I MAF to urban and other uses
13.27%
From data in SWRCB, 1991 and D WR, 1990b
major crops grown with State Water Project water in 1987. The SWP's largest single municipal contractor is the Metropolitan Water District of Southern Califor- nia, which has an entitlement to nearly one-half of the total water contracted, in 1989, this water district received 1.2 MAF from the SWP.
Considering the combined deliveries of the Central Valley Project and the State Water Project, about 85 percent of the water diverted from the estuary's Central Valley tributaries and the Delta goes to agriculture. The remaining 15 percent goes to municipal, industrial, and other uses (Figure 52).
The Estuary's Altered Flow Regime
Water development has changed the patterns of freshwater flow into the estuary. It not only has reduced the volume of water flowing into the Delta and the Bay, but also has affected the timing and quality of the flows. Reservoir operations and diversions alter both annual and seasonal flow patterns.
Annual Delta Outflow
Each year, diversions reduce the volume of fresh water that otherwise would flow through the estuary. During this century, the volume of the estuary's fresh- water supply that has been depleted each year by upstream diversions, in-Delta
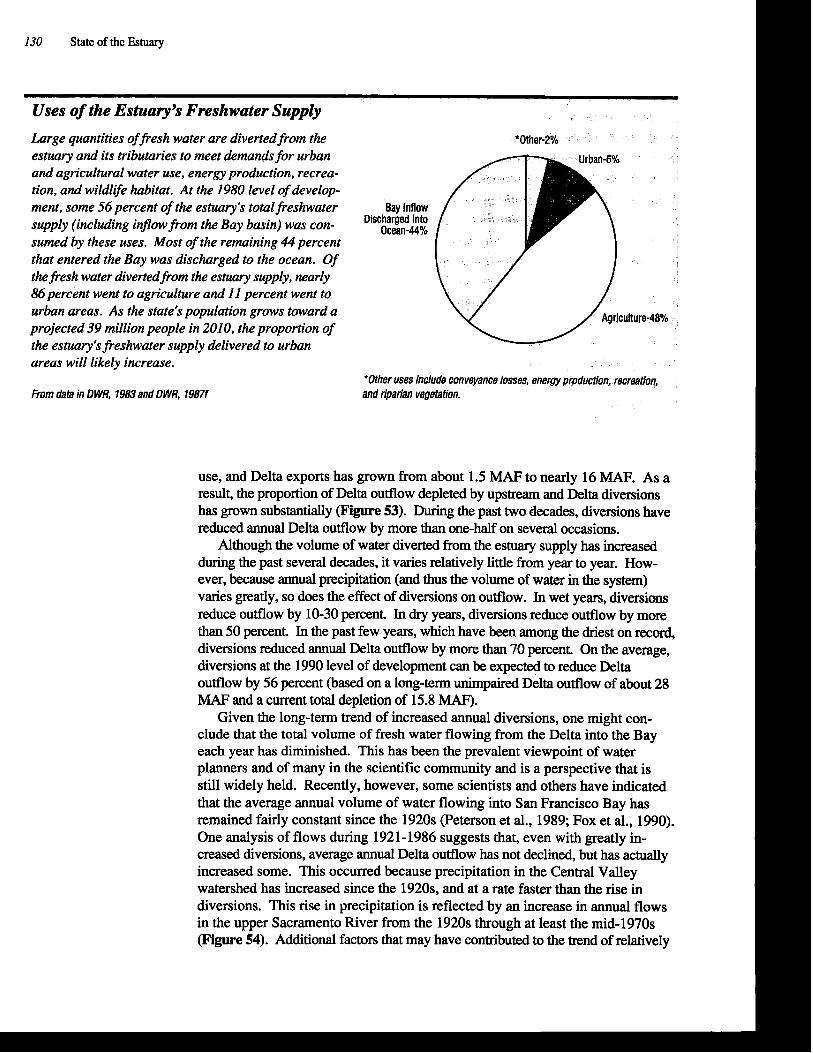
130 State of the Estuary
Uses of the Estuary's Freshwater Supply
Large quantities offresh water are divertedfrom the estuary and its tributaries to meet demands for urban and agricultural water use, energy production, recrea- tion, and wildlife habitat. At the 1980 level of develop- ment, some 56 percent of the estuary's totalfreshwater Bay Inflow
Discharged Into supply (including inflowfrom the Bay basin) was con- Ocean-44% sumed by these uses. Most of the remaining 44 percent that entered the Bay was discharged to the ocean. Of the fresh water divertedfrom the estuary supply, nearly 86percent went to agriculture and 11 percent went to urban areas. As the state's population grows toward a projected 39 million people in 2010, the proportion of the estuary's freshwater supply delivered to urban areas will likely increase.
*Other uses include conQt?yancB losses, energy production, recreation, From data in D WR, 1983 and DWR, 1987f and riparian vegeiation.
use, and Delta exports has grown from about 1.5 MAF to nearly 16 MAF. As a result, the proportion of Delta outflow depleted by upstream and Delta diversions has grown substantially (Figure 53). During the past two decades, diversions have reduced annual Delta outflow by more than one-half on several occasions.
Although the volume of water diverted from the estuary supply has increased during the past several decades, it varies relatively little from year to year. How- ever, because annual precipitation (and thus the volume of water in the system) varies greatly, so does the effect of diversions on outflow. In wet years, diversions reduce outflow by 10-30 percent. In dry years, diversions reduce outflow by more than 50 percent. In the past few years, which have been among the driest on record, diversions reduced annual Delta outflow by more than 70 percent. On the average, diversions at the 1990 level of development can be expected to reduce Delta outflow by 56 percent (based on a long-term unimpaired Delta outflow of about 28 MAF and a current total depletion of 15.8 MAF).
Given the long-term trend of increased annual diversions, one might con- clude that the total volume of fresh water flowing from the Delta into the Bay each year has diminished. This has been the prevalent viewpoint of water planners and of many in the scientific community and is a perspective that is still widely held. Recently, however, some scientists and others have indicated that the average annual volume of water flowing into San Francisco Bay has remained fairly constant since the 1920s (Peterson et al., 1989; Fox et al., 1990). One analysis of flows during 1921-1986 suggests that, even with greatly in- creased diversions, average annual Delta outflow has not declined, but has actually increased some. This occurred because precipitation in the Central Valley watershed has increased since the 1920s, and at a rate faster than the rise in diversions. This rise in precipitation is reflected by an increase in annual flows in the upper Sacramento River from the 1920s through at least the mid-1970s v i e 54). Additional factors that may have contributed to the trend of relatively

Figure 54 Sacramento River Flow at Bend Bridge near Red Blufl, 1892-1988
0 1 . 1 . I . , . , . , . , . I . , . , .
1890 1900 1910 1920 1930 1940 1950 1960 1970 1980
Year
From USGS data
I32 State of the Estuary
high Delta outflow since the 1920s include increased runoff from land use changes, water imports from outside the watershed, and the redistribution of groundwater (Fox et al., 1990).
Over the past sixty years, an increasing proportion of the estuary's freshwater supply has been diverted. During this same period, average annual Delta outflow has, surprisingly, remained fairly high. Considering the trends in precipitation and the changes in hydrological conditions that have occurred in the watershed, it is apparent that the average annual volume of fresh water reaching the Bay would have risen markedly during this period if diversions had not increased.
Seasonal Delta Outflow
Seasonal flows strongly affect physical variables and biological processes in the estuary. They affect water temperature, salinity, pollutant concentrations, and the location of the entrapment zone. They also influence the transport of eggs and young organisms through the Delta and into San Francisco Bay. Flows during the months of April, May, and June play an especially important role in determining the reproductive success and survival of many estuarine species including salmon, striped bass, and others. The reduction of spring outflow is one of the most signifi- cant adverse impacts of water development on the estuary's living resources.
Water development has drastically altered seasonal flows into and through the estuary. An analysis by the U.S. Geological Survey of Delta outflow from 1922 to 1986 indicates that flows have decreased substantially in April, May, and June, and have increased slightly in all other months (Peterson et al., 1989). Another analysis of Delta outflow data indicates that outflow has decreased only in April and May, and has increased from July through November (Fox et al., 1990). While the conclusions of these two analyses may differ in minor respects, both indicate that the estuary's spring flows have declined markedly in recent decades.
Today, water storage and diversions have a marked influence on Delta outflow nearly every month v i e 55). Compared to the average monthly flows that would occur without storage and diversions (based on 1922 to 1978 unimpaired flow data), today's level of water development reduces flows in every month except August, September, and October. The area between the two lines in Figure 55 represents the average volume of water that current storage and diversions prevent from reaching the Bay in an average year.
Effects of Diversion and Flow Alterations
Freshwater flows affect the estuary in many ways. This section describes how diversions and altered flow regime have affected salinity, pollutants, primary productivity and organic carbon influx, entrainment of fish, water circulation, and water transparency. It also emphasizes the effects of water resources development on populations of several fish species.
Salinity
In many segments of the estuary, but particularly upstream of Carqubz Strait, salinity is controlled primarily by freshwater flow. By altering the timing and volume of flows, water development has affected salinity patterns in the Delta and in parts of San Francisco Bay.

Under natural conditions, the Carquinez Strait/Suisun Bay region marked the approximate boundary between salt and fresh water in the estuary during much of the year. In the late summer and fall of drier years, when Delta outflow was minimal, sea water moved into the Delta from San Francisco Bay. Beginning in the 1920s, following several dry years and because of increased upstream storage and diversions, salinity intrusion became more frequent and extensive and began to affect water users upstream of Carquinez Strait (Means, 1928).
Since the 1940s, releases of fresh water from upstream storage facilities have in- creased summer and fall Delta outflows. These flows have correspondingly limited the extent of salinity intrusion into the Delta (SWRCB, 1991). Reservoir releases have helped to ensure that the salinity of water diverted from the Delta is acceptable during the summer and late fall for farming, municipal, and industrial uses.
Even with upstream releases to reduce the extent and frequency of saltwater intrusion into the Delta, the overall effect of changes in seasonal flows has been to increase salinity slightly in the western Delta and in Suisun Bay during spring and summer and to decrease it substantially during fall and winter (Fox et al., 1991). In dry years, relatively high salinities now occur yearlong (Williams and Fishbain, 1987). This has threatened to alter water and soil conditions within Suisun Marsh and to lower the production of important marsh plants, some of which are rare or endangered. In response to increased salinity in the marsh, a major local, state, and federal effort is underway to manage water and soil salinity by, among other means, regulating water movement in marsh channels. Salinity
134 State of the Estuary
increases in Suisun Bay have also caused some fishes such as Delta smelt to shift their habitat use upstream.
Reduced winter and spring Delta outflow has increased salinity in other parts of the estuary as well. One study indicates that 86 percent of the variation in salinity in parts of Central Bay is caused by spring Delta outflow. In years when spring outflow is low, salinity rises. It is interesting to note that the mean monthly salinity in parts of Central Bay increased steadily between 1922 and 1986, in pace with upstream diversions. Just as water development has reduced spring flows, so has summer salinity in Central Bay increased (Peterson et al., 1989). Another study suggests, however, that although salinity in the Bay is affected by Delta outflow, it is also influenced by changes in ocean salinity. This study sug- gests that an increase in ocean salinity since the 1940s is responsible for much of the rise in salinity at the mouth of the estuary at the Presidio (Fox et al., 1991).
Pollutants
Freshwater flow affects the length of time it takes for water to pass through the estuary. For example, when outflow is low, a given molecule of fresh water may reside in Suisun Bay for more than a month before moving downstream into San Pablo Bay; water may remain in San Pablo Bay for nearly three weeks before moving into Central Bay and out to the ocean. When outflow is high, water moves from the Delta to the ocean in just five clays (Smith, 1987). As residence time de- creases, so may the exposure of animals to pollutants dissolved in the water.
The relationship between flows and pollutants has been best documented in South Bay. In years of high Delta outflow, levels of silver in clams are lowest. Following winter floods, there is a decline in the levels of silver, copper, and cadmium in clams (Luoma et al., 1985). This most likely occurs because pulses of high outflow increase the exchange of water between South Bay and Central Bay and reduce the residence time of pollutants in South Bay. The relationship between flows and pollutant levels in organisms in other parts of the estuary has not been demonstrated.
Although high pulse flows may affect the exposure of some animals to some pollutants in the estuary, the State Water Resources Control Board does not consider the use of fresh water to flush pollutants a reasonable use of the water (SWRCB, 1990). Given the numerous demands on the estuary's limited supply of fresh water, many agree that it is preferable to lower pollutant exposure by placing stricter limits on the discharge of pollutants to the estuary, rather than to rely on flushing.
Primary Productivity and Organic Carbon Influx
Freshwater flows affect the avaiiability of food for organisms at the base of the estuary's food web. They do this in at least two ways: by influencing the abundance of phytoplankton within the estuary's waters and by affecting the influx of organic carbon to the estuary from outside sources.
Phytoplankton Production During the past two decades, scientists have spent considerable effort trying to understand the factors that regulate the production and abundance of phytoplank- ton in the estuary. As a result of extensive monitoring since the 1970s, details of the relationship between flows and phytoplankton in the estuary's northern and
&Freshwater Diversion and Altered How Regime 135
southern reaches are beginning to be understood. Although much has been learned, there remain many unanswered questions about this important aspect of the estuary's ecology.
In the estuary's northern reach, flows influence phytoplankton production and abundance primarily by affecting the location of the entrapment zone. Phytoplank- ton production (most of which occurs in the shoals) and abundance in San Pablo and Suisun bays are greatest when the entrapment zone is at the upstream end of either bay. Such a condition tends to increase the amount of time phytoplank- ters with high settling rates (most desirable diatoms) remain in the shoals where there is adequate light for their photosynthesis. Insufficient data have been collected in San Pablo Bay to determine what flows are required to stimu- late high production; however, in Suisun Bay, outflows in the 5,000 to 8,000 cfs range historically have been associated with maximum phytoplankton produc- tion (Ball, 1987). When Delta outflow is less than 5,000 cfs, the entrapment zone moves upstream into the deeper Delta waters and this reduces phytoplank- ton production in the shoals downstream.
Major declines in phytoplankton abundance and species composition in Suisun Bay and the Delta have occurred since the early 1970s. These declines are related to natural perturbations (the 1976-1977 and present droughts), water diversions, and inadvertent introductions of undesirable aquatic species. The once moderate-to-high spring through fall levels of desirable diatom phytoplankters in the Delta have declined. These declines correspond with the increased net flow of water across the Delta from north to south that occurs with the present methods of water export from the Delta. Also, and possibly a result of present water export methods, is the trend of increasing water transparency in the Delta since the early 1980s that is associated with the increased frequency of intense but short duration blooms of Melosira granulata , an undesirable phytoplankter. Present methods of high water exports also may be affecting concentrations of phytoplankton in the entrapment zone under low outflow conditions (6,000 cfs). Phytoplankton levels in the entrapment zone in the 1960s under such low outflows remained much higher than at present.
In South Bay, freshwater flows, tidal currents, and local weather patterns estab- lish conditions for phytoplankton blooms. When periods of high Delta discharge in ~ winter-spring coincide with periods of low tidal current speed during the tidal cycle, fresh water entering from Central Bay forms a distinct, less turbid, layer on top of the more saline South Bay water. This condition (known as salinity stratification) increases the depth to which light can penetrate, thereby providing more habitat in which phytoplankton are able to reproduce (Cloern, 1979; Cloern et al., 1985). In addition, salinity stratification isolates phytoplankton in the upper water layer from the benthic mollusks and other bottom-dwelling animals that consume them, reducing phytoplankton losses.
A positive correlation between January-April Delta outflow and February- May phytoplankton productivity in the channels of South Bay has been demon- strated for the period 1980-1987 (Cloem, 1990). Other factors, such as local flows from within the South Bay watershed, also may influence phytoplankton production and abundance in South Bay channels.
Although the mechanisms that regulate phytoplankton productivity in South Bay channels are beginning to be understood, much less is known about the mechanisms that influence phytoplankton productivity in the shoals. With more than 60 percent of South Bay's annual phytoplankton production occurring in
I these areas (areas that probably do not stratify), it is important to understand the relationship between Delta outflow, local flows, and other factors that may
-
136 State of the Estuary
influence phytoplankton production and abundance in the shoals. There also is a need for a better understanding of the significance of phytoplankton produc- tion throughout South Bay on organisms higher in the food web.
Organic Carbon Influx As described in Chapter 4, primary production occurs when plants and some bacteria utilize photosynthesis to convert the energy in sunlight into carbohydrates. This process "fixes" inorganic carbon into organic forms that may be consumed by animals higher in the food web. It is the energy stored in the chemical bonds of these organic molecules that fuels ecosystems.
The estuary ecosystem has many sources of organic carbon. Within the estuary itself, these include phytoplankton, benthic microalgae, seagrasses, macroalgae, and photosynthetic bacteria. In addition, substantial quantities of organic carbon enter from other, outside sources. The most sigmficant of these include riverine inflow, tidal marsh export, point sources, and runoff. Minor outside sources include atmos- pheric deposition and oil spills. Exchange between the Bay and the ocean is capable of drastically modQing supply and loss rates for the estuary's pool of organic carbon; however, this cannot be well quantified.
A recent analysis suggests that river flow can contribute a substantial amount of organic carbon to San Francisco Bay and that flow variation affects the influx of this material. The main sources of organic carbon carried in river flow are phytoplankton, aquatic macrophytes, litter Erom terrestrial vegetation, leaching of soils, and sewage effluent. Although no studies seem to have been conducted explicitly on the suitability of organic carbon in river flow as a food for primary consumers, some pertinent indirect evidence exists that about ten percent of the total organic carbon may be readily available for assimilation and metabolism by bacteria and perhaps higher organisms. Based on a comparison of the available sources, and assuming that only ten percent of the organic carbon carried in river flow is available for assimilation, during years of moderate river flow, rivers contri- bute the majority of carbon available in Suisun Bay (Table 16). For San Francisco Bay in its entirety, Delta discharge seems to be a relatively minor source of organic carbon, especially when compared to the amount of carbon contributed by phyto- '
plankton and benthic microalgae (Herbold et al., 1992). Although year-to-year fluctuations in riverine carbon loading largely reflect the corresponding variability in Delta outflow, the significance of this on biological productivity has not been demonstrated. Additional studies of the estuary's organic carbon sources and their relative contributions of energy to the food web ultimately could provide important i n f o d o n on which to base the management of freshwater flows.
Entrainment Each year, as Delta water is diverted to farm fields and to state and federal aque- ducts, millions of fish eggs, larvae, and juveniles are diverted, or entrained, as well. Of the approximately 1,800 siphons and pumps that divert water to Delta farms, none is screened to prevent the removal of fish. The state and federal pumps are screened to minimize the passage of juvenile and adult fish; however, neither the SWP or CVP is able to prevent removal of the millions of fish eggs and larvae that are pulled from Delta channels.
Pumping losses at the SWP and CVP facilities are a significant cause of mortality for striped bass, salmon, shad, and other species. According to the Department of Fish and Game, during 1976 through 1986, pumping operations killed an annual average of 6.5 million juvenile stripers greater than 20 millimeters
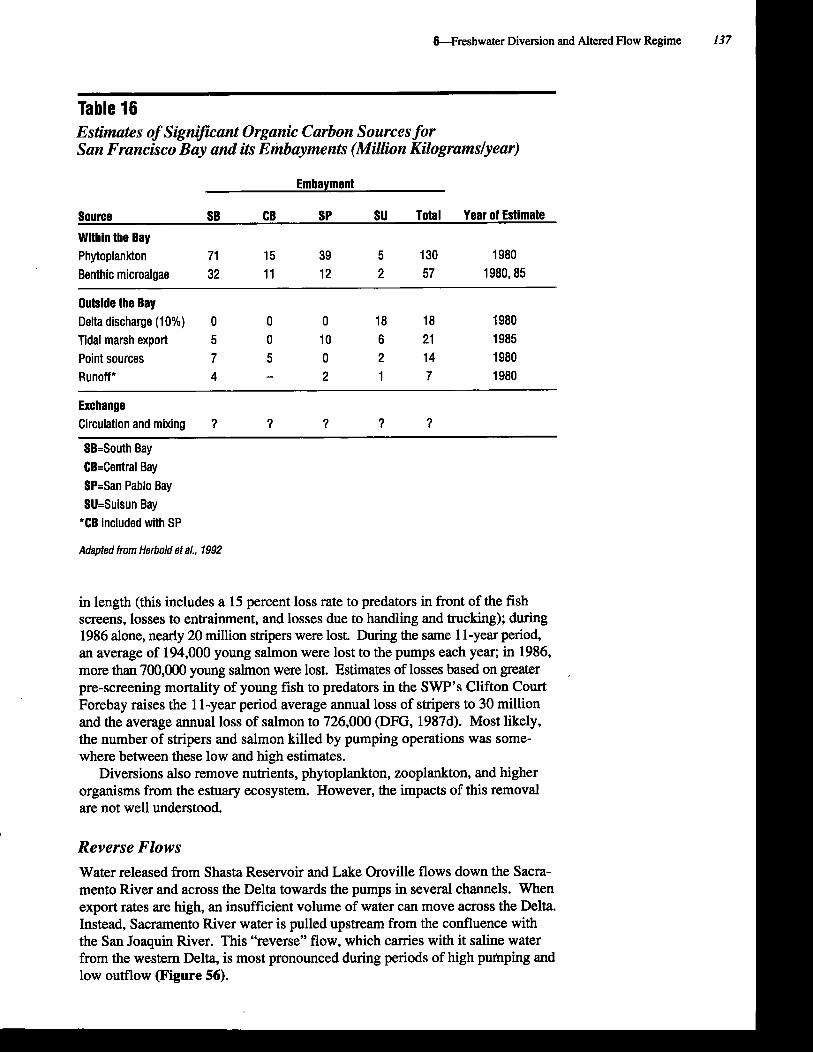
&Freshwater Diversion and
Table 16
Altered Flow Regime
Estimates of SignzBant Organic Carbon Sources for San Francisco Bay and its Embayments (Million Kilogramslyear)
Embayment
Source SB CB SP SU Total Ysar of Estimate
Within the Bay Phytoplankton 71 15 39 5 130 1980 Benthic microalgae 32 11 12 2 57 1980,85
Outside the Bay Delta discharge (1 0%) 0 0 0 18 18 1980 Tidal marsh export 5 0 10 6 21 1985 Point sources 7 5 0 2 14 1980 Runoff* 4 - 2 1 7 1980
Exchange Circulation and mixing ? ? ? ? ?
SB=South Bay CB=Central Bay SP=San Pablo Bay SU=Suisun Bay
*CB included with SP
Adapted from Herbold st a/., 1992
in length (this includes a 15 percent loss rate to predators in front of the fish screens, losses to entrainment, and losses due to handling and trucking); during 1986 alone, nearly 20 million stripers were lost. During the same 1 1-year period, an average of 194,000 young salmon were lost to the pumps each year; in 1986, more than 700,000 young salmon were lost. Estimates of losses based on greater ,
pre-screening mortality of young fish to predators in the SWP's Clifton Court Forebay raises the 1 1-year period average annual loss of stripers to 30 million and the average annual loss of salmon to 726,000 (DFG, 1987d). Most likely, the number of stripers and salmon killed by pumping operations was some- where between these low and high estimates.
Diversions also remove nutrients, phytoplankton, zooplankton, and higher organisms from the estuary ecosystem. However, the impacts of this removal are not well understood.
Reverse Flows Water released from Shasta Reservoir and Lake Oroville flows down the Sacra- mento River and across the Delta towards the pumps in several channels. When export rates are high, an insufficient volume of water can move across the Delta. Instead, Sacramento River water is pulled upstream from the confluence with the San Joaquin River. This "reverse" flow, which carries with it saline water from the western Delta, is most pronounced during periods of high pufnping and low outflow (Figure 56).
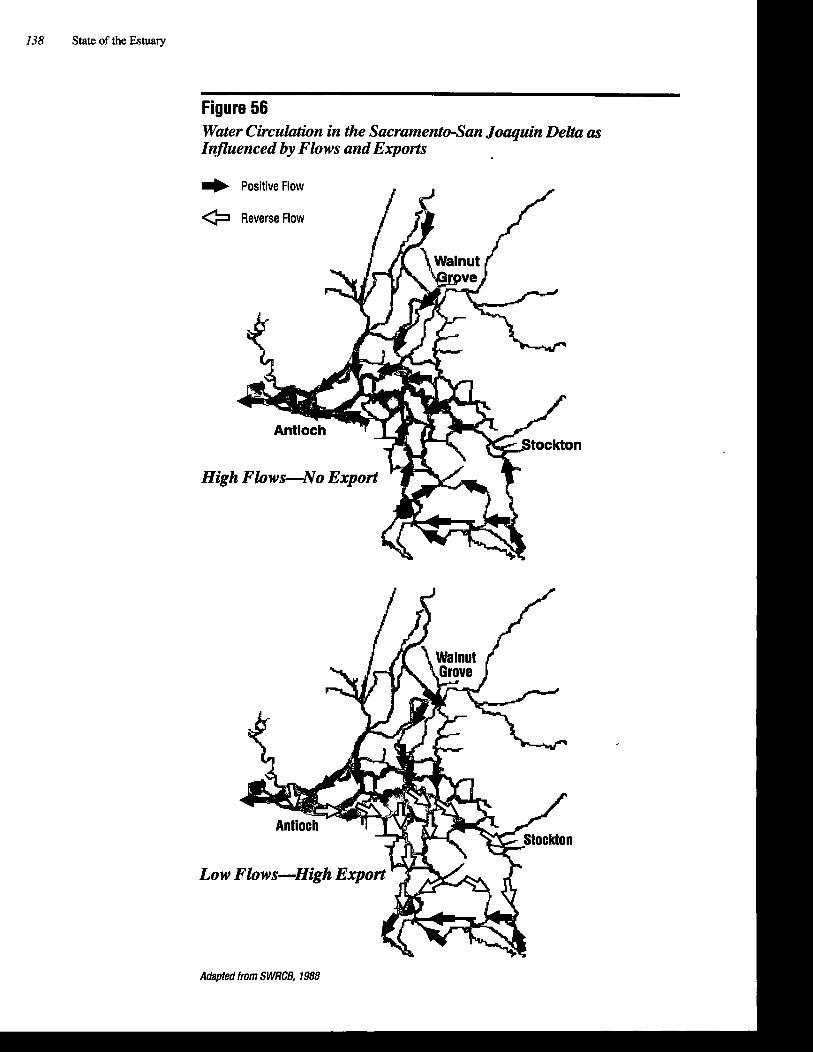
138 State of the Estuary
Figure 56 Water Circulation in the Sacramento-San Joaquin Delta as Influenced by Flows and Exports
Positive Flow r
Reverse Flow
High Flows-No Export
Low Flows-High Export
Adapted from SWRCB, 1988
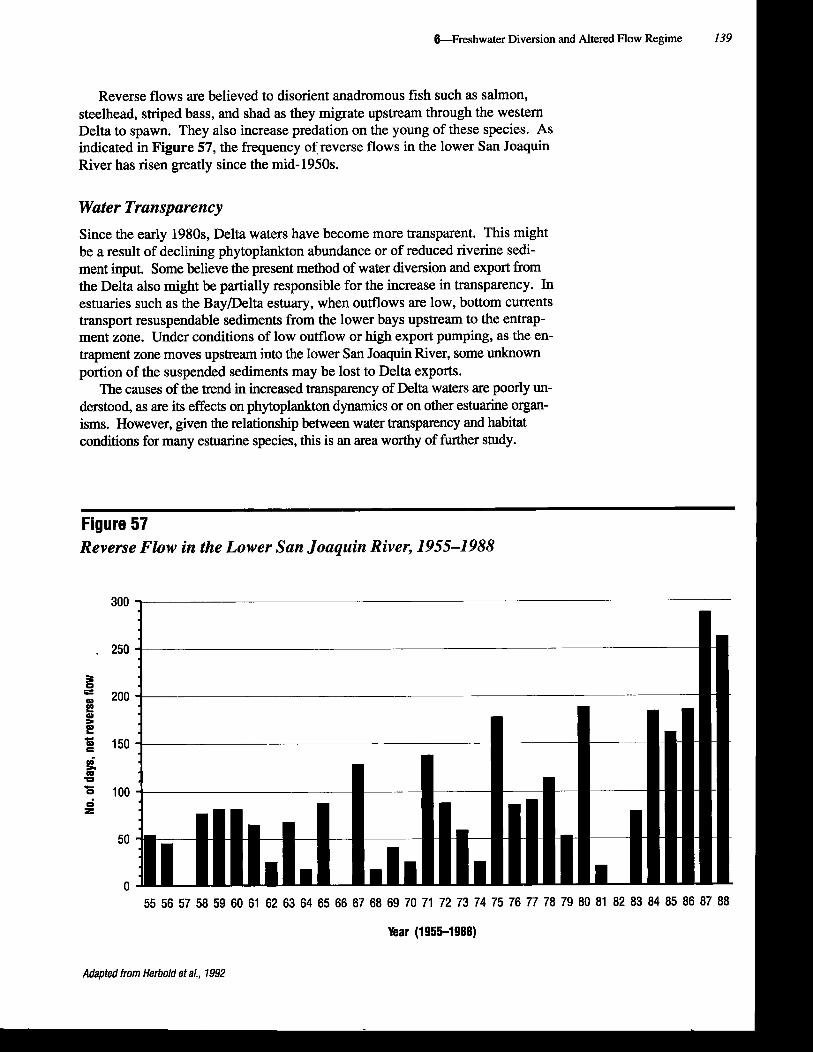
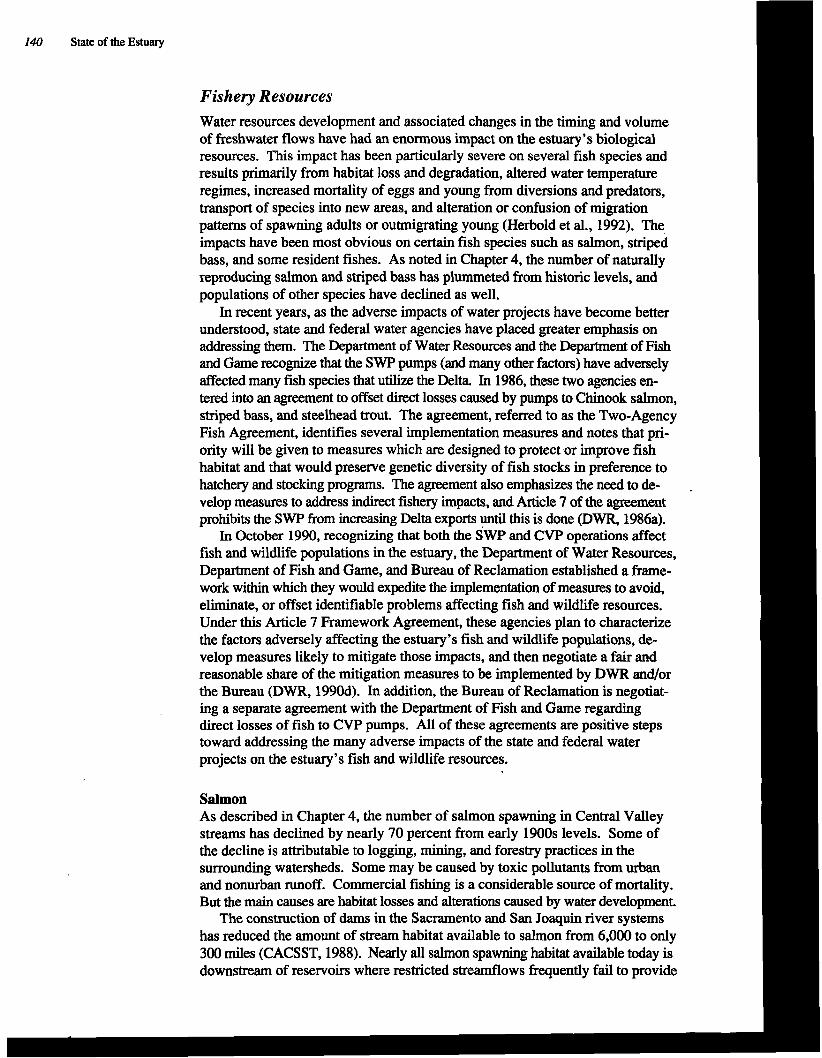
140 State of the Estuary
Fishery Resources Water resources development and associated changes in the timing and volume of freshwater flows have had an enormous impact on the estuary's biological resources. This impact has been particularly severe on several fish species and results primarily from habitat loss and degradation, altered water temperature regimes, increased mortality of eggs and young from diversions and predators, transport of species into new areas, and alteration or confusion of migration patterns of spawning adults or outmigrating young (Herbold et al., 1992). The impacts have been most obvious on certain fish species such as salmon, striped bass, and some resident fishes. As noted in Chapter 4, the number of naturally reproducing salmon and striped bass has plummeted from historic levels, and populations of other species have declined as well.
In recent years, as the adverse impacts of water projects have become better understood, state and federal water agencies have placed greater emphasis on addressing them. The Department of Water Resources and the Department of Fish and Game recognize that the SWP pumps (and many other factors) have adversely affected many fish species that utilize the Delta. In 1986, these two agencies en- tered into an agreement to offset direct losses caused by pumps to Chinook salmon, striped bass, and steelhead trout. The agreement, referred to as the Two-Agency Fish Agreement, identifies several implementation measures and notes that pri- ority will be given to measures which are designed to protect or improve fish habitat and that would preserve genetic diversity of fish stocks in preference to hatchery and stocking programs. The agreement also emphasizes the need to de- velop measures to address indirect fishery impacts, and Article 7 of the agreement prohibits the SWP from increasing Delta exports until this is done (DWR, 1986a).
In October 1990, recognizing that both the SWP and CVP operations affect fish and wildlife populations in the estuary, the Department of Water Resources, Department of Fish and Game, and Bureau of Reclamation established a frame- work within which they would ex@te the implementation of measures to avoid, eliminate, or offset identifiable problems affecting fish and wildlife resources. Under this Article 7 Framework Agreement, these agencies plan to characterize the factors adversely affecting the estuary's fish and wildlife populations, de- velop measures likely to mitigate those impacts, and then negotiate a fair and reasonable share of the mitigation measures to be implemented by DWR and/or the Bureau (DWR, 1990d). In addition, the Bureau of Reclamation is negotiat- ing a separate agreement with the Department of Fish and Game regarding direct losses of fish to CVP pumps. All of these agreements are positive steps toward addressing the many adverse impacts of the state and federal water projects on the estuary's fish and wildlife resources.
Salmon As described in Chapter 4, the number of salmon spawning in Central Valley streams has declined by nearly 70 percent from early 1900s levels. Some of the decline is attributable to logging, mining, and forestry practices in the surrounding watersheds. Some may be caused by toxic pollutants from urban and nonurban runoff. Commercial fishing is a considerable source of mortality. But the main causes are habitat losses and alterations caused by water development.
The construction of dams in the Sacramento and San Joaquin river systems has reduced the amount of stream habitat available to salmon from 6,000 to only 300 miles (CACSST, 1988). Nearly a l l salmon spawning habitat available today is downstream of reservoirs where restricted streamflows frequently fail to provide
&Freshwater Diversion and Altered Flow Regime 141
conditions necessary for successful reproduction. Flow fluctuations and, for some runs in some rivers, high water temperatures threaten reproductive success. The Sacramento River winter-run is especially vulnerable to warm water released from Shasta Dam that threatens salmon egg ripening, hatching, and rearing. The young of several runs that do manage to spawn successfully may be subjected to stressful water temperatures caused by reservoir operations and reduced stream cover.
For young salmon to reach the ocean, they must pass through the Delta and into Suisun Bay. A large number along the way, however, are diverted into Delta fields by agricultural water intakes or pulled by cross-Delta and reverse flows into the federal and state pumps (DFG, 1987d). Many of the young fish pulled into the central Delta do not survive.
The survival of outmigrating salmon smolts is improved when flows are high. In the Sacramento River, smolt survival is highest when flows are at or above 20,000 to 30,000 cfs. According to the U.S. Fish and Wildlife Service, spring flow reductions caused by water development in the Sacramento Valley, in com- bination with the diversion of water from the Sacramento River, has reduced the average smolt survival in the lower Sacramento River by at least 30 percent since 1940. Low flows and water diversion also adversely affect salmon smolt survival in the San Joaquin River (USFWS, 1987a).
Striped Bass The estuary's population of adult striped bass has declined from an estimated three million in the early 1960s, to about one-half million today. Much of this decline is a result of altered flow patterns and diversions which affect stripers in several ways.
Historically, striped bass spawned in many Delta waterways and upstream in both the Sacramento and San Joaquin rivers. Today, high concentrations of dissolved solids caused by a combination of low flows and agricultural returns in the San Joaquin River prevent stripers from migrating into the eastern Delta to spawn in the San Joaquin River upstream of Venice Island (DFG, 1989). With- out adequate spring flows in the San Joaquin River, stripers will continue to be unable to utilize former spawning habitat in that part of the estuary.
Some half to two-thirds of striped bass spawning now occurs in the Sacra- mento River, far upstream of the Delta. As eggs and larvae move downstream
I in April-July, instead of entering Suisun Bay, many are pulled by the SWP and CVP pumps into the central Delta through the Delta Cross Channel and also
I through Georgiana Slough. In the central Delta, there is high mortality from agricultural diversions and other factors that are not well understood. Research on the close relationship between the volume of Delta outflow during May-July and the survival of striped bass eggs and larvae suggest that flows of at least 10,000 cfs are needed to move eggs and larvae successfully past the Delta (USFWS, 1987b).
Each year, millions of striper eggs and larvae are lost to agricultural, munici- pal, and export intakes in the Delta. Screens do not exist to prevent the entrain- ment of eggs and larvae and none of the agricultural diversions is screened to prevent entrainment of young bass. Predation near the pumps increases losses.
As described in Chapter 4, many factors have been responsible for the decline of the striped bass population. The two most important flow-related factors appear to be inadequate spring flows and increased diversions since the 1970s. As noted at the beginning of this section, mitigation of CVP and SWP direct adverse impacts on striped bass are being developed as part of recent state .and federal agreements.
142 State of the Estuary
American Shad The estuary's population of American shad has declined since the 1940s. Water development is considered to be one of the major causes. Each year, federal and state water projects pull millions of young shad to the southern Delta and into project pumps. Fifty percent or more of the shad collected at the CVP and SWP fish protection devices die during salvage operations (DFG, 1987~). Unscreened agricultural diversions contribute to the mortality of young shad. Through their effect on the location of the entrapment zone and by direct removal, water diver- sions during May-July influence the availability and distribution of this species' chief food, zooplankton. As with salmon, there is a direct relationship between Delta inflow and the abundance of juvenile shad.
Delta Smelt Delta smelt, once one of the most common fish species in the Delta, has declined in numbers over time and appears to be at a critically low level. The population of this short-lived fish, which feeds entirely on planktonic copepods, is especially affected by habitat conditions in Suisun Bay and in the western Delta, One of the strongest determinants of Delta smelt abundance is high primary productivity in Suisun Bay during April through June. As productivity has declined since the early 1980s, so has the smelt population. Some consider the smelt's decline to be a result of increased Delta exports and the high frequency of reverse flows. According to the petition requesting that the California Fish and Game Commis- sion list the Delta smelt as endangered, the ... "best and probably only way of preventing it (Delta smelt) from becoming extinct is to maintain high enough freshwater outflow through the Delta to keep the entrapment zone in Suisun Bay during March, April, May, and June for most years. The entrapment zone should not be upstream from Suisun Bay for more than two years in a row" (Moyle, 1989). As noted in Chapter 4, the Department of Fish and Game believes other factors such as toxic substances, displacement of native food species (particularly Euryternora afinis) by exotics, and the invasion of the clam Potarnocorbula in Suisun Bay may be contributing to the decline (DFG, 1990b).
Bay Fishes The effects of freshwater flow on San Francisco Bay fish species is much more =cult to determine than on species that occur primarily in the Delta or up- stream. Even so, a long-term study of Bay fishes by the Department of Fish and Game (as part of the Interagency Ecological Studies Program described in Chapter 9) is beginning to show that the abundance and/or distribution of many Bay fishes are affected by Delta outflow. Some species, designated "wet year" species, increase their numbers during years of high Delta outflow, while popu- lations of "dry year" species decline. As indicated in Table 17, many Bay species seem to be relatively unaffected by outflow. Variation in the popula- tions of some marine species such as Pacific herring and California halibut probably result from changes in ocean conditions rather than from flow-related factors. It is interesting to note that many "wet year" species are those which are valued for their sport or commercial use.
A recent analysis of 1980-1990 Department of Fish and Game data indicates a close relationship between years of relatively high freshwater flows and the annual abundance of longfm smelt, starry flounder, Bay shrimp, and Pacific her- ring (C. Armor, pers. comm.). An analysis of 1980-1988 Department of Fish and Game data conducted for the Estuary Project similarly shows that the population
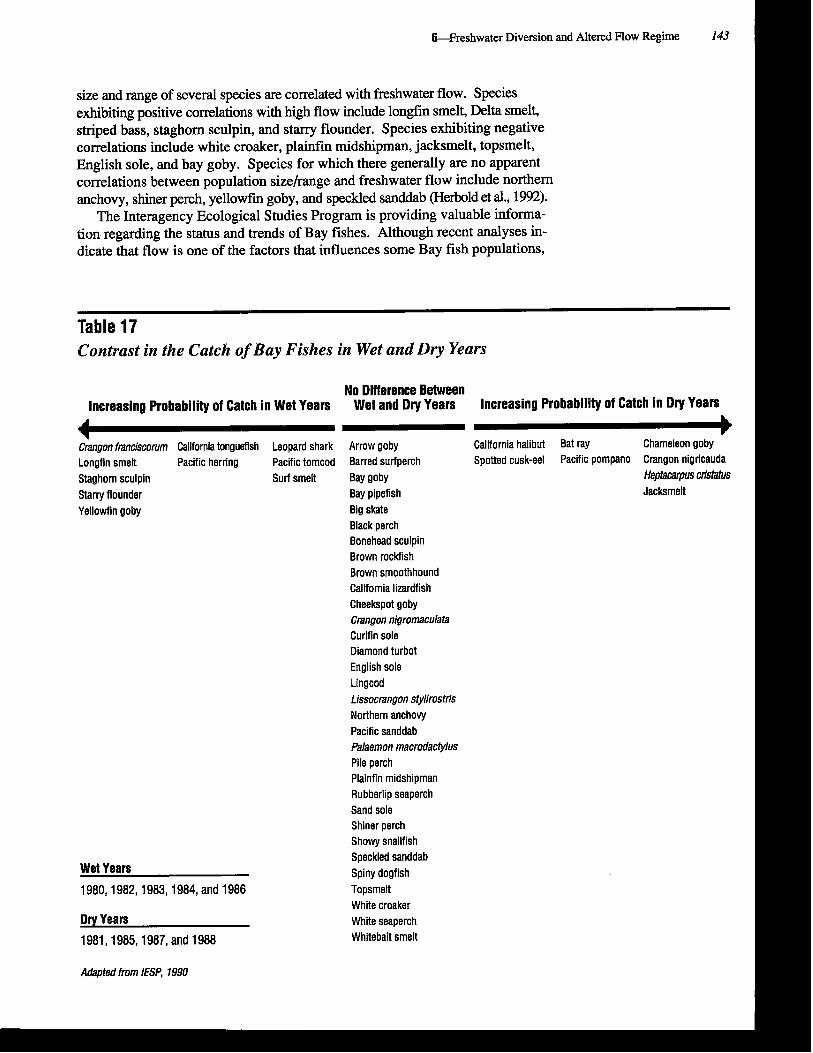
&Freshwater Diversion and Altered Flow Regime 143
size and range of several species are correlated with freshwater flow. Species exhibiting positive correlations with high flow include longfin smelt, Delta smelt, striped bass, staghorn sculpin, and starry flounder. Species exhibiting negative correlations include white croaker, plainfii midshipman, jacksmelt, topsmelt, English sole, and bay goby. Species for which there generally are no apparent correlations between population sizelrange and freshwater flow include northern anchovy, shiner perch, yellowfin goby, and speckled sanddab (Herbold et al., 1992).
The Interagency Ecological Studies Program is providing valuable informa- tion regarding the status and trends of Bay fishes. Although recent analyses in- dicate that flow is one of the factors that influences some Bay fish populations,
Table 17 Contrast in the Catch of Bay Fishes in Wet and Diy Years
No Difference Between Increasing Probability of Catch in Wet Years Wet and Dry Years Increasing Probability of Catch in Dry Years
n Crangon f ~ s c o r u m California tonguefish Leopard shark Arrow goby
D California halibut Bat ray Chameleon goby
Longfin smelt Pacific herring Pacific tomcod Barred surfperch Spotted cusk-eel Pacific pompano Crangon nigricauda Staghorn sculpin Surf smelt Bay goby Heptamrpus cristatus
Starry flounder Bay pipefish Jacksmelt
Yellowfin goby Big skate Black perch Bonehead sculpin Brown rockfish Brown smoothhound California lizardfish Cheekspot goby Crangon nigromaculata Curlfin sole Diamond turbot English sole Lingcod Lissocrangon stylirostris Northern anchovy Pacific sanddab Palaemon macrodactylus Pile perch Plainfin midshipman Rubberlip seaperch Sand sole Shiner perch Showy snailfish Speckled sanddab Spiny dogfish Topsmelt White croaker White seaperch Whitebait smelt
Wet Years
1980,1982,1983,1984, and 1986
Dry Years
1981,1985,1987, and 1988
Adapted from IESP, 1990
144 State of the Estuary
there is yet much to be learned regarding the relationship among flows, other variables, and population dynamics. Each additional year of data will enhance our understanding of flowlfish relationships.
The Future
As the end of the century approaches, water development is far from complete in the estuary watershed and in other parts of the State. With the State's popula- tion expected to increase to more than 39 million by 2010, and given the current plans of water resource developers, it is safe to bet that future demands on the estuary's fresh water d be considerable. To meet the expected demand, local interests are planning to construct additional water projects, the State anticipates completing the State Water Project, and the federal government is evaluating the way it operates the Central Valley Project.
Local Agency Projects
Many water agencies are considering developing additional surfacewater supplies within the estuary watershed to help meet anticipated future demand. Water agencies in the Sacramento Valley, San Francisco Bay area, Central Sierra, and San Joaquin Valley are studying, or have under construction, several projects that would further reduce the estuary's supply of fresh water. Although it is impos- sible to predict the outcome of all of the proposed projects, estimates by the Department of Water Resources indicate that by 2010, local agencies could be diverting at least 200,000 acre-feet of additional water from the estuary's freshwater supply ( D M , 1987~).
State Water Project Completion
The State Water Project has long-term contracts to deliver specified amounts of water each year to 30 contracting agencies. These agencies are in the Feather River basin, San Francisco Bay area, San Joaquin Valley, central coastal area, and southern California; their combined maximum annual entitlement is 4.2 million acre-feet. To help meet the State's contractual obligations to these agencies, the Department of Water Resources plans to increase the dependable supply of the SWP from its current level of 2.3 MAF to 3.2 MAF by 2010. This would require increasing the export capacity of the Delta Pumping Plant and also undertaking several associated projects and programs. The major planned features include the operation of four additional pumps at the Delta Pumping Plant, interim CVP supply purchase, Kern Water Bank, Los Banos Grandes Reservoir, South Delta facilities, and North Delta facilities ( D M , 1987~). In addition to increasing the SWP's dependable water supply, these projects and programs would seek to reduce reverse flows in the Delta; improve drinking water quality to over 20 million Californians; enhance wildlife habitat; improve flood protection; reduce fish losses in the Delta; and enhance local water qual- ity, supply, and circulation.
Providing additional reliable water supplies would require exporting at least an additional 900,000 acre-feet of fresh water from the Delta. To increase exports during winter and spring, DWR has installed four additional pumps at the Delta
&Freshwater Diversion and Altered Flow Regime 145
Pumping Plant. Operation of these pumps would raise the Delta Pumping Plant capacity from 6,400 cfs to 10,300 cfs. The volume of water pumped at this higher rate would submerge a football field under ten feet of water in one minute. Pump- ing at a rate greater than the existing 6,400 cfs capacity would necessitate DWR to reach agreement with the Department of Fish and Game regarding how to offset adverse project impacts to fish and wildlife and to obtain a revised federal permit from the Army Corps of Engineers.
To provide adequate flows of Delta water to the pumps would require im- proving the capacity of Delta channels to move Sacramento River water south- ward. In its North and South Delta Water Management programs currently under development, DWR is considering widening several channels, installing tidal structures in the Sacramento River, constructing an isolated channel between Hood and the Mokelurnne River, and enlarging Clifton Court Forebay. These and other features would be designed to facilitate the transfer of water from the Sacramento River while reducing some of the existing problems such as reverse flows. The final plan and corresponding costs for these modifications have yet to be developed.
Associated storage projects in the planning stage are the Los Banos Grandes Reservoir and the Kern Water Bank. Located just south of the existing San Luis Reservoir, Los Banos Grandes would store an additional 1.75 million acre-feet of water diverted from the Delta. Operation of the Kern Water Bank, a ground- water storage facility, at full capacity would enable the storage of an additional one MAF of exported Delta water. Together, these facilities would permit greater pumping to occur during the winter months when Delta outflow is highest and would help enable the S W to meet demand during dry years. Until these S W facilities are completed, DWR plans to help meet its supply obligations by purchasing water from the CVP. Currently, DWR and the Bureau of Reclama- tion are trying to determine the volume of water that will be available.
If constructed, these projects could have significant environmental impacts on the estuary and other areas. Although the frequency and extent of reverse flows would be reduced, some believe that the overall impact on fishery resources would be negative because increased exports, even during the winter months, would remove nutrients and increase mortality of young salmon, striped bass, and other fish species; this would offset any benefits from increasing Delta exports during the winter and increasing Delta outflow during the spring (USFWS, 1990b). However, according to the intent of the 1986 Two-Agency Fish Agree- ment, DWR may not increase exports until it reaches agreement with DFG on how to offset impacts to fishery resources.
Central Valley Project
Compared to the S W , changes in the operation of the federal Central Valley Project are more difficult to predict. The Bureau of Reclamation (Reclamation) currently is evaluating many options and constraints in its operation of the CVP. It probably will be many months until a revised long-term operating plan emerges.
As noted previously, the CVP is authorized by Congress to operate for a variety of purposes. One purpose is the provision of water for agricultural, municipal, and industrial uses. Reclamation typically meets its obligations to deliver specific amounts of water by entering into long-term contracts with water districts, munici- palities, or other organizations. These contractors, in turn, deliver water to the individual farmer or consumer.
I
146 State of the Estuary
In 1979, the U.S. Department of Interior placed a moratorium on the establish- ment of new, long-term water contracts for uncommitted CVP water. The morato- rium was enacted because of concerns about environmental (primarily fishery) and water quality effects of CVP operation. As a result, in 1985, the CVP delivered only about 7.5 MAF, although it had the physical capacity to deliver much more. In 1986, as required by Public Law 99-546, Reclamation agreed to operate the CVP in conjunction with the State Water Project in order to meet Delta water quality standards. Because of this agreement and other Reclamation actions on Trinity and Sacramento river fisheries and water quality, the Department of Interior lifted the moratorium on new CVP contracts. Presently, Reclamation has con- tracts with 294 CVP contractors to provide up to 8.58 MAF of water annually, depending on the amount of precipitation and subsequent water supply in CVP reservoirs. In meeting its contractual obligations to water users, Reclamation must also meet the terms and conditions in its State water rights permits and the provisions in various agreements with other federal, state, and local entities.
In 1987, Reclamation focus began to shift from one based on federally sup- ported construction to one based, instead, on water resource management. This was a result of environmental concerns, a farm economy burdened with increasingly costly projects, a revised public perception of Reclamation's mission, and budget- ary constraints at all levels of government that combined to make major agricultural water and power projects increasingly difficult to justify (USBR, 1988). Helping to effect this change was the Reclamation Reform Act of 1982, which requires all federal water contractors to develop and implement water conservation plans that include goals, measures, and time schedules. Reclamation requires water districts larger than 2,000 acres to develop water conservation plans and to update them every five years. In keeping with its new mission-the management, development, and protection of water and related resources in the interest of the American public -Reclamation is reevaluating its 1988 proposal to allocate some 1.5 MAF of "available and uncommitted CVP water."
The future operation of the CVP will be determined by the outcome of a number of ongoing activities, ranging from water resource planning studies, to state and federal legislation, to the status of endangered species. As the lead agency in water resource planning studies on the American, Stanislaus, and San Joaquin rivers, Reclamation currently is studying whether alternative operations would be beneficial and justified to meet the various beneficial uses. Although no specific plans have been formulated since the 1988 proposal, environmental impact statements will be prepared on all proposed actions that could result in operational changes.
Meeting Environmental Needs and Future Water Demand Throughout this century, a steadily increasing volume of water has been diver- ted from the estuary's freshwater supply. Based on existing plans by local and state agencies, it is likely that this trend will continue. Assuming construction of planned facilities by local agencies and completion of the SWP as currently envisioned, the estuary's freshwater supply could be depleted by at least an additional 1.1 MAF each year. Depending on the development of other local projects, SWP intermittent exports, and the ultimate operations of the CVP, depletions could be even greater. Under existing plans, the maximum combined pumping capacity of the CVP and SWP Delta facilities is expected to increase from the existing 11,000 cfs to 14,900 cfs, a diversion rate 33 percent greater than the average historic summer Delta outflow.
&Freshwater Diversion and Altered Flow Regime 147
Given these projections and the estuary's existing environmental problems, all three major stakeholders in state water issues+nvironmental groups, urban water suppliers, and farming interests-are seeking improvements in the way water is managed. Environmental groups, committed to changing water manage- ment statewide, are seeking ways to minimize adverse environmental impacts resulting from water project construction and operation and are seeking to offset past environmental damages. Of utmost interest to these groups is the allocation of additional water for the estuary and its tributaries. However, they are concerned that growing cities ultimately may demand, for urban uses, any water allocated for instream needs. At the same time, urban water agencies are increasingly womed about their ability to continue to provide reliable and high-quality water to growing urban populations. Agriculture fears it may lose its ability to retain adequate quan- tities of water as growing urban areas demand access to agricultural water. With all three stakeholders recognizing the need to break the decade-long stalemate in de- veloping new water policy, they recently adopted a consensus, rather than combat- ive, approach.
In an effort to try to resolve some of the most pressing problems of California water management, representatives of environmental groups, urban water suppliers, and agricultural water agencies began a series of discussions at the end of 1990. The goal of the discussions is to develop a new framework for California water management that is environmentally sound, economically viable, and broadly acceptable to these three, and other, interests. Participants in the discussions hope to develop a specific agreement to assist elected officials as they seek to meet the future water needs of the environment, cities, and agriculture. In July 1991, participants determined that their agreement would consist of a package of several elements that include:
Bay-Delta and other environmental guarantees.
Fish and wildlife habitat improvements.
Measures to improve water management, addressing water supply and demand, including, but not limited to, water transfers, water banking, urban conservation, wastewater management, irrigation efficiency, conjunctive use of surface and ground water, and groundwater management.
Facilities necessary to accomplish the elements referred to above, to provide reliable supplies for agricultural and urban uses, and to improve the quality of waters ultimately used for drinking.
Any agreement can only be implemented if it complies with federal and state laws and regulations. The parties agree to work together to achieve that compliance and to implement the agreement.
Although it is too soon to know what will be the outcome of the three-way discussions, it is encouraging that previously opposing forces in the California's water issues are, for the first time, trying to reach agreement on how best to solve these extremely complicated issues. During the next few years, as policy makers seek ways to balance more effectively the many competing uses of the state's water resources, these discussions likely will play an important role.
Water Quality Standards for the Eshary Under the federal Clean Water Act and EPA's implementing regulations, states are to establish designated uses for water bodies, and must adopt water quality criteria sufficient to protect those designated uses. EPA is to review and approve
148 State of the Estuary .
or disapprove all state-adopted water quality criteria (referred to as "objectives" in the California State Water Code). The State of California fvst proposed water quality objectives for the Delta in 1965. Since then, objectives for the Delta and Suisun Marsh have been established or modified several times (for a brief review of relevant actions, see SWRCB, 1988).
In 1978, the State Water Resources Control Board (State Board) adopted a water quality control plan (the Delta Plan) for the Sacramento-San Joaquin Delta and Suisun Marsh. The Delta Plan established water quality standards for three categories of beneficial uses: municipal and industrial, agriculture, and fish and wildlife. A key set of standards to protect fish and wildlife uses were the striped bass spawning and survival standards, established to provide minimum salinity and flow conditions to protect the fishery at levels that would have existed in the absence of the state and federal water projects. The Delta Plan emphasized striped bass protection because of its commercial importance and the relative abundance of information on the species, but also indicated that it considered the striped bass standards to be a surrogate for protecting other species. To im- plement the Delta Plan water quality standards, the State Board amended (in Decision-1485) the water right permits of the Department of Water Resources and the Bureau of Reclamation. Recognizing uncertainties associated with proposed water development facilities to be constructed and the need for addi- tional information on the Bay-Delta ecosystem, the State Board limited the Delta Plan to current and near-term conditions in the Delta. It also committed to review the 1978 objectives after about a decade.
In 1986, the State Court of Appeal, First District, issued a decision in United States v. State Water Resources Control Board, also known as the Racanelli or Delta Water Cases decision. In this decision, which addressed legal challenges to D-1485, the court directed the State Board to take a global perspective of water resources in developing water quality objectives.
In 1987, consistent with the court decision and as part of the triennial review of water quality criteria required by the federal Clean Water Act, the State Board began a process to review the Delta Plan objectives. The process eventually evolved into three phases: a water quality phase, an environmental impact report scoping phase, and a water right phase. In July, 1987, the State Board initiated the first phase, which included a public pkeedhg (known informally as the BayPelta hearing) to receive evidence on beneficial uses and water quality issues for the estuary. In October 1988, it issued a draft water quality control plan for the estuary (SWRCB, 1988). Phase 1 was completed in May, 1991, when, after considering comments on the draft plan, the State Board issued a highly modified final plan entitled, "Water Quality Control Plan for Salinity, San Francisco Bay/Sacramento- San Joaquin Delta Estuary" (SWRCB, 1991). This document, also known as the "Salinity Control Plan," includes salinity objectives for municipal/industrial and agricultural water supply, for estuarine and wildlife habitat in Suisun Marsh, and for striped bass spawning. Also included are dissolved oxygen and temperature objectives for Chinook salmon.
On September 3, 1991, EPA approved the Salinity Control Plan's salinity objectives for municipal/iidustrial and agricultural uses and the dissolved oxygen objective for salmon. However, it did not approve the plan's salinity objectives for estuarine and wildlife habitat in Suisun Marsh and for striped bass spawning or the temperature objectives for salmon. EPA did not approve these objectives because it believed they would not adequately protect the estuary's declining populations of salmon, striped bass, and other organisms.
6-Freshwater Diversion and Altered Flow Regime 149
Because EPA did not approve the State's water quality objectives, it is preparing to promulgate federal standards for salinity and temperature by the end of 1992. However, should the State Board adopt approvable objectives before then, federal promulgation efforts would cease.
Summary
Freshwater inflow is a major determinant of environmental conditions in the estuary. The volume and timing of freshwater inflow affect estuarine circulation patterns, water quality, and the abundance of many species of plants and animals. Considering the scope of its effects, freshwater inflow is perhaps the most important regulated variable influencing the estuary today.
Before the onset of water development projects in the estuary watershed in the latter half of the last century, the volume and timing of freshwater inflow into the estuary were determined by precipitation and natural hydrological conditions. Peak volumes of winter and spring runoff, in combination with vast acreages of pristine wetlands and some 6,000 miles of instream habitat, provided conditions for a highly diverse and productive estuarine ecosystem.
Throughout the past century and especially since the 1940s, water development for flood control, agriculture, and municipal uses has altered the volume and timing of freshwater inflow to the estuary. Today, hundreds of reservoirs in the Central Valley reduce the volume of water flowing to the estuary in the winter and spring and increase it during the summer. Diversions remove an average of more than half of the water that otherwise would reach San Francisco Bay. Water projects also affect salinity gradients and alter circulation patterns, especially in the estuary's northern reach.
Water development has affected many of the estuary's biological resources. It has increased the salinity of water and soil in Suisun Marsh, necessitating the implementation of a major effort there to better manage water and soil quality. It has adversely affected populations of economically important resources such as salmon and striped bass. For these and other fish species, water development has reduced the quantity and quality of spawning and rearing habitat and has increased mortality by altering migration routes. The entrainment of eggs and young in Delta diversions is a considerable source of mortality for many fish species. Other more subtle and less well understood effects of water development include the removal of nutrients, phytoplankton, and zooplankton in Delta diversions and the influence of altered flows on benthic biota. Changes in the populations of some Bay fishes are beginning to be correlated with altered flows.
State and local water resource development plans call for additional freshwater diversions from the estuary watershed, The State Water Project is expected to increase annual diversions from the Delta by at least 900,000 acre- feet; combined with additional diversions by locals, annual diversions from the estuary tributaries and the Delta are expected to increase by more than one million acre-feet in the coming years. The operation of four additional pumps at the State's Delta pumping plant would increase the combined rate of SWP and CVP Delta exports to more than 14,000 cfs, a flow one-third greater than the average volume of historic Delta outflow in summer. Plans to complete the State Water Project include several measures that could potentially reduce some of the Project's existing adverse impacts in the Delta by increasing
I
I50 State of the Estuary
diversions during winter months. These measures, however, would not address all of the existing export-related impacts to biological resources, and they may actually exacerbate some problems as total annual exports increase.
Throughout the past decade, there has been an increased recognition that water development is causing or contributing to environmental problems in the estuary and in other parts of the state. Discussions among environmental groups, urban water suppliers, and agricultural water agencies provide encouragement that these three major interests in statewide water issues may soon agree on the best way to meet the growing urban demand for fresh water while ensuring adequate protection for the estuary and its tributaries. Pending actions by the State Water Resources Control Board and the Environmental Protection Agency may help to ensure adequate estuarine water quality. Together, these private and public activities may result in the estuary's freshwater supply eventually being managed in a way that is scientifically and ecologically sound and economically and politically acceptable to all Californians.
Pollutants
Every day, thousands ofpounds ofpollutants enter the BaylDelta estuary. They come from many sources including sewage treatment plants, industrial facilities, forests, farm fields, mines, back yards, and urban streets. They find their way to even the estuary's most remote areas where they interact with water, sediment, plants, and animals.
This chapter describes the many aspects of the pollutant management issue in- cluding pollutant sources, quantities, distribution, and gects. It notes the successes
7 in reducing the quantities of some pollutants and points out the need for better control of others. It also discusses the factors that will influence the quantities and kinds of pollutants entering the estuary in thefuture. The information in this chapter is based primarily on the Status and Trends Report on Pollutants in the San Francisco Estuary (Davis et al.. 1991), but it also comes from other pertinent sources.
During the process of characterizing the pollutant issue, the following points have emerged:
1. Each year, an estimated 5,000 to 40,000 tons of at least 65 pollutants enter the estuary. Many of these pollutants are carcinogenic, teratogenic, or mutagenic.
2. The major sources of pollutants are urban runoff, nonurban runoff, municipal wastewater treatment plants, industrial facilities, rivers, and dredging.
3. Since the 1950s, improved treatment has lowered the quantity of biodegrad- able pollutants entering the estuary from wastewater treatment plants. As a result, effects in the estuary associated with low oxygen concentrations and high bacteria levels are now rare.
4. Improved treatment at municipal wastewater treatment plants and industrial facilities has reduced the discharge of some toxic trace elements, but these substances continue to enter the estuary in large quantities, especially from uncontrolled sources.
5. Pollutants are widespread in the estuary and reach highest concentrations in harbors, harbor entrances, marinas, and industrial waterways.
6. Pollutants that enter the estuary can concentrate at high levels in animal tissues, even though they occur at low concentrations in the water and sediments.
152 State of the Estuary
7. Bioassays of estuary water, sediments, municipal and industrial effluent, urban runoff, and nonurban runoff have elicited toxic effects in many test organisms.
8. Several biological indicators show that adverse physiological changes are occur- ring in the estuary's organisms, most likely as a result of exposure to pollutants. For example, PCBs appear to be reducing reproductive success in starry flounder in the eastern portion of Central Bay, and PCBs and DDE in black- crowned night heron eggs have been correlated with decreased embryo size and eggshell thickness, respectively.
9. Concentrations of silver, copper, and cadmium in South Bay clams vary in response to annual water circulation processes which dilute and transport these trace elements.
10. Concentrations of several pollutants in estuary waters exceed state water quality objectives. Concentrations of some pollutants in sediments exceed concentrations known to be associated with toxicity. Concentrations of some pollutants in animal tissues exceed international standards or guidelines for the protection of aquatic life.
11. Although pollutant effects may be demonstrated in laboratory bioassays, effects on animal behavior, population dynamics, or the structure of the estuary's fish and wildlife communities are poorly understood.
12. The effects of disinfectant byproducts on the quality of drinking water expor- ted from the Delta is a major concern of municipal water purveyors.
13. Discontinuing the use of a particular chemical may be more effective in reducing its presence in the estuary than treating it. Declines in the DDT and PCB levels in biota following bans on production or use are examples.
14. With the human population in the estuary watershed projected to grow to more than 12 million in the next 15 years, pollutant loading from urban runoff can be expected to increase.
From these findings, it is apparent that the estuary receives substantial pollutant loads and is exhibiting many pollutant-related effects. Until loads are reduced, these effects will continue.
What are Pollutants?
Pollutants are substances that adversely affect the physical, chemical, and bio- logical properties of the environment. According to the State Water Code (Sec. 13050 El]), pollution is an alteration of the quality of the waters of the state by waste to a degree which unreasonably affects (1) such waters for beneficial uses or (2) facilities which serve such beneficial uses. Pollution may include "con- tamination," an impairment of the quality of the waters of the state by waste to a degree which creates a hazard to the public health through poisoning or through the spread of disease (SWC Sec. 13050 [k]).
Pollutants may be found in soil, air, rivers, lakes, and ground water-in short, just about everywhere. Some pollutants occur naturally and have been compo- nents of natural ecosystems for millions of years: They have their greatest

-- -- - - - - --
Pollutant Concentrations Pollutants occur in the estuary in very small concentrations. To help get a feel for the units of masurement used to describe pollutants, here are a couple of examples:
i"i 15 Ibs.
Seawater has about 30 pounds of salt in each 1,000 30 parts per billion would result from adding less than pounds of pure water; its salt concentration is 30 a single grain of salt to a bathtub full of pure water. parts per thousand (30 ppt). In a bathtub of seawa- ter (about 60 gallons) there are about 15 pounds of Looking at it another way, one part per billion is the
salt. If, instead of 15 pounds, there were one equivalent of one second in 31.7year-s. It is also equiva-
teaspoon of salt, the resulting concentration would lent to 5 people out ofthe total population of the earth.
be about 30 parts per million. A concentration of
Adapted from PSWQA, 1988
impact when highly concentrated, often by human activities. Other pollutants are synthetic and have been introduced into the environment only recently. Even at low concentrations, synthetic pollutants may severely affect plants and animals that have no natural defenses against them.
Measurement of Pollutants
Pollution is usually expressed in terms of concentration, the quantity of a pol- lutant in a given amount of water, sediment, or animal tissue. The quantity of a pollutant in a sample is described as a fraction of the sample's total weight or volume. Because pollutants often occur in the environment and biota at very low concentrations, the units of measurement for describing pollutant concentra- tions are correspondingly low. Units commonly used are parts per thousand (ppt), parts per million (ppm), and parts per billion (ppb).
Although concentrations in the parts per million or parts per billion range may seem insignificant, some chemicals (especially some organic chemicals) can be harmful to animals even at these low concentrations. American oyster embryos, for example, will be killed if exposed to water containing silver at a concentration of less than 6 parts per billion.
Kinds of Pollutants
There are four kinds of pollutants in the estuary: inorganic chemicals, natural and synthetic organic chemicals, biological contaminants, and suspended sediments and other particles.

154 State of the Estuary
Inorganic Chemicals Inorganic chemicals, except for carbonates and carbon dioxide, are those that do not contain carbon. From a pollutant perspective, the most important inorganic chemicals are the trace elements (also known as trace metals or heavy metals) and compounds of phosphorus and nitrogen.
Trace elements occur naturally in low concentrations in the estuary's waters, carried there from the ocean and from soil. Most are necessary in small amounts to support plant and animal life. Refined into useful metals, enriched in many commercial products, or contained in fossil fuels, they also enter the estuary in sewage and industrial effluent and in urban and nonurban runoff at concentra- tions above background and in forms that are quite toxic. The trace elements in the estuary for which there is most concern are arsenic, cadmium, chromium, copper, lead, mercury, nickel, selenium, silver, and zinc (Phillips, 1987).
Nitrogen and phosphorus, primarily in the form of nitrates and phosphates, are nutrients necessary for plant growth. Occurring naturally at low concentra- tions in estuarine waters, these compounds enable the growth of algae and phy- toplankton, plants at the base of the aquatic food web. The introduction of high levels of nitrates and phosphates in incompletely treated municipal effluent or in agricultural runoff may stimulate excessive growth of aquatic plants. After the plants die, their decomposition may reduce the amount of dissolved oxygen available for fish and other organisms.
Organic Chemicals The term "organic," first used in 1808, originally pertained to the study of the substances in living cells. Since then, it has been broadened to include all natural and synthetic compounds that contain carbon. Many of the natural organic com- pounds are familiar. They are the stuff (fats, proteins, and carbohydrates) of which animals and plants are made. Natural products such as wood, leather, cotton, and wool all contain organic compounds. Organic materials, altered over millions of years, form the fossil fuels on which humans are currently so dependent.
Synthetic organic chemicals are organic compounds made by humans. Since 1828, when the first synthetic compound was made, the list of these chemicals has grown enormously. Today, tens of thousands of synthetic substances are produced each year. These plastics, pesticides, fertilizers, solvents, pharmaceu- ticals, detergents, and other products are as much a part of modern life as are wood and cotton.
Synthetic chemicals have changed our lives in remarkable'ways, but they also can pose severe threats to the natural systems on which we depend. Many synthetic compounds are resistant to decomposition and are toxic to living or- ganisms. Some, especially pesticides developed during the past several decades, are designed specifically to have these properties. Compounds containing chlorine or bromine, members of a group of elements known as halogens, are among the most persistent and toxic of organic chemicals. Familiar halogenated compounds include PCBs and pesticides such as DDT. Once these chemicals enter the environment, their detrimental effects may continue for decades. Re- cognition of the long-term environmental effects of these persistent compounds has gradually brought into production replacement formulations that are more short-lived yet still effective. The widespread pollution of the estuary with PCBs and DDT is a result of the former use and improper handling of these persistent compounds.
Biological Pollutants Organisms harmful to human health can enter the estuary from septic systems; in untreated municipal sewage and recreational boat discharges; and in runoff from farms, feedlots, and urban areas. Bacteria and viruses are the main agents of concern, particularly those organisms that cause cholera, hepatitis, salmo- nella, and typhoid.
Of the many species of microbes that human activities introduce into the estuary, only fecal coliform bacteria are monitored (since 1978, all municipal wastewater treatment plants test for coliform bacteria). Although these bacteria do not cause disease in humans, their occurrence in the estuary indicates that other harmful organisms may be present. To protect human health, when coli- form levels in the water are too high, officials close beaches or prohibit the harvest of shellfish.
Sediments and Other Particles Particles of organic and inorganic matter enter the estuary from shorelines and rivers. They are generated by natural sources such as eroding soil and decom- posing plant and animal wastes. Disturbance of the land surface, as in farming, residential construction, and road-building, can increase the influx of particulate material to receiving waters. Municipal wastewater also carries particulates. Once in the estuary, particulates are transported by currents until they settle to the bottom as sediment or are carried to the ocean. Dredging disturbs sedi- ments, releasing particles and adhered pollutants into the water column.
Particulates may affect estuarine waters in several ways. At high concentrations they may clog the gills of fish and reduce the penetration of sunlight, thereby lowering the production of phytoplankton. The settling of suspended material may smother benthic animals and modify the behavior of other aquatic organisms. Depending on grain size and organic carbon content, particulates can influence the bioavailability and toxicity of chemical pollutants. As a benefit, suspended material may bind some pollutants, reducing their availability to animals.
Mixtures of Pollutants Many pollutants enter the estuary in complex mixtures. A freshwater stream enter- ing the Bay, for example, may carry particles of asbestos from worn automobile brake shoes, petroleum hydrocarbons from a leaking engine crankcase, bits of synthetic rubber from worn tires, fertilizer from the lawn of a business park, organic pesticides from back yard gardens, bacteria from pet droppings, and arsenic and clay particles from eroded soil. Likewise, the effluent from wastewater treatment plants and industrial facilities may contain hundreds of separate compounds, from viruses to persistent pesticides.
Conventional Pollutants Conventional pollutants are defined in the federal Clean Water Act as total suspended solids, fecal coliform bacteria, biochemical oxygen demand, pH, and oil and grease. They are most often associated with effluent discharged from municipal wastewater treatment plants, but they also may be components of industrial effluent. Conventional pollutants were the fqst water pollutants to be regulated by state and federal laws.
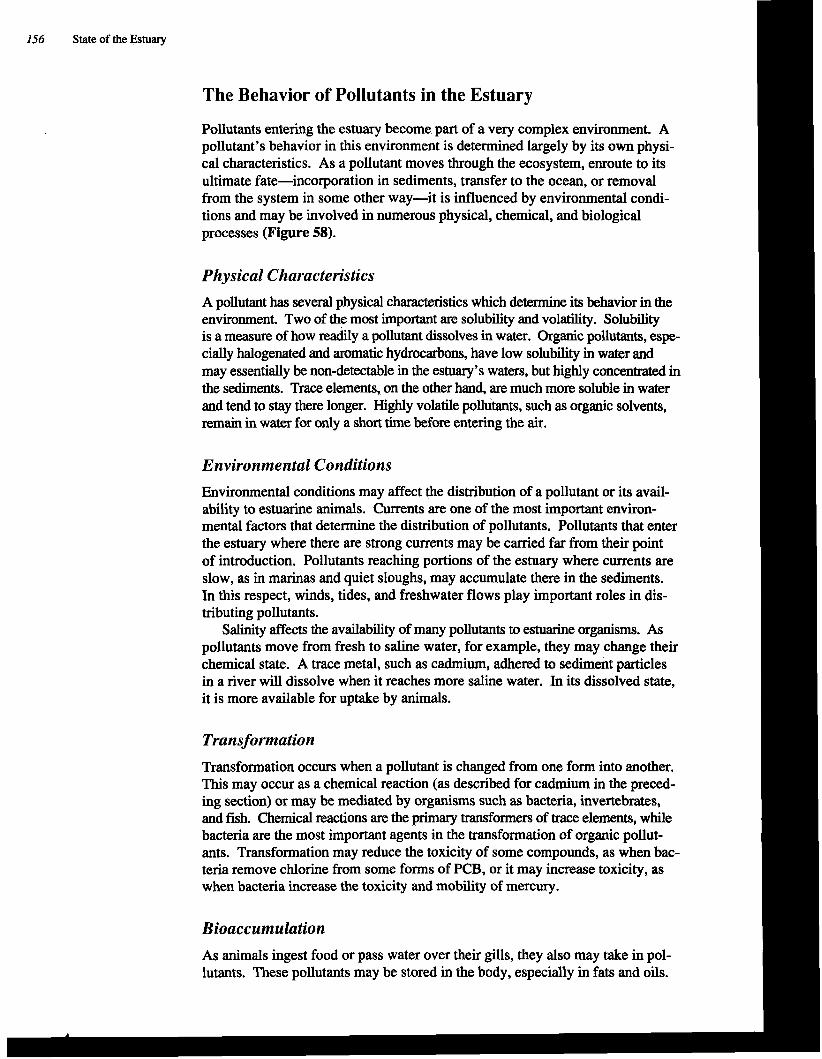
156 State of the Estuary
The Behavior of Pollutants in the Estuary
Pollutants entering the estuary become part of a very complex environment. A pollutant's behavior in this environment is determined largely by its own physi- cal characteristics. As a pollutant moves through the ecosystem, enroute to its ultimate fate-incorporation in sediments, transfer to the ocean, or removal from the system in some other way-it is influenced by environmental condi- tions and may be involved in numerous physical, chemical, and biological processes (Figure 58).
Physical Characteristics
A pollutant has several physical chamtenstics which determine its behavior in the environment. Two of the most important are solubility and volatility. Solubility is a measure of how readily a pollutant dissolves in water. Organic pollutants, espe- cially halogenated and aromatic hydrocarbons, have low solubility in water and may essentially be non-detectable in the estuary's waters, but highly concentrated in the sediments. Trace elements, on the other hand, are much more soluble in water and tend to stay there longer. Highly volatile pollutants, such as organic solvents, remain in water for only a short time before entering the air.
Environmental Conditions
Environmental conditions may affect the distribution of a pollutant or its avail- ability to estuarine animals. Currents are one of the most important environ- mental factors that determine the distribution of pollutants. Pollutants that enter the estuary where there are strong currents may be carried far from their point of introduction. Pollutants reaching portions of the estuary where currents are slow, as in marinas and quiet sloughs, may accumulate there in the sediments. In this respect, winds, tides, and freshwater flows play important roles in dis- tributing pollutants.
Salinity affects the availability of many pollutants to estuarine organisms. As pollutants move from fresh to saline water, for example, they may change their chemical state. A trace metal, such as cadmium, adhered to sediment particles in a river will dissolve when it reaches more saline water. In its dissolved state, it is more available for uptake by animals.
Transformation
Transformation occurs when a pollutant is changed from one form into another. This may occur as a chemical reaction (as described for cadmium in the preced- ing section) or may be mediated by organisms such as bacteria, invertebrates, and fish. Chemical reactions are the primary transformers of trace elements, while bacteria are the most important agents in the transformation of organic pollut- ants. Transformation may reduce the toxicity of some compounds, as when bac- teria remove chlorine from some forms of PCB, or it may increase toxicity, as when bacteria increase the toxicity and mobility of mercury.
Bioaccumulation
As animals ingest food or pass water over their gills, they also may take in pol- lutants. These pollutants may be stored in the body, especially in fats and oils.
1
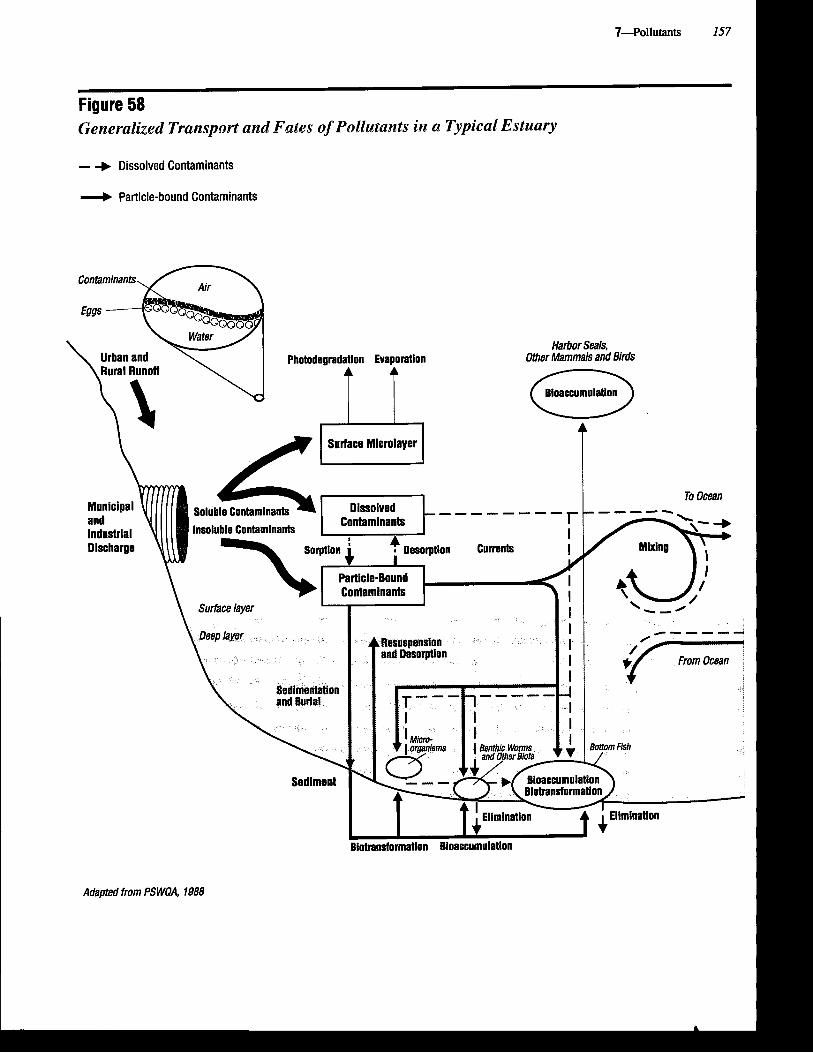
Figure 58 Generalized Transport and Fakes of Pollutants in a Typical Estuary
- + Dissolved Contaminants
+ Particle-bound Contaminants
Harbor Seals, Other Mammals and Birds
Bloaccumulation
A
\ Urban and \ I Photodearadatlon Evaporation \Rural Runoff \ I
4 Soluble Contamlnants
Surface Microlayer u To Ocean
- - Dl, I
lhn)nmInanh r and "UII~I..I..S...Y
nsolubie Contamlnants Industrial ~-
Discharge rptlon
Particle-Bound Contamlnants
Currents
Suhce layer
Sedimentation I I -+-I I and Burin1 r--- -----
Sediment I f ! Eliminatlo
Blotransformation Bioaccumuiatlon
Adapted from PSWOA, 1988

158 State of the Estuary
Over time, pollutant concentrations in the body may increase (bioaccumulate), even though they are low in water and sediments. Such concentrations might not affect the organism itself, but may adversely affect the health of an animal that consumes it.
Bioaccumulation also occurs when organisms eat contaminated prey. In this way, pollutants move through the food web and eventually may reach harm- ful levels in predators at the top, including fish-eating birds, seals, and humans.
Pollutants in the Estuary-A Chronicle of Change
To appreciate the current status of pollutants in the estuary, it helps to under- stand how the very nature of pollution has changed since the last century. This section traces this change and describes some of the progress made in reducing pollutant loads.
Before the arrival of Europeans, the few pollutants that entered the estuary came from natural sources such as the weathering of rocks, from oil seeps, and from the settlements of Native Americans along the shoreline. The effects of these pollutants were probably small and localized. The first major anthropogenic, or human-caused, pollutant effect on the estuary probably occurred during the gold mining' period between 1853 and 1884, when an estimated 3,500 tons of highly toxic mercury were used to extract gold. Undoubtedly, some of this mercury, along with millions of cubic yards of sediments, reached the estuary (Phillips, 1987).
By the end of the 1800s, untreated industrial and sewage wastes adversely affected water quality in many portions of the Bay. Oily discharges from bilge pumping and the flushing of storage and process tanks were common sights. Oil tankers frequently deposited oil on the shoreline in Marin and San Mateo counties.
A relict discharge pipe in San Pablo Bay - a reminder that industrial discharges into the Bay have occurred for more than a century. (Photo: Bob Walker)
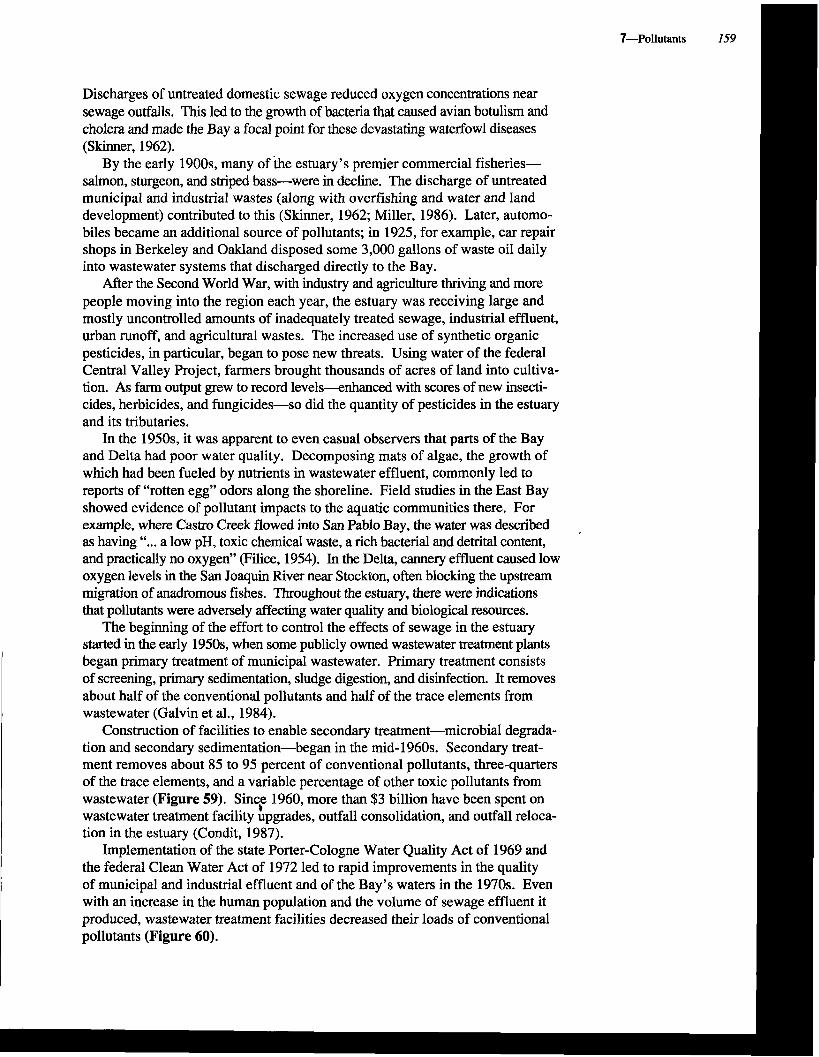
Discharges of untreated domestic sewage reduced oxygen concentrations near sewage outfalls. This led to the growth of bacteria that caused avian botulism and cholera and made the Bay a focal point for these devastating waterfowl diseases (Skinner, 1962).
By the early 1900s, many of the estuary's premier commercial fisheries- salmon, sturgeon, and striped bass-were in decline. The discharge of untreated municipal and industrial wastes (along with overfishing and water and land development) contributed to this (Skinner, 1962; Miller, 1986). Later, automo- biles became an additional source of pollutants; in 1925, for example, car repair shops in Berkeley and Oakland disposed some 3,000 gallons of waste oil daily into wastewater systems that discharged directly to the Bay.
After the Second World War, with industry and agriculture thriving and more people moving into the region each year, the estuary was receiving large and mostly uncontrolled amounts of inadequately treated sewage, industrial effluent, urban runoff, and agricultural wastes. The increased use of synthetic organic pesticides, in particular, began to pose new threats. Using water of the federal Central Valley Project, farmers brought thousands of acres of land into cultiva- tion. As farm output grew to record levels--enhanced with scores of new insecti- cides, herbicides, and fungicides-so did the quantity of pesticides in the estuary and its tributaries.
In the 1950s, it was apparent to even casual observers that parts of the Bay and Delta had poor water quality. Decomposing mats of algae, the growth of which had been fueled by nutrients in wastewater effluent, commonly led to reports of "rotten egg" odors along the shoreline. Field studies in the East Bay showed evidence of pollutant impacts to the aquatic communities there. For example, where Castro Creek flowed into San Pablo Bay, the water was described as having " ... a low pH, toxic chemical waste, a rich bacterial and detrital content, and practically no oxygen" (Filice, 1954). In the Delta, cannery effluent caused low oxygen levels in the San Joaquin River near Stockton, often blocking the upstream migration of anadromous fishes. Throughout the estuary, there were indications that pollutants were adversely affecting water quality and biological resources.
The beginning of the effort to control the effects of sewage in the estuary started in the early 1950s, when some publicly owned wastewater treatment plants began primary treatment of municipal wastewater. Primary treatment consists of screening, primary sedimentation, sludge digestion, and disinfection. It removes about half of the conventional pollutants and half of the trace elements from wastewater (Galvin et al., 1984).
Construction of facilities to enable secondary treatment-microbial degrada- tion and secondary sedimentation-began in the mid-1960s. Secondary treat- ment removes about 85 to 95 percent of conventional pollutants, three-quarters of the trace elements, and a variable percentage of other toxic pollutants from wastewater (Figure 59). Sincf 1960, more than $3 billion have been spent on wastewater treatment facility upgrades, outfall consolidation, and outfall reloca- tion in the estuary (Condit, 1987).
Implementation of the state Porter-Cologne Water Quality Act of 1969 and the federal Clean Water Act of 1972 led to rapid improvements in the quality of municipal and industrial effluent and of the Bay's waters in the 1970s. Even with an increase in the human population and the volume of sewage effluent it produced, wastewater treatment facilities decreased their loads of conventional pollutants (Figure 60).
160 State of the Estuary
Figure 59 Eflectiveness of Primary and Secondary Treatment
Conventionals Trace Blatile Extractable (BOD + TSS) Elements Organics Organics
Initial Loadings to
1 f l f l n % of Initial Loadlna
4% 23% 31 % 22%
Adapted from Galvin eta/,, 1984 in PSWGM, 1988
Reducing the discharge of conventional pollutants into the estuary during the past four decades has resulted in significant improvements in water quality. Foul odors and unsightly evidence of raw sewage discharges that were once prevalent in the Bay no longer occur. Levels of bacteria in Bay waters also have dropped (Luoma and Cloern, 1982). As a result, the 50-year-long ban on shellfish har- vesting in the waters of San Mateo County was partially relaxed in 1982.
In the late 1970s, advances in municipal wastewater treatment and pretreat- ment programs also reduced the load of toxic pollutants entering the estuary from municipal treatment plants. Pretreatment programs are aimed at reducing the amount of industrial waste discharged into mdnicipal wastewater treatment plants. By removing toxic pollutants at their sources rather than at municipal treat- ment plants, pretreatment reduces the stream of pollutants that may pass through the plants to contaminate the water, sludge, or air. It also may help treatment plants operate more effectively. Between 1975 and 1985, pretreatment programs and other advances reduced the amounts of trace elements discharged from municipal treatment plants by 37 to 92 percent (SFBRWQCB, 1988).
The treatment of waste water discharged directly from industrial facilities into the estuary also has improved. As indicated in Figure 61, loads of some pollutants from the biggest class of industrial dischargers, petroleum refineries,
PRIMARY TREATMENT
i / l ~ ~ F # : s e n t "
SECONDARY TREATMENT
% of Initial Loading nmalning alter Secondary matment
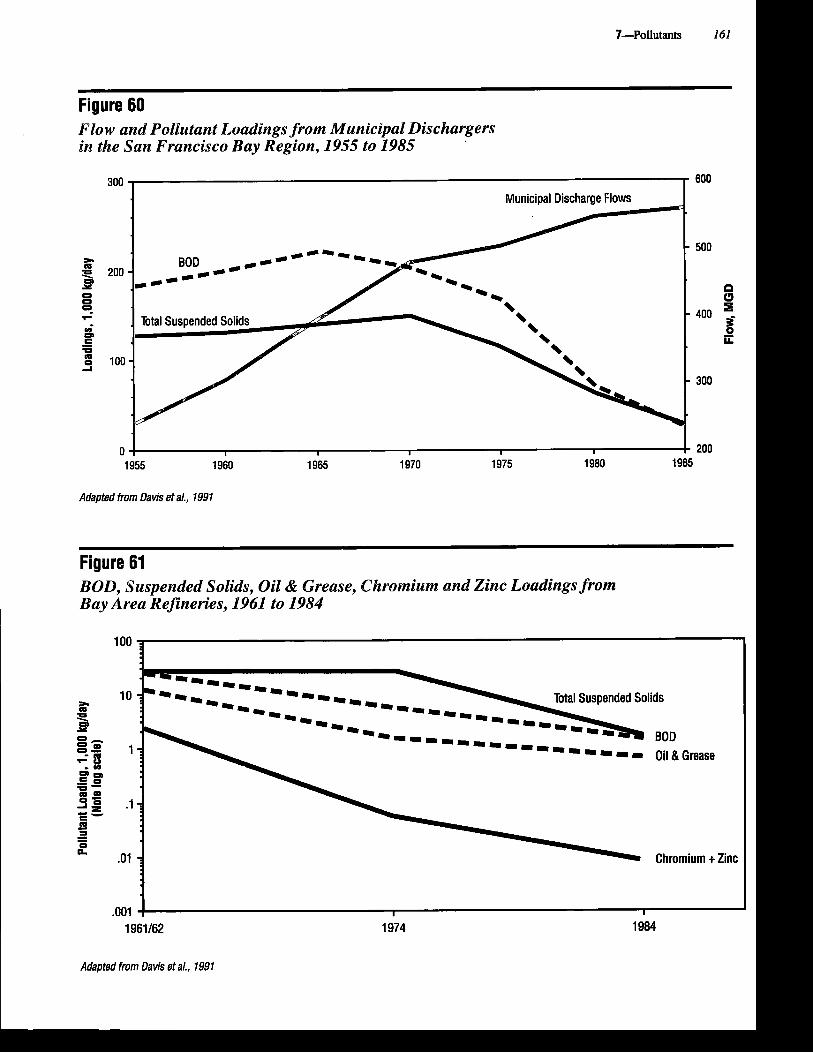
7-Pollutants 161
Figure 60 Flow and Pollutant Loadings from Municipal Dischargers in the Sam Francisco Bay Region, 1955 to 1985
300 600
500 * g 2,
0 n
0 8 9 r 400
z
E - d c u " 100 2
300
0 200 1955 1960 1965 1970 1975 1980 1985
Adapted from Davis eta/., 1991 I
Figure 61 BOD, Suspended Solids, Oil & Grease, Chromium and Zinc Loadings from Bay Area Refineries, 1961 to 1984
100
10 P P == 1 z j rii gE
g a .1 L E . = m .L 3 - - 0 Q,
.01
.001 1961162 1974 1984
Adapted from Davis et a/., 1991
Chromium t Zinc
I I
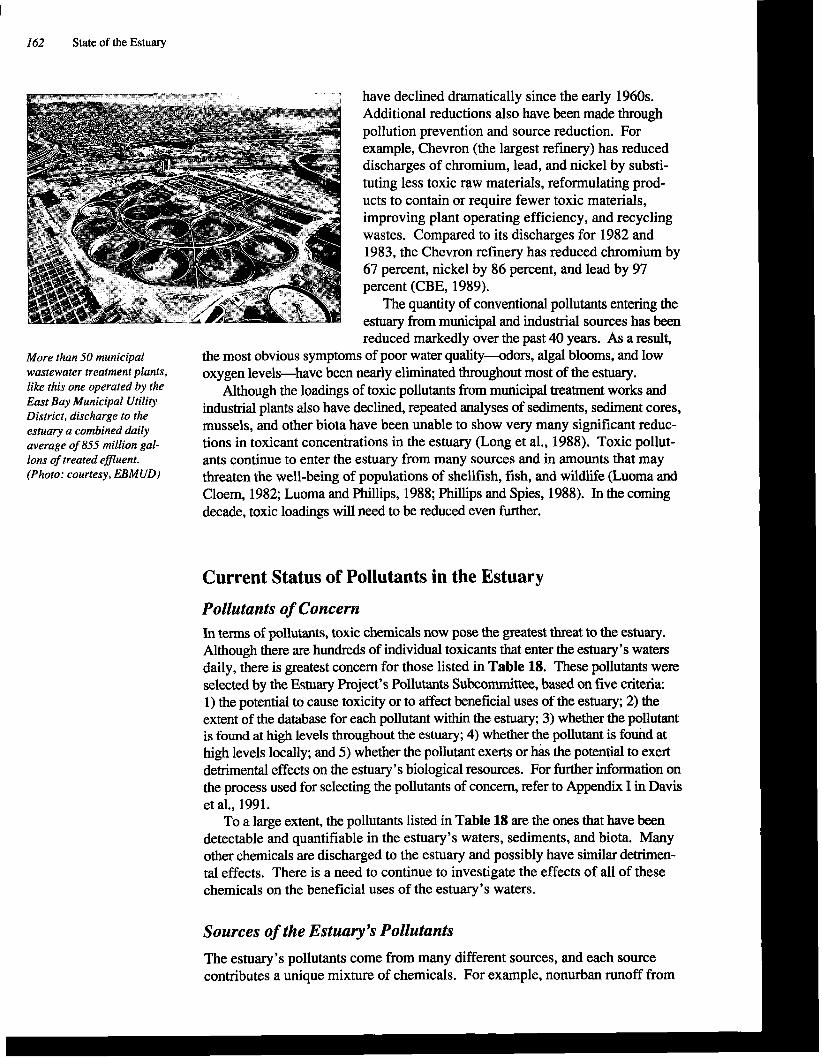
have declined dramatically since the early 1960s. I Additional reductions also have been made through pollution prevention and source reduction. For example, Chevron (the largest refinery) has reduced I discharges of chromium, lead, and nickel by substi- I tuting less toxic raw materials, reformulating prod- ucts to contain or require fewer toxic materials, improving plant operating efficiency, and recycling
67 percent, nickel by 86 percent, and lead by 97 percent (CBE, 1989).
The &ant& of ckventional pollutants entering the estuary from municipal and industrial sources has been I
More than 50 municipal wastewater treamtent plants, like this one operated by the East Bay Municipal Utiliw District, discharge to the estuary a combined daily average of 855 million gal- lons of treated efluent. (Photo: courtesy, EBMUD)
reduced markedly over the past 40 years. As a result, the most obvious symptoms of poor water quality-odors, algal blooms, and low oxygen levels-have been nearly eliminated throughout most of the estuary.
Although the loadings of toxic pollutants from municipal treatment works and industrial plants also have declined, repeated analyses of sediments, sediment cores, mussels, and other biota have been unable to show very many significant reduc- tions in toxicant concentrations in the estuary (Long et al., 1988). Toxic pollut- ants continue to enter the estuary from many sources and in amounts that may threaten the well-being of populations of shellfish, fish, and wildlife (Luoma and Cloem, 1982; Luoma and Phillips, 1988; Phillips and Spies, 1988). In the coming decade. toxic loadings will need to be reduced even further.
Current Status of Pollutants in the Estuasv 1 Pollutants of Concern In terms of pollutants, toxic chemicals now pose the greatest threat to the estuary. Althouh there are hundreds of individual toxicants that enter the estuary's waters daily, there is greatest concern for those listed in Table 18. These pollutants were selected by the Estuary Project's Pollutants Subcommittee, based on five criteria: 1) the potential to cause toxicity or to affect beneficial uses of the estuary; 2) the extent of the database for each uollutant within the estuary: 3) whether the pollutant is found at high levels throughout the estuary; 4) whether the pollutant is fouid at high levels locally; and 5) whether the pollutant exerts or h& the potential to exert detrimental effects on the estuary's biological resources. For further information on the process used for selecting the pollutants of concern, refer to Appendix I in Davis et al., 1991.
To a large extent, the pollutants listed in Table 18 are the ones that have been detectable and quantifiable in the estuary's waters, sediments, and biota. Many other chemicals are discharged to the estuary and possibly have similar detrimen- tal effects. There is a need to continue to investigate the effects of all of these chemicals on the beneficial uses of the estuary's waters.
Sources of the Estuary's Pollutants
The estuary's pollutants come from many different sources, and each source contributes a unique mixture of chemicals. For example, nonurban runoff from
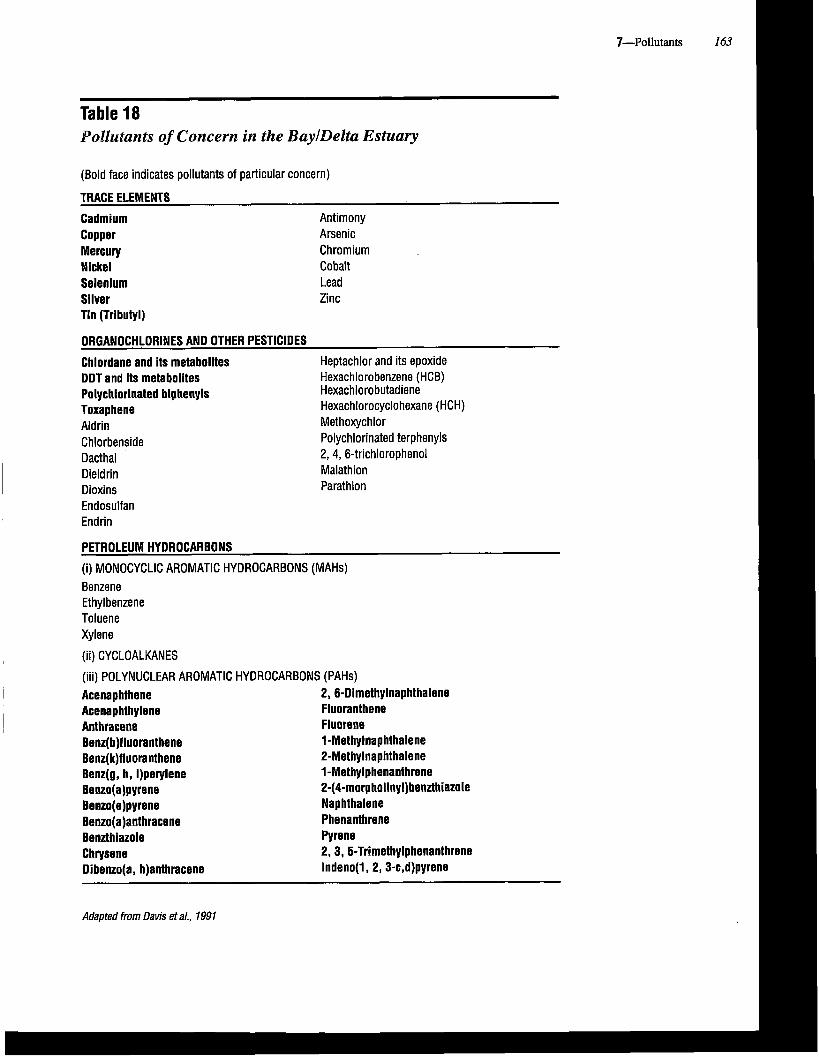
Table 18 Pollutants of Concern in the BaylDelta Estuary
(Bold face indicates pollutants of particular concern)
TRACE ELEMENTS
Cadmium Antimony Copper Arsenic Mercury Chromium Nickel Cobalt Selenium Lead Silver Zinc Tin (Tributyl)
ORGANOCHLORINES AND OTHER PESTICIDES
Chlordane and its metabolites Heptachlor and its epoxide DDT and its metabolites Hexachlorobenzene (HCB) Polychlorinated biphenyls Hexachlorobutadiene Toxaphene Hexachlorocyclohexane (HCH) Aldrin Methoxychlor Chlorbenside Polychlorinated terphenyls Dacthal 2,4,6-trichlorophenol Dieldrin Malathion Dioxins Parathion Endosulfan Endrin
PETROLEUM HYDROCARBONS
(i) MONOCYCLIC AROMATIC HYDROCARBONS (MAHs) Benzene Ethylbenzene Toluene Xylene
(ii) CYCLOALKANES
(iii) POLYNUCLEAR AROMATIC HYDROCARBONS (PAHs) Acenaphthene 2, 6-Dimethylnaphthalene Acenaphthylene Fluoranthene Anthracene Fluorene Benz(b)fluoranthene 1-Methylnaphthalene Benz(k)fluoranthene 2-Methylnaphthalene Benz(g, h, i)perylene 1-Methylphenanthrene Benzo(a)pyrene 2-(4-morphollnyl)benzthiazole Benzo(e)pyrene Naphthalene Benzo(a)anthracene Phenanthrene Benzthiazole Pyrene Chrysene 2,3, 5-Trimethylphenanthrene Dibenzo(a, h)anthracene Indeno(l,2, 3-c,d)pyrene
Adapted from Davis eta/., 1991
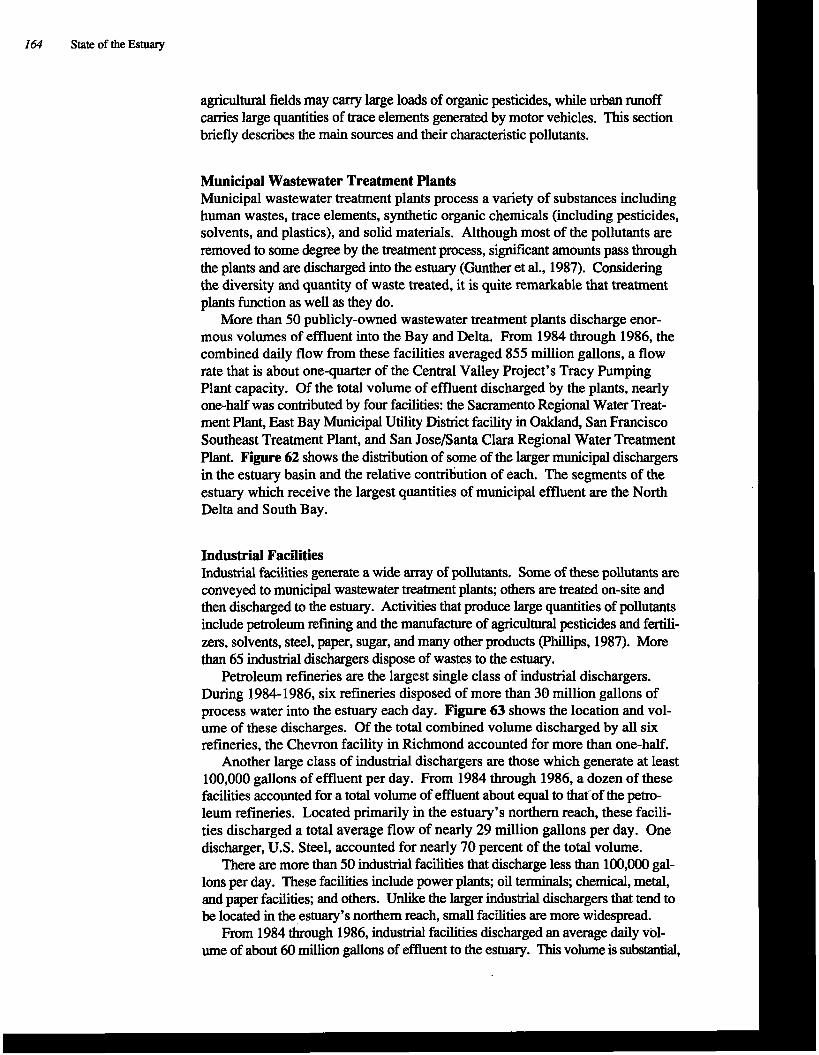
164 State of the Estuary
agricultural fields may carry large loads of organic pesticides, while urban runoff carries large quantities of trace elements generated by motor vehicles. This section briefly describes the main sources and their characteristic pollutants.
Municipal Wastewater Treatment Plants Municipal wastewater treatment plants process a variety of substances including human wastes, trace elements, synthetic organic chemicals (including pesticides, solvents, and plastics), and solid materials. Although most of the pollutadts are removed to some degree by the treatment process, signrficant amounts pass through the plants and are discharged into the estuary (Gunther et al., 1987). Considering the diversity and quantity of waste treated, it is quite remarkable that treatment plants function as well as they do.
More than 50 publicly-owned wastewater treatment plants discharge enor- mous volumes of effluent into the Bay and Delta. From 1984 through 1986, the combined daily flow from these facilities averaged 855 million gallons, a flow rate that is about one-quarter of the Central Valley Project's Tracy Pumping Plant capacity. Of the total volume of effluent discharged by the plants, nearly one-half was contributed by four facilities: the Sacramento Regional Water Treat- ment Plant, East Bay Municipal Utility District facility in Oakland, San Francisco Southeast Treatment Plant, and San Jose1Sant.a Clara Regional Water Treatment Plant. Figure 62 shows the distribution of some of the larger municipal dischargers in the estuary basin and the relative contribution of each. The segments of the estuary which receive the largest quantities of municipal effluent are the North Delta and South Bay.
Industrial Facilities Industrial facilities generate a wide array of pollutants. Some of these pollutants are conveyed to municipal wastewater treatment plants; others are treated on-site and then discharged to the estuary. Activities that produce large quantities of pollutants include petroleum refining and the manufacture of agricultural pesticides and fertili- zers, solvents, steel, paper, sugar, and many other products (Phillips, 1987). More than 65 industrial dischargers dispose of wastes to the estuary.
Petroleum refineries are the largest single class of industrial dischargers. During 1984-1986, six refineries disposed of more than 30 million gallons of process water into the estuary each day. Figure 63 shows the location and vol- ume of these discharges. Of the total combined volume discharged by all six refineries, the Chevron facility in Richmond accounted for more than one-half.
Another large class of industrial dischargers are those which generate at least 100,000 gallons of effluent per day. From 1984 through 1986, a dozen of these facilities accounted for a total volume of effluent about equal to that of the petro- leum refineries. Located primarily in the estuary's northern reach, these facili- ties discharged a total average flow of nearly 29 million gallons per day. One discharger, U.S. Steel, accounted for nearly 70 percent of the total volume.
There are more than 50 industrial facilities that discharge less than 100,000 gal- lons per day. These facilities include power plants; oil terminals; chemical, metal, and paper facilities; and others. Unlike the larger industrial dischargers that tend to be located in the estuary's northern reach, small facilities are more widespread.
From 1984 through 1986, industrial facilities discharged an average daily vol- ume of about 60 million gallons of effluent to the estuary. This volume is dManM,
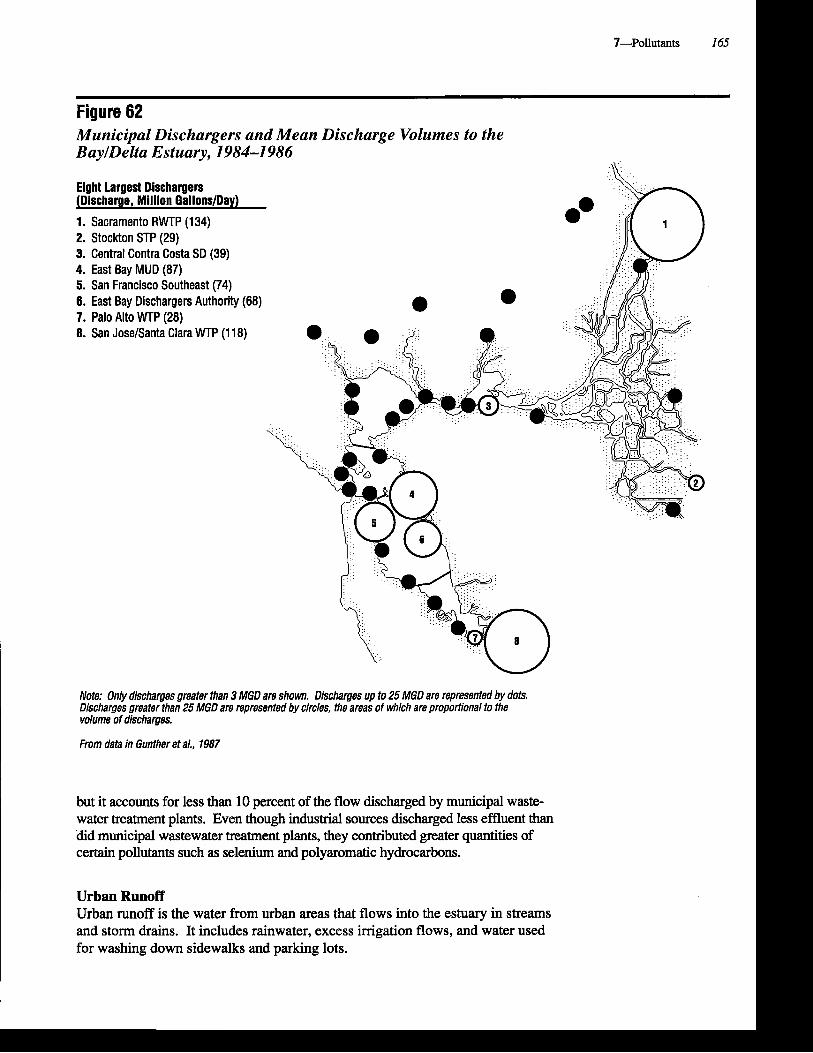
7-Pollutants 165
Figure 62 Municipal Dischargers and Mean Discharge Volumes to the BaylDelta Estuary, 1984-1 986
Eight Largest Dischargers jDischarge, Million Gallons/Day)
1. Sacramento RWP (1 34) 2. Stockton STP (29) 3. Central Contra Costa SD (39) 4. East Bay MUD (87) 5. San Francisco Southeast (74) 6. East Bay Dischargers Authority (68) 7. Palo Alto WTP (28) 8. San JoseISanta Clara WTP (1 18)
I
Note: Only discharges greater than 3 MGD are shown. Discharges up to 25 MGD are represented by dots. Discharges greater than 25 MGD are represented by circles, the areas of which are proportional to the volume of discharges.
From data in Gunther et a/., 1987
but it accounts for less than 10 percent of the flow discharged by municipal waste- water treatment plants. Even though industrial sources discharged less effluent than 'did municipal wastewater treatment plants, they contributed greater quantities of certain pollutants such as selenium and polyammatic hydrocarbons.
Urban Runoff Urban runoff is the water from urban areas that flows into the estuary in streams and storm drains. It includes rainwater, excess irrigation flows, and water used for washing down sidewalks and parking lots.
r

166 State of the Estuary
Figure 63 Industrial Facilities and Mean Discharge Volumes (Million GallonslDay) to the BaylDelta Estuary, 1984-1986
Refineries MGD
1. Tosco 4.4 2. Exxon 2.2 3. Shell Oil 4.3 4. Union Oil 2.5 5. Pacific Refining 0.2 6. Chevron USA (a) 16.7
@ Other industries MGD
1. McCorrnick and Baxter 0.2 2. Libbey-Owens-Ford 0.2 3. USS Posco 20.0 4. Dow Chemical 0.4 5. General Chemical 1.1 6. Stauffer Chemical 0.1 7. C&H Sugar 1 .O 8. Mare Island Shipyard 0.5 9. Chevron Chemical 0.2
10. Stauffer Chemical 0.1 11. San Francisco Int'l Airport 4.0 12. New United Motors 0.9
Notes (a) Flows from Chevron USA decreased substantially
after 1986. Average flow in 1990 was 7 MGD (b) Discharges of less than 0.1 MGD are not shown.
Names listed are those used during the period of study. Some facilities discharging greater than 0.1 MGD did not monitor toxic pollutants.
From data in Gunther et al., 1987
Sources of pollutants in urban runoff are extremely varied and include commer- cial, industrial, and residential land uses, as well as managed open space areas such as parks, cemeteries, planted road dividers, and construction sites. Everyday human activities in these areas-the application of pesticides and fertilizers to gardens and landscaping, operation of motor vehicles, and construction of roads and building* all contribute pollutants to urban runoff.
More than ten studies in the estuary basin and elsewhere during the past decade indicate the kinds of pollutants that occur in urban runoff. One national study, conducted over several years in 22 cities (including sites on Castro Creek in Alameda County, and in Fresno), showed that runoff commonly carries many trace elements and organic toxic materials (USEPA, 1983). Recent studies in Sacra- mento and Santa Clara counties confirmed the presence in runoff of trace elements such as arsenic, cadmium, chromium, copper, lead, nickel, and zinc, as well as nu- trients and sediments (Montoya et al., 1988; Woodward-Clyde Consultants, 1991).
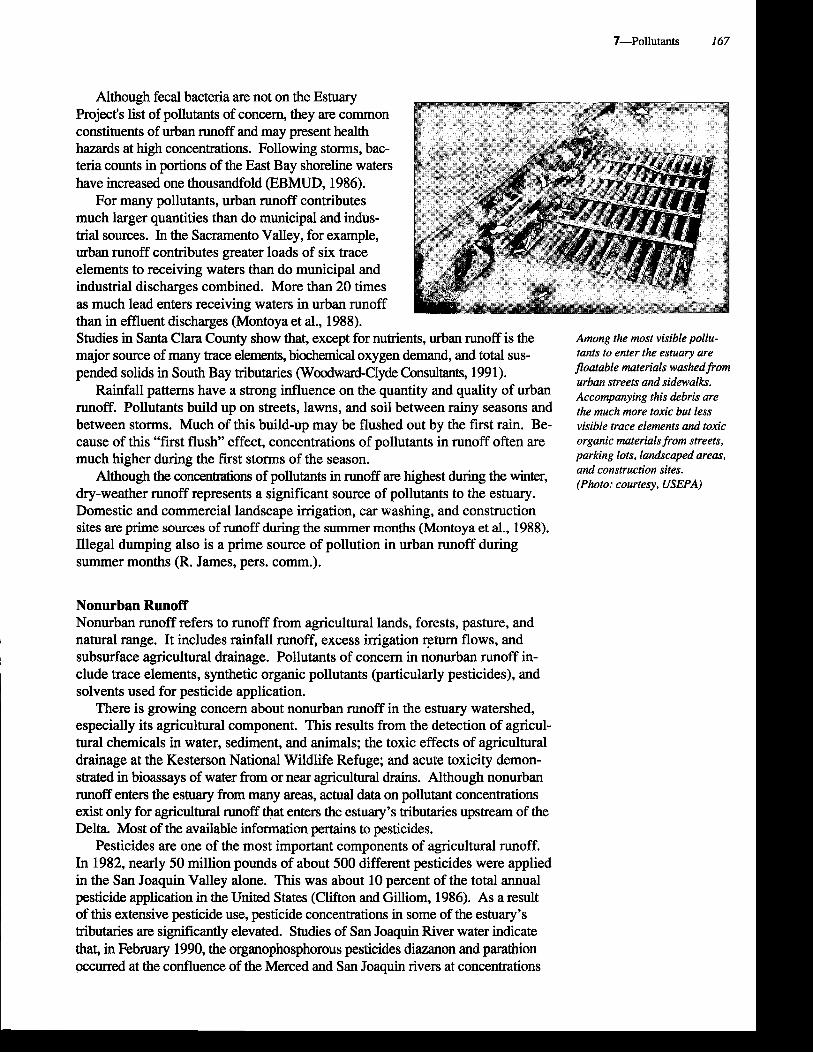
7-Pollutants 167
Although fecal bacteria are not on the Estuary Project's list of pollutants of concern, they are common constituents of urban runoff and may present health hazards at high concentrations. Following storms, bac- teria counts in portions of the East Bay shoreline waters have increased one thousandfold (EBMUD, 1986).
For many pollutants, urban runoff contributes much larger quantities than do municipal and indus- trial sources. In the Sacramento Valley, for example, urban runoff contributes greater loads of six trace elements to receiving waters than do municipal and industrial discharges combined. More than 20 times as much lead enters receiving waters in urban runoff than in effluent discharges (Montoya et al., 1988). studies in santa Clara county show that, except for nutrients, urban runoff is the Among the most visible pollu-
major source of many trace elements, biochemical oxygen demand, and total sus- tants to enter the estuary are
pended solids in South Bay tributaries (Woodward-Clyde Consultants, 1991). floatable materials warhedfiom urban sheets and sidewalks.
Rainfall patterns have a strong influence on the quantity and quality of urban Accompanying this debris are runoff. Pollutants build up on streets, lawns, and soil between rainy seasons and ,he much ,, toic b, less between storms. Much of this build-up may be flushed out by the first rain. Be- visible trace elements and toxic cause of this "first flush" effect, concentrations of pollutants in runoff often are organic materialsfiom streets,
much higher during the first storms of the season. parking lots, landscaped areas, and construction sites. Although the concentmtions of pollutants in runoff are highest during the winter, (photo: CouHesy, USEPA)
dry-weather runoff represents a significant source of pollutants to the estuary. Domestic and commercial landscape irrigation, car washing, and construction sites are prime sources of runoff during the summer months (Montoya et al., 1988). Illegal dumping also is a prime source of pollution in urban runoff during summer months (R. James, pers. comm.).
Nonurban Runoff Nonurban runoff refers to runoff from agricultural lands, forests, pasture, and natural range. It includes rainfall runoff, excess irrigation return flows, and subsurface agricultural drainage. Pollutants of concern in nonurban runoff in- clude trace elements, synthetic organic pollutants (particularly pesticides), and solvents used for pesticide application.
There is growing concern about nonurban runoff in the estuary watershed, especially its agricultural component. This results from the detection of agricul- tural chemicals in water, sediment, and animals; the toxic effects of agricultural drainage at the Kesterson National Wildlife Refuge; and acute toxicity demon- strated in bioassays of water from or near agricultural drains. Although nonurban runoff enters the estuary from many areas, actual data on pollutant concentrations exist only for agricultural runoff tlpt enters the estuary's tributaries upstream of the Delta. Most of the available information pertains to pesticides.
Pesticides are one of the most important components of agricultural runoff. In 1982, nearly 50 million pounds of about 500 different pesticides were applied in the San Joaquin Valley alone. This was about 10 percent of the total annual pesticide application in the United States (Clifton and Gilliom, 1986). As a result of this extensive pesticide use, pesticide concentrations in some of the estuary's tributaries are sigtllficantly elevated. Studies of San Joaquin River water indicate that, in February 1990, the organophosphorous pesticides diazanon and parathion occurred at the confluence of the Merced and San Joaquin rivers at concentrations
r

I
168 State of the Estuary
Agricultural drainage is a major source of trace elements and pesticides to the estuary. This drainage has made many miles of streams in the Central Valley toxic to aquatic organisms. (Photo: USBR)
of 0.28 ppb and 0.25 ppb, respectively. At these concentrations, diazanon exceeded EPA-recommended water quality criteria to protect aquatic life by 3 1 times; parathion exceeded the criteria by 19 times (CVRWQCB, 1990). Studies in the Sacramento River basin have also indicated elevated concentrations of pesticides in estuary tributaries that receive agricultural drain water (CVRWQCB, 1987).
The extent to which agriculture is a source of nonpoint pollutants other than pesticides is exemplified by small streams that carry excess irrigation water and subsurface drainage from farm fields. For example, in 1985, two channels in the San Joaquin Valley-Mud and Salt sloughs+ontributed 12 percent of the flow in the San Joaquin River at Vernalis. ~owevei , these sloughs contributed 81 percent of the selenium, 69 percent of the boron, 46 percent of the dissolved solids, and 44 percent of the molybdenum entering the river (CVRWQCB, 1988). These sloughs drain intensively cultivated agricultural lands on the west side of the Valley where runoff from soils high in selenium led to the serious ecological problems at the Kesterson National Wildlife Refuge in the early 1980s. Farming operations in the Delta also contribute substantial amounts of pollutants, par- ticularly organic materials, that may adversely affect estuarine water quality (SWRCB, 1991).
Riverine Inputs The rivers of the Central Valley carry large quantities of water and pollutants into the estuary. Although r i v e ~ e pollutants originate in municipal and indus- trial effluent discharges and in urban runoff and nonurban runoff, once carried past Sacramento or Vernalis, they are considered to have entered the estuary as riverine input. Although this aspect of pollutant loading to the estuary has not been well characterized, the best existing information indicates that riverine input is substantial.
Agricultural drainage is a major component of r i v e ~ e inputs, particularly during the early summer. Agricultural drainage may contribute over 30 percent of the total flow of the Sacramento River in May and June (Cornacchia et al.,
7-Pollutants 169
1984). It is estimated that agricultural drainage contributes more than 20 per- cent of the total time-averaged flow in the San Joaquin River and most of the flow during the summer (DWR, 1986b; Nichols et al., 1986).
Dredging and Dredged Material Disposal Considerable attention has been focused lately on the pollutant-related effects of dredging and dredged material disposal in the estuary. Dredging and the disposal of dredged sediment redistributes pollutants and may increase their availability to aquatic organisms. Studies indicate that sediments in many parts of the estuary have elevated concentrations of trace elements and organic pollutants. Pollutant concentrations are highest in sediments from harbors, harbor entrances, marinas, and industrial waterways (Long et al., 1988).
Given the complex way in which sediments and pollutants interact, it is difficult to determine the quantities of pollutants that are released when sediments are dredged. Estimates vary widely (Gunther et al., 1987; Segar, 1988). Also, it is im- portant to remember that, in most instances, the release of pollutants during dredg- ing does not represent a new source of pollutants, but the remobilization of pollutants previously discharged into the estuary from various sources.
Atmospheric Deposition Some pollutants enter the estuary directly from the air. These pollutants are generated by industrial plants, oil refineries, motor vehicles, and many other sources within the watershed.
Pollutants in the atmosphere exist in several forms-as vapor, as vapor adhered to particulate matter, and as aerosols. Through a variety of chemical and physical processes, a portion of these airborne pollutants reaches the es- tuary's water surface.
There have been very few estimates of the role of atmospheric deposition as a source of toxic pollutants to the estuary. The most recent estimates by Gunther et
I al. (1987) are based on deposition rates in other parts of the United States. Given the uncertainty of these estimates, they should be viewed only as indicators of the
1 possible role of airborne pollutants in the estuary's total loading of pollutants.
I With the possible exception of PCBs and PAHs, the contribution of airborne pollutants to the estuary's total pollutant loading seems to be relatively small com-
I pared to point and nonpoint pollutantgources. However, as noted below, these air pollutants may have significant adverse effects on organisms.
Marine Vessel Discharges Commercial and recreational vessels discharge sewage and gray water (waste water from kitchens and baths) into the Bay and Delta. This effluent can be a source of coliform bacteria, toxic soap residues, biochemical oxygen-demanding substances, suspended solids, oil and grease, and nutrients. Although houseboat operators are required to pump out wastes at approved facilities, they and the operators of other recreational vessels continue to discharge an unknown amount of waste directly into the estuary's waters. The discharge of untreated wastes has caused concern in several portions of the estuary including Richardson Bay, Alviso Slough, Redwood Creek, and parts of the Delta (BCDC, 1987).
Large commercial vessels also discharge ballast water within the estuary. This may introduce exotic species of aquatic organisms, with profound effects to the estuarine ecosystem, as noted in Chapter 4.
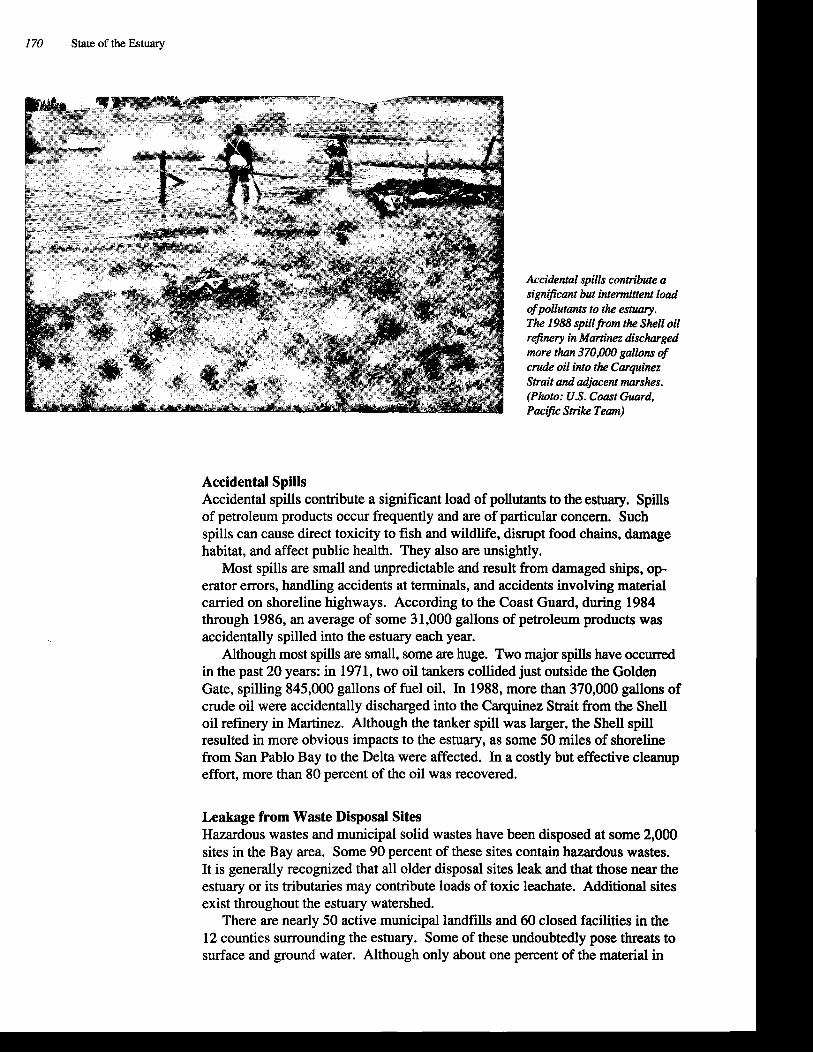
170 State of the Estuary
Accidental spills contribute a signc$cant but intenittent load of pollutants to the estuary. The 1988 spill from the Shell oil r&nery in Martinez discharged more than 370,000 gallons of crude oil into the Carquinez Strait and adjacent marshes. (Photo: U.S. Coast Guard, Pacific Smmke Team)
Accidental Spills Accidental spills contribute a significant load of pollutants to the estuary. Spills of petroleum products occur frequently and are of particular concern. Such spills can cause direct toxicity to fish and wildlife, disrupt food chains, damage habitat, and affect public health. They also are unsightly.
Most spills are small and unpredictable and result from damaged ships, op- erator errors, handling accidents at terminals, and accidents involving material carried on shoreline highways. According to the Coast Guard, during 1984 through 1986, an average of some 3 1,000 gallons of petroleum products was accidentally spilled into the estuary each year.
Although most spills are small, some are huge. Two major spills have occurred in the past 20 years: in 1971, two oil tankers collided just outside the Golden Gate, spilling 845,000 gallons of fuel oil. In 1988, more than 370,000 gallons of crude oil were accidentally discharged into the Carquinez Strait from the Shell oil refinery in Martinez. Although the tanker spill was larger, the Shell spill resulted in more obvious impacts to the estuary, as some 50 miles of shoreline from San Pablo Bay to the Delta were affected. In a costly but effective cleanup effort, more than 80 percent of the oil was recovered.
Leakage from Waste Disposal Sites Hazardous wastes and municipal solid wastes have been disposed at some 2,000 sites in the Bay area. Some 90 percent of these sites contain hazardous wastes. It is generally recognized that all older disposal sites leak and that those near the estuary or its tributaries may contribute loads of toxic leachate. Additional sites exist throughout the estuary watershed.
There are nearly 50 active municipal landfills and 60 closed facilities in the 12 counties surrounding the estuary. Some of these undoubtedly pose threats to surface and ground water. Although only about one percent of the material in
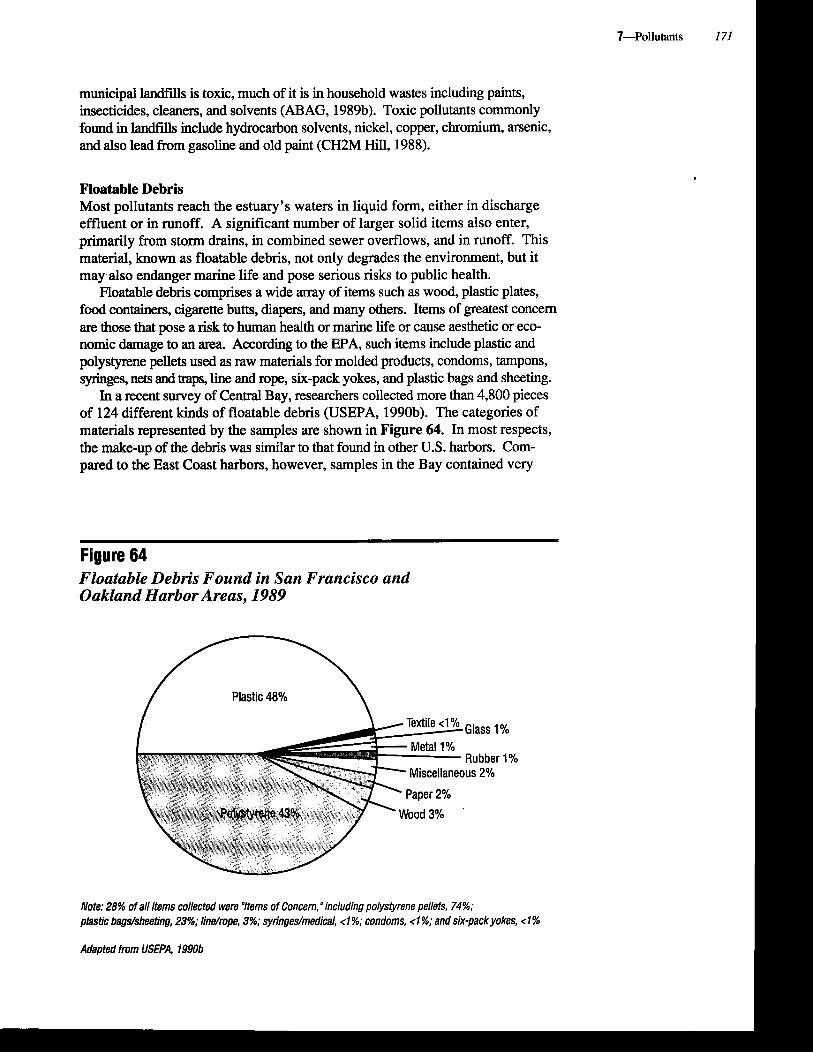
municipal landfills is toxic, much of it is in household wastes including paints, insecticides, cleaners, and solvents (ABAG, 1989b). Toxic pollutants commonly found in landfills include hydrocarbon solvents, nickel, copper, chromium, arsenic, and also lead from gasoline and old paint (CH2M Hill, 1988).
Floatable Debris Most pollutants reach the estuary's waters in liquid form, either in discharge effluent or in runoff. A significant number of larger solid items also enter, primarily from storm drains, in combined sewer overflows, and in runoff. This material, known as floatable debris, not only degrades the environment, but it may also endanger marine life and pose serious risks to public health.
Floatable debris comprises a wide m y of items such as wood, plastic plates, food containers, cigarette butts, diapers, and many others. Items of greatest concern are those that pose a risk to human health or marine life or cause aesthetic or eco- nomic damage to an area. According to the EPA, such items include plastic and polystyrene pellets used as raw materials for molded products, condoms, tampons, syringes, nets and traps, line and rope, six-pack yokes, and plastic bags and sheeting.
In a recent survey of Central Bay, researchers collected more than 4,800 pieces of 124 different kinds of floatable debris (USEPA, 1990b). The categories of materials represented by the samples are shown in Figure 64. In most respects, the make-up of the debris was similar to that found in other U.S. harbors. Com- pared to the East Coast harbors, however, samples in the Bay contained very
-
Figure 64 Floatable Debris Found in §an Francisco and Oakland Harbor Areas, 1989
Glass 1
Rubbe~ Miscellaneous 2%
Note: 28% of all items collected were "Items of Concern, " including polystyrene pellets, 74%; plastic bagusheeting, 23%; line/rope, 3%; syringes/medical, 4 % ; condoms, <I %; and six-pack yokes, 4 %
Adapted from USEPA, 1990b
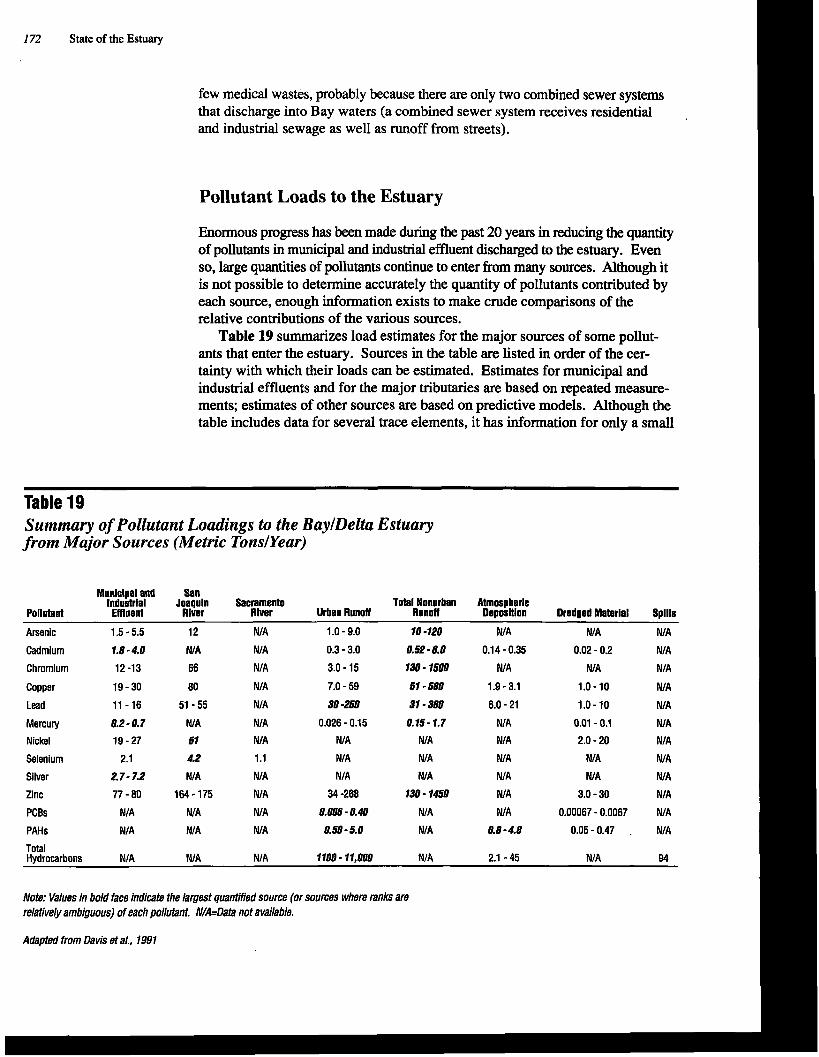
172 State of the Estuary
few medical wastes, probably because there are only two combined sewer systems that discharge into Bay waters (a combined sewer system receives residential . and industrial sewage as well as runoff from streets).
Pollutant Loads to the Estuary
Enormous progress has been made during the past 20 years in reducing the quantity of pollutants in municipal and industrial effluent discharged to the estuary. Even so, large quantities of pollutants continue to enter from many sources. Although it is not possible to determine accurately the quantity of pollutants contributed by each source, enough information exists to make crude comparisons of the relative contributions of the various sources.
Table 19 summarizes load estimates for the major sources of some pollut- ants that enter the estuary. Sources in the table are listed in order of the cer- tainty with which their loads can be estimated. Estimates for municipal and industrial effluents and for the major tributaries are based on repeated measure- ments; estimates of other sources are based on predictive models. Although the table includes data for several trace elements, it has information for only a small
Table 19 Summary of Pollutant Loadings to the BaylDelta Estuary from Major Sources (Metric Tonslyear)
Municipal and San lndusMal Joaquln Sactamento Total Nonurban Atmospheric
Pollutant Effluent Rlver Rlver Urban Runoff Runoff Deposition Dredged Material Spills
Arsenic 1.5 - 5.5 12 NIA 1.0 - 9.0 10 -120 NIA NIA NIA
Cadmium 1.8 - 4.0 NIA NIA 0.3 - 3.0 0.52- 6.0 0.14 - 0.35 0.02 - 0.2 NIA
Chromium 12 -13 66 NIA 3.0 - 15 130 - 1500 NIA NIA NIA
Copper 19-30 80 NIA 7.0 - 59 51 - 580 1.9-3.1 1.0 - 10 NIA
Lead 11 - 16 51 - 55 NIA 30 -250 31 - 360 6.0 - 21 1.0-10 NIA
Mercury 0.2-0.7 NIA NIA 0.026 - 0.15 0.15- 1.7 NIA 0.01 - 0.1 N/A
Nickel 19-27 51 NIA NIA NIA NIA 2.0 - 20 NIA
Selenium 2.1 4.2 1.1 NIA NIA NIA NIA NIA
Silver 2.7- 7.2 NIA NIA NIA NIA NIA NIA NIA
Zinc 77 - 80 164 - 175 NIA 34 -268 130 - 1450 NIA 3.0 - 30 NIA
PCBs NIA NIA NIA 0.008 - 0.40 NIA N/A 0.00067 - 0.0067 NIA
PAHs NIA NIA NIA 0.50 - 5.0 NIA 0.8 - 4.8 0.05 - 0.47 . NIA
Total Hvdrocarbons NIA NIA NIA 1100 - 11.DUD NIA 2.1 - 45 NIA 94
Mote: Values in bold face indicate the largest quantified source (or sources where ranks are relatively ambiguous) of each pollutant. IV/A=Data not available.
Adapted from Davis et al., 1991
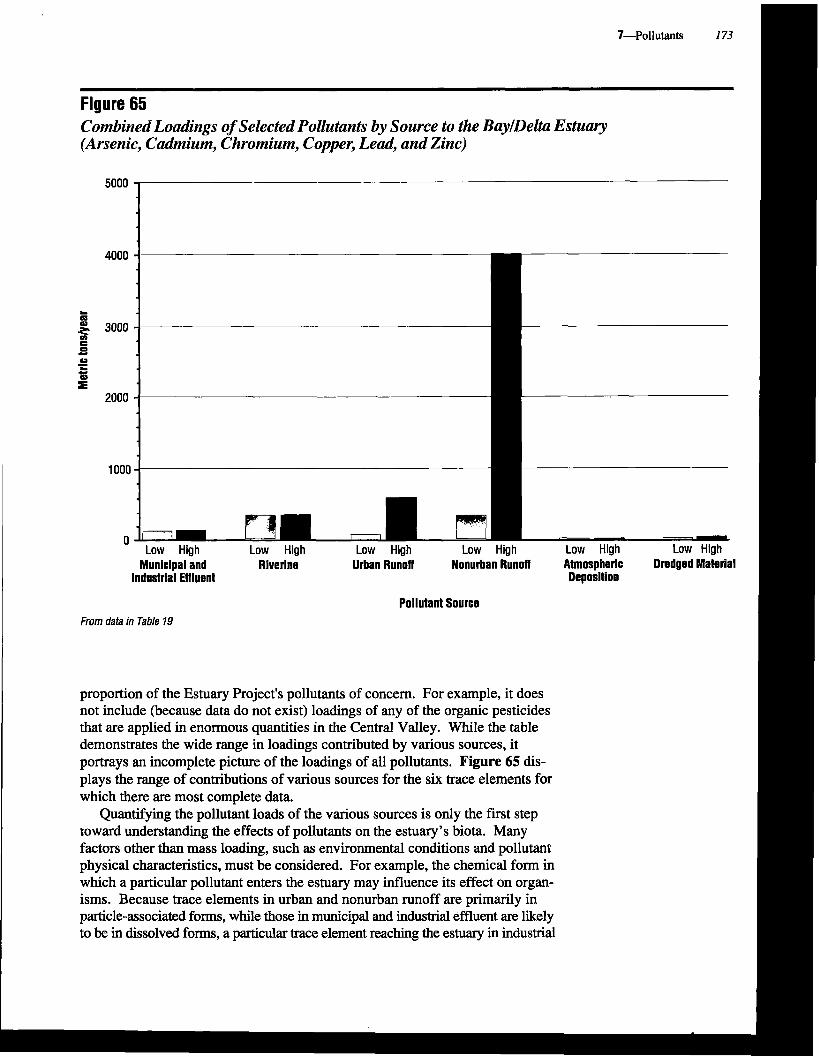
7-Pollutants 173
Flgure 65 Combined Loadings of Selected Pollutants by Source to the BaylDelta Estuary (Arsenic, Cadmium, Chromium, Copper, Lead, and Zinc)
5000
4000
b m 2 3000 C 0 - U - b L
ii! 2000
1000 -
0 Low High 0 Low High Low High Low High Low High .I Low High
Munlclpal and Rlverlne Urban Runoff Nonurban Runoff Atmospheric Dredged Material Industrial Effluent Deposltion
Pollutant Source From data in Table 19
proportion of the Estuary Project's pollutants of concern. For example, it does not include (because data do not exist) loadings of any of the organic pesticides that are applied in enormous quantities in the Central Valley. While the table demonstrates the wide range in loadings contributed by various sources, it portrays an incomplete picture of the loadings of all pollutants. Figure 65 dis- plays the range of contributions of various sources for the six trace elements for which there are most complete data.
Quantifying the pollutant loads of the various sources is only the first step toward understanding the effects of pollutants on the estuary's biota. Many factors other than mass loading, such as environmental conditions and pollutant physical characteristics, must be considered. For example, the chemical form in which a particular pollutant enters the estuary may influence its effect on organ- isms. Because trace elements in urban and nonurban runoff are primarily in particle-associated forms, while those in municipal and industrial effluent are likely to be in dissolved forms, a particular trace element reaching the estuary in industrial
174 State of the Estuary
effluent may have a different impact than if it were to enter in nonurban runoff. Also, the timing and distribution of pollutant inputs differ considerably among the various sources and this affects their bioavailability. All of these factors should be consid- ered in assessing the relative biological significance of different pollutant sources.
Pollutant Distribution in the Estuary
There are pollutants in the estuary's water, sediments, and organisms. From studies conducted during the past two decades, a picture of pollutant distribution is beginning to develop. Pollutants about which the most is known are those that have obvious biological effects and that have been studied extensively. Much additional research must be carried out before there will emerge an adequate understanding of the many factors that determine the distribution of each of the pollutants of concern and the hundreds of other chemicals that probably have effects on biota.
To enhance the understanding of pollutant distribution in the estuary, in early 1990, the San Francisco Bay Regional Water Quality Control Board initiated an effort to improve pollutant monitoring. Ultimately, this effort and the related activities of other agencies will form part of an estuary-wide monitoring program, as described in Chapter 9.
Pollutants in Water
Since the mid-1970s, there have been a number of studies of trace elements and organic pollutants in the estuary's waters. Most of these studies have occurred downstream of Carquinez Strait, usually in limited areas. The various pur- poses of the studies and the different methods used make it difficult to compare much of the data regarding pollutant concentrations and distribution. Less than a dozen studies have generated information using comparable methods and adequate levels of quality assurance. For a discussion of pollutant-related quality assurance issues, refer to O'Connor et al., 199 1.
The techniques for accurately measuring trace elements at elevated concen- trations in water have existed much longer than those for measuring organic compounds. As a result, most of the pollutant studies in the estuary have focused on these elements. Although the abiity to measure organic compounds accurately at concentrations approaching background is improving rapidly, overall there are few reliable data on concentrations of these pollutants in the estuary's waters.
Existing information regarding pollutant concentrations in estuary waters is summarized in Table 20. Although even the greatest concentrations of the pollut- ants listed in the table seem low, measured at concentrations of a few parts per bil- lion, several have exceeded state water quality objectives, the principal regulatory yardstick that establishes permissible levels of pollutants in water. Meeting state objectives will require more stringent controls on effluent discharges and runoff.
Pollutants in Sediments
Compared to background levels attributable to natural sources or to coastal reference concentrations, sediments in nearly all parts of the estuary exhibit slightly elevated pollutant concentrations. At some sites, particularly harbors, harbor
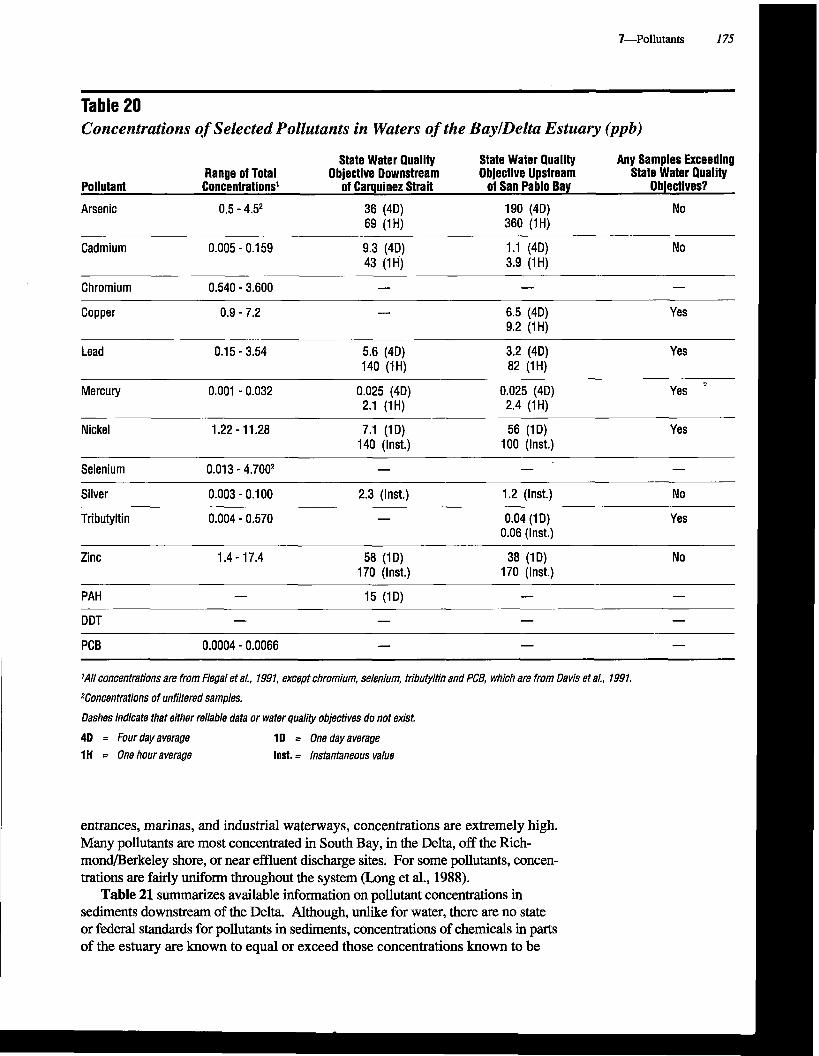
entrances, marinas, and industrial waterways, concentrations are extremely high. Many pollutants are most concentrated in South Bay, in the Delta, off the Rich- mond/Berkeley shore, or near effluent discharge sites. For some pollutants, concen- trations are fairly uniform throughout the system (Long et al., 1988).
Table 21 summarizes available information on pollutant concentrations in sediments downstream of the Delta. Although, unlike for water, there are no state or federal standards for pollutants in sediments, concentrations of chemicals in parts of the estuary are known to equal or exceed those concentrations known to be
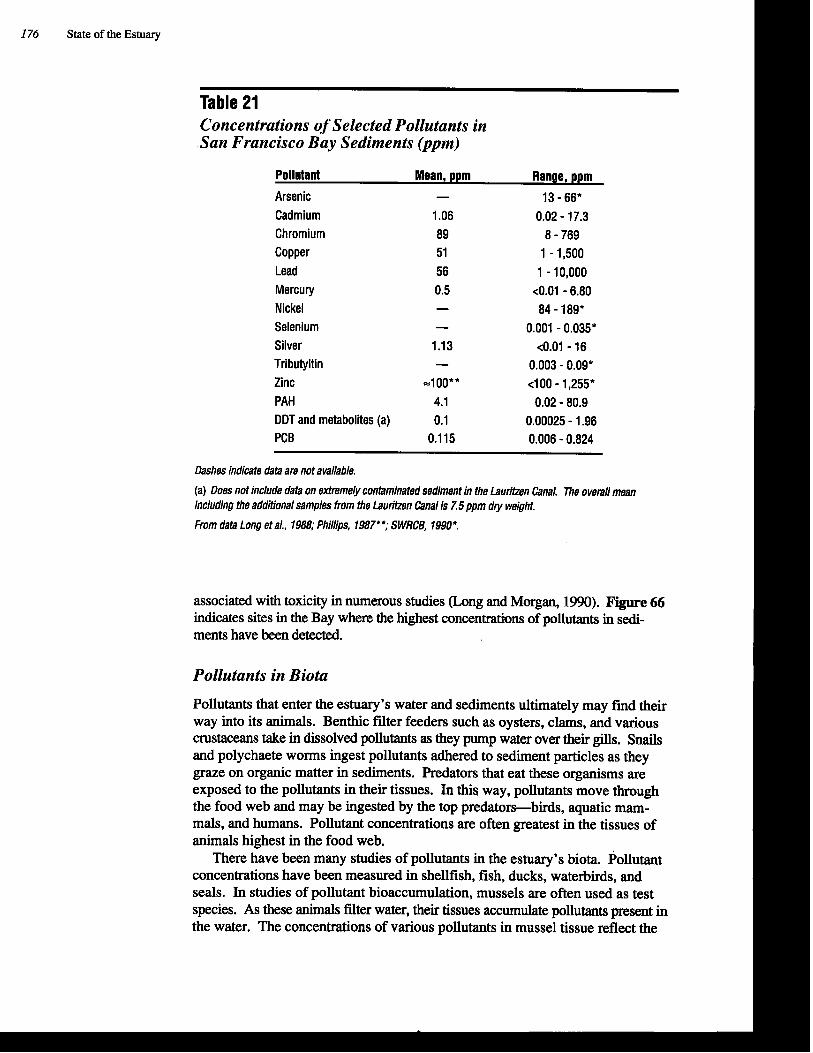
176 State of the Estuary
Table 21 Concentrations of Selected Pollutants in San Francisco Bay Sediments (ppm)
Pollutant Mean, ppm Range, ppm
Arsenic - 13 - 66* Cadmium 1.06 0.02 - 17.3 Chromium 89 8 - 769 Copper 51 1 - 1,500 Lead 56 1 - 10,000 Mercury 0.5 t0.01 - 6.80 Nickel - 84 - 189* Selenium - 0.001 - 0.035' Silver 1.13 <0.01 - 16 Tributyltin - 0.003 - 0.09' Zinc =loo** t100 - 1,255* PAH 4.1 0.02 - 80.9 DDT and metabolites (a) 0.1 0.00025 - 1.96 PCB 0.115 0.006 - 0.824
Dashes indicate data are not available.
(a) Does not include data on extremely contaminated sediment in the Laurifzen Canal. The overall mean including the additional samples from the Laurihen Canal is 7.5 ppm dry weight.
From data Long et al., 1988; Phillips, 1987* *; SWRCB, 1990".
associated with toxicity in numerous studies (Long and Morgan, 1990). Figure 66 indicates sites in the Bay where the highest concentrations of pollutants in sedi- ments have been detected.
Pollutants in Biota
Pollutants that enter the estuary's water and sediments ultimately may find their way into its animals. Benthic filter feeders such as oysters, clams, and various crustaceans take in dissolved pollutants as they pump water over their gills. Snails and polychaete worms ingest pollutants adhered to sediment particles as they graze on organic matter in sediments. Predators that eat these organisms are exposed to the pollutants in their tissues. In this way, pollutants move through the food web and may be ingested by the top predators-birds, aquatic mam- mals, and humans. Pollutant concentrations are often greatest in the tissues of animals highest in the food web.
There have been many studies of pollutants in the estuary's biota. Pollutant concentrations have been measured in shellfish, fish, ducks, waterbirds, and seals. In studies of pollutant bioaccurnulation, mussels are often used as test species. As these animals filter water, their tissues accumulate pollutants present in the water. The concentrations of various pollutants in mussel tissue reflect the
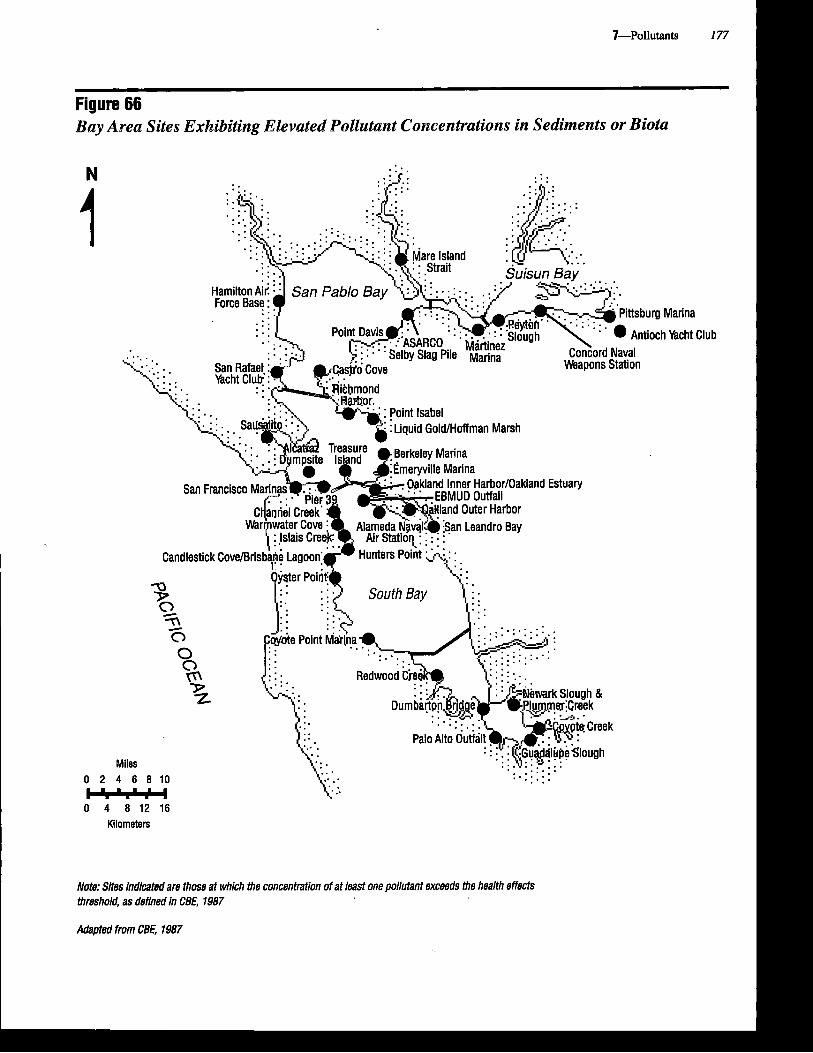
Figure 66 - Bav Area Sites Exkaibitin~ Ebvated Pollutant Concentrations in Sediments or Biota I
Club
Miles
.. oint Isabel . . . . :Liquid GoldNoffrnan Marsh I
Berkeley Marina :~rneryville Marina I
Inner HarborIOakland Estuary
.fa Hunters ~ o i h &: . Candlestick ~ove/Brisb~~r$ Lagoon: IlGctar Pnint:
y;:.
0 2 4 6 8 1 0 ...... 0 4 8 12 16
Kilometers
I Mote: Sites indicated are those at which the concentration of at least one oollutant exceeds the health effects 1 .................................
threshold, as defined in CBE, 1987
Adapted from CBE, 1987
178 State of the Estuary
availability of pollutants in the water. Table 22 summarizes available informa- tion on pollutant concentrations in the estuary's biota. As noted, the levels of many of the pollutants found in animal tissues are significantly elevated or exceed alert levels, indicating that pollutant concentrations exceed a state or international health safety level. Figure 66 indicates sites in the Bay where the highest concentrations of pollutants in shellfish and ducks have been found.
Pollutant Trends in Sediments and Biota It is apparent that pollutants are widespread in the estuary's sediments and biota. Concentrations of most pollutants are highest in the peripheral areas at harbors, harbor entrances, marinas, and in industrial waterways. Concentrations are lowest in the centers of the estuary's embayments. For many pollutants, there are no data to indicate that concentrations are increasing or decreasing. Table 23 summarizes what is known about the current temporal and geographic trends in pollutant concentrations in the estuary's sediments and biota.
Pollutant Effects in the Estuary
Pollutants that enter the estuary have a wide range of effects on estuarine organ- isms, ranging from very subtle physiological changes to death. While it is possible to measure concentrations of pollutants in water, sediments, and animal tissue, ,
it is often extremely difficult to determine the overall effect of a given pollutant on individual animals. Even more difficult to determine are the cause-and-effect relationships between pollutants and populations of a single species or the effects on the aquatic community as a whole.
The ability of various pollutants to elicit toxic responses in organisms varies markedly. Some pollutants, such as PCBs, may cause effects at extremely low concentrations (in the parts-per-trillion range). Others, like zinc or nickel, show effects only at relatively high concentrations. A pollutant's effect on a particu- lar organism generally is determined by its inherent toxicity to the organism, the chemical form in which it is available, and the dose over a given time period. Information regarding the general effects of some of the pollutants of concern is displayed in Table 24.
Although it is generally thought that pollutants may play a role in changing the composition of an estuary's biological resources, incontrovertible evidence of such effects is rare in any ecosystem. The Baypelta estuary is no exception. If pollutants are exerting detrimental impacts on the estuary's biota, those with the greatest toxicity and persistence are probably responsible for the largest impacts (Phillips, 1987).
During the past several years, scientists have studied the effects of pollutants on the estuary's biota. Using bioassays, they have found evidence of toxicity in the estuary's ambient water, municipal and industrial effluents, runoff, and sediments. Although toxicities vary with time and location, it is striking how widespread the effects are and the many ways in which pollutants affect organisms.
Toxicity of San Francisco Bay Ambient Water Although the quality of municipal and industrial effluent discharged to the Bay has been monitored for years, only recently has there been an attempt to evaluate the toxic potential of Bay water itself. The results of a recent study are interesting.
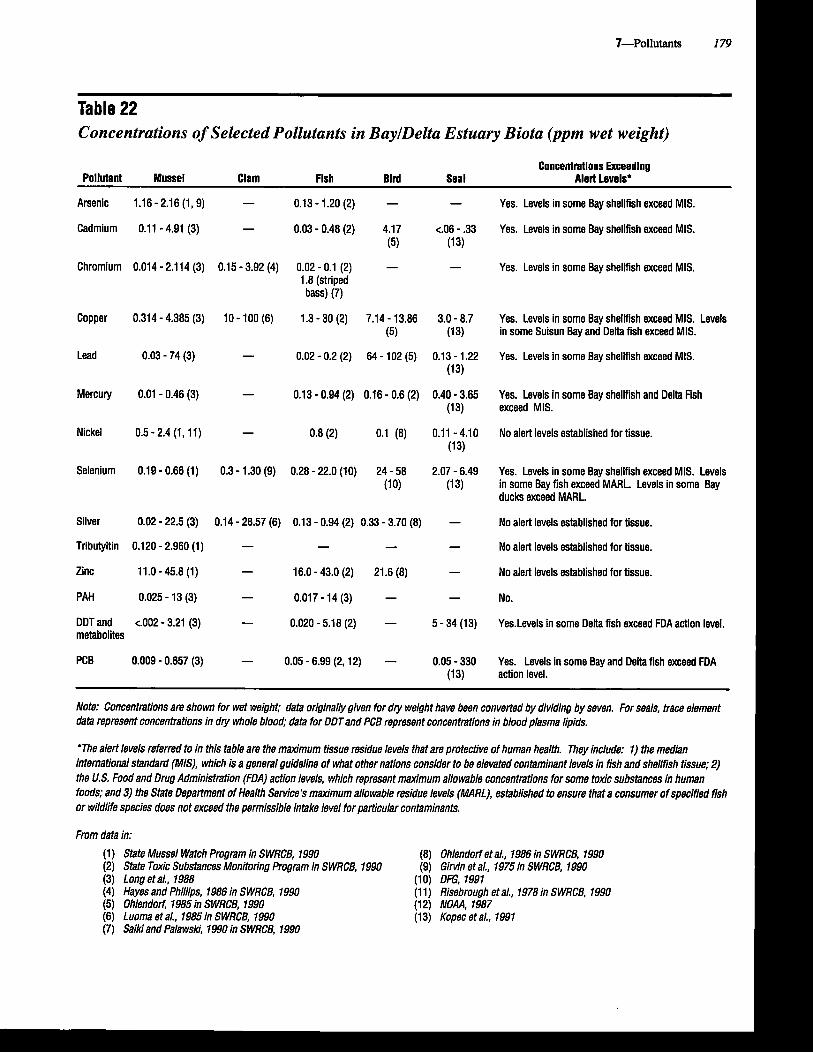
Table 22 Concentrations of Selected Pollutants in BaylDelta Estuary Biota (ppm wet weight)
Concentrations Exceeding Pollutant Mussel Clam Flsh Blnl Seal Alert Levels*
- - - -- - --
Arsenic 1.16 - 2.16 (1,9) - 0.13 - 1.20 (2) - - Yes. Levels in some Bay shellfish exceed MIS.
Cadmium 0.11 - 4.91 (3) - 0.03 - 0.48 (2) 4.17 <.06 - .33 Yes. Levels in some Bay shellfish exceed MIS. (5) (13)
Chromium 0.014 - 2.114 (3) 0.15 - 3.92 (4) 0.02 - 0.1 (2) - - Yes. Levels in some Bay shellfish exceed MIS. 1.8 (striped bass) (7)
Copper 0.314 - 4.385 (3) 10 - 100 (6) 1.3 - 30 (2) 7.14 - 13.86 3.0 - 8.7 Yes. Levels in some Bay shellfish exceed MIS. Levels (5) (13) in some Suisun Bay and Delta fish exceed MIS.
Lead 0.03 - 74 (3) - 0.02 - 0.2 (2) 64 - 102 (5) 0.13 - 1.22 Yes. Levels in some Bay shellfish exceed MIS. (13)
Mercury 0.01 - 0.46 (3) - 0.13 - 0.94 (2) 0.16 - 0.6 (2) 0.40 - 3.65 Yes. Levels in some Bay shellfish and Delta Fish (1 3) exceed MIS.
Nickel 0.5 - 2.4 (1,ll) - 0.8 (2) 0.1 (8) 0.11 - 4.10 No alert levels established for tissue. (1 3)
Selenium 0.19 - 0.66 (1) 0.3 - 1.30 (9) 0.28 - 22.0 (10) 24 - 58 2.07 - 6.49 Yes. Levels in some Bay shellfish exceed MIS. Levels (1 0) (13) in some Bay fish exceed MARL. Levels in some Bay
ducks exceed MARL.
Silver 0.02 - 22.5 (3) 0.14 - 28.57 (6) 0.13 - 0.94 (2) 0.33 - 3.70 (8) - No alert levels established for tissue.
Tributyltin 0.120 - 2.960 (1) - - - - No alert levels established for tissue.
Zinc 11.0 - 45.8 (1) - 16.0 - 43.0 (2) 21.6 (8) - No alert levels established for tissue.
PAH 0.025 - 13 (3) - 0.017 - 14 (3) - - NO.
DDT and <.002 - 3.21 (3) - 0.020 - 5.18 (2) - 5 - 34 (13) Yes.Levels in some Delta fish exceed FDA action level. metabolites
PCB 0.009 - 0.657 (3) - 0.05 - 6.99 (2,12) - 0.05 - 330 Yes. Levels in some Bay and Delta fish exceed FDA (13) action level.
Note: Concentrations are shown for wet weight; data originally given for dry weight have been converted by dividing by seven. For seals, trace element data represent concentrations in dry whole blood; data for DDT and PCB represent concentrations in blood plasma lipids.
'The alert levels referred to in this table are the maximum tissue residue levels that are protective of human health. l3ey include: 1) the median international standard (MIS), which is a general guideline of what other nations consider to be elevated contaminant levels in fish and shellfish tissue; 2) the U.S. Food and Drug Administration (FDA) action levels, which represent maximum allowable concentrations for some toxic substances in human foods; and 3) the State Department of Health Service's maximum allowable residue levels (MARL), established to ensure that a consumer of specified fish or wildlife species does not exceed the permissible intake level for particular contaminants.
From data in:
(1) State Mussel Watch Program in SWRCB, 11990 (8) Ohlendotf et a/., 1986 in S WRCB, 1990 (2) State Toxic Substances Monitoring Program in SWRCB, 1990 (9) Giwin eta/., 1975 in SWRCB, 1990 (3) Long et a/., 1988 (10) DFG, 1991 (4) Hayes and Phillips, 1986 in S WRCB, 1990 (1 1 ) Risebrough et al., 1978 in SWRCB, 1990 (5) Ohlendo~f, 1985 in SWRCB, 1990 (12) AIOAA, 1987 (6) Luoma st a/., 1985 in SWRCB, 1990 (1 3) Kopec et a/., 1991 (7) Saiki and Palawski. 1990 in SWRCB, 1990

180 State of the Estuary
Table 23 Pollutant Trends in BaylDelta Estuary Sediments and Biota
Pollutant Trends in Sediments
Arsenic Few sites highly contaminated. Data unavailable to determine geographic or temporal trend. (2)
Cadmium Ubiquitous in the Bay; patchy distribution. Possible increasing concentration from north to south. Highest concentrations in South Bay. Slight decrease in mean sediment concentrations since mid-1970s. (3)
Chromium Spread throughout system. Concentrations higher in basins than on periphery. Highest levels in San Pablo Bay. No temporal trend apparent. (3)
Trends In Biota
Data unavailable to determine geographic or temporal trend. (2)
Concentrations in mussels fairly uniform among various basins of S.F. Bay. Highest concentrations in South Bay. Possible general pattern of slightly decreasing concentrations in mussels during the 1980s. Wide variation in concentrations in biota from year to year. (3)
Concentrations In mussels highest in Central and South bays. There are no Bay-wide temporal trends apparent among mussels. (3)
Copper Spread throughout system. Concentrations higher on Appears to be in similar concentrations in bivalves throughout S.F. Bay; periphery than in basins. Data unavailable to determine very patchy distribution. Mean concentrations similar in basins and temporal trend. (3) peripheral areas, but highest levels occur in peripheral areas. No
temporal trends in concentrations in biota are apparent. (3)
Lead Spread throughout system at low concentrations. Concentratlons In mussels highest in peripheral anas. Concentrations Concentrations highest on peripheral areas. No in mussels highest in Central Bay and South Bay. Data unavailable to temporal trend apparent. (3) determine temporal trend. (3)
Mercury Patchy distribution. Concentrations higher in peripheral Concentrations fairly uniform in biota throughout S.F. Bay. Highest areas. Highest mean concentrations on South Bay levels in biota of South Bay. No significant temporal trend of periphery. No temporal trend apparent. (1,3) increasing or decreasing concentrations. (3)
Nickel Increasing concentrations from north to south. Highest concentrations in South Bay. No temporal trend apparent. (1)
Selenium Few data available. Concentrations 3-44x than that in shales. Highest concentration in San Pablo Bay. Data unavailable to determine temporal trend. (2)
Silver Increasing concentrations from Delta to South Bay. Highest concentration in Central and South bays. No temporal trend apparent. (1,3)
Tributyltin Concentrations highest at marinas and harbors. No temporal trend apparent. (1)
Concentrations elevated in mussels from Carquinez Strait area and In clams from South Bay. In general, levels in biota poorly characterized. Data unavailable to determine temporal trend. (2)
Concentrations in shellfish highest In northern and southern reaches of S.F. Bay. Concentrations In ducks In South Bay and Sulsun Bay are comparable to ducks from Kesterson National Wildlife Refuge that had reproductive problems. Recent increase in concentrations in North Bay scaup and sturgeon. (1,4)
Concentrations in shellfish increase along gradient from Delta to South Bay. No significant temporal trend of increasing or decreasing concentrations in biota. (1.3)
Concentrations of TBT are hlghest in marinas and harbors throughout the estuary; however, data are unavailable to determine geographic and temporal trends in concentrations in biota. (2)
Zinc Concentrations generally moderate and, with few Concentrations in biota are moderately elevated. Highest concentrations exceptions, fairly uniform. Highest concentrations occur in biota inhabiting peripheral areas of Central and South bays. at sites in Central and South bays. No temporal High concentrations in Sacramento R ier water above the estuary cause trend apparent. (1,2) mortality in young salmon. Data unavailable to determine temporal trend. (1,2)
PAH Concentrations higher in peripheral areas. Data un- Concentrations in m~ssels highest in South Bay. Concentrations in fish available to determine temporal trend. (3) highest in East Bay and lowest in San Pablo Bay. There is no apparent
temporal trend In concentrations in biota. (3)
DDT Concentrations higher in peripheral areas, with few Concentrations in clams hlstorlcaiiy highest In Sulsun Bay and Delta exceptions. Data unavailable to determine long-term biota; lowest in San Pablo Bay. Concentrations in fish relatively similar at temporal trend. (3) various sites, but somewhat lower in San Pablo Bay than in ~ e i t a
Concentrationsin oysters, clams, and mussels have declined steadily since early 1980s. Possible decline in concentrations in striped bass. (3)
PCB Widespread in system. Concentrations higher in Concentrations in clams end bottomflsh highest in eastern Cefitral Bay peripheral areas. Concentrations lowest in San and In South Bay. Concentrations in San Pablo Bay typically low. There was Pablo Bay. Data unavailable to determine temporal an apparent peak in PCB levels in mussels in 1981, then a decline to current trend. (3) levels. Data are insufficient to determine trends in other biota. (3)
Sources: (1) S WRCB, 1990; (2) Phillips, 1987; (3) Long et a/., 1988; (4) DFG, 1991
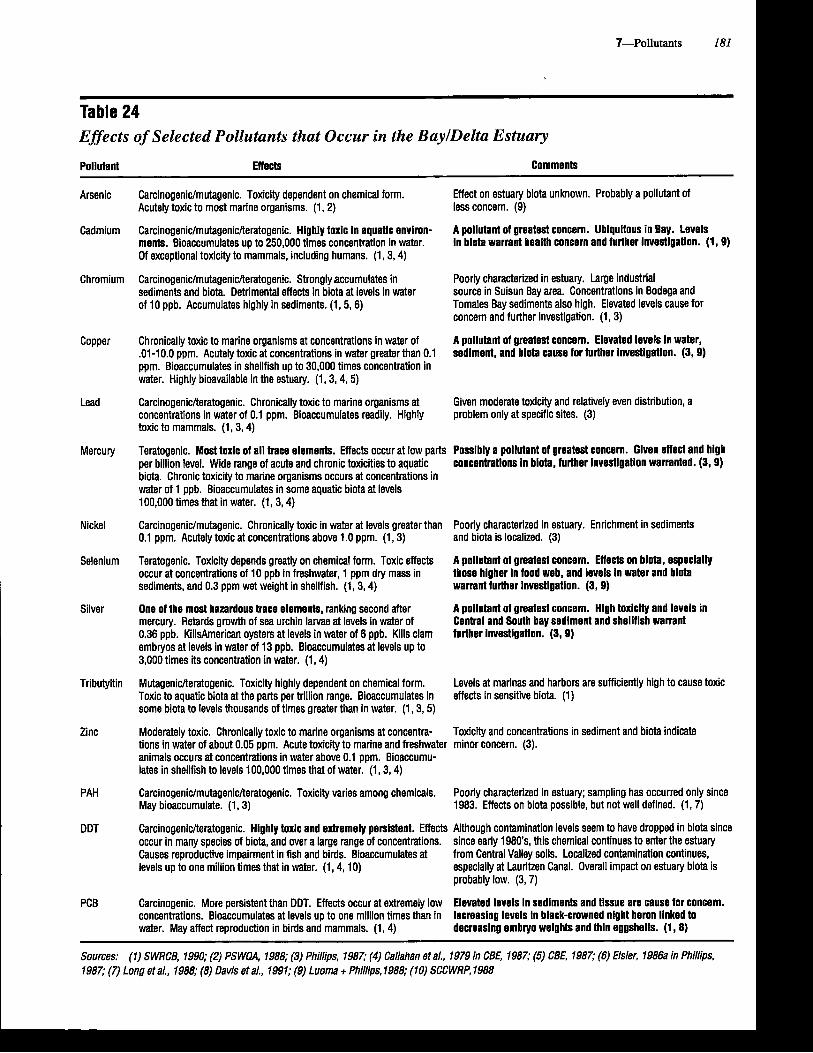
Table 24 Effects of Selected Pollutants that Occur in the BaylDelta Estuary
Pollutant Effects Comments
Arsenic
Cadmium
Chromium
Copper
Lead
Mercury
Nickel
Selenium
Silver
Tributyltin
Zinc
PAH
DDT
PCB
Carcinogenic/mutagenic. Toxicity dependent on chemical form. Effect on estuary biota unknown. Probably a pollutant of Acutely toxic to most marine organisms. (1,2) less concern. (9)
CarcinogenicImutageniclteratogenic. Highly toxlc in aquatlc environ- A pollutant of greatest concern. Ubiqultous In Bay. Levels ments. Bioaccumulates uo to 250.000 times concentration in water. In blota warrant health concern and further Investiuatlon. (1, 9) Of exceptional toxicity to mamma$, including humans. (1,3,4)
Carcinogeniclmutageniclteratogenic. Strongly accumulates in Poorly characterized in estuary. Large industrial sediments and biota. Detrimental effects in biota at levels in water source in Suisun Bay area. Concentrations in Bodega and of 10 ppb. Accumulates highly in sediments. (1,5,6) Tomales Bay sediments also high. Elevated levels cause for
concern and further investigation. (1,3)
Chronically toxic to marine organisms at concentrations in water of A pollutant of greatest concern. Elevated levels In water, .01-10.0 ppm. Acutely toxic at concentrations in water greater than 0.1 sediment, and biota cause for further investlgatlon. (3,9) ppm. Bioaccumulates in shellfish up to 30,000 times concentration in water. Highly bioavailable in the estuary. (1,3,4,5)
Carcinogenicheratogenic. Chronically toxic to marine organisms at Given moderate toxicity and relatively even distribution, a concentrations in water of 0.1 ppm. Bioaccumulates readily. Highly problem only at specific sites. (3) toxic to mammals. (1,3,4)
Teratogenic. Most toxic of al l trace elements. Effects occur at low parts Posstbly a pollutant of greatest concern. Glven effect and hlgh per billion level. Wide range of acute and chronic toxicities to aquatic concentrattons In biota, further investlgatlon warranted. (3, 9) biota. Chronic toxicity to marine organisms occurs at concentrations in water of 1 ppb. Bioaccumulates in some aquatic biota at levels 100,000 times that in water. (1,3,4)
Carcinogeniclmutagenic. Chronically toxic in water at levels greater than Poorly characterized in estuary. Enrichment in sediments 0.1 ppm. Acutely toxic at concentrations above 1.0 ppm. (1,3) and biota is localized. (3)
Teratogenic. Toxicity depends greatly on chemical form. Toxic effects A pollutant of greatest concern. Effects on biota, especially occur at concentrations of 10 ppb in freshwater, 1 ppm dry mass in those higher In food web, and levels In water and biota sediments, and 0.3 ppm wet weight in shellfish. (1,3,4) warrant further Investigation. (3,9)
One of the most hazardous trace elements, ranking second after A pollutant of greatest concern. High toxicity and levels In mercury. Retards growth of sea urchin larvae at levels in water of Central and South bay sedlment and shellflsh warrant 0.36 ppb. KillsAmerican oysters at levels in water of 6 ppb. Kills clam further investlgatlon. (3, 9) embryos at levels in water of 13 ppb. Bioaccumulates at levels up to 3,000 times its concentration in water. (1,4)
Mutagenicheratogenic. Toxicity highly dependent on chemical form. Levels at marinas and harbors are sufficiently high to cause toxic Toxic to aquatic biota at the parts per trillion range. Bioaccumulates in effects in sensitive biota. (1) some biota to levels thousands of times greater than in water. (1,3,5)
Moderately toxic. Chronically toxic to marine organisms at concentra- Toxicity and concentrations in sediment and biota indicate tions in water of about 0.05 ppm. Acute toxicity to marine and freshwater minor concern. (3). animals occurs at concentrations in water above 0.1 ppm. Bioaccumu- lates in shellfish to levels 100,000 times that of water. (1, 3,4)
Carcinogenic/mutagenic/teratogenic. Toxicity varies among chemicals. Poorly characterized in estuary; sampling has occurred only since May bioaccumulate. (1,3) 1983. Effects on biota possible, but not well defined. (1,7)
Carcinogenicheratogenic. Highly toxlc and extremely persistent. Effects Although contamination levels seem to have dropped in biota since occur in many species of biota, and over a large range of concentrations. since early 1980's, this chemical continues to enter the estuary Causes reproductive impairment in fish and birds. Bioaccumulates at from Central Valley soils. Localized contamination continues, levels up to one million times that in water. (1,4,10) especially at Lauritzen Canal. Overall impact on estuary biota is
probably low. (3,7)
Carcinooenic. More perslstent than DDT. Effects occur at extremely low Elevated levels In sediments and tlssue are cause for concern. concenfrations. Bioaccumulates at levels up to one million times than in Increasing levels In black-crowned nlght heron linked to water. May affect reproduction in birds and mammals. (1,4) decreasing embryo weights and thin eggshells. (1,8)
Sources: (1) S WRCB, 1990; (2) PS WQA, 1988; (3) Phillips, 1987; (4) Callahan et al., 1979 in CBE, 1987; (5) CBE, 1987; (6) Eisler, 1986a in Phillips, 1987; (7) Long et a/., 1988; (8) Davis eta/., 1991; (9) Luoma + Phillips, 1988; (10) SCCWRP, 1988
182 State of the Estuary
In 1989, scientists working under the auspices of the Lawrence Berkeley Laboratory and San Francisco Bay Regional Water Quality Control Board evalu- ated the toxicity of waters of San Francisco Bay, San Pablo Bay, and Carquinez Strait (Anderson et al., 1990). They exposed test organisms to water samples taken from sites far from the shoreline and to water taken from five shoreline marshes. Using standard bioassay tests, the researchers evaluated the effects of Bay water on minnow larvae, sea urchins, sand dollars, mussels, oysters, water fleas, and algae.
The bioassays indicated that the toxicity of the water far from the shoreline varied markedly among the test species and over time. Although some of the bioassay results were ambiguous, they suggest that Bay waters may be moder- ately toxic and that this toxicity may be elevated periodically. The bioassays also indicated toxic effects in water samples taken from four of the five marshes.
As part of the same study, water samples were taken from the Contra Costa Canal, a municipal and industrial water transport facility. Some of the bioassays using these samples indicated significant toxic effects. These results corrobo- rate previous reports of sporadic toxic events in the canal and indicate that additional monitoring would be useful.
Toxicity of Municipal and Industrial Efluents
In 1986, the Environmental Protection Agency developed a suite of effluent toxicity test protocols for use on the Pacific Coast. In 1987, EPA and the San Francisco Bay Regional Water Quality Control Board utilized the protocols to conduct bioassays of effluent discharged into the estuary from the Shell refmery at Martinez, the City of San Francisco's Southeast Water Pollution Control Plant, and the East Bay Dischargers Authority combined discharge. Results showed that the effluent from all three facilities was toxic at various dilutions. Effluent from the two wastewater treatment plants was about three times as toxic to mus- sel larvae as was the effluent from the Shell refmery. Additional tests on 13 discharges from petroleum refmeries, chemical plants, and municipal wastewa- ter treatment plants showed that, while the effluent of some of the industrial
ant concenh.ations into perspective. There are a pollutants in sample
concentration of a particular pollutant in a sample of Enviromental
able pollutant levels. The reference site is usually far ate to compa
characteristics such as depth and sediment type as
that h e been used in some stdies of pollutants in
Mwhboldt Bay, Bodega Head, and Tomales Bay.

7-Pollutants 183
facilities was toxic even when diluted, the effluent of many other facilities was not toxic even when undiluted (SFBRWQCB, 1987).
In 1990, the Regional Board reported on effluent toxicity testing for ten dis- charge sites. Although data indicated a wide range in the toxicity of the effluent tested, they also showed that the discharges were toxic even after dilution with ambient waters (SFBRWQCB, 1990).
Toxicity of Urban Runoff
Under a directive from the San Francisco Bay Regional Water Quality Control Board, the Santa Clara Valley Water District has begun a major program aimed at reducing nonpoint pollutant loads to South Bay. The first step of the program involved determining the toxicity of waters entering South Bay. Between February 1988 and April 1989, District consultants sampled water in the Santa Clara County portion of the South Bay watershed. Samples were taken from four streams; six reservoir release sites; and several industrial, commercial, residential, and open space areas. During dry periods, water was sampled only in the streams. Dur- ing wet periods, water was sampled in the streams, in reservoir releases, and at the various land areas. Bioassays of water samples were conducted using water fleas, fathead minnows, and a freshwater algae.
Results of bioassays conducted with dry season stream water indicated moderate toxicity in two of the four streams. During the wet season, however, water samples from all four streams and all developed land areas were toxic in about 80 percent
I
of the toxicity tests; only water sampled in the open space area was not toxic. In the stream water sampled during wet weather, cadmium, copper, lead, and zinc each exceeded EPA water quality criteria. Although researchers concluded that trace elements could be the cause for some of the toxicity, other chemicals probably were involved also (Woodward-Clyde Consultants, 199 1).
The Santa Clara Valley urban runoff monitoring program shows that wet sea- son urban runoff into San Francisco Bay may be toxic to sensitive aquatic species. This is not surprising, considering the variety and quantities of pollutants in urban runoff. Urban runoff monitoring programs now underway in other counties in the estuary watershed likely will show similar results and will support the need to reduce nonpoint pollutant loads to the estuary.
Toxicity of Nonurban Runoff
Agricultural runoff is one of the main contributors of nonurban runoff to the estuary. The extensively developed agricultural lands in the Central Valley, in particular, contribute large quantities of organic compounds and trace elements to the rivers that enter the Delta.
In spring of 1986, the Central Valley Regional Water Quality Control Board collected samples from water bodies known to carry high loads of agricultural runoff into the Sacramento River. Bioassays indicated that some of the samples were acutely toxic to water fleas; in samples that did not kill the fleas, flea re- production was inhibited. Fall surveys of agricultural drains showed little toxicity. In May and June of 1986 and 1987, toxicity coincided with the release of agri- cultural runoff (CVRWQCB, 1987).
Similar studies carried out on the San Joaquin River and its tributary drains during 1988- 1990, showed extraordinarily high levels of several agricultural pesticides. On several occasions, levels of some pesticides in parts of the river
~ 184 State of the Estuary
Selenium-A Pollutant from Near and Far Selenium is one of the estuary's few pollutants that has In I989 and 1990, while concentrations of selenium been studied extensively. At low concentrations, this in Humboldt Bay ducks remained at their 1986 level, natural trace element is utilized by aainzals as a nutrient. concentrations in surf scoters and sturgeon taken from At higher doses it is deadly. San Pablo and Suisun bays increased by threefold
over their 1986 levels. The mean concentration of In the ewly1980Sf sezemkmemriPd in drain- selenium in the scoters is now similar to that of the agefmnr in'8atedsoi' On the west side of the Centpa' severely qfeCted bjr* at Kesterson; the levels in Valley w a s f o d to cause birth wom-ties and deaths in S&,.geon far concen*&,ns at wh jch a b w many species of shorebirds and waterfowl at the ties are knaon to occur injkh. Kesterson National Wildlife R&ge near Los Barns. By the late 1 9 8 0 ~ ~ thousand;F of acres of Rejkge p o d had Although the biological t#ects of selenium in the Bay been drained andfilled to prevent additional bird deaths. are not yet well understood, there is ample evidence Selenium-laden agricultural drain water still flavs into for concern. the San Joaquin River. The work with selenium in the Bay exemplifies the ben- The largest source ofseleaium within San Francisco Bay efis of long-term monitoring of the estuary's organism. seem to be the petroleum refineries abng the Carquinez Without such a maitoping @art, regulatory agencies Strait. In recent years, the combined annual average dis- such as the State Water Resources Control Board and charge of seleniumfrom the refineries into Bay waters Regional Water Quality Control Boards would have a has exceeded two tons. much more dificult time assessing trends in pollutant
concentrations and making scientifcally sound In 1986, the California Department of Fish and Game regulatory decisions. began annual monitoring of selenium concentrations in surf scoters and white sturgeon in San Francisco Bay. In the early years of the study, average selenium con- centrations in the livers of Bay scoters were three to nine times greater than in livers of ducks sampled at Humboldt Bay.
exceeded the EPA recommended criteria by as much as 30 times. In many of the bioassays of water sampled from the river and its tributaries, all of the test or- ganisms died. At times, normal agricultural practices rendered as many as 50 miles of the river toxic (CVRWQCB, 1990).
Toxicity of Sediments
Most of the pollutants that enter the estuary are associated with particulate matter and ultimately are deposited in the sediments. Once there, these chemicals may affect organisms. The most common way to determine the potential bioavailability and toxicity of sediment pollutants on biota is the sediment bioassay.
Compared to other extensively developed areas on the West Coast (such as Puget Sound) relatively few sediment bioassays have been conducted in the Baypelta estuary. Of some three dozen sites evaluated, however, sediments from several have elicited toxic responses including developmental abnormalities and high mortality in amphipods, mussels, and oysters. Areas in which sedi- ments have proven to be most toxic include Point Molate, Suisun Slough Channel, central portion of South Bay, Islais Creek channel, Mare Island Strait, Oakland Middle Harbor, Redwood Creek, Hunters Point, Guadalupe Slough, Castro Cove, Richmond Harbor, and Treasure Island Naval Base (Chapman and Morgan, 1983; Long and Morgan, 1990).
,
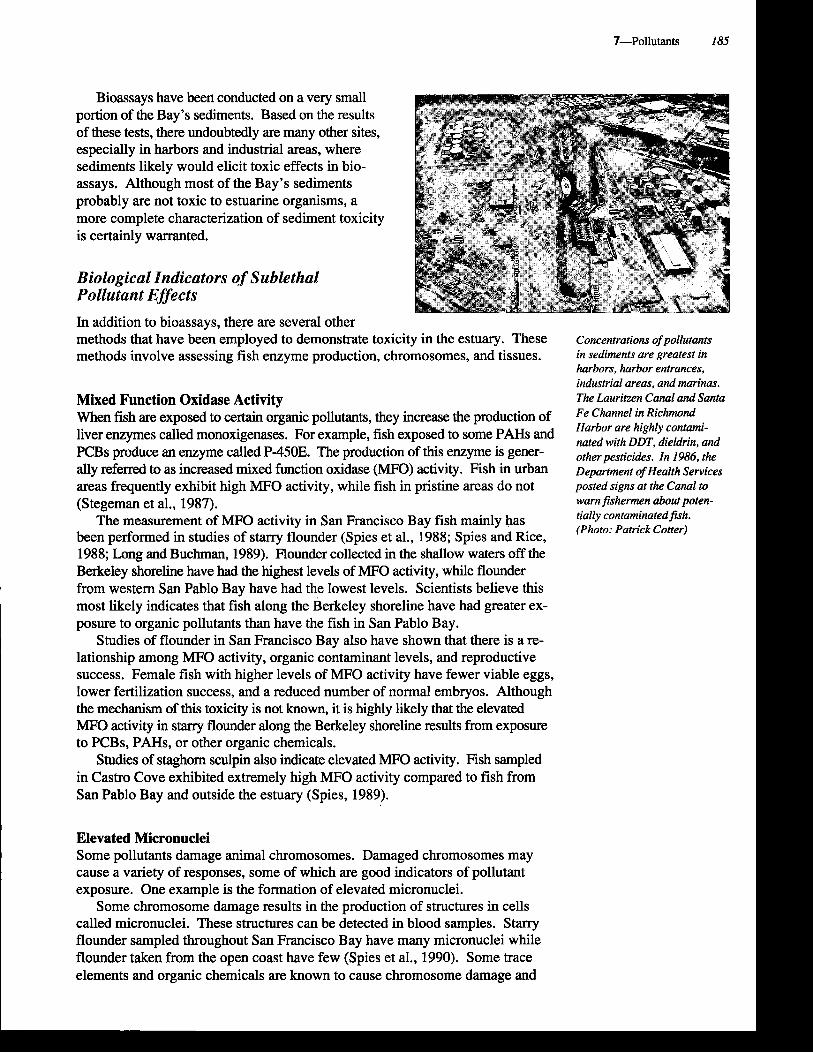
Bioassays have been conducted on a very small portion of the Bay's sediments. Based on the results of these tests, there undoubtedly are many other sites, especially in harbors and industrial areas, where sediments likely would elicit toxic effects in bio- assays. Although most of the Bay's sediments probably are not toxic to estuarine organisms, a more complete characterization of sediment toxicity is certainly warranted.
Biological Indicators of Sublethal Pollutant Effects
In addition to bioassays, there are several other methods that have been employed to demonstrate toxicity in the estuary. These methods involve assessing fish enzyme production, chromosomes, and tissues.
Mixed Function Oxidase Activity When fish are exposed to certain organic pollutants, they increase the production of liver enzymes called monoxigenases. For example, fish exposed to some PAHs and PCBs produce an enzyme called P-450E. The production of this enzyme is gener- ally referred to as increased mixed function oxidase (MFO) activity. Fish in urban areas frequently exhibit high MFO activity, while fish in pristine areas do not (Stegeman et al., 1987).
The measurement of MFO activity in San Francisco Bay fish mainly has been performed in studies of starry flounder (Spies et al., 1988; Spies and Rice, 1988; Long and Buchman, 1989). Flounder collected in the shallow waters off the Berkeley shoreline have had the highest levels of MFO activity, while flounder from western San Pablo Bay have had the lowest levels. Scientists believe this most likely indicates that fish along the Berkeley shoreline have had greater ex- posure to organic pollutants than have the fish in San Pablo Bay.
Studies of flounder in San Francisco Bay also have shown that there is a re- lationship among MFO activity, organic contaminant levels, and reproductive success. Female fish with higher levels of MFO activity have fewer viable eggs, lower fertilization success, and a reduced number of normal embryos. Although the mechanism of this toxicity is not known, it is highly likely that the elevated MFO activity in starry flounder along the Berkeley shoreline results from exposure to PCBs, PAHs, or other organic chemicals.
Studies of staghorn sculpin also indicate elevated MFO activity. Fish sampled in Castro Cove exhibited extremely high MFO activity compared to fish from San Pablo Bay and outside the estuary (Spies, 1989).
Elevated Micronuclei Some pollutants damage animal chromosomes. Damaged chromosomes may cause a variety of responses, some of which are good indicators of pollutant exposure. One example is the formation of elevated micronuclei.
Some chromosome damage results in the production of structures in cells called micronuclei. These structures can be detected in blood samples. Starry flounder sampled throughout San Francisco Bay have many micronuclei while flounder taken from the open coast have few (Spies et al., 1990). Some trace elements and organic chemicals are known to cause chromosome damage and
Concentrations of pollutants in sediments are greatest in harbors, harbor entrances, industrial areas, and m r i m . The Lauritzen Canal and Santa Fe Channel in Richmond Harbor are highly contami- nated with DDT, dieldrin, and other pesticides. In 1986, the Department of Health Services posted signs at the Cam1 to warn jishemn about poten- tially contaminatedjish. (Photo: Patrick Cotter)
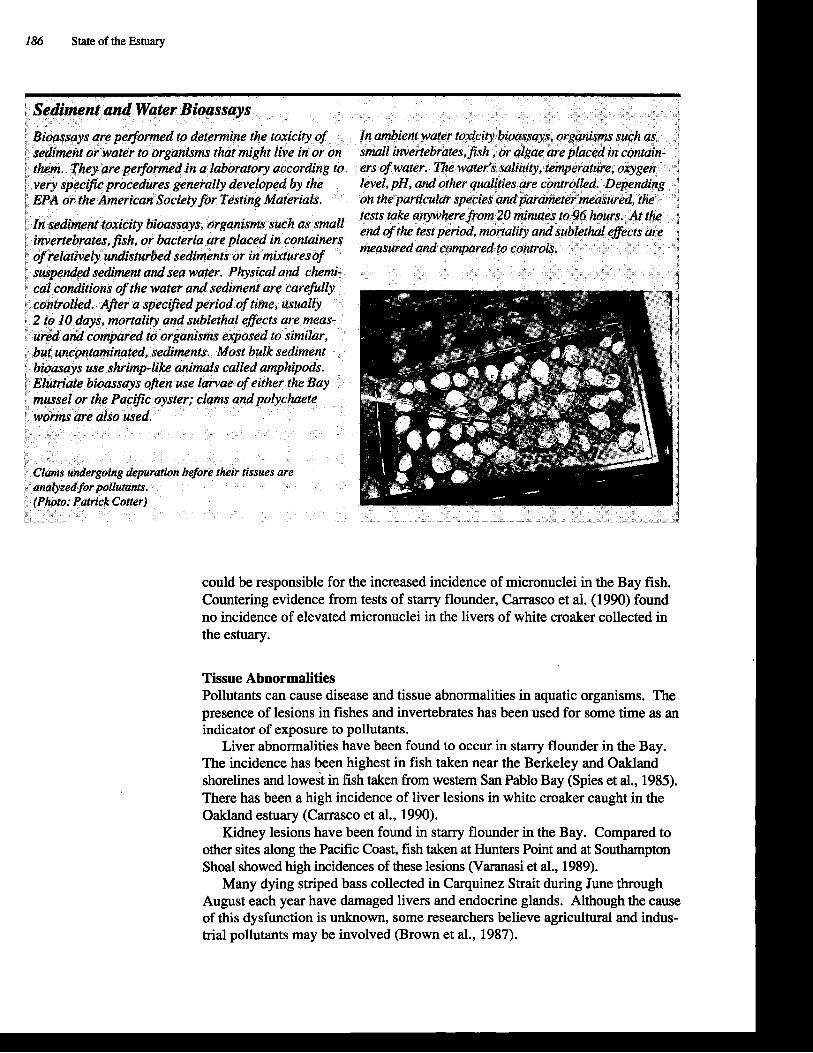
186 State of the Estuary
Bioassays are performed to determine the toxicity of In ambient water toxicity bioassays, organisms such as sediment or water to organisms that might live in or on mall iavertebrates,j?sh , or algae are placed in contain-
[ them. They are performed in a laboratoiy according to 1 very specijc procedures generally developed by the 1 EPA or the American Society for Testing Materials.
are I a n w e d for pullutms.
ers of water. The water's salinity, temperatwe, oxygen I level, pH, and other qualities are controlled. Depending 4 on the particukr species and parameter measred, the I tests take anywhere from 29 minutes to 96 hours, At the i end of the test period, mortality and sublethal dects are measured and compared to controk.
i
could be responsible for the increased incidence of micronuclei in the Bay fish. Countering evidence from tests of starry flounder, Carrasco et al. (1990) found no incidence of elevated micronuclei in the livers of white croaker collected in the estuary.
Tissue Abnormalities Pollutants can cause disease and tissue abnormalities in aquatic organisms. The presence of lesions in fishes and invertebrates has been used for some time as an indicator of exposure to pollutants.
Liver abnormalities have been found to occur. in starry flounder in the Bay. The incidence has been highest in fish taken near the Berkeley and Oakland shorelines and lowest in fish taken from western San Pablo Bay (Spies et al., 1985). There has been a high incidence of liver lesions in white croaker caught in the Oakland estuary (Carrasco et al., 1990).
Kidney lesions have been found in starry flounder in the Bay. Compared to other sites along the Pacific Coast, fish taken at Hunters Point and at Southampton Shoal showed high incidences of these lesions (Varanasi et al., 1989).
Many dying striped bass collected in Carquinez Strait during June through August each year have damaged livers and endocrine glands. Although the cause of this dysfunction is unknown, some researchers believe agricultural and indus- trial pollutants may be involved (Brown et al., 1987).
The Delta is a significant source of drinking water for some 20 million Califor- nians. Pollutants in Delta waters may adversely affect drinking water quality throughout the State. In recent years there has been increased awareness and concern for a certain class of pollutants known as disinfection byproducts @BPS). Anticipated changes in existing federal drinking water regulations may lower the maximum con taminant level for some DBPs. This most likely will require utilities that deliver drinking water to change their disinfection treatment processes to minimize DBP formation.
Disinfection byproducts form when organic precursor materials present in a drinking water source react with the disinfectant, such as chlorine or ozone. Disinfection byproduct precursors include aquatic humic substances which are non-biodegradable and that originate from peat soils or decaying vegetation. Trihalomethanes (THMs) are one group of DBPs that form when water contain- ing organic materials is chlorinated. Two of these compounds, chloroform and bromoform, are animal carcinogens and are suspected human carcinogens.
In the Delta, there are some 260 agricultural drains that discharge agricultural drainage into the waterways from the nearly 60 Delta islands (Brown and Caldwell, 1990). This drainage water is considered a major source of organic precursor ma- terial that contributes to the formation of DBPs upon chlorination of Delta waters.
Studies by the Department of Water Resources have found that water in the south Delta produces higher THM levels than does north Delta water (DWR, 1989a, 1989b). Preliminary findings of the DWR Delta Island Drainage Investi- gation indicate that agricultural drainage from Delta islands contributes 40 to 45 percent of the organic carbon involved in THM formation in Delta water supplies during the irrigation months and 38 to 52 percent during the winter leaching period. Agricultural pesticides applied upstream of the Delta may also contribute to the formation of THMs; however, further monitoring is needed before any conclusions can be made regarding the impact of pesticides on this aspect of Delta water quality.
Seawater intrusion also contributes to THM formation, by increasing bro- mide levels in Delta waters. Bromide ions in the water oxidize to a form which competes with chlorine and reacts more quickly with organic precursor material to form THMs and other DBPs during disinfection.
The high levels of organic DBP precursor material and elevated bromide levels resulting from seawater intrusion are significant for drinking water utilities using Delta water, especially for those with export pumps located in areas of the Delta most susceptible to seawater intrusion and located near Delta island agricultural drains. Some utilities have switched to disinfectants other than chlorine in order to comply with the current total THM standard. This not only is costly for utilities, but also may result in the formation of DBPs other than THMs, whose health effects are uncertain at this time.
The most reliable way to ensure good quality water for drinking water supplies is to control the release of contaminants into the water at their source. The federal Safe Drinking Water Act emphasizes source water protection and encourages water purveyors to use supplies from the highest quality source. In addition, the technologies necessary to control the release of pollutants at their source are often more effective than advanced drinking water treatment technolo- gies necessary to remove contaminants from drinking water supplies. Nonpoint sources of pollution, such as agricultural runoff and urban runoff, are more difficult

188 State of the Estuary
Pollution Prevention Over the past two decades, substantial progress has been made in controlling pollution. However, there are limits to the amount of environmental protection that can be achieved by current regulatory programs that emphasize management afi'er pollutants have been generated. These programs focus on treatment, con- trol, and disposal, and can sometimes result in the tran$er of pollutants from one environmental medium to another where they may continue to present a hazard. Pollution prevention is an alternative and complementary method of reducing pollutant loads to the environment.
Pollution prevention is any practice or activity that reduces, avoids, or eliminates the generation of wastes. Techniques focus on source reduction or recycling activities that reduce either the volume or toxicity of generated wastes. Only actions that are associated .- with waste-generating activities are considered to be pollution prevention measures. Spec@c activities for pollution prevention are those that:
1. Redesign or reformulate products.
2. S&tute rawmatet%& that irttroduce SmaAlerqua~s of hazardous substances into production processes.
3. Improve process technology aad eqwpment to alter the primary source of waste generation.
4. Improve plant operations (housekeeping).
5. Recycle polluted flcbstances a the site of its generation (closed-loop recycling).
Pollution prevention dOeS not include any form of treat- ment, pretreatment, incineration, managed disposal, or recycling outside ofthe waste-gen
Pollution prevention measures ofer potential means of reducing costs associated with the production and regulation of waste-generating activities. the generation of waste, industry can real1 associated with using materials more @cientty. 0 economic benefits of pollution prevention include lower costs incurred by both regulatory agencies and regulated parties associated with compliance with envi- ronmental regulations. The current level ofnational spending for pollution control is about $70 billion and is increasing; two-thirds of th~3 amount is spent by industry. Pollution prevention is a practical way to complement the costly process of pollutl'on control.
Product reformulation From OTA, 1986; CBE, 1989 wustes. {Photo: Jesse
to control than point sources of contamination and significantly impact the quality of Delta drinking water supplies. In order to develop technologies and best man- agement practices to reduce the discharge of pollutants from nonpoint sources into the Delta, continued monitoring programs and basic research are needed.
What Does the Future Hold?
In its natural state, sediments and naturally occurring chemicals influenced the estuary's waters and biota. Although little can be done to alter the introduction
into the estuary pollutants from natural processes, there is much that can be done to reduce the kinds and quantities of pollutants that enter as a direct or indirect result of human activities.
In the future, the quantity and forms of the pollutants entering the estuary will be determined largely by the number of people living within the estuary watershed, land-use patterns, use and disposal of pollutant-containing products, industrial processes, and treatment technologies. Of all the factors that influence pollutant loadings, population growth and land use are two for which some quantitative es- timates of future trends can be made. As described in Chapter 3, by the year 2005, the number of persons living in the 12 counties surrounding the estuary will in- crease from 7.5 million to 8.8 million. Additional growth in the Central Valley will bring the total population in the estuary watershed to almost 12 million.
Based on past trends, population growth within the estuary watershed will result in the production of greater volumes of domestic sewage,and household wastes. Although the per household volume of sewage and household wastes generated will probably decrease, as water conservation measures are applied more widely, it is unknown whether further reductions in pollutant loading can offset population growth. In the absence of additional control measures (pre- treatment and treatment) or effective pollution prevention, pollutant loads from municipal sources will increase along with increases in wastewater flows. The implementation of enhanced treatment methods at municipal plants could minimize the amount of total loading of trace elements and organic pollutants from this source (Davis et al., 1991).
Unlike municipal discharges, pollutant loads from industrial sources are not so directly tied to population growth. Future loadings from industrial sources will be determined by the number of facilities operating, chemical use, control measures, and pollution prevention. For both municipal and industrial sources, discontinuing the use of toxic chemicals that require treatment may be more cost effective than implementing enhanced treatment methods.
Projections indicate that the lands surrounding the estuary will become in- creasingly urbanized in the future. A recent study of the relationship between land use and pollutants indicates that the expansion of urban land use within the 12 estuary counties will likely increase the estuary's loading of many nonpoint pollutants (Blanchfield et al., 1991). This study, which evaluated two future growth scenario-ne based on existing county general plans and another based on modeled incentives and limitations-projects significant increases in the loadings of several pollutants in nonpoint runoff. Particularly noteworthy are large projected increases in zinc and lead. Although not evaluated in the study, loadings of petroleum hydrocarbons also are expected to increase substantially (Davis et al., 1991).
Although urban land use is projected to increase in the estuary watershed, agriculture will remain the major land use in the Central Valley. Unless there are substantial changes in farming practices, the estuary will continue to receive large loads of agricultural pollutants, primarily pesticides.
Other pollutant sources including atmospheric deposition, vessel wastes, spills, debris, and leaching from waste sites may be expected to continue to contribute harmful chemicals to the estuary. The trend toward more stringent standards for air emissions and a ban on land disposal of untreated hazardous wastes should reduce loadings from these sources. Vessel wastes, spills, and leaks from existing waste sites will continue as intermittent and localized pollutant sources.
190 State of the Estuary
Summary
In its natural state, the BayPelta estuary exhibited few, if any, adverse effects of pollutants. The sediment and naturally occurring chemicals that entered from upstream were assimilated into the estuarine ecosystem.
As urban, industrial, and agricultural activities expanded throughout the water- shed, pollutant loads and associated adverse effects increased. By the early part of this century, adverse effects of pollutants were common. Although the most obvious impacts were caused by the discharge of large quantities of nutrients, toxic chemicals also affected organisms.
During the 1960s and 1970s, improved treatment of municipal wastes reduced nutrient loadings and halted the most visible pollutant problems-algae blooms and low levels of dissolved oxygen-in many parts of the Bay and in the Delta. Although advanced treatment facilities also reduced the loading of toxic chemi- cals, these pollutants continued to enter the estuary's waters in large quantities. Today, conventional pollutants are considered to pose little threat to the estuary ecosystem, while toxic chemicals are the chief cause for concern.
Each year, some 5,000-40,000 tons of toxic pollutants enter the estuary. The bulk of these chemicals are carried in runoff from urban areas and farms. Effluent from municipal and industrial outfalls, dredging, atmospheric deposi- tion, spills, and other sources contribute the remainder. Although programs are in place to regulate the discharge of these pollutants, large quantities of toxic pollutants continue to enter the estuary.
Compared to background or reference sites, pollutants occur at elevated levels in the estuary's waters, sediments, and biota. Concentrations in sediments and biota are generally highest in harbors, marinas, and industrial waterways. Concentrations of some pollutants in sediment and biota are among the highest found in the world.
Bioassays of the estuary's water, sediments, and biota indicate that existing pollutant concentrations cause toxic effects. Bioassays of urban runoff, farm drainage, and municipal and industrial effluent also indicate evidence of toxic- ity. Other research shows that some Bay fish have damaged chromosomes and tissue abnormalities that are strongly correlated with high levels of organic pollutants. Carefully conducted tests clearly indicate that the estuary's biota are being exposed to toxic levels of pollutants.
During the past 30 years, giant strides have been made in addressing the estuary's complex pollutant problems. Today, however, a much more =cult task faces the people who live and work on the lands around the estuary and far upstream. This task is to lower toxic pollutant inputs until they no longer compromise the estuary's water quality and biological resources. Accomplish- ing this will require changing industrial and agricultural production practices, transportation patterns, and personal consumption habits. These changes, all of which can be accomplished with the concerted effort of the public and private sectors, should begin immediately.

Dredging and Waterway Modification
1 1986, when Estuary Project participants began the process of identaing the I BaylDelta estuary's key management issues, they discussed several topics con-
cerning the estuary's waterways-its embayments, channels, and tributary rivers and stream. These topics included dredging for navigation purposes, construc- tion and maintenance offlood control and bank protection projects, and sea level rise. From these discussions, a management issue emerged that comprised all of these topics and which, initially, was referred to as "waterway modification."
8 However, because there was such intense interest in dredging and the effects of dredged material disposal, this management issue soon became known as "dredg- ing and waterway modification." Reflecting this, the Estuary Project's Status and Trends Report on Dredging and Waterway Modification in the San Francisco Estuary (Gunther et al., 1990) is primarily a report on dredging issues. This chapter, too, focuses mainly on dredging, although it also touches briefly on other aspects of waterway modijkation.
Dredging in the BaylDelta estuary has been an issue of concern for many de- cades. Although there is consensus that dredging is necessary to enable safe naviga- tion of commercial, military, and recreational vessels, there is a diversity of views regarding the environmental effects of dredging and dredged material disposal. There also are many views on how best to manage dredging and disposal operations. Since the mid-1980s,Jishery, navigation, and water quality problem have heightened the interest in this issue, especially in the Sun Francisco Bay area.
This chapter explains why and where dredging occurs in the estuary. It describes the various kinds of dredges and dredging projects and the quuntities of material ex- cavated and disposed. It briefly discusses some of the potential enviromntal e#ects of dredging and dredged material disposal on biota and water quality. It also projects future dredging needs and describes ongoing eforts to establish a long-term management strategy for dredging and disposal activities: As noted above, this chapter also provides information, albeit in much less detail, on flood control projects and sea level rise.
Findings
During the process of characterizing the dredging and waterway modification issue, the following points have emerged:
1. Each year, some six million cubic yards of sediments enter the estuary, primarily from the Sacramento and San Joaquin river systems. Most of this material is deposited in waterways of the Bay and Delta, and some must be dredged to ensure adequate water depths for commercial, military, and recreational vessels. 191
192 State of the Estuary
2. Dredging is conducted by the Amy Corps of Engineers, the Navy, ports, commer- cial marina operators, local flood control and reclamation districts, and others.
3. During 1986-1987, the Army Corps of Engineers and the Navy dredged an .
annual average of 7.3 million cubic yards of material in the estuary. In combination with other projects, more than 8 million cubic yards of sediment were dredged and disposed each year.
4. Since 1975, there have been only three main sites for aquatic disposal of dredged material in San Francisco Bay. Of the dredged material disposed during 1986-1987,65 percent went to the Alcatraz Island disposal site. The remainder was disposed at sites in San Pablo Bay and Carquinez Strait, or at upland sites in the region.
5. Modeling and field studies indicate that much of the dredged material disposed at aquatic sites in the Bay stays there, some of it redepositing in dredged areas.
6. The dredging and disposal of estuarine sediments temporarily increases tur- bidity, influences benthic communities at and near disposal sites, and may affect the behavior and physiology of fish and other organisms. It also may redistribute toxic pollutants and increase their availability to aquatic organisms.
7. The two most hotly debated dredging issues in the past few years include the effects of dredged material disposal on Central Bay angler success and the redistribution and release of toxic contaminants in dredged sediment.
8. In 1989, the San Francisco Bay Regional Water Quality Control Board and the Bay Conservation and Development Commission took steps to reduce the volume of dredged material being disposed in San Francisco Bay until a better approach to managing dredged material can be developed.
9. In response to dredging-related environmental problems, the Army Corps of Engineers has initiated an effort involving state, federal, and other interests to develop a long-term management strategy for dredging and dredged material disposal. This effort, scheduled to be completed by 1995, seeks to eliminate unnecessary dredging activities, maximize the use of dredged material as a resource, and ensure that dredging activities are conducted in the most envi- ronmentally sound fashion possible.
10. Between 1995 and 2045, some 400 million cubic yards of sediments (an annual average of about 8 million cubic yards) are expected to be dredged in the estuary. Given the goals of the long-term management strategy, it is likely that the majority of this material will not be dumped in San Francisco Bay; a significant portion will be put to beneficial use and much of it will be disposed in the ocean.
11. More than 50 federally-sponsored flood control projects have been planned or constructed in the estuary basin and on the Central Valley tributaries. Local flood control projects occur on most of the streams in the urban basin. In the Delta, more than 57 individual levee systems protect several towns and more than 350,000 acres of farmland from floods. Levees also prevent flooding of seasonal wetlands and developed areas around San Francisco Bay.
12. Hood control projects adversely affect habitat conditions for fish and wildlife on the estuary's tributaries. Project features causing adverse impacts include alterations of channel configuration, removal of riparian vegetation, place- ment of revetment to reduce erosion, and construction of concrete channels.
&Dredging and Waterway Modification 193
In the Delta, levee maintenance standards affect habitat conditions by limiting the extent of vegetation allowed on the levees.
13. Alternative flood control measures that utilize features less damaging to stream courses and related habitats are beginning to be used in the estuary basin. Many of these measures are being incorporated in urban creek restora- tion efforts.
14. As a result of global warming, the rate of sea level rise has increased mark- edly in recent years. Combined with land subsidence, by 2037 the relative mean sea level is projected to rise by more than five feet in some areas at the edge to the estuary. In most parts of the estuary, the relative rise in sea level will be much less, but still substantial. Because even a moderate rise in sea level will affect the estuary's water quality, wetlands, and human activities on adjacent low-lying lands, it is imperative that steps begin to be taken now to plan for this.
The Need for Dredging
Dredging is the systematic excavation of bottom sediments. The primary reason for dredging in the estuary is to ensure that water depths in navigation channels, turning basins, docking slips, and marinas are deep enough for the safe passage of vessels. To a much lesser extent, dredging also is conducted to maintain flood control chan- nel capacities and as part of breakwater and bridge construction.
Most of the estuary is shallow, with some 70 percent of San Francisco Bay less than 18 feet deep. Because large military and commercial oceangoing vessels require as much as 40 feet of water, or more, they can access ports only by way of deepened channels. The operation of smaller, recreational vessels also requires dredging of marinas and their approach channels. Thus, the continuation of military operations, commercial shipping, and recreational boating in the estuary requires dredging. Without dredging, much of the shipping activity in the estuary would decline and eventually cease.
Sedimentation More than six million cubic yards of sediments enter the estuary each year, mostly from the Sacramento and San Joaquin rivers, and as many as 286 million cubic yards of existing sediments in the shallows of San Francisco Bay are resuspended by currents and wind-driven waves. As a result, areas that have been dredged lower than the surrounding substrate begin to refill with sediment. The rate at which the dredged areas fill ranges from 0.1 to 5.2 feet per year (USACE, 1990). To maintain design depths of dredged sites requires maintenance dredging. The frequency of maintenance dredging at a particular site depends on the rate at which it fills and may vary from once a year to once a decade.
Kinds of Dredges
Three kinds of dredges are used in the estuary: hopper, cutterhead, and clam- shell. Most dredging is undertaken with a self-propelled hopper dredge. This dredge, like a giant vacuum cleaner, pulls a slurry of sediment and water up
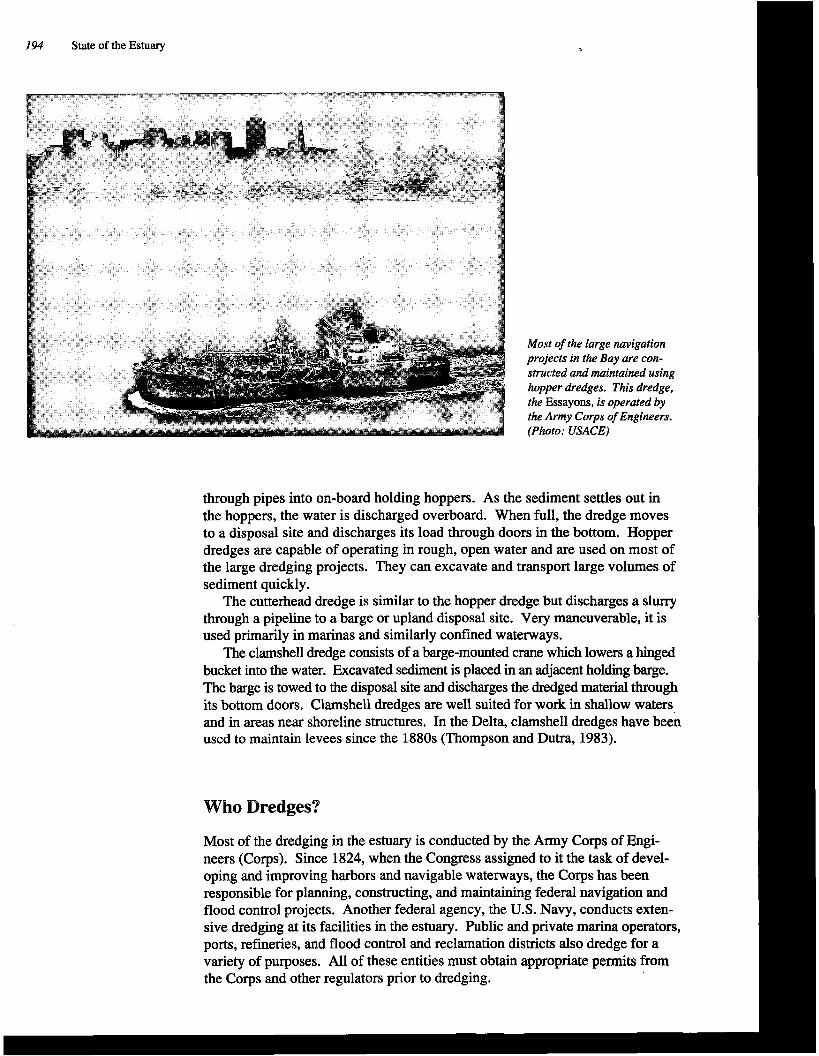
194 State of the Estuary
through pipes into on-board holding hoppers. As the sediment settles out in the hoppers, the water is discharged overboard. When full, the dredge moves to a disposal site and discharges its load through doors in the bottom. Hopper dredges are capable of operating in rough, open water and are used on most of the large dredging projects. They can excavate and transport large volumes of sediment quickly.
The cutterhead dredge is similar to the hopper dredge but discharges a slurry through a pipeline to a barge or upland disposal site. Very maneuverable, it is used primarily in marinas and similarly confined waterways.
The clamshell dredge consists of a barge-mounted crane which lowers a hinged bucket into the water. Excavated sediment is placed in an adjacent holding barge. The barge is towed to the disposal site and discharges the dredged material through its bottom doors. Clamshell dredges are well suited for work in shallow waters and in areas near shoreline structures. In the Delta, clamshell dredges have been used to maintain levees since the 1880s (Thompson and Dutra, 1983).
Who Dredges?
Most of the dredging in the estuary is conducted by the Army Corps of Engi- neers (Corps). Since 1824, when the Congress assigned to it the task of devel- oping and improving harbors and navigable waterways, the Corps has been responsible for planning, constructing, and maintaining federal navigation and flood control projects. Another federal agency, the U.S. Navy, conducts exten- sive dredging at its facilities in the estuary. Public and private marina operators, ports, refineries, and flood control and reclamation districts also dredge for a variety of purposes. All of these entities must obtain appropriate permits from the Corps and other regulators prior to dredging.
Most of the large navigation projects in the Bay are con- structed and maintained using hopper dredges. This dredge, the Essayons, is operated by the Army Corps of Engineers. (Photo: USACE)
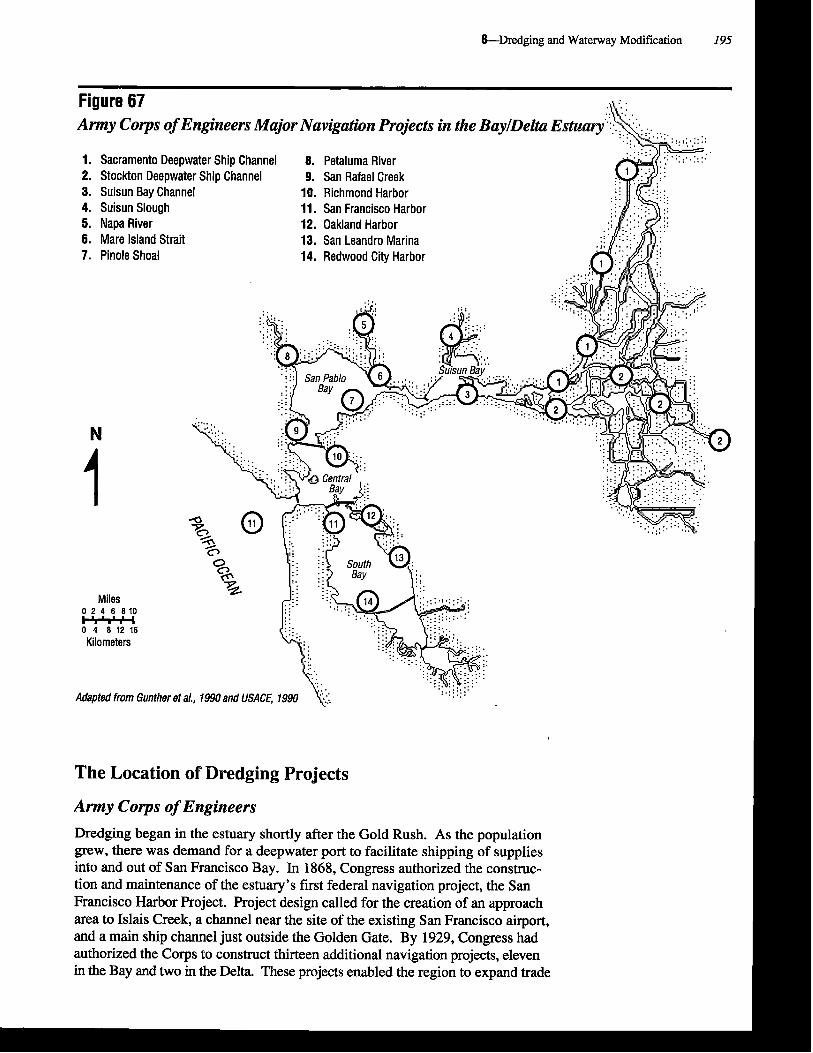
&Dredging and Waterway Modification 195
Figure 67 .$J,.: :
1. Sacramento Deepwater Ship Channel 8. Petaluma River 2. Stockton Deepwater Ship Channel 9. San Rafael Creek 3. Suisun Bay Channel 10. Richmond Harbor 4. Suisun Slough 11. San Francisco Harbor 5. Napa River 12. Oakland Harbor 6. Mare Island Strait 13. San Leandro Marina 7. Pinole Shoal 14. Redwood City Harbor
Miles 0 2 4 6 810 - 0 4 8 12 16
Kilometers
The Location of Dredging Projects
A m y Corps of Engineers
Dredging began in the estuary shortly after the Gold Rush. As the population grew, there was demand for a deepwater port to facilitate shipping of supplies into and out of San Francisco Bay. In 1868, Congress authorized the construc- tion and maintenance of the estuary's first federal navigation project, the San Francisco Harbor Project. Project design called for the creation of an approach area to Islais Creek, a channel near the site of the existing San Francisco airport, and a main ship channel just outside the Golden Gate. By 1929, Congress had authorized the Corps to construct thirteen additional navigation projects, eleven in the Bay and two in the Delta. These projects enabled the region to expand trade
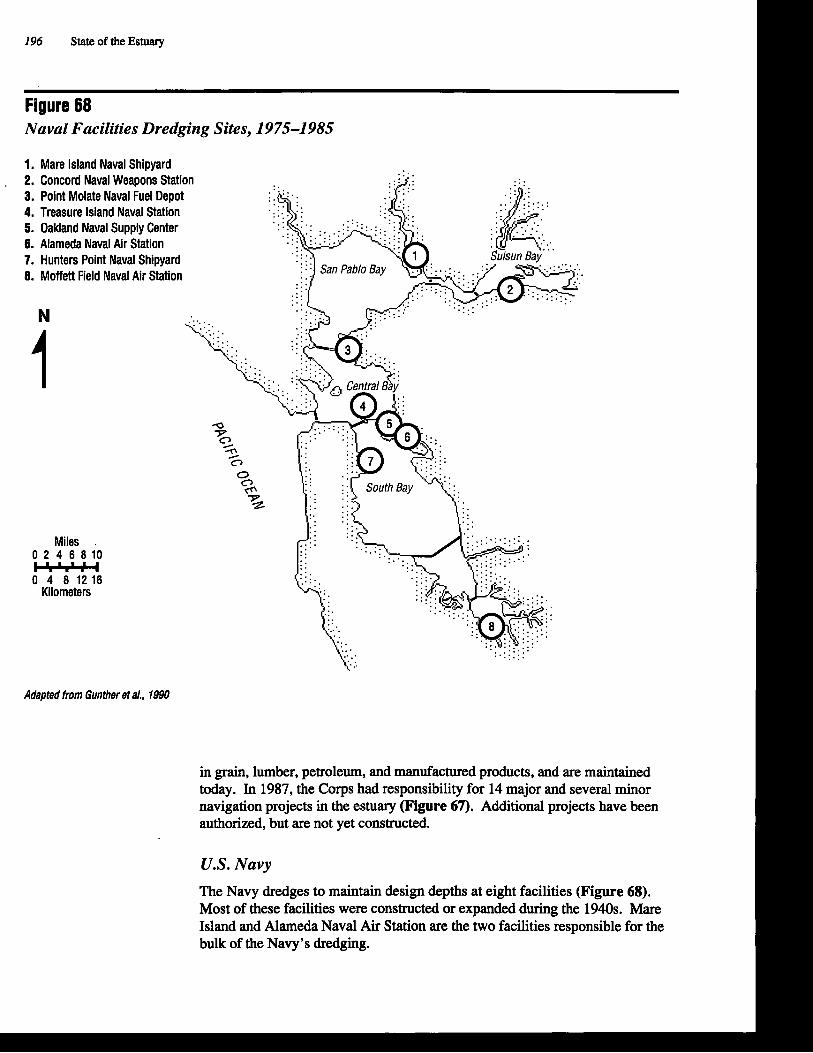
196 State of the Estuary
Figure 68 Naval Facilities Dredging Sites, 1975-1 985
1. Mare Island Naval Shipyard , 2. Concord Naval Weapons Station
3. Point Molate Naval Fuel Depot 4. Treasure Island Naval Station 5. Oakland Naval Supply Center 6. Alameda Naval Air Station 7. Hunters Point Naval Shipyard 8. Moffett Field Naval Air Station
Miles . 0 2 4 6 8 1 0 - 0 4 8 12 16
Kilometers
Adapted from Gunther et a/., 1990
in grain, lumber, petroleum, and manufactured products, and are maintained today. In 1987, the Corps had responsibility for 14 major and several minor navigation projects in the estuary (Figure 67). Additional projects have been authorized, but are not yet constructed.
U.S. Navy
The Navy dredges to maintain design depths at eight facilities (Figure 68). Most of these facilities were constructed or expanded during the 1940s. Mare Island and Alameda Naval Air Station are the two facilities responsible for the bulk of the Navy's dredging.
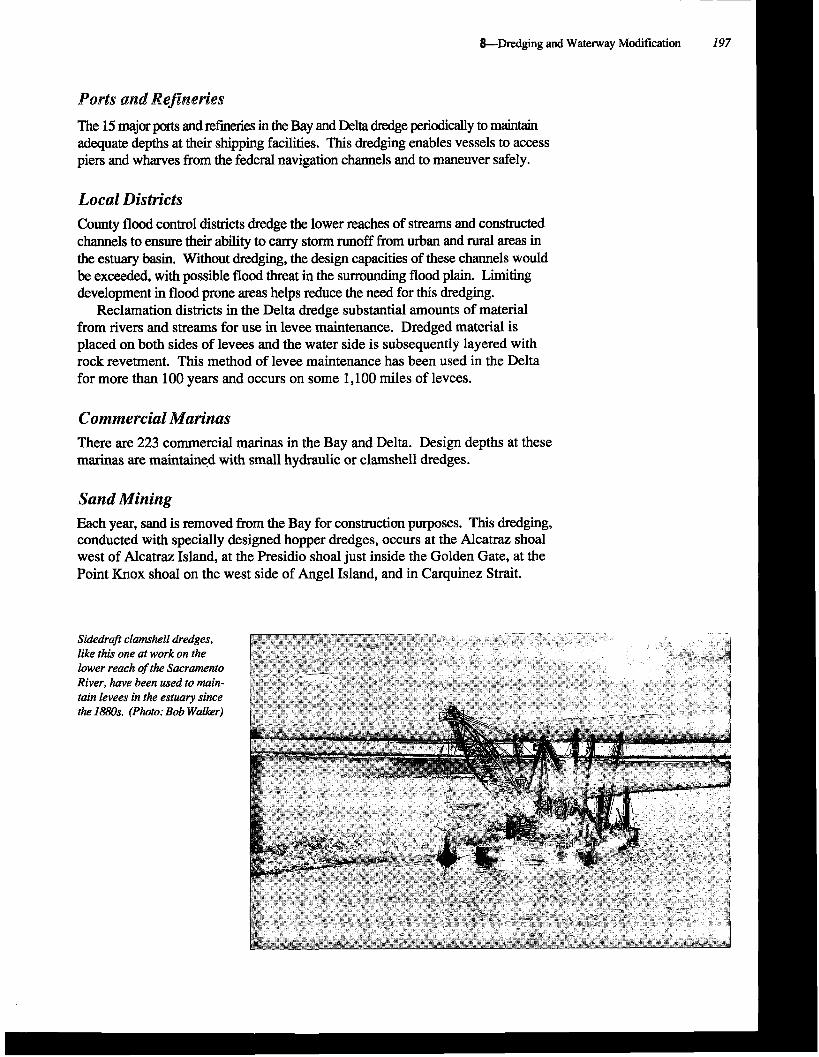
Ports and Wefineries
The 15 major ports and refineries in the Bay and Delta dredge periodically to maintain adequate depths at their shipping facilities. This dredging enables vessels to access piers and wharves from the federal navigation channels and to maneuver safely.
Local Districts County flood control districts dredge the lower reaches of streams and constructed channels to ensure their abilitv to carrv storm runoff from urban and rural areas in the estuary basin. Without dredging, the design capacities of these channels would be exceeded, with possible flood threat in the surrounding flood plain. Limiting
from rivers and streams for use in levee maintenance. Dredged material is placed on both sides of levees and the water side is subsequently layered with rock revetment. This method of levee maintenance has been used in the Delta for more than 100 years and occurs on some 1,100 miles of levees.
Commercial Marinas There are 223 commercial marinas in the Bay and Delta. Design depths at these marinas are maintained with small hydraulic or clamshell dredges.
Sand Mining Each year, sand is removed from the Bay for construction purposes. This dredging, conducted with specially designed hopper dredges, occurs at the Alcatraz shoal west of Alcatraz Island, at the Presidio shoal just inside the Golden Gate, at the Point Knox shoal on the west side of Angel Island, and in Carquinez Strait.
lower reach of the Sacramento River, hate been used to main- tain levees in the estuary since the 1880s. (Photo: Bob Walker)
198 State of the Estuary
Amounts of Material Dredged
Since the onset of dredging in the estuary, vast quantities of sediments have been excavated, transported, and disposed. Although accurate dredging records of the early navigation projects are unavailable, based on information for more re- cent years, it is reasonable to assume that perhaps one-third of a billion cubic yards of material was excavated in the century following the first navigation project.
Between the 1930s and the mid-1980s, the Army Corps of Engineers removed more than 175 million cubic yards of material from the Bay to maintain navigation features. From the 1940s to the present time, the Navy dredged some 58 million cubic yards of material from the Bay to maintain its channels. Additional projects in the Delta-the Stockton Ship Channel and the Sacramento Deep Water Ship Channel-also were constructed. An unknown amount of sediment was dredged by permittees to construct and maintain marinas and flood control features.
Between 1975 and 1985, the Army Corps of Engineers and the Navy to- gether dredged an annual average volume of more than 4.8 million cubic yards of material in the Bay and Delta. An unspecified, but smaller amount of mate- rial was dredged by permittees other than the Navy.
In 1986 and 1987, an average of 7.3 million cubic yards of material was dredged annually in the estuary, excluding permitted projects in the Delta and the 900,000 cubic yards of sand removed from the Bay for construction purposes. Combined with Delta levee maintenance and other projects, the total amount dredged annually exceeded eight million cubic yards. This is a considerable amount of material. By comparison, during 1977-1984, some ten million cubic yards of material were dredged annually in the Hudson River estuary in New York. Between one and two million cubic yards are dredged annually in h g e t Sound.
Disposal Sites
During the past 12 decades, dredged material has been disposed of at more than three dozen locations in and around the estuary. Disposal has occurred at aquatic sites in the Bay and Delta, on uplands, and in the ocean. Before the 1970s, the main criterion for selecting sites was their proximity to one or more ongoing or planned dredging projects. Most of the disposal sites were aquatic, generally as close as possible to the dredging sites. Some material, however, was disposed of on the adjacent shoreline (generally on wetlands) and outside the Golden Gate.
In the early 1970s, environmental considerations began to exert a strong influence on the regulation of dredged material disposal practices. Concerns regarding turbidity, release of pollutants, and impacts of indiscriminate disposal on the migration and rearing of salmon and striped bass eventually led to regulatory change. In May 1972, the Army Corps of Engineers reduced the number of aquatic disposal sites, designating six sites in the Bay at which dredged material could be placed. In addition, the Corps designated two ocean sites for limited disposal of dredged sediment. Subsequent policy changes reduced dredging disposal options even further.
Since 1975, the Corps has limited nearly all aquatic disposal of dredged material in the Bay to just three sites. These sites are located adjacent to Alcatraz Island, in San Pablo Bay, and in Carquinez Strait (Figure 69). A fourth aquatic site in Suisun Bay is available only for disposal of sandy material excavated by the Corps from the Suisun Bay Channel. Similarly, a site outside the Golden Gate is available only
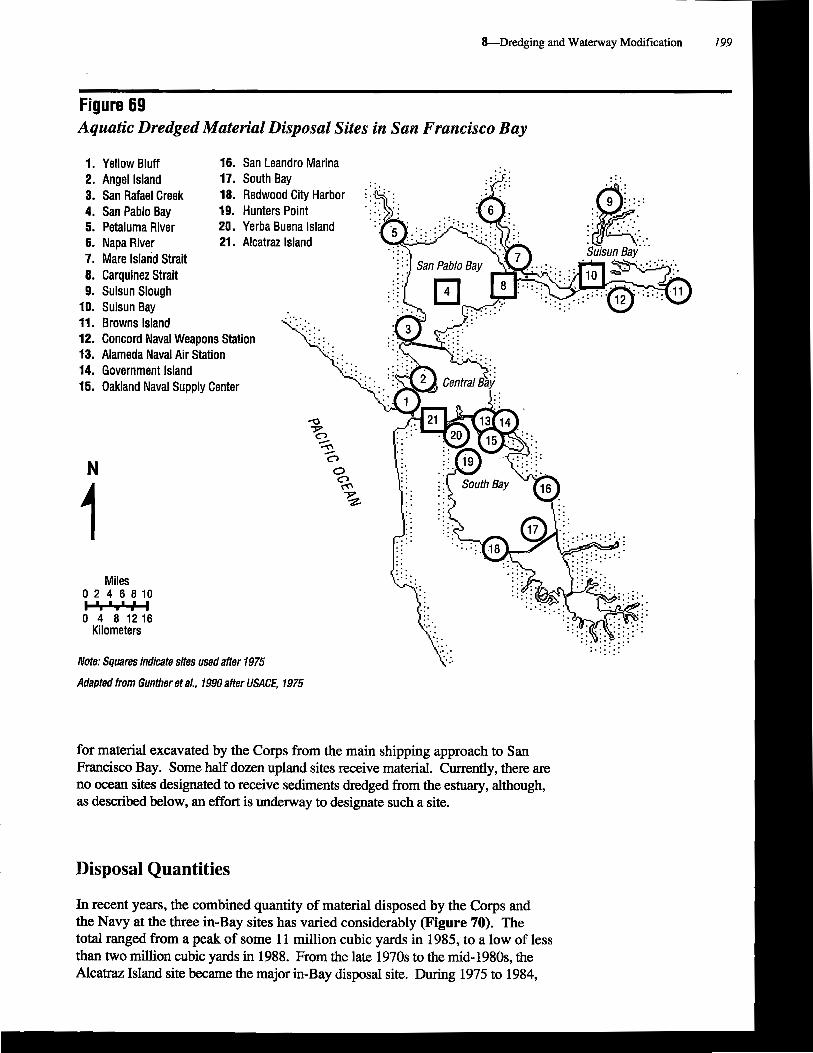
Figure 69 I Aquatic Dredged Material Disposal Sites in San Francisco Bay I
1. Yellow Bluff 16. San Leandro Marina 2. Angel Island 17. South Bay . . . . . . . 3. San Rafael Creek 18. Redwood City Harbor . . 4. San Pablo Bay 19. Hunters Point 5. Petalurna River 20. Yerba Buena Island 6. Naoa River 21. Alcatraz Island
Miles 0 2 4 6 8 1 0 - 0 4 8 12 16
Kilometers
Note: Squares indicate sites used after 1975
Adapted from Gunther et a/., 1990 after USACE, 1975
for material excavated by the Corps from the main shipping approach to San Francisco Bay. Some half dozen upland sites receive material. Currently, there are no ocean sites designated to receive sediments dredged from the estuary, although, as described below, an effort is underway to designate such a site.
Disposal Quantities I In recent years, the combined quantity of material disposed by the Corps and the Navy at the three in-Bay sites has varied considerably (Figure 70). The total ranged from a peak of some 11 million cubic yards in 1985, to a low of less than two million cubic yards in 1988. From the late 1970s to the mid-1980s, the Alcatraz Island site became the major in-Bay disposal site. During 1975 to 1984,
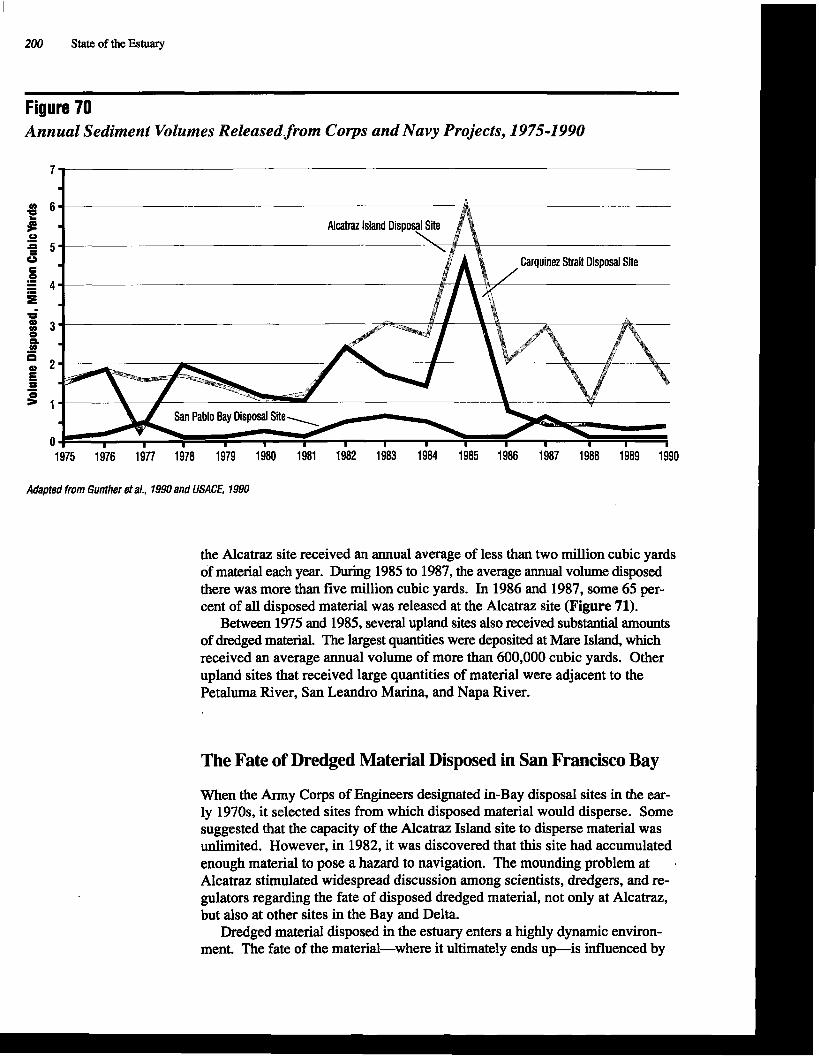
200 State of the Estuary
- - --
Figure 70 Annual Sediment Volumes Rebasedfrom Corps and Navy Projects, 1975-1990
I
6
1 U
= 5 8 e 0 - = 4 I a " 3 a (I)
i3 " 2 I -
1
0 1975 1976 1977 1978 1979 1980 1981 1982 1983 1984 1985 1986 1987 1988 1989 1990
Adapted from Gunther eta/., 1990 and USACE, 1990
the Alcatraz site received an annual average of less than two million cubic yards of material each year. During 1985 to 1987, the average annual volume disposed there was more than five million cubic yards. In 1986 and 1987, some 65 per- cent of all disposed material was released at the Alcatraz site (Figure 71).
Between 1975 and 1985, several upland sites also received substantial amounts of dredged material. The largest quantities were deposited at Mare Island, which received an average annual volume of more than 600,000 cubic yards. Other upland sites that received large quantities of material were adjacent to the Petaluma River, San Leandro Marina, and Napa River.
The Fate of Dredged Material Disposed in San Francisco Bay
When the Army Corps of Engineers designated in-Bay disposal sites in the ear- ly 1970s, it selected sites from which disposed material would disperse. Some suggested that the capacity of the Alcatraz Island site to disperse material was unlimited. However, in 1982, it was discovered that this site had accumulated enough material to pose a hazard to navigation. The mounding problem at . Alcatraz stimulated widespread discussion among scientists, dredgers, and re- gulators regarding the fate of disposed dredged material, not only at Alcatraz, but also at other sites in the Bay and Delta.
Dredged material disposed in the estuary enters a highly dynamic environ- ment. The fate of the material-where it ultimately ends up-is influenced by
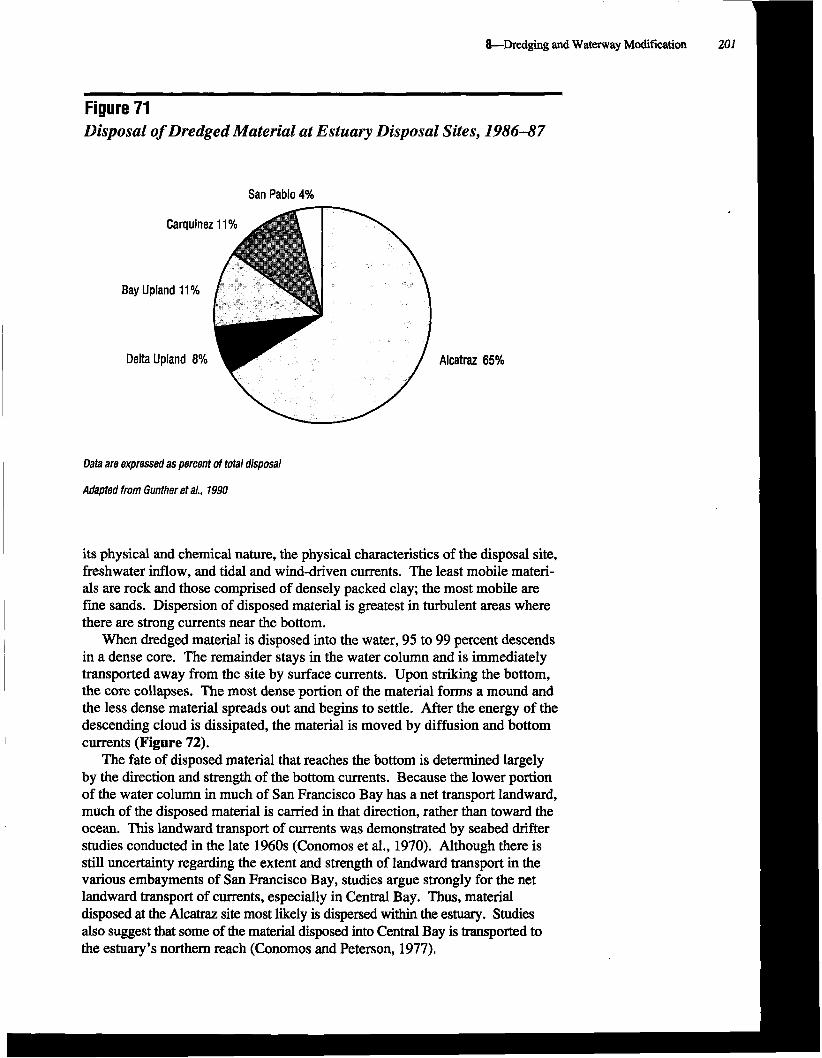
&Dredging and Waterway Modification 201 I
Figure 71 Disposal of Dredged Material at Estuary Disposal Sites, 1986-87
San Pablo 4%
Carauinez 11 % A
Bay Upland 11 %
Delta Upland 8% i Alcatraz 65%
Data are expressed as percent of total disposal
Adapted from Gunther et a/.. 1990
its physical and chemical nature, the physical characteristics of the disposal site, freshwater inflow. and tidal and wind-driven currents. The least mobile materi- als are rock and those comprised of densely packed clay; the most mobile are fine sands. Dispersion of disposed material is greatest in turbulent areas where there are strong currents near the bottom.
When dredged material is disposed into the water, 95 to 99 percent descends in a dense core. The remainder stays in the water column and is immediately transported away from the site by surface currents. Upon striking the bottom, the core collapses. The most dense portion of the material forms a mound and the less dense material spreads out and begins to settle. After the energy of the descending cloud is dissipated, the material is moved by diffusion and bottom currents (Figure 72).
The fate of disposed material that reaches the bottom is determined largely by the direction and strength of the bottom currents. Because the lower portion of the water column in much of San Francisco Bay has a net transport landward, much of the disposed material is carried in that direction, rather than toward the ocean. This landward transport of currents was demonstrated by seabed drifter studies conducted in the late 1960s (Conomos et al., 1970). Although there is still uncertainty regarding the extent and strength of landward transport in the various embayments of San Francisco Bay, studies m u e strongly for the net landward transport of currents, especially in Central Bay. Thus, material disposed at the Alcatraz site most likely is dispersed within the estuary. Studies also suggest that some of the material disposed into Central Bay is transported to the estuary's northern reach (Conomos and Peterson, 1977).
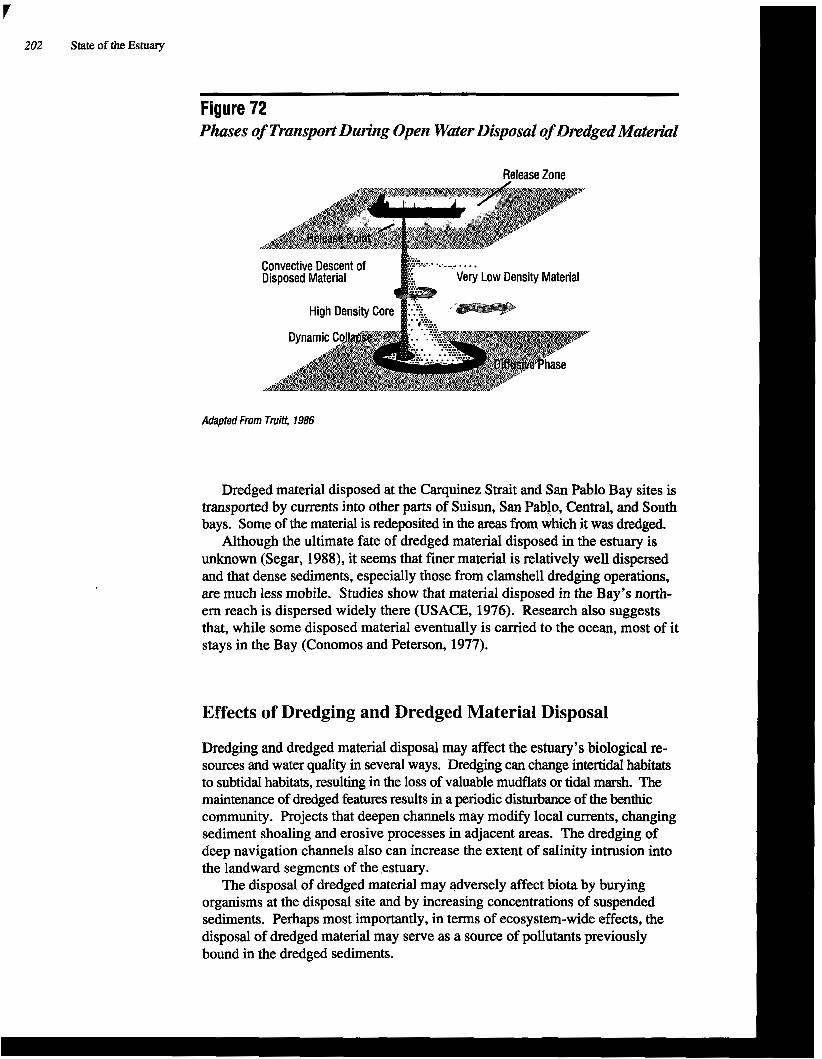
202 State of the Estuary
-- -
Figure 72 Phases of Transport During Open Water Disposal of Dredged Mateuial
Release Zone
... ...- Convective Descent of . . . . . . . . . . .. ..". . ---. . . . Disposed Material Very Low Density Material
Adapted From Tmitt, 1986
Dredged material disposed at the Carquinez Strait and San Pablo Bay sites is transported by currents into other parts of Suisun, San Pablo, Central, and South bays. Some of the material is redeposited in the areas from which it was dredged.
Although the ultimate fate of dredged material disposed in the estuary is unknown (Segar, 1988), it seems that frner material is relatively well dispersed and that dense sediments, especially those from clamshell dredging operations, are much less mobile. Studies show that material disposed in the Bay's north- em reach is dispersed widely there (USACE, 1976). Research also suggests that, while some disposed material eventually is carried to the ocean, most of it stays in the Bay (Conomos and Peterson, 1977).
Effects of Dredging and Dredged Material Disposal
Dredging and dredged material disposal may affect the estuary's biological re- sources and water quality in several ways. Dredging can change intertidal habitats to subtidal habitats, resulting in the loss of valuable mudflats or tidal marsh. The maintenance of dredged features results in a periodic disturbance of the benthic community. Projects that deepen channels may modify local currents, changing sediment shoaling and erosive processes in adjacent areas. The dredging of deep navigation channels also can increase the extent of salinity intrusion into the landward segments of the estuary.
The disposal of dredged material may adversely affect biota by burying organisms at the disposal site and by increasing concentrations of suspended sediments. Perhaps most importantly, in terms of ecosystem-wide effects, the disposal of dredged material may serve as a source of pollutants previously bound in the dredged sediments.

&Dredging and Waterway Modification 203
Burial of the Benthic Community
The most obvious impact of dredged material disposal on the benthic commu- nity is the burial of organisms, especially species that are unable to move quickly. Although many organisms that live on the surface of the bottom are able to burrow up through a layer of dredged material, organisms that live deep in the sediments usually perish if buried. In instances where the deposited material does not settle out quickly and, instead forms a fluid mud, oxygen levels are reduced and the substrate does not provide the physical support to enable the upward migration of burrowing species. Organisms exposed to these conditions usually do not survive.
Following the deposition of dredged materials, organisms begin to recolonize a disposal site. The rate of recolonization depends on the abundance of individuals available to recolonize the site and the grain size of the disposed material compared to indigenous material at the site. In general, dredged areas and disposal sites are recolonized rapidly once disposal ceases, with complete recovery often oc- curring within one year. In areas where the bottom is disturbed by currents, rees- tablishment of opportunistic organisms may be even faster. Many of the benthic species found in San Francisco Bay are able to reproduce for much of the year and can quickly recolonize disturbed areas (Nichols and Pamatmat, 1988).
At the designated disposal sites in San Francisco Bay, the high frequency of disposal events effectively prevents the reestablishment of diverse communities of benthic organisms. At these sites, the main impact of disposal is not outright burial of organisms, but the periodic disturbance of the benthos and the mainte- nance of conditions that favor only a few colonizer species. However, given the ability of many benthic species to reestablish themselves in disturbed areas, the existing disposal sites would support diverse benthic communities if disposal operations were to cease there.
/

204 State of the Estuary
Increased Suspended Sediment Concentrations Increased suspended sediment concentrations are an unavoidable consequence of dredging and disposal of dredged material. During dredging, sediments are suspended as the cutting device excavates material from the bottom. Clamshell dredges also release sediments into the water column as the bucket is raised from the bottom, and hopper dredges release suspended sediments during barge dewatering. Regardless of the dredging method, the aquatic disposal of material increases suspended sediment concentrations at the disposal site. Increases of suspended sediments have the potential to adversely affect the estuary's water quality and biota in several ways, as described in O'Comor (1991) and surnma- rized below. I
Increased sediment concentrations in the upper water column reduce sunlight penetration and this reduces the depth of the zone in which phytoplankton are productive. Experiments indicate that phytoplankton productivity is reduced at suspended sediment concentrations that may occur in estuaries during periods of high runoff or when wind and currents agitate sediments. However, the impact of dredged material disposal on phytoplankton is minimal and short-lived because the material dissipates quickly in the upper water column. For the disposal of dredged material to affect phytoplankton productivity, concentrations of suspended solids would have to be increased significantly in the upper water column for extended periods of time. Even during periods of frequent disposal operations, impacts on phytoplankton productivity are probably small.
The impact of increased suspended solids on estuary zooplankton is probably insignificant. Studies of the effects of suspended particulate matter on zooplankton reproductive success and feeding behavior indicate that the concentrations of suspended sediments in the estuary should not adversely affect the zooplankton species residing there. Zooplankton even thrive in parts of the estuary, such as in the entrapment zone, where levels of suspended solids are high.
Several studies indicate that egg and larval forms of fish and invertebrates can tolerate relatively high concentrations of suspended particulate matter. Estuarine species seem well-adapted to conditions of high turbidity. Several species, includ- ing striped bass, develop successfully in the turbid, northern reaches of the estuary.
Increased turbidity can cause acute and chronic effects in adult fishes. Direct . mortality results from impaired oxygen exchange caused by the laceration, irrita- tion, or clogging of the gills. However, laboratory studies of white perch, spot, bay anchovy, and other species indicate that the highest suspended sediment levels in the estuary would pose no threat to even the most sensitive species. Even at sus- pended sediment concentrations adjacent to disposal barges or in the water column immediately following disposal, fish would have to be exposed for several hours in order for death to occur; plumes of highly concentrated suspended solids last only for minutes.
The disposal of dredged material probably does not kill fish, but it can still have sublethal effects. Although sublethal effects of suspended sediments have not been investigated in the BayPelta estuary, such effects undoubtedly occur. They include various kinds of physiological changes such as changes in liver function and gill tissue. Striped bass swimming at high speed in turbid water experience depressed respiration, most likely because of gill clogging (Neumann
\
et al., 1982). Increased turbidity can effect behavioral changes in fish, includ- ing altered feeding patterns, foraging efficiency, modified prey response, and choice of habitat.

&Dredging and Waterway Modification 205
In recent years, an annual average of more than eight million cubic yards of dredged material have been disposed in the Bay. Although this is a consider- able amount of material, whose disposal definitely increases turbidity at least temporarily in the vicinity of disposal operations, it is a relatively small amount compared to the 80-286 million cubic yards of material resuspended naturally by winds, waves, and tides (Gunther et al., 1990). Accordingly, some believe that increased turbidity from dredging operations must be insignificant and have little impact on Bay biota. It is important to note, however, that the increased turbidity from natural processes is greatest in the shallow parts of the Bay. In- creased turbidity from dredged material disposal in the clearer areas, such as Central Bay, may have sigtllficant effects there. Also, as noted below, the fquency of disposal events may play an important role in determining turbidity-related effects of dredged material disposal.
Dredged Material as a Source of Pollutants
Many pollutants that enter the estuary ultimately are incorporated into the bottom sediments. As noted in Chapter 7, sediment pollutants are not evenly distributed throughout the estuary. In San Francisco Bay, the part of the estuary where pollutant distribution has been studied most thoroughly, pollutant concen- trations in sediments are highest in harbors, harbor entrances, marinas, and industrial waterways; they are lowest in the central portions of the embayments.
The dredging and disposal of contaminated sediments may release toxic chemi- cals into the water column, making them available for uptake by organisms and for transport throughout the food web. The bioavailability of these chemicals depends upon their physical state and the way in which organisms are exposed to them. ~ For example, most metallic and organic chemicals in dredged material will remain associated with particles, especially when the sediment is composed of fine particles and contains a significant amount of organic matter. Under such circumstances, organic contaminants are not readily bioavailable unless in- gested. Filter and deposit feeders that ingest these chemicals, however, may pass them along to animals that prey on them.
As described in Chapter 7, there are many trace elements and long-lasting organic chemicals such as PCB, DDT, and hydrocarbons in the estuary's sedi- ments. Although there is evidence that some organisms are being exposed to these chemicals, there is no evidence that the exposure is a result of dredging or dredged material disposal. There also is no evidence that b i ~ m a ~ c a t i o n , a step-wise increase in pollutant accumulation at higher levels in the food web, is occurring in the estuary due to dredging and dredged material disposal. Pollut- ants derived from dredged material may well be accumulating in organisms and exerting a negative influence in the estuary, although such a relationship remains to be proven or disproven.
Impact of Dredged Material Disposal on Angler Success
During the past several years, one of the most vigorously discussed aspects of dredged material disposal has been its impact on angler success in Central Bay. In 1987, anglers began to voice concerns regarding a decline in the catch per

206 State of the Estuary
Concern about the effects of dredged material disposal on fishing success and water quality led to this demonstra- tion at the Alcatraz Island disposal site in 1989. (Photo: Bob Walker)
angler effort on recreational boats. They reported that catches of striped bass, rock fish, halibut, and salmon had dropped. Although other factors such as freshwater diversions and pollutants could be partially responsible, they attributed much of the decline in angler success to turbidity caused by the increased frequency of dredged material disposal at the Alcatraz disposal site.
Data collected by the Department of Fish and Game support the anglers' observations of declined catch. The catch per unit effort (fish caught per angler hour) for striped bass declined in the late 1970s and 1980s. In San Pablo Bay, catch per unit effort declined from 1975 through 1987. In Central Bay, catch per unit effort declined after 1977 and remained low until 1987. The data show that it had gotten harder to catch fish in Central Bay.
Determining whether the disposal of dredged material in Central Bay has affected angler success is made difficult by the few measurements of turbidity or suspended sediment concentrations there. The best long-tenn data are those of the Department of Fish and Game, whose staff measure surfacewater clarity at eight stations each month. Given the extreme variability in turbidity in the Bay on a much shorter time scale, and the frequency with which the data are collected, it is not possible to determine adequately the turbidity trends in Central Bay. Tur- bidity may be responsible for fishing declines, but there are not enough data to prove this (O'Connor, 199 1).
The levels of suspended sediments in Central Bay are too low to kill fish directly. They are also too low, even in the vicinity of disposal operations, to cause gill clogging and respiratory impairment. However, they may be high enough to affect fish behavior.
Dredged material disposal in Central Bay has been shown to affect the move- ment of fish schools. In a recent study of striped bass prey species active at the Alcatraz site-northern anchovy, white croaker, and shiner perch-fish dispersed or moved away from the site immediately following a disposal event. Within an hour or two, the schools returned. It is not known whether the movements were caused by increased turbidity or the pressure wave produced by the disposal
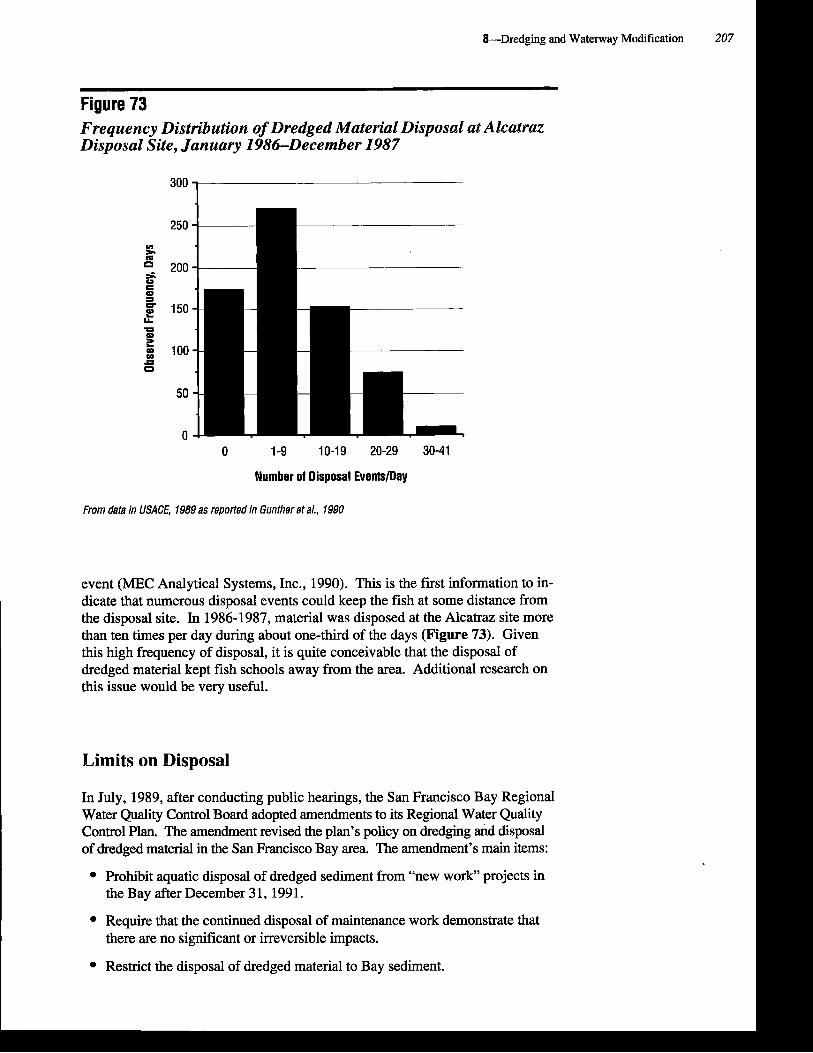
&Dredging and Waterway Modification
Fiaure 73 - Frequency Distribution of Dredged Material Disposal a&Alcatraz Disposal Site, January 1986-December 1987
Number of Disposal Eventmay I From data in USACE, 1989 as re~orted in Gunther et a/., 1990 I
event (MEC Analytical Systems, Inc., 1990). This is the first information to in- dicate that numerous disposal events could keep the fish at some distance from the disposal site. In 1986-1987, material was disposed at the Alcatraz site more than ten times per day during about one-third of the days (Figure 73). Given this high frequency of disposal, it is quite conceivable that the disposal of dredged material kept fish schools away from the area. Additional research on this issue would be very useful.
Limits on Disposal
In July, 1989, after conducting public hearings, the San Francisco Bay Regional Water Quality Control Board adopted amendments to its Regional Water Quality Control Plan. The amendment revised the plan's policy on dredging arid disposal of dredged material in the San Francisco Bay area. The amendment's main items:
Prohibit aquatic disposal of dredged sediment from "new work" projects in the Bay after December 3 1,199 1.
Require that the continued disposal of maintenance work demonstrate that there are no significant or irreversible impacts.
Restrict the disposal of dredged material to Bay sediment.
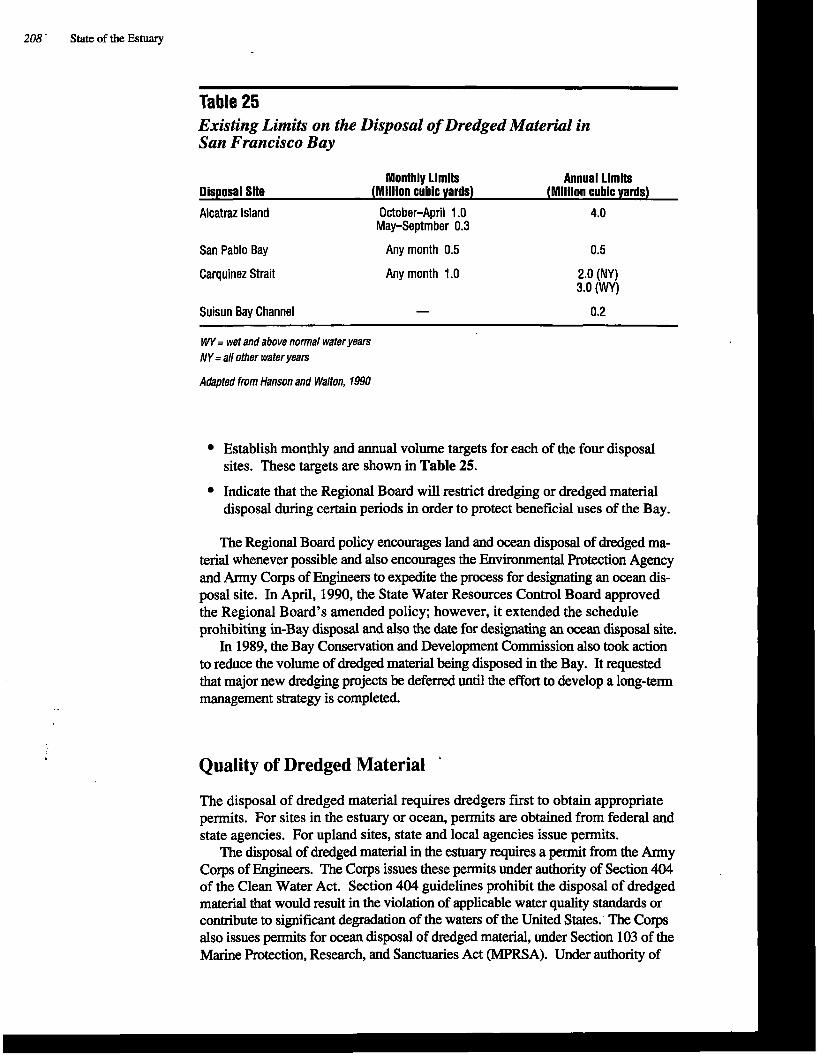
208 ' State of the Estuary
Table 25 Existing Limits on the Disposal of Dredged Material in San Francisco Bav
Disposa
Alcatraz Island
San Pablo Bay
Carquinez Strait
Monthlv Llmlts dnnual Llmlts I
October-April 1.0 May-Septmber 0.3
Any month 0.5
Any month 1.0
Suisun Bay Channel -
. .....
[Million
2.0 (NY) 3.0 (WY)
WY = wet and above normal water years NY = all other water years
Adaoted from Hanson and Walton, 1990
Establish monthly and annual volume targets for each of the four disposal sites. These targets are shown in Table 25.
Indicate that the Regional Board will restrict dredging or dredged material disposal during certain periods in order to protect beneficial uses of the Bay.
The Regional Board policy encourages land and ocean disposal of dredged ma- terial whenever possible and also encourages the Environmental Protection Agency and Army Corps of Engineers to e x m t e the process for designating an ocean dis- posal site. In April, 1990, the State Water Resources Control Board approved the Regional Board's amended policy; however, it extended the schedule prohibiting in-Bay disposal and also the date for designating an ocean disposal site.
In 1989, the Bay Conservation and Development Commission also took action to reduce the volume of dredged material being disposed in the Bay. It requested that major new dredging projects be deferred until the effort to develop a long-term management stratem is comuleted.
Quality of Dredged Material "
The disposal of dredged material requires dredgers first to obtain appropriate permits. For sites in the estuary or ocean, permits are obtained from federal and state agencies. For upland sites, state and local agencies issue permits.
The disposal of dredged material in the estuary requires a permit from the Army Corps of Engineers. The Corps issues these permits under authority of Section 404 of the Clean Water Act. Section 404 guidelines prohibit the disposal of dredged material that would result in the violation of applicable water quality standards or contribute to sigdicant degradation of the waters of the United States. The Corps also issues permits for ocean disposal of dredged material, under Section 103 of the Marine Protection, Research, and Sanctuaries Act (ME'RSA). Under authority of

&Dredging and Waterway Modification 209 I
Section 401 of the Clean Water Act, which gives states the authority to develop water quality objectives, the San Francisco Bay and Central Valley Regional Water Quality Control Boards determine compliance of proposed dredging projects in the Bay or Delta with state-adopted water quality objectives.
Demonstrating that a particular project complies with Sections 404 and 401 of the Clean Water Act, or Section 103 of MPRSA, often requires chemical and biological testing of sediments at the dredging and disposal sites. Technical guidelines and criteria for testing under both acts are developed by the Environ- mental Protection Agency in conjunction with the Army Corps of Engineers. The present testing schemes use similar tiered approaches to evaluate whether dredged material may be suitable for aquatic disposal. A tiered approach allows less exten- sive (and expensive) tests to be used initially. If existing information is sufficient to determine the acceptability of the dredged material, no further evaluation is neces- sary. However, if the material's suitability is questionable, chemical and biological tests are performed in successive tiers. Ultimately, material is considered suitable for aquatic disposal if it is shown that its disposal would present no sigruficant risk to aquatic resources that may be exposed to it.
Although the Clean Water Act and MPRSA testing schemes provide for similar evaluations, projects proposing to dispose maintenance dredged material in the Bay in recent years have generally been required to conduct only very limited biological testing for Section 40lcertification (water quality standards compliance). This involves determining whether the water column around a disposal site will, after initial mixing and dilution, be toxic to aquatic life. However, biological testing has not routinely been required to assess whether the sediments themselves, upon settling to the bottom, present a risk of short- or long-term impacts to bottom- dwelling animals or the fish and birds that may feed on them. Instead, this in- formation is inferred primarily from comparison with the quality of the sediment at the disposal site. If the dredged material is not significantly more contarni- nated than the disposal site (and it passed the water quality certification tests), it has been considered suitable for in-Bay disposal.
Considerable controversy has arisen in recent years over the adequacy of the evaluation program as applied to in-Bay disposal of dredged material. A perception has grown that there is less protection being given to the estuary than to the ocean, since much of the dredged material allowed under the Clean Water Act to be disposed at the Alcatraz site may not have passed the MPRSA criteria for ocean disposal. The long-term management strategy (described below) was initiated in response to this and other concerns, and to perceptions about how disposal of dredged material should best be managed. The long-term management strategy will standardize protocols and define tests to routinely be used for Bay and Delta sediments.
Other efforts are underway that will affect dredging and dredged material dis- posal in the estuary. The EPA and Army Corps of Engineers are currently develop- ing a national Clean Water Act testing manual for dredged material that will standardize and set minimum guidelines for required sediment testing. This national manual will be similar in many respects to the existing MPRSA manual and is ex- pected to be finalized in late 1992. In addition, the State has begun to develop state sediment quality objectives that will help define when dredged material is suitable for aquatic disposal. National sediment standards are also under development for some chemicals. These efforts are expected to significantly enhance management of dredging and dredged material disposal and to result in improved environmental quality overall (Brian Ross, pen. comm.).
/
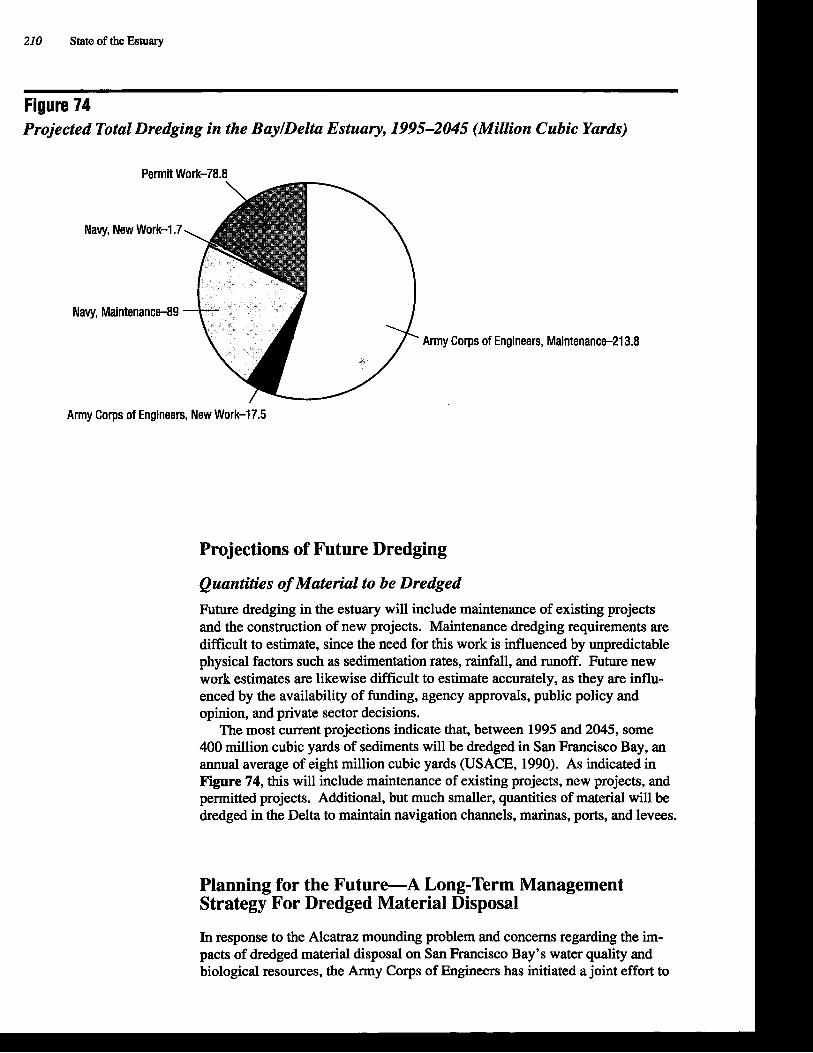
210 State of the Estuary
Figure 74 Projected Total Dredging in the BaylDelta Estuary, 1995-2045 (Million Cubic Yards)
Permit Work-78.8
Army Corps of Engineers,
Army Corps of Engineers, New Work-17.5
Projections of Future Dredging
Quantities of Material to be Dredged Future dredging in the estuary will include maintenance of existing projects and the construction of new projects. Maintenance dredging requirements are difficult to estimate, since the need for this work is influenced by unpredictable physical factors such as sedimentation rates, rainfall, and runoff. Future new work estimates are likewise difficult to estimate accurately, as they are influ- enced by the availability of funding, agency approvals, public policy and opinion, and private sector decisions.
The most current projections indicate that, between 1995 and 2045, some 400 million cubic yards of sediments will be dredged in San Francisco Bay, an annual average of eight million cubic yards (USACE, 1990). As indicated in Figure 74, this will include maintenance of existing projects, new projects, and permitted projects. Additional, but much smaller, quantities of material will be dredged in the Delta to maintain navigation channels, marinas, ports, and levees.
Planning for the Future-A Long-Term Management Strategy For Dredged Material Disposal
In response to the Alcatraz mounding problem and concerns regarding the im- pacts of dredged material disposal on San Francisco Bay's water quality and biological resources, the Army Corps of Engineers has initiated a joint effort to
&Dredging and Waterway Modification 211
develop a strategy for managing dredging activities in the San Francisco Bay area. The strategy (as is the process for developing it) is known as the Long- Term Management Strategy, or LTMS. The goals of the LTMS are to:
Maintain, in an economically and environmentally sound manner, those channels necessary for navigation in San Francisco Bay and estuary.
Eliminate unnecessary dredged material disposal in the San Francisco Bay and estuary.
Conduct dredge disposal in the most environmentally sound manner.
Maximize use of dredged material as a resource.
Establish a cooperative permitting framework for dredging applications.
Scheduled to be completed by 1995, the LTMS will specify where dredged material may be disposed in the ocean, in the Bay, and at upland sites.
Active LTMS participants include the Army Corps of Engineers, U.S. Environ- mental Protection Agency, Bay Conservation and Development Commission, San Francisco Bay Regional Water Quality Control Board, State Lands Commission, California Environmental Protection Agency, and dredging and environmental interests. In June, 199 1, these groups adopted a study plan laying out the necessary tasks that will lead to the preparation of the final strategy (USACE, 1991). The study plan focuses on three areas: in-Bay, ocean, and upland. The San Francisco Bay Regional Water Quality Control Board is leading studies of in- Bay disposal options and environmental impacts. With Corps support, the Regional Board will research the following:
Sediment movement and accumulation throughout the Bay system.
Bioaccumulation of contaminants within the estuarine food web.
Sublethal and chronic effects on fisheries.
Central Bay turbidity, particularly that associated with the Alcatraz Island disposal site, and its effects on fish migration and movement.
The U.S. Environmental Protection Agency has the lead on ocean studies and will conduct research in four areas off the San Francisco coastline. This work will encompass:
Physical oceanographic and hydrographic studies including satellite imagery.
Surveys of benthic infauna and epifauna.
Sediment profiles and analyses.
Seafloor surveys using a remote operated vehicle.
Analysis of existing mid-water and fisheries data, and bottom trawling to collect fish samples.
Shipboard observation of marine mammals and birds, and analysis of exist- ing Point Reyes Bird Observatory data.
With support from the Corps, the Bay Conservation and Development Commission is leading efforts to explore upland disposal and beneficial use opportunities, including:
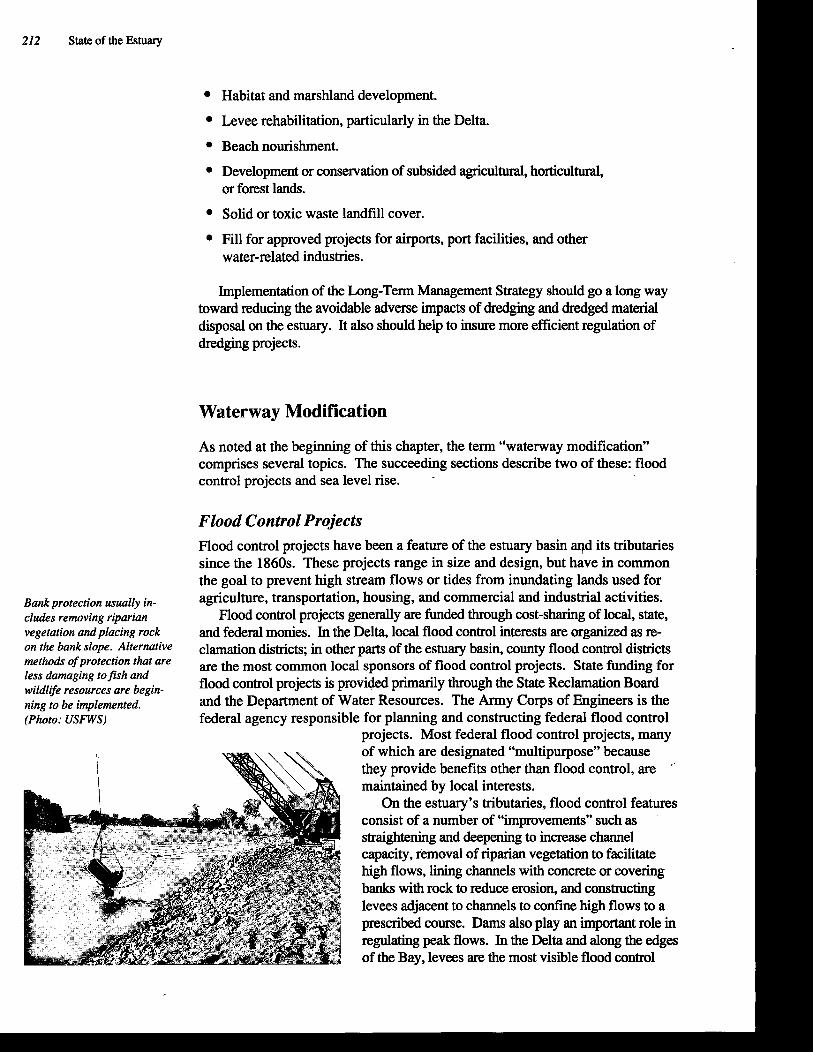
212 State of the Estuary
Habitat and marshland development.
Levee rehabilitation, particularly in the Delta.
Beach nourishment.
Development or conservation of subsided agricultural, horticultural, or forest lands.
Solid or toxic waste landfill cover.
Fill for approved projects for airports, port facilities, and other water-related industries.
Implementation of the Long-Term Management Strategy should go a long way toward reducing the avoidable adverse impacts of dredging and dredged material disposal on the estuary. It also should help to insure more efficient regulation of dredging projects.
Waterway Modification
As noted at the beginning of this chapter, the term "waterway modification" comprises several topics. The succeeding sections describe two of these: flood control projects and sea level rise.
Flood Control Projects Hood control projects have been a feature of the estuary basin q d its tributaries since the 1860s. These projects range in size and design, but have in common the goal to prevent high stream flows or tides from inundating lands used for
Bank protection usually in- agriculture, transportation, housing, and commercial and industrial activities. eludes removing riparian Hood control projects generally are funded through cost-sharing of local, state, vegetation and placing rock and federal monies. In the Delta, local flood control interests are organized as re- on the bank slope. Altm~ative clamation districts; in other parts of the estuary basin, county flood control districts methods ofprotection that are are the most common local sponsors of flood control projects. State funding for less damaging tojish and wildlife resources are begin- flood control projects is provided primarily through the State Reclamation Board ning to be implemented. and the Department of Water Resources. The Army Corps of Engineers is the (photo: uSFWS) federal agency responsible for planning and constructing federal flood control
projects. Most federal flood control projects, many of which are designated "multipurpose" because they provide benefits other than flood control, are maintained by local interests.
On the estuary's tributaries, flood control features consist of a number of "improvements" such as straightening and deepening to increase channel capacity, removal of riparian vegetation to facilitate high flows, lining channels with concrete or covering banks with rock to reduce erosion, and constructing levees adjacent to channels to confine high flows to a prescribed course. Dams also play an important role in regulating peak flows. In the Delta and along the edges of the Bay, levees are the most visible flood control
&Dredging and Waterway Modification 213
features. Most Bay levees prevent flooding of lands a few feet below sea level; those in the Delta protect lands as much as 20 feet below sea level.
Today, there are some 50 major federal flood control projects (including multi-purpose projects) in the estuary basin and Central Valley watershed in a planning stage, under construction, or completed. Of these, there are 17 projects in the San Francisco Bay area, 16 projects in the Sacramento Basin, 9 projects in the Delta-Central Sierra Basin, and 8 projects in the San Joaquin Basin (USACE, 1987). In addition, local interests throughout the estuary basin are planning, constructing, or maintaining smaller projects on scores of tributaries. Delta recla- mation districts maintain levee systems on nearly 60 islands.
The construction of flood control projects on streams usually results in severe impacts to stream channels and adjacent riparian corridors. Channel straightening, removal of instream and riparian vegetation, placement of rock revetment along banks, and construction of concrete channels greatly lower habitat values and reduce the ability of streams to support diverse populations of fish and wildlife. Project maintenance generally keeps habitat values low by preventing the growth of mature riparian vegetation on all but the uppermost portions of stream bank.
Along the Bay shoreline and in the Delta, levees result in drastically altered hydrologic conditions. In the Bay, levees prevent or inhibit tidal excursion into thousands of acres of seasonal wetlands; the3 also protect developments in the flood plain. In the Delta, levees keep more than 350,000 acres of seasonal farmed wetlands from flooding. Without these levees, much of the Delta would be open water.
In response to environmental concerns, requirements to mitigate unavoidable adverse project impacts, and the escalating costs of flood control project con- struction and maintenance, flood control project designers have started to utilize non-traditional methods of flood protection along stream courses. These methods minimize channel straightening; eliminate, where feasible, the use of rock revet- ment and concrete channels; and, as noted in Chapter 5, incorporate the use wetland vegetation to minimize erosion. Although the most notable federal project of this kind in the estuary basin is on Wildcat and San Pablo creeks in Contra Costa County (Riley, 1989), other, smaller projects incorporating similar designs have been constructed or are being planned. In the Delta, levee maintenance standards that have changed little in recent decades are a topic of discussion among farmers concerned with maintaining levees, and with environmental interests who would like to see more mature riparian vegetation on levees.
The public has provided much of the impetus for developing new alternatives to traditional flood control practices. Many community groups are also active in restoring streams already degraded by past flood control and unsound land develop- ment practices. With funding from local interests, the State Coastal Conservancy, Department of Water Resources, and the Environmental Protection Agency, stream restoration efforts are underway in nearly every county in the basin.
Given the rising interest in protecting the estuary basin's remaining streams and in restoring urban creeks to some semblance of their former condition, the next de- cade will most likely bring about many beneficial changes in the way flood control projects are designed, constructed, and maintained throughout the estuary basin.
Sea Level Rise
As described in Chapter 2, sea level has risen markedly since the last Ice Age. In the past 5,000 years, the rise has been fairly gradual and relatively constant. But
r
214 State of the Estuary
recent studies by the Environmental Protection Agency indicate that global warm- ing resulting from the "greenhouse effect" is accelerating the rate of sea level rise (USEPA, 1988). Although it is extremely difficult to predict how much the seas will rise, the National Research Council has established three scenarios of possible sea level rise by the year 2100 (NRC, 1987). Based on these scenarios, mean sea level could rise by 1.6 to 4.9 feet during the next century. Around the Bay/Delta estuary, the relative increase in sea level will be even greater on low- lying lands where sediment-deposited soils are expected to subside from soil compaction and consolidation. For example, according to a recent study con- ducted for the Bay Conservation and Development Commission, by the year 2037, the relative mean water level in Central Bay (at Sausalito) is projected to increase 0.30 to 0.48 feet above mean sea level. In South Bay (at Alviso Slough), where greater land subsidence is expected, the relative mean water level is pro- jected to rise 0.80 to 5.76 feet above mean sea level (BCDC, 1988). Extreme high water levels are expected to rise as well.
Attendant with these projected increases in water levels may be several impacts to estuarine water quality and habitats:
Salt water intrusion in tidal marshes, freshwater tributaries, and ground water
Submergence of tidal marshes in North and South bays
Increased periodic flooding of previously protected low-lying areas around the Bay and in the Delta
Increased shoreline and beach erosion
Given the very modest progress made in the past few years to reduce the pro- duction of greenhouse gases on a global scale, it is essentially a foregone conclu- sion that some amount of atmospheric warming and rise in sea level will occur in the coming decades. Agencies responsible for long-term land-use planning must begin to take actions to minimize the adverse impacts of sea level rise on the estuary's water quality, wetlands, and estuary-dependent human activities.
Summary
Most of San Francisco Bay and the Delta is naturally shallow and dredging is re- quired to enable the safe passage of vessels. The annual influx of some six million cubic yards of sediment into the estuary each year necessitates periodic dredging to maintain navigation channels, harbors, marinas, and other dredged areas. Dredging has been conducted for more than 120 years, primarily by the Army Corps of ~ngineers; the Navy, ports, and others who need access to the water.
During the mid-1980s, an average of more than eight million cubic yards of sediments was dredged annually from the estuary. Projections of future needs indicate that a similar quantity of sediments will be dredged annually during the next fifty years.
Dredging and dredged material disposal affect the estuary and its resources in many ways. Dredging removes benthic organisms and may alter currents. Deepening of channels in the upper reaches of the estuary may increase salinity intrusion there. Dredged material disposal influences the composition of benthic
&Dredging and Waterway Modification 215
communities, increases concentrations of suspended sediments, and may alter the behavior and physiology of fish and other animals. Most of these impacts are generally localized, but others, such as the redistribution of sediment pollut- ants, may be widespread. Although some impacts of dredging and dredged ma- terial disposal are fairly well understood, there is an inadequate grasp of the fate of dredged material disposed in the estuary and of the impacts associated with the redistribution and release of toxic pollutants.
The regulation of dredging has become more stringent during the past two de- cades. Since 1975, nearly all dredging disposal has been limited to three main sites in the Bay, and most of it occurs at the Alcatraz Island site. The recent buildup of dredged material at this site and the concern over the effects of disposal on an- gler success in Central Bay have led to the placement of limits on the amount of material that may disposed in the Bay. These events also have spurred the develop- ment by state and federal agencies, dredging interests, and environmental groups of a long-term management strategy that will guide dredging activities for the next 50 years.
Dredging will always be necessary to enable the passage of large vessels through the estuary. The challenge to policy makers is to design and implement a dredging program that will encourage navigation while eliminating the avoid- able adverse impacts of dredging and dredged material disposal on estuarine water quality and biological resources.
Flood control projects occur on many of the estuary's tributaries, in the Delta, and along the Bay shoreline. On streams, channelization, bank protection, and removal of riparian vegetation are the most visible features of flood control efforts. In the Delta and around the Bay, levees are prominent flood control features. Although most of the existing flood control projects have exacted a high envi- ronmental price, the rising interest in alternative flood control methods may bring major change to the ways that lands are made safe from flooding. These methods probably will not completely replace the more traditional flood control practices, but may become much more common, especially as rural land is de- veloped and as efforts grow to restore urban creeks.
Perhaps the most important and far-reaching aspect of waterway modifica- tion is the pending rise in sea level. Because this rise will occur over a long period of time, it may be difficult to convince the public, land use and transpor- tation planners, developers, regulatory agencies, and elected officials of its significance. For the same reason, it also may be difficult to effect the immedi- ate and long-term actions needed to lessen the impacts of sea level rise on the estuary, its wetlands, and the local and regional economy. Regardless of these difficulties, it is of utmost importance that an effort begin immediately to define the issue from a regional perspective and to identify and implement appropriate actions in various segments of the estuary basin.
Monitoring and Research
Clean Water Act amendments, which call for the ~ational ~ S t u a b program to com- prehensively understand the environmental problems facing United States estuar- I the effectiveness of actions taken as part of the development and implementation of a Comprehensive Conservation and Management Plan. In order to accomplish these directives, a comprehensive, regional monitoring and research program is needed that will increase understanding of the estuary and improve the ability to identify its hmn-induced stresses, assess the flectiveness of current management measures, and monitor the long-tern health of the ecosystem.
being conducted in the estuary. It also notes the efforts now underway to create a I
for the estuary. Consequently, much of the spec@ information in this chapter comes from the Project's various status and trends reports. An additional impor- tant source is the recent National Research Council report on monitoring in the marine environment (NRC, 1990a).
1. Useful environmental monitoring and research in the estuary must produce information pertinent to addressing the key management issues.
2. A large number of agencies and entities have regulatory responsibilities that require monitoring and research programs to be conducted.
3. Through the development of the Estuary Project's status and trends reports, a number of monitoring and research questions related to the five management issues have been identified.
4. During the course of characterizing the estuary's environmental problems, an understanding of these problems has been shown to be limited in many areas.
5. Gaps in our knowledge exist because of a lack of data, inadequate data analysis, or data that have yielded equivocal results.
218 State of the Estuary
6. Monitoring and research programs must be designed with the recognition that some management questions cannot be answered directly by monitoring and research activities.
7. Efforts are underway to develop more comprehensive, integrated, and respon- sive research and monitoring programs; a regional monitoring program proposed by the Estuary Project should encourage and augment these efforts.
Definitions and Distinctions
Monitoring is the collection of data for a specific purpose or goal. In the Bay/Delta estuary, current monitoring efforts include the collection of environmental infor- mation such as the number and health of the fish residing in the estuary, the quality and quantity of fresh water flowing through the ecosystem, and the sources and quantities of pollutants. Many environmental managers, scientists, technicians, and citizens are active in the collection, assessment, and archiving of these data with the goal of achieving more informed resource management decisions.
In the fall of 1990, the National Research Council (NRC) released a report that summarizes the kinds of monitoring programs being conducted in the '
nation's coastal waters and describes the limitations to these efforts (NRC, 1990a). The NRC report suggests a framework in which monitoring and research programs can be designed and implemented in a more efficient way. It includes a case study conducted for southern California that highlights the monitoring and research activities in that region, reviews the mandates that call for monitoring to be performed, and identifies the gaps and overla'ps in monitoring and research efforts (NRC 1990b). The report also recommends how to improve monitoring and research programs. The kind of analysis done in the southern California case study can be applied to monitoring and research efforts in the BayPelta estuary. In the southern California case study, the NRC report generally defined the distinctions between monitoring and research:
"The relationship between research and monitoring activities ... is com- plex, making it difficult to arbitrarily and consistently distinguish be- tween the two. In this report, monitoring generally refers to repeated measurements taken to comply with specflc regulations; research refers to measurement and experimental programs undertaken to answer more open-ended questions."
The southern California case study also suggests that monitoring and re- search are complementary activities which support each other. Each provides important information needed for resource management.
Often the same agency will fund or direct monitoring and research. Monitor- ing results can stimulate research programs, and research results have provided information helpful in devising strategies to minimize degradation of the environ- ment. Because the intent of this chapter is to provide an overview of monitoring in the state of the Baypelta estuary, the following discussion does not sharply distin- guish between "monitoring" and "research." Research is generally considered a subset of monitoring.
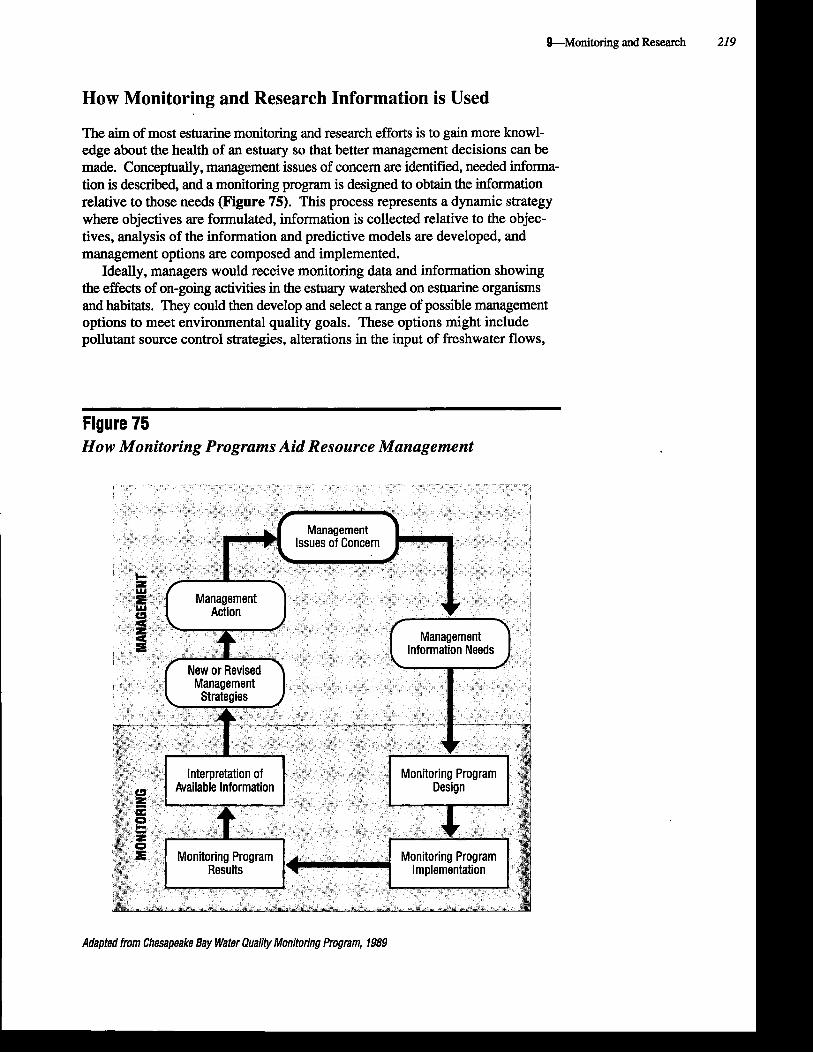
How Monitoring and Research Information is Used
The aim of most estuarine monitoring and research efforts is to gain more knowl- edge about the health of an estuary so that better management decisions can be made. Conceptually, management issues of concern are identified, needed informa- tion is described, and a monitoring program is designed to obtain the information relative to those needs (Figure 75). This process represents a dynamic strategy where objectives are formulated, information is collected relative to the objec- tives, analysis of the information and predictive models are developed, and management options are composed and implemented.
Ideally, managers would receive monitoring data and information showing the effects of on-going activities in the estuary watershed on estuarine organisms and habitats. They could then develop and select a range of possible management options to meet environmental quality goals. These options might include pollutant source control strategies, alterations in the input of freshwater flows,
Figure 75 How Monitoring Programs Aid Resource Management
Adapted from Chesapeake Bay Water Qua/@ Monitoring Program, 1989
220 State of the Estuary
and changes in land uses surrounding the estuary. This ideal level of prediction may not be possible to achieve due to the complex physical, chemical, and biolog- ical interactions that occur in the estuary. Nonetheless, the results of environ- mental monitoring do provide important information to a wide range of interests and decision makers. Monitoring information, as outlined by the NRC, can and should meet the following needs:
Help answer basic public health issues such as, "Is it safe to swim or eat fish or shellfish?"
Provide information needed to evaluate pollution reduction actions.
Provide an early warning system about the overall health of the estuary, allowing for early, lower-cost solutions to environmental problems before they become even more costly to correct.
Contribute to the knowledge of ecosystems and how they are affected by human activity. This knowledge allows managers and the public to set priorities for environmental protection and to assess long-term trends.
Provide essential data needed to build predictive models used to develop and select environmental management options.
Provide environmental managers the scientific basis for setting environmen- tal quality goals.
Determine compliance with the goals set out in water quality control programs.
Monitoring and research activities are conducted by a wide variety of agencies and individuals. They are based on the requirements of many different laws and represent a range of resource issues. The diversity of these activities suggests the continuing need for cooperation between monitoring and research programs so that a comprehensive understanding of the estuary can be gained in a cost- effective manner.
Monitoring and Research Programs in the BayDelta Estuary
Chapter 1 describes the many federal, state, and local agencies which regulate activities affecting the estuary. As shown in Table 26, many of these agencies are required to conduct monitoring and research programs as part of their man- agement responsibilities.
Research and monitoring activities are conducted for all five of the major management issues identified by the Estuary Project: biological resources, land use, altered freshwater flows, pollutants, and dredging and waterway modifica- tion. However, many of the monitoring activities do not fit neatly within a single management issue. For example, biological resources may be examined in relationship to altered flow regimes and pollutant-related effects. More than 70 research and monitoring projects are on-going in the estuary (AHI, 1991). At this time, an assessment of all of the monitoring and research projects has not been completed. Rather, for the purpose of this chapter, discussion centers on programs conducted by the federal, state, and local government agencies which focus on pollutants (i.e., toxics and water quality chemistry), biological resources,

&Monitoring and Research 221
Table 26 Primary Monitoring and Research Responsibilities in the BaylDelta Estuary
Biological Resources
Dischargers Municipal Industrial Others
State/Local DFG * DWR * DHS
BCDC ABAG SWRCB* SFBRWQCB CVRWQCB
Federal NOAA EPA USGS USCG usws * USCOE * USER *
Fish
- - -
Land Use
- - -
- - - + + - - -
* Members of Interagency Ecological Studies Prognm
and flows. As indicated in Figure 76, these three management issues receive the largest expenditures of monitoring effort and funds in the estuary.
Pollutants
National Programs Several federal agencies conduct monitoring and research programs designed to provide a national data base that tracks the health of the nation's marine and estuarine systems. These programs are not specifically intended to provide information to local environmental managers, but the information collected by these programs adds to the overall knowledge of the Bay/Delta estuary.
The National Oceanographic and Atmospheric Administration (NOAA) pro- vides basic information on the health of the nation's oceans and estuaries. NOAA is required to conduct programs in estuarine and coastal assessment, research,
Pollutants
+ + +
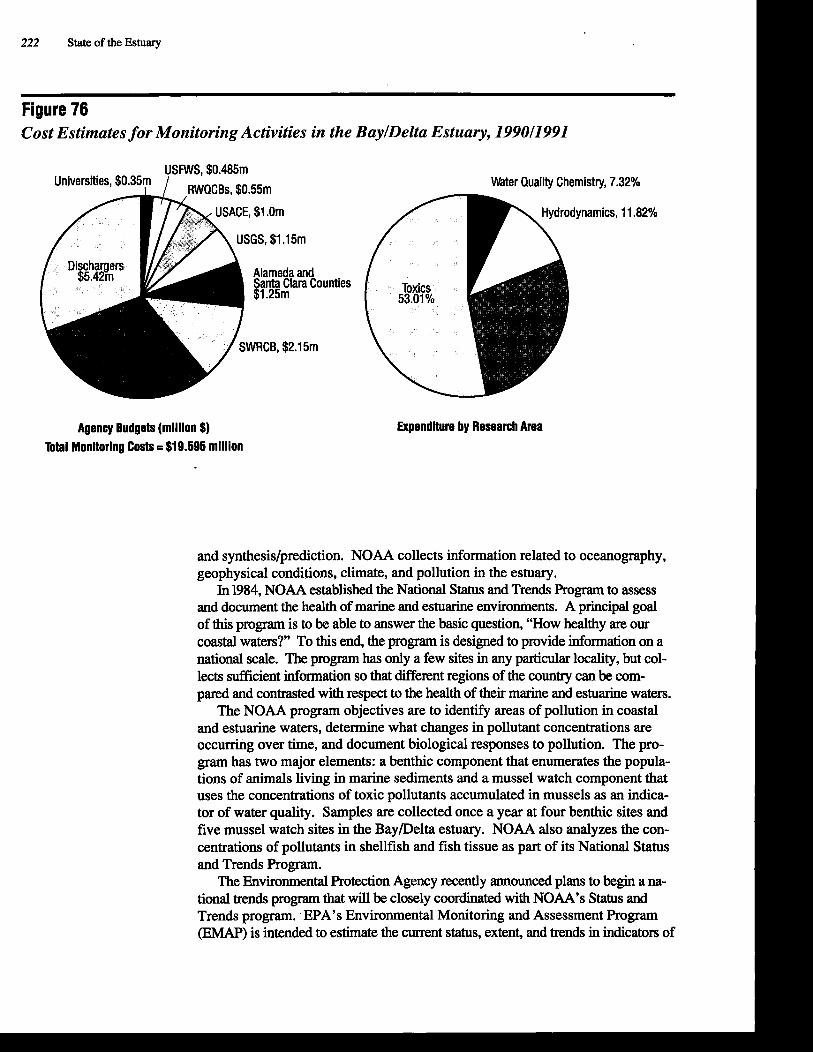
222 State of the Estuary
--
Figure 76 Cost Estimates for Monitoring Activities in the BaylDelta Estuary, 199011991
Universii Water Quality Chemistry, 7.32%
Agency Budgets (million $)
Total Monltorlng Costs u $19.595 million
Expenditure by Research Area
and synthesislprediction. NOAA collects information related to oceanography, geophysical conditions, climate, and pollution in the estuary.
In 1984, NOAA established the National Status and Trends Program to assess and document the health of marine and estuarine environments. A principal goal of this program is to be able to answer the basic question, "How healthy are our coastal waters?" To this end, the program is designed to provide information on a national scale. The program has only a few sites in any particular locality, but col- lects sufficient information so that different regions of the country can be com- pared and contrasted with respect to the health of their marine and estuarine waters.
The NOAA program objectives are to identify areas of pollution in coastal and estuarine waters, determine what changes in pollutant concentrations are occurring over time, and document biological responses to pollution. The pro- gram has two major elements: a benthic component that enumerates the popula- tions of animals living in marine sediments and a mussel watch component that uses the concentrations of toxic pollutants accumulated in mussels as an indica- tor of water quality. Samples are collected once a year at four benthic sites and five mussel watch sites in the BayPelta estuary. NOAA also analyzes the con- centrations of pollutants in shellfish and fish tissue as part of its National Status and Trends Program.
The Environmental Protection Agency recently announced plans to begin a na- tional trends program that will be closely coordinated with NOAA's Status and Trends program. EPA's Environmental Monitoring and Assessment Program (EMAP) is intended to estimate the current status, extent, and trends in indicators of
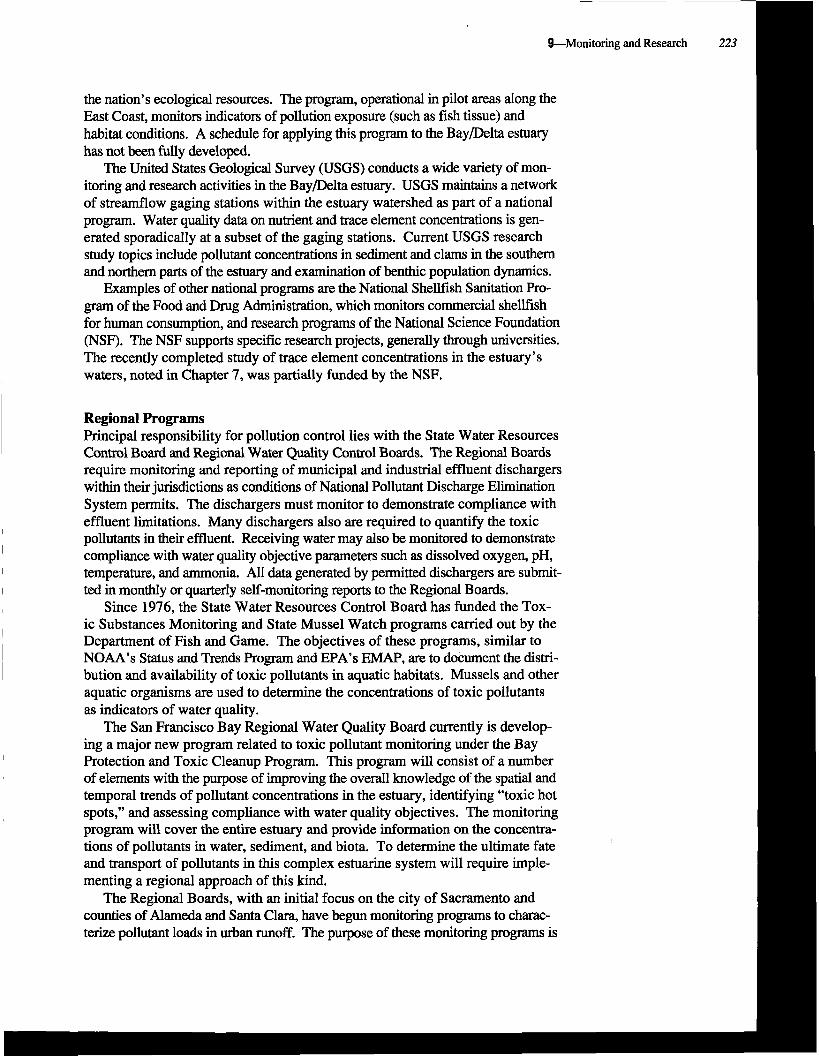
&Monitoring and Research 223
the nation's ecological resources. The program, operational in pilot areas along the East Coast, monitors indicators of pollution exposure (such as fish tissue) and habitat conditions. A schedule for applying this program to the BayPelta estuary has not been fully developed.
The United States Geological Survey (USGS) conducts a wide variety of mon- itoring and research activities in the BayPelta estuary. USGS maintains a network of streamflow gaging stations within the estuary watershed as part of a national program. Water quality data on nutrient and trace element concentrations is gen- erated sporadically at a subset of the gaging stations. Current USGS research study topics include pollutant concentrations in sediment and clams in the southern and northern parts of the estuary and examination of benthic population dynamics.
Examples of other national programs are the National Shellfish Sanitation Pro- gram of the Food and Drug Administration, which monitors commercial shellfish for human consumption, and research programs of the National Science Foundation (NSF). The NSF supports specific research projects, generally through universities. The recently completed study of trace element concentrations in the estuary's waters, noted in Chapter 7, was partially funded by the NSF.
Regional Programs Principal responsibility for pollution control lies with the State Water Resources Control Board and Regional Water Quality Control Boards. The Regional Boards require monitoring and reporting of municipal and industrial effluent dischargers within their jurisdictions as conditions of National Pollutant Discharge Elimination System permits. The dischargers must monitor to demonstrate compliance with effluent limitations. Many dischargers also are required to quantify the toxic pollutants in their effluent. Receiving water may also be monitored to demonstrate compliance with water quality objective parameters such as dissolved oxygen, pH, temperature, and ammonia. All data generated by permitted dischargers are subrnit- ted in monthly or quarterly self-monitoring reports to the Regional Boards.
Since 1976, the State Water Resources Control Board has funded the Tox- ic Substances Monitoring and State Mussel Watch programs carried out by the Department of Fish and Game. The objectives of these programs, similar to NOAA's Status and Trends Program and EPA's EMAP, are to document the distri- bution and availability of toxic pollutants in aquatic habitats. Mussels and other aquatic organisms are used to determine the concentrations of toxic pollutants as indicators of water quality.
The San Francisco Bay Regional Water Quality Board currently is develop- ing a major new program related to toxic pollutant monitoring under the Bay Protection and Toxic Cleanup Program. This program will consist of a number of elements with the purpose of improving the overall knowledge of the spatial and temporal trends of pollutant concentrations in the estuary, identifying "toxic hot spots," and assessing compliance with water quality objectives. The monitoring program will cover the entire estuary and provide information on the concentra- tions of pollutants in water, sediment, and biota. To determine the ultimate fate and transport of pollutants in this complex estuarine system will require imple- menting a regional approach of this kind.
The Regional Boards, with an initial focus on the city of Sacramento and counties of Alameda and Santa Clara, have begun monitoring programs to charac- terize pollutant loads in urban runoff. The purpose of these monitoring programs is
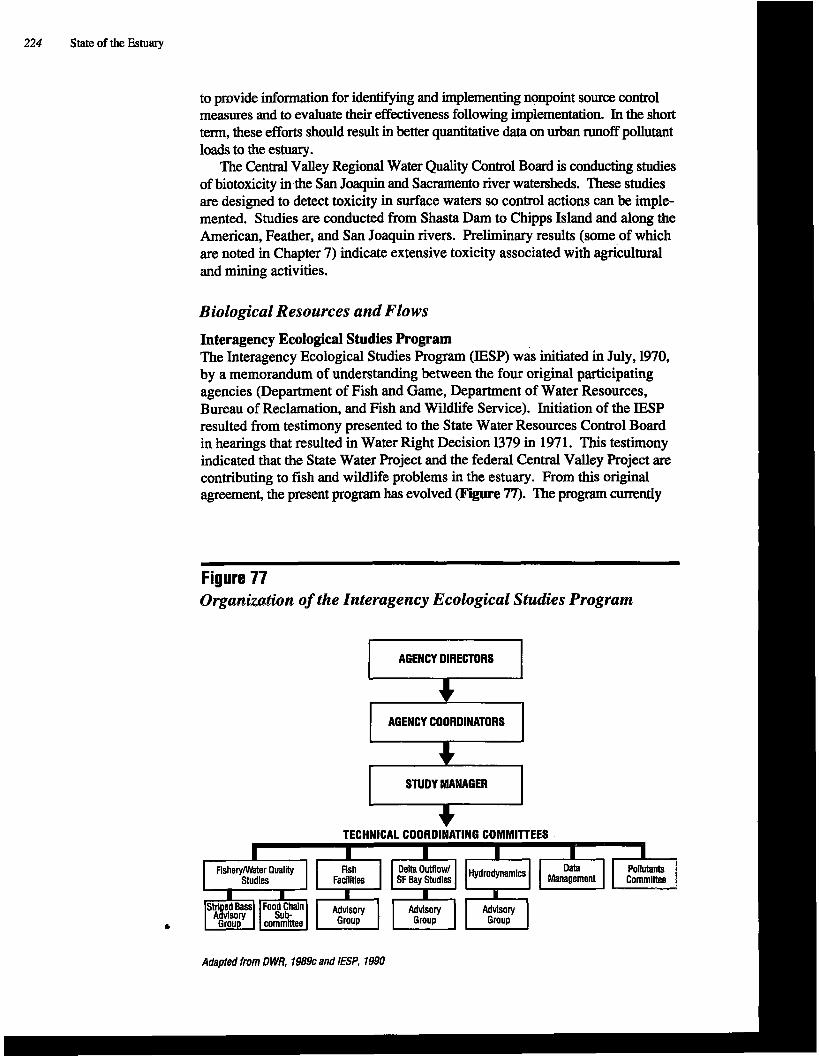
224 State of the Estuary
to p v i d e information for identifying and implementing nonpoint source control measures and to evaluate their effectiveness following implementation. In the short term, these efforts should result in better quantitative data on urban runoff pollutant loads to the estuary.
The Central Valley Regional Water Quality Control Board is conducting studies of biotoxicity inthe San Joaquin and Sacramento river watersheds. These studies are designed to detect toxicity in surface waters so control actions can be imple- mented. Studies are conducted from Shasta Dam to Chipps Island and along the American, Feather, and San Joaquin rivers. Preliminary results (some of which are noted in Chapter 7) indicate extensive toxicity associated with agricultural and mining activities.
Biological Resources and Flows
Interagency Ecological Studies Program The Interagency Ecological Studies Program (IESP) was initiated in July, 1970, by a memorandum of understanding between the four original participating agencies (Department of Fish and Game, Department of Water Resources, Bureau of Reclamation, and Fish and Wildlife Service). Initiation of the IESP resulted from testimony presented to the State Water Resources Control Board in hearings that resulted in Water Right Decision 1379 in 1971. This testimony indicated that the State Water Project and the federal Central Valley Project are contributing to fish and wildlife problems in the estuary. From this original agreement, the present program has evolved (Filgure 77). The program currently
Figure 77 Organization of the Interagency Ecological Studies Program
I AGENCY COORDINATORS I I STUDY MANAGER I +
TECHNICAL COORDINATING COMMITTEES
a committee
Adapted from D WR, 1989~ and IESP, 1990
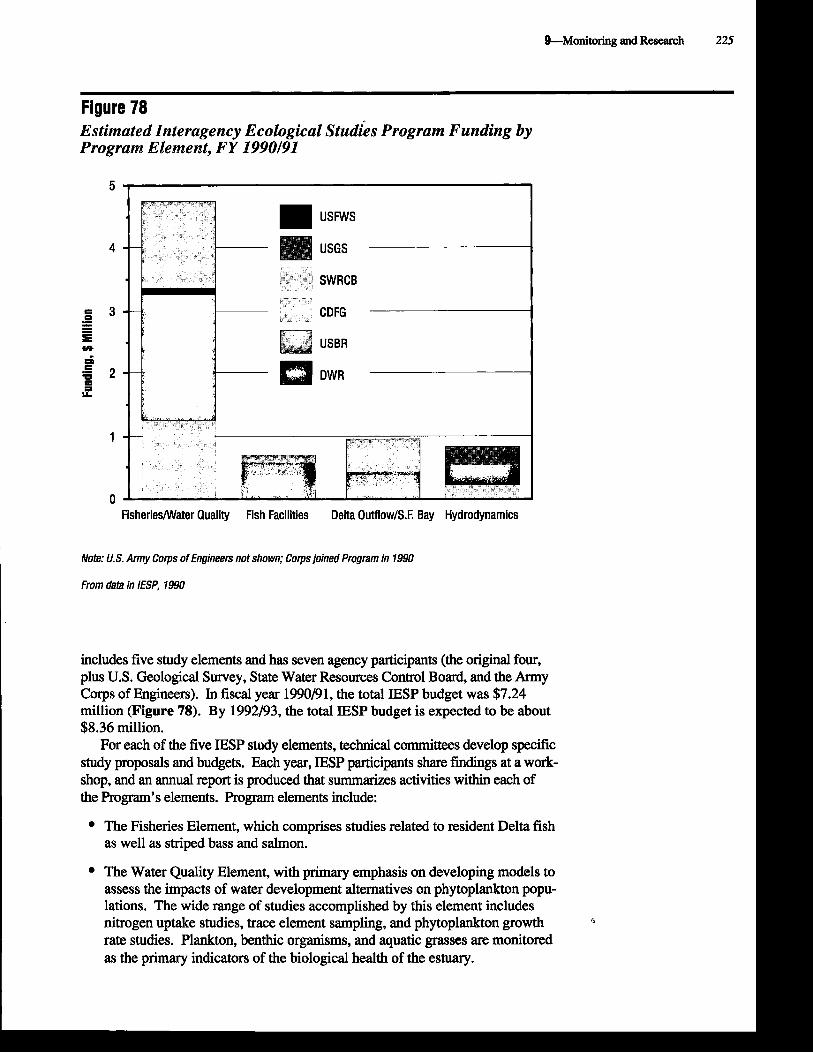
Fiaure 78 1
I $8.36 million. For each of the five IESP studv elements. technical committees develo~ smific
the Program's elements. Program elements include:
The Fisheries Element, which comprises studies related to resident Delta fish as well as striped bass and salmon.
The Water Quality Element, with primary emphasis on developing models to
nitrogen uptake studies, trace element sampling, i d phytoplankton growth rate studies. Plankton, benthic organisms, and aquatic grasses are monitored as the primary indicators of the biological health of the estuary.

226 State of the Estuary
The Fish Facilities Element, initially concerned with information related to designing fish protective features of the proposed Peripheral Canal. With voter defeat of the Canal, emphasis of the program shifted to obtaining a better understanding of effects of existing Delta pumping facilities on fish populations.
The Delta Outflow/San Francisco Bay Study Element, established in 1979, to begin developing information regarding the need for outflow standards to protect the Bay portion of the estuary. This element evolved from Water Right Decision 1485, which mandated that the CVP and SWP include a San Fran- cisco Bay element in their studies. It began with a biological and hydrodynamic component and brought the USGS and the SWRCB into the IESP.
Long-term monitoring provides The Hydrodynamics Element seeks to estimate how alterations in freshwater valuable information about the inflow affect circulation and trans~ort in the Bav and Delta. Efforts include estuary and the effectiveness collecting and analyzing data on flows, salinity, circulation patterns, and other of management actions. (Photo: courtesy, EBMUD) physical parameters of the system. Using this data, researchers are develop-
ing and refining mathematical models that predict how inflow affects the movement of water through the Delta, and within and between the various segments of the Bay. The ultimate goal of this effort is to develop the tools necessary for the IESP to determine cause-and-effect relationships between chariges in freshwater inflow and changes in the estuarine ecosystem.
Initially, the IESP included an element for Suisun Marsh water quality and soil salinity. This element was deleted from the Program in the late 1980s, when the Suisun Marsh Protection Plan began to be implemented.
Since 1984, hydrodynamic studies have been carried out through a subcom- mittee of the Delta Outflow/San Francisco Bay Technical Committee. A separate Hydrodynamics Committee was formed in early 1990 and the geographic scope of the studies was expanded to include the Delta.
Information gathered through IESP activities is designed to be used to assess the effects that different freshwater allocations may have on the estuary and its living resources. Assessments of this nature are essential to the setting of standards for the release of fresh water into the estuary.
In late 1988, the IESP underwent an outside review by a panel of experts in estuarine science. The review stemmed from the State Water Resources Control Board's dissatisfaction with the lack of definitive information presented to it during the Bay/Delta Hearing in 1987. Results of this review indicated, among other issues, that a "sound conceptual framework" is required of the IESP in or- der to more fully answer questions related to the overall health of the estuary. The IESP currently is under review and revision with the intent of reorganizing its efforts in order to study the estuary, from its headwaters to the ocean, in a more integrated way (for details of the IESP's specific activities, see IESP, 1990).
The Interagency Ecological Studies Program is a good example of the inte- gration of management issues within monitoring programs. Designed initially to assess the effects of water project operations on fish and wildlife populations, the IESP has evolved to consider a broader array of concerns including pollut- ants, flow regimes, and habitats.
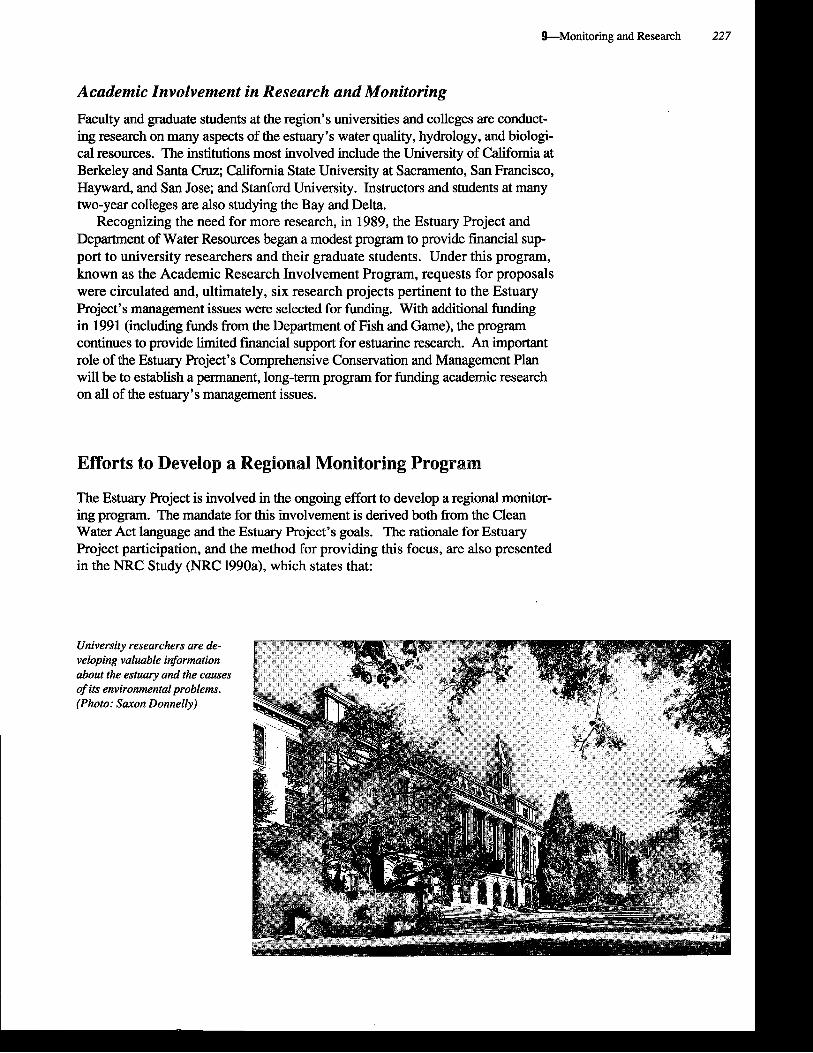
Academic Involvement in Research and Monitoring
Faculty and graduate students at the region's universities and colleges are conduct- ing research on many aspects of the estuary's water quality, hydrology, and biologi- cal resources. The institutions most involved include the University of California at Berkeley and Santa Cruz; California State University at Sacramento, San Francisco, Hayward, and San Jose; and Stanford University. Instructors and students at many two-year colleges are also studying the Bay and Delta.
Recognizing the need for more research, in 1989, the Estuary Project and Department of Water Resources began a modest program to provide financial sup- port to university researchers and their graduate students. Under this program, known as the Academic Research Involvement Program, requests for proposals were circulated and, ultimately, six research projects pertinent to the Estuary Project's management issues were selected for funding. With additional funding in 1991 (including funds from the De~artment of Fish and Game). the Dromam continues to provide limited financial support for estuarine research. An important role of the Estuary Project's Comprehensive Conservation and Management Plan will be to establish a permanent, long-term program for funding academic research on all of the estuary's management issues.
Efforts to Develop a Regional Monitoring Program
The Estuary Project is involved in the ongoing effort to develop a regional monitor- ing program. The mandate for this involvement is derived both from the Clean Water Act language and the Estuary Project's goals. The rationale for Estuary Project participation, and the method for providing this focus, are also presented in the NRC Studv (NRC 1990a). which states that:
University researchers are de- I veloping valuable information about the estuary and the causes of its environmntal problems. (Photo: Saxon Donnelly)
228 State of the Estuary
The EPA and NOAA should cooperate to develop a more effective national program to monitor environmental status and trends in the coastal ocean and estuaries. The program should combine regional programs with a sparser network of long-term stations and studies including some in natural areas not heavily influenced by human activities.
The nucleus for this network should be developed through NOAA's National Status and Trends Program and EPA's National Estuary Program and its related coastal water activities.
Those responsible for managing estuaries included under Section 320 of the Water Quality Act of 1987 (i.e., estuaries in the National Estuary Program) should be required to develop and implement a status and trends monitoring program. Regional monitoring should be designed as an integral part of the particular estuarine management strategy that is developed. It should also meet certain minimum requirements and protocols to ensure coherence and compatibility with the national monitoring network.
The concept of a regional monitoring program is not new. Several efforts have been made in past years to develop monitoring programs for the Bayl'elta estuary (METC, 1977; Home et al., 1982; Phillips, 1988). These efforts were not fully successful, largely because their defined objectives were not agreed to by all significant parties, and because they lacked adequate long-term financial support. Through the Estuary Project, there now exists an opportunity for dis- chargers, scientists, environmental groups, and regulators to reach consensus regarding monitoring objectives and procedures, and to ensure adequate funding for a successful regional program.
Renewed efforts to develop a regional monitoring program are already under- way. These efforts include: the Aquatic Habitat Institute's Framework for Pollutant Monitoring and Research in the San Francisco Bay-Delta (J. O'Connor, pers. comm.), policy directives in the State Water Resources Control Board's Pollutant Policy Document (SWRCB, 1990), the Regional Monitoring Program being developed under the Bay Protection and Toxic Cleanup Program (T. Mumley, pers. comm.), and the IESP's recent review and current restructuring with the aim of achieving greater estuary-wide knowledge. Although each of these efforts has a different focus, they are related in sigmficant ways. The Estuary Project intends to help integrate them into a comprehensive approach for monitoring and research that will enable the individual programs to develop and disseminate information neces- sary for addressing the estuary's critical management issues.
The Estuary Project's Regional Monitoring Strategy
The Estuary Project's Comprehensive Conservation and Management Plan will include a regional monitoring program that addresses all five management issues. The development of this program will be accomplished through a strategy that relies on, and interacts with, important efforts already underway. The purview of the monitoring strategy is broad, comprising an umbrella approach to the question of overall estuary health.
The Estuary Project's strategy for developing a regional monitoring pro- gram is shown in Figure 79. It includes an assessment of current monitoring
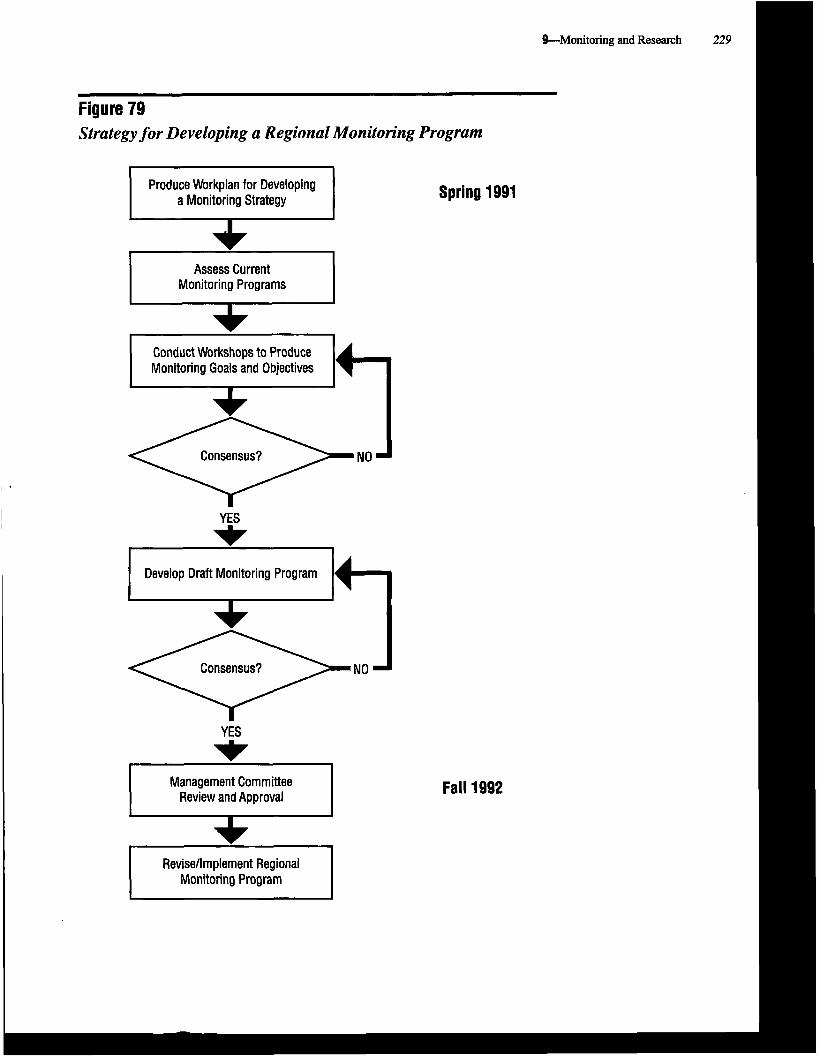
Figure 79 Strategy for Developing a Regional Monitoring Program
-
Produce Workplan for Developing a Monitoring Strategy Spring 1991
Assess Current Monitoring Programs
Conduct Workshops to Produce Monitoring Goals and Objectives
Consensus?
Develop Draft Monitoring Program
Consensus?
Management Committee Review and Approval Fall 1992
Revise/lmplement Regional Monitoring Program
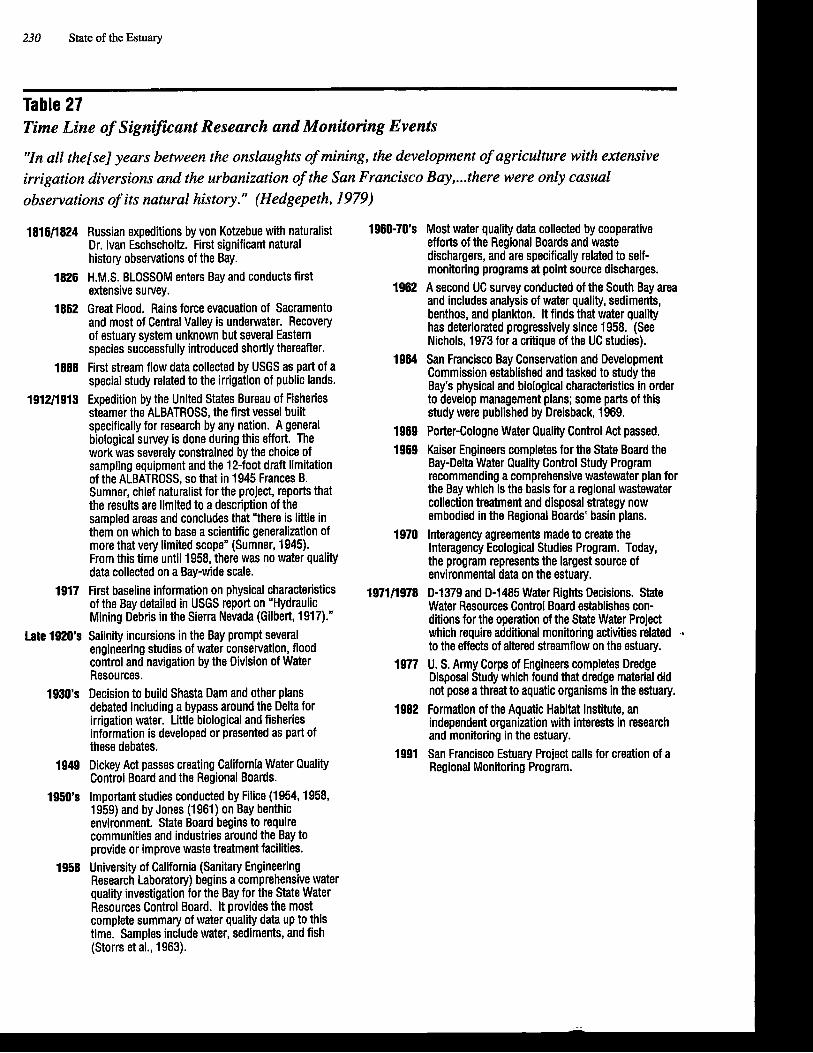
230 State of the Estuary
Table 27 Time Line of Significant Research and Monitoring Events
"In all the[se] years between the onslaughts of mining, the development of agriculture with extensive irrigation diversions and the urbanization of the San Francisco Bay, ... there were only casual observations of its natural history." (Hedgepeth, 1979)
1816/1824 Russian expeditions by von Kotzebue with naturalist Dr. Ivan Eschscholtz. First significant natural history observations of the Bay.
1826 H.M.S. BLOSSOM enters Bay and conducts first extensive survey.
1862 Great Flood. Rains force evacuation of Sacramento and most of Central Valley is underwater. Recovery of estuary system unknown but several Eastern species successfully introduced shortly thereafter.
1888 First stream flow data collected by USGS as part of a special study related to the irrigation of public lands.
1912/1913 Expedition by the United States Bureau of Fisheries steamer the ALBATROSS, the first vessel built specifically for research by any nation. A general biological survey is done during this effort. The work was severely constrained by the choice of sampling equipment and the 12-foot draft limitation of the ALBATROSS, so that in 1945 Frances B. Sumner, chief naturalist for the project, reports that the results are limited to a description of the sampled areas and concludes that "there is little in them on which to base a scientific generalization of more that very limited scope" (Sumner, 1945). From this time until 1958, there was no water quality data collected on a Bay-wide scale.
1917 First baseline information on physical characteristics of the Bay detailed in USGS report on "Hydraulic Mining Debris in the Sierra Nevada (Gilbert, 1917)."
Late 1920's Salinity incursions in the Bay prompt several engineering studies of water conservation, flood control and navigation by the Division of Water Resources.
1930's Decision to build Shasta Dam and other plans debated including a bypass around the Delta for irrigation water. Little biological and fisheries information is developed or presented as part of these debates.
1949 Dickey Act passes creating California Water Quality Control Board and the Regional Boards.
1950's Important studies conducted by Filice (1954,1958, 1959) and by Jones (1961) on Bay benthic environment. State Board begins to require communities and industries around the Bay to provide or improve waste treatment facilities.
1958 University of California (Sanitary Engineering Research Laboratory) begins a comprehensive water quality investigation for the Bay for the State Water Resources Control Board. It provides the most complete summary of water quality data up to this time. Samples include water, sediments, and fish (Storrs et al., 1963).
1960-70's Most water quality data collected by cooperative efforts of the Regional Boards and waste dischargers, and are specifically related to self- monitoring programs at point source discharges.
1962 A second UC survey conducted of the South Bay area and includes analysis of water quality, sediments, benthos, and plankton. It finds that water quality has deteriorated progressively since 1958. (See Nichols, 1973 for a critique of the UC studies).
1964 San Francisco Bay Conservation and Development Commission established and tasked to study the Bay's physical and biological characteristics in order to develop management plans; some parts of this study were published by Dreisback, 1969.
1969 Porter-Cologne Water Quality Control Act passed. 1969 Kaiser Engineers completes for the State Board the
Bay-Delta Water Quality Control Study Program recommending a comprehensive wastewater plan for the Bay which is the basis for a regional wastewater collection treatment and disposal strategy now embodied in the Regional Boards' basin plans.
1970 lnteragency agreements made to create the lnteragency Ecological Studies Program. Today, the program represents the largest source of environmental data on the estuary.
1971/1978 D-1379 and D-1485 Water Rights Decisions. State Water Resources Control Board establishes con- ditions for the operation of the State Water Project which require additional monitoring activities related .-
to the effects of altered streamflow on the estuary. 1977 U. S. Army Corps of Engineers completes Dredge
Disposal Study which found that dredge material did not pose a threat to aquatic organisms in the estuary.
1982 Formation of the Aquatic H a b i t Institute, an independent organization with interests in research and monitoring in the estuary.
1991 San Francisco Estuary Project calls for creation of a Regional Monitoring Program.
Summary
Monitoring and research in the BayPelta estuary have been intermittent through much of the 19th and 20th century (Table 27). It is only within the past 30 years that scientifically rigorous information has been collected in a systematic way. Currently, a number of local, state, and federal agencies have monitoring responsi- bilities and/or research programs ongoing in the estuary. These programs cover a wide range of resource issues including all five of the Estuary Project's manage- ment issues.
Several important efforts were made in the past 15 years to bring about a more coordinated regional monitoring strategy for the estuary. These efforts were not fully successful largely because they lacked clearly identified objectives, broad- based institutional support, and adequate long-term funding.
Recognizing the need for more effective and coordinated monitoring and research, renewed efforts to develop a regional monitoring program are now under- way. The Estuary Project recognizes the importance of these efforts and has begun to implement a strategy to assist them. It also recognizes the need for a regional monitoring program that is linked to a set of overall resource management questions and objectives, and which has adequate long-term financial support. Future Estuary
.Project actions will be directed at supporting ongoing efforts to develop a strong, coordinated, and well-funded regional monitoring program.
-
&Monitoring and Research 231
and research efforts and an analysis of how these efforts overlap or complement one another. At workshops, interested parties (dischargers, environmentavpublic interest groups, scientists, legislative representatives, and agency decision makers) will develop monitoring program goals and objectives and will idenm the essential management questions for which a regional monitoring program should provide useful information. A draft monitoring program will be presented to the Estuary Project's Management Committee for approval during the latter half of 1992. The final regional monitoring program will be implemented along with other actions in the CCMP.

A Comprehensive Approach to Addressing the Management Issues
During the past four years, the ~stuary Project has spent conriderable time and effort compiling technical information on the BaylDelta estuary's major management issues. As a result, several conclusions can be made. First and foremost, it is abundantly apparent that the estuary has some very real and sig- nificant environmental problems. These problems, many of which have existed for years, are documented by research and monitoring data. Although some are more systemic and serious than others, all of the problem are adversely
10 ajfecting the estuary's water quality, habitats, or fish and wildlife.
Another conclusion is that all of the Estua~y Project management issues are interrelated. Land use, pollutants, fleshwater flows, declining biological resources, and dredging and waterway modification are all linked in a web of interacting chemical, physical, and biological processes. To address these issues dectively will require developing a set of integrated actions that takes these links into consideration. For example, it would make little sense in the long run to try to lower the pollutant-related impacts of dredging without also reducing the quantities of pollutants that ultimately find their way into sedi- ments. Similarly, it would be unwise for public or private entities to spend large s u m of money to protect a particular wetland, while allowing incompati- ble activities on adjacent parcels.
A third conclusion is that many of the estuary's problem are getting worse, while only a few have improved. Regional population growth and urban expansion into rural lands are consuming valuable wildlife habitat and productive fannlaPId at an alarming rate. Pollutantsfrom point and nonpoint sources com'nue to degrade water quality. A large volume of sediments is expected to be dredgedfrom the estuary in the coming years. Zncreasedfrshwater diversions will continue to dect ecological conditions in the estuary and com'bute to declining populations of important sport and commercial fish and other biological resources.
Notable improvements during the past fav decades include better control of pollutants flom municipal and industrial sources, a declining rate of wetland loss, and a trend toward more effective regulation of dredging activities. These improvements have been substantial and have resulted flom an enhanced sci- entiJic understanding of the efects of certain activities, and also because the public has demanded them.
Finally, the fact that many of the estuary's environmental problems have not diminished, have become worse in recent years, or are expected to worsen in the near future indicates that additional actions are urgently needed to solve them. These actions will form the core of the Estuary Project's Comprehensive Conservation Management Plan.
233
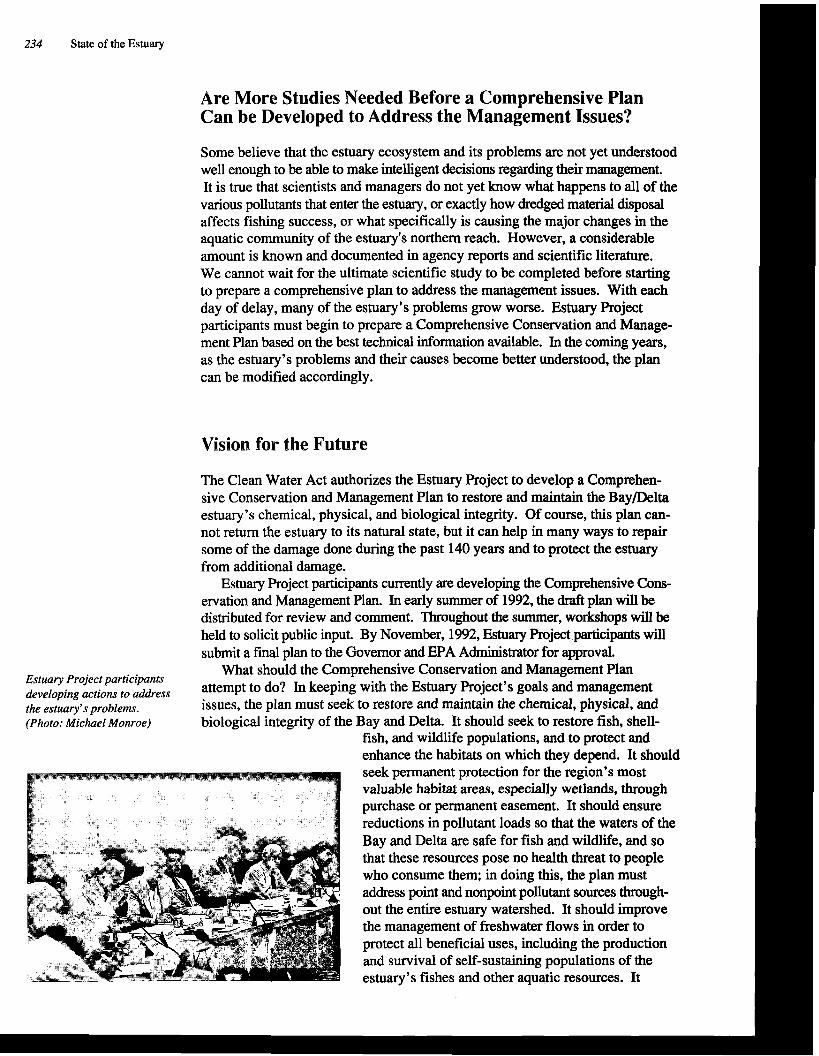
234 State of the Estuary
Are More Studies Needed Before a Comprehensive Plan Can be Developed to Address the Management Issues?
Some believe that the estuary ecosystem and its problems are not yet understood well enough to be able to make intelligent decisions regarding their management. It is true that scientists and managers do not yet know what happens to all of the various pollutants that enter the estuary, or exactly how dredged material disposal affects fishing success, or what specifically is causing the major changes in the aquatic community of the estuary's northern reach. However, a considerable amount is known and documented in agency reports and scientific literature. We cannot wait for the ultimate scientific study to be completed before starting to prepare a comprehensive plan to address the management issues. With each day of delay, many of the estuary's problems grow worse. Estuary Project participants must begin to prepare a Comprehensive Conservation and Manage- ment Plan based on the best technical information available. In the coming years, as the estuary's problems and their causes become better understood, the plan can be modified accordingly.
Vision for the Future
The Clean Water Act authorizes the Estuary Project to develop a Comprehen- sive Conservation and Management Plan to restore and maintain the Bay/Delta estuary's chemical, physical, and biological integrity. Of course, this plan can- not return the estuary to its natural state, but it can help in many ways to repair some of the damage done during the past 140 years and to protect the estuary from additional damage.
Estuary Project participants currently are developing the Comprehensive Cons- ervation and Management Plan. In early summer of 1992, the draft plan will be distributed for review and comment. Throughout the summer, workshops will be held to solicit public input. By November, 1992, Estuary Project participants will submit a final plan to the Governor and EPA Administrator for approval.
What should the Comprehensive Conservation and Management Plan Estuary Project participants developing actions to address attempt to do? In keeping with the Estuary Project's goals and management the estuary's problems. issues, the plan must seek to restore and maintain the chemical, physical, and (photo: Michael Monroe) biological integrity of the Bay and Delta. It should seek to restore fish, shell-
fish, and wildlife populations, and to protect and enhance the habitats on which thev depend. It should - seek permanent protection for the region's most valuable habitat areas, especially wetlands, through purchase or permanent easement. It should ensure I reductions in pollutant loads so that the waters of the Bay and Delta are safe for fish and wildlife, and so
. . . .
that these resources pose no health threat to people who consume them; in doing this, the plan must address point and nonpoint pollutant sources through- out the entire estuary watershed. It should improve the management of freshwater flows in order to protect all beneficial uses, including the production and survival of self-sustaining populations of the estuary's fishes and other aquatic resources. It
Appendix 1
Section 320, Clean Water Act, As Amended
~~~ - a (.) M ~ m e n t Canfaenee.-
(1) Nomlnntian of ~ s t ~ i ~ ~ . - m Goverm of any State may nominnte to the Administratar an estuary lying in whole a in within the State aa an ~ U U Y of n e t i d d@f]mce and re-t a management conference to develop COinprehendve manngement plan for the estuerg. The nomination Shall
documant the need fa the conference, the Ilkellhood of success, and information relating to the factors In parngmph (2).
(2) Canvenirrg of Canfereneer (A) In General.-In any case where the Administrator determines, on h b
own initiative ar upon nomination of a State under paragraph (11, that the a t t d ~ n a t a maintenance of thnt water quality in an estuary which assures protection of public water supplies and the proteetian and propegation of a b l a n d , lndiganous population of shellfish, fish, and wildlife, and &ows recreational activities, in and on the wate, requires the control of point and nonpoint sources of pollution to st@emsnt existin$! controls of pollution in mom than one State, the Administrator shan select such estuary end con- vene a management conference.
(B) Pda i ty Consideration.-The Administrator shall give priority consid- eration under this section to Long Island Sound, New Ymk and Connecticut; Narragansett Bay, Rhode Island; Buzzards Bay, Massachusetts; Puget Sound, WLuhington, New Yak-New Jersey Harbor, New Yuk and New Jersey; Dela- ware Bay, Delaware and New Jersey; Delaware Inland Bays, Delaware; Alhe marle Sound, North Camllna, Sarasota Bay, Florida; San Francisco Bay, Cdifomia; and Galveston Bay, Texas. (3) Boundary Displte Exception.-In any case in which a boundary between
two Stntes p a e s through an estuary and such boundary is disputed and is the Subject of an action in any court, the Administrator shall not convene a manage- ment aonfaence with respect to such estuary before a final adjudication has been ma& of such dbplte.
(b) Rrrpges of Confeenee.-The parposes of any management conference con- vened with reapect to an estuary under this subsection shan be to-
(1) mess trends in water quallty, nntural resources, and uses of the est~lary; (2) c o n r t , characterize, and me& data on toxics, nutrients, and nntural
rwtources within the estmrlne zone to identify the causes of environmental prob lemy
(3) develop the relatiwhip between the inplace loads and point and nonpoint loadlltp Of pollutants to the estuarine zone and the potential uses of the zone, water q d i t y , nnd natural resources;
(4) develop a comprehensive conservation and management plan t h t recom- priaity corrective actiorrs and compliance schedules addressing point and
nonpoint sources of pollution to restore and maintain the chemical, physical, and MolMCd integrity of the estuary, including restoration and maintenance of water quality, a balanced indigenous population of shellfish, fish and wildlife, and recreational activities in the estuary, and nssure that the desgnated uses of the estuary are protected;
(5) develop plans f u the coordi~ted implementation of the plan by the States a8 well as Federal and local agencies participating in the conference;
(6) monitor the effectiveness of actions taken pursuant to the plan; and (7) review all Federal financial assistance propam and Federal development
project in accordance with the requirements of Executive Order 12372, as in effect on September 17, 1983, to determine whether such assistance program or m e t would k consistent with and fmther the purposes of objectives of the plm prepared under this section.
P a plrpascs of paragraph (71, m h poprsms and projects shall not be limited to the ~ s h t a n c a programs and development projecm subject to Executive Order '12372, but may include any proprams listed in the mart recent Catalog of Federal Domulc Aesi!itnnce which may have an effect on the purposes and objectives of the plan developed mder this section.

Appendix I - 238
(=) Membars of Cmfaence.-The members of a management conference mw vend m d e t h b rection nhan Include, at a mlnlmum, tho Admlnbtrator and repra- rsntatlvea of-
(1) each State and faeign mtion located I n whole or In part i n the estuarine zone of the estuary f a which the conference la convend,
(2) international, Interstate, a re@onal egencies or entltiea having jurLsdic tian o v e a l l a a significant part o f the estuarfi
(3) each Interested Federal agency, as determined appropriate by the Admlw btrator;
(4) local governments having jurisdiction over any land or water withln t h estuarine zone, as determined appropriate by the Administratoq and
(5) affected industries, public and private educetional institutions, and the general public, as determined appropriate by the Administrator.
(d) Utilization of Er is t iw Data.-ln developing a conservation and management plan mder this section, the manapement conference shall survey end utilize exlst- lq reports, data, and studies reletirqt to the estuary that have been developed by or made available to Federal, intentate, State, and local agencies.
(e) Period of Conference.-A management conference convened under this see tion shall be convened far a period not to exceed 5 years. Such conference may be extended hy the Administrator, and i f terminated after the initial period, may be reconvened by the Administratar at any time thereafter, as may be necessary to meet the requirements of this section.
(f) Approval and Implementation Plans.- (1) ApprovaL-Not later than 120 days after the completion of a conserva-
tion and management plan and after providin? for publlc review and comment, the Administrator shall approve such plan i f the plan meets the requirements of this,section and the affected Governor or Governors con-.
(2) Implementation.-Upon approval of a conservation and management plan under thls section, such plan shall be implemented. Fun& authorized to be appropriated under titles Il and VI and section 319 of this Act may be used in accordance with the applicable requirements of this Act to assist States with the implementation of such plan.
(g) Grants.- (1) Recipients.-The Administrator is authorized to make grants to State,
interstate, and regional water pollution control agencies and entities, State coastal zone management agencies, interstate agencies, other public or nonprofit private agencies, institutiorrr, crpanizatiom, and individuals.
(2) Purposes.--Grants mder this subsection shall be made to pay for assistiw research, surveys, studies, and model in^ and other technical work necessary for the development of a conservation and management plan under this section.
(3) Federal Share.-The amount of grants to any person (including a State, interstate, a regional apency or entlty) under this subsection for a fiscal year shall not exceed 75 percent of the costs of such research, survey, studies, and work and shall be made on wndition that the non-Federal share of such costs are provided from non-Federal sources.
(h) Grant Reporting.-Any person (including a State, interstate, a regional agency a entity) that receives a pan t under subsection (g) shall report to the Ad- ministrator not later than 18 months after receipt of such grant and biennially thereafter on the propres being made under this section.
(1) Authorization of Appropriations.-There are authorized to be appropriated to the Administrator not to exceed S12,000,000 per fiscal year for each of fiscal years lB87, 1988, 1989, 1990, and 1981 for-
(1) expenses related to the administration of management conferences mder this section, not to exceed 10 percent of the amount appropriated undu this subsection;
(2) making ts mder rubsection (gh and (3) m a - d t c t h a Lmplpmentation of a comervation and management plan
bp the maMgamsnt conference or by the Administrator, in any c u e in which the d m o e has been terminated.
Thr Adrninbtrator rhqll provide up to $5,000,000 per fiscal year of the sums autho- rited to ba appropriated mdm this rubsection to the Administrator of the National OosMia and Atmompheric Adminlstration to carry out subsection a).
U) Research.- (1) Programs.-In order to determine the need to convene a management
emfaonce We thb aection ar at the request of such a management confer snes, the Administrator rhall coordinste and implement, through the National M d m PonutIon Proffram Office and the National Marine Pisheries Serdce of the Nationd Oceanic and Atmospheric Administration, M appropriate, for one or m a a wtuarim eonar-
(A) a long-term program of trend a e s m e n t monltorinp measuring vari- atiom In ponutant concentratiom, marlne ecology, and other physical or biddeal cnvitonmental parameters which may affect estuarine zones, to provide the Administrata the capacity to determine the potential and actual effects of alternative management strategies and measures;
(B) a Drwram of ecmvstem assessment assisting in the development of 0) baseline s'iudies which-determine the state of &twine zones and the effcets of natural and anthpogenic changes, and (ii) predictive models ~fIpabl8 of translating infamation on specific discharges or general pollutant loadings within estuarine zones into a set of probable effects on such zones;
(C) a comprehensive water auality sampling promam for the continuous manitaing of -nutrients, chlorini, acid pr=dpfi&i& dissolved oxygen, and POt8ntidl~ toxic wllutante (inoludi~tg organic chemicals and metals) in estu- kine zo&, aft& comultatim wit6 inierested State, local, interstate, or internatimal apencica and mview and malysis of all environmental ~ m p l i n u data presently collected from estuarine zones; and
(Dl a program of research to identify the movements of nutrients, sedi- ments and pollutants through estuarine zones and the impact of nutrients, sediments, and pollutants on water quality, the ecosystem, and designated or potential uses of the estuarine zones. (2) RcpaW.-The Administrator, in cooperation with the Administrator of
the Nationel Oeeahic and Atmmpheric Administration, shall submit to the COP p 8 B no lea often than wennlally a comprehensive report on the activities authorized under this r b a c t i o n Includinp-
(A) a lb t iw of priaity monitoring and research needs; (B) an assessment of the state and health of the Nation's estuarine zones,
to tha extent evaluated mder this subsection; (C) a discussion of pollution problems and trends in pollutant concentra-
tlm with a direct or indirect effect on water quality, th'e ecosystem, and designated a potential uses of each estuarine zone, to the extent evaluated mder this si~beection; and
(D) an evaluation of pollution abatement activities and management meaaUres so far implemented to determine the degree of improvement toward the objectives expressed i n subsection (bM4) of this section.
(k) DtflnIUomi.-Fa purposes of thls section, the terms "estuaryn and 'lestuarine ~" have the meanings such terms have in section 104(nK4) of this Act, except that the term "estuarine zonen shall also include associated aquatic ecosystems and tlKJOe partlom of tributaries draining into the estuary up to the historic height of migration of anadromous fish or the historic head of tidal influence, whichever is hfghr.

San Francisco Estuary Project Subcommittees
Biological Resources Subcommithe
Jim Arthur Joan Jurancich U.S. Bureau of Reclamation State Water Resources Control Board
Bob Batha Steve McAdam S.F. Bay Conservation and Development Commission S.F. Bay Conservation and Development Commission
Tom Harvey Trish Mulvey US. Fish and Wildlife Service Citizens Committee to Complete the R@ge
Bruce Herbold Denis Nickel U.S. Environmental Protection Agency, Region 9 U.S. Soil Conservation Service
Alan Jassby Leo Winternitz University of California, Davis State Water Resources Control Board
Dredging a d Waterway Modification Subcommittee
W i a m Boland Barry Nelson California Marine Affairs and Navigation Conference Save San Francisco Bay Association
Mike Carlin Joe O'Comor S.F. Bay Regional Water Quality Control Board Aquatic Habitat Institute
Mike Cheney Phil Oshida Golden Gate Ports Association U.S. Environmental Protection Agency, Region 9
Bill DuBois Alan Ram0 California Farm Bureau Federation Citizens for Better Environment
Steve Goldbeck Carol Schemmerling S.F. Bay Conservation and Development Commission Urban Creeks Council
Leonard Long Bob Tasto

Appendix 2 - 242
Flows Subcommittee
Pete Chadwick California Department of Fish and Game
William DuBois California Farm Bureau Federation
Dave Fleming Association of Bay Area Governments
John Fraser Association of California Water Agencies
Mike Hen The Baykeeper
Jerry Johns State Water Resources Control Board
John Krautkraemer Environmental Defense Fund
Steve McAdam S.F. Bay Conservation and Development Commission
Jim McDaniel California Department of Water Resources
Land Use Subcommittee
Dennis Barry Contra Costa County
Betty Croly Alarneda County
Dave Fleming Association of Bay Area Governments
Kassandra Fletcher Building Industry Association of Northern California
Ellen Johnck Bay Planning Coalition
Mem Levin Sun Mateo County
John Malamut Bay Planning Coalition
Richard Morat U.S. Fish and Wildlife Service
Chris Mobley National Marine Fisheries Service
Barry Nelson Save Sun Francisco Bay Association
Michele Pla' City and County of Sun Francisco
John Renning U.S. Bureau of Reclamation
Tom Rinn Metropolitan Water District of Southern California
Harry Seraydarian U.S. Environmental Protection Agency, Region 9
Arliss Ungar League of Women Voters of the Bay Area
Peter Morse Sacramento County Planning Department
Trish Mulvey Citizens Committee to Complete the Refuge
Tom Mumley S.F. Bay Regional Water Quality Control Board
Elizabeth Patterson California State Lands Commission
Emily Renzel City of Palo Alto
Barbara Salzman Marin Audubon Society
Felix Smith U.S. Fish and Wildlife Service
PoUutunts and QualZty AssruancelQllality Control Subcommittee
Chuck Batts Bay Area Dischargers Association
Barry Montoya Central Valley Regional Water Quality Control Board
Randy Brown California Department of Water Resources
Trish Mulvey Citizens Committee to Complete the Refuge
Mike Carlii Tom Mumley S.F. Bay Regional Water Quality Control Board S.F. Bay Regional Water Quality Control Board
John Cashrnan University of California, San Francisco
Joe O'Connor Aquatic Habitat Institute
Claire Elliott U.S. Environmental Protection Agency
Archie Greenberg East Bay Municipal Utility District
Ellen Johnck Bay Planning Coalition
Greg Karras Citizens for a Better Enviromnt
Maria Rea U.S. Environmental Protection Agency. Region 9
Fred Seto California Department of Health Services
Bob Spies Lawrence Livermore Laboratory
Herb Stone Bay Area League of Industrial Associations
Stanley Klemetson Ed Wyatt Building Industry Association of Northern California Association. of Bay Area Governments
Bruce MacFarlane National Marine Fisheries Service
Tom Maurer U.S. Fish and Wildlife Service
David Young U.S. Environmental Protection Agency, ORD
--
Wetlands Subcommittee
Arthur Feinstein Golden Gate Audubon Society
John Malamut Bay Planning Coalition
Kassandra Fletcher Steve McAdam Building Industry Association of Northern California S.F. Bay Conservation and Development Commission
Totton Heffelfmger Sierra Club, San Francisco Chapter
Marc Holmes Save San Francisco Bay Association
Ellen Johnck Bay Planning Coalition
Chris Mobley National Marine Fisheries Service
Liza Riddle California State Coastal Conservancy
Barbara S a h a n Marin Audubon Society
Robb Leidy Arliss Ungar U.S. Environmental Protection Agency, Region 9 League of Women Voters of the Bay Area
Appendix 2 - 244
P h n l n g Subcoinmhe
Loretta Barsamian U.S. Environmental Protection Agency, Region 9
Chuck Batts Bay Area Dischargers Association
Chuck Curry San Mateo County Council of Mayors
Arthur Feinstein Golden Gate Audubon Society
Kassandra Fletcher Building Industry Association of Northern California
James Haussener California Marine Parks and Harbors Association
Ellen Johnck Bay Planning Coalition
Steve McAdarn S.F. Bay Conservation and Development Commission
Jim McKevitt U.S. Fish and Wildlife Service
Sunne Wright McPeak Committee for Water Policy Consensus
Chris Mobley National Marine Fisheries Service
Barry Nelson Save Sun Francisco Bay Association
Michele Pla' City and County of San Francisco
Liza Riddle California State Coastgl Conservancy
Steve Ritchie SF. Bay Regional Water Quality Control Board
Pat Rutten National Marine Fisheries Service
Barbara Salirman Marin Audubon Society
Tom Wakeman U.S. Army Corps of Engineers
Glossary
Acre-Foot (AF) The quantity of water that will cover an acre of land to a depth of one foot (i.e., 43,560 cubic feet or 325,900 gallons).
Acute Effect Any toxic effect that is produced within a short period of time, generally 96 hours or less. Although the effect most frequently considered is mortality, the end result of an acute effect could be any harmful biological effect.
Algae Simple rootless plants that grow in bodies of water at rates in relative proportion to the amounts of nutrients available in the water or, in the case of nitrogen, in the atmosphere overlying the water body.
Ambient Monitoring Monitoring that is done to determine existing environmental conditions, pollutant levels, rates, or species in the environment.
Amphipods Small shrimp-like crustaceans such as sand fleas and related forms. Many live on the bottom (i.e., are benthic) and feed on algae and detritus.
Anadromous Pertaining to fish that spend part of their life cycle in the ocean and return to freshwater streams to spawn.
Beneficial Use Uses of waters of the State that may be protected against quality degradation. They in- clude, but are not limited to, domestic municipal, agricultural, and industrial supply; power generation; recreation; aesthetic enjoyment; navigation; and preservation and enhancement of fish, wildlife, and other aquatic resources or preserves. [Cal. Water Code Sec. 13050(f)].
Benthic Organisms Organisms that live in or on the bottom of a body of water.
Benthos The whole assemblage of plants or animals living on the bottom of a water body; distinguished from plankton.
Bioaccumulation The process by which a pollutant accumulates in the tissues of an organism. For example, certain chemicals in food eaten by a fish tend to accumulate in its liver and other tissues.
Bioassay A test procedure that measures the response of living plants, animals, or tissues to potential pollutants. For example, water fleas have been exposed to the waters of the BayPelta estuary, and their responses have been used to determine if the water is harmful to life.
245
Bioavailability The extent to which a pollutant is available for uptake and accumulation by living organisms.
Biochemical Oxygen Demand (BOD) The quantity of oxygen-demanding materials present in a sample as measured by a specific test. A major objective of conventional wastewater treatment is to reduce the biochemical oxygen demand so that the oxygen content of the water body will not be significantly reduced. Although BOD is not a specific compound, it is defined as a conventional pollutant under the federal Clean Water Act.
Biomagnification The process by which concentrations of pollutants increase (magnify) as they pass up the food web such that each animal in the food web has higher tissue concentrations than did its food. For example, concentrations of certain pollutants can increase as they are passed from plankton to salmon to seals.
Biota The animals, plants, and microbes that live in a particular location or region.
Bivalve An aquatic invertebrate animal of the class Bivalvia. Bivalves, such as clams and oysters, have two shells (valves), and most are filter feeders.
Bloom A proliferation of algae and/or higher aquatic plants in a body of water.
Brackish Water Water containing dissolved minerals in amounts that exceed normally acceptable stan- dards for municipal, domestic, and irrigation uses. Brackish water is considerably less saline than sea water.
Carcinogenic Causing cancer.
Chronic Effect Any toxic effect on an organism that results after exposure of long duration (often 1110th of the life span or more). The end result of a chronic effect can be death, although the usual effects are sublethal (e.g., inhibited reproduction or growth). These sublethal effects may be reflected by changes in the productivity and population structure of the community.
Combined Sewer Overflow (CSO) A pipe that discharges untreated wastewater during storms from a sewer system that carries both sanitary wastewater and stormwater. The overflow occurs because the system does not have the capacity to transport, store, or treat the increased flow caused by stormwater runoff.
Conventional Pollutant Conventional pollutants as specified under the federal Clean Water Act are total sus- pended solids, fecal coliform bacteria, biochemical oxygen demand, pH, and oil and grease. Today a large number of nonconventional and toxic pollutants are of concern in addition to the conventional pollutants.
Copepod A type of herbivorous microscopic crustacean (subclass Copepoda). Copepods are very important in the food chain because they are eaten by many fish or by other organisms that are eventually eaten by fish.
Dichloro diphenyl trichloroethane (DDT) A chlorinated hydrocarbon insecticide whose accumulation and persistence in aquatic and terrestrial ecosystems led to its ban in the United States in 1971 for virtually all but emergency uses. DDT metabolites include DDE and DDD.
Delta The delta of the Sacramento and San Joaquin rivers as defined in the California Water Code, Section 12220.
Delta Inflow Freshwater flows entering the Sacramento-San Joaquin Delta in the Sacramento, Cosumnes, Mokelumne and San Joaquin rivers; the Yolo Bypass; and various small streams draining the lands east of the Delta.
Delta Outflow Freshwater flows from the Delta into San Francisco Bay. This flow is calculated as total Delta inflow plus precipitation, minus in-Delta uses and exports.
Deposit Feeder Organisms that feed on organic material on and in bottom sediments. Because they ingest sediments directly to extract the organic component, these organisms may concentrate toxic contaminants.
Depuration The holding of clams, mussels, or oysters (for commercial or bioassay purposes) in clean water until pollutants are removed from the gut.
Detritus Dead organic material comprising mostly phytoplankton, large aquatic plants, and litter from terrestrial vegetation. This material provides substantial amounts of organic carbon to the estuary and may be an important source of energy for the food web in some parts of the estuarine ecosystem.
Disinfection Byproducts Pollutants formed when organic materials in a drinking water source react with the disinfectant, such as chlorine or ozone. Trihalomethanes (THMs) are a major group of disinfection byproducts.
Dissolved Oxygen Oxygen that is present (dissolved) in water and therefore available for fish and other aquatic animals to use. If the amount of dissolved oxygen in the water is too low, aquatic animals may die. Wastewater and naturally occurring organic matter contain oxygen-demanding substances that consume dissolved oxygen.
Domestic Wastewater (Sewage) Human-generated wastewater that flows from homes, businesses, and industries.
Drainage Basin The area of land from which water drains into a river; as, for example, the Sacramento River Basin, in which all land area drains into the Sacramento River. Also called "catchment area," "watershed," or "river basin."
Ecology The study of the interrelationships of living organisms to one another and to their surroundings.
Ecosystem A community of living organisms interacting with one another and with their physical environment, such as a rain forest, pond, or estuary. Damage to any part of a complex system may affect the whole. A system as complex as the Baypelta estuary can also be thought of as the sum of many interconnected ecosystems such as the rivers, wetlands, and bays. Ecosystem is thus a concept applied to communities of different scale, signifying the interrelationships that must be considered.
Effluent The liquid that flows out of a facility or household into a water body or sewer system. For example, the treated liquid discharged by a wastewater treatment plant is the plant's effluent.
Entrainment Direct entrainment occurs when fish are pulled along with water into a diversion struc- ture because of strong currents created by pumps. Indirect entrainment is caused by the transport of eggs or larve into less desirable areas because of induced flows in channels surrounding diversion structures.
Entrapment Zone An area in an estuary where seaward surface flows and landward bottom currents cause suspended materials (including certain small plants and animals) to accumulate. Par- ticles that sink from the surface flows into the bottom currents are carried upstream and toward the surface. Because the entrapment zone concentrates phytoplankton and zooplankton, it is an important area for some estuarine fish species (see Null Zone).
Environment The sum of all external influences and conditions affecting the life and development of an organism or ecological community.
Escapement The number of adult salmon escaping harvest and returning to the spawning grounds.
Estuary A partially enclosed, coastal water body where ocean water is diluted by out-flowing fresh water.
Estuary Basin The land and waters within the boundaries of the immediate San Francisco Bay water- shed, Suisun Marsh, and the Sacramento-San Joaquin Delta.
Eutrophication A condition in an aquatic ecosystem where high nutrient concentrations stimulate blooms of blue-green algae. Algal decomposition may generate odors and lower dissolved oxygen concentrations. Although eutrophication is a natural process in the aging of lakes, it is accelerated by point-and nonpoint pollutant loads.
Evapotranspiration The quantity of water transpired (given off) and evaporated from plant tissue and surrounding soil surfaces.
Filter Feeder An organism that feeds on microscopic food by filtering very large volumes of water. Because of the amount of water filtered, these organisms may tend to concentrate toxins. Filter feeders that live on bottom sediments (e.g., clams and oysters) are particularly susceptible to contamination.
Gravitational Circulation Net internal motions caused by horizontal density gradients. The denser fluid flows along the bottom and lighter fluid along the surface in an attempt to restore a stable vertical stratification. In the case of a longitudinal salinity gradient, this produces a net landward bottom current and compensating seaward current of fresher water at the surface.
Ground Water Underground water supplies stored in aquifers. Ground water is supplied by rain which soaks into the ground and flows downward until it collects at a point where the ground is not permeable. Ground water then usually flows laterally toward a river, lake, or the ocean. Wells tap ground water for consumptive uses.
Habitat The sum of environmental conditions in a specific place that is occupied by an organ- ism, population, or community.
Historic Flows The actual flows recorded during a specific period of time in the past.
Hydrocarbon An organic compound composed of carbon and hydrogen; for example, petroleum compounds.
Hydrodynamics The motion and action of water and other liquids, i.e., the dynamics of liquids, and the study thereof.
Hydrology The science of water in nature: its properties, distribution, and behavior.
Intertidal Area The area between high and low tide levels. The alternate wetting and drying of this area makes it a transition between land and water and creates special environmental conditions.
Lacustrine A wetland classification that includes permanently flooded lakes and reservoirs, inter- mittant lakes, and tidal lakes with ocean-derived salinities below 5 ppt.
Land Use The way land is developed and used in terms of the kinds of activities allowed (agriculture, residences, industries, etc.) and the size of buildings and structures permitted. Certain kinds of pollution problems are often associated with particular land-use practices, such as sedi- mentation from construction activities, oil and grease from streets and highways, and pesticides from agricultural lands and urban parks.
Loading The total amount of material entering a system from all sources.
Marsh A wetland where the dominant vegetation is non-woody plants such as grasses and sedges, as opposed to a swamp where the dominant vegetation is woody plants like trees.
Natural Flows The embayment and channel flows which existed at the time of the first Spanish exploration of California, i.e., before the Gold Rush. Natural flows were not measured.
Nonpoint Source Pollution Pollution that enters water from dispersed and uncontrolled sources (such as surface runoff) rather than through pipes. Nonpoint sources (e.g., forest practices, agricultural practices, on-site sewage disposal, and recreational boats) may contribute pathogens, suspended solids, and toxicants. While individual sources may seem insignificant, the cumulative effects of nonpoint source pollution can be significant.
Null Zone The region in a partially- or well-mixed estuary where the residual bottom currents are effectively zero. Landward of this point there is a net seaward residual velocity along the bottom caused by river inflow; seaward of the null zone, gravitational circulation produces a net landward transport of denser more saline water along the bottom. The null zone is the theoretical upstream boundary of the entrapment zone.
Nutrients Essential chemicals needed by plants or animals for growth. If other physical and chemical conditions are optimal, excessive amounts of nutrients can lead to degradation of water quality by promoting excessive growth, accumulation, and subsequent decay of plants, especially algae. Some nutrients can be toxic to animals at high concentrations
Palustrine A wetland classification that includes all nontidal wetlands dominated by trees, shrubs, peristent emergents, emergent mosses or lichen, and all such wetlands that occur in tidal areas where salinities due to ocean-derived salts are less than 5 ppt.
Pesticide A general term used to describe chemical substances that are used to destroy or control pest organisms. Pesticides include herbicides, insecticides, algicides, fungicides, and others. Many of these substances are manufactured and do not occur naturally in the environment. Others, such as pyrethrum, are natural toxins which are extracted from plants and animals.
Photosynthesis The process by which plants use light energy to make simple carbohydrates from carbon dioxide and water.
Phytoplankton Minute plants, usually algae, that live suspended in bodies of water and that drift about because they cannot move by themselves or because they are too small or too weak to swim effectively against a current.
Plankton Small plants (phytoplankton) and animals (zooplankton) that are suspended in the water and either drift with the currents or swim weakly.
Point Source Any discernible, confined, and discrete conveyance, including but not limited to any pipe, ditch, channel, tunnel, conduit, well, discrete fissure, container, rolling stock, concentrated animal feeding operation, or vessel or other floating craft, from which pollutants are or may be discharged.
' Pollutant A substance that adversely alters the physical, chemical, or biological properties of the environment. The term includes pathogens, toxic metals, carcinogens, oxygen-demand- ing materials, and al l other harmful substances. With reference to nonpoint sources, the term is sometimes used to apply to materials released in low concentrations from many activities which collectively degrade water quality. As defined in the federal Clean Water Act, pollutant means dredged spoil, solid waste, incinerator residue, sewage, garbage, sewage sludge, munitions, chemical wastes, biological materials, radioactive materials, heat, wrecked or discarded equipment, rock, sand, cellar dirt, and industrial, municipal, and agricultural waste discharged into water.
Polychlorinated Biphenyls (PCBs) A group of manufactured chemicals including about 70 different but closely related compounds made up of carbon, hydrogen, and chlorine. If released to the environment they persist for long periods of time and can biomagnify in food chains because they have no natural usage in the food web. PCBs are suspected of causing cancer in humans. PCBs are an example of an organic toxicant.
Polycyclic or Polynuclear Aromatic Hydrocarbons (PAHs) A class of complex organic compounds, some of which are persistent and cancer- causing. These compounds are formed from the combustion of organic material and are ubiquitous in the environment. PAHs are commonly formed by forest fires and by the combustion of gasoline and other petroleum products. They often reach the environ- ment through atmospheric fallout and highway runoff.
Pretreatment The treatment of industrial wastewater to remove contaminants prior to discharge into municipal sewage systems.
Primary Production The production of plant matter (plant tissues) from carbon dioxide and water through photosynthesis. By comparison, secondary production is the production of animal tissue. Different plant communities are often compared by measuring their rates of primary production.
Primary Treatment A wastewater treatment method that uses settling, skimming, and chlorination to remove solids, floating materials, and pathogens from wastewater. Primary treatment typically removes about 35 percent of BOD and less than half of the metals and toxic organic substances.
Salinity The salt content of water, usually expressed as ppt (grarnsbter), or ppm (milligratnsbter).
Salinity Intrusion The movement of salt water into a body of fresh water. It can occur in either surface water or ground water bodies.
Salvage Those fish diverted away from or reinoved from screens at intakes to diversion struc- tures and subsequently returned to a water body.
Secondary Treatment A wastewater treatment method that usually involves the addition of biological treat- ment to the settling, skimming, and disinfection provided by primary treatment. Sec- ondary treatment may remove up to 90 percent of BOD and significantly more metals and toxic organic material than primary treatment.
Sediment Material suspended in or settling to the bottom of a liquid, such as the sand and mud that make up much of the bottom of San Francisco Bay.
Semidiurnal Tide A tidal variation consisting of two high and two low tides per lunar day (24.84 hrs.). In San Francisco Bay, the cycle typically consists of a high high followed by a low low, a low high, a high low and back to a high high tide.
Shellfish An aquatic animal, such as a mollusk (clams and snails) or crustacean (crabs and shrimp), having a shell or shell-like exoskeleton.
Silviculture Practices associated with forest development.
Smolt An anadromous fish that is physiologically ready to undergo the transition from fresh to salt water; age varies depending on species and environmental conditions.
Source Control A practice, method, or technology that is used to reduce pollution from a source; for example, best management practices or end-of-pipe treatment.
Spawning The deposit of eggs (or roe) by fish and other aquatic life.
Species Diversity The number of species within a community of organisms. Areas of high diversity are characterized by a great variety of species. A biological community with high diversity is better capable of withstanding environmental disturbances. Pollution tends to reduce biological diversity.
Stormwater Water that is generated by rainfall and is often routed into drainage systems in order to prevent flooding.
Striped Bass Index (SBI) An index of the number of young bass which have survived through their first summer. Young bass are sampled with nets which are most efficient for fish about 1.5 inches in length. Sampling methods are consistent (with respect to location, frequency, technique, etc.) so that the number of young striped bass caught may be compared with the catch at various locations year to year. The number of young bass caught by the standard sampling methods allows statistical treatment of data to estimate the abundance of young striped bass and to correlate changes in the number caught with changes in environmental factors.
Subtidal Below the ebb and flow of the tide. Used to refer to the marine environment below mean lower low tide.
Suspended Solids Organic or inorganic particles that are suspended in and carried by the water. The term includes sand, mud, and clay particles as well as solids in wastewater.
Teratogenic Causing b i defects.
Total Suspended Solids (TSS) Particles of all sizes that are suspended in a measured volume of water. TSS reduce light penetration in the water column, can clog the gills of fish and invertebrates, and are often associated with toxic pollutants because organic materials and metals tend to bind to particles.
Toxic Poisonous, carcinogenic, or otherwise directly hannful to life.
Transpiration The process in which plant tissues give off water vapor to the atmosphere as an essential physiological process.
Treatment Chemical, biological, or mechanical procedures applied to an industrial or municipal discharge or to other sources to remove, reduce, or neutralize pollutants.
Turbidity A measure of the amount of material suspended in the water. Increasing the turbidity of the water decreases the amount of light that penetrates the water column. Sustained, high levels of turbidity are harmful to aquatic life.
Unimpaired Flow The embayment and channel flows which would exist in the absence of upstream impoundments and diversions of rainfall or snowmelt runoff, but in the presence of existing channel configurations, both upstream and in the Delta.
Water Column The water in a lake, estuary, or ocean which extends from the bottom sediments to the water surface. The water column contains dissolved and particulate matter and is the habitat for plankton, fish, and marine mammals.
Water Quality A term used to describe the chemical, physical, and biological characteristics of water, usually with regard to its suitability for a particular purpose.
Water Year A continuous 12-month period for which hydrologic records are compiled and summa- rized. In California, the water year begins October 1.
Watershed The geographic region within which water drains into a particular river, stream, or body of water. A watershed includes hills, bottom land, and the body of water into which the land drains. Watershed boundaries are defined by the ridges of separating watersheds. The BayPelta estuary's watersheds include those of the estuary basin and the Central Valley.
Wetlands Habitats where the influence of surface- or groundwater has resulted in development of plant or animal communities adapted to aquatic or intermittently wet conditions. Wetlands include tidal flats, shallow subtidal areas, swamps, marshes, wet meadows, bogs, and similar areas.
Zooplankton Free-floating aquatic animals found in most water bodies. Zooplankton range in size from microscopic protozoans to large jellyfish. In the estuary, they are an important food source for many species of fish and other organisms.

References
255
ABAG, 1989a. Projections 90. Forecasts for the San Francisco Bay area to the year 2005. Association of Bay Area Governments. Oakland, Calif. 293 pp.
ABAG, 1989b. Interim plan: San Francisco Bay area regional hazardous waste manage- ment plan. Association of Bay Area Governments. Oakland, Calif.
AHI, 199 1. Estuarine data index. Aquatic Habitat Institute. Richmond, Calif.
Alliance for Chesapeake Bay, 1992. Bay Journal. Vol2, No 2. Seven Valleys, Pem. 12 pp.
Anderson, S.L., E. Hoffman, D. Steward and J. Harte, 1990. Ambient toxicity character- ization of San Francisco Bay and adjacent wetland ecosystems. Prepared for State Water Resources Control Board. Lawrence Berkeley Laboratory, University of California. Berkeley, Calif. 85 pp.
Arthur, J.F. and M.D. Ball, 1979. Planktonic chlorophyll dynamics in the northern San Francisco Bay and Delta. In: T.J. Conomos (ed). San Francisco Bay: The Urbanized Estuary. Pages 265-285. Pacific Division, American Association for the Advance- ment of Science. San Francisco, Calif.
Arthur, J.F. and M.D. Ball, 1980. The significance of the entrapment zone location to the phytoplankton standing crop in the San Francisco Bay-Delta Estuary. U.S. Depart- ment of the Interior, Bureau of Reclamation. Sacramento, Calif. 89 pp.
Atwater, B.F., 1979. Ancient processes at the site of southern San Francisco Bay: movement of the crust and changes in sea level. In: T.J. Conomos (ed). San Fran- cisco Bay: The Urbanized Estuary. Pages 31-45. Pacific Division, American Association for the Advancement of Science. San Francisco, Calif.
Atwater, B.F., 1982. Geologic maps of historic margins of the Sacramento-San Joaquin Delta. U.S. Geological Survey, Misc. Field Studies, Map MF-1401.
Atwater, B.F., S.G. Conard, J.N. Dowden, C.W. Hedel, R.L. MacDonald and W. Savage, 1979. History, landforms, and vegetation of the estuary's tidal marshes. In: T.J. Conomos (ed). San Francisco Bay: The Urbanized Estuary. Pages 347-385. Pacific Division, American Association for the Advancement of Science. San Francisco, Calif.
Ball, M.D., 1987. Phytoplankton dynamics and planktonic chlorophyll trends in the San Francisco BayPelta Estuary. Exhibit 103, California State Water Resources Control Board, 1987 Water Quality~Water Rights Proceeding on the San Francisco Bay/ Sacramento-San Joaquin Delta, California. U.S. Bureau of Reclamation. Sacra- mento, Calif.
BCDC, 1986. Commercial fishing. Staff report. San Francisco Bay Conservation and Development Commission. San Francisco, Calif. 58 pp.
BCDC, 1987. Water quality in San Francisco Bay. Staff report. San Francisco Bay Conservation and Development Commission. San Francisco, Calif.
BCDC, 1988. Sea level rise: predictions and implications for San Francisco Bay. San Francisco Bay Conservation and Development Commission. Revised October. 100 pp.
BCDC, 1989. Assessment of San Francisco Bay highway and bridge projects. Staff report. San Francisco Bay Conservation and Development Commission. San Francisco, Calif.
Bellrose, F.C., 1980. Ducks, Geese and Swans of North America, 3rd. ed. Stackpole Books. Harrisburg, Pem. 540 pp.
BISF, 1985. Selenium and agricultural drainage: implications for San Francisco Bay and the California environment. Proceedings of the Second Selenium Symposium, March 23, 1985, Berkeley, Calif. Bay Institute of San Francisco. Tiburon, Calif. 178 pp.
Blanchfield, J.S., R. Twiss, S. McCreary and J. Sayer, 1991. The effects of land use change and intensification on the San Francisco Estuary. Draft report. June. Prepared by Bay Conservation and Development Commission for the San Francisco Estuary Project, U.S. Environmental Protection Agency. San Francisco, Calif.
Brown and Caldwell Consultants, 1990. Sanitary survey of the State Water Project, Final Report, October.
Brown, C.L., G. Young, R.S. Nishioka and H. Bern, 1987. Preliminary report on the physiological status of striped bass in the Carquinez Strait die-off. Fisheries Research 6: 5-16. Elsevier Science Publishers B.V. Amsterdam, Netherlands.
CACSST, 1988. Restoring the balance. Annual report. California Advisory Committee on Salmon and Steelhead Trout. Sausalito, Calif. 84 pp.
California Energy Commission, 1989. The impacts of global wanning on California. Interim report. Sacramento, Calif. 96 pp.
Carlton, J.T., -1979. Introduced invertebrates of San Francisco Bay. In: T.J. Conomos (ed). San Francisco Bay: The Urbanized Estuary. Pages 427-444. Pacific Division, American Association for the Advancement of Science. San Francisco, Calif.
Carlton, J.T., J.K. Thompson, L.E. Scheme1 and F.H. Nichols, 1990. Remarkable invasion of San Francisco Bay (California, USA) by the Asian clam Potamocorbula amurensis. I. Introduction and dispersal. Mar. Ecol. Prog. Ser. 66: 81-94.
Carney, S.M., M.R. Sorensen and E.M. Martin, 1983. Distribution of waterfowl species harvested in states and counties during 1971-80 hunting seasons. U.S. Fish and Wildl. Sew. Special Report - Wildl. No. 254. Washington, D.C.
Carrasco, K.R., K.L. Tilbury and M.S. Meyers, 1990. Assessment of the piscine micronuclei test as an in situ biological indicator of chemical contaminant effects. Can. J. Fish. Aquat. Sci. 47: 2123-2136.
CBE, 1987. Toxic hot spots in San Francisco Bay. Citizens for a Better Environment. San Francisco, Calif. 183 pp.
CBE, 1989. Toxics reduction works: the Chevron story. Citizens for a Better Environ- ment. San Francisco, Calif. 4 pp.
Chan, E., T.A. Bursztynsky, N. Hantsche and Y.S. Litwin, 1981. The use of wetlands for water pollution control. Association of Bay Area Governments. Berkeley, Calif.
Chapman, P.M. and J.D. Morgan, 1983. Sediment bioassays with oyster larvae. Bull. Env. Contam & Toxicol. 31: 438-444.
Cheng, R.T. and J.W. Gartner, 1984. Tides, tidal and residual currents in San Francisco Bay, California - results of measurements, 1979-1980. Part 1: description of data. United States Geological Survey. Water Resources Investigations Report 84-4339.
Chesapeake Bay Water Quality Monitoring Program, 1989. Second Biennial Report. Maryland Offlce of Env. Programs.
CH2M Hill, 1988. Water quality solid waste assessment test, Mountain View landfill.
Clifton, D.G. and R.J. Gilliom, 1986. Occurrence and transport of selenium and other trace elements in the San Joaquin River. Memorandum to manager of the San Joaquin Valley Drainage Program, 16 December 1986. U.S. Geological Survey. Sacramento, Calif.
Cloem, J.E., 1979. Phytoplankton ecology of the San Francisco Bay system: the status of our current understanding.' In: T.J. Conomos (4 ) . San Francisco Bay: The Urbanized Estuary. Pages 247-264. Pacific Division, American Association for the Advance- ment of Science. San Francisco, Calif.
Cloem, J.E., 1990. Annual variations in river flow and primary production in the South San Francisco Bay Estuary (USA). In: M. Elliott and D. Ducrotoy (eds). Estuaries and coasts: spatial and temporal intercomparisons, in press. Olsen & Olsen, Denmark.
Cloem, J.E., B.E. Cole, R.L.J. Wong and A.E. Alpine, 1985. Temporal dynamics of estua- rine phytoplankton: a case study of San Francisco Bay. Hydrobiologia 129: 153-176.
Cohen, A.N., 1990. An introduction to the ecology of the San Francisco Estuary. Pre- pared for the San Francisco Estuary Project, U.S. Environmental Protection Agency. San Francisco, Calif. 29 pp.
Collin, R.L., 1986. Science and environmental decisions. Draft paper. New York State Depart. Env. Conservation. Albany, New York. 13 pp.
Collins, J.W., 1892. Report on the fisheries of the Pacific Coast of the United States. Report of the U.S. Cornm. of Fish and Fisheries for 1888, part 11. The fisheries of California, pp. 21- 175.
Condit, R.J., 1987. Fiscal year 1985-1986 Municipal Division activities. California Regional Water Quality Control Board, San Francisco Bay Region. Appendix A in BADA, 1987, Pollutants in the Bay-Delta Estuary. Report prepared for the California State Water Resources Control Board, 1987 Water QualityIWater Rights Proceeding on the San Francisco BayISacramento-San Joaquin Delta, California. Bay Area Dischargers. Oakland, Calif.
Conomos, T.J., 1979. Properties and circulation of San Francisco Bay waters. In: T.J. Conomos (4). San Francisco Bay: The Urbanized Estuary. Pages 47-84. Pacific Division, American Association for the Advancement of Science. San Francisco, Calif.
Conomos, T.J., D.H. Peterson, P.R. Carlson and D.S. McCulloch, 1970. Movement of seabed drifters in the San Francisco Bay estuary and the adjacent Pacific Ocean: a preliminary report. U.S. Geological Survey Circular 637B. 8 pp.
Conomos, T.J. and D.H. Peterson, 1977. Suspended particle transport in San Francisco Bay: an overview. In: M. Wiley (ed.). Estuarine Processes, Vol. 2: Circulation, Sediments, and Transfer of Material in the Estuary. Pages 82-97. Academic Press. New York, New York.
Conomos, T.J., R.E. Smith, D.H. Peterson, S.W. Hager and L.E. Schemel, 1979. Pro- cesses affecting seasonal distributions of water properties in the San Francisco Bay estuarine system. In: T.J. Conomos (ed). San Francisco Bay: The Urbanized Estuary. Pages 115-142. Pacific Division of American Association for the Advancement of Science. San ~rancisco, Calif.
Comacchia, J.W., D.B. Cohen, G.W. Bowes, R.J. Schnagl and B.L. Montoya, 1984. Rice - herbicides Molinate (Ordram) and Thiobencarb (Bolero): a water quality assessment. Special Projects Report No. 84-4sp. California State Water Resources Control Board. Sacramento, Calif.
Cowardin, L.M., V. Carter, F.C. Golet and E.T. LaRoe, 1979. Classification of wet- lands and deepwater habitats of the United States. FWSIOBS-79/31. U.S. Fish and Wildlife Service, Office of Biological Services. Washington, D.C. 103 pp.
Cramer, S.P., 1990. Contribution of Sacramento basin hatcheries to ocean catch and river escapement of fall Chinook salmon. Prepared for California Department of Water Resources. December. Corvallis, Oregon. 113 pp.
CSLC, 1991. Delta-Estuary, California's inland coast, a public trust report. California State Lands Commission. May. Sacramento, Calif. 208 pp.
Cullitan, T.J., M.A. Warren, T.G. Goodspeed, D.E. Remer, C.M. Blackwell and J.J. McDonough, In, 1990. 50 years of population change along the nation's coasts. Coastal Trends Series. National Oceanographic and Atmospheric Administration. Rockville, MD. 41 pp.
CVAWU, 1987. The economics of Central Valley agriculture. Ranking of California counties, according to value of agricultural products sold, among 100 leading counties of the United States, 1929-1982. Exhibit 41, California State Water Resources Control Board, 1987 Water QualityIWater Rights Proceeding on the San Francisco BayISacramento-San Joaquin Delta, California. Central Valley Associa- tion of Water Users. Sacramento, Calif.
CVRWQCB, 1987. Sacramento River agricultural drain ambient toxicity test results for the months of November and December, 1986. February 6 memorandum from C. Foe to J. Bruns. California Regional Water Quality Control board, Central Valley Region. Sacramento, Calif.
CVRWQCB, 1988. Water quality in the lower San Joaquin River: Lander Avenue to Vernalis, May 1985 to March 1988. California Regional Water Quality Control Board, Central Valley Region. Sacramento, Calif.
CVRWQCB, 1990. Detection of pesticides in the San Joaquin watershed during February 1990. June 25 memorandum from C. Foe to D. Westcott and J. Bruns. California Regional Water Quality Control Board, Central Valley Region. Sacra- mento, Calif.
Davis, C.O., 1982. The San Francisco Bay ecosystem, a retrospective overview. In: W.J. Kockelman, T.J. Conomos and A.E. Leviton (eds). San Francisco Bay: Use and Protection. Pages 17-37. Pacific Division, American Association for the Advance- ment of Science. San Francisco, Calif.
Davis, J.A., A.J. Gunther, B.J. Richardson, J.M. O'Connor, R.B. Spies, E. Wyatt, E. Larson and E.C. Meiorin, 1991. Status and trends report on pollutants in the San Francisco Estuary. March. Prepared by the Aquatic Habitat Institute for the San Francisco Estuary Project, U.S. Environmental Protection Agency. San Francisco, Calif. 241 pp.
Dawson, W.L., 1923. The Birds of California, South Moulton Co., 3 vol. San Diego, Calif. 2121 pp.
Dedrick, K.G., 1989. San Francisco Bay tidal marshland acreages: recent and historic values. In: Magoon, O.T. et al. (eds). Proceedings of the sixth symposium on Coastal and Ocean Management. Omni Hotel. Charleston, South Carolina, July 11- 14,1989. Volume 1. 383 pp.
Denton, R.A. and J.R. Hunt, 1986. Currents in San Francisco Bay - final report. California State Water Resources Control Board Publication No. 86-7wr, March. Sacramento, Calif.
Detrich, P.J., 1986. The status and distribution of the bald eagle in California. M.S. Thesis, Calif. State Univ., Chico, Calif. 101 pp.
Dettman, D.H. and D.W. Kelley, 1987. The roles of Feather and Nimbus salmon and steel- head hatcheries and natural reproduction in supporting fall run chinook salmon popula- tions in the Sacramento River basin. D.W. Kelley & Associates. Newcastle, Calif.
DFG, 1987a. Summary of Delta outflow effects on San Francisco Bay fish and inverte- brates. Exhibit 59, California State Water Resources Control Board, 1987 Water Qualitymater Rights Proceeding on the San Francisco BayISacramento-San Joaquin Delta, California. California Department of Fish and Game. 37 pp.
0 DFG, 1987b. Factors affecting striped bass abundance in the Sacramento-San Joaquin
river system. Exhibit 25, California State Water Resources Control Board, 1987 Water QualitylWater Rights Proceeding on the San Francisco BayISacramento-San Joaquin Delta, Califomia. California Department of Fish and Game.
DFG, 1987c. Requirements of American Shad (Alosa Sapidissima). Exhibit 23, California State Water Resources Control Board, 1987 Water QualitylWater Rights Proceeding on the San Francisco BayISacramento-San Joaquin Delta, California. California Depart- ment of Fish and Game.
DFG, 1987d. Estimates of fish entrainment losses associated with the State Water Project and Federal Central Valley Project Facilities in the south Delta. Exhibit 17, California State Water Resources Control Board, 1987 Water QualityfWater Rights Proceeding on the San Francisco BayISacramento-San Joaquin Delta, California. California Department of Fish and Game. 3 1 pp.
DFG, 1989. Striped bass restoration and management plan for the Sacramento-San Joaquin Estuary. Phase I. California Department of Fish and Game. Sacramento, Calif. 39 pp.
DFG, 1990a. California Marine Fish Landings for 1977-1986. California Department of Fish and Game. Fish Bulletin 173. Sacramento, Calif. 52 pp.
DFG, 1990b. Report to the Fish and Game Commission: a status review of the Delta Smelt (Hypornesus transpacificus) in California. August. Candidate Species Status Report 90-2. California Department of Fish and Game. Sacramento, Calif. 98 pp.
DFG, 1991. Selenium verification study 1988-1990. Report 91-2-WQ. May. Prepared by the California Department of Fish and Game for the State Water Resources Control Board.
DPW, 193 1. Variation and control of salinity in the Sacramento-San Joaquin Delta and upper San Francisco Bay. Bulletin No. 27. California Department of Public Works, Sacramento, Calif.
Dreisback, R.H., 1969. Hardbook of the San Francisco Region. Environmental Studies. Palo Alto, Calif. 564 pp.
DWR, 1983. The California water plan, projected use and available water supplies to 2010. Bulletin 160-83. California Department of Water Resources. Sacramento, Calif. 268 pp.
DWR, 1986a. Agreement between the Department of Water Resources and Department of Fish and Game to offset direct fish losses in relation to the Harvey 0. Banks Delta Pumping Plant. December. Sacramento, Calif. 12 pp.
DWR, 1986b. Interagency delta health aspects monitoring program: project report. California Department of Water Resources. Sacramento, Calif.
DWR, 1987. Delta gross value, crop and livestock, comparison with State, 1985. Exhibit 340, California State Water Resources Control Board, 1987 Water Qualitymater Rights Proceeding on the San Francisco BayISacramento-San Joaquin Delta, Califor- nia. California Department of Water Resources. Sacramento, Calif.

DWR, 1987a. SacramentoISan Joaquin Delta historic flow tables. Exhibit 27, Califor- nia State Water Resources Control Board, 1987 Water QualitytWater Rights Proceeding on the San Francisco BayISacramento-San Joaquin Delta, California. California Department of Water Resources. Sacramento, Calif.
DWR, 1987b. California Central Valley unimpaired flow data. Exhibit 26, California State Water Resources Control Board, 1987 Water Qualitywater Rights Proceeding on the San Francisco BayISacramento-San Joaquin Delta, California. California Department of Water Resources. Sacramento. 38 pp.
DWR, 1987c. California water: looking to the future. Bulletin 160-87. California Department of Water Resources. Sacramento, Calif. 122 pp.
DWR, 1987d. Reservoir storage 1850-1990. Exhibit 9, California State Water Re- sources Control Board, 1987 Water Qualitywater Rights Proceeding on the San Francisco BayISacramento-San Joaquin Delta, California. California Department of Water Resources. Sacramento.
DWR, 1987e. Levels of development. 1920=Exhibit 28e; 1940=Exhibit 29e; 1990=Ex- hibit 30d. California State Water Resources Control Board. 1987 Water Quality1 Water Rights Proceeding on the San Francisco BayISacramento-San Joaquin Delta, California. California Department of Water Resources. Sacramento, Calif.
DWR, 1987f. Portion of net water use taken from SacramentoISan Joaquin Basin. Exhibit 20. California State Water Resources Control Board, 1987 Water Quality/ Water Rights Proceeding on the San Francisco BayISacramento-San Joaquin Delta, California. California Department of Water Resources. Sacramento, Calif.
DWR, 1988a. Management of the California State Water Project. Bulletin 132-88, Appendix F. California Department of Water Resources. Sacramento, Calif.
DWR, 1988b. West Delta Water Management Program. California Department of Water Resources, Central District. Sacramento, Calif. 35 pp.
DWR, 1989a. The Delta as a source of drinking water, summary of monitoring results -1983 to 1987. Interagency Delta Health Aspects Monitoring Program. January. California Department of Water Resources. Sacramento, Calif,
DWR, 1989b. The Delta as a source of drinking water, summary of monitoring results -1983 to 1987. Interagency Delta Health Aspects Monitoring Program. August. California Department of Water Resources. Sacramento, Calif.
DWR, 1989c. Annual report - Interagency Ecological Study Program for the Sacra- mento-San Joaquin Estuary. Department of Water Resources. Sacramento, Calif.
DWR, 1990a. DAYFLOW data, 1955-1990. California Department of Water Re- sources. Sacramento, Calif.
DWR, 1990b. North Delta Program. Draft Environmental Impact Report/Environmen- tal Impact Statement. California Department of Water Resources. Sacramento, Calif. 619 pp.
DWR, 1990~. South Delta Water Management Program. Draft Environmental Impact Report/Environmental Impact Statement. California Department of Water Re- sources. Sacramento, Calif. 494 pp.
DWR, 1990d. Framework of process to address fish and wildlife impacts of the State Water Project and Central Valley Project in the Sacramento-San Joaquin Estuary. Agreement between David Kennedy, DWR, Peter Bontadelli, DFG, and Lawrence Hancock, USBR. SeptemberIOctober. Sacramento, Calif. 6 pp.
EBMUD, 1986. Wet weather facilities: Draft Environmental Impact Report. East Bay Municipal Utility District. Oakland, Calif.
261
Fancher, L.E. and D.J. Alcorn, 1982. Harbor seal census in south San Francisco Bay (1972-1977 and 1979-1980). Calif. Fish and Game 68(2): 1 18-124.
Filice, F.P., 1954. An ecological study of the Castro Creek area of San Pablo Bay. Wasrnann J. Biolo. 12(1): 1-24.
Filice, F.P., 1958. Invertebrates from the estuarine portion of San Francisco Bay and some of the factors influencing their distribution. Wasmann J. Biol. 16: 159-21 1.
Filice, F.P., 1959. The effects of wastes on the distribution of bottom invertebrates in San Francisco Bay estuary. Wasmann J. Biol. 17: 1-17.
Flegal, A.R., G.A. Gill, G.J. Smith, S. Sanudo-Wilhemy, G. Scelfo and L.D. Anderson, 1991. Trace Element Cycles in the San Francisco Bay Estuary. University of Calif., Santa Cruz. Final Report to the State Water Resources Control Board. Sacramento, Calif. 58 pp.
Fox, J. P., T. R Mongan and W. J. Miller, 1990. Trends in freshwater inflow to San Fran- cisco Bay from the Sacramento-San Joaquin Delta. Water Res. Bull. 26(2): 101-1 16.
Fox, J. P., T. R. Mongan and W. J. Miller, 1991. Long-term annual and seasonal trends in surface salinity of San Francisco Bay. Journal of Hydrology 122 (1991) 93-1 17.
Gaines, D., 1974. A new look at the nesting riparian avifauna of the Sacramento Valley. California West. Birds 5(3): 61-79.
Galvin D.V. et al., 1984. Toxicant pretreatment planning study summary report. Municipality of Metropolitan Seattle. Seattle, Wash. 201 pp.
Gilbert, G.K., 1917. Hydraulic mining debris in the Sierra Nevada. U.S. Geological Survey Professsional Paper 105. 148 pp.
Gilbert, J.B. & Assoc., 1978. Report on effects of Delta outflow on the San Francisco Bay system. Prepared for the Association of Bay Area Governments. Berkeley, Calif. 103 pp.
Golden Gate Ports Association, 1985. Information brochure.
Granholm, S.L., 1989. Seasonal wetlands in San Francisco and San Pablo bays. Current status, projected losses, and cumulative losses since 1975. In: National Audubon Society, Napa-Solano Audubon Society, Marin Audubon Society, Santa Clara Audubon Society, Save SF Bay Assoc., Sierra Club Bay Chapter. Endangered Habitat: A Report on the Status of Seasonal Wetlands in San Francisco Bay. 55 pp.
Grinnell, J. and M.W. Wythe, 1927. Directory to the Bird-life of the San Francisco Bay Region. Pac. Coast Avifauna No. 18. Cooper Ornithological Club. Berkeley, Calif. 160 pp.
Grinell, J., J.S. Dixon and J.M. Linsdale, 1937. Fur-bearing Mammals of California: Their Natural History, Systematic Status and Relations to Man. 2 vols. Univ. California Press. Berkeley, Calif. 777 pp.
Gunther, A.J., 1987, Segmentation of the San Francisco Bay-Delta. Aquatic Habitat Institute. Richmond, Calif. 22 pp.
Gunther, A.J., J.A. Davis and D.J.H. Phillips, 1987. An assessment of the loading of toxic contaminants to the San Francisco Bay-Delta. Aquatic Habitat Institute. Richmond, Calif. 330 pp.
Gunther, A.J., J.A. Davis, J.M. O'Connor, D.J.H. Phillips, K.S. Kramer, B.J. Richardson and P. Williams, 1990. Status and trends report on dredging and waterway modifi- cation in the San Francisco Estuary. Prepared by the Aquatic Habitat Institute for the San Francisco Estuary Project, U.S. Environmental Protection Agency. March. San Francisco, Calif. 250 pp.
Hanson, C.H. and C.P Walton, 1990. Effects of dredging on striped bass. In: C.A. Simenstad, (ed). Effects of Dredging on Anadromous Pacific Coast Fishes: Work- shop Proceedings, Seattle, September 8-9, 1988. Pages 38-56. Washington Sea Grant Program, University of Washington. Seattle.
Harvey and Assoc., 1988. Guadalupe River Flood Control Planning Study - existing conditions report. Draft report prepared for the Santa Clara Valley Water District.
Harvey, T.E., K.J. Miller, R.L. Hothem, M.J. Rauzon, G.W. Page and R.A. Keck, 1992. Status and trends report on wildlife of the San Francisco Estuary. Prepared by the U.S. Fish & Wildlife Service for the San Francisco Estuary Project, U.S. Environ- mental Protection Agency. January. San Francisco, Calif. 279 pp & appendices.
Hayes, S.P. and P.T. Phillips, 1986. California state mussel watch: marine water quality monitoring program, 1984-1985. State Water Resources Control Board, Water Quality Monitoring Report No. 86-3WQ.
Hedgpeth, J.W., 1979. The Unsuspected Estuary. In: T.J. Conomos (ed). San Francisco Bay: The Urbanized Estuary. Pages 9-29. Pacific Division, American Association for the Advancement of Science. San Francisco, Calif.
Herbold, B. and P.B. Moyle, 1989. The ecology of the Sacramento-San Joaquin Delta: a community profile. U.S. Fish and Wildlife Service Biol. Rep. 85(7.22). xi + 106 pp.
Herbold, B., P.B. Moyle and A.D. Jassby, 1992. Status and trends report on aquatic resources of the San Francisco Estuary. Prepared by U.C. Davis for the San Francisco Estuary Project, U.S. Environmental Protection Agency. 257 pp. & appendices.
Holland, R., 1988. What about this vernal pool business? Pages 35 1-353. In: Proceed- ings of the National Wetland Symposium, Urban Wetlands, June 1988, Oakland, Calif. Association of Wetland Managers. New York, New York.
Home, A.J., H.B. Fischer and J.C. Roth, 1982. Proposed monitoring master plan for the San Francisco Bay-Delta. Aquatic Habitat Program, Univ. of California. SERL Report No. 84-6. Berkeley, Calif. 180 pp.
IESP, 1990. 1989 Annual Report, Interagency Ecological Studies Program for the Sacramento-San Joaquin Estuary. Interagency Ecological Studies Program. Novem- ber. Sacramento, Calif. 112 pp.
ESP, 1991. June Newsletter. Interagency Ecological Studies Program for the Sacra- mento-San Joaquin Delta. California Department of Water Resources. Sacramento, Calif. 6 pp.
Imberger, J., W.B. Kirkland, Jr. and H.B. Fischer, 1977. The effect of Delta outflow on the density stratification in San Francisco Bay. Hugo B. Fischer, Inc. Association of Bay Area Governments, Report HBF-77/02. Berkeley, Calif. 109 pp.
Jones, M.L., 1961. A quantitative evaluation of the benthic fauna off Pt. Richmond, Calif. University of California Publication. Zool. 67(3): 219-320.
Jones and Stokes, Assoc., Inc., 1977. San Francisco Bay shellfish: an assessment of the potential for commercial and recreational harvesting. Prepared for Association of Bay Area Governments. Berkeley, Calif. 171pp.
Josselyn, M., 1983. The ecology of the San Francisco Bay tidal marshes: a community profile. U.S. Fiih and Wildl. Serv., Div. of Biological Services. Washington, D.C. 102 pp.
Josselyn, M., M. Martindale and J.M. Duffield, 1989. Public access and wetlands: impacts of recreational use. Technical Report #9. Romberg Tiburon Center, Center for Environmental Studies, San Francisco State University. Tiburon, Calif. 56 pp.
Josselyn, M., L. Handley, M. Quarnmen and D. Peters, In press. The distribution of wetland habitats in the San Francisco Bay region. FWSIOBS-89/##. Office of Biological Services, U.S. Fish and Wildlife Service. Washington, D.C.
Kelley, R.L., 1989. Battling the Inland Sea: American Culture, Public Policy and the Sacramento Valley, 1850-1986. Univ. Calif. Press. 395 pp.
Kimrnerer, W., 1991. An evaluation of existing data in the entrapment zone of the San Francisco Bay Estuary. Draft report, September. Biosystems Analysis, Inc. Tiburon, Calif. 76 pp.
Kopec, A.D., S. Obrebski, S.G. Allen and L.E. Fancher, 1991. Toxic pollutant residues and health of San Francisco Bay harbor seals (Phoca vitulina). Ninth Biennial Conference on the Biology of Marine Mammals. December 5-9. Chicago, Ill.
Krebs, C.J., 1972. Ecology -The Experimental Analysis of Distribution and Abun- dance. Harper & Row. New York, New York. 694 pp.
Krone, R.B., 1979. Sedimentation in the San Francisco Bay system. In: T.J. Conomos (ed). San Francisco Bay: The Urbanized Estuary. Pages 31-45. Pacific Division, American Association for the Advancement of Science. San Francisco, Calif.
Leidy, R.A. and P.L. Fiedler, 1985. Human disturbance and patterns of fish species diversity in the San Francisco Bay drainage, California. Biological Conservation 33: 247-267.
Logan, S.H., 1990. Global warming and the Sacramento-San Joaquin Delta. Calif. Agric. 44(3): 16-18.
Long, E.R. and M.F. Buchman, 1989. An evaluation of candidate measures of biologi- cal effects for the national status and trends program. National Oceanographic and Atmospheric Administration Tech. Mem. NOS OMA 45. Seattle, Wash.
Long, E.R. and L.G. Morgan, 1990. The potential for biological effects of sediment- sorbed contaminants tested in the national status and trends program. National Oceanographic and Atmospheric Administration Tech. Mem. NOS OMA 52. Seattle, Wash. 175 pp.
Long, E.R., D. MacDonald, B.B. Matta, K. VanNess, M. Buchman and H. Harris, 1988. Status and trends in concentrations of contaminants and measures of biological stress in San Francisco Bay. National Oceanographic and Atmospheric Administra- tion, Technical Memorandum NOS OMA 41. Seattle, Wash.
Luoma, S.N. and J.E. Cloern, 1982. The impact of waste-water discharge on biological communities in San Francisco Bay. Pages 137-160. In: San Francisco Bay: Use and Protection. (Eds). W.J. Kockelman, T.J. Conomos and A.E. Leviton. Pacific Division, American Association for the Advancement of Science. San Francisco, Calif.
Luoma, S.N. and D.J.H. Phillips, 1988. Distribution, variability, and impacts of trace elements in San Francisco Bay. Mar. Pollut. Bull. 19: 413-425.
Luoma, S.N., D. Cain and C. Johannson, 1985. Temporal fluctuations of silver, copper, and zinc in the bivalve Macoma balthica at five stations in South San Francisco Bay. Hydrobiologia 129: 109-120.
Madrone Assoc., 1980. Sacramento-San Joaquin Delta wildlife habitat protection and restoration plan. Prepared for the U.S. Fish and Wildl. Serv. and California Dept. of Fish and Game.
McCulloch, D.S., Peterson, D.H., Carlson, P.R. and T.J. Conomos, 1970. A preliminary study of the effects of water circulation in the San Francisco Bay Estuary: U.S. Geological Survey Circular 637-A. 27 pp.

McLandress, M.R., 1983. Sex, age, and species differences in disease mortality of Ross' and lesser snow geese in California: implications for avian cholera research. Calif. Fish and Game 69(4): 196-206.
Means, T.H., 1928. Salt water problem, San Francisco Bay and Delta of Sacramento and San Joaquin rivers. Prepared for Association of Industrial Water Users of Contra Costa and Solano counties. 75 pp.
MEC Analytical Systems, Inc., 1990. Results of the Larkspur Landing dredge disposal monitoring program. Report to Golden Gate Bridge District. November. 38 pp.
Meiorin, E.C., 1986. Urban stormwater treatment at Coyote Hills Marsh, Fremont, California. Association of Bay Area Governments. Berkeley.
Meiorin, E.C., M.N. Josselyn, R. Crawford, J. Calloway, K. Miller, T. Richardson and R.A. Leidy, 1991. Status and trends report on wetlands and related habitats in the San Francisco Estuary. Prepared by the Association of Bay Area Governments for the San Francisco Estuary Project, U.S. Environmental Protection Agency. December. San Francisco, Calif. 209 pp.
METC, 1977. Recommendations for the integrated receiving water monitoring program for San Francisco Bay. Draft. Marine-Estuarine Technical Committee and San Francisco Bay and Estuary Advisory Committee. 141 pp & appendix.
Miller, W.J., 1986. The state of San Francisco Bay. Report prepared for the Bay Area Dischargers Association. Oakland, Calif.
Montoya, B.L., F.J. Blatt and G.E. Hanis, 1988. A mass loading assessment of major point and nonpoint sources discharging to surface waters in the Central Valley, California. 1985. Draft Report, Central Valley Regional Water Quality Control Board. Sacramento, Calif.
Moyle, P.B., 1976. Inland Fihes of California Univ. of Calif. Press. Berkeley, Calif. 405 pp.
Moyle, P.B., 1989. Petition to the California Fish and Game Commission to amend the official State list of endangered and threatened species, adding the Delta smelt (Hypomesus transpacificus).
Neumann, D.A., J.M. O'Connor and J.A. Sherk, 1982. Oxygen consumption of white perch (Morone americana), striped bass (M. s&tilis) and spot (Leiostomus mthuncs). Comp. Biochem. Physiol. 69(A): 467-478.
Nichols, F.H., 1973. A review of benthic faunal surveys in San Francisco Bay. U.S. Geological Survey. Circular 677. 20 pp.
Nichols, F.H. and J.E. Thompson, 1985. Persistence of an introduced mudflat commu- nity in south San Francisco Bay, California. Mar. Ecol. Prog. Ser. 24: 83-97.
Nichols, F.H. and M.M. Pamatmat, 1988. The ecology of the soft-bottom benthos of San Francisco Bay: a community profile. U.S. Fish and Wildlife Service Biological Report 85 (7-23). 73 pp.
Nichols, F.H., J.E. Cloern, S.N. Luoma and D.H. Peterson, 1986. Modification of an estuary. Science 231: 567-573.
Nichols, F.H., J.K. Thompson and L.E. Schemel, 1990. Remarkable invasion of San Francisco Bay (California, USA) by the Asian clam Potarnocorbula amurensis. II. Displacement of a former community. Mar. Ecol. Prog. Ser. 66: 95-101.
NOAA, 1985. Marine environmental assessment San Francisco Bay, 1985 annual sum- mary. National Environmental Satellite, Data, and Information Service. National Oceanographic and Atmospheric Administration. Washington, D.C. 122 pp.
NOAA, 1987. National estuarine inventory data atlas. Vol2., Land Use Characteris- tics. Strategic Assessment Branch. National Ocean Service. National Oceano- graphic and Atmospheric Administration. Rockville, MD.
NRC, 1987. Responding to Changes in Sea Level: Engineering Implications. National ~ese&ch Council, National Academy Press. Washington, D.C.
NRC, 1990a. Managing Troubled Waters. National Research Council, National Academy Press. Washington, D.C. 125 pp.
NRC, 1990b. Monitoring Southern California's Coastal Waters. National Research Council, National Academy Press. Washington, D.C.
O'Connor, J.M., 1991. Evaluation of turbidity and turbidity-related effects on the biota of the San Francisco Bay-Delta Estuary. A report submitted to the U.S. Army Corps of Engineers, San Francisco District, San Francisco, California. April. Aquatic Habitat Institute. Richmond, Calif. 84 pp.
O'Connor, J.M., J.A. Davis, R.B. Spies and A.R. Flegal, 1991. Quality assurance in environmental analysis applied to the San Francisco Estuary. Prepared by the Aquatic Habitat Institute for the San Francisco Estuary Project, U.S. Environmental Protection Agency. July. San Francisco, Calif. 57 pp.
Ogden Beeman & Associates, 1990. Long-term management strategy for dredged material in San Francisco Bay region. Benefits related to navigation channel maintenance. Technical Report Series. 63 pp.
OTA, 1986. Serious reduction of hazardous waste for pollution prevention and indus- trial efficiency. Office of Technology Assessment. U.S. Government Printing Office. Washington, D.C. 254 pp.
Pacific Maritime Association, 1990. Tonnage data, port by calendar quarters, 1971- 1990. 27 pp.
Perkins, J.B., S. Potter and L. Stone, 1991. Status and trends report on land use and population. Prepared by the Association of Bay Area Governments for the San Francisco Estuary Project, U.S. Environmental Protection Agency. San Francisco, Calif. 186 pp.
Peterson, D.H., D.R. Cayan, J.F. Festa, EH. Nichols, R.A. Walters, J.V. Slack, S.E. Hager and L.E. Schemel, 1989. Climate variability in an estuary: effects of rivefflow on San Francisco Bay. Geophysical Monograph 55. American Geophysical Union.
PFMC, 199 1. Review of 1990 ocean salmon fisheries. Pacific Fishery Management Council. Portland, Oregon. 104 pp.
Philip Williams and Assoc, 1989. An analysis of historic erosion rates of the salt marshes at the Corte Madera Ecological Reserve. Prepared for Golden Gate Bridge Highway and Transp. Dist. San Francisco, Calif. 25 pp.
Phillips, D.J.H., 1987. Toxic contaminants in the San Francisco Bay-Delta Estuary and their possible biological effects. Aquatic Habitat Institute. Richmond, Calif. 413 pp.
Phillips, D.J.H., 1988. Monitoring of toxic contaminants in the San Francisco Bay- Delta: a critical review emphasizing spatial and temporal trend monitoring. Aquatic Habitat Institute. Richmond, Calif. 220 pp.
Phillips, D.J.H. and R.B. Spies, 1988. Chlorinated hydrocarbons in the San Francisco estuarine system. Mar. Pollut. Bull. 19: 445-453.
Pisani, D.J., 1984. From the Family Farm to Agribusiness. University of California Press. 521 pp.

PSWQA, 1988. State of the Sound 1988 report. Puget Sound Water Quality Authority. Seattle, Wash. 225 pp.
Riley, A.L., 1989. Overcoming federal water policies. The Wildcat-San Pablo creeks case. Environment 31(10). 12 pp.
Riley, A.L., in press. Restore with Nature, a Guide to Urban Stream Restoration - Alternatives to Traditional Engineering Practices. Island Press.
Rubin, D.M. and D.S. McCulloch, 1979. The movement and equilibrium of bedforms in Central San Francisco Bay. In: T.J. Conomos (ed). San Francisco Bay: The Urban- ized Estuary. Pages 97-1 13. Pacific Division, American Association for the Advancement of Science. San Francisco, Calif.
SCCWRP, 1988. Impaired reproduction of white croaker of southern California. In: Southern California Coastal Water Research Project Annual Report, 1987. Pages 48-49.
Segar, D.A., 1988. A preliminary assessment of the environmental impacts of dredged ma- terial dumping at the Alcatraz durnpsite, San Francisco Bay, California. Tiburon Center for Environmental Studies, San Francisco State University. Tiburon, Calif. 60 pp.
SFBRWQCB, 1987. Results of preliminary effluent toxicity screening project. Staff report to Regional Water Quality Control Board, San Francisco Bay Region. April 15, 1987. Oakland, Calif.
SFBRWQCB, 1988. POTW toxic metal loading data compilation. September 6,1988 memorandum. San Francisco Bay Regional Water Quality Control Board. Oakland, Calif.
SFBRWQCB, 1990. Status of the effluent and ambient toxicity characterization program. Staff report to Regional Water Quality Control Board, San Francisco Bay Region. March 20, 1990. Oakland, Calif.
SFCVB, 1990. San Francisco Visitor Statistics. San Francisco Convention and Visitors Bureau. San Francisco, Calif.
Skinner, J.E. 1962. An historical review of the fish and wildlife resources of the San Francisco Bay area. Water Projects Branch Report No. 1. Calif. Dept. of Fish and Game. 226 pp.
Smith, L.W., 1987. A review of circulation and mixing studies of San Francisco Bay, California. U.S. Geological Survey Circular 1015. 38 pp.
Spies, R.B., 1989. Effects of the Shell oil spill on hydrocarbon metabolism in the staghorn sculpin (Leptocottus armatus) pilot reconnaissance study for the Shell oil spill recovery, assessment, and monitoring environmental effects program. June. Lawrence Livermore National Laboratory/Entrix Inc. 39 pp.
Spies, R.B. and D.W. Rice, Jr., 1988. Effects of organic contaminants on reproduction of the starry flounder Platichthys stellatus in San Francisco Bay. 11. Reproductive success of fish captured in San Francisco Bay and spawned in the laboratory. Mar. . Biol. 98: 191-200.
Spies, R.B., D.W. Rice, Jr. and J. Felton, 1988. Effects of organic contaminants on reproduction of the starry flounder Platichthys stellatus in San Francisco Bay. I. Hepatic contamination and mixed-function oxidase (MFO) activity during the reproductive season. Mar. Biol. 98: 18 1 - 189.
Spies, R.B., J.J. Stegeman, D.W. Rice, P. Thomas, B. Woodin, J.E. Hose, J.N. Cross and M. Prieto, 1990. Sublethal responses of Platichthys stellatus to organic contami- nants in San Francisco Bay with emphasis on reproduction. pp. 87-121. In: J.F. McCarthy and L.R. Shugart (eds). Biomarkers of Environmental contamination. Boca Raton, Florida.
Stegeman, J.J., F.Y. Teng and E.A. Snowberger, 1987. Induced cytochrome P450 in winter flounder (Pseudopleuronectes americanus) from coastal Massachusetts evaluated by catalytic assay and monoclonal antibody probes. Can. J. Fish. Aquat. Sci. 44: 1270-1277.
Stenzel, L.E. and G.W. Page, 1988. The results of the first comprehensive shorebird census of San Francisco and San Pablo bays. Wader Study Group Bull. 54: 43-48
Storrs, P.N., R.E. Selleck and E.A. Pearson, 1963. A comprehensive study of San Francisco Bay, 1960-62. South San Francisco Bay area, Suisun Baybwer San Joaquin River area, and San Pablo Bay area. Sanitary Engineering Research Laboratory. University of California, Berkeley. 22 1 pp.
Sumner, F.B., 1945. The Life History of an American Naturalist. Jacques Cattell Press. Lancaster, Penn. 298 pp.
SWC, 1987. Freshwater inflow to San Francisco Bay under natural conditions. Exhibit 262, California State Water Resources Control Board, 1987 Water QualityIWater Rights Proceeding on the San Francisco BayISacramento-San Joaquin Delta, California. State Water Contractors. Sacramento, Calif. 58 pp.
SWRCB, 1988. Water quality control plan for salinity. San Francisco BayISacramento- San Joaquin Delta Estuary. Draft. State Water Resources Control Board. Sacra- mento, Calif.
SWRCB, 1990. Pollutant policy document. San Francisco BayISacramento-San Joaquin Delta Estuary. June. State Water Resources Control Board. Sacramento, Calif.
SWRCB, 1991. Water quality control plan for salinity. San Francisco BayISacramento- San Joaquin Delta Estuary. 9 1- 15WR. May. State Water Resources Control Board. Sacramento, Calif.
Tetra Tech, 1987. Summary report of survey findings for the Baypelta Project. Prepared for the San Francisco Estuary Project, U.S. Environmental Protection Agency. San Francisco, Calif. 24 pp.
Thompson, J., 1957. The Settlement and Geography of the Sacramento-San Joaquin Delta, California Doctoral Dissertation, Stanford University. Palo Alto, Calif. 55 1 pp.
Thompson, J. and E.A. Dutra, 1983. The Tule Breakers, the Story of the California Dredge. University of the Pacific. Stockton, Calif. 368 pp.
Thompson, J.K. and F.H. Nichols, 1981. Benthic macrofaunal biomass of San Francisco Bay, California: JanuarylFebruary and August 1973. U.S. Geol. Surv. Open File Rep. 81-1331. 39 pp.
Truitt, C.L., 1986. Fate of dredged material during open-water disposal. Environmental effects of dredging technical notes, #EEDP-01-2. U.S. Army Corps of Engineers, Waterways Experiment Station. Vicksburg, Miss.
USACE, 1975. Final composite environmental statement, maintenance dredging, existing navigation projects, San Francisco Bay region, California: Volume 1. U.S. Army Corps of Engineers, San Francisco District. San Francisco, Calif.
USACE, 1976. Dredge disposal study, San Francisco Bay and Estuary: Appendix E, Material Release. U.S. Army Corps of Engineers, San Francisco District. San Francisco, Calif.
USACE, 1979. Sacramento-San Joaquin Delta environmental atlas. U.S. Army Corps of Engineers, Sacramento District. Sacramento, Calif.

USACE, 1987. Water resources development in California. U.S. Army Corps of Engineers, South Pacific Division. San Francisco, Calif. 138 pp.
USACE, 1989. Unpublished data on daily disposal events at the Alcatraz disposal site. Regulatory Branch, U.S. Army Corps of Engineers, San Francisco District. San Francisco, Calif.
USACE, 1990. Long-term management strategy for dredged material disposal in the San Francisco Bay region. Phase I: evaluation of existing management options. U.S. Army Corps of Engineers, San Francisco District. San Francisco, Calif. 114 pp.
USACE, 1991. FalVwinter LTMS update. Long-Term Mangement Strategy. U.S. Army Corps of Engineers, San Francisco District. San Francisco, Calif. 4 pp.
USBR, 1988. Draft environmental impact statements for proposed water contracting programs in the Sacramento River, American River, and Delta export service areas. Executive summary. U.S. Department of Interior, Bureau of Reclamation, Mid- Pacific Division. December. Sacramento, Calif. 25 pp.
USDC, 1989. Personal income data. Regional Economic Information System, U.S. Department of Commerce. Distributed by California Department of Finance. Sacramento, Calif.
USDI, 1988. Summary statistics on water, land, and related data. Bureau of Reclama- tion, U.S. Department of the Interior. Washington, D.C. 297 pp.
USEPA, 1983. Results of the National Urban Runoff Program. Volume 1. Water Planning Division. U.S. Environmental Protection Agency. Washington, D.C.
USEPA, 1988. The potential effects of global climate change on the United States. Report to Congress. Draft, Vols. 1,2,3. U.S. Environmental Protection Agency, Office of Policy, Planning, and Evaluation. Washington, D.C.
USEPA, 1990a. Progress in the National Estuary Program. Report to Congress. Environmental Protection Agency, Office of Water. Washington, D.C. 44 pp.
USEPA, 1990b. Harbor Studies Program. Final data report for the study of floatable debris in U.S. waters. November 1988-February 1989. Environmental Protection Agency. Washington, D.C. 193 pp.
USFWS, 1978. Concept plan for wintering waterfowl habitat preservation, Central Valley. U.S. Fish and Wildlife Service. Portland, Oregon. 116 pp.
USFWS, 1979. Concept plan for wintering waterfowl habitat preservation, California Coast. U.S. Fish and Wildlife Service. Portland, Oregon. 122 pp.
USFWS, 1987a. The needs of Chinook salmon, Oncorhynchus tshawytscha, in the Sacramento-San Joaquin Estuary. Exhibit 31, California State Water Resources Control Board, 1987 Water Quality~Water Rights Proceeding on the San Francisco Bay/Sacramento-San Joaquin Delta, California. U.S. Fish and Wildlife Service. Sacramento, Calif. 179 pp.
USFWS, 1987b. Goals and alternative standards/objectives for salmon, bass, and other fish. Exhibit 47, California State Water Resources Control Board, 1987 Water Quality/ Water Rights Proceeding on the San Francisco Bay/Sacramento-San Joaquin Delta, California. U.S. Fish and Wildlife Service. Sacramento, Calif.
USFWS, 1989a. Wetlands of the California Central Valley, status and trends - 1939 to mid-1980s. U.S. Fish and Wildlife Service, Region 1. Portland, Oregon. 29 pp.
USFWS, 1989b. Concept plan for waterfowl habitat protection, San Francisco Bay, California, North American Waterfowl Management Plan, Category 27. U.S. Fish and Wildlife Service, Region I. Portland, Oregon.
USFWS, 1990a. Final environmental assessment - potential additions to San Francisco Bay National Wildlife Refuge, Alameda, San Mateo and Santa Clara counties, California. U.S. Fish and Wildlife Service, Region 1. Portland, Oregon.
USFWS, 1990b. Draft coordination act report on the north Delta program draft environ- mental impact reportJenvironmenta1 impact statement. Preliminary draft, October. U.S. Fish and Wildlife Service. Sacramento, Calif.
USFWS, 1991. San Francisco Bay National Wildlife Refuge predator management plan and final environmental assessment. U.S. Fish and Wildlife Service. Newark, Calif. 54 pp.
Vance, J.E., Jr., 1964. Geography and urban evolution in the San Francisco Bay area. Institute of Government Studies, University of California. Berkeley, Calif. 89 pp.
Van Royen, W. and C.O. Siegel, 1959. Future development of the San Francisco Bay area, 1960-2020. Report prepared for U.S. Army Eng. Dist., San Francisco, by Bus. & Defense Services Adm., U.S. Dept. Commerce.
Varanasi, U., W.L. Richert and J.E. Stein, 1989. 32P-postlabeling analysis of DNA adducts in liver of wild English sole (Parophrys vetulus) and winter flounder (Pseudopleuronectes americanus). Cancer Res. 49: 1 17 1 - 1 177.
Ver Planck, W.E., 1958. Salt in California. Calif. Div. Mines Bull. 175. 168 pp.
Waterworks and Wastewater Digest, year, volume unknown.
Wetlands Training Institute, 1989. Field guide for delineating wetlands: unified Federal method. WTI 89-1. 13 1 pp.
Williams, P.B., 1988. Managing freshwater inflow to the San Francisco Bay estuary. Regulated Rivers: Research and Management 4:285-298.
Williams, P.B. and L. Fishbain, 1987. Analysis of changes in Delta outflow due to existing and future water development scenarios. Philip Williams and Associates, Report 412-1. San Francisco, Calif. Submitted by Environmental Defense Fund as Exhibit 2, California State Water Resources Control Board, 1987 Water QualityjWater Rights Proceeding on the San Francisco Bay/Sacramento-San Joaquin Delta, California.
Woodward-Clyde Consultants, 199 1. s a n k ~ l a r a Valley nonpoint source study. Vol. 1 : loads assessment report. Final Report submitted to Santa Clara Valley Water District. San Jose, Calif.
Personal Communication: Chuck Armor California Department of Fish and G u m , Stockton Neil Havlii Solano County Open Space Foundation, FairjTeld Perry Herrgese11 California Department of Fish and Game, Stockton Roger James Santa Clara Valley Water District, Sun Jose Lori Johnson Cargill Salt Company, Newark Judy Kelly Sun Francisco Bay Regional Water Quality Control Board, Oakland Loretta Meyer Port of Oakland, Oakland Lee Miller California Department of Fish and Game, Stockton Tom Murnley Sun Francisco Bay Regional Water Quality Control Board, Oakland Joe O'Comor Aquatic Habitat Institute, Richmond Brian Ross Environmental Protection Agency, Sun Francisco Jim Swanson California Deparmnt of Fish and Game, Yountville James Yuen Sun Francisco International Airport Planning Department, Sun Francisco