Physicochemical Characterization of Novel Epoxidized ... - MDPI
19
Citation: Dominguez-Candela, I.; Lerma-Canto, A.; Cardona, S.C.; Lora, J.; Fombuena, V. Physicochemical Characterization of Novel Epoxidized Vegetable Oil from Chia Seed Oil. Materials 2022, 15, 3250. https://doi.org/10.3390/ ma15093250 Academic Editor: Andrei Victor Sandu Received: 31 March 2022 Accepted: 28 April 2022 Published: 30 April 2022 Publisher’s Note: MDPI stays neutral with regard to jurisdictional claims in published maps and institutional affil- iations. Copyright: © 2022 by the authors. Licensee MDPI, Basel, Switzerland. This article is an open access article distributed under the terms and conditions of the Creative Commons Attribution (CC BY) license (https:// creativecommons.org/licenses/by/ 4.0/). materials Article Physicochemical Characterization of Novel Epoxidized Vegetable Oil from Chia Seed Oil Ivan Dominguez-Candela 1 , Alejandro Lerma-Canto 2 , Salvador Cayetano Cardona 1 , Jaime Lora 1 and Vicent Fombuena 2, * 1 Instituto de Seguridad Industrial, Radiofísica y Medioambiental (ISIRYM), Universitat Politècnica de València (UPV), Plaza Ferrándiz y Carbonell, s/n, 03801 Alcoy, Spain; [email protected] (I.D.-C.); [email protected] (S.C.C.); [email protected] (J.L.) 2 Technological Institute of Materials (ITM), Universitat Politècnica de València (UPV), Plaza Ferrándiz y Carbonell 1, 03801 Alcoy, Spain; [email protected] * Correspondence: [email protected] Abstract: In this study, a novel epoxidized vegetable oil (EVO) from chia seed oil (CSO) has been obtained, with the aim to be employed in a great variety of green products related to the polymeric industry, as plasticizers and compatibilizers. Previous to the epoxidation process characterization, the fatty acid (FA) composition of CSO was analyzed using gas chromatography (GC). Epoxidation of CSO has been performed using peracetic acid formed in situ with hydrogen peroxide and acetic acid, applying sulfuric acid as catalyst. The effects of key parameters as temperature (60, 70, and 75 ◦ C), the molar ratio of hydrogen peroxide:double bond (H 2 O 2 :DB) (0.75:1.0 and 1.50:1.0), and reaction time (0–8 h) were evaluated to obtain the highest relative oxirane oxygen yield (Y oo ). The evaluation of the epoxidation process was carried out through iodine value (IV), oxirane oxygen content (O o ), epoxy equivalent weight (EEW), and selectivity (S). The main functional groups were identified by means of FTIR and 1 H NMR spectroscopy. Physical properties were compared in the different assays. The study of different parameters showed that the best epoxidation conditions were carried out at 75 ◦ C and H 2 O 2 :DB (1.50:1), obtaining an O o value of 8.26% and an EEW of 193 (g·eq -1 ). These high values, even higher than those obtained for commercial epoxidized oils such as soybean or linseed oil, show the potential of the chemical modification of chia seed oil to be used in the development of biopolymers. Keywords: chia seed oil; fatty acids composition; epoxidized vegetable oil; epoxy equivalent weight 1. Introduction Nowadays, fossil-based materials use is increasing greenhouse gas emissions, wastes in landfills, and the exhaustion of non-renewable resources [1]. This situation leads to the need to find new alternatives in order to decrease the elevated production of fossil- based materials. One of the most promising renewables resources is vegetable oils (VO) because of their availability, relatively low cost, and non-toxicity [2]. According to the latest data of European Bioplastics Association, the land used to produce the renewable feedstock is approximately 0.0013% in 2021 and is estimated to increase up to 0.058% in 2026 [3]. This increase continues to be a very low value compared with food and feed land used (25% in 2021), indicating that there is not competition between the renewable feedstock for feed, food, and the production of bioplastics. In case of VO production, it increases each year where approximately 20% is used for industrial applications due to the concern of environmental problems [4]. VO is mainly formed by triglycerides, which are composed of three fatty acids (FAs) connected to glycerol molecules. In their structure, carbon-carbon double bonds enable VO to be easily transformed, increasing their reactivity. One of the several ways to take advantage of these double bonds in VO is through the epoxidation reaction, which introduces oxirane oxygen in double bonds [5]. Materials 2022, 15, 3250. https://doi.org/10.3390/ma15093250 https://www.mdpi.com/journal/materials
-
Upload
khangminh22 -
Category
Documents
-
view
1 -
download
0
Transcript of Physicochemical Characterization of Novel Epoxidized ... - MDPI

Citation: Dominguez-Candela, I.;
Lerma-Canto, A.; Cardona, S.C.; Lora,
J.; Fombuena, V. Physicochemical
Characterization of Novel
Epoxidized Vegetable Oil from Chia
Seed Oil. Materials 2022, 15, 3250.
https://doi.org/10.3390/
ma15093250
Academic Editor: Andrei
Victor Sandu
Received: 31 March 2022
Accepted: 28 April 2022
Published: 30 April 2022
Publisher’s Note: MDPI stays neutral
with regard to jurisdictional claims in
published maps and institutional affil-
iations.
Copyright: © 2022 by the authors.
Licensee MDPI, Basel, Switzerland.
This article is an open access article
distributed under the terms and
conditions of the Creative Commons
Attribution (CC BY) license (https://
creativecommons.org/licenses/by/
4.0/).
materials
Article
Physicochemical Characterization of Novel EpoxidizedVegetable Oil from Chia Seed OilIvan Dominguez-Candela 1 , Alejandro Lerma-Canto 2 , Salvador Cayetano Cardona 1 , Jaime Lora 1
and Vicent Fombuena 2,*
1 Instituto de Seguridad Industrial, Radiofísica y Medioambiental (ISIRYM), Universitat Politècnica deValència (UPV), Plaza Ferrándiz y Carbonell, s/n, 03801 Alcoy, Spain; [email protected] (I.D.-C.);[email protected] (S.C.C.); [email protected] (J.L.)
2 Technological Institute of Materials (ITM), Universitat Politècnica de València (UPV),Plaza Ferrándiz y Carbonell 1, 03801 Alcoy, Spain; [email protected]
* Correspondence: [email protected]
Abstract: In this study, a novel epoxidized vegetable oil (EVO) from chia seed oil (CSO) has beenobtained, with the aim to be employed in a great variety of green products related to the polymericindustry, as plasticizers and compatibilizers. Previous to the epoxidation process characterization,the fatty acid (FA) composition of CSO was analyzed using gas chromatography (GC). Epoxidation ofCSO has been performed using peracetic acid formed in situ with hydrogen peroxide and acetic acid,applying sulfuric acid as catalyst. The effects of key parameters as temperature (60, 70, and 75 ◦C),the molar ratio of hydrogen peroxide:double bond (H2O2:DB) (0.75:1.0 and 1.50:1.0), and reactiontime (0–8 h) were evaluated to obtain the highest relative oxirane oxygen yield (Yoo). The evaluationof the epoxidation process was carried out through iodine value (IV), oxirane oxygen content (Oo),epoxy equivalent weight (EEW), and selectivity (S). The main functional groups were identified bymeans of FTIR and 1H NMR spectroscopy. Physical properties were compared in the different assays.The study of different parameters showed that the best epoxidation conditions were carried out at75 ◦C and H2O2:DB (1.50:1), obtaining an Oo value of 8.26% and an EEW of 193 (g·eq−1). These highvalues, even higher than those obtained for commercial epoxidized oils such as soybean or linseedoil, show the potential of the chemical modification of chia seed oil to be used in the development ofbiopolymers.
Keywords: chia seed oil; fatty acids composition; epoxidized vegetable oil; epoxy equivalent weight
1. Introduction
Nowadays, fossil-based materials use is increasing greenhouse gas emissions, wastesin landfills, and the exhaustion of non-renewable resources [1]. This situation leads tothe need to find new alternatives in order to decrease the elevated production of fossil-based materials. One of the most promising renewables resources is vegetable oils (VO)because of their availability, relatively low cost, and non-toxicity [2]. According to thelatest data of European Bioplastics Association, the land used to produce the renewablefeedstock is approximately 0.0013% in 2021 and is estimated to increase up to 0.058% in2026 [3]. This increase continues to be a very low value compared with food and feedland used (25% in 2021), indicating that there is not competition between the renewablefeedstock for feed, food, and the production of bioplastics. In case of VO production,it increases each year where approximately 20% is used for industrial applications dueto the concern of environmental problems [4]. VO is mainly formed by triglycerides,which are composed of three fatty acids (FAs) connected to glycerol molecules. In theirstructure, carbon-carbon double bonds enable VO to be easily transformed, increasingtheir reactivity. One of the several ways to take advantage of these double bonds in VO isthrough the epoxidation reaction, which introduces oxirane oxygen in double bonds [5].
Materials 2022, 15, 3250. https://doi.org/10.3390/ma15093250 https://www.mdpi.com/journal/materials

Materials 2022, 15, 3250 2 of 19
Epoxidized vegetable oils (EVOs) are used as reagents and intermediates in the manufactureof polymers and are commonly used as plasticizers, compatibilizers, stabilizers, reactivediluents, or epoxy matrices for composites [6–9]. Several EVOs have been reported in theliterature, highlighting studies of linseed [10], cottonseed [11], soybean [12], karanja [13] orcastor oil [14], among others [15–18].
Notwithstanding, one of the VO with the most significant potential, due to its highamount of double bonds present in the FA chains, is the chia seed oil (CSO) (Salvia hispanica, L.).As it is possible to observe in Table 1, the iodine value (IV) of CSO, which is a parameter usedto determine the number of unsaturation in fats, oils, and waxes, is above 190 g I2/100 g.For this reason, CSO is one of the VO with the greatest potential for use in different sectors.Nowadays, CSO presents a market share of 20% of chia market with an expected increase of23.4% from 2019 to 2025 in order to use it for food and non-food applications [19]. Regardingfood applications, although is not widely used as others edible VOs, it is employed asfood complements and cooking oil [20]. Some authors have also suggested the additionof CSO in food applications due to its high benefits [21,22]. On the other hand, as non-food applications, CSO has been epoxidized and employed as environmentally friendlyplasticizer in one of the most promising industrial applications [23]. However, this studyshowed a lack of assessed parameters such as temperature and reagents concentrationthat can enhanced the epoxidation yield and no physico-chemical characterizations werecarried out. Therefore, CSO could be one of the best VO candidates to be epoxidized,due to its high availability of double bonds, which can lead to obtain one of the highesttheoretical oxirane oxygen content (Oo) even higher than EVOs of greater industrial use(linseed and soybean). CSO has the potential to obtain more Oo using fewer amountsof reagents (sulphuric and acetic acid or hydrogen peroxide e.g.), resulting in a low-costprocess and a more environmentally friendly EVO [24–26].
Table 1. Iodine value and theoretical oxirane oxygen content of different vegetable oils.
Vegetable Oil Initial Iodine Value(IV0, g I2/100 g)
Theoretical OxiraneOxygen Content (Oo, %) References
Castor 84 5.03 [14]Soybean 126 7.36 [27]Rubber 156 8.95 [28]
Cottonseed 107 6.32 [11]Linseed 188 10.6 [29]Canola 112 6.60 [5]
Sunflower 130 7.57 [30]Palm 62 3.76 [12]Olive 127 7.41 [31]Corn 115 6.76 [32]
Chia seed 197 11.05 Present study
Regarding the epoxidation process, selectivity (S) and Oo vary depending on thecatalyst used to obtain epoxides. Different methods have been studied, each with itsadvantages and disadvantages. For example, Guenter et al. employed molecular oxygento carry out the epoxidation process [33]. This method could be low-cost and ecologicalusing silver as the catalyst, but it is restricted to precursors like ethylene or butadieneand is not very efficient. The same authors studied the possibility of using halohydrinsthrough hypohalous acids and their respective salts, but this route was not environmentallyfriendly [33]. The most employed route to synthesize EVOs is the use of hydrogen peroxidewith in situ formed peroxyacid, as can be observed in Figure 1. This route presents somebenefits compared to preformed peroxyacids, such as safer processing and handling, aswell as requiring a minimum quantity of reagents to produce EVOs [34]. However, thisroute can lead to thermal runaway due to the exothermic reaction [35]. In order to reducethis risk, several actions can be considered such as comprehensive temperature control withadequate cooling capacity or dosing rate [36]. In this regard, this issue is taking into account

Materials 2022, 15, 3250 3 of 19
industrially due to this route is the most employed [37]. Moreover, it is commonly knownthat, in many epoxidation processes, the excess of molar ratio reagents and/or highertemperatures can lead to side-reactions, being the most common the oxirane ring cleavage.The ring-opening has been studied for the purpose of comprehending the influence offactors in these side-reactions. For instance, Cai et al. [38] have studied the ring-opening forthe epoxidation of cottonseed oil, where evaluated the effect of reagents taking into accountthe kinetic model. Furthermore, in the recent literature, the use of different epoxidationmethods such as chemoenzymatic, polyoxometalates or heterogeneous catalytic systems inthe presence of titanium silicate or ion exchange resin has been reported to overcome thisdrawback [4]. However, homogeneous catalysts have been proved to be more effective forindustrial-scale plants to produce EVOs in batch reaction over 8 h [39,40]. In this regard,the use of strong mineral acid with acetic acid leads to a higher reaction rate [41].
Materials 2022, 15, x FOR PEER REVIEW 3 of 19
some benefits compared to preformed peroxyacids, such as safer processing and han-
dling, as well as requiring a minimum quantity of reagents to produce EVOs [34]. How-
ever, this route can lead to thermal runaway due to the exothermic reaction [35]. In order
to reduce this risk, several actions can be considered such as comprehensive temperature
control with adequate cooling capacity or dosing rate [36]. In this regard, this issue is tak-
ing into account industrially due to this route is the most employed [37]. Moreover, it is
commonly known that, in many epoxidation processes, the excess of molar ratio reagents
and/or higher temperatures can lead to side-reactions, being the most common the oxirane
ring cleavage. The ring-opening has been studied for the purpose of comprehending the
influence of factors in these side-reactions. For instance, Cai et al. [38] have studied the
ring-opening for the epoxidation of cottonseed oil, where evaluated the effect of reagents
taking into account the kinetic model. Furthermore, in the recent literature, the use of dif-
ferent epoxidation methods such as chemoenzymatic, polyoxometalates or heterogeneous
catalytic systems in the presence of titanium silicate or ion exchange resin has been re-
ported to overcome this drawback [4]. However, homogeneous catalysts have been
proved to be more effective for industrial-scale plants to produce EVOs in batch reaction
over 8 h [39,40]. In this regard, the use of strong mineral acid with acetic acid leads to a
higher reaction rate [41].
Figure 1. Schematic representation of epoxidation by means of in situ formed peroxyacids.
The main purpose of this study was to develop a new EVO from chia seed oil (ECSO)
as a raw material due to its great potential, determined by the high IV. This new EVO was
carried out by in situ epoxidation process with acetic acid and hydrogen peroxide. In this
way, a new reagent for use in the polymeric industry can be obtained through a naturally
renewable resource as an alternative to the current petrochemical compounds or commer-
cially available EVOs. After the analysis by GC of the composition of the fatty acids of chia
oil obtained by cold mechanical extrusion, the epoxidation process was carried out, opti-
mizing key parameters such as temperature, the molar ratio of H2O2:DB, and reaction
time. The oxirane oxygen content (Oo) was analyzed by titration method and the func-
tional groups were confirmed using FTIR as well as 1H NMR spectroscopy. Further char-
acterization was performed to evaluate the changes in physical-chemical parameters such
as specific gravity, dynamic viscosity, and colorimetric coordinates.
2. Materials and Methods
2.1. Materials
Chia seed (Salvia hispanica, L.) was supplied by Frutoseco (Bigastro, Alicante, Spain)
and CSO was obtained by cold extraction using a CZR-309 press machine (Changyouxin
Trading Co., Zhucheng, China). Aqueous hydrogen peroxide (30 wt.%), glacial acetic acid
Figure 1. Schematic representation of epoxidation by means of in situ formed peroxyacids.
The main purpose of this study was to develop a new EVO from chia seed oil (ECSO)as a raw material due to its great potential, determined by the high IV. This new EVOwas carried out by in situ epoxidation process with acetic acid and hydrogen peroxide.In this way, a new reagent for use in the polymeric industry can be obtained through anaturally renewable resource as an alternative to the current petrochemical compoundsor commercially available EVOs. After the analysis by GC of the composition of the fattyacids of chia oil obtained by cold mechanical extrusion, the epoxidation process was carriedout, optimizing key parameters such as temperature, the molar ratio of H2O2:DB, andreaction time. The oxirane oxygen content (Oo) was analyzed by titration method and thefunctional groups were confirmed using FTIR as well as 1H NMR spectroscopy. Furthercharacterization was performed to evaluate the changes in physical-chemical parameterssuch as specific gravity, dynamic viscosity, and colorimetric coordinates.
2. Materials and Methods2.1. Materials
Chia seed (Salvia hispanica, L.) was supplied by Frutoseco (Bigastro, Alicante, Spain)and CSO was obtained by cold extraction using a CZR-309 press machine (ChangyouxinTrading Co., Zhucheng, China). Aqueous hydrogen peroxide (30 wt.%), glacial acetic acid(99.7 wt.%), and sulphuric acid (96 wt.%) were purchased from Sigma Aldrich (SigmaAldrich, Madrid, Spain). Reagents required for IV characterization such as Wijs solu-tion (ICl), 0.1 N sodium thiosulphate solution (Na2S2O3), potassium iodide (KI), andcyclohexane (C6H12), were supplied from Sigma Aldrich (Sigma Aldrich, Madrid, Spain).To determine oxirane oxygen content, chlorobenzene (C6H5Cl), crystal violet indicator,potassium acid phthalate (KHC8H4O4), and 0.1 N HBr solution in glacial acetic acid weresupplied from Panreac Química S.L.U. (Castellar del Vallés, Barcelona, Spain).

Materials 2022, 15, 3250 4 of 19
2.2. Epoxidation Process
Epoxidation reaction was performed in a three-necked round-bottom flask (1000 mLcapacity). The flask, equipped with a two-bladed stirrer, was immersed in a thermostaticwater bath where the temperature could be controlled to ± 0.1 ◦C of the desired temperature.A propeller mechanical stirrer was connected to the central neck, a drop-wise device wasintroduced in one of the side necks, and a thermometer was connected to the third neck.
Epoxidation of CSO was carried out using a peroxyacid generated in situ from anorganic acid. The most widely used in this process are formic (HCOOH) and acetic(CH3COOH) acids due to their high reactivity. The efficiency of these oxidants depends onthe operating temperature, taking into account that according to literature, acetic acid is themost effective above 60 ◦C [42]. Furthermore, acting as the catalyst, sulphuric (H2SO4) andnitric acid (HNO3) are the most employed. In this regard, sulphuric acid with an optimalvalue of 3 wt.% with respect to the sum of the masses of hydrogen peroxide and aceticacid, was the most effective inorganic acid in order to obtain the highest conversion tooxirane oxygen, as was reported [43]. Therefore, the procedure is summarized as follows:firstly, 232 g of CSO (0.776 mol double bond for each 100 g of oil) and 25.3 g of glacial aceticacid were maintained at a constant temperature (60 ◦C) and stirring rate (220 rpm), whichallowed a sufficient agitation to ensure proper mass transfer. After 10 min, sulphuric acidand hydrogen peroxide were mixed and added dropwise. The addition was completedwithin half an hour, at a constant rate following the method reported by Dinda et al. [44].Two different H2O2:DB molar ratios (MR) mentioned previously (MR 0.75 and MR 1.50) at60 ◦C were studied. MR 1.50 has been selected as the optimal amount of peroxide, whichmeans 1.50 moles of H2O2 for one mole of double blonds [45]. It should be noted thatCSO contains a higher iodine value compared to other VOs and, thus, a higher Oo can beobtained. Therefore, MR 0.75 (half of the MR 1.50) has also been tested in this epoxidationprocess in order to study the effect of hydrogen peroxide and the possibility to achievea reduction of the chemical compounds used. With respect to the temperature, differenttests have been carried out at 60, 70, and 75 ◦C ± 1 ◦C, studying the reaction from 0 to 8 hconsidering the ranges reported in previous literature [46]. Samples were extracted at 0.5,1.0, 1.5, 2.0, 4.0, 6.0 and 8.0 h, after adding the peroxide and sulphuric acid to monitor thereaction process. The collected samples were cooled at room temperature and then washedwith water until they were acid-free up to pH neutral. To purify and remove the excess ofwater, samples were centrifuged 10 min at 7000 rpm.
2.3. Characterization2.3.1. Fatty Acid Composition
Prior to quantitative determination, FAs of oils have been transformed into methylesters (FAMEs) following the standard method ISO 12966. The FAs profile was determinedusing HP/Agilent 6890 N gas chromatograph (Palo Alto, CA, USA) with Agilent 5973 Nmass spectrometer detector (GC-MS). Equipment is provided with a splitless injector, ion-ization detector mode (70 eV), and integrator. The GC-MS method applied was according toISO 12966. A DB-5MS capillary column (30 m length, 0.25 mm inner diameter, and 0.25 mmfilm thickness) from Teknokroma (Barcelona, Spain) was used using a temperature pro-gram from 140 to 300 ◦C at 20 ◦C/min. The injector and detector temperatures used were280 and 300 ◦C, respectively. The sample injection volume was 1 µL using a splitless injector.Helium was used as carrier gas at a flow rate of 1 µL/min. Each FA was identified throughthe retention time comparison between pure commercial standard and the studied sample.FA results were expressed as percentages of the total regarding FAMEs.
2.3.2. Iodine Value (IV)
The iodine value is referred to the mass of Iodine (I2 in grams) absorbed by 100 g of oil.It is an index used to determine the amount of unsaturation (double bonds) in FAs. Thisvalue was determined using Wijs solution (ICl) that reacted with double bonds and it was

Materials 2022, 15, 3250 5 of 19
possible to detect the evolution by using sodium thiosulfate solution. IV was determinedaccording to ISO 3961 using Equation (1):
IV =12.69 × c × (V1 − V2)
m(1)
where IV refers to the mass of Iodine per 100 g of oil (g I2/100 g oil), c to the normalityof sodium thiosulfate solution 0.1 N (Na2S2O3), V1 to the volume of Na2S2O3 needed fortitration of the blank (mL), V2 to the volume of Na2S2O3 needed for titration of the sample(CSO) (mL), and m refers to the amount of sample used (g). Moreover, it is possible todetermine the conversion of double bond (XIV) using Equation (2) [10]:
XIV(%) =
( IV0 − IVf
IV0
)× 100 (2)
where IV0 is the initial iodine value of the VO sample and IVf is the final iodine value ofthe EVO after the epoxidation process. At least five measurements were made for eachsample and the average values were reported.
2.3.3. Oxirane Oxygen Content (Oo)
The number of epoxy groups was determined using the direct method of titration withhydrobromic acid (HBr) solution in glacial acetic acid, using ASTM D1652. The sample wasdissolved in chlorobenzene, followed by the addition of drops of crystal violet and titrationusing 0.1 N HBr in glacial acetic acid. The oxirane oxygen content (Oo) was calculated withEquation (3):
Oo(wt. %) = 1.6 × Ni ×(V − B)
W(3)
where Ni refers to the normality of HBr in glacial acetic acid, V to the volume of HBrsolution for titration of the sample (mL), B to the volume of HBr solution for titration of theblank (mL), and W refers to the amount of sample used (g). At least five measurementswere made for each sample and the average values were reported.
To determine the percentage conversion to oxirane (YOO) Equation (4) has been employed:
YOO(%) =
(Oo
Othe
)× 100 (4)
where, Oo is the oxirane oxygen content experimentally obtained and Othe is the theoreticalmaximum oxirane oxygen content that was calculated using Equation (5) [43]:
Othe(wt. %) =
IVo2AMi⌈
100 +(
IVo2AMi
)× AMo
⌉× AMo × 100 (5)
Regarding Equation (5), IVo is the initial iodine value of the sample, AMi is the atomicmass of Iodine (126.9 g/mol), and AMo is the atomic mass of oxygen (16 g/mol). Moreover,the selectivity for oxirane oxygen (S) can be determined using Equation (6) [47].
S =
(O
Othe
)×(
IVo
IVo − IVf
)(6)
2.3.4. Epoxy Equivalent Weight (EEW)
The epoxy equivalent weight (EEW) is defined as the mass, expressed in grams, of theepoxy resin which contains one equivalent of the epoxy group (g·eq−1). It is one of the mostimportant features of epoxy resins, which is related to the crosslinking density and allows

Materials 2022, 15, 3250 6 of 19
the calculation of the required amount of crosslinking agent for the curing process [48]. TheEEW of ECSO was obtained following ASTM D1652 via titration using Equation (7):
EEW(
g·eq−1)=
(1000 × W
(V − B)× Ni
)(7)
2.3.5. Fourier Transform InfraRed (FTIR) Spectroscopy
The substitution of double bonds and changes in functional groups was identified byFourier Transform Infrared (FTIR) spectroscopy equipped with a horizontal attenuated totalreflection modulus (ATR). Both CSO and ECSO were analyzed using a Bruker Vector 22(Bruker Española, S. A, Madrid, España), averaging 20 scans at 4000–400 cm−1 and 4 cm−1
of resolution. It must be remarked that this method is immediate and straightforwardto evaluate the possible change of the main functional groups, allowing to correlate theprogress of epoxidations from infrared studies. However, the titration method obtains abetter accuracy than the FTIR spectroscopy method, as has been reported by [15,49]. Thus,the FTIR method was used to verify the evolution of the main functional groups.
2.3.6. Nuclear Magnetic Resonance (NMR) Spectroscopy1H NMR spectroscopy was employed to compare and confirm the chemical structure
of CSO and ECSO. Samples were analyzed using a Bruker AMX 500 unit (Bruker BioSpinGmbH, Rheinstetten, Germany) at 25 ◦C. Samples of 40 mg were dissolved in 0.6 mL ofdeuterated chloroform (CDCl3), mixed for 10 s and transferred to 5 mm NMR tubes fordata acquisition.
2.3.7. Physico-Chemical Properties
The method used to determine changes in specific gravity was a pycnometer, accordingto ASTM D1963. This method uses a 25 mL pycnometer maintaining a constant temperatureof 25 ◦C. All densities of liquids were obtained against water. The specific gravities ofuntreated CSO and epoxidized were measured using Equation (8):
ρr =Ws − We
Ww − We(8)
where Ws is the weight (g) of the sample in the pycnometer, We is the weight (g) of theempty pycnometer, and Ww is the weight (g) of water in the pycnometer. At least fivemeasurements were obtained with a maximum deviation of 3 × 10⁻³.
Dynamic viscosities were obtained using two Cannon-Fenske viscosimeters of300 and 450 mm with flow ranges from 5 × 10⁻⁵ to 2.5 × 10⁻⁴ m2·s−1 and from 5 × 10⁻⁴
to 2.5 × 10⁻² m2·s−1, respectively, at 20 ◦C. The assay has been carried out following theguidelines of the ASTM D-445. Viscosimeter was introduced in a water bath monitoring thetemperature with a precision of ± 0.1 ◦C. At least five measurements were measured with amaximum dynamic viscosity deviation of 1.02 mPa·s.
The colorimetric coordinates of CSO and ECSO were measured using a Hunter LabColorimeter (Colour Flex, Hunter Associates Inc., Reston, VA, USA). The instrument(45◦/0◦ geometry, D45 optical sensor, 10◦ observer) was calibrated before the experimentswith Black and White reference tiles, and Green tiles were used to verify the correctoperation. The values of luminance (L*) (0–100) represent lightness, parameters a* and b*indicate the approach from green (negative) to red (positive), and from blue (negative) toyellow (positive), respectively. At least five measurements were made for each sample andthe average values were reported. Color variation was evaluated by using Equation (9):
∆E =√
∆L2 + ∆a2 + ∆b2 (9)
Materials 2022, 15, 3250 7 of 19
3. Results3.1. CSO Extraction and Fatty Acid Composition
CSO was extracted by double cold extraction in a press machine to avoid chemicalchanges in the FA composition caused by high temperatures and the use of chemicalsolvents. Firstly, whole seeds were pressed to obtain oil and cake. Then, the residual cakewas pressed again in order to obtain a higher yield of oil extraction. At the end of thepressing process, oil was filtered and centrifuged at 4000 rpm to be cleaned, and then itwas stored in a cold dark room. The yield of extracted CSO was increased from 20.4% forthe first process to 24.5% adding up the oil obtained from the second press of the chia cake.This slow increase of extraction yield with the second press shows that no longer than twopresses are considered economically feasible, as reported by Kasote et al. [50]. This totalyield is in the same range that was reported by Ixtaina et al. [51], in which the productionyield of CSO was 24.8%.
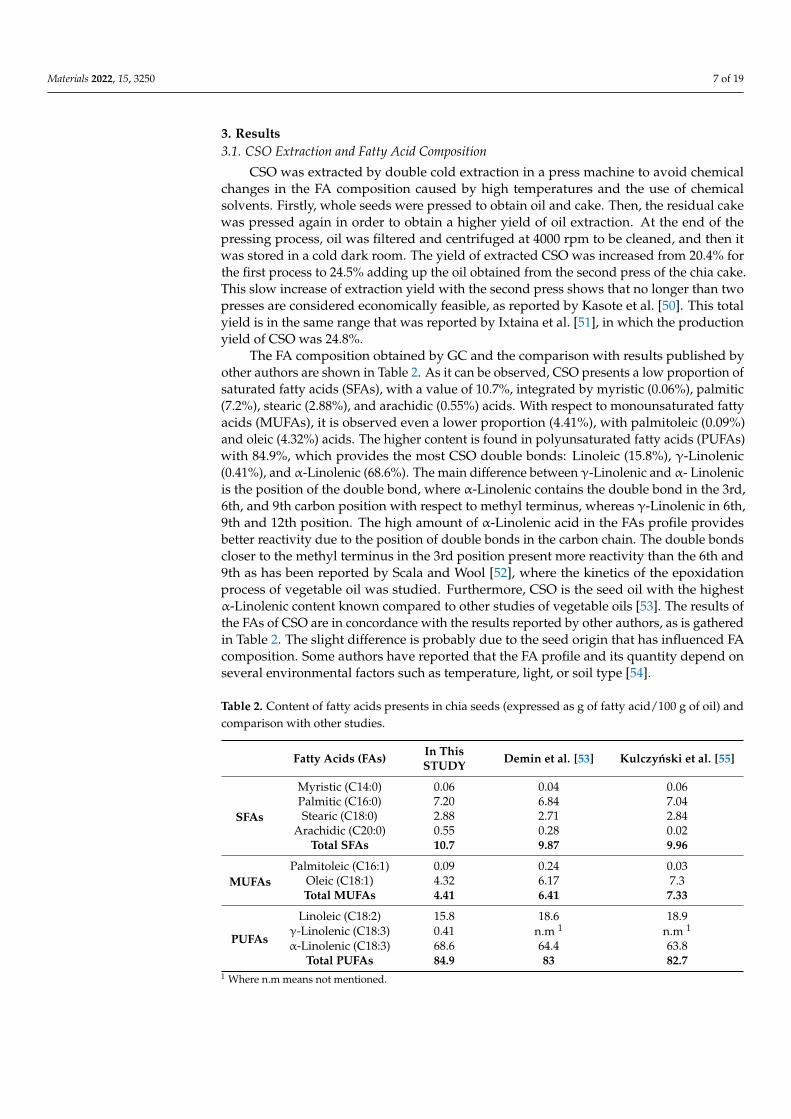
The FA composition obtained by GC and the comparison with results published byother authors are shown in Table 2. As it can be observed, CSO presents a low proportion ofsaturated fatty acids (SFAs), with a value of 10.7%, integrated by myristic (0.06%), palmitic(7.2%), stearic (2.88%), and arachidic (0.55%) acids. With respect to monounsaturated fattyacids (MUFAs), it is observed even a lower proportion (4.41%), with palmitoleic (0.09%)and oleic (4.32%) acids. The higher content is found in polyunsaturated fatty acids (PUFAs)with 84.9%, which provides the most CSO double bonds: Linoleic (15.8%), γ-Linolenic(0.41%), and α-Linolenic (68.6%). The main difference between γ-Linolenic and α- Linolenicis the position of the double bond, where α-Linolenic contains the double bond in the 3rd,6th, and 9th carbon position with respect to methyl terminus, whereas γ-Linolenic in 6th,9th and 12th position. The high amount of α-Linolenic acid in the FAs profile providesbetter reactivity due to the position of double bonds in the carbon chain. The double bondscloser to the methyl terminus in the 3rd position present more reactivity than the 6th and9th as has been reported by Scala and Wool [52], where the kinetics of the epoxidationprocess of vegetable oil was studied. Furthermore, CSO is the seed oil with the highestα-Linolenic content known compared to other studies of vegetable oils [53]. The results ofthe FAs of CSO are in concordance with the results reported by other authors, as is gatheredin Table 2. The slight difference is probably due to the seed origin that has influenced FAcomposition. Some authors have reported that the FA profile and its quantity depend onseveral environmental factors such as temperature, light, or soil type [54].
Table 2. Content of fatty acids presents in chia seeds (expressed as g of fatty acid/100 g of oil) andcomparison with other studies.
Fatty Acids (FAs) In ThisSTUDY Demin et al. [53] Kulczynski et al. [55]
SFAs
Myristic (C14:0) 0.06 0.04 0.06Palmitic (C16:0) 7.20 6.84 7.04Stearic (C18:0) 2.88 2.71 2.84
Arachidic (C20:0) 0.55 0.28 0.02Total SFAs 10.7 9.87 9.96
MUFAsPalmitoleic (C16:1) 0.09 0.24 0.03
Oleic (C18:1) 4.32 6.17 7.3Total MUFAs 4.41 6.41 7.33
PUFAs
Linoleic (C18:2) 15.8 18.6 18.9γ-Linolenic (C18:3) 0.41 n.m 1 n.m 1
α-Linolenic (C18:3) 68.6 64.4 63.8Total PUFAs 84.9 83 82.7
1 Where n.m means not mentioned.

Materials 2022, 15, 3250 8 of 19
3.2. Effect of Molar Ratio H2O2:Double Bond in the Epoxidation Process
To investigate the effect of molar ratio H2O2:DB, two experiments were made atMR 0.75 and 1.50 applying a constant temperature of 60 ◦C. In these conditions, both IVand Oo analyses were obtained to monitor the epoxidation reaction. As it is possible toobserve in Figure 2, IV0 was 197 g I2/100 g of oil for CSO, which is in accordance withImran et al. [56] and Timilsena et al. [57], where both obtained values of 193 and 204 gI2/100 g of oil, respectively. The plot representation shows that once the epoxidationprocess takes place, the IV decreases due to the reaction of double bonds, as reported byCampanella et al. [58] with soybean oil. In the assay carried out at MR 1.50, the IV decreasesmore sharply, showing a greater rate yield in the process of double bonds substitution.However, although the results using MR 1.5 have been better than those with MR 0.75, theauthors do not consider it appropriate to increase the MR above 1.5, due to an excess ofreagents can cause side-reactions as the oxirane ring cleavage. In addition, the slope of theIV curve changes at the first 4 h, being less pronounced with MR 0.75 due to less initialoxygen active donor in the reaction for the lower hydrogen peroxide ratio, which is stronglyrelated to the reduction of IV. Therefore, using MR 1.50 at 60 ◦C, IV is reduced up to 80.1 gI2/100 g of oil after 8 h of reaction, reaching almost a value of 60% for XIV. However, lowervalues were obtained using MR 0.75, with 42.2% for XIV and 114 g I2/100 g of oil for IV.
Materials 2022, 15, x FOR PEER REVIEW 8 of 19
Arachidic (C20:0) 0.55 0.28 0.02
Total SFAs 10.7 9.87 9.96
MUFAs
Palmitoleic (C16:1) 0.09 0.24 0.03
Oleic (C18:1) 4.32 6.17 7.3
Total MUFAs 4.41 6.41 7.33
PUFAs
Linoleic (C18:2) 15.8 18.6 18.9
γ-Linolenic (C18:3) 0.41 n.m1 n.m1
α-Linolenic (C18:3) 68.6 64.4 63.8
Total PUFAs 84.9 83 82.7 1 Where n.m means not mentioned.
3.2. Effect of Molar Ratio H2O2:Double Bond in the Epoxidation Process
To investigate the effect of molar ratio H2O2:DB, two experiments were made at MR
0.75 and 1.50 applying a constant temperature of 60 °C. In these conditions, both IV and
Oo analyses were obtained to monitor the epoxidation reaction. As it is possible to observe
in Figure 2, IV0 was 197 g I2/100 g of oil for CSO, which is in accordance with Imran et al.
[56] and Timilsena et al. [57], where both obtained values of 193 and 204 g I2/100 g of oil,
respectively. The plot representation shows that once the epoxidation process takes place,
the IV decreases due to the reaction of double bonds, as reported by Campanella et al. [58]
with soybean oil. In the assay carried out at MR 1.50, the IV decreases more sharply, show-
ing a greater rate yield in the process of double bonds substitution. However, although
the results using MR 1.5 have been better than those with MR 0.75, the authors do not
consider it appropriate to increase the MR above 1.5, due to an excess of reagents can
cause side-reactions as the oxirane ring cleavage. In addition, the slope of the IV curve
changes at the first 4 h, being less pronounced with MR 0.75 due to less initial oxygen
active donor in the reaction for the lower hydrogen peroxide ratio, which is strongly re-
lated to the reduction of IV. Therefore, using MR 1.50 at 60 °C, IV is reduced up to 80.1 g
I2/100 g of oil after 8 h of reaction, reaching almost a value of 60% for XIV. However, lower
values were obtained using MR 0.75, with 42.2% for XIV and 114 g I2/100 g of oil for IV.
Figure 2. Effect on Iodine value (IV) of the MR 0.75 and 1.50 during the epoxidation process.
Figure 3 shows the plot evolution of Oo and EEW. Inversely proportional to IV, when
MR increases, the presence of Oo increases as well. As reaction time proceeds, significant
differences were observed comparing both MR. It is known that hydrogen peroxide is an
active oxygen donor in the reaction [27]. Thus, when MR is increased from 0.75 to 1.50, an
Figure 2. Effect on Iodine value (IV) of the MR 0.75 and 1.50 during the epoxidation process.
Figure 3 shows the plot evolution of Oo and EEW. Inversely proportional to IV, whenMR increases, the presence of Oo increases as well. As reaction time proceeds, significantdifferences were observed comparing both MR. It is known that hydrogen peroxide is anactive oxygen donor in the reaction [27]. Thus, when MR is increased from 0.75 to 1.50, anincrease of Oo can be noticed. The reason for this result is the increase in peracetic acidformation due to a higher amount of hydrogen peroxide [10]. Peracetic acid acts as a vectorof oxygen, causing a conversion improvement. Then, doubling the amount of hydrogenperoxide, an increase of 36.8% in Oo from 4.48 wt.% to 6.13 wt.% was obtained at the endof the reaction. Taking Equation (5) into account, a theoretical maximum oxirane oxygencontent (Othe) of 11.05% was obtained, thus achieving a Yoo value of 55.6% for MR 1.50.This epoxidation yield value can be ascribed to the lower efficiency of acetic acid at 60 ◦C,when the most effective temperature is observed above 60 ◦C [42]. Results are gatheredin Table 3.

Materials 2022, 15, 3250 9 of 19
Materials 2022, 15, x FOR PEER REVIEW 9 of 19
increase of Oo can be noticed. The reason for this result is the increase in peracetic acid
formation due to a higher amount of hydrogen peroxide [10]. Peracetic acid acts as a vec-
tor of oxygen, causing a conversion improvement. Then, doubling the amount of hydro-
gen peroxide, an increase of 36.8% in Oo from 4.48 wt.% to 6.13 wt.% was obtained at the
end of the reaction. Taking Equation (5) into account, a theoretical maximum oxirane ox-
ygen content (Othe) of 11.05% was obtained, thus achieving a Yoo value of 55.6% for MR
1.50. This epoxidation yield value can be ascribed to the lower efficiency of acetic acid at
60 °C, when the most effective temperature is observed above 60 °C [42]. Results are gath-
ered in Table 3.
Related to selectivity (S) (values also summarized in Table 3), it is possible to appre-
ciate that this value slightly decreases at MR 1.50 compared to MR 0.75. These results
demonstrate that there are double bonds that were not replaced by epoxy groups. Alt-
hough XIV and Yoo for MR 1.50 are higher than for MR 0.75, the opposite occurs with S. It
is known that higher MR leads to an increment of Yoo and the presence of hydrolysis reac-
tions, i.e., epoxy ring cleavage [28]. For that reason, S for MR 1.50 is slightly lesser than
for MR 0.75 due to more presence of side-reactions caused by a higher amount of hydro-
gen peroxide. This is another reason why the use of higher reagent ratios is not technically
feasible, as the high reactivity of the fatty acids present in chia oil causes unwanted side
reactions. Therefore, the highest Oo and lowest EEW values were obtained for MR 1.50
with values of 6.13 wt.% and 260 g·eq−1, respectively.
Figure 3. Effect on oxirane oxygen (Oo) of the MR 0.75 and 1.50 at 60°C during the epoxidation pro-
cess.
Table 3. Main parameters used to characterize the epoxidation process of the chia seed oil (CSO) at
different molar ratios and temperatures.
Epoxidation Temperature
(°C) MR 1 IVf 2 XIV 3 Oo 4
EEW 5
(g·eq−1) YOO 6 S 7
1 60 0.75 114 ± 0.94 42.2 ± 0.48 4.48 ± 0.11 357 ± 8.9 39.9 ± 1.02 0.946 ± 1.88
2 60 1.50 80.1 ± 0.87 59.4 ± 0.41 6.13 ± 0.12 260 ± 4.94 55.6 ± 1.07 0.935 ± 1.92
3 70 1.50 37.9 ± 0.62 80.8 ± 0.32 7.61 ± 0.10 210 ± 3.10 68.9 ± 0.98 0.853 ± 1.70
4 75 1.50 13.1 ± 1.52 93.4 ± 0.75 8.26 ± 0.11 193 ± 2.39 74.8 ± 0.78 0.801 ± 1.79 1 Hydrogen peroxide to double bond (H2O2:DB); 2 Final iodine value (g I2/100 g oil); 3 Conversion
iodine value; 4 Oxirane oxygen content; 5 Epoxy equivalent weight; 6 Conversion to oxirane; 7 Selec-
tivity.
Figure 3. Effect on oxirane oxygen (Oo) of the MR 0.75 and 1.50 at 60◦C during the epoxidation process.
Table 3. Main parameters used to characterize the epoxidation process of the chia seed oil (CSO) atdifferent molar ratios and temperatures.
Epoxidation Temperature(◦C) MR 1 IVf
2 XIV3 Oo
4 EEW 5
(g·eq−1) YOO6 S 7
1 60 0.75 114 ± 0.94 42.2 ± 0.48 4.48 ± 0.11 357 ± 8.9 39.9 ± 1.02 0.946 ± 1.882 60 1.50 80.1 ± 0.87 59.4 ± 0.41 6.13 ± 0.12 260 ± 4.94 55.6 ± 1.07 0.935 ± 1.923 70 1.50 37.9 ± 0.62 80.8 ± 0.32 7.61 ± 0.10 210 ± 3.10 68.9 ± 0.98 0.853 ± 1.704 75 1.50 13.1 ± 1.52 93.4 ± 0.75 8.26 ± 0.11 193 ± 2.39 74.8 ± 0.78 0.801 ± 1.79
1 Hydrogen peroxide to double bond (H2O2:DB); 2 Final iodine value (g I2/100 g oil); 3 Conversion iodine value;4 Oxirane oxygen content; 5 Epoxy equivalent weight; 6 Conversion to oxirane; 7 Selectivity.
Related to selectivity (S) (values also summarized in Table 3), it is possible to ap-preciate that this value slightly decreases at MR 1.50 compared to MR 0.75. These resultsdemonstrate that there are double bonds that were not replaced by epoxy groups. AlthoughXIV and Yoo for MR 1.50 are higher than for MR 0.75, the opposite occurs with S. It is knownthat higher MR leads to an increment of Yoo and the presence of hydrolysis reactions,i.e., epoxy ring cleavage [28]. For that reason, S for MR 1.50 is slightly lesser than forMR 0.75 due to more presence of side-reactions caused by a higher amount of hydrogenperoxide. This is another reason why the use of higher reagent ratios is not technicallyfeasible, as the high reactivity of the fatty acids present in chia oil causes unwanted sidereactions. Therefore, the highest Oo and lowest EEW values were obtained for MR 1.50with values of 6.13 wt.% and 260 g·eq−1, respectively.
3.3. Effect of the Temperature in the Epoxidation Process
The influence of temperature on the epoxidation process was studied at 60 ◦C, 70 ◦C,and 75 ◦C with the best MR (1.50) previously detailed. In Figure 4, it is possible to observean increase in IV conversion at higher temperatures. As happened previously, the slope ofIV showed a sharper change at the first 4 h. This behavior can be ascribed to the higherreactivity of double bonds present in the 3rd position of methyl terminus of fatty acid inα-Linolenic acid [52], which react faster at the initial time of the experiments. In contrast,the less reactive double bonds (6th and 9th) present in α-Linolenic acid, Linoleic, and Oleicacid take a longer time to react. Then, increasing the temperature from 60 ◦C to 75 ◦C,an IV of 13.1 g I2/100 g of oil was obtained with regard to 80.1 g I2/100 g of oil at 60 ◦C.Therefore, the temperature is shown as the key factor to increase the conversion of IV.

Materials 2022, 15, 3250 10 of 19
Materials 2022, 15, x FOR PEER REVIEW 10 of 19
3.3. Effect of the Temperature in the Epoxidation Process
The influence of temperature on the epoxidation process was studied at 60 °C, 70 °C,
and 75 °C with the best MR (1.50) previously detailed. In Figure 4, it is possible to observe
an increase in IV conversion at higher temperatures. As happened previously, the slope
of IV showed a sharper change at the first 4 h. This behavior can be ascribed to the higher
reactivity of double bonds present in the 3rd position of methyl terminus of fatty acid in α-
Linolenic acid [52], which react faster at the initial time of the experiments. In contrast, the
less reactive double bonds (6th and 9th) present in α-Linolenic acid, Linoleic, and Oleic
acid take a longer time to react. Then, increasing the temperature from 60 °C to 75 °C, an
IV of 13.1 g I2/100 g of oil was obtained with regard to 80.1 g I2/100 g of oil at 60 °C. There-
fore, the temperature is shown as the key factor to increase the conversion of IV.
Figure 4. Effect on Iodine value (IV) of the temperature (60 °C, 70 °C, and 75 °C) with MR 1.50 during
the epoxidation process.
Regarding the formation of epoxy groups plotted in Figure 5, it increases as temper-
ature increases, accelerating the kinetic of epoxidation to form oxirane oxygen [46]. In the
same way as with IV, the Oo slope is higher at the first 4 h of reaction whereas, after that
time, this trend decreases. This reduction in reaction rate can be related to the decompo-
sition of peracetic acid, acetic acid, and hydrogen peroxide along the time [59]. With the
higher temperature (75 °C) studied, it is possible to obtain the highest value of Oo, 8.26
wt.%, or lowest EEW, 193 g·eq−1, obtaining a Yoo of 74.8%. An increase of 15°C from 60 °C
to 75 °C contributes to an improvement of 25.7% for Oo. It should be noted that higher
temperatures and extended time, increase the Oo but can also cause a greater oxirane
cleavage rate [44]. As Campanella et al. [60] and Gan et al. [61] studied for temperatures
higher than 75 °C in soybean and palm oil, respectively, the oxirane ring was destabilized,
which slowed the growth of the conversion to epoxy groups, even reducing the oxirane
oxygen formed. In this sense, all temperatures studied showed almost no conversion to
epoxy groups from 6 h onwards, being more pronounced with the temperature of 75 °C.
For this reason, the authors did not consider it appropriate to carry out the epoxidation
process at higher temperatures.
Regarding the selectivity, S, gathered in Table 3, it is possible to compare that it de-
creases substantially as temperature increases. At 70 °C and 75 °C the best Oo have been
obtained, as well as the lowest S. Thus, S decreases as higher is the temperature, which
indicates an increase in oxirane cleavage. Although Yoo was 74.8% with these conditions,
an interesting wt.% of Oo or EEW have obtained if they are compared to other reports.
Figure 4. Effect on Iodine value (IV) of the temperature (60 ◦C, 70 ◦C, and 75 ◦C) with MR 1.50 duringthe epoxidation process.
Regarding the formation of epoxy groups plotted in Figure 5, it increases as tem-perature increases, accelerating the kinetic of epoxidation to form oxirane oxygen [46].In the same way as with IV, the Oo slope is higher at the first 4 h of reaction whereas,after that time, this trend decreases. This reduction in reaction rate can be related to thedecomposition of peracetic acid, acetic acid, and hydrogen peroxide along the time [59].With the higher temperature (75 ◦C) studied, it is possible to obtain the highest value ofOo, 8.26 wt.%, or lowest EEW, 193 g·eq−1, obtaining a Yoo of 74.8%. An increase of 15◦Cfrom 60 ◦C to 75 ◦C contributes to an improvement of 25.7% for Oo. It should be noted thathigher temperatures and extended time, increase the Oo but can also cause a greater oxiranecleavage rate [44]. As Campanella et al. [60] and Gan et al. [61] studied for temperatureshigher than 75 ◦C in soybean and palm oil, respectively, the oxirane ring was destabilized,which slowed the growth of the conversion to epoxy groups, even reducing the oxiraneoxygen formed. In this sense, all temperatures studied showed almost no conversion toepoxy groups from 6 h onwards, being more pronounced with the temperature of 75 ◦C.For this reason, the authors did not consider it appropriate to carry out the epoxidationprocess at higher temperatures.
Materials 2022, 15, x FOR PEER REVIEW 11 of 19
Dinda et al. [44] used the same epoxidation method with cottonseed oil, reaching 4.96
wt.% for Oo with 80% for Yoo. Furthermore, Mungroo et al. [5] studied the epoxidation of
Canola oil using ion exchange resin as the catalyst, where 6.13 wt.% for Oo and 90% for Yoo
could be obtained. With the current values obtained with ECSO (8.26 wt.% for Oo or EEW
193 g·eq−1), it is possible to forecast that it could be an excellent EVO as an alternative to
the commercially available VO. A comparative example is found in the study carried out
by Samper et al. [62], where epoxidized soybean oil with EWW of 238 g·eq−1, is used to
manufacture a composite laminate with engineering applications. In addition, another ex-
ample is reported by Fombuena et al. [63], where green composites are manufactured us-
ing commercial epoxidized linseed oil with 8 wt.% as epoxy matrix. Therefore, the present
ECSO contains equal or even higher wt.% of Oo or lower EEW than the most commercially
available EVOs.
Figure 5. Effect on oxirane oxygen (Oo) of the temperature (60 °C, 70 °C, and 75 °C) using MR 1.50
during the epoxidation process.
3.4. FTIR Analysis
As an alternative to evaluating the characterization of the epoxidation reaction
through titration, FTIR spectroscopy is shown as an efficient tool for determining the rep-
resentative peaks. Figure 6 shows the spectrum of untreated CSO, taken as reference. The
characteristic peaks of double bonds are associated with 3010 cm−1 (=CH(v)) due to stretch-
ing of cis-olefinic bonds, 1652 cm−1 (C=C(v)) caused by stretching of disubstituted cis-ole-
fins, and 723 cm−1 (C=C(cis-δ)) due to the combination of out-of-plane deformation and rock-
ing vibration in cis-disubstituted olefins. Other characteristics peaks associated to methyl
and methylene groups are obtained from 2961 to 2851 cm−1 (-CH3(asym-v) and -CH2(sym and asym-
ν)) and from 1462 to 1375 cm−1 (-CH2(asym- δ) and –CH3(sym- δ)). Finally, the peak at 1743 cm−1
represents a carbonyl stretching (C=O(v)) of ester groups, and also the peak obtained at 821
cm−1 (C-O-C(v)) should be noted, barely visible in the untreated CSO but indicative of
oxirane oxygen. Compared to the characteristic peaks of untreated CSO described in the
literature, such as Timilsena et al. [64], a slight difference is shown due to the origin of
seed and climate conditions, which can influence the fatty acid composition.
Figure 5. Effect on oxirane oxygen (Oo) of the temperature (60 ◦C, 70 ◦C, and 75 ◦C) using MR 1.50during the epoxidation process.

Materials 2022, 15, 3250 11 of 19
Regarding the selectivity, S, gathered in Table 3, it is possible to compare that itdecreases substantially as temperature increases. At 70 ◦C and 75 ◦C the best Oo have beenobtained, as well as the lowest S. Thus, S decreases as higher is the temperature, whichindicates an increase in oxirane cleavage. Although Yoo was 74.8% with these conditions, aninteresting wt.% of Oo or EEW have obtained if they are compared to other reports. Dindaet al. [44] used the same epoxidation method with cottonseed oil, reaching 4.96 wt.% forOo with 80% for Yoo. Furthermore, Mungroo et al. [5] studied the epoxidation of Canolaoil using ion exchange resin as the catalyst, where 6.13 wt.% for Oo and 90% for Yoo couldbe obtained. With the current values obtained with ECSO (8.26 wt.% for Oo or EEW193 g·eq−1), it is possible to forecast that it could be an excellent EVO as an alternativeto the commercially available VO. A comparative example is found in the study carriedout by Samper et al. [62], where epoxidized soybean oil with EWW of 238 g·eq−1, is usedto manufacture a composite laminate with engineering applications. In addition, anotherexample is reported by Fombuena et al. [63], where green composites are manufacturedusing commercial epoxidized linseed oil with 8 wt.% as epoxy matrix. Therefore, thepresent ECSO contains equal or even higher wt.% of Oo or lower EEW than the mostcommercially available EVOs.
3.4. FTIR Analysis
As an alternative to evaluating the characterization of the epoxidation reaction throughtitration, FTIR spectroscopy is shown as an efficient tool for determining the representativepeaks. Figure 6 shows the spectrum of untreated CSO, taken as reference. The character-istic peaks of double bonds are associated with 3010 cm−1 (=CH(v)) due to stretching ofcis-olefinic bonds, 1652 cm−1 (C=C(v)) caused by stretching of disubstituted cis-olefins, and723 cm−1 (C=C(cis-δ)) due to the combination of out-of-plane deformation and rocking vibra-tion in cis-disubstituted olefins. Other characteristics peaks associated to methyl and methy-lene groups are obtained from 2961 to 2851 cm−1 (-CH3(asym-v) and -CH2(sym and asym-ν))and from 1462 to 1375 cm−1 (-CH2(asym-δ) and –CH3(sym-δ)). Finally, the peak at 1743 cm−1
represents a carbonyl stretching (C=O(v)) of ester groups, and also the peak obtained at821 cm−1 (C-O-C(v)) should be noted, barely visible in the untreated CSO but indicative ofoxirane oxygen. Compared to the characteristic peaks of untreated CSO described in theliterature, such as Timilsena et al. [64], a slight difference is shown due to the origin of seedand climate conditions, which can influence the fatty acid composition.
Materials 2022, 15, x FOR PEER REVIEW 12 of 19
Figure 6. FTIR spectrum of CSO.
The monitoring of the epoxidation reaction by FTIR spectroscopy at different MR and
temperatures has been focused on the characteristic peaks corresponding to double bonds
(Figure 7) and the plot evolution of the oxirane oxygen content (Oo) (Figure 8). All spectra
are obtained after 8 h of epoxidation reaction time. Figure 7a represents the plot evolution
of the peak at 3010 cm−1 (=CH(v)). It is possible to observe that the peak decreases drasti-
cally using MR 1.50 at 75 °C, which is in concordance with the analysis done by titration.
This indicates the low quantity of available doubles bonds after the epoxidation reaction.
Figure 7b,c show the graphical evolution of the peaks at 1652 (C=C(v)) and 723 cm−1 (C=C(cis-
δ)), respectively, with the same trend mentioned previously. In general, the characteristic
peaks of double bonds decrease when MR increase from 0.75 to 1.50 and the temperature
reaches 75 °C, obtaining fewer available double bonds.
Figure 7. FTIR spectra of ECSO obtained with different epoxidation conditions by the analysis of
characteristic peaks of the double bonds (a) 3010 cm−1 (=CH(v)), (b) 1652 cm−1 (C=C(v)) and (c) 723 cm−1
(C=C(cis-δ)).
Figure 6. FTIR spectrum of CSO.
The monitoring of the epoxidation reaction by FTIR spectroscopy at different MRand temperatures has been focused on the characteristic peaks corresponding to doublebonds (Figure 7) and the plot evolution of the oxirane oxygen content (Oo) (Figure 8).All spectra are obtained after 8 h of epoxidation reaction time. Figure 7a represents the

Materials 2022, 15, 3250 12 of 19
plot evolution of the peak at 3010 cm−1 (=CH(v)). It is possible to observe that the peakdecreases drastically using MR 1.50 at 75 ◦C, which is in concordance with the analysisdone by titration. This indicates the low quantity of available doubles bonds after theepoxidation reaction. Figure 7b,c show the graphical evolution of the peaks at 1652 (C=C(v))and 723 cm−1 (C=C(cis-δ)), respectively, with the same trend mentioned previously. Ingeneral, the characteristic peaks of double bonds decrease when MR increase from 0.75 to1.50 and the temperature reaches 75 ◦C, obtaining fewer available double bonds.
Materials 2022, 15, x FOR PEER REVIEW 12 of 19
Figure 6. FTIR spectrum of CSO.
The monitoring of the epoxidation reaction by FTIR spectroscopy at different MR and
temperatures has been focused on the characteristic peaks corresponding to double bonds
(Figure 7) and the plot evolution of the oxirane oxygen content (Oo) (Figure 8). All spectra
are obtained after 8 h of epoxidation reaction time. Figure 7a represents the plot evolution
of the peak at 3010 cm−1 (=CH(v)). It is possible to observe that the peak decreases drasti-
cally using MR 1.50 at 75 °C, which is in concordance with the analysis done by titration.
This indicates the low quantity of available doubles bonds after the epoxidation reaction.
Figure 7b,c show the graphical evolution of the peaks at 1652 (C=C(v)) and 723 cm−1 (C=C(cis-
δ)), respectively, with the same trend mentioned previously. In general, the characteristic
peaks of double bonds decrease when MR increase from 0.75 to 1.50 and the temperature
reaches 75 °C, obtaining fewer available double bonds.
Figure 7. FTIR spectra of ECSO obtained with different epoxidation conditions by the analysis of
characteristic peaks of the double bonds (a) 3010 cm−1 (=CH(v)), (b) 1652 cm−1 (C=C(v)) and (c) 723 cm−1
(C=C(cis-δ)).
Figure 7. FTIR spectra of ECSO obtained with different epoxidation conditions by the analysisof characteristic peaks of the double bonds (a) 3010 cm−1 (=CH(v)), (b) 1652 cm−1 (C=C(v)) and(c) 723 cm−1 (C=C(cis-δ)).
Materials 2022, 15, x FOR PEER REVIEW 13 of 19
On the other hand, the increase of MR from 0.75 to 1.50, leads to a higher intensity of
the oxirane oxygen group peak, (C-O-C(v)), located at 821 cm−1, following the same trend
as the titration method as it is observed in Figure 8a. This new molecular group, not de-
tectable in CSO, increases due to the insertion of oxygen into the double bonds through
peracetic acid formed by the epoxidation reaction process. In parallel form, in Figure 8b,
the same trend for the hydroxyl group (-OH(v)) can be observed at 3470 cm−1. In this case,
greater MR accelerates the presence of hydroxyl groups by oxirane ring decomposition in
the ECSO structure, as has been reported by Goud et al. [65]. The main reason is that the
great amount of hydrogen peroxide employed contributes to the epoxy group formation,
whereas another quantity is led to opening the oxirane ring obtaining hydroxyl groups
[45].
With regard to the temperature effect, the temperature at 75 °C increases the intensity
of the peaks corresponding to the hydroxyl group, compared with the MR effect. It indi-
cates that the opening of the oxirane ring is more pronounced at higher temperatures than
the MR ranges studied. This behavior has also been reported by Dinda et al. [44] during
cottonseed epoxidation, where the highest content of hydroxyl groups was obtained at 75
°C. In addition, this effect is increased with VOs with higher initial IV, which contributes
to obtaining a greater epoxy conversion as well as hydroxyl groups formation in a simul-
taneous process [66].
Figure 8. FTIR spectra of ECSO obtained with different epoxidation conditions by the analysis of
characteristics peaks of (a) oxirane oxygen, and (b) hydroxyl groups.
3.5. 1H NMR Analysis
1H NMR spectra were obtained to confirm the change of functional groups in ECSO
synthesized with the best conditions in the epoxidation process, i.e., MR 1.50 at 75 °C. In
Figure 9 the 1H NMR spectra of CSO and ECSO are plotted, showing a signal intensity (A)
at 5.3–5.5 ppm for CSO. This characteristic peak corresponds to vinyl hydrogens from
double bonds, which almost disappeared for the ECSO sample due to the conversion of
IV. This peak was split into two signals: on the one hand, a small signal of vinyl hydrogen
from double bonds located at 5.6 ppm, indicating that few double bonds remain after
epoxidation reaction as was corroborated by IV and FTIR; on the other hand, a signal at
5.3 ppm for the central hydrogen of the glyceride moiety [67]. In addition, two more sig-
nals were observed at 2.02 ppm (C), associated with hydrogen adjacent to double bonds,
and at 2.8 ppm (B), corresponding to allyl hydrogen between double bonds. After the
epoxidation process, the peak at 2.8 ppm disappeared completely to show a displacement
to 1.5 ppm (F) assigned to methylene hydrogens adjacent to oxirane groups in ECSO. The
newly formed group was also registered in two new peaks between 2.85–3.00 (E) and 3.00–
3.25 ppm (D) in ECSO. The first one corresponds to methylene hydrogens between two
Figure 8. FTIR spectra of ECSO obtained with different epoxidation conditions by the analysis ofcharacteristics peaks of (a) oxirane oxygen, and (b) hydroxyl groups.
On the other hand, the increase of MR from 0.75 to 1.50, leads to a higher intensityof the oxirane oxygen group peak, (C-O-C(v)), located at 821 cm−1, following the sametrend as the titration method as it is observed in Figure 8a. This new molecular group, notdetectable in CSO, increases due to the insertion of oxygen into the double bonds throughperacetic acid formed by the epoxidation reaction process. In parallel form, in Figure 8b,

Materials 2022, 15, 3250 13 of 19
the same trend for the hydroxyl group (-OH(v)) can be observed at 3470 cm−1. In this case,greater MR accelerates the presence of hydroxyl groups by oxirane ring decomposition inthe ECSO structure, as has been reported by Goud et al. [65]. The main reason is that thegreat amount of hydrogen peroxide employed contributes to the epoxy group formation,whereas another quantity is led to opening the oxirane ring obtaining hydroxyl groups [45].
With regard to the temperature effect, the temperature at 75 ◦C increases the inten-sity of the peaks corresponding to the hydroxyl group, compared with the MR effect. Itindicates that the opening of the oxirane ring is more pronounced at higher temperaturesthan the MR ranges studied. This behavior has also been reported by Dinda et al. [44]during cottonseed epoxidation, where the highest content of hydroxyl groups was obtainedat 75 ◦C. In addition, this effect is increased with VOs with higher initial IV, which con-tributes to obtaining a greater epoxy conversion as well as hydroxyl groups formation in asimultaneous process [66].
3.5. 1H NMR Analysis1H NMR spectra were obtained to confirm the change of functional groups in ECSO
synthesized with the best conditions in the epoxidation process, i.e., MR 1.50 at 75 ◦C. InFigure 9 the 1H NMR spectra of CSO and ECSO are plotted, showing a signal intensity(A) at 5.3–5.5 ppm for CSO. This characteristic peak corresponds to vinyl hydrogens fromdouble bonds, which almost disappeared for the ECSO sample due to the conversion of IV.This peak was split into two signals: on the one hand, a small signal of vinyl hydrogen fromdouble bonds located at 5.6 ppm, indicating that few double bonds remain after epoxidationreaction as was corroborated by IV and FTIR; on the other hand, a signal at 5.3 ppm for thecentral hydrogen of the glyceride moiety [67]. In addition, two more signals were observedat 2.02 ppm (C), associated with hydrogen adjacent to double bonds, and at 2.8 ppm (B),corresponding to allyl hydrogen between double bonds. After the epoxidation process, thepeak at 2.8 ppm disappeared completely to show a displacement to 1.5 ppm (F) assigned tomethylene hydrogens adjacent to oxirane groups in ECSO. The newly formed group wasalso registered in two new peaks between 2.85–3.00 (E) and 3.00–3.25 ppm (D) in ECSO.The first one corresponds to methylene hydrogens between two oxirane oxygen groups,whereas the second is related to hydrogens of the carbons of the new oxirane oxygengroup. The evidence of hydroxyl groups formed by the opening of the oxirane ring wasobserved in the 4–3.4 ppm region as was described by M. Farias et al. [68], who evaluatedthe epoxidation of soybean oil using a homogeneous catalyst such as molybdenum (IV)complex. In that study a lower conversion to oxirane oxygen and selectivity at 80 ◦C wasreported compared to this paper. The 1H NMR spectra obtained were consistent with theprevious analysis, confirming the formation of oxirane oxygen in double bonds of the ECSOsample as well as hydroxyl groups as a result of side-reactions.
3.6. Physico-Chemical Properties
Physico-chemical properties such as specific gravity, dynamic viscosity, and colorimet-ric coordinates have been measured before and after the epoxidation reaction process of theCSO at different MR and temperatures. These parameters can be taken as a quick and easymethodology to monitor the epoxidation process. Results obtained after 8 h of reactiontime are gathered in Table 4. With respect to specific gravity, low values in VO could beassociated with the presence of cis double bonds present in FA structure, which difficult thepackaging of the molecular chains [69]. The specific gravity value obtained in CSO, 0.9285,is in concordance with previous studies performed by Uzunova et al. [70] with valuesreported of 0.9288. As the epoxidation reaction advances and greater MR and temperaturesare employed to improve the reaction yield, the insertion of oxirane oxygen in the FAstructural chain increases the specific gravity of ECSO. Values reach up to 1.026, whichis 10.5% higher than untreated CSO. The epoxy groups contribute to increase molecularmass without significant change in its volume due to the variation from sp2 hybridizationof double bond (C=C) to sp3 hybridization of a single bond. This change improved chain

Materials 2022, 15, 3250 14 of 19
packing, even though the stress on the chains was increased by the insertion of epoxygroups [69].
Materials 2022, 15, x FOR PEER REVIEW 14 of 19
oxirane oxygen groups, whereas the second is related to hydrogens of the carbons of the
new oxirane oxygen group. The evidence of hydroxyl groups formed by the opening of
the oxirane ring was observed in the 4–3.4 ppm region as was described by M. Farias et
al. [68], who evaluated the epoxidation of soybean oil using a homogeneous catalyst such
as molybdenum (IV) complex. In that study a lower conversion to oxirane oxygen and
selectivity at 80 °C was reported compared to this paper. The 1H NMR spectra obtained
were consistent with the previous analysis, confirming the formation of oxirane oxygen
in double bonds of the ECSO sample as well as hydroxyl groups as a result of side-reac-
tions.
Figure 9. Comparison of CSO and ECSO by 1H NMR spectra.
3.6. Physico-Chemical Properties
Physico-chemical properties such as specific gravity, dynamic viscosity, and colori-
metric coordinates have been measured before and after the epoxidation reaction process
of the CSO at different MR and temperatures. These parameters can be taken as a quick
and easy methodology to monitor the epoxidation process. Results obtained after 8 h of
reaction time are gathered in Table 4. With respect to specific gravity, low values in VO
could be associated with the presence of cis double bonds present in FA structure, which
difficult the packaging of the molecular chains [69]. The specific gravity value obtained in
CSO, 0.9285, is in concordance with previous studies performed by Uzunova et al. [70]
with values reported of 0.9288. As the epoxidation reaction advances and greater MR and
temperatures are employed to improve the reaction yield, the insertion of oxirane oxygen
in the FA structural chain increases the specific gravity of ECSO. Values reach up to 1.026,
which is 10.5% higher than untreated CSO. The epoxy groups contribute to increase mo-
lecular mass without significant change in its volume due to the variation from sp2 hy-
bridization of double bond (C=C) to sp3 hybridization of a single bond. This change im-
proved chain packing, even though the stress on the chains was increased by the insertion
of epoxy groups [69].
Regarding the dynamic viscosity of untreated CSO, it depends on the presence of
unsaturations in the FA molecular chains. The presence of carbon-carbon double bonds
kinks the fatty acid chains, increasing the average distance between them [71]. Therefore,
an oil such as untreated CSO with high proportions of linolenic acid, i.e., a high amount
of double bonds, results in lower dynamic viscosity compared to more saturated vegeta-
ble oils with an average value of 32 mPa·s. In epoxidized samples, dynamic viscosity is
Figure 9. Comparison of CSO and ECSO by 1H NMR spectra.
Table 4. Comparative of physico-chemical properties of chia seed oil (CSO) and epoxidized chia seedoil (ECSO).
Sample SpecificGravity (ρr)
DynamicViscosity (mPa·s)
Colourimetric Coordinates ColourVariation (∆E)L* a* b*
CSO 0.9285 ± 2.2·10−3 32 ± 0.45 75.4 ± 0.21 −6.27 ± 0.30 31.5 ± 0.35 0ECSO MR 0.75 60 ◦C 0.9745 ± 1.2·10−3 109 ± 0.78 77.1 ± 0.28 6.73 ± 0.21 18.6 ± 0.21 18.4 ± 0.25ECSO MR 1.50 60 ◦C 0.9901 ± 2.3·10−3 163 ± 0.73 76.5 ± 0.23 2.91 ± 0.17 13.8 ± 0.49 19.9 ± 0.19ECSO MR 1.50 70 ◦C 1.0175 ± 1.7·10−3 420 ± 0.87 76.4 ± 0.28 −3.69 ± 0.35 4.47 ± 0.16 27.1 ± 0.44ECSO MR 1.50 75 ◦C 1.0260 ± 2.9·10−3 558 ± 1.02 79.6 ± 0.42 −2.85 ± 0.36 4.50 ± 0.21 27.5 ± 0.42
Regarding the dynamic viscosity of untreated CSO, it depends on the presence ofunsaturations in the FA molecular chains. The presence of carbon-carbon double bondskinks the fatty acid chains, increasing the average distance between them [71]. Therefore,an oil such as untreated CSO with high proportions of linolenic acid, i.e., a high amount ofdouble bonds, results in lower dynamic viscosity compared to more saturated vegetableoils with an average value of 32 mPa·s. In epoxidized samples, dynamic viscosity issubstantially higher as the performance of the epoxidation reaction progresses, reachingvalues of 558 mPa·s. These higher dynamic viscosities are ascribed to the increase ofmolecular weight and polarity in the structure compared to CSO, thus becoming strongerthe interaction between molecules [72]. In addition, this property could also be increased,especially at high temperatures, due to the opening of the oxirane ring to form hydroxyl,ketone, and carboxylic groups that increase the intermolecular bonding and, consequently,increase the viscosity [73].
Finally, the variation of the color as a consequence of the epoxidation process can beobserved in Figure 10. The untreated CSO is characterized by a yellow color, attributedto the high value of b* and L* (31.5 and 75.4 respectively), which are in concordancewith values reported by Timilsena et al. [57]. As the yield of the reaction progresses byincreasing the MR and the temperature, the greater presence of epoxy groups and lower IVin ECSO leads to decrease the yellow color, as it is possible to quantify by analyzing the b*parameter (decrease from 31.5 in CSO to 4.50 in ECSO). Regarding a*, a slightly reddish color(a* > 0) was observed in epoxidized samples with lesser epoxy groups (<6.3 wt.%) and

Materials 2022, 15, 3250 15 of 19
higher IV (>80 g I2/100 g of oil) such as MR 0.75 and 1.50 at 60 ◦C. As the epoxidationyield increases, a* decreases from 6.73 for ECSO MR 0.75 at 60 ◦C up to negative valuessuch as −3.69 and −2.85 for MR 1.50 at 70 ◦C and 75 ◦C, respectively, characterized by alightly green color. Alarcon et al. [74] reported pale-yellow color in both epoxidized Baruand Macaw vegetable oils with epoxy content of 5.98 wt.% and 5.39 wt.%, respectively,but with low IV content (<15 g I2/100 g of oil) regardless the initial color of virgin oil.Therefore, the change of color observed from yellow (CSO) to reddish or to pale-yellowof different epoxidized samples can be attributed to the final IV change, regardless of theepoxy content of the epoxidized sample. Besides, the brightness (L*) of ECSO slightlyincreases after each epoxidation process, where the highest value was obtained for MR1.50 at 75 ◦C. The noticeable color change can be quantified by analysing the color change(∆E). Aguero et al. [75] reported that a value greater than 5 implies a change visible tothe naked eye. In this case, an increase of noticeable color change has been observed forall epoxidation conditions (∆E > 5) compared to CSO, where no significant changes wereobserved between 70 ◦C and 75 ◦C.
Materials 2022, 15, x FOR PEER REVIEW 15 of 19
substantially higher as the performance of the epoxidation reaction progresses, reaching
values of 558 mPa·s. These higher dynamic viscosities are ascribed to the increase of mo-
lecular weight and polarity in the structure compared to CSO, thus becoming stronger the
interaction between molecules [72]. In addition, this property could also be increased, es-
pecially at high temperatures, due to the opening of the oxirane ring to form hydroxyl,
ketone, and carboxylic groups that increase the intermolecular bonding and, conse-
quently, increase the viscosity [73].
Table 4. Comparative of physico-chemical properties of chia seed oil (CSO) and epoxidized chia
seed oil (ECSO).
Sample Specific
Gravity (𝝆𝒓)
Dynamic
Viscosity
(mPa·s)
Colourimetric Coordinates Colour
Variation
(∆𝑬) L* a* b*
CSO 0.9285 ± 2.2·10−3 32 ± 0.45 75.4 ± 0.21 −6.27 ± 0.30 31.5 ± 0.35 0
ECSO MR 0.75 60 °C 0.9745 ± 1.2·10−3 109 ± 0.78 77.1 ± 0.28 6.73 ± 0.21 18.6 ± 0.21 18.4 ± 0.25
ECSO MR 1.50 60 °C 0.9901 ± 2.3·10−3 163 ± 0.73 76.5 ± 0.23 2.91 ± 0.17 13.8 ± 0.49 19.9 ± 0.19
ECSO MR 1.50 70 °C 1.0175 ± 1.7·10−3 420 ± 0.87 76.4 ± 0.28 −3.69 ± 0.35 4.47 ± 0.16 27.1 ± 0.44
ECSO MR 1.50 75 °C 1.0260 ± 2.9·10−3 558 ± 1.02 79.6 ± 0.42 −2.85 ± 0.36 4.50 ± 0.21 27.5 ± 0.42
Finally, the variation of the color as a consequence of the epoxidation process can be
observed in Figure 10. The untreated CSO is characterized by a yellow color, attributed to
the high value of b* and L* (31.5 and 75.4 respectively), which are in concordance with
values reported by Timilsena et al. [57]. As the yield of the reaction progresses by increas-
ing the MR and the temperature, the greater presence of epoxy groups and lower IV in
ECSO leads to decrease the yellow color, as it is possible to quantify by analyzing the b*
parameter (decrease from 31.5 in CSO to 4.50 in ECSO). Regarding a*, a slightly reddish
color (a* > 0) was observed in epoxidized samples with lesser epoxy groups (<6.3 wt.%)
and higher IV (>80 g I2/100 g of oil) such as MR 0.75 and 1.50 at 60 °C. As the epoxidation
yield increases, a* decreases from 6.73 for ECSO MR 0.75 at 60 °C up to negative values
such as −3.69 and −2.85 for MR 1.50 at 70 °C and 75 °C, respectively, characterized by a
lightly green color. Alarcon et al. [74] reported pale-yellow color in both epoxidized Baru
and Macaw vegetable oils with epoxy content of 5.98 wt.% and 5.39 wt.%, respectively,
but with low IV content (<15 g I2/100 g of oil) regardless the initial color of virgin oil.
Therefore, the change of color observed from yellow (CSO) to reddish or to pale-yellow
of different epoxidized samples can be attributed to the final IV change, regardless of the
epoxy content of the epoxidized sample. Besides, the brightness (L*) of ECSO slightly in-
creases after each epoxidation process, where the highest value was obtained for MR 1.50
at 75 °C. The noticeable color change can be quantified by analysing the color change (∆E).
Aguero et al. [75] reported that a value greater than 5 implies a change visible to the naked
eye. In this case, an increase of noticeable color change has been observed for all epoxida-
tion conditions (∆E > 5) compared to CSO, where no significant changes were observed
between 70 °C and 75 °C.
Figure 10. Influence of the MR and temperature on the color during the epoxidation process of the
chia seed oil (CSO). (a) Untreated chia seed oil (CSO), (b) ECSO MR 0.75 at 60 °C, (c) ECSO MR 1.50
at 60 °C, (d) ECSO MR 1.50:1 at 70 °C and (e) ECSO MR 1.50 at 75 °C.
Figure 10. Influence of the MR and temperature on the color during the epoxidation process of thechia seed oil (CSO). (a) Untreated chia seed oil (CSO), (b) ECSO MR 0.75 at 60 ◦C, (c) ECSO MR 1.50at 60 ◦C, (d) ECSO MR 1.50:1 at 70 ◦C and (e) ECSO MR 1.50 at 75 ◦C.
4. Conclusions
This research work assesses the development of a novel EVO obtained from chia seedoil (CSO). Previously to the epoxidation process, the fatty acid profile of CSO analyzed byGC showed polyunsaturated fatty acids (PUFAs) up to 84.9%, highlighting a proportionof α-Linolenic acid higher than 68.6%. These results make CSO an excellent candidate tobe an alternative to the current commercial epoxidized oils. Variables such as MR andtemperature have been studied in the epoxidation process. Results obtained with a MR 1.50provide more Oo caused by more peracetic acid formed that contributes to epoxy groupformation. In a second step, the effect of the temperature was evaluated at 60, 70, and75 ◦C. Epoxidation reaction at 75 ◦C provided the highest Oo (8.26 wt.%) and lowest EEW(193 g·eq−1) with conversion to oxirane of 74.8%, and the reduction of the iodine valuefrom 197 g I2/100 g oil up to 13.1 g I2/100 g oil, with a conversion for double bonds of93.4%. Although the conversion to oxirane is less than 90%, Oo obtained is similar to oreven higher than available commercial epoxidized vegetable oils. The use of higher ratiosof reactants and temperatures has not been carried out due to the problems provided byside-reactions as the oxirane ring cleavage, which reduces the efficiency of the process.The main functional groups formed by the epoxidation process have been confirmedby FTIR and 1H NMR spectroscopy, where both were in concordance with tendenciesobserved in the titration method. The influence of the epoxidation process in physico-chemical parameters such as specific gravity, dynamic viscosity, and color measurementhas been reported, demonstrating that these parameters, as well as FTIR studies, can beused for rapid monitoring of the reaction. Results indicate that the epoxidation processimplied a substantial increase in specific gravity and dynamic viscosity. All epoxidizedsamples showed an evident color variation (∆E > 5) from yellow (CSO) to light reddish forsamples with higher IV (>80 g I2/100 g of oil) or to pale-yellow for samples with lower IV(<35 g I2/100 g of oil), that can be ascribed to the final IV change of epoxidized samples.Therefore, it is possible to conclude that ECSO is a highly potential EVO considered analternative to the current epoxidized oils on the market, from an environmental point ofview, and with high interest to be used in the manufacture of polymers and biopolymers.

Materials 2022, 15, 3250 16 of 19
Author Contributions: Conceptualization, I.D.-C.; methodology, I.D.-C., A.L.-C. and S.C.C.; valida-tion, I.D.-C. and S.C.C.; formal analysis, I.D.-C. and A.L.-C.; investigation, I.D.-C.; resources, V.F.; datacuration, A.L.-C.; writing—original draft preparation, I.D.-C. and V.F.; writing—review and editing,S.C.C. and V.F.; visualization, J.L.; supervision, J.L. and V.F.; project administration, V.F.; fundingacquisition, I.D.-C., S.C.C., J.L. and V.F. All authors have read and agreed to the published version ofthe manuscript.
Funding: This research work was funded by the Ministry of Science and Innovation-“Retos de laSociedad”. Project reference: PID2020-119142RA-I00. I. Dominguez-Candela wants to thank Univer-sitat Politècnica de València for his FPI grant (PAID-2019- SP20190013) and Generalitat Valenciana(GVA) for his FPI grant (ACIF/2020/233).
Institutional Review Board Statement: Not applicable.
Informed Consent Statement: Not applicable.
Data Availability Statement: Not applicable.
Conflicts of Interest: The authors declare no conflict of interest.
Nomenclature
FTIR Fourier Transform InfraRed spectroscopy PUFA polyunsaturated fatty acidAMi atomic mass iodine (126.9 g/mol) S selectivityAMo atomic mass oxygen (16 g/mol) SFA saturated fatty acidB volume HBr for titration of blank (mL) T temperature (K)c normality thiosulfate (N) V volume HBr for titration of sample (mL)
CSO chia seed oil V1volume thiosulfate for titration blank(mL)
EEW epoxy equivalent weight (g·eq−1) V2volume thiosulfate for titration of sample(mL)
EVO epoxidized vegetable oil VO vegetable oilECSO epoxidized chia seed oil W amount of sample for epoxy content (g)FA fatty acids We weight of empty pycnometer (g)FAME fatty acids methyl esters Ws weight of the sample in pycnometer (g)GC gas chromatography Ww weight of water in pycnometer (g)IV iodine value XIV conversion of iodine value (%)IV0 initial iodine value (g I2/100 g oil) YOO oxirane oxygen yield (%)IVf final iodine value (g I2/100 g oil)m amount of sample in iodine value (g) Greek lettersMR molar ratio H2O2 to double bond ∆a difference of green to red (a*)MUFA monounsaturated fatty acid ∆b difference of blue to yellow (b*)Ni normality of HBr (N) ∆E color variationOo oxirane oxygen content (wt.%) ∆L difference of luminance (L*)Othe theorical maximum oxirane oxygen (%) ρr specific gravity
References1. Biermann, U.; Bornscheuer, U.; Meier, M.A.R.; Metzger, J.O.; Schäfer, H.J. Oils and Fats as Renewable Raw Materials in Chemistry.
Angew. Chem. Int. Ed. 2011, 50, 3854–3871. [CrossRef] [PubMed]2. Corma, A.; Iborra, S.; Velty, A. Chemical Routes for the Transformation of Biomass into Chemicals. Chem. Rev. 2007, 107,
2411–2502. [CrossRef] [PubMed]3. Bioplastics, E. Bioplastics Market Data. Available online: https://www.european-bioplastics.org/ (accessed on 19 April 2022).4. Danov, S.M.; Kazantsev, O.A.; Esipovich, A.L.; Belousov, A.S.; Rogozhin, A.E.; Kanakov, E.A. Recent advances in the field of
selective epoxidation of vegetable oils and their derivatives: A review and perspective. Catal. Sci. Technol. 2017, 7, 3659–3675.[CrossRef]
5. Mungroo, R.; Pradhan, N.C.; Goud, V.V.; Dalai, A.K. Epoxidation of Canola Oil with Hydrogen Peroxide Catalyzed by Acidic IonExchange Resin. J. Am. Oil Chem. Soc. 2008, 85, 887–896. [CrossRef]
6. Chieng, B.; Ibrahim, N.; Then, Y.; Loo, Y. Epoxidized Vegetable Oils Plasticized Poly (lactic acid) Biocomposites: Mechanical,Thermal and Morphology Properties. Molecules 2014, 19, 16024–16038. [CrossRef]
7. Sahoo, S.K.; Khandelwal, V.; Manik, G. Development of toughened bio-based epoxy with epoxidized linseed oil as reactivediluent and cured with bio-renewable crosslinker. Polym. Adv. Technol. 2018, 29, 565–574. [CrossRef]
8. Tee, Y.B.; Talib, R.A.; Abdan, K.; Chin, N.L.; Kadir Basha, R.; Md Yunos, K.F. Comparative Study of Chemical, Mechanical, Thermal,and Barrier Properties of Poly (Lactic Acid) Plasticized with Epoxidized Soybean Oil and Epoxidized Palm Oil. Bioresources 2015,11, 1518–1540. [CrossRef]

Materials 2022, 15, 3250 17 of 19
9. Xiong, Z.; Yang, Y.; Feng, J.; Zhang, X.; Zhang, C.; Tang, Z.; Zhu, J. Preparation and characterization of poly (lactic acid)/starchcomposites toughened with epoxidized soybean oil. Carbohydr. Polym. 2013, 92, 810–816. [CrossRef]
10. Jankovic, M.R.; Govedarica, O.M.; Sinadinovic-Fišer, S.V. The epoxidation of linseed oil with in situ formed peracetic acid: Amodel with included influence of the oil fatty acid composition. Ind. Crops Prod. 2020, 143, 111881. [CrossRef]
11. Carbonell-Verdu, A.; Bernardi, L.; Garcia-Garcia, D.; Sanchez-Nacher, L.; Balart, R. Development of environmentally friendlycomposite matrices from epoxidized cottonseed oil. Eur. Polym. J. 2015, 63, 1–10. [CrossRef]
12. Derawi, D.; Salimon, J. Optimization on Epoxidation of Palm Olein by Using Performic Acid. Eur. J. Chem. 2010, 7, 1440–1448.[CrossRef]
13. Garcia-Garcia, D.; Carbonell-Verdu, A.; Arrieta, M.P.; Loppez-Martinez, J.; Samper, M.D. Improvement of PLA film ductility byplasticization with epoxidized karanja oil. Polym. Degrad. Stab. 2020, 179, 109259. [CrossRef]
14. Sahoo, S.K.; Khandelwal, V.; Manik, G. Development of completely bio-based epoxy networks derived from epoxidized linseedand castor oil cured with citric acid. Polym. Adv. Technol. 2018, 29, 2080–2090. [CrossRef]
15. Vianello, C.; Piccolo, D.; Lorenzetti, A.; Salzano, E.; Maschio, G. Study of Soybean Oil Epoxidation: Effects of Sulfuric Acid andthe Mixing Program. Ind. Eng. Chem. Res. 2018, 57, 11517–11525. [CrossRef]
16. Zheng, J.L.; Wärnå, J.; Salmi, T.; Burel, F.; Taouk, B.; Leveneur, S. Kinetic modeling strategy for an exothermic multiphase reactorsystem: Application to vegetable oils epoxidation using P rileschajew method. AIChE J. 2016, 62, 726–741. [CrossRef]
17. Cai, X.; Ait Aissa, K.; Estel, L.; Leveneur, S. Investigation of the physicochemical properties for vegetable oils and their epoxidizedand carbonated derivatives. J. Chem. Eng. Data 2018, 63, 1524–1533. [CrossRef]
18. Shuttleworth, P.S.; Díez-Pascual, A.M.; Marco, C.; Ellis, G. Flexible bionanocomposites from epoxidized hemp seed oil thermoset-ting resin reinforced with halloysite nanotubes. J. Phys. Chem. B 2017, 121, 2454–2467. [CrossRef]
19. Chia Seeds Market Size Worth $4.7 Billion by 2025. Available online: https://www.grandviewresearch.com/press-release/global-chia-seeds-market (accessed on 15 April 2022).
20. Shen, Y.; Zheng, L.; Jin, J.; Li, X.; Fu, J.; Wang, M.; Guan, Y.; Song, X. Phytochemical and biological characteristics of mexican chiaseed oil. Molecules 2018, 23, 3219. [CrossRef]
21. Ullah, R.; Nadeem, M.; Imran, M.; Taj Khan, I.; Shahbaz, M.; Mahmud, A.; Tayyab, M. Omega fatty acids, phenolic compounds,and lipolysis of cheddar cheese supplemented with chia (Salvia hispanica L.) oil. J. Food Process. Preserv. 2018, 42, e13566. [CrossRef]
22. Nadeem, M.; Imran, M.; Taj, I.; Ajmal, M.; Junaid, M. Omega-3 fatty acids, phenolic compounds and antioxidant characteristics ofchia oil supplemented margarine. Lipids Health Dis. 2017, 16, 1–12. [CrossRef]
23. Dominguez-Candela, I.; Ferri, J.M.; Cardona, S.C.; Lora, J.; Fombuena, V. Dual plasticizer/thermal stabilizer effect of epoxidizedchia seed oil (Salvia hispanica L.) to improve ductility and thermal properties of poly (lactic acid). Polymers 2021, 13, 1283.[CrossRef]
24. Warwel, S. Complete and partial epoxidation of plant oils by lipase-catalyzed perhydrolysis. Ind. Crops Prod. 1999, 9, 125–132.25. Biermann, U.; Friedt, W.; Lang, S.; Lühs, W.; Machmüller, G.; Metzger, J.O.; Rüsch gen. Klaas, M.; Schäfer, H.J.; Schneider, M.P.
New syntheses with oils and fats as renewable raw materials for the chemical industry. Angew. Chem. Int. Ed. 2000, 39, 2206–2224.[CrossRef]
26. Wallace, J.C. Encyclopedia of Chemical Technology, 3rd ed.; John Wiley and Sons: New York, NY, USA, 1978; Volume 9.27. de Quadros, J.V.; Giudici, R. Epoxidation of soybean oil at maximum heat removal and single addition of all reactants. Chem. Eng.
Process. Process Intensif. 2016, 100, 87–93. [CrossRef]28. Okieimen, F.E.; Bakare, O.I.; Okieimen, C.O. Studies on the epoxidation of rubber seed oil. Ind. Crops Prod. 2002, 15, 139–144.
[CrossRef]29. Otabor, G.O.; Ifijen, I.H.; Mohammed, F.U.; Aigbodion, A.I.; Ikhuoria, E.U. Alkyd resin from rubber seed oil/linseed oil blend: A
comparative study of the physiochemical properties. Heliyon 2019, 5, e01621. [CrossRef]30. Benaniba, M.; Belhaneche-Bensemra, N.; Gelbard, G. Epoxidation of sunflower oil with peroxoacetic acid in presence of ion
exchange resin by various processes. Energ. Educ. Sci. Technol. 2008, 21, 71.31. Huang, Y.B.; Yao, M.Y.; Xin, P.P.; Zhou, M.C.; Yang, T.; Pan, H. Influence of alkenyl structures on the epoxidation of unsaturated
fatty acid methyl esters and vegetable oils. RSC Adv. 2015, 5, 74783–74789, (restar uno a todo a partir de aquí). [CrossRef]32. Sun, S.; Yang, G.; Bi, Y.; Liang, H. Enzymatic epoxidation of corn oil by perstearic acid. J. Am. Oil Chem. Soc. 2011, 88, 1567–1571.
[CrossRef]33. Sienel, G.; Rieth, R.; Rowbottom, K.T. Epoxides. In Ullmann’s Encyclopedia of Industrial Chemistry, 6th ed.; Wiley & Sons: Hoboken,
NJ, USA, 2003; Volume 12, pp. 269–284.34. Yadav, G.; Satoskar, D. Kinetics of epoxidation of alkyl esters of undecylenic acid: Comparison of traditional routes vs. Ishii-
Venturello chemistry. J. Am. Oil Chem. Soc. 1997, 74, 397–407. [CrossRef]35. Leveneur, S. Thermal safety assessment through the concept of structure–reactivity: Application to vegetable oil valorization.
Org. Process Res. Dev. 2017, 21, 543–550. [CrossRef]36. Moreno, V.C.; Russo, V.; Tesser, R.; Di Serio, M.; Salzano, E. Thermal risk in semi-batch reactors: The epoxidation of soybean oil.
Process Saf. Environ. Prot. 2017, 109, 529–537. [CrossRef]37. Tan, S.; Chow, W. Biobased epoxidized vegetable oils and its greener epoxy blends: A review. Polym.-Plast. Technol. Eng. 2010, 49,
1581–1590. [CrossRef]

Materials 2022, 15, 3250 18 of 19
38. Cai, X.; Zheng, J.L.; Aguilera, A.F.; Vernières–Hassimi, L.; Tolvanen, P.; Salmi, T.; Leveneur, S. Influence of ring-opening reactionson the kinetics of cottonseed oil epoxidation. Int. J. Chem. Kinet. 2018, 50, 726–741. [CrossRef]
39. Jadhav, P.D.; Patwardhan, A.V.; Kulkarni, R.D. Kinetic study of in situ epoxidation of mustard oil. Mol. Catal. 2021, 511, 111748.[CrossRef]
40. Sienkiewicz, A.M.; Czub, P. The unique activity of catalyst in the epoxidation of soybean oil and following reaction of epoxidizedproduct with bisphenol A. Ind. Crops Prod. 2016, 83, 755–773. [CrossRef]
41. Di Serio, M.; Russo, V.; Santacesaria, E.; Tesser, R.; Turco, R.; Vitiello, R. Liquid–liquid–solid model for the epoxidation of soybeanoil catalyzed by Amberlyst-16. Ind. Eng. Chem. Res. 2017, 56, 12963–12971. [CrossRef]
42. Wai, P.T.; Jiang, P.; Shen, Y.; Zhang, P.; Gu, Q.; Leng, Y. Catalytic developments in the epoxidation of vegetable oils and theanalysis methods of epoxidized products. RSC Adv. 2019, 9, 38119–38136. [CrossRef]
43. Goud, V.V.; Patwardhan, A.V.; Pradhan, N.C. Studies on the epoxidation of mahua oil (Madhumica indica) by hydrogen peroxide.Bioresour. Technol. 2006, 97, 1365–1371. [CrossRef]
44. Dinda, S.; Patwardhan, A.V.; Goud, V.V.; Pradhan, N.C. Epoxidation of cottonseed oil by aqueous hydrogen peroxide catalysedby liquid inorganic acids. Bioresour. Technol. 2008, 99, 3737–3744. [CrossRef]
45. Omonov, T.S.; Kharraz, E.; Curtis, J.M. The epoxidation of canola oil and its derivatives. RSC Adv. 2016, 6, 92874–92886. [CrossRef]46. Cai, C.; Dai, H.; Chen, R.; Su, C.; Xu, X.; Zhang, S.; Yang, L. Studies on the kinetics of in situ epoxidation of vegetable oils. Eur. J.
Lipid Sci. Technol. 2008, 110, 341–346. [CrossRef]47. Pérez, J.E.; Haagenson, D.; Pryor, S.; Ulven, C.; Wiesenborn, D. Production and characterization of epoxidized canola oil. Trans.
ASABE 2009, 52, 1289–1297. [CrossRef]48. Garea, S.-A.; Corbu, A.-C.; Deleanu, C.; Iovu, H. Determination of the epoxide equivalent weight (EEW) of epoxy resins with
different chemical structure and functionality using GPC and 1H-NMR. Polym. Test. 2006, 25, 107–113. [CrossRef]49. Durbetaki, A.J. Direct Titration of Oxirane Oxygen with Hydrogen Bromide in Acetic Acid. Anal. Chem. 1956, 28, 2000–2001.
[CrossRef]50. Kasote, D.M.; Badhe, Y.S.; Hegde, M.V. Effect of mechanical press oil extraction processing on quality of linseed oil. Ind. Crops
Prod. 2013, 42, 10–13. [CrossRef]51. Ixtaina, V.Y.; Martinez, M.L.; Spotorno, V.; Mateo, C.M.; Maestri, D.n.M.; Diehl, B.W.K.; Nolasco, S.M.; Tomas, M.C. Characteriza-
tion of chia seed oils obtained by pressing and solvent extraction. J. Food Compos. Anal. 2011, 24, 166–174. [CrossRef]52. La Scala, J.; Wool, R.P. Effect of FA composition on epoxidation kinetics of TAG. J. Am. Oil Chem. Soc. 2002, 79, 373–378. [CrossRef]53. Demin, M.; Rabrenovic, B.; Pezo, L.; Lalicic-Petronijevic, J. Influence of chia seeds (Salvia hispanica L.) and extra virgin olive oil
addition on nutritional properties of salty crackers. J. Food Meas. Charact. 2020, 14, 378–387. [CrossRef]54. Ayerza, R. Oil content and fatty acid composition of chia (Salvia hispanica L.) from five northwestern locations in Argentina. J. Am.
Oil Chem. Soc. 1995, 72, 1079–1081. [CrossRef]55. Kulczynski, B.; Kobus-Cisowska, J.; Taczanowski, M.; Kmiecik, D.; Gramza-Michalowska, A. The Chemical Composition and
Nutritional Value of Chia Seeds-Current State of Knowledge. Nutrients 2019, 11, 1242. [CrossRef]56. Imran, M.; Nadeem, M.; Manzoor, M.F.; Javed, A.; Ali, Z.; Akhtar, M.N.; Ali, M.; Hussain, Y. Fatty acids characterization, oxidative
perspectives and consumer acceptability of oil extracted from pre-treated chia (Salvia hispanica L.) seeds. Lipids Health Dis. 2016,15, 162. [CrossRef] [PubMed]
57. Timilsena, Y.P.; Vongsvivut, J.; Adhikari, R.; Adhikari, B. Physicochemical and thermal characteristics of Australian chia seed oil.Food Chem. 2017, 228, 394–402. [CrossRef]
58. Campanella, A.; Baltanás, M.A.; Capel-Sanchez, M.; Campos-Martin, J.; Fierro, J. Soybean oil epoxidation with hydrogen peroxideusing an amorphous Ti/SiO2 catalyst. Green Chem. 2004, 6, 330–334. [CrossRef]
59. Santacesaria, E.; Russo, V.; Tesser, R.; Turco, R.; Di Serio, M. Kinetics of performic acid synthesis and decomposition. Ind. Eng.Chem. Res. 2017, 56, 12940–12952, ((restar uno a partir de aquí). [CrossRef]
60. Campanella, A.; Baltanás, M.A. Degradation of the oxirane ring of epoxidized vegetable oils in liquid–liquid heterogeneousreaction systems. Chem. Eng. J. 2006, 118, 141–152. [CrossRef]
61. Gan, L.; Goh, S.; Ooi, K. Kinetic studies of epoxidation and oxirane cleavage of palm olein methyl esters. J. Am. Oil Chem. Soc.1992, 69, 347–351. [CrossRef]
62. Samper, M.D.; Petrucci, R.; Sanchez-Nacher, L.; Balart, R.; Kenny, J.M. Properties of composite laminates based on basalt fiberswith epoxidized vegetable oils. Mater. Eng. 2015, 72, 9–15. [CrossRef]
63. Fombuena, V.; Petrucci, R.; Dominici, F.; Jordá-Vilaplana, A.; Montanes, N.; Torre, L. Maleinized Linseed Oil as Epoxy ResinHardener for Composites with High Bio Content Obtained from Linen Byproducts. Polymers 2019, 11, 301. [CrossRef]
64. Timilsena, Y.P.; Vongsvivut, J.; Tobin, M.J.; Adhikari, R.; Barrow, C.; Adhikari, B. Investigation of oil distribution in spray-driedchia seed oil microcapsules using synchrotron-FTIR microspectroscopy. Food Chem. 2019, 275, 457–466. [CrossRef]
65. Goud, V.V.; Dinda, S.; Patwardhan, A.V.; Pradhan, N.C. Epoxidation of Jatropha (Jatropha curcas) oil by peroxyacids. Asia Pac. J.Chem. Eng. 2010, 5, 346–354. [CrossRef]
66. Kim, J.R.; Sharma, S. The development and comparison of bio-thermoset plastics from epoxidized plant oils. Ind. Crops Prod.2012, 36, 485–499. [CrossRef]
67. DeHonor-Marquez, E.; Nieto Alarcón, J.F.; Vigueras Santiago, E.; Hernández López, S. Effective and Fast Epoxidation Reaction ofLinseed Oil Using 50 wt% Hydrogen Peroxyde. Am. J. Chem. 2018, 8, 99–106.

Materials 2022, 15, 3250 19 of 19
68. Farias, M.; Martinelli, M.; Bottega, D.P. Epoxidation of soybean oil using a homogeneous catalytic system based on a molybdenum(VI) complex. Appl. Catal. A Gen. 2010, 384, 213–219. [CrossRef]
69. Harry-O’kuru, R.E.; Biresaw, G.; Tisserat, B.; Evangelista, R. Synthesis of Polyformate Esters of Vegetable Oils: Milkweed,Pennycress, and Soy. J. Lipids 2016, 2016, 3128604. [CrossRef]
70. Uzunova, G.; Nikolova, K.; Perifanova, M.; Gentscheva, G.; Marudova, M.; Antova, G. Physicochemical characterization of chia(Salvia hispanica) seed oil from Argentina. Bulg. Chem. Commun. 2016, 48, 131–135.
71. Wool, R.; Sun, X.S. Bio-Based Polymers and Composites; Elsevier: Amsterdam, The Netherlands, 2011.72. Wu, X.; Zhang, X.; Yang, S.; Chen, H.; Wang, D. The study of epoxidized rapeseed oil used as a potential biodegradable lubricant.
J. Am. Oil Chem. Soc. 2000, 77, 561–563. [CrossRef]73. Monono, E.M.; Haagenson, D.M.; Wiesenborn, D.P. Characterizing the epoxidation process conditions of canola oil for reactor
scale-up. Ind. Crops Prod. 2015, 67, 364–372. [CrossRef]74. Alarcon, R.T.; Gaglieri, C.; Lamb, K.J.; North, M.; Bannach, G. Spectroscopic characterization and thermal behavior of baru nut
and macaw palm vegetable oils and their epoxidized derivatives. Ind. Crops Prod. 2020, 154, 112585. [CrossRef]75. Agüero, A.; Morcillo, M.d.C.; Quiles-Carrillo, L.; Balart, R.; Boronat, T.; Lascano, D.; Torres-Giner, S.; Fenollar, O. Study of the
Influence of the Reprocessing Cycles on the Final Properties of Polylactide Pieces Obtained by Injection Molding. Polymers 2019,11, 1908. [CrossRef]