The effects of the coating stripping process on regenerated tool cutting edges
Upload
khangminh22Category
view
3download
0
ANODIC STRIPPING VOLTAMMETRY AT A GLASSY CARBON ELECTRODEFOR THE DETERMINATION OF PLATINUM SPECIES DERIVED
FROM CIS-DIAMMINEDICHLOROPLATINUM(II)
BY
DAVID REED ATHERTON
A DISSERTATION PRESENTED TO THE GRADUATE SCHOOLOF THE UNVERSITY OF FLORIDA IN
PARTIAL FULFILLMENT OF THE REQUIREMENTSFOR THE DEGREE OF DOCTOR OF PHILOSOPHY
UNIVERSITY OF FLORIDA
1984

Copyright 1984
by
David Reed Atherton

This work is dedicated to the late Henry Ornstein,who directed my natural curiosity into the fieldof chemistry.

ACKNOWLEDGEMENTS
I would like to thank all those whose efforts have made
my education possible and my stay enjoyable and enlight-
ening. Among those to be singled out are my parents for
their endless patience, understanding and enthusiasm as well
as support both moral and financial. Pam Vetro deserves a
special thanks for her encouragement and sacrifices toward
this goal. Gerhard Schmid has offered great assistance
throughout my stay. Susan Scherer did a fine job on the
artwork. Finally, I would like to thank Jeanne Karably for
the many hours of conversation that helped me keep my sanity
in Leigh Hall.

TABLE OF CONTENTS
Page
ACKNOWLEDGEMENTS iv
LIST OF TABLES vii
LIST OF FIGURES ix
ABSTRACT xi
CHAPTER
I INTRODUCTION 1
II CIS-DIAMMINEDICHLOROPLATINUM(II)
:
ANTI-CANCER DRUG 6
III CIS-DIAMMINEDICHLOROPLATINUM(II)
:
CHEMICAL COMPOUND 32
IV .THE PLATINUM ELECTRODE IN ACIDIC SOLUTIONS. . . 47
V ANODIC STRIPPING VOLTAMMETRY 6 3
Brief Introduction and History 63The Anodic Stripping Experiment 67The Deposition Step 72The Stripping Step 83
VI EXPERIMENTAL 129
Material and Reagents 129Equipment and Instruments 130Procedure 133
VII DATA, RESULTS AND DISCUSSION 143
Preliminary Investigations 143Preliminary ASV Experiments 153Carbon Electrode Evaluation 158Stripping Solution Optimization 161Conditioning of the Platinum Deposit 175Preliminary Deposition from Urine 182Preliminary Chelation Experiments 188Chloroplatinic Acid and its Dissolution .... 189

Chapter Page
Chelation Procedure Optimization 206Oxalic Acid as Stripping Solution Modifier. . . 216
VIII CONCLUSION 233
REFERENCES 236
BIOGRAPHICAL SKETCH 270

LIST OF TABLES
Table Page
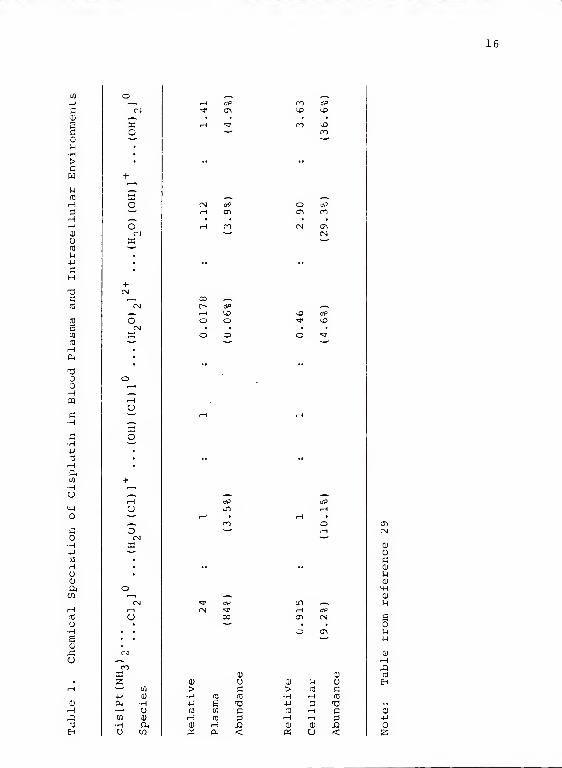
1. Chemical Speciation of Cisplatin in BloodPlasma and Intracellular Environments 16
2. Equilibrium Constants and Forward RateConstants for Cisplatin and Related Species . . 36
2 +3. Stability Constants of Some Pt Complexes . . 44
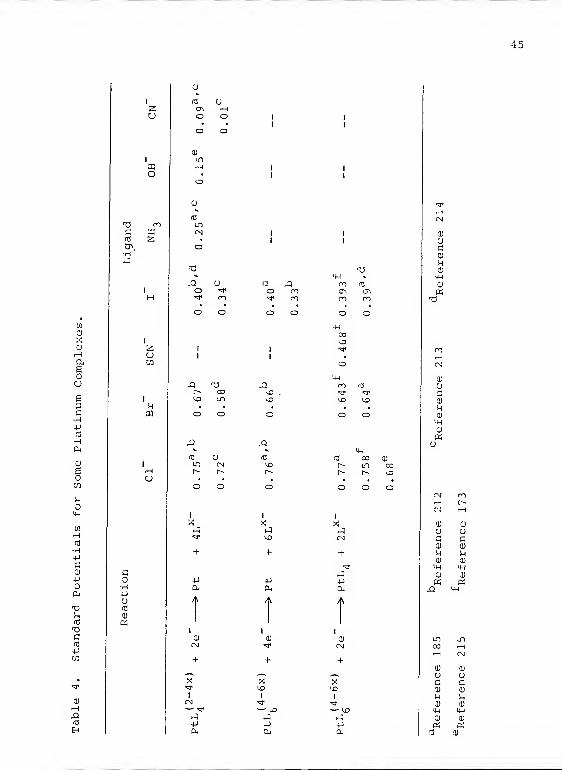
4. Standard Potentials for Some PlatinumComplexes 4 5
5. Status of the Platinum Electrode in AqueousAcid Solutions 52
6. Correlation Between Current and ElectrodeRotation Speed 147
7. Cyclic Voltammetric Data for 10 ppm Pt atSeveral Sweep Rates 149
8
.
Cyclic Voltammetric Peak Current Dependenceon Concentration of Cisplatin for SeveralScan Rates 151
9. Peak Currents Measured for Consecutive ASVExperiments without Surface Renewal 154
10. Peak Currents Measured for Consecutive ASVExperiments with Surface Renewal 157
11. Qualitative Evaluation of Stripping Media forPlatinum Redissolution 159
12. Peak Potentials for Platinum Oxidation andReduction in H„S0
4Solutions of Various pH as
Determined by Cyclic Voltammetry 172
13. Potential Program for Platinum Deposit Condi-tioning in 0.05 M H_S0
4177
14. Peak Heights and Peak Areas for a Series ofIdentical Experiments 178

LIST OF TABLES (continued)
Table Page
15. Deposition Currents and Relative StrippingPeak Heights for a Series of DepositionPotentials with Cisplatin as Analyte 180
16. Effect or Variation of Cisplatin Concen-tration on Relative Stripping Peak Height . . . 183
17. Qualitative Cyclic Voltammetric Evaluation ofElectrolytes for Chloroplatinic Acid Disso-lution and Subsequent Platinum Deposition . . . 195
18. Quantitative Evaluation of Electrolytes forChloroplatinic Acid Dissolution and SubsequentPlatinum Deposition 197
19. Evaluation of pH Dependence of the PtCltReduction Process 199
20. Aging Characteristics of Several AcidicBuffers with 19.3 ppm Pt added 204
21. Aging Characteristics of Several AcidicBuffers with 4.82 ppm Pt added 205
2-22. Dependence of the PtCl, Deposition Current
on Electrode Rotation Speed 207
23. Deposition Currents and Stripping Peak Heightsfor a Series of Deposition Potentials with
PtClg-
as Analyte 210
24. Results of Several Platinum ChelationProcedures with Cisplatin in 0.15 M NaCl asEvaluated by ASV 213
25. Results of Several Platinum ChelationProcedures with Spiked Urine Samples asEvaluated by ASV 215
26. Effects of Varying the Amount of ChelatingAgent on Platinum Recovery from Urine 217
27. Qualitative Results of Oxalic Acid Oxidationfor Quantitation of Platinum 225
LIST OF FIGURES
Figure Page
i. Structure of Cisplatin 14
2. Deoxyribonucleosides 18
3. Hydrolysis of cislatin and reactions of thehydrolysis products 35
4. Alignment of Pt (NH,. ) _C1,, toward positivelycharged electrode . . t 42
5. Cyclic voltammogram for a typical platinumelectrode in pure aqueous 0.5 M R_SO. .... 51
6. Differential pulse mode of the PAR Model 174 . 117
7. Cyclic voltammogram of 10 ppm Pt in0.15 M NaCl 145
8. I^et reductive current in 10 ppm Pt as afunction of electrode rotation speed 148
9
.
Cyclic voltammetric peak current dependenceupon sweep rate for 10 ppm Pt in 0.15 M NaCl . 15
10. Cyclic voltammetric peak current dependenceupon concentration of cisplatin for severalscan rates 152
11. Consecutive cyclic voltammograms of 25 ppm Ptsolutions at a carbon paste electrode .... 156
12. Differential pulse stripping curves for anuntouched glassy carbon surface 163
13. Cyclic voltammogram of platinum deposited onglassy carbon 167
14. Cyclic and DP voltammograms of platinumdeposited from 10 ppm Pt for 3 differenttimes 170

LIST OF FIGURES (continued)
Figure Page
15. DP voltammetric scans of platinum depositedfrom a cisplatin solution after conditioningCV scans 174
16. Effect of deposition potential on depositioncurrent and relative stripping peak height . . 181
17. Cyclic voltammograms of H„PtCl, in differentelectrolyte solutions 193
18. pH dependence of stripping peak height,pH 2 to 10 200
19. pH dependence of stripping peak height,pH 1 to 5 \ 201
20. Net deposition current in 10 ppm Pt as afunction of electrode rotation speed 209
21. Effect of deposition potential on deposition
current and stripping peak height, PtCl, asanalyte 211
22. Sequential cyclic voltammograms in PtCl^solution containing oxalic acid 218
23 Sequential cyclic voltammograms in PtCl,solution containing oxalic acid withdiffering cathodic conditions 221
24. Cyclic voltammograms obtained in oxalic acidsolution with a glassy carbon electrode bothwith and without a platinum deposit 227
25. Anodic DP voltammograms obtained in oxalicacid solution with a glassy carbon electrodeboth with and without a platinum deposit . . . 230
26. Anodic DP voltammograms obtained in oxalicacid solution with a glassy carbon electrodeboth with and without a platinum deposit . . . 232
Abstract of Dissertation Presented to the Graduate Schoolof the University of Florida in Partial Fulfillment of the
Requirements for the Degree of Doctor of Philosophy
ANODIC STRIPPING VOLTAMMETRY AT A GLASSY CARBON ELECTRODEFOR THE DETERMINATION OF PLATINUM SPECIES DERIVED
FROM CIS-DIAMMINEDICHLOROPLATINUM(II)
By
David Reed Atherton
August 1984
Chairman: Gerhard M. SchmidMajor Department: Chemistry
Following the administration of the anti-cancer drug
cis-diamminedichloroplatinum(II), plarinum is found through-
out the body as a number of species. The lack of platinum
deposition from untreated urine or from urine denatured with
acetonitrile or mineral acids led to the use of chelation by
sodium diethyldithiocarbamate followed by solvent extraction
using chloroform to isolate the platinum from urine. Evap-
oration of the solvent and digestion of the residue in aqua
regia was necessary to obtain a readily deposited form of
platinum, chloroplatinic acid. Redissolution in a pH 1.7,
0.1 M bisulfate/sulfate solution resulted in both a strongly
acidic buffer needed to prevent hydrolysis and a non-
complexing medium with optimum deposition characteristics.
Deposition from the hexachloroplatinate (IV) /buf fer
solution was performed at -0.2 V vs SCE, the most cathodic
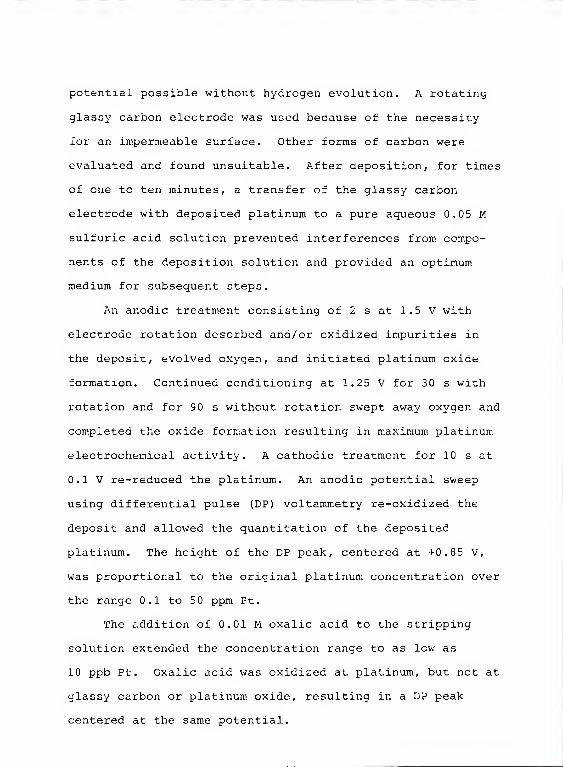
potential possible without hydrogen evolution. A rotating
glassy carbon electrode was used because of the necessity
for an impermeable surface. Other forms of carbon were
evaluated and found unsuitable. After deposition, for times
of one to ten minutes, a transfer of the glassy carbon
electrode with deposited platinum to a pure aqueous 0.05 M
sulfuric acid solution prevented interferences from compo-
nents of the deposition solution and provided an optimum
medium for subsequent steps.
An anodic treatment consisting of 2 s at 1.5 V with
electrode rotation desorbed and/or oxidized impurities in
the deposit, evolved oxygen, and initiated platinum oxide
formation. Continued conditioning at 1.25 V for 30 s with
rotation and for 90 s without rotation swept away oxygen and
completed the oxide formation resulting in maximum platinum
electrochemical activity. A cathodic treatment for 10 s at
0.1 V re-reduced the platinum. An anodic potential sweep
using differential pulse (DP) voltammetry re-oxidized the
deposit and allowed the quantitation of the deposited
platinum. The height of the DP peak, centered at +0.85 V,
was proportional to the original platinum concentration over
the range 0.1 to 5 ppm Pt.
The addition of 0.01 M oxalic acid to the stripping
solution extended the concentration range to as lew as
10 ppb Pt. Oxalic acid was oxidized at platinum, but net at
glassy carbon or platinum oxide, resulting in a DP peak
centered at the same potential.

CHAPTER I
INTRODUCTION
Cancer, the very word is capable of striking fear into
people everywhere. This disease, or more accurately group
of related diseases, and its causes and cures are common
news items. A 1975 National Institute of Health (NIH)
report stated that cancer is the number two cause of death
after heart disease (1) . One in four Americans will even-
tually die from some type of cancer (1) . The American
Cancer Society estimated that for 1982 there would be
835,000 newly diagnosed cancer cases and 430,000 deaths from
cancer (2) . Estimates for 1983 postulate over six hundred
thousand cases and over three hundred thousand deaths for
the eight most common cancers, including 117,000 deaths from
lung cancer, the most deadly form (3) . A unified war on
cancer was begun in 1971 when the National Cancer Act became
law, resulting in over $6 billion being spent to date (4)
.
The fight has not been without its successes. During
the 1970s, five year cures were developed for nearly a dozen
forms of cancer that had no cure before (4) . There are
three basic approaches to combating cancer once it has been
diagnosed. Radiotherapy, chemotherapy and surgery, either
alone or in combination, are used to help improve the

quality and increase the quantity of life of the cancer
patient.
Surgery usually meets with only partial success since
tumors often spread via lymph and blood circulation. Cancer
cells have lost shape specificity and thus lose adhesive
forces which normally bind cells. The result is that
cancerous cells break free and are carried from the tumor
site to lodge and multiply elsewhere. This process of
metastasis initiates new cancer growth and is responsible
for about 85% of cancer deaths (5)
.
Radiotherapy is the selective destruction of tumor
cells by either external or implanted radiation sources.
Since its inception in 1951 (6) cobalt-60 treatment of over
three million individuals has resulted in more than eleven
million patient-years of increased life expectancy (7)
.
Radiotherapy can cover a larger area of the body than
surgery but can not treat widespread metastases.
Chemotherapy for cancer began during World War II when
Dr. Charles B. Huggins showed that estrogen slowed the
growth of prostate cancer (8) . Drugs can be distributed
throughout the body by using the cancer patient's circula-
tory system. In this manner the chemotherapeutic agent can
locate a single cell, since even cancer cells require a
blood supply. There are noxv about 40 government-approved
anti-cancer drugs in general useage. There is but one
member of this group that is based on a heavy metal (9)
.
This lone inorganic compound is the object of this study.

The compound cis-diamminedichloroplatinum (II) , also
known as platinol and DBP but in the U. S. most commonly as
cisplatin, is a simple complex of divalent platinum. It can
be monitored by analytical techniques useful for platinum
itself as well as for the molecule. Atomic absorption
spectroscopy and high performance liquid chromatography are
two commonly used methods. This study was undertaken in
hopes of providing an alternative procedure.
The clinical monitoring of platinum in either blood
plasma or urine suggests an electrochemical technique
because of the high salt content of both solutions. The
electroanalytical methods' relative indifference to the
often confounding matrices of high salt content promises a
simpler procedure. Urine is an especially attractive
medium. It can be considered an almost protein-free ultra-
filtrate of the blood plasma (10) . Thus urinary platinum
levels would be closely related to unbound, active drug
concentrations in the blood.
Electroanalytical chemistry consists of three primary
branches, potentiometry , coulometry and voltammetry (11).
Dating from the 1920s and Heyrovsky's invention of the
polarographic technique, voltammetry is conceptually quite
simple. As the name implies, the current-potential behavior
of an analyte is measured. In practice, the potential is
varied in a systematic manner so as to cause electroactive
species to be either reduced or oxidized. The resultant

current gives information concerning the amount of the
analyte present.
A wide variety of voltammetric experiments may be done,
depending on how the potential is varied and the current
measured. Sensitivity is limited to solutions of about 10~ 5
moles per liter (M) for the simplest analysis techniques
— 7 —8(12, 13) or about 10 to 10 M with instrumentally more
complex procedures (12) . Currents due to processes other
than those of the analyte (s) represent the lower bound to a
useful signal. The effect of most of this background noise
has been compensated for in the more instrumentally elab-
orate techniques, thus giving the lower detection limits.
The remaining method to increase the signal to noise- ratio,
thus improving the sensitivity or detection limit, is by
increasing the signal. Preconcentration of the analyte (s)
will increase the analytical signal (12, 14). In using
electrochemical methods to preconcentrate by factors of
about 100 to over 1000, stripping voltammetry has an extra
experimental step which distinguishes it from other electro-
analytical methods (15) . One of the many available voltam-
metric techniques is subsequently used to electrochemically
strip the accumulated material from the electrode to com-
plete the analyses. Stripping voltammetry is divided into
anodic (ASV) and cathodic (CSV) variations depending on
whether the preconcentrated material is stripped by an
oxidative (anodic) or reductive (cathodic) path.
Accumulation by reduction and analysis by oxidation
will be employed in the quantitation of platinum. Anodic
stripping voltammetry is the technique of choice for several
reasons, including its sensitivity. Wang recently noted
"... there is no technique for trace metal analysis that
can compete with ASV on the basis of sensitivity per dollar
investment" (16, p. 104A) . ASV is the most sensitive
electrochemical technique (17) , determining concentrations
lower than any other electrochemical method (18) . It was
recently stated by Bond that "... there is no doubt that
this is the most sensitive polarographic [voltammetric]
method available . . ." (19, p. 439). In addition to being
capable of measuring concentrations as low as 10~ M (12,
20, 21) to 10-11
M (15), ASV can offer, as well, a degree of
selectivity because of the preconcentration step. Instru-
mentation is also inexpensive to buy and operate, easy to
use and the results are precise, accurate and rapidly
obtained (22)
.

CHAPTER II
CIS-DIAMMINEDICHLOROPLATINUM(II)
:
ANT I-CANCER DRUG
Cisplatin is now an established anti-cancer drug. The
v/ork in the early and mid 1960s which led tc this present
use is another example of serendipity in science and medi-
cine.
Barnett Rosenberg of Michigan State, at the time a
physicist, thought that the spindle fiber alignment during
mitotic cell division resembled lines of magnetic force like
those seen when ircn fillings are placed arcund a magnet
(23). His initial study was on the effects of an external
electromagnetic field upon cell division. His fortuitous
use of platinum electrodes for their inertness and of a
1000 hz alternating current to prevent electrolysis or
electrode polarization led to interesting and unexpected
results (24) . The Escherichia Coli bacteria used in prelim-
inary studies to check out the apparatus and culture media
did not divide normally, but continued to grow nonetheless.
Some eventually formed filaments up to 300 times normal
length (24). A long, careful series of control experiments
showed that the alternating current had not caused the
unusual growth but had caused the platinum electrodes io
dissolve to the extent of about 10 parts per million (ppm)
platinum (24) . The ammonium chloride in the particular
growth medium had led to the formation of (NH.)„FtCl, (24).4 2. 6
This compound was able to photochemically react to form any
of several compounds of the general formula
[Pt(NH3
) nCl
6 _n ]
(2-n) ", n=l, 2 or 3 (25). Rosenberg and
coworkers showed that Pt(NH.)2Cl., formed after UV light
irradiation, was the active compound (25, 26). By testing
the synthetic isomers of Pt(NH_)9Cl
4and the related plat-
inum (II) salts Pt(NH3
)
2Cl
2, it was established that only the
cis forms were active (25, 26).
.It was reasoned that since cell division, but not
growth, was stopped perhaps these compounds would prove
effective against cancerous cells, the most rapidly dividing
cells in an organism. The first results were reported in
1969 by Rosenberg and associates using cisplatin (27) . The
dosage level that killed half a sample (LD,..) of Swiss white
mice was determined to be 14 mg kg-
. Levels below the LDj- n
were then tested for tumor growth inhibitory action against
transplanted Sarcoma 180 (one of about 100 standard test
tumors) . Tumor growth was almost completely inhibited at
8 mg kg , which was less than LD,Q
(27) . A further study
by Rosenberg and VanCamp showed even more encouraging
results (28) . Even after the tumor had grown to a very
large size after eight days, a single intraperitoneal
injection of 8 mg kg of cisplatin caused complete rec
sion in nearly 100% of the test mice. These papers by

Rosenberg and coworkers trace the early development of this
now potent anti-cancer agent.
At this point in time, work with cisplatin had expanded
and other groups were involved in the late 1960s. Different
types of transplantable tumors (29, 30) as well as tumors
induced by carcinogens (31) or viruses (32) were studied and
the results reported. The outcomes of these investigations
were positive and spurred additional inquiries. Analogs of
cisplatin were soon considered (33-37). Scores of compounds
with either substitution of chloride by other halides,
nitrate, nitrite and other singly charged aniens or substi-
tution of ammonia were investigated. Amines including C_-C.
n-alkyl, C^-C^ iso-alkyl, C2~C 8 alicyclic and C,-C
7hetero-
cyclic amines and some diamino alkanes, aromatics and
cycloalkanes have ail shown activity (9) . These active and
many more inactive analogs have undergone scrutiny in the
search for second generation drugs based on platinum.
Generally the most satisfactory results were obtained with
the parent compound, which continued to be studied
primarily.
Summarizing nearly a decade of research on analogs of
his original compound, Rosenberg in 1979 gave the following
observations on platinum compound antineoplastic activity:
i. the complex should be electrically neutral,
ii. not all the ligands should leave or exchange,
iii. the 2 mono- or 1 bidentate leaving group (s)
should be in the cis positions,
iv. the tightly bound ligand(s) should be a
substitutional^ inert amine, and
v. the leaving ability of the labile ligand(s)
should be of intermediate lability (38).
Cleare has published a number of papers on the structure-
activity relationships of platinum compounds and summarizes
much of what has been done to this time in a recent review
(9) . Seeking to find compounds with the same activity but
decreased toxicity, or with an increased spectrum of activ-
ity is the goal of studies of cisplatin analogs.
By the time the parent compound had been submitted to
the National Cancer Institute (NCI) for human clinical
trials, over 140,000 other compounds had been screened for
anti-cancer activity (39) of which only 20 were inorganic
(40) . The Division of Cancer Treatment of the NCI approved
the start of human trials in 1971 (41). NCI drug research
is designed to run as a linear array (42) . A detailed
explanation of the phases of human trials in drug research,
with emphasis on cisplatin, can be consulted (43) . Follow-
ing the initial screening and preclinical investigations
with animals to determine formulations, toxicities and
pharmacology, Phase I studies begin.
Phase I studies are intended to learn how to use a
drug, find the maximum dose level tolerated at a given
schedule and evaluate any side effects (44, 45). Patients
in these trials have tumors which have shown resistance to
all other drugs and they are usually terminally ill. They

10
must have normal organ functions and have an estimated
survival of more than two months. Even so, promising
results are not expected due to the advanced stage of the
disease. Initial doses are developed from results of animal
tests. An example of a Phase I study with cisplatin used a
dose of one sixth the minimum lethal dose in dogs for the
45 human subjects (46, 47). The reports of this study show
that all the patients experienced nausea and vomiting, most
suffered kidney damage and nine of eleven with testicular
cancer had some response to drug treatment. Kidney damage,
due to strong binding at the membrane of the proximal
tubules, slowed the early human research (48). Neverthe-
less, sufficient progress was made and significant responses
to the drug were seen so that Phase II trials were begun in
1975 (23)
.
Phase II trials are designed to screen for any clinical
activity when the drug is nearly optimally used (45). Five
slow growing and five fast growing types of cancer and about
15 to 30 patients with each type are evaluated for tumor
regression, cell cycle sensitivity and mechanism of the
drug's action (43). During these trials, careful controls
are made with regard to patient histories, treatments and
side effects encountered. Information obtained from Phase I
studies allows the response to the drug to be more reliably
monitored because adverse effects are generally understood
and held to a minimum.

11
Following, or often running simultaneously, are Phase
III studies. These trials are designed to compare the
responses to a new drug to those of established regimes
(45) . The new agent is also evaluated in combination with
existing drugs. Combination therapy has the advantage of
several modes of action but generally decreased toxicities.
Upon successful completion of these trials, the drug is
recommended for general usage.
Success in the three phases of clinical evaluation led
to the approval of cisplatin as a human anticancer agent.
Government approval came in the United States by the Food
and Drug Administration (FDA) in December 1978 and in the
United Kingdom by the Department of Health and Social
Security in March 1979 (49) . By this time the NCI had
screened 1055 different platinum complexes with about 18%
showing some activity (50) . In the battle to control the
more than 100 different cancers over 300,000 compounds had
been screened by the time cisplatin was added to the approx-
imately 40 other drugs in general, approved usage (51)
.
In addition to the strictly clinical work which has
resulted in the present status of cisplatin, investigations
have also been carried out in related areas to broaden the
understanding of the drug. Studies designed to learn about
the mechanism (s) of action, to understand the pharmaco-
kinetics of the drug distribution and to further the
knowledge of toxic side effects have all been undertaken in
conjunction with clinical work or as separate experiments.

12
In the course of these and future determinations concerning
cisplatin and second generation analogs, methods to analyze
for the amount of platinum present are needed.
It is important to establish a drug's mechanism(s) of
action in order to obtain guidelines for optimal use of the
drug and to help in the design of more effective analogs.
The total action of the drug and the reaction of the body is
divided into three stages (52) . First the drug must be
transported to the site of action. During this process, the
compound may undergo structural modification. Metabolic
processes or a change in the chemical environment can
contribute to these alterations. In addition the drug may
be reversibly or irreversibly bound, possibly rendering it
ineffective, or it may be excreted. The second stage is the
inhibition of biochemical pathways leading to the desired
and any side effects. The third stage of drug action is
recovery of the body from the drug's effects. This recovery
may be due to elimination of the drug, repair mechanisms
which excise the affected areas, or by-passing of the
altered pathway or drug action site. Drug actions differ
from the actions of pathogens primarily in that the net
result is beneficial to the organism acted upon by the
agent. Mechanisms may be quite similar.
The best mechanistic conclusions arise from a consider-
able body of information obtained from researchers in many
related fields. A thorough knowledge of chemical, physical
and physiological properties of the drug is required to

13
ascertain its mechanism (s) of action. Physiological proper-
ties of cisplatin will be considered in this chapter with
details of the underlying chemical and physical properties
to follow in a subsequent chapter. As the relationships
between the physiological properties and the chemical and
physical characteristics are not completely separable, some
directly relevant characteristics of the compound will be
introduced here.
The structure of the cis-diamminedichloroplatinum (II)
molecule as determined by Truter and Milburn (53) may be
seen in Figure 1. The two ammonia ligands are tightly bound
while the chloride ligands are labile. In aqueous solution,
both chloride ions are slowly lost from the co-ordination
2 +sphere of the central Pt ion and are replaced by either
water or hydroxide. This equilibrium is effected by the
presence of chloride ion in the solution and the concentra-
tion of chloride ion determines the species distribution.
Due to the relatively high concentration of chloride ions in
the blood plasma (about 103 mil) , the cis- platin molecule
retains its chloride ions and remains elec- trically neu-
tral. It has been shown that the principal form of free
platinum in the blood and urine is the unchanged drug (54)
.
Because of the concentration gradient and the neutral
molecule's lipid solubility, the molecule is able to diffuse
unaided by cellular mechanisms or energy through the cell
membrane into cells (55). This physical transport, without
cellular intervention, is called passive diffusion (56).

o<
CO
14
I
in
I
G•H-P
dHCLwHu4-1
o
d)
s-i
o4J
opn-p
en
d)
n
enH

15
Within the cell, the molecule encounters a relatively
low chloride ion concentration of about 4mM. In this medium
the equilibrium is shifted and hydrolysis takes place (55,
57, 58). Following hydrolysis, deprotonation can take place
resulting in any of several species (38) . Equilibrium
calculations considering the concentration of chloride ions,
a body temperature of 37 °C, and a pH of 7.4 show that 84% of
the drug remains intact in the plasma compared to only 9.23%
in cells (59). The total speciation can be seen in Table 1.
Once inside the cell and hydrolyzed, the compound is
capable of binding to the various molecules it encounters.
The DNA molecule, with its alternating deoxyribose sugars
and phosphates groups as the backbone and purine and pyri-
midine bases as linking groups, provides several possible
binding sites (60). Pascoe and Roberts showed that DNA is
the predominantly bound intracellular molecule when they
obtained the following binding data (61)
:
Macromolecule DNA mRNA rRNA tRNA proteins
Pt per molecule 22 0.125 0.033 0.00067 0.00067
No evidence of platinum binding to ribose rings at either
the ring oxygen or at the exocyclic hydroxyl groups has been
found in any investigation of DNA, RNA or their constituent
parts (59). There is also no evidence of platinum-phosphate
group interactions with natural DNA or RNA (59). The strong
nucleophilicity of the nitrogen atoms of the organic base
groups enables binding to selectively occur at these points
on the DNA strand (60, 62). Base site binding is not unique
16
+>
ain
HuM-l
o
ao•H-P
Hu<u
ftw
EC
17
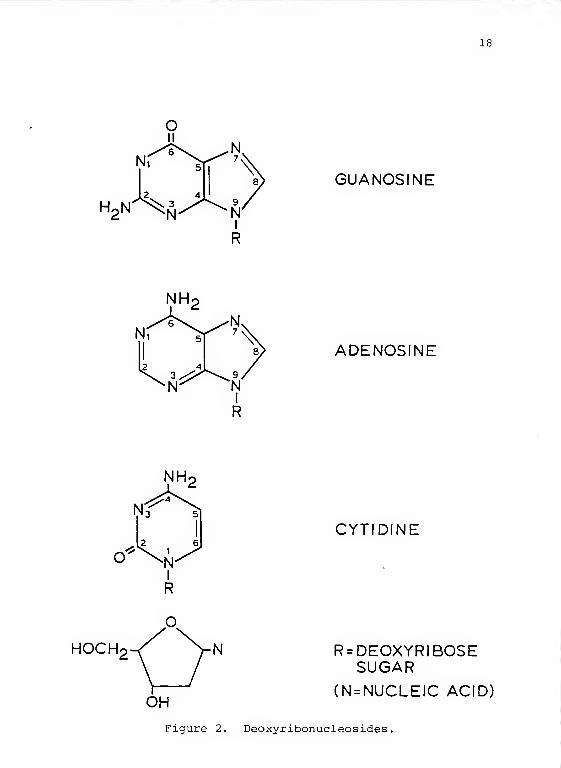
to any nucleic acid site but occurs with all nucleic acids
with the exception of thymine (36). Formation constants for
the binding of hydrolyzed cisplatin to the remaining DNA
9nucleic acids have been determined to be 1.06 x 10 for
4 4guanosine, 6.6 x 10 for cytosine and 2.4 x 10 for adeno-
sine (62) . The interaction is strongest and most rapid with
guanosine (G) (36, 58, 63) and takes place more slowly with
cytosine (C) and adenosine (A) (58, 64). Some evidence,
while confirming preferential guanosine binding, concludes
more binding at adenosine than cytosine (65, 66) . The
preferential binding of the divalent platinum species to one
site of the guanosine molecule is the important biochemical
reaction. See Figure 2 for DNA component structures.
A potentiometric study using cisplatin and DNA demon-
strated that both chloride ions were released in the binding
process but only one from the inactive trans configuration
of diamminedichloroplatinum (II) (67). That the chloride
ions must be lost intracellularly was shown when little and
2 +nonselective binding was seen when cis-Pt (NH.. ) „ was used
instead of cis-Pt (NH.. ) -CI- (66). Many studies have been
conducted that conclude the N(7) site of guanosine to be the
platinum binding site. Spin-spin counting by means of
195 1Pt - H NMR was used by Kong and Theophanides (68)
.
Using fast atom bombardment mass spectrometry, a reaction
product of [Pt (NH_ ) „ (G) „] Cl~ was isolated with the binding
occurring at the N(7) sites (69). An X-ray structure was
2
2+obtained for [Pt(en) (G)~] , where en represents the
18
H2N^ GUANOSINE
ADENOSINE
HOCH
CYTIDINE
R = DEOXYRIBOSESUGAR
(N = NUCLEIC ACID)
Figure 2. Deoxyribonucleosides
19
bidentate ethylenediammine molecule, which showed each
guanosine was bound at its N(7) site (70). Binding of
cisplatin to structurally similar adenosine has been shown
to be at the N(7) position and also at N(l) (71). The
cisplatin molecule is able to bind to two different sites as
a result of its two labile chloride ions. Completion of the
binding to the DNA molecule at a second site is the
determining factor in the anti-cancer activity.
It has been suggested that the 0(6) position in the
sane guanosine molecule could act as the second site for
platinum binding (72) . This location is known to be
involved in the hydrogen bonding between base pairs of
associated single DNA strands (72) . More evidence has been
gathered to suggest that the bidentate juncture is completed
when a second, adjacent guanosine is bound at its N(7) site
(73). The N(7) location is not involved in Watson-Crick
model base pairing (70) and so is more available than the
(6) position.
Studies with polymers of G-C segments or long strings
of guanosine followed by strings of cytidine demonstrated
that more platinum incorporation occurred with sequential
guanosine molecules than with alternating guanosine mole-
cules (74). These buoyant density studies, when extended to
DNA, showed increased platinum binding with increased
guanosine content (74) . NMR investigations showed adjacent
guanosines bound at their N(7) positions when cisplatin and
the CCGG unit were mixed (75) . Enzymatic fractionation of
20
the DNA-cisplatin reaction product showed platinum bound to
adjacent guanosines (76, 77) and also to guanosines separ-
ated by an unbound nucleoside (77)
.
The binding of platinum to DNA results in several
molecular changes. The DNA double helix has been observed
to shorten, change its viscosity which implies a change in
shape, unwind and rewind, form microloops, change its
denaturation melting curves and increase in sensitivity to
single-strand specific enzymes (78) . These results are
evidence of changes in the interstrand linkage (78)
.
Binding of the intracellular cisplatin species tc the N(7)
position of a guanosine nucleoside results in the loss of
hydrogen bonding between the guanosine and its associated
cytidine on the opposite strand. From pyrolysis mass
spectrometry experiments, the G-C base pairing perturbation
is in evidence as the increase in magnitude of the guanosine
and cytidine peaks compared to the peaks due to adenosine
and its associated thymidine, which do not change (79). A
second, adjacent guanosine on the same strand has its N(7)o
site approximately 3 . 4A from the first N(7) position (80).
As seen in Figure 1, the chloride-chloride distance and thuso
the required binding site separation is 3.3A. This further
supports the supposition of bidentate binding of the cis-
platin species between N(7) atoms of adjacent guanosine
nucleosides en a single strand of DNA. Interstrand cress-
linking has been shown to occur in only one of 150 bound
platinum atoms in vivo (81). The intrastrand attachment of

21
the cisplatin species is able to prevent the crosslinking of
complementary strands necessary for the formation of the DNA
double helix and thus inhibit the synthesis of DNA (82-87)
.
Several reviews cover the subject of cisplatin binding to
nucleic acids and DNA in considerable detail (59, 87-89).
The first report of cisplatin inhibition of DNA syn-
thesis in vivo was in 1970 (90) . Since that time, DNA
synthesis inhibition has become generally accepted as the
mode of antitumor activity. As Roberts said in a 1982
review on cisplatin, "Selective inhibition of DNA synthesis
appears to be the most likely biochemical lesion leading to
cell death" (91, p. 110). It has been reported that cis-
platin can kill cells in all stages of the cell cycle (92) .
2 +The spontaneous dissociation of cis-Pt (NH., ) » leaving DNA is
extremely slow at 37 C C (93) and changing the surrounding
chloride ion concentration has no effect on the rate (94).
Although platinum is not lost from DNA in vitro (95) , there
is evidence that platinum is removed from DNA in growing
cells following a single treatment with cisplatin (95, 96).
Nondividing cells can enzymatically excise platinum and
eliminate 50% of an initial dose in ^28 hours (95). Cell
recovery and survival depends on the ability to remove bound
platinum and thus repair DNA damage (91, 95). The exhibited
toxicity of the drug in cancer cells is manifested in the
differences between cancerous and normal cells. It is
widely held that the breakdown of processes to repair damage
to DNA, such as caused by cisplatin binding, is a major

22
factor in the transformation of normal cells to cancerous
cells. Cisplatin has been shown to be exceptionally toxic
to mutants with known DNA repair deficiencies (97-101)
.
This has been demonstrated using Chinese hamster ovary cells
in which 80% of normal cells compared to a small proportion
of mutant cells were able to fix DNA damage (101) and also
in human skin cells (99)
.
DNA replication is inhibited at therapeutic doses of
cisplatin while RNA and protein synthesis is affected only
at near lethal doses (102, 103). The 1970 paper by Harder
and Rosenberg is the first report of DNA synthesis inhibi-
tion in human cells in culture (102). One molecule of
cisplatin per 1000 DNA base sites is enough for biological
inactivation of the DNA molecule (104). Cytotoxicity of the
drug depends on the extent of reaction with DNA, the capa-
city of the particular cell to excise damage from the
template DNA and the ability of the cell to synthesize DNA
even with the damage. Any differences are reflected in the
sensitivity of various cell types to cisplatin. The drug
does not work equally well in all parts of the body (91)
.
The best results have been with testicular and ovarian
cancers. The initial approval in 1978 was for treatment of
these two forms of cancer (105). Very good results have
also been obtained in the treatment of bladder cancer (106)
and head and neck cancers (107) . Durant described the
developments in chemotherapy for bladder and head and neck
cancers as a change from previously resistant to presently
23
responsive (108). The U.S. FDA approved the use of
cisplatin against advanced bladder cancer in early 1982
(105) . Other significant outcomes with cisplatin treatment
have been with cervical and prostatic cancers, which have
progressed from unresponsive to resistant (108) . Unfortun-
ately, cisplatin is the only highly active drug available
for the treatment of advanced cervical cancer (109) . A
noncancer application was recently reported as 92.5% of mice
infected with a Trypanosoma parasite were freed of the
infestation (110).
Testicular cancers represent about 1% of all male
malignant tumors (111, 112), are the most common solid
tumors in 15 to 35 year olds (113) and the most deadly form
of cancer in 25 to 34 year olds (112) . Before the availa-
bility of cisplatin, 90% of patients with advanced non-
seminomatous testicular cancer died (113). Cisplatin is
most commonly used in combination with the more established
drugs vinblastin and bleomycin against testicular cancers.
A group of 47 patients treated with this regime had 34 com-
plete and 13 partial remissions for a 100% response rate
(114) . Results from a number of treatment centers in the
years 1975-1978 showed 63 complete and 53 partial remissions
for an 89% response rate in the 130 patients (115) . The
same synergistic treatment produced 132 disease-free
patients out of 171 admitted with disseminated testicular
cancer in a study reported in 1981 (116) . About 70% of all
testicular cancer patients and nearly 100% of those with

24
early or intermediate cancer can now be expected to live
(113).
Ovarian cancer is the most fatal gynecological malig-
nancy and estimates are that 1 in 100 American women will
die from it (23) . Early treatments using cisplatin showed
significantly better results compared to previously used
drugs (117, 118). In the years 1975 to 1979, 235 women were
treated with cisplatin with 28% showing complete or partial
remission (119). With various combination chemotherapies,
all including cisplatin, 52% of 251 women responded to
treatment in the years 1977 to 1979 (119). In mere recent
studies using cisplatin only for advanced ovarian cancer in
women with no prior treatment (a truer estimate of a drug's
effectiveness) , 50% of the women responded for an average of
12.5 months (120) .
As with virtually all chemotherapeutic agents used
against cancer, cisplatin has by virtue of its cytotoxic
nature undesirable side effects. Nausea and vomiting
accompany cisplatin use in most patients, commencing 1 to 2
hours after a dose (41, 83, 121) and lasting for 4 to 6
hours (121). This situation is often ameliorated by slow
infusion of the drug over a 24-hour period (122) . These and
other adverse effects are dose dependent and often dose
limiting. In some situations the patient will refuse
further treatment because of the severity of nausea and
vomiting. In other cases, treatment must be discontinued
because of one of several cumulative side effects.
As was mentioned earlier, kidney damage was encountered
in preliminary testing on humans and slewed the initial
applications research. The damage to kidney function,
causing a decrease in the filtering capacity of the kidneys,
has now largely been controlled (41, 48, 83, 123, 124).
Hydration of the patient by infusion of normal saline for
several hours before drug administration followed by the use
of mannitol to force diuresis was discovered in 1977 to
markedly decrease kidney damage (123). Only 5 to 10% of all
patients experience nephrotoxicity under this treatment -co
increase urine production (125) . There are about 1 1/4 mil-
lion nephrons in each kidney (56). The proximal tubules are
the nephronic subunits responsible for the majority of the
reabsorption of water, electrolytes and nutrients from the
blood (56). Renal damage occurs in the area where the
platinum concentration is the highest, in the proximal
tubules (126) . Although no change in kidney function or
urine composition is seen until after about 3 days (127)
,
light microscope evaluations of the damage in humans have
shown it to persist for at least 12 months following treat-
ment (128) .
Hydration and diuresis before, during and after cis-
platin administration has reduced the incidence and severity
of nephrotoxicity by reducing the urinary platinum concen-
tration (124) and decreasing the renal residence time of the
drug (129). This mode of treatment does not affect the
total urinary excretion of platinum, the tissue distribution

26
of the drug or the rate of elimination (124) . Because of
the life-threatening effects of compromised kidney function
such as excessive loss of magnesium and calcium (hypcmag-
nesemia has been seen in 50% of patients in some cases
(130)) or inadequate elimination of urea (hyperuricemia),
other strategies have been advanced. Chelation therapy with
diethyldithiocarbamate administered shortly after the drug
appears to prevent binding of the platinum species in the
kidney (131-134) . Sodium thiosulfate inactivates cisplatin
if mixed in solution but if injected one hour before the
drug it decreases renal damage (135) . By using the circad-
ian rhythm of urine volume to naturally decrease platinum
concentration in the kidney, toxicity has been reduced (136,
137) . A recent review covers the area of nephiotoxicity of
cisplatin (124) .
An often seen, non-life-threatening side effect is
hearing loss. Ototoxicity appears as hair cell loss in
rhesus monkeys (138) and hair cell loss with some scarring
in early as three days after dosage in guinea pigs (139) . A
study in 1974 found hearing loss at 2 kHz in 4 patients, at
4kHz in 14 patients and at 8 kHz in 18 patients in a group
of 30 (140) . Monitoring of the patient for any hearing loss
and discontinuation of cisplatin treatment if it is found,
is an effective deterrent. In about 30% of all patients
(41) hearing loss occurs in the range of 4 to 8 kHz, above
spoken language (41, 44, 83, 141). The loss is

27
irreversible, cumulative and can progress into the spoken
range of 1 to 4 kHz if the drug regime is not altered (44)
.
Physiological studies on a number of different types of
laboratory animals have shown no effect of cisplatin on
blood pressure or blood pressure regulation, heart rate,
respiration, EEG, neuromuscular transmission, muscle con-
traction, spinal reflex or body temperature regulation
(142) . Toxicities which occasionally appear are related to
the drug's mode of action. The faster growing tissues in
the body are sometimes damaged by cisplatin. The intestinal
mucosa and villi are rapidly growing tissues; nausea and
vomiting are signs of gastrointestinal distress. The bone
marrow is another area of very active cell growth and anemia
can often result from cisplatin treatment (143) . Other
areas, such as the lymphoid tissues, can be damaged as well.
Careful monitoring of body platinum levels is necessary to
best avoid these toxic side effects.
Cisplatin rapidly binds to blood proteins and is also
quickly eliminated, at least partially. The drug can enter
target cells and be an effective cytotoxin only if it
remains unbound. When a cisplatin/ serum protein complex was
made and injected into rats, the tightly bound drug proved
to be an insignificant reservoir of the drug (144) . The
concentration of free cisplatin is of primary importance.
Three hours after an IV bolus injection (^10 minute infu-
sion) only about 10% of the drug remains unbound (145, 146).

28
Ultimately up to 9 7% of the serum concentration may be
protein bound platinum (84).
The total body load of platinum is reduced through a
two step or bi-phasic elimination. This can be expressed
mathematically as:
Rate of elimination = Ae + Ee
. . 0.693where t, ,„ =1/2 ,a
a
a * 0.693and 4/2,3= ——
p
Reported values for the half-life of the initial, rapid
elimination of cisplatin from the blood plasma include about
30 minutes (146), 25 to 49 minutes (147), 23 minutes (148)
or 28 minutes (149). Other values reported for t, ,„ fall1/2 ,a
in the same range of one half to three quarters of an hour.
The second, much slower phase, follows the first and because
of much lower concentrations, data are imprecise. Values
of t1
,„ have been variously reported as 4 to 5 days (146),
58 to 73 hours (147), 67 hours (10) or 42.2 hours (148).
Traces of platinum have been found in the body up to
4 months after dosage (149). The first process is a combin-
ation of plasma protein binding, tissue absorption and
urinary excretion (of which little takes place initially)
.
The second process is primarily elimination from the body
through the urine, the other two courses being essentially
completed. Values measured for urinary excretion rates
include 17% in the first 4 hours (10) and 18 to 34% (147),
23% (10) and 20 to 30% (150) in the first day. Plasma

29
levels of platinum can range from a peak value of about
30 uM or 6 ppm (107) to zero. Blood plasma analysis can
lead to varying concentrations because of the rapid physical
and physiological processes.
There is not a selective uptake of cisplatin by any
particular type of tissue. Platinum has been found almost
everywhere in the body. A typical therapeutic dose of cis-
platin gives a concentration of platinum of about 1 ppm or
5 uM in tumor cells (151). Within normal body components,
the highest concentrations are in the liver (152-154),
kidney (152, 154) and intestines (152, 153). Very low
levels in the brain imply poor drug penetration of the
central nervous system (152, 154). Sensitive analytical
methods must be used to quantitate the small amounts of
platinum.
Several instrumental techniques have been used ih
cisplatin analysis by determining the concentration of
platinum. X-ray fluorescence, which gives total platinum
concentration, has been used and has a limit of detection
(LOD) of about 240 ppb (parts per billion) and a linear
dynamic range (LDR) of 570 to 5700 ppb (145). A molecular
fluorescence method to determine platinum bound to DNA uses
ethidium bromide, which also binds to DNA, as a fluorophore
(155). Because of the competition for binding sites, a
decrease in the fluorescence signal corresponds to an
increase in the amount of bound platinum. With a limit of
detection of about 1 platinum per 250 nucleic acids and a

30
linear relationship between fluorescence and bound platinum
up to 1 platinum per 5 nucleic acids, this is a very useful
technique for binding studies. High performance liquid
chromatography (HPLC) has been used in the determination of
several forms of platinum, using several detection methods.
Cisplatin and its metabolites were determined directly
from urine by complexation, extraction into chloroform,
injection onto the HPLC of the chloroform extract and UV
detection of the complex (156). Urine concentrations of 25
ppb were determined with 2.5% precision and 4% accuracy
(156). Platinum drug species have been determined by HPLC
with electrochemical detection (LCEC) . Using reductive LCEC
for untreated urine samples at mercury electrodes (157) or
either reductive or oxidative LCEC for filtered plasma
samples at glassy carbon electrodes (158), platinum
concentrations as low as 100 ppb have been measured.
Another HPLC method used either on line UV detection or off
line atomic absorption (AA) for platinum quantitation (159).
AA was also used in conjunction with an ion exchange chroma-
tographic separation to obtain unbound drug concentrations
as low as 40 ppb, with an LDR up to 2 ppm (160) .
Atomic absorption spectroscopy, in the flameless or
furnace mode, is probably the most widely used method for
platinum determination in cisplatin treatments. Depending
on sample preparation techniques, results can be total,
bound or filterable, or unbound platinum (161). Using
different degrees and methods of sample digestion, tissues

31
(162-164) and fluids (162, 165-167) have been successfully
analyzed with LOD ' s as low as 30 ppb (162, 163).
In addition to the specialized reviews of cisplatin
binding (59, 87-89) and nephrotoxicity (124), a number of
generalized reviews are available. A 1974 book (43) and a
more recent monograph (108) have appeared. An annual volume
on cancer chemotherapy has contained a section on cisplatin
each year since its inaugural issue in 1979 (91, 107, 119,
168). Reviews also periodically appear in journals (115,
121, 143, 151, 169)
.

CHAPTER III
CIS-DIAMMINEDICHLOROPLATINUM(II)
:
CHEMICAL COMPOUND
In order to develop an analytical method for the
determination of platinum originating as the drug cis-
diamminedichloroplatinum (II) , a survey of various proper-
ties of this compound was undertaken. Considering that
ultimately the drug and its metabolites were to be studied
in body fluids and that the analytical method was to be an
electrochemical technique, information deemed pertinent to
these areas was selectively obtained.
Dichlorodiarnmineplatinum (II) was first reported in 1845
by Peyrone (170) . It was Werner in 18 93 who first
distinguished two isomers by their distinct reaction pro-
ducts (171) . He assigned each isomer a different name and
more importantly described the geometries we are familiar
with today. The cis form is the therapeutically active
compound and will be primarily considered in this discus-
sion.
Cis-diamminedichloroplatinum (II) , or cisplatin, is
stable in powder form for over 2 years in a cool, dark place
and at least a year at room temperature (172) . The solid is
only slightly soluble in water. Values reported in the

33
literature include 2.2 g L (35) and 0.2523 g per 100 g
water at 25°C (173) . In pure aqueous solution the compound
hydrolyzes, the labile chloride ions being replaced by water
molecules. A 500 ppm aqueous solution of platinum as
cisplatin will hydrolyze to the extent of 10% within 40 min-
utes; a 50 ppm solution takes 60 minutes (174) . Isomeriza-
tion of cisplatin was measured at 20 °C in aqueous solution
and found to proceed by a first order process with a rate
-3 -1constant of 1.06 + 0.08 x 10 min (175). This reaction
represents another mechanism for the loss of therapeutic
activity and suggests that aqueous solution of the drug must
be used within a short time period.
With the addition of chloride ions, hydrolysis slows
and solubility at first decreases. In a 0.006 M solution of
KC1, the cisplatin solubility has decreased by 15% compared
to pure water (176) . The maximum decrease in solubility of
19% is seen at 0.015 and 0.030 M KC1, then the solubility
continually increases with increasing amount of chloride
(176). The solubility reaches that of pure water at ^ 0.8 M
KC1 and increases to 0.385 g per 100 mL in 4 M KC1 solution
(176) . The decrease in solubility was attributed to a shift
in the equilibrium of the hydrolysis reactions and the
increase to ion-dipole interactions, considering the cis-
platin molecule as a dipole (176). With 0.1% added chloride
a 500 ppm solution will take 6 hours instead of 40 minutes
to hydrolyze by 10% (174). In half normal saline (0.45%
chloride medium) less than a 5% loss will be noted for a

34
500 ppm solution (174). Using normal saline (0.15 M NaCl) a
1000 ppm solution will hydrolyze only about 3% at equilib-
rium, which is reached in less than an hour (177) and less
than 2% if protected from light (172) . While the addition
of chloride protects the drug from hydrolysis, the chloride
slowly replaces one of the ammonia ligands resulting in an
increase in pH (176) .
The hydrolysis of cisplatin proceeds in two steps,
consisting of the sequential replacement of the chloride
ions by water molecules. The cis configuration is retained
in the singly charged chloro-aquo compound as well as in the
doubly charged di-aquo compound. The water molecules bound
to the platinum can deprotonate resulting in three
additional species. A summary of the reactions of cisplatin
and accompanying thermodynamic data is shown in Figure 3 and
Table 2. Calculations based upon these equilibrium data
show that relatively little dissociation should take place
in the high chloride ion concentration and near neutral pH
of the blood plasma. Supporting data have been given in
Table 1. For preliminary studies, chloride ion concentra-
tions of 0.15 M, corresponding to normal saline, in neutral
solution should sufficiently mimic blood plasma.
During an anodic stripping vcltammetry experiment, the
analyte is first preconcentrated by reduction onto or into
the working electrode. The standard potential demonstrates
the feasibility of the procedure under expected conditions,

35
ta
+J
o
-3
ua,
in
•Hen
as

36
Table 2. Equilibrium Constants (K) and Forward RateConstants (k) for Cisplatin and Related Species asseen in Figure 3.

37
cis Pt(NH3
)2Cl
2+ 2e~^=Pt + 2NH + 2Cl~
E° = +0.49V [1] (185)
.
A recent patent was issued for a process which utilizes
cisplatin in a NaCl solution to obtain electroplated plati-
num (186). Oxidation of the drug will also occur as seen
from the standard potential of a possible product,
cis Pt(NH.)_Cl. + 2e~ cis Pt (NH- ) „Cl n + 2C1~J Z 4 ^ .} z £.
E° = +0.69V [2] (173,185)
This could interfere with subsequent anodic steps of the
experiment if the parent compound is present. In 1 M
chloride solution, the oxidation of cisplatin to cis
Pt(NH_)2Cl, was observed to occur at +0.70 V and the reverse
reduction occurred at +0.62 V (187).
In early platinum electrodeposition studies, primarily
for the platinization of platinum electrodes, it was found
that small quantities of lead acetate improved the overall
characteristics of the deposit (188, 189). Addition of lead
-3 -4acetate in the range of 10 to 10 M shifts the cathodic
current-voltage curve anodically by 100 to 200 mV (189)
,
increases the platinum deposition rate (189) and improves
the adherence and smoothness of the plate (188). One source

recommends a solution 3.5% (0.072 M) in platinum
(chloroplatinic acid) and 0.005% (1.3 x 10~ 4M) in lead
acetate (189). Perhaps the addition of similar amounts of
lead acetate will likewise enhance the present analysis.
A considerable number of electrochemical studies have
been done on complexes of platinum and in particular on
cis-diamminedichloroplatinum(II) . The majority of the work
has been polarographic , but electrodes other than the
dropping mercury electrode (DME) have been used.
Chakravarty and Banerjea found that cisplatin in 0.1 M KC1
had a polarographic half-wave potential (E ) of
approximately -0.1 V vs SCE (saturated calomel electrode)
(190). They further noted that the reaction was
irreversible. Kivalo and Laitinen found an E., /0 of about
-0.2 to -0.25 V vs SCE in 1.0 M NaCl (191). When they used
a rotating platinum electrode ins'tead of a DME, the E.. . was
about -0.35 V. Sundholm, using stationary electrode polaro-
graphy or linear sweep voltammetry, determined that both
peak current and peak potential varied with scan rate (192) .
He obtained the following data for a fresh 10 M cisplatin
solution in 1 M NaClO,,,4'
scan rate i e
-1P P
10 mVs 5.5 pA -0.15 V vs SCE
100 16.5 -0.25

39
This and additional data for different scan rates indicate
an irreversible electrode reaction.
These researchers all noticed a minimum in the reduc-
tion wave in the polarograms and voltammograms of cis-
diamminedichloroplatinum(II) but not for the trans form of
the complex (190, 191, 193). This observation led to
mechanistic studies and proposals by Sundholm. When gelatin
(a surface-active agent) v/as added in increasing amounts, a
continual decrease in the polarographic current before the
minimum was seen for the cis form (193). This inhibition of
the reduction process was also noticed more for the cis
complex when both cis and trans were studied in aged or
hydrolyzed solutions (193) .
Sundholm hypothesized that a direct interaction between
the unhydrolyzed cis compound and the electrode had taken
place (194). Inspection of the molecular structure, as seen
in Figure 1, leads to the conclusion that the cis configura-
tion is a dipole with the chloride side of the molecule the
negative end of the dipole. The trans molecule is not a
dipole. A study of the conductivity of cisplatin solutions
in NaCl showed a decrease for about one hour before stable
readings, 2 to 4% lower at 25 °C and 7 to 9% lower at 37 °C,
were achieved (195) . No such change in conductivity was
observed for the trans molecule. The authors attributed the
decrease to ion-dipole association, with only the cis form
capable of it (195) . Polarographically , at the potential
where reduction first begins to occur for cisplatin, the
40
mercury drop is positively charged since this potential is
positive of the zero point of charge (zpc) (196) . The
negative end of a dipole, the chlorides of cisplatin, will
be oriented toward the positive electrode surface. Reduc-
tion of the central platinum ion could take place via
chloride ion bridges (197, 198).
By measuring the polarographic drcp time as a function
of potential and plotting the resultant electrocapillary
curves for NaCIO solutions with and without added cis-
platin, Sundholm concluded that cisplatin is adsorbed (199)
.
The observed negative shift in the maximum of the curve
(electrocapillary maximum or ECM) with cisplatin present is
accounted for by adsorption of the molecule on the drop's
surface (199). Sundholm' s studies with linear sweep vol-
tammetry showed electrode coverages due to adsorption of
1 to 2% of a monolayer by trans Pt(NH_)2Cl„ (192) compared
to 60-70% for the cis isomer (194) . As the potential scan
continues beyond the zpc and the electrode surface becomes
negatively charged, the cisplatin dipole reorients. Without
the chloride bridges to the electrode surface, reduction is
more difficult. The reduction rate and resultant current
decrease and a current minimum is observed due to the
hindered electron transfer to the platinum ion (194) .
Most complexes of divalent platinum are square planar,
2dsp , with an unhybridized 6p orbital perpendicular to the
plane of the ligands (200) . This configuration holds for

41
Pt(NH3
)
2Cl
2and could provide an alternate means of platinum
reduction through the p orbital as seen in Figure 4 (201) .
This suggestion supports the observation that trans
Pt(NH3
)2Cl
2does not experience the polarographic minimum
the cis compound does due to electrode surface charge
reversal. The lack of a preferential orientation toward the
electrode surface in the trans configuration explains wh^ it
is not affected by surface charge or replacement of chloride
by water (hydrolysis) . The reduction inhibition in
hydrolyzed cisplatin solutions observed by Sundholm (193)
could also be explained by lack of preferential orientation
of the p^ orbital in a molecule without a dipole.
Investigations by Sundholm on the family of compounds
[Ft (NH3
)4 _n
Cln ]
2_n, n = 0, 1, 2, 3, 4 showed that increasing
the number of chlorides present facilitated the reduction of
the complex (194) . Increased reduction currents for a given
concentration and shifts in E.. ,'s were the results (194).
Kinetics of the reduction reaction were ascertained by
Sundholm (193) using the method of Kuta and Smoler (202)
.
By analyzing the time dependence of the current on a single
drop of mercury from a DME , it was determined that the
reduction is kinetically controlled in the case of cisplatin
and diffusion controlled for the trans isomer (193)
.
Having obtained a reasonable understanding of the
reduction process of the drug (at least on mercury and
platinum electrodes) information pertinent to the stripping

42
H3N
CIS
\ /OKOV V.
trans
Figure 4. Alignment of Pt(NH3 ) 2
Cl2
toward positively
charged electrode, after Sundholm (194).

43
step can next be examined. In order tc successfully com-
plete the ASV experiment, platinum must be oxidized in a
reproducible manner. Formation of a strong, stable complex
following oxidation is one convenient way to shift the
equilibrium between the reduced and oxidized forms of
platinum and to facilitate the stripping step. A variety of
complexing agents were considered as to appropriateness for
this purpose.
Molecular orbital treatment of square planar Pt
complexes reveals a greater stability with ligands with a
ir-orbital system (e.g. CN~ and SCN~) compared tc those
ligands without (e.g. Cl~, Br", H^O, NH-) (203-205). This
stability was observed by Watt and Cunningham when they
reported no deposition from 0.01 M aqueous solutions of
2- 2-Pt(CN)
4or Pt(SCN). before solvent reduction occurred
(206) . The overall order of bond strengths of Pt"+- liganc
bonds has been reported as CN~ > NO„~ > NH_ ^ OH~ > SCN~ >
l" > Br" > Cl~ > SoJ" > N03
" (173, 206, 207). Stability
2 +constants have been reported for many complexes of Pt
Those of some of the stronger complexes are given in
Table 3. Some standard potentials of interest have been
reported and are listed in Table 4.
Previous work on the determination of platinum by
electrochemical methods has been scarce. Using a hanging
mercury drop electrode (HMDE) , the decrease in the height of
the cathodic sulfide peak in CSV following analyte addition
was used to determine traces of Pt as well as Hg, Ag and Au

4 4
Table 3. Stability Constants of Some Pt"+Complexes
Ligand
45
a)
0)
Ha,Soa X! T3
I t
— ^

46
(216) . A polarographic method developed for ore analysis
makes use of catalytic hydrogen evolution as platinum
complexed with ethylenediamine is reduced (217). The method
has been extended to the determination of platinum derived
from cisplatin chemotherapy (218, 219). In the determina-
tion of palladium by ASV in 1 M HC1 , platinum interfered, as
its stripping peak at +0.7 V vs SCE was only 200 mV anodic
of the palladium peak (220) . An ASV technique utilizing
2- 2-electrochemical reduction of PtCl" and PtCl. in the
6 4
presence of lead acetate in an HC1 solution onto a graphite
electrode was developed for platinum analysis (221, 222).
The deposit was then electrochemically oxidized to provide
the quantification. Another ASV technique chemically
2- 2 +reduced PtCl, with electrogenerated Sn to form micro-
crystals of platinum on a carbon paste electrode (223). The
amount of deposit was determined from measurements of the
catalytic hydrogen evolution current. Similar work, from
the same group, codeposited platinum and tin to form a 1:1
compound which gave a stripping peak whose magnitude was
proportional to the platinum concentration (224). Another
2-ASV method utilizing a graphite electrode determined PtCl,
2 +with an excess of Hg added (225). Platinum quantification
resulted from measurement of a peak at +0.2 V vs SCE that
was reportedly derived from mercury oxidation from a
mercury-platinum compound formed during the deposition at
-1.0 V vs SCE.

CHAPTER IV
THE PLATINUM ELECTRODE IN ACIDIC SOLUTIONS
Obtaining a reproducible response from a limited amount
of platinum deposited on a graphite substrate is necessary
to successfully complete the electroanalytical method
developed in this study. The behavior of the platinum
deposit was expected to be similar in many respects to that
of a platinum metal electrode. The literature pertaining to
the platinum electrode is quite extensive, covering acidic,
basic and neutral solutions, both aqueous and nonaqueous
solvents and including cathodic and anodic conditions. Over
200 papers were consulted in order to better understand what
is still a topic of debate and often conjecture. The
following discussion focuses on the anodic activity of
platinum since anodic processes represent the final and
quantitative step in an ASV experiment. Acidic solutions
represent the majority of published work and are considered
primarily.
As early as 1924, experimenters were aware that the
response from a platinum electrode was dependent on its
prior history and treatment (226). Early studies on the
platinum electrode employed constant current techniques.
Cyclic voltammetry became an additional method of inquiry
48
starting with the work of Will and Knorr (227) . The elec-
trochemical deposition and redissolution of hydrogen at a
platinum surface has become well delineated by this tech-
nique. The state of the platinum surface itself is often
characterized by investigating the behavior of hydrogen
because it acts in a thermodynamically reversible manner and
the equilibrium coverage of the platinum surface with
adsorbed hydrogen atoms is determined by the applied poten-
tial. The electrochemically accessible surface area and the
degree of cleanliness or freedom from impurities are easily
determined in a reproducible fashion by hydrogen atom
adsorption and desorption. The body of information
regarding hydrogen adsorption and desorption is thus useful
in qualifying and quantifying various aspects of the
platinum surface prior to studies under anodic conditions.
The reactions of the platinum surface at anodic potentials
are not nearly as well understood as those at cathodic
potentials. The formation and reduction of an oxide film
has several generally accepted features, but much remains in
debate regarding mechanisms and the exact status of the
platinum surface under differing anodic conditions.
Within the potential window of 0.0 to 1.229 V vs the
reversible hydrogen electrode (RHE) , no continuous faradaic
oxidation or reduction occurs at a platinum electrode
surface in pure water at pH because of the thermodynamic
stability of water in this region. Various electrolytes
that are also stable within this potential region are used

49
to make solutions which are sufficiently electrically
conductive for study. When either the potential is scanned
or a constant current is applied to a platinum electrode, a
variety of electrochemical processes occur as seen in
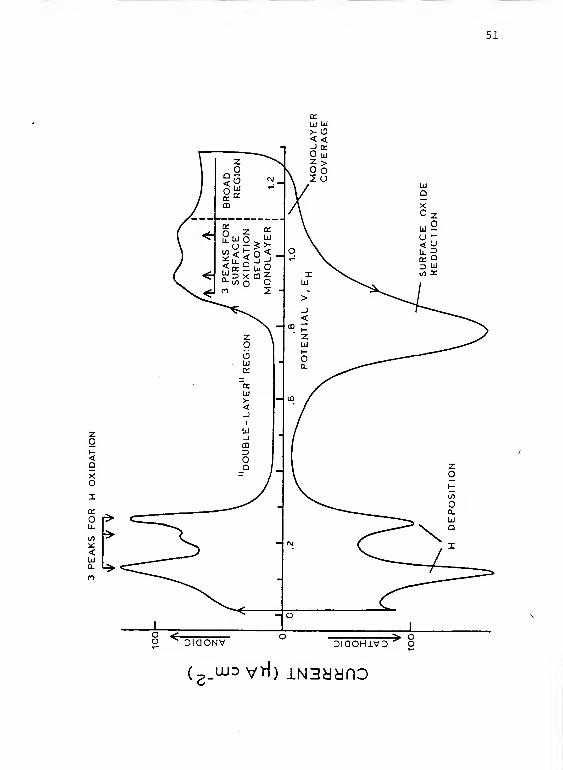
Figure 5. In a cyclic voltammetric experiment, hydrogen is
adsorbed in two peaks and desorbed in three. Oxygen is
deposited in three poorly defined peaks and a broad region
and is stripped in a single peak. These processes and a
number of other observations regarding the platinum surface
are summarized with references in Table 5.
The first indications of oxygen deposition on a plati-
num surface occur at ^ +0.8 V in pH = solutions. This is
a generally accepted observation. This potential, where the
oxide film starts to form, shifts cathodically ^ 60 mV for
each unit increase in pH. The shift was noticed by Kolthoff
and Tanaka in 1954 (228) . They also observed, in constant
current experiments, that the same results were obtained
with either a stationary or a rotating platinum electrode,
implying the process was not diffusion controlled. Bold and
Breiter observed the same pH dependence in the initial
oxidation of the surface as well as in oxygen evolution and
in the subsequent cathodic dissolution of the oxide film in
their early cyclic voltammetry experiments (229). They
suggested a two step process for the surface oxidation:
Pt + H2
> PtOH + H-1" + e~
and PtOH > PtO + H+
+ e~
.

UJ
51
° <O DiaONV oiaomvo^ o
( 2_lud vH) iN3auno
52
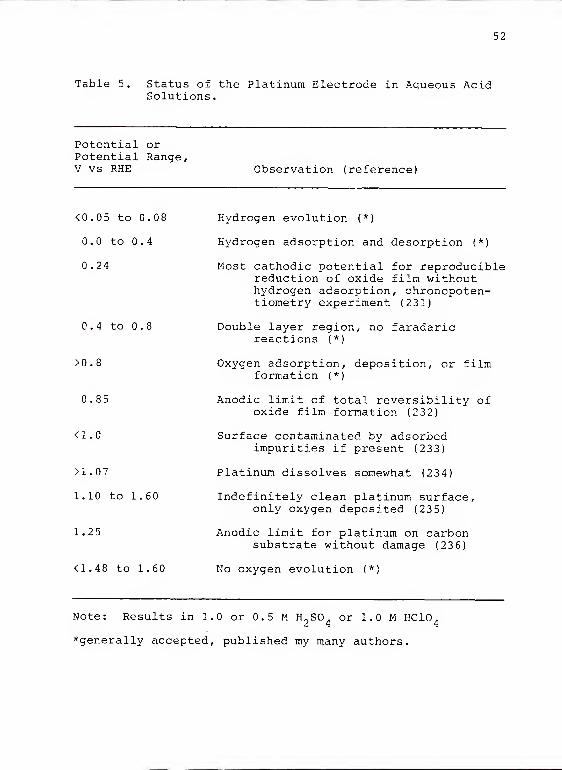
Table 5. Status of the Platinum Electrode in Aqueous AcidSolutions
.
Potential orPotential Range,V vs RHE Observation (reference)
<0.05 to 0.08 Hydrogen evolution (*)
0.0 to 0.4 Hydrogen adsorption and desorption (*)
0.24 Most cathodic potential for reproduciblereduction of oxide film withouthydrogen adsorption, chronopoten-tiometry experiment (231)
0.4 to 0.8 Double layer region, no faradaricreactions (*)
>0.8 Oxygen adsorption, deposition, or filmformation (*)
0.85 Anodic limit of total reversibility ofoxide film formation (232)
<1.0 Surface contaminated by adsorbedimpurities if present (233)
>1.07 Platinum dissolves somewhat (234)
1.10 to 1.60 Indefinitely clean platinum surface,only oxygen deposited (235)
1.25 Anodic limit for platinum on carbonsubstrate without damage (236)
<1.48 to 1.60 No oxygen evolution (*)
Note: Results in 1.0 or 0.5 M H-SO. or 1.0 M HClO,2 4 4
*generally accepted, published my many authors.

53
Significant reversibility of these two processes would
explain the observed pH dependence of the anodic as well as
cathodic reactions. More recent researchers have disagreed
with this early interpretation. The mechanism and the
species involved have yet to be conclusively ascertained.
Reversibility of formation of at least a portion of the
oxide layer is indicated in Table 5. The 19 73 paper by
Angerstein-Kozlowska, Conway and Sharp reported that total
reversibility of oxygen deposition up to 27% of a monolayer
was found (232). A monolayer in this sense is not neces-
sarily a one atom thick layer but an amount of deposited
atoms whose accumulated charge corresponds to a one atom
thick layer. Atoms may lie in clusters with bare metal in
other areas and the total charge could still define a
monolayer.
Rao, Damjanovic and Bockris had earlier used prere-
duced , oxide-free platinum electrodes in oxygen saturated
solutions to obtain equilibrium coverages at open circuit of
adsorbed oxygen corresponding to 135 yC cm " (237) . Using a
calculated monolayer coverage of about 500 yC cm , this
oxygen coverage also corresponds to 27% of a monolayer.
This coverage was attributed to one oxygen atom sharing two
electrons with four platinum atoms each sharing on the
average all its ^ 0.55 unpaired d electrons (237). The one
oxygen per four platinum atoms was also the formulated
reversible step in oxide film formation proposed by
Angerstein-Kozlowska, Conway and Sharp (232) . Similar

54
results were obtained by Appleby who considered the elec-
trode surface as a close packed plane of platinum atoms
(238) . This arrangement can only accommodate a coverage of
30% before nearest neighbor sites must be used for addi-
tional oxygen atoms (238) . Oxygen atoms on the platinum
surface beyond 6 = 0.3 must then bind by a more energetic
and less reversible process (238).
At more anodic potentials, the surface film continues
to grow. Reversibility of the anodic film is decreased.
This is generally attributed to a change in the mechanism of
the continuing growth. At coverages of less than a mono-
layer of oxygen, changes in the mechanism of the surface
oxidation process are indicated by several results. The
cyclic voltammograms of Angerstein-Kozlowska, Conway and
Sharp show three anodic current peaks (239) . They are due
to the aforementioned process at +0.89 V vs NHE and to two
previously unmentioned processes occurring at +0.94 to
0.95 V and at +1.04 to 1.05 V. These result in a combined
coverage of 78% of a monolayer of oxygen (232) . Biegler had
earlier reported two peaks at +0.95 V and +1.07 V (235).
One general interpretation is that of different lattice
sites with associated differences in energy for the binding
processes. A stepwise formation postulated to fit the
overall mechanism is:

55
Pt4
+ H2
^ ±Pt4OH + H
++ e 8- < .12 to .16,
Pt.OH + H o0=I±2Pt„0H + H+
+ e~ 6. < e o < .37 to .40,.
4_ " 2 ^ 2 " 12:
2OH + H
20;=^2PtOH + H
++ e~ 6 < 6
3
This proposed scheme of lattice occupation is not supposed
to represent true species, merely stoichiometric ratios.
However the actual film formation occurs, it is generally
agreed that a monolayer is not reached until the potential
has increased to ^ 1.1 V vs NHE, in the so-called broad
region of oxidation.
In the approximate potential range of +1.1 V to
+1.5 V the anodic current remains fairly constant and film
growth continues. Unlike the submonolayer oxidation, film
formation will continue at these potentials even when the
potential is held constant (239). Several spectroscopic
techniques have supplied corroborating evidence. An ESCA
study by Kim, Winograd and Davis furnished information about
the status of oxygen on a platinum surface held at various
potentials in 1 M HC104
(240). After 3 min at +0.94 V vs
NHE the surface corresponded to 56% Pt, 39% PtO , and
< 5% PtO (240) . This agrees well with a second lattice
site occupation of e2
= -37 to .40 with a peak potential
of +0.94 V already mentioned. Similar treatment, but at
+ 1.44 V, resulted in a surface composition of 39% Pt,
39% PtO , and 25% PtO (240) . The species PtO_ was notads c2
detected until ^ +1.8 V (240). Using Auger electron spec-
troscopy Johnson and Heldt discovered that between +0.8 V

56
and +1.0 V oxygen was weakly adsorbed, but at more anodic
potentials oxygen seemed to be absorbed into the surface
(241) . They found about 45 atomic percent oxygen under the
more anodic conditions, but could not distinguish oxidation
states of platinum.
A third technique, ellipsometry , has been used to
measure the film thickness on platinum. It was determinedo
that the film remained constant up to 1.12 V vs NHE at ^ 1 A
(242). At 1.22 V, the film was 2.5 A thick and slowlyo
thickened to 4.7 A at 1.62 V. This concept of oxygen
absorbing into the outer layers of platinum resulting in the
"place exchange" of platinum and oxygen atoms or ions has
been accepted by many. While it is not known whether oxygen
is absorbed, adsorbed, or if a true oxide is formed, the
explanations fit much of what is known.
Considerable evidence has been accumulated to support
the contention that upon subsequent reduction of the anodic
film, the resultant platinum is more active than before. A
review by James covers several proposed explanations (243)
.
One of the two most tenable theories purports that during
anodic treatment at sufficiently positive potentials,
impurities on the platinum surface desorb and/or oxidize.
This then allows the oxide film to form on a clean surface.
Reduction of the oxide film results in a clean platinum
surface free of impurities with an increased activity due to
an increased number of reaction sites. The other defensible
theory contends that upon reduction, a form of platinized
57
platinum results from either the rearrangement of platinum
atoms after the oxide film is decomposed or the redeposition
of platinum dissolved in the anodic treatment. The paper by
Rand and Woods contains a number of references to both
schools of thought (234) . Numerous other theories exist.
The relative importance of the two most accepted theories is
debated, but both have considerable support and are
important to this study because maximum activity and repro-
ducibility are necessary.
In partial confirmation of the latter idea, Biegler
found platinum in solution after repeated oxidation and
reduction (235) . Separate groups calculated platinum
-2 -1dissolution rates of 5 pg cm cycle when cyclic voltammo-
_2grams extended to +1.4 V vs NHE (234) and 4.5 yg cm
cycle when carbon supported platinum was cycled to +1.2 5 V
(236) . Untereker and Bruckenstein measured platinum dis-
solving in cycles between -0.25 V and +1.55 V by means of a
rotating ring disk electrode (RRDE) (244) . They made an
excellent case for the notion that platinum actually dis-
solved and redeposited rather than merely rearranged on the
surface during the oxide formation-reduction sequence. The
finding that roughening of the surface decreased with
increasing rotation rates supports the redeposition hypothe-
sis (244) . Two other RRDE studies found that all anodic
current up to +1.6 V was due to disk surface reactions since
no detectable current was obtained at the ring until oxygen
evolved at ^ +1.7 V at the disk (245, 246). This result

contradicts the platinum dissolution hypothesis. The
suggestion that platinum atoms rearrange to accommodate
subsurface oxide films of greater than a monolayer has other
proponents (232, 247-249). In any case, an increase in
activity resulting from an increase in the number of plati-
num atoms accessible to the solution is obtained and should
increase any signal generated during the course of this
work. The activation of a platinum deposit by oxide film
formation and reduction should play an important role in
procedural optimization.
Adsorption of organic compounds and inorganic ions at
the platinum surface is another mechanism of decreasing the
electrochemical activity. Breiter studied halide adsorption
in 1 M HC10. at platinum electrodes and also made reference
to a considerable number of earlier papers on the subject
(250) . He found that at potentials anodic of the zero point
of charge (zpc) , ^ 0.2 V vs NHE in 1 M acid, a monolayer of
chloride adsorbed when the solution concentration was
10 M. Chloride noticeably altered the cyclic voltammo-
grams obtained by Breiter at solution concentrations as low
as 10 M (250) . Chloride displaced the oxide film forma-
— 4tion reaction anodically at 10 M and decreased the total
amount of oxide formed and subsequently reduced (250) .
A paper examining the adsorption of Cs and SO ~ by
radiochemical methods found identical amounts of both ions
adsorbed at +0.17 V in 0.1 M H^SO. (251). Cesium ion
adsorption was minimal anodic of this potential, the zpc,

59
and sulfate icn adsorption increased until cxide film
formation commenced (251) . The potentials of maximum
sulfate ion adsorption were +0.75, +0.68 and +0.60 V in 0.1,
0.01 and 0.001 M H2S0
4respectively (251). This illustrates
the weak adsorption of sulfate ion since the oxide film
formation was not hindered. It also demonstrates the pH
dependence of the initiation of oxide film formation. In a
paper by Conway, Angers tein-Kozlowska, Sharp and Criddie
detailing a method for preparing high purity water, platinum
behavior in sulfuric acid solutions made with this water was
used as a check on solution purity (230) . Organic adsorp-
tion was considered the primary problem encountered. One of
their criteria for solution purity was no change in the
hydrogen adsorption and desorpticn peaks after cycling to
only +0.75 V, thus not allowing oxygen to deposit and clean
the surface. Phosphate, sulfate and perchlorate ions are
only slightly adsorbed on platinum, explaining why the
cyclic voltammograms obtained in acid solutions of these
anions are so similar (252) . The proper electrolyte and
sufficient solution purification play a significant role in
the collection of optimal data using a platinum electrode.
A clean and active platinum surface is necessary for
optimum performance in an electrochemical system. It is
recognized that several anodic-cathcdic treatments will
generally result in a clean surface with increased activity.
Maximum activation of a fresh platinum electrode may take a
considerable number of such cycles. Various authors using

6C
cyclic voltammetry have suggested a myriad of possibilities.
Inclusion or avoidance of hydrogen adsorption or evolution
and oxygen evolution, faster cathodic than anodic scans, and
varying scanning speeds, times and number of scans have all
been suggested. The common element is the deposition and
removal of oxygen. Approximate calculations by Gilman point
out the necessity of maintaining clean conditions. Con-
sidering diffusion controlled adsorption and average values
for adsorbable impurities of about 10~ M total concentra-
tion from reagents and solvent, a platinum surface can
become covered to the extent of 1% in about 50 s if the
solution is not stirred (252) . Only 2 s are needed xf the
solution is stirred (252) . He suggests that either the
electrolyte solution be shown to be sufficiently clean or
the platinum electrode should be cleaned before each use.
Biegler reproducibly activated a platinum electrode
by repetitive cyclic voltammetric scans in 1 M H SO. and
prepared for each new experiment by cleaning the surface by
pulsing the potential from cathodic to anodic potentials
(253) . Gilman has published a number of papers on pulsing
as a means of attaining reproducible surface states. His
first two papers on the multipulse potentiodynamic (MPP)
method detailed the preparation of platinum surfaces for CO
adsorption studies (254, 255) . He found he could attain
reproducible active areas and maintain the cleanliness for
> 100 s (253) . He also introduced the method for the study
of chloride and phosphate adsorption and desorption (256)
,
61
hydrogen adsorption (257) and platinum surface oxidation
(258). In each case a series of steps ensured the
reproducible surface conditions necessary for comparative
studies.
The method of Gilman used an initial applied potential
of +1.8 V vs NKE with stirring of the solution to desorb
and/or oxidize adsorbed impurities and evolve oxygen yas to
help sweep away any products. The oxide film also began to
form in this 2 s step. At the less anodic potentials of
+1.2 V or +1.5 V, the oxide layer was established and
maintained and molecular oxygen no longer evolved. During
30 s of stirring, products were removed and during 90 s
without stirring, solution quiescence and double layer
equilibrium conditions were reestablished. No current was
observed to flow after the first few seconds. A final
potential step to +0.4 V for 10 s reduced the oxide layer
(mostly within the first 0.1 s) and produced a clean plati-
num surface. A subsequent step or steps were sometimes used
to study various species and procedures. Initiating an
anodic scan to study the formation of the oxide film is an
example of one of Gilman' s foilowup procedures (258).
This discussion has highlighted some of the work done
with the platinum electrode in acidic solutions under anodic
conditions. The results which seemed relevant to the
present investigation have been emphasized. A great deal of
material on mechanisms has been omitted as not directly
applicable. Additional information can be obtained from
62
several reviews (239, 252, 259), a trilogy by Conway and
colleagues (232, 249, 260) and a recent dissertation which
studied single crystal planes of platinum (261)
.

CHAPTER V
ANODIC STRIPPING VOLTAMMETRY
Brief Introduction and History
Anodic stripping voltammetry (ASV) is the most commonly
used of a family of electrcanalytical techniques collec-
tively known as stripping analysis (SA) . The features
common to all members are the preconcentration step and the
stripping step. Preconcentration is a common analytical
procedure. It is useful in increasing the response due to
the analyte while ideally not affecting any response from
non-analytes. In other words, the goal is to increase the
signal but not the noise. Risks of sample loss and impurity
introduction, amongst others, accompany conventional sample
concentration methods. In stripping analysis, the sample
preconcentration is accomplished by electrochemical means at
a suitable electrode within the sample itself. The strip-
ping step or analytical measurement is usually carried out
within the same solution, minimizing the aforementioned
risks
.
Cathodic stripping voltammetry (CSV) is comprised of an
oxidative preconcentration and a reductive (cathodic)
stripping. This technique has been applied primarily to
inorganic anions which form sparingly soluble salts or

64
complexes with mercury ions. The mercury electrode used is
oxidized in the preliminary step to provide needed mercury
ions. Examples of analytes include Cl~, Br", I~, S ,
Cr04~, W0^~, MoOJ" and VO^" (262) as well as oxalate, suc-
cinate and dithiozonate (263). Organic molecules and ions,
in drug analysis, have been determined in the same manner
(264) .
Anodic stripping analysis comprises the other branch of
stripping analysis. In this method, a reductive preconcen-
tration step and an oxidative (anodic) stripping step are
employed. The most generally used form of anodic stripping
analysis determines metal ions by reducing them at a mercury
electrode to form an amalgam and subsequently stripping the
accumulated amalgam to complete the experiment (17). Solid
electrodes such as gold, platinum and several forms of
carbon or graphite are also occasionally used (18) . Analy-
sis of molecules is possible by adsorption of the molecule
or an electrochemical reaction product of the molecule onto
an electrode surface followed by anodic stripping of the
concentrated material (264, 265). For further information
on stripping analysis, the reader is referred to several
introductory articles, review articles and books (11, 12,
14, 16, 17, 19, 21, 262, 263, 2C6, 267).
Stripping analysis originated with G.G. Grower in 1917
(268) . He determined the thickness of a tin coating on
copper wire by electrochemically stripping it off. The
coated wire was the anode and a platinum cathode completed

65
the cell. A gas coulometer and a voltage source were in
series with the cell. While tin was being removed from
copper wire, the potential of the wire compared to a pure
tin reference wire was monitored. The first change in
monitored potential was interpreted as the completion of the
removal of tin. The second change was equated with the last
of tin-copper alloy being stripped. The coulometer reading
was related to the thickness of the tin coating. Similar
film or coating thickness experiments were reported by Evans
and Bannister in 1929, who determined Agl films on silver
(269) . Campbell and Thomas in 1939 reduced oxide films on
copper to discern coating thicknesses from a few monolayerso
to about 1000 A (270). Ogarev in 1946 (271) and Francis in
1948 (272) analyzed coatings on a variety of metals.
The first reported use of a deposition step prior to
stripping is credited to Zbinden in 1931 (273) . Attempting
to determine copper electrogravimetrically , he found the
weight of the deposit too small to be accurately measured.
He reversed the current flow and stripped the deposited
copper from the platinum substrate. By manually adjusting
the potential to obtain an approximately constant current,
the stripping continued until the current suddenly dropped.
Measuring the elapsed time of current flow enabled the
amount of copper deposited to be calculated. Zbinden
measured deposits of 6.36 pg of copper with errors as low as
3.3% (273). In 1938 Zakhar ' evskii performed similar experi-
ments to determine lead and copper (274) . By following the

66
current with an ammeter, he was able to measure as little as
10 pg of lead and 20 yg of copper. Elema in 1947
followed Zbinden's method in an attempt to routinely analyze
for copper (275) . He found he could determine 10-100 pg of
copper by a technique that even poorly trained personnel
could follow.
It wasn't until the 1950s that ASV was studied
seriously by several groups of researchers. Rogers and
co-workers investigated silver on platinum electrodes in
1952 (276) and later used a mercury film on platinum to
study silver (277) and lead (278). Hickling and Maxwell in
1955 examined mercury pool electrodes and the dissolution of
amalgams formed by constant potential stripping (279) . With
Shennan, they studied Cu , Pb , Tl, Cd, Zn and Mn by nearly
exhaustive electrolysis into the mercury pool (280). A
small mercury pool contained in a well at the end of a
"U-shaped" glass tube was used by Kalvoda in oscillopolaro-
graphic stripping (281) . Mercury drop electrodes were
employed by Barker in 1952 (282), by deMars and Shain (283)
and Nikelly and Cooke (284) in 1957 and by Kemula and Kublik
in 1958 (285) . The latter authors with Rakowska, studied
impurities in uranium salts and were able to measure
5 x 10 M cadmium (286) . A review in 1961 covers these
and other early anodic stripping experiments and also
discusses several types of mercury electrodes (287)
.
The large mercury pool electrode used by Cooke had a
slow rate of electro-oxidation (288) . Nikelly and Cooke

67
noted that platinum, gold, silver amalgam and mercury on
platinum electrodes required lengthy conditioning to give
reliable results (284) . It was the success with mercury
electrodes that permitted anodic stripping to become an
established analytical technique (II) . Theoretical treat-
ments of the hanging mercury drop electrode (HMDE) and the
thin film mercury electrode (TFME) were derived in I960
(289-291). Earlier theoretical attempts were of limited
utility, but laid the groundwork (292) . As these two terms
of mercury electrodes gained acceptance and improvements in
electronics and instrumentation came about, a more wide-
spread use of the technique arose in the early 1970s (11).
The Anodic Stripping Experiment
A typical anodic stripping experiment is comprised of a
series of separate steps in a fixed sequence. Care must be
taken in performing each stage because of the low concentra-
tions encountered. These individual tasks must be reproduc-
ibly done for optimum results to be attained. Unintentional
variations in any procedure could result in loss of accuracy
and/or precision.
The first step is sample preparation. This may be done
by any conventional method, depending on the sample, bearing
in mind the final form will be a solution with several
necessary properties. The analyte should generally not be
more concentrated than 1 ppm (17) . A variety of analytical
68
techniques, including polarography , are adequate for solu-
tions greater than this concentration. As in other electro-
chemical techniques, a supporting electrolyte is added for
several reasons. The movement or mass transfer of molecules
and ions in a solution may occur by several means. Diffu-
sion, mass transfer resulting from a concentration differ-
ence between two regions, and convection, resulting from
mechanical stirring or density differences, affect both
molecules and ions. Migration of charged particles due to
an applied electric field is a third method of mass trans-
fer. An indifferent or supporting electrolyte is added in
large excess to carry the majority of any current. Analytes
thus move by convection (if any) and diffusion only. By
decreasing the contribution of migration to total mass
transfer of the analytes, mathematical treatments are
simplified, and reproducibility is improved. Supporting
electrolytes also ensure a low solution resistance. The
supporting electrolyte may originate in the sample or sample
preparation procedure or may be added prior to analysis.
Purity of any added reagent is important, as the analytical
usefulness of the overall method is often limited by impuri-
ties in the supporting electrolyte (20)
.
The suitably prepared sample is added to the electro-
chemical cell. Typical cell volumes range from 100-200 mL
to as low as 5 or 6 pL in some special cases (293-295) . The
necessary electrodes are introduced, if not already incor-
porated into the cell. Electroactive oxygen is removed

69
prior to analysis, commonly by bubbling purified nitrogen or
helium through the solution. Oxygen removal is necessitated
by the fact that it can be electrochemically reduced in two
steps which will alter the pH of the solution and generate
new chemical agents (296) . The reductions shown below
produce a current flow over most of the negative potential
range (297)
.
In acid solution:2
+ 2H+
+ 2e~ > H o ? [3]
H2 2
+ 2H+
+ 2e > 2H [4]
In neutral or
base solution:2
+ 2H2
+ 2e~
—
> E2 °2
+ 20H~ ^
H2 2
+ 2e~ >20H~ [6]
Hydrogen peroxide (H2
C>2
) is a strong oxidizing agent and
could react with any analytes present. Hydroxide ion (0H~)
when formed may precipitate many metals present. The
removal of H or generation of 0H~ will increase the pH
unless the solution is adequately buffered. Oxygen may
oxidize deposited metals and thus decrease the analytical
signal
.
After ten to fifteen minutes of inert gas flow, oxygen
is removed and the preconcentration or deposition is per-
formed. Deposition is nearly always accomplished by
70
using a constant potential. This method enables a degree of
selectivity in the overall analysis since more noble metals
may be reduced in the presence of more difficultly reduced
metals. To increase the availability of anaiyte at the
working electrode surface, to increase the deposition rate,
convection is employed. This is achieved by either rotating
the working electrode, rotating the cell itself or using a
magnetic stirring bar and motor. A more fully detailed
discussion of the deposition step will be given later.
When the deposition step has been completed, a rest
period follows. A potential is usually still applied (12,
21, 263), although it may be at a more anodic value than
during deposition, in the case of ASV (263) . The stirring
is stopped to allow the solution to become quiescent (12,
15, 21) . If deposition continues, the reduction current
rapidly decays to the diffusion limited value (12, 21). At
least thirty seconds is chosen (14, 298) to ensure that
convection has ceased (298). In cases where mercury
electrodes are used, this rest period allows the
concentration distribution in the amalgam to become
sufficiently uniform (12, 15, 18, 19, 21). It has been
shown that two seconds is enough time for the thin film
mercury electrode (TFME) (299) and thirty seconds is
sufficient for the hanging mercury drop electrode (HMDE)
(291, 298). This rest time is especially important if
theoretical studies are undertaken, as stripping theories
require a uniform amalgam concentration distribution.
71
Although any deposition that may occur during this time
contributes only a small amount of material to the total
deposit (19) , the rest or quiescent period should be repro-
duced accurately.
In comparisons of available stripping techniques in
1957, Nikelly and Cooke (284) and deMars and Shain (283)
concluded that the best results were obtained when stripping
was done by linear potential sweep chronoamperometry , also
called linear sweep voltammetry (LSV) . This technique
became the procedure of choice for many researchers because
of its instrumental and methodological simplicity (12) . The
name anodic stripping voltammetry was applied to the overall
technique. Since LSV is merely polarography at other than a
DME and simple polarographic instrumentation is widely
available, this remains a common means of completing the
anodic stripping experiment.
With LSV and related methods, a current peak should
occur in the current-voltage curve for each substance
deposited and subsequently stripped. The potential at which
this peak is centered generally allows the identity of the
analyte to be determined. The height of the peak above the
baseline (current) and the area under the peak (charge) are
related to the original solution concentration of the
analyte. A more detailed discussion of various stripping
procedures and data handling methods will be presented
later.
72
The Deposition Step
The deposition or preconcentration step begins the
anodic stripping experiment. Sample preparation will have
been done according to the demands of the sample and experi-
ment. A supporting electrolyte will usually be present
along with the sample. The specifics of the deposition
procedure are dependent on the analyte, which also influ-
ences the choice of the working electrode. Prior knowledge
of the nature of the analyte (s) is required in order to
effect a useful deposition.
The working electrode most commonly used and most
practical for routine determinations is the mercury elec-
trode (17). This may take the form of a mercury drop as in
the HMDE or in the sessile MDE which sits upon a support.
Mercury may be used as a thin film supported on a substrate
in the TFME. The HMDE was reportedly used in
electrochemistry as far back as 1939 by Antweiler (300). A
review discusses many applications of the HMDE in
electroanalytical procedures, including stripping analysis
(20) .
The TFME was introduced to stripping analysis by
Gardiner and Rogers in 1953 (277) and Marple and Rogers in
1954 (278) . The reasoning leading to this particular
geometry was the desire to decrease the volume of the
working electrode without substantially decreasing the
surface area. This would lead to a greater preconcentration
under identical conditions. The TFME has been produced

73
using many metals such as Au , Pt, Ag and Ni as substrates.
Several forms of carbon have also been used since this
substrate was introduced in 196 5 (301) . The thin mercury
film can either be formed separately before the analysis is
begun or as part of the deposition step as shown by Florence
in 1970 (302). With mercury film thicknesses between 1 and
100 pm when preformed (12, 18) and less than 10 nm when
formed in situ (15) , the high surface area to volume ratio
desired and improved preconcentration have been obtained.
Problems can occur with mercury electrodes because of
interactions with the supporting substrate (15). The
substrate can dissolve in the mercury or form intermetallic
compounds with mercury or with the analytes, leading to
additional stripping peaks. Intermetallic compounds can
also form between metals concentrated at or within the
mercury (15, 17, 20, 21). Intermetallic compounds present
more of a problem with liquid mercury electrodes than with
the solid electrodes (18). Because of the greater concen-
trations in the TFME, intermetallic compounds are a more
severe problem with this type of mercury electrode. Com-
pounds of Au-Mn and Au-Sn (21), Ag-Cd, Ag-Zn, Au-Cd, Au-Zn,
Cu-Cd, Cu-Mn, Cu-Ni, Cu-Zn, Fe-Mn, Mn-Ni, Ni-Sb, Ni-Sn and
Ni-Zn (20,21) and Pt-Sb, Pt-Sn and Pt-Zn (20, 21, 285) have
been documented. The reproducible and easy to make HMDE and
the sensitive TFME are nevertheless popular in stripping
analyses (19)
.
74
However, the use of mercury demands not only that the
anaiyte be capable of forming an amalgam with or a film or.
mercury, but it must also be stripped before the electrode
material itself oxidizes. This limits the mercury elec-
trodes to studies of the less noble metals and precludes
their use in this investigation. Besides the generally used
mercury electrodes, Au , Ag and Pt among other metals have
served as solid electrodes. Various forms of graphite or
carbon have seen application as both supports for the TPME
and as electrodes directly. The use of carbon as a working
electrode has extended the range of anodic potentials
accessible and has enabled the more noble metals to be
determined as a result. Determinations of Ag , As, Au, Ba,
Bi, Cd, Cu, Ga, Ge , Hg, In, K, Mn, Ni, Pb, Pt, Rh, Sb, Ti
ana Zn (18) as well as Co, Fe and Sn (303) , Ir (304) , Pg
(305, 306) Ta (306) and Te (307, 308) have been reported
using carbon electrodes. Several sources provide informa-
tion for specific analyses (12, 21, 262, 263, 309, 310).
The ideal working electrode has a reproducible surface
composition, surface area and/or volume, and a low residual
or background current (17) . Mercury has been used exten-
sively in electroanalysis because it has these properties.
Solid electrodes, including carbon, can compete with mercury
in many ways and offer advantages in several areas. The
first suggestion for carbon as an electrode material in
voltammetric work by Rogers and Lord in 19 52 (311) led to
the experiments of Gay lor, Elving and Conrad with carbon

75
rods brushed with an insulating layer of melted wax before
use (312) . A fresh surface (akin to a new mercury drop from
a DME) could be obtained by breaking off the end of the rod.
A high residual current was present and the investigators
decided the carbon needed to be totally impregnated with
wax. The filling of all pores eliminated oxygen interfer-
ence and memory effects. The first wa:: impregnated graphite
(WIG) electrode was reported in 1954 by Lord and Rogers
(313) . The WIG electrode was successfully used by Gayior,
Conrad and Lander! in 1957 (314). A voltage range of -1.3 V
to +1.3 V vs SCE was reported in 19 59 by Morris and Schempf
(315) .
During this period, Adams was attempting to develop a
non-metallic analog to the DME (316) . He was experimenting
with suspensions of carbon particles in fluids that were
sufficiently immiscible in water to prevent the resultant
mixture from dissolving in the analytical solution. The
results were far from satisfactory and he concluded it would
be better to pack the "carbon paste" into a holder and use
it as a stationary or a rotating electrode. His initial
report on the carbon paste electrode was in 1958 (317)
.
Olson and Adams used carbon paste electrodes in ASV in 1963
(303) as did Jacobs (318).
These early investigations and successes with carbon as
a working electrode spurred an interest in carbon and
additional formulations were proposed and tested. Carbon in
packed beds, in silicone rubber, mixed with polypropylene

76
and polyethylene, in Teflon, in Kel-F polymer wax and in
various pure states such as low temperature isotropic,
pyrolytic, glassy, reticulated vitreous, and cloth have all
been investigated for general and specific applications
(319). Epoxy bonded graphite has been used as well (320).
Many anodic stripping investigations using carbon
electrodes have involved the analysis of mercury. Useful
stripping experiments were performed as early as 1964 (321)
with following works (322, 323) leading to results that
showed a thiocyanate medium best for mercury analysis (324) .
Nickel also presented special problems because it could not
be determined with mercury as the amalgam stripping was
obscured by mercury oxidation (325) and it partially com-
bined with platinum (326). Graphite proved a suitable
electrode material (303, 327). Gold (318, 328) and silver
(318) were successfully analyzed by ASV using carbon elec-
trodes. In the mid 1970s, a series of papers described the
use of co-deposited mercury in the stripping analysis of
several noble metals using graphite electrodes (225, 304,
306-308, 329-331). An interesting aspect of these studies
was that the mercury stripped off prior to the more noble
analytes and often the amount of mercury stripped was used
to quantitate the noble metal.
In 1962, the first reported use of pyrolytic carbon as
an electrode material by Laitinen and Rhodes (332) and the
initial manufacturing of gas impermeable glassy carbon
occurred (333) . Miller and Zittel used pyrolytic carbon for

77
aqueous voltammetry in 1963 (334) and reported on the
general usage of glassy carbon in 1965 (335) . Yoshimori and
collaborators determined gold by anodic stripping coulometry
using glassy carbon (336) . Florence chose glassy carbon as
the supporting material for his in situ formed TFME in 1970
because of its hardness, good electrical conductivity and
chemical inertness (302) . A recent review of glassy carbon
as an electrode material stated that glassy carbon, along
with pyrolytic carbon, possesses the largest useful poten-
tial range of any presently used form of carbon (337) . The
kinetics of a number of thoroughly studied redox systems
were investigated at glassy carbon (GC) , platinum (Pt)
,
carbon paste (CP) and wax inpregnated graphite (WIG) by
Taylor and Humffray (338). The rate constants they obtained
were in the order k > kGC
> k^ > kcp
. A study by Panzer
and Elving reported on the general characteristics of glassy
and pyrolytic carbon in aqueous and nonaqueous solutions
(339) . Glassy carbon appears superior to pyrolytic carbon
and is an excellent choice for electroanalytical electrodes.
No other material can compete in terms of hardness, chemical
inertness, low porosity, electrical conductivity, low
residual current and high overpotential for oxygen and
hydrogen evolution (337, 340, 341).
Problems do occur with glassy carbon, some common to
solid electrodes in general and some unique to carbon. As
is often observed with solid electrodes, it is difficult to
obtain good, homogeneous, analyte deposits (17). Several

78
monolayers may form if sufficient material is deposited and
this can lead to multiple peaks for a single analyte (337)
.
The extra peak(s) have been attributed to the stripping of
the individual monolayers, the first one deposited being
bound more strongly to the electrode surface than subsequent
layers are bound to it and to each other (342, 343). This
problem can limit an anodic stripping analysis to only one
analyte in some cases (17, 21). A problem unique to carbon
surfaces is that of the formation by either chemical or
electrochemical reactions of functional groups which contain
oxygen. These groups can be repeatedly oxidized and reduced
and can often only be removed physically (337) . However,
abrading a hard surface or wiping a softer one is often
enough to remove the unwanted effects.
In the anodic stripping experiment, preconcentration is
the result of electrochemical reduction of metallic ions at
the electrode surface. The resultant metal forms a film on
the surface of solid electrodes. Ions in the bulk of the
solution replace the ions at the electrode surface that have
been reduced and the process continues. The ion transport
process may be either diffusion, in unstirred solutions, or
convection, as is commonly done. Constant potential elec-
trolysis is the predominant means of obtaining the required
deposition. Constant current electrolysis can be used
instead, but without potential control it lacks the selec-
tivity often necessary. The reproducibility also suffers

79
when constant current electrolysis is used for deposition
and for these reasons, it is seldom employed.
Knowledge of the reduction behavior of the analyte(s)
at the particular working electrode used must be obtained
prior to the ASV experiment. The deposition potential,
E, , is chosen on the basis of polarographic E, ,_ values or
from peak values from cyclic voltammetry. Tabulated results
of previous investigations can also prove beneficial. In
any case, E, must not be less than 120/n mV (n = number of
electrons involved in the reduction) negative of the poten-
tial indicated by other techniques (14) . Deposition poten-
tial values recommended are usually 300 to 400 mV negative
of the E, . , E or reduction potential determined for the
analyte (21). This allows for an adequate safety margin to
ensure satisfactory deposition. Care must be taken not to
exceed the decomposition or reduction potential of any-
interfering substances. Generally it is not possible to use
a deposition potential more negative than -1.5 V vs. SCE in
neutral solution or about -1.2 to -1.0 V in acidic solution
because of hydrogen evolution (21).
By proper choice of the deposition potential, the
reduction may be limited by mass transport processes and not
by the charge transfer reaction rates. If E, is notdep
sufficiently cathodic, the kinetics of the charge transfer
reaction can limit the deposition rate. If electron transfer
is slower than mass transport, the process is said to be
irreversible under the given conditions. For the case where

80
electron transfer is fast enough to maintain a reaction rate
limited only by the mass transport process, the reaction is
said to be reversible. Reversibility or irreversibility and
reaction kinetics are often studied on their own merits.
More detailed discussions and treatments of the fundamentals
of electrode reactions and kinetics may be found elsewhere
(12, 15, 18, 19, 210, 344-349)
.
In a system controlled by mass transport processes an
increase in the reaction rate may be achieved by increasing
the mass transport, e.g. by stirring the solution or
rotating the electrode. An increase in the stirring or
rotation rate will give an increased flux of material to the
electrode surface and will yield an increased deposition
rate. This is one way to decrease deposition times and
increase the extent of preconcentration within given physi-
cal and kinetic limitations. The Levich equation for
rotating electrodes is useful to show how improvements in
the deposition may be accomplished (19, 266, 350).
i(t) = 0.62 n FAD2/3 co
1/2v"
1/6C(t) [7]
where i(t) is the deposition current as a function of time,
F is the Faraday constant, A is the electrode area, D is the
diffusion coefficient of the analyte, u is the angular
velocity, v is the kinematic viscosity of the solution and
C(t) is the solution concentration of the analyte. More
complete discussions of rotating electrodes and

electrochemistry in moving solutions can be found in
other sources (350-354)
.
In order to increase the reduction current, several
variables can be altered. As mentioned, increasing the
rotational speed of the electrode will have the desired
effect. The viscosity of the solution is difficult to
change so as to significantly alter the reduction current
because of the one sixth power dependence as well as the
narrow ranges of values accessible in a given analysis (19)
.
It can also be inferred that larger electrode surfaces will
increase the amount of the deposit. This modification is
limited practically because of the need for small surface
areas for the low concentrations encountered. A small
electrode is needed to minimize the residual current which
is proportional to the electrode area and to ensure coverage
of the surface by the analyte to avoid overvoltage and
undervoltage effects (14)
.
In the Levich equation the reduction current and the
analyte concentration are both given as functions of time.
Because as the deposition proceeds the bulk analyte concen-
tration decreases, the reduction current will necessarily
decrease as well. This process will fellow Lingane's
equations (355) ,
i(t) = ifle
kt[8]
where ip
is the current at the start of the deposition and

82
. ADk =
VS [91
where V is the solution volume, S is the diffusion layer
thickness and A and D are as before (353) . Although these
equations pertain strictly to diffusion limited experiments
only, the same general conclusions can be drawn for stirred
solutions. To increase the deposition current at any given
time, increasing the electrode area, decreasing the solution
volume or decreasing the diffusion layer thickness will have
the desired effect. The results are similar to those of
Levich if one realizes that stirring the solution results in
a decrease of the diffusion layer thickness.
In ASV experiments, complete deposition is not neces-
sary (12, 18, 277, 278, 288). Commonly only 2-3% of the
total amount available will be reduced during the deposition
step (12) . As a result, the deposition current remains
approximately constant and the amount deposited can be
calculated from (15)
x. tnumber moles = P eP no"nF l
This result shows that the stripping process will be
enhanced by longer deposition times. Long times are not
always advantageous as eventually the concentration will
begin to decrease as given by Lingane. The primary disad-
vantage of long deposition times is long total analysis
times and therefore decreased experimental throughput.
83
Because the deposition is not exhaustive yet the
technique was developed to be quantitative, reproducibility
in this procedure is critical. Every variable that can be
controlled, must be. The stirring rate or rotation speed,
the geometric placement of the stirring bar or rotating
electrode and other electrodes and the solution volume must
all be carefully reproduced (14) . The deposition time must
be accurately duplicated from experiment to experiment.
Times of the order of 2 to 3 minutes up to 45 minutes or an
hour are used depending on analyte concentration, cell
geometry, etc. Generally speaking, every facet of the
deposition should be regulated carefully to attain maximum
precision.
The Stripping Step
The actual electroanalysis occurs during the stripping
phase of the experiment. Historically, the early stripping
analyses used the simplest available stripping method, i.e.,
controlled current. Either a carefully controlled constant
current with the stripping time as an indication of the
amount of analyte, or any applied current in conjunction
with a coulometer was used in these experiments (268-275)
.
As more sophisticated methods were developed for polaro-
graphy and electrochemical instrumentation became more
widely available, an increased variety of stripping methods
also appeared. These include the classic electrochemical
84
procedures as well as variations of the polarographic
technique
.
Methods that have found application include those with
controlled current, constant potential, linearly changing
potential as well as alternating current and pulse methods.
Among the electrochemical techniques discussed in the
general literature of stripping analysis are chronoampero-
metry, chronopotentionetry and sine wave voltammetry (12,
20, 21), pulse, coulostatic and oscillographic stripping
(12, 21), coulometry with both constant potential and
controlled current (12, 20), differential pulse voltammetry
(11, 34i) and square wave voltammetry (11, 12, 2i). Chemi-
cal stripping (21) phase sensitive alternating current
detection (11) and fundamental as well as second harmonic
alternating current methods (341) are usee occasionally.
This listing is by no means complete, but illustrates the
diversity present.
The classic techniques of electrochemistry were the
first to be applied to stripping analysis because the
theoretical aspects were well founded and suitable instru-
mentation was readily available. As mentioned, coulometry
was first used, essentially without instruments. Batteries,
gas coulometers and ammeters were all that was available and
all that was necessary. With the advent of reliable voltage
and current sources, oscilloscopes and recorders, the field
of electrochemistry improvec.

85
Chronoamperometry is one of the earliest electrc-
analytical techniques developed. In this method, the
potential of a working electrode in an unstirred solution is
changed from a value where the reaction of interest does not
occur to a value where it occurs at the limiting rate.
Following this potential step, a large current begins tc
flow, decaying with time as the amount of available electro-
active material at the electrode surface decreases.
Cottrell, in 1902, derived the equation for this process
(356),
. ,. . nFAD 1^ C , . . ,
l(t) =1/2 1/2 [11]
IT t
(all symbols have been previously defined)
.
This equation was experimentally verified forty years
later by Laitinen and Kolthoff (357) and by Laitinen (358).
The use of chronoamperometry in stripping analysis was
reported in 1957 (359) . Because of the preconcentration
step, the Cottrell equation was not used directly to quan-
titate the analyte, although the experimental current did
follow the expected decay. A stripping theory for the
chronoamperometric method was developed in the same paper.
Shain improved the method by analyzing with both a long and
short deposition time to compensate for the charging current
present in both experiments (360). He determined iodine to
— 84 x 10 M with a silver electrode in a CSV experiment

so
(360) . He also derived an equation for use with a HMDE
(361). Chronoamperometry has found few applications in
stripping analysis because of the superiority of other
methods. A recent paper by Brainina and Vdovina contains an
equation for the stripping of metal films from solid elec-
trodes by chronoamperometry (362) .
Chronopctentiometry is similar to chronoamperometry in
that a diffusion limited process in an unstirred solution is
used. However the potential step is replaced by a current
step trcm zero applied current to some fixed, finite value
in the milliamp range. The potential of the working elec-
trode versus a suitable reference electrode is monitored as
a function of time. As the current: is applied, the poten-
tial rapidly assumes a value indicative of the most easily
reduced (or oxidized) species. The potential slowly changes
as the electroactive species reacts at a constant rate ana
the concentration ratio of the product to reactant changes.
When the analyte has completely reacted at the electrode
surface and the amount of reactant replenished by diffusion
from the bulk solution is insufficient to maintain the
applied current, the potential again rapidly changes. This
time a value associated with the next most easily reduced
(or oxidized) species is attained.
The time required for the electrolysis reaction, the
time needed for the concentration of the particular reactant
at the electrode surface to drop to zero, is called the
transition time. The term was introduced, although not in

87
the presently accepted sense, by Butler and Armstrong in
1933 (363, 364). An equation which relates this transition
time to the applied current and the concentration of the
species undergoing the electrode reaction was developed by
Sand in 1901 and bears his name (365, 366),
. 1/2 = nFAD 1/2 tt
1^ C [12]IT =
x = transition time
i = applied current.
Sand was studying diffusion coefficients, continuing work by
Weber who had been using constant current electrolysis to
study the diffusion process (367). Karaoglanoff developed
an equation which defined the potential vs time curve in
1906 (368) . Rosebrugh and Miller in 1910 reported on a
number of applied current functions and derived equations to
describe the results of these processes (369) .
The analytical value of chronopotentiometry was little
appreciated until instrumentation improved and Gierst and
j'uiiard demonstrated its utility, reviving the technique in
the early 1950s (370, 371). Berzins and Delahay in 1953
derived an equation for the chronopotentiometric stripping
of a deposit accumulated by constant current electrolysis
(372). Delahay and coworkers reported an early use of
anodic stripping chronopotentiometry and derived appropriate
theoretical expressions in 1957 (359). Chronopotentiometry

has found many applications in stripping analysis, consider-
ably more than chronoamperometry . It is limited to solu-
tions in the millimolar range and is used primarily to study
reaction kinetics. Excellent reviews covering chronopoten-
tiometry (373-375) and a discussion of anodic stripping
chronopotentiometry (12, p. 115) are available. A variation
of anodic stripping chronopotentiometry wherein a chemical
oxidant replaces the constant current source has been
increasingly used of late and will be discussed later.
Linear sweep voltammetry is the simplest of the more
commonly used stripping methods. It originated with the
development of polarography , credited to Heyrovsky who in
1922 reported the first use of it (376) . An instrument
capable of linearly scanning the potential was built and
used in 1925 (377) . The first general publication on
polarography to appear outside Heyrovsky 's native Czecho-
slovakia was in 1936 (378) .
Using the DME and collecting current-voltage data on a
point by point basis with a manual polarograph as well as
with the early recording polarographs was tedious and time
consuming. Matheson and Nichols in 1938 applied a continu-
ously varying potential to a rapidly dropping DME and used
an oscilloscope to monitor the current-voltage behavior
(379) . Laitinen and Kolthoff , because they used a platinum
electrode rather than a DME, coined the term "voltammetry"
in 1940 for the general technique of current-voltage curve
acquisition and reserved "polarography" to describe

89
experiments with the DME (380, 381). Theoretical studies of
the oscillographic polarographic technique of Matheson and
Nichols were undertaken independently by Sevick (382) and
Randies (383) in 1948. These studies led to a series of
equations which described the current-voltage relationship.
Over the course of the next fifteen years, revisions to
the Sevick-Randles equations were made (384-387) . Exten-
sions of the simple, reversible theory to include quasi-
reversible (384, 388) and irreversible (384, 389-391)
processes were derived. Reactions controlled by chemical
steps (392-394) and those involving insoluble products
deposited on inert electrodes (395) were considered.
Additional variations of the original theories to include
cylindrical (396) and spherical (390, 397-399) electrodes
were derived. A summary of many of these revisions is
' available (392)
.
Linear sweep voltammetry (LSV) is the most widely used
of the classic electrochemical methods for stripping analy-
sis (12). Rogers and coworkers were among the first to use
this variation of polarography to complete the anodic
stripping experiment (276-278) . However, they analyzed
their results using peak areas (coulometric determination)
rather than peak heights (from Sevick-Randles theory)
.
Hickling, Maxwell and Shennan in 1956 (280) and Nikelly and
Cooke (284) and deMars and Shain (283) in 1957 further
demonstrated the utility of this stripping method. Nikelly
and Cooke found that the Sevick-Randles equations fit the
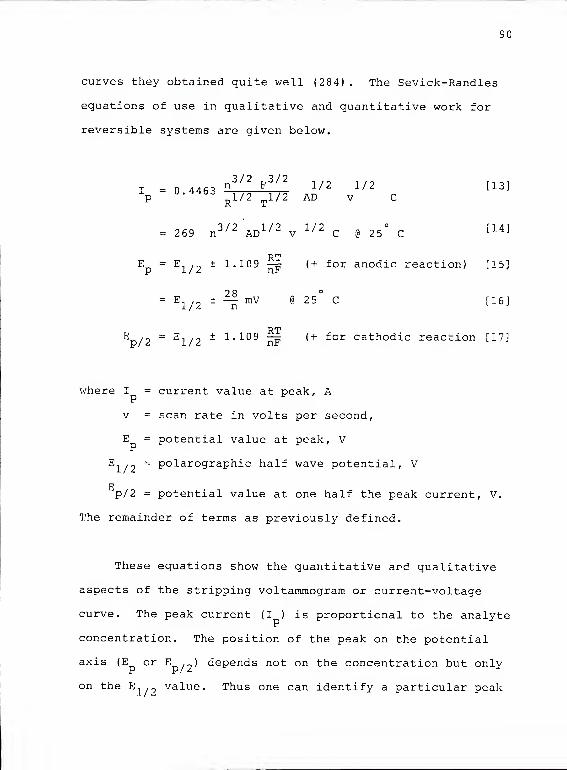
90
curves they obtained quite well (284) . The Sevick-Randles
equations of use in qualitative and quantitative work for
reversible systems are given below.
3/2 3/2I = o 4463
n F 1/2 1/2 t 13 Jip ^1/2 ^ 1/2 ad v c
= 269 n3/2 AD 1/2 v
1/2C @ 25° C
[14 ^
RTE = E
7 /0 ± 1.109 -= (+ for anodic reaction) [15]"p 1/2J-- AU ^ nF
,+ 18
/2"
n
J
p/2 ~ "1/2 * 1 ' J- UJ Hf
- Ji; /? ± ^| mV @ 25° C [16]
RTE , = E . ± 1.109 —= (+ for cathodic reaction [17]
where I = current value at peak, A
v = scan rate in volts per second,
E = potential value at peak, V
El/2
= PolarograPh i c half wave potential, V
p/2 = potential value at one half the peak current, V.
The remainder of terms as previously defined.
These equations show the quantitative and qualitative
aspects of the stripping voltammogram or current-voltage
curve. The peak current (I ) is proportional to the analyte
concentration. The position of the peak on the potential
axis (E or E , ) depends not on the concentration but only
on the E.. ._ value. Thus one can identify a particular peak

91
in cases of mixtures of electroactive species or unknown
analytes
.
Several groups of researchers have derived equations
for the stripping of deposits by LSV, often based on the
Sevick-Randles equations. Nicholson in 1957 used a solid
electrode and LSV for the dissolution step (342) . He
derived an equation for the expected current that resulted
from a fractional monolayer deposition. In comparing theory
to experiment, he used the peak area or charge for quantita-
tive measurements. He further studied depositions on solid
electrodes and revised his theories in 1960 (326) . Reinmuth
derived an equation specifically for linear sweep anodic
stripping voltammetry (LSASV) at a HMDE (289) which was
experimentally confirmed by Shain and Levison (291)
.
DeVries and Van Dalen published a series of papers in the
mid 1960s for the stripping theory of LSASV at a TFME
(299, 400, 401). Roe and Toni in 1965 (290) and White and
Lawson in 1970 (402) extended earlier work and derived their
own theories as well. Brainina undertook a great number of
theoretical studies of linear sweep film stripping from
indifferent electrodes starting in 1962 (403-407) . These
culminated in confirmative studies on reversible (408) ,
irreversible (409) and chemically assisted (410) stripping
analyses
.
Stripping analysis developed as a means to increase the
electrochemical signal to noise ratio. In the case of
LSASV, the increase in sensitivity or the decrease in limit
92
of detection (LOD) results from an enhancement of the
analytical current without an appreciable change in the
nonanalytical current. Analytical or faradaic current, i_,
results from an electrochemical process, the change in
oxidation state of a species of interest. The concomitant
flow of electrons or faradaic current is a measure of the
rate of the electrochemical reaction. Both the rate of mass
transfer and the rate of oxidation state change (charge
transfer) may control the magnitude of the faradaic current.
Nonanalytical currents can arise from a variety of sources.
Currents may be due to electrochemical reactions of impuri-
ries originating from the solvent, supporting electrolyte,
the analyte or the electrochemical cell, they may be due to
dissolved oxygen, or may be produced in the instrument
itself. These problem currents can generally be minimized.
Another nonanalytical current, the capacitive current, i,,
is a result of the physical process of a change in the
structural arrangement of the electrode-solution interface.
Mobile electrons in the part of the electrode in contact
with the solution, and the segment of solution within a few
molecular layers of the electrode surface comprise the
electrical double layer.
Models of the double layer have evolved from Quincke in
1861 (411) , Helmholtz in 1879 (412) and Perrin in 1904 (413)
who conceived of an excess or deficiency of electrons in the
electrode balanced by an equal excess of cations or anions
in the solution layer next to the electrode. Independent

93
improvements by Gouy (414) and Chapman (415) lead to an
expression of ion concentration and potential distribution
within the double layer. Stern in 1924 combined the pre-
vious models into a concept that remains in use today (416)
.
The structure of the double layer, the distribution of
electrons, ions, solvent molecules and other species at the
interface is the subject of many references (345, 349,
417-421)
.
The two layers of charge, electrons at the surface of
the electrode and ions in the solution near the electrode,
behave as a capacitor. When a potential is applied across a
capacitor or to an electrode (actually between a pair of
electrodes only one of which will be considered) charge will
accumulate to satisfy the following equation:
§ = C., [18]
where Q = charge in coulombs,
E = applied potential in volts and
C. = integral capacitance in farads.
This charge accumulation results in current flow into or out
of the capacitor or electrode-solution interface. It can be
seen from equation [18] that in an electrochemical experi-
ment anytime the area of the electrode, and thus its capaci-
tance, changes (as in a DME) or the applied potential
changes (as in an LSV experiment) the accumulated double
layer charge changes as well. This charge displacement
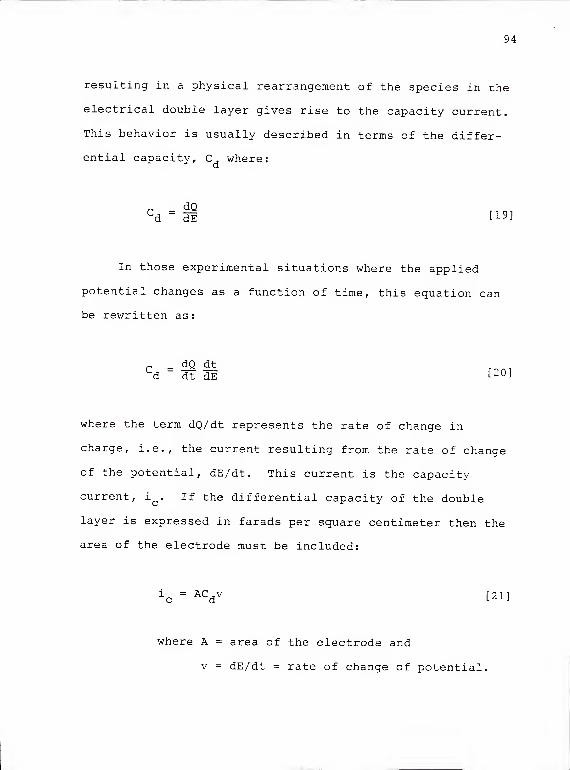
94
resulting in a physical rearrangement of the species in the
electrical double layer gives rise to the capacity current.
This behavior is usually described in terms of the differ-
ential capacity, C where:
Cd
=dE [19]
In those experimental situations where the applied
potential changes as a function of time, this equation can
be rewritten as:
r ^2 dt^d dt dE t 20 -
where the term dQ/dt represents the rate of change in
charge, i.e., the current resulting from the rate of change
of the potential, dE/dt. This current is the capacity
current, ic
. If the differential capacity of the double
layer is expressed in farads per square centimeter then the
area of the electrode must be included:
ic
= ACdv [2 1]
where A = area of the electrode and
v = dE/dt = rate of change of potential.
95
This equation again shows that changes in the area of the
electrode or the applied potential give rise to a capacity
current.
An approximate relationship between i and the peak
current in an LSV experiment is given by Delahay (422)
:
±c . , , ,n-8vl/2
^ 2.3 x 10 -Tn
p n ' C
where v is in volts per second and
3C is in moles per cm'
-1 -5 -1when n = 2, v = 0.015 Vs and C = 10 mol L , the capa-
city current becomes appreciable, i /i ^0.1. Either anc p
increase in the sweep rate or a decrease in the concentra-
tion will increase the effect of d on the analyticalc s
measurement. This discouraging fact places a limit on the
1/2lower concentration levels since i a v as seen fromP
equation [13] yet i a v. Many instrumental techniques have
been developed for polarography and then adapted to strip-
ping analysis in attempts to minimize the effect of capacity
current on the analysis.
One of the early methods for improving the polaro-
graphic technique was proposed by Muller in 1941 (423). A
simple, manually plotted derivative of the current-voltage
curve or polarogram was suggested as a means of separating
analytes with similar E . values. This method yielded

96
peaks and helped to suppress the rising background current.
Heyrovsky devised an automatic device to record first
derivatives in 1949 (424) and Airey and Smales developed an
automatic drop knocker for the DME to be used with this
method (425). As electronics improved, so did devices for
differentiating polarograms. Kelly, Jones and Fisher
updated the instrumentation in 1959 (426). Theories for
the resultant curves were derived by Shekun (^27) and Schapp
and McKenney (428) although a differentiation of the
existing theories seemed to agree with experimental results
just as well (429). Perone and coworkers constructed their
own instrument and performed LSV experiments at HKDE (429)
and were probably the first to apply the technique to
stripping analysis in 1965 (430) . They noted that decreased
deposition times could be used or increased sensitivity
attained because of the decrease in i and other interfer-c
ences (430) . Perone later used a WIG electrode for deriva-
tive LSASV (431) .
A method of immediate appeal is that of Semerano and
Riccoboni which was published in 1942 (432) . They used a
difference method wherein two identical DME's in two
separate electrochemical cells were employed. The analyte
was present in only one cell, but the supporting electrolyte
and everything else were identical in both cells. In this
manner the resultant subtractive current was due solely to
the analyte. There were reports on the same technique by
Kanevskii in 1944 (433) and Heyrovsky in 1947 (434).

97
Heyrovsky advocated using streaming mercury electrodes, as
the very short drop times were more reproducible and easier
to synchronize (434) . The drop knocker of Airey and Sruales
had its most successful application, up to that time, in
difference polarography (425) .
The difference method was applied with twin HI-IDE ' s in
19 58 by Martin and Shain (435) . Kemula in 1967 performed
difference ASV with twin HMDE's in the same solution (13).
A different deposition time was used for each electrode,
they were stripped simultaneously, and the difference
current recorded. Several recent methods have also used
only one solution for the analysis. A rotating split disk
electrode was used in 1978 where one half disk was stripped
after the deposition (436) . Both half disks were then
stripped together and the difference current plotted. Twin
TFME's on glassy carbon were used by Wang and Ariel in 1981
(437) and Wang and Greene in 1982 (438) . The difference
currents resulted because during deposition one electrode
was rotated and the other was not. Another technique used
two epoxy bonded graphite electrodes fabricated within the
same holder (439) . The difference current here was obtained
as a result of two different deposition times for the TFME's
formed. A variety of forms of the difference technique have
appeared in stripping analysis.
The earliest of the attempts to depart from conven-
tional DC polarography, and one which has become an impor-
tant branch today, was alternating current polarography.
98
Muller and coworkers made one of the first AC polarographs
in 1938 (440) . Their system consisted of a manual polaro-
graph with a small sinusoidal alternating voltage in series.
The resulting alternating current was displayed on an
oscilloscope. They observed that for a particular ion in
solution, at a particular voltage the alternating current
waveform was symmetric. At other direct voltages the
waveform appeared distorted. It was theorized that this
potential was the polarographic half wave potential. They
were able to locate the half wave potential within a few
millivolts by minimizing the distortion. Unfortunately
conditions of reversibility and low alternating voltage
level must apply to utilize this method.
A phenomenon observed in the Muller method, but not
exploited directly, was used by Boeke and van Suchtelen in
1939. They modified the Muller system to measure the phase
angle as well as the alternating current (441, 442). The
phase angle difference between the applied alternatingo
voltage and the observed alternating current is 90 at the
baseline and the diffusion limited current plateau but much
less in the rising portion of the polarogram (443) . The
idea of phase angle measurements and phase selective detec-
tion of alternating current later made a significant contri-
bution to AC polarography
.
The first practicable AC polarograph is often credited
to MacAleavy (444, 445), who published the first useful AC
polarogram (445) . Many groups were working at the same time

99
including Breyer and Gutmann who constructed their own,
similar device with a linearly varying direct voltage with a
superimposed alternating voltage (446) . Breyer continued to
investigate the field, published many papers and coauthored
a book (443) . The AC polarographic technique has been
applied in a number of studies as the stripping method in
ASV experiments (447-451) . It has not, however, been widely
accepted compared to other methods in ASV.
Two patents by Jessop for a phase selective current
detector extended the utility of AC polarography and enabled
more complete discrimination against charging current to be
realized (452, 453). This discrimination is due to the facto
that the capacity current has a phase angle of 90 preceding
the voltage (as will any capacitor in an AC circuit) whileo
the faradaic current leads the voltage by only 45 for
reversible systems at low frequency (11, 266, 443, 454).
With the use of phase selective detection, the charging
current can be decreased significantly. At the same point
in time as Jessop, Yasumori in 1956 (455) and Barker and
Faircloth in 1958 (456) reported the use of the difference
method in AC polarography. The phase selective methodology
supplanted such techniques in short order. A paper by Bond
on the theory and experimental aspects of AC polarography
both with and without phase selection is useful as a general
introduction to the techniques (457)
.
Underkofler and Shain in 1965 applied phase selective
AC voltammetry as the stripping technique in a series of

100
experiments (454) . They derived the following equation and
verified that the alternating current was indeed propor-
tional to concentration, the amplitude of the alternating
voltage and the square root of the frequency of the alter-
nating voltage:
2 2 1/2 1/2-; - n F
z AD X/Z co
1/ZC AE . 2 r ,nF
, ,_ „1AC 4rt x sech f^) (E-E1/2 )]
x sin (out + -sr
where oj = the frequency of the alternating voltage,
AE = the maximum magnitude of the alternating voltage
and E = the direct voltage.
Since the maximum current occurs when E = E . and therefore
2sech (0) = 1, the maximum alternating current is given by:
2 2 1/2 1/2i
- n Ff AD 1/Z ai
1/-C AE ....
p,AC 4RT *L ^ JJ
This agrees with the equation for reversible processes at
low frequency reported in the book by Breyer and Bauer for
conventional AC polarography (443). Breyer and Bauer also
treated irreversible cases and higher frequencies to arrive
at appropriately modified equations.
An extension of the theory of Underkofler and Shain to
more closely approach the experimental conditions and
results was undertaken by Delmastro and Smith (458) . Velghe

id
and Claeys performed similar experiments and investigated
the effects of several parameters in 1972 (459) . Morehead
and Davis thoroughly investigated the phase selective ASV of
cadmium (460) . A review of phase selective ASV has been
recently published (461).
A related AC technique, which also is used in an
attempt to reduce the effect of i , is second harmonic AC
voltammetry. When an alternating voltage is applied to a
redox system, the resulting alternating current; will contain
faradaic current at integral multiples of -Che applied or
fundamental frequency (443, 462, 463). These harmonics were
studied as early as 1951 by van Cakenberghe using AC polar-
ography to obtain information about transfer coefficients
for irreversible electrode reactions (464) . He used an
amplifier tuned to the frequency of the second harmonic. In
a paper on the general theory of AC polarography , Tachi and
Kambara outlined a number of expected effects, including the
presence of higher harmonics (465) . A second paper from
Tachi developed the second harmonic AC polarographic theory
in 1955 (466). Bauer and Elving measured harmonics by means
of a filter to eliminate the fundamental frequency and pass
the even harmonics (467). Bauer suggested the use of
harmonics, rather than the total alternating current, to
suppress capacity current in 1960 (462).
The concentrations of the species in a redox system
vary with the applied potential in a logarithmic manner
102
according to the Nernst equation. Thus the faradaic alter-
nating current nonlinearly follows the applied alternating
potential. The capacity current arises from the capacitor-
like properties of the double layer. Since capacitors
behave as almost perfectly linear elements in an AC circuit,
there should be no harmonics of the alternating capacity
current as there is with the non-linear alternating faradaic
current (462, 463). By use of frequency filters or other
frequency selective devices, higher harmonics can be studied
in the absence of the fundamental frequency. The capacity
current is thus suppressed relative to the faradaic current.
Since the second harmonic has considerably greater magnitude
than the higher harmonics, it is the most commonly used
harmonic
.
Smith and Reinmuth in 1961 constructed a second har-
monic AC polarograph to study this effect (463) . The use of
a phase selective detector in conjunction with the second
harmonic technique was demonstrated in 1963 by Smith (468)
.
Bauer derived reversible and quasi-reversible theories (469,
470) and with Foo obtained rate constant and transfer
coefficient data utilizing the theory (471) . McCord and
Smith extensively revised the theory of quasi-reversible
reactions under second harmonic AC conditions (472) . Bond
extended the theories to include the third harmonic and
discussed the relative merits of each (473, 474). Second
harmonic AC stripping voltammetry has been used both without
(293, 475, 476) and with (477) phase selection. It was

103
noted that theoretically the second harmonic technique
contains negligible capacity current but phase selection was
used to further reduce any remaining capacity current (477)
.
Additionally, more detailed discussions on the previously
mentioned AC techniques may be found in several references
(19, 443, 478).
An important characteristic of modern voltammetric
instruments is "potentiostatic" control of the working
electrode. With the introduction in 1942 of the three
electrode system or maintaining the potential of the working
electrode at any chosen value, Hickling opened the door to
many new areas of electrochemical research (479) . The term
"potentxostat" was coined to describe the system in the same
paper (479) . Previously, two electrode systems merely
applied the controlled potential between two electrodes.
Not only did the reference electrode (if one was used)
participate in the current flow, but the entire cell and
solution resistance contributed to voltage drops and mea-
surements. The potential of the working electrode at any
given time was not controlled or known with any certainty.
The three electrode system is designed so that no
current flows in the potentiostatic circuit, the working
electrode/reference electrode pair. The current flows
between the working electrode/auxiliary electrode pair, with
no potential control or measurement associated with the
auxiliary electrode. The potential is thus applied only
across rhe working electrode/solution interface, with

104
compensating potential at the auxiliary electrode ensuring
potentiostatic control. Incorporating potentiostatic
control to all electrochemical instruments required the
electronic advances which additionally spawned other varia-
tions of the classic polarographic technique.
One instrumental variation used in many commercial
instruments today is Tast or sampled DC poiarography . It
was developed in 1952 by Wahlin (480) and extensively
discussed in 1956 by Wahlin and Bresle (481) and Bresle
(482) . The Tast technique samples the polarographic current
during the later stages of the life of the drop from a DME
and this value is recorded and held until the current is
again sampled during the next drop. Since during this
sampling period the drop is not appreciably increasing in
size, changes in the total current are minimized and the
familiar oscillations of the conventional pclarogram are
considerably reduced. In addition, the capacity current
will be at a minimum since the change in area is at a
minimum and the faradaic current will be at a maximum
because the mercury drop has reached its maximum surface
area. Early developmental work by Elbel and coworkers (483,
484) and Kane (485, 486) into the mid 1960s has resulted in
the use of this technique by polarographers . Little atten-
tion has been focused on this polarographic modification in
voltammetry and stripping analysis since with an electrode
of fixed volume or surface area there is no reason to expect
any improvements
.

105
Probably the most important change in the classic
polarographic method has come about due to the introduction
of waveforms other than the simple linearly varying poten-
tial. Coupled with modern, low cost instrumentation, a
"renaissance in polarographic and voltammetric analysis" has
occurred according to Flato (487) . The first waveform
applied and the first of many introduced by Barker was the
square wave superimposed on a linearly varying potential.
Reported in a paper by Barker and Jenkins in 1952, square
wave polarography was devised as yet another method to cope
with capacity current (282) . The paper described the
operation of the instrument with a DME and also suggested
the use of it in ASV with a HMDE . A 22 5 Hz square wave with
amplitudes of 4, 12 or 35 mV was used. A series of papers
by Kambara in 1954 outlined the theory of square wave
polarography (488) while the instrumentation and theory
continued to be developed by Barker and coworkers (489-492)
.
Mitner and coworkers, working at the Atomic Energy Research
Establishment in England, as did Barker, reported on a
number of applications and the improvements seen with the
square wave polarograph (493-496) .
With the application of pulses, several currents arise
in addition to the direct faradaic and capacitive currents.
When the potential is suddenly changed a current pulse i
may occur if the potential pulse has brought the potential
into a region of reactivity of an electroactive species.
Additionally a current pulse i is required to charge the

106
double layer. The square wave (and other pulse) polaro-
graphs must measure the pulse i and discriminate against
pulse i as well as against direct i £ and direct i . From<-
~r c
the theories of Kambara (488), Barker and coworkers (490,
492, 497) and Ramaley and Krause in 1969 (498, 499) the
fundamental advantage of square wave (and other pulse
techniques) is evident.
The square wave faradaic current for a reversible
species given by Barker (497) is:
[24]
where AE = square wave amplitude in V,
nF(E-E )
P = exp [-l/z
1
RT J'
t = half period of square wave in s,
t = elapsed time after pulse application in s,
6 = t/x
and the rest of the terms have been defined previously.
This is strictly valid only if AE << ~ (497). If only theni
first half of a cycle is considered, the equation can be
reduced and is useful for general pulse techniques:
107
2 2 1 /?n F P D '
(1+P)Tr
It can be seen that a square wave (or pulse) voltammogram
will be symmetric about E,/2
(where i has its maximum
value). Additionally the maximum faradaic current, i , isP
proportional to the concentration of the analyte. Theoret-
ical equations for quasi-reversible and irreversible reac-
tions are also given (497)
.
The square wave and pulse capacity current is given by:
AE . -t ,i = -zr- exp [—— ] ,
26'c r rC
dl
where r = total resistance of the system in ohms
and <Z = double layer capacity in farads (500) .
Thus, reducing the cell resistance will reduce the capacity
current as well, evidence for the need for supporting
electrolytes even in pulse voltammetry. if only the time
dependence of the two pulse currents is considered the
reduced forms are:
4.-1/2f, pulse l^ ' i
and i , a e T281c, pulse LZ0J
108
The capacity current decays more rapidly than the faradaic
current following the pulse application. By delaying the
sampling of the total current, the ratio i,. . / if, pulse c, pulse
continues to increase. After 20 to 40 ms (19) or 50 ms (11)
i DU i senas decayed to practically zero. With delay times
as short as 1 to 2 ms the i_ n /i . ratio has risenf, pulse c, pulse
to values of from 5 to greater than 10 depending on
experimental conditions (500). These significant suppres-
sions of the capacity current relative to the faradaic
current show how the square wave and pulse techniques have
achieved their widespread acceptance. The factor of the
non-pulse currents must still be considered.
By applying the pulse during the last few milliseconds
of a mercury drop's lifetime or using electrodes of constant
volume or surface area, the direct if
and i will be approx-
imately constant. Since neither the area nor the linearly
changing part of the total potential will have changed
appreciably during the short pulse, changes in the direct i f
and i will be small as well. Barker's instrument wasc
designed to sample the current a fixed time after each
change in potential and generate the difference (282) . With
pulse rather than square wave instruments, the difference
between the after pulse and before pulse current samples is
the signal. In either case the current output is essen-
tially only pulse faradaic current.
The application of square wave voltammetry to stripping
analysis was suggested in the first square wave polarography

109
paper (282) and was later used by Barker in 1958 (501) . A
difference method of square wave ASV (SWASV) was also
reported in 1958 by Barker and Faircloth (456). A large
number of metals were analyzed by SWASV by von Sturm and
Ressel during the 1960s (502, 503). SWASV was one method
von Sturm later used to analyze high purity arsenic for
several impurities (504) . Kaplan and Sorokovskaya in 1964
reported on their investigations into SV7ASV (505). They
found little improvement over LSASV because of a variety of
instrumental problems. The early instrument complexity and
associated problems caused the technique to be seldom used,
although through Barker and others it has evolved into other
pulse methods commonly used. A review of square wave
polarography and voltammetry through 19 74 contains a number
of interesting and informative figures (500).
A brief mention will be made of the present day status
of square wave polarography and voltammetry due to the
Osteryoungs and coworkers. With a modern, dedicated instru-
ment (506) and recently developed theory (507) the entire
potential working range is scanned during the life of one
drop (508) as was suggested by Barker in 1957 (509). The
rapid scanning capabilities allow for signal averaging using
up to thirty drops (506) or for such diverse applications as
detectors for liquid chromatography (510). By scanning the
potential range of interest every few seconds, a three
dimensional i-E-t plot is obtained (510) . Kinetic infor-
mation can be obtained (511) and in 1982 Robert Osteryoung

110
said that it could become the dominate pulse technique of
the future (512). Optimization of a modern square wave
instrument for SWASV was described in a recent paper (513) •
A second waveform introduced in 1960 by Barker is the
staircase waveform (514) . Measuring the current at the end
of the steps of the staircase allows the experimenter to
obtain linear sweep voltammograms without capacity current.
Decay times of i were estimated to be en the order of
100 ys (514) . Mann was one of the first to apply staircase
waveforms, using rapid scan voltammetry at solid electrodes
for reversible systems (515-517). His instrument could scan
up to 40 Vs using steps up to 3 mV which lasted 2 to 5 ms
each. His primary applications were in cyclic voltammetry,
but the work demonstrated the technique's ability to dis-
criminate against capacity current. Similar instrumentation
was made (518) and theories advanced (518, 519) by groups in
the mid 1960s. Christie and Lingane reiterated Barker's
statement regarding i decay times of approximately 10 us
(519) . Further refinements in theory and technique resulted
in three papers in 1973 (520-522) . Ferrier and Schroeder
derived theories for reversible, quasi-reversible and
irreversible electrode reactions and introduced x.he idea of
varying both the time allowed for i to decay and the
sampling time in order to study kinetics (364) . A recent
paper approaches staircase voltammetric theory by con-
sidering the staircase waveform to be the sum of linearly
varying and sawtooth waveforms (523).
Ill
The first reported application of the staircase wave-
form to stripping analysis was in 1976. The theory of
staircase voltammetric stripping using a TFME by Christie
and Osteryoung indicated promise compared to other stripping
techniques (524) . Application by Osteryoung and coworkers,
using fast scan rates, enabled the stripping step to take
less than 2 s (525). A more recent paper discusses routine
lead analyses at 3 minutes per prepared sample (526) . The
authors used a commercial instrument, the Environmental
Sciences Associates, Inc. Model 3010A Trace Metal Analyzer,
which incorporates a staircase waveform as its stripping
method.
Another waveform introduced by Barker with Faircloth is
the triangular wave (527) . The method was initially used as
a means to measure double layer capacity. It was noted that
when a triangular voltage was impressed upon a capacitor,
the resulting current through the capacitor was a square
wave. In case of a polarographic cell, in essence a resis-
tor and a capacitor in series, a slightly distorted triang-
ular current resulted (527). The instantaneous current was
used to measure the double layer capacity. In 1971,
Sluyters and coworkers built and demonstrated a system
designed to discriminate against i by the same method
(528) .
dEFrom equation [21] , i = C, -rr. As mentioned by
Sluyters and coworkers, the derivative of a triangular wave
is a square wave (528) . Thus the capacity current resulting

112
from a triangular voltage is a square wave. It can be
eliminated by full wave rectification of the total alter-
nating current and filtering out the resultant direct
current, now corresponding to the capacity current. The
faradaic current resulting from the triangular voltage is
either triangular or distorted triangular (528). It is thus
possible to amplify the remaining AC after DC filtering and
obtain only the faradaic current component. Barker modified
the method by means of sample and hold circuitry to smooth
the resultant curves and eliminate the spikes often seen
(529) . Because of the simultaneous rise in popularity of
pulse techniques, little work has proceeded in this more
complex area.
Undoubtedly the most popular modification of the
original polarographic method to date is the family of pulse
techniques. Presently incorporated in a number of commer-
cial instruments, these methodologies date back to the early
work of Barker and are successful outgrowths of square wave
polarography. Published by Barker and Gardner in 1958 and
1960, two papers outline pulse polarography (530, 531). The
two original forms of pulse polarography, normal and deriva-
tive pulse polarography, remain relatively unchanged.
Normal pulse polarography (NPP) was so named because
the resultant polarograms resembled conventional DC polaro-
grams. The pulses applied vary in amplitude from zero to
several volts. The amplitude is proportional to the time
elapsed from the beginning of the experiment. The pulses

113
are superimposed on an initial potential which is adjustable
but remains fixed during a particular experiment. In other
words, pulses of increasing amplitude are superimposed
periodically on a set initial potential. The background
current flowing at the initial potential may result solely
from impurities or it could be due to ions of significant
concentration which are more easily reduced than the target
analyte. In any case, only the change in current resultant
from the pulse application is measured. As in the square
wave and staircase polarographs , the current is sampled
sufficiently late in the pulse and drop lifetime so that
capacity current has decayed to approximately zero. In the
instrument of Barker and Gardner, 40 ms pulses were applied
2 s after each drop started forming. The current was
sampled for the last 20 ms of each pulse (531). Divalent
ions could be detected at concentrations below 10 M with
baseline fluctuations representing only about 7% of the
total current present (531). In summary, NPP applies
voltage pulses of increasing amplitude to a fixed initial
potential. It measures only the change in faradaic current
resulting from the pulse by delaying the current measurement
until capacity current has decayed. The resultant NP
polarogram resembles a smoothed conventional polarogram with
significantly increased sensitivity.
The derivative pulse polarograph was so named because
the resultant polarograms resembled derivatives of conven-
tional DC polarograms. The applied pulses are of constant

114
magnitude and are superimposed on a linearly changing
potential. In the derivative mode of the Barker instrument,
the pulse amplitude, duration and delay time remained the
same as in the NP mode (531). The current sampling was
again during the last half of the pulse life to reduce i ,
but there were two current samples taken per pulse as in the
Barker square wave (282) . The current was sampled for 20 ms
at a fixed time after each change in potential. The differ-
ences between these two currents were displayed as a func-
tion of the underlying linearly varying potential to give
the derivative polarogram. Because the sweep rate used is
fairly small (1 to 10 mVs" ) and the pulse duration rela-
tively short (40 ms) , the applied potential due to the
linear sweep remains essentially constant (less than 1 mV
change) during any given pulse and the electrochemical
processes can be considered as due exclusively to the pulse
(11) .
The background current, in the absence of pulses,
varies in the same manner as in DC polarography . However,
application of the 50 mV pulses may result in a change in
current if the pulse alters the rate of an electrode reac-
tion. This change in the diffusion current will be greatest
at the steepest part of the underlying DC polarogram and
will be less on either side. Thus the resultant current
differences will be at a maximum near the half wave poten-
tial and nearly zero at the base current and limiting
current regions. The polarogram will be bell shaped, a

115
derivative pulse polarogram. The name now in common usage
is differential pulse polarography (DPP) since the polaro-
gram is not a true derivative but is approximated by a
differential as pointed out by Parry and Osteryoung (532)
.
The first instrument made in the U.S. and the first
which used the three electrode configuration (Barker's was a
two electrode system) capable of normal and differential
pulse polarography is credited to Parry and Osteryoung in
1964 (533) . In a paper in which they evaluated the instru-
ment, varied several important parameters and briefly
discussed pulse theory, the principles of their current
sampling scheme are discussed (532) . The current was
sampled for the last 10 ms before the pulse (5 to 200 mV in
amplitude) and then again for the last 10 ms of the 50 ms
pulse. The difference current is essentially free of
capacity current and is displayed against the linearly
varying potential. The scheme is used in modern commercial
instruments and is outlined in Figure 6.
Normal pulse polarography or voltammetry generally
follows the theory derived for the first pulse waveform, the
square wave. Theory for NPP was specifically derived by
Brinkman and Los in 1964 (534) and in more detail in 1967
(535). Experimental work by Fonds, Brinkman and Los con-
firmed the theoretical studies (536) . Oldham and Parry
developed an approach of their own at about the same time
(537, 538). Applications of normal pulse to stripping

Hft
H03
H+J
c0)
0)
P
•H

117
3*3!
4

118
analysis have generally not appeared, probably due to the
simultaneous development of differential pulse techniques.
The theoretical treatment of DPP is based on the early
square wave theories as well. Refinements have been and
continue to be made to better correlate with experimental
observations. Discussions began with Parry and Osteryoung
in 1965 (532) whose equations for small pulse amplitudes are
the same as for square wave except that Aifreplaces i
fin
equation [25]. Keller and Osteryoung in 1971 derived an
approach to use of DP at a HMDE and noted the response
should be about the same as at a DME (539). Rifkin and
Evans developed theories for a number of step functions
including DP at solid electrodes (540). Dillard and Hanck
used digital simulation to evaluate the current response in
DPP (541). Birke derived a rigorous theory for DPP in the
cases of reversible, quasi-reversible and irreversible
reactions (542). Aoki and Osteryoung used expanding and
stationary plane models for their derivation of DPP theory
(543) . Many investigators have contributed to the theoret-
ical understanding of DPP and other pulse voltammetric
techniques. With each refinement, the theory unfortunately
becomes more cumbersome as it better fits the experimental
observations
.
Christian, who had studied both NP and DP at the HMDE
(544) was the first to apply DP to stripping analysis in
1969 (545). He had preferred DP to NP because of the
flatter baseline (544) and chose this method to improve the

119
stripping step in ASV. One conclusion that spurred a
controversy and a number of papers was that a very dilute
supporting electrolyte could be used on the order of 10 M
-3although 10 M was his recommended minimum (545). Sieger-
man and ' Dom published another of the early DPASV papers in
1972 (546). They used a WIG in addition to the popular
HMDE. Copeland, with Christie, Osteryoung and Skogerboe
were first to report the use of the TFME with DPASV (547,
548) . They commented on the need for supporting electrolyte
and demonstrated problems associated with higher solution
resistances (547). Many instrumental parameters and several
types of graphite for the TFME support were investigated
(548) . A theory for pulsed stripping at a TFME was advanced
by Osteryoung and Christie (549) . They mentioned that after
a pulse, significant amounts of material may redeposit
before diffusing away thus enhancing the signal even more
compared to other stripping techniques (549). This obser-
vation had been made earlier regarding NPP if the initial
potential was chosen so that no reaction can take place
(533, 537). Since these early investigations, DPASV has
received a great deal of attention and is probably the most
popular form of ASV currently practiced. Modifications and
improvements are constantly attempted, including a differ-
ence DPASV experiment using twin TFME's on glassy carbon
substrates (550).
An interesting variation of DPASV was reported in 1979
by Kankare and Haapakka (551) . Called double step ASV, this

120
pulse technique was developed in order to utilize all the
faradaic current which differential pulse polarography only
samples. The authors assumed the capacity current flowing
during each of two consecutive pulses to be approximately
equal. Thus the difference between the total current
flowing through two consecutive pulses would be due only to
the difference in faradaic current. Some optimization was
reported, no theoretical work was attempted, and results
were similar to those of other pulse techniques. This is
one example of the possible complex waveforms that can be
expected with the use of modern computers in the laboratory
setting. A slightly different variation by Lane and Hubbard
utilizes a time delay between the two pulses of the two
pulse cycle (552). This method was called differential
double pulse voltammetry, the current difference between the
pulses in a cycle being the analytical signal. Still
another variation is differential normal pulse voltammetry,
introduced by Aoki, Osteryoung and Osteryoung (553). Two
pulses (rather than one) are added to the initial potential
as in NPP; the second pulse is larger than the first. The
difference current is recorded and the next pulse pair is
applied to the initial potential. Theories for irreversible
(553, 554), quasi-reversible (553) and reversible reactions
(555) have been reported. There seems to be no doubt that a
great many pulse waveforms will be investigated in
attempting to solve the varied problems in electroanalytical
chemistry. A few papers have appeared which discuss and/or

121
compare several of the previously mentioned polarographic
,
voltammetric and stripping techniques (487, 512, 556-560).
An instrumental technique unrelated to the pulse
waveforms just discussed which has been applied to stripping
analysis and was developed by Goto is semi-differential
electroanalysis . The semi-integral method of Oldham (561,
562) provided the idea for the initial paper of Goto and
Ishii (563) . The semi-derivative of the current with
respect to voltage,
e = ^—rf , [29]dE Ll
is instrumentally constructed and plotted versus the lin-
early varying potential to give a "derivative neopolarogram"
(563). Where conventional LSV gives broad peak and semi-
integral analysis gives a wave, semi-differential analysis
yields a sharp, narrow peak. In a comparison of the three
techniques in a series of cyclic voltammetry experiments,
the semi-differential method gave anodic and cathodic peaks
which were closer together on the potential axis and more
nearly the same in height than the other two methods (563).
2 +For the reversible ion of study, Cd , the authors
concluded there were fewer nonfaradaic interferences with
the semi-differential method compared to linear sweep and
semi-integral methods (563). Papers on the theory for
semi-differential electroanalysis (564) and parametric

122
effects on peak shape. (565) were followed by a paper on the
application to ASV at a HMBE (566) . Using a linearly
varying potential, reversible analytes produced the expected
-9sharp, symmetric peaks. Concentrations as low as 10 M
could be determined.
In a subsequent paper, a rotating glassy carbon elec-
trode with in situ formed TFME was used (567) . The semi-
differential ASV method was shown to be close to DPASV in
sensitivity and resolution but substantially faster. Scan
rates on the order of 160 mVs """ could be used. An unusual
aspect of the particular method is that the theory derived
indicates and the experimental data obtained confirm that a
pair of peaks of similar magnitude but opposite direction
result from the semi-differential stripping process at a
TFME (567) . It is considerably easier to measure a peak-
to-peak value than the single peak height obtained in
conventional LSASV and DPASV since no baseline need be
constructed. The peak-to-peak value of the semi-differen-
tial current obtained from the stripping from a TFME is
given by
e429 n
5/2F5/2 Av3/2 tj D
2/3N1/2
C
pp vl/6
R1.5
T1.5
where v = the scan rate,
t, = the deposition time,dep r
te£[30]

123
N = the revolutions per second of the
electrode,
and v = the kinematic viscosity of the solution (567)
Experiments confirmed the theoretically predicted
relationships given in this equation. In addition, the
capacity current is reduced by the semi-differential
procedure as,
AvC,e = r-rz [31]C
Ut)1/2
where t = the total elapsed scan time in s (567) .
This is less than the capacity current for LSASV without
semi-differential analysis given in equation [21] which is
just the numerator of equation [31], as long as t > 1/ir.
Further work on semi-differential electroanalysis
demonstrated that increased signals resulted from decreasing
the concentration of the supporting electrolyte (568) . As
the fraction of the total ionic strength due to the electro-
active species increased, the signal due to the analyte
increased as well. Goto and Ishii introduced the semi-
differential and semi-integral approach to square wave
voltammetry in 1979 (569). In 1980, the semi-differential
2 +ASV analysis of Hg at a rotating gold electrode was
enhanced by changing the analytical solution after

124
deposition (570). This process of medium exchange to
improve the stripping step has been used by a number of
investigators
.
Kalvoda, in 1957, reported the successful ASV determin-
ation of trace components in samples of VO„SO. by performing
the stripping step in a solution of pure H_S04
(571). The
2 +problems associated with VO,, continuing to be reduced had
been eliminated by removal of the interfering ion before the
analysis step. Philips and Shain in 1962 replaced their
steel analytical solution with separate stripping solutions
to eliminate the matrix effects on the tin analyses (572)
.
The ASV analysis of Dead Sea brine by Ariel and Eisner was
improved by carrying out the stripping process in different
media (573). To ensure peak separation and proper identifi-
cation of the peaks, five different media were chosen so as
to shift the peak potentials of the analytes cadmium, lead
and copper. Ariel, Eisner and Gottesfeld successfully
increased peak separation, reduced the high residual current
and shifted several peak potentials to more cathodic values
in a separate paper on Dead Sea brine analysis (574).
Gottesfeld and Ariel deposited copper from a steel sample
and then changed the medium for stripping in order to avoid
interferences from the high iron concentration (575).
Earlier problems with media exchange, including cross
contamination of solutions and sample oxidation during the
solution exchange, were the reasons for a micro flow cell
used by Kister and Ariel in 1971 (576). The general problem

125
of insufficient peak separation was addressed and a flow
system used with different complexing agents to improve the
i. •n • ^ r,v2+ ^.2+ „ 2+ -,-,2 + , _,+stripping analysis of Pb , Bi , Cu , Cd and Tl , also
in 1971 (577). A citrate buffer was used recently to
improve the analysis of lead with tin present by complexing
the tin to improve the peak separation (578). The method of
matrix or medium exchange can often improve a stripping
analysis by shifting the potential where an analyte strips.
This can increase peak separation in the case of more than
one analyte or allow the determination of difficultly
oxidized species. In addition interferences due to the
materials present in the analyte solution are eliminated by
the simple replacement of the analyte solution with a pure
stripping solution.
A stripping method which is not instrumentally con-
trolled is chemical stripping. In the original work and in
2 +the modern methodology, Hg acts as an oxidant to chem-
ically strip the analytes from the electrode. The initial
work by Bruckenstein and Nagal in 1961 used a rotating
platinum electrode with codeposited analytes and mercury
2 +(579). The excess Hg , added to form the TFME, chemically
oxidized the analytes from the film after the applied
deposition potential was discontinued. The cell potential
versus time was monitored. The resultant dissolution curve
resembled a chronopotentiometric curve and the data was
analyzed in this manner. Neeb (580) and Bruckenstein and
associates (581, 582) continued to develop the technique.

126
Bruckenstein and Bixler used several oxidizing agents to
strip silver from a platinum electrode (581). Theoretical
expressions and confirmational experiments were reported by
Marsh and Bruckenstein (582). Some of the problems encoun-
tered such as dissolved oxygen and easily reduced ions
acting as stripping agents and causing deviations in the
proportionality between transition time and concentration
were discussed by Kemula and Strojek (583). A series of
papers by Jagner, with several collaborators, beginning in
1976 developed this technique which led to a commercial
instrument (584-588). A derivative chemically stripped
method (585), simple instrumentation consisting of a poten-
tiostat and a pH meter (586) and the use of dissolved oxygen
to strip (587) were discussed. A prototype instrument
described and used on board ship for sea water analysis was
capable of sub part per billion limits of detection for Zn,
Cd, Pb and Cu (588) .
An unusual idea which shows great possibilities in
stripping analysis is the use of the preconcentration step
to prepare a solution of increased analyte concentration
which then is subsequently analyzed. The enriched solution
can either be analyzed at the same electrode it was previ-
ously deposited on or at a second electrode. The same
electrode method originated with Yarnitsky and Ariel (589).
They stripped the preconcentrated electrode for a short
period of time at a fixed potential then commenced a linear
cathodic scan to measure reduction currents before the

127
analytes could diffuse from the enriched zone near the
electrode. Kopanica and Stara performed essentially the
same experiment but used a DP scan after the rapid stripping
(590) . Little improvement over conventional DPASV was seen
(590) .
The other pre-enrichment technique, using a second
electrode, can be traced to Johnson and Allen (591) . This
technique named "stripping voltammetry with collection," was
performed using a rotating ring-disk electrode. By depos-
iting silver onto the disk and then linearly scanning the
disk potential, the silver was stripped. As the silver ions
were swept toward the ring by the rotating assembly, the
ring was kept at a constant cathodic potential in order to
reduce the silver ions as they arrived. By measuring ring
current as a function of the disk potential, a curve not
unlike a conventional linear sweep voltammogram was
obtained. Concentrations of silver as low as 10 M could
be detected (591). The authors also used a gold plated
glassy carbon disk and a platinum ring to successfully
determine mercury with only one stripping peak (592) . Laser
and Ariel used a glassy carbon based TFME ring-disk system
(593) and Shieffer and Blaedel used two tubular glassy
carbon based TFME in series in a flow through system (594,
595) to accomplish the same task. Two very recent papers by
Brihaye and Duyckaerts evaluate the effects of varying
several parameters (596) and compare LSASV with collection
to DPASV at a HMDE and to LSASV and DPASV at a TFME (597).

128
The possibilities for this technique are obvious from the
reported limits of detection, as low as 2 to 5 parts per
trillion for cadmium, lead and copper (596, 597). By
maintaining a constant collection potential at the ring, any
capacity current will be minimized and the ring current will
be predominately faradaic.

CHAPTER VI
EXPERIMENTAL
Materials and Reagents
All chemicals were of reagent grade quality, with the
exception cf the following. Fisher purifiea vanadyl sulfate
was used in the nitrogen scrubbing solution. Bethlehem
triple distilled mercury was used in saturated calomel
electrode fabrication, as the cathode in the pre-
electrolysis of solutions and for contacts in laboratory
made electrodes. Alfa Products potassium tetrachloroplat-
inate was used in cis-diamminedichloroplatinum (II) synthe-
sis. Urine samples were obtained as needed from this
investigator.
Water was triply distilled. In-hcuse deionized water
was used as the feed water for the first distillation from
alkaline potassium permanganate. The second and third
distillations were from an Heraeus all-quartz still. Water
was collected in precleaned glass 2L volumetric flasks with
ground glass stoppers. The singly distilled water, which
overflowed the quartz still feed, was collected for use in
washing. All solutions were made with triply distilled
water. Some solutions were pre-electrolyzed for further
purification as described below.
129
130
Nitrogen was obtained prepurified but was treated
further as described below. Laboratory tissues used in
electrode preparations were Kimwipes brand from Kimberly-
Clark Corporation. Standard laboratory glassware was used
and cleaned as described below.
Equipment and Instrumentation
The primary electrochemical instruments used were the
PAR 17 4A polarographic analyzer and PAR 175 progranmer from
Princeton Applied Research and the Houston RE 0074 X-Y
recorder. A PAR 173 potentiostat with a 176 current fol-
lower was used for solution pre-electrolysis . Potentials
were monitored using two Keithley instruments, the model
610C solid state electrometer and model 171 digital multi-
meter. A Coleman Instruments model 28C pH meter with a
Sargent model 30072-5 combination glass electrode was used
for pH measurements. Timing was done using a digital watch
with a stopwatch feature.
Pyrex glass electrochemical cells were manufactured in
the department's glass shop and were of conventional design.
The main cell, for depositions and cyclic voltammetry, had
compartments for the auxiliary and reference electrodes
separated from the working electrode compartment by a fine
porosity glass frit and a stopcock respectively. Nitrogen
could be introduced into the solution in the main compart-
ment by means of a medium porosity glass frit. It could
also be directed over the surface of the solution. The
131
cell had a working volume of about 80 mL and several experi-
ments could be performed using the same solution without
serious deplerion of the analyte.
A smaller cell was used for the stripping step of the
experiments and was filled with 25 mL of solution. Here,
the platinum auxiliary was in the same compartment as the
working electrode and both were separated from the reference
electrode compartment by a fine porosity glass frit.
nitrogen could be introduced into the solution through a
coarse porosity glass frit or directed over the solution
surface. A third cell, used for solution pre-eiectrolysis
,
contained nearly 2 50 mL. The reference electrode was
separated from the main compartment by a fine porosity glass
frit. A well in the bottom of the center of the main com-
partment contained about 10 mL of mercury which served as
the cathode. The mercury and the solution were stirred by a
magnetic stirring bar which floated on the mercury surface.
A platinum gauze anode and a glass capillary for continuous
nitrogen introduction were in close proximity to the
cathode.
Saturated calomel electrodes (SCE) were used as refer-
ence electrodes in all experiments. Those used with the
primary cell were constructed in the laboratory and con-
tained KCl/agar salt bridges. Other SCE ' s were Beckman
electrodes with ceramic junctions. The working electrodes
were rotated by a Beckman variable speed motor #188501. A
Beckman model 39084 vitreous carbon tip and a number of

132
other types of carbon, held in Teflon adaptors made in the
department's instrument shop to fit the Beckman motor were
used as working electrodes. A sample of charcoal cloth
obtained from MDA Scientific Inc., Glenview, II. was also
used as a working electrode. It was supported by an alli-
gator clip. The solution was stirred and the charcoal cloth
electrode was stationary.
Six forms of carbon other than the supplied Beckman
vitreous or glassy carbon were fitted to the rotating
electrode assembly for evaluation as working electrodes.
Graphite filled Teflon from Fluorocarbon Corp. in Anaheim,
California was machined as a disk which fit in a noncon-
ductive Teflon holder and also as an entire tip that fit
directly on the electrode drive shaft. A POCO FX9I pyro-
lytic spectographic electrode from Pocographic Inc.,
Decatur, Texas, was machined to fit a Teflon holder. Dylon
Grade RX epoxy bonded graphite from Dylon Industries Inc.,
Berea, Ohio, was mixed as directed and allowed to cure at
room temperature after being packed into the recesses of
Teflon holders. Glassy carbon rods from Atomergic Chemetals
Corp., Plainview, N.Y. of 3 mm diameter were also fitted
into Teflon holders. Nuchar C-115-N vegetable carbon from
the Chemical Division of West Virginia Pulp and Paper Co.
was used for the final two working electrodes. A "Kel-graf"
electrode was constructed by mixing the carbon powder with
finely chopped Kel-F polymer wax from 3M Company according
to Anderson and coworkers (320) . Carbon paste was made by

133
mixing the carbon powder with Nujol according to Schrn.id and
Bolger (598)
.
All working electrodes had diameters of 1/4" with the
exception of the carbon paste and Kel-graf electrodes which
had 3/16" diameters and the Atomergic glassy carbon rod of
3 mm diameter. All Teflon adapters were designed so that
only the face of the carbon disk was exposec to the solu-
tion. Electrical contact between the stainless steel drive
shaft of the motor asbembly and the various forms of carbon
was made by packed carbon paste.
Procedure
Laboratory glassware was thoroughly washed with soap
solution, rinsed with flowing deionized water and soaked at
least overnight in deionized water with frequent water
changes. An overnight soaking in chromic acid cleaning
solution and subsequent rinsing was followed by an overnight
soaking in 6 M HNO,.. Rinsing with deionized, singly and
triply distilled water completed the cleaning. Between
uses, volumetric ware was filled with the previous solution
if the flask was to be used in a similar manner at a later
date. Otherwise, flasks were filled with deionized water
ana sealed. By keeping all glassware, including cells,
filled with the same solution for the duration of the
experiments, equilibration of the ion exchange properties of
the glass was hopefully attained.
134
Commercial, pre-purifieu nitrogen in cylinders was
further treated to remove residual oxygen. A 0.1 M vanadyl
sulfate solution was used as recommended by Meites and
Meites (599). Zinc amalgam was added to reduce the vanadium
as it was oxidized by any residual oxygen. A paper by
Stromberg and Zhikharev describes the improvements in
electrochemical experiments, including ASV, attained with
this method of purifying the nitrogen stream (600). A
second gas scrubbing bottle filled with triply distilled
water was used after the vanadyl sulfate bottle to remove
any volatile components and to saturate the nitrogen with
water. Nitrogen exiting this scrubber was then introduced
into the cells by way of Teflon needle valves to control the
individual flow rates. In times when solutions were to be
changed often, two separate containers were used for each
solution so as to deaerate in one prior to introduction into
the particular electrochemical cell. In this manner,
solutions were free of oxygen before introduction into the
appropriate cell, thus improving throughput. A short
sparging time was used to remove any air and oxygen reincor-
porated into the solution during the transfer process and to
provide a blanket of nitrogen above the solution surface.
Chemicals were used as obtained in most cases. Excep-
tions included the synthesis and purification of cis-
diamminedichlorcplatinum(II) from K„PtCl. according to a
well known procedure (601). Chloroplatinic acid was made

135
by dissolution of platinum metal in freshly prepared aqua
regia. Sodium diethyldithiocarbamate was washed several
times with CHCi_ , vacuum dried and stored under vacuum. The
supporting electrolytes, aqueous NaCl and bisulfate/sulfate
buffer and the sulfuric acid stripping solution were indi-
vidually prepared and pre-electrolyzed at concentrations
greater than those used. This procedure yielded solutions
of increased purity and also minimized the time required for
the pre-electrolysis procedure.
Lingane used a mercury pool cathode at controlled
potential to lower the concentration of ncble metals in the
presence of baser metals in order to improve the polaro-
graphic analysis (602) . His suggestion to stir the mercury/
solution interface was incorporated here. Later rererences
to this method for removing impurities in supporting elec-
trolytes were made by Linyane (355) and Meites (603)
.
Following suggestions in these sources, solutions were
pre-electrolyzed overnight, at constant cathodic potential,
with the solution and mercury stirred by a magnetic stir bar
and motor and with a continuous nitrogen stream. The
bubbling nitrogen aided in stirring the solution as well as
removing gaseous products of the pre-electrolysis. Each
pre-electrolysis potential was chosen so as to be several
hundred millivolts cathodic of the mcst cathodic potential
to be encountered during regular use by the particular
solution.

136
A general procedure, refined throughout the investiga-
tion, was the treatment of the glassy carbon electrode
surface. Work with carbon paste was simplified by its ease
of surface renewal. The glassy carbon surface is another
matter. A variety of methods to store the electrode were
periodically evaluated to insure reproducible results
between sets of experiments and to quickly establish repro-
ducible results at the beginning of a series of studies.
Unsuccessful storage conditions included placing of the
working surface in aqueous solutions of 0.15 M NaCl, 0.0 5 M
H-SO. as well as triply distilled water. The electrode was
stored both with and without a platinum deposit in these
solutions and was also allowed to dry in air. Successful
storage finally resulted when the clean glassy carbon
surface was maintained in a nitrogen atmosphere. Between
experiments the electrode was kept above the solution in the
flowing nitrogen blanket. Overnight or longer, a glass tube
with a nitrogen inlet in the bottom was used to continuously
pass nitrogen over the glassy carbon surface and thus
exclude oxygen. At one time, 36 days passed between sets of
experiments. After storage in a nitrogen atmosphere, the
second and third experiments had results that were satisfac-
torily reproducible compared both to each other and to the
previous series of over a month before. This storage method
made unnecessary all other treatments that were attempted in
order to produce a reproducible surface.

137
Various methods were attempted to condition the elec-
trode surface between successive experiments. These dif-
fered in practice and intent from storage methods. Tried
and abandoned were constant current or controlled potential
under oxidative or reductive conditions. These conditioning
treatments were performed in pure supporting electrolyte
solution without any significant improvement in results.
Methods incorporating both anodic and cathodic conditions in
the same treatment by either linearly varying the potential
or pulsing the potential between two limits were tried.
Again there was no improvement in reproducibility. Polish-
ing of the glassy carbon surface resulted in erratic behav-
ior which only slowly improved. Following an initial
polishing with a 0.3 pm alumina suspension to a mirror like
finish, no further treatment was used other than gently
wiping the surface to remove any deposited platinum. After
a series of experiments, the results indicated a satisfac-
torily reproducible surface. At this point, any treatment
proved deleterious. Storage in a nitrogen atmosphere and
gentle wiping was all that was necessary to ensure repro-
ducible results for a series of experiments.
Removal of the platinum deposit, before the following
experiment was performed, was the only surface treatment
after polishing. Once it was verified that the platinum
deposit was not electrochemicall^ stripped from the surface,
mechanical cleaning of the surface was initiated as a
routine procedure. By holding a lab tissue loosely
135
against the washed glassy carbon surface as it was rotated
by the motor, the platinum deposit was wiped off. The
removed material was often visible as a black smudge on the
tissue. The completeness of the removal of the platinum,
arter about 10 s of this wiping, was periodically confirmed
by experiments performed either without a deposition or with
a deposition in a blank solution. The absence of any
stripping peak supported the contention that the platinum
was removed entirely. After wiping, the electrode was
either suspended above the solution in the nitrogen blanket
or immediately immersed in the next experiment's solution.
The electrochemical experiments were performed with
conditions varying depending on the investigation under-
taken. Ail solutions were deaerated before use with the
purified nitrogen previously discussed. When the rotating
electrode was used, the rotation was started well before any
measurement was taken to ensure the solution was in a state
of steady flux. Slight shaking or striking of the cell
released any entrapped nitrogen bubbles. When the electrode
rotation was stopped, the solution was allowed to come to
rest for at least 30 s before any electrochemical measure-
ments were made. In the deposition and stripping experi-
ments, the electrode was removed from the deposition
solution, the electrode body was thoroughly rinsed with
singly distilled water and then the body and the glassy
carbon surface were carefully washea with triply distilled
water, gently shaken to remove excess water and placed into

139
a separate cell containing the stripping solution. The
electrode was rotated tor several seconds to remove
entrapped gas bubbles and homogenize the cell solution and
the electrode/solution interface. Rotation was either
stopped or continued depending on the demands of the subse-
quent conditioning or stripping step.
The changing of the medium after the deposition to
optimize the stripping step has been previously discussed in
Chapter V. The advantages are well known but the technique
has not been fully utilized in the usual batch analyses by
ASV. Flow through systems have made more use of medium
exchange. The problems of sample oxidation during open
circuit, atmospheric transfer have been realized and were
specifically mentioned in a paper on tin analysis by ASV
with medium exchange (572). As discussed in Chapter IV, the
platinum deposited is subjected to an oxidation-reduction
regime prior to the stripping scan. Any air oxidation does
not present a problem in the quantitative voltammetric step
of platinum determination. Following the voltammetric scan,
the electrode was removed from the stripping solution and
cell, washed with singly distilled water, wiped as
described, rinsed with triply distilled water and reintro-
duced in the deposition solution or stored.
It should be noted that certain procedures became part
of the routine and did not vary in a set of experiments
covering hours or perhaps days or weeks. Instrumental
settings, electrode handling techniques, solution

140
compositions and other experimental aspects once established
as optimal continued to be performed. A second point to be
made concerns the concentration of platinum solutions. The
concentrations are referred to as ppm Pt or ppb Pt. The
particular platinum species is either cisplatin or chloro-
platinic acid. The identity can be inferred from the
context.
Following the completion of an experiment, or series of
experiments, useful information must be extracted from the
raw data. Qualitative information may be obtained by
inspection of a single result or by comparison of several
results. Quantitative knowledge of the system's behavior
often results from the measurement of the height of a
current peak in the case of voltammetric experiments. A
variety of methods is often discussed to reproducibly
measure these peak heights as they are the easiest quanti-
tative measurement to make. Peak areas are often difficult
to obtain and take longer than peak height determinations.
A K & E model 62 0005 compensating polar planimeter was used
in some cases for comparison purposes. Several sources were
consulted for guidance in peak height measurement tech-
niques .
Because of variation in peak shape, different measure-
ment techniques are preferred for different results.
Comparison to a true blank curve is optimal, but often
difficult, so reconstruction of a suitable baseline for a
peak is necessary. The book by Vydra, Stulik and Julakova
141
contains a summary of several methods (12) . Generally used
in the course of this work is the method of constructing a
straight line between the minima before and after the peak
and using this as a baseline. The distance between this
baseline and the apex of the peak was taken as the peak
height. This method was shown to be better when twc or more
peaks are in close proximity and the minima used are before
the first peak and after the last peak (604). Measuring the
height above one minimum only was useful in some cases where
the peak was elongated. Found not useful was the method of
Ariel and Eisner wherein two tangents are constructed, to
the rising side of the peak and to the baseline before the
peak, in order to locate a point of reference in a repro-
ducible manner (573). An empirical method developed by
Bartosek and coworkers for DPP measures the current at three
points of the peak, at the peak height maximum and before
and after this point (605) . It attempts to correct for any
slope in the baseline by subtracting the average contribu-
tion of the before and after measurements according to:
_ _ _ (
Ibp +
Tap ) [32]
S " Jp 2
where S = analytical signal,
I = current at the peak,P
I, = current before the peak andbp
I = current after the peak,ap
142
The signal is computed using measurements at the same three
potential values for both a blank and the analytical solu-
tion and calculating the difference. Using this method
produced greater variability and it was not used after
initial evaluation.
A final point concerning the instrumental and peak
currents should be made. In the differential pulse mode of
the instrument used, the true full scale current sensitivity-
is ten times what the switch indicates. For example, a DP
peak height of 28% full scale with an indicated current
range setting of 100 uA corresponds to an instrumentally
measured differential current of only 2.8 uA, not 28 pA.
This point should be remembered when data is discussed in
the following chapter. Any data has been corrected accord-
ingly.
CHAPTER VII
DATA, RESULTS AND DISCUSSION
Preliminary Investigations
In order to devise a complete ASV procedure for the
determination of trace amounts of platinum originating from
cisplatin in human fluids, preliminary investigations into
the electrochemical nature of the parent compound were
undertaken. As noted in Chapter III, a considerable body of
chemical and electrochemical data has been amassed for
cisplatin and related compounds. The drug was initially
studied in 0.15 M NaCl to both simulate the saline content
of human fluids and to prevent hydrolysis of the compound by
supplying sufficient chloride ions. Various forms of carbon
had to be evaluated for their utility as the electrode
material before the cisplatin studies could be undertaken.
Carbon paste, epoxy bonded graphite, charcoal cloth,
the Kel-graf formulation and carbon filled Teflon were
initially tested. The charcoal cloth was suspended by a
copper clip in such a manner that only the cloth was
immersed in the solution. The remaining carbon types were
placed in Teflon holders machined to replace the electrode
tip of the Beckman rotating electrode assembly. Only one
planar, disk-shaped surface of the carbon electrodes was

144
exposed to the solution. Cyclic voltammetry was performed
using 0.001 M Hg(N03
>2
in 0.15 M NaCl as the test solution
because of the ease of deposition and stripping of mercury.
From an evaluation of the cyclic voltammograms , carbon paste
was chosen for continued study. Deposition and stripping
peaks for mercury were sharpest, largest and best defined
using this electrode material. In addition, the background
current was by far the lowest for carbon paste, < 0.5 pA in
pure 0.15 M NaCl. Although no serious attempts were made to
optimize the performance of any of the electrode materials
studied, the differences were enough to justify the choice.
Having chosen carbon paste as the working electrode
material, the preconcentration step was first studied.
Existing data, commented on in Chapter III, was obtained
using a DME (190, 191, 193), with one exception (192).
These studies indicated a reduction potential just cathodic
of 0.0 V vs SCE. This information served as a useful
starting point to begin investigating the reduction process
on carbon paste. With a freshly prepared carbon paste
electrode, the cyclic voltammogram (CV) in Figure 7 was
obtained. Using this CV, the potential of -0.55 V vs SCE
was chosen as being sufficiently cathodic to serve as the
reduction or deposition potential in succeeding experiments.
In order to verify that the process was due to an electro-
chemically active species and followed the Levich equation
for a rotating electrode (equation [7]), the following
experiment was performed. The applied potential was fixed

145
CO
b
b
(0
b
bi
oi
CO
d
C\]
O"
LlI
u</)
if)
>
>1urd
COH-U
rd
+J
-p
ft
e
S-t

146
at -0.55 V vs SCE. The electrode was rotated at
constant speed and the average current over 2 to 5 s was
recorded 30 s after the electrode rotation speed had reached
its desired value. A series of increasing rotation speeds
was used. After the taking of 11 data points, the carbon
paste surface was renewed, the 10 ppm cisplatin solution was
replaced by a solution of pure 0.15 M NaCl supporting
electrolyte and the entire experiment was repeated. As seen
in Table 6 and Figure 8, the current flowing in the blank
solution is independent of electrode rotation rate in the
range of 1 to 50 rps and the net current due to the reduc-
1/2tion of cisplatin is linearly related to (rps) as pre-
dicted by the Levich equation.
Further experiments were performed to confirm the
identity of the species responsible for the observed current
peak in the CV of Figure 7. Cyclic voltammograms were
obtained at four different sweep rates using the same 10 ppm
Pt solution. The potential was swept from to -0.75 V vs
SCE and back. The difference between the currents measured
in the forward and reverse scans at the peak potential, E ,
was taken as the peak current, i . After each CV was
recorded in the 10 ppm solution, the electrode was washed
and transferred into a solution of pure supporting electro-
lyte. An identical CV experiment was run. The absence of a
peak at the potential where a peak had previously been
observed confirmed the identity of the species responsible
1/2for the previous peak. From equation [13], i a v C.
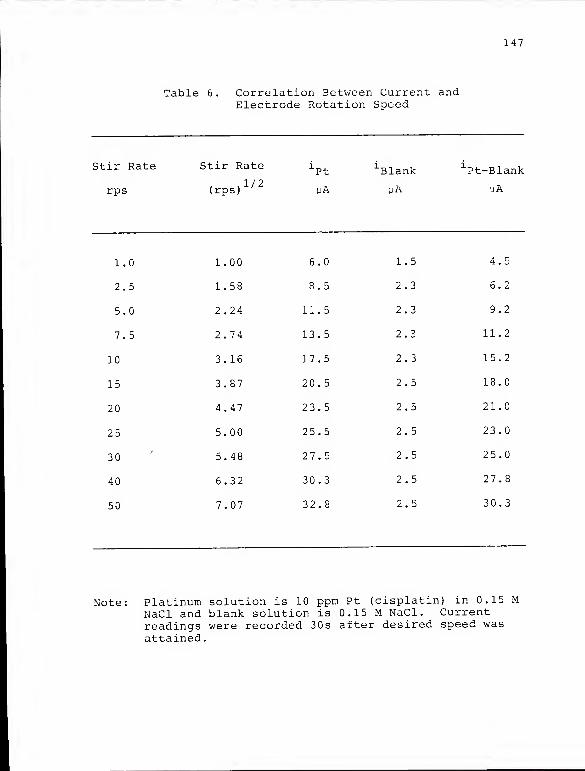
147
Table 6. Correlation Between Current andElectrode Rotation Speed
Stir Rate

148
30
25
20
<
c 15
£_
=3
u10
slope = 4.4 7
intercept = 0.0003
r2 = .9952
1 2 3 4 5 6
(rps) 1/2
Figure 8. Net reductive current in 10 ppm Pt as a
function of electrode rotation speed.

149
This relationship is demonstrated in Table 7 and Figure 9.
Data from a single CV at each sweep rate is presented in
Table 7. The linear relationship between peak current and
the square root of sweep rate is plotted in Figure 9.
The concentration dependence of the peak current was
evaluated at three different scan rates using cisplatin
solutions ranging from 1 to 100 ppm Pt. The results of the
CV experiments at 2 , 5 and 10 mVs are presented in Table 8
and Figure 10. The good agreement with the theory presented
in equation [13] is evident in the closeness of the points
to the linear least squares regression line and the fact
2that the r values are all above 99%. Upon the successful
conclusion of these preliminary experimental probes into the
Table 7. Cyclic Voltammetric Data for 10 ppm Pt at SeveralSweep Rates.
Sweep Rate
mVs
VSweep Rate
(mVs )
P
uA V vs SCE
5
2
1
0.5
2.24
1.41
1.00
0.71
3.68
1.72
1.05
0.80
-0.490
-0.440
-0.410
-0.388
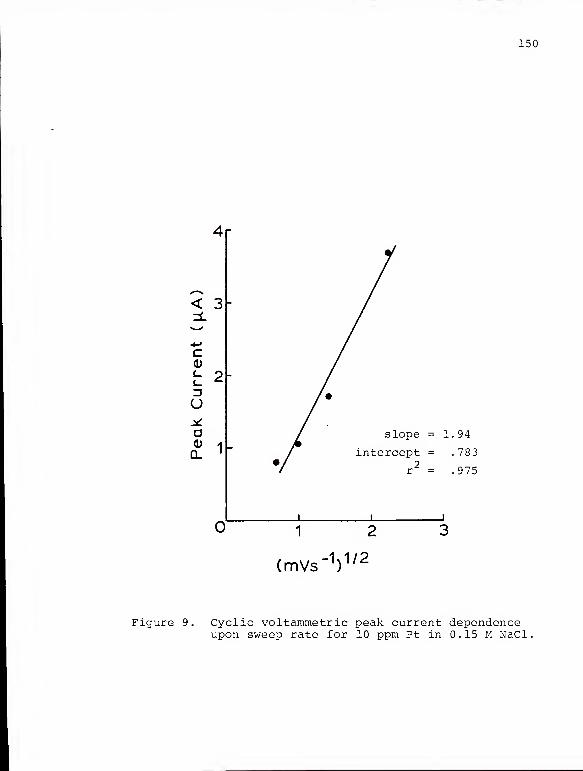
150
4r
< 3
c
l_
u
o
Q.
slope = 1.94
intercept = .783
r2
= .975
1 2
(mVs~V /2
Figure 9. Cyclic voltammetric peak current dependenceupon sweep rate for 10 ppm Pt in 0.15 M NaCl.
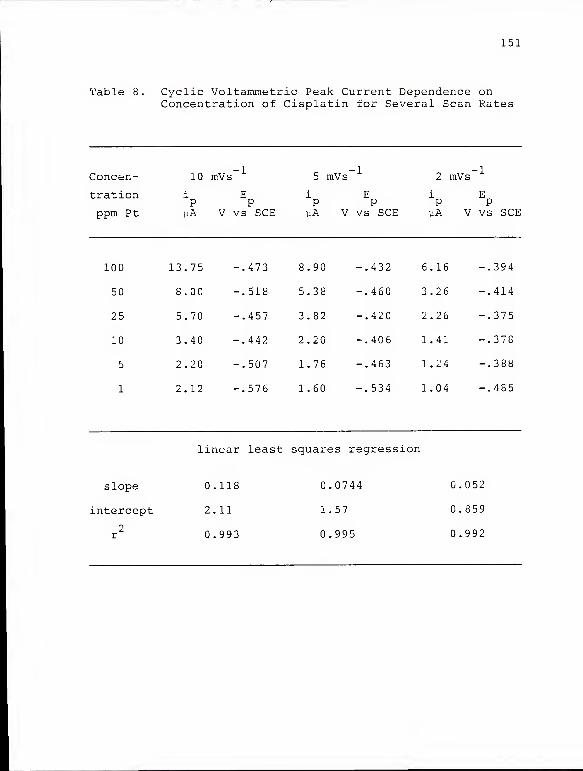
151
Table 8. Cyclic Voltammetric Peak Current Dependence onConcentration of Cisplatin for Several Scan Rates
Concen-
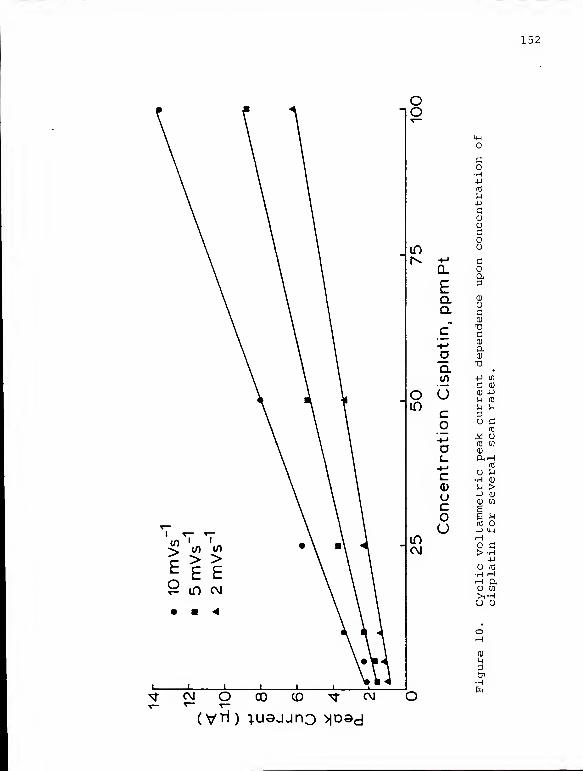
152
oo

153
reduction behavior of cisplatin in 0.15 M NaCl at a carbon
paste electrode, entire ASV experiments were attempted.
Preliminary ASV Experiments
A deposition potential (E, ) of -0.55 V vs SCE was
selected based on the cyclic voltammograms and potentio-
static studies with the rotating electrode. The carbon
paste electrode was rotated at 10 rps during a 2 minute
deposition from a 10 ppm Pt solution. When little signal
could be detected above the baseline of the subsequent
differential pulse (DP) voltammetric stripping scan, the
deposition potential was changed to -0.7 V vs SCE, the
concentration was increased to 25 ppm Pt and the rotation
speed was increased to 25 rps. This effort to accumulate
more cisplatin reduction product on the electrode surface
proved successful. A sharp peak with E about +0 . 5 V and a
second, rounded peak centered at about +0.7 5 V were obtained
when the DP stripping scan was carried out in the cisplatin
solution. The large, sharp peak at +0.5 V was present when
subsequent stripping scans were performed in the cisplatin
solution without any deposition. It was absent from both
linear sweep (LS) and DP stripping scans in 0.15 M NaCl
after deposition in cisplatin solution and transfer to a
separate cell. It was concluded that this peak was due to
cisplatin oxidation.
After deposition in cisplatin solution and transfer to
0.15 M NaCl, the smaller, rounded peak centered at +0.75 V

154
was all that was evident above a sloping baseline in the DP
stripping scans. When the deposition time was increased
from 2 to 10 minutes, this peak increased significantly in
height. The peak was attributed to the oxidation of a
cisplatin reduction product, probably platinum metal.
To discover whether in fact the deposit was removed
from the electrode surface during the stripping step,
several experiments were performed. A freshly prepared
carbon paste electrode surface which gave no stripping peak
in 0.15 M NaCl after deposition in pure 0.15 M NaCl was
subjected to a series of depositions in cisplatin solution
and stripping in 0.15 M NaCl solution. No attempt was made
to wipe or renew the electrode surface between experiments.
Illustrative data from two series of consecutive deposition
and stripping experiments is presented in Table 9. This
Table 9. Peak Currents Measured for Consecutive ASV Experi-ments without Surface Renewal
Cisplatin

155
data and many similar results establish the supposition that
the deposition product is not removed from the electrode
surface during the stripping step.
The cyclic voltammograms of Figure 11 provide addi-
tional supporting evidence. Both were obtained under
identical conditions, having been transposed horizontally
for clarity. A freshly prepared carbon paste electrode
surface was scanned anodically starting at 0.0 V vs SCE in a
25 ppm Pt solution with 0.15 M NaCl added. The scan was
reversed and reduction of the cisplatin may be observed as a
small peak at about -0.8 V on the cathodic scan of
Figure 11a. On the second anodic scan, oxidation of the
deposit is evident as a wave with an E. ,_ of about +0.85 V.
Figure lib followed 11a directly. The first anodic scan was
started at 0.0 V again. Note the decreased anodic current
in the potential range covered just previously. When the
scan direction was reversed, a second reduction is observed
at about -0.55 V in addition to the one at -0.8 V as before.
This is due to reduction of the oxidized deposit left on the
electrode after the scan of Figure 11a.
The results of four consecutive ASV experiments with 50
ppm Pt where the carbon paste electrode surface was renewed
before each experiment are presented in Table 10. These
results demonstrate the reproducibility attainable through
careful electrode surface preparation.
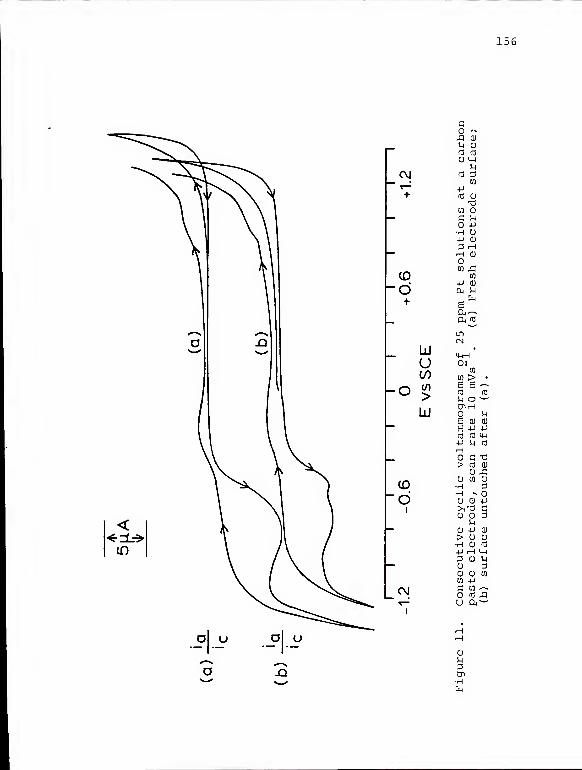
156
C\J
+
CO
d+
-o
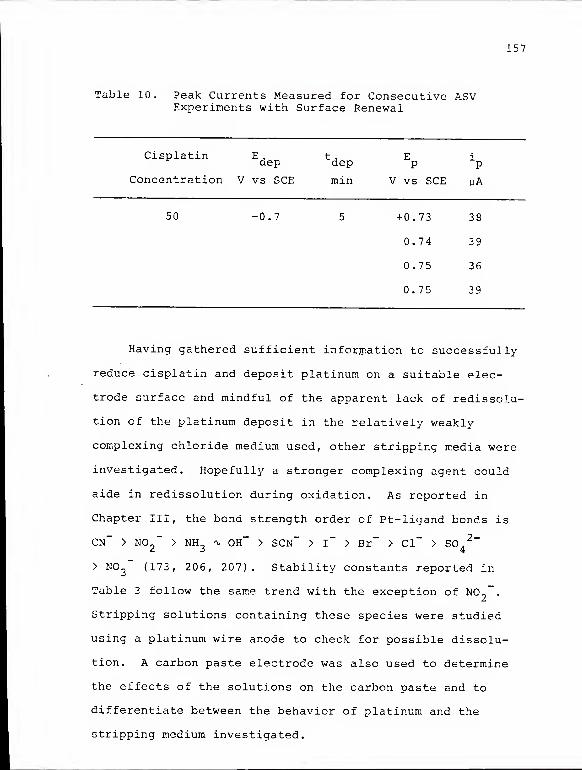
157
Table 10. Peak Currents Measured for Consecutive ASVExperiments with Surface Renewal
Cisplatin E , t , E iaep dep p p
Concentration V vs SCE min V vs SCE uA
50 -0.7 5 +0.73 38
0.74 39
0.75 36
0.75 39
Having gathered sufficient information to successfully
reduce cisplatin and deposit platinum on a suitable elec-
trode surface and mindful of the apparent lack of redissolu-
tion of the platinum deposit in the relatively weakly
complexing chloride medium used, other stripping media were
investigated. Hopefully a stronger complexing agent could
aide in redissolution during oxidation. As reported in
Chapter III, the bond strength order of Pt-Iigand bonds is
CN" > NO ~> NH_ % OH" > SCN" > i" > Br" > Cl~ > SO,
2-2 3 4
> NO_~ (173, 206, 207). Stability constants reported in
Table 3 follow the same trend with the exception of NO,,-
.
Stripping solutions containing these species were studied
using a platinum wire anode to check for possible dissolu-
tion. A carbon paste electrode was also used to determine
the effects of the solutions on the carbon paste and to
differentiate between the behavior of platinum and the
stripping medium investigated.

158
All solutions were prepared using the potassium or
sodium salt or in the case of ammonia, an aqueous solution
with added NaCl or NaOH. KCN was used by itself or with
1 M NaOH added to reduce the amount of HCN produced due to
hydrolysis. The qualitative results of Table 11 were enough
to dissuade further inquiry and redirect efforts at the
generally successful, although far from optimum, chloride
stripping medium. Because of the porous nature of the
carbon paste electrode material and the tenacious nature of
the platinum deposit, harder electrode materials were
reconsidered.
Carbon Electrode Evaluation
Graphite epoxy , pyrolytic graphite, a glassy carbon
rod, and the supplied Beckman vitreous or glassy carbon
electrode tip were chosen as sufficiently hard materials
that could be used with mechanical platinum removal without
changing the electrode surface area. Carbon paste had to be
carefully packed to ensure a constant surface area in
successive experiments, and it was considered inappropriate
to continually repeat the process. Graphite epoxy was
deemed inadequate because of the presence of small pits and
open spaces in the surface. Repeated polishing removed many
but new ones appeared. The inability to reproducibly clean
this surface eliminated it from consideration. The
pyrolytic graphite was void free and had less residual
current and a larger useful potential range than graphite

159
»!

160
epoxy. However, the cyclic voltammograms of cisplatin were
not as well defined as those using the carbon paste elec-
trode. Careful polishing helped to reduce residual current
but not enough to compete with carbon paste or either of the
glassy carbon electrodes. Because the Atomergic glassy
carbon rod was of a 3 mm diameter and had to be fitted into
a Teflon adaptor for use with the rotating electrode assem-
bly, the supplied Beckman electrode with a glassy carbon
disk diameter of 6 mm was used. Both forms had less resi-
dual current than did carbon paste and cisplatin CV peaks
had greater sharpness. Due to the larger surface area and
a better seal between the glassy carbon and the insulating
material, the Beckman electrode tip was further evaluated.
When a series of depositions in cisplatin solution and
strippings in 0.15 M NaCl solution were performed without
touching the exposed glassy carbon electrode surface, it was
noticed that a grey film built up on the glassy carbon
surface. This had not been seen with the more porous carbon
paste. Concurrently the peak centered at +0.7 V on the
stripping curves increased in height. When a series of
3 stripping scans was performed without any deposition, the
peak decreased in height to the baseline level. The next
series of depositions and stripping steps restored the peak
to its original size. The peak reached a maximum height and
did not increase with an increase in the total number of
depositions carried out without touching the surface.
Apparently only a finite amount of platinum could oxidize

161
during a particular stripping scan. Figure 12 shows a
series of twelve consecutive experiments which illustrate
the points mentioned.
Stripping Solution Optimization
From the results of cyclic voltammetrie and differ-
ential pulse voltammetric scans, the primary problem asso-
ciated with the oxidation of the deposited material is the
onset of solvent or supporting electrolyte oxidation before
the return of the curve to the baseline. The anodic current
begins to increase once again before platinum oxidation has
ceased. It was felt that lowering the pH of the stripping
solution would increase the anodic range of the solution due
to the pH dependence of the oxidation of water.
A series of DP stripping scans in 0.15 M NaCl with
varying concentrations of added HC1 was performed. The
resultant peaks were identically shaped ana located at the
-6 -4same potential in 0.15 M NaCl with 0.0 M, 10 M and 10 M
HCi. Peaks v/ere somewhat greater in height, narrower and
-2commenced about 100 mV more anodic with HCI added to 10 M.
In 1 M HCI, the stripping peak was nearly absent, due to CI
adsorption which delayed the platinum oxidation. Unfortun-
ately, the potential where the anodic current began to rise
again did not change as the pH was decreased. The steepness
of the current increase due to solvent decomposition was
also unchanged at the varying pH values. No advantage was
gained as a result of acidifying the 0.15 M NaCl with HCI.

Figure 12. Differential pulse stripping curves for anuntouched glassy carbon surface. All voltam-
mograms obtained at 5 raVs , 2 5 mV modulationamplitude, 0.5s repetition rate, in 0.15 MNaCl with initial potential of +0.1 V vs. SCE.All depositions (when done) were for 5 minat -0.7 V in 25 ppm Pt solution with theelectrode rotating at 25 rps. Figure A,consecutive deposition and stripping experi-ments; Figure B, consecutive DP scans, withoutdeposition, following curve e of Figure A;Figure C, consecutive deposition and strippingexperiments following curve h of Figure B.

163
i 1 1 1 1 1 r.3 .5 .7
V vs SCE
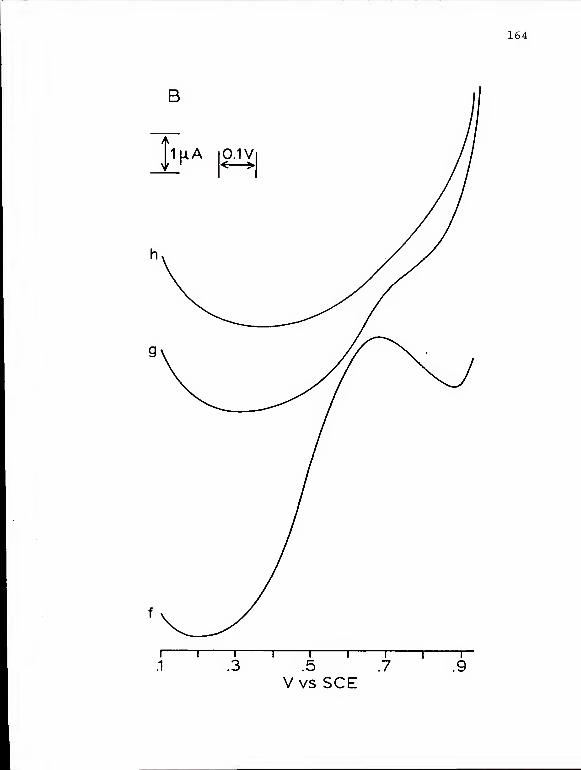
164
t 1 1 1 1 r.3 .5 .7
Vvs SCE
i r.9
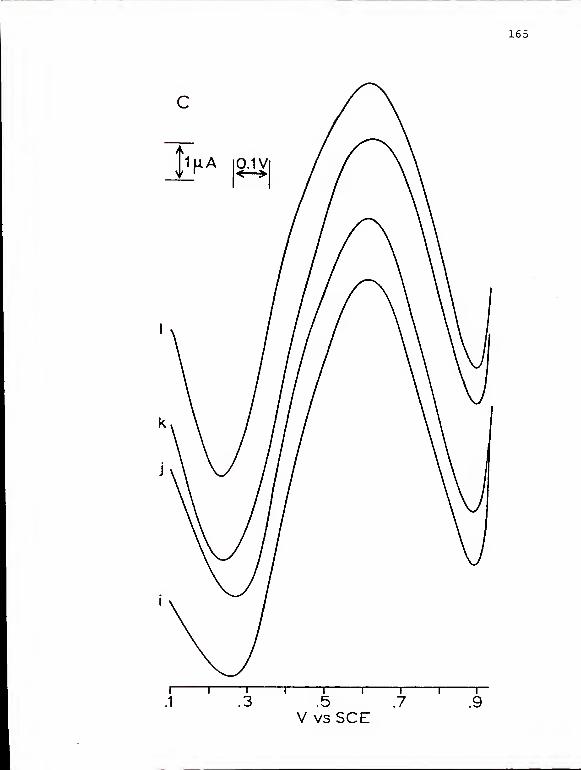
165
.7
i i
.5
V vsSCE

166
Cyclic voltanunograms obtained in 0.15 M NaCl acidified to
pH's of 4, 3, 2, 1 and with HC1 at clean glassy carbon
electrodes corroborate the results of the stripping
experiments. For the sake of completeness, deposition and
stripping experiments were performed using 0.15 M NaCl
adjusted to pH ' s of 8, 10, 11, 12, 13 and 14 with NaOH. No
improvement in the resolution between platinum oxidation and
solvent decomposition was observed. In fact the anodic
limit decreased as the pH increased.
Disenchanted with the results of the stripping experi-
ments carried out in 0.15 M NaCl, a final series of cyclic
voltammograms were obtained in this medium. After accumu-
lating platinum during four 5 min depositions from a fresh
10 ppm Pt solution, a family of curves was generated by
scanning the potential between +1.1 V vs SCE and a cathodic
limit which was initially -1.0 V. With each successive
scan, the cathodic reversal potential was made 100 mV less
cathodic, finally culminating in a scan which reversed at
+0.2 V. Following this series, 3 scans between the limits
of +1.1 V and -0.9V were run before a fourth cyclic volt-
ammogram, Figure 13, was recorded. Despite a total of 16
scans into the anodic region, the curve in Figure 13 was
virtually identical to the original curve of the series.
Little platinum, if any, had been lost due to dissolution.
The curve in Figure 13 is that of platinum. Since the
deposition product of cisplatin on a glassy carbon electrode
behaved essentially as a platinum electrode, it was at this

167
U
CO
i*
coAU(0
u
>1ww(13
rH
tn
o
P•HWOa,0)
Ld

168
point that literature pertaining to the platinum electrode
itself was consulted.
On the basis of the literature survey, 1 M H o S0. and
1 M HC10. were evaluated as potential stripping media. A
third medium, 1 M HNO.., was also investigated although it
was expected to give inferior results. Results of CV and
anodic DP voltammetry using small amounts of deposited
platinum on glassy carbon electrodes indicated little
difference between H n SO. and HC10. . Nitric acid gave poor
results as expected from the literature. Considering the
larger body of data that had been accumulated with H,SO„, it
was chosen for continued study. Results from an early set
of experiments demonstrated its utility. Seen in Figure 14
are three cyclic voltammograms and their corresponding DP
voltammograms . Each of the three curves in a given set was
obtained under identical conditions, except for the deposi-
tion time which was increased from 3 to 5 to 7 minutes.
Depositions were made at -0.7 V with the glassy carbon
electrode rotating at 40 rps in a 10 ppm Pt solution 0.15 M
in NaCl. After deposition the electrode was transferred to
a deoxygenated 1 M H„SO. solution. Three cyclic voltammo-
grams were run consecutively, scanning anodically from
+0.2 V to start the series. Only the third one was recorded
for presentation here. Following the third CV, which was
stopped at +0.15 V, the potential was increased to +0.6 V
and the DP voltammogram recorded. The electrode was washed,
wiped clean and readied for the next deposition.

170
NHU-QO

171
It was felt that there was no compelling reason that 1
M H,,SC / would be the optimum concentration. A series of2 4 c
experiments with 1, 0.5, 0.25, 0.1, 0.05 and 0.01 M H„SO. as
the solution for the cyclic and DP voltammetric scans was
performed. All depositions were performed identically. The
only significant difference occurred in the 0.01 M H^SO,
stripping solution where the curves were less well defined.
An anodic shift in the peak potentials of the oxidation and
the reduction of the platinum as the pH decreased was
observed. The shift in peak, potential for the oxidation,
E was more difficult to observe because the peak shapep,a t- f
also changed with pH. Data obtained at several concentra-
tions of H„SO. is presented in Table 12. The values of pH
-2were calculated using L = 1.2 x 10 to include the contri-
bution from the dissociation of HSO. .
From the qualitative aspect of a steeper rise in the
anodic current due to platinum oxidation seen in the lower
concentrations of H„SO., the three lower concentrations
(omitting 0.01 M) were investigated further. A series of
experiments was performed using the three concentrations of
H-SO. selected, 0.25, 0.1 and C.05 M. Identical depositions
from a 10 ppm Pt solution were performed. After the deposi-
tion either 1, 2, or 3 cyclic voltammetric scans were run in
the separate sulfuric acid solution. Each scan started at
0.2 V, went to 1.2 V, reversed and scanned cathodicaliy to
-0.2 V, reversed and ended at +0.15 V.

172
Table 12. Peak Potentials for Platinum Oxidation(E ) and Reduction (E ) in H„SO. Solutionsp,a' p,c' 2 4
Various pH as Determined by Cyclic Volt aminetry
H o S0, pH E E2 4 c p,c p,a
Concentration Calculated V vs SCE V vs SCE
moles L
0.01 1.78 0.29, 0.32 0.92, 0.89
0.05 1.23 0.38, 0.38 0.90, 0.91
0.1 0.96 0.42, 0.41 0.91,0.92
0.25 0.58 0.43 0.93
0.5 0.28 0.47, 0.47 0.95, 0.94
1.0 -0.01 0.49, 0.50 0.97, 0.98
Differential pulse voltammograms were then recorded, start-
ing at +0.5 V. The DP scans recorded in each of the three
H„SO. solutions after 0, 1, 2 or 3 conditioning cyclicZ 4
voltammetric scans are reproduced in Figure 15. It can be
seen that the peak shape improves and the peak height
increases after 2 or 3 conditioning scans. With the
increase from 2 to 3 conditioning scans before the DP scan,
the DP peak height decreased for the two more concentrated
H„SO. solutions. On the basis of the qualitative and
quantitative aspects of the DP peaks seen in Figure 15,
0.05 M H„SO. was selected for further experiments. It was
also decided to do 3 cyclic voltammetric conditioning scans
Figure 15. DP voltammetric scans of platinum deposited froma cisplatin solution after conditioning CVscans. Upper scan in each set obtained in 0.25 MH SO., middle scan in 0.1 M H SO, and lower scan
in 0.05 M H2SO.. DP conditions: 5 mVs" 1
, 25 mV
modulation amplitude, 0.5s pulse repetition rate.Number of CV scans before DP scan recorded:a) zero, b) one, c) two, d) three.

174

175
after deposition and before recording the DP voltammetric
curves for quantitative purposes.
Conditioning of the Platinum Deposit
Several aspects of the cyclic voltammetric conditioning
scans were varied in an attempt to optimize this step in the
overall process. Changes in the anodic limit, cathodic
limit and cathodic sweep rate were implemented and the
results evaluated from the resultant changes in the DP
scans. In a series of experiments with identical deposi-
tions, DP peak heights increased as the anodic limit of the
conditioning scans was increased from 0.6 V to 1.35 V.
Further increases in the anodic limit led to a decrease in
DP peak height and considerable variability in replicate
experiments. With little improvement seen with the anodic
limit at 1.35 V compared to 1.20 V, it was decided to avoid
any oxygen evolution which could dislodge deposited plati-
num. Subsequent conditioning scans were limited to 1.20 V.
Similar results were seen by varying the cathodic limit. In
the absence of hydrogen adsorption and desorption or in the
presence of hydrogen evolution, smaller DP peaks were
observed. By scanning to -0.20 V, gas evolution was avoided
but hydrogen adsorption and desorption was allowed.
Decreasing the cathodic scan rate relative to the anodic
scan rate yielded no significant changes in the resultant DP
curves and was not applied in further experiments.
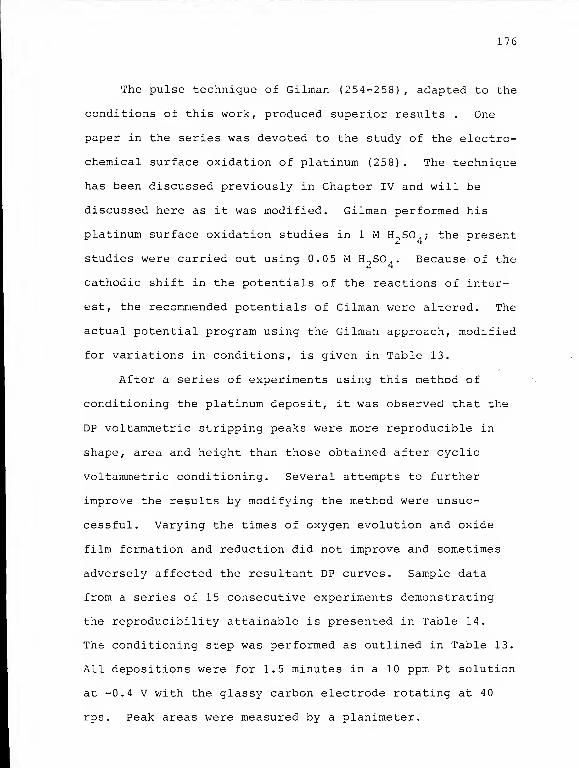
176
The pulse technique of Gilman (254-258) , adapted to the
conditions of this work, produced superior results . One
paper in the series was devoted to the study of the electro-
chemical surface oxidation of platinum (258). The technique
has been discussed previously in Chapter IV and will be
discussed here as it was modified. Gilman performed his
platinum surface oxidation studies in 1 M H„SO.; the present2 4 ^
studies were carried out using 0.05 M H SO.. Because of the
cathodic shift in the potentials of the reactions of inter-
est, the recommended potentials of Gilman were altered. The
actual potential program using the Gilman approach, modified
for variations in conditions, is given in Table 13.
After a series of experiments using this method of
conditioning the platinum deposit, it was observed that the
DP voltammetric stripping peaks were more reproducible in
shape, area and height than those obtained after cyclic
voltammetric conditioning. Several attempts to further
improve the results by modifying the method were unsuc-
cessful. Varying the times of oxygen evolution and oxide
film formation and reduction did not improve and sometimes
adversely affected the resultant DP curves. Sample data
from a series of 15 consecutive experiments demonstrating
the reproducibility attainable is presented in Table 14.
The conditioning step was performed as outlined in Table 13.
All depositions were for 1.5 minutes in a 10 ppm Pt solution
at -0.4 V with the glassy carbon electrode rotating at 40
rps . Peak areas were measured by a planimeter.
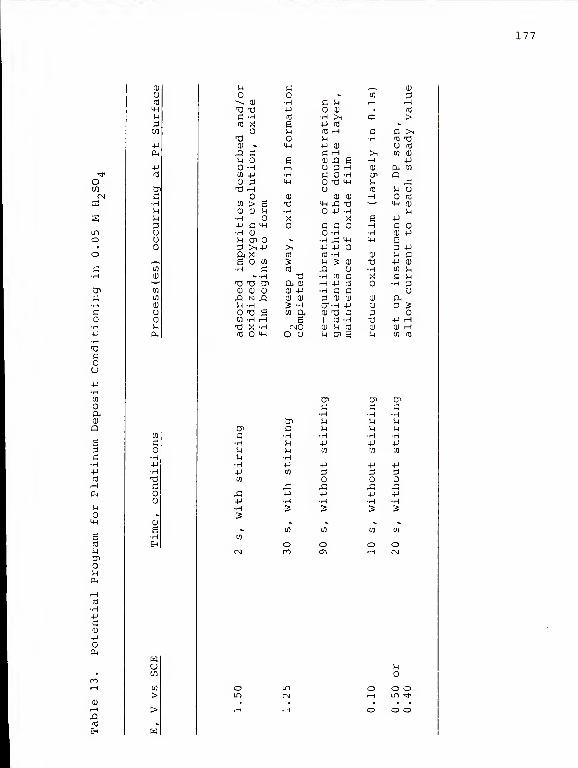
177
aoH44
•H
G
U-P
•HMOftCD
a
sgGH4-)
rd
O4-1
rd
Mrji
4-1
rd
CnCHMS^
3ou
S4

173
Table 14. Peak Heights and Peak Areas for a Series ofIdentical Experiments
Experiment # Height Area2
pA cm
1 19.5 18.7
2 19.5 19.1
3 19.5 20.2
4 21.0 19.7
5 20.5 21.7
6 20.5 18.6
7 21.5 21.4
8 18.5 19.8
9 22.0 18.0
10 17.5 18.1
11 21.5 18.0
12 17.0 16.8
13 19.0 16.7
14 20.5 19.6
15 18.5 17.3
mean 19.8 18.9
standard deviation 1.49 1.51
RSD 7.52% 7.99%
95% confidence interval (CI) 19.8 ± .85 18.9 ± .87

179
Before the analysis of samples of a more complex matrix
could be attempted, deposition of the drug from pure 0.15 M
NaCl and conditioning and stripping of the platinum deposit
in 0.05 M H„SO,. were studied in more detail. One series of2 4
experiments was designed so that each successive deposition
potential was more cathodic than the E, used in ther dep
previous experiment. The depositions were otherwise iden-
tical, as were the conditioning steps and stripping scans.
The deposition current was recorded at 30 s intervals during
the deposition. Following deposition, the electrode was
washed, transferred to 0.05 M H-SO., conditioned by the
modified Gilman method and the DP scan was applied. For
comparison of data from several experiments, the peak height
to deposition time ratio, or relative peak height, was used.
Because several depositions resulted in distorted peak
shapes indicative of too much accumulated platinum, deposi-
tion times needed to be shortened for replicate experiments
at the more cathodic potentials. A summary of the data from
the well characterized depositions is presented in Table 15
and Figure 16. In the plots of Figure 16, average values
are used for multiple determinations. This type of curve is
more useful for selecting an appropriate deposition poten-
tial than cyclic voltammograms since the potential is fixed
for each data point. Also, actual stripping experiments are
used to aid in the selection process. A deposition poten-
tial of -0.55 V was used as a result of this series of
experiments
.

180
Table 15. Deposition Currents and Relative StrippingPeak Heights for a Series of DepositionPotentials with Cisplatin as Analyte
E, i, at 30 s i t,dep dep p dep
V vs SCE yA uA miri"
+0.10 1.3, 1.3 0.35, 0.28
2.7, 2.4 0.30, 0.20
-0.10 5.6 0.90
-0.20 12.4 1.88
-0.25 16.8 3.00
-0.30 24.0 4.38
-0.35 31.5, 29.5 4.38, 4.25
-0.40 37.5 5.5
-0.45 42.0 6.0
-0.50 46.0 6.5
-0.55 47, 47 6.0, 6.8
-0.60 48 6.5
Note: For E, greater than +0.10 a net anodic currentdep 3
flowed; total deposition time ranged from 30 s
to 2 minutes.

181
n50
-40

182
A second series of experiments was designed to test the
response to variations in the concentration of cispiatin.
Solutions 0.10, 1.0 and 10 ppm in Pt were analyzed. Rela-
tive peak heights were again used to correct for differences
in deposition time necessary because of differences in
analyte concentration. Results of this series of experi-
ments are presented in Table 16. The increase in relative
peak height was approximately equal for both increases in
concentration. The average relative peak current for
10 ppm Pt is 6.66 times the average relative peak current
for 1 ppm Pt which is 6.50 times the average relative peak
current for 0.1 ppm Pt. The results detailed in these last
two series of experiments were sufficiently encouraging to
warrant the investigation of biological samples with added
drug.
Preliminary Depositions From Urine
The recent determination of cispiatin in blood plasma
by HPLC with electrochemical detection (LCEC) at a glassy
carbon electrode provided the initiative to attempt
depositions directly from untreated urine (159). Reductive
determination at an applied potential of between 0.0 and
-0.2 V vs silver/silver chloride could determine levels of
100 ppb cispiatin (159) . Sample preparation consisted of
directly injecting a filtered plasma sample (159). It was
felt that urine would be a less confounding matrix than
blood plasma. Solutions were made 10 ppm in platinum using

Ha,a•HM+J
W0)
>•H•PrQ
Ha)
co
co•H+J
(0
+J
C
u
ou
Qi
O
co•H4-)
tC
H!-i
>
O
-P -PU £IW -H
0>

184
one part 0.15 M NaCl to one part urine and were allowed to
equilibrate for one hour. Although net cathodic currents
were measured during deposition steps, oxidation of platinum
during stripping was not observed. Deposition potentials
ranging from -0.4 V to -1.0 V vs SCE were tried without
success. Cyclic voltammograms recorded with the solutions
revealed no indication of cisplatin reduction or platinum
oxidation.
To avoid the tedious sample preparations normally
associated with analysis of human fluids by ASV (see refer-
ence (606) for a review), several relatively simple methods
were attempted. Hydrochloric and nitric acids, singly and
in combination with and without boiling of the mixture,
failed to improve the results. Although the pH reached
values of 1.2 to less than and in the instance of boiling
nitric acid the urine was decolorized, no platinum oxidation
was in evidence. In a number of trials, the pH was adjusted
with NaOH to neutral and basic values, again without
success. Acetonitrile was added to the urine samples to
attempt to denature any proteins and permit the
determination of the added platinum. A mixture of one part
CH-CN to one part urine had a considerably extended cathodic
range compared to urine alone, but presented no evidence of
cisplatin reduction or platinum oxidation. Addition of more
cisplatin and allowing the mixture to sit overnight failed
to improve the results. Apparently a more demanding sample
pretreatment was necessary.

185
A 1983 paper detailing the determination of platinum in
urine by DPP of a platinum-ethylenediammine complex (218)
provided a key sample treatment idea. In the method in the
article, platinum was initially complexed with an aqueous
sodium diethyldithiocarbamate (NaDDTC) solution. The
neutral Pt(DDTC)„ complex was extracted into chloroform
(CHC1.J, the CHC1- evaporated, and the residue dissolved in
aqua regia. The ethylenediammine (en) complex was formed
2+from the aqua regia digest. The Pt(en) complex was
determined polarographically with a peak potential of -1.65
V vs SCE. Results were poorly reproducible when the en
complex was formed directly in the urine or an acid digest
of the urine. The problem of matrix interference was
largely solved by removing the platinum from the matrix
prior to complexation. Bartosek and Cattaneo in 1982 had
2 +made the Pt(en)„ complex in a borate buffer directly from
an acid digest of the biological sample (219) . Both proce-
dures can be traced to the work of Alexander, Hoh and Smythe
who developed the polarographic method for the analysis of
ores (217) . The analytical signal is attributed to a
catalytic current arising from hydrogen evolution on the
reduced Pt(en)„ which adsorbs on the mercury drops (217).
2 +Because of the difficulty of reducing the Pt(en) complex,
the Pt(DDTC):?complex itself was studied as a possible
intermediate in obtaining a platinum deposit.
Cathodic and anodic voltammetry has been performed with
Pt(DDTC) n in organic solvents (607). A reduction peak

b6
potential of -2.0 9 V vs Ag/AgCl in . 1 M LiCl in acetone and
an oxidative peak potential of +1.20 V vs SCE in methylene
chloride were obtained (607). These results indicate the
difficulty in obtaining a useable platinum deposit directly
from Pt(DDTC)_. As was expected by its extraction from
aqueous solution into CHC1.., Pt(DDTC)2
, shown below, is
nearly insoluble in water from pH 1 to 13 (157).
CH CH_
CH_CH2
"
,NC\ .Pt > CN
,CH CH3
CH2CH
3
Since sulfur chelators in general (608) and dithiocarbamates
4 +and DDTC specifically (609, 610) poorly complex with Pt ,
platinum must be in the lower oxidation state, Pt . This
necessity precludes the acid digestion of any sample prior
4 +to complexation as Pt generally results from these diges-
tions. Any acid digest adversely affects the complex
formation as well since DDTC is unstable in strongly acidic
conditions. If the pH < 2 , the half life of DDTC-
is about
7s (611) . The protonated form, HDDTC, is soluble to equal
extents in CHCl^ and water at pH 7.0 (612) but as the pH
increases to greater than 8 to 8.5, the free base pre-
dominates and is not extracted by CKC13
(612, 613). The
high ionic concentration encountered in urine samples,
particularly chloride ion, has been shown to have little
187
adverse effect on Pt(DDTC)„ formation and extraction from
pH 1.3 to 8.7 (614). In fact, the percent extracted and the
rate of extraction of several metal-DDTC chelates increase
with increasing amounts of added NaNO?
or NaCl when excess
DDTC is present (615) . The pclarographic method mentioned
previously (218) and two liquid chromatographic methods
(157, 616) all form the Pt(DDTC)2
complex directly in urine.
Chelation therapy by NaDDTC has been used in animals and
humans to decrease damage from platinum (often seen in the
kidneys) (131-134, 617). Platinum chelation is effective in
complex media.
The chromatographic method of Bannister, Sternson and
Repta covers several key points (15 7) . Although the drug
itself may be unstable and form a number of hydrolysis
products and the body may produce a number of metabolites,
all seem to react with DDTC to approximately the same
degree (157). Reaction times of 3 to 10 minutes are suffi-
cient (157). Platinum recovery was shown to increase from
86 to 95.8% as the pH was raised from 5.29 to 8.08 (157).
The complex did not deteriorate in CHC1-. in studies for over
2 months (157) . Use of NaDDTC to complex and extract
platinum species derived from cisplatin would seem to be
highly advantageous.

188
Preliminary Chelation Experiments
Initial tests involving chelation, extraction, and
dissolution were performed using cisplatin in 0.15 M NaCl to
avoid interferences from urine components. Using the
procedure of Vrana and coworkers (218) the precipitate
resulting from CHC1-. removal was tested for solubility in
several solutions. As expected, the precipitate did not
even dissolve in boiling 0.15 M NaCl solution but may have
dissolved to some extent in concentrated HC1 as judged by
direct observation. Cyclic voltammetry and ASV of the
resultant solutions gave no indication of any dissolution in
either case. A check on an aliquot of the solution before
CHC1- extraction revealed no electrochemical activity. The
suggested aqua regia dissolution gave a red-orange viscous
film which readily dissolved in 0.15 M NaCl to yield a
yellowish solution. From CV and ASV, a successful deposi-
tion of platinum was achieved from this pH 2.87 solution.
Adjustment of a second aliquot to pH 11.87 showed no elec-
trochemical activity. At this point the chelation proce-
dures of Vrana, Kleinwachter and Brabic (218), procedure I,
Bannister, Sternson and Repta (157), procedure II, and
Borch, Markovitz and Pleasants (616), procedure III were
evaluated.
The CHC1., extracts, after solvent removal, were treated
identically to compare the chelation efficiencies of the
three procedures. All were redissolved in a solution of
0.15 M NaCl and 0.2 M H-PO'/HPO^" pH 6 . 8 buffer. A fourth

189
extract was prepared according to procedure I (218) and
subsequently redissolved in 0.2 M Na_SO, and 0.2 M H PO~/
2-HPO. . The effect of CI ions was to be determined by
comparison to this solution. The significant increase in
response as seen by CV and ASV for the fourth sample led to
the conclusion that appreciable amounts of chloride ion
could be detrimental. After a brief review of the litera-
ture pertaining to the species formed upon aqua regia
dissolution of Pt(DDTC) n , H„PtCl, or chloroplatinic acid,
the three procedures were reevaluated.
Chloroplatinic Acid and its Dissolution
The species formed upon dissolution of platinum metal
in aqua regia is a mixture of H„PtCl " 6H n O and NO„[PtCl^]
(618) . The nitroso salt can be converted to chloroplatinic
acid by repeated dissolutions in aqueous HC1 (618, 619).
The resultant chloroplatinic acid is a stronger acid than
sulfuric acid (620) . Maatman and Addink demonstrated this
by titrations with strong base (620) . The titration curve
shape indicated a strong acid, with no inflection points
before the end point implying absence of HPtCl ~ (620) .
Measured pH values for equal molar solutions of the pure
acids were lower for H„PtCl, than for H_SO. (620) . Thez b z 4
2-conjugate base, PtCl, , is easily hydrolyzed and titrations
with strong base typically gave values of 2.3 H per Pt
(620). In the hydrolysis of PtCl" , chloride ions are
replaced by hydroxide ions in solutions as concentrated as
190
0.1 to 3 M KC1 (621). The time to hydrolyze one half of the
hexachloroplatinate (IV) ions increases with decreasing
concentration of HC1, reaching a value of about 860 hours in
0.047 M HC1 (621) .
Electrochemical reduction of PtCl," has been studied in6
various electrolyte solutions. A 1960 study using a rota-
ting platinum disk electrode reported good correlation
between reduction current and the square root of the rota-
tion speed (622) according to the Levich equation. Another
paper described different reduction mechanisms in the
presence and absence of chloride ion (623) . One polaro-
graphic wave was observed due to platinum species reduction
in 0.1 M Na-SO. (623). Hubbard and Anson reported two
different reduction products of PtCl^-
in chloride
• 2-contaming and chloride free solution, PtCl. and Pt metal
respectively (624) . They also concluded that in the absence
2-of chloride, all hydrolysis products of PtCl
fiwere appar-
ently reduced to platinum metal more readily than the parent
ion (624). Later work by Lau and Hubbard on the kinetics of
2- 2-PtCl, and PtCl. reduction detailed the decrease in the
rate of reduction in chloride solution as a result of
chloride ion adsorption on platinum and the resultant
competition for space on the electrode surface. between CI
2-and PtCl, (625) . Ginstrup has done considerable work on
the redox chemistry of Pt /Pt /Pt with chloride as well
as bromide ligands and summarized his and others' results in
a 1972 paper (626) . A considerable amount of material and

191
references are also available in the 1975 book on the
analytical chemistry of the platinum metals (618) .
Before continuing to evaluate and optimize the chela-
tion and extraction procedures, the redissolution of the
chloroplatinic acid was examined. A sample of platinum wire
was dissolved in aqua regia to serve as a standard source of
H^PtCl, for comparison of various electrolyte solutions. A
series of electrolytes and buffer solutions, all 95.5 ppm in
platinum, were studied by cyclic voltammetry to determine
their suitability as a redissolution electrolyte. Figure 17
shows typical resultant families of CV's used to qualita-
tively judge each electrolyte. Deposition of platinum and
the usual anodic and cathodic processes on platinum are
clearly visible. For each electrolyte evaluated, the glassy
carbon electrode was wiped clean and three scans were then
recorded sequentially starting cathodically from +1.0 V vs
SCE. Changes in hydrogen adsorption and desorption, oxide
2 —film formation and reduction and PtCl, deposition were used
to evaluate the merits of each of the tested solutions.
Table 17 contains some qualitative remarks about the
results
.
Based on the results of the cyclic voltammograms
,
0.1 M Na„SO., 0.1 M KH_PO./Na„HPO. and a solution of bothz 4 z. 4 z 4
were further evaluated. ASV experiments carried out with
depositions from 9.55 ppm Pt in each of the three test
solutions were performed. The results in Table 18 partially

c

193
C\J
+
q+
oo
CO+
uUCO
>>
C\J
r
i*
to
_k
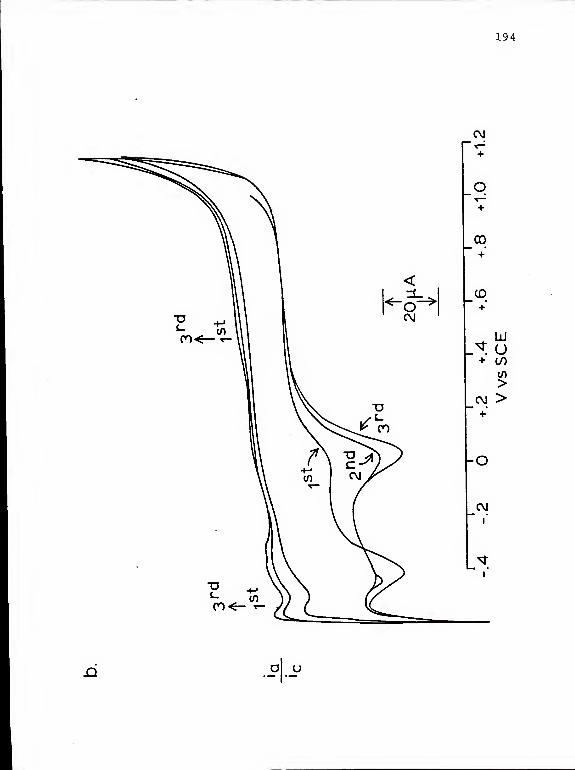
194
O U
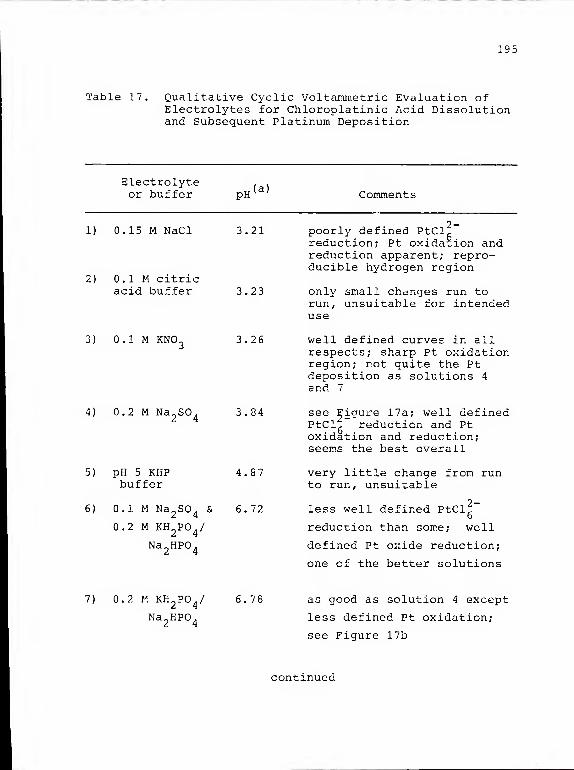
195
Table 17. Qualitative Cyclic Voltammetric Evaluation ofElectrolytes for Chloroplatinic hcid Dissolutionand Subsequent Platinum Deposition
Electrolyteor buffer PH
(a) Comments
1) 0.15 M NaCl
2) 0.1 M citricacid buffer
3.21 poorly defined PtClgreduction; Pt oxidation andreduction apparent; repro-ducible hydrogen region
3.23 only small changes run torun, unsuitable for intendeduse
3) 0.1 M KNO. 3.26 well defined curves in allrespects; sharp Pt oxidationregion; not quite the Ptdeposition as solutions 4
and 7
4) 0.2 M Na2S0
43.84 see Figure 17a; well definec
PtCl ~ reduction and Ptoxidation and reduction;seems the best overall
5) pH 5 KKP 4.8 7
buffer
6) 0.1 M Na„SO. & 6.72
0.2 M KH PO /
Na HPO.
very little change from runto run, unsuitable
2-"6
well
less well defined PtCl!
reduction than some;
defined Pt oxide reduction;
one of the better solutions
7) 0.2 M KH2P0
4/
Na2KP0
4
6.78 as good as solution 4 except
less defined Pt oxidation;
see Figure 17b
continued

196
Table 17. continued
Electrolyte pH(a ' Comments
or buffer
0.02 M KH2P0
4/ 6.79 best separation of PtClg and6
Lon; sua
but not optimal
Na-HPO. Pt oxide reduction; suitable
9) 0.1 M Na2B4 ?
9.32 irregularly shaped PtCl^" and
•10H2O Pt oxide reduction; limited
anodic range; suitable if high
pH desirable
(a) non buffered electrolytes have low pH due to addition ofchloroplatinic acid solution

197
Table 18. Quantitative Evaluation of Electrolytes forChloroplatinic Acid Dissolution and SubsequentPlatinum Deposition
Electrolyte E, t. Peak Heightdep dep 3
or buffer V vs SCE min yA Comments
0.1 M Na o S0 4-0.2

198
substantiate the choice of Na„SO. as the electrolyte for
chloroplatinic acid dissolution.
The pH dependence of the potentials at which the
platinum oxide film forms and is reduced has been discussed
in Chapter IV. Figure 17 illustrates this and also the pH
2-dependence of the reduction of PtCl, . In Figure 17a, a
cathodic peak at about +0.05 V seen in the first scan is
indicative of PtCl, reduction. In a series of solutions6
19.1 ppm in Pt and 0.1 M in Na~SO., the pH was adjusted to
several values using H„SO. or NaOH. Cyclic voltammograms
2-were obtained and the peak potential for PtCl
fi
reduction
was determined. In addition, a potential midway between
this peak potential and the peak potential of the hydrogen
adsorption process was chosen. It was felt that using these
two potentials, obtained independently for each pH, as
deposition potentials would be a better way to evaluate the
pH dependence of the deposition process. Results of these
experiments are presented in Table 19 and Figure 18. It was
inferred from Figure 18 that platinum deposition was poor if
2-the pH of the PtCl
fisolution was much greater than five.
In order to obtain more information concerning the depo-
sition process in the more acidic solutions, a series of
experiments was performed. Solutions 19.1 ppm in Pt and 0.1
M in Na„SO. were adjusted to final pH values of less than
five. Three deposition potentials were chosen, 0.0, -0.1
and -0.2 V. All other variables in the series of experi-
ments were identical. Results are presented in Figure 19.

199
2-Table 19. Evaluation of pH Dependence of the PtCl
fi
Reduction Process
5 = F ?•dep p, PtClg
pH E, ic dep pV vs SCE uA
2.98 0.0 10
4.80 -0.08 5.8
6.37 -0.25 1.8
9.2 3 -0.3 3 no peak
E, = 1/2 (E ^^-,2- + E „ , )dep p, PtClg p, Hads
pH E, idep pV vs SCE uA
2.98 -0.10 16
4.62 -0.35 12.3
6.37 -0.50 5.8
9.23 -0.65 no peak

200
Edep
Ep,PtClg
P/Hads)/2
Figure 18. pH dependence of stripping peak height,pH 2 to 10.

:oi
25
20
<zL
h-IOLd
I
<UJ
15
10
dep
0.0V
PH
Figure 19 pH dependence of stripping peak height, pH1 to 5.

202
From the results of Figure 19, either a small change in
2-E, or in the pH of the PtCl
fisolution causes a signifi-
cant change in the stripping peak height. For this reason,
a series of buffer solutions were investigated. The desired
pH of the buffer solutions chosen was in the range of 1.5 to
3 because of the improved deposition at low pH in evidence
in Figures 18 and 19. As seen from the slopes of the three
lines of Figure 19, the change in peak height with pH is
smaller with an increasingly cathodic deposition potential.
For this reason E, was chosen as cathodic as possibledep r
without incurring hydrogen evolution. The value of
-0.2 V vs. SCE was chosen for all buffer solutions.
The initial evaluation of buffer solutions consisted of
cyclic voltammograms of 0.01 M solutions of the pure buffers
at a glassy carbon electrode. The solutions were made 0.01
M in both the acid and its conjugate base. The following
acids (and their respective buffer solution pH) were used:
oxalic (2.15), bisulfate (2.35), phosphoric (2.53), glycine
or amino acetic acid (2.76), chloroacetic (2.95), tartaric
(2.98) and formic (3.65). Citric acid had been previously
used and was considered unsuitable. As a result of the
preliminary CV scans, formic acid was found unsuitable due
to a large anodic current in the potential range -0.1 to
+0.4 V. The other buffer solutions were evaluated further.
Solutions were made 0.01 M in buffer and 19.1 ppm in Pt
to evaluate the deposition process in each of the remaining
six buffers. Families of consecutive CV s and ASV

203
experiments were performed. On the basis of changes in the
platinum oxide film formation and reduction obtained from
the CV's and on the height of stripping peaks, bisulfate,
phosphate and chloroacetate were the best buffer solutions.
Buffer solutions of tartaric acid and glycine showed consid-
erably less platinum deposition than did the best three.
Oxalic acid buffer solution presented an entirely different
story. In the presence of platinum, oxalic acid is oxidized
just before the oxide film begins to form on the platinum.
On glassy carbon or oxidized platinum, no apparent oxidation
occurs. This phenomenon was investigated later, but to
avoid any possible interferences, oxalic acid was not
investigated as a buffer solution for chloroplatinic acid
dissolution.
To further investigate the attributes of the three
acidic buffers yielding the best results so far, solution
aging tests were performed. In the tests, a 0.2 M solution
of each acid with added H^PtCl, was adjusted to a final pH
of 2. In one set of experiments, the platinum concentration
was 19.3 ppm and in another set it was 4.82 ppm. Identical
ASV experiments were performed with each solution on succes-
sive days. Aging characteristics of the different solutions
can be seen in Tables 20 and 21. The pH of the six solu-
tions remained essentially unchanged over the test period.
However, the amount of platinum available for deposition
decreased with age. For both platinum concentrations, the
sulfuric acid buffer retained a greater amount of platinum
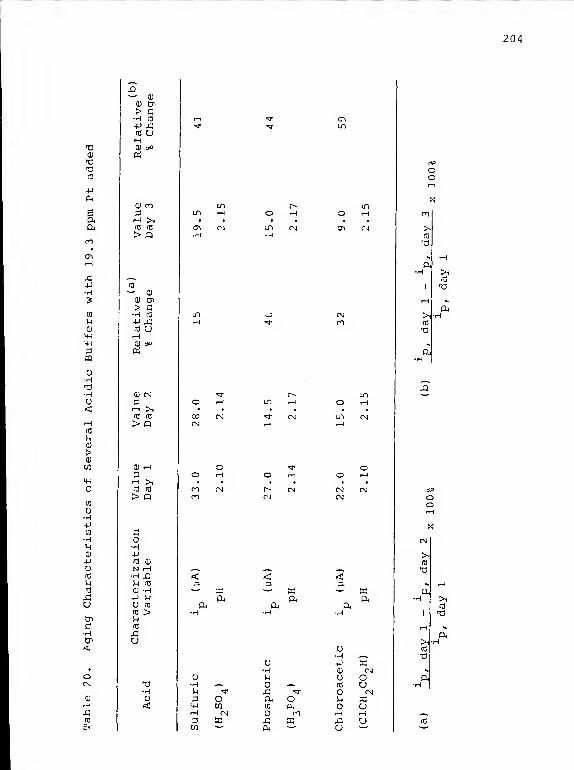
204
uH-Pen
HM<D+J
U03
Uid
UCnc-H

205
uCD
>
CO
4-1
o
en
u•H-Pen
HH0!
-P
Uit)
M
uCPc•H
<

206
in reducible form. At all times the chioroacetic acid
buffer solutions yielded less deposited platinum. Based
upon the data for these series of experiments, a buffer
consisting of 0.1 M HSO~ and 0.1 M SO^~ (both as their
sodium salts) was chosen for chloroplatinic acid dissolution
and subsequent platinum deposition.
To verify that chloroplatinic acid behaved as expected
in the 0.1 M bisulfate buffer, two experiments were per-
formed. In the first, deposition current was monitored as
function of electrode rotation speed at an E, of -0.2 Vdep
for a 10 ppm Pt solution. The current was recorded 3 s
after the increase in rotation speed. Data from this
experiment is presented in Table 22 and Figure 20. In the
second experiment, the deposition current was monitored
after 3 minutes of deposition and the stripping peak height
was measured for a series of ASV experiments where the only
variable was the deposition potential. This experiment
resembles an earlier one with cisplatin, summarized in Table
15 and Figure 16 except for the analytes. Data from the
present experiment is presented in Table 23 and Figure 21.
Chelation Procedure Optimization
At this point, all that remained to be optimized was
the chelation and extraction procedure. The three litera-
ture procedures previously mentioned were performed again,
using 25 ppm Pt as cisplatin in 0.15 M NaCl to test the
different procedures without interferences from urine

:07
2 —Table 22. Dependence of the PtCl, Deposition Current on
Electrode Rotation Speed
Stir Rate ±ptcl
2- ifilank
i^?- ^^(rps)
17 ^PA
bUA
bMA
2 20.4 0.8 19.6
2.5 26.3 0.9 25.4
3 31.2 0.9 30.3
3.5 35.9 1.0 34.9
4 38.2 1.2 37.0
4.5 41.5 1.1 40.4
5 52.0 1.1 50.9
5.5 54.0 1.0 53.0
6 56.9 1.0 55.9
6.5 59.6 1.0 58.6
7 62.0 1.0 61.0
7.5 65.3 1.0 64.3
8 68.2 1.0 67.2
8.5 71.4 1.0 70.4
9 75.0 1.1 74.0

Figure 20. Net deposition current in 10 ppm Pt as a func-tion of electrode rotation speed. Platinum
2-present as PtCl
fi
in 0.1 M bisulfate buffer.
Data from Table 22. Currents from rotation1/2speeds of (rps) <_ 4 . 5 not included in regres-
sion line because of audible and visible wobblein the rotating electrode assembly.

209
70
60
<_50
40LUcr
u
P30
OCL
LU
Q 20
slope = 5.76
intercept = 21.36
r2
= 0.996
10
3 4 5 6
(rps) 1 ' 28

210
Table 23. Deposition Currents and Stripping Peak Heightsfor a Series of Deposition Potentials with PtCl
~
as Analyte
E, i, at 3 min idep dep pV vs SCE yA \iA
+0.40
0.30 0.28
0.20 8.5 0.16
0.15 22.0 1.14
0.10 25.5 2.65
0.05 29.0 3.75
0.00 32.0 5.00
-0.05 33.5 6.65
-0.10 33.0 9.25
-0.15 33.0 8.80
-0.20 34.2 8.40
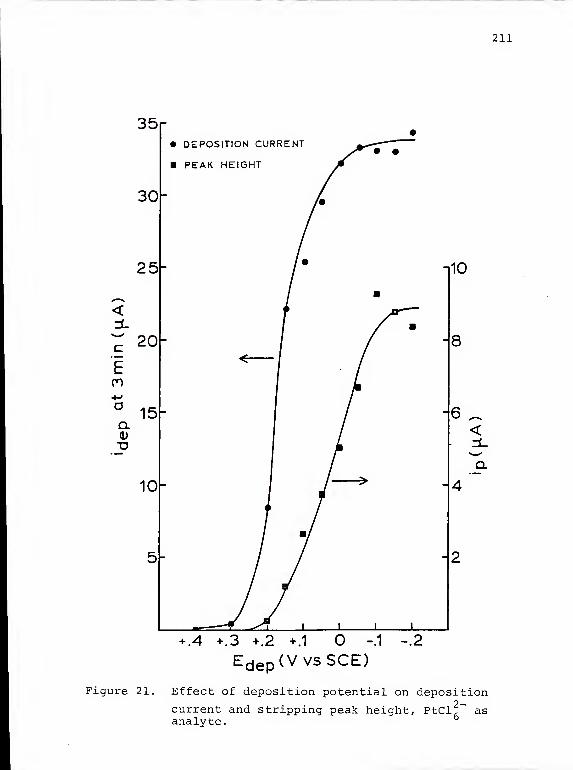
211
+ .4 +.3 +.2 +.1 -.1 -.2
Edep (VvsSCE)
Figure 21. Effect of deposition potential on deposition2 —current and stripping peak height, PtCl^ as
analyte.

212
constituents. The procedures differed little after the
Pt(DDTC)2
complex had been formed, so identical CHC1.,
extraction, aqua regia digestion and bisulfate buffer
redissolutions were performed. The differences in the
procedures lie in the chelation step.
The most recently published procedure, Procedure I
(218), seems to combine aspects of the two previous papers.
To 100 mL of cisplatin solution, 10 mL of 10% NaDDTC in .
1
M NaOH were added. The mixture was sealed in an Erlenmeyer
flask, heated over steam for about 15 minutes and cooled to
room temperature. Procedure II (157) was identical except
there was no heating. The mixture was left at room temper-
ature for one hour, about the time needed for the heated
solutions to cool. Procedure III (616) differed from
Procedure I only in that the cisplatin solution was adjusted
to pH 7 to 9 with 5% Na.CC»3before addition of 3.3 mL of 0.5
M NaDDTC. Procedures I and II use 1 g of NaDDTC while
Procedure II uses 0.28 g. Results of the entire ASV exper-
iment, with the conditions identical except for the three
chelation procedures, are presented in Table 24. These
three procedures were compared, using the same total amount
of platinum, by mixing 25 mL of cisplatin solution with 50
mL of a uniform, pooled, platinum free urine sample as the
test solutions. After equilibrating at room temperature for
one hour after mixing, the chelation procedures were begun.
A fourth sample was prepared as per Procedure I except 1 mL
of 10% NaDDTC in 0.1 M NaOH and 9 mL of 0.1 M NaOH was used

213
Table 24. Results of Several Platinum Chelation Procedureswith Cisplatin in 0.15 M NaCl as Evaluated byASV
Procedure E, t, idep dep pV vs SCE min yA
I -0.2 1 2.9
-0.2 1 2.7
-0.1 2 7.8
II -0.2 2 4.5
-0.2 2 3.7
-0.1 2 0.9
-0.1 2 1.0
III -0.2 2 7.0
-0.1 2 3.8
(a) I as ref. 218; II as ref. 157; III as ref. 616
Note: All procedures other than chelation procedurewere identical.

214
as chelating solution. Results of these experiments are in
Table 25.
Several things are apparent from an examination of the
results of the two sets of experiments. The difference in
Procedures I and II, the heating step, produced a signifi-
cant increase in the peak current due to platinum oxidation
when used for urine and aqueous samples. Values of the pH
after addition of the NaDDTC solution and before the CHC1
extraction was begun were in the range of 8.4 to 9.3 for all
solutions. It seemed that prior adjustment of the pH as
suggested by Procedure III was an unnecessary step consid-
ering the range suggested and that which was achieved when
NaOH was added with NaDDTC. Comparing results of Procedures
I and IV in Table 25 demonstrates that increasing the amount
of chelating agent results in an increase in the amount of
platinum in the final analytical solution. A final series
of experiments was performed to optimize the amount of
chelating agent added.
Having adopted the majority of the suggested items in
Procedure I with a few modifications in the CHC1, extraction
process, the amount of NaDDTC added was varied in a series
of experiments. Four entire procedures were performed
identically except for the amounts of 10% NaDDTC in
0.1 M NaOH and/or 0.1 M NaOH added to the spiked urine
samples. Following chelation, CHC1 extraction, solvent
removal, aqua regia dissolution and bisulfate/sulfate buffer
redissolution, deposition was carried out for three minutes
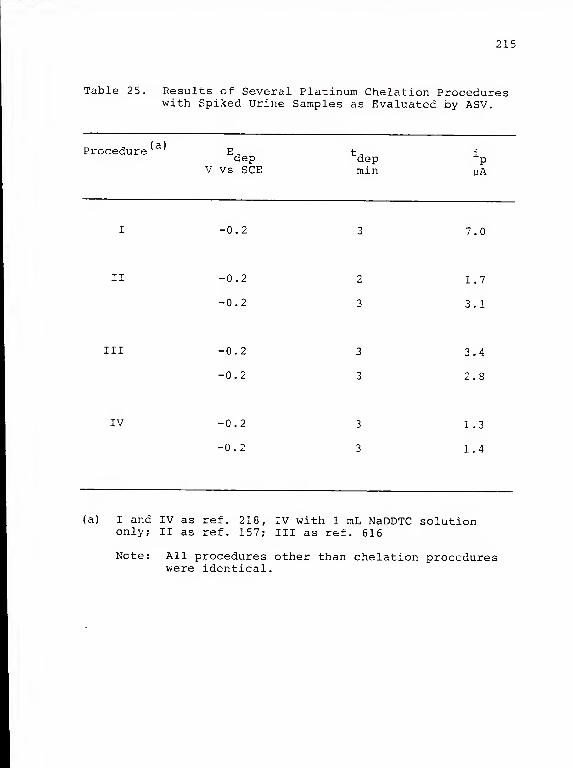
215
Table 25. Results of Several Platinum Chelation Procedureswith Spiked Urine Samples as Evaluated by ASV.
Procedure (a)
depV vs SCE
"depmin
PuA
-0.2 7.0
II •0.2
•0.2
1.7
3.1
III •0.2
•0.2
3.4
IV -0.2
-0
1.3
1.4
(a) I and IV as ref. 218, IV with 1 mL NaDDTC solutiononly; II as ref. 157; III as ref. 616
Note: All procedures other than chelation procedureswere identical.

216
at -0.2 V. Results of the experiments are given in
Table 26. The recommended amount of chelating agent seemed
to provide the greatest amount of platinum from the 10 ppm
Pt spiked urine samples. By comparing the results obtained
here with those of chloroplatinic acid solutions that were
analyzed by the same ASV procedure without the chelation
procedure, only about 10 to 20% of the platinum in the urine
could be recovered. The poor quality of the aged sample of
NaDDTC used is, in part, responsible for the low recovery of
platinum. No direct comparison was made between recoveries
from spiked urine and recoveries from water in this study.
The low recoveries from urine should not preclude the use of
chelation and solvent extraction because of the small
amounts of platinum that can be detected and quantitated,
especially when using oxalic acid as an aid to obtaining a
useful electrochemical signal.
Oxalic Acid as Stripping Solution Modifier
As mentioned earlier, the activity of oxalic acid on
platinum was discovered while investigating low pH buffers.
The first experiments with oxalic acid were with solutions
2-19.1 ppm in Pt (as PtCl,- ) , 0.01 M in oxalic acid and sodium
b
bioxalate and 0.1 M in Na„SO.. As seen in Figure 22, as the
amount of platinum deposited on the glassy carbon electrode
increased in successive cyclic voltammograms , the anodic
current peak increased in size as well. It should be noted
that the current sensitivity in the cathodic scans is ten

217
Cu <
u0)
>ou0)
•X
1
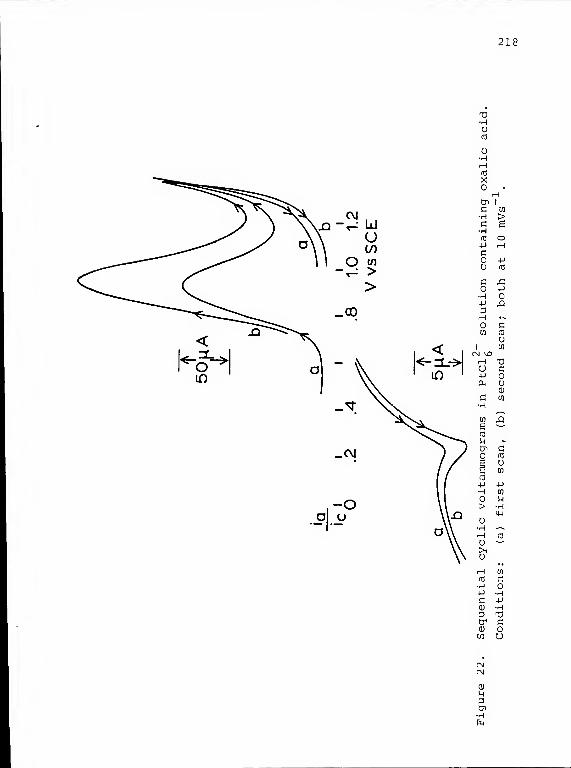
218
13

219
times that of the anodic scans. The scans were otherwise
identical and were recorded without interruption. The large
anodic current in evidence is due to oxalic acid oxidation
on the deposited platinum. Immediately following the CV's
of Figure 22 those of Figure 23 were recorded. These point
out several interesting aspects of the oxalic acid oxidation
initially realized.
The cathodic scan of Figure 23a illustrates the plat-
inum oxide reduction characteristics of this pK 2.60 medium.
Anodic scans b and c show the reproducibility attainable.
Both scans were commenced after the potential was held for
10 s at 0.1 V. At this potential, platinum oxide should be
2-reduced (see scan a) but additional PtCl, should not be
6
reduced to form platinum. As the peaks in scans b and c
indicate, no amount of platinum could be observed to
deposit. Scan d followed scan c but the cathodic scan was
reversed at +0.6 V. By reversing the scan at this poten-
tial, only partial reduction of the platinum oxide occurs.
Less anodic current is observed since oxalic acid is oxi-
dized to a diminished degree on platinum oxide compared to
platinum. A survey of the literature of oxalic acid behav-
ior at platinum and carbon electrodes was undertaken to
confirm the explanations extended.
The formation of an oxide film on platinum has been
cited as an inhibitor of the oxidation of oxalic acid by
many researchers (229, 627-631). In chronopotentiometric
experiments, Lingane observed that the oxidation of oxalic

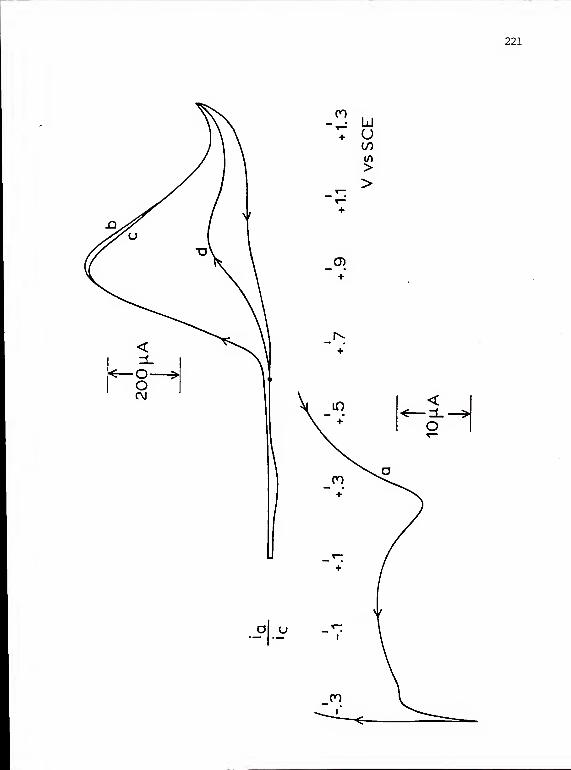
221

22;
acid was completely blocked by the anodic film on platinum
(229) . Giner observed that the same results were obtained
whether the platinum oxide was formed by prepolarization or
an anodic scan (631) . He also noted that both chemical and
electrochemical reduction of the platinum oxide had the same
effect of stopping inhibition of the oxalic acid oxidation.
Kornienko, Mirkind and Fioshin reported that reversing the
scan at E < E enabled succeeding scans to be identical as
no platinum oxide had yet formed (629). However if
E > E the next scan had up to 1000 times less anodic
current.
Adsorption of oxalic acid or one of its conjugate bases
appears to be necessary for uninhibited oxidation to occur.
It was noted that increasing the oxalic acid concentration
increased the anodic current until a limiting value was
reached, said to correspond to a saturation of the platinum
with adsorbed oxalate species (628) . Horanyi and associates
used radio-labeled oxalic acid to study adsorption and
oxidation simultaneously (630, 632). In the region
E < . 6 V vs RHE, oxalic acid is not oxidized but is
adsorbed, so studies were performed to show the effects of
other adsorbents (632). Strong adsorbers like chloride ion
were shown to block oxalic acid adsorption (632). At a
potential where oxalic acid is oxidized but platinum is not,
a constant stirring rate produced a constant anodic current
and adsorption (630). When the stirring was stopped, both
oxidation and adsorption decayed in parallel (630). It was

223
also observed that during a potential scan in a quiet
solution, as the anodic current increased the amount
adsorbed decreased (630). Anson and Schultz reported
inhibition of oxalic acid oxidation by adsorbed species and
by metals known to complex with oxalate (627).
The particular speciation of oxalate appears to be
important in the oxidation at platinum electrodes (633). It
seems accepted that oxalic acid is the reactant on platinum
(627, 633, 634). As the pH of the oxalic acid solution is
increased, the concentration of the oxalic acid itself will
decrease as the relatively strong acid dissociates to form
bioxalate and finally oxalate ions. It was observed that
with platinum electrodes, the anodic current began to
decrease as the pH increased above 2.5 (633). Other works
established that the oxidation proceeded as expected up to
pH 2.1 but above pH 3 oxidation occurred only after platinum
oxide formation had begun (627). Complementary results were
obtained with pyrolytic graphite electrodes (633). No
oxalic acid oxidation was observed in 1 M HC1 or 0.0 5 M
H„SO., but when the pH increased to greater than 2, oxida-
tion was observed (633) . The peak potential was determined
to be E = 0.99 ± 0.07 V vs SCE for 2 <_ pH _< 11.1 (633).
The pH dependence of the anodic current led Dryhurst and
McAllister to suggest that oxalic acid is oxidized on
platinum while one or both of the conjugate bases reacts on
pyrolytic graphite (633). From this information it seemed
that oxalic acid in acidic solution could provide a means to

224
increase the electrochemical signal from deposited platinum
beyond that from platinum oxide formation. The anodic
reaction of oxalic acid on platinum, but not the glassy
carbon substrate or the anodically formed platinum oxide,
would increase the sensitivity of the overall analytical
measurements
.
A series of experiments was performed to evaluate the
possible use of an oxalic acid solution for the quantitation
of deposits of platinum. A 5 ppm Pt solution in bisulfate
buffer was used to deposit platinum on the glassy carbon
electrode. The DP scans provided qualitative and quantita-
tive information suggesting that oxalic acid could act as
hoped and that optimization was possible. Qualitative
results of this series are in Table 27. Using the optimal
solution from the experiments summarized in Table 27, two
experiments were performed to show that oxalic acid was
oxidized on platinum but not glassy carbon. Cyclic voltam-
mograms of a glassy carbon electrode without and with
deposited platinum are shown in Figure 24. Little oxidation
of oxalic acid on glassy carbon is evident in Figure 24a.
However, following a 3 minute deposition from a 5 ppm Pt
solution the large anodic peak of Figure 24b appeared. The
sharp peak, starting at about +0.7 V with a peak at +0.83 V,
is due to the oxalic acid oxidizing on the small amount of
platinum. The anodic current decreases beyond the peak as
the platinum begins to oxidize and inhibit the reaction.

225

o >
G
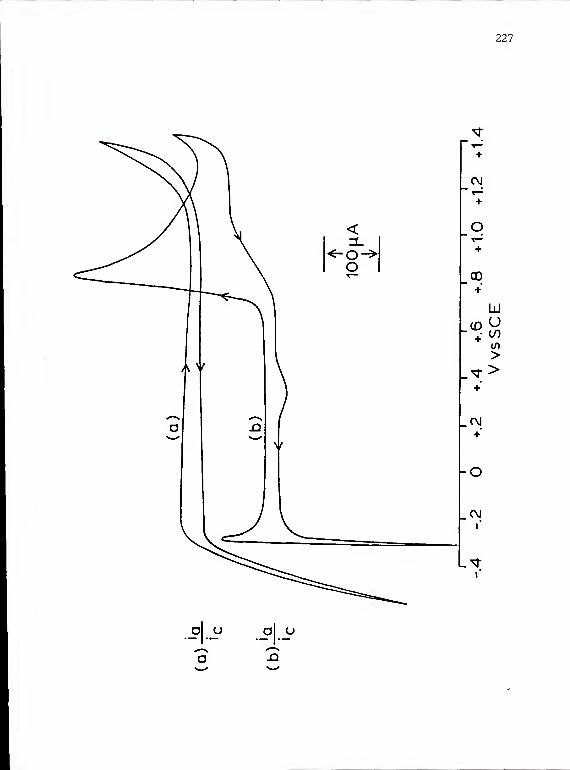
227
+
CM
+
q+
cq
+
(D u- :• </>
>
+
C\J
-O
CMr
i"
2

228
Feasibility of platinum quantitation was shown in another
series of experiments.
Results from several deposition, conditioning and DP
voltammetric scans are presented in Figures 25 and 26. In
Figure 25, all scans were recorded under identical condi-
tions. Curve a corresponds to the glassy carbon electrode,
without any deposition, carried through the conditioning and
then recorded. Curves b and c resulted from separate 3
minute depositions from a 0.963 ppm Pt solution. The peak
currents measured for curves b and c are 73.6 and 71.4 pA
respectively. These currents, about 6 to 10 times greater
than those usually obtained from solutions 10 times as
concentrated, represented a 60 to 100 times increase in
sensitivity using oxalic acid oxidation for platinum quanti-
tation. Figure 26 shows results from depositions from 0.1
and 0.01 ppm Pt solutions. All curves were recorded under
identical conditions. The peak currents of curves c and d
are 6.90 and 8.50 pA respectively. The peak height of curve
b is difficult to measure, but evidence of anodic current
due to oxalic acid oxidation is present. The use of oxalic
acid in sulfuric acid to quantitate the small amounts of
platinum deposited from these low concentration solutions
represents a beneficial technique.

Figure 25. Anodic DP voltammograms obtained in oxalic acidsolution with a glassy carbon electrode bothwith and without a platinum deposit. 0.01 M
oxalic acid in 0.1 M H~SO , 5 mVs , 25 mV
modulation amplitude, 0.5 s repetition rate; (a)
no platinum, (b) & (c) 3 min deposition from a
0.963 ppm Pt in 0.1 M HSo'/SO^" solution.
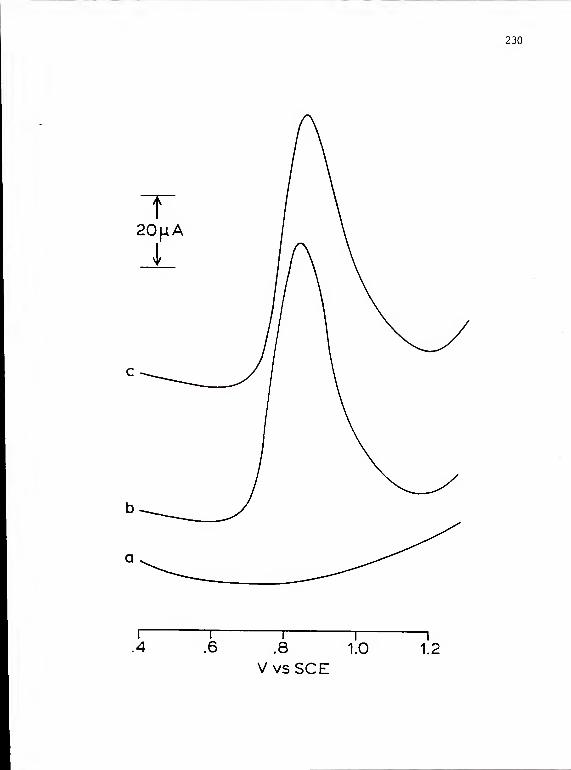
230
.4 .6 .8 1.0 1.2
VvsSCE

Figure 26. Anodic DP voltammograms obtained in oxalic acidsolution with a glassy carbon electrode bothwith and without a platinum deposit. 0.01 M
oxalic acid in 0.1 M H o S0 4, 5 mVs , 25 mV
modulation amplitude, 0.5 s repetition rate;(a) no platinum, (b) 10 min deposition from9.63 ppb Pt, (c) & (d) 5 min deposition from0.0963 ppm Pt.

232

CHAPTER VIII
CONCLUSION
The goal of developing an analytical method using
anodic stripping voltammetry for the determination of
platinum species derived from cis-diamminedichloro-
piatinum (II) , the largest selling anti-cancer drug in the
U.S. today (635) , was realized. Platinum concentration
levels that can be successfully determined range from
greater than the peak plasma level of about 6 ppm (107), to
near the lowest levels detected by other methods and are
sufficient for the monitoring of patients under treatment
with cisplatin. The methodology, while net as simple as
originally envisioned, is within the capabilities of a
clinical laboratory equipped with electrochemical instru-
mentation.
The complete procedure consists of several steps.
Removal of platinum, present as many different: species, from
urine is attained by forming a complex using the chelating
agent sodium diethyldithiocarbamate and solvent extraction
with chloroform. This procedure frees platinum from the
urine matrix more easily, safely and cleanly than acid
digestion procedures commonly used in elemental analyses.
Solvent evaporation and aqua regia digestion results in the

234
formation of chloroplatinic acid which, when redissolved in
bisulfate/sulfate buffer, is a stable, easily reduced form
of platinum. The deposition potential of -0.2 V vs SCE is
relatively anodic and few metals co-deposit, even if co-
extracted.
Following washing, transfer of the electrode with
deposited platinum to 0.0 5 M H?S0
4removed the possibility
of interference by components of the deposition solution in
the quantitation procedure. Since the platinum was shown
not to be removed from the glassy carbon surface by electro-
chemical means and the deposit behaves essentially as a
platinum electrode, a treatment to activate the deposit is
employed. Oxidation at +1.5 V and +1.2 V removes deposited
and/or adsorbed impurities and leaves a clean platinum oxide
film on the glassy carbon substrate. Re-reduction at +0.1 V
results in a clean, activated platinum film. An anodic
potential sweep, when performed using differential pulse
voltammetry, results in a peak centered at about +0.85 V.
This is considerably anodic of the oxidation processes of
other metals and provided further analytical selectivity.
The glassy carbon electrode used often presents prob-
lems to the electroanalytical chemist due to its surface
chemistry. By gently wiping to remove the deposited plat-
inum after an analysis and storage of the clean surface in
an inert nitrogen atmosphere, a reproducible electrode
response is maintained.

235
Incorporation of oxalic acid in the stripping medium
resulted in a lower minimum detectable platinum concentra-
tion. Since oxalic acid oxidizes on platinum commencing at
about +0.7 V but net on glassy carbon or platinum oxide, the
anodic current increases during the potential sweep until
the platinum begins to oxidize. The resultant differential
pulse voltammogram is similar to previous ones obtained
without oxalic acid, but with substantially larger anodic
currents. Any future work in this area using organic
compounds which behave similarly could result in further
improvement.
A final comment should be made on the possible direct
application of this method to the determination of platinum
from a variety of sources. Any sample preparation procedure
compatible with a sample containing platinum could be used
and if chloroplatinec acid resulted, the remainder of the
method developed in this study is sufficiently selective to
provide quantitation.

REFERENCES
1. US Dept. of HEW, Cancer Rates and Risks, Pub. Mo. (NIH)76-691, 1975.
2. Ingvild Hagen, County Residents in Cancer Study, TheIndependent Florida Alligator, Oct. 7, 1982, p. 20.
3. Jane E. Brody, Woman Cancer Patient Writes Recipe forLong Survival, Gainesville Sun, Feb. 6, 1983, p. 7E.
4. J. Arehart-Treichel, Sci. News, 119 (1981) 12.
5. J. Arehart-Treichel, Sci. News, 119 (1981) 55.
6. C.L. Greenstock, J. Chem. Educ . , 58 (1981) 156.
7. J.M. Beddoes, AECL Report No. 6850 (1980).
8. M. Clark, Newsweek, Nov. 2, 1981, p. 94.
9. M.J. Cleare in Structure-Activity Relationships ofAnti-Tumor Agents, D.N. Reinhoudt, T.A. Connors, H.M.Pinedo and K.W. van de Poll (Eds.), Martinus NijhoffPub., Boston, 1983, p. 59.
10. P.E. Gormley, J.M. Bull, A.F. LeRoy and R. Cysyk, Clin.Pharmacol. Ther. , 25 (1979) 351.
11. W.D. Ellis, J. Chem. Educ, 50 (1973) A131.
12. F. Vydra, K. Stulik and E. Julakova, ElectrochemicalStripping Analysis, John Wiley and Sons, New York,1976.
13. W. Kemula, Pure Appl. Chem., 15 (1967) 283.
14. I. Shain in Treatise on Analytical Chemistry, I. M.Kolthoff and P.I. Elving (Eds.), Part I Vol. 4 Ch. 50,Interscience , New York, 1963.
15. A.J. Bard and L.R. Faulkner, Electrochemical Methods,John Wiley and Sons, New York, 1980.
236
237
16. J. Wang, Environ. Sci. Technol., 16 (1982) 1C4A.
17. W.M. Peterson and R.V. Wong, American Lab, 13(11)(1981) 116.
18. J. A. Plambeck, Electroanalytical Chemistry, John Wileyand Sons, New York, 1982.
19. A.M. Bond, Modern Polarographic Methods in AnalyticalChemistry, Marcel Dekker, New York, 1980.
20. W. Kemula and Z. Kublik in Advances in AnalyticalChemistry and Instrumentation, Vol. 2, C.N. Reilley(Ed.), Interscience, New York, 1963.
21. E. Barendrecht in Electroanalytical Chemistry, Vol. 2,A.J. Bard (Ed.), Marcel Dekker, New York, 1967.
22. E.W. Zink and L.R. Askew, Food Prod. Dev. , 9 (1975) 48.
23. E. Wiltshaw, Platinum Met. Rev., 23 (1979) 90.
24. B. Rosenberg, L. VanCamp and T. Krigas, Nature, 205(1965) 698.
25. B. Rosenberg, L. VanCamp, E. Grimley and A.J. Thomson,J. Biol. Chem. , 242 (1967) 1347.
26. B. Rosenberg, E. Renshaw, L. VanCamp, J. Hardwich andJ. Drobnick, J. Bacterid., 93 (1967) 716.
27. B. Rosenberg, L. VanCamp, J.E. Trosko and V.H. Mansour,Nature, 222 (1969) 385.
28. B. Rosenberg and L. VanCamp, Cancer Res., 30 (1970)1799.
29. R.J. Kociba, S.D. Sleight and B. Rosenberg, CancerChemother. Rep., 54 (1970) 325.
30. T.A. Connors and A. Haddow, International Symposium:"Bacterial, Viral and Anti-Tumor Activities of PlatinumCompounds," Mich. State Univ., Sept. 1970.
31. C. Welsh, International Symposium: "Bacterial, Viraland Anti-Tumor Activities of Platinum Compounds," Mich.State Univ., Sept. 1970.
32. R. Hinz, International Symposium: "Bacterial, Viraland Anti-Tumor Activities of Platinum Compounds," Mich.State Univ., Sept. 1970.

238
33. T.A. Connors, M. Jones, W.C.J. Ross, P.D. Braddock,A.R. Khokhar and M.L. Tobel, Chem.-Biol . Interact., 5
(1972) 415.
34. M.J. Cleare and J.D. Hoeschele, Platinum Met. Rev., 17
(1973) 2.
35. M.J. Cleare and J.D. Hoeschele, Bioinorg. Chem. , 2
(1973) 187.
36. L.L. Munchausen and R.O. Rahn, Cancer Chemother. Rep.,59 (1975) 643.
37. M.J. Cleare, P.C. Hydes, B.W. Malerbi and D.M. Watkins,Biochimie, 60 (1978) 835.
38. B. Rosenberg, Cancer Treat. Rep., 63 (1979) 1433.
39. B. Rosenberg, Platinum Met. Rev., 15 (1971) 42.
40. M.J. Cleare, Cond. Chem. Rev., 12 (1974) 349.
41. M. Rozencweig, D.D. Von Hoff, M. Slavik and F.M.Muggia, Ann. Intern. Med., 86 (1977) 803.
42. L. Rothenberg and R.A. Terselic, Cancer Chemother.Rep., 54 (1970) 303.
43. S.K. Carter and M. Goldsmith in Recent Results inCancer Research Vol. 48, T.A. Connor and J.J. Roberts(Eds.), Springer Verlag, New York, 1974, p. 137.
44. J. A. Gottlieb and B. Drewinko, Cancer Chemother. Rep.,59 (1975) 621.
45. T.A. Connors, Platinum Met. Rev., 17 (1973) 98.
46. D.J. Higby, H.J. Wallace Jr., and J.F. Holland, CancerChemother. Rep., 57 (1973) 459.
47. D.J. Higby, H.J. Wallace Jr., D.J. Albert and J.F.Holland, Cancer, 33 (1974) 1219.
48. M.J. Cleare, Platinum Met. Rev., 21 (1977) 56.
49. M.J. Cleare, Platinum Met. Rev., 23 (1979) 53.
50. M.K. Wolpert-De Filippes in Cisplatin: Current Statusand New Developments, A.W. Prestayko, S.T. Crooke andS.K. Carter (Eds.), Academic Press, New York, 1980, p.
183.
51. J. A. Montgomery, Methods Cancer Res., 16 (1979) 3.

239
52. A.J. Thomson, Platinum Met. Rev., 21 (1977) 2.
53. M.R. Truter and C.W. Milburn, J. Chem. Soc. (A)
,
(1966) , 1609.
54. R. Safirstein, M. Daye and J.B. Guttenplan, CancerLetters, 18 (1983) 329.
55. M.D. Cridland, Fundamentals of Cancer Chemotherapy,University Park Press, Baltimore, 1978.
56. C.P. Anthony and G.A. Thibodeau, Textbook of Anatomyand Physiology, C.V. Mosby Co., St. Louis, 1979.
57. B. Rosenberg, Cancer Chemother. Rep. Part 1, 59 (1975)589.
58. D. Osoba, Can. J. Hosp. Pharm. , 33 U980) 81.
59. M.E. Howe-Grant and S.J. Lippard in Metal Ions inBiological Systems, Vol. 11, K. Sigel (Ed.), MarcelDekker, New York, 1980.
60. A.D. Kelman and H. J. Peresic, Cancer Treat. Rep., 63
(1979) 1445.
61. J.M. Pascoe and J.J. Roberts, Biochem. Pharmacol., 23
(1974) 1345.
62. P. Horacek and J. Drobnik, Biochem. -Biophys . Acta, 254(1971) 341.
63. A.B. Robins, Chem. -Biol. Interact., 6 (1973) 35.
64. P.J. Stone, A.D. Kelman and F.M. Sinex, Nature, 251(1974) 736.
65. L.L. Munchausen and R.O. Rahn, Biochem. -Biophys. Acta,414 (1975) 212.
66. S. Mansy, G.Y.H. Chu, R.E. Duncan and R.S. Tobias,J. Am. Chem. Soc, 100 (1978) 607.
67. J. P. Macquet and T. Theophanides , Bioinorg. Chem., 5
(1975) 59.
68. P. Kong and T. Theophanides, Inorg. Chem., 13 (1974)1167.
69. G. Puzo, J.C. Prome, J. P. Macquet and I.A.S. Lewis,Biomed. Mass. Spectrom. , 9 (1982) 552.
70. R.W. Gellert and R. Bau, J. Am. Chem. Soc, 97 (1975)7379.

240
71. K. Inagki, M. Kuwayama and Y. Kidani, J. Inorg.Biochem., 16(1982)59.
72. R.J. Pollock and B. Rosenberg, Bioch., 60 (1978) 859.
73. T.D. Tullius and S.J. Lippard, J. Am. Chem. Soc, 103(1981) 4620.
74. P.J. Stone, A.D. Kelman, F.M. Sinex, M.M. Bhargava andH.O. Halvorson, J. Med. Biol., 104 (1976) 793.
75. A.T.M. Marcelis, G.W. Canters and J. Reedijk, Reel.Trav. Chim. Pays-Bas, 100 (1981) 391.
76. W.M Scovell and L.R. Kroos, Biochem. Biophys. Res.Commun., 108 (1982) 16.
77. A.M.J. Fichtinger-Schepman, P.H.M. Lohman andJ. Reedijk, Nucl. Acids Res., 10 (1982) 5345.
78. S.T. Crooke, J. Rheumatol. (suppl . 8), 9 (1982) 61.
79. J. P. Macquet, K. Jankowski and J.L. Butour, Biochem.Biophys. Res. Commun., 92 (1980) 68.
80. L. Stryer, Biochemistry, W.H. Freeman and Co., SanFrancisco, 1975, p. 564.
81. J.J. Roberts and F. Friedlos, Biochem. Biophys. Acta,655,(1981) 146.
82. J.J. Roberts and J.M. Pascoe, Nature, 235 (1972) 282.
83. R.A. Ellerby, H.L. Davis Jr., F.J. Ansfield andG. Ramirez, Cancer, 34 (1974) 1005.
84. R.A. Bender, L.A. Zwelling, J.H. Doroshaw, G.Y. Locker,K.R. Hande, D.S. Murinson, M. Cohen, C.E. Meyers and B.
A. Chabner, Drugs, 16 (1978) 46.
85. R.A. Al-Rashid, Pediatric Cancer Chemotherapy, MedicalExamination Pub. Co., Garden City, New York, 1979.
86. L.A. Zwelling and K.W. Kohn, Cancer Treat. Rep., 63
(1979) 1439.
87. A.T.M. Marcelis and J. Reedijk, Reel. Trav. Chim.Pays-Bas, 102 (1983) 121.
88. R.C. Harrison and C.A. McAuliffe, Incrg. Persp. Biol.Med., 1 (1978) 267.
141
89. J.K. Barton and S.J. Lippard in Nucleic Acid-Metal IonInteractions, T.G. Spiro (Ed.), John Wiley and Sons,New York, 1980, p. 88.
90. J. A. Howie and G.R. Gale, Biochem. Pharmacol., 19(1970) 2757.
91. J.J. Roberts in Cancer Chemotherapy Annual 4, H.M.Pinedo (Ed.), Elsevier, New York, 1982, p. 95.
92. B. Drewinko and J. A. Gottlieb, Cancer Chemother. Rep.,59 (1975) 665.
93. N.P. Johnson, J.D. Hoeschele and R.O. Rahn, Chem.-Biol.Interact., 30 (1980) 151.
94. P.J. Stone and F.M. Sinex at the Second InternationalSymposium on Platinum Coordination Complexes in CancerChemotherapy, Oxford, April 1973 in Recent Results inCancer Research, Vol. 48, T. A. Connors and J. J.Roberts (Eds.), Springer-Verlag, New York, 1974, p. 68.
95. H.N. A. Fraval and J.J. Roberts, Cancer Res., 39 (1979)1793.
96. M.F. Pera Jr., C.J. Rawlings and J.J. Roberts, Chem.-Biol. Interact., 37 (1981) 245.
97. D.J. Beck and R.R. Brubaker, J. Bacteriol., 116 (1973)1247.
98. J. Drobnick, M. Urbankova and A. Krekulova, Hutat.Res., 17 (1973) 13.
99. H.N. A. Fraval, J.C. Rawlings and J.J. Roberts, Mutat.Res., 51 (1978) 121.
100. J. Brouever, P. van de Putte, A.M.J. Fichtinger-Schepman and J. Reedijk, Proc. Natl. Acad. Sci., USA,78 (1981) 7010.
101. R.E. Meyn, S.F. Jenkins and L.H. Thompson, Cancer Res.,42 (1982) 3106.
102. H.C. Harder and B. Rosenberg, Int. J. Cancer, 6 (1970)207.
103. J.M. Pascoe and J.J. Roberts, Biochem. Pharmacol., 23
(1974) 1359.
104. J. Drobnik and P. Horacek, Chem.-Biol. Interact., 7
(1973) 223.
105. L. Garmon, Sci. News, 121 (1982) 312.

242
106. F.M. Muggia and M. Rozencweig in Advances in CancerChemotherapy, S.K., Carter, A. Goldin, K. Kuretani,G. Mathe, Y. Sakurai, S. Tsukagoshi and H. Umezawa(Eds.), University Park Press, Baltimore, 1978, p. 141.
107. M. Rozencweig, D.D. Von Hoff, R. Abele and F.M. Muggiain Cancer Chemotherapy Annual 2, H.M. Pinedo (Ed.),Elsevier, New York, 1980, p. 107.
108. J.R. Durant in Cisplatin: Current Status and NewDevelopments, A.W. Prestayko, S.T. Crooke and S.K.Carter (Eds.), Academic Press, New York, 1980, p. 317.
109. W.M. Hogan and R.C. Young, Cancer Chemotherapy Annual4, H.M. Pinedo (Ed.), Elsevier, New York, 1982, p. 331.
110. M.S. Wysor, L.A. Zwelling, J.E. Sanders and M.M.Grenan, Science, 217 (1982) 454.
111. D.H. Collins and R.C.B. Pugh, Br. J. Urol., 36(suppl.)(1964) 1.
112. J.M. Williams and N.G. Popovich, Drug Intell. Clin.Pharm., 12 (1978) 226.
113. Associated Press, Drug Combination Nearly Eliminates a
Major Form of Testicular Cancer, Miami Herald, May 12,
1982, p. 2E.
114. L.H. Einhorn and J. P. Donohue , Ann. Intern. Med., 87
(1977) 293.
115. D.D. Von Hoff and M. Rozencweig in Advances in Pharma-cology and Chemotherapy, Vol. 16, S. Garatlini, A.Goldin, F. Hawking and I.J. Kopin (Eds.), AcademicPress, New York, 1979, p. 273.
116. L.H. Einhorn, S.D. Williams, T. Troner, R. Birch andF.A. Greco, New Engl. J. Med., 305 (1981) 727.
117. E. Wiltshaw and T. Kroner, Cancer Treat. Rep., 60(1976) 55.
118. E. Wiltshaw, S. Subramarian, C. Alexopoulos and G.Barker, Cancer Treat. Rep., 63 (1979) 1545.
119. M. Rozencweig, D.D. Von Hoff, R. Abele and F.M. Muggia,Cancer Chemotherapy Annual 1, H.M. Pinedo (Ed.),Elsevier, Mew York, 1979, p. 107.
120. D.M. Gershenson, J.T. Wharton, J. Herson, C.L. Edwardsand F.N. Rutledge , Obstet. and Gynec, 58 (1981) 487.

243
121. W.B. Pratt and R.W. Ruddon, The Anticancer Drugs,Oxford University Press, New York, 1979, p. 251.
122. C. Jacobs, J.R. Bertino, D.R. Goffinet, W.E. Fee andR.L. Goode, Cancer, 42 (1978) 2135.
123. D.J. Higby, J.J. Wallace Jr., D. Albert and J.F.Holland, J. Urol., 112 (1974) 100.
124. R.S. Goldstein and G.H. Mayor, Life Sci., 32 (1983)685.
125. D.M. Hayes, E. Cvitkovic, R.B. Golbey, E. Scheiner, L.Helson and I.H. Krakoff, Cancer, 39 (1977) 1372.
126. D.D. Choie, D.S. Longnecker and A. A. Del Campo, Lab.Invest., 44 (1981) 397.
127. R. Safirstein, P. Miller, S. Dikman, M. Lyman andC. Shapiro, Amer. J. Physiol., 241 (1981) F175.
128. M. Dentino, F.C. Luft, M.N. Yum, S.D. Williams and L.H.Einhorn, Cancer, 41 (1978) 1274.
129. J.L. Mark, Science, 192 (1976) 774.
130. R.L. Schilsky and T. Anderson, Ann. Int. Med., 90(1979) 929.
131. J.D. Khandelkar, Res. Commun. Chem. Pathol. Pharmacol.,40 (1983) 55.
132. G.R. Gale and L.M. Atkins, J. Clin. Hematol. Oncol., 11(1981) 41.
133. R.F. Borch, J.C. Katz, P.H. Lieder and M.E. Pleasants,Proc. Natl. Acad. Sci., USA., 77 (1980) 5441.
134. R.F. Borch and M.E. Pleasants, Proc. Natl. Acad. Sci.,USA, 76 (1979) 6611.
135. S.B. Howell and R. Taetle, Cancer Treat. Rep., 64(1980) 611.
136. W.J.M. Hrushesky, F.A. Levi, F. Halberg and B.J.Kennedy, Cancer Res., 42 (1982) 945.
137. F.A. Levi, W.J.M. Hrushesky, C.H. Blomquist, D.J.Lakatua, E. Haus , F. Halberg and B.J. Kennedy, CancerRes., 42 (1982) 950.
138. S.W. Stadnicki, R.W. Fleischman, V. Schaeppi andP. Merriam, Cancer Chemother. Rep., 59 (1975) 467.

244
139. R.W. Fleischman, S.W. Stadnicki, M.F. Ethier andV. Schaeppi, Toxicol. Appl. Pharmacol., 33 (1975) 320.
140. J.J. Piel, D. Meyer, C.P. Perlia and V.I. Wolfe, CancerChemother. Rep., 58 (1974) 871.
141. A.J. Lippman, C. Helson, L. Helson and I.H. Krakoff,Cancer Chemother. Rep., 57 (1973) 191.
142. Y. Furuta, K. Adachi , M. Ishikawa, K. Nakamura, S. Ito,K. Saito, T. Yamashita, T. Takahira, Y. Ozawa; et al.,Oyo Yakuri, 23 (1982) 517; through Chem. Abstr. 97(1982) 103898.
143. W.E. Evans, G.C. Yee, W.R. Crom, C.B. Pratt and A. A.
Green, Drug Intell. Clin. Pharm. , 16 (1982) 448.
144. W.C. Cole and W. Wolf, Chem. -Biol. Interact., 30 (1980)223.
145. S.J. Bannister, L.A. Sternson, A.J. Repta and G.W.James, Clin. Chem., 23 (1977) 2258.
146. C.J. Williams and J.M.A. Whitehouse, Br. Med. J., June23, 1979, 1689.
147. R.C. DeConti, B.R. Toftness, R.C. Lange and W.A.Creasy, Cancer Res., 33 (1973) 1310.
148. W.R. Crom, W.E. Evans, C.B. Pratt, M. Senzer,M. Denison, A. A. Green, F.A. Hayes and G. C. Yee,Cancer Chemother. Pharmacol., 6 (1981) 95.
149. J.J. Piel, G.V.S. Rayadu, C.P. Perlia, A.M. Friedmanand E.W. Fordham, Proc. Am. Assoc. Cancer Res., 15
(1974) 111.
150. D.M. Taylor, Biochimie, 60 (1978) 949.
151. B. Rosenberg in Nucleic Acid-Metal Ion Interactions,T.G. Spiro (Ed.), John Wiley and Sons, New York, 1980,p. 2.
152. R.C. Lange, R.P. Spencer and H.C. Harder, J. Nucl.Med., 14 (1973) 191.
153. P.H.S. Smith and D.M. Taylor, J. Nucl. Med., 15 (1974)349.
154. J.M. Hill, E. Loeb, A. Mac Lellan, M.O. Hill, A. Khanand J.J. King, Cancer Chemother. Rep., 59 (1975) 647.
155. J.L. Butour and J. -P. Macquet, Anal. Biochem. , 89
(1978) 22.

245
156. S.J. Bannister, L.A. Sternson and A.J. Repta,J. Chromatogr., 173 (1979) 333.
157. S.J. Bannister, L.A. Sternson and A.J. Repta, J.Chromatogr., 273 (1983) 301.
158. I.S. Krull, X.D. Ding, S. Braverman, C. Selavka, F.Hochberg and L.A. Sternson, J. Chromatogr. Sci., 21(1983) 166.
159. CM. Riley, L.A. Sternson and A.J. Repta, Anal.Biochem. , 124 (1982) 167.
160. Y. Chang, L.A. Sternson and A.J. Repta, Anal. Lett., 11
(1978) 449.
161. S.J. Bannister, Y. Chang, L.A. Sternson and A.J. Repta,Clin. Chem., 24 (1978) 877.
162. A.F. LeRoy, M.L. Wehling, H.L. Sponseller, VI. S.Friaref, R.E. Solomon, R.L. Dedrick, C.L. Litterst,T.E. Gram, A.M. Guarino and D.A. Becker, Biochem. Med.,18 (1977) 184.
163. M.F. Pera and H.C. Harder, Clin. Chem., 23 (1977) 1245.
164. M.L. Denniston, L.A. Sternson and A.J. Repta, Anal.Lett. 14 (1981) 451.
165. J. Smeyers-Verbeke , M.R. Detaevernier , L. Denis andD.L. Massart, Clin. Chim. Acta, 113 (1981) 329.
166. D.A. Hull, N. Muhammad, J.G. Lanese, S.D. Reich, T.T.Finkelstein and S. Fandrich, J. Pharm. Sci., 70 (1981)500.
167. J. P. Cano, J. Catalin, M. Bues-Charbit , J. Appl.Toxicol. , 2 (1982) 33.
168. M. Rozencweig, D.D. Von Hoff, R. Abele and F.M. Muggiain Cancer Chemotherapy Annual 3, H.M. Pinedo (Ed.),Elsevier, New York, 1981, p. 120.
169. A.W. Prestayko, J.C. D'Aoust, B.F. Issel and S.T.Crooke, Cancer Treat. Rev., 6 (1979) 17.
170. M. Peyrone, Ann. Chem., 51 (1845) 1.
171. A. Werner, Z. Anorg. Chem., 3 (1893) 267.
172. R.T. Dorr and W.L. Fritz, Cancer Chemotherapy Handbook,Elsevier, New York, 1980.

246
173. A. A. Grinberg, An Introduction to the Chemistry ofComplex Compounds, Trans, by J.R. Leach, D.H. Busch andR.F. Trimble (Eds.), Addison-VJesley Pub. Co., Reading,Massachusetts, 1962.
174. A.J. Repta, Cancer Treat. Rep., 63 (1979) 229.
175. Yu.G. Breusova-Raidala, N.N. Zheligovskaya and V.I.Spitsyn, Izv. Akad. Nauk SSSR, Ser. Khim. , 6 (1974)1242; through Chem. Abstr. , 81 (1974) 141484.
176. A. A. Grinberg, E.N. Inkova and A.I. Dobroborskaya, Zh.Neorg. Khim., 7 (1962) 987.
177. R.F. Greene, D.C. Chatter ji, P.K. Hiranaka and J.F.Gallelli, Am. J. Hosp. Pharm. , 36 (1979) 38.
178. J.W. Reishus and D.S. Martin Jr., J. Am. Chem. Soc, 83
(1961) 2457.
179. A.I. Stetsenko and L.B. Sel ' derkhanova, Zh. Necrg.Khim., 26 (1981) 164.
180. J.R. Perumareddi and A.W. Adamson, J. Phys. Chem., 72(1968) 414.
181. K.W. Lee and D.S. Martin Jr., Inorg. Chim. Acta, 17(1976) 105.
182. A.F. LeRoy, Cancer Treat. Rep., 63 (1979) 231.
183. K.A. Jensen, Z. Anorg. Allg. Chem., 242, (1939) 87.
184. A. A. Grinberg, Kh.I. Gil ' dengershel and E.P.Panteleeva, Zh. Neorg. Khim., 8 (1963) 2226.
185. R.N. Goldberg and L.G. Hepler, Chem. Rev., 68 (1968)229.
186. R.N. Rhoda, US Patent 4,358,352, Nov. 9, 1982.
187. J. P. Cushing and A.T. Hubbard, J. Electroanal. Chem.,23 (1969) 183.
188. J.F. Llopis and F. Colom in Encyclopedia of Electro-chemistry of the Elements, Vol. VI, A.J. Bard (Ed.),Marcel Dekker, New York, 1976.
189. A.M. Feltham and M. Spiro, Chem. Rev., 71 (1971) 177.
190. B. Chakravarty and D. Banerjea, J. Inorg. Nucl. Chem.,16 (1961) 288.

247
191. P. Kivalo and H.A. Laitinen, J. Am. Chem. Soc, 77(1955) 5205.
192. G. Sundholm, Suom. Kemistil. B, 41 (1968) 331.
193. G. Sundholm, Suom. Kemistil. B, 41 (1968) 3C6.
194. G. Sundholm, Commentat. Phys. -Math., 34 (1968) 39.
195. A.I. Stetsenko and L.B. Sel ' derkhanova , Dokl. Akad
.
Nauk. SSSR, 259 (1981) 1378.
196. J. Heyrovsky and J. Kuta , Principles of Polarography
,
Academic Press, New York, 19 66, p. 21.
197. A.N. Frumkin and N. Nikolaeva-Fedorovich, Progress inPolarography, Vol. I, Interscience Publishers Inc., NewYork, 1962, p. 223.
198. A.N. Frumkin and N.V. Nikolajeva, J. Chem. Phys., 26(1957) 1552.
199. G. Sundholm, Acta Chem. Scand. , 24 (1970) 335.
200. Umberto Belluco, Organometallic and Coordination Chem-istry of Platinum, Academic Press, New York, 1974.
201. C.H. Landford and II. B. Gray, Ligand Substitution Pro-cesses, W.A. Benjamin Inc., New York, 1965, p. 19.
202. J. Kuta and I. Smoler, Progress in Polarography,Vol. I, Interscience Publishers Inc., New York, 1962,p. 43.
203. H.B. Gray and C.B. Ballhausen, J. Amer. Chem. Soc, 85(1963) 260.
204. H. Basch and H.B. Gray, Inorg. Chem., 6 (1967) 365.
205. F.A. Cotton and C.B. Harris, Inorg. Chem., 6 (1967)369.
206. G.W. Watt and J. A. Cunningham, J. Electrochem. Soc,110 (1963) 716.
207. F. Basolo and R.G. Pearson, Mechanisms of InorganicReactions, 2nd Ed., John Wiley and Sons, New York,1967.
208. A. A. Grinberg and M.I. Gelfman, Dokl. Akad. Nauk. SSSR,133 (1960) 1081.
209. A. A. Grinberg and M.I. Gelfman, Dokl. Akad. Nauk. SSSR,137 (1961) 87.
248
210. A. A. Grinberg and M.I. Gelfman, Dokl. Akad. Nauk. SSSR,149 (1963) 1328.
211. L.G. Sillen and A.E. Martell, Stability Constants,Special Publication No. 25, The Chemical Society,London, 1971.
212. S.I. Ginzberg, translated by N. Kaner, P. Shelnitz(Ed.), Analytical Chemistry of the Platinum Metals,John Wiley and Sons, New York, 1975, p. 38.
213. A. A. Grinberg and M.I. Gelfman, Zh. Neorg. Khim. , 7
(1962) 992.
214. G. Melazzo and S. Caroli, Tables of Standard ElectrodePotentials, John Wiley and Sons, New York, 1978.
215. M.A. Antelman, The Encyclopedia of Chemical ElectrodePotentials, Plenum Press, New York, 1982.
216. H. Berge and P. Jeroschewski , Z. Anal. Chem. , 210(1965) 167.
217. P.W. Alexander, R. Hoh and L.E. Smythe , Talanta, 24(1977) 543, 549.
218. 0. Vrana, V. Kleinwachter and V. Brabec, Talanta, 30(1983) 288.
219. I. Bartosek and M.T. Cattaneo in Current Chemotherapyand Immunotherapy, Vol. 2, P. Perili and G.G. Gialdroni(Eds.), American Society for Microbiology, Washington,DC, 1982, p. 1382.
220. T.D. Gornostaeva and V.A. Pronin, Zh. Anal. Khim.,28 (1973) 1145.
221. N.A. Kolpakova, V.V. Nemova, A.G. Stromberg, Zh. Anal.Khim., 26 (1971) 1217.
222. V.V. Nemova, N.I. Belousova and N.A. Kolpakova inAdvances in Stripping Voltammetry (Russian) , Izd.Tomsk. Gos. Un-ta, 1973, p. 151.
223. L.S. Chulkina, S.I. Sinyakova and V.A. Zarinskii, Zh.Anal. Khim., 28 (1973) 1221.
224. V.A. Zarinskii and L.S. Chulkina, Zavod. Lab., 43(1977) 148.
225. I.G. Dominova, N.A. Kolpakova and A.G. Stromberg, Zh.Anal. Khim., 32 (1977) 1980.
226. L.P. Hammett, J. Am. Chem. Soc, 46 (1924) 7.
249
227. F. Will and C. Kncrr, Z. Elektrochem. , 64 (1960) 258,270.
228. I.M. Kolthoff and N. Tanaka, Anal. Chem. , 26 (1954)632.
229. W. Bold and M. Breiter, Electrochim. Acta, 5 (1961)145.
230. B.E. Conway, H. Angerstein-Kozlowska , W.B.A. Sharp andE.E. Criddle, Anal. Chem., 45 (1973) 1331.
231. J.J. Lingane, J. Electroanal. Chem., 1 (1959/60) 379.
232. H. Angerstein-Kozlowska, B.E. Conway and W.B.A. Sharp,J. Electroanal. Chem., 43 (1973) 9.
233. M.W. Breiter, Electrochim. Acta, 11 (1966) 905.
234. D.A.J. Rand and R. Woods, J. Electroanal. Chem., 35(1972) 209.
235. T. Biegler, J. Electrochem. Soc, 116 (1969) 1131.
236. K. Kinoshita, J.T. Lundquist and P. Stonehart,J. Electroanal. Chem., 48 (1973) 157.
237. M.L.B. Rao, A. Damjanovic and J. O'M. Bockris, J. Phys.Chem., 67 (1963) 2508.
238. A.J. Appleby, J. Electrochem. 'Soc . , 120 (1973) 1205.
239. A. Damjanovic and A.T. Ward in International Review ofScience, Physical Chemistry Series 2, Vol. 6, J. O'M.Bockris (Ed.), Butterworths , Boston, 1976, p. 104.
240. K.S. Kim, N. Winograd and R.E. Davis, J. Am. Chem.Soc, 93 (1971) 6296.
241. W.C. Johnson and L.A. Heldt, J. Electrochem. Soc, 121(1974) 34.
242. S.H. Kim, W. Paik and J. O'M. Bockris, Surface Sci., 33(1972) 617.
243. S.D. James, J. Electrochem. Soc, 114 (1967) 1113.
244. D.F. Untereker and S. Bruckenstein, J. Elec Soc, 121(1974) 360.
245. A. Damjanovic, A.T. Ward, B. Ulrick and M. O'Jea, J.Electrochem. Soc, 122 (1975) 471.

:50
246. V.I. Birss and A. Damjanovic, J. Electrochem. Soc, 130(1983) 1688.
247. K.J. Vetter and J.W. Schultze, J. Electroanal. Chem.
,
34 (1972) 131, 141.
248. S. Shibata and M.P. Sumino, Electrochim. Acta, 16(1971) 1511.
249. B.V. Tilak, B.F. Conway and H. Angerstein-Kozlowska, J.Electroanal. Chem., 48 (1973) 1.
250. M.W. Breiter, Electrochim. Acta, 8 (1963) 925.
251. V.E. Kazarinov and N.A. Balashova, Dokl. Akad. Nauk.SSSR, 157 (1964) 1174.
252. S. Gilman in Electroanalytical Chemistry, Vol. 2, A.J.Bard (Ed.), Marcel Dekker, New York, 1967.
253. T. Biegler, J. Electrochem. Soc, 114 (1967) 1261.
254. S. Gilman, J. Phys. Chem., 66 (1962) 2657.
2 55. S. Gilman, J. Phys. Chem., 67 (1963) 78.
256. S. Gilman, J. Phys. Chem., 68 (1964) 2098, 2112.
257. S. Gilman, J. Electroanal. Chem., 7 (1964) 382.
258. S. Gilman, Electrochim. Acta, 9 (1964) 1025.
259. J. P. Hoare in Advances in Electrochemistry and Elec-trochemical Engineering, Vol. 6., Paul Delahay (Ed.),Interscience, New York, 1967, p. 202.
260. B.E. Conway and S. Gottesfeld, J. Chem. Soc, F. Trans.I, 69 (1973) 1090.
261. C.L. Scortichini, Ph.D. Dissertation, University ofNorth Carolina at Chapel Hill, 1982.
262. Kh.Z. Brainina, Stripping Voltammetry in ChemicalAnalysis, Ralstead Press, New York, 1974.
263. Kh.Z. Brainina, Talanta, 18 (1971) 513.
264. W.F. Smyth and I.E. Davidson in Analytical ChemistrySymposia Series, Vol. 2, W.F. Smyth (Ed.) ElsevierScientific Publishing Co., New York, 1980, p. 271.
265. R. Kalvoda, Anal. Chim. Acta, 138 (1982) 11.
251
266. T.R. Copeland and R.K. Skogerbee, Anal. Chem. , 46
(1974) 1257A.
267. A. Drescher, Chem. Techn. , 26 (1974) 229.
268. G.G. Grower, Am. Soc. Test. Mater., Proc, 17 II (1917)129.
269. U.R. Evans and L.C. Bannister, Proc. Roy. Soc, A125(1929) 370.
270. W.E. Campbell and V.B. Thomas, Trans. Electrochem.Soc, 76 (1939) 303.
271. A. Ogarev, J. Applied Chem. USSR, English Transl., 19(1946) 311.
272. H.T. Francis, J. Electrochem. Soc, 93 (1948) 79.
273. C. Zbinden, Bull. Soc Chim. Biol., 13 (1931) 35;through Chem. Abstr. , 25 (1931) 5642.
274. M.S. Zakhar'evskii, Voprosy Pitaniya, 7 No. 4/5 (1938)180; through Chem. Abstr., 34 (1940) 1083.
275. B. Elema, Antonie van Leeuwenhock J. Microbiol. Serol.Jubilee Vol. Albert J. Kluyver, 12 (1947) 243; throughChem. Abstr., 44 (1950) 4367.
276. S.S. Lord Jr., R.C. O'Neill and L.B. Rogers, Anal.Chem., 24 (1952) 209.
277. K.W. Gardiner and L.B. Rogers, Anal. Chem., 25 (1953)1393.
278. T.L. Marple and L.B. Rogers, Anal. Chim. Acta, 11(1954) 574.
279. A. Hickling and J. Maxwell, Trans. Faraday Soc, 51(1955) 44.
280. A. Hickling, J. Maxwell and J.V. Shennan, Anal. Chim.Acta, 14 (1956) 287.
281. R. Kalvoda, Anal. Chim. Acta, 18 (1958) 132.
282. G.C. Barker and I.L. Jenkins, Analyst, 77 (1952) 685.
283. R.D. de Mars and I. Shain, Anal. Chem. 29 (1957) 1825.
284. J.G. Nikelly and W.D. Cooke, Anal. Chem., 29 (1957)933.
252
285. W. Kemula and Z. Kublik, Anal. Chim. Acta, 18 (1958)104.
286. W. Kemula, E. Rakowska and Z. Kublik, J. Electroanal.Chem., 1 (1959/60) 205.
287. A.G. Stromberg and E.A. Stromberg, Zavod. Lab., 27(1961) 3.
288. D.J. Rosie and W.D. Cooke, Anal. Chem., 27 (1955) 1360.
289. W.H. Reinmuth, Anal. Chem., 33 (1961) 85.
290. D.K. Roe and J. E.A. Toni, Anal. Chem., 37 (1965) 1503.
291. I. Shain and J. Lewinson, Anal. Chem., 33 (1961) 187.
292. G. Mamantov, P. Papoff and P. Delahay, J. Am. Chem.Soc, 79 (1957) 6358.
293. K. Stulik and M. Stulikova, Anal. Lett., 6 (1973) 441.
294. T.P. De Angelis and W.R. Heineman, Anal. Chem., 48(1976) 2262.
295. T.P. De Angelis, R.E. Bond, E.E. Brooks and W.R.Heineman, Anal. Chem., 49 (1977) 1792.
296. I.M. Kolthoff and C.S. Miller, J. Am. Chem. Soc, 63(1941) 1013.
297. D.R. Crow, Principles and Applications of Electro-chemistry, 2nd ed., John Wiley and Sons, New York,1979.
298. L.N. Vasil'eva and E.N. Vinogradova, Zavod. Lab., 27(1961) 1079.
299. W.T. de Vries and E. van Dalen, J. Electroanal. Chem.,8 (1964) 366.
300. H.J. Antweiler, Z. Electrochem. , 44 (1938) 831.
301. W.R. Mat son, D.K. Roe and D.E. Carritt, Anal. Chem., 3 7
(1965) 1595.
302. T.M. Florence, J. Electroanal. Chem., 27 (1970) 273.
303. C. Olson and R.N. Adams, Anal. Chim. Acta, 29 (1963)358.
304. M.S. Chemeris, N.A. Kolpakova, A.G. Stromberg and Yu.B. Vasil'ev, Elektrokhimiya, 12 (1976) 717.
253
305. G.N. Popov, V.V. Pnev and M.S. Zakharov, Zh. Anal.Khim. , 27 (1972) 1335.
306. L.N. Vasileva and S.G. Zasadych, Zh. Anal. Khim.,31 (1976) 1764.
307. Yu.A. Figel'son, E.Ya. Neiman and V.G. Yakovleva, Zh.Anal. Khim., 30 (1975) 300.
308. E.Ya. Neiman, Yu.A. Figel'son and V.G. Yakovleva, Zh.Anal. Khim., 30 (1975) 1977.
309. E.Ya. Neiman and I.N. Nikulina, Zh. Anal. Khim., 29(1974) 1177.
310. A. A. Kaplin, A.G. Stromberg and N.P. Pikula, Zavod.Lab., 43 (1977) 385.
311. L.B. Rogers and S.S. Lord Jr., Pittsburgh Conference enAnalytical Chemistry, March, 1952.
312. V.F. Gaylor, P.J. Elving and A.L. Conrad, Anal. Chem.
,
25 (1953) 1078.
313. S.S. Lord Jr. and L.B. Rogers, Anal. Chem., 26 (1954)284.
314. V.F. Gaylor, A.L. Conrad and J.H. Landerl, Anal. Chem.,29 (1957) 224.
315. J.B. Morris and J.M. Schempf, Anal. Chem., 31 (1959)287.
316. R.N. Adams, Electrochemistry at Solid Electrodes,Marcel Dekker, Inc., New York, 1969, p. 280.
317. R.N. Adams, Anal. Chem., 30 (1958) 1576.
318. E.S. Jacobs, Anal. Chem., 35 (1963) 2112.
319. D.J. Chesney, J.L. Anderson, D.E. Weisshaar and D.E.Tallman, Anal. Chim. Acta, 124 (1981) 321.
320. J.E. Anderson, D.E. Tallman, D.J. Chesney and J.L.Anderson, Anal. Chem., 50 (1978) 1051.
321. V.G. Barikov and O.A. Songina, Zavod. Lab., 30 (1964)1184.
322. S.P. Perone and W.J. Krettow, Anal. Chem., 37 (1965)968.
323. P. Emmott, Talanta, 12 (1965) 651.

254
324. R. Bilewicz, Z. Stojek and Z. Kublick, J. Electroanal.Chem., 96 (1979) 29.
325. J.T. Porter and W.D. Cooke, J. Am. Chem. Soc, 77(1955) 148.
326. M.M. Nicholson, Anal. Chem., 32 (1960) 1058.
327. Kh.Z. Brainina and V.B. Belyavskaya, Elektrokhimiyia, 3
(1967) 1153.
328. S.I. Sinyakova and L.S. Chulkina, Zh. Anal. Khim. , 23(1968) 841.
329. G.N. Popov, V.V. Pnev and M.S. Zakharov, Zh. Anal.Khim., 27 (1972) 2456.
3 30. E.Ya. Neiman, A. A. Nemodruk and Kh.Z. Brainina, Zh.Anal. Khim., 30 (1975) 1668.
331. E.Ya. Neiman and M.F. Sumenkova, Zh. Anal. Khim., 31(1976) 912.
332. H.A. Laitinen and D.R. Rhodes, J. Electrochem. Soc,109 (1962) 413.
333. S. Yamada and H. Sato, Nature, 193 (1962) 261.
334. F.J. Miller and H.E. Zittel, Anal. Chem., 35 (1963)1866.
335. H.E. Zittel and F.J. Miller, Anal. Chem., 37 (1965)200.
336. T. Yoshimori, M. Arakawa and T. Takeuchi , Talanta, 12(1965) 147.
337. W.E. van der Linden and J.W. Dieker, Anal. Chim. Acta,119 (1980) 1.
338. R.J. Taylor and A. A. Humffray, J. Electroanal. Chem.,42 (1973) 347.
339. R.E. Panzer and P.J. Elving, J. Electrochem. Soc, 119(1972) 864.
340. F.C. Cowland and J.C. Lewis, J. Mater. Sci., 2 (1967)507.
341. G.E. Batlev and T.M. Florence, J. Electroanal. Chem.,55 (1974) 23.
342. M.M. Nicholson, J. Am. Chem. Soc, 79 (1957) 7.

255
343. S.P. Perone, Anal. Chem., 35 (1960) 2091.
344. C.N. Reilley in Treatise on Analytical Chemistry,Part I, Vol. 4, Ch. 42, I.M. Kolthoff and P.J. Elving(Eds.), Interscience, New York, 1963.
345. J. Albery, Electrode Kinetics, Clarendon Press, Oxford,1975.
3 46. W.H. Reinmuth in Advances in Analytical Chemistry andInstrumentation, Vol. 1, C.N. Reilley (Ed.), Inter-science, New York, 1960, p. 241.
347. E. Gileadi, E. Kirowa-Eisner and J. Penciner, Inter-facial Electrochemistry, Addison Wesley, Reading,Massachusetts, 1975.
348. K.J. Vetter, Electrochemical Kinetics, Academic Press,New York, 1967.
349. P. Delahay, Double Layer and Electrode Kinetics, JohnWiley and Sons, New York, 1965.
350. V.G. Levich, Physicochemical Hydrodynamics, Prentice-Hall, Englewood Cliffs, New Jersey, 1962.
351. Yu.V. Pleskov and V.Yu. Filinovskii, The Rotating DiscElectrode, Plenum Publishing Corp., New York, 1976.
3 52. E. Pungor, Z. Feher and M. Varadi, Hydrodynamic Voltam-metry, CRC Crit. Pev. Anal. Chem. , 9 (2) (1980) 97.
353. A.C. Riddiford in Advances in Electrochemistry andElectrochemical Engineering, Vol. 4, P. Delahay andC.W. Tobias (Eds.), John Wiley and Sons, New York,1966.
354. R.G. Clem, McKee Pedersen Instruments Application NotesVIII, No. 1, 1973.
355. J.J. Lingane, Electroanalytical Chemistry, 2nd Ed.,Interscience, New York, 1958.
356. F.G. Cottrell, Z. Phys . Chem., 42 (1902) 385.
357. H.A. Laitinen and I.M. Kolthoff, J. Am. Chem. Soc, 61(1939) 3344.
358. H.A. Laitinen, Trans. Electrochem. Soc, 82 (1942) 289.
359. G. Mamantov, P. Papoff and P. Delahay, J. Am. Chem.Soc, 79 (1957) 4034.
360. I. Shain and S.P. Perone, Anal. Chem., 33 (1961) 325.

256
361. I. Shain and K.J. Martin, J. Phys. Chem. , 65 (1961)254.
362. Kh.Z. Brainina and V.M. Vdovina, Zavod. Lab., 38 (1972)1043.
363. J.A.V. Butler and G. Armstrong, Proc. Roy. Soc . , 139(1933) 406.
364. J.A.V. Butler and G. Armstrong, Trans. Faraday Soc, 30(1934) 1173.
365. H.J.S. Sand, Z. Phys. Chem., 35 (1900) 641.
366. H.J.S. Sand, Phil. Mag., 1 (1901) 45.
367. H.F. Weber, Wied. Ann. 7 (1879) 536.
368. Z. Karaoglanoff , Z. Elektrochem. , 12 (1906) 5.
369. T.R. Rosebrugh and W.L. Miller, J. Phys. Chem., 14(1910) 816.
370. L. Gierst and A. Juliard, Intern. Comm. Electrochem.Therm. Kin., 2nd Meeting, Tamburini, Milan, 1950p. 117, 279.
371. L. Gierst and A. Juliard, J. Phys. Chem. 57 (1953) 701.
372. T. Berzins and P. Delahay, J. Am. Chem. Soc, 75 (1953)4205.
373. P.J. Lingane, CRC Crit. Rev. Anal. Chem., 1 (1971) 587.
374. R.K. Jain, H.C. Gaur and B.J. Welch, J. Electroanal.Chem., 79 (1977) 211.
375. M. Paunovic, J. Electroanal. Chem., 14 (1967) 447.
376. J. Heyrovsky, Chem. Listy, 16 (1922) 256.
377. J. Heyrovsky and M. Shikata, Rec Trav. Chim. , 44(1925) 496.
378. J. Heyrovsky in Physikalische Methoden der AnalytichenChemie, W. Bottger (Ed.), Akademishe verlagsgesel-lschaft m.b.h., Leipzig, 1936.
379. L.A. Matheson and N. Nichols, Trans. Electrochem. Soc,73 (1938) 193.
380. H.A. Laitinen and I.M. Kolthoff, J. Phys. Chem., 45(1941) 1061, 1079.
257
381. H.A. Laitinen and I.M. Kolthoff, Science, 92 (1940)152.
382. A. Sevcik, Collect. Czech. Chem. Commun., 13 (1948)349.
383. J.E.B. Randies, Trans. Faraday Soc, 44 (1948) 327.
384. H. Matsuda and Y. Ayabe, Z. Elektrochem. , 59 (1955)494.
385. H. Matsuda, Z. Elektrochem., 61 (1957) 489.
386. W.H. Reinmuth, Anal. Chem., 34 (1962) 1446.
387. W.T. de Vries and E. van Dalen, J. Electroanal. Chem.,6 (1963) 490.
388. H. Matsuda and Y. Ayabe, Z. Elektrochem., 59 (1955)1059.
389. P. Delahay, J. Am. Chem. Soc, 75 (1953) 1190.
390. R.D. de Mars and I. Shain, J. Am. Chem. Soc, 81 (1959)2654.
391. W.H. Reinmuth, Anal. Chem., 32 (1960) 1891.
392. R.S. Nicholson and I. Shain, Anal. Chem., 36 (1964)706.
393. R.S. Nicholson and I. Shain, Anal. Chem., 37 (1965)178.
394. R.S. Nicholson and I. Shain, Anal. Chem., 37 (1965)190.
395. T. Berzins and P. Delahay, J. Am. Chem. Soc, 75 (1953)555.
396. M.M. Nicholson, J. Am. Chem. Soc, 76 (1954) 2539.
397. R.p. Frankenthal and I. Shain, J. Am. Chem. Soc, 78(1956) 2969.
398. W.H. Reinmuth, J. Am. Chem. Soc, 79 (1957) 6358.
399. W.H. Reinmuth, Anal. Chem., 33 (1961) 1793.
400. W.T. de Vries, J. Electroanal. Chem., 9 (1965) 448.
401. W.T. de Vries and E. van Dalen, J. Electroanal. Chem.,14 (1967) 315.

258
402. N. White and F. Lawson, J. Electroanal. Chem. , 25(1970) 409.
403. Kh.Z. Brainina, E.M. Roizenblat and V.B. Belyavskava,Zavod. Lab., 28 (1962) 1047.
404. Kh.Z. Brainina, Dokl. Akad. Nauk. USSR, 154 (1964) 665.
405. Kh.Z. Brainina and G.V. Yarunina, Elektrokhimiya,2 (1966) 781.
406. Kh.Z. Brainina, Elektrokhimiya, 2 (1966) 901.
407. Kh.Z. Brainina, Elektrokhimiya, 2 (1966) 1006.
408. Kh.Z. Brainina and V.B. Belyavskava, Elektrokhimiya,2 (1966) 1158.
409. Kh.Z. Brainina and V.B. Belyavskava, Elektrokhimiya,3 (1967) 1283.
410. Kh.Z. Brainina, A.M. Il'in, G.V. Yarunina and E.Ya.Neiman, Elektrokhimiya, 7 (1971) 888.
411. G. Quincke, Pogg. Ann., 113 (1861) 513.
412. H.L.F. Helmholtz, Ann. Physik. , 7 (1879) 337.
413. J. Perrin, J. Chim. Phys . , 2 (1904) 601.
414. G. Goury, J. Phys. 9 (1910) 457.
415. D.L. Chapman, Phil. Mag., 25 (1913) 475.
416. 0. Stern, Z. Elektrochem. , 30 (1924) 508.
417. R. Payne in Techniques of Electrochemistry, Vol. 1,E. Yeager and A.J. Salkind (Eds.), John Wiley and Sons,New York, 1972, p. 44.
418. D. Grahame, Chem. Rev., 41 (1947) 441.
419. B.E. Conway, Theory and Principles of Electrode Pro-cesses, Ronald Press, New York, 1965.
420. H.H. Bauer, Electrodics, John Wilev and Sons, New York,1972.
421. R. Parsons in Advances in Electrochemistry and Electro-chemical Engineering, Vol. 1, P. Delahay and C.W.Tobias (Eds.), Interscience , New York, 1961.
422. P. Delahay, New Instrumental Methods in Electrochem-istry, Interscience, New York, 1954.

259
423. O.H. Muller, J. Chem. Ed., 18 (1941) 320.
424. J. Heyrovsky, Chem. Listy, 43 (1949) 149.
425. L. Airey and A. A. Smales, Analyst, 75 (1950) 287.
426. M.T. Kelley, H.C. Jones and D.J. Fisher, Anal. Chem.,31 (1959) 1475.
427. L.Ya. Shekun, Russ. J. Phys . Chem., 36 (1962) 239.
428. W.B. Schaap and P.S. McKinney, Anal. Chem., 36 (1964)29.
429. S.P. Perone and T.R. Mueller, Anal. Chem., 37 (1965) 2.
430. S.P. Perone and J. P.. Birk, Anal. Chem., 37 (1965) 9.
431. S.P. Perone and H.E. Staplefeldt, Anal. Chem., 38(1966) 796.
432. G. Semerano and L. Riccoboni , Gazz. Chim. Ital., 72(1942) 297; through Chem. Abstr. , 38 (1944) 2895.
433. E.A. Kanevskii, J. Applied Chem. (USSR), 17 (1944) 514;through Chem. Abstr., 39 (1945) 4017.
434. J. Heyrovsky, Analyst, 72 (1947) 229.
435. K.J. Martin and I. Shain, Anal. Chem., 30 (1958) 1808.
436. L. Sipos, S. Kozar, I. Kontusic and M. Branica, J.Electroanal. Chem., 87 (1978) 347.
437. J. Wang and M. Ariel, Anal. Chim. Acta, 128 (1981) 147.
438. J. Wang and B. Greene, Anal. Chim. Acta, 144 (1982)137.
439. I. Cukrowski, E. Cukrowska and K. Sykut, J. Electro-anal. Chem., 125 (1981) 53.
440. R.H. Muller, R.L. Garman, M.E. Droz and J. Petras, Ind.Eng. Chem., Anal. Ed., 10 (1938) 339.
441. J. Boeke and H. van Suchtelen, Z. Elektrochem. , 45(1939) 753.
442. J. Boeke and H. van Suchtelen, Phil. Tech. Rev., 4
(1939) 231.
443. B. Breyer and H.H. Bauer, Alternating Current Polaro-graphy and Tensammetry, Interscience , New York, 19 63.

260
444. C. Mac Aleavy, Belgian Patent 443, C03 (1941).
445. C. Mac Aleavy, French Patent 886,848 (1942).
446. B. Breyer and F. Gutmann, Trans. Faraday Soc, 42(1946) 645.
447. U.H. Narayanan, K. Sundararajan and M.S. Kasabekar,J. Electrochem. Soc, 108 (1961) 710.
448. M. Kodama and T. Noda , Bull. Chem. Soc. Japan, 41(1968) 2401.
449. A.M. Bond, Anal. Chem., 42 (1970) 1165.
450. F. Vydra, M. Stulikova and P. Petals, J. Electroanal.Chem., 40 (1972) 99.
451. D.I. Levit, Anal. Chem., 45 (1973) 1291.
452. G. Jessop, British Patent 640,768 (1948).
453. G. Jessop, British Patent 776,543 (1957).
454. W.L. Underkofler and I. Shain, Anal. Chem., 37 (1965)218.
455. Y. Yasumori, J. Electrochem. Soc. Japan, 24 (1956) 309.
456. G.C. Barker and R.L. Faircloth, J. Polarog. Soc,1 (1958) 11.
457. A.M. Bond, Anal. Chem., 44 (1972) 315.
458. J.R. Delmastro and D.E. Smith, Anal. Chem., 38 (1966)169.
459. N. Velghe and A. Claeys , J. Electroanal. Chem., 35(1972) 229.
460. E.D. Moorhead and P.H. Davis, Anal. Chem., 45 (1973)2178.
461. T.P. Radhakrishnan, J. Electrochem. Soc. India, 28(1979) 5.
462. H.H. Bauer, J. Electroanal. Chem., 1 (1959/60) 256.
463. D.E. Smith and W.H. Reinmuth, Anal. Chem., 33 (1961)482.
464. J. van Cakenberghe, Bull. Soc. Chim. Beiges., 60 (1951)3; through Chem. Abstr. , 45 (1951) 9392.

261
465. I. Tachi and T. Kambara, Bull, Chem. Soc. Japan, 28(1955) 25.
466. M. Senda and I. Tachi, Bull. Chem. Soc. Japan, 28(1955) 632.
467. H.H. Bauer and P.J. Elving, Anal. Chem., 30 (1958) 334,341.
468. D.E. Smith, Anal. Chem., 35 (1963) 1811.
469. H.H. Bauer, Australian J. Chem., 17 (1964) 591.
470. H.H. Bauer, Australian J. Chem., 17 (1964) 715.
471. H.H. Bauer and D.C.S. Foo, Australian J. Chem., 19(1966) 1103.
472. T.G. McCord and D.E. Smith, Anal. Chem., 40 (1968) 289.
473. A.M. Bond, J. Electroanal. Chem., 35 (1972) 343.
474. A.M. Bond, J. Electroanal. Chem., 36 (1972) 235.
475. M. Stulikova and F. Vydra, J. Electroanal. Chem., 42(1973) 127.
476. M. Kopanica and V. Stara, J. Electroanal. Chem., 77(1977) 57.
477. H. Blutstein and A.M. Bond, Anal. Chem., 46 (1974)1531.
478. D.E. Smith in Electroanalytical Chemistry, Vol. 1,Ch. 1, A.J. Bard (Ed.), Marcel Dekker, New York, 1966.
479. A. Hickling, Trans. Faraday Soc, 38 (1942) 27.
480. E. Wahlin, Radiometer Polarographics , 1 (1952) 113.
481. E. Wahlin and A. Bresle, Acta Chem. Scand., 10 (1956)935.
482. A. Bresle, Acta Chem. Scand., 10 (1956) 943, 947, 951.
483. K. Kronenberger, H. Stehlow and A.W. Elbel, Polarogr.Ber., 5 (1957) 62.
484. A.W. Elbel, Z. Anal. Chem., 173 (1960) 70.
485. P.O. Kane, J. Polarogr. Soc, 8 (1962) 10.
486. P.O. Kane, J. Electroanal. Chem., 11 (1966) 276.

262
487. J.B. Flato, Anal. Chem. , 44 (11) (1972) 75A.
488. T. Kambara, Bull. Chem. Soc. Japan, 27 (1954) 523, 527,529.
489. G.C. Barker and I. Jenkins, A.E.R.E., C/R 924 (1956).
490. G.C. Barker and D.R. Cockbaine, A.E.R.E., C/R 1404(1957) .
491. G.C. Barker, A.E.R.E., C/R 1563 (1957).
492. G.C. Barker, R.L. Faircloth and A.W. Gardner, A.E.R.E.,C/R 1786 (1958)
.
493. D.J. Ferrett, G.W.C. Milner and A. A. Smales, Analyst,79 (1954) 731.
494. D.J. Ferrett and G.W.C. Milner, Analyst, 80 (1955) 132.
495. D.J. Ferrett and G.W.C. Milner, Analyst, 81 (1956) 193.
496. G.W.C. Milner and L.J. Slee, Analyst, 82 (1957) 139.
497. G.C. Barker, Anal. Chim. Acta, 18 (1958) 118.
498. L. Ramaley and M.S. Krause Jr., Anal. Chem. 41 (1969)1362.
499. M.S. Krause Jr. and L. Ramaley, Anal. Chem., 41 (1969)1365. '
500. P.E. Sturrock and R.J. Carter, CRC Crit. Rev. Anal.Chem., 5 (1975) 201.
501. G.C. Barker in Modern Electroanalytical Methods,G. Chariot (Ed.), Elsevier Publishing Co., Amsterdam,1958.
502. F. von Sturm and M. Ressel, Z. Anal. Chem., 186 (1961)63.
503. F. von Sturm and M. Ressel, Proc. Australian Conf.Electrochem. , Sydney, Hobart , Australia, 1963, p. 310;through Chem. Abstr. , 63 (1965) 6310.
504. P. Bersier, K. Finger and F. von Sturm, Z. Anal. Chem.,216 (1966) 189.
505. B.Ya. Kaplan and I. A. Sorokovskaya, Zavod. Lab., 30(1964) 1177.
506. C. Yarnitzky, R.A. Osteryoung and J. Ostervoung, Anal.Chem., 52 (1980) 1174.

263
507. J.H. Christie, J. A. Turner and R.A. Ostervoung, Anal.Chem., 49 (1977) 1899.
508. J. A. Turner, J.H. Christie, M. Vukovic and R.A.Osteryoung, Anal. Chem., 49 (1977) 1904.
509. G.C. Barker, Congress on Analytical Chemistry inIndustry, St. Andrews, June 1957.
510. R. Samuelsson, J. O'Dea and J. Osteryoung, Anal. Chem.,52 (1980) 2215.
511. J.J. O'Dea, J. Osteryoung and R.A. Ostervoung, Anal.Chem., 53 (1981) 695.
512. S.A. Borman, Anal. Chem., 54 (1982) 698A.
513. E.B. Buchanan Jr. and D.D. Soleta, Talanta, 30 (1983)459.
514. G.C. Barker in Advances in Polarography , I.S. Longmuir(Ed.), Pergamon Press, New York, 1960, p. 44.
515. C.K. Mann, Anal. Chem., 33 (1961) 1484.
516. C.K. Mann, Anal. Chem., 36 (1964) 2424.
517. C.K. Mann, Anal. Chem., 37 (1965) 326.
518. R.Sh. Nigmatullin and M.R. Vyaselev, Zh. Anal. Khim. 19(1964) 545.
519. J.H. Christie and P.J. Lingane, J. Electroanal. Chem.,10 (1965) 176.
520. D.R. Ferrier and R.R. Schroeder, J. Electroanal. Chem.,45 (1973) 343.
521. D.R. Ferrier, D.H. Chidester and R.R. Schroeder,J. Electroanal. Chem., 45 (1973) 361.
522. J.J. Zipper and S.P. Perone, Anal. Chem., 45 (1973)452.
523. S. Stefano and R. Seeber, Anal. Chem., 54 (1982) 2524.
524. J.H. Christie and R.A. Osteryoung, Anal. Chem., 48(1976) 869.
525. U. Eisner, J. A. Turner and R.A. Ostervoung, Anal.Chem., 48 (1976) 1609.
526. F.J. Szydlowski, K.L. Monti, S.P. Michalak and D.L.Dunmire, Anal. Lett., 13 (1980) 529.

264
527. G.C. Barker and R.L. Faircloth in Advances in Polaro-graphy, I.S. Longmuir (Ed.), Pergamon Press, New York,1960, p. 313.
528. J.H. Sluyters, J.S.M.C. Breukel and M. Sluyters-Rehbach, J. Electroanal. Chem. , 31 (1971) 201.
529. G.C. Barker, J. Electroanal. Chem., 41 (1973) 95.
530. G.C. Barker and A.W. Gardner, A.E.R.E., C/R 2297(1958)
.
531. G.C. Barker and A.W. Gardner, Z. Anal. Chem., 173(1960) 79.
532. E.P. Parry and R.A. Osteryoung, Anal. Chem., 37 (1965)1634.
533. E.P. Parrv and R.A. Osteryoung, Anal. Chem., 36 (1964)1366.
534. A. A. A.M. Brinkman and J.M. Los, J. Electroanal. Chem.,7 (1964) 171.
535. A. A. A.M. Brinkman and J.M. Los, J. Electroanal. Chem.,14 (1967) 269, 285.
53 6. A.W. Fonds, A. A. A.M. Brinkman and J.M. Los, J. Electro-anal. Chem., 14 (1967) 43.
537. K.B. Oldham and E.P. Parry, Anal. Chem., 38 (1966) 867.
538. K.B. Oldham and E.P. Parry, Anal. Chem., 40 (1968) 65.
539. H.E. Keller and R.A. Osteryoung, Anal. Chem., 43 (1971)342.
540. S.C. Rifkin and D.H. Evans, Anal. Chem., 48 (1976)1616.
541. J.W. Dillard and K.W. Hanck , Anal. Chem., 48 (1976)218.
542. R.L. Birke, Anal. Chem., 50 (1978) 1489.
543. K. Aoki and J. Osteryoung, J. Electroanal. Chem., 110(1980) 19.
544. G.D. Christian, J. Electroanal. Chem., 22 (1969) 333.
545. G.D. Christian, J. Electroanal. Chem., 23 (1969) 1.
546. H. Siegerman and G. O'Dom, American Lab., 4 (6) (1972)59.

265
547. T.R. Copeland, J.H. Christie, R.K. Skogerboe and R.A.Osteryoung, Anal. Chem. , 45 (1973) 995.
548. T.R. Copeland, J.H. Christie, R.A. Osteryoung and R.K.Skogerboe, Anal. Chem., 45 (1973) 2171.
549. R.A. Osteryoung and J.H. Christie, Anal. Chem., 46(1974) 351.
550. B. Lazar and S. Ben-Yaakov, J. Electroanal. Chem., 108(1980) 143.
551. J.J. Kankare and K.E. Haapakka, Anal. Chim. Acta, 111(1979) 79.
552. R.F. Lane and A.T. Hubbard, Anal. Chem., 48 (1976)1287.
553. K. Aoki, J. Osteryoung and R.A. Ostervoung, J. Electro-anal. Chem. 110(1980)1.
554. T.R. Brumleve and J. Osteryoung, Anal. Chem., 53 (1981)988.
555. T.R. Brumleve, J.J. O'Dea, R.A. Osteryoung andJ. Osteryoung, Anal. Chem., 53 (1981) 702.
556. A.M. Bond and D.R. Canterford, Anal. Chem., 44 (1972)721.
557. G.E. Batley and T.M. Florence, J. Electroanal. Chem.,55 (1974) 23.
558. A.M. Bond, Anal. Chim. Acta, 74 (1975) 163.
559. J. A. Turner, U. Eisner and R.A. Osteryoung, Anal. Chim.Acta, 90 (1977) 25.
560. R.A. Osteryoung and J. Osteryoung, Phil. Trans. R. Soc.London, A3 02 (1981) 315.
561. K.B. Oldham, Anal. Chem., 44 (1972) 196.
562. K.B. Oldham, Anal. Chem., 44 (1972) 1211.
563. M. Goto and D. Ishii, J. Electroanal. Chem., 61 (1975)361.
564. P. Dalrymple-Alford, M. Goto and K.B. Oldham, J. Elec-troanal. Chem., 85 (1977) 1.
565. P. Dalrymple-Alford, M. Goto and K.B. Oldham, AnalChem., 49 (1977) 1390.

266
566. M. Goto, K. Ikenoya, M. Kajihara and D. Ishii, Anal.Chim. Acta, 101 (1978) 131.
567. M. Goto, K. Ikenoya and D. Ishii, Anal. Chem., 51(1979) 110.
568. M. Goto, M. Grenness and K.B. Oldham, J. Electrochem.Soc, 126 (1979) 50.
569. M. Goto and D. Ishii, J. Electroanal. Chem., 102 (1979)49.
570. M. Goto, K. Ikenoya and D. Ishii, Bull. Chem. Soc.Japan, 53 (1980) 3567.
571. R. Kalvoda, Collect. Czech. Chem. Commun., 22 (1957)1390.
572. S.L. Phillips and I. Shain, Anal. Chem., 34 (1962) 262.
573. M. Ariel and U. Eisner, J. Electroanal. Chem., 5 (1963)362.
574. M. Ariel, U. Eisner and S. Gottesfeld, J. Electroanal.Chem., 7 (1964) 307.
575. S. Gottesfeld and M. Ariel, J. Electroanal. Chem., 9
(1965) 112.
576. G. Koster and M. Ariel, J. Electroanal. Chem., 33(1971) 339.
577. L. Zieglerova, K. Stulik and J. Dolezal, Talanta, 18(1971) 603.
578. E. Desimoni, F. Palmisano and L. Sabbatini, Anal.Chem., 52 (1980) 1889.
579. S. Bruckenstein and T. Nagal. Anal. Chem., 33 (1961)1201.
580. R. Neeb, Z. Anal. Chem., 190 (1962) 98.
581. S. Bruckenstein and J.W. Bixler, Anal. Chem., 37 (1965)786.
582. F.L. Marsh and S. Bruckenstein, Anal. Chem., 38 (1966)1498.
583. W. Kemula and J.W. Strojek, J. Electroanal. Chem., 12(1966) 1.
584. D. Jagner, A. Graneli, Anal. Chim. Acta, 83 (1976) 19.
267
585. D. Jagner and K. Aren, Anal. Chim. Acta, 100 (1978)375.
586. D. Jagner, Anal. Chem. , 50 (1978) 1925.
587. D. Jagner, Anal. Chem., 51 (1979) 342.
588. D. Jagner, Anal. Chim. Acta, 107 (1979) 29.
589. Ch. Yarnitsky and M. Ariel, J. Electroanal. Chem., 10(1965) 110.
59C. M. Kopanica and V. Stara, J. Electroanal. Chem., 127(1981) 255.
591. D.C. Johnson and R.E. Allen, Talanta, 20 (1973) 305.
592. R.E. Allen and D.C. Johnson, Talanta, 20 (1973) 799.
593. D. Laser and M. Ariel, J. Electroanal. Chem., 49 (1974)123.
594. G.W. Schieffer and W.J. Blaedel, Anal. Chem., 49 (1977)49.
595. G.W. Schieffer and W.J. Blaedel, Anal. Chem., 50 (1978)99.
596. C. Brihaye and G. Duyckaerts, Anal. Chim. Acta, 143(1982) 111.
597. C. Brihaye and G. Duyckaerts, Anal. Chim. Acta, 146(1983) 37.
598. G.M. Schmid and G.W. Bolger, Clin. Chem., 19 (1S73)1002.
599. L. Meites and T. Meites, Anal. Chem., 20 (1948) 984.
600. A.G. Stromberg and Yu.N. Zhikharev, Zavod. Lab., 31(1965) 1185.
601. J. Kleinberg (Ed.), Inorganic Synthesis, Vol. Ill,McGraw Hill, New York, 1963, p. 239.
602. J.J. Lingane, Ind. Eng. Chem. Anal. Ed., 16 (1944) 147.
603. L. Meites, Anal. Chem., 27 (1955) 416.
604. E.Ya. Neiman, G.M. Dolgopolova and N.A. Makulov, Zavod.Lab., 42 (1976) 765.
605. I. Bartosek, S. Daniel and S. Sykora, J. Pharm. Sci.,67 (1978) 1160.

268
606. J. Wang, J. Electroanal. Chem., 139 (1982) 225.
607. J.G.M. Van Der Linden and A.H. Dix, Inorg. Chim. Acta,35 (1979) 65.
608. T. Sekine and Y. Hasegawa, Solvent Extraction Chem-istry, Marcel Dekker, New York, 1977, p. 603.
609. J.H. Yoe and J.J. Kirkland, Anal. Chem., 26 (1954)1335.
610. A. Hulanicki, Talanta, 14 (1967) 1371.
611. A. Wyttenback and S. Bajo, Anal. Chem., 47 (1975) 2.
612. K.I. Aspila, C.L. Chakrabarti and V.S. Sastri, Anal.Chem., 47 (1975) 945.
613. K. Burger, Organic Reagents in Metals Analysis,Pergamon Press, New York, 1973.
614. M. Bobtelsky and J. Eisenstadter , Bull. Soc. Chim.France, (1957) 708.
615. S.V. Freger, M.I. Ovrutskii and G.S. Listetskaya, Zh.Anal. Khim. , 29 (1974) 19.
616. R.F. Borch, J.H. Markovitz and M.E. Pleasants, Anal.Lett., 12 (1979) 917.
617. W.C. Elliott, S.R. Newcom, D.C. Houghton, J. Baines-Hunter and W.M. Bennett, Cancer Res., 43 (1983) 3759.
618. S.I. Ginsberg, N.A. Ezerskaya, I.V. Prokof* eva, N.V.Fedorenko, V.I. Shlenskaya and N.K. Bel'skii, Analy-tical Chemistry of Platinum Metals, John Wiley andSons, New York, 1975, p. 67.
619. R. Gilchrist, Chem. Rev., 32 (1943) 277.
620. R.W. Maatman and C.J. Addink, J. Catal., 15 (1969) 210
621. E. Blasius, W. Preitz and R. Schmitt, J. Inorg. Nucl.Chem., 19 (1961) 115.
622. V.S. Temyanko, M.B. Bardin and Yu.S. Lyalikov, Izvest.Vysshikh. Ucheb . Zavedenii, Khim. i Kyim. Tekhnol., 2
(1959) 503; through Chem. Abstr., 54 (I960) 7430.
623. H. Yamamoto, Y. Kokubu, T. Nagai and T. Takei, DenkiKagaku, 33 (1965) 804; through Chem. Abstr., 64 (1966)13747.

!69
624. A.T. Hubbard and F.C. Anson, Anal. Chem. , 38 (1966)1887.
625. A.L.Y. Lau and A.T. Hubbard, J. Electroanal. Chem., 24(1970) 237.
626. 0. Ginstrup, Acta Chem. Scand. , 26 (1972) 1527.
627. F.C. Anson and F.A. Schultz, Anal. Chem., 35 (1963)1114.
628. Yu.A. Korostelin, S.V. Gorbachev and Z.N. Ryantseva,Zhur. Fiz. Khim. , 40 (1966) 1909.
629. A.G. Kornienko, L.A. Mirkind and M.Ya. Fioshin,Elektrokhimiya, 3 (1967) 1370.
630. G. Horanyi and G. Vertes, J. Electroanal. Chem., 43(1973) 225.
631. J. Giner, Electrochim. Acta, 4 (1961) 42.
632. G. Horanyi, D. Hegedus and E.M. Rizmayer, J. Electro-anal. Chem., 40 (1972) 393.
633. G. Dryhurst and D.L. McAllister, Anal. Chim. Acta, 72(1974) 209.
634. G. Inzelt and E. Szetey, Acta Chim. Acad. Sci. Hung.,107 (1981) 269; through Chem. Abstr. , 95 (1981) 177505
635. M. Sun, Science, 222 (1983) 145.

BIOGRAPHICAL SKETCH
David Reed Atherton was born July 3, 1952, in Bryn
Mawr, Pennsylvania. After moving to south Florida in 1961,
he continued his education and was graduated from Palm Beach
Gardens High School in 1970. He went on to receive a
Bachelor of Science degree in chemistry from North Carolina
State University in 1974. Coming back to Florida, he
enrolled at the University of Florida in 1974 and has
continued his formal and informal education in Gainesville.
270

I certify that I have read this study and that in ray
opinion it conforms to acceptable standards of scholarlypresentation and is fully adequate, in scope and quality, asa dissertation for the degree of Doctor of Philosophy.
jC-xL<s*x&A—
Gerhard M. Schmid, ChairmanAssociate Professor ofChemistry
I certify that I have read this study and that in myopinion it conforms to acceptable standards of scholarlypresentation and is fully adequate, in scope and quality, asa dissertation for the degree of Doctor of Philosophy.
Q. U>~* '{TuLyC
James D. Winefordnerraduate Research Professor
/of Chemistry
I certify that I have read this study and that in myopinion it conforms to acceptable standards of scholarlypresentation and is fully adequate, in scope and quality, asa dissertation for the degree of Doctor of Philosophy.
John G. DorseyAssistant Professor ofChemistry

I certify that T have read this study and that in myopinion it conforms to acceptable standards of scholarlypresentation and is fully adequate, in scope and quality, as
a dissertation for the degree of Doctor of Philosophy.
\l'U j\\Aj -f ._„ \ \_
Jimmy J. StreetAssociate Processor of SoilScience
This dissertation was submitted to the Graduate Faculty ofthe Department of Chemistry in the College of Liberal Artsand Sciences and to the Graduate School, and was accepted a:
partial fulfillment of the requirements for the degree of
Doctor of Philosophy.
August, 1984
Dean for Graduate Studiesand Research

UNIVERSITY OF FLORIDA
lllli3 1262 08553 0466
Copyright © 2022 FDOKUMEN