Stripping Platinum Metals from Catalytic Converter Units by ...
108
University of Central Florida University of Central Florida STARS STARS Retrospective Theses and Dissertations 1979 Stripping Platinum Metals from Catalytic Converter Units by Use Stripping Platinum Metals from Catalytic Converter Units by Use of Promoted Gas Phase Chlorine Attack of Promoted Gas Phase Chlorine Attack James Harold Finckbone University of Central Florida Part of the Chemistry Commons Find similar works at: https://stars.library.ucf.edu/rtd University of Central Florida Libraries http://library.ucf.edu This Masters Thesis (Open Access) is brought to you for free and open access by STARS. It has been accepted for inclusion in Retrospective Theses and Dissertations by an authorized administrator of STARS. For more information, please contact [email protected]. STARS Citation STARS Citation Finckbone, James Harold, "Stripping Platinum Metals from Catalytic Converter Units by Use of Promoted Gas Phase Chlorine Attack" (1979). Retrospective Theses and Dissertations. 412. https://stars.library.ucf.edu/rtd/412
-
Upload
khangminh22 -
Category
Documents
-
view
0 -
download
0
Transcript of Stripping Platinum Metals from Catalytic Converter Units by ...

University of Central Florida University of Central Florida
STARS STARS
Retrospective Theses and Dissertations
1979
Stripping Platinum Metals from Catalytic Converter Units by Use Stripping Platinum Metals from Catalytic Converter Units by Use
of Promoted Gas Phase Chlorine Attack of Promoted Gas Phase Chlorine Attack
James Harold Finckbone University of Central Florida
Part of the Chemistry Commons
Find similar works at: https://stars.library.ucf.edu/rtd
University of Central Florida Libraries http://library.ucf.edu
This Masters Thesis (Open Access) is brought to you for free and open access by STARS. It has been accepted for
inclusion in Retrospective Theses and Dissertations by an authorized administrator of STARS. For more information,
please contact [email protected].
STARS Citation STARS Citation Finckbone, James Harold, "Stripping Platinum Metals from Catalytic Converter Units by Use of Promoted Gas Phase Chlorine Attack" (1979). Retrospective Theses and Dissertations. 412. https://stars.library.ucf.edu/rtd/412

STRIPPING PLATINill-1 l•IETALS FROIIJ! CATALYTIC CONVERTER UNITS BY USE OF
PROI<IOTED GAS PHASE CHLORil~E ATTACK
BY
JAMES HAROLD FINCKBONE B.S., Florida Technological University, 1974
RESEARCH REPORT
Submitted in partial fulfillment of the requirements for the degree of Master of Science:
Industrial Chemistry in the Graduate Studies Program of the College of Natural Sciences of
University of Central Florida at Orlando, Florida
Winter Quarter 1979

ABSTRACT
STRIPPING PLATINUM METALS FROM CATALYTIC CONVERTER UNITS BY USE OF
PRCJ-10TED GAS PHASE CHLORINE ATTACK
A gas-phase system to oxidize and remove the
platinum and palladium from automotive catalytic con-
verter units was studied. The effects of varying
reaction temperature, time and reactant gas concen-
tration upon yields were monitored using a colori-
metric procedure based on the reagent p-nitroso-N,
N-dimethyl amiline. Chlorine plus carbon monoxide
at 700°-900d c. displayed the most promise for com-
merclal application.
ACKNOWLEDGEMENT
The profession~! direction and assistance of Dr.
Chris Clausen III have been invaluable and memorable in
so many ways. Professors Hertel, ldoux,Madsen and
Mattson all fUrnished special advice in this work and
on many other topics over the past decade of my
schooling at UCF. My parents' financial and social aid
has also been greatly appreciated.
iii

TABLE OF CONTENTS page
INTRODUCTION 1
I. The Catalytic Converter and Its Metallic Content 1
II. Chemical Attack of Platinum and Palladium 5
III. Chemistry of Platinum and Palladium 7
IV. Proposed Systems for Attack of the PGM on Catalyst Supports 15
EXPERIMENTAL
I. Catalyst Samples for Study 21
A. Sample Size/Particle Size 21
B. Procedure for Wet Chemical Prepara-tion of Sample Prior to Analysis 22
C. Nature/Types of Samples Studied 23
1. Chrysler Corporation's Small Oval Catalyst 24
2. Chrysler Corporation's Large Oval Catalyst 24
3. Ford Motor Corporation's Catalyst 25
II. Gas Phase Treatment (Chemical Attack) of Catalyst Samples 25
A. Equipment 26
iv

B. Gas-Phase Treatment Procedures 30
III. Sample Analysis 34
A. Equipment 34
B. Reagents 35
c. Procedures for Determination of Platinum and Palladium 36
1. Treatment for Iron Contamination in Sample 36
2. Colorimetric Analysis Based on the NDA-Pt and NDA-Pd Complexes 38
3. Advantages of Chosen Procedure, Using NDA Reagent 42
RESULTS
I. Reaction Variables/Parameters Under Study 45
II. Standards for Product Yield Evaluation 47
A. Calculation of PGM Content in Samples 47
B. Values for PGM Content in the Small Oval Chrysler Catalyst 48
C. Values for PGM Content in the Large Oval Chrysler Catalyst 49
D. Values for PGM Content in the Catalyst Tested from the Ford Motor Company 49
III. Physical/Chemical Fesults - Qualitative Observations 49
A. Flows of Reactant Gases 49
v

B. Optimum Sample Exposure to Chemical Attack 50
C. Sublimates and Products from a Run 51
IV. Physical/Chemical 'Results - Quantitative Observations 53
A. Distribution of Volatilized Products 53
B. Yields from the Chlorine Plus Carbon Monoxide Treatment of the Small Oval Chrysler Catalyst 56
1. Effects of Tempe1:ature Variability 56
2. Effects of Cl 2/CO Gas Concentra-tion Variability 58
3. Effects of Time of Reactant Gas Flow 59
C. Yields from the Chlorine Plus Carbon Monoxide Treatment of the Large Oval Chrvsler Catalyst and Ford Catalyst 60
1.
2.
3.
Effects of Temperature Variability 60
Effects of Cl2/CO Gas Concentra-tion Variability 62
Effects of Time of Reactant Gas Flow 65
D. Yields of Platinum and Palladium from the Chlorine Plus Nitric Oxide Treatment of the Large Oval Chrysler Catalyst 65
vi

E. Comparative Yields from Large and Small Oval Chrysler Catalyst Samples Under Identical Treatment Conditions 66
CONCLUSIONS
I. The Treatment Process
II. The Analytical Procedure
III. Application of this System
APPENDICES
A. Conditions and Results for Expet·imental Runs Featuring Plug Flow of Reactant Gases
69
71
74
through Samples 75
B. Data on Sample Collection Patterns 80
C, Calculation of Metal Concentration Values frorn Colorimetric Determination of Pt and Pd 83
D~ Results from Treatment of Small Oval Catalyst Samples 87
E. Results from Treatment of Large Oval Catalyst Samples 89
F. Data from Use of the NO plus Cl2 Treatment System 93
G~ Comparative Yields from Two Catalysts Unde·r Similal Treatment 94
Literature Cited 95 vii

LIST OF TABLES
I. Experimental Runs, Featuring Plug Flov7 of Reactant Gases Through Small Oval Chrysler Catalyst Samples 76
II. Experimental Runs, Featuring Plug Flow of Reactant Gases Through Large Oval Chrysler and Ford Catalyst Samples 77
·rrr. Yields of Platinum Content from Treatment of the Small Oval Chrysler Catalyst 78
IV. Yields of Platinum and Palladium Content from Treatment of the Large Oval Chrysler and Ford Catalysts 79
V. Distribution of Sublimed Yields from Treatment of the Small Oval Chrysler Catalyst 80
VI. Distribution of Sublimed Yields from Treat-ment of the Large Oval Chrysler Catalyst 81
Part 1. Part 2.
Type II Run Results Type III Run Results
VII. Yields of Platinum P.elative to Temperature
81 82
for the Small Oval Catalyst 87
VIII. Yields of Platinum Relative to CO Content in a Cl2/CO Mixture of Reactant Gases 87
IX. Yields of Platinum and Palladium as a Function of Temperature in the Treatment of the La:rge Oval-type Catalyst 89
X. Yields of Platinum and Palladium as a Function of the Reactant Gases Concentrations 91
viii

XI. Yields of Platinum and Palladium as a Function of Time for Reactant Gas Flow 92
XII. Yields of Platinum and Palladium from Use of the Cl2 plus NO Reactants System on the Large Oval Chrysler Catalyst 93
XIII. Relative Yields of Platinum from the Large Oval Chrysler Catalyst and the Small Oval Chrysler Catalyst Under Similar Reaction Conditions 9~
ix

LIST OF FIGUFES
1 All-Glass Reactor System Used in Gas-Phase Attack of Catalyst Samples 27
2.1 Yields of Platinum as a Function of Temperature, Using Clz/CO Treatment of the Small Oval
2.2
Catalyst 88
Pt Yield Versus Tempe~ature for Pt-Only Catalyst's Treatment 57
3.1 Yields of Platinum and Palladium as a Function of Temperature, Using Cl2/CO Treatment of the
3.2
Large Oval Catalyst 90
Pt Yield Versus Temperature for Pt Catalyst's Treatment
Pd
61

INTRODUCTION
I. The Catalytic Converter and Its Metallic Content
The efforts described herein are aimed at complet-
ing one portion of a picture, that picture being the II
technology for converting unacceptable and toxic auto-
motive exhaust gases to environmentally compatible com-
pounds before they leave the vehicle.
The symptoms of unchecked emissions became of
sufficient public and governmental concern to bring
about enactment of much legislation on the topic. The
Federal Clean Air Act of 1970 called for a 90% reduc-
tion by 1975 in the average 1970-71 levels of carbon
monoxide (CO), unburned hydrocarbons ("HC") and nitro•
gen· oxides ("NOx'') exiting engines.
Various innovations to increase the completeness
of engine combustion, such as "E.G.R. '' systems (~xhaust
&as ~ecirculation) and the PCV device (~ositive
crankcase ventilation of crankcase fumes back into the - -1

2
combustion chambers) proved insufficient to meet the
new law mandates. As a result, the automobile manufac
turers developed a secondary reaction system to com
plete the job of oxidizing CO to C02, and "HC" to C02
plus H20, as well as that of reducing NOx to N2 gas.
The primary component in this secondary system is the
"catalytic converter, rr which consists of a set of one
or more monolithic ceramic-based blocks with a honey
comb-like interior, often encased in stainless steel;
the blocks bear trace amounts of metals, usually in
their elemental state or in oxide form.
Exhaust gas flow is maintained through the blocks
by a difference between engine manifold and outside air
pressures. Most blocks are maintained at 300°-400°
F. with conversions of the exhaust gases taking place
on the many surfaces throughout the converter block's
interiors~ prior to entry of the gases into the sys
tem's muffler.
The platinum-group metals -- ruthenium, rhodium,
palladium (Pd), osmium, iridium, and platinum (Pt)

3
(the group will hereafter be referred to as the PGM,
with special emphasis on Pd and Pt) have been chosen
above many other possible and patented candidates for
use in the catalytic converter units manufactured in the
U. s., Japan and most European nations.
Numerous studies throughout the early 1970's showed
many of the base metals considered as useful agents for
catalyzing exhaust gas conversions to be plagued with
difficulties such as "poisoning," the irreversible
chemical reactions of the metals to inactive surfaces,
and fast "aging,'' short active life of catalyst due to
reformation to inactive surfaces. Typical candidates
were supported combinations of the first row transition
metals including the elements vanadium to copper (1).
Catalyst monoliths containing levels of 0.1 to
0.5% total weight of platinum and palladium have been
used for cars and trucks built in the U. S. since
1975, with rhodium and ruthenium receiving considera
tion for future high performance units. The cata
lytic converters are designed to operate efficiently
for 50,000 road miles.
4
As the units are designed to offer the maximum
active surface area to the total incoming exhaust flow
with minimal resistance to the flow, pretreatment of
the flow to remove solid particles or agents which
would poison the catalyst is impractical. Deactivation
of the PGM catalyst systems can be blamed on several
factors, including: 1. The reduction of organometal
lics such as those from leaded fUels upon surfaces of
the honeycomb interior and thereby blocking access to
active PGM atoms and crystals; 2. Unburned carbon
aceous and metallic particles likewise settling over
"active" sites; 3. A tendency for small Pt crystallites
to gradually reform to larger structures, thus lower
ing the ratio of available surface area to mass; 4.
Loss of PGM from the catalytic converter via oxidation
and volatilization as organometallics.
In 1977, the demand for platinum for use in conver
ter ovals rose by 5%, to a level of 0.74 million troy
ounces, this being 45% of the total U. S. Pt consump
tion (2). Since the U. s. A. has no significant de
posits of the PGM, it must import amounts sufficient

5
to fill the gap between a rising demand and the plati
num metals currently recycled domestically. Important
exporters of PGM such as Canada and South Africa fase
potential political upheavals which might halt their
production, and the U.S.S.R.'s ample reserves of those
metals can be and often are cut off to the U. s. If
automotive production and the mandates for clear air
are to continue, used converters will have to be re-
cycled; the rising prices for the PGM should provide
the incentive. '
Few discussions specifically describing recovery
of the PGM from automotive catalytic converter units
were reported in the media or chemical literature
through 1977,and the author chose to pursue investiga
tion of a recovery system used on other PGM-bearing>
scrap materials.
II. Chemical Attack of the Platinum Group Metals
This report examines removal of platinum and
palladium from catalytic converter supports selected
for use in the U. S., with consideration of choosing

6
optimum conditions for metal removal while using indus
trially feasible equipment and reagents. Specifically,
the study focused on a gas-phase chemical attack of the
supported Pt and Pd, and their separation from the
support matrix.
Few materials possess a potential for attack upon
Pt and Pd, via gas -- or liquid -- phase reactions.
The earliest and still most commonly-used reagent for
chemical attack on the PGM is via a hot ltaqua regia"
acids solution. Such a solution is most effective
against Pd and Pt. The other PGM are highly resistant,
except in the finely-divided metallic "blacks" form,
or alloyed with other, "baser" metals. Aqua regia
usage was retained in this study for comparison of its
proven effectiveness to the results from attack of
various oxidizing gases upon the catalysts.
Of prime and practical interest is removal of the
PGM catalysts without destruction or dissolution of
their silica-alumina ceramic supports. Avoiding such
dissolution would be a savings of reagents and energy
and might allow reuse of the supports in some other

7
application. Removal of desired PGM species as volati
lized, distillable compounds by gas-phase sweeping of
the supports can also be adapted to a labor-saving con
tinuous-type refining system if the necessary conditions
for a high cegree of separation are economically and
technically feasible. For example, dry gases, both
reactants and product-containing flows, might involve
less storage space than a combination of various
reactant, rinse and product-bearing acid solutions,
and would probably involve less costly pollution con
trol equipment and processes than a liquid system.
III. 17Chemistry of Platinum and Palladium"
Many common industrial acids, oxidizers and
alkalies, such as HCl, H2S04, HN03, NaOH, and Cl2,
often in combination with lesser amounts of agents
such as CO, NO, H2s and ethylene, have been considered
for practical chemical attack of the PGM. Conversion
to the chlorides and their "adducts" with other non
metallic species usually show the most promise, as
most of these combinations are water-soluble and

8
more kinetically stable; many PGM nitrates, sulfates
or other non-halides are unstable and ill-defined at
STI.
An important and typical reaction is:
Pt(s)2c12( ) ' PtC14(solid or gas) (or as g in presence
2 PtC16 (aq)
of NOCl, HCl, etc.
Platinum tetrachloride easily forms the hexa-
chloride a,ueous media and moderate solubility in
several polar solvents, such as ethyl acetate and
diethylether. In gas-phase attack, the volatility
of PtC14 helps to rapidly expo~e new surface area for
chemical attack. Both the tetrachloride and platinum's
dichloride have significant volatilities above 700°
C. (3). Pt combines in all four of its observed
oxidation states with chlorine, with PtCl and PtC13
existing over defined ranges well above room tempera-
ture (4). Discussions of platinum chlorides pre-
paration often suggest the formation of PtC14 at
270°-350° C. by direct gas-phase union of the elements,
and claim that the reaction proceeds through PtC13
to a water-insoluble PtC12 as heating elevates temp-

9
erature past 450° (5,6). Other research dealing with
mixtures of platinum chlorides and sodium or potassium
chloride has suggested the existence of volatile PtC14
and of PtC12 at temperatures up to 1400° c. (7). The
predominance of a volatile PtC12 betweenn 455° and
650° C., with equilibrium shifted to only PtC14 above
700° C. is reported (8). Such research has suggested
the utility and feasibility of high temperature distil-
lations of platinum chlorides and other related PGM
species for analysis and for recovery.
Literature data concerning the volatility of
palladium dichloride and transition points for subli-
mation are diverse and contradictory. PdC12
has been
called relatively "volatile" up to 700° C. (3), while
other researchers have claimed 300°-350° C. to be the
optimum sublLmation range (9). These same Russian
researchers reported that PtC14 was only 51-85% vola
tilized over the same range (9). A melting point of
678°-680° c. (under a pressure of two atmospheres in
chlorine gas) has been determined for PdC12 (10).

10
When chlorine is used in combination with other
gases to attack Pt and Pd, volatile species other than
the binary chlorides can be obtained at elevated temp
erature. CO and NO are the most studied co-reactants
in such systems. Usage of other nitrogen oxides,
phosphorous pentachloride, and alaminum trichloride
are also reported in such efforts (11, 12).
The periodic table's "family" of nickel, palladium,
and platinum all form established carbonyl complexes or
carbonyl halides. Nickel carbonyl, Ni(C0) 4, is of
economic importance in Ni purification metallurgy; a
carbonyl halide complex for nickel is not reported.
However, the stability of such complexes shows in
creased strength for palladium, and those with platinum
are often stable at room temperature (13). Such com
plexes at 25° C. and 1 atmosphere have been individually
characterized (14, 15, 16, 17).
Platinum will react with phosgene (COC12) and its
constituents (CO , Clz) at temperatures above 200° C.
to yield at least four distinct compounds stable at

11
room temperature. Eur.opean journals detailed preparations
of these as early as 1868-70 by reaction of Ct2
+ CO at
240°-250° C. with Pt sponge and with PtC12 (18).
Separation of such a reaction's products yielded
Pt(CO)Cl2 , Pt(C0) 2Cl2 and Pt(C0)3c14 (19): A r elated
species reported in 1891 was initially thought to be
11Pt(C0) 2c16" (20); however, later investigation revealed
it to be a complex of COC12 with PtC12 , or P~(COC1z)2Cl2 (21). A recent edition of the C.R.C. Handbook listed
"Pt(COCl2)Cl2~" stating that its decomposition precedes ·
a melting point (22).
The compound Pt(CO)Cl2 exists as a chloride
bridged dLmer in the solid and vapor states (23), and
is a stable orange-red solid at 25° C. It is readily
soluble without decomposition in HCl and cold water,
reportedly decomposing above 300° C. (19).
Further introduction of CO into the Pt (IV)
complex under high pressure and temperature creates
at least two more species -- Pt(Co) 2cl2 and Pt2(co)3
C14
(24). They have lower decomposition temperatures

12
and high liabilities than Pt(CO)C12 ; Pt(C0)2c12 has
a sufficiently high solubility in CC14 relative to
Pt(CO)C12 and Pt2(C0) 3C14 to allow its complete
separation by solvent extraction (24). Related species
stable above 400° C. have not been reported.
Palladium complexes from oirect union of the metal
or PdC12 with C12 and CO appear to be less stable than
platinum counterparts. One review reports the exis-
tence of Pd(CO)CI2 , Pd(C0) 2C12
and Pd(COCl) (15).
The later species decomposes at 250° C., with the others
0 being unstable above 60 C. (25). No such complexes
are believed to exist above 250° C. (15).
Discussions of the pi-bonding ability of CO often
cite corresponding properties of the NO molecule.
However, rather few studies of NO usage in the pre-
paration of gas-phase or solid complexes with platinum
metal chlorides have been reported. Perhaps higher
costs of reagents, the great corrosion of NO towards
handling equipment and the added toxicity are reasons
for this lack of experimental efforts. Mellor's
Treatise examined some of the scattered research on

13
such complexes prior to W.W.II. Of interest is the
presentation of a model system for the production of
nitrosyl chloride:
1) NO + C1 2 " NOC12
2) NOC12 -t NO ~ 2 NOCl
Kinetics data were cited in support (26).
Nitrosyl chloride (NOCl) has been used in the
chemical attack and refining of the precious metals for
centuries; it is considered to be the most active com-
ponent in aqua regia mixtures, as it accomplishes what
pure Cl2 often cannot. The widely accepted reaction
leading to its generation is thought to be:
HNO + 3(e) 3 HCl(e)
RT or higher·
(the high solubilities of the gases somewhat decrease
their release from the solution). Volume ratios of
3 to 5 parts HCl to 1 part HN03 are utilized, with 5%
to 20% water added to moderate the action. Heating
to 70°-110° C. greatly increases emission of the
active gases. N02, or nitrogen dioxide (fo~med upon
contact of air with NO), appears to aid the kinetics

14
of NOCl attack upon precious metals, yet N02 is unable
to render the corrosion of gold or tbe PG1 on its
own (27).
References to NOCl in refining and assaying are
often indirect, such as the fre!fuent and necessary
admonition that oxidations with aqua regia be followed
by an ''almost to dryness" evapo,~ation/boiling of the
solution. Depletion of nitrosyl chloride £1~-om such
solutions is further aided by the addition of area,
(NH2) 2co, or related compounds during heating.
Attempts to prepare a stable salt of Pt (IV) with
NOCl have been described (28). Standard handbooks of
inorganic compounds do not list any complexes of NOCl
0 with Pt or Pd as being stable under conditions of 25
C. and 1 atmosphere's pressure. A "wet" method
published in the 1840's relied on dissolution of
chloroplatinic acid, H2PtCl6 , in vacuum-filtered,
washed with concentrated H2so4 , then dried at 100° C.
(29). The product was believed to be tetrachloro
di(nitrogylchloride) platinum, Pt(NOC1) 2C14 (28).

Another approach was based upon the introduction of
distilled NOCl into sponge platinum of 100° C. (30).
A preparation of Pd(NOC1) 2 (originally named
"palladous dinitrosyl chloride") has been reported;
this di(nitrosylchloride) palladium (II) complex was
15
unstable with respect to water, and any related forms
were considered likewise unstable (31). A complex
manufactured by flowing a mixture of NO and methanol
0 vapor ove1· anhydrous PdC12 at 50 C. has been cited,
though with no suggestion as to the product's
structure (32).
IV. ''Proposed Systems for Attack of the PGM: on Catalysts''
American patents have included several systems
proposing chemical attack via gas-phase upon Pd and
Pt impregnated catalyst, relative to the catalyst/
support materials used in the petroleum industry for
"reforming" of hydrocarbon chains into gasoline, etc.
One 1962 patent described its proposed system as
"beneficial for cases where the ore (or- scrap) con•
taining a metal to be recovered is below the grade

16
required for economic recovery by methods heretofore
known" (33,34). The patent's process involved a
mixture of aqua regia heated and the generated NOCl
and C12 being distilled into a separate barrel-like
chamber, with a trap in between for drying. The
chamber could be agitated, and would allow a continu
ous flow of ore, chunks of catalyst, etc. for maximum
contact of gases with exposed precious metals. Sub
limed products/complexes would be re~overed from a
liquid trap, with a portion of the effluent gases
recycled. It was specified that all material be
crushed to 20 mesh or finer particle size prior to
entry. A temperature range of 100° to 1600° F (38°-
8700 C.) was said to volat111ze only the desired PGM
and gold salts, and convert iron to an insoluble,
non-volatile oxide (33).
The continuous, rather than batch-type, nature of
the process is noteworthy; in practice, precious metals
refiners must often handle scrap batch-wise for owner
settlement purposes, but a "recycler" of Pt-bearing
17
oval units would likely hold clear title to the entire
lot and find attractive the operations and capital
savings of a continuous process.
Other patented systems appeared in 1962, aimed
at the removal of PGM from used or poisoned hetero
geneous catalysts and related materials.
Two researchers at Universal Oil Products proposed
the stripping (by sublimation of salts) of the PGM
from inert supports by use of a NOx + AlC13
vapor
stream through the materials at 370°-600° C. (11).
The process was batch-wise, as the PGM-bearing cata
lysts would be contained in a tube reactor of quartz,
vycor or other non-porous refractory materials. A
proposed loading scheme involved the PGM-bearing
catalyst being "sandwiched" in a plug-flow: first,
to meet in flow of gas streams, a "plug" of powdered
A1C13 , followed by additional AlC13 or alumina in
a small "pills." Next came a section of glass wool,
then the catalyst to be stripped, with a final glass
wool plus. Hinged tube furnaces provided an ele
vated temperature (300° to 500° c.).

18
This 1962 patent also presented a brief review of
previous approaches to gas-phase attack of PGM upon
"spent" catalysts, claiming that the previous systems
were unable to remove more than 70 to 95% of PGM con-
tent, compared to the patented system, using AlC13
•
A number of parallel treatments of a Pt-bearing
catalyst (0.37% by weight) were presented, involving
usage of binary or ternary mixes of N2 plus Cl2
, CO,
H2S, etc.
One successful experiment was cited, where the
Pt content was reduced from 3700 ppm to 5 ppm using
a two-step system:
The first step involved passing air, N2 and c12 through the sample for 5 minutes at 500° C.; the second step involved addition of powdered A1Cl3 to the PGM-bearing catalyst, followed by a flow of N2 at 500° C for a time period sufficient to result in the catalyst changing color from gray/ brown to cream-white (35).
A comparison experiment of the system's effec-
tiveness using c12 or A1CI3 , plus CO, was not dis
cussed or proposed. The possibility of using
pressures above one atmosphere to reduce necessary

19
reactant contact time or optimum temperature was noted,
but not demonstrated, in the patent disclosure.
Mid~t7ay through "'ork on the present project, an
abstract appeared in the Chemical Abstracts describing
a proposed method for stripping Pd and Pt content from
used automotive catalytic converter blocks via a
gas-phase process (36). The abstract cited the patent
of a two-step approach to 1·emoving PGM from used cata-
lysts. The two-step process was as follows:
In Step A, a reactor holding the catalyst is maintained at 150°-250° C., and receives a gas flow containing 5% (by volume) or more of CO, COCl2, and Cl2, carried by an inert stream (N2 or Ar) for 1 to 2 hours.
A more specific sequence was also presented, to
treat a Pt and Pd-bearing sample:
Step A: 250° C. for 1 hour, with gas flow of 40% each of c12 and CO, plus 20% COC12 (no specific volumes were given in the abstract).
Step B: 470° C. for 3 hours, with a gas flow of 10% CO, "in a specified reactor equipped with slit vanes to recover the metals" (36).

20
The study described in this research report has
strived to further explore the usefulness of the Cl2
/CO
and Clz/NO gas combinations in attacking different
types of automotive catalytic converter units. The
effects of gas-phase concentration, contact times, and
temperatures on metal recovery yields have received
the major attention. Possible extensions not experi
mentally explored but which appear potentially fruit-
ful are suggested as well.

EXPERIMENTAL
I. Catalyst Samples for Study
A. Sample Size/Particle Size
Catalytic converter units from Ford Motor Company
and Chrysler Corporation were studied. Representative
portions of supported catalyst (hereafter referred to
as "S/C") were collected from three or more geographi•
cally isolated areas of a sampled converter oval by
means of hacksaw and plastic-headed mallet; SO to
100 gram portions served to diminish any non-uniform
PGM concentration's effects upon analysis. The con
verter units all contained two oval blocks; in each
case, S/C samples were from the 11 forward" member of
the pair -- the oval block closest to the engine.
The three to six g~am samples of S/C for
experimental study consisted of small "chunks"
and granules from the larger weights of S/C pre
viously described, with 90% or mo1e by weight being
21

22
particle sizes 4 to 40 mesh (U. s. standard sieve sizes).
Larger chunks were difficult to load and unload fYom
the gas-phase treatment apparatus, and the lower sur-
face to area ratio for finer sizes of paJ-ticles was
felt to lessen the desired maximum exposure of sample
to attacking gases and acids.
I.B. Procedure for ''Wet Chemical" Preparation of Sample Prior to Analysis
A 3 to 6 gram portion of S/C was accurately
weighed (~O.OOSg) and dried for 6 to 24 hours at 40°
to 50° C.
For comparison of the Pt and Pd yields from
separate experimental "runs," accurate values of
actual metals contents were needed. The results from
"wet chemical" attacks upon all of the different S/C
varieties were obtained. This was based on the
assumption that all PGM metals content amenable to
attack could be removed and determined by careful
application of the separation and analysis techniques,
and that PGM in the S/C samples could not be separated
and recovered any more thoroughly by the combination

23
of gas-phase treatment and post-treatment rinsing. No
evidence to refute the assumption was discovered.
"Wet chemical" (liquid-phase) attacks and separa
tion of PGM content from S/C samples were made as
follows:
An aqua regia mixture of 60 to 65% HCl and 30% HN03 (percentages by volume of concentrated acid to mixture volume) was used. A 3 to 6 gram sample was treated with 300 to 400 ml of aqua regia and heated to 60°-70° C. using intermittent magnetic stirring of the mixture.
The sample was cooled to 30°-35° c. and filtered through 2 circles of Whatman 411 filter paper, using "house" vacuum. Retaining the filtrate aside, the S/C sample was further crushed to an average particle size of 20 mesh or finer. This sample was again heated to 60°-80° C~, in an additional 150-200 ml of aqua regia, for two hours. This mixture's filtrate was boiled at 90° C. or higher to reduce volume and to r·emove all dissolved NOx. Destruction of residual HN03 was aided by additions of 10 to 20 ml of concentrated HCl and at least two evaporations to a syrup of 15 ml or less volume. Cooling to 20°-25° C. and a final filtration through Whatman #1 paper concluded the separation.
I.e. Nature/Types of Samples Studied
Three varieties of supported catalyst were studied.

24
Each unit was an "oval rod" shape, typically 400 to
1000 grams, 150 to 250 rnm length, and 100 to 250 mm
width.
1. Chrysler Corporation's "Small Oval" Catalyst
Chrysler Corporation supplied a pair of cata-
lytic converter oval blocks of a platinum-only catalyst
type. Due to their size relative to a set of similar-
ly shaped but larger volume blocks of a different
nature, these were named "small oval;" the others, the
"large oval blocks." Weight of the inlet member of
the "small oval" set was 496.02 grams. Chrysler iden-
tified this specimen with the following data:
"oval #7476-149 (50/0), set 777-Boron fleet 48,212 miles (use)~~
Data furnished by Chrysler claimed a platinum
content of 0.47 grams per oval unit (new); this would
be 9.27 x 10~ 4 grams Pt per gram S/C.
C.2. Chrysler Corporation's "Large Oval" Catalyst
Chrysler also provided a set of road-used cata-
lytic converter ovals bearing both Pt and Pd metals
as catalysts, in a 70/30 ratio by weight. The inlet

member of the pair was chosen for study, and had a
weight of 927!5 grams (Uncertainty originated from
25
the process of cutting the block prior to an accurate
weighing. The companion "outlet" oval weighed 927.45
grams.). The following data were furnished for this
ularge oval" block, by Chrysler Corporation:
"Set 381/U.O.P. 70-30 catalyst, 7471-175, Car 559, 49, 943 miles use." Reported loading of Pt and Pd) totaled 1.555 grams per o3a1. This corresponds to 1.17 (~.01) x 10· grams
3Pt per gram S/C, and 0.50
(~.01) x 10- grams Pd per gram S/C.
C.3. Ford Motor Corporation's Catalyst
The Ford Motor Corporation supplied four mono-
lithic/ceramic catalytic converter ovals. Two of
these were new, and two had received road or simu-
lated road use. For study, the ''used" oval fl H-317-
305-1 11 was selected:
It was tested by F.M.C. 2/16/74 on "engine" X0-584-1-13." Net weight of the oval was -327.97 grams. No indication as to Pt and/ or ~d content was offered with the units or accompanying letter.
II. Gas-Phase Treatment (Chemical Attack) of Catalyst Samples

26 A. Equipment
Tube Furnace
A Lindberg model/type 59344 console-54031 furnace combination was used, with an operating range of 400°-1200° C. The console was set for a proportional band of !6°, with reset at 6 M/R.
Pyrometer
A digital read out pyrometer/indicating thermometer served for temperature measurement, with iron/iron Constantan alloy lO gauge (AWG) thermocouples leading from the outside of the reactor tube (at 2 points). One point measured reaction temperature, with the other point measuring temperature of the out flowing gas/products stream.
Glass Reactor
The all-glass reactor system, as illustrated in Figure 1, consisted of the following components, from "upstream" to downstream end:
(a) A hand-blown Pyrex/Vycor adapter was connected to 3 incoming individual gas stream parts. The end connection was a 1" (25") O.D. Vycor male ball joint (18/8) used to couple with a corresponding opening on the reactor tube.
(b) The reactor tube was a quartz tube of 87 em length, of 25 nun (1") O.D. and 0.2 em well thickness, which had a female 18/8 Vycor ball joint at each end.

AL
L-G
LA
SS
Il
liAC
'rOR
SY
STE
I·l US~D
IH GAS-PFU~S:E
AT
TA
CK
O
F C
AT
AL
YS1
l SA
J.J.P
LES
Gas
In
flo
w
1 2 3
(a)
(b)
--~·
~----
-------------------------
4
4 &
5
are
jo
int
held
clo
sed
b
y sprin~
load
ed
cli
ps
du
rin
g
a ru
n
Co
mp
on
ents
o
f S
yst
em:
(a)
Py
rex
/Vy
cor
Inle
t-A
dap
ter
wit
h 3
li
meg
lass
p
ort
s to
ad
mit
re
acta
nt
& c
arr
ier
gase
s
(c)
(b)
Qu
artz
R
eacto
r T
ub
e,
25rru
n O
.D.,
2
.0
nun
wall
8
70
m
rn
lon
g,
wit
h fe
mal
e 1
8/8
nu
n b
all
jo
ints
o
f V
yco
r (m
id-s
ecti
on
en
clo
sed
wit
hin
fu
rnace
du
rin
g ru
n)
(c)
Cla
isen
Ad
apte
r,
of
bo
rosil
icate
g
lass,
wit
h
18/B
nml
mal
e b
all
jo
int
of
Vy
cor
At
7 is
a
secti
on
o
f fl
ex
ab
le
tub
ing
co
nd
ucti
ng
g
as
ou
tfl
ovJ
bet\
·Jee
n tr
ap
s.
9 G
as
ex
it
(e)
Gas
A
bso
rber/
Tra
ps,
o
f b
oro
sil
icate
g
lass,
(Ace
G
lass
C
o.
#8
74
6)
wit
h N
ylo
n b
ush
ing
s an
d
FET
FE
0-r
ing
s;
the
one
cou
ple
d to
th
e
ad
ap
ter
was
fi
lled
w
ith
10
%
(v/v
) H
CL,
th
e
oth
er
on
e w
ith
6M
N
aOH
(aq)
1 th
rou
gh
9
, re
specti
vely
, re
fer
to
op
enin
gs
in
syst
em u
po
n
dis
-ass
em
bly
an
d/o
r g
as
flo
w
du
rin
g o
pera
tio
n.

(c) A Claisen adapter of borosilicate glass (Ace Glass Co.) was fitted with a male Vycor 18/8 ball joint to couple with the reactor tube. ·
28
(d) Spring-loaded metal clips maintained tension on both sets of 18/8 ball joints during each experimental "run.''
(e) The downstream end of the Claisen adapter directed exiting gas flow into a tubular (38 mm o.c.) borosilicate glass gas absorber/trap (Ace Glass Co. assembly 8746). Polyethylene tubing (Tygon) of 13 mm ID carried gases from the side arm of this first trap of identical construction, prior to their venting into the fume hood.
(f) The first of the gas traps was filled to two-thirds of its capacity with 10% (v/v) HCl solution. The second trap was likewise filled with a 6M aqueous NaOH solution.
Post-Reactor Heating
An 18 mm width heating tape assembly and accompanying 110 volt powerstate-type transformer provided controlled heating of the exterior of the reactor tube, at an area of the tube "downstream" from the tube furnace's heating coils. This was provided to minimize condensation of any sublimates prior to the gas stream's entry into the first absorber.
Reactant Gases
"Commercial purity" nitrogen, carbon monoxide and chloYine gases were used, with no preliminary drying. Nitric oxide was provided from Airco lect~re-size bottles

Gas Flow Quantitative Measurement
Rotameters served to measure gas flow volumes from the individual cyliners, with manual adjustment of the regulators to correct selected flow volumes. These rotameters were used:
(a) For N2 measurement, a calibrated Brooks rotameter #1355-07ClAAA(#l) served for all runs.
(b) For CO measurement during all applicable runs, Brooks rotameter #1355-07ClAAA(#4) was used.
(c) For Cl2
measurement, an air-calibrated Gilmore rotameter (model # not avail-
29
able) with a range of 0 to 300 ml/minute was used. Corrected flow volume of Cl2 was calculated as follows:
True Flow Rate : 0.64 x Recorded Value (Rate)
0.64 is the quotient of (M.W. of N2) divided by (M.W. of Clz), taking the molecular weight of nitrogen (Nz) as equivalent to the average molecular weight of air.
(d) For measurement of NO flow, an aircalibrated Gilmore brand rotameter with a range of 0 to 300 ml (minute was used,with corrected NO volume (flow rate) calculated as (0.97) x (recorded flow rate).
Shaker Device
A Burrell flask/test tube shaker with angle settings from 5° to 8° was used, in sample work-up procedures.

30
II.B. Gas-Phase Treatment Procedures
In this discussion, a ''run" refers to a com-
plete sequence of the gas-phase treatment of a S/C
sample: Sample loading into the reactor, followed by
chemical attack of the sample with oxidizing gases at
elevated temperature, followed by removal of the S/C
sample and rinsing of any sublimed salts from the inner
walls of the reactor tube, collection of the acidic
solution in the first gas trap, and a shaking of the
S/C sample with dilute HCl solution. A sample for
each run weighed 3 to 6 grams, and was detailed from a
larger portion of S/C as described earlier. Drying of
each of the accurately-weighed samples for 6 to 24
hours prior to the run was performed, at 45° to 60°
c. An objective testing of how this drying might
improve performance of the reaction system, i.e.
improve yield, was not done.
Preparations prior to a run were as follows:
The quartz reactor tube was thoroughly rinsed by both 10% HCl and deionized water, then dried. A tuft of Pyrex "wool" sufficient to block movement of dust or S/C particles but not hinder gas flow was pushed into the

tube to a depth of 15-20 em. The S/C sample was carefully poured into the tube from the same end. A second "wool" tuft was added with gentle pressure to create a zone of S/C sample held 10-15 em from the downstream end of the tube. Loading the sample at this location allowed for adequate pre-heating of the incoming gases before contact with the sample.
31
A thermocouple was attached to the outside wall of the reactor tube at the section in which the sample was located by means of heat-resistant tape. A second thermocouple was attached outside of the tube wall at its downstream junction (with the Claisen adapter). This thermocouple allowed monitoring of the temperature of the heating tape wrapped around that area of the tube.
With all equipment and the sample in place, a run's
operation involved coordinated adjustments of gas flow
and furnace temperature, as is described:
The flow of N2 was commenced and closely monitored initially, with any signs of leakage or lack of outflow pressure within the system corrected. Insufficient lubrication of the 18/8 joints was an occasional problem. With proper flow, heating of the furnace was started. Upon an indication of desired reaction temperature being achieved, by means of the digital pyrometer read out, "starting" time was recorded, and the flows of chlorine and associate gas(es) were begun. Often three to five minutes would be required to adjust those flows to desired level, due to a tendency for flows to drop.

At the end of the desired 2 to 9 hour run length, flows of oxidizing gases and power to the furnace were simultaneously stopped, with N2 flow continued until the reactor tube temperature dropped to 50°-750 C. Power to the heating tape was usually stopped 15 to 30 minutes after the run itself was stopped. With the furnace temperature lowered, a bleed line from the N2 regulator was opened, and N2 directed into the C12 line just downstream of the Cl2 rotameter, to flush all remaining reaction gases from the reactor tube and adapters.
32
With no gas flow and furnace temperature close to
room levels, processing and removal of the S/C sample
was accomplished:
The reactor assembly was carefully taken apart to avoid contamination of the tube's inner wall surface or other areas possibly bearing sublimates from the reaction. Using a wash bottle with a Sio HCl solution, the inside wall of the reactor tube downstream of the plug holding in the S/C sample was rinsed, with the drippings collected for later analysis. The Claisen adapter was similarly rinsed.
The "wool" plugs, plus S/C sample, were pushed from the tube into a flask by means of a long brass rod (contact with iron containing materials could affect later analytical values). This material was the ''1esidue;" the solution derived from it was likewise deemed the 11 residue" sample from the run, after the rinsing of this S/C material.

The residue was added to an Erlenmeyer flask, along with a standard amount of 10% (v/v) HCl -- 100 ml per 5 grams of sample. The resultant slurry was shaken for 30-35 minutes with a Burrell shaker so as to dissolve any non-volatile PGM compounds still in the S/C material. Following shaking, the slurry was heated to 60°-70° C. for 40 to 60 minutes. The slurry was cooled to 40°-60° C. and vacuum-filtered through 2 discs of 55 mm Whatman #1 filter paper. This separated all but the finest support particulates in 7 to 10 minutes.
The solution from the first gas trap was carefully removed and transferred to a beaker or Erlenmeyer flask, with the absorber/ trap tube and lead-in arm rinsed at least twice with deionized H2o, these rinsings added to the "trap" sample. This trap sample frequently was heated to 60°-70° C. for a period sufficient to reduce its volume to a level comparable to that of the "residue" or "tube rinse" samples.
33
The residue sample for a run was always analyzed
separately. For some runs, separate determinations of
the PGM were made for the tube rinse, the adapter rinse,
and for the trap (rinse). A few runs involved a collec-
tive analysis from combined rinses. Others included
determinations of the residue, tube, and (adapter trap)
rinse, etc. Such variations were to observe any patterns
of special distribution of product sublimate which might
be happening.

34
III. Sample Analysis
A. Equipment
Aside from glassware common to most analytical
chemistry labs, several apparatus of specialized nature
or selected quality were necessary for sample prepara-
tion or analysis:
Spectrophotometer
Colorimetric measurements were made with a Bausch and Lomb Spectronic 20 visible/near IR spectrophotometer, adjusted for absorbance and transmittance readings at 525 nanometers. Absorbance levels of 0 to 0.5000 units were read from the instrument's meter and recorded directly; above A of 0.5000, the % transmittance value was recorded, with subsequent calculation of absorbance.
Liquid/Liquid Separation Funnel
A Squibb-type extraction funnel of 125 ml volume served in the extraction of iron impuri• ties from samples, via cupferron chelation.
pH Measurement
A Markson "Electromark" pH/conductivity analyzer with Polymark electrode was used in all pH measurements, with digital read out to t.Ol units. Prepared and standard solutions of pH 7.00 and pH 4.00 served in the standardization and adjustment of this meter; these standards were from Fisher Scientific.

35
Cooling Bath
An electrically-powered cooling bath system allowed rapid immersion and cooling of heated volumetric flasks prior to analysis of their contents. A temperature of 20° C. 11° C. was maintained.
Volumetric Glassware
The volumetric flasks and pipets used in this study met NBS 11Class A" standards.
III.B. Reagents
All chemicals used in this study's analysis were
ACS Reagent or J. T. Baker Company's "Analyzed Reagent"
standards, except where noted. Beyond the solutions of
NaOH, HCl, etc., specific reagents necessary to the
study were:
p-Nitroso-N, N-Dimethyl Aniline
Solutions of the colorimetric agent, pnitroso-N, N-dimethyl aniline, were prepared by addition of 5-10 ml of absolute ehtanol to a 100.0 ml volumetric flask, followed by 0.50 grams of reagent, then slowly filling the flask to volume, interrupting this to shake the flask and hasten dissolution of the reagent. Eastman "purified" grade p-Nitroso-N, N-dimethyl aniline was used. A dark green to olive solution was the result. Hereafter in this report, the colorimetric reagent will be referred to by the abbreviation "NDA."

36
Cupferron Reagent
Eastman "purified" grade cupferron was used as an agent for the separation of iron from samples, prior to their colorimetric analysis. A Solution of 1.5 grams cupferron per 25 ml deionized H2o was prepared on each lab date for analysis.
Buffer Solution
A buffer solution of pH 2.2!0.2 units served to insure maximum color development of the NDA-Pt and NDA-Pd absorbances. Preparation involved the addition of 53 to 60 ml of IM HCl. pH monitoring was used to reach the specified pH value.
From this buffer, a 10-to-12 fold dilute wash solution was prepared for rinsing, in preparation for each sample's determination.
III.C. Procedures for Determination of Platinum and Palladium
1. Treatment for Iron Contamination in Sample
All "residue" and most "rinse" samples were believed
to contain concentrations of iron which could signifi-
cantly alter values for Pt and Pd determination. There-
fore, all runs used in preparation of data for this
report, 1007 to 1331, inclusive, involved cupferron
pretreatment of each sample for iron removal. Cupferron
37
chelates iron selectively f1om a~ueous solution; the
"iron cupferrate" complex is selectively soluble in
chloroform, whereas Chlorides or related compounds of
Pt and Pd possibly existing in the sample are insoluble
in chloroform. Samples were treated in the following
manner:
pH was adjusted to 1 or low~r, by addition of concentrated HCl. The sample was added to a 125 ml Squibb funnel, and was followed by a volume of U.S.P. or reagent-grade chloroform equal to 1~ times sample volume. Next 5 to 6 ml of a 40% cupferron solution were added. The sealed fUnnel was vigorously shaken for 1 minute by hand. Within seconds following the complete separation of the CHC13 and aqueous layers, the brown layer of CHCl3 was drawn off carefully (free of trapped aqueous layer bubbles) and discarded. The addition of fresh CHC13 followed, repeating the 1~ volume formula, and vigorous shaking followed. If the second complete layer of CHC13 drawn off was yellow or brown, the addition of CHCl3 was repeated. The CHC13 layer was colorless upon separation of all iron cupferrate from the aqueous layer.
Each sample was readjusted to a pH of 2.2!.1 units with dilute (0.1 m to .2 m) NaOH, and diluted to volume in a suitable volumetric flask. Usually 25.0, 50.0 or 100.0 ml, this solution was termed the sample's "master" volume, for reference in its dilutions.

38
C.2. Colorimetric Analysis Based on the NDA-Pt and NDA-Pd Complexes
The colorimetric procedure selected for the deter-
mination of platinum and palladium was proposed in 1954
(37), when a family of reagents which react readily at
room temperature with minute amounts of Pd were found
to also react with Pt. The reaction with Pt, and to a
lesser degree, with the other four PGM occurs only at
elevated temperature, such as by heating solutions
bearing these metals to 80°-100° C. over 20 to 60
minutes. The resulting absorbance of light due to Pt
reagent and Pd reagent is additive, so that
A(Pt Pd, at 80°-100° C.)- A(Pd, 25° C.): A (Pt).
The agent para-nitroso-N, N-dimethyl aniline was
selected for use in this study because of its commer-
cial availability and solubility in both water and
ethanol. This reagent has received attention by other
PGM analysts since its introduction (39). A linear
absorbance over 0.7- 2.5 p.p.m. was reported for Pt
and a similar range of 0.2 - 1.0 p.p.m. was cited for
Pd determination (37, 38).

39
This method gives readings of maximum absorbance
for the Pt complex at 525 nanometers wave length; iron
complexes can seriously interfere at this same wave
length (39), and must be removed from samples prior to
their colorimetric analysis. The use of cupferron to
chelate the iron and allow solvent extraction was a
routine precursor to the analysis. Other species such
as aluminum complexes present in solutions from the
gas-phase stripping of platinum from the S/C samples
were not cited as positive interferences by earlier
researchers (37, 39).
In planning for each determination, a rough
estimate of Pt and Pd contents was made for the
"master" solution of that sample, in terms of "p.p.m."
(mg. metal ion per liter). It was desired to prepare
at least 6, and preferably 8, aliquots of identical
concentration per sample. Multiple aliquots were
analyzed for the following reasons:
One, to be able to calculate a more accurate average concentration from the determination; two, to provide for duplicates should one or more aliquots be lost during the procedure from contamination or breakage.

40
The desired concentration ranges for the aliquots
were related to the estimated ranges in the master sample,
and appropriate dilutions made, always using volumetric
pipets and flasks. For example, in making up a set of
aliquots using 25.0 ml volumetric flasks, the volume
of the other added chemicals (buffer and NDA reagent)
dictated a practical limit of 10 ml of rrmaster" solution
per aliquot. Filling flasks to over two-thirds of
their capacity presented difficulties during the color
development of the NDA-Pt complex. Filling to volume
was done after the heating necessary to color develop-
ment.
With exceptions noted, the originally-proposed
procedure (37) was followed in the determinations of
Pt and Pd concentration in the samples:
(a) 5 ml of the pH-adjusted buffer were added to a 50 ml volumetric flask.
(b) 1 ml of a 0.5% solution of NDA was pipetted into the flask, followed by several drops of deionized water, as needed, to wash and NDA splashed onto the inside wall of the flask neck.
(c) Addition of a 1.0 to 25.0 ml volume of sample was made. 5.0 to 25.0 ml were preferred for sufficient accuracy, balanced against over-filling of the flask prior to color development.
(d) 10 to 20 ml of the dilute buffered wash solution were then added to bring the aliquot's level to 33-35 ml.
(e) The aliquots of a sample only being measured colorimetrically for Pd are filled to volume with deionized H20. (This is in variance with the original literature, which recommended use of 95% EtOH for this purpose.) (37)
41
(f) For each aliquot of the sample to be color-developed for Pt determination, an identical aliquot, minus sample addition, was prepared. These served as "blanks;" one was brought to volume without heating, and served in the adjustment of the Spectronic 20 to 100% transmittance prior to readings of "Pd only" absorbance. The other ''blank" aliquots were 11Color-developed" simultaneously with those for determination of "Pt T- Pd."
(g) With the Spectronic 20 set at 525 nanometers and the calibration to "100% T" for the non-color developeri blank's reading made, the instrument was ready for accurate measurements of absorbance due to the Pd-NDA complex. Prematched cuvettes, or the same· cuvette (with thorough rinsing with both acetone and de-ionized HzO between each reading) were used.
For each reading of absorbance of an aliquot's solution, 1 to 3 ml of the aliquot's solution was poured into the cuvette, this was poured out, and then the 4 to 6 ml of solution to be measured added. Following the reading's recording, the sequence of acetone, de-ionized water, and sample rinsing was followed, prior to the reading to the next sample.
{h) Prior to their readings for absorb-

42
ance due to Pt plus Pd complexes, half of the aliquot flasks were heated to 100° C. for 23 minutes. The flasks for heating each had a lead metal "collar" added, to prevent their "tipping-over" due to occasional super-heating of the bath. The bath was a 1000 ml beaker one-third to half filled with tap water. The flasks were removed after the 231~ minutes and immediately transferred to a cooling bath maintained at 20° C
(i) After 5 minutes in the cooling bath, the aliquot flasks, both "blank" and sa·mple -containing, were removed, and filled to volume with de-ionized water.
(j) The 1 to 4 color-developed blanks were combined into 1 beaker-or flask-full of solution, and a portion from it used to adjust the Spectronic 20's % transmittance reading to 100%.
(k) The sample-containing aliquots were measured for their absorbances within 10 minutes of being filled to volume, similar in manner to the sequence given in (g).
III.C.3. Advantages of Chosen Procedure, Using NDA Reagent
The nature of the sample solutions obtained from
"~-1ork-up" of the gas-phase reaction's products suggested
the application of a spectrophotometric technique as
the most convenient route for measuring the low con-
centrations of PGM expected to be present in the cata-
lytic converter units. Usage of the NDA reagent for

43
colorimetric determinations was the exclusive choice
in this study, based on the following points:
(a) It showed high sensitivities for both Pd and Pt complexes which would allow the determination of both the very low concentrations and much higher concentrations (by appropriate dilutions). For example, samples of 3 to 6 grams with 0.3-0.5% (by weight) of Pt + Pd were routinely analyzed, along with traces of these metals that were 50-100 -- fold more dilute (e.g. rinses of sublimates from the gas-phase catalyst attacks).
The original researchers of the technique reported "practical" sensitivities for Pt and for Pd, respectively, as 01015 p.p.m. and 0.0067 p.p.m., in 1 em path cells (37). They reported ranges of Beer's Law obeyance as 0.7 to 2.5 p.p.m. for Pt, and 0.25 to 1.00 p.p.m. for Pd (37).
(b) Use of visible/near IR-long UV range units such as the B & L Spectronic 20 provided an economical alternative to more expensive and skilled-labor-intensive devices such as optical spectrography, enabling greater and wider potential application for industrial analysis.
(c) The additive absorbance scheme for measuring concentrations of Pt and Pd from separate aliquots of the same sample eliminated a need for additional reagents, dilutions to significantly different concentrations and other labor-intensive operations.
(d) The problems of interference by base metals or anions resulting from chemical

attack were easily controlled, with the serious problem of iron contamination completely eliminated by cupferron chelation (38).
(e) Where the concentrations of either
44
Pt or Pd relative to the other were significantly different relative to each other, there was available the option of quantitative ex• traction of the NDA-Pd complex at room temperature from the yet uncomplexed Pt ion (39).
(f) The original paper on additive absorbance analysis of Pt + Pd mixtures claimed attractively low values for "% standard deviation" -- 1.0~ for Pd, and 1.51 for Pt, when the metals were measured with the concentration ranges of maximum color development and optimum pH.

RESULTS
I. Reaction Variables/Parameters Under Study
Initially, both the conditions necessary to pro-
mote the desired reactions and the possible p~ysical
and chemical products of the proposed system were quite
unclear. Nineteen "runs" of the system apparatus were
initially studied for qualitative and quantitative
evidence of PGM compounds, as well as how a wide range
of several variables influenced the "evidence."
A choice of three main variable parameters was
made, and another 40 "runs" carried out, studying
samples from two types of PGM bearing catalytic con-
verters. Temperature, time and reactant concentrations
could be varied in a controlled manner, with repro•
ducible yields and effects.
Temperature was deemed the most significant
0 variable in determining yields. A range of 350 to
1025° C. was studied, using 100° increments in most
runs. 350° C. was the lowest practical temperature
45

46 for furnace operation and 1025° C. was selected as
the upper limit. Literature documentations of the
existence of volatile PGM species over 300° to 800° c.
and projected lower energy and reactor materials costs
evoked most interest in the lower end of the range.
Preliminary evidence of a high volatility for Pt and Pd
species above 800° C. prompted a number of runs at 900°
C. and 1025° C.
Chlorine gas was utilized as the main oxidizing
agent for all runs; carbon monoxide was selected as the
co-reactant for most runs, with nitric oxide and chlorine
used during a few selected runs. Considering the ratio
of c12 flow volume to that of its co-reactant gas, the
ratio "R" can be stated for each run for purposes of
comparison, i.e., R: (C12 volume)~(co-reactant volume)
where all volumes were in cubic centimeters per seconds.
For runs using c12 plus CO, the "R" range was 0.90 -
3.04, with most runs at .,R, = 1.68 or 3.04. Four runs
using Cl2 plus NO involved a ratio of 2.80 or 5.27.
The influence of varying ratios of the N2 carrier gas
to chlorine or combined reactants was not considered.

47
A number of runs identically conducted except for
the time of reactant gas flow were studied for both
types of S/C samples. Periods of 2, 4, and 6 hours
were considered in these runs. Original intentions to
study the effects of up to 10 hours of reactant flow
were abandoned early in the project due to an emphasis
on temperature and reactant concentrations over time,
as well as the impracticality of extended laboratory
hours. See Tables I plus II, Appendix A.
II. Standards for Product Yield Evaluation
A. Calculation of PGM Content in Samples
Data provided by Chrysler Corporation and Ford
Motor Company established an initial idea of how
many and how much of the PGM were o~iginally added to
the supports. The possibility that their figures
might lack accuracy or that some of the metals were
partly or completely removed during catalytic con
verter operation prompted the wet chemical stripping
of any PGM amenable to such attack and the use of "used"
converter ovals instead of new units.

48
A nine-step sequence of calculations was used to
arrive at values for the contents of platinum and
palladium upon samples initially treated with either
the gas-phase or wet chemical/liquid-phase methods, as
is more fully covered in Appendix C. In brief, known
concentrations of Pt and Pd were complexed and corres-
ponding absorbances recorded. Preparation of accurate
working curves and definitions of precision over various
portions of those curves in turn allowed measurements
of samples treated by the liquid-phase method. Values
for the Chrysler catalysts were accurately determined,
as were those for the Ford catalyst; the latter cata-
lyst proved to contain both Pt and Pd.
II.B. Values for PGM Content in the Small Oval Chrysler Catalyst
No evidence of palladium content in this type of
catalyst was found. The determinations of Pt content
led to a value of 1.14 (tO.lS) x lo-3 grams per gram
of S/C. Determined by spectrophotometric analysis of
solutions bearing all Pt content of the samples, this
was accepted as the actual content, fol- all compari-
sons of Pt yield via the gas-phase treatment.
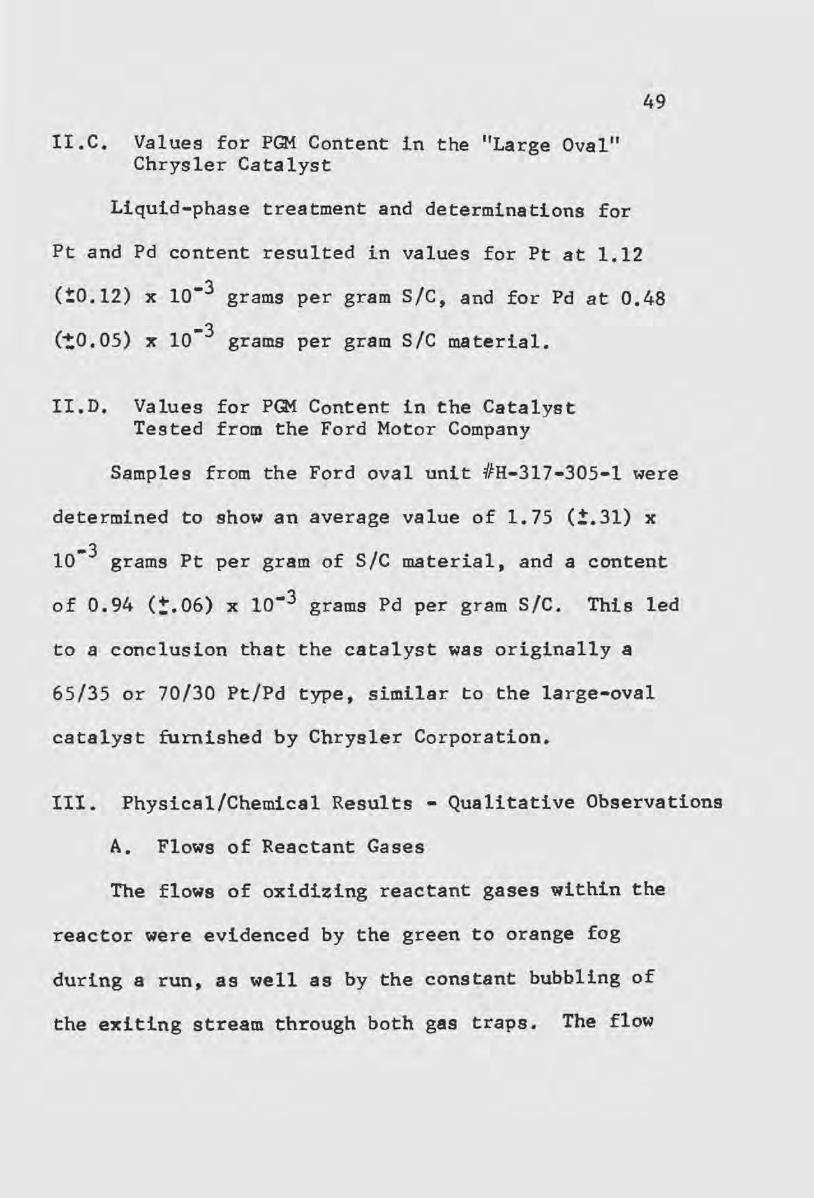
II.C. Values for PGM Content in the "Large Oval" Chrysler Catalyst
Liquid-phase treatment and determinations for
49
Pt and Pd content resulted in values for Pt at 1.12
(:0.12) x lo-3 grams per gram S/C, and for Pd at 0.48
(!0.05) x 10-3 grams per gram S/C material.
II.D. Values for PGM Content in the Catalyst Tested from the Ford Motor Company
Samples from the Ford oval unit #H-317-305-1 were
determined to show an average value of 1.75 (!.31) x
10-3 grams Pt per gram of S/C material, and a content
of 0.94 <:.06) x 10-3 grams Pd per gram S/C. This led
to a conclusion that the catalyst was originally a
65/35 or 70/30 Pt/Pd type, similar to the large-oval
catalyst fUrnished by Chrysler Corporation.
III. Physical/Chemical Results - Qualitative Observations
A. Flows of Reactant Gases
The flows of oxidizing reactant gases within the
reactor were evidenced by the green to orange fog
during a run, as well as by the constant bubbling of
the exiting stream through both gas traps. The flow

was noticeably paler or colorless in the reactor's
middle section at all elevated temperatures and
particularly above 800° C.
III.B. Optimum Sample Exposure to Chemical Attack
50
Yields from the first series of runs were low, i.e.,
0 to SO%. All involved exposure of the sample to the
gas flow with the S/C material in a porcelain combustion
boat. Several runs involved addition of aluminum
' chloride powder in an attempt to increase yields.
Results were still poor, and no visible, colored "zones"
of product sublimate were observed downstream within
the reactor or on the inside wall of the adapter.
An alternate method of exposing the S/C samples
was selected; its use resulted in an immediate increase
in yield of sublimed products and in a brown-orange
zone of sublimate downstream of the sample, on the
inside wall of the reactor tube. This was referred
to a "plug flow," and has been described in the
:Uxperimental section. This first run with 11plug flow,"
#1007, involved a c12 plus CO reactant gas combination.

51
Apparently, use of the combustion boat offered insuf-
ficient surface area of S/C for the reaction, although
the reason was not understood or investigated.
III.C. Sublimates and Products from A Run
Sublimates downstream of the sample-located section
within the reactor tube were observed for all 40 runs
using plug-flow treatment of samples.
Without addition of the heating tape near the
junction of the reactor tube and Claisen adapter, the
sublimate band was usually 3-8 em. long and dark-orange
to brown, and virtually opaque. Such bands were well
formed within the first two hours of a four hour run.
During run 1101, which involved use of an unusually
high level of CO relative to Cl2 , the band color was
a lighter auburn to yellow; whether this was caused by
a lower amount of sublimate or by the presence of a
different PGM complex was not investigated, but was
peculiar to the low Cl2/CO ratio.
Use of the heating tape resulted in a sizeable
decrease of color intensity and more translucence of

52
the sublimate bands; they were located along the adapter's
inside/inner wall, especially on the outer (top-most)
curve, with the remainder of the adapter's inside wall
usually "frosted" with a light yellow to lemon shade of
sublimate.
These yellow to brown sublimates may have been an•
hydrous or unstable to moisture, as they usually reacted
exothermically upon contact with the rinse solution
during product recovery. Care was taken to spray rinse
solution into any vapors from such contact, to lessen
minute amounts of vaporized Pt or Pd species escaping.
Another result of the "hydration" reaction was often a
slightly lighter yellow "foam" within the adapter or
gas trap lead-in tube. One instance of exposure to
laboratory air (of a freshly-completed run's adapter)
over about 36 hours resulted in a "lemon mer~ngue pie"
topping simulated within the adapter.
Preparation of rinse sample solutions suggested
on several occasions the presence of aluminum ion
within the solutions; the required adjustments of

53
pH prior to analysis (using NaOH) resulted in transient
formation of a white colloid over pH 6~ to 8~. A
volatilization of alumina as AlC13 during the runs is
suggested, in view of the aluminum ion's amphoteric
nature. Such behavior also suggested that the catalyst
support was not wholly inert to the proposed gas-phase
reaction system.
IV. Physical/Chemical Results - Quantitative Observations
A. Distribution of Volatilized Products
A major objective in the study was to maximize the
degree of reaction product volatilization and separation
from the sample matrix. Complete separation was not achieved
in any run, but degrees of such separation varied widely.
Platinum and/or palladium content within all samples was
assumed, and all but a handful of samples did contain
Pt and Pd (or Pt alone).
Tables I and II present the conditions of operation
for the 40 runs featuring plug flow location of the
sample. Tables III and IV cover these same runs'
results -- each is described in terms of the percentage

54
of Pt (and Pd) content on the sample which was con-
verted to compounds amenable to determination. In this
study, the small scale of operation dictated that all
recovered PGM be used for such determinations. Com-
mercially, these solutions would be directed to a
separate in-plant recovery unit or prepared for delivery
to an outside refiner.
The residue solution was analyzed separately for
each run. Four combinations were used, with regards
to collection of rinse samples from each run; these
have been labeled I, II, III and IV; and a presentation
of data regarding types II and III is found in Tables
V and VI, Appendix B.
These combinations were:
I - The rinse of the reactor tube only; with the rinses of the adapter and of the first gas trap maintained and analyzed separately.
II - Rinses of the tube and the adapter combined; trap rinse analyzed separately.
III - Tube rinse analyzed separately; adapter rinse and trap rinse analyzed together.
IV - All rinses combined and only one analysis necessary.

55
In the determination of values from runs involving
small oval Chrysler samples, type III was the combina
tion used. This was due to the fact that most of the
earlier runs didn't involve use of .the heating tape
and resulted in a heavy layer of sublimate within the
reactor tube. It was assumed that a large difference
between temperature existed between tube interior and
adapter interior, and the experimenter was curious as
to how much of the volatilized product would remain in
vapor form at such lowered temperatures. With one
exception, about 66 to 98% of all volatilized Pt was
found in the tube rinse. The use of heating tape made
little difference in such relative distributions.
Six runs involving large oval Chrysler catalyst
samples had rinse samples collected in the type III
manner; one run (#1113) found as little as 54% of the
"rinse 11 Pt in the tube section, with three others
showing less than 90% of the sublimed Pt in tbe tube
rinse. The yields of Pd did not parallel those for
Pt in the same runs, and percentages of Pd carried
over into the adapter and trap were larger.

56
The relatively-greater volatility of the sublimed Pd
species showed in the values for type II runs with
large oval Chrysler catalyst samples; the rinsed con-
tents from the first traps were analyzed separately from
the combined tube plus adapter rinse. In 3 of 4 such
analyzed runs (1315, 1317, 1313, 1310) 3 to 18 times as
much Pd as Pt was carried over into the trap. Such
behavior was not expected in view of the published
reports on Pd halides and Pd carbonyl halides cited in
the Introduction, and might justify elemental analysis
in future work in this area.
IV.B. Yields from the Chlorine Plus Carbon Monoxide Treatment of the Small Oval Chrysler Catalyst
1. Effects of temperature variability
Using Chrysler's platinum-only catalyst, the rela-
tionship of temperature to metal yield received much
attention, with 7 runs featuring a 4 hour reaction time
and a set ratio of 1.68 for chlorine to carbon monoxide
volume flow. Data from one of the runs was deleted
from final consideration (#1011, conducted at 600° C.)
due to unexplained variance of its data with that of
runs made at lower and higher temperature (see

57
Table VII for specific data on this series)~
Figures 2.1 (Appendix D) and 2.2 present the rela-
tionship of platinum yields via volatilization and over-
all chemical attack versus reaction temperature fo:t· the
6 runs under study.
Volatility and rate of chemical attack increase
sharply from 700° C. to 900° C., decreasing somewhat
above 1000° C.
Fig. 2. 2 Pt Yield versus Temperature for Pt only Catalyst's Treatment
80
50 %Pt
10
300
for total~ Pt found
~for Pt in Rinse
• 1000
A gas flow of N2 plus Cl2, with no co-reactant
gases also showed an increase of Pt compound volatility
with temperature increase:
Run 1050, at 450° C - 2.0% of Pt in Rinse Run 1118, at 900° C.- 25.0% of Pt in Rinse
Both values refer to percentage of Pt in sample.

IV.B.2. Effects of Cl2 /CO Gas Concentration Variability
58
The relationship of the ratio (by volume) of c12
to CO concentration was studied in 4 runs, all at
900° C. ov~r 4 hours, as this appeared to provide higher
yields of Pt than lower temperatures. Table VIII,
Appendix D, provides specific data& The sequence of
Cl2 io relative to CO %went as:
Run 1118 (100% Cl2) ~ Run 1202 (85% Cl2)
Run 1202 ~ Run 1303 (75% Cl2) ~ Run 1024 (63% Cl2)
The use of 75% Cl2 gave best overall yield of Pt
as well as best total attacked Pt, with Run 1024's use
of 63% Cl2 trailing slightly (54.7% of all available
Pt found in rinse). Notably, run 1303's overall yield
of 95.6% Pt was the best for all runs using the small
oval catalyst.
It is suggested that for this type of catalystt
the 75% .5% range for chlorine relative to carbon
monoxide may be an optimum, if testing at several other
temperatures at 2 to 4 hours shows similar yields.

59
IV.B.3. Effects of Time of Reactant Gas Flow
A set of 3 or more runs' data where all variables
were held identical except for gas flow time is not
available for comparison. However, 3 pairs of runs
involving samples of the small oval Chrysler catalyst
have been considered as to the effects of gas flow
time upon platinum yield. Sets of 3 or more runs data
would be moYe desi:rable in determining an optimum flow
time foT the process.
0 Runs 1024 and 1025 were each conducted at 900 C.
with 63% Cl2/37% CO flows. After 2 hours, the sample
in 1024 yielded 54.7% of its Pt in the rinse portions,
and 73.7% of all available Pt in the combined deter-
minations. After 6 hours, 1025's sample had only
yielded 84.8% of its Pt in the combined determinations,
so three times the length of flow didn't improve yield
dramatically.
At 1025° c. and the 63% ct2 /37% CO gas flows~ 2
hours (run 1216) yielded 45.4% of all Pt (in combined
fractions), with 4 hours (run 1026) giving 48.0% of
the available Pt.
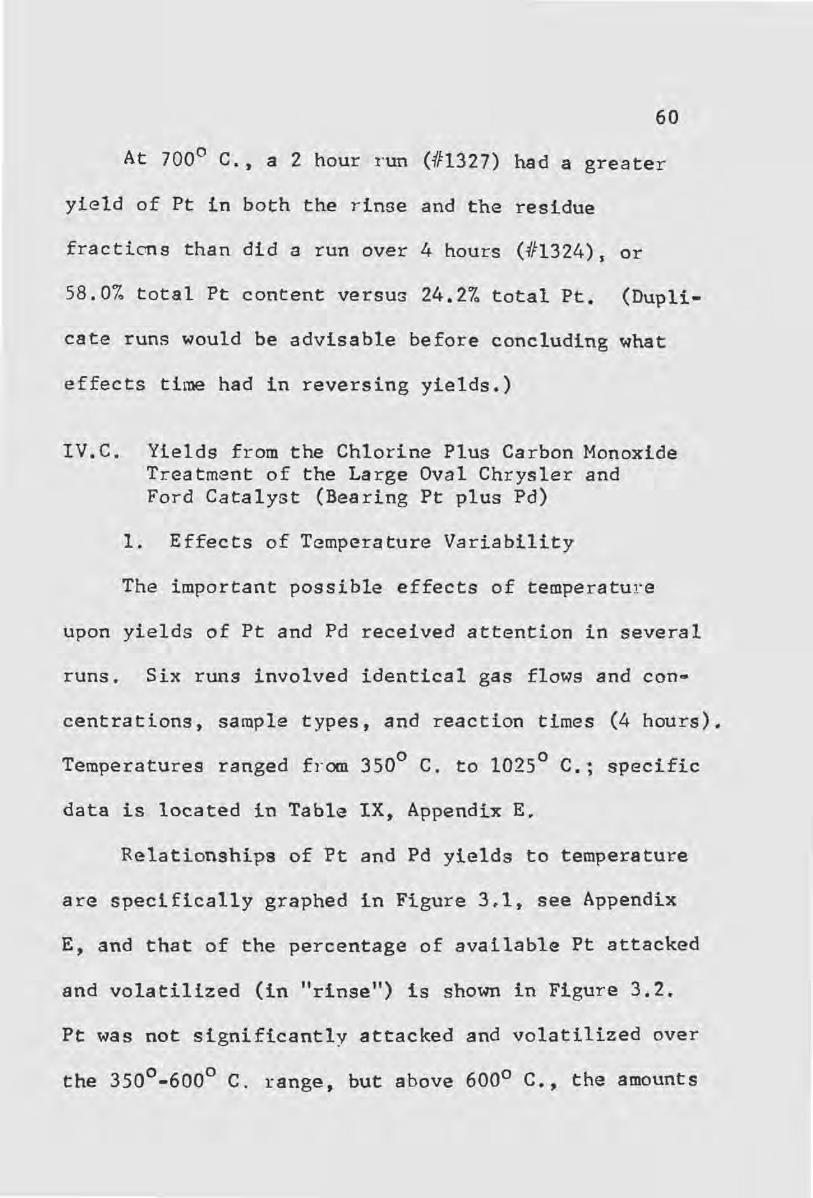
60
At 700° C&, a 2 hour run (1fl327) had a greater
yield of Pt in both the rinse and the residue
fractions than did a run over 4 hours (#1324)s or
58.0% total Pt content versus 24.2% total Pt. (Dupli-
cate runs would be advisable before concluding what
effects time had in reversing yields.)
IV.C. Yields from the Chlorine Plus Carbon Monoxide Treatment of the Large Oval Chrysler and Ford Catalyst (Bearing Pt plus Pd)
1. Effects of Temperature Variability
The important possible effects of temperature
upon yields of Pt and Pd received attention in several
runs. Six runs involved identical gas flows and con~
centrations, sample types, and reaction times (4 hours).
Temperatures ranged from 350° C. to 1025° C.; specific
data is located in Table IX, Appendix E.
Relationships of Pt and Pd yields to temperature
are specifically graphed in Figure 3~1, see Appendix
E, and that of the percentage of available Pt attacked
and volatilized (in "rinse'') is shown in Figure 3.2.
Pt was not significantly attacked and volatilized over
the 350°-600° C. range, but above 600° c., the amounts

61
increased rapidly, with no decrease over the 900°-
10250 Cc range. Conceivably, some maxima above 1000°
C~ could be deterrninedc Pd volatility paralleled
that for Pt up to 800° C., then dropped off to 4% by
1025° c.
Figure 3.2-Pt Yield Versus T~mperature
for Pt + Pd Catalyst's Treatment
60
%Pt
10
300
~for total Pt found
I I
'l 1 ~for Pt I ' in Rinse I
A pair of runs over 6 hours time and at the 63%
C1 2/37% CO concentration level allowed a comparison
between the effects of 450° C. (run 1122) and 900° C
(run 1120). Both showed similar recovered Pt levels
in the rinses (1.20% and 1.62%, respectively), but the
levels of Pt in the residue portions were markedly
lower at the higher temperature.
No analytical error could be held accountable.
Repeat~ of this set of conditions at the 6 hour level

62
might help to determine if some reversal of Pt's oxida-
tion was in effect. The same set of data showed an
increase of overall recovered Pd with an increase in
temperature (46.4% overall Pd yield at 450° C. and
76.3% Pd at 900° C) but a minute decrease in Pd carried
away from the attacked sample by sublimation (3.5%
versus 2.3%).
IV.C.2. Effects of Cl2 /CO Gas Concentration Variability
The more effective concentrations for c12 and CO
in the attack of Pt and Pd bearing S/C samples were
different from those for the platinum -- only S/C
samples. No sets of 3 or more runs identical except
for the Cl2/CO ratio were made with the Pt and Pd
catalysts; several selected pairs of runs using such
catalyst samples and identically conduct.except for the
ratio of Cl2 to CO will be discussed. Table X,
Appendix E, details yields from these pairs.
For runs 1108 and 1315, both conducted at 600° C.
over 6 hours, the higher CO concentration of the
former yielded higher overall levels of attack upon
the catalyst's Pt and Pd, i.e. 93.2% Pt versus 73.9io

63
Pt. In fact run 1108 involved the highest yields of
pl3tinum of all Chrysler large oval catalyst samples
(using the Cl2 + CO mixture)t and a rather good yield
of Pd relative to other conditions.
Overall Pt yield and Pt volatility were also
greatly increased by CO level increases in Run 1317
(37% CO) relative to run 1313J with only 25% CO.
Pd yield dropped slightly with the increased CO levels
(50.8% overall, versus 54.0% overall). But Pd in the
residue portion sample was only 35.2% (of available Pt)
for run 1317, and 50.5% for run 1313. The possibility
that higher CO levels might increase Pt volatility
but retard Pd volatility occurred to the experimenter
but was not explored in this study directly. Indus
trially, Pt recovery might receive higher priority
than Pd's due to economics; most likelys a compromise
in conditions favoring both metals stripping would
have to be sought.
At 900° C and 4 hours run time, a higher CO con•
centration for run 1128 resulted in a lower overall
yield of Pt than obtained with the 75% Cl2/25% CO

64
used in run 13065 (21.5% Pt versus 29~6% Pt ) Pt
rinse yield increased little with increased CO con
centration (9.3% Pt versus 4.3% Pt) Pd overall yield
increased slightly, with no increase in volatilized
product, with increased CO levelsw
Two runs with Ford catalyst samples suggested
that its nature might be different in some way from
that of th~ similarly-loaded (metal valu~s both
about 70% Pt and 30% Pd) large Chrysler S/C,
With both runs conducted at 850° C. over 6 hours,
run 1331's lower CO level (25% of reactant volume)
rasulted in over twice as much overall Pt yield as
in run 1129 (37% CO), and a similar increase in Pt
volatility. Palladium behavior was opposite Pt's so
far as volatility- the higher CO level meant 76.7%
of available Pd in the rinse fractions, versus 60.4%
with 25% CO in the reactant mix.
At 850° c., over 98% of both Pt and Pd contents
in both runs was either volatilized or unavailable
in the residue portions~ Lack of time prohibited
further runs with this potentially-interesting catalyst
and set of conditions.

65
IVaC.3. Effects of Time of Reactant Gas Flow
Results from comparisons of several pairs of
runs identical except time of reaction are not uniform;
no sets of 3 or more runs identical except for time
were conducted. It ·does appear that runs over 2-4
hours long were not conducive to higher Pt or Pd
yields; most extended runs saw some reversal of equili-
brium as regards Pt volatilization and attack. Pd
was continuously but slowly attacked for the duration
of all runs. Data from 4 "pairs" of runs differing
only with respect to reaction gas flow time are pre-
sented in Table XI, Appendix E.
RunG 1313 (2 hours) and 1310 (6 hours) were con
ducted with the 75% Clz/25% CO flows and at 800° C.;
increased run time did produce increases in overall
Pd and Pt yield. Volatilized Pt and Pd also increased
with run time, with Pd's change being most effected --
3.54% versus 20.4%~
IV.D. Yields of Platinum and Palladium from the Chlorine Plus Nitric Oxide T1eatment of the Large Oval Chrysler Catalyst

66
The use of NO in place of CO received attention
in 4 runs; three of these runs' samples were analyzed
and their values compared as to the effects of tempera•
ture and relative gas concentrations. Specific data
are listed in Table XII of Appendix F.
A usage of 900° C. in run 1211 resulted in a size-
able increase in Pt's volatility relative to that at
700° C. (run 1206), even though total Pt yield actually
dropped for the higher temperature run. Pd's behavior
was quite similar; values for 600° C. and 800° C~ would
be desired before drawing firm conclusions.
For runs 1212 and 1211, both at 900° C., the higher
Clz concentration in 1211 appeared to greatly enhance
overall Pt attack and Pt compound volatility, but
decreased volatility of Pd (8.23% from 26.7%).
Table XII also compares yields of Pt and Pd to
those from similar runs using Cl2/CO instead of Cl2/
NO. The NO co-reactant resulted in sharply higher
yields of Pt, and significantly higher Pd yields.
IV.E. Comparative Yields from Large and Small Oval Chrysler Catalyst Samples Under Identical Treatment Conditions

67
Several pairs of runs involving identical opera
ting conditions but different catalyst types have
been compared. Specific data are furnished in Table
XIII, Appendix G.
Of 6 such pairs, 4 show that similar treatment
yielded higher levels of chemical attack and recovery
of Pt in the small oval (Pt·bearing only) catalyst.
Only at 1025° C. and 350° C. were the large oval
cataly~t samples attacked more efficiently. At a
temperature of 350° c., with a 1.69 Cl2/CO ratio
and 4 hours reaction time! 84.3% of available Pt on
the large oval sample in run 1113 was attacked, while
only 62.6% of available total Pt on the small oval
catalyst sample was attacked. Volatility of Pt was
poor for both samples at the lower temperature.
At 900° c· over a four hour run period with a
1.68 Cl2/CO gas flow, chemical attack of the small oval
catalyst sample in run 1024 was an overall 73.7% for Pt,
versus 21 •. 1% for Pt in run 1128's sample~ 0 At 1025 C.,
the large oval catalyst sample in run 1218 was attacked
more efficiently than the small oval catalyst in run

68
1026 (65.3% total Pt versus 48.0% Pt).
It is believed that sufficient exc~ss of Cl2
volume flow existed to rule out this disparity based
on the "added" Pd content "using" so much of the c12
as to deprive the Pt of sufficient reactants. It is
more plausable that Pt and Pd chemistry in some ways .
contradict each other with respect to kinetics or other
equilibrium influences.

CONCLUSIONS
I. Treatment Process
Both platinum and palladium, as metallic "fines 11
and salts, can be stripped from their ceramic-type
supports in the automotive catalytic converts by the
promoted gas-phase attack of chlorine or by a combina~
tion of the gas-phase attack, followed by liquid-phase
rinsing of the soluble salts.
Platinum and palladium behave differently in their
response to such chemical attack under identical con
ditions (e~g. temperature, pressure, relative concentra
tion of the metal in the matrix)~ Platinum was found to
behave differently ~\'hen in combination with palladium
than \\'hen it is present alone in comparable matrices
and under identical conditions of chemical attack.
The gas-phase chemical attack upon Pt and Pd at
lower temperatures, e.g~, 300~600° c., may be as effi
cient (oxidized salt yields) as at much higher tern•
peratures, but in practice, the volatilities of any re-
69

70
sultant complexes with chlorine and carbon monoxide
or nitric oxide are not analytically or economically
significant below 700·750° C. A tenperature of 800-
9000 C. appears to be the maximum range for such
volatile complexes.
The Cl2 + NO system appeared to offer higher yields
for Pt and Pd at a given temperature, relative to c12
CO. However problems due to the corrosion of stainless
steel or other metallic handling equipment (e~g. rota-
meters) are also significantly higher for this syteme
For the small oval Chrysler catalyst, loaded with
Pt only:
- Best volatility of Pt complexes and best rate of chemical attack upon Pt appeared to be at 800-900° c.
- The lower concentration of CO at the 3.04 ratio (C12/CO) versus the 1.68 ratio favored chemical attack of the platinum.
For the large oval Chrysler catalyst and Ford
catalyst, both loaded with Pt and Pd:
- Maximum or best levels of chemical attack of Pt were at 450° to 800° C. 1 but with highest volatility for its complex with c12 and CO at 900-1025° c.

• Maximum levels of Pd chemical attack and of complex volatility were at 700°-9000 C.
- Platinum in such catalysts was attacked to
71
a greater extent at higher CO concentrations (lower Clz/CO ratio) than at lower concentrations, This was contrary to its behavior in the Pt-only catalyst.
- Under the conditions established for experimental study, a 2 hour reaction time was sufficient. It '~as observed that for reaction times over 4 to 6 hours, some previously-volatilized Pt might have been reduced and rendered unavailable for analysis, For Pd no such reversal of equilibrium occurred -- longer reaction times yielded more Pd salts.
The tendency for recovered palladium salts to be
concentrated further along (downstream) the reactor
tube system suggests that the complexes responsible for
its volatility '\-1ere more thermodynamically stable at
lower temperatures and/or had higher melting and boil-
ing points, relative to the comp1exes responsible for
platinum volatility. No conclusions could be drawn
as to an exact nature of such complexes, without deter-
minations of elemental composition and molecular
weights, etc.
II. The Analytical Procedure

72
The procedure is applicable to the concentration
levels suggested in the original literature. However,
the ten-fold difference between the relative standard
deviations report~d by the procedure's developers and
those achieved in this study suggest inaccuracy in the
previously reported values and/or in the application
of the procedure in the study. The high cost of the
platinum metals encourages and improves the economics
of anv feasible recovery system, but the low concen
trations of the PG1 in catalytic converter materials
mean that a lot of the capital and labor costs in a
system for the PGM, s recovery will be for cheap or
worthless by-products. High uncertainties and relative
standard deviations cast uncertainty on projected
efficiencies at any set of conditions --i.e., in run
1303 (a small oval Pt-bearing catalyst sample) the
overall recovery was found to be 95.6%, but with a t
27.3% uncertainty. 62% recovery of Pt versus 95%
recovery could make some difference in profitability
for a system.
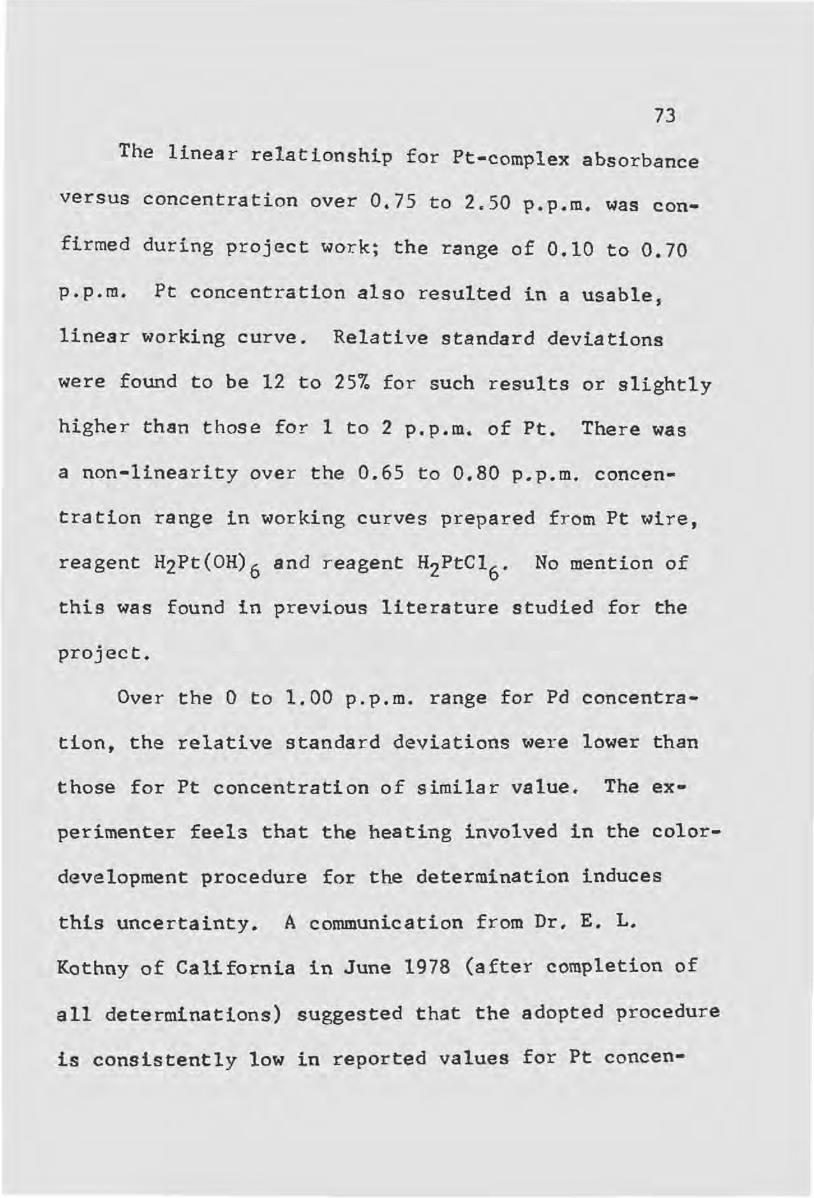
73
The linear relationship for Pt-complex absorbance
versus concentration over 0.75 to 2~50 p.p.m. was con
firmed during project work; the range of 0.10 to 0.70
p.p.m. Pt concentration also resulted in a usable s
linear working curve. Relative standard deviations
were found to be 12 to 25% for such results or slightly
higher than those for 1 to 2 p.p.m. of Pt. There was
a non-linearity over the 0.65 to 0.80 p.p.m. concen
tration range in working curves prepared from Pt wire,
reagent H2Pt(OH) 6 and reagent H2PtC16 • No mention of
this was found in previous literature studied for the
project.
Over the 0 to 1.00 p.p.m. range for Pd concentra
tion, the relative standard deviations were lower than
those for Pt concentration of similar value~ The ex
perimenter feels that the heating involved in the color
development procedure for the determination induces
this uncertainty. A communication from Dr, E. L.
Kothny of California in June 1978 (after completion of
all determinations) suggested that the adopted procedure
is consistently low in reported values for Pt concen-

74
tration whenever Pd is presents and also stated that a
combination of his procedure for Pt, plus a separate
use of the NDA reagent in determining Pd, would be more
reliable and accurate.
III. Application of this System
The Cl2 plus CO gas-phase treatment approach to
platinQ~ metals removal will require further refine
ment of reactor design and research on optimum condi·
tions to promote volatility of its ptoducts prior
to a demonstration-level application to industrial
use. The Cl2/NO pair will be more difficult, due to
NO's greater costs~ Effluent c12 and CO from one
reactor can be recycled, converted to innocuous by
products by currently available technology used for
pollution control in a number of industries, or
perhaps separated, with the CO directed to use as a
reducing agent elsewhere in a platinum metals pro•
cessing plant.
Next to o2 , c12 is industry's least expensive
oxidizing gas. It can be produced onasite by small-

to medimn•sized electrolytic units or transported
into a plant, according to economics~
75
CertainlyJ the secondary reclamation of the plati•
num metals is becoming a serious consideration for the
U.S., with fewer primary sources and constantly rising
prices. Recycling of the catalytic converter units
will likely be mandated by federal authority if not
by demands of private industry.

APPENDIX A 76
TABLE I. EXPERil·lENTAL RUNS, FEATURIHG PLUG FLO\'l OF REACTANT GASES THROUGH SI1ALL OVAL CHRYSLER CATALYST SAlviPLES
Run ., Tt
1007 1010 1016 1017 1018 1019 1024 1025 1026 1 0)1 1050 1101 1 111 111 5 1118 1202 1216 1"503 1 32L~ 1)27
.. ori' 1' • li .J....£J.
Samnle Size
(grarns)
3.00 3.00 4.50 3.00 3.00 3.50 3.00 4.50 3.00 2.50 2.50 ).00 3.00 3~00 ).00 3.00 3~00 3.00 ::;.ou 3~00
358 4 450 4 600 9 700 4 800 4 910 4 900 4 900 6
1025 4 450 4 450 3 600 4 350 4 700 4 900 4 900 4
1025 2 9UO 4 700 6 700 2
Gas Flows in 10-6m/s (measured in cc/s) Cl 2 CO N2
2.13 1.20 6.32 2.13 1.30 5.54 2.13 1.25 5.54 2.13 1.25 5.54 2.13 1.25 5.54 2.13 1.26 5.54 2.24 1.33 5.54 2.24 1.33 5.54 2.24 1.30 5.54 2.24 1.33 5.54 2.24 5.54 2.24 2.02 5.54-2.24 1.33 5.54 2.24 1~33 5.54 2.24 5.54 2.24 0.40 2.02 2.13 1.26 3.50 2.13 0~70 3.50 2.13 0.70 3.50 2.13 Oc70 3.50
1.78 1.64 1.70 1.70 1.70 1.69 1.68 1. 68 1.72 1.68
1 • 11 1 ~ 68 1 c 68
5.60 1. 68 3.04 3.04 3.04
Run numbers relate to the 1977-1978 dates upon \•lhiC11 they \'Jere performed, eeg., U1Q07" Oll 10/7/77, "1324 11 on 1/24/78.
Heating of the downstream end of the reactor tube \vas performed \aJ'i th Runs 1111 through 1327. Temperatures of 300-360°C \·Jere maintained by means of a heating tape.

APPENDI;{ A. 77
TABLE II. EA.PERII'·IEliTAL RUl~S, FEATURiliG PLUG FLO~,v OF REACTANT GASES THROUGH LARGE OVAL CHRYSLER Al~D FORD CAT.ALYST S.A.iviPLES
Sa1nple Run Gas Flows in 10-6m/s v T' Si3e Tbm). Time (measured in cc/s) Ratio .nilll
I
(gr9..rJs) (H) Cl2/CO if ( c Cl2 co }J 2
1014 4.00 600 4 2.13 1.25 5.54 1.70 1021 4.00 800 4 2.13 1.26 5.54 1.69 1104 4.00 475 4 2.24 1.33 5.54 1. 68 1103 4.00 600 6 2.24 1.33 5.54 1.68 111) 4.00 350 4 2.24 1.33 5.54 1 e 68 1120 4.00 900 6 2.24 1. 33 5.54 1. 68 1122 4.00 450 6 2.24 1.33 5.54 1. 68 1128 4.00 900 4 2c24 1.33 5.54 1.68 12vG 4.00 700 4 2.13 0.40* 3.50 5.27** 1207 4~00 900 2 2 e 13 0~40* 3.50 5.27** 1 211 4.00 900 4 2.13 0440* 3.50 5.27** 1212 4.00 900 4 0.90 0.32* 3.50 2.80** 1218 4.00 1025 4 2.13 1.30 3.50 1. 64 1:506 4.00 900 4 2.13 0.70 3.50 3.04 1 510 4.00 800 6 2.13 0.70 3.50 3.04 1 )13 4.00 800 2 2.13 0.70 3.50 3.04 1315 4.00 600 6 2.13 Ou70 3.50 3.04 1 )17 4.00 800 2 2.13 0.70 3.50 3.04
Usir1g Ford catalyst sarnples:
1129 5.00 850 6 2.24 1.33 5.54 1. 68 1)31 5.00 850 6 2.03 0.70 3.50 2.90
-x- Tl1ese values represent a flo'"' rate for nitric oxide (NO), used in place of carbon monoxide (CO).
** These values represent the volume to volume ratio for the use of chlorine and nitric oxide gases.
NOTE: The dov~stre~~ end of the reactor tube was heated to 230-400 C during all the above r1ll1s, v1ith the exception of Runs 1014 and 1021.

APPE1IDIX A
TABLE III.
'l it
1007 1010 1016 1 017 1018 1019 1024 1025 1026 1031 1C50 11 01 1 1 1 1 111 5 1118 1202 1210 1)0j 1)24 1)27
Tell!.n. (oc)
358 450 600 700 800 910 900 900
1025 450 ~-50 600 350 700 900 900
1025 900 700 700
78 YIELDS OF PLATilim~1 CONTEl~T FROI•I TREAT1:IE1JT OF THE St·IALL OVAL CHRYSLER CATALYST
Pt Found* in Rinse (~b)
0.44 3.20 8.2 8.04
30.8 44.9 54.7 69.9 38.9 7.12 1.96 3. 51 1.83 5.)8
25.1 14.6 35.7 62.2 8.01
11 • 5
c;o.02) (+0.70)
!+2.3) ;1.90) ;8.4) +12.6 +13.6 ;10.2 +10.0 -1.84 + -0.64 :t 1 11
+ • :; +9.2) ;4.0) -9.9)
~ ;18.~~ -2 10 +-.· (-J.6)
Pt Found* Pt in Rinse in Total relative to Total
(%) (ratioe100%)
74.5 !;7.8) 0.6 54.4 +12.7) 5.9 36.7 '+9.4) 22.3 40.2 ;9.9) 20.0 66.8 (-17.5) 46.1
73.7 ~;18.6) 74.2 84.8 -14.1) 82.4 64.8 !13.1) 60.0
21 .1 62.6 26e6 49.3 51.2 45.4 95.6 24.2 58.0
16 e 6 2~r9
20.2 50.5 28.5 79e0 65.1 33.1 19.8
* Pcrcc:1tages of Foru1d Pt refer to the percentage of the Pt content amenable to chemical attack v1i thin sar:1ple (speciraen) determined in the portion. ·Total Found Pt is a summatio11 o.f tl1e determinations of Rinse(s) ru1d Residue from a sample.
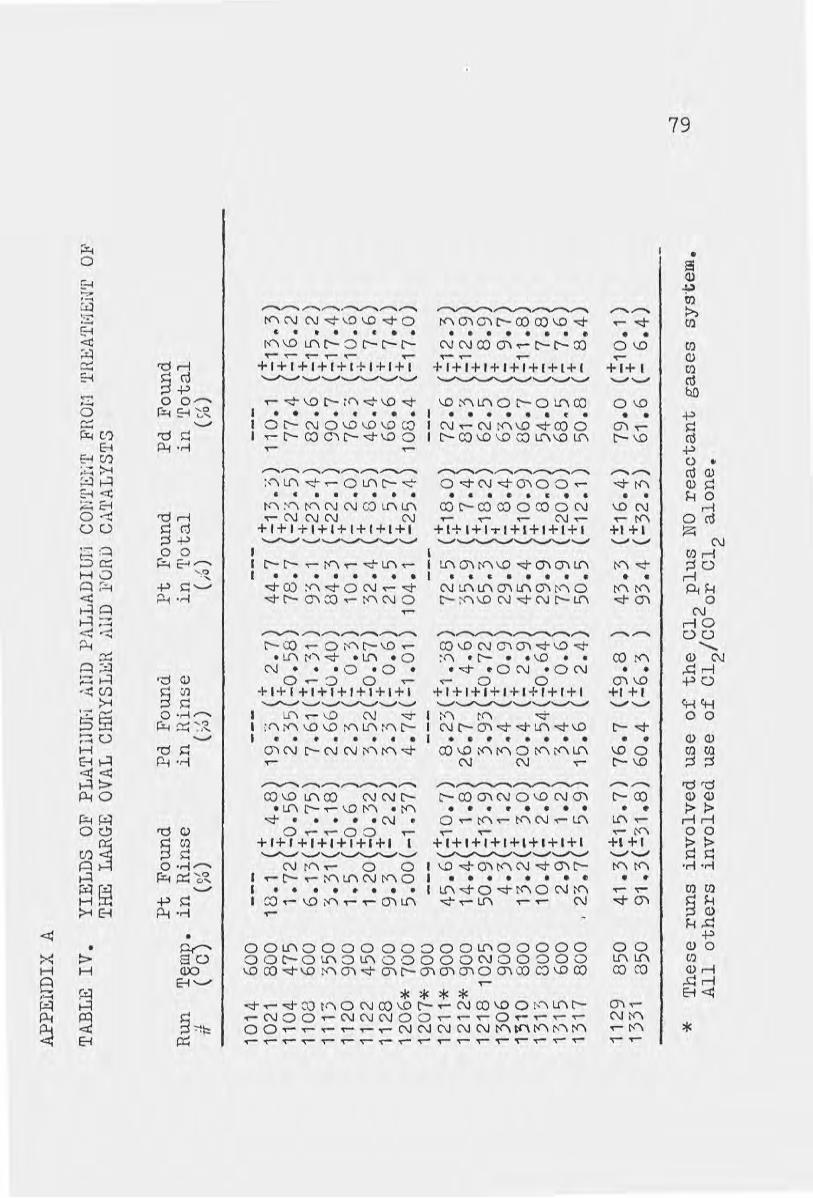
AP
PE
liD
IX
A
TA
BL
E
IV.
YIE
LD
S
OF
PLA
TIU
UI·l
A
1ID
l'A
LL
AD
IUI·'
l CO
Nr.L
'EJ:i
T FH
OI·1
TR
EATI
-'IEH
'l' O:
B' T
HE
L
AR
GE
O
VA
L
CI-I
RY
SLEH
. A
UD
li'
OR
D
CA
TA
LY
ST
S
Run
il
Pt
Fo
un
d
Tem
12.
in R
inse
( °
C)
(~b)
1014
60
0 10
21
80
0
11
04
47
5 11
08
600
1113
35
0 1
12
0
90
0
1122
4
50
11
28
900
12
06
*
700
12
07
*
90
0
1211
* 9
00
1212
-K-
900
1218
102
5 13
06
900
1;1
0
80
0
13
13
8
00
1
31
5
60
0
13
17
8
00
18
.1 (~
4
.8)
1.7
2(-
0s5
6)
6.13(~1.75)
3.31
(+1.
18)
1.5
~-0.6
) 1
.20
:!:
o.32
) 9
.3
:!: 2
.2)
5.0
0(-
1 ..
37
)
45.6~~10.7)
14
.4-
1.8~
50
.9 $
13.9
4
.3-
1.2
1
3.2
(! 3.
0l 1
0.4
(! 2
.6
~+
2.9
-1
.2
I 2
3,7
:!:
5.9
Pd
F
ou
nd
in
Rin
se
(?~)
11
29
8
50
1
33
1
85
0
41.3
(±15
.7)
76.7
(±
9.8
)
91
.3(!
31
.8)
60
.4
(!6
.3
)
Pt
Fou
nd
in T
ota
l ( i
b)
44
.7
78
.7
9)
.1
84
.3
10
.1
32
.4
21
.5
10
4.1
72
.5
)5.9
65
fl3
29
.6
45
.4
29
.9
73
.9
50
.5
43
.3
93
.4
Pd
Fou
nd
in T
ota
l (>
6)
11
0. 1
7
7.4
8
2.6
9
0.7
7
6,.
3
46
.4
66
.6
1 OE3
. 4
72
.6
81
.3
62
.5
63
.0
86
.7
54
.0
68~5
50
.8
79
.0 (~
10.1
) 6
1.6
(-
6.4
)
* T
hes
e ru
ns
inv
olv
ed
use
o
f th
e
c12
plu
s NO
re
acta
nt
gase
s sy
stem
. A
ll
oth
ers
in
vo
lved
use
o
f 0
12/C
O
or
01
2 alone~
-..J
\.
0

APPENDIX B 80
TAll~..JE V. DISTRIBUTION OF SUBLIMED YIELDS FROl'l TREATr~lENT OF THE S!·IALL OVAL CHRYSLER CATALYST
For Type III Runs1 :
Heat Amenable Pt .Amenable Pt Rm1 TBmn. Time Tape Tube Rinse Adap/Trap Rinse Ratio2
, ( c) (H) Used? (%) (%) if Yields
1031 450 4 No 6.77 0.35 10 ~ _.~.)
1115 700 4 Yes 3.98 1.40 2.8 1118 900 4 Yes 24.6 0.49 50.2 1202 900 4 Yes 12.7 1. 90 6.7 1019 900 4 l'Jo 44-.9 7.92 5.7 1024 900 4 No 3.82 53.2 0.1 1025 900 6 No 68.2 1.72 --o 7 )..~. 1)0) 900 4 Yes 59.1 3.16 18~7 1216 1025 2 Yes 25.1 10~6 2.4 1026 1025 4 No 25.9 13.0 2.0
ALL RlliiS EXCEPT 1118 (no CO added) and 1303 (a 3.04 ratio) V~RE CO:NlJUCTED \'liTH A Cl2/CO VOLID·JE FLOvl RATIO OF 1.68. 1Type I Collection: For the sample, Rinses of the
Reactor Tube, Adapter, and Trap were collected and ru1alyzed independently, follov1ing the run.
Type II Collection: Rinses of the Tube and Adapter were collected and analyzed together, with the Trap Rinse processed separately.
Type III Collection: The Tube Rinse and Adapter+Trap Rinse v1ere collected and analyzed independently~
TJ~e IV Collection: All Rinse factions were analyzed together.
From runs involving samples from gas-phase treatment of tre small oval Chrysler S/C, no Type I collections \vere made; Runs 1324 &1 327 \vere collected in the Type II manner; Runs 1007, 1010, 1011, 1016 & 1017 \verc collected in tl1e Type IV manner; all others \vere collected as per Type III. 2 "Ratio Yields" denotes the quotient of the percentage
of sample's amenable ·Pt in the Tube Rinse divided by the percentage of sample's amenable Pt in the Adapter plus Trap Rinse.

APP
E:t-I
DIX
B
TABL
E V
I.
DIS
TR
IBU
TIO
N
OF
SUB
LIM
ED
Y
IEL
DS
FRO
I·l
TREA
TI11 1E
NT
OF
THE
LAR
GE
OV
AL
CH
RY
SLER
C
ATA
LYST
PART
1
. T
ype
II R
un R
esu
lts.
1
Clf
/CO
A
men
able
P
t/P
d
Am
enab
le P
t/P
d
Rati
o2
Run
To
m).
Tim
e R
a io
T
ub
e/A
dap
t R
inse
T
rap
R
inse
Y
ield
s #
( c
(II)
(V
/V)
(%)
(%)
Pt
Pd
1315
60
0 6
3.0
4
2.6
8/
2.6
0
0.2
1/
0.7
8
12
.8
3.3
13
17
80
0
2 1
. 69
21
.8 /1
1.7
1
.96
/ 3
.90
11
• 1
3
.0
1313
8
00
4
3.0
4
9.4
9/
3.3
9
0.8
7/
0.1
5
10
.9
22
.6
13
10
sa
o·
6 3
.04
1
2.9
/ 1
2.9
0
.28
/ 7
.55
4
6.1
1
.7
1 Typ
es
of
co
llecti
on
patt
ern
s are
d
esc
rib
ed
\vi
th T
able
V
. R
uns
co
llecte
d
in t
he
Typ
e II
I p
att
ern
are
li
ste
d in
Part
2
of
this
T
ab
le.
Run
s 1
12
0,
1122
&
1306
v1e
re
co
llecte
d in
th
e
Typ
e I
patt
ern
, w
ith
no
sa
mp
les
inv
olv
ing
sa
mp
les
of
the la
rge
ov
al
Ch
rysl
er
S/C
co
llecte
d i
n t
he
fyp
e IV
man
ner
.
211 R
ati
o
Yie
ldn
d
en
ote
s th
e
qu
oti
en
t o
f th
e
perc
en
tag
e
of
sam
ple
's
amen
able
Pt
(or
Pd
) in
th
e
Tu
be/
Ad
apte
r R
inse
d
ivid
ed
by th
e p
erc
en
tag
e
of
amen
able
P
t (o
r P
d)
in t
he
Tra
p R
inse
.

APP
END
IX
B
TA
BL
E
VI.
D
IST
RIB
UT
ION
O
P SU
BL
II•i
ED
Y
IEL
DS
lt'
HQ
H
TR
EA
TM
EN
T
OF
THE
LAR
GE
OV
AL
CHRY
SLER
CA
TALY
ST
PAR
T
2.
Ty
pe III
Ru
n R
esu
lts
Cl~/
CO
Am
enab
le
Pt/
Pd
A
men
able
P
t/P
d
Rati
o
1 R
un
T@m)
• T
ime
R t
io
Tub
e R
inse
A
dap
t/T
rap
R
inse
Y
ield
s 'J.
( c
(H)
(V/V
) (I~)
( ~~)
P
t Pd
ff 11
13
3
50
4
1. 6
8 1
.79
/ 2
.50
1
. 52
/ 0
.16
1
• 2
15
.6
1104
47
5 4
1.6
8
1.4
7/
2.35
0.2~/
0 5
.88
1
10
8
60
0
4 1
. 68
4
.00
/ 1-
.98
2.1
3/
5.6
3
1 .8
8
0.3
5
1021
80
0 4-
~ 1
. 68
1
0.2
/1
3.8
7
.86
/ 5
.51
1
.30
2
.50
1
12
8
900
4 1
.68
8
.84
/ 2
.17
0
.51
/ 1
.06
1
7.3
2
.05
1
21
8
10
25
4
1-.6
9 4
5.5
I
2 .. o
s 5
.36
/ 1
.85
8
.49
1
.12
1n
Rat
io
Yie
lds
11
den
ote
s th
e
qu
oti
en
t o
f th
e
perc
en
tag
e o
f am
enab
le
Pt
(or
Pd
) in
th
e
Tub
e R
inse
d
ivid
ed
b
y th
e
perc
en
tag
e o
f am
enab
le P
t(o
r P
d)
in th
e
Ad
ap
ter/
T
rap
R
inse
.

APPENDIX C
CALCUUTION OF METAL CONCEi~TRATION VALUES FROM COLORIMETRIC DETERl1I~lATION OF PT AND PD
83
The following represents a summary of the calcu-
lations of values for a run's analytical results;
values for Pt content from run 1018 (a Pt•only sample)
have been selected for an example. "Residue" refers
to the solution of metal(s) dissolved from the
chemically~attacked S/C sample following a gas-phase
run or equivalent liquid-phase attack procedure using
aqua regia. "Rinse," or "Tube Rinse," etc. refers to
a solution which has resulted from the collection of
PGM-bearing sublimates from the inside walls of the
reaction glassware following a run. Sequentially,
each result was processed a~ follo~~s:
1. The average of the absorbance values from the 3 to 6 aliquots color developed is calculated. This aver·aged result .rtt· resents the absorbance due to Pt plus Pt complexes in solution. For example, the net average of 4 color developed aliquots' absorbances - 0.220, .215, .220 and .211 was 0.217.

84
2. Any absorbance value at 525 nanometers fo1 the non-color developed aliquots is due to Pd or other ions complexed w/NDA~ Such a value is usually zero for the Pt-only catalyst. For run 1018's 3 non-color developed aliquots, there was no absorbance; hence a conclusion of no Fe or Pd content was made.
3. The value for absorbance due to total Pt + Pd (or Pt) is co-ordinated with the correspond• ing concentration for the Pt-NDA complex known to give such a value for "absorbance." This is done on a previously plotted graph of A versus Pt concentration. Parallel maxima and minima for each point on the curve allow determination of error for a determined value of Pt~
For example, A of 0.217 corresponded to 0.94 (t.l2) p~p.m. Pt.
4. Grams Pt i11 the sample are then determined by the relationship formula:
Grams Pt : (Concentration (in p.p.m.))•l0-3 ·
• (''Dilution factor") • (volume of sample in mL/divided by 1000 mL)
Where "Dilution factor·n refers to the quotient of the original sample ("master") volume divided by the accurate volume of that sample in the aliquot used for Pt determination. Such dilution factors may range from 1 to 100 or more.
For run 1018's residue sample,
- ( (+ 2) ) lo--3 · (~) • Grams Pt - .94 -·1 p.p.m. · L
( SOmL ) or TOOOmL ' '

85
1.18 (!0,15) x 10·3 grams Pt in the sample.
S. At this point, the determined values of Pt (and Pd) per gram S/C sample are multiplied against the original sample weight used in the run.
In this example,
1.14 (!0.15) x lo-3grams Pt • 3e00 grams sample per gram s/c
gave 3.42 (~0.45) x 10•3 grams Pt present.
6. \~ere more than one set of aliquots have been developed for a sample, such as 2 sets, each on a separate lab date, the values for each date's sample can be combined and average, for a more accurate value. For example, a later date's analysis of the run 1018 residue sam~le yielded a value of 1.28 (.0«15) x 10· grams Pt. An average of this value and that from the first determination would be 1.23 (t0~15) x lo-3 gram Pt.
7. The percentage of the total available Pt obtained by the run (chemically attacked) is calculated by this relationship:
io available Pt = recovered by run
X 100%
Value for Pt obtained (grams) value for available Pt (grams)
For example, for run 1018,
1.23(~.15) x 10-3 grams x 100%: 36.0(t9.14)% 3.42(t.42) x lo-3 grams
Platinum in the various rinse samples resulting from the run could be calculated, and a total compared to the total available Pt in the

original sampJe.
8. Palladium must be calculated wherever evidenced in the non-color developed aliquots for a sample; the values for absorbance
86
due to Pd al"e subtracted from those for Pt Pd prior to calculation of Pt concentrations. as in step 31;
9. The uncertainty % given in step is derived by a calculation based on the absolute uncertainties for each value, e.g., a relation of p(uncertainty) = result % • (~ + ~).
A B
(Where A and B are the dividend and divisor values, and a and b are their respective uncertainties.)
For example for the 1018 "residue,"
A - 1.23 X 10⁻³ Pt and a - !~15 X lo-3 g Pt - g -B - 3.42 X lo-3 g Pt and b - !'~45 X 10-3 g Pt - -p .. 36.0 • ( .15 + &) : 9.14(%) -
1.23 3.42
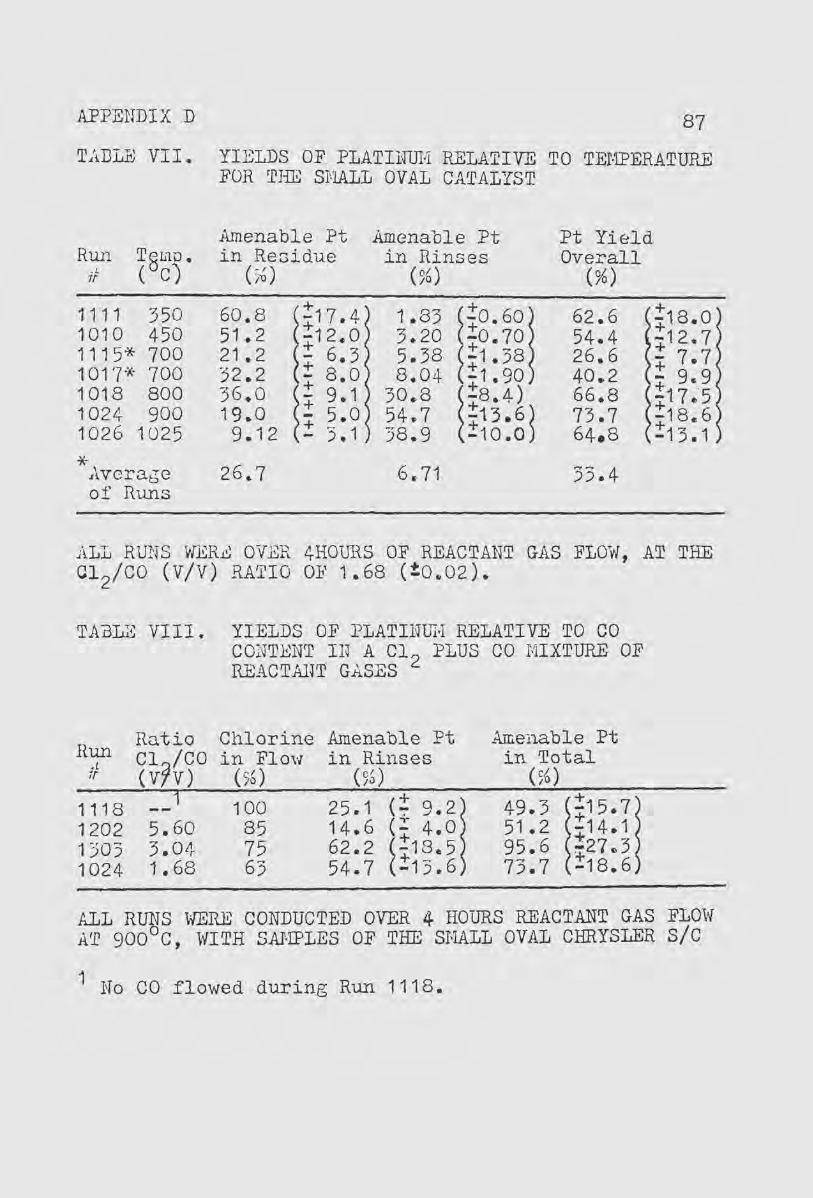
APPENDIX D 87
T.ADLE VII. YIELDS OF PLATilTU11 RELATIVE TO TEr·1PERATUP~ FOR TJffi Sl1ALL OVAL CATALYST
Amenable Pt Amenable Pt Pt Yield Run T~LlP. in ReGidue in Rinses Overall
I ( c) ( ~~) ( ~6) (%) if
1 1 1 1 350 60.8 !~17.4 1.83 ~~0.60l 62.6 ~~18.0) 1010 450 51.2 +12.0 3.20 +0.70 54.4 +12.7 1115* 700 21.2 - 6.3 5.38 ~+1.38 26.6 - 7.7 1 01 7•A- 700 )2.2 ! 8 0 8.04 40.2 +
+ • ;1.90 - 9c9 1018 800 36.0 1+ 9.1 30.8 !-8.4) 66.8 1024 900 19.0 + 5.0 54.7 ~13 .6 ~ 73.7 ~18e6~ 1026 1025 9.12 - 3.1 38.9 -10.0 64.8 -13.1
* 26~7 6.71 .Avcrat;e 33.4 of nuns
.ALL RUrJS Vf£R~ OVER 4HOilltS OF REACTAl~T GAS FLOW, AT THE Cl2/CO (V/V) RATIO OF 1.68 (±Oe02).
TA:OLE VIII. YIELDS OF PLATil'Jill·I RELATIVE TO CO COl~TBNT Il~ A Cl
2 PLUS CO r~1IXTURE OF
IlliliCT.AlJT GASES
llatio Chlorine Amenable Pt .Ame11able Pt Itun Clt/CO in Flov1 in Rinses in Total .£
if (V V) (55) (5~) (5~)
1118 1 100 25.1 (; 9.2l 49.3 (~15.7l
1202 5.60 85 14.6 <; 4.0 51.2 +14.1 1303 3.04 75 62.2 ~+18.5 95.6 1+27 .. 3 1024 1. 68 63 54.7 -1)e6 73.7 -18.6
ALL RUNS \illllli CONDUCTED OVER 4 liOURS REACTANT GAS FLO\~ AT 900°C, \iiTH SAI'vil?LES OF Tlill SI·'lALL OVAL CHRYSLER S/C
1 l\To CO flowed during Run 1118.

APPENDIX D 80
88
YIELDS OF PLATINUM AS A FUNCTION OF ~ ~ I TEr'lPERATURE, USING Cl2 /CO TREATJ.YIENT ---=-~
75
70
50
45 I
35
30
25
20
15
10
FIGURE 2.1
OF THE SMALL OVAL CHRISIER CATALYST -- -- - - -----
- -- -----
-=---l -1-------
Legend ·= Rinse Yield for Pt e- Total Yield for Pt
from Run's determinations Y-axis--Each increment
1 represents 1% of amenable Pt in sample/
X-axis--Each increment 0 represents 12.d C
(over 350-1050 C 1
-----500 600 700 800 900 1000

APP
EN
DIX
E
TA
BL
E
IX.
YIE
LD
S O
F PL
AT
INU
l1
AN
D
PAL
LA
DIU
!·I
AS
A F
UH
CT
ION
O
F T
EI•
1PE
RltT
UR
E
IH
TI-IE
TR
EATI
··lEH
T O
F TH
E LA
RG
E O
VA
L T
YPE
C
AT
AL
YS
T
.Am
enab
le
Pt
Am
enab
le
Pd
Am
enab
le
Pt
Am
enab
le
I)d
Run
Tg
m).
in R
inse
s in
Rin
ses
in T
ota
l i1
1 T
ota
l JL
(
c (~6)
( ;6)
(%
) (1~)
Tt
11
13
35
0 3
.31
!~
1.~8~
2.6
6 ~;
0.40
~ 8
4.3
1
;22
.1)
90
.7 ~~17.4~
1104
45
0 1
.72
+
0.5
6
2.)
5
+0
.58
70
.7
+2~.
2)
77
.4
+16
.2
11
08
6
00
6
.13
+
1.7
5
7.61
+1
.. 31
9
' • 1
+
2 2 " ~
-)
82 ..
6 -1
5.2
10
21
80
0
18
.1
-4
.8)
19
.3
(+2
.7)
44
.7
+1
).3
) 1
10
.1 ~in.6)
11
28
9
00
9
.3
(:!: 2.2~
).3
(-
0 .. 6
) 2
1.5
~+ 5
-7~
66
.6
+ 7
s4)
12
18
1
02
5
50
.9
(:!:1
3 .. 9
3
.93
(!
0 .. 7
2)
65
.3
-18
.2
62
.5
(-8
.9)
AL
L RUl~S
vTER
E C
OlJ
DU
CT
ED
A
T A
REA
CTA
NT
GAS
FLOW
RA
TIO
O
F 1
"69
(C
l 2/C0
) OV
ER
4-H
OU
RS ..
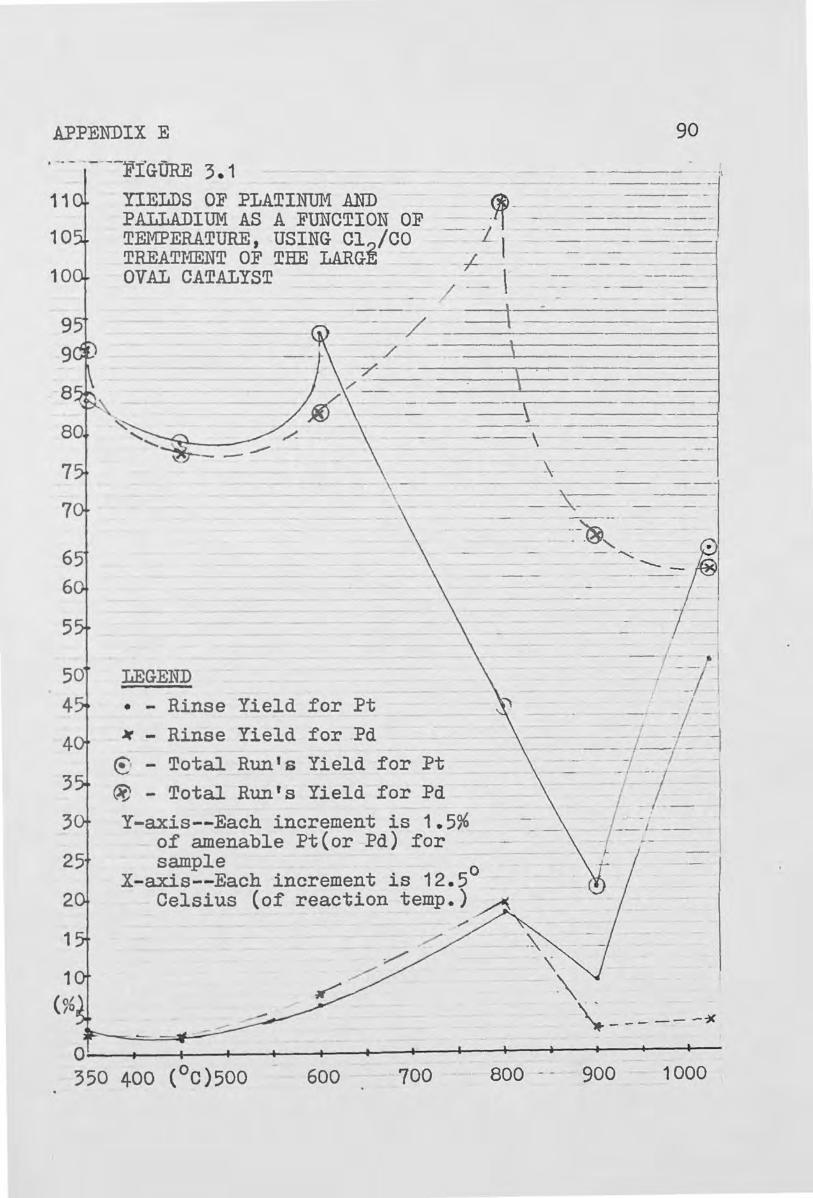
APPENDIX E 90
11
10
10
9 9
8
7
7
6
5
4
3
3
2
1
1
- --Fi~GfiRE 3. 1
YIELDS OF PLATINmi .AND PALLADIUM AS A FUNCTION OF TID1PERATURE , USING 012 /CO TREATI,IENT OF THE LARGE OVAL CATALYST
- i~ --1- I
/ - - \ ==l------1
. \ . . ---~-\ ----- ------~
LEGEI~D
• - Rinse Yield for Pt ~ - Rinse Yield for Pd
\-
€ - Total Run 1 s Yield for Pt ® - Total Run ' s Yield for Pd
Y-axis--Each increment is 1. 5% o£ amenable Pt(or Pd) for
- \ ___ , ---
sample 0 X- axis--Each increment is 12 . 5 Celsius (of reaction temp . ) ~
\
~ \
-~ __-- .I
~-·:-~~ -
\
- "' - -._
- ; - I - -- 1 I
' __ ; -_ . -! -
' - -1 ]_- - 1
-; --.; I - J __
; __ -J· --
\ ~ -- -~ ·- _..-
o~~--~--~--~~--~--~--~-+--~--+-~~~--
350 400 (°C)500 600 700 800 -- 900 1000

AP
PE
liD
IX
E
TA
BL
E
X.
YIE
LD
S
OF
PL
AT
IHU
I!
AN
D
PAL
LA
Diil
l·I
AS
A F
UN
CT
ION
O
F TH
E R
EAC
TAN
T G
ASE
S CONCElJTRATIOl~S
Run
# 11
08
1315
11
28
13
06
1317
13
13
11
29
13
31
Cl?
/CO
R
ati
o
(V/V
)
1.6
8
3.0
4
1. 6
8 3
.04
1.6
8
3.0
4
1. 6
8
3.0
4
Am
enab
le
Pt
in R
inse
s ( ~
6)
6.1
(~ 1
.8)
2.9
(-
1.2
9.3
(~
2.2
) 4
.3
( 1
.2)
23
.7 (~ 5
.9)
10
.4 (-
2.6
)
41
.3
(-++}
7.5,
7)
91
.3
(-j1
.8)
Am
enab
le
Pd
in R
inse
s (~~)
7.6
3
.4
3.3
3
.4
15
.6
3.5
76.7
6
0.4
(~ 1
.3)
(-0
.6)
(~ 0
,6)
(-0
.9)
c; 2
-4)
(-0
.6)
c; 9
.8)
(-6
.3)
lun
enab
le
Pt
i11
T
ota
l-x
-( ~
6)
93
.2 (~
23 ..
4)
7).
9
(-2
0.0
)
21
.5 (~
5.7
) 2
9.6
(-
8.4
)
50
.5 (~
12.1
) 2
9.9
(-
8.0
)
43
.3
C$1
6.4)
9
3.4
{-
32e3
)
An1
enab
le
Pd
in
To
tal
( ~6)
82
.6
68
.5
66
.6
63
.0
50
.8
54
.0
79
.0
61
.6
(~15.2)
(-7
.6)
(; 7
.4)
(-9
.7)
(~ 8
.4)
(-7
.8)
(~10.1)
(-6
.4)
* T
ota
l re
fers
to
th
e v
alu
e fo
r to
tal
met
al
co
nte
nt o~
the
sam
ple
, u
suall
y
the
sum
o
f in
dep
end
ent
valu
es
for
the
2 o
r m
ore
Rin
se fr
acti
on
s an
d th
e
Res
idu
e fr
acti
on
, an
d
com
par
ed t
o th
e f
igu
re
for
amen
able
P
t o
r P
d fr
om
an
am
ount
o
f sa
mp
le
of
that
run
's siz
e.

APPEl~DIX
E
TA
BL
E
XI.
Y
IEL
DS
O
F PL
AT
INill
•1
AlJD
PA
LLA
DIU
I·1
AS
A F
UIJ
CT
IOli
OF
TI{
\IE
FOR
R
EAC
TAN
T G
AS
FL
O\i
RUl~
VA
RIA
BL
ES
R
un
T~m~.
Rat
io
Tim
e ll
( C
) (C
l 2/C
O)
(H)
1104
11
22
13
17
10
21
11
28
1
12
0
13
13
1
31
0
450
450
80
0
80
0
90
0
90
0
800
80
0
1. 6
8
1.6
8
1. 6
8
1. 6
8
1. 6
8
1.,
68
3.0
4
3.0
4
4 6 2 4 4 6 2 6
Perc
en
tag
e
of
I~Ietal
Rela
tiv
e to
Actu
al
Co
nte
nt
in S
ampl
e ~G P
lati
nu
m
~~ P
alla
diu
m
In R
inse
In
To
tal
In R
inse
1.1
2
<;o
.56
) 7
8.7
(;
23
.5)
1.2
0
(-0
.32
) 3
2.4
(!
8.5
)
23 ..
7 18
.1
9.3
5
1.5
1
0.4
1
3.2
+
(+6.
0)
(-4
.8)
(~2.
18)
(-0
.6)
<;~.60)
(-.)
8 00
.)
50
.6
44
.7
21
.6
10"
1 2
9.9
45
.. 4
(~12.2)
(-1
3o
3)
(~ 5
.7)
(-2
.0)
c; a.
o)
(-1
0.9
)
2.3
5
3.5
2
15
.6
19
.3
3.2
3
2.3
3
.54
2
0.4
(;0
.58
) (-
0.5
7)
(~2.4)
(-2
.. 7)
(~0.57)
(-0
.3)
(~0.64)
(-2
.93
)
77
.4 (~
16.2
) 4
6.4
(-
7.6
)
50~8
11
0.1
6
6.5
7
6.3
5
4.1
8
6.7
<$ 8
.4)
(-1
3.3
) (~ 7
.4)
(-1
0.6
) (~ 7
.9)
(-1
1.8
)
SA1:
·1PL
ES
\VER
E A
LL
O
F TH
E LA
RG
E O
VA
L C
I-ff
iYSL
ER
CA
TA
LY
ST"
CO~TI1ENT:
Of
these
fo
ur
sets
, in
on
ly
one
case
d
oes
an
in
cre
ase
o
f ti
me
bri
ng
ab
ou
t a
un
ifo
rm i
ncre
ase
o
f y
ield
s fo
r b
oth
meta
ls--
in R
uns
1313
an
d
1310
, th
e h
igh
er
ch
lori
ne
co
nte
nt
resu
lts in
maj
or
incre
ase
s in
su
bli
med
Pt
and
P
d,
as
well
as
in
th
e
ov
era
ll le
vel
of
chem
ical
att
ack
th
rou
gh
ou
t th
e
sam
ple
.

APPENTIIX F 93
TABLE XII. YIELDS OF PLATINill1 AND PALLA.Diill1 FROrJ1 USE OF THE Cl2 PLUS NO REACTAI"'TS SYSTET'I 01{ THE LARGE OVAL CHRYSLER CATALYST
AnE.nable Pt/ Pd Amenable Pt/ Pd Total Pt/Pd Run T@rn). In Residue In Rinses In Sample
•I ( c (%) (%) (%) 7f
1206 700 99.1 I 103.7 5.00/ 4.74 104.1/108.4 1211 900 26.9/ 64.6 45.6/ 8.23 72.5/ 72.6
Ratio Alnenable Pt/Pd Amenable Pt/Pd Total Pt/Pd Run. Clf/NO In Residue In Rinses Found .,
(V V) ( ~6) (%) ( 16) if
1212 2.7 21.5/ 54.6 14.4/ 26.7 35.9/ 81.3
1211 5.2 26.9/ 64.6 45.6/ 8.23 72.5/ 72.6
Ratio 1 Amenable Pt/?d Amenable J?t/Pd Total Pt/Pd Run Cl,.,/X In Residue In Rinses Found
_.'L (V7V) (96) (%) {~&) 1t
1211 Cl 2/H0=5.2 26.9/ 64.6 45.6/ 8.23 72.5/ 72.6 1306 Cl 2/C0=3.0 25.3/ 59.6 4.22/ 3.26 29.5/ 63.0 1128 Cl 2/C0=1.7 12.2/ 63.3 9.35/ 3.23 21.6/ 66.5
ALL THREE Rill'JS WERE CONDUCTED AT 900°C OVER 4 HOURS
1These data are presented for comparison of the yields from use of the two gas systems under othe~vise identical conditions.

APPENDIX G 94
TABLE XIII. RELATIVE YIELDS OF PLATI!Iill·1 FROI~1 THE LARGE OVAL CHRYSLER C ... 4.TALYST AliD TI-IE SI·IALL OVAL CHRYSLER CATALYST UNDER SII;IILAR REACTIOl\T CONDITIONS
Run T0mp. Ratio Amenable Pt Pt Cll/CO Time Catalyst In Rinses Total -'L ( c) 1( Type (~b) ( 96) (V V) (H)
1026 1025 1. 69 4 Small 38.9 48.0 1218 1025 1. 69 4 Large 50.9 65.3 1 1 1 1 350 1.69 4 Small 1.8 62.6 1 1 1 3 350 1. 69 4 Large 3.3 84.3 1031 450 1. 69 4 Small 7.1 100.0+ 1010 450 1.69 4 Small 3.2 54.4 1104 450 1. 69 4 Large 1.7 78.7 1 02~- 900 1. 68 4 Small 54.7 73.7 1120 90CJ 1. 68 4 Large 9.3 21.5
1303 900 ).04 4 Sn1all 62.2 95.7 1306 900 3.04 4 Large 4.2 29.6
1025 9uO 1. 69 6 Small 69.5 84.8 1120 900 1. 69 6 Large 1. 5 10.1

LITERATURE CITED
( 1 )
(2)
(3)
(5)
(6)
(7)
(8)
(9)
( 10)
( 11 )
( 12)
Le\vis, 1•/illiam H. 11 l'l"itrogen Oxides Removal"; l~oyes Data Corp. : Parl{: Ridge, N.J., 1975; PP 3-78c
Sirrunons, Lionel E. SiiiDnons Precious :rv.ietaletter 1978,1J.(2), 2~
Beamish, F.E. "The Analytical Cl1emistry of the Noble I·Ietalsrr; Pergamon Press: London, England, 1966; p 17.
Streicher, S.; W6hler, L. Chern. Ber~ 1913,46, 1591-7; Beamish, 1966, ref. 61, p 18. --
Hartley, F.R. 11 The Chemistry of Platinum and Palladium"; Applied Science Publishers, Ltd~: London, England, 1973; p 275.
Canterford, J.H.; Colton, R. 11 Halides of the Second and Third Row Transition I"letals u; J. \'Iiley and Sons, Inc.: London, England, 1968; p 368.
Beamish 1 1966, p 20.
Beamish, 1966, p 21.
Plaksin, I.1{.; Shabarin, S.l{. Bull. Acad. Sci. U~R.s.s., Cl2sse Sci. Teche 1944, 305-8; Beamish, 1966, ref. 54, p 17.
Hartley, 1973, p 366.
Bicek, Ed\vard J.; Murray I·1aurice J. U.S. Patent 3 021 209, 1962.
Nixon, W.G.; et.al. u.s. Patent 2 860 045, 1958; Sittig, r·1., Ed. "I11organic Chemical and l·'Ietallurgical Encyclopedian; Noyes Data Corp.: Parle Ridge, N~J., 1968; p 534.
95

( 13)
(14)
( 1 5)
( 1 6)
( 1 7)
( 18)
( 19)
(~0)
( 21 )
(22)
(2])
(24)
(25)
T·lai tlis, Peter 1'1. "The Organic Chemistr:y of Palladium, Volume I (I'·1etal Complexes)"; Academic Press: New York, 1971; p 55.
Cotton, F.Albert; Wilkinson, Geoffrey "Advanced Inorganic Chemistry", 3rd ed.; I11terscience Publishers: Ne\v York, 1972..
I·Iai tlis, 1971 , p 56.
96
Calderazzo, F. In fiHalogen Chemistryn; Gutman, Victor, Ed.; Academic Press: London, England, 1967; Vol. 3, pp 383-93.
"Grnelins Handbuch der Anorganischen Chemie 11 ;
Verlag Chemie: Berlin, Germany, 1939, 1962; Teil C, Lieferung 1, Vol. 68, pp 116-9.
Schutzenberger, P. Ann. Chimt Phys. 1868, 15, 100; .~~. Chim. Phys. 1870,21, 350; "Gmelins Handbuch", 1962, Vol. 68, p 116~
Schutzenberger, P. J. Prakt~ Chern. 1871,.1,(2), 159; Bull. Soc~ Chim~ Fr. 1870,1!(2), 97; "Gr.1elins Handbuchn, 1962, Vol. 68, p 118.
PullinGer, Vl. J, Chern. Soc. 1891 , .2.2,, 599; Chern. Ber. 1391, 2ll., 2291 ; "Gmelins Handbuchrr, 1962,Vol. 68, p 117.
Robertson, J.B. J. South Afr~Chem. Institute 1929, 12, 41; "Gmelins Handbuch", 1962, Vol. 68, i)119.
·\·/east, R.C., Ed. "CRC Handbook of Cl1emistry and Physics", 54th ed.; CRC Press: Cleveland, Ohio, 1973.
Cotton, F. Albert; \vilkinson, Geoffrey, 1972, p 707.
Schutzenbereer, P. Chern. Rev. 1870,70, 1134; l·Ianchot, \'1. Cl1e1n. Ber. 1 92 5, 2.§., 25 21 ; "Gmeli11s Hanibuch 11 , 1962, Vol. 68, p 118.
l·Iai tlis, 1971 , pp 56-7.

(26)
(27)
(28)
(29)
(30)
( 31 )
(32)
(33)
( J'f)
()5)
(36)
(37)
(38)
97
I·Iellor, J.vl. "A Comprehensive Treatise on Inorga...~ic and Theoretical Chemistryn; LonGffian3 Green & Co.,Ltd.: London, England, 1937; Vol. VIII, p 613.
Colrnan, G. H.; et.al. In "Inorganic Syntheses, Vol. I"; Booth, Harold s., Ed~; }1c-Graw Hill Book Co.: New York, 1939; p 55.
11 Gmelins Handbuchrr, 1962, Vol. 68, p 93.
Bojre'. T·i.H.; Rogers, H.D. Philci111ag. 1840,17(3), · 397; J. Pralct. Chern, 1842, 2 6, 1 50; ttGmelins Handbuchu 1 1962, Vol. 68, P93.
Sudboroutsh, J.J. J. Chern. Sacs 1891,59, 663; "Gmelins Handbuch", 1962, Vol.68, p 93.
1·~ellor, 1937, Vol$ VIII, p 439.
1·1anchot, VI.; \'/ald.muller, A. Chern~ Ber. 1926,59; 2363.
Wolcott, Edison R. U.S. Patent 3 049 422, 1962.
Wolcott, Edison R. U.S. Patent 3 049 422, 1962; Sittig, 1968, p 533.
Bicclc a...11d I·lurray patent, 1962, p 4.
M~imoto, Yumi; et.ale Japan Patent 76-32 419, 1976; Chen1. Abstr. 197 6, 85, 127714\v.
Kirkland, J.J.; Yoe, John H. Anal. Chern. 1954,26(8), 1340-44.
Conrad, Anne L.; Ev~ns, Jean K. Ahal. Chern. 1960, 2£(1), 46-9.
97