Investigation of Mercury Reduction in Gold Stripping Process ...
159
University of Nevada, Reno Investigation of Mercury Reduction in Gold Stripping Process at Elevated Temperature A thesis submitted in partial fulfillment of the Requirement for the degree of Master of Science in Metallurgical Engineering By Irawan Pramudya Thom Seal, Ph.D, PE/Thesis Advisor August, 2015
-
Upload
khangminh22 -
Category
Documents
-
view
0 -
download
0
Transcript of Investigation of Mercury Reduction in Gold Stripping Process ...
University of Nevada, Reno
Investigation of Mercury Reduction in Gold Stripping Process
at Elevated Temperature
A thesis submitted in partial fulfillment of the
Requirement for the degree of Master of Science in
Metallurgical Engineering
By
Irawan Pramudya
Thom Seal, Ph.D, PE/Thesis Advisor
August, 2015

We recommend that the thesis
prepared under our supervision by
IRAWAN PRAMUDYA
Entitled
Investigation of Mercury Reduction in Gold Stripping Process at Elevated
Temperature
be accepted in partial fulfillment of the
requirement for the degree of
MASTER OF SCIENCE
Thom Seal, Ph.D., PE, Advisor
Carl Nesbitt, Ph.D., Committee Member
Dhanesh Chandra, Ph.D., Graduate School Representative
David W. Zeh, Ph.D., Dean, Graduate School
August, 2015
THE GRADUATE SCHOOL
University of Nevada, Reno
i
ABSTRACT
Mercury is present in many gold ores. By processing these ores, there is a
potential of emitting mercury to the environment. Carbon regeneration kiln stacks have
been observed as one of the primary source of mercury emission into the atmosphere.
Before it is recycled back into the carbon in leach (CIL) or carbon in columns (CIC),
carbon used in the gold extraction process needs to be reactivated thermally. Emission of
mercury can be minimized by keeping the mercury left in the carbon low before it goes to
the carbon regeneration kiln stacks.
The objective of this study is establishing the optimum elution conditions of
mercury cyanide from loaded carbon (which includes the eluent, concentration,
temperature and elution time) with respect to gold stripping. Several methods such as
acid washing (UNR-100, HCl or Ethanol/UNR-100) were investigated prior to the
stripping process. Furthermore, conventional pressurized Zadra and modified Zadra were
also studied with regards to mercury concentration in the solution and vapor state as well
as maximizing the gold stripping from industrial loaded carbon. 7% UNR-100 acid
washing of loaded carbon at 80oC was able to wash out approximately 90% of mercury
while maintaining the gold adsorption on the carbon (selective washing). The addition of
alcohol in the UNR-100 acid washing solution was able to enhance mercury washing
from 90% to 97%. Furthermore, mercury stripping using conventional pressurized
(cyanide-alkaline) Zadra was best performed at 80oC (minimal amount of mercury
reduced and volatilized) whereas using the same process only 40% of gold was stripped,
which makes this process not viable. When alcohol was added to the stripping solution, at

ii
80oC, 95% of gold was detected in the solution while keeping the reduction and
volatilization of mercury low.
The outcome of this study provides a better understanding of mercury behavior
during the acid washing and stripping processes so that the risk of mercury exposure and
contamination can be minimized while maximizing the gold overall recovery.
iii
Executive Summary
Experiments of UNR-100 (acetic acid) used for the acid washing on gold loaded
activated carbon were performed to determine the optimum condition of removing
mercury prior to the gold stripping process. Based on the experiments, 90% of mercury
was removed by UNR-100 at 80oC. When alcohol was added into UNR-100 solution,
97% of mercury was removed from the carbon at the same temperature.
Both UNR-100 or HCl solutions have a comparable result in removing calcium
and magnesium salts from the loaded carbon during the acid wash step. However, UNR-
100 is superior in removing mercury compared to HCl. With respect to gold, UNR-100 at
80oC removed very little gold from carbon as compared with industrial standard HCl acid
washing, 0.25% versus 0.96%. At 80oC, only minimum amount of mercury was reduced
and volatilized.
Based on this study, mercury removal from the gold loaded carbon prior to the
downstream process (gold stripping, electrowinning and carbon regeneration) minimizes
the mercury emissions, thus reducing workers exposure and environment impacts.

iv
ACKNOWLEDGEMENTS
I would like to extend my gratitude towards my Master’s thesis advisor Dr. Thom
Seal for his encouragement and guidance in my research and preparation of this thesis.
His advice, support, and help throughout finishing this task provided me motivation. I
respect his diligence and his devotion towards work that has motivated me to develop my
knowledge and experience.
I am thankful to Barrick Gold Corporation, Newmont Mining Corporation, and
Goldcorp, for financially supporting this project and giving me a chance to add
knowledge in this area.
I would like to thank Mr. Kangnian Zhong for his advice, help, and guidance, as
well as giving me a chance to work together with him in developing this project. I also
thank my friends (too many to list here but you know who you are!) for providing support
and friendship that I needed.
In addition, I would like to give my deepest gratitude to all of my committee
members, Dr. Thom Seal, Dr. Carl Nesbitt, Dr. Dhanesh Chandra for their valuable
thoughts and suggestions for this thesis.
I especially thank to my dad, mom, brother, sister and my little nephew. My hard
working parents have sacrificed their lives for us and provided unconditional love and
care. I would not have made it this far without them. My brother and sister have been my
best friend and thank them for all advice and support. I hope I can be a good role model
for my sister, so she will pursue her education as high as possible.
v
I dedicate this thesis to
my parents, brother, sister and Lionel K. Irawan
for their constant support and unconditional love.
I love you all dearly!
“Sometimes life is about risking everything for a dream no one can see but you” –
anonymous
vi
Table of Contents
Abstract i
Executive summary ii
Acknowledgement iv
Table of Contents vi
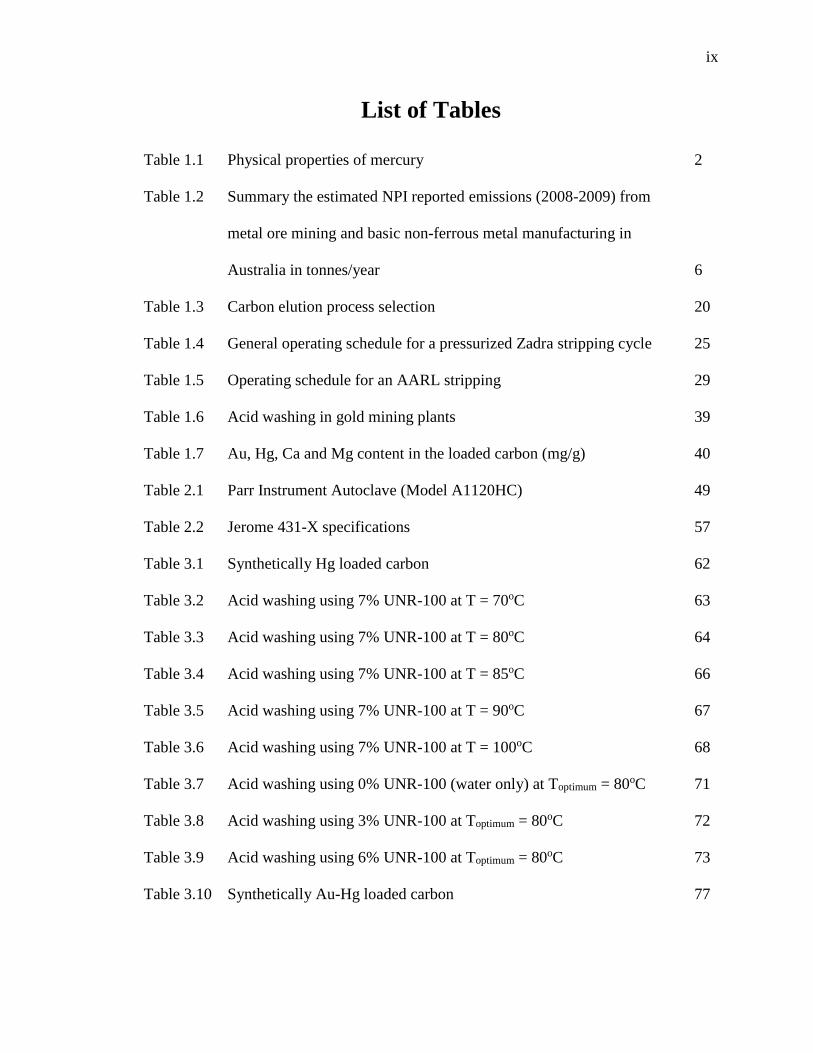
List of Tables ix
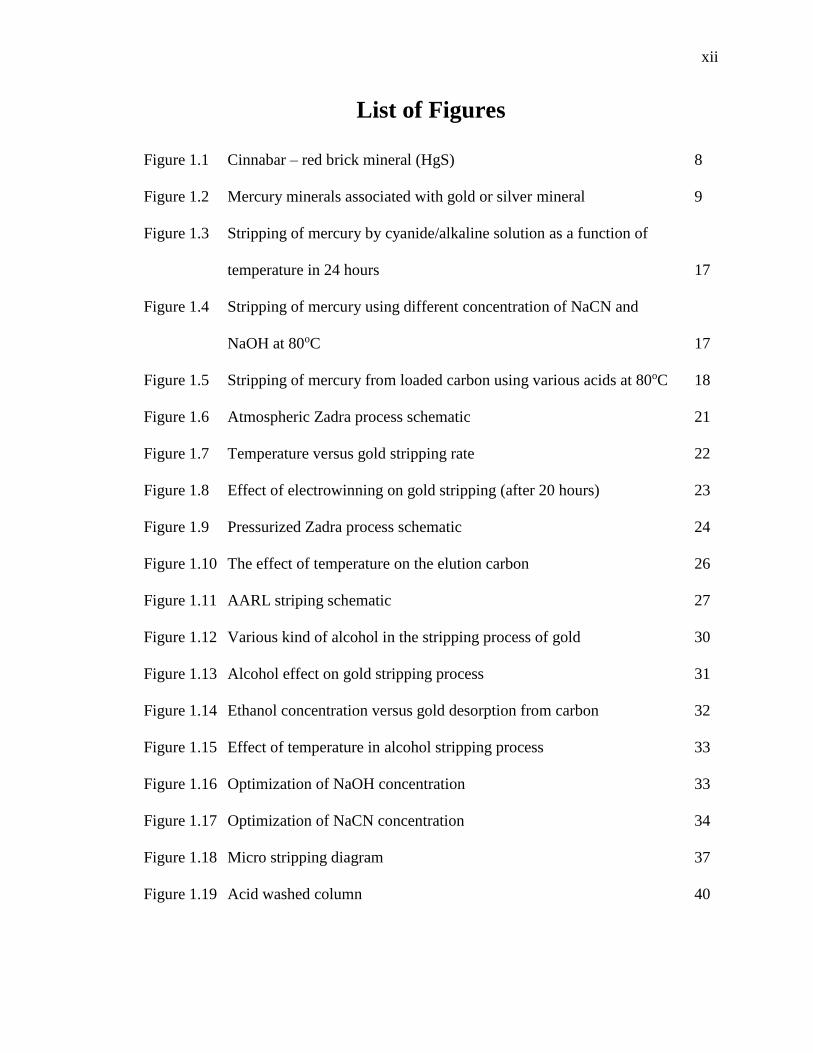
List of Figures xii
Chapter I - Introduction and Literature Review 1
1.1 Characteristic of mercury
1.2 The recovery of mercury from mineral extraction residues using
Hydrometallurgical techniques 2
1.3 Mineralogy and aqueous chemistry and toxicity of trace toxic elements 5
1.4 Deportment of trace toxic elements in gold ore processing by cyanidation 9
1.5 Minimizing mercury pollution in gold ore processing by UNR-group 13
1.6 Carbon elution/ stripping 18
1.6.1 Atmospheric Zadra stripping 20
1.6.2 Pressurized Zadra stripping 23
1.6.3 Anglo American Research Laboratory (AARL) stripping 25
1.6.4 Alcohol stripping 29
1.6.5 Micron stripping 35
1.7 Acid washing carbon 37
1.8 Acid washing followed by pressure Zadra by UNR-group 39
vii
Chapter II – Experimental 46
2.1 Materials 46
2.1.1 Industrial loaded carbon supplied by Nevada Gold Mines 46
2.1.2 Cyanide alkaline solution for the stripping process 47
2.1.3 Acetic acid for the acid washing solution 48
2.1.4 Other reagents 48
2.1.5 Equipment – autoclave 49
2.2 Experimental procedures 50
2.2.1 Synthetically loading carbon 50
2.2.2 Optimization of acid washing using UNR-100 in an autoclave 50
2.2.3 Zadra stripping in an autoclave 52
2.2.4 Acid washing using UNR-100 in a column 54
2.2.5 UNR technology on digestion of mercury from the carbon 55
2.2.6 Acid washing using mixture of UNR-100 and ethanol 56
2.3 Characterizations 56
2.3.1 Jerome 431-X Mercury Vapor Analyzer 57
2.3.2 Atomic Absorption Spectroscopy – Varian 55B 59
Chapter III – Results and discussion 62
3.1 Optimization of acid washing using UNR-100 on synthetically loaded carbon
in an autoclave 62
viii
3.2 Comparing acid washing on synthetically Au-Hg loaded carbon using HCl
and UNR-100 85
3.3 Column acid washing followed by stripping using Zadra on industrial gold
loaded carbon 87
3.4 Stripping using Zadra of industrial gold loaded carbon 101
3.5 Alcohol alkaline stripping of industrial gold loaded carbon 112
3.6 Acid washing using mixture of UNR-100 and alcohol of industrial gold
loaded carbon in an autoclave 114
3.7 Washing using alcohol on industrial gold loaded carbon 117
Chapter IV – Conclusion and future work 122
4.1 Conclusion 122
4.2 Future work 124
References 126
Appendix 137
ix
List of Tables
Table 1.1 Physical properties of mercury 2
Table 1.2 Summary the estimated NPI reported emissions (2008-2009) from
metal ore mining and basic non-ferrous metal manufacturing in
Australia in tonnes/year 6
Table 1.3 Carbon elution process selection 20
Table 1.4 General operating schedule for a pressurized Zadra stripping cycle 25
Table 1.5 Operating schedule for an AARL stripping 29
Table 1.6 Acid washing in gold mining plants 39
Table 1.7 Au, Hg, Ca and Mg content in the loaded carbon (mg/g) 40
Table 2.1 Parr Instrument Autoclave (Model A1120HC) 49
Table 2.2 Jerome 431-X specifications 57
Table 3.1 Synthetically Hg loaded carbon 62
Table 3.2 Acid washing using 7% UNR-100 at T = 70oC 63
Table 3.3 Acid washing using 7% UNR-100 at T = 80oC 64
Table 3.4 Acid washing using 7% UNR-100 at T = 85oC 66
Table 3.5 Acid washing using 7% UNR-100 at T = 90oC 67
Table 3.6 Acid washing using 7% UNR-100 at T = 100oC 68
Table 3.7 Acid washing using 0% UNR-100 (water only) at Toptimum = 80oC 71
Table 3.8 Acid washing using 3% UNR-100 at Toptimum = 80oC 72
Table 3.9 Acid washing using 6% UNR-100 at Toptimum = 80oC 73
Table 3.10 Synthetically Au-Hg loaded carbon 77
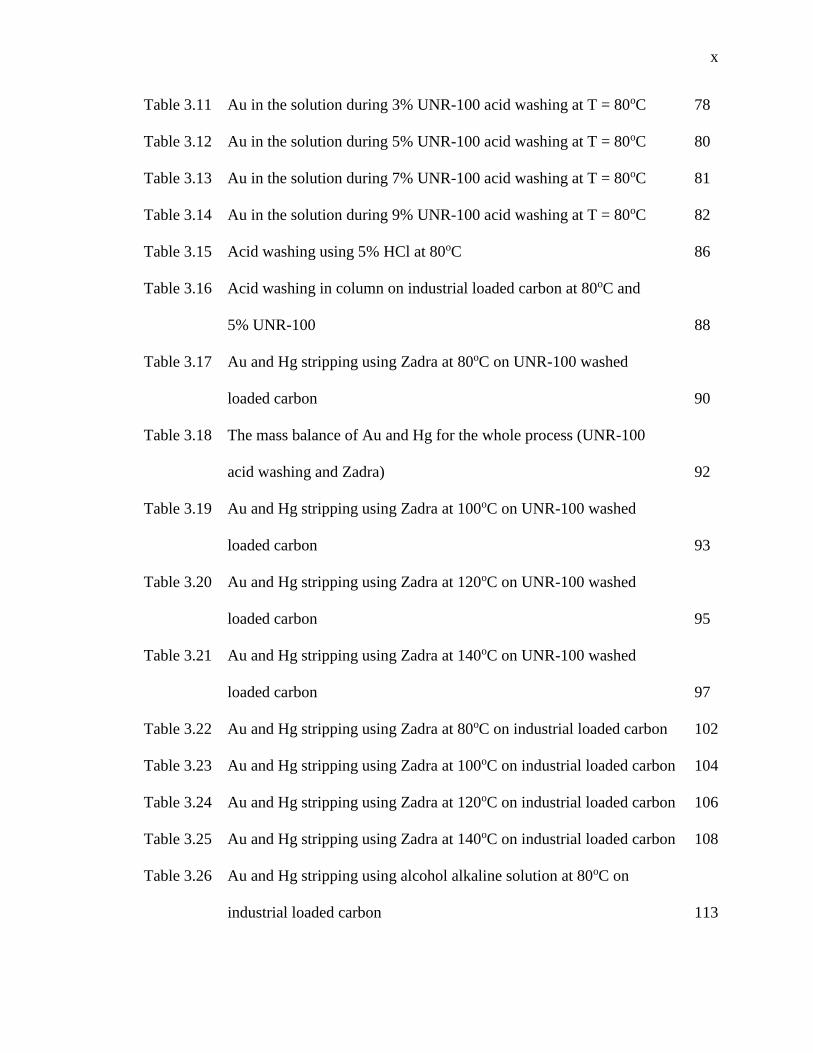
x
Table 3.11 Au in the solution during 3% UNR-100 acid washing at T = 80oC 78
Table 3.12 Au in the solution during 5% UNR-100 acid washing at T = 80oC 80
Table 3.13 Au in the solution during 7% UNR-100 acid washing at T = 80oC 81
Table 3.14 Au in the solution during 9% UNR-100 acid washing at T = 80oC 82
Table 3.15 Acid washing using 5% HCl at 80oC 86
Table 3.16 Acid washing in column on industrial loaded carbon at 80oC and
5% UNR-100 88
Table 3.17 Au and Hg stripping using Zadra at 80oC on UNR-100 washed
loaded carbon 90
Table 3.18 The mass balance of Au and Hg for the whole process (UNR-100
acid washing and Zadra) 92
Table 3.19 Au and Hg stripping using Zadra at 100oC on UNR-100 washed
loaded carbon 93
Table 3.20 Au and Hg stripping using Zadra at 120oC on UNR-100 washed
loaded carbon 95
Table 3.21 Au and Hg stripping using Zadra at 140oC on UNR-100 washed
loaded carbon 97
Table 3.22 Au and Hg stripping using Zadra at 80oC on industrial loaded carbon 102
Table 3.23 Au and Hg stripping using Zadra at 100oC on industrial loaded carbon 104
Table 3.24 Au and Hg stripping using Zadra at 120oC on industrial loaded carbon 106
Table 3.25 Au and Hg stripping using Zadra at 140oC on industrial loaded carbon 108
Table 3.26 Au and Hg stripping using alcohol alkaline solution at 80oC on
industrial loaded carbon 113

xi
Table 3.27 UNR-100/alcohol washing on industrial loaded carbon at 80oC 116
Table 3.28 Alcohol washing on industrial loaded carbon at 80oC 118
Table A-1 Mercury vapor at various temperatures 137
Table A-2 Concentration of saturated mercury vapor at different temperatures 138
xii
List of Figures
Figure 1.1 Cinnabar – red brick mineral (HgS) 8
Figure 1.2 Mercury minerals associated with gold or silver mineral 9
Figure 1.3 Stripping of mercury by cyanide/alkaline solution as a function of
temperature in 24 hours 17
Figure 1.4 Stripping of mercury using different concentration of NaCN and
NaOH at 80oC 17
Figure 1.5 Stripping of mercury from loaded carbon using various acids at 80oC 18
Figure 1.6 Atmospheric Zadra process schematic 21
Figure 1.7 Temperature versus gold stripping rate 22
Figure 1.8 Effect of electrowinning on gold stripping (after 20 hours) 23
Figure 1.9 Pressurized Zadra process schematic 24
Figure 1.10 The effect of temperature on the elution carbon 26
Figure 1.11 AARL striping schematic 27
Figure 1.12 Various kind of alcohol in the stripping process of gold 30
Figure 1.13 Alcohol effect on gold stripping process 31
Figure 1.14 Ethanol concentration versus gold desorption from carbon 32
Figure 1.15 Effect of temperature in alcohol stripping process 33
Figure 1.16 Optimization of NaOH concentration 33
Figure 1.17 Optimization of NaCN concentration 34
Figure 1.18 Micro stripping diagram 37
Figure 1.19 Acid washed column 40
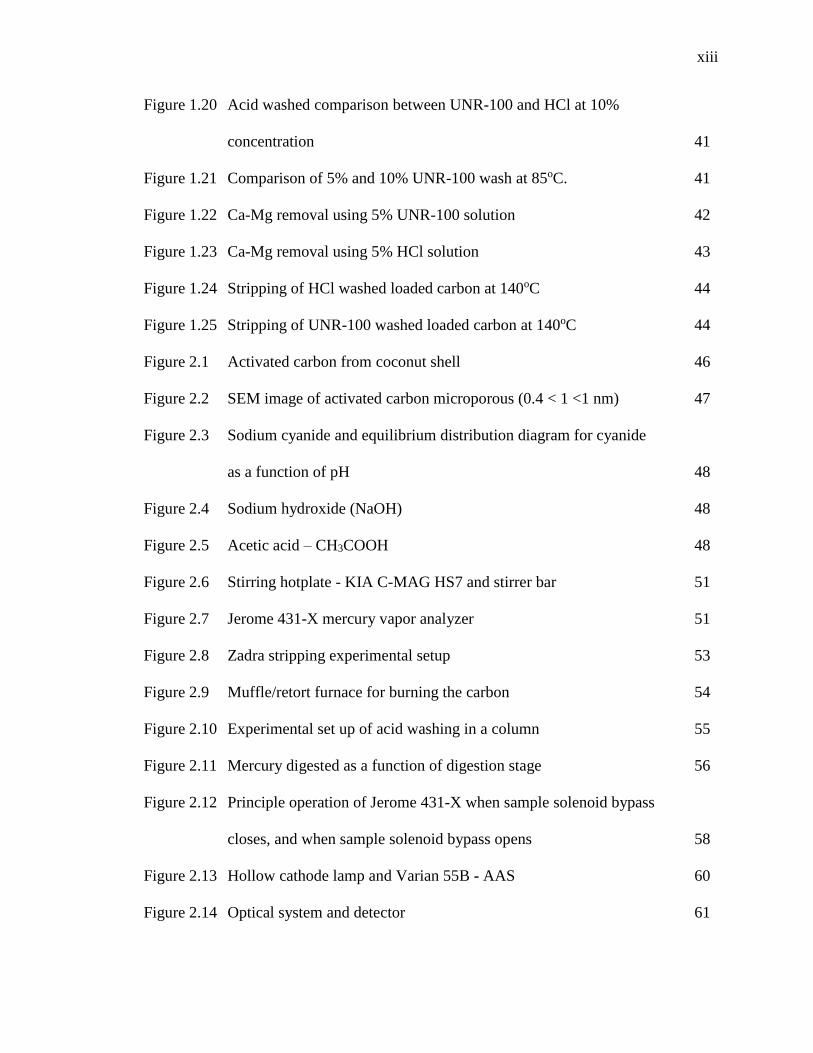
xiii
Figure 1.20 Acid washed comparison between UNR-100 and HCl at 10%
concentration 41
Figure 1.21 Comparison of 5% and 10% UNR-100 wash at 85oC. 41
Figure 1.22 Ca-Mg removal using 5% UNR-100 solution 42
Figure 1.23 Ca-Mg removal using 5% HCl solution 43
Figure 1.24 Stripping of HCl washed loaded carbon at 140oC 44
Figure 1.25 Stripping of UNR-100 washed loaded carbon at 140oC 44
Figure 2.1 Activated carbon from coconut shell 46
Figure 2.2 SEM image of activated carbon microporous (0.4 < 1 <1 nm) 47
Figure 2.3 Sodium cyanide and equilibrium distribution diagram for cyanide
as a function of pH 48
Figure 2.4 Sodium hydroxide (NaOH) 48
Figure 2.5 Acetic acid – CH3COOH 48
Figure 2.6 Stirring hotplate - KIA C-MAG HS7 and stirrer bar 51
Figure 2.7 Jerome 431-X mercury vapor analyzer 51
Figure 2.8 Zadra stripping experimental setup 53
Figure 2.9 Muffle/retort furnace for burning the carbon 54
Figure 2.10 Experimental set up of acid washing in a column 55
Figure 2.11 Mercury digested as a function of digestion stage 56
Figure 2.12 Principle operation of Jerome 431-X when sample solenoid bypass
closes, and when sample solenoid bypass opens 58
Figure 2.13 Hollow cathode lamp and Varian 55B - AAS 60
Figure 2.14 Optical system and detector 61
xiv
Figure 3.1 Acid washing using 7% UNR-100 at T = 70oC 64
Figure 3.2 Acid washing using 7% UNR-100 at T = 80oC 65
Figure 3.3 Acid washing using 7% UNR-100 at T = 85oC 66
Figure 3.4 Acid washing using 7% UNR-100 at T = 90oC 67
Figure 3.5 Acid washing using 7% UNR-100 at T = 100oC 68
Figure 3.6 Acid washing using 7% UNR-100 at various different temperatures 69
Figure 3.7 Percent of Hg in the solution within 4 hours 7% UNR-100 acid washing
and Hg in the vapor within 0.5 hour acid washing 70
Figure 3.8 Acid washing using 0% UNR-100 (water only) at Topt = 80oC 71
Figure 3.9 Acid washing using 3% UNR-100 at Topt = 80oC 72
Figure 3.10 Acid washing using 6% UNR-100 at Topt = 80oC 74
Figure 3.11 Acid washing using various concentration of UNR-100 at Topt = 80oC 75
Figure 3.12 Four hours acid washing using various concentration of UNR-100 at
Topt = 80oC 75
Figure 3.13 Acid washing using various concentration of UNR-100 at T = 70oC 76
Figure 3.14 Comparison of acid washing using various concentration of UNR-100
at T = 70oC and 80oC 77
Figure 3.15 Acid washing on synthetically Au-Hg loaded carbon using 3%
UNR-100 at 80oC 79
Figure 3.16 Acid washing on synthetically Au-Hg loaded carbon using 5%
UNR-100 at 80oC 80
Figure 3.17 Acid washing on synthetically Au-Hg loaded carbon using 7%
UNR-100 at 80oC 82
xv
Figure 3.18 Acid washing on synthetically Au-Hg loaded carbon using 9%
UNR-100 at 80oC 83
Figure 3.19 Percent Hg in the solution at 80oC and various concentration of
UNR-100 acid washing 84
Figure 3.20 Percent Au in the solution at 80oC and various concentration of
UNR-100 acid washing 84
Figure 3.21 Percent Au and Hg in the solution at 80oC and various concentration
of UNR-100 acid washing 85
Figure 3.22 Comparison of acid washing using 5% HCl and 7% UNR-100 at 80oC 87
Figure 3.23 Column acid washing set up 87
Figure 3.24 Hg and Au in the solution when acid washing using 5% UNR-100
was performed in a column at 80oC 89
Figure 3.25 Au and Hg presence in the solution – Zadra at 80oC 91
Figure 3.26 Hg(0) detected in the vapor – Zadra at 80oC 91
Figure 3.27 Au and Hg presence in the solution – Zadra at 100oC 93
Figure 3.28 Hg(0) detected in the vapor – Zadra at 100oC 94
Figure 3.29 Au and Hg presence in the solution – Zadra at 120oC 95
Figure 3.30 Hg(0) detected in the vapor – Zadra at 120oC 96
Figure 3.31 Au and Hg presence in the solution –Zadra at 140oC 97
Figure 3.32 Hg(0) detected in the vapor –Zadra at 140oC 98
Figure 3.33 Hg in the solution – Zadra after prewashed (UNR-100 acid
washing) industrial loaded carbon at various different temperatures 99
xvi
Figure 3.34 Au in the solution – Zadra after prewashed (UNR-100 acid
washing) industrial loaded carbon at various different temperatures 100
Figure 3.35 Au and Hg presence in the solution – Zadra at 80oC 102
Figure 3.36 Hg(0) detected in the vapor – Zadra at 80oC 102
Figure 3.37 Au and Hg presence in the solution – Zadra at 100oC 104
Figure 3.38 Hg(0) detected in the vapor – Zadra at 100oC 105
Figure 3.39 Au and Hg presence in the solution – Zadra at 120oC 106
Figure 3.40 Hg(0) detected in the vapor – Zadra at 120oC 107
Figure 3.41 Au and Hg presence in the solution – Zadra at 140oC 108
Figure 3.42 Hg(0) detected in the vapor – Zadra at 140oC 109
Figure 3.43 Summary of stripped Hg at various different stripping temperatures 110
Figure 3.44 Summary of stripped Au at various different stripping temperatures 110
Figure 3.45 Summary of reduced mercury detected by Jerome vapor analyzer at
various different stripping temperatures 111
Figure 3.46 Au and Hg presence in the solution – alcohol alkaline solution at 80oC 113
Figure 3.47 Hg(0) detected in the vapor - alcohol alkaline solution at 80oC 114
Figure 3.48 Hg and Au in the solution – UNR-100/alcohol washing on industrial
loaded carbon at 80oC 116
Figure 3.49 Hg(0) detected in the vapor – UNR-100/alcohol washing on industrial
loaded carbon at 80oC 117
Figure 3.50 Hg and Au in the solution – alcohol washing on industrial loaded carbon
at 80oC 119

xvii
Figure 3.51 Hg(0) detected in the vapor – alcohol washing on industrial loaded carbon
at 80oC 119
Figure 3.52 Gold ore processing flow diagram 121
Figure A.1 Jerome 431-X display and actual curves 139
1
CHAPTER 1
INTRODUCTION
Mercury is contained in many gold ores. By processing these ores – by the
conventional method of cyanide leaching, there is a potential of emitting mercury to the
environment. Carbon regeneration kiln stacks have been observed as one of the primary
source of mercury emission into the atmosphere. Before it is recycled back into the
process, the carbon in leach (CIL) or carbon in columns (CIC), carbon used in the gold
extraction process needs to be reactivated thermally [1,2]. Emission of mercury can be
minimized by removing the mercury from the carbon before it goes to the carbon
regeneration kiln stacks. The objective of this study is establishing the optimum elution
conditions of mercury cyanide from loaded carbon (which includes the eluent,
concentration, temperature and elution time) with respect to gold stripping off carbon. By
removing the mercury prior to gold stripping, the impact of mercury to the downstream
process is reduced. Thus, the pollution due to heavy metals, i.e. mercury particularly can
be minimized.
1.1. Characteristic of Mercury
Mercury is a silvery white liquid with an exceptionally low melting point of
234.321K (-38.829oC). In the periodic table, mercury is grouped in IIB related to zinc and
cadmium. Mercury has the atomic number of 80 and atomic mass of 200.59 [3-5 32-34].

2
Physical properties of mercury are summarized in Table 1-1 below [6,7].
Table 1-1. Physical properties of mercury [6,7].
Phase Liquid
Melting point 234.321 K (-38.829oC)
Boiling point 629.88 K (356.73oC)
Density 13.534 g/cm3 (at 0oC; 101,325 kPa)
Heat of vaporization 59.11 kJ/mol
Molar heat capacity 27.98/mol.K
Vapor Pressure 2 atm at 398oC
1.2. The recovery of mercury from mineral extraction residues using
hydrometallurgical techniques
The selective leaching of mercury from some concentrates and solid residues can
be achieved by the formation of a range of soluble mercury (II) species obtained by
complexation with certain reagents such as chloride, bromide, EDTA etc. Unit processes
involved in the mercury removal are precipitation, ion exchange, solvent extraction,
adsorption, membrane diffusion, cementation, electrolysis, and biological methods [5-8] 34-
38]. Precipitation of an insoluble mercury (I) or mercury (II) compound is the most
common process used [8]. HydroMet Corporation Limited, Australia has been involved in
developing some commercial processes for the recovery and removal of mercury from
mineral concentrates and residues. The final product of this process has been a high grade
mercury concentrate sold on the international market [8].

3
Selective Leaching of Sulfide Concentrates
Sulfide concentrates that contain mercury (in some cases as cinnabar) cause
problems and result in commercial penalties [8]. HydroMet has discovered that an acidic
(HCl) chlorobromide leach with a hypochlorite-bromine oxidant was exceptionally
effective for mercury leaching in the case of one certain Australian complex sulfide
concentrate [8]. This process has been commercialized in which mercury (II) sulfite
precipitated is recovered [37]. Cinnabar can be leached using the conventional process i.e
hypochlorite leaching followed by either carbon adsorption or zinc cementation to yield a
Zn-Hg amalgam [8].
Recovery of Mercury from Gold Cyanide Solutions
Precious metal bearing minerals often contain cyanide soluble mercury which is
eventually deposited on the carbon, cell cathodes and in the tailing pond. Several kind of
ion exchange resins such as Duolite A-7, Ionac A-305, and Schering TN02327 have been
studied for this mercury recovery purpose [9].
Selective Precipitation of Mercury Sulfide
Thioacetamide and thiocarbamate have been used to selectively precipitate
mercury to produce sulfide from a copper-mercury solution obtained by acid leaching.
Precipitation of mercury sulfide from solution by thioacetamide works best at pH of
about 2, so that it can be separated by filtration before significant copper is also
precipitated [9].
Treatment of Mercury Sulfur Residues
Trace levels of mercury is often found in sulfuric acid which is commonly
produced from SO2 gas generated by roasting of sulfide concentrates. The mercury
4
contaminated gas is usually scrubbed by weak acid and mist Cottrells. The mercury
contained in this washed liquor can be then cemented with aluminum metal pellets to
yield a solid residue which is primarily elemental mercury [9, 10].
Sulfatization process is another technique of removing mercury from roaster gases
which is closely related to the Outkumpu zinc plant at Kokkola in Finland in 1970 [9].
Roaster gasses are contacted with a recirculating 85-90% sulfuric acid in a sulfatizing
tower and then are scrubbed with a weak acid to remove chloride which is in the form of
HCl gas and HgCl2 gas. When selenium bearing concentrates are treated this way, the
sulfatizing product is washed to remove the soluble salts leaving a complex mercury-
selenium precipitate (HgSO4.xHg (0, S, Se, Te)) [9, 10]. Then, the mercury can be
recovered as Hg2SO3 and selenium as the element [9,10].
The roasting gas is scrubbed with an acidified of a mercuric chloride complex
(Hg2+ - chloride) dissolved in water at 30-40oC. Calomel (Hg2Cl2) is formed as follow:
Hg(v) + Hg2+ (aq) 2Hg(s)
or in another form as:
Hg + HgCl2 Hg2Cl2
The precipitate is then separated from the solution by decantation. The calomel is then chlorinated to
oxidize and convert the mercurous ion (Hg+) back to the soluble mercuric ion (Hg2+) as
shown below:
Hg2Cl2 (s) + Cl2 (g) = 2 HgCl2 (aq)

5
The chlorinated solution becomes the electrolyte for the electrowinning reactions
(courtesy: Thom Seal Ph.D).
Ethylene Leaching
Ethylene gas is being investigated as a reagent to form a strong complex with
mercury (II) which is operated at 4 atm. After the leaching process, pressure is released
and HgO can be precipitated [9].
1. 3. Mineralogy and aqueous chemistry and toxicity of trace toxic elements
Trace elements deportment during mineral processing is an area that concerns the
mining industry. Metal extraction processes incline to accumulate trace elements to
degrees that may cause hazards to both human health and the environment [10]. The role
of the minor trace elements in gold cyanidation; specifically lead, chromium, cobalt,
cadmium, mercury, arsenic, antimony, bismuth, selenium and tellurium; including their
mineralogy, aqueous solution chemistry, and toxicology is discussed in this section [10].
These trace elements have been studied in mineral processing as impurities in
base metals and concentrate products. Nevertheless, recent studies have been focused at
improving the safety of employees and meeting environmental regulations [12]. National
Pollutant Inventory (NPI), an Australian public database that displays information about
diffuse sources and emissions of 90 different substances to air, land and water reported
by industrial facilities, listed the trace elements that need to be measured and reported
annually for all mine and mineral processing facilities [13]. Table 1-2 summarizes the
estimated NPI reported emissions (2008-2009) from metal ore mining and basic non-
ferrous metal manufacturing in Australia in tonnes/year [9, 12].

6
Table 1-2. Summary the estimated NPI reported emissions (2008-2009) from metal ore
mining and basic non-ferrous metal manufacturing in Australia in tonnes/year [12, 14]
Pb Cd Hg As Sb Se
Metal ore mining
Air
150 4.7 0.7 44 2.3 0.9
Water
7.8 1.3 < 0.1 5.5 1.3 2.1
Land
1.6 < 0.1 < 0.1 4.9 0.2 0.3
Total
159 6 0.7 54 3.8 3.3
Basic non-ferrous metal manufacture
Air
260 10 9.9 47 8.4 0.8
Water
4.1 0.8 < 0.1 1.2 0.3 0.5
Land
< 0.1 < 0.1 < 0.1 0.4 < 0.1 < 0.1
Total 264 10.8 9.9 49 8.7 1.3
Bismuth and tellurium are not included as they are not required to be included in the
report under current legislation. Several other countries also assemble similar data which
is available publicly on the Internet, for instance Toxics Release Inventory – USA, and
National Pollution Release Inventory - Canada [15, 16].
Some emissions from gold mining operations contain arsenic which is largely
quick to disappear (dust containing arsenic minerals – unless dissolved like acid rock
drainage) and mercury (approximately 0.7 t/year), which is primarily from ore roasting
7
and carbon regeneration [10]. Lead and cadmium are also known for their toxicity and are
classified as a human carcinogen, however, little is known of their deportment in the gold
processing solutions. A more recent issue is mercury as a trace element in roasting of the
ore, oxidative pressure leaching and gold cyanidation [17, 18].
Another known carcinogen, arsenic, has been extensively investigated in gold
processing [19]. Mainly, the investigations were on precipitation and disposal of
solubilized arsenical wastes and several commercial processes from roasting, pressure
leaching or bacterial leaching of gold ores and concentrates [20]. Long term stability of
these treated wastes continues, as do investigations that focused at further minimizing
health and environmental risks.
Because of their lower concentration in gold ores, little is known about antimony
and bismuth. Furthermore, bismuth has a lower toxicity compared to antimony which is
comparable to arsenic in terms of its hazard on humans [20].
Selenium is an indispensable nutrient in trace amount, but unfortunately it is very
toxic at higher concentrations and ranked as the third most toxic trace element after
mercury and lead [19, 20]. Tellerium is believed to be less toxic, although it has to be
handled with care. Currently, little information is available relating the deportment of
selenium or tellurium in gold processing plants. Consequently, the chemical behavior of
antimony, selenium, bismuth and tellurium in gold processing needs to be studied so that
health and environment risks assessment can be investigated in more detail [20].
Mineralogy and aqueous chemistry of mercury
In this particular study, mercury will be reviewed in more detail related to the
mineralogy and aqueous chemistry in gold processing systems. Commonly, lead,

8
cadmium and mercury are grouped in environmental studies on account of their
toxicities, in spite of the significantly different lead solution chemistry [20-22].
Cadmium and mercury are grouped in IIB of the periodic table with a main
valence states of +II; however, mercury also forms elemental mercury (Hg0) and several
mercuruous (Hg+) compounds such as calomel (Hg2Cl2). While the highest concentration
of mercury ores contain up to 2.5%wt of Hg, the lowest one contains at least 0.1% wt of
Hg. Mercury is found frequently as the brick red mineral cinnabar (HgS) shown in
Figure 1-1 [23].
Figure 1-1. Cinnabar – red brick mineral (HgS) [7, 23].
Native mercury is rare, but and some of the other mercury minerals linked with gold or
silver ore are tiemannite (HgSe), corderoite (Hg3S2Cl2), coloradoite (HgTe), and gold or
silver mercury amalgam shown in Figure 1-2 [24-27].
9
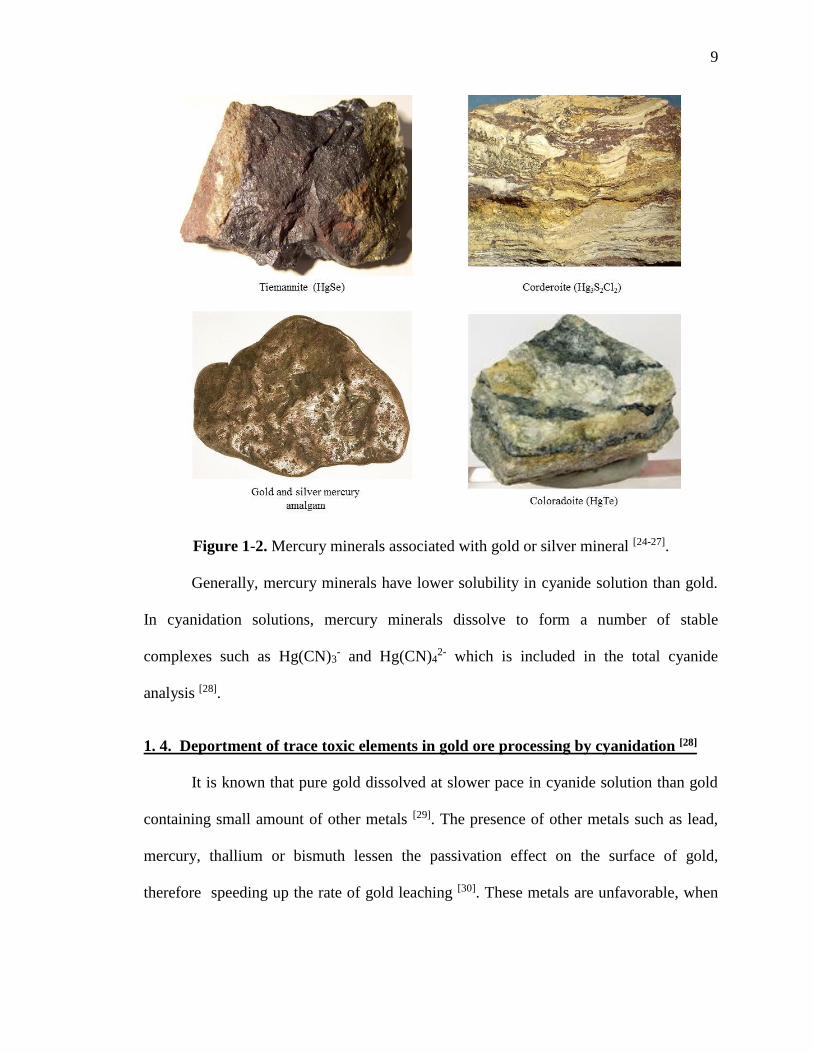
Figure 1-2. Mercury minerals associated with gold or silver mineral [24-27].
Generally, mercury minerals have lower solubility in cyanide solution than gold.
In cyanidation solutions, mercury minerals dissolve to form a number of stable
complexes such as Hg(CN)3- and Hg(CN)4
2- which is included in the total cyanide
analysis [28].
1. 4. Deportment of trace toxic elements in gold ore processing by cyanidation [28]
It is known that pure gold dissolved at slower pace in cyanide solution than gold
containing small amount of other metals [29]. The presence of other metals such as lead,
mercury, thallium or bismuth lessen the passivation effect on the surface of gold,
therefore speeding up the rate of gold leaching [30]. These metals are unfavorable, when
10
leached, because they compete for the adsorption sites and consume the stripping
reagents [28]. Additionally, they may also report to the final product and therefore need to
be eliminated during refining, but also to the tailings from where they may need to be
stabilized [28].
These toxic trace metals need to be isolated with the environment from gold
cyanidation after roasting of ores or concentrates, leaching, and also during reactivation
of carbon. Amalgamation is still used in developing countries by small gold miners to
recover gold. This process has released thousands of tons of mercury into the atmosphere
during separation of the gold from the mercury [28, 31].
In this segment, the deportment of trace elements especially mercury during gold
processing is reviewed, including leaching, carbon adsorption and stripping, cyanide
detoxification and tailings storage [28].
Behavior of Mercury during Cyanidation
As mentioned previously, trace amounts of soluble mercury in the cyanidation
process can elevate the rate of gold leaching [30, 32]. However, when amalgams are
created, the presence of mercury can actually decelerate the cyanidation [33]. The
extraction of mercury along with gold is about 10-40% which is highly depending on the
concentration of cyanide used, the mineralogy and liberation of the mercury [34] with the
leaching rate appearing to be slower than for copper and gold [35]. Further study by Oraby
et. al reported that mercuric chloride dissolved completely within 24 hours in 2.5 g/L
NaCN solution in an open air, whereas cinnabar (HgS) and elemental mercury only 10%
and 1% respectively under the same condition [36].
11
Adsorption onto Activated Carbon
The use of activated carbon to eliminate heavy metals from natural water and
wastewater has been well studied and documented [37]. However, the behavior of trace
metals during gold adsorption is less understood [28]. Based on a study conducted by
McDougall, Hg(CN)2 strongly adsorbs onto activated carbon and competes with gold for
adsorption sites whereas Hg(CN)42- species does not [38-40]. Fleming reported that at
higher pH (>9) and higher cyanide concentration the adsorption of mercury onto
activated carbon can be minimized due to the formation of highly charged mercury
complexes [41].
Stripping from Activated Carbon
Unlike gold and copper, at atmospheric temperature with the Zadra stripping
process, mercury is inadequately stripped from activated carbon [34, 35]. However, pressure
Zadra stripping was preferentially able to desorb mercury [42, 43]. Bunney et al. showed
that stripping of mercury was effectively stripped at temperatures below 100oC in strong
caustic cyanide solution whereas gold was best stripped at temperatures above 100oC [43].
Carbon Regeneration, Gold Electrowinning and Smelting
During carbon regeneration and gold smelting, lead, cadmium, and mercury can
be emitted to the atmosphere. Since lead and its compounds are not volatile, they can be
emitted to the atmosphere as fine particles. On the other hand, due to their volatility,
cadmium and mercury are emitted as gases to the atmosphere [44].
In processing plants using Merrill-Crowe to remove gold and silver, mercury co-
precipitates, mercury co-precipitates with zinc [45]. Furthermore, in gold electrowinning,
mercury (more electropositive) in the solution is reduced to its elemental state [35]. In both

12
cases, retorting at 600-700oC is effectively used to remove the elemental mercury from
gold [35, 46]. From this process, the isolated mercury can be captured as liquid metal and
sold for recycling [56]. Sheya et. al from US Bureau of Mines pointed out that mercury
from gold containing cyanide solution can be selectively electrowon [47].
The emission of mercury from carbon regeneration by scrubbing technologies has
resulted in initiating better mercury management during gold processing [48, 49]. Hence,
installation of a mercury capture system and this on-going research of removing mercury
prior to carbon regeneration and smelting were conducted [50-52].
Tailings
The complex forms of cyanide, such as cadmium and mercury cyano complexes,
are more resilient and release cyanide ions slowly as they decompose compared to free
cyanide [53]. Pore water from a tailings deposit containing mainly cinnabar was
investigated by Shaw et al. bolster the finding by Zagury et al that the weakly-complex
metal cyanide species were found in the fresh tailings, and only the strong-complex metal
cyanide remained in the aged tailings (presumably ferro- and ferricyanides) [54, 55]. These
two investigations designated that the more stable mercury cyanide complexes continue
to exist and could be recycled in the process or be contained from the environment [28].
Fixation and Encapsulation of Mercury Process
In general, two processes, fixation and encapsulation of stabilizing certain wastes
containing significant amount of trace metals have been examined. By definition, fixation
is precipitating the trace elements in the waste as insoluble compound or adsorption onto
suitable adsorbents [28]. On the other hand, encapsulation, sometimes referred as
solidification, is enclosing the trace metals in an insoluble matrix for long term disposal
13
in an environmentally responsible manner such as cement solidification, sulfur polymer
cements (SPC), chemically bonded phosphate ceramics (CBPCs), carbon and silicon
based polymers and calcined dolomite binders. [28, 56, 57].
The main methods of mercury fixation are adsorption on activated carbon and
precipitation with sulfide, sodium dimethyl dithiocarbamate (NaDTC) followed by
flocculation and dissolved air floatation, sodium polymeric thiocarbonate, or 1,3-
benzenediamidoethanethiol (BDET) as investigated by Tourro and Lipps, Tessele at al.,
Buckham, and Matlock et al. respectively [52, 58-60]. Based on those studies, it has been
claimed that the reagent used in fixation can remove most heavy metals from the solution
(including arsenic and selenium), without interfering with gold leaching or the adsorption
process [58, 59].
When there is no cyanide, mercury (II) may also be eliminated from solution by
adsorption onto finely divide minerals such as magnetite, vermiculite or zeolite [61], ion
exchange resins [62], synthetic crandallite [63], and iron oxyhydroxides for both inorganic
and methyl mercury [64]. Additionally, mercury binding compound, such as 2-mercapto-
benzothiazole, have been used as adsorbents for heavy metals removal from industrial
waste water [65].
1. 5. Minimizing mercury pollution in gold ore processing by UNR-group [66,1]
As mentioned previously, the precious metal industry is one of the biggest source
of heavy metal pollution [2]. The principle or primary emissions from gold mining
operations are arsenic and mercury, which are primarily from ore roasting and carbon
regeneration. However, little is known of their deportment in the gold processing
solutions. Lead and cadmium are also known as having toxicity and classified as human
14
carcinogen, respectively. A more recent issue is mercury as a trace natural mineral which
is affected by roasting of the ore, oxidative pressure leaching and gold cyanidation.
Significant attention has been applied on capturing and recycling the mercury emission.
The recycled mercury plays an important role in the mercury production [67]. The
deportment of mercury from the gold stripping process is deficiently studied and
understood [68]. Fuerstenau et. all has investigated the mass balance of mercury in loaded
carbon during the stripping process at 130-140oC in an autoclave for 8-14 hours [1]. Based
on his study, elemental mercury, Hg(0), was detected. Hence, during the stripping at high
temperature, some of Hg(II) was reduced to form Hg(0) [1].
Marsh, J. E. et al. described that Hg(CN)2 might be reduced in an aqueous
solution at 230oC as follow [69]:
HgC2N2 + 4H2O = Hg + CO + (NH4)2CO3
Based on the reaction above, Hg(II) in Hg(CN)2 is reduced to Hg(0) and then due to high
temperature of stripping, it is then volatized from the solution. Furthermore, Galvin J. P.
and Pritchard, H. O. reported that the thermal decomposition of mercury cyanide vapor is
in the range of 147-237oC [70].
Hg(CN)2(g) Hg(g) + C2N2(g)
When OH-, CN-, and Cl- ions, which have the ability to form Hg2(aq)2+ complexes,
are presented in the aqueous solution, the Hg2(aq)2+ ion can disproportionate to Hg(0) with
an equilibrium constant shown below [71]:
Hg2(aq)2+ Hg(aq)
2+ + Hg(aq)0
Kdisprop = [Hg2+ ][Hg(aq)
0 ]
[Hg22+]
= 5.5x10 -9 M
15
Solubility of metallic Hg in water at various temperatures is 3.2x10 -7 M at 20oC,
1.22x10⁻⁶ M at 78.7oC and 5.11x10⁻⁶ M at 134.8oC, they are 0.0161, 0.0612 and 0.256
mg/250 mL H2O respectively. The values analyzed of Hg(II) should include dissolved
Hg(0) [71, 72].
Aqueous Hg(CN)2 solution was investigated by using pulse technology by Fujita
et. al [73]. Based on the study, HgCN and Hg2(CN)2 were detected in the solution.
Absorption of the electron energy in water releases some free radicals and molecular
products as shown below [73]:
H2O 𝑒𝑎𝑞− , H, OH, H2, H2O2, etc.
Hydrated electron could produce mercurious species – HgCN shown below [73]:
𝑒𝑎𝑞− + Hg(CN)2 Hg(I)
Whereas the H radical in the solution could act as a reducing agent for Hg(CN)2:
2H + Hg(CN)2 Hg(I) + 2HCN
Furthermore, cyanide solution could be hydrolyzed at high temperature as shown
in the reaction below [74, 75]:
CN- + 2H2O NH3 +HCO2−
The formation of CN- ultimately leads to formation of ammonia, hydrogen and carbon
dioxide. The presence of hydrogen as a reductant reduces the Hg(CN)2 to Hg2(CN)2 and
increases the formation of Hg(0) significantly [74, 75].
Additionally, M. D. Adams reported that the NaCN used in the stripping process
is not a stable compound. At high temperature, NaCN is easily oxidized by oxygen and
hydrolyzed [76, 77]. The mechanism of reaction is shown as follow [76, 77]:
16
Hydrogen is a reducing agent [78], and the presence of hydrogen helps the
reduction of Hg(II) into Hg(0). Thus, several processes were investigated in this study to
remove as much as Hg(II) possible prior the stripping. Thus, when stripping is performed
at 110-140oC, a minimum amount of Hg(0) will be produced.
Fuerstenau et al. investigated mercury stripping and washing from loaded carbon
to minimize mercury pollution in gold ore processing [79]. Based on this study, it is also
concluded that the elution of mercury is best at lower than 100oC which supports the
prior study done by Jeffrey et al in 2009 [80]. When the temperature was increased, no
mercury was found in the stripping solution nor in the carbon [79]. It indicates that the
mercury was volatilized, in the form of its elemental state.
Mercury elution/stripping was also investigated as a function of time and
temperature as shown in Figure 1-3 below. 3.33 grams of loaded carbon (4.7 mg/g Au
and 4.1 mg/g Hg) was stripped in 500 ml solution contained 2.5% NaOH and 2.5%
NaCN for 24 hours in an autoclave. Based the graph, the stripping of mercury is best
conducted at 80-90oC with less than 5% Hg left in the carbon.

17
Figure 1-3. Cyanide stripping of mercury by cyanide/alkaline solution as a function of
temperature in 24 hours [79].
Different concentration of NaCN and NaOH was also studied on the stripping of
mercury as shown in Figure 1-4 below. It shows that 2.5% of NaCN and 2.5% NaOH
gives the better result (Figure 1-3).
Figure 1-4. Cyanide stripping of mercury using different concentration of NaCN and
NaOH at 80oC [79].

18
Furthermore, the effects of different acids were also studied on the mercury
stripping from the carbon as shown in Figure 1-5 [79]. Based on the graph, acetic acid was
able to strip mercury better at lower concentration.
Figure 1-5 Stripping of mercury from loaded carbon using various acids at 80oC [79].
1.6. Carbon elution/ stripping
An efficient elution process is crucial in order to achieve a good gold recovery.
Many methods are used commercially for recovering gold and silver from loaded
activated carbon [81]. The main processes are [81]:
Atmospheric Zadra Stripping
Pressurized Zadra Stripping
Anglo American Research Laboratory (AARL)
Alcohol Stripping
Micron Elution Procedure

19
The complete recovery of chemically desorbing gold from the carbon (stripping)
allows the carbon to be recycled for further use. Each method mentioned has advantages
and disadvantages which should be assessed and considered when determining which
process to use [81]. Table 1-3 summarizes the carbon elution processes that have been
used in the gold industry [82]. From a “system approach” point of view, Randol prefers the
Anglo Elution or AARL Strip process. The main reason why Anglo elution is favored is
it utilizes seven bed volume of fresh water to elute the carbon, which results in the
removal of chemicals such as acid and/or hydroxide from the carbon pores before the
thermal regeneration process [82].

20
Table 1-3. Carbon elution process selection [82].
1.6.1 Atmospheric Zadra Stripping[83]
Atmospheric pressure Zadra was the first commercial process developed
successfully for stripping gold from carbon by J. B Zadra et. al. at the U. S. Bureau
of Mines (USBM) in the early 1950’s and applied for the first time at Golden
Cycle Gold Corporation’s Carlton Mill at Victor, Colorado in 1951 [81, 84]. This
method is still used due to its simplicity.
21
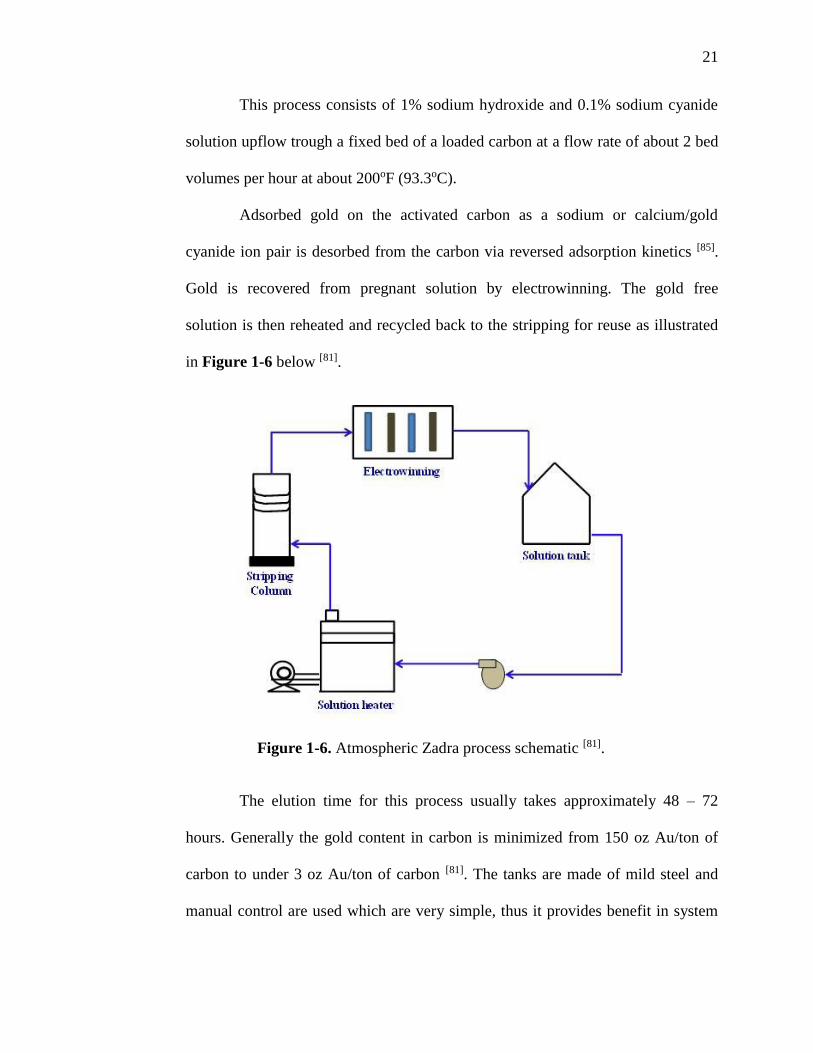
This process consists of 1% sodium hydroxide and 0.1% sodium cyanide
solution upflow trough a fixed bed of a loaded carbon at a flow rate of about 2 bed
volumes per hour at about 200oF (93.3oC).
Adsorbed gold on the activated carbon as a sodium or calcium/gold
cyanide ion pair is desorbed from the carbon via reversed adsorption kinetics [85].
Gold is recovered from pregnant solution by electrowinning. The gold free
solution is then reheated and recycled back to the stripping for reuse as illustrated
in Figure 1-6 below [81].
Figure 1-6. Atmospheric Zadra process schematic [81].
The elution time for this process usually takes approximately 48 – 72
hours. Generally the gold content in carbon is minimized from 150 oz Au/ton of
carbon to under 3 oz Au/ton of carbon [81]. The tanks are made of mild steel and
manual control are used which are very simple, thus it provides benefit in system
22
design and operation. The primary disadvantage of Zadra process is its low rate of
desorption; thus, it requires larger carbon inventories and equipment compared
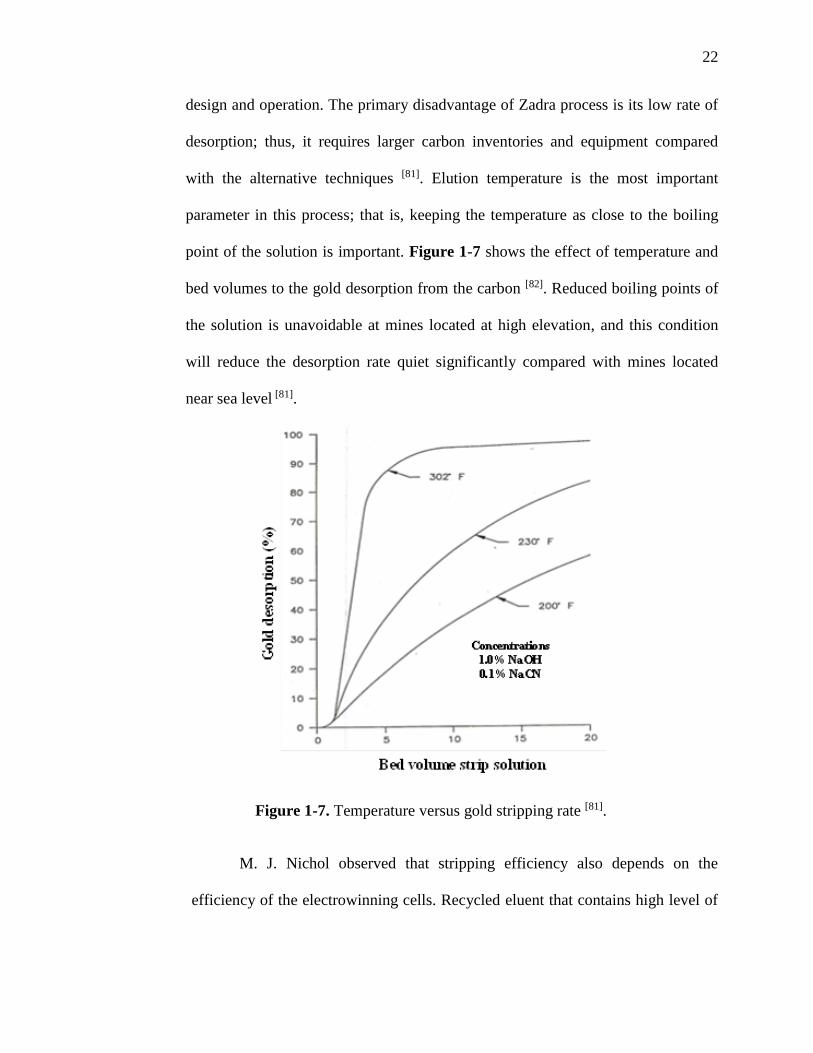
with the alternative techniques [81]. Elution temperature is the most important
parameter in this process; that is, keeping the temperature as close to the boiling
point of the solution is important. Figure 1-7 shows the effect of temperature and
bed volumes to the gold desorption from the carbon [82]. Reduced boiling points of
the solution is unavoidable at mines located at high elevation, and this condition
will reduce the desorption rate quiet significantly compared with mines located
near sea level [81].
Figure 1-7. Temperature versus gold stripping rate [81].
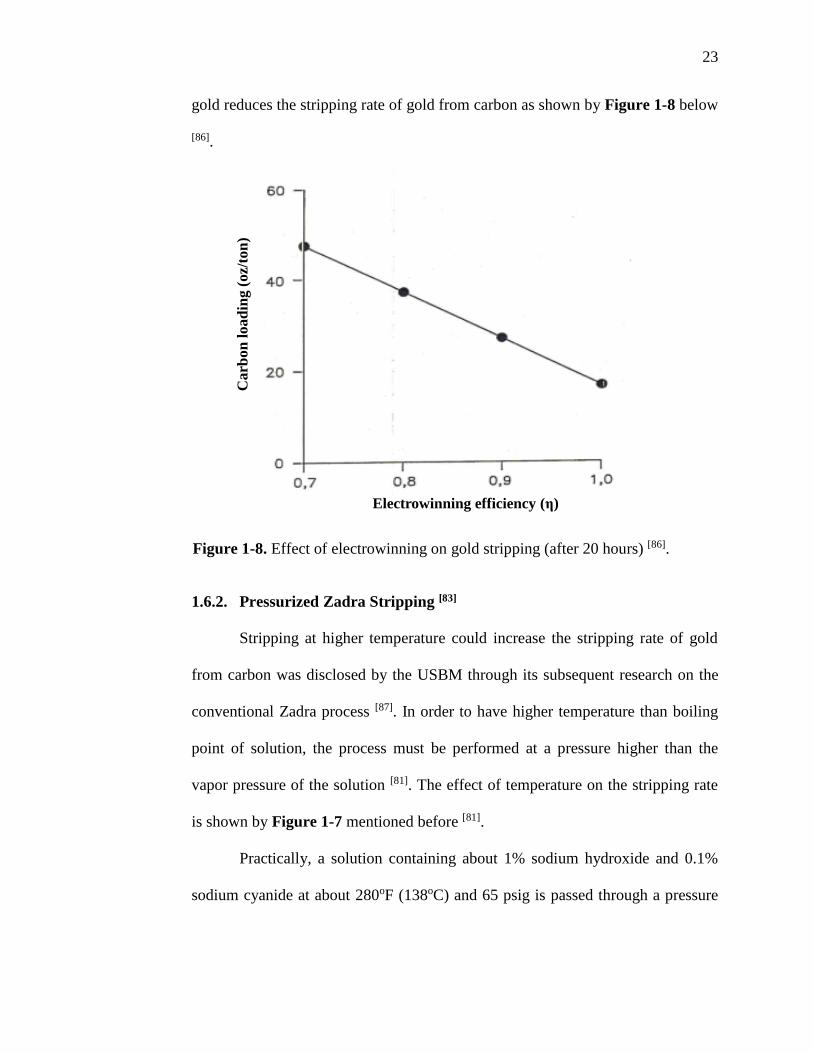
M. J. Nichol observed that stripping efficiency also depends on the
efficiency of the electrowinning cells. Recycled eluent that contains high level of
23
gold reduces the stripping rate of gold from carbon as shown by Figure 1-8 below
[86].
Figure 1-8. Effect of electrowinning on gold stripping (after 20 hours) [86].
1.6.2. Pressurized Zadra Stripping [83]
Stripping at higher temperature could increase the stripping rate of gold
from carbon was disclosed by the USBM through its subsequent research on the
conventional Zadra process [87]. In order to have higher temperature than boiling
point of solution, the process must be performed at a pressure higher than the
vapor pressure of the solution [81]. The effect of temperature on the stripping rate
is shown by Figure 1-7 mentioned before [81].
Practically, a solution containing about 1% sodium hydroxide and 0.1%
sodium cyanide at about 280oF (138oC) and 65 psig is passed through a pressure
Electrowinning efficiency (η)
Ca
rbo
n l
oad
ing (
oz/
ton
)
24
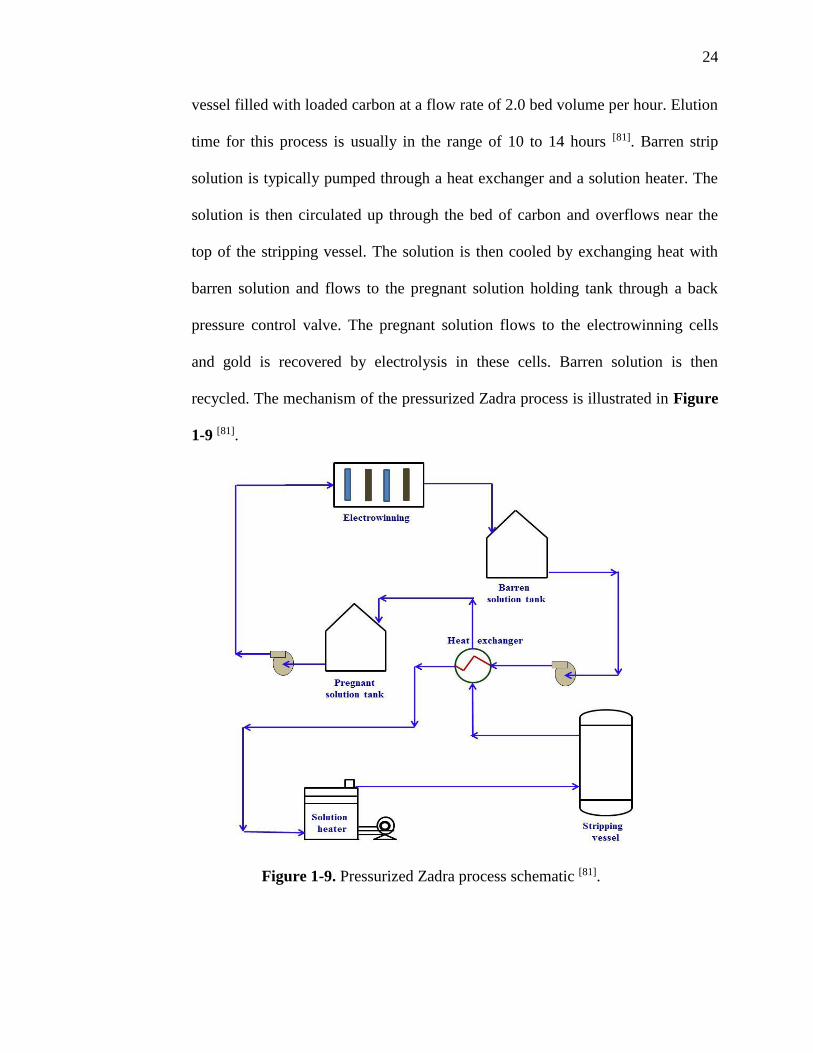
vessel filled with loaded carbon at a flow rate of 2.0 bed volume per hour. Elution
time for this process is usually in the range of 10 to 14 hours [81]. Barren strip
solution is typically pumped through a heat exchanger and a solution heater. The
solution is then circulated up through the bed of carbon and overflows near the
top of the stripping vessel. The solution is then cooled by exchanging heat with
barren solution and flows to the pregnant solution holding tank through a back
pressure control valve. The pregnant solution flows to the electrowinning cells
and gold is recovered by electrolysis in these cells. Barren solution is then
recycled. The mechanism of the pressurized Zadra process is illustrated in Figure
1-9 [81].
Figure 1-9. Pressurized Zadra process schematic [81].

25
The upper limit temperature of the pressurized Zadra is 356oF (180oC)
based on the USBM study. At temperatures higher than 356oF (180oC), cyanide
was decomposed and metallic gold precipitated in the carbon. However, in
practice, 300oF (149oC) is the upper limit used for maximum stripping efficiency
[2]. The stripping columns are generally designed with ratio of height to diameter
of 4 to 1 and upflow rate of 1 to 4 bed volumes per hour. This flow rate does not
significantly affect the stripping efficiency [81]. Table 1-4 summarizes the
operating schedule of pressurized Zadra process.
Table 1-4. General operating schedule for a pressurized Zadra stripping cycle [81].
Process Solution Time
Load column Transfer water 60 minutes
Elution 0.1% NaCN, 1% NaOH 480 minutes
Carbon cooling Fresh water 60 minutes
Unload column Transfer water 30 minutes
TOTAL 11 hours
1.6.3. Anglo American Research Laboratory (AARL) Stripping [81, 88]
President Brand Gold Mine, South Africa used the AARL technique for
the first time on a large scale in 1980 [88]. J. R. Davidson et al. studied the elution
that involved pretreatment of loaded carbon with sodium cyanide and sodium
hydroxide followed by elution with water. Three different sources of loaded
carbon were observed. Based on his observation, elution temperature was the
26
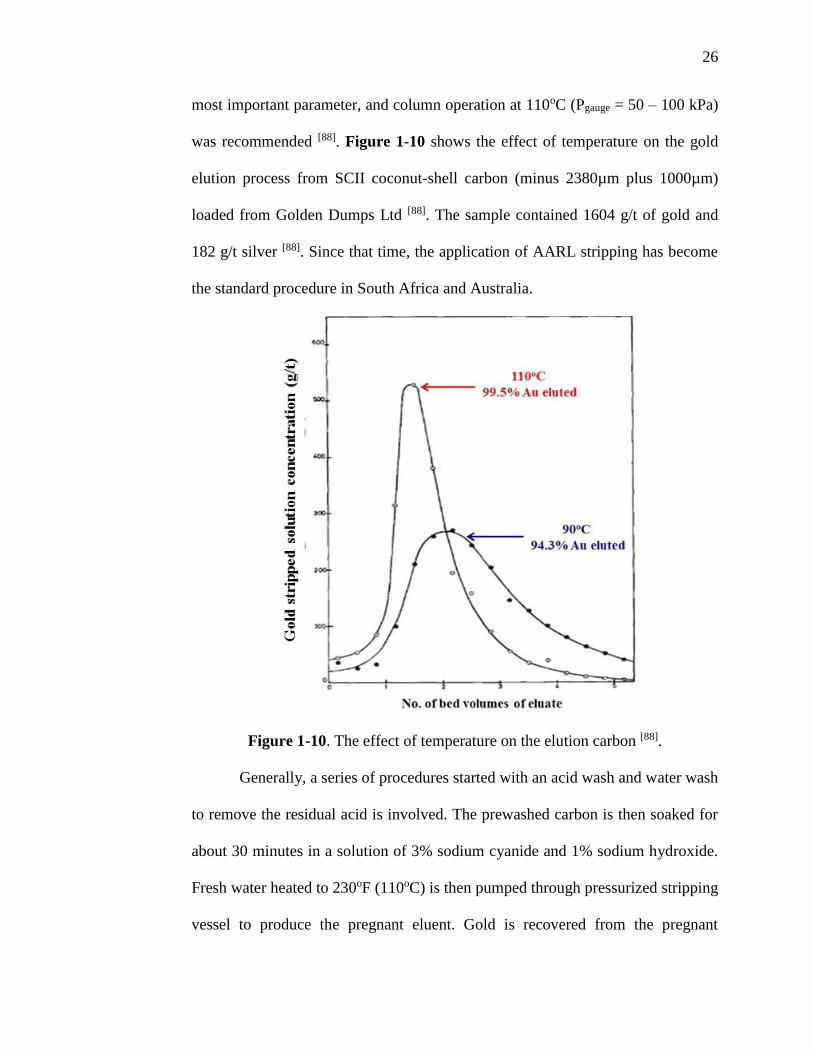
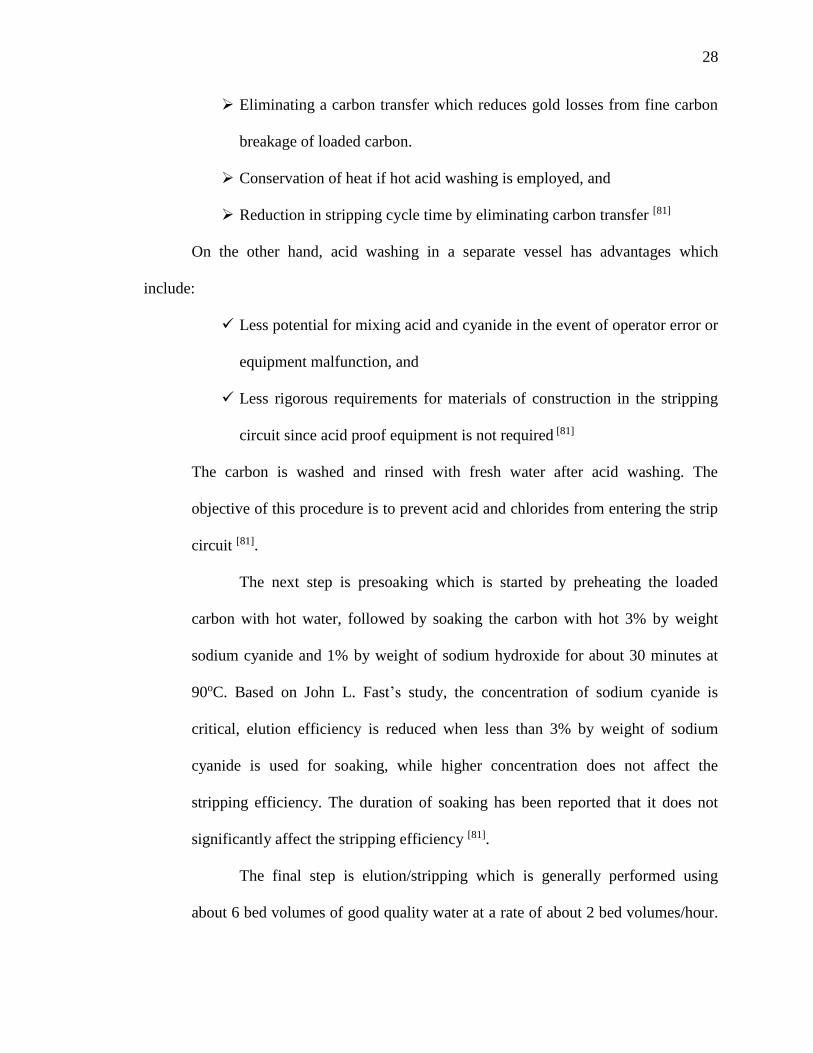
most important parameter, and column operation at 110oC (Pgauge = 50 – 100 kPa)
was recommended [88]. Figure 1-10 shows the effect of temperature on the gold
elution process from SCII coconut-shell carbon (minus 2380µm plus 1000µm)
loaded from Golden Dumps Ltd [88]. The sample contained 1604 g/t of gold and
182 g/t silver [88]. Since that time, the application of AARL stripping has become
the standard procedure in South Africa and Australia.
Figure 1-10. The effect of temperature on the elution carbon [88].
Generally, a series of procedures started with an acid wash and water wash
to remove the residual acid is involved. The prewashed carbon is then soaked for
about 30 minutes in a solution of 3% sodium cyanide and 1% sodium hydroxide.
Fresh water heated to 230oF (110oC) is then pumped through pressurized stripping
vessel to produce the pregnant eluent. Gold is recovered from the pregnant
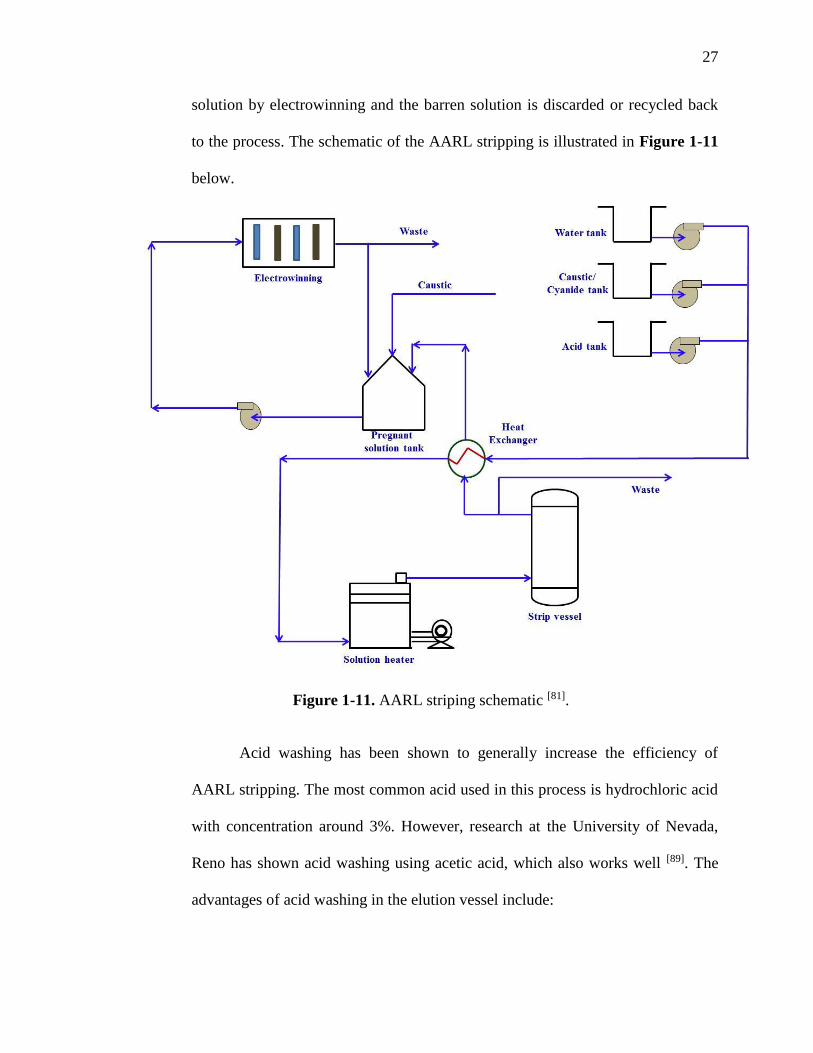
27
solution by electrowinning and the barren solution is discarded or recycled back
to the process. The schematic of the AARL stripping is illustrated in Figure 1-11
below.
Figure 1-11. AARL striping schematic [81].
Acid washing has been shown to generally increase the efficiency of
AARL stripping. The most common acid used in this process is hydrochloric acid
with concentration around 3%. However, research at the University of Nevada,
Reno has shown acid washing using acetic acid, which also works well [89]. The
advantages of acid washing in the elution vessel include:
28
Eliminating a carbon transfer which reduces gold losses from fine carbon
breakage of loaded carbon.
Conservation of heat if hot acid washing is employed, and
Reduction in stripping cycle time by eliminating carbon transfer [81]
On the other hand, acid washing in a separate vessel has advantages which
include:
Less potential for mixing acid and cyanide in the event of operator error or
equipment malfunction, and
Less rigorous requirements for materials of construction in the stripping
circuit since acid proof equipment is not required [81]
The carbon is washed and rinsed with fresh water after acid washing. The
objective of this procedure is to prevent acid and chlorides from entering the strip
circuit [81].
The next step is presoaking which is started by preheating the loaded
carbon with hot water, followed by soaking the carbon with hot 3% by weight
sodium cyanide and 1% by weight of sodium hydroxide for about 30 minutes at
90oC. Based on John L. Fast’s study, the concentration of sodium cyanide is
critical, elution efficiency is reduced when less than 3% by weight of sodium
cyanide is used for soaking, while higher concentration does not affect the
stripping efficiency. The duration of soaking has been reported that it does not
significantly affect the stripping efficiency [81].
The final step is elution/stripping which is generally performed using
about 6 bed volumes of good quality water at a rate of about 2 bed volumes/hour.
29
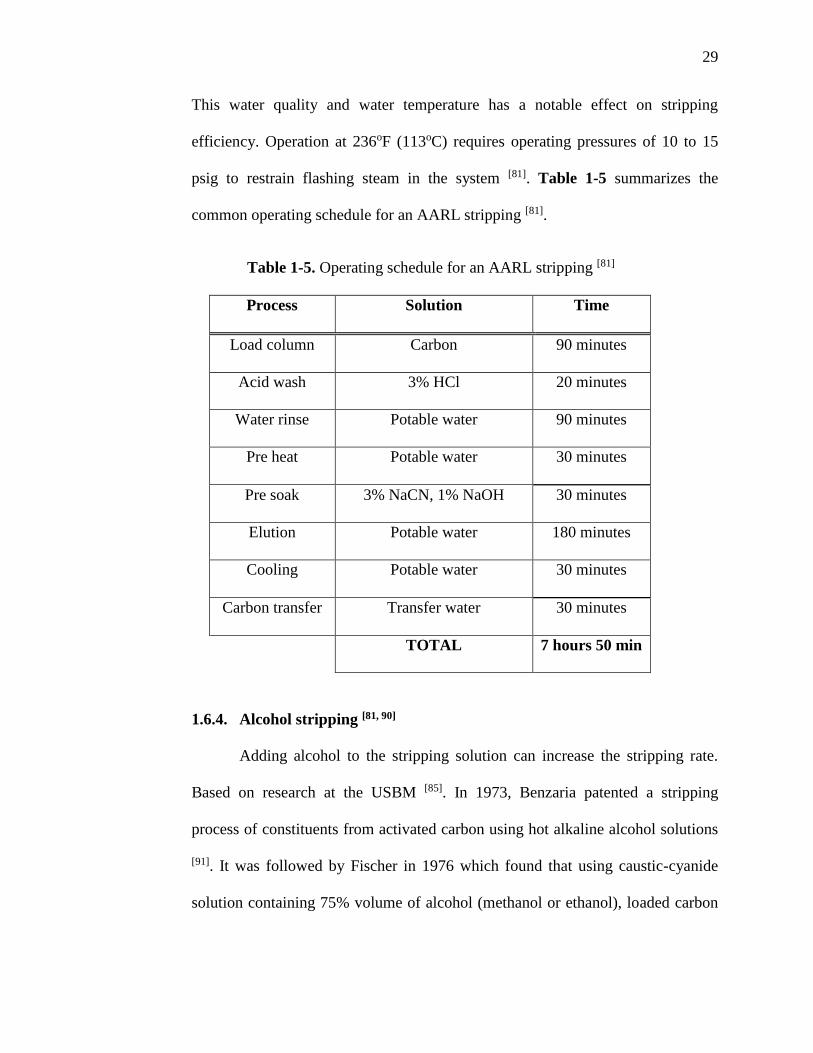
This water quality and water temperature has a notable effect on stripping
efficiency. Operation at 236oF (113oC) requires operating pressures of 10 to 15
psig to restrain flashing steam in the system [81]. Table 1-5 summarizes the
common operating schedule for an AARL stripping [81].
Table 1-5. Operating schedule for an AARL stripping [81]
Process Solution Time
Load column Carbon 90 minutes
Acid wash 3% HCl 20 minutes
Water rinse Potable water 90 minutes
Pre heat Potable water 30 minutes
Pre soak 3% NaCN, 1% NaOH 30 minutes
Elution Potable water 180 minutes
Cooling Potable water 30 minutes
Carbon transfer Transfer water 30 minutes
TOTAL 7 hours 50 min
1.6.4. Alcohol stripping [81, 90]
Adding alcohol to the stripping solution can increase the stripping rate.
Based on research at the USBM [85]. In 1973, Benzaria patented a stripping
process of constituents from activated carbon using hot alkaline alcohol solutions
[91]. It was followed by Fischer in 1976 which found that using caustic-cyanide
solution containing 75% volume of alcohol (methanol or ethanol), loaded carbon
30
from pure sodium cyanide solution was readily desorbed at room temperature [23].
This techniques, however, it is not effective to desorb gold and silver from loaded
carbon generated at commercial mine [90]. The most commonly used alcohols in
the stripping process are ethanol and methanol which gives almost the same
stripping efficiency. Although, isopropanol works as well, the efficiency is lower
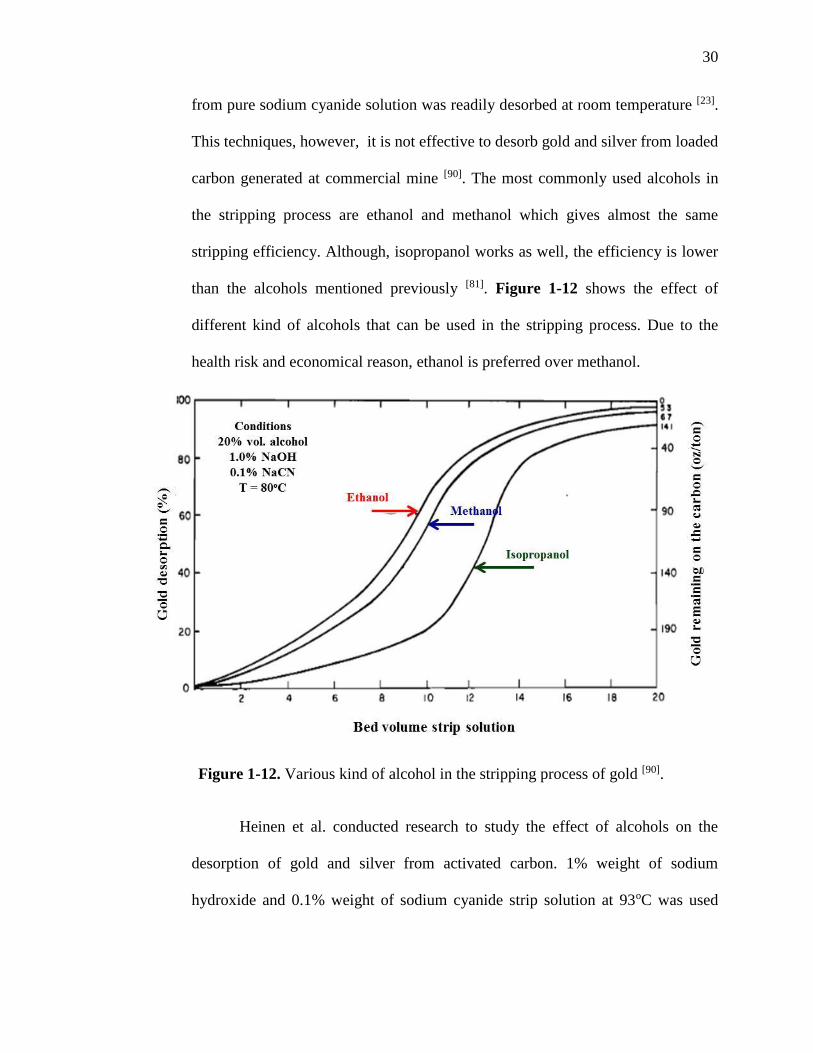
than the alcohols mentioned previously [81]. Figure 1-12 shows the effect of
different kind of alcohols that can be used in the stripping process. Due to the
health risk and economical reason, ethanol is preferred over methanol.
Figure 1-12. Various kind of alcohol in the stripping process of gold [90].
Heinen et al. conducted research to study the effect of alcohols on the
desorption of gold and silver from activated carbon. 1% weight of sodium
hydroxide and 0.1% weight of sodium cyanide strip solution at 93oC was used

31
with and without 20% volume of ethanol. The result of this study is displayed in
Figure 1-13 below [90]. Based on the graph, addition of ethanol significantly
increases the stripping of gold from the carbon.
Figure 1-13. Alcohol effect on gold stripping process [90].
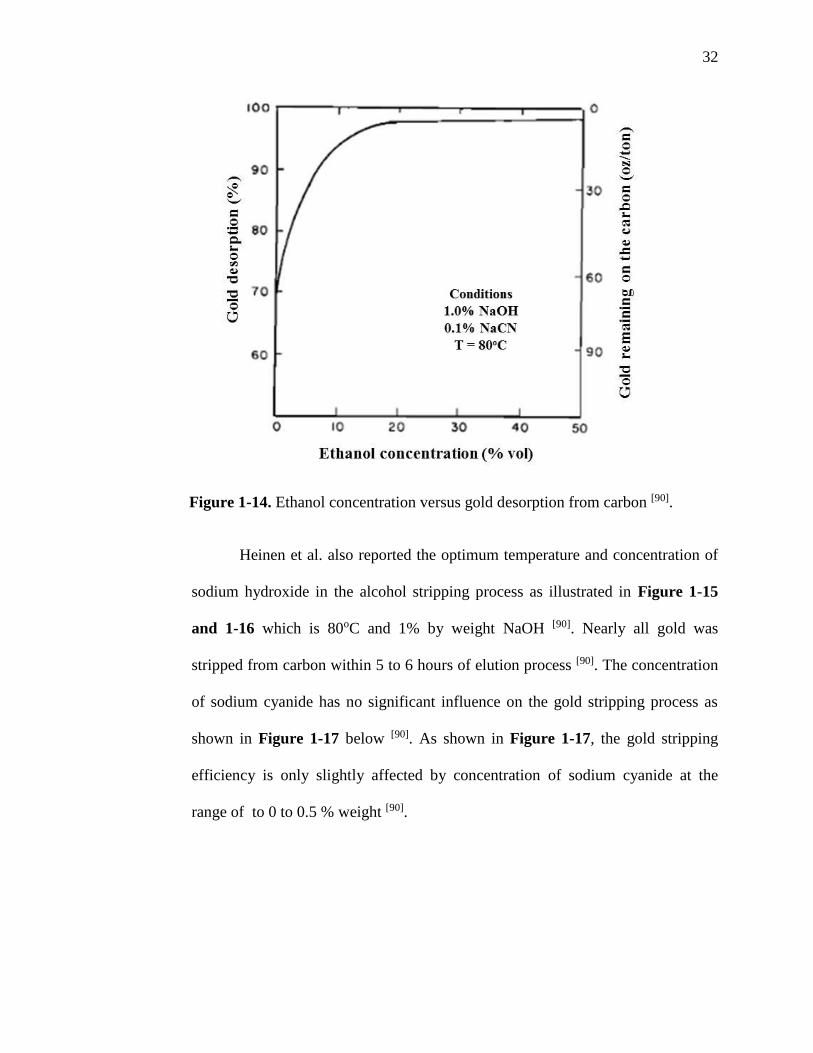
The concentration ethanol on the stripping process was also investigated.
It was found that the optimum condition was peaked at 20% volume of ethanol.
Higher ethanol content does not increase the stripping or desorption of the gold
from carbon. Figure 1-14 explains the effect of ethanol concentration on the
stripping or desorption gold [90].
32
Figure 1-14. Ethanol concentration versus gold desorption from carbon [90].
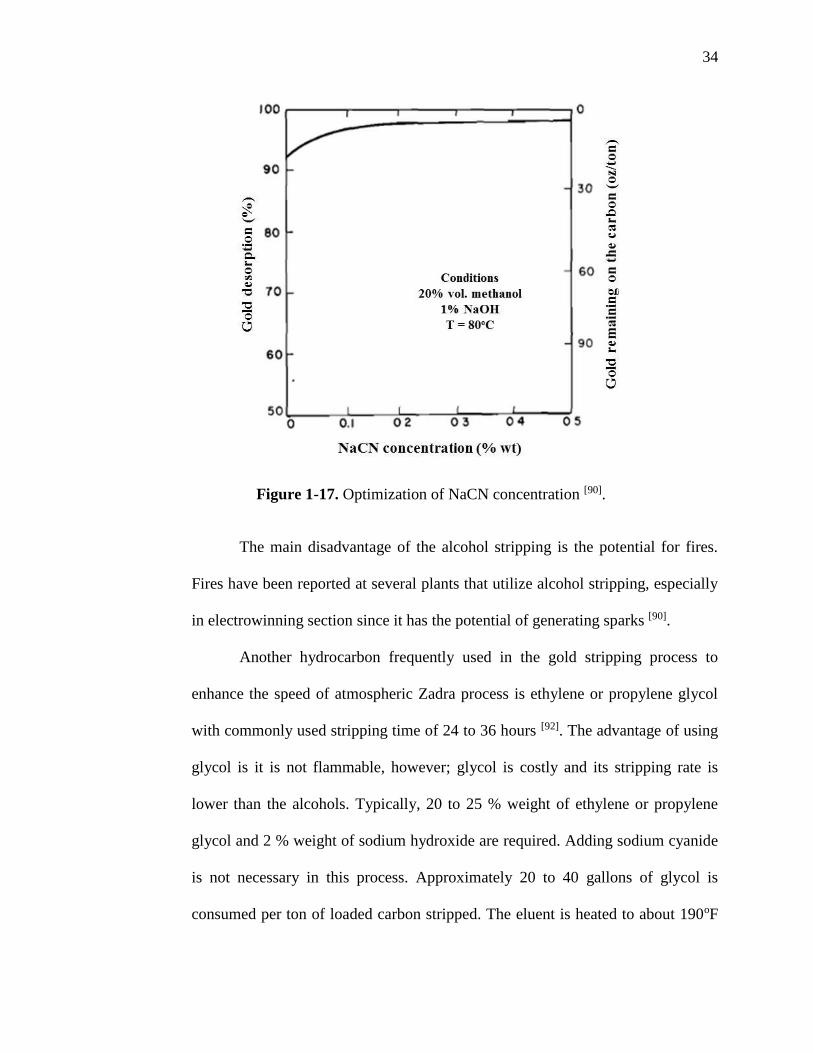
Heinen et al. also reported the optimum temperature and concentration of
sodium hydroxide in the alcohol stripping process as illustrated in Figure 1-15
and 1-16 which is 80oC and 1% by weight NaOH [90]. Nearly all gold was
stripped from carbon within 5 to 6 hours of elution process [90]. The concentration
of sodium cyanide has no significant influence on the gold stripping process as
shown in Figure 1-17 below [90]. As shown in Figure 1-17, the gold stripping
efficiency is only slightly affected by concentration of sodium cyanide at the
range of to 0 to 0.5 % weight [90].

33
Figure 1-15. Effect of temperature in alcohol stripping process [90].
Figure 1-16. Optimization of NaOH concentration [90].
34
Figure 1-17. Optimization of NaCN concentration [90].
The main disadvantage of the alcohol stripping is the potential for fires.
Fires have been reported at several plants that utilize alcohol stripping, especially
in electrowinning section since it has the potential of generating sparks [90].
Another hydrocarbon frequently used in the gold stripping process to
enhance the speed of atmospheric Zadra process is ethylene or propylene glycol
with commonly used stripping time of 24 to 36 hours [92]. The advantage of using
glycol is it is not flammable, however; glycol is costly and its stripping rate is
lower than the alcohols. Typically, 20 to 25 % weight of ethylene or propylene
glycol and 2 % weight of sodium hydroxide are required. Adding sodium cyanide
is not necessary in this process. Approximately 20 to 40 gallons of glycol is
consumed per ton of loaded carbon stripped. The eluent is heated to about 190oF
35
(88oC) and pumped through the stripping vessel at a flow rate about 2 bed
volumes per hour. Then the gold is recovered by electrowinning [81, 92].
1.6.5. Micron stripping [81, 93]
The newest stripping procedure used in the gold industry is micron
stripping which was developed at Micron Research Australia [93]. The process
requires pretreatment of loaded carbon with a caustic cyanide solution followed
by alcohol mixture elution [81, 93]. The micron stripping takes advantage of the
alcohol stripping (enhanced stripping rate) but enclose the alcohol to the closed
stripping unit in order to reduce or minimize the potential of fire dangers as the
pregnant eluent in this process does not contain alcohol anymore [81]. The elution
unit is arranged like a packed bed distillation tower with a heater on the base and
condenser on top. The micron stripping process is composed of the following
steps [81]:
1) Presoaking
The loaded carbon is first soaked in a 1 to 2% sodium hydroxide and 5 to
10% sodium cyanide at room temperature. If the carbon contains high
concentrations of gold, silver or copper, the sodium cyanide concentration
may be increased up to 20%. Once presoaking is finished, the solution is
then drained.
2) Desorption or stripping
About 0.5 bed volume alcohol, is then added. Heat is then applied on the
base of the packed bed tower or vessel. Organic vapor rises through the
36
carbon bed and is condensed. The condensate is pumped back to the top
and sprayed on the carbon.
3) Alcohol recovery
Once the stripping process is completed, alcohol recovery starts by
evaporating the alcohol from the pregnant solution. Once the solution
reaches the boiling point of water, the evaporation is then discontinued
and the draining of pregnant solution commences.
Following these three steps, the eluent from this micron stripping contains
negligible alcohol, with high concentration (about 2 to 3 times higher than those
in the loaded carbon) of recovered metals [81]. The illustration of the micron
stripping process is shown in Figure 1-18 below [81].

37
Figure 1-18. Micro stripping diagram [81].
1.7. Acid Washing of Carbon
Acid washed is often discussed in carbon elution or stripping and usually it is
carried out at different points in the carbon elution depending on operating management
and preferences [94]. Generally, AARL elution requires acid washing followed by caustic
cyanide solution before the elution itself. There are two reasons reported on the
advantages of acid washing loaded carbon before the elution. First, acid washing opens
38
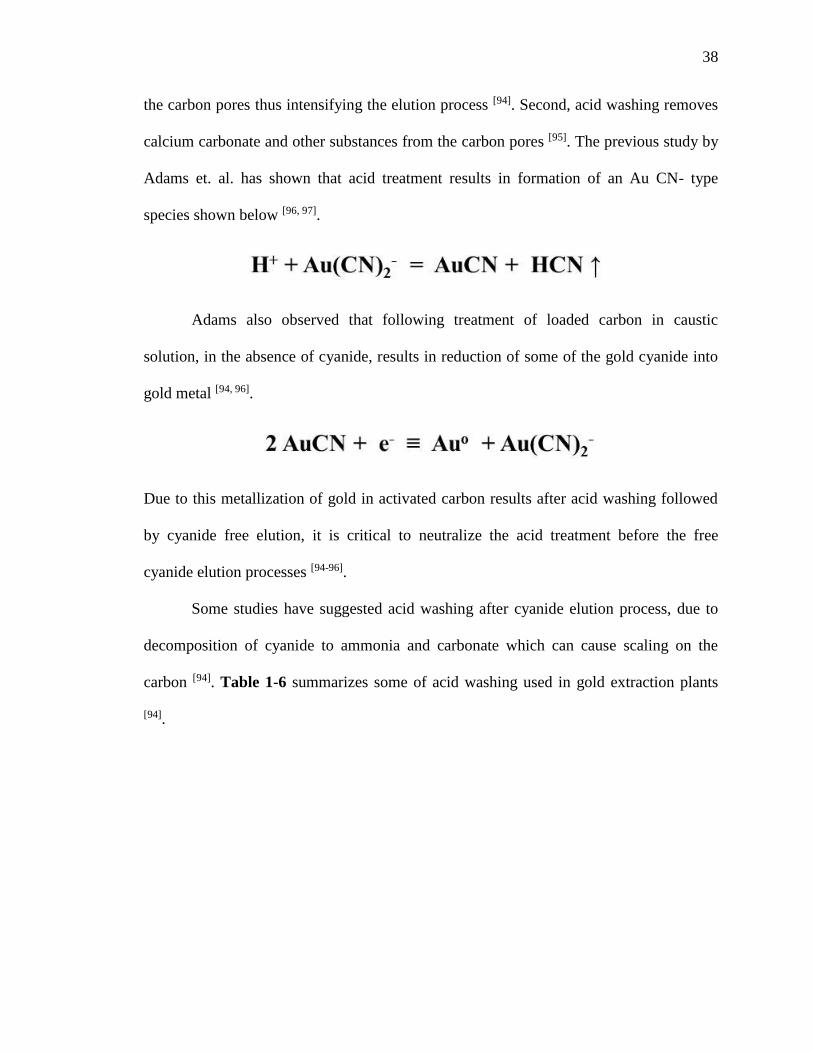
the carbon pores thus intensifying the elution process [94]. Second, acid washing removes
calcium carbonate and other substances from the carbon pores [95]. The previous study by
Adams et. al. has shown that acid treatment results in formation of an Au CN- type
species shown below [96, 97].
Adams also observed that following treatment of loaded carbon in caustic
solution, in the absence of cyanide, results in reduction of some of the gold cyanide into
gold metal [94, 96].
Due to this metallization of gold in activated carbon results after acid washing followed
by cyanide free elution, it is critical to neutralize the acid treatment before the free
cyanide elution processes [94-96].
Some studies have suggested acid washing after cyanide elution process, due to
decomposition of cyanide to ammonia and carbonate which can cause scaling on the
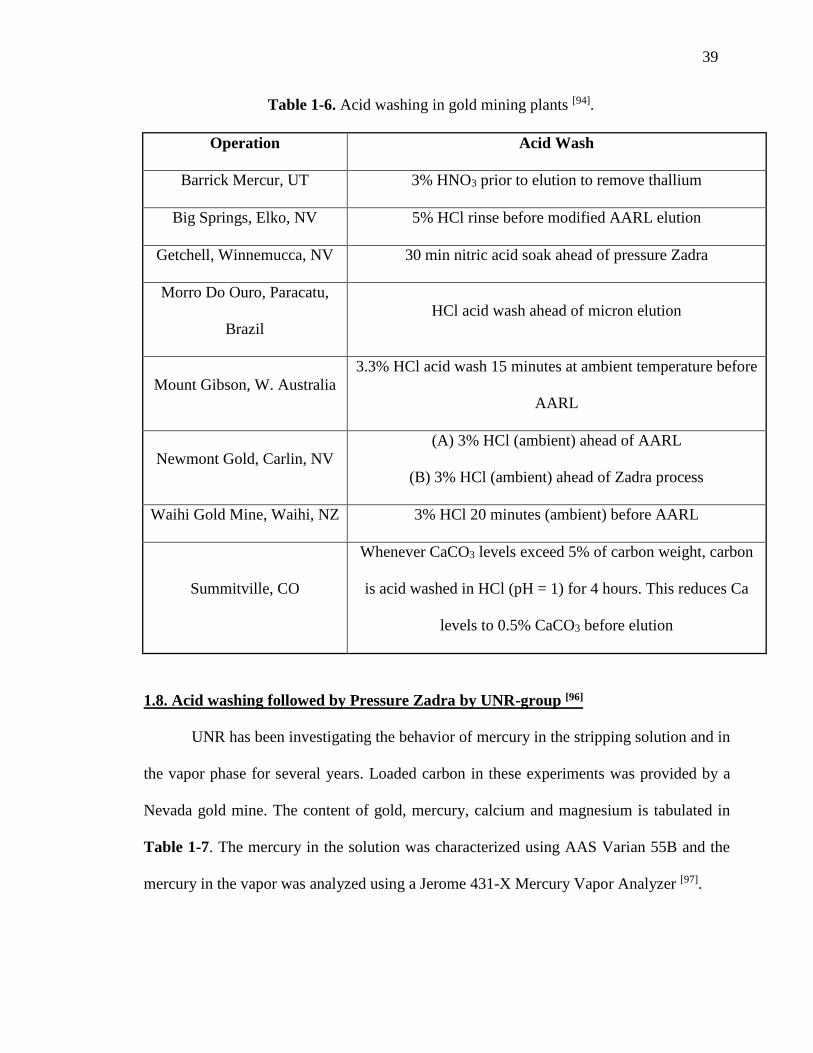
carbon [94]. Table 1-6 summarizes some of acid washing used in gold extraction plants
[94].
39
Table 1-6. Acid washing in gold mining plants [94].
Operation Acid Wash
Barrick Mercur, UT 3% HNO3 prior to elution to remove thallium
Big Springs, Elko, NV 5% HCl rinse before modified AARL elution
Getchell, Winnemucca, NV 30 min nitric acid soak ahead of pressure Zadra
Morro Do Ouro, Paracatu,
Brazil
HCl acid wash ahead of micron elution
Mount Gibson, W. Australia
3.3% HCl acid wash 15 minutes at ambient temperature before
AARL
Newmont Gold, Carlin, NV
(A) 3% HCl (ambient) ahead of AARL
(B) 3% HCl (ambient) ahead of Zadra process
Waihi Gold Mine, Waihi, NZ 3% HCl 20 minutes (ambient) before AARL
Summitville, CO
Whenever CaCO3 levels exceed 5% of carbon weight, carbon
is acid washed in HCl (pH = 1) for 4 hours. This reduces Ca
levels to 0.5% CaCO3 before elution
1.8. Acid washing followed by Pressure Zadra by UNR-group [96]
UNR has been investigating the behavior of mercury in the stripping solution and in
the vapor phase for several years. Loaded carbon in these experiments was provided by a
Nevada gold mine. The content of gold, mercury, calcium and magnesium is tabulated in
Table 1-7. The mercury in the solution was characterized using AAS Varian 55B and the
mercury in the vapor was analyzed using a Jerome 431-X Mercury Vapor Analyzer [97].

40
Table 1-7. Au, Hg, Ca and Mg content in the loaded carbon (mg/g)
Product
Content on loaded carbon (mg/g)
Hg Au Ca+Mg
Loaded carbon before acid washing 0.313 5.39 11.45
Prior to using Zadra stripping, loaded carbon was acid washed using either 10%
UNR-100 and 10% HCl in a glass column (15 x 300 mm) equipped with a controlled
heating tape as shown in Figure 1-19 below. Washed carbon was then dried in a vacuum
oven.
Figure 1-19. Acid washed column [96].
The effect of mercury stripping from the carbon using acid washed (UNR-100 and
HCl) is shown in Figure 1-20. Based on the graph, UNR-100 provides a significantly
higher stripping of mercury than HCl at the same temperature and concentration. UNR-
100 is even more effective at 90oC, as it was shown to strip about 70% of mercury in 8
hours washing. Different concentration of UNR-100 was also studied. 5% UNR-100 was
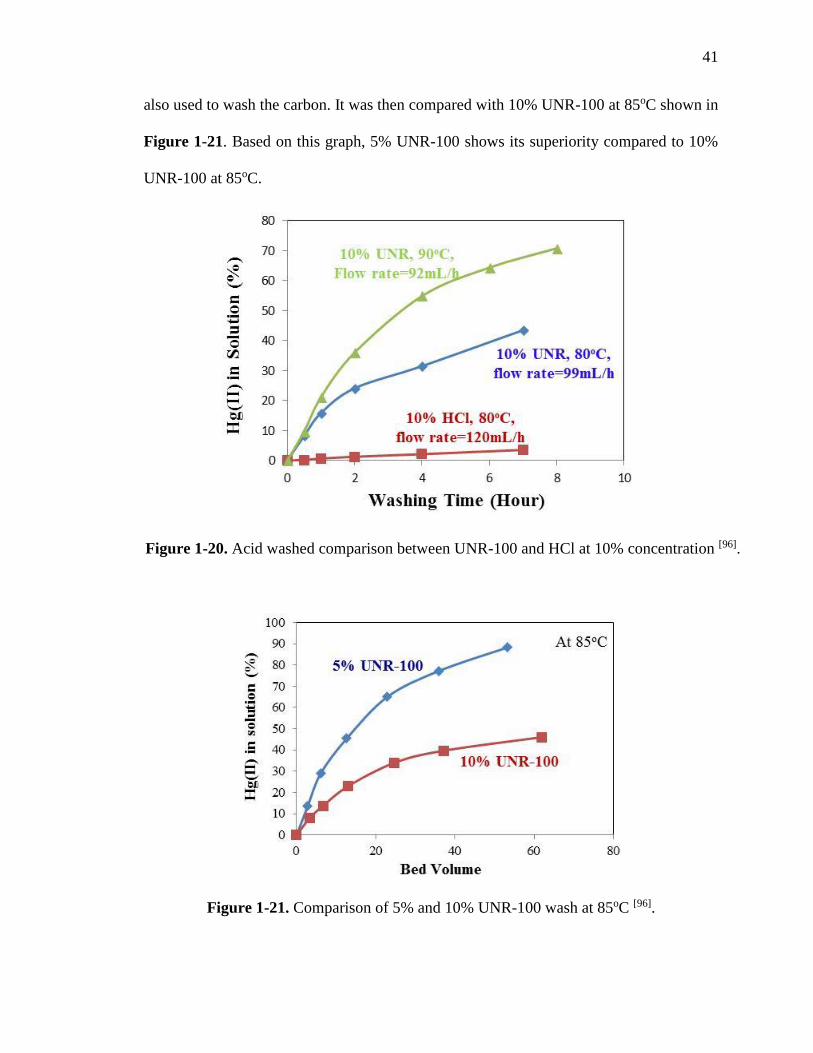
41
also used to wash the carbon. It was then compared with 10% UNR-100 at 85oC shown in
Figure 1-21. Based on this graph, 5% UNR-100 shows its superiority compared to 10%
UNR-100 at 85oC.
Figure 1-20. Acid washed comparison between UNR-100 and HCl at 10% concentration [96].
Figure 1-21. Comparison of 5% and 10% UNR-100 wash at 85oC [96].
42
Based on further investigation, the UNR-100 and HCl were also very selective
which means it stripped only mercury. 5% UNR-100 and 5% HCl only stripped 0.15%
and 1.5% of Au respectively. Thus, this acid wash provides a favorable technique to
separate the gold and mercury before gold stripping process using cyanide solution.
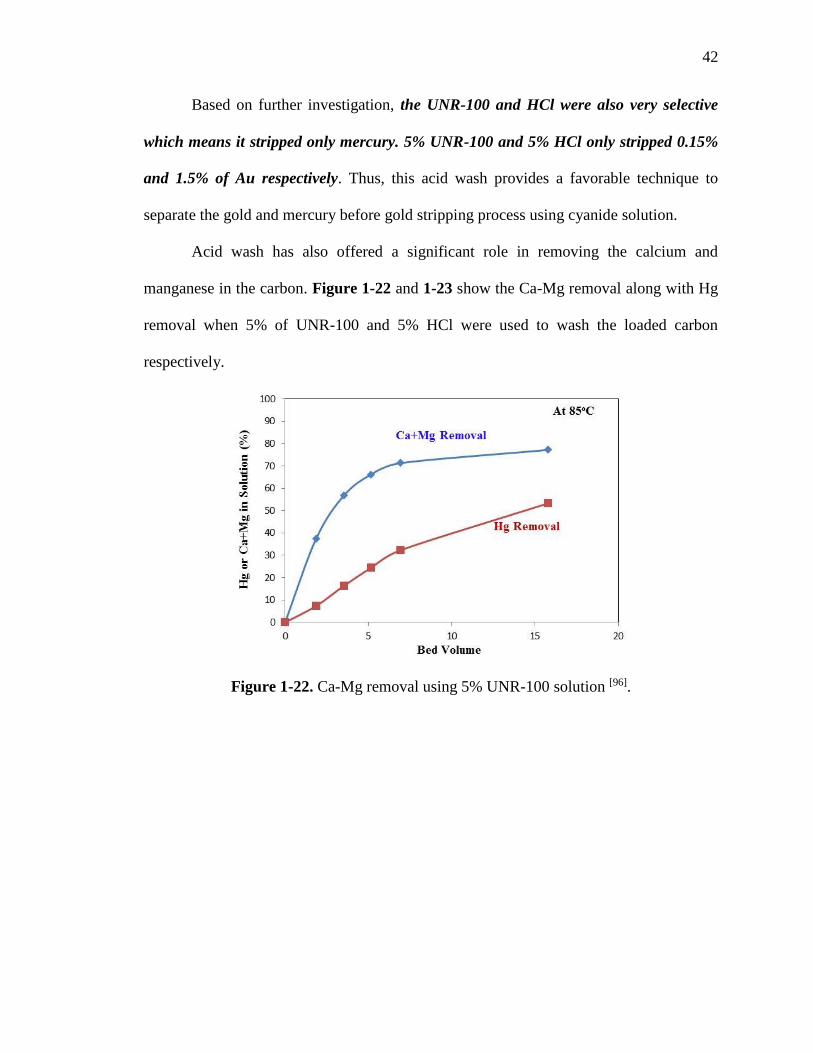
Acid wash has also offered a significant role in removing the calcium and
manganese in the carbon. Figure 1-22 and 1-23 show the Ca-Mg removal along with Hg
removal when 5% of UNR-100 and 5% HCl were used to wash the loaded carbon
respectively.
Figure 1-22. Ca-Mg removal using 5% UNR-100 solution [96].

43
Figure 1-23. Ca-Mg removal using 5% HCl solution [96].
Based on the results shown in Figure 1-22 and 1-23, the removal of Ca-Mg was
optimum at 6-8 bed volumes using acid wash (UNR-100 and HCl). HCl removed Ca-Mg
about 10% better than UNR-100 whereas UNR-100 showed its superiority on removing
Hg. At about 16 bed volumes, UNR-100 removed approximately 55% of Hg whereas
HCl removed less than 1%.
The conclusion of this acid wash is that HCl is favorable to remove Ca-Mg
whereas UNR-100 is favorable to remove Hg from loaded carbon. Additionally, neither
HCl and UNR-100 significantly removes Au from the carbon.
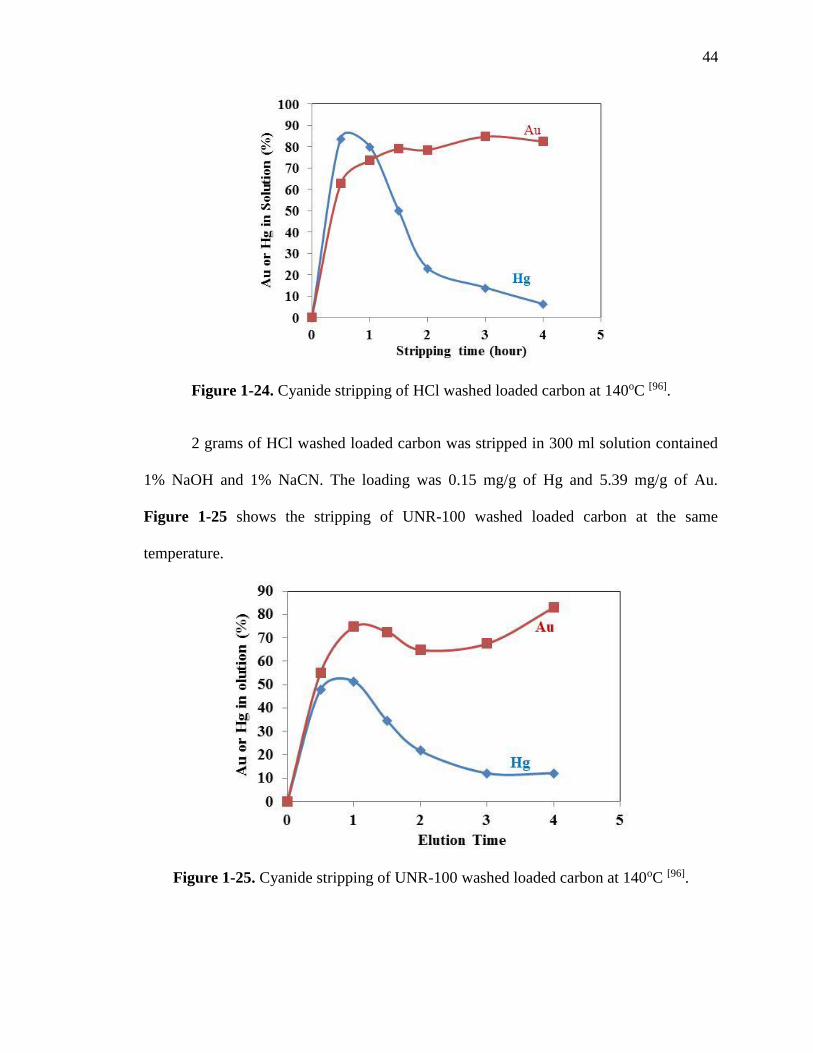
The washed loaded carbon was then cyanide stripped using Zadra in an autoclave
at 140oC. 2 grams of HCl washed loaded carbon was stripped in 300 ml solution
contained 1% NaOH and 1% NaCN. The loading was 0.313 mg/g of Hg and 5.39 mg/g of
Au. Figure 1-24 shows the stripping of 5% HCl washed loaded carbon at 140oC.
44
Figure 1-24. Cyanide stripping of HCl washed loaded carbon at 140oC [96].
2 grams of HCl washed loaded carbon was stripped in 300 ml solution contained
1% NaOH and 1% NaCN. The loading was 0.15 mg/g of Hg and 5.39 mg/g of Au.
Figure 1-25 shows the stripping of UNR-100 washed loaded carbon at the same
temperature.
Figure 1-25. Cyanide stripping of UNR-100 washed loaded carbon at 140oC [96].

45
Based on the two figures above, at high temperature, a lot of Hg(0) was produced
during the stripping process. The behavior of reduction of Hg on both stripping are
similar. Hg(II) reduction to Hg(0) is inevitable at 140oC in an extended period of time (>1
hour). There are two possible ways to avoid this reduction and possible emission. First,
removing Hg(II) as much as possible from loaded carbon prior to pressure Zadra
stripping and/or decreasing the elution time at the beginning of elution in which most of
the adsorbed Hg(II) is already desorbed. Secondly, replacing the stripped solution with
new solution to the autoclave for the rest Au elution. Hg(II) in then removed from the
stripped solution before the stripped solution enters the electrowinning process [98, 99].
46
CHAPTER 2
EXPERIMENTAL
2.1 Materials
2.1.1 Industrial loaded carbon supplied by Nevada Gold Mines
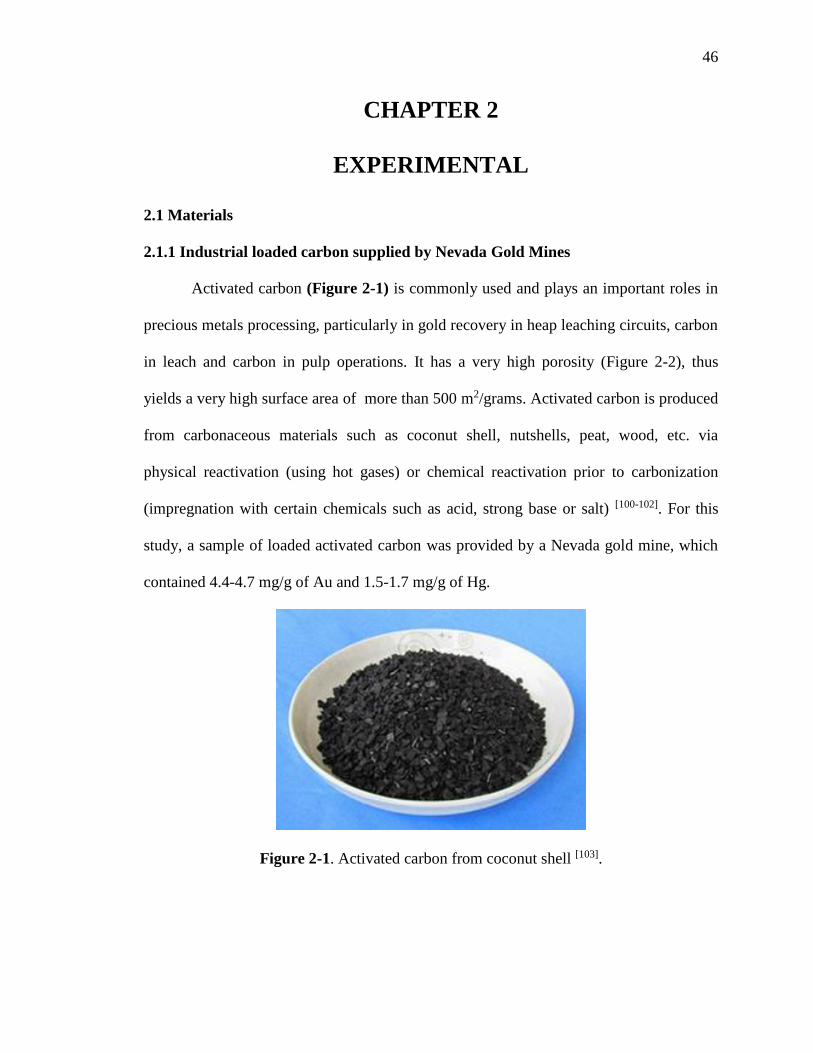
Activated carbon (Figure 2-1) is commonly used and plays an important roles in
precious metals processing, particularly in gold recovery in heap leaching circuits, carbon
in leach and carbon in pulp operations. It has a very high porosity (Figure 2-2), thus
yields a very high surface area of more than 500 m2/grams. Activated carbon is produced
from carbonaceous materials such as coconut shell, nutshells, peat, wood, etc. via
physical reactivation (using hot gases) or chemical reactivation prior to carbonization
(impregnation with certain chemicals such as acid, strong base or salt) [100-102]. For this
study, a sample of loaded activated carbon was provided by a Nevada gold mine, which
contained 4.4-4.7 mg/g of Au and 1.5-1.7 mg/g of Hg.
Figure 2-1. Activated carbon from coconut shell [103].

47
Figure 2-2. SEM image of activated carbon microporous (0.4 < 1 <1 nm) [104].
2.1.2 Cyanide alkaline solution for stripping process
Sodium cyanide (NaCN) and sodium hydroxide (NaOH) were used as a stripping
solution. NaCN is a highly toxicity, white, water soluble, inorganic compound shown in
Figure 2-3 (a). Due to its high reactivity with metals, this compound is commonly used
in gold mining industry [105]. Toxic gas of hydrogen cyanide (HCN) can be formed when
NaCN is mixed with an acid as shown in Figure 2-3 (b) [106].
Figure 2-3 (a) Sodium cyanide and (b) Equilibrium distribution diagram for cyanide as a
function of pH [105-106].
48
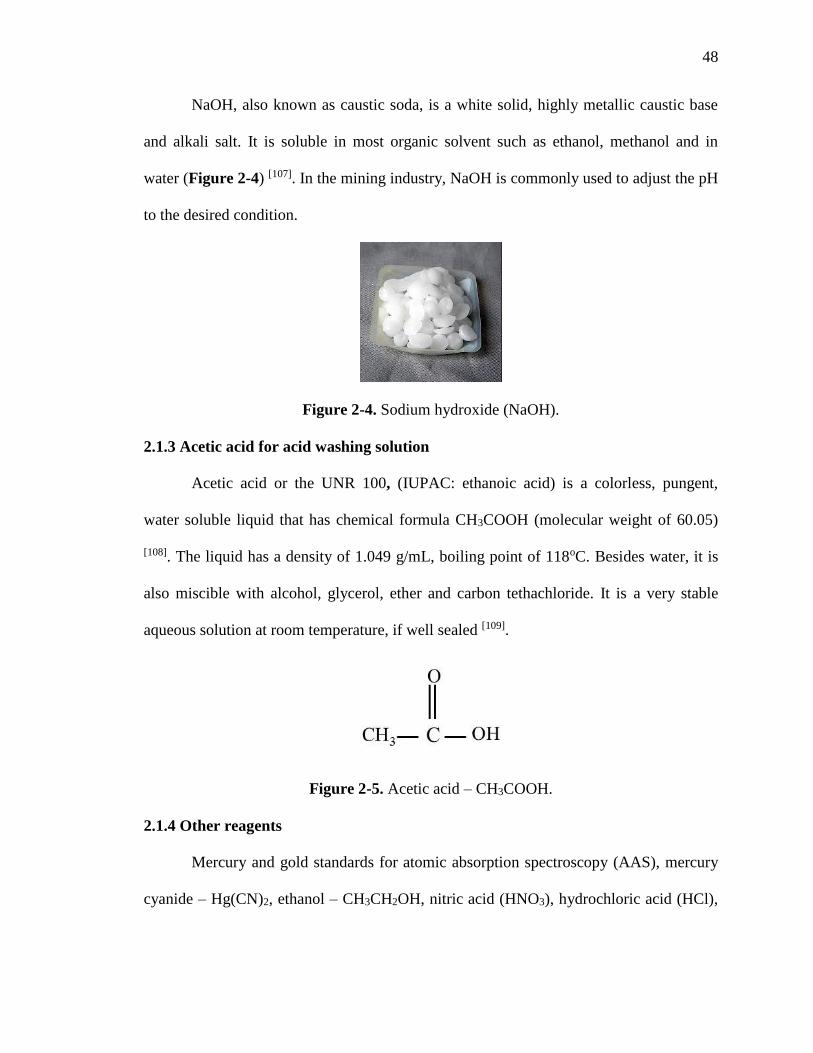
NaOH, also known as caustic soda, is a white solid, highly metallic caustic base
and alkali salt. It is soluble in most organic solvent such as ethanol, methanol and in
water (Figure 2-4) [107]. In the mining industry, NaOH is commonly used to adjust the pH
to the desired condition.
Figure 2-4. Sodium hydroxide (NaOH).
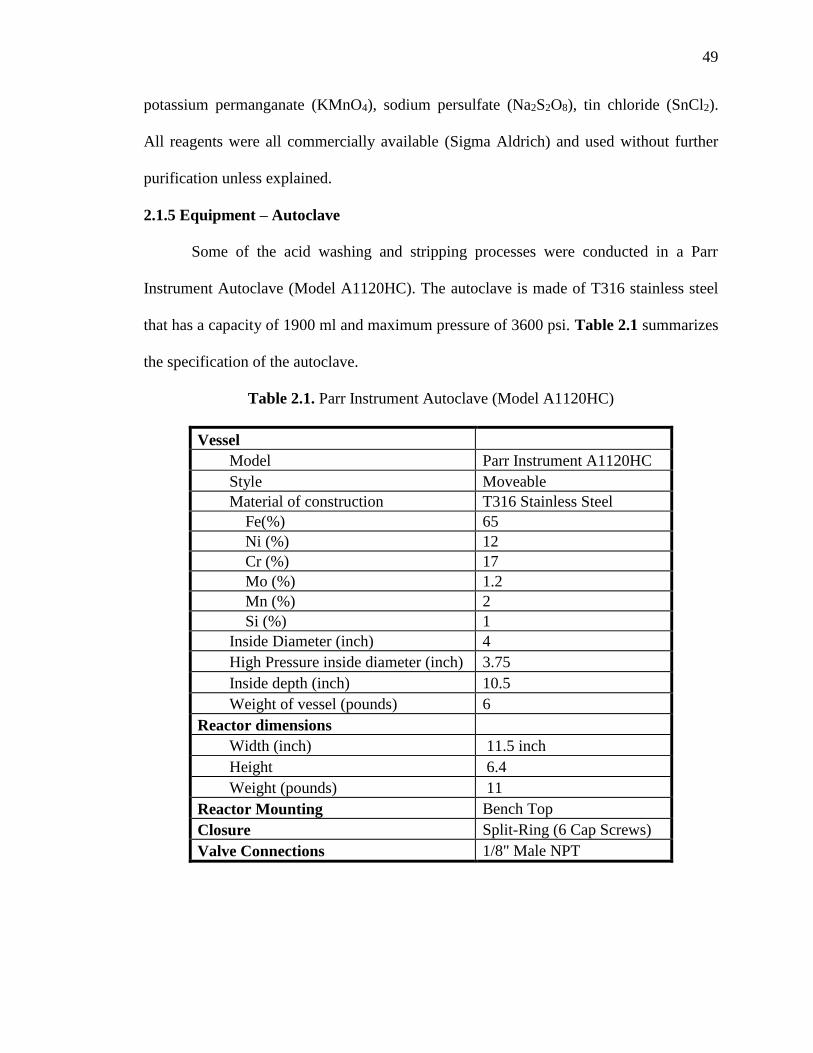
2.1.3 Acetic acid for acid washing solution
Acetic acid or the UNR 100, (IUPAC: ethanoic acid) is a colorless, pungent,
water soluble liquid that has chemical formula CH3COOH (molecular weight of 60.05)
[108]. The liquid has a density of 1.049 g/mL, boiling point of 118oC. Besides water, it is
also miscible with alcohol, glycerol, ether and carbon tethachloride. It is a very stable
aqueous solution at room temperature, if well sealed [109].
Figure 2-5. Acetic acid – CH3COOH.
2.1.4 Other reagents
Mercury and gold standards for atomic absorption spectroscopy (AAS), mercury
cyanide – Hg(CN)2, ethanol – CH3CH2OH, nitric acid (HNO3), hydrochloric acid (HCl),
49
potassium permanganate (KMnO4), sodium persulfate (Na2S2O8), tin chloride (SnCl2).
All reagents were all commercially available (Sigma Aldrich) and used without further
purification unless explained.
2.1.5 Equipment – Autoclave
Some of the acid washing and stripping processes were conducted in a Parr
Instrument Autoclave (Model A1120HC). The autoclave is made of T316 stainless steel
that has a capacity of 1900 ml and maximum pressure of 3600 psi. Table 2.1 summarizes
the specification of the autoclave.
Table 2.1. Parr Instrument Autoclave (Model A1120HC)
Vessel
Model Parr Instrument A1120HC
Style Moveable
Material of construction T316 Stainless Steel
Fe(%) 65
Ni (%) 12
Cr (%) 17
Mo (%) 1.2
Mn (%) 2
Si (%) 1
Inside Diameter (inch) 4
High Pressure inside diameter (inch) 3.75
Inside depth (inch) 10.5
Weight of vessel (pounds) 6
Reactor dimensions
Width (inch) 11.5 inch
Height 6.4
Weight (pounds) 11
Reactor Mounting Bench Top
Closure Split-Ring (6 Cap Screws)
Valve Connections 1/8" Male NPT

50
2.2 Experimental procedures
2.2.1. Synthetically loading carbon
Fresh activated carbon was dried in an oven at 80oC for 24 hours to
eliminate moisture adsorbed during the storing. Approximately 3% by weight
moisture was removed. Hg(CN)2 and AuCN purchased from Sigma Aldrich (99%
purity) were used to load the carbon.
25 grams of dried carbon was placed into an Erlenmeyer flask. Then, 200 ml
solution contains 1% NaOH, 0.1% NaCN, and desired amount of AuCN (144.5 mg)
and Hg(CN)2 (32.2 mg/g) were poured into the Erlenmeyer. The Erlenmeyer was
sealed and placed in a gyratory shaker for 24 hours at room temperature (23oC). The
speed of the shaker used was 40%.
Once finished, the carbon was isolated from the solution by filtration. The
filtrate was collected for analysis so the exact amount of Hg and Au no adsorbed
can be determined. Furthermore, the carbon was then washed using distilled water
until the water reached pH < 9 (about 30 times washing).
By following this procedure, approximately 4.91 mg/g Au and 0.94 mg/g
Hg were loaded onto the carbon. This carbon was then used for optimization of acid
washing using UNR-100 in an autoclave.
2.2.2 Optimization of acid washing using UNR-100 in an autoclave
2.5 grams of synthetically loaded carbon was used to study the mercury
washing using various concentrations of UNR-100 solution. UNR-100 solution was
heated up by the digital stirring hotplate (KIA C-MAG HS7) and a stirrer bar as
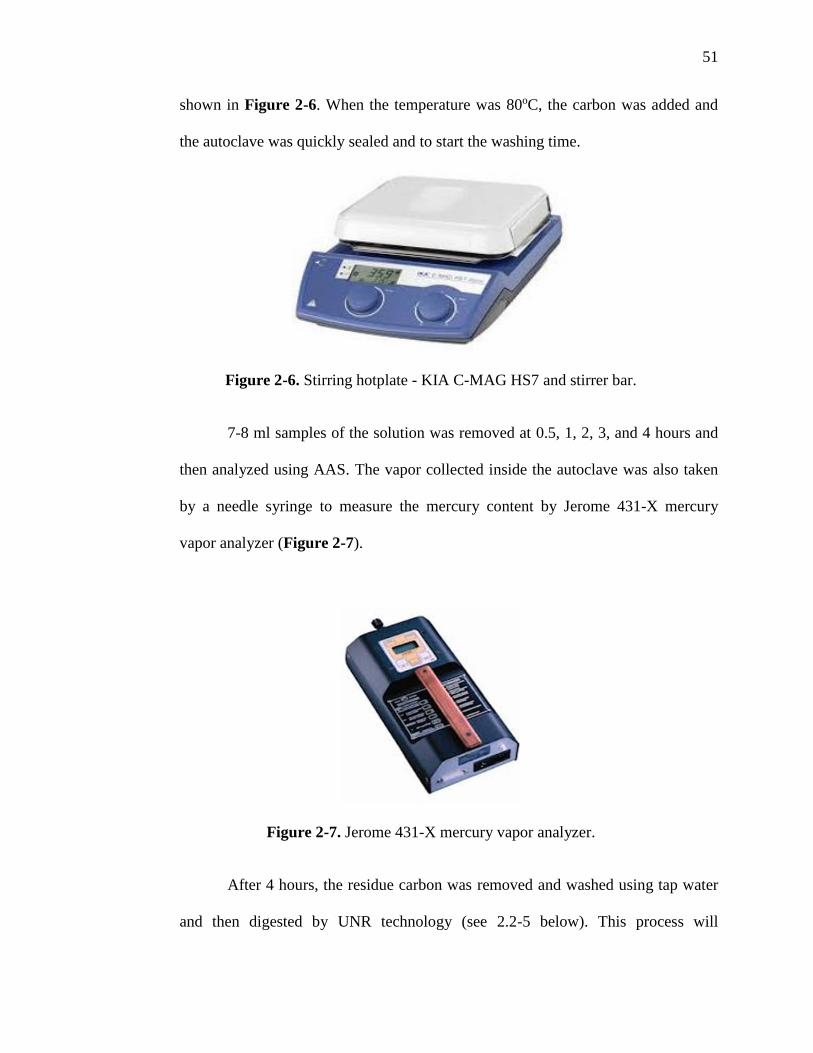
51
shown in Figure 2-6. When the temperature was 80oC, the carbon was added and
the autoclave was quickly sealed and to start the washing time.
Figure 2-6. Stirring hotplate - KIA C-MAG HS7 and stirrer bar.
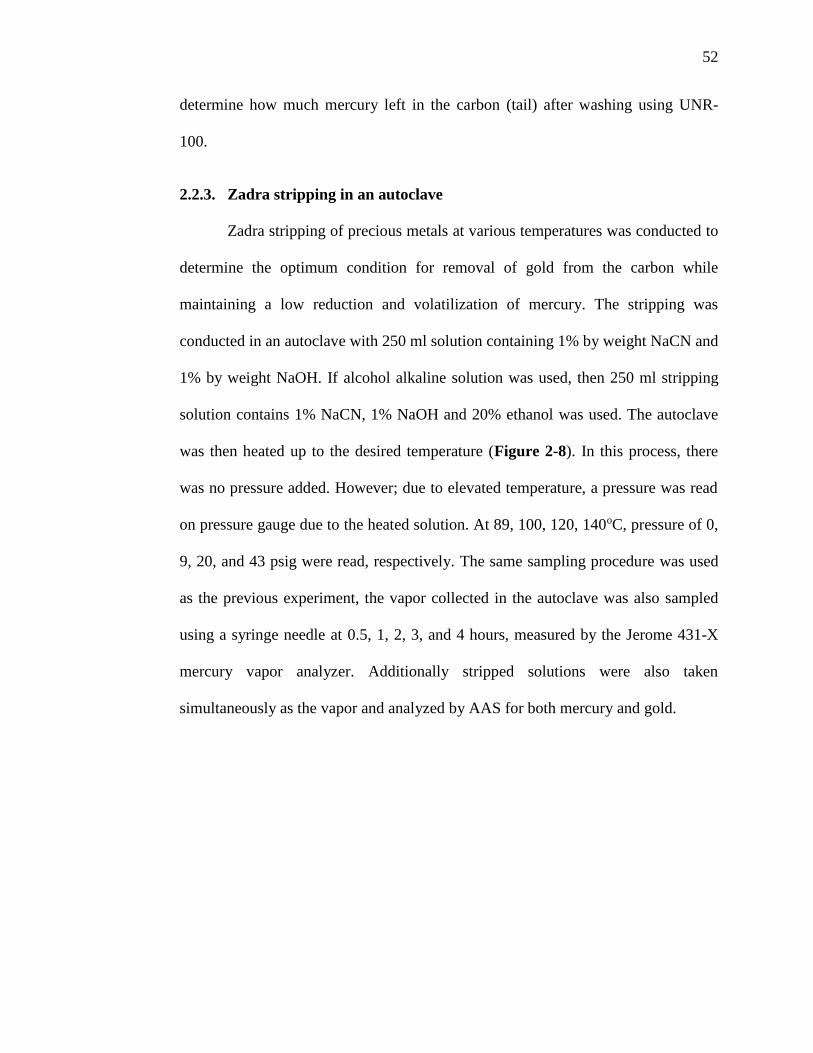
7-8 ml samples of the solution was removed at 0.5, 1, 2, 3, and 4 hours and
then analyzed using AAS. The vapor collected inside the autoclave was also taken
by a needle syringe to measure the mercury content by Jerome 431-X mercury
vapor analyzer (Figure 2-7).
Figure 2-7. Jerome 431-X mercury vapor analyzer.
After 4 hours, the residue carbon was removed and washed using tap water
and then digested by UNR technology (see 2.2-5 below). This process will
52
determine how much mercury left in the carbon (tail) after washing using UNR-
100.
2.2.3. Zadra stripping in an autoclave
Zadra stripping of precious metals at various temperatures was conducted to
determine the optimum condition for removal of gold from the carbon while
maintaining a low reduction and volatilization of mercury. The stripping was
conducted in an autoclave with 250 ml solution containing 1% by weight NaCN and
1% by weight NaOH. If alcohol alkaline solution was used, then 250 ml stripping
solution contains 1% NaCN, 1% NaOH and 20% ethanol was used. The autoclave
was then heated up to the desired temperature (Figure 2-8). In this process, there
was no pressure added. However; due to elevated temperature, a pressure was read
on pressure gauge due to the heated solution. At 89, 100, 120, 140oC, pressure of 0,
9, 20, and 43 psig were read, respectively. The same sampling procedure was used
as the previous experiment, the vapor collected in the autoclave was also sampled
using a syringe needle at 0.5, 1, 2, 3, and 4 hours, measured by the Jerome 431-X
mercury vapor analyzer. Additionally stripped solutions were also taken
simultaneously as the vapor and analyzed by AAS for both mercury and gold.
53
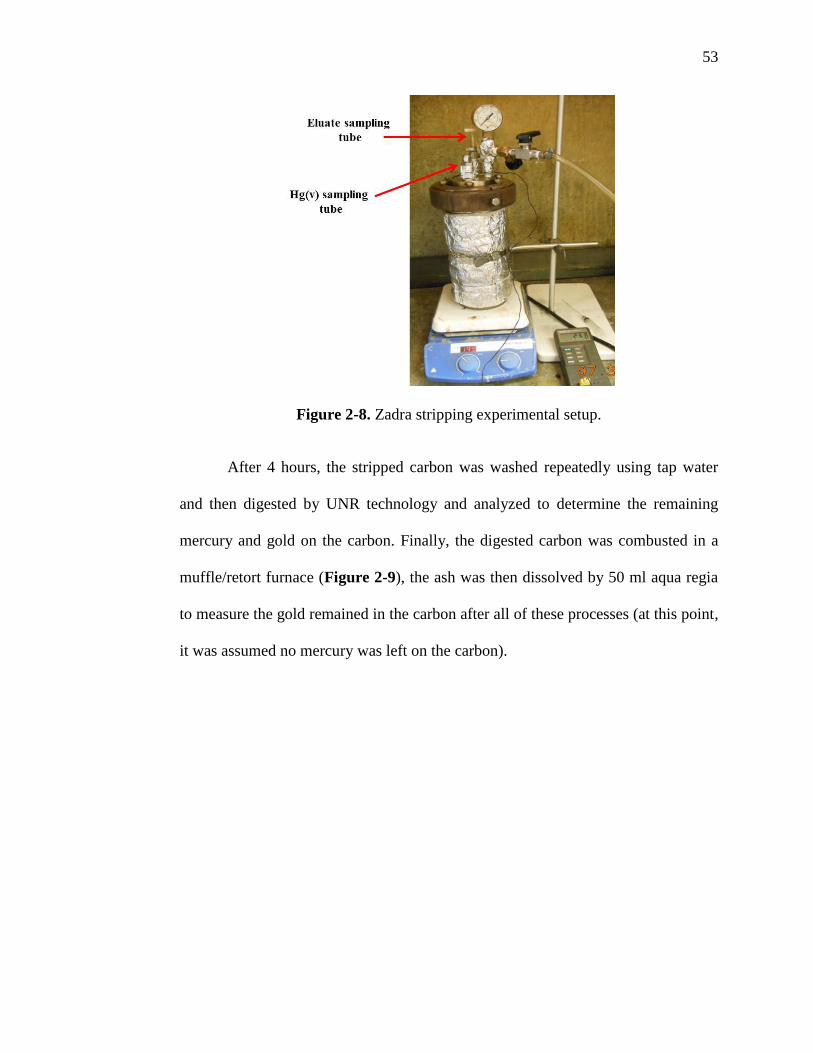
Figure 2-8. Zadra stripping experimental setup.
After 4 hours, the stripped carbon was washed repeatedly using tap water
and then digested by UNR technology and analyzed to determine the remaining
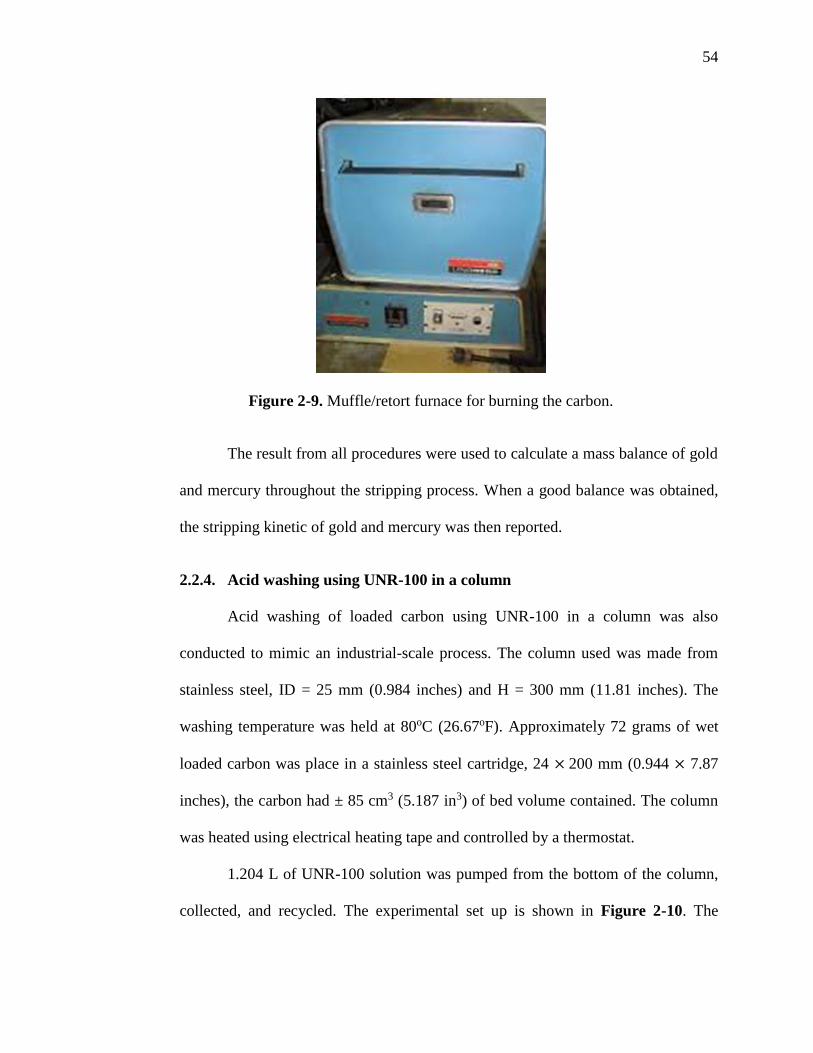
mercury and gold on the carbon. Finally, the digested carbon was combusted in a
muffle/retort furnace (Figure 2-9), the ash was then dissolved by 50 ml aqua regia
to measure the gold remained in the carbon after all of these processes (at this point,
it was assumed no mercury was left on the carbon).
54
Figure 2-9. Muffle/retort furnace for burning the carbon.
The result from all procedures were used to calculate a mass balance of gold
and mercury throughout the stripping process. When a good balance was obtained,
the stripping kinetic of gold and mercury was then reported.
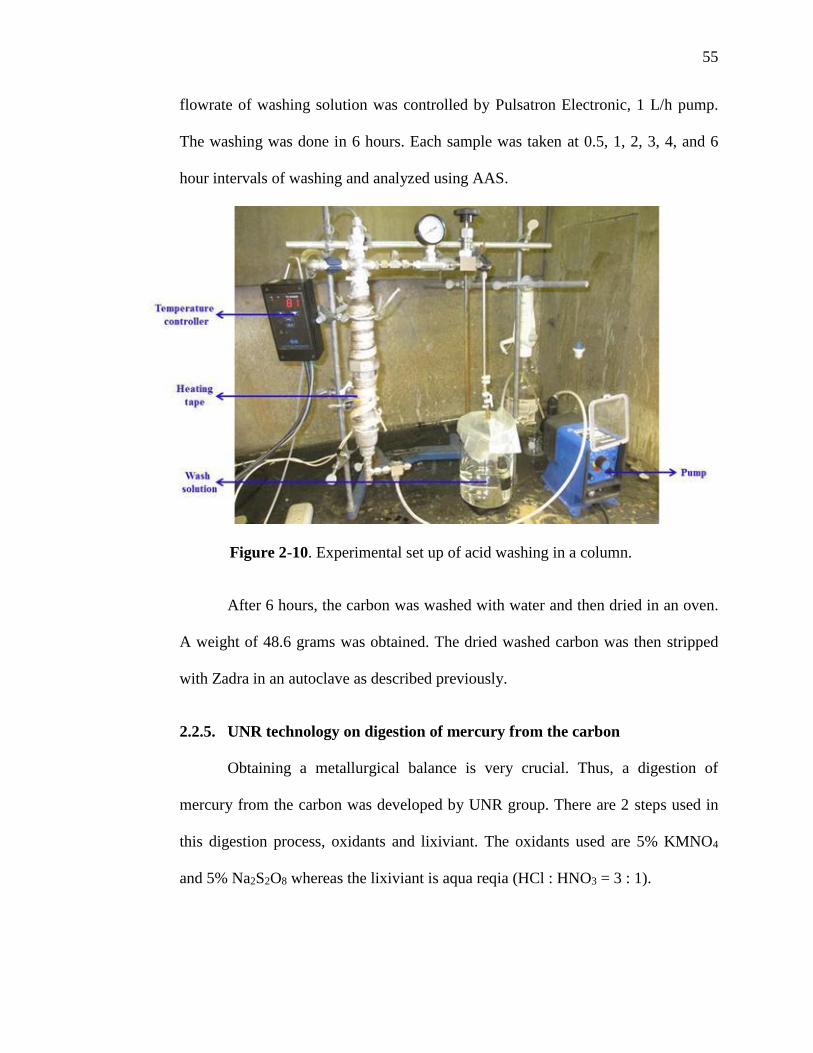
2.2.4. Acid washing using UNR-100 in a column
Acid washing of loaded carbon using UNR-100 in a column was also
conducted to mimic an industrial-scale process. The column used was made from
stainless steel, ID = 25 mm (0.984 inches) and H = 300 mm (11.81 inches). The
washing temperature was held at 80oC (26.67oF). Approximately 72 grams of wet
loaded carbon was place in a stainless steel cartridge, 24 × 200 mm (0.944 × 7.87
inches), the carbon had ± 85 cm3 (5.187 in3) of bed volume contained. The column
was heated using electrical heating tape and controlled by a thermostat.
1.204 L of UNR-100 solution was pumped from the bottom of the column,
collected, and recycled. The experimental set up is shown in Figure 2-10. The
55
flowrate of washing solution was controlled by Pulsatron Electronic, 1 L/h pump.
The washing was done in 6 hours. Each sample was taken at 0.5, 1, 2, 3, 4, and 6
hour intervals of washing and analyzed using AAS.
Figure 2-10. Experimental set up of acid washing in a column.
After 6 hours, the carbon was washed with water and then dried in an oven.
A weight of 48.6 grams was obtained. The dried washed carbon was then stripped
with Zadra in an autoclave as described previously.
2.2.5. UNR technology on digestion of mercury from the carbon
Obtaining a metallurgical balance is very crucial. Thus, a digestion of
mercury from the carbon was developed by UNR group. There are 2 steps used in
this digestion process, oxidants and lixiviant. The oxidants used are 5% KMNO4
and 5% Na2S2O8 whereas the lixiviant is aqua reqia (HCl : HNO3 = 3 : 1).
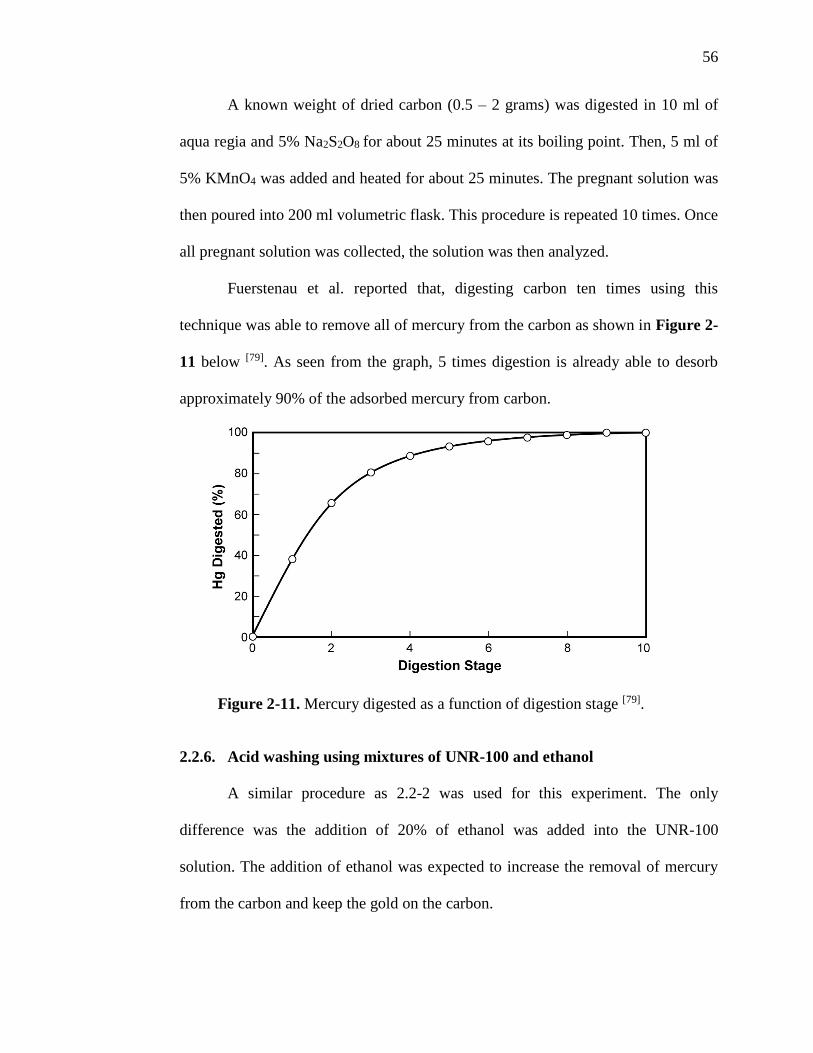
56
A known weight of dried carbon (0.5 – 2 grams) was digested in 10 ml of
aqua regia and 5% Na2S2O8 for about 25 minutes at its boiling point. Then, 5 ml of
5% KMnO4 was added and heated for about 25 minutes. The pregnant solution was
then poured into 200 ml volumetric flask. This procedure is repeated 10 times. Once
all pregnant solution was collected, the solution was then analyzed.
Fuerstenau et al. reported that, digesting carbon ten times using this
technique was able to remove all of mercury from the carbon as shown in Figure 2-
11 below [79]. As seen from the graph, 5 times digestion is already able to desorb
approximately 90% of the adsorbed mercury from carbon.
Figure 2-11. Mercury digested as a function of digestion stage [79].
2.2.6. Acid washing using mixtures of UNR-100 and ethanol
A similar procedure as 2.2-2 was used for this experiment. The only
difference was the addition of 20% of ethanol was added into the UNR-100
solution. The addition of ethanol was expected to increase the removal of mercury
from the carbon and keep the gold on the carbon.
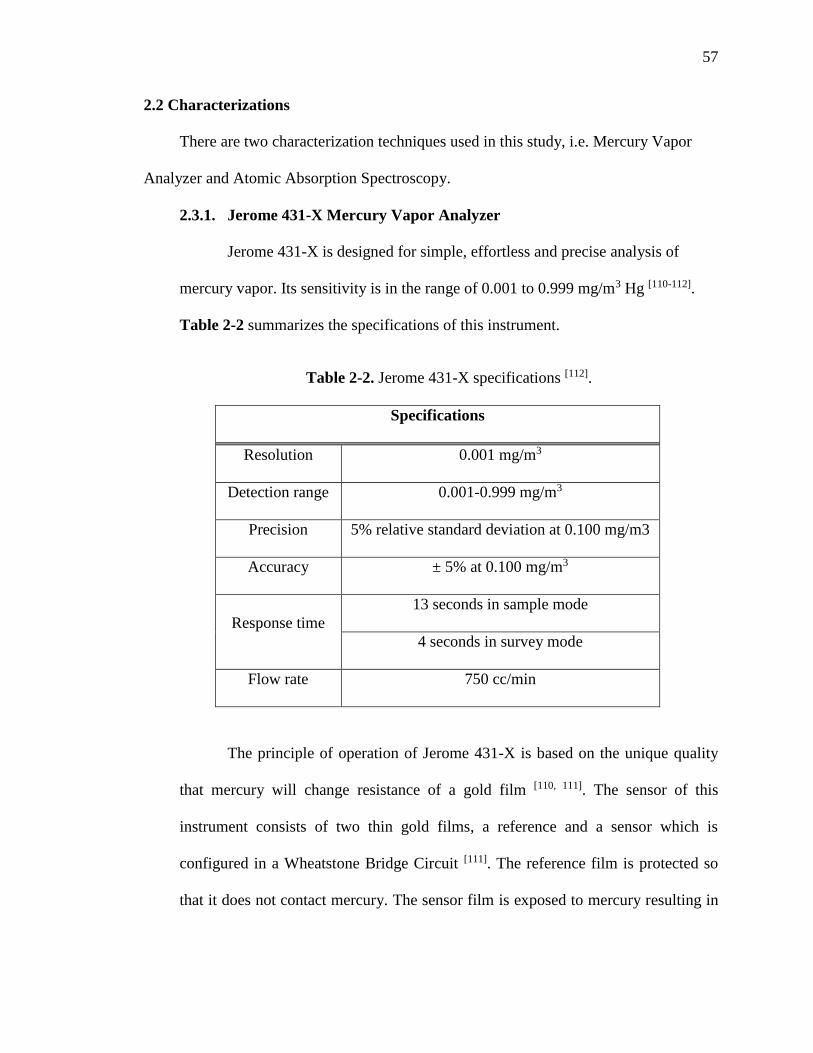
57
2.2 Characterizations
There are two characterization techniques used in this study, i.e. Mercury Vapor
Analyzer and Atomic Absorption Spectroscopy.
2.3.1. Jerome 431-X Mercury Vapor Analyzer
Jerome 431-X is designed for simple, effortless and precise analysis of
mercury vapor. Its sensitivity is in the range of 0.001 to 0.999 mg/m3 Hg [110-112].
Table 2-2 summarizes the specifications of this instrument.
Table 2-2. Jerome 431-X specifications [112].
Specifications
Resolution 0.001 mg/m3
Detection range 0.001-0.999 mg/m3
Precision 5% relative standard deviation at 0.100 mg/m3
Accuracy ± 5% at 0.100 mg/m3
Response time
13 seconds in sample mode
4 seconds in survey mode
Flow rate 750 cc/min
The principle of operation of Jerome 431-X is based on the unique quality
that mercury will change resistance of a gold film [110, 111]. The sensor of this
instrument consists of two thin gold films, a reference and a sensor which is
configured in a Wheatstone Bridge Circuit [111]. The reference film is protected so
that it does not contact mercury. The sensor film is exposed to mercury resulting in
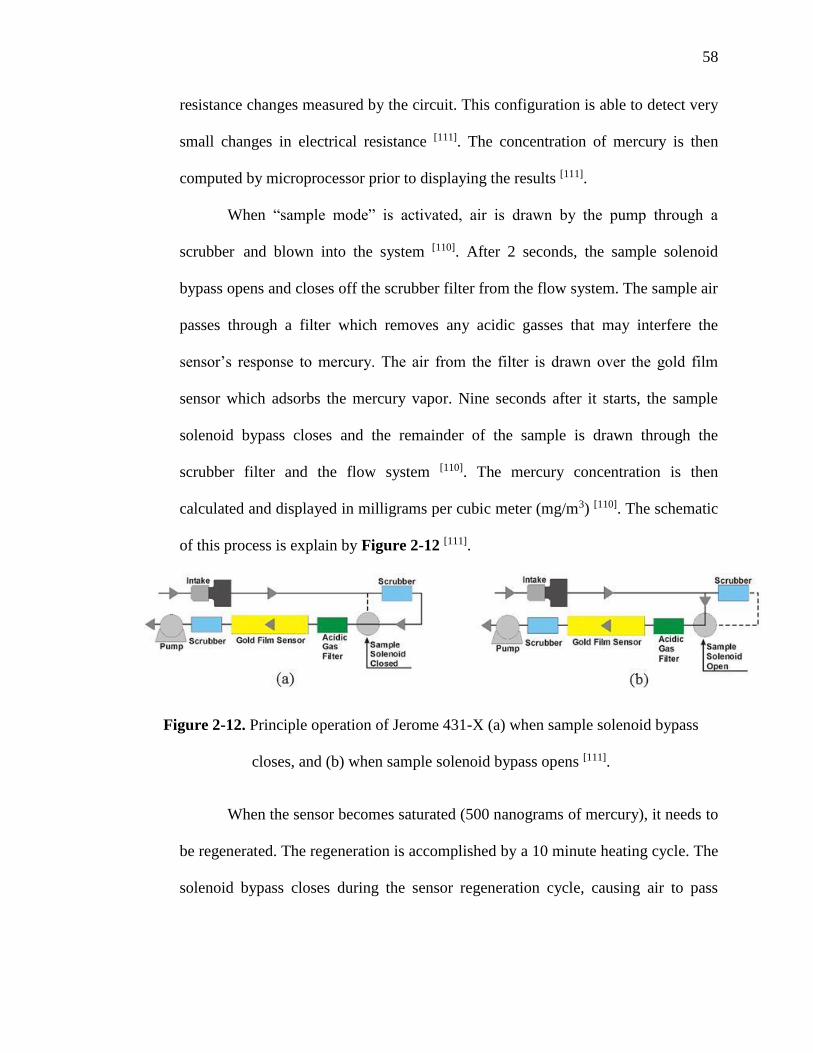
58
resistance changes measured by the circuit. This configuration is able to detect very
small changes in electrical resistance [111]. The concentration of mercury is then
computed by microprocessor prior to displaying the results [111].
When “sample mode” is activated, air is drawn by the pump through a
scrubber and blown into the system [110]. After 2 seconds, the sample solenoid
bypass opens and closes off the scrubber filter from the flow system. The sample air
passes through a filter which removes any acidic gasses that may interfere the
sensor’s response to mercury. The air from the filter is drawn over the gold film
sensor which adsorbs the mercury vapor. Nine seconds after it starts, the sample
solenoid bypass closes and the remainder of the sample is drawn through the
scrubber filter and the flow system [110]. The mercury concentration is then
calculated and displayed in milligrams per cubic meter (mg/m3) [110]. The schematic
of this process is explain by Figure 2-12 [111].
Figure 2-12. Principle operation of Jerome 431-X (a) when sample solenoid bypass
closes, and (b) when sample solenoid bypass opens [111].
When the sensor becomes saturated (500 nanograms of mercury), it needs to
be regenerated. The regeneration is accomplished by a 10 minute heating cycle. The
solenoid bypass closes during the sensor regeneration cycle, causing air to pass

59
through the scrubber filter, providing clean air for the purpose of regeneration [110,
112].
2.3.2. Atomic Absorption Spectroscopy – Varian 55B
Atomic absorption spectroscopy (AAS) is one of the most common
analytical technique to measure element concentration in aqueous the sample. It is
able to measure as low as several part per billion of a gram in a sample [113]. The
main principle of this technique is detection of change in light wavelength
specifically absorbed by an element.
AAS has been used in various application such as [113-114]:
Clinical analysis. Metal analysis in biological fluids such as blood and urine.
Environmental analysis. Tracking various elements in rivers, seawater,
drinking water, etc.
Pharmaceuticals. Monitoring quantitatively of a catalyst in the final
pharmaceutical products.
Industrial analysis. Analyzing the amount of metals in rocks for mining
industry, examining the major elements of raw materials.
The working principle of AAS is that each atom of different elements
absorbs specific wavelength of light. For instance with lead, a lamp containing lead
emits light from excited lead atoms that create the exact mix of wavelengths that are
absorbed by lead atoms presented in the sample. Furthermore, the sample first must
be atomized – converted into ground state free atoms in the vapor state – and then a
beam electromagnetic radiation is emitted from the excited lead atoms that passes
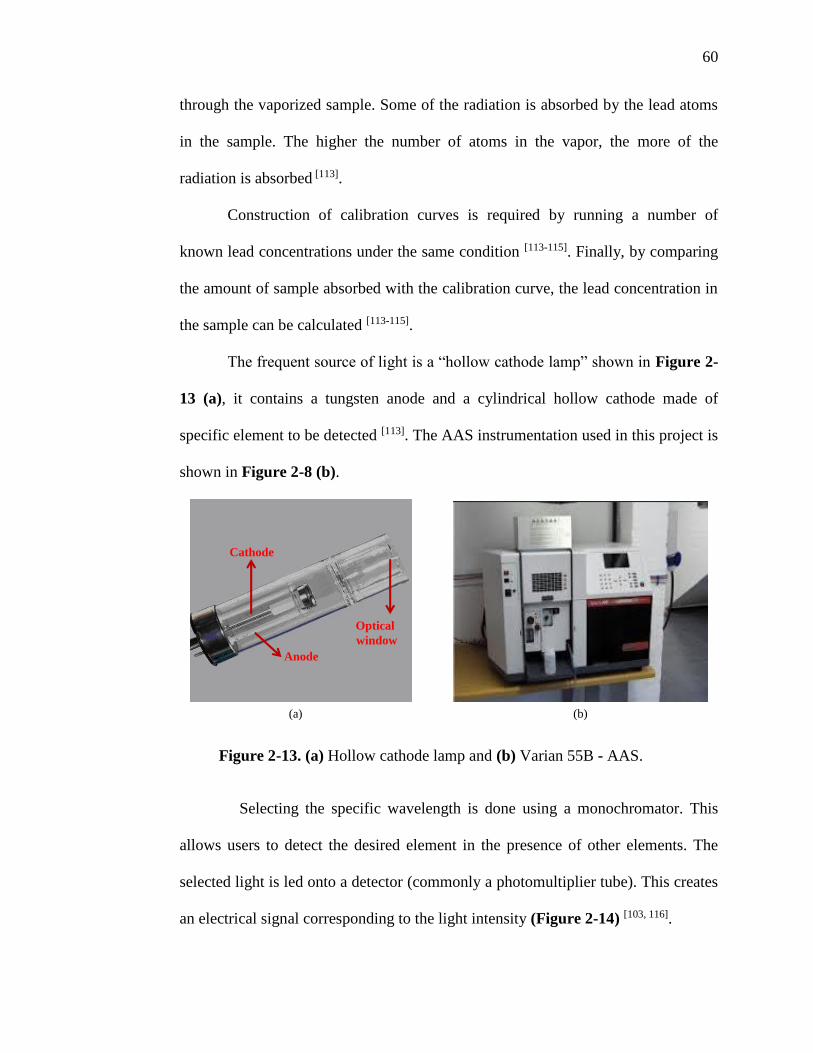
60
through the vaporized sample. Some of the radiation is absorbed by the lead atoms
in the sample. The higher the number of atoms in the vapor, the more of the
radiation is absorbed [113].
Construction of calibration curves is required by running a number of
known lead concentrations under the same condition [113-115]. Finally, by comparing
the amount of sample absorbed with the calibration curve, the lead concentration in
the sample can be calculated [113-115].
The frequent source of light is a “hollow cathode lamp” shown in Figure 2-
13 (a), it contains a tungsten anode and a cylindrical hollow cathode made of
specific element to be detected [113]. The AAS instrumentation used in this project is
shown in Figure 2-8 (b).
Figure 2-13. (a) Hollow cathode lamp and (b) Varian 55B - AAS.
Selecting the specific wavelength is done using a monochromator. This
allows users to detect the desired element in the presence of other elements. The
selected light is led onto a detector (commonly a photomultiplier tube). This creates
an electrical signal corresponding to the light intensity (Figure 2-14) [103, 116].
Optical
window
Cathode
Anode
(a) (b)
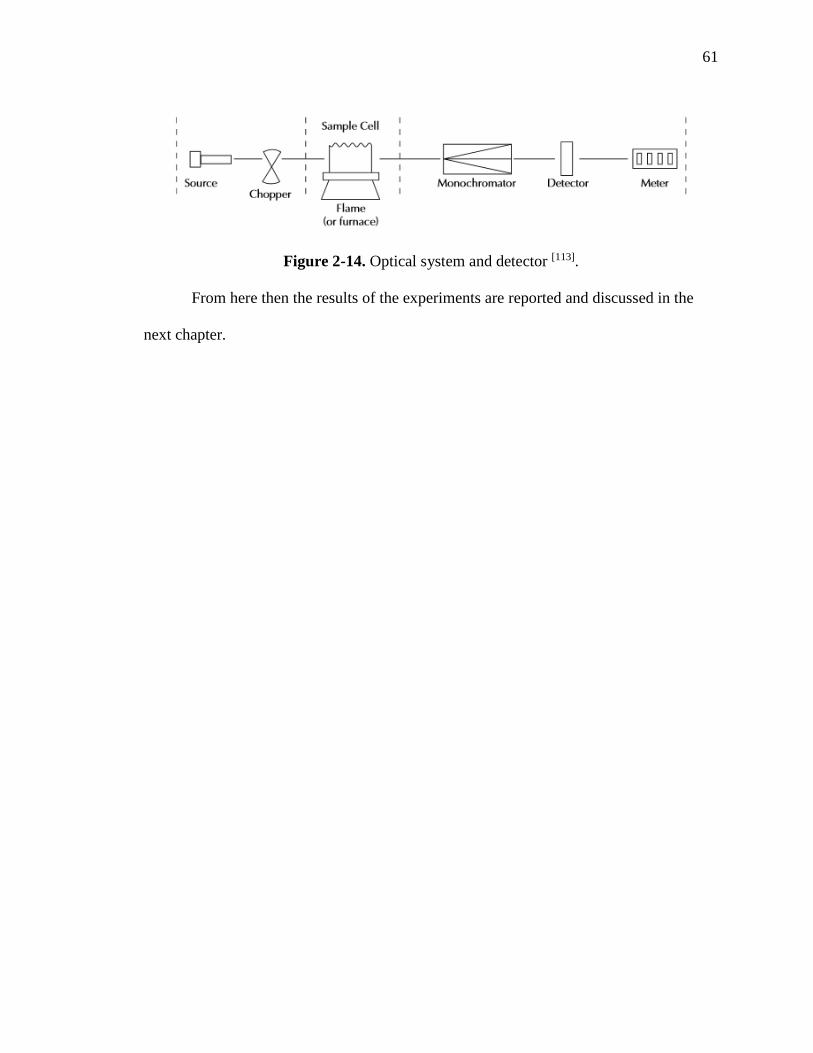
61
Figure 2-14. Optical system and detector [113].
From here then the results of the experiments are reported and discussed in the
next chapter.
62
CHAPTER 3
RESULTS AND DISCUSSION
3.1. Optimization of acid washing using UNR-100 on synthetically loaded carbon in
an autoclave.
The UNR-100 or acetic acid, used for removing Hg was optimized in this study.
Activated carbon was synthetically loaded with Hg only and both Au-Hg as described in
previous chapter. Table 3-1 summarizes the synthetically Hg loaded carbon obtained.
Table 3-1. Synthetically Hg loaded carbon.
Weight of
carbon
(g)
Vol. of
solution
( mL)
Initial Hg Wt (mg) Final Hg in
solution
(mg)
Adsorbed
Hg (mg)
Adsorption of
Hg (mg/g) Hg(CN)2 Hg
25.0 200 32.1 25.5 0.6~1.2 24.9 0.97~1.0
The effect of temperature on acid washing using 7% UNR-100 as pin point was
investigated. The UNR-100 washing was conducted in an autoclave at various
temperatures (70, 80 85, 90, and 100oC) which was heated by a stirring hotplate. 250 ml
of washing solution 7% UNR-100 was used to wash the 2.5 grams of synthetically loaded
carbon.
The Hg in the vapor and solution were analyzed using Jerome 431-X Mercury
Vapor Analyzer and AAS Varian 55B, respectively. The washed carbon (tail) was
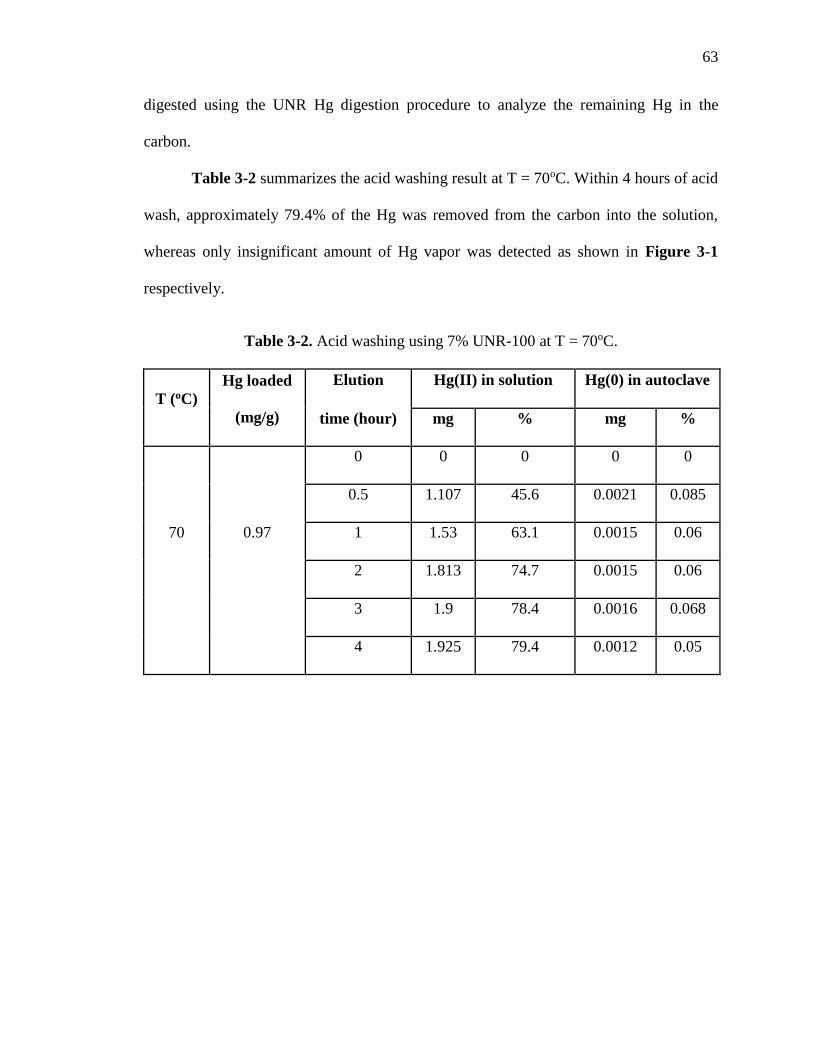
63
digested using the UNR Hg digestion procedure to analyze the remaining Hg in the
carbon.
Table 3-2 summarizes the acid washing result at T = 70oC. Within 4 hours of acid
wash, approximately 79.4% of the Hg was removed from the carbon into the solution,
whereas only insignificant amount of Hg vapor was detected as shown in Figure 3-1
respectively.
Table 3-2. Acid washing using 7% UNR-100 at T = 70oC.
T (oC)
Hg loaded
(mg/g)
Elution Hg(II) in solution Hg(0) in autoclave
time (hour) mg % mg %
0 0 0 0 0
0.5 1.107 45.6 0.0021 0.085
70 0.97 1 1.53 63.1 0.0015 0.06
2 1.813 74.7 0.0015 0.06
3 1.9 78.4 0.0016 0.068
4 1.925 79.4 0.0012 0.05
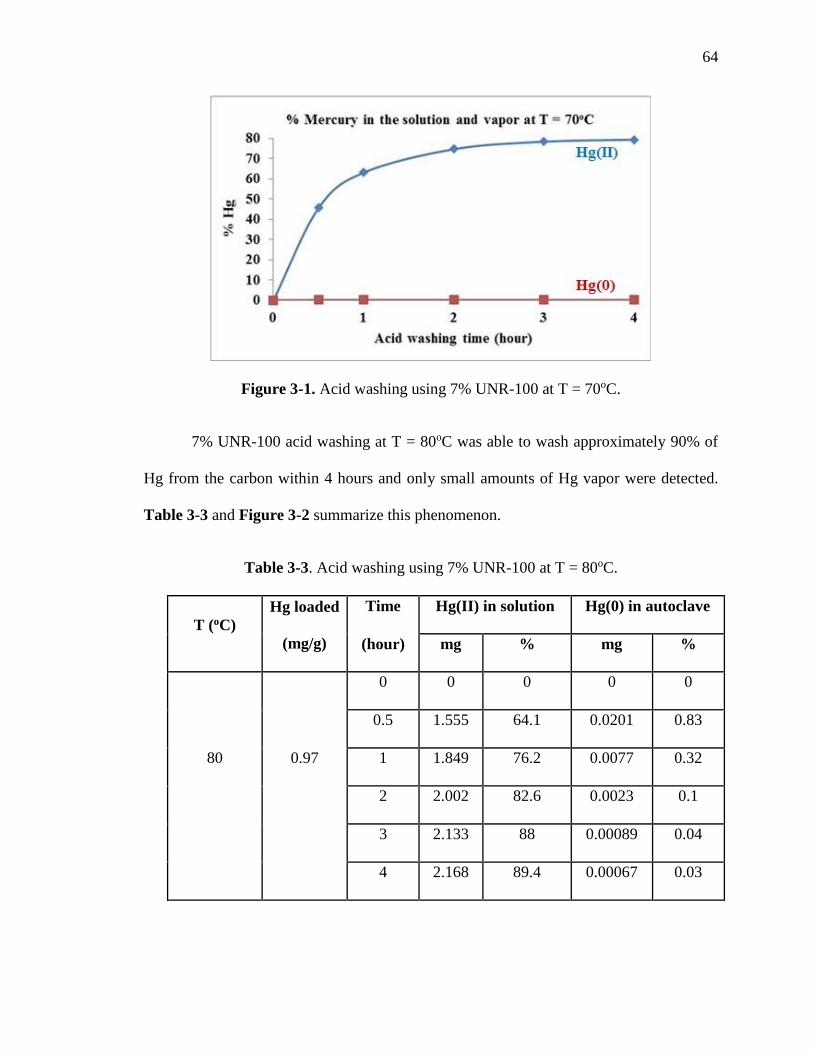
64
Figure 3-1. Acid washing using 7% UNR-100 at T = 70oC.
7% UNR-100 acid washing at T = 80oC was able to wash approximately 90% of
Hg from the carbon within 4 hours and only small amounts of Hg vapor were detected.
Table 3-3 and Figure 3-2 summarize this phenomenon.
Table 3-3. Acid washing using 7% UNR-100 at T = 80oC.
T (oC)
Hg loaded
(mg/g)
Time Hg(II) in solution Hg(0) in autoclave
(hour) mg % mg %
0 0 0 0 0
0.5 1.555 64.1 0.0201 0.83
80 0.97 1 1.849 76.2 0.0077 0.32
2 2.002 82.6 0.0023 0.1
3 2.133 88 0.00089 0.04
4 2.168 89.4 0.00067 0.03

65
Figure 3-2. Acid washing using 7% UNR-100 at T = 80oC.
UNR-100 acid washing at T = 85oC was able to wash approximately 90% of Hg
from the carbon within 4 hours and only a small amount of Hg vapor was detected.
Comparing this result with UNR-100 acid washing at 80oC, both of these temperature
conditions are comparable in removing the Hg from the carbon. Table 3-4 and Figure 3-
3 summarize the 7% UNR-100 acid washing at 85oC performance.

66
Table 3-4. Acid washing using 7% UNR-100 at T = 85oC.
T (oC)
Hg loaded
(mg/g)
Time Hg(II) in solution Hg(0) in autoclave
(hour) mg % mg %
0 0 0 0 0
0.5 1.616 67.3 0.0124 0.52
85 0.96 1 1.817 75.7 0.0082 0.34
2 2.027 84.5 0.0043 0.18
3 2.08 86.7 0.0021 0.087
4 2.151 89.6 0.0011 0.045
Figure 3-3. Acid washing using 7% UNR-100 at T = 85oC.
When the acid washing temperature was increased to 90oC, the effectiveness of
Hg removal slightly declined as shown in Table 3-5 and Figure 3.4 below. Within 4
hours, only approximately 85% of Hg was detected in the solution, and the Hg in the
vapor was four times higher than the 85oC acid washing.
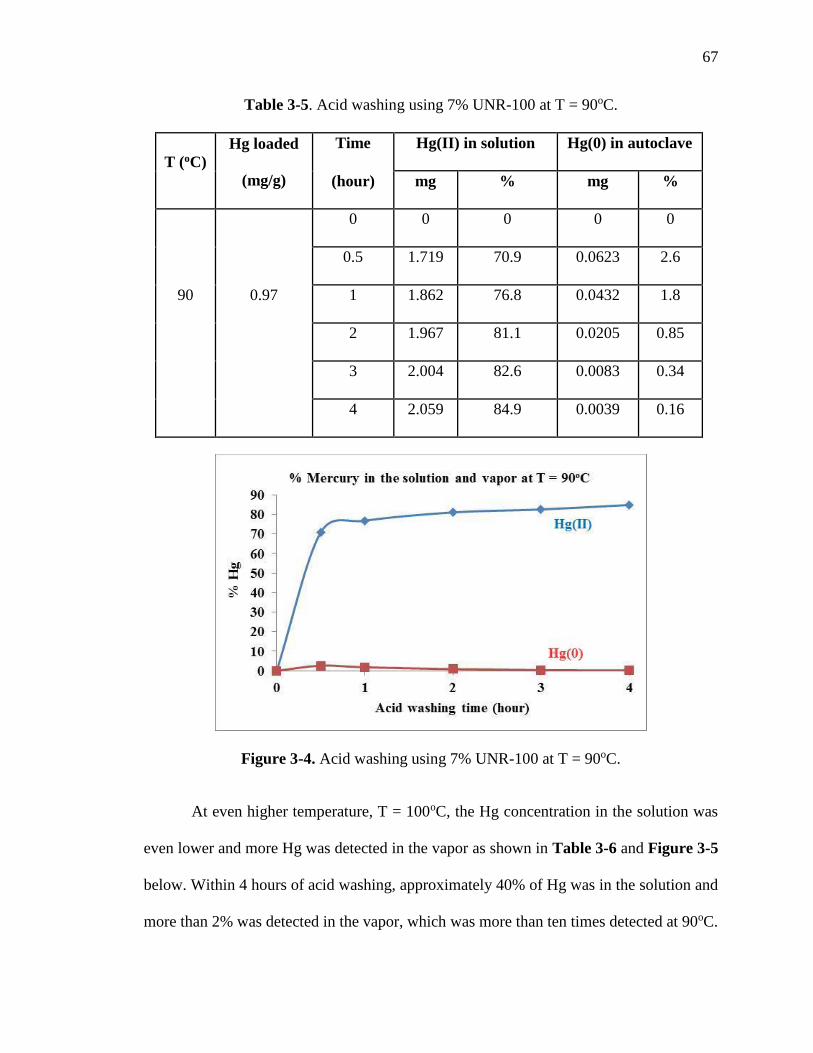
67
Table 3-5. Acid washing using 7% UNR-100 at T = 90oC.
T (oC)
Hg loaded
(mg/g)
Time Hg(II) in solution Hg(0) in autoclave
(hour) mg % mg %
0 0 0 0 0
0.5 1.719 70.9 0.0623 2.6
90 0.97 1 1.862 76.8 0.0432 1.8
2 1.967 81.1 0.0205 0.85
3 2.004 82.6 0.0083 0.34
4 2.059 84.9 0.0039 0.16
Figure 3-4. Acid washing using 7% UNR-100 at T = 90oC.
At even higher temperature, T = 100oC, the Hg concentration in the solution was
even lower and more Hg was detected in the vapor as shown in Table 3-6 and Figure 3-5
below. Within 4 hours of acid washing, approximately 40% of Hg was in the solution and
more than 2% was detected in the vapor, which was more than ten times detected at 90oC.
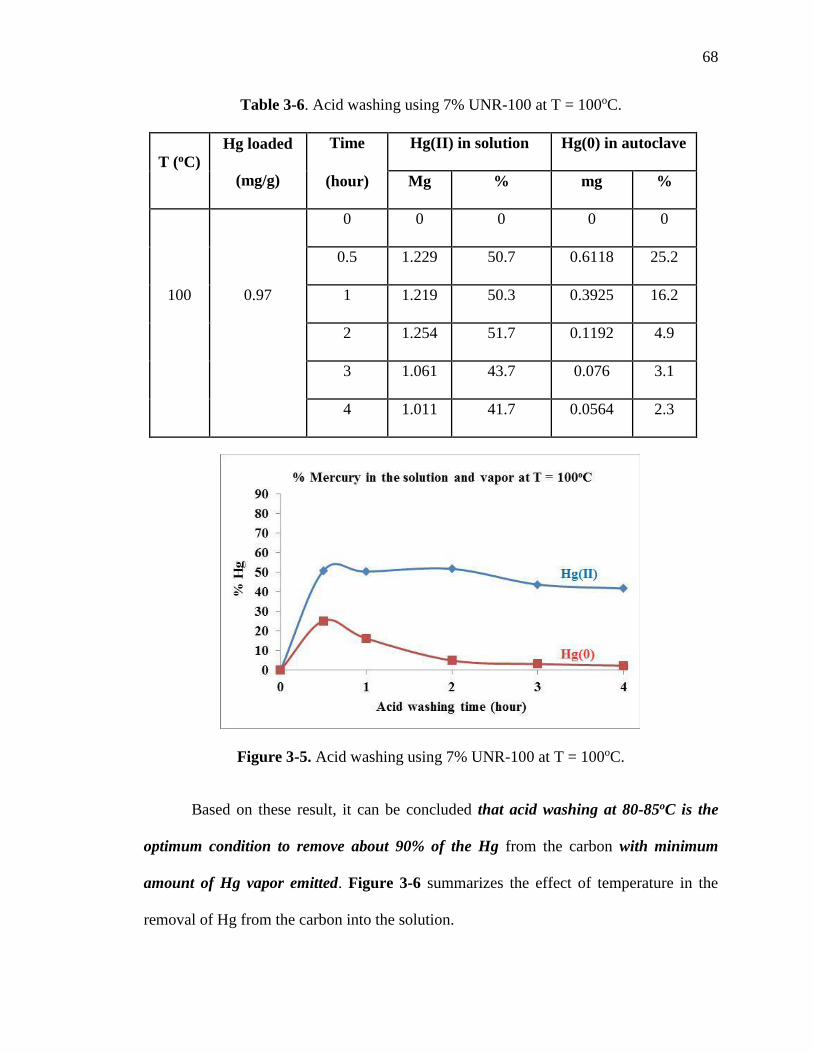
68
Table 3-6. Acid washing using 7% UNR-100 at T = 100oC.
T (oC)
Hg loaded
(mg/g)
Time Hg(II) in solution Hg(0) in autoclave
(hour) Mg % mg %
0 0 0 0 0
0.5 1.229 50.7 0.6118 25.2
100 0.97 1 1.219 50.3 0.3925 16.2
2 1.254 51.7 0.1192 4.9
3 1.061 43.7 0.076 3.1
4 1.011 41.7 0.0564 2.3
Figure 3-5. Acid washing using 7% UNR-100 at T = 100oC.
Based on these result, it can be concluded that acid washing at 80-85oC is the
optimum condition to remove about 90% of the Hg from the carbon with minimum
amount of Hg vapor emitted. Figure 3-6 summarizes the effect of temperature in the
removal of Hg from the carbon into the solution.
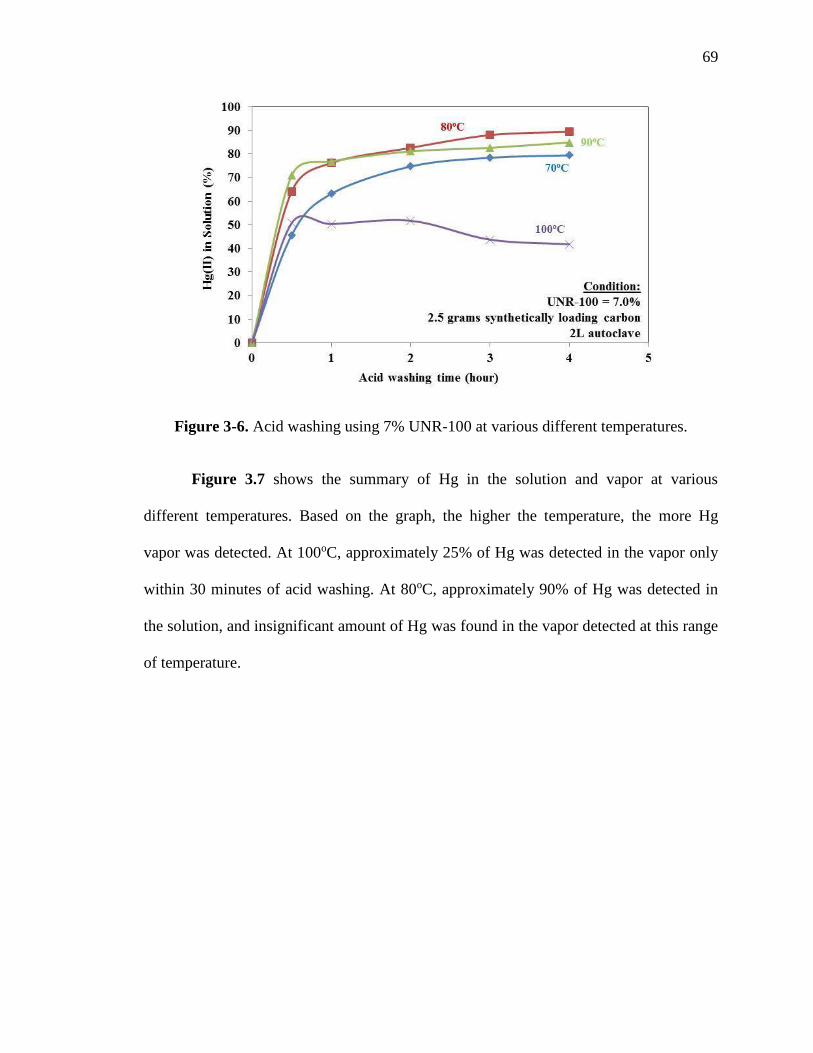
69
Figure 3-6. Acid washing using 7% UNR-100 at various different temperatures.
Figure 3.7 shows the summary of Hg in the solution and vapor at various
different temperatures. Based on the graph, the higher the temperature, the more Hg
vapor was detected. At 100oC, approximately 25% of Hg was detected in the vapor only
within 30 minutes of acid washing. At 80oC, approximately 90% of Hg was detected in
the solution, and insignificant amount of Hg was found in the vapor detected at this range
of temperature.
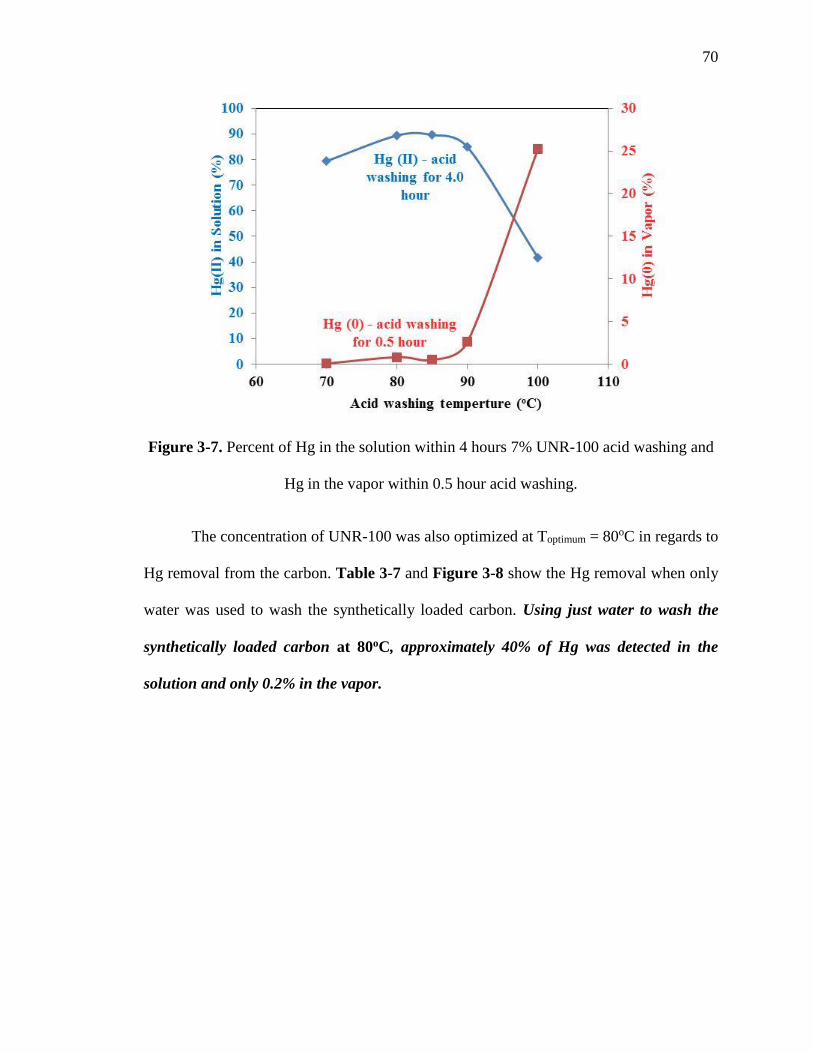
70
Figure 3-7. Percent of Hg in the solution within 4 hours 7% UNR-100 acid washing and
Hg in the vapor within 0.5 hour acid washing.
The concentration of UNR-100 was also optimized at Toptimum = 80oC in regards to
Hg removal from the carbon. Table 3-7 and Figure 3-8 show the Hg removal when only
water was used to wash the synthetically loaded carbon. Using just water to wash the
synthetically loaded carbon at 80oC, approximately 40% of Hg was detected in the
solution and only 0.2% in the vapor.
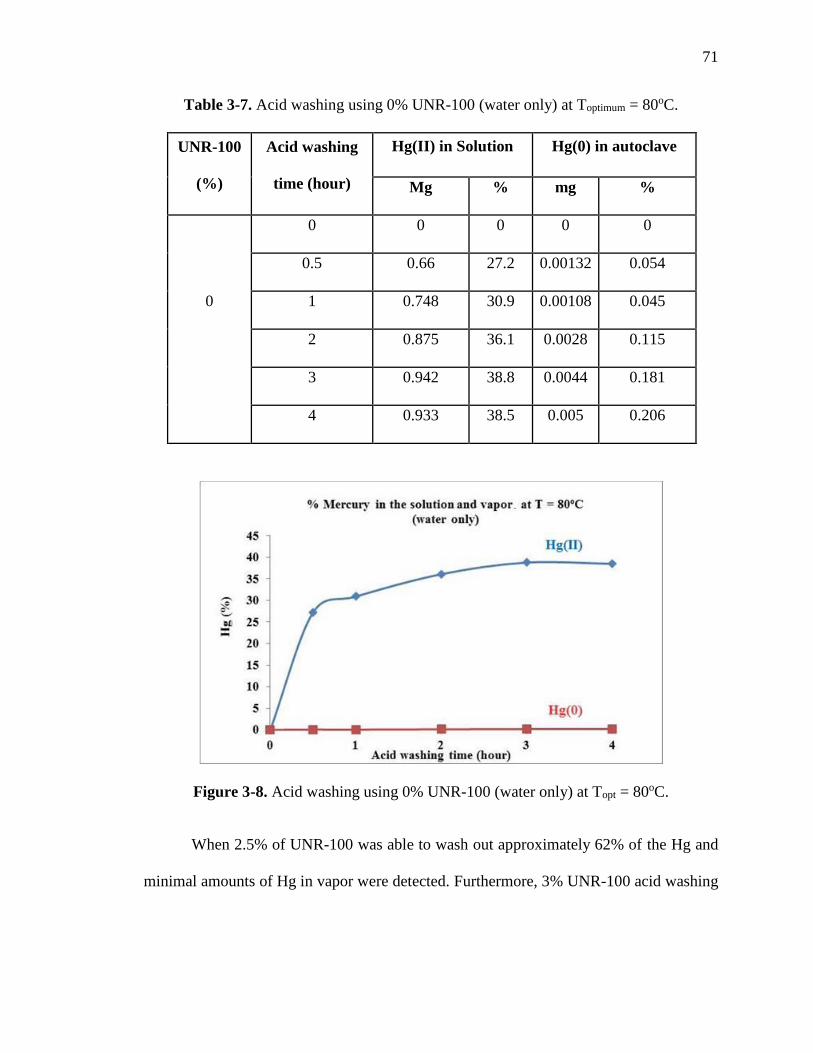
71
Table 3-7. Acid washing using 0% UNR-100 (water only) at Toptimum = 80oC.
UNR-100
(%)
Acid washing
time (hour)
Hg(II) in Solution Hg(0) in autoclave
Mg % mg %
0 0 0 0 0
0.5 0.66 27.2 0.00132 0.054
0 1 0.748 30.9 0.00108 0.045
2 0.875 36.1 0.0028 0.115
3 0.942 38.8 0.0044 0.181
4 0.933 38.5 0.005 0.206
Figure 3-8. Acid washing using 0% UNR-100 (water only) at Topt = 80oC.
When 2.5% of UNR-100 was able to wash out approximately 62% of the Hg and
minimal amounts of Hg in vapor were detected. Furthermore, 3% UNR-100 acid washing
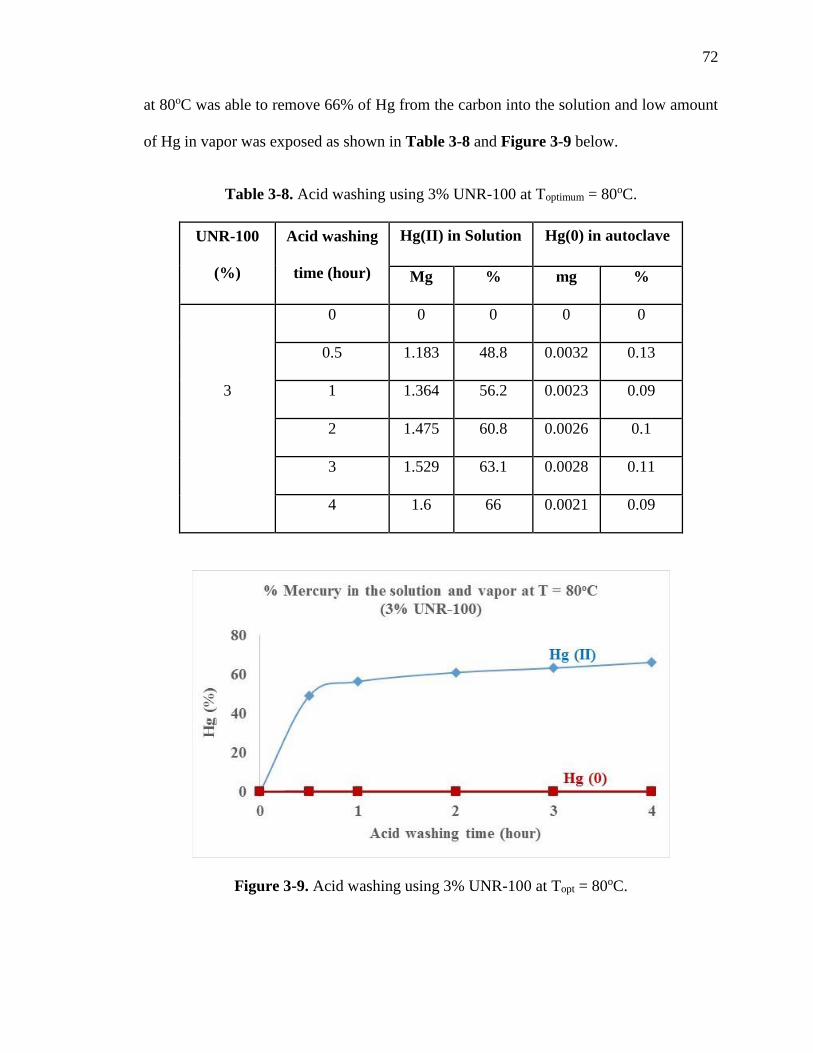
72
at 80oC was able to remove 66% of Hg from the carbon into the solution and low amount
of Hg in vapor was exposed as shown in Table 3-8 and Figure 3-9 below.
Table 3-8. Acid washing using 3% UNR-100 at Toptimum = 80oC.
UNR-100
(%)
Acid washing
time (hour)
Hg(II) in Solution Hg(0) in autoclave
Mg % mg %
0 0 0 0 0
0.5 1.183 48.8 0.0032 0.13
3 1 1.364 56.2 0.0023 0.09
2 1.475 60.8 0.0026 0.1
3 1.529 63.1 0.0028 0.11
4 1.6 66 0.0021 0.09
Figure 3-9. Acid washing using 3% UNR-100 at Topt = 80oC.
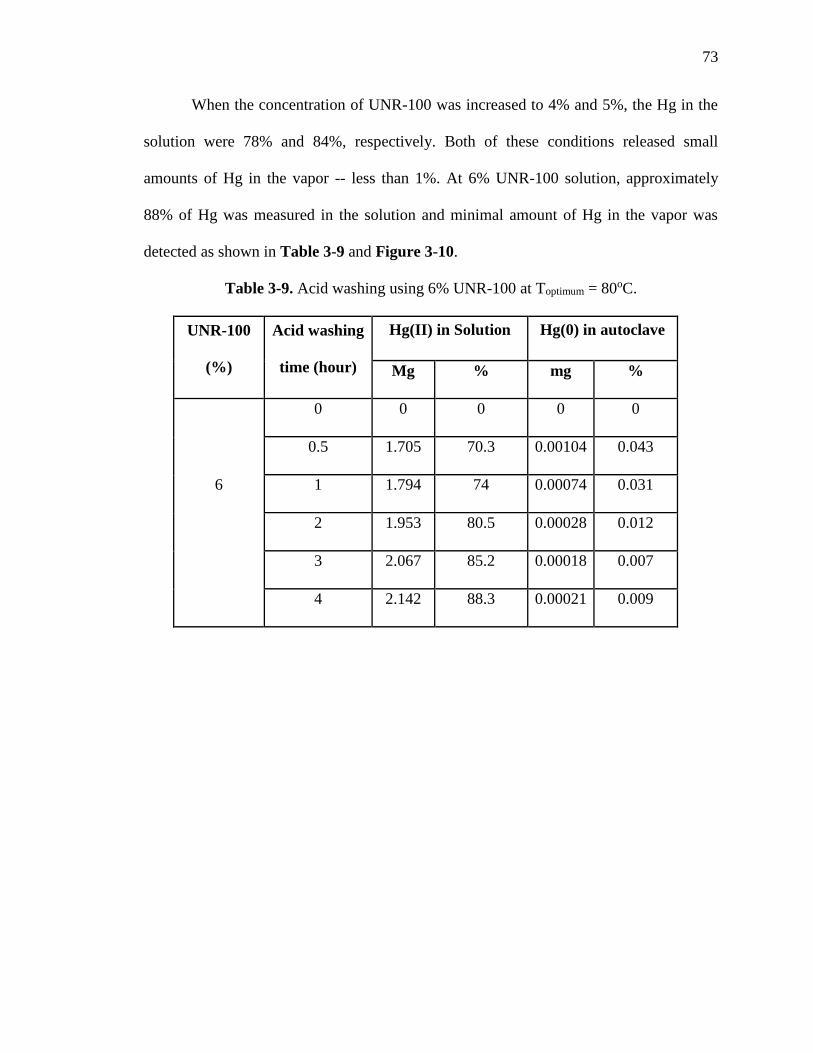
73
When the concentration of UNR-100 was increased to 4% and 5%, the Hg in the
solution were 78% and 84%, respectively. Both of these conditions released small
amounts of Hg in the vapor -- less than 1%. At 6% UNR-100 solution, approximately
88% of Hg was measured in the solution and minimal amount of Hg in the vapor was
detected as shown in Table 3-9 and Figure 3-10.
Table 3-9. Acid washing using 6% UNR-100 at Toptimum = 80oC.
UNR-100
(%)
Acid washing
time (hour)
Hg(II) in Solution Hg(0) in autoclave
Mg % mg %
0 0 0 0 0
0.5 1.705 70.3 0.00104 0.043
6 1 1.794 74 0.00074 0.031
2 1.953 80.5 0.00028 0.012
3 2.067 85.2 0.00018 0.007
4 2.142 88.3 0.00021 0.009
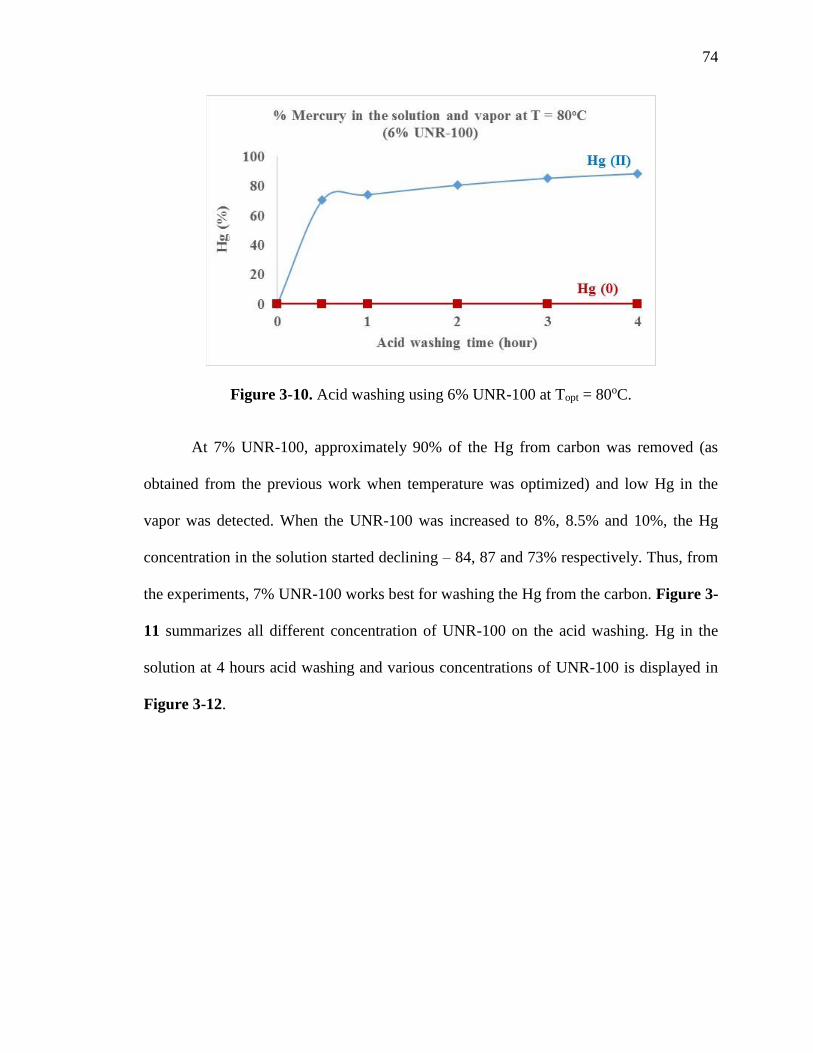
74
Figure 3-10. Acid washing using 6% UNR-100 at Topt = 80oC.
At 7% UNR-100, approximately 90% of the Hg from carbon was removed (as
obtained from the previous work when temperature was optimized) and low Hg in the
vapor was detected. When the UNR-100 was increased to 8%, 8.5% and 10%, the Hg
concentration in the solution started declining – 84, 87 and 73% respectively. Thus, from
the experiments, 7% UNR-100 works best for washing the Hg from the carbon. Figure 3-
11 summarizes all different concentration of UNR-100 on the acid washing. Hg in the
solution at 4 hours acid washing and various concentrations of UNR-100 is displayed in
Figure 3-12.
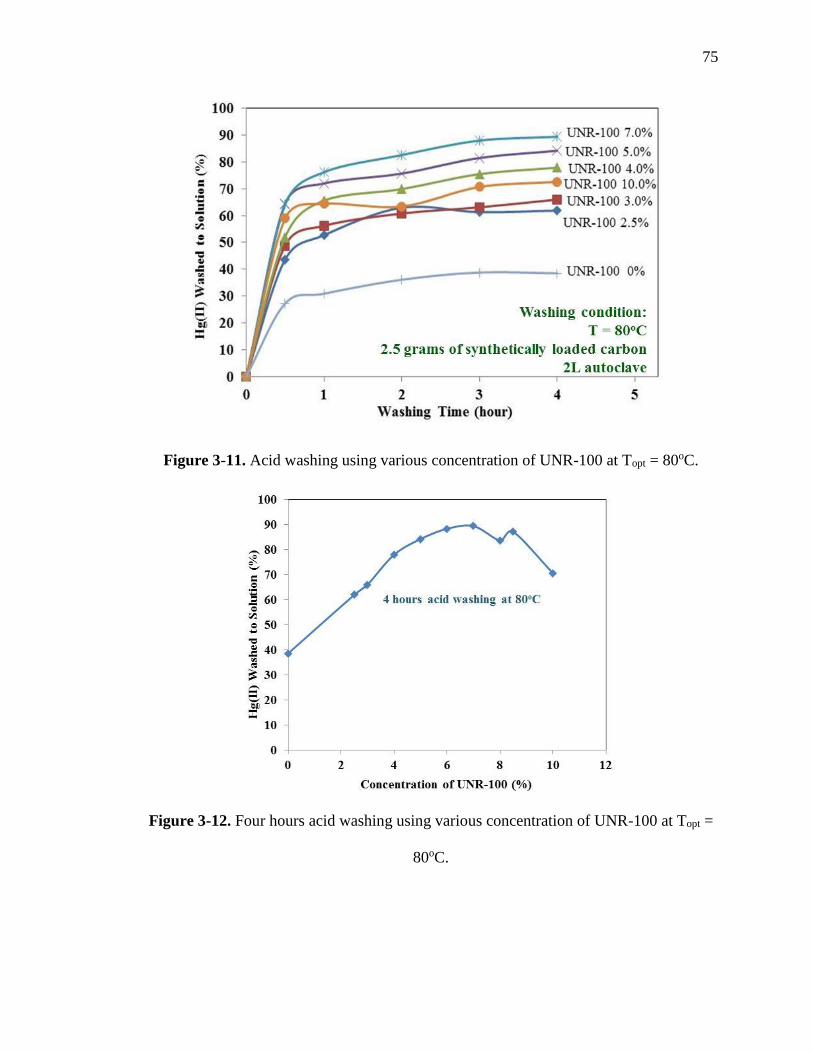
75
Figure 3-11. Acid washing using various concentration of UNR-100 at Topt = 80oC.
Figure 3-12. Four hours acid washing using various concentration of UNR-100 at Topt =
80oC.
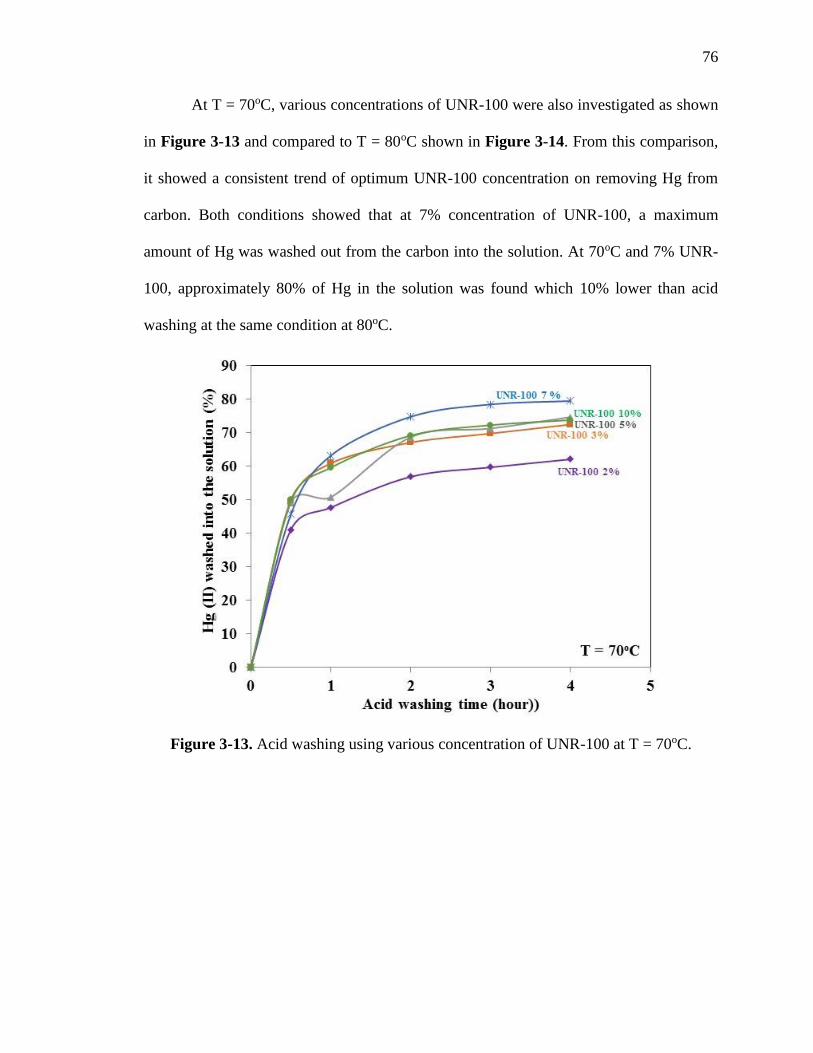
76
At T = 70oC, various concentrations of UNR-100 were also investigated as shown
in Figure 3-13 and compared to T = 80oC shown in Figure 3-14. From this comparison,
it showed a consistent trend of optimum UNR-100 concentration on removing Hg from
carbon. Both conditions showed that at 7% concentration of UNR-100, a maximum
amount of Hg was washed out from the carbon into the solution. At 70oC and 7% UNR-
100, approximately 80% of Hg in the solution was found which 10% lower than acid
washing at the same condition at 80oC.
Figure 3-13. Acid washing using various concentration of UNR-100 at T = 70oC.
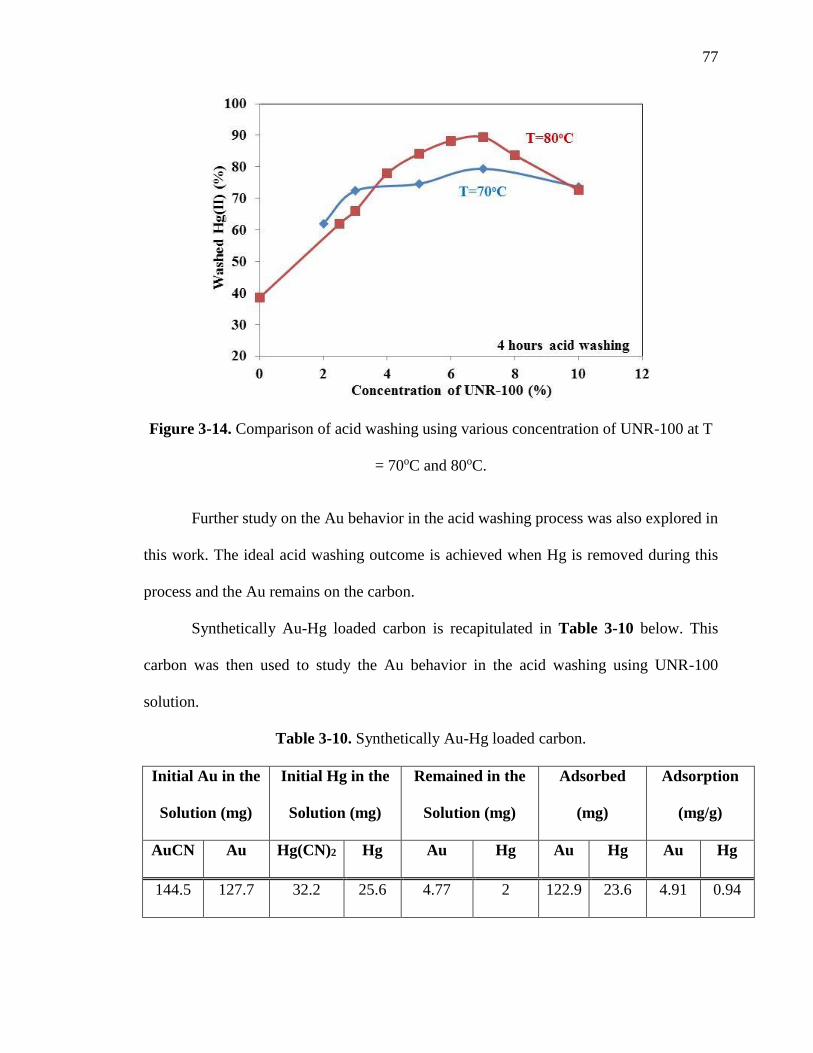
77
Figure 3-14. Comparison of acid washing using various concentration of UNR-100 at T
= 70oC and 80oC.
Further study on the Au behavior in the acid washing process was also explored in
this work. The ideal acid washing outcome is achieved when Hg is removed during this
process and the Au remains on the carbon.
Synthetically Au-Hg loaded carbon is recapitulated in Table 3-10 below. This
carbon was then used to study the Au behavior in the acid washing using UNR-100
solution.
Table 3-10. Synthetically Au-Hg loaded carbon.
Initial Au in the
Solution (mg)
Initial Hg in the
Solution (mg)
Remained in the
Solution (mg)
Adsorbed
(mg)
Adsorption
(mg/g)
AuCN Au Hg(CN)2 Hg Au Hg Au Hg Au Hg
144.5 127.7 32.2 25.6 4.77 2 122.9 23.6 4.91 0.94
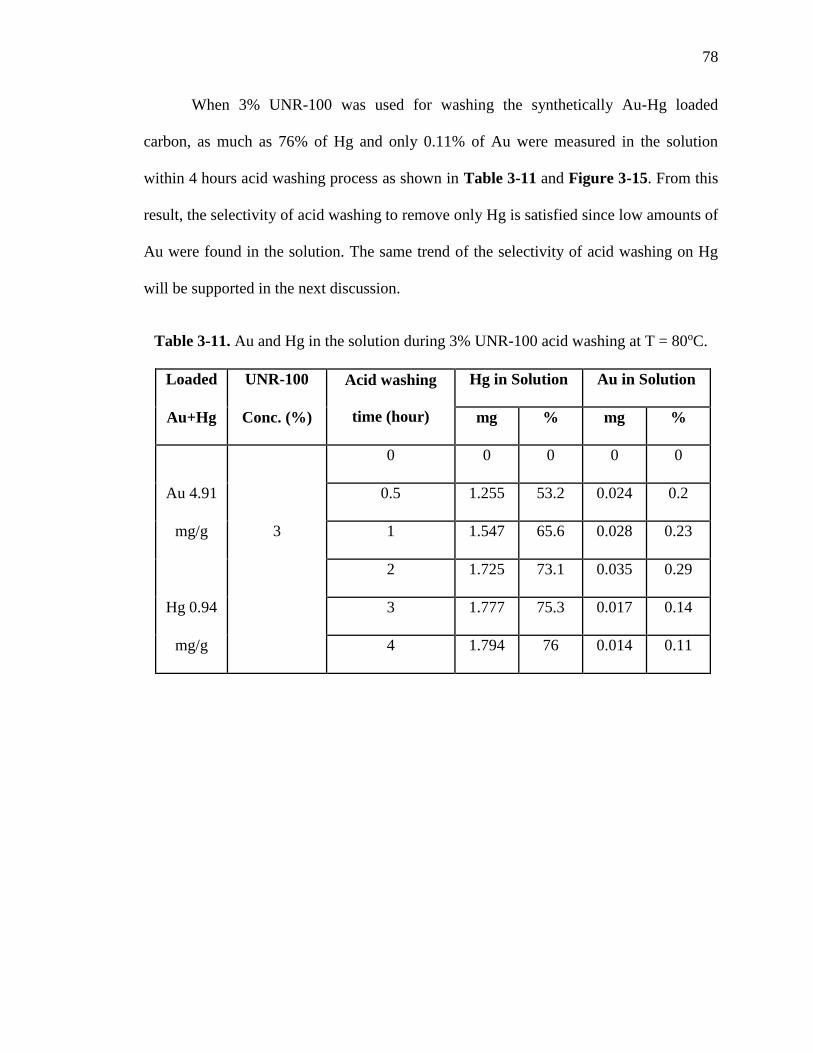
78
When 3% UNR-100 was used for washing the synthetically Au-Hg loaded
carbon, as much as 76% of Hg and only 0.11% of Au were measured in the solution
within 4 hours acid washing process as shown in Table 3-11 and Figure 3-15. From this
result, the selectivity of acid washing to remove only Hg is satisfied since low amounts of
Au were found in the solution. The same trend of the selectivity of acid washing on Hg
will be supported in the next discussion.
Table 3-11. Au and Hg in the solution during 3% UNR-100 acid washing at T = 80oC.
Loaded UNR-100 Acid washing
time (hour)
Hg in Solution Au in Solution
Au+Hg Conc. (%) mg % mg %
0 0 0 0 0
Au 4.91 0.5 1.255 53.2 0.024 0.2
mg/g 3 1 1.547 65.6 0.028 0.23
2 1.725 73.1 0.035 0.29
Hg 0.94 3 1.777 75.3 0.017 0.14
mg/g 4 1.794 76 0.014 0.11
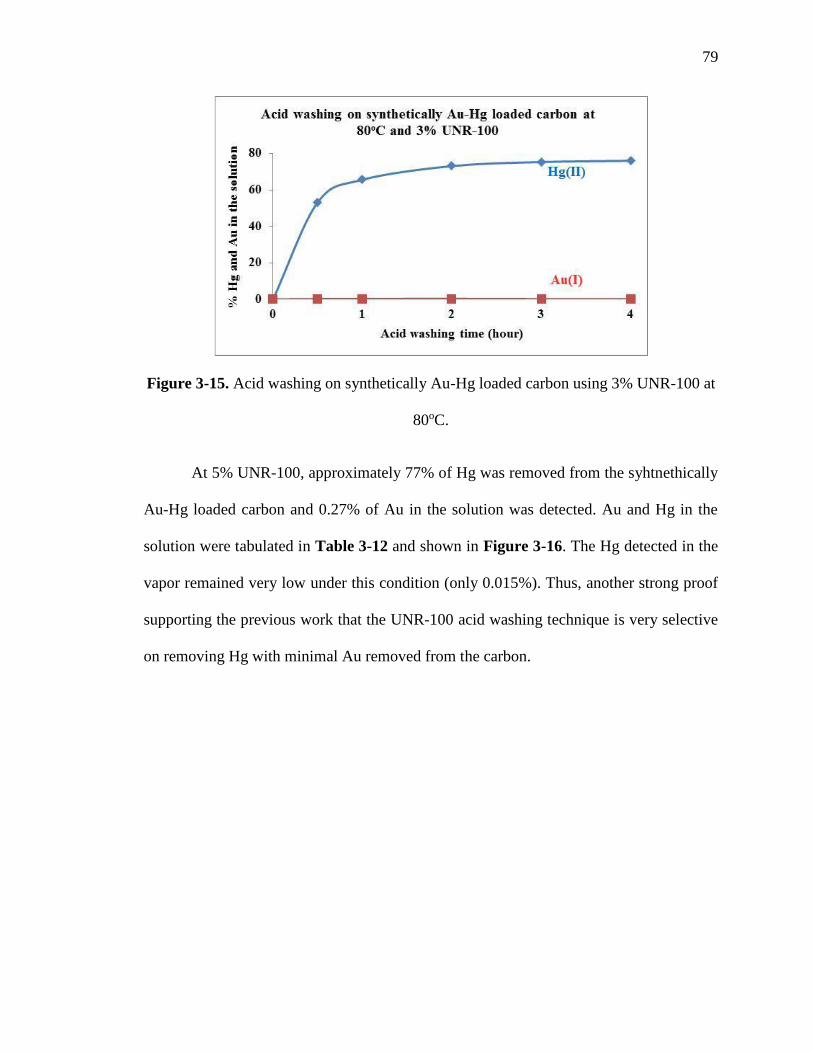
79
Figure 3-15. Acid washing on synthetically Au-Hg loaded carbon using 3% UNR-100 at
80oC.
At 5% UNR-100, approximately 77% of Hg was removed from the syhtnethically
Au-Hg loaded carbon and 0.27% of Au in the solution was detected. Au and Hg in the
solution were tabulated in Table 3-12 and shown in Figure 3-16. The Hg detected in the
vapor remained very low under this condition (only 0.015%). Thus, another strong proof
supporting the previous work that the UNR-100 acid washing technique is very selective
on removing Hg with minimal Au removed from the carbon.
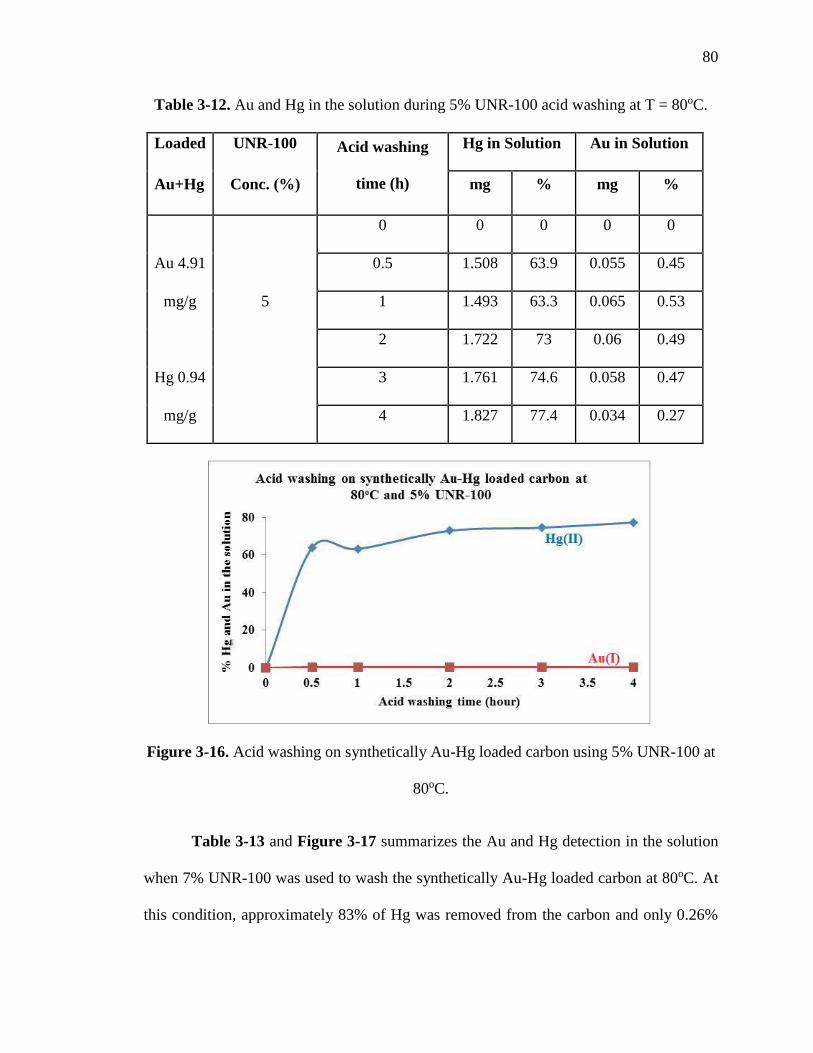
80
Table 3-12. Au and Hg in the solution during 5% UNR-100 acid washing at T = 80oC.
Figure 3-16. Acid washing on synthetically Au-Hg loaded carbon using 5% UNR-100 at
80oC.
Table 3-13 and Figure 3-17 summarizes the Au and Hg detection in the solution
when 7% UNR-100 was used to wash the synthetically Au-Hg loaded carbon at 80oC. At
this condition, approximately 83% of Hg was removed from the carbon and only 0.26%
Loaded UNR-100 Acid washing
time (h)
Hg in Solution Au in Solution
Au+Hg Conc. (%) mg % mg %
0 0 0 0 0
Au 4.91 0.5 1.508 63.9 0.055 0.45
mg/g 5 1 1.493 63.3 0.065 0.53
2 1.722 73 0.06 0.49
Hg 0.94 3 1.761 74.6 0.058 0.47
mg/g 4 1.827 77.4 0.034 0.27
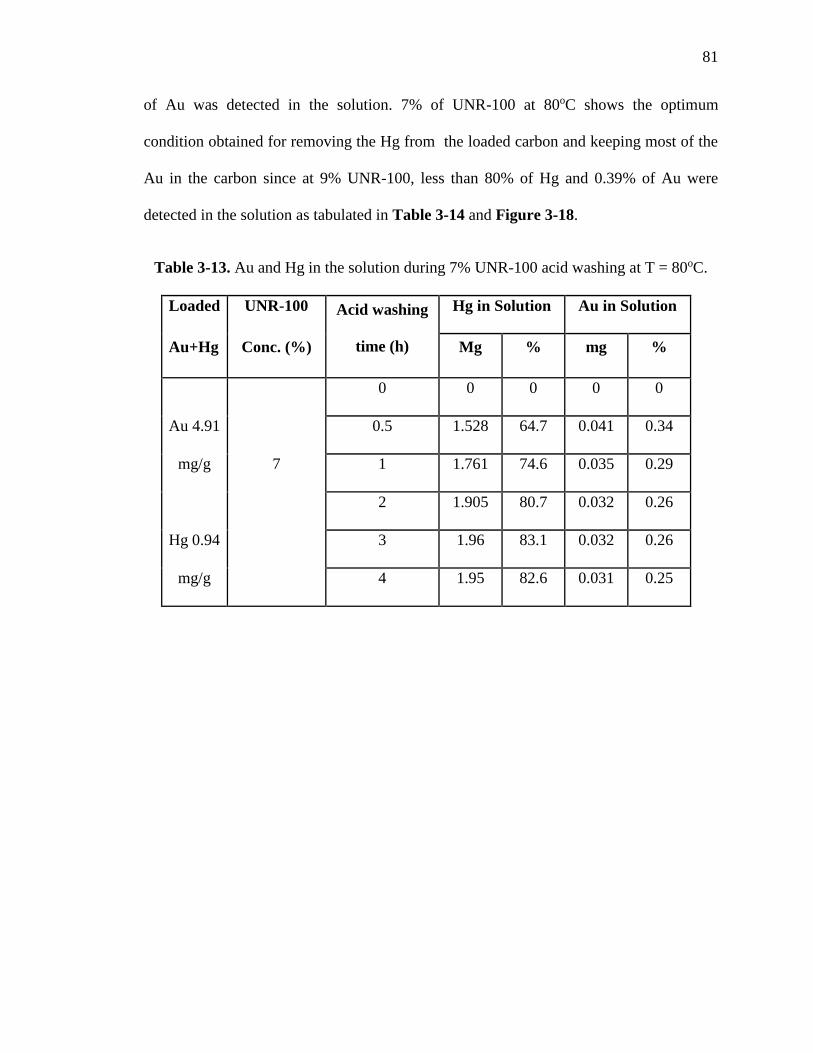
81
of Au was detected in the solution. 7% of UNR-100 at 80oC shows the optimum
condition obtained for removing the Hg from the loaded carbon and keeping most of the
Au in the carbon since at 9% UNR-100, less than 80% of Hg and 0.39% of Au were
detected in the solution as tabulated in Table 3-14 and Figure 3-18.
Table 3-13. Au and Hg in the solution during 7% UNR-100 acid washing at T = 80oC.
Loaded UNR-100 Acid washing
time (h)
Hg in Solution Au in Solution
Au+Hg Conc. (%) Mg % mg %
0 0 0 0 0
Au 4.91 0.5 1.528 64.7 0.041 0.34
mg/g 7 1 1.761 74.6 0.035 0.29
2 1.905 80.7 0.032 0.26
Hg 0.94 3 1.96 83.1 0.032 0.26
mg/g 4 1.95 82.6 0.031 0.25
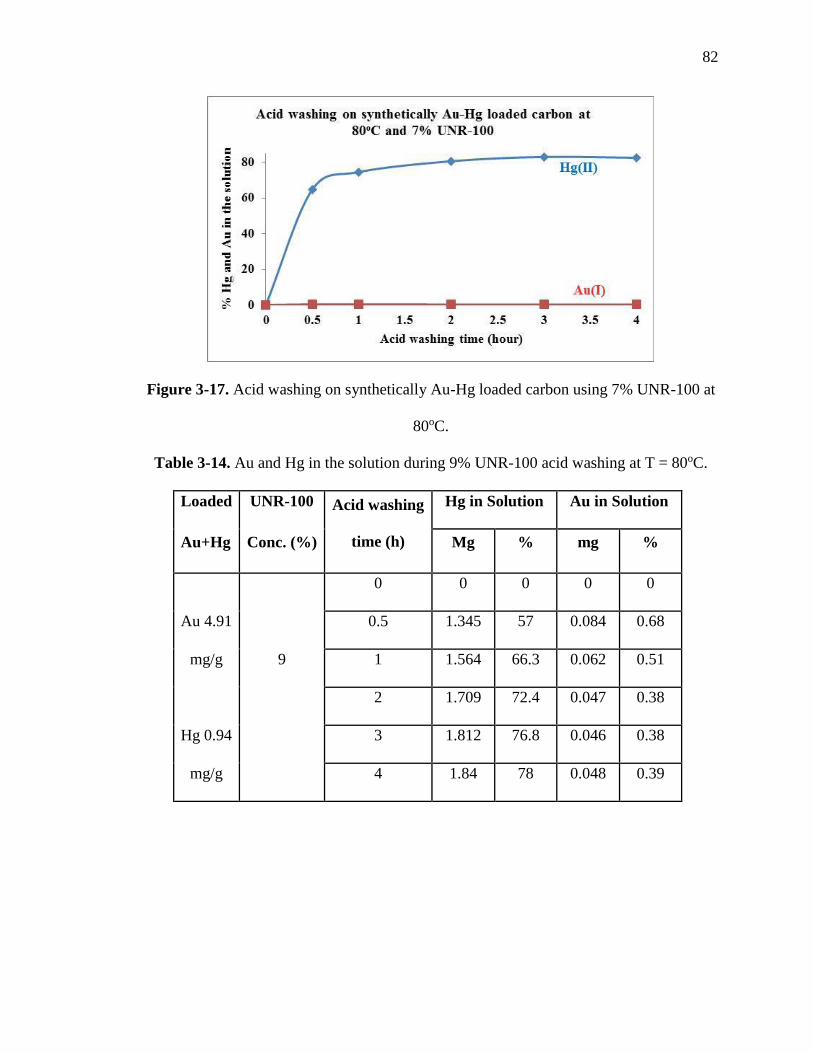
82
Figure 3-17. Acid washing on synthetically Au-Hg loaded carbon using 7% UNR-100 at
80oC.
Table 3-14. Au and Hg in the solution during 9% UNR-100 acid washing at T = 80oC.
Loaded UNR-100 Acid washing
time (h)
Hg in Solution Au in Solution
Au+Hg Conc. (%) Mg % mg %
0 0 0 0 0
Au 4.91 0.5 1.345 57 0.084 0.68
mg/g 9 1 1.564 66.3 0.062 0.51
2 1.709 72.4 0.047 0.38
Hg 0.94 3 1.812 76.8 0.046 0.38
mg/g 4 1.84 78 0.048 0.39

83
Figure 3-18. Acid washing on synthetically Au-Hg loaded carbon using 9% UNR-100 at
80oC
Figure 3-19, 3-20, and 3-21 summarize the different concentrations of UNR-100
acid washing at 80oC on the removal of Hg and Au, respectively, from the synthetically
Au-Hg loaded carbon. From the graph, it can be inferred that 7% UNR-100 provides the
best removal of Hg from the carbon. Furthermore, it is also clear that acid washing
using UNR-100 is very selective on removing most of the Hg with minimal amount of
Au washed out from the carbon. Thus, using this process, the loss of Au can be
minimized.
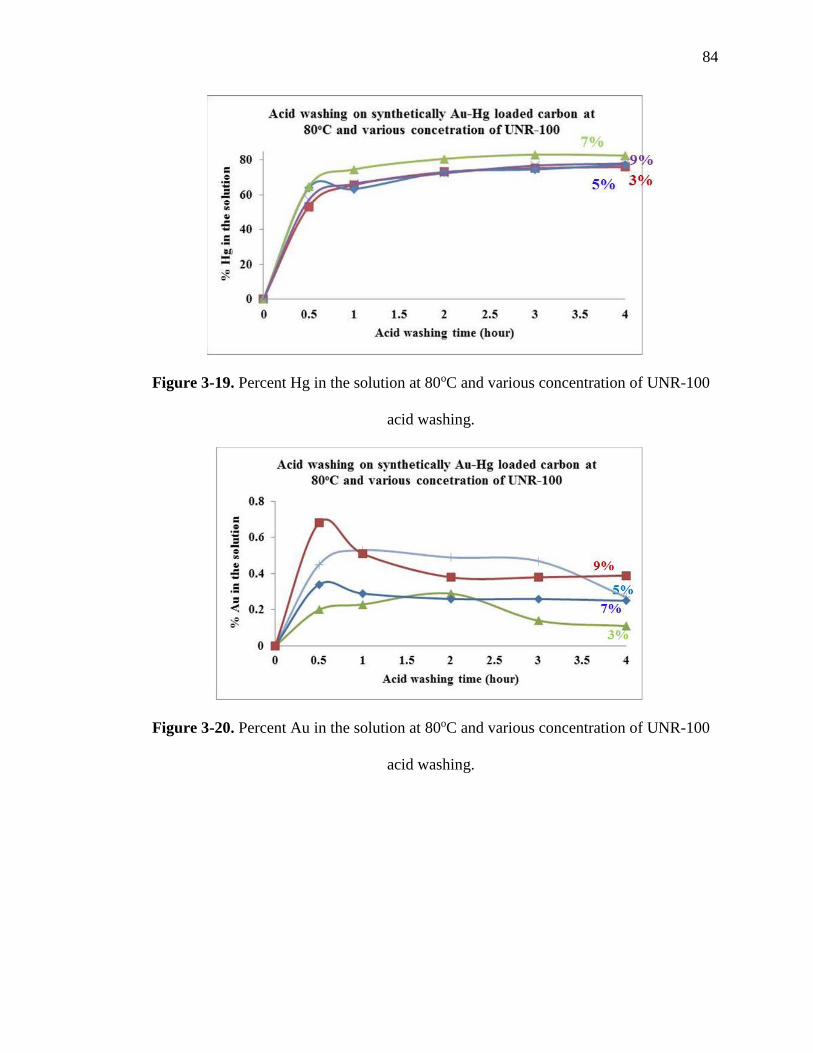
84
Figure 3-19. Percent Hg in the solution at 80oC and various concentration of UNR-100
acid washing.
Figure 3-20. Percent Au in the solution at 80oC and various concentration of UNR-100
acid washing.
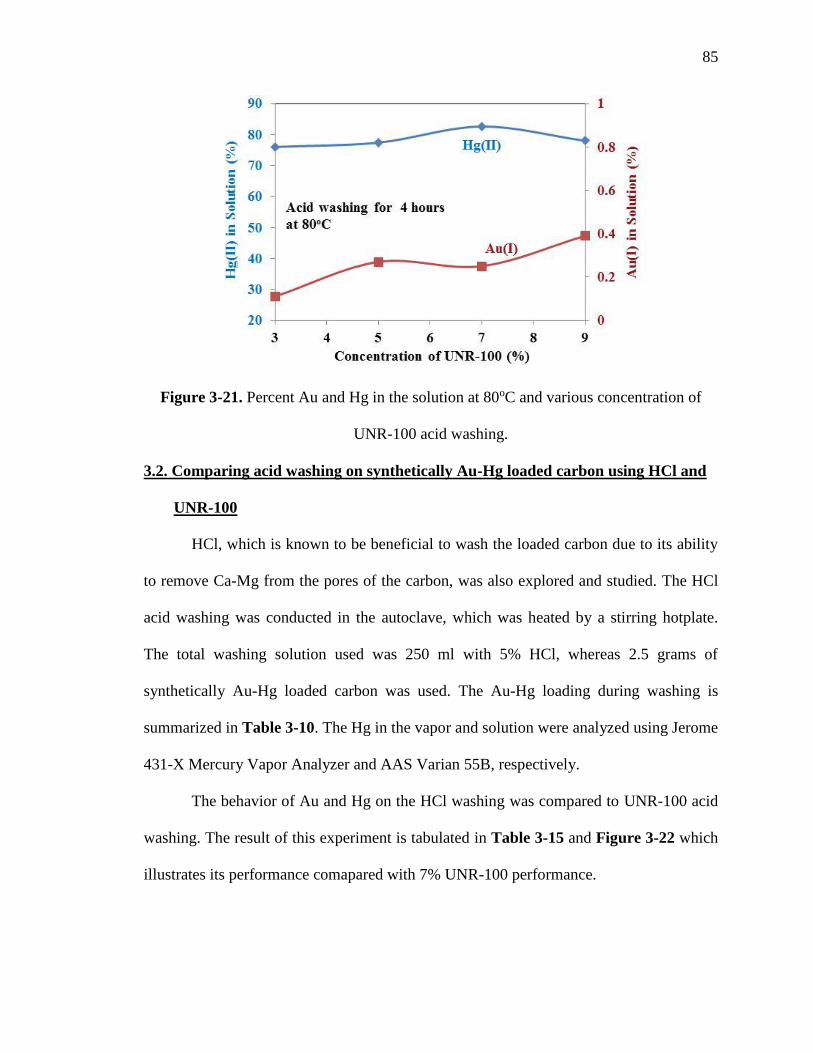
85
Figure 3-21. Percent Au and Hg in the solution at 80oC and various concentration of
UNR-100 acid washing.
3.2. Comparing acid washing on synthetically Au-Hg loaded carbon using HCl and
UNR-100
HCl, which is known to be beneficial to wash the loaded carbon due to its ability
to remove Ca-Mg from the pores of the carbon, was also explored and studied. The HCl
acid washing was conducted in the autoclave, which was heated by a stirring hotplate.
The total washing solution used was 250 ml with 5% HCl, whereas 2.5 grams of
synthetically Au-Hg loaded carbon was used. The Au-Hg loading during washing is
summarized in Table 3-10. The Hg in the vapor and solution were analyzed using Jerome
431-X Mercury Vapor Analyzer and AAS Varian 55B, respectively.
The behavior of Au and Hg on the HCl washing was compared to UNR-100 acid
washing. The result of this experiment is tabulated in Table 3-15 and Figure 3-22 which
illustrates its performance comapared with 7% UNR-100 performance.
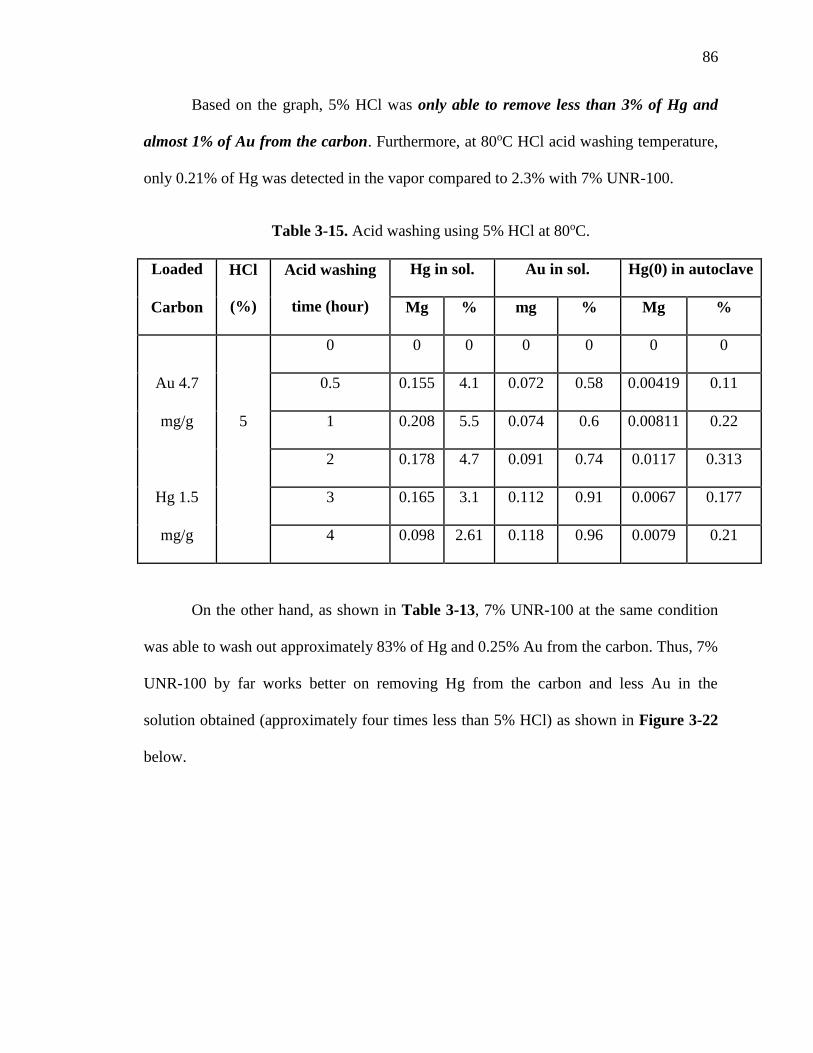
86
Based on the graph, 5% HCl was only able to remove less than 3% of Hg and
almost 1% of Au from the carbon. Furthermore, at 80oC HCl acid washing temperature,
only 0.21% of Hg was detected in the vapor compared to 2.3% with 7% UNR-100.
Table 3-15. Acid washing using 5% HCl at 80oC.
Loaded HCl
(%)
Acid washing
time (hour)
Hg in sol. Au in sol. Hg(0) in autoclave
Carbon Mg % mg % Mg %
0 0 0 0 0 0 0
Au 4.7 0.5 0.155 4.1 0.072 0.58 0.00419 0.11
mg/g 5 1 0.208 5.5 0.074 0.6 0.00811 0.22
2 0.178 4.7 0.091 0.74 0.0117 0.313
Hg 1.5 3 0.165 3.1 0.112 0.91 0.0067 0.177
mg/g 4 0.098 2.61 0.118 0.96 0.0079 0.21
On the other hand, as shown in Table 3-13, 7% UNR-100 at the same condition
was able to wash out approximately 83% of Hg and 0.25% Au from the carbon. Thus, 7%
UNR-100 by far works better on removing Hg from the carbon and less Au in the
solution obtained (approximately four times less than 5% HCl) as shown in Figure 3-22
below.

87
Figure 3-22. Comparison of acid washing using 5% HCl and 7% UNR-100 at 80oC.
3. 3. Column acid washing followed by stripping using Zadra on industrial loaded
carbon
Since the best condition of UNR-100 acid washing in autoclave had been
determined to be 7% UNR-100 at 80oC (pH of 2.25 fresh solution and 2.5 washed
solution), then a semi pilot scale of acid washing was conducted using a column shown in
Figure 3-23. The detail of the column dimension, set up and procedure have been
described in previous chapter in detail.
Figure 3-23. Column acid washing set up.
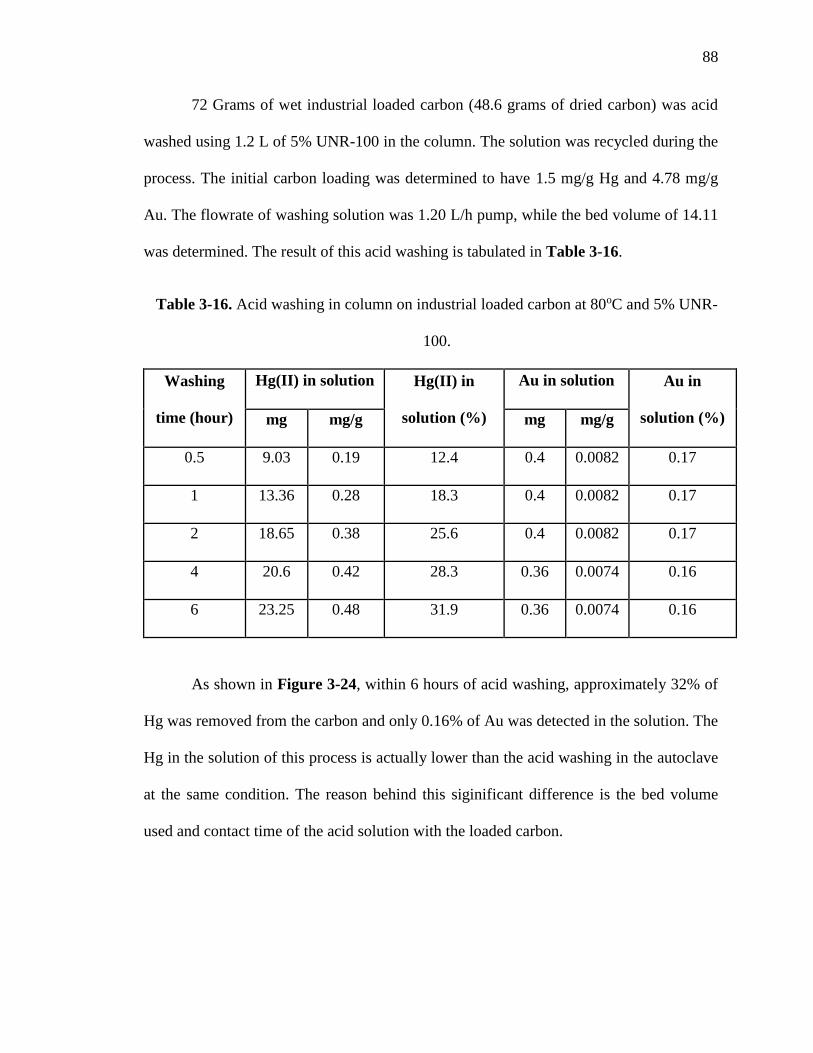
88
72 Grams of wet industrial loaded carbon (48.6 grams of dried carbon) was acid
washed using 1.2 L of 5% UNR-100 in the column. The solution was recycled during the
process. The initial carbon loading was determined to have 1.5 mg/g Hg and 4.78 mg/g
Au. The flowrate of washing solution was 1.20 L/h pump, while the bed volume of 14.11
was determined. The result of this acid washing is tabulated in Table 3-16.
Table 3-16. Acid washing in column on industrial loaded carbon at 80oC and 5% UNR-
100.
Washing
time (hour)
Hg(II) in solution Hg(II) in
solution (%)
Au in solution Au in
solution (%) mg mg/g mg mg/g
0.5 9.03 0.19 12.4 0.4 0.0082 0.17
1 13.36 0.28 18.3 0.4 0.0082 0.17
2 18.65 0.38 25.6 0.4 0.0082 0.17
4 20.6 0.42 28.3 0.36 0.0074 0.16
6 23.25 0.48 31.9 0.36 0.0074 0.16
As shown in Figure 3-24, within 6 hours of acid washing, approximately 32% of
Hg was removed from the carbon and only 0.16% of Au was detected in the solution. The
Hg in the solution of this process is actually lower than the acid washing in the autoclave
at the same condition. The reason behind this siginificant difference is the bed volume
used and contact time of the acid solution with the loaded carbon.

89
Figure 3-24. Hg and Au in the solution when acid washing using 5% UNR-100 was
performed in a column at 80oC.
The UNR-100 acid washed loaded carbon was then stripped using Zadra process
in an autoclave at various temperatures. The washed loaded carbon ‘head’ concentration
was 1.02 mg/g of Hg and 4.77 mg/g of Au. A 250 ml of stripping solution (1% of NaCN
and 1% of NaOH) and 2.5 grams of washed loaded carbon were used. The Hg and Au in
the solution were measured by AAS Varian 55B and the Hg in vapor was analyzed by
Jerome 431-X Mercury Vapor Analyzer. No pressure was added during the process, the
pressure built in the autoclave was due to the solution heated at 80, 100, 120 and 140oC
(0, 9, 20, and 43 psig, respectively).
Table 3-17 and Figure 3-25 show the presence of Hg and Au (during the Zadra
stripping at 80oC) in the solution which were about 90% and 36% respectively. At this
temperature, small amounts of Hg vapor were detected (less than 1%) as shown in Figure
3-26.
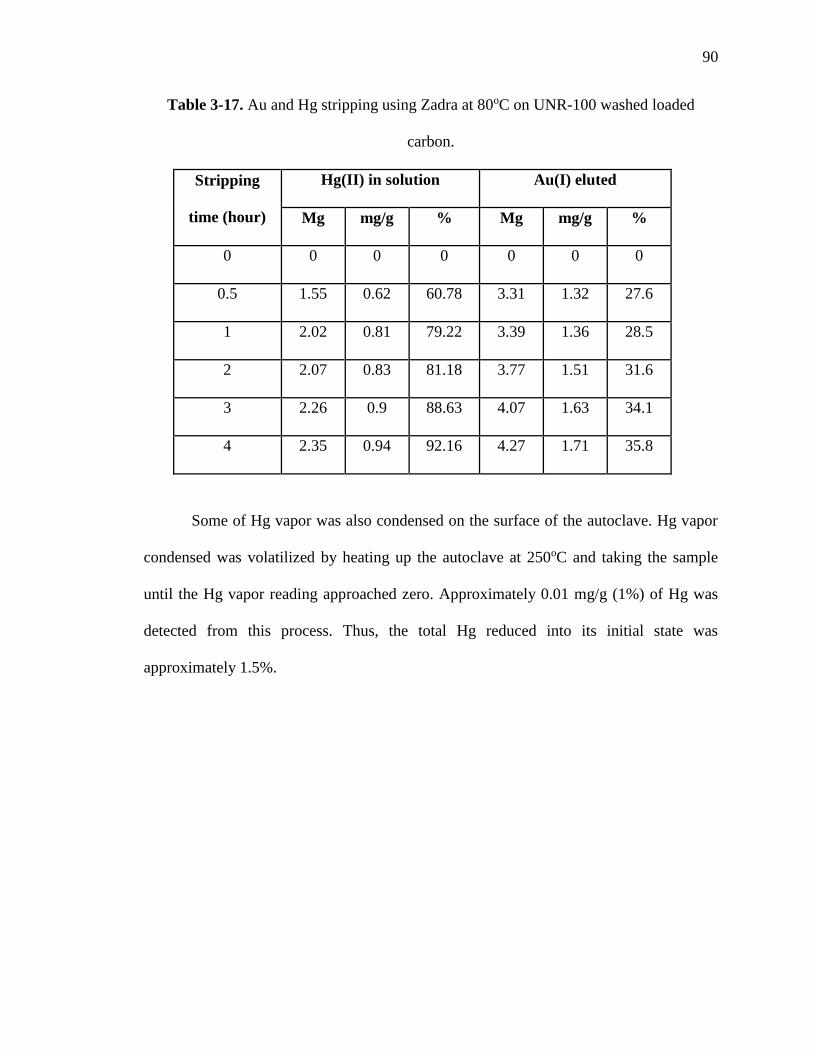
90
Table 3-17. Au and Hg stripping using Zadra at 80oC on UNR-100 washed loaded
carbon.
Stripping
time (hour)
Hg(II) in solution Au(I) eluted
Mg mg/g % Mg mg/g %
0 0 0 0 0 0 0
0.5 1.55 0.62 60.78 3.31 1.32 27.6
1 2.02 0.81 79.22 3.39 1.36 28.5
2 2.07 0.83 81.18 3.77 1.51 31.6
3 2.26 0.9 88.63 4.07 1.63 34.1
4 2.35 0.94 92.16 4.27 1.71 35.8
Some of Hg vapor was also condensed on the surface of the autoclave. Hg vapor
condensed was volatilized by heating up the autoclave at 250oC and taking the sample
until the Hg vapor reading approached zero. Approximately 0.01 mg/g (1%) of Hg was
detected from this process. Thus, the total Hg reduced into its initial state was
approximately 1.5%.
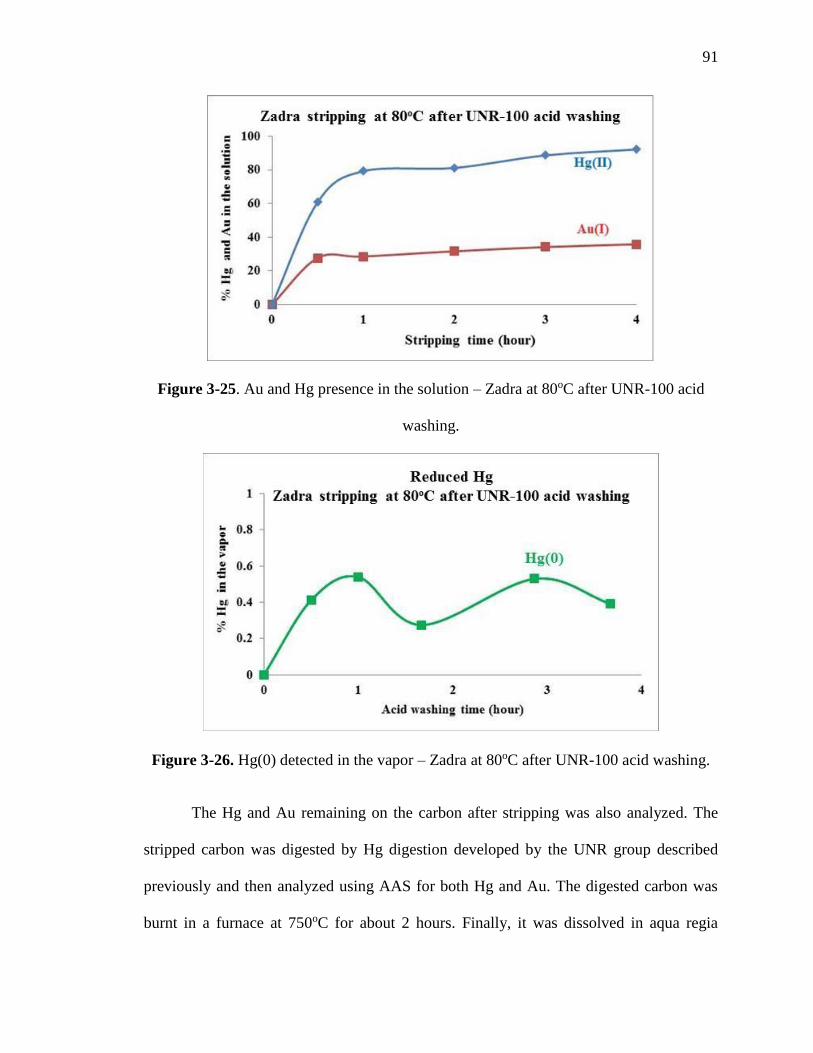
91
Figure 3-25. Au and Hg presence in the solution – Zadra at 80oC after UNR-100 acid
washing.
Figure 3-26. Hg(0) detected in the vapor – Zadra at 80oC after UNR-100 acid washing.
The Hg and Au remaining on the carbon after stripping was also analyzed. The
stripped carbon was digested by Hg digestion developed by the UNR group described
previously and then analyzed using AAS for both Hg and Au. The digested carbon was
burnt in a furnace at 750oC for about 2 hours. Finally, it was dissolved in aqua regia
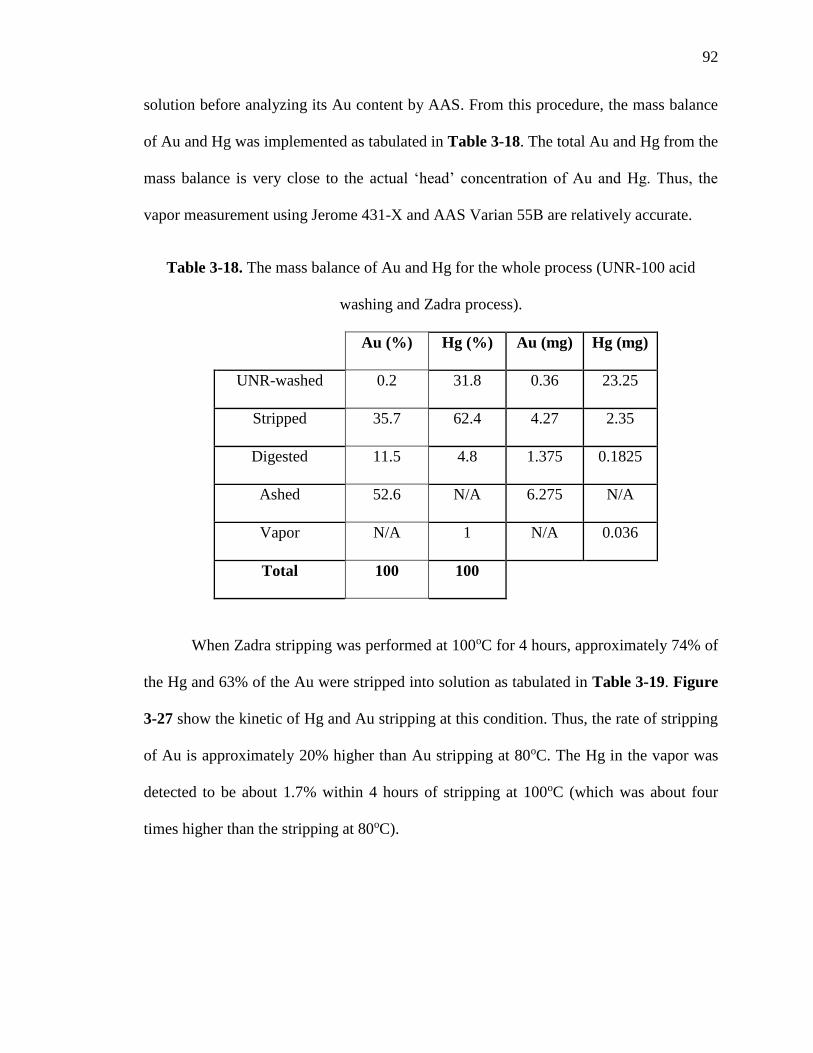
92
solution before analyzing its Au content by AAS. From this procedure, the mass balance
of Au and Hg was implemented as tabulated in Table 3-18. The total Au and Hg from the
mass balance is very close to the actual ‘head’ concentration of Au and Hg. Thus, the
vapor measurement using Jerome 431-X and AAS Varian 55B are relatively accurate.
Table 3-18. The mass balance of Au and Hg for the whole process (UNR-100 acid
washing and Zadra process).
Au (%) Hg (%) Au (mg) Hg (mg)
UNR-washed 0.2 31.8 0.36 23.25
Stripped 35.7 62.4 4.27 2.35
Digested 11.5 4.8 1.375 0.1825
Ashed 52.6 N/A 6.275 N/A
Vapor N/A 1 N/A 0.036
Total 100 100
When Zadra stripping was performed at 100oC for 4 hours, approximately 74% of
the Hg and 63% of the Au were stripped into solution as tabulated in Table 3-19. Figure
3-27 show the kinetic of Hg and Au stripping at this condition. Thus, the rate of stripping
of Au is approximately 20% higher than Au stripping at 80oC. The Hg in the vapor was
detected to be about 1.7% within 4 hours of stripping at 100oC (which was about four
times higher than the stripping at 80oC).
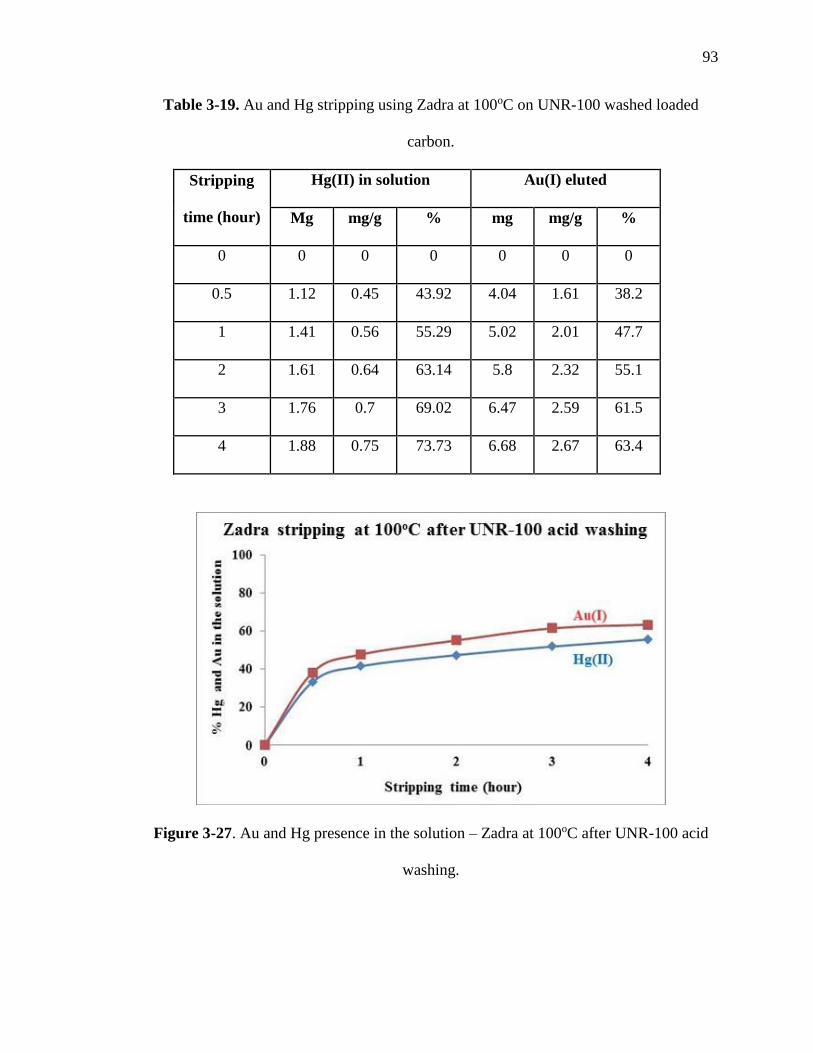
93
Table 3-19. Au and Hg stripping using Zadra at 100oC on UNR-100 washed loaded
carbon.
Stripping
time (hour)
Hg(II) in solution Au(I) eluted
Mg mg/g % mg mg/g %
0 0 0 0 0 0 0
0.5 1.12 0.45 43.92 4.04 1.61 38.2
1 1.41 0.56 55.29 5.02 2.01 47.7
2 1.61 0.64 63.14 5.8 2.32 55.1
3 1.76 0.7 69.02 6.47 2.59 61.5
4 1.88 0.75 73.73 6.68 2.67 63.4
Figure 3-27. Au and Hg presence in the solution – Zadra at 100oC after UNR-100 acid
washing.
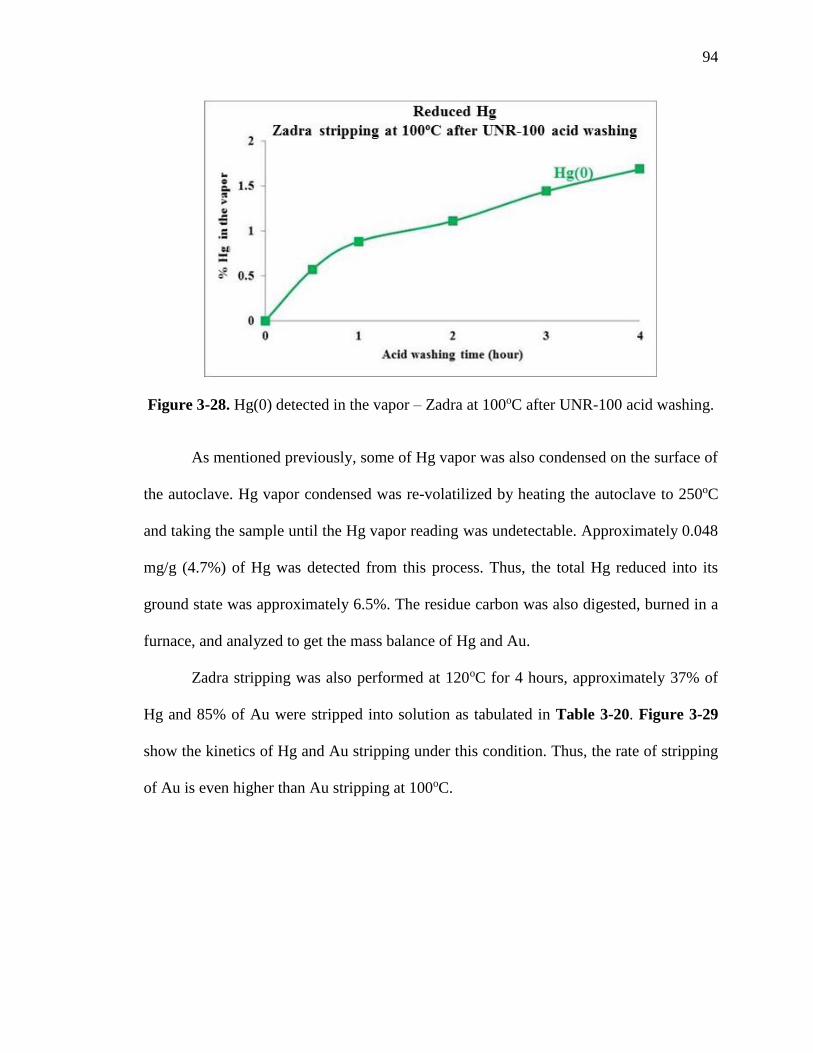
94
Figure 3-28. Hg(0) detected in the vapor – Zadra at 100oC after UNR-100 acid washing.
As mentioned previously, some of Hg vapor was also condensed on the surface of
the autoclave. Hg vapor condensed was re-volatilized by heating the autoclave to 250oC
and taking the sample until the Hg vapor reading was undetectable. Approximately 0.048
mg/g (4.7%) of Hg was detected from this process. Thus, the total Hg reduced into its
ground state was approximately 6.5%. The residue carbon was also digested, burned in a
furnace, and analyzed to get the mass balance of Hg and Au.
Zadra stripping was also performed at 120oC for 4 hours, approximately 37% of
Hg and 85% of Au were stripped into solution as tabulated in Table 3-20. Figure 3-29
show the kinetics of Hg and Au stripping under this condition. Thus, the rate of stripping
of Au is even higher than Au stripping at 100oC.
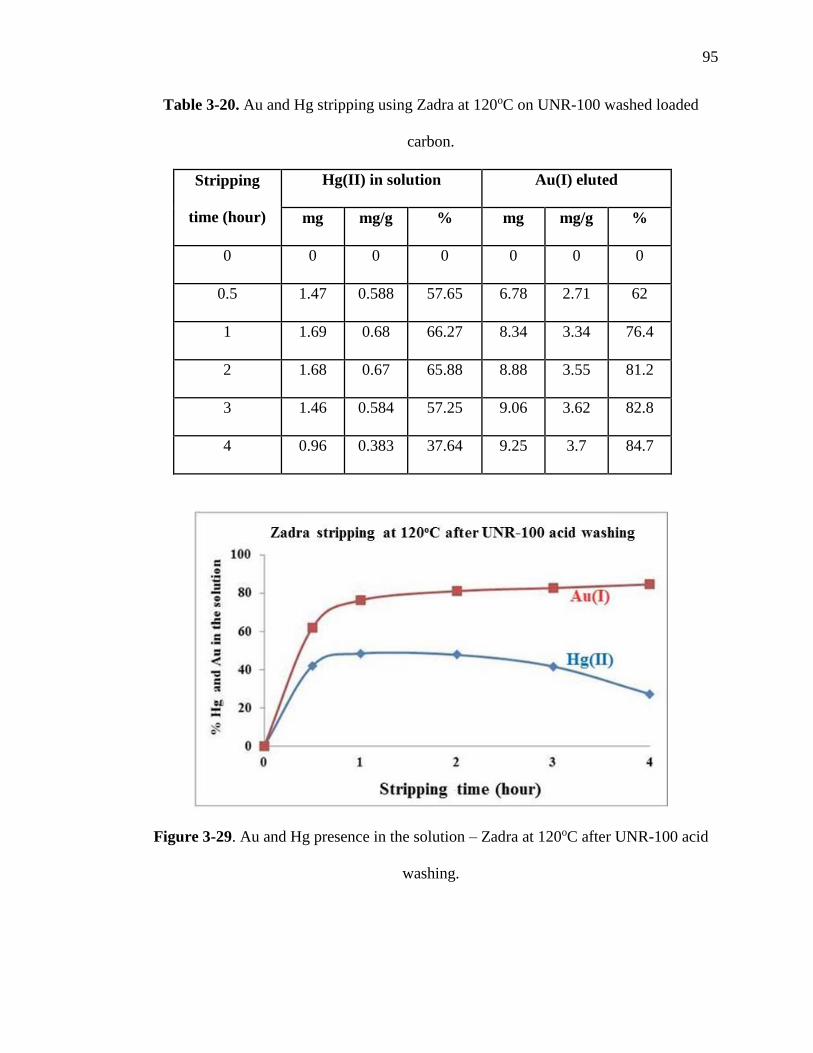
95
Table 3-20. Au and Hg stripping using Zadra at 120oC on UNR-100 washed loaded
carbon.
Stripping
time (hour)
Hg(II) in solution Au(I) eluted
mg mg/g % mg mg/g %
0 0 0 0 0 0 0
0.5 1.47 0.588 57.65 6.78 2.71 62
1 1.69 0.68 66.27 8.34 3.34 76.4
2 1.68 0.67 65.88 8.88 3.55 81.2
3 1.46 0.584 57.25 9.06 3.62 82.8
4 0.96 0.383 37.64 9.25 3.7 84.7
Figure 3-29. Au and Hg presence in the solution – Zadra at 120oC after UNR-100 acid
washing.
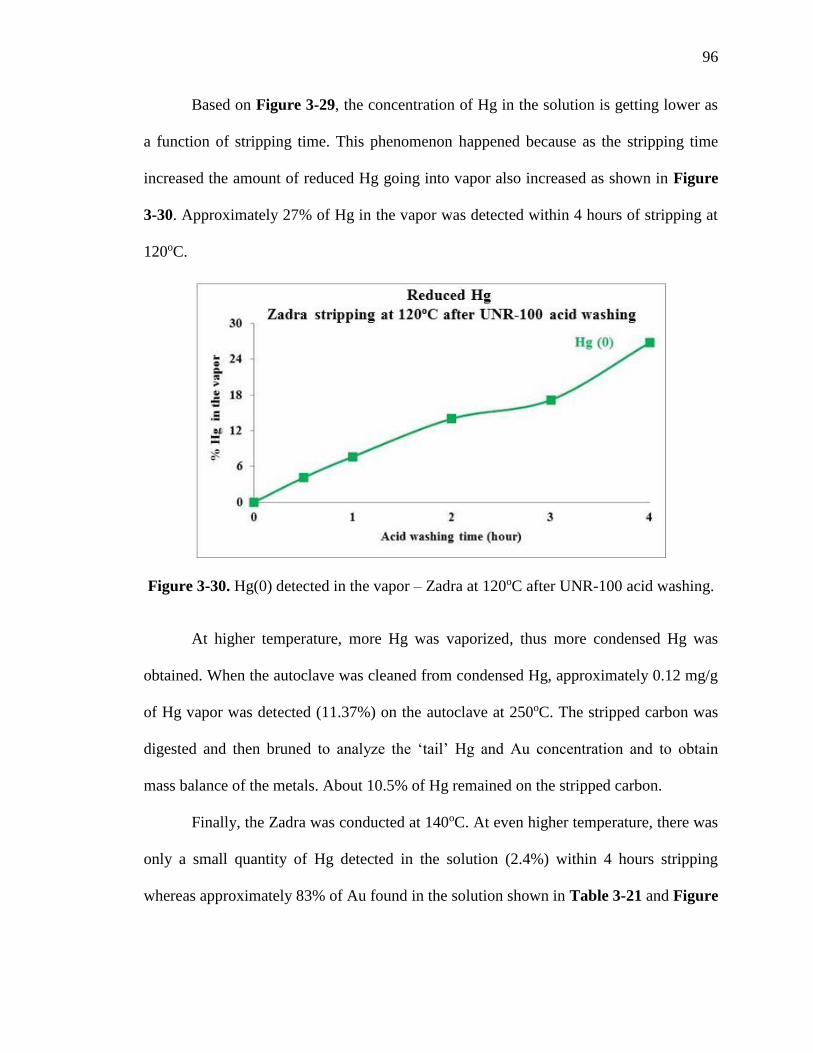
96
Based on Figure 3-29, the concentration of Hg in the solution is getting lower as
a function of stripping time. This phenomenon happened because as the stripping time
increased the amount of reduced Hg going into vapor also increased as shown in Figure
3-30. Approximately 27% of Hg in the vapor was detected within 4 hours of stripping at
120oC.
Figure 3-30. Hg(0) detected in the vapor – Zadra at 120oC after UNR-100 acid washing.
At higher temperature, more Hg was vaporized, thus more condensed Hg was
obtained. When the autoclave was cleaned from condensed Hg, approximately 0.12 mg/g
of Hg vapor was detected (11.37%) on the autoclave at 250oC. The stripped carbon was
digested and then bruned to analyze the ‘tail’ Hg and Au concentration and to obtain
mass balance of the metals. About 10.5% of Hg remained on the stripped carbon.
Finally, the Zadra was conducted at 140oC. At even higher temperature, there was
only a small quantity of Hg detected in the solution (2.4%) within 4 hours stripping
whereas approximately 83% of Au found in the solution shown in Table 3-21 and Figure
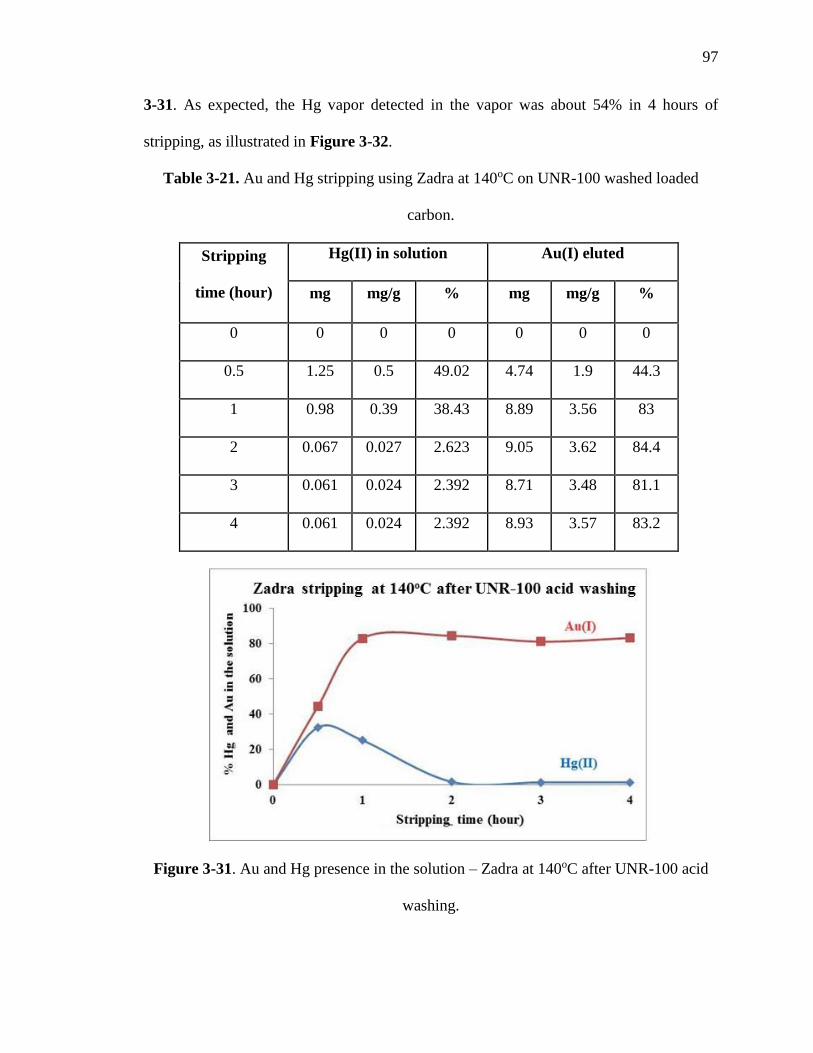
97
3-31. As expected, the Hg vapor detected in the vapor was about 54% in 4 hours of
stripping, as illustrated in Figure 3-32.
Table 3-21. Au and Hg stripping using Zadra at 140oC on UNR-100 washed loaded
carbon.
Stripping
time (hour)
Hg(II) in solution Au(I) eluted
mg mg/g % mg mg/g %
0 0 0 0 0 0 0
0.5 1.25 0.5 49.02 4.74 1.9 44.3
1 0.98 0.39 38.43 8.89 3.56 83
2 0.067 0.027 2.623 9.05 3.62 84.4
3 0.061 0.024 2.392 8.71 3.48 81.1
4 0.061 0.024 2.392 8.93 3.57 83.2
Figure 3-31. Au and Hg presence in the solution – Zadra at 140oC after UNR-100 acid
washing.
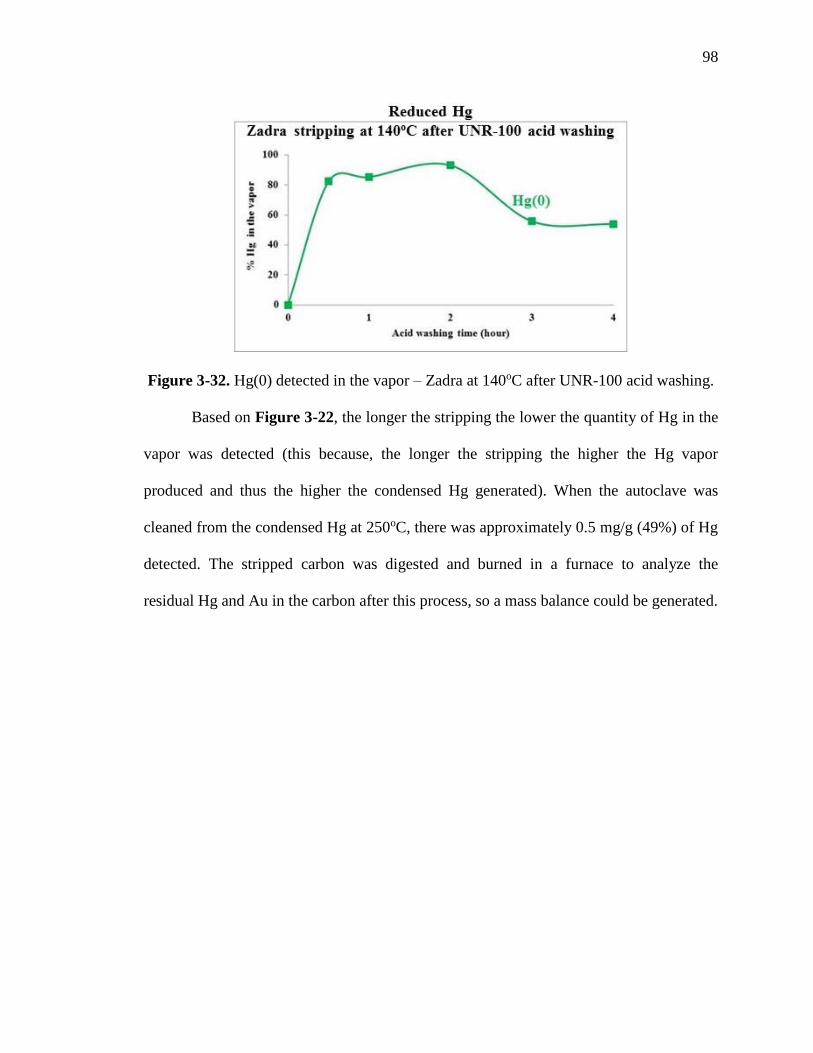
98
Figure 3-32. Hg(0) detected in the vapor – Zadra at 140oC after UNR-100 acid washing.
Based on Figure 3-22, the longer the stripping the lower the quantity of Hg in the
vapor was detected (this because, the longer the stripping the higher the Hg vapor
produced and thus the higher the condensed Hg generated). When the autoclave was
cleaned from the condensed Hg at 250oC, there was approximately 0.5 mg/g (49%) of Hg
detected. The stripped carbon was digested and burned in a furnace to analyze the
residual Hg and Au in the carbon after this process, so a mass balance could be generated.
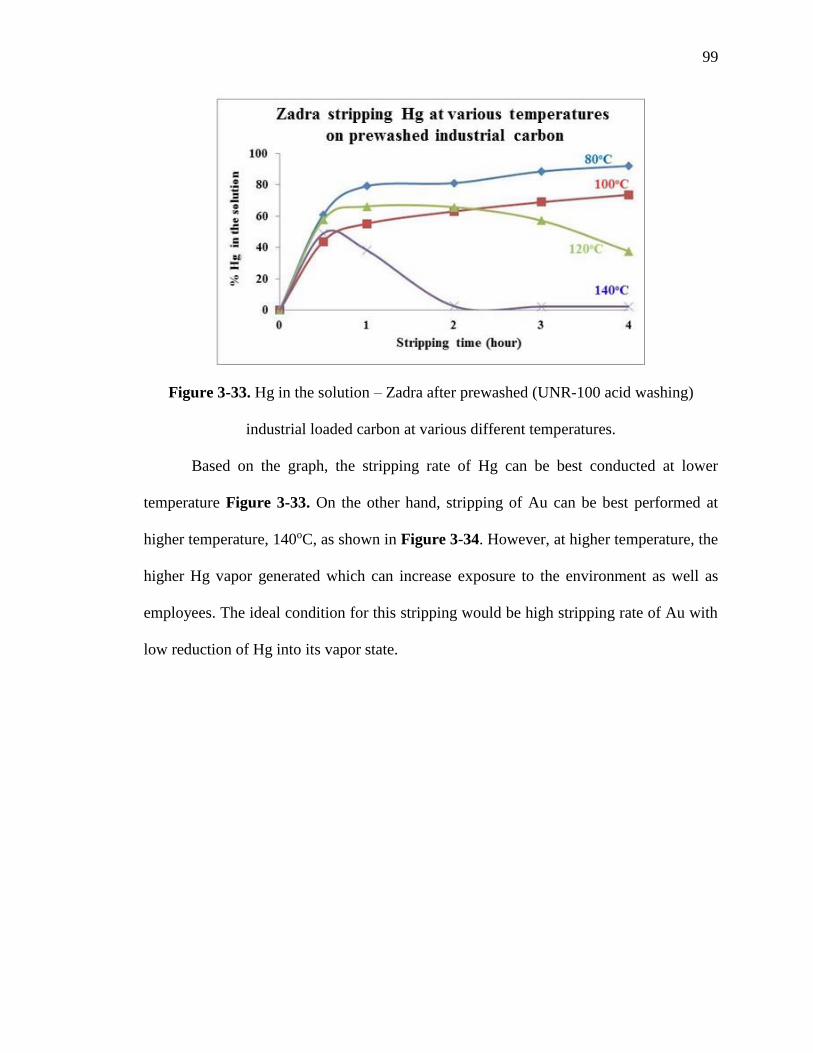
99
Figure 3-33. Hg in the solution – Zadra after prewashed (UNR-100 acid washing)
industrial loaded carbon at various different temperatures.
Based on the graph, the stripping rate of Hg can be best conducted at lower
temperature Figure 3-33. On the other hand, stripping of Au can be best performed at
higher temperature, 140oC, as shown in Figure 3-34. However, at higher temperature, the
higher Hg vapor generated which can increase exposure to the environment as well as
employees. The ideal condition for this stripping would be high stripping rate of Au with
low reduction of Hg into its vapor state.
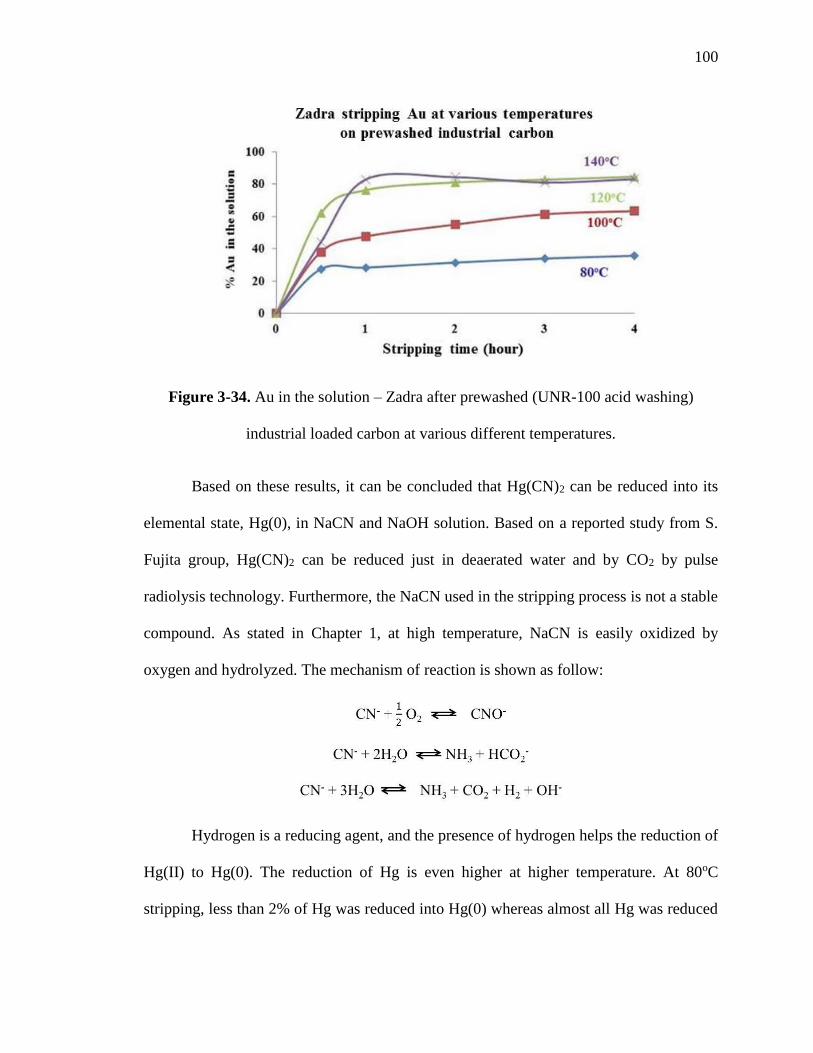
100
Figure 3-34. Au in the solution – Zadra after prewashed (UNR-100 acid washing)
industrial loaded carbon at various different temperatures.
Based on these results, it can be concluded that Hg(CN)2 can be reduced into its
elemental state, Hg(0), in NaCN and NaOH solution. Based on a reported study from S.
Fujita group, Hg(CN)2 can be reduced just in deaerated water and by CO2 by pulse
radiolysis technology. Furthermore, the NaCN used in the stripping process is not a stable
compound. As stated in Chapter 1, at high temperature, NaCN is easily oxidized by
oxygen and hydrolyzed. The mechanism of reaction is shown as follow:
Hydrogen is a reducing agent, and the presence of hydrogen helps the reduction of
Hg(II) to Hg(0). The reduction of Hg is even higher at higher temperature. At 80oC
stripping, less than 2% of Hg was reduced into Hg(0) whereas almost all Hg was reduced

101
at 140oC. Based on this result, the reduction of Hg is enhanced significantly by increasing
the temperature. Thus, any Au stripping process on carbon with a high Hg content at
temperature higher than 100oC will result in emission of Hg vapor, and consequently
jeopardize the environment and workers at the site.
3. 4. Stripping using Zadra on industrial loaded carbon
Zadra stripping without prior acid washed on industrial loaded carbon was
conducted to investigate the behavior of Hg stripping. The stripping was performed in a
2L autoclave and 2.5 grams of industrial carbon was used. 250 ml of stripping solution
that contained 1% of NaCN and 1% NaOH was utilized. Each stripping of the loaded
carbon was done at various temperatures. The head concentration on the carbon was 1.68
mg/g Hg and 4.4 mg/g Au.
Table 3-22 and Figure 3-35 show the percent stripped mercury at T = 80oC as a
function of time. Within 4 hours, approximately 93% of Hg and about 42% of Au were
measured in the solution. The trend is similar as the previous stripping experiments
showed that at 80oC low concentrations of Au and relatively high concentrations of Hg
(>90%) were stripped into the solution.

102
Table 3-22. Au and Hg stripping using Zadra at 80oC on industrial loaded carbon.
Stripping
time (hour)
Hg(II) in solution Au(I) in solution
mg mg/g % mg mg/g %
0 0 0 0 0 0 0
0.5 2.344 0.9376 55.81 2.77 1.11 25.21
1 2.782 1.1128 66.24 2.84 1.14 25.82
2 3.198 1.2792 76.14 3.86 1.54 35.07
3 3.676 1.4704 87.52 4.28 1.71 38.88
4 3.928 1.5712 93.52 4.64 1.86 42.21
Figure 3-35. Au and Hg presence in the solution – Zadra at 80oC.
At relatively low temperature, there was only a minimal amount of Hg vapor
produced as shown in Figure 3-36, which has the same behavior as Zadra on UNR-100
prewashed loaded carbon. The Jerome 431X mercury vapor analyzer detected
approximately 0.2% of Hg vapor at this temperature. It was also found that
approximately 0.06 mg/g (3.8%) of Hg vapor was condensed on the surface of the

103
autoclave. Thus, approximately 4% of Hg was reduced into Hg(0) during this process. By
analyzing the residual carbon (after elution), only 3% of the Hg is left on the carbon after
4 hours stripping at 80oC.
Figure 3-36. Hg(0) detected in the vapor - Pressurized Zadra at 80oC.
Zadra on industrial loaded carbon was also conducted at 100oC. From Table 3-23
and Figure 3-37, it can be seen that the Hg in the solution decreased between 3 and 4
hours stripping as a function of time. This phenomenon happened because the longer that
stripping at higher temperature, the more Hg in the solution was reduced as a vapor (see
the vapor of Hg produced below). Approximately, 65% of Au was detected in the
solution within 4 hours of stripping.
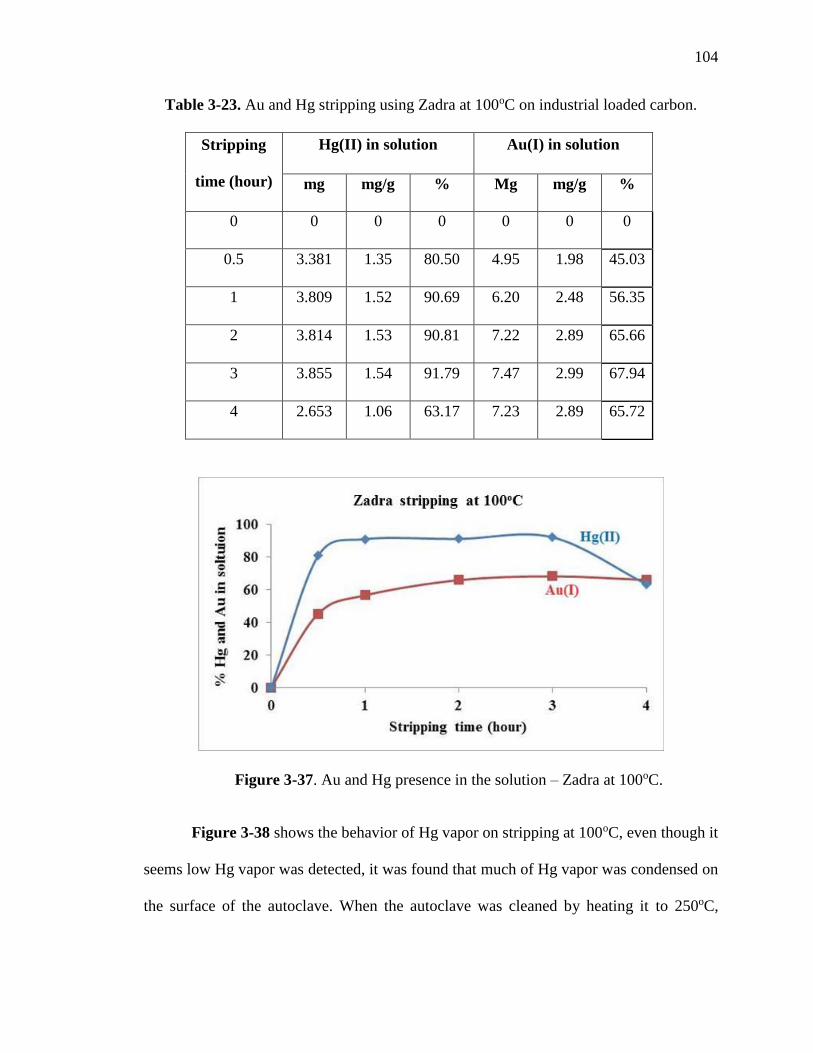
104
Table 3-23. Au and Hg stripping using Zadra at 100oC on industrial loaded carbon.
Stripping
time (hour)
Hg(II) in solution Au(I) in solution
mg mg/g % Mg mg/g %
0 0 0 0 0 0 0
0.5 3.381 1.35 80.50 4.95 1.98 45.03
1 3.809 1.52 90.69 6.20 2.48 56.35
2 3.814 1.53 90.81 7.22 2.89 65.66
3 3.855 1.54 91.79 7.47 2.99 67.94
4 2.653 1.06 63.17 7.23 2.89 65.72
Figure 3-37. Au and Hg presence in the solution – Zadra at 100oC.
Figure 3-38 shows the behavior of Hg vapor on stripping at 100oC, even though it
seems low Hg vapor was detected, it was found that much of Hg vapor was condensed on
the surface of the autoclave. When the autoclave was cleaned by heating it to 250oC,
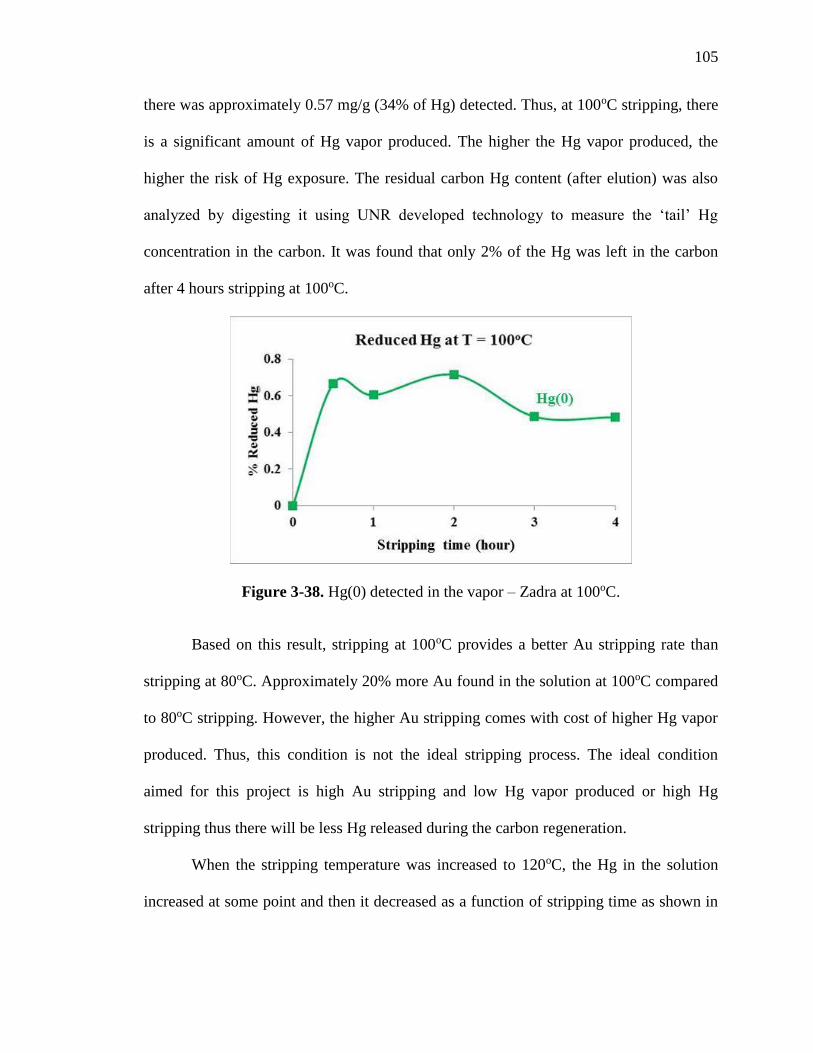
105
there was approximately 0.57 mg/g (34% of Hg) detected. Thus, at 100oC stripping, there
is a significant amount of Hg vapor produced. The higher the Hg vapor produced, the
higher the risk of Hg exposure. The residual carbon Hg content (after elution) was also
analyzed by digesting it using UNR developed technology to measure the ‘tail’ Hg
concentration in the carbon. It was found that only 2% of the Hg was left in the carbon
after 4 hours stripping at 100oC.
Figure 3-38. Hg(0) detected in the vapor – Zadra at 100oC.
Based on this result, stripping at 100oC provides a better Au stripping rate than
stripping at 80oC. Approximately 20% more Au found in the solution at 100oC compared
to 80oC stripping. However, the higher Au stripping comes with cost of higher Hg vapor
produced. Thus, this condition is not the ideal stripping process. The ideal condition
aimed for this project is high Au stripping and low Hg vapor produced or high Hg
stripping thus there will be less Hg released during the carbon regeneration.
When the stripping temperature was increased to 120oC, the Hg in the solution
increased at some point and then it decreased as a function of stripping time as shown in
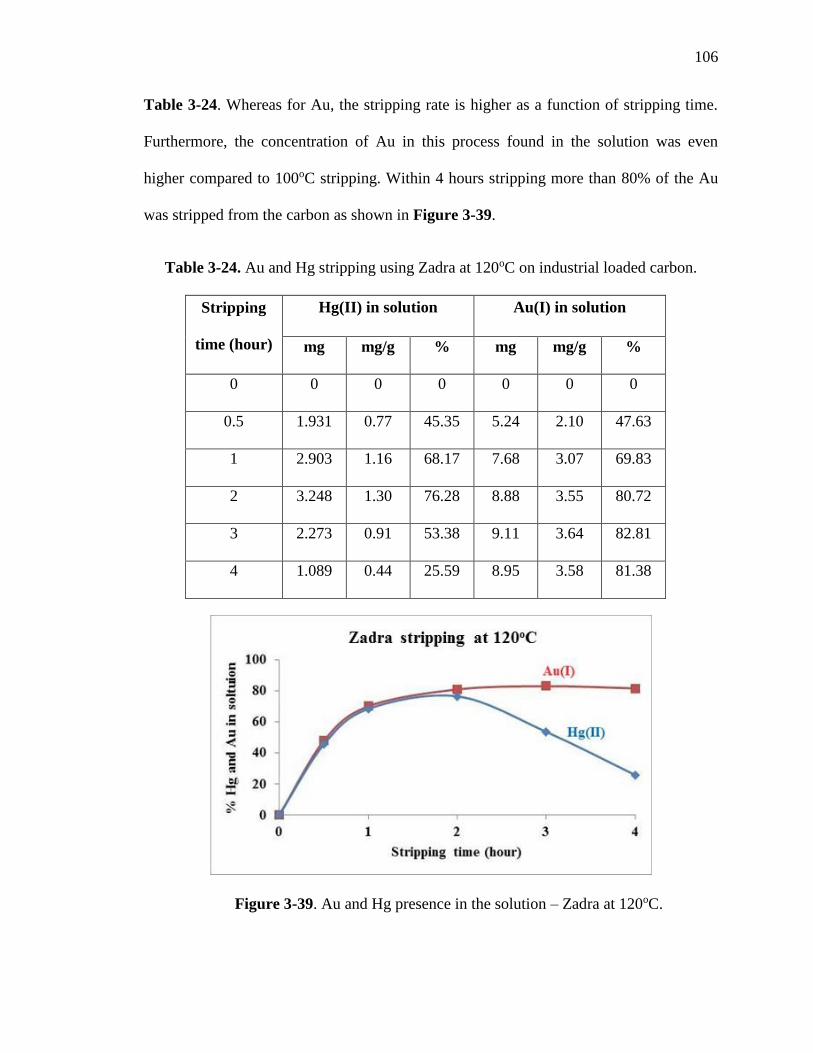
106
Table 3-24. Whereas for Au, the stripping rate is higher as a function of stripping time.
Furthermore, the concentration of Au in this process found in the solution was even
higher compared to 100oC stripping. Within 4 hours stripping more than 80% of the Au
was stripped from the carbon as shown in Figure 3-39.
Table 3-24. Au and Hg stripping using Zadra at 120oC on industrial loaded carbon.
Stripping
time (hour)
Hg(II) in solution Au(I) in solution
mg mg/g % mg mg/g %
0 0 0 0 0 0 0
0.5 1.931 0.77 45.35 5.24 2.10 47.63
1 2.903 1.16 68.17 7.68 3.07 69.83
2 3.248 1.30 76.28 8.88 3.55 80.72
3 2.273 0.91 53.38 9.11 3.64 82.81
4 1.089 0.44 25.59 8.95 3.58 81.38
Figure 3-39. Au and Hg presence in the solution – Zadra at 120oC.
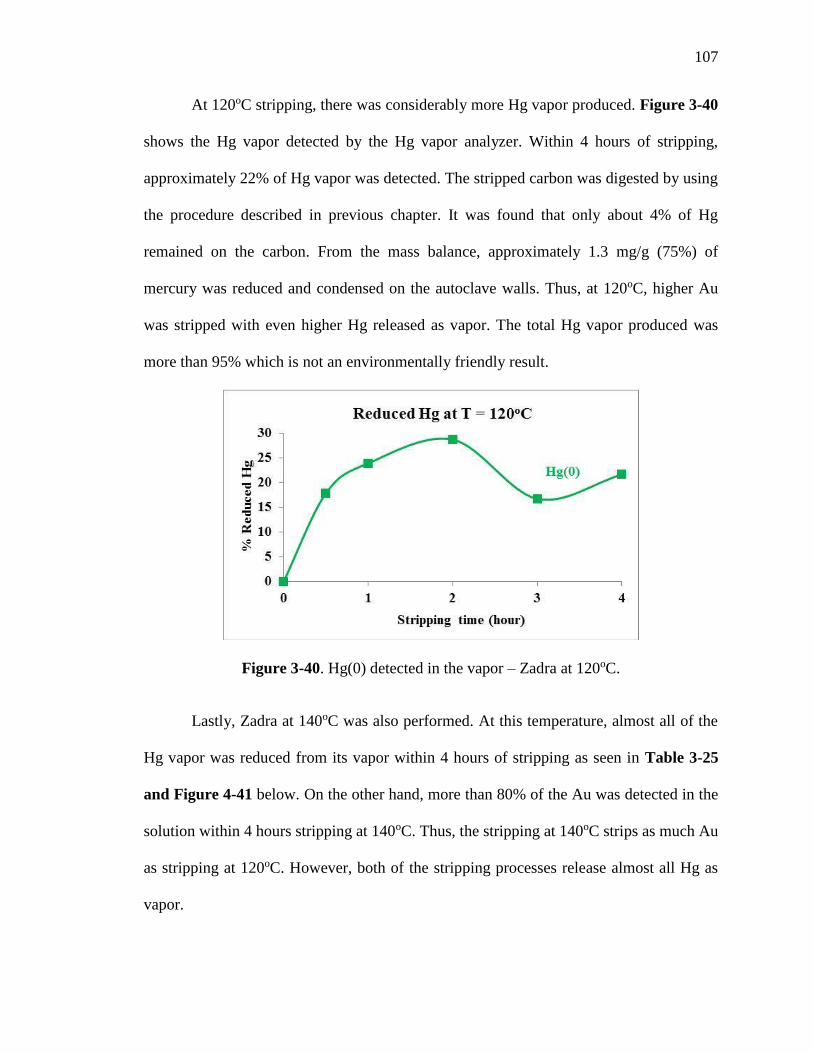
107
At 120oC stripping, there was considerably more Hg vapor produced. Figure 3-40
shows the Hg vapor detected by the Hg vapor analyzer. Within 4 hours of stripping,
approximately 22% of Hg vapor was detected. The stripped carbon was digested by using
the procedure described in previous chapter. It was found that only about 4% of Hg
remained on the carbon. From the mass balance, approximately 1.3 mg/g (75%) of
mercury was reduced and condensed on the autoclave walls. Thus, at 120oC, higher Au
was stripped with even higher Hg released as vapor. The total Hg vapor produced was
more than 95% which is not an environmentally friendly result.
Figure 3-40. Hg(0) detected in the vapor – Zadra at 120oC.
Lastly, Zadra at 140oC was also performed. At this temperature, almost all of the
Hg vapor was reduced from its vapor within 4 hours of stripping as seen in Table 3-25
and Figure 4-41 below. On the other hand, more than 80% of the Au was detected in the
solution within 4 hours stripping at 140oC. Thus, the stripping at 140oC strips as much Au
as stripping at 120oC. However, both of the stripping processes release almost all Hg as
vapor.

108
Table 3-25. Au and Hg stripping using Zadra at 140oC on industrial loaded carbon.
Stripping
time (hour)
Hg(II) in solution Au(I) in solution
Mg mg/g % mg mg/g %
0 0 0 0 0 0 0
0.5 4.036 1.61 96.10 5.54 2.22 50.36
1 4.001 1.60 95.26 8.06 3.22 73.24
2 0.064 0.03 1.52 9.15 3.66 83.21
3 0.003 0.00 0.07 9.08 3.63 82.56
4 0.0012 0.00 0.03 9.09 3.64 82.64
Figure 3-41. Au and Hg presence in the solution – Zadra at 140oC.
Figure 3-42 shows the rate of Hg vapor emission. As can be seen, it shows that
within 4 hours of stripping at 140oC, there was not much Hg vapor detected. This
happened because almost all of the Hg vapor was condensed on the autoclave early in the
process. The digestion of carbon yielded only approximately 3% of Hg remaining on the
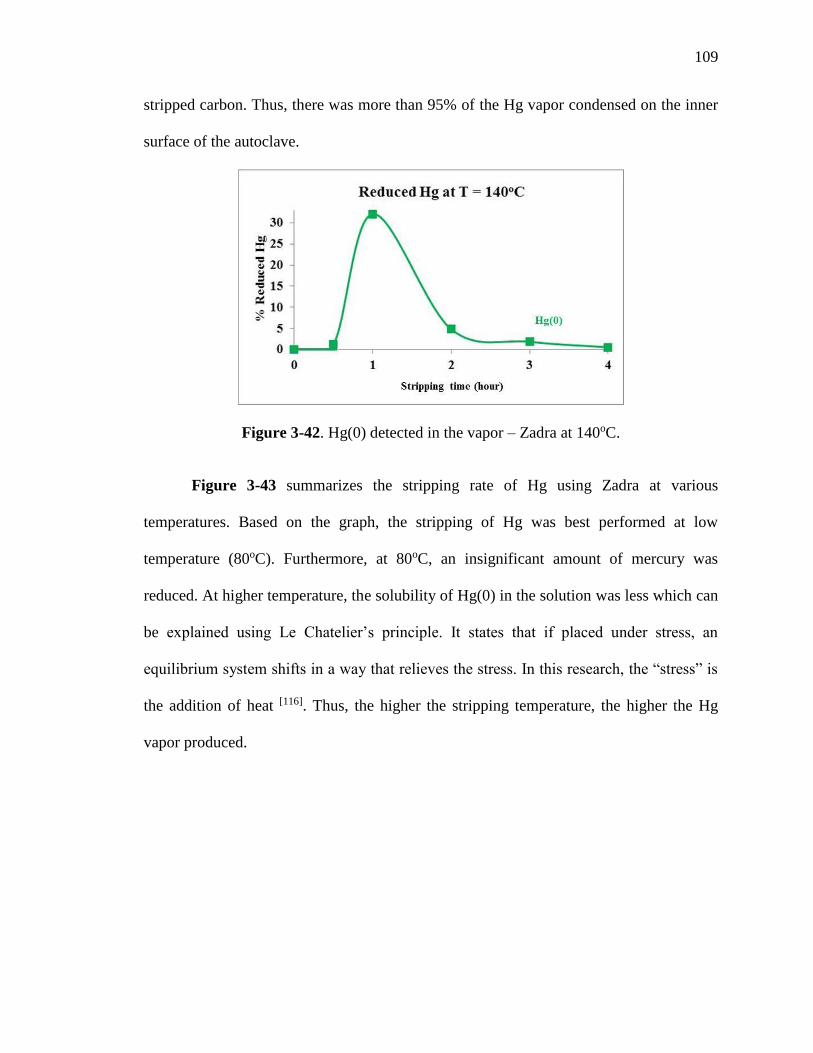
109
stripped carbon. Thus, there was more than 95% of the Hg vapor condensed on the inner
surface of the autoclave.
Figure 3-42. Hg(0) detected in the vapor – Zadra at 140oC.
Figure 3-43 summarizes the stripping rate of Hg using Zadra at various
temperatures. Based on the graph, the stripping of Hg was best performed at low
temperature (80oC). Furthermore, at 80oC, an insignificant amount of mercury was
reduced. At higher temperature, the solubility of Hg(0) in the solution was less which can
be explained using Le Chatelier’s principle. It states that if placed under stress, an
equilibrium system shifts in a way that relieves the stress. In this research, the “stress” is
the addition of heat [116]. Thus, the higher the stripping temperature, the higher the Hg
vapor produced.
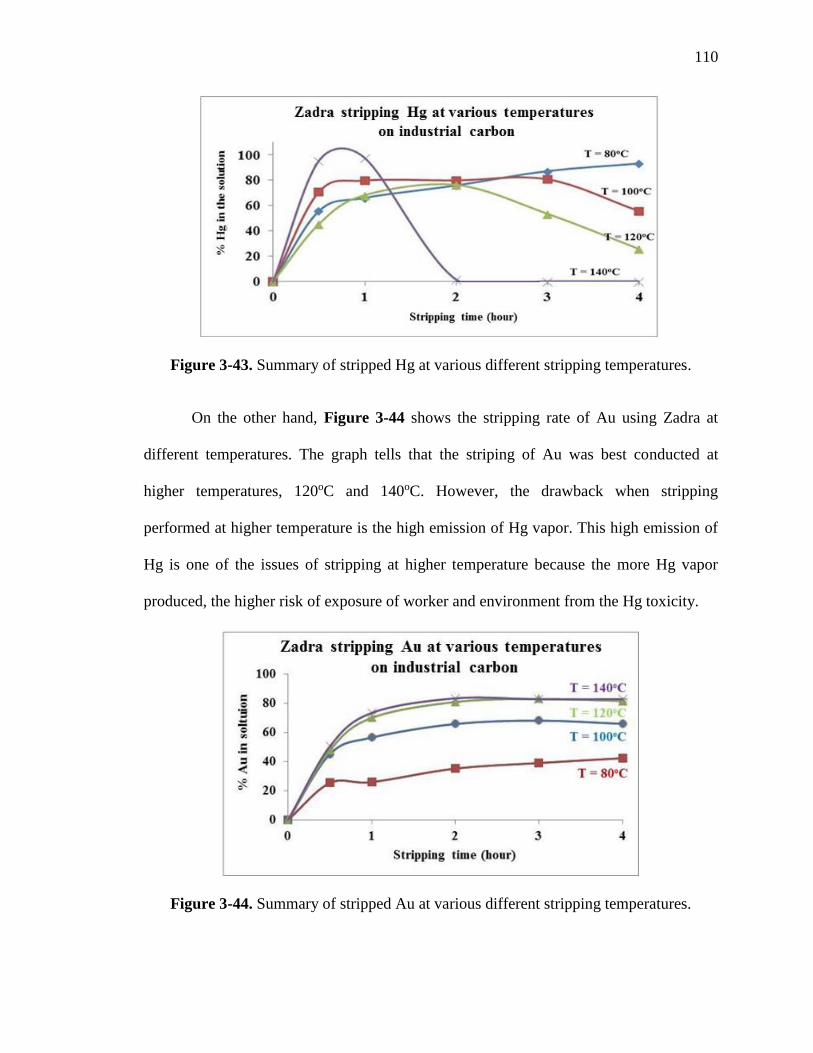
110
Figure 3-43. Summary of stripped Hg at various different stripping temperatures.
On the other hand, Figure 3-44 shows the stripping rate of Au using Zadra at
different temperatures. The graph tells that the striping of Au was best conducted at
higher temperatures, 120oC and 140oC. However, the drawback when stripping
performed at higher temperature is the high emission of Hg vapor. This high emission of
Hg is one of the issues of stripping at higher temperature because the more Hg vapor
produced, the higher risk of exposure of worker and environment from the Hg toxicity.
Figure 3-44. Summary of stripped Au at various different stripping temperatures.
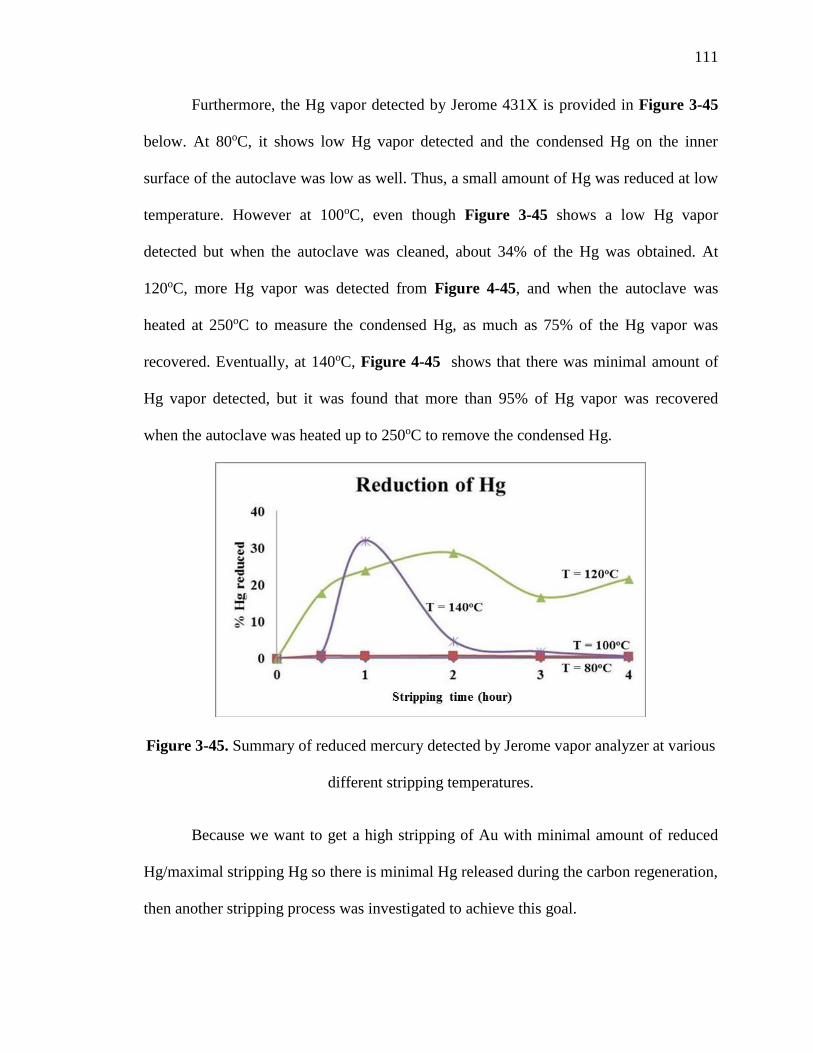
111
Furthermore, the Hg vapor detected by Jerome 431X is provided in Figure 3-45
below. At 80oC, it shows low Hg vapor detected and the condensed Hg on the inner
surface of the autoclave was low as well. Thus, a small amount of Hg was reduced at low
temperature. However at 100oC, even though Figure 3-45 shows a low Hg vapor
detected but when the autoclave was cleaned, about 34% of the Hg was obtained. At
120oC, more Hg vapor was detected from Figure 4-45, and when the autoclave was
heated at 250oC to measure the condensed Hg, as much as 75% of the Hg vapor was
recovered. Eventually, at 140oC, Figure 4-45 shows that there was minimal amount of
Hg vapor detected, but it was found that more than 95% of Hg vapor was recovered
when the autoclave was heated up to 250oC to remove the condensed Hg.
Figure 3-45. Summary of reduced mercury detected by Jerome vapor analyzer at various
different stripping temperatures.
Because we want to get a high stripping of Au with minimal amount of reduced
Hg/maximal stripping Hg so there is minimal Hg released during the carbon regeneration,
then another stripping process was investigated to achieve this goal.
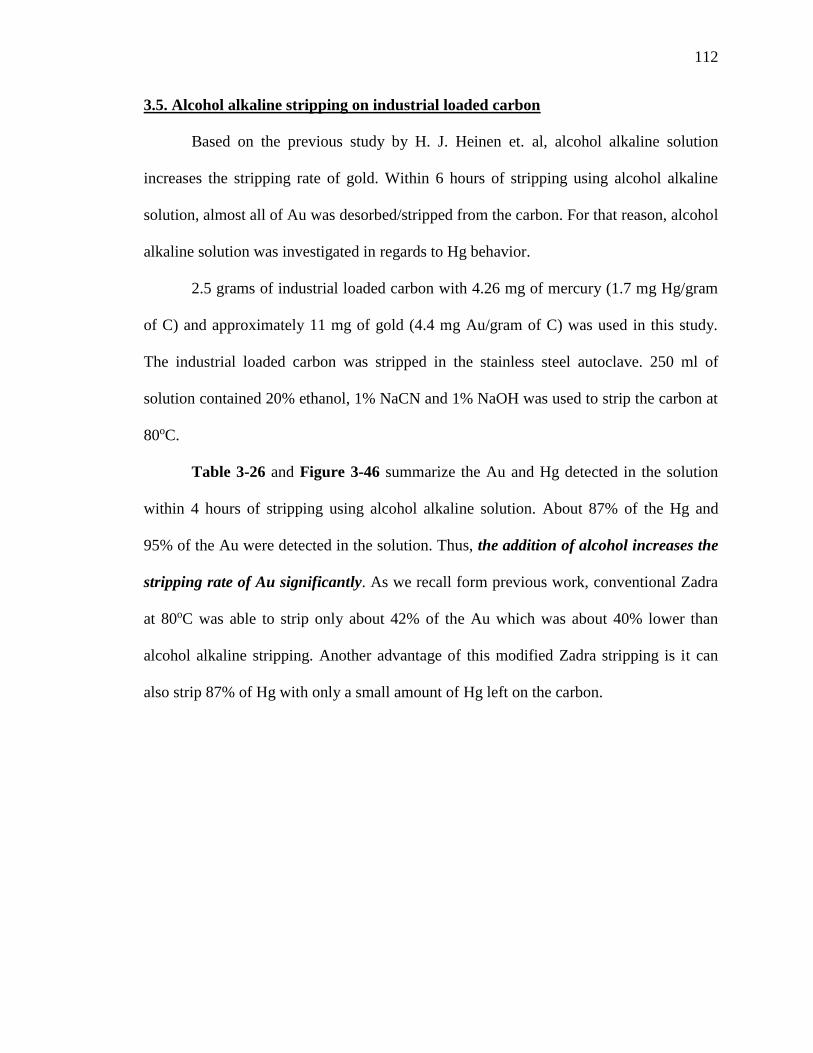
112
3.5. Alcohol alkaline stripping on industrial loaded carbon
Based on the previous study by H. J. Heinen et. al, alcohol alkaline solution
increases the stripping rate of gold. Within 6 hours of stripping using alcohol alkaline
solution, almost all of Au was desorbed/stripped from the carbon. For that reason, alcohol
alkaline solution was investigated in regards to Hg behavior.
2.5 grams of industrial loaded carbon with 4.26 mg of mercury (1.7 mg Hg/gram
of C) and approximately 11 mg of gold (4.4 mg Au/gram of C) was used in this study.
The industrial loaded carbon was stripped in the stainless steel autoclave. 250 ml of
solution contained 20% ethanol, 1% NaCN and 1% NaOH was used to strip the carbon at
80oC.
Table 3-26 and Figure 3-46 summarize the Au and Hg detected in the solution
within 4 hours of stripping using alcohol alkaline solution. About 87% of the Hg and
95% of the Au were detected in the solution. Thus, the addition of alcohol increases the
stripping rate of Au significantly. As we recall form previous work, conventional Zadra
at 80oC was able to strip only about 42% of the Au which was about 40% lower than
alcohol alkaline stripping. Another advantage of this modified Zadra stripping is it can
also strip 87% of Hg with only a small amount of Hg left on the carbon.
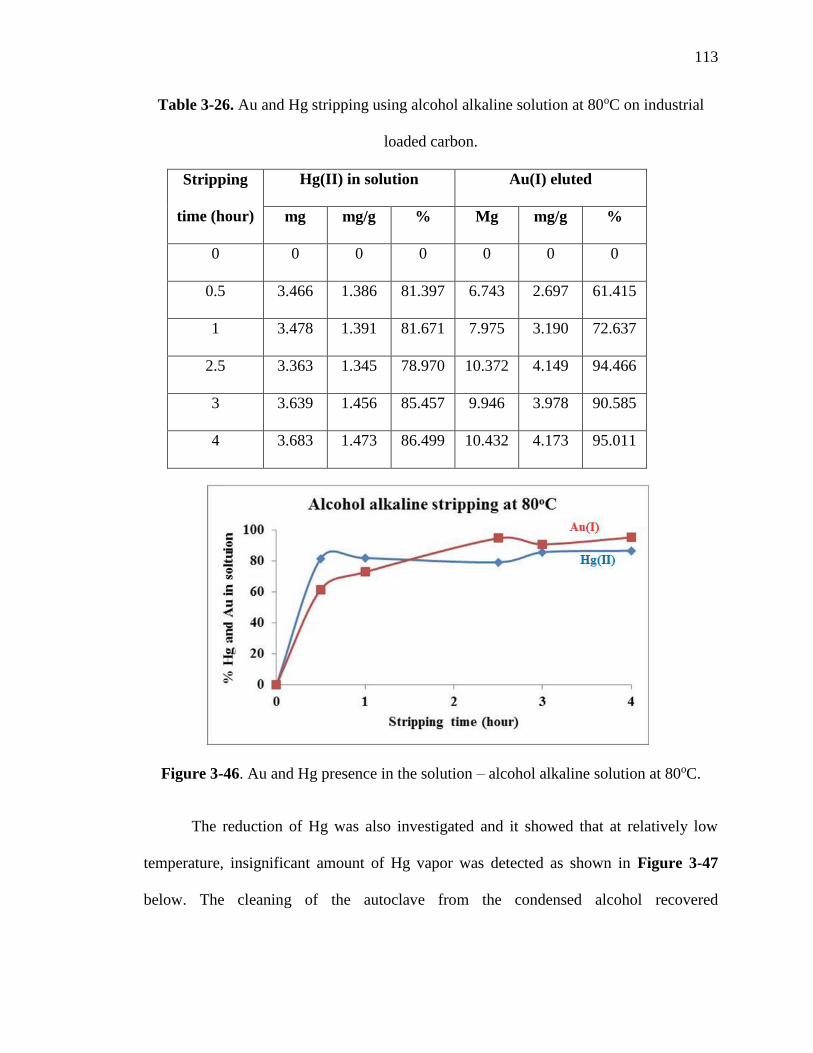
113
Table 3-26. Au and Hg stripping using alcohol alkaline solution at 80oC on industrial
loaded carbon.
Stripping
time (hour)
Hg(II) in solution Au(I) eluted
mg mg/g % Mg mg/g %
0 0 0 0 0 0 0
0.5 3.466 1.386 81.397 6.743 2.697 61.415
1 3.478 1.391 81.671 7.975 3.190 72.637
2.5 3.363 1.345 78.970 10.372 4.149 94.466
3 3.639 1.456 85.457 9.946 3.978 90.585
4 3.683 1.473 86.499 10.432 4.173 95.011
Figure 3-46. Au and Hg presence in the solution – alcohol alkaline solution at 80oC.
The reduction of Hg was also investigated and it showed that at relatively low
temperature, insignificant amount of Hg vapor was detected as shown in Figure 3-47
below. The cleaning of the autoclave from the condensed alcohol recovered
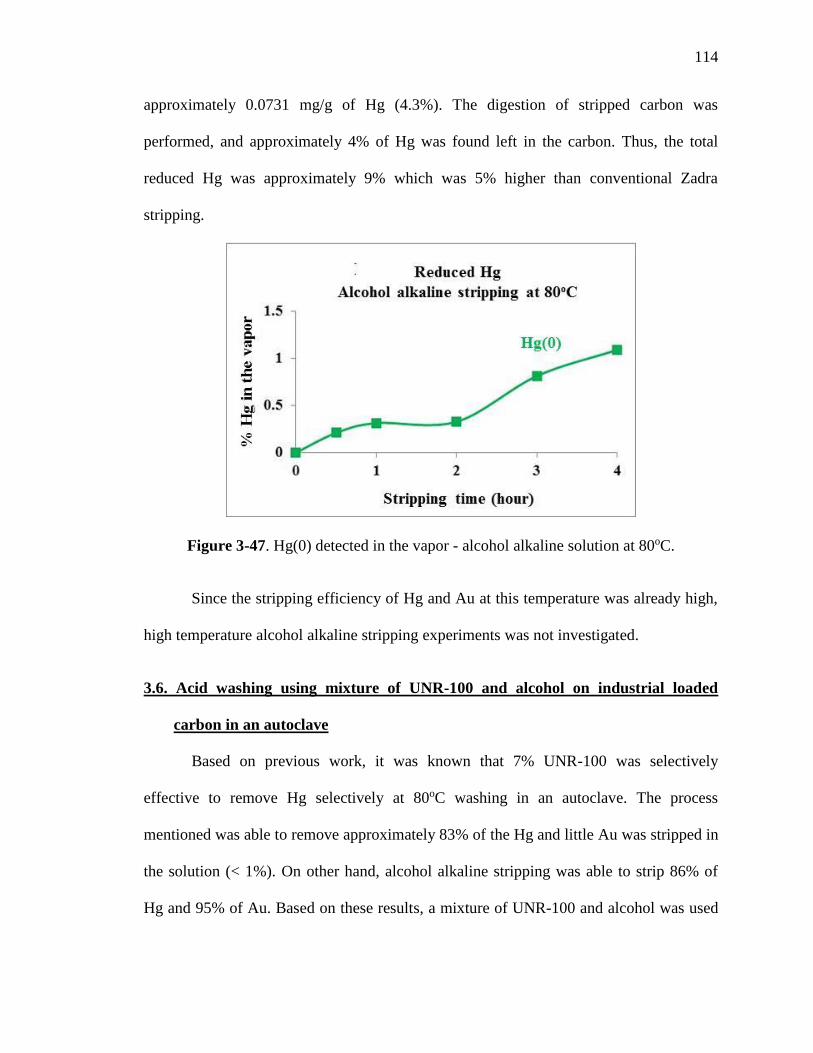
114
approximately 0.0731 mg/g of Hg (4.3%). The digestion of stripped carbon was
performed, and approximately 4% of Hg was found left in the carbon. Thus, the total
reduced Hg was approximately 9% which was 5% higher than conventional Zadra
stripping.
Figure 3-47. Hg(0) detected in the vapor - alcohol alkaline solution at 80oC.
Since the stripping efficiency of Hg and Au at this temperature was already high,
high temperature alcohol alkaline stripping experiments was not investigated.
3.6. Acid washing using mixture of UNR-100 and alcohol on industrial loaded
carbon in an autoclave
Based on previous work, it was known that 7% UNR-100 was selectively
effective to remove Hg selectively at 80oC washing in an autoclave. The process
mentioned was able to remove approximately 83% of the Hg and little Au was stripped in
the solution (< 1%). On other hand, alcohol alkaline stripping was able to strip 86% of
Hg and 95% of Au. Based on these results, a mixture of UNR-100 and alcohol was used
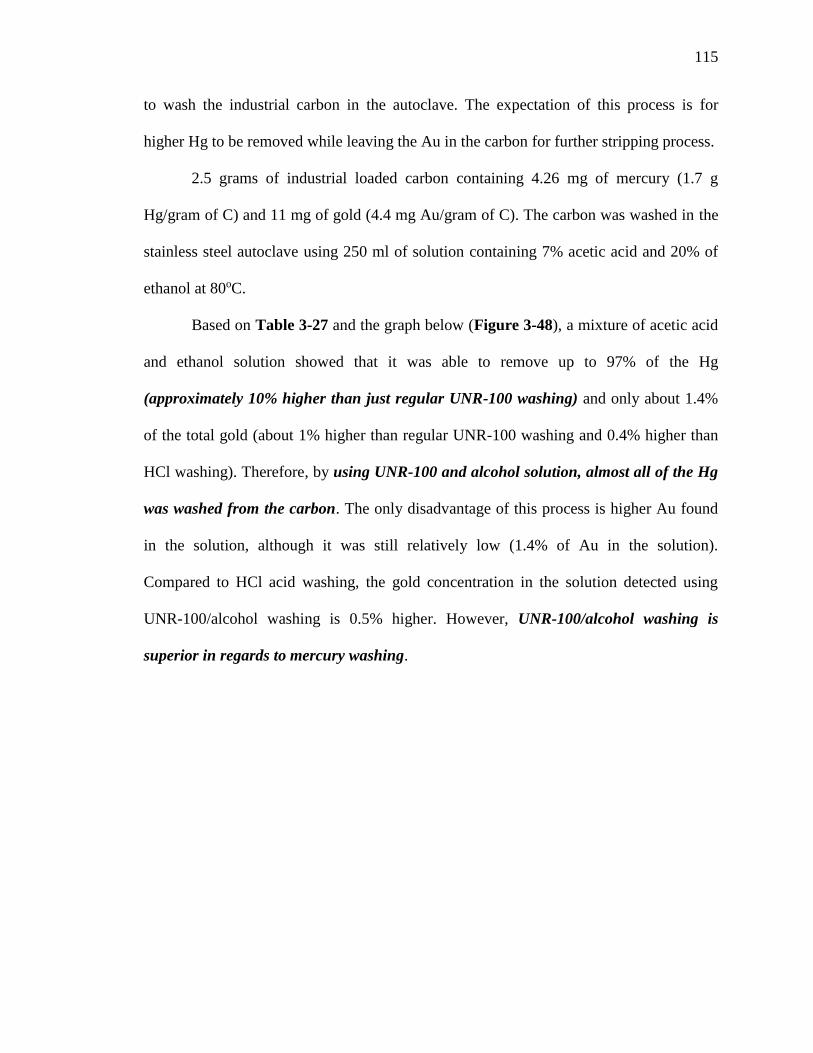
115
to wash the industrial carbon in the autoclave. The expectation of this process is for
higher Hg to be removed while leaving the Au in the carbon for further stripping process.
2.5 grams of industrial loaded carbon containing 4.26 mg of mercury (1.7 g
Hg/gram of C) and 11 mg of gold (4.4 mg Au/gram of C). The carbon was washed in the
stainless steel autoclave using 250 ml of solution containing 7% acetic acid and 20% of
ethanol at 80oC.
Based on Table 3-27 and the graph below (Figure 3-48), a mixture of acetic acid
and ethanol solution showed that it was able to remove up to 97% of the Hg
(approximately 10% higher than just regular UNR-100 washing) and only about 1.4%
of the total gold (about 1% higher than regular UNR-100 washing and 0.4% higher than
HCl washing). Therefore, by using UNR-100 and alcohol solution, almost all of the Hg
was washed from the carbon. The only disadvantage of this process is higher Au found
in the solution, although it was still relatively low (1.4% of Au in the solution).
Compared to HCl acid washing, the gold concentration in the solution detected using
UNR-100/alcohol washing is 0.5% higher. However, UNR-100/alcohol washing is
superior in regards to mercury washing.
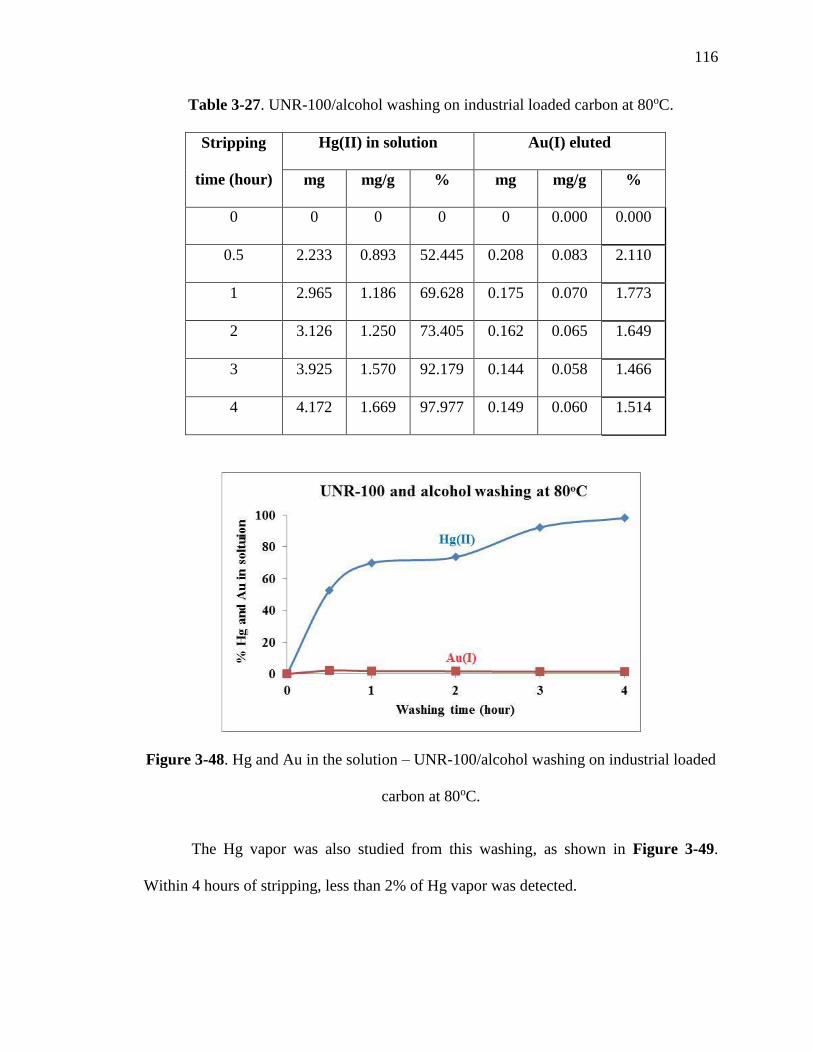
116
Table 3-27. UNR-100/alcohol washing on industrial loaded carbon at 80oC.
Stripping
time (hour)
Hg(II) in solution Au(I) eluted
mg mg/g % mg mg/g %
0 0 0 0 0 0.000 0.000
0.5 2.233 0.893 52.445 0.208 0.083 2.110
1 2.965 1.186 69.628 0.175 0.070 1.773
2 3.126 1.250 73.405 0.162 0.065 1.649
3 3.925 1.570 92.179 0.144 0.058 1.466
4 4.172 1.669 97.977 0.149 0.060 1.514
Figure 3-48. Hg and Au in the solution – UNR-100/alcohol washing on industrial loaded
carbon at 80oC.
The Hg vapor was also studied from this washing, as shown in Figure 3-49.
Within 4 hours of stripping, less than 2% of Hg vapor was detected.
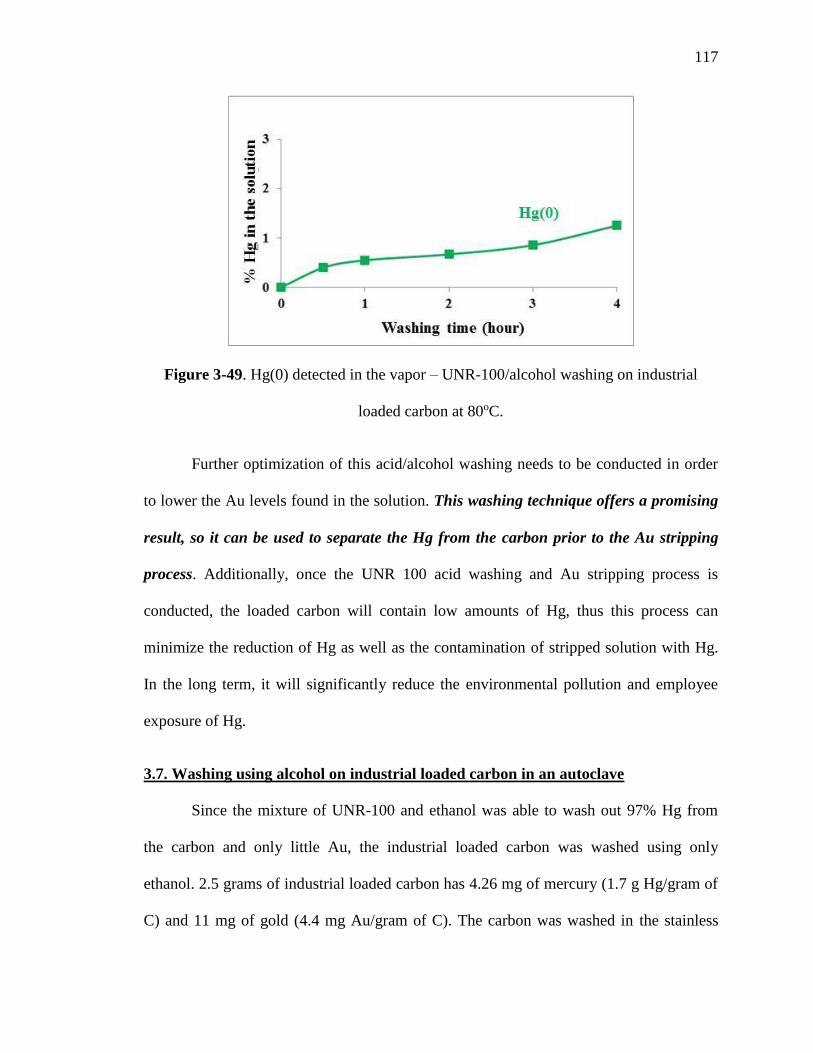
117
Figure 3-49. Hg(0) detected in the vapor – UNR-100/alcohol washing on industrial
loaded carbon at 80oC.
Further optimization of this acid/alcohol washing needs to be conducted in order
to lower the Au levels found in the solution. This washing technique offers a promising
result, so it can be used to separate the Hg from the carbon prior to the Au stripping
process. Additionally, once the UNR 100 acid washing and Au stripping process is
conducted, the loaded carbon will contain low amounts of Hg, thus this process can
minimize the reduction of Hg as well as the contamination of stripped solution with Hg.
In the long term, it will significantly reduce the environmental pollution and employee
exposure of Hg.
3.7. Washing using alcohol on industrial loaded carbon in an autoclave
Since the mixture of UNR-100 and ethanol was able to wash out 97% Hg from
the carbon and only little Au, the industrial loaded carbon was washed using only
ethanol. 2.5 grams of industrial loaded carbon has 4.26 mg of mercury (1.7 g Hg/gram of
C) and 11 mg of gold (4.4 mg Au/gram of C). The carbon was washed in the stainless
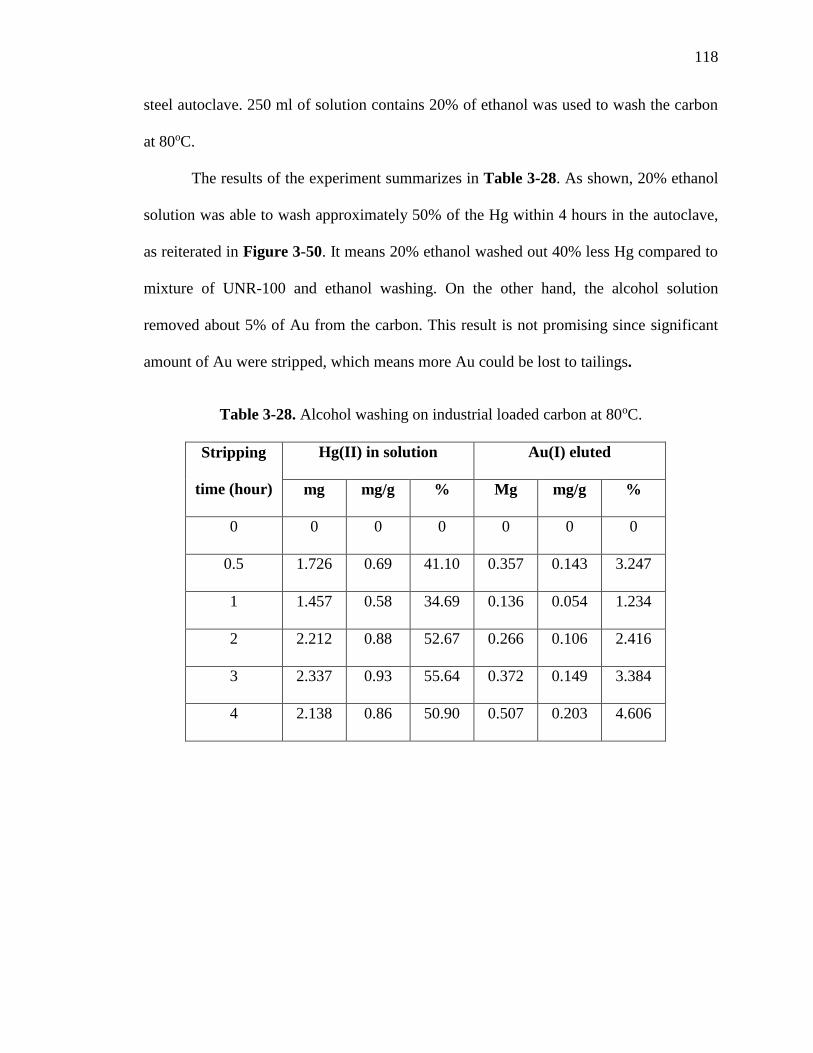
118
steel autoclave. 250 ml of solution contains 20% of ethanol was used to wash the carbon
at 80oC.
The results of the experiment summarizes in Table 3-28. As shown, 20% ethanol
solution was able to wash approximately 50% of the Hg within 4 hours in the autoclave,
as reiterated in Figure 3-50. It means 20% ethanol washed out 40% less Hg compared to
mixture of UNR-100 and ethanol washing. On the other hand, the alcohol solution
removed about 5% of Au from the carbon. This result is not promising since significant
amount of Au were stripped, which means more Au could be lost to tailings.
Table 3-28. Alcohol washing on industrial loaded carbon at 80oC.
Stripping
time (hour)
Hg(II) in solution Au(I) eluted
mg mg/g % Mg mg/g %
0 0 0 0 0 0 0
0.5 1.726 0.69 41.10 0.357 0.143 3.247
1 1.457 0.58 34.69 0.136 0.054 1.234
2 2.212 0.88 52.67 0.266 0.106 2.416
3 2.337 0.93 55.64 0.372 0.149 3.384
4 2.138 0.86 50.90 0.507 0.203 4.606
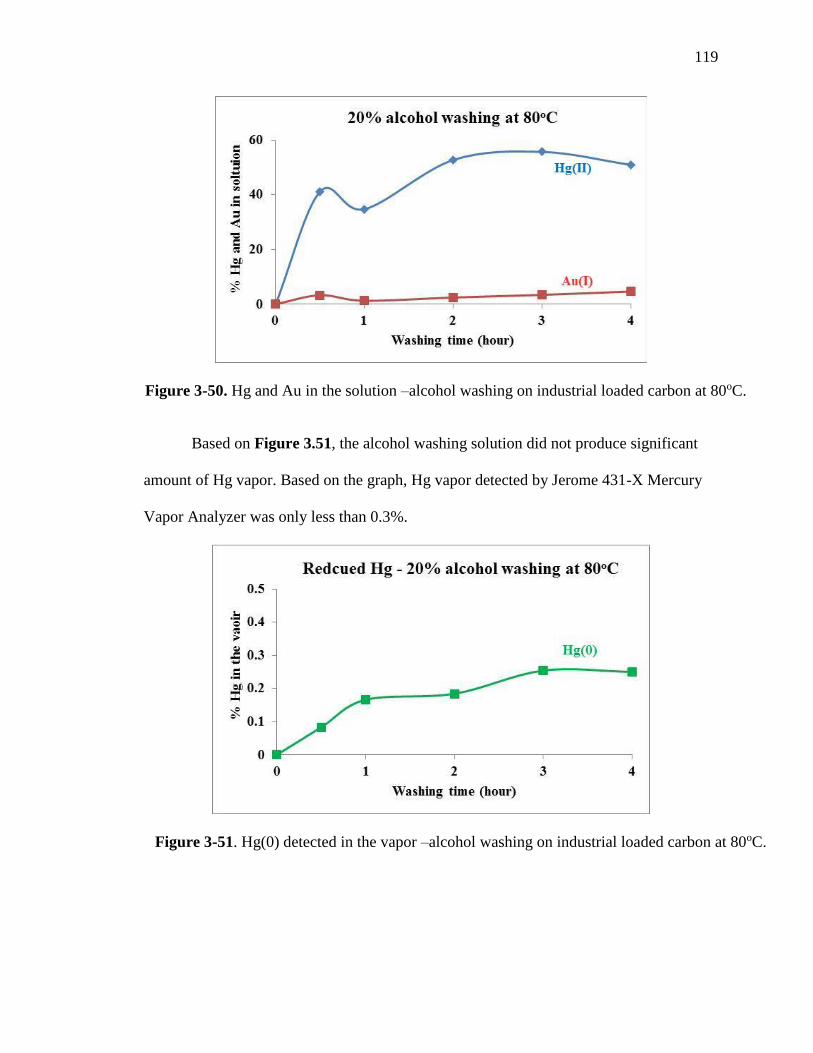
119
Figure 3-50. Hg and Au in the solution –alcohol washing on industrial loaded carbon at 80oC.
Based on Figure 3.51, the alcohol washing solution did not produce significant
amount of Hg vapor. Based on the graph, Hg vapor detected by Jerome 431-X Mercury
Vapor Analyzer was only less than 0.3%.
Figure 3-51. Hg(0) detected in the vapor –alcohol washing on industrial loaded carbon at 80oC.
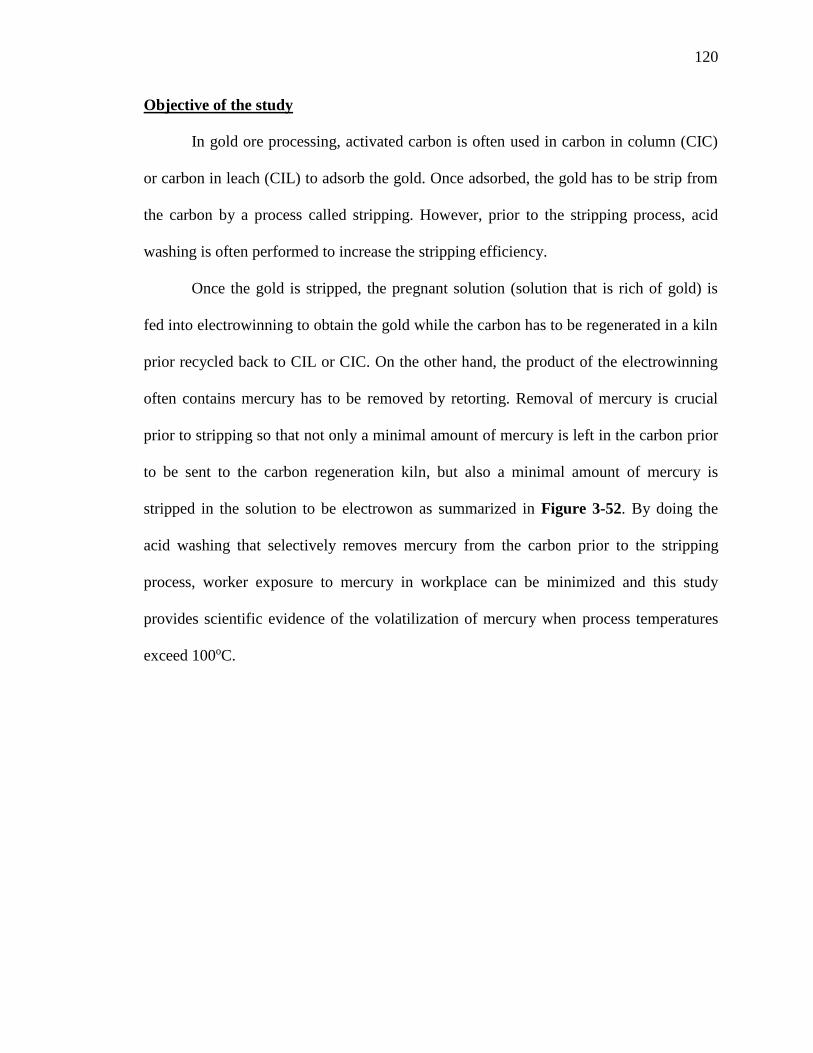
120
Objective of the study
In gold ore processing, activated carbon is often used in carbon in column (CIC)
or carbon in leach (CIL) to adsorb the gold. Once adsorbed, the gold has to be strip from
the carbon by a process called stripping. However, prior to the stripping process, acid
washing is often performed to increase the stripping efficiency.
Once the gold is stripped, the pregnant solution (solution that is rich of gold) is
fed into electrowinning to obtain the gold while the carbon has to be regenerated in a kiln
prior recycled back to CIL or CIC. On the other hand, the product of the electrowinning
often contains mercury has to be removed by retorting. Removal of mercury is crucial
prior to stripping so that not only a minimal amount of mercury is left in the carbon prior
to be sent to the carbon regeneration kiln, but also a minimal amount of mercury is
stripped in the solution to be electrowon as summarized in Figure 3-52. By doing the
acid washing that selectively removes mercury from the carbon prior to the stripping
process, worker exposure to mercury in workplace can be minimized and this study
provides scientific evidence of the volatilization of mercury when process temperatures
exceed 100oC.
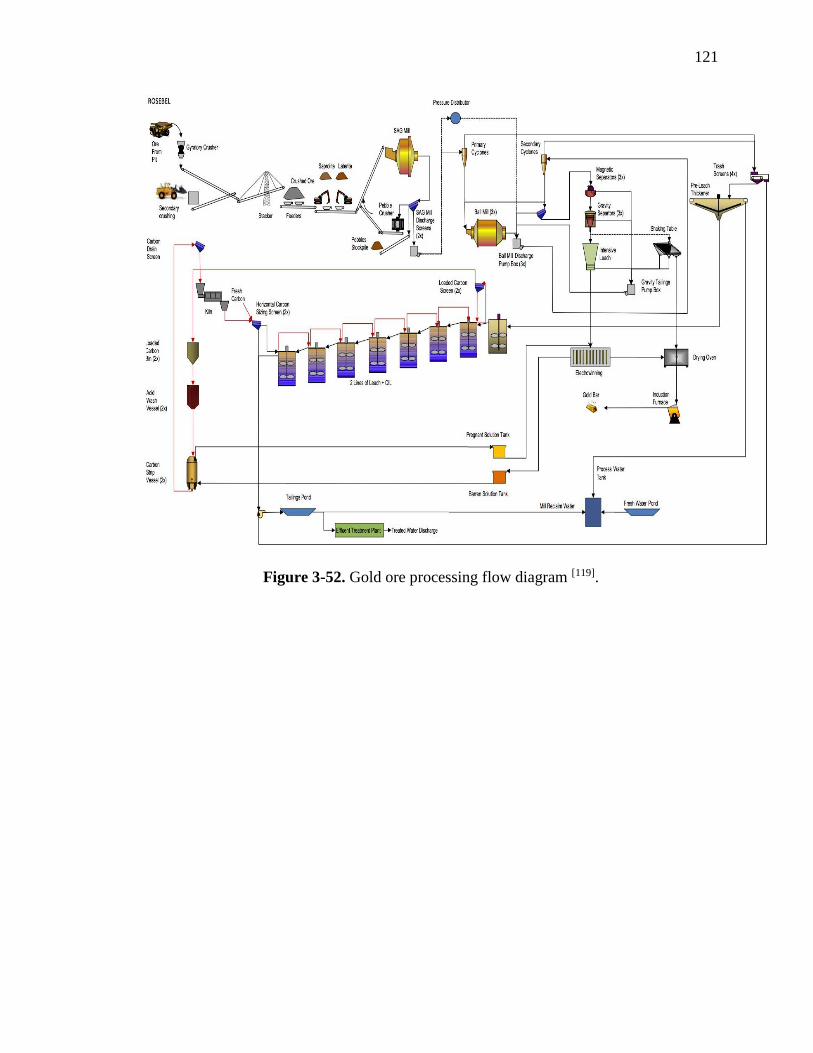
121
Figure 3-52. Gold ore processing flow diagram [119].
122
CHAPTER 4
CONCLUSION AND FUTURE WORK
4.1 Conclusion
UNR-100 acid washing of loaded carbon to remove mercury prior to the stripping
process is best conducted at 80oC. At temperatures higher than 100oC, significant amount
of mercury is reduced and volatilized into its elemental state, vaporized and then
condensed. 7% UNR-100 was optimized and acid washing in an autoclave at 80oC was
the best condition found, and the experiment was able to remove 90% of the mercury
from the carbon. Furthermore, the UNR-100 acid washing is very selective, it only
removes mercury and leaves the gold on the carbon. Thus, acid washing prior to gold
stripping process is a promising technique to minimize the mercury reduction in a
conventional Zadra which is typically conducted at >100oC.
Washing of loaded carbon with just water at 80oC was able to remove
approximately 40% of the mercury with only 0.2% of mercury reporting in the vapor.
UNR-100 acid washing in an autoclave offers better mercury removal (45% higher) as
compared with UNR-100 acid washing using a column. The bed volume and contact
volume of washing solution to the carbon play an important role here.
By comparing HCl and UNR-100 acid washing, UNR-100 is superior in washing
the mercury and keeping the gold on the carbon (less than 0.12% of gold was detected
in the solution). HCl washing was also able to strip almost 1% of the gold and 3% of the
mercury.
123
When 20% of alcohol is added into the UNR-100 solution, it is able to remove 97%
of mercury and 1.5% of gold. The addition of alcohol in UNR-100 acid washing not
only increased the removal of mercury from the carbon (almost all of the mercury was
in the solution within 4 hours of alcohol/UNR-100 washing at 80oC in an autoclave)
but also slightly increase the gold desorption during acid washing by 1.3% compared to
UNR-100 only washing. Furthermore, in a conventional Zadra stripping process,
mercury stripping was best conducted at 80oC, so that the reduction of mercury can be
minimized. However, stripping at this temperature is not able to strip most of gold from
the carbon (only 42% of gold can be stripped). The gold stripping is best performed at
140oC using conventional Zadra process, where 90% gold can be stripped. However, at
this temperature, almost all of the mercury on the carbon will be reduced and vaporized.
Thus, a new technique to improve the stripping of gold efficiency and minimize the
reduction of mercury is achieved by adding alcohol in the cyanide alkaline solution. By
adding 20% alcohol into the cyanide/alkaline solution, gold stripping can be increased
significantly (95% of gold in the solution detected) at 80oC stripping. Additionally, by
stripping at 80oC stripping, 87% of mercury can also be stripped from the carbon into the
solution with only about 1.5% of the mercury being reduced. Hence, a very small amount
of mercury is left in the carbon, thus minimizing the mercury pollution during the carbon
regeneration process. In conclusion, acid washing with UNR 100 at 80oC, removes up
to 90% of the Hg, nearly the same Ca & Mg salts as compared with the industry
standard HCl acid washing and 74% less gold (0.25% Au v 0.96%).
124
4.2 Future work
Since the mixture of alcohol/UNR-100 is able to selectively strip mercury, this type
of acid washing needs to be optimized. Different concentrations of alcohol, washing
temperature and time need to be performed so that the higher mercury removal can be
achieved while minimizing the desorption of gold.
Besides removing mercury, acid washing is also beneficial in removing the calcium
and magnesium (and their salts) contained in the carbon. The calcium and magnesium
balance for the washing industrial carbon by HCl, UNR-100, and mixture of UNR-
100/alcohol needs to be determined. By comparing different solutions, optimization of
calcium and magnesium removal can be determined.
Furthermore, investigating the feasibility of the acid solution and/or mixture of
acid-alcohol solution to be recycled. Thus, it will increase the economic visibility of the
processes. Moreover, determining a mercury precipitation technique from the washing
solution will be a great approach to reach the objective of this project, i.e. minimizing
mercury pollution in gold ore processing.
Experimentation with washing of loaded carbon with water at 80oC showed a Hg
removal of 40%. Further experiments are recommended to follow the water wash with
UNR 100 and UNR/alcohol combinations to optimize the Hg removal while minimizing
the gold removal. Additionally, optimization of column washing (bed volume, washing
time, temperature) is recommended to achieve comparable result as washing in an
autoclave.
Further study on identifying the Hg species in the vapor during the stripping process
is also recommended. Based on the results of this study, there is tendency that the
125
mercury detected by Jerome 431-X is not only from Hg(0), it can be other species. This
identification can be done by connecting the vapor outlet of the autoclave to the gas
chromatography mass spectroscopy (GC-MS). From GC-MS, molecular weight of the
species can be determined.
Acid washing might offer benefits in washing the precipitate formed by Merril
Crowe. Thus, acid washing before or after precipitation should be investigated as well.
Eventually, economic analysis on this project by tracking the reagents used will be
a good study to determine whether the processes are economical.
126
REFERENCES
1. M. Fuerstenau, K. Zhong, M. Misra, T. Seal and C. Nesbitt. Minimizing Mercury
Pollution During Gold Ore Processing. Department of Mining Engineering,
University of Nevada, Reno. Society for Mining, Metallurgy, and Exploration,
2012.
2. Q. Wang, , D. Kim, D. D. Dionysiou, G. A. Sorial, and D. Timberlake. Sources and
Remediation for Mercury Contamination in Aquatic System — a Literature
Review, Environmental Pollution, Vol. 131, pp. 323-336, 2004.
3. R. G. Reddy, J. L. Hendrix, and P. B. Queneau. Arsenic Metallurgy, Fundamental
and Applications. Proceedings The Metals and Minerals Society (TMS) Annual
Meeting, Phoenix, 1988.
4. M.D. Adams and C. A. Fleming. Metall. Trans. B., Vol. 20B, pp. 315-326, 1989.
5. C. Klauber. Surface Scienece, Vol. 203, pp. 118-128, 1989.
6. F. K. Leonid and S. C. Hansen. Mercury Handbook: Chemistry, Applications and
Environmental Impact. Royal Society of Chemistry, 2013.
7. http://en.wikipedia.org/wiki/Mercury_%28element%29
8. C. Guminiski. Journal of Phase Equilibrium. Vol. 13, pp. 339, 1992.
9. U. S. Environmental Protection Agency. Mercury and Arsenic Wastes, Removal,
Recovery, Treatment, and Disposal. New Jersey, USA, 1993.
10. J. H. Kyle, P. L. Breuer, K. G. Bunney, R. Pleysier, P. M. May. Review of Trace
Toxic Elements (Pb, Cd, Hg, As, Sb, Bi, Se, Te) and Their Deportment in Gold
127
Processing. Part 1: Mineralogy, aqueous chemistry and toxicity.
Hydrometallurgy, vol. 107, issue: 3-4, pp. 91-100, 2011.
11. J. H. Kyle, P. L. Breuer, K. G Bunney, and R. Pleysier. Review of Trace Toxic
Elements (Pb, Cd, Hg, As, Sb, Bi, Se, Te) and Their Deportment in Gold
Processing. Part II: Deportment in Gold Ore Processing by Cyanidation.
Hydrometallurgy, Vol. 111-112, pp. 10-21, 2012.
12. http://www.npi.gov.au/
13. Randol International LTD. Innovations in Gold & Silver Recovery, Phase IV, Vol.
12, pp. 7189, 1992, Boulder, Colorado.
14. http://www.npi.gov.au/npi-data/latest-data
15. http://www2.epa.gov/toxics-release-inventory-tri-program
16. http://www.ec.gc.ca/inrp-npri/
17. Newmont Mining Corporation, 2010. Mercury, ICMM take stance on mercury.
Published on Newmont Mining Corporation, website http://www.newmont.com.
Accessed 11 December, 2014.
18. http://www.newmont.com/features/our-environment-features/Newmont-ICMM-
Take-Stance-on-Mercury
19. R. G. Reddy, J. L. Hendrix, and P. B. Queneau. Arsenic Metallurgy, Fundamental
and Applications. Proceedings The Metals and Minerals Society (TMS) Annual
Meeting, Phoenix, 1988.
20. R. G. Reddy, V. Ramachandran. Arsenic Metallurgy, Fundamental and
Applications. Proceedings The Metals and Minerals Society (TMS) Annual
Meeting, San Francisco, 2005.

128
21. Y. Cai. Speciation and Analysis of Mercury, Arsenic and Selenium by Atomic
Fluroscence Spectrometry. Trends in Analytical Chemistry, Vol. 19, pp. 62-66,
2000.
22. G. M. Peters, W. A. Maher, J. P. Barford, and V. G. Gomes. Selenium Associations
in Estuarine Sediments: Redox Effects. Water, Air and Soil Pollution, Vol. 99, pp.
275-282, 1997.
23. http://en.wikipedia.org/wiki/File:Cinnabarit_01.jpg
24. G. C. Zarate. Copper and Mercury Behavior in Cynidation of Gold and Silver
Minerals. Paper No. 26, Proceedings 15th Annual Hydrometallurgical Meeting,
Vancouver, CIM, Montreal, 1985.
25. http://en.wikipedia.org/wiki/Tiemannite
26. http://en.wikipedia.org/wiki/Corderoite
27. http://www.mindat.org/photo-463416.html
28. J. H. Kyle, P. L. Breuer, K. G Bunney, and R. Pleysier. Review of Trace Toxic
Elements (Pb, Cd, Hg, As, Sb, Bi, Se, Te) and Their Deportment in Gold
Processing. Part II: Deportment in Gold Ore Processing by Cyanidation.
Hydrometallurgy, Vol. 111-112, pp. 10-21, 2012.
29. http://en.wikipedia.org/wiki/Tiemannite .
30. J. O. Marsden and C. I. House. The Chemistry of Gold Extraction, Society for
Mining, Metallurgy and Exploration, Littleton, Colorado, Chapter 6, 2nd. ed
31. L. D. Lacerda. Water, Air, and Soil Pollution, Vol. 97, pp. 209-221, 1997.
32. M. J. Nicol, C. A. Fleming, and R. I. Paul. The Chemistry of the Extraction of
Gold, Chapter 15.

129
33. M. J. Nicol. Gold Bulletin, Vol. 13, pp. 105-111, 1980.
34. D. M. Menne. Mercury in Gold Processing, Metallurgy, Electromagnetic Books,
Mt. Claremont, Western Australia, Vol. 1, 1991.
35. G. C. Zarate. Oiver, A. J. (Ed.), 15th Annual Hydrometallurgical Meeting,
Vancouver, Canada, Augus 18-22. CIM Metallurgical Society, paper No. 26,
1985.
36. E. A. Oraby, M. I. Jeffrey, and R. E. Browner. Journal of Mineral and
Metallurgical Processing, Vol. 27, pp. 184-189, 2010.
37. B. E. Reed. Removal of Heavy Metals by Activated Carbon. In: Sengupta, A. K.
(Ed.), Environmental Separation of Heavy Metals: Engineering Processes. CRC
Press, Chapter 7, 2002.
38. G. J. McDougall. Journal of the South African Institute of Mining and
Metallurgy, pp. 344-356, 1980.
39. M. D. Adams. Hydrometallurgy, Vol. 26, pp. 201-210, 1991.
40. A. S. Ibrado and D. W. Fuerstenau. Minerals and Metallurgical Processing, Vol.
6, pp. 23-28, 1989.
41. C. A. Fleming. The Metallurgical Society of AIME, Warrendale, Pa, pp. 839-857,
1982.
42. E. Smith. Metallurgy and Mineral Processing Plant at St. Joe’s El Indio Mine in
Chile. Minerals Engineering, October, 26-29, 1986.
43. K. Bunney, M. I. Jeffrey, R. Pleyser, and P. L. Breuer. Minerals and Metallurgical
Processing, Vol. 27, issue 4, pp. 205-211, 2010.
130
44. M. I. Corrin and D. F. Natusch. Physical and Chemical Characteristics of
Enviromental Lead. In: Boggess, W. R. (Ed.), Lead in the Enviroment, National
Science Foundation, Chapter 1.
45. J. D. Miller. Solution Concentration and Purification. In: John K. T and John F.
E (Ed.), Metallurgical Treatises. AIME, New York, N. Y., pp. 95-116, 1981.
46. http://miningeducation.blogspot.com/2012/02/retort-mercury-gold.html
47. S. A. N. Sheya, J. H. Maysilles, and R. G. Sandberg. Selectively Electrowinning of
Mercury from Gold Cyanide Solutions. Report of Investigations 9191, US Bureau
of Mines, 1988.
48. Newmont Mining Corporation. Mercury, ICMM take stance on mercury.
Published on Newmont Mining Corporation, 2010.
49. Barrick Gold Corporation. Barrick’s Mercury Management Philosophy, 2010.
50. Mine Safety and Health Administration. Federal Mine Agency Warns on Mercury
Risk. MSHA News release No. 97-0919a, 2007.
51. Kalgoorlie Consolidated Gold, Mines. Mercury Update. KCGM News and Views,
issue 3, March 2006.
52. C. H. Bucknam. A Green Chemistry Approach to Mercury Control during
Cyanide Leaching of Gold. Proceedings SME Annual Meeting and Exhibit,
Denver, Colorado, pp. 04-101, February 23-25, 2004.
53. A. Smith, and T. Mudder. The Chemistry and Treatment of Cyanidation Wastes.
Mining Journal Books, London, Chapter 3, 1991.
54. S. A. Shaw, T. A. Al, and K. T. MacQuarrie. Applied Geochemistry, Vol. 21, pp.
1986-1998, 2006.
131
55. G. J. Zargury, K. Oudjehani, and L. Deschenes. Science of the Total Environment,
Vol. 320, pp. 211-224, 2004.
56. S. Paria, P. K. Yuet. Solidification-stabilization of organic and inorganic
contaminants using Portland cement: a literature review. Environmental Reviews
14, pp. 217-255, 2006.
57. P. Randall, S. Chattopadhyay. Journal of Hazardous Materials B114, pp. 211-223,
2004.
58. F. J. Touro and D. A. Lipps. Sulfide Treatment to Inhibit Mercury Adsorption
onto Activated Carbon in CIP gold recovery circuits. US Patent 4,734,270, 1988.
59. F. Tessele, J. Rubio, M. Misra, and B. C. Jena. Minerals Engineering, Vol. 10, pp.
803-811, 1997.
60. M. M. Matlock, B. S. Howerton, J. D. Robertson, and D. A. Atwood. Industrial
and Engineering Chemistry Research, Vol. 41, pp. 5278-5282, 2002.
61. R. Melamed and A. B. da Luz. Science of the Total Environment, Vol. 368, pp.
403-406, 2006.
62. J. Monteagudo and M. Ortiz. Journal of Chemical Technology and Biotechnology,
Vol. 75, pp. 767-772, 2000.
63. J. Monteagudo, A. Duran, M. S. Carmona, R. G. Schwab, and P. Higueras. Journal
of Chemical Technology and Biotechnology, Vol. 78, pp. 399-405, 2003.
64. J. J. Rytuba. Science of the Total Environment, Vol. 260, pp. 57-71, 2000.
65. D. M. Manohar, K. A. Krishnan, and T. S. Anirudhan. Water Research, Vol. 36,
pp. 1609-1619, 2002.
132
66. E. A. Oraby, M. I. Jeffrey, and R. E. Browner. Journal of Mineral and
Metallurgical Processing, Vol. 27, pp. 184-189, 2010.
67. ACGIH. Threshold Limit Valves for Chemical Substances and Physical Agents
and Biological Exposure Induces. American Conference of Governmental
Industrial Hygienists, Cincinnati, Ohio, 1997.
68. K. Bunney, M. I. Jeffrey, R. Pleysier, and P. L. Breuer. Selective Elution of Gold,
Silver and Mercury Cyanide from Activated Carbon. Minerals & Metallurgical
Processing, Vol.27, issue 4, pp. 205-211, 2010.
69. J. E. Marsh and J. F. Struthers. Auto-reduction of Mercury and Silver Cyanides,
Proceedings of The Chemical Society (Great Britain), Vol. 18, pp. 249, 1903.
70. J. P. Galvin and H. O. Pritchard. The Journal of Physical Chemistry, Vol. 68,
No.5, pp. 1035-1038, 1964.
71. L. F. Kozin, S. C. Hansen. Mercury Handbook, Royal Society of Chemistry, 2013.
72. I. Sanemasa, Bull. Chem. Soc. Japan, Vol. 48, pp.1795, 1975.
73. S. Fujita et. al. Bulletin of The Chemical Society of Japan, Vol. 48, issue 11, pp.
3067—3072, , 1975.
74. M. D. Adams. J. S. Afr. Inst. Min. Metall., Vol. 90,issue 2, pp. 37-44, 1990.
75. M. D. Adams. J. S. Afr. Inst. Min. Metall., Vol.90, issue 3, pp. 67-73, 1990.
76. M. D. Adams. Journal of the South African Institute of Mining and Metallurgy,
Vol. 90, issue 2, pp. 37-44, 1990.
77. M. D. Adams. Journal of the South African Institute of Mining and Metallurgy ,
Vol. 90, issue 3, pp. 67-73, 1990.
133
78. S. Luidold and H. Antrekowitsch. Hydrogen as a reducing agent: State of the art
science and technology. JOM, Vol. 59, issue 6, pp. 20-26, 2007.
79. M. Fuerstenau, K. Zhong, M. Misra, T. Seal and C. Nesbitt. Minimizing Mercury
Pollution During Gold Ore Processing. Society for Mining, Metallurgy and
Exploration (Editor: C. A. Young and G. H. Luttrell), part 7, pp. 411-418, 2012.
80. M. Jeffrey, R. Pleysier, and K. Bunner. The South African Institute of Minning
and Metallurgy, pp. 475-483, 2009.
81. John L. Fast. Carbon Stripping – The Practical Alternatives. Denver Mineral
Engineers Inc, Littleton, CO.
82. Randol International LTD. Innovations in Gold & Silver Recovery, Phase IV, Vol.
12, pp. 6997, 1992, Boulder, Colorado.
83. J. B. Zadra, A. L. Engle and H. S. Heinen. Process for Recovering Gold and Silver
from Activated Carbon by Leaching and Electrolysis. U.S. Bureau of Mines, RI
4843, 1952.
84. C. K. Gupta and T. K. Mukherjee. Hydrometallurgy in Extraction Processes, Vol.
2, pp. 114, 1990, Boca Raton, Florida.
85. G. J. McDougall, R. D. Hancock, M. J. Nicol, O. L. Wellington, and R. G.
Copperthwaite. The Mechanism of the Adsorption of Gold Cyanide on Activated
Carbon. Journal of the South African Institute of Mining and Metallurgy, 1980.
86. M. J. Nichol. Elution Theory. Carbon School, South African Institute of Mining
and Metallurgy, 1986.
87. J. R. Ross, H. B. Salisbury, and G. M. Potter. Pressure Stripping from Activated
Carbon. AIME Annual Meeting, Chicago, Illinois, 1973.

134
88. R. J. Davidson and V. Veronese. Further Studies on the Elution of Gold from
Activated Carbon Using Water as the Eluant. Journal of the South African
Institute of Mining and Metallurgy, 1979.
89. M. C. Fuerstenau, K. Zhong, T. Seal, C. Nesbitt. Reduction of Hg(II) in Au
Elution at Elevated Temperature. Metallurgical Engineering, University of
Nevada, Reno, 2013.
90. H. J. Heinen, D. G. Peterson and R. E. Lindstrom. Gold Desorption from Activated
Carbon with Alkaline Alcohol Solutions. World Mining and Metals Technology
(Ed. A. Weiss, AIME, New York), Chapter 30, pp. 551-564, 1976.
91. J. R. Benzaria, C. Zundel. Elution Process for the Regeneration of Spent Activated
Carbon. US Patent 3,720,626; March 13, 1973.
92. D. D. Fischer. Process of Eluting Adsorbed Gold and/or Silver Values from
Activated Carbon. US Patent 3,935,006; January 27, 1976.
93. J. L. Fast. Glycol Stripping. Engineering and Mining Journal, June 1987.
94. D. M. Muir, W. D. Hinchliffe, and A. Griffin. Research and Developments in the
Micron Research (W. A.). Solvent Proedure for Gold Elution from Carbon.
Australia IMM Regional Conference on Gold Mining, Metallurgy and Geology,
1984.
95. Randol International LTD. Innovations in Gold & Silver Recovery, Phase IV, Vol.
12, pp. 7189, 1992, Boulder, Colorado.
96. M. D. Adams. The Mechanism of Adsorption of Aurocyanide onto Activated
Carbon – The Latest Development and Practical Ramifications. Randol Gold
Conference Sacramento, pp. 271-273, 1989.
135
97. M. C. Fuerstenau, K. Zhong, T. Seal, C. Nesbitt. Reduction of Hg(II) in Au
Elution at Elevated Temperature. Metallurgical Engineering, University of
Nevada, Reno, 2012.
98. Arizona Instrument Corporation, Operation Manual for Jerome 431-X Mercury
Vapor Analyzer.
99. M. Misra, J. Lorengo, J. B. Nanor, and C. B. Buckman. Minerals & Metallurgical
Processing, Vol. 15, Issue 4, pp. 60, 1998.
100. http://en.wikipedia.org/wiki/Activated_carbon
101. http://www.cabotcorp.com/solutions/products-plus/activated-carbon
102. http://en.wikipedia.org/wiki/Activated_carbon
103. http://varnakel.co.uk/shop/base-metals/gold-mining-coconut-shell-activated-carbon-
chemicals/
104. http://www.euromate.com.tr/en/aktif-karbon-nedir.asp
105. http://en.wikipedia.org/wiki/Sodium_cyanide
106. J. R. Parga, G. T. Munive, J. L. Venezuela, V. V. Vazquez, and G. G. Zamarripa.
Advances in Chemical Engineering and Science, Vol. 3, pp. 150-156, 2013.
107. http://www.chemspider.com/Chemical-Structure.14114.html
108. www.sigmaaldrich.com – product information sheet
109. Handbook of Chemistry and Physics, 74th ed., D.R. Lide, ed. (CRC Press, 1993),
p. 8-45 and 8-47.
110. http://www.ierents.com/Manuals/Jerome%20431.pdf
111. http://www.azic.com/wp-content/uploads/2014/12/700-0046-Jerome-431-X-
Mercury-Vapor-Analyzer-Users-Manual.pdf
136
112. http://www.geotechenv.com/pdf/rental/azi_jerome_431x.pdf
113. http://www.kau.edu.sa/Files/130002/Files/6785_AAs.pdf
114. http://www.chem.agilent.com/Library/usermanuals/Public/1541.pdf
115. http://www.perkinelmer.com/pdfs/downloads/bro_worldleaderaaicpmsicpms.pdf
116. http://www.chem.agilent.com/Library/applications/a-aa14.pdf
117. K. J. Mysels. Textbook Errors: The Solubility of Gases in Liquids. Journal of
Chemical Education, Vol. 32, pp. 399, 1955.
118. M. L. Huber, A. Laesecke, and D. G. Friend. The Vapor Pressure of Mercury,
NISTIR 6643, National Institute of Standard and Technology, pp. 20, Bould, US,
2006.
119. http://www.iamgold.com/english/operations/operating-mines/rosebel-gold-mine-
suriname/mining-processing/default.aspx
120. Naci Duru. Pressure Cyanidation. Master Thesis, December 2014, University of
Nevada, Reno
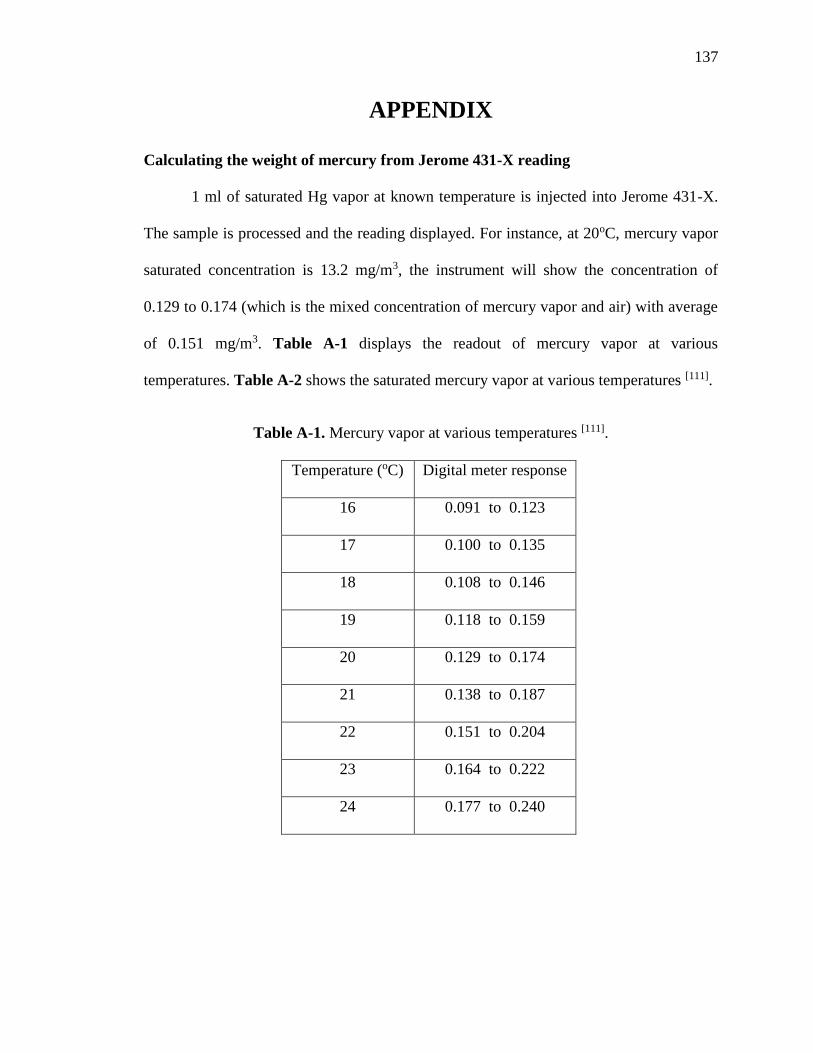
137
APPENDIX
Calculating the weight of mercury from Jerome 431-X reading
1 ml of saturated Hg vapor at known temperature is injected into Jerome 431-X.
The sample is processed and the reading displayed. For instance, at 20oC, mercury vapor
saturated concentration is 13.2 mg/m3, the instrument will show the concentration of
0.129 to 0.174 (which is the mixed concentration of mercury vapor and air) with average
of 0.151 mg/m3. Table A-1 displays the readout of mercury vapor at various
temperatures. Table A-2 shows the saturated mercury vapor at various temperatures [111].
Table A-1. Mercury vapor at various temperatures [111].
Temperature (oC) Digital meter response
16 0.091 to 0.123
17 0.100 to 0.135
18 0.108 to 0.146
19 0.118 to 0.159
20 0.129 to 0.174
21 0.138 to 0.187
22 0.151 to 0.204
23 0.164 to 0.222
24 0.177 to 0.240
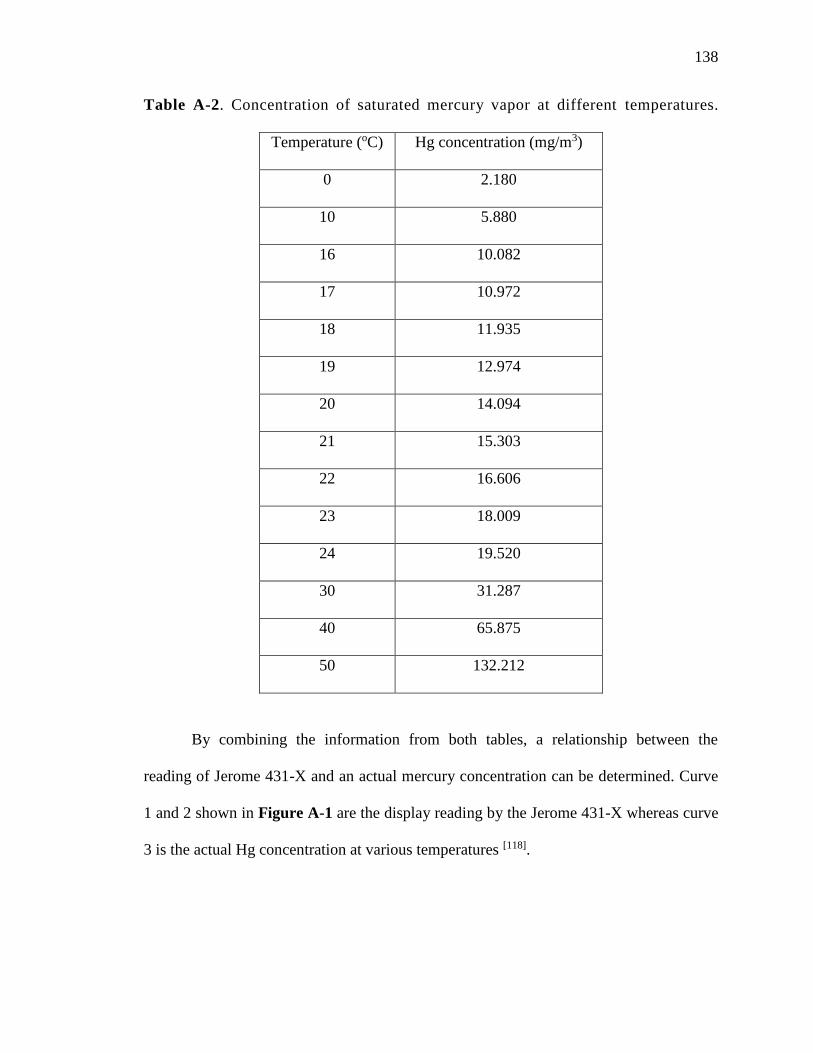
138
Table A-2. Concentration of saturated mercury vapor at different temperatures.
Temperature (oC) Hg concentration (mg/m3)
0 2.180
10 5.880
16 10.082
17 10.972
18 11.935
19 12.974
20 14.094
21 15.303
22 16.606
23 18.009
24 19.520
30 31.287
40 65.875
50 132.212
By combining the information from both tables, a relationship between the
reading of Jerome 431-X and an actual mercury concentration can be determined. Curve
1 and 2 shown in Figure A-1 are the display reading by the Jerome 431-X whereas curve
3 is the actual Hg concentration at various temperatures [118].
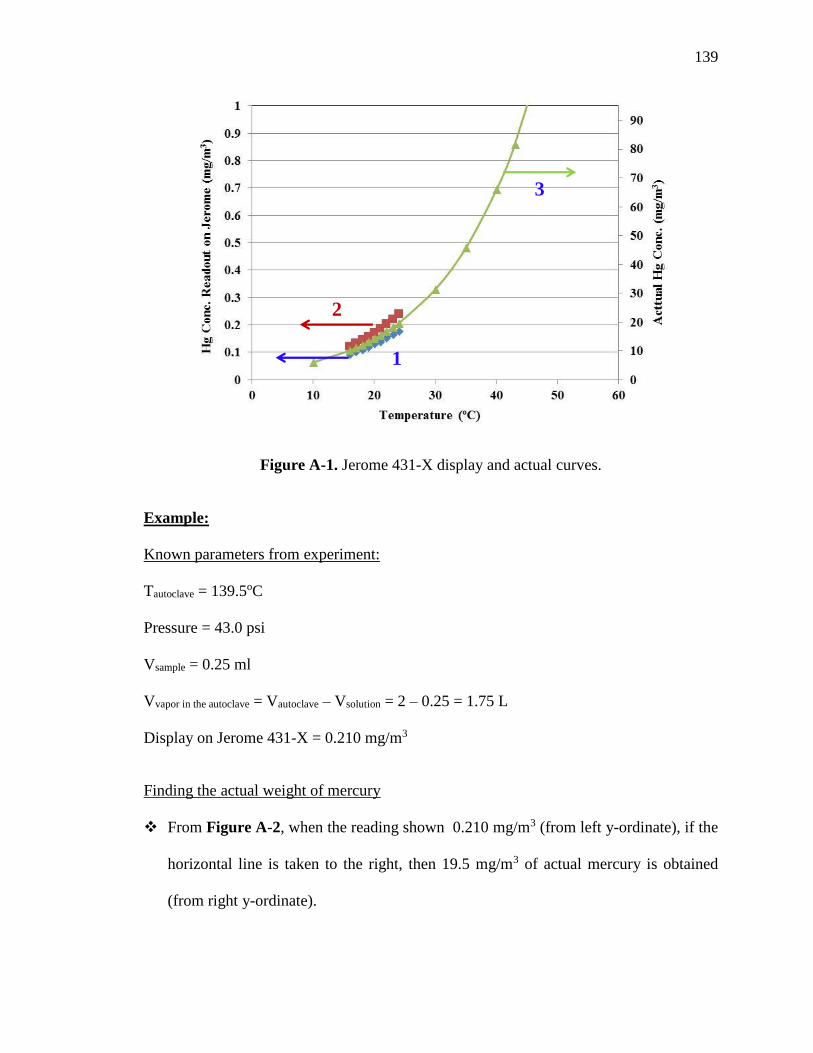
139
Figure A-1. Jerome 431-X display and actual curves.
Example:
Known parameters from experiment:
Tautoclave = 139.5oC
Pressure = 43.0 psi
Vsample = 0.25 ml
Vvapor in the autoclave = Vautoclave – Vsolution = 2 – 0.25 = 1.75 L
Display on Jerome 431-X = 0.210 mg/m3
Finding the actual weight of mercury
From Figure A-2, when the reading shown 0.210 mg/m3 (from left y-ordinate), if the
horizontal line is taken to the right, then 19.5 mg/m3 of actual mercury is obtained
(from right y-ordinate).
1
2
3
140
Since the instrument is based on 1 ml of sample, thus if only 0.25 ml sample taken,
then the value of reading should be multiplied by 4. Thus, the actual mercury
concentration is 4 × 19.5 = 78 mg/m3.
The pressure factor = 43+14.7
14.7= 3.93
Vapor volume = 1.75× 10⁻³ m3.
Thus, weight of Hg = 78 × 1.75× 10-3 × 3.93 = 0.54 mg of Hg