Mercury speciation in a tropical soil association; Consequence of gold mining on Hg distribution in...
79
Mercury speciation in a tropical soil association; 1 2 3 4 5 6 7 8 9 10 11 12 13 14 15 16 17 18 19 Consequence of gold mining on Hg distribution in French Guiana. Stéphane GUEDRON a,* , Sylvain GRANGEON b , Bruno LANSON b , and Michel GRIMALDI c . a Environmental Geochemistry Group - LGIT, Observatory of Earth and Planetary Science (OSUG), University of Grenoble / CNRS - Maison des Géosciences, 1381, rue de la Piscine - Domaine Universitaire - 38400 Saint-Martin-D'Hères, France. b Mineralogy & Environments - LGCA, Observatory of Earth and Planetary Science (OSUG), University of Grenoble / CNRS - Maison des Géosciences, 1381, rue de la Piscine - Domaine Universitaire - 38400 Saint-Martin-D'Hères, France. c UMR Bioemco- Biogéochimie et Ecologie des Milieux Continentaux, UMR211, Institut de Recherche pour le Développement, 32 avenue Henri Varagnat, 93143 Bondy, France. * Corresponding author – Present address: Institut F.A.-Forel, route de Suisse 10, CP416, 1290 Versoix, Switzerland. E-mail: [email protected] 20 21 22 Tel : +41-223-790-311 Fax : +41-223-790-329 1 insu-00424551, version 1 - 16 Oct 2009 Author manuscript, published in "Geoderma 153, issues 3-4 (2009) 331-346" DOI : 10.1016/j.geoderma.2009.08.017
-
Upload
agrocampus-ouest -
Category
Documents
-
view
0 -
download
0
Transcript of Mercury speciation in a tropical soil association; Consequence of gold mining on Hg distribution in...

Mercury speciation in a tropical soil association; 1
2
3
4
5
6
7
8
9
10
11
12
13
14
15
16
17
18
19
Consequence of gold mining on Hg distribution in French Guiana.
Stéphane GUEDRONa,*, Sylvain GRANGEONb, Bruno LANSONb, and Michel
GRIMALDIc.
a Environmental Geochemistry Group - LGIT, Observatory of Earth and Planetary
Science (OSUG), University of Grenoble / CNRS - Maison des Géosciences, 1381,
rue de la Piscine - Domaine Universitaire - 38400 Saint-Martin-D'Hères, France.
b Mineralogy & Environments - LGCA, Observatory of Earth and Planetary Science
(OSUG), University of Grenoble / CNRS - Maison des Géosciences, 1381, rue de la
Piscine - Domaine Universitaire - 38400 Saint-Martin-D'Hères, France.
c UMR Bioemco- Biogéochimie et Ecologie des Milieux Continentaux, UMR211,
Institut de Recherche pour le Développement, 32 avenue Henri Varagnat, 93143
Bondy, France.
* Corresponding author – Present address: Institut F.A.-Forel, route de Suisse 10,
CP416, 1290 Versoix, Switzerland.
E-mail: [email protected] 20
21
22
Tel : +41-223-790-311
Fax : +41-223-790-329
1
insu
-004
2455
1, v
ersi
on 1
- 16
Oct
200
9Author manuscript, published in "Geoderma 153, issues 3-4 (2009) 331-346"
DOI : 10.1016/j.geoderma.2009.08.017

Abstract. 23
24
25
26
27
28
29
30
31
32
33
34
35
36
37
38
39
40
41
42
43
44
45
46
47
Mercury (Hg) speciation was compared in French Guiana pristine soils and in
Hg contaminated soils impacted by former (~1950’s) gold-mining activities which
used Hg for gold amalgamation. Four selective extractions were performed on soil
samples to assess the fraction of Hg present as Hg(II) and bond to organic matter
(extracted by NH4OH and KOH), to amorphous iron oxides (ascorbate) and to soil
components other than refractory minerals (HCl/HNO3). In addition, pyrolysis was
used to quantify the content of elemental Hg in contaminated soils. X-ray diffraction
(XRD) and X-ray fluorescence micro-mapping (µXRF) were used in combination to
selective extractions to assess the nature of targeted components, the possible
overlaps between the different extraction procedures and the spatial correlation
between Si, K, Fe, Au and Hg.
In soil profiles from pristine toposequences, Hg concentrations (0.01-
0.49 µg.g-1) decreased with increasing depth in soil matrix. Hg concentrations also
decreased from ferralsols to acrisols and further to gleysols. In pristine soil matrix, Hg
was mainly associated to the clay size fraction (< 2 µm) which was mainly constituted
of amorphous and crystalline Fe oxides (Al-substituted goethite and hematite),
gibbsite and fine organic matter (OM), whose relative abundances vary along the soil
association. Total Hg concentration was positively correlated with sulfurs and organic
carbon suggesting the association of Hg with OM sulfur-bearing functional groups.
Gleysols were depleted in Hg because of the prevailing reducing conditions that lead
to the dissolution of iron oxides. In the same soil profiles, Hg concentrations in
ferruginous nodules, which make up most of the soil coarse fraction (> 2 mm), were
similar to those reported in the pristine soil matrix. These nodules mainly contained
Al-substituted hematite and goethite and were especially abundant upslope in
2
insu
-004
2455
1, v
ersi
on 1
- 16
Oct
200
9

ferralsols and acrisols. Gold-mined gleysols were strongly disorganized by former
activities as neither the original structure nor the texture was preserved. Soil
granulometry was dominated by gravels, sands and silts. Hg concentrations (0.09-
9.22 µg.g-1) largely exceeded those in pristine soils. µXRF allowed the identification
of Au-amalgamated Hg and of elemental Hg droplets. Pyrolysis confirmed Hg to be
mainly present in its elemental form in contaminated soils. Selective extractions
showed additional minor contributions of Hg(II) associated to OM, and to Al or Fe
oxides.
48
49
50
51
52
53
54
55
56
57
58
59
60
61
62
The combination of selective extractions with XRD and µXRF data showed
that extraction efficiency is strongly dependent on the soil type, and that this
efficiency needs to be determined on a soil-by-soil basis for Hg speciation studies.
KOH extraction was especially delicate as crystalline and amorphous oxides were
extracted together with organic matter.
Key-words: Mercury, Tropical soils, French Guiana, gold-mining, XRD, selective
extraction, speciation.
3
insu
-004
2455
1, v
ersi
on 1
- 16
Oct
200
9

1. Introduction 63
64
65
66
67
68
69
70
71
72
73
74
75
76
77
78
79
80
81
82
83
84
85
86
Tropical soils from the Amazonian basin are known to have accumulated
atmospheric Hg over millions of years, thus inducing geochemical backgrounds
higher than those reported in boreal and temperate climate soils (Carmouze et al.,
2001). In addition, past and current gold mining activities, which represent the main
contribution to anthropogenic emissions (Lacerda, 1997; Roulet et al., 1998; Guedron
et al., 2006), contribute to increase further the total Hg concentrations in these soils.
Small-scale mining activities have increased significantly during the worldwide gold
rush, created by the gold price increase in the 1980’s. UNIDO (United Nations
Industrial Development Organization) estimates that in 2004 10 to 15 million people
were working in small-scale gold mines releasing 650-1000 tons of Hg annually
(Veiga and Baker, 2004). In addition to this major atmospheric emission, gold mining
activities release large amounts of Hg-rich particles into hydrosystems where
methylmercury (MMHg) production has been clearly identified in anoxic and suboxic
areas (Benoit et al., 2003; Coquery et al., 2003). In turn, MMHg accumulation along
the aquatic food chains is a threat to Amerindian populations whose diet relies mainly
on fish (Lebel et al., 1996; Frery et al., 2001; Barbosa et al., 2003). To assess Hg
mobility and its availability to methylating microorganisms, it is thus crucial to
determine how Hg is bond to soil particles.
The retention capacity of tropical soils varies as a function of soil components
which depends on soil types and horizons (Charlet and Sposito, 1987; Charlet and
Sposito, 1989; Fontes and Gomes, 2003). In particular, the relative proportions of soil
components responsible for Hg retention [clay minerals, Fe-, Al-, and Mn-
(oxyhydr)oxides, organic matter] vary with the geochemical conditions which in turn
4
insu
-004
2455
1, v
ersi
on 1
- 16
Oct
200
9

depend on the topographic position along the soil association (Boulet et al., 1993; do
Valle et al., 2005; Fritsch et al., 2005; Fritsch et al., 2006).
87
88
89
90
91
92
93
94
95
96
97
98
99
100
101
102
103
104
105
106
107
108
109
110
111
Hg has a high affinity for soil organic matter, especially for reduced sulfur
groups such as thiol ligands (Schuster, 1991; Skyllberg et al., 2000; Khwaja et al.,
2006; Skyllberg et al., 2006). High Hg levels can also be associated to Fe-
(oxyhydr)oxides. In particular, amorphous or poorly crystalline oxides are known as
sinks for metal contaminants owing to their large surface area and/or microporous
structure (Trivedi and Axe, 2001). Ferruginous nodules, formed during the lateritic
weathering process, also contain elevated Hg contents (Roulet and Lucotte, 1995;
Roulet et al., 1998; De Oliveira et al., 2001; Brabo et al., 2003).
Solid-phase chemical speciation has been widely used on sediment samples
to decipher metal distribution in contaminated systems (Wallschlager et al., 1998;
Rodriguez Martin-Doimeadios et al., 2000; Beldowski and Pempkowiak, 2003; Bloom
et al., 2003; Boszke et al., 2006). Most of the recent studies of Hg speciation in
natural or contaminated sediments, soils and tailings used sequential extraction
procedure (SEP) or Hg pyrolysis procedure following published recommendations
(Eagenhouse et al., 1978; Di Giulio and Ryan, 1987; Biester and Scholz, 1997;
Bloom et al., 2003). While some studies strictly follow the described SEP (Sanchez et
al., 2005; Beldowski and Pempkowiak, 2007), many authors adapt it to the studied
matrix. Each extraction step of the SEPs for soils and sediments is critical, as it is
challenging to obtain an adequate recovery by preventing losses, contamination or
speciation changes, and limiting the interferences (Leermakers et al., 2005).
In the present study, the speciation of Hg among soil components was
determined in soil profiles along pristine soil toposequences and in soils
contaminated with Hg by former gold mining in a French Guiana watershed.
5
insu
-004
2455
1, v
ersi
on 1
- 16
Oct
200
9

Separate selective extractions were used to quantify Hg distribution between soil
carrier phases, in order to avoid cumulative errors intrinsic to SEPs. In addition, the
combination of X-ray diffraction (XRD) and chemical analysis allowed the
identification of the extracted phases and of possible overlaps between selective
extractions (cross recoveries). Intrinsic limitations of the selective extraction
procedure are discussed in the light of these results.
112
113
114
115
116
117
118
119
120
121
122
123
124
125
126
127
128
129
130
131
132
133
134
135
2. Materials and methods.
2.1. Research areas
The former gold mine flat is located in French Guiana (Fig. 1) on the Combat
Creek watershed (52°23’W, 4°35’N), a small catchment of ~1 km² covered by tropical
rain forest. Except for the two hilltops and for the lowland, the relief is characterized
by steep slopes (15-30%). The climate is tropical humid, with an annual average
rainfall of ~4000 mm (Barret, 2004).
The Combat Creek watershed is located on the ‘Amina series’ of the Guiana
Proterozoic shield consisting primarily of darkschist and thin sandstones (Milési et al.,
1995). Large gravel deposits from ancient rivers contain large amounts of gold,
resulting from the weathering of auriferous quartz veins from the Proterozoic shield
(Milési et al., 1995).
Soil distribution within the Combat Creek watershed is typical of French Guiana
and is related to soil position along the slopes (Boulet et al., 1979; Grimaldi et al.,
2001; Guedron et al., 2006). Ferralsols dominate upslope (Deckers et al., 1998),
having typically a high clay (< 2 µm size fraction) content and a micro-aggregated
structure extending over 1 m depth, which allows a good vertical water drainage
(Guehl, 1984). Ferruginous nodules are present throughout the entire ferralsol
6
insu
-004
2455
1, v
ersi
on 1
- 16
Oct
200
9

profiles. Halfway down the slopes, ferralsols steadily evolves to acrisols, a massive
alteritic horizon with a high content of fine silts at shallow depth (< 1 m). During
rainfalls, a perched aquifer forms on the slope above this massive alteritic horizon.
Following rainfalls, the aquifer is evacuated laterally, exporting preferentially clay-size
particles and dissolution products (Molicova et al., 1997; Grimaldi et al., 2004).
Downslope, the soils become hydromorphic, with dominant sands. A permanent
aquifer is present and slowly drained by the river, thus imposing reducing conditions.
Whatever the soil type, field observations have shown that quartz, kaolinite, and Fe-
Al-(oxyhydr)oxides dominate mineralogy, quartz being the sole remnant from the
primary rock-forming minerals. In the massive alteritic horizon, a few muscovite
crystals were also observed. Soil pH ranged from 4.2 to 4.9. The upper part of the
studied watershed (ferralsols and acrisols) was considered to be pristine based on
the soil structure and texture.
136
137
138
139
140
141
142
143
144
145
146
147
148
149
150
151
152
153
154
155
156
157
In the lowland, ancient ‘Long Tom’ sluices and gold-bearing gravel heaps attest
of former gold mining activities dated from the early 1950’s. These activities involved
the removal of fine particles with water, in order to concentrate heavier gold-rich
particles. Soils are thus strongly disorganized, and neither original structure nor
texture is preserved. Present day soil granulometry reflects the former activity as
gravels, sands and silts are dominant, while the clay-size fraction is almost absent.
Hg droplets were also observed in these gold-mined gleysols during a prospective
“panning” campaign. These soils can be described as disorganized gleysols
according to their present geochemical characteristics.
7
insu
-004
2455
1, v
ersi
on 1
- 16
Oct
200
9

2.2. Sampling collection and analysis 158
159
160
161
162
163
164
165
166
167
168
169
170
171
172
173
174
175
176
177
178
179
180
181
2.2.1 Soil collection
Three toposequences were sampled in the pristine part of the watershed, (i)
the first in the upper part of the basin, (ii) the second on the west (mountain) side and
(iii) the third next to the outlet of the basin (Fig. 1). Toposequences II and III reached
the gold-mined flats (profiles II-0 and III-0 in Fig. 1).
Thirteen profiles were collected in the former gold-mined flat. SL0 to SL9
profiles were mesh-sampled over a restricted 250 m² area in the flat zone (Fig. 1). G5
profile was sampled on a gravel heap. Soil profiles were sampled systematically
every 10 or 20 cm, down to 1-2 m depth, using an auger and collected in sterile
polyethylene bags.
2.2.2 Soil conditioning, granulometry and chemical analysis
Granulometry was determined with standard sieving and sedimentation
procedures (Avery and Bascomb, 1974; Rowell, 1994). Identification of the various
fractions was performed according to the Udden-Wentworth classification scheme
(Wentworth, 1922), and “gravel”, “sand”, “silt” and “clay” thus refer to particle
diameters (x) of x > 2 mm, 2 mm < x < 50 µm, 50 µm < x < 2 µm and x < 2 µm,
respectively. Total soil organic carbon ([C]), sulfur ([S]), and nitrogen ([N])
concentrations were determined from the dry combustion of soil sample aliquots
crushed and sieved to 63 µm, using a Fisons 1500CHNS auto-analyzer.
Soil samples aliquots used for Hg analysis, selective extractions and XRD
analysis were freeze-dried and sieved to x < 2 mm. This size fraction was
subsequently crushed to x < 63 µm. Ferruginous nodules were crushed also to x
< 63 µm and subsequently freeze-dried. Total Hg concentrations ([HgT]) were
8
insu
-004
2455
1, v
ersi
on 1
- 16
Oct
200
9

determined by atomic absorption spectrophotometry after dry mineralization and gold
amalgamation with an automatic mercury analyzer (Altec, Model AMA 254). All
analyses were duplicated. The relative error was routinely ±5% and always
under ±10% (Roos-Barraclough et al., 2002). Detection limit (defined as three times
the standard deviation (SD) of the blank) is 0.005 µg g-1. Concentrations obtained for
repeated analyses of certified reference materials (CRMs) never exceeded the
published range of concentration (0.090 ±0.012 µg g-1 and 0.091 ±0.008 µg g-1 for
CRMs 7002, and MESS-3, respectively). Total dissolved Hg concentration [(HgT)D]
were analyzed by cold vapor atomic fluorescence spectrometry (CVAFS) after
conversion of all mercury species to Hg0 (Bloom and Fitzgerald, 1988), using a
Tekran® instrument (Model 2500). Additional information on the method is available
elsewhere (Bloom and Fitzgerald, 1988). (HgT)D concentrations obtained for
repeated analyses of CRMs never exceeded the published range of concentration
(12.6 ±1.1 ng L-1 for ORMS-3). The detection limit is 0.05 ng L-1 (Bloom and
Fitzgerald, 1988).
182
183
184
185
186
187
188
189
190
191
192
193
194
195
196
197
198
199
200
201
202
203
204
205
Dissolved Fe and Al were determined by inductively coupled plasma-atomic
emission spectrometry (ICP-AES) using a Perkin-Elmer optima 3300DV. Calibration
was performed with using standard solutions for Fe and Al (Fluka® 44903 for Fe and
Fluka® 06155 for Al). Relative analytical errors were estimated for each sample from
triplicate measurements and were lower than 10%.
2.3. Selective extraction procedure for Hg and major element analysis
2.3.1 Sample selection
Along soil profiles, samples were selected on the basis of characteristics such
as granulometry, C and/or Hg contents, reflecting the textural and structural
9
insu
-004
2455
1, v
ersi
on 1
- 16
Oct
200
9

variations along soil profiles. In pristine soils, the selection criteria were extreme
contents of C, Hg, clay-size fraction, and fine-silt fraction which increased in alterites.
In contaminated gleysols from the gold-mined flat, the selection relied mainly on the
abundance of the clay- and sand-size fractions, as well as on C and Hg
concentrations.
206
207
208
209
210
211
212
213
214
215
216
217
218
219
220
221
222
223
224
225
226
227
228
229
230
In addition to selected samples, selective extractions were performed for
quality assurance/quality controls (QA/QC) on 2 CRMs, namely a light sandy soil
(CRM 7002 - Czech Metrological Institute) and a marine sediment (MESS-3 -National
Research Council of Canada - Ottawa) and on two natural samples. The latter two
samples [acrisol I-1 (0-10 cm), and contaminated gleysol SL6 (30-50 cm)] were
chosen as models for the pristine and contaminated parts, respectively, of the
watershed. On all samples [HgT] was measured on both the supernatant and the
solid residue to assess extraction recovery. In addition, XRD data was systematically
collected on solid residues to identify dissolved mineral species.
2.3.2 Selective extraction materials and procedure
Four chemical extractions were chosen to selectively extract the main Hg
carrier phases reported in the literature for tropical soils: organic matter, amorphous
Fe oxides, and crystalline Fe/Al oxides.
For a given sample, selective extractions were performed on separate aliquots
of dry soil (~ 40 mg). All analytical procedures were conducted using ultra clean
sample handling to avoid laboratory contamination of low-level sample extracts and a
cross-contamination of high-level samples (Cossa and Gobeil, 2000). Specifically, all
materials in contact with the samples were previously acid washed (1 week in HNO3
20%, 1 week in HCl 10%). All solutions were prepared from reagent grade chemicals
and supra-pure acids. Selective extractions were performed under a laminar hood in
10
insu
-004
2455
1, v
ersi
on 1
- 16
Oct
200
9

8 ml Teflon® vessels at a 1:100 solid-to-liquid ratio (Bloom et al., 2003). At the end of
the extraction time, samples were centrifuged to 3000 rpm for 20 min. The
supernatant was analyzed for major elements. The solid residue was rinsed 3 times
with 4 mL MilliQ® water to obtain a final volume of ~16 mL, which was subsequently
freeze-dried before Hg analysis. The Hg content extracted by a given extraction was
calculated as:
231
232
233
234
235
236
237
238
239
240
241
242
243
244
245
246
247
248
249
250
251
252
253
254
255
[Hg]extracted (ng g-1) = ([HgT] × Msample – MHg in residue) / Msample (1)
where Msample is the mass of the aliquot used (in g) and MHg in residue the mass of Hg
measured in the residue (in ng).
To extract Hg bond to fulvic and humic compounds, a sample aliquot was
digested in NH4OH (1M) for 1h (Di Giulio and Ryan, 1987; Rodriguez Martin-
Doimeadios et al., 2000; Veiga and Baker, 2004). Another extraction focused on
organo-chelated Hg was performed by a 18h KOH digestion (1M) (Bloom et al.,
2003). Extraction of Hg bond to amorphous Fe(III) oxide minerals and ferrihydrite
was performed by adding ascorbate to a sample aliquot and allowing it to react at
room temperature for 24h (Kostka and Luther III, 1994). Finally, extraction of Hg
associated to all soil components except refractory minerals (i.e., silicates, primary
minerals) was determined after the digestion of soil sample aliquot in a Suprapur
HCl/HNO3 solution (1/9 v/v ratio) for 10h at 70°C (Coquery et al., 1997; Bloom et al.,
2003). All species associated to a specific extractant are labeled as follow: (i)j where i
is the element and the subscribe j describes the extractant (i.e., (i)NH4OH for NH4OH,
(i)KOH for KOH, (i)Asco for ascorbate and (i)HCl/HNO3 for HCl/HNO3) and square brackets,
[i]j, are used for calculated concentrations (1). The concentration of Hg related to
crystalline and refractory minerals (RC) is calculated as the difference between [HgT]
and ascorbate plus NH4OH extractions:
11
insu
-004
2455
1, v
ersi
on 1
- 16
Oct
200
9

[Hg]RC (ng g-1) = (([HgT] × Msample)– MHg Asco – MHg NH4OH) / Msample (2) 256
257
258
259
260
261
262
263
264
265
266
267
268
269
270
271
272
273
274
275
276
277
278
279
This should be equivalent to a complete HF/HCl/HNO3 extraction. Similar calculations
were made to estimate the fraction of Hg bond to crystalline Fe and Al oxides ([i]Cryst).
For this purpose, concentrations obtained after HCl/HNO3 extraction were considered
as related to amorphous and crystalline Fe and Al oxides but not to refractory
minerals. Thus, [i]Cryst was calculated as the difference between HCl/HNO3 and
ascorbate extraction :
[i]Cryst (mg g-1) = ([i]HCl/HNO3 × MHCl/HNO3 – [i]Asco × MAsco) / Msample (3)
A complementary pyrolysis procedure was used to assess the amount of Hg0 present
in the soils (Biester, 1994; Biester and Scholz, 1997; Bollen et al., 2008). After
heating a ~1g sample aliquot for 48 hours at 180°C in a porcelain crucible, the
content of Hg0 was determined from the difference in Hg concentrations between raw
and treated samples.
2.4. Physical methods
2.4.1 X-ray diffraction
X-ray diffraction (XRD) was performed on selected samples [Nodules I-2 (10-
20 cm), I-1 (30-40 cm) and I-1 (180-200 cm)] for routine mineralogical identification,
but also to identify the minerals targeted by the various selective extractions on CRM
7002, and MESS-3 standards, as well as on samples I-1 (0-10 cm) and SL6 (30-
50 cm). For this purpose, XRD patterns were collected on solid residues of the
different extractions, and compared to those obtained on the untreated samples.
XRD patterns were recorded on randomly oriented powders using a Bruker
D5000 powder diffractometer equipped with a Si(Li) solid-state detector from Baltic
Scientific Instruments and CuKα radiation (λ = 1.5418 Å). Intensities were recorded
12
insu
-004
2455
1, v
ersi
on 1
- 16
Oct
200
9

from 5 to 80°2θ, using 0.04°2θ steps, and 40 s counting time per step.
Measurements were duplicated on the CRM 7002 set of samples to ensure sampling
homogeneity and selective extraction reproducibility (data not shown).
280
281
282
283
284
285
286
287
288
289
290
291
292
293
294
295
296
297
298
299
300
301
302
303
304
Mineralogical identification and unit-cell refinement
Basic data processing operations (e.g. background removal, diffractogram
normalization) and mineralogical identification, based on peak positions and relative
intensities, were performed using the Bruker Diffracplus EVA software and the ICDD
database.
Relative intensities of XRD lines varied between raw and treated samples as
the result of specific mineral dissolutions. To overcome the intensity variations due to
the amount of measured sample, all XRD patterns were normalized to a selected
quartz peak, as quartz was present in all samples and not dissolved by the reagents
used. The peak used for normalization was selected so that (i) there is no peak
overlap with other minerals and (ii) that its intensity is statistically meaningful. For iron
oxides (hematite and goethite) present in Al-rich environments, experimental peak
positions may differ significantly from theoretical ones as the result of isomorphic Al-
for-Fe substitutions. In such case, theoretical unit-cell parameters of iron oxides were
refined using the U-Fit program (Evain, 1992) to assess their Al-contents.
2.4.2 Micro X-ray fluorescence mapping and elemental analysis.
SL6 (30-50 cm) sample was freeze-dried, sieved to 300 µm and used for
elemental mapping focused on Hg, Au, Al, Cl, Fe, Cr, Si, Ti, Mn, Ni, Ca and K. X-ray
fluorescence yields (XRF) were measured with an Eagle III µ-XRF spectrometer
(Röntgenanalytik Messtechnik GmbH) equipped with a Rh anode and a 40 µm poly-
capillary. XRF was measured for 300 s per point over a 1.28×1.00 mm2 surface area.
The spectrometer was operated under vacuum at 25 kV and 500 µA so as to
13
insu
-004
2455
1, v
ersi
on 1
- 16
Oct
200
9

maximize the fluorescence yield at the Hg Lα edge (9.99 keV) while keeping a
statistically significant signal on light elements (down to Al Kα radiation - 1.49 keV).
Further details on the method are given elsewhere (Doering et al., 2004).
305
306
307
308
309
310
311
312
313
314
315
316
317
318
319
320
321
322
323
324
325
326
327
2.5 Statistical treatment.
Since geochemical data were not normally distributed, the following
parameters are reported: mean, standard error on the mean (SEM), median, 25th and
75th percentiles (25th perc. and 75th perc., respectively) and the number of
observations (N - Webster, 2001). In addition, non parametric Mann-Whitney rank
sum test (U test) and Kruskal-Wallis one way analysis of variance on ranks (H test)
were used to compare two or more than two data sets, respectively. Pearson
correlations were applied to compare multiple data set pairs. Correlation coefficient
(CC) and P values (P) are reported.
3. Results
3.1 Blanks and CRMs
3.1.1 Mineralogy (QA/QC)
XRD patterns obtained on treated CRM samples indicate that halite was
dissolved by all reagents (Supplementary data - Figs E1b. to E1e. and E2b to E2e).
For CRM 7002, the chlorite component was partly dissolved by both NH4OH and
KOH. Exception made of halite, the effect of ascorbate was negligible. Most of the
minerals identified by XRD were thus only affected by HCl/HNO3: clinochlore, calcite
and dolomite were totally dissolved, and an intensity decrease was observed for
hornblende and, to a lesser extent, for kaolinite (Supplementary data – Figs E1e. and
E2e.).
14
insu
-004
2455
1, v
ersi
on 1
- 16
Oct
200
9

3.1.2 Extraction recoveries (QA/QC) 328
329
330
331
332
333
334
335
336
337
338
339
340
341
342
343
344
345
346
347
348
349
350
351
For NH4OH, KOH and HCl/HNO3 extractions, summation of MHg in both the
supernatant and the solid residue led to total Hg concentration consistent with those
of CRM 7002, MESS-3 and I-1 (10-20cm) sample. Relative error was routinely less
than ±10% (Tab. E1). Hg recovery was lower with ascorbate extraction, possibly due
to the loss of Hg0 in the supernatant following HgII reduction (Battke et al., 2008).
Consistent with this hypothesis, additional measurements of [(Hg)D] in the
supernatant confirmed a steady decrease with time at the end of the extraction.
3.2. Pristine soils
3.2.1 Granulometry, chemistry and mineralogy
In the pristine area, the relative proportion of the clay-size fraction (< 2 µm)
decreased from ~90% in ferralsols to less than 30% in acrisols and gleysols (Fig. 2).
Ferruginous nodules made up most of the abundant gravel size fractions (x > 2 mm)
in ferralsols and acrisols, whereas for gleysols vegetal debris prevailed in this size
fraction. In the < 2 mm fraction, total C and S contents in superficial horizons
decreased from ferralsols and acrisols to gleysols while the C/N ratios were similar
for all soils, thus indicating an homogeneous mineralization of the fine organic matter
(OM - Bravard and Righi, 1991).
Minerals extracted by HCl/HNO3 in sample I-1 (0-10cm) were identified as Al-
substituted iron oxides (goethite and hematite) and gibbsite (Fig. 3). Quartz, anatase,
kaolinite, and muscovite being essentially unaffected by the HCl/HNO3 extraction
(Supplementary data – Fig. E3e.).
For HCl/HNO3 and ascorbate extractions, Fe and Al concentrations were
correlated to the content of the clay size fraction (Tab. 1) showing that crystalline and
15
insu
-004
2455
1, v
ersi
on 1
- 16
Oct
200
9

amorphous Fe and Al oxides were central in this fine fraction. Large Al and Fe
concentrations were measured in supernatants following KOH, ascorbate and
NH4OH extractions. XRD confirmed that no crystalline Fe or Al oxides were dissolved
by NH4OH, thus supporting the dissolution of amorphous (or poorly crystalline) Fe
and/or Al minerals. In addition, goethite was partially dissolved by ascorbate and
hematite by KOH, as indicated by the ~10-20% intensity decrease of their
characteristic XRD lines after these chemical extractions (Fig. 3). For all pristine soil
samples, partial dissolution of these well-crystallized species is supported by the
higher Al and Fe concentrations measured in KOH (median = 52.6% and 12.1% of
[Al]HCl/HNO3 and [Fe]HCl/HNO3) and ascorbate (median = 24.7% and 21.7% of [Al]HCl/HNO3
and [Fe]HCl/HNO3) extracts compared to NH4OH extracts (median=9.1% and 3.6% of
[Al]HCl/HNO3 and [Fe]HCl/HNO3) (H test, P < 0.001).
352
353
354
355
356
357
358
359
360
361
362
363
364
365
366
367
368
369
370
371
372
373
374
375
376
[Fe]HCl/HNO3, [Al]HCl/HNO3, [Fe]Asco and [Al]Asco decreased steadily along the slopes from
ferralsols to gleysols (Fig. 4), [Fe]Asco and [Al]Asco being commonly lower than [Fe]Cryst
and [Al]Cryst for all profiles (Fig. 4). In ferralsols and acrisols, amorphous Fe and Al
oxides were most abundant in the A horizon and in the top 50 cm of the B horizon,
where weathering was most intense and granulometry dominated by clays. In the C
horizon, the relative proportion of amorphous oxides decreased while well
crystallized oxides and residual primary minerals became predominant, more
especially in the fine silt size fraction. Al-for-Fe substitutions were identified in
goethite (~33 Al mol%) and hematite (~10 Al mol%) from XRD unit-cell
determinations and confirmed by the positive correlations between [Fe]Cryst and
[Al]Cryst in B and C horizons (Fig. 4 - CC = 0.76; P < 0.01). Similar correlation was
observed between [Fe]Asco and [Al]Asco (CC = 0.98; P < 0.01) for the whole profiles of
pristine soils. The better correlation found between [Fe] and [Al] for ascorbate than
16
insu
-004
2455
1, v
ersi
on 1
- 16
Oct
200
9

for crystalline oxide is suggestively due to an increase in [Al] related to Al extraction
from gibbsite and in a lesser extent from kaolinite during HCl/HNO3 extraction.
377
378
379
380
381
382
383
384
385
386
387
388
389
390
391
392
393
394
395
396
397
398
399
400
401
3.2.2 Hg in pristine soils
Total mercury concentrations measured in pristine soils matrix (0.01-
0.49 µg.g-1 - Fig. 2) were consistent with those recently reported for French Guiana
soils (0.09-0.50 µg.g-1 - Richard et al., 2000; Grimaldi et al., 2001; Guedron et al.,
2006), the highest concentrations being measured in ferralsols. [HgT] decreased
along the slope in acrisols and in gleysols (Fig. 2).
[HgT] were positively correlated with [Hg] extracted by HCl/HNO3, KOH,
NH4OH and ascorbate (Tab. 1). In turn, [Hg] extracted by the four reagents were
positively correlated to the content of the clay-size fraction, [S] and [C]. The clay-size
fraction, which is composed of OM (S-groups) and Fe and Al minerals, thus
represents the main Hg reservoir (Tab. 1).
In general, [Hg] extracted by all four reagents decreased with depth and from
ferralsols to gleysols. However, Figure 5 shows that Hg extraction yields can be
separated in two sets: (i) ferralsols and superficial acrisols and (ii) deep acrisol
alteritic (C) horizons and gleysols. In both sets, NH4OH extraction yields were
significantly larger than ascorbate ones but followed the same trend. (Hg)NH4OH and
(Hg)Asco extraction yields were highest in superficial horizons of both ferralsols and
acrisols and steadily decreased with depth. Only in the upstream profiles I-1 and I-2
(Hg)NH4OH and (Hg)Asco extraction yields were constant with depth. In gleysols and
deep alteritic horizons of acrisols, both (Hg)NH4OH and (Hg)Asco decreased rapidly with
depth, whereas (Hg)RC extraction yields increased strongly with increasing depth.
(Hg)RC decreased with increasing depth in the B horizons of ferralsols and acrisols,
then increasing steadily in the ferralsol C horizons. (Hg)KOH extraction yields were
17
insu
-004
2455
1, v
ersi
on 1
- 16
Oct
200
9

highly variable with highest values in ferralsol and acrisol B horizons. In pristine
gleysols (profile II-1), (Hg)KOH extraction yields increased with increasing depth over
the first 50 cm, while decreasing in the C horizon.
402
403
404
405
406
407
408
409
410
411
412
413
414
415
416
417
418
419
420
421
422
423
424
425
3.3 Ferruginous nodules in pristine soils
3.3.1 Chemistry and mineralogy
Ferruginous nodules (> 2 mm) were abundant (mean ±RSD = 45.8 ±28.6%
total weight), especially in superficial horizons of the pristine toposequences, their
relative abundance decreasing from ferralsols to gleysols. Nodules from samples I-2
(10-20 cm), I-2 (30-40 cm) and I-2 (180-200 cm) contained quartz, Al-substituted
hematite and goethite, gibbsite and kaolinite. Figure 6 shows the steady increase of
muscovite (Mu), paragonite (Pa), gibbsite (Gb) and rutile (Ru) contents from surface
(sample I-2, 10-20 cm) to depth (sample I-2, 180-200 cm - Fig E4). This
mineralogical evolution is consistent with chemical data as [Fe]HCl/HNO3 and [Al]HCl/HNO3
steadily decreased with increasing depth.
Position of the iron oxide peaks (goethite and hematite) shifted to lower
angular values with increasing depth (Fig. 6, inset), thus indicating the lengthening of
unit-cell parameters, and thus the probable decrease of Al-for-Fe substitution, since
the ionic radius of Al is smaller than Fe (Shannon, 1976). The extent of this
substitution was assessed for the two oxides by refinement of the unit-cell
parameters and empirical relations between the Al content and the lattice parameters
(Schulze, 1984; Stanjek and Schwertmann, 1992). Al substitutions in hematite
decreased from 17 mol% (surface) to 10 mol% (deep alteritic horizons) and were
almost constant (~20 mol%) over the entire profile for goethite. Uncertainty on lattice
parameters (and therefore on Al substitution quantification) was low for hematite
18
insu
-004
2455
1, v
ersi
on 1
- 16
Oct
200
9

owing to the sharp and numerous diffraction peaks, but higher for goethite. Indeed,
few isolated diffraction peaks were available for the determination of the unit-cell
parameters and peaks were broadened.
426
427
428
429
430
431
432
433
434
435
436
437
438
439
440
441
442
443
444
445
446
447
448
449
The intensity of hematite diffraction lines increased with decreasing depth,
thus indicative of a higher proportion of hematite towards the surface, consistent with
its status of final alteration product of iron-rich phases (Schwertmann and Latham,
1986). Hematite and goethite are indeed the most thermodynamic stable iron oxides
in surface conditions. Amorphous oxides were present as minor constituents since Al
and Fe extracted by ascorbate and NH4OH never exceeded 7% of their HCl/HNO3
counterparts (Fig. E5). As in pristine soils matrix, KOH extraction likely induced the
partial dissolution of gibbsite as [Al]KOH was large (median = 51.5% of [Al]HCl/HNO3).
3.3.2 Hg in ferruginous nodules of pristine soils
For surface horizons, [HgT] were much lower in nodules than in the soil matrix.
[HgT] increased with increasing depth, similar values being obtained for nodules and
soil matrix in the deepest sample of acrisol I-1 profile. [HgT] were even larger in
nodules than in soil matrix for ferralsol I-2 samples below 50 cm depth (Fig. E5).
[HgT] was positively correlated with [Hg]HCl/HNO3 and [Hg]KOH (P < 0.05) and
with [Fe]HCl/HNO3 and [Al]HCl/HNO3 (P < 0.05). (Hg)HCl/HNO3 extraction yields were larger
in ferralsol nodules from deep horizons compared to surface ones. Conversely, in
acrisols they were larger for surface horizons. For all nodules these yields scattered
about 80%. (Hg)Asco and (Hg)NH4OH extraction yields rarely exceeded 10% and rapidly
decreased with increasing depth in both acrisols and ferralsols. (Hg)KOH (44.8
±30.2%) extractions yields were systematically larger than the sum (Hg)Asco +
(Hg)NH4OH, and progressively decreased downwards in I-1 and I-2 profiles.
19
insu
-004
2455
1, v
ersi
on 1
- 16
Oct
200
9

3.4 Contaminated gold-mined soils 450
451
452
453
454
455
456
457
458
459
460
461
462
463
464
465
466
467
468
469
470
471
472
3.4.1 Granulometry, mineralogy and chemistry
In the gold-mined flat, contaminated gleysols contained a large proportion of
gravel size fractions (mainly quartz gravels and stones, mean ± RSD = 42.7 ±24.6%
total weight) and the < 2 mm fraction was dominated by sands in contrast with
pristine soils (Fig. 2b). Total organic C largely exceeded the concentrations
determined in pristine soils and elevated C/N ratios were characteristic of poorly
mineralized OM (data not shown). Leaves and wood debris were visible in the litter.
Minerals present in sample SL6 after HCl/HNO3 extraction were quartz,
kaolinite, muscovite, diaspore, rutile and microcline. Gibbsite was for the most part
dissolved by HCl/HNO3, which also possibly partially dissolved kaolinite. The
absence of Fe oxides is consistent with the low [Fe]HCl/HNO3 values (0.35 mg.g-1).
Amorphous and crystalline Fe and Al oxides were scarce in contaminated soils
as shown by the low Al and Fe concentrations extracted by any reagent compared to
pristine soils. For all soil profiles, [Al]HCl/HNO3 and [Fe]HCl/HNO3 were maximum in
surface horizons, and sharply decreased to ~5 mg.g-1 at ~40 cm depth, except for II-
0, SL0 and G5 profiles.
As for pristine soils, partial gibbsite dissolution by KOH was evidenced by
chemistry data as [Al]KOH (median = 76.3% of [Al]HCl/HNO3) were larger than [Al]Asco
(median = 55.7% of [Al]HCl/HNO3) and [Al]NH4OH (median = 28.5% of [Al]HCl/HNO3) (U test,
P < 0.05). Fe oxides were also more attacked by ascorbate ([Fe]Asco median = 31.1%
of [Fe]HCl/HNO3) than by KOH and NH4OH ([Fe]KOH : median = 17.3% of [Fe]HCl/HNO3
and [Fe]NH4OH : median = 14.8% of [Fe]HCl/HNO3).
20
insu
-004
2455
1, v
ersi
on 1
- 16
Oct
200
9

3.4.2 Hg in contaminated gold mined soils 473
474
475
476
477
478
479
480
481
482
483
484
485
486
487
488
489
490
491
492
493
494
495
496
497
[HgT] values measured in gleysols from the gold-mined flat (up to ~10 µg.g-1 in
SL6 profile) were up to 5 times higher than those determined in gleysols from the
pristine area (Fig. 2b). Although extremely variable, even over very short distances,
these values were consistent with those determined in Hg-contaminated soils from
different gold-mining regions (Lechler et al., 1997; Lechler et al., 2000; Richard et al.,
2000; Sladek and Gustin, 2003), and positively correlated with [Hg] extracted by all
four reagents (Tab. 2a and 2b). Contrarily to the pristine area, where gleysols were
the pole of lowest [HgT], the only significant correlation of [HgT] with other soil
parameters was observed with the sand-size fraction (P < 0.05).
µ-XRF map (Fig. 7) shows that Hg was not homogeneously distributed in
sample SL6 (30-50cm). Indeed, Hg is essentially present as “hot-spots” of 30 to
100 µm in diameter. In these hot-spots, Hg concentration is not correlated with any
element (data not shown), except for a covariation with Au (Fig. 7). These spots are
thus likely Hg0 droplets, possibly amalgamated with Au. Consistently, pyrolysis
measurements showed that almost 60% of total Hg was desorbed at 180°C.
However, lower percentages of desorbed Hg were determined for SL8 and SL7
samples, thus suggesting that Hg0 was not systematically the main Hg form over the
entire former gold-mined flat (Fig. 8). Consistently, selective extractions have shown
that Hg was partially associated to OM and amorphous oxides for some samples as
shown by the NH4OH and ascorbate extraction yields. Such associations remained
however minor as (Hg)NH4OH (median = 28.4%) and (Hg)Asco (median = 14.7%)
extraction yields only seldom exceeded 50 and 30%, respectively (Fig. 8). Relative
proportion of Hg associated to refractory minerals was negligible as (Hg)HCl/HNO3
extraction yields were systematically ~100%. In this case, large (Hg)RC reflect the
21
insu
-004
2455
1, v
ersi
on 1
- 16
Oct
200
9

proportion related to Hg0 (Fig.8). KOH extraction yields also were high (median =
86.5%), being always higher than 80% in the uppermost 40 cm.
498
499
500
501
502
503
504
505
506
507
508
509
510
511
512
513
514
515
516
517
518
519
520
521
4. Discussion
4.1 Selective extractions
Further investigation was performed to unravel the reactions leading to Hg
reduction and loss during ascorbate extraction, although [Hg]Asco were not biased,
being calculated from the analysis of the solid residue. Results of the pyrolysis
procedure were also questionable as the pyrolysis (180°C) of marine sediment
MESS-3 has shown no significant desorption of Hg, while almost 70% of total Hg
desorbed from light sandy soil CRM 7002 under the same conditions. It is thus likely
that in addition to Hg0, Hg bond to OM was partially desorbed during pyrolysis.
Pyrolysis temperature (180°C) was indeed close to the temperature range reported
by Biester and Scholz (1997) for the thermal release of Hg bound to organic
compounds (200-350°C). This is especially relevant for the assessment of the
different Hg-compartments in organic-rich contaminated soils.
Cross recoveries between selective extractions were observed for both CRMs
and natural samples, but it was also possible to attribute selective mineral extractions
to each reagent. The selective character of a given extraction depends on the
considered soil matrix, as reagent selectivity depends both on the nature of
components present and on their reactivity with respect to a given reagent.
Overlapping extractions further increase the uncertainty on the relative proportion of
Hg associated to any carrier phase. Although chemical data may help to assess
cross recoveries, the restricted and variable selectivity of the different reagents
precludes the use of selective extractions as standardized procedures for
22
insu
-004
2455
1, v
ersi
on 1
- 16
Oct
200
9

environmental studies. Specifically, the use of selective extractions needs preliminary
investigation to assess reagent selectivity for a given soil matrix.
522
523
524
525
526
527
528
529
530
531
532
533
534
535
536
537
538
539
540
541
542
543
544
545
4.2 Hg distribution in pristine soils
The study of Hg distribution in a soil has to take into account the original soil
cover formation, its current evolution and its present topographic position, that is its
position in the soil association (Fritsch et al., 2006). These factors are indeed
responsible, at least partially, for the relative abundance and the reactivity of soil
organic and mineral components, including Hg carriers, thus providing additional
insight in the Hg natural equilibrium and contents.
4.2.1 Hg carrier phases in soil profiles
A positive correlation between the relative amount of the clay-size fraction and
C, S, [Fe] and [Al] extracted by HCl/HNO3, NH4OH and ascorbate is shown in Table
2. Hg is thus likely associated with finely divided Fe and Al organic complexes and/or
with organic coatings on Fe/Al oxides. Several authors have already shown that in
Amazonian micro-aggregated horizons, micropeds develop from the bonding
between clays, organic matter and iron oxides through the formation of carbon-
coatings on mineral surfaces (Tandy et al., 1990; Malengreau and Sposito, 1997; Do
Nascimento et al., 2004).
Specific bonding of Hg with sulfur groups from finely divided organic matter
may be inferred from the above described correlations for all pristine soils. This is
consistent with previous reports of organics, and more especially of reduced sulfur
groups, being the most effective sorbents for Hg in acidic environments (pH < ~4.5-
5.0), compared to iron oxides and clay minerals (Andersson, 1979; Schuster, 1991;
Roulet and Lucotte, 1995; Skyllberg et al., 2000; Skyllberg et al., 2006; Manceau and
23
insu
-004
2455
1, v
ersi
on 1
- 16
Oct
200
9

Nagy, 2008). 546
547
548
549
550
551
552
553
554
555
556
557
558
559
560
561
562
563
564
565
566
567
568
569
In addition to this essential organic contribution, Hg contents in soils from
French Guiana are also controlled by the actual nature of Fe and Al (oxyhydr)oxides
(Roulet and Lucotte, 1995; Roulet et al., 1998). In pristine soil matrix, large [Hg]Asco
and [Hg]HCl/HNO3 values were indeed attributed to Al-substituted amorphous and
crystalline Fe oxides. As a result of their larger surface areas compared to their
crystalline counterparts, amorphous or poorly crystalline species have an increased
adsorption capacity, (Schwertmann and Latham, 1986; Schwertmann and Cornell,
2000). The positive correlation between [Hg]KOH and [Al]KOH supports also the
importance of Al oxides as a reservoir for Hg. This reservoir is accessible through
KOH and, to a lesser extent, through ascorbate extractions, thus the large [Al]Asco
plead for the partial dissolution of (amorphous) Al (oxyhydr)oxides (Schwertmann
and Latham, 1986).
In nodules, as in soil matrix, Hg is bond to Al and Fe oxides. Ferruginous
nodules are abundant in ferralsols and acrisols, where they represent ~50% of total
soil materials and thus represent large Hg reservoirs, [HgT] being similar in nodules
and soil matrix. In addition to Al-substituted hematite and goethite, gibbsite
contributes significantly to Hg retention in soil nodules, especially in surface horizons,
as suggested by the large (Hg)KOH extraction yields associated with large [Al]KOH
values. This observation is consistent with the strong affinity of Hg(II) for gibbsite
(Kim et al., 2004a; Kim et al., 2004b; Weerasooriya et al., 2007).
Finally, the contribution of refractory minerals (identified as muscovite,
anatase, rutile and kaolinite) is non negligible, although minor, in pristine soils as the
median (Hg)HCl/HNO3 extraction yield is only 89.8%.
24
insu
-004
2455
1, v
ersi
on 1
- 16
Oct
200
9

4.2.2 Influence of soil structure on Hg distribution in soil profiles 570
571
572
573
574
575
576
577
578
579
580
581
582
583
584
585
586
587
588
589
590
591
592
593
594
From the above description, it appears that the vertical distribution of OM,
Al/Fe (oxyhydr)oxides and ferruginous nodules in the soil matrix rules Hg distribution.
In the following section, pedological and chemical characteristics responsible for the
spatial distribution of these components in soil profiles will be discussed.
Upslope, large [HgT] have been measured in the matrix of the ferralsol micro-
aggregated horizons (i.e., A and B horizons). The micro-aggregated structure confers
a good water drainage capacity to ferralsols, favoring water flow and oxidizing
conditions. As a result, Hg is spread throughout these micro-aggregated horizons as
the result of both significant leaching and migration of atmospheric inputs (Guedron
et al., 2006). Plant litter is rapidly mineralized in surface horizons, and the rapid
turnover of humic substances leads to the migration of fulvic acids in deeper organo-
mineral horizons where they are complexed to Fe and Al oxides (Roulet and Lucotte,
1995). Thus, Hg originating from plant litter decomposition and/or from atmospheric
fallouts can migrate into the organo-mineral horizons as organic-Hg complexes and
progressively adsorb onto Al/Fe (oxyhydr)oxides. Soil ecosystem engineers (soil
invertebrates and roots) also play an important role in the particulate transfer of Hg
by enhancing aggregation (Velasquez et al., 2007) and soil hydraulic conductivity
(Grimaldi et al., 2008) through biogenic soil organization. In the micro-aggregated B
horizon of ferralsols, the distribution of amorphous Fe oxides is positively correlated
to [HgT], although their relative abundance is lower than or similar to that of the
crystalline varieties. The comparison of [Fe]Cryst and [Fe]Asco indicates that the relative
proportion of crystalline Fe oxides is increased further in the superficial layer and in
the deep alteritic horizons compared to the micro-aggregated B horizon of ferralsols.
In addition, the positive correlations between [Hg]RC and [Fe]Cryst or [Al]Cryst
25
insu
-004
2455
1, v
ersi
on 1
- 16
Oct
200
9

throughout the entire soil profile suggest that [Hg]RC is partially associated to Al-
substituted crystalline Fe oxides. In this case, the sum of [Hg] adsorbed onto
amorphous and crystalline Fe oxides would be comparable or larger than the part
related to organic compounds.
595
596
597
598
599
600
601
602
603
604
605
606
607
608
609
610
611
612
613
614
615
616
617
618
The micro-aggregated structure of ferralsols disappears progressively with
increasing depth, giving rise to deep mineral horizons with a continuous structure
composed of large mineral relics. Parental material relics “dilute” Al/Fe oxides and
thus reduce the overall sorption capacity of deep horizons. Another essential factor is
the lower permeability of deep horizons which limits the downward migration of Hg
(Guedron et al., 2006). Hg content thus mainly results from rock weathering and
pedogenesis (Guedron et al., 2006), [HgT] being mainly associated with coarse-
grained goethite and hematite.
In ferralsol nodules, Hg is mainly bond to Al-substituted hematite and goethite,
and to gibbsite. As in ferralsol matrix, highest [HgT] values were measured in the
micro-aggregated horizon. Indeed, the downward decrease of (Hg)HCl/HNO3 extraction
yields and the mineralogical evolution suggest that A and B horizons nodules are
primarily composed of neo-formed minerals, thus indicating an advanced stage of
pedogenesis and weathering in superficial horizons. Mineral neoformation also
appears to favor the incorporation of atmospheric Hg inputs.
Halfway down the slope, in acrisols, a similar mineralogical and structural
contrast is observed between superficial (A and B horizons) and alteritic horizons.
This transition is sharp as evidenced by the increase of the silt fraction and by the
decrease of [HgT]. As for ferralsol, the increase of refractory minerals with increasing
depth is most likely responsible for the observed decrease of [HgT].
26
insu
-004
2455
1, v
ersi
on 1
- 16
Oct
200
9

Downslope, in gleysols, [HgT] were lower since fine organic fraction, S and
amorphous oxides are less abundant than upslope, even though carrier phases were
similar to those identified in ferralsols and acrisols. Gleysols are depleted in iron
oxides and the main minerals are kaolinite, gibbsite, muscovite and quartz. Hg
extracted by NH4OH never exceeds 40% of [HgT] in gleysol surface horizons and
rapidly decreases with depth. Hg bond to amorphous oxides never exceeds 20% of
[HgT], and almost 50% of [HgT] is likely associated to Al-substituted crystalline Fe
oxides, gibbsite and to refractory minerals. Consistently, Hg, Fe, and Al extracted by
HCl/HNO3 are together positively correlated in the gleysol profile. In depth, Hg is less
abundant and mainly associated to refractory minerals since (Hg)RC extraction yields
increase with increasing depth.
619
620
621
622
623
624
625
626
627
628
629
630
631
632
633
634
635
636
637
638
639
640
641
642
643
4.2.3 Influence of soil formation on the distribution of Hg over the soil association
The soil association results from the ferralsols current imbalance, which leads
to temporal and spatial evolutions (Boulet et al., 1993; Grimaldi et al., 2004).
Because of their major role as Hg reservoirs, the following description of Hg
distribution along the toposequence will thus focus on OM and Fe oxides behavior in
the soil association.
In organic horizons, the [HgT] decrease along the slopes correlates with the
decrease of their C and S contents. However, organic horizons in gleysols are
characterized by an increased proportion of OM in gravel size fractions (> 2 mm) and
thus by a lower degree of mineralization of coarse OM because of hydromorphy.
Consequently, the overall reactivity of coarse OM towards Hg (including the reactivity
of S groups) decreases when all soil fractions are considered even if C and S remain
abundant (Andersson, 1979; Kerndorff and Schnitzer, 1980; Schnitzer and Kerndorff,
1981; Ochs et al., 1994; Gasper et al., 2007).
27
insu
-004
2455
1, v
ersi
on 1
- 16
Oct
200
9

The decreasing proportion of Fe and Al (oxyhydr)oxides down the slope
results from the combined effect of diffuse erosion and leaching due to the lateral
drainage of horizons overlying the alteritic horizons of acrisols and of the progressive
occurrence of hydromorphy (Boulet et al., 1979; Fritsch et al., 1986; Fritsch et al.,
2006; Grimaldi et al., 2004; Lucas et al., 1996). Drainage induces a texture
coarsening from the original clayey texture of ferralsols to the sandy-loam texture of
gleysols, whereas hydromorphy induces the dissolution of crystalline and amorphous
Al-bearing Fe oxides and the export of the reduction products through the
hydrographic network (Grimaldi et al., 2008). Both processes result in the relative
increase of coarse fractions composed mainly of quartz and neoformed kaolinite
(Boulet, 1978; Roulet et al., 1998) which possess a low affinity for Hg (Sarkar et al.,
1999; Sarkar et al., 2000).
644
645
646
647
648
649
650
651
652
653
654
655
656
657
658
659
660
661
662
663
664
665
666
667
4.3 Influence of former gold mining activities on anthropogenic Hg pool in soils
In contrast to pristine soils, Hg appears to be associated mainly with the
prevailing sandy fraction. In highly contaminated sites Hg has been identified as Hg0,
insoluble cinnabar and metacinnabar (Lechler et al., 1997; Slowey et al., 2005;
Slowey and Brown, 2007). In the present study, mercury sulfides (cinnabar and
metacinnabar) are most likely insignificant as no positive correlation was found
between Hg and S. (Hg)HCl/HNO3 extraction yields are systematically close to 100%
and support further the low amount of mercury sulfides which are essentially
insoluble in concentrated HCl/HNO3 (Mikac et al., 2002; Mikac et al., 2003)..
The probable presence of Hg0 is supported by the observation of macroscopic
Hg0 droplets during a prospective “panning” in the sandy horizon of gold-mined
gleysols (50-100 cm depth) next to profile III-0. It was however impossible to assess
28
insu
-004
2455
1, v
ersi
on 1
- 16
Oct
200
9

the distribution of the Hg0 droplets along vertical profiles. µXRF confirmed the
presence of isolated Hg0 droplets (~100 µm in diameter) in sample SL6 (30-50cm),
possibly amalgamated with micrometric gold particles. Consistently, pyrolysis
measurements have shown that Hg0 generally prevail in the former gold-mined flat
soils, with some exceptions (e.g., SL7 and SL8 profiles). In the latter profiles, the
reduced contribution of Hg0 can result from its oxidation, known to be fast in tropical
environments (Dominique et al., 2007). If geochemical conditions are not
permanently reducing, as in the surface horizons, Hg0 can be oxidized, allowing
adsorption onto OM and minerals. The relative proportion of Hg bond to OM is
however lower than in pristine soils, (Hg)NH4OH extraction yields rarely exceeding
50%. As previously discussed, the overall limited mineralization of OM is most likely
responsible for the low reactivity of OM for Hg. Similarly, the relative proportion of Hg
bond to amorphous Fe oxides is low (up to 15%), these oxides being scarce in
hydromorphic environments. Finally, the part related to refractory minerals (i.e.,
quartz, kaolinite and muscovite) appears to be negligible since (Hg)HCl/HNO3 extraction
yields are always close to 100%.
668
669
670
671
672
673
674
675
676
677
678
679
680
681
682
683
684
685
686
687
688
689
690
5. Conclusion
The combination of selective extractions with physical techniques (XRD and
µXRF) significantly improved the determination of Hg speciation by allowing the
identification of Hg carrier phases targeted by the different extractants. However, the
quantification of Hg associated to a given carrier phase is affected by intrinsic bias,
especially because of probable overlaps between the different extraction procedures.
Thus, selective extractions can not be used as a standard procedure for natural
29
insu
-004
2455
1, v
ersi
on 1
- 16
Oct
200
9

samples since the use of selective extractions requires the preliminary assessment of
reagent selectivity for a given soil matrix.
691
692
693
694
695
696
697
698
699
700
701
702
703
704
705
706
707
708
709
710
711
712
713
714
By coupling XRD and selective extractions, the main Hg carrier phases in
pristine soils were identified as sulfur groups from organic matter, amorphous and
crystalline Al-substituted Fe oxides and, to a lower extent, Al oxides. The relative
contribution of these carriers to the overall Hg concentration was dependent on their
relative abundance which is controlled by the pedogenetic evolution along the slopes,
and more especially by redox conditions, hydric properties, and ecosystem
engineers. In the former gold-mined flat, Hg was found mainly as Hg0, possibly
amalgamated with Au, and as oxidized HgII associated with organic matter, Fe and/or
Al oxides in surface horizons.
5.1 Concluding Remarks
These findings have major implications on the contamination of hydrosystems
in tropical regions, where soil erosion due to deforestation, gold mining and
agricultural processes are intense and lead to the release of Hg-rich clay-size
particles as shown by the low proportion of clay-size fractions in gold-mined gleysols.
When entering suboxic and anoxic environments (e.g. river or dam sediments), Hg
bond to clay-size particles indeed becomes accessible to ferri- and sulfato-reducing
bacteria that are the main factors of Hg methylation (Fitzgerald and Lamborg, 2003;
Fleming et al., 2006). Hg bound to OM and Fe oxides is specifically concerned as
these major components of the clay-size fraction are essential nutriments for
methylating micro-organisms and final electron acceptors of their metabolism. In
addition, former gold mined soils are potential important sources of Hg for
methylating bacteria. Indeed, Dominique et al. (2007) have shown that anthropogenic
30
insu
-004
2455
1, v
ersi
on 1
- 16
Oct
200
9

Hg0 from former gold-mining activities also promotes the production of MMHg in the
Amazonian hydrosystems and its availability to trophic webs.
715
716
717
718
719
720
721
722
723
724
725
726
727
728
729
730
731
732
733
734
735
736
737
Acknowledgments
This research was supported mainly by the CNRS through its “Mercury in
French Guiana” research program and by the Boulanger Mine Company (CMB –
Cayenne) through a Ph.D. granted to Stéphane Guédron. The authors thank Manuel
Munoz and Mathieu Corazzi (LGCA – Grenoble) for the assistance with µXRF
mapping, Vincent Perrot and Nicolas Geoffroy (LGIT – Grenoble) for technical
support during the project, and Max Sarrazin (IRD – Cayenne) who performed soil
granulometry and C, N and S analyses.
References
Andersson, A., 1979. Mercury in soils. In: J.O. Nriagu (Editor), The biogeochemistry
of mercury in the environment. Elsevier, Amsterdam, pp. 80-111.
Avery, B.W. and Bascomb, C.L., 1974. Soil survey laboratory methods. Technical
Monograph, 6. Soil Survey of England and Wales, Harpenden.
Barbosa, A.C., Souza, J.D., Dorea, J.G., Jardim, W.F. and Fadini, P.S., 2003.
Mercury Biomagnification in a Tropical Black Water, Rio Negro, Brazil. Arch.
Environ. Contam. Toxicol. 45(2): 235-246.
Barret, J., 2004. Illustrated Atlas of French Guyana. French Guyana Publications,
Cayenne, 219 pp (in French).
Battke, F., Ernst, D., Fleischmann, F. and Halbach, S., 2008. Phytoreduction and
volatilization of mercury by ascorbate in Arabidopsis thaliana, European beech
and Norway spruce. Appl. Geochem. 23(3): 494-502.
31
insu
-004
2455
1, v
ersi
on 1
- 16
Oct
200
9

Beldowski, J. and Pempkowiak, J., 2003. Horizontal and vertical variabilities of
mercury concentration and speciation in sediments of the Gdansk Basin,
Southern Baltic Sea. Chemosphere. 52: 645-654.
738
739
740
741
742
743
744
745
746
747
748
749
750
751
752
753
754
755
756
757
758
759
760
761
Beldowski, J. and Pempkowiak, J., 2007. Mercury transformations in marine coastal
sediments as derived from mercury concentration and speciation changes
along source/sink transport pathway (Southern Baltic). Estuarine Coastal Shelf
Sci. 72(1-2): 370-378.
Benoit, J.M., Gilmour, C.C., Heyes, A., Mason, R.P. and Miller, C.L., 2003.
Geochemical and biological controls over methylmercury production and
degradation in aquatic ecosystems. In: Y. Cai and O.C. Braids (Editors),
Biogeochemistry of Environmentally Important Trace Elements. Oxford
University Press, pp. 262-297.
Biester, H., 1994. Moglichkeiten der anwendung eines temperaturgesteuerten
pyrolyseverfahrens zur bestimmung der bindungsform des quecksilbers in
boden und sedimenten. Heidelberger Geowiss. Abh. 75, 156 pp.
Biester, H. and Scholz, C., 1997. Determination of mercury binding forms in
contaminated soils: Mercury pyrolysis versus sequential extractions. Environ.
Sci. Technol. 31: 233-239 (in German).
Bloom, N.S. and Fitzgerald, W.F., 1988. Determination of volatil mercury species at
the picogram level by low-temperature gas chromatography with cold-vapor
atomic fluorescence detection. Anal. Chim. Acta. 208: 151-161.
Bloom, N.S., Preus, E., Katon, J. and Hiltner, M., 2003. Selective extractions to
assess the biogeochemically relevant fractionation of inorganic mercury in
sediments and soils. Anal. Chim. Acta. 479: 233-248.
32
insu
-004
2455
1, v
ersi
on 1
- 16
Oct
200
9

Bollen, A., Wenke, A. and Biester, H., 2008. Mercury speciation analyses in HgCl2-
contaminated soils and groundwater - Implications for risk assessment and
remediation strategies. Water Res. 42(1-2): 91-100.
762
763
764
765
766
767
768
769
770
771
772
773
774
775
776
777
778
779
780
781
782
783
784
785
Boszke, L., Kowalski, A., Szczuciński, W., Rachlewicz, G., Lorenc, S.A. and Siepak,
J., 2006. Assessment of mercury mobility and bioavailability by fractionation
method in sediments from coastal zone inundated by the 26 December 2004
tsunami in Thailand. Environ. Geol. 51(4): 527-536.
Boulet, R., 1978. Existence of high lateral differentiation systems in French Guiana's
ferrallitic soils: a new example of an imbalanced pedological cover. Soil Sci. 2:
75-82 (in French).
Boulet, R., Grugiere, J.M. and Humbel, F.X., 1979. Relationships between soil
organization and water dynamics of septentrional French Guiana. Agronomic
consequences of an evolution controlled by a mainly tectonic desequilibrium.
Soil Sci. 1: 3-18 (in French).
Boulet, R., Lucas, Y., Fritsch, E. and Paquet, H., 1993. Landscape geochemistry:
role of soil cover. In: French. Acad. Sci. (Editor), Sedimentology and surface
geochemistry, Paris, pp. 55-76 (in French).
Brabo, E.S., Angelica, R.S., Silva, A.P., Faial, K.R.F., Mascarenhas, A.F.S., Santos,
E.C.O., Jesus, I.M. and Loureiro, E.C.B., 2003. Assessment of mercury levels
in soils, waters, bottom sediments and fishes of the Acre state in brazilian
amazon. Water Air Soil poll. 147: 61-77.
Bravard, S. and Righi, D., 1991. Characterization of fulvic and humic acids from an
oxisol-spodosol toposequence of Amazonia, Brazil. Geoderma. 48(1-2): 151-
162.
33
insu
-004
2455
1, v
ersi
on 1
- 16
Oct
200
9

Carmouze, J.P., Lucotte, M. and Boudou, A., 2001. Le Mercure en Amazonie Rôle
de l'homme et de l'environnement, Risques sanitaires. IRD Editions, Bondy,
494 pp (in French).
786
787
788
789
790
791
792
793
794
795
796
797
798
799
800
801
802
803
804
805
806
807
808
809
Charlet, L. and Sposito, G., 1987. Monovalent ion adsorption by an oxisol. Soil Sci.
Soc. Am. J. 51: 1155-1160.
Charlet, L. and Sposito, G., 1989. Bivalent ion adsorption by an Oxisol. Soil Sci. Soc.
Am. J. 53(5): 691-695.
Coquery, M., Cossa, D. and Sanjuan, J., 1997. Speciation and sorption of mercury in
two macro-tidal estuaries. Marine Chem. 58(1-2): 213-227.
Coquery, M., Cossa, D., Azemard, S., Peretyazhko, T. and Charlet, L., 2003.
Methylmercury formation in the anoxic waters of the Petit-Saut reservoir
(French Guiana) and its spreading in the adjacent Sinnamary river. J. Phys.
IV. 107: 327-331.
Cossa, D. and Gobeil, C., 2000. Mercury speciation in the Lower St. Lawrence
estuary. Can. J. Fish. Aquat. Sci. 57: 138-147.
De Oliveira, S.M.B., Melfi, A.J., Fostier, A.H., Forti, M.C., Favaro, D.I.T. and Boulet,
R., 2001. Soils as an important sink for mercury in the Amazon. Water Air Soil
Poll. 26: 321-337.
Deckers, J., Nachtergaele, F. and Spaargaren, O., 1998. World reference base for
soil resources. ACCO Publishers, 165 pp.
Di Giulio, R.T. and Ryan, E.A., 1987. Mercury in soils, and clams from a North
Carolina peatland. Water, Air and soil poll. 33: 205–219.
Do Nascimento, N.R., Bueno, G.T., Fritsch, E., Herbillon, A.J., Allard, T., Melfi, A.J.,
Astolfo, R., Boucher, H. and Li, Y., 2004. Podzolization as a deferralitization
34
insu
-004
2455
1, v
ersi
on 1
- 16
Oct
200
9

process: a study of an Acrisol-Podzol sequence derived from Palaeozoic
sandstones in the northern upper Amazon Basin. Eur. J. Soil Sci. 55: 523-538.
810
811
812
813
814
815
816
817
818
819
820
821
822
823
824
825
826
827
828
829
830
831
832
833
834
Do Valle, C.M., Santana, G.P., Augusti, R., Egreja Filho, F.B. and Windmoller, C.C.,
2005. Speciation and quantification of mercury in Oxisol, Ultisol, and Spodosol
from Amazon (Manaus, Brazil). Chemosphere. 58(6): 779-792.
Doering, E.R., Havrilla, G.J. and Miller, T.C., 2004. Disilicide Diffusion Coating
Inspection by Micro X-Ray Fluorescence Imaging. J. Nondestr. Eval., 23(3):
95-105.
Dominique, Y., Muresan, B., Duran, R., Richard, S. and Boudou, A., 2007. Simulation
of the Chemical Fate and Bioavailability of Liquid Elemental Mercury Drops
from Gold Mining in Amazonian Freshwater Systems. Environ. Sci. Tech.
41(21): 7322 -7329.
Eagenhouse, R.P., Young, D.R. and Johnson, J.N., 1978. Geochemistry of mercury
in Palos Verdes sediments. Environ. Sci. Technol. 12: 1151–1157.
Evain, M., 1992. U-FIT: A Cell Parameter Refinement Program. IMN Nantes.
Fitzgerald, W.F. and Lamborg, C.H., 2003. Geochemistry of mercury in the
environment. In: B. Sherwood Lollar (Editor), Treatise on Geochemistry.
Elsevier, pp. 107-148.
Fleming, E.J., Mack, E.E., Green, P.G. and Douglas, C.N., 2006. Mercury
methylation from unexpected sources: molybdate-inhibited freshwater
sediments and iron-reducing bacterium. Appl. Environ. Microbiol. 72(1): 457-
464.
Fontes, M.P.F. and Gomes, P.C., 2003. Simultaneous competitive adsorption of
heavy metals by the mineral matrix of tropical soils. Appl. Geochem. 18(6):
795-804.
35
insu
-004
2455
1, v
ersi
on 1
- 16
Oct
200
9

Frery, N., Maury-Brachet, R., Maillot, E., Deheeger, M., Merona de, B. and Boudou,
A., 2001. Goldmining activities and mercury contamination of native
Amerindian communities in french Guiana: key role of fish in dietary uptake.
Environ. Health Persp. 109: 449-456.
835
836
837
838
839
840
841
842
843
844
845
846
847
848
849
850
851
852
853
854
855
856
857
858
859
Fritsch, E., Bocquier, G., Boulet, R., Dosso, M. and Humbel, F.X., 1986.
Transforming systems of ferrallitic cover in French Guiana, structural analysis
of a supergene formation and mode of representation. ORSTOM notebook,
Pedol. Ser. 12(4): 361-395 (in French).
Fritsch, E., Morin, G., Bedidi, A., Bonnin, D., Balan, E., Caquineau, S. and Calas, G.,
2005. Transformation of haematite and Al-poor goethite to Al-rich goethite and
associated yellowing in a ferralitic clay soil profile of the middle Amazon Basin
(Manaus, Brazil). Eur. J. Soil Sci. 56(5): 575-588.
Fritsch, E., Herbillon, A.J., doNascimento, N.R., Grimaldi, M. and Melfi, A.J., 2006.
From Plinthic Acrisols to Plinthosols and Gleysols: iron and groundwater
dynamics in the tertiary sediments of the upper Amazon basin. Eur. J. Soil Sci.
58: 989-1006.
Gasper, J.D., Aiken, G.R. and Ryan, J.N., 2007. A critical review of three methods
used for the measurement of mercury (Hg2+)-dissolved organic matter stability
constants. Appl. Geochem. 22(8): 1583-1597.
Grimaldi, C., Grimaldi, M., Millet, A., Bariac, T. and Boulègue, J., 2004. Behavior of
chemical solutes during a storm in a rainforested headwater catchment.
Hydrol. Process. 18: 93-106.
Grimaldi, C., Guedron, S. and Grimaldi, M., 2008. Mercury distribution in tropical soil
profiles related to origin of mercury and soil processes. Sci. Total Environ.
401: 121-129.
36
insu
-004
2455
1, v
ersi
on 1
- 16
Oct
200
9

Grimaldi, M., Gaudet, J.P., Grimaldi, C., Melieres, M.A. and Spadini, L., 2001.
Sources, budget and transfers in soils and sediments. In: CNRS (Editor),
Mercury in French Guiana research Program. Final report, part one: the region
of Saint Elie and the Petit Saut reservoir. CNRS-PEVS, pp. 5-15 (in French).
860
861
862
863
864
865
866
867
868
869
870
871
872
873
874
875
876
877
878
879
880
881
882
883
884
Guedron, S., Grimaldi, C., Chauvel, C., Spadini, C. and Grimaldi, M., 2006.
Weathering versus atmospheric contributions to mercury concentrations in
French Guiana soils. Appl. Geochem. 21: 2010-2022.
Guehl, J.M., 1984. Water dynamic in French Guiana tropical humid forest soil.
Influence of the pedological cover . Ann. For. Sci. 41(2): 195–236 (in French).
Kerndorff, H. and Schnitzer, M., 1980. Sorption of metals on humic acid . Geochim.
Cosmochim. Acta. 44: 1701-1708.
Khwaja, A., Bloom, P.R. and Brezonik, P.L., 2006. Binding constants of divalent
Mercury (Hg2+) in soil humic acids and soil organic matter. Environ. Sci.
Technol. 40: 844-849.
Kim, C., Rytuba, J. and Brown, J.G.E., 2004a. EXAFS study of mercury (II) sorption
to Fe- and Al- (hydr)oxides I. Effect of chloride and sulfate. J. Colloid Interface
Sci. 270: 9-20.
Kim, C., Rytuba, J.J. and Brown, J.G.E., 2004b. EXAFS study of mercury (II) sorption
to Fe- and Al- (hydr)oxides I. Effect of pH. J. Colloid Interface Sci. 271: 1-15.
Kostka, J.E. and Luther III, G.W., 1994. Partitioning and speciation of solid phase
iron in saltmarsh sediments. Geochim. Cosmochim. Acta. 58(7): 1701–1710.
Lacerda, L.D., 1997. Global mercury emissions from gold and silver mining. Water
Air Soil Poll. 97: 209-221.
Lebel, J., Mergler, D., Lucotte, M., Amorin, M., Dolbec, J., Miranda, D., Arantes, G.,
Rhéault, I. and Pichet, P., 1996. Evidence of early nervous system disfunction
37
insu
-004
2455
1, v
ersi
on 1
- 16
Oct
200
9

in Amazonian populations exposed to low levels of methylmercury.
Neurotoxicol. 17: 157-168.
885
886
887
888
889
890
891
892
893
894
895
896
897
898
899
900
901
902
903
904
905
906
907
908
909
Lechler, P.J., Miller, J.R., Hsu, L.-C. and Desilets, M.O., 1997. Mercury mobility at the
Carson River Superfund Site, west-central Nevada, USA: Interpretation of
mercury speciation data in mill tailings, soils, and sediments. J. Geochem.
Explor. 58(2-3): 259-267.
Lechler, P.J., Miller, J.R., Lacerda, L.D., Vinson, D., Bonzongo, J.-C., Lyons, W.B.
and Warwick, J.J., 2000. Elevated mercury concentrations in soils, sediments,
water, and fish of the Madeira River basin, Brazilian Amazon: a function of
natural enrichments? Sci. Total Environ. 260: 87-96.
Leermakers, M., Baeyens, W., Quevauviller, P. and Horvat, M., 2005. Mercury in
environmental samples: Speciation, artifacts and validation. Trends Anal.
Chem. 24(5): 383-393.
Lucas, Y., Nahon, D., Cornu, S. and Eyrolle, F., 1996. Soil genesis and dynamics in
equatorial areas. C. R. Acad. Sci. 322(1): 1-16 (In French).
Malengreau, N. and Sposito, G., 1997. Short-time dissolution mechanisms of
kaolinitic tropical soils. Geochim. Cosmochim. Acta; 61(20): 4297-4307.
Manceau, A. and Nagy, K.L., 2008. Relationships between Hg(II)–S bond distance
and Hg(II) coordination in thiolates. Dalton Trans. 11: 1385–1508.
Mikac, N., Foucher, D., Niessen, S. and Fischer, J.-C., 2002. Extractability of HgS
(cinnabar and metacinnabar) by hydrochloric acid. Anal. Bioanal. Chem.
374(6): 1028-1033.
Mikac, N., Foucher, D., Niessen, S., Lojen, S. and Fischer, J.-C., 2003. Influence of
chloride and sediment matrix on the extractability of HgS (cinnabar and
metacinnabar) by nitric acid. Anal. Bioanal. Chem. 377(7): 1196-1201.
38
insu
-004
2455
1, v
ersi
on 1
- 16
Oct
200
9

Milési, J.P., Egal, E., Ledru, P., Vernhet, Y., Thiéblemont, D., Cocherie, A., Tegyey,
M., Martel-Jantin, B. and Lagny, P., 1995. Mineralizations of the northern
French Guiana in their geological setting. Mining Res. Chron. 518: 5-58 (in
French).
910
911
912
913
914
915
916
917
918
919
920
921
922
923
924
925
926
927
928
929
930
931
932
933
934
Molicova, H., Grimaldi, M., Bonell, M. and Hubert, P., 1997. Using TOPMODEL
towards identifying and modelling the hydrological patterns within a headwater
humid, tropical catchment. Hydrolog. Process. 11: 1169-1196.
Ochs, M., Cosovic, B. and Stumm, W., 1994. Coordinative and hydrophobic
interaction of humic substances with hydrophilic Al2O3 and hydrophobic
mercury surfaces. Geochim. Cosmochim. Acta. 58(2): 639-650.
Richard, S., Arnoux, A., Cerdan, P., Reynouard, C. and Horeau, V., 2000. Mercury
levels of soils, sediments and fish in French Guiana, South America. Water Air
Soil Poll. 124: 221-244.
Rodriguez Martin-Doimeadios, R.C., Wasserman, J.C., Garcia Bermejo, L.F.,
Amouroux, D., Berzas Nevado, J.J. and Donard, O.F.X., 2000. Chemical
availability of mercury in stream sediments from the Almaden area, Spain. J.
Environ. Monit. 2: 360-366.
Roos-Barraclough, F., Givelet, N., Martinez-Cortizas, A., Goodsite, M.E., Biester, H.
and Shotyk, W., 2002. An analytical protocol for determination of total mercury
concentration in solid peat samples. Sci. Tot. Environ. 292: 129-139.
Roulet, M. and Lucotte, M., 1995. Geochemistry of mercury in pristine and flooded
ferralitic soil of a tropical rain forest in French Guiana, South America. Water,
Air, Soil Poll. 80: 1079-1088.
Roulet, M., Lucotte, M., Saint-Aubin, A., Tran, S., Rheault, I., Farella, N., Da Silva,
E.D., Dezencourt, J., Passos, C.J.S., Soares, G.S., Guimaraes, J.R.D.,
39
insu
-004
2455
1, v
ersi
on 1
- 16
Oct
200
9

Mergler, D. and Amorim, M., 1998. The geochemistry of mercury in central
Amazonian soils developed on the Alter-do-Chao formation of the lower
Tapajos River Valley, Para state, Brazil. Sci. Total Environ. 223(1): 1-24.
935
936
937
938
939
940
941
942
943
944
945
946
947
948
949
950
951
952
953
954
955
956
957
958
Rowell, D.L., 1994. Soil Science : methods and applications. British Library, Harlow
(England).
Sanchez, D.M., Quejido, A.J., Fernandez, M., Hernandez, C., Schmid, T., Millan, R.,
Gonzalez, M., Aldea, M., Martan, R. and Morante, R., 2005. Mercury and trace
element fractionation in Almaden soils by application of different sequential
extraction procedures. Anal. Bioanal. Chem. 381(8): 1507-1513.
Sarkar, D., Essington, M.E. and Misra, K.C., 1999. Adsorption of mercury(II) by
variable charge surfaces of quartz and gibbsite. Soil Sci. Soc. Am. J. 63:
1626-1636.
Sarkar, D., Essington, M.E. and Misra, K.C., 2000. Adsorption of mercury(II) by
kaolinite. Soil Sci. Soc. Am. J. 64: 1698-1975.
Schnitzer, M. and Kerndorff, H., 1981. Reactions of fulvic acid with metal ions. Water,
Air, Soil Poll. 15: 97-108.
Schulze, D.G., 1984. The influence of aluminium on iron oxides. VIII. Unit-cell
dimension of Al-substituted goethites and estimation of Al from them. Clays
Clay Miner. 32(1): 36-44.
Schuster, E., 1991. The behavior of mercury in the soil with special emphasis on
complexation and adsorption processes- a review of the literature. Water Air
Soil Poll. 56: 667-680.
Schwertmann, U. and Latham, M., 1986. Properties of iron oxides in some new
caledonian oxisols. Geoderma. 39: 105-123.
40
insu
-004
2455
1, v
ersi
on 1
- 16
Oct
200
9

Schwertmann, U. and Cornell, R.M., 2000. Iron oxides in the laboratory : preparation
and characterization. Wiley-VCH, Weinheim, 188 pp.
959
960
961
962
963
964
965
966
967
968
969
970
971
972
973
974
975
976
977
978
979
980
981
982
983
Shannon, R., 1976. Revised effective ionic radii and systematic studies of interatomic
distances in halides and chalcogenides. Acta Crystallogr. 32(5): 751-767.
Skyllberg, U., Xia, K., Bloom, P.R., Nater, E.A. and Bleam, W.F., 2000. Binding of
mercury(II) to reduced sulfur in soil organic matter along upland-peat soil
transects. J. Environ. Qual. 29: 855-865.
Skyllberg, U., Bloom, P.R., Qian, J., Lin, C.-M. and Bleam, W.F., 2006. Complexation
of Mercury(II) in Soil Organic Matter: EXAFS Evidence for Linear Two-
Coordination with Reduced Sulfur Groups. Environ. Sci. Technol. 40(13):
4174-4180.
Sladek, C. and Gustin, M.S., 2003. Evaluation of sequential and selective extraction
methods for determination of mercury speciation and mobility in mine waste.
Appl. Geochem. 18(4): 567-576.
Slowey, A.J., Rytuba, J.J. and Brown, J.G.E., 2005. Speciation of mercury and mode
of transport from placer Gold Mine Tailings. Environ. Sci. Technol. 39(6):
1547-1554.
Slowey, A.J. and Brown, J.G.E., 2007. Transformations of mercury, iron, and sulfur
during the reductive dissolution of iron oxyhydroxide by sulfide. Geochim.
Cosmochim. Acta. 71(4): 877-894.
Stanjek, H. and Schwertmann, U., 1992. The influence of aluminium on iron oxides.
Part XVI: hydroxyl and aluminium substitution on synthetic hematites. Clays
Clay Miner. 40(3): 347-354.
Tandy, J.C., Grimaldi, M., Grimaldi, C. and Tessier, D., 1990. Mineralogical and
textural changes in French Guiana oxisols and their relation with
41
insu
-004
2455
1, v
ersi
on 1
- 16
Oct
200
9

microaggregation. In: L.A. Douglas (Editor), Soil micromorphology. A basic
and applied science. 8. International Working Meeting of Soil
Micromorphology. Developments in Soil Science. Elsevier, Amsterdam, pp.
191-198.
984
985
986
987
988
989
990
991
992
993
994
995
996
997
998
999
1000
1001
1002
1003
1004
1005
1006
1007
1008
Trivedi, P. and Axe, L., 2001. Ni and Zn Sorption to Amorphous versus Crystalline
Iron Oxides: Macroscopic Studies. J. Colloid Interface Sci., 244: 221-229.
Veiga, M. and Baker, R., 2004. Protocols for environmental and health assessment
of mercury released by artisanal and small scale miners. Report to the Global
mercury project: removal of barriers to introduction of cleaner artisanal gold
mining and extraction technologies, GEF/UNDP/UNIDO; 2004. p. 170.
Velasquez, E., Pelosi, C., Brunet, D., Grimaldi, M., Martins, M., Rendeiro, A.C.,
Barrios, E. and Lavelle, P., 2007. This ped is my ped: Visual separation and
near infrared spectra allow determination of the origins of soil
macroaggregates. Pedobiologia. 51(1): 75-87.
Wallschlager, D., Desai, M.V.M., Spengler, M. and Wilken, R.-D., 1998. Mercury
speciation in floodplain soils and sediments along a contaminated river
transect. J. Environ. Qual. 27: 1034-1044.
Webster, R., 2001. Statistics to support soil research and their presentation. Eur. J.
Soil Sci. 52(2): 331-340.
Weerasooriya, R., Tobschall, H.J., Seneviratne, W. and Bandara, A., 2007.
Transition state kinetics of Hg(II) adsorption at gibbsite-water interface. J.
Hazard. Mater. 147(3): 971-978.
Wentworth, C.K., 1922. A scale of grade and class terms for clastic sediments. J.
Geol. 30: 377-392.
42
insu
-004
2455
1, v
ersi
on 1
- 16
Oct
200
9

Table 1: Pearson correlation matrix (correlation coefficient (CC), P value (P) and
number of samples (N)) of pristine soils extracted Hg, Hg extraction yields, Fe, Al,
Clay size fraction, Fine silts, C and S for total and (a) HCl/HNO3 (labeled HCl) and
ascorbate (labeled Asco) selective extractions, and (b) KOH and NH4OH selective
extractions.
insu
-004
2455
1, v
ersi
on 1
- 16
Oct
200
9

Table 1a
Statistics
[Hg]HCl
(µg g-1)(Hg)HCl
(%)[Fe]HCl
(mg g-1)[Al]HCl
(mg g-1)Clay
(g/100g)Silt
(g/100g)C
(g/100g)S
(g/100g)[Hg]KOH
(µg g-1)(Hg)KOH
(%)[Fe]KOH
(mg g-1)[Al]KOH
(mg g-1)Clay
(g/100g)Silt
(g/100g)C
(g/100g)S
(g/100g)
CC 1.00 0.45 0.19 0.15 0.59 - 0.60 0.42 0.62 0.89 0.32 0.33 0.37 0.59 - 0.60 0.42 0.62 P 1.E-41 3.E-03 2.E-01 3.E-01 9.E-05 7.E-05 7.E-03 2.E-05 7.E-14 5.E-02 5.E-02 3.E-02 9.E-05 7.E-05 7.E-03 2.E-05N 40 40 40 40 38 38 40 40 38 38 36 36 38 38 40 40
CC 0.48 0.18 0.13 0.56 - 0.57 0.40 0.58 0.63 0.21 0.15 0.48 - 0.42 0.26 0.51 P 2.E-03 3.E-01 4.E-01 3.E-04 2.E-04 1.E-02 9.E-05 2.E-05 2.E-01 4.E-01 3.E-03 1.E-02 1.E-01 1.E-03N 40 40 40 38 38 40 40 38 36 36 36 36 38 38
CC 0.25 0.16 0.38 - 0.44 0.31 0.28 - 0.02 - 0.10 0.38 - 0.28 0.15 0.33 P 1.E-01 3.E-01 2.E-02 6.E-03 5.E-02 8.E-02 9.E-01 6.E-01 2.E-02 1.E-01 4.E-01 4.E-02N 40 40 38 38 40 40 36 36 36 36 38 38
CC 0.69 0.34 - 0.33 0.16 0.24 0.60 0.62 - 0.38 - 0.15 0.48 P 8.E-07 4.E-02 4.E-02 3.E-01 1.E-01 1.E-04 1.E-04 2.E-02 4.E-01 3.E-03N 40 38 38 40 40 36 34 34 36 36
CC 0.57 - 0.42 0.12 0.39 0.68 - 0.48 0.16 0.50 P 2.E-04 9.E-03 5.E-01 1.E-02 1.E-05 4.E-03 4.E-01 2.E-03N 38 38 40 40 34 34 36 36
CC - 0.80 0.37 0.80 - 0.80 0.37 0.80 P 3.E-09 2.E-02 2.E-09 3.E-09 2.E-02 2.E-09N 38 38 38 38 38 38
CC - 0.57 - 0.70 - 0.57 - 0.70 P 2.E-04 1.E-06 2.E-04 1.E-06N 38 38 38 38
CC 0.47 0.47 P 0.00251 3.E-03N 40 40
Clay (g/100g)
Silt (g/100g)
[HgT] (µg g-1)
[Hg]HCl
(µg g-1)
(Hg)HCl
(%)
C (g/100g)
[Fe]HCl
(mg g-1)
[Al]HCl
(mg g-1)
[HgT] (µg g-1)
[Hg]KOH
(µg g-1)
(Hg)KOH
(%)
[Fe]KOH
(mg g-1)
[Al]KOH
(mg g-1)
Clay (g/100g)
Silt (g/100g)
C (g/100g)
insu
-004
2455
1, v
ersi
on 1
- 16
Oct
200
9

Statistics
[Hg]Asco
(µg g-1)(Hg)Asco
(%)[Fe]Asco
(mg g-1)[Al]Asco
(mg g-1)Clay
(g/100g)Silt
(g/100g)C
(g/100g)S
(g/100g)[Hg]NH4OH
(µg g-1)(Hg)NH4OH
(%)[Fe]NH4OH
(mg g-1)[Al]NH4OH
(mg g-1)Clay
(g/100g)Silt
(g/100g)C
(g/100g)S
(g/100g)
CC 0.77 0.21 0.40 0.35 0.59 - 0.60 0.42 0.62 0.90 0.45 0.27 0.08 0.59 - 0.60 0.42 0.62 P 1.E-08 2.E-01 1.E-02 3.E-02 9.E-05 7.E-05 7.E-03 2.E-05 2.E-15 4.E-03 1.E-01 6.E-01 9.E-05 7.E-05 7.E-03 2.E-05N 39 39 40 40 38 38 40 40 40 40 39 40 38 38 40 40
CC 0.73 0.68 0.60 0.64 - 0.66 0.56 0.59 0.74 0.31 0.08 0.70 - 0.70 0.65 0.71 P 2.E-07 2.E-06 5.E-05 2.E-05 9.E-06 2.E-04 8.E-05 4.E-08 6.E-02 6.E-01 1.E-06 9.E-07 7.E-06 3.E-07N 39 39 39 37 37 39 39 40 39 40 38 38 40 40
CC 0.62 0.51 0.39 - 0.35 0.37 0.32 0.23 0.06 0.68 - 0.68 0.67 0.67 P 3.E-05 9.E-04 2.E-02 4.E-02 2.E-02 4.E-02 2.E-01 7.E-01 3.E-06 3.E-06 2.E-06 2.E-06N 39 39 37 37 39 39 39 40 38 38 40 40
CC 0.98 0.42 - 0.52 0.30 0.37 0.64 0.06 - 0.24 0.23 0.15 P 3.E-27 8.E-03 7.E-04 6.E-02 2.E-02 1.E-05 7.E-01 2.E-01 2.E-01 4.E-01N 40 38 38 40 40 39 37 37 39 39
CC 0.37 - 0.47 0.22 0.31 - 0.01 - 0.22 0.06 - 0.07 P 2.E-02 3.E-03 2.E-01 5.E-02 9.E-01 2.E-01 7.E-01 7.E-01N 38 38 40 40 38 38 40 40
CC - 0.80 0.37 0.80 - 0.80 0.37 0.80 P 3.E-09 2.E-02 2.E-09 3.E-09 2.E-02 2.E-09N 38 38 38 38 38 38
CC - 0.57 - 0.70 - 0.57 - 0.70 P 2.E-04 1.E-06 2.E-04 1.E-06N 38 38 38 38
CC 0.47 0.47 P 3.E-03 3.E-03N 40 40
[HgT] (µg g-1)
[Hg]NH4OH
(µg g-1)
(Hg)NH4OH
(%)
[Fe]NH4OH
(mg g-1)
[Al]NH4OH
(mg g-1)
Clay (g/100g)
Silt (g/100g)
Clay (g/100g)
Silt (g/100g)
C (g/100g)
[HgT] (µg g-1)
[Hg]Asco
(µg g-1)
(Hg)Asco
(%)
[Fe]Asco
(mg g-1)
C (g/100g)
[Al]Asco
(mg g-1)
Table 1b
insu
-004
2455
1, v
ersi
on 1
- 16
Oct
200
9

Table 2: Pearson correlation matrix (correlation coefficient (CC), P value (P) and
number of samples (N)) of contaminated soils extracted Hg, Hg extraction
yields, Fe, Al, Clay size fraction, Fine silts, C and S for total and (a)
HCl/HNO3 (labeled HCl) and ascorbate (labeled Asco) selective
extractions, and (b) KOH and NH4OH selective extractions.
insu
-004
2455
1, v
ersi
on 1
- 16
Oct
200
9

Table 2a
Statistics
[Hg]HCl
(µg g-1)(Hg)HCl
(%)[Fe]HCl
(mg g-1)[Al]HCl
(mg g-1)Clay
(g/100g)Sand
(g/100g)C
(g/100g)S
(g/100g)[Hg]KOH
(µg g-1)(Hg)KOH
(%)[Fe]KOH
(mg g-1)[Al]KOH
(mg g-1)Clay
(g/100g)Sand
(g/100g)C
(g/100g)S
(g/100g)
CC 1.00 0.22 - 0.29 - 0.34 - 0.52 0.50 - 0.09 - 0.08 0.88 0.22 - 0.21 - 0.38 - 0.52 0.50 - 0.09 - 0.08 P 4.E-86 2.E-01 8.E-02 4.E-02 1.E-03 2.E-03 6.E-01 7.E-01 2.E-12 2.E-01 2.E-01 2.E-02 1.E-03 2.E-03 6.E-01 7.E-01N 37 37 37 37 37 37 37 37 35 35 37 37 37 37 37 37
CC 0.22 - 0.30 - 0.35 - 0.52 0.50 - 0.09 - 0.08 0.55 - 0.20 - 0.29 - 0.46 0.52 - 0.27 - 0.25 P 2.E-01 8.E-02 4.E-02 1.E-03 2.E-03 6.E-01 7.E-01 7.E-04 3.E-01 9.E-02 6.E-03 1.E-03 1.E-01 1.E-01N 37 37 37 37 37 37 37 35 35 35 35 35 35 35
CC - 0.50 - 0.80 - 0.14 0.22 0.21 0.19 0.01 0.18 - 0.04 0.26 - 0.40 - 0.34 P 2.E-03 3.E-09 4.E-01 2.E-01 2.E-01 3.E-01 9.E-01 3.E-01 8.E-01 1.E-01 2.E-02 4.E-02N 37 37 37 37 37 37 35 35 35 35 35 35
CC 0.86 0.37 - 0.32 - 0.14 - 0.08 0.54 0.37 - 0.29 0.00 0.04 P 8.E-12 3.E-02 5.E-02 4.E-01 6.E-01 6.E-04 3.E-02 8.E-02 1.E+00 8.E-01N 37 37 37 37 37 37 37 37 37 37
CC 0.42 - 0.41 - 0.11 - 0.07 0.57 - 0.49 0.09 0.22 P 1.E-02 1.E-02 5.E-01 7.E-01 2.E-04 2.E-03 6.E-01 2.E-01N 37 37 37 37 37 37 37 37
CC - 0.85 0.05 0.09 - 0.85 0.05 0.09 P 4.E-11 8.E-01 6.E-01 4.E-11 8.E-01 6.E-01N 37 37 37 37 37 37
CC - 0.38 - 0.41 - 0.38 - 0.41 P 2.E-02 1.E-02 2.E-02 1.E-02N 37 37 37 37
CC 0.94 0.94 P 2.1E-18 2.E-18N 37 37
[HgT] (µg g-1)
[Hg]KOH
(µg g-1)
(Hg)KOH
(%)
[Fe]KOH
(mg g-1)
[Al]KOH
(mg g-1)
Clay (g/100g)
Sand (g/100g)
C (g/100g)
C (g/100g)
[Fe]HCl
(mg g-1)
[Al]HCl
(mg g-1)
Clay (g/100g)
Sand (g/100g)
[HgT] (µg g-1)
[Hg]HCl
(µg g-1)
(Hg)HCl
(%)
insu
-004
2455
1, v
ersi
on 1
- 16
Oct
200
9
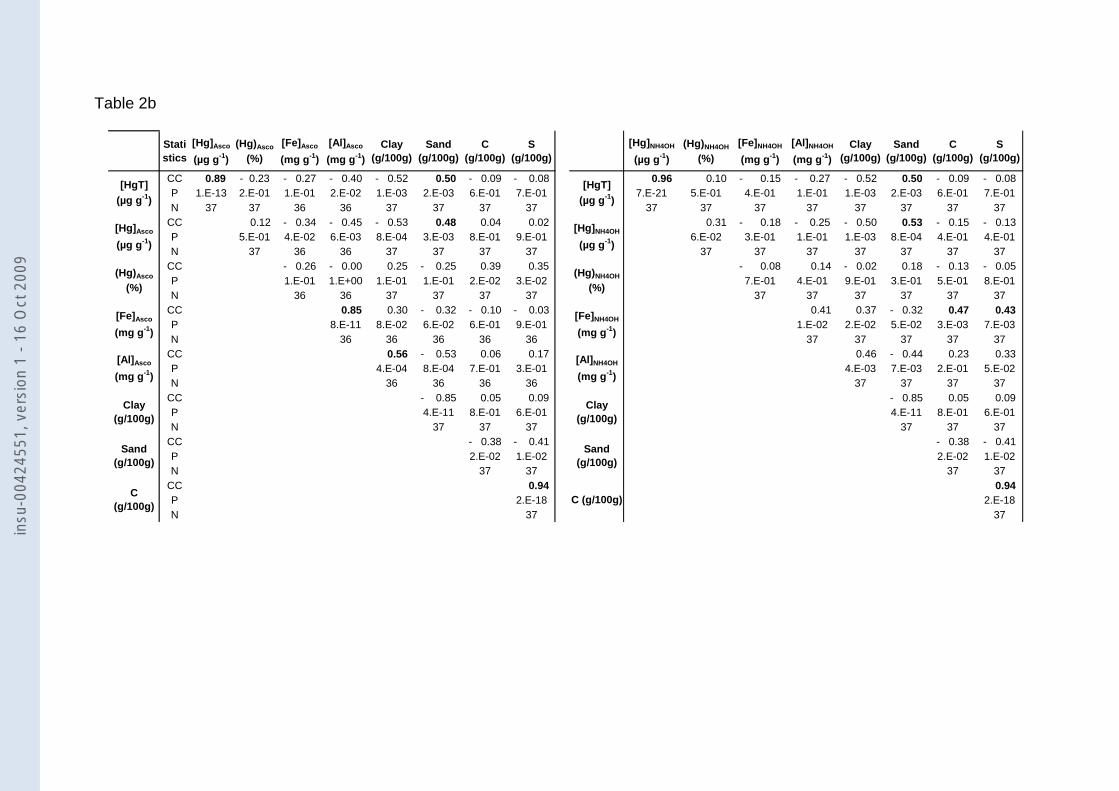
Table 2b
Statistics
[Hg]Asco
(µg g-1)(Hg)Asco
(%)[Fe]Asco
(mg g-1)[Al]Asco
(mg g-1)Clay
(g/100g)Sand
(g/100g)C
(g/100g)S
(g/100g)[Hg]NH4OH
(µg g-1)(Hg)NH4OH
(%)[Fe]NH4OH
(mg g-1)[Al]NH4OH
(mg g-1)Clay
(g/100g)Sand
(g/100g)C
(g/100g)S
(g/100g)
CC 0.89 - 0.23 - 0.27 - 0.40 - 0.52 0.50 - 0.09 - 0.08 0.96 0.10 - 0.15 - 0.27 - 0.52 0.50 - 0.09 - 0.08 P 1.E-13 2.E-01 1.E-01 2.E-02 1.E-03 2.E-03 6.E-01 7.E-01 7.E-21 5.E-01 4.E-01 1.E-01 1.E-03 2.E-03 6.E-01 7.E-01N 37 37 36 36 37 37 37 37 37 37 37 37 37 37 37 37
CC 0.12 - 0.34 - 0.45 - 0.53 0.48 0.04 0.02 0.31 - 0.18 - 0.25 - 0.50 0.53 - 0.15 - 0.13 P 5.E-01 4.E-02 6.E-03 8.E-04 3.E-03 8.E-01 9.E-01 6.E-02 3.E-01 1.E-01 1.E-03 8.E-04 4.E-01 4.E-01N 37 36 36 37 37 37 37 37 37 37 37 37 37 37
CC - 0.26 - 0.00 0.25 - 0.25 0.39 0.35 - 0.08 0.14 - 0.02 0.18 - 0.13 - 0.05 P 1.E-01 1.E+00 1.E-01 1.E-01 2.E-02 3.E-02 7.E-01 4.E-01 9.E-01 3.E-01 5.E-01 8.E-01N 36 36 37 37 37 37 37 37 37 37 37 37
CC 0.85 0.30 - 0.32 - 0.10 - 0.03 0.41 0.37 - 0.32 0.47 0.43 P 8.E-11 8.E-02 6.E-02 6.E-01 9.E-01 1.E-02 2.E-02 5.E-02 3.E-03 7.E-03N 36 36 36 36 36 37 37 37 37 37
CC 0.56 - 0.53 0.06 0.17 0.46 - 0.44 0.23 0.33 P 4.E-04 8.E-04 7.E-01 3.E-01 4.E-03 7.E-03 2.E-01 5.E-02N 36 36 36 36 37 37 37 37
CC - 0.85 0.05 0.09 - 0.85 0.05 0.09 P 4.E-11 8.E-01 6.E-01 4.E-11 8.E-01 6.E-01N 37 37 37 37 37 37
CC - 0.38 - 0.41 - 0.38 - 0.41 P 2.E-02 1.E-02 2.E-02 1.E-02N 37 37 37 37
CC 0.94 0.94 P 2.E-18 2.E-18N 37 37
C (g/100g)
[Al]Asco
(mg g-1)
Clay (g/100g)
Sand (g/100g)
C (g/100g)
[HgT] (µg g-1)
[Hg]Asco
(µg g-1)
(Hg)Asco
(%)
[Fe]Asco
(mg g-1)
[HgT] (µg g-1)
[Hg]NH4OH
(µg g-1)
(Hg)NH4OH
(%)
[Fe]NH4OH
(mg g-1)
[Al]NH4OH
(mg g-1)
Clay (g/100g)
Sand (g/100g)
insu
-004
2455
1, v
ersi
on 1
- 16
Oct
200
9

Figure captions
Fig. 1: Top left: french Guiana map with the studied site location (closed circle). Right
and bottom: detailed map of the studied site, including general watershed scheme
with soil sampling locations, and associated legend.
Fig. 2: Evolutions with depth of total Hg, C and C/N ratio for (a) pristine and (b)
contaminated soils. Evolutions with depth of the clay- and sand-size fractions are
reported for pristine and contaminated soils, respectively.
Fig. 3: XRD patterns normalized on quartz peak (refer to the text for details) for raw
samples, and following ascorbate, KOH, NH4OH and HCl/HNO3 extractions.
Fig. 4: Top : Evolutions with depth of Fe and Al concentrations extracted by
ascorbate and corresponding Al/Fe ratio. Bottom: same graphs as top, focused on
calculated crystalline + residual fraction in pristine soils.
Fig. 5: Evolutions with depth of (Hg)HCl/HNO3, (Hg)CR, (Hg)Asco, (Hg)NH4OH, and (Hg)KOH
extraction yield (%) in pristine soils. Triangles, circles and squares refer to
toposequence I, II and III, and white, grey and black filled colours refer to ferralsols,
acrisols and gleysols, respectively.
Fig. 6: XRD patterns of nodules from pristine soils I-2 (10-20cm), I-2 (30-40cm), and
I-2 (180-200cm).
Fig. 7: µXRF mapping of Si, K, Fe, Au and Hg of SL6 (30-50 cm) sample and counts
measured on Lα edge fluorescence of Hg and Au versus Kα radiation of Si, K and
Fe, and comparison on counts measured for Hg (Y axis) versus Au (X axis).
Fig. 8: Evolution with depth of (Hg)HCl/HNO3, (Hg)CR, (Hg)Asco, (Hg)NH4OH, (Hg)KOH and
(Hg0) pyrolysis extraction yields (%) in contaminated soils.
insu
-004
2455
1, v
ersi
on 1
- 16
Oct
200
9

Fig. 1.
insu
-004
2455
1, v
ersi
on 1
- 16
Oct
200
9

Fig. 2.a.
Pristine soils
Hg (ng g-1)
0 200 400 1200
Dep
th (c
m)
020406080
100120140160180200
C (g/100g)
0 2 4 6 8 10
Clay fraction (g/100g) (<2mm)
0 20 40 60 80 100
S (g/100g)
0.00 0.03 0.05 0.08 0.10
Ferralsol (I-2)Ferralsol (II-3)Ferralsol (III-2)Acrisol (I-1) Acrisol (II-2)Acrisol (III-1) Gleysol (II-1)
insu
-004
2455
1, v
ersi
on 1
- 16
Oct
200
9

Contaminated soils
Hg (ng g-1)0 1000 2000 6000 9000
Dep
th (c
m)
0
20
40
60
80
100
120
140
C (g/100g)
0 5 10 15 20 25
S (g/100g)
0.00 0.05 0.10 0.15 0.20 0.25
Sand fraction (g/100g) (<2mm)
0 20 40 60 80 100
II-0SL0SL1SL2SL3SL4SL5SL6SL7SL8SL9G5III-0
Fig. 2.b.
insu
-004
2455
1, v
ersi
on 1
- 16
Oct
200
9

Fig. 3.
insu
-004
2455
1, v
ersi
on 1
- 16
Oct
200
9

Fig. 4.
[Al]Cryst (mg g-1)
0 10 20 30 45 600
50
100
150
200
[Al]Asco (mg g-1)
0 5 10 15 20 250
50
100
150
200
[Fe]Asco (mg g-1)
0 5 10 15 20 25 30D
epth
(cm
)
0
50
100
150
200 [Al]Asco (mg g-1)
0 5 10 15 20 25
[Fe]
Asc
o (m
g g-1
)
0
10
20
30
R² = 0.
95
0 2 4 60
2
4
6
8
[Fe]Cryst (mg g-1)0 10 20 30 40 50 80 100120
Dep
th (c
m)
0
50
100
150
200
[Al]Cryst (mg g-1)0 20 40 60 80
[Fe]
Cry
st (
mg
g-1)
0
20
40
60
R² = 0.
55
insu
-004
2455
1, v
ersi
on 1
- 16
Oct
200
9

Fig. 5.
(Hg)NH4OH Extraction Yield (%)
0 20 40 60 80 100
Dep
th (c
m)
0
50
100
150
200
[Hg]HCl/HNO3 Extraction Yield (%)
0 20 40 60 80 100D
epth
(cm
)0
50
100
150
200
(Hg)Asco Extraction Yield (%)
0 20 40 60 80 1000
50
100
150
200
(Hg)CR Extraction Yield (%)
0 20 40 60 80 1000
50
100
150
200
Ferralsol (I-2)Ferralsol (II-3)Ferralsol (III-2)Acrisol (I-1) Acrisol (II-2)Acrisol (III-1) Gleysol (II-1)
(Hg)KOH Extraction Yield (%)
0 20 40 60 80 1000
50
100
150
200
insu
-004
2455
1, v
ersi
on 1
- 16
Oct
200
9

Fig. 6.
insu
-004
2455
1, v
ersi
on 1
- 16
Oct
200
9

Fig . 7.
insu
-004
2455
1, v
ersi
on 1
- 16
Oct
200
9

Fig . 8.
(Hg)HCl Extraction Yield (%)
80 85 90 95 100
Dep
th (c
m)
0
20
40
60
80
100
120
140
(Hg)NH4OH Extraction Yield (%)
0 20 40 60 80 100
Dep
th (c
m)
0
20
40
60
80
100
120
140
(Hg)CR Extraction Yield (%)
0 20 40 60 80 1000
20
40
60
80
100
120
140
(Hg)Asco Extraction Yield (%)
0 20 40 60 80 1000
20
40
60
80
100
120
140
(Hg)KOH Extraction Yield (%)
0 20 40 60 80 1000
20
40
60
80
100
120
140
II-0SL0SL1SL2SL3SL4SL5SL6SL7SL8SL9G5III-0
Pyrolysis extraction yield (%)
0 20 40 60 80 1000
20
40
60
80
100
120
140
insu
-004
2455
1, v
ersi
on 1
- 16
Oct
200
9

Supplementary data 2
(Electronic table)
Table E1: Percent recoveries of Hg in supernatant and solid residue for Certified materials CRM 7002, MESS-3 and sample I-1 (0-
10 cm) for ascorbate, NH4OH , KOH and HCl/HNO3 selective extractions.
Sample CRM 7002 MESS- 3 I-1 (0-10 cm) CRM 7002 MESS- 3 CRM 7002 MESS- 3 I-1 (0-10 cm) CRM 7002 MESS- 3 I-1 (0-10 cm)
Mean 98.8 68.7 60.4 102.1 93.5 106.5 96.4 87.9 101.0 114.9 109.5Std. Error 12.3 13.4 5.31 9.57 10.9 13.6 5.45 3.27 6.46 19.1 9.70 Median 89.9 62.9 60.4 99.0 88.2 94.5 96.5 90.4 96.7 95.6 108.5
0.25 Perc. 75.5 55.6 53.5 90.3 80.4 90.5 89.3 83.7 96.7 91.0 95.70.75 Perc. 116.2 77.8 67.3 114.8 107.9 117.8 103.5 91.5 110.7 127.6 123.3Size (N) 6 5 3 3 3 5 3.0 3 7 5 4
Ascorbate KOH HCl/HNO3NH4OH
insu
-004
2455
1, v
ersi
on 1
- 16
Oct
200
9

Supplementary Figure captions
Fig. E1a: X-ray diffraction pattern of CRM Mess-3 (black trace) showing identified
minerals (colored ticks)
Fig. E1b: Normalized X-ray diffraction patterns of CRM Mess-3 before and after
NH4OH extraction (black and red traces, respectively) showing identified
minerals (colored ticks)
Fig. E1c: Normalized X-ray diffraction patterns of CRM Mess-3 before and after KOH
extraction (black and red traces, respectively) showing identified minerals
(colored ticks)
Fig. E1d: Normalized X-ray diffraction patterns of CRM Mess-3 before and after
ascorbate extraction (black and red traces, respectively) showing identified
minerals (colored ticks)
Fig. E1e: Normalized X-ray diffraction patterns of CRM Mess-3 before and after
HCl/HNO3 extraction (black and red traces, respectively) showing
identified minerals (colored ticks)
Fig. E2a: X-ray diffraction pattern of CRM 7002 (black trace) showing identified
minerals (colored ticks)
Fig. E2b: Normalized X-ray diffraction patterns of CRM 7002 before and after
NH4OH extraction (black and red traces, respectively) showing identified
minerals (colored ticks)
Fig. E2c: Normalized X-ray diffraction patterns of CRM 7002 before and after KOH
extraction (black and red traces, respectively) showing identified minerals
(colored ticks)
insu
-004
2455
1, v
ersi
on 1
- 16
Oct
200
9

Fig. E2d: Normalized X-ray diffraction patterns of CRM 7002 before and after
ascorbate extraction (black and red traces, respectively) showing identified
minerals (colored ticks)
Fig. E2e: Normalized X-ray diffraction patterns of CRM 7002 before and after
HCl/HNO3 extraction (black and red traces, respectively) showing
identified minerals (colored ticks)
Fig. E3a: X-ray diffraction pattern of sample I-1(0-10m) (black trace) showing
identified minerals (colored ticks)
Fig. E3b: Normalized X-ray diffraction patterns of sample I-1(0-10m) before and after
NH4OH extraction (black and red traces, respectively) showing identified
minerals (colored ticks)
Fig. E3c: Normalized X-ray diffraction patterns of sample I-1(0-10m) before and after
KOH extraction (black and red traces, respectively) showing identified
minerals (colored ticks)
Fig. E3d: Normalized X-ray diffraction patterns of sample I-1(0-10m) before and after
ascorbate extraction (black and red traces, respectively) showing identified
minerals (colored ticks)
Fig. E3e: Normalized X-ray diffraction patterns of sample I-1(0-10m) before and after
HCl/HNO3 extraction (black and red traces, respectively) showing
identified minerals (colored ticks)
Fig. E4: X-ray diffraction pattern of nodules from sample I-1(180-200m) (black trace)
showing identified minerals (colored ticks)
Fig. E5: Total Hg, (Hg)HCl/HNO3, (Hg)residual, (Hg)Asco, (Hg)NH4OH, and (Hg)KOH extractions
extraction yield (%) vertical profiles in nodules of pristine soils. Triangles
refer to toposequence I, triangles up refers to surface nodules, and
insu
-004
2455
1, v
ersi
on 1
- 16
Oct
200
9

triangle down to deeper horizons III. white and grey filled colours refer to
oxisol and ultisol, respectively. Filled triangles refer to sol matrix and hair-
crossed symbols refer to nodules.
insu
-004
2455
1, v
ersi
on 1
- 16
Oct
200
9

Meas3 non attaque - batch 1
00-021-1272 (*) - Anatase, syn - TiO2 - Y: 1.92 % - d x by: 1. - WL: 1.5406 - Tetragonal - a 3.7852 - b 3.78520 - 01-075-0306 (C) - Halite - NaCl - Y: 6.09 % - d x by: 1. - WL: 1.5406 - Cubic - a 5.64000 - b 5.64000 - c 5.6400000-036-0426 (*) - Dolomite - CaMg(CO3)2 - Y: 6.26 % - d x by: 1. - WL: 1.5406 - Rhombo.H.axes - a 4.8092 - b 01-080-0886 (C) - Kaolinite - Al2(Si2O5)(OH)4 - Y: 2.14 % - d x by: 1. - WL: 1.5406 - 0 - I/Ic PDF 1.1 -
01-074-1137 (C) - Clinochlore - Al2Mg5Si3O10(OH)8 - Y: 2.09 % - d x by: 1. - WL: 1.5406 - 0 - I/Ic PDF 1. - 01-082-2450 (C) - Muscovite - (Na0.07K0.90Ba0.01)(Al1.84Ti0.04Fe0.07Mg0.04)(Si3.02Al0.98)O10( - Y: 2.75 00-009-0466 (*) - Albite, ordered - NaAlSi3O8 - Y: 2.48 % - d x by: 1. - WL: 1.5406 - 0 - I/Ic PDF 2.1 - 00-019-0932 (I) - Microcline, intermediate - KAlSi3O8 - Y: 1.23 % - d x by: 1. - WL: 1.5406 - 0 - 00-046-1045 (*) - Quartz, syn - SiO2 - Y: 27.87 % - d x by: 1. - WL: 1.54439 - Hexagonal - a 4.91344 - b 4.913400-046-1045 (*) - Quartz, syn - SiO2 - Y: 66.86 % - d x by: 1. - WL: 1.5406 - Hexagonal - a 4.91344 - b 4.91344 Operations: X Offset 0.000 | X Offset -0.033 | Background 0.021,1.000 | ImportMeas3 non attaque - batch 1 - File: BT20_SYLSTEPH.RAW - Type: 2Th/Th locked - Start: 5.000 ° - End: 80.000
Lin
(Cou
nts)
0
1000
2000
3000
4000
5000
6000
7000
8000
9000
10000
11000
12000
13000
14000
15000
16000
17000
2-Theta - Scale5 10 20 30 40 50 60 70
CRM Mess-3 / raw sample
Fig. E1a. X-ray diffraction pattern of CRM Mess-3 (black trace) showing identified minerals (colored ticks)in
su-0
0424
551,
ver
sion
1 -
16 O
ct 2
009

Meas3 non attaque - batch 1
00-021-1272 (*) - Anatase, syn - TiO2 - Y: 1.63 % - d x by: 1. - WL: 1.5406 - Tetragonal - a 3.7852 - b 3.78520 - 01-075-0306 (C) - Halite - NaCl - Y: 5.16 % - d x by: 1. - WL: 1.5406 - Cubic - a 5.64000 - b 5.64000 - c 5.6400000-036-0426 (*) - Dolomite - CaMg(CO3)2 - Y: 5.30 % - d x by: 1. - WL: 1.5406 - Rhombo.H.axes - a 4.8092 - b 01-080-0886 (C) - Kaolinite - Al2(Si2O5)(OH)4 - Y: 1.81 % - d x by: 1. - WL: 1.5406 - 0 - I/Ic PDF 1.1 - 01-074-1137 (C) - Clinochlore - Al2Mg5Si3O10(OH)8 - Y: 1.77 % - d x by: 1. - WL: 1.5406 - 0 - I/Ic PDF 1. - 01-082-2450 (C) - Muscovite - (Na0.07K0.90Ba0.01)(Al1.84Ti0.04Fe0.07Mg0.04)(Si3.02Al0.98)O10( - Y: 2.33
00-009-0466 (*) - Albite, ordered - NaAlSi3O8 - Y: 2.10 % - d x by: 1. - WL: 1.5406 - 0 - I/Ic PDF 2.1 - 00-019-0932 (I) - Microcline, intermediate - KAlSi3O8 - Y: 1.04 % - d x by: 1. - WL: 1.5406 - 0 - 00-046-1045 (*) - Quartz, syn - SiO2 - Y: 23.60 % - d x by: 1. - WL: 1.54439 - Hexagonal - a 4.91344 - b 4.913400-046-1045 (*) - Quartz, syn - SiO2 - Y: 56.62 % - d x by: 1. - WL: 1.5406 - Hexagonal - a 4.91344 - b 4.91344 Operations: Background 0.014,1.000 | ImportN1 (true) batch1 - File: BT26_SylSteph_1scan.RAW - Type: 2Th/Th locked - Start: 5.000 ° - End: 80.000 ° - StepOperations: X Offset 0.000 | X Offset -0.033 | Background 0.021,1.000 | ImportMeas3 non attaque - batch 1 - File: BT20_SYLSTEPH.RAW - Type: 2Th/Th locked - Start: 5.000 ° - End: 80.000
Lin
(Cou
nts)
0
1000
2000
3000
4000
5000
6000
7000
2-Theta - Scale5 10 20 30 40 50 60 70 8
CRM Mess-3 / NH4 OH
Fig. E1b. Normalized X-ray diffraction patterns of CRM Mess-3 before and after NH4 OH extraction (black and red traces, respectively) showing identified minerals (colored ticks)
insu
-004
2455
1, v
ersi
on 1
- 16
Oct
200
9

Meas3 non attaque - batch 1
00-021-1272 (*) - Anatase, syn - TiO2 - Y: 1.63 % - d x by: 1. - WL: 1.5406 - Tetragonal - a 3.7852 - b 3.78520 - 01-075-0306 (C) - Halite - NaCl - Y: 5.16 % - d x by: 1. - WL: 1.5406 - Cubic - a 5.64000 - b 5.64000 - c 5.6400000-036-0426 (*) - Dolomite - CaMg(CO3)2 - Y: 5.30 % - d x by: 1. - WL: 1.5406 - Rhombo.H.axes - a 4.8092 - b 01-080-0886 (C) - Kaolinite - Al2(Si2O5)(OH)4 - Y: 1.81 % - d x by: 1. - WL: 1.5406 - 0 - I/Ic PDF 1.1 - 01-074-1137 (C) - Clinochlore - Al2Mg5Si3O10(OH)8 - Y: 1.77 % - d x by: 1. - WL: 1.5406 - 0 - I/Ic PDF 1. - 01-082-2450 (C) - Muscovite - (Na0.07K0.90Ba0.01)(Al1.84Ti0.04Fe0.07Mg0.04)(Si3.02Al0.98)O10( - Y: 2.33
00-009-0466 (*) - Albite, ordered - NaAlSi3O8 - Y: 2.10 % - d x by: 1. - WL: 1.5406 - 0 - I/Ic PDF 2.1 - 00-019-0932 (I) - Microcline, intermediate - KAlSi3O8 - Y: 1.04 % - d x by: 1. - WL: 1.5406 - 0 - 00-046-1045 (*) - Quartz, syn - SiO2 - Y: 23.60 % - d x by: 1. - WL: 1.54439 - Hexagonal - a 4.91344 - b 4.913400-046-1045 (*) - Quartz, syn - SiO2 - Y: 56.62 % - d x by: 1. - WL: 1.5406 - Hexagonal - a 4.91344 - b 4.91344 Operations: Y Scale Mul 1.000 | Background 0.014,1.000 | ImportMESS3 KOH - MESSK2 Batch1 - File: BT22_SylSteph.RAW - Type: 2Th/Th locked - Start: 5.000 ° - End: 80.00Operations: X Offset 0.000 | X Offset -0.033 | Background 0.021,1.000 | ImportMeas3 non attaque - batch 1 - File: BT20_SYLSTEPH.RAW - Type: 2Th/Th locked - Start: 5.000 ° - End: 80.000
Lin
(Cou
nts)
0
1000
2000
3000
4000
5000
6000
7000
2-Theta - Scale5 10 20 30 40 50 60 70 8
CRM Mess-3 / KOH
Fig. E1c. Normalized X-ray diffraction patterns of CRM Mess-3 before and after KOH extraction (black and red traces, respectively) showing identified minerals (colored ticks)
insu
-004
2455
1, v
ersi
on 1
- 16
Oct
200
9

Meas3 non attaque - batch 1
00-021-1272 (*) - Anatase, syn - TiO2 - Y: 1.63 % - d x by: 1. - WL: 1.5406 - Tetragonal - a 3.7852 - b 3.78520 - 01-075-0306 (C) - Halite - NaCl - Y: 5.16 % - d x by: 1. - WL: 1.5406 - Cubic - a 5.64000 - b 5.64000 - c 5.6400000-036-0426 (*) - Dolomite - CaMg(CO3)2 - Y: 5.30 % - d x by: 1. - WL: 1.5406 - Rhombo.H.axes - a 4.8092 - b 01-080-0886 (C) - Kaolinite - Al2(Si2O5)(OH)4 - Y: 1.81 % - d x by: 1. - WL: 1.5406 - 0 - I/Ic PDF 1.1 - 01-074-1137 (C) - Clinochlore - Al2Mg5Si3O10(OH)8 - Y: 1.77 % - d x by: 1. - WL: 1.5406 - 0 - I/Ic PDF 1. - 01-082-2450 (C) - Muscovite - (Na0.07K0.90Ba0.01)(Al1.84Ti0.04Fe0.07Mg0.04)(Si3.02Al0.98)O10( - Y: 2.33
00-009-0466 (*) - Albite, ordered - NaAlSi3O8 - Y: 2.10 % - d x by: 1. - WL: 1.5406 - 0 - I/Ic PDF 2.1 - 00-019-0932 (I) - Microcline, intermediate - KAlSi3O8 - Y: 1.04 % - d x by: 1. - WL: 1.5406 - 0 - 00-046-1045 (*) - Quartz, syn - SiO2 - Y: 23.60 % - d x by: 1. - WL: 1.54439 - Hexagonal - a 4.91344 - b 4.913400-046-1045 (*) - Quartz, syn - SiO2 - Y: 56.62 % - d x by: 1. - WL: 1.5406 - Hexagonal - a 4.91344 - b 4.91344 Operations: Background 0.014,1.000 | ImportSample A4 - batch1 - File: BT17_SylSteph.RAW - Type: 2Th/Th locked - Start: 5.000 ° - End: 80.000 ° - Step: 0.Operations: X Offset 0.000 | X Offset -0.033 | Background 0.021,1.000 | ImportMeas3 non attaque - batch 1 - File: BT20_SYLSTEPH.RAW - Type: 2Th/Th locked - Start: 5.000 ° - End: 80.000
Lin
(Cou
nts)
0
1000
2000
3000
4000
5000
6000
7000
2-Theta - Scale5 10 20 30 40 50 60 70 8
CRM Mess-3 / Ascorbate
Fig. E1d. Normalized X-ray diffraction patterns of CRM Mess-3 before and after ascorbate extraction (black and red traces, respectively) showing identified minerals (colored ticks)
insu
-004
2455
1, v
ersi
on 1
- 16
Oct
200
9

Meas3 non attaque - batch 1
00-021-1272 (*) - Anatase, syn - TiO2 - Y: 1.63 % - d x by: 1. - WL: 1.5406 - Tetragonal - a 3.7852 - b 3.78520 - 01-075-0306 (C) - Halite - NaCl - Y: 5.16 % - d x by: 1. - WL: 1.5406 - Cubic - a 5.64000 - b 5.64000 - c 5.6400000-036-0426 (*) - Dolomite - CaMg(CO3)2 - Y: 5.30 % - d x by: 1. - WL: 1.5406 - Rhombo.H.axes - a 4.8092 - b 01-080-0886 (C) - Kaolinite - Al2(Si2O5)(OH)4 - Y: 1.81 % - d x by: 1. - WL: 1.5406 - 0 - I/Ic PDF 1.1 - 01-074-1137 (C) - Clinochlore - Al2Mg5Si3O10(OH)8 - Y: 1.77 % - d x by: 1. - WL: 1.5406 - 0 - I/Ic PDF 1. - 01-082-2450 (C) - Muscovite - (Na0.07K0.90Ba0.01)(Al1.84Ti0.04Fe0.07Mg0.04)(Si3.02Al0.98)O10( - Y: 2.33
00-009-0466 (*) - Albite, ordered - NaAlSi3O8 - Y: 2.10 % - d x by: 1. - WL: 1.5406 - 0 - I/Ic PDF 2.1 - 00-019-0932 (I) - Microcline, intermediate - KAlSi3O8 - Y: 1.04 % - d x by: 1. - WL: 1.5406 - 0 - 00-046-1045 (*) - Quartz, syn - SiO2 - Y: 23.60 % - d x by: 1. - WL: 1.54439 - Hexagonal - a 4.91344 - b 4.913400-046-1045 (*) - Quartz, syn - SiO2 - Y: 56.62 % - d x by: 1. - WL: 1.5406 - Hexagonal - a 4.91344 - b 4.91344 Operations: Y Scale Mul 0.750 | Background 0.014,1.000 | ImportMESS3 H1 batch1 - File: BT21_SylSteph.RAW - Type: 2Th/Th locked - Start: 5.000 ° - End: 80.000 ° - Step: 0.0Operations: X Offset 0.000 | X Offset -0.033 | Background 0.021,1.000 | ImportMeas3 non attaque - batch 1 - File: BT20_SYLSTEPH.RAW - Type: 2Th/Th locked - Start: 5.000 ° - End: 80.000
Lin
(Cou
nts)
0
1000
2000
3000
4000
5000
6000
7000
2-Theta - Scale5 10 20 30 40 50 60 70 8
CRM Mess-3 / HCl/HNO3
Fig. E1e. Normalized X-ray diffraction patterns of CRM Mess-3 before and after HCl extraction (black and red traces, respectively) showing identified minerals (colored ticks)
insu
-004
2455
1, v
ersi
on 1
- 16
Oct
200
9

Batch3 - CRM 7002 non attaqué
00-005-0628 (*) - Halite, syn - NaCl - Y: 1.05 % - d x by: 1. - WL: 1.5406 - Cubic - a 5.63080 - b 5.63080 - c 5.6300-005-0586 (*) - Calcite, syn - CaCO3 - Y: 0.88 % - d x by: 1. - WL: 1.5406 - Rhombo.H.axes - a 4.98276 - b 4.01-071-1060 (C) - Hornblende - Na.9K.4Ca1.6Mg2.9Fe1.4Ti.5Al2.4Si6O24 - Y: 0.65 % - d x by: 1. - WL: 1.5406
01-082-0038 (C) - Clinochlore IIb-4 (Cr-, Mg-rich) - (Mg0.99Al0.01)5(Al0.67Fe0.33)(Si3.02Al0.98)O10(OH)8 - Y: 01-082-2450 (C) - Muscovite - (Na0.07K0.90Ba0.01)(Al1.84Ti0.04Fe0.07Mg0.04)(Si3.02Al0.98)O10( - Y: 0.44 00-009-0466 (*) - Albite, ordered - NaAlSi3O8 - Y: 8.34 % - d x by: 1. - WL: 1.5406 - 0 - I/Ic PDF 2.1 - 00-019-0932 (I) - Microcline, intermediate - KAlSi3O8 - Y: 12.51 % - d x by: 1. - WL: 1.5406 - 0 - 00-046-1045 (*) - Quartz, syn - SiO2 - Y: 33.87 % - d x by: 1. - WL: 1.54439 - 0 - I/Ic PDF 3.4 - 00-046-1045 (*) - Quartz, syn - SiO2 - Y: 68.14 % - d x by: 1. - WL: 1.5406 - 0 - I/Ic PDF 3.4 - Operations: Background 0.120,1.000 | ImportBatch3 - CRM 7002 non attaqué - File: BT3_SylSteph.RAW - Type: 2Th/Th locked - Start: 5.000 ° - End: 80.000
Lin
(Cou
nts)
0
1000
2000
3000
4000
5000
6000
7000
8000
9000
10000
11000
12000
13000
14000
15000
16000
17000
18000
19000
20000
21000
22000
23000
24000
25000
26000
27000
28000
29000
30000
31000
32000
33000
34000
2-Theta - Scale5 10 20 30 40 50 60 70 8
CRM 7002 / raw sample
Fig. E2a. X-ray diffraction pattern of CRM 7002 (black trace) showing identified minerals (colored ticks)in
su-0
0424
551,
ver
sion
1 -
16 O
ct 2
009

Batch3 - CRM 7002 non attaqué
00-005-0628 (*) - Halite, syn - NaCl - Y: 1.05 % - d x by: 1. - WL: 1.5406 - Cubic - a 5.63080 - b 5.63080 - c 5.6300-005-0586 (*) - Calcite, syn - CaCO3 - Y: 0.88 % - d x by: 1. - WL: 1.5406 - Rhombo.H.axes - a 4.98276 - b 4.01-071-1060 (C) - Hornblende - Na.9K.4Ca1.6Mg2.9Fe1.4Ti.5Al2.4Si6O24 - Y: 0.65 % - d x by: 1. - WL: 1.5406 01-082-0038 (C) - Clinochlore IIb-4 (Cr-, Mg-rich) - (Mg0.99Al0.01)5(Al0.67Fe0.33)(Si3.02Al0.98)O10(OH)8 - Y: 01-082-2450 (C) - Muscovite - (Na0.07K0.90Ba0.01)(Al1.84Ti0.04Fe0.07Mg0.04)(Si3.02Al0.98)O10( - Y: 0.44
00-009-0466 (*) - Albite, ordered - NaAlSi3O8 - Y: 8.34 % - d x by: 1. - WL: 1.5406 - 0 - I/Ic PDF 2.1 - 00-019-0932 (I) - Microcline, intermediate - KAlSi3O8 - Y: 12.51 % - d x by: 1. - WL: 1.5406 - 0 - 00-046-1045 (*) - Quartz, syn - SiO2 - Y: 33.87 % - d x by: 1. - WL: 1.54439 - 0 - I/Ic PDF 3.4 - 00-046-1045 (*) - Quartz, syn - SiO2 - Y: 68.14 % - d x by: 1. - WL: 1.5406 - 0 - I/Ic PDF 3.4 - Operations: Y Scale Mul 1.458 | Background 0.014,1.000 | ImportN2 - Batch1 - File: BT23_SylSteph.RAW - Type: 2Th/Th locked - Start: 5.000 ° - End: 80.000 ° - Step: 0.040 ° - Operations: Background 0.120,1.000 | ImportBatch3 - CRM 7002 non attaqué - File: BT3_SylSteph.RAW - Type: 2Th/Th locked - Start: 5.000 ° - End: 80.000
Lin
(Cou
nts)
0
1000
2000
3000
4000
5000
6000
7000
8000
9000
10000
11000
12000
13000
14000
15000
16000
17000
18000
19000
20000
21000
22000
2-Theta - Scale5 10 20 30 40 50 60 70 8
CRM 7002 / NH4 OH
Fig. E2b. Normalized X-ray diffraction patterns of CRM 7002 before and after NH4 OH extraction (black and red traces, respectively) showing identified minerals (colored ticks)
insu
-004
2455
1, v
ersi
on 1
- 16
Oct
200
9

Batch3 - CRM 7002 non attaqué
00-005-0628 (*) - Halite, syn - NaCl - Y: 1.05 % - d x by: 1. - WL: 1.5406 - Cubic - a 5.63080 - b 5.63080 - c 5.6300-005-0586 (*) - Calcite, syn - CaCO3 - Y: 0.88 % - d x by: 1. - WL: 1.5406 - Rhombo.H.axes - a 4.98276 - b 4.01-071-1060 (C) - Hornblende - Na.9K.4Ca1.6Mg2.9Fe1.4Ti.5Al2.4Si6O24 - Y: 0.65 % - d x by: 1. - WL: 1.5406 01-082-0038 (C) - Clinochlore IIb-4 (Cr-, Mg-rich) - (Mg0.99Al0.01)5(Al0.67Fe0.33)(Si3.02Al0.98)O10(OH)8 - Y: 01-082-2450 (C) - Muscovite - (Na0.07K0.90Ba0.01)(Al1.84Ti0.04Fe0.07Mg0.04)(Si3.02Al0.98)O10( - Y: 0.44
00-009-0466 (*) - Albite, ordered - NaAlSi3O8 - Y: 8.34 % - d x by: 1. - WL: 1.5406 - 0 - I/Ic PDF 2.1 - 00-019-0932 (I) - Microcline, intermediate - KAlSi3O8 - Y: 12.51 % - d x by: 1. - WL: 1.5406 - 0 - 00-046-1045 (*) - Quartz, syn - SiO2 - Y: 33.87 % - d x by: 1. - WL: 1.54439 - 0 - I/Ic PDF 3.4 - 00-046-1045 (*) - Quartz, syn - SiO2 - Y: 68.14 % - d x by: 1. - WL: 1.5406 - 0 - I/Ic PDF 3.4 - Operations: Y Scale Mul 1.125 | Background 0.014,1.000 | ImportSample F batch1 - File: BT12_SylSteph.RAW - Type: 2Th/Th locked - Start: 5.000 ° - End: 80.000 ° - Step: 0.04Operations: Background 0.120,1.000 | ImportBatch3 - CRM 7002 non attaqué - File: BT3_SylSteph.RAW - Type: 2Th/Th locked - Start: 5.000 ° - End: 80.000
Lin
(Cou
nts)
0
1000
2000
3000
4000
5000
6000
7000
8000
9000
10000
11000
12000
13000
14000
15000
16000
17000
18000
19000
20000
21000
22000
2-Theta - Scale5 10 20 30 40 50 60 70 8
CRM 7002 / KOH
Fig. E2c. Normalized X-ray diffraction patterns of CRM 7002 before and after KOH extraction (black and red traces, respectively) showing identified minerals (colored ticks)
insu
-004
2455
1, v
ersi
on 1
- 16
Oct
200
9

Batch3 - CRM 7002 non attaqué
00-005-0628 (*) - Halite, syn - NaCl - Y: 1.05 % - d x by: 1. - WL: 1.5406 - Cubic - a 5.63080 - b 5.63080 - c 5.6300-005-0586 (*) - Calcite, syn - CaCO3 - Y: 0.88 % - d x by: 1. - WL: 1.5406 - Rhombo.H.axes - a 4.98276 - b 4.01-071-1060 (C) - Hornblende - Na.9K.4Ca1.6Mg2.9Fe1.4Ti.5Al2.4Si6O24 - Y: 0.65 % - d x by: 1. - WL: 1.5406 01-082-0038 (C) - Clinochlore IIb-4 (Cr-, Mg-rich) - (Mg0.99Al0.01)5(Al0.67Fe0.33)(Si3.02Al0.98)O10(OH)8 - Y: 01-082-2450 (C) - Muscovite - (Na0.07K0.90Ba0.01)(Al1.84Ti0.04Fe0.07Mg0.04)(Si3.02Al0.98)O10( - Y: 0.44
00-009-0466 (*) - Albite, ordered - NaAlSi3O8 - Y: 8.34 % - d x by: 1. - WL: 1.5406 - 0 - I/Ic PDF 2.1 - 00-019-0932 (I) - Microcline, intermediate - KAlSi3O8 - Y: 12.51 % - d x by: 1. - WL: 1.5406 - 0 - 00-046-1045 (*) - Quartz, syn - SiO2 - Y: 33.87 % - d x by: 1. - WL: 1.54439 - 0 - I/Ic PDF 3.4 - 00-046-1045 (*) - Quartz, syn - SiO2 - Y: 68.14 % - d x by: 1. - WL: 1.5406 - 0 - I/Ic PDF 3.4 - Operations: Background 0.014,1.000 | ImportSample A3 - Batch3 - File: BT16_SylSteph.RAW - Type: 2Th/Th locked - Start: 5.000 ° - End: 80.000 ° - Step: 0.Operations: Background 0.120,1.000 | ImportBatch3 - CRM 7002 non attaqué - File: BT3_SylSteph.RAW - Type: 2Th/Th locked - Start: 5.000 ° - End: 80.000
Lin
(Cou
nts)
0
1000
2000
3000
4000
5000
6000
7000
8000
9000
10000
11000
12000
13000
14000
15000
16000
17000
18000
19000
20000
21000
22000
2-Theta - Scale5 10 20 30 40 50 60 70 8
CRM 7002 / Ascorbate
Fig. E2d. Normalized X-ray diffraction patterns of CRM 7002 before and after ascorbate extraction (black and red traces, respectively) showing identified minerals (colored ticks)
insu
-004
2455
1, v
ersi
on 1
- 16
Oct
200
9

Batch3 - CRM 7002 non attaqué
00-005-0628 (*) - Halite, syn - NaCl - Y: 1.05 % - d x by: 1. - WL: 1.5406 - Cubic - a 5.63080 - b 5.63080 - c 5.6300-005-0586 (*) - Calcite, syn - CaCO3 - Y: 0.88 % - d x by: 1. - WL: 1.5406 - Rhombo.H.axes - a 4.98276 - b 4.01-071-1060 (C) - Hornblende - Na.9K.4Ca1.6Mg2.9Fe1.4Ti.5Al2.4Si6O24 - Y: 0.65 % - d x by: 1. - WL: 1.5406 01-082-0038 (C) - Clinochlore IIb-4 (Cr-, Mg-rich) - (Mg0.99Al0.01)5(Al0.67Fe0.33)(Si3.02Al0.98)O10(OH)8 - Y: 01-082-2450 (C) - Muscovite - (Na0.07K0.90Ba0.01)(Al1.84Ti0.04Fe0.07Mg0.04)(Si3.02Al0.98)O10( - Y: 0.44
00-009-0466 (*) - Albite, ordered - NaAlSi3O8 - Y: 8.34 % - d x by: 1. - WL: 1.5406 - 0 - I/Ic PDF 2.1 - 00-019-0932 (I) - Microcline, intermediate - KAlSi3O8 - Y: 12.51 % - d x by: 1. - WL: 1.5406 - 0 - 00-046-1045 (*) - Quartz, syn - SiO2 - Y: 33.87 % - d x by: 1. - WL: 1.54439 - 0 - I/Ic PDF 3.4 - 00-046-1045 (*) - Quartz, syn - SiO2 - Y: 68.14 % - d x by: 1. - WL: 1.5406 - 0 - I/Ic PDF 3.4 - Operations: Background 0.014,1.000 | ImportBatch 2 Extraction HG - CRM + HCl - File: BT2_SylSteph.RAW - Type: 2Th/Th locked - Start: 5.000 ° - End: 80.Operations: Background 0.120,1.000 | ImportBatch3 - CRM 7002 non attaqué - File: BT3_SylSteph.RAW - Type: 2Th/Th locked - Start: 5.000 ° - End: 80.000
Lin
(Cou
nts)
0
1000
2000
3000
4000
5000
6000
7000
8000
9000
10000
11000
12000
13000
14000
15000
16000
17000
18000
19000
20000
21000
22000
2-Theta - Scale5 10 20 30 40 50 60 70 8
CRM 7002 / HCl/HNO3
Fig. E2e. Normalized X-ray diffraction patterns of CRM 7002 before and after HCl extraction (black and red traces, respectively) showing identified minerals (colored ticks)
insu
-004
2455
1, v
ersi
on 1
- 16
Oct
200
9

Batch 7 -- M1 sans attaque
00-029-0713 (I) - Goethite - Fe+3O(OH) - Y: 27.70 % - d x by: 1. - WL: 1.5406 - Orthorhombic - a 4.56000 - b 9.00-033-0664 (*) - Hematite, syn - Fe2O3 - Y: 3.03 % - d x by: 1. - WL: 1.5406 - Rhombo.H.axes - a 5.0356 - b 5.01-070-2038 (C) - Gibbsite - Al(OH)3 - Y: 69.49 % - d x by: 1. - WL: 1.5406 - Monoclinic - a 8.68400 - b 5.0780000-021-1272 (*) - Anatase, syn - TiO2 - Y: 15.48 % - d x by: 1. - WL: 1.5406 - Tetragonal - a 3.7852 - b 3.78520
00-005-0586 (*) - Calcite, syn - CaCO3 - Y: 1.31 % - d x by: 1. - WL: 1.5406 - Rhombo.H.axes - a 4.989 - b 4.9801-080-0886 (C) - Kaolinite - Al2(Si2O5)(OH)4 - Y: 59.38 % - d x by: 1. - WL: 1.5406 - Triclinic - a 5.15770 - b 8.01-080-0742 (C) - Muscovite 2M1 - (K0.82Na0.18)(Fe0.03Al1.97)(AlSi3)O10(OH)2 - Y: 25.54 % - d x by: 1. - WL00-009-0466 (*) - Albite, ordered - NaAlSi3O8 - Y: 10.22 % - d x by: 1. - WL: 1.5406 - Triclinic - a 8.144 - b 12.700-019-0932 (I) - Microcline, intermediate - KAlSi3O8 - Y: 23.23 % - d x by: 1. - WL: 1.5406 - Triclinic - a 8.560 -00-046-1045 (*) - Quartz, syn - SiO2 - Y: 57.51 % - d x by: 1. - WL: 1.5406 - Hexagonal - a 4.91344 - b 4.91344 Operations: Background 0.014,1.000 | ImportBatch 7 -- M1 sans attaque - File: BT7_SylSteph_bl.RAW - Type: 2Th/Th locked - Start: 5.000 ° - End: 80.000 °
Lin
(Cou
nts)
0
1000
2000
3000
4000
5000
6000
7000
8000
9000
2-Theta - Scale5 10 20 30 40 50 60 70
I1 (0-10 cm) / raw sample
Fig. E3a. X-ray diffraction pattern of sample I-1(0-10m) (black trace) showing identified minerals (colored ticks)in
su-0
0424
551,
ver
sion
1 -
16 O
ct 2
009

Batch 7 -- M1 sans attaque
00-029-0713 (I) - Goethite - Fe+3O(OH) - Y: 20.38 % - d x by: 1. - WL: 1.5406 - Orthorhombic - a 4.56000 - b 9.00-033-0664 (*) - Hematite, syn - Fe2O3 - Y: 2.23 % - d x by: 1. - WL: 1.5406 - Rhombo.H.axes - a 5.0356 - b 5.01-070-2038 (C) - Gibbsite - Al(OH)3 - Y: 51.13 % - d x by: 1. - WL: 1.5406 - Monoclinic - a 8.68400 - b 5.0780000-021-1272 (*) - Anatase, syn - TiO2 - Y: 11.39 % - d x by: 1. - WL: 1.5406 - Tetragonal - a 3.7852 - b 3.78520 00-005-0586 (*) - Calcite, syn - CaCO3 - Y: 0.97 % - d x by: 1. - WL: 1.5406 - Rhombo.H.axes - a 4.989 - b 4.9801-080-0886 (C) - Kaolinite - Al2(Si2O5)(OH)4 - Y: 43.69 % - d x by: 1. - WL: 1.5406 - Triclinic - a 5.15770 - b 8.
01-080-0742 (C) - Muscovite 2M1 - (K0.82Na0.18)(Fe0.03Al1.97)(AlSi3)O10(OH)2 - Y: 18.79 % - d x by: 1. - WL00-009-0466 (*) - Albite, ordered - NaAlSi3O8 - Y: 7.52 % - d x by: 1. - WL: 1.5406 - Triclinic - a 8.144 - b 12.7800-019-0932 (I) - Microcline, intermediate - KAlSi3O8 - Y: 17.09 % - d x by: 1. - WL: 1.5406 - Triclinic - a 8.560 -00-046-1045 (*) - Quartz, syn - SiO2 - Y: 42.31 % - d x by: 1. - WL: 1.5406 - Hexagonal - a 4.91344 - b 4.91344 Operations: Y Scale Mul 1.000 | Y Scale Mul 1.500 | Background 0.000,1.000 | ImportN1-batch1 - File: BT25_BL.RAW - Type: 2Th/Th locked - Start: 5.000 ° - End: 80.000 ° - Step: 0.040 ° - Step timOperations: Background 0.014,1.000 | ImportBatch 7 -- M1 sans attaque - File: BT7_SylSteph_bl.RAW - Type: 2Th/Th locked - Start: 5.000 ° - End: 80.000 °
Lin
(Cou
nts)
0
1000
2000
3000
4000
5000
6000
2-Theta - Scale7 10 20 30 40 50 60 70
I1 (0-10 cm) / NH4 OH
Fig. E3b. Normalized X-ray diffraction patterns of sample I-1(0-10m) before and after NH4 OH extraction (black and red traces, respectively) showing identified minerals (colored ticks)
insu
-004
2455
1, v
ersi
on 1
- 16
Oct
200
9

Batch 7 -- M1 sans attaque
00-029-0713 (I) - Goethite - Fe+3O(OH) - Y: 27.70 % - d x by: 1. - WL: 1.5406 - Orthorhombic - a 4.56000 - b 9.00-033-0664 (*) - Hematite, syn - Fe2O3 - Y: 3.03 % - d x by: 1. - WL: 1.5406 - Rhombo.H.axes - a 5.0356 - b 5.01-070-2038 (C) - Gibbsite - Al(OH)3 - Y: 69.49 % - d x by: 1. - WL: 1.5406 - Monoclinic - a 8.68400 - b 5.0780000-021-1272 (*) - Anatase, syn - TiO2 - Y: 15.48 % - d x by: 1. - WL: 1.5406 - Tetragonal - a 3.7852 - b 3.78520 00-005-0586 (*) - Calcite, syn - CaCO3 - Y: 1.31 % - d x by: 1. - WL: 1.5406 - Rhombo.H.axes - a 4.989 - b 4.9801-080-0886 (C) - Kaolinite - Al2(Si2O5)(OH)4 - Y: 59.38 % - d x by: 1. - WL: 1.5406 - Triclinic - a 5.15770 - b 8.
01-080-0742 (C) - Muscovite 2M1 - (K0.82Na0.18)(Fe0.03Al1.97)(AlSi3)O10(OH)2 - Y: 25.54 % - d x by: 1. - WL00-009-0466 (*) - Albite, ordered - NaAlSi3O8 - Y: 10.22 % - d x by: 1. - WL: 1.5406 - Triclinic - a 8.144 - b 12.700-019-0932 (I) - Microcline, intermediate - KAlSi3O8 - Y: 23.23 % - d x by: 1. - WL: 1.5406 - Triclinic - a 8.560 -00-046-1045 (*) - Quartz, syn - SiO2 - Y: 57.51 % - d x by: 1. - WL: 1.5406 - Hexagonal - a 4.91344 - b 4.91344 Operations: Background 0.014,1.000 | ImportBatch 8 -- Ech H - File: BT8_SylSteph.RAW - Type: 2Th/Th locked - Start: 5.000 ° - End: 80.000 ° - Step: 0.040 Operations: Background 0.014,1.000 | ImportBatch 7 -- M1 sans attaque - File: BT7_SylSteph_bl.RAW - Type: 2Th/Th locked - Start: 5.000 ° - End: 80.000 °
Lin
(Cou
nts)
0
1000
2000
3000
4000
5000
6000
7000
8000
9000
10000
11000
12000
13000
2-Theta - Scale5 10 20 30 40 50 60 70 8
I1 (0-10 cm) / KOH
Fig. E3c. Normalized X-ray diffraction patterns of sample I-1(0-10m) before and after KOH extraction (black and red traces, respectively) showing identified minerals (colored ticks)
insu
-004
2455
1, v
ersi
on 1
- 16
Oct
200
9

Batch 7 -- M1 sans attaque
00-029-0713 (I) - Goethite - Fe+3O(OH) - Y: 27.70 % - d x by: 1. - WL: 1.5406 - Orthorhombic - a 4.56000 - b 9.00-033-0664 (*) - Hematite, syn - Fe2O3 - Y: 3.03 % - d x by: 1. - WL: 1.5406 - Rhombo.H.axes - a 5.0356 - b 5.01-070-2038 (C) - Gibbsite - Al(OH)3 - Y: 69.49 % - d x by: 1. - WL: 1.5406 - Monoclinic - a 8.68400 - b 5.0780000-021-1272 (*) - Anatase, syn - TiO2 - Y: 15.48 % - d x by: 1. - WL: 1.5406 - Tetragonal - a 3.7852 - b 3.78520 00-005-0586 (*) - Calcite, syn - CaCO3 - Y: 1.31 % - d x by: 1. - WL: 1.5406 - Rhombo.H.axes - a 4.989 - b 4.9801-080-0886 (C) - Kaolinite - Al2(Si2O5)(OH)4 - Y: 59.38 % - d x by: 1. - WL: 1.5406 - Triclinic - a 5.15770 - b 8.
01-080-0742 (C) - Muscovite 2M1 - (K0.82Na0.18)(Fe0.03Al1.97)(AlSi3)O10(OH)2 - Y: 25.54 % - d x by: 1. - WL00-009-0466 (*) - Albite, ordered - NaAlSi3O8 - Y: 10.22 % - d x by: 1. - WL: 1.5406 - Triclinic - a 8.144 - b 12.700-019-0932 (I) - Microcline, intermediate - KAlSi3O8 - Y: 23.23 % - d x by: 1. - WL: 1.5406 - Triclinic - a 8.560 -00-046-1045 (*) - Quartz, syn - SiO2 - Y: 57.51 % - d x by: 1. - WL: 1.5406 - Hexagonal - a 4.91344 - b 4.91344 Operations: Background 0.000,1.000 | ImportSample A8 - Batch1 - File: Bt18_BL.RAW - Type: 2Th/Th locked - Start: 5.000 ° - End: 80.000 ° - Step: 0.040 ° -Operations: Background 0.014,1.000 | ImportBatch 7 -- M1 sans attaque - File: BT7_SylSteph_bl.RAW - Type: 2Th/Th locked - Start: 5.000 ° - End: 80.000 °
Lin
(Cou
nts)
0
1000
2000
3000
4000
5000
6000
7000
8000
9000
2-Theta - Scale5 10 20 30 40 50 60 70
I1 (0-10 cm) / Ascorbate
Fig. E3d. Normalized X-ray diffraction patterns of sample I-1(0-10m) before and after ascorbate extraction (black and red traces, respectively) showing identified minerals (colored ticks)
insu
-004
2455
1, v
ersi
on 1
- 16
Oct
200
9

Batch 7 -- M1 sans attaque
00-029-0713 (I) - Goethite - Fe+3O(OH) - Y: 27.70 % - d x by: 1. - WL: 1.5406 - Orthorhombic - a 4.56000 - b 9.00-033-0664 (*) - Hematite, syn - Fe2O3 - Y: 3.03 % - d x by: 1. - WL: 1.5406 - Rhombo.H.axes - a 5.0356 - b 5.01-070-2038 (C) - Gibbsite - Al(OH)3 - Y: 69.49 % - d x by: 1. - WL: 1.5406 - Monoclinic - a 8.68400 - b 5.0780000-021-1272 (*) - Anatase, syn - TiO2 - Y: 15.48 % - d x by: 1. - WL: 1.5406 - Tetragonal - a 3.7852 - b 3.78520 00-005-0586 (*) - Calcite, syn - CaCO3 - Y: 1.31 % - d x by: 1. - WL: 1.5406 - Rhombo.H.axes - a 4.989 - b 4.9801-080-0886 (C) - Kaolinite - Al2(Si2O5)(OH)4 - Y: 59.38 % - d x by: 1. - WL: 1.5406 - Triclinic - a 5.15770 - b 8.
01-080-0742 (C) - Muscovite 2M1 - (K0.82Na0.18)(Fe0.03Al1.97)(AlSi3)O10(OH)2 - Y: 25.54 % - d x by: 1. - WL00-009-0466 (*) - Albite, ordered - NaAlSi3O8 - Y: 10.22 % - d x by: 1. - WL: 1.5406 - Triclinic - a 8.144 - b 12.700-019-0932 (I) - Microcline, intermediate - KAlSi3O8 - Y: 23.23 % - d x by: 1. - WL: 1.5406 - Triclinic - a 8.560 -00-046-1045 (*) - Quartz, syn - SiO2 - Y: 57.51 % - d x by: 1. - WL: 1.5406 - Hexagonal - a 4.91344 - b 4.91344 Operations: Background 0.014,1.000 | ImportBatch 8 -- Ech H - File: BT8_SylSteph.RAW - Type: 2Th/Th locked - Start: 5.000 ° - End: 80.000 ° - Step: 0.040 Operations: Background 0.014,1.000 | ImportBatch 7 -- M1 sans attaque - File: BT7_SylSteph_bl.RAW - Type: 2Th/Th locked - Start: 5.000 ° - End: 80.000 °
Lin
(Cou
nts)
0
1000
2000
3000
4000
5000
6000
7000
8000
9000
10000
11000
12000
13000
2-Theta - Scale5 10 20 30 40 50 60 70 8
I1 (0-10 cm) / HCl/HNO3
Fig. E3e. Normalized X-ray diffraction patterns of sample I-1(0-10m) before and after HCl extraction (black and red traces, respectively) showing identified minerals (colored ticks)
insu
-004
2455
1, v
ersi
on 1
- 16
Oct
200
9

M1 180-200 Batch1
00-021-1276 (*) - Rutile, syn - TiO2 - Y: 6.78 % - d x by: 1. - WL: 1.5406 - Tetragonal - a 4.5933 - b 4.59330 - c 00-029-0713 (I) - Goethite - Fe+3O(OH) - Y: 31.26 % - d x by: 1. - WL: 1.5406 - Orthorhombic - a 4.59072 - b 9.00-033-0664 (*) - Hematite, syn - Fe2O3 - Y: 88.55 % - d x by: 1. - WL: 1.5406 - Rhombo.H.axes - a 5.0356 - b
01-070-2038 (C) - Gibbsite - Al(OH)3 - Y: 49.73 % - d x by: 1. - WL: 1.5406 - Monoclinic - a 8.68400 - b 5.0780001-080-0886 (C) - Kaolinite - Al2(Si2O5)(OH)4 - Y: 48.56 % - d x by: 1. - WL: 1.5406 - Triclinic - a 5.15770 - b 8.00-019-0932 (I) - Microcline, intermediate - KAlSi3O8 - Y: 20.84 % - d x by: 1. - WL: 1.5406 - Triclinic - a 8.560 -01-083-2129 (C) - Paragonite 3T - NaAl2(Si3Al)O10(OH)2 - Y: 18.76 % - d x by: 1. - WL: 1.5406 - Hexagonal - a01-086-1384 (C) - Muscovite 2M1 - K0.894Al1.93(Al0.943Si2.829O10)((OH)1.744F0.256) - Y: 20.84 % - d x by: 00-046-1045 (*) - Quartz, syn - SiO2 - Y: 23.52 % - d x by: 1. - WL: 1.5406 - Hexagonal - a 4.91344 - b 4.91344 Operations: Background 0.000,0.000 | ImportM1 180-200 Batch1 - File: BT34_SylSteph_uni.RAW - Type: 2Th/Th locked - Start: 5.000 ° - End: 80.000 ° - Ste
Lin
(Cou
nts)
0100200300400500600700800900
100011001200130014001500160017001800190020002100220023002400250026002700280029003000310032003300340035003600370038003900
2-Theta - Scale5 10 20 30 40
Nodule I2 (180-200 cm) / HCl/HNO3
Fig. E4. X-ray diffraction pattern of nodules from sample I-1(180-200m) (black trace) showing identified minerals (colored ticks)in
su-0
0424
551,
ver
sion
1 -
16 O
ct 2
009

Fig. E5.
(Hg)HCl Extraction Yield (%)
0 20 40 60 80 1000
20406080
100120140160180200
[Hg] (ng g-1)
0 100 200 300 400 500
Dep
th (c
m)
020406080
100120140160180200
Nodule Ferralsol (I-2)Nodule deep Ferralsol (I-2)Nodule Acrisol (I-1) Nodule deep Acrisol (I-1)Ferralsol matrix (I-1) Acrisol matrix (I-1)
(Hg)KOH Extraction Yield (%)
0 20 40 60 80 1000
20406080
100120140160180200
[Al]HCl0 10 20 40 60 80 100
Dep
th (c
m)
020406080
100120140160180200
[Fe]HCl(mg g-1)
insu
-004
2455
1, v
ersi
on 1
- 16
Oct
200
9


![[Human and wild mammal parasitosis in French Guiana]](https://static.fdokumen.com/doc/165x107/633660bb02a8c1a4ec022a28/human-and-wild-mammal-parasitosis-in-french-guiana.jpg)