Prenatal nutritional supplementation and autism spectrum ...
199
Prenatal nutritional supplementation and autism spectrum disorders in two European population-based cohorts Elizabeth Anne DeVilbiss, MPH, MS A Thesis Submitted to the Faculty of Drexel University by Elizabeth Anne DeVilbiss in partial fulfillment of the requirements for the degree of Doctor of Philosophy June 2017
-
Upload
khangminh22 -
Category
Documents
-
view
0 -
download
0
Transcript of Prenatal nutritional supplementation and autism spectrum ...

Prenatal nutritional supplementation and autism spectrum disorders in two
European population-based cohorts
Elizabeth Anne DeVilbiss, MPH, MS
A Thesis
Submitted to the Faculty
of
Drexel University
by
Elizabeth Anne DeVilbiss
in partial fulfillment of the
requirements for the degree
of
Doctor of Philosophy
June 2017

© Copyright 2017
Elizabeth A. DeVilbiss. All Rights Reserved.

ii
Dedication
For Vivienne
You can do anything.

iii
Acknowledgements
This thesis is the product of the support and graciousness of innumerable individuals, most notably Dr. Brian Lee who I would like to thank for an optimal level of guidance. I am grateful for having adequate opportunity to work things out on my own, for people learn best through doing. Without his understanding and encouragement, I would not have gotten this far – thank you for believing in me. I am in awe of the eloquence of his speech and of the brilliance of his mind; you are an incredible model of what I can hope to become. Thank you for the tremendous amount of time that you have invested in me.
I would also like to acknowledge Drs. Craig Newschaffer, Cecilia Magnusson, Dheeraj Rai, Christine Ladd-Acosta, Kristen Lyall, Renee Gardner, Christina Dalman, and Lucy Robinson. Thank you for your expert insight and kindness. I have learned a lot from you – thank you for sharing your minds and time with me.
Thank you to my former mentors, Dr. Rob Schnatter, Anthony Baker, Neal Kubala, and Rob Schroeder for your encouragement, for believing in me so fiercely, and for holding me in the highest esteem. You all seemed to know what I could accomplish long before I did. I cannot surprise you!
I am grateful to my family, including my father, mother, and sister, for teaching me that I can do anything. I cannot surprise you either! Thank you for your selfless dedication to me. I would have been lost without your emotional, physical, and financial support. I know that you will always be there for me, even if I am in college for 13 years. I promise that this is it.
Thank you to my mother and our nannies for the beautiful care of our daughter during the time that I worked on my dissertation – to my mother, who selflessly cared for her granddaughter throughout the first year – thank you for being unchangingly faithful to us; to Barbara, whose confidence helped ease my mind and guilt at the beginning; and to Lainey and Lydia, who respected our daughter as an individual and treated her as their own. Knowing that my daughter was in kind, loving, and gentle hands helped me work efficiently while she was in their care. I’m so glad to have and to have found each of you; you were each perfect for the stage that you cared for our daughter.
I could not have done this without my husband’s financial support. Thank you for encouraging me to earn my PhD (although I told you the opposite just a few months ago) and for working to be such a mindful and emotionally present father. I appreciate your willingness to actively challenge yourself and to learn so you can do what’s best for our daughter.
My daughter, you have always been wise beyond your years, an “old soul”. Thank you for gracefully understanding the importance of my work. I value our time together more than anything else and love you more than words can articulate.
I am humbled to have such incredible people in my life. Thank you all for your kind words, support, and guidance along the way.
Lastly, thank you to Dr. Enrique Schisterman for giving me an incredible opportunity to further advance my skills, to be challenged, and for seeing my potential. I’m eagerly looking forward to working with and learning from you and your colleagues.
iv
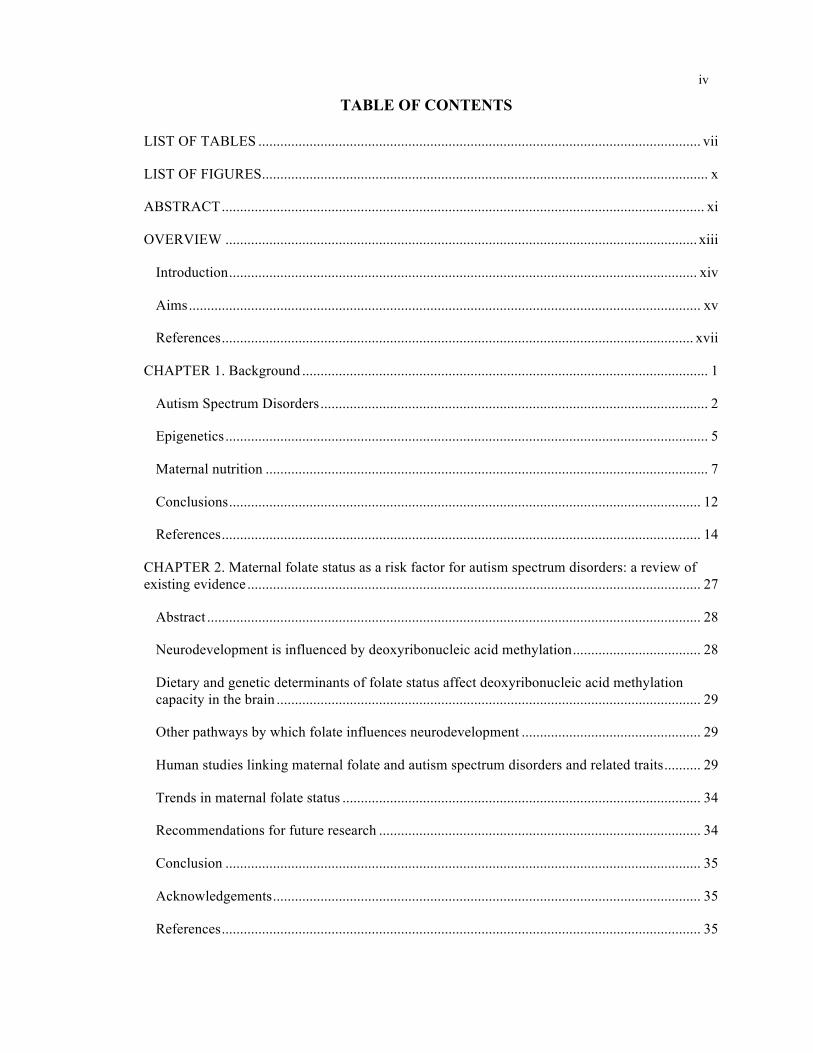
TABLE OF CONTENTS
LIST OF TABLES ......................................................................................................................... vii
LIST OF FIGURES.......................................................................................................................... x
ABSTRACT.................................................................................................................................... xi
OVERVIEW ................................................................................................................................. xiii
Introduction................................................................................................................................ xiv
Aims............................................................................................................................................ xv
References................................................................................................................................. xvii
CHAPTER 1. Background ............................................................................................................... 1
Autism Spectrum Disorders.......................................................................................................... 2
Epigenetics.................................................................................................................................... 5
Maternal nutrition ......................................................................................................................... 7
Conclusions................................................................................................................................. 12
References................................................................................................................................... 14
CHAPTER 2. Maternal folate status as a risk factor for autism spectrum disorders: a review of existing evidence ............................................................................................................................ 27
Abstract ....................................................................................................................................... 28
Neurodevelopment is influenced by deoxyribonucleic acid methylation................................... 28
Dietary and genetic determinants of folate status affect deoxyribonucleic acid methylation capacity in the brain .................................................................................................................... 29
Other pathways by which folate influences neurodevelopment ................................................. 29
Human studies linking maternal folate and autism spectrum disorders and related traits.......... 29
Trends in maternal folate status .................................................................................................. 34
Recommendations for future research ........................................................................................ 34
Conclusion .................................................................................................................................. 35
Acknowledgements..................................................................................................................... 35
References................................................................................................................................... 35

v
TABLE OF CONTENTS (continued)
CHAPTER 3. Study I: Prenatal nutritional supplementation and autism spectrum disorders in the Stockholm Youth Cohort: population-based cohort study....................................................... 38
Abstract ....................................................................................................................................... 40
Introduction................................................................................................................................. 41
Methods....................................................................................................................................... 42
Results......................................................................................................................................... 49
Discussion ................................................................................................................................... 52
Acknowledgements..................................................................................................................... 57
References................................................................................................................................... 59
Tables.......................................................................................................................................... 64
Figure .......................................................................................................................................... 70
Appendices
Appendix 1: Methods Supplement 1 ....................................................................................... 71
Appendix 2: Methods Supplement 2 - Text matching in R ..................................................... 76
Appendix 3: Supplementary Tables and Figure ...................................................................... 78
CHAPTER 4. Study II: Prenatal nutritional supplementation, folate-related genes, and autism-related traits in the ALSPAC birth cohort...................................................................................... 88
Abstract ....................................................................................................................................... 90
Introduction............................................................................................................................... 191
Methods....................................................................................................................................... 93
Results......................................................................................................................................... 99
Discussion ................................................................................................................................. 102
Acknowledgements................................................................................................................... 108
References................................................................................................................................. 109
Figure ........................................................................................................................................ 116
Tables........................................................................................................................................ 117

vi
TABLE OF CONTENTS (continued)
Appendices
Appendix 4: Supplementary Tables and Figures................................................................... 124
Appendix 5: Autism supplement ........................................................................................... 147
CHAPTER 5. Conclusions........................................................................................................... 158
Summary of findings ................................................................................................................ 159
Future directions ....................................................................................................................... 164
References................................................................................................................................. 166
APPENDIX 6. Literature review: Maternal nutrients and child cognition .................................. 169
References................................................................................................................................. 175
Vita ............................................................................................................................................... 177

vii
LIST OF TABLES
1. Epidemiologic studies assessing maternal folate status and autism spectrum disorders (ASD) or ASD-related traits ...................................................................................................................... 31
Stockholm Youth Cohort
2. Selected characteristics of the SYC study sample born 1996-2007 by maternal supplement use .................................................................................................................................................. 64
3. Crude and adjusted odds ratios and 95% confidence intervals for supplement use and ASD with and without intellectual disability, and any ASD .................................................................. 66
4. Adjusted odds ratios and 95% confidence intervals for full analysis stratified by hospitalizations during pregnancy.................................................................................................. 68
5. Potential impact of unmeasured confounding on the propensity score estimate for maternal multivitamin supplementation and risk of ASD with ID ............................................................... 69
ALSPAC
6. Selected gene characteristics and allelic frequencies of the ALSPAC genetic sample by child autism status ................................................................................................................................. 117
7. Selected characteristics of the ALSPAC samples by maternal supplementation .................... 118
8. Unadjusted relationships between nutrient supplementation and dietary folate for factor scores and IQ................................................................................................................................ 120
9. Adjusted relationships between nutrient supplementation and dietary folate for factor scores and IQ........................................................................................................................................... 121
10. Mean IQ by maternal vitamin supplementation and child MTHFR677 genotype................. 122
11. Mean IQ by maternal dietary folate intake and child MTHFR677 genotype ........................ 123
Appendix – Stockholm Youth Cohort
A1. Derivation of SYC supplement user groups from ATC codes................................................ 79
A2. ICD-8, ICD-9, and ICD-10 codes used to identify history of specific neuropsychiatric conditions before birth ................................................................................................................... 80
A3. Minimally adjusted odds ratios and 95% confidence intervals for supplement use and ASD with and without intellectual disability, and any ASD .................................................................. 81
A4. Crude and adjusted odds ratios and 95% confidence intervals for supplement use and ID only................................................................................................................................................. 82
A5. SYC analytic sample sizes ...................................................................................................... 83
A6. Selected characteristics of the SYC study sample born 1996-2007 by child ASD................. 84

viii
LIST OF TABLES (continued)
Appendix – ALSPAC
A7. Enzyme functions of genes in folate metabolism.................................................................. 125
A8. Individual measures used to derive factor scores in ALSPAC ............................................. 126
A9. Language factors: individual measures with factor loadings ≥ 0.50..................................... 127
A10. Selected characteristics of the ALSPAC supplementation sample (n = 11,741) by IQ availability.................................................................................................................................... 128
A11. Relationships between dietary folate intake and nutrient supplementation for autism, factor scores, and IQ............................................................................................................................... 130
A12. Relationships between nutrient supplementation for autism, factor scores, and IQ ........... 131
A13. Relationships between variant alleles in folate metabolism and factor scores and IQ ....... 132
A14. Interactions between folic acid supplementation and genetic variants in folate metabolism for factor scores and IQ................................................................................................................ 133
A15. Interactions between vitamin supplementation and genetic variants in folate metabolism for factor scores and IQ................................................................................................................ 134
A16. Interactions between dietary folate and child genetic variants in folate metabolism and factor scores and IQ .................................................................................................................... 135
A17. Interactions between dietary folate and maternal genetic variants in folate metabolism and factor scores and IQ ..................................................................................................................... 136
A18. Unadjusted relationships between nutrient supplementation and dietary folate for factor scores and IQ................................................................................................................................ 138
A19. Adjusted relationships between nutrient supplementation and dietary folate for factor scores and IQ................................................................................................................................ 139
A20. Odds ratios between dietary folate intake and nutrient supplementation for factor scores and IQ........................................................................................................................................... 140
A21. Odds ratios between supplementation, factor scores, and IQ ............................................. 141
A22. Odds ratios between variant alleles in folate metabolism and factor scores and IQ ........... 142
A23. Odds ratios for interactions between folic acid supplementation and genetic variants in folate metabolism for factor scores and IQ .................................................................................. 143
A24. Odds ratios for interactions between vitamin supplementation and genetic variants in folate metabolism for factor scores and IQ ................................................................................. 144

ix
LIST OF TABLES (continued)
A25. Odds ratios for interactions between dietary folate and child genetic variants in folate metabolism and factor scores and IQ .......................................................................................... 145
A26. Odds ratios for interactions between dietary folate and maternal genetic variants in folate metabolism and factor scores and IQ ........................................................................................... 146
A27. Selected characteristics of the ALSPAC samples by autism .............................................. 150
A28. Odds ratios and 95% confidence intervals for maternal nutrient supplementation and autism ........................................................................................................................................... 152
A29. Odds ratios between dietary folate intake and nutrient supplementation for autism .......... 152
A30. Relationships between variant alleles in folate metabolism and autism ............................. 153
Appendix – Overall
A31. Studies examining relationships between maternal folic acid supplementation and/or folate intake and child cognition ............................................................................................................ 170
A32. Studies examining relationships between maternal multivitamin supplementation and child cognition....................................................................................................................................... 172
A33. Studies examining relationships between maternal iron supplementation and/or intake and child cognition.............................................................................................................................. 174

x
LIST OF FIGURES
1. Derivation of reviewed literature ............................................................................................... 30
2. Derivation of Stockholm Youth Cohort study samples ............................................................. 70
3. ALSPAC sample derivation ..................................................................................................... 116
4. Mean IQ by maternal folic acid supplementation and child MTHFR677 genotype................ 122
5. Mean IQ by maternal dietary folate intake and child MTHFR677 genotype .......................... 123
Appendices
A1. Absolute standard biases for covariates in ASD propensity score models ............................. 85
A2. ASD prevalence in the Stockholm Youth Cohort by birth year.............................................. 86
A3. Maternal nutrient supplementation in the Stockholm Youth Cohort by birth year................. 87
A4. Distribution of ALSPAC continuous outcome measures by autism ..................................... 154

xi
ABSTRACT
Prenatal nutritional supplementation and autism spectrum disorders in two European population-based cohorts
Elizabeth Anne DeVilbiss, MPH, MS
Objective: In two prospective population-based cohorts, we examined whether prenatal nutrient
supplementation is protective against autism and its sub-components, and whether associations
depend upon relevant genotypes.
Study design: The Stockholm Youth Cohort (SYC) is a total population register-based cohort of
children living in Stockholm County, Sweden. Self-reported supplement and drug use was
assessed at first antenatal visit. ASD was ascertained after 4 to 15 years of follow-up covering all
pathways to ASD care and services in Stockholm County. Intellectual disability was ascertained
through two Stockholm-based registers. The Avon Longitudinal Study of Parents and their
Children, UK (ALSPAC) is a population-based prospective birth cohort study based in Avon,
England. Nutritional supplements were reported at 18-weeks gestation regarding use during
pregnancy. Factor analysis produced seven factor scores related to autism and 1 combined score
based on traits assessed at multiple ages, and IQ scores were obtained at 8.5 years of age.
Methods: In the SYC, adjusted odds ratios (ORs) and 95% confidence intervals (CI) were
estimated using multivariable regression, sibling controls, and propensity score matching. In
ALSPAC, linear regression was used to calculate β estimates with 95% confidence intervals (CI)
for factor scores and IQ. Supplementation was examined in main effects models and in
interaction models with maternal and child genetic variants involved in folate metabolism.
Results: In the SYC, maternal multivitamin use was associated with lower odds of ASD with ID
in the child relative to mothers who did not use folic acid, iron, or multivitamins in regression
(OR: 0.69 [95% CI: 0.57 to 0.84], sibling control (0.77 [0.52 to 1.15]), and propensity score
matched (0.68 [0.54 to 0.86]) analyses. Findings were not specific to ASD, as similar estimates
were found for ID only. There was no consistent evidence that either iron or folic acid use were

xii
associated with lower risk of ASD.
In ALSPAC, vitamin supplementation was associated with higher language acquisition skills,
while folic acid use were associated with lower articulation scores; both of these relationships
were also observed for higher dietary folate. Vitamin and folic acid supplementation were
associated with higher IQ scores in the child; associations between folic acid supplementation and
IQ appeared to depend upon child MTHFR677 genotype. There was no strong evidence of
relationships between iron and ASD sub-components.
Conclusions: Our findings suggest that maternal nutrition may be related to specific features of
autism such as cognition and facets of language development, and may depend upon genes
involved in folate metabolism, specifically child MTFHR677. Further scrutiny of maternal
nutrition and its role in the etiology of autism, cognition, and language development is warranted.

xiii
OVERVIEW

xiv
Introduction
Maternal nutrition has been shown to influence neurodevelopment.[1-3] In particular,
maternal folate status regulated by dietary and genetic factors early in pregnancy may influence
risk of autism spectrum disorders (ASD)[4]. Evidence is inconsistent regarding whether prenatal
nutrient supplementation is protective against autism and its sub-components, and whether
associations depend on relevant genotypes. Few studies have accounted for the possibility that
sub-components may have varying etiologies.[5-7]
An American case-control study reported reduced ASD risk with prenatal vitamins,[8]
folic acid,[9] and iron.[10] Interestingly, lower mean folic acid intake was found for children
with ASD with a lower cognitive function but not for ASD with higher functioning, suggesting
that nutrients may differentially affect ASD risk depending on co-occurrence with intellectual
disability. In the prospective Norwegian Mother and Child Cohort study (MoBa), maternal folic
acid intake, but not other vitamins and minerals, in the peri-conceptional period and early
pregnancy, was associated with lower risk of autistic disorder.[11] The Danish National Birth
Cohort (DNBC) study reported null associations between folic acid and multivitamin intake and
ASD or any of its subtypes.[12]
Studies have linked self-reported folic acid supplementation or dietary folate during
pregnancy with both reduced and strengthened ASD traits.[13-18] Discrepancies may be due to
dissimilarities in trait etiology[19, 20] differences in timing of folic acid initiation, dose,
frequency, or duration, and/or methodological inconsistencies including timing of outcome
assessment and assessment instruments.[4, 20] To date, all published studies of maternal folate
biomarkers and child ASD or autistic traits have found null relationships.[21, 22] However, these
biomarker studies also evaluated nutrient intake and reported associations with reduced ASD
symptoms. The body of evidence does not seem to support a protective association between
maternal multivitamins[23-27], folic acid and/or dietary folate intake[17, 23, 28, 29], or
supplementary and/or dietary iron intake[23-25, 28, 30] and child cognition. Most biomarker

xv
folate studies also have not found associations between maternal plasma or blood folate and
cognitive function.[29, 31-34]
Schmidt et al (2011)[8] explored effect modification between nutritional factors and
functional genetic variants involved in folate metabolism as carried by the mother or child and
risk of ASD. They found significant interaction effects between periconceptional prenatal
vitamin use and maternal MTHFR 677 TT, CBS rs234715 GT + TT, and child COMT 472 AA
genotypes, with greater autism risk observed for variant genotypes and among mothers not taking
prenatal vitamins. Another study reported that low daily folate intake (< 400 mg/d) was
associated with lower mental development in the child at 1, 3, 6, and 12 months only among
MTHFR677 TT mothers.[35]
Aims
To provide richer etiological context, the following aims involve investigation of ASD
sub-components.
Aim 1: In the Stockholm Youth Cohort (SYC), investigate self-report of maternal nutritional
supplementation with folic acid, iron, and multivitamins and ASD and intellectual disability. Use
multiple analytic strategies to help clarify these relationships.
Aim 2: In the Avon Longitudinal Study of Parents and their Children, UK (ALSPAC), investigate
maternal nutritional supplementation with folic acid, iron, and vitamins as they relate to autism
sub-components.
Aim 3: In ALSPAC, examine potential interactions between maternal nutrient supplementation
and relevant genetic variants as they relate to autism sub-components.
Organization of the dissertation
This dissertation consists of 5 chapters. Following the abridged background information
in this overview, Chapter 1 contains expanded background information relevant to autism,

xvi
maternal nutrient supplementation, and genes involved in one-carbon metabolism. Chapter 2 is a
review paper that includes an overview of what is known about the role of folate in the etiology
of neurodevelopmental disorders; a summary of relevant biological, genetic and epigenetic
mechanisms; and evidence from human observational studies and randomized controlled trials
that have examined the relationship between maternal folate and ASD or related traits. Chapters
3 is the Stockholm Youth Cohort study, designed to evaluate whether maternal supplementation
with folic acid, iron, and multivitamins nutrient supplementation is associated with reduced risk
of ASD and ID, and Chapter 4 is the ALSPAC study, investigating relationships between
maternal nutrient supplementation, relevant genetic variants, and ASD sub-components. Chapter
5 contains a summary of findings and future directions.
xvii
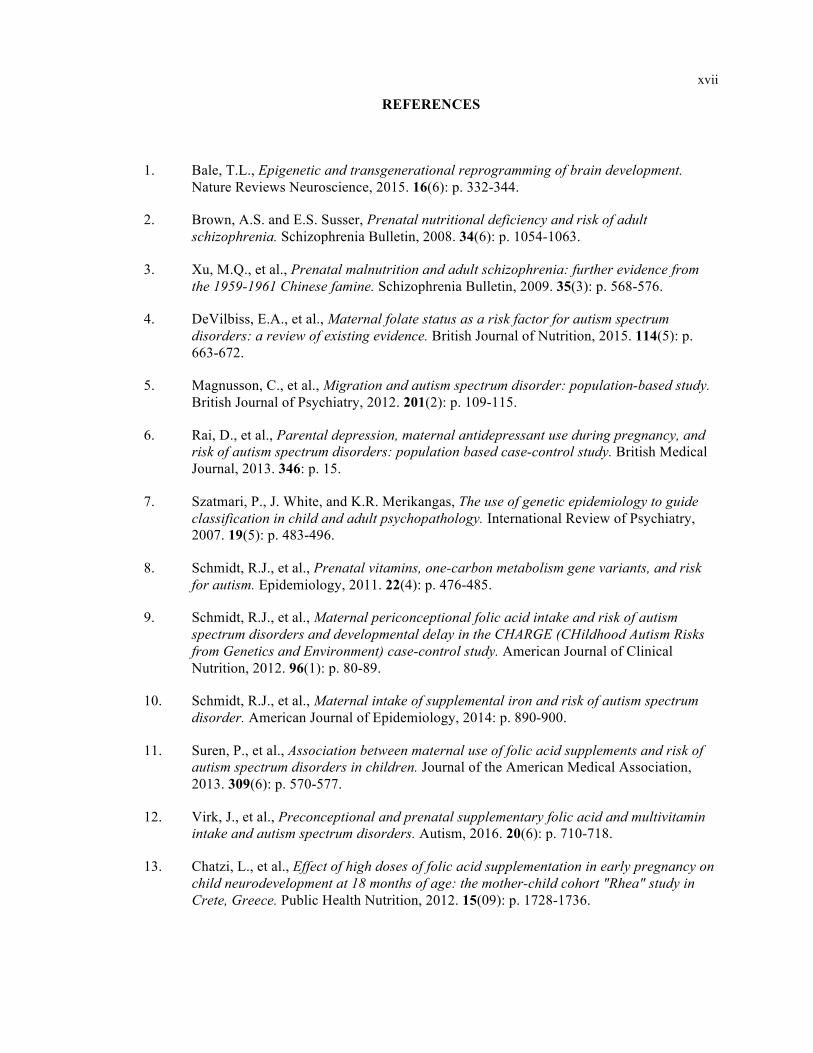
REFERENCES
1. Bale, T.L., Epigenetic and transgenerational reprogramming of brain development.
Nature Reviews Neuroscience, 2015. 16(6): p. 332-344.
2. Brown, A.S. and E.S. Susser, Prenatal nutritional deficiency and risk of adult schizophrenia. Schizophrenia Bulletin, 2008. 34(6): p. 1054-1063.
3. Xu, M.Q., et al., Prenatal malnutrition and adult schizophrenia: further evidence from the 1959-1961 Chinese famine. Schizophrenia Bulletin, 2009. 35(3): p. 568-576.
4. DeVilbiss, E.A., et al., Maternal folate status as a risk factor for autism spectrum disorders: a review of existing evidence. British Journal of Nutrition, 2015. 114(5): p. 663-672.
5. Magnusson, C., et al., Migration and autism spectrum disorder: population-based study. British Journal of Psychiatry, 2012. 201(2): p. 109-115.
6. Rai, D., et al., Parental depression, maternal antidepressant use during pregnancy, and risk of autism spectrum disorders: population based case-control study. British Medical Journal, 2013. 346: p. 15.
7. Szatmari, P., J. White, and K.R. Merikangas, The use of genetic epidemiology to guide classification in child and adult psychopathology. International Review of Psychiatry, 2007. 19(5): p. 483-496.
8. Schmidt, R.J., et al., Prenatal vitamins, one-carbon metabolism gene variants, and risk for autism. Epidemiology, 2011. 22(4): p. 476-485.
9. Schmidt, R.J., et al., Maternal periconceptional folic acid intake and risk of autism spectrum disorders and developmental delay in the CHARGE (CHildhood Autism Risks from Genetics and Environment) case-control study. American Journal of Clinical Nutrition, 2012. 96(1): p. 80-89.
10. Schmidt, R.J., et al., Maternal intake of supplemental iron and risk of autism spectrum disorder. American Journal of Epidemiology, 2014: p. 890-900.
11. Suren, P., et al., Association between maternal use of folic acid supplements and risk of autism spectrum disorders in children. Journal of the American Medical Association, 2013. 309(6): p. 570-577.
12. Virk, J., et al., Preconceptional and prenatal supplementary folic acid and multivitamin intake and autism spectrum disorders. Autism, 2016. 20(6): p. 710-718.
13. Chatzi, L., et al., Effect of high doses of folic acid supplementation in early pregnancy on child neurodevelopment at 18 months of age: the mother-child cohort "Rhea" study in Crete, Greece. Public Health Nutrition, 2012. 15(09): p. 1728-1736.

xviii
14. Villamor, E., et al., Maternal intake of methyl-donor nutrients and child cognition at 3 years of age. Paediatr Perinat Epidemiol, 2012. 26(4): p. 328-35.
15. Roth, C., et al., Folic Acid Supplements in Pregnancy and Severe Language Delay in Children. Jama-Journal of the American Medical Association, 2011. 306(14): p. 1566-1573.
16. Wehby, G.L. and J.C. Murray, The effects of prenatal use of folic acid and other dietary supplements on early child development. Maternal and child health journal, 2008. 12(2): p. 180-187.
17. Julvez, J., et al., Maternal use of folic acid supplements during pregnancy and four-year-old neurodevelopment in a population-based birth cohort. Paediatric and perinatal epidemiology, 2009. 23(3): p. 199-206.
18. Steenweg-de Graaff, J., et al., Folate concentrations during pregnancy and autistic traits in the offspring. The Generation R Study. The European Journal of Public Health, 2014: p. cku126.
19. Ronald, A., et al., Genetic heterogeneity between the three components of the autism spectrum: A twin study. Journal of the American Academy of Child and Adolescent Psychiatry, 2006. 45(6): p. 691-699.
20. Steer, C.D., J. Golding, and P.F. Bolton, Traits contributing to the autistic spectrum. PloS one, 2010. 5(9): p. e12633.
21. Braun, J.M., et al., Brief report: are autistic-behaviors in children related to prenatal vitamin use and maternal whole blood folate concentrations? Journal of autism and developmental disorders, 2014. 44(10): p. 2602-2607.
22. Steenweg-de Graaff, J., et al., Folate concentrations during pregnancy and autistic traits in the offspring - the Generation R study. European Journal of Public Health, 2015. 25(3): p. 431-433.
23. Christian, P., et al., Prenatal Micronutrient Supplementation and Intellectual and Motor Function in Early School-aged Children in Nepal. Jama-Journal of the American Medical Association, 2010. 304(24): p. 2716-2723.
24. Li, Q., et al., Effects of Maternal Multimicronutrient Supplementation on the Mental Development of Infants in Rural Western China: Follow-up Evaluation of a Double-Blind, Randomized, Controlled Trial. Pediatrics, 2009. 123(4): p. E685-E692.
25. Li, C., et al., Prenatal micronutrient supplementation is not associated with intellectual development of young school-aged children. The Journal of nutrition, 2015. 145(8): p. 1844-1849.
26. McGrath, N., et al., Effect of maternal multivitamin supplementation on the mental and psychomotor development of children who are born to HIV-1 - Infected mothers in Tanzania. Pediatrics, 2006. 117(2): p. E216-E225.

xix
27. Prado, E.L., et al., Maternal multiple micronutrient supplementation and other biomedical and socioenvironmental influences on children's cognition at age 9–12 years in Indonesia: follow-up of the SUMMIT randomised trial. The Lancet Global Health, 2017. 5(2): p. e217-e228.
28. Boeke, C.E., et al., Choline Intake During Pregnancy and Child Cognition at Age 7 Years. American Journal of Epidemiology, 2013. 177(12): p. 1338-1347.
29. Campoy, C., et al., Effects of prenatal fish-oil and 5-methyltetrahydrofolate supplementation on cognitive development of children at 6.5 y of age. American Journal of Clinical Nutrition, 2011. 94(6): p. 1880S-1888S.
30. Zhou, S.J., et al., Effect of iron supplementation during pregnancy on the intelligence quotient and behavior of children at 4 y of age: long-term follow-up of a randomized controlled trial. American Journal of Clinical Nutrition, 2006. 83(5): p. 1112-1117.
31. Wu, B.T.F., et al., Early Second Trimester Maternal Plasma Choline and Betaine Are Related to Measures of Early Cognitive Development in Term Infants. Plos One, 2012. 7(8): p. 8.
32. Bhate, V., et al., Vitamin B(12) status of pregnant Indian women and cognitive function in their 9-year-old children. Food and Nutrition Bulletin, 2008. 29(4): p. 249-254.
33. Tamura, T., et al., Folate status of mothers during pregnancy and mental and psychomotor development of their children at five years of age. Pediatrics, 2005. 116(3): p. 703-708.
34. Veena, S.R., et al., Higher maternal plasma folate but not vitamin B-12 concentrations during pregnancy are associated with better cognitive function scores in 9-to 10-year-old children in South India. The Journal of nutrition, 2010. 140(5): p. 1014-1022.
35. Garcia, C.D., et al., Maternal MTHFR 677C > T genotype and dietary intake of folate and vitamin B-12: their impact on child neurodevelopment. Nutritional Neuroscience, 2009. 12(1): p. 13-20.


1
CHAPTER 1. Background

2
Autism spectrum disorders
ASD Phenotypes and Diagnosis
Autism spectrum disorder (ASD), or autism, is conventionally regarded as a pervasive
and lifelong neurodevelopmental disorder characterized by deficits in reciprocal social
interactions and communication, and repetitive behaviors and restricted interests.[1] Within these
domains, individuals with ASD may have behaviors at the lower extremes of normally distributed
continuums.[2, 3] Multi-system comorbidities commonly accompany the behavioral features
among individuals affected with ASD. Comorbidities involve not only the nervous system
(intellectual disability, anxiety, attention problems, sleep disruption, sensory differences,
epilepsy), but also the gastrointestinal (reflux, food selectivity), and immune systems (recurrent
infections),[4, 5] possibly reflecting common underlying mechanisms.[6] Due to its heterogenity,
autism could be viewed as a syndrome consisting of a variety of phenotypes, or traits.[7] While
specific sets tend to occur together,[8] each individual with autism exhibits a unique set of
phenotypes,[9] each of which may vary in severity and etiology.[10] The combination of
phenotypes displayed by an individual with ASD is a reflection of that person’s unique genetics
and early environmental influences.[7]
ASD can be difficult to diagnose due to its heterogenous presentation and absence of
known biomarkers.[4] Diagnosis is based on International Classification of Disease (ICD) or
Diagnostic and Statistical Manual of Mental Disorders (DSM) criteria. Diagnostic tools
developed from DSM criteria include the revised Autism Diagnostic Interview (ADI-R)[11] and
the Autism Diagnostic Observation Schedule (ADOS).[12] Clinical signs are usually present by
3 years of age.[13]
Epidemiology
While autism was first described by Dr. Leo Kanner in 1943,[14] and Dr. Hans Asperger
in 1944,[15] references to individuals meeting the clinical profile have gone back several
centuries.[4] ASD was believed to be rare through the 1980s, having a prevalence between 3 and
3
5 in 10,000 individuals.[6, 16] Measured rates of autism prevalence began increasing in the
1980s.[17] In U.S. surveillance populations, measured rates have increased from 1 in 152 to 1 in
68 children 8 years of age between 2002 and 2010[18], but remained stable between 2010 and
2012.[19] ASD is now thought to be only second to intellectual disability in prevalence of
serious developmental disabilities in the U.S.[4] ASD is observed in all populations, and the
increasing trend of measured autism rates has also been observed in the U.K.[20] and
Taiwan.[21] These prevalence figures do not take into account that ASD is 4 to 5 times more
common among boys than among girls (1 in 42 and 1 in 189, respectively, in U.S.
populations).[18, 22]
Changes in diagnostic practices, increased awareness, and changes in other modifiable
risk factors (e.g., advanced parental age) may partially account for the increase in ASD
prevalence. A register-based study in Denmark reported that for children born between January
1, 1980, and December 31, 1991, 33% (95% CI: 0%-70%) of the increase in reported ASD
prevalence was explained by changes in diagnostic criteria, while 60% (95% CI: 33%-87%) could
be explained by diagnostic changes and inclusion of outpatient contacts combined.[23]
About 53% of the increase in autism diagnoses within a California sample could be
explained by changes in diagnostic practices (26%),[24] increased awareness (16%),[25] and
advanced parental age (11%).[26, 27] Reported rates in the 1960s only included autistic disorder,
excluding Childhood Disintegrative Disorder, Pervasive Developmental Disorder Not Otherwise
Specified (PDD-NOS), and Asperger Disorder,[1] while current rates report autism as a single
category, per the Diagnostic and Statistical Manual of Mental Disorders, Fifth Edition (DSM-
5).[1] There is also the potential for overascertainment, given that symptoms of these disorders
may resemble or arise with intellectual disability, attention deficit hyperactivity disorder, or
obsessive-compulsive disorder.[28]
Neuropathology
Postnatal brain overgrowth has been observed among individuals with ASD, especially in

4
regions necessary for executing high-order social and cognitive processes.[29] In particular,
overgrowth has been observed in the prefrontal cortex, responsible for concentration and
judgment, and in the prefrontal cortex, responsible for comprehension of language and
emotion.[30-39] Neuroimaging studies have reported differences in synchronization across
cortical networks, with lowered functional connectivity relating to social cognition, language,
working memory, and problem solving in individuals with ASD.[1]
Cortical overgrowth may be the result of an excess of neurons in the frontal and
prefrontal cortices reported among children with autism,[40] with rapid neuron formation
potentially interfering with experience-dependent maturation and specialization.[41] Since
cortical layer formation and neuronal differentiation occur in prenatal development,[40] these
processes may become dysregulated in individuals with ASD prenatally. Neuroanatomical
findings in postmortem brain samples also support a prenatal onset of ASD.[42, 43]
Neurogenesis begins in the cerebral cortex at 9-10 weeks gestation and steadily increases in most
cortical regions until 24-26 weeks gestation.[44] Cortical synapses increase six-fold from 28
weeks gestation to 15 months of age, which is when peak synaptic density peaks in the prefrontal
cortex.[45]
Genetic risk factors
The causes of ASD can only be articulated in up to 15% of cases in which specific
genetic variants have been identified,[46] most commonly with rare inherited conditions such as
Fragile X Syndrome, Rett Syndrome, and Tuberous Sclerosis. No identified single genetic
aberration accounts for more than 1% of cases, suggesting extreme genetic heterogeneity among
affected individuals. Hundreds of genes are estimated to be involved in ASD,[47] but none of the
identified genetic causes are specific to the disorder.[1] These genes have been identified through
genome-wide association studies (GWAS) and whole genome and exome sequencing.
Postsynaptic density genes such as Neurexin 1, Neuroligins, and SHANK3 have been identified
as ASD risk factors through the study of rare inherited conditions that are caused by de novo

5
mutations and are associated with increased risk of ASD. Some genetic risk factors involve organ
systems besides the nervous system, such as the immune and gastrointestinal systems, which may
play a role in ASD comorbidities.[6] Copy number variations are large-scale deletions of
duplications of chromosome regions.[48] A systematic review[49, 50] cited that cytogenetically
detectable chromosome abnormalities were found in 7.4% (129/1749) of ASD cases (range: 0-
54%).
Monozygotic twins are genetically identical, while dizygotic twins are as genetically
comparable as singleton full siblings but share the same prenatal environment. Diagnostic
concordance studies have produced monozygotic concordance rates ranging from 50-100% and
dizygotic concordance rates ranging from 0-36%,[51-55] with inter-study variability a function of
case definition (ASD or autism) and child sex. The largest of these studies cites ASD
concordance figures of 76% for 128 monozygotic twin pairs and 18-34% for 186 opposite sex
and 254 same sex dizygotic pairs, respectively.[53] Comparatively, families with one affected
child have had sibling recurrence rates ranging from 13%[56] to 19%[57].
Dizygotic concordance figures suggest the relative contribution of shared environmental
influences, while the absence of full concordance between monozygotic pairs and the range of
symptom variation within concordant pairs[58] indicate a role of non-shared environmental
influences. Recent large studies cited highly variable contributions of shared and non-shared
environmental factors in ASD twin liability (shared: 5 and 58%, unshared: 4 and 46%).[52, 56]
Epigenetics
Differential genetic expression among monozygotic twins discordant for ASD is
regulated by epigenetics,[59, 60] the modulator through which environmental factors can
influence genetic expression. Environmental factors may influence genetic expression
independent of or dependent upon genotype. If vulnerability to environmental factors is
influenced by genotype, gene-environment interaction is present.

6
Epigenetic marks define the chromatin state,[61] permitting or preventing transcriptional
regulator complexes access to DNA sequences.[62] Histone tail methylation is associated with
the tight winding of DNA around histones such that gene transcription machinery is unable to
associate with the DNA.[62, 63] Since DNA methylation is crucial in properly controlling
genetic information, both hyper- and hypomethylation are implicated in inappropriate regulation
of gene function.[64]
One-carbon metabolism
In one-carbon (folate) metabolism, the methyl groups necessary for DNA methylation are
derived from dietary methyl group intake; folate is said to be the predominant dietary methyl
donor.[65, 66] Folate (as methyl-tetrahydrofolate, 5-MTHF) can donate a methyl group to the
amino acid homocysteine, using Vitamin B12 as a cofactor,[67] and Vitamin B6 is required for the
conversion of tetrahydrofolate to 5,10-MTHF.[68] Since the reaction cannot proceed in the
absence of B12, deficiency of B12 results in functional deficiency of folate, though deficiency
during pregnancy is rare due to large maternal storage.[69] Since this transfer lowers
homocysteine concentrations,[70] folic acid and vitamin B12 are both inversely related to
homocysteine levels;[68, 71-73] homocysteine is commonly used as an indicator of functional
folate status.[74-76]
DNA methylation
DNA methylation patterns are dependent upon the availability of methyl donors and
cofactors and the proper functioning of one-carbon metabolism. Embryonic DNA could become
hypomethylated if maternal plasma does not contain sufficient levels of methyl donors (such as
folate) and cofactors (such as vitamin B12) at critical periods in development.[77] While
methylation patterns of the genome are first established in the peri-conceptional period,
widespread changes in DNA methylation continue throughout gestation. Dietary deficiency of
methyl donors has been associated with DNA hypomethylation in the brains[78] and
placentas[79] of animals, and in genes controlling brain development in rat fetuses.[80]

7
Embryonic hypomethylation could also result from polymorphisms in maternal genes
coding for key enzymes involved in one-carbon metabolism. If any of the enzymes on the
pathway between folate and 5-MTHF acquire functional mutations, it may impair the ability of
folate and/or folic acid to be converted to 5-MTHF and act as an efficient methyl donor.
Polymorphisms in the MTHFR gene, which metabolizes folate into a form capable of methyl
donation, can reduce enzymatic activity, attenuating the ability of folate to be an effective methyl
donor.[81-83] This connects the status of epigenetic modifications to the functioning of the one-
carbon metabolic pathway.[81, 84]
Since DNA methylation of gene promoter regions represses downstream gene expression,
hypomethylation can result in inappropriate transcription of genes that might otherwise be
repressed. Failure to repress genes appropriately has been connected to neurodevelopmental
disorders,[60] with epigenetic changes implicated in the development of Rett, Angelman, and
Fragile X syndromes.[85] DNA hypomethylation has also been associated with ASD.[86, 87]
The MeCP2 gene, associated with Rett Syndrome, is involved in DNA methylation,
involving the covalent addition of a methyl or hydroxy methyl to DNA cytosine nucleotides.[88]
Maternal nutrition
Folate and folic acid
Folate is a water-soluble B complex vitamin (vitamin B9).[67] Folate is the natural form
of the B vitamin, while folic acid is the synthetic oxidized form of folate used in supplements and
food fortification.[89] Since folate cannot be synthesized by humans,[90] it must be obtained
from dietary sources including liver, kidney, leafy green vegetables, some citrus fruits, whole
grains, potatoes, and dairy.[91]
The fetus is dependent upon maternal intake of folate through active placental
transport.[92] Brain folate concentrations are elevated in the fetus early in gestation.[92] Women
of childbearing age are typically recommended to take at least 400 µg folic acid daily for the
prevention of neural tube defects, while recommendations for high-risk women are 4 or 5 g per

8
day.[93-96] In the U.S., folic acid supplementation recommendations were put forth by the CDC
in 1992[97] and cereal fortification of cereal grain products with folate (140 µg/ 100 g) began in
1996,[98] resulting in an elevation in median serum folate from 12.6 ug/L in 1994 to 18.7 ug/L in
1998.[98] Grain fortification is generally not an established practice in the rest of the world,
including Europe.
While folate is perhaps most well known for its role in DNA methylation, it is also
involved in the myelination of nerves, DNA and neurotransmitter synthesis, and the methylation
of phospholipids in neuronal membranes.[67, 99-102] Due to its role in DNA synthesis, folate
deficiency may result in deficient DNA repair, inducing DNA damage and neuronal death.[68]
This is supported by work that has shown that dietary maternal folic acid intake affects the
development of the neocortex and other regions of the brain by reducing the number of progenitor
cells through its influence on cell mitosis and apoptosis.[103] The neocortex is the part of the
brain responsible for cognition, attention and social competence, which can be aberrant in ASD.
Iron
Iron is a large, charged ion that provides a binding site for oxygen in hemoglobin,
facilitating oxygen delivery to the tissues of multi-cellular organisms.[104] Sixty-five to 75% of
the iron in an average person resides in hemoglobin in red blood cells.[104] Iron-deficiency
anemia is the most common nutritional anemia, and typically results from inadequate dietary iron
intake or excessive blood loss.[104] The World Health Organization estimates that iron
deficiency and its resultant anemia affects 52% of pregnant women in developing countries
worldwide.[105] The developing fetus is dependent upon maternal sources of iron.[106] Since in
pregnancy, a large portion of maternal iron stores is diverted to the fetus,[104] maternal
deficiency can cause fetal and infantile deficiency.[107, 108] Iron is involved in the myelination
of nerves and in neurotransmitter synthesis.[109]
Sweden recommendations and use
Nordic Nutritional Recommendations (NNR) advise that women consume 400 µg folic

9
acid per day during childbearing age and 500 µg folic acid per day during pregnancy, and 15 mg
iron per day[110]. In one study of Swedish women conducted 2006-2009, dietary folic acid and
iron intake alone was insufficient to meet these guidelines[110]. After accounting for
supplementary intake, daily intake estimates among pregnant women were 430 µg folic acid and
15.0 mg iron.
The official recommendation from the National Board of Health and Welfare since 1996
is to take a folic acid supplement with 400 µg per day, beginning one month prior to conception
and continuing through the end of the first trimester.[111] In a study conducted in southwest
Sweden in 2013, 30% of pregnant women reported using folic acid-containing supplements
during the first trimester.[112] Regarding iron supplementation, guidelines from the Swedish
Society of Obstetrics and Gynecology from 1991 through the study period recommended
initiation of iron supplementation of 100 mg per day in weeks 20-24 (this recommendation was
removed in 2008), while women with anemia should commence iron supplementation
immediately at 200 mg daily.[113]
U.K. recommendations and use
The British Nutrition Foundation cites 300 µg folic acid per day for pregnant women and
14.8 mg iron for females 15-50 years of age as Reference Nutrient Intakes.[114] These are the
quantities of nutrients that are considered sufficient to ensure that the needs of 97.5% of the group
are met. Pregnant women in the Avon Longitudinal Study of Parents and Children (ALSPAC)
based in southwest England reported mean dietary folate and iron intakes of 250 µg and 10.4 mg,
respectively.[115] Cohorts of other pregnant women in the UK reported similar intakes 251 µg
and 10.0 mg[116] and 242 µg and 10.5 mg[117] folate and iron, respectively.
The Royal College of Obstetrics and Gynecologists recommends 400 µg supplementary
folic acid per day preconception through the 1st trimester of pregnancy and 5 mg per day for high-
risk pregnant women.[118, 119] Iron supplementation is only advised for pregnant women who
are anemic or at risk of becoming anemic. In a study conducted in England in 2001, 43% of

10
mothers reported taking folic acid-containing supplements prior to pregnancy and 67% reported
use in the first trimester. In this group of women, combined daily dietary and supplementary
intake was around 510 µg.[120]
Maternal nutrition and ASD
Maternal nutrition has been shown to influence neurodevelopment.[121-131] The
success of folic acid fortification and supplementation in prevention of neural tube defects
(NTDs) is well known, as folic acid is documented to prevent up to 75% of NTDs.[132-134]
Since U.S. fortification was introduced, incidences of NTDs have been reduced by between 35%
and 78%.[63, 89, 135-137] The evidence for gestational nutrition influencing the risk of ASD is
mixed.[138] Two population-based studies[139, 140] reported reduced risk of ASD with
maternal folic acid supplementation and intake in the peri-conceptional period and early
pregnancy, while another reported no associations between early folate supplementation and ASD
risk.[141] One study reported a protective association between prenatal vitamins, but not
ordinary multivitamins,[142] while another also reported no associations between early
multivitamin supplementation and ASD risk.[141] A protective association has also been
reported between prenatal maternal iron[143] and ASD.
Maternal nutrition and autism-related traits
Studies have similarly linked self-reported folic acid use during pregnancy with both
reduced and strengthened ASD traits. Prospective cohort studies have linked self-reported
maternal folic acid or dietary folate with traits related to autism including improved receptive and
expressive communication at 18 months,[144] higher vocabulary scores,[145] a reduced risk of
severe language delay,[146] but also unfavorable development of the personal-social domain at 3
years of age,[147] improved verbal and social competence, but not executive functioning scores
at 4 years,[148] and less autistic traits at 6 years.[149]
One biomarker study reported an association between higher maternal plasma folate and
higher cognitive test scores at 9-10 years.[131] Others found no associations between maternal

11
blood or plasma folate and neurodevelopment at 18 months (16-36 w gestation)[150] or 5 years
(19-37 w gestation)[151]. There were also no associations observed between maternal blood
folate and social responsiveness at 4-5 years (11-21 w gestation)[152] and cognitive function at
6.5 years (20 and 30 w gestation and delivery).[153]
A dietary deficiency of vitamin B12 was negatively associated with mental development at
1, 3, 6, and 12 months.[126] Children of mothers with low plasma B12 (lowest decile) performed
more slowly on a sustained attention task than children of mothers with high plasma B12 (highest
decile), but there was no difference in the two groups for intelligence.[154] A biomarker study
did not report an association between vitamin B12 and cognitive test scores at 9-10 years.[131]
Early life iron deficiency is associated with impaired cognition, socialization, and
language development,[155-157] and poor iron status has also been associated with ASD.[158,
159] In a randomized controlled trial (RCT) in Nepal, children’s intellectual functioning was
higher in an iron/folic acid group at 7 – 9 years compared to a placebo group, but not in iron/folic
acid/zinc or multiple micronutrient groups.[160] In an Indonesian RCT, no difference in mental
development was reported among children of mothers taking standard and low dose folic acid and
iron.[161] In other RCTs, children of mothers who took iron had similar IQ scores at 4 years as
children of mothers taking placebo[162] and children of mothers who took folic acid alone or in
combination with iron scored similarly on mental development at 3, 6, and 12 groups and IQ at 7
– 10 years.[163, 164] A prospective cohort of dietary and supplementary iron intake reports no
relationship with intelligence at mean 7.8 years[165]
While studies of maternal multivitamin supplementation report null findings with regard
to mental development through 12 months[163], 18 months[166], and 2 – 6 years[167] and
intelligence at 7-9 years [160] and 7 – 10 years[164], a recent randomized controlled trial in
Indonesia reported higher cognitive development at 9 – 12 years of age among children of
mothers given multiple micronutrients compared to mothers given iron and folic acid.[168]

12
Genes related to folate metabolism and ASD
MTHFR is perhaps the most examined gene in folate metabolism with respect to ASD.
There has been an increase in the frequency of the C677T allele and its homozygous genotype in
individuals born in the last quarter of the 20th century, as compared to the first three
quarters,[169] with a greater frequency of this polymorphism in individuals with ASD.[170, 171]
Independent associations between ASD and MTHFR[171, 172] have been replicated in the
literature, but research indicates that the relationship between the C677T variant and autism does
not hold under conditions of higher folate nutritional status.[173] A meta-analysis of studies of
MTHFR C677T and A1298C through the year 2012 reported the C677T polymorphism being
associated with increased ASD risk, (T vs C allele: OR = 1.42, 95% confidence interval: [1.09,
1.85]) while the A1298C polymorphism was only significantly associated with reduced ASD in a
recessive model (CC vs AA+CC: 0.73 [0.56, 0.97]). The C677T polymorphism was associated in
ASD only in children from countries without food fortification.[174] Other genes in folate
metabolism have been examined to a limited extent among individuals with ASD.
Associations with ASD have also been reported between other functional gene variants
involved in one-carbon metabolism, such as catechol-O-methyltransferase (COMT),[175]
transcobalamin II (TCN2),[175] 5-methyltetraydrofolate-homocysteine methyltransferase
(MTRR),[176] and cystathionine-β-synthase (CBS),[172] while associations have not been
reported between ASD and either betaine-homocysteine S-methyltransferase (BHMT), 5-
methyltetrahydrofolate-homocysteine methyltransferase (MTR), folate receptor 1 (FOL1), or
folate receptor 2 (FOLR2).[172]
In the gestational environment, maternal and/or child genes related to folate metabolism
may influence the risk of ASD, which may interact with maternal intake of nutrients involved in
folate metabolism (folic acid, vitamin B12). Schmidt et al (2011)[142] explored effect
modification between nutritional factors and functional genetic variants involved in folate
metabolism (MTHFR, COMT, MTRR, BHMT, FOLR2, CBS, and TCN2) as carried by the

13
mother or child and risk of ASD. They found significant interaction effects for maternal MTHFR
677 TT, CBS rs234715 GT + TT, and child COMT 472 AA genotypes, with greater autism risk
observed when mothers did not report taking prenatal vitamins periconceptionally. Another study
reported that low daily folate intake (< 400 mg/d) was associated with lower mental development
in the child at 1, 3, 6, and 12 months only among MTHFR677 TT mothers.[126]
Conclusions
While maternal nutrition may be related to ASD, evidence is inconsistent regarding
whether prenatal nutrient supplementation is protective against autism and related traits, and
whether associations depend on relevant genotypes. In examination of relationships between
nutritional supplementation and ASD, few studies have accounted for the possibility that autism-
related traits may have varying etiologies.
Since investigating related traits in addition to clinically diagnosed ASD would provide
richer etiological context, we examine these relationships in two prospective population-based
cohorts. In the Stockholm Youth Cohort, we investigate maternal nutritional supplementation
with folic acid, iron, and multivitamins and ASD, stratified by intellectual disability. In
ALSPAC, we investigate maternal nutritional supplementation with folic acid, iron, and vitamins,
and potential interactions with genes involved in folate metabolism as they relate to autism and
related factors. Multiple analytic strategies will be utilized to help clarify these relationships.

14
REFERENCES
1. Levy, S.E. and D. Mandell, Autism. Lancet, 2009. 374: p. 1627-1638.
2. Wing, L., The continuum of autistic characteristics, in Diagnosis and assessment in autism. 1988, Springer. p. 91-110.
3. Skuse, D.H., et al., Social communication competence and functional adaptation in a general population of children: preliminary evidence for sex-by-verbal IQ differential risk. Journal of the American Academy of Child & Adolescent Psychiatry, 2009. 48(2): p. 128-137.
4. Newschaffer, C.J., et al., The epidemiology of autism spectrum disorders. Annual Reviews of Public Health, 2007. 28: p. 235-58.
5. Simonoff, E., et al., Psychiatric disorders in children with autism spectrum disorders: prevalence, comorbidity, and associated factors in a population-derived sample. Journal of the American Academy of Child & Adolescent Psychiatry, 2008. 47(8): p. 921-929.
6. Herbert, M.R., et al., Autism and environmental genomics. Neurotoxicology, 2006. 27(5): p. 671-684.
7. Crespi, B.J., Autism As a Disorder of High Intelligence. Frontiers in Neuroscience, 2016. 10.
8. Happé, F. and A. Ronald, The ‘fractionable autism triad’: a review of evidence from behavioural, genetic, cognitive and neural research. Neuropsychology review, 2008. 18(4): p. 287-304.
9. Van Os, J., ‘Salience syndrome’replaces ‘schizophrenia’in DSM‐V and ICD‐11: psychiatry’s evidence‐based entry into the 21st century? Acta Psychiatrica Scandinavica, 2009. 120(5): p. 363-372.
10. Ronald, A., et al., Genetic heterogeneity between the three components of the autism spectrum: A twin study. Journal of the American Academy of Child and Adolescent Psychiatry, 2006. 45(6): p. 691-699.
11. Lord, C., M. Rutter, and A. Couteur, Autism Diagnostic Interview-Revised: a revised version of a diagnostic interview for caregivers of individuals with possible pervasive developmental disorders. Journal of autism and developmental disorders, 1994. 24(5): p. 659-685.
12. Lord, C., et al., The Autism Diagnostic Observation Schedule—Generic: A standard measure of social and communication deficits associated with the spectrum of autism. Journal of autism and developmental disorders, 2000. 30(3): p. 205-223.
13. McPartland, J.C., B. Reichow, and F.R. Volkmar, Sensitivity and specificity of proposed DSM-5 diagnostic criteria for autism spectrum disorder. Journal of the American Academy of Child & Adolescent Psychiatry, 2012. 51(4): p. 368-383.

15
14. Kanner, L., Follow-up study of eleven autistic children originally reported in 1943. Journal of Autism and Developmental Disorders, 1971. 1(2): p. 119-145.
15. Asperger, H., 'Autistic psychopathy' in childhood, in Autism and Asperger syndrome, U. Frith, Editor. 1991, Cambridge University Press: New York, NY. p. 37-92.
16. Gillberg, C., S. Steffenburg, and H. Schaumann, Is autism more common now than ten years ago? The British Journal of Psychiatry, 1991. 158(3): p. 403-409.
17. Blaxill, M.F., What's going on? The question of time trends in Autism. Public Health Reports, 2004. 119(6): p. 536-551.
18. Baio, J., Prevalence of Autism Spectrum Disorders: Autism and Developmental Disabilities Monitoring Network, 14 Sites, United States, 2008. Morbidity and Mortality Weekly Report. Surveillance Summaries. Volume 61, Number 3. Centers for Disease Control and Prevention, 2012.
19. Christensen, D.L., Prevalence and characteristics of autism spectrum disorder among children aged 8 years—autism and developmental disabilities monitoring network, 11 sites, United States, 2012. MMWR. Surveillance Summaries, 2016. 65.
20. Duchan, E. and D.R. Patel, Epidemiology of autism spectrum disorders. Pediatric Clinics of North America, 2012. 59(1): p. 27-43.
21. Chien, I.-C., et al., Prevalence and incidence of autism spectrum disorders among national health insurance enrollees in Taiwan from 1996 to 2005. Journal of child neurology, 2011. 26(7): p. 830-834.
22. Fombonne, E., Epidemiology of pervasive developmental disorders. Pediatric research, 2009. 65(6): p. 591-598.
23. Hansen, S.N., D.E. Schendel, and E.T. Parner, Explaining the increase in the prevalence of autism spectrum disorders: the proportion attributable to changes in reporting practices. JAMA Pediatr, 2015. 169(1): p. 56-62.
24. King, M. and P. Bearman, Diagnostic change and the increased prevalence of autism. International Journal of Epidemiology, 2009. 38(5): p. 1224-1234.
25. Liu, K.-Y., M. King, and P.S. Bearman, Social influence and the autism epidemic. AJS; American journal of sociology, 2010. 115(5): p. 1387.
26. Liu, K., N. Zerubavel, and P. Bearman, Social demographic change and autism. Demography, 2010. 47(2): p. 327-343.
27. King, M.D., et al., Estimated autism risk and older reproductive age. American Journal of Public Health, 2009. 99(9): p. 1673-1679.
28. Billstedt, E., Autism and Asperger syndrome: coexistence with other clinical disorders. Acta Psychiatrica Scandinavica, 2000. 102(5): p. 321-330.

16
29. Chayer, C.l. and M. Freedman, Frontal lobe functions. Current neurology and neuroscience reports, 2001. 1: p. 547-552.
30. Minshew, N.J. and D.L. Williams, The new neurobiology of autism: cortex, connectivity, and neuronal organization. Archives of neurology, 2007. 64(7): p. 945.
31. Chawarska, K., et al., Early generalized overgrowth in boys with autism. Archives of General Psychiatry, 2011. 68(10): p. 1021-1031.
32. Hazlett, H.C., et al., Early brain overgrowth in autism associated with an increase in cortical surface area before age 2 years. Archives of General Psychiatry, 2011. 68(5): p. 467-476.
33. Courchesne, E., et al., Neuron number and size in prefrontal cortex of children with autism. Jama, 2011. 306(18): p. 2001-2010.
34. Courchesne, E., et al., Mapping early brain development in autism. Neuron, 2007. 56(2): p. 399-413.
35. Sparks, B., et al., Brain structural abnormalities in young children with autism spectrum disorder. Neurology, 2002. 59(2): p. 184-192.
36. Courchesne, E., R. Carper, and N. Akshoomoff, Evidence of brain overgrowth in the first year of life in autism. Jama, 2003. 290(3): p. 337-344.
37. Courchesne, E., et al., Unusual brain growth patterns in early life in patients with autistic disorder an MRI study. Neurology, 2001. 57(2): p. 245-254.
38. Smith, E.E. and S.M. Kosslyn, Cognitive psychology: Mind and brain. 2006: Pearson Prentice Hall.
39. Yang, Y. and A. Raine, Prefrontal structural and functional brain imaging findings in antisocial, violent, and psychopathic individuals: a meta-analysis. Psychiatry Research: Neuroimaging, 2009. 174(2): p. 81-88.
40. Stoner, R., et al., Patches of disorganization in the neocortex of children with autism. New England Journal of Medicine, 2014. 370(13): p. 1209-1219.
41. Polšek, D., et al., Recent developments in neuropathology of autism spectrum disorders. Translational neuroscience, 2011. 2(3): p. 256-264.
42. Kemper, T.L. and M. Bauman, Neuropathology of infantile autism. Journal of neuropathology and experimental neurology, 1998. 57(7): p. 645.
43. Rodier, P.M., et al., Embryological origin for autism: developmental anomalies of the cranial nerve motor nuclei. Journal of Comparative Neurology, 1996. 370(2): p. 247-261.
44. Zecevic, N., Synaptogenesis in layer I of the human cerebral cortex in the first half of gestation. Cerebral Cortex, 1998. 8(3): p. 245-252.
45. Huttenlocher, P.R. and A.S. Dabholkar, Regional differences in synaptogenesis in human cerebral cortex. Journal of Comparative Neurology, 1997. 387(2): p. 167-178.

17
46. Folstein, S.E. and B. Rosen-Sheidley, Genetics of austim: complex aetiology for a heterogeneous disorder. Nature Reviews Genetics, 2001. 2(12): p. 943-955.
47. Betancur, C., Etiological heterogeneity in autism spectrum disorders: more than 100 genetic and genomic disorders and still counting. Brain Research, 2011. 1380: p. 42-77.
48. Marshall, C.R., et al., Structural variation of chromosomes in autism spectrum disorder. American Journal of Human Genetics, 2008. 82(2): p. 477-488.
49. Xu, J., et al., Molecular cytogenetics of autism. Current Genomics, 2004. 5(4): p. 347-364.
50. Vorstman, J., et al., Identification of novel autism candidate regions through analysis of reported cytogenetic abnormalities associated with autism. 2006, Nature Publishing Group.
51. Bailey, A., et al., Autism as a strongly genetic disorder: evidence from a British twin study. Psychological medicine, 1995. 25(01): p. 63-77.
52. Hallmayer, J., et al., Genetic Heritability and Shared Environmental Factors Among Twin Pairs With Autism. Archives of General Psychiatry, 2011. 68(11): p. 1095-1102.
53. Frazier, T.W., et al., A Twin Study of Heritable and Shared Environmental Contributions to Autism. Journal of Autism and Developmental Disorders, 2014. 44(8): p. 2013-2025.
54. Taniai, H., et al., Genetic influences on the broad spectrum of autism: Study of proband‚Äêascertained twins. American Journal of Medical Genetics Part B: Neuropsychiatric Genetics, 2008. 147(6): p. 844-849.
55. Rosenberg, R.E., et al., Characteristics and concordance of autism spectrum disorders among 277 twin pairs. Archives of pediatrics & adolescent medicine, 2009. 163(10): p. 907-914.
56. Sandin, S., et al., The familial risk of autism. Journal of the American Medical Association, 2014. 311(17): p. 1770-1777.
57. Ozonoff, S., et al., Recurrence risk for autism spectrum disorders: a Baby Siblings Research Consortium study. Pediatrics, 2011. 128(3): p. e488-e495.
58. Muhle, R., S.V. Trentacoste, and I. Rapin, The genetics of autism. Pediatrics, 2004. 113(5): p. e472-e486.
59. Jones, P.A. and M.L. Gonzalgo, Altered DNA methylation and genome instability: A new pathway to cancer? Proceedings of the National Academy of Sciences, 1997. 94(6): p. 2103-2105.
60. Robertson, K.D. and A.P. Wolffe, DNA methylation in health and disease. Nature Reviews Genetics, 2000. 1(1): p. 11-19.
61. Berger, S.L., et al., An operational definition of epigenetics. Genes & development, 2009. 23(7): p. 781-783.

18
62. Kouzarides, T., Chromatin modifications and their function. Cell, 2007. 128(4): p. 693-705.
63. Schaevitz, L.R. and J.E. Berger-Sweeney, Gene-environment interactions and epigenetic pathways in autism: the importance of one-carbon metabolism. ILAR Journal, 2012. 53(3-4): p. 322-340.
64. Jenuwein, T., The epigenetic magic of histone lysine methylation. Febs Journal, 2006. 273(14): p. 3121-3135.
65. LaSalle, J.M., A genomic point-of-view on environmental factors influencing the human brain methylome. Epigenetics, 2011. 6(7): p. 862-869.
66. Lopatina, N., et al., Elevated expression and altered pattern of activity of DNA methyltransferase in liver tumors of rats fed methyl-deficient diets. Carcinogenesis, 1998. 19(10): p. 1777-1781.
67. Cosar, A., et al., Folate and homocysteine metabolisms and their roles in the biochemical basis of neuropsychiatry. 2014.
68. Mattson, M.P. and T.B. Shea, Folate and homocysteine metabolism in neural plasticity and neurodegenerative disorders. Trends in neurosciences, 2003. 26(3): p. 137-146.
69. Moussa, H.N., et al., Folic acid supplementation: what is new? Fetal, obstetric, long-term benefits and risks. Future Science Oa, 2016. 2(2): p. 11.
70. Olthof, M.R., et al., Low dose betaine supplementation leads to immediate and long term lowering of plasma homocysteine in healthy men and women. The Journal of nutrition, 2003. 133(12): p. 4135-4138.
71. Steenweg-de Graaff, J., et al., Maternal folate status in early pregnancy and child emotional and behavioral problems: the Generation R Study. The American journal of clinical nutrition, 2012. 95(6): p. 1413-1421.
72. Clarke, R., et al., Folate, vitamin B12, and serum total homocysteine levels in confirmed Alzheimer disease. Archives of neurology, 1998. 55(11): p. 1449.
73. Quadri, P., et al., Homocysteine, folate, and vitamin B-12 in mild cognitive impairment, Alzheimer disease, and vascular dementia. The American journal of clinical nutrition, 2004. 80(1): p. 114-122.
74. Laanpere, M., et al., Folate-mediated one-carbon metabolism and its effect on female fertility and pregnancy viability. Nutrition reviews, 2010. 68(2): p. 99-113.
75. Stevenson, J.P., et al., Phase I clinical and pharmacogenetic trial of irinotecan and raltitrexed administered every 21 days to patients with cancer. Journal of Clinical Oncology, 2001. 19(20): p. 4081-4087.
76. Cravo, M.L., et al., Hyperhomocysteinemia in chronic alcoholism: Correlation with folate, vitamin B-12, and vitamin B-6 status. American Journal of Clinical Nutrition, 1996. 63(2): p. 220-224.

19
77. Ghoshal, K., et al., A folate-and methyl-deficient diet alters the expression of DNA methyltransferases and methyl CpG binding proteins involved in epigenetic gene silencing in livers of F344 rats. The Journal of nutrition, 2006. 136(6): p. 1522-1527.
78. Christman, J.K., et al., Reversibility of changes in nucleic acid methylation and gene expression induced in rat liver by severe dietary methyl deficiency. Carcinogenesis, 1993. 14(4): p. 551-557.
79. Kim, J.-M., et al., Effect of folate deficiency on placental DNA methylation in hyperhomocysteinemic rats. The Journal of nutritional biochemistry, 2009. 20(3): p. 172-176.
80. Niculescu, M.D., C.N. Craciunescu, and S.H. Zeisel, Dietary choline deficiency alters global and gene-specific DNA methylation in the developing hippocampus of mouse fetal brains. The FASEB journal, 2006. 20(1): p. 43-49.
81. Ulrey, C.L., et al., The impact of metabolism on DNA methylation. Human molecular genetics, 2005. 14(suppl 1): p. R139-R147.
82. Renieri, A., et al., Diagnostic criteria for the Zappella variant of Rett syndrome (the preserved speech variant). Brain and Development, 2009. 31(3): p. 208-216.
83. Luikenhuis, S., et al., Expression of MeCP2 in postmitotic neurons rescues Rett syndrome in mice. Proceedings of the National Academy of Sciences of the United States of America, 2004. 101(16): p. 6033-6038.
84. Niculescu, M.D. and S.H. Zeisel, Diet, methyl donors and DNA methylation: interactions between dietary folate, methionine and choline. The Journal of nutrition, 2002. 132(8): p. 2333S-2335S.
85. Zhao, X., et al., Epigenetics and neural developmental disorders. Epigenetics, 2007. 2(2): p. 126-134.
86. Melnyk, S., et al., Metabolic imbalance associated with methylation dysregulation and oxidative damage in children with autism. Journal of autism and developmental disorders, 2012. 42(3): p. 367-377.
87. Nguyen, A., et al., Global methylation profiling of lymphoblastoid cell lines reveals epigenetic contributions to autism spectrum disorders and a novel autism candidate gene, RORA, whose protein product is reduced in autistic brain. The FASEB journal, 2010. 24(8): p. 3036-3051.
88. Abdolmaleky, H.M., et al., Methylomics in psychiatry: modulation of gene–environment interactions may be through DNA methylation. American Journal of Medical Genetics Part B: Neuropsychiatric Genetics, 2004. 127(1): p. 51-59.
89. Berry, R.J., K.S. Crider, and M. Yeargin-Allsopp, Periconceptional Folic Acid and Risk of Autism Spectrum Disorders. Jama-Journal of the American Medical Association, 2013. 309(6): p. 611-613.

20
90. Lucock, M., et al., Nonenzymatic degradation and salvage of dietary folate: physicochemical factors likely to influence bioavailability. Biochemical and molecular medicine, 1995. 55(1): p. 43-53.
91. Lucock, M., Folic acid: nutritional biochemistry, molecular biology, and role in disease processes. Molecular genetics and metabolism, 2000. 71(1): p. 121-138.
92. Greenblatt, J.M., L.C. Huffman, and A.L. Reiss, Folic acid in neurodevelopment and child psychiatry. Progress in Neuro-Psychopharmacology and Biological Psychiatry, 1994. 18(4): p. 647-660.
93. American College of Obstetricians and Gynecologists, ACOG Practice Bulletin: Clinical Management Guidelines for Obstetrcian-Gynecologists: Number 44, July 2003. (Replaces Committee Opinion Number 252, March 2001). Obstetrics and gynecology, 2003. 102(1): p. 203-213.
94. American College of Obstetricians and Gynecologists, ACOG Practice Bulletin: Clinical Management Guidelines for Obstetrcian-Gynecologists: Number 231, December 1996. Seizure disorders in pregnancy. Int J Gynaecol Obstet, 1997. 56: p. 279-286.
95. Nunes, V.D., et al., Diagnosis and management of the epilepsies in adults and children: summary of updated NICE guidance. Bmj, 2012. 344(jan26 2): p. e281-e281.
96. Wilson RD, L.D., American Congress of Obstetricians and Gynecologists, The Society of Obstetricians and Gynecologists of Canada and The Society of Gynecologic Oncologists of Canada. Genetic considerations for a woman’s annual gynaecological examination. 2012. 34(3): p. 276-284.
97. Centers for Disease Control and Prevention (CDC), Recommendations for the Use of Folic Acid to Reduce the Number of Cases of Spina Bifida and Other Neural Tube Defects. MMWR Recomm. Rep., 1992. 41: p. 1-7.
98. Lawrence, J.M., et al., Trends in serum folate after food fortification. The Lancet, 1999. 354(9182): p. 915-916.
99. Ramakrishna, T., Vitamins and brain development. Physiological research, 1999. 48: p. 175-188.
100. Black, M.M., Effects of vitamin B12 and folate deficiency on brain development in children. Food and nutrition bulletin, 2008. 29(2 Suppl): p. S126.
101. Dror, D.K. and L.H. Allen, Effect of vitamin B12 deficiency on neurodevelopment in infants: current knowledge and possible mechanisms. Nutrition reviews, 2008. 66(5): p. 250-255.
102. Fernstrom, J.D., Can nutrient supplements modify brain function? The American journal of clinical nutrition, 2000. 71(6): p. 1669s-1673s.
103. Craciunescu, C.N., et al., Folic acid deficiency during late gestation decreases progenitor cell proliferation and increases apoptosis in fetal mouse brain. The Journal of nutrition, 2004. 134(1): p. 162-166.

21
104. Andrews, N.C., Iron homeostasis: Insights from genetics and animal models. Nature Reviews Genetics, 2000. 1(3): p. 208-217.
105. World Health Organization, Iron deficiency anaemia: assessment, prevention and control: a guide for programme managers. 2001.
106. Millard, K.N., et al., Changes in the expression of intestinal iron transport and hepatic regulatory molecules explain the enhanced iron absorption associated with pregnancy in the rat. Gut, 2004. 53(5): p. 655-660.
107. Tchernia, G., et al., Erythrocyte ferritin in human neonates: Maternofetal iron kinetics revisited. Clinical and Laboratory Haematology, 1996. 18(3): p. 147-153.
108. Colomer, J., et al., Anaemia during pregnancy as a risk factor for infant iron deficiency: report from the Valencia Infant Anaemia Cohort (VIAC) study. Paediatric and perinatal epidemiology, 1990. 4(2): p. 196-204.
109. Beard, J.L., Effectiveness and strategies of iron supplementation during pregnancy. American Journal of Clinical Nutrition, 2000. 71(5): p. 1288S-1294S.
110. Lundqvist, A., et al., Reported dietary intake in early pregnant compared to non-pregnant women - a cross-sectional study. BMC Pregnancy and Childbirth, 2014. 14: p. 10.
111. Cawley, S., et al., A review of European guidelines on periconceptional folic acid supplementation. Eur J Clin Nutr, 2016. 70(2): p. 143-54.
112. Eriksson, L., [Use of folic acid supplements among pregnant women during the first trimester]. Gothenburg University, Department of diet and sports sciences, 2014.
113. SFOG, Halso-overvakning vid normal graviditet (Routine antenatal care). ARG rapport, 1991. 21: p. 37-38.
114. British Nutrition Foundation. Nutrition Requirements. 2016 October 2017 [cited 2017 16 April 2017]; Available from: https://www.nutrition.org.uk/attachments/article/261/Nutrition%20Requirements_Revised%20Oct%202016.pdf.
115. Rogers, I. and P. Emmett, Diet during pregnancy in a population of pregnant women in South West England. ALSPAC Study Team. Avon Longitudinal Study of Pregnancy and Childhood. European journal of clinical nutrition, 1998. 52(4): p. 246-250.
116. Henderson, L., The National Diet & Nutrition Survey: Adults Aged 19-64 Years: Vol 1: Types and Quantities of Foods Consumed. 2002.
117. Mathews, F. and H. Neil, Nutrient intakes during pregnancy in a cohort of nulliparous women. Journal of human nutrition and dietetics, 1998. 11(2): p. 151-162.
118. Royal College of Obstetricians and Gynaecologists RCOG statement on preconceptual folate supplementation to prevent preterm birth. 2009.

22
119. Royal College of Obstetricians and Gynaecologists. Healthy eating and vitamn supplements in pregnancy. 2014 October 2014 [cited 2017 16 April 2017]; Available from: https://www.rcog.org.uk/globalassets/documents/patients/patient-information-leaflets/pregnancy/pi-healthy-eating-and-vitamin-supplements-in-pregnancy.pdf.
120. Langley-Evans, S. and A. Langley-Evans, Use of folic acid supplements in the first trimester of pregnancy. The journal of the Royal Society for the Promotion of Health, 2002. 122(3): p. 181-186.
121. Bale, T.L., Epigenetic and transgenerational reprogramming of brain development. Nature Reviews Neuroscience, 2015. 16(6): p. 332-344.
122. Brown, A.S. and E.S. Susser, Prenatal nutritional deficiency and risk of adult schizophrenia. Schizophrenia Bulletin, 2008. 34(6): p. 1054-1063.
123. Xu, M.Q., et al., Prenatal malnutrition and adult schizophrenia: further evidence from the 1959-1961 Chinese famine. Schizophrenia Bulletin, 2009. 35(3): p. 568-576.
124. Georgieff, M.K., The role of iron in neurodevelopment: fetal iron deficiency and the developing hippocampus. Biochemical Society Transactions, 2008. 36: p. 1267-1271.
125. Hibbeln, J.R., et al., Maternal seafood consumption in pregnancy and neurodevelopmental outcomes in childhood (ALSPAC study): an observational cohort study. Lancet, 2007. 369(9561): p. 578-585.
126. Garcia, C.D., et al., Maternal MTHFR 677C > T genotype and dietary intake of folate and vitamin B-12: their impact on child neurodevelopment. Nutritional Neuroscience, 2009. 12(1): p. 13-20.
127. Durga, J., et al., Folate and the methylenetetrahydrofolate reductase 677C -> T mutation correlate with cognitive performance. Neurobiology of Aging, 2006. 27(2): p. 334-343.
128. Gale, C.R., et al., Oily fish intake during pregnancy - association with lower hyperactivity but not with higher full-scale IQ in offspring. Journal of Child Psychology and Psychiatry, 2008. 49(10): p. 1061-1068.
129. Isaacs, E.B., et al., The effect of early human diet on caudate volumes and IQ. Pediatric Research, 2008. 63(3): p. 308-314.
130. Melse-Boonstra, A. and N. Jaiswal, Iodine deficiency in pregnancy, infancy and childhood and its consequences for brain development. Best Practice & Research Clinical Endocrinology & Metabolism, 2010. 24(1): p. 29-38.
131. Veena, S.R., et al., Higher maternal plasma folate but not vitamin B-12 concentrations during pregnancy are associated with better cognitive function scores in 9-to 10-year-old children in South India. The Journal of nutrition, 2010. 140(5): p. 1014-1022.
132. Sweeney, M.R., J. McPartlin, and J. Scott, Folic acid fortification and public health: report on threshold doses above which unmetabolised folic acid appear in serum. BMC public health, 2007. 7(1): p. 41.
23
133. Yang, Q., et al., Folic acid source, usual intake, and folate and vitamin B-12 status in US adults: National Health and Nutrition Examination Survey (NHANES) 2003 - 2006. The American journal of clinical nutrition, 2010. 91(1): p. 64-72.
134. Pitkin, R., et al., Dietary Reference Intakes for Thiamin, riboflavin, niacin, vitamin B6, folate, vitamin B12, Pantothenic acid, biotin and choline. 2000, National Academy Press, Washington, DC.
135. Oakley Jr, G.P., M.J. Adams, and C.M. Dickinson, More Folic Acid for Everyone, Now1. J. Nutr, 1996. 126: p. 751S-755S.
136. Daly, L.E., et al., Folate levels and neural tube defects. JAMA: the journal of the American Medical Association, 1995. 274(21): p. 1698-1702.
137. Bailey, L.B. and J.F. Gregory, Folate metabolism and requirements. The Journal of nutrition, 1999. 129(4): p. 779-782.
138. Cheslack-Postava, K., K. Liu, and P.S. Bearman, Closely Spaced Pregnancies Are Associated With Increased Odds of Autism in California Sibling Births. Pediatrics, 2011. 127(2): p. 246-253.
139. Schmidt, R.J., et al., Maternal periconceptional folic acid intake and risk of autism spectrum disorders and developmental delay in the CHARGE (CHildhood Autism Risks from Genetics and Environment) case-control study. The American journal of clinical nutrition, 2012. 96(1): p. 80-89.
140. Suren, P., et al., Association between maternal use of folic acid supplements and risk of autism spectrum disorders in children. Journal of the American Medical Association, 2013. 309(6): p. 570-577.
141. Virk, J., et al., Preconceptional and prenatal supplementary folic acid and multivitamin intake and autism spectrum disorders. Autism, 2016. 20(6): p. 710-718.
142. Schmidt, R.J., et al., Prenatal vitamins, one-carbon metabolism gene variants, and risk for autism. Epidemiology, 2011. 22(4): p. 476-485.
143. Schmidt, R.J., et al., Maternal intake of supplemental iron and risk of autism spectrum disorder. American Journal of Epidemiology, 2014: p. 890-900.
144. Chatzi, L., et al., Effect of high doses of folic acid supplementation in early pregnancy on child neurodevelopment at 18 months of age: the mother-child cohort "Rhea" study in Crete, Greece. Public Health Nutrition, 2012. 15(09): p. 1728-1736.
145. Villamor, E., et al., Maternal intake of methyl-donor nutrients and child cognition at 3 years of age. Paediatr Perinat Epidemiol, 2012. 26(4): p. 328-35.
146. Roth, C., et al., Folic Acid Supplements in Pregnancy and Severe Language Delay in Children. Jama-Journal of the American Medical Association, 2011. 306(14): p. 1566-1573.

24
147. Wehby, G.L. and J.C. Murray, The effects of prenatal use of folic acid and other dietary supplements on early child development. Maternal and child health journal, 2008. 12(2): p. 180-187.
148. Julvez, J., et al., Maternal use of folic acid supplements during pregnancy and four-year-old neurodevelopment in a population-based birth cohort. Paediatric and perinatal epidemiology, 2009. 23(3): p. 199-206.
149. Steenweg-de Graaff, J., et al., Folate concentrations during pregnancy and autistic traits in the offspring. The Generation R Study. The European Journal of Public Health, 2014: p. cku126.
150. Wu, B.T.F., et al., Early Second Trimester Maternal Plasma Choline and Betaine Are Related to Measures of Early Cognitive Development in Term Infants. Plos One, 2012. 7(8): p. 8.
151. Tamura, T., et al., Folate status of mothers during pregnancy and mental and psychomotor development of their children at five years of age. Pediatrics, 2005. 116(3): p. 703-708.
152. Braun, J.M., et al., Brief report: are autistic-behaviors in children related to prenatal vitamin use and maternal whole blood folate concentrations? Journal of autism and developmental disorders, 2014. 44(10): p. 2602-2607.
153. Campoy, C., et al., Effects of prenatal fish-oil and 5-methyltetrahydrofolate supplementation on cognitive development of children at 6.5 y of age. American Journal of Clinical Nutrition, 2011. 94(6): p. 1880S-1888S.
154. Bhate, V., et al., Vitamin B(12) status of pregnant Indian women and cognitive function in their 9-year-old children. Food and Nutrition Bulletin, 2008. 29(4): p. 249-254.
155. Tamura, T., et al., Cord serum ferritin concentrations and mental and psychomotor development of children at five years of age. Journal of Pediatrics, 2002. 140(2): p. 165-170.
156. Siddappa, A.M., et al., Iron deficiency alters auditory recognition memory in newborn infants of diabetic mothers. Pediatric Research, 2004. 55(6): p. 1034-1041.
157. Lozoff, B., E. Jimenez, and A.W. Wolf, Long-term developmental outcome of intfants with iron deficiency. New England Journal of Medicine, 1991. 325(10): p. 687-694.
158. Herguner, S., et al., Ferritin and iron levels in children with autistic disorder. European Journal of Pediatrics, 2012. 171(1): p. 143-146.
159. Reynolds, A., et al., Iron Status in Children With Autism Spectrum Disorder. Pediatrics, 2012. 130: p. S154-S159.
160. Christian, P., et al., Prenatal Micronutrient Supplementation and Intellectual and Motor Function in Early School-aged Children in Nepal. Jama-Journal of the American Medical Association, 2010. 304(24): p. 2716-2723.

25
161. Schmidt, M.K., et al., Mental and psychomotor development in Indonesian infants of mothers supplemented with vitamin A in addition to iron during pregnancy. British Journal of Nutrition, 2004. 91(2): p. 279-285.
162. Zhou, S.J., et al., Effect of iron supplementation during pregnancy on the intelligence quotient and behavior of children at 4 y of age: long-term follow-up of a randomized controlled trial. American Journal of Clinical Nutrition, 2006. 83(5): p. 1112-1117.
163. Li, Q., et al., Effects of Maternal Multimicronutrient Supplementation on the Mental Development of Infants in Rural Western China: Follow-up Evaluation of a Double-Blind, Randomized, Controlled Trial. Pediatrics, 2009. 123(4): p. E685-E692.
164. Li, C., et al., Prenatal micronutrient supplementation is not associated with intellectual development of young school-aged children. The Journal of nutrition, 2015. 145(8): p. 1844-1849.
165. Boeke, C.E., et al., Choline Intake During Pregnancy and Child Cognition at Age 7 Years. American Journal of Epidemiology, 2013. 177(12): p. 1338-1347.
166. McGrath, N., et al., Effect of maternal multivitamin supplementation on the mental and psychomotor development of children who are born to HIV-1 - Infected mothers in Tanzania. Pediatrics, 2006. 117(2): p. E216-E225.
167. Dobo, M. and A. Czeizel, Long-term somatic and mental development of children after periconceptional multivitamin supplementation. European journal of pediatrics, 1998. 157(9): p. 719-723.
168. Prado, E.L., et al., Maternal multiple micronutrient supplementation and other biomedical and socioenvironmental influences on children's cognition at age 9–12 years in Indonesia: follow-up of the SUMMIT randomised trial. The Lancet Global Health, 2017. 5(2): p. e217-e228.
169. Mayor-Olea, A., et al., Human genetic selection on the MTHFR 677C> T polymorphism. BMC medical genetics, 2008. 9(1): p. 104.
170. Guo, T., et al., Methylenetetrahydrofolate reductase polymorphisms C677T and risk of autism in the Chinese Han population. Genetic Testing and Molecular Biomarkers, 2012. 16(8): p. 968-973.
171. Boris, M., et al., Association of MTHFR gene variants with autism. J Am Phys Surg, 2004. 9(4): p. 106-108.
172. Schmidt, R.J., et al., Maternal periconceptional folic acid intake and risk of autism spectrum disorders and developmental delay in the CHARGE (CHildhood Autism Risks from Genetics and Environment) case-control study. American Journal of Clinical Nutrition, 2012. 96(1): p. 80-89.
173. Chango, A., et al., The effect of 677C->T and 1298A->C mutations on plasma homocysteine and 5, 10-methylenetetrahydrofolate reductase activity in healthy subjects. British journal of nutrition, 2000. 83(06): p. 593-596.

26
174. Pu, D., Y. Shen, and J. Wu, Association between MTHFR Gene Polymorphisms and the Risk of Autism Spectrum Disorders: A Meta-Analysis. Autism Research, 2013.
175. James, S.J., et al., Metabolic endophenotype and related genotypes are associated with oxidative stress in children with autism. American Journal of Medical Genetics Part B: Neuropsychiatric Genetics, 2006. 141(8): p. 947-956.
176. Molloy, A.M., et al., Maternal and fetal plasma homocysteine concentrations at birth: The influence of folate, vitamin B12, and the 5, 10-methylenetetrahydrofolate reductase 677C->T variant. American journal of obstetrics and gynecology, 2002. 186(3): p. 499-503.

27
CHAPTER 2. Maternal folate status as a risk factor for autism spectrum disorders: a review of existing evidence

28
Reprinted with permission
Maternal folate status as a risk factor for autism spectrum disorders: a reviewof existing evidence
Elizabeth A. DeVilbiss1,*, Renee M. Gardner2, Craig J. Newschaffer1,3 and Brian K. Lee1,31Department of Epidemiology and Biostatistics, Drexel University School of Public Health, Philadelphia, PA 19104, USA2Department of Public Health Sciences, Division of Public Health Epidemiology, Karolinska Institutet, 171 77 Stockholm, Sweden3AJ Drexel Autism Institute, Philadelphia, PA 19104, USA
(Submitted 2 March 2015 – Final revision received 9 May 2015 – Accepted 2 June 2015)
AbstractEmerging evidence from epidemiological studies supports the notion that maternal folate status regulated by dietary and genetic factors earlyin pregnancy may influence the risk of autism spectrum disorders (ASD). In this review, we provide an overview of what is known about therole of folate in the aetiology of neurodevelopmental disorders; summarise relevant biological, genetic and epigenetic mechanisms; andsynthesise the evidence from human observational studies and randomised controlled trials that have examined the relationship betweenmaternal folate and ASD or related traits. Much of the existing literature on this topic is subject to limitations such as potential confounding byhealthy behaviours and other dietary factors, and exposure assessed within limited exposure windows. As the existing evidence isinconclusive, further research remains to be conducted in order to verify this hypothesis. Complete assessment of maternal functional folatestatus through the pre- and peri-conceptional periods requires biological measurement of folate, vitamin B12 and homocysteine and geneticvariants involved in one-carbon metabolism and epigenetic mechanisms. In addition to more complete assessment of maternal functionalfolate status, careful consideration of potential confounding is warranted.
Key words: Autism: Epigenetics: Folic acid: Neurodevelopment: Pregnancy
Autism spectrum disorders (ASD) are neurodevelopmentaldisorders characterised by impaired social function, abnormalcommunication and repetitive or unusual behaviour(1).Although the measured prevalence of ASD was no greater thanfive per 10 000 individuals in the 1980s, estimated rates in USsurveillance populations have increased to one in sixty-eightchildren in 2010(2). Recent genetic and epidemiological studiessuggest that the heritability of ASD is approximately 50 %(3,4),indicating that non-heritable risk factors contribute to a sub-stantial proportion of ASD risk.Recent epidemiological studies(5,6) have suggested a possible
link between maternal folate status during pregnancy and riskof ASD in children. As folate cannot be synthesised by humansand is entirely derived from dietary sources, folate status can bemodified through increased intake of folate-rich foods such asleafy green vegetables, folic acid (FA) supplements or for-tification of the food supply. This raises the intriguing prospectthat, much like with neural tube defects(7,8), the incidence ofASD may be decreased through interventions that enrichmaternal folate status. This review aims to summarise the bio-logical, genetic and epidemiological evidence linking folatestatus and the risk of ASD. In addition, we discuss the researchchallenges that remain to be addressed before any firm
conclusion can be drawn about the possible link betweenmaternal folate status and risk of ASD.
Neurodevelopment is influenced by deoxyribonucleic acidmethylation
Documentation of problems in ASD core areas such as com-munication, socialisation and attention in children <12 months ofage(9,10) supports the notion that disruption of neurodevelop-mental processes during the pre- and perinatal period maycontribute to ASD. In particular, epigenetic modifications duringperi-conception are increasingly recognised as having lastingdevelopmental implications with regard to ASD(11). One espe-cially relevant epigenetic process crucial to neurodevelopment isDNA methylation, which influences gene expression through themethylation of cytosine residues in CpG dinucleotides. DNAmethylation depends on the availability of dietary methyl donorssuch as folate, choline and methionine, which are interrelatedthrough one-carbon metabolism. Changes to the availability offolate or other methyl donors can affect DNA methylationcapacity, with potential downstream neurodevelopmentalconsequences.
*Corresponding author: E. A. DeVilbiss, email [email protected]
Abbreviations: ASD, autism spectrum disorders; FA, folic acid; MTHFR, methylene tetrahydrofolate reductase.
British Journal of Nutrition, page 1 of 10 doi:10.1017/S0007114515002470© The Authors 2015

29
Reprinted with permission
During the peri-conceptional period, methylation patterns ofthe genome (with the exception of imprinted genes) are firstestablished, beginning with de-methylation of maternal andpaternal DNA, followed by re-methylation of the combinedgenome. De-methylation occurs in the pre-implantationembryo, and it is generally completed by the 16- or 32-cellmorula stage, about 4 d after fertilisation. Methylation levelsthen increase markedly through the blastocyst stage, about 5 dpost fertilisation(12,13). Thus, even before a pregnancy can beconfirmed, a high concentration of dietary methyl donors isrequired to establish epigenetic patterns in the cells of thedeveloping embryo(14).Another critical window occurs during early pregnancy,
in which the brain rapidly begins to develop. In the 1st monthof gestation, the central nervous system begins to form withneurogenesis and cell migration occurring in the forebrain,midbrain and hindbrain(15). Neurogenesis in most cortical andsubcortical structures occurs between 5 and 25 weeks ofgestation(15). The development of functional neuron networks(16)
requires high concentrations of methyl donors for cellulardifferentiation(17), as DNA methylation is essential for individualcell viability(18,19). Early modifications in DNA methylation thatcause developing brain cells to deviate from proper differentiationcan result in irreversible reductions or expansions of neuronpools(16). Consequently, epigenetic dysregulation during theperiod when brain organisation develops could result inalterations in brain connectivity(20–22).
Dietary and genetic determinants of folate status affectdeoxyribonucleic acid methylation capacity in the brain
Embryonic DNA can become hypomethylated if maternalplasma does not contain sufficient levels of methyl donors suchas folate and cofactors such as vitamin B12 at critical periods indevelopment(23). Dietary deficiency of methyl donors has beenassociated with DNA hypomethylation in the brains(24) of ratsand in genes controlling brain development in rat fetuses(20).For example, a maternal diet low in choline, another dietarymethyl donor, resulted in global DNA hypomethylation andincreased expression of genes that turn off cell cycling andpromote early differentiation in the hippocampus of fetalmice(20).Although environmental exposures (e.g. decreased dietary folate
intake) can result in embryonic hypomethylation, hypomethylationalso can occur via genetic regulation of processes relevant to bothfolate metabolism and DNA methylation. For example, functionalhypomethylation can result from polymorphisms in the offspringgene coding for protein readers of DNA methylation patterns,namely methyl-CpG-binding protein 2 (MeCP2), a methyl-bindingdomain protein. This can have important structural and functionalconsequences, as neurons without functional MeCP2 in the cortexhave been found to have significantly smaller dendritic arbours inboth humans(21) and mice(22).Another example of genetic regulation is with 5-
methyltetrahydrofolate (5-MTHF), the functional methyl donorform of folate, which is synthesised from a folate derivative by theenzyme methylene tetrahydrofolate reductase (MTHFR). Human
carriers of the MTHFR C677T and A1298C polymorphisms havelower enzyme activity, reducing the production of 5-MTHF and theability of folate to function as a methyl donor in the production ofmethionine and subsequent DNA methylation(25). Interestingly, ameta-analysis of eight studies on the relationship between childMTHFR polymorphisms and ASD(26) reported that the C677Tpolymorphism was only associated with ASD in children living incountries without food fortification. The dependence of a geneticassociation on a background of the dietary environment is sug-gestive evidence that gene–environment interactions are instru-mental in pathways linking folate status with child ASD.
Collectively, the existing human and animal research on one-carbon metabolism suggests that maternal folate status could bea biologically plausible risk factor for ASD through its impact onDNA methylation.
Other pathways by which folate influencesneurodevelopment
In addition to the effects on DNA methylation, folate status caninfluence neurodevelopment through multiple other pathways.Mutations in the folate receptor 1 (FOLR1) gene coding for folatereceptor α (FRα) have been associated with severe hypomyeli-nation in the brains of affected patients(27). Because cellularuptake of metabolised folate (MTHF) is mediated by FRα (alongwith other proteins), functional mutations in FOLR1 also result insystemic folate deficiency(27). Moreover, the folate cycle is per-ipherally involved in the creation of essential phospholipids (e.g.phosphatidylcholine) and neurotransmitters (e.g. serotonin)(28).Therefore, reduced availability of dietary methyl donors duringkey exposure windows could interfere with the production ofthese critical neurodevelopmental elements. Children with ASDhave been found to exhibit dysregulated serotonergic function(29),as well as lower levels of phosphatidylcholine in plasma, incomparison with typically developing children(30). Finally, asfolate is also involved in DNA synthesis, folate deficiency mayresult in deficient DNA repair, inducing DNA damage and neu-ronal death(31). This is consistent with work demonstrating thatdietary maternal FA deficiency in mice affects the development ofthe neocortex and other regions of the brain by reducing thenumber of progenitor cells through its influence on cell mitosisand apoptosis(32).
Although a comprehensive review examining folate andaltered neurodevelopment is beyond the scope of this paper,other authors have reviewed such literature in detail(33,34).
Human studies linking maternal folate and autismspectrum disorders and related traits
Methods
To identify studies examining maternal folate status and autism orrelated traits specified as such, PubMed was first searched for theterms (folic acid or folate) (autis*) on 21 January 2014, with nodate range specified. This search was repeated periodicallythrough 15 April 2015, to ensure inclusion of new relevant stu-dies. As of 15 April 2015, this search produced 136 citations.
2 E. A. DeVilbiss et al.

30
Reprinted with permission
Criteria for inclusion in the review were original research articlesexamining FA or folate exposure during pregnancy, with autismor related traits as outcomes in the offspring. Studies (or aspects ofmanuscripts(35)) examining multivitamins without specific men-tion of FA were excluded. Additional exclusion criteria werebiochemical studies and/or those focused on understandingbiological mechanisms, animal studies and ecological studies, thelattermost because of the lack of rigour and inability to drawcausal inference. Of the search results, four citations remainedafter application of inclusion and exclusion criteria (Fig. 1).Because of the existence of relevant literature on ASD traits not
designated as such, literature for review was also selected fromreferences of included (five additional studies) and excludedsearch results (one additional study). As many references exam-ined numerous outcomes, autism outcomes experts were con-sulted to identify the most ASD-relevant outcomes (executivefunction, communication and social competence) within the tenarticles selected for review. Included studies were evaluatedbased on quality of measured exposure and outcome, control forrelevant confounders, biases and other analytical issues.The human evidence linking maternal folate status with ASD
and related traits comes from various studies distinguished bystudy design (observational v. randomised), how folate status ismeasured (e.g. self-reported folate or supplement intake v.biomarker measurement) and study outcome (clinical diag-noses of ASD v. ASD-related traits). We discuss this evidence inthe following sections, organised by these characteristics. Allstudies are summarised in Table 1.
Observational studies of maternal folate and autismspectrum disorders
To date, there are only two published epidemiological studiesexamining maternal folate status during pregnancy and diag-
noses of ASD. Despite differences in size, populations andstudy designs, an American case–control study by Schmidtet al.(5) and a Norwegian cohort study by Suren et al.(6) reportedsimilar protective associations for maternal FA intake in theperi-conceptional period and early pregnancy, and children’srisk of ASD. The case–control study featured 429 cases and 278controls, whereas the cohort study featured 85 176 children, ofwhom only 270 had been diagnosed with ASD. The OR for thecase–control study(5) was 0·62 (95 % CI 0·42, 0·92) for a meandaily FA intake of ≥600 v. <600 μg in the 1st month of preg-nancy, whereas the cohort study(6) estimated an OR of 0·61(95 % CI 0·41, 0·90) for FA supplementation in the month beforeand first 2 months of pregnancy compared with no supple-mentation. Furthermore, the case–control study found that thereduced risk for FA intake ≥600 μg was only evident formothers and/or children having the MTHFR C677T variant(5).
Although these studies support that maternal folate status mayinfluence ASD risk, there are important considerations. Forexample, the ASD prevalence in the Norwegian study was 0·3%.Given that 1 % is the generally accepted figure for worldwide ASDprevalence(43), this disparity is a strong indication of case under-ascertainment that may influence results. The potential forascertainment bias is supported by evidence that mothers ofseverely affected children had lower response rates.
Another limitation is that both studies relied on self-reportedmaternal intake of FA. Self-reports can introduce recall orreporting bias, although the concern is less in the prospectivelydesigned Norwegian study, which assessed peri-conceptional FAuse at 18 weeks of gestation, well before the birth of the child(6).To what degree such self-reports reflect actual folate exposure isunclear, as no biomarkers were available in these studies. Inaddition, social, economic, behavioural and environmental factorscan influence self-reported vitamin supplementation(44,45). Forinstance, in a study of childbearing-age women in the USA,
PubMed search (Folic acid or folate) (autis*)
(n 136)
Christian et al.JAMA (2010)(41)
Referenced (n 6) In scope (n 4)
Suren et al.JAMA (2013)(6)
Braun et al.J Autism Dev Disord (2014)(35)
Ecological (n 1)
Animal study (n 9)
Biochemical/mechanism (n 16)
Not autism or traits (n 21)
Not pregnancy (n 23)
Not folate (n 28)
Not original research (n 34)
Out of scope (n 132)
Dobo & CzeizelEur J Pediatr (1998)(42)
Roth et al.JAMA (2011)(37)
Schmidt et al.Am J Clin Nutr (2012)(5)
Julvez et al.Paediatr Perinat Epidemiol (2009)(38)
Wehby & Murray, MaternChild Health J (2007)(39)
Veena et al.J Nutr (2010)(40)
Steenweg-de Graaff et al.Eur J Public Health (2014)(36)
Fig. 1. Derivation of reviewed literature.
Maternal folate status and autism: a review 3

31
Reprinted with permission
Table 1. Epidemiologic studies assessing maternal folate status and autism spectrum disorders (ASD) or ASD-related traits
Reference (country)Study design and
number of children Exposure assessment Outcome Results
Self-reported maternal folate status and ASD diagnosisSuren et al.(6)
(Norway)Cohort study of
85 176 (114 AD;56 Asperger;100 PDD-NOS)
FA supplementation 4 weeksbefore to 8 weeks afterconception; questionnaire at18 weeks of gestation
AD, with or without languagedelay at 36 months; Aspergersyndrome; PDD-NOS
Children of FA users v. non-usershad 0·61 (95% CI 0·41, 0·90)times the odds of AD; protectiveassociation only in AD withlanguage delay (OR 0·49;95% CI 0·25, 0·99) but not inAD without language delay(OR 0·91; 95% CI 0·46, 1·81);FA use not associated withAsperger or PDD-NOS
Schmidt et al.(5)
(USA)Case–control study of
429 ASD; 278 TD;130 DD
Dietary and vitamin FA intake3 months before pregnancy andin the 1st month of pregnancy;questionnaire at 2–5 years afterbirth
ASD defined by AutismDiagnostic Interview-Revisedand the Autism DiagnosticObservation Schedule–Generic
Children of mothers taking ≥600v. <600 μg FA in the 1st monthof pregnancy had reduced oddsof ASD (OR 0·62; 95% CI 0·42,0·92). In stratified analyses, theassociation was only evidentwhen the mother and/or childhad the MTHFR C677T variantgenotype
Self-reported maternal folate status and ASD-related traitsSteenweg-de
Graaff et al.(36)
(The Netherlands)
Cohort study of 3893children
FA supplement use and wheninitiated; questionnaire at<18 weeks of gestation
Autistic traits at 6 years – SocialResponsiveness Scale (SRS)short form, PervasiveDevelopmental Problemssubscale of the Child BehaviorChecklist
Use of FA associated with lowerSRS scores: ‘pre-conceptionstart’ v. ‘no use’: –0·042,95% CI –0·068, –0·017‘Start< 10 week’ v. ‘no use’:–0·041, 95% CI –0·066, –0·016‘Start >10 week’ v. ‘no use’:–0·057, 95% CI –0·089, –0·025
Roth et al.(37)
(Norway)Cohort study of
38 954 children(204 severelanguage delay)
FA supplementation 4 weeksbefore to 8 weeks afterconception; questionnaire at17 weeks of gestation
Severe language delay at3 years – MacArthurCommunication DevelopmentInventory UK short form
Maternal FA only (OR 0·55; 95%CI 0·35, 0·86) or in combinationwith other supplements (OR0·55; 95% CI 0·39, 0·78)associated with reduced riskof severe language delay.Supplements without FA notassociated with severelanguage delay (OR 1·04;95% CI 0·62, 1·74)
Julvez et al.(38)
(Spain)Cohort study of
420 childrenFA supplementation at the end of
the first trimester; questionnaireat a median of 12·4 weeks ofgestation
Verbal competence and executivefunction at 4 years (McCarthyScales of Children’s Abilities)
Social competence at 4 years(California Preschool SocialCompetence Scale)
FA use associated with higherverbal (3·98 pt, 95% CI 0·66,7·31) and social competence(3·97 pt, 95% CI 0·81, 7·14)scores. Use of vitamins withoutFA associated withimprovements in verbal (6·52 pt,95% CI 0·46, 12·58), but notsocial competence scores(3·73 pt, 95% CI –1·86, 9·32).FA use not associated withexecutive function scores
Wehby & Murray(39)
(USA)Cohort study of
6774 childrenFA supplementation for at least
3 d/week during the 3 monthsbefore becoming aware ofpregnancy through firsttrimester; questionnaire at≥6 months after birth
Personal-social and languagedomains at 3 years (Denverdevelopmental screening)
FA use associated with somewhatpoorer performance within thepersonal-social domain,compared with non-use of FA(OR 1·78; 95% CI 0·94, 3·38).No associations observedbetween FA use and languagedevelopment (OR 0·91; 95% CI0·55, 1·50)
Biomarker-assessed maternal folate status and ASD-related traitsBraun et al.(35) (USA) Cohort study of
209 childrenMaternal whole blood folate at a
mean of 16 weeks of gestation(range: 11–21 weeks)
SRS scores at 4–5 years Folate concentrations associatedwith slightly higher SRS scores(0·6/SD, 95% CI 0·3, 1·5) andSRS scores≥ 60 (OR 1·42;95% CI 0·81, 2·49)
4 E. A. DeVilbiss et al.

32
Reprinted with permission
women of normal weight were more likely to use supplementswith FA, compared with women who were overweight orobese(46). However, this difference was not statistically significant.In a study of the Kaiser Permanente Medical Care Program inNorthern California, alcohol users were less likely to take multi-vitamins than non-alcohol users during pregnancy(47). Data fromthe National Maternal and Infant Health Survey indicate thatregular multivitamin users before and after pregnancy were morelikely to be older, white, married, have a wanted pregnancy, lesslikely to consume six or more drinks per week during pregnancyand have greater levels of education and income than mothersnot using multivitamins regularly(48). In another study maternal FAuse in the peri-conceptional period was associated with increasedsocio-economic status(49). These factors can be difficult to com-pletely adjust for in observational studies(44).Exposure assessment in the Norwegian study was of FA as a
single nutrient formulation. Although this study had informationon multivitamin usage available, it did not explicitly account forthis in analyses, indicating that FA content of multivitamins was<400 μg (the amount in single nutrient formulations) in Norwayat the time of the study. The exclusion of multivitamin usage fromstatistical analyses leaves the possibility of confounding by otherdietary factors, as FA and multivitamin use may be positivelycorrelated. For example, increased maternal intake of iron(50)
or n-3 fatty acids(51) has been associated with a reduced risk ofASD. In a recent study, FA use in the peri-conceptional periodwas associated with a higher intake of other B vitamins(49).However, the Norwegian study found that fish oil supple-mentation was not similarly associated with a reduced risk of
ASD, suggesting that maternal healthy behaviours, such as mul-tivitamin use, were not responsible for the observed protectiveeffect observed for FA(6).
The American case–control study considered both supple-mentary FA and dietary folate from select high concentrationsources, but not total dietary folate intake. This study didexamine potential confounding by other nutrients and foundthat adjustment for total amounts of other nutrients from dietaryand supplementary sources actually strengthened the reductionin risk between FA and ASD in the 1st month of pregnancy(5).
It is important to emphasise the exposure windows assessed bythese two studies. The protective association reported by theprospective Norwegian study was of FA use in the month beforeconception and in the first 2 months of pregnancy. This study alsoexamined FA use at 22 weeks of gestation and found no asso-ciation. Meanwhile, the American case–control study assessedexposure in the 1 month of pregnancy only. It is difficult toascertain how the use of different exposure windows influencedstudy results because of their other methodological differences.However, despite their limitations, the studies’ similar OR werestrong and robust to confounder control and sensitivity analyses.
Observational studies of self-reported maternal folate andautism spectrum disorder traits
In contrast to the limited evidence concerning maternal folatestatus and ASD diagnoses, four prospective cohort studies havelinked self-reported maternal folate with traits related to autism,such as social competence and verbal abilities, but not to
Table 1 Continued
Reference (country)Study design and
number of children Exposure assessment Outcome Results
Steenweg-deGraaff et al.(36)
(The Netherlands)
Cohort study of3893 children
Maternal plasma folate at amedian of 13·2 weeks ofgestation (90% range:10·5–17·2 weeks)
Autistic traits at 6 years – SRSshort form, PervasiveDevelopmental Problemssubscale of the Child BehaviorChecklist
Folate concentrations notassociated with SRS scores(–0·004 pts/1 SD increase;95% CI –0·013, 0·004) orodds of probable ASD(OR 1·03; 95% CI 0·76, 1·39)
Veena et al.(40)
(India)Cohort study of
536 childrenMaternal plasma folate at a mean
of 30 (SD 2) weeks of gestationLanguage production at 9–10
years – A DevelopmentalNeuropsychologicalAssessment
Folate concentrations notassociated with languageproduction scores
Randomised trials of FA supplementation and ASD-related traitsChristian et al.(41)
(Nepal)Cohort follow-up of
676 childrenAssignment of daily supplement
use at a mean of 11 weeks(SD 5·1) of gestation:FA+ iron + vitamin A,FA+ iron + zinc + vitamin A,FA+ iron + zinc + vitaminA+multiple micronutrients,control of vitamin A only
Executive functioning at 7–9years: Stroop numbers test,backward digit span from theWechsler memory scale,go/no-go test
Executive function scoresimproved in the FA+ iron grouprelative to controls for Strooptest (failure proportion –0·14,95% CI –0·23, –0·04) andbackward digit span (0·36,95% CI 0·01, 0·71), butnot for go/no-go test
Dobo & Czeizel(42)
(Hungary)Cohort follow-up of
625 childrenAssignment of multivitamin with
FA or placebo-like traceelement at least 1 month beforeconception through 2 months ofgestation
Speaking, communication andsociability at 2 years –
Developmental QuotientSpeech and sociability at
6 years – Goodenough mandrawing test
No differences in developmentalscores in children of mothersassigned to take a multivitaminwith FA compared with traceelement controls
AD, autistic disorder; PDD-NOS, pervasive developmental disorder not otherwise specified; FA, folic acid; TD, typically developing; DD, developmental delay.
Maternal folate status and autism: a review 5

33
Reprinted with permission
executive function. However, results are not wholly inagreement.These cohort studies differ in their selection of FA exposure
windows. Three studies assessed whether FA use had com-menced before pregnancy (4 weeks before conception(37),3 months before becoming aware of pregnancy(39) or pre-conception(36)), whereas the remaining study limited assess-ment of the exposure window to after pregnancy had beenestablished – at the end of the first trimester(38).Studies assessing FA use before pregnancy reported a
reduced risk of severe language delay at 3 years(37), lowerautistic trait scores (less autistic traits) at 6 years(36), but alsounfavourable development of the personal-social domain at 3years of age(39). The research investigating FA use only duringpregnancy reported improved verbal and social competence,but not executive functioning scores at 4 years(38). Measuresused to assess these outcomes are provided in Table 1.A concern of many of the studies examining folate and ASD is
that self-report of folate may be a poor surrogate for biologicalfolate status. To that end, in the Generation R Study, althoughFA users had higher plasma folate concentrations at a median of13 weeks of gestation(36), associations between maternalplasma folate and ASD traits did not persist as they had for self-report of FA supplementation. These discordant results couldbe related to the timing of biological sampling, given that themost crucial period for dietary methyl donor availability is likelyin the peri-conceptional period. Therefore, if folate were indeedprotective against ASD, peri-conceptional folate levels would bemore relevant to measure. This also may indicate that residualconfounding may be partly responsible for the observed pro-tective effect, in that health-related behaviours are more com-mon among women who take supplements.In particular, one health-related behaviour that could con-
found observed protective effects of FA on developmentaloutcomes is dietary intake of nutrients other than FA(49). This isa possibility in the study in which improvements in verbal andsocial competence scores were noted for children of mothersusing multivitamins both with (n 244) and without FA (n 28)(52).A second study reported significant associations between mul-tivitamin and/or mineral use and reduced risk on the personal-social and language scales, but suggested a relationshipbetween maternal FA use and unfavourable development onthe personal-social scale(39). This may indicate that a compo-nent of multivitamins other than FA may be responsible for theobserved protective association. Alternatively, as 83 % of indi-viduals in this latter study reported multivitamin and/or mineraluse and only 3·2 % of the total sample in the study reportedFA use, this is perhaps suggestive of confounding by indicationamong the small sample of FA users. Conversely, theNorwegian study(37) that examined severe language delayreported results both for mothers taking FA only and thosetaking it in combination with other supplements, and reportedsimilar OR (FA only: OR 0·55; 95 % CI 0·35, 0·86; FA with othersupplements: OR 0·55; 95 % CI 0·39, 0·78). A fourth study didnot consider the use of other vitamins in their analyses(36).Results from these studies were inconsistent, but overall
tended to support a protective effect. Self-report of FA sup-plementation in early pregnancy, either alone or in combination
with other vitamins, was associated with reduced risk of ASD-related traits in three of the four studies, whereas a harmfulassociation was noted in one of the studies. However, becauseof potential confounding by other nutrients, two of the threestudies reporting protective associations cannot specificallyascribe this protection to FA. In addition, if health-relatedbehaviours are incompletely controlled in these studies,observed associations may be biased because of residualconfounding.
Observational studies of maternal folate biomarker andautism spectrum disorder traits
Three epidemiological studies of biologically ascertainedmaternal FA status and ASD traits were identified, one ofwhich(36,52,53) was discussed in the preceding section. Thisstudy reported no association between maternal serum folateconcentrations at a median of 13 weeks of gestation and childautistic traits(36). Another study of 209 children reported a weakpositive association between maternal whole blood folateconcentrations at a mean of 16 weeks of gestation and SocialResponsiveness Scale scores at 4–5 years(35). Within the domainof language production, an Indian study of 536 births reportedthat significant associations with maternal serum folate at30± 2 weeks of gestation did not persist after adjustment(40).
One advantage of these studies is that use of a biomarker forfolate status mitigates the measurement error associated withsubjective, self-reported measures. However, as previouslydescribed, assessment at different time periods may affect find-ings. As folate concentrations might be expected to be mostsimilar within short time intervals, folate biomarkers measuredlater in pregnancy might be less correlated with peri-conceptionalvalues than those measured earlier in pregnancy. Studies of FAusage patterns during pregnancy indicate that FA use is typicallycommenced within the first trimester(54–56). It is thus not likely thatmaternal folate even at 13 weeks of gestation, the earliest ofbiomarker measurement of these three studies, is highly corre-lated with concentrations during the peri-conceptional period.Results of these studies may therefore not be as meaningful asthose measuring maternal folate by the time of neural tube clo-sure at 6 weeks of gestation(6,55) or by development of basic brainstructures at 5–10 weeks of gestation(57).
In summary, the studies utilising biomarker measures offolate status do not consistently support an overall effect. Aweak association was reported in the cohort assessing folate at16 weeks of gestation, but reduced risks of ASD-related traitswere not shown in the cohorts assessing maternal folate bio-markers at 13 and 30 weeks of gestation. However, given thetiming of maternal folate biomarker measurement, thesefindings should be interpreted with caution.
Folate supplementation and autism spectrum disordercharacteristics: randomised trials
Only two randomised trials have examined relationshipsbetween maternal FA supplementation and ASD traits. A Nepalistudy of 676 mother–child pairs reported higher executivefunctioning scores among 7- to 9-year-old children of women
6 E. A. DeVilbiss et al.

34
Reprinted with permission
assigned to take daily iron/FA at a mean of 11 weeks ofgestation, as compared with a control group assigned to takedaily vitamin A supplements(41). Similar findings were notreported among children of women assigned to take iron/FA/zinc or iron/FA/zinc and micronutrients. Conversely,a Hungarian study of 625 mother–child pairs reported nomeaningful differences in developmental scores assessingspeech, communication and sociability at 2 and 6 yearsbetween children of mothers assigned to take multivitaminscontaining FA at least 1 month before conception through2 months gestation, compared with children of mothers takingtrace elements only(42).Although both studies were randomised, were of similar size
and had a high rate of follow-up, the potential effect of FA couldnot be isolated in either study, as FA was taken with othervitamins. The multivitamin supplement in the Hungarianstudy(42) contained zinc, which may have an inhibitory role,as evidenced by the Nepali(41) study and as described in theliterature(58,59). As the Hungarian study most likely examinedthe most critical exposure window, results produced by thisstudy may have been more meaningful had this study examinedFA use independent of other vitamins.
Trends in maternal folate status
Although maternal folate status may be a biologically plausiblerisk factor for ASD, the collective evidence is not conclusive.Similar to ASD prevalence, maternal folate status has undergonea large change in recent decades, especially for countries thathave adopted fortification. In the USA, the recommendation of400 μg of daily supplemental FA for women of childbearing agewas put forth by the Centers for Disease Control and Prevention(CDC) in 1992(60) and cereal fortification with folate began in1996(61). These actions resulted in an elevation in median serumfolate from 12·6 μg/l in 1994 to 18·7 μg/l in 1998(61). However,one possible misconception is that if maternal folate status wasindeed causal for ASD, then the introduction of FA fortification inthe 1990s should have resulted in a decline in ASD prevalence.Given the apparent rise in ASD prevalence in the USA over thepast two decades, this would appear to contradict the possiblerole of maternal folate status.Such ecologic thinking can be misleading, as it is more likely
that changes in diagnostic practices, increased awareness andsecular trends in other modifiable risk factors (e.g. advancedparental age) would offset any potentially beneficial effects ofhigher folate. In a California study(62), approximately 26 % of theincrease in autism between 1992 and 2005 could be directlyattributed to changes in diagnostic criteria. In particular, a sepa-rate study noted that higher autism prevalence was significantlyassociated with corresponding declines in the prevalence ofmental retardation and learning disabilities between 1994 and2003(63). Within the California sample, it was estimated that 16 %of the increase in autism prevalence over time was because ofsocial influence and increased awareness(64) and that 11% wasattributable to the increase in parental age over time(65,66). Thus,much of the increase in autism diagnoses within this Californiasample could be explained by changes in diagnostic practices,increased awareness and advanced parental age.
It has been suggested that the coincident timing of FA for-tification with the beginning of the increase in measured autismprevalence(67) is not random, but rather the reflection of alterednatural selection. The natural selection theory is that increasedmaternal folate status arising from these FA policy changesincreased survival rates of infants with the MTHFR C677T poly-morphism, who in the absence of increased FA in uteromay havebeen miscarried. For example, there has been an increase in thefrequency of the C677T allele and its homozygous genotype inindividuals born in the last quarter of the twentieth century, ascompared with the first three quarters(68), with a greater fre-quency of this polymorphism in autistic individuals(69,70). Whetherthis hypothesis carries weight remains to be examined.
Recommendations for future research
In this review, we examined the evidence that maternal folatestatus, especially early in pregnancy, might be involved in thedevelopment of ASD. The evidence to date is inconclusive, andhighlights future research needs.
More complete assessment of maternal functional folatestatus
As folate intake is not the single determinant of functional folatestatus, studies with more complete assessment of this measurewould allow for improved exposure assessment and clearerunderstanding of this aetiology.
With regard to folate measures, much of the epidemiologicaldata on this topic use self-reported dichotomous data on mul-tivitamin/FA intake as a surrogate for prenatal folate exposure.In contrast to self-reported measures, biological measures offolate status are not subjective, and therefore they are notsubject to recall bias, as self-report may be. The use of serum orplasma folate as an indicator of folate status enables theexploration of potential dose–response effects, which is criticalin establishing causality. Furthermore, given that one folatebiomarker measurement is not necessarily indicative of amother’s folate status throughout pregnancy, serum folatemeasured at multiple time points before conception andthroughout the first trimester would provide a more completeview of maternal folate status during this critical period ofdevelopment. Repeated folate measurements may also helpelucidate a critical window for adequate methyl donor avail-ability, revealing potential mechanisms of ASD development.
It is important to note that only one of the studies reviewed inthis paper measured maternal vitamin B12
(40), and none of thestudies measured plasma homocysteine status in their analyses.Vitamin B12 and homocysteine are important components in thefunctional pathways connecting dietary methyl donors to neuro-development. Deficiency of vitamin B12 results in functionaldeficiency of folate, as the reaction cannot proceed in the absenceof vitamin B12. For example, peri-conceptional vitamin B12 defi-ciency is linked with abnormal brain development in children(71).
Homocysteine is a more complete indicator of methyl donorstatus and functionality, as folate is only one of three majordietary methyl donors. Dietary methyl donors are not func-tionally independent of one another, but rather changes in
Maternal folate status and autism: a review 7

35
Reprinted with permission
concentration of one donor result in compensatory changes inthe others. Thus, the folate-ASD hypothesis may be furthersubstantiated if links between other agents in the folate meta-bolic pathway are reported. Future studies should incorporatevitamin B12 and total homocysteine concentration measure-ments into their exposure assessments in the peri-conceptionalperiod and in early pregnancy to account for the complexinterdependency between these dietary factors.
Incorporating genetic data
To assess vulnerability to low maternal folate, to examineinteractions between dietary and genetic factors and to under-stand the potential capability of maternal folate intake to offsetgenetic risk factors, further study is needed in which importantgenetic factors are sequenced. Most of the previously reviewedstudies found in the literature did not explore associationsbetween both dietary folate and genetic risk factors. A notableexception was the case–control study of FA intake and ASD(5).It is conceivable that if any of the enzymes on the pathway
between folate and 5-MTHF acquire functional mutations, it mayimpair the ability of folate and/or FA to be converted to 5-MTHFand act as an efficient methyl donor. For example, polymorph-isms in the MTHFR gene, which metabolises folate into a formcapable of methyl donation, can reduce enzymatic activity,attenuating the ability of folate to function effectively. Other keyenzymes on this pathway include dihydrofolate reductase, whichconverts synthetic FA and dihydrofolate into trihydrofolate(THF)(72), and serine hydroxymethyltransferase, which convertsTHF into 5,10-MTHF with vitamin B6 as a co-enzyme(73).Functional mutations in enzymes related to the other two dietarymethyl donors, choline and betaine, could also affect the actionof folate because of compensatory changes that may occurthrough their interrelated metabolic pathways. Last, mutations inthe MeCP2 gene can prevent the MeCP2 protein product frombinding to and interpreting DNA methylation marks, resulting infunctional hypomethylation by allowing downstream genes toinappropriately escape repression. Such mutations would also beworthwhile to assess in study cohorts.
Conclusion
Animal and human data indicate that maternal folate statuscould be a biologically plausible risk factor for ASD. Insufficientfolate intake can result in DNA hypomethylation, and hypo-methylation is associated with neurodevelopment. However,the weight of evidence regarding the role of maternal folatestatus and the development of ASD is far from unequivocal.Given their limitations in study design, especially with regard totiming of exposure and potential confounding by other vita-mins, the randomised trials and studies of maternal folate bio-markers provide little insight into the potential role of FA as aprotective factor against ASD traits.Studies of self-reported maternal FA use and ASD and related
traits are inconsistent, providing limited evidence of a protectiveeffect. Nevertheless, methodological limitations exist, includingpotential confounding by other nutrients and residual confound-ing by health-related behaviours, and thus these results should be
interpreted with caution. However, the two epidemiological stu-dies of FA intake and ASD diagnoses incorporated various sensi-tivity analyses or controlled for multivitamin use, therebysuggesting reduced susceptibility to confounding.
In light of an apparent rising prevalence along with the pro-found individual, familial and societal burden of ASD, there is anurgent need to fill in the gaps in what is currently known ofthe relationship between folate and ASD. To investigate thisaetiology most effectively and efficiently, large historical archivesof existing prospective, population-based cohorts should beutilised. Complete assessment of maternal functional folate statusrequires repeated biological measurement of folate, vitamin B12
and homocysteine through the first trimester of pregnancy, aswell as folate-relevant genetic variants involved in one-carbonmetabolism and epigenetic mechanisms. Information on dietaryand supplemental intake ideally would be available to relatemeasures of folate status in a large population, and aid in inter-pretation of existing studies utilising measures of self-report.Children’s ASD diagnoses should be assessed from a clinicalsource, with high levels of case ascertainment.
As ASD is complex, heterogeneous and multi-causal, exploringenvironmental influences in conjunction with functionally rele-vant genes may help identify an additional subset of causes forwhich genetic contributions may be indirect. If one-carbonmetabolism is involved in the aetiology of ASD, this provides apotential route for prevention through nutritional interventionin the pre- and peri-conceptional periods, especially for thesubgroup of children having specific genetic risk factors for ASD.
Acknowledgements
The authors thank Connor Kerns for assistance in managementof manuscript scope.
This research received no specific grant from any fundingagency, commercial or not-for-profit sectors.
E. A. D. and B. K. L. conceptualised and designed the study,drafted the manuscript and approved the final manuscript. R. M. G.and C. J. N. reviewed and revised the manuscript, and approvedthe final manuscript.
There are no conflicts of interest.
References
1. Levy SE & Mandell D (2009) Autism. Lancet 374, 1627–1638.2. Baio J (2012) Prevalence of autism spectrum disorders: Autism
and Developmental Disabilities Monitoring Network, 14 sites,United States, 2008. MMWR Surveill Summ 61, 1–19.
3. Gaugler T, Klei L, Sanders SJ, et al. (2014) Most genetic risk forautism resides with common variation. Nat Genet 46, 881–885.
4. Sandin S, Lichtenstein P, Kuja-Halkola R, et al. (2014) Thefamilial risk of autism. JAMA 311, 1770–1777.
5. Schmidt RJ, Tancredi DJ, Ozonoff S, et al. (2012) Maternalpericonceptional folic acid intake and risk of autism spectrumdisorders and developmental delay in the CHARGE (CHild-hood Autism Risks from Genetics and Environment) case-control study. Am J Clin Nutr 96, 80–89.
6. Suren P, Roth C, Bresnahan M, et al. (2013) Associationbetween maternal use of folic acid supplements and risk ofautism spectrum disorders in children. JAMA 309, 570–577.
8 E. A. DeVilbiss et al.

36
Reprinted with permission
7. Wald N (1991) Prevention of neural tube defects – results ofthe Medical Research Council Vitamin Study. Lancet 338,131–137.
8. Williams J, Mai CT, Mulinare J, et al. (2015) Updated estimatesof neural tube defects prevented by mandatory folic acidfortification – United States, 1995–2011. MMWR Morb MortalWkly Rep 64, 1–5.
9. Maestro S, Muratori F, Cesari A, et al. (2005) Course of autismsigns in the first year of life. Psychopathology 38, 26–31.
10. Maestro S, Muratori F, Cavallaro MC, et al. (2002) Attentionalskills during the first 6 months of age in autism spectrumdisorder. J Am Acad Child Adolesc Psychiatry 41, 1239–1245.
11. Schaevitz LR & Berger-Sweeney JE (2012) Gene-environmentinteractions and epigenetic pathways in autism: the impor-tance of one-carbon metabolism. ILAR J 53, 322–340.
12. Haaf T (2006) Methylation dynamics in the early mammalianembryo: implications of genome reprogramming defects fordevelopment. Curr Top Microbiol Immunol 310, 13–22.
13. Mayer W, Niveleau A, Walter J, et al. (2000) Embryogenesis –demethylation of the zygotic paternal genome. Nature 403,501–502.
14. Geiman TM & Muegge K (2010) DNA methylation in earlydevelopment. Mol Reprod Dev 77, 105–113.
15. Rice D & Barone S Jr (2000) Critical periods of vulnerability forthe developing nervous system: evidence from humans andanimal models. Environ Health Perspect 108, 511–533.
16. Zeisel SH (2011) The supply of choline is important for fetalprogenitor cells. Semin Cell Dev Biol 22, 624–628.
17. LaSalle JM (2011) A genomic point-of-view on environmentalfactors influencing the human brain methylome. Epigenetics 6,862–869.
18. Li E, Bestor TH & Jaenisch R (1992) Targeted mutation of theDNA methyltransferase gene results in embryonic lethality.Cell 69, 915–926.
19. Okano M, Bell DW, Haber DA, et al. (1999) DNA methyl-transferases Dnmt3a and Dnmt3b are essential for de novomethylation and mammalian development. Cell 99, 247–257.
20. Niculescu MD, Craciunescu CN & Zeisel SH (2006) Dietarycholine deficiency alters global and gene-specific DNAmethylation in the developing hippocampus of mousefetal brains. FASEB J 20, 43–49.
21. Armstrong D, Dunn JK, Antalffy B, et al. (1995) Selectivedendritic alterations in the cortex of Rett syndrome. J Neuro-path Exp Neur 54, 195–201.
22. Kishi N & Macklis JD (2010) MeCP2 functions largelycell-autonomously, but also non-cell-autonomously, inneuronal maturation and dendritic arborization of corticalpyramidal neurons. Exp Neurol 222, 51–58.
23. Dominguez-Salas P, Moore SE, Baker MS, et al. (2014)Maternal nutrition at conception modulates DNA methylationof human metastable epialleles. Nat Commun 5, 3746.
24. Christman JK, Sheikhnejad G, Dizik M, et al. (1993) Reversi-bility of changes in nucleic acid methylation and geneexpression induced in rat liver by severe dietary methyldeficiency. Carcinogenesis 14, 551–557.
25. Chango A, Boisson F, Barbe F, et al. (2000) The effect of677C->T and 1298A->C mutations on plasma homocysteineand 5, 10-methylenetetrahydrofolate reductase activity inhealthy subjects. Br J Nutr 83, 593–596.
26. Pu D, Shen Y & Wu J (2013) Association between MTHFRgene polymorphisms and the risk of autism spectrumdisorders: a meta-analysis. Autism Res 6, 384–392.
27. Steinfeld R, Grapp M, Kraetzner R, et al. (2009) Folate receptoralpha defect causes cerebral folate transport deficiency:a treatable neurodegenerative disorder associated withdisturbed myelin metabolism. Am J Hum Genet 85, 354–363.
28. Miller AL (2008) The methylation, neurotransmitter, and anti-oxidant connections between folate and depression. AlternMed Rev 13, 216–226.
29. Chugani DC, Muzik O, Behen M, et al. (1999) Developmentalchanges in brain serotonin synthesis capacity in autistic andnonautistic children. Ann Neurol 45, 287–295.
30. El-Ansary AK, Ben Bacha AG & Al-Ayahdi LY (2011) Impairedplasma phospholipids and relative amounts of essentialpolyunsaturated fatty acids in autistic patients fromSaudi Arabia. Lipids Health Dis 10, 63.
31. Mattson MP & Shea TB (2003) Folate and homocysteinemetabolism in neural plasticity and neurodegenerative dis-orders. Trends Neurosci 26, 137–146.
32. Craciunescu CN, Brown EC, Mar M-H, et al. (2004) Folic aciddeficiency during late gestation decreases progenitor cellproliferation and increases apoptosis in fetal mouse brain.J Nutr 134, 162–166.
33. Greenblatt JM, Huffman LC & Reiss AL (1994) Folic-acid inneurodevelopment and child-psychiatry. Prog Neuropsycho-pharmacol Biol Psychiatry 18, 647–660.
34. Schaevitz L, Berger-Sweeney J & Ricceri L (2014) One-carbonmetabolism in neurodevelopmental disorders: using broad-based nutraceutics to treat cognitive deficits in complexspectrum disorders. Neurosci Biobehav Rev 46, 270–284.
35. Braun JM, Froehlich T, Kalkbrenner A, et al. (2014) Briefreport: are autistic-behaviors in children related to prenatalvitamin use and maternal whole blood folate concentrations?J Autism Dev Disord 44, 2602–2607.
36. Steenweg-de Graaff J, Ghassabian A, Jaddoe VW, et al. (2015)Folate concentrations during pregnancy and autistic traits inthe offspring. The Generation R Study. Eur J Public Health 25,431–433.
37. Roth C, Magnus P, Schjolberg S, et al. (2011) Folic acid sup-plements in pregnancy and severe language delay in children.JAMA 306, 1566–1573.
38. Julvez J, Fortuny J, Mendez M, et al. (2009) Maternal use offolic acid supplements during pregnancy and four-year-oldneurodevelopment in a population-based birth cohort.Paediatr Perinat Epidemiol 23, 199–206.
39. Wehby GL & Murray JC (2008) The effects of prenatal use offolic acid and other dietary supplements on early childdevelopment. Matern Child Health J 12, 180–187.
40. Veena SR, Krishnaveni GV, Srinivasan K, et al. (2010) Highermaternal plasma folate but not vitamin B-12 concentrationsduring pregnancy are associated with better cognitive functionscores in 9-to 10-year-old children in South India. J Nutr 140,1014–1022.
41. Christian P, Murray-Kolb LE, Khatry SK, et al. (2010) Prenatalmicronutrient supplementation and intellectual and motorfunction in early school-aged children in Nepal. J Am Med304, 2716–2723.
42. Dobo M & Czeizel A (1998) Long-term somatic and mentaldevelopment of children after periconceptional multivitaminsupplementation. Eur J Pediatr 157, 719–723.
43. Division of Birth Defects – National Center on Birth Defectsand Developmental Disabilities, Centers for Disease Controland Prevention (2013) Autism spectrum disorders data &statistics. http://www.cdc.gov/ncbddd/autism/documents/asd_prevalence_table_2013.pdf (accessed 15 October 2013).
44. Lawlor DA, Davey Smith G, Kundu D, et al. (2004) Thoseconfounded vitamins: what can we learn from the differencesbetween observational versus randomised trial evidence?Lancet 363, 1724–1727.
45. Pouchieu C, Levy R, Faure C, et al. (2013) Socioeconomic,lifestyle and dietary factors associated with dietary supple-ment use during pregnancy. PLoS ONE 8, e70733.
Maternal folate status and autism: a review 9

37
Reprinted with permission
46. Tinker SC, Hamner HC, Berry RJ, et al. (2012) Does obesitymodify the association of supplemental folic acid with folatestatus among nonpregnant women of childbearing age in theUnited States? Birth Defects Res A Clin Mol Teratol 94, 749–755.
47. Avalos LA, Kaskutas LA, Block G, et al. (2009) Domultivitamin supplements modify the relationship betweenprenatal alcohol intake and miscarriage? Am J Obstet Gynecol201, 563.e1–563.e9.
48. Wu TJ, Buck G & Mendola P (1998) Can regular multivitamin/mineral supplementation modify the relation betweenmaternal smoking and select adverse birth outcomes? AnnEpidemiol 8, 175–183.
49. Bjorke-Monsen AL, Roth C, Magnus P, et al. (2013) Maternal Bvitamin status in pregnancy week 18 according to reporteduse of folic acid supplements. Mol Nutr Food Res 57, 645–652.
50. Schmidt RJ, Tancredi DJ, Krakowiak P, et al. (2014) Maternalintake of supplemental iron and risk of autism spectrumdisorder. Am J Epidemiol 180, 890–900.
51. Lyall K, Munger KL, O’Reilly ÉJ, et al. (2013) Maternal dietaryfat intake in association with autism spectrum disorders. Am JEpidemiol 178, 209–220.
52. Steenweg-de Graaff J, Roza SJ, Steegers EA, et al. (2012)Maternal folate status in early pregnancy and child emotionaland behavioral problems: the Generation R Study. Am J ClinNutr 95, 1413–1421.
53. Schlotz W, Jones A, Phillips DI, et al. (2010) Lower maternalfolate status in early pregnancy is associated with childhoodhyperactivity and peer problems in offspring. J Child PsycholPsychiatry 51, 594–602.
54. McNulty B, Pentieva K, Marshall B, et al. (2011) Women’scompliance with current folic acid recommendations andachievement of optimal vitamin status for preventing neuraltube defects editorial comment. Obstet Gynecol Surv 66,541–542.
55. Brough L, Rees GA, Crawford MA, et al. (2009) Social andethnic differences in folic acid use preconception and duringearly pregnancy in the UK: effect on maternal folate status.J Hum Nutr Diet 22, 100–107.
56. Pietruszka B & Brzozowska A (2006) Folic acid supplementationpractice in Europe – plenary lecture. Pol J Food Nutr Sci 15/56,93–99.
57. Sadler TW (2011) Langman’s Medical Embryology. Philadel-phia: Lippincott Williams & Wilkins.
58. Ghishan FK, Said HM, Wilson PC, et al. (1986) Intestinaltransport of zinc and folic-acid – a mutual inhibitory effect. AmJ Clin Nutr 43, 258–262.
59. Milne DB, Canfield WK, Mahalko JR, et al. (1984) Effect of oralfolic-acid supplements on zinc, copper, and iron-absorptionand excretion. Am J Clin Nutr 39, 535–539.
60. Anonymous (1992) Recommendations for the use of folic acidto reduce the number of cases of spina bifida and other neuraltube defects. MMWR Recomm Rep 41, 1–7.
61. Lawrence JM, Bpetitti D, Watkins M, et al. (1999) Trends inserum folate after food fortification. Lancet 354, 915–916.
62. King M & Bearman P (2009) Diagnostic change andthe increased prevalence of autism. Int J Epidemiol 38,1224–1234.
63. Shattuck PT (2006) The contribution of diagnostic substitutionto the growing administrative prevalence of autism in USspecial education. Pediatrics 117, 1028–1037.
64. Liu K-Y, King M & Bearman PS (2010) Social influence and theautism epidemic. Am J Soc 115, 1387–1434.
65. Liu K, Zerubavel N & Bearman P (2010) Social demographicchange and autism. Demography 47, 327–343.
66. King MD, Fountain C, Dakhlallah D, et al. (2009) Estimatedautism risk and older reproductive age. Am J Public Health99, 1673–1679.
67. Rogers EJ (2008) Has enhanced folate status duringpregnancy altered natural selection and possibly autism pre-valence? A closer look at a possible link. Med Hypotheses 71,406–410.
68. Mayor-Olea A, Callejon G, Palomares AR, et al. (2008) Humangenetic selection on the MTHFR 677C>T polymorphism.BMC Med Genet 9, 104.
69. Guo T, Chen H, Liu B, et al. (2012) Methylenetetrahydrofolatereductase polymorphisms C677T and risk of autism in theChinese Han population. Genet Test Mol Biomarkers 16,968–973.
70. Boris M, Goldblatt A, Galanko J, et al. (2004) Association ofMTHFR gene variants with autism. J Am Physicians Surg 9,106–108.
71. Black MM (2008) Effects of vitamin B12 and folate deficiencyon brain development in children. Food Nutr Bull 29,S126–S131.
72. Kalmbach RD, Choumenkovitch SF, Troen AP, et al. (2008)A 19-base pair deletion polymorphism in dihydrofolatereductase is associated with increased unmetabolized folicacid in plasma and decreased red blood cell folate. J Nutr 138,2323–2327.
73. Schirch L & Peterson D (1980) Purification and properties ofmitochondrial serine hydroxymethyltransferase. J Biol Chem255, 7801–7806.
10 E. A. DeVilbiss et al.

38
CHAPTER 3. Study I: Prenatal nutritional supplementation and autism spectrum disorders in the Stockholm Youth Cohort: population-based cohort study

39
Prenatal nutritional supplementation and autism spectrum disorders in the Stockholm
Youth Cohort: population-based cohort study
Elizabeth A DeVilbiss, Cecilia Magnusson, Renee M Gardner, Dheeraj Rai, Craig J Newschaffer, Kristen Lyall, Christina Dalman, Brian K Lee
Department of Epidemiology and Biostatistics, Drexel University School of Public Health, 3215 Market St, Philadelphia, PA 19104, USA, Elizabeth A DeVilbiss PhD candidate, Craig J Newschaffer professor, Brian K Lee associate professor Department of Public Health Epidemiology, Department of Public Health Sciences, Karolinska Institutet, SE-171 77 Stockholm, Sweden, Cecilia Magnusson adjunct professor, Renee M Gardner assistant professor, Christina Dalman professor Centre for Academic Mental Health, School of Social and Community Medicine, University of Bristol, Oakfield House, Oakfield Grove, Bristol, BS8 2BN, United Kingdom, Dheeraj Rai consultant senior lecturer A.J. Drexel Autism Institute, 3020 Market St #560, Philadelphia, PA 19104, USA, Craig J Newschaffer director, Kristen Lyall assistant professor
Correspondence to: Elizabeth DeVilbiss, 3215 Market St., Philadelphia, PA 19104, USA, [email protected]
Short title: Prenatal nutritional supplementation and autism spectrum disorders
Keywords: autism, folic acid, iron, multivitamins, neurodevelopment, pregnancy

40
ABSTRACT
Objectives: We evaluated whether nutrient supplementation during pregnancy is associated with
reduced risk of autism spectrum disorder (ASD) and intellectual disability (ID).
Design: The Stockholm Youth Cohort is a population-based prospective cohort of individuals
living in Stockholm County, Sweden. We identified a population-based sample of 273,107
mother-child pairs through population registers. Our study sample was restricted to children who
were 4 to 15 years of age by December 31, 2011 and were born 1996-2007. Using multivariable
logistic regression, sibling controls, and propensity score matching, we estimated adjusted odds
ratios (ORs) and 95% confidence intervals (CI) between folic acid, iron, and multivitamin
supplement use reported at the first antenatal visit and child ASD and ID from register data
through 2011.
Results: Prevalences of child ASD with ID in the maternal multivitamin use group and the group
with no use of folic acid/iron/multivitamins were 158 cases/61,934 (0.26%) and 430 cases/90,480
(0.48%), respectively. Maternal multivitamin use was associated with lower odds of ASD with
ID in the child relative to mothers who did not use folic acid, iron, or multivitamins in regression
(OR: 0.69 [95% CI: 0.57 to 0.84], sibling control (0.77 [0.52 to 1.15]) and propensity score
matched (0.68 [0.54 to 0.86]) analyses. Findings were not specific to ASD, as similar estimates
were found for ID only. There was no consistent evidence that either iron or folic acid use were
associated with lower risk of ASD.
Conclusions: Maternal multivitamin supplementation appeared to be associated with a reduced
risk of intellectual disability with and without ASD using three different analytic methods with
different assumptions. Although making causal inference using observational data is difficult,
our findings suggest that further scrutiny of maternal nutrition and its role in the etiology of
intellectual disability is warranted.

41
INTRODUCTION
With the heritability of autism spectrum disorders (ASD) estimated to be between 50 and
80%,[1, 2] non-heritable risk factors contribute to a substantial proportion of ASD risk. Research
suggests that ASD likely develops prenatally.[3-5] Maternal nutrition influences
neurodevelopment[6-8] and could influence the risk of ASD.[9] However, results from
population-based studies have been inconsistent. An American case-control study (CHARGE -
CHildhood Autism Risks from Genetics and Environment)[10] and a Norwegian cohort study[11]
reported reduced risk of ASD with maternal folic acid supplementation and intake in the peri-
conceptional period and early pregnancy. Meanwhile, a Danish cohort study reported no
associations between early folic acid or multivitamin supplementation and ASD risk.[12]
Maternal iron intake[13] and prenatal vitamin use[14] were both associated with reduced ASD
risk in CHARGE, while no association between ordinary multivitamin use and ASD was
reported.[14] To date, all published studies of maternal folate biomarkers and child ASD or
autistic traits have found null relationships.[15, 16] Clarifying the potential role of nutritional
supplements is a delicate endeavor, given the potential for ASD etiology to differ by presence of
intellectual disability (ID),[17-19] although this has not been well-studied in the context of
nutritional supplementation.
The body of evidence does not seem to support a protective association between maternal
multivitamins[20-24], folic acid and/or dietary folate intake[20, 25-27], or supplementary and/or
dietary iron intake[20-22, 25, 28] and child cognition. Most biomarker folate studies also have
not found associations between maternal plasma or blood folate and cognitive function.[26, 29-
32]
Another critical aspect in considering this association is that it may be confounded by
maternal characteristics.[9, 33] Namely, persons who have a given dietary pattern are likely to be
different from persons who do not have that dietary pattern; potential differences may include

42
socioeconomic characteristics, disease status, healthy behaviors, or pregnancy characteristics.[9,
33] If these differences are not properly accounted for, then results may be due to confounding.
In the present study, three analytic strategies were employed to elucidate potential
associations between maternal nutrient supplementation with iron, folic acid, and multivitamins
and risk of offspring ASD and ID. These included multivariable regression with adjustment for a
large number of covariates, sibling controls to account for familial environmental and genetic
confounding, and propensity score matching to ensure balanced comparisons between exposed
and unexposed individuals. The authors’ a priori approach was to use the different strengths of
the three analytic approaches to triangulate on a conclusion. The multivariable regression
analysis in the whole sample provides the most generalizable and interpretable estimates, but is
the most susceptible to limitations such as confounding from observed and unobserved
characteristics. The propensity score matched analyses are intended to help determine whether
confounding from observed characteristics or data from highly dissimilar individuals unduly
influences results, but are not necessarily generalizable. The sibling-matched analyses serve as a
barometer as to whether estimates are confounded by unobserved shared familial confounders but
suffer from low statistical power. Thus, no one method is necessarily sufficient to gauge
causality of any observed association. Converging results from all three methods, however,
strengthens causal inference.
METHODS
Study sample
Data were drawn from the Stockholm Youth Cohort, a total population register-based
cohort of children living in Stockholm County, Sweden, for at least four years in 2001 through
2011.[34] The study sample was, for the purpose of availability of exposure data, restricted to
children who were born in Sweden in 1996-2007, and who were thus aged 4 to 15 years at the end
of follow-up in December 2011. Children who were not in the Medical Birth Register (MBR) (n

43
= 17,029), not linked to birth mother (n = 41), adopted (n = 193), or who had missing data on
family disposable income (n = 298) or maternal age (n = 5) were excluded (Figure 2). Children
may not be recorded in the MBR if birth records are not sent from the delivery hospital to the
register.[35] Although an earlier report about the quality of the MBR[35] cited that 1-2% of
children born in Sweden are not recorded in the register, the report acknowledged that this rate
has increased in recent years.
Multivariable regression analyses were based on the whole cohort, propensity score
analyses were based on a subset of matched groups, and sibling analyses were based on the whole
cohort with single children removed (Figure 2 and Table 4). Siblings were restricted to members
of the study sample born within the study period, and were defined as having the same birth
mother.
Ethical approval was given by the Regional Ethical Review Board in Stockholm,
Sweden.
Patient involvement
No patients were involved in setting the research question or the outcome measures, nor
were they involved in developing plans for design or implementation of the study. No patients
were asked to advise on interpretation or writing up of results. There are no plans to disseminate
the results of the research to study participants or the relevant patient community.
Case ascertainment
ASD data were drawn from computerized registers covering all pathways of ASD
diagnosis and care in Stockholm County. Case ascertainment is described in detail
elsewhere.[34] Pediatric healthcare and habilitation services are available free of charge in
Sweden. Developmental screening occurs at regular intervals, whereby children with suspected
autism are referred for structured diagnostic assessments by specialists.[36] ASD is recorded via

44
ICD-10 (F84), and DSM-IV (299) codes in registers covering child and adolescent mental health,
habilitation, and pediatric in-patient and outpatient services.
Intellectual disability was ascertained through the Clinical Database for Child and
Adolescent Psychiatry in Stockholm using DSM-IV (317-319) classification and supplemented
with Habilitation Register data, which categorizes autism by intellectual disability.[18, 37] For
any ASD, medical records review indicated that 96.0% of recorded cases were consistent with
diagnostic criteria.[37] When assessing the validity of ASD case status by co-occurring ID, ASD
with ID was confirmed in 68 of 90 (75.6%); 17 of the 22 non-confirmed ASD with ID cases had
ASD but no documentation of ID.[34]
Maternal supplement use
Recommendations regarding supplement use for pregnant women during the study period
are discussed in Methods Supplement 1. Briefly, pregnant women are advised to take 400 ug/d
folic acid during the first trimester[38]. Through 2008, 100 mg/d iron was recommended for
pregnant women during weeks 20-24, but is currently only recommended for pregnant women
who are anemic (in a 200 mg/d dosage)[39]. There were no guidelines for multivitamin use
during the study period. Self-reported supplement and drug use was assessed at first antenatal
visit. Gestational week at first antenatal visit was recorded in the MBR from mid-1995 onwards
(median: 10.7 weeks; interquartile range: 9.0 -12.7 weeks).[35] Most women attended scheduled
antenatal care visits, as they are free of charge in Sweden.[40] Using a standardized form, the
woman was interviewed by a midwife at the first visit and asked if she had used any drug at any
point during pregnancy. Drug information was recorded by the midwife and later transcribed into
the MBR as Anatomical Therapeutic Chemical (ATC) classification codes (Table A1) or free
text.
Exposure variables were individually created based on ATC code and free text matches
(Methods Supplement 1), and combined in the creation of five non-overlapping exposure groups:

45
multivitamins; folic acid; iron; folic acid and iron; no use of multivitamins, folic acid, or iron.
For all analyses, this latter group served as the reference category against which other supplement
use groups were compared. The multivitamins category included individuals who noted use of
any multivitamin (MV), regardless of any combined use with additional iron and/or FA.
Multivitamin formulations in Sweden commonly include multiminerals; these combinations were
included in the “multivitamins” category. Multiminerals such as calcium/magnesium
supplements without evidence of inclusion of folic acid or iron in the formulation were classified
as “none”. Since MBR data do not reliably discern between multi- and prenatal vitamins, they
were combined and are referred to as multivitamins. Register data also do not contain
information regarding dosage, timing of initiation, frequency, or duration. Midwife interview of
self-reported maternal folic acid use has been reported to correspond well with plasma folate
levels among Swedish women,[41] so it is not unreasonable that other supplements may
correspond similarly.
Covariates
National identification numbers enabled record linkage between national registers held by
Statistics Sweden and the National Board of Health and Welfare. Registers utilized include the
MBR for child and pregnancy characteristics,[35, 42] the Integrated Database for Labour Market
Research for socioeconomic factors,[17] and national and regional health registers for inpatient,
outpatient, prescription drug, and psychiatric data.[34] All covariates were chosen a priori based
on published relationships with ASD[43] and/or the use of supplements.
Child factors were sex, birth year (unordered single year categories), and years resided in
Stockholm County (continuous) to account for length of follow-up. Sociodemographic data
included maternal country of birth (Sweden, Other Europe, Outside Europe), maternal
education[44] (pre-secondary, secondary, post-secondary, missing), and disposable family
income (quintiles). Family income was calculated after tax deductions, was adjusted for family
46
size, and based on birth year to account for inflation.
Maternal covariates included age in years (< 25, 25 - < 30, 30 - < 35, 35+), parity (1, 2,
3+), smoking at first antenatal visit (yes, no, missing), and body mass index (BMI) at first
antenatal visit in kg/m2 (underweight: < 18.5, normal: 18.5 - < 25, overweight: 25 - < 30, obese:
≥30, and missing).
Lifetime history of maternal neurologic or psychiatric conditions before the child’s birth
(anxiety disorders, ASD, bipolar disorder, depression, intellectual disability, non-affective
psychoses, stress-related disorders, and epilepsy - yes/no for each (Table A2) were ascertained
from the National Patient Register (NPR) and the Stockholm County Adult Outpatient Psychiatric
Register. Both registers have high validity.[45]
Medication use (antiepileptics and antidepressants - yes/no for each) was ascertained via
the MBR (self-report at first antenatal visit by interview, available for the entire study period) and
the Prescription Drug Register (records of prescribed dispensed drugs, available for births 2006-
2007). Some validation work has been conducted examining the concordance of maternal drug
use during pregnancy in the Prescription Drug Register and the MBR. For example, 69% of
mothers with antiepileptic use recorded in the Prescription Drug Register also had corresponding
information in the MBR.[46]
Primary analyses
Regression analyses used generalized estimating equation (GEE) models with logit link,
clustered by mother, to calculate odds ratios (ORs) with 95% confidence intervals (CI) between
supplement intake and each outcome (any ASD, ASD with ID, and ASD without ID). An
exchangeable correlation matrix was assumed.
After removal of covariates imparting < 5% change to the estimates for the autism with
ID multivariate regression GEE analysis, only maternal birth country and birth year remained
(Table A3). Removing these covariates only minimally increases precision, reducing confidence
47
interval width only by 0.01 – 0.02. Minimally adjusted models were therefore adjusted for birth
year and maternal birth country and fully adjusted models included all covariates described
above.
Sibling-matched analyses were performed using conditional logistic models matched on
mother and adjusted for sex, parity, and birth year. Propensity score analyses were conducted
separately for each exposure and were compared against non-users of folic acid, iron and
multivitamins. Propensity scores were estimated using logistic regression including all covariates
with observed or hypothesized associations with supplementation and/or ASD described above.
Odds ratios were calculated for matched samples using GEE models with logit link, clustered by
mother. Details of propensity score matching are described in the Methods Supplement 1.
Analyses were conducted using SAS software, version 9.3 (SAS Institute Inc., Cary, North
Carolina) and R.
Sensitivity analyses
Maternal hospitalizations: We hypothesized that underlying, possibly unobserved health
factors might influence an apparent increase in risk associated with use of only folic acid. To
investigate, a post-hoc sensitivity analysis was conducted, stratifying by number of maternal
hospitalizations during pregnancy excluding the delivery (0 vs. 1 or more, in a ~45:55 split).
Although other health factors were considered as stratification factors (e.g., maternal epilepsy),
these analyses were not possible due to the small number of folic acid users with children with
ASD with (n = 15) or without ID (n = 63).
Unmeasured confounding: The method of Lin et al[47] was used to examine robustness
of an observed association to unmeasured confounding. The goal of this analysis was to assess
whether an observed association between multivitamin use and risk of ASD with ID was likely to
be qualitatively changed under reasonable assumptions about unmeasured confounding. A
hypothetical binary confounder that reduced the risk of ASD was assumed to be more prevalent

48
among multivitamin users than in non-users across a range of plausible parameters. Because the
association from the propensity score analysis is theoretically the most robust to measured
confounding, this association was the basis of this test of unmeasured confounding.
Intellectual disability: As a means to evaluate specificity of multivitamin findings for
ASD with ID, additional post-hoc sensitivity analyses examined ID only as an outcome.
Individuals with known congenital or metabolic causes of intellectual disability were excluded
from these analyses.

49
RESULTS
Study sample
The study sample consisted of 273,107 mother-child pairs, categorized into groups:
multivitamins (n = 62,840, 23.0%), iron only (n = 90,138, 33.0%), iron + folic acid (n = 25,445,
9.3%), folic acid only (n = 2789, 1.0%), and none of the above (n = 91,895, 33.7%) (Table 2).
The multivitamin group included MV only (n = 17,539, 6.4%), MV + Iron (n = 37,046, 13.6%),
MV + folic acid (FA) (n = 1602, 0.6%), and MV + Iron + FA (n = 6653, 2.4%).
Event rates (ASD, ASD with ID, ASD without ID) were as follows for the groups:
multivitamin (1.7%, 0.3%, 1.4%), iron (2.1%, 0.5%, 1.6%), iron + folic acid (2.0%, 0.5%, 1.5%),
folic acid (2.8%, 0.5%, 2.3%), and none (2.2%, 0.5%, 1.8%).
In the cohort, supplement user groups differed from one another across multiple health
and socioeconomic characteristics (Table 2). Multivitamin users tended to be older, primiparous,
more educated, higher-income, less likely to smoke, and more likely to be born in Sweden than
non-users. Folic acid users were similar to multivitamin users but were more likely to be
immigrants than non-users and have epilepsy or taking antiepileptics. Conversely, mothers taking
iron only or in combination with folic acid tended to be younger, multiparous, less educated,
lower-income, and more likely to be immigrants and smokers than non-users. Depression and
antidepressant use were more prevalent among all categories of supplement users vs. non-users.
Primary analyses
Multivitamin use: Regression analysis indicated that multivitamin use was associated
with lower likelihood of ASD with ID relative to non-use of folic acid, iron, or multivitamins in
all analyses (multivariate regression OR and 95% CI: 0.69 [0.57 to 0.84]). Point estimates from
the sibling control (0.77 [0.52 to 1.15]), and propensity score analyses (0.68 [0.54 to 0.86]) were
similar, although the sibling control estimate had a wider CI that included 1 (Table 3).
Multivitamin use was not associated with ASD without ID in any analysis.

50
Folic acid and iron: Although imprecision due to small numbers of folic acid only users
was evident, there was a suggestion of an elevated association between folic acid and ASD
without ID in the regression (1.29 [0.99 to 1.67]) and sibling control (1.70 [0.94 to 3.10])
analyses, that was attenuated in the propensity score analysis (1.10 [0.83 to 1.48]). Iron use was
not associated with ASD with or without ID in any analysis.
Sensitivity analyses
Maternal hospitalizations: Evidence of an elevated risk of child ASD with folic acid use
was limited to mothers with at least one hospitalization during pregnancy (1.59 [1.21 to 2.10] for
any ASD; Table 4). No evidence of elevated risk with folic acid use was seen in mothers with
zero hospitalizations (0.84 [0.54, 1.30] for any ASD). Importantly, the associations of
multivitamin use with lower risk of ASD with ID persisted in this sensitivity analysis (no
hospitalizations: 0.64 [0.47 to 0.87], any hospitalizations: 0.75 [0.58 to 0.97]).
Unmeasured confounding: Sensitivity analysis of the multivitamin propensity score
finding did not provide support for the presence of unmeasured confounding (Table 5).
Intellectual disability: After excluding children with known congenital (n = 897) or
metabolic (n = 194) causes of intellectual disability, 1048 of 272,018 children had ID without
ASD (0.4%). Regression analysis indicated that multivitamin use was associated with lower
likelihood of ID only relative to non-use of folic acid, iron, or multivitamins in all analyses
(multivariate regression OR and 95% CI: 0.67 [0.54 to 0.81]). Point estimates from the
propensity score (0.73 [0.56 to 0.93]) and sibling control (0.74 [0.48 to 1.14]) analyses were
similar, although the wider CI for the sibling analysis included 1 (Table A4).
There was a suggestion of an elevated association between folic acid and ID only in the
regression (1.47 [0.90 to 2.39]) and propensity score analyses (1.56 [0.90 to 2.69]) that was
attenuated in the sibling control (1.15 [0.33 to 4.00]) analysis. The sibling analysis showed a
suggestion of a lower likelihood of ID only associated with iron (0.76 [0.56 to 1.02]), while

51
regression (0.98 [0.85 to 1.13]) and propensity score estimates (0.93 [0.79 to 1.09]) did not. All
analyses indicated that iron + folic acid was associated with lower likelihood of ID only
(regression: 0.69 [0.54 to 0.88], sibling control: 0.51 [0.31 to 0.83], and propensity score: 0.64
[0.50 to 0.82]).

52
DISCUSSION
Principal findings
The present population-based study used multivariable regression, sibling controls and
propensity score matching to examine associations of nutritional supplementation during
pregnancy and risk of child ASD and intellectual disability. With their different analytic
strengths, limitations, and sample compositions, all three analyses appeared to converge in
suggesting that maternal multivitamin use was associated with reduced risk of ID with and
without ASD in the child. Given the absence of associations between multivitamins and ASD
without ID, this seems to suggest that associations observed for ASD with ID may be related to
ID, rather than being linked to ASD.
There was no consistent evidence that either iron or folic acid use were associated with
lower risk of ASD or ID. Although there was a possible association of folic acid use with higher
risk of ASD, this was limited to women with hospitalization during pregnancy. Moreover, there
was no association of the iron + folic acid group with ASD risk. This suggests that rather than
use of folic acid, problems associated with hospitalization that may have led to folic acid use
were underlying this result. There was also a possible association of folic acid use with higher
risk of ID only, though the three analytic methods converged in suggesting a reduced risk of ID
with folic acid + iron, which was specific to ID.
Strengths and limitations
The main strengths of the present study include the relatively large, population-based
sample in which advanced analytic methods were used to provide a more solid base for inference.
The case-finding approach covered all pathways to ASD care and services in Stockholm County
in the context of a universal healthcare system, thus increasing the likelihood that ASD cases
were identified. In addition, the availability of intellectual disability diagnoses helped discern
specificity of observed associations.
Propensity score matching[48] and sibling control[49] analyses were used to examine

53
whether results obtained using conventional regression were likely to be influenced by either
observed or unobserved confounding. Such confounding is possible, given that nutritional
supplement users were different from non-users in ways that may influence ASD and ID risk. As
shown in Figure A1, propensity score matching was effective in balancing covariate distributions
between exposed and unexposed persons. Because propensity score estimates were similar to the
regression estimates, this suggested that neither confounding from observed covariates nor undue
influence from non-comparable individuals affected results.
By comparing within sibling-matched sets, sibling analyses neutralize potential shared
observed and unobserved confounders such as maternal genetics that might predict both
supplement use and child ASD or ID risk. This control comes at a cost, since sibling studies have
lower sample sizes, leading to imprecise estimates and high type II error, among other
limitations.[50] In the present study, point estimates for associations between multivitamins and
ID with and without ASD were similar across regression, propensity score, and sibling analyses.
Although the sibling estimates’ CI included 1, the point estimates were similar to the regression
estimates, supporting the possibility that familial confounding was not driving these associations.
Together, the three analyses appeared to triangulate to point toward associations between
multivitamin use and ID with and without ASD.
Calculations of the potential impact of unmeasured confounding suggest that an
unmeasured confounder would have to be a strong protective factor, exerting an effect above and
beyond the covariates matched in propensity score analyses, in order to nullify the potential
associations between multivitamin use and ID with and without ASD. Because a maternal trait
that predicts multivitamin use (higher intelligence) may decrease risk of ID, analyses controlled
for maternal education level, ID, and ASD. Since healthy lifestyle is a well-known confounder in
studies of nutritional supplement use,[33] our analyses also controlled for maternal BMI but were
unable to assess the contribution of diet or other nutritional supplements. However, the sibling
control analyses, which would be expected to control for such cognitive and behavioral

54
confounders similar across pregnancies, produced point estimates consistent with the regression
analyses.
The observation that folic acid use was associated with higher risk of ASD with ID only
in women with a hospitalization during pregnancy suggests confounding by causes of
hospitalization such as chronic somatic or psychiatric conditions, acute illness, pregnancy-related
disorders, or psychosocial distress.[51-53] Whether this occurs through structural pathways (e.g.,
folic acid being prescribed at higher rates among women hospitalized during pregnancy) or
through biological pathways (e.g., folate insufficiency due to a chronic condition or medication)
remains to be seen. Potential exposure to anti-folates through either maternal history of
epilepsy[54] and use of an anti-epileptic medication[55] during pregnancy have both been
associated with increased risk of child ASD and were more prevalent in the folic acid group,
making confounding by indication possible.
Exposure assessment was limited, since type, timing, and dose of supplements could not
be determined. Changes to nutritional status or supplement use after the first antenatal visit could
not be assessed. It is possible that the reported supplement was not taken, or a supplement was
taken but not reported. Prevalences of supplement use observed here are in the range of estimates
from other studies in the Swedish population during the same time period.[56, 57] The extent of
misclassification is unknown; however, because supplement use was prospectively ascertained, it
may be less likely that such misclassification could wholly explain the present findings.
Even if causal associations could be established between multivitamins and ID with and
without ASD, it cannot be determined from the data whether there is a critical window for
exposure or what dosage levels are required. For ASD with ID, it cannot be determined from the
data what specific nutrients or combinations thereof may be responsible. However, converging
associations between folic acid + iron and reduced risk of intellectual disability may indicate that
these two nutrients in combination may have etiological relevance for ID without ASD.
External validity is also not assured, since different populations have different

55
backgrounds of supplement use, fortification, dietary patterns, and health risks. Lastly, although
the study featured a relatively large sample size, small cells made it difficult to obtain precise
estimates from lower-powered analyses, particularly the sibling control analyses.
Comparison with other studies
The findings are in mixed alignment with the existing literature. The three case-control
studies reporting reduced ASD risk with prenatal vitamins,[14] folic acid,[58] and iron[13] were
from the CHARGE study in the U.S. Interestingly, lower mean folic acid intake in CHARGE
was found for children with ASD with a lower cognitive function but not for ASD with higher
functioning, suggesting that nutrients may differentially affect ASD risk depending on co-
occurrence with intellectual disability. In the prospective Norwegian Mother and Child Cohort
study (MoBa), maternal folic acid intake, but not other vitamins and minerals, in the peri-
conceptional period and early pregnancy, was associated with lower risk of autistic disorder.[11]
The Danish National Birth Cohort (DNBC) study reported null associations between folic acid
and multivitamin intake and ASD or any of its subtypes.[12] To date, all published studies of
maternal folate biomarkers and child ASD or autistic traits have found null relationships.[15, 16]
However, these biomarker studies also evaluated nutrient intake and reported associations with
reduced ASD symptoms. The body of evidence does not seem to support a protective association
between maternal multivitamins[20-24], folic acid and/or dietary folate intake[20, 25-27], or
supplementary and/or dietary iron intake[20-22, 25, 28] and child cognition. Most biomarker
folate studies also have not found associations between maternal plasma or blood folate and
cognitive function.[26, 29-32]
Exposure timing could have played a role in differences among findings for iron and folic
acid. In the current study, supplementation was assessed at median 10.7 weeks pregnancy. The
observed association for folic acid intake in CHARGE was for exposure through the first month
of pregnancy, and findings were null after the second month of pregnancy. In MoBa, the
protective association pertained to exposure through the first trimester, while the DNBC study
56
examined exposure through 8 weeks gestation. Conversely, biomarker studies with positive
findings had assessed maternal folate after the first trimester.
Another possibility that may contribute to differences between studies is that the
background nutritional contexts of the countries where the studies conducted differ. For example,
while the U.S. engages in folic acid fortification, Sweden, Norway, and Denmark do not. Fish oil
supplements are routinely taken in Norway by nearly 60% of pregnant women[59] but are rarely
used in Sweden. Similarly, serum 25-hydroxyvitamin D levels in pregnant women are lower in
Sweden[60] than in Denmark,[61] corresponding with the difference in latitude.
Such differences may be illustrative in explaining why a reduced risk of ASD with folic
acid or iron was not observed. Data suggest that nutritional intake may differ between
cohorts.[62] MoBa participants reported combined daily dietary and supplementary folic acid
(615 µg) and iron (40.4 mg)[59] concentrations similar to levels associated with protection
against ASD in the CHARGE study (600 ug folic acid,[58] 57.1 mg iron[13]). DNBC
participants reported 575 ug combined dietary and supplementary folic acid.[63] In contrast,
combined dietary folate and supplementary folic acid (430 µg) and iron intake (15.0 mg) among
Swedish pregnant women[62] were less than in CHARGE or MoBa. Taken together, it is not
unreasonable to conclude that effects of supplements taken in one country may differ from those
in another country, depending on whether combined dietary and supplement levels of nutrients
reach a threshold necessary to elicit protection.
Conclusions and policy implications
We observed associations between gestational multivitamin supplement use and lower
risk of intellectual disability with and without autism. There does not yet exist a sufficient body
of mechanistic evidence supporting these findings. Verification in independent epidemiologic
investigations with improved exposure assessment, perhaps in randomized studies, is necessary
before a level of evidence suggesting practice change could be reached.
57
ACKNOWLEDGEMENTS
Authorship: Cecilia Magnusson and Christina Dalman provided the data used in the study. All
authors designed the study. Elizabeth A DeVilbiss performed the data analysis and drafted the
manuscript. All authors had full access to all of the data (including statistical reports and tables)
in the study and can take responsibility for the integrity of the data and the accuracy of the data
analysis. All authors interpreted data, critically revised, and approved the final manuscript. All
authors agreed to be accountable for all aspects of the work in ensuring that questions related to
the accuracy or integrity of any part of the work are appropriately investigated and resolved.
Transparency declaration: Elizabeth A DeVilbiss affirms that the manuscript is an honest,
accurate, and transparent account of the study being reported; that no important aspects of the
study have been omitted; and that any discrepancies from the study as planned have been
explained.
Funding: NIH 1 R21 ES023760-01A1, "Early life vitamin D levels and risk of autism spectrum
disorders" , the Swedish Research Council, NIHR Biomedical Research Centre (BRC) Bristol.
Funders facilitated Elizabeth A. DeVilbiss and Brian K. Lee to perform their authorship
responsibilities. Researchers were independent from funders.
Data sharing: No additional data available
Copyright/license for publication: “The Corresponding Author has the right to grant on behalf
of all authors and does grant on behalf of all authors, a worldwide licence to the Publishers and its
licensees in perpetuity, in all forms, formats and media (whether known now or created in the
future), to i) publish, reproduce, distribute, display and store the Contribution, ii) translate the
Contribution into other languages, create adaptations, reprints, include within collections and
create summaries, extracts and/or, abstracts of the Contribution, iii) create any other derivative
work(s) based on the Contribution, iv) to exploit all subsidiary rights in the Contribution, v) the
inclusion of electronic links from the Contribution to third party material where-ever it may be

58
located; and, vi) licence any third party to do any or all of the above.”
Competing interests: “All authors have completed the ICMJE uniform disclosure form at
www.icmje.org/coi_disclosure.pdf and declare: no support from any organisation for the
submitted work; no financial relationships with any organisations that might have an interest in
the submitted work in the previous three years; no other relationships or activities that could
appear to have influenced the submitted work.”
Ethical approval: This research has ethical approval as part of Psychiatry Sweden “Psykisk
ohälsa, psykiatrisk sjukdom: förekomst och etiologi,” [Mental health and psychiatric disorders –
prevalence and etiology] approved by the Stockholm Regional Ethical Review Board (number
2010/1185-31/5).
59
59 REFERENCES
1. Gauglerl, T., et al., Most genetic risk for autism resides with common variation. Nature Genetics, 2014. 46(8): p. 881-885.
2. Sandin, S., et al., The familial risk of autism. Journal of the American Medical Association, 2014. 311(17): p. 1770-1777.
3. Lyall, K., R.J. Schmidt, and I. Hertz-Picciotto, Maternal lifestyle and environmental risk factors for autism spectrum disorders. International Journal of Epidemiology, 2014. 43(2): p. 443-464.
4. Newschaffer, C.J., et al., The epidemiology of autism spectrum disorders. Annual Reviews of Public Health, 2007. 28: p. 235-58.
5. Stoner, R., et al., Patches of disorganization in the neocortex of children with autism. New England Journal of Medicine, 2014. 370(13): p. 1209-1219.
6. Bale, T.L., Epigenetic and transgenerational reprogramming of brain development. Nature Reviews Neuroscience, 2015. 16(6): p. 332-344.
7. Brown, A.S. and E.S. Susser, Prenatal nutritional deficiency and risk of adult schizophrenia. Schizophrenia Bulletin, 2008. 34(6): p. 1054-1063.
8. Xu, M.Q., et al., Prenatal malnutrition and adult schizophrenia: further evidence from the 1959-1961 Chinese famine. Schizophrenia Bulletin, 2009. 35(3): p. 568-576.
9. DeVilbiss, E.A., et al., Maternal folate status as a risk factor for autism spectrum disorders: a review of existing evidence. British Journal of Nutrition, 2015. 114(5): p. 663-672.
10. Schmidt, R.J., et al., Maternal periconceptional folic acid intake and risk of autism spectrum disorders and developmental delay in the CHARGE (CHildhood Autism Risks from Genetics and Environment) case-control study. The American journal of clinical nutrition, 2012. 96(1): p. 80-89.
11. Suren, P., et al., Association between maternal use of folic acid supplements and risk of autism spectrum disorders in children. Journal of the American Medical Association, 2013. 309(6): p. 570-577.
12. Virk, J., et al., Preconceptional and prenatal supplementary folic acid and multivitamin intake and autism spectrum disorders. Autism, 2016. 20(6): p. 710-718.
13. Schmidt, R.J., et al., Maternal intake of supplemental iron and risk of autism spectrum disorder. American Journal of Epidemiology, 2014: p. 890-900.
14. Schmidt, R.J., et al., Prenatal vitamins, one-carbon metabolism gene variants, and risk for autism. Epidemiology, 2011. 22(4): p. 476-485.

60
60 15. Braun, J.M., et al., Brief report: are autistic-behaviors in children related to prenatal
vitamin use and maternal whole blood folate concentrations? Journal of autism and developmental disorders, 2014. 44(10): p. 2602-2607.
16. Steenweg-de Graaff, J., et al., Folate concentrations during pregnancy and autistic traits in the offspring - the Generation R study. European Journal of Public Health, 2015. 25(3): p. 431-433.
17. Magnusson, C., et al., Migration and autism spectrum disorder: population-based study. British Journal of Psychiatry, 2012. 201(2): p. 109-115.
18. Rai, D., et al., Parental depression, maternal antidepressant use during pregnancy, and risk of autism spectrum disorders: population based case-control study. British Medical Journal, 2013. 346: p. 15.
19. Szatmari, P., J. White, and K.R. Merikangas, The use of genetic epidemiology to guide classification in child and adult psychopathology. International Review of Psychiatry, 2007. 19(5): p. 483-496.
20. Christian, P., et al., Prenatal Micronutrient Supplementation and Intellectual and Motor Function in Early School-aged Children in Nepal. Jama-Journal of the American Medical Association, 2010. 304(24): p. 2716-2723.
21. Li, Q., et al., Effects of Maternal Multimicronutrient Supplementation on the Mental Development of Infants in Rural Western China: Follow-up Evaluation of a Double-Blind, Randomized, Controlled Trial. Pediatrics, 2009. 123(4): p. E685-E692.
22. Li, C., et al., Prenatal micronutrient supplementation is not associated with intellectual development of young school-aged children. The Journal of nutrition, 2015. 145(8): p. 1844-1849.
23. McGrath, N., et al., Effect of maternal multivitamin supplementation on the mental and psychomotor development of children who are born to HIV-1 - Infected mothers in Tanzania. Pediatrics, 2006. 117(2): p. E216-E225.
24. Prado, E.L., et al., Maternal multiple micronutrient supplementation and other biomedical and socioenvironmental influences on children's cognition at age 9–12 years in Indonesia: follow-up of the SUMMIT randomised trial. The Lancet Global Health, 2017. 5(2): p. e217-e228.
25. Boeke, C.E., et al., Choline Intake During Pregnancy and Child Cognition at Age 7 Years. American Journal of Epidemiology, 2013. 177(12): p. 1338-1347.
26. Campoy, C., et al., Effects of prenatal fish-oil and 5-methyltetrahydrofolate supplementation on cognitive development of children at 6.5 y of age. American Journal of Clinical Nutrition, 2011. 94(6): p. 1880S-1888S.
27. Julvez, J., et al., Maternal use of folic acid supplements during pregnancy and four-year-old neurodevelopment in a population-based birth cohort. Paediatric and perinatal epidemiology, 2009. 23(3): p. 199-206.

61
61 28. Zhou, S.J., et al., Effect of iron supplementation during pregnancy on the intelligence
quotient and behavior of children at 4 y of age: long-term follow-up of a randomized controlled trial. American Journal of Clinical Nutrition, 2006. 83(5): p. 1112-1117.
29. Wu, B.T.F., et al., Early Second Trimester Maternal Plasma Choline and Betaine Are Related to Measures of Early Cognitive Development in Term Infants. Plos One, 2012. 7(8): p. 8.
30. Bhate, V., et al., Vitamin B(12) status of pregnant Indian women and cognitive function in their 9-year-old children. Food and Nutrition Bulletin, 2008. 29(4): p. 249-254.
31. Tamura, T., et al., Folate status of mothers during pregnancy and mental and psychomotor development of their children at five years of age. Pediatrics, 2005. 116(3): p. 703-708.
32. Veena, S.R., et al., Higher maternal plasma folate but not vitamin B-12 concentrations during pregnancy are associated with better cognitive function scores in 9-to 10-year-old children in South India. The Journal of nutrition, 2010. 140(5): p. 1014-1022.
33. Lawlor, D.A., et al., Those confounded vitamins: what can we learn from the differences between observational versus randomised trial evidence? Lancet, 2004. 363(9422): p. 1724-1727.
34. Idring, S., et al., Autism spectrum disorders in the Stockholm Youth Cohort: design, prevalence and validity. PloS one, 2012. 7(7): p. e41280.
35. Rosen, The Swedish Medical Birth Register - A summary of content and quality, The National Board of Health and Welfare. 2003, Centre for Epidemiology.
36. Axén, M., ADHD, lindrig utvecklingsstörning och autismspektrumtillstånd hos barn, ungdomar och vuxna [ADHD, mild mental retardation and autism spectrum disorders in children, adolescents and adults]. 2010, Stockholm: Stockholms läns landsting.
37. Idring, S., et al., Changes in Prevalence of Autism Spectrum Disorders in 2001-2011: Findings from the Stockholm Youth Cohort. Journal of Autism and Developmental Disorders, 2015. 45(6): p. 1766-1773.
38. Cawley, S., et al., A review of European guidelines on periconceptional folic acid supplementation. Eur J Clin Nutr, 2016. 70(2): p. 143-54.
39. SFOG, Halso-overvakning vid normal graviditet (Routine antenatal care). ARG rapport, 1991. 21: p. 37-38.
40. Kallen, B., Use of folic acid supplementation and risk for dizygotic twinning. Early Human Development, 2004. 80(2): p. 143-151.
41. George, L., et al., Plasma folate levels and risk of spontaneous abortion. Journal of the American Medical Association, 2002. 288(15): p. 1867-1873.
42. Cnattingius, S., et al., A quality study of a medical birth registry. Scandinavian Journal of Public Health, 1990. 18(2): p. 143-148.

62
62 43. Lyall, K., et al., The Changing Epidemiology of Autism Spectrum Disorders. Annu Rev
Public Health, 2016.
44. Rai, D., et al., Parental socioeconomic status and risk of offspring autism spectrum disorders in a Swedish population-based study. Journal of the American Academy of Child & Adolescent Psychiatry, 2012. 51(5): p. 467-476. e6.
45. Sullivan, P.F., et al., Family history of schizophrenia and bipolar disorder as risk factors for autism. Arch Gen Psychiatry, 2012. 69(11): p. 1099-1103.
46. Stephansson, O., et al., Drug use during pregnancy in Sweden - assessed by the Prescribed Drug Register and the Medical Birth Register. Clin Epidemiol, 2011. 3: p. 43-50.
47. Lin, D.Y., B.M. Psaty, and R.A. Kronmal, Assessing the sensitivity of regression results to unmeasured confounders in observational studies. Biometrics, 1998. 54(3): p. 948-963.
48. Stuart, E.A., Matching Methods for Causal Inference: A Review and a Look Forward. Statistical Science, 2010. 25(1): p. 1-21.
49. Susser, E., M.G. Eide, and M. Begg, Invited Commentary: The Use of Sibship Studies to Detect Familial Confounding. American Journal of Epidemiology, 2010. 172(5): p. 537-539.
50. Frisell, T., et al., Sibling Comparison Designs Bias From Non-Shared Confounders and Measurement Error. Epidemiology, 2012. 23(5): p. 713-720.
51. Rostad, B. and B. Schei, Factors predicting antenatal hospital admission in pregnancy. Scandinavian Journal of Primary Health Care, 1998. 16(2): p. 85-89.
52. Lindholm, E.S., et al., Health Care Consumption during Pregnancy in relation to Maternal Body Mass Index: A Swedish Population Based Observational Study. J Obes, 2015. 2015: p. 215683.
53. Lee, B.K., et al., Maternal hospitalization with infection during pregnancy and risk of autism spectrum disorders. Brain Behavior and Immunity, 2015. 44: p. 100-105.
54. Leonard, H., et al., Maternal health in pregnancy and intellectual disability in the offspring: A population-based study. Annals of Epidemiology, 2006. 16(6): p. 448-454.
55. Christensen, J., et al., Prenatal Valproate Exposure and Risk of Autism Spectrum Disorders and Childhood Autism. Journal of the American Medical Association, 2013. 309(16): p. 1696-1703.
56. Granfors, M., et al., No association between use of multivitamin supplement containing vitamin D during pregnancy and risk of Type 1 Diabetes in the child. Pediatr Diabetes, 2016. 17(7): p. 525-530.
57. Ericson, A., B. Källén, and A. Åberg, Use of multivitamins and folic acid in early pregnancy and multiple births in Sweden. Twin Research, 2001. 4(02): p. 63-66.

63
63 58. Schmidt, R.J., et al., Maternal periconceptional folic acid intake and risk of autism
spectrum disorders and developmental delay in the CHARGE (CHildhood Autism Risks from Genetics and Environment) case-control study. American Journal of Clinical Nutrition, 2012. 96(1): p. 80-89.
59. Haugen, M., et al., Dietary supplements contribute substantially to the total nutrient intake in pregnant Norwegian women. Annals of Nutrition and Metabolism, 2008. 52(4): p. 272-280.
60. Brembeck, P., A. Winkvist, and H. Olausson, Determinants of vitamin D status in pregnant fair-skinned women in Sweden. British Journal of Nutrition, 2013. 110(5): p. 856-864.
61. Petersen, S.B., et al., Maternal Vitamin D Status and Offspring Bone Fractures: Prospective Study over Two Decades in Aarhus City, Denmark. Plos One, 2014. 9(12): p. 12.
62. Lundqvist, A., et al., Reported dietary intake in early pregnant compared to non-pregnant women - a cross-sectional study. BMC Pregnancy and Childbirth, 2014. 14: p. 10.
63. Mikkelsen, T.B., M. Osler, and S.F. Olsen, Validity of protein, retinol, folic acid and n-3 fatty acid intakes estimated from the food-frequency questionnaire used in the Danish National Birth Cohort. Public Health Nutrition, 2006. 9(6): p. 771-778.
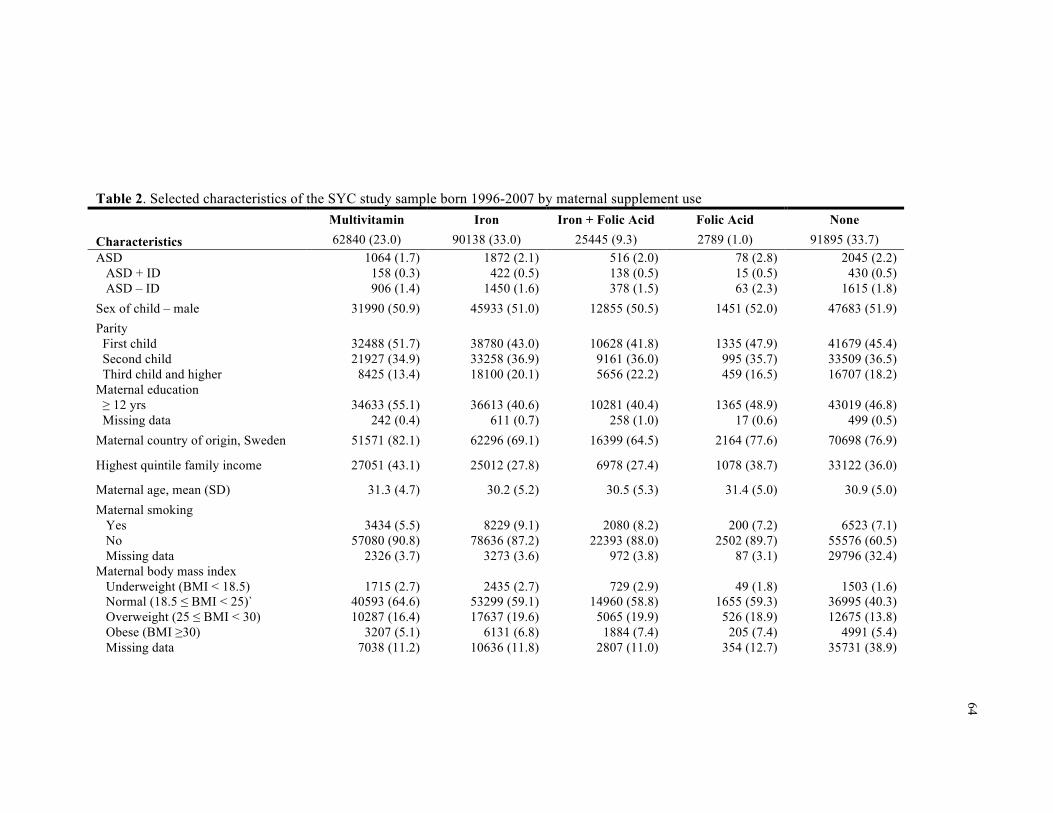
64
Table 2. Selected characteristics of the SYC study sample born 1996-2007 by maternal supplement use Multivitamin Iron Iron + Folic Acid Folic Acid None
Characteristics 62840 (23.0) 90138 (33.0) 25445 (9.3) 2789 (1.0) 91895 (33.7) ASD ASD + ID ASD – ID
1064 (1.7) 158 (0.3) 906 (1.4)
1872 (2.1) 422 (0.5)
1450 (1.6)
516 (2.0) 138 (0.5) 378 (1.5)
78 (2.8) 15 (0.5) 63 (2.3)
2045 (2.2) 430 (0.5)
1615 (1.8) Sex of child – male 31990 (50.9) 45933 (51.0) 12855 (50.5) 1451 (52.0) 47683 (51.9) Parity First child Second child Third child and higher
32488 (51.7) 21927 (34.9)
8425 (13.4)
38780 (43.0) 33258 (36.9) 18100 (20.1)
10628 (41.8)
9161 (36.0) 5656 (22.2)
1335 (47.9)
995 (35.7) 459 (16.5)
41679 (45.4) 33509 (36.5) 16707 (18.2)
Maternal education ≥ 12 yrs Missing data
34633 (55.1)
242 (0.4)
36613 (40.6)
611 (0.7)
10281 (40.4)
258 (1.0)
1365 (48.9)
17 (0.6)
43019 (46.8)
499 (0.5) Maternal country of origin, Sweden 51571 (82.1) 62296 (69.1) 16399 (64.5) 2164 (77.6) 70698 (76.9)
Highest quintile family income 27051 (43.1) 25012 (27.8) 6978 (27.4) 1078 (38.7) 33122 (36.0)
Maternal age, mean (SD) 31.3 (4.7) 30.2 (5.2) 30.5 (5.3) 31.4 (5.0) 30.9 (5.0) Maternal smoking Yes No Missing data
3434 (5.5)
57080 (90.8) 2326 (3.7)
8229 (9.1)
78636 (87.2) 3273 (3.6)
2080 (8.2)
22393 (88.0) 972 (3.8)
200 (7.2)
2502 (89.7) 87 (3.1)
6523 (7.1)
55576 (60.5) 29796 (32.4)
Maternal body mass index Underweight (BMI < 18.5) Normal (18.5 ≤ BMI < 25)` Overweight (25 ≤ BMI < 30) Obese (BMI ≥30) Missing data
1715 (2.7)
40593 (64.6) 10287 (16.4)
3207 (5.1) 7038 (11.2)
2435 (2.7)
53299 (59.1) 17637 (19.6)
6131 (6.8) 10636 (11.8)
729 (2.9)
14960 (58.8) 5065 (19.9)
1884 (7.4) 2807 (11.0)
49 (1.8)
1655 (59.3) 526 (18.9)
205 (7.4) 354 (12.7)
1503 (1.6)
36995 (40.3) 12675 (13.8)
4991 (5.4) 35731 (38.9)

65
Table 2 (continued). Selected characteristics of the SYC study sample born 1996-2007 by maternal supplement use Multivitamin Iron Iron + Folic Acid Folic Acid None
Characteristics 62840 (23.0) 90138 (33.0) 25445 (9.3) 2789 (1.0) 91895 (33.7) Maternal medications Antidepressant use Antiepileptic use
1017 (1.6)
118 (0.2)
1368 (1.5)
119 (0.1)
367 (1.4) 215 (0.8)
38 (1.4) 65 (2.3)
916 (1.0) 125 (0.1)
Maternal neuropsychiatric conditions Anxiety disorders Autism Bipolar disorder Depression Epilepsy Intellectual disability Non-affective psychotic disorders Stress disorders
870 (1.4)
64 (0.1) 115 (0.2)
2036 (3.2) 347 (0.6)
19 (0.0) 140 (0.2)
1210 (1.9)
1209 (1.3)
127 (0.1) 159 (0.2)
2571 (2.9) 391 (0.4)
68 (0.1) 258 (0.3)
1668 (1.9)
347 (1.4)
34 (0.1) 56 (0.2)
695 (2.7) 282 (1.1)
20 (0.1) 83 (0.3)
475 (1.9)
35 (1.3)
5 (0.2) 9 (0.3)
82 (2.9) 69 (2.5)
2 (0.1) 11 (0.4) 70 (2.5)
1176 (1.3)
120 (0.1) 176 (0.2)
2434 (2.7) 470 (0.5)
67 (0.1) 281 (0.3)
1648 (1.8)

66
Table 3. Crude and adjusted odds ratios and 95% confidence intervals for supplement use and ASD with and without intellectual disability, and any ASD
Sample Sibling Sibling Propensity score Multivariate Multivariate Adjustment Unadjusted Adjusteda PS matched Unadjusted Adjustedb
Model CLRc CLRc OLR and GEEd GEEe GEEe ASD with ID Folic acid 0.81 (0.28 to 2.36) 0.94 (0.29 to 3.04) 1.14 (0.64 to 2.04) 1.16 (0.69 to 1.94) 1.20 (0.71 to 2.01) Iron 0.84 (0.64 to 1.10) 0.90 (0.67 to 1.21) 0.96 (0.82 to 1.13) 0.99 (0.87 to 1.14) 0.95 (0.83 to 1.11) Folic acid and Iron 0.81 (0.54 to 1.22) 0.99 (0.63 to 1.57) 1.06 (0.86 to 1.30) 1.14 (0.93 to 1.38) 1.03 (0.84 to 1.26) Multivitamin 0.60 (0.42 to 0.86) 0.77 (0.52 to 1.15) 0.68 (0.54 to 0.86) 0.54 (0.45 to 0.65) 0.69 (0.57 to 0.84) ASD without ID Folic acid 1.46 (0.87 to 2.45) 1.70 (0.94 to 3.10) 1.10 (0.83 to 1.48) 1.30 (1.00 to 1.68) 1.29 (0.99 to 1.67) Iron 0.93 (0.81 to 1.07) 0.96 (0.81 to 1.12) 0.95 (0.88 to 1.04) 0.92 (0.85 to 0.98) 0.96 (0.89 to 1.04) Folic acid and Iron 0.91 (0.73 to 1.13) 1.00 (0.78 to 1.29) 0.84 (0.74 to 0.94) 0.85 (0.76 to 0.95) 0.89 (0.79 to 1.00) Multivitamin 0.93 (0.79 to 1.10) 1.00 (0.83 to 1.20) 0.95 (0.85 to 1.06) 0.82 (0.75 to 0.89) 0.94 (0.85 to 1.03) Any ASD Folic acid 1.30 (0.82 to 2.06) 1.48 (0.87 to 2.51) 1.17 (0.89 to 1.51) 1.27 (1.01 to 1.60) 1.27 (1.01 to 1.60) Iron 0.91 (0.80 to 1.03) 0.95 (0.83 to 1.09) 0.93 (0.87 to 1.01) 0.93 (0.87 to 0.99) 0.96 (0.90 to 1.03) Folic acid and Iron 0.89 (0.73 to 1.07) 1.01 (0.81 to 1.25) 0.89 (0.81 to 0.99) 0.91 (0.82 to 1.00) 0.92 (0.83 to 1.02) Multivitamin 0.86 (0.74 to 1.00) 0.95 (0.81 to 1.13) 0.86 (0.78 to 0.95) 0.76 (0.71 to 0.82) 0.89 (0.82 to 0.97) Analytic sample sizes are documented in Table A5, ranging from 15,575 mothers and 16,086 children (Folic acid ASD with ID propensity score analysis) to 178,083 mothers and 273,107 children (any ASD multivariate sample analyses). a Adjusted for child sex, parity, and birth year b Adjusted for child characteristics (sex, birth year, and years resided in Stockholm County), socioeconomic indicators (education, family income, and maternal birth country), maternal characteristics (age, BMI, parity, smoking status), medication use during pregnancy (anti-depressants or anti-epileptics), and specific neuropsychiatric diagnoses before birth (anxiety disorders, autism, bipolar disorder, depression, epilepsy, intellectual disability, non-affective psychotic disorder, and stress disorder)

67
Table 3 (continued). Crude and adjusted odds ratios and 95% confidence intervals for supplement use and ASD with and without intellectual disability, and any ASD c Conditional logistic regression, matched on birth mother d Propensity scores were calculated with covariates in b as predictors of supplement use in ordinary logistic regression models (maternal age was a continuous covariate); in the matched sample, propensity scores were used as predictors of ASD in generalized estimating equation logistic regression models grouped by birth mother e Generalized estimating equation logistic regression, grouped by birth mother

68
68
Table 4. Adjusted odds ratios and 95% confidence intervals for multivariate analysisa stratified by hospitalizations during pregnancy
Hospitalizations Sample None n = 121,689
1 or more n = 148,324 Model GEEb GEEb
ASD with ID Folic acid 0.70 (0.25 to 2.00) 1.58 (0.86 to 2.89) Iron 1.05 (0.85 to 1.31) 0.87 (0.72 to 1.06) Folic acid and Iron 1.17 (0.87 to 1.57) 0.96 (0.73 to 1.26) Multivitamin 0.64 (0.47 to 0.87) 0.75 (0.58 to 0.97) ASD without ID Folic acid 0.88 (0.55 to 1.43) 1.59 (1.16 to 2.16) Iron 1.04 (0.92 to 1.17) 0.92 (0.83 to 1.02) Folic acid and Iron 0.94 (0.78 to 1.13) 0.87 (0.74 to 1.01) Multivitamin 1.01 (0.88 to 1.17) 0.89 (0.79 to 1.01) Any ASD Folic acid 0.84 (0.54 to 1.30) 1.59 (1.21 to 2.10) Iron 1.04 (0.93 to 1.16) 0.91 (0.83 to 1.00) Folic acid and Iron 0.99 (0.85 to 1.17) 0.89 (0.78 to 1.02) Multivitamin 0.94 (0.82 to 1.07) 0.87 (0.78 to 0.97)
a Adjusted for child characteristics (sex, birth year, and years resided in Stockholm County), socioeconomic indicators (education, family income, and maternal birth country), maternal characteristics (age, BMI, parity, smoking status), medication use during pregnancy (anti-depressants or anti-epileptics), and specific neuropsychiatric diagnoses before birth (anxiety disorders, autism, bipolar disorder, depression, epilepsy, intellectual disability, non-affective psychotic disorder, and stress disorder)
b Generalized estimating equation logistic regression, grouped by birth mother

69
69
Table 5. Potential impact of unmeasured confounding on the propensity score estimate for maternal multivitamin supplementation and risk of ASD with ID
Prevalence of confounder Reduced risk of ASD with ID due
to confoundera Multivitamin
users Non-users Adjusted OR
(95% CI)
- 0% 0% 0.69 (0.57 to 0.84)b
25% 20% 10% 0.71 (0.59 to 0.86) 25% 40% 20% 0.73 (0.60 to 0.89) 25% 60% 30% 0.75 (0.62 to 0.91) 25% 80% 40% 0.78 (0.64 to 0.95) 50% 20% 10% 0.73 (0.60 to 0.89) 50% 40% 20% 0.78 (0.64 to 0.95) 50% 60% 30% 0.84 (0.69 to 1.02) 50% 80% 40% 0.92 (0.76 to 1.12)
a Assumes that the elevated risk of ASD with ID due to the unmeasured confounder is the same in both multivitamin users and non-users b The original reported estimate in Table 2 Sensitivity analysis of our propensity score finding did not provide support for the presence of unmeasured confounding. For example, even if there were an unmeasured confounder that reduced the risk of ASD with ID by 50%, and had 40% prevalence among multivitamin users and 20% prevalence in non-users, the corrected PS estimate would remain protective (OR: 0.78 [0.64 to 0.95]). The unmeasured confounder would have to exert such an effect above and beyond the covariates matched in propensity score analyses. We believe the ranges of the parameters represent a realistic range of plausible values. While stronger influences, such as having an affected first-degree family member, are in theory plausible, shared genetic familial factors are controlled for in the sibling analyses, which produced a similar adjusted OR among matched siblings.
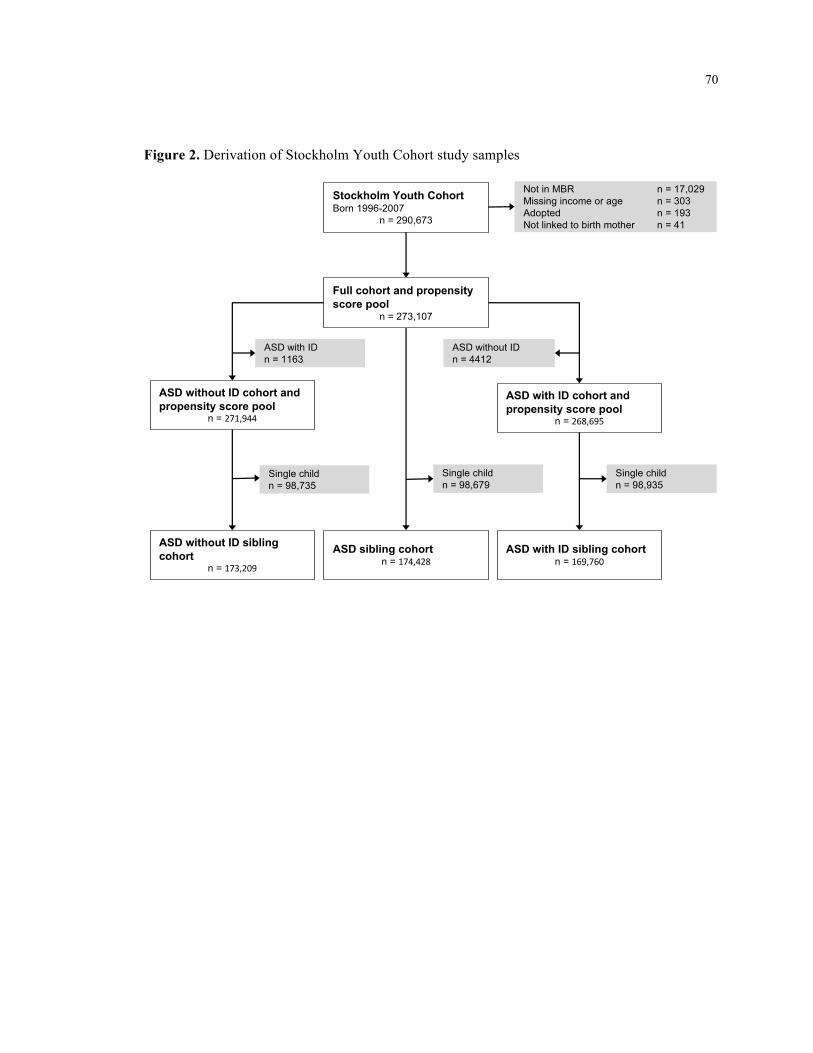
70
70
Figure 2. Derivation of Stockholm Youth Cohort study samples
Full$cohort$and$propensity$score$pool
n"="273,107
Not"in"MBR" n"="17,029Missing"income"or"age" n"="303Adopted" n"="193Not"linked"to"birth"mother n"="41
Stockholm$Youth$CohortBorn"1996B2007
n"="290,673
ASD"without"IDn"="4412
ASD"with"IDn"="1163
ASD$with$ID$cohort$and$propensity$score$pool
n"="268,695
ASD$without$ID$cohort$and$propensity$score$pool
n"="271,944
Single"childn"="98,935
ASD$with$ID$sibling$cohortn"="169,760
ASD$without$ID$sibling$cohort
n"="173,209
Single"childn"="98,735
Single"childn"="98,679
ASD$sibling$cohortn"="174,428,

71
APPENDIX 1: Methods Supplement 1

72
72 Methods Supplement 1
Supplement recommendations and use
The official recommendation from the National Board of Health and Welfare since 1996
is to take a folic acid supplement with 400 µg per day, beginning one month prior to conception
and continuing through the end of the first trimester.[1] Regarding iron supplementation,
guidelines from the Swedish Society of Obstetrics and Gynecology from 1991 through the study
period recommended initiation of iron supplementation of 100 mg per day in weeks 20-24 (this
recommendation was removed in 2008), while women with anemia should start iron
supplementation immediately at 200 mg daily.[2] We were unable to find any guidelines
regarding multivitamin supplement use in Sweden during the study period. As the reviewer
points out, use of multivitamins in pregnant Swedish women may vary by time and place. A
large study in southeast Sweden for children born 1997-1999 found that 18% of pregnant women
take multivitamins,[3] supporting that estimates of use of multivitamins in the present study do
not appear to be unreasonably low.
Actual recommendations regarding diet and nutrition vary depending on the health
practitioner seen. For example, a 2003 study in Sweden found that 41% of midwives who were
responsible for individual counseling provided recommendations regarding use of iron
supplements that were consistent with the policy.[4] Prenatal supplements are purchased at the
pharmacy and this purchase is subsidized by the universal health care system. Because of
repeated antenatal visits, it is possible that a woman’s intake might change after this point. We
acknowledge that timing, among other aspects of supplement use such as dose, are necessary to
investigate in further studies.
While there is no tradition of using omega 3 fatty acid (e.g., cod liver oil) supplements
in Sweden,[3] women in Sweden reported a wide variety of supplement use during pregnancy.
For example, in a study of >15,000 women in Sweden giving birth during the timeframe of our
study, 89% of women used some sort of supplement during pregnancy.[5] Thus, we are careful

73
73 to clarify that the ‘no MV/FA/iron’ group is likely to be taking other supplements at some point
during pregnancy. Because of the prior studies on folic acid, iron, and multivitamins and ASD,
we restricted our study to these exposures a priori.
Free text coding of nutritional supplementation
Free text coding of supplements and other drugs was performed in R. Manual coding
was performed on the most common 1,002 (2.4%) of 41,020 free text responses. Since the 1,002
manually coded values occurred 338,555 times from a total of 414,907 free text responses,
manual examination of these values represented 81.6% of the free text data.
Manual coding informed an automated exact and fuzzy pattern matching process. Exact
matching was used to account for known generic, Swedish, and international brand names,
abbreviations, and non-standard terms, whereas fuzzy matching was integrated to account for
punctuation and spacing differences, and misspellings.[6] Automated matches were reviewed,
false positives were removed as necessary, and coding was optimized accordingly. R code for
pattern matching is included in Methods Supplement II.
Propensity score analyses
Propensity score (PS) matching can create a sample matched on all observed covariates,
including maternal health indicators. The goal of matching is to make exposed and unexposed
groups more comparable, or balanced, on these characteristics. PS matching aims to reduce bias
due to confounding by comparing the outcomes of matched groups that primarily differ in their
exposure. As such, PS matching reduces dependence on model-based assumptions and increases
robustness of resulting statistical models.[7]
PS analyses were conducted separately for each exposure and were compared against
non-users of folic acid, iron and multivitamins. k:1 nearest neighbor greedy matching was
implemented with a caliper of 0.05 - 0.1 standardized difference using the MatchIt package in

74
74 R.[8] Exact matching on birth year was specified for multivitamin models to improve balance.
Unexposed to exposed matching ratios were a function of size of the exposed group, with ratios
ranging from 1:1 to 5:1. Balance was assessed through comparison of standardized mean
difference of covariates before and after matching. PS matching resulted in well-balanced
comparison groups (eFigure 1).
Population preventive fraction
Given the low prevalence of ID only, the estimated unadjusted odds ratio (uOR) of 0.51
should approximate a relative risk. The estimated prevalence of ID only among mothers not
taking multivitamin supplements (908/209,416 = 0.43%) and uOR suggest that if the association
between multivitamins and ASD with ID could be assumed to be causal, absolute risk among
children of mothers not taking supplements could be reduced from 434 to 212 per 100,000 with
supplementation[9]. Similarly, the prevalence of ASD with ID among mothers not taking
multivitamin supplements (963/207,193 = 0.46%) and uOR (0.54) suggest that absolute risk
among children of mothers not taking supplements could be reduced from 465 to 214 per 100,000
with supplementation. This translates to a combined reduction for intellectual disability with and
without ASD from 899 to 426 per 100,000 with multivitamin supplementation.
Assumptions that may be unsupported are implicit in this calculation and given that
underlying mechanisms are unknown, this estimate must be cautiously interpreted.[10]
Moreover, assuming a causal link could be established between multivitamin use and ID, it is
uncertain how this magnitude of absolute effect would translate to other populations that have
different backgrounds of nutritional supplement use, fortification, dietary patterns, and health
risks.

75
75
REFERENCES 1. Cawley, S., et al., A review of European guidelines on periconceptional folic acid
supplementation. Eur J Clin Nutr, 2016. 70(2): p. 143-54.
2. SFOG, Halso-overvakning vid normal graviditet (Routine antenatal care). ARG rapport, 1991. 21: p. 37-38.
3. Granfors, M., et al., No association between use of multivitamin supplement containing vitamin D during pregnancy and risk of Type 1 Diabetes in the child. Pediatr Diabetes, 2016. 17(7): p. 525-530.
4. Wulff, M. and E.C. Ekstrom, Iron supplementation during pregnancy in Sweden: to what extent is the national recommendation followed? Acta Obstet Gynecol Scand, 2003. 82(7): p. 628-35.
5. Aronsson, C.A., et al., Use of dietary supplements in pregnant women in relation to sociodemographic factors - a report from The Environmental Determinants of Diabetes in the Young (TEDDY) study. Public Health Nutr, 2013. 16(8): p. 1390-402.
6. Peters, L., et al., An approximate matching method for clinical drug names. AMIA Annual Symposium Proceedings, 2011. 2011: p. 1117-1126.
7. Ho, D.E., Matching as nonparametric preprocessing for reducing model dependence in parametric causal inference. Political Analysis, 2007. 15: p. 199-236.
8. Ho, D., et al., MatchIt: nonparametric preprocessing for parametric causal inference. 2011, 2011. 42(8): p. 28.
9. Darrow, L.A. and N.K. Steenland, Confounding and bias in the attributable fraction. Epidemiology, 2011. 22(1): p. 53-8.
10. Greenland, S., Concepts and pitfalls in measuring and interpreting attributable fractions, prevented fractions, and causation probabilities. Annals of Epidemiology, 2015. 25(3): p. 155-161.

76
76 Appendix 2: R code for exposure derivation
#~~~~~ Pattern matching in free text of old MBR~~~~~# # Find patterns that indicate usage of a drug #~~ IRON ~~~# # fuzzy matching ironmatches <- NULL patterns <- c("NIFEREX","HEMOFER","BLUTSAFT","DUROFERON","JÄRN","JÄRNTILLSKOTT", "JÄRNTABL","FERRONOL","ERCOFER","FE TABL", "GLOBIFER", "FE 100 MG", "VENOFER","FERRO","HEMIRON") for (i in patterns){ temp <- agrep(i, drugs$drugs) ironmatches[[i]] <- as.character(drugs$drugs[temp]) } # exact matching patterns <- c("FE","IRON","FE KOMB FOLACID","FE M FOLACIN","FE, FOLACIN", "IRON-FOLLIC PLU,","FE & VITAMINER","FE-SAFT", "VITAMINER +FE","VIT/MINERAL/FE","FE-VITAMINER", "FE & ACO VITAMINER","FE + VITAMINER","FE MED VITAMINER", "FE OCH C-VITAMINER","FE VITAMINER","VITAMINER/FE","FLYTANDE FE", "T. FE","FE+","FLYT FE") ironmatches[["EXACT"]] <- patterns # exact matching for specifc part patterns <- c("JÄRN") for (i in patterns){ temp <- grep(i, drugs$drugs) ironmatches[[i]] <- c(ironmatches[[i]], as.character(drugs$drugs[temp])) } # manual cleaning of incorrect matches incorrect <- c(# from JÄRN # "PUMPAKÄRNE-EXTRAKT","SE JORNAL ANTECKNING","PUMPAKÄRNE-EXTRAKT", # from FE TABL # "DEXOFEN TABL","TRANDATE TABLETT 100","TRIOBE TABLETT","ALVEDON FORTE TABLET", "POSTAFEN TABL","POSTAFEN TABL","LUGNANDE TABL.","TRANDATE TABLETT 200","ALVEDON FORTE TABL 1", "BLTR HÖJANDE TABL","DEXOFEN TABL 50","DEXOFEN TABL 50 MG","DEXOFEN TABL.","DEXOFEN TABLETT", "DEXOFEN TABLETT 100","DIANE TABLETT 2 MG/","FOLSYRE TABL","POSTAFEN TABL 25", "POSTAFEN TABL.V","ILLAMÅENDE TABL","ILLAMÅNENDE TABL","ILLLAMÅENDE TABL I T", "POSTAFEN TABL 25 MG", # from FE 100 MG # "TRANDATE 100 MG","DEXOFEN 100 MG","ZOLOFT 100 MG","DOLOXENE 100 MG","T TRANDATE 100 MG", "T. TRANDATE 100 MG","T.DEXOFEN 100 MG","T.TRANDATE 100 MG"," TRAMDATE 100 MG", "T TRANDATE 100 MG","T .TRANDATE 100 MG","T.SOLOFT 100 MG","TANDATE 100 MG","TRAMDATE 100 MG", # from FERRO # "BETAFERON","CAFERGOT","INJ BETAFERON","TOCOFEROL","BETAFERONINJ","BEFERON","BERROCCA BRUS", "CEFERGOT","CHOLECALCIFEROL","ERRONL","FERRHYD","FEROMYN S","FERRACODIL", "EFEROX","ERGOKALCIFEROL","ERGOKALICIFEROL APL","FERMONEST","FEROMFOL","FEROMOL","FEROMOL 15 ML", "T BERROCA","SERRODETTE","SERROVENT DISKUS","OMEPRAZOL ERRO","PROGESTERRON VAG", "INJ. INTERFERON","INTERFERON","FERRATI", # from HEMIRON # "REMIRON","REMIRON 15 MG","T REMIRON","T.REMIRON-S") for (i in 1:length(ironmatches)) { ironmatches[[i]] <- setdiff(ironmatches[[i]], incorrect) } #~~~ FOLIC ACID ~~~# folicmatches <- NULL # fuzzy matching patterns <- c("FOLSYRA","FOLACIN","FEMIBION","HEMOPLETT","TRIOBE","FOLIC", "FERRONOL","HEMOFER PLUS","BIOFOLIN") for (i in patterns){ temp <- agrep(i, drugs$drugs) folicmatches[[i]] <- as.character(drugs$drugs[temp]) } # exact matching

77
77 patterns <- c("HEMOFER +","HEMOFER+","HEMOPLUS", "T.HEMOFER+","T HEMOFER +","HEMOFER MED FOL","T HEMOFER M FOL", "HEMOFER M FOLS","T HEMOFER FOLS","HEMOFER+FOL","T.HEMOFER M FOL", "THEMOFER+",".HEMOFER+","HEMOFER M. FOLS","T HEMOFER MED F", "HEMOFER M FOL","HAEMOFER +","HEMOFER+BVIT","TABL HEMOFER MED FOL", "THEMOFER M FOL","THEMOFER M. FOL","VITAMINER + FOL", "T VITAMINERAL M. FOL","VITAMINER MED F","VITAMINER/ FOLS", "HÄMO-FER+") folicmatches[["EXACT"]] <- patterns # exact matching for specifc part patterns <- c("FOLS","FOLAC","FEMIBIO","FOLIC") for (i in patterns){ temp <- grep(i, drugs$drugs) folicmatches[[i]] <- c(folicmatches[[i]], as.character(drugs$drugs[temp])) } # manual cleaning of incorrect matches incorrect <- c(# from TRIOBE# "TRIOMEGA","TRIONETTA","T TRIOMEGA","T TRIONETTA","TRIONETTA 28","TRIODERON","TRIOMEGA F KVINNA", "TRIOMEGALL", # from FOLIC# "KYOLIC","DIFLICAN","DUFLICAN","PROCYANIDOLIC","SOLICO","SYMFONIC","T METABOLIC PRE","T KOLICIN", "KRYOLIC (VITLÖK)","FOLIO", # from HEMOFER PLUS# "HEMOFER BLUTSAFT") for (i in 1:length(folicmatches)) { folicmatches[[i]] <- setdiff(folicmatches[[i]], incorrect) } #~~~ MULTIVITAMIN ~~~# # fuzzy matching mvmatches <- NULL patterns <- c("MITT VAL KVINNA", "MULTIVITAMIN","MITT VAL", "VITAMIN KVINNA","MAMMAVITAL","KVINNA VITAMIN", "VITAMAX","KVINNA", "APOTEKET KVINNA", "MULTIPLEX","ENOMDAN", "BEROCCA","GRAVITAMIN", "MULTI KVINNA","MIVITOTAL","KVINNA VITAL","VIT FÖR GRAVIDA","MULTIVIT GRAVID", "PREGNACARE","MULTIVIT","KVINNA GRAVID", "ACO KVINNA","ACO FAMIL","ACO FERTIL","ACO MULT","ACO GRAV", "KVINNAMITTVAL","VITAMIN FÖR GRAVIDA") for (i in patterns){ temp <- agrep(i, drugs$drugs) mvmatches[[i]] <- as.character(drugs$drugs[temp]) } # fuzzy matching with lower tolerance patterns <- c("ACO VITAMIN") for (i in patterns){ temp <- agrep(i, drugs$drugs, max.distance=0.001) mvmatches[[i]] <- as.character(drugs$drugs[temp]) } # exact matching patterns <- c("MATERNA") mvmatches[["EXACT"]] <- patterns # exact matching for specifc part patterns <- c("VITAMINERAL","VITAPLEX","ACO Q") for (i in patterns){ temp <- grep(i, drugs$drugs) mvmatches[[i]] <- c(mvmatches[[i]], as.character(drugs$drugs[temp])) } # manual cleaning of incorrect matches incorrect <- c(# from MULTIPLEX# "MULTIPLEX OMEGA","MULTIPLEX OMEGA3","MULTIPLEX C","MULTIPLEX C-VITAMIN", "OMEGA 3 MULTIPLEX","OMEGA3 MULTIPLEX", # from ACO VITAMIN # "FOLSYRA O VITAMIN","FOLSYRA O VITAMINER") for (i in 1:length(mvmatches)) { mvmatches[[i]] <- setdiff(mvmatches[[i]], incorrect) }

78
78
APPENDIX 3: Supplementary Tables and Figure

79
Table A1. Derivation of SYC supplement user groups from ATC codes
Supplement use Logic Folic acid onlya Contains B03BB
(B03BB, B03BB01, B03BB51)
AND Does not contain B03A OR A11A OR A11B
Iron onlyb Contains B03A (B03A, B03AA, B03AB, B03AC, B03AD, B03AE)
AND Does not contain B03BB OR A11A OR A11B
Iron and Folic acid Contains B03BB AND Contains B03A AND Does not contain B03BB OR A11A OR A11B
Multivitaminsc Contains A11A (A11A, A11AA, A11AB)
OR Contains A11B (A11B, A11BA)
Non-use (ref) Does not contain B03BB, B03A, A11A, or A11B a Folic acid use is recorded as B03BB, “Folic acid and derivatives”, including ATC codes B03BB, B03BB01, and B03BB51. b Iron use is recorded as B03A, “Iron preparations”, which includes B03A, B03AA, B03AB, B03AC, B03AD, and B03AE. c Multivitamin use is recorded as A11A, “Multivitamins, combinations” or A11B, “Multivitamins, plain”. This includes ATC codes A11A, A11AA, A11AB, A11B, and A11BA.
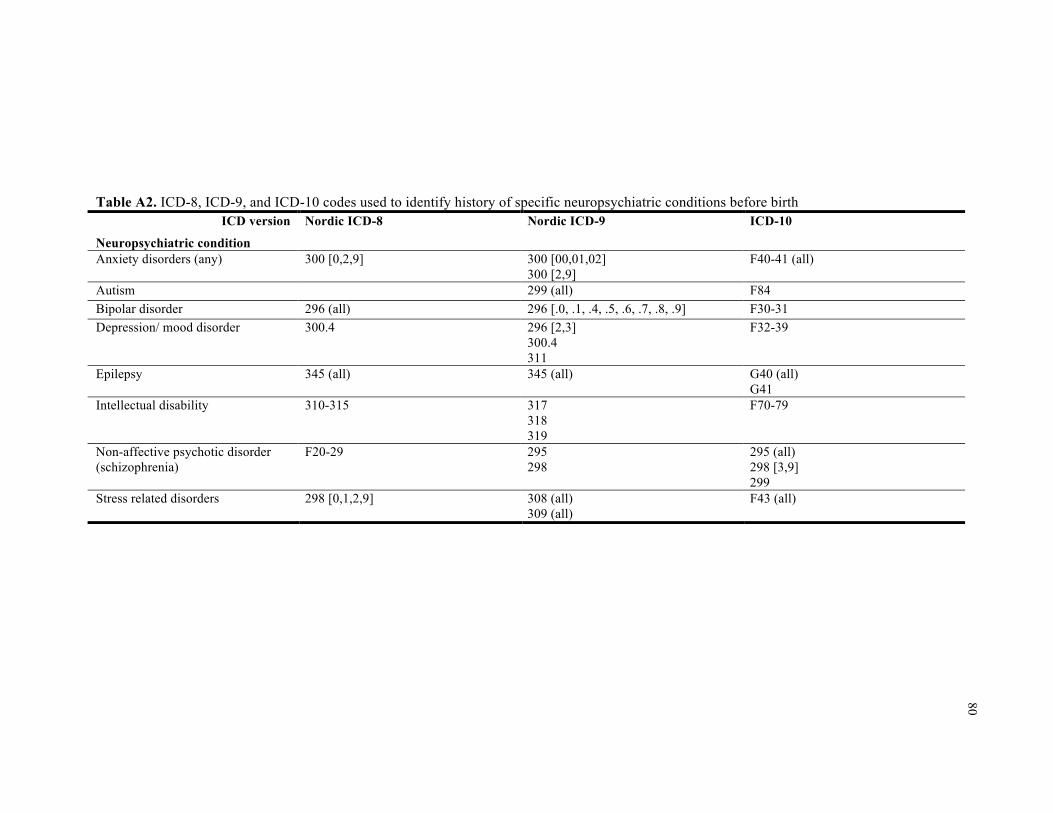
80
Table A2. ICD-8, ICD-9, and ICD-10 codes used to identify history of specific neuropsychiatric conditions before birth
ICD version Nordic ICD-8 Nordic ICD-9 ICD-10
Neuropsychiatric condition Anxiety disorders (any) 300 [0,2,9] 300 [00,01,02]
300 [2,9] F40-41 (all)
Autism 299 (all) F84 Bipolar disorder 296 (all) 296 [.0, .1, .4, .5, .6, .7, .8, .9] F30-31 Depression/ mood disorder 300.4 296 [2,3]
300.4 311
F32-39
Epilepsy 345 (all) 345 (all) G40 (all) G41
Intellectual disability 310-315 317 318 319
F70-79
Non-affective psychotic disorder (schizophrenia)
F20-29 295 298
295 (all) 298 [3,9] 299
Stress related disorders 298 [0,1,2,9] 308 (all) 309 (all)
F43 (all)

81
81
Table A3. Minimally adjusted odds ratios and 95% confidence intervals for supplement use and ASD with and without intellectual disability, and any ASD
Sample Full Adjustment Minimala
Model GEEb ASD with ID Folic acid 1.21 (0.72, 2.03) Iron 0.97 (0.84, 1.11) Folic acid and Iron 1.06 (0.87, 1.30) Multivitamin 0.66 (0.55, 0.80) ASD without ID Folic acid 1.28 (0.99, 1.66) Iron 0.95 (0.88, 1.02) Folic acid and Iron 0.88 (0.78, 0.99) Multivitamin 0.89 (0.81, 0.97) Any ASD Folic acid 1.27 (1.01, 1.60) Iron 0.95 (0.89, 1.01) Folic acid and Iron 0.92 (0.83, 1.02) Multivitamin 0.85 (0.78, 0.91)
a Adjusted for birth year and maternal birth country b Generalized estimating equation logistic regression, grouped by birth mother

82
Table A4. Crude and adjusted odds ratios and 95% confidence intervals for supplement use and ID only
Sample Sibling Sibling Propensity score Full Full Adjustment Unadjusted Adjusteda PS matched Unadjusted Minimalb
Model CLRc CLRc OLR and GEEd GEEe GEEe ASD with ID Folic acid 0.81 (0.28 to 2.36) 0.94 (0.29 to 3.04) 1.14 (0.64 to 2.04) 1.16 (0.69 to 1.94) 1.21 (0.72 to 2.03) Iron 0.84 (0.64 to 1.10) 0.90 (0.67 to 1.21) 0.96 (0.82 to 1.13) 0.99 (0.87 to 1.14) 0.97 (0.84 to 1.11) Folic acid and Iron 0.81 (0.54 to 1.22) 0.99 (0.63 to 1.57) 1.06 (0.86 to 1.30) 1.14 (0.93 to 1.38) 1.06 (0.87 to 1.30) Multivitamin 0.60 (0.42 to 0.86) 0.77 (0.52 to 1.15) 0.68 (0.54 to 0.86) 0.54 (0.45 to 0.65) 0.66 (0.55 to 0.80) ID only Folic acid 0.93 (0.27 to 3.24) 1.15 (0.33 to 4.00) 1.56 (0.90 to 2.69) 1.38 (0.85 to 2.23) 1.47 (0.90 to 2.39) Iron 0.71 (0.53 to 0.94) 0.76 (0.56 to 1.02) 0.93 (0.79 to 1.09) 0.99 (0.88 to 1.14) 0.98 (0.85 to 1.13) Folic acid and Iron 0.45 (0.24 to 0.72) 0.51 (0.31 to 0.83) 0.64 (0.50 to 0.82) 0.70 (0.55 to 0.90) 0.69 (0.54 to 0.88) Multivitamin 0.62 (0.41 to 0.95) 0.74 (0.48 to 1.14) 0.73 (0.56 to 0.93) 0.51 (0.42 to 0.61) 0.67 (0.54 to 0.81) Analytic sample sizes are documented in Table A5, ranging from 15,787 mothers and 16,376 children (folic acid propensity score analysis) to 177,682 mothers and 272,018 children (full sample analyses). a Adjusted for child sex, parity, and birth year (continuous) b Adjusted for birth year and maternal birth country c Conditional logistic regression, matched on birth mother d Propensity scores were calculated with covariates in b as predictors of supplement use in ordinary logistic regression models (maternal age was a continuous covariate); in the matched sample, propensity scores were used as predictors of ASD in generalized estimating equation logistic regression models grouped by birth mother e Generalized estimating equation logistic regression, grouped by birth mother
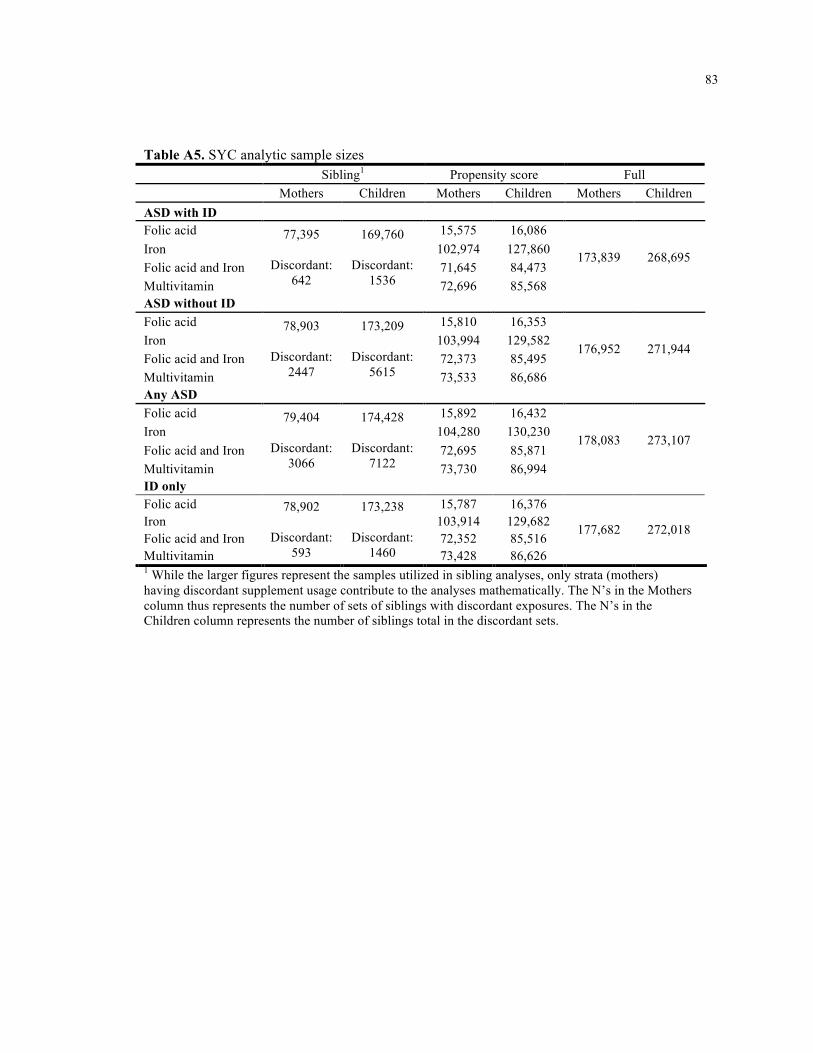
83
83
Table A5. SYC analytic sample sizes Sibling1 Propensity score Full Mothers Children Mothers Children Mothers Children ASD with ID Folic acid 15,575 16,086 Iron 102,974 127,860 Folic acid and Iron 71,645 84,473 Multivitamin
77,395
Discordant: 642
169,760
Discordant: 1536 72,696 85,568
173,839 268,695
ASD without ID Folic acid 15,810 16,353 Iron 103,994 129,582 Folic acid and Iron 72,373 85,495 Multivitamin
78,903
Discordant: 2447
173,209
Discordant: 5615 73,533 86,686
176,952 271,944
Any ASD Folic acid 15,892 16,432 Iron 104,280 130,230 Folic acid and Iron 72,695 85,871 Multivitamin
79,404
Discordant: 3066
174,428
Discordant: 7122 73,730 86,994
178,083 273,107
ID only Folic acid 15,787 16,376 Iron 103,914 129,682 Folic acid and Iron 72,352 85,516 Multivitamin
78,902
Discordant: 593
173,238
Discordant: 1460 73,428 86,626
177,682 272,018
1 While the larger figures represent the samples utilized in sibling analyses, only strata (mothers) having discordant supplement usage contribute to the analyses mathematically. The N’s in the Mothers column thus represents the number of sets of siblings with discordant exposures. The N’s in the Children column represents the number of siblings total in the discordant sets.

84
84
Table A6. Selected characteristics of the SYC study sample born 1996-2007 by child ASD ASD with ID ASD without ID No ASD
Characteristics 1163 (0.4) 4412 (1.6) 267,532 (98.4) Nutrient supplementation Folic acid Iron Iron + FA Multivitamins None
15 (1.3)
422 (36.3) 138 (11.9) 158 (13.6) 430 (37.0)
63 (1.4)
1450 (32.9) 378 (8.6)
906 (20.5) 1615 (36.6)
2711 (1.0)
88,266 (33.0) 24,929 (9.3)
61,776 (23.1) 89,850 (33.6)
Sex of child – male 848 (72.9) 3298 (74.8) 135,766 (50.8) Parity First child Second child Third child and higher
490 (42.1) 419 (36.0) 254 (21.8)
2280 (51.7) 1396 (31.6)
736 (16.7)
122,140 (45.7)
97,035 (36.3) 48,357 (18.1)
Maternal education ≥ 12 yrs Missing data
413 (35.5)
11 (1.0)
1773 (40.2)
11 (0.3)
123,725 (46.3)
1605 (0.6) Maternal country of origin, Sweden 665 (57.2) 3497 (79.3) 198,966 (74.4)
Highest quintile family income 264 (22.7) 1309 (29.7) 91,668 (34.3)
Maternal age, mean (SD) 30.4 (5.5) 30.3 (5.3) 30.7 (5.0) Maternal smoking Yes No Missing data
116 (10.0) 905 (77.8) 142 (12.2)
525 (11.9)
3316 (75.2) 571 (12.9)
19,825 (7.4)
211,966 (79.2) 35,741 (13.4)
Maternal body mass index Underweight (BMI < 18.5) Normal (18.5 ≤ BMI < 25)` Overweight (25 ≤ BMI < 30) Obese (BMI ≥30) Missing data
30 (2.6)
561 (48.2) 226 (19.4)
113 (9.7) 233 (20.0)
93 (2.1)
2101 (47.6) 868 (19.7)
395 (9.0) 955 (21.7)
6308 (2.4)
144,840 (54.1) 45,096 (16.9)
15,910 (6.0) 55,378 (20.7)
Maternal medications Antidepressant use Antiepileptic use
15 (1.3)
7 (0.6)
131 (3.0)
27 (0.6)
3560 (1.3)
608 (0.2) Maternal neuropsychiatric conditions Anxiety disorders Autism Bipolar disorder Depression Epilepsy Intellectual disability Non-affective psychotic disorders Stress disorders
22 (1.9) 11 (1.0)
3 (0.3) 35 (3.0) 11 (1.0)
6 (0.5) 9 (0.8)
24 (2.1)
76 (1.7) 80 (1.8) 13 (0.3)
195 (4.4) 45 (1.0)
8 (0.2) 15 (0.3)
134 (3.0)
3539 (1.3)
259 (0.1) 499 (0.2)
7588 (2.8) 1503 (0.6)
162 (0.1) 749 (0.3)
4913 (1.8)

85
85
Figure A1. Absolute standard biasesa for covariates in ASD propensity score modelsb Each graph incorporates data from propensity score models for any ASD; graphs for ASD with ID and ASD without ID were largely similar a The purpose of these plots is to indicate the relative improvement in covariate balance after matching. Absolute standardized bias is the absolute value of the weighted difference in covariate means between the treatment (supplement users) and control group (non-supplement users) divided by the standard deviation in the exposed group. If treated and control groups were perfectly balanced on all measured covariates, absolute standard bias would be equal to zero, indicating perfect matching. Absolute standard biases were calculated for all covariates used to calculate the propensity score. b Propensity scores were calculated using logistic regression.

86
86
Figure A2. ASD prevalence in the Stockholm Youth Cohort by birth year

87
87
Figure A3. Maternal nutrient supplementation by birth year

88 CHAPTER 4. Study II: Prenatal nutritional supplementation, folate-related genes, and
autism-related traits in the ALSPAC birth cohort
89 Prenatal nutritional supplementation, folate-related genes, and autism-related traits in the ALSPAC birth cohort
Elizabeth A DeVilbiss1, Brian K Lee1,3, Woori Kim2, Craig J Newschaffer1,3, Renee M Gardner4, Kristen Lyall1,3, Jean Golding5, Dheeraj Rai6,7, Christine Ladd-Acosta2
1 Department of Epidemiology and Biostatistics, Drexel University School of Public Health, 3215 Market St, Philadelphia, PA 19104, USA 2 Johns Hopkins Bloomberg School of Public Health, 615 N. Wolfe Street, Baltimore, MD 21205, USA 3 A.J. Drexel Autism Institute, 3020 Market St #560, Philadelphia, PA 19104, USA 4 Department of Public Health Epidemiology, Department of Public Health Sciences, Karolinska Institutet, SE-171 77 Stockholm, Sweden 5 Centre for Child and Adolescent Health, School of Social and Community Medicine, University of Bristol, Oakfield House, Oakfield Grove, Bristol, BS8 2BN, United Kingdom 6 Centre for Academic Mental Health, School of Social and Community Medicine, University of Bristol, Senate House, Tyndall Avenue, Bristol, BS8 1TH, United Kingdom 7 Avon and Wiltshire Partnership NHS Mental Health Trust, Bristol, United Kingdom
Correspondence to: Elizabeth DeVilbiss, Department of Epidemiology and Biostatistics, Drexel University School of Public Health, 3215 Market St, Philadelphia, PA 19104, USA, [email protected]
Short title: Prenatal nutritional supplementation, folate-related genes, and autism-related traits in ALSPAC
Keywords: folic acid, iron, vitamins, pregnancy, ASD, language, cognition, IQ, MTHFR, methylenetetrahydrofolate reductase
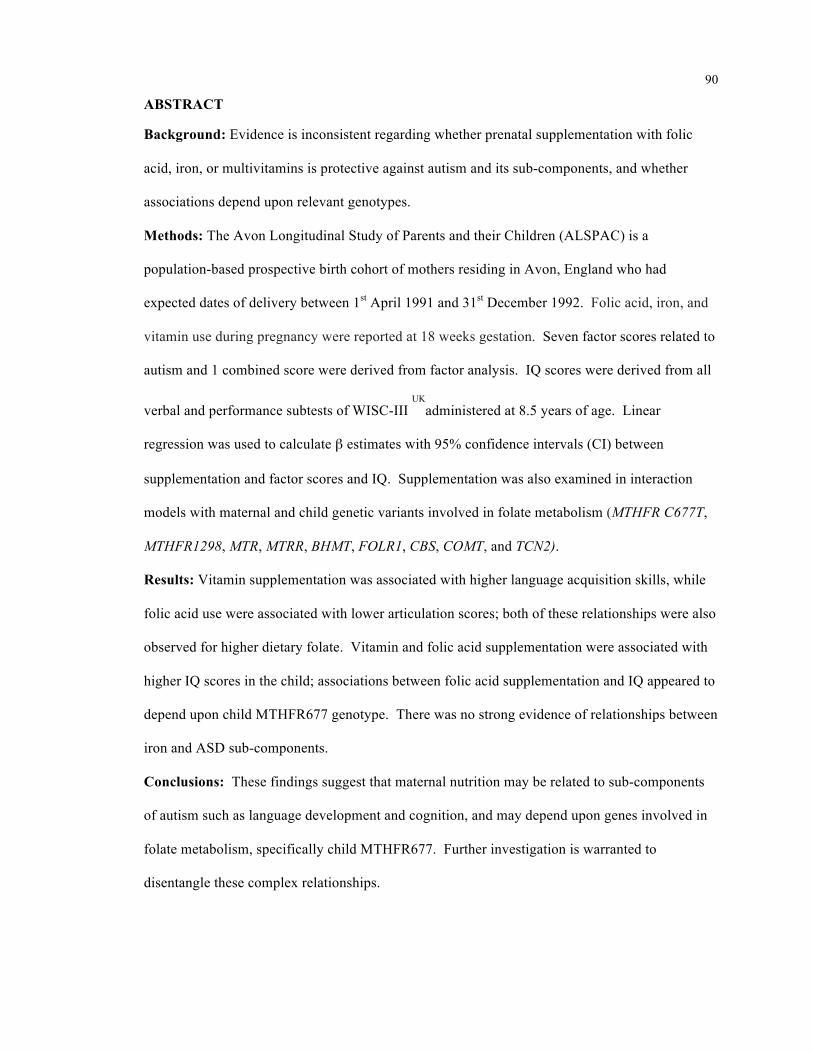
90 ABSTRACT
Background: Evidence is inconsistent regarding whether prenatal supplementation with folic
acid, iron, or multivitamins is protective against autism and its sub-components, and whether
associations depend upon relevant genotypes.
Methods: The Avon Longitudinal Study of Parents and their Children (ALSPAC) is a
population-based prospective birth cohort of mothers residing in Avon, England who had
expected dates of delivery between 1st April 1991 and 31st December 1992. Folic acid, iron, and
vitamin use during pregnancy were reported at 18 weeks gestation. Seven factor scores related to
autism and 1 combined score were derived from factor analysis. IQ scores were derived from all
verbal and performance subtests of WISC-III UK
administered at 8.5 years of age. Linear
regression was used to calculate β estimates with 95% confidence intervals (CI) between
supplementation and factor scores and IQ. Supplementation was also examined in interaction
models with maternal and child genetic variants involved in folate metabolism (MTHFR C677T,
MTHFR1298, MTR, MTRR, BHMT, FOLR1, CBS, COMT, and TCN2).
Results: Vitamin supplementation was associated with higher language acquisition skills, while
folic acid use were associated with lower articulation scores; both of these relationships were also
observed for higher dietary folate. Vitamin and folic acid supplementation were associated with
higher IQ scores in the child; associations between folic acid supplementation and IQ appeared to
depend upon child MTHFR677 genotype. There was no strong evidence of relationships between
iron and ASD sub-components.
Conclusions: These findings suggest that maternal nutrition may be related to sub-components
of autism such as language development and cognition, and may depend upon genes involved in
folate metabolism, specifically child MTHFR677. Further investigation is warranted to
disentangle these complex relationships.

91 INTRODUCTION
Approximately 1.5% - 2.0% of children in the US[1, 2] and UK[3] are estimated to have
autism spectrum disorder (ASD). While reported prevalence has increased in dramatically in
recent decades,[4] ASD etiology remains largely unknown. Research suggests that ASD
develops prenatally, and generally involves both heritable and non-heritable risk factors.[5-9]
Maternal nutrition and ASD
Maternal nutrition has been shown to influence neurodevelopment.[10-12] In particular,
maternal folate status regulated by dietary and genetic factors early in pregnancy may influence
risk of ASD.[13] Two population-based studies[14, 15] reported reduced risk of ASD with
maternal folic acid supplementation and intake in the peri-conceptional period and early
pregnancy, while another reported no associations between early folate supplementation and ASD
risk.[16] The evidence for multivitamins is mixed. One study reported a protective association
between prenatal vitamins, but not ordinary multivitamins,[17] while another study also reported
no associations between early multivitamin supplementation and ASD risk.[16] A protective
association has also been reported between prenatal iron supplementation[18] and ASD.
Maternal nutrition and autism-related traits
There is a need to examine not just clinical ASD diagnosis but also quantitative ASD
sub-components, or traits, because individuals with ASD may have behaviors at the extremes of
normally distributed continuums[19, 20] and traits may have distinct etiologies.[21] Studies have
linked self-reported folic acid supplementation or dietary folate during pregnancy with both
reductions and increases in ASD traits as measured by quantitative scores.[22-27] Discrepancies
may be due to dissimilarities in trait etiology[21, 28] differences in timing of folic acid initiation,
dose, frequency, or duration, and/or methodological inconsistencies including timing of outcome
assessment and outcome definition or assessment instruments.[13, 28] The majority of biomarker
folate studies have not found associations between maternal plasma or blood folate and cognitive
function (null: [29-32], protective:[33]) and no association was observed between maternal blood

92 folate and social responsiveness at 4-5 years.[34]
Genes related to folate metabolism
Gene variants in folate metabolism confer less efficient metabolism and higher
homocysteine levels (Table A7). A meta-analysis of studies of MTHFR C677T and A1298C
reported the C677T polymorphism being associated with increased ASD risk, (T vs C allele: OR
= 1.42, 95% confidence interval: [1.09, 1.85]) while the A1298C polymorphism was only
associated with reduced ASD in a recessive model (CC vs AA+CC: 0.73 [0.56, 0.97]). The
C677T polymorphism was associated in ASD only in children from countries without food
fortification.[35]
Schmidt et al (2011)[17] explored effect modification between prenatal vitamin use and
functional genetic variants involved in folate metabolism (MTHFR, COMT, MTRR, BHMT,
FOLR2, CBS, and TCN2) as carried by the mother or child and risk of ASD. They found
interactions between periconceptional prenatal vitamin use and maternal MTHFR 677 TT, CBS
rs234715 GT + TT, and child COMT 472 AA genotypes, with greater autism risk observed for
variant genotypes and among mothers not taking prenatal vitamins. Another study reported that
low daily folate intake (< 400 mg/d) was associated with lower mental development in the child
at 1, 3, 6, and 12 months only among MTHFR677 TT mothers.[36]
In order to address prior inconsistencies and remaining questions in the associations
between folate and other nutrients and ASD, in a population-based prospective birth cohort, we
investigated maternal nutritional supplementation with folic acid, iron, and vitamins, and
potential interactions with genes involved in folate metabolism as they relate to ASD sub-
components. In alignment with the NIMH Research Domain Criteria (RDoC) initiative[37], this
research is focused on exploring risk factors that may differentially impact sub-components of
autism. In addition, since all individuals are on quantitative trait spectra, this research involves
examination of the underlying drivers of traits in a population more broadly, rather than limiting
investigation to clinically diagnosed autism.

93 METHODS
Sample description
Data were obtained from the Avon Longitudinal Study of Parents and their Children
(ALSPAC), a population-based prospective birth cohort study designed to investigate factors
impacting children’s health and development. Study methods are described in detail elsewhere
(http://www.alspac.bris.ac.uk).[38, 39] Briefly, expectant mothers living around Bristol, England
and due to deliver between 1st April 1991 and 31st December 1992 were eligible for inclusion.
Mothers who were resident in the area but left shortly after enrolment were omitted from further
follow-up. Eligible families were defined as one-year surviving singleton children and their
mothers (Figure 3). The supplementation sample was restricted to children with non-missing
autism and factor score data and mothers with folic acid, iron, and multivitamin supplementation
data. The genetic sample further excluded mothers and children without genotype data.
Ethics statement
Ethical approval was obtained from the ALSPAC Law and Ethics Committee and the
Local Research Ethics Committees (Bristol and Weston, Southmead, and Frenchay Health
Authorities). All research was within the guidelines set out by these bodies. Participating
mothers provided written informed consent to the use of anonymized linked data for research at
enrolment.
Exposure definition
Self-reported supplement use of folic acid, iron and vitamins was assessed through
mailed questionnaire at 18 weeks gestation: “During this pregnancy have you been taking any of
the following?: iron (yes/no), folic acid/folate (yes/no), vitamins (yes/no)”. Due to substantial
overlap between the folic acid and other two categories (only 99 mothers in the vitamin sample
were taking folic acid alone), the variables were examined in their original forms, and are

94 therefore not mutually exclusive.
Outcome definition
Quantitative ASD sub-components
Steer et al (2010)[28] utilized factor analysis to analyze 93 individual measures assessed
in ALSPAC between 6 months and 9 years related to the social/communication, and repetitive
behavior domains of ASD (Table A8). Forty-six of the 93 individual measures related to 12
standard assessment tests.[40-51] Repeat measures were used so that enduring traits could be
identified. Seven factors were found to be independently predictive of ASD (p < 0.001) and
collectively explained 85% of the variance in ASD diagnoses, and were chosen on the basis of
interpretability and parsimony.[28] The factors were labeled verbal ability (VA), social
understanding (SU), repetitive-stereotyped behavior (RSB), social inhibition (SI), language
acquisition (LA), semantic-pragmatic skills (SPS), and articulation (A). Four factors (VA, SU,
RSB, SI) were most specific to ASD, while the other factors (LA, SPS, A) were more specific to
learning and language disabilities. Factor loadings are reported in the original report.[28] A
combined score was derived (factor mean score - FM) to provide insights not discernable among
individual factors. The factor scores are continuous, with higher scores representative of stronger
abilities. Continuous factor scores were originally derived to have a mean of 0 and a standard
deviation of 1.
IQ
The WISC-III UK
[52] was used to assess cognitive function at 8.5 years old. Raw scores from
5 verbal subtests and 5 performance subtests were age-scaled. Total IQ scores were derived from
the sum of the scaled total for all verbal and performance subtests. All tests were administered by
members of the ALSPAC psychology team, who were trained in these methods.

95 Measurement of potential confounders
Potential confounders were identified through published literature. Information on
potential confounders was ascertained at various points during and after pregnancy through
questionnaire, unless otherwise stated. Maternal body mass index (BMI) in kg/m2 was derived
from height and pre-pregnancy weight reported at 12 weeks gestation (correlation between
reported pre-pregnancy weight and weight measured at the first antenatal visit at 10-12 weeks
gestation was 0.96.[53]), and was classified in categories (underweight: < 18.5, normal: 18.5 - <
25, overweight: 25 - < 30, obese: ≥30, missing). Maternal history of severe depression,
schizophrenia, and other psychiatric problems (self-reported psychiatric problem other than
schizophrenia, anorexia nervosa, or severe depression) were assessed at 12 weeks gestation (yes,
no, missing). Covariates assessed at 18 weeks included parity (1, 2, 3+, missing), tobacco
smoked (yes, no) during the first three months of pregnancy, and antidepressant use during
pregnancy (yes, no, missing). Maternal education was assessed at 32 weeks gestation (Below O-
level, O-level, Above O-level, missing; O-levels are UK school-leaving qualifications taken at
age 16). Child biological sex was obtained from the birth notification and maternal age at
delivery was derived from the mother’s and child’s birth dates. For covariates with missing data,
categorical variables were utilized with “Missing” as a category.
For further information, the ALSPAC study website contains a searchable data
dictionary: (http://www.bris.ac.uk/alspac/researchers/data-access/data-dictionary/).
Genotyping
ALSPAC mothers (n = 10,015) were genotyped using the Illumina 660K quad chip at
Centre National de Génotypage, Paris. Quality control measures were performed using PLINK
software[54] (v1.07). Subjects were excluded based on incorrect sex assignments, unusual
autosomal or X-chromosome heterozygosity, >5% individual missingness, evidence of cryptic
relatedness (>12.5% identity-by-descent [IBD]), and evidence of non-European ancestry
96 determined from multidimensional scaling analysis. The resulting dataset consisted of 8340
mothers.[55]
ALSPAC children (n = 9912) were genotyped using the Illumina HumanHap550 quad
genome-wide SNP genotyping platform by the Wellcome Trust Sanger Institute (Cambridge, UK)
and the Laboratory Corporation of America (Burlington, NC, USA) supported by 23andMe.
Subject exclusion was based on incorrect sex assignments, extreme heterozygosity (<0.320 and
>0.345 for Wellcome Trust Sanger Institute data and <0.310 and >0.330 for LabCorp data), >3%
individual missingness, evidence of cryptic relatedness (>10% IDB), or non-European ancestry.
The resulting dataset consisted of 8365 children.[56, 57]
From a total of 557,124 SNP markers,[55] SNPs were removed based on a minor allele
frequency of <1%, a call rate of <95%, or deviation from Hardy-Weinberg equilibrium (mothers:
p<1.0×10⁻⁶, children: p<5×10⁻⁷),[55-57] leaving 526,688 maternal[55] and 500,527 child SNPs in
the genome-wide data set.[57] Imputation of genotyped data was conducted with Markov Chain
Haplotyping software (v1.0.16)[58, 59] (autosomal reference set: CEU HapMap phase 2 [release
22] individuals).[60]
For this study, maternal and child genotypes for nine SNPs on eight genes were selected
for evaluation of interaction effects based on previous literature[17] and availability in the
ALSPAC database: MTHFR C677T (rs1801133), MTHFR A1298C (rs1801131), COMT G472A
(rs4680), MTRR A66G (rs1801394), BHMT G716A (rs3733890), TCN2 G776C (rs1801198), CBS
T (rs234715), MTR A2756G (rs1805087), and FOLR1 A (rs2071010).
Statistical methods
All statistical analyses were run using SAS software, version 9.3 (SAS Institute Inc.,
Cary, North Carolina).
Linear regression was used to calculate β parameter estimates and p-values for
continuous factor scores and IQ. Continuous factor scores were rescaled to 100-point ranges in

97 regression analyses so β parameter estimates can be interpreted as percent change in outcome.
Folic acid, iron, and vitamins were all included as exposures in all models so were therefore
adjusted for one another. Supplement main effect and models also incorporating folic acid- and
vitamin-genetic interaction were considered.
An additive inheritance model was assumed for SNPs in interaction models. Due to
small numbers of homozygous FOLR1 AA individuals in the genetic sample (n = 20 mothers and
20 children, 0.4%), this SNP was coded assuming a dominant model. Multiplicative interaction
models were run separately for each SNP examined and included terms for supplement use (yes
[ref], no), an ordinal genotype term coded by number of risk variants (0 [ref], 1, or 2), a
supplement-gene interaction term for each folic acid and vitamins, and adjustment for potential
confounders of maternal supplement use. Comparisons with cell counts less than 5 were not
calculated. Epistatic interaction was not considered, and risk variants were defined based upon
previously published literature.[17, 61]
Adjusted models included the following potential confounders: maternal age at child’s
birth, education, and parity. We also examined, in main effects models, further adjustment for
child’s sex, pre-pregnancy body mass index (BMI) category, smoking status, anti-depressant use
during pregnancy, severe depression, and other psychiatric conditions. However, as these
changed supplementation estimates less than 0.2% for factor scores (mean: 0.04%) and less than
0.1 points for IQ (mean: 0.04 pt), they were not included in final adjusted models.
To examine whether supplement findings were specific to supplement use, dietary folate
was included in supplement main effects models and examined in interaction models. Dietary
folate intake was estimated based on a food frequency questionnaire administered at 32 weeks
gestation, and excluded supplementary nutrient intake. Dietary folate was classified into
categories based on distributional characteristics and the Reference Nutrient Intake of 300 µg
folic acid per day for pregnant women set forth by the British Nutrition Foundation[62] (< 200
[27.6%], 200 - < 300 [52.0%] and ≥ 300 µg / day [20.5%]). To address multiple testing, main

98 findings replicated for dietary folate are emphasized, as well as findings with magnitude of at
least 1.0% or 1 IQ point.
In an alternate parameterization, logistic regression was used to calculate odds ratios
(ORs) with 95% confidence intervals (CI) for the lowest 10th percentile of outcomes relative to
the upper 90th percentile.

99 RESULTS
Sample description
Among 15,445 fetuses and 15,243 mothers, there were 14,309 one-year surviving
singleton children (Figure 3). The supplementation sample consisted of 11,741 children and their
mothers with autism data, all factor score data, and all supplementation data (folic acid, iron, and
vitamins [82.1% eligible children and mothers]). The genetic sample was further restricted to
4897 mother-child pairs (34.2% eligible children and mothers) with maternal and child genotype
data. Allele frequencies were similar to those reported in other Caucasian populations (Table 6).
Supplementation and genetic sample sizes for IQ analyses were 6633 and 3726,
respectively, due to substantial levels of IQ missingness (46.0% did not participate). Mothers of
children with missing IQ data were not representative of the full supplementation sample; they
were less likely to use vitamins and more likely to have children with lower factor scores (factor
mean score, repetitive stereotyped behavior, verbal ability, and semantic pragmatic skills).
Mothers of children with missing IQ were also more likely to be multiparous, have less than 12
years education, were younger, more likely to smoke, and less likely to have normal BMI than
mothers of children with IQ data available (Table A10).
In the supplementation sample, prevalence of supplement use was 32.4% overall
(3800/11,741), consisting of overlapping groups of folic acid (n = 1021, 8.7%), iron (n = 2540,
21.6%), and vitamin (n = 1936, 16.5%) users. Prevalence of supplement use was similar in the
genotype sample. In both samples, supplement users tended to be more educated, have lower
BMI, and were more likely to be taking anti-depressants and have depression than non-users
(Table 7). Continuous factor scores are displayed in Table 7 on their original scale (mean = 0,
SD = 1 in full ALSPAC sample).

100 Maternal prenatal supplementation
Relative to non-use of folic acid, iron, or vitamins, folic acid use was associated with
higher child IQ scores (2.0 pt [0.01]), but poorer articulation scores (-1.1% [0.01]). Vitamins
were associated with higher language acquisition scores and IQ (1.0% [0.1] and 1.2 pt [0.02],
respectively - Table 9). Crude associations between folic acid and vitamins and higher semantic
pragmatic skills attenuated after adjustment (Tables 8 and 9). A crude elevated association
between iron and and IQ attenuated following adjustment; there was no strong evidence of
relationships between iron and ASD sub-components.
There was evidence of a potential dose-response relationship between dietary folate
intake and higher language acquisition skills (0.7 pt [0.04] and 2.9 pt [< 0.0001] for 200 – < 300
µg and ≥ 300 µg, respectively). Unadjusted relationships between higher dietary folate and higher
semantic pragmatic skills and IQ attenuated following adjustment. Folic acid and vitamin
supplementation estimates were similar in models with dietary folate as in models without dietary
folate (Tables A11 and A12).
In cut-point models, directionality resembled that of continuous models (Table A20).
Interaction between relevant genotypes and maternal prenatal supplementation
For each interaction assessment, the reference group is mothers taking supplements and
the homozygous non-risk variant genotype.
Continuous models
Of 180 each folic acid and vitamin-SNP continuous interaction comparisons, 14 had folic
acid interactions and four had vitamin interactions (p < 0.05 - Tables A14 and A15). Only the
interaction between folic acid, child MTHFR677A and IQ was replicated for dietary folate.
Associations between folic acid supplementation or higher dietary folate and increased IQ were
limited to MTHFR677 GG (non-variant) children. Among MTHFR677 GG children, the
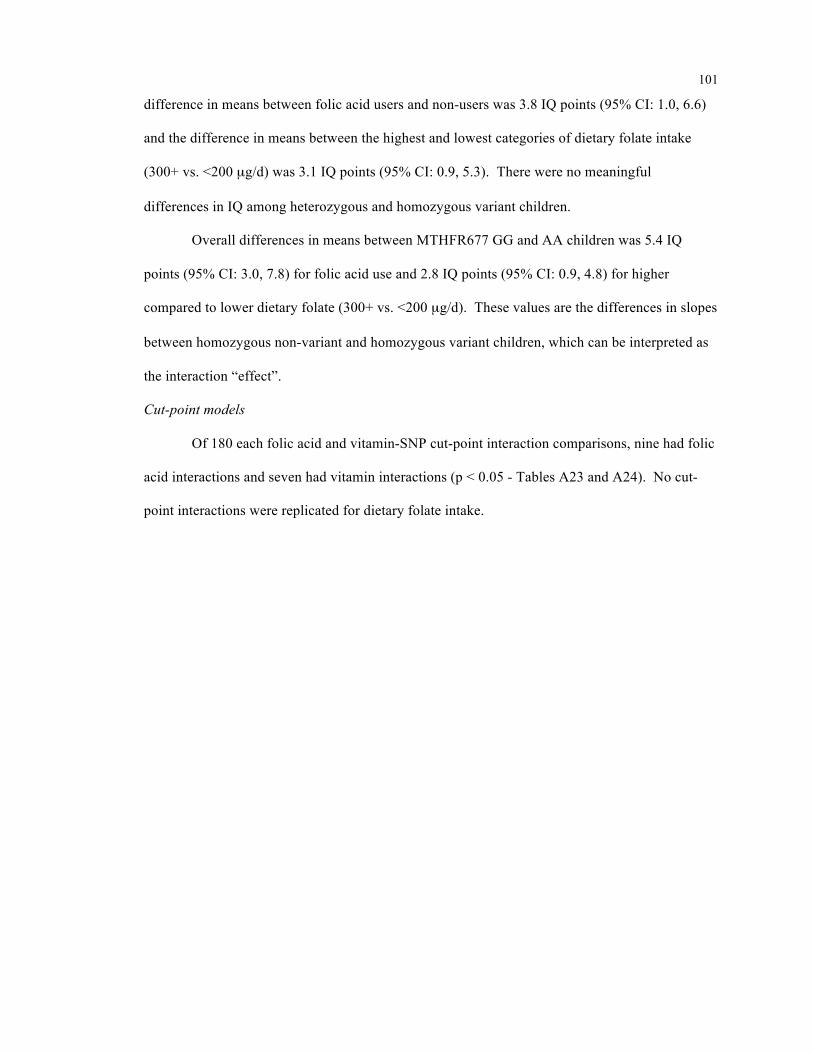
101 difference in means between folic acid users and non-users was 3.8 IQ points (95% CI: 1.0, 6.6)
and the difference in means between the highest and lowest categories of dietary folate intake
(300+ vs. <200 µg/d) was 3.1 IQ points (95% CI: 0.9, 5.3). There were no meaningful
differences in IQ among heterozygous and homozygous variant children.
Overall differences in means between MTHFR677 GG and AA children was 5.4 IQ
points (95% CI: 3.0, 7.8) for folic acid use and 2.8 IQ points (95% CI: 0.9, 4.8) for higher
compared to lower dietary folate (300+ vs. <200 µg/d). These values are the differences in slopes
between homozygous non-variant and homozygous variant children, which can be interpreted as
the interaction “effect”.
Cut-point models
Of 180 each folic acid and vitamin-SNP cut-point interaction comparisons, nine had folic
acid interactions and seven had vitamin interactions (p < 0.05 - Tables A23 and A24). No cut-
point interactions were replicated for dietary folate intake.

102 DISCUSSION
Summary of findings
In this prospective birth cohort, we examined relationships between maternal folic acid,
iron, and vitamin supplement use and ASD sub-components, while accounting for heterogeneity
in genes involved in folate metabolism. Findings tended to be more specific to language and
learning disabilities than they were to sub-components more specific to autism. Vitamin use was
associated with higher language acquisition skills, while folic acid use was associated with poorer
articulation scores; both of these relationships were also observed for higher dietary folate.
Vitamin and folic acid supplementation were both associated with higher IQ scores in the child;
associations between folic acid supplementation and IQ appeared to depend upon child
MTHFR677 genotype. There was no strong evidence of relationships between iron and ASD
sub-components.
Strengths and limitations
Despite the size of the ALSPAC cohort, the low prevalence of autism made it difficult to
examine in main effects models (n = 141, 1.2%) and precluded investigation of interactions with
nutrient supplementation, dietary intake, and relevant genetic variants (n = 65, 1.3%). However,
an averaged trait score correlated (ρ = 0.16, p < 0.0001) with autism diagnoses and the use of
multiple characteristics associated with autism provided a richer, and perhaps more informative,
context for exploring this etiology. While 88 of 93 of the individual measures used to derive
factor scores were obtained through self-completed questionnaires, there is research to suggest
that maternal reporting has a high sensitivity for detecting developmental differences.[63] In
addition, while many standard measures used were abbreviated or adapted, short forms have
acceptable reliability.[64]
Findings for IQ should be cautiously interpreted since compared to mothers of children
with IQ data, mothers of children with missing IQ were less likely to be highly educated and were
more likely to have children with lower factor scores (lower abilities). Both of these factors are

103 associated with lower child IQ. Since mothers of children with missing IQ were also less likely
to use vitamins, this could have biased findings toward an apparent protective association.
We examined a subset of genes involved in folate metabolism, though other folate-
relevant genes warrant investigation into potential B vitamin interactions, such as dihydrofolate
reductase (DHFR[65]) and reduced folate carriers 1 and 2(RFC-1[66, 67] RFC-2[68]) that have
previously shown to be associated with autism. While we restricted interaction assessment to
comparisons in which all cell counts were greater than or equal to 5, small strata limited our
ability to detect interactions, and some findings may be due to chance. Focusing on findings
replicated for dietary folate and having at least magnitude of 1% or 1 IQ point helped identify
associations more likely to be of etiological importance and worthy of further investigation.
Since these relationships were primarily examined in Caucasian individuals, this work has limited
generalizability to non-white populations. The consideration of genetic heterogeneity is an
important one, given that previous studies have reported different associations between prenatal
nutrition and autism[17] and mental development[36] as a function of maternal and child folate-
related genotypes.
Lastly, we did not have biological samples, and cannot rule out measurement error in
exposures, which were self-reported through mailed survey.
Existing literature
Maternal nutrition has previously been reported to relate to child language development.
In the U.S. National Maternal and Infant Health Survey, prenatal multivitamin/mineral use was
associated with reduced odds for moderate risk on the language scale,[25] and in a Norwegian
cohort, maternal use of folic acid supplements in early pregnancy were associated with a reduced
risk of severe language delay,[24] both at 3 years of age. The Norwegian study reported similar
odds ratios for mothers taking folic acid only and mothers taking it in combination with other
supplements.
Our study reports protective associations between both vitamin use and higher dietary

104 folate and higher language acquisition scores, which is in alignment with these findings. A
contradictory finding is our report of associations between folic acid use, higher dietary folate,
and lower articulation scores, another aspect of language development. Differences in these
findings could reflect the loadings of individual measures on these factors (Table A9). Language
acquisition was derived primarily from elements of standard assessment instruments, albeit in
some cases abbreviated or adapted. The articulation measure is largely based on a single question
from ALSPAC questionnaires (relating to certain sounds such as th, sss or t .), which may have
implications on its validity.
We report associations between vitamin and folic acid supplementation and higher IQ
scores in the child. Folic acid and vitamin supplementation was associated with 2.0 and 1.2 point
increases in IQ in the full sample. For folic acid, this association was only apparent among
homozygous non-variant MTHFR677 children, whereby supplementation was associated with a
3.8 point (95% CI: 1.0, 6.6) increase in IQ. Comparatively, a 5 point IQ difference is associated
with IQ differences in children who were exposed to high lead concentrations,[69] or were
breastfed rather than formula fed as infants.[70] However, the body of evidence does not seem to
support a protective association between maternal folic acid and/or dietary folate and child
cognition (null:[26, 32, 71], protective:[72]) or multivitamins and child cognition (null: [72-75],
protective:[76]). The majority of biomarker folate studies have also not found associations
between maternal plasma or blood folate and cognitive function - Table A31 (null: [29-32],
protective:[33]). The two studies reporting protective relationships were randomized controlled
trials assessing iron and folic acid and child intelligence at 7-9 years in Nepal[72] and multiple
micronutrients and intellectual ability at 9-12 years in Indonesia.[76] Protection in the latter
study was limited to children of anemic mothers, but was not observed in the full sample or
among children of undernourished mothers. This study indicates that discrepancies could be
partially due to the underlying nutritional status of studied populations, specifically of iron in that
study.
105 Dietary nutrient intake in populations with null findings could be higher than in studies
with positive findings. One of the studies with null findings was a prospective cohort conducted
in the United States. A separate U.S. cohort of 1777 pregnant women between 1999 and 2002
reported mean dietary intakes of 365 µg folate and 16.7 mg iron.[77] Another study with null
findings was a randomized controlled trial conducted in Hungary, Spain, and Germany.[32] A
separate study reported the following dietary folate intakes among women in the 2nd and 3rd
trimesters of pregnancy, respectively: Hungary – 429 and 396 µg, Spain – 324 and 304 µg, and
Germany – 271 and 254 µg.[78] In our supplementation sample, mothers had mean daily dietary
intakes of 245 µg folate and 10.3 mg iron. In the event of a causal relationship between maternal
folic acid or vitamins and child cognition, a threshold-level effect could be partially responsible
for the observed discrepancies. This possibility could be supported by a study in Indonesia
reporting no difference in mental development between infants whose mothers took low and high
doses of iron and folic acid (60 mg iron with 250 µg folic acid and 120 mg iron with 500 µg folic
acid, respectively),[79] but since there was no placebo group, it is not possible to determine
whether the low dose was protective. Other potential contributors could be differences in
assessment instruments, age at assessment, and/or differences in timing of initiation, dose,
frequency, or duration of nutrient exposure.
In the current study, relationships between folic acid supplementation and dietary folate
and IQ were dependent upon child MTHFR677 genotype, with positive associations only
apparent among homozygous non-variant MTHFR677 children. A previous study of mental
development reported that low daily folate intake (< 400 mg/d) was associated with lower mental
development in the child at 1, 3, 6, and 12 months only among MTHFR677 TT mothers.[36] A
previous study of autism reported an interaction between maternal, but not child MTHFR677, and
prenatal vitamin use. [17] Non-use of prenatal vitamins and the A variant allele were associated
with higher risk. The prior study also reported interactions for maternal CBS and child COMT

106 variants. MTHFR677 interactions reported in these previous studies were for maternal rather
than child genotypes, which we did not observe for either folic acid or vitamin supplementation,
or dietary folate (Tables A14, A15, and A17). Differences in interactions between our and
previous studies could be partially due to differences in outcome constructs, variations in the
genetics of studied populations, or a reflection of relatively small strata.
Possible mechanisms
It has been shown that some children with autism have reduced methylation capacity.[80]
Dietary nutritional supplementation could influence autism traits through one-carbon metabolism,
whereby the methyl groups necessary for DNA methylation are derived from dietary methyl
group intake; folate is the predominant dietary methyl donor.[81, 82] DNA methylation
influences gene expression by restricting gene transcription machinery from associating with the
DNA.[83] DNA methylation patterns are dependent upon methyl donor availability and the
proper functioning of one-carbon metabolism, with the latter affected by functional
polymorphisms in genes involved in folate metabolism. For instance, carriers of the MTHFR
C677T and A1298C polymorphisms have lower enzyme activity, reducing the ability of folate to
function as a methyl donor[84].
Future work
Our findings suggest that maternal folic acid and vitamin supplementation may be related
to sub-components of autism such as language development and cognition, and may depend upon
genes involved in folate metabolism, specifically child MTHFR677. Further investigation is
warranted to disentangle these complex relationships in large population-based samples and
randomized controlled trials. This requires careful consideration of multiple determinants of
maternal nutritional status including supplementary and dietary intake, biological measurement of
folate and homocysteine (a marker of functional folate status) in the peri-conceptional period and
throughout pregnancy, and robust interaction assessment of genes involved in one-carbon

107 metabolism.

108
ACKNOWLEDGEMENTS
Ethics approval and consent to participate: Ethical approval was obtained from the ALSPAC
Law and Ethics Committee and the Local Research Ethics Committees (Bristol and Weston,
Southmead, and Frenchay Health Authorities). All research was within the guidelines set out by
these bodies. Participating mothers provided written informed consent to the use of anonymized
linked data for research at enrolment.
Consent for publication: Not applicable
Availability of data and material: The data that support the findings of this study are available
from ALSPAC but restrictions apply to the availability of these data, which were used under
license for the current study, and so are not publicly available. Proposals to access ALSPAC data
require a formal request to the ALSPAC Executive Committee using the procedures outlined in
the ALSPAC Access Policy:
http://www.bristol.ac.uk/alspac/researchers/access/
Competing interests: The authors declare that they have no competing interests.
Funding: NIH 1 R21 ES023760-01A1, "Early life vitamin D levels and risk of autism spectrum
disorders" Funders facilitated Elizabeth A. DeVilbiss and Brian K. Lee to perform their
authorship responsibilities.
Authors' contributions: All authors designed the study. EAD performed the data analysis and
drafted the manuscript. All authors interpreted the data, critically revised, and approved the final
manuscript. All authors agreed to be accountable for all aspects of the work in ensuring that
questions related to the accuracy or integrity of any part of the work are appropriately
investigated and resolved.
Acknowledgements: The authors are thankful to the families who participated in this study, as
our research would not have been possible without their gracious consent.

109
109 REFERENCES
1. Christensen, D.L., Prevalence and characteristics of autism spectrum disorder among children aged 8 years—autism and developmental disabilities monitoring network, 11 sites, United States, 2012. MMWR. Surveillance Summaries, 2016. 65.
2. Zablotsky B, B.L., Maenner MJ, Schieve LA, Blumberg SJ Estimated Prevalence of Autism and Other Developmental Disabilities Following Questionnaire Changes in the 2014 National Health Interview Survey. National health statistics reports; no 87, 2015. 21.
3. Russell, G., et al., Prevalence of parent-reported ASD and ADHD in the UK: findings from the Millennium Cohort Study. Journal of autism and developmental disorders, 2014. 44(1): p. 31-40.
4. Lyall, K., et al., The Changing Epidemiology of Autism Spectrum Disorders. Annu Rev Public Health, 2016.
5. Lyall, K., R.J. Schmidt, and I. Hertz-Picciotto, Maternal lifestyle and environmental risk factors for autism spectrum disorders. International Journal of Epidemiology, 2014. 43(2): p. 443-464.
6. Newschaffer, C.J., et al., The epidemiology of autism spectrum disorders. Annual Reviews of Public Health, 2007. 28: p. 235-58.
7. Stoner, R., et al., Patches of disorganization in the neocortex of children with autism. New England Journal of Medicine, 2014. 370(13): p. 1209-1219.
8. Connors, S.L., et al., Fetal mechanisms in neurodevelopmental disorders. Pediatric Neurology, 2008. 38(3): p. 163-176.
9. Bauman, M.L. and T.L. Kemper, Neuroanatomic observations of the brain in autism: a review and future directions. International Journal of Developmental Neuroscience, 2005. 23(2-3): p. 183-187.
10. Bale, T.L., Epigenetic and transgenerational reprogramming of brain development. Nature Reviews Neuroscience, 2015. 16(6): p. 332-344.
11. Brown, A.S. and E.S. Susser, Prenatal nutritional deficiency and risk of adult schizophrenia. Schizophrenia Bulletin, 2008. 34(6): p. 1054-1063.
12. Xu, M.Q., et al., Prenatal malnutrition and adult schizophrenia: further evidence from the 1959-1961 Chinese famine. Schizophrenia Bulletin, 2009. 35(3): p. 568-576.
13. DeVilbiss, E.A., et al., Maternal folate status as a risk factor for autism spectrum disorders: a review of existing evidence. British Journal of Nutrition, 2015. 114(5): p. 663-672.

110
110 14. Schmidt, R.J., et al., Maternal periconceptional folic acid intake and risk of autism
spectrum disorders and developmental delay in the CHARGE (CHildhood Autism Risks from Genetics and Environment) case-control study. The American journal of clinical nutrition, 2012. 96(1): p. 80-89.
15. Suren, P., et al., Association between maternal use of folic acid supplements and risk of autism spectrum disorders in children. Journal of the American Medical Association, 2013. 309(6): p. 570-577.
16. Virk, J., et al., Preconceptional and prenatal supplementary folic acid and multivitamin intake and autism spectrum disorders. Autism, 2016. 20(6): p. 710-718.
17. Schmidt, R.J., et al., Prenatal vitamins, one-carbon metabolism gene variants, and risk for autism. Epidemiology, 2011. 22(4): p. 476-485.
18. Schmidt, R.J., et al., Maternal intake of supplemental iron and risk of autism spectrum disorder. American Journal of Epidemiology, 2014: p. 890-900.
19. Wing, L., The continuum of autistic characteristics, in Diagnosis and assessment in autism. 1988, Springer. p. 91-110.
20. Skuse, D.H., et al., Social communication competence and functional adaptation in a general population of children: preliminary evidence for sex-by-verbal IQ differential risk. Journal of the American Academy of Child & Adolescent Psychiatry, 2009. 48(2): p. 128-137.
21. Ronald, A., et al., Genetic heterogeneity between the three components of the autism spectrum: A twin study. Journal of the American Academy of Child and Adolescent Psychiatry, 2006. 45(6): p. 691-699.
22. Chatzi, L., et al., Effect of high doses of folic acid supplementation in early pregnancy on child neurodevelopment at 18 months of age: the mother-child cohort "Rhea" study in Crete, Greece. Public Health Nutrition, 2012. 15(09): p. 1728-1736.
23. Villamor, E., et al., Maternal intake of methyl-donor nutrients and child cognition at 3 years of age. Paediatr Perinat Epidemiol, 2012. 26(4): p. 328-35.
24. Roth, C., et al., Folic Acid Supplements in Pregnancy and Severe Language Delay in Children. Jama-Journal of the American Medical Association, 2011. 306(14): p. 1566-1573.
25. Wehby, G.L. and J.C. Murray, The effects of prenatal use of folic acid and other dietary supplements on early child development. Maternal and child health journal, 2008. 12(2): p. 180-187.
26. Julvez, J., et al., Maternal use of folic acid supplements during pregnancy and four-year-old neurodevelopment in a population-based birth cohort. Paediatric and perinatal epidemiology, 2009. 23(3): p. 199-206.

111
111 27. Steenweg-de Graaff, J., et al., Folate concentrations during pregnancy and autistic traits
in the offspring. The Generation R Study. The European Journal of Public Health, 2014: p. cku126.
28. Steer, C.D., J. Golding, and P.F. Bolton, Traits contributing to the autistic spectrum. PloS one, 2010. 5(9): p. e12633.
29. Wu, B.T.F., et al., Early Second Trimester Maternal Plasma Choline and Betaine Are Related to Measures of Early Cognitive Development in Term Infants. Plos One, 2012. 7(8): p. 8.
30. Bhate, V., et al., Vitamin B(12) status of pregnant Indian women and cognitive function in their 9-year-old children. Food and Nutrition Bulletin, 2008. 29(4): p. 249-254.
31. Tamura, T., et al., Folate status of mothers during pregnancy and mental and psychomotor development of their children at five years of age. Pediatrics, 2005. 116(3): p. 703-708.
32. Campoy, C., et al., Effects of prenatal fish-oil and 5-methyltetrahydrofolate supplementation on cognitive development of children at 6.5 y of age. American Journal of Clinical Nutrition, 2011. 94(6): p. 1880S-1888S.
33. Veena, S.R., et al., Higher maternal plasma folate but not vitamin B-12 concentrations during pregnancy are associated with better cognitive function scores in 9-to 10-year-old children in South India. The Journal of nutrition, 2010. 140(5): p. 1014-1022.
34. Braun, J.M., et al., Brief report: are autistic-behaviors in children related to prenatal vitamin use and maternal whole blood folate concentrations? Journal of autism and developmental disorders, 2014. 44(10): p. 2602-2607.
35. Pu, D., Y. Shen, and J. Wu, Association between MTHFR Gene Polymorphisms and the Risk of Autism Spectrum Disorders: A Meta-Analysis. Autism Research, 2013.
36. Garcia, C.D., et al., Maternal MTHFR 677C > T genotype and dietary intake of folate and vitamin B-12: their impact on child neurodevelopment. Nutritional Neuroscience, 2009. 12(1): p. 13-20.
37. Cuthbert, B.N. and T.R. Insel, Toward the future of psychiatric diagnosis: the seven pillars of RDoC. Bmc Medicine, 2013. 11: p. 8.
38. Boyd, A., et al., Cohort Profile: The 'Children of the 90s'-the index offspring of the Avon Longitudinal Study of Parents and Children. International Journal of Epidemiology, 2013. 42(1): p. 111-127.
39. Fraser, A., et al., Cohort profile: the Avon Longitudinal Study of Parents and Children: ALSPAC mothers cohort. International Journal of Epidemiology, 2013. 42(1): p. 97-110.
40. Goodman, R., The Strengths and Difficulties Questionnaire: a research note. Journal of child psychology and psychiatry, 1997. 38(5): p. 581-586.

112
112 41. Goodman, R., et al., The development and well‚Äêbeing assessment: description and
initial validation of an integrated assessment of child and adolescent psychopathology. Journal of child psychology and psychiatry, 2000. 41(5): p. 645-655.
42. Buss, A. and R. Plomin, Temperament: Early developing personality traits. Hillsdale, NJ: Lawrence Ezibaum Associates. 1984, Inc.
43. Elander, J. and M. Rutter, Use and development of the Rutter parents' and teachers' scales. International Journal of Methods in Psychiatric Research, 1996.
44. Fenson, L., et al., MacArthur communicative inventories. San Diego: Singular, 1993.
45. Frankenburg, W.K. and J.B. Dodds, The Denver developmental screening test. The Journal of pediatrics, 1967. 71(2): p. 181-191.
46. Gathercole, S.E., et al., The children's test of nonword repetition: A test of phonological working memory. Memory, 1994. 2(2): p. 103-127.
47. Nowicki, S. and M.P. Duke, Individual differences in the nonverbal communication of affect: The Diagnostic Analysis of Nonverbal Accuracy Scale. Journal of Nonverbal behavior, 1994. 18(1): p. 9-35.
48. Rust, J., The manual of the Wechsler objective language dimensions (WOLD): UK edition. London: The Psychological Corporation, 1996.
49. Skuse, D., et al., Evidence from Turner's syndrome of an imprinted X-linked locus affecting cognitive function. Nature, 1997. 387(6634): p. 705.
50. Wechsler, D., Wechsler intelligence scale for children - Third Edition UK. 1992, London: The Psychological Corporation.
51. Bishop, D.V.M., Development of the Children's Communication Checklist (CCC): A method for assessing qualitative aspects of communicative impairment in children. Journal of Child Psychology and Psychiatry and Allied Disciplines, 1998. 39(6): p. 879-891.
52. Wechsler, D., S. Golombok, and J. Rust, WISC-III UK Wechsler Intelligence Scale for Children: UK Manual. Sidcup, UK: The Psychological Corporation, 1992.
53. Richmond, R.C., et al., Using Genetic Variation to Explore the Causal Effect of Maternal Pregnancy Adiposity on Future Offspring Adiposity: A Mendelian Randomisation Study. Plos Medicine, 2017. 14(1): p. 24.
54. Purcell, S., et al., PLINK: a tool set for whole-genome association and population-based linkage analyses. The American Journal of Human Genetics, 2007. 81(3): p. 559-575.
55. Evans, D.M., et al., Genome-wide association study identifies loci affecting blood copper, selenium and zinc. Human molecular genetics, 2013. 22(19): p. 3998-4006.

113
113 56. Paternoster, L., et al., Genome-wide association study of three-dimensional facial
morphology identifies a variant in PAX3 associated with nasion position. The American Journal of Human Genetics, 2012. 90(3): p. 478-485.
57. Kemp, J.P., et al., Phenotypic dissection of bone mineral density reveals skeletal site specificity and facilitates the identification of novel loci in the genetic regulation of bone mass attainment. PLoS Genet, 2014. 10(6): p. e1004423.
58. Li, Y., et al., Genotype imputation. Annual review of genomics and human genetics, 2009. 10: p. 387-406.
59. Li, Y., et al., MaCH: using sequence and genotype data to estimate haplotypes and unobserved genotypes. Genetic epidemiology, 2010. 34(8): p. 816-834.
60. Frazer, K.A., et al., A second generation human haplotype map of over 3.1 million SNPs. Nature, 2007. 449(7164): p. 851-861.
61. Cariaso, M. and G. Lennon, SNPedia: a wiki supporting personal genome annotation, interpretation and analysis. Nucleic Acids Res, 2012. 40(Database issue): p. D1308-12.
62. British Nutrition Foundation. Nutrition Requirements. 2016 October 2017 [cited 2017 16 April 2017]; Available from: https://www.nutrition.org.uk/attachments/article/261/Nutrition%20Requirements_Revised%20Oct%202016.pdf.
63. Filipek, P., et al., Practice parameter: Screening and diagnosis of autism Report of the Quality Standards Subcommittee of the American Academy of Neurology and the Child Neurology Society. Neurology, 2000. 55(4): p. 468-479.
64. Fenson, L., et al., Short-form versions of the MacArthur communicative development inventories. Applied Psycholinguistics, 2000. 21(01): p. 95-116.
65. Adams, M., et al., Preliminary evidence for involvement of the folate gene polymorphism 19bp deletion-DHFR in occurrence of autism. Neuroscience letters, 2007. 422(1): p. 24-29.
66. James, S.J., et al., Metabolic endophenotype and related genotypes are associated with oxidative stress in children with autism. American Journal of Medical Genetics Part B: Neuropsychiatric Genetics, 2006. 141(8): p. 947-956.
67. James, S.J., et al., A functional polymorphism in the reduced folate carrier gene and DNA hypomethylation in mothers of children with autism. American Journal of Medical Genetics Part B: Neuropsychiatric Genetics, 2010. 153(6): p. 1209-1220.
68. Sanders, S.J., et al., Multiple recurrent de novo CNVs, including duplications of the 7q11. 23 Williams syndrome region, are strongly associated with autism. Neuron, 2011. 70(5): p. 863-885.
69. Carpenter, D.O., Effects of metals on the nervous system of humans and animals. International Journal of occupational medicine and environmental health, 2001. 14(3): p. 209-218.

114
114 70. Anderson, J.W., B.M. Johnstone, and D.T. Remley, Breast-feeding and cognitive
development: a meta-analysis. American Journal of Clinical Nutrition, 1999. 70(4): p. 525-535.
71. Boeke, C.E., et al., Choline Intake During Pregnancy and Child Cognition at Age 7 Years. American Journal of Epidemiology, 2013. 177(12): p. 1338-1347.
72. Christian, P., et al., Prenatal Micronutrient Supplementation and Intellectual and Motor Function in Early School-aged Children in Nepal. Jama-Journal of the American Medical Association, 2010. 304(24): p. 2716-2723.
73. Li, Q., et al., Effects of Maternal Multimicronutrient Supplementation on the Mental Development of Infants in Rural Western China: Follow-up Evaluation of a Double-Blind, Randomized, Controlled Trial. Pediatrics, 2009. 123(4): p. E685-E692.
74. Li, C., et al., Prenatal micronutrient supplementation is not associated with intellectual development of young school-aged children. The Journal of nutrition, 2015. 145(8): p. 1844-1849.
75. McGrath, N., et al., Effect of maternal multivitamin supplementation on the mental and psychomotor development of children who are born to HIV-1 - Infected mothers in Tanzania. Pediatrics, 2006. 117(2): p. E216-E225.
76. Prado, E.L., et al., Maternal multiple micronutrient supplementation and other biomedical and socioenvironmental influences on children's cognition at age 9–12 years in Indonesia: follow-up of the SUMMIT randomised trial. The Lancet Global Health, 2017. 5(2): p. e217-e228.
77. Rifas-Shiman, S.L., et al., Dietary Quality during Pregnancy Varies by Maternal Characteristics in Project Viva: A US Cohort. Journal of the American Dietetic Association, 2009. 109(6): p. 1004-1011.
78. Franke, C., et al., Dietary Intake of Natural Sources of Docosahexaenoic Acid and Folate in Pregnant Women of Three European Cohorts. Annals of Nutrition and Metabolism, 2008. 53(3-4): p. 167-174.
79. Schmidt, M.K., et al., Mental and psychomotor development in Indonesian infants of mothers supplemented with vitamin A in addition to iron during pregnancy. British Journal of Nutrition, 2004. 91(2): p. 279-285.
80. Main, P.A., et al., Folate and methionine metabolism in autism: a systematic review. The American journal of clinical nutrition, 2010. 91(6): p. 1598-1620.
81. LaSalle, J.M., A genomic point-of-view on environmental factors influencing the human brain methylome. Epigenetics, 2011. 6(7): p. 862-869.
82. Lopatina, N., et al., Elevated expression and altered pattern of activity of DNA methyltransferase in liver tumors of rats fed methyl-deficient diets. Carcinogenesis, 1998. 19(10): p. 1777-1781.

115
115 83. Schaevitz, L.R. and J.E. Berger-Sweeney, Gene-environment interactions and epigenetic
pathways in autism: the importance of one-carbon metabolism. ILAR Journal, 2012. 53(3-4): p. 322-340.
84. Chango, A., et al., The effect of 677C->T and 1298A->C mutations on plasma homocysteine and 5, 10-methylenetetrahydrofolate reductase activity in healthy subjects. British journal of nutrition, 2000. 83(06): p. 593-596.
85. Boris, M., et al., Association of MTHFR gene variants with autism. J Am Phys Surg, 2004. 9(4): p. 106-108.
86. Anonymous. Applied Biosystems TaqMan SNP Genotyping Assays. Assay Search. . 2007 [cited 2017 January 13, 2017]; Vol. 2007:[Available from: https://products.appliedbiosystems.com/ab/en/US/adirect/ab?cmd ABGTKeywordSearch&catID 601283.

116
Figure 3. ALSPAC sample derivation
Eligible'samplen"="14,309
Multiple"births"(twins) n"="404Did"not"survive"one"year n"="732
ALSPACn"="15,445
Missing"autism"data n"="23Missing"trait"scores n"="1517Missing"supplementation n"="1028
Supplementation'samplen"="11,741
Genotype'samplen"="4897
Missing"genotype"data n"="6844
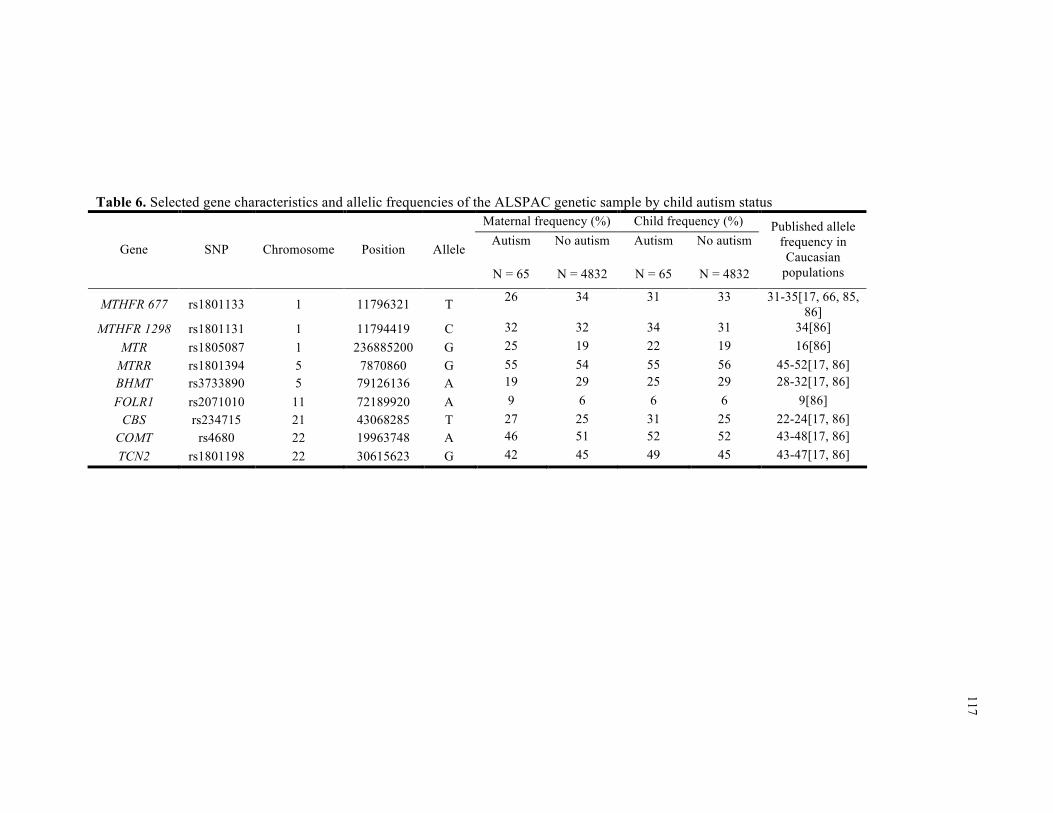
117
Table 6. Selected gene characteristics and allelic frequencies of the ALSPAC genetic sample by child autism status
Maternal frequency (%) Child frequency (%)
Gene SNP Chromosome Position Allele Autism
N = 65
No autism
N = 4832
Autism
N = 65
No autism
N = 4832
Published allele frequency in Caucasian
populations
MTHFR 677 rs1801133 1 11796321 T 26 34 31 33 31-35[17, 66, 85, 86]
MTHFR 1298 rs1801131 1 11794419 C 32 32 34 31 34[86] MTR rs1805087 1 236885200 G 25 19 22 19 16[86]
MTRR rs1801394 5 7870860 G 55 54 55 56 45-52[17, 86] BHMT rs3733890 5 79126136 A 19 29 25 29 28-32[17, 86] FOLR1 rs2071010 11 72189920 A 9 6 6 6 9[86]
CBS rs234715 21 43068285 T 27 25 31 25 22-24[17, 86] COMT rs4680 22 19963748 A 46 51 52 52 43-48[17, 86] TCN2 rs1801198 22 30615623 G 42 45 49 45 43-47[17, 86]

118
118 Table 7. Selected characteristics of the ALSPAC samples by maternal supplementation
Supplementation
(n = 11,741) Genotype (n = 4897)
Supplement use Any None Any None Characteristics 3800 (32.4) 7941 (67.6) 1501 (30.6) 3396 (69.4) Supplement use Folic acid 1021 (8.7) 0 (0.0) 416 (8.5) 0 (0.0) Iron 2540 (21.6) 0 (0.0) 944 (19.3) 0 (0.0) Vitamins 1936 (16.5) 0 (0.0) 838 (17.1) 0 (0.0) Sex of child – male 1919 (50.5) 4124 (51.9) 706 (47.0) 1698 (50.0) Parity
First child 1691 (44.5) 3502 (44.1) 697 (46.4) 1555 (45.8) Second child 1272 (33.5) 2778 (35.0) 517 (34.4) 1212 (35.7) Third child and higher 763 (20.1) 1535 (19.3) 264 (17.6) 597 (17.6) Missing 74 (2.0) 126 (1.6) 23 (1.5) 32 (0.9)
Maternal education ≥ 12 yrs 1447 (38.1) 2648 (33.4) 738 (49.2) 1384 (40.8) Missing 209 (5.5) 333 (4.2) 46 (3.1) 84 (2.5)
Maternal age, mean (SD) 28.3 (5.0) 28.3 (4.8) 29.1 (4.8) 29.0 (4.5) Maternal smoking - yes 930 (24.5) 1862 (23.5) 302 (20.1) 631 (18.6) Maternal body mass index
Underweight (BMI < 18.5) 201 (5.3) 307 (3.9) 76 (5.1) 114 (3.4) Normal (18.5 ≤ BMI < 25) 2553 (67.2) 5208 (65.6) 1061 (70.7) 2340 (68.9) Overweight (25 ≤ BMI < 30) 413 (10.9) 1172 (14.8) 159 (10.6) 487 (14.3) Obese (BMI ≥30) 151 (4.0) 419 (5.3) 64 (4.3) 170 (5.0) Missing 482 (12.7) 835 (10.5) 141 (9.4) 285 (9.4)
Maternal antidepressant use Yes 46 (1.2) 60 (0.8) 15 (1.0) 14 (0.4) Missing 31 (0.8) 26 (0.3) 6 (0.4) 8 (0.2)
Depression Yes 383 (10.1) 607 (7.6) 129 (8.6) 223 (6.6) Missing 199 (5.2) 317 (4.0) 45 (3.0) 86 (2.5)
Other psych disorders Yes 83 (2.2) 178 (2.2) 29 (1.9) 68 (2.0) Missing 199 (5.2) 317 (4.0) 45 (3.0) 86 (2.5)

119
119 Table 7 (continued). Selected characteristics of the ALSPAC samples by maternal supplementation
Supplementation
(n = 11,741) Genotype (n = 4897)
Supplement use Any None Any None Characteristics 3800 (32.4) 7941 (67.6) 1501 (30.6) 3396 (69.4)
Autism 53 (1.4) 88 (1.1) 21 (1.4) 44 (1.3) Continuous outcomes, mean (SD) Factor mean score -0.0003 (0.38) 0.011 (0.37) 0.044 (0.34) 0.035 (0.35) Repetitive stereotyped behavior -0.037 (0.96) 0.029 (0.92) 0.0073 (0.90) 0.039 (0.86) Social understanding -0.024 (0.95) 0.012 (0.94) -0.0006 (0.97) 0.039 (0.96) Verbal ability 0.027 (0.96) 0.0096 (0.95) 0.12 (0.71) 0.077 (0.84) Social inhibition 0.0066 (0.93) 0.0038 (0.91) 0.027 (0.99) 0.015 (0.94) Semantic pragmatic skills 0.041 (0.92) 0.0061 (0.93) 0.18 (0.94) 0.10 (0.95) Articulation -0.043 (0.92) 0.021 (0.90) -0.076 (0.96) -0.0029 (0.94) Language acquisition 0.027 (0.96) -0.0056 (0.98) 0.047 (0.94) -0.023 (0.96) IQ 105 (16) 104 (16) 107 (16) 105 (16)

120
Table 8. Unadjusted relationshipsa between nutrient supplementation and dietary folate for factor scoresb and IQd
Supplementation Dietary folate intake Outcome Folic acid Vitamins Iron 200 - < 300 µg ≥ 300 µg FM 0.1 (0.76) 0.2 (0.34) -0.6 (0.01) 0.8 (<.0001) 0.9 (0.0001) RSB -0.1 (0.48) -0.5 (<.0001) -0.1 (0.39) 0.0 (0.64) -0.3 (0.02) SU -0.5 (0.20) -0.7 (0.01) 0.1 (0.60) 0.5 (0.02) 0.7 (0.02) VA 0.4 (0.08) 0.5 (0.0003) -0.4 (0.004) 0.3 (0.02) 0.2 (0.19) SI 0.3 (0.50) 0.2 (0.39) -0.2 (0.46) 0.1 (0.74) -0.5 (0.08) SPS 1.6 (<.0001) 1.3 (<.0001) -0.8 (0.005) 1.9 (<.0001) 2.3 (<.0001) A -1.3 (0.001) -0.9 (0.001) 0.0 (0.91) -0.8 (0.0004) -1.3 (<.0001) LA -0.3 (0.64) 1.0 (0.01) -0.1 (0.71) 0.4 (0.19) 2.5 (<.0001) IQ 4.0 <(.0001) 3.0 (<.0001) -2.1 (0.001) 2.8 (<.0001) 3.6 (<.0001)
a β (p-value); Models include supplements (iron, folic acid, and vitamins) and dietary folate intake; associations p < 0.05 are bolded b β estimate indicates percentage change in factor score (higher scores reflect higher abilities); RSB – repetitive stereotyped behavior, FM – factor mean score, SU – social understanding, VA – verbal ability, SI – social inhibition, SPS – semantic pragmatic skills, A – articulation, IQ – intellectual quotient, LA- language acquisition d β estimate indicates change in IQ points

121
Table 9. Adjusted relationshipsa between nutrient supplementation and dietary folate for factor scoresb and IQd
Supplementation Dietary folate intake Outcome Folic acid Vitamins Iron 200 - < 300 µg ≥ 300 µg FM -0.2 (0.49) -0.1 (0.61) -0.4 (0.10) 0.4 (0.03) 0.4 (0.10) RSB -0.1 (0.53) -0.4 (0.0002) -0.1 (0.31) 0.0 (0.69) -0.3 (0.03) SU -0.5 (0.24) -0.6 (0.04) 0.1 (0.83) 0.5 (0.03) 0.7 (0.02) VA 0.2 (0.45) 0.3 (0.04) -0.3 (0.07) 0.1 (0.47) -0.1 (0.54) SI 0.3 (0.44) 0.2 (0.50) -0.3 (0.39) 0.1 (0.67) -0.5 (0.09) SPS 0.4 (0.31) 0.3 (0.17) -0.1 (0.82) 0.6 (0.002) 0.5 (0.03) A -1.1 (0.01) -0.7 (0.01) 0.0 (0.98) -0.5 (0.04) -0.8 (0.01) LA 0.1 (0.93) 1.0 (0.01) -0.3 (0.47) 0.7 (0.04) 2.9 (<.0001) IQ 2.0 (0.01) 1.2 (0.02) -0.9 (0.14) 0.8 (0.10) 0.8 (0.15)
a β (p-value); Models include supplements (iron, folic acid, and vitamins), dietary folate intake, maternal age, parity, and education; associations p < 0.05 are bolded b β estimate indicates percentage change in factor score (higher scores reflect higher abilities); RSB – repetitive stereotyped behavior, FM – factor mean score, SU – social understanding, VA – verbal ability, SI – social inhibition, SPS – semantic pragmatic skills, A – articulation, IQ – intellectual quotient, LA- language acquisition d β estimate indicates change in IQ points

122
122
Table 10. Mean IQ by maternal folic acid supplementation and child MTHFR677 genotype
Vitamin use Genotype
FA+ FA-
MTHFR677 GG 105.5 (ref) 101.6 (0.007) MTHFR677 AG 102.9 (ref) 102.2 (0.67) MTHFR677 AA 99.5 (ref) 101.1 (0.55) a Model includes iron, folic acid, vitamins, child MTHFR677 genotype, vitamin-SNP interaction, folic acid-SNP interaction, maternal age, parity, and education Figure 4. Mean IQ by maternal folic acid supplementation and child MTHFR677 genotype
14:28 Tuesday, May 16, 2017 114:28 Tuesday, May 16, 2017 1
105.5
101.6
102.9
102.2
99.5
101.1
94
95
96
97
98
99
100
101
102
103
104
105
106
107
108
109
IQ (P
oint
s)
FA+ FA-
Folic acid supplementation
MTHFR677 AAMTHFR677 AGMTHFR677 GG
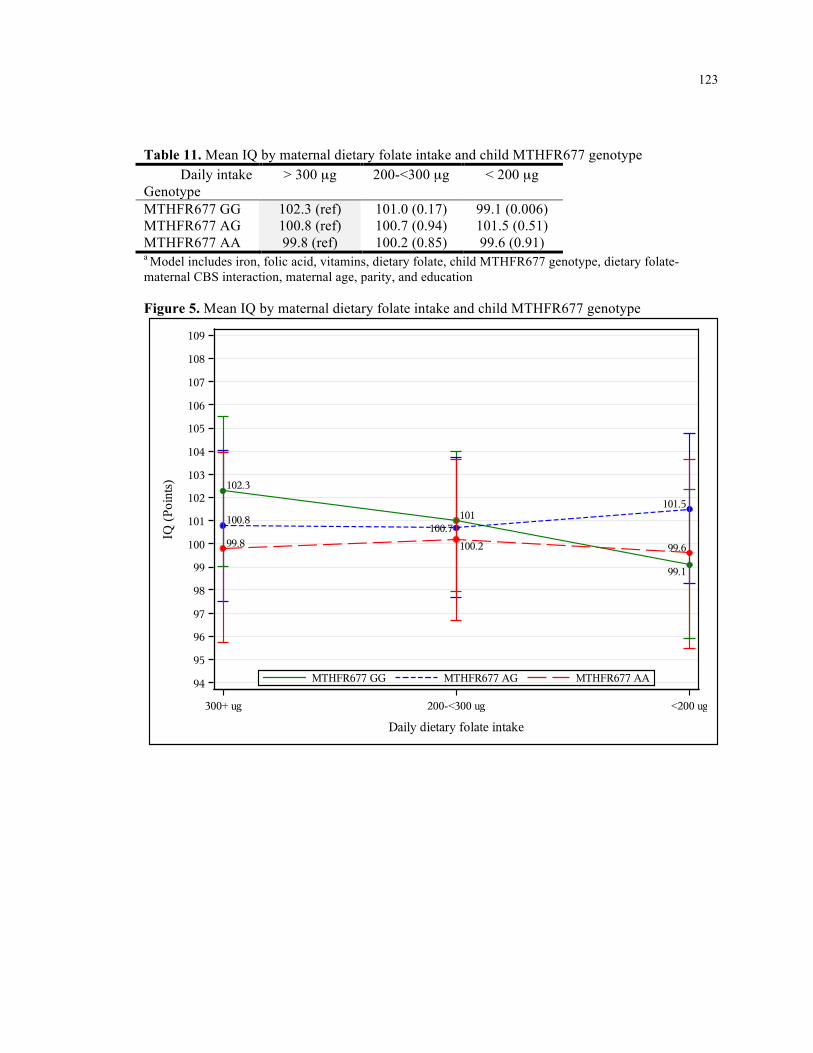
123
123
Table 11. Mean IQ by maternal dietary folate intake and child MTHFR677 genotype
Daily intake Genotype
> 300 µg 200-<300 µg < 200 µg
MTHFR677 GG 102.3 (ref) 101.0 (0.17) 99.1 (0.006) MTHFR677 AG 100.8 (ref) 100.7 (0.94) 101.5 (0.51) MTHFR677 AA 99.8 (ref) 100.2 (0.85) 99.6 (0.91) a Model includes iron, folic acid, vitamins, dietary folate, child MTHFR677 genotype, dietary folate-maternal CBS interaction, maternal age, parity, and education Figure 5. Mean IQ by maternal dietary folate intake and child MTHFR677 genotype
14:28 Tuesday, May 16, 2017 114:28 Tuesday, May 16, 2017 1
102.3
101
99.1
100.8100.7
101.5
99.8 100.2 99.6
94
95
96
97
98
99
100
101
102
103
104
105
106
107
108
109
IQ (P
oint
s)
300+ ug 200-<300 ug <200 ug
Daily dietary folate intake
MTHFR677 AAMTHFR677 AGMTHFR677 GG

124
124 APPENDIX 4: Supplementary Tables and Figures
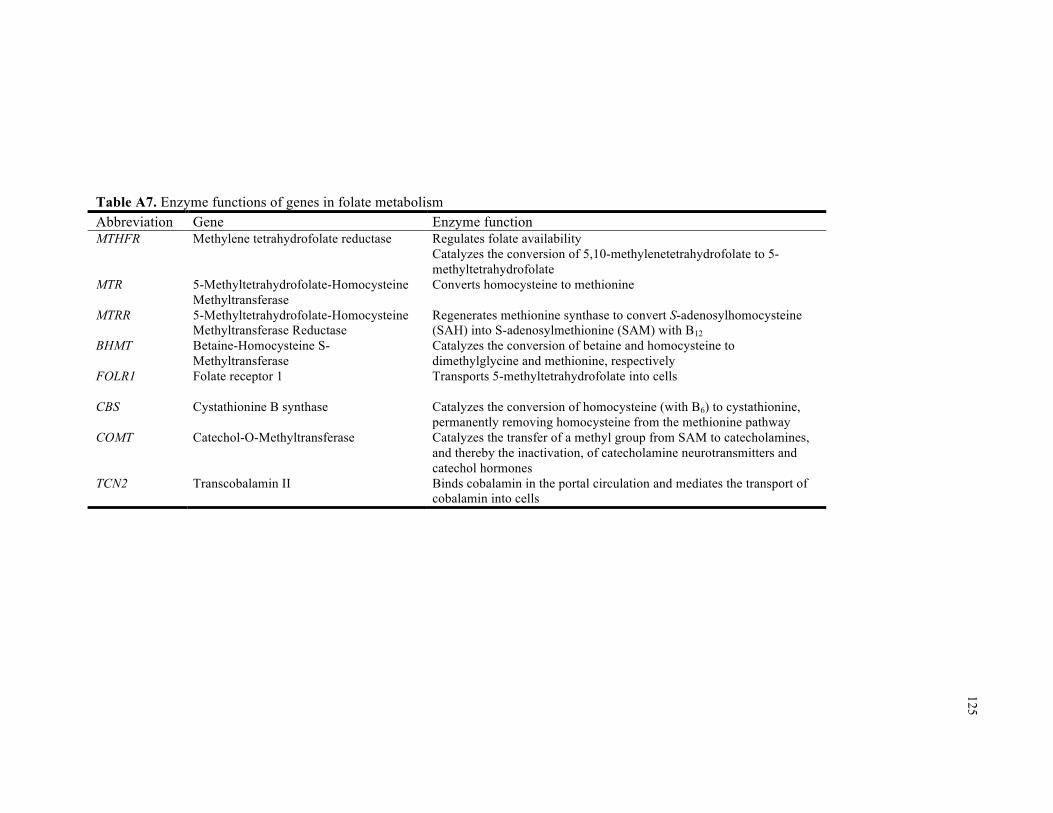
125
Table A7. Enzyme functions of genes in folate metabolism Abbreviation Gene Enzyme function MTHFR Methylene tetrahydrofolate reductase
Regulates folate availability Catalyzes the conversion of 5,10-methylenetetrahydrofolate to 5-methyltetrahydrofolate
MTR 5-Methyltetrahydrofolate-Homocysteine Methyltransferase
Converts homocysteine to methionine
MTRR 5-Methyltetrahydrofolate-Homocysteine Methyltransferase Reductase
Regenerates methionine synthase to convert S-adenosylhomocysteine (SAH) into S-adenosylmethionine (SAM) with B12
BHMT Betaine-Homocysteine S-Methyltransferase
Catalyzes the conversion of betaine and homocysteine to dimethylglycine and methionine, respectively
FOLR1
Folate receptor 1
Transports 5-methyltetrahydrofolate into cells
CBS Cystathionine B synthase Catalyzes the conversion of homocysteine (with B6) to cystathionine, permanently removing homocysteine from the methionine pathway
COMT Catechol-O-Methyltransferase Catalyzes the transfer of a methyl group from SAM to catecholamines, and thereby the inactivation, of catecholamine neurotransmitters and catechol hormones
TCN2 Transcobalamin II Binds cobalamin in the portal circulation and mediates the transport of cobalamin into cells

126
Table A8. Individual measures used to derive factor scores in ALSPAC
Age1 Measure Age1 Measure 6, 18 DDST - Communication Combines words
6, 18, 30, 42 Pretend play Empathy CDI - gestures Musical CDI - imitates words
57, 69, 81
Pronouncing certain sounds CDI - objects 81 Nonverbal communication CDI - response to language DAWBA - Compulsions score
15
CDI - understand score DAWBA - Number compulsions 15, 24, 38 CDI - vocabulary DAWBA - Social fears
18, 30, 42, 57, 69, 77 Repetitive behavior DAWBA - Tics or twitches CDI - combines words
91
SCDC CDI - grammar (irregular) Nonword repetition 24, 38 CDI - grammar (regular) WISC - verbal IQ
38 CDI - complexity WOLD - comprehension 38, 57, 69 EAS - Sociability
8y
WOLD - oral expression Avoids eye contact CCC - coherence Communication CCC - conversational context Echoes what said CCC - conversational rapport Intelligibility CCC - inappropriate initiation Prefers gestures CCC - intelligibility & fluency Stays mainly silent CCC - stereotyped conversation
38, 57, 69, 81
Stumbles on words CCC - syntax score 42 Rutter Prosocial
9y
DANVA - faces 47, 81, 97, 9y SDQ Prosocial
1 Age is designated in months unless otherwise indicated (y: years) DDST: Denver Developmental Screening test, CDI: MacArthur Infant Communicative development inventories (words and gestures), EAS: Emotionality Activity Sociability, SDQ: Strengths and Difficulties Questionnaire, DAWBA: Development and Well-Being Assessment, WISC: Wechsler Intelligence Scale for Children, WOLD: Wold sentence copying test, WISC: Wechsler Intelligence Scale for Children, CCC: Children’s communication checklist, DANVA: Diagnostic Analysis of Nonverbal Accuracy

127
Table A9. Language factors: individual measures with factor loadings ≥ 0.50
Language acquisition Articulation DDST – Communication (18m) Pronouncing certain sounds CDI – understand score (15m) (57, 69, 81m) CDI – imitates words (15m) CDI – gestures (15m) CDI – objects (15m) CDI – vocabulary (15, 24m) CDI – grammar (regular) (24m) CDI – grammar (irregular) (24m)
CDI – combines words (24m) DDST: Denver Developmental Screening test, CDI: MacArthur Infant Communicative development inventories (words and gestures), WOLD: Wold sentence copying test, WISC: Wechsler Intelligence Scale for Children, CCC: Children’s communication checklist, Language acquisition was derived most heavily from the Denver Developmental Screening Test (DDST) communication score and multiple elements of the MacArthur Infant Communicative Development Inventory (CDI). Articulation was predominantly based on the “pronouncing certain sounds” measure. This was a question that related to certain sounds such as th, sss or t .{Steer, 2010 #186} Of the individual measures indicated here, Wold oral expression and WISC verbal IQ were assessed by trained personnel or involved computerized data entry, while the others were based on mailed questionnaires completed by the primary caregiver.

128
Table A10. Selected characteristics of the ALSPAC supplementation sample (n = 11,741) by IQ availability
IQ data Yes No Characteristics 6633 (56.5) 5108 (43.5) Supplement use Folic acid 600 (9.1) 421 (8.2) Iron* 1335 (20.1) 1205 (23.6) Vitamins* 1157 (17.4) 779 (15.3) Sex of child – male* 3300 (49.8) 2742 (53.7) Parity*
First child 3051 (46.0) 2142 (41.9) Second child 2322 (35.0) 1728 (33.8) Third child and higher 1164 (17.6) 1134 (22.2) Missing 96 (1.5) 104 (2.0)
Maternal education* ≥ 12 yrs 2828 (42.6) 1267 (24.8) Missing 172 (2.6) 370 (7.2)
Maternal age, mean (SD)* 29.2 (4.5) 27.2 (5.0) Maternal smoking – yes* 1187 (17.9) 1605 (31.4) Maternal body mass index*
Underweight (BMI < 18.5) 264 (4.0) 244 (4.8) Normal (18.5 ≤ BMI < 25) 4597 (69.3) 3164 (61.9) Overweight (25 ≤ BMI < 30) 900 (13.6) 685 (13.4) Obese (BMI ≥30) 311 (4.7) 259 (5.1) Missing 561 (8.5) 756 (14.8)
Maternal antidepressant use* Yes 31 (0.5) 72 (1.4) Missing 27 (0.4) 30 (0.6)
Depression Yes 460 (6.9) 530 (10.4) Missing 149 (2.3) 367 (7.2)
Other psych disorders - yes 152 (2.3) 109 (2.3) Autism 69 (1.0) 72 (1.4) Continuous outcomes, mean (SD)
Factor mean score* 0.040 (0.33) -0.036 (0.41) Repetitive stereotyped behavior* 0.036 (0.88) -0.029 (1.0) Social understanding 0.0065 (0.99) -0.0072 (0.88) Verbal ability* 0.11 (0.69) -0.11 (1.20) Social inhibition 0.011 (0.96) -0.0037 (0.86) Semantic pragmatic skills* 0.13 (0.96) -0.13 (0.85) Articulation -0.0087 (0.96) 0.011 (0.82) Language acquisition -0.0091 (0.97) 0.023 (0.98)
* Chi-square test produced p < 0.05

129
129 CONTINUOUS ANALYSES

130
Table A11. Relationshipsa between dietary folate intake and nutrient supplementation for factor scoresb and IQc Daily folate intake FM RSB SU VA SI SPS A LA IQ < 200 µg (Ref) 200 - < 300 µg 0.41 -0.04 0.52 0.08 0.10 0.63 -0.48 0.66 0.77 ≥ 300 µg 0.39 -0.26 0.68 -0.09 -0.51 0.54 -0.78 2.85 0.82 Supplement Folic acid -0.23 -0.11 -0.48 0.15 0.33 0.36 -1.09 0.05 2.03 Vitamins -0.11 -0.43 -0.55 0.28 0.19 0.33 -0.67 1.04 1.21 Iron -0.38 -0.12 0.06 -0.26 -0.26 -0.06 -0.01 -0.29 -0.86
a Models include supplements (iron, folic acid, and vitamins), dietary folate intake, maternal age, parity, and education; associations p < 0.05 are color-coded and bolded; Red = higher risk, blue = lower risk b β estimate indicates percentage change in factor score associated with each risk allele (higher scores reflect higher abilities); RSB – repetitive stereotyped behavior, FM – factor mean score, SU – social understanding, VA – verbal ability, SI – social inhibition, SPS – semantic pragmatic skills, A – articulation, IQ – intellectual quotient, LA- language acquisition c β estimate indicates change in IQ points associated with each risk allele

131
Table A12. Relationshipsa between nutrient supplementation for autismb, factor scoresc, and IQd Supplement FM RSB SU VA SI SPS A LA IQ Folic acid -0.10 -0.08 -0.55 0.23 0.40 0.50 -0.99 0.05 1.91 Vitamins 0.07 -0.41 -0.46 0.31 0.21 0.48 -0.57 1.22 1.26 Iron -0.47 -0.13 0.08 -0.28 -0.37 -0.11 0.00 -0.44 -0.61
a Models include supplements (iron, folic acid, and vitamins), dietary folate intake, maternal age, parity, and education; associations p < 0.05 are color-coded and bolded; Red = higher risk, blue = lower risk b Odds ratio estimate c β estimate indicates percentage change in factor score associated with supplement use (higher scores reflect higher abilities); RSB – repetitive stereotyped behavior, FM – factor mean score, SU – social understanding, VA – verbal ability, SI – social inhibition, SPS – semantic pragmatic skills, A – articulation, IQ – intellectual quotient, LA- language acquisition d β estimate indicates change in IQ points associated with supplement use

132
Table A13. Relationshipsa between variant alleles in folate metabolism and factor scoresb and IQc
a Unadjusted associations p < 0.05 are color-coded and bolded; Red = higher risk, blue = lower risk; blank cells have at least one cell count < 5
b β estimate indicates percentage change in factor score associated with each risk allele (higher scores reflect higher abilities); RSB – repetitive stereotyped behavior, FM – factor mean score, SU – social understanding, VA – verbal ability, SI – social inhibition, SPS – semantic pragmatic skills, A – articulation, IQ – intellectual quotient, LA- language acquisition c β estimate indicates change in IQ points associated with each risk allele
Person Variant FM RSB SU VA SI SPS A LA IQ BHMT A -0.14 -0.06 0.16 -0.12 -0.01 0.16 -0.03 -0.55 0.87 CBS T 0.04 -0.11 0.34 -0.11 -0.13 0.03 0.12 0.32 -0.19 COMT A 0.12 -0.09 -0.28 0.21 0.39 -0.05 0.21 -0.07 0.60 FOLR1 AG+AA
0.29 0.34 0.49 0.11 -1.11 1.18 0.49 -1.61 1.12 MTHFR1298 G
-0.17 0.10 -0.13 -0.06 -0.30 0.00 -0.11 -0.21 0.02 MTHFR677 A 0.06 -0.08 0.04 -0.12 0.26 0.09 -0.14 0.51 0.02 MTR G 0.19 0.06 0.17 -0.13 -0.02 0.26 0.70 -0.48 0.04 MTRR G 0.29 0.12 0.11 0.08 0.43 0.33 -0.29 -0.05 -0.27
Child
TCN2 C 0.26 0.02 -0.08 0.05 0.12 0.23 0.21 0.34 0.05 BHMT A 0.17 0.08 0.04 -0.17 0.54 0.23 0.03 -0.13 0.44 CBS T -0.03 -0.09 0.14 -0.07 0.23 -0.41 -0.05 0.50 -0.54 COMT A 0.03 0.02 0.15 0.02 0.46 -0.17 -0.25 -0.19 -0.11 FOLR1 AG+AA
0.26 0.40 -0.29 0.07 -0.39 0.54 0.07 -0.26 0.91 MTHFR1298 G
-0.16 0.03 0.06 -0.11 -0.27 0.13 -0.28 -0.04 -0.18 MTHFR677 A 0.33 0.08 -0.05 0.01 0.37 0.13 0.20 0.39 0.41 MTR G 0.24 0.05 0.25 -0.21 -0.04 0.21 0.58 0.10 0.50 MTRR G 0.17 0.06 -0.07 0.00 0.01 0.29 -0.04 0.28 0.09
Mother
TCN2 C 0.08 -0.07 -0.24 0.00 -0.08 0.20 0.09 0.61 0.27

133
Table A14. Interactionsa between folic acid supplementation and genetic variants in folate metabolism for factor scoresb and IQc
Person Variant FM RSB SU VA SI SPS A LA IQ BHMT A -0.94 -0.46 0.54 -0.11 -2.24 0.94 -0.33 -1.28 2.83 CBS T 1.39 0.08 1.75 -0.57 1.85 0.63 0.63 1.16 -0.66 COMT A -1.13 -0.56 -0.94 0.15 0.30 -0.71 0.26 -2.25 -1.36 FOLR1 AG+AAd 0.91 0.11 -0.11 -0.22 2.41 -0.64 3.76 -2.63 -0.81 MTHFR1298 G -0.10 -0.11 0.49 -0.05 -0.84 0.54 0.13 -0.50 -0.70 MTHFR677 A 0.33 -0.21 -1.34 0.55 -1.02 1.72 0.38 0.88 2.74 MTR G -0.24 0.23 -1.43 -0.63 -0.65 0.19 1.31 0.67 -0.96 MTRR G -0.92 0.19 -0.56 -0.13 -1.59 -0.33 -0.62 -0.37 -0.71
Child
TCN2 C -1.02 -0.28 0.80 -0.41 -1.52 -0.97 -0.82 0.64 -0.66 BHMT A 0.01 -0.81 1.13 0.17 -0.08 1.61 -1.09 -0.13 3.12 CBS T 1.09 0.02 1.51 -0.59 0.16 0.21 1.48 1.99 0.53 COMT A -0.54 -0.55 0.33 0.12 -0.39 0.29 -0.37 -0.91 -0.31 FOLR1 AG+AAd 0.24 0.30 -0.36 -0.15 1.55 -0.18 2.18 -3.60 0.24 MTHFR1298 G -0.34 0.20 0.46 -0.28 -1.00 0.38 -0.08 -1.25 1.87 MTHFR677 A -0.26 -0.29 -1.86 0.32 -0.62 0.98 -0.69 1.73 1.20 MTR G -0.30 0.01 -0.23 -0.76 -0.78 1.13 1.13 -1.10 0.69 MTRR G -0.96 0.34 -0.68 -0.40 -1.47 0.74 -1.22 -0.94 0.75
Mother
TCN2 C -0.44 0.10 0.02 -0.09 -1.36 0.03 -0.66 0.47 0.50 a Associations p < 0.05 are color-coded and bolded; Red = higher risk, blue = lower risk; models include iron, folic acid, vitamins, SNP, folic acid-SNP interaction, vitamin-SNP interaction, maternal age, parity, and education
b β estimate indicates the difference in the percentage change in the average factor score per variant allele whose mothers did not supplement compared to those whose mothers did supplement (based on a common contrast to the average factor score for maternal non-supplementers with wild-type alleles); RSB – repetitive stereotyped behavior, FM – factor mean score, SU – social understanding, VA – verbal ability, SI – social inhibition, SPS – semantic pragmatic skills, A – articulation, IQ – intellectual quotient, LA- language acquisition (higher scores reflect higher abilities) c β estimate indicates the difference in the average IQ per variant allele whose mothers did not supplement compared to those whose mothers did supplement (based on a common contrast to the average IQ for maternal non-supplementers with wild-type alleles) d FOLR1 estimates are calculated for homozygous AA and heterozygous AG combined due to small numbers of homozygous individuals.

134
Table A15. Interactionsa between vitamin supplementation and genetic variants in folate metabolism for factor scoresb and IQc
Person Variant FM RSB SU VA SI SPS A LA IQ BHMT A -0.24 -0.18 -0.47 -0.05 0.64 0.24 0.45 -1.49 -1.94 CBS T -0.26 0.29 -0.95 0.33 0.37 -0.65 -0.15 -1.04 -1.78 COMT A 1.18 0.16 0.80 -0.03 0.85 0.78 1.04 0.28 1.43 FOLR1 AG+AAd -0.34 -0.19 1.19 0.36 0.09 0.34 -1.06 -2.76 -0.15 MTHFR1298 G -0.92 0.00 -0.96 0.10 0.33 -0.73 -1.09 -1.07 -0.65 MTHFR677 A 0.56 -0.13 -0.43 -0.15 0.20 0.26 1.39 1.49 0.70 MTR G 0.58 -0.21 0.61 0.18 0.51 0.26 -0.10 1.10 0.25 MTRR G 0.67 -0.01 0.82 0.30 -0.11 -0.04 0.63 0.48 1.17
Child
TCN2 C -0.33 -0.10 -0.93 -0.04 0.67 -0.56 0.48 -0.52 -1.43 BHMT A -0.89 -0.10 -0.88 -0.03 0.10 -0.63 -0.62 -0.88 -2.32 CBS T -0.90 -0.02 -1.00 0.27 -0.52 -1.03 0.03 -1.34 -1.78 COMT A 0.53 -0.09 0.28 -0.13 0.26 0.27 0.98 0.66 0.47 FOLR1 AG+AAd 0.12 -0.38 1.23 0.02 1.25 -0.23 0.12 -1.43 -1.89 MTHFR1298 G -0.32 0.00 -0.83 -0.13 0.62 -0.11 -1.00 0.70 0.11 MTHFR677 A 0.59 0.21 0.86 0.09 0.10 0.53 0.01 -0.28 0.15 MTR G 0.51 -0.14 1.00 0.32 0.35 0.28 -0.43 0.24 -0.74 MTRR G -0.52 -0.44 -0.07 -0.13 -0.20 -0.69 0.04 0.62 -1.25
Mother
TCN2 C -0.25 -0.04 -0.62 -0.10 0.36 0.01 -0.01 -0.32 -0.82 a Associations p < 0.05 are color-coded and bolded; Red = higher risk, blue = lower risk; models include iron, folic acid, vitamins, SNP, folic acid-SNP interaction, vitamin-SNP interaction, maternal age, parity, and education
b β estimate indicates the difference in the percentage change in the average factor score per variant allele whose mothers did not supplement compared to those whose mothers did supplement (based on a common contrast to the average factor score for maternal non-supplementers with wild-type alleles); RSB – repetitive stereotyped behavior, FM – factor mean score, SU – social understanding, VA – verbal ability, SI – social inhibition, SPS – semantic pragmatic skills, A – articulation, IQ – intellectual quotient, LA- language acquisition (higher scores reflect higher abilities) c β estimate indicates the difference in the average IQ per variant allele whose mothers did not supplement compared to those whose mothers did supplement (based on a common contrast to the average IQ for maternal non-supplementers with wild-type alleles) d FOLR1 estimates are calculated for homozygous AA and heterozygous AG combined due to small numbers of homozygous individuals.

135
Table A16. Interactionsa between dietary folate and child genetic variants in folate metabolism and factor scoresb and IQc
Person SNP Variable FM RSB SU VA SI SPS A LA IQ < 200 µg 0.67 0.46 0.51 -0.15 0.52 0.62 0.39 -0.77 0.71 BHMT A 200 -<300 µg 0.80 0.20 0.77 -0.22 0.82 0.78 0.63 -0.39 -0.32 < 200 µg -0.14 -0.39 -0.53 0.89 0.23 0.22 -1.44 0.23 2.28 CBS T 200 -<300 µg -0.04 -0.11 -0.05 0.03 -0.75 0.37 -0.40 1.15 0.52 < 200 µg -0.48 -0.19 -0.13 0.11 0.72 0.06 -0.98 -1.43 0.77 COMT A 200 -<300 µg -0.46 -0.10 -0.25 -0.10 -0.70 0.47 -0.69 0.01 1.21 < 200 µg -0.65 -0.26 -0.58 -0.72 0.51 -1.65 0.53 1.58 -0.77 FOLR1 AG+AAd 200 -<300 µg 0.37 -0.51 -0.11 -0.20 1.75 -1.07 1.54 1.19 1.58 < 200 µg 0.17 -0.16 -0.25 -0.16 1.22 0.43 -1.53 1.94 -0.10 MTHFR1298 G 200 -<300 µg -0.13 -0.06 -0.36 -0.32 0.62 0.31 -0.86 0.89 0.86 < 200 µg 0.00 0.03 -0.98 0.29 0.66 -0.12 0.85 -1.30 2.16 MTHFR677 A 200 -<300 µg 0.01 -0.25 -0.60 0.50 0.75 0.01 0.26 -1.00 0.94 < 200 µg -0.52 -0.45 -0.95 -0.09 -1.21 -0.46 0.55 2.08 -1.16 MTR G 200 -<300 µg -0.41 -0.13 -1.14 -0.46 -0.28 0.07 0.39 1.12 -0.48 < 200 µg -0.25 -0.29 -0.67 0.28 0.20 -0.76 0.39 0.24 0.56 MTRR G 200 -<300 µg -0.48 -0.27 -0.19 0.23 -1.00 -0.58 0.33 -0.03 0.67 < 200 µg 0.42 0.25 -1.08 -0.32 0.93 0.65 0.38 0.82 1.26
Child
TCN2 C 200 -<300 µg 0.11 0.01 -0.68 -0.34 -0.12 0.67 0.42 0.99 0.10 a Associations p < 0.05 are color-coded and bolded; Red = higher risk, blue = lower risk; models include supplements (iron, folic acid, vitamins), dietary folate (ref: ≥ 300 µg/d), SNP (ref: 0 risk variants), dietary folate-SNP interactions, maternal age, parity, and education
b β estimate indicates the difference in the percentage change in the average factor score per variant allele whose mothers did not supplement compared to those whose mothers did supplement (based on a common contrast to the average factor score for maternal non-supplementers with wild-type alleles); RSB – repetitive stereotyped behavior, FM – factor mean score, SU – social understanding, VA – verbal ability, SI – social inhibition, SPS – semantic pragmatic skills, A – articulation, IQ – intellectual quotient, LA- language acquisition (higher scores reflect higher abilities) c β estimate indicates the difference in the average IQ per variant allele whose mothers did not supplement compared to those whose mothers did supplement (based on a common contrast to the average IQ for maternal non-supplementers with wild-type alleles) d FOLR1 estimates are calculated for homozygous AA and heterozygous AG combined due to small numbers of homozygous individuals

136
Table A17. Interactionsa between dietary folate and maternal genetic variants in folate metabolism and factor scoresc and IQd
Person SNP Variable FM RSB SU VA SI SPS A LA IQ < 200 µg -0.30 0.36 -1.36 0.16 0.40 -0.56 -0.19 -0.54 1.62 BHMT A 200 -<300 µg -0.73 0.10 -0.95 -0.03 0.23 -0.41 -0.29 -1.60 0.57 < 200 µg 0.32 -0.12 -0.35 0.18 0.92 0.77 -1.08 0.99 0.86 CBS T 200 -<300 µg -0.23 0.11 -0.27 -0.33 -0.72 0.62 -1.34 1.67 -0.69 < 200 µg 0.16 0.13 0.08 0.08 1.09 -0.21 -0.62 -0.27 0.38 COMT A 200 -<300 µg -0.12 0.12 0.32 0.05 -0.17 -0.10 -0.75 -0.13 -0.10 < 200 µg -0.39 -0.21 1.76 -0.61 0.45 0.05 -0.79 -1.44 -3.41 FOLR1 AG+AAd 200 -<300 µg 0.53 -0.14 0.88 -0.42 -0.04 0.07 0.44 2.16 -1.11 < 200 µg 0.45 -0.17 -0.49 -0.16 1.70 1.34 -0.22 -0.11 0.74 MTHFR1298 G 200 -<300 µg -0.13 -0.26 0.00 0.13 0.44 0.43 -0.47 -0.68 0.66 < 200 µg -0.03 -0.04 0.10 0.20 0.17 -1.13 0.28 0.33 0.01 MTHFR677 A 200 -<300 µg -0.41 -0.29 -0.52 0.00 0.92 -0.75 0.16 -0.59 -0.32 < 200 µg 0.27 -0.11 -0.91 0.14 0.55 -1.10 1.18 1.74 -0.26 MTR G 200 -<300 µg 0.06 0.34 -0.97 -0.48 0.65 -1.08 1.73 0.23 -1.32 < 200 µg -0.51 0.14 -1.04 0.04 -0.44 -0.07 0.29 -1.15 1.59 MTRR G 200 -<300 µg -0.69 -0.06 -0.62 0.22 -0.57 -0.34 -0.78 -0.48 1.19 < 200 µg 0.64 0.57 -0.89 -0.01 1.27 -0.14 0.12 0.77 -0.45
Mother
TCN2 C 200 -<300 µg 0.16 0.43 -0.53 -0.46 0.38 0.04 -0.41 1.35 0.34 a Associations p < 0.05 are color-coded and bolded; Red = higher risk, blue = lower risk; models include supplements (iron, folic acid, vitamins), dietary folate (ref: ≥ 300 µg/d), SNP (ref: 0 risk variants), dietary folate-SNP interactions, maternal age, parity, and education
b β estimate indicates the difference in the percentage change in the average factor score per variant allele whose mothers did not supplement compared to those whose mothers did supplement (based on a common contrast to the average factor score for maternal non-supplementers with wild-type alleles); RSB – repetitive stereotyped behavior, FM – factor mean score, SU – social understanding, VA – verbal ability, SI – social inhibition, SPS – semantic pragmatic skills, A – articulation, IQ – intellectual quotient, LA- language acquisition (higher scores reflect higher abilities) c β estimate indicates the difference in the average IQ per variant allele whose mothers did not supplement compared to those whose mothers did supplement (based on a common contrast to the average IQ for maternal non-supplementers with wild-type alleles) d FOLR1 estimates are calculated for homozygous AA and heterozygous AG combined due to small numbers of homozygous individuals

137
137
CUT-POINT ANALYSES

138
Table A18. Unadjusted relationshipsa between nutrient supplementation and dietary folate for factor scoresb and IQd
Supplementation Dietary folate intake Outcome Folic acid Vitamins Iron 200 - < 300 µg ≥ 300 µg FM 1.07 (0.83, 1.38) 0.97 (0.81, 1.15) 1.06 (0.89, 1.28) 0.75 (0.65, 0.87) 0.79 (0.66, 0.95) RSB 0.95 (0.74, 1.22) 1.22 (1.03, 1.43) 1.09 (0.91, 1.30) 0.98 (0.84, 1.14) 1.16 (0.97, 1.39) SU 1.15 (0.90, 1.47) 1.28 (1.09, 1.51) 0.91 (0.76, 1.09) 0.93 (0.81, 1.08) 0.98 (0.82, 1.17) VA 0.83 (0.63, 1.09) 0.64 (0.52, 0.77) 1.20 (1.00, 1.44) 0.79 (0.68, 0.91) 0.78 (0.64, 0.93) SI 1.22 (0.96, 1.55) 1.05 (0.89, 1.24) 0.94 (0.79, 1.13) 1.04 (0.90, 1.21) 1.27 (1.07, 1.51) SPS 0.70 (0.52, 0.93) 0.82 (0.68, 0.99) 1.13 (0.94, 1.35) 0.79 (0.68, 0.91) 0.70 (0.58, 0.85) A 1.44 (1.14, 1.81) 1.30 (1.11, 1.52) 0.92 (0.77, 1.10) 1.12 (0.97, 1.30) 1.31 (1.10, 1.56) LA 1.18 (0.92, 1.51) 0.85 (0.71, 1.01) 0.92 (0.77, 1.11) 0.99 (0.86, 1.14) 0.64 (0.53, 0.78) IQ 0.50 (0.33, 0.74) 0.72 (0.56, 0.92) 1.32 (1.04, 1.68) 0.82 (0.67, 0.99) 0.80 (0.63, 1.02)
a Odds ratio (95% confidence interval); Models include supplements (iron, folic acid, and vitamins) and dietary folate intake; associations p < 0.05 are bolded b β estimate indicates percentage change in factor score (higher scores reflect higher abilities); RSB – repetitive stereotyped behavior, FM – factor mean score, SU – social understanding, VA – verbal ability, SI – social inhibition, SPS – semantic pragmatic skills, A – articulation, IQ – intellectual quotient, LA- language acquisition d β estimate indicates change in IQ points

139
Table A19. Adjusted relationshipsa between nutrient supplementation and dietary folate for factor scoresb and IQd
Supplementation Dietary folate intake Outcome Folic acid Vitamins Iron 200 - < 300 µg ≥ 300 µg FM 1.16 (0.90, 1.50) 1.05 (0.88, 1.25) 1.00 (0.84, 1.20) 0.82 (0.71, 0.95) 0.89 (0.74, 1.07) RSB 0.94 (0.73, 1.21) 1.19 (1.01, 1.40) 1.11 (0.93, 1.33) 0.98 (0.84, 1.14) 1.16 (0.97, 1.39) SU 1.11 (0.87, 1.43) 1.24 (1.05, 1.45) 0.94 (0.78, 1.12) 0.91 (0.79, 1.06) 0.94 (0.79, 1.13) VA 0.96 (0.73, 1.26) 0.74 (0.60, 0.90) 1.08 (0.90, 1.29) 0.90 (0.78, 1.04) 0.94 (0.78, 1.14) SI 1.16 (0.91, 1.48) 1.03 (0.87, 1.22) 0.97 (0.81, 1.17) 0.99 (0.86, 1.15) 1.20 (1.00, 1.43) SPS 0.87 (0.65, 1.16) 0.98 (0.81, 1.19) 0.99 (0.82, 1.19) 0.99 (0.85, 1.14) 0.97 (0.80, 1.18) A 1.34 (1.06, 1.69) 1.24 (1.06, 1.46) 0.94 (0.79, 1.13) 1.02 (0.87, 1.18) 1.14 (0.96, 1.37) LA 1.13 (0.88, 1.45) 0.85 (0.71, 1.02) 0.94 (0.78, 1.13) 0.96 (0.84, 1.11) 0.61 (0.50, 0.75) IQ 0.61 (0.41, 0.92) 0.87 (0.68, 1.12) 1.14 (0.89, 1.45) 1.01 (0.83, 1.24) 1.08 (0.84, 1.38)
a Odds ratio (95% confidence interval); Models include supplements (iron, folic acid, and vitamins), dietary folate intake, maternal age, parity, and education; associations p < 0.05 are bolded b β estimate indicates percentage change in factor score (higher scores reflect higher abilities); RSB – repetitive stereotyped behavior, FM – factor mean score, SU – social understanding, VA – verbal ability, SI – social inhibition, SPS – semantic pragmatic skills, A – articulation, IQ – intellectual quotient, LA- language acquisition d β estimate indicates change in IQ points

140
Table A20. Odds ratiosa between dietary folate intake and nutrient supplementation for factor scoresb, and IQb
Daily folate intake FM RSB SU VA SI SPS A LA IQ < 200 µg (Ref) 200 - < 300 µg 0.82 0.98 0.91 0.90 0.99 0.99 1.02 0.96 1.01 ≥ 300 µg 0.89 1.16 0.94 0.94 1.20 0.97 1.14 0.61 1.08 Supplement Folic acid 1.16 0.94 1.11 0.96 1.16 0.87 1.34 1.13 0.61 Vitamins 1.05 1.19 1.24 0.74 1.03 0.98 1.24 0.85 0.87 Iron 1.00 1.11 0.94 1.08 0.97 0.99 0.94 0.94 1.14
a Models include supplements (iron, folic acid, and vitamins), dietary folate intake, maternal age, parity, and education; associations p < 0.05 are color-coded and bolded; Red = higher risk, blue = lower risk b RSB – repetitive stereotyped behavior, FM – factor mean score, SU – social understanding, VA – verbal ability, SI – social inhibition, SPS – semantic pragmatic skills, A – articulation, IQ – intellectual quotient, LA- language acquisition

141
Table A21. Odds ratiosa between supplementationb, factor scoresc, and IQe
Supplement FM RSB SU VA SI SPS A LA IQ Folic acid 1.10 0.97 1.11 0.96 1.10 0.82 1.29 1.11 0.66 Vitamins 1.00 1.18 1.25 0.71 1.03 0.90 1.21 0.85 0.88 Iron 1.02 1.12 0.91 1.12 1.02 1.00 0.96 0.96 1.10
a Odds ratio associated with supplementation compared to no supplementation of having a child with autism, low factor scores, or low IQ (higher scores reflect higher abilities); associations p < 0.05 are color-coded and bolded; Red = higher risk, blue = lower risk b Supplementation models include iron, folic acid, vitamins, maternal age, parity, and education. c RSB – repetitive stereotyped behavior, FM – factor mean score, SU – social understanding, VA – verbal ability, SI – social inhibition, SPS – semantic pragmatic skills, A – articulation, IQ – intellectual quotient, LA- language acquisition

142
Table A22. Odds ratiosa between variant alleles in folate metabolism and factor scoresb and IQb
Person Variant FM RSB SU VA SI SPS A LA IQ BHMT A 0.95 0.98 0.85 1.07 1.04 1.00 1.00 1.10 1.02 CBS T 1.10 1.14 0.99 0.95 0.99 0.92 1.04 0.94 0.92 COMT A 0.94 1.07 1.08 0.91 0.91 0.94 1.01 1.02 1.08 FOLR1 AG+AA 0.86 0.89 0.77 1.05 1.28 0.66 1.01 1.00 0.99 MTHFR1298 G 1.06 1.05 1.05 1.05 1.08 0.96 1.02 1.03 1.12 MTHFR677 A 1.03 1.00 0.98 1.11 0.91 1.06 1.04 0.91 0.91 MTR G 1.08 0.99 0.97 1.19 1.00 0.97 0.89 1.00 0.97 MTRR G 0.88 0.91 1.00 0.91 0.90 0.95 1.08 1.04 1.17
Child
TCN2 C 0.85 0.95 1.03 0.91 1.04 1.00 0.90 1.06 1.03 BHMT A 0.88 0.98 0.86 1.05 0.83 1.10 1.02 1.06 1.00 CBS T 1.12 1.09 1.04 1.01 0.95 1.14 1.06 0.86 0.95 COMT A 0.95 0.95 0.99 1.02 0.90 1.03 1.09 0.98 1.18 FOLR1 AG+AA 1.01 0.84 0.91 1.07 1.17 0.80 0.98 1.01 0.88 MTHFR1298 G 1.12 1.11 1.00 1.11 1.13 0.81 1.07 1.01 1.08 MTHFR677 A 0.90 0.88 1.06 1.01 0.83 1.08 0.97 0.88 0.86 MTR G 0.97 0.89 0.95 1.16 0.98 0.94 0.94 0.86 0.91 MTRR G 0.97 0.95 0.99 0.97 0.94 1.03 1.02 1.08 1.13
Mother
TCN2 C 1.01 1.00 1.04 1.00 1.05 1.07 0.94 1.00 1.09 a Odds ratio associated with a single variant allele (compared to individuals with no variant alleles) of having a child with low factor scores or low IQ (higher scores reflect higher abilities); unadjusted associations p < 0.05 are color-coded and bolded; Red = higher risk, blue = lower risk; blank cells had at least one cell count < 5 b RSB – repetitive stereotyped behavior, FM – factor mean score, SU – social understanding, VA – verbal ability, SI – social inhibition, SPS – semantic pragmatic skills, A – articulation, IQ – intellectual quotient, LA- language acquisition

143
Table A23. Odds ratios for interactionsa between folic acid supplementation and genetic variants in folate metabolism for factor scoresb and IQb
Person Variant FM RSB SU VA SI SPS A LA IQ BHMT A 1.11 1.37 0.88 0.94 1.20 0.72 1.15 0.66 0.57 CBS T 0.80 0.83 0.58 1.15 0.68 0.82 0.90 0.59 1.85 COMT A 1.72 1.95 1.40 1.03 0.91 1.41 0.96 1.66 0.77 FOLR1 AG+AAc 0.69 0.91 0.47 1.32 0.64 2.41 0.56 1.37 - MTHFR1298 G 1.05 1.24 1.28 1.11 1.10 0.95 0.92 1.01 0.79 MTHFR677 A 1.04 1.25 1.09 1.00 1.37 0.69 1.01 1.15 1.05 MTR G 0.98 0.90 1.36 1.59 1.61 0.46 0.70 1.18 4.92 MTRR G 1.60 0.99 0.99 1.20 1.22 1.10 1.14 1.06 0.62
Child
TCN2 C 1.27 1.56 0.60 0.95 1.25 1.41 1.00 1.08 1.91 BHMT A 0.80 1.86 0.78 0.49 0.95 0.79 1.42 0.59 0.75 CBS T 0.67 1.01 0.67 1.32 0.70 0.54 0.86 0.46 1.18 COMT A 1.68 1.47 1.13 1.27 1.14 1.02 0.95 0.84 1.09 FOLR1 AG+AAc 0.87 0.60 0.60 1.51 0.92 0.66 0.77 2.69 0.33 MTHFR1298 G 1.08 0.97 0.98 1.53 1.17 0.99 0.91 0.88 0.65 MTHFR677 A 1.25 1.07 1.03 0.72 1.46 0.79 1.17 0.98 3.57 MTR G 0.80 1.02 1.14 1.29 1.40 0.52 0.70 2.25 2.16 MTRR G 1.34 0.88 0.92 1.46 1.04 0.56 0.74 0.99 0.34
Mother
TCN2 C 1.13 1.04 0.77 0.84 1.41 0.92 1.00 1.00 1.46 a Odds ratio associated with maternal non-supplementation per single variant allele (compared to individuals with no variant alleles whose mothers used supplements) of having a child low factor scores or IQ (higher scores reflect higher abilities); associations p < 0.05 are color-coded and bolded; Red = higher risk, blue = lower risk; models include iron, folic acid, vitamins, SNP, folic acid-SNP interaction, vitamin-SNP interaction, maternal age, parity, and education b RSB – repetitive stereotyped behavior, FM – factor mean score, SU – social understanding, VA – verbal ability, SI – social inhibition, SPS – semantic pragmatic skills, A – articulation, IQ – intellectual quotient, LA- language acquisition c FOLR1 estimates are calculated for homozygous AA and heterozygous AG combined due to small numbers of homozygous individuals.

144
Table A24. Odds ratios for interactionsa between vitamin supplementation and genetic variants in folate metabolism for factor scoresb and IQb
Person Variant FM RSB SU VA SI SPS A LA IQ BHMT A 1.14 1.27 1.01 1.19 1.06 0.85 0.85 1.53 1.55 CBS T 1.17 0.96 1.46 0.94 0.78 1.19 0.85 1.15 1.15 COMT A 0.58 0.86 0.82 0.85 0.67 0.73 0.75 1.02 0.98 FOLR1 AG+AAc 2.23 0.64 0.63 0.44 0.99 0.94 1.28 1.36 0.55 MTHFR1298 G 1.40 1.25 1.11 0.77 1.05 1.04 1.21 1.24 1.50 MTHFR677 A 0.85 0.86 1.09 1.29 0.80 0.84 0.80 0.77 0.89 MTR G 0.81 1.16 0.81 0.78 1.00 0.87 1.09 1.05 0.61 MTRR G 0.74 0.83 0.77 0.66 0.95 1.25 0.83 0.69 0.69
Child
TCN2 C 0.90 0.84 1.27 1.43 0.83 1.06 0.87 1.02 1.30 BHMT A 1.34 1.21 1.33 1.16 1.06 1.09 1.14 1.56 1.86 CBS T 1.47 1.05 1.54 1.22 1.00 1.36 0.78 1.10 1.23 COMT A 0.79 1.11 0.83 0.75 0.83 0.71 0.72 1.15 1.09 FOLR1 AG+AAc 2.26 1.02 0.67 0.73 0.80 0.69 0.82 0.77 1.48 MTHFR1298 G 1.17 1.04 1.02 1.00 0.88 1.39 1.18 0.94 0.94 MTHFR677 A 0.73 0.74 0.87 0.93 0.73 0.83 1.27 1.07 1.15 MTR G 0.64 1.03 0.76 0.70 1.23 0.68 1.60 1.22 1.00 MTRR G 1.22 1.30 1.33 1.01 0.96 1.21 0.86 0.83 1.11
Mother
TCN2 C 0.83 0.91 1.26 1.63 0.92 0.93 1.08 0.86 1.07 a Odds ratio associated with maternal non-supplementation per single variant allele (compared to individuals with no variant alleles whose mothers used supplements) of having a child low factor scores or IQ (higher scores reflect higher abilities); associations p < 0.05 are color-coded and bolded; Red = higher risk, blue = lower risk; models include iron, folic acid, vitamins, SNP, folic acid-SNP interaction, vitamin-SNP interaction, maternal age, parity, and education b RSB – repetitive stereotyped behavior, FM – factor mean score, SU – social understanding, VA – verbal ability, SI – social inhibition, SPS – semantic pragmatic skills, A – articulation, IQ – intellectual quotient, LA- language acquisition c FOLR1 estimates are calculated for homozygous AA and heterozygous AG combined due to small numbers of homozygous individuals.
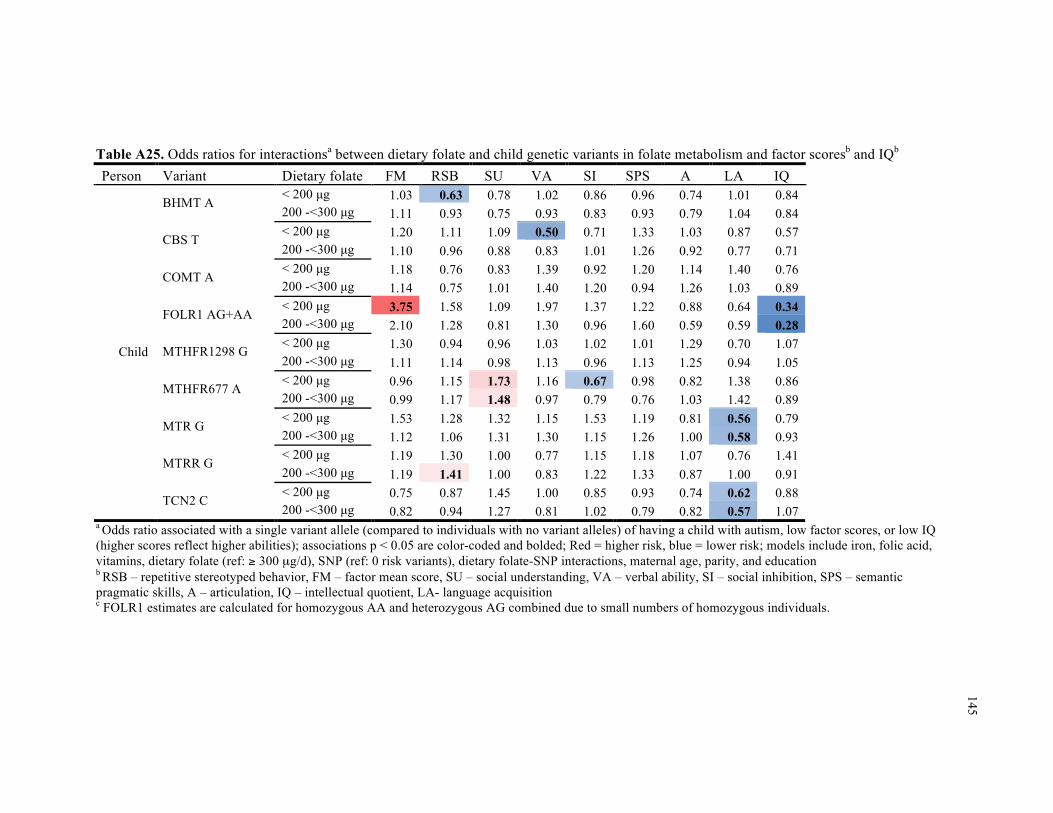
145
Table A25. Odds ratios for interactionsa between dietary folate and child genetic variants in folate metabolism and factor scoresb and IQb
Person Variant Dietary folate FM RSB SU VA SI SPS A LA IQ < 200 µg 1.03 0.63 0.78 1.02 0.86 0.96 0.74 1.01 0.84 BHMT A 200 -<300 µg 1.11 0.93 0.75 0.93 0.83 0.93 0.79 1.04 0.84 < 200 µg 1.20 1.11 1.09 0.50 0.71 1.33 1.03 0.87 0.57 CBS T 200 -<300 µg 1.10 0.96 0.88 0.83 1.01 1.26 0.92 0.77 0.71 < 200 µg 1.18 0.76 0.83 1.39 0.92 1.20 1.14 1.40 0.76 COMT A 200 -<300 µg 1.14 0.75 1.01 1.40 1.20 0.94 1.26 1.03 0.89 < 200 µg 3.75 1.58 1.09 1.97 1.37 1.22 0.88 0.64 0.34 FOLR1 AG+AA 200 -<300 µg 2.10 1.28 0.81 1.30 0.96 1.60 0.59 0.59 0.28 < 200 µg 1.30 0.94 0.96 1.03 1.02 1.01 1.29 0.70 1.07 MTHFR1298 G 200 -<300 µg 1.11 1.14 0.98 1.13 0.96 1.13 1.25 0.94 1.05 < 200 µg 0.96 1.15 1.73 1.16 0.67 0.98 0.82 1.38 0.86 MTHFR677 A 200 -<300 µg 0.99 1.17 1.48 0.97 0.79 0.76 1.03 1.42 0.89 < 200 µg 1.53 1.28 1.32 1.15 1.53 1.19 0.81 0.56 0.79 MTR G 200 -<300 µg 1.12 1.06 1.31 1.30 1.15 1.26 1.00 0.58 0.93 < 200 µg 1.19 1.30 1.00 0.77 1.15 1.18 1.07 0.76 1.41 MTRR G 200 -<300 µg 1.19 1.41 1.00 0.83 1.22 1.33 0.87 1.00 0.91 < 200 µg 0.75 0.87 1.45 1.00 0.85 0.93 0.74 0.62 0.88
Child
TCN2 C 200 -<300 µg 0.82 0.94 1.27 0.81 1.02 0.79 0.82 0.57 1.07
a Odds ratio associated with a single variant allele (compared to individuals with no variant alleles) of having a child with autism, low factor scores, or low IQ (higher scores reflect higher abilities); associations p < 0.05 are color-coded and bolded; Red = higher risk, blue = lower risk; models include iron, folic acid, vitamins, dietary folate (ref: ≥ 300 µg/d), SNP (ref: 0 risk variants), dietary folate-SNP interactions, maternal age, parity, and education b RSB – repetitive stereotyped behavior, FM – factor mean score, SU – social understanding, VA – verbal ability, SI – social inhibition, SPS – semantic pragmatic skills, A – articulation, IQ – intellectual quotient, LA- language acquisition c FOLR1 estimates are calculated for homozygous AA and heterozygous AG combined due to small numbers of homozygous individuals.

146
Table A26. Odds ratios for interactionsa between dietary folate and maternal genetic variants in folate metabolism and factor scoresb and IQb
Person Variant Dietary folate FM RSB SU VA SI SPS A LA IQ < 200 µg 1.27 0.79 1.28 0.67 0.73 1.28 0.89 0.93 0.97 BHMT A 200 -<300 µg 1.68 1.22 1.21 0.87 0.85 1.16 1.07 1.17 0.96 < 200 µg 0.96 1.10 1.05 0.76 0.71 0.71 0.97 0.77 0.48 CBS T 200 -<300 µg 1.30 0.97 0.97 1.11 1.14 0.93 1.23 0.78 0.68 < 200 µg 0.96 0.74 0.96 1.28 0.74 1.19 0.95 1.08 0.74 COMT A 200 -<300 µg 1.00 0.67 0.94 1.16 0.98 1.05 1.12 1.04 0.99 < 200 µg 2.37 1.88 0.48 1.50 1.20 1.16 1.07 1.25 0.71 FOLR1 AG+AA 200 -<300 µg 1.86 1.47 0.79 1.37 1.58 1.80 0.98 0.82 0.65 < 200 µg 1.03 0.90 0.88 0.89 0.74 0.70 1.02 0.74 0.69 MTHFR1298 G 200 -<300 µg 1.04 1.09 1.08 0.78 0.87 1.02 1.08 1.01 0.78 < 200 µg 1.02 0.89 1.31 0.92 0.77 1.29 0.96 1.28 1.02 MTHFR677 A 200 -<300 µg 1.28 1.02 1.33 1.09 0.87 1.05 1.06 1.36 1.01 < 200 µg 0.92 1.06 1.30 1.06 0.95 1.18 0.74 0.73 0.79 MTR G 200 -<300 µg 0.88 0.76 1.63 1.33 0.85 1.27 0.83 0.91 1.33 < 200 µg 1.51 0.93 1.22 0.99 1.17 1.14 0.81 1.23 0.99 MTRR G 200 -<300 µg 1.42 1.20 1.17 0.93 1.06 1.26 1.15 1.01 0.89 < 200 µg 0.71 0.76 1.40 0.91 0.85 0.78 0.88 0.90 1.01
Mother
TCN2 C 200 -<300 µg 0.86 0.80 1.37 1.12 0.94 0.88 1.27 0.77 1.11
a Odds ratio associated with a single variant allele (compared to individuals with no variant alleles) of having a child with autism, low factor scores, or low IQ (higher scores reflect higher abilities); associations p < 0.05 are color-coded and bolded; Red = higher risk, blue = lower risk; models include iron, folic acid, vitamins, dietary folate (ref: ≥ 300 µg/d), SNP (ref: 0 risk variants), dietary folate-SNP interactions, maternal age, parity, and education b RSB – repetitive stereotyped behavior, FM – factor mean score, SU – social understanding, VA – verbal ability, SI – social inhibition, SPS – semantic pragmatic skills, A – articulation, IQ – intellectual quotient, LA- language acquisition c FOLR1 estimates are calculated for homozygous AA and heterozygous AG combined due to small numbers of homozygous individuals.

147
147 APPENDIX 5: Autism supplement

148
148 Outcome definition
Autism
Several sources were combined to identify individuals with autism in the ALSPAC
cohort. The Bristol Child Health computer system data was searched for individuals who had
special education needs. With parental permission, medical and community child-health records
were searched to identify autism cases. A consultant pediatrician confirmed that diagnostic
information from medical records was consistent with ICD-10 criteria (World Health
Organization’s International Statistical Classification of Diseases and Related Health Problems,
Tenth Revision). Additional sources included text responses to any question on diagnoses given
to the child in questionnaires (6 months – 11 years), the mother’s answer to the question “Have
you ever been told that your child has autism, Asperger’s syndrome or autistic spectrum
disorder?” (9 years), classification by the educational system as requiring special educational
needs due to ASD (16 years), and ad hoc letters from parents to the Study Director. A validation
exercise was carried out using maternal responses to the ALSPAC questionnaire at 91 months,[1]
with screening questions designed to identify an autism spectrum disorder. All individuals
identified had been previously identified.
Statistical methods
Statistical methods were similar to those detailed for cut-point models in the main text.
Logistic regression was used to calculate odds ratios (ORs) with 95% confidence intervals (CI)
for autism. Comparisons with cell counts less than 5 were not calculated; this excluded all autism
interaction comparisons.
Adjusted models included the following potential confounders: maternal age at child’s
birth, education, and parity. Further adjustment for child’s sex, pre-pregnancy body mass index
(BMI) category, smoking status, anti-depressant use during pregnancy, severe depression, and
other psychiatric conditions in main effects models changed supplementation estimates less than
149
149 1% of autism odds ratios, so they were not included in final adjusted models.
Results
Prevalences of child autism were 161 cases/11,741 in the supplementation sample and 65
cases/4897 in the genetic sample. There was no strong evidence of relationships between folic
acid, vitamins, or iron and autism.

150
Table A27. Selected characteristics of the ALSPAC samples by autism
Supplementation
(n = 11,741) Genotype (n = 4897)
autism No autism autism No autism Characteristics 141 (1.2) 11600 (98.8) 65 (1.3) 4832 (98.7) Supplement use Folic acid 18 (12.8) 1003 (8.7) 9 (13.9) 407 (8.4) Iron 36 (25.5) 2504 (21.6) 16 (24.6) 928 (19.2) Vitamins 28 (19.9) 1908 (16.5) 11 (16.9) 827 (17.1) Sex of child – male 115 (81.6) 5928 (51.1) 52 (80.0) 2352 (48.7) Parity
First child 62 (44.0) 5131 (44.2) 31 (47.7) 2221 (46.0) Second child 52 (36.9) 3998 (34.5) 25 (38.5) 1704 (35.3) Third child and higher 25 (17.7) 2273 (19.6) 9 (13.9) 852 (17.6) Missing 2 (1.4) 198 (1.7) 0 (0.0) 55 (1.1)
Maternal education ≥ 12 yrs 61 (43.3) 4034 (34.8) 33 (50.8) 2089 (43.2) Missing 2 (1.4) 540 (4.7) 1 (1.5) 129 (2.7)
Maternal age, mean (SD) 29.5 (4.6) 28.3 (4.9) 29.7 (4.4) 29.1 (4.6) Maternal smoking - yes 25 (17.7) 2767 (23.9) 12 (18.5) 921 (19.1) Maternal body mass index
Underweight (BMI < 18.5) 8 (5.7) 500 (4.3) 4 (6.2) 186 (3.9) Normal (18.5 ≤ BMI < 25) 97 (68.8) 7664 (66.1) 43 (66.2) 3358 (69.5) Overweight (25 ≤ BMI < 30) 14 (9.9) 1571 (13.5) 3 (4.6) 643 (13.3) Obese (BMI ≥30) 7 (5.0) 563 (4.9) 5 (7.7) 229 (4.7) Missing 15 (10.6) 1302 (11.2) 10 (15.4) 416 (8.6)
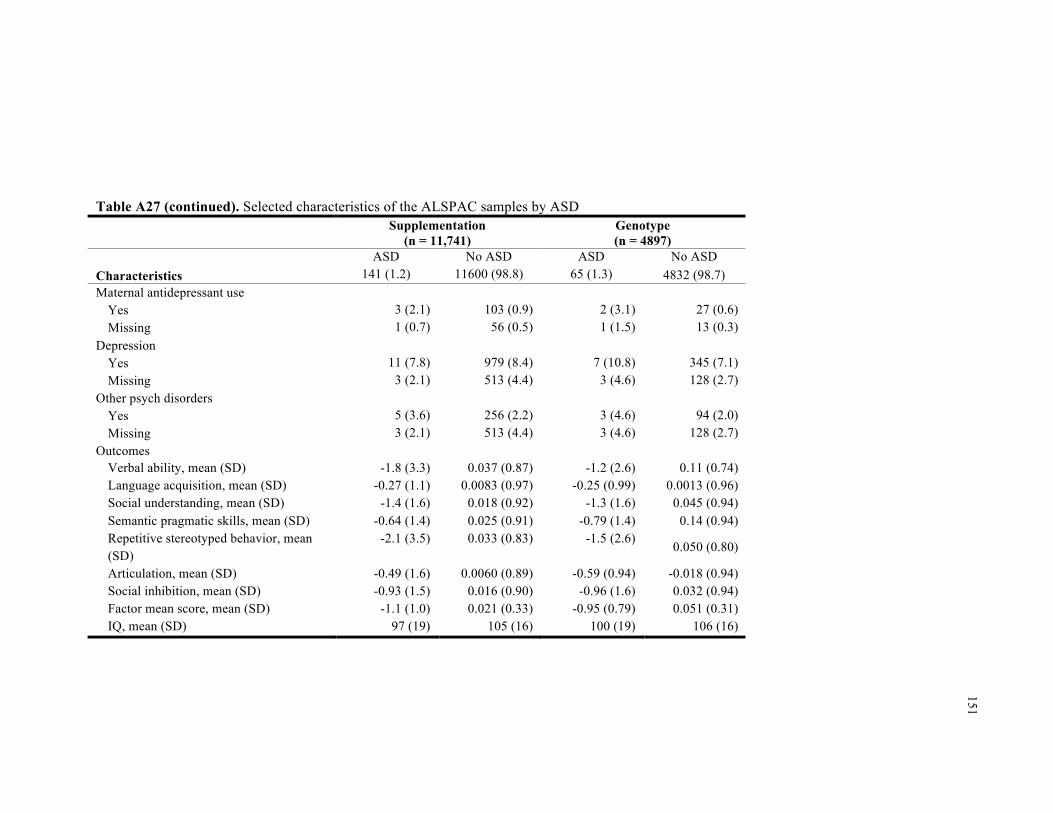
151
Table A27 (continued). Selected characteristics of the ALSPAC samples by ASD
Supplementation (n = 11,741)
Genotype (n = 4897)
ASD No ASD ASD No ASD Characteristics 141 (1.2) 11600 (98.8) 65 (1.3) 4832 (98.7) Maternal antidepressant use
Yes 3 (2.1) 103 (0.9) 2 (3.1) 27 (0.6) Missing 1 (0.7) 56 (0.5) 1 (1.5) 13 (0.3)
Depression Yes 11 (7.8) 979 (8.4) 7 (10.8) 345 (7.1) Missing 3 (2.1) 513 (4.4) 3 (4.6) 128 (2.7)
Other psych disorders Yes 5 (3.6) 256 (2.2) 3 (4.6) 94 (2.0) Missing 3 (2.1) 513 (4.4) 3 (4.6) 128 (2.7)
Outcomes Verbal ability, mean (SD) -1.8 (3.3) 0.037 (0.87) -1.2 (2.6) 0.11 (0.74) Language acquisition, mean (SD) -0.27 (1.1) 0.0083 (0.97) -0.25 (0.99) 0.0013 (0.96) Social understanding, mean (SD) -1.4 (1.6) 0.018 (0.92) -1.3 (1.6) 0.045 (0.94) Semantic pragmatic skills, mean (SD) -0.64 (1.4) 0.025 (0.91) -0.79 (1.4) 0.14 (0.94) Repetitive stereotyped behavior, mean (SD)
-2.1 (3.5) 0.033 (0.83) -1.5 (2.6) 0.050 (0.80)
Articulation, mean (SD) -0.49 (1.6) 0.0060 (0.89) -0.59 (0.94) -0.018 (0.94) Social inhibition, mean (SD) -0.93 (1.5) 0.016 (0.90) -0.96 (1.6) 0.032 (0.94) Factor mean score, mean (SD) -1.1 (1.0) 0.021 (0.33) -0.95 (0.79) 0.051 (0.31) IQ, mean (SD) 97 (19) 105 (16) 100 (19) 106 (16)

152
152
Table A28. Odds ratios and 95% confidence intervals for maternal nutrient supplementation and autism Supplement Unadjusted Adjusteda
Folic acid 1.46 (0.81, 2.63) 1.29 (0.71, 2.35) Vitamins 1.20 (0.79, 1.84) 1.13 (0.73, 1.74) Iron 1.05 (0.66, 1.66) 1.15 (0.73, 1.83) a Models include supplements (iron, folic acid, and vitamins), maternal age, parity, and education
Table A29. Odds ratiosa between dietary folate intake and nutrient supplementation for autism Supplement Unadjusted Adjusteda
Folic acid 1.58 (0.86, 2.89) 1.45 (0.79, 2.67) Vitamins 1.24 (0.81, 1.91) 1.19 (0.77, 1.83) Iron 1.01 (0.62, 1.63) 1.07 (0.65, 1.74) Daily folate intake < 200 µg (Ref) (Ref) 200 - < 300 µg 1.38 (0.91, 2.11) 1.27 (0.83, 1.95) ≥ 300 µg 1.18 (0.70, 1.99) 1.06 (0.62, 1.80) a Models include supplements (iron, folic acid, and vitamins), dietary folate intake, maternal age, parity, and education

153
153
Table A30. Relationshipsa between variant alleles in folate metabolism and autismb
Person Variant OR (95% CI) BHMT A 0.85 (0.57, 1.27) CBS T 1.31 (0.90, 1.90) COMT A 1.03 (0.73, 1.44) FOLR1 AG+AA 0.95 (0.43, 2.10) MTHFR1298 G 1.13 (0.78, 1.63) MTHFR677 A 0.89 (0.61, 1.29) MTR G - MTRR G 0.94 (0.66, 1.33)
Child
TCN2 C 0.79 (0.56, 1.11) BHMT A - CBS T 1.09 (0.73, 1.62) COMT A 0.82 (0.58, 1.16) FOLR1 AG+AA 1.57 (0.82, 3.03) MTHFR1298 G 1.02 (0.70, 1.47) MTHFR677 A - MTR G 1.45 (0.97, 2.17) MTRR G 1.03 (0.73, 1.45)
Mother
TCN2 C 1.11 (0.78, 1.57) a Unadjusted associations; blank cells have at least one cell count < 5
b Odds ratio is designated per risk allele, except for FOLR1 in which odds ratio is designated for heterozygous (AG) and homozygous (AA) genotypes combined.

154
154
Figure A4. Distribution of continuous outcome measures by autism

155
155
Figure A4 (continued). Distribution of continuous outcome measures by autism

156
156
Figure A4 (continued). Distribution of continuous outcome measures by autism

157
157
REFERENCES 1. Buss, A.H. and R. Plomin, Temperament (PLE: Emotion): Early developing personality
traits. Vol. 3. 2014: Psychology Press.

158
CHAPTER 5. Conclusions
159
Summary of findings
While maternal nutrition may be related to ASD, evidence is inconsistent regarding
whether prenatal nutrient supplementation is protective against autism and related traits, and
whether associations depend on presence of intellectual disability and/or relevant genotypes. Few
studies have accounted for the possibility that autism-related traits may have varying
etiologies.[1-3]
An American case-control study reported reduced ASD risk with prenatal vitamins,[4]
folic acid,[5] and iron.[6] Interestingly, lower mean folic acid intake was found for children with
ASD with a lower cognitive function but not for ASD with higher functioning, suggesting that
nutrients may differentially affect ASD risk depending on co-occurrence with intellectual
disability. In the prospective Norwegian Mother and Child Cohort study (MoBa), maternal folic
acid intake, but not other vitamins and minerals, in the peri-conceptional period and early
pregnancy, was associated with lower risk of autistic disorder.[7] The Danish National Birth
Cohort (DNBC) study reported null associations between folic acid and multivitamin intake and
ASD or any of its subtypes.[8]
Studies have linked self-reported folic acid supplementation or dietary folate during
pregnancy with both reduced and strengthened ASD traits.[9-14] Discrepancies may be due to
dissimilarities in trait etiology[15, 16] differences in timing of folic acid initiation, dose,
frequency, or duration, and/or methodological inconsistencies including timing of outcome
assessment and assessment instruments.[16, 17] The body of evidence does not seem to support a
protective association between maternal multivitamins[18-22], folic acid and/or dietary folate
intake[13, 18, 23, 24], or supplementary and/or dietary iron intake[18-20, 23, 25] and child
cognition.
Schmidt et al (2011)[4] explored effect modification between nutritional factors and
functional genetic variants involved in folate metabolism as carried by the mother or child and
risk of ASD. They found interactions between periconceptional prenatal vitamin use and

160
maternal MTHFR 677 TT, CBS rs234715 GT + TT, and child COMT 472 AA genotypes, with
greater autism risk observed among mothers not taking prenatal vitamins. Another study reported
that low daily folate intake (< 400 mg/d) was associated with lower mental development in the
child at 1, 3, 6, and 12 months only among MTHFR677 TT mothers.[26] Since investigating
related traits in addition to clinically diagnosed ASD would provide richer etiological context, we
examine these relationships in two prospective population-based cohorts.
This dissertation examined relationships between maternal nutrient supplementation,
ASD, related traits, and genotypes relevant to folate metabolism. The Stockholm Youth Cohort
(SYC) was used to investigate self-report of maternal nutritional supplementation with folic acid,
iron, and multivitamins and ASD and intellectual disability. The SYC is a total population
register-based cohort of children living in Stockholm County, Sweden. Self-reported supplement
and drug use was assessed at first antenatal visit; most women attended scheduled antenatal care
visits, as they are free of charge in Sweden. The case-finding approach covered all pathways to
ASD care and services in Stockholm County in the context of a universal healthcare system, thus
increasing the likelihood that ASD cases were identified. Intellectual disability was ascertained
through two Stockholm-based registers.
Persons who have a given dietary pattern are likely to be different from persons who do
not have that dietary pattern in terms of socioeconomic characteristics, disease status, healthy
behaviors, or pregnancy characteristics.[17, 27] If these differences also relate to ASD or ID and
are not properly accounted for, then findings may be due to confounding. To address this,
multiple analytic methods provided a more solid base for inference. These included multivariable
regression with adjustment for a large number of covariates, sibling controls to account for
familial environmental and genetic confounding, and propensity score matching to ensure
balanced comparisons between exposed and unexposed individuals. The a priori approach was to
use the different strengths of the three analytic approaches to triangulate on a conclusion. With
their different analytic strengths, limitations, and sample compositions, all three analyses

161
appeared to converge in suggesting that maternal multivitamin use was associated with reduced
risk of ID with and without ASD in the child. Given the absence of associations between
multivitamins and ASD without ID, this seems to suggest that associations observed for ASD
with ID may be related to ID, rather than being linked to ASD.
Calculations of the potential impact of unmeasured confounding suggest that an
unmeasured confounder would have to be a strong protective factor, exerting an effect above and
beyond the covariates matched in propensity score analyses, in order to nullify the potential
associations between multivitamin use ID with and without ASD.
Since healthy lifestyle is a well-known confounder in studies of nutritional supplement
use,[27] our analyses controlled for maternal BMI but were unable to assess the contribution of
diet or other nutritional supplements. However, the sibling control analyses, which would be
expected to control for such cognitive and behavioral confounders similar across pregnancies,
produced point estimates consistent with the regression analyses.
There was no consistent evidence that either iron or folic acid use were associated with
lower risk of ASD or ID. Although there was a possible association of folic acid use with higher
risk of ASD, this was limited to women with hospitalization during pregnancy. Moreover, there
was no association of the iron + folic acid group with ASD risk. This suggests that rather than
use of folic acid, problems associated with hospitalization that may have led to folic acid use
were underlying this result. There was also a possible association of folic acid use with higher
risk of ID only, though the three analytic methods converged in suggesting a reduced risk of ID
with folic acid + iron, which was specific to ID.
Exposure assessment was limited since type, timing, and dose of supplements could not
be determined. Changes to nutritional status or supplement use after the first antenatal visit could
not be assessed. It is possible that the reported supplement was not taken, or a supplement was
taken but not reported. Prevalences of supplement use observed here are in the range of estimates
from other studies in the Swedish population during the same time period.[28, 29] The extent of

162
misclassification is unknown, but since supplement use was prospectively ascertained, it may be
less likely that such misclassification could wholly explain the present findings. External validity
is also not assured, since different populations have different backgrounds of supplement use,
fortification, dietary patterns, and health risks.
Data from the Avon Longitudinal Study of Parents and their Children, UK (ALSPAC)
were used to investigate maternal nutritional supplementation with folic acid, iron, and vitamins
as they relate to autism sub-components, and whether associations depend upon genes involved in
folate metabolism. ALSPAC is a population-based prospective birth cohort study based in Avon,
England that was designed to investigate factors impacting children’s health and development.
Nutritional supplements examined were folic acid, iron, and vitamins reported at 18-weeks
gestation regarding use during pregnancy. Seven factor scores related to autism and 1 combined
score were derived from factor analysis of 93 individual traits assessed in ALSPAC at multiple
ages and IQ scores were obtained at 8.5 years of age. The factors were labeled verbal ability
(VA), social understanding (SU), repetitive-stereotyped behavior (RSB), social inhibition (SI),
language acquisition (LA), semantic-pragmatic skills (SPS), and articulation (A). Four factors
(VA, SU, RSB, SI) were most specific to ASD, while the other factors (LA, SPS, A) were more
specific to learning and language disabilities.
Findings tended to be more specific to language and learning disabilities than they were
to sub-components more specific to autism. Vitamin use was associated with higher language
acquisition skills, while folic acid use was associated with poorer articulation scores; each of
these relationships were also observed for higher dietary folate. Vitamin and folic acid
supplementation were both associated with higher IQ scores in the child. Associations between
folic acid supplementation and IQ appeared to depend upon child MTHFR677 genotype, though
this observation was limited to continuous models. There was no strong evidence of relationships
between iron and ASD sub-components. Since the ALSPAC population consisted primarily of
Caucasian individuals, this work has limited generalizability to non-white populations.

163
The unique data contained within the SYC and ALPSAC made them particularly
appropriate for investigation of the distinct, but interrelated aims of this dissertation. In the SYC,
I investigated relationships between self-report of maternal nutritional supplementation with folic
acid, iron, and multivitamins and ASD and intellectual disability. In ALSPAC, I examined
maternal nutritional supplementation with folic acid, iron, and vitamins as they relate to IQ and
quantitative ASD sub-components, and whether associations depended upon relevant genotypes.
The large size of the Swedish study permitted the use of propensity score and sibling analyses,
which used subsets of the full regression sample, providing a stronger base for inference. These
methods were not practical with the smaller ALSPAC sample. Despite the fairly large size of the
ALSPAC cohort, the low prevalence of autism in these data made it difficult to examine in main
effects models (n = 141, 1.2%) and precluded investigation of interactions with nutrient
supplementation, dietary intake, and relevant genetic variants (n = 65, 1.3%). The a priori focus
of the ALSPAC data were the multiple characteristics associated with autism, that provided a
richer, and perhaps more informative, context for exploring this etiology. These data also
contained an averaged trait score that correlated with autism diagnoses. Given the multiple
comparisons conducted using ALSPAC data, some of the findings in that study may be due to
chance. Focusing on findings replicated for dietary folate, having a magnitude of at least 1% or 1
IQ point, or of relevance to the SYC findings, helped identify associations more likely to be of
etiological importance and worthy of further investigation.
While the SYC study focus was autism and the complimentary ALSPAC focus was of
autism sub-components, the two studies overlapped in their examination of IQ measures. In the
SYC data, intellectual disability (IQ < 70) was examined both with and without co-occurring
autism. In ALSPAC, IQ was examined as a continuous and dichotomized measure, with a 10th
percentile cut-point (IQ ≤ 82). Both studies produced positive associations between maternal
multivitamin/vitamin supplementation and IQ. In the SYC data, there were consistent
associations between maternal multivitamin supplementation and reduced risk ID with and

164
without ASD. In the ALSPAC data, maternal vitamin and folic acid supplementation and
increased dietary folate intake were associated with increased IQ. Collectively, these findings
suggest that maternal nutrition may be related to specific features of autism such as cognition and
facets of language development, and may depend upon maternal and genes involved in folate
metabolism, specifically child MTHFR677. Further scrutiny of maternal nutrition and its role in
the etiology of autism, cognition, and language development is warranted.
Future directions
Further study of maternal nutrient supplementation and ASD should address limitations
of work reported in this dissertation, primarily, improved exposure assessment and more robust
gene-environment interaction assessment. Given that healthy lifestyle is a well-known
confounder in studies of nutritional supplement use, protection against confounding should also
be a priority of future work.
To identify relevant exposure windows, exposure assessment should span the pre- and
peri-conceptional periods, and throughout pregnancy. Given that nutrients other than folic acid
and iron in multivitamins could influence neurodevelopment, future work should examine
multiple determinants of maternal nutritional status, including a complete account of dietary and
supplementary nutrient intake (e.g., timing of initiation, dose, frequency, and duration).
Researchers should consider zinc, which is known to inhibit folic acid[18, 30-32], and other B
vitamins involved in folate metabolism such as B12 and B6, since they can impact the
functionality of folate as a dietary methyl donor. To obviate potential issues with self-report as a
surrogate for prenatal nutrient exposure, biomarkers could additionally be utilized including
blood and/or plasma folate, homocysteine, B12, and B6. Homocysteine is frequently used as a
measure of functional folate status, incorporating dietary, supplementary, and genetic influences.
Important considerations of outcome assessment in future work include the timing of
outcome assessment and use of validated assessment instruments. These studies should include
assessment of autism sub-components including cognition (IQ) and facets of language

165
development.
Further gene-environment work on this etiology requires large sample sizes for adequate
power to detect possible associations. While we examined a subset of genes involved in folate
metabolism, other folate-relevant genes warrant investigation into potential B vitamin
interactions, such as dihydrofolate reductase (DHFR[33]) and reduced folate carriers 1 and
2(RFC-1[34, 35] RFC-2[36]) that have previously shown to be associated with autism. As other
nutrients in multivitamins may be relevant in the etiology of ASD and related traits, biomarkers
and genes relevant to their metabolism also deserve examination. Multiplicative models were
used to investigate potential interactions between maternal nutrient supplementation due to its
ease of interpretation and the model conventionally reported in the gene-environment literature.
Since the absence of multiplicative interaction does not necessarily convey the absence of
interaction, further work should also consider other tests for interaction, such the additive model.
As was conducted in the first part of this dissertation, to address potential confounding by
maternal health behaviors, future work should consider advanced methods such as sibling
controls to account for familial environmental and genetic confounding and propensity score
matching to ensure balanced comparisons between exposed and unexposed individuals. Another
option for addressing potential confounding is utilization of a randomized study design.
There does not yet exist a sufficient body of mechanistic evidence supporting these
findings. Verification in independent epidemiologic investigations with improved exposure
assessment and more robust gene-environment interaction assessment, perhaps in randomized
studies, is necessary before a level of evidence suggesting practice change could be reached.

166
REFERENCES
1. Magnusson, C., et al., Migration and autism spectrum disorder: population-based study. British Journal of Psychiatry, 2012. 201(2): p. 109-115.
2. Rai, D., et al., Parental depression, maternal antidepressant use during pregnancy, and risk of autism spectrum disorders: population based case-control study. British Medical Journal, 2013. 346: p. 15.
3. Szatmari, P., J. White, and K.R. Merikangas, The use of genetic epidemiology to guide classification in child and adult psychopathology. International Review of Psychiatry, 2007. 19(5): p. 483-496.
4. Schmidt, R.J., et al., Prenatal vitamins, one-carbon metabolism gene variants, and risk for autism. Epidemiology, 2011. 22(4): p. 476-485.
5. Schmidt, R.J., et al., Maternal periconceptional folic acid intake and risk of autism spectrum disorders and developmental delay in the CHARGE (CHildhood Autism Risks from Genetics and Environment) case-control study. American Journal of Clinical Nutrition, 2012. 96(1): p. 80-89.
6. Schmidt, R.J., et al., Maternal intake of supplemental iron and risk of autism spectrum disorder. American Journal of Epidemiology, 2014: p. 890-900.
7. Suren, P., et al., Association between maternal use of folic acid supplements and risk of autism spectrum disorders in children. Journal of the American Medical Association, 2013. 309(6): p. 570-577.
8. Virk, J., et al., Preconceptional and prenatal supplementary folic acid and multivitamin intake and autism spectrum disorders. Autism, 2016. 20(6): p. 710-718.
9. Chatzi, L., et al., Effect of high doses of folic acid supplementation in early pregnancy on child neurodevelopment at 18 months of age: the mother-child cohort "Rhea" study in Crete, Greece. Public Health Nutrition, 2012. 15(09): p. 1728-1736.
10. Villamor, E., et al., Maternal intake of methyl-donor nutrients and child cognition at 3 years of age. Paediatr Perinat Epidemiol, 2012. 26(4): p. 328-35.
11. Roth, C., et al., Folic Acid Supplements in Pregnancy and Severe Language Delay in Children. Jama-Journal of the American Medical Association, 2011. 306(14): p. 1566-1573.
12. Wehby, G.L. and J.C. Murray, The effects of prenatal use of folic acid and other dietary supplements on early child development. Maternal and child health journal, 2008. 12(2): p. 180-187.
13. Julvez, J., et al., Maternal use of folic acid supplements during pregnancy and four-year-old neurodevelopment in a population-based birth cohort. Paediatric and perinatal epidemiology, 2009. 23(3): p. 199-206.

167
14. Steenweg-de Graaff, J., et al., Folate concentrations during pregnancy and autistic traits in the offspring. The Generation R Study. The European Journal of Public Health, 2014: p. cku126.
15. Ronald, A., et al., Genetic heterogeneity between the three components of the autism spectrum: A twin study. Journal of the American Academy of Child and Adolescent Psychiatry, 2006. 45(6): p. 691-699.
16. Steer, C.D., J. Golding, and P.F. Bolton, Traits contributing to the autistic spectrum. PloS one, 2010. 5(9): p. e12633.
17. DeVilbiss, E.A., et al., Maternal folate status as a risk factor for autism spectrum disorders: a review of existing evidence. British Journal of Nutrition, 2015. 114(5): p. 663-672.
18. Christian, P., et al., Prenatal Micronutrient Supplementation and Intellectual and Motor Function in Early School-aged Children in Nepal. Jama-Journal of the American Medical Association, 2010. 304(24): p. 2716-2723.
19. Li, Q., et al., Effects of Maternal Multimicronutrient Supplementation on the Mental Development of Infants in Rural Western China: Follow-up Evaluation of a Double-Blind, Randomized, Controlled Trial. Pediatrics, 2009. 123(4): p. E685-E692.
20. Li, C., et al., Prenatal micronutrient supplementation is not associated with intellectual development of young school-aged children. The Journal of nutrition, 2015. 145(8): p. 1844-1849.
21. McGrath, N., et al., Effect of maternal multivitamin supplementation on the mental and psychomotor development of children who are born to HIV-1 - Infected mothers in Tanzania. Pediatrics, 2006. 117(2): p. E216-E225.
22. Prado, E.L., et al., Maternal multiple micronutrient supplementation and other biomedical and socioenvironmental influences on children's cognition at age 9–12 years in Indonesia: follow-up of the SUMMIT randomised trial. The Lancet Global Health, 2017. 5(2): p. e217-e228.
23. Boeke, C.E., et al., Choline Intake During Pregnancy and Child Cognition at Age 7 Years. American Journal of Epidemiology, 2013. 177(12): p. 1338-1347.
24. Campoy, C., et al., Effects of prenatal fish-oil and 5-methyltetrahydrofolate supplementation on cognitive development of children at 6.5 y of age. American Journal of Clinical Nutrition, 2011. 94(6): p. 1880S-1888S.
25. Zhou, S.J., et al., Effect of iron supplementation during pregnancy on the intelligence quotient and behavior of children at 4 y of age: long-term follow-up of a randomized controlled trial. American Journal of Clinical Nutrition, 2006. 83(5): p. 1112-1117.
26. Garcia, C.D., et al., Maternal MTHFR 677C > T genotype and dietary intake of folate and vitamin B-12: their impact on child neurodevelopment. Nutritional Neuroscience, 2009. 12(1): p. 13-20.

168
27. Lawlor, D.A., et al., Those confounded vitamins: what can we learn from the differences between observational versus randomised trial evidence? Lancet, 2004. 363(9422): p. 1724-1727.
28. Granfors, M., et al., No association between use of multivitamin supplement containing vitamin D during pregnancy and risk of Type 1 Diabetes in the child. Pediatr Diabetes, 2016. 17(7): p. 525-530.
29. Ericson, A., B. Källén, and A. Åberg, Use of multivitamins and folic acid in early pregnancy and multiple births in Sweden. Twin Research, 2001. 4(02): p. 63-66.
30. Dobo, M. and A. Czeizel, Long-term somatic and mental development of children after periconceptional multivitamin supplementation. European journal of pediatrics, 1998. 157(9): p. 719-723.
31. Ghishan, F.K., et al., Intestinal Transport of Zinc and Folic-Acid - a Mutual Inhibitory Effect. American Journal of Clinical Nutrition, 1986. 43(2): p. 258-262.
32. Milne, D.B., et al., Effect of Oral Folic-Acid Supplements on Zinc, Copper, and Iron-Absorption and Excretion. American Journal of Clinical Nutrition, 1984. 39(4): p. 535-539.
33. Adams, M., et al., Preliminary evidence for involvement of the folate gene polymorphism 19bp deletion-DHFR in occurrence of autism. Neuroscience letters, 2007. 422(1): p. 24-29.
34. James, S.J., et al., Metabolic endophenotype and related genotypes are associated with oxidative stress in children with autism. American Journal of Medical Genetics Part B: Neuropsychiatric Genetics, 2006. 141(8): p. 947-956.
35. James, S.J., et al., A functional polymorphism in the reduced folate carrier gene and DNA hypomethylation in mothers of children with autism. American Journal of Medical Genetics Part B: Neuropsychiatric Genetics, 2010. 153(6): p. 1209-1220.
36. Sanders, S.J., et al., Multiple recurrent de novo CNVs, including duplications of the 7q11. 23 Williams syndrome region, are strongly associated with autism. Neuron, 2011. 70(5): p. 863-885.
169
169 APPENDIX 6. Literature review: Maternal nutrients and child cognition
Studies were identified through Pubmed searches and references of reviews and meta-analyses. On January 25, 2017 a search of “(pregnancy OR prenatal) supplement (intelligence OR iq)” yielded 54 hits, and on January 30, 2017, a search of “(pregnancy OR prenatal) plasma (intelligence OR iq)” yielded 62 hits. Hits were retained if they had relevance to maternal folic acid and/or iron supplementation and/or intake or multivitamin supplementation, and child cognition, and examined an unexposed or control group.

170
Table A31. Studies examining relationships between maternal folic acid supplementation and/or folate intake and child cognition
Author, year, country
Study design, sample size
Nutrient Timing
Construct at age - instrument Results
Folic acid Positive Christian, P; 2010, Nepal[1]
RCT n = 676
Treatment: Fe (60 mg) + FA (400 ug) + Vitamin A (1000-µg retinol equivalents) Control: Vitamin A Mean 11 w gestation through 3 mo postpartum
Intelligence at 7-9 y - Universal Nonverbal Intelligence Test (UNIT)
The mean UNIT T score in the Fe + FA group was 51.7 (8.5) and in the control group was 48.2 (10.2), with an adjusted mean difference of 2.38 (95% CI: 0.06-4.70; p = 0.04).
Negative Campoy, C; 2011, Germany, Spain and Hungary[2]
RCT n = 37 5-MTHF n = 35 Fish oil + 5-MTHF n = 45 C
Treatments: 5-methyl tetrahydrofolate (400 µg) Fish oil + 5-methyl tetrahydrofolate Control: Placebo Plasma/erythrocyte folate during 2nd and 3rd trimester, and birth 20 w gestation until birth
Mental processing at 6.5 y - Kaufman Assessment Battery for Children (KABC): Mental Processing Composite (MPC)
No significant difference in cognitive scores between groups No association of maternal plasma or erythrocyte folate concentrations during pregnancy and at the time of delivery with cognitive function
Boeke, C; 2013, USA[3]
Prospective cohort n = 813
Mean daily intake of folate from FFQ and supplements Mean 11.7 and 29.1 w gestation
Intelligence at 7 y - Kaufman Brief Intelligence Test-II edition (KBIT-II)
Folate intake was not associated with intelligence, regardless of whether food and supplement intake was assessed separately.
Julvez, J; 2009, Spain[4]
Prospective cohort n = 420
FA containing supplements Vitamins without folic acid No folic acid or other vitamin supplements Median 12.4 w gestation
General cognition at 4 y - McCarthy Scales of Children’s Abilities (MSCA)
FA supplement use during pregnancy was not associated with global cognitive scores.

171
Table A31 (continued). Studies examining relationships between maternal folic acid supplementation and/or folate intake and child cognition
Author, year, country
Study design, sample size
Nutrient Timing
Construct at age - instrument Results
Folic acid Biomarker studies Positive Veena, SR; 2010, India[5]
Prospective cohort n = 536
Plasma folate, B12, and tHcy 30 ± 2 w gestation
Kaufman assessment battery at 9-10 y
1 SD increase in maternal folate associated with 0.1-0.2 SD increase in cognitive test scores No consistent associations with B12 or tHcy
Negative Wu, BTF; 2012, Canada[6]
Prospective cohort n = 154
Plasma folate and tHcy 16 and 36 w gestation
Cognitive skills at 18 mo - Bayley Scales of Infant Development
No association of folate and tHcy with cognitive function
Bhate, V; 2008, India[7]
Prospective cohort n = 108
Erythrocyte folate and tHcy 28 w gestation
Intelligence at 9 y - Raven’s Colored Progressive Matrices
No association of erythrocyte folate or tHcy with intelligence
Tamura, T; 2005, USA[8]
Prospective cohort n = 335
Red cell and plasma folate – 19, 26 and 37 w gestation tHcy concentrations – 26 and 37 weeks Low folate-(plasma folate <11 nmol/L) Red cell folate <430 nmol/L) High tHcy (tHcy > 7µmol/L
IQ at 5 y - Differential Ability Scale (verbal, nonverbal and General IQ)
No difference in IQ between children of mothers with normal and deficient folate and tHcy groups No difference in test scores across quartiles of folate status
Interaction del Rio Garcia, C; 2009, Mexico[9]
Prospective cohort n = 253
Daily dietary intake of folate First trimester FFQ
Mental development 0-12 mo - Bayley Scales of Infant Development-II Mental Development Index (MDI)
Mean MDI was reduced by 1.8 points (95% CI: –3.6 to –0.04) in infants of mothers with folate intake < 400 µ g/d who were MTHFR677 TT carriers.
Acronyms and abbreviations: Fe iron, FA folic acid, w weeks, mo months, tHcy total homocysteine, CI confidence interval, SD standard deviation, MTHFR methylenetetrahydrofolate reductase

172
Table A32. Studies examining relationships between maternal multivitamin supplementation and child cognition
Author, year, country
Study design, sample size
Nutrient Timing Construct at age - instrument Results
Multivitamin Positive Prado, E; 2012, Indonesia
RCT n = 1466 MVM n = 1413 C
Treatment: MVM: Fe (30 mg) + FA (400 µg) + Vitamins: A (800 ug), B1 (1.4 mg), B2 (1.4 mg), B3 (18.0 mg), B6 (1.9 mg), B12 (1.6 µg), C (70 mg), D (200 IU), E (10.0 mg) + Minerals Cu (2.0 mg), I (150 µg) Se (65 µg), Zn (15.0 mg) Control: Fe (30 mg) + FA (400 µg) 1st prenatal visit to 3 mo postpartum
Intellectual ability (Verbal ability: general knowledge – Information test, Verbal ability: semantic memory and lexical retrieval - Speeded picture naming test, Non-verbal ability: spatial pattern copying – Block design test)
In children of anaemic mothers, the MMN group scored significantly higher in general intellectual ability (B=0.18 [95% CI 0.06–0.31], p=0.0047). No significant effect of MMN was noted for the representative sample or undernourished mothers.
Negative Li, Q; 2009, China[10]
RCT n = 1305 n = 438 Fe + FA n = 396 MVM n = 471 C
Mental development at 3, 6, and 12 mo - Bayley Scales of Infant Development: Mental development index (MDI)
No significant difference in MDI score at 3 and 6 mo Mean MDI score among children of MVM group increased by 1 and 1.22 points compared to children of FA, or FA + Fe at 12 mo
Li, C; 2015, China[11]
RCT n = 1744 n = 562 Fe + FA n = 578 MVM n = 604 C
Treatments: FA (400 µg) FA + Fe (60 mg) MVM: FA, Fe (30 mg) + Vitamins A (800 µg), B1 (1.4 mg), B2 (1.4 mg), B3 (18 mg), B6 (1.9 mg), B12 (2.6 µg), C (70 mg), D (5 µg), E (10 mg) + Minerals: Cu (2.0 mg), I (150 µg), Se (65 µg), Zn (15 mg) Mean 13.8 w gestation until birth
IQ at 7-10 y - Wechsler Intelligence Scale for Children Fourth Edition (WISC-IV)
Mean differences in IQ were not significant between FA and either Fe + FA or MVM supplementation.

173
Table A32 (continued). Studies examining relationships between maternal multivitamin supplementation and child cognition
Author, year, country
Study design, sample size
Nutrient Timing Construct at age - instrument Results
Multivitamin Negative McGrath, N; 2006, Tanzania[12]
RCT n = 140 T n = 137 C
Treatment: MVM+A: A (6000 ug), B1 (20 mg), B2 (20mg), B6 (25mg), B3 (100 mg), B12 (50 g), C (500 mg), E (30 mg), FA (800 ug) OR MVM-A Control: Vitamin A (6000 ug) OR Placebo HIV-infected mothers < 28 w gestation to 18 mo postpartum
Mental development at 6, 12, 18 mo - Bayley Scales of Infant Development Mental development index (MDI)
No significant difference in MDI between MVM and controls at any age
Christian, P; 2010, Nepal[1]
RCT n = 676 n = 200 MVM Vit A
MVM: Vitamins A (1000 ug), B1 (1.6 mg), B2 (1.8 mg), B3 (20 mg), B6 (2.2 mg), FA (400 ug), B12 (2.6 ug), C (100 mg), D (10 ug), E (10 mg), K (65 ug), Minerals: Cu (2.0 mg), Fe (60 mg), Mg (100 mg), Zn (30 mg) Control: Vitamin A (1000 ug) Early pregnancy through 3 mo postpartum
Intelligence at 7-9 y - Universal Nonverbal Intelligence Test (UNIT)
No significant difference in mean UNIT T score between MVM and controls
Acronyms and abbreviations: Fe iron, FA folic acid, MVM multivitamin, Cu copper, I iodine, Se selenium, Zn zinc, w weeks, mo months, CI confidence interval

174
Table A33. Studies examining relationships between maternal iron supplementation and/or intake and child cognition
Author, year, country
Study design, sample size
Nutrient Timing Construct at age - instrument Results
Iron Positive Christian, P; 2010, Nepal[1]
RCT n = 676
Treatment: Fe (60 mg) + FA (400 ug) + Vitamin A (1000 µg) Control: Vitamin A (1000 µg) Early pregnancy through 3 mo postpartum
Intelligence at 7-9 y - Universal Nonverbal Intelligence Test (UNIT)
Significant difference in the mean UNIT T score in the Fe + FA group was 51.7 (8.5) compared to the control group was 48.2 (10.2), with an adjusted mean difference of 2.38 (95% CI, 0.06-4.70; p = 0.04).
Negative Li, Q; 2009[10] and 2015[11], China
RCT 3 – 12 mo [10] n = 438 T n = 471 C 7-10 yr [11] n = 562 T n = 604 C
Treatment: FA (400 µg) + Fe (60 mg) Control: FA (400 µg) 14 w gestation until birth
Mental development at 3, 6, and 12 mo - Bayley Scales of Infant Development: Mental development index (MDI) [10] IQ at 7-10 y - Wechsler Intelligence Scale for Children Fourth Edition (WISC-IV) [11]
No significant difference in MDI or IQ between FA and FA + Fe groups at any age
Zhou, SJ; 2006, Australia[13]
RCT n = 153 T n= 149 C
Treatment: Fe (20 mg) Control: Placebo 20 w gestation until birth
IQ at 4 y - Stanford-Binet Intelligence Scale
No significant difference in mean IQ between Fe and placebo groups
Boeke, CE; 2013, USA[3]
Prospective cohort n = 813
Mean daily intake of iron from FFQ and supplements Mean 11.7 and 29.1 w gestation
Intelligence at mean 7.8 y - Kaufman Brief Intelligence Test-II edition (KBIT-II)
No association between iron intake and intelligence
Acronyms and abbreviations: Fe iron, FA folic acid, w weeks, mo months, CI confidence interval
175
175
REFERENCES
1. Christian, P., et al., Prenatal Micronutrient Supplementation and Intellectual and Motor Function in Early School-aged Children in Nepal. Jama-Journal of the American Medical Association, 2010. 304(24): p. 2716-2723.
2. Campoy, C., et al., Effects of prenatal fish-oil and 5-methyltetrahydrofolate supplementation on cognitive development of children at 6.5 y of age. American Journal of Clinical Nutrition, 2011. 94(6): p. 1880S-1888S.
3. Boeke, C.E., et al., Choline Intake During Pregnancy and Child Cognition at Age 7 Years. American Journal of Epidemiology, 2013. 177(12): p. 1338-1347.
4. Julvez, J., et al., Maternal use of folic acid supplements during pregnancy and four-year-old neurodevelopment in a population-based birth cohort. Paediatric and perinatal epidemiology, 2009. 23(3): p. 199-206.
5. Veena, S.R., et al., Higher maternal plasma folate but not vitamin B-12 concentrations during pregnancy are associated with better cognitive function scores in 9-to 10-year-old children in South India. The Journal of nutrition, 2010. 140(5): p. 1014-1022.
6. Wu, B.T.F., et al., Early Second Trimester Maternal Plasma Choline and Betaine Are Related to Measures of Early Cognitive Development in Term Infants. Plos One, 2012. 7(8): p. 8.
7. Bhate, V., et al., Vitamin B(12) status of pregnant Indian women and cognitive function in their 9-year-old children. Food and Nutrition Bulletin, 2008. 29(4): p. 249-254.
8. Tamura, T., et al., Folate status of mothers during pregnancy and mental and psychomotor development of their children at five years of age. Pediatrics, 2005. 116(3): p. 703-708.
9. Garcia, C.D., et al., Maternal MTHFR 677C > T genotype and dietary intake of folate and vitamin B-12: their impact on child neurodevelopment. Nutritional Neuroscience, 2009. 12(1): p. 13-20.
10. Li, Q., et al., Effects of Maternal Multimicronutrient Supplementation on the Mental Development of Infants in Rural Western China: Follow-up Evaluation of a Double-Blind, Randomized, Controlled Trial. Pediatrics, 2009. 123(4): p. E685-E692.
11. Li, C., et al., Prenatal micronutrient supplementation is not associated with intellectual development of young school-aged children. The Journal of nutrition, 2015. 145(8): p. 1844-1849.
12. McGrath, N., et al., Effect of maternal multivitamin supplementation on the mental and psychomotor development of children who are born to HIV-1 - Infected mothers in Tanzania. Pediatrics, 2006. 117(2): p. E216-E225.

176
176
13. Zhou, S.J., et al., Effect of iron supplementation during pregnancy on the intelligence quotient and behavior of children at 4 y of age: long-term follow-up of a randomized controlled trial. American Journal of Clinical Nutrition, 2006. 83(5): p. 1112-1117.

177
Vita Elizabeth Anne DeVilbiss, PhD, MPH, MS
Education 2017, 2012 Drexel University – Philadelphia, PA
Doctorate of Philosophy Degree (Ph.D.), Epidemiology: June 2017 Master of Public Health (M.P.H.) Degree, Epidemiology and Biostatistics: June 2012 Advisor & Dissertation Chair: Brian K. Lee, Ph.D. Dissertation Title: “Prenatal nutritional supplementation and autism spectrum disorders in two European population-based cohorts” GPA: 3.9/4.0
2006 Duke University – Durham, NC Master of Science Degree (M.S.), Biomedical Engineering: September 2006 GPA: 3.5/4.0 2005 The Pennsylvania State University – University Park, PA Bachelor of Science Degree (B.S.), Chemical Engineering: May 2005 Minor: Bioengineering GPA: 3.5/4.0 Professional Experience 2011-2017 ExxonMobil Biomedical Sciences, Inc.
Environmental and Occupational Epidemiology Intern, Contractor Clinton, NJ
2008-2010, Merck & Co., Inc. 2006-2007 Staff Vaccine Engineer West Point, PA Publications Schnatter, AR; Chen, M; DeVilbiss, EA; Lewis, RJ; Gallagher, E. Systematic Review and Meta-Analysis of Selected Cancers in Petroleum Refinery Workers, submitted to EHP 6/2017, in review. DeVilbiss, EA; Magnusson, C; Gardner, RM, Rai, D; Newschaffer, CJ; Lyall, K; Dalman, C; Lee, BK. Prenatal nutritional supplementation and autism spectrum disorders in the Stockholm Youth Cohort, submitted to BMJ 11/2016, in review. DeVilbiss, EA; Gardner, RM; Newschaffer, CJ; Lee, BK. Maternal folate status as a risk factor for autism spectrum disorders: a review of existing evidence. British Journal of Nutrition 09/2015; 114 (5):663-672. DeVilbiss, E and Lee, BK. Brief Report: Trends in US National Autism Awareness from 2004 to 2014: The Impact of National Autism Awareness Month. Journal of Autism and Developmental Disorders 06/2014; 44(12). Glass, DC; Schnatter, AR; Tang, G; Irons, RD; Rushton, L; Ryder, J; Sim, M; Pearlman, E; Sorahan, T; Armstrong, A; Verma, D; Marcella, S; Chen, M; DeVilbiss, E. Risk of myeloproliferative disease and chronic myeloid leukaemia following exposure to low-level benzene in a nested case-control study of petroleum workers. Occupational and Environmental Medicine 04/2014; 71(4):266-274. Reviewer: Nutrition, Psychological Medicine, Journal of Clinical Psychopharmacology, Journal of Autism and Developmental Disorders, Environmental Health Perspectives, Journal of Nutrition Conferences Panel speaker - Recent Advances in Statistical Methods for Autism Research. International Meeting for Autism Research 05/2016; Baltimore, MD. Poster - Maternal Use of Prenatal Nutritional Supplements and Risk of Autism in the Stockholm Youth Cohort. International Meeting for Autism Research 05/2015; Salt Lake City, UT. Teaching Assistantships: Intermediate Biostatistics I & II, Introduction to Descriptive Epidemiology and Biostatistics (2x), Introduction to Analytic Epidemiology and Biostatistics (2x), Introduction to Epidemiology - Executive Program, Design and Analysis of Epidemiological Studies, Infectious Disease Epidemiology, Cancer Epidemiology