nutritional anthropometric survey - Action Against Hunger
27
1 NUTRITIONAL ANTHROPOMETRIC SURVEY CHILDREN UNDER FIVE YEARS (6 TO 59 MONTHS) MANDERA CENTRAL AND KHALALIO DIVISIONS FINAL REPORT March 7 th – March 12 th , 2005 Rachel Onyiro – Senior Nurse/Nutritionist AAH Mandera Base Peris Mwaura – Nutritionist, AAH Mandera
-
Upload
khangminh22 -
Category
Documents
-
view
0 -
download
0
Transcript of nutritional anthropometric survey - Action Against Hunger
1
NUTRITIONAL ANTHROPOMETRIC SURVEY
CHILDREN UNDER FIVE YEARS (6 TO 59 MONTHS)
MANDERA CENTRAL AND KHALALIO DIVISIONS
FINAL REPORT
March 7th – March 12th, 2005
Rachel Onyiro – Senior Nurse/Nutritionist AAH Mandera Base
Peris Mwaura – Nutritionist, AAH Mandera
2
ACKNOWLEDGEMENTS
AAH Kenya mission would like to thank the following for their support and active participation in the survey. UNICEF District Commissioner Mandera Mandera Central chiefs and elders Ministry of Health Gedo Health Consortium World Food Programme Local survey team Mandera Polytechnic who gave us the training premises District Steering Committee Mothers and caretakers
3
INTRODUCTION Background The district of Mandera is part of the North Eastern Province of Kenya and is dominated by ethnic Somalis, predominantly Muslims. The district covers an area of 26,474 km2 and shares international boundaries with Ethiopia to the North, Somalia to the East, as well as national boundaries with Wajir district to the West and South West. Mandera district has 18 administrative divisions* with 82 locations and 119 sub locations. The projected 2005 population for the entire district, according to data from the UN 2005 Food Security Assessment is approximately 311,777 people. The total population of Mandera Central and Khalalio divisions is estimated to be 63,658. The area has a very harsh, dry and hot climate with temperatures ranging from 30 – 40 degrees centigrade with a mean annual rainfall of around 250mm. The district has in theory two rainy seasons, the long rains and the short rains. The long rains occur in the month of April to June while short rains occur in October to December. From December to April there is the long dry season, and from June to October the main dry season. The population of Mandera is primarily described as 80% nomadic and pastoralist. According to an earlier assessment† not more than 7% of the population of the district are merchants, traders and salaried workers living in urban centers. Around 15% of the population lives along the river Dawa, natural border with Ethiopia. They are agro-pastoralists with limited access to irrigation. In other regions, rain dependant agriculture exists, however, there is little land in the region with potential for cultivation and agriculture is of minor importance. The rest of the population consider themselves pastoralists. Not all of the population herd livestock or are nomadic. Currently more of the pastoralist groups are settled or partly settled than living full time in grazing areas with livestock. Chronic problems in the district stem from political, social and economic marginalization and the area has poor infrastructure, very limited employment opportunities, limited education and health care. The population is, similarly to Somalia, divided into clans. The four main clans are the Garre (who speak Borana), Degodia, Murule and Corner tribe (who speak Somali), each principally occupying a geographically distinct area within the district. There are community elders and locally elected chiefs and sub chiefs who interact between the communities and government officials. Current health problems in the district can be seen to extend from the last severe drought in 1991 and 1992. Poor rainy seasons have followed one after another, which have not permitted the majority of those who lost their herds to return to their way of life. The floods of 1998 pushed the whole society close to collapse: as they destroyed most of the cattle and brought new diseases to the one that was still alive. The successive droughts in the two years that have followed the floods have eliminated the small benefits brought about by the excess pastures and high water tables left behind by the heavy rains. At the time of the survey, the main NGOs and UN agencies operating in the area are: - United Nations World Food Programme (WFP): carrying out targeted food distributions
through their EMOP programme across the whole district. - Rural Community Integrated Development Agency (RACIDA): runs the following
programmes: Water and sanitation, Education, Agriculture and Peace building in Mandera District.
* Mandera Central, Banisa, Ashabito, Dandu, Elwak, Rhamu, Kutulo, Malkameri, Takaba, Wargadud, Khalalio, Fino, Lafey, Rhamu Dimtu, Hareri, Shimbir Fatuma, Warankara, Libehia. † Nutritional Causal Analysis Mandera district, November/December 2001, Abigail Montani, Action Against Hunger UK
4
- Mandera Educational Development Society (MEDS): is focused on water, health and education. They operate mainly in Takaba, El Wak and Mandera town.
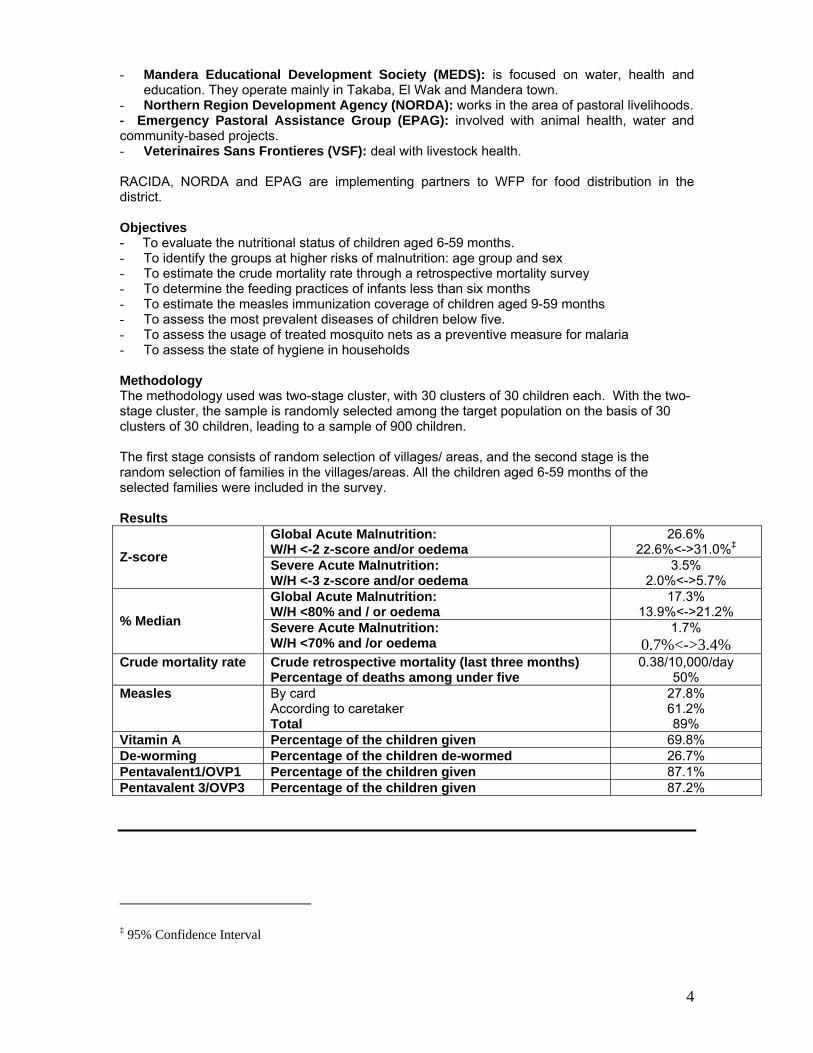
- Northern Region Development Agency (NORDA): works in the area of pastoral livelihoods. - Emergency Pastoral Assistance Group (EPAG): involved with animal health, water and community-based projects. - Veterinaires Sans Frontieres (VSF): deal with livestock health. RACIDA, NORDA and EPAG are implementing partners to WFP for food distribution in the district. Objectives - To evaluate the nutritional status of children aged 6-59 months. - To identify the groups at higher risks of malnutrition: age group and sex - To estimate the crude mortality rate through a retrospective mortality survey - To determine the feeding practices of infants less than six months - To estimate the measles immunization coverage of children aged 9-59 months - To assess the most prevalent diseases of children below five. - To assess the usage of treated mosquito nets as a preventive measure for malaria - To assess the state of hygiene in households Methodology The methodology used was two-stage cluster, with 30 clusters of 30 children each. With the two-stage cluster, the sample is randomly selected among the target population on the basis of 30 clusters of 30 children, leading to a sample of 900 children. The first stage consists of random selection of villages/ areas, and the second stage is the random selection of families in the villages/areas. All the children aged 6-59 months of the selected families were included in the survey. Results
Global Acute Malnutrition: W/H <-2 z-score and/or oedema
26.6% 22.6%<->31.0%‡ Z-score Severe Acute Malnutrition:
W/H <-3 z-score and/or oedema 3.5%
2.0%<->5.7% Global Acute Malnutrition: W/H <80% and / or oedema
17.3% 13.9%<->21.2%
% Median Severe Acute Malnutrition: W/H <70% and /or oedema
1.7% 0.7%<->3.4%
Crude mortality rate Crude retrospective mortality (last three months) Percentage of deaths among under five
0.38/10,000/day 50%
Measles By card According to caretaker Total
27.8% 61.2% 89%
Vitamin A Percentage of the children given 69.8% De-worming Percentage of the children de-wormed 26.7% Pentavalent1/OVP1 Percentage of the children given 87.1% Pentavalent 3/OVP3 Percentage of the children given 87.2%
‡ 95% Confidence Interval

5
INTRODUCTION The district of Mandera is part of the North Eastern Province of Kenya and is dominated by ethnic Somalis, predominantly Muslims. The district covers an area of 26,474 km2 and shares international boundaries with Ethiopia to the North, Somalia to the East, as well as national boundaries with Wajir district to the West and South West. Mandera district has 18 administrative divisions§ with 82 locations and 119 sub locations. The projected 2005 population for the entire district, according to data from the UN 2005 Food Security Assessment is approximately 311,777 people. The total population of Mandera Central and Khalalio divisions is estimated to be 63,658. The area has a very harsh, dry and hot climate with temperatures ranging from 30 – 40 degrees centigrade with a mean annual rainfall of around 250mm. The district has in theory two rainy seasons, the long rains and the short rains. The long rains occur in the month of April to June while short rains occur in October to December. From December to April there is the long dry season, and from June to October the main dry season. The population of Mandera is primarily described as 80% nomadic and pastoralist. According to an earlier assessment** not more than 7% of the population of the district is merchants, traders and salaried workers living in urban centers. Around 15% of the population lives along the river Dawa, natural border with Ethiopia. They are agro-pastoralists with limited access to irrigation. In other regions, rain dependant agriculture exists, however, there is little land in the region with potential for cultivation and agriculture is of minor importance. The rest of the population consider themselves pastoralists. Not all of the population herd livestock or are nomadic. Currently more of the pastoralist groups are settled or partly settled than living full time in grazing areas with livestock. Chronic problems in the district stem from political, social and economic marginalization and the area has poor infrastructure, very limited employment opportunities, limited education and health care. The population is, similarly to Somalia, divided into clans. The four main clans are the Garre (who speak Borana), Degodia, Murule and Corner tribe (who speak Somali), each principally occupying a geographically distinct area within the district. There are community elders and locally elected chiefs and sub chiefs who interact between the communities and government officials. Current health problems in the district can be seen to extend from the last severe drought in 1991 and 1992. Poor rainy seasons have followed one after another, which have not permitted the majority of those who lost their herds to return to their way of life. The floods of 1998 pushed the whole society close to collapse: as they destroyed most of the cattle and brought new diseases to the one that was still alive. The successive droughts in the two years that have followed the floods have eliminated the small benefits brought about by the excess pastures and high water tables left behind by the heavy rains. At the time of the survey, the main NGOs and UN agencies operating in the area are: - United Nations World Food Programme (WFP): carrying out targeted food distributions
through their EMOP programme across the whole district.
§ Mandera Central, Banisa, Ashabito, Dandu, Elwak, Rhamu, Kutulo, Malkameri, Takaba, Wargadud, Khalalio, Fino, Lafey, Rhamu Dimtu, Hareri, Shimbir Fatuma, Warankara, Libehia. ** Nutritional Causal Analysis Mandera district, November/December 2001, Abigail Montani, Action Against Hunger UK
6
- Rural Community Integrated Development Agency (RACIDA): runs the following programmes: Water and sanitation, Education, Agriculture and Peace building in Mandera District.
- Mandera Educational Development Society (MEDS): is focused on water, health and education. They operate mainly in Takaba, El Wak and Mandera town.
- Northern Region Development Agency (NORDA): works in the area of pastoral livelihoods. - Emergency Pastoral Assistance Group (EPAG): involved with animal health, water and
community-based projects. - Veterinaires Sans Frontieres (VSF): deal with livestock health. RACIDA, NORDA and EPAG are implementing partners to WFP for food distribution in the district. Food Security The district perennial erratic rainfall has contributed to food insecurity. The only river in the district is seasonal and although its level is low for the season, it seems that there is no fear that it will run dry sooner than usual. Along the riverine area, farmers grow vegetables, fruits and maize. Due to the current drought, the farmers are harvesting the maize prematurely in order to sell it as fodder for the livestock. The vegetables and fruits grown are only found in the towns near the river. Pastoralists mainly inhabit the rest of the district. In this month of March, most of the pasture was already depleted and the community had started to seek for grazing areas in the neighbouring countries. Some people relied on milk from goats and camel, others had no access to milk. Coping mechanisms include selling of livestock, collection and sale of firewood and reed material for thatching in order to get money to purchase food. This has resulted in falling livestock prices and escalating prices of cereals and other food commodities. They have also resulted in migration to major towns in the district, reliance on remittances from working relatives and migration to areas with water and pasture. The district is being supplied with food by WFP in conjunction with the lead agency ARID LANDS, and the implementing partners like NORDA, RACIDA and EPAG who are identifying people in need. Health The district has one district hospital in Mandera town and health centres/dispensaries in each of the divisions. Routine measles immunisation is done in all the health facilities in the district and occasional outreach EPI campaigns are conducted in the district. Most of health facilities reported to have sufficient drugs to treat the children and adults form their common ailments. Surgery and complicated cases are referred to Mandera district hospital. Most reported diseases were respiratory infections, worms, malaria, diarrhoea and skin conditions. A high number of cases of anaemia have been reported in the district as well and antenatal anaemia (associated with poor diet and parasitic infections). Feeding and Child Care Practices Exclusive breast-feeding is almost non-existent. Almost all mothers introduced fluids other than breast milk within the first week after birth. They introduced cow’s or camels milk or tea with milk. Most of the mothers stop breast feeding their children as early six months or immediately when they get pregnant as they consider breast feeding during pregnancy as a taboo and they have a belief that the child will be malnourished because its considered bad milk. They start early weaning which is a health hazard to the infant since the digestive system is not fully developed. Breast milk is nutritionally sufficient up to the age of six months after which complementary food needs to be introduced to the child’s’ diet. The weaning food consists of porridge, camel milk and goats’ milk. At the time of migration to the greener pastures, all the camels (which serve as a source of milk for children) are taken by the men, and the mothers only remain with the few goats for milk. Generally the mothers in the community have poor weaning practices.
7
Water and Sanitation The situation in term of water has not reached a critical level as most of the people in Mandera central have access to borehole which is dug next to Suftu by the Ministry of Water and Irrigation and the pump is fully operational. The water is salty but better than none. The riverine community get their water from river Dawa during rainy season, but dry season they buy water as much as 10 shillings per jerrican. Most of the people do not filter the water neither do they boil it before consumption. A few latrines were observed mainly in towns and there is no proper waste disposal and there is lack of clean water in the households. There is lack of proper health education especially in the places where mobile team does not reach. There were evidence of skin conditions such as scabies and ring worms which are which are attributed with poor personal hygiene. Sanitation is at best poor in rural areas where few households use latrines. Health facilities and schools have been equipped with latrines in the past by Oxfam Quebec and Action Against Hunger 2003 but attempts to improve sanitation in remote villages have remained unsuccessful. Education The population is almost entirely Muslim, with clearly defined gender roles and strict adherence to religious teachings and practices. Women roles with the society involve collection of water, care of the settled populations of sheep and goats, though some may be seen in the badia with grazing herds and importantly the care of the children. Consequently, this has made the number of the girls who go to school for formal education to be very limited. Most of the girls who are of school going age were seen herding the sheep and fetching water. Likewise the number of boys who go to school is also minimal compared to the population. They take learning of Koran seriously which takes four years and they loose interest for the formal education, so they opt to go herd the camels. Most women undergo female genital mutilation as a cultural practice as early as twelve years and after this they are married off. This denies them the chance for formal education even though there are a number of government schools with few pupils. Generally illiteracy is very high among the rural women. Justification of the Survey On 14th July 2004, President Kibaki sent an urgent appeal for food to save around 3.3 million Kenyans from starvation and declared the famine situation in the country a national disaster. The situation allegedly originated in several years of erratic rainfalls and subsequent crop failure in 4 provinces, including North Eastern. In some areas, grain production has been contaminated by aflatoxin. Consequences for the pastoral areas were reported as: lack of forage and water, increase in the price of basic commodities such as grain, and decrease in the price of livestock. The Kenya Food Security Meeting through his sub-sectors suggested that the district of Mandera was the most affected by water shortage and come third after Turkana and Marsabit concerning food deficiency. Action Against Hunger’s attention was drawn on Mandera in the absence of other international agencies operating in the district or mentioning intention to assess the situation. The June edition of the Drought Monitoring Bulletin for Mandera published by Arid Lands Resource Management Project singled out four divisions, supposedly at emergency stage due to shortage of food and water††. The report also suggests an increasing trend in children malnutrition based on monthly
†† Drought Monitoring Bulletin: Mandera District, Arid Lands Resource Management Project Drought Early Warning System, June 2004
8
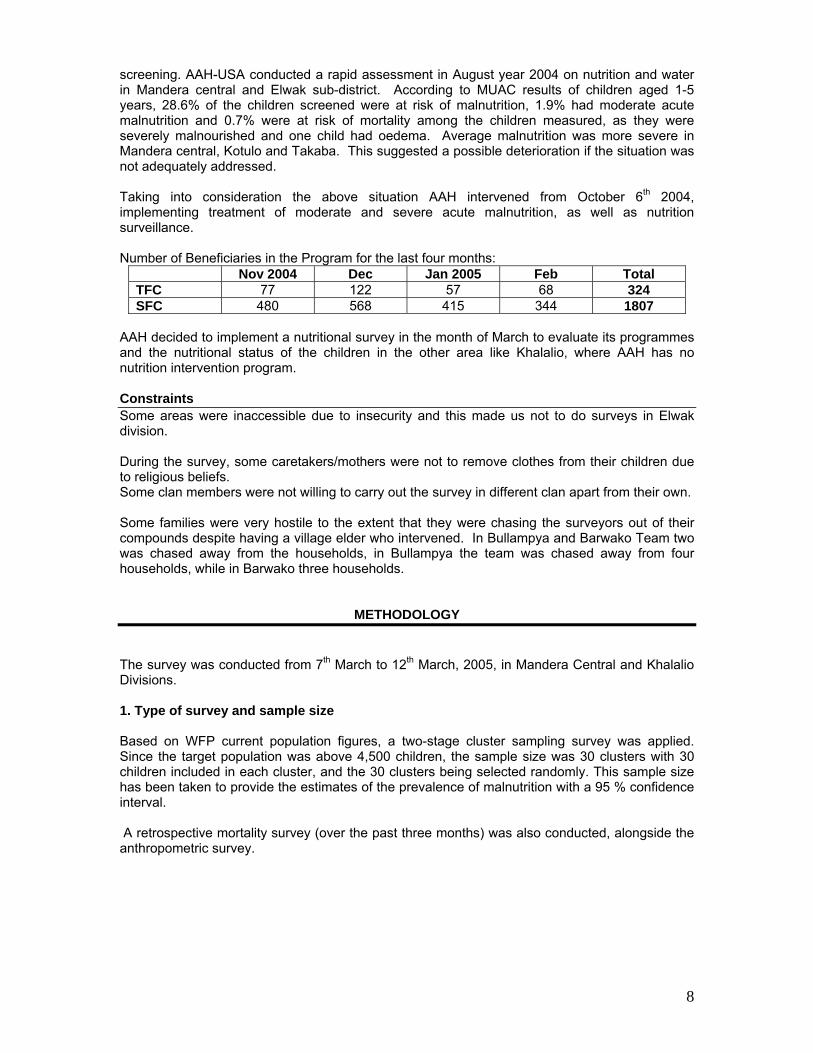
screening. AAH-USA conducted a rapid assessment in August year 2004 on nutrition and water in Mandera central and Elwak sub-district. According to MUAC results of children aged 1-5 years, 28.6% of the children screened were at risk of malnutrition, 1.9% had moderate acute malnutrition and 0.7% were at risk of mortality among the children measured, as they were severely malnourished and one child had oedema. Average malnutrition was more severe in Mandera central, Kotulo and Takaba. This suggested a possible deterioration if the situation was not adequately addressed. Taking into consideration the above situation AAH intervened from October 6th 2004, implementing treatment of moderate and severe acute malnutrition, as well as nutrition surveillance. Number of Beneficiaries in the Program for the last four months:
Nov 2004 Dec Jan 2005 Feb Total TFC 77 122 57 68 324 SFC 480 568 415 344 1807
AAH decided to implement a nutritional survey in the month of March to evaluate its programmes and the nutritional status of the children in the other area like Khalalio, where AAH has no nutrition intervention program. Constraints Some areas were inaccessible due to insecurity and this made us not to do surveys in Elwak division. During the survey, some caretakers/mothers were not to remove clothes from their children due to religious beliefs. Some clan members were not willing to carry out the survey in different clan apart from their own. Some families were very hostile to the extent that they were chasing the surveyors out of their compounds despite having a village elder who intervened. In Bullampya and Barwako Team two was chased away from the households, in Bullampya the team was chased away from four households, while in Barwako three households.
METHODOLOGY The survey was conducted from 7th March to 12th March, 2005, in Mandera Central and Khalalio Divisions. 1. Type of survey and sample size Based on WFP current population figures, a two-stage cluster sampling survey was applied. Since the target population was above 4,500 children, the sample size was 30 clusters with 30 children included in each cluster, and the 30 clusters being selected randomly. This sample size has been taken to provide the estimates of the prevalence of malnutrition with a 95 % confidence interval. A retrospective mortality survey (over the past three months) was also conducted, alongside the anthropometric survey.
9
2. Sampling methodology For estimating the acute malnutrition rate among children 6-59 months, a two-stage cluster sampling is used:
♦ At the first stage, 30 clusters were randomly selected from the list of the bullas in the targeted areas. The selection is done in such a way that every bulla as a chance to be selected proportional to its population size.
♦ At the second stage, i.e. the selection of the households within each cluster, the standard EPI methodology was used: a pen was spun while being at the central point of the selected cluster, defining a random direction. The houses along the direction indicated by the pen are numbered, until the limit of the cluster. The first house to survey is chosen randomly, with the “random number table”. The following houses to survey are chosen by proximity, at the right of the one that has just been surveyed. All the children aged 6-59 months encountered in the households in that direction are measured. A household was defined as a group of people who shared a ‘cooking pot’.
Along with this survey, the infants below 6 months met in the households designated by the methodology (even when no child between 6 and 59 months is present will be measured). No specific figure of infant to be measured is required. Similarly, a retrospective mortality survey is done in the households designated by the methodology, whether or not children are present. 3. Data Collection 3.1. Anthropometry a) Children 6-59 months During the anthropometric survey, for each selected child aged 6 to 59 months, the following information was recorded
♦ Age: recorded with the help of a local calendar of events ♦ Gender: male or female ♦ Weight: children were weighed without clothes, with a SALTER weighing scale of 25 kg
(precision of 100g). ♦ Height: children were measured on a measuring board (precision of 0.1 cm). Children
less than 85 cm were measured lying down, while those greater than or equal to 85 cm were measured standing up.
♦ Mid-Upper Arm Circumference: MUAC was measured at mid-point of left upper arm for measured children (precision of 0.1 cm).
♦ Bilateral oedema: assessed by the application of normal thumb pressure for at least 3 seconds to both feet.
Other information on the immunization status of the children and the retrospective morbidity are collected:
♦ Measles vaccination: assessed by checking for measles vaccination on EPI cards and asking caretakers.
♦ Pentavalent 1/OPV1 vaccination ♦ Pentavalent 3/OPV3 vaccination ♦ Vitamin A supplementation within the past year ♦ De-worming within the past 6 months ♦ Morbidity: was the child sick during the past 2 weeks, and what pathology did s/he
present
10
b) Children below 6 months ♦ Age ♦ Gender ♦ Weight ♦ Height ♦ Feeding practices: the mothers are asked how their babies are fed: exclusive breast-
feeding, mixed feeding, or exclusive weaning food diet. ♦ Weaning food: when the baby is receiving another food or drink than milk, the type of
food is recorded. 3.2. Retrospective mortality, water and sanitation practices The questionnaires are available in annex. 4. Indicators, guidelines and formulas used
4.1. Acute Malnutrition
• Weight-for-Height Index For the children, acute malnutrition rates were estimated from the weight for height (WFH) index values combined with the presence of oedema. The WFH indices are compared with NCHS‡‡ references. WFH indices were expressed both in Z-scores and percentage of the median. The expression in Z-scores has true statistical meaning and allows inter-study comparison. The percentage of the median on the other hand is commonly used to identify eligible children for feeding programs. Guidelines for the results expressed in Z-scores: • Severe malnutrition is defined by WFH < -3 SD and/or existing bilateral oedema on the lower
limbs of the child • Moderate malnutrition is defined by WFH < -2 SD and ≥ -3 SD and no oedema. • Global acute malnutrition is defined by WFH < -2 SD and/or existing bilateral oedema Guidelines for the results expressed in percentage according to the median of reference: • Severe malnutrition is defined by WFH < 70 % and/or existing bilateral oedema on the lower
limbs • Moderate malnutrition is defined by WFH < 80 % and ≥ 70 % and no oedema. • Global acute malnutrition is defined by WFH <80% and/or existing bilateral oedema
• Children’s Mid-Upper Arm Circumference (MUAC) The weight for height index is the most appropriate index to quantify wasting in a population in emergency situations where acute forms of malnutrition are the predominant pattern. However the mid-upper arm circumference (MUAC) is a useful tool for rapid screening of children at a higher risk of mortality. The MUAC is only taken for children with a height of 75 cm and more. The guidelines are as follows: MUAC < 110 mm severe malnutrition and high risk of mortality MUAC ≥ 110 mm and <120 mm moderate malnutrition and moderate risk of mortality MUAC ≥ 120 mm and <135 mm risk of malnutrition MUAC ≥ 135 mm ‘adequate’ nutritional status
‡‡ NCHS: National Center for Health Statistics (1977) NCHS growth curves for children birth-18 years. United States. Vital Health Statistics. 165, 11-74.
11
4.2. Mortality The crude mortality rate (CMR) is determined for the entire population surveyed for a given period. The CMR is calculated from the death rate for the entire population (DR). The formulas are as follows: Death Rate (DR) = n / [(N1 + N2) / 2] Where n = number of deaths within a given period N1 = number of persons alive over a given period N2 = number of persons alive at the time of the survey Crude Mortality Rate (CMR) = (DR x 10,000) / number of days in the period. The period corresponds to 3 months (90 days) preceding the survey. Therefore, CMR = (DR x 10,000) /90. It is expressed per 10,000-people / day. Alert level: 1/10,000 people/day Emergency level: 2/10,000 people/day The proportion of deaths within the past three months among the under five years old is also calculated. 5. Field work All the surveyors participating in the survey underwent a four-day training, which included a pilot survey. Six teams of three surveyors each (2 measurers and one supervisor) executed the fieldwork. AAH-USA staff supervised all the teams in the villages. The survey, including the training, lasted for a period of 9 days. 6. Data analysis Data processing and analysis were carried out using EPI-INFO 5.0 software and EPINUT 2.2 program.
12
RESULTS A total of 930 children were measured but due to some aberrant data the measurements of 921 children only were included in the analysis. Table 1: Distribution by age and sex
BOYS GIRLS TOTAL AGE (In months) N % N % N %
Sex Ratio
06 – 17 94 51.1% 90 48.9% 184 20.0% 1.04 18 – 29 110 51.6% 103 48.4% 213 23.1% 1.07 30 – 41 116 51.6% 109 48.4% 225 24.4% 1.06 42 – 53 88 47.3% 98 52.7% 186 20.2% 0.90 54 – 59 50 44.2% 63 55.8% 113 12.3% 0.79 Total 458 49.7% 463 50.3% 921 100% 0.99
Figure 1. Distribution of the sample by age and sex The gender distribution shows a good balance: both genders are equally represented. The imbalance different age groups are equally represented as well: the imbalance observed in the graph is due to the fact that age groups gather a different number of months. 2. Anthropometric analysis
2.1. Acute malnutrition
♦ Distribution of malnutrition in Z-scores for children aged 6 to 59 months Table 5. Weight For Height Distribution by age in Z-scores
<-3 STD >=-3&<-2 STD >=-2 STD OEDEMA Age groups (months)
N N % n % n % n %
06-17 184 5 2.7% 40 21.7% 138 75.0% 1 0.5% 18-29 213 8 3.8% 55 25.8% 150 70.4% 0 0.0% 30-41 225 3 1.3% 44 19.6% 174 77.3% 4 1.8% 42-53 186 5 2.7% 44 23.7% 136 73.1% 1 0.5% 54-59 113 5 4.4% 30 26.5% 78 69.0% 0 0.0% TOTAL 921 26 2.8% 213 23.1% 676 73.4% 6 0.7%
The distribution of acute malnutrition in z-scores shows that Global Acute Malnutrition is 26.6 % with 3.5% of the children being severely malnourished and 23.1 being moderately malnourished.
-150 -100 -50 0 50 100 150
06 – 17
18 – 29
30 – 41
42 – 53
54 – 59
Mon
ths
Age and Gender sample distribution
Boys
Gilrs

13
Table 6. Weight for Height vs. oedema in Z-scores
Presence of oedema < -2 SD ≥ -2 SD
YES Marasmus/Kwashiorkor 4 0.4%
Kwashiorkor 2 0.2%
NO Marasmus 239 26.0%
Normal 676 73.4%
Both types of malnutrition, kwashiorkor and marasmus, were found in the sample. 97.6% of the cases of acute malnutrition found in this survey are marasmus.
Figure 2: Distribution in Z-scores. The mean Z-Scores of the sample, – 1.47, indicates an under-nourished population. The standard deviation is 0.88: the fact that it is between 0.80 and 1.2 indicates that the quality of the data is good, and that the sample can be used for representing the population. Table 7. Global and Severe Acute Malnutrition by Age Group in Z-scores
Results in Z-scores Children 6 - 59 months (n=921)
Children 6 - 29 months (n=397)
Global acute malnutrition Weight/height index <-2 Z or oedema
26.6% 22.6% <--> 31.0%§§
27.5% 21.4% <--> 34.5%
Severe acute malnutrition Weight/height index <-3 Z or oedema
3.5% 2.0% <--> 5.7%
3.5% 1.5% <--> 7.5%
Statistically, there is no significant difference between the malnutrition rates observed among the children aged 6-29 months and the children aged 30-59 months old (p =0.6). §§ 95% Confidence interval.
-5
0
5
10
15
20
25
30
-4.75
-4.25
-3.25
-2.25
-1.25
-0.25 0.7
51.7
52.7
53.7
54.7
5
ReferenceSample
14
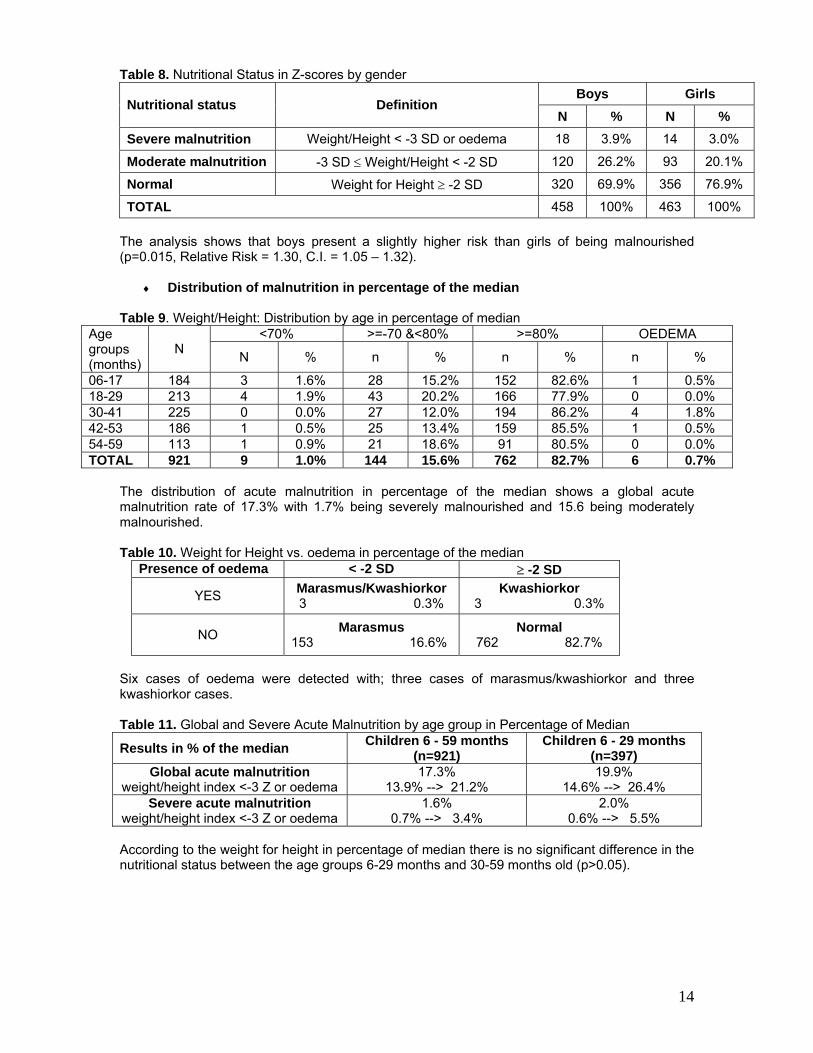
Table 8. Nutritional Status in Z-scores by gender Boys Girls
Nutritional status Definition N % N %
Severe malnutrition Weight/Height < -3 SD or oedema 18 3.9% 14 3.0%
Moderate malnutrition -3 SD ≤ Weight/Height < -2 SD 120 26.2% 93 20.1%
Normal Weight for Height ≥ -2 SD 320 69.9% 356 76.9%
TOTAL 458 100% 463 100% The analysis shows that boys present a slightly higher risk than girls of being malnourished (p=0.015, Relative Risk = 1.30, C.I. = 1.05 – 1.32).
♦ Distribution of malnutrition in percentage of the median Table 9. Weight/Height: Distribution by age in percentage of median
<70% >=-70 &<80% >=80% OEDEMA Age groups (months)
N N % n % n % n %
06-17 184 3 1.6% 28 15.2% 152 82.6% 1 0.5% 18-29 213 4 1.9% 43 20.2% 166 77.9% 0 0.0% 30-41 225 0 0.0% 27 12.0% 194 86.2% 4 1.8% 42-53 186 1 0.5% 25 13.4% 159 85.5% 1 0.5% 54-59 113 1 0.9% 21 18.6% 91 80.5% 0 0.0% TOTAL 921 9 1.0% 144 15.6% 762 82.7% 6 0.7%
The distribution of acute malnutrition in percentage of the median shows a global acute malnutrition rate of 17.3% with 1.7% being severely malnourished and 15.6 being moderately malnourished. Table 10. Weight for Height vs. oedema in percentage of the median
Presence of oedema < -2 SD ≥ -2 SD
YES Marasmus/Kwashiorkor 3 0.3%
Kwashiorkor 3 0.3%
NO Marasmus 153 16.6%
Normal 762 82.7%
Six cases of oedema were detected with; three cases of marasmus/kwashiorkor and three kwashiorkor cases. Table 11. Global and Severe Acute Malnutrition by age group in Percentage of Median
Results in % of the median Children 6 - 59 months (n=921)
Children 6 - 29 months (n=397)
Global acute malnutrition weight/height index <-3 Z or oedema
17.3% 13.9% --> 21.2%
19.9% 14.6% --> 26.4%
Severe acute malnutrition weight/height index <-3 Z or oedema
1.6% 0.7% --> 3.4%
2.0% 0.6% --> 5.5%
According to the weight for height in percentage of median there is no significant difference in the nutritional status between the age groups 6-29 months and 30-59 months old (p>0.05).
15
♦ Nutritional status of the children below six months 39 children aged below six months were measured. 3 of them were below one-month-old and 49.0 cm height: their nutritional status cannot be assessed, as the reference tables start at 49.0cm. Their weight is greater than 2.5kg, so they are not considered as little birth weight. The analysis here after includes therefore 36 children. The sample being very small, no statistical extrapolation can be done from these results about the nutritional status of the infants in the Divisions surveyed. Table 12. Distribution by age and sex
Age (months) Boys Girls Total
1 6 3 9 2 3 2 5 3 5 3 8 4 1 3 4 5 2 8 10
Total 17 19 36 Table 13. Weight/Height: Distribution by Age in z-scores
<-3 STD >=-3 &<-2 STD >=-2 STD Age (months) N N % n % N %
1 9 0 0.0% 0 0.0% 9 28.1% 2 5 0 0.0% 0 0.0% 5 15.6% 3 8 1 50.0% 0 0.0% 7 21.9% 4 4 1 50.0% 1 50.0% 2 6.3% 5 10 0 0.0% 1 50.0% 9 28.1% TOTAL 36 2 100% 2 100% 32 100% Table 14. Weight/Height: Distribution by Age in percentage of median
<70% >=70 &<80% >=80% Age (months) N N % n % N %
1 9 0 0.0% 0 0.0% 9 30.0% 2 5 0 0.0% 1 25.0% 4 13.3% 3 8 1 50.0% 0 0.0% 7 23.3% 4 4 1 50.0% 1 25.0% 2 6.7% 5 10 0 0.0% 2 50.0% 8 26.7%
TOTAL 36 2 100% 4 100% 30 100%
• Feeding practices Table 13. Feeding practices
Feeding practices Frequency Percentage Exclusive breastfeeding 12 33.3% Mixed feeding (breast milk and weaning food) 24 66.7% Total 36 100%
2.2. Risk of mortality: children’s MUAC The MUAC is analysis for children whose height is >= 75 cm. A total of 767 children have therefore been included in the analysis.
16
Table 14. MUAC distribution according to nutritional status
75 – 90 cm height ≥ 90 cm height TOTAL Criteria Nutritional status N % N % N %
< 110 mm Severe malnutrition 0 0.0% 1 0.2% 1 0.1% 110 mm ≥ MUAC < 120 mm Moderate malnutrition 1 0.3% 2 0.4% 3 0.4% 120 mm ≥ MUAC < 135 mm At risk of malnutrition 114 35.7% 64 14.3% 178 23.2%
TOTAL 319 100% 448 100% 767 100% According to MUAC measurements, it was revealed that 0.2% of the children sampled were severely malnourished i.e. they are at high risk of mortality, 0.4% was moderately malnourished and 23.2% were at risk of malnutrition. 76.3 had a good nutritional status. 5. Mortality rate The crude mortality was calculated from the figures collected from all visited households, whether or not they had under-five children. There were 1,019 children under five years old alive at the time of the survey, as well as 2,439 above five years, meaning a total of 3,458 (N2) individuals alive. The under-five group represents 41% of the population. At the beginning of the recall period, there were 995 children under five years old, and 2,442 above five alive, meaning a total of 3,437 (N1) individuals. Within this recall period, the demographic changes have been recorded by the teams as follows: - 29 births - 12 deaths (n), among who 6 (50%) were below five years old. - 36 individuals who migrated out of the district - 40 individuals who migrated into the districts. Death Rate (DR) = 12/[(3458+3437)/2] = 0.00348 Crude Mortality Rate (CMR) = [0.00348 x 10,000]/90 people/day = 0.38 According to the above formula, the crude mortality rate is 0.38/10,000/day. 6. Presumed causes of mortality The main presumed cause of death*** among the children under five years old was measles (six cases).
Table 17. Presumed causes of death
Under five Above five Cause of Death
N % N % Malaria 2 33.3% 3 50.0% Diarrhea 2 33.3% 1 16.7%
Bloody diarrhea 0 0.0% 1 16.7% Respiratory infection 2 33.3% 0 0.0%
Unknown 0 0.0% 1 16.7% Total 6 100.0% 6 100.0%
*** As mentioned by the community.
17
7. Immunization and morbidity 1. Vaccination coverage Measles: The measles coverage survey is part of the anthropometric survey. Therefore, the sample surveyed for this question is the same that the one analyzed for the malnutrition rates. Measles vaccination is done from the age of nine months; therefore only the children aged 9-59 months (868 children) were included in this analysis. Since there was a measles campaign in October year 2004, most of the children sampled had been given measles vaccine which was given together with vitamin A supplementation.
Table 15. Measles vaccination coverage
N % According to the EPI card 241 27.8% According to the caretaker 531 61.2% Not immunized 96 11.0% Total 868 100%
Pentavalent 1/OVP1:
Pentavalent 3/OVP3: N % Vaccinated 748 82.7% Not vaccinated 156 17.2% Total 904 100%
Vitamin A: Number of children who received Vitamin A during the last year: N % Received 631 69.8% Not received 273 30.2% Total 904 100%
De-worming: Number of children who have been de-wormed within the last 6 months: N % De-wormed 241 26.7% Not de-wormed 663 73.3% Total 904 100%
3. Morbidity Out of the 904 children constituting the sample, 361 (39.9%) have been reported presenting health problems within the 2 weeks preceding the survey. The pathologies and the number of cases are reported in the following table:
N % Vaccinated 788 87.1%
Not vaccinated 116 12.9% Total 904 100%
18
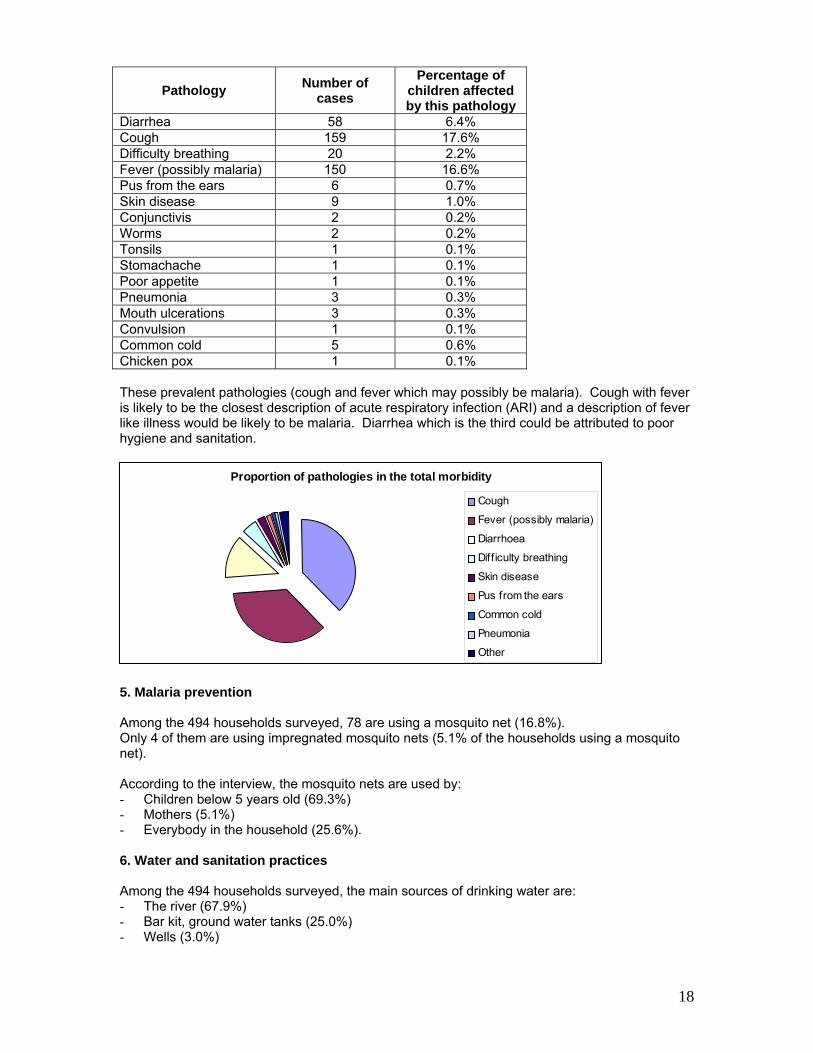
Pathology Number of cases
Percentage of children affected by this pathology
Diarrhea 58 6.4% Cough 159 17.6% Difficulty breathing 20 2.2% Fever (possibly malaria) 150 16.6% Pus from the ears 6 0.7% Skin disease 9 1.0% Conjunctivis 2 0.2% Worms 2 0.2% Tonsils 1 0.1% Stomachache 1 0.1% Poor appetite 1 0.1% Pneumonia 3 0.3% Mouth ulcerations 3 0.3% Convulsion 1 0.1% Common cold 5 0.6% Chicken pox 1 0.1% These prevalent pathologies (cough and fever which may possibly be malaria). Cough with fever is likely to be the closest description of acute respiratory infection (ARI) and a description of fever like illness would be likely to be malaria. Diarrhea which is the third could be attributed to poor hygiene and sanitation.
5. Malaria prevention Among the 494 households surveyed, 78 are using a mosquito net (16.8%). Only 4 of them are using impregnated mosquito nets (5.1% of the households using a mosquito net). According to the interview, the mosquito nets are used by: - Children below 5 years old (69.3%) - Mothers (5.1%) - Everybody in the household (25.6%). 6. Water and sanitation practices Among the 494 households surveyed, the main sources of drinking water are: - The river (67.9%) - Bar kit, ground water tanks (25.0%) - Wells (3.0%)
Proportion of pathologies in the total morbidity
Cough
Fever (possibly malaria)
Diarrhoea
Diff iculty breathing
Skin disease
Pus from the ears
Common cold
Pneumonia
Other
19
- Boreholes (2.1%) - Tanks (1.7%) - Other (neighbor tap) (0.2%). Considering the water sources, particular bullas had certain characteristics. There were more river responses in Neboi and Border Point 1, Mandera town was more likely to respond to donkey cart – (which fetches water from the river for the people to buy) and well. Those using tanks could either be richer families who had constructed their own, groups or individuals or associations who had collectively constructed one or finally poorer families that purchased water from the former. Price of the 20l jerry can of water: - 1 (0.2%) - 3 (2.4%) - 5 (83.9%) - 10 (13.5) The above figures shows that among the households sampled, they buy their water at a range of 1 shilling to 10 shillings per jerry can of twenty liters. Types of toilet used: - Own pit latrine (56.9%) - The bush (39.9%) - VIP latrine (Ventilated Improved Latrine) (0.6%) - Others (neighbor pit latrines) (2.6%) The population not using toilets is staying in the bullas outside Mandera town All the households sampled do wash their hands after visiting the toilet.
20
DISCUSSION According to the previous nutrition surveys conducted by MSF-Spain since year 2000 July, the results for GAM and SAM are as follows: July 2000 March 2001 March 2002 AAH March 05 GAM% 20.3%†††
16.7%<->23.9% 20.5 %
17.0%<->21.2% 26.7%
22.8%<->31.1% 26.6%
22.6%<->31.0%SAM% 2.2%
0.9%<->3.5% 1.5 %
0.9%<->2.3% 4.7%
3.5%<->6.5% 3.5%
2.0%<->5.7% The GAM has been on an increasing trend since year 2000, despite the programs implemented in the areas to address malnutrition. The situation at the time of this survey is similar to the one observed in March 2002. According to the results, 26.6% of the children measured had a low Weight for Height index and 3.5% were severely malnourished. The GAM rate is above the emergency threshold of 15% as defined by WHO‡‡‡, while SAM rate remains slightly below the emergency level of 4%. The survey indicates a relatively crude mortality rate of, 0.4/10,000/day, which is low and below the alert level of 1 / 10,000/day. The presumed causes of mortality are the most common diseases (Malaria, diarrhea, and respiratory infection). Malnutrition is not mentioned, which is not surprising give the relatively low rate of severe malnutrition. Therefore, the nutritional situation in Mandera Central and Khalalio is considered a chronic emergency, and actions must be taken to address it. There are different factors that contribute to the low nutritional status of the population in Mandera. Inadequate food intake due to food insecurity is the immediate cause of greatest importance when considering the causes of malnutrition. Poor climate condition results in inadequate pasture and lack of water continues to result in decreased milk and animal production. The market prices of milk and meat increase during the dry season. In terms of agricultural productivity, there is limited supplies of fruits and maize and its only available among the riverine community who carry out irrigation agriculture along river Dawa. Rainfall is erratic and no rainfall dependant agriculture can be carried out in other areas of Mandera. The overall situation within Mandera and Khalalio is one of chronic poverty and considerable underdevelopment compounded with successive drought. Therefore relief food remains the only regular food for many of the population. Despite the substantial amount of food aid distributed to minimize the impact of the drought on food insecurity, the food aid did not improve the nutritional status of children as it was expected. The relief food is intended to ensure appropriate food intake to the most vulnerable people, but the results suggest that that both the quantity and quality of food consumed in the household remains inadequate. This could be explained by various factors such as sharing. The supplementary ration within the household or with the neighbours, thereby considerably reducing the food intake per person. In essence, the nutritional needs of the Mandera population who basically rely on food aid, are not met, due to underlying food insecurity and high levels of vulnerability. In any effect, improved food intake alone has a limited impact because of the burden of diseases which afflict the population.
††† 95% Confidence Interval ‡‡‡ WHO classification of Wasting prevalence in populations, 2000
21
39.9% of all the children surveyed were reported sick in two weeks immediately prior to the survey. Fever (presumed to be malaria), diarrhea and cough were the most common problems. The situation with regard to the provision of health care services is extremely precarious, as already mentioned through the numerous reports compiled by the other organizations that have done survey in Mandera central (i.e. Oxfam Quebec and MSF-Spain). Health services have a serious diminished capacity and provide a significantly reduced coverage both in geographically and in the types and level of services provided. The recent nutrition survey has found that the immunization coverage is relatively high (around 89%, 87.1%have received pentavalent 1 and OPV1, 82.7 pentavalent 3 and OPV3, 69.8% Vitamin A and 26.7% have been dewormed ) and there is still room for improvement. The Ministry of Health currently runs mobile teams that are also charged with implementing present and future initiatives for immunization campaigns. A child should receive a BCG vaccination to protect against tuberculosis this is given at birth or the first contact with the baby it is given together with birth polio. three doses of pentavalent to protect against diphtheria, pertussis and tetanus,it is given at six weeks or at the first contact with the baby. Four doses of oral polio vaccine to prevent poloimylitis and one dose of measles vaccination before the age of one year. During measles compain,it is given up to age fourteen years. Within the Khalalio division, very few children got immunization despite the fact that there was measles campaign carried out by Ministry of Health. They are therefore more exposed to childhood diseases which will most likely affect their nutritional status. Vitamin A supplementation coverage was relatively high since it was given during measles campaign by the Ministry of Health. Vitamin A deficiency causes and blindness in children and impairs a child immune system thereby increases its chance of dying from common childhood diseases. Vitamin A deficiency exerts a measurable impact on child morbidity and mortality and chances of survival. In Mandera, breast milk is the only source of Vitamin A for the first few months of life, and perhaps the most important source until the age of two years. The other source is animal milk; therefore, it is advisable that supplementation should start at the age of six months. The survey also underscores that weaning practices are generally poor. Exclusive breast-feeding: breast-feeding during the first few years of life protects children from various infections, provides an ideal source of nutrients, and is economical and safe. However, almost all mothers included fluids other than breast milk within the first week after birth. This can contribute growth faltering and micro-nutrient malnutrition, and it poses more risk if clean water is not readily available. Children should be exclusively breastfed during the first four to six months for optimum growth, according to the WHO recommendations. 17% of the surveyed households do have a mosquito net: the malaria prevention practices are far too insufficient. Hygiene: safe food and drinking water are a basic necessity for good health and development. The survey shows that 68% of the households get their drinking water from the river, which can be a significant carrier of diseases such as cholera and typhoid and diarrhea. This could be avoided by such simple actions such as boiling drinking water and washing the hands before preparing and handling food. According to all the households sampled, they do wash their hands after visiting the toilet which contradicts the significant proportion of children who had diarrhea two weeks immediately prior to the survey, which may have significantly affected their nutritional status. Disposal of faeces: the inadequate disposal of human excreta and poor personal hygiene in general is associated with the range of diseases including diarrhea. 39.9% of the households sampled did not have proper disposal facilities for faeces; they were using the bush or open field. In many circumstances, children defecate near the house, which increases the level of contamination of the environment they play and live in.

22
CONCLUSION
After four months of relief program composed of General Food Distribution (WFP) plus therapeutic and supplementary feeding program for malnourished children, Action Against Hunger (AAH) the Global Acute Malnutrition rate is still at 26.6% z-scores. Despite all the food made available in the area, we note that the nutritional status has not improved since the year 2002 when the survey done by MSF-Spain revealed 26.7% of Global Acute Malnutrition. In Mandera malnutrition is mainly as a result of inadequate food intake and infections. The interplay between these two immediate causes tends to create a vicious circle: a malnourished child, whose resistance to illness is compromised, falls ill, and malnutrition worsens. Diseases, in particular infectious ones, affect dietary intake and nutrient utilization. Children who enter into this malnutrition-infection cycle can quickly fall into a potentially fatal spiral as one condition feeds on the other. GAM rate has never gone below 20% since the year 2000, where the first baseline was done. Acute malnutrition is a chronic issue in Mandera, and it needs to be addressed both in its immediate symptoms and its causal roots. Recommendations
• AAH to extend the program to cover Khalalio, where malnutrition rates are similar to the Mandera ones.
• To continue food aid intervention as a short-term measure to avoid any further
deterioration. • To improve access to primary health care: the existing rural health facilities should be
totally operational (according to their level) in term of staffing and medical supply. Besides, the quality of the medical services rendered by the hospital must be improved and appraised to its due level.
• Health Education: it is clear that family care practices relating to hygiene and infant⁄child
feeding especially exclusive breast-feeding and the timely introduction of solid foods, have to be improved. This could be facilitated through community based programs in coordination with the primary health care programs already established in the area, in order to increase awareness and sensitization within the community. This will prevent diseases as well as malnutrition, which will in turn ensure growth, development and survival of young children.
• Other mid and long-term food and non-food interventions should be implemented: both emergency and development interventions need to operate side by side in order to have a sustainable impact on the overall health and nutritional status of the population:
• Food for Work: any ‘Food for Work’ projects have to be thoroughly investigated in terms
of needs, viability, sensible timetabling and practically within the community and subsequent sufficient materials as well as technical support.
• To lobby on the chronic and precarious living condition in Mandera in order to bring in
more input into the area through long term projects that would aim at creating sustainable livelihood.
23
• Accessibility to food need to be improved. In view of harsh climatic conditions, agricultural production is limited. Agriculture productivity along river Dawa could be improved by promoting dry lands farming techniques, including irrigation. Further, more focus should be put on increasing livestock production by improving animal health and encouraging small scale poultry farming. Marketing infrastructure and food preservation techniques should be improved.

24
Annex 1: DATE: CLUSTER No: VILLAGE: TEAM No:
N°. Family N°.
Age Mths
Gender M/F
Weight xx,x Kg
Height Xxx,x Cm
Sitting Height
Xxx,x cm
Oedema Y/N
MUAC
mm
Measles Y/H/N
(1) 1
2
3
4
5
6
7
8
9
10
11
12
13
14
15
16
17
18
19
20
21
22
23
24
25
26
27
28
29
30
31
32
(1) Measles*: Y=according to EPI card, H=according to mother, N=not immunized against measles
ANTHROPOMETRIC SURVEY QUESTIONNAIRE CHILDREN FROM 6 TO 59 MONTHS
25
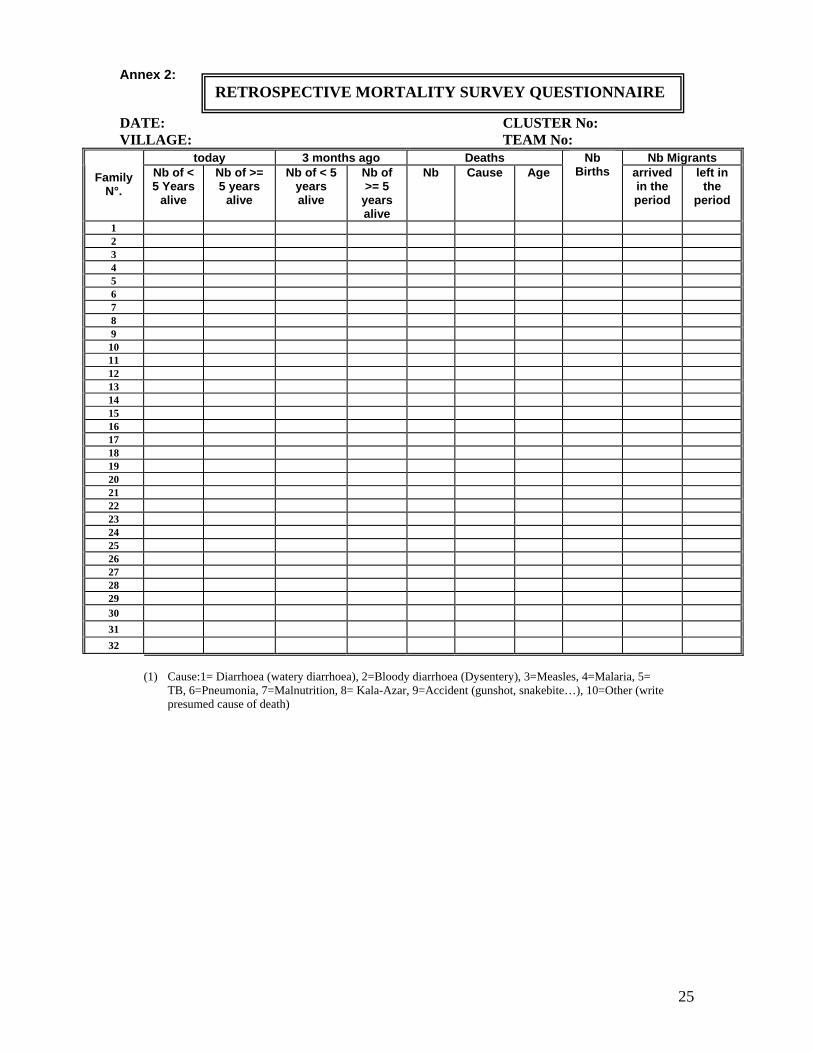
Annex 2: DATE: CLUSTER No: VILLAGE: TEAM No:
today 3 months ago Deaths Nb Migrants Family
N°. Nb of < 5 Years
alive
Nb of >= 5 years
alive
Nb of < 5 years alive
Nb of >= 5
years alive
Nb Cause Age Nb
Births arrived in the period
left in the
period
1 2 3 4 5 6 7 8 9 10 11 12 13 14 15 16 17 18 19 20 21 22 23 24 25 26 27 28 29 30
31
32
(1) Cause:1= Diarrhoea (watery diarrhoea), 2=Bloody diarrhoea (Dysentery), 3=Measles, 4=Malaria, 5=
TB, 6=Pneumonia, 7=Malnutrition, 8= Kala-Azar, 9=Accident (gunshot, snakebite…), 10=Other (write presumed cause of death)
RETROSPECTIVE MORTALITY SURVEY QUESTIONNAIRE
26
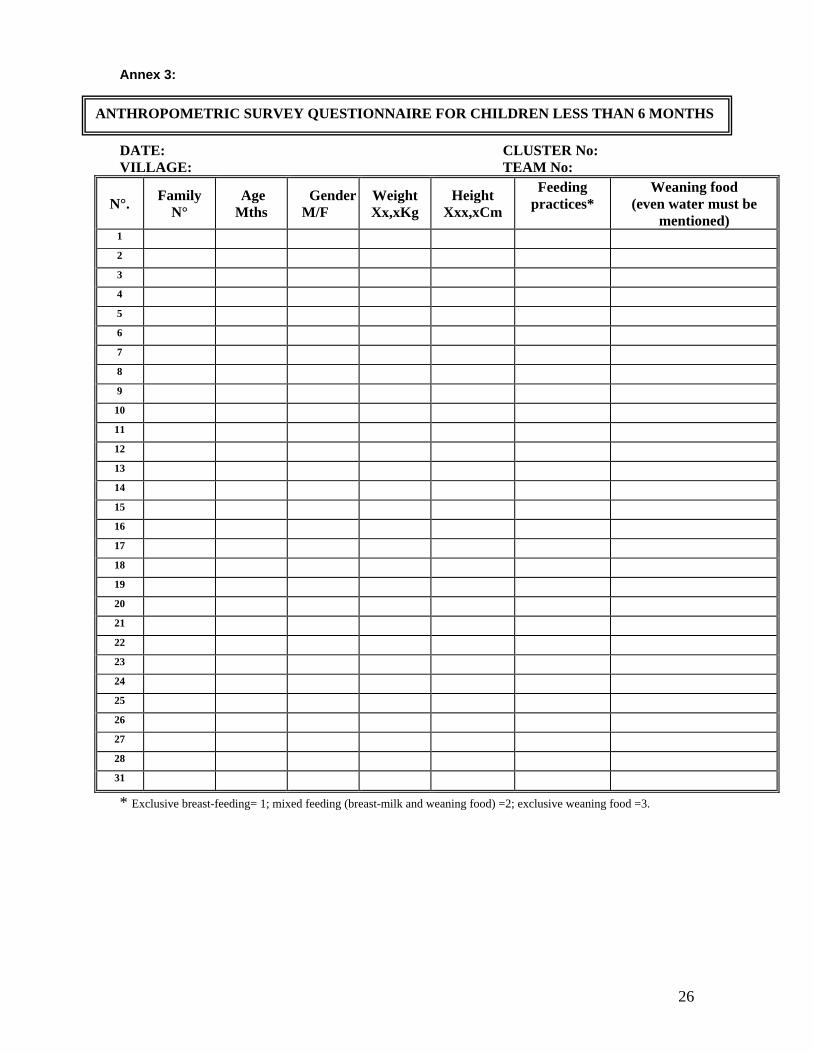
Annex 3:
DATE: CLUSTER No: VILLAGE: TEAM No:
N°. Family N°
Age Mths
Gender M/F
Weight Xx,xKg
Height Xxx,xCm
Feeding practices*
Weaning food (even water must be
mentioned) 1
2
3
4
5
6
7
8
9
10
11
12
13
14
15
16
17
18
19
20
21
22
23
24
25
26
27
28
31
* Exclusive breast-feeding= 1; mixed feeding (breast-milk and weaning food) =2; exclusive weaning food =3.
ANTHROPOMETRIC SURVEY QUESTIONNAIRE FOR CHILDREN LESS THAN 6 MONTHS
27
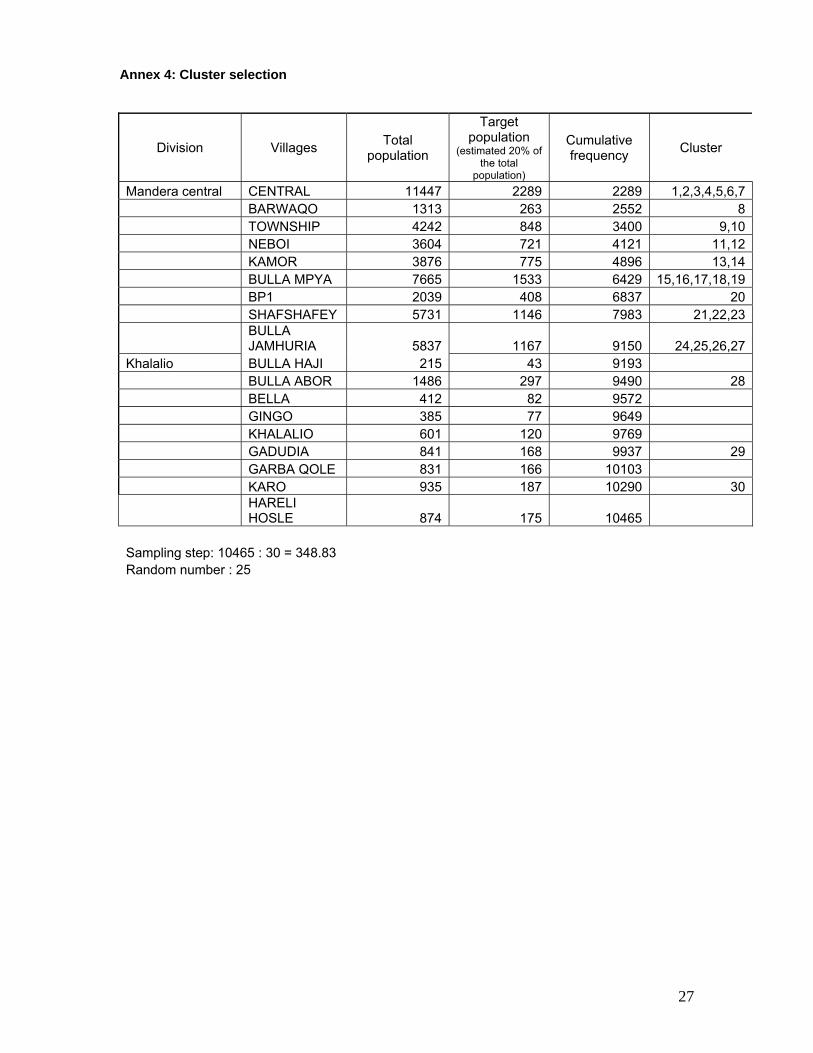
Annex 4: Cluster selection
Division Villages Total population
Target population
(estimated 20% of the total
population)
Cumulative frequency Cluster
Mandera central CENTRAL 11447 2289 2289 1,2,3,4,5,6,7 BARWAQO 1313 263 2552 8 TOWNSHIP 4242 848 3400 9,10 NEBOI 3604 721 4121 11,12 KAMOR 3876 775 4896 13,14 BULLA MPYA 7665 1533 6429 15,16,17,18,19 BP1 2039 408 6837 20 SHAFSHAFEY 5731 1146 7983 21,22,23
BULLA JAMHURIA 5837 1167 9150 24,25,26,27
Khalalio BULLA HAJI 215 43 9193 BULLA ABOR 1486 297 9490 28 BELLA 412 82 9572 GINGO 385 77 9649 KHALALIO 601 120 9769 GADUDIA 841 168 9937 29 GARBA QOLE 831 166 10103 KARO 935 187 10290 30
HARELI HOSLE 874 175 10465
Sampling step: 10465 : 30 = 348.83 Random number : 25