NUTRITIONAL AND HYGIENIC ASSESSMENT OF FOODS
254
Saurashtra University Re – Accredited Grade ‘B’ by NAAC (CGPA 2.93) Solanki, Daxa G., 2011, “Nutritional and Hygienic Assessment of Foods Sold by Small Venders in Rajkot City”, thesis PhD, Saurashtra University http://etheses.saurashtrauniversity.edu/id/eprint/722 Copyright and moral rights for this thesis are retained by the author A copy can be downloaded for personal non-commercial research or study, without prior permission or charge. This thesis cannot be reproduced or quoted extensively from without first obtaining permission in writing from the Author. The content must not be changed in any way or sold commercially in any format or medium without the formal permission of the Author When referring to this work, full bibliographic details including the author, title, awarding institution and date of the thesis must be given. Saurashtra University Theses Service http://etheses.saurashtrauniversity.edu [email protected] © The Author
-
Upload
khangminh22 -
Category
Documents
-
view
0 -
download
0
Transcript of NUTRITIONAL AND HYGIENIC ASSESSMENT OF FOODS

Saurashtra University Re – Accredited Grade ‘B’ by NAAC (CGPA 2.93)
Solanki, Daxa G., 2011, “Nutritional and Hygienic Assessment of Foods Sold
by Small Venders in Rajkot City”, thesis PhD, Saurashtra University
http://etheses.saurashtrauniversity.edu/id/eprint/722 Copyright and moral rights for this thesis are retained by the author A copy can be downloaded for personal non-commercial research or study, without prior permission or charge. This thesis cannot be reproduced or quoted extensively from without first obtaining permission in writing from the Author. The content must not be changed in any way or sold commercially in any format or medium without the formal permission of the Author When referring to this work, full bibliographic details including the author, title, awarding institution and date of the thesis must be given.
Saurashtra University Theses Service http://etheses.saurashtrauniversity.edu
© The Author

i
NUTRITIONAL AND HYGIENIC ASSESSMENT
OF FOODS
SOLD BY SMALL VENDORS
IN RAJKOT CITY
THESIS SUBMITTED TO
SAURASHTRA UNIVERSITY
FOR THE DEGREE OF
Ph. D. (HOME SCIENCE)
SUBMITTED BY
SOLANKI DAXA G.
GUIDED BY
DR. NILAMBARI DAVE
HEAD,
SMT. S. B. GARDI INSTITUTE OF HOME SCIENCE
SAURASHTRA UNIVERSITY
RAJKOT - 360 005
INDIA
2008

ii
STATEMENT UNDER UNIVERSITY Ph.D. RULES ORDI. Ph. 10
I hereby declare that,
The research work presented in this thesis entitle “Nutritional and
Hygienic Assessment of Foods Sold by Small Vendors in Rajkot City”
has not been submitted for my other degree of this or any other university
on any occasion.
To the best of my knowledge no work of this type has been reported on
the above subject.
All the work presented in this thesis is original and wherever references
have been made, it has been clearly indicated.
Countersign by Guide Sign of Research
Scholar
Date: Date:
Place: Place:

iii
CERTIFICATE OF APPROVAL
This thesis directed and supervised by the candidate’s guide has been
accepted by the Smt. S. B. Gardi Institute of Home Science, Saurashtra
University, Rajkot in the fulfillment of the requirements for the degree of
DOCTOR OF PHILOSOPHY
(HOME SCIENCE)
Title: Nutritional and Hygienic Assessment of Foods Sold
By Small Vendors in Rajkot City
Candidate: Solanki Daxa G.
Guide Head
Dr. Nilambari Dave Dr. Nilambari Dave Smt. S. B. Gardi Institute Smt. S. B. Gardi Institute Of Home Science of Home Science Saurashtra University Saurashtra University Rajkot Rajkot

iv
Acknowledgement
On the occasion of fulfilling my desire of satisfactory completion of the present
work, I bow before almighty God to express my deep gratitude for the divine grace.
I would like to take this opportunity to express my great sense of gratitude to
wards Dr. Nilambari Dave, Head Smt. S.B. Gardi Institute of Home science
Saurashtra University Rajkot for her valued guidance to undertake and accomplish
the present study. Sense of obligation is also felt for Dr. Chakrawal, Dr. Joshi and
Mr. Vyas for providing their expert help.
I acknowledge with reverence the eternal inseparation, unending and
blessing, care and love of my parents Mr. Girdharlal Solanki and Mrs. Kundanben
Solanki and husband Jitesh Jotangiya without that, I would not have been able to
complete this work. Thanks also goes to my daughter Rutvi, son Maittray, who have
through out the time, been pillar of support not only to support but also to boost their
spirits in difficult times.
I would like to give special thank to my best friend Renu P. Panjabi Lecturer
in Microbiology Department M. V.M. Science and Home Science College Rajkot,
who helped me in all possible ways and substituted her presence wherever
necessary. I feel indebted to her for showing keen interest in my work and for this
meticulous guidance through valuable suggestion and fruitful discussions. I would
also like to thank my colleague Miss Bhavna Vaid for her help and support.
I would also like to thank to all those who directly or indirectly contributed to
my research work.
I pay due respect to all the great scientists whose valuable achievements
became the base for my present humble work.
Finally, I am thankful to Saurashtra University Rajkot for providing me the
research facilities.
Date Candidate

v
C0NTENTS
No. Content Pg.No.
CHAPTER – 1 INTRODUCTION 1-23
1.1 Food 1
1.2 Nutrition 2
1.3 Good Health 3
1.4 Sanitation 3
1.5 Microorganisms 4
1.6 Hygiene 6
1.7 Food Contamination 9
1.8 Small Vendor’s Foods 11
1.9 Vendor’s Hygienic Training 13
1.10 Technological Aspects to Street Food Vending 15
1.11 Food Safety and Importance of safe Food 16
1.12 Statement of Problem 19
1.13 Significance of the Study 19
1.14 Operational Definitions 21
1.15 Objectives of the Study 22
1.16 Justification of the Study 22
1.17 Justification of the Sample 23
1.18 Hypotheses 23
CHAPTER- 2 REVIEW OF LITERATURE 24-47
2.1 Nutrition Related Literature 24
2.2 Microbial Related Literature 34
CHAPTER -3 MATERIALS AND METHODS 48-82
3.1 Sampling 48

vi
3.2 Sample Selection and Preparation for Nutritional Analysis 61
3.3 Sample Preparation for 62 Microbiological Analysis
3.4 Hygienic Practices 62
3.5 Statistical Analysis 62
3.6 Methods of Nutritional Analysis of Food 63
3.7 Methods of Microbial Analysis of Food 75
CHAPTER – 4 RESULTS AND DISCUSSION 83-222
4.1 Nutritional Analysis of Foods 83
4.2 Microbial Analysis of Foods 164
4.3 Hygienic Analysis of Foods 208
CHAPTER – 5 SUMMARY AND CONCLUSIONS 223-228
5.1 Summary 223
5.2 Conclusions 224
5.3 Suggestions 227
5.4 Recommendations for Further Study. 228
BIBLOGRAPHY 229-236
APPENDIX 237-248
1. Gujarati Questionnaire 237-243
2. English Version of Questionnaire 244-248

vii
Index of Figure
No. Content Pg.No.
1 Modes of Transmission of Infection in Food Service. 8
2 Food Contamination 9
3 Cough and Sneezes (Respiratory Tracks) 13
4 Comparative No. of CFU's of Paubhaji from different areas
and HM
168
5 Comparative No. of CFU's of Panipuri from different areas
and HM
172
6 Comparative No. of CFU's of Bhel from different areas and
HM
175
7 Comparative No. of CFU's of Pizza from different areas and
HM
178
8 Comparative No. of CFU's of Burger from different areas and
HM
181
9 Comparative No. of CFU's of Kacchi Dabeli from different
areas and HM
184
10 Comparative No. of CFU's of Chinese Rice from different
areas and HM
187
11 Comparative No. of CFU's of Chinese Bhel from different
areas and HM
191
12 Comparative No. of CFU's of Mendu Vada from different
areas and HM
194
13 Comparative No. of CFU's of Masala Dosa from different
areas and HM
197
14 Comparative No. of CFU's of Vegetable Kolhaouri from
different areas and HM
201
15 Comparative No. of CFU's of Paneer Tikka Masala from
different areas and HM
205

viii
Index of Table
No. Content Pg.No.
1 General Characteristics of Some Microorganisms 6
2 Ingredients and Amounts for Vendor’s and Standardized
Home Made Paubhaji
50
3 Ingredients and Amounts for Vendor’s and Standardized
Home Made Panipuri
51
4 Ingredients and Amounts for Vendor’s and Standardized
Home Made Bhel
52
5 Ingredients and Amounts for Vendor’s and Standardized
Home Made Pizza
53
6 Ingredients and Amounts for Vendor’s and Standardized
Home Made Burger
54
7 Ingredients and Amounts for Vendor’s and Standardized
Home Made Kacchi Bread
55
8 Ingredients and Amounts for Vendor’s and Standardized
Home Made Chinese Rice
56
9 Ingredients And Amounts for Vendor’s and Standardized
Home Made Chinese Bhel
57
10 Ingredients and Amounts for Vendor’s and Standardized
Home Made Mendu Vada
58
11 Ingredients and Amounts for Vendor’s and Standardized
Home Made Masala Dosa
59
12 Ingredients and Amounts for Vendor’s and Standardized
Home Made Vegetable Kolhapuri
60
13 Ingredients and Amounts for Vendor’s and Standardized
Home Made Panner Tikka Masala
61
14 Thiamine Standard and Sample 69
15 Nutrient Agar 76
16 MacConkey’s Agar 77
17 Nutritional Value of Pau Bhaji (100gm) for Macronutrients 84
18 Nutritional Value of Pau Bhaji (100gm) for Micronutrients 85

ix
19 Statistical Analysis of Pau Bhaji (Area-A) 87
20 Statistical Analysis of Pau Bhaji (Area-B) 88
21 Statistical Analysis of Pau Bhaji (Area-C) 89
22 Statistical Analysis of Pau Bhaji (Area-D) 90
23 Nutritional Value of Pani Puri (100gm) for Macronutrients 91
24 Nutritional Value of Pani Puri (100gm) for Micronutrients 92
25 Statistical Analysis of Panipuri (Area-A) 94
26 Statistical Analysis of Panipuri (Area-B) 95
27 Statistical Analysis of Panipuri (Area-C) 96
28 Statistical Analysis of Panipuri (Area-D) 97
29 Nutritional Value of Bhel (100gm) for Macronutrients 98
30 Nutritional Value of Behl (100gm) for Micronutrients 99
31 Statistical Analysis of Bhel (Area-A) 101
32 Statistical Analysis of Bhel (Area-B) 102
33 Statistical Analysis of Bhel (Area-C) 103
34 Statistical Analysis of Bhel (Area-D) 104
35 Nutritional Value of Pizza (100gm) for Macronutrients 105
36 Nutritional Value of Pizza (100gm) for Micronutrients 106
37 Statistical Analysis of Pizza (Area-A) 107
38 Statistical Analysis of Pizza (Area-B) 108
39 Statistical Analysis of Pizza (Area-C) 109
40 Statistical Analysis of Pizza (Area-D) 110
41 Nutritional Value of Burger (100gm) for Macronutrients 111
42 Nutritional Value of Burger (100gm) for Micronutrients 112
43 Statistical Analysis of Burger (Area-A) 114
44 Statistical Analysis of Burger (Area-B) 115
45 Statistical Analysis of Burger (Area-C) 116
46 Statistical Analysis of Burger (Area-D) 117
47 Nutritional Value of Kacchi Bread (100gm) for Macronutrients 118
48 Nutritional Value of Kacchi Bread (100gm) for Micronutrients 119
49 Statistical Analysis of Kacchi Bread (Area-A) 120
50 Statistical Analysis of Kacchi Bread (Area-B) 121

x
51 Statistical Analysis of Kacchi Bread (Area-C) 122
52 Statistical Analysis of Kacchi Bread (Area-D) 123
53 Nutritional Value of Chinese Rice (100gm) for Macronutrients 124
54 Nutritional Value of Chinese Rice (100gm) for Micronutrients 125
55 Statistical Analysis of Chinese Rice (Area-A) 127
56 Statistical Analysis of Chinese Rice (Area-B) 128
57 Statistical Analysis of Chinese Rice (Area-C) 129
58 Statistical Analysis of Chinese Rice (Area-D) 130
59 Nutritional Value of Chinese Bhel (100gm) for Macronutrients 131
60 Nutritional Value of Chinese Bhel (100gm) for Micronutrients 132
61 Statistical Analysis of Chinese Bhel (Area-A) 134
62 Statistical Analysis of Chinese Bhel (Area-B) 135
63 Statistical Analysis of Chinese Bhel (Area-C) 136
64 Statistical Analysis of Chinese Bhel (Area-D) 137
65 Nutritional Value of Mendu Vada (100gm) for Macronutrients 138
66 Nutritional Value of Mendu Vada (100gm) For Micronutrients 139
67 Statistical Analysis of Mendu Vada (Area-A) 141
68 Statistical Analysis of Mendu Vada (Area-B) 142
69 Statistical Analysis of Mendu Vada (Area-C) 143
70 Statistical Analysis Of Mendu Vada (Area-D) 144
71 Nutritional Value of Masala Dosa (100gm) for Macronutrients 145
72 Nutritional Value of Masala Dosa (100gm) for Micronutrients 146
73 Statistical Analysis of Masala Dosa (Area-A) 148
74 Statistical Analysis of Masala Dosa (Area-B) 149
75 Statistical Analysis of Masala Dosa (Area-C) 150
76 Statistical Analysis of Masala Dosa (Area-D) 151
77 Nutritional Value of Vegetable Kolhapuri (100gm) for
Macronutrients
152
78 Nutritional Value of Vegetable Kolhapuri (100gm) for
Micronutrients
153
79 Statistical Analysis of Vegetable Kolhapuri (Area-A) 154
80 Statistical Analysis of Vegetable Kolhapuri (Area-B) 155
xi
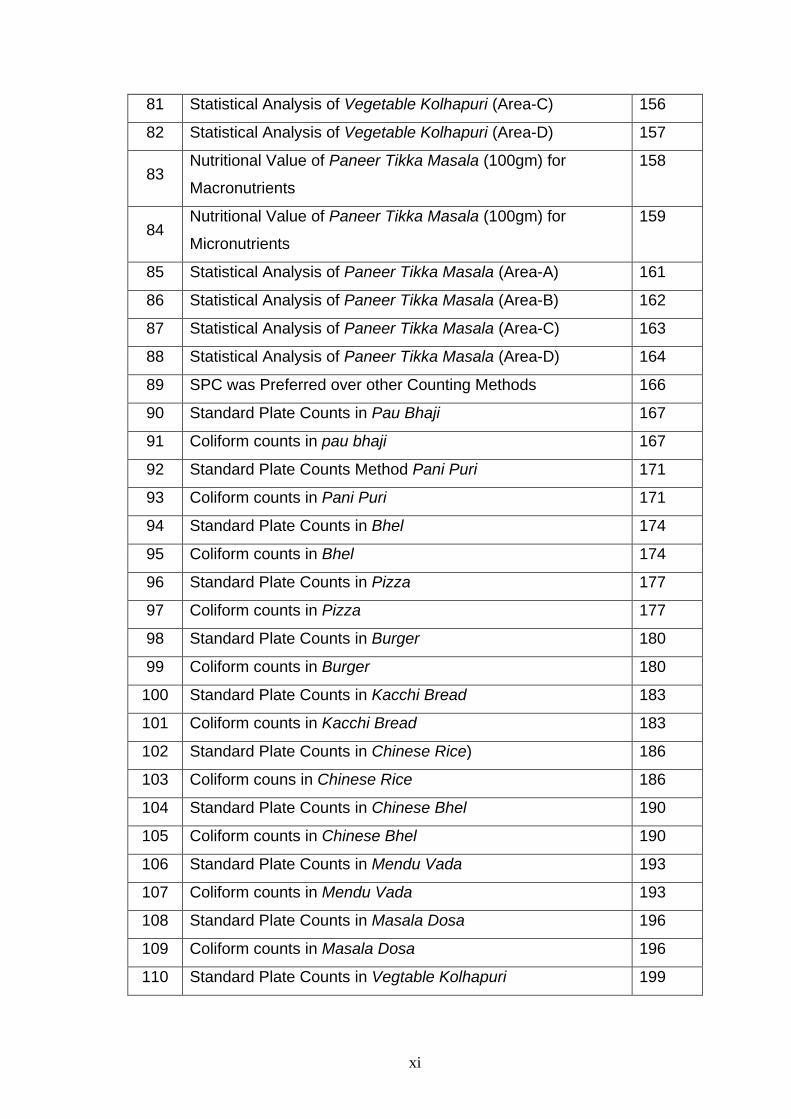
81 Statistical Analysis of Vegetable Kolhapuri (Area-C) 156
82 Statistical Analysis of Vegetable Kolhapuri (Area-D) 157
83 Nutritional Value of Paneer Tikka Masala (100gm) for
Macronutrients
158
84 Nutritional Value of Paneer Tikka Masala (100gm) for
Micronutrients
159
85 Statistical Analysis of Paneer Tikka Masala (Area-A) 161
86 Statistical Analysis of Paneer Tikka Masala (Area-B) 162
87 Statistical Analysis of Paneer Tikka Masala (Area-C) 163
88 Statistical Analysis of Paneer Tikka Masala (Area-D) 164
89 SPC was Preferred over other Counting Methods 166
90 Standard Plate Counts in Pau Bhaji 167
91 Coliform counts in pau bhaji 167
92 Standard Plate Counts Method Pani Puri 171
93 Coliform counts in Pani Puri 171
94 Standard Plate Counts in Bhel 174
95 Coliform counts in Bhel 174
96 Standard Plate Counts in Pizza 177
97 Coliform counts in Pizza 177
98 Standard Plate Counts in Burger 180
99 Coliform counts in Burger 180
100 Standard Plate Counts in Kacchi Bread 183
101 Coliform counts in Kacchi Bread 183
102 Standard Plate Counts in Chinese Rice) 186
103 Coliform couns in Chinese Rice 186
104 Standard Plate Counts in Chinese Bhel 190
105 Coliform counts in Chinese Bhel 190
106 Standard Plate Counts in Mendu Vada 193
107 Coliform counts in Mendu Vada 193
108 Standard Plate Counts in Masala Dosa 196
109 Coliform counts in Masala Dosa 196
110 Standard Plate Counts in Vegtable Kolhapuri 199

xii
111 Coliform counts in Vegetable Kolhapuri 200
112 Standard Plate Counts in Paneer Tikka Masala 203
113 Coliform counts in Paneer Tikka Masala 204
114 Hygienic and Sanitation Observations or
Sanitary Practices (Pau Bhaji)
208
115 Hygienic and Sanitation Observations or
Sanitary Practices (Pani Puri)
209
116 Hygienic and Sanitation Observations or
Sanitary Practices (Bhel)
210
117 Hygienic and Sanitation Observations or
Sanitary Practices (Pizza)
211
118 Hygienic and Sanitation Observations or
Sanitary Practices (Burgar)
212
119 Hygienic and Sanitation Observations or
Sanitary Practices (Kacchi Bread)
213
120 Hygienic and Sanitation Observations or
Sanitary Practices (Chinese Rice)
214
121 Hygienic and Sanitation Observations or
Sanitary Practices (Chinese Bhel)
215
122 Hygienic and Sanitation Observations or
Sanitary Practices (Mendu Vada)
216
123 Hygienic and Sanitation Observations or
Sanitary Practices (Masala Dosa)
217
124 Hygienic and Sanitation Observations or
Sanitary Practices (Vegetable Kolhapuri)
218
125
Hygienic and Sanitation Observations or
Sanitary Practices (Paneer Tikka Masala)
219

1
Chapter - 1
INTRODUCTION
1.1 FOOD
All living things need food. Plants require soil, nutrients, water, air and
sunlight in order to thrive. Food is the "fuel" which supplies chemical energy to
the body to support daily activities and synthesis of necessary chemicals
within the body. Food is a prime necessity of life. Even a religious book such
as “The Gita” recognizes the basic dictum "of food are beings made".
Human’s basic drive for food is to satisfy his hunger. Food is intimately woven
into the physical economic psychological, intellectual and social life of man. It
is a part of his culture and is filled with many different meaning and symbols
for all individuals at various ages and stages of their maturity (Manay, 1996
and Sabarwala, 1999).
Food is also source of power. Food is much more than a substance
supplying nutrients for health. Food is a symbol of hospitality and friendship
throughout the world. Food is a status symbol. It is an outlet of emotion. It is a
source of security people feel reasonably secure when they have enough food
stored up to take care of them during periods of scarcity. Familiar foods also
give a sense of security when one has to eat away from home.
Food is a more basic need of man than shelter and clothing. It provides
adequate nutrition for the body's growth, maintenance, repair and
reproduction. Food furnishes the body with the energy required for all human
activities. It provides materials required for the building and renewal of body
tissues and the substances that act to regulate body processes (Peckhan,
1974 and Sabarwala, 1999).
All through the history show that food has played important roles
besides that of nutrition. Wars have been fought for food. People have been
known to steal, rob and kill for it, explorers have searched the world for new
foods. Sciences have been built on food and food related discoveries have

2
been rewarded; fortunes have been made and lost in foodstuffs. Food has
helped in creating history (Potter, 1995).
1.2 NUTRITION
The importance of nutrition is simply brought out in the title “food
becomes you.” We should perhaps add, “If you eat the wrong food, you
become the wrong person.” In nutrition related work we are often concerned
with making and assessment of the nutritional status of the individual or a
group (Kinder, 1956).
Nutrition is the science of food the nutrients and other substances in it.
It deals with their action, interaction and balance in relationship to health and
disease. Nutrition is also concerned with socioeconomic, cultural and
psychological implication of food. Energy is required for all human activities; it
provides materials required for the building and renewal of body tissues and
the substances that act to regulate body processes. An individual food such
as milk may fulfill all these functions or as in the case of sugar any one
functions. However, all the above functions of food must be served by the diet
in order to maintain the body in good health. Most foods fulfill more than one
function as they are complex mixtures of a number of chemical substances
(Srilakshmi, 2002).
Food is the usual vehicle for meeting the need for nutrients, but foods
differ in their nutrient content. No one food can be depended upon to provide
all the nutrients necessary for normal growth and health. Nutritive value refers
to the nutrient content of a specific amount of food. Nutrients promote health
by making possible the normal operation and maintenance of the body. No
matter how different people are in size, appearance, activity, race or age they
all need the same nutrients (Packhan, 1979).

3
1.3 GOOD HEALTH
Good health is a state of complete physical, mental and social well
being and not merely the absence of disease or infirmity. The food that one
eats provides the basis for good health and no discussion of routine for
healthful living would be complete without mentioning food.
Finally good health means more than just the well being of the body;
one's mind and spirit should be functioning smoothly as one's body.
Good nutrition and fitness are the twin physical structures underlying
good health. But good health has other enormous benefits besides the most
obvious ones. If you are healthy you look good. (Archibald, 1986 and Lowe,
1955)
1.4 SANITATION
The word "Sanitation" is derived from the Latin word “Sanitas” which
means "health". Further, this word is applied to the Food Sanitation that is the
creation and maintenance of hygienic and healthful conditions while
processing, preparing and handling food. Sanitation is the application of a
science to provide wholesome food handled in a hygienic environment by
healthy food handlers to prevent contamination.
Proper sanitation practices are important in maintaining food safety.
Lack of hygienic practices can contribute to outbreak of food borne illnesses
(Marriott, 1985).
1.4.1 Principles of Sanitation
To sanitize means, to reduce the bacterial contamination of the area
being treated to a safe level. This condition is considered to be superior to
physically clean and slightly less desirable than sterile. To ensure that the
environment and equipment not only have been cleaned, but also are

4
protected against microbial contamination, it is thus necessary to apply
sanitation.
It may appear to be unnecessary to sanitize cooking utensils that are
subjected to heat during cooking. However, heat from cooking is not always
uniform enough to heat all parts of the item to a high temperature for a long
enough time to ensure effective sanitization.
Sanitation of items, which come in contact with food, requires a
washing area away from the food preparation area. The work station should
be equipped with three or more sinks, separate drain boards for clean and
soiled items and an area for scrapping and rinsing food wastes into a garbage
container or disposal (Marriott, 1985).
1.5 MICROORGANISMS
Microorganisms are form of life found on all non-sterilized matter that
can be decomposed. This word is of Greek origin and means "Small” and
"living beings". These organisms can not be seen with the naked eye,
metabolize in a manner similar to microorganism since they intake
nourishment, discharge waste products and reproduce. It is believed that
these tiny organisms were discovered in 1693 by a Dutch merchant named
Anton van Leeuwenhoek through lenses that he developed. He observed
microorganisms in food and water from other materials.
Fast Food is highly perishable, since they contain nutrients required for
microbial growth. Control of microbial proliferation is necessary to reduce food
spoilage and to eliminate food borne illness (Frazier and westhoff; 1983).
1.5.1. Microorganisms and Sanitation
To comprehend fully the principles of food sanitation, one must
understand the role of microorganisms in food spoilage and food poisoning.
Microorganisms are found throughout the natural environment. These
microorganisms cause food spoilage through colour and flavour
degradation and food borne infection through ingestion of food, which

5
contains microorganisms of public health concern. The importance of
sanitation practices is to combat the proliferation and activity of food spoilage
and food poisoning microorganisms. A major challenge of the sanitarian is to
protect the production area and other involved areas from the microorganisms
that can reduce the wholesomeness of foodstuffs.
1.5.2 Nutrient Requirements for Growth of Microorganisms
Food is food to humans and microbes. In addition to water and oxygen
(except for anaerobes), microorganisms have other nutritional requirements
as well. Most microbes need external sources of nitrogen, energy, minerals
and vitamins to support their growth.
1.5.3 Temperature for Growth of Microorganisms
Microorganisms have an optimum temperature as well as minimum
and maximum temperature for growth. Therefore, the environmental
temperature determines not only the proliferation but also the genera of
microorganisms that will thrive and the extent of microbial activity that occurs.
These characteristics have been responsible for the use of temperature as a
method of controlling microbial activity.
1.5.4 pH for Growth of Microorganisms
The pH for optimal growth of most of the microorganisms is near
neutrality (7.0) while yeasts can grow in an acid environment, but grow best in
an intermediate acid (4.0-4.5) range, acidophilic (acid-loving) bacteria will
grown on food or debris down to a pH of approximately 5.2, Below 5.2,
microbial growth is dramatically reduced from growth in the normal pH range.
1.5.5 Relative Humidity
This extrinsic factor affects microbial growth and it then can be affected
by temperature. All microorganisms have high requirements for water to
support their growth and activity. A high relative humidity can cause moisture
condensation on food equipments; condensation causes moist surfaces,
which are conducive to microbial growth and spoilage. Also microbial growth

6
is inhibited by a low relative humidity. Bacteria require the highest relative
humidity out of the various microorganisms. Optional relative humidity for
Bacteria is 92% or higher, whereas yeast need 90% or higher [Marriott, 1985]
Table No. 1
General characteristics of some micro organisms
Species Remark / Significance
B. anthracis Causative agent of anthrax disease in humans and
animals.
B. cereus Gastroenteritis / food poisoning
B. licheniformis Produces antibiotic – Bacteria
B. polymyxa Produces antibiotic polymyxin
B. subtilis Produces biosurfactant surfactant used for
bioremediation, oil spill dispersion and enhanced oil
recovery.
1.6 HYGIENE
The word "Hygiene" is used to describe a system of sanitary
principles for the preservation of health. Personal hygiene refers to the
cleanliness of a person's body. The health of workers plays an important part
in food sanitation. People are potential source of microorganisms that cause
illness to other through transmission of virus or through food poisoning
(Hasior and Horman, 1967).
1.6.1 Health Status of Food Handlers
In its simplest form the word "health" means the absence of disease.
Health status, on the other hand, is an outcome of health indicated by or
measured by injury, sickness, disease, physical and physico-social
functioning other than morbidity and mortality. In fact, it is a general term for
the state of health of an individual group or population that reflects the degree
to which a person is able to function physically, emotionally and socially, with
or without aid from the health care system.
The concept of health status, well being of workers in food service
establishments particularly the food handlers applies to the self-assessed or
self-reported perception of a person with respect to his or her health condition.

7
Food handler is the key person to maintain food safety in the food
service establishment, since he/she deals with unpackaged food, food
equipments or utensils, or food contact surfaces. In this context, therefore,
people known or suspected to be suffering from or to be a carrier of a disease
or illness, likely to be transmitted through food, should not come to work or
allowed to enter any food handling area if there is a likelihood of their
contaminating food.
The conditions or the specific infections which should be reported to
management so that any need for medical examination and/or possible
exclusion from food handling could be considered including - Jaundice,
Diarrhea, Vomiting, Fever, Sore throat with fever, discharges from the ear or
nose, visibly infected skin lesions (boils, cuts etc.).
It is important to remember that any worker infected by the above
mentioned microbes should not touch food or equipments/utensils used to
process, prepare or serve food. Contaminated foods can cause several
illnesses including respiratory diseases e.g. cold, sore throats, Pneumonia,
and tuberculosis, gastrointestinal diseases, e.g. vomiting, diarrhea, dysentery,
Typhoid fever, Infectious Hepatitis etc. Even if a food handler does not feel
sick, he or she can still be carrying microorganisms on their body or clothes
that can cause illness if they get into food. Hence, food handlers should
maintain a high degree of personal cleanliness and hygiene (Sabarwala,
1999).
1.6.2 Employee Hygiene
Employee should not be in contact with food and with equipment and
utensils used in processing, preparation and serving of food. Human illnesses
that may be transmitted through food are diseases of the respiratory tract,
such as the common cold, sore throat, Pneumonia, scarlet fever, tuberculosis
and trench mouth. A person with this condition is known as a carrier.

8
Figure No. 1
Modes of transmission of infection in food service.
When employees become ill, their bacterial count and potential as a
source of contamination increases dramatically. Staphylococci are normally
found in and around boils, pimples, carbuncles and infected cuts, eyes and
ears. A sinus infection, sore throat nagging cough and other symptoms of the
common cold are further signs that microorganisms are increasing in number.
The same principle applies to gastrointestinal ailments such as diarrhea or an
upset stomach. When evidence of illness passes some of the microorganisms
that caused the illness may remain as a source of recontamination.
Employee hygienic practices, it is beneficial to look at different parts of
the human body in terms of potential sources of bacterial contamination
(Marriott, 1885).
Food handler
Coughing Sneezing
Soiled or unclean hands
Organisms on Food
Customer
Incubation Period
Illness

9
1.7 FOOD CONTAMINATION
Food also contains a wide range of natural chemical compounds,
which have no nutritional function. Some of these compounds may even act
as anti-nutritional factors, interfering with the utilization of some of the
nutrients present in these foods, while others may be potentially toxic,
resulting in illness and death, if consumed in large quantities.
Figure No. 2
FOOD CONTAMINATION
Contamination means exposing food to filth, toxic substances, manual
contact during service or preparation if such food will not be subsequently

10
cooked prior to serving, rodent or insect contact or infestation or any condition
which permits introduction of pathogenic micro organisms or foreign matter.
Then such food may be serving as a potent source of disease causing
organisms.
Our food can get contaminated by the water used for cooking or
washing the soil in which the food is grown, by the container used for storage,
preparation and service by the personal handling of the food at various stages
etc. Contaminants in foodstuffs can chiefly be classified as physical, biological
and chemical contaminants:
(1) Physical contaminants include extraneous matter such as sand, soil,
hair etc.
(2) Biological contaminants consist of microorganisms such as fungi, and
their metabolic products.
(3) Chemical contaminants - on the other hand, are the products of fast
growing modern technology. Modernization of the population's lifestyles
also has resulted in the production of synthetic chemicals for use in all
aspects of modern life.
1.7.1 Contamination Sources for Food and Ingredients
Food products are rich sources of nutrients and generally have pH
values of about 4.0 to 7.0 since food products are excellent nutritional sources
for both man & microorganisms. Food products are contaminated with soil, air
and waterborne microorganisms. Harvesting, processing, distribution and
preparation generally lead to contamination of foods.
Unfortunately one of the most viable contamination sources is the food
product itself. If raw products are not handled in a appropriate way, they
become contaminated and support microbial growth. Equipment can be
instrumental in the contamination of food, of all the viable sources of exposing
microorganisms to food; employees are the largest contamination source.
Employees, through unsanitary practices, contaminate food that they touch
with spoilage and pathogenic microorganisms that they come in contact with
through work and other parts of the environment. Various parts of the body

11
such as the hands, hair, nose and mouth harbour microorganisms that can be
transferred to food during processing, packaging, preparation and service by
touching breathing, coughing or sneezing. Because of the warm temperature
supplied by the human body microorganisms rapidly proliferate on humans,
especially if hygienic practices are not conducted.
Although water serves as a cleaning medium during the sanitation
operation and is an ingredient added in the formulation of various processed
foods, it can also serve as a source of contamination. The airborne
microorganisms enter food the during food processing, packaging, storage
and preparation areas. Air contamination can result from unclean air
surrounding the food plant or from contamination through improper sanitary
practices.
Rodents can transmit the disease if they are not eradicated. But
rodents carry disease-producing microorganisms on their feet, fur and in their
intestinal tract. As with flies and cockroaches, these rodents transfer filth from
garbage dumps and sewers to food or food processing and food service areas
(Marriott, 1985).
1.8 SMALL VENDOR’S FOODS
Vendor's foods are an essential part of the food system in developing
countries. One is the relocation of vendors into "food centers" located at
strategic site where people congregate in the city. Persons of all income
levels eat vendor's food, but poorer people spend more on them than the
better off. Fast food is more popular in Rajkot school, college canteens. Many
people like office workers are eating daily one meal outside the home.
Vendor's food is very cheap and unhygienic food but very tasty.
The Food and Agricultural Organization of the United Nations (FAO)
defines street foods as 'ready-to-eat foods and beverages prepared and/or
sold by vendors, especially in streets and other similar public places.'
Vendor's foods are a heterogeneous food category consisting of meals and

12
snacks. They are inexpensive and available foods that, in many countries
form an integral part of the diet, because they are consumed with regularity
and consistency across all income groups, but particularly among the urban
poor and in some countries by children. Changing life-styles have led to large
numbers of people eating out.
International organizations have paid particular attention to the safety
of street foods and much less to the composition and presentation of their
nutritional quality (Gupta, 1996).
1.8.1 Vendor’s Food is a Major Occupation
Street (Vended) foods are not only a major occupation in developing
countries; they provide essential food service to millions of productive urban
workers. Contrary to assumptions, many sellers pay daily market fees. Inside
walk vendors paid dues to their own self regulating organization so as to avoid
clashes with the police. Indeed fear that the police or Military would break-up
their carts or shacks and destroy their merchandise was the greatest problem
for street sellers. Bribes and protection, money was higher than what license
fees might have been. Vendor's food is very cheap, easily available on the
road. Middle class families twice in a week have dinner outside. Street food
business provides almost 50% margins (Gill, 1993).
1.8.2 Reasons for Consumers to Consume Street Vendors Food
People eat street foods for certain as reason fast-food are cheap
convenient and save a time Economics of scale plus high cost of cooking fuel
often make street foods cheaper than food prepared at home. Further
traditional foods often take hours to cook.
Their choice is between hours of preparation and ready -to-eat food at
almost the same price. For working woman, there is no question which they
would choose. A similar choice is reflected in the fact that some 40 percent of
all meals in the U.S. are eaten out of the home.
(www.doh.gov.2a/com/department of food control/streetfood.)

13
1.9 VENDOR’S HYGENIC TRAINING
An integrated action plan on street foods should have a strong
educational and training component. Food handlers need to be trained in food
hygiene and good food handling practices and also in small business
management. They should be knowledgeable about regulatory aspects of
preparing and selling street food. It is desirable that such training be imparted
within an overall program for vended food improvement. As far as possible
such qualified vendors should be asked to wear something distinctive, such
as an apron or a badge, which may also give them recognition and an
enhanced sense of pride in their work. N.G.O. can play an important role in
educational and training programs in motivating vendors towards better
performance and in raising financial and other resources. Personal hygiene
of employees who handle food during processing and preparation is an
important part of sanitation.
Figure No. 3
Cough and Sneezes (Respiratory Tracks)
Humans are the major source of food contamination. Food
handlers can be sources of bacteria causing illness in others through
transmissions of these harmful bacteria.
The food handler diseased or
carrier
Open Sores cuts, boils
Prepared Food
Food is consumed
Soil in hands (intestinal tract)
Illness Results
Pathogens are
Excreted

14
Employees to assure personal hygiene should conduct the following
practices.
(1) Physical health should be maintained and protected through practice of
proper nutrition and physical cleanliness.
(2) Illness should be reported to the employer before working with food so
that work adjustments can be made to protect food from the
employee's illness or disease.
(3) Hygienic work habits should be developed to eliminate potential food
contamination.
(4) During the work shift, hands should be washed after (a) using the toilet
(b) handling garbage or other soiled materials, (c) handling uncooked
muscle foods (Perishable foods), (d) handling money, (e) smoking, (f)
coughing and sneezing.
(5) Personal cleanliness should be maintained by (a) daily bathing and use
of deodorants (b) washing hair at least twice a week (c) cleaning
fingernails daily (d) use of a hat or hair net while handling food (e)
wearing clean underclothing and uniforms.
(6) Employee hands should not touch food service equipment and utensils.
Disposable gloves should be used when contact is necessary.
(7) Rules such as "no smoking" should be followed and other precautions
related to potential contamination should be taken (Marriott 1985).
1.9.1 Basic Facilities to be provided to Vendors
Among the very basic facilities to be provided by the local authority are
space, water, electricity, lavatories and garbage disposal services. Depending
upon the local situation, serious consideration should also be given to the
provision of community or collaborative cooking promoting community
cleaning and sanitation of utensils, provision of tableware and the likes. The
logistics of such common services would need to be worked out carefully and
in consultation with vendors. This may help in the recovery of day-to-day
running costs from the vendors on a "cost recovery only" basis.

15
1.9.2 Needs to Local Facilities
There are a range of options that are available one is the relocation of
vendors into "food centers" located at strategic sites where people congregate
in the city. In such centers, they would operate under one roof and have
facilities such as water, electricity and a garbage disposal service. Some cities
may consider following this approach in highly congested city centers or other
similar locations and licensed vendors to operate only from these centers. In
the peripheral areas vendors may be allowed to operate as before but within
regulatory systems.
Another approach is that of "special areas" for street food vending
where again the necessary facilities are provided by the local body, yet
another option might be to allow street food vending within specified time
periods, local facilities such as water, electricity, waste disposal and toilets by
the local bodies is bound to require capital investment and additional recurring
maintenance costs. (http:/www street market.com.street/contact Docs/c.)
1.10 TECHNOLOGICAL ASPECTS OF STREET FOOD VENDING
It would be useful to involve appropriate technical institutions in the
subject. This will enable further scientific and technical inputs appropriate to
the needs of both vendors and consumers. These might include improved
water storage and dispensing equipment, improvements in preparation of
foods to achieve more nutritious meals, improvements in maintaining food at
the correct temperature and innovative designs for food stalls and push carts,
wearing clean clothes. Foods prepared and sold by street vendors in certain
countries is another important area which may call for attention from technical
institutions. National authorities could sponsor work on these matters. The
impact of such improvements on the ultimate cost of the food and on vendor's
income should be carefully considered so that they are not burdened with
unrecoverable costs.

16
1.11 FOOD SAFETY AND IMPORTANCE OF SAFE FOOD
Food Safety has always been an important issue. The reasons for this
are manifold. There is a strong consumer awareness of food quality and
safety and this continues to increase. International trade in food has also
increased the risk of infections agents being disseminated from the original
point of production to locations thousands of kilometers away. The
consequence of this is that there is an increased risk to human health, as well
as implications for international trade in food. As a result, there has recently
been a realization in many countries of the need for an integrated approach to
food safety.
Food safety is improved by defining the basic concepts, hazard and
toxicity. 'Hazard' is the relative probability that harm or injury will result when
the substance is used in a proposed manner and quantity while 'toxicity' is the
capacity of a substance to produce harm or injury of any kind under any
conditions. Food or ingredient is safe. It should not be based on its inherent
toxicity.
There after comprehensive review of the different terms used in the
context of food and its safety concerns. This includes both negative attributes
such as spoilage, contamination, adulteration, food safety hazards and
positive attributes such as the origin, colour, flavour, texture etc.
After comprehensive review of the different terms used in the context of
food and its safety concerns the importance of safe food and hazards which
are a concern to food safety is covered here under (Bamji, 1996).
1.11.1 Safe Food Handling for Optimum Nutrition
Good nutrition and food safety are important consumer issues of the
age. Nutrition, food safety and health are integrally related because no food is
nutritious if it’s not handled properly.

17
Overall Americans enjoy a very safe food supply. USFDA the Food and
Drug Administration, the Environmental Protection Agency, State and Local
Health Departments and others are all working together to ensure that food is
safe, wholesome and accurately labeled.
The consumers are concerned about food safety because even though
food is inspected, it can contain bacteria that can cause illness, if it is not
handled properly. Fruits and vegetables may contain bacteria. These bacteria
are present throughout our environment.
At the right temperature, in just a few hours’ small amounts of bacteria
that we can’t see, smell or taste can multiply to dangerous levels on food and
cause food borne illness, sometimes called food poisoning. Common
symptoms of many food borne illnesses are style-like and include diarrhea
which prevents the body’s absorption of the nutrients in food.
Everyone in the food chain plays a role in safety. Most of us eat foods
grown and packaged many miles away. Yet safe handling of food is as critical
in the home as it is in a processing plant, retail store or restaurant. The food
prepared in homes, Lorries and in safety of the food on the family table.
Perishable foods should be refrigerated within two hours of purchase
so that food poisoning bacteria do not multiply; proper storage of food
prolongs its self-life and preserves nutrients as well as safety. Foods stored
to long gradually spoil and also will loose nutritional value.
Frozen foods will maintain top flavour and nutritional value if the freezer
is kept at or below OoC (Gill, 1993).
(1) Preparing Food
Cleanliness is the first critical step in safe food preparation. It is
necessary that hands are thoroughly washed with soap and water before
handling food. Hands, utensils, cutting boards, must also be washed and work
areas after handling raw products must also be cleaned.

18
Frozen foods should never be thawed at room temperature. Instead of
this the food must be thaw safely in the refrigerator, or in the microwave only
immediately before cooking.
(2) Serving Foods
Food safety errors can be made during the serving and handling of
cooked food.
While serving foods one must be sure to wash hands thoroughly with
hot soapy water. Serve cooked products must be served on clean plates and
with clean utensils.
Foods should never be kept at room temperature longer than two
hours, one hour in hot weather. During serving, hot foods should be held
above 80o C and cold foods should be kept cold.
(3) Leftovers
When handling leftovers, cleanliness and temperature control are
critical with hands, before handling leftovers and use clean utensils surface.
Food spoilage bacteria may grow in the refrigerator, so discard any
outdated foods. Most foods will remain safe in the refrigerator for about four
days, but use highly perishable foods such as stuffing or gravy within one to
two days.
(4) Food Safety Tips
(1) Keep it safe; refrigerate those foods, which will be used quickly. Freeze
perishable foods if you can’t use them in one or two days. Freezer should
register of, ref. 10o C.
(2) Don’t thaw food on the kitchen counter because bacteria multiply rapidly at
room temperature.
(3) Wash hands before preparing foods. Wash hands and utensils after
contact with perishable foods. Wash cutting boards or other work surfaces;

19
as bacteria often present on raw foods, can spread to other foods if you don’t
clean them properly.
(4) Never leave perishable food out for more than two hours.
(http://www.street market.com.).
1.12 STATEMENT OF PROBLEM
“Nutritional and Hygienic Assessment of Foods Sold by Small Vendors
in Rajkot City.”
1.13 SIGNIFICANCE OF THE STUDY
The present study is to find out the nutritional and hygienic quality of
foods sold by small vendors. Most of people who are daily eating outside the
home, cannot always afford expensive food from hotels or restaurants.
Vended food is easily available at cheaper rates. By this study the researcher
will be able to find out nutrients and microbial quality in small vendors foods.
Although, Vendor's food is very cheap, but whether it maintains good quality
or not that is to be found out by this study. People will know about difference
between homemade foods and vendor's foods by this study. Many people
have misconceptions regarding what to eat, why to eat and how to eat. On
other hand they are vulnerable to food poisoning as well as many infections
arising out of vended food. This study will help people by providing scientific
knowledge about the quality of food they eat; it will be of great help to them in
choosing right food. It can also help the statutory body like PFA, FPO etc. to
evaluate new standards to the vender food/ street food.
The following are some of the important aspects that can be
benefited from the study.
1.13.1 Significance to society
(1) People of Rajkot city will be able to gain awareness regarding basic
concepts of Nutrition.

20
(2) People of Rajkot city will be able to understand nutritional quality of
vendor foods.
(3) People of Rajkot city will be able to understand microbial quality of
vendor’s foods.
(4) They will be able to know about difference between home made and
vendor sold food in respect to its hygienic and nutritional quality.
1.13.2 Signification to the Home science discipline
Human nutrition is a major part of the Home Science. The
results of this study will help the society choosing proper and qualitative
foods. Food is the nutritive material consumed by humans. It is metabolized in
the body functioning for the purpose of energy, repair, maintenance and other
vital processes of the body. Due to the change in life style, people now a day
prefer going for fast foods, which are readily available. But due to unhygienic
handling, external contamination or inferior quality of raw materials used
bacteria contaminate this fast food.
To assess the nutritional status of a population researchers use
surveys. One kind of survey, determines what food people eat, calculates or
measures the nutrients in them, and compares the amounts of nutrients
consumed with a standard such as the R.D.A. Another kind of survey, a
nutritional status survey - assesses the nutritional status of the people
themselves. Any one interested in nutrition needs not only to study nutrients
and foods but also to acquire an understanding of the human body. The
interactions among foods nutrients and the body are not as simple as one
might expect.
One situation represents a lifestyle where every meal is eaten at home
under relaxed conditions. The other represents a lifestyle where every meal is
eaten outside the home under hurried or hectic conditions.

21
1.14 OPERATIONAL DEFINATION
1.14.1 Vendor's foods
FAO defines vendor's food as a street food, as ready to eat foods
prepared and sold by vendors, especially in street and the similar public
places.
1.14.2 Nutritional Assessment
Quantitative assessment of different nutrients in food by different
chemical methods.
1.14.3 Hygienic Assessment
Observations regarding practices followed by the vendors while
preparing foods.
1.14.4 Microbial Assessment
Assessment of microbial population present in food.
1.14.5 Food Quality
Food quality refers to the attributes that influence a products value to a
consumer.
1.14.6 Food Hygiene
Food Hygiene refers to all conditions and measures necessary to
ensure the safety and suitability of food at all stages of the chain.
1.14.7 Food Sanitation
Food Sanitation means creating and maintaining hygiene and healthful
conditions in the food preparation storing and serving areas.
1.14.8 Food Handler
The persons who prepare food and sell it.

22
1.15 OBJECTIVE OF THE STUDY
(1) To study nutrient components of food sold by small vendors.
(2) To study hygienic factors of food sold by small vendors.
(3) To study microorganisms those are present in food by various
methods.
(4) To compare between home made and vended food with respect to
nutritional quality.
(5) To compare between home made and vended food with respect to
hygienic qualities.
1.16 JUSCTIFCATION OF THE STUDY
The knowledge will help consumers to understand the importance of
food we eat. It will help consumers to change our eating practices and
motivate consumers to eat nutritious and hygienic foods.
The people of Rajkot city are health conscious and diet conscious.
They will be able to take scientific decision what to eat and are what not to
eat. Most people like eating a small vendor’s food. Most of working woman
and their family are generally eating outside the children need a nutritious
food. Better nutrition in childhood leads to optional physical and mental growth
their work efficiency will be increased and will be able to produce more in less
time. The counts will thus benefit economically whenever they become health
conscious, a number of nutritional deficiencies and food poisoning can be
kept at bay.
The study will help us to know about food contamination and
unhygienic foods, which microorganisms are present in food. The
contamination has always been a potential source of illness but proper
storage and handling of food can avoid this problem. The major cause of
health problems associated with food is the microorganisms that are present
in food. The key to a safe food supply is control of the microorganisms in the
23
various types of food that constitute the diet. As would be anticipated the
microorganisms of concern vary with the chemical and physical properties of
specific foods and include certain bacteria. Microorganisms enter the food
supply in a variety of ways by contamination through water, soil, hand and
vessels. Vended foods on a health risk basis are categorized into "high risk
foods" and "lower risk foods". The bulk of food borne illness is associated with
microbiological contaminations of foods. Same time home made food may be
rich in nutrients and number of microorganisms may also be very less.
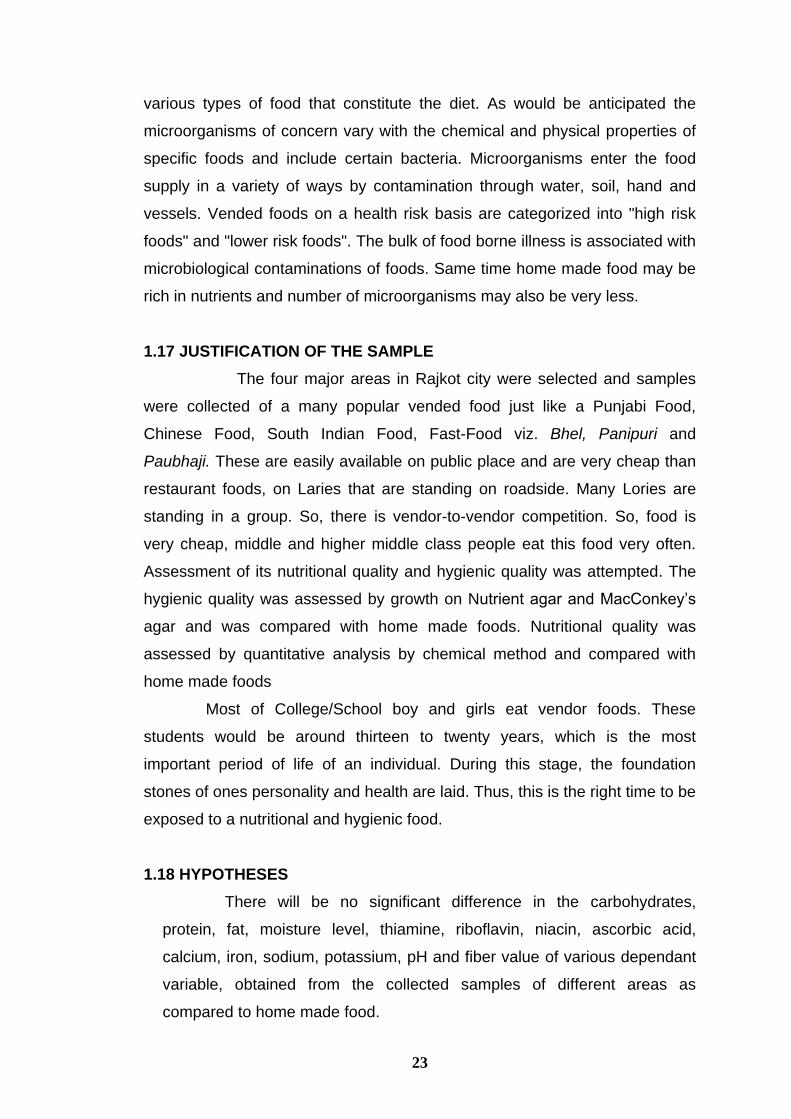
1.17 JUSTIFICATION OF THE SAMPLE
The four major areas in Rajkot city were selected and samples
were collected of a many popular vended food just like a Punjabi Food,
Chinese Food, South Indian Food, Fast-Food viz. Bhel, Panipuri and
Paubhaji. These are easily available on public place and are very cheap than
restaurant foods, on Laries that are standing on roadside. Many Lories are
standing in a group. So, there is vendor-to-vendor competition. So, food is
very cheap, middle and higher middle class people eat this food very often.
Assessment of its nutritional quality and hygienic quality was attempted. The
hygienic quality was assessed by growth on Nutrient agar and MacConkey’s
agar and was compared with home made foods. Nutritional quality was
assessed by quantitative analysis by chemical method and compared with
home made foods
Most of College/School boy and girls eat vendor foods. These
students would be around thirteen to twenty years, which is the most
important period of life of an individual. During this stage, the foundation
stones of ones personality and health are laid. Thus, this is the right time to be
exposed to a nutritional and hygienic food.
1.18 HYPOTHESES
There will be no significant difference in the carbohydrates,
protein, fat, moisture level, thiamine, riboflavin, niacin, ascorbic acid,
calcium, iron, sodium, potassium, pH and fiber value of various dependant
variable, obtained from the collected samples of different areas as
compared to home made food.

24
Chapter – 2
REVIEW OF LITERATURE
2.1 NUTRITION RELATED LITERATURE
Kamaliya (2006) in his study planned to enrich commercially
available bread with wheat bran (WB) and analyzed its nutritional merit to find
out its possible uses in the dietary management of people suffering from
various chronic diseases. Good quality raw materials were purchased from the
local market of Vallabh Vidhyanagar and Anand. One method of bread
preparation was selected through market and literature survey. Both the breads
(EB-Experimental Bread and CB-Control bread) were analyzed for only
moisture (AOAC, 1970). However the carbohydrate and energy value were
reduced in EB as compared to CB, Both the situations have beneficial effect on
chronic diseases. Calcium, phosphorus and iron content were estimated 2 to 3
times higher in EB as compared to CB, which is again beneficial in some
deficiency diseases and even to healthy human beings.
Vaid and Dave (2006) had reported that Handwa, a fermented savory of
Gujarat state served as main meal, or as a snack item. Cooked handwa was
analyzed for pH, ash, iron, carbohydrates, and protein. After fermentation, pH
of batter decreased from 4.79 to 3.77. Solar cooked handwa had the highest
pH (3.89) while conventionally cooked had pH 3.78. Moisture content was the
least in microwave-cooked handwa (39.89 gm. per 100 gm.) while highest in
conventionally cooked handwa (54.4 gm. Per 100 gm.). Solar cooked handwa
had the highest carbohydrate content; iron and protein content.
Mubeen and Sarkara (2006) had carried out the nutritional composition,
terrible acidity and pH of Yoghurt estimated before and after inoculation and
fermentation. pH of the yoghurt samples was obtained by „Elico‟ pH meter
model No-L1-163. (Protein was estimated by Kjeldahl method, fat by Soxhlet
method, (AOAC, 1970). Sodium and potassium was estimated by ELICO‟S

25
flame photometer. The percent change of ash value was increased by +25.58,
which was significant (P<0.05), the percent change of protein level was +51.12
which was highly significant increase. Increase of fat the percent decrease after
fermentation was -29.80, which was found to be highly significant. Shahani and
Chandan (1979) reported that culturing causes the partial digestion of proteins,
carbohydrates and fats, improves the digestibility of fat and produces
anticholesterolemic compounds. The carbohydrate percent decrease. The
percentage change of calcium, phosphorus, potassium and iron was increased
by +1.41, +22.4, +67.48 and +142.5, which was highly significant. Culturing
caused increase in these respective nutrients, this helps in the better
bioavailability and absorption of nutrients. The sodium value decreased with a
high significance, with a percent value of -30.90. The addition of supplementary
culture L. acidophilus did not increase the magnesium levels and the percent
change observed was -13.34, which was significant at (P<0.05).
Vasavada and Dave (2006) in a study made different variation in
ingredients for preparing dhokala and it was compared with the traditional
Dhokala for its nutritive value. Traditional dhokala (A) was prepared by using
rice, black gram dal, Bengal gram dal, curd and salt. Variations were made
using dry Corn (B) and Kodri (varagu) (C) instead of rice. Total amount and rest
of ingredients and procedure were kept same. Carbohydrate content was
highest in sample (A). Free amino acid, protein, iron, thiamine, riboflavin and fat
were highest in sample (B), while calcium content was highest in sample (C). It
was found that variation of corn improves free amino acid, protein, iron,
riboflavin and thiamine values. It is also moderately acceptable. Its texture was
very good but the flavor and taste were found average Variation of kodri
improves calcium and other nutrient comparatively traditional sample. Its
acceptability was highest. Its color and flavors were found highest compared to
other two samples. It is also concluded that both the modification were found
highest in nutritive value and in acceptability.
Goswami and Mehta (2006) had reported that dahi is highly nutritive and
its therapeutic value is also high as it gives protein, riboflavin and calcium in
highest range. The procedure carried out included taking 100 ml of Goat‟s milk

26
in a clean container and then heating at 95o C for 5 minutes while cooling at 40o
C. The suspension of homogenized 50 ml egg white was added in goat‟s milk
mixed well then 2 ml of pasteurized Amul milk was added and again mixed
well. This seeded milk 100 ml was transferred into 150 ml of big china clay pot
and incubated at 34o C for about 8 hours. The pH was measured by using pH
meter, which falls on 3.5. Now 100 grams of Bengal gram flour is added along
with approximately 5 grams of sugar and mixed well then again it was kept for
incubation process for about 10 hours. The batter is mixed well with 5 grams of
salt (as per taste) and 10 ml of Luke warm water and dispended in small bowl
and steamed at 110o C for 10 minutes. Standard recipe was prepared using
same procedure except it was not fortified with egg white. From the
observations it can be concluded that the nutritive value of carbohydrate,
protein, iron, calcium, riboflavin, and thiamine increased in enriched fermented
food compared to standard fermented food recipe but the fat content
decreases. The product acceptability of this recipe was generally good and
there were remarkable increase found.
Shah and Vasavada (2004) in her study, the food was modified and
compared with the standard item. The sample „A‟ served as standard
containing rice flour, black gram flour and wheat flour, Fenugreek seeds, salt
and sugar were added along with it. It was then allowed to ferment by adding
buttermilk for 8 to 10 hours and finally cooked. The variation was done using
vegetables (carrot and bottle gourd) in sample „B‟ and wheat semolina in
sample „C‟. Other ingredients remained the same as standard „A‟. Moreover the
cooking pattern too remained the same for all. It was found that addition of
vegetables in „B‟ increases the amount of calcium; its color was very good,
whereas texture, flavors and taste were moderate; overall it was moderately
accepted. The sample „C‟ got highest preference in terms of texture, flavors
and taste; whereas, it increased the amount of carbohydrate, fat, protein, iron,
riboflavin and thiamine.
Dave (2004) had reported that Vada is traditional fermented food, which
is commonly prepared from fermented black gram dal and rice. Adding
buttermilk or curd and warm water and allowing the mixture to stand at room

27
temperature for at least eight to ten hours for fermentation before deep fat in
frying was drained out paper. In present study, different variations were made
in ingredients of vada like soybean, green gram, cheese and coconut.
Carbohydrate was high in sample A compared to sample B, C and D, Free
amino acids, protein, iron and calcium were found to be higher in sample B, C
and D. Calcium, iron and fat content were found the deep frying was done in
hot oil till golden brown.
Dave and Joshi (2004) had reported dhokala is a traditional Gujarati
fermented food, which is commonly prepared from parboiled rice, black gram
dal, and salt. In present study different variations were made in ingredients for
preparing dhokala and it was compared with the standard (A-traditional)
dhokala for its nutritive value as well as its acceptability. Standard dhokala (A)
was prepared using parboiled rice, black gram dal, curd and salt. Variations
were done using soybean (B) (pretreated for destroying anti nutritional factors)
as well as peanuts (C) in two different recipes. Total amount and rest of the
ingredients were kept common as in standard dhokala. Fermentation time (10
hr.) and all the cooking procedures were kept same for all the samples.
Carbohydrate and sodium content was highest in Sample 1 (Standard). Free
Amino acids, protein, iron and calcium were found highest while ascorbic acid
content was found lowest in Sample B (10% Soybean). Fat and thiamin
contents were found highest in sample C (10% Peanuts). It can be concluded
that, addition of 10% soybean to the standard dhokala improves free amino
acid, protein, iron and calcium values.
Joshi and Dave (2004) carried out a study in which analysis of different
nutrients was done from well-known commercially available white bread
samples from the market of Rajkot city, Gujarat, India have been analyzed for
different. nutrients. The fresh white bread samples were obtained from market
distributors at the time when they received breads from the bakeries. Total
carbohydrate, total soluble proteins, fat, ascorbic acid, riboflavin, thiamin,
calcium, sodium, potassium, and iron were analyzed. All the sample of breads
obtained from Rajkot city were found nutritionally better then the average
values. Calcium, iron, thiamine and riboflavin contents of the breads obtained

28
from Rajkot city were also found better. Therefore it is concluded that the
breads obtained from Rajkot city may be nutritionally enriched or fortified.
In a study conducted in Gujarat, India shown that there were different
types of cakes and unsorted cakes. It provides larger share of energy, proteins,
fat and carbohydrates than any other nutrients to the body. It is often called the
stuff of life. The food value of shortened cake provides important amount of
energy giving nutrients and also provide minerals like iron, Ca+2 etc. In present
study analysis of different nutrients from commercially available shortened
cake, which was collected from Rajkot City, were done by Standard Chemical
methods. Finding shows that the entire samples were found good for health
and nutrition. (Mehta 2004).
Rathod and Rupapara (2004) carried out on study of a synthetic fruit
juices powder that were available in the market which were dissolved in water
and served, or in the form of bottle syrup. Synthetic fruit flavors and colors were
added in the powder. These juices provide some vitamins, minerals and sugar,
depending on fruit used. In the present study analysis of different nutrients from
commercially available synthetic fruit juice powder, this was collected from
Rajkot City.
Aghera (2004) had reported that “Bari” is a preparation made from Cow
or Buffalo‟s colostrums. Two varieties of “Bari”, viz. (1) with sugar and (2)
without sugar were prepared providing steam-heat treatment. The protein,
carbohydrate, fat, minerals, ash and moisture were tested. The analysis reports
more fat and carbohydrate in “sweet-Bari” than without sugar Bari. “Bari”
without sugar contains more moisture than “sweet-Bari”. “Bari” also contains
carotene, protein, vitamin-A, fat and carbohydrate in large quantity.
Geriya (2004) carried out a study of acceptability of idli on addition of
5%, 10%, 15% and 20% soybean, and compared with standard idli. Hedonic
scale was used to study the acceptability. Standard idli had the highest
acceptability, while among the modified idlies one containing 15% soybean
showed the highest, and 20% soybean showed the least acceptability.

29
Kamdar (2004) had reported that the nutritive value of ragi is better than
that of rice and other cereals. It is rich in calcium, iron and phosphorus. Sukhdi
on addition of 20%, 40%, 60% and 80% ragi was studied and compared with
standard sukhdi. Hedonic scale was used to study acceptability standard,
sukhdi had the highest acceptability, while among the modified sukhdi one
containing 20% ragi showed the highest, and 80% ragi showed the least
acceptability.
Pandya and Bagathariya (2004) had reported that a survey of
youngsters been carried out in Rajkot City of Gujarat State. Sample size was
taken 100. In this, 76 were girls and 24 were boys of age group between 18-25
years. These samples belong to different economic groups, i.e. High, Middle,
Low for this frequently preferred fast food, while 39% less frequently preferred
fast food. Pizza and Bread butter are most popular fast food than rest of the all
others, while macaroni and noodles are very less preferred.
Raval and Parmar (2004) in a study carried out analysis of different
nutrients from commercially available baby food, which was collected from
Rajkot city where done by well-known method. Finding shows that all the
samples were found good for health and nutrition.
Nakum and Gohel (2004) had reported that Vada is a popular fermented
food of south, in present study, variations were made in one of the ingredients
for preparing vada and it was compared with the standard vada for its nutritive
values as well as for its acceptability. It was observed that addition of 10%
soybean improved calcium, iron, and vitamin C value. It was also having
moderately acceptable taste and colour, texture was found average. Addition of
10% peanut improved, acceptability and texture contents were found highest
compare to all samples.
Ankleshwaria and Karkar (2002) studied depending upon the sodium
and potassium content, the snacks were classified as low (<100 mg), moderate
(100 - 400 mg), high (400-1000 mg) and very high (>1000 mg) sodium or

30
potassium containing snacks. Among all the samples analyzed 18% samples
had low, 41% had moderate, 6% had high and 35% had very high sodium
content, 53% samples had low and 47% had moderate potassium content. The
ready-to-eat easily perishable fasting snacks had highest sodium and
potassium content. Overall the sodium content of the fasting snacks ranged
from 1160 mg to 66.67 mg and the potassium content ranged from 353.33 mg
to 1.1 mg, percent. Not a single snack analyzed had ideal K/Na ratio of 1.5 as
suggested by JNC, the highest ratio recorded being 0.76.
West Africa, women comprise 60 and 80 percent of the workforce in
trading (Ruel, 1998). The need for women to save time in food preparation has
increased the share of the food budget spent on processed foods, convenience
foods, snacks, and meals available as street foods.
In a paper titled, „Greek street food vending: An old habit turned new‟ by
Matalas and Mary (1996), state that, In Greece, street foods made their
appearance in the 6th Century BC with the development of urban communities.
Hot lentil soup was the only available street food in the „agora‟ of the Greek
cities, as eating while wandering around the market was not considered
appropriate. Many foods popular in ancient times were rediscovered during the
Byzantine period and are popular today. The authors provide a precise
evolution of the main Greek street foods from the ancient times to the present.
Price is a minor factor in the selection of street foods; taste, quality and
freshness are the food attribute Greeks are looking for in selecting street foods.
Street foods enjoy a wide accessibility. The authors describe the licensing,
processing, packaging and distribution of street foods. They consider street
foods under these categories: (a) foods without any preparation; (b) street
cooked foods, and (c) ready-to-eat foods; which provide extensive information
on the nutritional, chemical and microbiological quality of street foods.
A paper titled, „Street foods in America: a true melting pot‟ by Taylor and
co-workers (1996). In the USA, stated that, there is a vast array of food choice,
but relatively little information about consumption patterns and their contribution
to the diet of Americans. This paper provides an overview of the foods available

31
and the health, safety and regulatory issue associated with consumption of
street foods, Street foods have been part of the American scene since the 17th
century. The street vendor market became a business of the lower class.
„Public (street) foods in Australia‟ was studied by Wahlqvist and co-
workers (1995). They stated that the concept of street foods is rarely seen as
being a part of developed countries such as Australia with its 5,400
supermarkets and 13,000 other retail establishments. The preferred term is
„public foods‟ rather than „street foods‟ since the locations of supply and
consumption are more varied than the street e.g. sports grounds, church fetes,
shopping malls, cinemas etc. By „public foods‟ they refer to the immediate
purchase and consumption of ready-to-eat foods in public places. Public foods
have an element of environmental proximity about them, which require little
anticipation, planning or preparation on the part of the consumer. They form
part of the class of convenience foods but are purchased and usually
consumed in a public location. Though some foods are undoubtedly purchased
for later consumption in the home, e.g. jams, preserved fruit and cakes from
church and other fetes. They are part of a rising trend in Australian and other
western societies, the convenience food trend.
Bhatt and Waghray (1995) narrated that, although profile of street
foods sold in Asian countries‟ was Studies Street foods have been around for
hundreds of years, the proliferation of street foods in Asian countries is a new
phenomenon. It began in the 1940s. Foods are selected because of taste and
low cost, they are not selected for their nutritional value, although the food
energy and protein value of cooked street food is higher than that which could
be obtained from prepackaged processed food. The authors considers food
safety a major issue and for this reason describe in detail the Hazard Analysis
Critical Control Points (HACCP) on how to conduct the HACCP analysis in the
field to determine critical control points. The HACCP concept has been applied
to street foods in 23% of the countries which participated in the WHO street-
vended food survey.

32
Various authors like Quisumbing (1995); Kennedy and Peters (1992);
Rogers (1996); Handa (1996) had reported that in Ghana, women play a crucial
role in the economy, controlling a large share of market activity and commodity
trading. There are a small number of studies that have examined the impact of
women‟s employment on the economic and social well being of the family.
Women‟s access to the cash economy contributed to an improved economic
standing of households in which children are being raised. Food consumption,
measured by adjusted consumption expenditure, was highest in those
households where women were the primary head of their household.
Bhatt and Waghray (1994) continued with their paper „Street foods in
America‟ and the Studies were conducted in some of the African countries like
Nigeria and Morocco. They have shown that the major street food vendors
usually earn more than the country‟s minimum wage. In Nigeria it is cheaper to
buy street food than to cook it. Eating street foods begins in infancy. In
Senegal, yoghurt is frequently given to the babies as weaning food and is never
prepared at home. Street foods were the major source of nutrients for many of
the adolescents (n>142) in Abeokuta (Nigeria). Between 40 and 70% intake of
all the major sources of food groups were obtained from street foods which
were the major sources of dairy products (70%), legumes (60%), fish (50%),
meat (50%) and eggs (50%); 21% of energy for males and 29% energy for
females was supplied by street foods. Street foods also supplied greater than
50% total proteins, 64% calcium and 60% vitamin A for both males and
females. For other minerals (iron) and vitamins (thiamine and ascorbic acid)
street foods supplied greater than 50% of total intake. Selection of street foods
is based on taste, price, and on nutritional quality too.
Bhatt and Waghray (1994) also examined „Street foods in Latin
America‟ in the next paper. Street food industry is part of the informal economy
of the Latin American countries. Most of the street vendors earn more than the
minimum wage. Miriam de Chavez and co-workers (1984) look specifically at
Mexican street food in „the sale of street food in Latin America. The Mexican
case: jeopardy J. in the paper which follows. Mexico has an old tradition of
street foods. Fruits and juices are prominent items along with cooked snacks

33
and meals. As in other Latin American countries, food safety and licensing are
important issue, as are the economic aspects of street foods, which represent
an important sector of the economy.
Amirthaveri and Lakshmi (1994) had reported that a breakfast provides a
large proportion of our needs for energy, complex carbohydrate, protein, dietary
fiber and many vitamins and minerals. For all the breakfast items selected the
raw ingredients were carefully weighed and with the help of the nutritive value
book, the nutrients were calculated for each preparation. The loss of nutrients
occurs. The maximum loss was shown with regard to ascorbic acid but that
was the known fact and also it was due to the specific characteristic and
chemical nature of ascorbic acid. In the case of energy only minimum loss
occurs during the processing and cooking. Totally the percentage of loss of iron
was more when compared to calcium but for both the nutrients same ash
solution was used for analysis. The fiber loss varied from item to item that may
be due to pre-preparation or cooking or during analysis.
Goyle and Dugar (1994) in a study showed that the protein content
ranged from 5.4 to 10.7 g/100g, fat from 11.5 to 30.5 g/100g and crude fiber
from 0.20 to 0.59 g/100g. The quality of oil extracted from the snacks obtained
from the canteens was found to be inferior when compared to that of the oil
extracted from the samples prepared in the laboratory as the values of
alcoholic acidity and acidity of extracted fat of the former were found to be
significantly higher than those of the latter.
Rosenberg and Trotler (1993) describe „Street food vending: The
Isaraeli scenario‟ in their paper. Street food vending as seen in developing
countries is not part of the Isaraeli scenerio. Street food vending as seen in
developing countries is not part of the Israeli version. Street foods are generally
available at Falafel, sunflower seeds, nuts, ice cream or pizza are all part of the
daily culinary street scene. Israeli food fairs were also described. The nature of
the Israeli trend in street foods includes two major characteristics. First, it is an
established and organized activity, mainly localized in commercial urban
centers. Second, it is mainly for snacking purpose, and does not confirm to the

34
FAO definition because it is neither prepared nor sold by street vendors and
hawkers.
A study was conducted on urban household food security and nutrition
by Haddad (1993). One of the key objectives was to identify vulnerable
households in an urban environment. While the study was not specifically
designed as a comparison of male-and female-headed households, difference
in gender and headship emerged as a significant factor in the analysis. Ghanna
women have a strong presence in the urban economy, especially in the rapidly
growing informal sector, working as street food vendors and petty traders; they
balance their livelihood with the responsibilities of feeding and caring for their
children and other family members. To gain a better understanding of urban
women‟s livelihood and vulnerability to food insecurity, this paper highlights the
main findings of a larger study on Urban Food and Nutrition Security in Accra,
focusing on the difference in employment, income, consumption, and food
security between male-and female-headed households.
Cheri (1971) in his study the samples were taken after 4h of
slaughter and immediately packed in HDPE and stored at 2, -1oC. From 6 kg lot
of sample, measurement of pH and determination of cooking loss pH of finely
minced samples were determined after homogenizing 10 g of the sample with
50 ml distilled water using laboratory homogenizer (make Insala Co.). pH of the
samples were recorded using reference and glass electrode portable type
digital pH meter (model Khera).
2.2 MICROBIAL RELATED LITERATURE
Siddika (2006) in his study reported that microorganisms used as a
culture in preparing yoghurt are believed to synthesize vitamin B complex.
Yoghurt drinks are also available in markets, which are also highly nutritious
food. All the samples were tested for their microbiological qualities using the
parameters of total viable count (per ml), coli form count (per ml), yeast count
(per ml), mould count (per ml). The total viable count per ml of yoghurt samples
were 89.17 (±6.29) X 104, 88.33 (±7.53) X 104, 89.67 (±9.60) X 104

35
respectively. Statistical analysis showed that there was no significant difference
among the different samples. No coliforms bacteria were detected in the
sample, which may be due to strict sanitary condition followed during collection
and processing of milk.
Kowsalya and Shymy (2005) had carried out a comparative study of
reports and findings of several authors that point out hazards in the
consumption of beverage is due to poor handling and hygienic practices
adopted by the food vendors. Actions like nose picking, finger licking, nail
biting, sneezing, scratching and failure to wash hands after visiting toilet arouse
feelings of disgust in the minds of people. To study the hygienic practices
followed by the sellers and restaurant workers, a simple interview
scheduled/checklist was framed to draw information on aspects like personal
hygienic of vendor the usage, storage and disposal of water. Microbial
contamination of selection beverages the total bacterial count in different
beverages. The results from plate count techniques revealed the presence of
bacteria in all the samples analyzed except in commercial canned juices. An
unhygienic habit of smoking, chewing betel during work and spitting nearby
was seen in 20.32 and 28 % respectively of petty shop workers, where as in
cool bars and restaurants these practices were not followed. Forty eight per
cent of pantry shop workers and 20 per cent of restaurant workers
scratched/picked nose during work. Similar unhygienic practicing among the
vendors of India was reported by Shuping and Guzman, 1984. The samples
were found to be contaminated especially with Escherichia coli and other
physical agents such as dirt.
Dave (2004) had reported that Chutney is an inevitable component of
Indian fast food. Chutney is usually made of tomatoes, spices and herbs. Ten
samples of chutney were randomly collected from the road side food vendors of
Rajkot city. SPC (Standard plate count) method was determine total CFU/ml.
pH was determined used pH meter. Gram staining examination was used for
identification of colony forming units. The samples were found containing
lactobacillus, Staphylococcus, Escherichia coli, Clostridium sporogenes and
streptococcus. pH, water content, nutrient content, storage temperature and

36
time are some intrinsic and extrinsic factors affecting the microbial quality of
chutney. Microbial contamination may occur at almost all stages in the
preparation and serving of chutney. Preparing gadgets, storage and serving
utensils, soil, water, spices and food handlers are major sources of bacterial
contamination in chutney. This type of microbial contamination is one of the
responsible factors for food born diseases like nausea, vomiting, diarrhea,
bacillary dysentery, abdominal cramp and pain. This type of foodstuff may be
hazardous to the health of consumers and requires utmost care to be taken
towards maintenance of proper sanitation and hygienic measures.
Avashia and Dave (2004) had reported that Milk is a nutritive
medium for human beings as well as for bacteria. 25 Random samples of raw
milks from cow origin of uncontrolled vendors were collected and
bacteriological analysis was made. According to standard methods colonies of
streptococci, lactobacilli, staphylococci, gram +ve bacilli and few colonies of coli
form group of organisms were detected on different culture media. From the
findings it was concluded that the raw milk is often contaminated from
uncontrolled vendors.
Trivedi and Vyas (2004) A study among Ladies hostel at Rajkot city
during process of cooking. Microbiological assessment were made by agar
plate method and by ASA strike method for air sampling, average colony count
were 155 on nutrient agar plate and 50 colonies on agar strip. Air flora changes
according to time to time and place to place and methods to methods.
Vyas and Joshi (2004) had carried out a study on Jam & Tomato
Ketchup samples. Randomly Jam and Tomato Ketchup samples were
purchased having ISI mark from local departmental stores. Four samples were
screened for microbiological, analysis at various intervals by SPC method, and
by Howard method. At the time of opening all samples were within the limits for
mould count while all specimens at initial level showed presence of
lactobacillus in remarkable numbers. All specimens were screened at the
interval of 15 days for microbiological screening and for chemical changes such
as pH.

37
In study by Nansal and Madhu (2003) ten government and private
school canteens of Chandigarh were surveyed at random to determine the
hygiene standards maintained in their kitchens. The total bacterial counts of
food samples (Table - I) ranged from 3.60 X 10⁵ to 1.93 X 10⁷ CFUgm/ml, with
pattie having the highest counts and sambhar the lowest counts. The gram
negatives count was between 2.20 X 10³ to 1.75 X 10⁵ CFUgm/ml; the highest
being in sandwich and the lowest in sambhar. The total bacterial counts of
water ranged from 3.10 X 10⁵ to 2.49 X 10⁶ CFU/ml. The gram-negative counts
were between 3.10 X 10³ to 1.67 X 10⁴ CFU/ml.
Kannappan and Varma (2003) carried out a study on South Indian fast
food products namely, Gobimanchuri, Pani and puri, Fried rice, Churmuri,
Masalapuri, fried fish and noodles procured from 6 different locations in Mysore
city. The samples were analyzed for total plate count, coliform, yeast and
moulds and Staphylococcus aureus, Escherichia coli, Bacillus cereus and
Vibrio parahaemolyticus and others. Few of them were screened for
antagonism by Pediococcus pentosaceous NCIM 2292. The spent culture of
Pediococcus showed highest inhibition against Bacillus cereus and
Staphylococcus aureus than its cells. The panipuri sample was analyzed
saprately viz. Pani Puri and masala puri. In poori and noodles, total plate count
values were log 4.77 cfu/g, log 2.77 cfu/ml and log 7.14 cfu/g, respectively. In
masalapuri, Gobimanchuri, and Chumuri, Staphylococcus aureus and
Escherichia coli counts were 6.39, 4.69 and 5.14 log cfu g and 6.39, 6.07 and
6.47 log cfu/g, respectively. Poori at one location had 6.47 loads of Vibrio
parahaemolycticus. It was evident from the results that most of the fast foods
were contaminated with spoilage bacteria with the low level of Bacillus cereus.
In a study Sathisbabu and Rati (2003) had collected the Pani Puri and
masala from street vendors in labeled sterile plastic covers. The samples were
transported and held at 4oC till analysis on the same day. The prevalence of
Yersinia enterocolitica an emerging food borne pathogen was studied in
panipuri, which is crowned as the king of evening snacks. The snack product
panipuri consist of three separate items viz. pani, puri and masala. Eight

38
samples of panipuri each consisting of individual items of pani, puri and masala
collected from surrounding area of Mysore city was analyzed for mesophilic
aerobes, coliforms and Yersinia spp. Amongst the pani, puri and masala
samples, the latter sample showed high level of contamination recording
mesophlic aerobes, coliform and Yersinia spp counts up to 6.9, 6.4 and 6.1
log10 CFU/g, respectively. Escherichia coli were present in three samples of
masala. The identification based on microscopic character and key biochemical
tests conducted on 33 pure cultures isolated from Yersinia selective plates
showed six cultures to be Y. enterocolitica. Characterization of these six
isolates for virulence factors showed two isolates to be virulent stains as they
showed positive reaction to auto agglutination and crystal violet binding tests.
A survey was conducted to study the consumption pattern of food in
Kochi, following which eight commonly consumed street foods were collected
from three different sources viz. (i) a street vendor (ii) restaurant and (iii) a
house in the city. All the samples were analyzed for proximate composition and
tested for adulteration. Four most widely and frequently consumed foods were
subjected to microbial evaluation. Hazard analysis critical control points
(HACCP) evaluation of one food sample was carried out and hygienic practices
adopted by street vendors and restaurant workers were also evaluated. The
study revealed the presence of non-permitted colours, artificial sweeteners,
adulterant oils and poor sanitary quality of food. The HACCP analysis of Bengal
gram curry showed high microbial counts in raw and soaked samples. The
hygienic practice adopted by vendors and restaurant personnel were far
satisfactory. Though foods from all sources were nutrient dense, home made
foods were less expensive and quality wise superior to both restaurant and
street foods. (Chandrasekhar and Kowsaly, 2003).
Kaul and Mahajan (2002) had conducted a survey of Fresh milk shakes,
ice and packed flavoured milk samples from various shops in Chandigarh
collected aseptically in sterile vials. Samples of milkshakes and flavoured milks
were screened for their bacterial counts. The total and gram negative counts of
freshly prepared milkshakes were found to lie between 106 – 108 and 104 – 106
Colony Forming Unit (CFU) / ml respectively. Samples of mango shakes

39
showed the highest counts for both total and gram negative organisms. The
lowest total count was observed in chocolate shake samples while banana
shake samples gave the lowest gram-negative counts. The total and gram-
negative counts for ice lay between 105 – 106 and 103 – 104 CFU/ ml
respectively. For packed flavoured milks, the total and gram negative counts in
the present investigation lay between 105 – 107 and 103 – 105 CFU/ ml
respectively. Response to other questions revealed that in three (27.3%) out of
11 shops, the workers washed their hands with plain water where as in eight
shops (72.7%) soap and water was being used. For cleaning glasses, 45.5 per
cent of personnel used soap and water where as 54.5 per cent used detergent
and water. Six out of nine shops (66.7%) were using detergent while three
shops (33.3%) were using soap for cleaning and wiping clothes. For cleaning
mixer jars, 7 out of 11 shops (63.6%) used detergent and water while in four
shops (36.4%) the personnel cleaned the jars only with plain water.
Musleh and Ahmed (2001) had reported that the quantitative
aspect of bacterial flora from muscle, gills and intestinal content of Indian Shad
(Tenualosa ilisha) was evaluated during ice storage in insulated polystyrene
and wooden boxes. The initial total bacterial count in the muscle of the fish
stored in insulated boxes was 3.5 X 10⁴ CFU/g and it increased to 1.8 X 10⁹
CFU/g after 18 days when the fish became orgnoleptically unfit for
consumption. The intestinal contents contained the highest load of bacteria,
followed by gills. The bacterial flora of the fishes stored in wooden boxes
showed comparatively high count of 4.4 X 10⁶, 1.8 X 10⁷ and 4.9 X 10⁷ CFU/g
for muscle intestinal contents respectively. The bacterial flora of the different
parts of the fish kept in wooden boxes increased rapidly during storage for 8
days bacterial load exceeding those fishes stored in insulated boxes for 18
days. Initially, Coryneform group was found predominant by in both types of
storage followed by Micrococcus, Achromobacter, and Aeromonas. No
Enterobactor was found in muscle and gills initially. Absence of Pseudomonas
was also observed.
Kumari and Prasad (2001) had done a study on fish. A total of 80
samples, (40gills and 40 intestines) from 40 rohu fishes were collected from

40
different fish markets of Patna in sterilized plastic bags for isolation of aerobic
bacteria. Escherichia coli, Pseudomonas spp. Staphylococcus spp., Klebsiella
spp. and proteus spp. were isolated from samples. The prevalence rates of
these microorganisms among gills and intestines were found to be statistically
(P<0.05). The public health significance of different members of aerobic
bacteria isolated is discussed. The microbiological analysis is important to
generate data changes during handling of equipment, transport of live fish and
cleaning, extent of spoilage of fishes. The present findings suggest that the
market fish of Patna was contaminated with several pathogens, which are
generally associated with different clinical conditions of human beings. Though,
absence of Salmonella is a good sign for consumers, the public health
importance of the above findings cannot be ignored.
Gupta and Mann (2000) for a study on Mishti Doi, collected samples of
Mishti Doi (Sweetened Dahi) sold in and around Calcutta market and analyzed
them for microbiological, chemical and ultra structural characteristics. The wide
variations in different parameters can be attributed to manufacturing conditions
and the type of starter cultures used. This survey was particularly exploited for
the standardization of a good quality Mishti Doi. Two promising starter
combinations were developed comprising streptococcus. Experimental samples
presented different casein-stabilizer matrices showing defined distribution of
lactic acid bacteria and yeast cells in the experimental samples.
Gaborone and Botswana (2000) had conducted a study to this evaluate
the microbiological safety and quality of street foods sold. A total of 148 point-
of-sale composite street food samples were bought and analyzed between
June 2001 and May 2002. The analysis focused on the level of contamination
of various street foods with Bacillus cereus. The B. cereus (vegetative and
spores), total spore, and total viable counts were determined on all the
samples. Also B. cereus isolates from 444 individual point-of-sale food samples
were characterized with respect to their biochemical profiles and
enterotoxigenic properties. The B. cereus contamination rate for point-of-sale
foods was 65%. The B. cereus counts ranged from not detectable to levels as
high as 9.1 logs CFU/g. Despite the high rate of contamination of some

41
samples, generally, most samples had Bacillus cereus counts of less than 4
logs cfu/g; hence, they were of acceptable microbiological quality. Bacillus
diarrheal enterotoxin was detected from 52 isolates from individual‟s portions of
meals using the B. cereus enterotoxin reserved passive latex agglutination kit.
Results of the assay revealed that 59.6% of the B. cereus isolates were
enterotoxigenic. Most of the enterotoxigenic isolates were obtained from
vegetables samples.
Three varieties of Ready-to-Eat (RTE) fried foods, viz., samosa,
batetawada and patra sold at railway stalls, small shops and streets in Mumbai
city were examined for microbiological safety. Samples of samosa, batatawada
(11.1% each) and patra (45%) had staphylococcal counts of more than 3 logs.
Samples of samosa from streets showed higher counts of all organisms, but
only the counts of total fecal coli form were statistically significant (p<0.05).
Samples of batatawada from streets also showed higher counts, but the
difference was not significant. Packed samples did not differ from foods sold
open. Among the three food items, patra samples were the most contaminated.
Ready-to-eat (RTE) fried fruits/snacks are quite popular in Mumbai city. They
are sold almost everywhere and at every kind of outlet, either open or packed.
Open foods are mostly exposed to environmental pollution and handling. Most
of the time, the open foods sold in small shops are exposed to dust and soot
from the atmosphere, the bad handlers involved have poor personal hygienic
and also the customers often like to feel the food texture before purchase, thus,
contaminating the food further. (Kakar and Udipi, 1998).
In a study done by Guha and Das (1994), counts of mesophile aerobes,
aerobic spore formers and staphylococci in market samples of ice cream varied
in relation to the sources and packages. Higher counts of coliforms were
prevalent in samples collected from local vendors; ice-cream samples from
parlors and hostels showed higher staphylococci count. With reference to the
packages, ice cream sold in cups had higher counts of coliforms and
staphylococci, while aerobic spore formers were on a higher side in ice-cream
bars.

42
Bansal (1993) on a study, developed a quantitative comprehensive
scoring system for the gradation of hygiene standards of catering
establishments. The food handlers were evaluated with the help of a two point
scale of 9 variables, namely: clean clothing; protective apparels as above,
apron, hair and beard restrains; washing hands before cooking or returning
from a break; free from communicable diseases and wounds; health
consciousness; at least primary education; training in food safety and hygiene
practices; manicured nails; substance use during food handling. Microbial
contaminants are responsible for over 90 per cent of episodes of food-borne
illnesses. Majority of food handlers being illiterate, they have no training for
food hygiene, and the legal approaches. In his study, it was observed that none
of the establishments met the model regulations. Their physical structure was
not compatible with good hygiene: facilities for the preparation and storage of
the raw and cooked food articles were scanty, leaving aside the delicate
provision of adequate refrigeration; chances of high cross contamination of
food articles; unhygienic food handlers and handling procedures; plenty of files
and vermin; poor water supply quality, all of which have been conclusively
documented to lead to food-borne illnesses.
Bacillus brevis, B. circulans, B. laterosporus, B. licheniformis, B.
pumilus, B. stearothermophilus and B. subtilies were isolated from Indian snack
and foods. Higher count of 4.2 log10 (CFU/g) and a lower count of 2.6 log10
(CFU/g) were observed in bisibele bhath and uppma, respectively. The isolated
cultures were positive for production of either one or more of the following:
hemolysins, phospholipase, protease, and lipase analyzed. A few selected
cultures of Bacillus species occurring as post-processing contaminants in plain
cooked rice reached cell populations, which were sufficient to cause health
hazards. These findings indicate the significance of Bacillus species as post-
processing contaminations in processed foods and were done. (Varadraj and
Keshava 1992).
Sharma and Joshi (1991) in a study on various milk and milk products
reported that, salmonella spp. could be isolated from 5 samples of milk
products. Among these, S. weltevreden and S. enteritieds could be isolated

43
from two samples each whereas S. typhimurium was isolated from one sample.
Various other microorganisms isolated from these samples were Escherichia.
coli, Klebsiella spp., Pseudomonas spp., Alkaligenes faecalis and Proteus spp.
The public health importance of these findings is received.
Sarada and Bagum (1991) had reported the bacteriological quality of ice
creams and water ice, which are referred as lollies, sold in Banglore city. One
hundred and twenty samples of ice creams in cups, cones, and barsand lollies
from hotels, parlors and local vendors are assessed for standard plate count
and coli forms. Microbiologically, no significant differences were found between
samples from hotels, parlors and local vendors. The counts were comparatively
less in lollies than in ice creams. Out of the total samples collected for the
study, only 47 samples for standard plate count and 74 for coli forms were
meeting the standards prescribed by Bureau of Indian Standards.
Grawal and Tiwari (1989) studied Twenty five market samples of
rasmalai & reported that all showed a very high aerobic plate count which
ranged from 102 – 106 CFU/g. Staphylococcus aureus was the most common
isolate (76%) followed by Escherichia coli (72%) and Klebsiella (68%). The
other organisms isolated were species of Pseudomonas (52%) Enterobacter
(44%), Bacillus (32%), and Citrobacter (8%). However, no correlation could be
established between the types of isolate with the total aerobic count. Samples
having an aerobic count of 103 – 104 cfu/g yielded majority of the enteric
organisms. Only one isolate of Staphylococcus aureus could be type with the
usual set of phages routinely used for typing clinical isolates.
In a study carried out by Guha and Das (1989), one hundred samples of
ice cream of ten different manufacturers, marketed in Calcutta were analyzed
over a period of two years for standard plate count, psychrophilic and lipolytic
bacteria yeast, mould, enterococci, coliform and fecal coliform and also for the
presence of pathogenic microorganisms. 22% of the samples were within the
numerical limit suggested by ISI; only 12% could be classed as of grade A
quality as per U.S. Public Health Service code. Presence of Escherichia coli
was confirmed in 37% of the samples. Most of the strains of Escherichia coli

44
(95.1%) were resistant to penicillin but sensitive to chloramphenicol (91.9%).
Multiple resistances were observed in coliform as well as in the isolates of
Escherichia Coil. Out of eight serotypes of enteropathogenic variety, all were
resistant to more than one antibiotic used in the study. Public Health
significance of coliform and Escherichia coli in ice cream was discussed.
Salmonella, coagulase positive Staphylococcus aureus, Vibri parahaemolyticus
were not detected.
Rao (1979) had done a study on various finished products analysis for
total counts and yeasts and moulds and primary isolations. Presence or
absence of staphylococci, Salmonella and coliforms were also carried out
utilizing standard methods and media. Incorporate nutrient agar (NA) and
nutrient both (NB) as well as by the agar cup assay method. Staphylococci,
coliforms, Salmonella and moulds were not present in the finished product.
Usually Bacillus strains have been reported as common contaminants in wheat
and bakery products present in the flour, air and equipments. The normal
cooking eliminated the gram-negative rods, cocci and the vegetative cells of the
Bacillus and pathogens.
Rao and Bhagirath (1978) had conducted a study of vegetarian and non
vegetarian preparation from kitchens for their coliform count. From each item
containing coliforms, about 20% of colonies were picked from violet red bile
agar plates and biochemically characterized. Coliforms were recovered from
64% of samples, salads had the highest coliforms, followed by vegetable
curries. Escherichia coli from foods, water and human sources, Klebsiella and
Enterobacter from foods and non-lactose fermenters (NLF) from foods and
human sources were examined for resistance to twelve antibiotics. Most of the
organisms were resistant to amplicillin, penicillin, chloramphenicol,
erythromycin and sulphadimidine. Escherichia coli from foods (1 strain) were
sensitive to amphicillin, penicillin and chloramphenicol.
Ito and Chen (1978) conducted a study in which Fresh figs were pureed,
the puree mixed with one of three syrup variables (water, light or heavy syrup),
the pH adjusted at 0.1 pH intervals from 4.6 to 5.4, and the tubes were

45
inoculated with a composite of 5 tubes A and 5 tubes B. Clostridium botulinum
spores at 2 inoculums levels (102 or 106 spores/tube). Anaerobic incubation
was done at 30 o C for almost 1 yr. The results of our experiments show that
maintenance of pH 4.9 or below in this product will prevent the outgrowth of Cl.
botulinum spores. An inoculated pack utilizing commercial procedures
confirmed these results.
In a study done by Pradhan and Chetty (1978) the microbial tests on
foods may be quantitative to detect total number of organisms or qualitative to
identify certain kinds of organisms or the products elaborate by them. The
coliform group is being used as an index of quality of food products in general
and for frozen foods in particular. Recent studies indicate that fecal streptococci
along with total counts can serve effectively as indices of food quality
particularly among precooked frozen foods.
Tamhane (1978) had reported that for acid foods with pH value less than
3.5 acid uric bacteria, yeasts and moulds are troublesome organisms. Their
heat resistance is generally low. Foods held at recommended frozen storage
temperature (-18 o C) are microbiologically stable as hardly any growth occurs
at temperatures much below 10 o C. Majority of bacteria and fungi grow
between 20 o and 45 o. The temperature optima for bacterial pathogens are 30 o
or higher. The availability of water for microbial growth is commonly measured
by its activity. Few food poisoning bacteria grow at pH 4 or lower.
Shehnaz (1975) conducted a study to assess the nutritional and
chemical changes occurring in Bengal (Cicer arietinum) and tiled bean
(Delicious lablab) due to insect infestation. The uric acid content of the samples
was estimated and an experiment on weaning rats was carried out to determine
the nutritive value of insect legume samples. Results of the physical, chemical
and biological tests showed that the losses due to insect infestation are not
only quantitative but also qualitative.

46
In a study conducted by Kamat and Syllable (1973), Pedha samples
purchased from the local market were examined for their total microbial profile
in terms of psychrophilic, mesophilic, thermophilic counts, and coliforms and for
the presence of coagulate-positive Staphylococci. Coli forms, surprisingly,
could not be detected in any of the samples examined. Staphylococci were
detected in 14 of the 16 samples of which four were coagulate-positive and
64.3 per cent of the strains isolated haemolysed human red blood cells. The
need to establish microbiological quality standards to protect the consumer has
been stressed.
Israni and Mankar (1973) had carried out a study of 62 samples of Gulab
Jamun mix by standard plate Counts, for Staphylococcal Counts, Yeast and
Mould Counts, Coli forms, Faecal Coliforms and for the presence of
Salmonella. Yeasts were not observed in any of the samples studied while,
moulds were observed in 29% samples. Similarly Staphylococci were observed
in 22% samples. The Coli forms were in the range of nil 1100 and Faucal
Coli forms in the range of nil 500. Coli forms were observed in all except 2
samples studied. Only 13% samples indicated nil feacal coli forms while rest of
the samples was positive for feacal coli forms. The mean standard Plate
Counts reported in the present study were 12 X 104 CFU/gm. Out of the 62
samples, yeasts were not observed in any of the samples studied. Moulds were
observed 29% samples while rest of the samples indicated moulds counts. The
range of coli forms and faucal coli forms was from nil 1100 and nil 500
respectively. The BIS (2) has recommended that coli forms and Staphylococci
be absent in ready gulab Jamun Mix. Coli forms were recorded in all except 2
samples and Faucal Coli forms in 87% of the samples studied. Staphylococci
were seen in 22% samples only, while 78% samples indicated nil
Staphylococcal counts, and therefore were in agreement with the standards
recommended by BIS (2). No Salmonella were isolated from any of the
samples studied.
Krishnaswamy and Parthasarathy (1973) had reported incidence of
microorganisms on cashew nut at different stages of processing in 7 different
cashew-processing units in Tamilnadu sector has been examined. The extent

47
and type of contamination depended on the level of sanitation that prevailed in
the units studied. Yeasts and moulds, aerobic mesophilic spores, aerobic-
thermophilies, thermophilic flat-sours and staphylococci (non-coagulase) were
present to a limited extent. Salmonella and clostridium perfringens were not
present.

48
Chapter – 3
MATERIALS AND METHODS
There are different food zones in the Rajkot city where small street
vendors, sell their food products on lorries. Vended food items are very popular in
Rajkot city. Rajkot city has a population of about 12 lakes and a large number of
people eat food from the vendor’s daily in afternoon as a substitute of lunch. The
reason for this is busy schedule, working couples, working parents. Students and
people who are daily commuters from near places for their work find it a good,
cheap substitute for their lunch. To prepare the food early in morning and carry it
to work place is now day-by-day loosing the charm & its place is taken by vended
food available in areas near workplace. About public eats food items outside their
home in evenings especially on Sunday, or other holidays. With need of time,
changing atmosphere eating out has become a fashion or habit.
This study is related to food items sold by small vendors, which are found in
large number and to, which citizens of Rajkot city frequently go for their delicacies.
3.1 SAMPLING
Food samples were collected from the four main areas, which are selected
on the basis of their popularity, and the nutrient profile, microbial analysis and
hygienic practices were carried out. Freshly prepared food samples were
collected from four different food zones of city like (1) Indira circle, (2) Bhaktinagar
circle (3) Sant Kabir road (4) Race Course ring road.
The researcher had collected twelve food items from each food zone and
food items were also prepared at home for comparison of the nutritional and
hygienic profile. The twelve food items were as follows.

49
(1) Fast food & Snacks: (1) Pau bhaji (2) Pani puri (3) Bhel (4) Kacchi bread
(5) Burger (6) Pizza.
(2) Chinese food: (7) Chinese Rice (8) Chinese Bhel.
(3) South Indian food: (9) Masala dosa (10) Mendu vada.
(4) Punjabi food items: (11) Vegetable kolhapuri (12) Paneer tikka masala.
All food samples were collected, and at that time all vendors were asked
about approximate amount of ingredients used in cooking of 5 kg food items. On
bases of that amount raw ingredients for 100 Gms of food was calculated.
Generally middle and higher middle class people of Rajkot city prepared
the above selected items at home. Fifty middle class families were given a
questionnaire to find out the ingredients and correct method of cooking of above
mentioned twelve items. On the basis of the results of questionnaire the average
ingredients were obtained and a recipe was standardized.
After standardizing home made recipes for ingredients and amount they
were prepared compared with vendor’s food samples for nutritional and microbial
quality.

50
Table No. 2
INGREDIENTS AND AMOUNTS FOR VENDOR’S AND STANDARDIZED
HOME MADE PAUBHAJI
Ingredients
Amounts in (100 gm)
Vendor’s foods
(gm)
Standardized home
made foods (gm)
Potato 7 12
Tomato 5 10
Onion 5 5
Cabbage 5 5
Cauli Flower 7 7
Bens 3 5
Brinjal - 2
Gourd - 2
Oil 15 10
Butter 2 5
Garlic (dry) 2 1
Lemmon - 5
Spices 10 3
Water 15 7
Wheat flour (refined) 20 20
Homemade pau bhaji is nutritionally rich as compared to vendor’s food.
Vendor’s food is containing more amount of oil, spices and water there by making
it unfit, heavy for digestion and also more perishable.

51
Table No. 3
INGREDIENTS AND AMOUNTS FOR VENDOR’S AND STANDARDIZED
HOME MADE PANI PURI
Ingredients
Amounts in (100 gm)
Vendor’s foods
(gm)
Standardized home
made foods (gm)
Wheat flour (refined) 10 10
Rava 5 5
Bengal gram 15 25
Potato 5 15
Pudina - 5
Coriander - 3
Date - 3
Oil 11 6
Onion 1 2
Lemon - 3
Jaggery - 2
Tamarind Pulp 10 -
Spices 3 3
Water 43 20
Home made food is containing more amount of Bengal gram and potato
thereby is nutritionally rich as compared to vendor’s foods. Vendor’s foods is rich
in oil and tamarimed pulp making it tangy for tongue but harmful for body in long
term.

52
Table No. 4
INGREDIENTS AND AMOUNTS FOR VENDOR’S AND STANDARDIZED
HOME MADE BHEL
Ingredients
Amounts in (100 gm)
Vendor’s foods
(gm)
Standardized home
made foods (gm)
Rice Puffed 20 25
Potato 5 7
Tomato 5 5
Onion 10 7
Bengal gram (whole) 5 10
Wheat flour (refined) 5 5
Green chilly 2 5
Coriander 2 2
Date - 5
Tamarind pulp 5 5
Pomegranate 5 7
Sev 10 15
Spices 5 5
Water 11 10
Home made Bhel is containing more amount of Bengal gram, sev, rich
(puffed) thereby is rich in proteins and more amount of vegetables. Where as
vendor’s foods are is more watery. As water used may also not be potable or unfit
for human consumption.

53
Table No. 5
INGREDIENTS AND AMOUNTS FOR VENDOR’S AND STANDARDIZED
HOME MADE PIZZA
Ingredients
Amounts in (100 gm)
Vendor’s foods
(gm)
Standardized home
made foods (gm)
Wheat flour (refined) 30 30
Cheese 5 10
Tomato 10 15
Onion 10 10
Potato 10 15
Cabbage 10 -
Butter 8 2
Spice 10 10
Oil 5 2
Water 2 2
Nutritional content of home made food is rich as it contains large amount of
potato and tomato. While vendors food contain more amount of Butter (fats) and
cabbage a cheap ingredient widely available.

54
Table No. 6
INGREDIENTS AND AMOUNTS FOR VENDOR’S AND STANDARDIZED
HOME MADE BURGER
Ingredients
Amounts in (100 gm)
Vendor’s foods
(gm)
Standardized home
made foods (gm)
Wheat flour (refined) 30 30
Potato 10 20
Onion 12 10
Tomato 10 10
Green Chilly 10 3
Cheese 3 5
Butter 5 7
Spices 2 2
Water 20 15
Home made food is containing large amount of potato, butter, while vendor’s
food is containing more amount of onion, water.

55
Table No. 7
INGREDIENTS AND AMOUNTS FOR VENDOR’S AND STANDARDIZED
HOME MADE KACCHI BREAD
Ingredients
Amounts in (100 gm)
Vendor’s foods
(gm)
Standardized home
made foods (gm)
Wheat flour (refind) 10 10
Potato 10 15
Onion 5 8
Groundnuts 5 8
Bengal Gram dal 2 3
Sev 5 5
Green chili 10 3
Tomato 10 5
Tamarind pulp 5 1
Pomegranate 2 5
Lemon - 5
Date - 5
Garlic 5 3
Spices 5 5
Water 25 20
Home made kacchi Bread as compared to vendors food is rich in potato,
groundnuts , sev, while vended contains more amount of water.

56
Table No. 8
INGREDIENTS AND AMOUNTS FOR VENDOR’S AND STANDARDIZED
HOME MADE CHINESE RICE
Ingredients
Amounts in (100 gm)
Vendor’s foods
(gm)
Standardized home
made foods (gm)
Rice 30 45
French Beans 5 10
Cabbage 7 7
Onion 3 3
Cheese 3 3
Spices 5 5
Water 47 27
A nutritional content of home made Chinese rice is high in terms of rice,
beans. While vended food is containing less amount of actual food content and
more water. Again making it easily perishable in small time.

57
Table No. 9
INGREDIENTS AND AMOUNTS FOR VENDOR’S AND STANDARDIZED
HOME MADE CHINESE BHEL
Ingredients
Amounts in (100 gm)
Vendor’s foods
(gm)
Standardized home
made foods (gm)
Noodles 20 20
Ground nuts 3 8
Cabbage 10 5
Corn flour 20 25
Tomato 10 5
Onion 10 5
Cheese 1 7
Spices 5 5
Water 11 10
Sauces 10 10
Home made bhel is rich in protein as it contains more corn flour, ground
nuts. While it contains less amount of raw vegetables and more cheese as
compared to vendors food which is containing bulk of raw vegetables.

58
Table No. 10
INGREDIENTS AND AMOUNTS FOR VENDOR’S AND STANDARDIZED
HOME MADE MENDU VADA
Ingredients
Amounts in (100 gm)
Vendor’s foods
(gm)
Standardized home
made foods (gm)
Black Gram dal 10 10
Oil 20 15
Green Gram dal 10 15
Onion 5 5
Tomato 10 10
Potato 5 5
Spices 5 5
Water 35 30
Home made menduvada is rich in green gram dal and vendor’s food is more
oily and having less nutrients compared to home made ones and of course it is
containing more water hence easily perishable.

59
Table No. 11
INGREDIENTS AND AMOUNTS FOR VENDOR’S AND STANDARDIZED
HOME MADE MASALA DOSA
Ingredients
Amounts in (100 gm)
Vendor’s foods
(gm)
Standardized home
made foods (gm)
Black gram dal 5 5
Rice 10 10
Oil 10 8
Potato 10 15
Onion 5 10
Tomato 10 20
Green Gram dal 5 15
Spices 5 5
Water 35 12
Nutritional content of home made dosa is rich as it contains more amounts of
green dal and vegetables, while vendor’s food is more only and containing large
amount of water.

60
Table No. 12
INGREDIENTS AND AMOUNTS FOR VENDOR’S AND STANDARDIZED
HOME MADE VEGETABLE KOLHAPURI
Ingredients
Amounts in (100 gm)
Vendor’s foods
(gm)
Standardized home
made foods (gm)
Tomato 20 15
Onion 10 15
Oil 10 10
Cheese 3 3
Cabbage 5 5
Butter 2 2
Cauli Flower 5 5
French beans 5 5
Coriander leaves 3 3
Capsicum 10 10
Spices 5 5
Water 20 20
Vegetable kolhapuri home made is rich in tomatoes and onions and there it’s
nutritionally richer as compared to vendor’s food.

61
Table No. 13
INGREDIENTS AND AMOUNTS FOR VENDOR’S AND STANDARDIZED
HOME MADE PANNER TIKKA MASALA
Ingredients
Amounts in (100 gm)
Vendor’s foods
(gm)
Standardized home
made foods (gm)
Paneer 10 20
Tomato 10 15
Onion 10 10
Coriander 5 5
Cheese 5 5
Spices 10 5
Water 50 40
Home made panner tikka masala contains more amount of tomato as
compared to vendor’s food which is containing more amount of water thereby
decreasing its keeping quality and making it more perishable.
3.2 SAMPLE SELECTION AND PREPARATION FOR NUTRITIONAL
ANALYSIS
All the food items that were collected were freshly prepared by vendors.
All the food samples were collected at 10:00 p.m on first day and packed in
plastic containers. After this, these samples were individually homogenized in
mixer and 100 gm sample was packed immediately in containers. These
containers were stored at -34ºC in freezer. Home made food sample were also
prepared, homogenized and preserved along with samples collected from
vendors.
The chemical analysis was carried out, next day at 9.00 A.M

62
3.3 SAMPLE PREPARATION FOR MICROBIAL ANALYSIS
From each of the homogenized food samples exactly 1 gm food
sample was weighed and suspended in 9 ml of sterile Distilled water blank. This
was considered as 101 dilutions. After which serial dilutions 102, 103 were
prepared and 103 dilutions were selected for inoculation of bacteriological media.
3.4 HYGIENIC PRACTICES
Observations were made for hygienic practices as compared to
homemakers such as; wearing clean clothes, apron and hair cap, washing hands,
nails cut, smoking during work, chewing betel, splitting near by, scratching nose
while work.
3.5 STATISTICAL ANALYSIS
As per the above observation of the samples collected, it is observed that the
various nutritive properties have got variations in their values, but after applying
the scientific statistical tools (t-test) on the same data. It is observed from the
analysis that the calculated value is more/less than the tabulated value (approach
p value); therefore the hypothesis is accepted or rejected (Pal and Sarka 2005,
Gupta, 2004).
This research project was undertaken for the purpose and with the aim of
awareness towards nutritional and microbial quality of vendor’s foods.

63
3.6 METHODS OF NUTRITIONAL ANALYSIS OF FOOD
3.6.1 Determination of Total Carbohydrates
Carbohydrates were determined by method of Sadashivam and Manickam
(1991).
PRINCIPLE
Carbohydrates are first hydrolyzed into simple sugars using dilute
hydrochloric acid. In hot acidic medium glucose is converted into hydroxymethyl
furfurals. This compound reacts with anthrone to a green coloured product with
absorption maximum at 630 mm.
REAGENTS
(1) 2.5 N – HCI
(2) Anthrone reagent 95 %
(3) Standard glucose
PROCEDURE
The sample 100mg was weighed and hydrolyzed by keeping it in boiling
water bath for three hours with 5 ml of 2.5 N – HCI and is cooled to room
temperature. It was then neutralize with solid sodium carbonate until the
effervescence ceases. Total volume was made 100 ml with distilled water and
centrifuged. The supernatant was collected 0.5 ml aliquots were taken for
analysis. The volume was made 1 ml in all the tubes including the sample tubes
by adding distilled water. Then were 4 ml of anthrone reagent was added all the
tubes were heated for eight minutes in a boiling water bath there after cooled
rapidly and reading was taken of the green to dark green colour that developed at
630 nm. The graph of standard was plotted. From the graph amount of
carbohydrate present in the sample was calculated.

64
CALCULATION
Amount of carbohydrate present in 100 mg of the sample
Mg of glucose = X 100 Volume of test sample
3.6.2 Determination of Fat (AOAC 1970)
PRINCIPLE
Oil from a known quantity of food is extracted with petroleum ether. It is then
distilled off completely, dried, the oil weighed and the % oil is calculated.
REAGENTS
(1) Petroleum ether [40° – 160° C]
(2) Whatman filter paper No. 1
PROCEDURE
Standard procedure of Association of Official Analytical Chemist (AOAC)
(1970) was adopted for the determination of fats and oils. The sample 5.0 Gms
was weighed on the fat free paper and hanged firm on the upper portion on the
extraction chamber gripped on its sides. The bottom flask was filled with ether. It
was heated to nearly 4 to 6 hours depending upon the material. The thimble
containing fat free material was carefully removed from the chamber. The residue
was air-dried at room temperature and the dried material was weighed on after
evaporation of ether from the extracted material and the percentage composition
of fat were calculated.
Weight of oil (g) X 100 Fat = Weight of sample (g)

65
3.6.3 Determination of Protein
Protein was determined by Kjeldhal method of Sadashivam and Manickam
(1991)
PRINCIPLE
The nitrogen in protein or any organic material is converted to ammonium
suplhate by H2SO4 during digestion. This salt on steam distillation librates
ammonia, which is collected in boric acid solution and titrated against H2SO4.
REAGENTS
(1) Sulphuric acid (2) Potassium sulphate (3) Sodium hydroxide (4)
Indicator solution (5) Boric acid standard (6) HCI or H2SO4
PROCEDURE
Take 0.5 gm food sample digest it with 10 ml of concentrated sulfuric acid
along with a pinch of digestion mixture. After transparence digestion volume was
made up to 10 ml with distilled water. Take 10 ml of digested sample in Kjeldahal
flask along with 10 ml of 50% NaOH and distill it for 10 minutes, to liberate the
ammonia from the sample. The liberated ammonia was collected in 5 ml of 2 %
boric acid containing mixed indicator [methyl, red, blue]. Titrate the ammonium
borate solution formed with 0.02 N sulphuric acids to a purplish grey end point.
Blank was carried out in a similar manner without the sample, using 5 ml or 10 ml
of distilled water.
CALCULATION
Titer. NH2SO4 0.28 Vol. 100 Protein % = reading X X X made up X X 6.25
1 0.02 aliquot sample 1000 taken taken

66
3.6.4 Determination of Crude Fiber
Fiber was determined by method of Sadashivam and Manickam (1991).
PRINCIPLE
During the acid and subsequent alkali treatment oxidative hydrolytic
degradation of the native cellulose and considerable degradation of lignin occurs.
The residue obtained after final filtration is weighed, incinerated, cooled and
weighed again. The loss in weight gives crude fiber content.
REAGENTS
(1) Sulphuric acid solution [0.255 + 0.005 N]
(2) Sodium hydroxide solution [0.313 + 0.005 N]
PROCEDURE
Extract 2 gm of ground material with ether or petroleum ether to remove fat.
After extraction with ether boil, 2 g of dried material with 200 ml of sulphuric acid
for 30 min. filter it through muslin and wash it with boiling water until washings are
no longer acidic. There after boil with 200 ml of sodium hydroxide solution for 30
min. Filter it through muslin cloth again and wash with 25 ml of boiling 1.25%
H2SO4 three 50 ml portions of water and 25 ml alcohol. Remove the residue and
transfer to ashing dish [W1]. Dry the residue for 2h at 130 + 2ºC cool the dish in
desiccators and weigh [W2]. Ignite for 30 min at 600 + 15ºC. Cool in desiccators
and reweigh [W3].
CALCULATION
Loss in weight on ignition (W2 – W1) – (W3 – W1) % fiber in ground = X 100 Sample Weight of the sample

67
3.6.5 Determination of Ascorbic Acid
Ascorbic acid was determined by method of Sadashivam and Manickam
(1991).
PRINCIPLE
Ascorbic acid is first dehydrogenated by bromination. The dehydroascorbic
acid is then reacted with 2, 4-dinitrophentyl hydrazine to form osazone and
dissolved in sulphuric acid to give an orange – red colour solution, which is
measured at 540 nm.
REAGENTS
(1) 4 % oxalic acid
(2) 0.5N sulphric acid
(3) 2% 2, 4-dinitrophenyl / hydrazine reagent.
(4) 10% thiourea solution
(5) 80% sulphuric acid
(6) Bromine water
(7) Standard ascorbic acid.
PROCEDURE
Grind 0.5 – 5.0 gm of sample material either mechanically or using a pestle
and mortar in 25-50 ml 4% oxalic acid solution, centrifuge or filter and collect the
liquid.
Transfer an aliquot (10 ml) to a conical flask and add bromine water drop
wise with constant mixing. The enolic hydrogen atoms in ascorbic acid are
removed by bromine when the extract turns orange yellow due to excess bromine
expels it by blowing in air. Now make up volume (25 or 50 ml) with 4% oxalic acid
solution.

68
Similarly convert 10 ml of stock ascorbic acid solution into dehydrates form
by bromination.
Standard dehydrate ascorbic solution into a series of tubes serial diluted.
Take 2 ml of brominated food sample extract. Make up the volume to 3 ml with
distilled water. Add 1 ml of DNPH reagent followed by 1-2 drops of thiourea and
incubate at 37ºC for 3hrs. After incubation dissolve the orange red osazone
crystals formed by adding 7 ml of 80 % sulphuric acid, measure absorbance at
540 nm.
CALCULATION
0.5 mg V2 100 ml Vit C = X X X 100
V1 ml 5 ml Wt. of sample
3.6.6 Determination of Moisture (AOAC 1970)
The sample (100 mg) was weighed (to kill the bacteria it was kept in an
oven at 105oC for 5 hrs) and then transferred it into the desiccators. It was dried
till constant weight was obtained from it. The loss in weight of the moisture per
100 gm of the sample was calculated.
3.6.7 Determination of Thiamine
Thiamine was determined by method of Sadashivam and Manickam
(1991).
PRINCIPLE
Alkaline potassium ferricyanide oxidizes thiamine to thiochrome, which is a
fluorescent compound. The thiochrome is extracted in isobutyl alcohol and
measured in a fluorimeter.

69
REAGENTS
(1) 15% NAOH
(2) 1%Potassium Ferricyanide
(3) Isobutyl Alcohol
(4) Sodium Sulphate (anhydrous)
(5) 0.1 N HCL
(6) Stand Thiamine Hydrochloride
PROCEDURE
Sample hydrolysis (acid)
(1) 10 gm foodstuff in conical flask.
(2) Add 125 ml of 0.1 NHCl
(3) Hydrolyse it in boiling water bath for 45 min.
(4) Cool it to RT. Adjust pH 4.5 with saturated sodium acetate.
Thiamine standard
Stock: 1 mg thiamine hydrochloride 100 ml with 0.1 N HCl.
Working standard: 1 ml stock 100 ml with 0.1 HCl (conc. 1 µg/ml).
Table No. 14
Thiamine standard & Sample
Reagent Standard Sample
S1 S2 S3 S4 A B
Sample - - - - 5 5
Working std. 1 2 3 4 - -
distilled water 4 3 2 1 - -
K3 [Fe (CN) 6] 3 3 3 3 3 -
15% NaOH - - - - - 3
Mix well
Isobutyl Alcohol
15 15 15 15 15 15
Shake for 2 min. allow it to settling remove the bottom layer. Then add 1 spatula of
anhydrous sodium sulphate. Then read in fluorimeter by using filter (Primary violet
& secondary blue).

70
CALCULATION
(Std. conc. µg) F. R. of (a-b) Vol. made-up 100 B1 (%mg) = X X X F. R. of Std. Aliq. Taken Sample taken 1000
3.6.8 Determination of Riboflavin
Riboflavin was determined by method of Sadashivam and Manickam
(1991)
PRINCIPLE
Riboflavin fluorescence at wavelength 440 to 500 nm. the intensity of
fluorescence is proportional to the concentration of riboflavin in dilute solutions.
The riboflavin is measured in terms of the difference in fluorescence before and
after chemical reaction.
REAGENTS
(1) 0.1 n H2SO4
(2) Sodium acetate 2.5 M
(3) Potassium permanganate 4%
(4) Hydrogen peroxide 3%
(5) Sodium hydrosulfate [solid]
(6) Riboflavin standard
PROCEDURE
Accurately weigh 2-5 gm sample and add 75ml 0.1 N H2SO4 and mix and
autoclave at 15 lbs for 30 min. Shake the flask every 5 min. let it cool to room
temperature and add 5 ml 2.5 M sodium acetate solution. Mix and let it stand for at
least 1 hr. The solution is now at pH 4.5 make up the volume 100 ml with distilled

71
water. Take 10 ml of sample solution add water 1 ml and 0.5 ml potassium
permanganate [4 %] after a time lapse of 2 min., hydrogen peroxide [3 %] is
added 0.5 ml, take the reading in fluori meter.
CALCULATION
Riboflavin mcg gB C
A B
R
S
V
V./100 100
1
=-
-´ ´ ´
A= reading of the sample plus riboflavin standard.
B= reading of sample plus water
C= reading after adding sodium hydrosulphite
R= Standard riboflavin added= µg/V1 of sample solution
V= original volume of sample solution= ml
V1= volume of sample solution taken for measurement (10ml)
S= sample weight (g)
3.6.9 Determination of Niacin
Niacin was determined by method of Sadashivam and Manickam
(1991).
PRINCIPLE
Niacin reacts with cyanogens bromide to give a pyridine compound, which
undergoes rearrangement-yielding derivatives. These derivatives couple with
aromatic diamines to give yellow coloured pigment under proper conditions. The
intensity of the yellow colour produced is proportional to the amount of niacin
present.
REAGENTS
(1) 4N H2SO4
(2) 60% basic lead acetate.
(3) Thymol blue indicator
(4)10 N sodium hydroxide

72
(5) Conc. H2SO4
(6) 40% ZnSO4
(7) Potassium cyanogens bromide
(8) 4% aniline
(9) Alcohol
(10) Standard niacin
PROCEDURE
Grind the sample (5g) in 4N H2SO4 (30 ml) and steam it for 30 min Cool
and make up the volume to 50 ml with distilled water. Filter through Whatman filter
paper No. 1. Add 60% basic lead acetate to the filtrate. Adjust the pH to 0.5 with a
thymol blue indicator. After this centrifuge the sample with 10 N NaOH. To the
supernatant add 2 ml conc. H2SO4 and allow it to stand for 1 hour, centrifuge
collect the supernatant add 5 ml 40 % ZnSO4 and adjust pH to 8.4 with 10 N
NaOH. Centrifuge and collect the supernatant of the source material. Take 0.1 ml
to 0.5 ml of the standard niacin solution. Take different volumes of sample
solution. Make up the volume to 6 ml with distilled water add 3 ml of cyanogens
bromide, after 10 min add 1 ml of 4% aniline read the yellow colour developed
after 5 min at 420 nm.
CALCULATION
Draw a standard graph with the reading of the standard niacin. Find out the
niacin content in the sample volume taken and calculate for gm. weight of the
sample.
3.6.10 Determination of Calcium
Calcium was determined by the titrimetric method of AOAC 1970
PROCEDURE
Prepare an ash of the food as described previously; make up the volume to
10 ml with glass distilled water. Two and four ml of ash solution was taken in

73
centrifuge tubes 3-4 drops of bromocresol green indicator was added and pH was
adjusted to 4.8 to 5.0 blue colour with a saturated solution of sodium acetate. The
calcium was precipitated as calcium oxalate by the addition of 4% oxalic acid till
the solution changed to a yellow shade. Heat at 70oC on sand bath for 45 minutes
& allow it to settle overnight. The tubes were centrifuged and the supernatant
drained out and the precipitates were washed with 3 ml of 2% ammonia solution to
remove the excess oxalic acid. Add to the tube 3 ml of 1 N H2SO4 and keep it at
60o to 80oC for 5 minutes and titrate against 0.01 N KMnO4 until a slight pink
colour appears which persists for 30 seconds. For blank 3 ml of NH2SO4 was
taken and heated in a water bath at 60o – 80oC for 3-4 min and titrated against
0.01 N KMnO4 until a slight pink colour appears which persists for 30 seconds.
CALCULATION
Titration reading S-B [Calcium mg %] =
A liqout taken [ml]
N of KMNO4 0.2 X X
0.01 N 1 ml
Volume made-up X X 100
Sample wt (g)
3.6.11 Determination of Iron
Iron was determined by method of Sadashivm and Manickam (1991)
REAGENTS
(1) Ferric acid
(2) Potassium thiocynate -20%
(3) Hydrochloric acid – 2N

74
PROCECURE
Ferric ammonium sulfate 2 to 10 ml in flask. Add 1 ml 2N HCl and 5 ml of
20% KCNs make up volume 100 ml with distilled water and after 10 min. measure
optical density at 480 nm in colorimeter.
STANDARD CURVE FOR IRON
Construction of standard curve. 2.6 /2.8 gm ferric ammonium sulfate was
dissolved in 1 lit. Distilled water, few drops of conc. H2SO4 was added to the
solution to make it colorless / transparent Concentration of iron in this solution was
0.3 mg per ml. To make the working standard 10 ml of stock solution was taken
and diluted to 100 ml.
2 ml, 4 ml, 6 ml, 8 ml and 10 ml of working standard was taken in
volumetric flasks 5 ml potassium thiocyanate and 1 ml HCl was added. Volume
was made 100 ml Content of the flasks was mixed well. The red colour was read
at 480 nm.
CALCULATION
A graph was plotted of concentration on X axis versus optical density on Y axis.
From that concentration of Iron (mg) was obtained.
3.6.12 Determination of Sodium and Potassium
Sodium & Potassium was determined by method of Sadashivm and
Manickam (1991).
PROCEDURE
Take 10 mg of ash sample in a 250 ml conical flask and acidify it with nitric
acid, evaporate it to dryness on a water bath. Add further 25 ml of concentrated
HNO3 and heat to near boiling until the acid is evaporated to a small volume. The
presence of brown fumes indicates the unoxidized organic matter. Add some more

75
conc.HNO3 and small quantities of H2SO4 for complete ashing of organic matter.
Final residue is colorless dissolve this residue in small amount of HCl and warm
distilled water filter the contents neutralize it with con. NH4OH and diluted it to
suitable volume.
SODIUM: 0.634 gm of dry A R grade NaCl
Should be accurately weighed dissolved in pure distilled water and washed into a
500 ml volumetric flask.
POTASSIUM: 477 gm of dry A R grade KCl should be accurately weighed
dissolved in pure distilled water and washed in to a 500 ml volumetric flask.
Take an ashing-colourised sample in flask and make up volume 100ml with
distilled water. Take standard NaCl take 2 to 20 ml and make a volume 100ml with
distilled water. There after take the readings using flame photometer.
CALCULATION
K & Na 1000 ppm = 1 mg in 100 gm food.
3.6.13 Measurement of pH
Finely minced sample were used to determine. The pH after homogenizing
10 gm of the sample with 50 ml distilled water using laboratory pH meter. pH of
the samples was recorded using reference and glass electrode portable type
digital pH meter.
3.7 METHODS OF MICROBIAL ANALYSIS OF FOOD
3.7.1 Selection of media
Selection of medium was carried out keeping in mind the various types of
microorganisms that may be present in the food samples.
Two different media were selected:

76
(1) The Nutrient Agar medium: This is the media used for the general
cultivation and isolation of microorganisms. It supports growth of majority
of common microorganisms found in nature. This medium is routinely used
in microbiological laboratories for general cultivation & isolation of bacteria.
(2) The MacConkey’s agar medium: This medium is a selective and a
differential medium. It was used for cultivation and isolation of specific
group of organisms’ namely enteric group. As chances of microorganisms
belonging to this group being present in food samples were high. These
organisms are generally present in water and may enter food via use of
improper or non-potable water used during the various stages of
preparation of food.
This medium is selective for such enteric (gram negative) bacteria as it
inhibits the gram positive bacteria. Further gram-negative bacteria are
differentiated into lactose fermented and lactose non-fermented group on this
medium.
To get well-isolated and countable colonies, as we are carrying out
quantitative analysis, serially diluted samples were inoculated on these medias.
3.7.2 Preparation of media
Table No. 15
Nutrient Agar
1. Nutrient Agar Peptone 1 gm
All the ingredients were dissolved in distilled water except
agar powder and then pH was adjusted to 7.6.
Thereafter agar powder was added and it was autoclaved
at 15 lbs pressure for 15 min.
Meat Extract 0.3 gm
NaCl 0.5 gm
Distilled
water
100 ml
pH 7.6
Agar 3 gm

77
Table No. 16
MacConkey’s Agar
2. MacConkey’s Agar: Peptone 2.0 gm
All the ingredients were dissolved in distilled water except
agar and then pH was adjusted to 7.6. Thereafter agar
was added and was sterilized by autoclaving at 15 lbs
pressure for 15 min. After sterilization 1 ml of 1% Neutral
red solution (indicator dye) was added before pouring the
plates
NaCl 0.5 gm
Bile Salt 0.5 gm
Lactose 1.0 gm
Distilled
water
100 ml
pH 7.6
Agar 3 gm
Both the above media after autoclaving were poured into previously
sterilized petri dishes, aseptically. The plates were allowed to cool and solidify
(Salle, 1992).
3.7.3 Inoculation of Media by Samples
The Nutrient agar and MacConkey’s agar plate were inoculated with
selected dilution, which were prepared by the serial dilutions of selected samples.
A quantitative estimation was to done, known volume of diluted samples say 0.1
ml was plated on agar plates in strict aseptic conditions.
0.1 ml of selected sample, with help of a sterile pipette was poured on the
medium plates and then it was evenly spread with help of sterile glass spreader in
strict aseptic conditions. So as to prevent any chances of contamination with
aerial or other microorganisms during any stages of analysis.
The spreader was used with a light hand and gentle spreading should be
done, by periodically rotating the Petri dish at right angles till the sample is
completely absorbed into the medium.

78
Thereafter plates are incubated in inverted position at 37oC for 24 hrs.
(1) Quantitative Analysis
Next day the number of visible colonies is counted from each plate and
number of organisms (C.F.U.) present in each sample per ml is calculated by
using the formula
Y N = -------
Vx
N= No. of orgs/ ml.
Y= No. of colonies.
X= dilution
V= aliquots amount of.
This gives us an average, approximate idea of number of organisms
present in 1 gm of food sample collected.
(2) Qualitative Analysis
Colony characters of different types of colonies present on Nutrient agar
plate were noted down. Gram staining was done from different types of visible
colonies present on plate. The result of gram staining gave us rough idea of
different morphological types of bacteria, which were present in the collected
sample.
There by the researcher got an approximate idea of different types of
organisms and number of organisms/ml present in different food samples
collected.
On MacConkey’s agar the type of colony present is colourless (of lactose
non-fermented group) or pink coloured colonies (lactose ferment or group) were

79
counted and gram staining was also done from selected colonies. It gave us idea
regarding the number of enteric organisms present / gm of food sample.
Depending on these results we can ascertain how far food is safe for
human consumption.
3.7.4 Standard Plate Count Method
PROCEDURE
Dissolve all the ingredients except agar powder and then adjust the pH to
7.6 add agar powder and heat to dissolve medium completely. Auto clave at 15
lbs pressure for 15 min there after pour agar in previously sterilized Petri dishes.
Prepare serial dilution of given sample adding 1 gm in 9 ml distilled water will give
101 dilution [1: 10] again add 1 ml from 101 tube to 9 ml d/w will give 102 [1:100]
dilution and so on [101 to 108]. Inoculate 0.1 ml of suspension from each dilution
on N. agar and MacConkey’s agar plate spread, strictly in aseptic conditions.
Incubate the plates at 37ºC for 24 hrs in incubator in inverted position (Salle A.
1992)
3.7.5 Gram Staining
Gram staining is a differential staining technique, which separates bacteria
into two groups depending upon their staining properties. It is the most used
bacterial staining process and is very useful in identification of bacteria.
Gram staining method employs two different stains, a mordent and a
decolouriser. At the end of staining procedure, cells are divided into two groups.
Those cells, which retain the colour of primary dye, are called gram positive and
those, which loose the colour of primary dye and take the colour of the counter
stain are called gram negative. The gram-positive characteristic results from the
ability of a cell to resist the loss of primary stain during decolorization step, as
compared to gram-negative cells, which do not possess this ability.

80
Principle
Gram positive and gram-negative bacteria are stained differently due to
differences in their surface chemical structure.
Numerous explanations have been given to explain mechanism of gram reaction.
(1) Gram-negative bacteria contain a higher percentage of lipids than gram-
positive bacteria. Gram-negative cell walls are also thinner than gram-positive
cells. During staining procedure, alcohol treatment extracts the lipid, which results
in increased porosity or permeability of gram-negative cell wall. Thus gention
violet – iodine complex is extracted and gram-negative organisms are decolorized.
Gram +ve bacteria are dehydrated, permeability is reduced and gention-violet
iodine complex is not removed.
(2) Peptidoglycan content is higher in cell wall of gram positive bacteria as
compared to gram negative bacteria. So in gram positive bacteria gention-violet
iodine complex is trapped in the wall following ethanol (alcohol) treatment. It
causes decrease in the diameter of pores in cell wall peptidoglycan. In gram
negative bacteria peptidoglycan is also less extensively cross-linked, so pores
remain sufficiently large after ethanol treatment, so gention-violet iodine complex
extracted.
(3) Lipoidal material extracted from gram positive organisms differs from gram
negative organisms as gram positive lipoidal material contains much larger
proportion of unsaturated fatty acids, which have greater affinity with oxidizing
agents. Mordents are oxidizing agents. They increase affinity of an organism for
basic stains (Salle, 1992).
(4) Stearn & Stearn Theory
This theory involves isoelectric point, which is defined as pH at which
ionization of an amphoteric compound occurs at maximum rate.
According to Stearn and Stearn Theory its protein content determines
staining capacity of a cell. The proteins are amphoteric and thus bacterial cells
also exhibit amphoterism. For single bacterial cells, there is an isoelectric range

81
as there are many proteins in the cell. The isoelectric range of gram positive
bacteria is lower than that of gram negative bacteria.
As a rule, the bacterial cells can react with both, acidic and basic dyes. In
acidic conditions they react with basic dyes and in alkaline conditions with acidic
dyes. There is no reaction at all at the isoelectric pH. At the pH below isoelectric
range, the cells behave as alkali and react with acidic dye. At pH above the
isoelectric range, the cells behave as acid and react with basic dye.
The isoelectric range of gram positive bacteria is lower than gram negative
bacteria, thus more acidic. Thus at reaction pH, they behave as stronger acid
than gram negative bacteria. As a result of this, they can bind more firmly than
gram negative bacteria. So the decolorizing agent alcohol fails to remove the dye
from the cells of gram positive bacteria. In case of gram negative bacteria,
however, the binding between stain and cells is less firm and it can be easily
removed by alcohol.
(6) The Mordant
Grams iodine is an oxidizing agent, it increases the overall affinity of the
organisms for the basic dyes – Gention Violet increases.
Requirements
Clean glass slide, 1% Gention violet, Gram’s Iodine, Safranine, alcohol.
PROCEDURE
(1) Take a clean glass slides and prepares a uniform smear from sample of
choice.
(2) Allow the smear to air dry & heat fix the smear.
(3) After slide gets cooled, cover the smear with gention violet and allow it to act
for 1 min.
(4) Wash off gention violet with water.

82
(5) Cover the smear with grams iodine and allow it to act for 2-3 mins.
(6) Wash off the iodine with water.
(7) Tilt the slide and drop wise add alcohol over the smear, so that it runs off the
edge of the slide after passing over the smear. Continue this until the drop of
alcohol picks up no purple colour from the smear. This is the most important step
of this technique and it should not be overdone.
(8) Rinse the slide with water, to remove any residual alcohol.
(9) Cover the smear with safranine and allow it to act for 7-10 min.
(10) Wash off the safranine with water, blot dry and examine under oil-immersion
lens (Salle, 1992).

83
Chapter – 4
RESULT & DISCUSSION
4.1 NUTRITIONAL ANALYSIS
In the whole research main emphasis is given on the comparison of
nutritive value of home made food sample and vendor food sample. The
comparison is also done with respect to the area from where samples were
collected as for example,
1. Area – A (Indira Circle IC = A) where majority of the customers,
belonged to cream class and middle class of the society.
2. Area – B (Bhaktinagar Circle BTC = B) where customers of vended
food generally belongs to middle class family.
3. Area – C (Sant Kabir road SK = C) customers here are from middle
class of the society used to come frequently for vended food.
4. Area – D (Race course road RC = D) where customers belongs to all
the classes of the society.
That’s why these different areas were selected. Food samples were
compared for nutritive value, microbial load and hygienic practices. Punjabi
and fast foods are of main choice in vended food now a day.
4.1.1 Pau Bhaji Pau bhaji is a palatable recipe most prevalent in Gujarat. A combination
of bread and or pau, eaten with vegetable made up of almost all seasonal
vegetables available. Good to eat, nice to pocket and there by preferred food
by office goers in form of a mini lunch. Thereby its availability in the form of
vendors’ food is more prevalent.
Pau bhaji consumed on day to day basis, it may lead to deficiency of
vitamin its daily requirement is not supplemented from other foods consumed.

84
Table No. 17
Nutritional Value of Pau Bhaji (100gm) for Macro Nutrients
Nutrients Areas
A B C D Home
Made(HM)
Carbohydrate(gm) 10.00 11.00 8.00 11.00 12.00
Protein (gm) 1.20 1.30 1.20 1.90 6.40
Fat (gm) 16.00 17.00 15.00 17.00 18.00
Fibre (gm) 0.10 0.01 0.09 0.08 0.10
Moisture (%) 60.00 62.00 61.00 60.00 56.00
(1) Carbohydrate
Homemade sample contains more carbohydrates than all other vended
food samples. Sample (B) and (D) were found equal and more than sample
(A) and (C). Home made Sample contain more amounts of onion, tomato, and
potatoes. That is the reason; vended food sample contains more amount of
water than homemade sample. Carbohydrate content of HM sample was
high.
(2) Protein
Protein content of homemade sample was very high compared to all
good than any other samples. Sample (D) had more protein value than (A),
(B) and (C). Home made sample was having more protein because of more
use of green beans, but vended sample use more water and tomatoes.
(3) Fat
Like other nutrition, fat value of the home made sample was found to
be more because it contains high quantity of butter, as compared to other
vended food samples. Sample (B) and (D) were found to contain equal and
more than sample (A) and (C). All vended samples contain more fat because
they use more oil and less amount of butter.
(4) Fibre
Value of fiber in sample (A) and homemade is found to be equal and
was more than other vended samples. Sample (B) had less amount of fiber
than all food samples. Sample (B) to be more water than other samples.

85
(5) Moisture
Sample (B) had more moisture than any other food samples. So home
made samples contain less moisture than any other samples because of less
water and maximum use of vegetables in preparation.
Table No.18
Nutritional Value of Pau Bhaji (100gm) for Micro Nutrients
Nutrients Areas
A B C D Home
made(HM)
Thiamine (mg) 0.005 0.004 0.005 0.002 0.30
Riboflavin (mg) 0.12 0.20 0.20 0.29 0.20
Niacin (mg) 0.80 0.70 0.15 0.80 0.40
Ascorbic acid (mg) 0.05 0.04 0.45 0.40 1.00
Calcium (mg) 25.00 26.00 16.90 18.00 30.00
Iron (mg) 0.12 0.12 0.04 0.03 0.08
Sodium (mg) 14.50 14.00 12.00 13.00 13.00
Potassium (mg) 25.00 26.00 18.00 20.00 26.00
(6) Thiamine
Thiamine value of home made sample is more than any other food
samples, because in pau bhaji, amount of vegetable are more than any other
food samples. In case of vended food samples thiamine concentration of
sample (A) and (C) is equal but more than sample (B) and (D).
(7) Riboflavin
Value of riboflavin is more in sample (D). Sample (B) and (C) and
home made were found equal and more than sample (A).
(8) Niacin
Niacin concentration is much more in sample (A) and (D) but sample
(A) and (D) were found equal. Sample (C) had less amount of niacin than all
vended food samples.

86
(9) Ascorbic acid
Homemade food sample contains more vitamin C than any other food
samples. Sample (C) had more vitamin C than all vended food samples. Use
of lemon in home made food sample made the sample rich in vitamin C.
(10) Calcium
Homemade food sample contains more calcium concentration as
compared to other food samples. Sample (C) had less amount of calcium
than other food samples.
(11) Iron
Concentration of iron in sample (A) and (B) was more than any other
food sampled but were found equal. Homemade sample had more iron than
sample (C) and (D) but less than sample (A) and (B).
(12) Sodium
Level of sodium in all the food samples, as compared to sample (A),
was recorded much higher. Sample (B) had more sodium than sample (C)
and (D) and home made food.
(13) Potassium
The value of homemade food sample and sample (B) were same and
more than other vended samples. Sample (A) had more potassium than
sample (C) and (D). Sample (C) had less amount of potassium than other
vended and home made sample.
Home made pau bhaji is nutritionally rich in protein, fibre, thiamine,
and ascorbic acid, calcium, iron and potassium. It contains less amount of
sodium compared to the vendor’s food.

87
Table No. 19
(14) STATISTICAL ANALYSIS OF PAU BHAJI (AREA ---A)
T-TEST
NUTRIENTS T-VALUE RESULT
Carbohydrate .035 S
Protein .000 S
Fat .021 S
Thiamin .017 S
Riboflavin .000 S
Ascorbic acid .017 S
Niacin .008 S
Calcium .003 S
Iron .008 S
Sodium .001 S
Potassium .000 S
Moisture .008 S
Fibre .566 NS
NS= Not significant=T-value>0.05, S= Significant = T-value<0.05
Pau bhaji available in vendors place in area contains less amount of
fibre, while all other nutrients are significantly varying.

88
Table No.20
(15) STATISTICAL ANALYSIS OF PAU BHAJI (AREA ---B)
T-TEST
NUTRIENTS T-VALUE RESULT
Carbohydrate .035 S
Protein .000 S
Fat .287 NS
Thiamin .076 NS
Riboflavin .028 S
Ascorbic acid .013 S
Niacin .021 S
Calcium .009 S
Iron .008 S
Sodium .000 S
Potassium .000 S
Moisture .001 S
Fibre .006 S
NS= Not significant=T-value>0.05, S= Significant = T-value<0.05
Vended pau bhaji available from area B contains less amounts of fat
and thiamin, while other nutrients are significantly varying amount.

89
Table No.21
(16) STATISTICAL ANALYSIS OF PAU BHAJI (AREA ---C)
T-TEST
NUTRIENTS T-VALUE RESULT
Carbohydrate .003 S
Protein .000 S
Fat .070 NS
Thiamin .017 S
Riboflavin .000 S
Ascorbic acid .014 S
Niacin .044 S
Calcium .000 S
Iron .021 S
Sodium .000 S
Potassium .000 S
Moisture .021 S
Fibre .032 S
NS= Not significant=T-value>0.05, S= Significant = T-value<0.05
Pau bhaji available at third area contains fewer amounts of fats, while
other nutrients are varying significantly.

90
Table No.22
(17) STATISTICAL ANALYSIS OF PAU BHAJI (AREA ---D)
T-TEST
NUTRIENTS T-VALUE RESULT
Carbohydrate .035 S
Protein .000 S
Fat .070 NS
Thiamin .649 NS
Riboflavin .001 S
Ascorbic acid .013 S
Niacin .008 S
Calcium .000 S
Iron .008 S
Sodium .000 S
Potassium .000 S
Moisture .021 S
Fibre .032 S
NS= Not significant=T-value>0.05, S= Significant = T-value<0.05
Vended pau bhaji at area D contains fewer amounts of fat and
thiamin, while other nutrients are significantly varying.
4.1.2 Pani Puri
Panipuri a combination of roasted puris made of flour consumed with
mixture of boiled potatoes, black gram dipped in tangy water base made from
mint, tamarind with all other spices.
Pani Puri is a preferred vended food as a tit-bit among females and
college going teenagers. As vendors generally use less amount of black gram
and quality of salts used is not standard. This food is lacking sufficient protein,
sodium, potassium and fibre.

91
Table No. 23 Nutritional Value of Pani Puri (100gm) for Macro Nutrients
Nutrients Areas
A B C D Home
made(HM)
Carbohydrate (gm) 6.00 7.00 10.00 4.90 18.00
Protein (gm) 3.80 2.90 1.90 3.15 4.18
Fat (gm) 11.00 10.00 10.00 9.90 5.60
Fibre (gm) 0.20 0.10 0.21 0.19 0.20
Moisture (%) 75.00 76.00 75.00 73.00 70.00
(1) Carbohydrates
The Carbohydrate value of homemade food sample was more than any
other vended food samples. Sample (C) had more carbohydrate than sample
(A), (B) and (D) but less than homemade sample. Homemade sample use
more potato and Bengal gram then other vended sample. So Carbohydrate
content was more.
(2) Protein
All vended samples contain less protein and homemade sample contains
maximum protein value. Sample (A) protein value found more than any other
vended samples but less than home made sample. Sample (D) had protein
value more than sample (B) and (C) but less than homemade sample (A).
Home made contains more protein as it makes use of more Bengal gram in
masala of Panipuri than any other vended food samples.
(3) Fat
Sample (A) contained more fat than any other vended food samples
and home made samples, because vendor use more oil in puri and also
masala. Homemade sample contains less fat value than other vended food
samples. The smoking temperature affects the fat absorption. Fat absorption
is greater in the fats with the lowest smoking points.
(4) Fibre
Sample (C) had contained more fiber value than any other vended and
home made sample. Homemade sample and sample (A) value were found
equal but less than sample (C) and ore than (B) and (D).

92
(5) Moisture
The moisture content in home made foods was less than vended
sample because home made foods require more potatoes, Bengal gram
than vended foods sample.
Table No. 24
Nutritional Value of Pani Puri (100gm) for Micro Nutrients Nutrients Areas
A B C D Home
made(HM)
Thiamine (mg) - 0.01 0.01 0.015 0.020
Riboflavin (mg) 0.20 0.20 0.20 0.20 0.70
Niacin (mg) 0.10 0.17 0.16 0.20 0.80
Ascorbic acid (mg) 0.05 0.50 0.50 - 1.00
Calcium (mg) 20.00 21.00 16.80 15.00 25.00
Iron (mg) 0.08 0.09 0.16 0.16 0.19
Sodium (mg) 16.60 17.00 10.10 19.00 10.10
Potassium (mg) 27.70 27.00 25.00 27.00 28.00
(6) Thiamine
Homemade food sample had very more thiamine than vended food
samples. Sample (D) thiamine value was maximum among vended sample.
Sample (A) contains almost negligible thiamine.
(7) Riboflavin
Homemade food sample showed presence of substantially more
riboflavin than all vended food sample. All vended food samples are found to
have equal values of riboflavin.
(8) Niacin
Home made sample contain good amount of Niacin than any other
vended food samples. Sample (D) had more Niacin than other vended
samples.

93
(9) Ascorbic acid
Homemade sample contained more vitamin C than all vended
samples. Sample (D) contains almost negligible vitamin C. Sample (A), (B)
and (C) were found to contain equal value but less than home made sample.
(10) Calcium
All vended sample contains less calcium and homemade sample
contains more calcium value. Sample (B) calcium value found only 4.05 less
than homemade sample but at the same time, it was maximum compared to
other vended food samples.
(11) Iron
Homemade sample contained more Iron than any other vended
samples. Sample (C) and (D) had found to have amount of iron equal, more
than sample (A) and (B). Sample (B) had more than sample (A).
(12) Sodium
Sample (D) had been found to contain more than all other food
samples. Sample (B) had more sodium than sample (C) and (A) and home
made sample. Sample (A) had more sodium than sample (C) and home
made sample. Sample (C) and home made were found equal but less than
all vended food samples.
(13) Potassium
Homemade sample was found to have maximum potassium among
are vended food samples. Vento’s sample (A), (B) and (D) were found to
have equal but more than sample (C) and less than homemade sample.
Sample (C) had less potassium than all other food samples.
Macro nutrients available in home made panipuri are carbohydrate,
protein in large amount as compared to vendor’s food, while it contains less
amount of fat and moisture as compared to vendors’ food.

94
Home made panipuri contains all micro nutrients, some of which are
lacking in vendors preparations. It contains less amount of sodium compared
to vender’s food. While is rich in thiamin, riboflavin, niacin, ascorbic acid and
calcium and iron.
Table No. 25 (14) STATISTICAL ANALYSIS OF PANIPURI (AREA---A)
T-TEST
NUTRIENTS T-VALUE RESULT
Carbohydrate .000 S
Protein .190 NS
Fat .000 S
Thiamin .000 S
Riboflavin .000 S
Ascorbic acid .002 S
Niacin .000 S
Calcium .002 S
Iron .022 S
Sodium .061 NS
Potassium .021 S
Moisture .847 NS
Fibre .399 NS
NS= Not significant=T-value>0.05, S= Significant = T-value<0.05
The variation in micro and macro nutrients except protein, sodium,
moisture and crude fibre were non significant, where as the rest of the
nutrients varied significantly.

95
Table No. 26 15) STATISTICAL ANALYSIS OF PANIPURI (AREA---B)
T-TEST
NUTRIENTS T-VALUE RESULT
Carbohydrate .000 S
Protein .000 S
Fat .000 S
Thiamin .002 S
Riboflavin .009 S
Ascorbic acid .007 S
Niacin .008 S
Calcium .074 NS
Iron .003 S
Sodium .002 S
Potassium .021 S
Moisture .022 S
Fibre .150 NS
NS= Not significant=T-value>0.05, S= Significant = T-value<0.05
The variation in micro and macro nutrients except calcium and crude
fibre were non significant, where as the rest of the nutrients varied
significantly.

96
Table No. 27 (16) STATISTICAL ANALYSIS OF PANIPURI (AREA---C)
T-TEST
NUTRIENTS T-VALUE RESULT
Carbohydrate .009 S
Protein .000 S
Fat .001 S
Thiamin .002 S
Riboflavin .007 S
Ascorbic acid .009 S
Niacin .007 S
Calcium .012 S
Iron .070 NS
Sodium .251 NS
Potassium .021 S
Moisture .019 S
Fibre .287 NS
NS= Not significant=T-value>0.05, S= Significant = T-value<0.05
In the sample collected from area-C the iron, sodium and fibre contents
were at par statistically. However, other values were found to be statistical
significantly.

97
Table No. 28 17) STATISTICAL ANALYSIS OF PANIPURI (AREA---D)
T-TEST
NUTRIENTS T-VALUE RESULT
Carbohydrate .000 S
Protein .068 NS
Fat .141 NS
Thiamin .019 S
Riboflavin .008 S
Ascorbic acid .002 S
Niacin .003 S
Calcium .002 S
Iron .007 S
Sodium .960 NS
Potassium .021 S
Moisture .355 NS
Fibre .141 NS
NS= Not significant=T-value>0.05, S= Significant = T-value<0.05
In the sample collected from area-C the protein, fat, sodium, moisture
and fibre contents, were at par statistically. However, other values were found
to be statistical significantly.
4.1.3 Bhel
Bhel is again a food prevalent in Gujarat used for tit- bit among children
and teenagers. A combination of roasted puris of wheat mixed with masala
prepared from mashed potatoes, Bengal gram, onion, sev, salt, papper and
rock salt. A novel combination may contain pomegranate also, served with
chutney of mint and tamarind.

98
Table No. 29 Nutritional Value of Bhel (100gm) for Macro Nutrients
Nutrients Areas
A B C D Home
made(HM)
Carbohydrate (gm) 18.00 12.50 12.50 15 17.00
Protein (gm) 3.55 3.50 2.62 3.20 4.18
Fat (gm) 6.00 7.50 5.00 7.00 9.80
Fibre (gm) 0.55 0.25 00.35 0.35 0.40
Moisture (%) 65.00 75.90 44.90 60.00 60.00
(1) Carbohydrates
Sample (A) had more carbohydrate than other food sample. Sample
(B) and (C) carbohydrate values were found to be equal but less than sample
(A) and (D) and home made samples. But homemade sample had less
carbohydrate value than sample (A). Carbohydrate values of D were found
more than sample (B) and (C) but less than sample (A) and Home made
sample. Sample (A) and Home made sample contain more amount of
potatoes and puffed rice and onion.
(2) Protein
All vended food samples contain less protein than homemade food
samples. Sample (A) had more protein value than other vended food
samples. Sample (B) had protein value more than sample (C) and (D) but
less than sample (A) and homemade sample. Sample (D) protein value is
less than home made sample and sample (A) and (B) but more than sample
(C). Sample (C) was found to have less protein value because this sample
contains less Bengal gram but home made sample contain more Bengal
gram.
(3) Fat
Homemade food sample contains more fat than any other food
samples. Sample (B) and (D) had to be more than sample (A) and (C) but
sample (B) and (D) were found equal. Home made sample contain more
amount of oil in Bengal gram, Sev, Rice puffed all vended food samples
contain less amount of sev. Etc.

99
(4) Fibre
Sample (A) had more fiber value than any other sample. Home made
sample had less fiber but more than other food samples. Sample (B) had
less than any other vended samples and home made samples.
(5) Moisture
Sample (B) had moisture value more than any other samples and home
made sample. Second high values recorded in sample (A) and (C). This
sample value was equal but more than home made sample and sample (D).
Home made and sample (D) moisture values found are equal but less than all
vended food sample. Home made sample value less than other food sample
because it had less chatani and more potatoes and Bengal gram.
Table No. 30
Nutritional Value of Bhel (100gm) for Micro Nutrients
Nutrients Areas
A B C D Home
made(HM)
Thiamine (mg) 0.02 0.50 0.05 0.02 0.06
Riboflavin (mg) 0.20 0.40 0.30 0.20 0.70
Niacin (mg) 0.60 0.80 0.60 0.70 0.80
Ascorbic acid (mg) 0.25 0.25 0.50 0.20 1.50
Calcium (mg) 23.00 20.0 25.00 22.00 22.50
Iron (mg) 0.01 0.06 0.02 0.01 0.02
Sodium (mg) 13.00 12.00 14.00 14.00 15.00
Potassium (mg) 9.80 12.00 12.00 10.00 13.00
(6) Thiamine
Home made sample contain maximum thiamine than any other vended
samples. Sample (A) and (D) thiamine values were found equal but less than
any other food samples.
(7) Riboflavin
Homemade sample contained riboflavin more than vended samples.
Sample (B) had more riboflavin than other vended samples. Sample (A) and
(D) were found to have equal values but less than sample (B) and (C) and
home made sample.

100
(8) Niacin
Home made food sample and sample (B) had more niacin than other
vended samples but equal value were found in sample (B) and home made
sample.
(9) Ascorbic acid
Vitamin C value was found to be high in home made sample than all
vended samples. Sample (C) had more vitamin C than all other vended
samples. Sample (A) and (B) were found to have equal but less value as
compared to sample (C) and home made sample. Sample (D) had less
vitamin C than any other food samples. Homemade sample had more
pomegranate and tomato.
(10) Calcium
Calcium value is more in home made sample and vended sample (C).
Sample (A) had calcium value more than sample (B) and (D) but less than
sample (C) and home made sample. Sample (D) calcium content is more
than sample (B).
(11) Iron
Iron value is more in sample (B) than any other food samples. Home
made sample and sample (C) had more iron than sample (A) and (C) but less
than sample (B). Sample (A) and (D) were found equal but less than all food
samples.
(12) Sodium
Sodium content is more in home made sample than all other vended
samples. Sample (C) and (D) were found to have more sodium than any
other vended samples but less than home made sample and equal to each
other.
(13) Potassium
Home made sample had more potassium than any other vended food
samples. Sample (B) and (C) were found to have equal and more potassium
than (A) and (C) but less than homemade sample.
.
Nutritionally bhel prepared at home is rich in protein, fat and fiber, while
contains less moisture as compared to vended food.

101
Nutritionally home made Bhel is rich in thiamine, riboflavin, niacin,
ascorbic acid and sodium and potassium.
Table No. 31 (14) STATISTICAL ANALYSIS OF BHEL (AREA---A)
T-TEST
NUTRIENTS T-VALUE RESULT
Carbohydrate .070 NS
Protein .043 S
Fat .000 S
Thiamin .000 S
Riboflavin .000 S
Ascorbic acid .001 S
Niacin 1.84 NS
Calcium .407 NS
Iron .000 S
Sodium .000 S
Potassium .032 S
Moisture 4.25 NS
Fibre .005 S
NS= Not significant=T-value>0.05, S= Significant = T-value<0.05
The bhel sample collected from area A was statistically at par for
niacin, calcium, carbohydrate and moisture contents. However, other values
were found to be statistical significant.

102
Table No. 32 (15) STATISTICAL ANALYSIS OF BHEL (AREA---B)
T-TEST
NUTRIENTS T-VALUE RESULT
Carbohydrate .000 S
Protein .045 S
Fat .000 S
Thiamin .000 S
Riboflavin .000 S
Ascorbic acid . 001 S
Niacin .566 NS
Calcium .120 S
Iron .000 S
Sodium .005 S
Potassium .048 S
Moisture .842 NS
Fibre .000 S
NS= Not significant=T-value>0.05, S= Significant = T-value<0.05
In the sample collected from area B the niacin and moisture content,
were at par statistically insignificantly. However, other values were found to
be statistical significantly.

103
Table No. 33 (16) STATISTICAL ANALYSIS OF BHEL (AREA---C)
T-TEST
NUTRIENTS T-VALUE RESULT
Carbohydrate .000 S
Protein .043 S
Fat .000 S
Thiamin .000 S
Riboflavin .002 S
Ascorbic acid .002 S
Niacin .000 S
Calcium .001 S
Iron .267 NS
Sodium .059 NS
Potassium .048 S
Moisture .000 S
Fibre .062 NS
NS= Not significant=T-value>0.05, S= Significant = T-value<0.05
The bhel sample collected from area C is statistically at par for iron,
sodium and fiber contents. However, other values were found to be statistical
significantly.

104
Table No. 34
(17) STATISTICAL ANALYSIS OF BHEL (AREA---D)
T-TEST
NUTRIENTS T-VALUE RESULT
Carbohydrate .006 S
Protein .028 S
Fat .003 S
Thiamin .000 S
Riboflavin .002 S
Ascorbic acid .000 S
Niacin .001 S
Calcium .305 NS
Iron .129 NS
Sodium .059 NS
Potassium .000 S
Moisture .258 NS
Fibre .062 NS
NS= Not significant=T-value>0.05, S= Significant = T-value<0.05
The bhel sample collected from area D were statistically at par for
calcium, iron, sodium, moisture and fibre contents. However, other values
were found to be differing significantly.
4.1.4 Pizza
In today is world of globalization we can see globalization in food habits
also. Fast junk food is preferred by children. Pizza is one such food available
in different type’s .As a general pattern it composed of a pizza base made
from fermented batter of Maida and wheat flour, served with different toppings
of vegetables, pasta, and macaroni with cheese.

105
Table No. 35
Nutritional Value of Pizza (100gm) for Macro Nutrients
Nutrients Areas
A B C D Home
made(HM)
Carbohydrate (gm) 16.00 16.00 17.00 15.00 19.00
Protein (gm) 2.80 2.80 2.70 2.60 2.90
Fat (gm) 12.00 12.80 10.30 13.00 5.60
Fibre (gm) 0.01 0.01 0.01 0.009 0.01
Moisture (%) 58.00 56.00 60.00 61.00 55.00
(1) Carbohydrates
Homemade food sample had more carbohydrates than other food
sample. Sample (A) and (B) carbohydrates values were found equal and less
than home made sample, but were more than other vended food samples.
Homemade sample contain more amount of potatoes and cheese but vended
sample contain more cabbage.
(2) Protein
Like carbohydrates, all vended food samples contain less protein than
homemade food samples. Sample (A) and (B) contain same amount of
protein and more than other vended food. Homemade sample had more
cheese than other food so, it had more protein.
(3) Fat
Sample (D) fat value is more than any other sample. Sample (B) has
less fat but is more than other food samples. Sample (C) contained less fat
than all the vended food samples but was more than home made food
samples. In all vended samples, pizza is baked with good amount of butter
so, the fat content was more.
(4) Fibre
Home made sample, sample (A), (B), (C) had equal fiber values.
Sample (D) had only 0.001 gm less fiber than other samples.
(5) Moisture
Sample (D) moisture value found more than any other sample and
second high value recorded in sample (C). Home made and sample (B) had
less moisture value. Moisture content of homemade sample was least in all
food samples as more potatoes & cheese were used.

106
Table No. 36
Nutritional Value of Pizza (100gm) for Micro Nutrients
Nutrients Areas
A B C D Home
made(HM)
Thiamine (mg) 0.010 0.010 0.009 0.012 0.010
Riboflavin (mg) 0.20 0.30 0.20 0.02 0.40
Niacin (mg) 0.40 0.40 0.30 0.50 0.80
Ascorbic acid (mg) 0.35 0.30 0.41 0.30 1.00
Calcium (mg) 30.00 30.00 29.00 28.00 31.00
Iron (mg) 0.32 0.33 0.31 0.29 0.40
Sodium (mg) 12.00 31.00 10.10 12.00 20.00
Potassium (mg) 22.00 23.00 25.00 24.00 20.00
(6) Thiamine
Sample (D) contains maximum thiamine. But sample (A) and (B) and
homemade sample contained same thiamine which is found to be less than
sample (D).
(7) Riboflavin
Homemade sample contained riboflavin more than all vended samples.
Sample (B) had more Riboflavin than other vended sample. Sample (A), (C)
and (D) had same value but were less than sample (B).
(8) Niacin
The value of niacin in homemade sample was found to be maximum.
Among vended samples, sample (D) had more niacin. Sample (A), (B) had
less niacin than sample (D) but more than sample (C).
(9) Vitamin C
Vitamin C value is more in home made sample than all vended
samples. Sample (C) had more vitamin C than all other vended food, but
sample (A) had fewer vitamins C, sample (B) and (D) vitamin C values were
less than all vended foods.
(10) Calcium
Vended sample had less calcium than homemade sample indicating
calcium richness of homemade sample. Sample (A) and (B) had equal
calcium value but less than home made sample. Sample (C) had less
calcium than sample (A) and (B) but more than sample (D). So sample (D)
had least amount of calcium.

107
(11) Iron
Homemade sample had more iron than all the vended food samples.
Sample (B) had more iron than any other vended food.
(12) Sodium
Homemade sample had more sodium than all vended food samples.
Sample (B) had more sodium than all other the vended food samples.
Sample (A) and (D) had less sodium than sample (B) but more than that of
the (C) sample. Sample (C) had less amount of sodium than all vended food.
(13) Potassium
Sample (C) had more potassium than all vended food samples.
Sample (D) had less than sample (C) but found to be more than other
samples.
Home made Pizza contained more carbohydrate and protein, while had
less amount of fat and moisture as compared to vendors’ food. Nutritionally
home made Pizza is rich in riboflavin, niacin, ascorbic acid, calcium and iron.
Table No. 37
(14) STATISTICAL ANALYSIS OF PIZZA (AREA---A)
T-TEST
NUTRIENTS T-VALUE RESULT
Carbohydrate .021 S
Protein .070 NS
Fat .005 S
Thiamin 1.00 NS
Riboflavin .000 S
Ascorbic acid .002 S
Niacin .000 S
Calcium .070 NS
Iron .000 S
Sodium .002 S
Potassium .649 NS
Moisture .070 NS
Fibre 1.00 NS
NS= Not Significant=T-value>0.05, S=Significant=T-value <0.05

108
The Pizza sample collected from area A is statically at par for that
protein, thiamin, calcium, potassium, moisture, and fibre content. However,
other values were found to be differing significantly.
Table No. 38
(15) STATISTICAL ANALYSIS OF PIZZA (AREA---B)
T-TEST
NUTRIENTS T-VALUE RESULT
Carbohydrate .021 S
Protein .070 NS
Fat .005 S
Thiamin .000 S
Riboflavin .000 S
Ascorbic acid .002 S
Niacin 1.00 NS
Calcium .070 NS
Iron .000 S
Sodium .000 S
Potassium .070 NS
Moisture .070 NS
Fibre 1.00 NS
NS= Not significant=T-value>0.05, S= Significant = T-value<0.05
The sample under this group were found to contain almost same level of
protein, niacin, calcium, potassium, moisture and fiber as the variation found
was statistically non-distinguishable. However, other values were found to
vary significantly.
.

109
Table No. 39
(16) STATISTICAL ANALYSIS OF PIZZA (AREA---C)
T-TEST
NUTRIENTS T-VALUE RESULT
Carbohydrate .281 NS
Protein .021 S
Fat .001 S
Thiamin .000 S
Riboflavin .000 S
Ascorbic acid .008 S
Niacin .000 S
Calcium .013 S
Iron .000 S
Sodium .000 S
Potassium .008 S
Moisture .003 S
Fibre .190 NS
NS= Not significant=T-value>0.05, S= Significant = T-value<0.05
The Pizza sample collected from area C were statistically at par for
carbohydrate and fiber contents. However, other values were found to be
statistical significantly.

110
Table No. 40
(17) STATISTICAL ANALYSIS OF PIZZA (AREA---D)
T-TEST
NUTRIENTS T-VALUE RESULT
Carbohydrate .021 S
Protein .020 S
Fat .007 S
Thiamin .000 S
Riboflavin .000 S
Ascorbic acid .002 S
Niacin .000 S
Calcium .014 S
Iron .000 S
Sodium .000 S
Potassium .008 S
Moisture .003 S
Fibre .190 NS
NS= Not significant=T-value>0.05, S= Significant = T-value<0.05
The Pizza sample collected from area D the fiber content, were at par
statistically. Where as other values were found to be significantly different.
4.1.5 Burger
Burger is consists of a combination of pau along with Tikki, which is
prepared from potatoes other green vegetables and is generally deep fried
served by placing Tikka in between slitted pau along with raw tomato,
cucumber, cheese sometimes mayonnaise etc. along with salad leaves.

111
Table No. 41 Nutritional Value of Burger (100gm) for Macro Nutrients
Nutrients Areas
A B C D Home
made(HM)
Carbohydrate(gm) 14.00 15.00 14.00 13.00 16.00
Protein (gm) 2.62 2.10 2.20 2.40 2.80
Fat (gm) 2.00 3.10 2.10 3.00 4.60
Fiber (gm) 0.02 0.02 0.02 0.02 0.03
Moisture (%) 55.00 60.00 60.00 59.0 56.0
(1) Carbohydrates
Home made sample had more carbohydrate than vended food
samples and moisture content found to be less because more amount potato
used in cutlet. Sample (B) had more carbohydrates than other vended food
but less than homemade samples.
(2) Protein
Homemade food sample had more than the entire vended sample.
Sample (A) had more protein than any other vended sample. Sample (D) had
less protein than sample (A) and more than other vended food. Sample (B)
had less protein among all the vended food. So simple (C) had less amount of
protein than all food samples. Sample (D) had more moisture than sample
(A) .
(3) Fat
Fat content of home made sample is found to be more as compared to
vended food, because in burger, cheese & butter was used more than vended
food. Among vended food samples, sample (B) had more fat. Sample (A)
had least fat content as sample (A) had less cheese & butter.
(4) Fibre
Homemade sample value of fiber was found to be more than all the
vended food samples but all vended samples had almost equal amount of
fiber content.
(5) Moisture
Sample (B) and (C) had more moisture than other food samples. But
sample (D) had less moisture than sample (B) and (C) and more than sample

112
(A). Homemade food sample had less moisture than sample (B), (C) and
(D) and more than sample (A).
Table No. 42
Nutritional Value of Burger (100gm) for Micro Nutrients
Nutrients Areas
A B C D HM
Thiamine (mg) 0.005 0.004 0.004 0.005 0.015
Riboflavin (mg) 0.25 0.23 0.2 0.20 0.06
Niacin (mg) 0.30 0.40 0.4 0.30 0.80
Ascorbic acid (mg) 0.52 0.56 0.40 0.50 0.75
Calcium (mg) 26.00 25.00 23.00 27.00 28.00
Iron (mg) 0.20 0.10 0.20 0.23 0.30
Sodium (mg) 12.00 13.00 12.00 15.00 17.00
Potassium (mg) 20.00 21.00 22.00 22.0 25.0
(6) Thiamine
Homemade sample had more thiamine than all vended samples. But
sample (A) and (D) values were found to be equal but less than home made
sample. Sample (B) and (C) had same thiamine value but less than all the
food samples.
(7) Riboflavin
Riboflavin value of homemade sample was maximum among all the
samples. Sample (A) had more riboflavin than other vended food samples.
Sample (B) had less than sample (A) and more than sample (C) and (D).
(8) Niacin
Homemade sample had more niacin than all other food samples.
Sample (B) and (C) had same amount of niacin which is more than sample
(A) and (D) and is found to be less than home made samples.
(9) Vitamin C
Vitamin C value of home made food is found to be more than other
food samples because it was prepared with good quantity of tomatoes,
capsicum and green chattani. Sample (B) had more Vitamin C than other
vended food samples but less than home made sample.
(10) Calcium
Homemade sample had good amount of calcium than any other food
samples. Sample (D) had more calcium than all other vended food. Sample

113
(A) had less calcium than sample (D). Sample (B) contains less amount
of calcium than sample (D) but more than sample (C).
(11) Iron
Homemade sample had more iron than other samples. Sample (D)
had more iron than other vended food samples.
(12) Sodium
Homemade sample had more sodium value than vended foods.
Sample (D) had more sodium value than other vended food. Sample (B) had
less sodium than sample (D) but more than other vended food. Sample (A)
and (C) had same amount of sodium, which is found to be less among all the
food samples.
(13) Potassium
Homemade sample had more potassium than vended sample.
Sample (C) and (D) had same potassium value which is more than other
vended food samples. Sample (B) had more potassium than sample (A) and
less than sample (C) and (D). Sample (A) had least potassium among all
vended food samples.
Home made burger contains more amounts of carbohydrate, protein,
fat and fibre. Less amount of moisture compared to vendors food.
Home made food is rich in thiamin, niacin, ascorbic acid and calcium,
iron, sodium and potassium and it contains less amount of riboflavin
compared to vendor food.

114
Table No. 43
(14) STATISTICAL ANALYSIS OF BURGER (AREA---A)
T-TEST
NUTRIENTS T-VALUE RESULT
Carbohydrate .013 S
Protein .068 NS
Fat .007 S
Thiamin .000 S
Riboflavin .000 S
Ascorbic acid .000 S
Niacin .655 NS
Calcium .021 S
Iron .002 S
Sodium .003 S
Potassium .010 S
Moisture .287 NS
Fibre .079 NS
NS= Not significant=T-value>0.05, S= Significant = T-value<0.05
The sample under his group were found to contain almost same level
of protein, niacin, moisture and fiber as the variation found was statistically
non significant. However, other values were found to vary significantly.

115
Table No. 44
(15) STATISTICAL ANALYSIS OF BURGER (AREA---B)
T-TEST
NUTRIENTS T-VALUE RESULT
Carbohydrate .082 NS
Protein .003 S
Fat .000 S
Thiamin .000 S
Riboflavin .000 S
Ascorbic acid .000 S
Niacin .553 NS
Calcium .013 S
Iron .000 S
Sodium .003 S
Potassium .012 S
Moisture .008 S
Fibre .079 NS
NS= Not significant=T-value>0.05, S= Significant = T-value<0.05
The variation in micro and macro nutrients except carbohydrate,
niacin and crude fibre were non significant, where as the rest of the nutrients
varied significantly.

116
Table No. 45
(16) STATISTICAL ANALYSIS OF BURGER (AREA---C)
T-TEST
NUTRIENTS T-VALUE RESULT
Carbohydrate .013 S
Protein .002 S
Fat .007 S
Thiamin .000 S
Riboflavin .000 S
Ascorbic .000 S
Niacin .553 NS
Calcium .014 S
Iron .002 S
Sodium .003 S
Potassium .010 S
Moisture .008 S
Fibre .079 NS
NS= Not significant=T-value>0.05, S= Significant = T-value<0.05
The sample under his group were found to contain almost same level of
niacin and fiber as the variation found was statistically non significant.
However, other values were found to vary significantly.

117
Table No. 46
(17) STATISTICAL ANALYSIS OF BURGER (AREA---D)
T-TEST
NUTRIENTS T-VALUE RESULT
Carbohydrate .006 S
Protein .052 NS
Fat .000 S
Thiamin .000 S
Riboflavin .000 S
Ascorbic acid .000 S
Niacin .655 NS
Calcium .000 S
Iron .002 S
Sodium .002 S
Potassium .010 S
Moisture .007 S
Fibre .079 NS
NS= Not significant=T-value>0.05, S= Significant = T-value<0.05
The sample under his group were found to contain almost same
level of protein, niacin and fiber as the variation found was statistically non
significant. However, other values were found to vary significantly.
4.1.6 Kacchi Dabeli Bread
Kacchi Bread an Indian version of Burger consists of pau with in slitted
from between. In between the two slits is filled with a mixture prepared from
boiled potato, tomato, peanuts, pomegranate and other spices, served along
with mint, tamarind and garlic chutney and topped with sev

118
Table No. 47
Nutritional Value of Kacchi Bread (100gm) for Macro Nutrients
Nutrients Areas
A B C D HM
Cabohydrate (gm) 15.00 12.00 13.00 11.00 17.00
Protein (gm) 4.00 4.00 2.90 2.60 3.15
Fat (gm) 10.00 9.00 10.10 8.50 5.50
Fibre (gm) 0.02 0.02 0.02 0.03 0.04
Moisture (%) 55.00 54.00 60.00 64.00 61.00
(1) Carbohydrates
Homemade sample has more carbohydrate than other vended
food. Sample (A) has more carbohydrate than all the vended food samples.
Homemade sample had maximum carbohydrate because it had good amount
of onion, potatoes. In vended food samples, filling of bread was in fewer
amounts and that is why amount of potatoes & onion were less.
(2) Protein
Sample (A) and (B) had same protein content and more than vended
food and home made food sample. Home made had less protein than
sample (A) and (B) but more than other vended food. Value of protein is
more because of use of groundnuts. Sample (A) and (B) had more
groundnuts, Bengal gram dal.
(3) Fat
Sample (C) had more fat than vended food and home made food
sample. Home made sample less fat than all vended sample. In vended food,
oil was used in good amount and fried groundnuts were used.
(4) Fibre
Home made sample has more fiber value than vended samples but
sample (D) had more fiber than vended sample. Nutritive value of sample
(A), (B) and (C) are equal but percentage value of sample (C) was recorded
more because it contains more moisture.
(5) Moisture
Sample (D) moisture content was more than all other food samples.
Sample (C) had less moisture than sample (D). Sample (A) has less moisture
than sample (C) and (D) and more than other samples. Sample (B) had more

119
moisture than home made sample and less than other vended sample.
Homemade food had less moisture content than all the other food samples.
Table No. 48
Nutritional Value of Kacchi Bread (100gm) for Micro Nutrient
Nutrients Areas
A B C D Home
made(HM)
Thiamine (mg) 0.015 0.012 0.02 0.02 0.10
Riboflavin (mg) 0.20 0.20 0.30 0.20 0.80
Niacin (mg) 0.40 0.40 0.17 0.36 0.36
Ascorbic acid (mg) 0.75 0.60 0.40 0.60 0.90
Calcium (mg) 15.00 14.00 10.00 10.00 16.00
Iron (mg) 0.10 0.10 0.20 0.20 0.21
Sodium (mg) 14.80 13.00 12.50 12.60 12.50
Potassium (mg) 26.00 26.00 28.00 26.00 28.00
(6) Thiamine
Homemade sample had more thiamine than vended food. Sample (C)
and (D) values were equal and more than other vended food material.
(7) Riboflavin
Homemade sample riboflavin value is found to be more than other
vended food samples.
(8) Niacin
Sample (A) and (B) had same value and more than other samples.
But niacin value of sample (D) and homemade found to be equal and more
than sample (C).
(9) Vitamin C
Homemade sample had more vitamin C than other food samples.
Sample (A) had less vitamin C than homemade samples.
(10) Calcium
Homemade sample had more calcium. Sample (A) had more calcium
than any other vended food samples. Sample (B) had more calcium than
sample (C) and (D) but less than other samples.
(11) Iron
Homemade sample had more value of iron than other food sample.
Sample (C) and (D) had same iron value and sample (A) and (B) had same
value of calcium, but less than other sample.

120
(12) Sodium
Sample (A) had more sodium than other food samples. Sample (B)
had more value of sodium than sample (C) and (D) and home made sample.
Sample (D) had more sodium than sample (C) and homemade sample.
Sample (C) and homemade sample had same value of sodium but less than
other sample.
(13) Potassium
Sample (C) and homemade sample were found to have equal
amount of potassium, which is, and more than other food samples.
Sample (A), (B) and (D) had same value of potassium but less than
sample (C) and homemade sample.
Home made kacchi bread is nutritionally rich and it contains more
amounts of carbohydrate, protein and fibre and less amount of fat
compared to vendor food.
Home made food is rich in thiamine riboflavin, ascorbic acid,
calcium, iron and potassium and less amount of sodium compared to
vendors’ food. Table No. 49
(14) STATISTICAL ANALYSIS OF KACCHI BREAD (AREA---A)
T-TEST
NUTRIENTS T-VALUE RESULT
Carbohydrate .033 S
Protein .661 NS
Fat .000 S
Thiamin .478 NS
Riboflavin .000 S
Ascorbic .000 S
Niacin .044 S
Calcium .074 NS
Iron .289 NS
Sodium .145 NS
Potassium .021 S
Moisture .020 S
Fibre .036 S
NS= Not significant=T-value>0.05, S= Significant = T-value<0.05

121
In the sample collected from area A the protein, thiamin, calcium, iron,
sodium content were at par statistically. However, other values were found
significantly different.
Table No. 50
(15) STATISTICAL ANALYSIS OF KACCHI BREAD (AREA---B)
T-TEST
NUTRIENTS T-VALUE RESULT
Carbohydrate .003 S
Protein .661 NS
Fat .013 S
Thiamin .348 NS
Riboflavin .000 S
Ascorbic acid .066 NS
Niacin .044 S
Calcium .015 S
Iron .289 NS
Sodium .054 NS
Potassium .021 S
Moisture .023 S
Fibre .036 S
NS= Not significant=T-value>0.05, S= Significant = T-value<0.05
The Kacchi Babeli bread sample collected from area B were statistically at
par for that protein, thiamin, ascorbic acid, iron and sodium contents.
However, other values were found to be differing significantly.

122
Table No. 51
(16) STATISTICAL ANALYSIS OF KACCHI BREAD (AREA---C)
T-TEST
NUTRIENTS T-VALUE RESULT
Carbohydrate(gm) .008 S
Protein .174 NS
Fat .000 S
Thiamin .878 NS
Riboflavin .000 S
Ascorbic acid .018 S
Niacin .000 S
Calcium .005 S
Iron .287 NS
Sodium .889 NS
Potassium .022 S
Moisture .185 NS
Fibre .036 S
NS= Not significant=T-value>0.05, S= Significant = T-value<0.05
The sample under his group were found to contents almost same
level of protein, thiamin, iron, sodium, and moisture as the variation found
was statistically non significant. However, other values were found to vary
significantly.

123
Table No. 52
(17) STATISTICAL ANALYSIS OF KACCHI BREAD (AREA---D)
T-TEST
NUTRIENTS T-VALUE RESULT
Carbohydrate(gm) .001 S
Protein .038 S
Fat .002 S
Thiamin .878 NS
Riboflavin .000 S
Ascorbic acid .066 NS
Niacin .055 NS
Calcium .005 S
Iron .267 NS
Sodium .783 NS
Potassium .021 S
Moisture .019 S
Fibre .051 NS
NS= Not significant=T-value>0.05, S= Significant = T-value<0.05
The sample under his group were found to contain almost same level
of thiamin, ascorbic acid, niacin, iron, sodium and fiber as the variation found
was statistically non significant. However, other values were found to vary
significantly.
4.1.7 Chinese Rice
A prevalent Chinese food served on almost all road side lorries
consisting of rice along with seasonal vegetables carrot, beans fried and
tossed together in Chinese rice. Here rice is parboiled generally hours before
serving and fried along with vegetables at the time of serving. As storage
during in between period may not be up to mark and may serve as breeding
ground of or microorganisms.

124
Table No. 53
Nutritional Value of Chinese Rice (100gm) for Macro Nutrients
Nutrients Areas
A B C D Home
made(HM)
Carbohydrate(gm) 13.00 11.00 12.00 10.00 20.00
Protein (gm) 1.60 1.30 1.20 1.30 1.90
Fat (gm) 3.0 2.20 3.00 2.90 3.00
Fibre (gm) 0.01 0.011 0.012 0.01 0.01
Moisture (%) 65.00 66.00 68.00 69.00 65.00
(1) Carbohydrates
Homemade sample contains more carbohydrates than any other
food samples because of use of good quality of rice. Sample (A) had
more carbohydrates than other vended sample. Sample (C) contains
slightly less carbohydrates. Vended samples contain more cabbage than
rice and thus decrease carbohydrates amount. Sample (B) and (C)
contain least amount of carbohydrates.
(1) Proteins
All vended sample contains less protein and homemade sample
contains maximum protein value. Sample (A) protein value found only 0.3
less than home made sample, but at the same time, it was maximum
amongst all other vended food sample. Value of sample (B), (C) and (D)
varies but the differences found to be negligible.
(2) Fat
Sample (A), (C) and homemade sample contains maximum fat value
but sample (D) contains only 0.1 gm less fat value. Sample (B) contains very
less amount of fat than any other samples. These values depend on oil used
in rice and invisible fat.
(3) Fibre
All food samples contain almost same amount of fibers because of use
of vegetables. But sample (B) and (C) contain little more fiber than other
sample. Home made sample (A), (D) contains almost equal amount of fibers.
(5) Moisture
Sample (D) contains more moisture than any other food sample.
Sample (A) and home made food contain same amount of moisture. Sample

125
(C) has only 1% less moisture than sample (D). So, carbohydrate value
was less, as the moisture level found is high. Carbohydrates value of
homemade sample was high as it has less moisture value.
Table No. 54
Nutritional Value of Chinese Rice (100gm) for Micro Nutrients
Nutrients Areas
A B C D Home
made(HM)
Thiamine (mg) 0.001 0.002 0.005 0.001 0.10
Riboflavin (mg) 0.20 0.30 0.20 0.20 0.30
Niacin (mg) 0.24 0.21 0.20 0.21 0.12
Ascorbic acid (mg) 0.01 0.01 - - 0.1
Calcium (mg) 15.00 16.00 14.00 16.00 18.0
Iron (mg) 0.16 0.13 0.12 0.14 0.19
Sodium (mg) 21.00 22.00 20.00 19.50 23.00
Potassium (mg) 11.10 10.10 10.10 10.00 11.0
(6) Thiamine
Homemade sample thiamine value found is more than any other
vended food. Vended food samples contained more or less thiamine value.
Sample (C) contained more thiamine than other vended food. Homemade
sample contains more thiamine as it makes use of more rice than any other
food samples.
(7) Riboflavin
Riboflavin value of home made sample and (B) sample was same and
maximum among all the food samples. Sample (A), (C) and (D) were found
to have equal amount of riboflavin.
(8) Niacin
Niacin value of sample (A) was maximum but sample (B), (C) and (D)
contained relatively less amount of niacin than sample (A). Homemade
sample contained very less amount of niacin.
(9) Vitamin C
Homemade sample contained more vitamin C than any other vended
food sample. Sample (A) and (B) contained same vitamin C values.
Homemade sample contained good amount of vitamin C as it was prepared
by adding lemon juice.

126
(10) Calcium
Homemade sample contained maximum calcium than other food
samples. Sample (B) and (D) contain same amount of calcium but it was
more than sample (A) and (C). Sample (A) had less amount of calcium.
(11) Iron
Home made sample contain good amount of iron than vended food
samples. Sample (A) contains more iron than any other vended food sample.
Sample (B) and (D) contain more iron than sample (C).
(12) Sodium
Homemade sample contained more sodium than other food sample.
Sample (B) sodium value was more than any other vended food sample.
Sample (A) had more value than sample (C) and (D). Sample (C) had more
sodium than sample (D). So sample (D) had less sodium than other food
samples.
(13) Potassium
Potassium value of sample (A) and homemade was found to be same
but other vended food sample contains less potassium. All other vended food
contained almost equal amount of potassium.
Nutritionally home made Chinese rice is rich in carbohydrate,
protein and fat and less amount of Moisture as compared is vendor food.
Home made Chinese rice is rich in thiamin, riboflavin, ascorbic acid,
calcium, iron and sodium as compared to vended food, while ascorbic acid is
completely absent in vended food from two different places.

127
Table No. 55
(14) STATISTICAL ANALYSIS OF CHINESE RICE (AREA---A)
T-TEST
NUTRIENTS T-VALUE RESULT
Carbohydrate .001 S
Protein .021 S
Fat 1.00 NS
Thiamin .007 S
Riboflavin .287 NS
Ascorbic acid .006 S
Niacin .000 S
Calcium .021 S
Iron .070 NS
Sodium .070 NS
Potassium .830 NS
Moisture 1.00 NS
Fibre .989 NS
NS= Not significant=T-value>0.05, S= Significant = T-value<0.05
The sample under this group were found to contents almost same level of
fat, riboflavin, iron sodium, potassium, moisture, fibre as the variation found
was statistically non significant. However, other was found to vary
significantly.

128
Table No. 56
(15) STATISTICAL ANALYSIS OF CHINESE RICE (AREA---B)
T-TEST
NUTRIENTS T-VALUE RESULT
Carbohydrate .002 S
Protein .001 S
Fat .287 NS
Thiamin .007 S
Riboflavin 1.00 NS
Ascorbic acid .006 S
Niacin .000 S
Calcium .287 NS
Iron .001 S
Sodium .070 NS
Potassium .830 NS
Moisture .287 NS
Fibre 1.00 NS
NS= Not significant=T-value>0.05, S= Significant = T-value<0.05
The sample under this group were found to contain almost same level of
fat, riboflavin, calcium, sodium, potassium, moisture, fibre as the variation
found was statistically non significant. However other values were found to
vary significantly.

129
Table No. 57
(16) STATISTICAL ANALYSIS OF CHINESE RICE (AREA---C)
T-TEST
NUTRIENTS T-VALUE RESULT
Carbohydrate .000 S
Protein .001 S
Fat 1.00 NS
Thiamin .007 S
Riboflavin .287 NS
Ascorbic acid .000 S
Niacin .000 S
Calcium .021 S
Iron .001 S
Sodium .070 NS
Potassium .830 NS
Moisture .070 NS
Fibre 1.00 NS
NS= Not significant=T-value>0.05, S= Significant = T-value<0.05
The sample under this group were found to contain almost same level
of fat, riboflavin, sodium, potassium, moisture, fibre as the variation found was
statistically non significant. However, other was found to vary significantly.

130
Table No. 58
(17) STATISTICAL ANALYSIS OF CHINESE RICE (AREA---D)
T-TEST
NUTRIENTS T-VALUE RESULT
Carbohydrate .002 S
Protein .001 S
Fat .287 NS
Thiamin .007 S
Riboflavin .287 NS
Ascorbic acid .000 S
Niacin .000 S
Calcium .287 NS
Iron .003 S
Sodium .007 S
Potassium .830 NS
Moisture .070 NS
Fibre 1.00 NS
NS= Not significant=T-value>0.05, S= Significant = T-value<0.05
The sample under this group were found to contain almost same level
of fat, riboflavin, calcium, potassium, moisture, fibre as the variation found
was statistically non significant. However, other was found to vary
significantly.
4.1.8 Chinese Bhel
Chinese rice, here noodles replace rice, noodles are also boiled and
kept, long before, just for easier serving. At the time of serving it is leased
with parboiled vegetables in soya sauce and other Chinese ingredients. This
gives it a tangy taste and thereby making it popular among young customers.

131
Table No. 59
Nutritional Value of Chinese Bhel (100gm) for Macro Nutrients
Nutrients Areas
A B C D Home
made(HM)
Carbohydrate(gm) 8.00 16.00 13.00 12.00 20.00
Protein (gm) 1.90 2.20 3.50 3.00 3.20
Fat (gm) 2.00 2.23 2.90 2.50 6.80
Fibre (gm) 0.009 0.008 0.007 0.008 0.01
Moisture (%) 65.00 65.00 65.00 65.30 64.00
(1) Carbohydrates
Carbohydrates value of homemade sample was found to be more.
Among all vended samples, sample (A) contains less carbohydrate. Sample
(B) had more carbohydrates than other vended food and sample (B) and (C)
carbohydrates values were almost same. In homemade sample, noodles
were used in more proportion. Sample (A) contains least amount of
carbohydrates.
(2) Protein
Sample (C) contains maximum protein but home made contain only
0.3 gm less than sample (C). Sample (D) has 0.2 gm less than homemade
sample. Sample (A) contains least amount of protein. Sample (B) had more
protein than sample (A).
(3) Fat
Homemade sample had more fat than other food samples. All vended
samples had ⅓rd less value than homemade food sample. All vended
samples fat value ranging from 2.0 to 2.9 gm Chinese bhel of home made
contains good amount of cheese and vended sample lack this ingredient
because of its quit expensiveness.
(4) Fibre
Homemade sample contained more fiber than any other food samples.
All vended food samples contained almost same amount of fiber. But sample
(C) contain 0.001 gm less fiber than other sample. Home made sample make
use of cabbage and phanasi and so fiber concentration was more.

132
(4) Moisture
Sample (C) contains maximum value of moisture. All food samples
have 0.3% less moisture than sample (C). Sample (A), (B) and (C) had
same moisture content but it is 1% more than homemade sample.
Table No. 60
Nutritional Value of Chinese Bhel (100gm) for Micro Nutrients
Nutrients Areas
A B C D Home
made(HM)
Thiamine (mg) - 0.001 0.005 0.001 0.10
Riboflavin (mg) 0.02 0.20 0.20 0.20 0.30
Niacin (mg) 0.40 0.30 0.32 0.40 0.12
Ascorbic acid (mg) 0.12 0.10 - - 0.10
Calcium (mg) 15.00 15.00 16.00 14.00 40.00
Iron (mg) 0.16 0.10 0.12 0.10 0.19
Sodium (mg) 21.00 21.00 19.5 21.00 20.00
Potassium (mg) 14.20 14.00 14.00 14.90 17.00
(6) Thiamine
Homemade sample contained maximum thiamine value but sample (A)
had no thiamine. Sample (B) and (D) thiamine value is almost equal but
sample (C) thiamine value is found more than sample (B) and (D).
(7) Riboflavin
Homemade sample had maximum riboflavin than any other food
samples. All vended food samples had almost same riboflavin value.
(8) Niacin
The sample (A) and (D) value of niacin found are more than any other
food sample. Sample (B) and (C) values are found same but they are less
than that of sample (A) and (D). The Homemade sample niacin value less
than sample (A) and (D).
(9) Vitamin C
Value of vitamin C value of was found to be sample (A) found 0.02 mg
more than other food samples. Among other samples, sample (B) and
homemade food contained same amount of vitamin C. Sample (C) and (D)
contain almost negligible amount of vitamin C.

133
(10) Calcium
Home made food sample contain more amount of calcium than vended
food. Among vended food samples, sample (C) contained more calcium.
Sample (A) and (B) values found were same but less than that of sample (C).
But sample (D) contain least amount of calcium.
(11) Iron
Homemade sample had more iron than vended food sample. Sample
(A) iron value was maximum among vended food. Sample (B) and (D) values
found were equal but less than other food samples. Sample (C) iron
concentration found was less than sample (A) and more than sample (B) and
(D).
(12) Sodium
Sample (A), (B) and (C) had same sodium value but home made
sample had 1.0 mg less sodium than sample (A), (B) and (C). Sample (C)
value was found to be lesser than that of homemade and other vended food
sample.
(13) Potassium
Homemade sample had high potassium content than any other food
sample. All vended food samples had average value of around 14.0 mg.
Sample (B) and (C) had same value of potassium but lesser than other
vended food. Sample (D) value was maximum and sample (A) had lesser
than sample (D).
Home made bhel is rich in carbohydrate, fat and fiber and less
amount of moisture as compared to vended food.
In Lories of micro nutrients also home made Chinese bhel is richer as it
contains more amounts of thiamine, riboflavin, calcium, iron and potassium as
compared to vended food. Home made food contains less amount of niacin
as compared to vended food.

134
Table No. 61
(14) STATISTICAL ANALYSIS OF CHINESE BHEL (AREA---A)
T-TEST
NUTRIENTS T-VALUE RESULT
Carbohydrate .000 S
Protein .000 S
Fat .001 S
Thiamin .007 S
Riboflavin .087 NS
Ascorbic acid 1.00 NS
Niacin .087 NS
Calcium .000 S
Iron .228 NS
Sodium .287 NS
Potassium .027 S
Moisture .770 NS
Fibre .172 NS
NS= Not significant=T-value>0.05, S= Significant = T-value<0.05
In the Chinese bhel sample collected from area-A the riboflavin, ascorbic
acid, niacin, iron, sodium, moisture and fiber contains were at par statistically.
However, other values were found statistical significantly.

135
Table No. 62
(15) STATISTICAL ANALYSIS OF CHINESE BHEL (AREA---B)
T-TEST
NUTRIENTS T-VALUE RESULT
Carbohydrate .008 S
Protein .000 S
Fat .000 S
Thiamin .008 S
Riboflavin .566 NS
Ascorbic acid 1.00 NS
Niacin .087 NS
Calcium .000 S
Iron .228 NS
Sodium .287 NS
Potassium .027 S
Moisture .770 NS
Fibre .172 NS
NS= Not significant=T-value>0.05, S= Significant = T-value<0.05
In the Chinese bhel sample collected from area-B the riboflavin,
ascorbic acid, niacin, iron, sodium, moisture and fiber contain were at par
statistically. However, other values were found statistical significantly.

136
Table No. 63
(16) STATISTICAL ANALYSIS OF CHINESE BHEL (AREA---C)
T-TEST
NUTRIENTS T-VALUE RESULT
Carbohydrate .000 S
Protein .284 NS
Fat .000 S
Thiamin .007 S
Riboflavin .566 NS
Ascorbic acid .000 S
Niacin .087 NS
Calcium .000 S
Iron .228 NS
Sodium .287 NS
Potassium .027 S
Moisture .770 NS
Fibre .172 NS
NS= Not significant=T-value>0.05, S= Significant = T-value<0.05
In the Chinese bhel sample collected from area-C the protein,
riboflavin, niacin, iron, sodium, moisture and fiber contain were at par
statistically. However, other values were found statistical significantly.

137
Table No. 64
(17) STATISTICAL ANALYSIS OF CHINESE BHEL (AREA---D)
T-TEST
NUTRIENTS T-VALUE RESULT
Carbohydrate .008 S
Protein .000 S
Fat .000 S
Thiamin .076 NS
Riboflavin .566 NS
Ascorbic acid .000 S
Niacin .087 NS
Calcium .000 S
Iron .228 NS
Sodium .287 NS
Potassium .027 S
Moisture .770 NS
Fibre .172 NS
NS= Not significant=T-value>0.05, S= Significant = T-value<0.05
In the Chinese bhel sample collected from area-D the thiamin,
riboflavin, niacin, iron, sodium, moisture and fiber contain were at par
statistically. However, other values were found statistical significantly.
4.1.9 Mendu Vada
A south Indian delicacy comprising of Urad dal Vadas mixed in sambher.
Vada are prepared from Black gram dal, which is soaked crushed and
partially fermented vada there by deep fried in oil.
Where sambher is prepared from dal along with tomatoes and other
seasonal vegetables along with tamarind now days due to availability of junk
food such items are less preferred by children, but obviously are popular
among middle aged people.

138
Table No. 65
Nutritional Value of Mendu Vada (100gm) for Macro Nutrients
Nutrients Areas
A B C D Home
made(HM)
Carbohydrate(gm) 10.00 11.00 9.0 10.00 15.00
Protein (gm) 4.37 4.40 5.00 4.40 2.80
Fat (gm) 24.00 25.00 23.00 25.00 15.00
Fibre (gm) 0.07 0.07 0.08 0.07 0.001
Moisture (%) 65.00 67.00 68.00 65 60.00
(1) Carbohydrates
Homemade food sample had more carbohydrate than all vended food
samples. Sample (B) had more value than other vended food samples.
Sample (A) and (D) values were found to be equal and more than sample (C).
(2) Protein
Sample (C) had more protein value than all food samples. Sample (B)
and (D) were found to have equal values that were more than were home
made food sample and sample (A). Sample (A) protein value found only 0.03
gm less than sample (B) and (D) but at the same time, it was maximum than
that of home made sample, so home made sample had less protein than all
vended food samples.
(3) Fat
Sample (B) and (D) were found to have equal and more fat than all
food samples. Sample (A) had more fat than sample (C) and homemade
sample. Sample (C) had less amount of fat than all vended food sample.
Homemade sample had very less amount of fat than all vended foods.
(4) Fibre
Sample (C) had more fiber compare to all other food samples, sample
(A), (B) and (D) were found equal and more than homemade sample but less
than sample (C). Homemade sample had less fiber than all vended food
samples.

139
(5) Moisture
Sample (C) had more moisture than all food samples. Sample (B) had
more moisture value than sample (A) and (D) and home made sample.
Sample (A) and (D) were found to have equal and more moisture than
homemade sample. Homemade sample had less moisture than all vended
food samples.
Table No. 66
Nutritional Value of Mendu Vada (100gm) for Micro Nutrients
Nutrients Areas
A B C D Home
made(HM)
Thiamine (mg) 0.05 0.03 0.04 0.04 0.50
Riboflavin (mg) 0.10 0.10 0.20 0.10 0.56
Niacin (mg) 0.16 0.15 0.14 0.15 0.16
Ascorbic acid (mg) 0.075 0.06 0.008 0.008 0.07
Calcium (mg) 30.00 30.00 40.00 40.00 50.00
Iron (mg) 0.06 0.07 0.09 0.08 0.18
Sodium (mg) 10.00 12.00 10.00 11.00 12.50
Potassium (mg) 22.00 25.00 26.00 25.00 26.00
(6) Thiamine
Homemade sample had maximum thiamine than all vended food
samples. Sample (A) had more thiamine than other vended food samples.
Sample (C) and (D) were found to have equal values but were more than
sample (B). So sample (B) had less thiamine.
(7) Riboflavin
The value of homemade sample was more than other any vended
samples. Sample (C) had more riboflavin than sample (A), (B) and (D). The
sample (A), (B) and (D) were found to have equal but less riboflavin than
home made sample and sample (C).
(8) Niacin
The value of sample (A) and homemade sample were found to be
equal and more than other food samples. Sample (B) and (D) were found to

140
have equal niacin content which was but less than sample (A) and home
made sample and was more than sample (C).
(9) Ascorbic acid
The value of homemade sample was more than all vended food
samples. All vended food samples had very less amount of ascorbic acid
compare to homemade samples. Sample (D) contains almost negligible
vitamin C.
(10) Calcium
The homemade sample had more calcium than all vended food
samples. Sample (C) and (D) were found to have equal and more than
calcium sample (A) and (C). Sample (A) and (C) were found to have equal
but less calcium than all food samples.
(11) Iron
The value of homemade sample was more than all vended food
samples. Sample (C) had more iron than sample (A), (B) and (D). Sample
(D) had more iron than sample (A) and (B). Sample (B) had more iron than
sample (A). Thus sample (A) had least amount of iron.
(12) Sodium
Homemade sample had more sodium than all vended food samples.
Sample (A) and (B) were found to contain equal but less than home made
sample and more than sample (C) and (D). Sample (D) had more than
sample (C). So sample (C) had less amount of sodium than other food
samples.
(13) Potassium
The value of home made food sample and sample (C) were found to
be equal and more than other food samples. Sample (D) had more value than
sample (A) and (B). Sample (B) had more than sample (A). So sample (A)
had less amount of potassium.
The home made recipe is rich in carbohydrate but it contains
less amount of protein, fat, fiber and moisture compared to food sample of
vended vada collected from different areas.
The home made food is rich in vitamins like thiamine, calcium, and
iron and salts sodium and potassium compared to vended food samples.

141
Table No. 67
(14) STATISTICAL ANALYSIS OF MENDU VADA (AREA---A)
T-TEST
NUTRIENTS T-VALUE RESULT
Carbohydrate .003 S
Protein .006 S
Fat .000 S
Thiamin .287 NS
Riboflavin .000 S
Ascorbic acid .003 S
Niacin .000 S
Calcium .000 S
Iron .000 S
Sodium .057 NS
Potassium .004 S
Moisture .000 S
Fibre .006 S
NS= Not significant=T-value>0.05, S= Significant = T-value<0.05
The Mendu vada sample collected from area A were statistically at par
for thiamine and sodium contents. However, other values were found to
statistical significantly.

142
Table No. 68
(15) STATISTICAL ANALYSIS OF MENDU VADA (AREA---B)
T-TEST
NUTRIENTS T-VALUE RESULT
Carbohydrate .008 S
Protein .005 S
Fat .000 S
Thiamin .021 S
Riboflavin .000 S
Ascorbic acid .000 S
Niacin .000 S
Calcium .000 S
Iron .000 S
Sodium .000 S
Potassium .319 NS
Moisture .013 S
Fibre .001 S
NS= Not significant=T-value>0.05, S= Significant = T-value<0.05
The Mendu vada sample collected from area B were statistically at
par for potassium contents. However, other values were found to statistical
significantly.

143
Table No. 69
(16) STATISTICAL ANALYSIS OF MENDU VADA (AREA---C)
T-TEST
NUTRIENTS T-VALUE RESULT
Carbohydrate .001 S
Protein .007 S
Fat .001 S
Thiamin .287 NS
Riboflavin .000 S
Ascorbic acid .000 S
Niacin .001 S
Calcium .000 S
Iron .000 S
Sodium .057 NS
Potassium .649 NS
Moisture .001 S
Fibre .006 S
NS= Not significant=T-value>0.05, S= Significant = T-value<0.05
The Mendu vada sample collected from area C were statistically at par
for thiamine, sodium and potassium contents. However, other values were
found to statistical significantly.

144
Table No. 70
(17) STATISTICAL ANALYSIS OF MENDU VADA (AREA---D)
T-TEST
NUTRIENTS T-VALUE RESULT
Carbohydrate(gm) .001 S
Protein .005 S
Fat .000 S
Thiamin .287 NS
Riboflavin .000 S
Ascorbic acid .003 S
Niacin .000 S
Calcium .000 S
Iron .000 S
Sodium .319 NS
Potassium .013 S
Moisture .000 S
Fibre .006 S
NS= Not significant=T-value>0.05, S= Significant = T-value<0.05
The Mendu vada sample collected from area D were statistically at
par for thiamine and sodium contents. However, other values were found to
statistical significantly.
4.1.10 Masala Dosa
Another south Indian delicacy comprising of soft crispy dosa prepared
from combination of rice and Urad dal, soaked crushed and fermented. Along
with different types of masala combinations prepared from onion, potato, peas
and simple dosa prepared in oil or butter.
Masala dosa served along with coconut chutney comprising of coconut,
green chilies, garlic and curd. Sambhar is prepared from Bengal gram dal
along with seasonal vegetables tomato and tamarind pulp.

145
Table No. 71
Nutritional Value of Masala Dosa (100gm) for Macro Nutrients
Nutrients Areas
A B C D Home
made(HM)
Carbohydrate(gm) 12.00 20.00 11.00 16.00 20.00
Protein (gm) 2.90 2.80 1.40 2.10 2.9
Fat (gm) 13.20 13.10 13.00 12.20 8.0
Fibre (gm) 0.02 0.02 0.017 0.019 0.02
Moisture (%) 69.00 68.00 70.00 74.50 65.00
(1) Carbohydrates
The amount of carbohydrates present in home made food sample and
sample (B) was more than all vended samples. Sample (D) had more
carbohydrate than sample (C) and (A). So sample (C) had least amount of
carbohydrate. Homemade sample & (B) contain more amounts of potatoes
and onion in masala.
(2) Protein
Home made sample and sample (A) were found to have protein
content equal, which was more than that of all vended samples. Sample (B)
had amount of protein only 0.1 gm less than home made and sample (A).
Sample (C) had less amount of protein than all food samples. Home made
dosa had more protein value because of more amount of black gram dal.
(3) Fat
The amount of fat as sample (A) was maximum than all food samples.
Sample (B) had more fat than sample (C), (D) and home made sample.
Sample (C) had more fat than sample (D) and home made sample. Sample
(D) had fewer amounts than all vended food but more than homemade
sample. So home made sample had least amount of fat amount than all
vended food. Home made sample contain less amount of oil and is cooked in
non stick pan so fat content is very less as compared to vended foods.
(4) Fibre
The value of fiber in sample (A), (B) and homemade was equal .Which
was more than sample (C) and (D). Sample (D) had more fiber content than
sample (C). So sample (C) had least fiber content than all food samples.

146
(5) Moisture
Sample (C) and (D) contain more moisture than any other food
samples. Sample (A) had more moisture than sample (B) and home made
sample. Sample (B) more than home made sample. Homemade sample
contain less moisture than all vended food samples. Homemade food
contains more potatoes and dal and less amount of water.
Table No. 72
Nutritional Value of Masala Dosa (100gm) for Micro Nutrients
Nutrients Areas
A B C D Home
made(HM)
Thiamine (mg) 0.015 0.013 0.005 0.015 0.1
Riboflavin (mg) 0.20 0.20 0.15 0.20 0.5
Niacin (mg) 0.18 0.17 0.15 0.15 0.3
Ascorbic acid (mg) - - 0.01 - 0.9
Calcium (mg) 20.00 18.00 16.80 17.00 20.00
Iron (mg) 0.11 0.10 0.08 0.08 0.16
Sodium (mg) 66.00 89.00 93.9 70.00 98.00
Potassium (mg) 22.00 23.00 22.0 26.00 25.00
(6) Thiamine
Home made had dosa more thiamine than other vended food samples.
Sample (A) and (D) were found to have equal but less thiamine than home
made food and more than sample (C) and (B). Sample (B) had more than (C)
but less than other food samples. Sample (C) had very less amount of
thiamine than home made sample.
(7) Riboflavin
Homemade food sample had good amount of riboflavin than any other
food samples, sample (A), (B) and (D) were found to have equal but more
than sample (C).
(8) Niacin
Niacin value of homemade food sample was found to be more among
all vended samples. Sample (A) had more niacin than other vended samples.

147
(9) Ascorbic acid
Homemade food sample were found to contain more vitamin C than all
vended food samples. Sample (C) had vitamin C less than homemade
sample, sample (A), (B) and (D) contain almost negligible amount of vitamin
C.
(10) Calcium
Home made sample and sample (A) calcium value found was equal
and it was more than other vended food samples. Sample (B) had more
calcium content than sample (C) and (D). So sample (C) had less than all
vended and home made samples.
(11) Iron
Homemade sample had more iron value than vended samples.
Sample (A) has more than other vended sample. Sample (B) had less than
sample (A) but more than sample (C) and (D). Sample (C) and (D) were
found to have equal but less than all other food samples.
(12) Sodium
Homemade food had more sodium value than all vended food
samples. Sample (C) had more sodium than sample (A), (B) and (D).
(13) Potassium
Sample (D) had good amount of potassium than any other food
samples. Homemade sample had more potassium than sample (A), (B) and
(C).
Home made masala dosa is rich in carbohydrate and contains less
amount of fat and moisture compared is vended food sample.
The home made food is rich in thiamine, riboflavin, niacin, ascorbic
acid and sodium is completely absent in three vended sample and is present
in negligible amount in one sample. Less amount of Potassium is present in
all vended sample except sample from Area D.

148
Table No. 73
(14) STATIS TICAL ANALYSIS OF MASALA DOSA (AREA---A)
T-TEST
NUTRIENTS T-VALUE RESULT
Carbohydrate .000 S
Protein 1.00 NS
Fat .003 S
Thiamin .007 S
Riboflavin .036 S
Ascorbic acid .005 S
Niacin .061 NS
Calcium .070 NS
Iron .003 S
Sodium .000 S
Potassium .021 S
Moisture .003 S
Fibre .556 NS
NS= Not significant=T-value>0.05, S= Significant = T-value<0.05
The sample under this group were found to content almost same level
of protein, niacin, calcium and fiber as the variation found was statistically no
significantly. However, other values were found to vary significantly.

149
Table No. 74
(15) STATIS TICAL ANALYSIS OF MASALA DOSA (AREA---B)
T-TEST
NUTRIENTS T-VALUE RESULT
Carbohydrate .287 NS
Protein 1.00 NS
Fat .000 S
Thiamin .007 S
Riboflavin .036 S
Ascorbic acid .278 NS
Niacin .061 NS
Calcium .070 NS
Iron .008 S
Sodium .000 S
Potassium .021 S
Moisture .002 S
Fibre .556 NS
NS= Not significant=T-value>0.05, S= Significant = T-value<0.05
The sample under this group were found to content almost same level of
carbohydrate, protein, ascorbic acid, niacin, calcium and fiber as the variation
found was statistically nonsignificantly. However, other values were found to
vary significantly.

150
Table No. 75
(16) STATIS TICAL ANALYSIS OF MASALA DOSA (AREA---C)
T-TEST
NUTRIENTS T-VALUE RESULT
Carbohydrate .000 S
Protein .023 S
Fat .000 S
Thiamin .006 S
Riboflavin .026 S
Ascorbic acid .005 S
Niacin .051 NS
Calcium .008 S
Iron .000 S
Sodium .004 S
Potassium .021 S
Moisture .003 S
Fibre .143 NS
NS= Not significant=T-value>0.05, S= Significant = T-value<0.05
The sample under this group were found to content almost same level of
niacin, and fiber as the variation found was statistically nonsignificantly.
However, other values were found to vary significantly.

151
Table No. 76
(17) STATIS TICAL ANALYSIS OF MASALA DOSA (AREA---D)
T-TEST
NUTRIENTS T-VALUE RESULT
Carbohydrate .021 S
Protein .023 S
Fat .000 S
Thiamin .007 S
Riboflavin .036 S
Ascorbic acid .005 S
Niacin .051 NS
Calcium .008 S
Iron .000 S
Sodium .000 S
Potassium .287 NS
Moisture .000 S
Fibre .198 NS
NS= Not significant=T-value>0.05, S= Significant = T-value<0.05
The sample under this group were found to content almost level of niacin,
potassium and fiber as the variation found was statistically no significantly.
However, other values were found to vary significantly.
4.1.10 Vegetable Kolhapuri
Vegetable Kolhapuri is a North Indian delicacy preferred by people
who like to eat hot and spicy food. A combination of available vegetables
prepared in onion, tomato, garlic, Green chili, coriander garnished with
cheese. Generally it is eaten with chapatti or Nan.

152
Table No. 77
Nutritional Value of Vegetable Kolhapuri (100gm) for Macro Nutrients
Nutrients Areas
A B C D Home
made(HM)
Carbohydrate(gm) 5.00 5.00 4.00 3.00 5.00
Protein (gm) 2.27 2.00 2.90 3.00 2.60
Fat ( gm) 8.00 7.00 6.00 8.00 8.0
Fibre (gm) 0.02 0.01 0.04 0.018 0.02
Moisture (%) 68.00 78.00 74.00 71.0 73.00
(1) Carbohydrates
The amount of carbohydrate in sample (A) and (B) and home made
were found to be equal and more than sample (C) and (D). Homemade and
sample (A), (B) had more carbohydrate because higher content of tomato and
onion.
(2) Protein
Sample (D) had more protein than other food samples. Homemade
sample had more protein than sample (A) and (B). These percentage value
differences are very less, but sample (C) had contains more amount of
paneer and beans.
(3) Fat
The sample of home made food and sample (A) and (D) were found
equal amount of fat and was more than sample (B) and (C). The homemade,
sample (A) and (D) had more content of fat because maximum butter and
cheese is used than other samples.
(4) Fibre
The homemade food and sample (A) were found to have equal and
more fiber than other food samples.
(5) Moisture
Sample (B) had more moisture than other vended and homemade
samples. Homemade sample had more moisture than sample (A), (C) and
(D). Sample (D) had more moisture than sample (C) and (A).

153
Table No. 78
Nutritional Value of Vegetable Kolhapuri (100gm) for Micro Nutrients
Nutrients Areas
A B C D Home
made(HM)
Thiamine (mg) 0.003 0.003 0.004 0.003 0.05
Riboflavin (mg) 0.12 0.10 0.30 0.20 0.30
Niacin (mg) 0.16 0.18 0.24 0.20 0.08
Ascorbic acid (mg) 0.17 0.09 - - 0.42
Calcium (mg) 15.0 16.00 17.00 17.00 20.00
Iron (mg) 20.00 13.00 12.00 12.0 15.00
Sodium (mg) 0.08 0.07 0.09 0.08 0.10
Potassium (mg) 28.10 26.10 25.1 27.1 26.0
(6) Thiamine
The homemade sample had more thiamine than all vended food
samples. Sample (C) had more thiamine than sample (A), (B) and (D).
(7) Riboflavin
Sample (C) and homemade food sample were found to have equal and
more riboflavin than other food samples. Sample (D) had more riboflavin than
sample (A) and (B).
(8) Niacin
Sample (C) had more niacin than other food samples. Sample (D) had
less niacin content than (C) but more amount of niacin than other food
samples.
(9) Ascorbic acid
The homemade sample amount of vitamin C was more than other
vended samples. Sample (A) had more than sample (B). The homemade
sample contain more lemon juice so maximum value of vitamin C.
(10) Calcium
Homemade sample had more calcium than all vended food samples.
Sample (C) and (D) were found to have equal but more calcium than sample
(A) and (B) but less than homemade sample.
(11) Sodium
The value of sample (A) was more than other food samples.
Homemade sample had more sodium than sample (B), (C) and (D) and less
than sample (A).

154
(12) Iron
The homemade food sample had more iron than all vended food
samples. Sample (C) had more iron than other vended food samples.
(13) Potassium
Sample (A) had more potassium than other vended and homemade sample.
Sample (D) had more than home made sample and sample (B) and (C).
The home made vegetable Kolhapuri and sample collected from area A &
B were having same amount of nutrients. Sample A is containing less amount
of moisture compared to all other food sample.
The home made food sample is rich in thiamine, riboflavin but it contains
less amount of niacin, ascorbic acid is present in less amount in sample A &
B, while is completely absent in sample C, D and home made food rich in
calcium, iron, sodium and less amount of potassium compared to other
sample. Sample A contains maximum amount of calcium compared to all
other food sample.
Table No. 79
(14) STATISTICAL ANALYSISOF VEGETABLE KOLHAPURI (AREA---A)
T-TEST
NUTRIENTS T-VALUE RESULT
Carbohydrate .208 NS
Protein .021 S
Fat .287 NS
Thiamin .014 S
Riboflavin .087 NS
Ascorbic acid .000 S
Niacin .000 S
Calcium .003 S
Iron .003 S
Sodium .248 NS
Potassium .066 NS
Moisture .003 S
Fibre 1.00 NS

155
NS= Not significant=T-value>0.05, S= Significant = T-value<0.05
In the sample collected from area-A the carbohydrate fat, riboflavin, sodium,
potassium and fiber contents were at par statistically insignificants. However,
other values were found statistical significantly.
Table No. 80
(15) STATISTICAL ANALYSISOF VEGETABLE KOLHAPURI (AREA---B)
T-TEST
NUTRIENTS T-VALUE RESULT
Carbohydrate .208 NS
Protein .117 NS
Fat .287 NS
Thiamin .014 S
Riboflavin .082 NS
Ascorbic acid .000 S
Niacin .000 S
Calcium .008 S
Iron .070 NS
Sodium .248 NS
Potassium 1.00 NS
Moisture .003 S
Fibre .649 NS
NS= Not significant=T-value>0.05, S= Significant = T-value<0.05
The Vegetable kolhapuri sample collected from area B were
statistically at par for carbohydrate, protein, fat, riboflavin, iron, sodium,
potassium and fiber contents. However, other values were found statistical
significantly.

156
Table No. 81
(16) STATISTICAL ANALYSISOF VEGETABLE KOLHAPURI (AREA---C)
T-TEST
NUTRIENTS T-VALUE RESULT
Carbohydrate .054 NS
Protein .496 NS
Fat .070 NS
Thiamin .014 S
Riboflavin 1.00 NS
Ascorbic acid .000 S
Niacin .000 S
Calcium .021 S
Iron .070 NS
Sodium .295 NS
Potassium 1.00 NS
Moisture .287 NS
Fibre .072 NS
NS= Not significant=T-value>0.05, S= Significant = T-value<0.05
In the sample collected from area-C the carbohydrate, protein, fat,
riboflavin, iron, sodium, potassium moisture and fiber contents were at par
statistically insignificants. However, other values were found statistical
significantly.
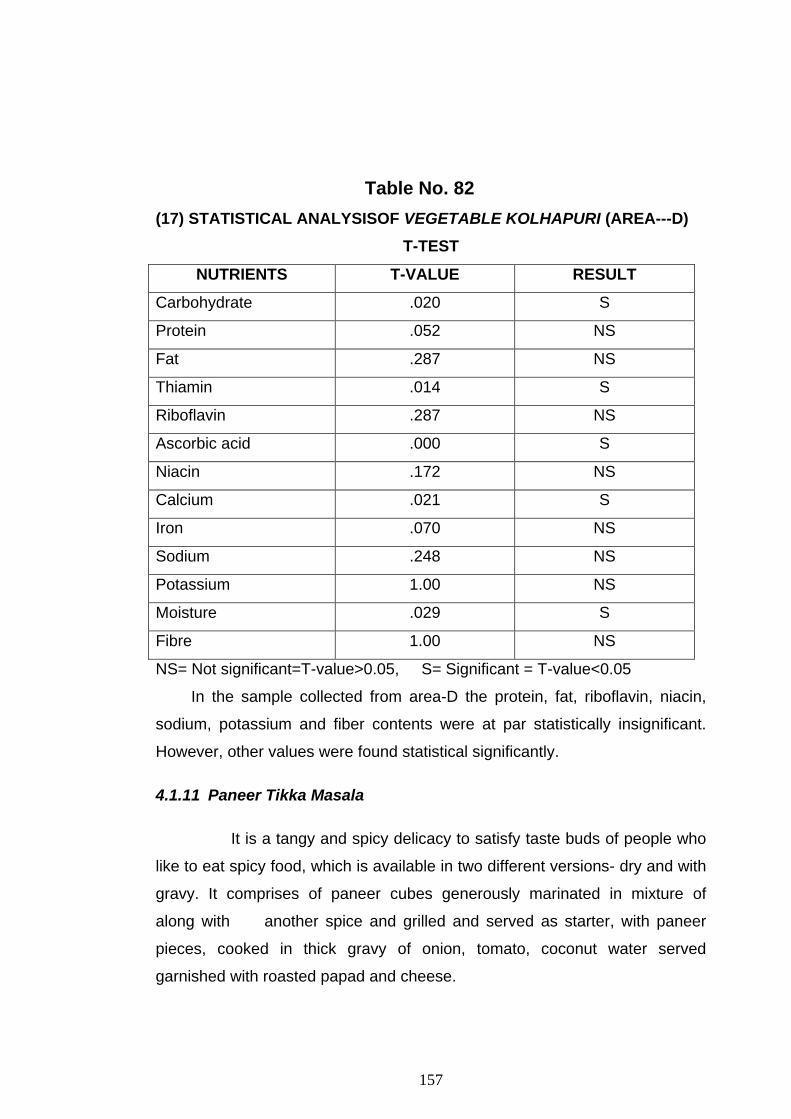
157
Table No. 82
(17) STATISTICAL ANALYSISOF VEGETABLE KOLHAPURI (AREA---D)
T-TEST
NUTRIENTS T-VALUE RESULT
Carbohydrate .020 S
Protein .052 NS
Fat .287 NS
Thiamin .014 S
Riboflavin .287 NS
Ascorbic acid .000 S
Niacin .172 NS
Calcium .021 S
Iron .070 NS
Sodium .248 NS
Potassium 1.00 NS
Moisture .029 S
Fibre 1.00 NS
NS= Not significant=T-value>0.05, S= Significant = T-value<0.05
In the sample collected from area-D the protein, fat, riboflavin, niacin,
sodium, potassium and fiber contents were at par statistically insignificant.
However, other values were found statistical significantly.
4.1.11 Paneer Tikka Masala
It is a tangy and spicy delicacy to satisfy taste buds of people who
like to eat spicy food, which is available in two different versions- dry and with
gravy. It comprises of paneer cubes generously marinated in mixture of
along with another spice and grilled and served as starter, with paneer
pieces, cooked in thick gravy of onion, tomato, coconut water served
garnished with roasted papad and cheese.

158
Table No. 83
Nutritional Value of Paneer Tikka Masala (100) for Macro Nutrients
Nutrients Areas
A B C D Home
made(HM)
Carbohydrate(gm) 3.00 3.90 4.00 4.00 5.00
Protein (gm) 2.80 2.90 3.00 2.90 1.05
Fat (gm) 6.00 5.90 5.00 5.00 7.80
Fibre (gm) 0.01 0.01 0.09 0.09 0.01
Moisture (%) 80.00 81.00 78.0 80.00 80.00
(1) Carbohydrates
Home made sample of paneer tikka masala is compared with vended
paneer tikka with reference to carbohydrates from different area. In different
areas, composition may change because of change in quality that maintains
price level. So, depending upon locality ingredients and quality of food differs.
The recipe of paneer tikka masala is different. As in case of sample (A), (B),
(C), (D), venders use onion, tomato and paneer in less quantity but they use
more water, whereas in home made sample, tomato, onion & paneer are in
much more quantity so that has help to prepare carbohydrates rich food. So
as compared to samples (A), (B), (C) and (D), homemade sample contained
more carbohydrates. Carbohydrates of sample (C) and (D) is more than
sample (A) and (B) because the area from where sample (D) was collected, is
the choice of customers of all classes of the society. That’s why tomato,
onion and paneer were more in sample (D) as compare to rest of the
samples. The area from which sample (A) was taken, customers were mostly
higher-class people and they generally like more gravy than paneer pieces.
(2) Protein
Protein value of homemade sample is very good than any other
samples. Sample (C) had more protein value than (A), (B) and (D) because
customers of that particular area belong to lower class and therefore they
want somewhat Gujarati taste in Punjabi food. So for that vendor use bengal
gram flour to make gravy thicker. The sample (A), (B) and (D) protein value
found lesser which was as per demand of that particular locality.

159
(3) Fat
Like other nutrients fat value of the homemade sample found much
more because it contains more quantity of butter. As compare to other
vended food samples, sample (A) contain more fat because the vendor are
located in the area where higher class customers used to come frequently
and they demand good amount of butter as well as oil.
(4) Fibre
Value of fibers in samples (A), sample (B) and homemade sample is
found to be equal. This is due to use of ginger in gravy. But sample (C) and
(D)’s fiber value is equal but as compare to rest of the three samples, it is
very less.
(5) Moisture
Moisture level of sample (A), (D) and home made food is equal but
value of sample (B) is having 1% moisture content more than any other
samples. In sample (C) contain lesser moisture than any other samples
because bengal gram flour was used in preparation of sample (C).
Table No. 84
Nutritional Value of Paneer Tikka Masala (100gm) for Micro Nutrients
Nutrients Areas
A B C D Home
made(HM)
Thiamine (mg) 0.05 0.03 0.04 0.05 0.15
Riboflavin (mg) 0.20 0.20 0.30 0.3 0.19
Niacin (mg) 0.16 0.15 0.20 0.16 0.01
Ascorbic acid (mg) 0.15 0.09 - - 0.47
Calcium (mg) 25.00 24.00 17.0 20.0 30
Iron (mg) 15.00 13.00 15.0 15.0 16.0
Sodium (mg) 0.08 0.07 0.08 0.08 0.10
Potassium (mg) 14.0 13.00 13.0 13.0 15.00
(6) Thiamine
Thiamine value of home made sample is more than any other food
sample because in this sample, amount of onion is more than any other food
sample. In case of vended food samples, thiamine concentration of sample
(A) and sample (D) is equal. Thiamine value of sample (B) is very less than
any other food samples.

160
(7) Riboflavin
Value of riboflavin is more in sample (C) and sample (D) whereas
riboflavin values of sample (A) and sample (D) are equal, but lesser than
sample (C). Coriander was not used in homemade food sample so; riboflavin
amount was lesser in that as compare to other food products.
(8) Niacin
Niacin concentration is much more in sample (C) than any other
sample as in gravy of that food contained Bengal gram flour. That’s why
value of niacin in other samples was less because other samples do not
contain bengal gram flour was not used is preparation.
(9) Vitamin C
Homemade food sample contains more vitamin C than any other
samples. Sample (C) and sample (D) don’t have vitamin C at all, whereas
food sample (A) and sample (B) have very less amount of vitamin C. Use of
lemon in home made food sample made the sample rich in vitamin C.
(10) Calcium
Homemade food sample contains more calcium concentration as
compare to other food samples because paneer was used in excess amount.
But in sample (A), (B), (C) and (D) use of paneer was limited therefore
calcium is in lesser proportion. Sample (A) and sample (B) has more calcium
than sample (C) and (D). Minimum calcium was found in sample (C) as the
area from which the sample (C) collected was from lower middle class
locality. So, the customers from that locality don’t like paneer taste and could
not afford high price of recipe if paneer were more. Therefore demand of
paneer was very less.
(11) Iron
Concentration of iron in homemade sample, paneer was more than
any other sample. Amount of iron in sample (A), (C) and (D) were found to be
equal but sample (B) contain less iron.
(12) Sodium
Level of sodium in all the food samples, as compare to homemade
sample, was recorded much higher. Usage of tomato was much more in
case of homemade food sample. (A), (C) and (D) were found equal and more

161
than sample (B). So sample (B) had less amount of sodium than other
food sample.
(13) Potassium
Concentration of potassium was more in homemade sample but
sample (B), (C) and (D) contains less amount of potassium than sample (A).
Home made food sample is rich in carbohydrate and fat but is
containing less amount of protein compared to vended food sample.
The nutritional value of home made food sample is rich in thiamine,
ascorbic acid, calcium, iron, sodium and potassium. Sample C&D are
completely lacking ascorbic acid and is present negligible amount in other two
samples.
Table No. 85
(14) STATISTICAL ANALYSIS OF PANEER TIKKA MASALA (AREA---A)
T-TEST
NUTRIENTS T-VALUE RESULT
Carbohydrate . 013 S
Protein .000 S
Fat .038 S
Thiamin .000 S
Riboflavin .137 NS
Ascorbic acid .000 S
Niacin .000 S
Calcium .001 S
Iron .287 NS
Sodium .172 NS
Potassium .133 NS
Moisture .833 NS
Fibre .378 NS
NS= Not significant=T-value>0.05, S= Significant = T-value<0.05

162
In the sample collected from area-A the riboflavin, iron, sodium,
potassium, moisture and fiber contents were at par statistically insignificants.
However, other values were found statistical significantly.
Table No. 86
(15) STATISTICAL ANALYSIS OF PANEER TIKKA MASALA (AREA---B)
T-TEST
NUTRIENTS T-VALUE RESULT
Carbohydrate . 046 S
Protein .000 S
Fat .041 S
Thiamin .000 S
Riboflavin .137 NS
Ascorbic acid .000 S
Niacin .140 NS
Calcium .001 S
Iron .021 S
Sodium .134 NS
Potassium .021 S
Moisture .393 NS
Fibre .378 NS
NS= Not significant=T-value>0.05, S= Significant = T-value<0.05
The paneer tikka masala sample collected from area B were statistically at
par for riboflavin, niacin, sodium, moisture and fibre contents. However, other
values were found statistical significantly.
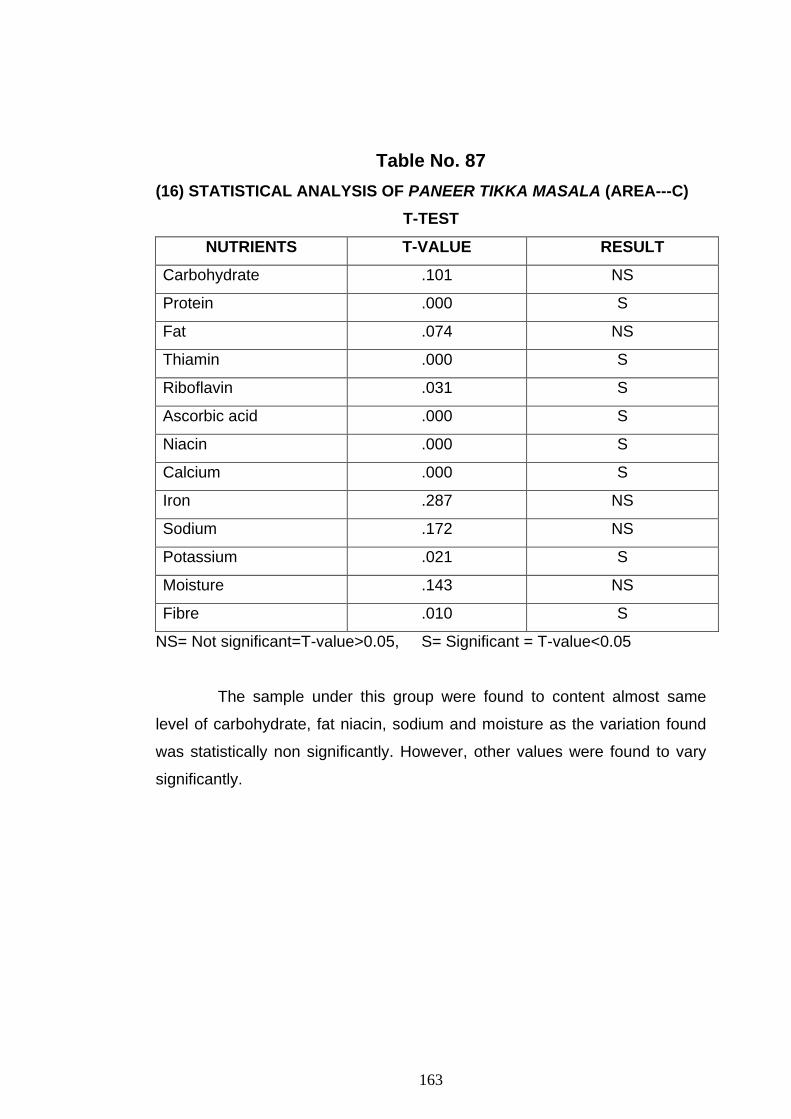
163
Table No. 87
(16) STATISTICAL ANALYSIS OF PANEER TIKKA MASALA (AREA---C)
T-TEST
NUTRIENTS T-VALUE RESULT
Carbohydrate .101 NS
Protein .000 S
Fat .074 NS
Thiamin .000 S
Riboflavin .031 S
Ascorbic acid .000 S
Niacin .000 S
Calcium .000 S
Iron .287 NS
Sodium .172 NS
Potassium .021 S
Moisture .143 NS
Fibre .010 S
NS= Not significant=T-value>0.05, S= Significant = T-value<0.05
The sample under this group were found to content almost same
level of carbohydrate, fat niacin, sodium and moisture as the variation found
was statistically non significantly. However, other values were found to vary
significantly.

164
Table No. 88
(17) STATISTICAL ANALYSIS OF PANEER TIKKA MASALA (AREA---D)
T-TEST
NUTRIENTS T-VALUE RESULT
Carbohydrate .101 NS
Protein .000 S
Fat .079 NS
Thiamin .000 S
Riboflavin .031 S
Ascorbic acid .000 S
Niacin .210 NS
Calcium .000 S
Iron .287 NS
Sodium .177 NS
Potassium .021 S
Moisture .834 NS
Fibre .010 S
NS= Not significant=T-value>0.05, S= Significant = T-value<0.05
The sample under this group were found to content almost same level of
carbohydrate, fat niacin, iron, sodium and moisture as the variation found was
statistically no significantly. However, other values were found to vary
significantly.
4.2 MICROBIAL ANALYSIS
Microbial examination of food gives us information regarding (1) the
quality of raw food (2) The sanitary condition under which food is processed
(3) The effectiveness of its method of preservation.
Food contains a large number of microbial organisms, which enter into
it through the various ways like by ingredients used, handling and
preparation. These microorganisms, which are present in food, if not properly
treated and remain alive/viable, may multiply during course of its storage
time, lapsed between its preparation and its consumption.

165
(1) The microorganisms are generally present as a normal flora on raw
vegetable, which are used in the preparation of food. They may enter
into food if these vegetables / fruits used are improperly washed. The
knife / board used for chopping vegetables is contaminated. The tray
or vessel used for storage of chopped vegetables are not clean or is
contaminated. The water used for washing or the soaking of
vegetables, which get tarnished during the period between its being
chopped and cooked, is contaminated. Many times the time period of
storage of vegetables or gap between its chopping and cooking if more
it also increases the chances of its getting contaminated. The microbial
population present can bloom up there by affecting the nutritional
quality degrading it even before it’s cooked.
(2) The oil, condiments, spices used in cooking of food should be of good
quality, stored nicely in airtight containers. These if contaminated can
also contaminate the food.
(3) The vessels used for storage of vegetable prior to, during and after its
chopping, for purpose of washing chopped food, cooking as well as for
storage after cooking should also be taken into account, any
negligence at these stages will simply add to the overall microbial
count of the cooked food. They’re by affecting its nutritional quality and
making it unsafe for human consumption.
(4) Water – the life is required at each and every stage of preparation of
food, water is inevitable. If water is contaminated or unclean it’s the
main culprit for making the food unsafe for human consumption.
As majority of diseases caused in the human are water borne. They
contribute for as large as 60% of day-to-day ailments in humans.
Majority of these are transmitted from unhealthy unhygienic food.
(5) Handling [Manual]: The improper Manual handling, hygienic practices
are also equally responsible for the contamination of food. The unhygienic
practices are not washing hands before preparation.
- Long and dirty nail filled with dirt.
- Dirt and grim in area where preparation is done.

166
- Wearing dirty clothes; not using duster but hands are swapped on the
clothes every time.
- Sneezing, coughing, smoking, chewing while cooking or preparing of
food.
- Scratching, picking nose, spitting near by area.
Prepared food sample were collected from four different areas as well
as homemade food. All these samples were analyzed both quantitatively and
qualitatively.
The quantitative analysis was done by standard plate count [SPC].
Table No. 89
SPC was preferred over other counting methods
Method Limitations, Advantages
(1) Direct Counting by Petroff Hausser Counting Chamber
Difficult or impossible to distinguish between living and dead cells. It is easy and inexpensive, quick but microbial population must be fairly large.
(2) Direct Electronic counters Not very useful in counting bacteria due to interference by small debris particles.It can’t distinguish between living and dead cells.
(3) Viable count Technique In accurate counts, if sample is not properly diluted or cells are not well dispersed or mixing is not proper. But it is simple, sensitive and widely used for routine study.
SPC method is useful in determining the density of microbial
population in water, milk, food etc. It is also useful to determine number of
specific pathogenic or non-pathogenic bacteria or fungi using selective media.
The researcher had used SPC method to assess the microbial
population present in food and growing them on MacConkey’s Agar plate
isolated the pathogenic organisms if present.
MacConkeys agar plate is used to assess presence of gram –ve
organisms belonging to family entero bactericide [enteric gp] responsible for

167
intestinal disorders in humans. As intestinal are directly correlated with
digestive systems of the humans. This system is responsible for the digestion
of the ingested food, fruits in humans.
4.2.1 Pau Bhaji
Table No. 90
STANDARD PLATE COUNTS IN PAU BHAJI
Food
Sample
pH
TNC CFU / 1ml food sample
Gram staining Randomly Selected Colonies (% Viable count)
Spore Forms
Yeast Cell
Gram -ve rods
Gram +ve Cocci
In bunch In chain
A 4.4 380x102 50 10 120 130 50
B 4.5 300 x102 30 15 100 100 30
C 4.5 305 x102 50 20 80 120 40
D 4.2 290 x102 40 15 100 90 40
HM 4.5 150 x102 10 10 40 20 05
Table No. 91
COLI FORM COUNTS IN PAUBHAJI
Food Sample
TNC CFU / 1ml Food sample
Gram staining Gram –ve Short rod
(Presence %)
A 1 x10² 100
B 2 x10² 100
C 1 x10² 100
D 1 x10² 100
HM - -

Fig. No. 4 comparative No. of CfU's of Paubhaji from different areas and HM
380
300
305
290
150
0
50
100
150
200
250
300
350
400
A B C D HM
Food Sample
TNC
CFU
/ 1m
l fo
od s
ampl
e
Food Sample
168

169
The sample was collected from 4 different places and their microbial
population was assessed and correlated with that of home made food.
Some of these products have low (acidic) pH as compared to home
made food. The number of CFU in vended food sample was much more
almost double as compared to home made food. Therefore by hygienic point
of view the quality of such food is poor can be considered as deteriorated
food product.
As show in Table No. 90 - 91 and Figure No. 4
The number of spore formers present in vended food was very high
almost five times that of home made food. These spore formers generally are
acquired from dust, which is most prevalent in conditions, environment where
these foods are prepared. The spore formers can easily survive in dust, for
longer periods of time and also in adverse environmental conditions like
acidic pH. But when they get suitable environmental conditions, they can
germinate & proliferate.
When these are pathogenic their presence in food is a cause of
concern, they can cause food poisoning.
The number of yeast cells present in vended food is also high
(minimum 50% more) as compared to home made food. Yeast if baker’s
yeast used in preparation of bread then it may not be harmful. But being a
fungus can easily survive and proliferate at low (acidic) pH. Some yeast can
be pathogenic also.
As compared to spore formers and yeast the number of gram negative
rods, was very high. The growth obtained on N-agar is further confirmed by
growing these organisms on MacConkeys Agar medium. As compared to
vended food the number of gram negative bacteria is very less in home made
food. On MacConkeys medium, gram negative bacteria are not found in
home made food, which clearly indicates that home made food is safe for
consumption. Where as vended food shows presence of gram negative CFU

170
on MacConkeys agar medium a clear indication of its being contaminated
with coliform group of microorganisms.
This strongly supports the chances of transmission of intestinal
pathogens and reason for infections (gastro intestinal) on consumption of
such contaminated food.
This type of microorganisms is generally present and they may enter
into food preparation via use of contaminated water during different stages of
food preparation.
These microorganisms (gram negative) can be further confirmed by
growth on selective media. Thus it can help us to know which microbial
organism (specific genus) is present, so that we can ascertain the chances of
type of infection, that can be speeded by such type of contaminated food,
when consumed.
The number of gram positive Cocci present in branch and chain in
vended food is also very high as compared to home made food. They are
generally 4 to 6 times more in vended foods as compared to home made
food.
These organisms are generally a common inhabitant of human skin.
They grow on nasal membranes and skin. As well they are found in gastro
intestinal and urinary tract of warm-blooded animals.
Their presence in food indicates unhygienic conditions and practices
during its preparation as well chances of water, which is used in preparation
being fecal, contaminated.

171
4.2.2 Pani Puri
Table No. 92
STANDARD PLATE COUNTS IN PANIPURI
Food
Sample
pH
TNC CFU / 1ml food sample
Gram staining Randomly Selected Colonies (% Viable count)
Spore Forms
Yeast Cell
Gram -ve rods
Gram +ve Cocci
In bunch In chain
A 3.6 300 x102 10 - 50 25 20
B 3.5 295 x102 09 - 45 20 15
C 3.7 280 x102 08 - 50 22 18
D 3.6 285 x102 10 - 48 24 16
HM 4.8 150 x102 05 - 25 15 05
Table No. 93
COLI FORM COUNTS IN PANIPURI
Food Sample
TNC CFU / 1ml Food sample
Gram staining Gram –ve Short rod
(Presence %)
A 2 x10² 100
B 1 x10² 100
C 2 x10² 100
D 1 x10² 100
HM - -

172

173
The pH of Pani Puri samples, which are collected from 4 different places,
is low (acidic) as compared to home made. The low pH can affect the normal
flora of body and can create an imbalance in normal digestion process of
body.
The number of CFU / 1.0 ml is very high in vended food as compared
to the homemade. The different types of microbial organisms found in it are:
As show in Table No. 92- 93 and Figure No.5
Spore former are organisms which can enter food through dust and dirt
in the environment where food is prepared and served (road side stalls). As
these are highly resistant, their presence in food is a matter of concern for
health.
The number of gram negative organisms present in food is high almost
double of that which is present in home made food. These organisms show
100% viability when grown on MacConkey’s agar medium indicating chances
of presence of infectious coliform group of microorganisms. These coliforms
were not present in homemade food strongly supporting its consumption as
compared to the vended food.
Again the chances of entry of these coliforms into the food are from
use of contaminated water or water from unhealthy places.
The number of gram positive Cocci in bunches or in chain is also
high in vended food as compared to homemade food. Presence of these
microorganisms in food clearly indicates the unhygienic means / practices of
the person who are employed or engaged in the preparation of such foods.
Also the microorganisms can enter through improperly cleaned vessels,
leftover food particles in the corners, orifices of the vessels used for
preparation & storage of such food materials.

174
4.2.3 Bhel
Table No. 94
STANDARD PLATE COUNTS IN BHEL
Food
Sample
pH
TNC CFU / 1ml food sample
Gram staining Randomly Selected Colonies (% Viable count)
Spore Forms
Yeast Cell
Gram -ve rods
Gram +ve Cocci
In bunch In chain
A 5.1 295 x102 15 - 50 15 17
B 5.0 250 x102 10 - 40 20 19
C 4.9 275 x102 12 - 45 25 21
D 4.5 260 x102 15 - 47 22 22
HM 5.9 190 x102 07 - 30 05 05
Table No. 95
COLI FORM COUNTS IN BHEL
Food Sample
TNC CFU / 0.01 ml Food sample
Gram staining Gram –ve Short rod
(Presence %)
A 10 x102 100
B 7 x10² 100
C 5 x10² 100
D 8 x10² 100
HM - -

0
50
100
150
200
250
300
TN
C C
FU
/ 1
ml
foo
d s
amp
le
A B C D HM
Food Sample
Fig. No. 6 Comparative No. of CFU's of Bhel from different areas and HM
Food Sample
175

176
The food samples collected from different places show acidic pH
as compared to home made food. Low or acidic pH clearly indicates this food
is hazardous, unfit for human consumption.
The microbial population in vended food was recorded high as
compared to homemade preparation, clear indication of these foods unsafe /
harmful for consumption when consumed from roadside stalls as compared to
homemade preparation.
As show in Table No. 94 – 95 and Figure No. 6
The number of spore formers was high in vended food, almost double
of what is present in homemade food. The few numbers, which is present in
home made food, may be attributed to the dry, uncooked material, which is
used in this preparation. As some of the food constituents who are used as
such them way they are marketed. But same food from vendors the
population of spore formers doubles.
This may be because of its being contaminated by dust and dirt, a
common place where spores of organisms can survive for long durations.
Thus vended food is contaminated with dust & dirt from roads, where it is
generally available.
Yeast is not present indicating absence of pathogenic or non-
pathogenic fungi.
The number of gram negative rods present is also high in vended food
as compared to home made food.
The organisms when grown on MacConkeys agar medium show 100%
viability in vended food. Where as homemade foods are not showing any of
such contaminants. Thus the vended food is contaminated with viable gram –
ve short rods, which may be pathogenic. The source of contamination can be
water, which is used in preparation of such food.
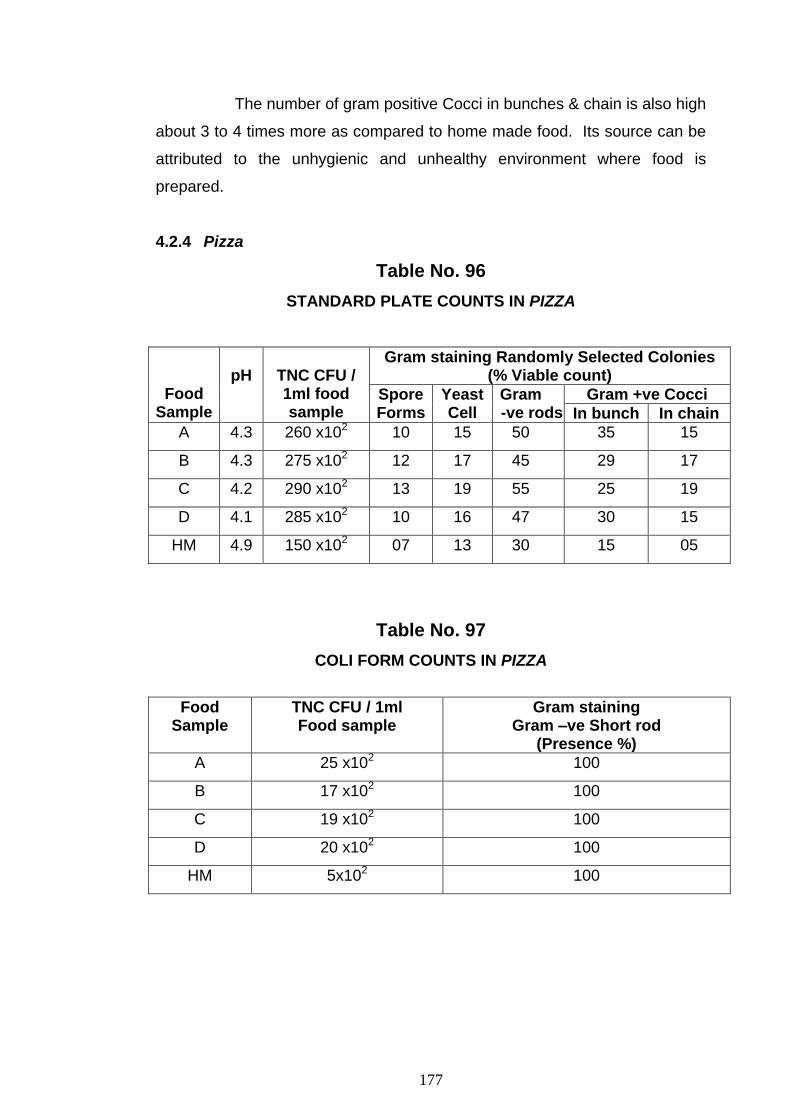
177
The number of gram positive Cocci in bunches & chain is also high
about 3 to 4 times more as compared to home made food. Its source can be
attributed to the unhygienic and unhealthy environment where food is
prepared.
4.2.4 Pizza
Table No. 96
STANDARD PLATE COUNTS IN PIZZA
Food Sample
pH
TNC CFU / 1ml food sample
Gram staining Randomly Selected Colonies (% Viable count)
Spore Forms
Yeast Cell
Gram -ve rods
Gram +ve Cocci
In bunch In chain
A 4.3 260 x102 10 15 50 35 15
B 4.3 275 x102 12 17 45 29 17
C 4.2 290 x102 13 19 55 25 19
D 4.1 285 x102 10 16 47 30 15
HM 4.9 150 x102 07 13 30 15 05
Table No. 97
COLI FORM COUNTS IN PIZZA
Food Sample
TNC CFU / 1ml Food sample
Gram staining Gram –ve Short rod
(Presence %)
A 25 x102 100
B 17 x102 100
C 19 x102 100
D 20 x102 100
HM 5x10² 100

A B C D HM
260275 290 285
150
0
50
100
150
200
250
300
TN
C C
FU
/ 1m
l fo
od
sam
ple
Food Sample
Fig. No. 7 Comparative No. of CFU's of Pizza from different areas and HM
Food Sample
178

179
Microbial analysis of pizza samples collected from 4 different places was
carried out. pH of vended food was very acidic more than that of home made
food.
Here the presence of living microbial organisms was verified almost all
samples as well as home made food shows presence of
They are present as a resistant dormant form. Generally acquired from
air, may be dust, dirt. The basic food material used in pizza bread, if not
stored properly or unhygienic practices are employed in the handling; storing
and its transportation may result in its getting contaminated with these
organisms.
As homemade pizza is also showing presence of these organisms,
improper packaging, storage & place of storage before it’s marketing may be
responsible for entry of these organisms.
As show in Table No. 97 – 96 and Figure No. 7
The vended food spore formers quantity is more than home made, that
may correlate to the improper, unhygienic condition during its preparation and
is adding to overall microbial population. These organisms may also enter via
the salad, dressings, which are made on pizza bread, various other toppings
made.
Presence of yeast cells in all the samples including home made is due
to the use of these organisms in preparatory stage of bread for fermentation
and well as desired sponginess in bread.
If these organisms are not pathogenic their presence may not be a
matter of much concern.
The gram negative rods are a clear indication of presence of coliforms
which is confirmed by their growth on MacConkey’s agar medium, ‘these
generally enter in the food via water which is main cause of its spread.
Unclear, no potable water which is unfit for human consumption is deployed
in preparation of food and is responsible for contamination of such food items
(If further their specificity is checked by growing them on other selective &

180
biochemical media, they do not belong to infectious / pathogenic group,
then it may not be much concern. But if pathogenic contaminants are found,
they are to proliferate with time and such food if left over, simply lead to
increase in overall population & when consumed may result in enteric
disorders.
Gram positive Cocci are found to be in family of Micrococaceae. Not
all members are pathogens, they may be saprophytes also. These organisms
are normally found as an inhabitant of human skin and mucous membrane.
They may get entry into food via unhygienic practices of the persons who are
responsible / involved in the preparation of such foods.
4.2.5 Burger
Table No. 98
STANDARD PLATE COUNTS IN BURGER
Food
Sample
pH
TNC CFU / 1ml food sample
Gram staining Randomly Selected Colonies (% Viable count)
Spore Forms
Yeast Cell
Gram -ve rods
Gram +ve Cocci
In bunch In chain
A 3.9 290 x102 30 08 45 10 20
B 4.1 280 x102 25 09 60 15 18
C 4.0 275 x102 27 10 55 17 19
D 4.1 285 x102 32 09 50 20 20
HM 5.0 125 x102 20 08 35 05 07
Table No. 99
COLI FORM COUNTS IN BURGER
Food Sample
TNC CFU / 101 ml Food sample
Gram staining Gram –ve Short rod
(Presence %)
A 10 x102 100
B 7 x10² 100
C 9 x10² 100
D 10 x102 100
HM 2 x10² 100

Fig. No. 8 Comparative No. of CFU's of Burger from different areas and HM
29
0
28
0
27
5
28
5
12
5
0
50
100
150
200
250
300
350
A B C D HM
Food Sample
TN
C C
FU
/ 1
ml
foo
d s
am
ple
Food Sample
181

182
Sample of burger were collected from 4 different places and they were
analyzed for the presence of quantity and quality of microorganisms in them.
All the samples exhibited less pH as compared to homemade food. The high
acidity of these foods at first glance makes them inappropriate for human
consumption on regular basis.
The microbial population was analyzed, by counting of number of
CFUs which was almost triple in these samples as compared to the home
made food. Such samples if left unattended and consumed after a gap of few
hrs after preparation can be very harmful for health.
As show in Table No. 98 - 99 and Figure No. 8
The number of spore formers is again high in samples but spore
formers are also present in home made food. The presence of spore formers
can be attributed to the presence of raw vegetables, cheese etc. in it. May be
presence of pau, which if not stored properly before use can also be
responsible for gathering them from air dust of the environment, or from the
environment where they are prepared & marketed.
The number of yeast cells present per sample is round about same to
that found in home made samples. This may be due to baker’s yeast used for
fermentation during preparation of pau (bread) used in burger. Further
analysis carried out on selective, biochemical Medias can help us to know if
any pathogenic / infectious yeast is not present.
The number of gram negative short rods present in samples is higher
than those present in home made food. These organisms are further grown
on MacConkeys agar medium, exhibiting 100% viability and sufficiently high
count of CFU’s.
These organisms can be enteric pathogens, which can enter via
contaminated water used for preparation of food at different stages.

183
Presence of gram positive Cocci in bunches & chain is also high in
samples as compared to home made food. It ranges from 3-4 times more
number of organisms. This indicates unhygienic conditions as well as
unhygienic manual practices that may occur during its preparation & handling.
4.2.6 Kacchi Dabeli Bread
Table No. 100
STANDARD PLATE COUNTS IN KACCHI DABELI BREAD
Food
Sample
pH
TNC CFU / 1ml food sample
Gram staining Randomly Selected Colonies (% Viable count)
Spore Forms
Yeast Cell
Gram -ve rods
Gram +ve Cocci
In bunch In chain
A 4.2 310 x102 12 25 42 35 50
B 4.8 295 x102 15 24 40 38 48
C 4.5 300 x102 17 22 45 37 49
D 4.9 315 x102 16 24 48 34 50
HM 5.3 150 x102 07 20 10 15 20
Table No. 101
COLI FORM COUNTS IN KACCHI DABELI BREAD
Food Sample
TNC CFU 1ml Food sample
Gram staining Gram –ve Short rod
(Presence %)
A 50 x102 100
B 55 x102 100
C 58 x102 100
D 57 x102 100
HM 10 x102 100

184

185
It is a type of food, which is quite famous in all age groups as well as it is
cheaper.
When analysis of this food was carried out again pH of vended food
was low as compared to home made food. The microbial analysis showed
presence of large number of CFU in vended food, almost double of what is
present in home made food.
As show in Table No. 100 -101 and Figure No. 9
The number of spore formers was high a clear indication of it’s
contaminated from dust and air, dirt. This type of contamination is found
more in food sold from road stalls found in (rural) area where concrete roads
are not present. Dust & mud is more, because of it chances of contamination
by air borne microorganisms increases.
Yeast is found in almost all of the preparation. As in this food
bread is used. Bakers yeast is used in the preparation of bread to bring about
fermentation. Therefore presence of yeast (if baker’s yeast) is not of much
concern.
But if apart from it any other pathogenic yeast is present, then it
can make food unfit for human consumption.
The gram positive rods present are in vended food quite high in
number as compared to home made food. It is 5 times more in vended food.
When these organisms are further grown on MacConkey’s agar medium it
shows 100% viability. Here gram negative rods are also present in home
made food which is further confirmed by growth on different selective /
biochemical media. It can give us clear picture regarding the organisms
present and its nature (pathogenic or non pathogenic).
But presence of gram positive shorts rods indicates use of
contaminated water in its preparation.

186
Presence of gram positive Cocci in bunch & Cocci in chain is high in
vended food as compared to home made food.
Here as compared to Cocci present in bunches, the number of Cocci in
chain is high. Indicating streptococci may be present which are generally
present in fermented food. Here due to use of bread, presence of
streptococci may be relevant.
Further investigation can help us to ascertain that if they are non
pathogenic, can’t be of a lot concern. Their presence can be considered as
normal.
4.2.7 Chinese Rice
Table No. 102
STANDARD PLATE COUNTS IN CHINESE RICE
Food
Sample
pH
TNC CFU / 1ml food sample
Gram staining Randomly Selected Colonies (% Viable count)
Spore Forms
Yeast Cell
Gram -ve rods
Gram +ve Cocci
In bunch In chain
A 5.0 175 x102 05 - 10 45 28
B 5.1 180 x102 03 - 15 40 30
C 4.9 190 x102 02 - 25 35 32
D 5.1 185 x102 05 - 22 38 29
HM 5.5 70 x102 - - 01 10 08
Table No. 103
COLIFORM COUNTS IN CHINESE RICE
Food Sample
TNC CFU / 1ml Food sample
Gram staining Gram –ve Short rod
(Presence %)
A 5 x10² 100
B 8 x10² 100
C 10 x102 100
D 8 x10² 100
HM - -

175
180
190
185
70
0 20 40 60 80 100 120 140 160 180 200
TNC CFU / 1ml food sample
A
B
C
D
HM
F
o
o
d
S
a
m
p
l
e
Fig. No. 10 Comparative No. of CFU's of Chinese Rice from different areas and HM
Food Sample
187

188
One of typical food product, widely consumed is Chinese rice. The
product if home made has less acidity as compared to vended samples. The
microbial assessment, gives a general idea of different types of microbial
organisms that are present along with their amount.
All the vended samples show as usual a high count of CFU’s as
compared to home made food. At first glance it is not suitable, unsafe for
human consumption. Although they all may not be infectious & / pathogens,
but will contribute to an overall increase in human flora of intestine.
As show in Table No. 102 -103 and Figure No. 10
Spore former in vended food shows presence of spores, a clear
indication of its being contaminated with dust. As this food, method of
preparation involves, partial cooking in advance, which may be hours before it
is actually consumed. This partially cooked food if not properly stored, not
only will get contaminated, but also will serve as a good source or platform for
breeding of these organisms. The spores can germinate as partial cooking
(boiling) may serve as a heat shock helping (by serving as a stimulant) in
germination of otherwise dormant spores. These spores germinate in-
between time, which serves as incubation period may increase in population.
As the remaining process of cooking involves just tossing of partially
cooked food, may not eliminate these organisms, vegetative cells that can
easily withstand temperature of cooking 80-85oC for 5-7 minutes.
Yeast cells is not present, indicating temperature of its storage 30oC or
above not suitable for growth, as pH of partially cooked food may also be
(between 6-7) not suitable for their growth.
Gram negative rods are present in a large numbers in vended food,
again a clear-cut indication of use of unsuitable unsafe or use of non-potable
water in cooking of food.

189
Organisms’ further growth on MacConkey’s agar gives us a proof
of presence of coliforms. Although completed confirmed test for detection of
coliform is not done. But still chances of presence of coliforms can’t be
omitted, as non-potable water is one, which is contaminated with fecal
contaminants.
Gram positive Cocci is present of in large numbers in vended food
almost 3-4 times of what is present in home made food. This gives us a clear
indication of unhygienic practices by manual staff involved in preparation of
food. These unhygienic practices are one of most common reason for
contamination of such food material by these organisms.

190
4.2.8 Chinese Bhel
Table No. 104
STANDARD PLATE COUNTS IN CHINESE BHEL
Food
Sample
pH
TNC CFU / 1ml food sample
Gram staining Randomly Selected Colonies (% Viable count)
Spore Forms
Yeast Cell
Gram -ve rods
Gram +ve Cocci
In bunch In chain
A 4.5 200 x102 07 - 25 40 45
B 4.8 210 x102 10 - 20 38 40
C 4.6 180 x102 09 - 22 37 38
D 4.8 210 x102 10 - 24 34 42
HM 5.0 90 x102 - - 10 12 15
Table No. 105
COLIFORM COUNTS IN CHINESE BHEL
Food Sample
TNC CFU / 1ml Food sample
Gram staining Gram –ve Short rod
(Presence %)
A 15 x102 100
B 17 x102 100
C 18 x102 100
D 17 x102 100
HM 5 x10² 100

200210
180
210
90
0
50
100
150
200
250
TNC
CFU
/ 1m
l foo
d sa
mpl
e
A B C D HM
Fig. No. 11 Comparative No. of CFU's of Chinese Bhel from different areas and HM
Food Sample
191

192
Samples collected from different area of city were analyzed and
correlated with home made sample.
Acidity of vended samples was high (pH low) as compared to home
made. The total number of CFU, viable cells present in these samples was
very high, on an average almost double of that of home made samples. The
presence of viable organisms in itself is not a matter of large concern as not
all microbial organisms are pathogenic majority of this is simply saprophytes.
Saprophytes as such are not harmful, but they may affect alter the chemical
constituents of food. Thereby reducing the nutritive value of food.
As show in Table No. 104 -105 and Figure No. 11
Spore formers in case of homemade food were completely absent as
compared to vended food. These spore formers as mentioned earlier
generally are air borne and enter via dust & dirt which may come in contact
with food during course of its marketing. As a dormant, resistant, they can
easily survive on dry material during its storage and later on act as a culprit in
human body (cause infections).
Presence of gram negative road is a matter of concern, a clear indication
of use of non-potable water. But if not pathogenic, their presence can be
simply ignored.
Yeast is not found in these particular food samples. May be yeast being
a mold, requires dampness, low temperature. As all the ingredients used in
this preparation are dry, therefore stored in dry conditions where temperature
is more than 30oC. So chances of proliferation of molds are very less.
Presence of gram positive cocci is a clear indication of unhygienic
practices during its course of preparation and serving. Although most of them
are saprophytes some potent pathogens also belong to this group and their
presence cannot be completely ignored until and unless confirmed.

193
4.2.9 Mendu Vada
Table No. 106
STANDARD PLATE COUNTS IN MENDU VADA
Food
Sample
pH
TNC CFU / 1ml food sample
Gram staining Randomly Selected Colonies (% Viable count)
Spore Forms
Yeast Cell
Gram -ve rods
Gram +ve Cocci
In bunch In chain
A 4.9 300 x102 15 08 25 40 60
B 4.6 290 x102 17 07 32 42 67
C 4.7 295 x102 18 07 35 44 65
D 4.6 280 x102 17 06 28 41 62
HM 5.1 170 x102 05 - 10 11 15
Table No. 107
COLIFORM COUNTS IN MENDU VADA
Food Sample
TNC CFU / 1ml Food sample
Gram staining Gram –ve Short rod
(Presence %)
A 10 x102 100
B 9 x10² 100
C 15 x102 100
D 25 x102 100
HM 8x10² 100

300290 295
280
170
0
50
100
150
200
250
300
TNC
CFU
/ 1m
l food
sam
ple
A B C D HM
Fig. No. 12 Comparative No. of CFU's of Mendu vada from different areas and
HM
Food Sample
194
195
Samples collected from different parts of city were analyzed for its overall
acidity and microbial counts. The foods available from market were more
acidic as compared to home made food. The more acidic taste is not good
and harmful for human consumption.
The microbial analysis indicates presence of around double number of
CFU’s in these samples as compared to home made food. Again being
fermented food living organisms may be presented in completely prepared
food, if not harmful – does not matter much. But as number of CFU’s in food
samples from different places is high it indicates, its quality either not freshly
prepared dough or may be not properly store, handled in a unhygienic
manner. Again further investigation for absence of any pathogenic or
infectious organisms may help us to know, whether it is fit or unfit for human
consumption.
As show in Table No. 106 - 107 and Figure No. 12
The number of spore formers present in different food samples was
almost 3-4 times of what was in home made food, clear indication of improper
storage during course of preparation and utilization and consumption. As
they can generally gain entry from air, dust where they may be present as
dormant form. But presence of few spore forming organisms in home made
preparation is a matter of concern and the reason & its source of entry into
food needs to be ascertained so that it can be prevented.
Presence of yeast cells in different food samples, and its presence in
homemade food is a clear indication of utilization of commercially available
products for fermentation. Where as in home made food it is allowed to
ferment by itself by help of normal flora which may be present in it.
Presence of gram negative short rods is a matter of concern. Almost all
the samples showed their presence. The quantity was higher in vended
samples compared to homemade food.

196
These organisms were further confirmed by growth on
MacConkeys agar medium. They belong to coliform group. But as all
organisms belonging to this group may not be pathogens. Further
biochemical test and growth on selected media can help us to know exactly
which organism is present. But the chances of this type of contamination,
which is generally passed on by use of water unsafe for drinking, can’t be
ruled out.
Presence of these Cocci in vended sample was 4 times more than in
home made food. The common reason behind it is the unhygienic practices
of manual staff that is responsible for handling of the food during its course of
preparation, storage and distribution.
4.2.10 Masala Dosa
Table No. 108
STANDARD PLATE COUNTS IN MASALA DOSA
Food
Sample
pH
TNC CFU / 1ml food sample
Gram staining Randomly Selected Colonies (% Viable count)
Spore Forms
Yeast Cell
Gram -ve rods
Gram +ve Cocci
In bunch In chain
A 3.8 275 x102 25 05 42 36 50
B 4.1 270 x102 23 10 45 39 45
C 4.1 290 x102 20 08 47 40 49
D 4.5 275 x102 24 06 43 38 48
HM 5.0 90 x102 10 - 25 20 15
Table No. 109
COLIFORM COUNTS IN MASALA DOSA
Food Sample
TNC CFU / 1ml Food sample
Gram staining Gram –ve Short rod
(Presence %)
A 34 x102 100
B 40 x102 100
C 46 x102 100
D 38 x102 100
HM - -

Fig. No. 13 Comparative No. of CFU's of Masala Dosa from different areas
and HM
275
270
290
275
90
0 50 100 150 200 250 300 350
A
B
C
D
HM
F
o
o
d
S
a
m
p
l
e
TNC CFU / 1ml food sampleFood Sample
197

198
Masala Dosa is light in digestion and is one of major food article of
some parts of our country. As such fermentation food products have been
included in our diet as they contain helpful, microorganisms, which are
friendly to our stomach; intestine and they help in digestion.
But many times if food batter is left unattended, it may get
contaminated with other unwanted harmful organisms also, which may not
only affect the nutritional quality of the food, but at the same time affect
digestive system of its consumer.
These food contaminants may enter from surrounding environment,
and then flourish, bloom easily as there is availability of appropriate
environment suitable for their growth.
The overall acidity of food may increase and chances of other
contaminants to flourish. These contaminants may remain as dormant forms
but become activated on decrease in pH of medium.
The number of CFU is almost 4 times higher in vended food as
compared to home made preparation. A clear indication that batter, which is
prepared, is not fresh, as compared to home made batter. The more is time
lapse between its preparation and consumption, more & more bacteria or
other fermenting organisms will be produced. The quantitatively it will be
giving us a very high microbial count.
As show in Table No. 108 - 109 and Figure No.13
The population of spore formers in vended food is high 2 to 2.5 times
more as compared to home made food. This may be an indication of its
being contaminated with dust / dirt or any other air borne organisms.
Yeast cells are completely absent in homemade food, but present in
the entire commercially available food sample. This indicates preparation is
allowed to undergo fermentation with help of marketed available fermenting

199
samples. Where as homemade it is allowed to ferment naturally no
artificial fermenting agent are added.
Presence of gram negative short rods indicate use of improper cleaned
vessels, clean non potable or water unsafe for human consumption during
stages of its preparation & or cooking. All the samples commercially available
show CFU on MacConkeys agar medium as compared to home made food
where they are absent. This may be because of use of clean water, vessels
& prevalence of hygienic condition in environment where it’s prepared i.e.
home.
Presence of gram positive Cocci is again 2-3 times more in food
available from market as compared to home made food, may be because of
unhygienic practices of the persons who ware responsible for preparation of
food.
4.2.11 Vegetable Kolhapuri
Table No. 110
STANDARD PLATE COUNTS IN VEGETABLE KOLHAPURI
Food
Sample
pH
TNC CFU / 1ml food sample
Gram staining Randomly Selected Colonies (% Viable count)
Spore Forms
Yeast Cell
Gram -ve rods
Gram +ve Cocci
In bunch In chain
A 4.7 260 x102 20 02 40 35 38
B 4.6 265 x102 22 05 45 37 40
C 4.8 270 x102 24 04 44 39 41
D 4.5 280 x102 20 02 41 36 43
HM 5.9 130 x102 13 03 15 20 17

200
Table No. 111
COLIFORM COUNT IN VEGETABLE KOLHAPURI
Food Sample
TNC CFU / 1ml Food sample
Gram staining Gram –ve Short rod
(Presence %)
A 70 x102 100
B 60 x102 100
C 65 x102 100
D 67 x102 100
HM 12 x102 100

260
265
270
280
130
0 50 100 150 200 250 300
TNC CFU / 1ml food sample
A
B
C
D
HM
F
o
o
d
S
a
m
p
l
e
Fig. No. 14 Comparative No. of CFU's of Vegetable Kolhapuri from different areas and HM
Food Sample
201

202
The food sample collected from different locations of city showed high
acidity as compared to home made food. A clear indication of more use of
acidic ingredients or use of condiments that add to the overall acidity of
completed food preparation, making it unsuitable, unsafe for consumption on
daily basis. Microbial assessment showed large number of CFU / 1 ml food
sample almost twice of that of food prepared at home. The presence of these
microbial organisms can also help in contribution of more acidic condition in
food. As presence of microbial organisms results in microbial activity utilizing
different substrates and their decomposition. In the end products of
decomposition are acids there by acidity as well microbial population both
increase when there is a time lapse between preparation and consumption of
such food.
As show in Table No. 110 – 111 and Figure No. 14
Spore forming organisms are found in almost all food preparation.
Only difference is number of spore formers are high in samples commercially
available as compared to food prepared at home. It may be contributed to the
air borne pollution, dust, and dirt in vended sample. But to ascertain cause of
presence of such spores in homemade sample is difficult necessary and a
matter of concern. May be improper washing of vegetables used particularly
if they are bought from road side stalls, and are stale & gathered dust which
may have deposited on them & has not been washed during course of
washing. These spore formers can easily withstand high temperature used in
cooking and thereby later on affect the keeping quality of food after its
preparation. Because food if left over after preparation, stored in inappropriate
condition, will only result in germination of spores into vegetative cells, which
affect the nutritional qualities as well as making it unfit for human
consumption.
Presence of yeast cell in all samples as well as home made food is
contributed by the use of curd, cheese, in such type of preparation. As these
are fermented food products having fermentation organisms in them. These
ingredients are generally added at last stages of cooking, or at end of
preparation for purpose of garnishing may contribute to the over all microbial
population in food.

203
Gram negative Rods are again detected in all food samples
collected from different city areas including homemade food. Only difference
is their population in vended samples is almost 2-3 times more as compared
to home made food samples. The organisms are confirmed for presence of
coliforms by growing them on MacConkey’s agar medium. All vended
samples show presence of large number of coliforms as compared to home
made were number is few; presence of 1-2 coliform is also not desirable.
Gram positive Cocci is presence of these in large number particularly
those in chain in vended food are again contributed to the use of curd,
yoghurt, cheese in these foods. Presence of Cocci in bunch is generally due
to unhygienic practices of vendors involved in preparation presence of Cocci
in chain is also found in home made food, but as said earlier its contributed by
use of curd, yoghurt, cheese added at last stages of cooking or garnishing of
food.
4.2.12 Paneer Tikka Masala
Table No. 112
STANDARD PLATE COUNTS IN PANEER TIKKA MASALA
Food
Sample
pH
TNC CFU / 1ml food sample
Gram staining Randomly Selected Colonies (% Viable count)
Spore Forms
Yeast Cell
Gram -ve rods
Gram +ve Cocci
In bunch In chain
A 4.7 300 x102 10 09 50 18 30
B 4.3 300 x102 08 06 55 17 25
C 4.9 290 x102 09 08 50 22 22
D 4.7 280 x102 10 09 62 20 24
HM 5.1 150 x102 03 06 30 10 12

204
Table No. 113
COLIFORM COUNTS IN PANEER TIKKA MASALA
Food Sample
TNC CFU / 1ml Food sample
Gram staining Gram –ve Short rod
( Presence %)
A 155 x102 100
B 65 x102 100
C 60 x102 100
D 62 x102 100
HM 10 x102 100

3
0
0
3
0
0
2
9
0
2
8
01
5
0
0
50
100
150
200
250
300
TN
C C
FU
/ 1m
l fo
od
sam
ple
A B C D HM
Food Sample
Fig. No. 15 Comparative No. of CFU's of Paneer tikka masala from different areas
and HM
Food Sample
205

206
Food samples collected from different parts of city exhibited high acidity
as compared to home made food. The presence of CFU’s is again high in all
the vended food samples as compared to home made. It’s almost double a
matter of concern. Here even home food is showing quite a large number of
CFU’s. But as one of major constituents is cottage cheese a fermented food
product, so presence of living organisms can be attributed to it. Apart from it
use of curd, cheese during preparation can also add to the overall microbial
population in the food.
As show in Table No. 112 – 113 and Figure No. 15
The number of spore formers is high almost two to three times in
vended food as compared to home made sample. Thereby making it
undesirable food for human consumption. The cause of its presence in food
should be ascertained and efforts should be made to prevent their presence
in food.
They are Present in all samples is due to the use of curd, cheese,
yoghurt. These organisms present are in vended food more as compared to
home made food. But the number is not much high as compared to home
made food.
Presence of these organisms itself is a matter of concern. Although
not all of them are pathogenic or infectious. They are further confirmed by
growth on MacConkeys agar medium all vended samples show a high
viability of coliforms. But again if confirmed that they are not pathogenic /
infectious, then further thinking can be done whether such food can be
consumed & if consumed what are their chances of affecting the general
health of the consumers.
These observed in all vended samples. Their quantity is almost
double than that present in home made food giving a clear indication of
unhygienic practices of handlers, person involved in preparation.

207
Presence of Cocci in chain may be due to use of curd & yoghurt,
cheese in these preparations. All being fermented food products, added in
later, last stages or for purpose of garnishing. Therefore may contribute to
overall microbial population load in food.
The reason behind the microbial analysis of food is to prevent spoilage
& the spread of food borne diseases. Food borne diseases are 2 types.
(1) Food Infections: are those in which microbial organisms are present in
food at the time of eating, they grow in host and cause disease.
(2) Food intoxications: are those diseases in which microbial organisms
grow in food, producing a substance therein which is toxic to man and
animals.
Food poisoning is the toxicity introduced into food by microbial
organisms & their products.
People generally do not eat food, which show visible spoilage but
sometimes if the appearance, flavors and tastes are normal they do eat them.
Certain foods may show no sign of spoilage and yet are responsible for food
poisoning. The fact that organisms are present in food does not necessarily
mean they are harmful. Most of the organisms that cause spoilage of food
are harmless saprophytes.
However, there are some forms of illness caused by organisms, which
are growing in foods.
Egs of food intoxications – Staphylococcal food poisoning and botulism
as the ingestion of the toxin causes the diseases symptoms.
Egs of food infection – diseases like Salmonellosis and enteritis
caused by Salmonella sp. and Cl. perfringes as these diseases are caused by
ingestion of organisms.

208
4.3 HYGIENIC PRACTICES
Table No. 114 HYGIENIC AND SANITATION OBSERVATION
OR SANITARY PRACTICES (Pau Bhaji)
Sr. No.
Details No. of Vendor’s (Out of four)
Home made (Only one)
1. Hygienic practices
(a) Wearing clean clothes 1 1
(b) Using apron and hair cap - 1
(c) Washing hands before Preparation
- 1
(d) Nails cut and while sneezing & Coughing
- 1
2. Unhygienic practices
(a) Smoking during work 1 -
(b) Chewing betel 2 -
(c) Spitting near by Scratching/picking nose while work
1 -
Regarding hygienic and sanitation observation one out of four vendors
were wearing clean clothes. None of them used apron or hair cap, washed
hands before preparing food, nails were not clean and cut and they did not
take precautions while coughing and sneezing.
On the contrary they were practicing unhygienic habits like smoking,
chewing tobacco and spitting nearby and picking nose.

209
Table No. 115 HYGIENIC AND SANITATION OBSERVATION
OR SANITARY PRACTICES
(Pani Puri)
Sr. No.
Details No. of Vendor’s (Out of four)
Home made (Only one)
1. Hygienic practices
(a) Wearing clean clothes 1 1
(b) Using apron and hair cap 1 1
(c) Washing hands before Preparation
- 1
(d) Nails cut and while sneezing & Coughing
1 1
2. Unhygienic practices
(a) Smoking during work 1 -
(b) Chewing betel 2 -
(c) Spitting near by 1 -
(d)
Scratching/picking nose While work
1 -
Here only 25% vendors were wearing clean clothes. Using aprons,
their nails were cut and precautions while coughing and sneezing. None of
them had healthy practices of washing hands before preparing food.
Vendors were found practicing one or other unhygienic habit of
either smoking, chewing betel spitting or picking nose during work

210
Table No. 116
HYGIENIC AND SANITATION OBSERVATION OR
SANITARY PRACTICES (Bhel)
Sr. No.
Details No. of Vendor’s (Out of four)
Home made (Only one)
1. Hygienic practices
(a) Wearing clean clothes 1 1
(b) Using apron and hair cap 1 1
(c) Washing hands before Preparation
- 1
(d) Nails cut and while sneezing & Coughing
1 1
2. Unhygienic practices
(a) Smoking during work 1 -
(b) Chewing betel 2 -
(c) Spitting near by 2 -
(d) Scratching/picking nose While work
1 -
As a general rule it was observed that none of the vendors had habit of
washing hands before preparations of food. While 25% of them were wearing
clean clothes or using apron nails cut and taking precautions while coughing
and sneezing during preparations.
Unhygienic practices observed during preparation like chewing tobacco,
smoking, spitting, nose picking.

211
Table No. 117 HYGIENIC AND SANITATION OBSERVATION
OR SANITARY PRACTICES
(Pizza)
Sr. No.
Details No. of Vendor’s (Out of four)
Home made (Only one)
1. Hygienic practices
(a) Wearing clean clothes 1 1
(b) Using apron and hair cap 2 1
(c) Washing hands before Preparation
- 1
(d) Nails cut and while sneezing & Coughing
1 1
2. Unhygienic practices
(a) Smoking during work 1 -
(b) Chewing betel 2 -
(c) Spitting near by 1 -
(d) Scratching/picking nose While work
2 -
Only 25% of vendors were wearing clean clothes with nails cut and
followed healthy practice of taking precautions during coughing, sneezing
50% of them used aprons and hair cap. None of them had habit of washing
hands during preparation.
Chewing tobacco, picking nose was commonly observed and
smoking and spitting in near of food preparing zone.

212
Table No. 118
HYGIENIC AND SANITATION OBSERVATION OR
SANITARY PRACTICES (Burgar)
Sr. No.
Details No. of Vendor’s (Out of four)
Home made (Only one)
1. Hygienic practices
(a) Wearing clean clothes Nil 1
(b) Using apron and hair cap 1 1
(c) Washing hands before Preparation
- 1
(d) Nails cut and while sneezing & Coughing
- 1
2. Unhygienic practices
(a) Smoking during work 1 -
(b) Chewing betel 2 -
(c) Spitting near by 2 -
(d) Scratching/picking nose While work
1 -
As a general rule it was observed that none of the vendors had
habit of washing hands before preparations of food, while 25% of them were
wearing clean clothes or using apron. Nails were not clean and cut and they
did not take precautions while coughing and sneezing.
Chewing tobacco, picking nose was commonly observed and
smoking and spitting in near of food preparing zone.

213
Table No. 119
HYGIENIC AND SANITATION OBSERVATION OR
SANITARY PRACTICES (Kacchi bread)
Sr. No.
Details No. of Vendor’s (Out of four)
Home made (Only one)
1. Hygienic practices
(a) Wearing clean clothes 2 1
(b) Using apron and hair cap 3 1
(c) Washing hands before Preparation
1 1
(d) Nails cut and while sneezing & Coughing
2 1
2. Unhygienic practices
(a) Smoking during work 3 -
(b) Chewing betel 4 -
(c) Spitting near by 2 -
(d) Scratching/picking nose While work
1 -
Only 50% wear clean clothes during preparation while 25% of them
washed hands before preparation. Only 50 % were nails cut and had practice
of taking precaution while sneezing and coughing while majority of them used
apron and hair cap.
Vendors were found practicing one or other unhygienic habit of either
smoking, chewing betel spitting or picking nose during work.

214
Table No. 120
HYGIENIC AND SANITATION OBSERVATION OR
SANITARY PRACTICES (Chinese Rice)
Sr. No.
Details No. of Vendor’s (Out of four)
Home made (Only one)
1. Hygienic practices
(a) Wearing clean clothes 1 1
(b) Using apron and hair cap - 1
(c) Washing hands before Preparation
2 1
(d) Nails cut and while sneezing & Coughing
- 1
2. Unhygienic practices
(a) Smoking during work 2 -
(b) Chewing betel 4 -
(c) Spitting near by 1 -
(d) Scratching/picking nose While work
1 -
Here vendors 25% were wearing clean clothes and 50% of them
washed their hands before food preparation. None of them was using aprons
or hair cap and took precautions while coughing or sneezing during food
preparation.
All the vendors were found chewing betel, some (50%) also smoked
and one -fourth had unhealthy practice of spitting and nose picking during
food preparation.

215
Table No. 121 HYGIENIC AND SANITATION OBSERVATION
OR SANITARY PRACTICES
(Chinese Bhel)
Sr. No.
Details No. of Vendor’s (Out of four)
Home made (Only one)
1. Hygienic practices
(a) Wearing clean clothes 1 1
(b) Using apron and hair cap - 1
(c) Washing hands before Preparation
2 1
(d) Nails cut and while sneezing & Coughing
1 1
2. Unhygienic practices
(a) Smoking during work 4 -
(b) Chewing betel 2 -
(c) Spitting near by - -
(d) Scratching/picking nose While work
1 -
One fourth were wearing clean clothes and had their nails cuts and were
taking precaution during coughing and sneezing. One half had habit of
washing hands before food preparation but none of them were apron or
covered their hair while food preparation.
All vendors were found smoking half of them were also found
chewing betel, picking nose, while none had habit of spitting nearby.

216
Table No. 122
HYGIENIC AND SANITATION OBSERVATION OR
SANITARY PRACTICES (Mendu Vada)
Sr. No.
Details No. of Vendor’s (Out of four)
Home made (Only one)
1. Hygienic practices
(a) Wearing clean clothes 1 1
(b) Using apron and hair cap 1 1
(c) Washing hands before Preparation
1 1
(d) Nails cut and while sneezing & Coughing
1 1
2. Unhygienic practices
(a) Smoking during work 2 -
(b) Chewing betel 3 -
(c) Spitting near by 2 -
(d) Scratching/picking nose While work
1 -
One out of four vendors (only 25% vendors) had the habit of wearing
apron clean clothes had cut nails or washed hands before preparation.
While only 25% had the habit of picking nose while 50% smoked and
spitted nearby and75% were found chewing betel during work.

217
Table No. 123 HYGIENIC AND SANITATION OBSERVATION
OR SANITARY PRACTICES
(Masala Dosa)
Sr. No.
Details No. of Vendor’s (Out of four)
Home made (Only one)
1. Hygienic practices
(a) Wearing clean clothes 2 1
(b) Using apron and hair cap 3 1
(c) Washing hands before Preparation
1 1
(d) Nails cut and while sneezing & Coughing
1 1
2. Unhygienic practices
(a) Smoking during work 2 -
(b) Chewing betel 2 -
(c) Spitting near by 1 -
(d) Scratching/picking nose While work
1 -
Only 50% were clean clothes during preparation while 25% of then
washed hands before preparation and had nails cut and had practice of taking
precaution while seizing and coughing while majority of them used apron and
hair cap.
One out of four vendors had habit of picking nose and spitting near by
while one half of them had habit of smoking and chewing betel during food
preparation.

218
Table No. 124 HYGIENIC AND SANITATION OBSERVATION
OR SANITARY PRACTICES (Vegetable Kolhapuri)
Sr. No.
Details No. of Vendor’s (Out of four)
Home made (Only one)
1. Hygienic practices
(a) Wearing clean clothes 1 1
(b) Using apron and hair cap 1 1
(c) Washing hands before Preparation
- 1
(d) Nails cut and while sneezing & Coughing
1 1
2. Unhygienic practices
(a) Smoking during work 1 -
(b) Chewing betel 2 -
(c) Spitting near by 1 -
(d) Scratching/picking nose While work
1 -
None of the vendors had the habit of washing hands before food
preparation while one of four had habit of wearing apron, clean clothes, keep
nails cut and took precaution during coughing and sneezing.
Only one of four had unhygienic practice of smoking spitting nearby or
picking nose while half of them had practice of chewing betel during work.

219
Table No. 125 HYGIENIC AND SANITATION OBSERVATION
OR SANITARY PRACTICES (Paneer Tikka Masala)
Sr. No.
Details No. of Vendor’s
Out of (4) Home made
Only (1)
1. Hygienic practices
(a) Wearing clean clothes - 1
(b) Using apron and hair cap 2 1
(c) Washing hands before Preparation
- 1
(d) Nails cut and while sneezing & Coughing
- 1
2. Unhygienic practices
(a) Smoking during work 3 -
(b) Chewing betel 4 -
(c) Spitting near by 2 -
(d) Scratching/picking nose While work
2 -
None of vendors were wearing clean clothes or washed hands before
preparation and had nails cut or practiced safe methods during coughing or
sneezing. While one half of them were found wearing aprons.
While all the vendors were found chewing tobacco during the work and
majority of them were found smoking. Half of them had habit of spitting here
and there and picking of nose during work.
The studies have shown that overall microbial count in vended food
samples is high as compared to home made food.
The contaminations of foods are from the natural sources that takes
place before food are harvested or gathered or during handling, processing of
the raw products before they enter in market. This point if responsible for
contamination it is applicable to both vended and home made food.

220
Additional contamination may come from the equipments coming
in contact with food during processing. As a general rule vendors are using
equipments haphazardly without taking care of its cleaning, sanitation before
and after its use. If not properly cleaned and kept as such the number of
microbial organisms present on equipment simply increase and add to the
microbial count of the food, for processing of which its used later.
Contamination of food during handling and processing is of major concern. It
is adds to overall count of microorganisms present in food.
Personnel engaged in food processing, preparation could contaminate
food during handling and processing. Studies by various workers suggest
that human beings shed from 103 to 104 viable organisms per minute. The
numbers and type of organisms shed is closely related to the working
environment.
The role of food handlers in food borne disease outbreaks have been
clearly demonstrated, therefore from public health aspect this source of
contamination has received considerable attention.
The main reasons for contamination of food-by-food handlers are,
(1) Unhygienic environment where food is prepared.
(2) Use of improperly cleaned / sanitized utensils, equipments during the
preparation of food.
(3) Improper care in storage of food during and after its preparation.
(4) Hands and clothing’s of workers can serve as intermediate sources of
contamination.
(5) Unhygienic practices of vendors.
The hygienic practices used at home are far beyond the reach of
vendors. As the environment and the conditions prevailing at both these
places are wide apart.
But still the unhygienic practices of vendors can result in overall
increase of contamination or microbial count of food.

221
The practices like smoking, chewing of tobacco, betel Etc. As
during this type of activities there is a constant movement of lips, and tongue
and talking while doing this work, chances are there that few organisms
present in oral cavity of mouth are released in air and from there they can
settle on food thereby contaminating it.
During sneezing when droplets in form of fluid are released into
environment settle on dust and are dust may later on contaminate food.
Whenever a person sneezes or coughs or spits in that area or in the
near vicinity, there are chances of releasing microorganisms, which may
directly or indirectly settle on food contaminating it.
Directly when vendors or persons involved, sneeze or cough without
taking any precautions like keeping a handkerchief on mouth. The microbial
organisms are directly released from mouth & or nose into the atmosphere
near by.
Indirectly they may cover their nose or mouth while sneezing or
coughing with handkerchief, or their own clothes or with any piece of cloth
available. If they later clean their hands with those clothes, they contaminate
their hands. Many times same cloth is used as a mop, or a cloth for cleaning
of plates, or holding serving spoon etc.
Cleaning their hands with the clothes wore by them also contaminate
them. Many times if nothing is available they use them (wore clothes) for
cleaning the plates also.
Another such problem is excessive sweating of these people. They
are use of same clothes, for cleaning it, or simply draining it of by hands. As
sweat is also a type of body secretion, which comes in contact with skin, it
gets contaminated with normal flora of skin. Many times this may also fall in
food. If there are open wounds, abrasions on skin, it gets contaminated with
the organisms present over there also.

222
One of most prevalent unhygienic practice among vendors is
scratching or pricking of nose. With them having long uncut, unclean nails full
with dirt and grim. Later on when with same hands after washing or without
properly washing or as such used for handling of food. The dirt of nose which
may be present on such washed / unwashed or improperly washed hands
can also result in overall increase in microbial count of food.
Particularly vendors use their hands at many stages of food
preparation for mixing of food, addition of various ingredients, spices by
hands also results in overall increase in microbial population of food.
Use of unclean, dirty clothes for cleaning of hands, mopping the
platform or their area of work or for cleaning the plates it further contaminates
them rather than cleaning and it adds to overall microbial population rather
than reducing it.
If persons are suffering from any contagious disease, their body
secretions like breath or sneeze may contaminate and infect food with
microorganisms. Therefore overall health & personal hygienic of persons
involved in handling of food is of importance & major concern.

223
Chapter – 5
SUMMARY & CONCLUSIONS
5.1 SUMMARY
In the present study, knowledge gained through this study will help
people to understand the importance of food they eat. It will help them in
changing their eating practices and motivate them to eat nutritious and hygienic
foods.
The present study was important for the larger community interest. The
present study was conducted in Rajkot city, which is the largest city of
Saurashtra region. Vendor’s food items are very popular in Rajkot city and
various popular food zones. Main four places were selected, as maximum
public is taking advantage of these lorries. Researcher has selected twelve
recipes from each of the zones and the same food items were also prepared at
home to evaluate nutritional as well hygienic profile. Study was carried out
considering nutritional importance and microbiological assessment and
hygienic assessment of the foods sold by small vendors and home made foods.
The data was collected using chemical methods and observation
methods. Assessment of nutritional quality was done by chemical methods.
Analysis of carbohydrate, protein, fat, fiber, moisture, thiamine, Riboflavin,
Niacin, ascorbic acid, Iron, calcium, sodium, potassium was done.
Microbiological assessment was done by developing colonies on nutrient agar
and MacConkey’s agar and hygienic assessment was done by only observation
methods. All vended food was compared with home made foods.
This study’s results would help the society choosing proper and
qualitative foods. The people of Rajkot city are health conscious and diet
conscious. They will be able to take scientific decision what to eat and what
not to eat, most people like eating small vendor’s foods such foods are
frequently eaten by school or college girls and boys and working women. The

224
counts will thus benefit economically whenever they become health conscious
a number of nutritional deficiencies and food poisoning can be kept at bay.
The bulk of food borne illness is associated with microbiological
contamination of foods. Same time home made food is rich in nutrients and
microorganisms are very less. Most of the people daily eating outside the
home, cannot always afford expensive food from hotels, restaurants. Vended
food is easily available at cheaper rates. This study will be able to find out
nutrients and which microorganisms are present in small vendor’s foods.
Vendor’s food is very cheaper, but does not maintain good health. People will
know about difference between home made food and vendor’s food by this
study. Unhygienic foods items are rich in cholesterol is also identified by this
study.
People are provided with scientific knowledge about food they eat; it will
be of great help to them and scientific knowledge about vended foods, and
making choice of food items.
5.2 CONCLUSION
All the samples, which were collected from different places of Rajkot,
showed low pH, or were highly acidic. There may be two reasons for it.
5.2.1 Pau bhaji
The vended food had low pH and presence of various
microorganisms. Its preparation was found to be done in unhygienic condition.
5.2.2 Panipuri
Water used for panipuri was highly acidic and containing large number
of microorganisms that may act as opportunists and attack the body
when overall defence mechanism of body is weak.
5.2.3 Bhel
Although major constituents are dry but it’s rich in spore forming
microorganisms due to its unhygienic and unhealthy preparation condition.

225
5.2.4 Pizza
Here although presence of certain saprophytes it’s observed which may
Serve as opportunists. Their entry into food via unhygienic preparation
practices can’t be ruled out.
5.2.5 Burger
The presences of enteric pathogens into food make it unsafe for food
consumption. The unhygienic condition and manual practice are responsible for
it.
5.2.6 Kacchi Dabeli Bread
Presence of gram negative organisms in food is a matter of concern. If
they are not pathogenic it can be simply taken for presence, but if pathogenic,
can result in intestinal disorders.
5.2.7 Chinese Rice
Presence of specific organisms indicates its unhygienic storage and manual
practices in its handling. But presence of coliforms is a matter of concern and
should be detected. Whether or not they are serious intestinal pathogens
transmitted non potable water.
5.2.8 Chinese Bhel
Food materials are not stored and prepared hygienically and its responsible
for overall microbial count of food material.
5.2.9 Mendu Vada
Presence of gram negative organisms indicates use of non potable water and
unhygienic practices are responsible for overall microbial count of food sample.
5.2.10 Masala Dosa
Unhygienic preparation of food use of non potable water in all collected
samples is matter of concern and thorough thinking is necessary before
consuming such products from health point of view.
5.2.11 Vegetable Kolhapuri
Use of non potable water during preparation of food harvested
unhygiencally or grown in sewage water responsible for coli forms were present
in all samples, which is great concern.

226
5.2.12 Paneer Tikka Masala
Presence of coli form indicates unhygienic practices of person involved in
food preparation along with use of non potable water.
Use of ingredients like citric acid in food is observed, so as to make them
tangy, in taste. The tangy taste of these foods is main reason for their
consumption. Although this tangy taste savors our taste bud, changes the
taste of our mouth for some time. But all people know that such type of food is
very harmful to us and our digestive system. It increases overall acidity and in
the long term may be a possible reason for the development of ulcers, that
can’t be ruled out. Viruses are also potent pathogens, which may be
transmitted through air, water.
Whenever fermented foods or fermented products are used in any type
of food preparation then chances are there, they may contribute to microbial
population of such food preparation.
Fermentation food products are generally stored in refrigerators at low
temperature, when these organisms can’t proliferate. And in baked
fermentation products also they are destroyed at high temperature of baking.
And these fermented products have a time specified on them, the time period
during which they have to be consumed after their production. But if during
storage appropriate environment is not available, it may serve as a source or
breeding ground for organisms. When such food products are used in
preparation of other food, they contribute to overall microbial population of that
food.
Presence of different types of spherical bacteria in bunches / chains –
cocci in food is an indication of unhygienic practices. The population or
microbial count of such organisms is very less in home made food, clear
indication that hygienic standards are maintained when foods are prepared at
home as compared to restaurants, hotels or at roadside stalls.

227
The maintenance of hygienic conditions, during preparation of food as
well as cleans and dust free environment of home.
Another reason for an overall high microbial count of different food
samples collected from different parts of city. Is that these foods are generally
not freshly prepared. At homes foods are freshly prepared and if left over they
are stored in proper hygienic conditions, temperature. The conditions of storage
generally help in blooming of microorganisms already present, overall microbial
count increase as time lapse after its preparation increases.
By using the above mentioned procedures different nutrients were
analyzed, nutrient content of all the samples was observed from carbohydrate
and proteins were higher in home made sample. Fat is higher in vended food
while water soluble vitamins like vitamins B1, B2, B3, vitamin C and minerals like
calcium, iron and sodium were considerably lower in food samples prepared by
small vendors. This is because small vendors start preparation of foods very
early like cutting of vegetables or they may be practicing reheating very often
so that water-soluble vitamins get destroyed.
Thus it comes in form of a advice that home made food is better than
food available from roadsides in each and every aspect. It is good for health,
nutritious and of course economical on our pocket.
5.3 Suggestions
Several studies have been undertaken to determine the nutritional
content of street foods. To obtain a better profile of the nutritional aspects of
street foods, an additional study may be necessary for different groups of the
population, particularly the children and women. This would assist the
estimation of the percentage of the daily nutrient requirements met from these
sources. Such information could then be used in developing education for the
consumers and also for training of vendors to promote preparation of more
nutritious foods.

228
5.4 Recommendations For Further Study
(1) Assessment of food adulterants that may be in food sold by street
vendors.
(2) Analysis of typical food borne pathogens that may be in particular
food (responsible for various types of food poisoning).
(3) Training of vendors regarding preparation of food and maintenance
of prepared food such that its nutrient value is maintained fit for
consumptions were after 6-8 hrs. of preparation.
(4) A general survey of people who consume at least 4 times vended
food in a week and for type of routine ailments they suffer from.
(5) Nutritional assessment of hot drinks and aerated vended drinks.
(6) Nutritional and hygienic comparison of vended foods with restaurant
and star hotels.

229
BIBLIOGRAHY
1. Aghera B., [2004], Analysis of nutritional composition of Bari made
from cow’s colostrums, presented in seminar, Rajkot.
2. Amirthaveri M. and Lakshmi V., [1994], Assessing the nutrient
content has selected south Indian break fast items, J. of the Indian
nutrition diet, 31, 166-167.
3. Ankleshwaria N. and Karkar P., [2002], Studies formulation of a
database of sodium and potassium content of commonly consumed
traditional Indian fasting snacks, J. of applied nutrition, 27, 33 - 38.
4. Antonia leda and many Yannakoulia, [1996], Greek street food
vending, http:// www. street market.com.street/contect.Docs/c.
5. AOAC, (Association of Official Analytical Chemist) [1970], Official
methods of analysis of AOAC international, (vol-1 & 11) seventeenth
Ed., AOAC international Gaithershury M.D. USA.
6. Archibald T. and Mepherson B., [1986], Food for man from the post to
the future, Awashti associates published, Allahabad.
7. Avashia R. and Dave N., [2004], Microbiological screening of cow’s
raw milk sample from unaseptic and unhygienic source, presented in
seminar, Rajkot.
8. Bagatharia P. and Pandya R., [2004], A brief study on menstruations
cycle, presented in seminar, Rajkot.
9. Bamji S., [1996], Textbook of human nutrition, Oxford & IBH
publishing co pvt. Ltd.
10. Ban Wart J.George, [1987], Basic food microbiology, CBS publishers,
Delhi.
11. Bansal R., [1993], Scoring systerm for evaluating food hygiene of
catering, The J .of Nutrition diet, 31, 8.
12. Bhatt and Waghray, [1994], Street foods in Africa studies conducted
in some of the African countries like Nigreia and Morocco, http://www.
amazon.com.
13. Bhatt and Waghray, [1994 and 1995], Profile of street foods sold in
Asian countries, http:/www. ajon. org/.com.

230
14. Bhatt,[1995],Street foods in latin America,
http://www.nri.org/projects/street foods/com.
15. Carol J. and Merrily F., [1980], Nutrition principles and application in
health promotion, J.B lippinlott company, Philadelphia, London.
16. Chandrasekhar S. and Kowsaly C., [2003], Proximate composition
microbial and chemical contamination of street vended foods versus
homemade and restaurant foods from Kochi, Kerala, J. food science
technol., 40, 58-62.
17. Dave P., [2004], Microbial study of chutney - A fast food component
and its sources of contamination, The paper presented in seminar
Rajkot.
18. Dave N. And Joshi H. (20040, A study on nutritional composition and
sensory evaluation of modified dhokala, presented in conference
Anand.
19. Fennedy R. and Harda C., [1996], Examination of the impact of
women’s and social well. Being of the family, www.pjbs.org/pjinon
line/fin/com.
20. Frazier W. and Weshoff D., [1983], Food Microbiology, Tata,
Macgraw-Hill Publishing Company Limited, New Delhi.
21. George H., [1966], Nutrition brace, Academic press Inc Ltd, London.
22. Geriya B., [2004], A study on acceptability of idli on addition of
soybean presented in seminar, Rajkot.
23. Gill H. K, [1993], Health and disease, Ashish publishing, Delhi.
24. Gopalan C.and Sastri R., [1995], Nutritive value of Indian foods, NIN
and ICMR, Hyderabad.
25. Goswami T. and Mehta S., [2006], Assessment of nutritional
composition and sensory evaluation of enriched fermented food
derived from goat’s milk egg white and pulses. Presented in
conference, Anand.
26. Goyle A. and Dugar N., [1994], Quality evaluation of three-canteen
snacks nutritive fat and bacteriological, J. of Indian food packer, 31,
166-167.
27. Grawal J.and Tiwari R., [1989], Microbiological quality of rasmalai, J.
food science technol, 27, 178-179.

231
28. Guha A.and Das H., [1994], Microorganisms in ice creams and their
public health significance, J. food technol, 16, 161-163.
29. Gunasekaran G., [1987], Laboratory manual in microbiology, CRC
publishing. Florida.
30. Gupta S., [2004], Fundamentals of statistics, Himalaya publishing
house, Delhi.
31. Gupta P., [1996], Diet nutrition & life style, RBSA publishers, Jaipur.
32. Gupta R.,and Mann B., [2000], Microbiological chemical and
untrastructural charachetistics of mishti doi, J. food science technol.,
57, 54.
33. Haddad, [1993], Urban house hold food security and nutrition,
www.doh.gov.za/ com.
34. Harold M. D., [1970], You and your health, Pacific press publishing,
U.S.A, [vol. 1, 2, 3].
35. Harris D. and, Horman B. [1972], Flavor changes in reheated
chicken, J. food technol., 37, 72 79-21.
36. Hasior D. and Horman B., [1967], Personal home and community
health, The Mc Millan Company, London.
37. Helaen A, [1989], Introductory nutrition, Mushy college publishing,
New york.
38. Hoda S. Ahmed and Srivastava P., [2002], Effect of microwave oven
processing hot air over cooking curing and phosphate treatment on
physico chemical sensory and textural characteristics of buffalo meat
products, J. of foods technol, 39, 240-245.
39. Israni R. and Mankar S., [1973], Microbiological studies on gulab
jamun, Indian food packer, 18-19.
40. Ito k. and Chen K., [1978], Effect of pH on the growth of clostridium
botulinam in canned food, J. food science techno. , 43, 16 -21.
41. Jackson N., [1973], Soil chemical analysis, Prentice hall of India pvt.
Ltd., New Delhi.
42. John E. pushing and D., [1992], Green basic of food science, http://
www.street/ tgreb.com.
43. John M., [1975], Success in nutrition, John M. publishers, London.

232
44. John T. Nickerson, [1974], Microbiology of food and food processing,
American Elsevier publishing company, New York.
45. Joshi H. and Dave N., [2004], A study on nutritional composition of
commercially avllable breads, presented in conference, Anand.
46. Kakar D. and Udipi S., [1998], Microbiological quality of fried ready to
eat food sold in Mumbai city, J. food science technol., 35, 335-335.
47. Kamalama G., [1996], Health and nutritional status in India, APH
Publishing Corporation, New Delhi.
48. Kamaliya K., [2006], Remas optimization bread formula and its
nutritional evaluation, presented in conference, Anand.
49. Kamat M. and Syllable G., [1973], Microbiological quality of pedha,
Indian food packer, 50-51.
50. Kamdar H., [2004], Effects of ragi levels on acceptability of sukhadi
presented in seminar, Rajkot.
51. Kannappan S. and Varma B., [2003], Bacterial profile of fast foods of
Mysore region and their inhibitory pattern by Pediococcus pentosace
our NCIM 2292, J. food science technol., 40, 443 - 445.
52. Kaul M. and Mahajan N., [2002], A bacteriological study of
milkshakes and packed flavoured milks sold by shops in Chandigarh,
The ind. J. nutrition diet, 41,174.
53. Kinder F., [1956]. Meal management, the Macmillan Company, New
Delhi and Brett Macmillan Ltd, New York.
54. Kowsalya S. and Shymy P., [2005], Microbial contamination and
adulteration of selected beverages of malappuram district Kerala, The
Ind J. nutrition. Diet, 42, 492.
55. Krishnaswamy M. and Parthasarathy N., [1973], Further studies on
microbiological qualities of cashew nut, J. Food science technol., 10,
1-5.
56. Kumari S. and Prasad D., [2001], Microbiological quality of fish rohu
marketed in Patna and its public health significance, J. food science
technol., 38, 6-7
57. lowe B., [1955], Experimental cookery, John Elley and Sons Inc. New
York.

233
58. Manay S., [1996], Food facts and principles, New age International
publisher, Delhi.
59. Manja K.and Sankaran R., [1994], Methods for determining bacterial
population in foods and food products, J. food science technolo, 31,
1-2
60. Marriott G., [1985], Principles of food sanitation, published by Van N.
Ostrand Reinhold Company, New york.
61. Mehta P. (2004), Nutritional Analysis of different cake and unsorted
cake, presented in conference, Rajkot.
62. Mubeen S. and Sarkara R., [2006], A study on nutritional composition
of the titrable acidity and pH of yoghurt, Presented in conference,
Anand.
63. Pal N. and Sarka S., [2005], Statistics concept and applications,
prentice Hall of India Private limited, New Delhi.
64. Nakum V. and Gohel J., [2004], A study on nutritional composition
and sensory evaluation of modified “maisuri vada “presented in
seminar.
65. Nansal N. and Madhu K., [2003], A Bacteriological study of the
hygiene maintained in school canters of Chandigarh with special
reference to E. coil, The ind J. nutrition diet, 41, 352.
66. Pandya R. and Bagathariya P., [2004], A study on fast food habit in
younger generation, presented in seminar, Rajkot.
67. Park K., [1994], Preventive and social medicine, Banarsidas Bhanot
publishers, Jabalpur.
68. Peckhan G. and Jeanne H. Freeland – Graves, [1979], Foundations
of feed preparation, Macmillan Publishing Co., New York.
69. Potter N. and Josheph H., [1975], Food science, CBS publishers and
distributors, New delhi.
70. Powar C.B, [1994], General microbiologi, 1, Daginawala H.F hillialaya
publishing house, New Delhi.
71. Pradhan D. and Chetty K., [1978], Recent advances in microbial
analysis of foods, Indian food packer, 39- 46.
72. Rao V. and Bhagirath B., [1978], Incidence of drug resistant coliforms
in some ready to serve foods, J. food science technol., 15, 201 –204.

234
73. Rao V., [1979], Microbial studies on inpack processed chapattis, J.
food science technol., 16, 61-63.
74. Rathod G. and Rupapara R., [2004], A study on nutrition composition
of synthetic fruit juice powder, presented in seminar, Rajkot.
75. Raval S. and Parmar N. [2004], A study on nutritional composition
commercially available baby food, presented in seminar, Rajkot.
76. Reddy B. and Buusan Y., [1994], Bacteriological quality of ice cream
marketed in Tirupati a pilgrimage town of India, J. food science
technology, 31, 51-152.
77. Rajlakshmi R., [1974], Applied nutrition, University Oxford and IBH
Publishing, New Delhi.
78. Richard J. B. Willis, [1994], Your health in your hands, The Stan
borough press ltd, New York.
79. Rodert cruickshank, [1973], Medical microbiology-infection and
immunity, Longman group limited, Newyork.
80. Rosenberg and Trotler, [1993], street food vending,
http://www.youtube.com.
81. Rupapara R. and Rathod G., [2004], A study on nutritional analysis of
commercially available shorter cake, Presented in seminar, Rajkot,
82. Ruth M. Griswold, [1962], The Experimental study of foods, U.S.A.
83. Sabarwala B., [1994], Health physiology and anatomy,
Commonwealth publishers, Delhi.
84. Sabarwala B., [1999], Community nutrition and health. Ajay Varma
common wealth publisher, New Delhi.
85. Sabarwala B., [1999], Health and nutritional care, Commonwealth
publishers, Delhi.
86. Sabarwala B., [1999], Nutrition and health promotion, Commonwealth
health publishers, New Delhi.
87. Sabarwala B., [19991], Health Physiology and anatomy,
Commonwealth publishers, New Delhi.
88. Sadashivam S. and Manickam, [1991], Biochemical methods for
agricultural sciences, Wiley Eastern Ltd., New Delhi.
89. Salle A., [1992], Fundamental Principles of Bacteriology, Tata Mc
graw Hill Publishing Company. Ltd., New Delhi.

235
90. Sarada M. and Bagum J., [1991], The microbiological quality of ice
creams sold in Bangalore city, J. food science technol., vol. 28 no. 5
317 –318.
91. Sathisbabu H. and Rati E., [2003], Prevalence of Yersinia
enterocolitiea in panipuri street food, India J. food science technol.,
40, 303-305.
92. Shah B. and Vasavada R., [2004], Nutritional analysis and sensory
evaluation of fermented modified uttapam, presented in conference in
Rajkot.
93. Sharma D. and Joshi D., [1991], Bacteriological quality of milk
products with special reference to salmonella and its public health
significance, J. food science technol., 29 , 105 –107.
94. Shehnaz A., [1975], Theophilus effect of insect infestation of the
chemical composition and nutritive value of Bengal gram, J. Food
science technol., 12, 300-302.
95. Shukla, P. [1982], Nutritional problems of India, Prentice Hall of India
Private Lmited, New Delhi.
96. Siddika A., [2006], Studies on microbial qualities of permeated
yoghurt drinks manufactured from skim milk by adding different types
of flavors and levels of sugars, presented in seminar, Anand.
97. Singh D. and Narayan K., [1994], Effect of hydrogen in concentration
and sucrose on exterotoxin production by Bacillus cereus, J. Food
science technol., 31, 338-339.
98. Srilakshmi B., [2001], Food science, New age International [P]
Limited, New Delhi.
99. Srilakshmi B., [2002], Nutrition science, New age International [P]
Limited, Chennai.
100. Swaminathan M. [1984], Handbook of food and nutrition, Bappco
publication, Mysor.
101. Swaminathan M., [1985], Essentials of food and nutrition, volume I &
II, The Bangalore Printing and Publishing Co. Ltd., Bangalore.
102. Tamhane D., [1978], Microbial contamination and control, Indian food
packer, 47-50.

236
103. Taylor and co-workers, [1996], Street foods in America,
http://www.foodproduct/ sing.com.
104. Trivedi H. and Vyas C., [2004], Air microbes among kitchen area of
ladies hostel at Rajkot city, presented in seminar, Rajkot.
105. Trustier N., [1991] Street food vending, http://praticaltion.org.
/docs/com.
106. Uddin M. and Mein U., [2001], Bacteriological changes of India shad
during ice storage, J. food science technol., 380, 639-642.
107. Vaid B. and Dave N., [2006], Nutrient profile of handwa cooked by
conventional microwave and solar cooking, presented in conference,
Anand.
108. Varadaraj M.and Keshava,N. [1992], Occurrence of bacillus cereus
and other bacillus species in Indian snack and lunch foods and their
ability to grow in a rice preparation, J. food nutrition technol., 29.344 –
346.
109. Vasavada K. and Dave P., [2006], Effect of different ingredient on
nutritive value and acceptability of dhokala, presented in conference,
Anand.
110. Vyas B. and Joshi K., [2004], A small screening of microbial
population in jam and tomato catsup sold at local departmental
stores, presented in seminar, Rajkot.
111. www.doh.gov.2a/com/department of food control/streetfood.)
112. All missing References is collected from (1994, 1995 and 1996),
http:/www:nri.arg/project/ Street foods/com.

244
ENGLISH VERSION OF QUESTIONNAIRE
Daxa G. Solanki
Smt. S. B. Gardi Institute of Home Science, Saurashtra University, RAJKOT.
Dear Madam, Ingredients and weight of your homemade food is important for my research work. So pleases provide me following information.
(1) NAME: _______________ (2) Number of Family Members: _____________________ (3) Monthly Income of family:
More then 15,000 More then10, 000 More then 8,000 INFORMATION AND INGREDIENTS OF HOMEMADE RECIPES
1. Weight of ingredients for paubhaji, for how many persons? ______ Potato ________ gm/kg. Tomato ________ gm/kg. Onion ________gm/kg.
Cabbage ________gm/kg. CauliFlower ________gm/kg. Beans ________gm/kg. Brinjal ________gm/kg. Gourd ________gm/kg.
Oil ________gm/kg. Butter ________gm/kg. Garlic ________gm/kg. Lemon ________gm/kg. Spices ________gm/kg. water ________gm/kg. Refined wheat flour________gm/kg.

245
2. Weight of ingredients for panipuri, for how many persons? ______ Wheat flour (refined) _______gm/kg. Rava _______gm/kg. Bengal gram _______gm/kg. Potato _______gm/kg. Puddina _______gm/kg. Coriander _______gm/kg. Date _______gm/kg. Oil _______gm/kg. Onion _______gm/kg. Lemone _______gm/kg. Jaggery _______gm/kg. Tamarind pulp _______gm/kg. Spice _______gm/kg. Water _______gm/kg. 3. Weight of ingredients for Bhel, for how many persons? ______ Puffed Rice _______gm/kg. Potato _______gm/kg. Tomato _______gm/kg. Onion _______gm/kg. Bengal gram (whole) _______gm/kg. Wheat flour (refined) _______gm/kg. Green chilly _______gm/kg. Coriander _______gm/kg. Date _______gm/kg. Tamarind pulp _______gm/kg. Pomegranate ______ _gm/kg. Sev _______gm/kg. Spice _______gm/kg. Water _______gm/kg. 4. Weight of ingredients for Pizza, for how many persons? ______ Wheat flour (refined) ________gm/kg. Chees ________gm/kg. Tomato ________gm/kg Onion ________gm/kg. Potato ________gm/kg. Cabbage ________gm/kg. Butter ________gm/kg. Spice ________gm/kg. Water ________gm/kg. Oil ________gm/kg.

246
5. Weight of ingredients for Burger, for how many persons? ______ Wheat flour (refined) _______gm/kg. Potato _______gm/kg. Onion _______gm/kg. Tomato _______gm/kg. Green chill _______gm/kg. Cheese _______gm/kg. Butter _______gm/kg. Water _______gm/kg. Spice _______gm/kg. 6. Weight of ingredients for Kacchi Bread, for how many persons? ______ Wheat flour (refined) _______gm/kg. Potato _______gm/kg. Onion _______gm/kg. Groundnuts _______gm/kg. Bengal Gram dal _______gm/kg. Sev _______gm/kg. Green chill _______gm/kg. Tomato _______gm/kg. Tamarind pulp _______gm/kg. Pomegranate _______gm/kg. Lemon _______gm/kg. Date _______gm/kg. Garlic _______gm/kg. Water _______gm/kg. Spice _______gm/kg. 7. Weight of ingredients for Chinese Rice, for how many persons? ______
Rice _______gm/kg.
French Beans _______gm/kg. Cabbage _______gm/kg. Onion _______gm/kg. Cheese _______gm/kg. Spice _______gm/kg. Water _______gm/kg. Sauces ______gm/kg.

247
8. Weight of ingredients for Chinese Bhel, for how many persons? ______ Noodles ______gm/kg.
Groundnuts ______gm/kg. Cabbage ______gm/kg. Corn Flour ______gm/kg. Tomato ______gm/kg. Onion ______gm/kg. Cheese ______gm/kg. Spice ______gm/kg. Sauce ______gm/kg. Water ______gm/kg. 9. Weight of ingredients for Mendu vada, for how many persons? ______ Black gram dal ______gm/kg. Oil ______gm/kg. Green gram dal ______gm/kg. Onion ______gm/kg. Tomato ______gm/kg. Potato ______gm/kg. Spice ______gm/kg. Water ______gm/kg. 10. Weight of ingredients for Masala Dosa, for how many persons? ______ Black gram dal ______gm/kg. Rice ______gm/kg. Oil ______gm/kg. Potato ______gm/kg. Onion ______gm/kg. Tomato ______gm/kg. Green gram dal ______gm/kg. Spice ______gm/kg. Water ______gm/kg. 11. Weight of ingredients for Vegetable Kolhapuri, for how many persons?
_______ Tomato ______gm/kg. Onion ______gm/kg. Oil ______gm/kg. Cheese ______gm/kg. Cabbage ______gm/kg. Butter ______gm/kg. Cauli Flower ______gm/kg. French beans ______gm/kg. Coriander leaves ______gm/kg. Capsicum ______gm/kg. Spice ______gm/kg. Water ______gm/kg.

248
12. Weight of ingredients for Panner Tikka Masala, for how many persons? ______
Paneer ______gm/kg.
Tomato ______gm/kg. Onion ______gm/kg. Coriander ______gm/kg. Cheese ______gm/kg. Spice ______gm/kg. Water ______gm/kg. Oil ______gm/kg. THANK YOU