Dietary Supplements: Policy, Science and the DoD - Health.mil
Upload
independentCategory
view
0download
0
doi: 10.1152/japplphysiol.00249.200293:990-999, 2002. First published 31 May 2002;J Appl Physiol
Hawley and Louise M. BurkeBruce, Theodore A. Macrides, David T. Martin, Angela Moquin, Alan Roberts, John A. Gregory R. Cox, Ben Desbrow, Paul G. Montgomery, Megan E. Anderson, Clinton R.metabolism and endurance performanceEffect of different protocols of caffeine intake on
You might find this additional info useful...
29 articles, 13 of which you can access for free at: This article citeshttp://jap.physiology.org/content/93/3/990.full#ref-list-1
5 other HighWire-hosted articles: This article has been cited by http://jap.physiology.org/content/93/3/990#cited-by
including high resolution figures, can be found at: Updated information and serviceshttp://jap.physiology.org/content/93/3/990.full
can be found at: Journal of Applied Physiology about Additional material and informationhttp://www.the-aps.org/publications/jappl
This information is current as of June 5, 2013.
http://www.the-aps.org/. 2002 the American Physiological Society. ISSN: 8750-7587, ESSN: 1522-1601. Visit our website at(monthly) by the American Physiological Society, 9650 Rockville Pike, Bethesda MD 20814-3991. Copyright ©
yearphysiology, especially those papers emphasizing adaptive and integrative mechanisms. It is published 12 times a publishes original papers that deal with diverse area of research in appliedJournal of Applied Physiology
by guest on June 5, 2013http://jap.physiology.org/
Dow
nloaded from
Effect of different protocols of caffeine intakeon metabolism and endurance performance
GREGORY R. COX,1 BEN DESBROW,1 PAUL G. MONTGOMERY,2 MEGAN E. ANDERSON,1
CLINTON R. BRUCE,3 THEODORE A. MACRIDES,4 DAVID T. MARTIN,1 ANGELA MOQUIN,1
ALAN ROBERTS,2 JOHN A. HAWLEY,3 AND LOUISE M. BURKE1
1Sports Science and Sports Medicine, Australian Institute of Sport, Belconnen, Australian CapitalTerritory 2616; 2Centre for Sports Studies, University of Canberra, Bruce, Australian CapitalTerritory 2617; 3Exercise Metabolism Group, School of Medical Sciences, RMIT University,Bundoora, Victoria 3083; and 4Natural Products Unit, Department of MedicalLaboratory Science, RMIT University, Melbourne, Victoria 3001, AustraliaReceived 25 March 2002; accepted in final form 24 May 2002
Cox, Gregory R., Ben Desbrow, Paul G. Montgomery,Megan E. Anderson, Clinton R. Bruce, Theodore A.Macrides, David T. Martin, Angela Moquin, Alan Rob-erts, John A. Hawley, and Louise M. Burke. Effect ofdifferent protocols of caffeine intake on metabolism and en-durance performance. J Appl Physiol 93: 990–999, 2002.First published May 31, 2002; 10.1152/japplphysiol.00249.2002.—Competitive athletes completed two studies of 2-hsteady-state (SS) cycling at 70% peak O2 uptake followed by7 kJ/kg time trial (TT) with carbohydrate (CHO) intakebefore (2 g/kg) and during (6% CHO drink) exercise. In StudyA, 12 subjects received either 6 mg/kg caffeine 1 h preexercise(Precaf), 6 � 1 mg/kg caffeine every 20 min throughout SS(Durcaf), 2 � 5 ml/kg Coca-Cola between 100 and 120 min SSand during TT (Coke), or placebo. Improvements in TT wereas follows: Precaf, 3.4% (0.2–6.5%, 95% confidence interval);Durcaf, 3.1% (�0.1–6.5%); and Coke, 3.1% (�0.2–6.2%). InStudy B, eight subjects received 3 � 5 ml/kg of different coladrinks during the last 40 min of SS and TT: decaffeinated, 6%CHO (control); caffeinated, 6% CHO; decaffeinated, 11%CHO; and caffeinated, 11% CHO (Coke). Coke enhanced TTby 3.3% (0.8–5.9%), with all trials showing 2.2% TT enhance-ment (0.5–3.8%; P � 0.05) due to caffeine. Overall, 1) 6 mg/kgcaffeine enhanced TT performance independent of timing ofintake and 2) replacing sports drink with Coca-Cola duringthe latter stages of exercise was equally effective in enhanc-ing endurance performance, primarily due to low intake ofcaffeine (�1.5 mg/kg).
carbohydrate; ergogenic aids; cola drink
MANY STUDIES HAVE REPORTED an enhancement of pro-longed, submaximal exercise after caffeine ingestion(2, 7, 9, 10, 14–16, 19, 22, 23, 27, 29). The mecha-nism(s) proposed to explain these benefits includes anincreased utilization of plasma free fatty acids (FFA)(27) and/or intramuscular triacylglycerol (10), whichacts to reduce the rate of muscle glycogenolysis (10,27), as well as favorable changes in central nervous
system (CNS) cues (6) and/or neuromuscular function(21, 32).
In the majority of these studies (7, 9, 10, 14–16, 23,27, 29), the “performance” protocol used was a test ofexercise “capacity” (i.e., the time to exhaustion at afixed submaximal power output). Furthermore, insome of these studies (7, 9, 10, 19), subjects exercisedafter an overnight fast and usually with the intake ofwater (or no fluid) during the exercise task. Such con-ditions fail to simulate the nature of a sporting eventand to represent the ideal nutritional preparation forendurance exercise (1). One recent study that simu-lated the conditions of real-life athletic competitionreported enhancement of performance of a 1-h cyclingtime trial (TT) when caffeine was ingested in conjunc-tion with a carbohydrate (CHO)-electrolyte drink (22).In that study, caffeine was ingested before and duringthe TT, in contrast to the typical research protocols inwhich a single dose of caffeine is ingested 60 min beforean exercise task (7, 9, 14–16, 23, 27, 29).
Caffeine intake during sporting events has becomemore popular and practical since the advent of special-ized foods such as sports gels that contain both CHOand caffeine. We have also observed a widespreadpractice in endurance sports in which competitorsdrink defizzed Coca-Cola during the latter stages of anevent, in replacement of their earlier use of a CHO-electrolyte drink. Testimonials from athletes indicatethat they believe that the intake of Coca-Cola late inthe event provides an ergogenic benefit due to theintake of caffeine (D. T. Martin, unpublished observa-tions), despite the caffeine concentration in cola drinks(�65 mg per typical 500-ml serving) being substan-tially less than the caffeine doses associated with er-gogenic benefits in laboratory research protocols [4–9mg/kg body mass (BM); �280–630 mg].
Address for reprint requests and other correspondence: L. M.Burke, Dept. of Sports Nutrition, P. O. Box 176, Belconnen ACT2616, Australia (E-mail: [email protected]).
The costs of publication of this article were defrayed in part by thepayment of page charges. The article must therefore be herebymarked ‘‘advertisement’’ in accordance with 18 U.S.C. Section 1734solely to indicate this fact.
J Appl Physiol 93: 990–999, 2002.First published May 31, 2002; 10.1152/japplphysiol.00249.2002.
8750-7587/02 $5.00 Copyright © 2002 the American Physiological Society http://www.jap.org990
by guest on June 5, 2013http://jap.physiology.org/
Dow
nloaded from
We were interested to determine the effect of varyingprotocols of caffeine intake on metabolism and perfor-mance during prolonged cycling, undertaken in con-junction with the nutritional protocols recommendedfor endurance sport (e.g., a preevent CHO-rich break-fast, and the use of a sports drink to replace CHO andfluid throughout the event). We chose an exercise taskinvolving a preload of steady-state (SS) cycling duringwhich SS metabolic measurements could be made, fol-lowed by a TT of known and appropriate reliability tomeasure performance (20).
Our first intention was to determine the importanceof the timing of intake of conventional doses of caffeine(6 mg/kg BM), comparing a protocol in which the caf-feine was ingested 60 min before an endurance cyclingtask with a protocol in which this dose was consumedthroughout the exercise task. We hypothesized that thedifferent ingestion protocols would have diverse effectson substrate metabolism during submaximal exercisebut that both would enhance the performance of asubsequent TT. Furthermore, we believed that therewould be minimal risk of producing a urinary caffeineconcentration �12 �g/ml, which is the level at whichthe International Olympic Committee (IOC) deems apositive doping offence to have occurred (23). A second-ary aim of this first study was to compare the effects ofCoca-Cola ingestion late in the exercise protocolagainst the intake of larger (conventional) caffeinedoses. Originally, we hypothesized that any benefitsfrom Coca-Cola intake would be largely mediated by aplacebo effect, so that a Coca-Cola treatment would notenhance performance compared with the outcome ofanother placebo trial. However, after data in our firststudy supported an ergogenic effect arising from theuse of Coca-Cola, we undertook a second investigationto allow this treatment to be provided in a double-blindprotocol and to determine the separate effects of thecaffeine content of Coca-Cola and its higher CHO con-tent (11% CHO compared with the 6% CHO content ofthe sports drink). We hypothesized that, if we couldreplicate the ergogenic effects of Coca-Cola treatmentin a rigorous research design, either or both of thesefactors could be important in explaining any perfor-mance enhancement.
METHODS
Subjects and Preliminary Testing
Twelve highly trained male cyclists or triathletes [age27.1 � 1.3 yr, mass 76.7 � 1.8 kg, peak O2 uptake (V̇O2 peak)66.4 � 1.3 ml �kg�1 �min�1; values are mean � SE] who werecycling �250 km/wk were recruited to participate in Study A.A separate group of eight equally highly trained male cyclistsor triathletes with similar physiological characteristics andtraining history (age 27.8 � 2.1 yr, mass 69.4 � 1.1 kg,V̇O2 peak 71.2 � 2.2 ml �kg�1 �min�1) were recruited for StudyB. None of these subjects was a scholarship holder at theAustralian Institute of Sport. Subjects’ background caffeineintake was investigated by questionnaire and found to varybetween occasional intake during competitive events to ha-bitual daily intake of �150 mg/day. All subjects were fullyinformed of the nature and possible risks of the investigation
before giving their written consent. The investigation wasapproved by the Human Research Ethics Committee of theAustralian Institute of Sport.
On his first visit to the laboratory, each subject performeda maximal, incremental test to exhaustion on an electromag-netically braked cycle ergometer (Lode Instruments, Gro-ningen, The Netherlands). The maximal test protocol hasbeen described in detail previously (18). During the maximaltest, which typically lasted between 10 and 12 min, subjectsinspired air through a two-way Hans Rudolph valve attachedto a custom-built automated Douglas bag gas-analysis sys-tem (Australian Institute of Sport, Belconnen, ACT, Austra-lia) for which calibration and operation details have beenpreviously described (12). V̇O2 peak was defined as the highestO2 uptake subjects attained during two consecutive 30-ssampling periods, whereas peak sustained power output(PPO) was calculated from the last completed work rate, plusthe fraction of time spent in the final, noncompleted workrate (18). The results of this maximal test were used toestablish a work rate that corresponded with �70% ofV̇O2 peak (63% of PPO), which was to be used for all subse-quent experimental trials.
Overview of Study Designs
In both Study A and Study B, each subject undertook fourexperimental trials, with training and nutritional statusbeing controlled before each trial. Subjects refrained fromconsuming caffeine-containing substances (coffee, chocolate,and soft drinks) for 48 h before each experiment. Diet andexercise diaries were used to standardize food intake andtraining for each subject for the period lasting 24–48 h beforeeach trial. During the 24-h period immediately before eachtrial, subjects were instructed to refrain from all training andwere provided with a prepacked standard diet with an energycontent of 200 kJ/kg BM, composed of 63% CHO (8 g/kg BM),20% fat, and 17% protein. Food and exercise diaries wereused to check compliance.
Each experimental trial consisted of 120 min of SS cyclingat 70% V̇O2 peak immediately followed by a 7 kJ/kg TT. Eachtrial was undertaken under conditions designed to mimicrecommended nutritional practices for endurance sport. Spe-cifically, exercise commenced 2 h after the intake of a stan-dardized CHO-rich meal providing 2 g CHO/kg BM. In addi-tion, subjects were provided with a commercial sports drink(6.3% CHO, 18 mmol/l sodium) to allow replacement of fluid(7 � 5 ml/kg over �2.5 h) and CHO (total of 2.1 g/kg over�2.5 h) during exercise.
The four experimental treatments undertaken in bothStudy A and Study B were provided according to a Latinsquare design.
Study A Treatments
Study A treatments were as follows: 1) 6 mg/kg caffeineintake ingested 1 h before the cycling protocol (Precaf); 2) 6 �1 mg/kg caffeine intake ingested every 20 min during the first120 min of the cycling protocol (Durcaf); 3) Coca-Cola in-gested (2 � 5 ml/kg) during the latter stages of the cyclingprotocol to replace the standardized intake of sports drink(Coke); and 4) placebo capsule (Placebo).
In three of the trials (Precaf, Durcaf, and Placebo), subjectsreceived a series of capsules in an identical procedure, withthe knowledge that in two of the trials the capsules couldcontain caffeine. In the Coke trial, subjects received Coca-Cola as a transparent treatment.
991CAFFEINE INTAKE AND EXERCISE CAPACITY
J Appl Physiol • VOL 93 • SEPTEMBER 2002 • www.jap.org
by guest on June 5, 2013http://jap.physiology.org/
Dow
nloaded from

Study B Treatments
The 3 � 5 ml/kg sports drinks provided at 80 and 100 minof SS and during the TT were replaced with a range ofCoca-Cola beverages that were manipulated to provide thefollowing: 1) decaffeinated cola-flavored drink, 6% CHO (con-trol); 2) caffeinated (13 mg/100 ml) cola-flavored drink, 6%CHO (Caf); 3) decaffeinated cola-flavored drink, 11% CHO(extraCHO); and 4) caffeinated (13 mg/100 ml) cola-flavoreddrink, 11% CHO (Coke).
At the end of each of the studies, subjects completed aquestionnaire in which they were asked to identify the orderof treatments received during the study and nominate whichtreatment and trial they perceived was associated with theirbest performance.
Experimental Protocol: Study A
On the morning of an experiment, subjects reported to thelaboratory between 0700 and 0800 after a 12- to 14-h over-night fast. After sitting quietly for 10–15 min, a Tefloncatheter (Terumo, 20G, Tokyo, Japan) was inserted into avein in the antecubital fossa, and a resting blood sample wastaken. The catheter was subsequently flushed with 2–3 ml of0.9% sterile saline to ensure patency of the vein. Subjectswere then fed a standard breakfast (fruit juice, toasted breadand jam, and a Power Bar), providing a CHO intake of 2 g/kg.This meal was consumed within 15 min, and subjects thenrested in the laboratory while postprandial blood sampleswere taken at 60 and 90 min. In all trials except for Coke,subjects ingested opaque capsules containing either 6 mg/kgcaffeine (Precaf) or a placebo (Polycose) (Durcaf and Placebo)immediately after the 60-min blood sample had been taken.
After resting for 115 min, subjects voided, were reweighed,and then mounted the cycle ergometer. At 119 min, a bloodsample was taken, and in the three trials outlined above,subjects ingested another capsule containing either 1 mg/kgcaffeine (Durcaf) or the placebo (Precaf, Placebo). After 120min, subjects began cycling at 100 W, increasing 50 W eachminute until a SS workload equal to 63% PPO (�246 W) wasachieved. A bottle containing 5 ml/kg of a 6.3% CHO-electro-lyte (18 mmol/l sodium) drink was provided at the onset ofexercise with instructions that it was to be consumed withinthe next 20 min.
Respiratory gas was collected during 5–10 and 15–20 minof exercise, with a blood sample being collected at 20 min.Immediately after this sample had been taken, subjects werepresented with a new bottle of CHO-electrolyte drink andeither a capsule containing 1 mg/kg caffeine (Durcaf), aplacebo capsule (Precaf, Placebo), or no capsule. This patternof collection of respiratory gas and blood samples and pre-sentation of capsules and CHO-electrolyte drinks continuedon a 20-min cycle until 100 min of SS. At this point in theCoke trial, the drink was changed to 5 ml/kg of defizzedCoca-Cola (10.9% CHO, 5 mmol/l sodium). A further cycle ofdata was collected from 115–120 min, and, after exactly 120min of SS cycling, subjects dismounted the ergometer toallow it to be adjusted into a pedaling rate-dependent (linear)mode. A linear factor was individualized so that at �100 rpmeach subject would be cycling at a workload of 82.5% of PPO(�85% of V̇O2 peak). This workload was chosen as it repre-sents the maximum intensity that subjects can sustain for�30 min after a 2-h preload (J. A. Hawley, unpublishedobservations).
After a 3-min rest, subjects commenced a 7 kJ/kg TT thattypically lasted �30 min. During this ride, they were pro-vided with 5 ml/kg of CHO-electrolyte drink or defizzedCoca-Cola, depending on the nature of their trial. Subjects
were instructed to complete the TT “as fast as possible,” anda financial incentive was provided to all subjects to producethe fastest average TT time. The same researcher supervisedeach TT and provided standardized feedback to each subject.The only information available to subjects during a TT waselapsed work as a percentage of the final work; furthermore,subjects were given the results of their TT only after theentire study was completed. No respiratory or blood sam-ples were collected during the TT. On completion of the TT,subjects were towel dried and weighed. A final blood sam-ple was taken 3 min after the completion of each TT.Subjects then provided a urine specimen of at least 80 ml,which was frozen for later determination of urinary caf-feine concentration.
Throughout the SS ride, subjective ratings of perceivedexertion (RPE) were recorded after each gas collection byusing the modified Borg scale (3). Heart rate was recordedthroughout all experimental trials by using personal telem-etry (Polar Accurex Plus, Polar Electro OY, Kempele, Fin-land).
Blood Sampling and Analyses
Twelve milliliters of blood were collected at each samplingtime, of which 50 �l were immediately analyzed for bloodglucose and lactate concentrations by a blood and oximetryanalyzer (ABL 725, Radiometer Medical A/S, Copenhagen,Denmark). A further 6 ml were placed in a tube containingfluoride heparin and centrifuged at 4,000 rpm for 5 min. Theplasma was stored at �80°C and later analyzed for plasmacaffeine and insulin concentration. Plasma insulin concentra-tions were determined by radioimmunoassay (Incstar, Still-water, MN). A further 2-ml aliquot of blood was mixed in atube containing lithium heparin and centrifuged at 4,000rpm for 5 min. Five hundred microliters of plasma wereplaced in a tube containing 500 �l of ice-cold 3 M perchloricacid, mixed vigorously on a vortex mixer, and centrifuged for5 min at 10,000 rpm. Eight hundred microliters of thissupernatant were added to a tube containing 200 �l of 6 Mpotassium hydroxide (KOH), mixed, and centrifuged. Theresultant supernatant was analyzed for glycerol with anenzymatic spectrophotometric analysis (25). The remainingblood was added to an aliquot of preservative consisting ofEGTA and reduced glutathione in normal saline, mixedgently, and spun in a centrifuge. The plasma was lateranalyzed for FFA concentration by using an enzymatic col-orimetric method (NEFAC code 279–75409, Wako, Tokyo,Japan).
Plasma and Urinary Caffeine Analysis
The plasma and urinary caffeine analyses were under-taken by using a HPLC technique, according to the methodsof Delbeke and De Backer (8).
Reagents and standards. Caffeine, theophylline, and �-hy-droxyethyltheophylline were purchased from Sigma Chemi-cal (St Louis, MO). HPLC grade tetrahydrofuran and aceto-nitrile were from EM Science (Gibbstown, NJ), and aqueousHPLC solvent was prepared by using water obtained from aMilli-Q water purification system from Millipore (Bedford,MA). Ammonia buffer (pH 9) was prepared by the addition ofammonia to a saturated ammonium chloride solution.
For the extraction of caffeine in urine, 1 ml of urine in a 10ml screw-capped plastic centrifuge tube was mixed with 100mg of NaCl, 50 �l of the internal standard (�-hydroxyethyl-theophylline, 100 �g/ml), 100 �l of ammonium buffer, and 5ml of extraction solvent CHCl3-MeOH (9:1, vol/vol). Aftervortexing for 2 min, the samples were centrifuged at 4,000
992 CAFFEINE INTAKE AND EXERCISE CAPACITY
J Appl Physiol • VOL 93 • SEPTEMBER 2002 • www.jap.org
by guest on June 5, 2013http://jap.physiology.org/
Dow
nloaded from
rpm for 5 min. The organic layer was isolated and passedthrough a Pasteur pipette containing anhydrous Na2SO4.The extract was evaporated to dryness under a stream of N2
in a 40°C heating block. The residue was reconstituted in150-�l HPLC eluant, and 25 �l were injected onto the HPLCsystem. The concentration range for the standard curve was2.5–20 �g/ml.
For the extraction of caffeine in plasma, 1 ml of plasma ina 10-ml screw-capped plastic centrifuge tube was added to 1ml of 0.15 M Ba(OH)2. The tube was vortexed for 1 min, 1 mlof 5% zinc sulphate was added, and the tube was vortexed fora further 1 min. After protein precipitation, the sample wascentrifuged at 4,000 rpm for 5 min. The upper layer wastransferred to a Wassermann tube, and 100 mg of NaCl, 50 �lof internal standard (�-hydroxyethyltheophylline, 100 �g/ml), and 100 �l of ammonia buffer were added. Extractionwas performed with the addition of 5 ml CHCl3-MeOH (9:1vol/vol) by vortexing for 2 min followed by centrifugation at4,000 rpm for 5 min. The organic layer was isolated andpassed through a Pasteur pipette containing anhydrousNa2SO4. The extract was evaporated to dryness under astream of N2 in a 40°C heating block. The residue wasreconstituted in 150-�l HPLC eluant, and 25 �l were injectedonto the HPLC system. The concentration range for thestandard curve was 2.5–20 �g/ml.
HPLC analysis of caffeine in urine and plasma sampleswas performed with a Waters analytic HPLC system (Wa-ters, Milford, MA). This consisted of a Waters model 600EPowerline quaternary solvent delivery system and a WatersWISP 717 Plus autoinjector. The samples were separated atroom temperature on an Adsorbosphere HS C18 column (5�m, 4.6 mm ID � 150 mm; Alltech Associates, Deerfield, IL)with an Adsorbosphere C18 guard column, (5 �m, 4.6 mmID � 7.5 mm). The mobile phase for the separation was 10mM KH2PO4-acetonitrile-tetrahydrofuran (94.5:3.5:1.25 vol/vol/vol), and the flow rate was 1.0 ml/min. The peaks weredetermined with a Waters 484 tunable absorbance detectorat 273 nm. The data were processed with Waters Millenium2010 multisystem software data analysis system. Peakheights were used for quantitation, and the retention time forcaffeine elution was 15.3 min, and for the internal standard�-hydroxyethyltheophylline it was 10.8 min.
Rates of Fat and CHO Oxidation
Instantaneous rates of whole body CHO and fat oxidation(g/min) were calculated from the respiratory gases collectedduring SS, by using the nonprotein respiratory exchangeratio (RER) values (24). Total rates of substrate oxidationduring the four 120-min periods of SS exercise bouts wereestimated from the area under the CHO and fat vs. timecurves for each subject.
Experimental Protocol: Study B
Apart from the following minor differences, Study B wasconducted using the same protocol as Study A.
Cola drinks were introduced at 80 min of SS instead of 100min, after feedback from many of the subjects in Study A thatthey would not consume such large amounts of fluid in thelast 20 min of a real race as asked to consume in our TT.Therefore, in Study B, they were offered 2 � 5 ml/kg of thecola-flavored drinks at 80 and 100 min of SS and a further 5ml/kg during TT with the understanding that they couldchose to drink a comfortable or typical volume of this lastdrink. The volume that was freely consumed in the TT of thefirst trial was then provided in all subsequent trials. Thisdesign ensured that subjects would consume at least 10
ml/kg of cola-flavored drink, as received in Study A, butallowed this dose to be consumed in a manner simulating thereal-life race behavior of the subjects.
To suit subject availability, all trials were held in theevening. For the 48-h period of each trial, subjects followed astandardized diet and exercise protocol and caffeine with-drawal as in Study A.
Urinary and plasma caffeine measurements were notmade.
Statistical Analyses
The statistical analyses were undertaken by using Statis-tica software for Windows (version 5.1, StatSoft, Tulsa, OK).Data from the four trials were compared by using a two-factor (treatment and time) ANOVA with repeated measures.Newman-Keuls post hoc tests were conducted when ANOVArevealed a significant difference or interaction between treat-ments. Total CHO and fat oxidation between trials werecompared by using a one-way ANOVA with Newman-Keulspost hoc test. Analysis of TT performance data was by themixed-method methodology, incorporating considerations ofany effect due to the order of trials. This analysis was con-ducted by using SAS version 6.12 software package (SASInstitute, Carey, NC). Significant differences were acceptedwhen P � 0.05. All data are reported as means � SE.
RESULTS
Study A
Pretrial standardization. Examination of food andexercise diaries revealed that subjects complied withthe pretrial standardization. No exercise was under-taken during the 24-h period before each trial, andcomplete caffeine withdrawal was reported for 48 hbefore each trial. There were no differences amongtreatments for reported intakes of CHO and energyduring the 24-h pretrial: 8.0 � 0.1 g/kg and 199 � 2kJ/kg (Precaf), 7.9 � 0.1 g/kg and 198 � 2 kJ/kg(Durcaf), 8.0 � 0.1 g/kg and 199 � 2 kJ/kg (Coke), and8.0 � 0.1 g/kg and 199 � 2 kJ/kg (Placebo), respectively[not significant (NS)].
Drinks consumed during exercise. Subjects compliedwith the consumption of their drinks during each treat-ment. Mean total intake of CHO provided by drinks inPlacebo, Precaf, and Durcaf was 151 g (�2.1 g/kg), with187 g CHO (2.6 g/kg) being provided in the Coketreatment. Mean total intake of caffeine provided inthe Coke treatment was 94 mg (1.3 mg/kg).
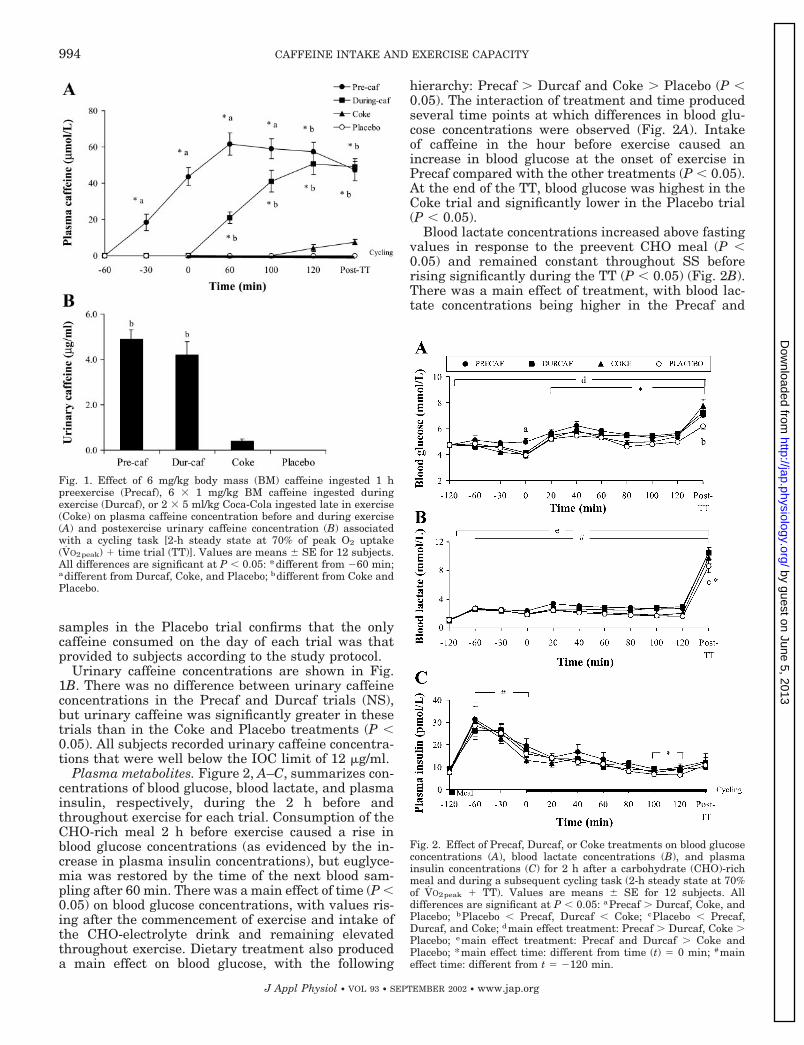
Plasma and urinary caffeine. Plasma caffeine pro-files before and during exercise differed according tothe treatment intervention (Fig. 1A). In both protocolsinvolving caffeine intake of 6 mg/kg, plasma caffeineconcentrations peaked �2 h after the (first) dose. ThePrecaf trial resulted in higher plasma caffeine concen-trations than in Durcaf at all time points until 100 minof SS (P � 0.05). There were no differences in plasmacaffeine concentrations after 120 min of SS or immedi-ately after TT between these treatments. The Coketreatment produced a small rise in plasma caffeineconcentrations, with peak values being observed imme-diately post-TT. The absence of caffeine in plasmasamples at 60 min before exercise in all trials, insamples up to 100 min in the Coke trial, and in all
993CAFFEINE INTAKE AND EXERCISE CAPACITY
J Appl Physiol • VOL 93 • SEPTEMBER 2002 • www.jap.org
by guest on June 5, 2013http://jap.physiology.org/
Dow
nloaded from
samples in the Placebo trial confirms that the onlycaffeine consumed on the day of each trial was thatprovided to subjects according to the study protocol.
Urinary caffeine concentrations are shown in Fig.1B. There was no difference between urinary caffeineconcentrations in the Precaf and Durcaf trials (NS),but urinary caffeine was significantly greater in thesetrials than in the Coke and Placebo treatments (P �0.05). All subjects recorded urinary caffeine concentra-tions that were well below the IOC limit of 12 �g/ml.
Plasma metabolites. Figure 2, A–C, summarizes con-centrations of blood glucose, blood lactate, and plasmainsulin, respectively, during the 2 h before andthroughout exercise for each trial. Consumption of theCHO-rich meal 2 h before exercise caused a rise inblood glucose concentrations (as evidenced by the in-crease in plasma insulin concentrations), but euglyce-mia was restored by the time of the next blood sam-pling after 60 min. There was a main effect of time (P �0.05) on blood glucose concentrations, with values ris-ing after the commencement of exercise and intake ofthe CHO-electrolyte drink and remaining elevatedthroughout exercise. Dietary treatment also produceda main effect on blood glucose, with the following
hierarchy: Precaf � Durcaf and Coke � Placebo (P �0.05). The interaction of treatment and time producedseveral time points at which differences in blood glu-cose concentrations were observed (Fig. 2A). Intakeof caffeine in the hour before exercise caused anincrease in blood glucose at the onset of exercise inPrecaf compared with the other treatments (P � 0.05).At the end of the TT, blood glucose was highest in theCoke trial and significantly lower in the Placebo trial(P � 0.05).
Blood lactate concentrations increased above fastingvalues in response to the preevent CHO meal (P �0.05) and remained constant throughout SS beforerising significantly during the TT (P � 0.05) (Fig. 2B).There was a main effect of treatment, with blood lac-tate concentrations being higher in the Precaf and
Fig. 2. Effect of Precaf, Durcaf, or Coke treatments on blood glucoseconcentrations (A), blood lactate concentrations (B), and plasmainsulin concentrations (C) for 2 h after a carbohydrate (CHO)-richmeal and during a subsequent cycling task (2-h steady state at 70%of V̇O2peak TT). Values are means � SE for 12 subjects. Alldifferences are significant at P � 0.05: aPrecaf � Durcaf, Coke, andPlacebo; bPlacebo � Precaf, Durcaf � Coke; cPlacebo � Precaf,Durcaf, and Coke; dmain effect treatment: Precaf � Durcaf, Coke �Placebo; emain effect treatment: Precaf and Durcaf � Coke andPlacebo; *main effect time: different from time (t) 0 min; #maineffect time: different from t �120 min.
Fig. 1. Effect of 6 mg/kg body mass (BM) caffeine ingested 1 hpreexercise (Precaf), 6 � 1 mg/kg BM caffeine ingested duringexercise (Durcaf), or 2 � 5 ml/kg Coca-Cola ingested late in exercise(Coke) on plasma caffeine concentration before and during exercise(A) and postexercise urinary caffeine concentration (B) associatedwith a cycling task [2-h steady state at 70% of peak O2 uptake(V̇O2peak) time trial (TT)]. Values are means � SE for 12 subjects.All differences are significant at P � 0.05: *different from �60 min;adifferent from Durcaf, Coke, and Placebo; bdifferent from Coke andPlacebo.
994 CAFFEINE INTAKE AND EXERCISE CAPACITY
J Appl Physiol • VOL 93 • SEPTEMBER 2002 • www.jap.org
by guest on June 5, 2013http://jap.physiology.org/
Dow
nloaded from
Durcaf trials than in the Coke and Placebo trials (P �0.05). An interaction of time and treatment was alsoobserved, with blood lactate concentrations at the com-pletion of the TT being lower in the Placebo trial thanin the other trials (P � 0.05). Plasma insulin concen-trations increased in response to the preexercise mealand then gradually declined during exercise so thatconcentrations at 100 and 120 min were lower thanpreexercise values (P � 0.05) (Fig. 2C). There were nodifferences in plasma insulin responses arising fromthe different treatments.
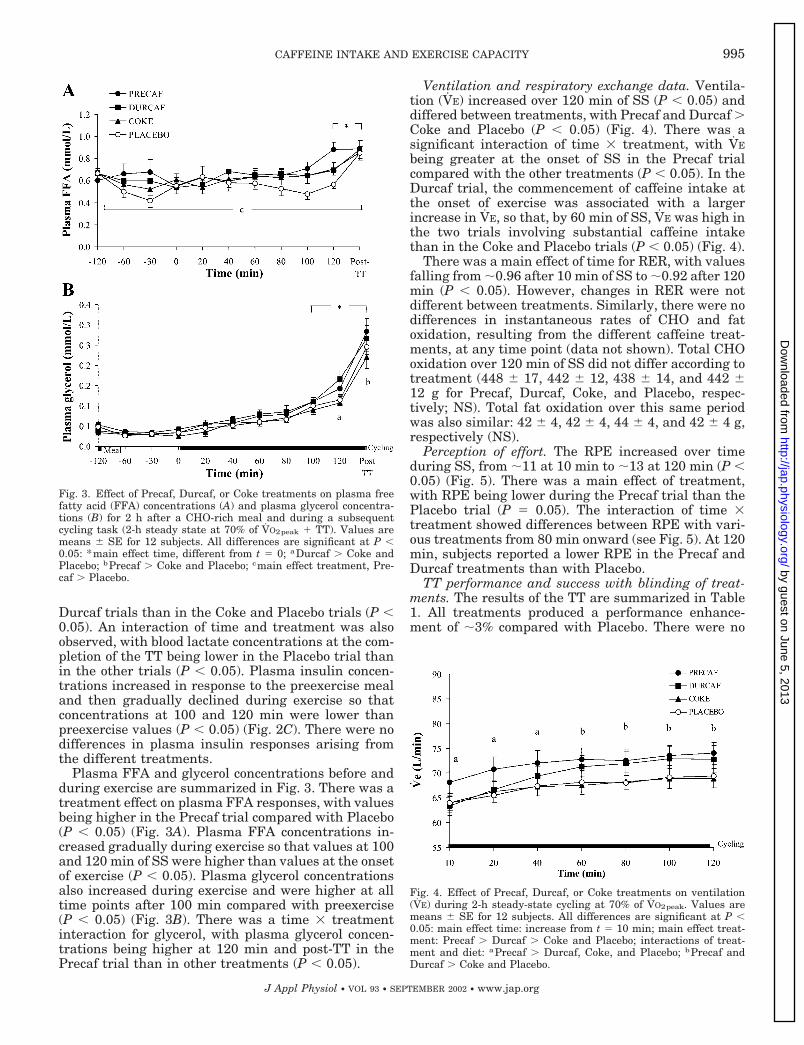
Plasma FFA and glycerol concentrations before andduring exercise are summarized in Fig. 3. There was atreatment effect on plasma FFA responses, with valuesbeing higher in the Precaf trial compared with Placebo(P � 0.05) (Fig. 3A). Plasma FFA concentrations in-creased gradually during exercise so that values at 100and 120 min of SS were higher than values at the onsetof exercise (P � 0.05). Plasma glycerol concentrationsalso increased during exercise and were higher at alltime points after 100 min compared with preexercise(P � 0.05) (Fig. 3B). There was a time � treatmentinteraction for glycerol, with plasma glycerol concen-trations being higher at 120 min and post-TT in thePrecaf trial than in other treatments (P � 0.05).
Ventilation and respiratory exchange data. Ventila-tion (V̇E) increased over 120 min of SS (P � 0.05) anddiffered between treatments, with Precaf and Durcaf �Coke and Placebo (P � 0.05) (Fig. 4). There was asignificant interaction of time � treatment, with V̇E
being greater at the onset of SS in the Precaf trialcompared with the other treatments (P � 0.05). In theDurcaf trial, the commencement of caffeine intake atthe onset of exercise was associated with a largerincrease in V̇E, so that, by 60 min of SS, V̇E was high inthe two trials involving substantial caffeine intakethan in the Coke and Placebo trials (P � 0.05) (Fig. 4).
There was a main effect of time for RER, with valuesfalling from �0.96 after 10 min of SS to �0.92 after 120min (P � 0.05). However, changes in RER were notdifferent between treatments. Similarly, there were nodifferences in instantaneous rates of CHO and fatoxidation, resulting from the different caffeine treat-ments, at any time point (data not shown). Total CHOoxidation over 120 min of SS did not differ according totreatment (448 � 17, 442 � 12, 438 � 14, and 442 �12 g for Precaf, Durcaf, Coke, and Placebo, respec-tively; NS). Total fat oxidation over this same periodwas also similar: 42 � 4, 42 � 4, 44 � 4, and 42 � 4 g,respectively (NS).
Perception of effort. The RPE increased over timeduring SS, from �11 at 10 min to �13 at 120 min (P �0.05) (Fig. 5). There was a main effect of treatment,with RPE being lower during the Precaf trial than thePlacebo trial (P 0.05). The interaction of time �treatment showed differences between RPE with vari-ous treatments from 80 min onward (see Fig. 5). At 120min, subjects reported a lower RPE in the Precaf andDurcaf treatments than with Placebo.
TT performance and success with blinding of treat-ments. The results of the TT are summarized in Table1. All treatments produced a performance enhance-ment of �3% compared with Placebo. There were no
Fig. 4. Effect of Precaf, Durcaf, or Coke treatments on ventilation(V̇E) during 2-h steady-state cycling at 70% of V̇O2peak. Values aremeans � SE for 12 subjects. All differences are significant at P �0.05: main effect time: increase from t 10 min; main effect treat-ment: Precaf � Durcaf � Coke and Placebo; interactions of treat-ment and diet: aPrecaf � Durcaf, Coke, and Placebo; bPrecaf andDurcaf � Coke and Placebo.
Fig. 3. Effect of Precaf, Durcaf, or Coke treatments on plasma freefatty acid (FFA) concentrations (A) and plasma glycerol concentra-tions (B) for 2 h after a CHO-rich meal and during a subsequentcycling task (2-h steady state at 70% of V̇O2peak TT). Values aremeans � SE for 12 subjects. All differences are significant at P �0.05: *main effect time, different from t 0; aDurcaf � Coke andPlacebo; bPrecaf � Coke and Placebo; cmain effect treatment, Pre-caf � Placebo.
995CAFFEINE INTAKE AND EXERCISE CAPACITY
J Appl Physiol • VOL 93 • SEPTEMBER 2002 • www.jap.org
by guest on June 5, 2013http://jap.physiology.org/
Dow
nloaded from
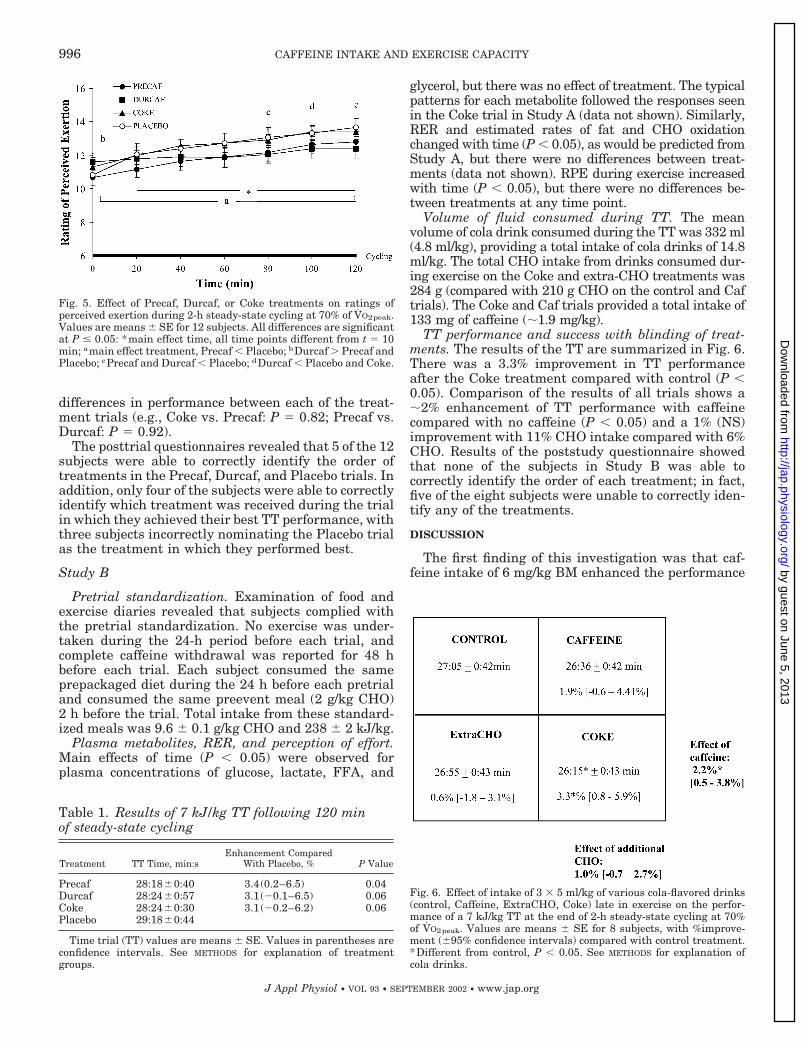
differences in performance between each of the treat-ment trials (e.g., Coke vs. Precaf: P 0.82; Precaf vs.Durcaf: P 0.92).
The posttrial questionnaires revealed that 5 of the 12subjects were able to correctly identify the order oftreatments in the Precaf, Durcaf, and Placebo trials. Inaddition, only four of the subjects were able to correctlyidentify which treatment was received during the trialin which they achieved their best TT performance, withthree subjects incorrectly nominating the Placebo trialas the treatment in which they performed best.
Study B
Pretrial standardization. Examination of food andexercise diaries revealed that subjects complied withthe pretrial standardization. No exercise was under-taken during the 24-h period before each trial, andcomplete caffeine withdrawal was reported for 48 hbefore each trial. Each subject consumed the sameprepackaged diet during the 24 h before each pretrialand consumed the same preevent meal (2 g/kg CHO)2 h before the trial. Total intake from these standard-ized meals was 9.6 � 0.1 g/kg CHO and 238 � 2 kJ/kg.
Plasma metabolites, RER, and perception of effort.Main effects of time (P � 0.05) were observed forplasma concentrations of glucose, lactate, FFA, and
glycerol, but there was no effect of treatment. The typicalpatterns for each metabolite followed the responses seenin the Coke trial in Study A (data not shown). Similarly,RER and estimated rates of fat and CHO oxidationchanged with time (P � 0.05), as would be predicted fromStudy A, but there were no differences between treat-ments (data not shown). RPE during exercise increasedwith time (P � 0.05), but there were no differences be-tween treatments at any time point.
Volume of fluid consumed during TT. The meanvolume of cola drink consumed during the TT was 332 ml(4.8 ml/kg), providing a total intake of cola drinks of 14.8ml/kg. The total CHO intake from drinks consumed dur-ing exercise on the Coke and extra-CHO treatments was284 g (compared with 210 g CHO on the control and Caftrials). The Coke and Caf trials provided a total intake of133 mg of caffeine (�1.9 mg/kg).
TT performance and success with blinding of treat-ments. The results of the TT are summarized in Fig. 6.There was a 3.3% improvement in TT performanceafter the Coke treatment compared with control (P �0.05). Comparison of the results of all trials shows a�2% enhancement of TT performance with caffeinecompared with no caffeine (P � 0.05) and a 1% (NS)improvement with 11% CHO intake compared with 6%CHO. Results of the poststudy questionnaire showedthat none of the subjects in Study B was able tocorrectly identify the order of each treatment; in fact,five of the eight subjects were unable to correctly iden-tify any of the treatments.
DISCUSSION
The first finding of this investigation was that caf-feine intake of 6 mg/kg BM enhanced the performance
Fig. 6. Effect of intake of 3 � 5 ml/kg of various cola-flavored drinks(control, Caffeine, ExtraCHO, Coke) late in exercise on the perfor-mance of a 7 kJ/kg TT at the end of 2-h steady-state cycling at 70%of V̇O2peak. Values are means � SE for 8 subjects, with %improve-ment (�95% confidence intervals) compared with control treatment.*Different from control, P � 0.05. See METHODS for explanation ofcola drinks.
Fig. 5. Effect of Precaf, Durcaf, or Coke treatments on ratings ofperceived exertion during 2-h steady-state cycling at 70% of V̇O2peak.Values are means � SE for 12 subjects. All differences are significantat P � 0.05: *main effect time, all time points different from t 10min; amain effect treatment, Precaf � Placebo; bDurcaf � Precaf andPlacebo; cPrecaf and Durcaf � Placebo; dDurcaf � Placebo and Coke.
Table 1. Results of 7 kJ/kg TT following 120 minof steady-state cycling
Treatment TT Time, min:sEnhancement Compared
With Placebo, % P Value
Precaf 28:18�0:40 3.4(0.2–6.5) 0.04Durcaf 28:24�0:57 3.1(�0.1–6.5) 0.06Coke 28:24�0:30 3.1(�0.2–6.2) 0.06Placebo 29:18�0:44
Time trial (TT) values are means � SE. Values in parentheses areconfidence intervals. See METHODS for explanation of treatmentgroups.
996 CAFFEINE INTAKE AND EXERCISE CAPACITY
J Appl Physiol • VOL 93 • SEPTEMBER 2002 • www.jap.org
by guest on June 5, 2013http://jap.physiology.org/
Dow
nloaded from
of a TT undertaken at the end of a prolonged cyclingbout under nutritional conditions recommended forendurance athletes; i.e., after the intake of a CHO-richmeal and with the intake of CHO throughout exercise.This performance enhancement occurred whether thecaffeine was consumed before the cycling bout orthroughout exercise. These results are consistent withthe findings of other studies reporting enhanced capac-ity for submaximal exercise with intakes of caffeine inthe hour before exercise (7, 9, 10, 14–16, 19, 22, 23, 27,29). They are also supported by the more recent work ofKovacs et al. (22), in which a 1-h cycling TT wasimproved after caffeine consumption, both before andduring exercise. The novelty of the present findings isthe direct comparison of the timing of the intake ofcaffeine and in the use of dietary conditions and anexercise protocol that simulates the real-life situationof competitive sport.
Another unique aspect of the present investigationwas the study of the effect of consuming Coca-Cola as areplacement for sports drink during the latter stages ofthe endurance cycling task. This treatment was inves-tigated to replicate a practice of many endurance ath-letes in competitive cycling, running, triathlon, andskiing events, who believe that it provides a useful“caffeine hit.” However, we found that the amounts ofCoca-Cola typically consumed by athletes caused onlya minor increase in plasma caffeine concentration (Fig.1A) and minimal impact on urinary caffeine (Fig. 1B),compared with the doses of caffeine typically associ-ated with ergogenic benefits under laboratory condi-tions (4, 22, 23, 30). Nevertheless, in contrast to ourhypothesis, intake of Coca-Cola was associated with aperformance enhancement similar to that attained bythe larger caffeine doses, when compared directly us-ing a placebo-controlled but unblinded presentation ofthe treatment design. The second part of the investi-gation (Study B), in which Coca-Cola was provided in arigorous double-blind placebo design, replicated thefindings of Study A and found a performance enhance-ment of identical magnitude. The ergogenic effect wasexplained by both the intake of small amounts of caf-feine and an increase in CHO intake.
Although the transparent allocation of the Coketreatment in the first study represents a weaker re-search design than a double-blind presentation, weconsidered it a necessary starting point for the inves-tigation of any potential effects of the Coca-Cola use byendurance athletes. Although Coke was provided as atransparent treatment to subjects, we took care in theorganization of a placebo control so that subjects wouldreceive psychological motivation in all trials. The re-searcher in charge of the TT measurements was keptblind to the treatment received by subjects to removeany bias in encouragement provided. Posttrial ques-tionnaires revealed that most subjects were deceivedby the blinding of treatments. Furthermore, 25% of thegroup nominated the Placebo trial as the treatment inwhich they felt they performed best, as would be ex-pected if pure chance rather than knowledge of thetreatments determined this outcome. The results of
Study A provided justification for conducting a moreelaborately controlled study on the effects of the Coketreatment on endurance performance, including inves-tigation of the separate and additive effects of ingest-ing caffeine and higher concentrations of CHO towardthe end of prolonged cycling.
The present investigation fails to provide clear evi-dence of the mechanism(s) underlying the performanceenhancement seen with all of the active treatments.We originally hypothesized that the different caffeineintake protocols would result in different metabolicprofiles; in particular the presence or absence of anearly elevation in plasma FFA concentration with aconcomitant CHO “sparing” effect. Others have re-ported that intake of caffeine in the hour before exer-cise resulted in an increase in plasma FFA concentra-tions and increased fat oxidation, both from blood-borne and intramuscular stores in the subsequentexercise task (7, 10, 19). Furthermore, a recent studyhas shown that this glycogen sparing effect is limitedto the first 15–30 min of exercise (27) but is associatedwith enhancement of endurance performance (27). Forthis reason, we hypothesized that preingestion of caf-feine would alter RER values early in exercise,whereas ingestion of caffeine throughout exercisewould not further increase plasma fatty acid availabil-ity above those levels already associated with pro-longed submaximal cycling. However, although thePrecaf trial was associated with higher overall concen-trations of plasma FFA compared with the Placebotrial, we were unable to detect any differences in ratesof substrate utilization between trials based on respi-ratory gas exchange data. There are several possibili-ties to explain our findings.
First, even if early intake of caffeine attenuatesmuscle glycogenolysis, it is possible that such changesin muscle metabolism are not detectable by conven-tional RER measures. For example, Spriet et al. (27)reported that, compared with a placebo, preingestion ofa large dose of caffeine (9 mg/kg BM) significantlyreduced muscle glycogenolysis during the first 15 minof continuous cycling at 80% of maximal O2 uptake(V̇O2 max) (27). This reduction in glycogen utilizationoccurred in the absence of any changes in whole bodyrates of CHO oxidation (estimated from RER values)during this period. Indeed, the RER values in the studyof Spriet et al. are actually higher with caffeine inges-tion than placebo (0.85 vs. 0.81), although it should benoted that the exercise intensities of the two trials atthis time point are different from each other and the(intended) exercise protocol of cycling at 80% V̇O2 max
(i.e., 82 vs. 74% of V̇O2 max for caffeine vs. placebo).Spriet et al. suggested that their recreational cyclistsmight not have attained SS conditions at such highwork rates. Furthermore, as in the present study, theyfound that V̇E was higher after caffeine intake. There-fore, it is possible that, after moderate-to-high doses ofcaffeine (6–9 mg/kg), conventional pulmonary gas ex-change data cannot detect differences in muscle me-tabolism, especially early in exercise.
997CAFFEINE INTAKE AND EXERCISE CAPACITY
J Appl Physiol • VOL 93 • SEPTEMBER 2002 • www.jap.org
by guest on June 5, 2013http://jap.physiology.org/
Dow
nloaded from
Second, others have suggested that high-CHO avail-ability might inhibit the effect of caffeine on mobiliza-tion of FFA and fat oxidation (31). Indeed, in our study,subjects were tested in conditions promoting optimalCHO status: 1 day of rest and high-CHO intake, apreexercise CHO meal, and regular intake of CHOthroughout exercise. Other workers have also usedconditions of preexercise CHO intake and feedingthroughout exercise and found that caffeine ingestionhad no effect on FFA concentrations (22).
Most importantly, however, there is considerable evi-dence that the ergogenic benefits of caffeine on exerciseperformance are not limited to, or always explained by,the so-called “metabolic theory” (for review see Ref. 26).One early investigation in support of this view is ofparticular interest to the present study, because caffeinewas administered before and during prolonged exercise.Ivy et al. (19) fed trained cyclists 250 mg of caffeine (�3.6mg/kg) 60 min before a 2-h ride on an isokinetic ergome-ter followed by an additional 250 mg at 15-min intervalsfor the first 90 min of exercise. Caffeine ingestion in-creased the total work performed in the 2-h ride by 7.4%compared with control. However, plasma FFA concentra-tions and estimated rates of CHO and fat oxidation weresimilar between trials, failing to explain the performancebenefits (19).
More recent evidence against the metabolic theory isprovided by Graham et al. (13), who quantified musclemetabolism by a combination of direct arteriovenousbalance methods and muscle biopsies after subjectsingested 6 mg/kg caffeine during 1 h of submaximalexercise. They found that, although caffeine ingestionstimulated the sympathetic nervous system, it did notalter leg fatty acid uptake, net muscle glycogenolysis,or rates of CHO and fat metabolism in the monitoredleg (13). Another study from this group confirmed thatintake of caffeine and another methylxanthine com-pound, theophylline, can prolong endurance duringcycling at 80% V̇O2 max without affecting muscle glyco-gen utilization (17). However, others have found indi-vidual variability in the metabolic response to caffeine:one-half of a group of subjects was shown to “spare”glycogen during the first 15 min of exercise after caf-feine intake (9 mg/kg) compared with a placebo treat-ment, whereas glycogen utilization was unaffected inthe other one-half of the group after caffeine treatment(5). Taken collectively, the results of these studiesindicate that glycogen sparing after caffeine ingestionis a variable response but seems most likely to occurwith larger caffeine doses (�6 mg/kg) and power out-puts eliciting �70% V̇O2 max.
The mechanism for performance enhancement withcaffeine ingestion in the present study could be due toan effect on the CNS or a direct effect of caffeine onskeletal muscle (28). Caffeine ingestion has beenshown to affect the CNS (6) and to elicit greater motorunit recruitment and alter neurotransmitter function(32). Caffeine also affects the CNS in ways that causeit to override fatigue signals during exercise (6). In-deed, in the present study, the subjective ratings ofperception of effort at the end of the 120-min SS ride
were lower with both caffeine ingestion protocols com-pared with placebo.
The design of Study B allows some insight into themechanisms underlying the observed performance en-hancement with Coca-Cola. The dose of caffeine asso-ciated with the late feeding of Coca-Cola (1.3 and 1.9mg/kg in Studies A and B, respectively), although it didnot cause substantial rises in plasma or urinary caf-feine concentration in Study A, was found to provide aworthwhile performance enhancement. These caffeinedoses are smaller than the lowest dose of caffeine thathas been previously reported to enhance exercise per-formance (i.e., 2.1 mg/kg) (22). These findings are insupport of emerging evidence (15, 22) that caffeineachieves an ergogenic effect at intakes of 1–3 mg/kg;these doses are substantially lower than those used inearlier studies. Furthermore, there is no dose responseto caffeine intake, because performance benefits arenot increased when larger doses of caffeine are con-sumed (15, 22, 23).
The amount of CHO ingested late in exercise wasgreater with Coca-Cola than with the sports drink or6% CHO cola drinks (74 vs. 44 g in Study A and 114 vs.61 g in Study B, respectively) and caused subtle differ-ences in the rate of change of blood glucose concentra-tions in the last 45 min of exercise (Fig. 2). As recentlynoted, the maintenance of high (i.e., 5–6 mM) plasmaglucose concentrations typically associated with theingestion of CHO throughout prolonged (2 h), moder-ate-intensity (�70% VO2max) exercise can improve ex-ercise performance by mechanisms other than alter-ations in substrate utilization (11). However, accordingto the results of Study B, the increase in CHO intakeduring the latter stages of prolonged cycling made onlya small contribution to the overall performance en-hancement.
An important practical finding of the study was thatall protocols of caffeine intake produced urinary caf-feine concentrations �12 �g/ml, which is the levelabove which the antidoping guidelines of the IOC deema positive test for caffeine use to have occurred. Someindividual variability in urinary caffeine levels afterstandard caffeine doses is noted (23), and there is oneliterature report of a subject returning a urinary caf-feine level �12 �g/ml after a caffeine intake of 6 mg/kg(4). However, our results support the consensus thatcaffeine intakes of up to 6 mg/kg pose a minor risk ofcausing an athlete to contravene the IOC urinary caf-feine limits (26). Based on the results of the presentstudy, the use of Coca-Cola as a sports drink in thelatter part of a race is likely to produce a minimal effecton urinary caffeine levels.
In summary, the results of the present investigationshow that the intake of moderate doses of caffeine (6mg/kg) enhanced the performance of a cycling TT,undertaken with a sports-specific protocol and underthe dietary conditions promoted for optimal sports per-formance. This ergogenic benefit to performance wasobserved whether caffeine was ingested 1 h beforeexercise or in a series of doses throughout the exercisebout and was achieved without contravening the re-
998 CAFFEINE INTAKE AND EXERCISE CAPACITY
J Appl Physiol • VOL 93 • SEPTEMBER 2002 • www.jap.org
by guest on June 5, 2013http://jap.physiology.org/
Dow
nloaded from
porting limit for caffeine use by antidoping codes of theIOC. We also found support for the observed practice ofconsuming Coca-Cola as a replacement for sports drinkduring the last part of an endurance event. Whenprovided in a double-blind design, the Coca-Cola pro-tocol also produced an enhancement of a TT perfor-mance at the end of the 2-h cycling task, with thebenefits being largely due to the ingestion of the smallamount of caffeine (�1.5 mg/kg). The direct compari-son of the ingestion of larger amounts of caffeine withthe Coca-Cola protocol, albeit in a transparent butplacebo-controlled design, suggests that all protocols ofcaffeine use are of equal and worthwhile benefit to theperformance of a prolonged cycling task.
We acknowledge the technical assistance of Dr. Kieran Fallon,Michelle Minehan, Ben Rattray, Kelly Linaker, and Simone Ransleyin the collection of data, and Michael Kunz and Nicole Kalafatis forthe plasma and urinary caffeine analysis. We thank Professor DonBirkett from Flinders University for assistance in verifying thecaffeine data.
This study was funded through a grant from Nestle Australia tothe Department of Sports Nutrition at the Australian Institute ofSport.
REFERENCES
1. American College of Sports Medicine, American DieteticAssociation, and Dietitians of Canada. Nutrition and ath-letic performance. Med Sci Sports Exerc 32: 2130–2145, 2000.
2. Berglund B and Hemmingsson P. Effects of caffeine ingestionon exercise performance at low and high altitudes in cross-country skiers. Int J Sports Med 3: 234–236, 1982.
3. Borg G. Simple rating methods for estimation of perceivedexertion. In: Physical Work and Effort, edited by Borg G. Oxford,UK: Pergamon, 1977, p. 39–45.
4. Bruce CR, Anderson ME, Fraser SF, Stepto NK, Klein R,Hopkins WG, and Hawley JA. Enhancement of 2000-m row-ing performance after caffeine ingestion. Med Sci Sports Exerc32: 1958–1963, 2000.
5. Chesley A, Howlett RA, Heigenhauser GJF, Hultman E,and Spriet LL. Regulation of muscle glycogenolytic flux duringintense aerobic exercise after caffeine ingestion. Am J PhysiolRegul Integr Comp Physiol 275: R596–R603, 1998.
6. Cole KJ, Costill DL, Starling RD, Goodpaster BH, TrappeSW, and Fink WJ. Effect of caffeine ingestion on perception ofeffort and subsequent work production. Int J Sport Nutr 6:14–23, 1996.
7. Costill DL, Dalsky GP, and Fink WJ. Effects of caffeineingestion on metabolism and exercise performance. Med SciSports Exerc 10: 155–158, 1978.
8. Delbeke FT and De Backer P. Threshold level for theophyllinein doping analysis. J Chromatogr B Biomed Appl 687: 247–252,1996.
9. Denadai BS and Denadai MLDR. Effects of caffeine on time toexhaustion in exercise performed below and above the anaerobicthreshold. Braz J Med Biol Res 31: 581–585, 1998.
10. Essig D, Costill DL, and Van Handel PJ. Effects of caffeineingestion on utilisation of muscle glycogen and lipid during legergometer cycling. Int J Sports Med 1: 86–90, 1980.
11. Febbraio MA, Chiu A, Angus DJ, Arkinstall MJ, and Haw-ley JA. Effects of carbohydrate ingestion before and during
exercise on glucose kinetics and performance. J Appl Physiol 89:2220–2226, 2000.
12. Gore CJ, Catcheside PG, French SN, Bennet JM, andLarforgia J. Automated V̇O2 max calibrator for open circuit in-direct calorimetry systems. Med Sci Sports Exerc 29: 1095–1103,1997.
13. Graham TE, Helge JW, MacLean DA, Kiens B, and RichterEA. Caffeine ingestion does not alter carbohydrate or fat metab-olism in human skeletal muscle during exercise. J Physiol 529:837–847, 2000.
14. Graham TE, Hibbert E, and Sathasivam P. Metabolic andexercise endurance effects of coffee and caffeine ingestion. J ApplPhysiol 85: 883–889, 1998.
15. Graham TE and Spriet LL. Metabolic, catecholamine, andexercise performance responses to various doses of caffeine.J Appl Physiol 78: 867–874, 1995.
16. Graham TE and Spriet LL. Performance and metabolic re-sponses to a high caffeine dose during prolonged exercise. J ApplPhysiol 71: 2292–2298, 1991.
17. Greer F, Friars D, and Graham TE. Comparison of caffeineand theophylline ingestion: exercise metabolism and endurance.J Appl Physiol 89: 1837–1844, 2000.
18. Hawley JA and Noakes TD. Peak sustained power outputpredicts V̇O2 max and performance time in trained cyclists. EurJ Appl Physiol 65: 79–83, 1992.
19. Ivy JL, Costill DL, Fink WJ, and Lower RW. Influence ofcaffeine and carbohydrate feedings on endurance performance.Med Sci Sports Exerc 11: 6–11, 1979.
20. Jeukendrup A, Saris WHM, Brouns F, and Kester ADM. Anew validated endurance performance test. Med Sci Sports Exerc28: 266–270, 1996.
21. Kalmar JM and Carafelli E. Effects of caffeine on neuromus-cular function. J Appl Physiol 87: 801–808, 1999.
22. Kovacs EMR, Stegen JHCH, and Brouns F. Effect of caffein-ated drinks on substrate metabolism, caffeine excretion, andperformance. J Appl Physiol 85: 709–715, 1998.
23. Pasman WJ, van Baak MA, Jeukendrup AE, and de HaanA. The effect of different dosages of caffeine on endurance per-formance time. Int J Sports Med 16: 225–230, 1995.
24. Peronnet F and Massicotte D. Table of nonprotein respiratoryquotient: an update. Can J Sport Sci 16: 23–29, 1991.
25. Pinter JK, Hayashi JA, and Watson JA. Enzymatic assay ofglycerol, dihydroxyacetone and glyceraldehydes (Abstract). ArchBiochem Biophys 121: 404, 1967.
26. Spriet LL. Ergogenic aids: recent advances and retreats. In:Perspectives in Exercise Science and Sports Medicine, edited byLamb DR and Murray R. Carmel, IN: Cooper, 1997, p. 185–238.
27. Spriet LL, MacLean DA, Dyck DJ, Hultman E, CederbladG, and Graham TE. Caffeine ingestion and muscle metabolismduring prolonged exercise in humans. Am J Physiol EndocrinolMetab 262: E891–E898, 1992.
28. Tarnopolsky M and Cupido C. Caffeine potentiates low fre-quency skeletal muscle force in habitual and nonhabitual caf-feine consumers. J Appl Physiol 89: 1719–1724, 2000.
29. Van Soeren MH and Graham TE. Effect of caffeine on metab-olism, exercise endurance, and catecholamine responses afterwithdrawal. J Appl Physiol 85: 1493–1501, 1998.
30. Van Soeren MH, Sathasivam P, Spriet LL, and GrahamTE. Caffeine metabolism and epinephrine responses during ex-ercise in users and nonusers. J Appl Physiol 75: 805–812, 1993.
31. Weir J, Noakes TD, Myburgh K, and Adams B. A highcarbohydrate diet negates the metabolic effects of caffeine dur-ing exercise. Med Sci Sports Exerc 19: 100–105, 1987.
32. Wilson DF. Effect of caffeine intake on neuromuscular trans-mission in the rat. J Appl Physiol 25: 695–704, 1975.
999CAFFEINE INTAKE AND EXERCISE CAPACITY
J Appl Physiol • VOL 93 • SEPTEMBER 2002 • www.jap.org
by guest on June 5, 2013http://jap.physiology.org/
Dow
nloaded from
Copyright © 2022 FDOKUMEN