Earth-Science Reviews - EarthByte
59
Global continental and ocean basin reconstructions since 200 Ma M. Seton a, ⁎, R.D. Müller a , S. Zahirovic a , C. Gaina b, 1 , T. Torsvik b, c, d, e , G. Shephard a , A. Talsma a , M. Gurnis f , M. Turner f , S. Maus h , M. Chandler g a EarthByte Group, School of Geosciences, Madsen Building F09, University of Sydney, NSW, 2006, Australia b Centre for Geodynamics, Geological Survey of Norway, Leiv Eirikssons vei 39, N-7491 Trondheim, Norway c Physics of Geological Processes/School of Geosciences, University of Oslo, 0316 Oslo, Norway d Center for Advanced Study, Norwegian Academy of Science and Letters, Drammensveien 78, 0271 Oslo, Norway e School of Geosciences, University of the Witwatersrand, Wits 2050, South Africa f Seismological Laboratory, California Institute of Technology, Pasadena, CA, USA g School of Ocean and Earth Science and Technology (SOEST), University of Hawai'i at Manoa, 1680 East–west Rd., POST # 806, Honolulu, HI 96822, USA h National Geophysical Data Center, NOAA, 325 Broadway, Boulder, CO 80305-3328, USA abstract article info Article history: Received 16 March 2011 Accepted 2 March 2012 Available online 15 March 2012 Keywords: Plate reconstructions Plate motion model Panthalassa Laurasia Tethys Gondwana Global plate motion models provide a spatial and temporal framework for geological data and have been effective tools for exploring processes occurring at the earth's surface. However, published models either have insufficient temporal coverage or fail to treat tectonic plates in a self-consistent manner. They usually consider the motions of selected features attached to tectonic plates, such as continents, but generally do not explicitly account for the continuous evolution of plate boundaries through time. In order to explore the coupling between the surface and mantle, plate models are required that extend over at least a few hundred million years and treat plates as dynamic features with dynamically evolving plate boundaries. We have constructed a new type of global plate motion model consisting of a set of continuously-closing topological plate polygons with associated plate boundaries and plate velocities since the break-up of the supercontinent Pangea. Our model is underpinned by plate motions derived from reconstructing the seafloor-spreading history of the ocean basins and motions of the continents and utilizes a hybrid absolute reference frame, based on a moving hotspot model for the last 100 Ma, and a true-polar wander corrected paleomagnetic model for 200 to 100 Ma. Detailed regional geological and geophysical observations constrain plate boundary inception or cessation, and time-dependent geometry. Although our plate model is primarily designed as a reference model for a new generation of geodynamic studies by providing the surface boundary conditions for the deep earth, it is also useful for studies in disparate fields when a framework is needed for analyzing and interpreting spatio-temporal data. © 2012 Elsevier B.V. All rights reserved. Contents 1. Introduction . . . . . . . . . . . . . . . . . . . . . . . . . . . . . . . . . . . . . . . . . . . . . . . . . . . . . . . . . . . . . . 213 2. Methodology . . . . . . . . . . . . . . . . . . . . . . . . . . . . . . . . . . . . . . . . . . . . . . . . . . . . . . . . . . . . . 214 2.1. Absolute reference frames . . . . . . . . . . . . . . . . . . . . . . . . . . . . . . . . . . . . . . . . . . . . . . . . . . . . 214 2.2. Relative plate motions . . . . . . . . . . . . . . . . . . . . . . . . . . . . . . . . . . . . . . . . . . . . . . . . . . . . . . 214 2.3. Geomagnetic polarity timescales . . . . . . . . . . . . . . . . . . . . . . . . . . . . . . . . . . . . . . . . . . . . . . . . . 216 2.4. Continuously closed plate polygons . . . . . . . . . . . . . . . . . . . . . . . . . . . . . . . . . . . . . . . . . . . . . . . . 216 3. Regional continental and ocean floor reconstructions . . . . . . . . . . . . . . . . . . . . . . . . . . . . . . . . . . . . . . . . . . . 217 3.1. Atlantic and Arctic . . . . . . . . . . . . . . . . . . . . . . . . . . . . . . . . . . . . . . . . . . . . . . . . . . . . . . . 217 3.1.1. South Atlantic . . . . . . . . . . . . . . . . . . . . . . . . . . . . . . . . . . . . . . . . . . . . . . . . . . . . . 217 3.1.2. Central Atlantic . . . . . . . . . . . . . . . . . . . . . . . . . . . . . . . . . . . . . . . . . . . . . . . . . . . . . 218 3.1.3. Northern Atlantic . . . . . . . . . . . . . . . . . . . . . . . . . . . . . . . . . . . . . . . . . . . . . . . . . . . . 220 Earth-Science Reviews 113 (2012) 212–270 ⁎ Corresponding author. Tel.: + 61 2 9351 4255. E-mail address: [email protected] (M. Seton). 1 Now at Physics of Geological Processes/School of Geosciences, University of Oslo, 0316 Oslo, Norway. 0012-8252/$ – see front matter © 2012 Elsevier B.V. All rights reserved. doi:10.1016/j.earscirev.2012.03.002 Contents lists available at SciVerse ScienceDirect Earth-Science Reviews journal homepage: www.elsevier.com/locate/earscirev
-
Upload
khangminh22 -
Category
Documents
-
view
0 -
download
0
Transcript of Earth-Science Reviews - EarthByte

Earth-Science Reviews 113 (2012) 212–270
Contents lists available at SciVerse ScienceDirect
Earth-Science Reviews
j ourna l homepage: www.e lsev ie r .com/ locate /earsc i rev
Global continental and ocean basin reconstructions since 200 Ma
M. Seton a,⁎, R.D. Müller a, S. Zahirovic a, C. Gaina b,1, T. Torsvik b,c,d,e, G. Shephard a, A. Talsma a, M. Gurnis f,M. Turner f, S. Maus h, M. Chandler g
a EarthByte Group, School of Geosciences, Madsen Building F09, University of Sydney, NSW, 2006, Australiab Centre for Geodynamics, Geological Survey of Norway, Leiv Eirikssons vei 39, N-7491 Trondheim, Norwayc Physics of Geological Processes/School of Geosciences, University of Oslo, 0316 Oslo, Norwayd Center for Advanced Study, Norwegian Academy of Science and Letters, Drammensveien 78, 0271 Oslo, Norwaye School of Geosciences, University of the Witwatersrand, Wits 2050, South Africaf Seismological Laboratory, California Institute of Technology, Pasadena, CA, USAg School of Ocean and Earth Science and Technology (SOEST), University of Hawai'i at Manoa, 1680 East–west Rd., POST # 806, Honolulu, HI 96822, USAh National Geophysical Data Center, NOAA, 325 Broadway, Boulder, CO 80305-3328, USA
⁎ Corresponding author. Tel.: +61 2 9351 4255.E-mail address: [email protected] (M. Seto
1 Now at Physics of Geological Processes/School of Ge
0012-8252/$ – see front matter © 2012 Elsevier B.V. Alldoi:10.1016/j.earscirev.2012.03.002
a b s t r a c t
a r t i c l e i n f oArticle history:Received 16 March 2011Accepted 2 March 2012Available online 15 March 2012
Keywords:Plate reconstructionsPlate motion modelPanthalassaLaurasiaTethysGondwana
Global plate motion models provide a spatial and temporal framework for geological data and have beeneffective tools for exploring processes occurring at the earth's surface. However, published models eitherhave insufficient temporal coverage or fail to treat tectonic plates in a self-consistent manner. They usuallyconsider the motions of selected features attached to tectonic plates, such as continents, but generally donot explicitly account for the continuous evolution of plate boundaries through time. In order to explorethe coupling between the surface and mantle, plate models are required that extend over at least a fewhundred million years and treat plates as dynamic features with dynamically evolving plate boundaries. Wehave constructed a new type of global plate motionmodel consisting of a set of continuously-closing topologicalplate polygons with associated plate boundaries and plate velocities since the break-up of the supercontinentPangea. Our model is underpinned by plate motions derived from reconstructing the seafloor-spreading historyof the ocean basins and motions of the continents and utilizes a hybrid absolute reference frame, based on amoving hotspot model for the last 100 Ma, and a true-polar wander corrected paleomagnetic model for 200to 100 Ma. Detailed regional geological and geophysical observations constrain plate boundary inception orcessation, and time-dependent geometry. Although our plate model is primarily designed as a referencemodel for a new generation of geodynamic studies by providing the surface boundary conditions for the deepearth, it is also useful for studies in disparate fields when a framework is needed for analyzing and interpretingspatio-temporal data.
© 2012 Elsevier B.V. All rights reserved.
Contents
1. Introduction . . . . . . . . . . . . . . . . . . . . . . . . . . . . . . . . . . . . . . . . . . . . . . . . . . . . . . . . . . . . . . 2132. Methodology . . . . . . . . . . . . . . . . . . . . . . . . . . . . . . . . . . . . . . . . . . . . . . . . . . . . . . . . . . . . . 214
2.1. Absolute reference frames . . . . . . . . . . . . . . . . . . . . . . . . . . . . . . . . . . . . . . . . . . . . . . . . . . . . 2142.2. Relative plate motions . . . . . . . . . . . . . . . . . . . . . . . . . . . . . . . . . . . . . . . . . . . . . . . . . . . . . . 2142.3. Geomagnetic polarity timescales . . . . . . . . . . . . . . . . . . . . . . . . . . . . . . . . . . . . . . . . . . . . . . . . . 2162.4. Continuously closed plate polygons . . . . . . . . . . . . . . . . . . . . . . . . . . . . . . . . . . . . . . . . . . . . . . . . 216
3. Regional continental and ocean floor reconstructions . . . . . . . . . . . . . . . . . . . . . . . . . . . . . . . . . . . . . . . . . . . 2173.1. Atlantic and Arctic . . . . . . . . . . . . . . . . . . . . . . . . . . . . . . . . . . . . . . . . . . . . . . . . . . . . . . . 217
3.1.1. South Atlantic . . . . . . . . . . . . . . . . . . . . . . . . . . . . . . . . . . . . . . . . . . . . . . . . . . . . . 2173.1.2. Central Atlantic . . . . . . . . . . . . . . . . . . . . . . . . . . . . . . . . . . . . . . . . . . . . . . . . . . . . . 2183.1.3. Northern Atlantic . . . . . . . . . . . . . . . . . . . . . . . . . . . . . . . . . . . . . . . . . . . . . . . . . . . . 220
n).osciences, University of Oslo, 0316 Oslo, Norway.
rights reserved.
213M. Seton et al. / Earth-Science Reviews 113 (2012) 212–270
3.1.4. Arctic Basins . . . . . . . . . . . . . . . . . . . . . . . . . . . . . . . . . . . . . . . . . . . . . . . . . . . . . . 2243.2. Pacific Ocean and Panthalassa . . . . . . . . . . . . . . . . . . . . . . . . . . . . . . . . . . . . . . . . . . . . . . . . . . 225
3.2.1. Izanagi plate . . . . . . . . . . . . . . . . . . . . . . . . . . . . . . . . . . . . . . . . . . . . . . . . . . . . . . 2253.2.2. Farallon plate . . . . . . . . . . . . . . . . . . . . . . . . . . . . . . . . . . . . . . . . . . . . . . . . . . . . . 2273.2.3. Phoenix plate . . . . . . . . . . . . . . . . . . . . . . . . . . . . . . . . . . . . . . . . . . . . . . . . . . . . . 235
3.3. Tethys/Indian Ocean . . . . . . . . . . . . . . . . . . . . . . . . . . . . . . . . . . . . . . . . . . . . . . . . . . . . . . 2393.3.1. East African margins . . . . . . . . . . . . . . . . . . . . . . . . . . . . . . . . . . . . . . . . . . . . . . . . . . 2393.3.2. Antarctic margin . . . . . . . . . . . . . . . . . . . . . . . . . . . . . . . . . . . . . . . . . . . . . . . . . . . . 2413.3.3. West Australian margins . . . . . . . . . . . . . . . . . . . . . . . . . . . . . . . . . . . . . . . . . . . . . . . . 2423.3.4. Tethys Ocean . . . . . . . . . . . . . . . . . . . . . . . . . . . . . . . . . . . . . . . . . . . . . . . . . . . . . 243
3.4. Marginal and back-arc basins . . . . . . . . . . . . . . . . . . . . . . . . . . . . . . . . . . . . . . . . . . . . . . . . . . 2453.4.1. Caribbean . . . . . . . . . . . . . . . . . . . . . . . . . . . . . . . . . . . . . . . . . . . . . . . . . . . . . . . 2453.4.2. Mongol–Okhotsk Basin . . . . . . . . . . . . . . . . . . . . . . . . . . . . . . . . . . . . . . . . . . . . . . . . . 2473.4.3. North American margins . . . . . . . . . . . . . . . . . . . . . . . . . . . . . . . . . . . . . . . . . . . . . . . . 2473.4.4. Proto-South China Sea . . . . . . . . . . . . . . . . . . . . . . . . . . . . . . . . . . . . . . . . . . . . . . . . . 2483.4.5. Western Pacific and SE Asian back-arc basins . . . . . . . . . . . . . . . . . . . . . . . . . . . . . . . . . . . . . . 2483.4.6. SW Pacific Back-arc basins and marginal seas . . . . . . . . . . . . . . . . . . . . . . . . . . . . . . . . . . . . . . 248
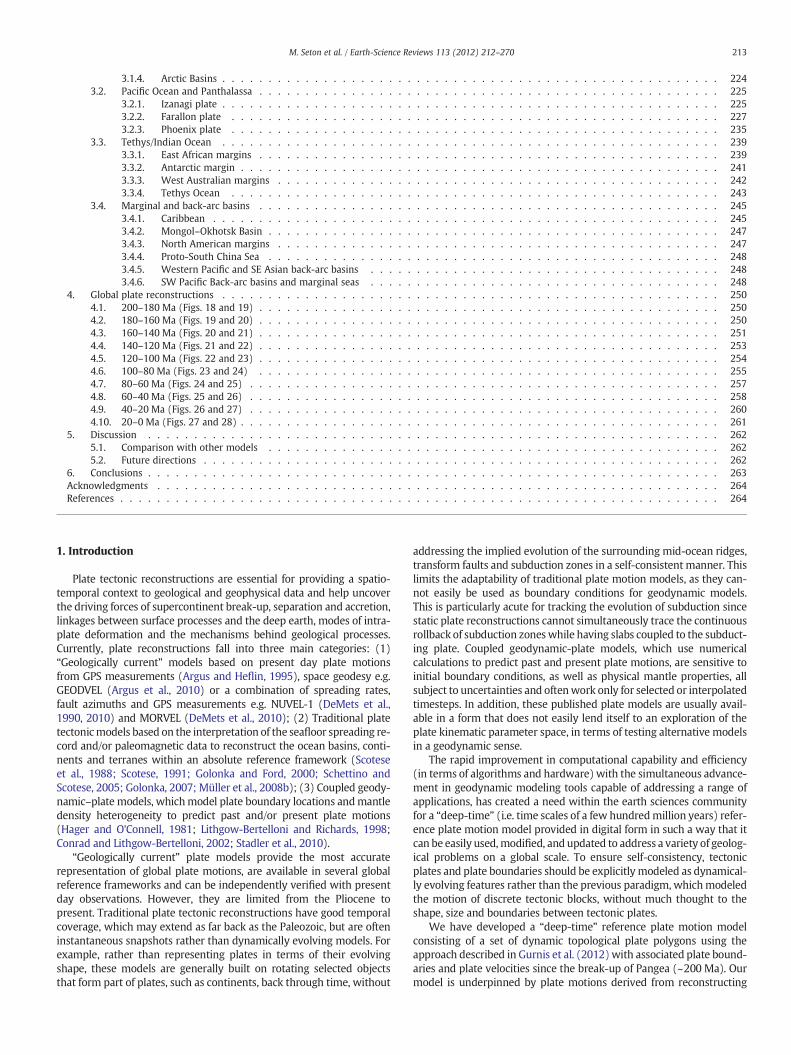
4. Global plate reconstructions . . . . . . . . . . . . . . . . . . . . . . . . . . . . . . . . . . . . . . . . . . . . . . . . . . . . . . 2504.1. 200–180 Ma (Figs. 18 and 19) . . . . . . . . . . . . . . . . . . . . . . . . . . . . . . . . . . . . . . . . . . . . . . . . . . 2504.2. 180–160 Ma (Figs. 19 and 20) . . . . . . . . . . . . . . . . . . . . . . . . . . . . . . . . . . . . . . . . . . . . . . . . . . 2504.3. 160–140 Ma (Figs. 20 and 21) . . . . . . . . . . . . . . . . . . . . . . . . . . . . . . . . . . . . . . . . . . . . . . . . . . 2514.4. 140–120 Ma (Figs. 21 and 22) . . . . . . . . . . . . . . . . . . . . . . . . . . . . . . . . . . . . . . . . . . . . . . . . . . 2534.5. 120–100 Ma (Figs. 22 and 23) . . . . . . . . . . . . . . . . . . . . . . . . . . . . . . . . . . . . . . . . . . . . . . . . . . 2544.6. 100–80 Ma (Figs. 23 and 24) . . . . . . . . . . . . . . . . . . . . . . . . . . . . . . . . . . . . . . . . . . . . . . . . . . 2554.7. 80–60 Ma (Figs. 24 and 25) . . . . . . . . . . . . . . . . . . . . . . . . . . . . . . . . . . . . . . . . . . . . . . . . . . . 2574.8. 60–40 Ma (Figs. 25 and 26) . . . . . . . . . . . . . . . . . . . . . . . . . . . . . . . . . . . . . . . . . . . . . . . . . . . 2584.9. 40–20 Ma (Figs. 26 and 27) . . . . . . . . . . . . . . . . . . . . . . . . . . . . . . . . . . . . . . . . . . . . . . . . . . . 2604.10. 20–0 Ma (Figs. 27 and 28) . . . . . . . . . . . . . . . . . . . . . . . . . . . . . . . . . . . . . . . . . . . . . . . . . . . . 261
5. Discussion . . . . . . . . . . . . . . . . . . . . . . . . . . . . . . . . . . . . . . . . . . . . . . . . . . . . . . . . . . . . . . 2625.1. Comparison with other models . . . . . . . . . . . . . . . . . . . . . . . . . . . . . . . . . . . . . . . . . . . . . . . . . 2625.2. Future directions . . . . . . . . . . . . . . . . . . . . . . . . . . . . . . . . . . . . . . . . . . . . . . . . . . . . . . . . 262
6. Conclusions . . . . . . . . . . . . . . . . . . . . . . . . . . . . . . . . . . . . . . . . . . . . . . . . . . . . . . . . . . . . . . 263Acknowledgments . . . . . . . . . . . . . . . . . . . . . . . . . . . . . . . . . . . . . . . . . . . . . . . . . . . . . . . . . . . . . 264References . . . . . . . . . . . . . . . . . . . . . . . . . . . . . . . . . . . . . . . . . . . . . . . . . . . . . . . . . . . . . . . . . 264
1. Introduction
Plate tectonic reconstructions are essential for providing a spatio-temporal context to geological and geophysical data and help uncoverthe driving forces of supercontinent break-up, separation and accretion,linkages between surface processes and the deep earth, modes of intra-plate deformation and the mechanisms behind geological processes.Currently, plate reconstructions fall into three main categories: (1)“Geologically current” models based on present day plate motionsfrom GPS measurements (Argus and Heflin, 1995), space geodesy e.g.GEODVEL (Argus et al., 2010) or a combination of spreading rates,fault azimuths and GPS measurements e.g. NUVEL-1 (DeMets et al.,1990, 2010) and MORVEL (DeMets et al., 2010); (2) Traditional platetectonicmodels based on the interpretation of the seafloor spreading re-cord and/or paleomagnetic data to reconstruct the ocean basins, conti-nents and terranes within an absolute reference framework (Scoteseet al., 1988; Scotese, 1991; Golonka and Ford, 2000; Schettino andScotese, 2005; Golonka, 2007; Müller et al., 2008b); (3) Coupled geody-namic–plate models, whichmodel plate boundary locations andmantledensity heterogeneity to predict past and/or present plate motions(Hager and O'Connell, 1981; Lithgow-Bertelloni and Richards, 1998;Conrad and Lithgow-Bertelloni, 2002; Stadler et al., 2010).
“Geologically current” plate models provide the most accuraterepresentation of global plate motions, are available in several globalreference frameworks and can be independently verified with presentday observations. However, they are limited from the Pliocene topresent. Traditional plate tectonic reconstructions have good temporalcoverage, which may extend as far back as the Paleozoic, but are ofteninstantaneous snapshots rather than dynamically evolving models. Forexample, rather than representing plates in terms of their evolvingshape, these models are generally built on rotating selected objectsthat form part of plates, such as continents, back through time, without
addressing the implied evolution of the surrounding mid-ocean ridges,transform faults and subduction zones in a self-consistent manner. Thislimits the adaptability of traditional plate motion models, as they can-not easily be used as boundary conditions for geodynamic models.This is particularly acute for tracking the evolution of subduction sincestatic plate reconstructions cannot simultaneously trace the continuousrollback of subduction zoneswhile having slabs coupled to the subduct-ing plate. Coupled geodynamic-plate models, which use numericalcalculations to predict past and present plate motions, are sensitive toinitial boundary conditions, as well as physical mantle properties, allsubject to uncertainties and oftenwork only for selected or interpolatedtimesteps. In addition, these published plate models are usually avail-able in a form that does not easily lend itself to an exploration of theplate kinematic parameter space, in terms of testing alternative modelsin a geodynamic sense.
The rapid improvement in computational capability and efficiency(in terms of algorithms and hardware) with the simultaneous advance-ment in geodynamic modeling tools capable of addressing a range ofapplications, has created a need within the earth sciences communityfor a “deep-time” (i.e. time scales of a few hundredmillion years) refer-ence plate motion model provided in digital form in such a way that itcan be easily used,modified, and updated to address a variety of geolog-ical problems on a global scale. To ensure self-consistency, tectonicplates and plate boundaries should be explicitly modeled as dynamical-ly evolving features rather than the previous paradigm, whichmodeledthe motion of discrete tectonic blocks, without much thought to theshape, size and boundaries between tectonic plates.
We have developed a “deep-time” reference plate motion modelconsisting of a set of dynamic topological plate polygons using theapproach described in Gurnis et al. (2012)with associated plate bound-aries and plate velocities since the break-up of Pangea (~200 Ma). Ourmodel is underpinned by plate motions derived from reconstructing

0˚ 30˚ 60˚ 90˚ 120˚ 150˚ 180˚ −150˚ −120˚ −90˚ −60˚ −30˚ 0˚
−60˚
−30˚
0˚
30˚
60˚
ANTANT
NAZSAM
PAC
AUS
PH
EUR NAM
CCAR
CAP
INDAFR
J
SOM
ARA
−50 −42 −34 −26 −18 −10 −2 2 9 16 23 30 37 44 49 50
Gravity Anomaly [mGals]
Fig. 1. Global gravity anomalies from satellite altimetry (Sandwell and Smith 2009). Red lines denote present day plate boundaries from the plate boundary set presented in thisstudy. AFR= Africa, ANT= Antarctica, ARA= Arabia, AUS= Australia, C = Cocos, CAP= Capricorn, CAR= Caribbean, EUR= Eurasia, IND= India, NAM=North America, NAZ=Nazca, PAC = Pacific, PH = Philippine, SAM = South America, SOM = Somalia. (For interpretation of the references to color in this figure legend, the reader is referred to the webversion of this article.)
214 M. Seton et al. / Earth-Science Reviews 113 (2012) 212–270
the seafloor-spreading history of the ocean basins and motions of thecontinents and built around a hybrid absolute reference frame. In recon-structing the ocean floor, we use satellite-derived gravity anomalies(Sandwell and Smith, 2009) (Fig. 1) and an updated set of magneticanomaly identifications to construct seafloor spreading isochrons for allthe major oceanic plates. We use a combination of public and in-housemagnetic anomaly data, which were line leveled and then gridded, toproduce global magnetic anomaly grids and compare with our seafloorspreading isochrons (Figs. 2, 3, 5–7, 9, 11, 13, 14). We derive a globalset of finite rotations for relative motions between all the major plates.In addition, we restore now-subducted oceanic crust for themajor platesfollowing themethodology inMüller et al. (2008b), by using evidence ofsubduction, slabwindows and anomalous volcanism from onshore geol-ogy and the rules of plate tectonics.We create a set of dynamically closedplate polygons in onemillion year time intervals,which evolve froma se-ries of dynamically evolving plate boundaries (Figs. 18–28).
In building a topological closed plate polygon network, we havedeliberately excluded many of the smaller tectonic plates andmicro-plates in order to produce a self-consistent global dataset forthe community. However, the method of Gurnis et al. (2012) allowsfor construction of more detailed topological plate polygon networks.The data involved in reproducing our models are being made publiclyavailable enabling researchers to either use our model as a frameworkin which to build upon for their particular area of expertise, input intogeodynamic simulations as surface boundary conditions or to under-stand the context of regional tectonics. We hope that this paper andthe accompanying data will help those researchers from disparatefields critically evaluate plate reconstructions, determine areas inneed of further analysis, use as a basis to further refine models andexplore the limitations and sources of error inherent in plate motionmodels.
2. Methodology
There are four main components that comprise our plate motionmodel: an absolute reference frame, the relative motions between tec-tonic plates linked via a plate circuit, the geomagnetic polarity timescaleand a collection of plate boundaries that combine to form a network of
continuously closed plate polygons. The continuously closed plate poly-gons were created using GPlates software (www.gplates.org).
2.1. Absolute reference frames
The anchor for any global plate motion model is an absolute refer-ence frame (i.e. how the plates move relative to a fixed referencesystem, such as the spin axis). A comprehensive discussion of abso-lute reference frames and the merits of each can be found in Torsviket al. (2008). Our model uses a hybrid reference frame, which mergesa moving Indian/Atlantic hotspot reference frame (O'Neill et al.,2005) back to 100 Ma with a paleomagnetically-derived true polarwander corrected reference frame (Steinberger and Torsvik, 2008)back to 200 Ma. This reference frame links to the global plate circuitthrough Africa, as Africa has been surrounded by mid-ocean ridgesfor at least the last 170 Ma and, according to Torsvik et al. (2008),Africa has moved less than 500 km over the past 100 Ma.
All the major tectonic plates are linked to Africa via the seafloorspreading or rifting back to 200 Ma, except the Pacific and associatedplates, such as the Farallon, Izanagi, Phoenix and Kula. The Pacificplate can only be linked to the plate circuit for times younger than83.5 Ma, after the establishment of seafloor spreading between thePacific and West Antarctic plates. Prior to this time we switch to afixed Pacific hotspot reference frame for the Pacific plate, using acombination of Wessel and Kroenke (2008) and Wessel et al.(2006). We assume that the Pacific reference frame is fixed relativeto other hotspots as we have no reliable model for whether the Pacificmantle plumes moved relative to each other or relative to the Earth'sspin axis before 83.5 Ma, although some authors have invoked motionbetween some hotspots in the Pacific to account for paleo-latitude esti-mates from paleomagnetic data for the Ontong-Java Plateau (Riisageret al., 2003).
2.2. Relative plate motions
In building our relative plate motion model, we combine pub-lished and new magnetic anomaly identifications (magnetic anomalypicks) and their associated rotations to construct a global set of

−80˚ −70˚ −60˚ −50˚ −40˚ −30˚ −20˚ −10˚ 0˚ 10˚ 20˚−60˚
−50˚
−40˚
−30˚
−20˚
−10˚
0˚
10˚
−80˚ −70˚ −60˚ −50˚ −40˚ −30˚ −20˚ −10˚ 0˚ 10˚ 20˚−60˚
−50˚
−40˚
−30˚
−20˚
−10˚
0˚
10˚
−50 −40 −30 −20 −10 0 10 20 30 40 50
Magnetic Intensity Anomaly [nTesla]
Plate BoundaryIsochrons
SAM-AFRExtinct Ridge
Tectonic Boundary
AFR-EANT
SAM-EANT
SAM-MAL
NAM-NWA
BB & OTH
SouthAmerica
Colorado
Patagonia
Parana
P-E
RG
NW Africa
South Africa
Southern/Austral Segment
Central Segment
BT
BT
AB
WR
AB
WRRG
Equatorial Segment
Falkland Segment
Scotia Sea
SouthAmerica
Colorado
Patagonia
Parana
NW Africa
South Africa
Southern/Austral Segment
Central Segment
Equatorial Segment
Falkland Segment
Scotia Sea
Antarctica
LIPproduct
Non-oceanic
a
b
Fig. 2. (a) Gridded magnetic anomalies for the South Atlantic. Seafloor spreadingisochrons used in this study plotted as thin black lines. Due to poor data coverage,correlations between the gridded data and isochrons are difficult. AB = AgulhasBasin, BT = Benue Trough, P-E = Parana Flood Basalts, RG = Rio-Grande Rise, WR =Walvis Ridge. (b) Seafloor spreading isochron map colored by spreading system orplate pair. Map abbreviations are same as a. Legend abbreviations are: AFR = SouthAfrica, BB = Back-arc Basins, EANT = East Antarctica/Antarctica, MAL = Malvinas,NWA = Northwest Africa, OTH = Other spreading systems outside area of interest,SAM = South America.
−80˚ −70˚ −60˚ −50˚ −40˚ −30˚ −20˚ −10˚ 0˚ 10˚
0˚
10˚
20˚
30˚
40˚
50˚
60˚
−50 −40 −30 −20 −10 0 10 20 30 40 50
Magnetic Intensity Anomaly [nTesla]
−80˚ −70˚ −60˚ −50˚ −40˚ −30˚ −20˚ −10˚ 0˚ 10˚
0˚
10˚
20˚
30˚
40˚
50˚
60˚
NorthAmerica NF
Eurasia
Iberia
NWAfrica
SouthAmerica
Caribbean CLIP
Greenland
Lab Sea
CentralAtlantic
EquatorialAtlantic
BBKT
CG
NorthAmerica NF
Eurasia
Iberia
NWAfrica
SouthAmerica
CLIP
Greenland
Lab Sea
CentralAtlantic
Caribbean
Equatorial Atlantic
BB
RT
RP
KT
CG
RR
MM
MM
DS
DS
RT
RP
RR
a
b
Plate BoundaryIsochrons
SAM-AFRExtinct Ridge
Tectonic Boundary
NAM-POR
GRN-EUR
NAM-EUR
NAM-NWA
NAM-IBR
NAM-GRN
BB & OTH
LIPproduct
Non-oceanic
Fig. 3. (a) Gridded magnetic anomalies for the Central and North Atlantic. Seafloorspreading isochrons used in this study plotted as thin black lines. BB = Bay of Biscay,CG = Charlie-Gibbs Fracture Zone, CLIP = Caribbean Large Igneous Province, DS =Davis Strait, JFZ = Jacksonville Fracture Zone, KT = Kings Trough, MM=Morocco Me-seta, NF = Newfoundland, RR = Rekyjanes Ridge, RP = Rockall Plateau, RT = RockallTrough. (b) Seafloor spreading isochron map colored by spreading system or plate pair.Map abbreviations are same as a. Legend abbreviations are: AFR = Africa, BB = Back-arc Basins, EUR = Eurasia, GRN = Greenland, IBR = Iberia, NAM = North America,NWA = Northwest Africa, OTH = Other spreading systems outside area of interest,POR = Porcupine, SAM = South America.
215M. Seton et al. / Earth-Science Reviews 113 (2012) 212–270
seafloor spreading isochrons (see Section 3: Regional continental andocean floor reconstructions for details). This is largely based on theglobal plate model presented in Müller et al. (2008a), which buildsupon the present day seafloor agegrid work of Müller et al. (1997)and includes a database consisting of over 70,000 magnetic anomalyidentifications, extinct and active spreading ridge locations and bound-ary locations defining the transition from continental to oceaniccrust. Seafloor spreading isochrons were constructed at Chrons 5o(10.9 Ma), 6o (20.1 Ma), 13y (33.1 Ma), 18o (40.1 Ma), 21o (47.9 Ma),
25y (55.9 Ma), 31y (67.7 Ma), 34y (83.5 Ma), M0 (120.4 Ma), M4(126.7 Ma), M10 (131.9 Ma), M16 (139.6 Ma), M21 (147.7 Ma), andM25 (154.3 Ma) with more detailed timesteps during major tectonic

216 M. Seton et al. / Earth-Science Reviews 113 (2012) 212–270
events. A finer set of seafloor spreading isochrons was drawn in back-arc and marginal basins. Quoted ages use Cande and Kent (1995) fortimes after 83.5 Ma and Gradstein et al. (1994) for times prior to83.5 Ma. The letter “y” stands for young end of chron and “o” for oldend of chron. We verify our isochron interpretation by correlatingwith the magnetic lineations in the World Digital Magnetic AnomalyMap (WDMAM) (Maus et al., 2007), the Earth Magnetic Anomaly Grid(EMAG2) (Maus et al., 2009) and our own preferredmagnetic anomalycompilation (Fig. 2). EMAG2 includes a compilation of both ship-trackand long-wavelength satellite magnetic anomaly data with trend-gridding based on the Müller et al. (2008a) isochrons in most areas,hence WDMAM and our own compilation are preferred for correlation.We constrain fracture zone locations using global gravity from satellitealtimetry (Sandwell and Smith, 1997, 2005) (Fig. 1). The boundarybetween oceanic and continental lithosphere was taken from Mülleret al. (2008a), except where otherwise stated in the text.
The computation of finite rotations and construction of seafloorspreading isochrons are relatively straightforward for areas whereboth flanks of a spreading system are preserved (e.g. Atlantic, SEIndian Ridge, Pacific–Antarctic Ridge), but becomes more problematicin other settings. When only one flank of a spreading system ispreserved (e.g. Pacific–Farallon, Pacific–Kula, Pacific–Izanagi, Pacific–Phoenix), we compute half-stage rotations (stage rotation betweenadjacent isochrons on one flank) and double the half-stage angle (i.e.assume that spreading was symmetrical) to create a full stage rotation,following the methodology of Stock and Molnar (1988). This assump-tion of spreading symmetry is reasonable as the maximum cumulativespreading asymmetry globally is only 10%, on average (Müller et al.,1998b). In instances where crust from both flanks has been subducted,we rely on the onshore geological record (e.g. mapping of majorsutures, terrane boundaries and active and ancient magmatic arcs) tohelp define the locations of paleo-plate boundaries and use inferencesfrom younger, preserved crust to estimate earlier spreading directionsand rates. Where continental terranes have crossed ocean basins weuse the implied history of mid-ocean ridge evolution and subductionto create synthetic ocean floor by constructing isochrons based onassuming spreading symmetry and ensuring triple junction closure.The location of mid-ocean ridges as they intersect continents can befurther constrained by tracking slabwindow formation along continen-tal margins (Thorkelson, 1996) and their correlation to anomalousgeochemistry and volcanism (Bradley et al., 1993; Sisson and Pavlis,1993; Breitsprecher et al., 2003; Madsen et al., 2006), elevated geother-mal gradients (Bradley et al., 1993; Thorkelson, 1996; Lewis et al., 2000)and the eruption ofmassive sulfides (Haeussler et al., 1995; Rosenbaumet al., 2005).We do not use arguments for the location subduction basedon mantle tomography as our model is solely underpinned by surfaceconstraints.
Triple junction closure follows the rules set out in McKenzie andMorgan (1969) where we assume that the ridge axes are perpendic-ular to the spreading direction, transform faults are purely strike-slip features, plates are rigid and spreading is symmetrical. We usethe finite difference method to compute spreading along the thirdarm of a triple junction. In addition, we assume that ridge–ridge–ridge triple junctions are stable features, but note that there isevidence that fast seafloor spreading rates cause triple junction insta-bility and complexities in spreading (Bird and Naar, 1994).
2.3. Geomagnetic polarity timescales
Geomagnetic polarity timescales (GPTS) correlate the reversals ofthe Earth's geomagnetic field, most often the sequence of magneticanomalies recorded on the ocean floor, to those based on biostratigra-phy, cyclostratigraphy (which includes Earth's orbital variations),absolute ages from radiometric studies and average spreading ratesfor interpolation.
The early GPTS for the Cenozoic (Heirtzler et al., 1968) andMesozoic (Larson and Pitman, 1972) have been superseded by arange of updated timescales. Cande and Kent (1995) (CK95) devel-oped a timescale for the Cenozoic (0–83.5 Ma) based on a model ofsmoothly varying spreading rates in the South Atlantic (Cande andKent, 1992) with the inclusion of astronomical information for thepast 5.23 Ma. Gradstein et al. (1994) (G94) presented an integratedgeomagnetic and stratigraphic Mesozoic timescale, which is com-monly merged with the CK95 timescale to create a hybrid timescalethrough to the Mesozoic (e.g. (Müller et al., 2008b)). The GTS2004timescale (Gradstein et al., 2004) recalibrated CK95 using alternativetie-points from updated radiometric ages and astronomical tuning forthe Cenozoic and updated the Mesozoic timescale using the method-ology of Cande and Kent (1992) and additional radiometric ageconstraints. The most recent GPTS (Gee and Kent, 2007) is a hybridmodel, which uses CK95 for the Cenozoic and CENT94 (Channell,1995) for the Mesozoic and includes sub-chrons from Lowrie andKent (2004). The choice of GPTS (i.e. the ages assigned to each mag-netic anomaly chron) has major implications for the timing of geolog-ical events and the significance of geological processes. For example,the inferred mid-Cretaceous seafloor spreading pulse (Larson, 1995)is apparent if using the CK94G95 timescale but diminished if usingGTS2004 due to a ~4 million year difference in the age assigned toM0 (~120 Ma) (Seton et al., 2009) (Table 1).
The occurrence of magnetic reversals in the so-called JurassicQuiet Zone is not awidely accepted explanation formagnetic anomaliesof ages 157 Ma and older, which are rather modeled as geomagneticintensity variations (Gee and Kent, 2007). Despite this, geomagnetictimescales based on detailed magnetic anomalies collected closer tothe seafloor (using a deep towed magnetometer) in regions of highseafloor spreading rates (in the Pacific ocean) suggest the existence of arange of short reversals spanning from M29 to M40 (Sager et al., 1998)or M29 to M44 (Tivey et al., 2006) (T06). Dating of Jurassic Quiet Zonebased on the timescale of Sager et al. (1998) has been also attemptedin the Central AtlanticOceanbyRoeser et al. (2002) andBird et al. (2007).
We ensure that our data, including magnetic anomaly identifica-tions, finite rotations and seafloor spreading isochrons are calibratedto one timescale. We choose the CK95 geomagnetic reversal timescalefor the Cenozoic (to Chron 34y; 0–83.5 Ma), G94 for the Mesozoic(Chrons M0–M33; 120.4–158.1 Ma) and T06 for the Jurassic (ChronsM34–M44; 160.3–169.7 Ma), as our standard. Our continuously closedplate polygons can be combined using either timescale.
2.4. Continuously closed plate polygons
A network of tectonic plates, bounded by a series of plate bound-aries, combines to cover the surface of the Earth. Most plate tectonicmodels reconstruct features on the surface of the Earth withoutregard to the plate margins and are created in time intervals that aretoo sparse for current needs. These models are insufficient for studiesthat couple motions of the plates to other dynamic earth processes,for example mantle convection and oceanic and atmospheric circula-tion. This prompted Gurnis et al. (2012) to develop a novel methodolo-gy to create a set of dynamically closed plate polygons back in time. Thecontinuously closing plate (CCP) methodology works by assigning adifferent Euler pole for each plate boundary that constitutes a platepolygon, ensuring that the polygon remains topologically closed as afunction of time (Gurnis et al., 2012). The feature is built into the platereconstruction software GPlates (Boyden et al., 2011).
We use the CCP method and the base set of plate polygons inGurnis et al. (2012) to create a new set of dynamically closed platepolygons based on the plate motion model presented in this studyfor the last 200 Ma. The plate polygons are built using a series ofplate boundaries, the location and timing of which have been deter-mined by using present day plate boundaries (Bird, 2003), geologicalevidence for locations of island arcs, magmatic arcs, sutures and

Table 1Summary table of magnetic chrons used in this study and referred to in text with agesbased on alternative timescales. CK94, G94, T06 refers to a merged Cande and Kent(1995) (Chrons 0–34), Gradstein et al. (1994) (Chrons M0–M33) and Tivey et al.(2006) (M34–M44) timescale. GTS2004 from Gradstein et al. (2004). GK07 refers tothe timescale presented in Gee and Kent (2007).
Chron Abbreviation Age—CK95,G94, T06
Age—GST 2004 Age—GK07
Young Old Young Old Young Old
C1n 1 0.0 0.8 0.0 0.8 0.0 0.8C2An.1n 2 2.6 3.0 2.5 3.0 2.6 3.0C3An.1n 3 5.9 6.1 6.0 6.3 5.9 6.1C4An 4 8.7 9.0 8.8 9.1 8.7 9.0C5n.2n 5 9.9 10.9 10.0 11.0 9.9 10.9C5Dn 5D 17.3 17.6 17.2 17.5 17.3 17.6C6n 6 19.0 20.1 18.7 19.7 19.0 20.1C7n.2n 7 24.8 25.2 24.2 24.6 24.8 25.2C8n.2n 8 26.0 26.6 25.5 26.2 26.0 26.6C9n 9 27.0 28.0 26.7 27.8 27.0 28.0C10n.1n 10 28.3 28.5 28.2 28.5 28.3 28.5C11n.2n 11 29.8 30.1 29.9 30.2 29.8 30.1C12n 12 30.5 30.9 30.6 31.1 30.5 30.9C13n 13 33.1 33.5 33.3 33.7 33.1 33.5C15n 15 34.7 34.9 34.8 35.0 34.7 34.9C16n.2n 16 35.7 36.3 35.7 36.3 35.7 36.3C17n.1n 17 36.6 37.5 36.5 37.2 36.6 37.5C18n.2n 18 39.6 40.1 39.0 39.5 39.6 40.1C19n 19 41.3 41.5 40.4 40.7 41.3 41.5C20n 20 42.5 43.8 41.6 42.8 42.5 43.8C21n 21 46.3 47.9 45.3 47.2 46.3 47.9C22n 22 49.0 49.7 48.6 49.4 49.0 49.7C23n.2n 23 51.0 51.7 51.1 51.9 51.0 51.7C24n.3n 24 52.9 53.3 53.3 53.8 52.9 53.3C25n 25 55.9 56.4 56.7 57.2 55.9 56.4C26n 26 57.6 57.9 58.4 58.7 57.6 57.9C27n 27 60.9 61.3 61.7 62.0 60.9 61.3C28n 28 62.5 63.6 63.1 64.1 62.5 63.6C29n 29 64.0 64.7 64.4 65.1 64.0 64.7C30n 30 65.6 67.6 65.9 67.7 65.6 67.6C31n 31 67.7 68.7 67.8 68.7 67.7 68.7C32n.1n 32 71.1 71.3 71.0 71.2 71.1 71.3C33n 33 73.6 79.1 73.6 79.5 73.6 79.1C34n 34 83.5 120.4 84.0 125.0 83.0 120.6M0r M0 120.4 121.0 124.6 125.0 120.6 121.0M1n M1 121.0 123.7 125.0 127.6 121.0 123.2M3n M3 124.1 124.7 127.6 128.1 123.6 124.1M5n/M4 M4 126.7 127.7 129.8 130.8 125.7 126.6M6n M6 128.2 128.3 131.2 131.4 126.9 127.1M7n M7 128.4 128.6 131.6 131.9 127.2 127.5M8n M8 129.0 129.3 132.2 132.5 127.8 128.1M9n M9 129.5 129.8 132.8 133.1 128.3 128.6M10n M10 130.2 130.6 133.5 133.9 128.9 129.3M10Nn.3n M10N 131.6 131.9 135.0 135.3 130.2 130.5M11n M11 132.1 132.7 135.7 136.4 130.8 131.5M12n M12 134.0 134.2 137.6 137.8 132.6 132.8M13n M13 135.3 135.5 139.1 139.3 134.1 134.3M14n M14 135.8 136.0 139.5 139.8 134.5 134.8M15n M15 136.2 137.2 140.4 140.7 135.6 136.0M16n M16 137.9 139.6 141.1 142.1 136.5 137.9M17n M17 140.3 140.8 142.6 142.8 138.5 138.9M18n M18 142.4 143.0 144.0 144.6 140.5 141.2M19n M19 143.7 144.7 145.1 146.0 141.9 143.1M20n.2n M20 145.4 146.0 146.5 147.2 143.8 144.7M21n M21 146.8 147.7 147.8 148.5 145.5 146.6M22n.1n M22 148.1 149.5 148.9 150.1 147.1 148.6M23n.1n M23 150.7 151.1 151.0 151.3 150.0 150.7M24n.1n M24 152.1 152.5 152.3 152.5 151.4 151.7M25n M25 154.1 154.3 154.1 154.4 153.4 154.0M26.1n M26 155.0 155.1 155.1 155.1 154.3 155.3M27n M27 155.4 155.5 155.7 155.9 155.6 155.8M28n M28 155.7 155.8 156.0 156.3 156.1 156.2M29.1n M29 156.0 156.1 157.3 157.4 156.5 157.3M30.1n M30 156.8 157.2 N/A N/A N/A N/AM31n M31 157.4 157.6 N/A N/A N/A N/AM32n M32 157.7 157.9 N/A N/A N/A N/AM33n M33 158.0 158.1 N/A N/A N/A N/AM34 M34 160.3 160.9 N/A N/A N/A N/AM35 M35 161.0 161.1 N/A N/A N/A N/A
Table 1 (continued)
Chron Abbreviation Age—CK95,G94, T06
Age—GST 2004 Age—GK07
Young Old Young Old Young Old
M36 M36 161.3 161.8 N/A N/A N/A N/AM37 M37 162.0 162.4 N/A N/A N/A N/AM38 M38 162.5 163.5 N/A N/A N/A N/AM39 M39 163.7 165.4 N/A N/A N/A N/AM40 M40 165.5 166.2 N/A N/A N/A N/AM41 M41 166.3 167.0 N/A N/A N/A N/AM42 M42 167.1 168.2 N/A N/A N/A N/AM43 M43 168.2 168.9 N/A N/A N/A N/AM44 M44 168.9 169.7 N/A N/A N/A N/A
217M. Seton et al. / Earth-Science Reviews 113 (2012) 212–270
major faults through time as well as an analysis of plate motion vectorsbased on our kinematic model. The Euler poles describing themotion ofeach plate margin are derived from the plate tectonic model presentedin this study. Each plate boundary featurewithin the dataset has a set offeature-specific attributes assigned. For example, mid-ocean ridgefeatures include information on the plate to the left and right of thespreading ridge and whether it is an active or extinct feature; subduc-tion zones contain information regarding the polarity of subduction,dip angle (when known) and the duration of activity; transform faultstrack the sense and direction of motion.
Our set of continuously closed plate polygons covers the entire sur-face of the Earth with no gaps in one million year time intervals. Thesecan be used as input into geodynamic modeling software, to extractplate velocity data for each tectonic plate through time, to reconstructraster data and to “cookie-cut” geological data based on tectonic plate.Using the CCP algorithm code in GPlates, the time interval betweenclosed polygons can be made arbitrarily small and is only limited tohow the underlying start and end ages of both margins and polygonshas been encoded. For ease of use, the polygons are presented as staticpolygons at 1 million year time intervals. All data are available in digitalformat and can be downloaded from the following location: ftp://ftp.earthbyte.org/papers/Seton_etal_Global_ESR/Seton_etal_Data.zip.
3. Regional continental and ocean floor reconstructions
In the following section, we will describe the plate kinematicmodels we used for each region of the world. We separate the globeinto four main regions: the Atlantic and Arctic; the Pacific andPanthalassa; the Tethys and Indian/Southern Ocean; and marginaland back-arc basins. We suggest that the accompanying data withthis paper be loaded in order to most easily follow the plate bound-aries and configurations mentioned in the text.
3.1. Atlantic and Arctic
3.1.1. South AtlanticOver the recent decades there has been considerable debate on
the exact timing and kinematics of the opening of the South AtlanticOcean. It is commonly accepted that rifting in the South Atlanticoccurred progressively from south to north along reactivated oldertectonic lineaments dating from the late Triassic–early Jurassic(Daly et al., 1989) and was associated with substantial intra-continental deformation within Africa and South America(Unternehr et al., 1988; Nürnberg and Müller, 1991; Eagles, 2007;Torsvik et al., 2009; Moulin et al., 2010). To account for these motions,South America and Africa are subdivided using Jurassic–Cretaceoussedimentary basins, which document the various rift phases relatedto the dispersal of west Gondwana. South America is commonly sub-divided into the Patagonia, Colorado and Parana subplates and Africainto South, Northwest and Northeast Africa (Nürnberg and Müller,1991; Torsvik et al., 2009) (Fig. 2). Internal deformation withinboth continents is required to minimize gaps/overlaps in full-fit

218 M. Seton et al. / Earth-Science Reviews 113 (2012) 212–270
reconstructions (see discussions in Eagles, 2007, Torsvik et al., 2009,and Moulin et al., 2010).
Rifting prior to seafloor spreading in the southernmost Atlantic(“Falkland segment”) is believed to have occurred in the early Jurassic(190 Ma) and involved dextral movement between Patagonia and theColorado sub-plate until the early Cretaceous (126.7 Ma) (Torsvik etal., 2009) (Fig. 2). Opening propagated northward into the “Southern/Austral segment” adjacent to the Colorado sub-plate in the late Jurassic(around 150 Ma) based on late Jurassic–early Cretaceous sediment filland activation (Nürnberg and Müller, 1991) and the onset of deforma-tion for a “fit” reconstruction using spreading rate interpolation (Eagles,2007) or early Cretaceous (140 Ma) according to Schettino and Scotese(2005). The model of Torsvik et al. (2009) suggests that rifting wasaccommodated between the Colorado and Parana subplates, Coloradoand Africa, and Parana and Africa from 150 Ma and was associatedwith dextral strike-slip motion between Patagonia/Colorado subplateand Parana (Nürnberg and Müller, 1991; Torsvik et al., 2009). Furthernorth, rifting adjacent to the Parana subplate and south of the WalvisRidge/Rio Grande Rise is believed to have occurred by about 130 Ma(Nürnberg and Müller, 1991), 132 Ma corresponding to the Parana–Etendeka magmatic event peak (Torsvik et al., 2009), 134 Ma basedon the presence of Anomaly M10 and the GTS2004 timescale (Moulinet al., 2010) or 135 Ma based on dating of the continent–ocean transi-tion (Bradley, 2008). The oldest magnetic anomaly that has beenidentified is M4 (~127 Ma) (Nürnberg and Müller, 1991; Torsvik et al.,2009) adjacent to Falkland and Parana/Chacos basin. Coincident withopening along the South Atlantic rift was the activation of the Westand Central African Rift systems and the Central African Shear Zone(Binks and Fairhead, 1992; Genik, 1992; Guiraud and Maurin, 1992;Torsvik et al., 2009).
The “Central” segment of the South Atlantic margin (Fig. 2) ischaracterized by widespread Aptian salt basin formation. Rifting con-tinued propagating northward and extended into the African interior,active in the Benue Trough by at least 118 Ma (Nürnberg and Müller,1991), although earlier extension in the Benue Trough is possible(Torsvik et al., 2009). The onset of seafloor spreading in the “Central”segment is difficult to ascertain because the oceanic crust adjacent tothe margin formed during the Cretaceous Normal Superchron (CNS),however Anomaly M0 has been identified extending to latitude 22°S(Cande et al., 1988; Nürnberg and Müller, 1991; Müller et al., 1999).Torsvik et al. (2009) used the shape and age of the Aptian salt basinsto further refine the opening history in this section of the margin andsuggested that seafloor spreading only reached north of the WalvisRidge–Rio Grande Rise at ~112 Ma, much later than 120.4 Ma sug-gested by previous models.
The “Equatorial” segment of the South Atlantic margin (Fig. 2) wasthe youngest region of plate break-up. Magnetic anomalies cannot beinterpreted due to equatorial formation of the oceanic crust relativeto spreading direction. However, Anomaly 33 and fracture zonesegments are well defined. Seafloor spreading is believed to havepropagated into this area after Anomaly M0 (120.4 Ma) (Nürnbergand Müller, 1991), ~100 Ma (Torsvik et al., 2009), 105 Ma (Moulinet al., 2010) or 102–96 Ma (Eagles, 2007), corresponding to a subtlebend in the fracture zones in the South Atlantic. Either coincidentor subsequent to the opening of the equatorial segment, the areasundergoing continental extension in the African interior ceased butonly after a short-lived compressional phase in the late Cretaceous(around 85–80 Ma) observed in folding and faulting across seismicsections (Nürnberg and Müller, 1991; Binks and Fairhead, 1992;Schettino and Scotese, 2005).
The spreading history along the entire length of the South Atlanticfrom Anomaly 34 (83.5 Ma) onwards is relatively uncomplicated withmost studies in agreement that largely symmetrical spreading occurredafter Anomaly 34 to the present day (LaBrecque and Rabinowitz, 1977;Shaw and Cande, 1990; Nürnberg andMüller, 1991; Torsvik et al., 2009;Moulin et al., 2010). The stability and symmetry of this spreading
system during the Cenozoic led to this region being used as a type ex-ample for calibrating the geomagnetic reversal timescale (Cande andKent, 1992).
Recent models have been developed to refine rifting and minimizemisfits in the South Atlantic. Although no model accurately restoresall continental margins without gaps or overlaps, we find that themodel of Torsvik et al. (2009) agrees well with continental stretchingrates and conjugate margin rifting episodes. We therefore implementthe model of Torsvik et al. (2009) for the early rifting phase of theSouth Atlantic, including intra-continental deformation in SouthAmerica and Africa but adjust their rotations to be consistent withthe Gradstein et al. (1994) timescale for the Mesozoic. In the earlyJurassic (190 Ma), we follow a plate boundary between Patagonia andSouth Africa connected to the Permian–Triassic to Jurassic rifting inthe Karoo Basin (Banks et al., 1995; Catuneanu et al., 2005) and alongthe Agulhas-Falkland Fracture Zone to the Panthalassic subductionzone to the west. The South Atlantic central rift propagated northward,with extension between Colorado, Parana and Africa from 150 Ma.Rifting reached the African continental interior through the West andCentral African Rift Zones, along the Central African Shear Zone at131.7 Ma, connecting with the West and Central African Rift Zones.These continental rift zones encompass the major hydrocarbon-producing Cretaceous basins of the Central andWest African rift systemfrom East Niger to Sudan. We cease rifting in the interior of Africa atabout 85 Ma.
We use the model of Nürnberg and Müller (1991) for the seafloorspreading record but refine the timing of the onset of seafloor spread-ing to 132 Ma to correspond to the peak of magmatism (Torsvik et al.,2009). In addition, we switch to the updated Cenozoic rotations ofMüller et al. (1999) from Anomaly 34 to the present day. The polespresented in Müller et al. (1999) are similar to those of Shaw andCande (1990) but reflect finer scale changes in spreading directiondue to the inversion method used for fracture zone interpretation(Müller et al., 1999). Our seafloor spreading isochrons match wellwith the magnetic lineations observed in our magnetic anomaly grid(Fig. 2), although poor data coverage hinders broad scale correlation.
We also incorporate spreading in the Agulhas Basin (southernmostSouth Atlantic) between South America and the Malvinas Plate(LaBrecque and Hayes, 1979; Marks and Stock, 2001) from Anomaly34 (83.5 Ma) to Anomaly 30 (~66Ma) according to the rotations ofNürnberg and Müller (1991). The extinct spreading ridge associatedwith this spreading system as well as distinct fracture zone trends areclearly observed in satellite gravity data (Marks and Stock, 2001)(Fig. 1).
3.1.2. Central AtlanticThe Central Atlantic contains the region between North America
conjugate to Northwest Africa bounded by Pico and Gloria FractureZones to the north and the 15° 20′N and Guinean Fracture Zones tothe south (Fig. 3). Break-upmarked the beginning of Pangea separationand involved at least a three-plate system between North America,Northwest Africa and the Moroccan Meseta (Fig. 3). Rifting was con-trolled by pre-existing structures leading to the formation of a seriesof rift basins during late Triassic–early Jurassic between North Americaand Northwest Africa (Lemoine, 1983; Klitgord and Schouten, 1986),which subsequently filled with salt and became inactive during plateseparation. In addition, transtensional rifting between Northwest Africaand theMoroccanMeseta formed rift basins along the Atlas rift (Labailset al. 2010). The first stage of Atlas Mountain uplift occurred during theopening of the Central Atlantic (Beauchamp, 1998). Incorporatingmotion along the Atlas rift has implications for full-fit reconstructionsof the Central Atlantic.
The establishment of seafloor spreading in the Central Atlantic isdebated, with ages ranging from 175 Ma marked by the West AfricanCoast Magnetic Anomaly and East Coast Magnetic Anomaly and anextrapolation of spreading rates (Klitgord and Schouten, 1986;

120 Ma
320˚ 340˚ 0˚ 20˚
90 Ma
320˚ 340˚ 0˚ 20˚
60 Ma
320˚ 340˚ 0˚ 20˚
30 Ma
320˚ 340˚ 0˚ 20˚
0 Ma
0 20 40 60 80 100 120 140 160
Age of Oceanic Lithosphere (m.yrs)
20˚
40˚
120 Ma
320˚ 340˚ 0˚ 20˚
20˚
40˚
90 Ma
320˚ 340˚ 0˚ 20˚
20˚
40˚
60 Ma
320˚ 340˚ 0˚ 20˚
20˚
40˚
30 Ma
320˚ 340˚ 0˚ 20˚
20˚
40˚
0 Ma
NAM GRN EUR IBR AFR NWA NEA POR
Plate Name
219M. Seton et al. / Earth-Science Reviews 113 (2012) 212–270

220 M. Seton et al. / Earth-Science Reviews 113 (2012) 212–270
Müller and Roest, 1992; Müller et al., 1999), 170–171 Ma based on areview of global passive margins (Bradley, 2008), diachronous open-ing with 200 Ma in the south progressing to 185 Ma in the northbased on dating of post-rift sediment deposition (Withjack et al.,1998) and 200 Ma according to model of Schettino and Turco(2009). A recent re-evaluation of the Central Atlantic opening(Labails et al., 2010) suggests that the earliest seafloor spreading oc-curred at 190 Ma (maximum at 203 Ma) based on an updated mag-netic anomaly grid and interpretation of salt basins offshoreMorocco and North America (Sahabi et al., 2004). In this model,spreading was initially very slow at half-spreading rates of ~8 mm/yr with an increase in spreading rate and direction at 170 Ma to~17 mm/yr and spreading asymmetry until Anomaly M0(120.4 Ma). This is in contrast to previous models (Klitgord andSchouten, 1986; Bird et al., 2007) that invoke an early ridge jump at170 Ma rather than significant spreading asymmetry to account forincreased crustal accretion onto the North American plate.
Anomalies M25–M0 (~154–120 Ma) and 34–30 (~84–65 Ma) arewell established primarily due to the density of data on the westernflank (Klitgord and Schouten, 1986; Müller and Roest, 1992; Mülleret al., 1999). The spreading rates in the Central Atlantic in the Cenozo-ic are quite slow making identification of magnetic anomalies moredifficult than for the Mesozoic (Klitgord and Schouten, 1986). Anom-alies from 25 (~56 Ma) onwards have been identified quite consis-tently between studies (Klitgord and Schouten, 1986; Müller andRoest, 1992; Müller et al., 1999) with the main difference occurringbetween Anomalies 8 and 5 (~26–10 Ma) due to finer constraintson fracture zone trends using the models by Müller and Roest(1992) and Müller et al. (1999).
We have implemented the early break-up history of Labails et al.(2010) to define the Jurassic–early Cretaceous history of the CentralAtlantic as a highly asymmetric, slow spreading system. We initiatethe Central Atlantic rift prior to 200 Ma together with a transtensionalplate boundary between Northwest Africa and Morocco along theAtlas rift using rotations derived from Labails et al. (2010). TheCentral Atlantic rift connects to a major transform fault along theJacksonville Fracture Zone to the south linkingwithMesozoic rift basinsin the Caribbean (see Section 3.4.1: Caribbean). To the north, the CentralAtlantic rift extends into the northern Atlantic, where Triassic/Jurassicrifts are observed (see Section 3.1.3: North Atlantic). Immediately fol-lowing the initiation of seafloor spreading in the Central Atlantic wasthe cessation of transtensional motion along the Atlas rift and the firststage of uplift of the Atlas Mountains (Beauchamp, 1998).
We initiate seafloor spreading at 190 Ma (Labails et al. 2010) andsubsequently use the magnetic anomaly picks from Klitgord andSchouten (1986) and rotations from Müller et al. (1997) for M25–M0 (~154–120 Ma). Spreading propagated northward between theIberia–Newfoundland margin during Anomaly M20 (~146 Ma)(Müller et al., 1997) (Fig. 4). To the south, spreading in the CentralAtlantic connected with the Equatorial Atlantic in the late Cretaceous.We incorporate the Cenozoic rotations from Müller et al. (1999),which have been updated from those of Müller and Roest (1992)and use the isochrons from Müller et al. (2008a). The isochronsmatch well with the gridded magnetic anomalies (Fig. 3) and fracturezone identifications from global satellite gravity (Sandwell and Smith,2009) (Fig. 1).
3.1.3. Northern AtlanticThe Northern Atlantic encompasses the area between Newfound-
land–Iberia and the Eurasian Basin in the Arctic Ocean (Figs. 3 and 5).
Fig. 4. (a) Agegrid reconstructions of the Central and North Atlantic at 120, 90, 60, 30, 0 Ma hthe extent of continental crust (gray polygons). Plate boundaries from our continuously clostars, large igneous provinces and flood basalts as brown polygons and coastlines as thin blaAtlantic for each reconstruction time listed above. Feature descriptions as in panel (a). Abbrplate, IBR = Iberian plate, AFR = African plate, NWA = Northwest African plate, NEA = Ncolor in this figure legend, the reader is referred to the web version of this article.)
It includes active and extinct spreading systems, ridge–hotspot inter-actions related to the Iceland plume, volcanic and magma-poor mar-gins and microcontinent formation (e.g. Jan Mayen). The NorthernAtlantic underwent episodic continental extension in the Permo-Triassic, late Jurassic, early and mid Cretaceous, with reactivationand basin formation largely following pre-existing structures fromthe closure of the Iapetus Ocean and subsequent Baltica–Laurentiacollision (400–450 Ma) (Dore et al., 1999; Silva et al., 2000;Skogseid et al., 2000; Kimbell et al., 2005). Seafloor spreading propa-gated from the Central Atlantic starting in the late Cretaceous in sixdistinct phases: Iberia–Newfoundland, Porcupine–North America,Eurasia–Greenland (conjugate to Rockall), North America–Greenland(Labrador Sea), Eurasia–Greenland (Greenland and Norwegian Seaand Jan Mayen), North America–Eurasia (Eurasian Basin, ArcticOcean) (Figs. 3–5).
3.1.3.1. Iberia–Newfoundland. The Iberia–Newfoundland margin is atype example of a highly extended, magma-poor, rifted continentalmargin (Boillot et al., 1988; Srivastava et al., 2000; Hopper et al.,2004; Peron-Pinvidic et al., 2007) with two main phases of extension.Extension during the late Triassic to early Jurassic formed large riftbasins within the continental lithosphere of both margins (Tucholkeand Whitmarsh, 2006) and was followed by a period of quiescencein the early–mid Jurassic marked by subsidence and the accumulationof shallow-water carbonates (Tankard and Welsink, 1987). Thesecond phase of deformation, from late Jurassic to early Cretaceous,formed a wide zone of layered basalts, gabbros and serpentinizedmantle (“transitional” crust) indicative of seafloor spreading andmantle exhumation (Srivastava et al., 1990; Tucholke and Whitmarsh,2006; Peron-Pinvidic et al., 2007; Sibuet et al., 2007).
The onset and location of normal seafloor spreading are widelydebated. The interpretation of low amplitude magnetic anomalies asold as Anomaly M21 (~147 Ma) related to ultraslow seafloor spread-ing within the southern part of the transition zone (Srivastava et al.,2000; Sibuet et al., 2007) is the oldest seafloor spreading age assignedto the margin. Other studies have instead suggested younger ages forthe onset of seafloor spreading: Anomalies M3–M5 (~124–128 Ma)based on deep sea drilling and seismic refraction (Whitmarsh andMiles, 1995; Russell and Whitmarsh, 2003) and late Aptian (~112–118 Ma) based on stratigraphic studies (Tucholke et al., 2007).Although the earliest timing of seafloor spreading remains controver-sial, reconstructions between the Iberia and Newfoundland marginfrom Anomaly M0 (~120 Ma) onwards are well established withchanges in spreading rates occurring at Anomaly 25 (~56 Ma) coinci-dent with the initiation of spreading further north in the Norwegian–Greenland Sea (Srivastava and Tapscott, 1986; Srivastava et al., 2000).
Related to the development of the Iberia–Newfoundland margin isthe opening of the Bay of Biscay north of Iberia and the motion of theIberia block itself. The Bay of Biscay formed at a ridge–ridge–ridgetriple junction (Klitgord and Schouten, 1986) commonly believedto have opened in the late Cretaceous (110–83.5 Ma) according toMüller et al. (1997). However, Anomalies M0 to 33 (~120–79 Ma)have been identified (Sibuet et al., 2004) suggesting that seafloorspreading initiated in the Bay of Biscay at the same time as an in-crease in spreading rate and cessation of mantle exhumation alongthe Iberia–Newfoundland margin (Sibuet et al., 2007). The end of sea-floor spreading occurred at Anomaly 33 (~79 Ma) (Roest andSrivastava, 1991; Sibuet et al., 2004).
Most models agree that the Iberian continental block was fixed rel-ative to Africa since the start of rifting along the Iberia–Newfoundland
ighlighting the age–area distribution of oceanic lithosphere at the time of formation andsing plate polygon dataset are denoted as thick white lines, hotspot locations as yellowck lines. (b) Reconstructions showing the outlines of the plates in the Central and Northeviations are: NAM = North American plate, GRN = Greenland plate, EUR = Eurasianortheast African plate, POR = Porcupine plate. (For interpretation of the references to

0˚
20˚40
˚
60˚
80˚
100˚
120˚
140˚
160˚180˚
−160˚
−140
˚
−120
˚
−100˚
−80˚
−60˚
−40˚−20˚
0˚
20˚
40˚
60˚
80˚
100˚
120˚
140˚
160˚180˚
−160˚
−140
˚
−120
˚
−100˚
−80˚−60˚
−40˚
NorthAmerica
Eurasia
Eurasia
Greenland
JM
LR
Eurasian Basin
Canada Basin
Baffin Bay
PB
CRNR
MB
BarentsShelf
North SlopeAlaska
Svalbard
DS
KR
MR
GR
NS
AR
MD
AR
−50 −40 −30 −20 −10 0 10 20 30 40 50
Magnetic Intensity Anomaly [nTesla]
NorthAmerica
Eurasia
Eurasia
Greenland
JM
LR
Eurasian Basin
Canada Basin
Baffin Bay
PB
MDCRNR
MB
AR
BarentsShelf
North SlopeAlaska
Svalbard
DS
KR
MR
GR
NS
AR
a
b
Plate BoundaryIsochrons
EUR-JM2Extinct Ridge
Tectonic Boundary
NAM-MDR
GRN-EUR
NAM-EUR
GRN-JM1&2
EUR-JM1
NAM-NSA
BB & OTH
LIPproduct
Non-oceanic
Fig. 5. (a) Gridded magnetic anomalies for the Arctic. Seafloor spreading isochronsused in this study plotted as thin black lines. AL = Alpha Ridge, AR = Aegir Ridge,CR = Chukchi Ridge, DS = Davis Strait, GR = Gakkel Ridge, JM = Jan Mayen, KR =Kolbeinsey Ridge, LR = Lomonosov Ridge, MB = Makarov Basin, MD = MendeleevRidge,MR=Mohns Ridge, NR=Northwind Ridge, NS=Nares Strait, PB= PodvodnikovBasin. (b) Seafloor spreading isochron map colored by spreading system or plate pair.Map abbreviations are same as a. Legend abbreviations are: BB = Back-arc Basins,EUR = Eurasia, GRN = Greenland, JAM = Jan Mayen, MDR = Mendeleev, NAM =North America, NOR= Norway, NSA= North Slope Alaska, OTH = Other spreading sys-tems outside area of interest.
221M. Seton et al. / Earth-Science Reviews 113 (2012) 212–270
margin until Anomaly 10 (~28 Ma) (Srivastava and Tapscott, 1986)based on geological evidence from the Pyrenees and geophysical datafrom the Northern Atlantic (Roest and Srivastava, 1991; Sibuet et al.,2004). The location of the plate boundary is proposed to have beenlocated north of the Kings Trough from M0 (~120 Ma) to the Eocene(Srivastava et al., 1990), extended along the Kings Trough into the Bayof Biscay and along the Pyrenees from the Eocene to Anomaly 10(~28 Ma) (Klitgord and Schouten, 1986; Roest and Srivastava, 1991;Whitmarsh and Miles, 1995) and was followed by southward ridgejump along the Azores transform fault and Straits of Gibraltar(Klitgord and Schouten, 1986; Roest and Srivastava, 1991).
In our plate kinematic model, we use the boundary between con-tinental and oceanic crust interpretation of Todd et al. (1988) for theNewfoundland margin and Boillot and Winterer (1988) andSrivastava et al. (2000) for the Iberia margin. We take the age givenby Srivastava et al. (2000) for the initiation of ultra-slow seafloorspreading based on their interpretation of magnetic anomalies backto M20 (~146 Ma) as we believe that this corresponds to the bound-ary between true continental crust and oceanic/transitional crust. Ourseafloor spreading isochrons are based on Müller et al. (1997) andcorrelate well with magnetic anomaly grids (Fig. 3).
In our plate model, we fix Iberia to Africa from the initiation ofseafloor spreading in the Eocene and use the rotations of Srivastavaand Tapscott (1986) for seafloor spreading between the Iberia–Newfoundland margin (~146 Ma) to Anomaly 10 (~28 Ma) (Fig. 4).We define the plate boundary between Iberia and Eurasia along theKings Trough through the Pyrenees, connecting with the northernTethyan subduction zone (Fig. 4). In addition, we incorporate spreadingin the Bay of Biscay between Iberia and Eurasia based on timing ofSibuet et al. (2004) (~120 Ma) and the finite difference method forthe rate and direction of spreading. After Anomaly 10 (~28 Ma), weincorporate a southern jump of the plate boundary to the Azores trans-form fault and along the Straits of Gibraltar leading to the capture ofIberia by the Eurasian plate (Fig. 4).
3.1.3.2. Porcupine–North America. The Porcupine Abyssal Plain isbounded by the Kings Trough, Labrador Sea and Charlie Gibbs FractureZone (Figs. 3 and 4). The existence of the Porcupine Plate as an indepen-dent plate during the Eocene–Oligocene was first hypothesized bySrivastava and Tapscott (1986) in order to account for overlappingreconstructed anomalies in the Porcupine Abyssal Plain when using asingle pole of rotation for North Atlantic opening and to explain Eocenedeformation recorded along the north Biscay and Porcupine margins.The need for a separate Porcupine Plate was challenged by Gerstelland Stock (1994) when they computed new rotations for Eurasia–North America without overlaps between the magnetic anomalies.However, these reconstructions were themselves challenged as theycould not account for the observed intra-plate deformation recordedboth onshore and offshore in the Porcupine Abyssal Plain (Srivastavaand Roest, 1996).
A major phase of rifting occurred from the late Jurassic to earlyCretaceous, marked by the formation of extensional basins alongboth margins (Rowley and Lottes, 1988) and the deposition of syn-rift sediments in the Barremian/late Hauterivian 130–125 Ma (DeGraciansky et al., 1985). Seafloor spreading began by at least themid–late Albian (110–105 Ma) based on the dating of the sedimentsabove tholeiitic basalt from DSDP sites 550 and 551 and an Aptianregional unconformity (De Graciansky et al., 1985) and supportedby the interpretation of Anomaly 34 (~84 Ma) seaward of this loca-tion (Srivastava and Tapscott, 1986; Müller and Roest, 1992). Furtherrefinement based on magnetic anomalies is not possible as the earlypart of this crust was formed during the CNS.
Magnetic anomalies from 34 (~84 Ma) are well identified in thePorcupine Abyssal Plain and initially formed as a continuous spread-ing ridge to the north and south (i.e. between North America andEurasia) (Fig. 4). Magnetic anomalies between 25 and 13 (~56-33 Ma)

222 M. Seton et al. / Earth-Science Reviews 113 (2012) 212–270
record the motion of the independent Porcupine plate relative toEurasia (Srivastava and Tapscott, 1986; Srivastava and Roest, 1989;Müller and Roest, 1992). Spreading in the Porcupine Abyssal Plain wascoincident with spreading in the Labrador Sea between Anomalies34–13 (~84–33 Ma). After Anomaly 13 (~33 Ma), the Porcupine plateceased its independent motion and spreading continued via NorthAmerica–Eurasia motion.
We use the rotations of Srivastava and Roest (1989) for the initialrift phase between the Porcupine and North American Plate and in-corporate the onset of break-up and seafloor spreading at 110 Ma(Müller et al., 1997), marked by a regional unconformity and datingof sediments at DSDP 550 (De Graciansky et al., 1985). We use ourpreferred rotations from Srivastava and Roest (1989) for the earlyspreading phase and the initiation of independent motion of thePorcupine Plate between Anomalies 25 and 13 (~56–33Ma) (Fig. 4).This results in a small clockwise rotation of Eurasia and counter-clockwise rotation of Iberia relative to the Porcupine Plate. The cessa-tion of independent Porcupine motion coincides with the cessation ofseafloor spreading in the neighboring Labrador Sea and the establish-ment of a simple two-plate system (North America and Eurasia) todescribe the plate motions in the North Atlantic (Fig. 4). From Anomaly13 (~33 Ma) onwards, we use the rotations of Lawver et al. (1990). Acomparison with fracture zone traces and satellite gravity data revealsa slight mismatch due to the compression inferred from our modelthat is supported by the seafloor spreading fabric (Srivastava andRoest, 1996).
3.1.3.3. Rockall–North America/Greenland. The Rockall region in theNorth Atlantic encompasses spreading between the Rockall Plateauconjugate to North America along its southern arm and conjugate toGreenland along its northern arm (Fig. 3). A failed rift basin in theRockall Trough exists adjacent to the Eurasian margin. Previous au-thors have determined that Rockall behaved as an independentplate throughout part of its history (Srivastava and Roest, 1989;Müller and Roest, 1992) but recent re-analysis of the magnetic anom-alies and satellite gravity data can be explained by Eurasia–NorthAmerica and Eurasia–Greenland motion (Gaina et al., 2002).
The Rockall Plateau underwent periods of extension in the earlyTriassic, early and mid-Jurassic and early, mid and late Cretaceous(Knott et al., 1993). The majority of rifting in the Rockall Trough oc-curred in the mid–late Cretaceous, continuing into the Eocene afteran earlier Triassic–Jurassic rift phase (Cole and Peachey, 1999). Simul-taneous rifting in the Porcupine Abyssal Plain occurred in the Creta-ceous (Srivastava and Tapscott, 1986). Spreading between theRockall Plateau and North America was established at ~83 Ma inde-pendent of the Eurasian plate according to the models of Srivastavaand Roest (1989) and Müller and Roest (1992) or as part of theEurasian plate from Anomaly 33 (~79 Ma) based on a reinterpreta-tion of magnetic anomalies and fracture zone locations from satellitegravity data (Gaina et al., 2002) or 83 Ma according to Cole andPeachey (1999). Spreading propagated to the northwest into theLabrador Sea (Srivastava and Tapscott, 1986; Rowley and Lottes,1988; Müller and Roest, 1992; Gaina et al., 2002).
The establishment of a three-plate system between North America,Eurasia/Rockall and Greenland occurred after Anomaly 25 (~56 Ma)(Srivastava and Tapscott, 1986; Rowley and Lottes, 1988; Gaina etal., 2002). After the cessation of spreading in the Labrador Sea, thesystem reorganized into a two-plate configuration with spreading be-tween Rockall/Eurasia and Greenland along the Reykjanes Ridge(Srivastava and Tapscott, 1986) after Anomaly 13 (~33Ma) to thepresent day (Fig. 3).
In constructing our model for spreading in the Rockall region, weseparate the margin into two segments: Rockall Plateau/Eurasiarelative to North America and Rockall Plateau/Eurasia relative toGreenland. Preceding the opening of the ocean basin between Rockalland North America, rifting occurred in the Rockall Trough (landward
of the Rockall Plateau) in the mid–late Cretaceous, coincident withrifting in the Porcupine Basin to the south (Fig. 4). The main riftphase then jumped westward between the Rockall Plateau (fixed toGreenland) and North America at ~85 Ma (Gaina et al., 2002), similarto previous studies (Rowley and Lottes, 1988). We follow the plateboundaries in this area from Srivastava and Tapscott (1986) for theearliest part of its history. Rifting progressed to seafloor spreadingby Chron 33o (~79 Ma) (Gaina et al., 2002) and propagated into theLabrador Sea (Gaina et al., 2002) (Fig. 4). We follow the plate recon-structions of Gaina et al. (2002) whereby spreading initiated betweenthe Rockall Plateau and Greenland after Chron 25 forming a triplejunction between the North American, Greenland and Eurasian plates(Fig. 4). As the pole of rotation describing Eurasia–North America mo-tion accounts for the magnetic anomalies in the area, we do not incor-porate motion between the Rockall Plateau and Eurasia, as proposedby other authors (Srivastava and Roest, 1989; Müller and Roest,1992).
Seafloor spreading isochrons were constructed based on the mag-netic anomaly identification and finite rotations of Gaina et al. (2002)and compared to the several magnetic anomaly datasets (Fig. 3). Wefind that there is generally good agreement between the griddedmagnetic anomaly data and our seafloor spreading isochrons butfind interpretation difficult proximal to the spreading axis. This maybe due to the thermal influence of the Iceland hotspot on the mid-ocean ridge together with slow seafloor spreading rates. We findvery good agreement between our fracture zone trends and thoseexpressed in the satellite gravity data (Fig. 1).
3.1.3.4. Labrador Sea and Baffin Bay. The Labrador Sea is located be-tween North America and Greenland south of Baffin Bay in theCanadian Arctic (Fig. 3). Continental stretching in the LabradorSea produced a narrow and symmetrical margin with less than100 km of extension (Dunbar and Sawyer, 1989) at around 130 Ma(Umpleby, 1979) based on the dating of pre to early syn-rift sedi-ments. Rifting in the Labrador Sea is believed to have begun only afterthe initiation of seafloor spreading in the Rockall Trough (Srivastavaand Tapscott, 1986).
The onset of seafloor spreading in the Labrador Sea is quite contro-versial. The oldest magnetic anomaly identified in the area is Anomaly33 (~79 Ma) but spreading is believed to have initiated earlier duringthe CNS around 90–92 Ma (Rowley and Lottes, 1988; Roest andSrivastava, 1989; Gaina et al., 2002). An analysis of reprocessed seis-mic data (Chalmers, 1991; Chalmers and Laursen, 1995) suggeststhat seafloor spreading began much later at Anomaly 27 (~61 Ma)with thin continental crust extending into the region where oldermagnetic anomalies have been interpreted. However, this young ageis inconsistent with the sedimentary–tectonic history of the basinsaround the Labrador Sea which record post-rift deposition and aphase of thermal subsidence around 100–62 Ma and fault block rota-tion between 80 and 63 Ma. Other estimates for the onset of seafloorspreading come from an analysis of global passive margins (Bradley,2008), invoking an age of between 109 Ma and 68 Ma for the initia-tion of spreading.
An interpretation of seafloor spreading anomalies by Roest andSrivastava (1989) produced similar results to Srivastava andTapscott (1986) except for a re-identification of Anomaly 25(~56 Ma), which yielded a more symmetrical spreading system im-plying a significant change in spreading direction in the LabradorSea. The change in spreading direction was linked to the initiationof the Greenland–Eurasia plate boundary and a change in spreadingdirection experienced in the Central and South Atlantic (Rowley andLottes, 1988). Spreading is believed to have continued to Chron 7(~25 Ma) (Rowley and Lottes, 1988) or just after Chron 13 (~33 Ma)(Roest and Srivastava, 1989; Gaina et al., 2002).
Northward propagation of the Labrador Sea rift into Baffin Baythrough the Davis Strait (Fig. 3) has been dated to the late Aptian–

223M. Seton et al. / Earth-Science Reviews 113 (2012) 212–270
early Cenomanian (110–100 Ma) by the deposition of fluvial sedi-ments during active rifting and occurred at least 20 Ma after the initi-ation of rifting in the Labrador Sea. Although there are no identifiablemagnetic anomalies in Baffin Bay, seismic refraction profiles indicatethat the area is floored by oceanic crust (Chalmers and Pulvertaft,2001) and is predicted by the Labrador Sea opening model of Roestand Srivastava (1989). The cessation of seafloor spreading in BaffinBay may have been coincident with the termination of spreading inthe Labrador Sea.
For the Labrador Sea and Baffin Bay, we use a set of rotations thatare based on the model presented in Roest and Srivastava (1989) andGaina et al. (2002). We model continental extension starting at135 Ma by extrapolation to match the Mesozoic basins on the NorthAmerican and conjugate Greenland margin. We invoke seafloorspreading at Chron 33 (~79 Ma) and incorporate a major change inspreading direction between Chrons 31–25 (68–56 Ma), which wassubsequently followed by oblique spreading and eventually cessationof spreading after Anomaly 13 (33 Ma) (Roest and Srivastava, 1989;Gaina et al., 2002) (Fig. 4). The extinct ridge matches well with a neg-ative gravity anomaly observed in the satellite gravity data (Sandwelland Smith, 2009). We infer that the spreading axis in the Labrador Seaand Baffin Bay was joined across the Davis Strait via left-lateral trans-form faults (Rowley and Lottes, 1988; Roest and Srivastava, 1989)from 63 Ma. We model the cessation of spreading in Baffin Bay tobe coincident with the Labrador Sea at 33 Ma (Fig. 4).
We use the magnetic anomaly identifications of Gaina et al. (2002)to construct seafloor spreading isochrons in the Labrador Sea. Themagnetic lineations in this area are not well resolved (Fig. 3) andmay be due to a combination of high sedimentation rates, spreadingobliquity and data resolution. However, a continuation of magneticlineations from the Rockall segment into the southern Labrador Sea(i.e. the expression of the triple junction) is clearly observed. Al-though we agree that oceanic crust floors Baffin Bay, no magnetic lin-eations can be resolved from the global gridded magnetic anomalydata (Figs. 3 and 5).
3.1.3.5. Greenland–Eurasia and Jan Mayen microcontinent. The separa-tion of Greenland and Eurasia is occurring along the ReykjanesRidge adjacent to the Rockall Plateau, through Iceland and along theKolbeinsey and Mohns Ridge in the Norwegian and Greenland Seas(Figs. 3 and 5). The margin has undergone several rift phases sincethe Triassic primarily during the mid Jurassic–early Cretaceous andlate Cretaceous–early Cenozoic (Brekke, 2000). The late Jurassic–early Cretaceous rift phase created most of the basin structuresin the hydrocarbon-bearing MØre and VØring Basins, offshoreNorway (Skogseid et al., 2000). The final rift phase at the Campanian–Maastrichtian boundary (~70 Ma) (Skogseid et al., 2000) was followedby volcanism (mid Paleocene to early Eocene) and finally to break-upand volcanism prior to Chron 25 (~56 Ma).
Traditionally, spreading between Greenland and Eurasia is mod-eled as a two-plate system with seafloor spreading initiating around55–56 Ma, near the Paleocene–Eocene boundary (Talwani andEldholm, 1977; Srivastava and Tapscott, 1986; Rowley and Lottes,1988; Peron-Pinvidic et al., 2007). An updated interpretation includ-ing new geophysical data suggests that the system underwent severalplate boundary changes since the inception of seafloor spreadingaround Anomaly 25 (~56 Ma) (Gaina et al., 2009). Fracture zonetrends mark changes in spreading direction at Chron 21 (~47 Ma)and Chron 18 (~40 Ma) (Gaina et al., 2009). A major reorganizationof the system occurred at Anomaly 13 (~33 Ma) with relative motionbetween Greenland and Eurasia migrating from NW–SE to NE–SW,leading to the cessation of spreading in the Labrador Sea, the amal-gamation of Greenland with North America and the cessation ofspreading in the Norway Basin.
Spreading in the Norway Basin (part of the Norwegian Sea) wasinitiated at 56 Ma isolating the Jan Mayen microcontinent (which
was still fixed to Greenland) from the MØre and VØring Basin mar-gins. Spreading along the extinct Aegir Ridge formed magnetic linea-tions (fan-shaped from Chron 21) in the Norway Basin until aboutAnomaly 13 (33–30 Ma) when the spreading ridge jumped west-ward, likely as a result of ridge–hotspot interactions and initiatedspreading along the Kolbeinsey Ridge (Gaina et al., 2009). This is incontrast to a model of simultaneous spreading east and west of JanMayen at Anomaly 13 (~33 Ma), initiation of spreading along theKolbeinsey Ridge at Anomaly 7 (~25 Ma) and cessation of spreadingin the Norway basin at Anomaly 7 (~25 Ma) (Talwani and Eldholm,1977; Nunns, 1983). Using new marine geophysical data, Gaina etal. (2009) suggest further complications in the rifting and spreadinghistory of the Jan Mayen microcontinent and Faeroe Islands withnumerous triple junctions and ridge propagators leading to significantcontinental stretching and the formation of rift-related basins. TheMohns Ridge was connected to the Aegir Ridge from the initiation ofspreading at ~55–56Ma until 30 Ma and the cessation of spreading inthe Norway Basin. After the seaward ridge jump, theMohns Ridge linkedto the Kolbeinsey Ridge defining the boundary between Greenland andEurasia.
We use a combination of magnetic anomaly picks and rotationsfrom Gaina et al. (2002) and Gaina et al. (2009) to reconstruct the en-tire Greenland–Eurasia margin. We do not incorporate the complexspreading (triple junctions and ridge propagators) around the JanMayen microcontinent implied by the model of Gaina et al. (2009),but envisage that these will be incorporated in a further release. Inour model, spreading initiates along the entire Greenland–Eurasiamargin at 56 Ma, initially connecting up to the spreading in theEurasian Basin to the north and the Greenland–Eurasia–North Americatriple junction in the south (Fig. 5). At 33 Ma, spreading between NorthAmerica and Greenland in the Labrador Sea ceased fusing the twoplates together, shutting down the Greenland–Eurasia–North Americatriple junction and leading to a change in spreading rate and directionalong the Greenland–Eurasia spreading system. The Jan Mayen micro-continent rifted off the Norwegian margin at 56 Ma forming the fan-shaped Norway Basin along the Aegir Ridge between 56 and 33–30 Ma(Fig. 5). The Aegir Ridge connected to the Mohns Ridge in the northand Reykjanes Ridge in the south via a series of transform faults. Spread-ing then jumped to the Kolbeinsey Ridge at 30 Ma, connecting with theMohns Ridge further north and forming the present day plate configura-tion (Fig. 5). A comparison between our resultant seafloor spreadingisochrons and the magnetic anomaly grids reveals that our trendsmatch quite well with the magnetic lineations from the gridded dataset.
3.1.3.6. Lomonosov Ridge–Eurasia (Eurasian Basin). The Eurasian Basinis the youngest ocean basin within the Arctic Ocean and was formedby spreading between the Lomonosov Ridge and the Barents Shelfalong the Gakkel and Nansen Ridges (Fig. 5). The continental natureof the Lomonosov Ridge has been confirmed through seismic reflec-tion imaging (Jokat et al., 1992) and ACEX drilling (Moran et al.,2006). The broad scale early rift phase mimics those of the North At-lantic margin but is less well constrained due to the remoteness of theregion, data quality and persistent ice-coverage. Although the BarentsShelf is agreed to have formed part of the Eurasian margin, there isdebate in the literature as to whether the Lomonosov Ridge hasbeen fixed to the North American plate since at least 80 Ma(Srivastava and Tapscott, 1986; Rowley and Lottes, 1988) or whetherit operated as an independent plate until at least Anomaly 13(~33 Ma) (Jackson and Gunnarsson, 1990; Brozena et al., 2003). Thelack of evidence for contemporaneous seafloor spreading in otherparts of the Arctic Ocean and the good fit of the magnetic anomaliesin the Eurasian Basin are cited as reasons for the Lomonosov Ridgebeing part of the North American Plate. However, a recent compila-tion of marine geophysical data identified a feature that resemblesan extinct spreading ridge near the Lomonosov Ridge, which possiblyconnected spreading in the Eurasian Basin with spreading in the

224 M. Seton et al. / Earth-Science Reviews 113 (2012) 212–270
Labrador Sea (Brozena et al., 2003), thus requiring independentmotionof the Lomonosov Ridge.
The last rifting phase (late Cretaceous) led to break-up and sea-floor spreading at 68 Ma (Rowley and Lottes, 1988) or around Anom-aly 25 (~56 Ma) (Srivastava, 1985; Gaina et al., 2002) in the southaround Svalbard and at 50 Ma in the Laptev Sea (Rowley and Lottes,1988). There appears to be a consensus in early studies that the oldestmagnetic anomaly that can be confidently identified is Anomaly25–24 (~56–53 Ma) (Srivastava, 1985; Srivastava and Tapscott,1986; Rowley and Lottes, 1988; Gaina et al., 2002), yet there isspace landward of Anomalies 25–24 (~56–53 Ma) to suggest that sea-floor spreading initiated earlier. The early spreading phase was theresult of transtensional opening (Rowley and Lottes, 1988) producingslow seafloor spreading rates, strike-slip motion between Svalbardand Greenland (Srivastava and Tapscott, 1986) and displacementalong the Nares Strait (Srivastava, 1985). After Chron 13 (33 Ma),true seafloor spreading was established coincident with the majorreorganization of the Greenland–Eurasia system and cessation ofLabrador Sea spreading. Currently, the Eurasian Basin is undergoingthe slowest observed seafloor spreading rates, with a full rate of~10–13 mm/yr.
We have used the magnetic anomaly picks and finite rotations ofGaina et al. (2002) to describe the opening of the Eurasian Basinfrom Anomaly 24 (~53 Ma) to the present day. The rotations usedare the same as for North America–Eurasia. We incorporate theplate boundary model of Rowley and Lottes (1988) whereby theGakkel and Nansen Ridges connect to the Baffin Bay ridge axisthrough the Nares Strait and Mohns Ridge via a major strike-slipfault with minor compression between Greenland and Svalbard(Fig. 5). In our interpretation, we couple the Lomonosov Ridge withNorth America as the rotations of Gaina et al. (2002) to describeNorth America–Eurasia motion do not result in overlap of the mag-netic anomalies. The seafloor spreading isochrons we implement aredigitized from Gaina et al. (2002) and match well with the magneticanomaly grid (Fig. 5).
3.1.4. Arctic BasinsThe Arctic Ocean encompasses the Eurasian and Amerasia Basins
(divided into the Canada, Makarov and Podvodnikov Basins) as wellas numerous continental blocks such as the Lomonosov, Mendeleev,Alpha, Northwind and Chukchi Ridges (Fig. 5). The Cenozoic EurasianBasin (see Section 3.1.3.6: Eurasian Basin) has a distinct spreadinghistory from the late Jurassic–Cretaceous Amerasia Basin. The earlyMesozoic evolution of the Arctic region involves the closure of theSouth Anyui Basin along the North Siberian subduction zone, markedby the South Anyui suture (Nokleberg et al., 2001; Sokolov et al.,2002; Kuzmichev, 2009). This resulted in pre-breakup rifting in theearliest Jurassic, forming the Dinkum and Banks graben systems inAlaska and North America, respectively and the subsequent isolationof the Northwind and Chukchi Ridge by the earliest late Cretaceous(Grantz et al., 1998).
Rifting and opening of the Canada Basin is believed to have resultedfrom anticlockwise rotation of the North Slope Alaska–Chukotka Blockaway from the Canadian Arctic Islands, with a possible early strike-slip component, sometime from the late Jurassic to mid Cretaceous(Carey, 1955; Rowley and Lottes, 1988; Grantz et al., 1998; Alvey etal., 2008). Although the rotation model is supported by paleomagneticdata (Halgedahl and Jarrard, 1987), the fan-shaped nature of the mag-netic lineations (Taylor et al., 1981) and crustal thickness mapping(Alvey et al., 2008), the exact timing of the rotation of Alaska and forma-tion of the Canada Basin is debated. The dating of the magnetic anoma-lies in the Canada Basin is difficult due to extensive volcanicoverprinting, low amplitude signature of the magnetic anomaliesand high sedimentation rates. Anomalies M25–M11 (~154–132 Ma)have been tentatively identified (Taylor et al., 1981; Srivastavaand Tapscott, 1986), but other magnetic anomaly interpretations are
possible. An analysis of rift-related structures and stratigraphy (Grantzet al., 1998) reveals that the opening of the Canada Basin could haveoccurred as early as the late Jurassic–earliest Cretaceous. Less well-accepted models exist to explain the opening of the Canada Basinsuch as a non-rotational, step-wise late Jurassic–late Cretaceous open-ing model (Lane, 1997) and a model involving trapped crust fromKula–Pacific spreading (Churkin and Trexler, 1980).
Following the opening of the Canada Basin, Alvey et al. (2008)postulated that the Mendeleev and Alpha Ridges in the central Arcticformed either: (1) During continental rifting from the Canadianmarginin the late Jurassic trapping Jurassic ocean floor in the Marakov/Podvodnikov Basin (Grantz et al., 1998); (2) During continental riftingfrom the Lomonosov Ridge forming the Marakov/Podvodnikov Basinsduring the late Cretaceous–mid Eocene (Alvey et al., 2008); (3) A hy-brid model which includes an element of Jurassic ocean floor in thePodvodnikov Basin and a Cenozoic Marakov Basin (Alvey et al., 2008)or (4) The ridges formed purely via LIP emplacement related to theIceland plume in the late Cretaceous (Forsyth et al., 1986; Lawverand Müller, 1994; Lawver et al., 2002; Jokat et al., 2003; Dove et al.,2010) overprinting old oceanic crust. Interpretations suggesting a Ce-nozoic age for the Marakov Basin match well with the identification ofAnomalies 34–21 (~84–46 Ma; late Cretaceous–mid Eocene) (Taylor etal., 1981) as well as crustal thickness estimates (Alvey et al., 2008) inthe Marakov Basin, but crustal thickness estimates postulate that thePodvodnikov Basin must be floored by older oceanic floor (Alvey et al.,2008). The volcanic nature of the Mendeleev and Alpha Ridges hasbeen confirmed from recovered basalt samples of late Cretaceous age(Jokat et al., 2003), an age slightly younger than the predicted locationof the Iceland plume around 130 Ma (Hauterivian/Berremian) (LawverandMüller, 1994). However, this does not preclude a continental naturefor the Mendeleev and Alpha Ridges. Subsequent to the opening of theMarakov/Podvodnikov Basins, the locus of spreading jumped to the Eur-asian Basin at ~56 Ma, forming the youngest piece of ocean floor in theArctic domain.
We have incorporated a model whereby initial rifting occurred be-tween the North American and Alaskan margins in the early Jurassic(~210–200 Ma) followed by the isolation of the Northwind andChukchi Ridges by the earliest late Cretaceous, triggered by the sub-duction of the Anyui Ocean. We invoke a simple counterclockwise ro-tational model for the opening of the Canada Basin whereby theNorth Slope of Alaska starts to rotate at 145 Ma (latest Jurassic)with seafloor spreading initiating at 142 Ma (Berriasian), with amuch lower spreading rate in the south due to its proximity to thepole of rotation, creating fan-shaped anomalies. The timing is consis-tent with paleomagnetic data from Alaska but is inconsistent withprevious magnetic anomaly interpretations (Taylor et al., 1981;Srivastava and Tapscott, 1986). Cessation of spreading in the CanadaBasin and rotation of North Slope occurred at 118 Ma, coincidentwith a change in the southern North Slope margin from largelystrike-slip to convergence due to a change in spreading direction inPanthalassa. We use the finite rotations and seafloor spreading iso-chrons from Model 1 presented in Alvey et al. (2008), however wemodify the isochrons to extend the interpretation of the CanadaBasin over the Alpha Ridge and into the Marakov Basin. The isochronsare not constrained by magnetic anomaly identifications but ratherare a synthetic interpretation of the timing and orientation of spread-ing based on the rotation of the North Slope of Alaska. Hence, we donot expect an exact correlation with the magnetic anomaly grid.
The preferred model presented in Alvey et al. (2008) based oncrustal thickness estimates, invokes Cenozoic spreading in the Mara-kov Basin. We do not incorporate a younger Marakov Basin as thiswould require either a short-lived subduction zone along either theLomonosov or Mendeleev Ridge during the opening of this basin forwhich there is no geological evidence. Instead, we suggest that theAlpha and Mendeleev Ridges are predominately LIP-related featuresassociated with the Iceland plume that overprinted the Canada

225M. Seton et al. / Earth-Science Reviews 113 (2012) 212–270
Basin in the early Cretaceous (Lawver and Müller, 1994) and not partof a rifted Cenozoic continental margin. In our model the Makarovand parts of the Podvodnikov Basin form the northern extent of theCanada Basin. We do agree with Alvey et al. (2008) that there maybe a trapped piece of Jurassic ocean floor from the Anyui Basin inthe Podvodnikov Basin, which would explain the anomalous crustalthickness and would provide a mechanism for the Mendeleev Ridgehaving some continental affinities as continental material may havebeen isolated during Jurassic rifting.
3.2. Pacific Ocean and Panthalassa
Present day seafloor spreading in the Pacific basin involves nine oce-anic plates: the Pacific, Antarctic, Nazca, Cocos and Juan De Fuca platesand the smaller Rivera, Galapagos, Easter and Juan Fernandez micro-plates along the East Pacific Rise (Bird, 2003) (Fig. 1). Additionally, thePacific basin seafloor spreading record preserves clear evidence thatseveral now extinct plates (e.g. Farallon, Phoenix, Izanagi, Kula, Alukand Bauer plates) existed within the Pacific and proto-Pacific basin(Panthalassa) since at least the Jurassic/Cretaceous. In addition, the on-shore geological record from the Pacific margins provides evidence forthe opening and closure of several marginal basins, particularly alongthe western North American margin.
Previous plate tectonic models of the Pacific have largely focusedon identifying magnetic lineations and deriving relative plate motionsbetween presently active plates where both sides of the spreadingridge are preserved (e.g. Juan De Fuca–Pacific spreading (Atwater,1970, 1990; Engebretson et al., 1985; Caress et al., 1988; Stock andMolnar, 1988; Wilson, 1988; Atwater and Severinghaus, 1990),Pacific–Antarctic spreading (Stock and Molnar, 1987; Cande et al.,1998; Larter et al., 2002), the east Pacific Rise (Cande et al., 1982;Tebbens and Cande, 1997) and Cocos and Nazca spreading (Wilson,1996)). Other plate tectonic models have focused on identifying mag-netic lineations in the older parts of the Pacific, particularly the northand western Pacific, where conjugate magnetic lineations no longerexist as they have been subducted (e.g. Kula–Pacific (Rea and Dixon,1983; Engebretson et al., 1985; Lonsdale, 1988; Mammerickx andSharman, 1988; Atwater, 1990), Izanagi–Pacific (Larson et al., 1972;Woods and Davies, 1982; Sager and Pringle, 1987; Handschumacheret al., 1988; Sager et al., 1988; Nakanishi et al., 1992; Nakanishi andWinterer, 1998), Farallon–Pacific (Atwater, 1970, 1990; Engebretsonet al., 1985; Caress et al., 1988; Stock and Molnar, 1988; Wilson, 1988;Atwater and Severinghaus, 1989), Phoenix–Pacific spreading (Stockand Molnar, 1987; Cande et al., 1998; Sutherland and Hollis, 2001;Larson et al., 2002; Larter et al., 2002; Viso et al., 2005) and the platesrelated to the break-up of the Ontong Java–Hikurangi–Manihiki Pla-teaus (Taylor, 2006)). Beyond this, few studies have attempted to deriverelative plate rotation models of these now vanished plates (e.g.Engebretson et al., 1985; Stock and Molnar, 1988) to establish a longertectonic history of the Pacific plate where minimal or no informationabout the seafloor spreading record exists.
Another common approach to constrain plate tectonic models ofthe Pacific has been through the interpretation of the onshore geolo-gy, in particular examining anomalous volcanism and geochemistryassociated with ridge subduction, crustal shortening rates and events,accretion of exotic terranes, ophiolite emplacement, large-scale crust-al deformation and massive sulfide and other subduction related ore-deposit formation (e.g. Bradley et al., 1993; Haeussler et al., 1995;Madsen et al., 2006; Sun et al., 2007). This information is sometimestranslated into a schematic representation of past plate configura-tions based purely on the onshore record but these plate reconstruc-tion schematics are often only snapshots in time rather than evolvingand are not quantitatively derived through the seafloor spreading re-cord. Nevertheless, they are helpful in developing conceptual modelsfor the evolution of now vanished ocean crust.
Engebretson et al. (1985) presented a quantitative plate kinematicmodel of the seafloor spreading record focused on the northernPacific basin for the past 180 Ma and is currently the most compre-hensive and often cited study on Pacific plate reconstructions. Thisstudy enabled subsequent authors to place their regional tectonic re-constructions and geological observations into a Pacific-wide tectonicframework. The model of Engebretson et al. (1985) is based on an ab-solute reference frame using fixed Atlantic and fixed Pacific hotspots(Morgan, 1972) with relative plate motions for the Pacific, Farallon,Izanagi, Kula and Phoenix plates determined by computing the dis-placements of each plate relative to the absolute reference framerather than via plate circuit closure as is commonly used. Since thepublication of Engebretson et al. (1985), additional data acquisition,updated interpretations and more accurate magnetic anomaly time-scales have been published, providing improved constraints onthe Izanagi–Pacific, Phoenix–Pacific, Farallon–Phoenix and Pacific–Antarctic ridges.
The Pacific triangle is an area of the western Pacific where threeMesozoic magnetic lineation sets (Japanese, Hawaiian and Phoenixlineations) intersect (Fig. 6), recording the birth of the Pacific platefrom three “parents”: the Farallon, Izanagi and Phoenix plates. Theevolution of the three parent plates has influenced the developmentof subsequent seafloor spreading systems in the Pacific. The north-western (Japanese) lineations represent spreading between thePacific and Izanagi plates and young towards the west–northwest,the easternmost (Hawaiian) lineations represent spreading betweenthe Pacific and Farallon plates and young towards the east and thesouthernmost (Phoenix) lineations represent spreading between thePacific and Phoenix plates and young towards the south (Atwater,1990; Nakanishi et al., 1992) (Fig. 6). These three plates radiatedout from the emerging Pacific plate during the Mesozoic and existedprior to the establishment of the Pacific plate in a simple ridge–ridge–ridge configuration. We will present an assessment of thePacific and Panthalassa by describing each parent plate with theirassociated children.
3.2.1. Izanagi plateThe M-sequence Japanese magnetic lineation set found in the
westernmost Pacific represents the last preserved fragments of awestward-younging Jurassic–Cretaceous spreading system (Fig. 6).Early reconstructions of the area linked the Japanese lineation set tothe younger, Cenozoic seafloor spreading history of the Pacific–Kularidge (Larson et al., 1972). To reconcile the geometry of the preservedNE–SW trending Japanese lineations with the E–W trending Cenozoiclineations formed by Pacific–Kula spreading, Woods and Davies(1982) introduced the idea of an independent Izanagi plate, althoughsome models still prefer a single Kula plate (Norton, 2007). Due toprogressive subduction since the Mesozoic, the entire crust thatfloored the Izanagi plate as well as the portion of the Pacific platerecording the death of the Izanagi has been lost, leaving behind onlythe Mesozoic fragment of the Pacific plate. This complicates recon-structions as few present day constraints exist to tie down tectonicparameters for the evolution of the area. Additionally, there are noconstraints on the history of the Izanagi plate prior to the birth ofthe Pacific plate.
Magnetic anomalies M33–M0 (~158–120 Ma) of the Japanese line-ation set have been confidently identified in the northwest Pacific(Sager and Pringle, 1988; Handschumacher et al., 1988; Sager et al.,1988; Atwater, 1989; Nakanishi et al., 1992; Nakanishi and Winterer,1998). A recent deep-tow magnetometer survey over the PigafettaBasin in the vicinity of ODP drill site 801C revealed a low amplitudemagnetic anomaly sequence extending to M44 (~170 Ma), within theJurassic Quiet Zone (Tivey et al., 2006) with Anomaly M42 (~168 Ma)corresponding to the location of ODP drill site 801C (Tominaga et al.,2008). Previous interpretations infer the oldest crust in the Pacific tobe 175 Ma (Engebretson et al., 1985; Müller et al., 1997) based on

130˚ 140˚ 150˚ 160˚ 170˚ 180˚ −170˚−10˚
0˚
10˚
20˚
30˚
40˚
50˚
Pacific
SR
ODP801
KFZ
HR
OJP
MPM
Ellice Basin
North America
Philippine
Australia
Caroline
Amur
Okhotsk21
21
M16
M10
M4
M0
M21
M25
M29
33
31
25
M0
M4
M10
M16
M21
M25
M29
M37 M37
M37
M29
M25M21
M16 M10
M4
M0
130˚ 140˚ 150˚ 160˚ 170˚ 180˚ −170˚−10˚
0˚
10˚
20˚
30˚
40˚
50˚
Pacific
SR
KFZ
HR
OJP
MPM
North America
Philippine
Australia
Caroline
Amur
Okhotsk21
21
M16
M10
M4
M0
M21
M25
M29
33
31
25
M0
M4
M10
M16
M21
M25
M29
M37 M37
M37
M29
M25M21
M16 M10
M4
M0
Ellice Basin
−50 −40 −30 −20 −10 0 10 20 30 40 50
Magnetic Intensity Anomaly [nTesla]
a b
Plate Boundary Isochrons
PAC-IZAExtinct Ridge
Tectonic BoundaryPAC-FARPAC-KUL
PAC-PHXPAC-MANBB & OTH
LIPproduct
Non-oceanic
Fig. 6. (a) Gridded magnetic anomalies for the Western Pacific, based on isotropic gridding of a combination of public domain and in-house data. Seafloor spreading isochrons usedin this study plotted as thin black lines. Numbers correspond to magnetic anomaly chron. HR = Hess Rise, OJP = Ontong Java Plateau, SR = Shatsky Rise. (b) Seafloor spreadingisochron map colored by spreading system or plate pair. Legend abbreviations are: BB = Back-arc Basins, FAR = Farallon, IZA = Izanagi, KUL = Kula, MAN = Manihiki, OTH =Other spreading systems outside area of interest, PAC = Pacific, PHX = Phoenix.
226 M. Seton et al. / Earth-Science Reviews 113 (2012) 212–270
interpolation to the center of the Pacific triangle, but this age ap-pears to be inconsistent with the recent dating of magnetic anoma-lies and the dating from ODP site 801C, which is located ~750 kmfrom the inferred center of the Pacific triangle. After the initiationof spreading between the Pacific and Izanagi plates, the ridge under-went some instability with one or more proposed ridge jumps pos-tulated to explain the anomalously large distance between theadjacent isochrons along a spreading corridor between M33 and29 (~158–156 Ma) (Sager et al., 1998). Analysis of the magneticanomalies and seafloor fabric flanking this proposed ridge jumphas not found an abandoned spreading center. Spreading continuedwith relatively high seafloor spreading rates between M29 and 25(~156-154 Ma) (Nakanishi et al., 1992) before decreasing to aver-age rates until M21 (~147 Ma).
The fracture zone pattern observed in the satellite gravity data andmapped via ship track data (Sager et al., 1988; Nakanishi andWinterer, 1998; Sager et al., 1998) indicates a large 24° clockwise ro-tation of the Izanagi plate relative to the Pacific at M21 (~147 Ma)(Sager et al., 1999), particularly evident along the Kashima FractureZone near the Izu-Bonin–Mariana trench (Fig. 6). The change inspreading direction from NW–SE to NNW–SSE coincides with theeruption of the Shatsky Rise at the Izanagi–Farallon–Pacific triplejunction (Nakanishi et al., 1999; Sager et al., 1999) followed by theprogressive reorganization and migration of the triple junction centerfor a period of about 2 million years. The period between AnomaliesM21 and 20 (~147–145 Ma) also corresponds to changes in spreadingrate and direction in the Pacific, Atlantic and Indian Oceans (Sager etal., 1988; Nakanishi et al., 1999). The youngest identified Japaneselineation corresponds to M0 (~120 Ma) (Nakanishi et al., 1999; Sageret al., 1999; Tominaga and Sager, 2010) trending similar to the post-
M20 (~145 Ma) lineations (Fig. 6). This would suggest no measuredchange in spreading direction between at least 145–120 Ma. The ocean-ic crust to the north of M0 (~120 Ma) is inferred to have formed duringthe CNS and represents the youngest preserved oceanic lithosphere as-sociated with Izanagi–Pacific spreading.
Previous interpretations have tied the cessation of spreadingbetween the Pacific and Izanagi plates to the onset of spreadingbetween the Kula and Pacific plates (Engebretson et al., 1985), some-time between 83.5 and 70 Ma (Lonsdale, 1988; Atwater, 1989) (seeSection 3.2.2.1: Kula plate). In these models, the orientation of theIzanagi–Pacific ridge is depicted as a side-stepping E–W orientedridge perpendicular to the East Asian margin. As the oldest discern-able Japanese magnetic lineation is oriented NE–SW, an E–Worientedmid-ocean ridge requires a major change in spreading direction post-M0 (~120 Ma). However, there are no fracture zones present in thepost-Mesozoic crust of the NW Pacific to suggest a major change inspreading direction during the CNS (Fig. 1).
An alternative approach to constrain the orientation and cessation ofthe Izanagi–Pacific ridge is through an analysis of the onshore geologicalrecord in east Asia together with the preserved seafloor spreadingrecord in the NW Pacific (Whittaker et al., 2007; Seton et al., inpreparation). The younging northwestward sequence of magnetic line-ations and the presence of Indian-type mantle geochemical signaturesin various volcanic arcs of the northwest Pacific (Straub et al., 2009) in-dicate a ridge subducted under east Asia at some time in the past.Whittaker et al. (2007) assumed no change in spreading direction ofthe Pacific–Izanagi fromM0 (~120 Ma) onwards as there is no evidencefor a major change in spreading direction post-M0 (~120 Ma) resultingin the mid ocean ridge intersecting the east Asian margin in a sub-parallel fashion. The timing for the intersection of the ridge with the

227M. Seton et al. / Earth-Science Reviews 113 (2012) 212–270
margin forming a slabwindow can be constrained through a number ofgeological observations from Japan and Korea. The geology in southernand central Japan records a pulse of volcanism and anomalous heatflowmeasurements (Agar et al., 1989; DiTullio, 1993; Sakaguchi, 1996;Lewis and Byrne, 2001) indicative of the presence of a slab window inthe late Cretaceous-early Cenozoic. The cessation of granitic plutonismin Korea suggests that subduction was terminated along east Asiaaround 60–50Ma (Sagong et al., 2005). In addition, seismic tomogra-phy profiles across east Asia reveal a break in the continuity of slabmaterial in themid-mantle (Seton et al., in preparation) possibility indi-cating the subduction of a mid-ocean ridge and slab break-off event.Based on this model, the cessation of spreading between the Izanagiand Pacific plates (i.e. the death of the Izanagi plate) occurred around55–50 Ma followed by the complete subduction of the Izanagi platealong the East Asian margin by 40 Ma. In this model, the cessation ofspreading between the Izanagi and Pacific plate is not correlated withthe initiation of spreading in the Kula plate, as suggested by previousstudies.
We model the Mesozoic–early Cenozoic evolution of the Izanagiplate using constraints still preserved on the Pacific plate. We definethe onset of spreading between the Pacific and Izanagi plates to190 Ma, 15–20million years earlier than previous interpretations. Webase our age estimation, which is a maximum age, on the following:
(1) The location of the oldest identified magnetic anomaly, M44(~170 Ma) (Tivey et al., 2006) is over 750 km from the inferredcenter of the Pacific triangle
(2) ODP site 801C, which lies within M42 (~168 Ma) is consistentwith the dating of microfossils overlying pillow basalts(Lancelot et al., 1990; Tivey et al., 2006)
(3) An extrapolation of intermediate seafloor spreading rates(~30–40 mm/yr) from the location of M44 to the center ofthe Pacific triangle suggests an approximate age to be closerto around 190 Ma.
(4) A younger age for the initiation of seafloor spreading betweenthe Izanagi–Pacific, Farallon–Pacific and Phoenix–Pacific wouldrequire anomalously high spreading rates or substantialspreading asymmetry. This cannot be discounted as Tominagaet al. (2008) suggest a rapid spreading rate of ~75 mm/yr.Therefore, we believe an age of 190 Ma for the birth of thePacific plate is a maximum age.
We have incorporated the Japanese magnetic lineations and frac-ture zones of Sager et al. (1988) and Nakanishi et al. (1999) togetherwith fracture zone traces based on satellite gravity anomaly data(Sandwell and Smith, 2009) to define the seafloor spreading historybetween the Izanagi and Pacific plates. Our resultant seafloor spread-ing isochrons match well with the magnetic lineations seen in ourmagnetic anomaly grid from M25 (~154 Ma) onwards when themagnetic anomaly signature is strongest (Fig. 6). Magnetic lineationsprior to M25 (~154 Ma) have larger variability (Tominaga and Sager,2010) and are not observed in our magnetic anomaly grid (Fig. 6)(see Tominaga and Sager, 2010 for details). The ridge jump prior toM26 (~155 Ma) postulated by Sager et al. (1998) has not been incorpo-rated as we were unable to identify magnetic lineations or an aban-doned ridge. In addition, the conjugate ridge flank is absent.
We incorporate the major 24° clockwise change in spreading di-rection at M21 (~147 Ma) (Sager et al., 1988) primarily constrainedvia the Kashima Fracture Zone which shows continuity from at leastM28–M10 (~156–130 Ma) (Fig. 6). This major change in spreadingdirection is coincident with the eruption of the southern-end of theShatsky Rise at the Farallon–Izanagi–Pacific triple junction followedby triple junction instability. According to the model of Sager et al.(1988) two simultaneous triple junctions and at least nine small,short-lived ridge jumps occurred at the Pacific–Farallon–Izanagi junc-tion. This led to an 800 km northeast jump in the triple junctioncenter clearly observed in the gridded magnetic anomaly dataset
between M21 (~147 Ma) and M16 (~138 Ma) (Fig. 6). Due to thecomplexity of the triple junction solutions and the lack of preserveddata between the Izanagi and Farallon plates, we incorporate a simplemodel whereby the Pacific–Izanagi–Farallon triple junction remainsin a ridge–ridge–ridge configuration during its entire history. As theinstability of this triple junction is believed to have existed for only2 million years (Sager et al., 1999), we believe that our assumptionis reasonable and follows the broad scale development of the area.
The fracture zones in the westernmost Pacific do not show a majorchange in trend after M20 (~146 Ma) (Fig. 6). No discernable fracturezone trends after M0 indicate the direction of motion during the CNShence we assume that no change in the direction of motion occurredfrom M20 to the CNS and use a fixed stage rotation pole for this entireperiod. As much of the evidence for the late Cretaceous–early Cenozoichistory of the Izanagi plate has been lost due to subduction along theeast Asianmargin, we assume nomajor change in spreading rate, direc-tion and accretion fromM0 (last dated anomaly, ~120 Ma) to the cessa-tion of spreading along the Izanagi–Pacific ridge.
Finite rotations were computed for Izanagi–Pacific spreadingusing the half-stage pole method and assuming spreading symmetryand rely heavily on fracture zone traces for direction of motion. Foryounger times when no preserved crust exists, we assume an inter-mediate full spreading rate of ~80 mm/yr (similar to the spreadingrate in the late Cretaceous), spreading symmetry and a consistentspreading direction to model the position of the mid-ocean ridge.We find that this results in the Pacific–Izanagi ridge intersecting theeast Asian margin around 55–50 Ma in a sub-parallel orientationand is consistent with geological and seismic tomography observa-tions, as explained in Seton et al. (in preparation). Our model suggeststhat spreading continued along the Pacific–Izanagi ridge after the es-tablishment of the Kula–Pacific ridge to the east, contrary to mostprevious models. The preserved seafloor spreading record in the re-gions adjacent to the Pacific–Izanagi ridge preserves no evidence tosuggest a readjustment of the plate driving forces due to the mergingof two major plates (i.e. the death of the Izanagi plate) prior to 55 Ma.Instead, we find that spreading between the Kula and Pacific platesunderwent a major change in spreading rate and direction at Anom-aly 24 (~55–53 Ma), which resulted in a dramatic doubling of thespreading rate of the Kula plate and a counter-clockwise change inspreading direction from largely N–S to NW–SE. Our model is instark contrast to the prevailing models for the Izanagi–Pacific andKula–Pacific ridges, but our interpretation is kinematically self-consistent, matches geological observations and can be linked to thesubduction history as seen in seismic tomography (Seton et al., inpreparation).
The birth of the Izanagi plate is far more uncertain. The Izanagiplate must have existed prior to the birth of the Pacific plate as partof a three-plate ridge–ridge–ridge triple junction with the Farallonand Phoenix plates, based on the rules of triple junction closure. How-ever, there is no crust preserved in the seafloor spreading recordreflecting this early history as it has been progressively subductedunder the east Asian margin. We model a simple geometry wherebythe spreading direction between the Izanagi–Farallon plates is con-strained by the oldest Pacific–Izanagi and Pacific–Farallon isochronsvia triple junction closure, intermediate spreading rates and spread-ing symmetry. We constructed the positions of the spreading ridgesby computing small circle arcs between Izanagi–Pacific, Farallon–Pacificand Phoenix–Pacific spreading. The spreading direction between theIzanagi and Phoenix plates is similarly constrained using triple junctionclosure between the Pacific–Izanagi and Pacific–Phoenix plates and thelength of the spreading ridges determined by intersection with thePacific margins.
3.2.2. Farallon plateEarly mapping of magnetic lineations in the western Pacific identi-
fied a set of NW–SE trending Mesozoic magnetic lineations loosely

228 M. Seton et al. / Earth-Science Reviews 113 (2012) 212–270
bounded by the Shatsky and Hess Rises and the Mid Pacific Mountains(Figs. 6 and 7). These lineations, termed the Hawaiian lineations,formed during NE–SW directed spreading between the Pacific andnow extinct Farallon plate between at least M29–M0 (~156–120 Ma)(Larson et al., 1972; Atwater and Severinghaus, 1990). The Mesozoic
−170˚ −160˚ −150˚ −140˚ −130˚ −120˚ −110˚ −100˚10˚
20˚
30˚
40˚
50˚
60˚
Pacific
North America
R
25
31
34
3125 21 18 13
34 31 25
6 5
18 13
6 5
5C
J
YTT ST QT
W
21
Molokai
Clarion
Pioneer
Murray
Mendocino
Laurentian Margin
−170˚ −160˚ −150˚ −140˚ −130˚ −120˚ −110˚ −100˚10˚
20˚
30˚
40˚
50˚
60˚
Pacific
North America
R
25
31
34
3125 21 18 13
34 31 25
6 5
18 13
6 5
5C
J
YTT ST QT
W
21
Molokai
Clarion
Pioneer
Mendocino
Murray
−50 −40 −30 −20 −10 0 10 20 30 40 50Magnetic Intensity Anomaly [nTesla]
a
b
Plate BoundaryIsochrons
PAC-VANExtinct Ridge
Tectonic Boundary
PAC-FAR
PAC-KUL
PAC-JDF
PAC-RIV
PAC-COC
LIPproduct
Non-oceanic
Laurentian Margin
Fig. 7. (a) Gridded magnetic anomalies for the northeast Pacific. Seafloor spreading iso-chrons used in this study plotted as thin black lines. Numbers correspond to magneticanomaly chron. QT = Quesnellia Terrane, ST = Stikinia Arc, W = Wrangellia, YTT =Yukon/Tanana Terrane. (b) Seafloor spreading isochronmap colored by spreading systemor plate pair. Map abbreviations are same as a. Legend abbreviations are: COC = Cocos,FAR = Farallon, JDF = Juan De Fuca, KUL = Kula, PAC = Pacific, R = Rivera/Guadalope,VAN = Vancouver.
oceanic crust on the Farallon plate subducted under North Americabeginning in the late Mesozoic (Bunge and Grand, 2000) and clearlyimaged as seismically fast material under central and eastern NorthAmerica (Bunge and Grand, 2000; Liu et al., 2010). The Hawaiianlineations show a clockwise change in spreading direction at M11(~133 Ma) (Sager et al., 1988; Atwater and Severinghaus, 1990) withno major change in spreading direction during the early history ofPacific–Farallon spreading due to the uniformity of the magnetic linea-tions (Fig. 6) even though fracture zone traces prior to M25 (~154 Ma)are absent (Fig. 1). The pole of rotation to describe Mesozoic spreadingwas likely located in the south or equatorial Pacific due to the slightlyfan-shaped nature of the lineations (Figs. 6 and 7).
The Hawaiian lineations form a magnetic bight with the Japaneselineation set in the north and trace the Pacific–Farallon–Izanagi triplejunction (Fig. 6). The Shatsky Rise erupted along the triple junctioncenter between M21 and 19 (~147–143 Ma), as confirmed by ODPleg 198 (Mahoney et al., 2005) either as a result of a mantle plumehead reaching the surface or decompression melting at a mid-oceanridge (Mahoney et al., 2005; Sager, 2005). The eruption of the ShatskyRise was coincident with an 800 km, nine-stage jump in the locationof the triple junction during which time the triple junction switchedbetween ridge–ridge–ridge and ridge–ridge–transform configura-tions (Nakanishi et al., 1999). The triple junction regained its stabilityafter the initial eruptive phase followed by waning volcanism formingthe Papanin Ridge along the triple junction center until M1 (~121–124 Ma) (Nakanishi et al., 1999).
In the south, the Hawaiian lineations disappear beneath the Mid-Pacific Mountains obscuring the trace of the Pacific–Farallon–Phoenixtriple junction. Further east, the Hawaiian lineations form a complexjunction with several discrete fan-shaped lineation sets (e.g. Magellanand Mid-Pacific Mountain lineation sets) (Tamaki and Larson, 1988)characteristic of crust that formed during microplate formation at fast-spreading triple junction centers. These fan-shaped lineations wereactive between M15 and M1 (~138–121 Ma). In addition, a set ofshort ENE–WSWtrending lineations south of theMid-PacificMountainshas been identified as M21 (~147 Ma) to M14 (~136 Ma) (Nakanishiand Winterer, 1998) and is suggested to have formed between thePhoenix plate and the postulated Trinidad plate.
East of the M-anomalies is a wide zone of crust which formedduring the CNS. Indicators of spreading direction are observed inthe prominent Mendocino, Pioneer, Murray, Molokai and Clarionfracture zones (Figs. 1 and 7). The Mendocino, Molokai and Clarionfracture zones record two clear changes in spreading direction: onebetween M0 and the middle of the CNS (Granot et al., 2009) and an-other clockwise change to almost E–W trending sometime towardsthe end of the CNS (Atwater, 1989; Searle et al., 1993b). No clearer in-dication of timing has been established. The isochrons that bound thebeginning and end of the CNS in this region cannot be restored with-out significant misfit along length. Atwater et al. (1993), thereforeproposed that spreading asymmetry and/or a series of ridge jumpsmust have occurred during the CNS between smaller segment of theocean floor bounding the two isochrons. The Hess, Liliuokalani andSculpin ridges were suggested as possible remnants of this earlyspreading history, whereas others suggest that they were instead re-lated to the formation of the Hess Rise (Hillier, 2007). Oceanic crustthat formed by Pacific–Farallon spreading during the CNS has alsobeen identified in the central–south Pacific, east of the ManihikiRise suggesting that the Pacific–Farallon ridge propagated southwardafter the Mesozoic (Fig. 8).
The Cenozoic lineations record five major episodes of break-up ofthe Farallon plate including the formation of the Kula, Vancouver,Cocos, Nazca and Juan De Fuca plates (Fig. 8) and extend almost theentire length of the eastern Pacific Ocean. In the northeast Pacific,the lineations are some of the best-mapped in the world, as observedin the magnetic grid compilation (Fig. 7). Spreading appears simplefor the early Cenozoic with progressive complexity approaching the

240˚ 260˚ 280˚ 300˚ 320˚ 340˚
120 Ma
240˚ 260˚ 280˚ 300˚ 320˚ 340˚
100 Ma
240˚ 260˚ 280˚ 300˚ 320˚ 340˚
50 Ma
240˚ 260˚ 280˚ 300˚ 320˚ 340˚
30 Ma
240˚ 260˚ 280˚ 300˚ 320˚ 340˚
10 Ma
240˚ 260˚ 280˚ 300˚ 320˚ 340˚
0 Ma
0 20 40 60 80 100 120 140 160
Age of Oceanic Lithosphere (m.yrs)
240˚ 260˚ 280˚ 300˚ 320˚ 340˚
0˚
20˚
40˚
120 Ma
240˚ 260˚ 280˚ 300˚ 320˚ 340˚
0˚
20̊
40̊
100 Ma
240˚ 260˚ 280˚ 300˚ 320˚ 340˚
0˚
20̊
40̊
50 Ma
240˚ 260˚ 280˚ 300˚ 320˚ 340˚
0˚
20˚
40˚
30 Ma
240˚ 260˚ 280˚ 300˚ 320˚ 340˚
0˚
20˚
40˚
10 Ma
240˚ 260˚ 280˚ 300˚ 320˚ 340˚
0 ˚
20˚
40˚
0 Ma
Plate NameNAM
NAM GRN RIVNAM KUL IBR JDF POR
SAM PAC AFR FAR
FAR
NAZ VAN
VAN
COC IZA CAR
229M. Seton et al. / Earth-Science Reviews 113 (2012) 212–270

230 M. Seton et al. / Earth-Science Reviews 113 (2012) 212–270
trench. The most prominent bend observed in all fracture zones in thenortheast Pacific occurred just prior to Chron 33 (~79 Ma) wherespreading changed from roughly E–W to ENE–WSW (Atwater et al.,1993). Atwater et al. (1993) suggested that the inferred continuityof the spreading system provides evidence of a simple two-plate sys-tem during this time, negating the need for microplate formation (e.g.Chinook plate). Anomaly 33 (~79 Ma) corresponds to the oldestclearly identified magnetic anomaly related to Pacific–Kula spreading(Lonsdale, 1988; Atwater, 1989) (see Section 3.2.2.1: Kula plate),marking the minimum timing for the initial break-up of the Farallonplate. Spreading was reasonably steady between Chrons 32–24(~71–53 Ma), connecting with spreading along the Kula–Pacificridge to the north at the Great Magnetic Bight (Fig. 7). Anomaly 24(~55–53 Ma; late Paleocene–early Eocene) corresponds to a majorhemisphere-wide plate reorganization event and is manifested in a20° clockwise change in spreading direction between the Pacific andFarallon plates from WSW–ENE to E–W (Atwater, 1989), a changein spreading direction between Pacific–Kula plates (Lonsdale, 1988)and the break-up of the Farallon plate into the Vancouver plate ateither Chron 24 (~55–53 Ma) (Atwater, 1989) or 23 (~51–52 Ma)(Menard, 1978; Rosa and Molnar, 1988) (Fig. 8). The break-up ofthe Farallon plate occurred in between the Pioneer and Murray frac-ture zones (Atwater, 1989) (Fig. 7) with oblique compression andslow relative motion (Rosa and Molnar, 1988). At this time, themid-ocean ridge was located proximal to the subduction zone andwas followed by a period of complex spreading and/or spreadinginstability forming a “disturbed zone” between Anomalies 19–12(~41–31 Ma) (Atwater, 1989). Another major change in spreadingdirection is evident in the seafloor spreading record between theMurray and Pioneer fracture zones at Anomaly 10 (~28 Ma), formingthe Monterey and Arguello plates (Atwater, 1989). South of theMurray fracture zone, the Guadalupe plate formed between Anoma-lies 7 and 5 (~25-10 Ma) (Mammerickx and Klitgord, 1982; Atwater,1989). These plates formed progressively as transform faults inter-sected with the Farallon subduction zone. After Chron 10 (~28 Ma),the Vancouver plate is often referred to as the Juan De Fuca plate, co-inciding with the establishment of the San Andreas fault no earlierthan 30 Ma (Atwater, 1970) (Fig. 8).
Spreading between the Pacific and Farallon plates during theMesozoic occurred in the region conjugate to the North Americanmargin. However, starting in the CNS, the Pacific–Farallon spreadingextended southward as far south as the Eltanin fracture zone in theSouth Pacific (Figs. 7 and 9). Magnetic anomalies 34 (~84 Ma) to 6(~20 Ma) on the Pacific plate associated with Pacific–Farallon spread-ing conjugate to the South American margin have been identified(Herron, 1972; Cande et al., 1982; Mayes et al., 1990). This is restrict-ed to Anomalies 23–6 (~52–20 Ma) on the Nazca plate (Cande andHaxby, 1991). Seafloor spreading between Anomalies 34–21 (~84–47 Ma) was reasonably stable until a major reorganization of thespreading system at Chron 21 (~47 Ma), observed in fracture zonetrends in the South Pacific (Mayes et al., 1990). The cessation of spread-ing between the Pacific and Farallon plates occurred during break upinto the Cocos and Nazca plates at 23 Ma (see Section 3.2.2.3: Nazcaand Cocos plates).
Our model for spreading between the Pacific and Farallon platesincorporates spreading initiation at 190 Ma, based on the evidencepresented earlier in the manuscript (see Section 3.2.1: Izanagiplate), even though the oldest Hawaiian lineation identified is M29(~156 Ma). The model we have implemented closely follows that of
Fig. 8. (a) Agegrid reconstructions of the northeast Pacific at 120, 100, 50, 30, 10, 0 Ma highliextent of continental crust (gray polygons). Plate boundaries from our continuously closinglarge igneous provinces and flood basalts as brown polygons and coastlines as thin black lieach reconstruction time listed above. Feature descriptions as in panel (a). Abbreviations aplate, FAR = Farallon plate, GRN = Greenland plate, IBR = Iberian plate, IZA = IzanagiNAZ = Nazca plate, PAC = Pacific plate, POR = Porcupine plate, RIV = Rivera plate, SAM =to color in this figure legend, the reader is referred to the web version of this article.)
Atwater and Severinghaus (1990). We use their seafloor spreadingisochrons, with adjustments based on Nakanishi et al. (1992), forthe Mesozoic lineations. Our resultant seafloor spreading isochronsmatch well with our magnetic anomaly grid (Figs. 6 and 7) in thenorth and central sections of the Mesozoic lineations but fail to ac-count for the fan-shaped lineations in the south. This is a direct con-sequence of our decision to exclude the reconstruction of numerousmicroplates at the Pacific–Farallon–Phoenix triple junction (e.g.Magellan, Mid-Pacific Mountains and Trinidad lineation sets) and in-stead focus our model the broad-scale development of the area. Tothe north, the Hawaiian Mesozoic lineations show a clear magneticbight with the Japanese lineations (Figs. 6 and 7), highlighting thegeometric stability of the Pacific–Izanagi–Farallon triple junctionfrom M29 to M22 (~156–148 Ma). A major clockwise change inspreading direction is recorded in the Japanese lineations and fracturezones at M21 (~147 Ma) leading to a period of instability of thePacific–Izanagi–Farallon triple junction (see Section 3.2.1: Izanagiplate). Interestingly, this does not correspond to an adjustment ofthe Pacific–Farallon relative plate motion suggesting that the adjust-ment was related to the Shatsky Rise rather than a regional or globalplate reorganization.
Finite rotations for the Pacific–Farallon ridge were derived using thehalf-stage polemethodwith an assumption of spreading symmetry andaverage spreading rates. Reconstruction of the Pacific–Izanagi–Farallon,Pacific–Phoenix–Farallon and Pacific–Kula–Farallon triple junctionsadditionally followed the principles of triple junction closure. Al-though ridge jumps have been proposed for early CNS spreading(Atwater et al., 1993), we have followed a simple model of seafloorspreading throughout the CNS as we cannot identify remnant fea-tures describing the proposed ridge jumps without access to high-resolution multibeam bathymetry data. Towards the end of the CNS,constraining the precise timing of the change in spreading directionobserved in the Mendocino, Molokai and Clarion fracture zones isdifficult. We extrapolate using the Müller et al. (2008a) model andsuggest that a change in spreading direction between the Pacificand Farallon plates occurred at 103 Ma, closely corresponding withthe observed bend in Pacific hotspots at ~99 Ma, implied by Veevers(2000) and Wessel and Kroenke (2008), based on an updated sea-mount dataset.
The Shatsky Rise formed at the Izanagi–Farallon–Pacific triplejunction and as a consequence, part of the Shatsky Rise must haveerupted onto the Farallon and Izanagi plates. We have modeled theconjugate Shatsky Rise (Farallon) and find that it intersects theNorth American margin at 90 Ma, correlating well with the onset ofthe Laramide Orogeny in western North America and a shallow seis-mically fast region underlying western North America (Liu et al.,2010). As the geological evidence and seismic tomography imagesare independent of the plate reconstructions used, our assumptionof largely symmetrical seafloor spreading and average spreadingrates between Pacific–Farallon appears to be reasonable.
After the CNS, we model seafloor spreading based on Atwater andSeveringhaus (1990) for the northeast Pacific but without small-scaleridge adjustments associated with plate break-up events (Fig. 8). Weconcur with the interpretation of Atwater et al. (1993) that the mostnotable change in spreading direction observed in all northeast Pacificfracture zones occurred at Chron 33 (~79 Ma). This timing correspondsto our initiation of seafloor spreading between the Kula and Pacificplates and establishment of the Pacific–Kula–Farallon triple junction(see Section 3.2.2.1: Kula plate) (Fig. 8). Further southward, the
ghting the age–area distribution of oceanic lithosphere at the time of formation and theplate polygon dataset are denoted as thick white lines, hotspot locations as yellow stars,nes. (b) Reconstructions showing the outlines of the plates in the northeast Pacific forre: AFR = African plate, CAR = Caribbean plate, COC = Cocos plate, EUR = Eurasianplate, JDF = Juan de Fuca plate, KUL = Kula plate, NAM = North American plate,South American plate, VAN = Vancouver plate. (For interpretation of the references

−60˚
−50˚
−40˚
−30˚
−20˚
−10˚
0˚
10˚
20˚
−150˚ −140˚ −130˚ −120˚ −110˚ −100˚ −90˚ −80˚ −70˚
Pacific
N.Am
South America
Antarctica
Nazca
2521 18
13
34 31 2521 18 13
34 3125 21
18 136
5
65
5
6
56
13 18
21
5
6
5
6
13
18
21
6
5
5 613 18 21
25
Co
E
B
J
MenardEltanin
F
H
G GR
EPR
CR
PAR
−60˚
−50˚
−40˚
−30˚
−20˚
−10˚
0˚
10˚
20˚
−150˚ −140˚ −130˚ −120˚ −110˚ −100˚ −90˚ −80˚ −70˚
Pacific
N.Am
South America
Antarctica
Nazca
2521 18 13
34 31 2521 18 13
34 3125 21
18 136
5
65
5
6
56
13 18
21
5
6
5
6
13
18
21
6
5
5 613 18 21
25
Co
E
B
J
MenardEltanin
F
H
G GR
EPR
CR
PAR
−50 −40 −30 −20 −10 0 10 20 30 40 50
Magnetic Intensity Anomaly [nTesla]
Plate BoundaryIsochrons
PAC-WANTExtinct Ridge
Tectonic Boundary
PAC-FAR
PAC-NAZ
FAR-WANT
PAC-RIV
NAZ-COC
NAZ-BAU
PAC-COC
LIPproduct
Non-oceanic
a
b
Fig. 9. (a) Gridded magnetic anomalies for the southeast Pacific. Seafloor spreading iso-chrons used in this study plotted as thin black lines. Numbers correspond to magneticanomaly chron. B = Bauer Microplate, CR = Chile Ridge, E = Easter Microplate, EPR =East Pacific Rise, F = Friday Microplate, G = Galapagos Microplate, GR = GalapagosRidge, J= Juan FernandezMicroplate, PAR=Pacific–Antarctic Ridge. (b) Seafloor spread-ing isochron map colored by spreading system or plate pair. Map abbreviations are sameas a. Legend abbreviations are: BAU=Bauer, COC=Cocos, FAR= Farallon, NAZ=Nazca,PAC = Pacific, RIV = Rivera/Guadalope, WANT = West Antarctica/Antarctica.
231M. Seton et al. / Earth-Science Reviews 113 (2012) 212–270
Pacific–Farallon ridge extended to the Eltanin fracture zone and Pacific–Farallon–Antarctic triple junction. Spreading along the Pacific–Antarcticand Farallon–Antarctic ridges initiated at Chron 34 (~83.5 Ma) (seeSection 3.2.3.1: Pacific–Antarctic spreading). Our model for the south-east Pacific is similar to that ofMayes et al. (1990)with nomajor changein spreading rate between Anomalies 33 and 21 (~79–47 Ma) followedby a change in spreading direction after Chron 21 (~47 Ma), recorded inthe fracture zones in the South Pacific particularly along the Eltaninfracture zone. At this time, the Pacific–Farallon spreading ridge extend-ed further southward, connecting up with spreading associated withthe Aluk Plate.
The break-up of the Farallon plate into the Vancouver plate atChron 24 (~53 Ma) (Atwater, 1989) resulted in minor relative motionalong the Pioneer fracture zone (Figs. 7 and 8). Our finite rotations todescribe Pacific–Vancouver spreading are taken from Müller et al.(1997). As the Pacific–Farallon ridge approached the North Americansubduction zone, spreading became more complex with the forma-tion of numerous microplates, ridge jump and propagation events.Our model incorporates the Vancouver and Juan De Fuca plates(Fig. 8) but excludes the other proposed microplates, such as theMonterey, Arguello and Guadalupe plates, as no published poles ofrotation to describe their history are available. Spreading betweenthe Pacific and Farallon plates ceased in the area to the west ofSouth and Central America at 23 Ma (Chron 6B) as the plate separatedinto the Cocos and Nazca plates.
3.2.2.1. Kula plate. The existence of the Kula plate during the lateCretaceous to the Paleocene/Eocene has been known since theearly identification of northward younging, E–W trending magneticanomalies in the northern Pacific (Rea and Dixon, 1983; Lonsdale,1988; Mammerickx and Sharman, 1988; Atwater, 1990) (Fig. 7).These magnetic anomalies, located north of the Chinook Trough,represent only the southern (Pacific) flank of Kula–Pacific spread-ing, the remainder having been subducted beneath the Aleutiantrench. The initiation of the Pacific–Kula ridge occurred within theFarallon plate and marks the first stage of Farallon plate break-up.Additionally, prevailing models of the Pacific (e.g. Engebretson etal., 1985) imply that cessation of spreading along the Izanagi–Pacif-ic ridge preceded the establishment of the Pacific–Kula Ridge,therefore suggesting that Pacific–Izanagi and Pacific–Kula spread-ing was not simultaneous. This assumption has implications forthe formation of the northern Pacific and plate driving forces inthe area.
The oldest well recognized magnetic anomaly associated withKula–Pacific spreading is either Anomaly 31 (~68 Ma) or possibly32 (~71Ma) (Rea and Dixon, 1983; Lonsdale, 1988) although someauthors interpret Anomaly 33 (~79 Ma) (Mammerickx and Sharman,1988) and tentatively Anomaly 34 (~83.5 Ma) (Atwater, 1990;Norton, 2007). The conventional view is that after the death of theIzanagi plate, the locus of rifting and spreading jumped eastward tothe Chinook Trough where E–W trending magnetic lineations formedvia simple Kula–Pacific spreading. However, Rea and Dixon (1983) pos-tulated that two spreading ridges formed along existing Pacific–Farallonfracture zones after a change in spreading direction at ~83.5 Ma form-ing a second plate, the Chinook plate, south of the Chinook Trough.
The Stalemate Fracture Zone delineates the western extent of theKula plate (Fig. 6) and tracks the motion of the Kula plate from N–Sadjacent to Anomalies 34/31 (83.5–71 Ma) to 25 (~56 Ma) to NWfrom Anomalies 24 (~55–53 Ma) to 20/19 (~44–41 Ma). Additionally,Lonsdale (1988) interpreted an extinct spreading ridge adjacent toAnomalies 20/19 (~44–41 Ma) as well as a short sequence of Anom-alies 21–20 (47–44 Ma) on the western side of this extinct ridge.The study of Lonsdale (1988) therefore suggests a spreading historyfor the Kula plate involving N–S spreading from 32 to 25 (~71–56Ma) followed by a major change in plate motion by 20–25° atChron 24 (~55–53 Ma). The cessation of spreading along the Pacific–

232 M. Seton et al. / Earth-Science Reviews 113 (2012) 212–270
Kula ridgewas initially believed to have occurred at Chron 25 (~56 Ma)(Byrne, 1979) and later to 43–47 Ma corresponding to themajor Pacificplate reorganization event (Engebretson et al., 1985). The identificationof an extinct spreading ridge in the far northwest corner of the plate byLonsdale (1988) further refined the cessation of spreading to aroundChron 18 (~40 Ma). However, the identification of this ridge wasbased on a small number of ship tracks and seismic profiles.
To the east, the Kula plate is delineated by the Great MagneticBight, which traces the Pacific–Kula-Farallon triple junction in aridge–ridge–ridge configuration from Chron 34/31 (~84–71 Ma) to25 (~56 Ma) (Fig. 7). This is followed by a “T” anomaly correspondingto Chron 24 (55–53 Ma), which likely formed during a reorganizationof the Pacific–Kula–Farallon triple junction (Lonsdale, 1988; Atwater,1990).
The Great Magnetic Bight traces the location of the Kula–Farallon–Pacific triple junction (Figs. 7 and 8). Previous models have predictedthe location and orientation of the resultant Kula–Farallon ridge(for which there is no preserved evidence in the seafloor spreadingrecord) based on triple junction closure and tracking evidence ofa slab window beneath western North American margin (e.g.Engebretson et al., 1985; Atwater, 1990; Breitsprecher et al., 2003;Madsen et al., 2006). Most models lead to a reasonably consistent re-sult of a NE–SW trending spreading ridge intersecting the NorthAmerican margin and forming a slab window somewhere near thepresent-day Pacific Northwest (Engebretson et al., 1985; Atwater,1990; Breitsprecher et al., 2003; Madsen et al., 2006).
Our interpretation for the Kula plate closely follows the modelof Lonsdale (1988). However, we have interpreted Anomaly 33(~79 Ma) north of the Chinook Trough as the oldest identifiedmagneticanomaly based on the interpretation in Atwater (1990) and our ownanalysis of the magnetic anomalies in the area. Most authors haveonly been able to interpret anomalies back to 32 (~71 Ma) as it is thelast clearly identified magnetic anomaly, however the new griddedmagnetic anomaly datasets such as WDMAM, EMAG2 and our owngridded compilation (Figs. 6–7) show E–W trending magnetic linea-tions south of Anomaly 32 (~71 Ma). There is space south of our inter-preted Anomaly 33 (~79 Ma) to accommodate a very small portion ofolder crust (possibly back to Anomaly 34 (~84 Ma)), but we believethat the establishment of the stable Pacific–Kula–Farallon triple junc-tion in a ridge–ridge–ridge configuration must have occurred at 33(~79 Ma) and not earlier. Importantly, ourmodel has contemporaneousPacific–Izanagi and Pacific–Kula spreading (see Section 3.2.1: Izanagiplate) joined by a NNW–SSE transform. In our model, we have continu-ing N–S directed Pacific–Kula spreading until Anomaly 25 (~56 Ma)followed by an anticlockwise change in spreading direction starting atAnomaly 24 (~55–53 Ma), as suggested by Lonsdale (1988) andexpressed in the Stalemate Fracture Zone. The magnetic anomalygrids clearly show the NE–SW trending magnetic lineations corre-sponding to the youngest part of Pacific–Kula spreading (Fig. 6).We fol-low the interpretation of Lonsdale (1988) for the cessation of Pacific–Kula spreading to be around 41–40 Ma. We compute finite rotationsbased on the half-stage pole method between Chrons 33–22 (~79–49 Ma) as only the Pacific flank of the spreading system is preserved.We use the magnetic lineations of Lonsdale (1988) and the StalemateFracture Zone to compute finite rotations between Chrons 21–20(~47–44 Ma) using the traditional method.
The factor leading to the abrupt change in plate motion betweenthe Kula and Pacific plates was suggested to be a result of the tempo-rary elimination of northward slab pull when subduction shifted fromthe Siberian margin to the Aleutian Trench (Lonsdale, 1988). In ourmodel, we argue that the subduction of the Izanagi–Pacific ridge at55–50 Ma resulted in the temporary cessation of subduction andslab break-off along the east Asian margin leading to a change inmotion of the Kula plate to the northwest. The intersection of thePacific–Izanagi ridge with subduction under East Asia eliminated theridge push force thus enabling the Kula plate to move to the west.
The change in spreading direction in the Kula plate identified byLonsdale (1988) matches with the change in the Pacific plate drivenby the subduction of the Izanagi ridge (see Section 3.2.1: Izanagiplate) and changes that were occurring along the Pacific–Farallonspreading system (see Section 3.2.2: Farallon plate).
To the east, we model the Kula–Farallon ridge based on triplejunction closure and the finite difference method resulting in a stableNE–SW orientation of the Kula–Farallon ridge, consistent with previ-ous studies. The Yellowstone hotspot located offshore the NorthAmerican margin in the Paleocene/Eocene (Fig. 8) was used as afurther constraint to guide the position of the NE–SW trending Kula–Farallon ridge, as mid-ocean ridges are known to preferentially evolvenear hotspots (Müller et al., 1998b). As a result our modeled positionof the Kula–Farallon ridge with respect to the North American margincorrelates with onshore geological and geochemical evidence of anorthward migrating slab window near the northern US/Canadianmargin (Atwater, 1990; Breitsprecher et al., 2003; Madsen et al.,2006). Additionally, our position of the Kula–Farallon ridge is supportedby seismic tomography (Bunge and Grand, 2000).
3.2.2.2. Vancouver/Juan De Fuca plate. The recognition of a difference intrend by about 11° between the fracture zones north of the Murrayfracture zone in the northeast Pacific and those to the south (Fig. 1),led Menard (1978) to suggest that the Farallon plate broke into twoplates around 47–49 Ma Ma (Chrons 22–21). Menard (1978) termedthe new plate north of the Murray Fracture Zone, the Vancouverplate. Differential motion between the Vancouver and Farallon platewas confirmed and dated to Chron 21 (~47 Ma) with the spacing ofmagnetic anomalies in the area between the Murray and Pioneerfracture zone possibly indicating either asymmetric spreading or aridge jump between Anomalies 21 (~47 Ma) and 13 (~33 Ma) (Rosaand Molnar, 1988). The model of Rosa and Molnar (1988) impliesslow transpressional motion across the plate boundary, which lies be-tween the Murray and Pioneer fracture zones as a “set of curving,tooth-like disjunctures” (Atwater, 1990) clearly seen between Anom-alies 19 and 13 (~41–33 Ma) (Fig. 7) possibly indicative of diffusedeformation.
The intersection of the Murray transform fault with the NorthAmerican subduction zone around 30 Ma led to the establishmentof the San Andreas Fault and corresponds to the establishment ofthe Juan De Fuca plate at the expense of the Vancouver plate. Thespreading history of the Juan De Fuca plate is very complex (Wilsonet al., 1984; Wilson, 1988) most likely due to its proximity to theCascadia subduction zone. Spreading involved counter-clockwise mo-tion followed by progressive clockwise rotation starting at Chron 5D(~17 Ma) (Atwater, 1990) and a series of propagating rifts and micro-plate formation (Wilson et al., 1984; Wilson, 1988). Currently, theJuan De Fuca plate is limited at its southern end by the MendocinoFracture Zone and is subducting slowly along the Cascadia subductionzone (Fig. 7).
Our reconstructions of the Vancouver/Juan De Fuca plates arelargely based on the detailed tectonic maps of Atwater andSeveringhaus (1990) unchanged from the model used by Müller etal. (1997). We implement the break-up of the Farallon plate intothe Farallon and Vancouver plates along the Pioneer Fracture Zoneat Chron 22 (~50–49 Ma) (Fig. 8). We use the finite rotations fromMüller et al. (1997) for the Vancouver plate and the rotations in thisstudy for the Farallon plate. Our rotations result in transpressionalmotion along the transform fault connecting the Farallon andVancouver plates. The Juan de Fuca plate is modeled as a simpletwo-plate system and we do not include the detailed interpretationof Wilson (1988) as there are no rotations associated with the iso-chrons making it difficult to incorporate into our tectonic model. Onthe broad scale, our seafloor spreading isochrons match well withthe magnetic lineations from our magnetic grid compilation (Fig. 7),

120 Ma
220̊ 240̊ 260̊ 280̊ 300̊ 320̊ 340̊
100 Ma
220˚ 240˚ 260˚ 280˚ 300˚ 320˚ 340˚
80 Ma
220˚ 240˚ 260˚ 280˚ 300˚ 320˚ 340˚
40 Ma
220˚ 240˚ 260˚ 280˚ 300˚ 320˚ 340˚
10 Ma
220˚ 240˚ 260˚ 280˚ 300˚ 320˚ 340˚
0 Ma
0 10 20 30 40 50 60 70 80 90 100110120130140150160260
Age of Oceanic Lithosphere (m.yrs)
120 M
60˚
40˚
20˚
0˚ a
220̊ 240̊ 260̊ 280̊ 300̊ 320̊ 340̊
60˚
40˚
20˚
0˚ 100 Ma
220˚ 240˚ 260˚ 280˚ 300˚ 320˚ 340˚
60˚
40˚
20˚
0˚ 80 Ma
220˚ 240˚ 260˚ 280˚ 300˚ 320˚ 340˚
60˚
40˚
20˚
0˚ 40 Ma
220˚ 240˚ 260˚ 280˚ 300˚ 320˚ 340˚
60˚
40˚
20˚
0˚ 10 Ma
220˚ 240˚ 260˚ 280˚ 300˚ 320˚ 340˚
60˚
40˚
20˚
0˚ 0 Ma
NAM
ANT HIK SND NSC SSC CQL BAU CAZ
SAM PAC AFR FAR NAZ MAN COC
ESC
IZA
ESC
CAR
Plate Name
233M. Seton et al. / Earth-Science Reviews 113 (2012) 212–270

234 M. Seton et al. / Earth-Science Reviews 113 (2012) 212–270
however there are some inconsistencies, particularly approaching thetrench as we do not include small scale block rotations.
3.2.2.3. Nazca and Cocos plates. The East Pacific Rise is currently thesite of very fast seafloor spreading between the Pacific and Nazcaand Cocos plates and dominates the seafloor of the SE Pacific(Fig. 9). Other active seafloor spreading ridges are the Chile Ridge(active spreading between the Nazca and Antarctic plates) and theGalapagos Spreading Centre Nazca–Cocos spreading) (Fig. 9). TheNazca plate incorporates oceanic crust that formed as a result ofPacific–Nazca, Pacific–Farallon, Nazca–Cocos and Nazca–Antarcticspreading as well as the Bauer microplate (Fig. 9). The Cocos plate in-cludes oceanic crust that formed as a result of Cocos–Pacific andCocos–Nazca as well as spreading in the Rivera and Mathematicianmicroplates.
Both the Nazca and Cocos plates formed as a result of the break-upof the southern part of the Farallon plate at approximately 23 Ma(Hey, 1977; Lonsdale, 2005) or Chron 6By (~23 Ma) (Barckhausenet al., 2008). The break-up of the Farallon plate is believed to havebeen driven by a combination of increased northward pull after theearlier break-up of the Farallon plate to the north (Lonsdale, 2005),an increase in slab pull at the Middle America subduction zone dueto an increase in its length (Lonsdale, 2005) and/or the weakeningof the plate along the point of break-up due to the influence of theGalapagos hotspot (Hey, 1977; Lonsdale, 2005; Barckhausen et al.,2008). In addition, plate break-up was preceded by a major plate re-organization in the Southeast Pacific at 24 Ma leading to a change inmotion of the Farallon plate 1–2 million years before break-up(Tebbens and Cande, 1997; Lonsdale, 2005; Barckhausen et al.,2008). Although the Nazca and Cocos plates are now independentplates, an interpretation of their history must consider the evolutionof the Farallon plate (see Section 3.2.2: Farallon plate) to understandthe nature of the oceanic lithosphere in this region older than 23 Ma.
The oldest portion of theNazca plate, adjacent to the South Americanmargin includes the crust that formed due to Farallon–Pacific spreading.Magnetic anomalies up to Anomaly 23 (~51 Ma) have been tentativelyidentified on the Nazca plate (Cande andHaxby, 1991) butmost modelsconfidently identify magnetic anomalies only back to Anomaly 13(~33 Ma) (Handschumacher, 1976; Pardo-Casas and Molnar, 1987;Tebbens and Cande, 1997). Pardo-Cassas and Molnar (1987) and Rosaand Molnar (1988) computed finite rotations and their uncertaintiesto describe the motion of Pacific–Farallon spreading by assumingsymmetrical spreadingwhere both flankswere not presently preserved.These rotations were used as a basis for the rotation model of Tebbensand Cande (1997) for the Nazca–Pacific–Antarctic triple junction. ASouth Pacific-wide study by Mayes et al. (1990) computed rotationsfor the Pacific–Farallon and Pacific–Nazca ridges.
The crust that formed between the Pacific–Nazca plates subse-quent to plate break-up at 23 Ma has a complex spreading history.Spreading occurred as a northward “step-wise triple junction migra-tion” (see Tebbens and Cande, 1997 for a description of this process)between the Pacific–Nazca–Antarctic ridges, leaving behind a recordof ridge jumps and microcontinent formation particularly at Anoma-lies 6 (~20 Ma) and 5A (~12 Ma) (Tebbens and Cande, 1997) includ-ing the Friday microplate south of the Chile Fracture Zone (Fig. 9).This complexity in the spreading pattern has hindered the interpreta-tion of magnetic anomalies post-Oligocene. Although most of thecrust created during this spreading phase is preserved in the present
Fig. 10. (left) Agegrid reconstructions of the southeast Pacific at 120, 100, 80, 40, 10, 0 Ma hithe extent of continental crust (gray polygons). Plate boundaries from our continuously clostars, large igneous provinces and flood basalts as brown polygons and coastlines as thin bPacific for each reconstruction time listed above. Feature descriptions as in panel (left). Ab= Caribbean plate, CAZ = Chasca plate, COC = Cocos plate, CQL = Catquil plate, ESC = EMAN = Manihiki plate, NAM = North American plate, NAZ = Nazca plate, NSC = Northplate, SSC = South Scotia Sea plate. (For interpretation of the references to color in this fig
day record, it has been suggested that isolated sections of Nazca–Pacificspreading have been captured by the Cocos plate to the north andsubsequently subducted under the Middle America trench (Tebbensand Cande, 1997). Finite rotations and their uncertainties to describethe post break-up phase of Nazca–Pacific and Nazca–Antarctic motionwere computed using a combination of the Hellinger technique(Tebbens and Cande, 1997), existing rotations (Pardo-Casas andMolnar, 1987) and the interpretation of South Pacific magnetic anoma-lies (Mayes et al. 1990).
A major component of the seafloor spreading history of the Nazcaplate involves the formation of the Bauer Microplate (Fig. 9). TheBauer microplate formed along the northern East Pacific Rise andgrew by crustal accretion and counter-clockwise rotation betweenPacific and Nazca spreading (Goff and Cochran, 1996; Eakins andLonsdale, 2003) shortly after a major plate reorganization event at20 Ma (Fig. 9). The formation of the Bauer microplate is unlike thestep-wise triple junctionmigrationmodels used to explain the forma-tion of the microplates associated with the Pacific–Nazca–Antarctictriple junction. Spreading is believed to have initiated at 17 Ma vianorthward propagation of the East Pacific Rise and southward propa-gation of the Galapagos Rise during counter clockwise rotation of thespreading axes (Eakins and Lonsdale, 2003). Rotation and spreadingcontinued about a pole proximal to the spreading axis creating fan-shaped anomalies until 6 Ma when the spreading ridge realignedwith the dominant East Pacific Rise spreading ridge and the Bauermicroplate was captured by the Nazca plate (Eakins and Lonsdale,2003) (Fig. 10).
The other smaller microplates within the Nazca/Cocos/Pacificrealm are the presently active Easter and Juan Fernandez microplates,which form small pseudo-circular plates along the actively spreadingEast Pacific Rise. These plates are believed to have become active ataround Chron 3o (~5 Ma) during a major plate reorganization eventin the SE Pacific (Tebbens and Cande, 1997) and have rotated aboutan axis close to the center of the plate by between 80 and 90°(Searle et al., 1993a). Themechanism for the formation of these platesis believed to be the same process responsible for the development ofthe Hudson and Friday microplates related to the northward migrat-ing Nazca–Pacific–Antarctic ridge (Bird et al., 1998).
To the north, the Cocos–Pacific spreading ridge was only estab-lished in its present form from Chron 2A (~3 Ma) (Atwater, 1990).Between 23 Ma and Chron 2A (~3 Ma), spreading was being accom-modated along the Mathematician and Rivera Ridges to the northand the Cocos–Pacific to the south (Atwater, 1990; Eakins andLonsdale, 2003). Spreading in this area included many block rotationsand ridge jumps possibly due to the proximity of the Cocos–Pacificspreading center to the Middle America trench and Galapagos hot-spot. The magnetic lineations that formed due to Cocos–Pacificspreading are fan-shaped with strongly curved fracture zones ob-served in the satellite gravity anomalies indicating a pole of rotationclose to the northern end of the plate (Figs. 1 and 9).
The present day Cocos–Nazca ridge strides the Galapagos hotspotand intersects the Middle America convergent margin at the BulboaFracture Zone (Fig. 9). This E–W directed spreading ridge was estab-lished around 23 Ma, coinciding with the break-up of the Farallonplate. The early spreading history is quite complex, requiring severalridge jumps during its formation (Barckhausen et al., 2008), themost significant of which is the Malpelo Ridge, which became extinctaround 15–10 Ma (Meschede et al., 1998a). In addition, numerous
ghlighting the age–area distribution of oceanic lithosphere at the time of formation andsing plate polygon dataset are denoted as thick white lines, hotspot locations as yellowlack lines. (right) Reconstructions showing the outlines of the plates in the southeastbreviations are: AFR = African plate, ANT = Antarctic plate, BAU = Bauer plate, CARast Scotia Sea plate, FAR = Farallon plate, HIK = Hikurangi plate, IZA = Izanagi plate,Scotia Sea plate, PAC = Pacific plate, SAM = South American plate, SND = Sandwichure legend, the reader is referred to the web version of this article.)

150˚ 160˚ 170˚ 180˚ −170˚ −160˚ −150˚−50˚
−40˚
−30˚
−20˚
−10˚
0˚
10˚
OJP
LHR
SFB
NFBNLB
CR
MP
CP
TS
CS
SS
LB
HT
MP
EB
HP
Pacific
Australia
M29 M21
M16
M10
M4
M0
34
31
34 1
OT
34 31
150˚ 160˚ 170˚ 180˚ −170˚ −160˚ −150˚−50˚
−40˚
−30˚
−20˚
−10˚
0˚
10˚
OJP
LHR
SFB
NFBNLB
CR
MP
CP
TS
CS
SS
LB
HT
MP
HP
Australia
M29 M21
M16
M10
M4
M0
34
31
34 1
OT
34 31
OT
EBPacific
−50 −40 −30 −20 −10 0 10 20 30 40 50Magnetic Intensity Anomaly [nTesla]
a
b
Plate BoundaryIsochrons
PAC-WANTExtinct Ridge
Tectonic Boundary
PAC-FAR
MAN-HIK
PAC-PHX
PAC-MAN
MAN-CHS
HIK-SEM
BB & OTH MAN-SEM
LIPproduct
Non-oceanic
Fig. 11. (a) Gridded magnetic anomalies for the southwest Pacific. Seafloor spreadingisochrons used in this study plotted as thin black lines. Numbers correspond to mag-netic anomaly chron. CP = Campbell Plateau, CR = Chatham Rise, CS = Coral Sea,EB = Ellice Basin, HP = Hikurangi Plateau, HT = Havre Trough, LB = Lau Basin,LHR = Lord Howe Rise, MP = Manihiki Plateau, NFB = North Fiji Basin, NLB =North Loyalty Basin, OJP = Ontong Java Plateau, OT = Osbourn Trough, SFB = SouthFiji Basin, SS = Solomon Sea. (b) Seafloor spreading isochron map colored by spreadingsystem or plate pair. Map abbreviations are same as a. Legend abbreviations are: BB =Back arc Basins, CHS = Chasca, FAR = Farallon, HIK = Hikurangi, MAN = Manihiki,OTH = Other, PAC = Pacific, PHX = Phoenix, SEM = Southeast Manihiki, WANT =West Antarctica/Antarctica.
235M. Seton et al. / Earth-Science Reviews 113 (2012) 212–270
pseudo-faults indicating rift propagation to the east have been identifiedin the seafloor fabric, the majority in the vicinity of the Galapagos hot-spot (Atwater, 1990). Further complications occur close to the MiddleAmerica trench where several ridge jumps have isolated spreading sys-tems, particularly in the Panama Basin (Lonsdale and Klitgord, 1978).
We incorporate the magnetic anomaly identifications fromMunschy et al. (1996) to derive a set of finite rotations and seafloorspreading isochrons between the Pacific and Nazca plates and also ex-tend our analysis to include the parts of Pacific–Farallon spreadingthat are currently preserved on the Nazca plate. The magnetic anom-aly identifications of Munschy et al. (1996) do not extend to the east-ernmost Nazca plate where we would expect to find the oldestpreserved oceanic lithosphere corresponding to Pacific–Farallonspreading, mainly due to a lack of data and signal intensity. Instead,we predict the age of the oceanic lithosphere in this area by reconstruct-ing the conjugate Pacific–Nazca isochrons. We find that the resultantlocation of isochrons closely corresponds to the interpretation of mag-netic anomalies from Cande and Haxby (1991) and matches well withthe magnetic lineations observed on our magnetic anomaly grid(Fig. 9). Thus, our model predicts that the oldest ocean floor off SouthAmerica corresponds to Anomaly 23 (~51 Ma) (Fig. 10). We derive anew set of finite rotations to describe Pacific–Nazca spreading largelybased on the rotations of Mayes et al. (1990) to be consistent with ourmagnetic pick compilation. We do not incorporate the detailed triplejunction migration model of Tebbens and Cande (1997).
The seafloor spreading model we implement for the Bauer micro-plate and its relationship to Pacific–Nazca spreading incorporate thefinite rotations of Eakins and Lonsdale (2003). We implement spread-ing in the fan-like pattern whereby the pole of rotation is locatedclose to the ridge axis (Fig. 10). Although magnetic anomalies cannotbe clearly discerned, we have implemented the timing of Eakins andLonsdale (2003) with spreading initiating at 17 Ma and continuinguntil 6 Ma. The locus of spreading then jumps back to the Pacific–Nazca ridge (Fig. 10).
The model for the Cocos and Mathematician/Rivera plates incorpo-rates the magnetic anomaly identification of Munschy et al. (1996)together with the finite rotations derived from Eakins and Lonsdale(2003) between 17.3 and 11.9 Ma and newly derived finite rotationfor 23 Ma and 10.9 Ma. We reconstruct the shape and location of theCocos Ridge from Meschede et al. (1998b). We model spreading alongthe Galapagos Spreading Centre (Cocos–Nazca) based on the finite dif-ference method. We do not include the small-scale ridge jumps thatoccurred along the Cocos–Nazca Ridge, instead we model a simpletwo plate system with an eastward propagating ridge (Figs. 9–10).
3.2.3. Phoenix plateUntil recently, the prevailing view for the evolution of the Phoenix
plate was that the Phoenix–Pacific spreading ridge was active sincethe birth of the Pacific plate to at least the mid–late Cretaceous as asimple two-plate system with N–S directed spreading (Larson andChase, 1972). The E–W trending Phoenix lineations (so named dueto their proximity to the Phoenix Islands) form the southern armof the Pacific triangle (Fig. 6) with magnetic anomalies rangingfrom M29 (~156 Ma) to M1 (~123 Ma) (Larson, 1976; Cande et al.,1978; Atwater, 1990) and possibly M0 (~120 Ma) (Larson, 1997;Nakanishi and Winterer, 1998). Undated, presumably older magneticlineations can be traced north of M29 (~156 Ma) (Nakanishi et al.,1992; Nakanishi and Winterer, 1998) close to the inferred center ofthe Pacific triangle. The lineations disappear under the Ontong JavaPlateau to the west and abut against a complex set of fan-shapedlineations (Magellan lineations) and NE–SW directed lineations(M21–14; ~147–136 Ma) south of the Mid-Pacific Mountains(Nakanishi and Winterer, 1998) to the east. The complex Magellanand Mid-Pacific lineations suggest the existence of several micro-plates (e.g. Trinidad and Magellan) at the Phoenix–Pacific–Farallontriple junction (Atwater, 1990) with patterns similar to the fast
spreading migrating microplates of the East Pacific Rise (Tebbensand Cande, 1997).
The ocean floor within the Ellice Basin and directly east of theTonga–Kermadec subduction zone is intrinsically linked to the evolu-tion of the Pacific–Phoenix ridge after M0 (~120 Ma) (Figs. 6 and 11).

236 M. Seton et al. / Earth-Science Reviews 113 (2012) 212–270
Early models predicted that the area formed as part of a simple, con-tinuous N–S directed spreading system until the end on the CNS(Larson and Chase, 1972). However, the anomalously fast seafloorspreading rates required to populate the region with crust formedduring the CNS (Atwater, 1990) as well as the identification of tectonicstructures and seafloor fabric such as the E–W trending Nova CantonTrough, the E–W trending Osbourn Trough and the N–S directed sea-floor fabric and side-stepping fracture zones in the Ellice Basin suggesta more complex history for the area. Based on the interpretation ofthe seafloor spreading structures, two distinct models have been devel-oped to explain the evolution of the Pacific–Phoenix ridge after M1/M0(~123–120 Ma): a successive southward ridge jump model (Winterer,1976; Larson, 1997; Billen and Stock, 2000; Müller et al., 2008b) and aplateau break-up model (Taylor, 2006).
In the successive ridge jumpmodel theNova Canton Trough, an E–Wgravity low located south and parallel to theMesozoic lineations (Figs. 6and 11), is interpreted as an abandoned spreading center associatedwith Pacific–Phoenix spreading (Rosendahl et al., 1975; Winterer,1976; Müller et al., 2008b). A zone of disrupted seafloor fabric boundedby two prominent E–W trending gravity lows in the northern ElliceBasin observed in satellite gravity data led to the idea of a rift zoneassociated with N–S directed spreading along the Pacific–Phoenixridge (Larson, 1997). The abandoned ridge/rift zone model impliesthat the Pacific–Phoenix ridge either became extinct shortly after M0(~120 Ma) or that the spreading ridge jumped to another location, like-ly to the south subsequent toM0 (~120 Ma), during a regional plate re-organization. The timing is constrained by the identification ofmagneticanomaly M0 (~120 Ma) just north of the Nova-Canton Trough (Larson,1997; Nakanishi andWinterer, 1998). The southern ridge jumpmodel issupported by the identification of the E–W trending Osbourn Trough(located to the east of the Tonga–Kermadec Trench and north of theLouisville Seamount Chain) as an extinct spreading ridge of Cretaceousage (Lonsdale, 1997; Billen and Stock, 2000) (Fig. 11) rather than alate stage crack in the Pacific plate (Small and Abbott, 1998).
The seafloor spreading morphology in the vicinity of the OsbournTrough confirms roughly north–south spreading along a slow-intermediate spreading center (Worthington et al., 2006; Downeyet al., 2007) whereas the early motion appears to be parallel to theWishbone Ridge (Figs. 1 and 2g). Spreading along the OsbournTrough is believed to have initiated right after M0 (~120 Ma) (Davyet al., 2008) leading to the separation of the Manihiki and HikurangiPlateaus. The timing cannot be constrained from the seafloor spread-ing record as the early crust would have formed during the CNS.Instead, the timing for the initiation of spreading is constrainedfrom the dating of rift-related structures on the southern side of theManihiki Plateau (e.g. Nassau-Suwarrow Scarp) and the northernside of the Hikurangi Plateau (e.g. Rapuhia Scarp) (Lonsdale, 1997;Billen and Stock, 2000; Sutherland and Hollis, 2001; Davy et al.,2008). The cessation of spreading is poorly constrained but mostauthors tie the termination of spreading along the Osbourn Troughwith the docking of the Hikurangi Plateau to the Chatham Rise. Unfor-tunately, the timing of collision between the Hikurangi Plateau andChatham Rise is also ill constrained. Some authors favor collision at105–100 Ma (Lonsdale, 1997; Sutherland and Hollis, 2001; Davy etal., 2008) based on geological observations and the onset of extensionin New Zealand whereas others favor collision around 80–86 Ma(Billen and Stock, 2000;Worthington et al., 2006). The youngest mag-netic anomalies associated with the Osbourn Trough are as young asAnomalies 33 (~79 Ma) or 32 (~71 Ma) (Billen and Stock, 2000) orAnomaly 34 (~84 Ma) but prior to ~87 Ma (Downey et al., 2007).Based on the age range allowed from the magnetic anomaly interpre-tation and the age constraints on the initiation of spreading betweenthe Pacific and Antarctic plate to the south, Müller et al. (2008b) sug-gested that the spreading along the Osbourn Trough ceased at 85 Ma,leading to a final jump in the plate boundary to the south along thepresent day Pacific–Antarctic ridge.
The plateau break-upmodel (Taylor, 2006) suggests that theOntongJava Plateau,Manihiki andHikurangi Plateauswere joined at the time oftheir eruption. This mega-LIP erupted around Aptian time based on thedating of sediment overlying pillow basalts (Winterer et al., 1974) andAr/Ar dating (Mahoney et al., 1993). Taylor (2006) based his interpreta-tion on recently collectedmarine geophysical data from the Ellice Basin,which he believes was formed during the separation of the Ontong JavaandManihiki Plateau and confirmed by Chandler et al. (in press). In theTaylor (2006) model, the Nova-Canton Trough is interpreted as an ex-tension of the Clipperton Fracture Zone (Larson et al., 1972; Joseph etal., 1990; Taylor, 2006) based on side-scan sonar data (Joseph et al.,1992) and not an abandoned spreading ridge. The disturbed “riftzone” identified by Larson (1997) is instead interpreted as the northernpart of an E–Wdirected spreading systemwith stair-stepped, large off-set E–W trending fracture zones and N–S abyssal hill fabric (Taylor,2006) separating the Ontong Java and Manihiki Plateaus. This modelsuggests that after M0 (~120 Ma), the tectonic regime changed fromN–S directed Pacific–Phoenix spreading to E–W directed spreading be-tween the Pacific plate and a new Manihiki plate. Coincidently, N–Sdirected spreading was occurring between the Manihiki and Hikurangiplateaus, as suggested in the previous model. The differential motionbetween the two spreading systems requires a triple junction betweenthe Pacific, Manihiki and Hikurangi plates (Taylor, 2006). The timing ofplateau break-up is unconstrained from the seafloor spreading recordas no magnetic anomalies can be interpreted. However, rift structureson the eastern side of the Ontong Java plateau and western marginof the Manihiki plateau suggest that this occurred around 120 Ma,matching well with the dated break-up of the Manihiki and Hikurangiplateaus. Further supporting the common origin of the Ontong Java,Manihiki and Hikurangi Plateaus is similar geochemical compositionsbetween the three plateaus suggesting a related source (Mahoney etal., 1993; Hoernle et al., 2010).
The other main feature on the seafloor attributed to Pacific–Phoenixspreading is the Tongareva triple junction trace in the SW Pacific(Larson et al., 2002; Pockalny et al., 2002; Viso et al., 2005). TheTongareva triple junction trace is a roughly NNW–SSE linear featurewhich starts at the northeastern corner of the Manihiki Plateau in thePernyn Basin and extends to west of the Cook Islands before it changestrend to NW–SE until it reaches spreading associated with Pacific–Antarctic Ridge (Fig. 11). The western side of the triple junction traceconsists of ENE trending abyssal hill topography and directly east, themorphology is NNW–SSE trending (Larson et al., 2002; Pockalny et al.,2002). This lineament is believed to record the migration of a ridge–ridge–ridge triple junction between the Pacific–Farallon–Phoenix plates(Larson et al., 2002) whereas more detailed analysis revealed that thetriple junction likely flipped between ridge–ridge–ridge and ridge–ridge–transform configurations throughout its evolution (Pockalnyet al., 2002). Sutherland andHollis (2001) suggested that this lineamentwas a rift but this has been refuted by subsequent studies (e.g. (Larsonet al., 2002). The eastern margin of the Manihiki Plateau comprises adramatic transtensional scarp (Winterer et al., 1974; Stock et al.,1998) suggesting that the easternmost portion of a presumably largerManihiki Plateau was rifted off the margin and was controlled by theplatemotions related to the triple junction. Larson et al. (2002) hypoth-esized that a piece traveled across Panthalassa on the Farallon plate andanother piece rifted to the south with the Phoenix plate. The timing foractivity along the triple junction is poorly constrained. Spreading isbelieved to have initiated around 120 Ma, based on the dating ofcarbonate sedimentation on the Manihiki Plateau (Larson et al., 2002)with termination around 84 Ma (Larson et al., 2002).
Our model for the evolution of the Phoenix plate incorporatessimple N–S directed spreading in the Mesozoic followed by a majorplate reorganization at ~120 Ma (M0) coincident with the eruptionof the Ontong Java–Manihiki–Hikurangi plateau as one mega-LIP, assuggested by Taylor (2006) and Chandler et al. (in press) (Fig. 10).This spreading system shuts down at 86 Ma, after which spreading

120˚ 140˚ 160˚ 180˚ 200˚ 220˚
140 Ma
120˚ 140˚ 160˚ 180˚ 200˚ 220˚
120 Ma
120˚ 140˚ 160˚ 180˚ 200˚ 220˚
80 Ma
120˚ 140˚ 160˚ 180˚ 200˚ 220˚
40 Ma
120˚ 140˚ 160˚ 180˚ 200˚ 220˚
20 Ma
120˚ 140˚ 160˚ 180˚ 200˚ 220˚
0 Ma
120˚ 140˚ 160˚ 180˚ 200˚ 220˚
60˚
40˚
20˚140 Ma
120˚ 140˚ 160˚ 180˚ 200˚ 220˚
60˚
40˚
20˚120 Ma
120˚ 140˚ 160˚ 180˚ 200˚ 220˚
60̊
40̊
20̊a
120˚ 140˚ 160˚ 180˚ 200˚ 220˚
60˚
40˚
20˚a
120˚ 140˚ 160˚ 180˚ 200˚ 220˚
60˚
40˚
20˚
60˚
40˚
20˚
a
120˚ 140˚ 160˚ 180˚ 200˚ 220˚
0 Ma
0 20 40 60 80 100 120 140 160
Age of Oceanic Lithosphere (m.yrs) Plate NameANT AUS PAC
SLY AUS NTY
LHR
LAU
EUR PHX JUN HIK IZA NBR
PHL NFB ENK WNK SOL CAR
80 M
40 M
237M. Seton et al. / Earth-Science Reviews 113 (2012) 212–270
was accommodated along the Pacific–Farallon and Pacific–AntarcticRidges (Figs. 10 and 12).
The Mesozoic lineations are constrained by magnetic anomalyidentification from Munschy et al. (1996), with geophysical data(including satellite derived gravity data) constraining the location ofthe Osbourn Trough, Nova Canton Trough and Tongareva triple junctiontrace. Our seafloor spreading isochronsmatch themagnetic anomaly gridquite well for the central andwestern part of theMesozoic lineations butthere is a poormatch to the east corresponding to the fan-shapedMagel-lan and Mid-Pacific Mountain lineations (Figs. 6 and 11). We do not re-construct these complex lineation sets due to a lack of age constrainson initiation and cessation of themicroplates at the Pacific–Phoenix–Far-allon triple junction thatwould have formed these lineations. In addition,our aim is tomodel the broad scale development and the evolution of thelarger plates in the area rather than the smaller scale microplates. Finiterotations are derived for the E–W trending M-series anomalies by usingthe half-stage pole methodology and following the fracture zones tracedfrom satellite gravity data (Sandwell and Smith 2009).
Our reconstructions are based on the model of Taylor (2006) andChandler et al. (in press) with roughly E–W directed spreading form-ing the crust underlying the Ellice Basin between the Ontong Java andManihiki Plateaus and simultaneous rifting of the Manihiki andHikurangi plateaus from a N–S directed spreading system along theOsbourn Trough. We initiate this spreading system at 120 Ma, corre-sponding to the timing of the LIP eruption and the dating of rift-related sequences along the margin. The oceanic crust betweenthese plateaus formed during the CNS so no correlations can be ob-served in the magnetic anomaly grids (Fig. 11). However, the satellitederived gravity data indicates fracture zone trends and limited abys-sal hill fabric. We derive our own finite rotations for the opening ofthe Osbourn Trough region by following fracture zone traces. The sep-aration of the mega-LIP requires that a triple junction was active ac-commodating motion between the Ontong Java and HikurangiPlateaus during its formation. We reconstruct the arm of the triplejunction based on the finite difference method.
We suggest a further two triple junctions were located to the eastof the Manihiki Plateau, one of which formed the Tongareva triplejunction trace. However, unlike previous interpretations (Larson etal., 2002; Viso et al., 2005), we suggest that the triple junction repre-sented spreading between the Manihiki, Hikurangi and a new platewe term the Chasca plate to the east of the Manihiki and Hikurangiplates (Fig. 10). The Chasca plate, which was located off the SouthAmerican margin, is named after the Incan goddess of dawn and twi-light. Our finite rotations were derived by using a combination offracture zone and triple junction traces and the finite differencemethod. A second triple junction between the Hikurangi, Manihikiand a new plate we term the Catequil plate was required to accountfor the trends in the seafloor fabric to the west of the Tongareva triplejunction trace. The Catequil plate is named after the Incan god ofthunder and lightning.
The fracture zone traces between the Manihiki and HikurangiPlateau show a change in direction but this change has never been
Fig. 12. (left) Agegrid reconstructions of the southwest Pacific at 140, 120, 80, 40, 20,0 Ma highlighting the age–area distribution of oceanic lithosphere at the time of forma-tion and the extent of continental crust (gray polygons). Plate boundaries from ourcontinuously closing plate polygon dataset are denoted as thick white lines, hotspot lo-cations as yellow stars, large igneous provinces and flood basalts as brown polygonsand coastlines as thin black lines. (right) Reconstructions showing the outlines of theplates in the southwest Pacific for each reconstruction time listed above. Feature de-scriptions as in panel (left). Abbreviations are: ANT = Antarctic plate, AUS = Austra-lian plate, CAR = Caroline plate, ENK = East Norfolk Basin plate, EUR = Eurasianplate, HIK = Hikurangi plate, IZA = Izanagi plate, JUN = Junction plate, LAU = LauBasin plate, LHR = Lord Howe Rise plate, NBR = New Britain plate, NFB = North FijiBasin plate, NTY = Neo-Tethys plate, PAC = Pacific plate, PHL = Philippine Seaplate, PHX = Phoenix plate, SLY = South Loyalty Basin plate, SOL = Solomon Seaplate, WNK = West Norfolk Basin plate. (For interpretation of the references to colorin this figure legend, the reader is referred to the web version of this article.)

WS
GR
SWIR
SEIR
RLS
AAR
Antarctica
Scotia
Australia
Pacific
EB
KP
EM
CP
AT
AAB
WS
GR
SWIR
SEIR
RLS
AAR
Antarctica
Scotia
Australia
Pacific
EB
KP
EM
CP
AT
AAB
−50 −40 −30 −20 −10 0 10 20 30 40 50
Magnetic Intensity Anomaly [nTesla]
a
b
Plate BoundaryIsochrons
PAC-WANTExtinct Ridge
Tectonic Boundary
ANT-END
AUS-EANT
WANT-FAR
ALK-WANT
EANT-FLK
SAM-AFR
AUS-WANT SAM-MAL
EANT-AFR EANT-SAM EANT-IND
LIPproduct
Non-oceanic
Fig. 13. (a) Gridded magnetic anomalies for the circum-Antarctic. Seafloor spreading iso-chrons used in this study plotted as thin black lines. AAB = Australia–Antarctic Basin,AAR = American–Antarctic Ridge, AT = Adare Trough, CP = Campbell Plateau, EB =Enderby Basin, EM = Emerald Basin, GR = Gunnerus Ridge, KP = Kerguelan Plateau,RLS = Riiser-Larson Sea, SEIR = Southeast Indian Ridge, SWIR = Southwest Indian Ridge,WS = Weddell Sea. (b) Seafloor spreading isochron map colored by spreading systemor plate pair. Map abbreviations are same as a. Legend abbreviations are: AFR = Africa,ALK = Aluk, AUS = Australia/Lord Howe Rise, BB = Back arc Basins, EANT = EastAntarctica/Antarctica, END = Enderby, FAR = Farallon, FLK = Falkland, IND = India,MAL = Malvinas, OTH = Other (Adare Trough and Emerald Basin), PAC = Pacific,SAM = South America, WANT = West Antarctica/Antarctica.
238 M. Seton et al. / Earth-Science Reviews 113 (2012) 212–270
dated. We hypothesize that the date of the change in spreading direc-tion occurred at 100 Ma as this corresponds to a time when the frac-ture zones in other parts of the Pacific change direction as well as achange in the bend of Pacific hotspots. In addition, a clockwise changein spreading direction between the Manihiki and Hikurangi plates at100 Ma leads to a change in the plate boundary east of Australiafrom convergence to strike-slip, coincident with a change from sub-duction related tectonics to passive margin formation and extension.A further refinement of the plate kinematic model for the plateaubreak-up using improved gravity and vertical gravity gradient gridsis presented in Chandler et al. (in press).
The cessation of spreading along all arms of our triple junctionshas been dated based on the timing of collision between theHikurangi Plateau and the Chatham Rise. As stated previously, thereare two competing models for the timing of collision. We implementthe docking of the Hikurangi Plateau to the Chatham Rise at 86 Mabased on the evidence presented in Worthington et al. (2006) relatedto a major episode of metamorphism and garnet growth in the AlpineSchist (Vry et al., 2004) and the seafloor spreading constraints pre-sented in Billen and Stock (2000). The docking led to the shut-downof the seafloor spreading system in the South Pacific and a changein the east Australian margin from strike-slip to convergence(Fig. 12). After the cessation of spreading, the spreading ridge jumpedto the south to initiate rifting and seafloor spreading betweenthe Pacific and Antarctic plates. An earlier timing for docking of theHikurangi Plateau requires that rifting and seafloor spreading betweenthe Pacific and Antarctic plates started earlier than observed or thatthere were two contemporaneous spreading ridges located in closeproximity in the South Pacific. It would also require fast seafloor-spreading rates between the Manihiki and Hikurangi plateaus not sup-ported by the seafloor morphology. To the east, the Pacific–FarallonRidge extended to the south connecting up with the Pacific–AntarcticRidge at the Pacific–Antarctic–Farallon triple junction.
3.2.3.1. Pacific–Antarctic spreading. The Pacific–Antarctic Ridge and as-sociated ocean floor dominate the South Pacific (Fig. 13) and form acrucial link in the global plate circuit. Early reconstructions of theSouth Pacific recognized that spreading between the Pacific and theAntarctic/Marie Byrd Land margin involved at least a three-platesystem, this third plate was named the Bellinghausen plate and locatedeast of theMarie Byrd Land seamounts (Stock andMolnar, 1987; Eagleset al., 2004a,b). Rifting between the Chatham Rise and Antarctica/MarieByrd Land is believed to have occurred at 90 Ma (Larter et al., 2002;Eagles et al., 2004a) with the initiation of spreading between thePacific and Bellinghausen plates at Anomaly 33r (83.0–79.1 Ma)(Stock and Molnar, 1987; Larter et al., 2002) contemporaneous withPacific–Antarctic/Marie Byrd Land spreading (Molnar et al., 1975;Cande et al., 1982; Stock and Molnar, 1987; Mayes et al., 1990; Candeet al., 1995; Larter et al., 2002; Croon et al., 2008) or 80 Ma forBellinghausen spreading (Eagles et al., 2004a, b). Spreading betweenthe Campbell Plateau and Marie Byrd Land occurred from Anomaly33r (83.0–79.1 Ma) (Larter et al., 2002; Eagles et al., 2004a). The cessa-tion of the Bellinghausen plate as an independent plate and its accretiononto the Pacific platewas initially believed to have occurred at Anomaly25 (~56 Ma) (Stock andMolnar, 1987), but thiswas revised to Anomaly27 (~61 Ma) during a time of major plate reorganization (Cande et al.,1995). Cande et al. (1995) also found that any relative motion betweenthe Bellinghausen and Antarctic plates was much smaller than previ-ously thought.
New finite rotations based on the improved South Pacific datasetwere computed for spreading between the Pacific and Antarctic platesfrom Anomaly 27 (~61 Ma) to the present day (Cande et al., 1995)and were used in the detailed model of Eagles et al. (2004a,b). Spread-ing between the Pacific and Antarctic plates occurred as a two-platesystem with major changes in spreading direction recorded betweenChron 27 (~61 Ma) and 20 (~43 Ma), between Chrons 13 (~33Ma)

−50˚
−40˚
−30˚
−20˚
−10˚
0˚
10˚
20˚
WSB
MZB
EFR
SWIR
SEIR
CIR
CR
MB
MR WB
BRMP
AG
C
P
SR
Antarctica
Australia
Sundaland
India
Arabia
Africa
Somalia
AAB
KP
0˚
10˚
20˚
CR
SR
Sundaland
India
Arabia
Africa
Somalia
a
b
239M. Seton et al. / Earth-Science Reviews 113 (2012) 212–270
and 6C (~24 Ma) and at Chron 3a (~6 Ma) (Cande et al., 1995; Croon etal., 2008). A recent update of the seafloor spreading history between thePacific and Antarctic plates (Croon et al., 2008) is in general agreementwith the model of Cande et al. (1995) for times 61 Ma to 12.3 Ma, butthe model and rotations differ slightly for younger times.
To construct our seafloor spreading isochrons between the Pacificand Antarctic plates, we used the magnetic anomaly pick identifica-tions and finite rotations of Cande et al. (1995) for times from61 Ma to the present day, which are also used in the model ofEagles et al. (2004a,b). Croon et al. (2008) provide updated rotationsfor times younger than 12.3 Ma but they are not incorporated into ourmodel. As noted by Croon et al. (2008) the effect of using these rota-tions on motion between the Pacific and western North America issmall and hence will not significantly alter Pacific plate motion. Weanticipate that these rotations will be included in the next generationof our global plate tectonic model. For times between 61 Ma and83.5 Ma, we followed the magnetic anomaly interpretation and finiterotations of Larter et al. (2002) for Pacific–Antarctic/Marie Byrd Landspreading and Pacific–Bellinghausen spreading. We assigned an ageof 90 Ma for the Antarctic margin conjugate to the Chatham Plateau toreflect the initiation of rifting and an age of 80 Ma for the onset ofspreading between the Campbell Plateau and Antarctic margins. Vali-dating the shape and location of our seafloor spreading isochrons inthis region using the magnetic grid compilation is difficult due to thepaucity of data available in this region (Fig. 13). Some magnetic linea-tions can be identified adjacent to the Campbell Plateau and clearlyreflect a clockwise change in spreading direction between Anomalies31 (~68 Ma) and 25 (~56 Ma) consistent with our isochrons.
−50˚
−40˚
−30˚
−20˚
−10˚WSB
MZB
EFR
SWIR
SEIR
CIR
MB
MR WB
BRMP
AG
C
P
Antarctica
Australia
AAB
KP
−50 −40 −30 −20 −10 0 10 20 30 40 50
Magnetic Intensity Anomaly [nTesla]
Plate BoundaryIsochrons
EANT-AFRExtinct Ridge
Tectonic Boundary
IND-AFR
AUS-EANT
AUS-AFR
AFR-MAD
ARA-SOM
END-EANT
BB & OTH EANT-IND
AUS-IND AUS-GIN/WB MAD-SEY
LIPproduct
Non-oceanic
Fig. 14. (a) Gridded magnetic anomalies for the Indian Ocean. Seafloor spreading iso-chrons used in this study plotted as thin black lines. A = Argo Abyssal Plain, AAB =Australia–Antarctic Basin, BR = Broken Ridge, C = Cuvier Abyssal Plain, CIR = CentralIndian Ridge, CR= Carlsberg Ridge, EFR = East Africa Rift, G = Gascoyne Abyssal Plain,KP = Kerguelan Plateau, MB = Mascarene Basin, MP = Madagascar Plateau, MR =Mascarene Ridge, MZB = Mozambique Basin, P = Perth Abyssal Plain, SEIR = South-east Indian Ridge, SR = Sheba Ridge, SWIR = Southwest Indian Ridge, WB =WhartonBasin. (b) Seafloor spreading isochron map colored by spreading system or plate pair.Map abbreviations are same as a. Legend abbreviations are: AFR = Africa, ALK = Aluk,AUS=Australia/LordHoweRise, BB=Back arc Basins, EANT=East Antarctica/Antarctica,END = Enderby, FAR = Farallon, FLK = Falkland, IND = India, MAL = Malvinas,OTH = Other (Adare Trough and Emerald Basin), PAC = Pacific, SAM = South America,WANT = West Antarctica/Antarctica.
3.3. Tethys/Indian Ocean
The present day Indian Ocean comprises five main plates: the Indo-Australian, Antarctic, African, Somali andArabian plates (Figs. 1 and 14).In addition, the Indo-Australian plate is often subdivided into threeplates: the Australian, Indian and Capricorn plates along a zone of dif-fuse deformation in the East Indian Ocean (Demets et al., 1994; Royerand Gordon, 1997;Weissel et al., 1980) (Figs. 1 and 14). Several smallerplates exist along the East African margin associated with continentalrifting and diffuse deformation, including the proposed Nubian andLake Victoria plates (Lemaux et al., 2002; Bird, 2003). Prior to Gondwa-na break-up and the opening of the Indian Ocean, a now entirely van-ished ocean basin, the Tethys Ocean, existed between Gondwana andLaurasia. The evidence for this ocean basin is primarily preserved inthe terranes and ophiolite complexes along southern Eurasia and theMediterranean. The Indian Ocean preserves a record of the earlybreak-up history of Gondwana along the East African, Antarctic andWest Australian passive margins. An extensive mid ocean ridge net-work developed separating India, Antarctica, Australia, Madagascarand Africa. In addition, a long-lived subduction zone to the north con-sumed oceanic lithosphere from the Tethys Ocean eventually leadingto the uplift of the Himalayas resulting from the collision of the Indiancontinent with southern Eurasia.
Detailed reconstructions of the Indian Ocean as they currentlystand are problematic, leading to gaps and overlaps in full-fit recon-structions, motions of continental blocks that are inconsistent withindependently modeled motions of neighboring plates and notstrongly constrained by geological observations. A concerted interna-tional collaborative effort is currently underway to update recon-structions for the entire Indian Ocean with completion expected byearly 2013. Our current model is an amalgamation of a number ofpublished models for different portions of the Indian Ocean. We willbegin by describing the early break-up history of Gondwana and for-mation of the Indian Ocean followed by the Cenozoic–recent opening.Lastly we will discuss our current model for the inferred opening andclosure history of the Tethys Ocean.
3.3.1. East African marginsThe break-up of Gondwana initiated in the early Jurassic between
West Antarctica, Africa and Madagascar following a long period ofrifting along the Permo-Triassic Karoo Rift and eruption of the

240 M. Seton et al. / Earth-Science Reviews 113 (2012) 212–270
Karoo Volcanics during the early Jurassic (around 185–180 Ma) (Cox,1992; Forster, 1975; Jourdan et al., 2005; Reeves, 2000; Storey et al.,2001) (Fig. 14). The cessation of volcanism along the Karoo Rift ledto a seaward jump in the locus of rifting, initiating contemporaneous-ly between Africa and Antarctica in the Mozambique Basin and Riiser-Larson Sea (Simpson et al., 1979; Marks and Tikku, 2001; Eagles andKönig, 2008) and Africa and Madagascar in the West Somali Basin(Smith and Hallam, 1970; Hankel, 1994) and either contemporane-ously or earlier between Africa and West Antarctica in the WeddellSea (Livermore and Hunter, 1996; König and Jokat, 2006).
Separation between Africa and Antarctica/Madagascar formingthe Mozambique Basin, Riiser-Larson Sea and West Somali Basin isbelieved to have initiated in the early–mid Jurassic supported by thestratigraphy and pre-rift structures along the conjugate margins(Smith and Hallam, 1970; Bunce and Molnar, 1977; Norton andSclater, 1979; Ségoufin and Patriat, 1980; Scrutton et al., 1981;Coffin and Rabinowitz, 1987; Lawver and Scotese, 1987; Reeves,2000; Müller et al., 2008b). The transition from continental riftingto seafloor spreading is believed to have occurred either at183–177 Ma based on Eagles and Konig (2008) full-fit reconstruction,170 Ma (Müller et al., 1997; Reeves and DeWit, 2000), 167 Ma (Königand Jokat, 2006) or 165 Ma based on matching tectonic sequences inAfrica and East Antarctica (Coffin and Rabinowitz, 1987; Livermoreand Hunter, 1996; Marks and Tikku, 2001). Early full-fit reconstruc-tions place Madagascar west of the Gunnerus Ridge (Royer andCoffin, 1992) whereas most recent studies place Madagascar to theeast (Marks and Tikku, 2001; Eagles and König, 2008) thereby elimi-nating overlap issues between Antarctica and Madagascar.
The oldest identified magnetic anomalies interpreted in theMozambique and West Somali Basins and Riiser-Larson Sea areAnomalies M25–M24 (~154–152 Ma) (Ségoufin and Patriat, 1980;Rabinowitz et al., 1983; Coffin and Rabinowitz, 1987; Roeser et al.,1996; Marks and Tikku, 2001; Jokat et al., 2003). However, somehave inferred Jurassic Quiet Zone crust between the oldest magneticanomalies and the continental slope (Coffin and Rabinowitz, 1987)possibly as old as M40 (~166 Ma) (Gaina et al., 2010). Spreading inall basins was directed N–S for most of the opening history, confirmedthrough the interpretation of fracture zones (Heirtzler and Burroughs,1971), but a NNE–SSW direction can also be seen in the older oceaniccrust fabric. Paleomagnetic (McElhinny et al., 1976), seismic andgravity anomaly data (e.g. (Rabinowitz, 1971; Bunce and Molnar,1977; Coffin and Rabinowitz, 1987, 1988; Storey et al., 1995) supportthe southward motion of Madagascar relative to Africa during the Ju-rassic and Early Cretaceous.
The spreading histories of the Mozambique/Riiser-Larson Sea andthe West Somali Basin diverge at about M10 (~130–132 Ma). Spread-ing in the West Somali Basin ceased either at M10 (~130–132 Ma)(Rabinowitz et al., 1983; Coffin and Rabinowitz, 1987; Eagles andKönig, 2008) or M0 (~120 Ma) (Ségoufin and Patriat, 1980;Cochran, 1988; Müller et al., 1997; Marks and Tikku, 2001; Mülleret al., 2008a) depending on the magnetic anomaly identificationused. After the cessation of spreading, the mid-ocean ridge jumpedsouthward initiating spreading in between Madagascar and Antarcti-ca. The timing of the southern ridge jump and seafloor spreading his-tory in the surrounding Enderby Basin and Weddell Sea has majorimplications for the plate boundary configurations in the Mesozoic In-dian Ocean. For example, the model of Eagles and Konig (2008) infersa southward ridge jump from the West Somali Basin at M10 (~130–132 Ma) transferred Madagascar to the African plate and initiatedspreading in the Enderby Basin. In this model Madagascar did notact as an independent plate throughout any of its Mesozoic–Cenozoichistory. Other models propose that Madagascar must have acted in-dependently, at least for part of its history (e.g. Marks and Tikku,2001). The mid-ocean ridge which formed the Mesozoic magneticlineations in the Mozambique Basin/Riiser-Larson Sea continuedthroughout the Cenozoic eventually becoming the Southwest Indian
Ridge where highly oblique, ultra-slow seafloor spreading is occur-ring (Patriat and Ségoufin, 1988; Royer et al., 1988).
The final break-up of Gondwana continental blocks occurred withthe separation of Madagascar and India forming the Mascarene Basin.Previous interpretations of the area suggest that rifting initiated in thelate Cretaceous (Norton and Sclater 1979; Masson 1984; (Bernard andMunschy, 2000) with the oldest magnetic anomaly identified beingAnomaly 34 (~84 Ma) or 33 (~79 Ma). A major change to NE–SWspreading is recorded in the fracture zones and magnetic lineationsaround Anomaly 31 (~68 Ma) (Bernard and Munschy, 2000). Part oftheMascarene Ridge jumped northward isolating the Seychelles micro-continent (Masson, 1984). The model of Bernard and Munschy (2000)suggests contemporaneous spreading between the easternmost partof the Mascarene Basin and spreading to the north between theSeychelles and Laxmi Ridge, implying a cessation of spreading in theMascarene Basin as late as Anomaly 27 (~61Ma). The oldest identifiedmagnetic lineation between the Seychelles and Laxmi Ridge in the EastSomali andWest ArabianBasin is Anomaly 28 (~63 Ma) (Masson, 1984;Collier et al., 2008) based on the dating of syn-rift volcanics offshorefrom the Seychelles (Collier et al., 2008) or Anomaly 27 (~61 Ma)(Chaubey et al., 1998) defining the initiation of spreading along theCarlsberg Ridge.
We have adopted a model for East Africa whereby pre-breakupmargin extension was initiated at 180 Ma as a response to thermalweakening by the eruption of the Karoo flood basalts. We initiate sea-floor spreading at 160 Ma along the entire East Africa margin after thecessation of rifting in theKaroo Rift, about 5 million years before the lastconfidently datedmagnetic anomaly,M25 (~154 Ma) (Fig. 15).We con-nect the rift to the mid-ocean ridge that developed between Patagoniaand Southern Africa (Torsvik et al., 2009) andWeddell Sea to the south-west and to a transform in the Tethys to the northeast (Figs. 14 and 15).The identification ofmagnetic anomalies and fracture zone trends is dif-ficult in the area due to thick sediment cover and volcanic overprinting.Weakly trendingmagnetic lineations observed in themagnetic anomalygrid confirm the N–S directed spreading direction (Fig. 14). We adoptthemodel for the cessation of spreading in theWest Somali Basin short-ly afterM0 (~120 Ma) andnot atM10 (~131 Ma) as suggested by Eaglesand Konig (2008). The cessation of spreading at M10 (~131 Ma) resultsin the position of Africa relative to Madagascar and Antarctica that is in-compatible with newly interpreted aeromagnetic data in the area(König and Jokat, 2010). After the cessation of spreading, we implementa southward ridge jump towards the site of Madagascar Ridge andConrad Rise eruption. Our model implies that Madagascar operated asan independent plate from 144 to 115 Ma, based on our interpretationof the West Somali Basin. Spreading in the Mozambique/Riiser-LarsonSea continued unabated throughout theMesozoic and along the South-west Indian Ridge to the present day.
Our model for the separation of Madagascar and India is similar tothat presented in Masson (1984) and Müller et al. (1997). Although theoldest magnetic anomaly identified is Anomaly 34 (~84 Ma), we initiaterifting at 87 Ma, preceded by a period of strike-slipmotion between Indiaand Madagascar. A major change in spreading direction occurred atAnomaly 31 (~68 Ma) to NE–SW spreading based on an interpretationof the fracture zone trends in the basin. Spreading in the MascareneBasin ceased at 64 Ma resulting in a northward ridge jump and initiationof spreading between India and the Seychelles microcontinent formingthe crust in the East Somali andWest Arabian Basins. However, spreadingmay have continued to at least Anomaly 27 (~61 Ma) in the easternMascarene Basin (Bernard and Munschy, 2000). The spreading ridge be-tween the Seychelles to the south and Laxmi ridge to the north (CarlsbergRidge) is modeled based on triple junction closure with India and Arabia.The Carlsberg Ridge connected with the Central Indian Ridge to thesoutheast and the Sheba Ridge via a series of large offset transform faultsto the northwest. The Sheba Ridge separates Arabia from Africa/Somalia,which we initiate at 20 Ma to coincide with the initiation of the EastAfrican Rift. The Sheba Ridge propagated into the Red Sea at 15 Ma.

160 Ma 140 Ma
20˚ 40˚ 60˚
120 Ma
20˚ 40˚ 60˚
80 Ma
20˚ 40˚ 60˚
40 Ma
20˚ 40˚ 60˚
0 Ma
40˚
20˚
0 ˚160 Ma
40˚
20˚
0˚140 Ma
20˚ 40˚ 60˚
40˚
20˚
0˚120 Ma
20˚ 40˚ 60˚
40˚
20˚
0˚80 Ma
20˚ 40˚ 60˚
40˚
20˚
0˚40 Ma
20˚ 40˚ 60˚
40˚
20˚
0˚0 Ma
0 20 40 60 80 100 120 140 160
Age of Oceanic Lithosphere (m.yrs) Plate NameANT WGD NWA SOM AFR IND NEA EGD NTY
Fig. 15. Agegrid reconstructions of the east African basins at 160, 140, 120, 80, 40, 0 Ma highlighting the age–area distribution of oceanic lithosphere at the time of formation and theextent of continental crust (grey polygons) and reconstructions showing the outlines of the plates in the east African basins for each reconstruction time listed above. Plate boundariesfrom our continuously closing plate polygon dataset are denoted as thick white lines, hotspot locations as yellow stars, large igneous provinces and flood basalts as brown polygons andcoastlines as thin black lines. Abbreviations are: AFR = African plate, ANT = Antarctic plate, EGD = east Gondwana plate, IND = Indian plate, NEA = northeast African plate, NTY =Neo-Tethys plate, NWA = northwest African plate, SOM = Somali plate, WGD = west Gondwana plate.
241M. Seton et al. / Earth-Science Reviews 113 (2012) 212–270
3.3.2. Antarctic marginThe Antarctic margin bordering the Indian Ocean involves at least
four distinct spreading phases, including (from west to east): theWeddell Sea opening between West Antarctica and South America,the Riiser-Larson Sea between Antarctica and Africa (conjugate tothe Mozambique Basin), the Enderby Basin between Antarctica andIndia/Elan Bank and the Southern Ocean between Antarctica andAustralia (Figs. 13 and 14).
The opening of the Weddell Sea is believed to have initiated as athree-plate system between Antarctica, South America and Africa(Marks and Tikku, 2001), or initially as a two-plate system with N–Sdirected spreading between South America and Antarctica (Kovacset al., 2002). The transition from seafloor spreading to incipient
spreading is believed to have occurred at ~167 Ma (König and Jokat,2006), 165 Ma (Livermore and Hunter, 1996; Marks and Tikku,2001) and 160 Ma (Ghidella et al., 2002; Müller et al., 2008a). TheM-series magnetic anomalies are difficult to identify but a recentstudy by Konig and Jokat (2006) identified magnetic anomalies asold as M17 (~140 Ma) with seafloor spreading believed to have initi-ated around M20 (~146 Ma), suggesting 15–20 Ma of rifting andcontinental stretching before the establishment of seafloor spreading.Seafloor spreading was initially very slow, directed north–south (Königand Jokat, 2006). The Cenozoic magnetic anomalies are well-identified(LaBrecque and Barker, 1981; Kovacs et al., 2002) eventually leading tothe establishment of the American–Antarctic Ridge (Fig. 13). Due to sub-duction starting in the Cretaceous, the entire northern plate involved in

242 M. Seton et al. / Earth-Science Reviews 113 (2012) 212–270
Weddell Sea spreading has been subducted including parts of theCenozoic crust from the Antarctic (southern) plate.
Spreading in the Riiser-Larson Sea (conjugate to MozambiqueBasin, west of the Gunnerus Ridge), has been dated with a well-defined sequence from at least M24 (∼152–153 Ma) (Roeser et al.,1996; Jokat et al., 2003), although a recent reinterpretation of mag-netic anomalies suggests that magnetic anomalies as old as M40(~166 Ma) exist in both the Riiser-Larson and Mozambique Basins(Gaina et al., 2010). The spreading system here continued into theCenozoic to the west and north of the Conrad Rise where Anomalies34 (∼83.5 Ma) to 28 (∼63 Ma) have been identified (Goslin andSchlich, 1976; Royer and Coffin, 1992). This spreading ridge developedinto the ultra-slow Southwest Indian Ridge (Patriat and Ségoufin,1988).
East of the Gunnerus Ridge and west of the Bruce Rise lies theEnderby Basin (Fig. 13) recording the opening and seafloor spreadinghistory between Antarctica and India. The paucity of data in the areaand the identification of magnetic anomaly sequences on the conju-gate Indian side in the Bay of Bengal and south of Sri Lanka have ledto two alternative theories for the break-up of Antarctica and India:(1) Break up and seafloor spreading during the CNS (Royer andCoffin, 1992; Banerjee et al., 1995; Müller et al., 2000; Jokat et al.,2010), or (2) Break-up and seafloor spreading in the Mesozoic at135 Ma with the oldest identified magnetic anomaly being M11(~132 Ma) (Ramana et al., 1994, 2001; Desa et al., 2006) or M9(~129 Ma) (Gaina et al., 2007). The model of Marks and Tikku(2001) tentatively identified anomalies M10Ny–M1 (~132–121 Ma)in the West Enderby Basin, whereas the most recent model of Jokatet al. (2010) for the West Enderby Basin suggests break-up betweenIndia and Antarctica during the CNS (~90–118 Ma).
The Mesozoic spreading model implies contemporaneous openingwith the well-documented M-sequence anomalies (M10–M0; ~132–120 Ma) off the Perth Abyssal Plain (Powell et al., 1988; Müller et al.,1998a). The model of Gaina et al. (2007) further incorporates micro-continent formation (Elan Bank) due to one or several ridge jumps as-sociated with the Kerguelen Plume (Müller et al., 2000; Gaina et al.,2003).
The area east of the Bruce Rise and Vincennes Fracture Zone andsouth of Australia involves rifting, break-up and seafloor spreadingbetween Antarctica and Australia forming the Southern Ocean(Figs. 13 and 14). The conjugate Australia and Antarctic margins con-sist of a wide zone of highly extended continental crust adjacent to anarrow zone of incipient oceanic crust formed by slow to ultra-slowseafloor spreading. Continental rifting is believed to have initiated at165 Ma based on the dating of syn-rift sedimentary sequences withinthe Australian rift basins and increased tectonic subsidence rates(Totterdell et al., 2000) or 160 Ma (Powell et al., 1988). However,the nature of break-up and transition to true seafloor spreadingalong the margin remains controversial (Tikku and Cande, 1999;Sayers et al., 2001). The timing of break-up is inferred to be around100 Ma based on the identification of seafloor spreading magneticanomalies adjacent to the margin (Cande and Mutter, 1982) or by ex-trapolation of the spreading rate (Veevers et al., 1990), 135–125 Mabased on the relationship between continental margin sequencesand the oceanic crust from seismic data (Stagg and Willcox, 1992)or 83.5 Ma based on the dating of the oldest magnetic anomaly(Tikku and Cande, 1999; Whittaker et al., 2007), depending on howthe crust in the transition zone is defined. The oldest magnetic anom-aly that can be identified is Anomaly 34 (~84 Ma) (Cande and Mutter,1982; Tikku and Cande, 1999; Whittaker et al., 2007) but Anomalies34 (~84 Ma) and 33 (~79 Ma) are located in a zone of transitionalcrust (i.e. morphology not typical of abyssal hill fabric), thereforeAnomaly 32 (71 Ma) is often quoted as the oldest magnetic anomalyto indicate true seafloor spreading. The direction of spreading haspreviously been modeled as N–S, however a recent reanalysis of grav-ity and magnetic anomaly profiles (Whittaker et al., 2007) suggests
early seafloor spreading (Anomalies 34–27; ~84-61 Ma) via NW–SEdirected spreading. Spreading developed into a N–S configurationand has continued to the present day with a dramatic increase inspreading rate from Anomaly 13 (~33 Ma) (Tikku and Cande, 1999).
We adopt a model for the Antarctic margins, which suggests con-temporaneous rifting in the Weddell Sea, Riiser-Larson Sea and theEast African margins starting in the late Jurassic, at 180 Ma, after thecessation of Karoo volcanism and seaward jump in the locus of rifting.We model the opening of the Weddell Sea based on Konig and Jokat(2006), with M20 (~146 Ma) corresponding to the oldest oceaniccrust in the area. Comparison of our seafloor spreading isochronswith our magnetic anomaly compilation is difficult (Figs. 13 and 14)due to the lack of data coverage and weak magnetic anomaly signa-tures. Spreading continued until the end of the CNS (83.5 Ma) whenthere was a reorganization of the spreading ridge system leading tothe establishment of spreading along the American–Antarctic Ridge.This ultra-slow spreading system is currently intersecting the Sand-wich subduction zone, one of the few regions of the world where anactive mid ocean ridge is intersecting a subduction zone. The MesozoicWeddell spreading center connected with spreading in the Riiser-Larson Sea/Mozambique Basin in a triple junction configuration.
Further east, we initiate rifting between Antarctica and India inthe Enderby Basin (central and eastern parts) at 160 Ma to coincidewith the initiation of rifting between Australia and Antarctic, whichhas been well dated. We adopt the Mesozoic seafloor spreadingmodel in Gaina et al. (2007) using the finite rotations that describemotion between Antarctica and the Elan Bank from Gaina et al.(2003) for the central and eastern Enderby Basin. Here, seafloorspreading initiated at 132 Ma with M9 (~129 Ma) corresponding tothe oldest identified magnetic anomaly. The initiation of spreadingin the Enderby Basin results in strike-slip motion between India andMadagascar of over 1000 km. A ridge jump isolating the Elan Bankmicrocontinent occurred at 120 Ma coincident with the eruption ofthe Kerguelen Plateau. For the Western Enderby Basin, we initiatebreak-up during the CNS at around 118 Ma, consistent with themodel of Jokat et al. (2010).
We model a simple scenario for the rifting, break-up and seafloorspreading history between Australia and Antarctica with rifting initi-ating at 165 Ma based on the evidence presented in Totterdell et al.(2000) and break-up at 99 Ma (Müller et al., 2000; Müller et al.,2008a). The rift boundary extended into the Enderby Basin from165 Ma and extended eastward to connect with the WesternPanthalassic subduction zone along eastern Australia. We incorporatethe oldest magnetic anomaly as Anomaly 34 (~83.5 Ma) based on themodel of Tikku and Cande (2000) with a N–S direction of spreading.We do not incorporate the NW–SE early separation motion of Australiaand Antarctica (Whittaker et al., 2007) but anticipate that this will beincorporated in a future model. We use the rotations and magneticanomaly identifications of Müller et al. (1997) for Anomalies 31–18(~68–40 Ma) and Royer and Chang (1991) from Anomaly 18(~40 Ma) to the present day. Our resultant seafloor spreading isochronsmatch verywell with the trends observed in ourmagnetic anomaly grid(Figs. 13 and 14).
3.3.3. West Australian marginsTheWest Australian continental margin is an old, sediment-starved
volcanic continentalmargin, which formed as a result of multistage rift-ing and seafloor-spreading during a late Paleozoic and early Mesozoicphase of East Gondwana break-up (Baillie and Jacobson, 1995;Bradshaw et al., 1988; Veevers, 1988). The area can be separated intofour distinct zones: the Argo Abyssal Plain, alongside the Browse andRoebuck (former offshore Canning Basin) basins, the Gascoyne AbyssalPlain, alongside the Exmouth Plateau and the Northern CarnarvonBasin, the Cuvier Abyssal Plain delimited by the Cape Range FractureZone (CRFZ) and Wallaby-Zenith Fracture Zones (WZFZ), and includesthe Southern Carnarvon Basin, the Exmouth Sub-basin and theWallaby

150 Ma
60˚ 80˚ 100˚ 120˚
130 Ma
60˚ 80˚ 100˚ 120˚
100 Ma
60˚ 80˚ 100˚ 120˚
80 Ma
60˚ 80˚ 100˚ 120˚
50 Ma
60˚ 80˚ 100˚ 120˚
0 Ma
0 20 40 60 80 100 120 140 160Age of Oceanic Lithosphere (m.yrs)
40˚
20˚150 Ma
60˚ 80 ˚ 100˚ 120˚
40˚
20˚130 Ma
60˚ 80˚ 100˚ 120˚
40˚
20˚100 Ma
60˚ 80˚ 100˚ 120˚
40˚
20˚80 Ma
60˚ 80˚ 100˚ 120˚
40˚
20˚50 Ma
60˚ 80˚ 100˚ 120˚
40˚
20˚0 Ma
Plate NameANT AUS CAP
ANT AUS CAP
SOM
NEA
EUR IND JUN EGD NTY NJU
EUR IND JUN EGD NTY NJU
Fig. 16. (left) Agegrid reconstructions of thewest Australianmargin at 150, 130, 100, 80, 50,0 Ma highlighting the age–area distribution of oceanic lithosphere at the time of formationand the extent of continental crust (gray polygons). Plate boundaries fromour continuouslyclosing plate polygon dataset are denoted as thick white lines, hotspot locations as yellowstars, large igneous provinces and flood basalts as brown polygons and coastlines as thinblack lines. (right) Reconstructions showing the outlines of the plates in thewest Australianmargins for each reconstruction time listed above. Feature descriptions as in panel (left).Abbreviations are: ANT = Antarctic plate, AUS = Australian plate, CAP = Capricorn plate,EGD = east Gondwana plate, EUR = Eurasian plate, IND = Indian plate, JUN = Junctionplate, NEA = northeast African plate, NJU = north Junction plate, NTY = Neo-Tethysplate, NWA= northwest African plate, SOM= Somali plate. (For interpretation of the ref-erences to color in thisfigure legend, the reader is referred to theweb version of this article.)
243M. Seton et al. / Earth-Science Reviews 113 (2012) 212–270
and Zenith plateaus and the Perth Abyssal Plain extending from theWZFZ to the Naturaliste Plateau in the south (Fig. 14).
Rifting in the Argo Abyssal Plain started around 230 Ma (e.g.Müller et al., 2005) eventually leading to the separation of the WestBurma block/Argoland from the Australian continental margin. Thetransition from rifting to seafloor spreading has been constrained bythe dating of magnetic anomalies in the Argo Abyssal Plain andthrough tectonic subsidence analysis along the margin. The interpre-tation of magnetic lineations resolves that seafloor spreading initiatedimmediately prior to Anomaly M26 (~155 Ma) (Fullerton et al., 1989;Sager et al., 1992; Müller et al., 1998a; Heine and Müller, 2005) withNW–SE directed spreading. Previous models have invoked a south-ward propagating ridge along the Western Australian margin, whichstarted in the Argo Abyssal Plain progressing southward. Spreadingin the Gascoyne and Cuvier Abyssal Plains initiated at M10(~132 Ma) (Johnson et al., 1976, 1980; Larson, 1977; Falvey andMutter, 1981; Powell et al., 1988; Fullerton et al., 1989; Sager etal., 1992; Müller et al., 1998a) and marked the break-up betweenAustralia and Greater India. The model for the opening of the ArgoAbyssal Plain presented in Heine and Müller (2005) differs from pre-vious models and that of Robb et al. (2005) in that spreading betweenthe Argo and Gascoyne Abyssal Plains initiated almost simultaneouslywith the same orientation. The model also invoked a landward ridgejump at M13 (~136 Ma). Further southward, spreading in the PerthAbyssal Plain which records break-up between Australia and India oc-curred around 132 Ma based on the mapping of magnetic anomalies(Veevers et al., 1985; Müller et al., 1998a) and involved several sea-ward ridge jumps towards the Kerguelan plume (Müller et al.,2000). However, the majority of the crust may have formed duringthe CNS.
We adopt the model for the formation of the Argo and GascoyneAbyssal Plains following Heine and Müller (2005) which involvesNW–SE oriented rifting of West Burma from the northwestern mar-gin of Australia at around 156 Ma (Fig. 16). The continent–oceanboundary along Australia's western margin is from Heine andMüller (2005). Spreading continued until a landward ridge jump atM13 (~136 Ma). We infer that the plate boundary connected with aTethyan spreading ridge located to the north of India/Greater Indiato the west and a transform fault to the north (Fig. 16). Our model in-vokes a southward propagating ridge into the Cuvier and Perth Abys-sal Plain at 132 Ma following the models presented in Müller et al.(1998a) and Müller et al. (2000). The mid-ocean ridge associatedwith spreading in the Perth Abyssal Plain formed a triple junctionwith mid-ocean ridge opening the Enderby Basin (between East Ant-arctica and India) (e.g. Gaina et al., 2007) and the Australia–Antarcticmid-ocean ridge (Fig. 16). The NW-–SE directed spreading along theWestern Australian margin persisted until around 99 Ma. The fracturezones record a dramatic change in trend from NW–SE to roughly N–Sat around 99Ma (Müller et al., 1998a). The change to N–S spreadingforms the oldest crust associated with the Wharton Ridge/WhartonBasin. Seafloor spreading in the Wharton Basin ceased at 43 Ma(Singh et al., 2010).
3.3.4. Tethys OceanThe Tethys Ocean represents a now largely subducted ocean basin
that existed between Gondwanaland and Laurasia and involves a histo-ry of successive continental rifting events along the northernGondwanamargin, oceanic basin formation and accretion of Gondwana-derivedcontinental blocks onto the southern Laurasian margin and Indochina/SE Asia. The majority of Tethyan oceanic crust no longer exists due tolong-lived subduction along the southern Eurasian margin, except inthe Argo Abyssal Plain off NW Australia where a fragment of in-situoceanic crust recording the youngest Tethyan spreading system is pre-served (Fullerton et al., 1989; Heine and Müller, 2005). In addition, theIonian Sea and several basins in the eastern Mediterranean (e.g. LevantBasin) may be floored byMesozoic Tethyan oceanic crust (Stampfli and

244 M. Seton et al. / Earth-Science Reviews 113 (2012) 212–270
Borel, 2002; Müller et al., 2008b), however identification of magneticanomalies is difficult. The limited amount of preserved in-situ oceaniccrust of Tethyan origin hampers our knowledge and understanding ofthe evolution and structure of the Tethys Ocean. Instead we primarilyrely on the accreted terranes and sutures in SE Asia, southern Eurasia,Arabia and throughout the Mediterranean and southern and centralEurope (e.g. Sengor, 1987; Metcalfe, 1996; Stampfli and Borel, 2002)as they record the timing of continental block collision, ophiolite em-placement, back-arc basin development and provide paleo-latitudinalestimates of continental material derived from the northern Gondwanamargin.
Successive rifting events from the Gondwanamargin have led to thesubdivision of the Tethys Ocean into several oceanic domains: thepaleo- and neo-Tethys (e.g. Stampfli and Borel, 2002) or the paleo-,meso- and neo-Tethys (Metcalfe, 1996; Heine et al., 2004) (Fig. 3a–d).The additional subdivision by Metcalfe (1996) and Heine et al. (2004)stems from an alternative rift history for crust that formed after thepaleo-Tethys, which affects whether the Argo Abyssal Plain is classifiedas part of the Tethys or Indian Ocean domains.
The paleo-Tethys formed after the initiation of rifting and seafloorspreading between the European and Asian Hunic superterrane (e.g.North China, Indochina, Tarim, Serindia, Bohemia) and the northernGondwana margin (Metcalfe, 1996; Stampfli and Borel, 2002;Blakely, 2008). The timing of passive margin formation is dependenton the margin segment and ranges from Ordovician/Silurian basedon subsidence analysis in the western Tethys (Stampfli, 2000;Stampfli and Borel, 2002) or the late/early Devonian based on theGondwana affinity of Devonian vertebrate faunas in the Hun super-terrane (Metcalfe, 1996), Devonian to Triassic passive margin se-quences along the southern margin of South China (Metcalfe, 1996)and the dating of oceanic deep-marine ribbon bedded cherts in theChang-Rai region of Thailand (Sashida et al., 1993; Metcalfe, 1996).The direction of spreading is uncertain due to the lack of in-situ pre-served crust, however the seafloor spreading model of Stampfli andBorel (2002) invokes NE–SW directed spreading orthogonal to the in-ferred margin. The passage of the Hunic superterrane from south tonorth was facilitated by northward-dipping subduction along thesouthern Eurasian margin. The Hunic superterrane accreted to thesouthern Laurasian margin diachronously in the Carboniferous–Permian (Stampfli and Borel, 2002). The cessation of spreading inthe paleo-Tethys is difficult to establish, however most modelersagree the paleo-Tethys spreading ridge jumped southward alongthe northern Gondwana margin and initiated the rifting of a new con-tinental sliver from the Gondwana margin (e.g. Metcalfe, 1996;Stampfli and Borel, 2002; Blakely, 2008) after the accretion of theHunic superterrane.
The second main phase of rifting isolated the Cimmerian terranefrom the Gondwana margin some time in the Pennsylvanian–earlyPermian (Metcalfe, 1996; Stampfli and Borel, 2002), constrained bychanges in biota (Shi and Archbold, 1998) and evidence of rifting onthe northwest shelf of Australia (Falvey and Mutter, 1981; Müller etal., 2005), northern Pakistan and Afghanistan (Boulin, 1988; Pogueet al., 1992) and Iran (Stocklin, 1974). The Cimmerian terrane com-prises elements including Sibumasu (Sino-Burma-Malaya-Sumatracontinental sliver), Qiangtang (North Tibet), Helmand (Afghanistan),Iran and possibly Lhasa/South Tibet (Fig. 18a). The ocean basin thatformed between the Gondwana margin to the south and the Cimme-rian terrane is labeled as the meso-Tethys in the models of Metcalfe(1996) and Heine et al. (2004) but the neo-Tethys for most othermodels. Continued northward-dipping subduction of paleo-Tethysoceanic lithosphere along southern Laurasia carried the Cimmerianterrane northward, leading to its accretion and closure of the paleo-Tethys ocean starting in the late Triassic (Metcalfe, 1996; Stampfliand Borel, 2002; Golonka et al., 2006; Blakely, 2008). Accretion isconstrained by the Cimmerian orogeny in present-day Iran, whichinitiated in the late Triassic (Sengor, 1987; Stampfli and Borel, 2002;
Hassanzadeh et al., 2008), the collision of Sibumasu/Malaya to Indo-china by 250–220 Ma (Metcalfe, 1999; Stampfli and Borel, 2002;Golonka, 2007) and 200–160 Ma for other elements including Qiang-tang (North Tibet) and Helmand (Stampfli and Borel, 2002). The ac-cretion of South Tibet varies from 200 to 160 Ma (Stampfli andBorel, 2002), 150 Ma (Golonka et al., 2006) and 120 Ma related to aseparate episode of accretion (Metcalfe, 1996).
Following closure of the paleo-Tethys and accretion of the Cimme-rian terrane, several back-arc basins opened as a response to slab-pullforces along the Tethyan subduction zone. The major back-arccomplexes include the Pindos, Maliac, Meliata, Küre, Sangpan, Kudi,Vardar (Stampfli and Borel, 2002) and the early Cretaceous Taurus,Troodos, Hatay and Baer-Bassit ophiolite complexes (Whitechurchet al., 1984). The closure of these back-arc basins varied along themargin from Triassic to Cenozoic (Stampfli and Borel, 2002), with adate of ~70–65 Ma for the obduction of the Taurus, Troodos, Hatayand Baer-Bassit ophiolite complexes (Whitechurch et al., 1984) andan early Cenozoic age of obduction for the Pindos and Vardar back-arc basins (Stampfli and Borel, 2002). As these back-arc basinsopened and closed, inferred NE–SW directed spreading continued inthe meso-Tethys (or neo-Tethys ocean) orthogonal to the Gondwanarifted margin (Stampfli and Borel, 2002). The cessation of spreading inthe meso- or neo-Tethys is difficult to ascertain. However, Stampfliand Borel (2002) postulate that the subduction of the mid-ocean ridgediachronously across the margin can be tied to the initiation of riftingof theArgoland Block/West Burma from thenorthwest shelf of Australia,thus timing the cessation of spreading in the meso-/neo-Tethys ocean.
A third phase of rifting along the northern Gondwana margin in thenorthwest Australian shelf initiated in the late Triassic (Müller et al.,2005). The models of Metcalfe (1996) and Heine et al. (2004) label theresultant ocean basin as the neo-Tethys as their models extend theArgo Abyssal Plain mid-ocean ridge north of Greater India. Hence, thisocean basin forms part of the Tethys ocean domain. However, mostother studies associate the Argo Abyssal Plain with the Indian Ocean be-cause they follow the Argo spreading ridge southward between Indiaand Australia, thus representing earliest Indian Ocean spreading. Thepreserved seafloor spreading record in the Argo Abyssal Plain confirmsthat spreading initiated around 156 Ma leading to the separation of theWest Burma Block from the northwest Australian margin (Heine andMüller, 2005). The model of Metcalfe (1996) suggests that Lhasa(South Tibet) also rifted off the northern margin of Greater India at thetime. Spreading in the Argo Abyssal Plain is described in the IndianOcean section of this paper. The West Burma Block was carried north-ward due to continuing subduction along the northern Tethyan marginand sutured to Sibumasu in the Cretaceous around 80 Ma (Lee andLawver, 1995; Metcalfe, 1996; Heine and Müller, 2005).
The termination of spreading in the Tethys Ocean is controversial.The model of Stampfli and Borel (2002) suggests cessation of spread-ing in the early Cretaceous when the meso- or neo-Tethys spreadingridge intersected the Tethyan subduction zone. However, othermodels (Metcalfe, 1996; Heine et al., 2004; Heine and Müller, 2005)suggest that neo-Tethyan spreading continued through the Creta-ceous, merging into the Wharton Basin spreading ridge from theend of the CNS to 43 Ma (Heine et al., 2004). The final closure of theTethys Ocean started with the collision of Greater India to the southernEurasianmargin either around 55 Ma (Lee and Lawver, 1995) or 35 Ma(Van der Voo et al., 1999b; Hafkenscheid et al., 2001; Aitchison et al.,2007) marked by the Indus-Tsangpo Suture zone and ended with theclosure of the Tethyan seaway between Arabia and Iran forming theZagros Mountains (Hessami et al., 2001). Several fragments of Tethyanocean floor are postulated to underlay some of the basins in the easternMediterranean (see Müller et al., 2008a).
In theMediterranean region, several Cenozoic back-arc basins formeddue to the convergence between Eurasia and Africa (Rosenbaum et al.,2002). The Liguro–Provençal basin opened from around early Oligocene(~35 Ma) due to the eastward rollback of Apennines subduction (e.g.

245M. Seton et al. / Earth-Science Reviews 113 (2012) 212–270
Carminati et al., 2004) and the rotation of Corscia and Sardinia (Speranzaet al., 2002) and the accretion of the Kabylies blocks to the African mar-gin (e.g. Rosenbaum et al., 2002). Additional extensional basins such asthe Pannonian basin were associated with Africa–Eurasia collision andassociated with the Carpathian, Ionian and Hellenic subduction zones(Faccenna et al., 2001).
Our model for the evolution of the Tethys Ocean closely followsthat of Heine et al. (2004), which is largely based on Stampfli andBorel (2002) except in the Jurassic–Cretaceous. We agree with theseparation of the Tethys into three oceanic domains, as first suggestedby Metcalfe (1996) and adopted by Heine et al. (2004). We define thepaleo-Tethys as the ocean basin that formed after the separation ofthe Hunic superterrane from the northern Gondwana margin, themeso-Tethys as the ocean basin that formed after the separation ofthe Cimmerian terrane from the northern Gondwana margin andthe neo-Tethys as the ocean basin that formed when West Burma/Argoland separated from northwest Australia. Finite rotations de-scribing the opening of all three basins as well as associated seafloorspreading isochrons are mostly derived by following the model ofStampfli and Borel (2002) and Heine et al. (2004).
We follow a Devonian openingmodel for the paleo-Tethys (Metcalfe,1996) but donot discount that openingmay have been diachronous andoccurred as early as the Silurian (Stampfli and Borel, 2002) in the west-ern Tethys. As the reconstructions presented in this paper do not extendbeyond 200 Ma, we will not describe the accretionary history of theHunic superterrane. We agree with Stampfli and Borel (2002) that thecessation of spreading in the paleo-Tethys led to southern ridge jump,initiating opening of the meso-Tethys around 280 Ma, coincident withthe collision of the Hunic terrane to the southern Laurasian marginand the initiation of rifting of the Cimmerian terrane from the northernGondwana margin in the early–mid Permian (Metcalfe, 1996). We in-voke NE–SW directed spreading for the meso-Tethys consistent withStampfli and Borel (2002). The accretion of the Cimmerian terrane tothe southern Laurasian margin also marks the closure of the paleo-Tethys ocean. We broadly follow the timing of accretion based onGolonka et al. (2006) andGolonka (2007). The uncertainty in the south-ern extent of the Laurasian margin means that the timing of accretionmay change significantly depending on the southern extent of theLaurasian continental margin. Following the closure of the paleo-Tethys, a margin-wide episode of back-arc opening occurred along thesouthern Eurasian margin—from China to western Europe. This back-arc system was responsible for the crust that now forms part of theCretaceous aged ophiolite complexes through southern Europe, Cyprus(Troodos), Iran and Oman. Although these basins are known to haveexisted after the closure of the paleo-Tethys,wedo not include their for-mation (e.g. Whitechurch et al., 1984; Robertson, 2000; Stampfli andBorel, 2002) as we focused on the broad-scale development of the Te-thys Ocean. However, these back-arc basins have played a vital role inthe development of the region and we anticipate that a thorough re-view of ophiolite complexes and back-arc basin correlatives will be in-cluded in the next generation of the plate motion model.
Our model invokes continuous seafloor spreading in themeso-Tethysfrom 280Ma to 145–140Ma. The neo-Tethys ocean forms with riftingand seafloor spreading in the Argo Abyssal Plain, following the model ofHeine andMüller (2005), isolating theWest Burma Block from the Gond-wana margin. We initiate seafloor spreading at 156 Ma and extend themid-ocean ridge westward, north of Greater India where it intersectswith a Tethyan transform fault. The accretion ofWest Burma to Sibumasuoccurred at 80 Ma, followingHeine andMüller (2005). Seafloor spreadingin the neo-Tethyan ocean continued unabated eventually transforminginto the Wharton basin spreading ridge system in the eastern IndianOcean until 43 Ma (Singh et al., 2010).
In the western Mediterranean, we reconstruct the continentalblocks that comprise southern Europe and the Middle East in thesame manner as in Müller et al. (2008a). The basins floored by ocean-ic crust in the Mediterranean fall into two types. The Mesozoic basins
in the eastern Mediterranean (e.g. Levant basin and Ionian Sea) repre-sent the oldest preserved in-situ ocean floor, ranging in age from about270 Ma (Late Permian) to 230 Ma (Middle Triassic) according to ourmodel. The Cenozoic basins in the western Mediterranean (e.g. Liguro–Provençal Basin) are reconstructed based on the tectonic model androtations from Speranza et al. (2002), describing a Miocene counter-clockwise rotation of Corsica–Sardinia relative to Iberia and France,thereby creating accommodation space for back-arc opening.
3.4. Marginal and back-arc basins
The present day distribution of the continents and oceans includesmany smaller ocean basins that formed either in a back-arc settingbehind a retreating subduction zone (Karig, 1971; Sleep and Toksoz,1971; Uyeda and Kanamori, 1979; Taylor and Karner, 1983;Faccenna et al., 2001; Sdrolias and Müller, 2006) or as a result of con-tinental rifting without the influence of a subduction zone formingmarginal seas. The presence of ophiolites embedded within accretedterranes provides evidence for the opening and closing of marginalseas and back-arc basins in the past, most notably along the Tethyanmargin and in the western North American margin.We havemodeledsome of the major marginal and back-arc basins observed in the sea-floor spreading record today. We have also modeled the opening ofthree critical marginal and back-arc basins that existed in the pastbut have been subsequently destroyed. These include the Mongol–Okhotsk Ocean in Central Asia, the marginal basins that formed inthe Caribbean, off the coast of western North America and theproto-South China Sea. We also model the opening of the Caribbean,which includes a combination of marginal seas and back-arc basins.
3.4.1. CaribbeanThe Caribbean resides between the North American and South
American plates and contains Jurassic–Cretaceous ocean floor in theGulf of Mexico and Venezuela Basin, Cenozoic ocean basins such asthe Cayman Trough, Gernada and Yucatan Basins, numerous conti-nental blocks, accreted terranes, volcanic arcs and the CaribbeanLarge Igneous Province (CLIP) (Figs. 3 and 9). The sedimentary basinssurrounding the Gulf of Mexico are some of the world's most produc-tive hydrocarbon bearing basins, prompting quite detailed studies ofthe tectonic evolution of the region (Pindell, 1987; Burke, 1988;Ross and Scotese, 1988; Pindell and Kennan, 2009). The developmentof the Caribbean is tied to break-up of Pangea and rifting in theCentral Atlantic, which extended into the Caribbean during the Triassicto earliest Cretaceous. This early phase formed rift basins, stretchedcontinental crust and salt basins in areas such as the South FloridaBasin, Great Bank of the Bahamas, Yucatan and along northern SouthAmerica (Pindell and Kennan, 2009). To thewest, a continuous subduc-tion zone along the easternmargin on Panthalassa was consuming oce-anic lithosphere beneath the western margin of the proto-Caribbean/trans-American region.
The Gulf of Mexico is bounded by predominately Triassic–Jurassicsyn-rift structures and salt bearing basins and is partly floored byJurassic–Cretaceous oceanic crust. The timing of seafloor spreadingin the Gulf of Mexico is not well constrained with ages ranging from158 to 170 Ma based on the timing of salt deposition and regionalchanges in structural trend and block rotations (Buffler and Sawyer,1983; Ross and Scotese, 1988; Pindell and Kennan, 2009). The cessa-tion of extensional faulting in the SE Gulf of Mexico and the dating ofa post-rift unconformity (Ross and Scotese, 1988; Marton and Buffler,1999; Pindell and Kennan, 2009), places the cessation of seafloorspreading in the latest Jurassic-earliest Cretaceous between 145 and135 Ma. The opening of the Gulf of Mexico led to a two-stage anti-clockwise rotation of the Yucatan Block away from North Americainto its present day location (Pindell and Kennan, 2009).
The existence of a proto-Caribbean Basin has been hypothesizedbased on the accommodation space created by the relative motion

246 M. Seton et al. / Earth-Science Reviews 113 (2012) 212–270
between the North and South American plates. The development ofthis basin (its orientation and timing) is therefore purely dependenton the chosen plate tectonic model. Opening of the basin was eithercoincident with spreading in the Gulf of Mexico (Meschede and Frisch,1998; Pindell and Kennan, 2009) or initiated only after a southwardridge jump in the early Cretaceous (Ross and Scotese, 1988). Modelsthat propose the encroachment of proto-Pacific oceanic lithosphereinto the Caribbean (e.g. Ross and Scotese, 1988; Pindell and Kennan,2009) imply that all evidence of the proto-Caribbean Basin was sub-ducted by the late-Cretaceous–early Cenozoic, whereas models that donot invoke an advancing trench relate NE–SW trending magneticlineations in the Venezuela Basin (Ghosh et al., 1984) to the proto-Caribbean Basin (Meschede and Frisch, 1998).
One of the major features that controlled the broad-scale develop-ment of the Caribbean is the nature of the plate boundary betweenthe Caribbean and Panthalassa/Pacific Ocean. Most models agreethat east-dipping trans-America subduction was consuming proto-Pacific oceanic lithosphere during the Triassic–Cretaceous (Ross andScotese, 1988; Meschede and Frisch, 1998; Pindell and Kennan,2009). However, models subsequently diverge into either “Pacific or-igin” (Malfait and Dinkelman, 1972; Burke, 1988; Ross and Scotese,1988; Pindell and Kennan, 2009) or “intra-American origin” scenarios(Meschede and Frisch, 1998; James, 2006). “Pacific-origin” scenariospropose a switch in the polarity of the trans-American plate boundaryfrom east-dipping to southwest-dipping in the late Cretaceous alongthe Caribbean/Greater Antilles Arc, causing the subduction of theproto-Caribbean Basin and encroachment of oceanic lithospherefrom the Pacific domain into the Caribbean. The timing of this polarityflip is believed to be around 100–90 Ma (Ross and Scotese, 1988;Pindell and Kennan, 2009) and constrained to 90 Ma in the south onAruba and within the Bonaire Block (van der Lelij et al., 2010). Con-tinued northeastward rollback of the subduction hinge eventuallycaused collision with Yucatan and accretion of the arc along theBahamas Platform. In the model of Ross and Scotese (1988) this ac-cretion led to a jump in the locus of subduction westward, initiatingsubduction along the Panama–Costa Rica Arc around 60 Ma. Howev-er, other models place the initiation of Panama–Costa Rica Arc to80–88 Ma (Pindell and Kennan, 2009) before the accretion of theCaribbean Arc to the Bahamas Platform. Recent tectonostratigraphicand geochemical data from exposed rocks in southern Costa Ricaand western Panama indicate protoarc initiation on top of CLIP base-ment occurred between 75 and 73 Ma (Buchs et al., 2010). Irrespec-tive of timing, in the “Pacific origin” model, the initiation of thePanama–Costa Rica Arc trapped Pacific-derived oceanic lithosphere(now underlying the Venezuela Basin) as well as the CLIP onto theCaribbean plate. “Intra-American origin”models assume a continuoustrans-America east-dipping subduction zone, which provided a per-manent barrier between the Pacific/Panthalassa and Caribbean. Con-currently, southwest-dipping subduction to the east of the proto-Caribbean Basin led to the docking of tectonic elements along theBahaman Platform. In the “intra-American” model, the origin of theoceanic lithosphere underlying the Venezuela Basin and the CLIP areboth derived in-situ. This model implies that the Panama–Costa RicaArc was built upon a much older arc sequence.
After ~60 Ma,mostmodels for the Caribbean are largely similar on abroad scale. After the establishment of subduction along the Panama–Costa Rica Arc, the Caribbean plate became a stationary featureinfluenced only by the relative motions between the North and SouthAmerican plates (Ross and Scotese, 1988). The southern margin of theBahaman platform changed from convergence to sinistral strike-slipafter the accretion of arc terranes with E–W transform faults dominat-ing the region. To the east, west-dipping subduction and arc volcanismalong the Aves Ridge were still occurring. To the south, thermochrono-logical and sedimentological analyses suggest that the Bonaire Blockcollided with the South American margin at ~50 Ma thereby constrain-ing the change from convergence to strike-slip along South America
(van der Lelij et al., 2010). The new tectonic regime led to opening ofthe Yucatan and Grenada–Tobago Basins in the Paleogene, CaymanTrough since the Eocene (Ross and Scotese, 1988; Pindell and Kennan,2009) and the Puerto Rico Basin in the Oligocene (Ross and Scotese,1988).
The Yucatan Basin currently resides between Cuba and theCayman Ridge and is believed to have formed prior to the collisionof the Caribbean Arc as a passive response to the northwestward roll-back of the trench (Pindell et al., 2006). The cessation of spreading iscorrelated with the docking of the arc terranes along Cuba and theBahaman Platform. The Grenada–Tobago Basin formed as a back-arcbetween the Aves Ridge and Lesser Antilles Ridge due to the eastwardrollback of the Lesser Antilles Trench. The timing of spreading isunconstrained by magnetic anomaly interpretations but initiation isbelieved to have occurred sometime in the Paleogene based on thecessation of plutonism on the Aves Ridge (Pindell et al., 1988) andfrom seismic stratigraphy and heatflow measurements within thebasin (Speed, 1985; Pindell and Kennan, 2009). Spreading is believedto have ceased in theOligocene coincidentwith the collision of the Less-er Antilles forearc with the Venezuelan margin (Pindell and Kennan,2009). The Cayman Trough formed as a left-lateral pull-apart basin be-tween two major transform faults starting at Chron 19 (~41 Ma)(Rosencrantz et al., 1988; Ross and Scotese, 1988) based on the inter-pretation of magnetic anomalies. The Puerto Rico Basin opened in theOligocene–earlyMiocene as a result of relativemotion betweenHispan-iola and the Caribbean plate (Ross and Scotese, 1988).
Our model largely follows the hierarchical model of Ross andScotese (1988) (with an updated timescale) and elements ofPindell and Kennan (2009), with minor adjustments based on recentgeological information and an updated spreading model in theCentral and Equatorial Atlantic. Rifting in the Caribbean since theTriassic connected to the Central Atlantic rift zone through Floridaand Gulf of Mexico and extended westward to the trans-Americasubduction zone, which was actively consuming Panthalassic oceanfloor. In our model, we follow the initiation of spreading in the Gulfof Mexico at 170 Ma based on Ross and Scotese (1988) coincidentwith accelerated seafloor spreading rates in the Central Atlantic(Labails et al., 2010) (Fig. 8). We update the cessation of spreadingto 145 Ma based on evidence presented in Pindell and Kennan(2009). After the cessation of spreading in the Gulf of Mexico, wemodel a ridge jump to the south initiating the opening of theproto-Caribbean Basin within the accomodation space created bythe relative motion between the North and South American plates(Fig. 8). Spreading was NW–SE directed and initiated around145 Ma forming a triple junction to the east between the midocean ridge of the Central Atlantic and rift axis of the Equatorial/South Atlantic. To the west, the mid ocean ridge of the proto-Caribbean Basin formed a ridge–ridge–transform triple junctionwith the spreading ridge of the Andean back-arc basin and thetrans-American subduction zone.
We favor the “Pacific-origin” model for the formation of theCaribbean plate with a subduction polarity flip of the trans-Americasubduction zone to west-dipping along the eastern boundary of theCaribbean Arc at 100 Ma (Fig. 8). The rollback of this subductionzone led to the consumption of the actively spreading proto-Caribbean ocean floor and encroachment of the Farallon plate intothe Caribbean domain. Our model predicts that the oceanic litho-sphere intruding into the Caribbean (and currently underlying theVenezuela Basin) formed along the Pacific–Farallon ridge betweenChrons M16-M4 (~139–127 Ma) at a latitude of around 10–15°S,agreeing well with paleomagnetic constraints, which suggest anequatorial formation for the oceanic crust of the Nicoya Complex(Duncan and Hargraves, 1984). The continued roll-back of theCaribbean Arc subduction zone led to the formation of the YucatanBasin as a back-arc in the late Cretaceous with cessation of spreadingoccurring at 70 Ma when the Caribbean Arc accreted to the Bahaman
247M. Seton et al. / Earth-Science Reviews 113 (2012) 212–270
Platform. The accretion led to a jump in the locus of subduction west-ward along the newly developed Panama–Costa Rica to accommodatethe continued eastward motion of the Farallon plate, trapping Faral-lon oceanic lithosphere onto the Caribbean plate in the process. Theeruption of the Caribbean flood basalt province occurred around90 Ma on top of the oceanic lithosphere that now underlies much ofthe Caribbean ocean floor (Sinton et al., 1998). The Caribbean floodbasalt province (or CLIP) has been suggested to be the product ofthe Galapagos hotspot (Pindell and Kennan, 2009), however in ourmodel the CLIP erupted on Farallon oceanic lithosphere over2000 km away from the present day position of the Galapagos hot-spot precluding this as a source, even assuming the motion of hot-spots relative to each other (Fig. 10).
Coincident with subduction along the proto-middle Americatrench was west-dipping subduction to the east along the Aves/LesserAntilles Ridge, consuming Atlantic Ocean floor (Fig. 8). The rollback ofthis subduction zone led to the formation of the Grenada Basin be-tween the Aves and Lesser Antilles Arcs in the Paleogene. In the mid-dle Eocene (41 Ma), relative motion between North America andCaribbean began to form the Cayman Trough along sinistral faultsthat later merge with the Lesser Antilles trench. In the early Miocene(20 Ma), the Cayman Trough continued to expand and develop, andthe Chortis Block moved over the Yucatan promontory. Westwardmotion of the North American plate relative to the slow movingCaribbean plate was accommodating the opening of the CaymanTrough. The Puerto Rico Basin formed in the Oligocene–early Miocenedue to a similar process. Currently, opening is continuing within theCayman Trough accommodated by the motion along the boundingtransforms. Active subduction of Atlantic oceanic lithosphere is oc-curring along the Lesser Antilles Trench, which connects up to theMid-Atlantic Ridge along the Researcher Ridge and Royal Trough(Müller et al., 1999).
3.4.2. Mongol–Okhotsk BasinThe Mongol–Okhotsk Basin is a Mesozoic ocean basin that existed
between the Siberian craton to the north and the Amuria/Mongoliablock to the south. The Mongol–Okhotsk suture zone defines basinclosure (Apel et al., 2006; Golonka et al., 2006; Cocks and Torsvik,2007). Evidence for the existence of the Mongol–Okhotsk Basin isfound in a series of remnant island arc volcanics and ophiolitesadjacent to the suture zone as well as a large area of seismically fastmaterial in the lower mantle underlying Siberia imaged in seismictomography (Van der Voo et al., 1999a).
The opening of the Mongol–Okhotsk Basin is not well constrained,ages range from 610 to 570 Ma (Sengör et al., 1993), Ordovician(Cocks and Torsvik, 2007), Cambrian (Harland et al., 1990) andPermian (Zorin, 1999; Kravchinsky et al., 2002). The large age rangestems from the associations made between geological units in theSiberia, Mongolia and North China realm and the definition of theocean basins that existed between these geological units. A zirconage of 325 Ma from a leucogabbro pegmatite has been associatedwith oceanic crust from the Mongol–Okhotsk Ocean (Tomurtogoo etal., 2005) indicating that seafloor spreading was active from at leastthe late Carboniferous. In addition, paleomagnetic data suggests thatSiberia and Mongolia were separated by 10–15° (Zorin, 1999) bythe Permian. The presence of continental volcano-sedimentary se-quences and granitoid magmatism proximal to the suture zone indi-cates that the basin was being subducted northward during thePermian (Zorin, 1999), Triassic and Jurassic (Stampfli and Borel,2002; Golonka et al., 2006). It is difficult to ascertain when seafloorspreading ceased in the Mongol–Okhotsk Basin. Triassic MORB basaltsin the eastern part of the Mongol–Okhotsk belt (Golonka et al., 2006)provide a minimum age for seafloor spreading. Continued subductionalong the Siberian margin led to initial closure of the Mongol–Okhotsk Ocean sometime in the Jurassic (Van der Voo et al., 1999a;Zorin, 1999; Kravchinsky et al., 2002; Stampfli and Borel, 2002;
Golonka et al., 2006; Golonka, 2007) based on collision followed byfolding and intrusion of granitic batholiths in Mongolia and the trans-Baikal area (Golonka et al., 2006) and the formation of the Mongol–Okhotsk Suture (Tomurtogoo et al., 2005). Complete closure may haveended as late as the early Cretaceous (Zorin, 1999) based on the cessa-tion of compression in the area (Zorin, 1999). Alternative models existthat predict an older initial closure age of late Carboniferous (Badarchet al., 2002; Cocks and Torsvik, 2007), but again, thismay be due to a dif-ference in the definition of the Mongol–Okhotsk Ocean.
We have modeled the opening of the Mongol–Okhotsk Basin inthe late Carboniferous to account for the zircon data of Tomurtogooet al. (2005), followed by the onset of subduction along the Siberianmargin in the late Permian. We continue seafloor spreading in theMongol–Okhotsk Basin until the Permo-Triassic boundary (250 Ma).Based on our initiation and termination of spreading, we suggestthat the Mongol–Okhotsk Ocean had a maximum width of about4000 km. We model the closure of the Mongol–Okhotsk Basin to150 Ma (late Jurassic) based on the overwhelming evidence in the lit-erature for the dating of the Mongol–Okhotsk Suture.
3.4.3. North American marginsThe western North American margin is characterized by the accre-
tion of native and exotic terranes throughout the late Paleozoic andMesozoic. The timing of formation of the numerous terranes with is-land arc affinities, their accretion onto the continental margin andother subduction-related structures provide constraints for the age,orientation and tectonics associated with the oceanic basins thatformed adjacent to the margin. The Laurentian peri-continental mar-gin was a passive Atlantic-style margin until the early Mesozoic(Nokleberg et al., 2001). Many accretion events have been recordedalong this margin but we simplify them into three main sectors: theYukon-Tanana/Quesnellia/Stikina terrane, the East Klamath terraneand the Wrangellia superterrane separated by major fault systems.There are many alternative interpretations for the source of the ter-ranes, their age of formation, timing and location of accretion andtheir field relationships. Our model relies heavily on the reconstruc-tions represented in Nokleberg et al. (2001) and Colpron et al.(2007) but note that other alternative scenarios exist.
Arc magmatism occurred along the western Laurentian margin~390–380 Ma forming many of the rocks of the Yukon-Tanana Terrane(YTT) andwestern Kootenay terranes (Nokleberg et al., 2001) currentlylocated in Yukon and southern Alaska (Fig. 7). The base of the YTT hasisotopic, geochemical characteristics indicating a Laurentian source forthe terrane (Nokleberg et al., 2001). Following a period of arc magma-tism was a period with coeval rift-related magmatism leading to therifting of the YTT from the Laurentian margin around 360–320 Ma(Mortensen, 1992; Nokleberg et al., 2001; Colpron et al., 2002; Nelsonet al., 2006). The separation of the YTT was driven by N–NE dippingsubduction and led to the opening of the Slide Mountain Ocean. TheSlide Mountain ophiolite, which is currently emplaced onto the YTTand Cassier Terranes (Nokleberg et al., 2001) preserves evidence ofthis paleo-ocean basin. The Slide Mountain Ocean is less commonly re-ferred to as the Anvil Ocean (Hansen, 1990). Some of the rocks relatedto arc magmatism were left on the margin (in the parautochthonousrocks of east–central Alaska and the Kootenay terrane) before the open-ing of the Slide Mountain Ocean while the majority of the YTT formedthe base of the frontal arc (Nokleberg et al., 2001).
The Slide Mountain Ocean opened due to west–southwest slabroll-back, reaching a maximum width in the early Permian (Nelsonet al., 2006) of around 1300 km (Nokleberg et al., 2001). Spreadingin the back-arc basin ceased at around 280–260 Ma coincident witha subduction polarity reversal (Mortensen, 1992; Nokleberg et al.,2001) recorded in west-facing coveal calc-alkalic and alkalic plutons(Nokleberg et al., 2001). The subduction polarity reversal led to theformation of two adjacent arcs, the Stikinia and Quesnellia Arcs, over-lying the YTT via a southwest-dipping subduction zone along the

248 M. Seton et al. / Earth-Science Reviews 113 (2012) 212–270
eastern side of the YTT. This subduction led to the closure of the SlideMountain Ocean and the accretion of the YTT/Quesnellia Arc to theLaurentian margin by the middle Triassic (240–230 Ma) (Hansen,1990; Nokleberg et al., 2001; Nelson et al., 2006). The Stikinia Arcwas still intraoceanic when the YTT/Quesnellia Arc accreted to themargin as it trends outboard of the Cache Creek Terrane (Fig. 7).The Cache Creek Terrane is a mid-Paleozoic to mid Jurassic oceanicterrane with exotic Permian Tethyan faunas in limestone blocks andlong-lived island edifices (Nelson and Mihalynuk, 1993; Mihalynuket al., 1994). The Cache Creek Terrane, which is very distinct fromthe Slide Mountain Terrane implies that another ocean basin, theCache Creek Ocean, formed in between the Stikinia Arc to the westand the rapidly retreating YTT/Quesnellia Arc to the east. Based ontrend-surface analysis of the distribution of Permian coral genera,taxonomic diversity and paleomagnetic data, Belasky and Runnegar(1994) predict that the Stikinia Arc was located up to 6700 km fromthe Laurentian margin in the early Permian and that the EasternKlamath terrane was located proximal to the Stikinia Arc.
To address the field relationships of the YTT, Quesnellia Arc, CacheCreek Terrane and Stikinia Arc, Colpron et al. (2007) invoke an “oroclinal”model whereby the Stikinia Arc segment rotated counterclockwise con-suming the Cache Creek Ocean along a west–southwest-dipping sub-duction zone. The rotation of the Stikinia Arc may have initiated asearly as ~230 Ma. The timing of accretion of the Stikinia Arc to theNorth American margin and therefore the closure of the Cache CreekOcean is tightly constrained to around 172–174 Ma (Colpron et al.,2007 and references therein). However, collision may have started inthe early Jurassic coincident with a phase of cooling (Nokleberg et al.,2001).
The next major event to affect the margin was the accretion of theexotic Wrangellia superterrane. The basement of theWrangellia super-terrane consists of Triassic flood basalts (285–297 Ma) that formed atequatorial latitudes and overlain by a carbonate platform (Richardset al., 1991; Greene et al., 2008). Although recent data suggests initialcollision with the North American margin at about 175 Ma (Gehrels,2001, 2002; Colpron et al., 2007), the main accretion event occurredat 145–130 Ma (Nokleberg et al., 2001; Trop et al., 2002). There iscontroversy over whether the allochthonous terranes (includingWrangellia) of southern Alaska and western Canadawere originally ac-creted (1) ≤1000 km of their existing location, offshore present dayBritish Columbia, Oregon, and Washington, during the late Mesozoicand early Cenozoic or (2) were located 1000–5000 km along the west-ern coast of the North American Craton and subsequently transportednorthwards during the Late Cretaceous and Cenozoic (Keppie andDostal, 2001; Stamatakos et al., 2001). After collision, the Wrangelliaterrane underwent margin-parallel dextral motion but the amount ofdextral motion is a matter of debate.
We model the evolution of the marginal and back-arc basins thatformed along the western North American margin as describedabove. We create a set of synthetic seafloor spreading isochrons to de-pict the opening of the Slide Mountain Ocean starting at 340 Mabased on a margin parallel opening and a maximum opening widthof 1300 km, suggested by Nokleberg et al. (2001). Break-up mayhave been at least partially driven by a mantle plume as our recon-structions show that the plume associated with the present dayAzores hotspot closely corresponds to the break-up location. Osmiumisotopes suggest that Azores has a deep origin (Schaefer et al., 2002)suggesting that this plume may have been long-lived but whetherhotspots are active and can be traced as far back as 340 Ma remainsopen to debate. We terminate spreading in the Slide MountainOcean at 280 Ma followed by a subduction polarity flip along theYTT and the establishment of an eastward retreating subductionzone. Subduction led to the consumption of the Slide MountainOcean along this southwest–west dipping subduction zone.
We form the Cache Creek Ocean in between the retreating YTTand the Stikinia Arc and East Klamath at 280 Ma with a cessation of
spreading in the Cache Creek Ocean simultaneous with the accretionof the YTT along the Laurentian margin at 230 Ma. This is followed bythe subduction of the Cache Creek Ocean behind a rapidly retreatingwest-dipping subduction zone along the eastern side of the StikiniaArc and East Klamath (Fig. 17). The Stikinia Arc and East Klamath ac-crete to the North American margin at 172 Ma (Fig. 17), resulting inthe emplacement of the Cache Creek ophiolite between the StikiniaArc and the Quesnellia Arc. We accrete the Wrangellia superterraneto the margin at 140 Ma following the northern accretion model.The accretion of the Wrangellia Terrane marks the true establishmentof the boundary between North America and the Pacific.
3.4.4. Proto-South China SeaA Mesozoic–Cenozoic back-arc basin situated adjacent to the
Eurasian passive margin, named the proto-South China Sea, is incor-porated into many regional models of SE Asia (Hamilton, 1979;Holloway, 1982; Williams et al., 1988; Hutchison, 1989; Lee andLawver, 1994; Hall, 2002). Rifting is believed to have initiated alongthe South China margin in the late Cretaceous (Ru and Pigott, 1986;Lee and Lawver, 1994) although a rift-related unconformity is datedto the early Cretaceous (Lee and Lawver, 1994). This rift event ledto the separation of northern Borneo from the South China marginresulting in the formation of NE–SW trending structures and sedi-mentary basins (Lee and Lawver, 1994). The provenance of ophioliticigneous rocks in northwest Borneo from late Jurassic–late Cretaceous(based on the dating of sediments overlying pillow basalts) is tied tothe proto-South China Sea (Hutchison, 2005), further constrainingthe timing of formation of the basin.
The cessation of spreading in the proto-South China Sea and itslateral extent is unknown. Most models invoke the initiation of clo-sure in the early Cenozoic/early Neogene beneath Kalimantan/north-ern Borneo and Palawan (Ludwig et al., 1979; Williams et al., 1988;Lee and Lawver, 1994; Hall, 2002). The closure is believed to havebeen triggered either by the counterclockwise rotation of Borneo(Hall, 2002) or by the southeast extrusion of Indochina (Lee andLawver, 1994).
We model the opening of the proto-South China Sea during riftingbetween the stable Eurasian margin and northern Borneo during thelate Cretaceous (~90 Ma) with spreading orthogonal to the Eurasianmargin. The cessation of spreading occurred at 50 Ma coincident withthe clockwise rotation of the neighboring Philippine Sea plate. The dra-matic change inmotion of the Philippine Sea plate reorganized the plateboundaries in the area leading to the establishment of a subductionzone between Palawan and the proto-South China Sea, which began ac-tively consuming the proto-South China Sea since 50 Ma with an in-crease in convergence rate from 25Ma. We model complete closure ofthe proto-South China Sea at around 10 Ma behind a subduction zonelocated along Palawan and the north Borneo/Kalimantan margin.
3.4.5. Western Pacific and SE Asian back-arc basinsThe continental blocks and basins in SE Asia comprise one of the
most complex regions in the world. Most models focus on the Cenozoicinterpretation of onshore geology, including: Rangin et al. (1990), Leeand Lawver (1995), and Hall (2002). Other models couple the seafloorspreading history in the back-arc basins of both SE Asia and theWesternPacific for a continent and ocean basin evolution (Gaina and Müller,2007). The model we use in our reconstructions is based on Gaina andMüller (2007) and additionally incorporate the rotation of thePhilippine Sea plate based on Hall et al. (1995) and the seafloor spread-ingmodel of Sdrolias et al. (2003b) for spreading in the Parece Vela andShikoku Basins. For further details of the model, we refer to Sdrolias etal. (2003b) and Gaina and Müller (2007).
3.4.6. SW Pacific Back-arc basins and marginal seasThe SW Pacific is characterized by a series of marginal basins
(Tasman and Coral Seas), submerged continental slivers (Lord Howe

200 Ma
240° 260° 280° 300° 320° 340°
180 Ma
240° 260° 280° 300° 320° 340°
170 Ma
240° 260° 280° 300° 320° 340°
150 Ma
240° 260° 280° 300° 320° 340°
140 Ma
0 10 20 30 40 50 60 70 80 90 100 110 120 130 140 150 160 260
Age of Oceanic Lithosphere (m.yrs)
0°
20°
40°
60°
200 Ma
240° 260° 280° 300° 320° 340°
0°
20°
40°
60°
180 Ma
240° 260° 280° 300° 320° 340°
0°
20°
40°
60°
170 Ma
240° 260° 280° 300° 320° 340°
0°
20°
40°
60°
150 Ma
240° 260° 280° 300° 320° 340°
0°
20°
40°
60°
140 Ma
Plate NameNAM SAM PAC EUR FAR IZA CAR
Fig. 17. (left) Agegrid reconstructions of Mesozoic North America at 200, 180, 170, 150, 140 Ma highlighting the age–area distribution of oceanic lithosphere at the time of forma-tion and the extent of continental crust (gray polygons). Plate boundaries from our continuously closing plate polygon dataset are denoted as thick white lines, hotspot locations asyellow stars, large igneous provinces and flood basalts as brown polygons and coastlines as thin black lines. (right) Reconstructions showing the outlines of the plates around Me-sozoic North America for each reconstruction time listed above. Feature descriptions as in panel (left). Abbreviations are: CAR = Caribbean plate, EUR = Eurasian plate, FAR =Farallon plate, IZA = Izanagi plate, NAM = North American plate, PAC = Pacific plate, SAM = South American plate. (For interpretation of the references to color in this figurelegend, the reader is referred to the web version of this article.)
249M. Seton et al. / Earth-Science Reviews 113 (2012) 212–270

250 M. Seton et al. / Earth-Science Reviews 113 (2012) 212–270
Rise, Mellish Rise, Louisiade, Papuan, Kenn, Dampier and ChesterfieldPlateaus), island arcs (Norfolk, Three-Kings, Loyalty, New Hebrides,Vitiaz and Lau-Colville Ridges), back-arc basins (South Loyalty,North Loyalty, Norfolk, South Fiji, North Fiji and Lau Basins andHavre Trough) as well as numerous features with an uncertain origin(e.g. D'Entrecasteaux Zone and Basin and Rennell Trough and Basin)(Fig. 11). In a broad sense, these features developed behind the east-ward migrating Australia–Pacific plate boundary from the late Meso-zoic to the present day (Karig, 1971; Symonds et al., 1996; Müller etal., 2000; Crawford et al., 2002; Sdrolias et al., 2003a). Our plate mo-tion model incorporates the opening model for the Tasman and CoralSeas based on Gaina et al. (1998) and Gaina et al. (1999). We incorpo-rate the model of Sdrolias et al. (2003a) and Sdrolias et al. (2004) forthe formation of the back-arc basin and island arc systems seaward ofthe Lord Howe Rise. For further details, we refer to the abovemen-tioned publications.
4. Global plate reconstructions
Our regional kinematic models fit within a hierarchical global platecircuit tied to a hybrid moving hotspot/true polar wander corrected ab-solute reference frame through Africa. We create a set of dynamic platepolygons since the time of Pangea break-up with the assumption thatthe plates themselves are rigid. The birth of a plate (the establishmentof relative motion after a break in the lithosphere), can be defined intwo ways: either the initiation of rifting due to weakening of the litho-sphere by basal heating forming a series of faults and rift-related struc-tures (sometimes called incipient spreading), or the initiation ofseafloor spreading, when there is a complete break of the lithosphereand extrusion of the mantle. Our plate boundary set distinguishes be-tween the two modes via a continental/oceanic rift or mid-oceanridge coding of the plate boundaries, which allows for the constructionof a plate polygon dataset using either mode. The plate polygons pre-sented in this study follow the former definition but an ancillary set canbe produced to follow the later definition. Below we describe tectonicevents every 20 million years with accompanying maps (Figs. 18–28)and also provide the plate polygon and plate boundary files. These filescan be directly loaded into GPlates software for reconstructions in onemillion year time intervals.
4.1. 200–180 Ma (Figs. 18 and 19)
Prior to the Mesozoic, the continents were amalgamated into onebig supercontinent, Pangea, surrounded by two ancient oceans,Panthalassa and the smaller Tethys Ocean. By the early–mid Mesozo-ic, Pangea was undergoing slow continental break-up centered alonga rift zone extending from the Arctic, North Atlantic (adjacent to theNorwegian shelf and Iberia–Newfoundland margins), Central Atlanticand along the Jacksonville Fracture Zone through Florida and the Gulfof Mexico in the Caribbean region. The Caribbean rift zone, definedby a series of Mesozoic rift basins, connected with east-dippingtrans-America subduction, which was consuming oceanic lithospherefrom Panthalassa. At 190 Ma, there was a change from rift to driftalong the early Atlantic rift, restricted to the Central Atlantic. Contem-poraneously, dextral motion was occurring along the early Atlas Rift,isolating Morocco.
The Panthalassic Ocean was entirely surrounded by subductionduring the mid–early Mesozoic. We model seafloor spreading as asimple three-plate system between the Izanagi, Farallon and Phoenixplates. The three arms of the triple junction extended outward inter-secting with the circum-Panthalassic margins with minor margin mi-gration: east of Australia (Izanagi–Phoenix ridge), along the Amurianmargin (Izanagi–Farallon ridge) and southernNorth America (Farallon–Phoenix ridge). At 190Ma, the birth of the Pacific plate established amore complex spreading ridge system involving three triple junctionsand six spreading centers (Izanagi–Farallon, Izanagi–Phoenix, Izanagi–
Pacific, Phoenix–Farallon, Phoenix–Pacific, Farallon–Pacific). Initiallyspreading along the Pacific ridges was slow/moderate (70–80mm/yr)with a progressive increase in spreading rates to a peak in the midCretaceous. In northeast Panthalassa, closure of the Cache Creek Ocean(back-arc basin which formed between the Yukun-Tanana Terraneand the Stikinia Arc) was occurring along a southwest dipping subduc-tion zone on the eastern side of the Stikinia Arc. In northwesternPanthalassa, the Mongol–Okhotsk Ocean (an ancient ocean basinwhich formed between Amuria and Siberia) continued its closure vianortheast directed subduction along the southern Siberia margin. ThisMongol–Okhotsk subduction zone connected with the landward-facing northern Panthalassic subduction zone to its northeast and theTethyan subduction zone to its southwest.
In the Tethys Ocean, the remnant paleo-Tethys was separatedfrom the actively spreading meso-Tethys ocean by the continentalblocks of the Cimmerian terrane (e.g. Iran, Afghanistan, Pakistan,South Tibet, Sibumasu). The Tethyan subduction zone located alongthe southern Laurasian margin was driving the opening of theMeso-Tethys and consumption of the paleo-Tethys ocean. Active rift-ing was occurring along the Argo Abyssal Plain (NW Australia) thatwe suggest extended to the north of Greater India and westward tothe East Africa/Karoo Rift, marking the break-up of Gondwanalandinto West Gondwana (including South America, most of Africa andArabia) and East Gondwana (including Antarctica, Australia, India,eastern Africa, Madagascar). We continue the Karoo Rift southward toconnect with extension along the Agulhas-Falkland transform. Thisplate boundary between West Gondwana and Patagonia connectedwith east-dipping subduction along the South American/Panthalassamargin.
An extensive seaway between the Tethys Ocean and Panthalassaexisted in the mid-Mesozoic. We envisage that the confluence ofthese two oceanic domains occurred north of Australia at the so-called Junction region/plate (Seton and Müller, 2008). The differentialmotion between the meso-Tethys and Izanagi plates results in con-vergence and we model the subduction of Izanagi lithosphere be-neath a westward verging subduction zone.
4.2. 180–160 Ma (Figs. 19 and 20)
At 180 Ma, early opening by ultra-slow seafloor spreading contin-ued in the Central Atlantic with ongoing rifting in the northernAtlantic and Caribbean. A readjustment of the plate-mantle systemoccurred at 170 Ma, coincident with a doubling of seafloor spreadingrates in the Central Atlantic (Labails et al., 2010) and the establish-ment of seafloor spreading in the Gulf of Mexico. Evidence forchanges in plate motion and accretion events in the Tethys Oceanand Panthalassa at 170 Ma (see below) may indicate a global platereorganization event at this time.
This time period saw the accelerated growth of the Pacific plate atthe expense of the Izanagi, Farallon and Phoenix plates. In northeastPanthalassa, closure of the Cache Creek Ocean, obduction of theCache Creek Terrane and accretion of the Stikinia Arc occurredalong the Laurentian margin between 175 and 172 Ma. The accretionof the Stikinia Arc forced a jump in the locus of subduction and rever-sal of subduction polarity from southwest to northeast along the newLaurentian margin, establishing the Farallon subduction zone. Thenorthwest Panthalassa margin interacted with the Mongol–OkhotskOcean, which continued its closure along the southern Siberia sub-duction zone.
Rifting continued along the southern Tethyan margin, adjacent toArgoland/West Burma and northern Greater India to the east Africanrifts. In the western Tethys, volcanism ceased along the Karoo Rift at180 Ma leading to a jump in the locus of rifting from the Karoo Riftto the area between Africa and Madagascar/Antarctica, later formingtheWeddell and Riiser-Larson Sea and Mozambique andWest SomaliBasins. Incipient spreading in the Mozambique and West Somali

60˚S
30˚S
0˚
30˚N
60˚N
0 20 40 60 80 100 120 140 160 180 200 220 240 260 280
Age of Oceanic Lithosphere [m.y.]
200 Ma
IZA
IZA
SMT
NMT
FAR
PHXPHXGondwanaland
Laurasia
AmuriaLaurentia
North Pole South Pole
0 10 20 30 40 50 60 70 80 90 100 110 120 130 140 150 160 170 180 190 200 210 220 230 240 280
Age of Oceanic Lithosphere [m.y.]
200 Ma
Gondwanaland
Gondwanaland
IZA
IZA
FAR
FAR
PHX
NMT
SMT
Laurasia
Amuria
Laurentia
a
b
Fig. 18. Global plate reconstructions from 200 Ma to the present day in 20 million year time intervals. Basemap shows the age–area distribution of oceanic lithosphere at the time offormation. Red lines denote subduction zones, black lines denote mid-ocean ridges and transform faults. Brown polygons indicate products of plume-related excessive volcanism.Yellow stars are present day hotspot locations. Absolute plate velocity vectors are denoted as black arrows. Abbreviations for the plates are the same as in previous figures. Addi-tional abbreviations include: ALA = Alaska, CA = Central Atlantic, CAP = Capricorn, CAR = Caribbean, CAT = Catequil, CCO = Cache Creek Ocean, COL = Colorado, CS = CarolineSea, JUN = Junction, MOO = Mongol–Okhotsk Ocean, NL = North Loyalty Basin, NMT = North Meso-Tethys, NNT = North Neo-Tethys, PAR = Parana, PAT = Patagonia, PS =Philippine Sea, PSC = Proto-South China Sea, SCO = Scotia Sea, SLB = South Loyalty Basin, SMT = South Meso-Tethys, TS = Tasman Sea.
251M. Seton et al. / Earth-Science Reviews 113 (2012) 212–270
Basins connected with both the Weddell Sea rift and the Agulhas-Falkland transform in the south. In the northern Tethys, closure ofthe paleo-Tethys and accretion of the Cimmerian terrane occurredalong the southern Laurasian margin at 170 Ma. Spreading in themeso-Tethys continued with an acceleration in spreading rate afterthe complete accretion of the Cimmerian terrane at 170 Ma. At165 Ma, rifting extended southward from Argoland to the area be-tween Australia and India (adjacent to the Gascoyne, Cuvier andPerth Abyssal Plains) thereby initiating a plate boundary betweenIndia and Australia. This connected with the newly established riftmargin between Australia and Antarctica at 165 Ma and extendedinto the Enderby Basin from 165 Ma to the west connected with theWestern Panthalassic subduction zone along eastern Australia to theeast.
4.3. 160–140 Ma (Figs. 20 and 21)
The Central Atlantic continued spreading between 160 and140 Ma, connecting with the Gulf of Mexico ridge system to thesouth. After the cessation of spreading in the Gulf of Mexico, themid-ocean ridge jumped southward initiating the opening of theproto-Caribbean Basin through the accommodation space createddue to the relative motion between the North and South Americanplates. Spreading was NW–SE directed and initiated around 145 Maforming a triple junction to the east between the mid ocean ridge ofthe Central Atlantic and rift axis of the Equatorial/South Atlantic. Tothe west, the spreading ridge of the proto-Caribbean Basin formed aridge–ridge–transform triple junction with the spreading ridge ofthe Andean back-arc basin and the trans-American subduction zone.

60˚S
30˚S
0˚
30˚N
60˚N
0 20 40 60 80 100 120 140 160 180 200 220 240 260 280
Age of Oceanic Lithosphere [m.y.]
180 Ma
PAC
FLK East Gondwana
West Gondwana
IZA
IZA
SMT JUN
NMT
FAR
PHXPHX
Laurasia
AmuriaLaurentia
North Pole South Pole
0 10 20 30 40 50 60 70 80 90 100 110 120 130 140 150 160 170 180 190 200 210 220 230 240 280
Age of Oceanic Lithosphere [m.y.]
180 Ma
IZA
IZA
PAC
JUN
FAR
FAR
PHX
NMT
SMT
Laurasia
Amuria
Laurentia
East Gondwana
West Gondwana
West Gondwana
FLK
a
b
Fig. 19. Description same as Fig. 18.
252 M. Seton et al. / Earth-Science Reviews 113 (2012) 212–270
In the South Atlantic, extension began within continental SouthAmerica at 150 Ma, partitioning the southern part of the continentinto the Parana and Colorado subplates and inducing a rift zone be-tween South America and Africa, which connected to the Agulhas-Falkland transform to the south.
The Agulhas-Falkland transform extended eastward connecting tothe mid-ocean ridge in the Weddell Sea, which was established at160 Ma. The Weddell Sea ridge joined with mid-ocean ridges alongEast Africa, including between Africa and Antarctica in theMozambiqueBasin/Riiser-Larson Sea and Africa and Madagascar in the West SomaliBasin. This newly established ridge system led to an acceleration ofbreak-up between East and West Gondwana. From 144 Ma onwards,Madagascar operated as an independent plate. In the eastern Tethys,rifting extended along the Argo Gascoyne, Cuvier and Perth AbyssalPlains forming a triple junction between the Australia/Antarctic riftmargin and the Enderby rift. By 156 Ma, NW–SE oriented seafloorspreading begun in theArgo Abyssal Plain, riftingWest Burma/Argolandand establishing the mid-ocean ridge system that resulted in the
formation of the neo-Tethys ocean. Spreading in the meso-Tethys con-tinued the meso-Tethys ridge intersected the Tethyan subductionzone around 140–145 Ma resulting in a southern ridge jump and con-tinuation of seafloor spreading in the meso-Tethys.
Spreading and growth of the Pacific plate continued in Panthalassa,with a gradual increase in spreading rate. The eruption of the ShatskyRise at the Pacific–Izanagi–Farallon triple junction led to a major read-justment of the triple junction center and was coincident with a majorclockwise change in spreading direction, by 24°, between the Pacificand Izanagi plates atM21 (~147 Ma). This resulted in an increased clock-wise rotation and a change in configuration of the Pacific–Izanagi, Iza-nagi–Phoenix and Izanagi–Farallon ridges. The Mongol–Okhotsk Oceanclosed at 150 Ma forming the Mongol–Okhotsk Suture.
In the Arctic Ocean, the Canada Basin initiated opening at 145 Ma viacounterclockwise rotation of North Slope of Alaska with seafloorspreading starting at 142 Ma. The Canada Basin spreading ridge con-nected with the North Atlantic rift zone, which extended as far southas the Kings Trough adjacent to the Newfoundland/Iberia margin. The

60˚S
30˚S
0˚
30˚N
60˚N
0 20 40 60 80 100 120 140 160 180 200 220 240 260 280
Age of Oceanic Lithosphere [m.y.]
160 Ma
IZA IZA
SMT
NMTFAR
PHXPHX
PAC
FLK Antarctica
East Gondwana
West Gondwana
LaurasiaAmuriaLaurentia
CA
JUN
North Pole South Pole
0 10 20 30 40 50 60 70 80 90 100 110 120 130 140 150 160 170 180 190 200 210 220 230 240 280
Age of Oceanic Lithosphere [m.y.]
160 Ma
CA
IZA
IZA
AntarcticaFLK
PAC
JUN
FAR
FAR
PHX
NMT
SMT
Laurasia
Amuria
Laurentia
East Gondwana
West Gondwana
West Gondwana
a
b
Fig. 20. Description same as Fig. 18.
253M. Seton et al. / Earth-Science Reviews 113 (2012) 212–270
plate boundary follows theKings Trough through the Pyrenees connect-ing with the northern Tethyan subduction zone and to the south con-nects with the Central Atlantic mid-ocean ridge.
4.4. 140–120 Ma (Figs. 21 and 22)
The Central Atlantic and Iberia–Newfoundland spreading ridge con-tinued and connected via a series of rift zones to the Canada Basin inthe Arctic and to the South Atlantic spreading center to the south. In ad-dition, rifting between North America and Greenland initiated around135Ma, establishing Greenland as an independent plate and markingthe end of the Laurentian continental landmass. The proto-CaribbeanSea continued its growth via differential motion between South andNorthAmerica. Seafloor spreading initiated in the southern SouthAtlanticby 132 Ma coincidingwith a peak inmagmatism (Parana–Etendeka LargeIgneous Province) and the initiation of rifting in the African continentalinterior via the West and Central African rift zones. At this time, we
break the African continent into three discrete plates: South, NW andNE Africa. Seafloor spreading between Madagascar and the East Africanmargin ceased around 120 Ma. In the South Atlantic, seafloor spreadingpropagated northward to the central segment of this ocean by 125 Ma.
The early–mid Cretaceous marks a significant increase in seafloorspreading rates in Panthalassa corresponding to the mid-Cretaceousseafloor spreading pulse. Spreading was occurring between the Pacific,Farallon, Izanagi and Phoenix plates. In northern Panthalassa, NorthSlope of Alaska was continuing its counterclockwise rotation and open-ing of the Canada Basin.
The southwest Panthalassic margin, along eastern Australia in-volved the opening of the South Loyalty Basin, due to roll-back ofthe southwest Panthalassic subduction zone from 140 Ma. TheSouth Loyalty Basin was actively opening until 120 Ma until a majorchange in the plate configurations in the SW Panthalassic Ocean.
Seafloor spreading in the meso-Tethys continued after its southernridge jump at 140 Ma. Coincidently, spreading along the neo-Tethys

North Pole South Pole
0 10 20 30 40 50 60 70 80 90 100 110 120 130 140 150 160 170 180 190 200 210 220 230 240 280
Age of Oceanic Lithosphere [m.y.]
140 Ma
IZA
IZA
Antarctica
PAT
COL
PAC
JUN
FAR
FAR
PHXEurasia
Laurentia
East Gondwana
West Gondwana
West Gondwana
NNT NNT
a
b
60˚S
30˚S
0˚
30˚N
60˚N
0 20 40 60 80 100 120 140 160 180 200 220 240 260 280
Age of Oceanic Lithosphere [m.y.]
140 Ma
IZAIZA
NNTJUN
FAR
ALA
PHXPHX
PAC
PATAntarctica
West Gondwana
East Gondwana
EurasiaLaurentia
PC
COL
Fig. 21. Description same as Fig. 18.
254 M. Seton et al. / Earth-Science Reviews 113 (2012) 212–270
ridge extending from the Argo Abyssal Plain to north of Greater India.After a landward ridge jump of the neo-Tethys ridge at 135 Ma, themid-ocean ridge propagated southward to open the Gascoyne, Cuvierand Perth Abyssal Plains between India and Australia. The WestAustralian spreading ridge system joinedwith the Enderby Basin spread-ing ridge, separating Antarctica from the Elan Bank/India, to thewest andto the rift between Australia and Antarctica to the east. The initiationof seafloor spreading in the Enderby Basin accommodated strike-slipmotion between India and Madagascar of over 1000 km and connectedto the West Somali Basin spreading ridge. The East African and WeddellSea spreading ridges were active during this time period and connectedto the South Atlantic via the Agulhas-Falkland transform.
4.5. 120–100 Ma (Figs. 22 and 23)
Spreading along the Central Atlantic ridge continued into theproto-Caribbean Sea until 100 Ma. Spreading extended southward
along the South Atlantic ridge with a northward propagation leadingto seafloor spreading in the “Central” segment by 120 Ma and in the“Equatorial” segment by 110 Ma. Extension along the West andCentral African rifts, including the Benue Trough continued during thistime period. Further north, spreading between Iberia andNewfoundlandconnected to a rift zone adjacent to the Rockall and Porcupine Plateausand continued to the Labrador Sea/Baffin Bay (between Greenland andNorth America) and between Greenland and Eurasia. Break-up betweenPorcupine and North America occurred from 110 Ma. These NorthAtlantic rift zones connected with the Canada Basin spreading centeruntil about 118 Ma when spreading ceased in the Canada Basin. Spread-ing terminated when the rotation of North Slope Alaska ceased, coinci-dent with a change in the southern North Slope margin from largelystrike-slip to convergence due to a change in spreading direction inPanthalassa.
Ultra fast seafloor spreading rates were occurring in Panthalassa to-gether with the eruption of a suite of Large Igneous Provinces, most

60˚S
30˚S
0˚
30˚N
60˚N
0 20 40 60 80 100 120 140 160 180 200 220 240 260 280Age of Oceanic Lithosphere [m.y.]
120 Ma
IZAIZA
JUN
GRN
FAR
ALA
CHA
CATHIK
PAC
PAC
MAN
Antarctica
Australia
India
SAF
NEANWA
SouthAmerica
EurasiaNorthAmerica
North Pole South Pole
0 10 20 30 40 50 60 70 80 90 100 110 120 130 140 150 160 170 180 190 200 210 220 230 240 280
Age of Oceanic Lithosphere [m.y.]
120 Ma
IZA
IZA
Antarctica
PAC
PAC
JUN
FAR
FAR
EurasiaAustralia
India IndiaCHA
CAT
HIKMAN
ALA
GRN
SAF
NEA
NEASAM
NWA
NWA
SouthAmerica
NorthAmerica
a
b
Fig. 22. Description same as Fig. 18.
255M. Seton et al. / Earth-Science Reviews 113 (2012) 212–270
notably the eruption of the Ontong-Java, Manihiki and Hikurangi Pla-teaus at 120 Ma. The eruption of this mega-LIP led directly to thebreak-up of the Phoenix plate into four plates: the Hikurangi, Manihiki,Chasca and Catequil plates. The separation occurred at 120 Ma in an E–W direction in the Ellice Basin between the Ontong Java and ManihikiPlateaus with simultaneous rifting of the Manihiki and Hikurangi pla-teaus from a N–S directed spreading system along the Osbourn Trough.An additional two triple junctions were active in the region leading tothe break-up of the Eastern Manihiki Plateau and the development ofthe Tongareva triple junction. The eastern triple junction representedspreading between the Manihiki, Phoenix and Chasca plate and thesouthern triple junction represented spreading between the Hikurangi,Catequil and Manihiki plates. The initiation of the Pacific–Manihiki–Hikurangi triple junction led to change in the tectonic regime along east-ern Australia. Prior to 120 Ma, the Phoenix platewas subducting beneaththe east Australia margin, which changed to the Hikurangi plate and asmall portion of the Catequil plate but with a decreased rate of conver-gence after 120 Ma.
In the Tethys Ocean, spreading was continuing along the westernAustralian margin, connecting to spreading in the Enderby Basin andrifting between Australia and Antarctica. A ridge jump at 120 Maisolated the Elan Bank microcontinent, roughly coincident with theeruption of the Kerguelen Plateau. A strike-slip margin betweenIndia and Madagascar joined to a transform in the Tethys Ocean andnot to the West Somali Basin spreading ridge which had become ex-tinct at 120 Ma. Spreading continued in the Mozambique Basin/RiiserLarson Sea and continued to the Weddell Sea and north to the SouthAtlantic spreading ridge.
4.6. 100–80 Ma (Figs. 23 and 24)
The Mid and South Atlantic Ridges were well established from100 Ma. As spreading occurred, rifting in the interior of Africa ceasedat about 85 Ma. The Mid-Atlantic ridge propagated northward to be-tween the Porcupine margin and between North America and theRockall margin at 50 Ma. Rifts were still active surrounding Greenland.

60˚S
30˚S
0˚
30˚N
60˚N
0 20 40 60 80 100 120 140 160 180 200 220 240 260 280
Age of Oceanic Lithosphere [m.y.]
100 Ma
IZA
IZA
JUN
GRN
FAR
CHA
CATHIK
PAC
PAC
MAN
Antarctica
Australia
India
SAF
NEANWA
SouthAmerica
EurasiaNorthAmerica
North Pole South Pole
0 10 20 30 40 50 60 70 80 90 100 110 120 130 140 150 160 170 180 190 200 210 220 230 240 280
Age of Oceanic Lithosphere [m.y.]
100 Ma
IZA
IZA
Antarctica
PAC
PAC
JUN
FAR
FAR
Eurasia
Australia
India IndiaCHA
CAT
HIKMAN
GRN
SAF
NEA
NEASAM
NWA
NWA
SouthAmerica
NorthAmerica
a
b
Fig. 23. Description same as Fig. 18.
256 M. Seton et al. / Earth-Science Reviews 113 (2012) 212–270
The south of the Mid Atlantic Ridge connected to the actively openingproto-Caribbean Sea along amajor transform fault. The westernmarginof the Caribbean plate underwent a change in subduction polarity fromeast-dipping to west-dipping at 100 Ma. The rollback of this subductionzone along the Caribbean Arc led to the consumption of the activelyspreading proto-Caribbean ocean floor and encroachment of theFarallon plate into the Caribbean domain (Fig. 9). The continued roll-back of the Caribbean Arc subduction zone led to the formation of theYucatan Basin as a back-arc in the late Cretaceous. The eruption of theCaribbean flood basalt province occurred around 90 Ma overlying oce-anic lithosphere that formed on the Farallon plate and later migratedto the Caribbean region.
In Panthalassa, spreading was occurring along the Pacific–Izanagi,Pacific–Farallon, Farallon–Izanagi and along the ridges associated withthe plateau break-up region. A change in spreading direction is recordedin the Mendocino, Molokai and Clarion fracture zones (associated withPacific–Farallon spreading), which we date to 103–100 Ma coincident
with an observed bend in the hotspot trails on the Pacific plate, suggest-ing a plate reorganization at this time. In addition, wemodel a clockwisechange in spreading direction in theOsbourn Trough region based on ourage estimate for a bend in observed fracture zones between theManihikiand Hikurangi plateaus. The change in spreading direction modified thenature of the boundary east of Australia from convergence to dominantlystrike-slip. At 86 Ma, we model the docking of the Hikurangi Plateauwith the Chatham Rise triggering a cessation in spreading associatedthe Ontong-Java, Manihiki and Hikurangi plateaus. After the cessationof spreading along these ridges axes, the locus of extension jumpedsouthward between Antarctica and the Chatham Rise, establishing thePacific–Antarctic spreading ridge. To the east, the Pacific–Farallon Ridgeextended to the south connecting with the Pacific–Antarctic Ridge atthe Pacific–Antarctic–Farallon triple junction.
After the cessation of the spreading centers associated with the LIPbreak-up, the Pacific plate became the dominant plate in Panthalassaand it is at this time that we switch to the Pacific Ocean. In the

60˚S
30˚S
0˚
30˚N
60˚N
0 20 40 60 80 100 120 140 160 180 200 220 240 260 280
Age of Oceanic Lithosphere [m.y.]
80 Ma
IZA
IZA
JUN
GRN
IBR
FAR
PACPAC
LHR
Antarctica
Australia
IndiaAFR
SouthAmerica
EurasiaNorthAmerica
North Pole South Pole
0 10 20 30 40 50 60 70 80 90 100 110 120 130 140 150 160 170 180 190 200 210 220 230 240 280
Age of Oceanic Lithosphere [m.y.]
80 Ma
IZA
IZA
Antarctica
LHR
PAC
PAC
JUN
FAR FAR
EurasiaAustraliaIndia
India
GRN
IBR
AFR
AFR
SAM
SouthAmerica
NorthAmerica
a
b
Fig. 24. Description same as Fig. 18.
257M. Seton et al. / Earth-Science Reviews 113 (2012) 212–270
western Pacific, the Tasman Sea was opening from 84 Ma leading tothe establishment of the Lord Howe Rise plate. Further north, theproto-South China Sea initiated its opening between the SouthChina margin and Borneo/Kalimantan.
In the Tethys/Indian Ocean, spreadingwas occurring along theWestAustralian margins continuing the separation of India and West BurmafromAustralia. Amajor change direction is recorded in the fracture zonetrends at 99 Ma, led to a change in the motion of the Indian plate.Spreading became dominantly N–S directed establishing spreading intheWharton Basin. TheWestAustralianmid ocean ridge system formeda triple junctionwith the Australian–Antarctic ridge at 99 Ma (initiationof ultra-slow seafloor spreading) and spreading between India andAntarctica north of Elan Bank. The Indian–Antarctic ridge (or SoutheastIndian Ridge) connected with the African–Antarctic ridge (or South-west Indian Ridge) from 100 Ma. Rifting between India andMadagascarin the Mascarene Basin initiated at 87 Ma. The Southwest Indian Ridgeconnected with spreading in the Malvinas plate in the southernmost
Atlantic at 83.5 Ma and the American–Antarctic ridge (establishedafter the cessation of spreading in the Weddell Sea). The West Burmacontinental sliver reached the Eurasian margin and accreted startingat 87 Ma and sutured to Sibumasu at 73 Ma.
4.7. 80–60 Ma (Figs. 24 and 25)
The South and Mid-Atlantic ridges continued spreading. The Mid-Atlantic Ridge propagated northward into the North Atlantic with theinitiation of seafloor spreading in the Labrador Sea (between NorthAmerica and Greenland) and between Rockall and Greenland at79 Ma. Spreading propagated from the Labrador Sea to Baffin Bay by63 Ma across the Davis Straits via left-lateral transform faults andconnected to the Arctic via the Nares Strait. In the Caribbean, spreadingin the proto-Caribbean Sea ceased at 80 Ma whereas the Caribbean Arcsubduction zone continued its northeastward rollback. The YucatanBasin opened as a back-arc in the late Cretaceous with cessation

60˚S
30˚S
0˚
30˚N
60˚N
0 20 40 60 80 100 120 140 160 180 200 220 240 260 280
Age of Oceanic Lithosphere [m.y.]
60 Ma
IZAIZA
JUN
GRN
IBR
CARFAR
PACPAC
LHR
Antarctica
Australia
IndiaAFR
SouthAmerica
EurasiaNorthAmerica
North Pole South Pole
0 10 20 30 40 50 60 70 80 90 100 110 120 130 140 150 160 170 180 190 200 210 220 230 240 280
Age of Oceanic Lithosphere [m.y.]
60 Ma
IZA
Antarctica
LHR
PAC
PAC
JUN
FAR FAR
EurasiaAustraliaIndia
India
GRN
IBR
AFR
AFR
SAM
CAR
SouthAmerica
NorthAmerica
a
b
Fig. 25. Description same as Fig. 18.
258 M. Seton et al. / Earth-Science Reviews 113 (2012) 212–270
occurring at 70 Ma when the Caribbean Arc accreted to the BahamanPlatform. The accretion led to a jump in the locus of subduction west-ward along the newly developed Panama–Costa Rica to accommodatethe continued eastward motion of the Farallon plate, trapping Farallonoceanic lithosphere onto the Caribbean plate.
The Pacific was dominated by the break-up of the Farallon plateinto the Kula plate at 79 Ma initiating spreading along the E–W trend-ing Kula–Pacific ridge and the NE–SW trending Kula–Farallon ridge.The Kula–Farallon Ridge follows the location of the Yellowstone hot-spot and intersects the North American margin inWashington/BritishColumbia before migrating northward along the margin. The break upof the Farallon plate into the Kula plate coincides with a major changein spreading direction observed in all northeast Pacific fracture zones.In our model spreading continued along the Pacific–Izanagi ridgeafter the establishment of the Kula–Pacific ridge to the east connectedvia a large offset transform fault. The Pacific–Izanagi ridge was rapidlyapproaching the East Asian margin and was proximal by 60 Ma. In thesouthern Pacific, spreading was occurring along the Pacific–Antarctic
ridge, extending eastward to connect with the Pacific–Farallon andFarallon–Antarctic spreading ridges. At 67 Ma, a change in spreadingdirection is recorded in the fracture zones of the South Pacific.
In the Indian Ocean, spreading was occurring along the WhartonRidge, Southeast Indian Ridge, Southwest Indian Ridge and in the Mas-carene Basin. Spreading in the Mascarene Basin ceased at 64 Ma jump-ing northward, isolating the Seychelles microcontinent and initiatingspreading between India and the Seychelles along the Carlsberg Ridge.The Southwest Indian Ridge connected with spreading in the Malvinasplate until 66 Ma. After this, the Southwest Indian Ridge connected di-rectly with the American–Antarctic and South Atlantic Ridge.
4.8. 60–40 Ma (Figs. 25 and 26)
Seafloor spreading propagated into the Eurasia–Greenland marginalong the Reykjanes Ridge by 58 Ma, forming a triple junction be-tween North America, Greenland and Eurasia. The Jan Mayen micro-continent rifted off the margin forming the fan-shaped Norway

60˚S
30˚S
0˚
30˚N
60˚N
0 20 40 60 80 100 120 140 160 180 200 220 240 260 280
Age of Oceanic Lithosphere [m.y.]
40 Ma
KUL
VAN
GRN
IBR
CARFAR
PACPAC
East Antarctica
Australia
IndiaAFR
SouthAmerica
EurasiaNorthAmerica
PS
SSNL
North Pole South Pole
0 10 20 30 40 50 60 70 80 90 100 110 120 130 140 150 160 170 180 190 200 210 220 230 240 280
Age of Oceanic Lithosphere [m.y.]
40 Ma
KUL
PS
EastAntarctica
WANT
PAC
PAC
FAR FAREurasia
AustraliaIndia
India
GRN
IBR
AFR
AFR
SAM
CAR
SouthAmerica
NorthAmerica
PS
SSNL
a
b
Fig. 26. Description same as Fig. 18.
259M. Seton et al. / Earth-Science Reviews 113 (2012) 212–270
Basin along the Aegir Ridge. The Aegir Ridge connected to the MohnsRidge to the north and Reykjanes Ridge to the south via a series oftransform faults. Spreading in the Eurasian Basin to the north initiat-ed around 55 Ma along the Gakkel/Nansen Ridge. This ridge con-nected to the Baffin Bay ridge axis through the Nares Strait and theMohns Ridge to the south via major strike-slip faults with minor com-pression between Greenland and Svalbard. In our model the Lomono-sov Ridge is coupled to North America. The initiation of spreading inthe Eurasian Basin also coincides with the initiation of independentmotion of the Porcupine Plate, resulting in a small clockwise rotationof Eurasia and counter-clockwise rotation of Iberia relative to the Por-cupine Plate. A change in spreading direction is also observed in theLabrador Sea.
The Mid-Atlantic Ridge connects with the west-dipping subduc-tion zone bordering the Caribbean via a transform fault. By the middleEocene, relative motion between North America and the Caribbeanbegan to form the Cayman Trough along sinistral faults that latermerge with the Lesser Antilles trench. East-dipping subduction wasstill occurring along the Middle America margin bordering the Pacific.
In the Pacific, the Pacific–Izanagi ridge started to subduct under theEast Asianmargin between 55 and 50 Ma, signaling the death of the Iza-nagi plate coincident with a dramatic change in spreading directionfrom N–S to NW–SE between Kula–Pacific spreading. The Kula–PacificRidge connected with the Pacific–Farallon Ridge and Kula–FarallonRidge from 60 to 55 Ma. After 55 Ma, the eastern Pacific was dominatedby the rupture of the Farallon plate close to the Pioneer Fracture Zone,forming the Vancouver plate. The break-up resulted in minor relativemotion along the Pioneer fracture zone. Further south, spreading wascontinuing along the Pacific–Farallon, Pacific–Antarctic, Farallon–Antarctic and Pacific–Aluk Ridges. The fracture zones associated withthe Pacific–Antarctic Ridge close to the Campbell Plateau record achange in spreading direction at 55 Ma, coincident with other eventsthat occurred in the Pacific at this time.
In thewestern Pacific, spreading in theproto-South China Sea ceasedat 50 Ma coincident with the clockwise rotation of the neighboringPhilippine Sea plate. The dramatic change in motion of the PhilippineSea plate reorganized the plate boundaries in the area leading to theestablishment of a subduction zone between Palawan and the proto-

60˚S
30˚S
0˚
30˚N
60˚N
0 20 40 60 80 100 120 140 160 180 200 220 240 260 280
Age of Oceanic Lithosphere [m.y.]
20 Ma
NAZ
COC
J
CARPAC PAC
Antarctica
Australia
IndiaAFR
SOMCAPSouth
America
EurasiaNorthAmerica
PS
CS
SS
NB
SCO
J
North Pole South Pole
0 10 20 30 40 50 60 70 80 90 100 110 120 130 140 150 160 170 180 190 200 210 220 230 240 280
Age of Oceanic Lithosphere [m.y.]
20 Ma
PS
Antarctica
PAC
PAC
COC NAZEurasia
AustraliaIndia
CAP
AFR
SOM
AFR
ARA
J
SAM
CAR
SouthAmerica
NorthAmerica
PSSS
NB
SCO
a
b
Fig. 27. Description same as Fig. 18.
260 M. Seton et al. / Earth-Science Reviews 113 (2012) 212–270
South China Sea, which led to the subduction of the proto-South ChinaSea after 50 Ma. Spreading was occurring in the West Philippine Basinand Celebes Sea. Further south, spreading initiated in the North LoyaltyBasin behind the proto-Tonga–Kermadec Trench.
The Indian Ocean was dominated by a series of mid ocean ridgessuch as the Wharton Ridge, Southeast Indian Ridge, Southwest IndianRidge and Carlsberg Ridge. Prior to 55 Ma, subduction was occurringalong the Tethyan subduction zone, consuming crust that formedduring meso and neo Tethys spreading. At 55 Ma, the northern tipof Greater India marks the start of collision between India and Eurasiaand the uplift of the Himalayas. Closure of the Tethys Ocean in thisarea occurred by about 43 Ma. Full closure of the neo-Tethys betweenIndia and Eurasia also corresponds to the cessation of spreading in theWharton Basin, which describes Australia–India motion.
4.9. 40–20 Ma (Figs. 26 and 27)
At 40 Ma, the Atlantic Ocean consisted of a continuous mid-oceanridge system that extended from the South America–Antarctica–Africa
triple junction to the Eurasian Basin in the north. The cessation of inde-pendent Porcupine motion occurred at 33 Ma coinciding with thecessation of seafloor spreading in the neighboring Labrador Sea andBaffin Bay and the establishment of a simple two-plate system to de-scribe the plate motions in the North Atlantic. From 33Ma onwards,Greenland and North America have been fused into one plate. Atabout 30 Ma, spreading jumped from the Aegir Ridge in the NorwayBasin to the Kolbeinsey Ridge connecting up with the Mohns Ridgevia a series of transform faults. Further south, adjacent to the Iberianmargin, a southern jump of the plate boundary at 28 Ma from theKings Tough to the Azores transform fault and along the Straits ofGibraltar led to the capture of Iberia by the Eurasian plate.
In the Pacific, spreading between the Kula–Pacific and Kula–Farallonceased at 40 Ma, leading to the Pacific plate consisting of the Pacific,Vancouver, Farallon, Aluk and Antarctic plates. The intersection of theMurray transform fault with the North American subduction zonearound 30 Ma led to the establishment of the San Andreas Fault andcorresponds to the establishment of the Juan De Fuca plate at the ex-pense of the Vancouver plate. A further rupture of the Farallon plate

60˚S
30˚S
0˚
30˚N
60˚N
0 20 40 60 80 100 120 140 160
a
b
180 200 220 240 260 280
Age of Oceanic Lithosphere [m.y.]
0 Ma
NAZ
COCCAR
PAC
R
J
PAC
AntarcticaAntarctica
Australia
IndiaAFR
SOM
ARA
CAPLB
NFBSouthAmerica
EurasiaNorthAmerica
PS
SCO
J
North Pole South Pole
0 10 20 30 40 50 60 70 80 90 100 110 120 130 140 150 160 170 180 190 200 210 220 230 240 280
Age of Oceanic Lithosphere [m.y.]
0 Ma
PS
Antarctica
PAC
PAC
COCNAZEurasia
Australia
India
CAP
AFR
SOM
AFR
SOM
ARA
J
SAM
CAR
R
SouthAmerica
NorthAmerica
PS
LBNFB
SCO
Fig. 28. Description same as Fig. 18.
261M. Seton et al. / Earth-Science Reviews 113 (2012) 212–270
occurred at 23 Ma leading to the establishment of the Cocos and Nazcaplates and initiation of the East Pacific Rise, Galapagos Spreading Centreand Chile Ridge.
In the Western Pacific, spreading in the West Philippine Basinceased at 38 Ma whereas spreading continued in the Celebes Sea.The formation of the Caroline Sea occurred behind a rapidly south-ward migrating subduction zone. By 30 Ma, spreading initiated inthe Shikoku and Parece Vela Basins behind the west-dipping Izu-Bonin–Mariana Arc. Spreading terminated in the Celebes Sea. In theSW Pacific, spreading initiated in the Solomon Sea at 40 Ma and inthe South Fiji Basin at 35 Ma. Cessation of spreading in the SouthFiji Basin occurred at 25 Ma.
In the IndianOcean, spreading continued along the Southwest IndianRidge, Southeast Indian Ridge, Central Indian Ridge and Carlsberg Ridge.Extension along the East Africa rifts was established at 30 Ma leading tothe break-up of Africa into Somalia plate. Rifting along the Sheba Ridge,separating Arabia from Africa/Somalia initiated at 30 Ma.
4.10. 20–0 Ma (Figs. 27 and 28)
Spreading in the South, Central and North Atlantic continued un-abated for the last 20 million years. In the Caribbean, the CaymanTrough continued to expand and develop, and the Chortis Blockmoved over the Yucatan promontory. Westward motion of the NorthAmerican plate relative to the slowmoving Caribbean platewas accom-modating the opening of the Cayman Trough. Active subduction of At-lantic oceanic lithosphere has been occurring along the Lesser AntillesTrench, which connects to the Mid-Atlantic Ridge along the ResearcherRidge and Royal Trough.
In the Pacific, spreading was occurring along the Pacific–Juan DeFuca, Pacific–Nazca, Pacific–Cocos, Cocos–Nazca, Pacific–Antarcticand Nazca–Antarctic ridges. The Bauer microplate formed along theEast Pacific Rise at 17 Ma and continued until 6 Ma. The locus ofspreading then jumped back to the East Pacific Rise (between thePacific and Nazca plates). The East Pacific Rise is the fastest spreading

262 M. Seton et al. / Earth-Science Reviews 113 (2012) 212–270
ridge system (excluding back-arc opening) and currently encompassesmicroplate formation at the Easter, Juan Fernandez and Galapagosplates. Currently, the Juan De Fuca plate is limited at its southern endby the Mendocino Fracture Zone and is subducting slowly along theCascadia subduction zone.
The western Pacific is dominated by the opening of a series ofback-arc basins due to the roll-back of the subduction hinge of theTonga–Kermadec and Izu-Bonin–Mariana trenches. Spreading in theShikoku and Parece Vela Basins and South China Sea ceased at15 Ma. By 9 Ma, spreading initiated in the Mariana Trough. Wemodel complete closure of the proto-South China Sea at around10 Ma behind a subduction zone located along Palawan and thenorth Borneo/Kalimantan margin. In the SW Pacific, spreading inthe Lau Basin initiated by 7 Ma with back-arc extension occurring inthe Havre Trough.
In the Indian Ocean, diffuse deformation occurring in the middleof the Indo-Australian plate led to the development of the Capricornplate in the central–east Indian Ocean at 20 Ma. Further west, we ini-tiate spreading along the Sheba Ridge at 20 Ma. The Sheba Ridgepropagated into the Red Sea at 15 Ma.
5. Discussion
5.1. Comparison with other models
Our plate motion model offers an alternative approach to tradi-tional global plate reconstructions. Tectonic features that reside onthe surface of the Earth are not modeled as discrete features but rath-er the plates themselves are modeled as dynamically evolving fea-tures. The nature of the plate boundaries that combine to form aplate will necessarily change based on the magnitude and directionof motion of each plate. Therefore, one of the supplementary out-comes of this approach is the ability to directly compare competingtectonic models, most easily expressed through plate velocity vectorsfor a common set of points on the surface of the Earth. We directlycompare the plate motion model presented in Gurnis et al. (2012)to the model presented in this study (Fig. 29).
In this study we have adopted a new absolute plate motion modelfor Africa for times prior to 100 Ma based on a true-polar wander cor-rected paleomagnetic reference frame (Steinberger and Torsvik,2008). This new reference frame allows us to extend our plate recon-structions back to 200 Ma, the time of Pangea break-up, with the po-tential to model processes occurring during supercontinent break-upand dispersal. The Gurnis et al. (2012) dataset was restricted to thepast 140 million years. Adjusting the absolute reference frame causesa global shift in the absolute positioning of the continents but in the-ory, should not affect the relative motion and therefore the nature ofthe plate boundary between plates. However prior to 83.5 Ma, the Pa-cific plate can no longer link to the African plate circuit via seafloorspreading (see Section 2: Methodology) requiring a distinct absolutereference frame for the Pacific realm. As a result, a change in the ab-solute reference frame for either the African or Pacific realms willchange the nature of the plate boundaries that border the Pacific/Panthalassic Ocean (Fig. 29).
Relative motions between most of the plates in Panthalassa havebeen updated compared to the Gurnis et al. (2012) model. We reinter-preted the M-series Japanese magnetic lineations leading to a dramaticchange in spreading direction by about 24° and an updated orientationof the Izanagi–Farallon and Izanagi–Phoenix ridges. The change in theIzanagi plate motion results in an increase in the convergence rateand more orthogonal convergence in northern Panthalassa borderingeastern Laurasia but more oblique convergence in the area furthersouth adjacent to the Junction plate (Fig. 29).
Another major addition to the model presented in this study is theimplementation of the plateau break-up model of Taylor (2006) for theOntong-Java, Manihiki and Hikurangi plateaus (Fig. 29). Incorporating
the plateau break-up has consequences for the evolution of the Phoenixplate and the easternGondwanamargin.MostMesozoicmodels for east-ern Gondwana propose a long-lived convergent plate margin along theeastern edge of Australia (Veevers, 2006; Cluzel et al., 2010; Matthewset al., 2011), expressed through andesitic volcanism that occurredalong the Queensland margin north to Papua New Guinea (Jones andVeevers, 1983) and Aptian–Albian andesitic volcanogenic detritus ineast Australian continental basins (e.g. Eromanga and Surat Basins)(Hawlader, 1990; Veevers, 2006). Plate velocity vectors using eitherGurnis et al. (2012) or this study, predict a convergent margin betweenthe Phoenix plate and eastern Gondwana during this time (Fig. 29).There is ambiguity as to whether the margin continued as a convergentmargin or whether there was a major tectonic regime change after~120 Ma, coincident with the eruption of the Ontong-Java, Manihikiand Hikurangi plateaus and subsequent change in the mid ocean ridgeconfiguration in southern Panthalassa. Extensive magmatism recordedin theWhitsunday Volcanic Province is attributed to continental marginbreak-up rather than from a convergent margin setting (Bryan et al.,1997) while others invoke a rift-related volcanics associated withwest-dipping subduction (Veevers, 2006). New Caledonia and parts ofNew Zealand, which were located at the easternmost boundary of theAustralian continent record subduction related magmatism until atleast 99 Ma (Veevers, 2006) or 95 Ma (Cluzel et al. 2010) suggesting con-vergence was occurring along eastern Gondwana. Although the platemotionmodel of Gurnis et al. (2012) does not include the rotations asso-ciated with the plateau break-up, both models predict continuing con-vergence until 100 Ma (Fig. 29).
At 100–99 Ma, a major tectonic regime change is recorded in east-ern Australia (Veevers, 2006). Sedimentation in the east Australianbasins changed from volcanogenic dominated to quartzose sandstone(Veevers, 2006), the basins themselves changed from a prolongedperiod of subsidence to uplift (Matthews et al., 2011) and volcanismbecame alkalitic (Veevers, 2006). In addition, the eastern marginchanged to a period of extension and passivemargin formation (e.g. ex-tension in the Lord Howe Rise and New Caledonia Basins), which arebelieved to have formed adjacent to a strike-slip margin defining theboundary between Panthalassa and eastern Gondwana (Jones andVeevers, 1983; Veevers, 2006). A hiatus in subduction-related volca-nism in Eastern Australia, New Caledonia and New Zealand is recordedbetween 95 and 83Ma (Cluzel et al., 2010). This major tectonic regimechange is coincident with a change in spreading direction in theplates associated with the plateau break-up and bordering the easternGondwanamargin at this time. The result is that the eastern Gondwanamargin changes from convergent to strike-slip, as predicted by geolog-ical observations. This is in contrast to the model of Gurnis et al. (2012)which suggests oblique convergence after 100–99 Ma (Fig. 29). In ourcurrent platemotionmodel, a strike-slip dominatedmargin is predictedfrom 100 to 86 Ma, which marks the timing of Hikurangi plateau colli-sion with the Chatham Rise and the cessation of mid ocean ridge sub-duction related to the plateau break-up. The plate adjacent to easternAustralia became the Pacific plate and all subsequent motions havebeen between the Pacific and Australian or Lord Howe Rise plates.
Additional differences between the relative plate motions pre-sented in Gurnis et al. (2012) and this study include an updatednorthern Atlantic based on Gaina et al. (2009) and the Arctic basedon Alvey et al. (2008). The changes here are minor adjustments anddo not substantially change plate motion directions or the nature ofthe plate boundaries in the area.
5.2. Future directions
Our global plate motion model presents the development of thecontinents and oceans on a global scale within a rigid plate frame-work, underpinned by a combination of marine geophysical data, on-shore geological data and plate tectonic principles. Although we havepresented our preferred interpretations for each region based on

0 10 20 30 40 50 60 70 80 90 100 110 120 130 140 150 160 260Age of Oceanic Lithosphere [m.yrs]
120 Ma 90 Ma
Australia
Australia
India
Eurasia Eurasia
Antarctica Antarctica
IzanagiIzanagi
HIKHIK
CAT CAT
JUN JUN
Fig. 29. Global comparison between the Gurnis et al. (2012) plate motion model and the one presented in this study, centered on Australia and the western Panthalassic margin.Reconstructions are shown at 120 and 90 Ma with red plate velocity vectors denoting the Gurnis et al. (2012) model and blue plate velocity vectors from this study. Dark green lineindicates the east Australian margin.
263M. Seton et al. / Earth-Science Reviews 113 (2012) 212–270
available data, there are regions that could benefit from re-analysis ofthe seafloor spreading and break-up history, which will have a sig-nificant flow-on effect further down the global plate circuit. Theseinclude:
(1) The early break-up history between Africa and South Americato account for significant overlaps and gaps between the twomargins. Refining the history between these two plates willlead to a revision of the Mesozoic history of the Caribbean re-gion (i.e. the accommodation space created to form theproto-Caribbean Sea and the rift basins associated withhydrocarbon-bearing basins in the Gulf of Mexico), a moretightly constrained equatorial Atlantic and also the plateboundaries surrounding the Weddell Sea, which are very ill-constrained due to a paucity of data.
(2) The early break-up history and Mesozoic spreading betweenAfrica and Antarctica. A further refinement of the opening his-tory of this area will affect the motions of Antarctica, India andAustralia and the interaction (plate boundary processes) alongthe eastern Gondwana margin bordering Panthalassa.
(3) The break-up history of the Pacific–Marie Byrd Land margin(~100–83 Ma), which has consequences for the motion of thePacific plate and associated plates, such as the Izanagi, Phoenix,Farallon, Hikurangi, Manihiki, Catequil and Chasca plates. ThePacific plate can only be linked to the plate circuit, throughAfrica, when there is a mid-ocean ridge (or rift) between thePacific and Antarctica/Marie Byrd Land. Greater constraintson the timing of break-up between the Campbell Plateau andAntarctica and a revised set of finite rotations to describe theopening will potentially mean we can confidently extend thePacific plate's link to the plate circuit further back in time anddecrease the uncertainty in Pacific plate motion during thistime interval.
A major improvement that is essential for global plate motionmodels that extend into the Mesozoic is a more robust Pacific abso-lute plate motion model. The latest models available with associatedpublished rotation poles for Pacific hotspots (Wessel et al. 2006;Wessel and Kroenke 2008) result in major shifts and rotations ofthe Pacific plate, which are inconsistent with geological observations;
for example their Pacific hotpot models, combined with a relativeplate motion model for motion between the Farallon and Pacificplates, result in transform motion between the Farallon and NorthAmerican plates, while geological observations indicate subductionbeing active (DeCelles, 2004). This model also leads to an anomalousamount of material entering the mantle in the southern hemisphere(Shephard et al., 2012). This inconsistency may result from the as-sumption of Pacific hotspot fixity and poor sampling of Pacific sea-mount chains due to a paucity of available data. A new approachusing a combination of methods, for example moving hotspot models,paleomagnetics and coupled geodynamic-plate motion models, mayresult in a more robust model for the Pacific plate prior to ~83 Maand may potentially extend the Pacific absolute reference frame tothe earliest Mesozoic.
A further limitation of the present model is that the entire surfaceof the earth is represented as rigid blocks, which is clearly not true forsome plate interiors and plate boundaries (Gordon and Stein, 1992;Bird, 2003). Deforming regions within plate interiors or straddlingplate boundaries will clearly be required for reconstructions beyondthose presented here. For future models, deforming regions cannow be encompassed within the domain of an evolving, closed poly-gon and consequently incorporated as an extension of the CCP algo-rithm (see Gurnis et al., 2012). We expect that such deformingregions will be represented as deforming meshes within continuouslyclosing polygons as the lowest level of a global hierarchy. Such func-tionality has now been incorporated in experimental versions ofGPlates and will be a part of a new generation of global plate recon-structions. The first region to be addressed within a deforming platenetwork is the opening of the rift basins within the interior of Africaas the accounting of this extension will have flow-on effects for allthe plates that hang-off the African-centered plate circuit.
6. Conclusions
There are currently three main types of plate motion models thatenable us to place features on the surface of the earth into theirspatio-temporal context. Geologically-current plate motion modelsare ideal because they provide a set of plate velocity vectors and de-lineate the boundaries between tectonic plates in a self-consistent

264 M. Seton et al. / Earth-Science Reviews 113 (2012) 212–270
way (i.e. the combined area of the plates equals the area of the Earth).However, they are restricted to the Pliocene, making analysis of su-percontinent break-up and accretion, the linkages between the deepearth and surface processes and larger-scale tectonic cycles unrealis-tic. Traditional plate motion models do not treat plates in a self-consistent way but rather reconstruct discrete features on the surfaceof the Earth without regard to the evolving nature of plate bound-aries. Coupled geodynamic models are prone to large uncertaintiesand have not been successful at replicating past plate motions consis-tently in deep time.
In this paper, we have presented a new type of global plate motionmodel, which extends into deep time and involves a continuouslyevolving and self-consistent set of plate polygons and plate bound-aries from the time of Pangea break-up. Our model is underpinnedby a detailed analysis of the seafloor spreading record for the majortectonic plates. Our regional models are built within a hierarchicalplate circuit framework linked to a hybrid absolute reference framethat includes moving Indian/Atlantic hotspots and a true polar wan-der corrected paleomagnetic-based model.
The plate motion model presented in this study will be of particu-lar use to geodynamicists who require surface boundary conditionsfor the motions of the plates through time to link to models of theconvecting mantle. However, our hope is that it can also be used asa framework for further detailed work so that we may converge to-wards an ever-improved set of global plate reconstructions. We pro-vide all data freely in digital form, welcome feedback to improveour models and anticipate that refinements to the plate model willbe published in the future. The plate polygon data files with associat-ed rotation file and an accompanying coastline and continent–oceanboundary file can be downloaded from the following location: ftp://ftp.earthbyte.org/papers/Seton_etal_Global_ESR/Seton_etal_Data.zip.
Acknowledgments
We thank Roi Granot and an anonymous reviewer for agreeing toreview such a lengthy manuscript and for their thoughtful and carefulreview, which greatly improved the manuscript. We would also liketo thank members of the EarthByte Group and the group at Caltechled by Michael Gurnis who have contributed over many years towardsthe continuous improvement of the global plate motion model andassociated files. This project was funded through Australian ResearchCouncil grants FL0992245 and DP0987713.
References
Agar, S., Cliff, R., Duddy, I., Rex, D., 1989. Short Paper: Accretion and uplift in the Shi-manto Belt, SW Japan. Journal of the Geological Society 146, 893.
Aitchison, J.C., Ali, J.R., Davis, A.M., 2007. When and where did India and Asia collide.Journal of Geophysical Research 112, B05423.
Alvey, A., Gaina, C., Kusznir, N., Torsvik, T., 2008. Integrated crustal thickness mappingand plate reconstructions for the high Arctic. Earth and Planetary Science Letters274, 310–321.
Apel, E., B¸Rgmann, R., Steblov, G., Vasilenko, N., King, R., Prytkov, A., 2006. Independentactive microplate tectonics of northeast Asia from GPS velocities and block modeling.Geophysical Research Letters 33, L11303.
Argus, D.F., Heflin, M.B., 1995. Plate motion and crustal deformation estimated withgeodetic data from the Global Positioning System. Geophysical Research Letters22, 1973–1976.
Argus, D.F., Gordon, R.G., Heflin, M.B., Ma, C., Eanes, R.J., Willis, P., Peltier, W.R., Owen,S.E., 2010. The angular velocities of the plates and the velocity of Earth's centrefrom space geodesy. Geophysical Journal International 180, 913–960.
Atwater, T., 1970. Implications of plate tectonics for the Cenozoic tectonic evolution ofWestern North America. Geological Society of America Bulletin 81, 3513–3536.
Atwater, T., 1990. Plate tectonic history of the northeast Pacific and western NorthAmerica. In: Winterer, E.L., Hussong, D.M., Decker, R.W. (Eds.), The Eastern PacificOcean and Hawaii, Volume N: The Geology of North America. Geological Society ofAmerica, Boulder, Colorado, pp. 21–72.
Atwater, T., 1989. Magnetic Anomalies in the North Pacific. Geological Society of America:Geology of North America.
Atwater, T., Severinghaus, J., 1989. Magnetic Anomalies in the North Pacific: GeologicalSociety of America, v. Geology of North America.
Atwater, T., Severinghaus, J., 1990. Tectonic maps of the northeast Pacific. In: Winterer,E.L., Hussong, D.M., Decker, R.W. (Eds.), The Eastern Pacific Ocean and Hawaii,Volume N: The Geology of North America. Geological Society of America, Boulder,Colorado, pp. 15–20.
Atwater, T., Sclater, J., Sandwell, D., 1993. Fracture zone traces across the North PacificCretaceous Quiet Zone and their tectonic implications. In: Pringle, M.S., et al. (Ed.),Mesozoic Pacific: Geology, Tectonics, and Volcanism. Geophysical MonographSeries, vol. 77. AGU, Washington, D.C., pp. 137–154.
Badarch, G., Dickson Cunningham, W., Windley, B.F., 2002. A new terrane subdivisionfor Mongolia: implications for the Phanerozoic crustal growth of Central Asia. Journalof Asian Earth Sciences 21, 87–110.
Baillie, P.W., Jacobson, E., 1995. Structural evolution of the Carnarvon Terrace, WesternAustralia. The APEA Journal 35, 321–332.
Banerjee, B., Sengupta, B., Banerjee, P., 1995. Signals of Barremian (116 Ma) or youngeroceanic crust beneath the Bay of Bengal along 14 N latitude between 81 E and 93 E.Marine Geology 128, 17–23.
Banks, N., Bardwell, K., Musiwa, S., 1995. Karoo rift basins of the Luangwa Valley, Zambia.Geological Society London Special Publications 80, 285.
Barckhausen, U., Ranero, C.R., Cande, S.C., Engels, M., Weinrebe, W., 2008. Birth of anintraoceanic spreading center. Geology 36, 767.
Beauchamp, W.H., 1998. Tectonic evolution of the Atlas Mountains, North Africa.Belasky, P., Runnegar, B., 1994. Permian longitudes of Wrangellia, Stikinia, and Eastern
Klamath terranes based on coral biogeography. Geology 22, 1095–1098.Bernard, A., Munschy, M., 2000. Were the Mascarene and Laxmi Basins (western Indian
Ocean) formed at the same spreading centre? Comptes Rendus de l'Academie desSciences Series IIA Earth and Planetary Science 330, 777–783.
Binks, R., Fairhead, J., 1992. A plate tectonic setting for Mesozoic rifts of West and Cen-tral Africa. Tectonophysics 213, 141–151.
Billen, M.I., Stock, J., 2000. Morphology and origin of the Osbourn Trough. Journal ofGeophysical Research-Solid Earth 105, 13481–13489.
Bird, P., 2003. An updated digital model of plate boundaries. Geochemistry, Geophysics,Geosystems 4, 1027. doi:10.1029/2001GC000252.
Bird, R.T., Naar, D.F., 1994. Intrafransform origins of mid-ocean ridgemicroplates. Geology22, 987–990.
Bird, R.T., Naar, D.F., Larson, R.L., Searle, R.C., Scotese, C.R., 1998. Plate tectonic recon-structions of the Juan Fernandez microplate: transformation from internal shearto rigid rotation. Journal of Geophysical Research-Solid Earth 103, 7049–7067.
Bird, D., Hall, S., Burke, K., Casey, J., Sawyer, D., 2007. Early Central Atlantic Ocean sea-floor spreading history. Geosphere 3, 282.
Blakely, R., 2008. Gondwana paleogeography from assembly to breakup: A 500 my od-yssey. Resolving the late Paleozoic ice age in time and space, p. 1.
Boillot, G., Girardeau, J., Kornprobst, J., 1988. Rifting of the Galicia margin: crustal thin-ning and emplacement of mantle rocks on the seafloor. In: Goillot, G., Winterer, E.L.(Eds.), Proceedings of the Ocean Drilling Program, Scientific Results 103, 741–756.
Boillot, G., Winterer, E., 1988. Drilling on the Galicia margin: retrospect and prospect.Proceedings of the Ocean Drilling Program, Scientific Results 103, 809–828.
Boulin, J., 1988. Hercynian and Eocimmerian events in Afghanistan and adjoining re-gions. Tectonophysics 148, 253–278.
Boyden, J.A., Müller, R.D., Gurnis, M., Torsvik, T.H., Clark, J.A., Turner, M., Ivey-Law, H.,Watson, R.J., Cannon, J.S., 2011. Next-generation plate-tectonic reconstructionsusing GPlates. In: Keller, G.R., Baru, C. (Eds.), Geoinformatics: Cyberinfrastructurefor the Solid Earth Sciences. Cambridge University Press, pp. 95–114.
Bradley, D.C., Haeussler, P.J., Kusky, T.M., 1993. Timing of early Tertiary ridge subduc-tion in southern Alaska. US Geological Survey Bulletin 2068, 163–177.
Bradley, D., 2008. Passivemargins through Earth history. Earth-Science Reviews 91, 1–26.Bradshaw, M.T., Yeates, A.N., Beynon, R.M., Brakel, A.T., Langford, R.P., Totterdell, J.M.,
Yeung, M., 1988. Paleogeographic evolution of the North West Shelf region. In:Purcell, P.G., Purcell, R.R. (Eds.), The North West Shelf of Australia: Petroleum Ex-ploration Society of Australia Symposium: Perth, pp. 29–53.
Breitsprecher, K., Thorkelson, D., Groome, W., Dostal, J., 2003. Geochemical confirma-tion of the Kula-Farallon slab window beneath the Pacific Northwest in Eocenetime. Geology 31, 351.
Brekke, H., 2000. The tectonic evolution of the Norwegian Sea continental margin withemphasis on the Voring and More basins. Geological Society London Special Publi-cations, v. 167, p. 327.
Brozena, J., Childers, V., Lawver, L., Gahagan, L., Forsberg, R., Faleide, J., Eldholm, O.,2003. New aerogeophysical study of the Eurasia Basin and Lomonosov Ridge: im-plications for basin development. Geology, 31, p. 825.
Bryan, S.E., Constantine, A.E., Stephens, C.J., Ewart, A., Schon, R.W., Parianos, J., 1997.Early Cretaceous volcano-sedimentary successions along the Eastern Australiancontinental margin — implications for the break-up of Eastern Gondwana. Earthand Planetary Science Letters 153, 85–102.
Buchs, D.M., Arculus, R.J., Baumgartner, P.O., Baumgartner-Mora, C., Ulianov, A., 2010.Late Cretaceous arc development on the SW margin of the Caribbean Plate: in-sights from the Golfito, Costa Rica, and Azuero, Panama, complexes. Geochemistry,Geophysics, Geosystems 11, Q07S24.
Buffler, R.T., Sawyer, D.S., 1983. Distribution of crust and early history, Gulf of Mexicobasin. Gulf Coast Association Geological Society Transcripts 35, 334–344.
Bunce, E.T., Molnar, P., 1977. Seismic reflection profiling and basement topography inthe Somali Basin: possible fracture zones between Madagascar and Africa. Journalof Geophysical Research 82, 5305–5311.
Bunge, H., Grand, S., 2000. Mesozoic plate-motion history below the northeast PacificOcean from seismic images of the subducted Farallon slab. Nature 405, 337–340.
Burke, K., 1988. Tectonic evolution of the Caribbean. Annual Review of Earth and Plan-etary Sciences 16, 201–230.
Byrne, T., 1979. Late Paleocene demise of the Kula–Pacific spreading center. Geology 7, 341.

265M. Seton et al. / Earth-Science Reviews 113 (2012) 212–270
Cande, S.C., Haxby,W.F., 1991. Eocene propagating rifts in the Southwest Pacific and theirconjugate features on the Nazca Plate. Journal of Geophysical Research 96, 19609.
Cande, S.C., Herron, E.M., Hall, B.R., 1982. The early Cenozoic tectonic history of thesoutheast Pacific. Earth and Planetary Science Letters 57, 63–74.
Cande, S.C., Kent, D.V., 1992. A new geomagnetic polarity time scale for Late Cretaceousand Cenozoic. Journal of Geophysical Research 97, 13917–13951.
Cande, S.C., Kent, D.V., 1995. Revised calibration of the geomagnetic polarity timescale forthe Late Cretaceous and Cenozoic. Journal of Geophysical Research 100, 6093–6095.
Cande, S.C., Larson, R.L., LaBrecque, J.L., 1978. Magnetic lineations in the Pacific JurassicQuiet Zone. Earth and Planetary Science Letters 41, 434–440.
Cande, S.C., Mutter, J.C., 1982. A revised identification of the oldest sea-floor spreadinganomalies between Australia and Antarctica. Earth and Planetary Science Letters58, 151–160.
Cande, S., Labrecque, J., Haxby, W., 1988. Plate kinematics of the South Atlantic: ChronC34 to present. Journal of Geophysical Research 93, 13479–13492.
Cande, S.C., Raymond, C.A., Stock, J., Haxby, W.F., 1995. Geophysics of the Pitman fracturezone and Pacific–Antarctic plate motions during the Cenozoic. Science 270, 947–953.
Cande, S., Stock, J., Raymond, C., Müller, R.D., 1998. New constraints on an old plate tec-tonic puzzle of the Southwest Pacific. Eos 79, 81–82.
Caress, D.W., Menard, H.W., Hey, R.N., 1988. Eocene reorganization of the Pacific-Faral-lon Spreading Center north of the Mendocino Fracture Zone. Journal of GeophysicalResearch 93, 2813–2838.
Carey, S.W., 1955. The orocline concept in geotectonics. Royal Society of Tasmania Pro-ceedings 89, 255–288.
Carminati, E., Doglioni, C., Scrocca, D., 2004. Alps vs Apennines. Special volume of theItalian Geological Society for the IGC, vol. 32, pp. 141–151.
Catuneanu, O., Wopfner, H., Eriksson, P., Cairncross, B., Rubidge, B., Smith, R., Hancox,P., 2005. The Karoo basins of south-central Africa. Journal of African Earth Sciences43, 211–253.
Chalmers, J.A., 1991. New evidence on the structure of the Labrador Sea/Greenlandcontinental margin. Journal of the Geological Society of London 148, 899–908.
Chalmers, J.A., Laursen, K.H., 1995. Labrador Sea: the extent of continental and oceaniccrust and the timing of the onset of seafloor spreading. Marine and PetroleumGeology 12, 205–217.
Chalmers, J., Pulvertaft, T., 2001. Development of the continental margins of the LabradorSea: a review. Geological Society London Special Publications 187, 77.
Chandler, M., Wessel, P., Seton, M., Taylor, B., Hyeong, K., Kim, S., in press. Reconstruct-ing Ontong Java Nui: Implications for Pacific absolute plate motion, hotspot driftand true polar wander. Earth and Planetary Science Letters.
Channell, J.E.T., 1995. Recalibration of the geomagnetic polarity timescale. Reviews ofGeophysics 33, 161–168.
Chaubey, A.K., Bhattacharya, G.C., Murty, G.P.S., Srinivas, K., Ramprasad, T., Rao, D.G., 1998.Early Tertiary seafloor spreading magnetic anomalies and paleo-propagators in theNorthern Arabian Sea. Earth and Planetary Science Letters 154, 41–52.
Churkin, M., Trexler, J.H., 1980. Circum-Arctic plate accretion-isolating part of a Pacificplate to form the nucleus of the Arctic Basin. Earth and Planetary Science Letters49, 356–362.
Cluzel, D., Adams, C., Meffre, S., Campbell, H., Maurizot, P., 2010. Discovery of Early Cre-taceous rocks in New Caledonia; new geochemical and U–Pb zircon age constraintson the transition from subduction to marginal breakup in the Southwest Pacific.
Cocks, L.R.M., Torsvik, T.H., 2007. Siberia, the wandering northern terrane, and itschanging geography through the Palaeozoic. Earth-Science Reviews 82, 29–74.
Cochran, J.R., 1988. The Somali Basin, Chain Ridge and the origin of the northern SomaliBasin gravity and geoid low. Journal of Geophysical Research 93, 11985–12008.
Coffin, M.F., Rabinowitz, P.D., 1987. Reconstruction of Madagascar and Africa: evidencefrom the Davie Fracture Zone and western Somali Basin. Journal of Geophysical Re-search 92, 9385–9406.
Coffin, M.F., Rabinowitz, P.D., 1988. Evolution of the East African continental marginand the Western Somali Basin. 78 pp.
Cole, J., Peachey, J., 1999. Evidence for Pre-Cretaceous Rifting in the Rockall Trough: AnAnalysis using Quantitative Plate Tectonic Modelling. Geological Society PubHouse, p. 359.
Collier, J., Sansom, V., Ishizuka, O., Taylor, R., Minshull, T., Whitmarsh, R., 2008.Age of Seychelles–India break-up. Earth and Planetary Science Letters 272,264–277.
Colpron, M., Logan, J.M., Mortensen, J.K., 2002. U–Pb zircon age constraint for lateNeoproterozoic rifting and initiation of the lower Paleozoic passive margin ofwestern Laurentia. Canadian Journal of Earth Sciences 39, 133–143.
Colpron, M., Nelson, J.A.L., Murphy, D.C., 2007. Northern Cordilleran terranes and theirinteractions through time. GSA Today 17, 4–10.
Conrad, C., Lithgow-Bertelloni, C., 2002. How mantle slabs drive plate tectoncs. Science298, 207–209.
Cox, K.G., 1992. Karoo igneous activity, and the early stages of the break-up of Gondwa-naland. In: Storey, B.C., Alabaster, T., Pankhurst, R.J. (Eds.), Magmatism and thecauses of continental break-up. : Geological Society Special Publication, 68. Geo-logical Society, London, pp. 137–148.
Crawford, T., Meffre, S., Symonds, P.A., 2002. Tectonic Evolution of the SW Pacific: lessonsfor the geological evolution of the Tasman fold belt system in eastern Australiafrom 600 to 220 Ma. In: Hillis, R., Müller, R.D. (Eds.), Evolution and Dynamics of theAustralian Plate.
Croon, M.B., Cande, S.C., Stock, J.M., 2008. Revised Pacific–Antarctic plate motionsand geophysics of the Menard Fracture Zone. Geochemistry, Geophysics, Geo-systems 9, 7.
Daly, M., Chorowicz, J., Fairhead, J., 1989. Rift basin evolution in Africa: the influenceof reactivated steep basement shear zones. Geological Society London SpecialPublications 44, 309.
Davy, B., Hoernle, K., Werner, R., 2008. Hikurangi Plateau: Crustal structure, rifted for-mation, and Gondwana subduction history. Geochemistry, Geophysics, Geosys-tems 9, Q07004.
De Graciansky, P., Poag, C., Cunningham Jr., R., Loubere, P., Masson, D., Mazzullo, J.,Montadert, L., Muller, C., Otsuka, K., Reynolds, L., 1985. The Goban Spur transect:geologic evolution of a sediment-starved passive continental margin. Bulletin ofthe Geological Society of America 96, 58.
Decelles, P., 2004. Late Jurassic to Eocene evolution of the Cordilleran thrust belt andforeland basin system, western USA. American Journal of Science 304, 105.
Demets, C., Gordon, R.G., Argus, D.F., Stein, S., 1990. Current plate motions. GeophysicalJournal International 101, 425–478.
Demets, C., Gordon, R.G., Argus, D.F., 2010. Geologically current platemotions. GeophysicalJournal International 181, 1–80.
Demets, C., Gordon, R., Vogt, P., 1994. Location of the Africa-Australia-India triple junc-tion and motion between the Australian and Indian plates: Results from an aero-magnetic investigation of the Central Indian and Carlsberg ridges. GeophysicalJournal International 119, 893–930.
Desa, M., Ramana, M., Ramprasad, T., 2006. Seafloor spreading magnetic anomaliessouth off Sri Lanka. Marine Geology 229, 227–240.
DiTullio, L., 1993. Geologic summary and conceptual framework for the study of ther-mal maturity within the Eocene-Miocene Shimanto Belt, Shikoku, Japan. Thermalevolution of the Tertiary Shimanto Belt, southwest Japan: an example of ridge-trench interaction, p. 1.
Dore, A., Lundin, E., Jensen, L., Birkeland, ÿ, Eliassen, P., Fichler, C., 1999. Principal tec-tonic events in the evolution of the northwest European Atlantic margin. Geologi-cal Society of London 5, 41.
Downey, N.J., Stock, J.M., Clayton, R.W., Cande, S.C., 2007. History of the CretaceousOsbourn spreading center. Journal of Geophysical Research 112, B04102.
Dove, D., Coakley, B., Hopper, J., Kristoffersen, Y., 2010. Bathymetry, controlled sourceseismic and gravity observations of the Mendeleev ridge; implications for ridgestructure, origin, and regional tectonics. Geophysical Journal International 1, 348.
Dunbar, J., Sawyer, D., 1989. Patterns of continental extension along the conjugate mar-gins of the central and North Atlantic Ocean and Labrador Sea. Tectonics 8.
Duncan, R., Hargraves, R., 1984. Plate tectonic evolution of the Caribbean region inthe mantle reference frame. The Caribbean-South American Plate Boundary andRegional Tectonics, p. 81ñ93.
Eagles, G., 2007. New angles on South Atlantic opening. Geophysical Journal Interna-tional 168, 353–361.
Eagles, G., König,M., 2008. Amodel of plate kinematics inGondwana breakup.GeophysicalJournal International 173, 703–717.
Eagles, G., Gohl, K., Larter, R.D., 2004a. High-resolution animated tectonic reconstructionof the South Pacific and West Antarctic margin — art. no. Q07002. Geochemistry,Geophysics, Geosystems 5 7002-7002.
Eagles, G., Gohl, K., Larter, R.D., 2004b. Life of the Bellingshausen plate. GeophysicalResearch Letters 31 7603-7603.
Eakins, B.W., Lonsdale, P.F., 2003. Structural patterns and tectonic history of the Bauermicroplate, Eastern Tropical Pacific. Marine Geophysical Researches 24, 171–205.
Engebretson, D.C., Cox, A., Gordon, R.G., 1985. Relative Motions between Oceanic andContinental Plates in the Pacific Basin. Geol. Soc. of Am.
Faccenna, C., Becker, T.W., Lucente, F.P., Jolivet, L., Rossetti, F., 2001. History of subduc-tion and back arc extension in the Central Mediterranean. Geophysical Journal In-ternational 145, 809–820.
Falvey, D.A., Mutter, J.C., 1981. Regional plate tectonics and the evolution of Australia'spassive margins. Journal of Australian Geology and Geophysics 6, 1–29.
Forster, R., 1975. The geological history of the sedimentary basins of southern Mozam-bique, and some aspects of the origin of the Mozambique Channel. Palaeogeogra-phy, Palaeoclimatology, Palaeoecology 17, 267–287.
Forsyth, D.A., Asudeh, I., Green, A.G., Jackson, H.R., 1986. Crustal structure of the north-ern Alpha Ridge beneath the Arctic Ocean. Nature 322, 349–352.
Fullerton, L.G., Sager, W.W., Handschumacher, D.W., 1989. Late Jurassic–Early Cretaceousevolution of the eastern Indian Ocean adjacent to northwest Australia. Journal ofGeophysical Research 94, 2937–2953.
Gaina, C., Müller, R.D., 2007. Cenozoic tectonic and depth/age evolution of the Indone-sian gateway and associated back-arc basins. Earth-Science Reviews 83, 177–203.
Gaina, C., Müller, D.R., Royer, J.Y., Stock, J., Hardebeck, J., Symonds, P., 1998. The tectonichistory of the Tasman Sea: a puzzle with 13 pieces. Journal of Geophysical Research103, 12413–12433.
Gaina, C., Müller, R.D., Royer, J.-Y., Symonds, P., 1999. The tectonic evolution of theLouisiade Triple Junction. Journal of Geophysical Research 104, 12927–12939.
Gaina, C., Roest, W.R., Müller, R.D., 2002. Late Cretaceous–Cenozoic deformation ofnortheast Asia. Earth and Planetary Science Letters 197, 273–286.
Gaina, C., Müller, R.D., Brown, B., Ishihara, T., 2003. Micro-continent formationaround Australia. In: Hillis, R., Müller, R.D. (Eds.), The Evolution and Dynamicsof the Australian Plate, vol. 22. Geol. Soc. Aust. Spec. Publ., Geological Societyof Australia.
Gaina, C., Müller, R.D., Brown, B., Ishihara, T., Ivanov, S., 2007. Breakup and early sea-floor spreading between India and Antarctica. Geophysical Journal International170, 151–169.
Gaina, C., Gernigon, L., Ball, P., 2009. Palaeocene–Recent plate boundaries in the NEAtlantic and the formation of the JanMayenmicrocontinent. Journal of the GeologicalSociety 166, 601.
Gaina, C., Labails, C., Reeves, C., 2010. The Early Opening of the Indian Ocean: An AfricanPerspective, 2010 Fall Meeting, Volume Abstract T13C-2222. AGU, San Francisco,California. 13–17 Dec.
Gee, J., Kent, D., 2007. Source of Oceanic magnetic anomalies and the geomagneticpolarity timescale. Treatise on Geophysics 5, 455ñ507.

266 M. Seton et al. / Earth-Science Reviews 113 (2012) 212–270
Gehrels, G.E., 2001. Geology of the Chatham Sound region, southeast Alaska and coastalBritish Columbia. Canadian Journal of Earth Sciences 38, 1579–1599.
Gehrels, G.E., 2002. Detrital zircon geochronology of the Taku terrane, southeast Alaska.Canadian Journal of Earth Sciences 39, 921–931.
Genik, G., 1992. Regional framework, structural and petroleum aspects of rift basins inNiger, Chad and the Central African Republic (CAR). Tectonophysics 213, 169–185.
Gerstell, M., Stock, J., 1994. Testing the porcupine plate hypothesis. Marine GeophysicalResearches 16, 315–323.
Ghidella, M.E., Yanez, G., LaBrecque, J.L., 2002. Revised tectonic implications for themagnetic anomalies of the western Weddell Sea. Tectonophysics 347, 65–86.
Ghosh, N., Hall, S., Casey, J., 1984. Seafloor spreading magnetic anomalies in theVenezuelan Basin. The Caribbean–South American Plate Boundary and RegionalTectonics, pp. 65–80.
Goff, J.A., Cochran, J.R., 1996. The Bauer scarp ridge jump: a complex tectonic sequencerevealed in satellite altimetry. Earth and Planetary Science Letters 141, 21–33.
Golonka, J., 2007. Late Triassic and Early Jurassic palaeogeography of the world.Palaeogeography, Palaeoclimatology, Palaeoecology 244, 297–307.
Golonka, J., Ford, D., 2000. Pangean (Late Carboniferous–Middle Jurassic) paleoenvir-onment and lithofacies. Palaeogeography, Palaeoclimatology, Palaeoecology 161,1–34.
Golonka, J., Gahagan, L., Krobicki,M.,Marko, F., Oszczypko,N., Slaczka, A., 2006. Plate-tectonicevolution and paleogeography of the circum-Carpathian region: the Carpathians andtheir foreland: geology and hydrocarbon resources. AAPG Memoir 84, 11-46.
Gordon, R.G., Stein, S., 1992. Global tectonics and space geodesy. Science 256, 333.Goslin, J., Schlich, R., 1976. Structural limits of the South Crozet Basin; relations to
Enderby Basin and the Kerguelen-Heard Plateau. International Geological Congress,Abstracts, vol. 25 (3), pp. 884–885.
Guiraud, R., Maurin, J.C., 1992. Early Cretaceous rifts of Western and Central Africa: anoverview. Tectonophysics 213, 153–168.
Gradstein, F.M., Agterberg, F.P., Ogg, J.G., Hardenbol, S., Vanveen, P., Thierry, J., Huang,Z.H., 1994. A Mesozoic time scale. Journal of Geophysical Research-Solid Earth99, 24051–24074.
Gradstein, F., Ogg, J., Smith, A., Agterberg, F., Bleeker, W., Cooper, R., Davydov, V.,Gibbard, P., Hinnov, L., House, M., 2004. A Geologic Time Scale 2004. CambridgeUniversity Press.
Granot, R., Cande, S.C., Gee, J.S., 2009. The implications of long-lived asymmetry of rem-anent magnetization across the North Pacific fracture zones. Earth and PlanetaryScience Letters 288, 551–563.
Grantz, A., Clark, D., Phillips, R., Srivastava, S., Blome, C., Gray, L., Haga, H., Mamet, B.,McIntyre, D., Mcneil, D., 1998. Phanerozoic stratigraphy of Northwind Ridge, mag-netic anomalies in the Canada basin, and the geometry and timing of rifting in theAmerasia basin, Arctic Ocean. Geological Society of America Bulletin 110, 801.
Greene, A.R., Scoates, J.S., Weis, D., 2008. Wrangellia flood basalts in Alaska: a record ofplume–lithosphere interaction in a Late Triassic accreted oceanic plateau. Geochemistry,Geophysics, Geosystems 9, 12004.
Gurnis, M., Turner, M., Zahirovic, S., Dicaprio, L., Spasojevic, S., Müller, R.D., Boyden, J.,Seton, M., Manea, V., Bower, D., 2012. Plate tectonic reconstructions with continu-ously closing plates. Computers and Geosciences 38, 35–42.
Haeussler, P.J., Bradley, D., Goldfarb, R., Snee, L., Taylor, C., 1995. Link between ridgesubduction and gold mineralization in southern Alaska. Geology 23, 995.
Hafkenscheid, E., Buiter, S.J.H., Wortel, M.J.R., Spakman, W., Bijwaard, H., 2001. Modellingthe seismic velocity structure beneath Indonesia: a comparison with tomography.Tectonophysics 333, 35–46.
Hager, B.H., O'Connell, R.J., 1981. A simple global model of plate dynamics and mantleconvection. Journal of Geophysical Research 86, 4843–4867.
Halgedahl, S., Jarrard, R., 1987. Paleomagnetism of the Kuparuk River formation fromoriented drill core: evidence for rotation of the North Slope block. In: Tailleur,I.L., Weimer, P. (Eds.), Alaskan North Slope Geology. Soc. Econ. Paleont. and Min.,Pacific Section, Los Angeles, pp. 581–617.
Hall, R., 2002. Cenozoic geological and plate tectonic evolution of Southeast Asia andthe SW Pacific: computer-based reconstructions, models and animations. Journalof Asian Earth Sciences 20, 353–431.
Hall, R., Fuller, M., Ali, J.R., Anderson, C.D., 1995. The Philippine Sea plate: magnetismand reconstructions. In: Taylor, B., Natland, J.H. (Eds.), A Synthesis of WesternPacific Drilling Results, vol. 88. American Geophysical Union, pp. 371–404.
Hamilton, W., 1979. Tectonics of the Indonesian Region. USGS Professional Paper 1078,345.
Handschumacher, D.W., 1976. Post-Eocene Plate Tectonics of the Eastern Pacific. In:G.H.S., et al. (Ed.), The Geophysics of the Pacific Ocean Basin and its Margin: A Vol-ume in Honour of George P. Woollard. American Geophysical Union, WashingtonD.C., pp. 177–202.
Handschumacher, D., Sager, W., Hilde, T., Bracey, D., 1988. Pre-Cretaceous tectonic evo-lution of the Pacific plate and extension of the geomagnetic polarity reversal timescale with implications for the origin of the Jurassic 'Quiet Zone'. Tectonophysics155, 365–380.
Hankel, O., 1994. Early Permian to middle Jurassic rifting and sedimentation in EastAfrica and Madagascar. Geologische Rundschau 83, 703–710.
Hansen, V.L., 1990. Yukon-Tanana terrane: a partial acquittal. Geology 18, 365.Harland, W.B., Armstrong, R.L., Cox, A.V., Craig, I.E., Smith, A.G., Smith, D.G., 1990. A
Geologic Time Scale. Camibridge University Press, Cambridge.Hassanzadeh, J., Stockli, D.F., Horton, B.K., Axen, G.J., Stockli, L.D., Grove, M., Schmitt,
A.K., Walker, J.D., 2008. U–Pb zircon geochronology of late Neoproterozoic–EarlyCambrian granitoids in Iran: implications for paleogeography, magmatism, andexhumation history of Iranian basement. Tectonophysics 451, 71–96.
Hawlader, H., 1990. Diagenesis and reservoir potential of volcanogenic sandstones—Cretaceous of the Surat Basin, Australia. Sedimentary Geology 66, 181–195.
Heine, C., Muller, R., 2005. Late Jurassic rifting along the Australian North West Shelf:margin geometry and spreading ridge configuration. Australian Journal of EarthSciences 52 (1), 27–39.
Heine, C., Müller, R.D., Gaina, C., 2004. Reconstructing the lost Eastern Tethys OceanBasin: constraints for the convergence history of the SE Asian margin and marinegateways. In: Clift, P., Hayes, D., Kuhnt, W., Wang, P. (Eds.), Continent–Ocean Interac-tions in Southeast Asia, Volume 1149: Geophys. Monogr. Ser. American GeophysicalUnion, Washington.
Heirtzler, J., Burroughs, R., 1971. Madagascar's paleoposition: new data from theMozambique channel. Science (New York, N.Y.) 174, 488.
Heirtzler, J.R., Dickson, G.O., Herman, E.M., Pitman III, W.C., Lepichon, X., 1968. Marinemagnetic anomalies, geomagnetic field reversals, and motions of the ocean floorand continents. Journal of Geophysical Research 73, 2119–2136.
Herron, E.M., 1972. Sea Floor Spreading and the Cenozoic History of the East-CentralPacific. Geological Society of America Bulletin 83, 1671–1692.
Hessami, K., Koyi, H.A., Talbot, C.J., Tabishi, H., Shabanian, E., 2001. Progressive uncon-formities within an evolving foreland fold–thrust belt, Zagros Mountains. Journalof the Geological Society 158, 969.
Hey, R., 1977. Tectonic evolution of the Cocos–Nazca spreading center. Geological Societyof America Bulletin 88, 1404–1420.
Hillier, J., 2007. Pacific seamount volcanism in space and time. Geophysical JournalInternational 168, 877–889.
Hoernle, K., Hauff, F., Van Den Bogaard, P., Werner, R., Mortimer, N., Geldmacher, J.,Garbe-SchˆNberg, D., Davy, B., 2010. Age and geochemistry of volcanic rocksfrom the Hikurangi and Manihiki oceanic plateaus. Geochimica et CosmochimicaActa.
Holloway, N., 1982. North Palawan block, Philippines—its relation to Asian mainlandand role in evolution of South China Sea. AmericanAssociation of PetroleumGeologistsBulletin 66, 1355ñ1383.
Hopper, J., Funck, T., Tucholke, B., Larsen, H., Holbrook, W., Louden, K., Shillington, D.,Lau, H., 2004. Continental breakup and the onset of ultraslow seafloor spreadingoff Flemish Cap on the Newfoundland rifted margin. Geology 32, 93.
Hutchison, C.S., 1989. Geological Evolution of South-east Asia, p. 368.Hutchison, C.S., 2005. Geology of North-west Borneo. Elsevier Science Ltd., Sarawak,
Brunei and Sabah.Jackson, H., Gunnarsson, K., 1990. Reconstructions of the Arctic: Mesozoic to present.
Tectonophysics 172, 303–322.James, K., 2006. Arguments for and against the Pacific origin of the Caribbean Plate.
Geologica Acta 4, 279.Johnson, B.D., Powell, C.M., Veevers, J.J., 1976. Spreading history of the eastern Indian
Ocean and Greater India's northward flight from Antarctica and Australia. Geolog-ical Society of America Bulletin 87, 1560–1566.
Johnson, B.D., Powell, C.M., Veevers, J.J., 1980. Early spreading history of the IndianOcean between India and Australia. Earth and Planetary Science Letters 47,131–143.
Jokat, W., Uenzelmann-Neben, G., Kristoffersen, Y., Rasmussen, T., 1992. LomonosovRidge—a double-sided continental margin. Geology 20, 887.
Jokat, W., Ritzmann, O., Schmidt-Aursch, M.C., Drachev, S.S., Gauger, S., Snow, J.H.,2003. Geophysical evidence for reduced melt production on the Arctic ultraslowGakkel mid-ocean ridge. Nature 423, 962–965.
Jokat, W., Nogi, Y., Leinweber, V.T., 2010. New aeromagnetic data from the westernEnderby Basin and consequences for Antarctic–India break-up. GeophysicalResearch Letters 37, L21311.
Jones, J.G., Veevers, J.J., 1983. Mesozoic origins and antecedents of Australia's EasternHighlands. Journal of the Geological Society of Australia 30, 305–322.
Joseph, D., Shor, A., Hussong, D., Malikides, M., 1990. The origin of the Nova CantonTrough reexamined. Transactions, American Geophysical Union 71, 1640.
Joseph, D., Taylor, B., Shor, A.N., 1992. New sidescan sonar and gravity evidence that theNova-Canton Trough is a fracture zone. Geology 20, 435–438.
Jourdan, F., FÈraud, G., Bertrand, H., Kampunzu, A.B., Tshoso, G., Watkeys, M.K., Le Gall,B., 2005. Karoo large igneous province: Brevity, origin, and relation to mass extinc-tion questioned by new 40Ar/39Ar age data. Geology 33, 745.
Karig, D.E., 1971. Origin and development of marginal basins in the Western Pacific.Journal of Geophysical Research 76, 2542.
Keppie, J.D., Dostal, J., 2001. Evaluation of the Baja controversy using paleomagneticand faunal data, plume magmatism, and piercing points. Tectonophysics 339,427–442.
Kimbell, G., Ritchie, J., Johnson, H., Gatliff, R., 2005. Controls on the structure and evo-lution of the NE Atlantic margin revealed by regional potential field imaging and3D modelling. Geological Society of London 6, 933.
Klitgord, K., Schouten, H., 1986. Plate kinematics of the central Atlantic. In: Vogt, P.R.,Tucholke, B.E. (Eds.), The Western North Atlantic Region, DNAG, Volume M: TheGeology of North America. Geol. Soc. Am., Boulder, CO, United States, pp. 351–378.
Knott, S., Burchell, M., Jolley, E., Fraser, A., 1993. Mesozoic to Cenozoic Plate Recon-structions of the North Atlantic and Hydrocarbon Plays of the Atlantic margins,Volume 4, Geological Society of London, p. 953.
König,M., Jokat,W., 2006. TheMesozoic breakupof theWeddell Sea. Journal of GeophysicalResearch 111, B12102.
König, M., Jokat, W., 2010. Advanced insights into magmatism and volcanism of theMozambique Ridge and Mozambique Basin in the view of new potential fielddata. Geophysical Journal International 180, 158–180.
Kovacs, L.C., Morris, P., Brozena, J., Tikku, A., 2002. Seafloor spreading in the WeddellSea from magnetic and gravity data. Tectonophysics 347, 43–64.
Kravchinsky, V.A., Cognè, J.P., Harbert, W.P., Kuzmin, M.I., 2002. Evolution of the Mongol–Okhotsk Ocean as constrained by new palaeomagnetic data from the Mongol-Okhotsk suture zone, Siberia. Geophysical Journal International 148, 34–57.

267M. Seton et al. / Earth-Science Reviews 113 (2012) 212–270
Kuzmichev, A.B., 2009. Where does the South Anyui suture go in the New Siberianislands and Laptev Sea?: implications for the Amerasia basin origin. Tectonophysics463, 86–108.
Labails, C., Olivet, J., Aslanian, D., Roest, W., 2010. An alternative early opening scenariofor the Central Atlantic Ocean. Earth and Planetary Science Letters.
Labrecque, J.L., Hayes, D.E., 1979. Seafloor spreading history of the Agulhas Basin. Earthand Planetary Science Letters 45, 411–428.
LaBrecque, J.L., Barker, P., 1981. The age of the Weddell Basin. Nature 290, 489–492.LaBrecque, J.L., Rabinowitz, P.D., 1977. Magnetic anomalies bordering the continental
margin of Argentina: Tulsa. Amer. Assoc. Petr. Geol. map series.Lancelot, Y., Larson, R.L., et al., 1990. Proc. ODP Initial Reports 129. Ocean Drilling
Program, College Station, TX.Lane, L.S., 1997. Canada basin, Arctic Ocean — evidence against a rotational origin
[Review]. Tectonics 16, 363–387.Larson, R.L., 1995. The mid-Cretaceous superplume episode. Scientific American 272, 66–70.Larson, R.L., 1997. Superplumes and ridge interactions between Ontong Java andManihiki
plateaus and the Nova-Canton trough. Geology 25, 779–782.Larson, R.L., Chase, C.G., 1972. Late Mesozoic evolution of the Western Pacific. Geological
Society of America Bulletin 83, 3627–3644.Larson, R.L., Pitman, W.C.I., 1972. World-wide correlation of Mesozoic magnetic anom-
alies, and its implications. Geological Society of America Bulletin 83, 3645–3662.Larson, R., Smith, S., Chase, C., 1972. Magnetic lineations of Early Cretaceous age in the
western equatorial Pacific Ocean. Earth and Planetary Science Letters 15, 315–319.Larson, R.L., Pockalny, R.A., Viso, R.F., Erba, E., Abrams, L.J., Luyendyk, B.P., Stock, J.M.,
Clayton, R.W., 2002. Mid-Cretaceous tectonic evolution of the Tongareva triplejunction in the southwestern Pacific Basin. Geology 30, 67–70.
Larson, R.L., 1976. Late Jurassic and Early Cretaceous evolution of the Western CentralPacific Ocean. Journal of Geomagnetism and Geoelectricity 28, 219–236.
Larson, R.L., 1977. Early Cretaceous breakup of Gondwanaland off western Australia.Geology 5, 57–60.
Larter, R.D., Cunningham, A.P., Barker, P.F., Gohl, K., Nitsche, F.O., 2002. Tectonic evolu-tion of the Pacific margin of Antarctica 1. Late Cretaceous tectonic reconstructions.Journal of Geophysical Research-Solid Earth 107, 2345.
Lawver, L.A., Müller, R.D., 1994. Iceland hotspot track. Geology 22, 311.Lawver, L.A., Müller, R.D., Srivastava, S.P., Roest, W., 1990. Opening of the Arctic Ocean.
In: Bleil, U., Thiede, J. (Eds.), Geological History of the Polar Oceans: Arctic VersusAntarctic, pp. 29–62.
Lawver, L.A., Scotese, C.R., 1987. A revised reconstruction of Gondwanaland. AGU Geo-physical Monograph 40, 17–23.
Lawver, L., Grantz, A., Gahagan, L., 2002. Plate kinematic evolution of the present Arcticregion since the Ordovician. Geological Society of America Special Papers 360, 333.
Lee, T.-Y., Lawver, L.A., 1994. Cenozoic plate reconstruction of the South China Searegion. Tectonophysics 235, 149–180.
Lee, T.-Y., Lawver, L.A., 1995. Cenozoic plate reconstruction of SoutheastAsia. Tectonophysics251, 85–138.
Lemaux, J., Gordon, R.G., Royer, J.Y., 2002. Location of the Nubia–Somalia boundaryalong the Southwest Indian Ridge. Geology 30, 339–342.
Lemoine, M., 1983. Rifting and early drifting: Mesozoic central Atlantic and LigurianTethys. Initial Reports of the Deep Sea Drilling Project 76, 885ñ895.
Lewis, J.C., Byrne, T.B., Pasteris, J.D., London, D., Morgan, G.B., 2000. Early Tertiary fluidflow and pressure-temperature conditions in the Shimanto accretionary complexof south-west Japan: constraints from fluid inclusions. Journal of Metamorphic Ge-ology 18, 319–333.
Lithgow-Bertelloni, C., Richards, M., 1998. The Dynamics of Cenozoic and MesozoicPlate Motions. Reviews of Geophysics 36, 27–78.
Liu, L., Gurnis, M., Seton, M., Saleeby, J., M¸Ller, R., Jackson, J., 2010. The role of oceanicplateau subduction in the Laramide orogeny. Nature Geoscience 3, 353–357.
Livermore, R., Hunter, R., 1996. Mesozoic seafloor spreading in the southern WeddellSea. Geological Society London Special Publications 108, 227.
Lonsdale, P., 1988. Paleogene history of the Kula plate: offshore evidence and onshoreimplications. Geological Society of America Bulletin 100, 733.
Lonsdale, P., 1997. An incomplete geologic history of the southwest Pacific basin. GSAAbstracts with Programs, vol. 29, p. 25.
Lonsdale, P., 2005. Creation of the Cocos and Nazca plates by fission of the Farallonplate. Tectonophysics 404, 237–264.
Lonsdale, P., Klitgord, K.D., 1978. Structure and tectonic history of the eastern PanamaBasin. Geological Society of America Bulletin 89, 981–999.
Lowrie, W., Kent, D., 2004. Geomagnetic polarity timescales and reversal frequencyregimes: timescales of the Paleomagnetic Field. Geophysical Monograph Series145, 117ñ129.
Ludwig, W.J., Kumar, N., Houtz, R.E., 1979. Profiler-Sonobuoy measurements in theSouth China Sea basin. Journal of Geophysical Research 84, 3505–3518.
Madsen, J.K., Thorkelson, D.J., Friedman, R.M., Marshall, D.D., 2006. Cenozoic to Recentplate configurations in the Pacific Basin: Ridge subduction and slab window mag-matism in western North America. Geosphere 2, 11–34.
Mahoney, J.J., Storey, M., Duncan, R.A., Spencer, K.J., Pringle, M., 1993. Geochemistryand geochronology of Leg 130 basement lavas: nature and origin of the OntongJava Plateau. In: Berger, W.H., Kroenke, L.W., Mayer, L.A. (Eds.), Proceedings ofthe Ocean Drilling Program, Scientific Results, vol. 130. Ocean Drilling Program,Texas A&M University, College Station, TX, pp. 3–22.
Mahoney, J., Duncan, R., Tejada, M., Sager, W., Bralower, T., 2005. Jurassic–Cretaceousboundary age and mid-ocean-ridge-type mantle source for Shatsky Rise. Geology33, 185.
Malfait, B.T., Dinkelman, M.G., 1972. Circum-Caribbean Tectonic and Igneous Activityand the Evolution of the Caribbean Plate. Geological Society of America Bulletin83, 251–272.
Mammerickx, J., Klitgord, K., 1982. Northern East Pacific rise: evolution from 25 my BPto the present. Journal of Geophysical Research 87, 6751–6759.
Mammerickx, J., Sharman, G.F., 1988. Tectonic evolution of the North Pacific during theCretaceous quiet period. Journal of Geophysical Research 93, 3009–3024.
Marks, K.M., Stock, J.M., 2001. Evolution of the Malvinas Plate south of Africa. MarineGeophysical Researches 22, 289–302.
Marks, K.M., Tikku, A.A., 2001. Cretaceous reconstructions of East Antarctica, Africa andMadagascar. Earth and Planetary Science Letters 186, 479–495.
Marton, G., Buffler, R., 1999. Jurassic–early cretaceous tectono-paleogeographic evolutionof the southeastern gulf of Mexico basin. Sedimentary Basins of the World 4, 63–91.
Masson, D.G., 1984. Evolution of the Mascarene basin, western Indian Ocean, and thesignificance of the Amirante arc. Marine Geophysical Researches 6, 365–382.
Matthews, K.J., et al., 2011. Dynamic subsidence of Eastern Australia during the Creta-ceous. Gondwana Research 19, 372–383.
Maus, S., Sazonova, T., Hemant, K., Fairhead, J.D., Ravat, D., 2007. National geophysicaldata center candidate for the world digital magnetic anomaly map. Geochemistry,Geophysics, Geosystems 8, Q06017. doi:10.1029/2007GC001643.
Maus, S., Barckhausen, U., Berkenbosch, H., Bournas, N., Brozena, J., Childers, V.,Dostaler, F., Fairhead, J., Finn, C., Von Frese, R., 2009. EMAG2: a 2-arc min resolutionEarth Magnetic Anomaly Grid compiled from satellite, airborne, and marine mag-netic measurements. Geochemistry, Geophysics, Geosystems 10, Q08005.
Mayes, C.L., Lawver, L.A., Sandwell, D.T., 1990. Tectonic history and new isochron chartof the South Pacific. Journal of Geophysical Research 95, 8543–8567.
Mcelhinny, M.W., Embleton, B.J.J., Daly, L., Pozzi, J.P., 1976. Paleomagnetic evidence forthe location of Madagascar in Gondwanaland. Geology 4, 455–457.
McKenzie, D.P., Morgan, J., 1969. The evolution of triple junctions. Nature 224, 125–133.Menard, H.W., 1978. Fragmentation of the Farallon plate by pivoting subduction. Journal
of Geology 86, 99–110.Meschede, M., Frisch, W., 1998. A plate-tectonic model for the Mesozoic and Early
Cenozoic history of the Caribbean plate. Tectonophysics 296, 269–291.Meschede, M., Barckhausen, U., Worm, H.U., 1998a. Extinct spreading on the Cocos
Ridge. Terra Nova 10, 211–216.Meschede, M., Barckhausen, U., Worm, H.U., 1998b. Extinct spreading on the Cocos
Ridge: Terra Nova. The European Journal of Geosciences 10, 211–216.Metcalfe, I., 1996. Gondwanaland dispersion, Asian accretion and evolution of Eastern
Tethys. Australian Journal of Earth Sciences 43, 605–623.Metcalfe, I., 1999. Gondwana dispersion and Asian accretion: an overview. In: Metcalfe, I.
(Ed.), Gondwana Dispersion and Asian Accretion. A.A. Balkema, Rotterdam, pp. 9–29.Mihalynuk, M.G., Nelson, J.A., Diakow, L.J., 1994. Cache Creek terrane entrapment:
oroclinal paradox within the Canadian Cordillera. Tectonics 13, 575–595.Molnar, P., Atwater, T., Mammerickx, J., Smith, S.M., 1975. Magnetic anomalies, ba-
thymetry and the tectonic evolution of the South Pacific since the Late Cretaceous.Geophysical Journal of the Royal Astronomical Society 40, 383–420.
Moran, K., Backman, J., Brinkhuis, H., Clemens, S.C., Cronin, T., Dickens, G.R., Eynaud, F.,Gattacceca, J., Jakobsson, M., Jordan, R.W., 2006. The Cenozoic palaeoenvironmentof the Arctic Ocean. Nature 441, 601–605.
Morgan, W.J., 1972. Plate motions and deep mantle convection. GSA Memoir 132, 7–22.Mortensen, J., 1992. Pre-mid-Mesozoic tectonic evolution of the Yukon-Tanana terrane,
Yukon and Alaska. Tectonics 11, 836–853.Moulin, M., Aslanian, D., Unternehr, P., 2010. A new starting point for the South and
Equatorial Atlantic Ocean. Earth-Science Reviews 98, 1–37.Müller, R.D., Roest, W.R., 1992. Fracture zones in the North Atlantic from combined
Geosat and Seasat data. Journal of Geophysical Research 97, 3337–3350.Müller, R.D., Roest, W.R., Royer, J.-Y., Gahagan, L.M., Sclater, J.G., 1997. Digital isochrons
of the world's ocean floor. Journal of Geophysical Research 102, 3211–3214.Müller, R.D., Mihut, D., Baldwin, S., 1998a. A new kinematic model for the formation
and evolution of the Northwest and West Australian margin. In: Purcell, P.G.,Purcell, R.R. (Eds.), The Sedimentary Basins ofWestern Australia, 2. PetroleumExplo-ration Society of Australia, Perth, pp. 55–72.
Müller, R.D., Roest, W.R., Royer, J.-Y., 1998b. Asymmetric seafloor spreading expressesridge–plume interactions. Nature 396, 455–459.
Müller, R.D., Cande, S.C., Royer, J.-Y., Roest, W.R., Maschenkov, S., 1999. New constraintson the Late Cretaceous/Tertiary plate tectonic evolution of the Caribbean. In: Mann,P. (Ed.), Caribbean Basins, Volume 4: Sedimentary Basins of the World. Elsevier,Amsterdam, pp. 39–55.
Müller, R.D., Gaina, C., Tikku, A., Mihut, D., Cande, S., Stock, J.M., 2000. Mesozoic/Cenozoictectonic events around Australia. In: Richards, M., Gordon, R. (Eds.), The Historyand Dynamics of Global Plate Motions, Volume 121: American Geophysical UnionMonograph. American Geophysical Union, pp. 161–188.
Müller, R., Goncharov, A., Kritski, A., 2005. Geophysical evaluation of the enigmaticBedout basement high, offshore northwestern Australia. Earth and Planetary ScienceLetters 237, 264–284.
Müller, R.D., Sdrolias, M., Gaina, C., Roest, W.R., 2008a. Age, spreading rates and spreadingasymmetry of the world's ocean crust. Geochemistry, Geophysics, Geosystems 9.
Müller, R.D., Sdrolias, M., Gaina, C., Steinberger, B., Heine, C., 2008b. Long-term sea-level fluctuations driven by ocean basin dynamics. Science 319, 1357–1362.
Munschy, M., Antoine, C., Gachon, A., 1996. Tectonic evolution in the Tuamotu IslandsRegion, Central Pacific Ocean. Comptes Rendus de l'Academie des Sciences SeriesIIA Earth and Planetary Science 323, 941–948.
Nakanishi, M., Tamaki, K., Kobayashi, K., 1992. A new Mesozoic isochron chart of thenorthwestern Pacific Ocean: paleomagnetic and tectonic implications. GeophysicalResearch Letters 19, 693–696.
Nakanishi, M., Winterer, E.L., 1998. Tectonic history of the Pacific–Farallon–Phoenix tri-ple junction from late Jurassic to early Cretaceous: an abandoned Mesozoic spread-ing system in the central Pacific basin. Journal of Geophysical Research-Solid Earth103, 12453–12468.

268 M. Seton et al. / Earth-Science Reviews 113 (2012) 212–270
Nakanishi, M., Sager, W.W., Klaus, A., 1999. Magnetic lineations within Shatsky Rise,northwest Pacific Ocean: implications for hot spot-triple junction interaction andoceanic plateau formation. Journal of Geophysical Research-Solid Earth 104,7539–7556.
Nelson, J.A., Mihalynuk, M., 1993. Cache Creek ocean: closure or enclosure? Geology 21,173.
Nelson, J.A.L., Colpron, M., Piercey, S.J., Dusel-Bacon, C., Murphy, D.C., Roots, C.F., 2006.Paleozoic tectonic and Metallogenetic Evolution of Pericratonic Terranes in Yukon,Northern British Columbia and Eastern Alaska 1: Paleozoic Evolution andMetallogenyof Pericratonic Terranes at the Ancient PacificMargin of North America, Canadian andAlaskan Cordillera, p. 323.
Nokleberg, W., Parfenov, L., Monger, J., Norton, I., Chan Uk, A., Stone, D., Scotese, C.,Scholl, D., Fujita, K., 2001. Phanerozoic Tectonic Evolution of the Circum-NorthPacific. US Dept. of the Interior, US Geological Survey.
Norton, I.O., Sclater, J.G., 1979. A model for the evolution of the Indian Ocean and thebreakup of Gondwanaland. Journal of Geophysical Research 84, 6803–6830.
Norton, I., 2007. Speculations on Cretaceous tectonic history of the northwest Pacificand a tectonic origin for the Hawaii hotspot. Geological Society of America SpecialPapers 430, 451.
Nunns, A.G., 1983. Plate tectonic evolution of theGreenland-Scotland Ridge and surroundingregions. In: Bott, M.H.P., Saxov, S., Talwani, M., Thiede, J. (Eds.), Structure and Develop-ment of the Greenland–Scotland Ridge. Plenum, New York, New York, pp. 11–30.
Nürnberg, D., Müller, R.D., 1991. The tectonic evolution of the South Atlantic from LateJurassic to present. Tectonophysics 191, 27–53.
O'Neill, C., Müller, R.D., Steinberger, B., 2005. On the uncertainties in hotspot recon-structions, and the significance of moving hotspot reference frames. Geochemistry,Geophysics, Geosystems 6. doi:10.1029/2004GC000784.
Pardo-Casas, F., Molnar, P., 1987. Relative motion of the Nazca (Farallon) and SouthAmerican plates since Late Cretaceous time. Tectonics 6, 215–232.
Patriat, P., Ségoufin, J., 1988. Reconstruction of the central Indian Ocean. Tectonophysics155, 211–234.
Peron-Pinvidic, G., Manatschal, G., Minshull, T., Sawyer, D., 2007. Tectonosedimentaryevolution of the deep Iberia-Newfoundland margins: evidence for a complexbreakup history. Tectonics 26.
Pindell, J.L., B., S.F., 1987. Geological evolution of the Caribbean Region: A plate tectonicperspective. The Caribbean Region. : The Geology of North America, vol. 1. Geol.Soc. America, Boulder, Colorado.
Pindell, J., Kennan, L., 2009. Tectonic evolution of the Gulf of Mexico, Caribbean andnorthern South America in themantle reference frame: an update. Geological SocietyLondon Special Publications 328, 1.
Pindell, J.L., Cande, S., Pitman III, W.C., Rowley, D.B., Dewey, J.F., Labrecque, J., Haxby, W.,1988. A plate-kinematic framework for models of Caribbean evolution. Tectonophysics155, 121–138.
Pindell, J., Kennan, L.S., K-P, M., 2006. Foundations of Gulf of Mexico and Caribbeanevolution: eight controversies resolved. Geologica Acta 4, 303ñ341.
Pockalny, R.A., Larson, R.L., Viso, R.F., Abrams, L.J., 2002. Bathymetry and gravity dataacross amid-Cretaceous triple junction trace in the southwest Pacific basin. GeophysicalResearch Letters 29, 1007.
Pogue, K.R., Dipietro, J.A., Khan, S.R., Hughes, S.S., Dilles, J.H., Lawrence, R.D., 1992. LatePaleozoic rifting in northern Pakistan. Tectonics 11, 871–883.
Powell, C.M., Roots, S.R., Veevers, J.J., 1988. Pre-breakup continental extension in EastGondwanaland and the early opening of the eastern Indian Ocean. Tectonophysics155, 261–283.
Rabinowitz, P.D., 1971. Gravity anomalies across the East African continental margin.Journal of Geophysical Research 76, 7107–7117.
Rabinowitz, P.D., Coffin, M.F., Falvey, D., 1983. The separation of Madagascar and Africa.Science 220, 67–69.
Ramana, M.V., Nair, R.R., Sarma, K.V.L.N.S., Ramprasad, T., Krishna, K.S., Subrahmanyam,V., D'Cruz, M., Subrahmanyam, C., Paul, J., Subrahmanyam, A.S., Sekhar, D.V.C.,1994. Mesozoic anomalies in the Bay of Bengal. Earth and Planetary Science Letters121, 469–475.
Ramana, M.V., Krishna, K.S., Ramprasad, T., Desa, M., Subrahmanyam, V., Sarma, K., 2001.Structure and tectonic evolution of the northeastern Indian Ocean. Indian Ocean - aPerspective, vols. 1 and 2. A A Balkema Publishers, Rotterdam, pp. 731–816.
Rangin, C., Jolivet, L., Pubellier, M., 1990. A simple model for the tectonic evolution ofsoutheast Asia and Indonesia region for the past 43 my. Bulletin de la SociétéGéologique de France 8, 889–905.
Rea, D.K., Dixon, J.M., 1983. Late Cretaceous and Paleogene tectonic evolution of theNorth Pacific Ocean. Earth and Planetary Science Letters 65, 145–166.
Reeves, C., 2000. The geophysical mapping of Mesozoic dyke swarms in southern Africaand their origin in the disruption of Gondwana. Journal of African Earth Sciences30, 499–513.
Reeves, C., DeWit, M., 2000. Making endsmeet in Gondwana: retracing the transforms ofthe Indian Ocean and reconnecting continental shear zones. Terra Nova 12, 272–280.
Richards, M.A., Jones, D.L., Duncan, R.A., Depaolo, D.J., 1991. A mantle plume initiationmodel for the formation of Wrangellia and other oceanic flood basalt plateaus.Science 254, 263–267.
Riisager, P., Hall, S., Antretter, M., Zhao, X., 2003. Paleomagnetic paleolatitude of EarlyCretaceous Ontong Java Plateau basalts: implications for Pacific apparent andtrue polar wander. Earth and Planetary Science Letters 208, 235–252.
Robb, M.S., Taylor, B., Goodliffe, A.M., 2005. Re examination of the magnetic lineationsof the Gascoyne and Cuvier Abyssal Plains, off NW Australia. Geophysical JournalInternational 163 (1), 42–55.
Robertson, A.H.F., 2000. Mesozoic–Tertiary tectonic–sedimentary evolution of a southTethyan oceanic basin and its margins in southern Turkey. Geological Society,London, Special Publications 173, 97–138.
Roeser, H.A., Fritsch, J., Hinz, K., 1996. The development of the crust off DronningMaud Land,East Antarctica. In: Storey, B.C., King, E.C., Livermore, R.A. (Eds.), Weddell Sea Tectonicsand Gondwana Break-upGeological Society, London, Special Publications 108, 243–264.
Roeser, H., Steiner, C., Schreckenberger, B., Block, M., 2002. Structural development ofthe Jurassic Magnetic Quiet Zone off Morocco and identification of Middle Jurassicmagnetic lineations. Journal of Geophysical Research 107, 2207.
Roest, W.R., Srivastava, S.P., 1989. Seafloor spreading in the Labrador Sea: a new recon-struction. Geology 17, 1000–1004.
Roest, W., Srivastava, S., 1991. Kinematics of the plate boundaries between Eurasia, Iberia,andAfrica in theNorthAtlantic from the Late Cretaceous to thepresent. Geology19, 613.
Rosa, J.W.C., Molnar, P., 1988. Uncertainties in reconstructions of the Pacific, Farallon,Vancouver, and Kula plates and constraints on the rigidity of the Pacific andFarallon (and Vancouver) plates between 72 and 35 Ma. Journal of GeophysicalResearch 93, 2997–3008.
Rosenbaum, G., Lister, G.S., Duboz, C., 2002. Relative motions of Africa, Iberia andEurope during Alpine orogeny. Tectonophysics 359, 117–129.
Rosenbaum, G., Giles, D., Saxon, M., Betts, P.G., Weinberg, R.F., Duboz, C., 2005. Subduc-tion of the Nazca Ridge and the Inca Plateau: insights into the formation of ore de-posits in Peru. Earth and Planetary Science Letters 239, 18–32.
Rosencrantz, E., Ross, M.I., Sclater, J.G., 1988. Age and spreading history of the CaymanTrough as determined from depth, heat flow and magnetic anomalies. Journal ofGeophysical Research 93, 2141–2157.
Rosendahl, B.R., Moberly, R., Halunen, A.J., Rose, J.C., Kroenke, L.W., 1975. Geologicaland geophysical studies of the Canton Trough region. Journal of GeophysicalResearch 80, 2565–2574.
Ross, M., Scotese, C., 1988. A hierarchical tectonic model of the Gulf of Mexico andCaribbean region. Tectonophysics 155, 139–168.
Rowley, D.B., Lottes, A.L., 1988. Plate-kinematic reconstructions of the North Atlanticand Arctic: Late Jurassic to present. Tectonophysics 155, 73–120.
Royer, J.-Y., Chang, T., 1991. Evidence for relative motions between the Indian andAustralian plates during the last 20 m.y. from plate tectonic reconstructions: impli-cations for the deformation of the Indo-Australian plate. Journal of GeophysicalResearch 96, 11779–11802.
Royer, J.-Y., Coffin, M.F., 1992. Jurassic to Eocene plate tectonic reconstructions in theKerguelen Plateau region. In: S.W., Wise, J., Julson, A.P., Schlich, R., Thomas, E.(Eds.), Proceedings of the Ocean Drilling Program, Scientific Results, vol. 120.Ocean Drilling Program, Texas A&M University, College Station, TX, pp. 917–930.
Royer, J.-Y., Patriat, P., Bergh, H., Scotese, C.R., 1988. Evolution of the Southwest IndianRidge from the Late Cretaceous (anomaly 34) to the middle Eocene (anomaly 20).Tectonophysics 155, 235–260.
Royer, J.Y., Gordon, R.G., 1997. The motion and boundary between the Capricorn andAustralian plates. Science 277, 1268–1274.
Ru, K., Pigott, J.D., 1986. Episodic rifting and subsidence in the South China Sea. AmericanAssociation of Petroleum Geologists Bulletin 70, 1136–1155.
Russell, S.M., Whitmarsh, R.B., 2003. Magmatism at the west Iberia non-volcanic riftedcontinental margin: evidence from analyses of magnetic anomalies. GeophysicalJournal International 154, 706–730.
Sager, W.S., Pringle, M.S., 1987. Tectonic evolution of the Central Pacific during the Cre-taceous Quiet Period. EOS Transactions American Geophysical Union 68, 44–45.
Sager, W.W., Fullerton, L.G., Buffler, R.T., Handschumacher, D.W., 1992. Argo AbyssalPlain magnetic lineations revisited: implications for the onset of seafloor spreadingand tectonic evolution of the eastern Indian Ocean. Proceedings of the Ocean Dril-ling Program, Scientific Results 123 (College Station, Texas, ODP).
Sager, W., 2005. What built Shatsky Rise, a mantle plume or ridge tectonics? GeologicalSociety of America Special Papers 388, 721.
Sager, W., Handschumacher, D., Hilde, T., Bracey, D., 1988. Tectonic evolution of thenorthern Pacific plate and Pacific–Farallon Izanagi triple junction in the Late Jurassicand Early Cretaceous (M21–M10). Tectonophysics 155, 345–364.
Sager, W.W., Weiss, C.J., Tivey, M.A., Johnson, H.P., 1998. Geomagnetic polarity reversalmodel of deep-towprofiles from thePacific Jurassic Quiet Zone. Journal of GeophysicalResearch-Solid Earth 103, 5269–5286.
Sager, W.W., Kim, J., Klaus, A., Nakanishi, M., Khankishieva, L.M., 1999. Bathymetry ofShatsky Rise, northwest Pacific Ocean: implications for ocean plateau developmentat a triple junction. Journal of Geophysical Research-Solid Earth 104, 7557–7576.
Sagong, H., Kwon, S., Ree, J., 2005. Mesozoic episodic magmatism in South Korea and itstectonic implication. Tectonics 24.
Sahabi, M., Aslanian, D., Olivet, J., 2004. A new starting point for the history of the cen-tral Atlantic. Comptes Rendus Geoscience 336, 1041–1052.
Sakaguchi, A., 1996. High paleogeothermal gradient with ridge subduction beneath theCretaceous Shimanto accretionary prism, southwest Japan. Geology 24, 795.
Sandwell, D.T., Smith, W.H.F., 1997. Marine gravity anomaly from Geosat and ERS-1satellite altimetry. Journal of Geophysical Research-Solid Earth 102,10039–10054.
Sandwell, D.T., Smith, W.H.F., 2005. Retracking ERS-1 altimeter waveforms for optimalgravity field recovery. Geophysical Journal International 163, 79–89.
Sandwell, D., Smith, W., 2009. Global marine gravity from retracked Geosat and ERS-1altimetry: ridge segmentation versus spreading rate. Journal of Geophysical Re-search 114.
Sashida, K., Igo, H., Hisafa, K.I., Nakornsri, N., Ampornmaha, A., 1993. Occurrence of Pa-leozoic and Early Mesozoic radiolaria in Thailand (preliminary report). Journal ofSoutheast Asian Earth Sciences 8, 97–108.
Sayers, J., Symonds, P.A., Direen, N.G., Bernadel, G., 2001. Nature of the continent–oceantransition on the non-volcanic rifted margin in the central Great Australian Bight.In: Wilson, R.C.L., Whitmarsh, R.B., Taylor, B., Froitzheim, N. (Eds.), Non-volcanicrifting of continental margins: a comparison of evidence from land and sea, Vol-ume Special Publication, Geological Society of London, pp. 51–76.

269M. Seton et al. / Earth-Science Reviews 113 (2012) 212–270
Schaefer, B.F., Turner, S., Parkinson, I., Rogers, N., Hawkesworth, C., 2002. Evidence forrecycled Archaean oceanic mantle lithosphere in the Azores plume. Nature 420,304–307.
Schettino, A., Scotese, C.R., 2005. Apparent polar wander paths for the major continents(200 Ma to the present day): a palaeomagnetic reference frame for global platetectonic reconstructions. Geophysical Journal International 163, 727–759.
Schettino, A., Turco, E., 2009. Breakup of Pangaea and plate kinematics of the centralAtlantic and Atlas regions. Geophysical Journal International 178, 1078–1097.
Scotese, C.R., 1991. Jurassic and cretaceous plate tectonic reconstructions. Palaeogeography,Palaeoclimatology, Palaeoecology 87, 493–501.
Scotese, C.R., Gahagan, L.M., Larson, R.L., 1988. Plate tectonic reconstructions of theCretaceous and Cenozoic ocean basins. Tectonophysics 155, 27–48.
Scrutton, R.A., Heptonstall, W.B., Peacock, J.H., 1981. Constraints on the motion of Mad-agascar with respect to Africa. Marine Geology 43, 1–20.
Sdrolias, M., Müller, R.D., 2006. The controls on back-arc basin formation. Geochemistry,Geophysics, Geosystems 7, Q04016. doi:10.1029/2005GC001090.
Sdrolias, M., Müller, R.D., Gaina, C., 2003a. Tectonic evolution of the SW Pacific usingconstraints from back-arc basins. In: Hillis, R., Müller, R.D. (Eds.), Evolution andDynamics of the Australian Plate, Geological Society of Australia Special Publication22 and Geological Society of America Special Paper.
Sdrolias, M., Müller, R.D., Gaina, C., 2003b. Tectonic evolution of the Southwest Pacificusing constraints from backarc basins. In: Hills, R.R., Müller, R.D. (Eds.), Evolutionand Dynamics of the Australian Plate. Geological Society of Australia Special Publi-cation, vol. 22, pp. 343–359.
Sdrolias, M., Müller, R.D., Mauffret, A., Bernardel, G., 2004. Enigmatic formation of theNorfolk Basin, SW Pacific: a plume influence on back-arc extension. Geochemistry,Geophysics, Geosystems 5, Q06005.
Searle, R., Bird, R., Rusby, R., Naar, D., 1993a. The development of two oceanic micro-plates: Easter and Juan Fernandez microplates, East Pacific Rise. Journal of theGeological Society 150, 965.
Searle, R., Holcomb, R., Wilson, J., Holmes, M., Whittington, R., Kappel, E., Mcgregor, B.,Shor, A., 1993b. The Molokai fracture zone near Hawaii, and the Late Cretaceouschange in Pacific/Farallon spreadingdirection. TheMesozoic Pacific:Geology, Tectonics,and Volcanism: A Volume in Memory of Sy Schlanger, p. 155.
Segoufin, J., Patriat, P., 1980. Existence d'anomalies mesozoîques dans le bassin de Mo-zambique. Comptes Rendus de l'Academie des Sciences 287, 109–112.
Sengor, A., 1987. Tectonics of the Tethysides: orogenic collage development in a colli-sional setting. Annual Review of Earth and Planetary Sciences 15, 213–244.
Sengör, A.M.C., Cin, A., Rowley, D.B., S-Y, N., 1993. Space-time patterns of magmatismalong the Tethysides: A Preliminary Study. Journal of Geology 101, 51–84.
Seton, M., Müller, R., 2008. Reconstructing the junction between Panthalassa and Tethyssince the Early Cretaceous. Eastern Australasian Basins III, p. 263ñ266.
Seton, M., Gaina, C., Müller, R.D., Heine, C., 2009. Mid-Cretaceous seafloor spreadingpulse: fact or fiction? Geology 37, 687.
Seton, M., Whittaker, J., Flament, N., Müller, R., Gurnis, M., in preparation. A case for atop-down plate reorganization at 50 Ma. Nature Geosciences, v.
Shaw, P., Cande, S.C., 1990. High-resolution inversion for South Atlantic plate kinematicsusing joint altimeter and magnetic anomaly data. Journal of Geophysical Research95, 2625–2644.
Shephard, G.E., Bunge, H.P., Schuberth, B.S.A., Müller, R.D., Talsma, A.S., Moder, C.,Landgrebe, T.C.W., 2012. Testing absolute plate reference frames and the implica-tions for the generation of geodynamic mantle heterogeneity structure. Earthand Planetary Science Letters 317–318, 204–217.
Shi, G., Archbold, N., 1998. Permian marine biogeography of SE Asia. Biogeography andGeological Evolution of SE Asia. Backhuys, Leiden, p. 57ñ72.
Sibuet, J., Srivastava, S., Spakman, W., 2004. Pyrenean orogeny and plate kinematics.Journal of Geophysical Research 109, B08104.
Sibuet, J., Srivastava, S., Manatschal, G., 2007. Exhumed mantle-forming transitionalcrust in the Newfoundland–Iberia rift and associated magnetic anomalies. Journalof Geophysical Research 112, B06105.
Silva, E.A., Miranda, J., Luis, J., Galdeano, A., 2000. Correlation between the Palaeozoicstructures from West Iberian and Grand Banks margins using inversion of magnet-ic anomalies. Tectonophysics 321, 57–71.
Simpson, E.S.W., Sclater, J.G., Parsons, B., Norton, I.O., Meinke, L., 1979. Mesozoicmagneticlineations in theMozambique Basin. Earth and Planetary Science Letters 43, 260–264.
Singh, S.C., Carton, H., Chauhan, A.S., Androvandi, S., Davaille, A., Dyment, J., Cannat, M.,Hananto, N.D., 2010. Extremely thin crust in the Indian Ocean possibly resultingfrom Plume–Ridge Interaction. Geophysical Journal International.
Sinton, C., Duncan, R., Storey, M., Lewis, J., Estrada, J., 1998. An oceanic flood basaltprovince within the Caribbean plate. Earth and Planetary Science Letters 155,221–235.
Sisson, V.B., Pavlis, T.L., 1993. Geologic consequences of plate reorganization: An exam-ple from the Eocene southern Alaska fore arc. Geology 21, 913.
Skogseid, J., Planke, S., Faleide, J., Pedersen, T., Eldholm, O., Neverdal, F., 2000. NE Atlanticcontinental rifting and volcanic margin formation. Dynamics of the NorwegianMargin, vol. 167, p. 295ñ326.
Sleep, N.H., Toksoz, M.N., 1971. Evolution of marginal seas. Nature 233, 548–550.Small, C., Abbott, D., 1998. Subduction obstruction and the crack-up of the Pacific plate.
Geology 26, 795–798.Smith, A.G., Hallam, A., 1970. The fit of the southern continents. Nature 225, 139–144.Sokolov, S., Ye, B., Morozov, O., Shekhovtsov, V., Glotov, S., Ganelin, A.,
Kravchenko-Berezhnoy, I., 2002. South Anjui suture, northeast Arctic Russia.Tectonic Evolution of the Bering Shelf-Chukchi Sea-Arctic Margin and AdjacentLandmasses, pp. 209–223.
Speed, R.C., 1985. Cenozoic collision of the Lesser Antilles arc and continental SouthAmerica and the origin of the El Pilar fault. Tectonics 4, 41–69.
Speranza, F., Villa, I., Sagnotti, L., Florindo, F., Cosentino, D., Cipollari, P., Mattei, M.,2002. Age of the Corsica–Sardinia rotation and Liguro–Provençal basin spreading:new paleomagnetic and Ar/Ar evidence. Tectonophysics 347, 231–251.
Srivastava, S.P., 1985. Evolution of the Eurasian Basin and its implication to the motionof Greenland along Nares Strait. Tectonophysics 114, 29–53.
Srivastava, S.P., Roest,W.R., 1989, Seafloor spreading history II–IV, in East Coast BasinAtlasSeries: Labrador Sea, J.S. Bell (co-ordinator). Atlantic Geoscience Centre, GeologicSurvey of Canada, Map sheets L17-2–L17-6.
Srivastava, S.P., Roest, W.R., 1996. Porcupine plate hypothesis — comment. MarineGeophysical Researches 18, 589–593.
Srivastava, S.P., Tapscott, C.R., 1986. Plate kinematics of the North Atlantic. In: Vogt,R.R., Tucholke, B.E. (Eds.), The Western North Atlantic Region, Volume M: The Ge-ology of North America. Geol. Soc. Am., pp. 379–405.
Srivastava, S., Schouten, H., Roest, W., Klitgord, K., Kovacs, L., Verhoef, J., Macnab, R., 1990.Iberian plate kinematics: a jumping plate boundary between Eurasia and Africa.
Srivastava, S.P., Sibuet, J.C., Cande, S., Roest, W.R., Reid, I.D., 2000. Magnetic evidence forslow seafloor spreading during the formation of the Newfoundland and Iberianmargins. Earth and Planetary Science Letters 182, 61–76.
Stadler, G., Gurnis, M., Burstedde, C.,Wilcox, L., Alisic, L., Ghattas, O., 2010. The dynamics ofplate tectonics and mantle flow: From local to global scales. Science 329, 1033.
Stagg, H.M.J., Willcox, J.B., 1992. A case for Australia–Antarctica separation in theNeocomian (c.a. 125 Ma). Tectonophysics 210, 21–32.
Stamatakos, J.A., Trop, J.M., Ridgway, K.D., 2001. Late Cretaceous paleogeography ofWrangellia: paleomagnetism of the MacColl Ridge Formation, southern Alaska,revisited. Geology 29, 947–950.
Stampfli, G.M., Borel, G.D., 2002. A plate tectonic model for the Paleozoic and Mesozoicconstrained by dynamic plate boundaries and restored synthetic oceanic iso-chrons. Earth and Planetary Science Letters 196, 17–33.
Stampfli, G.M., 2000. Tethyan Oceans. In: Bozkurt, E., Winchester, J.A., Piper, J.D.A.(Eds.), Tectonics and Magmatism in Turkey and the Surroundings AreaGeologicalSociety, London, Special Publications 173, 1–23.
Steinberger, B., Torsvik, T., 2008. Absolute plate motions and true polar wander in theabsence of hotspot tracks. Nature 452, 620–623.
Stock, J., Molnar, P., 1987. Revised history of early Tertiary plate motion in the south-west Pacific. Nature 325, 495–499.
Stock, J., Molnar, P., 1988. Uncertainties and implications of the Late Cretaceous andTertiary position of North America relative to the Farallon, Kula, and Pacific plates.Tectonics 7, 1339–1384.
Stock, J., Luyendyk, B., Clayton, R., Party, S.S., 1998. Tectonics and structure of the ManihikiPlateau,western PacificOcean. EOSTransactions of theAmericanGeophysical Union 79.
Stocklin, J., 1974. Possible ancient continental margins in Iran. The Geology of Conti-nental Margins, pp. 873–887.
Storey, M., Mahoney, J.J., Saunders, A.D., Duncan, R.A., Kelley, S.P., Coffin, M.F., 1995.Timing of hot spot-related volcanism and the breakup of Madagascar and India.Science 267, 852–855.
Storey, B.C., Leat, P.T., Ferris, J.K., 2001. The location of mantleplume centers during theinitial stages of Gondwana breakup. Mantle Plumes: Their Identification ThroughTime, pp. 71–80.
Straub, S., Goldstein, S., Class, C., Schmidt, A., 2009. Mid-ocean-ridge basalt of Indiantype in the northwest Pacific Ocean basin. Nature Geoscience 2, 286–289.
Sun,W., Ding, X., Hu, Y.-H., Li, X.-H., 2007. The golden transformation of the Cretcaous platesubduction in the west Pacific. Earth and Planetary Science Letters 262, 533–542.
Sutherland, R., Hollis, C., 2001. Cretaceous demise of the Moa Plate and strike-slip mo-tion at the Gondwana margin. Geology 29, 279–282.
Symonds, P.A., Colwell, J.B., Struckmeyer, H.I.M., Willcox, J.B., Hill, P.J., 1996. Mesozoicrift basin development off eastern Australia. Mesozoic Geology of the EasternAustralia Plate, vol. 43. Geological Society of Australia, Brisbane, pp. 528–542.
Talwani, M., Eldholm, O., 1977. Evolution of the Norwegian–Greenland Sea. GeologicalSociety of America Bulletin 88, 969–999.
Tamaki, K., Larson, R.L., 1988. The Mesozoic tectonic history of the Magellan microplatein the western Central Pacific. Journal of Geophysical Research 93, 2857–2874.
Tankard, A.J., Welsink, H.J., 1987. Extensional tectonics and stratigraphy of Hibernia OilField, Grand Banks, Newfoundland. American Association of Petroleum GeologistsBulletin 71, 1210–1232.
Taylor, B., 2006. The single largest oceanic plateau: Ontong Java-Manihiki-Hikurangi.Earth and Planetary Science Letters 241, 372–380.
Taylor, B., Karner, G., 1983. On the evolution of marginal basins. Reviews of Geophysics21, 1727–1741.
Taylor, P.T., Kovacs, L.C., Vogt, P.R., Johnson, G.L., 1981. Detailed aeromagnetic investi-gation of the Arctic Basin. II. Journal of Geophysical Research 86, 6323–6333.
Tebbens, S.F., Cande, S.C., 1997. Southeast Pacific tectonic evolution from early Oligoceneto Present. Journal of Geophysical Research-Solid Earth 102, 12061–12084.
Thorkelson, D.J., 1996. Subduction of diverging plates and the principles of slab win-dow formation. Tectonophysics 255, 47–63.
Tikku, A.A., Cande, S.C., 1999. The oldest magnetic anomalies in the Australian–AntarcticBasin: are they isochrons? Journal of Geophysical Research 104, 661–677.
Tikku, A.A., Cande, S.C., 2000. On the fit of Broken Ridge and Kerguelen plateau. Earthand Planetary Science Letters 180, 117–132.
Tivey, M., Sager, W., Lee, S., Tominaga, M., 2006. Origin of the Pacific Jurassic quiet zone.Geology 34, 789.
Todd, B., Reid, I., Keen, C., 1988. Crustal structure across the southwest Newfoundlandtransform margin. Canadian Journal of Earth Sciences 25, 744–759.
Tominaga, M., Sager, W.W., 2010. Revised Pacific M‐anomaly geomagnetic polaritytimescale. Geophysical Journal International 182, 203–232.
Tominaga, M., Sager, W.W., Tivey, M.A., Lee, S.M., 2008. Deep-tow magnetic anomalystudy of the Pacific Jurassic Quiet Zone and implications for the geomagnetic

270 M. Seton et al. / Earth-Science Reviews 113 (2012) 212–270
polarity reversal timescale and geomagnetic field behavior. Journal of GeophysicalResearch 113, B07110.
Tomurtogoo, O., Windley, B., Kroner, A., Badarch, G., Liu, D., 2005. Zircon age and occur-rence of the Adaatsag ophiolite and Muron shear zone, central Mongolia: constraintson the evolution of the Mongol–Okhotsk ocean, suture and orogen. Journal of theGeological Society 162, 125.
Torsvik, T., Steinberger, B., Cocks, L., Burke, K., 2008. Longitude: linking Earth's ancientsurface to its deep interior. Earth and Planetary Science Letters 276, 273–282.
Torsvik, T., Rousse, S., Labails, C., Smethurst, M., 2009. A new scheme for the opening ofthe South Atlantic Ocean and the dissection of an Aptian salt basin. GeophysicalJournal International 177, 1315–1333.
Totterdell, J., Blevin, J., Bradshaw, B., Colwell, J., Kennard, J., 2000. A new sequence frame-work for the Great Australian Bight: starting with a clean slate. The APPEA Journal 95.
Trop, J.M., Ridgway, K.D., Manuszak, J.D., Layer, P., 2002. Mesozoic sedimentary-basindevelopment on the allochthonous Wrangellia composite terrane, WrangellMountains basin, Alaska: a long-term record of terrane migration and arc construc-tion. Geological Society of America Bulletin 114, 693.
Tucholke, B., Whitmarsh, R., 2006. The Newfoundland–Iberia conjugate rifted margins.Principles of Phanerozoic Regional Geology.
Tucholke, B., Sawyer, D., Sibuet, J., 2007. Breakup of the Newfoundland Iberia rift.Geological Society London Special Publications 282, 9.
Umpleby, D., 1979. Geology of the Labrador shelf. Geological Survey of CanadaCommission Gèologique du Canada.
Unternehr, P., Curie, D., Olivet, J.L., Goslin, J., Benzarty, P., 1988. South Atlantic fits andintraplate boundaries in Africa and South America. Tectonophysics 155, 169–179.
Uyeda, S., Kanamori, H., 1979. Back-arc opening and the mode of subduction. Journal ofGeophysical Research 84, 1049–1061.
Van Der Lelij, R., Spikings, R., Kerr, A., Kounov, A., Cosca, M., Chew, D., Villagomez, D.,2010. Thermochronology and Tectonics of the Leeward Antilles: evolution of theSouthern Caribbean Plate Boundary Zone and accretion of the Bonaire Block.
Van Der Voo, R., Spakman, W., Bijwaard, H., 1999a. Mesozoic subducted slabs underSiberia. Nature 397, 246–249.
Van Der Voo, R., Spakman, W., Bijwaard, H., 1999b. Tethyan subducted slabs underIndia. Earth and Planetary Science Letters 171, 7–20.
Veevers, J.J., 2000. Change of tectono-stratigraphic regime in the Australian plateduring the 99 Ma (mid-Cretaceous) and 43 Ma (mid-Eocene) swerves of the Pacific.Geology 28, 47–50.
Veevers, J., 2006. Updated Gondwana (Permian–Cretaceous) earth history of Australia.Gondwana Research 9, 231–260.
Veevers, J.J., 1988. Morphotectonics of Australia's north-western margin - a review. In:Purcell, P.G., Purcell, R.R. (Eds.), The North West Shelf of Australia: Petroleum Ex-ploration Society of Australia Symposium: Perth, pp. 19–27.
Veevers, J.J., Tayton, J.W., Johnson, B.D., 1985. Prominent magnetic anomaly alongthe continent–ocean boundary between the northwestern margin of Australia(Exmouth and Scott plateaus) and the Argo abyssal plain. Earth and PlanetaryScience Letters 72, 415–426.
Veevers, J.J., Stagg, H.M.J., Willcox, J.B., Davies, H.L., 1990. Pattern of slow seafloor spread-ing (b4mm/year) from breakup (96Ma) to A20 (44.5Ma) off the southernmargin ofAustralia. BMR Journal of Australian Geology and Geophysics 11, 499–507.
Viso, R.F., Larson, R.L., Pockalny, R.A., 2005. Tectonic evolution of the Pacific-Phoenix-Farallon triple junction in the South Pacific ocean. Earth and Planetary Science Let-ters 233, 179–194.
Vry, J., Baker, J., Maas, R., Little, T., Grapes, R., Dixon, M., 2004. Zoned (Cretaceous andCenozoic) garnet and the timing of high grade metamorphism, Southern Alps:New Zealand. Journal of Metamorphic Geology 22, 137ñ157.
Weissel, J.K., Anderson, R.N., Geller, C.A., 1980. Deformation of the Indo-AustralianPlate. Nature 287, 284–291.
Wessel, P., Kroenke, L., 2008. Pacific absolute plate motion since 145Ma: an assessmentof the fixed hot spot hypothesis. Journal of Geophysical Research 113, B06101.
Wessel, P., Harada, Y., Kroenke, L.W., 2006. Toward a self-consistent, high-resolution absoluteplate motion model for the Pacific. Geochemistry, Geophysics, Geosystems 7, Q03L12.
Whitechurch, H., Juteau, T., Montigny, R., 1984. Role of the Eastern Mediterraneanophiolites (Turkey, Syria, Cyprus) in the history of the Neo-Tethys. GeologicalSociety, London, Special Publications 17, 301–317.
Whitmarsh, R.B., Miles, P.R., 1995. Models of the development of the West Iberia riftedcontinental margin at 40-degrees-30′N deduced from surface and deep-tow mag-netic anomalies. Journal of Geophysical Research-Solid Earth 100, 3789–3806.
Whittaker, J., Müller, R.D., Leitchenkov, G., Stagg, H., Sdrolias, M., Gaina, C., Goncharov,A., 2007. Major Australian–Antarctica plate reorganization at Hawaiian-Emperorbend time. Science 318, 83–86.
Williams, P., Johnston, C., Almond, R., Simamora, W., 1988. Late Cretaceous to earlyTertiary structural elements of West Kalimantan. Tectonophysics 148, 279–297.
Wilson, D.S., 1988. Tectonic history of the Juan de Fuca Ridge over the last 40 millionyears. Journal of Geophysical Research 33, 11,863–11,876.
Wilson, D.S., 1996. Fastest known spreading on theMiocene Cocos‐Pacific plate boundary.Geophysical Research Letters 23, 3003–3006.
Wilson, D.S., Hey, R.N., Nishimura, C., 1984. Propagation as a mechanism of reorienta-tion of the Juan de Fuca Ridge. Journal of Geophysical Research 89, 9215–9225.
Winterer, E., 1976. Anomalies in the tectonic evolution of the Pacific. In: Sutton, G.,Manghnani, M., Moberly, R. (Eds.), The Geophysics of the Pacific Ocean Basin andits Margins. AGU, Washington D.C., pp. 269–278.
Winterer, E., Lonsdale, P., Matthews, J., Rosendahl, B., 1974. Structure and acoustic stra-tigraphy of the Manihiki Plateau. Deep Sea Research 21, 793–814.
Withjack,M.O., Schlische, R.W., Olsen, P.E., 1998. Diachronous rifting, drifting, and inversionon the passive margin of central eastern North America — an analog for other passivemargins. AAPG Bulletin-American Association of Petroleum Geologists 82, 817–835.
Woods, M.T., Davies, G.F., 1982. Late Cretaceous genesis of the Kula plate. Earth andPlanetary Science Letters 58, 161–166.
Worthington, T.J., Hekinian, R., Stoffers, P., Kuhn, T., Hauff, F., 2006. Osbourn Trough:structure, geochemistry and implications of a mid-Cretaceous paleospreadingridge in the South Pacific. Earth and Planetary Science Letters 245, 685–701.
Zorin, Y.A., 1999. Geodynamics of the western part of the Mongolia-Okhotsk collisionalbelt, Trans-Baikal region (Russia) and Mongolia. Tectonophysics 306, 33–56.