annual report 2011-12 - National Centre for Earth Science ...
100
ANNUAL REPORT 2011-12 Centre for Earth Science Studies Akkulam, Thiruvananthapuram - 695 031, India
-
Upload
khangminh22 -
Category
Documents
-
view
0 -
download
0
Transcript of annual report 2011-12 - National Centre for Earth Science ...
ANNUAL REPORT 2011-12
Centre for Earth Science Studies
Akkulam, Thiruvananthapuram - 695 031, India

Editorial Board
Dr. N. P. Kurian (Director)
Dr. N. Subhash (Chairman)
Dr. G. R. Ravindra Kumar (Member)
Ms. Sheela Nair (Member)
Sri. S.Sidharthan (Convener)
Secretarial Assistance
Ms.Sindhu Kumari M I
Mr.Sreekanth Pai D
i
CESS Annual Report 2011-2012C
on
ten
ts
Contents
Preface……………………………………………………………………………............................................................... v
1. Earth System Dynamics1.1. Crustal Evolution and Geodynamics
1.1.1 Metasedimentary rocks of the Kerala Khondalite belt: petrology and Geodynamics of their formation................... 11.1.2 Mafic igneous activity......................................................................................................................................... 31.1.3 Tectonothermal History of the Kerala Khondalite Belt ...................................................................................... 41.1.4 Graphitization process in Kollam District, Kerala, India...................................................................................... 61.1.5 Late Quaternary sediments in the coastal wetlands, Kollam district, Kerala........................................................... 71.1.6 Spatio-temporal shore changes during Holocene and tracing the evolutionary history of the Ashtamudi Estuary, 7
Southern Kerala................................................................................................................................................1.1.7 Quaternary evolution of the coastal plains of central Kerala............................................................................... 10
1.2. Atmospheric Processes1.2.1 Measurement of cloud parameters and cloud modelling......................................................................................... 111.2.2 Continuous measurement of ambient carbon monoxide ....................................................................................... 121.2.3 Solar Ultraviolet-B and atmospheric trace constituents in relation to climate change .............................................. 121.2.4 Rainfall validation and characterization: cloud physics studies using megha-tropiques data .................................... 13
1.3. Coastal Processes1.3.1 Shoreline Management Plan for Kerala coast ...................................................................................................... 131.3.2 Study on Depletion of Heavy Mineral Content in the Beach washings of IREL, Chavara................................... 14
2. Natural Hazards2.1. Landslides
2.1.1 Investigation of landslides and land subsidence..................................................................................................... 172.1.2 Human-induced land modifications and its impacts: A study in Thodupuzha taluk, Idukki district, Kerala ......... 17
2.2. Earthquake Monitoring2.2.1 Seismicity in Idukki region ................................................................................................................................ 182.2.2 Monitoring Indian Shield Seismicity with 10 BBS to understand Seismotectonics of the region using VSat
connectivity........................................................................................................................................................ 192.3. Tsunami
2.3.1 Tsunami and Storm Surge Inundation Modelling and Mapping for the Coasts of Kerala, Karnataka, Goa,Maharashtra and Lakshadweep........................................................................................................................... 20
2.3.2 Establishment of Wave Gauge Stations along the Coastal Waters of Kerala....................................................... 212.3.3 Oil Spill Modelling for Selected Locations of Kerala and Lakshadweep................................................................ 21
3. Natural Resources and Management3.1. Water Resources
3.1.1 Appraisal of drinking water potential of springs in Pathanamthitta, Kottayam and Idukki districts of Kerala.... 233.1.2 Water and sediment quality monitoring and assessment of estuaries of Kerala: a case study from Kochi estuary
and Periyar river................................................................................................................................................ 233.1.3 Environmental impact assessment of major settlement distribution patterns and infrastructure development,
with emphasis on drinking water facilities in Thiruvananthapuram district, Kerala .............................................. 243.2. Terrain Analysis and Landuse Studies
3.2.1 Study of landuse/land cover changes as linked to climate change in Kerala ..................................................... ... 253.2.2 Valley formation and geomorphic processes under tropical wet and dry climate: Examples from Kerala ................... 253.2.3 Assessment and monitoring of land quality for sustainable agriculture: a GIS based approach coupled with
technology implementation.................................................................................................................................. 263.2.4 Land system analysis of Kabani river basin in Wayanad district, Kerala............................................................... 26

ii
CESS
Ann
ual R
epor
t 2
011-
2012
Co
nte
nts
3.2.5 River bank mapping: Methodology development and coordination ......................................................................... 263.2.6 River bank mapping of Ittikkara river................................................................................................................ 27
3.3. Environmental Assessment3.3.1 Effect of Urbanization on the buildup of urban heat island in Kochi ................................................................. 273.3.2 Exploring inter relationship between environmental degradation and poverty: selected micro-level case studies
across Kerala ..................................................................................................................................................... 283.3.3 Study of urbanization between Kochi and Thrissur............................................................................................. 283.3.4 Tropical freshwater Myristica swamps of Kerala and its ecological and evolutionary significance............................. 293.3.5 Environmental degradation of Muvattupuzha river basin, causes, consequences and strategies for river restoration.. 303.3.6 Nitrous oxide and methane in coastal ocean and estuaries..................................................................................... 313.3.7 Environmental management plan for Alappuzha-Sherthalai canal and Kanjikuzhy grama panchayat ................... 313.3.8 Coastal Ocean Monitoring and Prediction System, COMAPS............................................................................ 32
3.4 Coastal Zone Management3.4.1 Cadastral scale Coastal Regulation Zone maps for Coastal Zone Management of urban areas in Kerala............... 33
. 3.4.2 Integrated Island Management Plans (IIMPS) for Lakshadweep islands 343.5 Biophotonics
3.5.1 Diffuse Reflectance Imaging for Gingival Mapping and Antimicrobial Photodynamic Therapy............................ 343.5.2 Sunlight-induced multi-spectral fluorescence imaging system for vegetation assessment............................................ 363.5.3 Monitoring the impact of environmental changes in corals of Lakshadweep archipelago by fluorescence imaging.... 37
3.6 GIS and Remote Sensing Applications in Natural Resources Management3.6.1 Agricultural Atlas of Kerala............................................................................................................................. 383.6.2 Digital Resource Atlas of Kerala....................................................................................................................... 383.6.3 Cadastral Level Decision Support System for Management of Natural Resources in Thiruvananthapuram
District.............................................................................................................................................................. 393.6.4 Natural resources and environmental data base updation and utilization for local level planning in Kerala-
Database infrastructure support.......................................................................................................................... 403.6.5 Soil based Plant Nutrient Management Plan for the agro-ecosystems of Kerala.................................................... 403.6.6 Road network updation using high resolution remote sensing data and GPS - A pilot project for Kerala
Spatial Data Infrastructure (KSDI)................................................................................................................... 413.6.7 Creation of a model GIS database for Malappuram Municipality under the Spatial Urban Information
System (SUIS).................................................................................................................................................. 423.7 Energy Studies
3.7.1 The Social impacts of energy technologies: Two case studies at different environs of Thiruvananthapuramdistrict............................................................................................................................................................... 42
3.8 Climate Change Studies3.8.1 Effect of urbanization on the buildup of urban heat island in Kochi................................................................... 42
4. Consultancy Programmes4.1 Coastal Regulation Zone Status Reports .......................................................................................................................... 43
5. List of Projects5.1. Grant-in-aid projects…………………………………………………....................................................................... 455.2. Consultancy projects…………………………………………………........................................................................ 495.3. Plan Projects…………………………………………………………...................................................................... 525.4. R & D Library infrastructure projects………………………………………............................................................ 555.5. R & D building infrastructure projects……………………………....................................................................... 56
6. Honours, Awards & Academic Activities6.1. Honours & Awards................................................................................................................................................... 576.2. Membership in Committees............................................................................................................................................. 576.3. Visits Abroad................................................................................................................................................................ 58

iiiCESS Annual Report 2009-2010
CESS Annual Report 2011-2012C
on
ten
ts
6.4 Internship / Summer Training…………………………......................................................................................... 586.5. Ph. D Students.......................................................................................................................................................... 596.6. Post Graduate Studentship Programme........................................................................................................................... 606.7 M.Sc / B.Tech / M.Tech Dissertation Programmes....................................................................................................... 61
7. Library .................................................................................................................................................................. 63
8. Publications8.1 Research Papers8.1.1. In Journals…………………………………………………….............................................................................. 658.1.2. In Conference Proceedings/Books.…………………………………………............................................................ 668.2. Project Reports………………………………………………………................................................................... 68
9. Conference, Seminar, Workshop9.1 Inauguration of the Ocean State Forecast System for Kerala............................................................................................... 719.2 Brain Storming Workshop on Earth System Sciences and Natural Resources Management.............................................. 719.3 Prof. C. Karunakaran Endowment Lecture Series........................................................................................................ 729.4. High level meeting of Hazard Vulnerability and Risk Assessment (HVRA) cell........................................................... 739.5 Launching of the project on Green Technology Centres in selected Grama Panchayats of Kerala...................................... 749.6 Workshop on Vembanad Management Plan................................................................................................................... 749.7 Brainstorming workshop on ‘Philosophy and Research Methodology and Geography’........................................................ 749.8 National Wetlands Day................................................................................................................................................. 749.9 Invited Lectures............................................................................................................................................................. 749.10 Conference/ Workshop / Symposium / Seminar Attended............................................................................................ 76
10. Extension10.1 World Wetland Day 2012............................................................................................................................................. 7910.2 Earth Day 2011........................................................................................................................................................... 7910.3 National Science Day 2012........................................................................................................................................... 8010.4 Exhibition.................................................................................................................................................................... 8010.5 Lectures for students..................................................................................................................................................... 8010.6 Earth Science Forum..................................................................................................................................................... 8110.7 Earth Watch Centre...................................................................................................................................................... 81
11. Committees11.1. Statutory Committees……………………………………………………............................................................. 8311.2. Internal Committees……………………………………………………................................................................ 84
12. Staff Details12.1. Director’s Office…………………………………………………………............................................................. 8712.2. Atmospheric Sciences Division…………………………………………................................................................... 8712.3. Chemical Sciences Division………………………………………………............................................................... 8712.4 Central Geomatics Laboratory....................................................................................................................................... 8712.5. Environmental Sciences Division………………………………………................................................................... 8712.6. Geosciences Division……………………………………………………................................................................ 8712.7. Marine Sciences Division……………………………………………….................................................................. 8712.8. Resources Analysis Division……………………………………………................................................................. 8712.9. Training & Extension Division………………………………………................................................................... 8712.10. Library…………………………………………………………………............................................................. 8712.11. Camp Office, Kochi…………………………………………………….............................................................. 8812.12. Administration…………………………………………………………............................................................ 88
iv
CESS
Ann
ual R
epor
t 2
011-
2012
Co
nte
nts
12.13. New Recruitments.......................................................................................................................................................... 8812.14. Retirements……………………………………………………………................................................................. 8812.15. Obituary....................................................................................................................................................................... 89
13. Balance Sheet……………………………………………………………......................................................... 91

vCESS Annual Report 2009-2010
CESS Annual Report 2011-2012
Preface
Preface
I have great pleasure in presenting this Annual Report of CESS for
the year 2011-12. This reporting period continued to be another
creditable year for CESS in its efforts to grow as a leading R & D
centre in the country in the field of Earth Sciences. CESS continued
to undertake R&D activities for the improved knowledge of earth’s
processes for sustainable development of our natural resources,
conservation of environment and mitigation of natural hazards
in accordance with its stated objectives. Notable are the implemen-
tation of 44 sponsored R & D projects and consultancy service to
several public/private sector undertakings and agencies from dif-
ferent parts of the country, thus assuring a role for CESS in the
developmental programmes of the country and in generating nec-
essary funds to cater to the establishment and infrastructure costs.
CESS continued to enhance its infrastructural facilities. The year
saw setting up of a modern Geo Fluids Research Laboratory
equipped with Digital Microscope and a miniature type fluores-
cence spectrometer. Efforts were on to set up a National Micro
Laser Raman Spectrometer facility with funding from Ministry of
Earth Sciences. A Brain Storming Workshop on Earth System
Sciences and Natural Resources Management with the objective of
working out a frame work for the future research agenda of CESS
was organized, inviting distinguished Geoscientists from across
the country, during July 21-22, 2011. The 12th
Plan proposals were
prepared and submitted incorporating research recommendations
that emerged during deliberations in the Workshop.
The focus of R & D activities of CESS continued under the fol-
lowing broad themes: Crustal Evolution and Geodynamics, Natural
Hazards, Coastal Processes and Management, Atmospheric Pro-
cesses, Natural Resources and Environmental Management.
Programmes under geodynamics and crustal evolution studies fo-
cused on topics like palaeomagnetism, petrology, fluid inclusion
studies, seismicity and terrain analysis and land subsidence investi-
gations. Geochemical studies on Cretaceous dykes in Kerala traced
them to two distinctive mantle sources at different depths formed
by different degrees of partial melting. The igneous activity was
interpreted in terms of final breakup of Gondwana from the
Seychelles and the Madagascar and the geodynamic evolution of
the Indian Ocean region in terms of Reunion and Marion plume
activity. Whole rock major and trace element geochemistry and
mineral chemistry of the granulite facies rocks from the Kerala
Khondalite belt have been carried out to understand the
tectonothermal history and crustal growth mechanism in the
southern granulite terrain in India. Isotopic investigations on
charnockites of Precambrian southern granulite terrain were also
carried out during this period. A project funded by the MoES,
Government of India to study the palaeo fluids in the sediment
fills of the Petroliferous Basins of Western Offshore including
the offshore basins of Kerala was taken up in collaboration with
the Oil and Natural Gas Corporation (ONGC).
CESS continued studies on palaeoenvironmental and
palaeoclimatic aspects of Quaternary sediments of the southern
Kerala coast. The studies unfolded many geological events that
have taken place in the Holocene – the time span representing
the past 10,000 years in the geologic calendar. The studies re-
vealed the rapid terregenous flux under the rising spells of sea
level in the Early Holocene.
Investigation of different hazards, and providing inputs for
disaster preparedness and mitigation, was another core activity
of CESS. Around 100 tremors were recorded and catalogued at
our Peechi seismic observatory. A few earthquake and land sub-
sidence incidents were investigated. A new project to under-
stand soil piping phenomena was initiated. Our studies docu-
mented the significant control the occurrence/non-occurrence
and migration of mudbank has on the shoreline changes and
erosion/accretion along Munambam-Chettuwa coastal zone.
Erosion along the Neendakara-Alappad coastal sector was at-
tributed to beach sand mining and construction of coastal struc-
tures such as breakwaters, groins and seawalls. Tsunami inunda-
tion mapping based on numerical modeling was prepared for
the west coast upto Mumbai.
CESS continued to monitor solar ultraviolet B radiation and
minor constituents such as ozone, water vapour, carbon mon-
oxide besides carrying out a major programme on cloud physics
and precipitation. The abnormal modulation of atmospheric
parameters associated with 2004 Tsunami was studied. Proxim-
ity of thunder clouds and probability of lightning strikes was
continuously measured over a mountain valley using an electric
field mill designed and modified in CESS. Thundercloud for-
mation and electrical charging processes in relation to precipita-
tion is a key area of current scientific investigations. Study of
water to air fluxes of methane and nitrous oxide, their concen-
tration and distribution in the estuarine and oceanic waters found
that estuarine production and discharge are the major sources of
these greenhouse gases in the coastal waters.

vi
CESS Annual Report 2011-2012
Preface
CESS implemented a number of projects on natural resources
management covering wide ranging subjects like assessment of
land system, analysis of terrain character, geomorphic evolu-
tion, nature of valley formation, quality of land for sustainable
agricultural development, trend of urbanization, study on land
use change as linked to climate change and settlement system,
and drinking water condition. Water conservation activities were
continued in Chadayamangalam Block in selected 20 water sheds
under Hariyali Project. Environmental impact assessment stud-
ies were carried out at different locations of the State for differ-
ent activities such as sand extraction, brick clay mining, soil quar-
rying, hard rock quarrying.
CESS continued to provide consultancy to Government De-
partments and Public/Private Sector Undertakings on earth sci-
ence related topics. Detailed geophysical survey was carried out
in the Special Security Zone in and around the Sri Padmanabha
Swami temple using electrical resistivity sounding and profiling
to explore and map subsurface features. We also undertook a
detailed study for the Indian Rare Earths Ltd. to address the
causative factors for depletion of heavy mineral content along
the Chavara coast. CESS initiatives in preparation of cadastral
level Coastal Regulation Zone (CRZ) maps have enabled local
bodies to make decisions on coastal development with a per-
spective of Integrated Coastal Zone Management (ICZM). Such
maps have been prepared for Kollam and Thiruvananthapuram
Corporations and work is in progress for Kochi Corporation
and Maradu municipality.
CESS Library added 11 new books and subscribed to 50 jour-
nals and online data base on ‘Environment Complete’ pub-
lished by EBSCO. Our academic programme continued to be
vibrant with as many as 28 registered students and three Ph.D
awards during the year. CESS provided studentship to 8 stu-
dents among the 33 students who did their M.Sc/M.Tech dis-
sertations. Mr. S. Vishnu Mohan and Ms. V. Dhanya secured
Young Scientist Award and Best Poster Award respectively un-
der the theme of Earth System Studies and Geo-informatics in
the 24th
Kerala Science Congress organized by the KSCSTE. Our
publication record was moderately good with 31 papers pub-
lished in national/international journals.
The year witnessed the organization of several seminars/work-
shops/outreach programmes on different aspects of Earth Sci-
ences. The 10th
Professor C. Karunakaran Endowment Lecture
was delivered by Prof. Raghuram Murtugudde of University of
Maryland. The first High Level Meeting of the Hazard Vulner-
ability and Risk Assessment Cell under the Disaster Manage-
ment Department of Govt. of Kerala was held at CESS on 12th
May 2011. The inauguration of the Ocean State Forecast System
for the Kerala Coast, followed by a workshop at Vizhinjam
harbour on 16th
July 2011, to educate coastal community about
the use of sea state forecast system was significant. A National
Brain Storming Workshop on Philosophy and Research Method-
ology in Geography was held during 7-8 December 2011. Observa-
tion of World Wetland Day, Earth Day and Science Day, and partici-
pation in Exhibitions, lectures for students were the other high-
lights of our outreach programmes.
The year was notable for the initiation of a proposal by Govern-
ment of Kerala for take over of CESS by the Ministry of Earth
Sciences, Government of India. As a result of this effort and our
continued and sustained advancement in earth science related re-
search activities we are at the door steps of achieving status as
national Centre for Earth Sciences. The guidance and support re-
ceived from the KSCSTE, Research Council, and Management
Committee, and the unrelenting cooperation and support from
the scientists and staff have been great driving force in our accom-
plishments. Acknowledging their support and cooperation, I
present this Annual Report before you.
Dr.N.P.Kurian
Director
1
CESS Annual Report 2011-2012
Ea
rth Syste
m D
yna
mics
1
Earth System Dynamics
1.1 Crustal Evolution and Geodynamics
1.1.1 Metasedimentary rocks of the Kerala Khondalite
belt: petrology and Geodynamics of their formation
The Kerala Khondalite Belt (KKB) has rekindled interest because
of its location, proximity and similarity in tectonic style, metamor-
phism and age pattern to Sri Lanka and Madagascar. However,
inadequate comprehensive data set, specifically on the structural
and geochrnonological aspects, have been major constraints in
understanding the evolution of KKB, in turn southern India,
with respects its position within East Gondwana. The Petrologic
and geochemical studies so far on rocks from the KKB as well as
investigations on the structural geology within the Achenkovil Shear
Zone (ASZ) have presented results of studies on the develop-
ment of arrested charnockites, the migmatisation of metapelites
and garnet-biotite gneisses and the generation of leucogranites,
geochemistry and thermobarometric evolution of the main litholo-
gies and on the mineral chemical and whole rock isotope dating of
rocks. These studies presented a complex tectono-metamorphic
history spanning most of the Proerozoic era and continuing to the
Pan-African. One of the aspects overlooked was on the nature of
origin and interrelation between different gneissic variants, includ-
ing charnockite types (arrested and massive). Major goal of this
project was to address this problem by detailed quarry based field
examination and trace and REE analysis of closely spaced samples.
New sets of mineral chemical data generated by us were in confor-
mity with the published data and with reports constraining the P–
T conditions of metamorphism of KKB. We applied improved
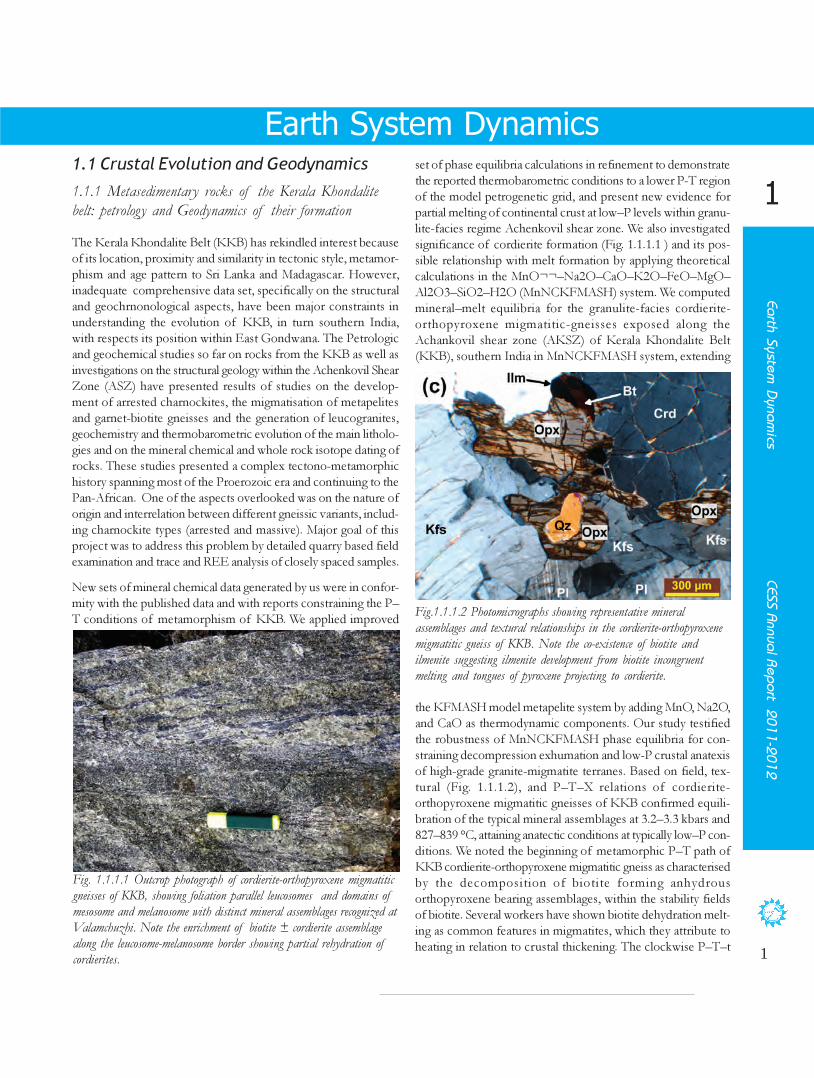
Fig. 1.1.1.1 Outcrop photograph of cordierite-orthopyroxene migmatitic
gneisses of KKB, showing foliation parallel leucosomes and domains of
mesosome and melanosome with distinct mineral assemblages recognized at
Valamchuzhi. Note the enrichment of biotite ± cordierite assemblage
along the leucosome-melanosome border showing partial rehydration of
cordierites.
Fig.1.1.1.2 Photomicrographs showing representative mineral
assemblages and textural relationships in the cordierite-orthopyroxene
migmatitic gneiss of KKB. Note the co-existence of biotite and
ilmenite suggesting ilmenite development from biotite incongruent
melting and tongues of pyroxene projecting to cordierite.
set of phase equilibria calculations in refinement to demonstrate
the reported thermobarometric conditions to a lower P-T region
of the model petrogenetic grid, and present new evidence for
partial melting of continental crust at low–P levels within granu-
lite-facies regime Achenkovil shear zone. We also investigated
significance of cordierite formation (Fig. 1.1.1.1 ) and its pos-
sible relationship with melt formation by applying theoretical
calculations in the MnO¬¬–Na2O–CaO–K2O–FeO–MgO–
Al2O3–SiO2–H2O (MnNCKFMASH) system. We computed
mineral–melt equilibria for the granulite-facies cordierite-
orthopyroxene migmatitic-gneisses exposed along the
Achankovil shear zone (AKSZ) of Kerala Khondalite Belt
(KKB), southern India in MnNCKFMASH system, extending
the KFMASH model metapelite system by adding MnO, Na2O,
and CaO as thermodynamic components. Our study testified
the robustness of MnNCKFMASH phase equilibria for con-
straining decompression exhumation and low-P crustal anatexis
of high-grade granite-migmatite terranes. Based on field, tex-
tural (Fig. 1.1.1.2), and P–T–X relations of cordierite-
orthopyroxene migmatitic gneisses of KKB confirmed equili-
bration of the typical mineral assemblages at 3.2–3.3 kbars and
827–839 °C, attaining anatectic conditions at typically low–P con-
ditions. We noted the beginning of metamorphic P–T path of
KKB cordierite-orthopyroxene migmatitic gneiss as characterised
by the decomposition of biotite forming anhydrous
orthopyroxene bearing assemblages, within the stability fields
of biotite. Several workers have shown biotite dehydration melt-
ing as common features in migmatites, which they attribute to
heating in relation to crustal thickening. The clockwise P–T–t

2
CESS
Ann
ual R
epor
t 2
011-
2012
Eart
h Sy
stem
Dyn
amic
s
1
Fig. 1.1.1.3 P–T–X pseudosection showing derived phase relations oftypical mineral assemblages and solidus-suprasolidus separation in relationto cordierite and biotite stability. The metamorphic P–T path (arrow)typically follows clockwise array, showing isothermal decompression forcrustal evolution.
path (Fig. 1.1.1.3) implies crustal thickening-related heating as thecause for dehydration melting. Experiments have proved that thebiotite dehydration reaction can generate ~30% melts in rocks,contributing to the formation of migmatitic gneisses ranging frommetatexites to diatexites as observed in the cordierite-orthopyroxene
migmatitic gneisses of KKB. The sequence of reactions involvingthe formation cordierite-orthopyroxene-melt assemblage is con-sistent with an isothermal decompression (with a pressure dropof >1.5 kbars) at high temperatures (>800 °C), forming leucosomes.Biotite dehydration melting reactions, occurring above 4.5 kbarsconstrain prograde arm of the P–T trajectory which we interpretedas a product of crustal thickening, which was followed by rapiddecompression. Our conclusions indicate low–P metamorphismand anatexis can be traced to convergent setting, where melt buoy-ancy considerably decreases density of the lithosphere and modi-fies rheology leading to rapid exhumation of the lower crust. There-fore, the crustal evolution in the Kerala Khondalite Belt is corre-lated with two stage processes: (i) thickening of the crust in relationto a continental-arc setting, followed by (ii) exhumation along ahigh-temperature stable geotherm with sufficient pressure releaseassociated with syn- to post-convergence transpression and
Fig. 1.1.1.4 Field relations in the high-K metagranites. Note patchesof arrested charnockite overprinting gneissic fabric adjacent topegmatite veins.
transtension.
In the KKB, potasic and sodic types of granitoids are interlayeredin meter to kilometer scale and occur dominantly towards southand southwestern part of the KKB. Gneisses with conspicu-ous augen texture dominate towards the northeastern marginof KKB along the Achankovil zone. Strong foliation is notedin both sodic and potassic types defined by bands of quartzo-feldspathic and mafic mineralogy (Fig. 1.1.1.4). Nature of con-tact between each type is not clear to permit field based classifica-tions. High-grade metamorphism and deformation has largelymodified the contact and earlier structure. In field, gneisses aremedium to coarse-grained with marked inequigranularity ofthe minerals, foliation, and preferred orientation of the feldsparand biotite grains. We examined gneissic variants disposition,interrelation and genesis from different angles by applying fieldbased techniques, petrographic characteristics, mineral chemicalchanges and trace and REE analysis. These results were synthe-
sized and integrated to interpret their space and time relations
New petrological and geochemical data with the available geo-chronology of the high-K granites of the KKB were successfulin defining the nature and origin of these granites and theirgeodynamic setting. Geochemical exercise documented linearvariation of major and trace elements on Harker diagrams sug-gesting an igneous origin of the gneisses. We recognized comple-mentary major element patterns in the two rock groups withK2O/Na2O higher (>1) in high-K granites, while increase inNa2O content in tonalites. Our focus on metagranitoids docu-mented high-K granites to have a narrow silica range (64–73 wt%), high K2O/Na2O ratios (1.08–3.34), with all samples show-ing high-K affiliation, low Nb/La (0.07-0.27) and La/Th (1.60-
3
CESS Annual Report 2011-2012
Ea
rth Syste
m D
yna
mics
1
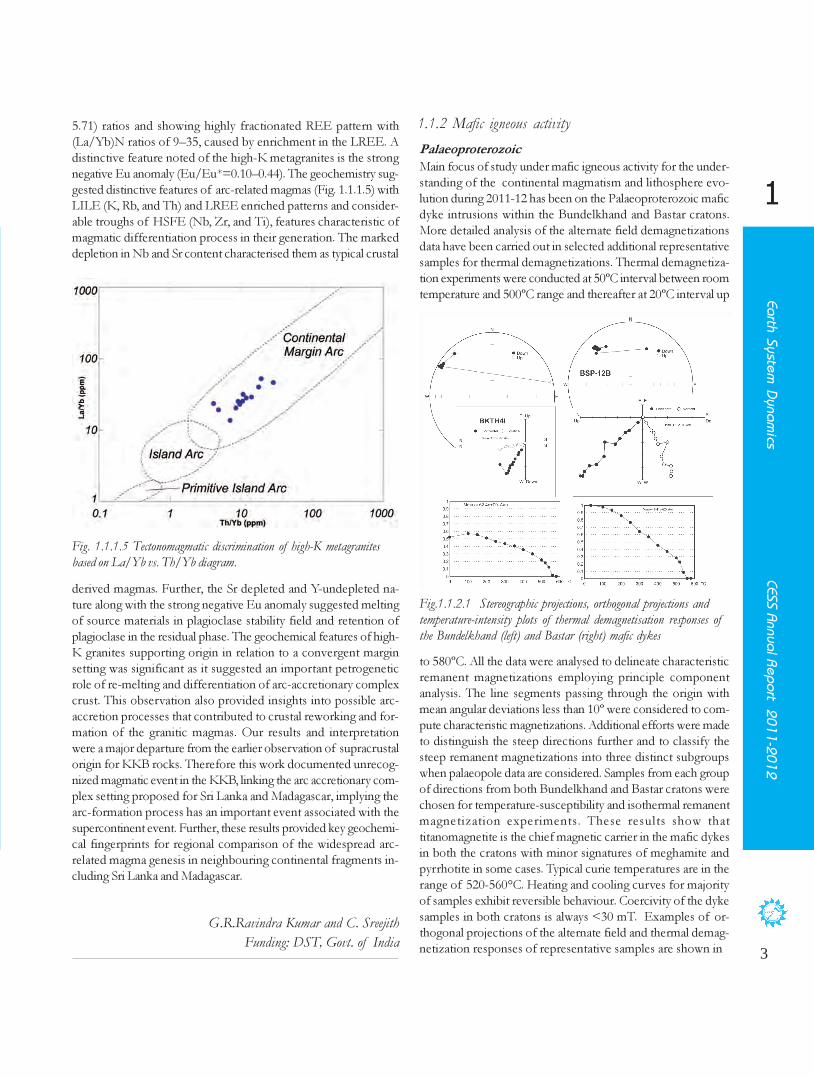
Fig. 1.1.1.5 Tectonomagmatic discrimination of high-K metagranites
based on La/Yb vs. Th/Yb diagram.
5.71) ratios and showing highly fractionated REE pattern with
(La/Yb)N ratios of 9–35, caused by enrichment in the LREE. A
distinctive feature noted of the high-K metagranites is the strong
negative Eu anomaly (Eu/Eu*=0.10–0.44). The geochemistry sug-
gested distinctive features of arc-related magmas (Fig. 1.1.1.5) with
LILE (K, Rb, and Th) and LREE enriched patterns and consider-
able troughs of HSFE (Nb, Zr, and Ti), features characteristic of
magmatic differentiation process in their generation. The marked
depletion in Nb and Sr content characterised them as typical crustal
derived magmas. Further, the Sr depleted and Y-undepleted na-
ture along with the strong negative Eu anomaly suggested melting
of source materials in plagioclase stability field and retention of
plagioclase in the residual phase. The geochemical features of high-
K granites supporting origin in relation to a convergent margin
setting was significant as it suggested an important petrogenetic
role of re-melting and differentiation of arc-accretionary complex
crust. This observation also provided insights into possible arc-
accretion processes that contributed to crustal reworking and for-
mation of the granitic magmas. Our results and interpretation
were a major departure from the earlier observation of supracrustal
origin for KKB rocks. Therefore this work documented unrecog-
nized magmatic event in the KKB, linking the arc accretionary com-
plex setting proposed for Sri Lanka and Madagascar, implying the
arc-formation process has an important event associated with the
supercontinent event. Further, these results provided key geochemi-
cal fingerprints for regional comparison of the widespread arc-
related magma genesis in neighbouring continental fragments in-
cluding Sri Lanka and Madagascar.
G.R.Ravindra Kumar and C. Sreejith
Funding: DST, Govt. of India
1.1.2 Mafic igneous activity
Palaeoproterozoic
Fig.1.1.2.1 Stereographic projections, orthogonal projections and
temperature-intensity plots of thermal demagnetisation responses of
the Bundelkhand (left) and Bastar (right) mafic dykes
Main focus of study under mafic igneous activity for the under-
standing of the continental magmatism and lithosphere evo-
lution during 2011-12 has been on the Palaeoproterozoic mafic
dyke intrusions within the Bundelkhand and Bastar cratons.
More detailed analysis of the alternate field demagnetizations
data have been carried out in selected additional representative
samples for thermal demagnetizations. Thermal demagnetiza-
tion experiments were conducted at 50ºC interval between room
temperature and 500ºC range and thereafter at 20ºC interval up
to 580ºC. All the data were analysed to delineate characteristic
remanent magnetizations employing principle component
analysis. The line segments passing through the origin with
mean angular deviations less than 10º were considered to com-
pute characteristic magnetizations. Additional efforts were made
to distinguish the steep directions further and to classify the
steep remanent magnetizations into three distinct subgroups
when palaeopole data are considered. Samples from each group
of directions from both Bundelkhand and Bastar cratons were
chosen for temperature-susceptibility and isothermal remanent
magnetization experiments. These results show that
titanomagnetite is the chief magnetic carrier in the mafic dykes
in both the cratons with minor signatures of meghamite and
pyrrhotite in some cases. Typical curie temperatures are in the
range of 520-560°C. Heating and cooling curves for majority
of samples exhibit reversible behaviour. Coercivity of the dyke
samples in both cratons is always <30 mT. Examples of or-
thogonal projections of the alternate field and thermal demag-
netization responses of representative samples are shown in

4
CESS Annual Report 2011-2012
Ea
rth Syste
m D
yna
mics
1
1.1.3 Tectonothermal History of the Kerala Khondalite
Belt
T. Radhakrishna
Funding: DST, GoI
Trace Element Chemistry
Fig. 1.1.2.2 (a) Nb/Y vs Zr/Y plot for samples of 85-90 Ma and
65-70 Ma dykes compared with Madagascan ferrotholeiites and (b)
Diagram comparing the dykes and Madagascan basalts with the upper
and lower bounds on data obtained for lavas from the Iceland
Neovolcanic zone. Details of procedures for fractional melting curves
shown for garnet and spinel lherzolite, melt parameters and partition
coefficients in (a) and sources for different fields marked in (b) and
additional explanation are in the original source (Radhakrishna and
Mathew Joseph, Geol. Soc. Am. Bull., 2011; doi: 10.1130/
B30288.1). ( : central Kerala leucogabbro; : north Kerala
leucogabbro; : Agali-Coimbatore dolerite) and the open symbols
represent 65-70 Ma dykes ( : central Kerala dolerites; : north
Kerala dolerites). Stars denote high Mg-Ti basalts of Madagascar.
figure 1.1.2.1. Some of the sites which failed to obtain within-
site coherence were discarded. Other sites with good within-site
coherence are classified into distinct groups of remanent mag-
netization components and calculated between-site mean for
each set of directions. Interestingly there is a good one to one
correspondence between the distinct directions delineated from
Bundelkhand and Bastar cratons. Efforts were made to inte-
grate the recent zircon/baddeleyite U-Pb isotope dates and also
to make correlations with the remanent magnetizations of the
South Indian shield in order to assign ages to the discrete mag-
netizations.
Late Cretaceous
With regard to the Cretaceous mafic dykes in Kerala along the west-
ern coastal stretch of India, our earlier results of palaeomagnetism
and geochemistry were further analysed to characterise magma com-
positions and their petrogenetic history, palaeopole determinations
and compare with the synthetic apparent polar wander path pro-
posed based on data from all other continents. Further the data
were analysed to assess the true polar wander contributions and
the mantle plume evolution in the Indian Ocean region. The data
clearly distinguishes two distinct magmas that cannot be genetically
related to have occurred so near in age at 65 Ga and 85-90 Ma.
Several comparisons could be drawn between the 65-70 Ma dykes
and the Deccan flood basalts and the 85-90 Ma dykes and the
Madagascan magmatism. Petrogenetic interpretations advocate a
low degree of melting of garnet lherzolite mantle at depths corre-
sponding to transition zone for the older dykes, whereas, the
younger dykes are the products of moderate melting of spinel
lherzolite mantle at shallower depths. These two magma types
were linked to the Reunion and Marion mantle plume activity and
to the breakup between India and Seychelles and India-Seychelles
and Madagascar. The pole data for the 85-90 Ma suggest that the
true polar wander contribution is minimal whereas the interpreta-
tions on the contribution from true polar wander for the 65-70 Ma
dykes are equivocal. The results were interpreted in terms of migra-
tion of Marion and Reunion plumes in the Indian Ocean region.
These interpretations are consistent with the interpretations and
predictions for the mantle plume migrations based on Global
Mantle Circulation Models in the Indian Ocean region.
Additional geochemical and palaeomagnetic work has been carried
out to further constrain the interpretations that have been carried
out under the Indo French Cooperation for Promotion of Ad-
vanced Research (IFCPAR) project and interpretations are under
progress.
Trace elements and REE whole rock analyses of 37 rock samples
were carried out at the National Geophysical Research Institute
(NGRI), Hyderabad, India, using a Perkin Elmer ICPMS - Elan
DRC II instrument and three granite standards (USGS standards
G-1 and G-2; Japanese standard granite JG-2). Significantly, the
following major & trace element relationships were brought out
and have been ploted. SiO2
(Wt%) Vs TiO2
(Wt%), Normative
Qts Vs TiO2
(Wt%), MgO (Wt%), FeO (Wt%), Co (Wt%), Nb
(Wt%), Normative Opx – Ilm Vs TiO2
(Wt%), Y(ppm). Fig. 1.1.3.1
and Fig. 1.1.3.2: The relationship between TiO2 and SiO2 is repre-

5
CESS Annual Report 2011-2012
Ea
rth Syste
m D
yna
mics
1
Fig. 1.1.3.3 The relationship between TiO2 and SiO2 is representative
of most FM components – TiO2 decreases with increasing SiO2, and so
Fig. 1.1.3.1 The relationship between TiO2 and SiO2 is representative
of most FM components – TiO2 decreases with increasing SiO2, and so
does FeO and MgO
Fig. 1.1.3.2 The relationship between TiO2 and SiO2 is representative
of most FM components – TiO2 decreases with increasing SiO2, and so
does FeO and MgO
Fig. 1.1.3.4 The relationship between TiO2 and SiO2 is representative
of most FM components – TiO2 decreases with increasing SiO2, and so
does FeO and MgO
sentative of most FM components – TiO2 decreases with in-
creasing SiO2, and so does FeO and MgO (Fig. 1.1.3.3 and Fig.
1.1.3.4). Leucogranites define this trend well, and migmatites
follow it to lower SiO2 but with more scatter. This reflects the
fact that both biotite and ilmenite contribute to the TiO2 bud-
get in migmatites whereas in the leucogranites ilmenite is the
main player. The normative Qz plot gives an improved picture
of this because the SiO2 invovled with feldspars and ‘pyroxene’
phases is accounted for. This shows that some distinct rocks
with low normative Qz have high TiO2 – reflecting high Il-
menite modal proportions.
One way to consider the role of garnet or other FM phases is to
look at normative Opx- corrected for ilmenite component (as
that may take up trace elements like Co, Y, Nb etc). Leucogranites
display clear relations between normative Opx-Ilm and TiO2
and also Y, which suggests a role for biotite (Ti) and garnet (Y).
Migmatites mostly continue the trend in terms of Ti but not in
terms of Y – this clearly demonstrates that the Y-host is not the
Ti-host. The Y-host is garnet.
The Nb-Co plot indicates that Co in leucogneisses is in the
ilmenite. In some migmatites it has to occur in another phase as
well (e.g. magnetite), or the ilmenite has to have higher Co. The
correlation of Y with Nb in the leucogneisses is likely to reflect
the petrographic observation that garnet and ilmenite + magne-
tite increase in abundance together, and that garnet often has
ilmenite or magnetite inclusions. Most leucogranites, and many
migmatites, appear to consist of mixtures of melt + variable
Grt + Ilm (Mgt - magnetite) residua or crystals.
Fig. 1.1.3.5 shows the spectrum of REE patterns for all gneisses
classified on the basis of major element chemistry as leucogranites
/ granites. Fractionated LREE patterns are typical, but HREE
and Eu display differences that reflect non-melt compositional
factors involving Grt and feldspars.
The REE chemistry indicates that the leucogranites are seldom
just simply ‘melts’ - they vary due to some fractionation, but
more importantly they are liquid + crystal mixes, with minor /
moderate residual material (e.g. Grt + Bt + Sill. maybe Qz) in
some, peritectic Grt (and ilm?) in others, all of these perhaps in
some, and only in a few cases is the result simply crystallised melt
(forming minimum-melt compositions of Qz-Kfs-Plag-Grt-
Ilm-Apat / Mnz etc).
Monazite Mineral Textures and Chemistry
Monazite microanalysis (samples KAI, KUL and KNJ) was pre-
ceded by detailed SEM imaging using secondary and back-scat-
tered electrons. Selected examples of monazite textural relation-
ships and internal structures that reflect chemical variations were
studied in detail. The consistency of the data obtained is eluci-
dated by Fig. 1.1.3.6.
Zircon Ti Thermometry

6
CESS Annual Report 2011-2012
Ea
rth Syste
m D
yna
mics
1
Nandakumar V, Simon L Harley* & Anoop S. S
*Professor of Lower Crustal Process, University of Edinburgh.
Fig. 1.1.3.5 Leucogranite REE
1.1.4 Graphitization process in Kollam District, Kerala,
India
minerals. In cases where the coexisting Ti-phase is a mineral other
than rutile, such as ilmenite or Ti-magnetite, the a TiO2
will be less
than unity and the temperatures calculated will only be minimal.
This situation applies to all four of the samples studied from the
KKB, as the coexisting ‘Ti saturating” phase is either ilmenite or
magnetite-ilmenite solid solution in all cases. For this reason, Ti-
in-zircon temperatures are reported in Table -1 for a selection of
effective a TiO2
values, and those temperatures obtained for unit Ti
activity are minimal. In all cases the temperatures have been calcu-
lated using the calibration of Ferry & Watson (2007).
Fig. 1.1.3.6 Monazite-Brabantite-Huttonite diagram (Th+U+Si)
versus (REE+Y+P) for samples from the KKB.
The incorporation of Ti in zircon has been calibrated as a
geothermometer in recent experimental studies by Watson and
co-workers. For actual temperatures to be determined it is neces-
sary that the zircon is buffered by the presence of rutile and
quartz, and that equilibrium has been attained between the three
The objectives of the project are to identify and classify different
types of graphite, associated with different environments, based
on their physico-chemical characteristics (associations), to characterise
the graphite by XRD, SEM, TGA techniques and to find out the
source of Carbon of Graphitization by stable carbon isotope stud-
ies.
Extensive field work was conducted in three taluks of Kollam
district and graphite-bearing and associated rock samples having
different mineral assemblages were collected from Khondolite suite
of rocks and its variants like Quartzofeldspathic gneiss, Garnet-
Biotite gneiss and Garnetiferrous Biotite Sillimanite gneiss. Graphite
is mainly associated with garnet and biotite and in some cases, there
is an association of sillimanite also. The sampling locations are
Nilamel, Azhanthakkuzhi, Cherukara, Chithara, Boundary Mukku,
Ottumala, Karalikonam and Manjappara (Kottarakkara Taluk),
Arayil (Kollam Taluk) and Eyyappacha (Pathanapuram Taluk).
Five samples were analysed for XRD, SEM, TGA and Stable Car-
bon Isotopes. The samples were crushed to separate the graphite
flakes, which were hand picked and treated with 1:1 HCL and kept
on a hot plate at about 1000
C, to remove iron oxides and carbon-
ates, several times till the supernatent solution becomes colourless.
This was followed by heating with HF to make them free of sili-
cates. The samples thus treated were washed throughly, dried and
powdered in agate mortar.
The results available for selected graphite samples were compared
and compiled. The X-Ray diffractograms reveal the orderly nature
of graphite as evidenced by sharp and well defined peaks, having
interplanar spacing (d002
) values between 3.34A0
to 3.35A0
& 1.67A0
to 1.68A0
. The values are strictly in concordance with those for
highly ordered standard graphite, crystallized with a hexagonal frame
work having perfect hexagonal layers of carbon atoms show paral-
Table. 1.1.3.1 Ti in Zircon Temperatures for KKB Samples
7
CESS Annual Report 2011-2012
Ea
rth Syste
m D
yna
mics
1
lel ordered stacking sequence. The SEM photomicrographs display
a unique morphology of six-sided basal sections, perfect mica-
ceous cleavage and arrangements of well formed individual layers
in a regular book - type stacking sequence. The thermal decompo-
sition pattern exhibited by TGA fluctuates from sample to sample,
with regard to the starting and maximum decomposition tem-
perature. The stable carbon isotope values fall in the range of – 6.4
0
/00
to -22.3 0
/00.
Remaining work is in progress.
Ansom Sebastian
1.1.5 Late Quaternary sediments in the coastal wetlands,
Kollam district, Kerala
It was followed subsequently by a spell of dry climate around 5
- 4 kyr BP and period of high rainfall in the beginning of Late
Holocene. These changing climate events of the Holocene had
significant role in carbon sequestration in the wetlands and also
reddening of sediments in the exposed areas. Quantitative esti-
mation carried out (as an example) in the Polachira wetland of
the Paravur Lake reveals that this wetland system holds an
amount of 30.94 million tonnes of clay dominant sediments
(on dry basis) up to a level of about 10m below ground level
(bgl). The estimated quantity of organic and inorganic carbon in
the sediments are 1.24 million tonnes and 0.31 million tonnes,
respectively. This clearly indicates that the wetlands in this part of
the west coast plays a pivotal role in trapping substantial quanti-
ties of carbon and other green house gases, which are otherwise
return to the atmosphere imparting marked changes in regional
climate.Kerala has a wetland wealth of 127930 ha comprising 34,200 ha of
inland wetlands and 93730 ha of coastal wetlands (Nair, 2007). The
coastal wetlands in southern Kerala, south of Achankovil Shear
Zone, especially around Kollam, show antecedent characteristics
and are seen incised on the Neogene sediments. The Ashtamudi
lake and Paravur lake are the major wetlands in Kollam district.
These wetlands enfold 20 - 35 m thick deposits of Holocene (the
geologic time span representing the past 10,000 years) sediments
containing many proxy evidences of landform evolution and cli-
mate changes. Holocene sedimentation in these basins was initi-
ated at about 8920 ±110 yrs BP and is represented mainly by sub-
fossil wood/peat or carbonaceous clays. The borehole cores gener-
ally exhibit a coarsening upward sequence comprising fluvially de-
rived coarse to medium grained sands at the top followed down-
ward by an organic matter rich, silt and clay dominated sediments
resting uncoformably over an erosional surface. The borehole cores
in the upper estuarine region of the Ashtamudi basin reveal that
the cores are capped further by 2 – 4m thick yellowish brown, silt
and clay rich sediments with higher ä13
Corg
and ä15
N values indicat-
ing marine affinity of originally deposited sediments, that have
been later subjected to post depositional changes. The similarity in
the C14
ages of a wood sample (7490 ± 90 yrs BP) and the embed-
ding sediments (7480 ± 80 yrs BP) at 5m bgl of the Pangod bore-
hole core indicates heavy discharge of sediments from the uplands
and, quick burial of vegetation during Early Holocene. Palynologi-
cal analysis of the Kallada borehole core shows that Holocene
sedimentation in the depositional site took place under marine /
nearly marine environment and later changed to brackish water and
finally to fresh water environment.
An overall evaluation of the proxy evidences in the sedimentary
archives reveals that southern Kerala has experienced dramatic
changes in climate and sea level during Holocene period. The changes
are well recorded in the sedimentary deposits of the coastal low-
lands of the state. The sedimentological, geochronological, pa-
lynological and stable isotopic studies carried out in the borehole
samples collected from southern Kerala reveal that the period 10 -
5 kyrs BP had experienced extremely high rainfall than the present.
Padmalal D
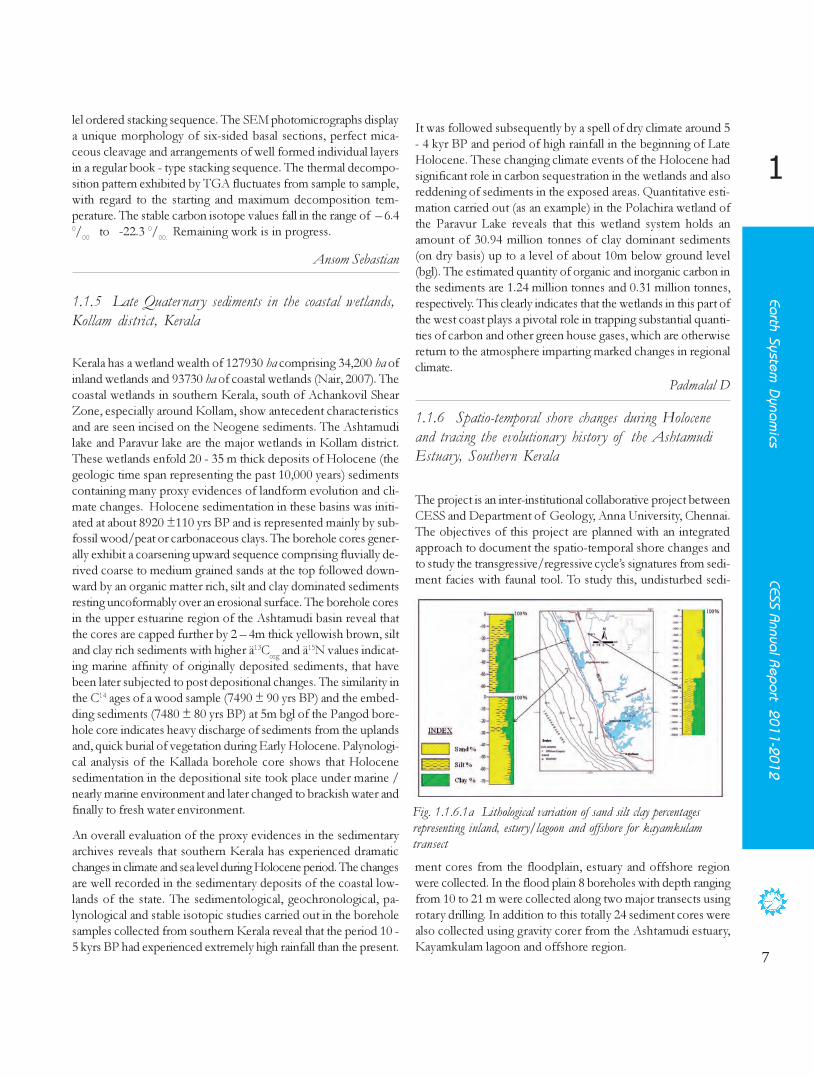
1.1.6 Spatio-temporal shore changes during Holocene
and tracing the evolutionary history of the Ashtamudi
Estuary, Southern Kerala
Fig. 1.1.6.1a Lithological variation of sand silt clay percentages
representing inland, estury/lagoon and offshore for kayamkulam
transect
The project is an inter-institutional collaborative project between
CESS and Department of Geology, Anna University, Chennai.
The objectives of this project are planned with an integrated
approach to document the spatio-temporal shore changes and
to study the transgressive/regressive cycle’s signatures from sedi-
ment facies with faunal tool. To study this, undisturbed sedi-
ment cores from the floodplain, estuary and offshore region
were collected. In the flood plain 8 boreholes with depth ranging
from 10 to 21 m were collected along two major transects using
rotary drilling. In addition to this totally 24 sediment cores were
also collected using gravity corer from the Ashtamudi estuary,
Kayamkulam lagoon and offshore region.

8
CESS Annual Report 2011-2012
Ea
rth Syste
m D
yna
mics
1
Fig.1.1.6.1b Lithological variation of sand silt clay percentages
representing inland, estuary/lagoon and offshore for Neendakara
Fig. 1.1.6.2a & b Sediment classification for (a) Kayamkulam (b)
Neendakara transect.
ig. 1.1.6.3a & b Dipositional environment for (a) Kayamkulam and
(b) Neendakara
The sediment cores were analyzed for lithological variation, detrital
and clay mineralogy, radiocarbon dating and distribution of
foraminifer’s assemblages. The result of textural studies indicates
the variation of sediment lithological unit along the inland-la-
goon/estuary and offshore region of Neendakara and
Kayamkulam transect. In the Kayamkulam transect the down
core lithological variation of sand-silt-clay percentages (Fig. 1.1.6.1a)
indicates the dominance of sand up to a depth of 11 m followed
by the equal amount of silt and clay content. In the lagoon core the
sandy sediments dominates at the top but it drastically decreased
further down with an enrichment of fine type of sediments (clay).
In the offshore region the top 30 cm is rich in sand-silt-clay and
silty clay sediments and further down the percentage of sand is
increased. In the southern transect covering the Neendakara (Fig.
1.1.6.1b), the top 9 m core is carpeted by sandy sediments of
terrigenous origin. Below 10 m the fine type of sediments domi-
9
CESS Annual Report 2011-2012
Ea
rth Syste
m D
yna
mics
1
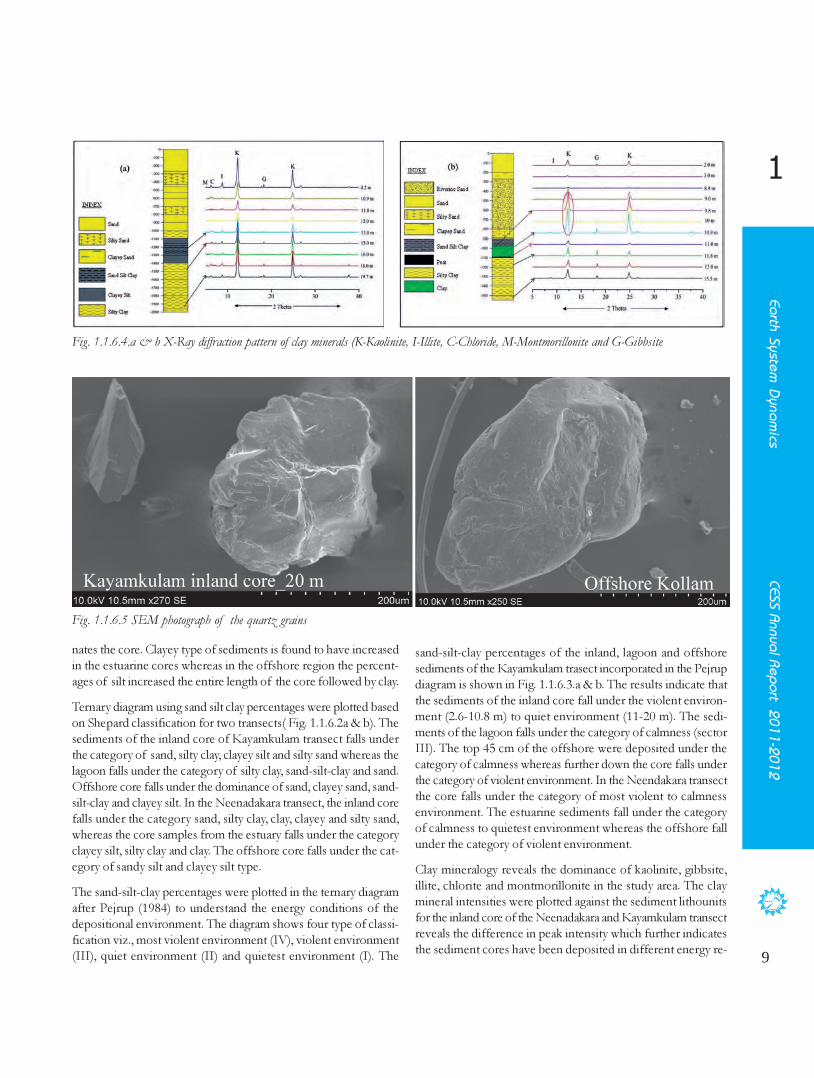
Fig. 1.1.6.4.a & b X-Ray diffraction pattern of clay minerals (K-Kaolinite, I-Illite, C-Chloride, M-Montmorillonite and G-Gibbsite
Fig. 1.1.6.5 SEM photograph of the quartz grains
nates the core. Clayey type of sediments is found to have increased
in the estuarine cores whereas in the offshore region the percent-
ages of silt increased the entire length of the core followed by clay.
Ternary diagram using sand silt clay percentages were plotted based
on Shepard classification for two transects( Fig. 1.1.6.2a & b). The
sediments of the inland core of Kayamkulam transect falls under
the category of sand, silty clay, clayey silt and silty sand whereas the
lagoon falls under the category of silty clay, sand-silt-clay and sand.
Offshore core falls under the dominance of sand, clayey sand, sand-
silt-clay and clayey silt. In the Neenadakara transect, the inland core
falls under the category sand, silty clay, clay, clayey and silty sand,
whereas the core samples from the estuary falls under the category
clayey silt, silty clay and clay. The offshore core falls under the cat-
egory of sandy silt and clayey silt type.
The sand-silt-clay percentages were plotted in the ternary diagram
after Pejrup (1984) to understand the energy conditions of the
depositional environment. The diagram shows four type of classi-
fication viz., most violent environment (IV), violent environment
(III), quiet environment (II) and quietest environment (I). The
sand-silt-clay percentages of the inland, lagoon and offshore
sediments of the Kayamkulam trasect incorporated in the Pejrup
diagram is shown in Fig. 1.1.6.3.a & b. The results indicate that
the sediments of the inland core fall under the violent environ-
ment (2.6-10.8 m) to quiet environment (11-20 m). The sedi-
ments of the lagoon falls under the category of calmness (sector
III). The top 45 cm of the offshore were deposited under the
category of calmness whereas further down the core falls under
the category of violent environment. In the Neendakara transect
the core falls under the category of most violent to calmness
environment. The estuarine sediments fall under the category
of calmness to quietest environment whereas the offshore fall
under the category of violent environment.
Clay mineralogy reveals the dominance of kaolinite, gibbsite,
illite, chlorite and montmorillonite in the study area. The clay
mineral intensities were plotted against the sediment lithounits
for the inland core of the Neenadakara and Kayamkulam transect
reveals the difference in peak intensity which further indicates
the sediment cores have been deposited in different energy re-

10
CESS Annual Report 2011-2012
Ea
rth Syste
m D
yna
mics
1
T. N. Prakash
Funding: DST. GoI
1.1.7 Quaternary evolution of the coastal plains of
central Kerala
Fig. 1.1.7.1 Palaeo shoreline limit
gime. In order to further strengthen the transportational history
of sediments in the region, microtextural studies of quartz grains
using Scanning Electron Microscope techniques were employed.
Selected samples representing the northern and southern transect
were sent for C14 dating. Radiocarbon dating has been carried
out on the wood sample collected at a depth of 16m in the
Kayamkulam lagoon (9o
10’ 5’’N: 76o
27’ 24’’ E) yielded the age
8560 ±143 YBP, which indicates the early Holocene. Further stud-
ies are in progress to ascertain the transgressive /regressive phase
on the sediment cores using different proxy indicators.
to develop a coastal evolution model. Field validation and
refinement of base map and geomorphic map were carried out
during 2011-12. Currently, the study area is under the influence of
different geomorphic processes like Marine, Fluvial, and Fluvio-
Marine Processes. The landform units were demarcated based on
their genesis and landuse of the study area was depicted under
various themes. The Quaternary sediments of study area constitute
beach sands, coastal alluvium, valley fills and buried lime shell,
peat beds, and calcareous clay deposits. Fig.1.1.7.1 shows inferred
disposition of palaeo-shoreline representing the alignment of sea
during Quaternary. About five successive beach ridges and swales
aligned parallel to the present shoreline were identified (Fig. 1.1.7.2),
though at some places these ridges/swales truncate abruptly. They
occur 4 to 7 km landward from the present shore line. The alignment
of ridges and swales indicate retreating patterns of sea and
configuration of erstwhile depositional environments.
The statistical analyses of recent beach sediments collected at an
interval of 2 km revealed that majority of these samples are
moderate to very well sorted and are negatively skewed showing
dominance of marine environment. Textural analysis of sub surface
sediments collected from 40 locations ranging from 5-75 m revealed
that the majority of them fall under clayey silt/clayey sand and
under silty sand/silty clay category. XRD analysis of the clay fraction
below 2 microns using standard procedure revealed the presence
of different clay minerals like Gibbsite, Kaolinite, Chlorite,
Montmorillite, and Illite in various proportions. The clay mineral
assemblages of the sediments provide a direct indication of their
depositional environment. These results indicate that the coastal
area was subjected to fluctuations in the climate ranging from high
rainfall and good drainage condition leading to the formation of
Kaolinite clays and poor drainage conditions leading to the
formation of Montmorillonite clays. The presence of fresh or
Fig. 1.1.7.2 Beach ridges and swales
Ernakulam district of central Kerala bears the richest
manifestation of Quaternary Period in the state. The district has
a shoreline length of 50 km, with northern limit at Munumbam
and southern boundary at Anthakaran Azhi. An average width
of 8 km landward from the shoreline forms the Quaternary
deposition limit in Ernakulam. More than 70% of the study
area is covered by water body.
Major objectives of the project are (a) to map the study area
systematically on 1:50,000 scale using satellite images, aerial
photographs and SOI topographic sheets, (b) to identify the
geomorphic features, (c) to reconstruct litho/chrono-stratigraphic
sequence of Quaternary formations at selected sections and (d)

11
CESS Annual Report 2011-2012
Ea
rth Syste
m D
yna
mics
1
Fig. 1.1.7.3 Location of core samples
saline water is also reflected by the mineralogy of different clay
minerals. Further, the clay minerals assemblage has a direct
relationship with the bedrock as well as soils of drainage basins.
Clays were found to be rich in organic matter and might have
deposited under estuarine or shallow water intertidal or fluvio-
marine environment. Data from bore hole depths ranging from
5-70 m, below the surface pertaining to different locations
(Fig.1.1.7.3 ) were examined.
Chemical analysis using standard titration method (Walkey-Black)
revealed that the percentage of organic matter lies between 0.4%
and 8.2%. The XRF analysis for the major, minor and trace
elements for 30 samples collected from different locations were
carried out. The results show abundance of certain elements in the
sub-surface sediments. The maximum age of the Quaternary
sediments collected from Vaduthala, a location situated 6 km
landward of the present day shore line, from a depth of 50 m
recorded an age of 52,300 YBP+5630 YBP (upper Pleistocene).
From the same location fresh (undecomposed) peat beds at 40 m
depth provided an age of 41,790 +570 YBP. Peat beds at a depth
of 45 m at Vallarpadam also provided 46,900+3920 YBP indicating
the lateral extent of these beds landward. On the other hand, the
greyish black clays rich in fossils collected from Vallarpadam from
a depth of 20 m gave an age of 4,044 +00 YBP (early Holocene).
An intermediate age of 22,365 +355 YBP (upper Pleistocene) was
however recorded for the clay beds collected at a depth of 25 m
from the Goshree Bridge. Hence, the Quaternary sediments of
Ernakulam district provide early Holocene to upper Plistocene
age. The younger Holocene beds deposited at shallow depths
are rich in shell deposits, while the older peat deposits occurring
at depths ranging from 40 to 60 m are devoid of shell fragments.
The Quaternary evolution study of Ernakulam district has
brought to light the presence of a large sedimentary basin of
10km long and 6km wide area. These sediments are rich in peat,
decayed wood and organic matter and the layer thicknesses vary
from place to place. C14 dating of the peat, decayed wood and
clay rich in organic matter collected from depths of 50m, 45m,
40 m, 25 m 20 m below the ground level from different locations
gave ages of 52,300 YBP, 46,900 YBP, 41,790 YBP, 22,365 YBP
and 4,044 +00 YBP respectively. The repeated occurrence of
peat and decayed wood from the same bore hole at different
depths in Willingdon and Bolgatty Islands indicates that similar
depositional environmental conditions recurred during
Quaternary. The project work is in its final phase and a coastal
evolution model for the study area is under preparation.
John Paul
1.2 Atmospheric Processes
1.2.1 Measurement of cloud parameters and cloud
modelling
Fig. 1.2.1.1 Diurnal pattern of condensation particle density
In connection with the studies on the distribution of rainfall
and rain drop size pattern, it is desirable to have information on
cloud occurrences, their altitudinal distribution, condensation
particle concentration and liquid water content. This project was
initiated with the objectives to set up ground stations for cloud
base height measurement using LIDAR technology giving time-
distribution over a site along with cloud base height and vertical
visibility. Condensation particle counters were used to estimate
the available concentration of condensation nuclei at the mea-
surement location.
A Ceilometer employing LIDAR technique (Vaisala make) was
used for monitoring cloud base heights at CESS. The second
12
CESS Annual Report 2011-2012
Ea
rth Syste
m D
yna
mics
1
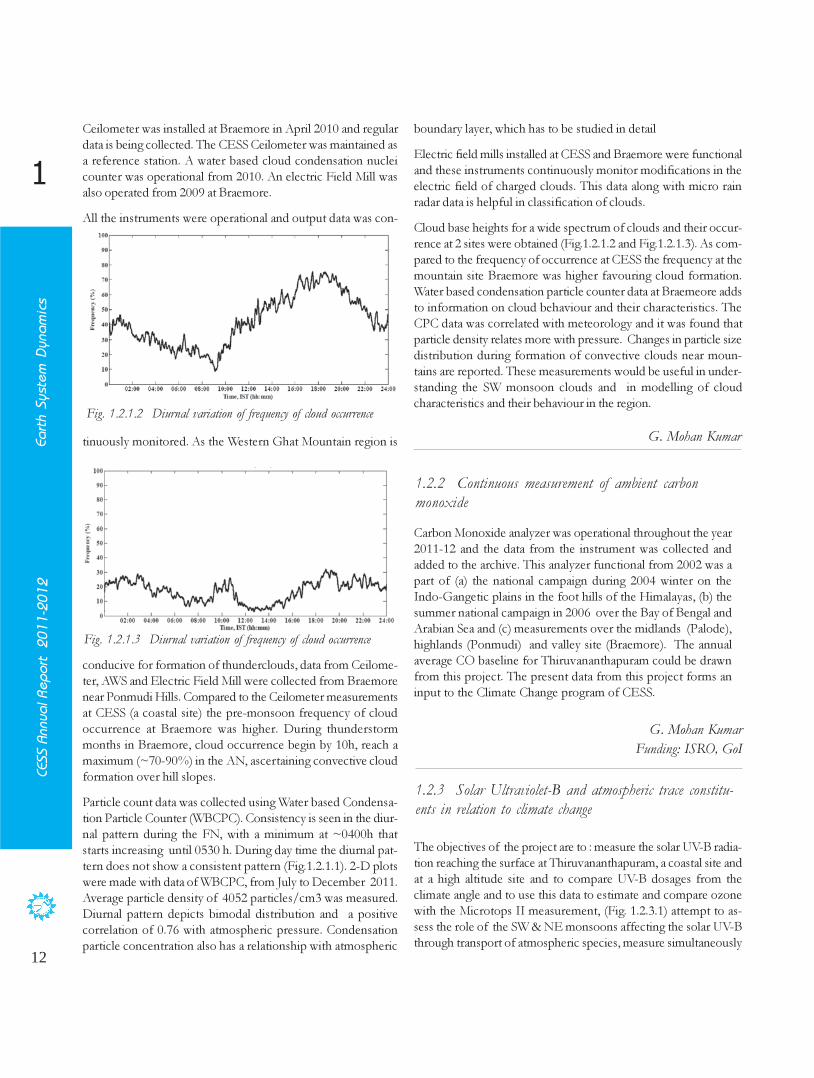
Fig. 1.2.1.2 Diurnal variation of frequency of cloud occurrence
Fig. 1.2.1.3 Diurnal variation of frequency of cloud occurrence
boundary layer, which has to be studied in detail
Electric field mills installed at CESS and Braemore were functional
and these instruments continuously monitor modifications in the
electric field of charged clouds. This data along with micro rain
radar data is helpful in classification of clouds.
Cloud base heights for a wide spectrum of clouds and their occur-
rence at 2 sites were obtained (Fig.1.2.1.2 and Fig.1.2.1.3). As com-
pared to the frequency of occurrence at CESS the frequency at the
mountain site Braemore was higher favouring cloud formation.
Water based condensation particle counter data at Braemeore adds
to information on cloud behaviour and their characteristics. The
CPC data was correlated with meteorology and it was found that
particle density relates more with pressure. Changes in particle size
distribution during formation of convective clouds near moun-
tains are reported. These measurements would be useful in under-
standing the SW monsoon clouds and in modelling of cloud
characteristics and their behaviour in the region.
G. Mohan Kumar
1.2.2 Continuous measurement of ambient carbon
monoxide
Carbon Monoxide analyzer was operational throughout the year
2011-12 and the data from the instrument was collected and
added to the archive. This analyzer functional from 2002 was a
part of (a) the national campaign during 2004 winter on the
Indo-Gangetic plains in the foot hills of the Himalayas, (b) the
summer national campaign in 2006 over the Bay of Bengal and
Arabian Sea and (c) measurements over the midlands (Palode),
highlands (Ponmudi) and valley site (Braemore). The annual
average CO baseline for Thiruvananthapuram could be drawn
from this project. The present data from this project forms an
input to the Climate Change program of CESS.
G. Mohan Kumar
Funding: ISRO, GoI
Ceilometer was installed at Braemore in April 2010 and regular
data is being collected. The CESS Ceilometer was maintained as
a reference station. A water based cloud condensation nuclei
counter was operational from 2010. An electric Field Mill was
also operated from 2009 at Braemore.
All the instruments were operational and output data was con-
tinuously monitored. As the Western Ghat Mountain region is
conducive for formation of thunderclouds, data from Ceilome-
ter, AWS and Electric Field Mill were collected from Braemore
near Ponmudi Hills. Compared to the Ceilometer measurements
at CESS (a coastal site) the pre-monsoon frequency of cloud
occurrence at Braemore was higher. During thunderstorm
months in Braemore, cloud occurrence begin by 10h, reach a
maximum (~70-90%) in the AN, ascertaining convective cloud
formation over hill slopes.
Particle count data was collected using Water based Condensa-
tion Particle Counter (WBCPC). Consistency is seen in the diur-
nal pattern during the FN, with a minimum at ~0400h that
starts increasing until 0530 h. During day time the diurnal pat-
tern does not show a consistent pattern (Fig.1.2.1.1). 2-D plots
were made with data of WBCPC, from July to December 2011.
Average particle density of 4052 particles/cm3 was measured.
Diurnal pattern depicts bimodal distribution and a positive
correlation of 0.76 with atmospheric pressure. Condensation
particle concentration also has a relationship with atmospheric
1.2.3 Solar Ultraviolet-B and atmospheric trace constitu-
ents in relation to climate change
The objectives of the project are to : measure the solar UV-B radia-
tion reaching the surface at Thiruvananthapuram, a coastal site and
at a high altitude site and to compare UV-B dosages from the
climate angle and to use this data to estimate and compare ozone
with the Microtops II measurement, (Fig. 1.2.3.1) attempt to as-
sess the role of the SW & NE monsoons affecting the solar UV-B
through transport of atmospheric species, measure simultaneously

13
CESS Annual Report 2011-2012
Ea
rth Syste
m D
yna
mics
1
total ozone and water vapour using dedicated instruments at these
environments and quantify changes in the atmospheric water
vapour column in relation to the total ozone with the correspond-
ing changes in solar UV-B radiation. Significance is in climate change,
especially when tropical tropospheric water column varies.
Diurnal and monthly plots were prepared for ozone, water vapour
and solar UV-B radiation at 305, 312 & 320 nm. A few excursions
in UV flux associated with ozone depressions and water vapour
fluctuations were picked out and satellite data on those episodes
were searched. The satellite data from Terra/Aqua and from Mo-
dis instrument were utilized for this purpose.
Convincing evidence on corresponding fluctuations in the 4-5 epi-
sodes of ozone /water vapour depression concurrent with UV
enhancements could not be reached. Continuous observations are
essential to arrive at the possible linkage among solar UV-ozone-
water vapour.
Solar UV Bio-meter and Recorder Microtops II
Fig. 1.2.3.1 Instruments used for solar UV measurements
G. Mohan Kumar
1.2.4 Rainfall validation and characterization: cloud
physics studies using megha-tropiques data
atmospheric electric field mill data. Percentage of convective and
stratiform duration in all seasons was computed. A decrease in
charge on rain drops was observed from start to end of a rain
event.
Rain rate, drop size, fall velocity distribution and its vertical profile
was measured during 2011 - 12 using an impact type Disdrometer,
Optical laser disdrometer and Micro Rain Radar. All the
instruments were operational throughout the year and data from
these were monitored continuously. Prototype of a raindrop charge
sensor was designed and developed in the Electronics
instrumentation laboratory of ASD. The unit was fabricated and
installed at CESS. One of the optical disdrometers procured was
installed at Braemore to study the size and velocity distribution of
raindrops in orographic events.
Experiments conducted with impact type disdrometer and optical
laser disdrometer concluded that during strating of a stratiform
precipitation event total number of drops are high and about
85% are smaller drops (D < 1 mm). During initiation of a
convective event total number of drops are less and about 90%
are larger drops (D > 4 mm). Further, precipitation events from
convective and stratiform clouds are identified from MRR and
G. Mohan Kumar
Funding: Space Applications Centre, Ahmedabad
1.3 Coastal Processes
1.3.1 Shoreline Management Plan for Kerala coast
Fig. 1.3.1.1 Comparison of model computed wave heights with
measured heiights at Arappa in the Munambam-Chettuva coast during
monsoon
The present study is to develop Shoreline Management Plans
(SMP) recommending appropriate sustainable coastal protection
measures for Muthalapozhi, Vadanappally and Kozhikode and
to monitor the performance of the pilot groins constructed at
Panathura, Thiruvananthapuram. It is proposed to have a com-
prehensive analysis of the problem of erosion through Shore-
line Management Plans and prescribe better and more effective
coastal protection measures.
The coastal stretches between Munambam and Chettuwa tidal
inlets in Thrissur and Beypore tidal inlet and Elathur headland in
Kozhikode are being studied for developing the SMP. One of
the important factors that influence shoreline modifications along
both the above coasts is mudbanks.
Detailed observations on the coastal process along Kozhikode
coast (Beypore-Puthiyapa) have been undertaken during 2011-
12. Fine grid bathymetry was generated up to a depth of 15m.
Nearshore wave and current data were collected deploying wave-
tide gauges and current meters during pre-monsoon, monsoon
and post-monsoon. Shoreline has been regularly monitored
through GPS mapping. Sediments were collected from the beach
and nearshore and were analysed for grain size distribution. Beach
profile data were collected during different months.

14
CESS Annual Report 2011-2012
Ea
rth Syste
m D
yna
mics
1
K. V. Thomas
Funding: MoES through ICMAM P.D., Chennai
1.3.2 Study on Depletion of Heavy Mineral Content
in the Beach Washings of IREL, Chavara
It is observed that the shoreline changes and erosion/accretion
process are significantly controlled by the occurrence,
nonoccurrence and migration of mudbanks that form along
these coastal sectors. Mudbanks are features that appear during
monsoon season in different sectors along the Kerala coast.
Here waves get dampened which otherwise would have been
very rough due to monsoon waves. Mudbanks have migrated
and formed at different locations of Munambam-Chettuwa
coast, thereby inducing significant shoreline changes along these
sectors. Mudbanks have been reported to have formed at Nattika,
Edamuttom and Kaipamangalam during the past 40-45 years.
During the monsoons of 2009-11 the mudbanks have formed
at Arattukadavu-Bhajanamadom about 10 km north of the
Munamabam inlet.
Numerical model studies are being carried out using various
modules of MIKE 21 model to understand the coastal pro-
cesses and computing sediment transport and shoreline varia-
tion within the study sectors. Model has been calibrated and
validated for Munambam-Chettuwa coast with the wave, cur-
rent and shoreline variation data collected during pre-monsoon,
monsoon and post-monsoon (Fig. 1.3.1.1).
The construction of breakwaters at Munambam has caused
deposition of beach sediment on the north side of the north
breakwater for about 3 km. The ongoing construction of break-
waters at Chettuwa has caused the development of beach north
of the Chettuwa inlet. Unlike the Munambam and Chettuwa
sectors, the construction of breakwaters at Beypore and Puthiyapa
has caused significant beach development on the south side of
the breakwaters. It is a reflection on the differences in the sedi-
ment transport at Muanmaba-Chettuwa and Beypore-Puthiyapa
coastal sectors.
ments and sediment sampling in the offshore, nearshore and beach
adjoining the beach washing collection sites of IREL, Chavara.
Numerical models were set up to examine the system and to un-
ravel the processes at work and finally to compute the sediment
budget.
No discernible changes in the wind, wave and current characteristics
other than those of inter-annual changes are noticed over a decade.
In order to understand the sedimentary dynamics of the study
area, beach and innershelf morphological changes have been stud-
ied. Beach profile measurements indicated that barring the two
stations adjacent to the southern breakwater at Kayamkulam inlet,
all other stations show accretion tendencies during the post-mon-
soon season and erosion tendencies during the pre-monsoon and
monsoon seasons. The continued and enhanced rate of accretion
at stations adjacent to the breakwater even during the pre-mon-
soon is evidently due to the impact of breakwater, which acts like a
groin trapping the sediments transported by the predominant
northerly currents.
The circulation pattern, sediment transport and related processes in
the innershelf have been studied using the Sand Transport Mod-
ule (ST) available under the comprehensive MIKE21 Flow Model-
ling system (FM). In addition to the computations using MIKE21,
the LITDRIFT and LITPROFILE modules of the LITPACK
modelling system were also used for the estimation of sediment
budget. Separate models have been set up for different seasons by
giving the appropriate sedimentological and hydrodynamic data as
input. The calibration and validation of the sediment transport
during the three seasons were carried out by comparing the simu-
lated results with the magnitude of sediments collected using sedi-
ment traps. The spatial and temporal variations in the sediment
transport during the three seasons have been studied in detail by
carrying out thorough analyses of the longshore and cross-shore
transport rates, total sediment load, changes in bed level, etc. at
important locations along the coast. Based on the above studies
Fig. 1.3.2.1 Scheme of deployment of equipments off Chavara coast
during (a) July 2010 and (b) November, 2010 & April-May 2011
The project was launched with the objectives to (i) study the
changes, if any, in the hydrodynamic and sedimentologic charac-
teristics in the innershelf of Chavara coast, (ii) carry out numeri-
cal model studies to understand and analyse the current coastal
processes of the region and estimate the beach sediment budget
and (iii) identify the factors responsible for the reported reduc-
tion in the heavy mineral content in the beach washings, and
arrive at remedial measures, if any, possible. The Final Report
of this project was submitted during the year.
In order to understand the physical processes and the factors
responsible for the reduction in the heavy mineral content of
beach along the Chavara coast, field experiments were conducted
( Fig. 1.3.2.1 and Fig. 1.3.2.2) involving hydrodynamic measure-

15
CESS Annual Report 2011-2012
Ea
rth Syste
m D
yna
mics
1
like on the beach, the reduction in the innershelf started much
early, as early as 1987. The average heavy mineral concentration in
the surficial sediments of the innershelf of Neendakara-
Kayamkulam sector has drastically reduced from 17% in 1987 to
8% in 2011.
Fig.1.3.2.2 Deployment of equipments in progress: (a) Directional
Wave Gauge, (b) Non-Directional Wave Gauge, (c) Acoustic Doppler
Current Profiler (d) Recording Current Meter (e) Sediment trap
assembly (f) A deployment site with the watch & ward team on duty
the estimate of sediment transport in the on/off shore direc-
tions, alsongshore directions and thus the beach sediment budget
was carried out. Shoreline retreat had been substantial along the
Neendakara-Kovilthottam sector during 1968-2006 which was re-
duced during 2006-10, due to shore protection measures. The
entire Azhikal-Ponmana sector was affected by severe erosion dur-
ing 1968-89 while the rate of erosion reduced in most of the
sectors except the mining sites during 1989-2006. During 2006-10
shoreline erosion was significant only at the mining sites because
of the presence of seawalls elsewhere. The bathymetry of the area
extending up to 20 m depth was measured and supplemented
with cross-shore profiles at selected locations. The bathymetric
changes that occurred during the past one decade were carefully
studied utilising the past data. A relative deepening of the entire
innershelf, particularly shallower portions of depths less than 15
m, has been noticed barring the offshore region of Kayamkulam.
During the past one decade the total heavy mineral content has
reduced drastically in the beach and the innershelf sediments. Un-
T. S. Shahul Hameed
Funding: Indian Rare Earths Limited


17
CESS Annual Report 2011-2012
Natural H
azards
2
Natural Hazards
2.1 Landslides
2.1.1 Investigation of landslides and land subsidence
Fig. 2.1.1.1 View of the collapsed surface
G. Sankar
2.1.2 Human-induced land modifications and its
impacts: A study in Thodupuzha taluk, Idukki district,
Kerala
Land subsidence at Tattekanni, Idukki district
A land subsidence has occurred on 19-11-2010 near Tattekanni in
Thodupuzha taluk, Idukki district. CESS carried out an investiga-
tion of the affected locality to find out the causative factors of the
subsidence. Since the Neriyamangalam – Cheruthoni road at
Thattekanni was affected by this process, the District Collector of
Idukki requested CESS to conduct a joint investigation with the
Soil Conservation Department and the Public Works Department,
Government of Kerala. During March joint investigation was car-
ried out to understand the nature of soil pipes developed beneath
the road. The department has agreed to prepare a plan to salvage
the affected site.
Land subsidence at Peringasserry
A land subsidence (Fig. 2.1.1.1) occurred at Peringassery in
Thodupuzha Taluk, Idukki district on 10 August 2011 at about 5
pm on the Paramada-Udumbanoor road. The incident occurred
on the land belonging to Sri Padmanaban, Muthupalakkal house,
Peringassery. The exposed cavity of the subsidence has a diameter
of 2.5 m and a depth of 2 meters approximately. At the time of
inspection it was covered partially by the collapsed roof earth mate-
rial. The cavity is interconnected by underground pipe like features
(Fig. 2.1.1.2). The soil type is mainly lateritic on the top and clayey in
the bottom. The landuse is mainly mixed crops with rubber. The
area has substantial thickness of soil. A spring is seen emerging at
about 200m north of the collapsed section, which could be an
outlet of the pipe. An important aspect is that this pipe is ferrying
water beneath the main Paramada-Udumbannur road. The initial
estimates indicate that the pipes are at a depth of about 2.2m
from the road level. The nature and size of pipes beneath the
road section is not very clear.
The subsidence occurred here was due to a natural process called
piping. Soil Piping is the subsurface erosion of soil by percolating
waters to produce pipe-like conduits below the ground. Previ-
ously, CESS has reported incidences of piping from Thirumeni
village in Taliparamba taluk in Kannur district, Palkkayam vil-
lage, Mannaghat taluk of Palakkad district and Venniyanimala in
the Thodupuazha taluk, Udayagiri locality in the Udumbanchola
taluk of Idukki district and also Tattekanni in the Thodupuzha
taluk of the Idukki district.
Fig. 2.1.1.2 Top view of the subsided portion. Flow direction is shown
with the dotted arrow
Thodupuzha Taluk witnessed large scale land modifications dur-
ing the last few decades. Extensive paddy fields and forest areas
were converted to settlement, cultivation and infrastructure de-
velopments. Dearth of sufficient level land motivated the occu-
pation and development of steep slope areas. In the eastern
parts of the Thodupuzha taluk shallow landslides become fre-
quent phenomena during the extended rainy days. About 32
landslide spots were identified around these areas during the
fieldwork. Majority of these incidences were initiated during the
last ten year period. The angle of slope in all these incidents was
above 16 degrees and the land use was either mixed crops or
mixed crops with settlements. The investigation on the distri-
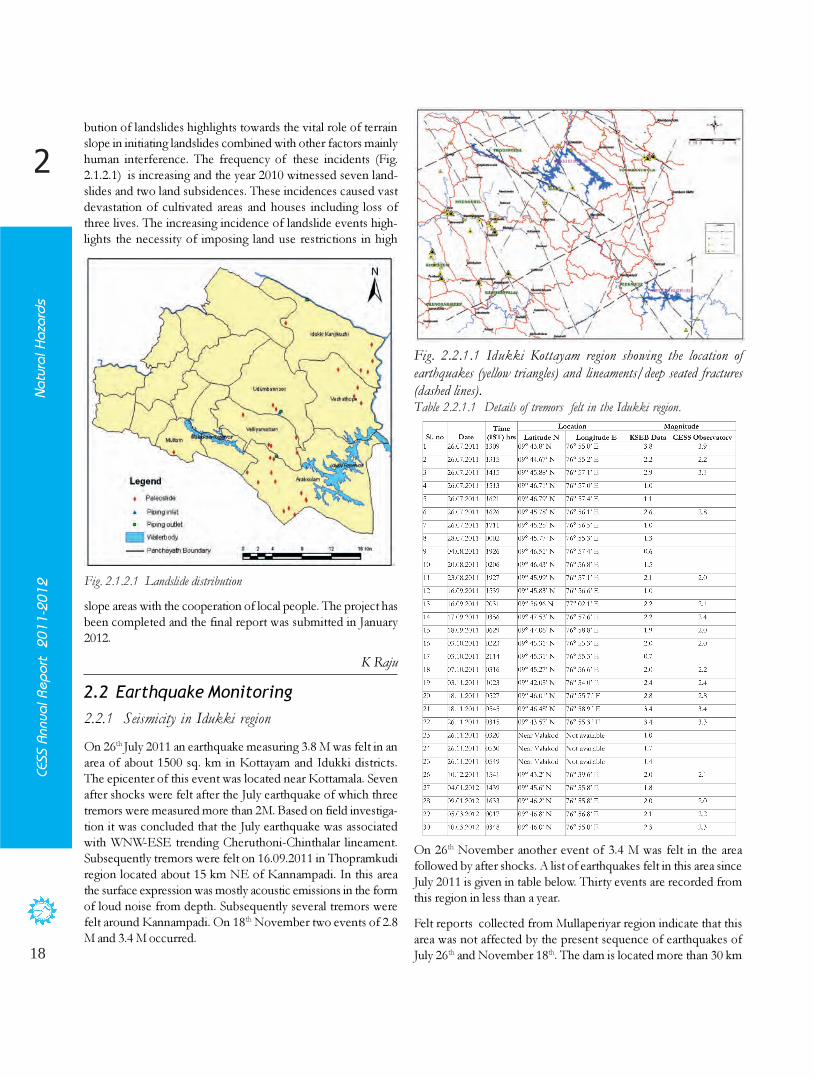
18
CESS Annual Report 2011-2012
Natural H
azards
2
K Raju
2.2 Earthquake Monitoring
Fig. 2.1.2.1 Landslide distribution
2.2.1 Seismicity in Idukki region
Fig. 2.2.1.1 Idukki Kottayam region showing the location of
earthquakes (yellow triangles) and lineaments/deep seated fractures
(dashed lines).
bution of landslides highlights towards the vital role of terrain
slope in initiating landslides combined with other factors mainly
human interference. The frequency of these incidents (Fig.
2.1.2.1) is increasing and the year 2010 witnessed seven land-
slides and two land subsidences. These incidences caused vast
devastation of cultivated areas and houses including loss of
three lives. The increasing incidence of landslide events high-
lights the necessity of imposing land use restrictions in high
slope areas with the cooperation of local people. The project has
been completed and the final report was submitted in January
2012.
On 26th
July 2011 an earthquake measuring 3.8 M was felt in an
area of about 1500 sq. km in Kottayam and Idukki districts.
The epicenter of this event was located near Kottamala. Seven
after shocks were felt after the July earthquake of which three
tremors were measured more than 2M. Based on field investiga-
tion it was concluded that the July earthquake was associated
with WNW-ESE trending Cheruthoni-Chinthalar lineament.
Subsequently tremors were felt on 16.09.2011 in Thopramkudi
region located about 15 km NE of Kannampadi. In this area
the surface expression was mostly acoustic emissions in the form
of loud noise from depth. Subsequently several tremors were
felt around Kannampadi. On 18th
November two events of 2.8
M and 3.4 M occurred.
Table 2.2.1.1 Details of tremors felt in the Idukki region.
On 26th
November another event of 3.4 M was felt in the area
followed by after shocks. A list of earthquakes felt in this area since
July 2011 is given in table below. Thirty events are recorded from
this region in less than a year.
Felt reports collected from Mullaperiyar region indicate that this
area was not affected by the present sequence of earthquakes of
July 26th
and November 18th
. The dam is located more than 30 km

19
CESS Annual Report 2011-2012
Natural H
azards
2
John Mathai
from the epicenter. Strong ground motions were felt up to 15 km
from the epicenter. However, the deep seated fracture plane where
the present movements are located is oriented in WNW-ESE di-
rection. When it is traced to the east it passes close to Mullaperiyar
(Fig. 2.2.1.1).
2.2.2 Monitoring Indian Shield Seismicity with 10 BBS
to understand Seismotectonics of the region using VSat
connectivity
The broadband observatory at
Peechi, operated by CESS in the
campus of the Kerala Forest Re-
search Institute (KFRI) was estab-
lished in 1999, as a part of strength-
ening earthquake monitoring in the
peninsular India and improving the
detection and location capabilities of
earthquakes in the shield region. The
station has been recording local, re-
gional and teleseismic events since
then. The main objective of the
project is to maintain and operate
the station to record high quality
data. The data recorded here is used
for the studies of local/ regional
earthquakes. The observatory plays
host to a large number of visitors,
including students and thus serve a
good educational facility to the pub-
lic. It also serves to provide infor-
mation on earthquakes to govern-
ment agencies as well as media and
general public.
Continuous archiving of data,
phase picks, wave form files and cata-
logue of events recorded in the ob-
servatory are being routinely carried
out and the details sent to the IMD
on a half-yearly basis. Data up to
December 31, 2011 were sent to
National Seismic Database Centre
during January, 2012. The continu-
ous data are being transmitted
online to NGRI, Hyderabad
through VSat connectivity. The seismic data from the broadband
station are useful to evaluate the seismogenic potential of the Pen-
insular India and the western Ghat region in Kerala in particular.
The Observatory is maintained well and recorded continuous data.
Out of the total 1531 events recorded during March 2011– Feb
2012, there were 1453 global events, 29 events from other parts
of India (mainly from Karnataka, Maharastra, Sikkim-Nepal
border, Kashmir, India-Myanmar border) and 24 from
Andaman-Nicobar region. Among the regional events, 9 events
are from the neighboring area of Tamil Nadu (mainly from
Vallakovil, Dharapuram; Thirupur District), one each from
Madikkery, Kudagu district, Karnataka state and Nalgonda dis-
trict of Andhra Pradesh. Other than earthquakes the observa-
tory recorded a few local explosions also. An explosion in Athani
cracker manufacturing unit which claimed six lives on 28th
De-
cember was well recorded at Peechi.
During the reporting period, 24 events were recorded within
Kerala state (Table 2.2.2.1). Eighteen events in the magnitude
range of 1.4 to 3.9 originated in Idukki district, which is ~100
km south east of Peechi. There are felt reports of some events in
the form of developing cracks and fissures in a few houses.
Table 2.2.2.1 List of local earthquakes in Kerala recorded at the Pecchi Broad Band Observatory during
2011-12

20
CESS Annual Report 2011-2012
Natural H
azards
2
Fig. 2.2.2.1 Seismic events in Kerala during 2011-2012 recorded at
Peechi observatory maintained by CESS
Sreekumari Kesavan
Funding: DST, GoI
2.3.1 Tsunami and Storm Surge Inundation Modelling
and Mapping for the Coasts of Kerala, Karnataka, Goa,
Maharashtra and Lakshadweep
2.3 Tsunami
This project forms the part of a national project on “Tsunami and
Storm Surge Inundation Modelling” co-ordinated by ICMAM Project
Directorate, Chennai. The task taken up by Centre for Earth Science
Studies (CESS) is to model numerically the tsunami inundation
for the coastal stretches of Kerala, Karnataka, Goa and Lakshadweep
of the west coast of India. The project is on the verge of comple-
tion and final report is under preparation. The globally accepted
TUNAMI N2 model has been used for the model computations
with reference to two historical tsunami sources and a hypothetical
potentially worst case that may affect the west coast of India, in case
it happens. The historical sources of tsunami are Sumatra and
Makran. A hypothetical case of an earthquake of intensity similar
to that of 26th
December Sumatra earthquake occuring in Makran
was studied since the worst case simulations form the basis for
evacuation in the event of a tsunami affecting the west coast of
India.
During the year, the study pertained to the coasts of Karnataka and
Goa. For Karnataka, lesser run-up and slight variations among
different locations of the coastal stretch are observed for the Sumatra
tsunami. The run-up was in the range 2-3 m for certain southern
locations like Munchuru, Padu, Tottam and Gangoli, while the
Other local events such as an event from Kodakara (Thrissur
district; ML = 2.3), three Pulpeta-Thirurangady events
(Malappuram district; ML = 2.0-2.2) and two events from Viyyur
(Thrissur district; ML = 2.0 and 2.7) were also felt by many
people but no damages were reported. The local events recorded
in Kerala state are shown in Fig. 2.2.2.1. Fieldwork has been
carried out immediately after the July 26th
event and November
18th
events to collect felt reports from the Idukki region. Based
on the felt reports intensity maps showing isoseismals were
prepared. The felt reports in the epicentral region correspond to
an intensity of IV in the MM scale. The WNW- ESE trend of
the isoseismals coincides with the Chinthalar- Cheruthoniar lin-
eament.
Fig. 2.3.1.1 Tsunami inundation map for a sector of Karnataka coast

21
CESS Annual Report 2011-2012
Natural H
azards
2
T. S. Shahul Hameed
Funding: Ministry of Earth Sciences, Government of India
northern locations like Durakeri, Honavar, Kelaginakeri showed
run up of 1-2 m only. A maximum inundation of 1400 m was
predicted at Nagur north by the model. The simulation for Makran
source predicted a uniform run-up of 2-3 m for the entire coastal
stretch except in places like Durakeri, Kelaginakeri, Hadikeri and
Belekeri where the run-up was in the range of 1-2 m. A maximum
inundation of 1380 m was predicted by the model at Honavar.
The simulation results project hypothetical case as the most vul-
nerable source to the coast of Karnataka. The inundation was
extensive for the entire coast with a maximum of 3470 m at
Hirematha.
For the coast of Goa also the hypothetical case really dominates in
terms of increased run-up and inundation. At places like Mashen,
Nagorcem, Vasvado the run-ups exceeded 4 m. The other loca-
tions along the coast showed a run-up pattern in the range of 3-4
m with a maximum inundation of 2320 m at Baga. But for the
Sumatra simulation the run-ups were in the range of 1-2 m all
along the coast except at some locations like Mashen Nagorcem
and Sasmolem where it was in the range of 2-3 m. The Makran
simulation predicted a 2-3 m run-up for the entire coastal stretch
of southern Goa upto Bogmalo and thereafter the values decreased
to the range 1-2 for the northern coasts of Goa. A maximum
inundation of 1550 m was predicted by the model at Siolim.
2.3.2 Establishment of Wave Gauge Stations along the
Coastal Waters of Kerala
Fig. 2.3.2.1 Deployment of wave rider buoy off Valiyathura at 30 m
depth
L. Sheela Nair
Funding: INCOIS, MoES, GoI
Centre for Earth Science Studies, Thiruvananthapuram in collabo-
ration with Indian National Centre for Ocean Information Ser-
vices (INCOIS) under the Ministry of Earth Sciences (MoES),
Government of India is establishing a few coastal observation
stations along the Kerala coast. This programme is fully funded by
INCOIS, Hyderabad. Two stations for measurement of waves
were proposed to be set up during the 11th
Plan period, one each at
Thiruvananthapuram and Kozhikode, which are typical represen-
tation of the differing wave energy regime of this coast.
On May 4th
of 2011 the first wave gauge station was established
and commissioned in the coastal waters off Valiathura in
Thiruvananthapuram with the deployment of a Wave Rider Buoy
at 30 m water depth (Fig. 2.3.2.1). The coastal station gives real time
data on coastal weather conditions which includes wave param-
eters, sea surface temperature and salinity. This information is vital
to the local community especially the fishermen as they can plan
their activities/operations and also timely warning can be given for
their safety during extreme weather conditions like tsunami, cy-
clones, storm surges etc. Another important application of this
data which could be of great help to the fishermen community is
that the data can be used for identifying potential fishing zones.
The data from the buoy are extensively used for the calibration
of observations made by the satellite sensors. Long-term real
time buoy data from coastal buoys/observation stations are
also being used for various applications like, fisheries, coastal
zone management, oil exploration, offshore/coastal engineer-
ing works etc. Another significant application of buoy data is in
the field of calibration and validation of sea-state forecasting
model. In addition to this the real time data will be dissemi-
nated to the various scientific communities/research organiza-
tions/institutes to carry out their research work which is mostly
multi-disciplinary.
2.3.3 Oil Spill Modelling for Selected Locations of
Kerala and Lakshadweep
Oil spill modelling project for Kerala and Lakshadweep coasts
was taken up by CESS in July 2009. Three locations namely -
Vizhinjam, Neendakara, and Cochin along the Kerala coast and
Kavaratti in Lakshadweep group of islands were selected for the
study.
As part of the hydrodynamic data collection for the Kavaratti
island current meters, wave and tide gauges were deployed at
two locations during the period 19th
October – 2nd
December,
2011. The first location was at 5m water depth in open sea on
the northeastern side of the island (very near to the Desalina-
tion plant) and the second one was at 2m water depth inside the
lagoon on the western side.
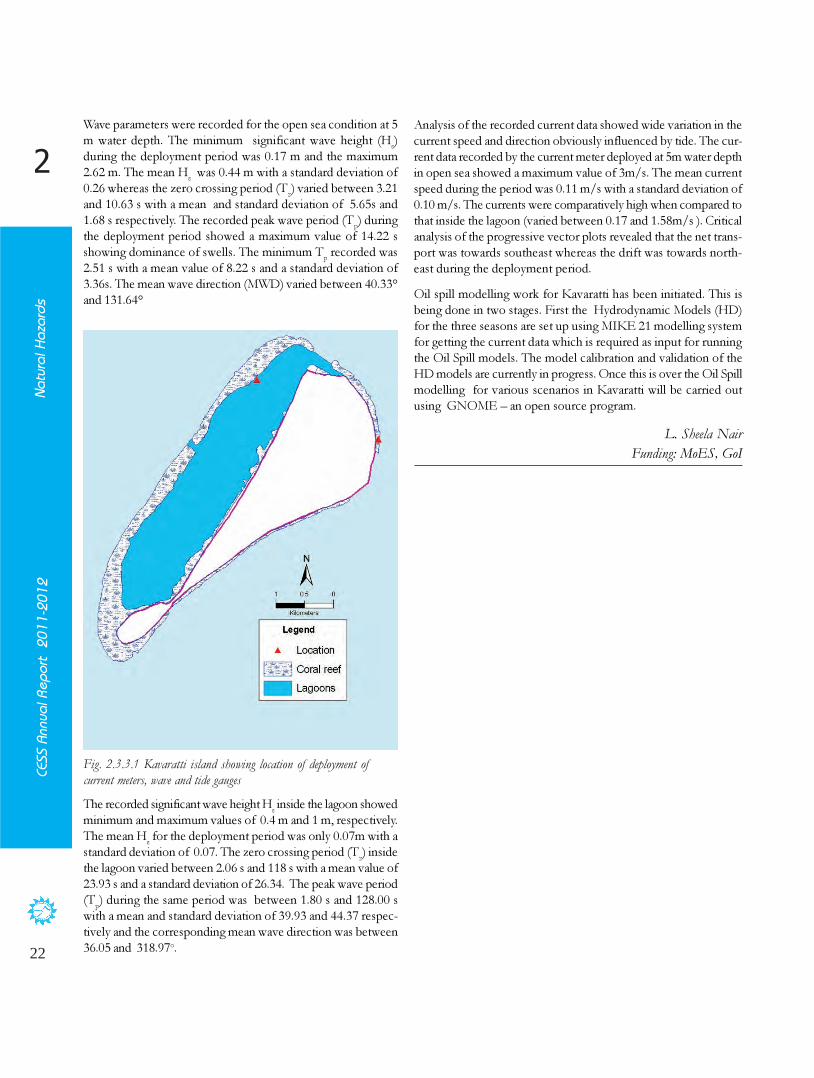
22
CESS Annual Report 2011-2012
Natural H
azards
2
L. Sheela Nair
Funding: MoES, GoI
Fig. 2.3.3.1 Kavaratti island showing location of deployment of
current meters, wave and tide gauges
Wave parameters were recorded for the open sea condition at 5
m water depth. The minimum significant wave height (Hs
)
during the deployment period was 0.17 m and the maximum
2.62 m. The mean Hs
was 0.44 m with a standard deviation of
0.26 whereas the zero crossing period (Tz
) varied between 3.21
and 10.63 s with a mean and standard deviation of 5.65s and
1.68 s respectively. The recorded peak wave period (Tp
) during
the deployment period showed a maximum value of 14.22 s
showing dominance of swells. The minimum Tp
recorded was
2.51 s with a mean value of 8.22 s and a standard deviation of
3.36s. The mean wave direction (MWD) varied between 40.33°
and 131.64°
The recorded significant wave height Hs
inside the lagoon showed
minimum and maximum values of 0.4 m and 1 m, respectively.
The mean Hs
for the deployment period was only 0.07m with a
standard deviation of 0.07. The zero crossing period (Tz
) inside
the lagoon varied between 2.06 s and 118 s with a mean value of
23.93 s and a standard deviation of 26.34. The peak wave period
(Tp
) during the same period was between 1.80 s and 128.00 s
with a mean and standard deviation of 39.93 and 44.37 respec-
tively and the corresponding mean wave direction was between
36.05 and 318.97o
.
Analysis of the recorded current data showed wide variation in the
current speed and direction obviously influenced by tide. The cur-
rent data recorded by the current meter deployed at 5m water depth
in open sea showed a maximum value of 3m/s. The mean current
speed during the period was 0.11 m/s with a standard deviation of
0.10 m/s. The currents were comparatively high when compared to
that inside the lagoon (varied between 0.17 and 1.58m/s ). Critical
analysis of the progressive vector plots revealed that the net trans-
port was towards southeast whereas the drift was towards north-
east during the deployment period.
Oil spill modelling work for Kavaratti has been initiated. This is
being done in two stages. First the Hydrodynamic Models (HD)
for the three seasons are set up using MIKE 21 modelling system
for getting the current data which is required as input for running
the Oil Spill models. The model calibration and validation of the
HD models are currently in progress. Once this is over the Oil Spill
modelling for various scenarios in Kavaratti will be carried out
using GNOME – an open source program.

23
Natural Resources &
M
anagem
ent
3
CESS Annual Report 2011-2012
Natural Resources and Management
3.1 Water Resources
3.1.1 Appraisal of drinking water potential of springs
in Pathanamthitta, Kottayam and Idukki districts of
Kerala
3.1.2 Water and sediment quality monitoring and
assessment of estuaries of Kerala: a case study from
Kochi estuary and Periyar river
Eig. 3.1.1.1 Study area showing geology and spring locations
The project aims to locate and map unexploited springs and to
make an appraisal of their drinking water potential in the
Pathanamthitta, Kottayam and Idukki districts of Kerala covering
an area of nearly 10000 km2
. The quality of spring water was deter-
mined in terms of physical, chemical and bacteriological properties
using standard methods. The geological aspects of the springs
were examined to maintain and manage water potential. A total of
120 springs were identified and located (Fig. 3.1.1.1) and water
samples were collected from 80 springs for hydro-geochemical evalu-
ation. The chemical quality of spring water from all sources satis-
fies BIS/WHO drinking water standard except in the case of pH,
which showed acidic (5.23-6.67) nature. EC ranges from 22.14 to
33.04 μs/cm with an average of 27.5 μs/cm, indicating low range
of dissolved salts, which could be attributed to the swift move-
ment through the fractures /aquifer layers. TDS, generally the sum
of dissolved ionic concentration, varies between 15.81 to 236
mg/L with an average of 41.06 mg/L.
Major ion and nutrient concentration were determined and the
values were found to be lower than the maximum permissible
levels. Bacterial contamination (coliform) which was randomly
observed can be attributed to the prevailing unhygienic condi-
tion. Among cations, Ca and Na are the primary ions while the
Cl and HCO3
are the dominant anions. Piper diagram was used
to interpret the chemical evolution of spring water which de-
pends on pattern recognition techniques and the dominant wa-
ter types evolved are Ca-Cl-HCO3, Na-Ca-Cl-HCO3 ,
Ca-Na-Cl-
HCO3, Na-Cl-HCO3
K Anoop Krishnan
Fig. 3.1.2.1 Dissolved Oxygen (DO) rates recorded during different
seasons from the surface and bottom samples
The study aimed to assess the level of heavy metal (Hg, Pb, Zn,
Cd, Cr, Cu, Ni, Fe) contamination in the surface sediments of
Cochin estuary and Periyar river which receive pollutants from
both small scale and large scale industries, boatyards, dockyards,
fishing harbour, the Cochin shipyard etc. The major source of
mercury pollution in the Periyar River is from the Travancore
Cochin Chemicals Ltd (TCL). Most of the older industrial units
in the region still deploy obsolete technologies and discharges
highly concentrated toxic effluents after little or no treatment.

24
CESS Annual Report 2011-2012
Natural Resources &
M
anagem
ent
3
3.1.3 Environmental impact assessment of major
settlement distribution patterns and infrastructure
development, with emphasis on drinking water facilities
in Thiruvananthapuram district, Kerala
The objective of the project is to assess the environmental
factors such as relief, geomorphology, climate etc. and their im-
pact on major settlements with special reference to drinking
Fig. 3.1.3.1 Net annual ground water availability in the study area
water resource availability. Primary and secondary data on water re-
sources like number of wells, ponds, lakes, ground water fluctua-
tions, rainfall, recharge potential, piped water distribution and sup-
ply status in the urban and rural sectors were collected. Data have
been compiled, processed, digitized and relevant thematic maps in
GIS format were prepared for Thiruvananthapuram district. Sec-
ondary data from Kerala Water Authority, Ground Water Depart-
ment, Panchayat Offices, Irrigation Department and Fisheries were
analysed to see the status of demand and supply for the study area
and environmental constraints. The study area consists of 1633
panchayat ponds, 171 private ponds, 6 quarry pools, 34 irrigation
tanks, 69 holy ponds and few streams. The maximum usable water
resource from all the listed sources is estimated to be 793 m3
. In the
study area, recharge from rainfall during monsoon season is 128.18
MCM and in non monsoon is 150.11MCM and natural drainage
during non monsoon season is 30.48 MCM. It is observed that
ground water potentials are very good in Vamanapuram block
(49.24MCM) followed by Vellanad block (47.81 MCM), Nemom
(28.48 MCM) and Kilimanoor (23.5 MCM),while the poor ground
water potentials were reported from blocks viz Perumkadavila
(11.13MCM) Athiyanoor (11.13MCM), Parasala (13.12MCM),
Nedumangad (16.55MCM), Thiruvananthapuram block
(14.90MCM), Chiryankhil (17.28MCM) and Varkala (18.41MCM).
The net annual ground water availability is shown in Fig. 3.1.3.1
V. Shravan Kumar
The estuary also receives untreated effluents from domestic and
agricultural sectors, fish processing units etc. The presence of
Hg, Cd, Zn and Pb in the sediment of Cochin estuary is matter
of great concern due to their high concentration and potential
toxicity to marine biota.
Sediment and water samples taken from 22 locations of the
Periyar River and Cochin estuary (Monsoon, Post Monsoon,
Pre Monsoon) were analysed for the heavy metal concentration.
Metal concentration in sediments varies seasonally and signifi-
cantly with in broad range – Pb (8ppm to 150 ppm), Zn (17
ppm to 2600 ppm), Cu ( 7ppm to 549 ppm), Cr (84 ppm to
583 ppm), Ni (7 ppm to 218 ppm) and Fe (1.1 % to 22.93%).
The estuarine part with fine sediment particles had relatively
high metal concentration where as lower reaches of Periyar river
with coarse texture of sediment showed low levels of metals
except Zinc. Organic Carbon and fine sediments were high in
the estuarine part indicating high absorption of Organic com-
pound on clay minerals.
Presence of heavy metals showed significant seasonal variation
with low values during the monsoon and post-monsoon peri-
ods and the highest values were recorded during the pre-mon-
soon periods in almost all samples. The pre-monsoon increase
in heavy metal content could be related to the biogeochemical
changes occurring in water increases the sediment Organic Car-
bon.
The seasonal value of Dissolved Oxygen recorded at the surface
and bottom samples are depicted in Figure 3.1.2.1. DO values
of both surface and bottom water exhibited significant sea-
sonal variations. Low DO and high Organic Matter were ob-
served in premonsoon season. High DO values recorded in
post monsoon period. The lowest value of DO was 2.73 mg/
l due to the rapid decomposition of Organic matter. Heavy
metal enrichments are mainly due to the anthropogenic inputs
enhanced by settling of metals due to organic flocculation and
inorganic precipitation. Increase of water temperature and con-
siderable growth of algae also changes the level of DO in the
water body. There by disturbing the water ecological balance,
this results in mortality of selected plants and animal species
and encouraging over growth of others.
P. K. Omana

25
CESS Annual Report 2011-2012
Natural Resources &
M
anagem
ent
3
3.2 Terrain Analysis and Landuse Studies
3.2.1 Study of landuse/land cover changes as linked to
climate change in Kerala
The objectives of the project are to assess land use/land cover
changes in Kerala covering forests, agricultural land and urban ar-
eas, to measure trend of change in natural vegetation cover, to
measure change in paddy land and to assess change in wet lands
and finally to study the linkage between landuse change and rain-
fall change if any.
The study area spreads over seven districts. Work is being attempted
district by district. During this period land use map of Alappuzha
district has been prepared for the years 1967 and 2008 at 1:50,000
scale based on Toposheets and Satellite imageries (LISS III and
LISS IV). These maps were then overlaid in GIS environment to
generate the land use change map between 1967 and 2008. The
land use matrix has been computed. Preparation of land use maps
and the land use change matrix for Kottayam district are progress-
ing.
Data on the land utilization pattern of Kerala and the selected
seven districts have been collected from Bureau of Economics and
Statistics, Centre for Development Studies, and State Planning
Board. The data set is being prepared since 1956-57. Data on area
and production of 18 crops in selected districts of Kerala have
been collected. Triennial averages of the land utilization pattern,
and area, production and productivity of important crops for Kerala
were also calculated and the temporal changes were also worked
out.
It emerges from the analysis of land use data pertaining to
Alappuzha district that there is significant decrease in the area un-
der paddy cultivation which has came down from 581 km2
in 1967
to 314 km2
in 2008 and there is considerable growth in the category
of SMT (settlement with mixed tree crops) during the last four
decades. The land use change matrix shows that 157 km2
of areas
under paddy cultivation has been diverted to settlements with
mixed tree crops and another 110 km2
is now kept as fallow land.
It is also clear from the land use change matrix that the area under
agglomerated settlement has also increased from 4 km2
in 1967 to
20 km2
in 2008. Change to agglomerated settlements can be con-
sidered as irreversible change.
The land utilization pattern of Kerala and the selected districts
were also analyzed based on statistical data obtained from the
Department of Economics and Statistics, Government of Kerala.
The area of land put to non agricultural use increased considerably
during the last fifty years. At the same time total cropped area and
the area sown more than once show slight improvement. The area
under barren and uncultivable land, permanent pastures and graz-
ing land, miscellaneous tree crops and cultivable waste land showed
decreasing trend. The area under current fallow has increased.
Srikumar Chattopadhyay
3.2.2 Valley formation and geomorphic processes
under tropical wet and dry climate: Examples from
Kerala
Fig. 3.2.2.1 Digital Elevation Model (DEM) of Neyyar basin
In order to elaborate upon the various forms of valleys and their
genetic relationship with the streams’ gradational forces in com-
bination with geologic structure, climatic conditions, weathering
rates and landscape evolution processes, Valapattanam,
Bharathapuzha, Periyar, Kabani (east-flowing), Achankovil,
Kallada, Ittikara and Neyyar river basins were studied. The major
objectives are (i) to classify the valleys of selected river basins in
different geomorphic and climatic settings based on their mor-
phology, sediment characteristics and morpho-tectonic features,
(ii) to elucidate geomorphic setting of various valley types within
the same river basin, (iii) to characterize /differentiate valley types
under different rivers as linked to geomorphic and climatic varia-
tions, (iv)) to link valley formation with terrain evolution pro-
cesses in different physiographic units in Kerala and its relation
to the river morphosis widely observed in the low-level regions
of Kerala, and (v) to assimilate all data through GIS application.
Base maps of the river basins and selected thematic maps were
prepared. Valley profiles were surveyed in selected sites of Ittikara,
Achankovil and Neyyar rivers. Stream flow and velocity were mea-
26
CESS Annual Report 2011-2012
Natural Resources &
M
anagem
ent
3
sured to compute the discharge of the tributary streams of
Achankovil and Neyyar river using current meter. Digital eleva-
tion model of Neyyar basin is given in Fig. 3.2.2.1. The work is
in progress.
Mahamaya Chattopadhyay
3.2.3 Assessment and monitoring of land quality for
sustainable agriculture: a GIS based approach coupled
with technology implementation
The project aims to prepare land use/land cover of Kannur
district using satellite imagery, to prepare a geochemical atlas and
to discuss the issues emerging out of the analysis with experts
and users. Maps of relief, drainage, slope, aspect, landforms,
geology, soil type, soil moisture, NDVI, land use/ land cover,
landslide prone areas, flood prone areas, agriculturally drought
prone areas, watersheds, panchayats and density of population
were prepared in 1:50,000 scale and digitized in ArcGIS format.
Data analysis showed that 14.9 % of the total area in the district
is agriculturally drought prone during summer and the district
faces acute drinking water shortage. It also showed that about 6
% of the total area is flood prone during monsoon and 2.1 %
of the area is landslide prone. Heavy surface runoff and erosion
proneness necessitate soil and water conservation measures. Ag-
riculture in Kannur is controlled by terrain, water availability and
soil. Soil chemistry also plays an important role in agricultural
production. About 33% of the area in the district needs high
priority for land and water conservation. Geochemical atlas is
also prepared for the entire district.
B. Sukumar
3.2.4 Land system analysis of Kabani river basin in
Wayanad district, Kerala
The objectives of the study are: (i) to analyse the geomorphic
process and land system in Kabani river basin, (ii) to compute
morphometric and hypsometric data for understanding land-
form characteristics and its evolution, (iii) to work out relation-
ship between landform unit and drainage discharge and (iv) to
identify geomorphic indicators which help understand geomor-
phic system and predict landform changes.
Computation of river sinuosity and its linkage with lithology
and structure for Cherupuzha - Chundal puzha segment of
Kabani river basin has been carried out. Sinuosity index ranges
from 1.19 – 1.99. Cross sections have been worked out across
selected locations. Using morphometric data, watersheds have
been prioritized and map on priority watershed has been prepared.
Kabani river basin is a seventh order stream covering an area of
1648 km 2
. Eleven fifth order basins were selected for detailed
analysis. Morphometric and hypsometric analyses have been at-
tempted to understand basin characteristics. Rose diagrams were
drawn for all 11 fifth order basins to identify the main direction of
flow. These data were further used to assess structural control on
drainage development. Morphometric indices were used to priori-
tize 11 sub basins of Kabani river and a map depicting priority
sub-basins has been prepared. Pedo - geomorphic analysis indi-
cates close relationship between landform units and soil. Bhavali
watershed is selected as a sample basin for land system analysis and
watershed management.
Srikumar Chattopadhyay
3.2.5 River bank mapping: Methodology development and
coordination
River Management Fund (RMF) constituted by the Department
of Revenue, Government of Kerala has initiated river bank map-
ping and sand auditing programme in order to restore river health,
estimate minable quantity of sand available in each river and de-
velop a bench mark data base for subsequent monitoring. CESS
was requested to develop methodology and coordinate the work.
The river bank mapping forms the first phase of this activity.
Mapping has been initiated in five rivers namely, Kabbini
(Wayanad), Bharatapuzha (Palakkad), Chalakudi (Trissur),
Karamana and Vamanapuram (Trivandrum).
The major objectives of the project are (a) to develop a guideline
for river bank mapping including data format and reporting out-
line, (b) to train volunteers and supervise field work, (c) to digitise
Karamana river bank maps, and (d) to prepare river bank informa-
tion system
The methodology envisaged for river bank mapping is similar to
that of Panchayat Resource Mapping in which all details are gath-
ered for every survey plot in cadastral maps in 1:3960/ 1:5000
scales. It is proposed to gather information regarding the river
under three broad heads, like physical, manmade and landuse fea-
tures. Data collection is limited to a distance of 50 meter from the
river bank on either side. Data format has been worked out, which
is being filled up for every 100m distance along the river. A MoU
has also been worked out by CESS for use of Revenue Depart-
ment.
Work began with training class in Trivandrum. The training mod-
ule consists of one day theoretical class followed by field training
along Karamana river. All five teams attended the class. On their

27
CESS Annual Report 2011-2012
Natural Resources &
M
anagem
ent
3
3.3 Environmental Assessment
return these teams started working in their respective areas. Subse-
quently CESS team visited all the five project sites and held discus-
sion with the respective groups working for the river. In some
cases repeat visits were undertaken. Field maps were verified and
necessary guidance provided to the field teams.
Karamana river was taken up in order to develop a model for river
bank information system. River bank mapping of the Karamana
river has been carried out by the Civil Engineering Department of
Mar Bassilius College of Engineering, Trivandrum. The maps and
data formats were handed over to CESS for digitisation and fur-
ther work. The field maps obtained form the field team were
digitised in RAD’s GIS laboratory. Toposheet, Image and GPS
data were used for geo-referencing. The information collected from
the field in maps and data formats were brought into a single
database which will be helpful in analysis and data viewing. Three
maps for each Panchayat depicting physical features, land use and
man made features have been prepared.
River bank mapping covered the section of Karamana river flow-
ing through seven Panchayats of Trivandrum district, namely
Aruvikkara, Aryanadu, Uzhamalackal, Vilavoorkal, Vellanadu,
Vattiyoorkavu and Vilappil. In certain cases Karamana river coin-
cides the Panchayat boundary.
The second stage was to develop river bank information system.
The maps were integrated into a user interactive system using
Dreamweaver CS3 software that provides a visual inteface.
River bank mapping has been completed for all the five rivers
taken up in the first phase, however digitisation and developing
of information system for Kabini, Bharatapuzha, Chalakudy and
Vamanapuram rivers are yet to be completed
Srikumar Chattopadhyay & John Mathai
Funding: Department of Revenue, GoK
3.2.6 River bank mapping of Ittikkara river
River bank mapping of Ittikara river has been taken up to develop
a catchment management plan and generate baseline data for sand
auditing. The major objectives of the study are (1) to characterize
and map river banks as per the guidelines issued by the Revenue
Department, (2) to evaluate catchment characteristics, (3) to digi-
tize river bank maps and prepare River Bank Information System
and total management plan for the river basin.
The work began by the month of January, 2012. It is proposed to
map around 48km long stretch of the Ittikkara river flowing from
Ittiva panchayat to Paravoor panchayat. In all there are 10 panchayats
falling along the course of the river proposed to be mapped.
Cadastral maps of all these 10 Panchayats have been collected.
The river course has been traced.
Field work was initiated and all details covering physical features,
land use and man made features are being mapped in cadastral
scale (1: 3960). A structured data is being used for gathering all
information. A 50 meter buffer on both the sides of the river
bank was marked and data were collected for this strip.
So far mapping and data collection have been completed for a
stretch of 23km from Ittiva down stream. Cross profiles were
measured for 13 locations within this stretch. Profile measure-
ments were planned on an average at an interval of 500m. The
cross sections were plotted. Further work on sand assessments
is being taken up.
It is observed that river banks are subject to erosion and various
kinds of human intervention. The vested land along the river
course is almost nonexistant indicating encroachment. There are
rock body exposed within the river bed. These rock bodies cut-
ting across the river course acts as check dams. Sand deposits are
noticed in the upstream part of this feature. Sands are being
mined from these sites. There are certain stretches where sand
mining has been so intensive that bed rock is exposed. Govern-
ment has barred any further mining is such sites and adjoining
areas. River cross profile study and identification of other fea-
tures are important to maintain river ecosystem. There is overall
degradation of river ecosystem. This study will help to identify
such stretches and a proper action plan can be worked out based
on this information.
Srikumar Chattopadhyay
Funding: Department of Revenue, GoK
3.3.1 Effect of Urbanization on the buildup of urban
heat island in Kochi
The major objectives of this project are to study the develop-
ment and intensity of Urban Heat Island (UHI) in the Kochi
region, to examine the relation between urban growth, land cover
types, and the development of the urban heat island phenom-
enon at the Ernakulam city and the neighboring rural areas and
to investigate the UHI as a regional climate change input and the
feasibility of integrating it into regional climate change models.
Classification of the study area was carried out in accordance
with the thermal climate zone classification and Local Climate
Zone (LCZ) maps were prepared. Recording stations were in-
stalled to continuously record air temperature, humidity, soil
moisture, wind, rainfall, solar radiation, etc., at various locations
in the study area covering different LCZ zones. The data was

28
CESS Annual Report 2011-2012
Natural Resources &
M
anagem
ent
3
recorded at 15 minutes intervals, compiled and analysed. In ad-
dition mobile traverse surveys were carried out during different
seasons and air temperature, humidity and ground level trace gas
concentration in the study area were recorded. The UHI, humid-
ity and ground level methane concentration maps were prepared.
It is observed that the highest pre-dawn UHI intensity during
winter season was 4.6 o
C and that during summer was 3.4 o
C.
Corresponding values of evening UHI were 2.8 o
C and 2.2 o
C
respectively. It was noticed that the recorded UHI pattern is in
good agreement with the LCZ zone maps prepared on the basis
of the urban land use classification. Significant thermally active
LCZ present in the region are compact low-rise and compact
mid-rise. The observed maximum and minimum values of
ground level mixing ratio of methane within the Kochi urban
region were 3.89 ppm and 2.09 ppm respectively during winter
season and were 3.21 ppm and 1.71 ppm respectively during the
summer. The humidity variation across the study area had a
range of 25.32 to 23.35 g/m3
during the evening and 24.70 to
22.60 during pre-dawn hours.
E. J. Zachariah
3.3.2 Exploring inter relationship between environmen-
tal degradation and poverty: selected micro-level case
studies across Kerala
Nexus between poverty and environmental degradation is an
important research topic particularly in the realm of interface
science. Environmental degradations would primarily affect the
common property resources and thereby the livelihood condi-
tions of the poor people. Degradation of environmental re-
source base can make certain categories of people destitute even
while the economy as a whole grows. It is possible to capture
this relation only at the micro level. The project - ‘Exploring
interrelationship between environmental degradation and pov-
erty: Selected micro level case studies across Kerala’ tries to analyse
the spatial association between environmental degradation and
poverty distribution.
The objectives of the projects are (a) to evaluate extent of degra-
dation of environmental resource base through mapping and
data analysis both in the macro and micro level, (b) to analyse
driving forces leading to environmental degradation, (c) to con-
duct socio- economic survey to understand the extent of pov-
erty, (d) to map distribution of poverty affected areas/ settle-
ments, and (e) to study spatial interrelation between environ-
mental degradation and poverty.
After analyzing secondary data and considering district profile
eight panchayats were selected from Kannur and Wayanad districts.
These panchayats represent different types of resource base, like
fisheries in the coastal Panchayat, wet land agriculture in the mid
lands, plantation and forestry in the plateau areas. Agricultural
labourers constitute more than 35% of the total population. Inci-
dence of poverty in these panchayats is relatively high compared to
the district average. The underlying reasons range from poor access
to resources, uneconomic holdings of majority of farmers, limited
employment opportunities, excessive dependence on agriculture,
industrial backwardness, absence of urbanization, fall in produc-
tion and productivity of crops and excessive borrowing to meet
non-agricultural needs which has led to indebtedness of farmers.
The lack of productivity in the agricultural sector has led to a gen-
eral slowdown in the economy. Population engaged in business
activities and transportation sector is meager. Less than 10% of
the total population is engaged in the service sector. It is observed
that the poverty stricken people overwhelmingly depend on local
natural resources and live in places which are ecologically more vul-
nerable. About 80% of the jobs that the poor undertake are de-
pendent on natural resources (agriculture, forestry and fisheries).
In Wayanad district especially in the study area this linkage is more
visible. In Meppadi and Thondernadu environmental problems
like landslide, flood etc are comparatively high. The level of poverty
is also high in these panchayats. The tribal people settled in the
river banks and foot hills are the major victims of these problems.
In Kannur district, especially in Eramom Kuttoor and Padiyoor
panchayats, most of the area is covered by laterite duricrust. High
temperature, water scarcity and lack of adequate capital hampered
income earning opportunities of the people. In Pattuvam panchayat
many people earn their livelihood being engaged in inland fishing
sector. In recent years the amount of fish catch decreased very sharply
due to water pollution. Disguised unemployment is a common
phenomenon.
This project is in the final stage. Data analyses have been com-
pleted. Some field investigation was undertaken to cross check
some of the results. Final report preparation has been initiated.
Srikumar Chattopadhyay
3.3.3 Study of urbanization between Kochi and Thrissur
This project is taken up with the objectives of studying urbaniza-
tion trend between Kochi and Thrissur, to analyse land use / land
cover changes and to give suggestions for better living conditions
and environment. Urbanisation is taking place rapidly between
Kochi and Thrissur Corporations. As a result there is spatial ex-
pansion of built up area around the urban centers and along the
National High ways Numbers 47 and 17. Most of the water logged
areas and paddy fields are being reclaimed for residential, industrial
and for other purposes and even shape of the islands in Vypin and
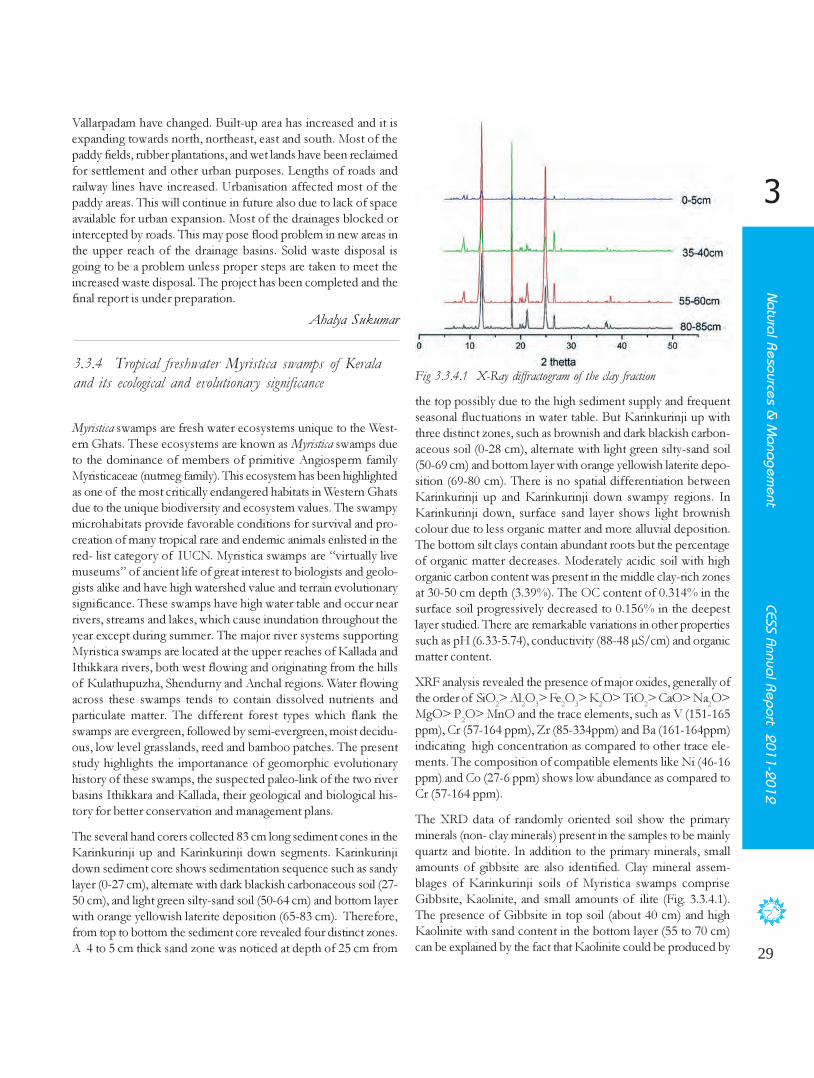
29
CESS Annual Report 2011-2012
Natural Resources &
M
anagem
ent
3
3.3.4 Tropical freshwater Myristica swamps of Kerala
and its ecological and evolutionary significance
Vallarpadam have changed. Built-up area has increased and it is
expanding towards north, northeast, east and south. Most of the
paddy fields, rubber plantations, and wet lands have been reclaimed
for settlement and other urban purposes. Lengths of roads and
railway lines have increased. Urbanisation affected most of the
paddy areas. This will continue in future also due to lack of space
available for urban expansion. Most of the drainages blocked or
intercepted by roads. This may pose flood problem in new areas in
the upper reach of the drainage basins. Solid waste disposal is
going to be a problem unless proper steps are taken to meet the
increased waste disposal. The project has been completed and the
final report is under preparation.
Ahalya Sukumar
Myristica swamps are fresh water ecosystems unique to the West-
ern Ghats. These ecosystems are known as Myristica swamps due
to the dominance of members of primitive Angiosperm family
Myristicaceae (nutmeg family). This ecosystem has been highlighted
as one of the most critically endangered habitats in Western Ghats
due to the unique biodiversity and ecosystem values. The swampy
microhabitats provide favorable conditions for survival and pro-
creation of many tropical rare and endemic animals enlisted in the
red- list category of IUCN. Myristica swamps are “virtually live
museums” of ancient life of great interest to biologists and geolo-
gists alike and have high watershed value and terrain evolutionary
significance. These swamps have high water table and occur near
rivers, streams and lakes, which cause inundation throughout the
year except during summer. The major river systems supporting
Myristica swamps are located at the upper reaches of Kallada and
Ithikkara rivers, both west flowing and originating from the hills
of Kulathupuzha, Shendurny and Anchal regions. Water flowing
across these swamps tends to contain dissolved nutrients and
particulate matter. The different forest types which flank the
swamps are evergreen, followed by semi-evergreen, moist decidu-
ous, low level grasslands, reed and bamboo patches. The present
study highlights the importanance of geomorphic evolutionary
history of these swamps, the suspected paleo-link of the two river
basins Ithikkara and Kallada, their geological and biological his-
tory for better conservation and management plans.
The several hand corers collected 83 cm long sediment cones in the
Karinkurinji up and Karinkurinji down segments. Karinkurinji
down sediment core shows sedimentation sequence such as sandy
layer (0-27 cm), alternate with dark blackish carbonaceous soil (27-
50 cm), and light green silty-sand soil (50-64 cm) and bottom layer
with orange yellowish laterite deposition (65-83 cm). Therefore,
from top to bottom the sediment core revealed four distinct zones.
A 4 to 5 cm thick sand zone was noticed at depth of 25 cm from
Fig 3.3.4.1 X-Ray diffractogram of the clay fraction
the top possibly due to the high sediment supply and frequent
seasonal fluctuations in water table. But Karinkurinji up with
three distinct zones, such as brownish and dark blackish carbon-
aceous soil (0-28 cm), alternate with light green silty-sand soil
(50-69 cm) and bottom layer with orange yellowish laterite depo-
sition (69-80 cm). There is no spatial differentiation between
Karinkurinji up and Karinkurinji down swampy regions. In
Karinkurinji down, surface sand layer shows light brownish
colour due to less organic matter and more alluvial deposition.
The bottom silt clays contain abundant roots but the percentage
of organic matter decreases. Moderately acidic soil with high
organic carbon content was present in the middle clay-rich zones
at 30-50 cm depth (3.39%). The OC content of 0.314% in the
surface soil progressively decreased to 0.156% in the deepest
layer studied. There are remarkable variations in other properties
such as pH (6.33-5.74), conductivity (88-48 μS/cm) and organic
matter content.
XRF analysis revealed the presence of major oxides, generally of
the order of SiO2
> Al2
O3
> Fe2
O3
> K2
O> TiO2
> CaO> Na2
O>
MgO> P2
O> MnO and the trace elements, such as V (151-165
ppm), Cr (57-164 ppm), Zr (85-334ppm) and Ba (161-164ppm)
indicating high concentration as compared to other trace ele-
ments. The composition of compatible elements like Ni (46-16
ppm) and Co (27-6 ppm) shows low abundance as compared to
Cr (57-164 ppm).
The XRD data of randomly oriented soil show the primary
minerals (non- clay minerals) present in the samples to be mainly
quartz and biotite. In addition to the primary minerals, small
amounts of gibbsite are also identified. Clay mineral assem-
blages of Karinkurinji soils of Myristica swamps comprise
Gibbsite, Kaolinite, and small amounts of ilite (Fig. 3.3.4.1).
The presence of Gibbsite in top soil (about 40 cm) and high
Kaolinite with sand content in the bottom layer (55 to 70 cm)
can be explained by the fact that Kaolinite could be produced by

30
CESS Annual Report 2011-2012
Natural Resources &
M
anagem
ent
3
continental weathering. Gibbsite in these sediment samples is
due to its occurrence in aluminous clays and is a common prod-
uct of weathering reaction with low hydrolysis that is typical for
cool to temperate and dry climates. Clay mineralogy studies were
used to determine the paleoclimatic and depositional environ-
mental conditions of Karinkurinji down and up swamps.
The grain size analysis of two core samples indicates that
Karinkurinji swamps varied in texture from loamy sand to sandy
loam and in depth with sandy mud. The average content of
sand was with in the range 95.24% (top) to 24.56% (bottom)
and the ranges of silt and clay fractions are 3.46% to 13.22% and
2.53% to37.36%, respectively.
A total of 8 sediment sub- samples were analysed for palyno-
logical investigation with the help of the French Institute,
Pudussery. Several dominant pollen types were identified from
the core samples. Some are identified up to species levels and
some up to the level of family. The major ones identified are:-
Poaceae, Bombax ceiba (Bombacaceae), Combretaceae, Aporosa
cardiosperma (Euphorbiaceae), Schleichera oleosa (Sapindaceae),
Knema attenuata (Myristicaceae). Semecar pus auriculata
(Anacardiaceae), Combretaceae, Borassus flabellifer, Baccaurea
courtallensis (Euphorbiaceae), Schleichera oleosa (Sapindaceae),
Melastomataceae, Gomphandra tetrandra (Icacinaceae) and Algal
gel.
In shallow core samples the analytical result pollen reflects only
the present day vegetation, dominated by Poaceae, Combretaceae
and Semecarpus pollen grains, which record a uniform presence in
all the layers investigated. The same is the case with Myristicaceae,
which plays a dominant part of the present day vegetation in the
swamps. The mineralogical studies and trace elements of Myristica
swamps have provided information on the depositional envi-
ronment.C. N. Mohanan
3.3.5 Environmental degradation of Muvattupuzha
river basin, causes, consequences and strategies for river
restoration.
Fig. 3.3.5.1 Map showing the spatial distribution of mining
locations in the Muvattupuzha river basin.
The concern for the environment has grown up in the last few
decades due to the growing awareness on the impact caused by
various anthropogenic activities like extraction and utilization of
living and non-living resources, waste disposal and pollution.
In Kerala, the scenario of resource utilization has changed dras-
tically over the past 4-5 decades due to the rise in foreign remit-
tances and subsequent economic developments. Although Kerala
is a state with low per capita land and resource availability, the
exploitation of natural resources is not in tune with the prin-
ciples of sustainable development. As a consequence, many of
the highly populated areas in the midlands and lowlands are
affected severely by the adverse effects of resource extraction and
waste generation. Indiscriminate quarrying of soil and hard rocks,
cutting of laterite blocks, extraction of sand from instream and
floodplain areas, filling of wetlands for various non-agricultural
uses, deforestation etc., in many of the occasions, created serious
environmental problems in the Muvattupuzha river basin. Lack
of adequate data base on these issues is a major set back in
chalking out strategies for the conservation / management of
this important river basin.
The present study deals with various issues/environmental prob-
lems related to mining and quarrying in the Muvattupuzha river
basin, located on the southern side of Kochi city; one of the fast
developing urban-cum-industrial centres in South India. We hope
the report will be useful to all stake holders who are interested in
the socio-economic development and prosperity of the state in
general and the Muvattupuzha river basin in particular.
In the Muvattupuzha river basin, the environmental degrada-
tion is mainly attributed to various human activities like mining
and quarrying, deforestation, pollution etc. Major mining/quar-
rying activities noticed in this river basin are flood plain and
instream sand mining, hard rock quarrying, soil quarrying and
laterite block cutting (Fig.3.3.5.1). Graphite mining is limited to
a small area of Kalloorkad in the grama panchayat of Ernakulam
district. The indiscriminate mining predominates in the highly
populated midland and lowland regions of the river basin. A
spatial analysis of the activities reveals their clandestine presence
in the midland part of Ernakulam district. As the Kochi city and
its satellite towns require infrastructural facilities for several mega
developmental projects, therequirements of building materials
would also increase correspondingly. The rampant mining and

31
CESS Annual Report 2011-2012
Natural Resources &
M
anagem
ent
3
K. Maya
related processes widespread in the area create many hazardous
on-site and off-site impacts/environmental problems. Creation
of scars on the earth’s surface, fallow land etc. could adversely
affect the biophysical components in the river basin. The im-
pacts of mining, in most cases, leave permanent mark on the
land which modifies significantly the natural lanforms of the
area. Unsupported mines often promote soil erosion, changes
in soil texture, soil compaction etc. Due to various mining ac-
tivities, the area of land for the sustainable use would reduce
substantially. Except floodplain mining (lowlands), all the other
activities are severe in Ernakulam district.
3.3.6 Nitrous oxide and methane in coastal ocean and
estuaries
Fig. 3.3.6.2 Vertical distribution of dissolved N2
O at a few locations
in the ocean off Kayamkulam and Thottappally
Fig. 3.3.6.1 Vertical distribution of dissolved CH4
at a few locations
in the ocean off Kayamkulam and Thottappally
Nitrous Oxide and Methane are strong greenhouse gases capable
of significant global warming. These gases are known to be
abundant in the coast regions under anthropogenic influence.
The production of both gases is linked to bacterial activity under
anoxic or near anoxic conditions. It was in this background that
this research program was taken up. The major objectives of
this project was to measure the concentration and distribution
of dissolved methane and nitrous oxide in the Kadinamkulam,
Paravoor, Ashtamudi, Kayamkulam, Vembanad, and
Kodungalloor estuaries and the adjoining coastal ocean and to
estimate the amount of methane and nitrous oxide discharged
into the ocean in dissolved form, from these estuaries.
Water to air fluxes and dissolved gas in water were determined
in esturies and coastal ocean. TOC in the sediments were
measured at all locations. Sulphate, Phosphate, Nitrite, DO,
Salinity, and pH, of the water were also measured. Dissolved
methane and nitrous oxide at different depths were measured
and vertical distributions as well as contour plots were prepared
(Fig. 3.3.6.1and Fig. 3.3.6.2). Estuarine water contains very high
levels of dissolved methane and nitrous oxide. The vertical
distribution of these gases in the estuary shows higher values in
the bottom layers compared to surface layers, indicating
production in estuarine sediments. It is observed that the
concentration of dissolved methane and nitrous oxide in the
coastal region is significantly higher than that measured in the
open ocean.Unlike in the estuary, the general pattern in the vertical
distribution of dissolved methane in the coastal ocean shows a
high in the surface layers compared to the bottom layer, indicating
estuarine discharge as a major source of dissolved methane in
the coastal ocean.
3.3.7 Environmental management plan for Alappuzha-
Sherthalai canal and Kanjikuzhy grama panchayat
E.J. Zachariah
Funding: MoES, GoI
This action research project aims to prepare a management plan
for the Alleppey-Shertallai (A-S) canal and Kanjikuzhy Gram
panchayat by involving local people. Revisit of some of the en-
vironmental issues identified during a survey conducted in 2003
also forms part of this project.
The A-S canal is not continuous with flowing water. There are 22
segments. Water flows only among nine segments through vents,
for rest of the 13 segments water is stagnant and over flows
during monsoon months. Water is generally polluted with dense
growth of weeds in many segments. Only four segments,
namely, Varagady, Ponnittassery-2, Ponnittassery-1 and Kattayil
are relatively clean and therefore some people living nearby use
water from these four segments for domestic purposes. Canal
water from most of the segments is used for irrigation pur-
poses.

32
CESS Annual Report 2011-2012
Natural Resources &
M
anagem
ent
3
Fig. 3.3.7.1 Land use map of Ward-II, Kanjikuzhy Grama Panchayat
Srikumar Chattopadhyay
Funding: KSCSTE, GoK
Analysis of quality of canal water for three time points, Novem-
ber 2008, March 2009 and February 2010, indicate that water in
all segments of A-S canal is polluted. In some segments DO
values are so low that even fishes can not survive. Organic pol-
lution is very high. Some segments show high nitrite concentra-
tion, indicative of industrial pollution. Calcium hardness is
prevalent in all canal segments. Segment to segment variations
in water quality are related to local influence. Degraded vegetative
matter within the canal has also contributed. The canal depth
has reduced considerably. Many segments, which were renovated
under Hariyali scheme, have again been weed infested. One time
cleaning operation is not sufficient. There is a need for sustained
effort to enhance economic potential of this canal.
The suggested management plan envisages user group forma-
tion, canal renovation, introducing picsiculture, restoration of
flow and similar other environmental management practices.
There is a need to form A-S canal Management Committee
drawing representatives from all five Grama Panchayats. Regular
monitoring is also suggested to assess impact of intervention
projects and to devise mid course corrections.
In case of Kanjikuzhy Panchayat, which is well known for veg-
etable cultivation, the work began with documentation of ca-
dastral level landuse and other amenities for all wards. A sample
landuse map is given in Fig. 3.3.7.1. Major environmental prob-
lems in each Ward have been listed by considering all these infor-
mation and interacting with local people. Similar exercise was un-
dertaken in the year 2003 also. The major problems are: water log-
ging and flooding during monsoon months, scarcity of drinking
water, water pollution, sand mining, increased use of fertilisers
and pesticides, salinity in wells and streams, improper waste dis-
posal, declining agricultural productivity, and non cultivation of
paddy lands. Severity of problems has also been worked out based
on spatial spread. Water logging and flooding emerged as the most
serious problem as it is affecting 10 Wards followed by discharge
of industrial effluents (reported from 8 Wards) and siltation of
streams (6 Wards). Environmental appraisal maps have been pre-
pared for entire panchayat.
Environmental management action plan proposes watershed based
approach to control water logging, prevention of salinity intru-
sion, pond renovation, rehabilitation of sand mining ditches, pre-
vention of ground water pollution, rejuvenation of sacred groves,
promotion of nature tourism, use of fallow land, management
of agricultural waste, replacement of coconut plants and enhance-
ment of land productivity. Some of the issues warrant Panchayat
level initiatives and there are certain issues which can be handled at
the Ward level. Management of water logging and flood problem
requires inter-panchayat plans. Formations of user committees are
significant. There is a need to monitor development initiatives
regularly and take appropriate corrective measures as and when
necessary.
This report will be useful for management of A-S canal and prepa-
ration of development report of Kanjikuzhy Grama Panchayat.
Lessons learnt from renovation work of A-S canal will be useful
for undertaking such initiatives in future. EMP of Kanjikuzhy
Gram Panchayat can be used as an example for other coastal
Panchayats to prepare such reports.
3.3.8 Coastal Ocean Monitoring and Prediction System,
COMAPS
The prime objective of this long term project funded by MoES,
Government of India, is to assess the sources, levels, pathways
and effects of various pollutants along the coastal areas of Kerala,
Karnataka and Lakshadweep islands. (Fig. 3.3.8.1)
Recent studies revealed that in the Cochin offshore region, the
concentration of trace metals were very high (Cd: 2.17μg/g; Pb:
26.90μg/g & Hg: 0.62μg/g). The estuary receives heavy influx of
terrestrial sewage, industrial effluents and other anthropogenic

33
CESS Annual Report 2011-2012
Natural Resources &
M
anagem
ent
3
Fig.. 3.3.8.1 Study area
pollutants. Blooming of an indicator in phytoplankton species,
Leptocylindrus sp., showed its presence with a cell count ranging
from 20,000 to1, 50,000 cells/L., signifying the aggravate phase of
pollution. Besides, the higher figure of E.coli and faecal Streptococci
indicates sombre microbial pollution in Cochin coastal waters.
Many illegal sewers and the canals from the urban centers carrying
the market wastes, septic tank effluents and animal carcasses finally
enter the dynamic coastal waters results in the gross contamination
with alarmingly increasing growth of pathogenic bacteria.
At Mangalore, the highest density of infectious organisms like
E.coli (50-870 CFU/ml) and faecal Streptococci (60-1640 CFU/ml)
were noticed. The adjoining river mouths/near shore region showed
high TSS, excess nutrients and low dissolved oxygen due to mas-
sive influx of freshwater from riverine sources(Gurupur and
Nethravathi). In Kavaratti, the primary productivity, Chlorophyll a
and phytoplankton biomass were recorded very low. The phy-
toplankton, represented by the genera Phaeocystis sp. (adversely af-
fect fishery) and Skeletonema sp. showed its representation with a
maximum cell count of 3180 and 800 cells/L., respectively. It shows
the enrichment of nutrients taking place in lagoon due to the
unscientific disposal of sewages and other waste materials. The
nearshore waters of Kavaratti are drastically affected by microbial
pollution which could be the influence of domestic waste dis-
posal.
K. V. Thomas
Funding: MoES, GoI
3.4 Coastal Zone Management
3.4.1 Cadastral scale Coastal Regulation Zone maps for
Coastal Zone Management of urban areas in Kerala
One of the major initiatives in the country towards bringing all the
development programmes in the coastal zone under the umbrella
of Integrated Coastal Zone Management (ICZM) is the Coastal
Regulation Zone (CRZ) Notification (MoEF, 2011 & 1991). The
Notification declares a defined coastal stretch as CRZ and regulates
Fig. 3.4.1.1 Location map showing sample points in Kattakkal Kayal,
Sakthikulangara area of Kollam Corporation
construction and other activities within this defined CRZ.
The project on Cadastral sale CRZ maps for urban areas in
Kerala was taken up with the support of the Kerala State
Council for Science, Technology and Environment
(KSCSTE).
The main objective of the project is to develop Coastal
Zone Management (CZM) Plans with cadastral based CRZ
maps for the coastal zone of Kerala to facilitate easy and
transparent implementation of CRZ regulations. The
High Tide Line (HTL), Low Tide Line (LTL) and CRZ
demarcated on cadastral based CRZ maps help to identify
the sensitive coastal ecosystems to be conserved and areas
for development.
The cadastral level CRZ/CZM maps of Kozhikode, Varkala,
Kollam and Thiruvananthapuram urban areas have been pre-
pared in the 1st
phase. In the 2nd
phase the cadastral scale CRZ/
CZM maps of Kochi Corporation, Maradu & Kanhangad Mu-
nicipalities are under preparation. A GIS based CRZ informa-
tion system is also under development. High resolution satel-
lite imageries are being used to prepare CRZ/CZM maps along
with detailed field mapping.
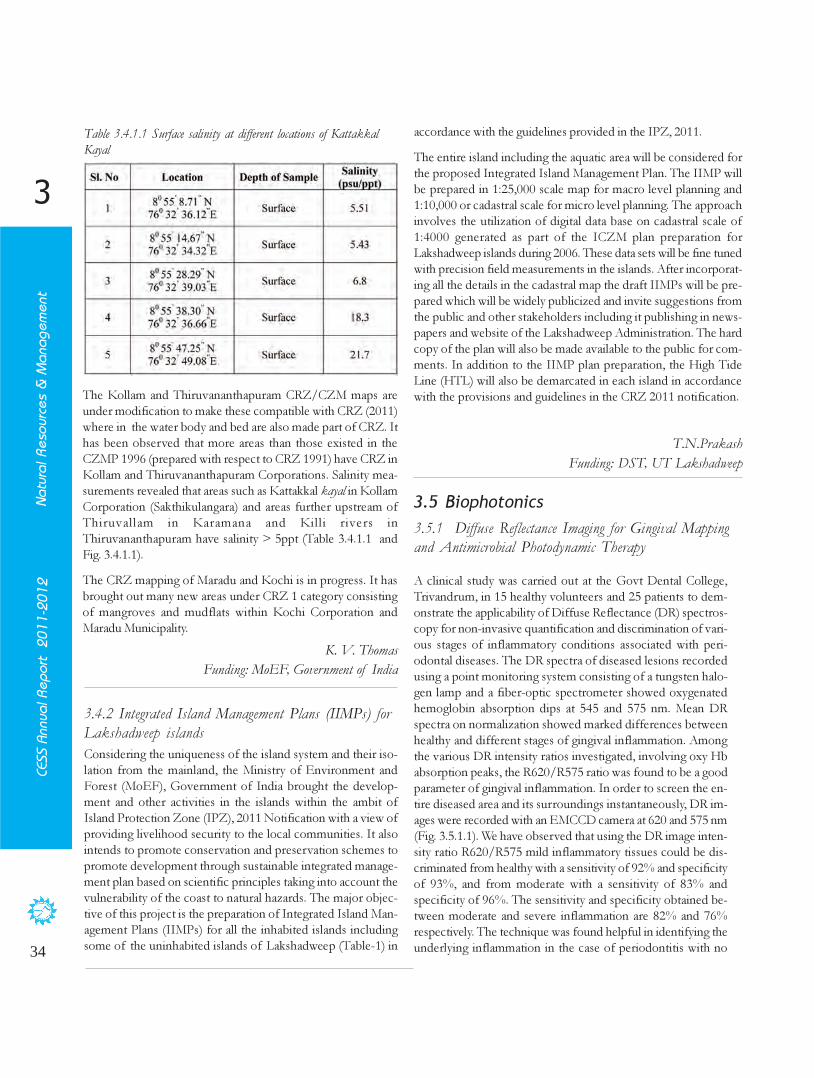
34
CESS Annual Report 2011-2012
Natural Resources &
M
anagem
ent
3
3.5 Biophotonics
3.5.1 Diffuse Reflectance Imaging for Gingival Mapping
and Antimicrobial Photodynamic Therapy
The Kollam and Thiruvananthapuram CRZ/CZM maps are
under modification to make these compatible with CRZ (2011)
where in the water body and bed are also made part of CRZ. It
has been observed that more areas than those existed in the
CZMP 1996 (prepared with respect to CRZ 1991) have CRZ in
Kollam and Thiruvananthapuram Corporations. Salinity mea-
surements revealed that areas such as Kattakkal kayal in Kollam
Corporation (Sakthikulangara) and areas further upstream of
Thiruvallam in Karamana and Killi rivers in
Thiruvananthapuram have salinity > 5ppt (Table 3.4.1.1 and
Fig. 3.4.1.1).
The CRZ mapping of Maradu and Kochi is in progress. It has
brought out many new areas under CRZ 1 category consisting
of mangroves and mudflats within Kochi Corporation and
Maradu Municipality.
K. V. Thomas
Funding: MoEF, Government of India
A clinical study was carried out at the Govt Dental College,
Trivandrum, in 15 healthy volunteers and 25 patients to dem-
onstrate the applicability of Diffuse Reflectance (DR) spectros-
copy for non-invasive quantification and discrimination of vari-
ous stages of inflammatory conditions associated with peri-
odontal diseases. The DR spectra of diseased lesions recorded
using a point monitoring system consisting of a tungsten halo-
gen lamp and a fiber-optic spectrometer showed oxygenated
hemoglobin absorption dips at 545 and 575 nm. Mean DR
spectra on normalization showed marked differences between
healthy and different stages of gingival inflammation. Among
the various DR intensity ratios investigated, involving oxy Hb
absorption peaks, the R620/R575 ratio was found to be a good
parameter of gingival inflammation. In order to screen the en-
tire diseased area and its surroundings instantaneously, DR im-
ages were recorded with an EMCCD camera at 620 and 575 nm
(Fig. 3.5.1.1). We have observed that using the DR image inten-
sity ratio R620/R575 mild inflammatory tissues could be dis-
criminated from healthy with a sensitivity of 92% and specificity
of 93%, and from moderate with a sensitivity of 83% and
specificity of 96%. The sensitivity and specificity obtained be-
tween moderate and severe inflammation are 82% and 76%
respectively. The technique was found helpful in identifying the
underlying inflammation in the case of periodontitis with no
3.4.2 Integrated Island Management Plans (IIMPs) for
Lakshadweep islands
T.N.Prakash
Funding: DST, UT Lakshadweep
Considering the uniqueness of the island system and their iso-
lation from the mainland, the Ministry of Environment and
Forest (MoEF), Government of India brought the develop-
ment and other activities in the islands within the ambit of
Island Protection Zone (IPZ), 2011 Notification with a view of
providing livelihood security to the local communities. It also
intends to promote conservation and preservation schemes to
promote development through sustainable integrated manage-
ment plan based on scientific principles taking into account the
vulnerability of the coast to natural hazards. The major objec-
tive of this project is the preparation of Integrated Island Man-
agement Plans (IIMPs) for all the inhabited islands including
some of the uninhabited islands of Lakshadweep (Table-1) in
accordance with the guidelines provided in the IPZ, 2011.
The entire island including the aquatic area will be considered for
the proposed Integrated Island Management Plan. The IIMP will
be prepared in 1:25,000 scale map for macro level planning and
1:10,000 or cadastral scale for micro level planning. The approach
involves the utilization of digital data base on cadastral scale of
1:4000 generated as part of the ICZM plan preparation for
Lakshadweep islands during 2006. These data sets will be fine tuned
with precision field measurements in the islands. After incorporat-
ing all the details in the cadastral map the draft IIMPs will be pre-
pared which will be widely publicized and invite suggestions from
the public and other stakeholders including it publishing in news-
papers and website of the Lakshadweep Administration. The hard
copy of the plan will also be made available to the public for com-
ments. In addition to the IIMP plan preparation, the High Tide
Line (HTL) will also be demarcated in each island in accordance
with the provisions and guidelines in the CRZ 2011 notification.
Table 3.4.1.1 Surface salinity at different locations of Kattakkal
Kayal

35
CESS Annual Report 2011-2012
Natural Resources &
M
anagem
ent
3
Fig. 3.5.1.1 The DR imaging setup for clinical studies of gingival
mapping
inflammation in gingiva. Early detection of disease and future
disease progression can be monitored using this technique.
It was found that oxy Hb concentration increases during gingival
inflammation, which alters the tissue absorbance at 575 nm. In
clinical diagnostic procedures, gingival inflammation is considered
as the initial stage of periodontal breakdown. This is often de-
tected clinically by BOP (bleeding on probing) as it is an objective
measure of gingival inflammation and is a reliable and verifiable
measure. BOP is very well correlated with histological changes of
gingivitis, and is readily interpretable in terms of clinical signifi-
cance and can be highly correlated with gingival indices (GI). Clini-
cally, active periods show bleeding either spontaneously or with
probing. The study results show that sites with BOP correspond
well with the false colored image ratio R620/R575 pixel value.
The exact point of inflammation in moderately inflamed and se-
verely inflamed gingiva can be seen in the false colored images are
not at all observable using conventional diagnostic procedures
(Fig.3.5.1.2). The identification of disease location enhances the
opportunity for site specific treatments like photodynamic therapy.
Periodontal destruction is site specific and does not occur in all
parts of the gum and teeth at the same time, but rather on a few
teeth at any given time. DR imaging identifies areas with early
inflammatory changes in the underlying tissues even when the
sites appear clinically healthy. This helps in identifying sites that are
prone to disease. It is very common to find sites of periodontal
destruction next to sites with little or no destruction. Therefore,
the severity of periodontitis increases with the development of
new disease sites and increased breakdown of existing sites, or
both. Currently used diagnostic procedures cannot distinguish be-
tween disease-active and disease-inactive sites at any given point of
time and cannot reliably identify susceptible individuals based on
Fig. 3.5.1.2 False coloured DR image intensity ratio (R620/R575)
showing regions of inflammation.
disease active and inactive sites. Also, chronic periodontitis is
now considered a site-specific disease, but what has continued to
puzzle periodontal researchers is the unpredictability of the dis-
ease at a patient and site-level. In this context, diffuse reflectance
imaging using DR image ratio R620/R575 proves to be an effec-
tive tool to pin point locations of inflammation and to precisely
demarcate areas with increased vascularity or gingival inflamma-
tion.
During March 2012, the project Co-investigator from Azezzia
Dental College, Dr. K. Nandakumar and Mr. Prasanth
Chandrasekhar visited the Bulgarian Academy of Sciences in Sofia
and carried out joint PDT studies with the collaborating group
using porphyrin and chlorin based photosensitizers on oral
pathogens.
N. Subhash
Funding: Indo Bulgarian collaborative project funded by DST,
Government of India
(b)(a)
(c) (d)

36
CESS Annual Report 2011-2012
Natural Resources &
M
anagem
ent
3
B
extract the very low fluorescence signals in the presence of high
levels of diffusely reflected sunlight. The chlorophyll fluores-
cence spectral images were recorded at the near-red (PSII emis-
sion ) and far-red (PS I emission) bands and their false coloured
image ratio was used to obtain stress sensitive signatures of
outdoor plants. In addition, solar reflectance images of vegeta-
tion at 420, 531, 571, 600, 670, 694 and 720 nm were measured
and Photochemical reflectance index (PRI) and NDVI were de-
termined. Senescence induced changes in colocasia and sweet
potato plants due to herbicide attack, drought and nutrient
stresses were studied by growing these plants in the campus and
comparing the results with a control group. Photosynthesis pa-
rameters of vegetation such as photosynthesis rate, transpira-
tion, stomatal conductance and internal CO2
were measured
using CI-340 photosynthesis system for correlation.
The ability of different reflectance image intensity ratios and
Photochemical Reflectance Index (PRI) in stress detection was
assessed and compared with sunlight-induced fluorescence im-
age ratio. Higher PRI values seen in the case of the healthy leaves
indicate less stressful conditions, whereas the progressively lower
values seen during yellowing of leaves indicate substantial stress.
Among the different reflectance images ratios used, R694/R420
and R694/ R720 showed clear distinction of senescence from
healthy green leaves. The net photosynthesis rate (Pn) and sto-
matal conductance showed constant values for the control plants,
whereas for the stressed plants they were low. The decrease in
Fig. 3.5.2.1(c): False coloured fluorescence image ratio F687/759
derived using FLD principle
3.5.2 Sunlight-induced multi-spectral fluorescence
imaging system for vegetation assessment
A multi-spectral imaging system to measure sunlight-induced
fluorescence and reflectance images of vegetation at selected wave-
lengths was developed. The system consists of an EMCCD
camera with Nikon lens and LCT filter with 7 nm FHWM and
an optional filter wheel with discrete narrow band interference
filters for wavelength selection. During fluorescence studies the
Fraunhofer Line Discrimination (FLD) technique was used to
Fig. 3.5.2.1 (a&b): Sunlight-induced fluorescence image of the
vegetation at 687nm and 759nm
(a)
(b)
A
(c)
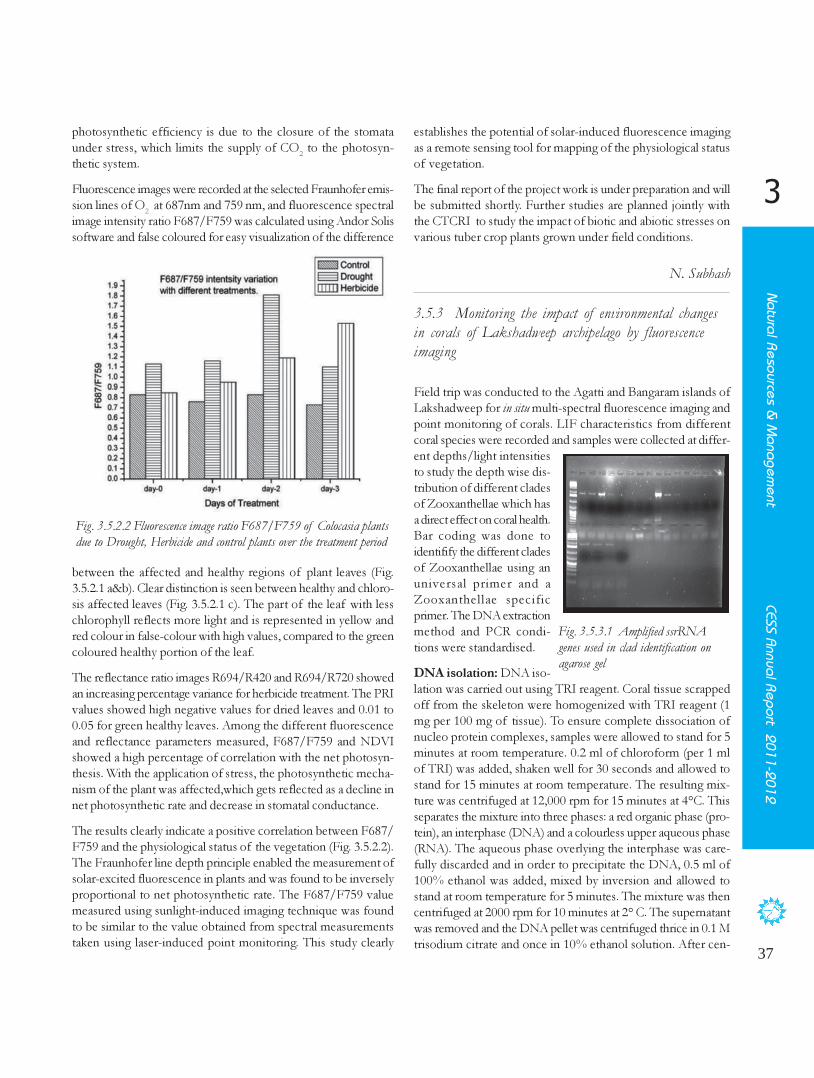
37
CESS Annual Report 2011-2012
Natural Resources &
M
anagem
ent
3
Fig. 3.5.2.2 Fluorescence image ratio F687/F759 of Colocasia plants
due to Drought, Herbicide and control plants over the treatment period
photosynthetic efficiency is due to the closure of the stomata
under stress, which limits the supply of CO2
to the photosyn-
thetic system.
Fluorescence images were recorded at the selected Fraunhofer emis-
sion lines of O2
at 687nm and 759 nm, and fluorescence spectral
image intensity ratio F687/F759 was calculated using Andor Solis
software and false coloured for easy visualization of the difference
between the affected and healthy regions of plant leaves (Fig.
3.5.2.1 a&b). Clear distinction is seen between healthy and chloro-
sis affected leaves (Fig. 3.5.2.1 c). The part of the leaf with less
chlorophyll reflects more light and is represented in yellow and
red colour in false-colour with high values, compared to the green
coloured healthy portion of the leaf.
The reflectance ratio images R694/R420 and R694/R720 showed
an increasing percentage variance for herbicide treatment. The PRI
values showed high negative values for dried leaves and 0.01 to
0.05 for green healthy leaves. Among the different fluorescence
and reflectance parameters measured, F687/F759 and NDVI
showed a high percentage of correlation with the net photosyn-
thesis. With the application of stress, the photosynthetic mecha-
nism of the plant was affected,which gets reflected as a decline in
net photosynthetic rate and decrease in stomatal conductance.
The results clearly indicate a positive correlation between F687/
F759 and the physiological status of the vegetation (Fig. 3.5.2.2).
The Fraunhofer line depth principle enabled the measurement of
solar-excited fluorescence in plants and was found to be inversely
proportional to net photosynthetic rate. The F687/F759 value
measured using sunlight-induced imaging technique was found
to be similar to the value obtained from spectral measurements
taken using laser-induced point monitoring. This study clearly
establishes the potential of solar-induced fluorescence imaging
as a remote sensing tool for mapping of the physiological status
of vegetation.
The final report of the project work is under preparation and will
be submitted shortly. Further studies are planned jointly with
the CTCRI to study the impact of biotic and abiotic stresses on
various tuber crop plants grown under field conditions.
N. Subhash
3.5.3 Monitoring the impact of environmental changes
in corals of Lakshadweep archipelago by fluorescence
imaging
Fig. 3.5.3.1 Amplified ssrRNA
genes used in clad identification on
agarose gel
Field trip was conducted to the Agatti and Bangaram islands of
Lakshadweep for in situ multi-spectral fluorescence imaging and
point monitoring of corals. LIF characteristics from different
coral species were recorded and samples were collected at differ-
ent depths/light intensities
to study the depth wise dis-
tribution of different clades
of Zooxanthellae which has
a direct effect on coral health.
Bar coding was done to
identifify the different clades
of Zooxanthellae using an
universal primer and a
Zooxanthellae specific
primer. The DNA extraction
method and PCR condi-
tions were standardised.
DNA isolation: DNA iso-
lation was carried out using TRI reagent. Coral tissue scrapped
off from the skeleton were homogenized with TRI reagent (1
mg per 100 mg of tissue). To ensure complete dissociation of
nucleo protein complexes, samples were allowed to stand for 5
minutes at room temperature. 0.2 ml of chloroform (per 1 ml
of TRI) was added, shaken well for 30 seconds and allowed to
stand for 15 minutes at room temperature. The resulting mix-
ture was centrifuged at 12,000 rpm for 15 minutes at 4°C. This
separates the mixture into three phases: a red organic phase (pro-
tein), an interphase (DNA) and a colourless upper aqueous phase
(RNA). The aqueous phase overlying the interphase was care-
fully discarded and in order to precipitate the DNA, 0.5 ml of
100% ethanol was added, mixed by inversion and allowed to
stand at room temperature for 5 minutes. The mixture was then
centrifuged at 2000 rpm for 10 minutes at 2° C. The supernatant
was removed and the DNA pellet was centrifuged thrice in 0.1 M
trisodium citrate and once in 10% ethanol solution. After cen-

38
CESS Annual Report 2011-2012
Natural Resources &
M
anagem
ent
3
E Saravanan
3.6.2 Digital Resource Atlas of Kerala
trifugation at 2000 rpm for 5 minutes at 4°C the DNA pellet was
resuspended in 75% ethanol and stored for further studies.
Gene amplification: After DNA extraction, the small subunit
ribosomal RNA genes were amplified from total nucleic acid
using both universal eukaryotic primer,
[ss5 (5' – GGTTGATCCTGCCAGTAGTCATATGCTTG-3') and ss3
(5'–GATCCTTCCGCAGGTTCACCTACGGAAACC-3')]and Zoox-
anthellae specific primer [ss5Z (an equimolar mixture of the oligo-
nucleotides 5'-GCAGTTATAATTTATTTGATGGTCACTGCTAC-
3' and 5'-GCAGTTATAGTTTATTTGATGGTTGCTGCTAC-3') and
ss3Z (5'-AGCACTGCGTCAGTCCGAATAATTCACCGG-3')].
Amplifications were performed using a thermal cycler with the
following thermal profile: 30 cycles for 5 minutes at 94°C, 1
minute at 94°C, 2 minutes at 50°C, 3 minutes at 72°C and 10
minutes at 72°C. The PCR products were analyzed by electro-
phoresis and stained with ethidium bromide. PCR products on
agarose gel amplified using universal primer are shown in
Fig.3.5.3.1. Initially amplicons were obtained only for universal
primer. However, when the once amplified PCR products were
used instead of total DNA the ssrRNA gene was amplified.
Sequencing the products would help us identify the different
clades of Zooxanthellae that the corals harbour.
Four large glass tanks with temparature controllers and UV light
illuminators were set up at the Central Marine Fisheries Research
Institute (CMFRI), Vizhinjam to the study heat induced stress
on corals. The tanks were well aerated and the temperature in all
the four tanks was maintained at the optimum temperature of
26°C using an immersible heater and a thermostat. The coral
samples will stand at the optimum temperature for five days
minimum for acclimatization. Apart from imaging, tissue
samples will be taken to study the changes in Zooxanthellae
subspecies and to identify the fluorescent proteins in corals.
N Subhash
Funding: DST, Government of India
3.6 GIS and Remote Sensing
Applications in Natural Resources
Management
3.6.1 Agricultural Atlas of Kerala
matic maps in the form of resource document (Agricultural Atlas)
for planning.
In the first phase, spatial data on crop land use were collected from
sources like viz., Department of Economics and Statistics, De-
partment of Agriculture, Department of Livestock, Poultry and
Fisheries, Department of Soil Survey and Revenue, IMD, RARS
Stations, and Agricultural University. The data collected were used
for the preparation of series of multi colour thematic maps using
Arc GIS 9.3.
Derivative maps will be generated from spatial and non spatial data
using GIS software. After procuring the Satellite Data from NRSC,
Hyderabad for entire Kerala, the crop land use analysis will be
carried out using Arc GIS and ERDAS Image Processing Software
in the laboratory. Subsequently field work will be carried out in
selected areas for ground truth verification of crop land use. In the
second half of the third phase final data base will be created using
GIS and Remote Sensing and finally multi colour thematic maps
will be prepared and an atlas will be brought out
The objectives of the project are (a) to provide detailed database
and spatio-temporal characteristics of the productivity of major
food grains collected from various sources and to substantiate
with Remote Sensing and GIS Technology, (b) to digitize the
crop land use and related natural resources available from vari-
ous scales, (c) to study the present conditions, its problems and
prospect of agricultural activities, (d) to document the data in
GIS format for updation and (e) to prepare multi-colour the-
The main objective of this project is to revise the Resource Atlas of
Kerala published in 1984 in digital format in CD as well as in hard
copy. Maps of physical aspects and climate will be digitized and
used for the revised atlas. For other thematic maps, district and
taluks will be used as unit of study for the preparation of maps.
Data from secondary sources like Census of India, Agricultural
Dept., Bureau of Economics and Statistics and other departments
will be collected and converted into appropriate thematic maps.
The maps will be prepared in GIS environment to enable us to
update periodically without much delay. Atlas maps will be pub-
lished both in CD and as well as hard copy with Survey of India
approval.
During the period under report data were collected, processed, and
200 maps were digitised. These include Kerala- administrative
divisons, relief, drainage, soil, demographic aspects (Cesnus, 2001),
area under banana, turmeric, cardamaom, cocoa, food crops, non
foodcrops, drumstick, ginger, pepper, sugarcane, lemongrass, rub-
ber, coffee, paddy, fodder grass, papaya, sweet potato, pine apple,
tamrind, mango, jack, tapioca, plaintain, cahew, tea, sesamum, and
coconut from 1985-1995, 1995-2005 and percentage to the total
cropped area from 1985-1995 and 1995-2005. Demographic as-
pects includes total, male and female population, percentage to the
total population, density of population, sex ratio, total workers,
main workers, cultivators, agricultural labourers, literates, SC popu-

39
CESS Annual Report 2011-2012
Natural Resources &
M
anagem
ent
33.6.3 Cadastral Level Decision Support System for
Management of Natural Resources in Thiruvanantha-
puram District
B. Sukumar
lation, ST population and households. Most of the maps are
completed and the final report is under preparation.
Fig. 3.6.3.1 A screen shot of the releif map included in the Decision Support System for Neyyattinkara Taluk, Trivandrum
The objectives of the project are (a) integration of land and water
resource information in a cadastral base through integration of
geo-informatics with particular focus on local level development,
(b) developing a spatial information base for various levels of
urban/rural planning, (c) developing a standard format for data
exchange and (d) developing a Decision Support System (DSS) to
establish a Resource Information Centre with the participation of
panchayat functionaries / people’s representatives. However, due
to the large volume of work components involved and inordinate
delay in completing the Differential GPS (DGPS) survey, it was
decided to modify the objective and complete the project by devel-
oping a DSS for the LSGD blocks and municipality of one taluk at
cadastral level.
Thus after integrating the digital database the DSS for the
Neyyattinkara taluk was prepared. However the thematic maps per-
taining to bio-physical resources of Thiruvananthapuram district
has been transformed with reference to the post-processed Ground
Control Points (GCPs) generated during the DGPS survey in the
non-forested areas of the Thiruvananthapuram district. Local body-
wise distribution of the inventory/ derivative thematic database
has been computed based on UTM Zone-43 projection. Parcel-
wise distribution of the themes has been generated for all the
thematic layers of Neyyattinkara taluk. A cadastral level Decision
Support System has been built using the Map server for hosting to
the web. The user can explore, manipulate and extract reliable spa-
tial database according to their requirement.
The project deliverables were in two phases viz., DGPS mapping
for establishing of Principal Reference Points (PRPs) and Ground
Control Points (GCPs) and Cadastral Level Decision Support Sys-
tem software development. The PRP mapping services covered
seven districts, where 28 PRPs have been established by making 72
hours continuous observation in seven districts viz
Thiruvananthapuram, Kollam, Alappuzha, Kottayam, Ernakulam,

40
CESS Annual Report 2011-2012
Natural Resources &
M
anagem
ent
3
Jayaprasad B K
Funding: Kerala State Planning Board
3.6.5 Soil based Plant Nutrient Management Plan for
the agro-ecosystems of Kerala
Fig.3.6.4.1 Landuse map of Marayoor hills in the Agro-Climatic
Zone 17
Jayaprasad B K
3.6.4 Natural resources and environmental data base
updation and utilization for local level planning in
Kerala-Database infrastructure support
Thrissur, and Malappuram. In order to geo-reference cartosat-1
imagery of the Thiruvananthapuram District, 316 Ground con-
trol Points have also been surveyed. The Project is completed
and the Software is ready for hosting in intranet/internet. The
three reports published on completion of the project are (a)
Report on GCPs for Thiruvananthapuram District, (b) Report
on PRPs for Thiruvananthapuram, Kollam, Alappuzha,
Kottayam, Ernakulam, Thrissur, and Malappuram districts and
(c) Cadastral level Decision Support System for
Thiruvananthapuram district, Kerala.
The main objective of the project was to prepare Agro Ecologi-
cal Unit-wise atlases for Kerala State based on the classification
made by the National Bureau of Soil Survey and Landuse Planning
(NBSS & LUP). Twenty Three Agro-ecological units (AEU’s) have
been delineated for the State based on climatic variations, land
form and soil by the NBSS & LUP. They are the Southern Coastal
Plain, Northern Coastal Plain, Onattukara Sandy Plain, Kuttanadu,
Pokkali Lands, Kole Lands, Kaipad Lands, Southern Laterites,
South Central Laterites, North Central Laterites, North Laterites,
Southern and Central Foot Hills, Northern Foot Hills, Southern
High Hills, Northern High Hills, Kumily Hills, Marayoor Hills,
Attappady Hills, Attappady Dry Hills, Wayanad Central Plateau,
Wayanad Eastern Plateau, Palakkad Central Plains and the Palakkad
Eastern Plains. In the case of the municipal corporations in Kerala;
one more unit called the ‘Habitation Unit’ was also added. On the
basis of the master polygons delivered by National Bureau of Soil
Survey and Land use Planning (ICAR) Bangalore, twenty three
agro-ecological units and habitation unit atlases were prepared us-
ing Natural Resource and Environmental Data Base (NREDB)
generated utilizing IRS P6 imagery and other related database.
The atlas consisted of 4650 color maps and a 1176 page report.
The atlases were released on 5th
March 2012 at the workshop on
‘Agro-ecological planning for agricultural development in Kerala, a
paradigm shift’ organized by the Kerala State Planning Board.
The Government of Kerala has launched a ‘Plant Nutrient Man-
agement Plan’ covering agro-ecosystems in the State. The project
envisages analyzing 2.30 lakh soil samples from 999 panchayats
and preparation of nutrient management plans for all the
panchayats. In addition, the production potential of major crops
in 23 agro-ecological zones of the State will be analyzed by a team
of agronomists. Farmers would then be issued nutrient advisory
cards.
The project is being implemented by the Department of Agricul-
ture with the support of Indian Council of Agricultural Research
(ICAR) institutes, Kerala Agriculture University (KAU), Kerala
Forest Research Institute (KFRI), Centre for Earth Sciences Studies
(CESS) and Indian Institute of Information Technology and Man-
agement-Kerala (IIITM-K), under the leadership of National Bu-
reau of Soil Survey and Land Use Planning, Bangalore. The project
is being coordinated by the Kerala State Planning Board. The na-
tional bureau has already completed the delineation of the 14 dis-
tricts into 23 agro-ecological zones based on climate and soil. Cor-
porations are grouped under the Habitation unit. Macro and micro

41
CESS Annual Report 2011-2012N
atural Resources & M
anagement
3
3.6.6 Road network updation using high resolution remotesensing data and GPS - A pilot project for Kerala SpatialData Infrastructure (KSDI),
Jayaprasad B KFunding: Kerala State Planning Board
nutrients in each zone will be analyzed and nutrient managementplan prepared for each zone and local body. CESS has undertakenspatial data processing using GIS and prepared base maps forlocating sample sites. The volunteers have demarcated the soilsample sites in the base maps of local bodies. Based on the resultsof soil analysis, many analytical and synthetic maps will be pre-pared using the spatial analysis tools available in the GIS. A com-prehensive nutrient management plan would then be made avail-able for the farmers. The soil analysis reports are awaited for thepreparation of derivative maps for the local bodies.
The Quick Bird image with a resolution of 0.60 meters, whichhas a fair coverage in terms of archive data over the Kerala State,is ideal for delineating road network up to the local body-level.Satellite image study was supplemented with extensive field workfor validating and updating disjoint portion of the linear roadnetwork and other spatial features of interest.
The services of the local volunteers and officials from the corre-
sponding local body were utilized for field assistance and label-ing of road segments with local names.
The ‘Road Register’ available with the concerned local body andPublic Works Department was used for labeling of roads andlanes. For widening roads, road width information has to beincorporated in the database. Category-wise road numbers areessential for future updation and labeling.
Road networks are very vital for development of any region. Lackof good connectivity isolates regions from educational institu-tions, health institutions, social support network and sources ofincome. In the absence of good connectivity, the surplus producescannot be transported to the market and this lowers the income ofthe local community. Good and well maintained road networksare essential for micro level planning activities.
For sectoral development at local level, the database has to be up-dated by utilizing the high resolution remote sensing data such asQuick Bird with resolution of 0.6 meter, so that the roads at localbody level can be incorporated in the cadastral scale. CESS has takenup a pilot study of road database updation using high resolutionremote sensing data and GPS survey for framing up the method-ology. In order to demonstrate the capability of satellite data prod-uct, one panchayat in the Parassala Block has been taken up.
Updation and integration of the transportation network was at-tempted with CARTOSAT-1 and Quick Bird Satellite data supple-mented with attributes such as road segment labels, junctions andlocal area names. A detailed field work has also been carried out forroad survey using the GPS, so as to work out the methodologiesfor updating the transportation network, its limitations, time andcost.
An attempt has been made to evaluate and compare the extent ofroad network generated with the help of the satellite data and datagenerated by PWD, CESS and KSREC for road network in ParassalaPanchayat of Parassala Block. A table of comparison has also beenmade. Apart from delineating the road network data from multi-resolution and multi -temporal satellite images and data capturedfrom the field, customized GIS application software has also beendeveloped in open source to demonstrate the utility of software inextracting the road database information by querying. The software‘Road Information System’ is a customized GIS application devel-oped in Map Server Open source UMN.
Fig. 3.6.6.1 Road network of Parassala panchayat seen from theQuickBird satellite image
B.K.JayaprasadFunding: IT Dept., GoK

42
CESS Annual Report 2011-2012
Natural Resources &
M
anagem
ent
3
K. Vijayakumar
more populated with agricultural workers compared to other areas
in the district. This has enabled a comparison between agricultural
and non-agricultural areas in their modes of energy use. The gen-
eral socio economic features of the households of the regions
surveyed formed the backdrop and this study has been completed
and the final project report was submitted.
It can be said without doubt that of all the technological develop-
ments so far made, electrification has had the maximum capacity to
affect the way people live, work, entertain and communicate. Hence,
the study has dealt with awareness, adoption and impact of vari-
ous applications through micro level study at household level. The
study conducted in Kilimanoor panchayat, which has an agricul-
tural background, yielded interesting insights. Some thoughts on
the presently relevant twin problems of energy and food securities
are also discussed in the report.
B.K.Jayaprasad
Funding: Information Kerala Mission, GoK
3.7 Energy Studies
3.7.1 The Social impacts of energy technologies: Two
case studies at different environs of Thiruvanantha-
puram district
Energy is the prime mover of economic growth. It occupies the
central stage in developmental issues. This implies that for the
fructification of the concept of inclusive growth, energy has to
be provided to the needy in the manner and form required by
them. The broad objectives of the project are to bring out the
salient features of socio-economic and other impacts of energy
technologies which are used in day to day life in rural panchayat
of Kilimanoor and in the urban area of Pattom, both in
Thiruvananthapuram district. The methodology involved was
to carry out household survey in the chosen areas employing a
detailed and comprehensive questionnaire. The survey was con-
ducted in randomly chosen one hundred house holds in each of
the study area which comprise of regions in two different envi-
rons. The rural panchayat of Kilimanoor also happens to be
3.6.7 Creation of a model GIS database for
Malappuram Municipality under the Spatial Urban
Information System (SUIS)
‘Urban Information System’ is the backbone for city planning.
The digital maps and GIS database can be useful for preparation
of various master plans for projects in the municipality limits. It
can be also used to collect property tax, plan and execute disaster
management plans, streamline traffic flow, planning utilities like
water supply, sewage system and electricity. CESS and Informa-
tion Kerala Mission have initiated a collaborative project to cre-
ate a model GIS data base with plot level details for Malappuram
municipality.
CESS is entrusted with DGPS survey for generating Principal
Reference Points (PRPs)and Ground Control Points(GCPs),
field survey verification and vetting, geo-referencing and digiti-
zation of cadastral and satellite imagery, providing faculty train-
ing for municipal personnel and surveyors, ward-wise atlas prepa-
ration and customization. DGPS survey has been completed.
The World View-2 satellite imagery with a spatial resolution of
0.50 mts has been geo-referenced with reference to the post
processed DGPS data. Training of municipal personnel and
surveyors has been completed. Extraction of land use theme
has also been completed. The remaining components of the
project work are progressing.
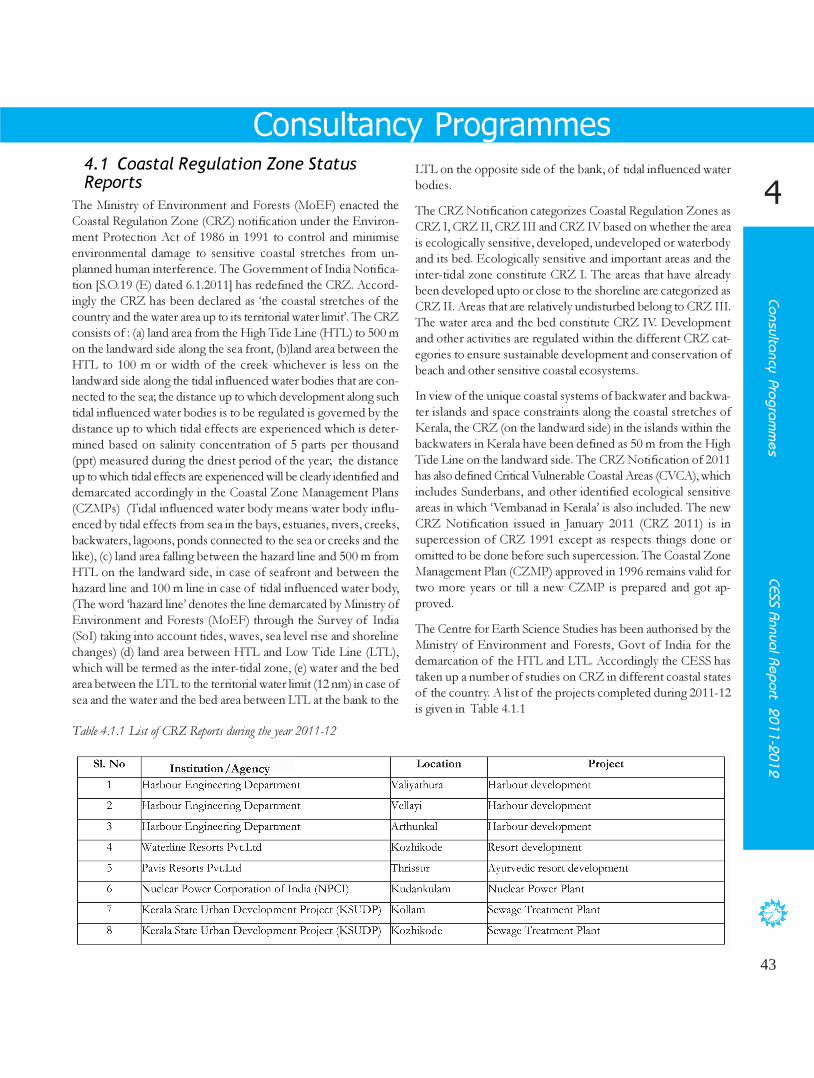
43
CESS Annual Report 2011-2012
Co
nsulta
ncy Pro
gra
mm
es
4
Consultancy Programmes
4.1 Coastal Regulation Zone Status
Reports
Table 4.1.1 List of CRZ Reports during the year 2011-12
The Ministry of Environment and Forests (MoEF) enacted the
Coastal Regulation Zone (CRZ) notification under the Environ-
ment Protection Act of 1986 in 1991 to control and minimise
environmental damage to sensitive coastal stretches from un-
planned human interference. The Government of India Notifica-
tion [S.O.19 (E) dated 6.1.2011] has redefined the CRZ. Accord-
ingly the CRZ has been declared as ‘the coastal stretches of the
country and the water area up to its territorial water limit’. The CRZ
consists of : (a) land area from the High Tide Line (HTL) to 500 m
on the landward side along the sea front, (b)land area between the
HTL to 100 m or width of the creek whichever is less on the
landward side along the tidal influenced water bodies that are con-
nected to the sea; the distance up to which development along such
tidal influenced water bodies is to be regulated is governed by the
distance up to which tidal effects are experienced which is deter-
mined based on salinity concentration of 5 parts per thousand
(ppt) measured during the driest period of the year; the distance
up to which tidal effects are experienced will be clearly identified and
demarcated accordingly in the Coastal Zone Management Plans
(CZMPs) (Tidal influenced water body means water body influ-
enced by tidal effects from sea in the bays, estuaries, rivers, creeks,
backwaters, lagoons, ponds connected to the sea or creeks and the
like), (c) land area falling between the hazard line and 500 m from
HTL on the landward side, in case of seafront and between the
hazard line and 100 m line in case of tidal influenced water body,
(The word ‘hazard line’ denotes the line demarcated by Ministry of
Environment and Forests (MoEF) through the Survey of India
(SoI) taking into account tides, waves, sea level rise and shoreline
changes) (d) land area between HTL and Low Tide Line (LTL),
which will be termed as the inter-tidal zone, (e) water and the bed
area between the LTL to the territorial water limit (12 nm) in case of
sea and the water and the bed area between LTL at the bank to the
LTL on the opposite side of the bank, of tidal influenced water
bodies.
The CRZ Notification categorizes Coastal Regulation Zones as
CRZ I, CRZ II, CRZ III and CRZ IV based on whether the area
is ecologically sensitive, developed, undeveloped or waterbody
and its bed. Ecologically sensitive and important areas and the
inter-tidal zone constitute CRZ I. The areas that have already
been developed upto or close to the shoreline are categorized as
CRZ II. Areas that are relatively undisturbed belong to CRZ III.
The water area and the bed constitute CRZ IV. Development
and other activities are regulated within the different CRZ cat-
egories to ensure sustainable development and conservation of
beach and other sensitive coastal ecosystems.
In view of the unique coastal systems of backwater and backwa-
ter islands and space constraints along the coastal stretches of
Kerala, the CRZ (on the landward side) in the islands within the
backwaters in Kerala have been defined as 50 m from the High
Tide Line on the landward side. The CRZ Notification of 2011
has also defined Critical Vulnerable Coastal Areas (CVCA), which
includes Sunderbans, and other identified ecological sensitive
areas in which ‘Vembanad in Kerala’ is also included. The new
CRZ Notification issued in January 2011 (CRZ 2011) is in
supercession of CRZ 1991 except as respects things done or
omitted to be done before such supercession. The Coastal Zone
Management Plan (CZMP) approved in 1996 remains valid for
two more years or till a new CZMP is prepared and got ap-
proved.
The Centre for Earth Science Studies has been authorised by the
Ministry of Environment and Forests, Govt of India for the
demarcation of the HTL and LTL. Accordingly the CESS has
taken up a number of studies on CRZ in different coastal states
of the country. A list of the projects completed during 2011-12
is given in Table 4.1.1
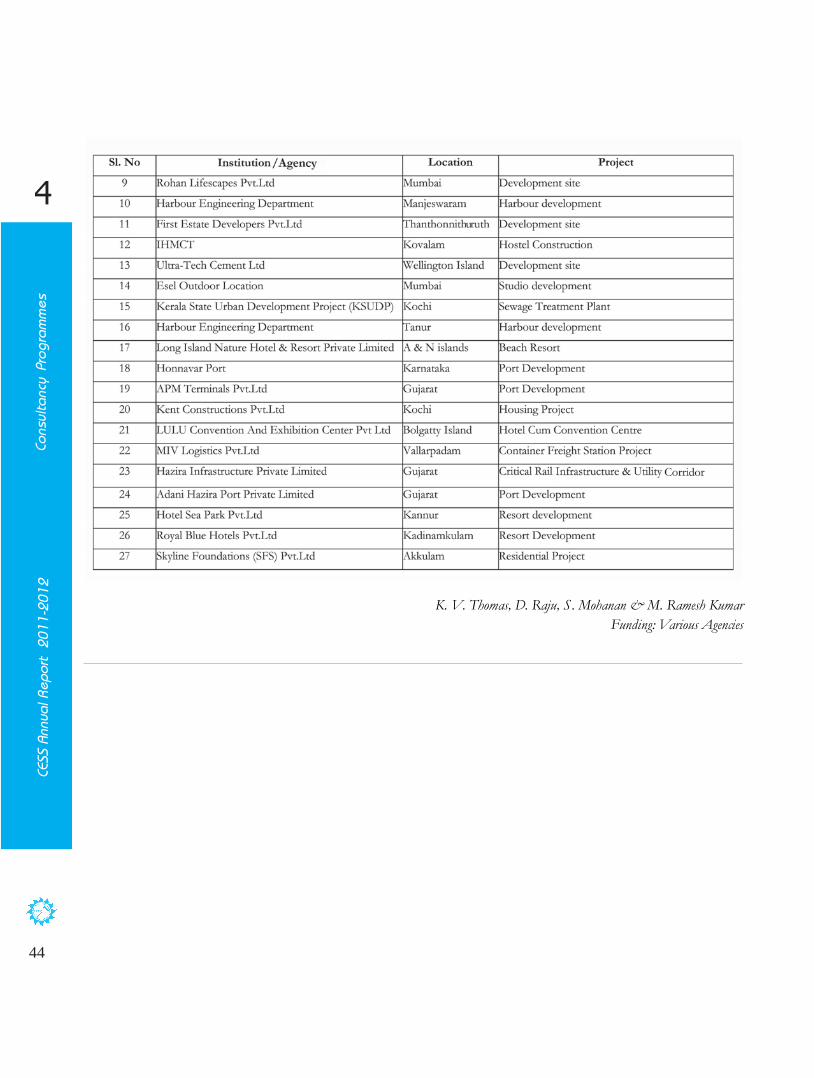
44
CESS Annual Report 2011-2012
Co
nsulta
ncy Pro
gra
mm
es
4
K. V. Thomas, D. Raju, S. Mohanan & M. Ramesh Kumar
Funding: Various Agencies

45CESS Annual Report 2011-12
List of Proje
cts
5
Lis
t of Projects
5.1 External G
rant-in-aid P
rojects

46CESS Annual Report 2011-12
List of Proje
cts
5

47CESS Annual Report 2011-12
List of Proje
cts
5
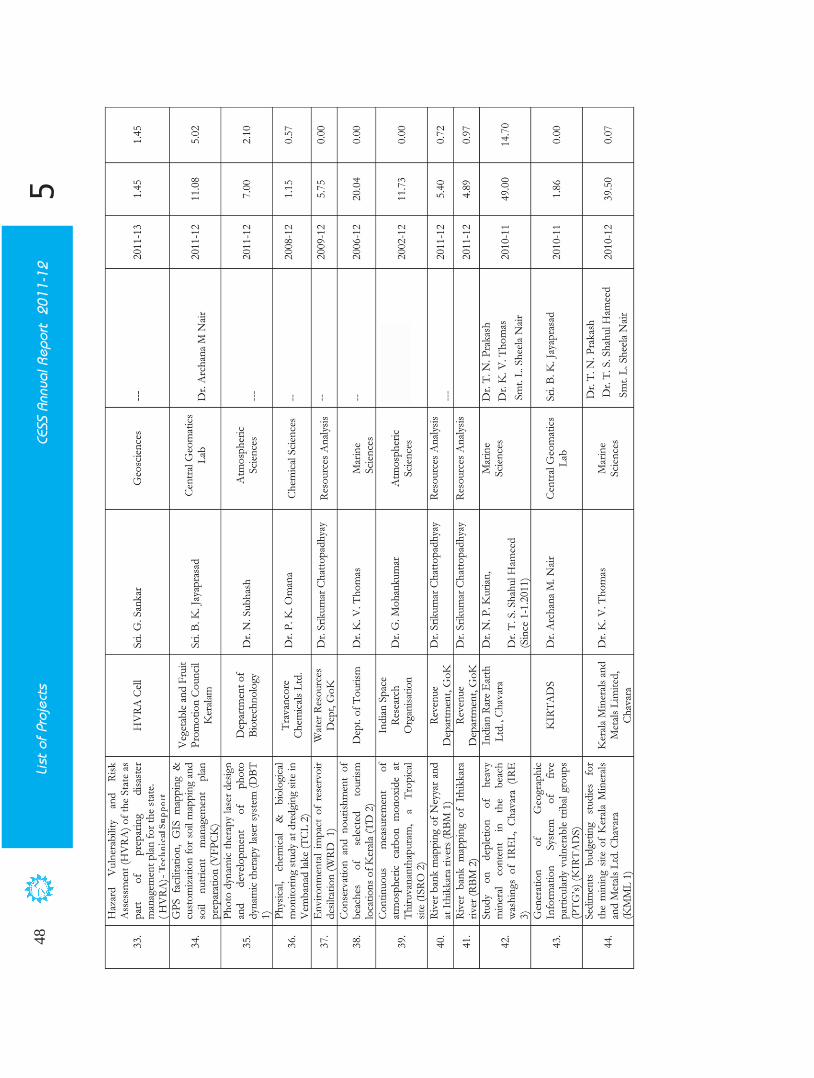
48CESS Annual Report 2011-12
List of Proje
cts
5

49CESS Annual Report 2011-12
List of Proje
cts
5
5.2 Consultancy P
rojects
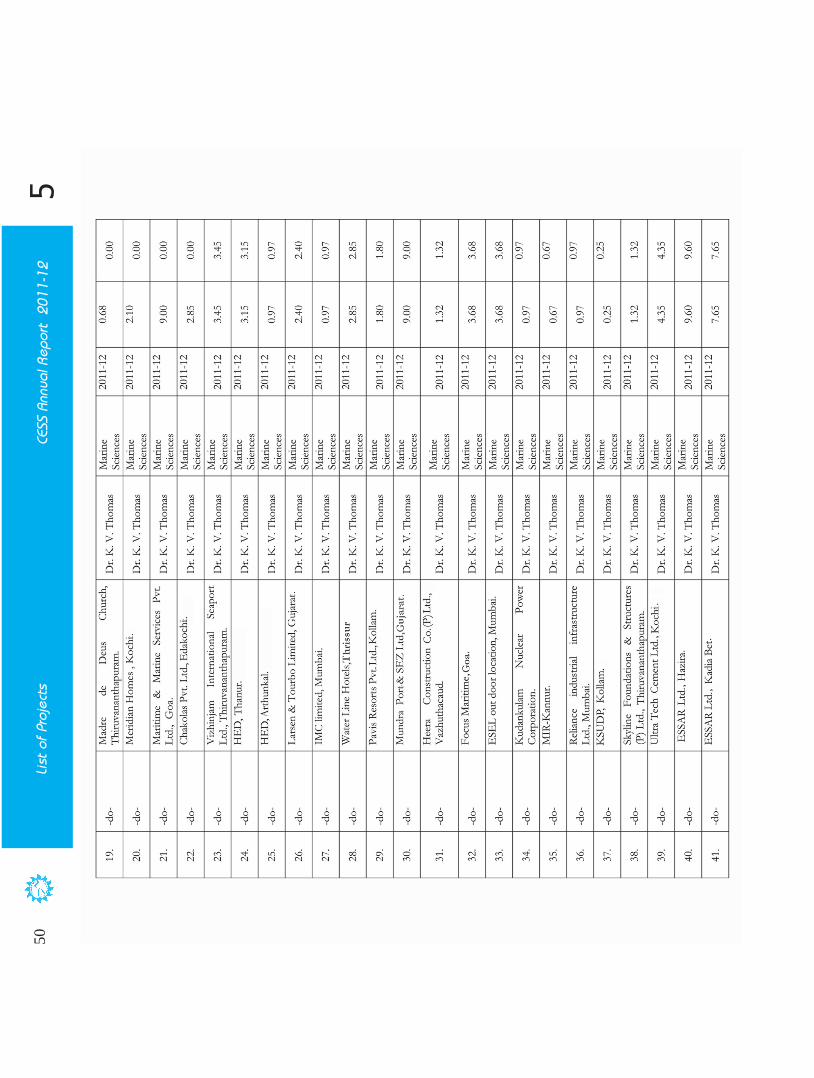
50CESS Annual Report 2011-12
List of Proje
cts
5

51CESS Annual Report 2011-12
List of Proje
cts
5

52CESS Annual Report 2011-12
List of Proje
cts
5
5.3 Plan Projects
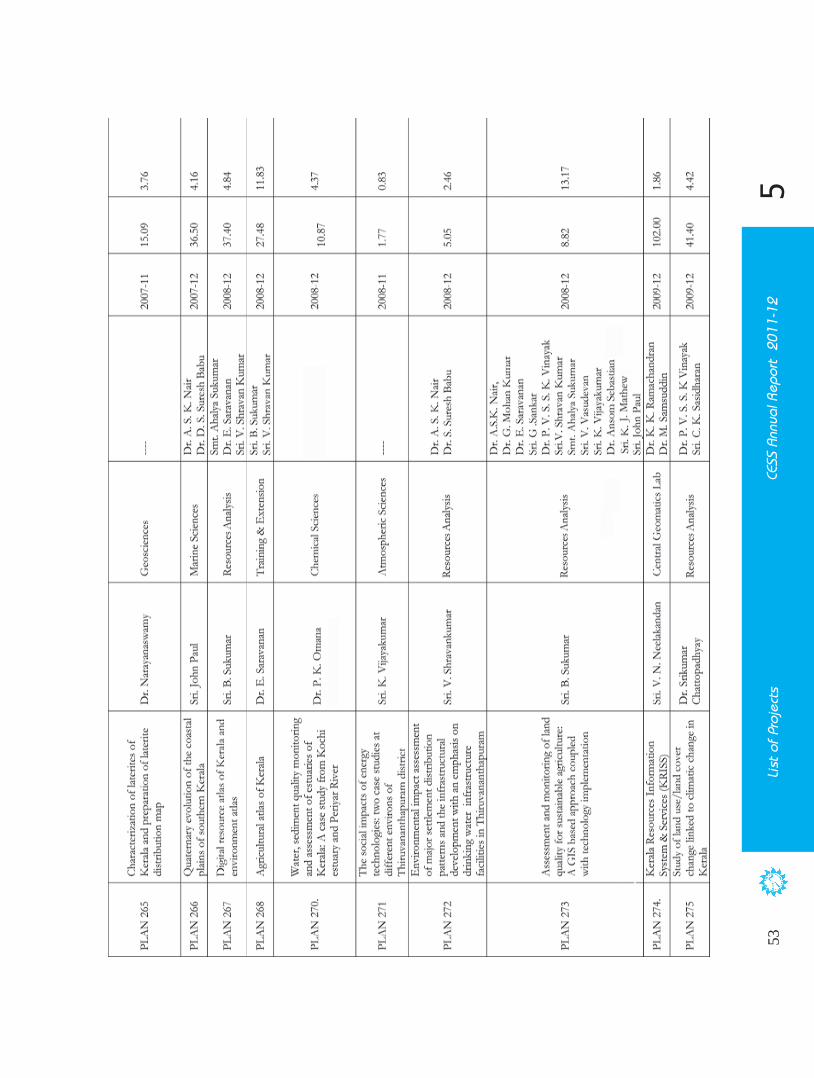
53CESS Annual Report 2011-12
List of Proje
cts
5

54CESS Annual Report 2011-12
List of Proje
cts
5

55CESS Annual Report 2011-12
List of Proje
cts
5
5.4 R &
D
Laboratory Infrastructure Projects
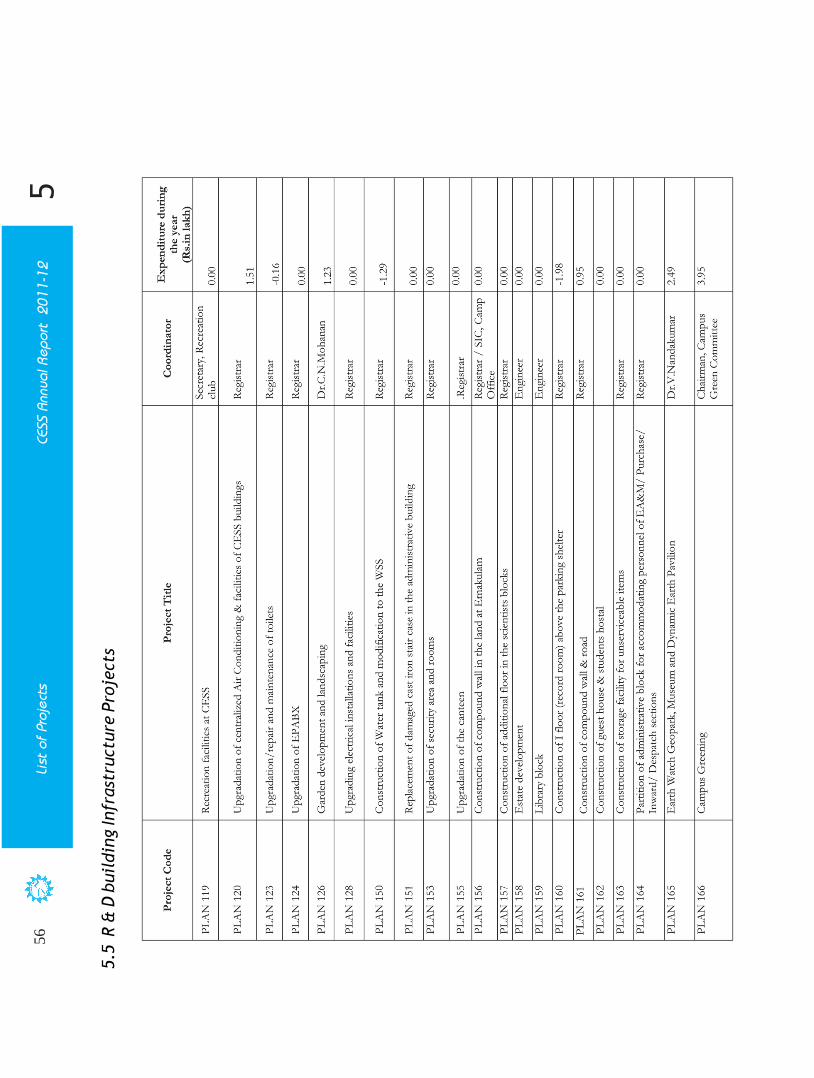
56CESS Annual Report 2011-12
List of Proje
cts
5
5.5 R &
D b
uilding Infrastructure P
rojects

57
CESS Annual Report 2011-12H
onours, Awards &
Academic Activities
6
Honours, Awards & Academic Activities6.1 Honours & Awards
6.2 Membership in CommitteesDr. N. P. Kurian
Dr. Shamji V R has been awarded Ph.D De-gree under the Faculty of Marine Sciences,Cochin University of Science and Technology,for his thesis, ‘Studies on beach morphologi-cal changes using numerical models’. Dr. N.P. Kurian, Director, Centre for Earth ScienceStudies was his supervising guide.
Dr. Balachandran K P has been awarded Ph.DDegree under Faculty of Physics, MahatmaGandhi University, Kottayam for his thesis,‘Investigation of the relationship betweenatmospheric electrical conductivity and meteo-rological parameters’. Dr. S. Muralidas, Scien-tist-F (retired), Centre for Earth Science Stud-ies was the supervising guide for his Ph.Ddissertation work.
Vishnu Mohan S secured the Young Scien-tist Award of the Kerala State Council forScience, Technology and Environment forhis paper entitled “Evidences of changingclimate in the past 10000 years from the sedi-mentary archives of southern Kerala” pre-sented in the 24th Kerala Science Congressheld at Rubber Research Institute of India,
Kottayam during 29-31 January 2012.
Dhanya V has won the Best Poster Awardof the Kerala State Council for Science, Tech-nology and Environment for her posterpresentation entitled, ‘Is Achankovil anantecedent river ?’ during the 24th KeralaScience Congress held at Rubber ResearchInstitute of India, Kottayam from 29 to31 January 2012. She has also received Prof.N. P. Aiyyar Young Geographer’s award during the 33rd IGC (NAGI)seminar held at Burdwan University, West Bengal during 11-13November 2011.
Member, Project Management Board, Coastal Engineering Divi-sion, National Institute of Ocean Technology, Ministry of EarthSciences, Government of India.
Member, Board of Studies in Physical Oceanography under theFaculty of Marine Sciences, Cochin University of Science and Tech-nology, Cochin.
Member, Kerala Dam Safety Authority by Water Resources (InterState Water Cell) Department, Government of Kerala.
Member, Kerala Protection of River Banks of Regulation ofRemoval of Sand Rules 2002- State High Level Committee forRiver Management Fund by Revenue (P) Department, Govern-ment of Kerala.
Member, Governing Body, LBS Centre for Science & Technologyby Higher Education Department, Government of Kerala.
Member, Kerala Coastal Zone Management Authority
Member, Working Group for Water Sector by Water Resources(IR) Department, Government of Kerala.
Member, Governing Body, Institute of Land and Disaster Man-agement, Revenue Department, Government of Kerala.
Dr. K. V. ThomasMember, KCZMA subcommittees to look into various CRZissue implementation, policies, violations and reports.Dr. Srikumar ChattopadhyayEditor of the ANNALS, National Association of Geographers,India
Chairman of the Committee constituted for assessing the dam-ages to the properties of local people due to the blasting opera-tions in a 7 km long tunnel of Sengulam Augmentation Scheme.
Expert Member in the Assessment Committee of C-DIT.
Dr. R. Ajayakumar Varma
Guest Editor of a Special issue on Fluorescence in Natural Sys-tems being brought out by the International Journal of Spec-troscopy (Hindawi Publishing Corporation, USA).
Member of the Governing Council of STIC (Sophisticated Test& Instrumentation Centre), Cochin.
Member, State Level EIA Authority (SEIAA)
Member, Technical Committee of Karumpukonam Commu-nity Ecosystem Management Committee constituted by Dept.of Environment & Climate Change.
Dr. C. N. Mohanan
Dr. N Subhash
Sri. John MathaiMember, State Level EIA Authority (SEIAA)Dr. E. J. Zachariah
Member, Research Advisory Committee, Sophesiticated Test andInstrumentation Centre, Kochi.
Member, Panel of Laboratory Assessors, National AccreditationBoard for Testing & Calibration Laboratories, Department ofScience and Technology, GoI

58
CESS Annual Report 2011-12
Honours, Aw
ards &
Academ
ic Activities
6
Dr. C. M. Harish
6.3 Visits Abroad
6.4 Internship / Summer Training
Member of the Board of Studies in Environmental Studies at
CUSAT
Dr.Mahamaya Chattopadhyay visited
Bremen, Germany on invitation
from the Centre for Tropical Marine
Ecology (ZMT) for a period of three
weeks starting from 15 May 2011. The
purpose of visit included develop-
ing and furthering discussions on the
proposed collaborative project be-
tween CESS and ZMT, on ‘Interde-
pendencies between Kerala rivers and backwaters: Consequences
for water quality, ecology, economy and environmental gover-
nance’. Dr. Chattopadhyay delivered two lectures on ‘Water-
shed characteristics and water quality: A case study of the Kall Ar
basin, Kerala’ and on ‘Terrain evaluation of the Periyar Plateau,
Kerala’.
Dr. K. Anoop Krishnan visited ZMT,
Bremen, Germany during 12 January
2012 to 23 January 2012 in connection
with the project “Interdependencies be-
tween River systems and Vembanad
lake”.
Sri. Prasanth C. S, Ph.D Research
Scholar, Biophotonics Laboratory, At-
mospheric Sciences Division (ASD),
visited Bulgarian Academy of Sciences
(BAS), Sofia, Bulgaria in March, 2012
as a part of the joint Indo-Bulgarian
project funded by the DST, Govt of
India. The work mainly focuses on the
photodynamic inactivation of gram-
negative pathogenic bacteria using new
generation photosensitizers and is being supervised by Dr. N.
Subhash, Scientist G & Head, ASD. The Azezzia Dental College,
Kollam and Rajiv Gandhi Centre for Biotechnolgy, Trivandrum,
are the institutions collaborating in this study from India whereas
from BAS the Institute of Electronics, Institute of Microbiology
and the Institute of Organic Chemistry are involved.

59
CESS Annual Report 2011-12
Honours, Aw
ards &
Academ
ic Activities
6
6.5 Ph. D Students

60
CESS Annual Report 2011-12
Honours, Aw
ards &
Academ
ic Activities
6
6.6 Post Graduate Studentship Programme
CESS supports post graduate students by awarding studentships, to improve research aptitude among students in different areas of
Earth Sciences. During the academic year 2011-12, 58 applications were received from meritorious students from different parts of
Kerala and fourteen of them were awarded studentship of Rs. 2000/- month during the period of their P.G. dissertation work in
CESS. The details of students who were awarded the studentship are given in the table below:
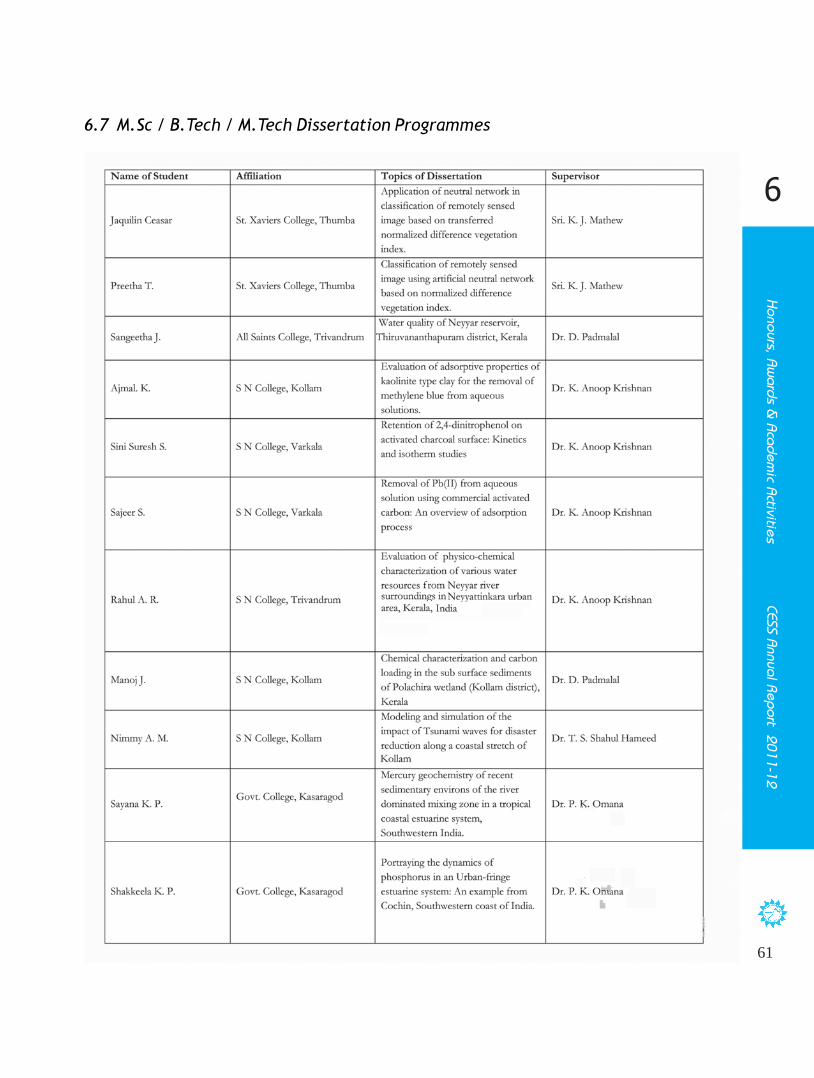
61
CESS Annual Report 2011-12
Honours, Aw
ards &
Academ
ic Activities
6
6.7 M.Sc / B.Tech / M.Tech Dissertation Programmes

62
CESS Annual Report 2011-12
Honours, Aw
ards &
Academ
ic Activities
6

63
CESS Annual Report 2011-2012
Library
7
Library
CESS Library is one of the advanced libraries in Earth Sciences in terms of its collection and services. The collection includes books,
journals, back volumes, CDs, VCDs, CD ROM database, maps, atlases, project reports, reference books, annual reports etc. The
Institute has subscribed to 50 national and international journals and receives many more journals as gratis. The library has subscribed
to the online database titled ‘Environment Complete’ published by EBSCO which contains more than 2.4 million records from more
than 2,200 domestic and international titles going back to the year 1888.
The major services rendered to users by the library are reference service, literature search, library membership, reprint service, press
clipping service and document delivery service. E-mail alerts are sent to scientists who request for new arrival of books and publica-
tions. The bound
volumes of publi-
cations of CESS sci-
entists up to the year
2011 are available for
reference. Library
has good network
connectivity with
facility for internet
browsing and offers
current awareness
service such as list-
ing of new addi-
tions, display of
CESS publications,
useful article display,
fellowship informa-
tion, forthcoming
conferences, semi-
nars etc. Library has
taken institutional
membership in re-
puted libraries in
the city to enable ac-
cess to the users.
Library is using the software KOHA, an integrated open source library management software, that supports all in house operations
of the library. Bibliographic records of books available in the library can be accessed through OPAC. Web OPAC module has been
developed and incorporated with the KOHA so as to enable users to search the library database from their desktop inside the campus.
The database of books is being updated on a day-to-day basis of recently acquired books. Library collection and details of all inhouse
project reports are included in the database.
Fig. 7.1 A screen shot of the Online Public Access Catalogue (OPAC) software installed in the CESS Libray


65
CESS Annual Report 2011-12
Pub
lica
tio
ns
8
Publications
8.1 Research Papers
8.1.1 In Journals
Anjali R, Mohan Kumar G, Sreekanth T S (2011) Anomalous variations in atmospheric carbon monoxide associated with the
Tsunami, Asian J. Atoms. Environ., 5(1), pp.47-55.
Anoop Krishnan K, Sreelekshmi K G and Baiju R S (2011) Nickel (II) adsorption onto biomass based activated carbon obtained from
sugarcane bagasse pith, J. Bioresource Technology, Elsevier, 102, pp.10239-10247.
Ansar S, Dhanya C R, Thomas G., Chandran A, John L, Prasanthi S, Vishnu R and Zachariah E J (2011) Urban-Rural cooling rates over
Thiruvananthapuram. J. Ind.Geophys.Union , 16(1), pp.29-36.
Anu Baburaj N, Subhash N, Prasanth C S and Prakash T N (2011) Laser-induced fluorescence spectral signatures of corals in
Lakshdweep and Palk Bay. Int. J. Oceans and Oceanography 5 (2), pp.143-152.
Arjun S, Kalarani P, Dhanya S S, Praveen A K, Reshmi N P, Kurian M V, Ramana Murthy T S, Shahul Hameed and Prakash T N
(2011) Numerical simulation of the Makran 1945 tsunami on the southwest coast and Lakshadweep islands of India. Marine Geodesy
Special Issue on Tsunamis, 34(1), pp.68-76.
Baba M, Jean Jose J, Udayakumar P, Narendra Babu K (2011) Unusual foaming along Thiruvananthapuram coast, Scientific correspon-
dence, Current Science, 100(8), pp.1121.
Chattopadhyay S (2011) Critical environmental issues and democratic initiatives: Lessons from Kerala. J. Centre for Creative Learning
and Research, 1, pp.38-46.
Hamza Varikodan, HariKumar R, Vishnu R, Sasi Kumar V, Sampath S, Murali Das S and Mohan Kumar G (2011) Observational
Study of cloud base height and its frequency over a tropical station, Thiruvananthapuram, using a ceilometer, Int. J. Remote Sensing
(TRES-PAP-2010-0148.R2).
Harikumar R, Sampath S and Sasi Kumar V (2011) Altitudinal and temporal evolution of raindrop size distribution observed over
a tropical station using a K-band radar. Int. J. Remote Sensing, 33 (10), pp-3286-3300.
Jayanthi J L, Subhash N, Manju S, Philip E K and Beena V T (2011) Diagnostic evaluation of the diagnostic performance of auto
fluorescence and diffuse reflectance in oral cancer detection: a clinical study, J. Biophotonics, 4 (10), pp. 696-706, DOI:10.1002/
jbio.201100037.
Jayanthi J L, Nisha G U, Manju S, Philip E K, Jeemon P, Baiju K V, Beena V T, Subash N (2011) Diffuse reflectance spectroscopy:
diagnostic accuracy of a non-invasive screening technique for early detection of malignant changes in the oral cavity, BMJ open, DOI:
10.1136/bmjopen- 2011-000071.
Jean Jose J, Udayakumar P, Chandran A, Narendra Babu K and Sudhananadh V S (2011) Zooplankton diversity in Vallarpadam, India:
influence of hydrochemistry, season and semi diurnal cycle, Asian J. Water, Environment and Pollution, 8(1), pp.103-108.
Padmalal D, Remya S I, Jissy Joythi S, Baijulal B, Babu K N and Baiju R S (2011) Water quality and dissolved inorganic fluxes of N, P,
K, SO4
and K of a small catchment river in the southwestern coast of India, Environmental Monitoring and Assessment, 184,
pp.1541-1557, DOI 10.1007/s10661-011-2059-x.
Padmalal D, Kumaran K P N, Nair K M, Baijulal B, Ruta B Limaye and Vishnu Mohan S (2011) Evolution of the coastal wetland
systems of SW India during holocene: evidence from marine and terrestrial archives of Kollam coast, Kerala. Quaternary Int., 237,
pp.123-139, DOI:10.1016/j.quaint.2010.12.021.
Praveen S S, Reshmi A K, Dhanya P, Arjun, Kalarani S, Kurian N P, Ramana Murthy M V, Shahul Hameed T S and Prakash T N (2011)
Numerical Simulation of 26 December 2004 Tsunami on the Southwest coast and Lakshadweep islands of India, Marine Geodesy
Special Issue on Tsunamis, 34(1), pp.59-67.
Prasanth Chandra Sekhar, Joseph Betsy, Janam Presanthila, Narayanan Subhash (2012) Discrimination of periodontal diseases using
diffuse reflectance spectral intensity ratios, J.Biomedical Optics, 17(2), pp.027001-2-027001-9.

66
CESS Annual Report 2011-12
Pub
lica
tio
ns
8
8.1.2 In Conference Proceedings/Books
Sharreekul Ansar, Dhanya C R, George Thomas, Aswathy Chandran, Liji John, Prasanthi S, Vishnu R and Zacharizh E J (2011) A
Study of Urban/Rural Cooling Rates in Thiruvananthapuram, Kerala. J. Ind. Geophys. Union, 16(1), pp.29-36.
Sheela A M, Letha J, Sabu Joseph, Ramachandran K K and Manoj Chacko (2011) Computation of physical characteristics of a lake
system using IRS P6 (LISS-iii) imagery, Int. j. Applied Earth Observation and Geoinformation, pp.222-232.
Sheela Nair L, Sundar V and Kurian N P (2011) Numerical modelling studies on the effect of breakwater on coastal processes- A case
study along a stretch of Kerala coast India, Int. J. Ocean and Climate Systems, 2(4), pp.291-302.
Sreebha S and Padmalal D (2011) Environmental Impact Assessment of sand mining from the small catchment river in the south-
western coast of India, Environmental Management, 47, pp.130-140.
Sudhanandh V S, Shibu R, Ajimon V J and Narendra Babu K (2011) Water quality effects of harbour activities assessed with
integrated ecotoxicological parameters in Kerala, India. African J. Environmental Science and Technology, 5(11), pp.924-932.
Sudhanandh V S, Potty V P, Ouseph P P and Narendra Babu K (2012) Distribution of potentially pathogenic enteric bacterial in coastal
sea waters along the Southern Kerala Coast, India. J. Environmental Biology, 33, pp.61-66.
Sudhanandh V S, Udaya Kumar P, Ouseph P P and Narendra Babu K (2011) Dispersion and accumulation trend of heavy metals in
sediments and its textural characteristics a case study in India, J. Human Ecology, 36(2), pp.85-90.
Sudhanandh V S, Ouspeh P P and Narendra Babu K (2011) Zooplanktons role in the distributional status of autochthonous
Vibriocholerae, a case study using principal analysis, J. Environmental Science and Engineering, 52(4), pp.321-325.
Suresh Kumar, Nair P, Shenoy K T, Muralidharan, Vijayalakshmi N R, Nikhil S, Ancy Simon, Neethy Varghese, Vidhya Ramaswamy
(2011) Study of morbidity pattern of a population exposed to industrial air pollution at Trivandrum and Pune, India. BIOINFO
Environment and Pollution, pp.01-04.
Thomas G and Zachariah E J (2011) Ground level volume mixing ratio of methane in a tropical coastal city, Environ. Monit. Assess,
DOI 10.1007/s 10661-011-2084-9.
Thomas G and Zachariah E J (2011) Urban heat Island in a Tropical city interlaced by Wetlands, J. of Environmental Science and
Engineering, 5, pp.234-240.
Udaya Kumar P, Chandran A, Jean Jose J, Prasanthan V, Deepak M P and Narendra Babu K (2011) Heavy metals in the polychaete
Glycera longipinnis from the Southwest of India, Chemistry and Ecology, 27(4), pp.327-336.
Udayakumar P, Jean Jose J, Rajesh B R and Narendra Babu K (2011) Seasonal dynamics of dissolved metals in surface coastal waters
of SW India, Bulletin of Environmental Contamination and Toxicology DOI:10.1007/S128-011-0402-0).
Vijaya Kumar & Chattopadhyay S (2011) House hold energy consumption in rural Kerala, India, Lessons from four gramapanchayats,
Annals National Association of Geographers, India, XXXI, (1 ), pp.12-20.
Archana M Nair and Soumya G S (2011) Spectral analysis of reiner gamma lunar swirl using M3 data, Proc. Conference Planetary
Sciences and Exploration PLANEX 12-14 December 2011 at PRL, Ahmedabad, pp.23-24.
Anooja S and Padmalal D (2012) Provanance of late quaternary sediments in the coastal lands of Kollam district, Kerala, Proc. 24th
Kerala Science Congress, RRII, Kottayam, pp.357-360.
Anooja S, Baijulal B, Maya K, Sreebha S and Padmalal D (2011) Impact of sand mining on river bed changes and bed material
characteristics- a case analysis, National Seminar on Mining of River Sand and its Impacts on the Environment, CWRDM, pp.173-181.
Anoopa Prasad C, Vishnu Thilakan K C, Vimal M K, Sreeraj M K and Thomas K V (2012) Mining induced shoreline changes and
morphological modifications, Proc. 24th
Kerala Science Congress, RRII, Kottayam, pp.348-350.
Baijulal B, Jissy Jyothi S, Padmalal D and Maya K(2011) Environmental effects of alluvial sand mining on the biological environment

67CESS Annual Report 2009-2010
CESS Annual Report 2011-12
Pub
lica
tio
ns
8
of Kerala rivers, National Seminar on Mining of River Sand and its Impacts on the Environment, CWRDM, pp.195-205.
Dhanya G, Renoy G, Ramachandran K K and Mookambiga A (2011) Assessment of run-off characteristics in Thiruvananthapuram
city using techniques of geoinformatics. In: Proc. Conference on Remote Sensing and GIS for Environmental Management, (Pub-
lished by World Education, New Delhi), pp.77-93.
Dhanya V (2012) Is Achankovil an antecedent river? Proc. 24th
Kerala Science Congress, RRII, Kottayam, pp.361-363.
Jayanthi J L, Subhash N, Manju S, Nisha G U, Beena V T (2012) Diffuse reflectance imaging: a tool for guided biopsy, SPIE-BiOS
Photonics West conference, San Francisco, California, USA, January 21-26, 2012, Proc.SPIE 8220, 822004; http://dx.doi.org/10.1117/
12.907734
John Mathai (2012) Recent tremors in the Idukki region and its implications on Mullaperiyar. Proc. 24th
Kerala Science Congress, RRII,
Kottayam, pp.367-368.
Maya K, Padmalal D, Santhosh V and Aneesh S R (2011) Instream and floodplain sand mining from Muvattupuzha river basin,
consequences and strategies, National Seminar on Mining of River Sand and its Impacts on the Environment, CWRDM, pp.111-124.
Mohanan C N, Thomas K V (2011) The Status of Mangroves in Kerala, In: Towards Conservation and Management of Mangrove
Ecosystems in India (Eds) Bhatt J R, Macintosh D J, Nayar T S, Pandey C N and Nilaratna N P, IUCN, India, pp. 154-159.
Noujas V, Badrees K O and Thomas K V (2012) Numerical model studies on siltation of a harbour at Muthalapozhi along
southwest coast of India, Proc. 24th
Kerala Science Congress, RRII, Kottayam, pp.335-337.
Padmalal D (2011) Construction grade sand -sources and strategies, Proc. National Seminar on Mining of River Sand and its Impacts
on the Environment, CWRDM. pp.55-64.
Prasanth C S, Joseph Betsy, Subhash N (2012) Non invasive detection of periodontal disease using diffuse reflectance spectroscopy –
A clinical study, SPIE-BiOS Photonics West conference, San Francisco, California, USA, January 21-26, 2012, Proc. SPIE 8230, 823011;
http://dx.doi.org/10.1117/12.907693
Raji S Nair, Aparna G Nair and Subhash N (2012) Herbicide stress detection in Colocasia esculenta plants by multi-spectral solar
reflectance imaging, Proc. 24th
Kerala Science Congress, RRII, Kottayam, pp.6-9.
Remya S I, Anooja S, Vishnu Mohan S and Baijulal B (2012) Textural dependence of C-org and C-inorg in the borehole sediments of
coastal wetlands of Kerala – A case study, Proc. 24th
Kerala Science Congress, RRII, Kottayam, pp.506-508.
Resmi R, Baburaj B, Santhosh V, Sreebha S and Padmalal D (2011) EIA of river sand mining using Rapid Impact Assessment Matrix
(RIAM) – A case study, National Seminar on Mining of River Sand and its Impacts on the Environment, CWRDM, pp.183-189.
Sajeer S, Arunima R, Anoop Krishnan K, Baiju R S,.Liji T M, Narendra Babu K (2011) Removal of Pb (II) from aqueous solution
using activated carbon: An overview of batch adsorption studies, In. Proc. National Conference on Emerging Trends in Biodiversity
Conservation & Sustainable management Department of Zoology, Christian College, Chengannur, pp.47-57.
Sampad Kumar Panda, Shirish S Gedam, Deepak R Samal, Raghavendra Balerao and Sukumar B (2011) Satellite remote sensing and
its applications for sustainable agricultural development in Peruvumba river basin, Kannur district, Kerala Proc. 2nd
National Confer-
ence on Geospatial technologies and applications held at CSRE, IIT, Mumbai, pp.220-226.
Sasidharan C K and Sivanandan P (2011) Ecotourism for Inclusive Growth: A case study of Ashtamudi Lake, Proc. 13th
World Lake
Conference, Wuhan, China 2009, pp 1-6.
Vandana M (2012) Evolution of micro level landforms in Kabani river basin Wayanad plateau, Kerala, In. Proc. 24th
Kerala Science
Congress, RRII, Kottayam, pp.364-366.
Vishnu Mohan S, Baiju R S and Padmalal D (2011) Indication of sea level changes on sediment dispersal pattern of a tropical river and
estuary, SW, India. Proc. 24th
Annual Convention of Indian Institute of Geomorphologists and National Conference on Coastal
Dynamics and Geomorphology Anna University, Chennai, pp 40-41.
Vishnu Mohan S, Sreebha S, Padmalal D, Maya K and Linikrishna K L (2011). Sand mining in Pamba river, National Seminar on
Mining of River Sand and its Impacts on the Environment, CWRDM, pp.141-151.

68
CESS Annual Report 2011-12
Pub
lica
tio
ns
8
Vishnu Mohan,S and Padmalal D (2012) Evidences of changing climate in the past 10000 years from the sedimentary archives of
southern Kerala, In. Proc. 24th
Kerala Science Congress, RRII, Kottayam, pp.329-331.
8.3 Project Reports
D. S. Suresh Babu et al.,(2011) Value Addition of selected placer minerals (Ilmenite and zircon) with special reference to the
Kayamkulam-Thotapally deposits of Kerala, Project Report No.CESS-PR-01-2011.
D. Padmalal et al., (2011) Environmental appriasal & sand auditing of Periyarriver, Ernakulam district, Kerala, Project Report No.CESS-
PR-02-2011.
K. Narendra Babu et al., (2011) Impacts of urbanization on soil and water resources of some selected cities Kerala, Project Report
No.CESS-PR-03-2011.
K. Narendra Babu et al., (2011) Interstitial water chemistry of Aquatic Environments and its significance in nutrient dynamics: a case
study, Project Report No.CESS-PR-04-2011.
Mahamaya Chattopadhyay (2011) Landscape evaluation in relational to fluvio-estuarine and denundational system: A case study of
the Periyar basin Kerala, Project Report No.CESS/TR-1-2011.
Mahamaya Chattopadhyay (2011) Geomorphic setting, landscape alterations and fluvial regime change in the Western Ghats prov-
enance of southern Sahyadri, Report Submitted to Director, CESS
K Raju et al., (2011) Human induced land modifications and its impacts: a study in Thodupuzha taluk-Idukki district, Kerala, Report
submitted to Director, CESS
K Vijayakumar et al., (2011) The social impacts of Energy Technologies: Two case studies at different environs of Thiruvananthapuram
district, Report submitted to Director, CESS
John Mathai et al., (2011) Report on Evaluation of Water Source in Valiyakulam, Chenkal Panchayat, Report submitted to District
Panchayat
John Mathai (2011) Report on the Earthquakes in Upputhura Village, Idukki district on November 18th
2011, Report submitted to
Department of Revenue, Government of Kerala.
Thomas K.V, Raju.D High Tide Line and Coastal Regulation Zone for the Proposed Fishery Harbour at Valiathura,
Thiruvananthapuram for M/s Harbour Engineering Department, Govt of Kerala.
Thomas K.V, Raju.D High Tide Line And Coastal Regulation Zone for the Proposed Fishery Harbour at Vellayil, Kozhikode for
Harbour Engineering Department, Govt of Kerala.
Thomas K.V, Raju.D High Tide Line and Coastal Regulation Zone for the Proposed Fishery Harbour (Second Stage) at Arthunkal for
Harbour Engineering Department, Govt of Kerala.
Thomas K.V, Raju.D, Sreeraj.M.K HTL, LTL and CRZ for Proposed Resort Cum Village at Ramanattukara, Kozhikode, Kerala for
Waterline Resorts (P) LTD., Kozhikode.
Thomas K.V, Raju.D, Rafeeque.M.K HTL, LTL and CRZ for the Proposed Ayurvedic Resort at Pannyurkulam, Chavakkad in
Thrissur District, Kerala for Pavis Resorts (P) Ltd., Thrissur.
Thomas K.V, Raju.D HTL, LTL AND CRZ for the Proposed Nuclear Power Plant at Kundamkulam for Nuclear Power Corporation
of India.
Thomas K.V, Raju.D, Rafeeque.M.K HTL, LTL and CRZ for the Proposed Sewage Treatment Plant at Kureepuzha, Kollam for
Kerala Sustainable Urban Development Project, Thiruvananthapuram.
Thomas K.V, Raju.D HTL, LTL and CRZ for the Proposed Sewage Treatment Plant at Karimbanapalam, Kozhikode for Kerala
Sustainable Urban Development Project, Thiruvananthapuram.

69CESS Annual Report 2009-2010
CESS Annual Report 2011-12Publications
8
Thomas K.V, Raju.D Demarcation of HTL, LTL AND CRZ for a Development Site in Dadar, Mumbai, Maharashtra for RohanLifescapes Pvt. Ltd.
Thomas K.V, John Paul, Vasudevan.V, Raju.D High Tide Line and Coastal Regulation Zone for Fishery Harbour at Manjeswaram,Kasaragod, Kerala for Harbour Engineering Department, Govt of Kerala.
Thomas K.V, Raju.D, Mohanan.S HTL, LTL and CRZ for Proposed Residential and Commerical Project at Thanthonnithuruth,Ernakulam for First Estate Properties Pvt.Ltd.
Thomas K.V, Raju.D Coastal Regulation Zone Status Report for Proposed Hostel at Kovalam, Thiruvananthapuram for Instituteof Hotel Management and Catering Technology, Kovalam.
Thomas K.V, Raju.D, Mohanan.S HTL, LTL and CRZ for the Proposed Development Site in Cochin Port Area in Willingdon Islandin Ernakulam, Kerala for Ultra Tech Cement Ltd Kochi.
Thomas K.V, Raju.D HTL, LTL and CRZ of the Site for Redevelopment of Film Studio in Village Turbe, Chembur, Mumbai,Maharashtra for Esel Outdoor Location, Mumbai
Thomas K.V, Raju.D HTL, LTL and CRZ for Proposed Sewage Tretment Plant at Mudamveli in Kochi, Kerala for Kerala SustainableUrban Development Project, Thiruvananthapuram.
Thomas K.V, Raju.D, Sreeraj.M.K High Tide Line and Coastal Regulation Zone for Proposed Fishery Harbour at Tanur, Malappuram,Kerala for Harbour Engineering Department, Govt of Kerala.
Thomas K.V, Raju.D HTL, LTL and CRZ for the Proposed Beach Resort at Lalaji Bay, Long Island at Andaman and Nicobar Islandsfor Long Island Nature Hotel and Resort Pvt. Ltd, Kochi
Thomas K.V, Raju.D High Tide Line and Coastal Regulation Zone for Proposed Port Construction at Honnavar, Uttara Kannada,Karnataka for Honnavar Port Pvt. Ltd, Karnataka.
Thomas K.V, Raju.D Delineation of HTL, LTL and CRZ for Expansion of APM Terminal at Pipavav Port, Gujarat for APMTerminals Ltd.
Thomas K.V, Raju.D, Sreeraj.M.K High Tide Line and Coastal Regulation Zone for the Proposed Housing Project at Edakochi,Ernakulam, Kerala for Kent Constructions Pvt Ltd Kochi.
Thomas K.V, Raju.D, Sreeraj.M.K HTL, LTL and CRZ for the Proposed Hotel Cum Convention Centre at Bolgatty in Ernakulam,Kerala for Lulu Convention and Exhibition Centre Pvt. Ltd Kochi.
Thomas K.V, Raju.D, Sreeraj.M.K HTL, LTL and CRZ for the Proposed Container Freight Station Project at Vallarpadam, Ernakulamfor MIV Logistics Pvt. Ltd Kochi.
Thomas K.V, Raju.D Delineation of HTL, LTL and CRZ for Critical Rail Infrastructure & Utility Corridor, Surat, Gujarat for HaziraInfrastructure Pvt. Limited.
Thomas K.V, Raju.D Delineation of HTL, LTL and CRZ for Hazira Port Area, Surat, Gujarat for Adani Hazira Port Pvt. Limited.
Thomas K.V, Raju.D HTL, LTL and CRZ for Hotel Sea Park at Payyambalam, Kannur, Kerala for Hotel Sea Park Pvt. LimitedKannur.
Thomas K.V, John Paul, Vasudevan.V HTL, LTL and CRZ for Resort Development in Kadinamkulam, Thiruvananthapuram forRoyal Blue Hotels Pvt. Limited Thiruvananthapuram.
Thomas K.V, Raju.D HTL, LTL and CRZ for Survey Nos.1882 and 1888 in Village Kadakampally, Thiruvananthapuram for SkylineFoundations and Structures Pvt. Ltd Thiruvananthapuram.


71
CESS Annual Report 2011-12
Conference, Sem
inar, W
orkshop
9
Conference, Seminar, Workshop
Shri. Oommen Chandy, Hon’ble Chief Minister of Kerala inaugurates the ‘Ocean State Forcast and Fishery Information System for Kerala at Vizhinjam,
Thiruvananthapuram. Dr. Satheesh C. Shenoi, Director, INCOIS, Shri. Shashi Tharoor, M.P, Smt. Jameela Prakasam M.L.A, Smt. K. Chandrika, Mayor,
Thiruvananthapuram Corporation, Smt. Gladis Alex, Councillor Vizhinjam, Dr. N. P. Kurian, Director, CESS and Dr.K.K.Ramachandran, Member
Secretary, KSCSTE are also seen.
9.1 Inauguration of the Ocean State Forecast System for Kerala
The first phase of the Ocean State Forecast System for the Keralacoast jointly established by Indian National Centre for OceanInformation Services (INCOIS), Hyderabad and CESS at Vizinjamharbour, near Thiruvananthapuram was formally inaugurated byShri Oommen Chandy, Hon’ble Chief Minister of Kerala on 16th
of July 2011. The Electronic Display Board facility set up atVizhinjam harbour for the dissemination of the sea state forecastinformation to the local fishermen community was unveiled by Dr.Shashi Tharoor, Member of Parliament from Thiruvananthapuram.Smt. Jameela Prakasam, Member Legislative Assembly, Keralapresided over the function.Dr. N. P. Kurian, Director CESS deliveredthe welcome speech and Dr. Satheesh C Shenoi, Director, INCOISintroduced the Ocean State Forcast and Fishery Information System.Smt. K. Chandrika, Mayor, Corporation of Thiruvananthapuram,Smt. Gladis Alex, Councilor, Vizhinjam and Dr. K. K.Ramachandran, Member Secretary, Kerala State Council for Science,Technology and Environment also spoke on the occasion. Dr. T.M. Balakrishnan, Head, Information Services Group, INCOISproposed the vote of thanks.The information system issues real time details on tides, wind, waves,ocean current, etc for the use of the coastal community, Coast Guard,National Hydrographic Office etc. Information on Potential Fishing
Zones is also disseminated through electronic sign boards installedat designated points. The data is processed at INCOIS andbulletins and forecast warnings are issued on weather conditions,storms etc. through their website.
As part of this project another coastal observation station andelectronic display board will be established in Kozhikode soon.The programme will be further expanded by establishing morecoastal observation stations along the Kerala coast during the12th Plan period.
A workshop was also organized after the inaugural function toeducate the coastal community about the use of sea state forecastsystem.
9.2 Brain Storming Workshop on Earth
System Sciences and Natural Resources
Management
A Brain Storming Workshop was organized in CESS during
July 21-22, 2011 with the objectives of having a critical appraisal
of the various research activities that have been carried out at
CESS with special reference to the current status at the national/
international scenario and the developmental needs of the state,

72
CESS
Ann
ual R
epor
t 2
011-
12Co
nfer
ence
, Se
min
ar,
Wor
ksho
p
9
9.3 Prof. C. Karunakaran EndowmwentLecture
Dr. Shailesh Nayak, Chairman, RC, CESS & Secretary, Ministry of Earth Sciences, Government of India addressing the brain storming session
and working out a broad framework for the future agenda ofresearch activities. The proceedings included an overview onthe Centre’s activities by the Director, presentations by thescientists of the Centre under a few broad themes, givingbackground and gist of the work carried out until now and theprospects of future research and the perceptions of the experts.The invited experts of different specializations who took partin the workshop were Dr. Shailesh Nayak, Chairman, RC, CESS& Secretary, Ministry of Earth Sciences, Government of India,Prof. S. K. Tandon, Professor, Dept. of Geology and PVC(Retd), Delhi University, Dr. S. Sinha Roy, DDG, GSI (Retd.),Prof. V. Sundar, Dept. of Ocean Engineering, IIT Madras, Dr.P. Vethamony, Scientist-G, NIO, Dr. P.V. Joseph, VisitingProfessor, Dept. of Atmospheric Sciences, Cochin Universityof Science & Technology, Dr. B. Nagender Nath, Scientist-G,NIO, Dr. H.S. Sharma, Dept. of Geography, University ofRajasthan, Dr. P.C.S. Devara, Scientist-G, IITM, Pune, Prof. P.Ravi Gupta, Dept. of Earth Sciences, IIT, Roorkee, Prof.Baleshwar Thakur, Professor (Retd), School of Geography,Delhi University, Dr. B.K. Saha, Member, RC, CESS & DDG,GSI (Retd.), Dr. K. Krishnamoorthy, Member, RC, CESS &Director, Space Physics Laboratory, VSSC and Prof. V.N.Sivasankara Pillai, Member, RC, CESS & Former Director,School of Environmental Sciences, CUSATThe presentations, expert opinions and the perceptions on thefuture research activities covered the following themes viz. solid-earth geoscience studies, atmospheric electricity and minorconstituents, coastal processes and coastal zone management,sedimentological and mineralogical aspects of coastal zone,
Quaternary geology of Kerala, environmental quality and pollution,environmental studies and impact assessments, natural resourcesmanagement, remote sensing of the environment and geomaticsfor planning and development. The objectives of the workshopwere fully realised and the proceedings brought out for futurereference.
Prof. Raghuram Murtugudde, Dept. of Atmospheric and OceanSciences of the Earth System Science Inter-disciplinary Centre, Uni-versity of Maryland, U.S.A, delivered the 10th lecture in the Prof.C.Karunakaran Endowment lecture series on 16th July 2011 at theCESS auditorium. The topic of the lecture was ‘Earth, Life andSustainability: A long-term perspective.
Prof. Murtugudde is internationally acclaimed for his contributionsin earth system modelling. At present he is working on regionalearth system prediction. The lecture was attended by a large gather-ing of scientists and students from other institutions in and aroundThiruvananthapuram. Dr. N. P. Kurian, Director, CESS welcomedthe gathering. Shri. M. P. Muraleedharan, former Director, Geologi-cal Survey of India paid tributes to Prof. C. Karunakaran. Dr. K.Krishnamurthy, Director, Space Physics Laboratory, Vikram SarabhaiSpace Centre introduced the speaker. Dr. Srikumar Chattopadhyay,Head, Resource Analysis Division proposed the vote of thanks.

73CESS Annual Report 2009-2010
CESS Annual Report 2011-12Conference, Sem
inar, Workshop
9
Prof. Raghuram Murtugudde, Dept. of Atmospheric and Ocean Sciences of the Earth System Science Interdisciplinary Centre, University of Maryland, U.S.Adelivering the Endowment Lecture
9.4. High level meeting of HazardVulnerability and Risk Assessment (HVRA)cell
Dr. Nivedita P Haran, Additional Chief Secretary, Department of Revenueand Disaster Management presiding over the first high level meeting of theHazard Vulnerability and Risk Assessment Cell at Centre for Earth ScienceStudies, Thiruvananthapuram.
A rsearch cell to study Hazard Vulnerability and Risk Assessment(HVRA) was set up by the Department of Revenue and DisasterManagement, Kerala State Disaster Management Authority incollaboration with the Centre for Earth Science Studies andInstitute of Land and Disaster Management. The first high level
meeting of the HVRA Cell was held at Centre for Earth ScienceStudies on 12th May 2011. The meeting was presided over byDr. Nivedita P Haran, Additional Chief Secretary, Departmentof Revenue and Disaster Management. Smt. C. A. Latha, IAS,Hon. Secretary, SDMA delivered the welcome address and Sri.G. Sankar proposed vote of thanks.The agenda of the meetingwere to discuss modus operandi (i) to identify the available data,(ii) to initiate HVRA related data sharing between stakeholderdepartments, (iii) to collect and compile data from stakeholderdepartments and institutions, (iv) to identify Nodal Officersfrom each department. The Addl. Chief Secretary in herpresidential address declared that the HVRA Cell has startedfunctioning officially. She opined that this being the first of itskind in the country, the Government of India looks uponKerala as the model for HVRA also like many other ‘KeralaModels’. Dr. N.P Kurian, Director CESS and Vice Chairman(Research) of the cell gave an invited address in the openingsession. Shri. G. Sankar, Principal Investigator and Dr. SekharL. Kuriakose, Head (Scientist) HVRA Cell, provided a briefoverview of the general approach towards conducting HVRAand the activities proposed in the first phase of the HVRAprogramme. The meeting had 4 rounds of expert’s interactivesessions. Dr. C.T.S Nair, Executive Vice President, KSCSTEchaired the afternoon interactive sessions. Directors and Scientistsof CESS, CWRDM, NATPAC, KSDI, KSREC and senior
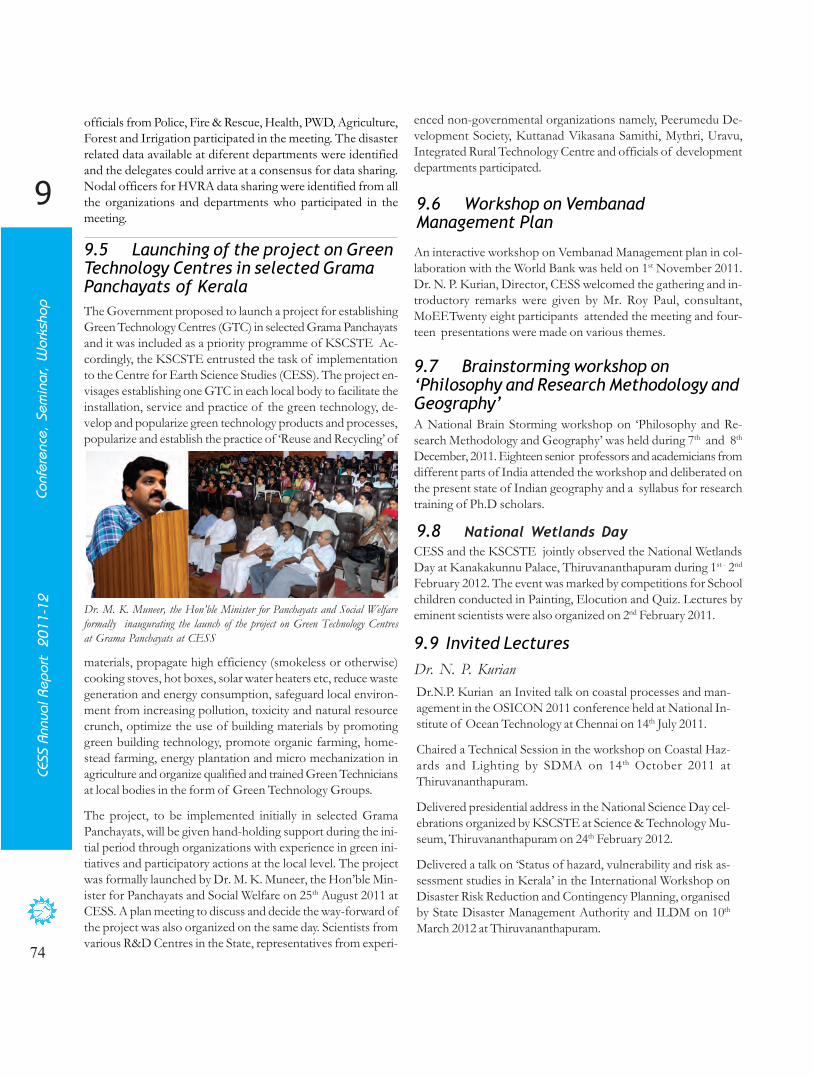
74
CESS
Ann
ual R
epor
t 2
011-
12Co
nfer
ence
, Se
min
ar,
Wor
ksho
p
9
9.5 Launching of the project on GreenTechnology Centres in selected GramaPanchayats of Kerala
officials from Police, Fire & Rescue, Health, PWD, Agriculture,Forest and Irrigation participated in the meeting. The disasterrelated data available at diferent departments were identifiedand the delegates could arrive at a consensus for data sharing.Nodal officers for HVRA data sharing were identified from allthe organizations and departments who participated in themeeting.
Dr. M. K. Muneer, the Hon’ble Minister for Panchayats and Social Welfareformally inaugurating the launch of the project on Green Technology Centresat Grama Panchayats at CESS 9.9 Invited Lectures
Dr. N. P. KurianDr.N.P. Kurian an Invited talk on coastal processes and man-agement in the OSICON 2011 conference held at National In-stitute of Ocean Technology at Chennai on 14th July 2011.
Chaired a Technical Session in the workshop on Coastal Haz-ards and Lighting by SDMA on 14th October 2011 atThiruvananthapuram.
Delivered presidential address in the National Science Day cel-ebrations organized by KSCSTE at Science & Technology Mu-seum, Thiruvananthapuram on 24th February 2012.
Delivered a talk on ‘Status of hazard, vulnerability and risk as-sessment studies in Kerala’ in the International Workshop onDisaster Risk Reduction and Contingency Planning, organisedby State Disaster Management Authority and ILDM on 10th
March 2012 at Thiruvananthapuram.
The Government proposed to launch a project for establishingGreen Technology Centres (GTC) in selected Grama Panchayatsand it was included as a priority programme of KSCSTE Ac-cordingly, the KSCSTE entrusted the task of implementationto the Centre for Earth Science Studies (CESS). The project en-visages establishing one GTC in each local body to facilitate theinstallation, service and practice of the green technology, de-velop and popularize green technology products and processes,popularize and establish the practice of ‘Reuse and Recycling’ of
materials, propagate high efficiency (smokeless or otherwise)cooking stoves, hot boxes, solar water heaters etc, reduce wastegeneration and energy consumption, safeguard local environ-ment from increasing pollution, toxicity and natural resourcecrunch, optimize the use of building materials by promotinggreen building technology, promote organic farming, home-stead farming, energy plantation and micro mechanization inagriculture and organize qualified and trained Green Techniciansat local bodies in the form of Green Technology Groups.
The project, to be implemented initially in selected GramaPanchayats, will be given hand-holding support during the ini-tial period through organizations with experience in green ini-tiatives and participatory actions at the local level. The projectwas formally launched by Dr. M. K. Muneer, the Hon’ble Min-ister for Panchayats and Social Welfare on 25th August 2011 atCESS. A plan meeting to discuss and decide the way-forward ofthe project was also organized on the same day. Scientists fromvarious R&D Centres in the State, representatives from experi-
enced non-governmental organizations namely, Peerumedu De-velopment Society, Kuttanad Vikasana Samithi, Mythri, Uravu,Integrated Rural Technology Centre and officials of developmentdepartments participated.
9.6 Workshop on VembanadManagement Plan
An interactive workshop on Vembanad Management plan in col-laboration with the World Bank was held on 1st November 2011.Dr. N. P. Kurian, Director, CESS welcomed the gathering and in-troductory remarks were given by Mr. Roy Paul, consultant,MoEF.Twenty eight participants attended the meeting and four-teen presentations were made on various themes.
9.7 Brainstorming workshop on‘Philosophy and Research Methodology andGeography’A National Brain Storming workshop on ‘Philosophy and Re-search Methodology and Geography’ was held during 7th and 8th
December, 2011. Eighteen senior professors and academicians fromdifferent parts of India attended the workshop and deliberated onthe present state of Indian geography and a syllabus for researchtraining of Ph.D scholars.
9.8 National Wetlands DayCESS and the KSCSTE jointly observed the National WetlandsDay at Kanakakunnu Palace, Thiruvananthapuram during 1st - 2nd
February 2012. The event was marked by competitions for Schoolchildren conducted in Painting, Elocution and Quiz. Lectures byeminent scientists were also organized on 2nd February 2011.
75CESS Annual Report 2009-2010
CESS Annual Report 2011-12Conference, Sem
inar, Workshop
9
Dr. Srikumar ChattopadhyayDelivered a lecture on Sustainable management of common prop-erty natural resources: macro perspective and micro act in the Inter-national Geography Congress held at CWRDM, Kozhikode, May6, 2011.
Delivered a lecture on Disaster management and Role of Local SelfGovernment for the delegates from Bihar, Jharkhand & West Ben-gal.
Delivered two lectures for participants of the Refresher’s Course inEnvironmental Science organised by Academic Staff College, KeralaUniversity on 13th February 2012. The lectures were on ‘Mainstreaming environmental issues for sustainable development’ and‘Environmental ethics’.
Panel presentation on “Disaster Management : Learning nature’ slaw and apply them correctly” in the International workshop onDisaster Risk Reduction and Contingency Planning organised byILDM on 10th March 2012.
Delivered a lecture on “Why study geography” for the P.G Stu-dents and conducted field study on “Role of panchayats for sus-tainable land use planning: Exploring the frontiers with examplesfrom Kerala” in Department of Geography and EnvironmentManagement, Vidyasagar University, Medinipore on 17th & 18th
March 2012. Also delivered key note presentation on “NaturalResource Management: A frame work” on19th March 2012.
Dr. K. V ThomasDelivered an invited talk on coastal hazards in the workshop onCoastal Hazards and Lighting organized by SDMA on 14th Octo-ber 2011 at Thiruvananthapuram
Chaired a session in the National seminar on Climate Change andVariability organized by Dept. of Atmospheric Sciences, CUSAT atKochi during 26-27th March 2012.
Sri. John Mathai
Dr. P. V. S. S. K. Vinayak
Dr. A. S. K. NairDelivered lectures on ‘Water Resources and Irrigation Issues inKerala’ and ‘Remote Sensing and GIS’ during the STP TrainingProgramme on GIS at the IMG, Thiruvanathapuram on 2nd
September, 2011.
Delivered a lecture on “Participatory Rural Appraisal” in the oneday training programme under the Westernghat DevelopmentProgramme on 29th September, 20111 at VJT Hall,Thiruvananthapuram.
Delivered an invited lecture on ‘Global warming – A Myth orReality” and chaired the session on “Role of Remote Sensing inBiodiversity Monitoring’ in the International Seminar on emerg-ing Threats and Challenges to Biodiversity Policy Framework forSustainable Management, held at Sri.Venkateswara University,Tirupati during 2 – 4 March, 2012.
Dr. Ajayakumar Varma
Delivered an invited talk on natural hazards scenario of Kerala inthe workshop on Coastal Hazards and Lighting organized bySDMA on 14th October 2011 at Thiruvananthapuram
Delivered a talk on natural hazard prone areas in Kerala in theWorkshop on Disaster management held on 31st October 2011 atKochi organized by the Institute of Engineers India.
Delivered a talk on ‘Technology Options for Solid Waste Manage-ment’ in the National Seminar on Municipal Solid Waste Manage-ment- Issues & Prospects organized by MA College,Kothamangalam and sponsored by the University Grants Com-mission during 2nd and 3rd March 2012.
Delivered a talk on ‘EIA- A Case Study’ in the National Seminar onEnvironmental Impact Assessment organized by the Department
of Environmental Sciences, Kerala University on 31st March 2012.
Attended the Focus Group Discussion (FGD) meeting onVembanad Wetland system convened for the Senior Officials ofthe Ministry of Environment & Forests, Govt. of India, TheWorld Bank and development depts. & agencies of Govt. ofKerala on 21st March 2012 and made three presentations on‘Summary of the FGD held on November 1, 2011; Inventoryof pollution load & mitigation measures and Land use man-agement covering Vembanad & its immediate catchment’.
Delivered a lead talk on “Global Warming and Climate Change”in a National Seminar at Acharya Nagarjuna University, Gunturon 28th and 29th October 2011.
Sri. B. K. JayaprasadDelivered a lecture on Remote Sensing and GIS as a tool forBio-resource Assessment on 29th July, 2011 at Kerala Agricul-tural University.
Delivered a lecture at College of Engineering, Trivandrum on2nd November, 2011 for the teachers in Civil Engineering fromthe approved Engineering colleges in the state on ‘Appli-cations of Geospatial Data in Urban Planning and Other fields,’in connection with a short term course on ‘Geoinformatics forCivil Engineering’ sponsored by Directorate of Technical Edu-cation, Kerala.
Delivered a talk on the methodology adopted to prepare ‘Agro-Ecological Unit wise Atlases for Kerala’ on 5th March, 2012 inconnection with the workshop on ‘Agro-Ecological Planningfor Agricultural Development in Kerala ; A paradigm shift’ atMascot Hotel, Thiruvananthapuram , organized by the KeralaState Planning Board, Govt.of Kerala

76
CESS
Ann
ual R
epor
t 2
011-
12Co
nfer
ence
, Se
min
ar,
Wor
ksho
p
9
9.10 Conference/ Workshop / Symposium / Seminar Attended

77CESS Annual Report 2009-2010
CESS Annual Report 2011-12Conference, Sem
inar, Workshop
9
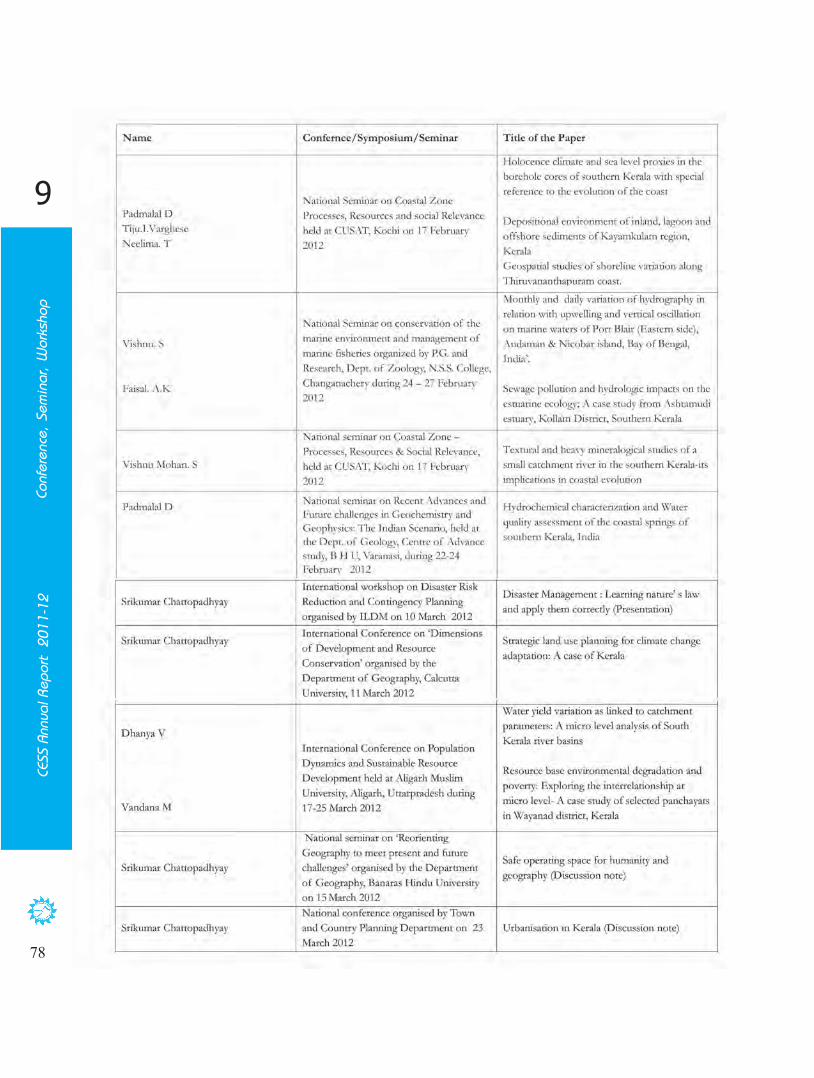
78
CESS
Ann
ual R
epor
t 2
011-
12Co
nfer
ence
, Se
min
ar,
Wor
ksho
p
9

79
CESS Annual Report 2011-12
Exte
nsio
n
10
Extension
10.1 World Wetland Day 2012
Hon’ble Chief Minister of Kerala Shri. Oommen Chandy inaugurating the World Wetland Day 2012 celebrations at the Kanakakkunnu Palace
by lighting the lamp. Shri. K Muraleedharan MLA, Prof. V. N. Rajasekharan Pillai, Executive Vice President of KSCSTE and Ex-Officio
Principal Secretary, Science & Technology Department, Ms. Meera Mehrishi, Additional Secretary, Ministry of Environment and Forests,
Government of India, Dr.Siddharth Kaul, Advisor, Ministry of Environment and Forests, Dr. K. K. Ramachandran, Member Secretary,
KSCSTE and Dr. N. P. Kurian, Director, Centre for Earth Science Studies are also seen.
ogy Department, welcomed the gathering and Dr. K. K.
Ramachandran, Member Secretary, KSCSTE proposed vote of
thanks. Earlier on 1st
February 2012 painting, elocution and quiz
competitions were held for school children and the winners re-
ceived certificates and trophies from the Hon’ble Chief Minister.
The National Celebrations of World Wetland Day 2012 was jointly
organised by CESS and KSCSTE at Kankakunnu Palace,
Thiruvananthapuram on 2nd
February 2012. As part of the celebra-
tions a seminar on Wetlands and Tourism was inaugurated by the
Hon’ble Chief Minister of Kerala, Shri. Oommen Chandy. The
Chief Minister in his inaugural address stated that Kerala will give
special consideration to set up the State Wetland Authority mooted
by the Centre. During his inaugural speech, he stressed the need
for paying serious attention to utilize our rivers, lakes and wetlands
for the development of the State. He declared that the Wetland
Institute will be headquartered at Kottayam and also give top
priority to the Vembanad Development Authority to make
Vembanad Lake and the six rivers debouching into it viz.
Achenkovil, Manimala, Meenachil, Muvattupuzha, Pamba and
Periyar, pollution free. Shri. K. Muralidharan MLA presided over
the function. Ms. Meera Mehrishi, Additional Secretary, Ministry
of Environment and Forests, Government of India, Dr.Siddharth
Kaul Advisor, Ministry of Environment and Forests and Dr. N. P.
Kurian, Director, Centre for Earth Science Studies spoke on the
occasion. Prof. V. N. Rajasekharan Pillai, Executive Vice President
of KSCSTE and Ex-Officio Principal Secretary, Science & Technol-
10.2 Earth Day 2011
Earth Day 2011 was observed in CESS on 28th
April 2011.
Students from different schools in Thiruvananthapuram visited
the laboratories of CESS and interacted with the scientists. An
elocution competition for students was held on the topic ‘Green

80
CESS
Ann
ual R
epor
t 2
011-
12Ex
tens
ion
10
Earth’. An invited talk on the same topic was also arranged for thestudents, which was delivered by Shri. P. Narayana Kurup, notedEnvironmentalist. Certificates, cash awards and mementoes weredistributed to the winners by Director, CESS.
10.3 National Science Day 2012National Science Day was observed on 29th February 2012. A lec-ture on ‘Dynamics oscillations in nature’ was delivered by Prof.M.S. Gopinathan IISER, Thiruvananthapuram and another lec-ture on ‘Solar terrestrial physics: Emerging perspectives’ was deliv-ered by Dr. Tarun Kumar Pant, Space Physics Laboratory, VSSC.
10.4 Exhibition
A view of the exhibition stall of CESS at the agricultural fair held at Thodupuzha
CESS participated in the exhibition organized in connection withthe ‘Karshika Mela’ (Agricultural fair) held at ThodupuzhaNewmans College ground from 26th December 2011 to 1st Janu-ary 2012. Every day nearly 20000 people visited the exhibition stall.Experts from various fields delivered talks and conducted interac-tion sessions. CESS pavilion presented posters and models high-
lighting the research activities. Malayalam brochure titled‘Bhuchalanam: Ariyenda vasthuthakal’ and a hand book on CESSvision were distributed among the public.
B.K.Jayaprasad demonstrated two customized GIS Applicationsentitled “District Resource Information System” and “CadastralLevel Decision Support System” developed in CESS in connectionwith the 24th Kerala Science Congress Expo during 28-31 January2012.
10.5 Lectures for students
Scientist conducting interactive session with students of Bishop Hodges HigherSecondary School, Mavelikkara
ondary School, Mavelikkara visited CESS on 27th July 2011. Sci-entists Sri. G. Sankar, S.Sidharthan, B.K. Jayaprasad and Ms.V.Dhanya gave talks on Natural Hazards Management, RemoteSensing, Geographic Information System and Natural Resources.
Dr.K.Anoop Krishnan conducted an interactive lectureprogramme for the PG students of University College,Trivandrum , MES College Ponnani on the topic”Quality as-pects and Viable Remedies for the Restoration of Water Re-source in Indian Subcontinent” on behalf of Earth Science Fo-rum (ESF), CESS, on 27th August 2011.
Shri. BK Jayaprasad demonstrated the capabilities of GIS insolving Earth related problems and delivered a lecture on “GISApplications” for PG Students from the Departments of Geol-ogy, University College, Kariavattom , and MES College Ponnani.
Shri. G. Sankar delivered a lecture on disaster management atCotton Hill GHS on 17th October 2011.
Dr.EJ Zachariah delivered a lecture at Kendriya Vidyala, Pattomin connection with the observance of the National Science Day2012.
Dr. R Ajayakumar Varma attended the National Seminar ‘Mu-nicipal Solid Waste Management- Issues and Prospects’ orga-nized by MA College, Kothamangalam and sponsored by theUniversity Grants Commission during 2-3 March 2012 and de-livered a talk on Technology Options for Solid Waste Manage-ment on 2nd March 2012.
Dr. R Ajayakumar Varma attended National Seminar on Envi-ronmental Impact Assessment organized by the Departmentof Environmental Sciences, Kerala University and delivered atalk on ‘EIA- A Case Study’ on 31st March 2012.
Dr. Archana M Nair delivered a talk on ‘Remote Sensing andGeophysical Methods for Geoexploration’ at Dept. of Civil Eng.IIT Guwahati on 2nd March 2012
Dr. Srikumar Chattopadhyay delivered two lectures for participantsof the Refresher’s Course in Environmental Science organised byAcademic Staff College, Kerala University on 13th February 2012.The lectures were on Main streaming environmental issues forsustainable development and Environmental ethics.
Senior secondary students from the Bishop Hodges Higher Sec-

81
CESS Annual Report 2011-12
Exte
nsio
n
10
10.6 Earth Science Forum
The Earth Science Forum initiated interactive sessions on frontier areas of Earth Sciences for the benefit of Post Graduate students
in geology studying in different Universities in Kerala. The programme was inaugurated on 26th
March 2011. Forty six students from
the University of Kerala attended the inaugural session. Senior scientists of the Centre conducted interactive sessions for students
on fifteen identified topics. The following lectures were delivered: ‘Quality aspects and viable remedies for the restoration of Water
Resources in Indian subcontinent’ by Dr. K. Anoop Krishnan, Scientist, CESS; ‘GIS Applications’ by Mr. B. K. Jayaprasad, Scientist,
CESS; ‘Satellite communications for societal applications’ by Dr. K. S. Das Gupta, Director, IIST, Trivandrum; ‘Assessment of heavy
metals in the environmental compartments of the central and northern coast of Kerala, by Sri. Udaya Kumar P, Research Scholar,
CESS and ‘Numerical modelling of tsunami propagation in the South East Arabian Sea (SEAS) and inundation along the Kerala
coast’ by Mr. Praveen S.S., Senior Research Fellow, CESS.
Pictures taken on the occasion of the Onam celebrations organized by the CESS Recreation Club on September 2, 2011
10.7 Earth Watch Centre
Efforts are on to establish an Earth Watch Centre (Museum & Park) intended to take the visitors on a journey through our planet’s
past, present and future, with interactive exhibits and impressive technology, including a 4D and 3D experience. Children and adults
alike can appreciate the creation of the Earth, follow the planet through its evolution and even catch glimpses of its future. It is hoped
that a journey through the Earth Watch Centre will be an exciting and engaging experience for all as the Earth Watch Centre is intended
to unravel all aspects of the planet we live in. Population growth, concepts of time and the realities of climate change could also be
presented. Survey of the CESS campus was carried out to physically ascertain the extent of land available at present with CESS.


83
CESS A
nnua
l R
ep
ort 2
01
1-2
01
2Co
mm
itte
es
11
Committees
Dr. Shailesh R Nayak
Secretary, Ministry of Earth Sciences, Government of India
Prithvi Bhavan, Lodhi Road, New Delhi
Dr. B. K. Saha
(Former Senior Deputy Director General
Geological Survey of India)
School of Oceanographic Studies
Jadavpur University, Kolkata
Dr. V. Raghavaswamy
Group Director
Land use, Urban study Remote Sensing, GIS area,
National Remote Sensing Centre
Balanagar, Hyderabad
Prof. A. D. Rao
Centre for Atmospheric Sciences
Indian Institute of Technology
New Delhi
Prof. V. N. Sivasankara Pillai
(Former Director,
School of Environmental Studies
CUSAT), Santhi,43/2205 A
SRM Road, Kochi
Dr. K. Krishnamoorthy FNA, FASc, FNNASc
Director,
Space Physics Laboratory
Vikram Sarabhai Space Centre
Thruvananthapuram
Prof. S. Anirudhaan
Head, Department of Geology
University of Kerala, Kariavattom
Thiruvananthapuram
Member Secretary
Kerala State Council for Science,
Technology & Environment
Thiruvananthapuram
Director
Centre for Earth Science Studies
Thiruvananthapuram
Chairman
Member
Member
Member
Member
Member
Member
Permanent Invitee
Ex-Officio Convener
11.1 Statutory Committees
11.1.1 Research Council
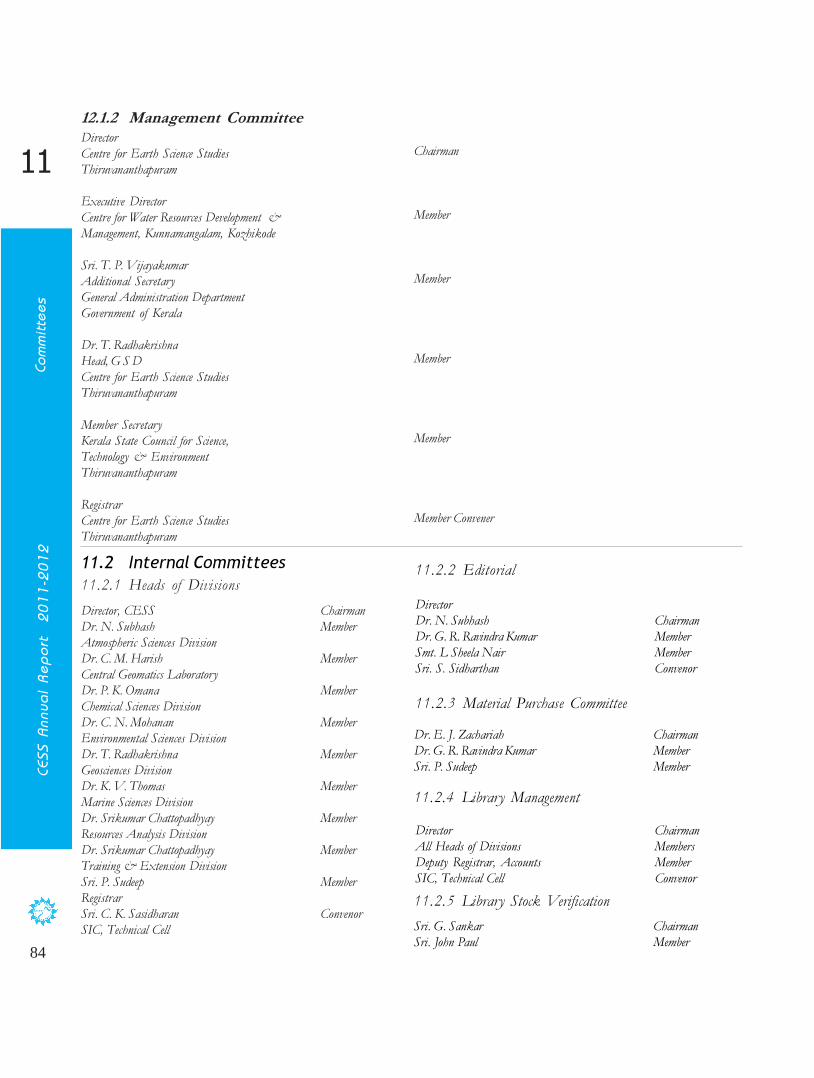
84
CESS A
nnua
l R
ep
ort 2
01
1-2
01
2Co
mm
itte
es
11
11.2.5 Library Stock Verification
12.1.2 Management Committee
Director
Centre for Earth Science Studies
Thiruvananthapuram
Executive Director
Centre for Water Resources Development &
Management, Kunnamangalam, Kozhikode
Sri. T. P. Vijayakumar
Additional Secretary
General Administration Department
Government of Kerala
Dr. T. Radhakrishna
Head, G S D
Centre for Earth Science Studies
Thiruvananthapuram
Member Secretary
Kerala State Council for Science,
Technology & Environment
Thiruvananthapuram
Registrar
Centre for Earth Science Studies
Thiruvananthapuram
Chairman
Member
Member
Member
Member
Member Convener
11.2 Internal Committees
11.2.1 Heads of Divisions
Director, CESS Chairman
Dr. N. Subhash Member
Atmospheric Sciences Division
Dr. C. M. Harish Member
Central Geomatics Laboratory
Dr. P. K. Omana Member
Chemical Sciences Division
Dr. C. N. Mohanan Member
Environmental Sciences Division
Dr. T. Radhakrishna Member
Geosciences Division
Dr. K. V. Thomas Member
Marine Sciences Division
Dr. Srikumar Chattopadhyay Member
Resources Analysis Division
Dr. Srikumar Chattopadhyay Member
Training & Extension Division
Sri. P. Sudeep Member
Registrar
Sri. C. K. Sasidharan Convenor
SIC, Technical Cell
11.2.2 Editorial
Director
Dr. N. Subhash Chairman
Dr. G. R. Ravindra Kumar Member
Smt. L Sheela Nair Member
Sri. S. Sidharthan Convenor
11.2.3 Material Purchase Committee
Dr. E. J. Zachariah Chairman
Dr. G. R. Ravindra Kumar Member
Sri. P. Sudeep Member
11.2.4 Library Management
Director Chairman
All Heads of Divisions Members
Deputy Registrar, Accounts Member
SIC, Technical Cell Convenor
Sri. G. Sankar Chairman
Sri. John Paul Member

85CESS Annual Report 2009-2010
CESS A
nnua
l R
ep
ort 2
01
1-2
01
2Co
mm
itte
es
11
Sri. P. Rajesh Member
Sri. K. Eldhose Member
11.2.6 Canteen
Sri. G. Sankar Chairman
Dr. Reji Srinivas Member
Dr. Archana M Nair Member
Sri. P. Rajesh Member
Smt. K. V. Padmaja Kumari Convenor
11.2.7 Plan Project Evaluation & Monitoring
Dr. S. Chattopadhyay Chairman
Sri. John Mathai Member
Dr. K. V. Thomas Member
Dr. G. Mohan Kumar Member
Sri. C. K.Sasidharan Convenor
Dr. K. V. Thomas Chairman
Sri. G. Sankar Member
Sri. S. Sidharthan Member
Smt. L. Sheela Nair Member
Sri. D. Raju Member
Sri. K. Eldhose Member
Smt. Indu Janardanan Member
Smt. K. V. Padmaja Kumari Convenor
11.2.9 Campus Green Committee
Dr. V. Nandakumar Chairman
Dr. Tomson J Kallukalom Member
Dr. Archana M Nair Member
Sri. Shravan Kumar Member
Sri. John Paul Member
Sri. M. Ramesh Kumar Member
Sri. S. Mohanan Member
11.2.8 Campus Development Committee


87
CESS A
nnua
l R
ep
ort 2
01
1-2
01
2Staff D
etails
12
Staff Details
12.1 Directors office
Dr. N. P. Kurian Director
Sri. N. Rajasekharan Nair P. A to Director
Sri. C. K. Sasidharan Scientist-E1 & SIC, TC
Sri. S. Sidharthan Scientist-E1 & SIC, WIC
Smt. V. Geethamol Stenographer (Gr. 1)
Sri. V. Chandran Nair Helper (Gr. 2)
Dr. N. Subhash Scientist-G & Head
Dr. E. J. Zachariah Scientist-F
Dr. G. Mohan Kumar Scientist-F
Sri. V. Muralidharan Scientist-E2
Sri. K. Vijayakumar Scientist-E1
Sri. K. J. Mathew Scientist-E1
Sri. Mohammed Ismail Technical Officer (Gr. 4)
Smt. Nita Sukumar Technical Officer (Gr. 1)
12.2 Atmospheric Sciences Division
12.3 Chemical Sciences Division
Dr. K. Narendra Babu Scientist-F & Head
Dr. P. K. Omana Scientist-E2
Dr. K. Anoop Krishnan Scientist-B
Smt. T. M. Liji Technical Officer (Gr. 1)
12.5 Environmental Sciences Division
Dr. R. Ajayakumar Varma Scientist-G
Dr. C. N. Mohanan Scientist-E2 & Head
Dr. D. Padmalal Scientist-E1
Dr. K. Maya Scientist-E1
Dr. A. Krishnakumar Scientist-B
12.4 Central Geomatics Laboratory
Dr. M. Samsuddin Scientist-G (on deputation)
Dr. K. K. Ramachandran Scientist-F (on deputation)
Dr. C. M. Harish Scientist-F & Head
Sri. B. K. Jayaprasad Scientist-C
Dr. Archana M . Nair Scientist-B
Sri. P. B. Vipin Technical Officer (Gr. 1)
12.6 Geo Sciences Division
Dr. V. Nandakumar Scientist-E1
Dr. Tomson J Kallukalam Scientist-B
Sri. N. Nishanth Technical Officer (Gr. 1)
Sri. S. S. Salaj Technical Officer (Gr. 1)
Sri. K. Eldhose Technical Asst. (Gr. 1)
12.7 Marine Sciences Division
Dr. K. V. Thomas Scientist-G & Head
Dr. T. N. Prakash Scientist-F
Dr. T. S. Shahul Hameed Scientist-F
Dr. A. S. K. Nair Scientist-E2
Sri. V. Vasudevan Scientist-E2
Smt. L. Sheela Nair Scientist-E1
Sri. John Paul Scientist-E1
Dr. D. S. Suresh Babu Scientist-E1
Dr. Reji Srinivas Scientist-B
Sri. S. Mohanan Technical Officer (Gr. 4)
Sri. A. Vijayakumaran Nair Technical Officer (Gr. 4)
Sri. M. Ajith Kumar Technical Officer (Gr. 4)
Sri. M. Ramesh Kumar Technical Officer (Gr. 4)
Sri. M. K. Rafeeque Technical Officer (Gr. 1)
Sri. M. K. Sreeraj Technical Officer (Gr. 1)
Sri. Louis Williams Helper (Gr. 2)
Dr. Srikumar Chattopadhyay Scientist-G & Head
Sri. B. Sukumar Scientist-F
Sri. Shravan Kumar Scientist-E2
Smt. Ahalya Sukumar Scientist-E2
Dr. Mahamaya Chattopadhyay Scientist-E1
Smt. C. Sakunthala Technical Officer ( Gr. 4)
Sri. K. Surendran Stenographer (Gr. 1)
12.8 Resources Analysis Division
12.9 Training & Extension Division
Sri. G. Balasubramonian Scientist-F & Head
Dr. E. Saravanan Scientist-E1
Dr. Ansom Sebastian Scientist-E1
Dr. K. Raju Scientist-C
Smt. K. K. Rimsy Technical Officer (Gr. 1)
Smt. S. Najumunniza Technical Assistant (Gr. 5)
Dr. T. Radhakrishna Scientist-G & Head
Sri. John Mathai Scientist-G
Dr. C. P. Rajendran Scientist-G (on long Leave)
Dr. Narayanaswamy Scientist-F
Sri. G. Sankar Scientist-F
Dr. G. R. Ravindrakumar Scientist-F
12.10 Library
Smt. K. Reshma Professional Asst. (Gr. 1)
Sri. P. M. Gopakumar Clerical Assistant
88
CESS A
nnua
l R
ep
ort 2
01
1-2
01
2Staff D
etails
12
12.14 Retirements
Sri. G. Balasubramanian
Scientist-F & Head, Training &
Extension Division
superannuated on 30 April 2011
Dr. B. Sukumar
Scientist- F
Resources Analysis Division
superannuated on
30 September 2011
12.12 Administration
Sri. P. Sudeep Registrar
Sri. M. Philip Internal Audit Officer
Sri. M. A. K. H Rasheed Deputy Registrar
Smt. K. V. Padmaja Kumari Assistant Registrar
Sri. T. D. Bashardeen P.A to Registrar
Sri. R. Haridas Section Officer
Smt. K. Viswabharathy Section Officer
Sri. C. M. Yousuf Section Officer
Sri. M. Madhu Madhavan Section Officer
Smt. R. Jaya Section Officer
Smt. G. Lavanya Section Officer
Sri. S. Krishnakumar Office Asst. (Gr. 2)
Smt. Femi R. Sreenivasan Office Asst. (Gr. 1)
Sri. Rajesh P Office Asst. (Gr. 1)
Smt. Rasi P. C Office Asst. (Gr. 1)
Sri. Siju V Office Asst. (Gr. 1)
Smt. S. R. Surekha Office Asst. (Gr. 1)
Sri. K. M. Dinesh Office Asst. (Gr.
Smt.Smitha Vijayan Office Asst. (Gr. 1)
Smt. K. S. Anju Office Asst. (Gr. 1)
Sri. P. H. Shinaj Office Asst. (Gr. 1)
Smt. D. Shimla Office Asst. (Gr. 1)
Sri. V. Subair Technical Officer (Gr. 1)
Smt. Indu Janardanan Technical Officer (Gr. 1)
Smt. P. Prabhavathy Stenographer (Gr. 1)
Smt. N. J. Saramma Typist (Gr. 1)
Smt. K. Prasanna Typist (Gr. 1)
Smt. K. Nirmala Clerical Assistant
Sri. N. Jayapal Clerical Assistant
Sri. K. R. Satheesan Clerical Assistant
Sri. M. Parameswaran Nair Skilled Assistant
Sri. C. Surendran Skilled Assistant
Sri. N. Unni Helper (Gr. 1)
Smt. S. Vimala Kumari Helper (Gr. 1)
Sri. P. S. Anoop Helper (Gr. 1)
Smt. P. S. Divya Helper (Gr. 1)
Sri. B. Rajendran Nair Helper (Gr. 2)
Sri. P. Saseendran Nair Helper (Gr. 2)
Sri P. Rajendra Babu Helper (Gr. 2)
Sri. K. Sudeerkumar Driver (Gr. 1)
12.13 New Recruitments
Smt. D. Shimla
Office Assistant (Gr. 1)
Administration
Smt. V. Geethamol
Stenographer (Gr. 1)
Director’s Office
Sri. K. Sudeer Kumar
Driver (Gr.1)
Administration
12.11 Camp Office
Dr. P. V. S. S. K. Vinayak Scientist-F & SIC
Sri. K. R. Unnikrishnan Scientist-F
Ms. Sreekumari Kesavan Scientist-C
Sri. D. Raju Technical Officer (Gr. 4)
Smt. M. K. Radha Typist (Gr. 1)
Smt. K. S. Anju
Office Assistant (Gr. 1)
Administration
Sri. P. H. Shinaj
Office Assistant (Gr. 1)
Administration
Smt. Indu Janardhanan
Technical Officer (Gr.1)
Estate Management

89CESS Annual Report 2009-2010
CESS A
nnua
l R
ep
ort 2
01
1-2
01
2Staff D
etails
12
Dr. K. Narendra Babu
Head, Chemical Sciences Division
superannuated on 31 November
2011
Dr. Narayanaswamy
Scientist-F, Geo Sciences Division
superannuated on 31 January
2012
Sri. C. Surendran
Skilled Assistant,Administration
superannuated on 30 April 2011
12.15 Obituary
Sri. K. R Unnikrishnan,
Scientist-F, Camp Office,
Kochi expired
on 26th
June 2011
Sri. V. Vasudevan,
Scientist E2, Marine Sciences
Division, expired
on 24th
March 2012


91CESS Annual Report 2011-12
Bala
nce Sheet
13
Balance Sheet