Hygienic Activity recognition in hospitals using sensors Data
69
HYGIENIC ACTIVITY RECOGNITION IN HOSPITALS USING SENSOR DATA Submitted By Shahanshah Abbas (10-CP-05) Jawwad Azam (10-CP-63) Mohsin Muhammad Ali (10-CP-75) Advisor: Dr. Muhammad Awais Azam Department of Computer Engineering, Faculty of Telecommunication and Information Engineering, University of Engineering and Technology, Taxila
Transcript of Hygienic Activity recognition in hospitals using sensors Data
HYGIENIC ACTIVITY RECOGNITION IN
HOSPITALS USING SENSOR DATA
Submitted By
Shahanshah Abbas (10-CP-05)
Jawwad Azam (10-CP-63)
Mohsin Muhammad Ali (10-CP-75)
Advisor:
Dr. Muhammad Awais Azam
Department of Computer Engineering,
Faculty of Telecommunication and Information Engineering,
University of Engineering and Technology, Taxila
Hygienic Activity Recognition In Hospitals Using RFID sensors data
Page i
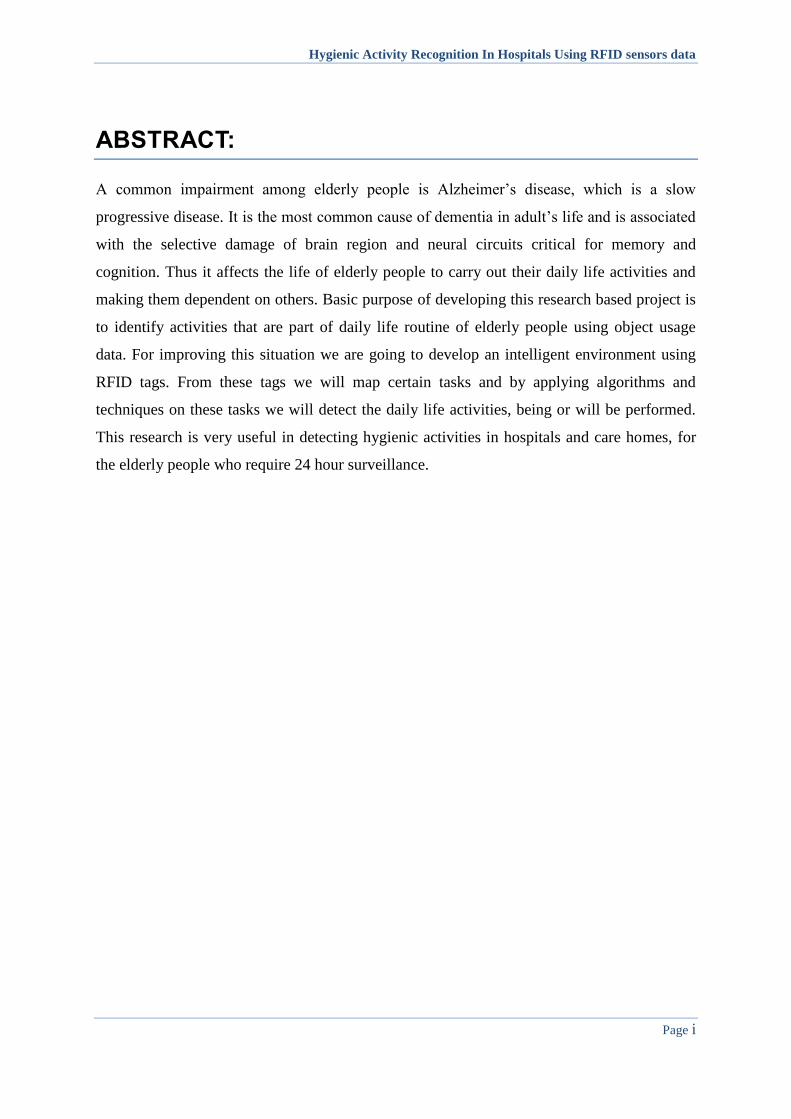
ABSTRACT:
A common impairment among elderly people is Alzheimer’s disease, which is a slow
progressive disease. It is the most common cause of dementia in adult’s life and is associated
with the selective damage of brain region and neural circuits critical for memory and
cognition. Thus it affects the life of elderly people to carry out their daily life activities and
making them dependent on others. Basic purpose of developing this research based project is
to identify activities that are part of daily life routine of elderly people using object usage
data. For improving this situation we are going to develop an intelligent environment using
RFID tags. From these tags we will map certain tasks and by applying algorithms and
techniques on these tasks we will detect the daily life activities, being or will be performed.
This research is very useful in detecting hygienic activities in hospitals and care homes, for
the elderly people who require 24 hour surveillance.

Hygienic Activity Recognition In Hospitals Using RFID sensors data
Page ii
UNDERTAKING
I certify that research work titled “hygienic activity recognition in hospitals using RFID
sensors” is my own work. The work has not, in whole or in part, been presented elsewhere
for assessment. Where material has been used from other sources it has been properly
acknowledged.
Shahanshah Abbas (10-CP-05)
Signature
Jawwad Azam (10-CP-63)
Signature
Mohsin Muhammad Ali (10-CP-75)
Signature

Hygienic Activity Recognition In Hospitals Using RFID sensors data
Page iii
ACKNOWLEDGEMENT
Firstly we would like sincerely to thank our supervisor Dr. Muhammad Awais Azam for
helping us in entering the world of research and providing guidance, motivation and countless
advice throughout the working of this project. We are amazed that we have reached so far,
and definitely it would have not been possible without the excellent support. Apart from that
we would like to thank other faculty members for helping us in solving some issue during the
implementation.
Hygienic Activity Recognition In Hospitals Using RFID sensors data
Page iv
TABLE OF CONTENTS:
ABSTRACT: ------------------------------------------------------------------------------------------------ i
UNDERTAKING ----------------------------------------------------------------------------------------- ii
ACKNOWLEDGEMENT ------------------------------------------------------------------------------ iii
TABLE OF CONTENTS:------------------------------------------------------------------------------- iv
LIST OF FIGURES: ------------------------------------------------------------------------------------viii
LIST OF TABLES: -------------------------------------------------------------------------------------- ix
ABBREVIATIONS --------------------------------------------------------------------------------------- x
CHAPTER 1 ----------------------------------------------------------------------------------------------- 1
INTRODUCTION: ---------------------------------------------------------------------------------------- 1
1.1 PROBLEM STATEMENT ---------------------------------------------------------------- 2
1.2 AIMS & OBJECTIVES -------------------------------------------------------------------- 2
1.3 BACKGROUND ---------------------------------------------------------------------------- 2
1.4 DELIVERABLES --------------------------------------------------------------------------- 3
1.5 TOOLS USED ------------------------------------------------------------------------------- 4
1.6 ORGANIZATION OF THESIS ----------------------------------------------------------- 4
CHAPTER 2 ----------------------------------------------------------------------------------------------- 6
LITERATURE REVIEW -------------------------------------------------------------------------------- 6
2.1 ALZHEIMER’S ----------------------------------------------------------------------------- 6
2.1.1 WHAT CAUSES ALZHEIMER'S DISEASE? ----------------------------------- 6
2.1.2 SIGNS AND SYMPTOMS ---------------------------------------------------------- 8
2.1.3 TREATMENT-------------------------------------------------------------------------- 9
2.2 DENSE SENSING TECHNIQUE: ------------------------------------------------------10
2.2.1 RFID SENSORS ----------------------------------------------------------------------10
2.2.1.1 Active RFID Tag system ----------------------------------------------------------11
2.2.1.2 Passive RFID tag systems ---------------------------------------------------------11
2.2.1.3 Semi-passive Tag system ---------------------------------------------------------12
2.2.1.4 Low frequency Band RFID (LF RFID) -----------------------------------------13
2.2.1.5 High frequency Band RFID (HF RFID) ----------------------------------------13
Hygienic Activity Recognition In Hospitals Using RFID sensors data
Page v
2.2.1.6 Ultra high Frequency Band RFID (UHF RFID) -------------------------------14
2.2.1.7 Working of RFID technology ----------------------------------------------------14
2.3 TASE (Task Associated Sensor Events) ------------------------------------------------14
2.4 DISJUNCTIVE NORMAL FORM (DNF) ---------------------------------------------15
2.5 GATS APPROACH ------------------------------------------------------------------------16
CHAPTER 3 ----------------------------------------------------------------------------------------------17
METHODOLOGY: --------------------------------------------------------------------------------------17
3.1. FEATURE DETECTION -----------------------------------------------------------------17
3.2. FEATURE EXTRACTION ---------------------------------------------------------------17
3.3. MODELING OF HIGH LEVEL ACTIVITIES ----------------------------------------18
3.4. A DIAGRAMATICAL OVERVIEW ---------------------------------------------------19
3.5. GENERAL FRAMEWORK --------------------------------------------------------------20
3.5.1. Low-Tier: ------------------------------------------------------------------------------20
3.5.1.1. Cost ----------------------------------------------------------------------------------21
3.5.2. High Tier: ------------------------------------------------------------------------------22
3.5.2.1. Modeling Hygienic Activities: --------------------------------------------------22
3.6. FLOW CHART: ----------------------------------------------------------------------------23
3.7. GENERATING ALTERNATIVE TASKS SEQUENCES (GATS): ---------------24
3.8. POSSIBLE HYGENIC ACTIVITIES: --------------------------------------------------30
3.9. REAL LIFE DATA EXAMPLE: --------------------------------------------------------32
3.10. EXPERIMENTAL DESIGNS: --------------------------------------------------------33
3.10.1. Sequential: --------------------------------------------------------------------------33
3.10.2. Half Completed: --------------------------------------------------------------------34
3.10.3. Parallel: ------------------------------------------------------------------------------34
3.11. CHALLENGES: -------------------------------------------------------------------------34
3.11.1. Problem #1: identification of ‘start’ and ‘stop’ of an activity within the
sensor stream -------------------------------------------------------------------------------------34
Solution: ----------------------------------------------------------------------------------------34
3.11.2. Problem #2: Identification of activities started in parallel or left half
completed 35
Solution: ----------------------------------------------------------------------------------------35
CHAPTER 4 ----------------------------------------------------------------------------------------------37
Hygienic Activity Recognition In Hospitals Using RFID sensors data
Page vi
ALGORITHM IMPLEMENTATION ----------------------------------------------------------------37
4.1 JAVA -----------------------------------------------------------------------------------------37
4.1.1 HISTORY OF JAVA -----------------------------------------------------------------37
4.1.2 APPLICATIONS OF JAVA --------------------------------------------------------38
4.1.2.1 Standalone application: ------------------------------------------------------------38
4.1.2.2 Applets: ------------------------------------------------------------------------------38
4.1.3 SIGNIFICANT FEATURES OF JAVA -------------------------------------------39
4.1.3.1 Platform independence ------------------------------------------------------------39
4.1.1.1 Object orientation ------------------------------------------------------------------39
4.1.1.2 Rich standard library ---------------------------------------------------------------39
4.2 NET BEANS: -------------------------------------------------------------------------------40
4.2.1 CREATE A NEW PROJECT -------------------------------------------------------40
4.2.2 MOUNT A DIRECTORY SPECIFY A LOCATION ---------------------------41
4.2.2.1 Add a new class to the project ----------------------------------------------------41
4.2.2.2 Compiling and debugging --------------------------------------------------------41
4.3 SOFTWARE REQUIREMENT SPECIFICATION: ----------------------------------42
4.3.1 Introduction ----------------------------------------------------------------------------42
4.3.1.1 Identification ------------------------------------------------------------------------42
4.3.1.2 Purpose ------------------------------------------------------------------------------43
4.3.1.3 Project Scope: -----------------------------------------------------------------------43
4.3.1.4 Overview: ---------------------------------------------------------------------------43
4.3.2 Overall description: -------------------------------------------------------------------44
4.3.2.1 Product perspective: ---------------------------------------------------------------44
4.3.2.2 Implementation Constraints ------------------------------------------------------44
4.3.2.3 Operating Environment: -----------------------------------------------------------44
4.3.3 Functional and Specific Requirements---------------------------------------------45
4.3.3.1 Overall Environment --------------------------------------------------------------45
4.3.3.2 Use case Recording sensor Event ----------------------------------------------46
Description: --------------------------------------------------------------------------------46
4.3.3.3 Use Case Task extraction: --------------------------------------------------------46
Description: --------------------------------------------------------------------------------47
Hygienic Activity Recognition In Hospitals Using RFID sensors data
Page vii
4.3.3.4 Use case Activity Recognition: --------------------------------------------------47
Description: --------------------------------------------------------------------------------47
4.3.4 Text Files -------------------------------------------------------------------------------48
4.3.5 User Interface --------------------------------------------------------------------------49
CONCLUSION: ------------------------------------------------------------------------------------------53
5.1 RESULTS -----------------------------------------------------------------------------------53
5.2 FUTURE ENHANCMENTS: ------------------------------------------------------------55
GLOSSARY: ---------------------------------------------------------------------------------------------56
REFERENCES: ------------------------------------------------------------------------------------------58
Hygienic Activity Recognition In Hospitals Using RFID sensors data
Page viii
LIST OF FIGURES:
Figure 1: Nerve cells (neurons) in the brain. In Alzheimer's there are microscopic 'plaques' and 'tangles'
between and within brain cells. .............................................................................................................................. 7
Figure 2: RFID Readers ....................................................................................................................................... 11
Figure 3: Passive RFID tag systems..................................................................................................................... 12
Figure 4: Semi-passive Tag system ..................................................................................................................... 13
Figure 5: A diagrammatical view of project......................................................................................................... 19
Figure 6: Hierarchal Framework of ADLs ........................................................................................................... 20
Figure 7: Flow chart model of project ................................................................................................................. 23
Figure 8: Example data sensor events and its associated tasks ........................................................................... 35
Figure 9: Use case Diagram ................................................................................................................................ 45
Figure 10: Sensor Events..................................................................................................................................... 46
Figure 11: Use case “Task Extraction" ................................................................................................................ 46
Figure 12: Activity Recognition ............................................................................................................................ 47
Figure 13: User Interface 1 .................................................................................................................................. 49
Figure 14: User Interface 2 .................................................................................................................................. 50
Figure 15: Results ................................................................................................................................................ 51
Figure 16: Example of Assistance provided. ........................................................................................................ 51
Figure 17: the help tab ......................................................................................................................................... 52

Hygienic Activity Recognition In Hospitals Using RFID sensors data
Page ix
LIST OF TABLES:
Table 1: Task associated sensor events and its character representation ............................................................ 25
Table 2: Prior probability distribution for each task given the sensor event ....................................................... 25
Table 3: Conditional probability values for each task given the 1st four events .................................................. 26
Table 4: Associated cost for task streams ............................................................................................................. 27
Table 5: Hygienic Activities associated with Tasks and their character representation ...................................... 28
Table 6: Prior probability distribution for each Hygienic Activity ...................................................................... 28
Table 7: Base Utility of different Hygienic Activities ........................................................................................... 29
Table 8 :Set of Possible Hygienic Activities along with associated tasks and sensor events ............................... 31
Table 9: Sensor Events Description...................................................................................................................... 32
Table 10: Tasks description .................................................................................................................................. 32
Hygienic Activity Recognition In Hospitals Using RFID sensors data
Page x
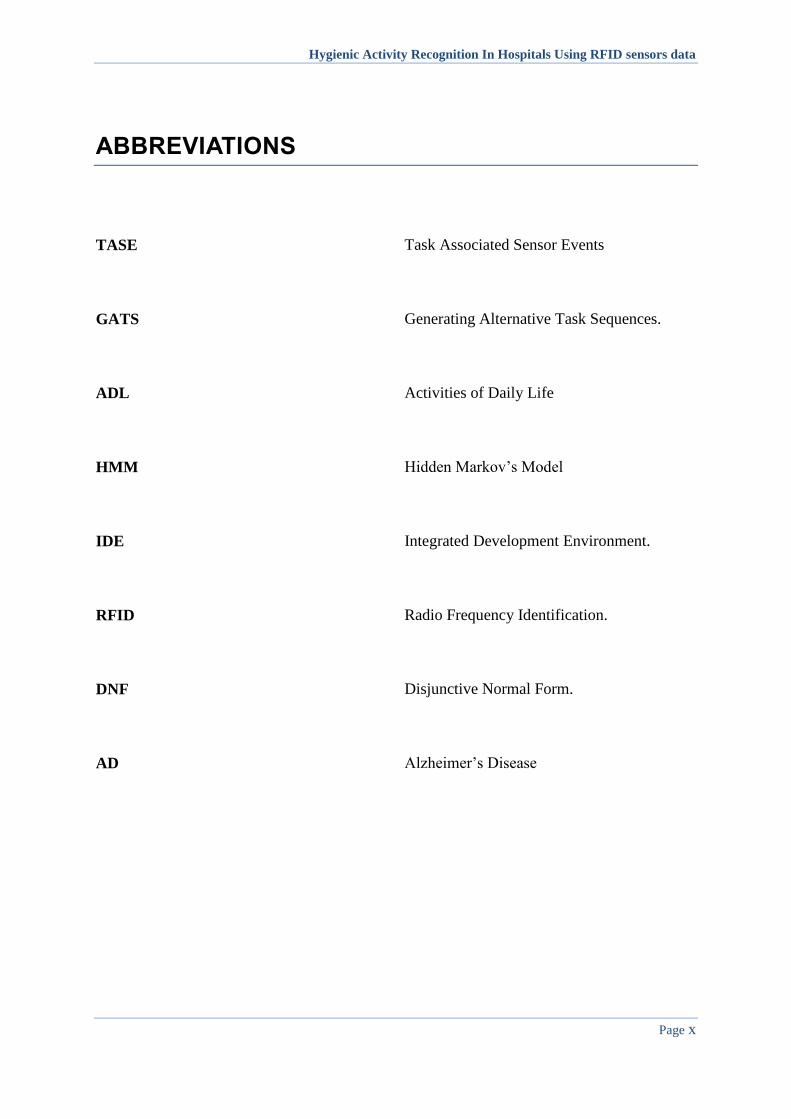
ABBREVIATIONS
TASE Task Associated Sensor Events
GATS Generating Alternative Task Sequences.
ADL Activities of Daily Life
HMM Hidden Markov’s Model
IDE Integrated Development Environment.
RFID Radio Frequency Identification.
DNF Disjunctive Normal Form.
AD Alzheimer’s Disease
Hygienic Activity Recognition In Hospitals Using RFID sensors data
Page 1
CHAPTER 1
INTRODUCTION:
For the past few decades the business of life has lead more elderly people to be a part of the
society again. A common disease appearing in elderly people now-a-days is Alzheimer’s,
which is an irreversible, progressive brain disease that slowly destroys memory and thinking
skills. Because of this they require more assistance in carrying out their daily life activities.
However, the current requirement of society has made it very tough for the young people to
look after their elderlies. One way to check whether the parents are safe in their homes Is to
find out Activity of Daily Life (ADL) which the elderly people are carrying out, and offer
assistance if they have some sort of problem in it.
Currently ‘Dense sensing’ technique is best preferred technique for feature detection. In this
technique RFID tags are embedded on various things in homes, with wireless transmitter and
sensors, which pass the information when the object is touched, through radio frequencies.
Feature extraction is done through various techniques like Hidden Markov (HMM)[1], Task
Associated Sensor Events (TASE) [1]and Generating Alternative Task Sequences
(GATS)[1]. HMM is not an efficient technique because it can only recognize an activity done
in a regular pattern fed to the computer by the programmer [1], but its human nature that
people do tasks in irregular pattern. So at this point the HMM technique fails to give accurate
results, so for improving this we use GATS in which a task is performed repeatedly in many
sequences.
For the last phase we use high level modeling, in which our objective is to support
recognition of tasks through feedback from beliefs held about ADLs.
Hygienic Activity Recognition In Hospitals Using RFID sensors data
Page 2
1.1 PROBLEM STATEMENT
Elderly people with Alzheimer’s disease often given a set of activities by their doctors or
health visitors which provide simulation to do their own work and feel independent of other.
But they still need help to carry out these activities, but young generation with a fast and busy
routine are unable to assist them properly. So a solution is required as a solution to this
problem.
Hospitals and day-care centers are created as its solution but with the fast growth of this
disease more man power is required and which in turn also becoming a costly solution. So
our goal is to provide a better and cost effective solution, which we tried to achieve in this
project, as we tried to replace the personal assistance with digital assistance by making the
environment around the patient a smart environment.
1.2 AIMS & OBJECTIVES
Aims and objectives for this project are mention as follow.
Making the environment Smart.
Providing assistance to low entropy and elderly people.
Reduce the man power cost.
1.3 BACKGROUND
In most articles activity recognition is the goal and not the solution to a specific problem. A
lot of methods are proposed, most of them quiet robust, but limited to an experimental setup,
meaning most research is still fundamental.[3]
Hygienic Activity Recognition In Hospitals Using RFID sensors data
Page 3
The methods that are developed to tackle real life problems are often very goal specific and
hardly useful for slightly different scenario’s. It’s logical that each goal needs its own
solution, but if a solution is too goal specific it is worthless for large scale implementations
and usage. The problem is to build a stable basis for activity recognition that is generic to a
certain degree, perhaps branched to specific domains or general purposes.
Activity recognition systems based on video tracking can –and have proven to- be robust but
often consider too many assumptions to be programmed into the system to reach robustness
that it severely reduces the flexibility of that system [M.J. Meinders et al.] [3].This means
that if the system were to be used for a slightly other purpose or space, of perhaps its initial
scenario undergoes changes, the systems needs to be reprogrammed and or recalibrated
completely. The basic flaw of using a video tracking approach in a human activity
recognition system is that the fundamental methods filter out to much information in the first
stages that is needed later on in the process, instead of keeping in mind which overall
information is needed. A good way to give insight to information loss is to measure the
similarity of a reconstructed model of the end-data to the original video input.
Many other researcher’s proposed their own solution for activity recognition but we are going
to extend the work of Usman Naeem et al.by slightly changing their algorithm.
1.4 DELIVERABLES
In the end of the project we will be providing following deliverables.
Algorithm for recognition of ADLs and providing assistance.
Implementation of the designed algorithm.
Accuracy of algorithm.
Hygienic Activity Recognition In Hospitals Using RFID sensors data
Page 4
1.5 TOOLS USED
We used Netbeans IDE for the implementation of the algorithm and using JAVA language.
1.6 ORGANIZATION OF THESIS
This thesis comprises of four chapters including this Introduction. In Chapter 2, Literature
review, the will look at the context where the proposed research will be applied, which is care
of the elderly with Alzheimer’s disease in smart homes. How the environment can be made
smart and a brief description about the sensors that can be used. Related state of the art
research will also be described. There has been substantial amount of research relating to
interpreting ADLs and on Smart Homes. The research has been revolved around the idea of
trying to determine what type of ADL the elderly person is carrying out.
In Chapter three, methodology, we will be discussing the algorithm made to recognize the
ADLs and how can we provide assistance to the elderly people by using this algorithm, is
described in detail. The Algorithm consist of three phases namely dense sensing, in which we
get the data from the smart environment by means of sensors and This data is used as the
input of our algorithm. The second phase is Activity recognition, in which the data gathered
from dense sensing is used to find tasks associated with the sensors and then after series of
calculation the task streams are generated along with their costs and utility values. On the
basis of these cost and utility values the most likely to occur task stream is picked up and the
utility of the ADLs is calculated and ADL with highest utility is picked up. Then at the Third
and final phase the recognized ADL’s mandatory and optional tasks are matched with the
task stream selected. And the missing tasks in the task stream are sent to the performer
through PDA device or by any other means to let him/her know what he/she is skipping. In
this way assistance can be provided to the elderly people and Alzheimer’s patients to carry
out their daily life activities.

Hygienic Activity Recognition In Hospitals Using RFID sensors data
Page 5
In Chapter four, Implementation, the language and the IDE which we are using to implement
our algorithm is discussed along with the reasons why we selected them for implementation.
Software requirement specification document is also discussed in which all the requirements,
flow charts, entities and the interfaces of the software application is discussed.
The final chapter concludes the thesis, as well as discussion about particular issues that could
be investigation as an extension of this research.
Hygienic Activity Recognition In Hospitals Using RFID sensors data
Page 6
CHAPTER 2
LITERATURE REVIEW
In this chapter we will discuss some the work which has been done so far by Dr. Usman
Naeem (section 2.1). Later in this chapter we will highlight some of the techniques,
algorithms and components used in the recognition of activities.
2.1 ALZHEIMER’S
Alzheimer's disease is a progressive disease that destroys memory and other important
mental functions. It's the most common cause of dementia — a group of brain disorders that
results in the loss of intellectual and social skills. These changes are severe enough to
interfere with day-to-day life.
In Alzheimer's disease, the connections between brain cells and the brain cells themselves
degenerate and die, causing a steady decline in memory and mental function. Current
Alzheimer's disease medications and management strategies may temporarily improve
symptoms. This can sometimes help people with Alzheimer's disease maximize function and
maintain independence. But because there's no cure for Alzheimer's disease, it's important to
seek supportive services and tap into your support network as early as possible. [5]
2.1.1 WHAT CAUSES ALZHEIMER'S DISEASE?
Like all types of dementia, Alzheimer's is caused by brain cell death. It is a
neurodegenerative disease, which means there is progressive brain cell death that happens
over a course of time. The total brain size shrinks with Alzheimer's - the tissue has
progressively fewer nerve cells and connections.

Hygienic Activity Recognition In Hospitals Using RFID sensors data
Page 7
Figure 1: Nerve cells (neurons) in the brain. In Alzheimer's there are microscopic 'plaques' and 'tangles' between and
within brain cells.
While they cannot be seen or tested in the living brain affected by Alzheimer's disease,
postmortem/autopsy will always show tiny inclusions in the nerve tissue, called plaques and
tangles:[6]
Plaques are found between the dying cells in the brain - from the build-up of a protein
called beta-amyloid (you may hear the term "amyloid plaques").
The tangles are within the brain neurons - from a disintegration of another protein,
called tau.
The abnormal protein clumps, inclusions, in the brain tissue are always present with the
disease, but there could be another underlying process that is actually causing the Alzheimer's
- scientists are not yet sure. [6]
This sort of change in brain nerves is also witnessed in other disorders,3 and researchers want
to find out more than just that there are protein abnormalities - they also want to know how
these develop so that a cure or prevention might be discovered. [6]

Hygienic Activity Recognition In Hospitals Using RFID sensors data
Page 8
2.1.2 SIGNS AND SYMPTOMS
Symptoms can be diagnosed at any stage of Alzheimer's dementia and the progression
through the stages of the disease is monitored after an initial diagnosis, too, when the
developing symptoms dictate how care is managed.
The cognitive decline is in at least TWO of the five symptom areas listed below (from
guidelines jointly produced by the National Institute on Aging and the Alzheimer's
Association): [6]
1. Worsened ability to take in and remember new information, for example:
"Repetitive questions or conversations
Misplacing personal belongings
Forgetting events or appointments
Getting lost on a familiar route."
2. Impairments to reasoning, complex tasking, exercising judgment:
"Poor understanding of safety risks
Inability to manage finances
Poor decision-making ability
Inability to plan complex or sequential activities."
3. Impaired visuospatial abilities (but not, for example, due to eye sight problems):
"Inability to recognize faces or common objects or to find objects in direct view
Inability to operate simple implements, or orient clothing to the body."
4. Impaired speaking, reading and writing:
"Difficulty thinking of common words while speaking, hesitations
Speech, spelling, and writing errors."
5. Changes in personality and behavior, for example:

Hygienic Activity Recognition In Hospitals Using RFID sensors data
Page 9
Out-of-character mood changes, including agitation; less interest, motivation or initiative;
apathy; social withdrawal
Loss of empathy
Compulsive, obsessive or socially unacceptable behavior.
2.1.3 TREATMENT
There is currently no cure for Alzheimer's disease. However, drug treatments are available
that can temporarily alleviate some symptoms or slow down their progression in some
people.
People with Alzheimer's have been shown to have a shortage of the chemical acetylcholine in
their brains. The drugs Aricept, Exelon and Reminyl (trade names for the drugs donepezil
hydrochloride, rivastigmine and galantamine) work by maintaining existing supplies of
acetylcholine. As of March 2011, these drugs are recommended as an option for people in the
mild-to-moderate stages of Alzheimer's disease. Please refer to the National Institute for
Health and Clinical Excellence (NICE) website for guidance (see Useful organizations at the
end of this factsheet). Side-effects are usually minor but may include diarrhea, nausea,
insomnia, fatigue and loss of appetite.
A drug called Ebixa (trade name for the drug memantine) was launched in the UK in 2002.
Ebixa works in a different way from the other three and is the only drug that is recommended
for people in both the moderate and severe stages of Alzheimer's disease. Side-effects may
include dizziness, headaches and tiredness, and - rarely - hallucinations or confusion.
These drugs are not a cure, but they may stabilize some of the symptoms of Alzheimer's
disease for a limited period, typically 6-12 months or longer. [7]
Hygienic Activity Recognition In Hospitals Using RFID sensors data
Page 10
2.2 DENSE SENSING TECHNIQUE:
In today’s world the elderly people often thought to the dependent people on others and are
neglected by the society. Due to Alzheimer disease, the rate of accidents in elderly people is
very high in performing daily life activities. As Alzheimer is one of the major impairment
that elderly people suffer from and this leads the elderly people not being able to live
independently due to forgetfulness. Therefore, modeling human behaviors such as daily
routines and activities by sensor data gathered from daily life pattern is one of the emerging
realms of today’s world.
As activities and behavior recognition is one the important issue, many researchers and
scientist tried to pose many solutions to this problem. Most of them relay on visual
surveillance of the elderly people activities and behaviors while most of the observer posed to
detect daily life activities and behavior of people using RFID sensors and object usage data.
Elderly people. Hence, the recognizing of activities by the implementation of algorithms and
models are very important and should very precise because many important things such as
medicine allocation would depend on it. The implementation components and algorithms
devised by researchers are discussed in the section below.
2.2.1 RFID SENSORS
Many different sensors have been used by scientists and researcher so far for the feature
detection of elderly people. These sensors are divided into different types on the bases of
frequency band with which they operate that are low frequency, high frequency and ultra-
high frequency. Here frequency refers to the size of the radio waves used to communicate
between RFID transmitter and frequency reader.
The three main broad categories of RFID sensor system active, passive and semi passive
RFID tag system

Hygienic Activity Recognition In Hospitals Using RFID sensors data
Page 11
2.2.1.1 Active RFID Tag system
Active RFID tags have their own source of power. This is used to power the circuits and
broader cast signals to others. These tags are more reliable than the passive and semi passive
tag systems. Due to built-in power supply they have stronger strength of signals and allows
the worker to use it in places such as under water, metal or from long distances. But these
tags are very inexpensive than passive and semi passive tags. The most modern active RFID
tags can transmit from hundreds of meters with its long life battery.
Figure 2: RFID Readers
2.2.1.2 Passive RFID tag systems
Passive RFID tags don't have an internal source of power. There is an electrical current that is
created in the antenna by the incoming radio frequency signal from the reader. This means
that the antenna has to be able to collect power from the incoming signal and also transmit
the outbound signal to the reader. A passive tag can respond with identification numbers or
non-volatile storage data. It can be read from about 10 cm to a couple of meters and since
they don't have to have a power source on the device, they can be extremely small (they can
be embedded in a sticker or under the skin).
Hygienic Activity Recognition In Hospitals Using RFID sensors data
Page 12
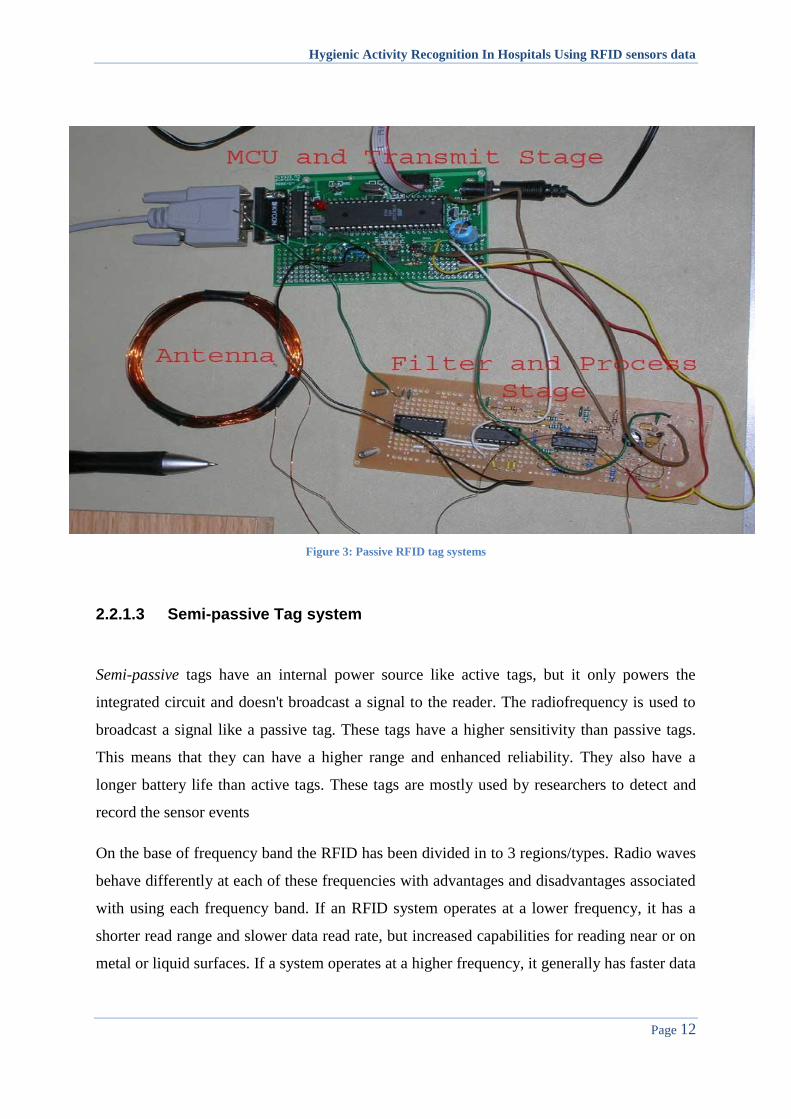
Figure 3: Passive RFID tag systems
2.2.1.3 Semi-passive Tag system
Semi-passive tags have an internal power source like active tags, but it only powers the
integrated circuit and doesn't broadcast a signal to the reader. The radiofrequency is used to
broadcast a signal like a passive tag. These tags have a higher sensitivity than passive tags.
This means that they can have a higher range and enhanced reliability. They also have a
longer battery life than active tags. These tags are mostly used by researchers to detect and
record the sensor events
On the base of frequency band the RFID has been divided in to 3 regions/types. Radio waves
behave differently at each of these frequencies with advantages and disadvantages associated
with using each frequency band. If an RFID system operates at a lower frequency, it has a
shorter read range and slower data read rate, but increased capabilities for reading near or on
metal or liquid surfaces. If a system operates at a higher frequency, it generally has faster data

Hygienic Activity Recognition In Hospitals Using RFID sensors data
Page 13
transfer rates and longer read ranges than lower frequency systems, but more sensitivity to
radio wave interference caused by liquids and metals in the environment.
Figure 4: Semi-passive Tag system
2.2.1.4 Low frequency Band RFID (LF RFID)
The LF band covers frequencies from 30 KHz to 300 KHz. Typically LF RFID systems
operate at 125 KHz, although there are some that operate at 134 KHz. This frequency band
provides a short read range of 10 cm, and has slower read speed than the higher frequencies,
but is not very sensitive to radio wave interference. LF RFID applications include access
control and livestock tracking.
2.2.1.5 High frequency Band RFID (HF RFID)
The HF band ranges from 3 to 30 MHz Most HF RFID systems operate at 13.56 MHz with
read ranges between 10 cm and 1 m. HF systems experience moderate sensitivity to
interference. HF RFID is commonly used for ticketing, payment, and data transfer
applications.
Hygienic Activity Recognition In Hospitals Using RFID sensors data
Page 14
2.2.1.6 Ultra high Frequency Band RFID (UHF RFID)
The Ultra high frequency band covers the range from 300 MHz to 3 GHz. Systems
complying with the Ultra high frequency Gen2 standard for RFID use the 860 to 960 MHz
band. The read range of passive Ultra high frequency systems can be as long as 12 m, and
UHF RFID has a faster data transfer rate than LF or HF. UHF RFID is the most sensitive to
interference, but many UHF product manufacturers have found ways of designing tags,
antennas, and readers to keep performance high even in difficult environments. Passive UHF
tags are easier and cheaper to manufacture than LF and HF tags.
UHF RFID is used in a wide variety of applications, ranging from retail inventory
management, to pharmaceutical anti-counterfeiting, to wireless device configuration. The
bulk of new RFID projects are using UHF opposed to LF or HF, making UHF the fastest
growing segment of the RFID market.
2.2.1.7 Working of RFID technology
RFID tags are embedded on different things with a source and a transmitter. When any of the
objects is touched the event is recorded and is transmitted to the system with the help of
transmitter using radio frequency. The ultra-high frequency used in RFID tags, because this
frequency band covers the range from 300 MHz to 3 GHz. The read range using this
frequency band is up to 12m, which can be easily read by the RFID reader.
2.3 TASE (Task Associated Sensor Events)
In TASE, task recognition is simply done by segmenting sensor events in to segments that
corresponds to a particular task. But the problem with this approach is that sometimes sensor
events are generated in incorrect manners and they have no resemblance with the task that is
Hygienic Activity Recognition In Hospitals Using RFID sensors data
Page 15
actually being conducted out. In order to carry out task segmentation we assign a probability
P [a/b] for each task “a” and for sensor event b. the entire sensor stream is segmented in to
appropriate task segments, the segmented task are then further used to determine which ADL
is currently active in the higher tier of the activity recognizer. Therefore this approach was
replaced by GATS approach discussed in the later part of the report.
2.4 DISJUNCTIVE NORMAL FORM (DNF)
In Boolean algebra, the DNF is the process of normalizing of a logical formula which is a
disjunction of conjunctive clauses. In other words we can say that it is OR of AND. It is also
called sum or products. As a normal form it is very useful in proving automated proving of
theorems. A DNF formula is in full disjunctive normal form if each of its variables appears
exactly once in every clause. Here some of the examples of disjunctive normal form are
(1)
Here we have used “+” symbol instead of OR (v) in separating the sensor stream from one
another. All logical formulas can be converted into disjunctive normal form. However, in
some cases conversion to DNF can lead to an exponential explosion of the formula. The
formal grammar for Disjunctive normal form is as follow
1) disjunction → conjunction
2) disjunction → disjunction ∨ conjunction
3) conjunction → literal
4) conjunction → (conjunction ∧ literal)
5) literal → variable
6) literal → ¬variable
Hygienic Activity Recognition In Hospitals Using RFID sensors data
Page 16
2.5 GATS APPROACH
The basic objective of GATS Approach is to output ordered list of Alternating Task Sequence
by giving the input set of events. This approach also works on the similar lines as it makes
use of task associated sensor events and all the possible combinations of TASE stream given
the possible incoming sensor events.
The basic difference between this approach and TASE approach that this approach employs a
simple algorithm which works out on all the possible combinations for each task given the
sensor event .The technique is expensive than previous techniques but a best first manner in
synchronization with plan recognition of task and higher level of activities. The main
objective of this approach is to separate that distinctive task associated objects that has no
resemblance with the actual task actually being conducted.
This technique is implemented in a similar way to how TASE segmentation is generally
carried out as it requires sensor events that mapped to their associated hypothesized tasks that
make use of the object.
Hygienic Activity Recognition In Hospitals Using RFID sensors data
Page 17
CHAPTER 3 METHODOLOGY:
The finding of activities is divided into three phases
1) Feature detection.
2) Feature extraction.
3) Modeling of upcoming activity from the given tasks.
3.1. FEATURE DETECTION
Currently ‘Dense sensing’ technique is best preferred technique for feature detection. In this
technique RFID tags are embedded on various things in homes, with wireless transmitter and
sensors, which pass the information when the object is touched, through radio frequencies.
3.2. FEATURE EXTRACTION
Feature extraction is done through various techniques like Hidden Markov (HMM)[1], Task
Associated Sensor Events (TASE) [1]and Generating Associative Task Sequences
(GATS)[1]. HMM is not an efficient technique because it can only recognize an activity done
in a regular pattern fed to the computer by the programmer [1], but its human nature that
people do tasks in irregular pattern. So at this point the HMM technique fails to give accurate
results, so for improving this we use GATS in which a task is performed repeatedly in many
sequences.

Hygienic Activity Recognition In Hospitals Using RFID sensors data
Page 18
3.3. MODELING OF HIGH LEVEL ACTIVITIES
For the last phase we use high level modeling, in which our objective is to support
recognition of tasks through feedback from beliefs held about ADLs.
In most articles activity recognition is the goal and not the solution to a specific problem. A
lot of methods are proposed, most of them quiet robust, but limited to an experimental setup,
meaning most research is still fundamental.[3]
The methods that are developed to tackle real life problems are often very goal specific and
hardly useful for slightly different scenario’s. It’s logical that each goal needs its own
solution, but if a solution is too goal specific it is worthless for large scale implementations
and usage. The problem is to build a stable basis for activity recognition that is generic to a
certain degree, perhaps branched to specific domains or general purposes.
Activity recognition systems based on video tracking can –and have proven to- be robust but
often consider too many assumptions to be programmed into the system to reach robustness
that it severely reduces the flexibility of that system [M.J. Meinders et al.] [3].This means
that if the system were to be used for a slightly other purpose or space, of perhaps its initial
scenario undergoes changes, the systems needs to be reprogrammed and or recalibrated
completely. The basic flaw of using a video tracking approach in a human activity
recognition system is that the fundamental methods filter out to much information in the first
stages that is needed later on in the process, instead of keeping in mind which overall
information is needed. A good way to give insight to information loss is to measure the
similarity of a reconstructed model of the end-data to the original video input.
Hygienic Activity Recognition In Hospitals Using RFID sensors data
Page 19
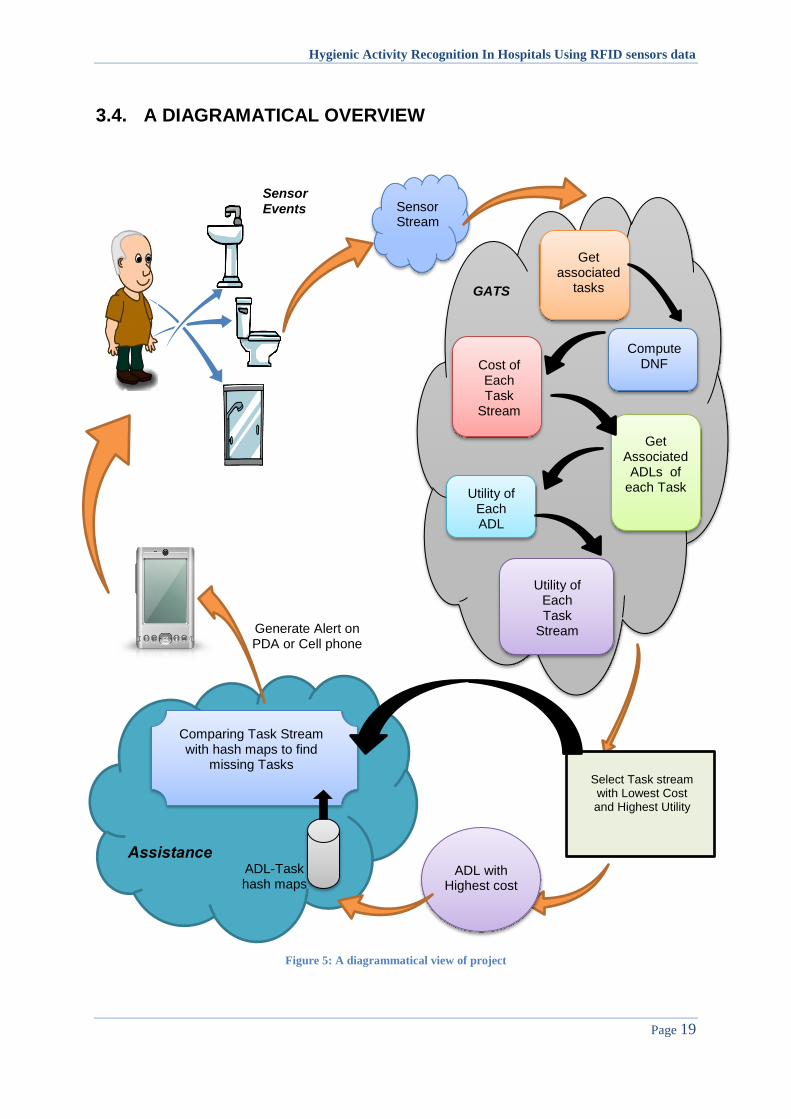
3.4. A DIAGRAMATICAL OVERVIEW
Figure 5: A diagrammatical view of project
Sensor Events Sensor
Stream
Get associated
tasks
Compute
DNF Cost of Each Task
Stream
Get Associated ADLs of
each Task Utility of
Each ADL
Utility of Each Task
Stream
GATS
Select Task stream with Lowest Cost and Highest Utility
ADL with Highest cost
ADL-Task hash maps
Comparing Task Stream with hash maps to find
missing Tasks
Assistance
Generate Alert on PDA or Cell phone
Hygienic Activity Recognition In Hospitals Using RFID sensors data
Page 20
ADLs
Task stream
Tasks
Sensor Stream
Sensor events
High-Tier
Low-Tier
Feature Extraction
Feature Detection
Utility Function
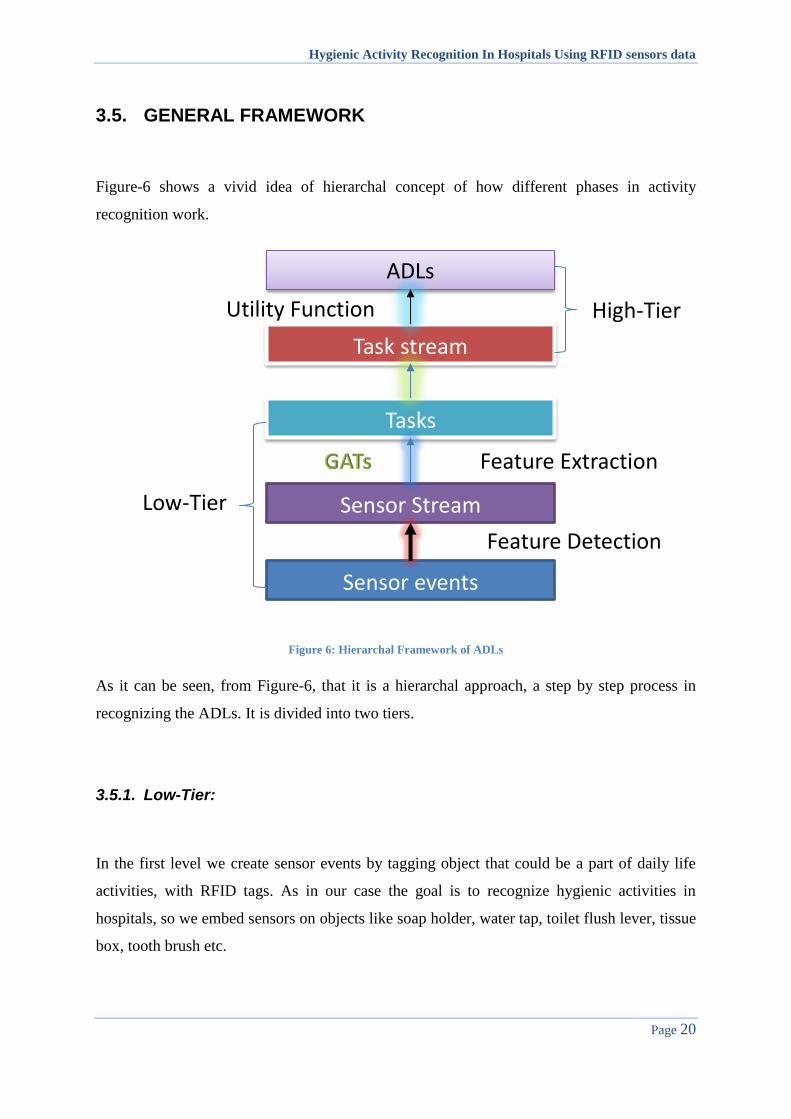
3.5. GENERAL FRAMEWORK
Figure-6 shows a vivid idea of hierarchal concept of how different phases in activity
recognition work.
Figure 6: Hierarchal Framework of ADLs
As it can be seen, from Figure-6, that it is a hierarchal approach, a step by step process in
recognizing the ADLs. It is divided into two tiers.
3.5.1. Low-Tier:
In the first level we create sensor events by tagging object that could be a part of daily life
activities, with RFID tags. As in our case the goal is to recognize hygienic activities in
hospitals, so we embed sensors on objects like soap holder, water tap, toilet flush lever, tissue
box, tooth brush etc.
Hygienic Activity Recognition In Hospitals Using RFID sensors data
Page 21
Sensor data will give us sensor associated tasks, and then we apply different techniques of
low level modeling to recognized sub-tasks of an activity. Low level modeling is completely
related with getting data from sensor and the extracting task from that data as (explained
earlier). Different approaches and algorithm is used for getting sequences of task such as
GATS, Task Associated Sensor Events and Hidden Markov Model etc. Here in our project
we are using only the GATS technique so it is explained below in section-3.
In lower tier we will have an input data comprising on the list sensor events. Then we will
find out the tasks associated with all the events from a pre-defined data set. After doing that
we will take all the associative tasks of events and find their disjunctive normal form which
will give us certain task streams and calculate probability for each task. Now by multiplying
the highest probability values of tasks according to sensor events, we will find the cost of
each task stream. At the end we will assign a utility value of each task by defining it
compulsory or not for the completion of a hygienic activity, according to pre-defined models.
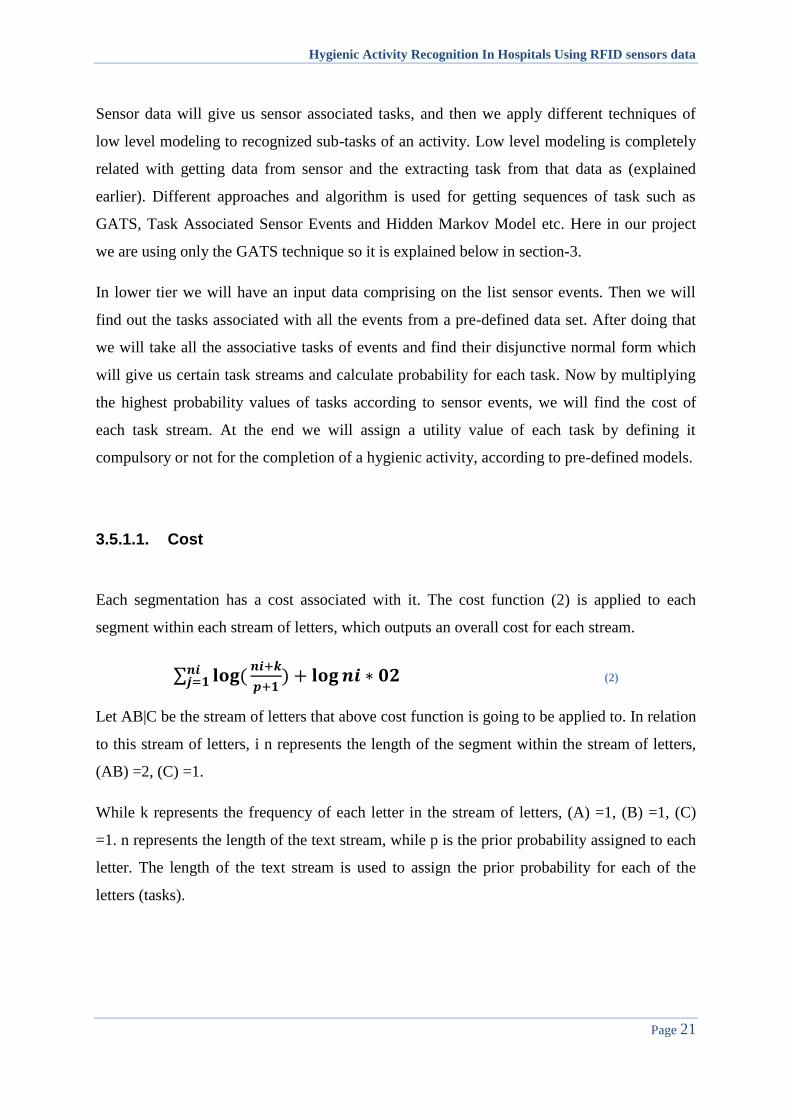
3.5.1.1. Cost
Each segmentation has a cost associated with it. The cost function (2) is applied to each
segment within each stream of letters, which outputs an overall cost for each stream.
∑
(2)
Let AB|C be the stream of letters that above cost function is going to be applied to. In relation
to this stream of letters, i n represents the length of the segment within the stream of letters,
(AB) =2, (C) =1.
While k represents the frequency of each letter in the stream of letters, (A) =1, (B) =1, (C)
=1. n represents the length of the text stream, while p is the prior probability assigned to each
letter. The length of the text stream is used to assign the prior probability for each of the
letters (tasks).
Hygienic Activity Recognition In Hospitals Using RFID sensors data
Page 22
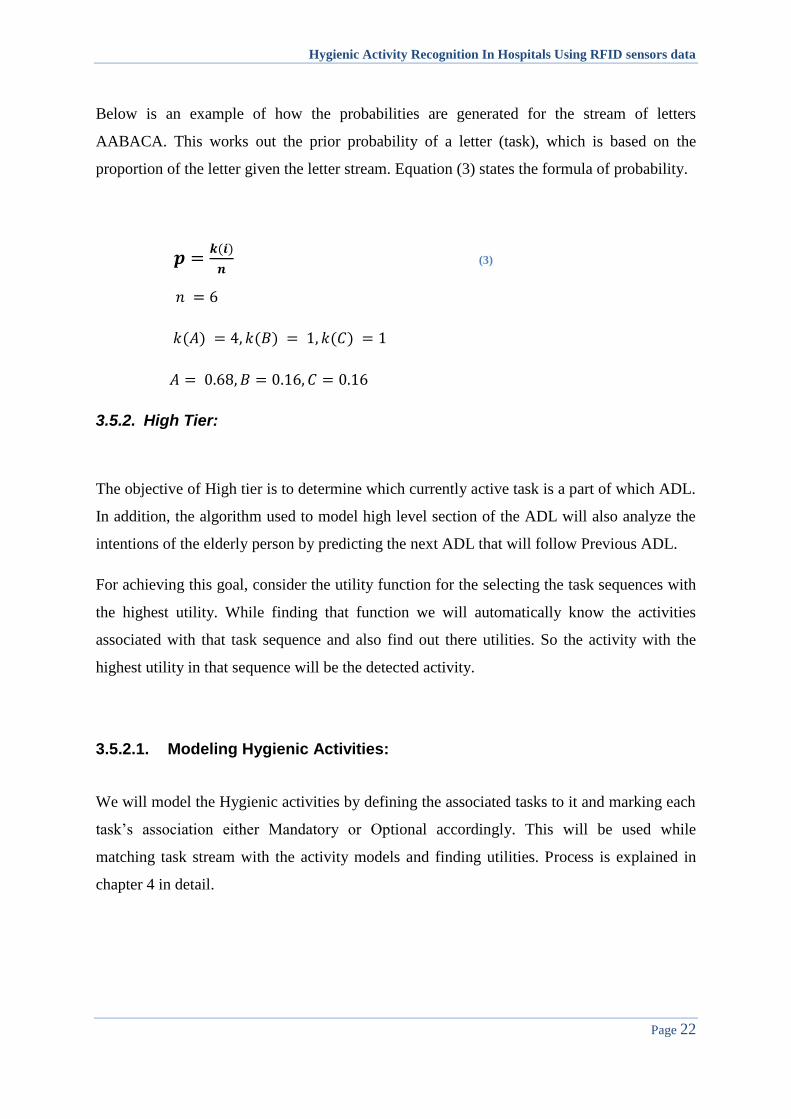
Below is an example of how the probabilities are generated for the stream of letters
AABACA. This works out the prior probability of a letter (task), which is based on the
proportion of the letter given the letter stream. Equation (3) states the formula of probability.
(3)
3.5.2. High Tier:
The objective of High tier is to determine which currently active task is a part of which ADL.
In addition, the algorithm used to model high level section of the ADL will also analyze the
intentions of the elderly person by predicting the next ADL that will follow Previous ADL.
For achieving this goal, consider the utility function for the selecting the task sequences with
the highest utility. While finding that function we will automatically know the activities
associated with that task sequence and also find out there utilities. So the activity with the
highest utility in that sequence will be the detected activity.
3.5.2.1. Modeling Hygienic Activities:
We will model the Hygienic activities by defining the associated tasks to it and marking each
task’s association either Mandatory or Optional accordingly. This will be used while
matching task stream with the activity models and finding utilities. Process is explained in
chapter 4 in detail.

Hygienic Activity Recognition In Hospitals Using RFID sensors data
Page 23
3.6. FLOW CHART:
A basic flow chart model for our project is displayed below in figure 5. It has some
limitations and challenges on which we are still working. They are discussed in next section.
Figure 7: Flow chart model of project
In figure 2, the whole process is described. First of all we tag the objects and get the Unique
Identification (UID) of the tag and store it in a text file along with its other attributes like
object name, associated Tasks etc. Now when a person touch a tagged object the RFID tag
will become active and sends its UID to the system where this application is installed or to
the server. The system will then read the details of sensor event and put it in an array. After
performing this activity the system will check if there is any other tag activated or not if yes
then it will repeat the previous process thus creating a sensor stream.
Hygienic Activity Recognition In Hospitals Using RFID sensors data
Page 24
Now once the stream is created the array is traversed in a Queue manner and calculate the
probability and cost of each associated task with sensor events. Then the tasks with the lowest
cost is selected and stored in another array.
Then once again the system checks for new tag data. If ‘yes’ then it will go all the way back
and repeat the process , if ‘no’ then it will get the details of tasks and its associated ADLs
stored in another text file and calculated the cost and probability of each ADL. The ADL with
the lowest cost is the activity the person is currently performing.
3.7. GENERATING ALTERNATIVE TASKS SEQUENCES (GATS):
Hidden Markov Model [1] is best when people done things in regular pattern but often
elderly people carry out their daily life activities in irregular pattern. Therefore we use GATS
technique as replacement of Hidden Markov model to output ordered lists of alternative tasks
sequences given an input set of events. Each task sequences have associated cost. The
cheapest task sequence is taken as most likely task sequence as an input for further high level
recognition of activities. The function of the lower tier to recognize tasks can be represented
as:
E1, E2, … En {<TS1, c1> + <TS2, c2> + <TSm, cm>}
Where E1, E2…En denotes the sensor events, TS stands for task sequences consistent with
event sequence. The m is a parameter chosen when the lower tier is asked for its set of task
sequences that matches the event.
As the list of possible task sequences has different length according to number of different
events in a given task sequence, therefore firstly we will work on the discriminatory power of
the event and the algorithm used to create the list. The GATS approach mitigates the chances
of not being able to recognize tasks that have been carried out via different variations, as it
takes in to consideration all the possible types of task sequences given the task.

Hygienic Activity Recognition In Hospitals Using RFID sensors data
Page 25
Let’s take an example, suppose a person goes to washroom and triggers a series of sensor
events E1, E1, E2 etc. objects mapped to these sensor events are suppose.
E1= Water Tap; E2= tooth paste; E3=tooth Brush; E4=soap; E5=paper towel
Sensor Event Objects Associated Tasks
Character
representation of
Tasks
E1 Water tap
Washing hands +
brushing teeth +
washing face
A+B+C
E2 Tooth paste Brushing teeth B
E3 Tooth brush Brushing teeth B
E4 Soap Washing hands +
washing face A+C
E5 Towel Towel Use D
E6 Toilet Flush Lever Using Flush E
E7 Toilet Paper Using Flush E
Table 1: Task associated sensor events and its character representation
Each task is then assigned prior probabilities given the sensor event. As our scenario is not in
posterior situation therefore the probability values are based on the number of associations
each task has with the sensor event.
Tasks E1 E2 E3 E4 E5 E6 E7
Washing
Hands(A)
0.33 - - 0.5 - - -
Brushing Teeth
(B)
0.33 1 1 - - - -
Washing Face
(C)
0.33 - - 0.5 - - -
Towel Use (D) - - - - 1 - -
Using Flush (E) - - - - - 1 1
Table 2: Prior probability distribution for each task given the sensor event

Hygienic Activity Recognition In Hospitals Using RFID sensors data
Page 26
Given the following sensor events were detected E1, E4, E5, E6 and E7, the TASE stream of
letters will be as follows with probability values for each task given the sensor event:
(A+B+C)(A+C)(D)(E)(E) = (AA+AC+BA+BC+CA+CC)(D)(E)(E) (4)
Now if A cannot be repeated then AA can be simplified to A. The probability to associate
with this reduced A is taken as the maximum of the two conditional probabilities. For some
tasks the education of AA to one instance of the task A may be inappropriate. So the equation
1 will become
(A+AC+BA+BC+CA+C)(D)(E)(E)
= (AD+ACD+BAD+BCD+CAD+CD)(E)(E)
= (ADE+ACDE+BADE+BCDE+CADE+CDE)(E)
= (ADE+ACDE+BADE+BCDE+CADE+CDE) (5)
This gives the possible segmentations in disjunctive normal form, where each possible task
sequence is separated by a ‘+’. The cost of each conjunct is computed using product of the
proportions, which are assigned according to the task given the sensor event.
When there are repetitions of the same task in immediate sequence then the maximum of the
probabilities is used rather than the product. This is easily done by computing the product as
a tree and remembering the maximum probability of each task in the leaf of the tree.
Now the Task Associated Sensor Events stream = DE+ACDE+BADE+BCDE+CADE+CDE.
E1 E4 E5 E6 E7
A+B+C A+C D E E
0.33 0.33 0.33 0.5 0.5 1 1 1
Table 3: Conditional probability values for each task given the 1st four events
Hygienic Activity Recognition In Hospitals Using RFID sensors data
Page 27
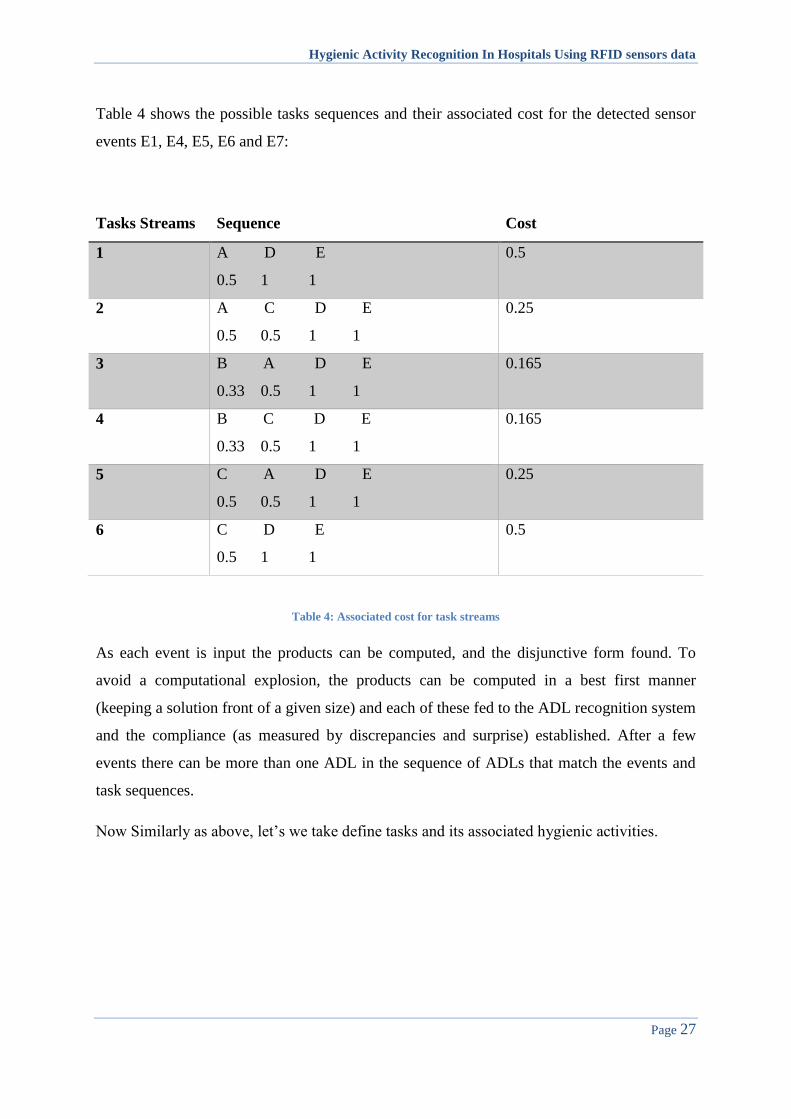
Table 4 shows the possible tasks sequences and their associated cost for the detected sensor
events E1, E4, E5, E6 and E7:
Tasks Streams Sequence Cost
1 A D E
0.5 1 1
0.5
2 A C D E
0.5 0.5 1 1
0.25
3 B A D E
0.33 0.5 1 1
0.165
4 B C D E
0.33 0.5 1 1
0.165
5 C A D E
0.5 0.5 1 1
0.25
6 C D E
0.5 1 1
0.5
Table 4: Associated cost for task streams
As each event is input the products can be computed, and the disjunctive form found. To
avoid a computational explosion, the products can be computed in a best first manner
(keeping a solution front of a given size) and each of these fed to the ADL recognition system
and the compliance (as measured by discrepancies and surprise) established. After a few
events there can be more than one ADL in the sequence of ADLs that match the events and
task sequences.
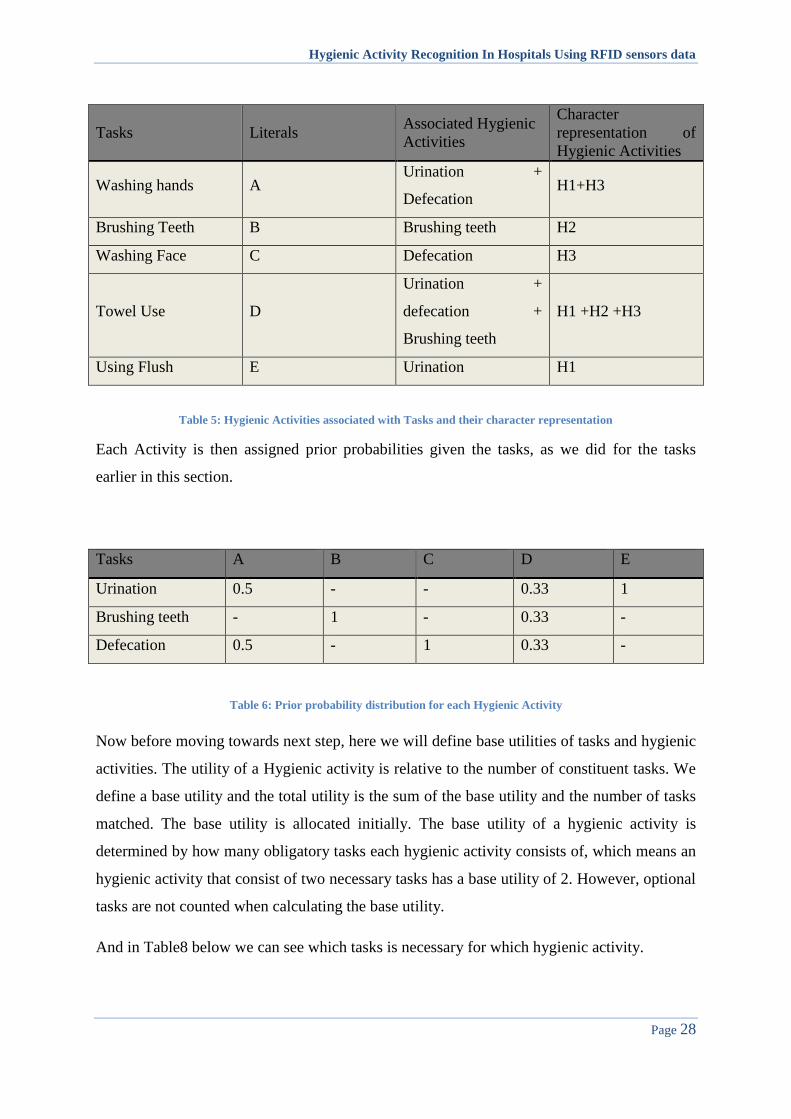
Now Similarly as above, let’s we take define tasks and its associated hygienic activities.
Hygienic Activity Recognition In Hospitals Using RFID sensors data
Page 28
Tasks Literals Associated Hygienic
Activities
Character
representation of
Hygienic Activities
Washing hands A Urination +
Defecation H1+H3
Brushing Teeth B Brushing teeth H2
Washing Face C Defecation H3
Towel Use D
Urination +
defecation +
Brushing teeth
H1 +H2 +H3
Using Flush E Urination H1
Table 5: Hygienic Activities associated with Tasks and their character representation
Each Activity is then assigned prior probabilities given the tasks, as we did for the tasks
earlier in this section.
Tasks A B C D E
Urination 0.5 - - 0.33 1
Brushing teeth - 1 - 0.33 -
Defecation 0.5 - 1 0.33 -
Table 6: Prior probability distribution for each Hygienic Activity
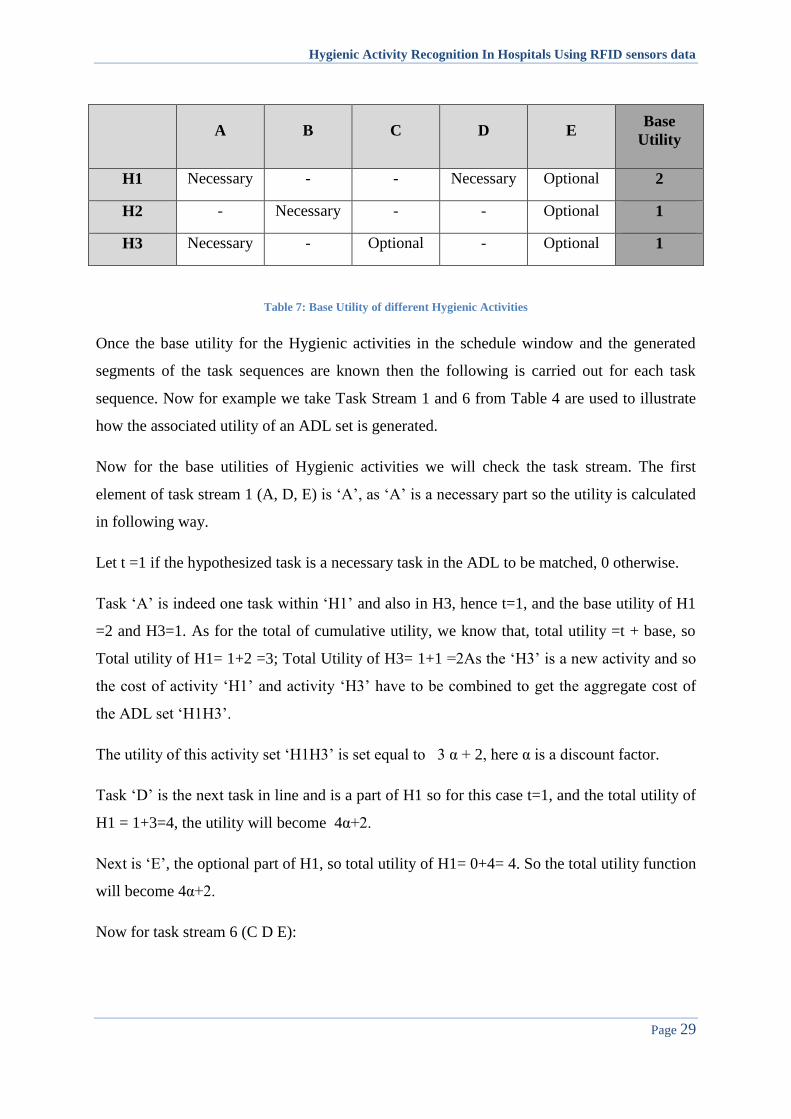
Now before moving towards next step, here we will define base utilities of tasks and hygienic
activities. The utility of a Hygienic activity is relative to the number of constituent tasks. We
define a base utility and the total utility is the sum of the base utility and the number of tasks
matched. The base utility is allocated initially. The base utility of a hygienic activity is
determined by how many obligatory tasks each hygienic activity consists of, which means an
hygienic activity that consist of two necessary tasks has a base utility of 2. However, optional
tasks are not counted when calculating the base utility.
And in Table8 below we can see which tasks is necessary for which hygienic activity.
Hygienic Activity Recognition In Hospitals Using RFID sensors data
Page 29
A B C D E
Base
Utility
H1 Necessary - - Necessary Optional 2
H2 - Necessary - - Optional 1
H3 Necessary - Optional - Optional 1
Table 7: Base Utility of different Hygienic Activities
Once the base utility for the Hygienic activities in the schedule window and the generated
segments of the task sequences are known then the following is carried out for each task
sequence. Now for example we take Task Stream 1 and 6 from Table 4 are used to illustrate
how the associated utility of an ADL set is generated.
Now for the base utilities of Hygienic activities we will check the task stream. The first
element of task stream 1 (A, D, E) is ‘A’, as ‘A’ is a necessary part so the utility is calculated
in following way.
Let t =1 if the hypothesized task is a necessary task in the ADL to be matched, 0 otherwise.
Task ‘A’ is indeed one task within ‘H1’ and also in H3, hence t=1, and the base utility of H1
=2 and H3=1. As for the total of cumulative utility, we know that, total utility =t + base, so
Total utility of H1= 1+2 =3; Total Utility of H3= 1+1 =2As the ‘H3’ is a new activity and so
the cost of activity ‘H1’ and activity ‘H3’ have to be combined to get the aggregate cost of
the ADL set ‘H1H3’.
The utility of this activity set ‘H1H3’ is set equal to 3 α + 2, here α is a discount factor.
Task ‘D’ is the next task in line and is a part of H1 so for this case t=1, and the total utility of
H1 = 1+3=4, the utility will become 4α+2.
Next is ‘E’, the optional part of H1, so total utility of H1= 0+4= 4. So the total utility function
will become 4α+2.
Now for task stream 6 (C D E):

Hygienic Activity Recognition In Hospitals Using RFID sensors data
Page 30
‘C’ lies within H3 but is optional so t=0, total utility =1 , then ‘D’ which belongs to activity
H1, and ‘E’ optional part of H1 yielding total utility function α+3.
In comparison to task stream 1(4α+2), the associated utility of the ADL set which is based on
task stream 6 (α+3) is smaller if, α< √3∕2, the value of α is chosen as per suggested by Usman
Naeem et al [1].
These associated utilities suggest that the ADL set based on task stream 1 is the correct set, as
all the tasks have been identified correctly and match the current hygienic Activities schedule
window. Now as this stream comprises of two hygienic activities so we will select with
higher utility i.e. H1 (Urination), which is correctly recognized by the above algorithm.
This process is carried out for all the task sequences. The ADL set with highest utility is
taken and its corresponding task sequence is used as input for the higher tier ADL recognition
component.
3.8. POSSIBLE HYGENIC ACTIVITIES:
In the real life scenario it is difficult to define all the activities which a person could perform
and of course every person instantiate an activity differently. So for the sake of simplification
we have developed a chart of possible hygienic activities along with their associated tasks
and sensor events, which a dementia or Alzheimer’s patient can perform.
Sr. no Hygienic Activities Tasks Sensor Events
1 Taking Bath Opening shower tap
(t1)
Shower tap touch (e1)
Applying shampoo
(t2)
Shampoo bottle (e2)
Applying shampoo
(t3)
Soap holder
(e3)
Closing shower tap
(t4)
Shower tap touch (e1)
Using Towel
(t5)
Towel holder
(e4)

Hygienic Activity Recognition In Hospitals Using RFID sensors data
Page 31
2 Urination Use flush
(t6)
Flush lever
(e5)
Toilet paper
(e6)
Flush shower
(e7)
Washing hands
(t7)
Basin tap
(e8)
Soap holder
(e3)
Basin tap
(e8)
Using Towel
(t5)
Towel holder
(e4)
3 Brushing Teeth Opening Basin Tap
(t8)
Basin tap
(e8)
Picking up Tooth Brush
(t9)
Tooth brush cup (e9)
Applying Tooth Paste
(t10)
Tooth paste
(e10)
Closing Basin tap
(t11)
Basin tap
(e8)
Using Towel
(t5)
Towel holder
(e4)
4 Defecation Washing Hands/ face
(t7)
Basin tap
(e8)
Soap holder
(e3)
Basin tap
(e8)
Using towel
(t5)
Towel holder
(e4)
Table 8 :Set of Possible Hygienic Activities along with associated tasks and sensor events
Hygienic Activity Recognition In Hospitals Using RFID sensors data
Page 32
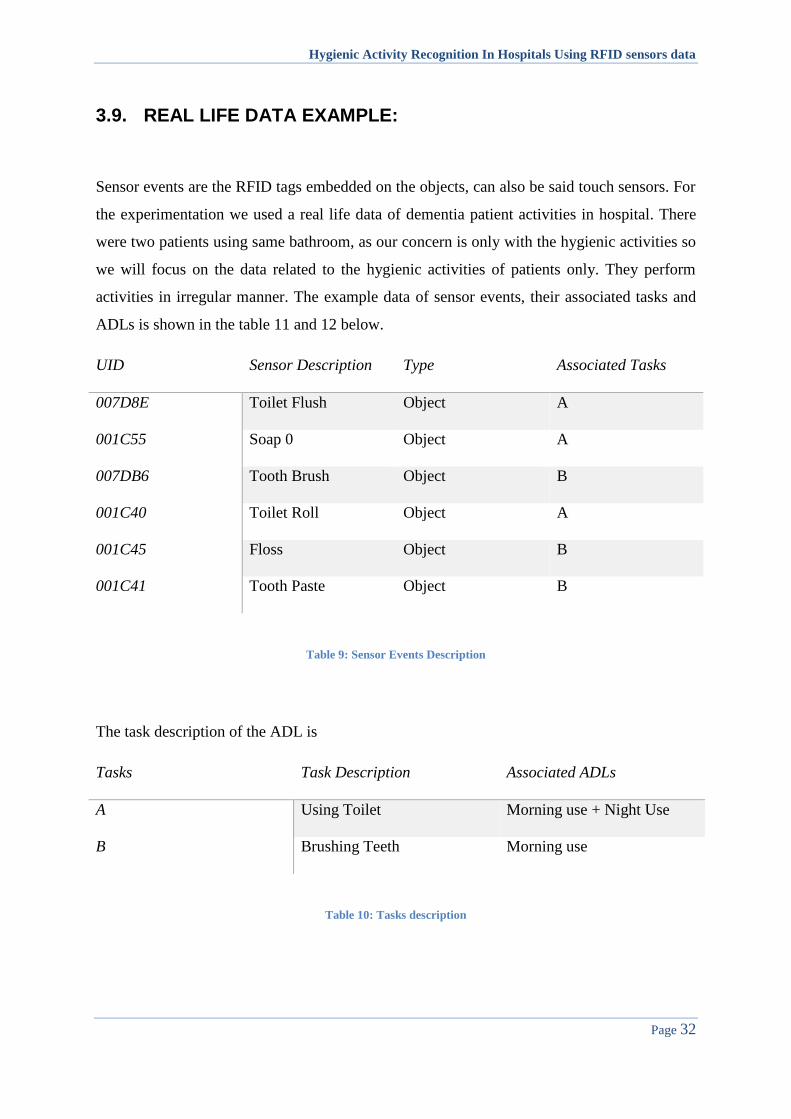
3.9. REAL LIFE DATA EXAMPLE:
Sensor events are the RFID tags embedded on the objects, can also be said touch sensors. For
the experimentation we used a real life data of dementia patient activities in hospital. There
were two patients using same bathroom, as our concern is only with the hygienic activities so
we will focus on the data related to the hygienic activities of patients only. They perform
activities in irregular manner. The example data of sensor events, their associated tasks and
ADLs is shown in the table 11 and 12 below.
UID Sensor Description Type Associated Tasks
007D8E Toilet Flush Object A
001C55 Soap 0 Object A
007DB6 Tooth Brush Object B
001C40 Toilet Roll Object A
001C45 Floss Object B
001C41 Tooth Paste Object B
Table 9: Sensor Events Description
The task description of the ADL is
Tasks Task Description Associated ADLs
A Using Toilet Morning use + Night Use
B Brushing Teeth Morning use
Table 10: Tasks description
Hygienic Activity Recognition In Hospitals Using RFID sensors data
Page 33
3.10. EXPERIMENTAL DESIGNS:
We have constructed a set of Experimental designs which we will be using to test our
algorithm. Three different types of scenarios are discussed here that we will be using in
experiments. These scenarios are of an Alzheimer’s patient in a medical facility where the
doctor has advised him some tasks he should carry out daily at particular times. Patient can
perform these prescribed tasks in three different ways: sequential order, partially completed
and parallel activities.
3.10.1. Sequential:
In the first scenario he performs all his tasks sequentially, i.e. he will complete a task he is
currently doing before going to the next task. Let’s suppose the doctor suggested him to do a
morning wash up at 9 AM. He goes to the toilet on the first day and uses the flush then
washes his hands and then washes his face and then in last he brushes his teeth.
Every day he performs all the tasks in different way but in sequential manner. Let’s assign all
the tasks an alphabet. Brushing teeth => A; Face wash =>B; Hand wash => C. And each
activity is associated with some sensors as follow.
A => tooth brush, tooth paste, water tap.
B => toilet flush, toilet roll.
C => soap, water tap.
D => soap, water tap.
Now the can perform any activity one by one but he don’t follow the same order of
performing it.
Hygienic Activity Recognition In Hospitals Using RFID sensors data
Page 34
3.10.2. Half Completed:
In second scenario he starts performing a task but leave it half completed and move on to the
next task. For example he started brushing his teeth, he touched the tooth brush, water tap
then instead of applying tooth paste on the brush he started using toilet flush and never
touched the tooth paste again.
3.10.3. Parallel:
Let’s suppose he started doing two activities in parallel like he started washing his hands and
brushing his teeth in parallel i.e. he opened the water tap then picked up the tooth brush then
applied soap to the hand then applied tooth paste on the tooth brush.
Our aim is to identify all those activities that patient is performing considering the above
mentioned scenarios.
3.11. CHALLENGES:
There are many challenges that we face while dealing with the sensor data streams for ADL
recognition.
3.11.1. Problem #1: identification of ‘start’ and ‘stop’ of an activity within
the sensor stream
As we have to pick data predefined sensor stream so how can we find out the stream of
which length is to be picked or after how much sensor events a task is completed.
Solution: we will mark our data with ‘motion start’ and ‘motion stop’, this will help us in
arranging data and discriminate different task data.

Hygienic Activity Recognition In Hospitals Using RFID sensors data
Page 35
e1 e2 e3 e4 e5
A+B A+C A C+B A+B+C
A B C
TASKs
Associated Tasks
Sensor events
3.11.2. Problem #2: Identification of activities started in parallel or left
half completed
We faced difficulty in recognizing the activities if a person starts to perform tasks in parallel
or leave a task half completed.
Solution: So solution which we found suitable was to check the sensors and its association.
For example if the person has left a task incomplete then we will track out the possible event
that he missed by the associated tasks of its past events. For example if the past two or three
events have a common task event then we will find out what sensor is missing from the
predefined association of that common task and we will add that event and mark the task as
complete.
For example, see figure below for the sensor and task associations.
Figure 8: Example data sensor events and its associated tasks
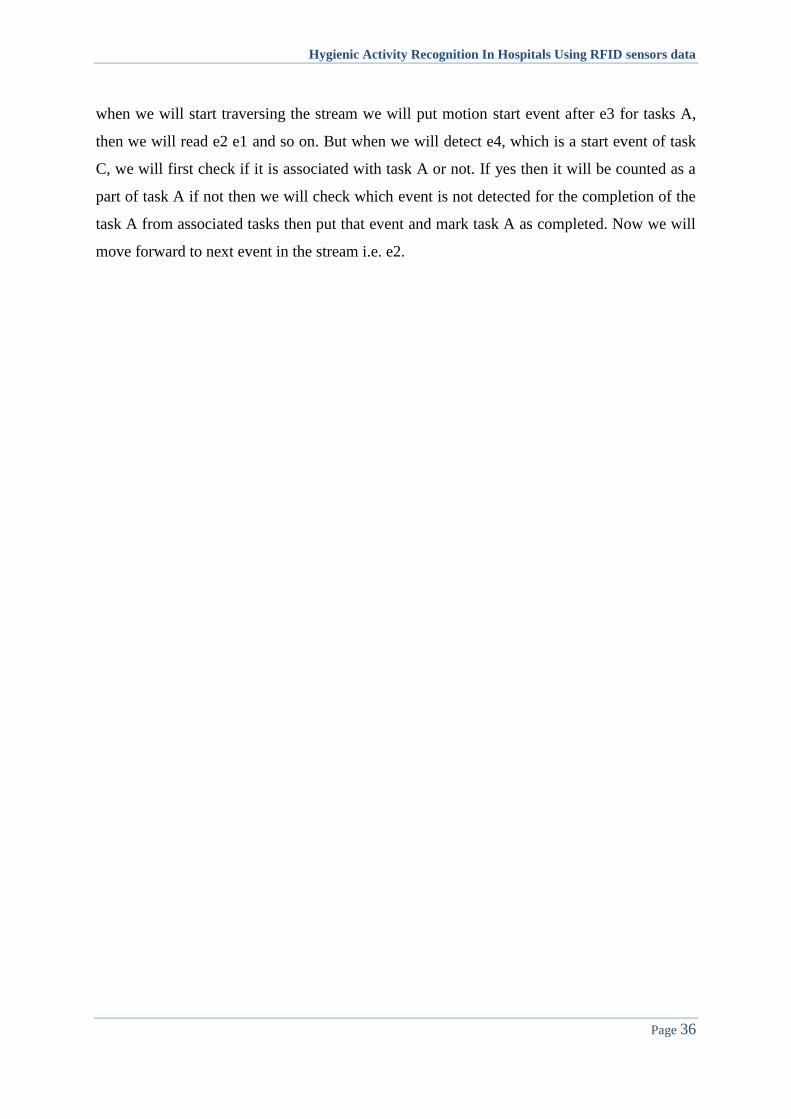
Now suppose we received a sensor event sequence as {e3, e2, e1, e4, e2, e5}. Let’s say we
have tagged e3, e4 and e5 as the start motion detector for task A, B and C respectively. Now
Hygienic Activity Recognition In Hospitals Using RFID sensors data
Page 36
when we will start traversing the stream we will put motion start event after e3 for tasks A,
then we will read e2 e1 and so on. But when we will detect e4, which is a start event of task
C, we will first check if it is associated with task A or not. If yes then it will be counted as a
part of task A if not then we will check which event is not detected for the completion of the
task A from associated tasks then put that event and mark task A as completed. Now we will
move forward to next event in the stream i.e. e2.

Hygienic Activity Recognition In Hospitals Using RFID sensors data
Page 37
CHAPTER 4 ALGORITHM IMPLEMENTATION
The language which we are using for the implementation of the algorithm is JAVA and the
compiler we chose for this purpose is Neat beans (IDE).
4.1 JAVA
Java is computer programming language that is class based and object oriented. It is designed
to have as few implementation dependencies as any other programming language. It is often
called “WORA” (write once, run anywhere). Meaning that code that runs on one platform
does not need to be recompiled to run on another. Java programs are compiled to class file
(byte code) that can run on any java virtual machine (JVM). The language derives much of
its syntax from C and C++ but has a simpler object model and fewer low-level facilities. Now
days it is most popular language for client server web application.
4.1.1 HISTORY OF JAVA
Java was originally evolved from a language named Oak. Oak was developed in the early
nineties at Sun Microsystems as a platform-independent language aimed at allowing
entertainment appliances such as video game consoles and VCRs to communicate. Oak was
first slated to appear in television set-top boxes designed to provide video-on-demand
services. Just as the deals with the set-top box manufacturers were falling through, the World
Wide Web was coming to life. As Oak’s developers began to recognize this trend, their focus
shifted to the Internet and Web-Runner, an Oak-enabled browser, was born. Oak’s name was
changed to Java and Web-Runner became the Hot Java web browser. The excitement of the
Hygienic Activity Recognition In Hospitals Using RFID sensors data
Page 38
Internet attracted software vendors such that Java development tools from many vendors
quickly became available. That same excitement has provided the impetus for a multitude of
software developers to discover Java and its many wonderful features.
4.1.2 APPLICATIONS OF JAVA
There are two basic types of Java applications
4.1.2.1 Standalone application:
These run as a normal program on the computer. They may be a simple console application
or a windowed application. These programs have the same capabilities of any program on the
system. For example, they may read and write files. Just as for other languages, it is easily to
write a Java console program than a windowed program. So despite the leanings of the
majority of Java books, the place to start Java programming is a standalone console Program,
not an applet!
4.1.2.2 Applets:
These run inside a web browser. They must be windowed and have limited power. They run
in a restricted JVM (Java Virtual Machine) called the sandbox from which file I/O and
printing are impossible.

Hygienic Activity Recognition In Hospitals Using RFID sensors data
Page 39
4.1.3 SIGNIFICANT FEATURES OF JAVA
Java has significant advantages compared to other languages. Some of its features are
explained below.
4.1.3.1 Platform independence
Java compilers do not produce native object code for a particular platform but rather ‘byte
code’ instructions for the Java Virtual Machine (JVM). Making Java code work on a
particular platform is then simply a matter of writing a byte code interpreter to simulate a
JVM. What this all means is that the same compiled byte code will run unmodified on any
platform that supports Java.
4.1.1.1 Object orientation
Java is a pure object-oriented language. This means that everything in a Java program is an
object and everything is descended from a root object class.
4.1.1.2 Rich standard library
One of Java’s most attractive features is its standard library. The Java environment includes
hundreds of classes and methods in six major functional areas.
Language Support classes for advanced language features such as strings, arrays,
threads, and exception handling.
Utility classes like a random number generator, date and time functions, and
container classes.
Input/output classes to read and write data of many types to and from a variety of
sources.
Hygienic Activity Recognition In Hospitals Using RFID sensors data
Page 40
Networking classes to allow inter-computer communications over a local network or
the Internet.
Abstract Window Toolkit for creating platform-independent GUI applications.
Applet is a class that lets you create Java programs that can be downloaded and run
on a client browser.
4.2 NET BEANS:
Net Beans is an integrated development environment (IDE) for developing basically with
java and also with other programming languages. It is an application platform frame work
especially for java desktop applications. It allows the application to be developed from a set
of modular software components called modules. The applications based on this platform can
be extended to third party developer. The platform offers reusable services common to
desktop applications, among the features of the platform are: Following are step-by-step
instructions to help NetBeans IDE greenhorns to get started developing Java applications
with Net Beans IDE. The basic steps described are as follows.
1. Create a new project
2. Mount a directory - specify a location to save project files
3. Add a new class to the project
4. Compile and run a Java program
4.2.1 CREATE A NEW PROJECT
Start NetBeans. Then Start a new project: Main Menu -> Project -> Project Manager -> New
Project. After write the project a name. Click OK. Click New. And Under Filesystems, Select
Local Directory. And then Click Next.
Hygienic Activity Recognition In Hospitals Using RFID sensors data
Page 41
4.2.2 MOUNT A DIRECTORY SPECIFY A LOCATION
To specify a location on a disk drive where project files will be stored, mount a directory as
part of the project. To the project, add a directory to hold project files: Main Menu File
Mount File system. Select a directory to hold the project. (Note: Don't open the desired
directory, just select it. If you accidentally open the desired directory, just click the up
directory arrow next to the "Look in" drop down list, and then select the desired project
directory with a single click.) Click Finish.
4.2.2.1 Add a new class to the project
Right click on a mounted project directory. Select New Java Class Edit the Java class as
desired. Name the class and click Finish.
4.2.2.2 Compiling and debugging
Go to Main Menu Build Execute to compile and run the main Java class in one step.
After executing, you should see results similar to the following.
In the File systems Explorer, one must be assure that the main Java class is selected.
1) User interface management
2) Storage management
3) User setting management
4) Integrated development tool
5) Net Beans visual library
6) Windows management.
7) Wizard frame work

Hygienic Activity Recognition In Hospitals Using RFID sensors data
Page 42
4.3 SOFTWARE REQUIREMENT SPECIFICATION:
In this section, a description of the behavior of a system to be developed and include a set of
use cases that describe interactions the users will have with the software. In addition it also
contains non-functional requirements. Non-functional requirements impose constraints on the
design or implementation (such as performance engineering requirements, quality standards,
or design constraints).
Software requirements specification establishes the basis for agreement between customers
and contractors or suppliers (in market-driven projects, these roles may be played by the
marketing and development divisions) on what the software product is to do as well as what it
is not expected to do. Software requirements specification permits a rigorous assessment of
requirements before design can begin and reduces later redesign. It should also provide a
realistic basis for estimating product costs, risks, and schedules.
4.3.1 Introduction
The Software which we are going to make is implementation of the algorithm explained in
Chapter 3 of this thesis. Description of requirements of this software and the stake-holders is
given below.
4.3.1.1 Identification
This software system considered for development is offered in groups in University of
Engineering and Technology, Taxila. The features, interfaces and other specification are
developed by the project team itself. The ultimate end user of this project will be other
students and administration of University of Engineering and Technology Taxila.
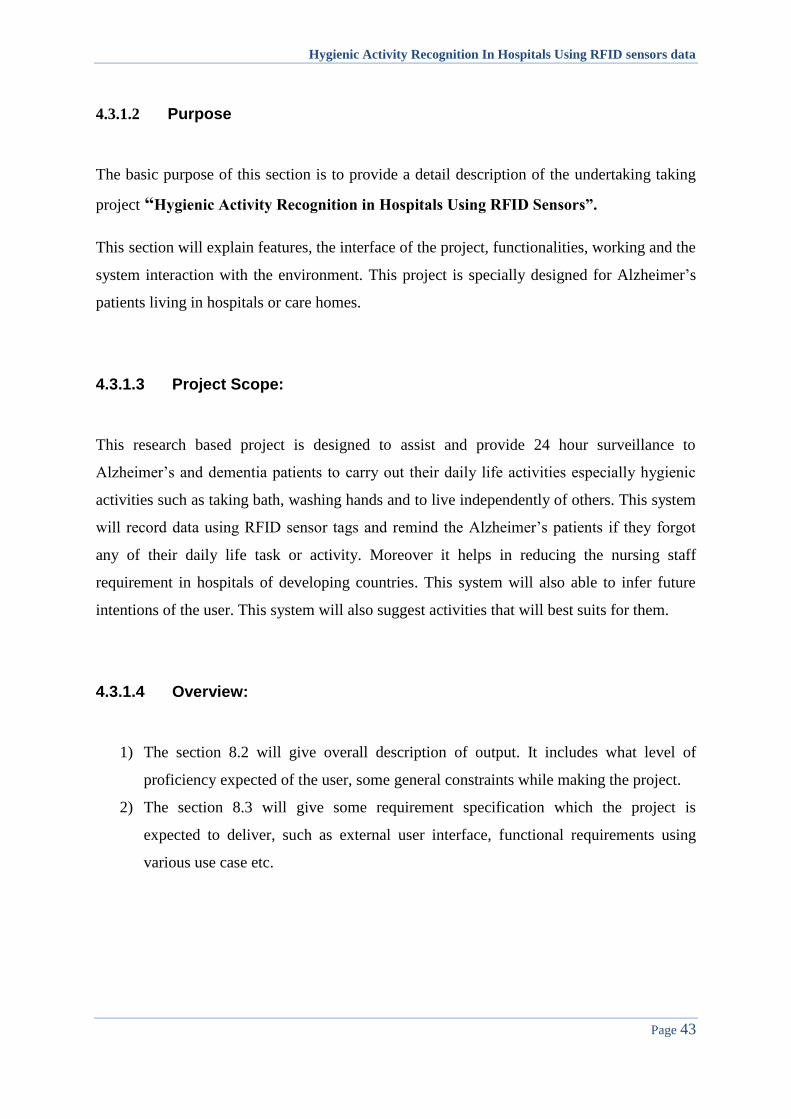
Hygienic Activity Recognition In Hospitals Using RFID sensors data
Page 43
4.3.1.2 Purpose
The basic purpose of this section is to provide a detail description of the undertaking taking
project “Hygienic Activity Recognition in Hospitals Using RFID Sensors”.
This section will explain features, the interface of the project, functionalities, working and the
system interaction with the environment. This project is specially designed for Alzheimer’s
patients living in hospitals or care homes.
4.3.1.3 Project Scope:
This research based project is designed to assist and provide 24 hour surveillance to
Alzheimer’s and dementia patients to carry out their daily life activities especially hygienic
activities such as taking bath, washing hands and to live independently of others. This system
will record data using RFID sensor tags and remind the Alzheimer’s patients if they forgot
any of their daily life task or activity. Moreover it helps in reducing the nursing staff
requirement in hospitals of developing countries. This system will also able to infer future
intentions of the user. This system will also suggest activities that will best suits for them.
4.3.1.4 Overview:
1) The section 8.2 will give overall description of output. It includes what level of
proficiency expected of the user, some general constraints while making the project.
2) The section 8.3 will give some requirement specification which the project is
expected to deliver, such as external user interface, functional requirements using
various use case etc.
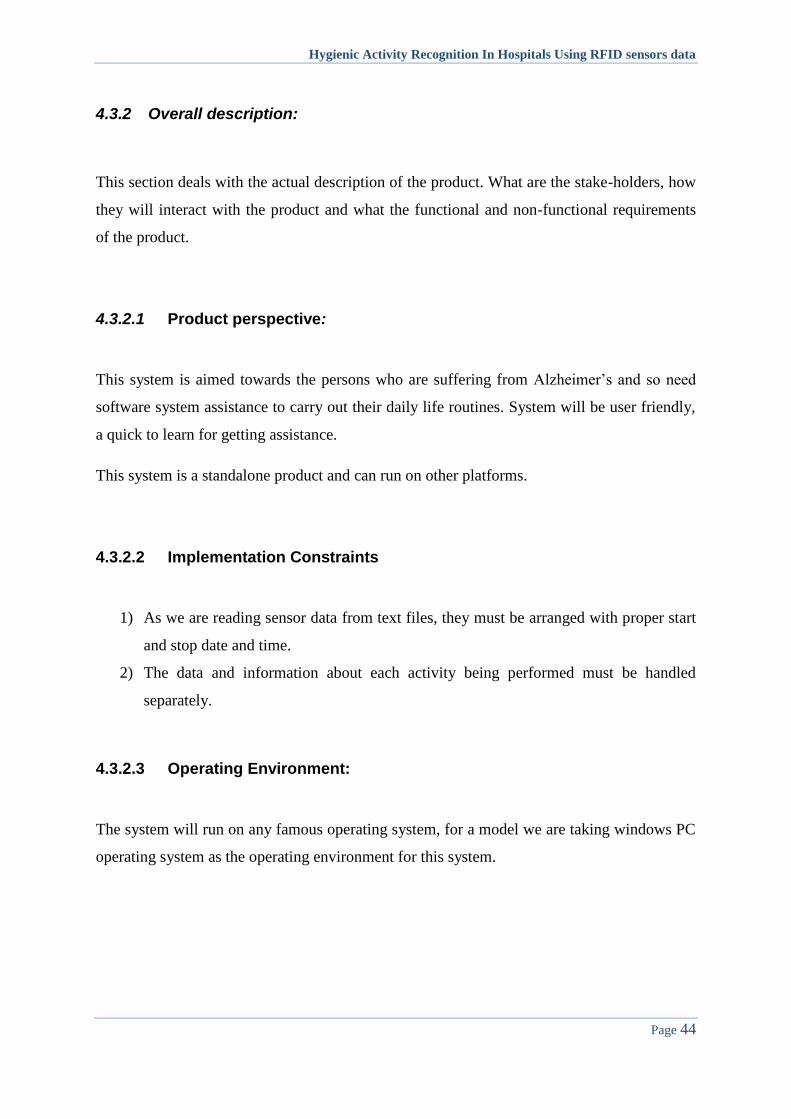
Hygienic Activity Recognition In Hospitals Using RFID sensors data
Page 44
4.3.2 Overall description:
This section deals with the actual description of the product. What are the stake-holders, how
they will interact with the product and what the functional and non-functional requirements
of the product.
4.3.2.1 Product perspective:
This system is aimed towards the persons who are suffering from Alzheimer’s and so need
software system assistance to carry out their daily life routines. System will be user friendly,
a quick to learn for getting assistance.
This system is a standalone product and can run on other platforms.
4.3.2.2 Implementation Constraints
1) As we are reading sensor data from text files, they must be arranged with proper start
and stop date and time.
2) The data and information about each activity being performed must be handled
separately.
4.3.2.3 Operating Environment:
The system will run on any famous operating system, for a model we are taking windows PC
operating system as the operating environment for this system.

Hygienic Activity Recognition In Hospitals Using RFID sensors data
Page 45
4.3.3 Functional and Specific Requirements
This section describes how the user interacts with system in operating environment and use
case of each step separately.
4.3.3.1 Overall Environment
The overall interaction of the user with the system will be as
Figure 9: Use case Diagram
The system has two active actors, the user and the system. The user touches the sensor
objects and information which will be recorded. The user can touch sensor events in parallel
or half completed manner. After recording sensor events, the system will extracts the
expected tasks which the user is likely to perform and in the last step the system will model
high level activity from the extracted tasks.
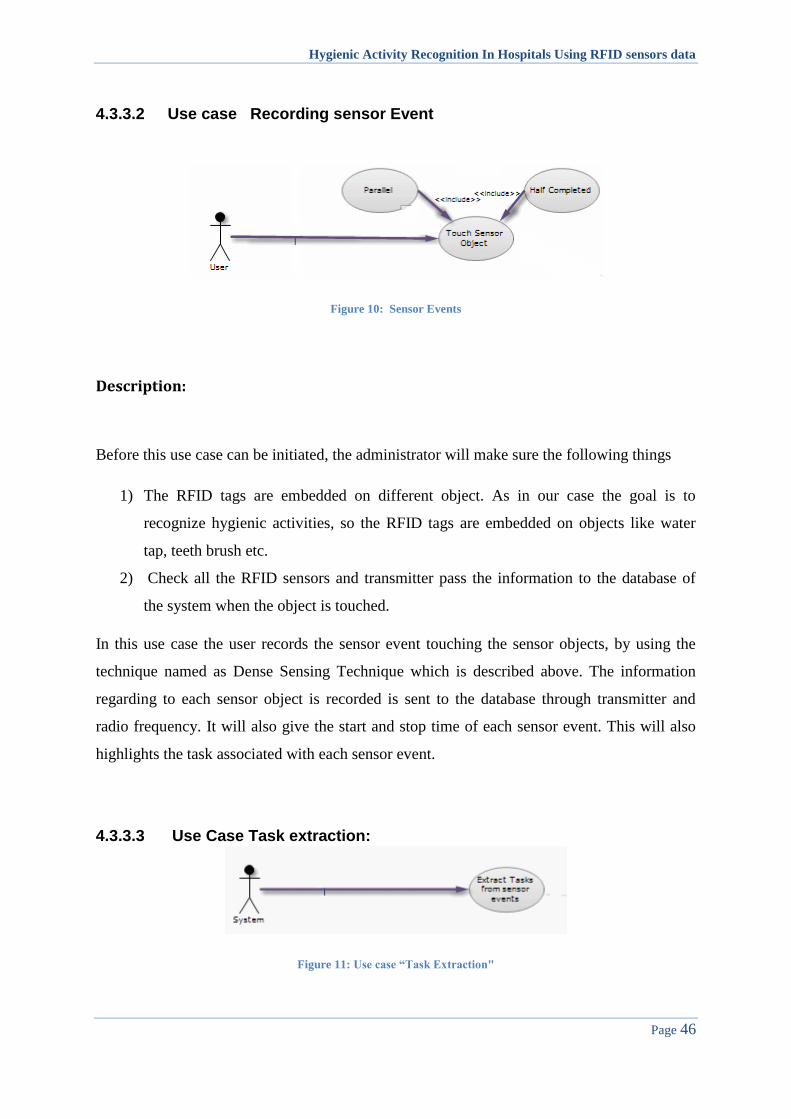
Hygienic Activity Recognition In Hospitals Using RFID sensors data
Page 46
4.3.3.2 Use case Recording sensor Event
Figure 10: Sensor Events
Description:
Before this use case can be initiated, the administrator will make sure the following things
1) The RFID tags are embedded on different object. As in our case the goal is to
recognize hygienic activities, so the RFID tags are embedded on objects like water
tap, teeth brush etc.
2) Check all the RFID sensors and transmitter pass the information to the database of
the system when the object is touched.
In this use case the user records the sensor event touching the sensor objects, by using the
technique named as Dense Sensing Technique which is described above. The information
regarding to each sensor object is recorded is sent to the database through transmitter and
radio frequency. It will also give the start and stop time of each sensor event. This will also
highlights the task associated with each sensor event.
4.3.3.3 Use Case Task extraction:
Figure 11: Use case “Task Extraction"
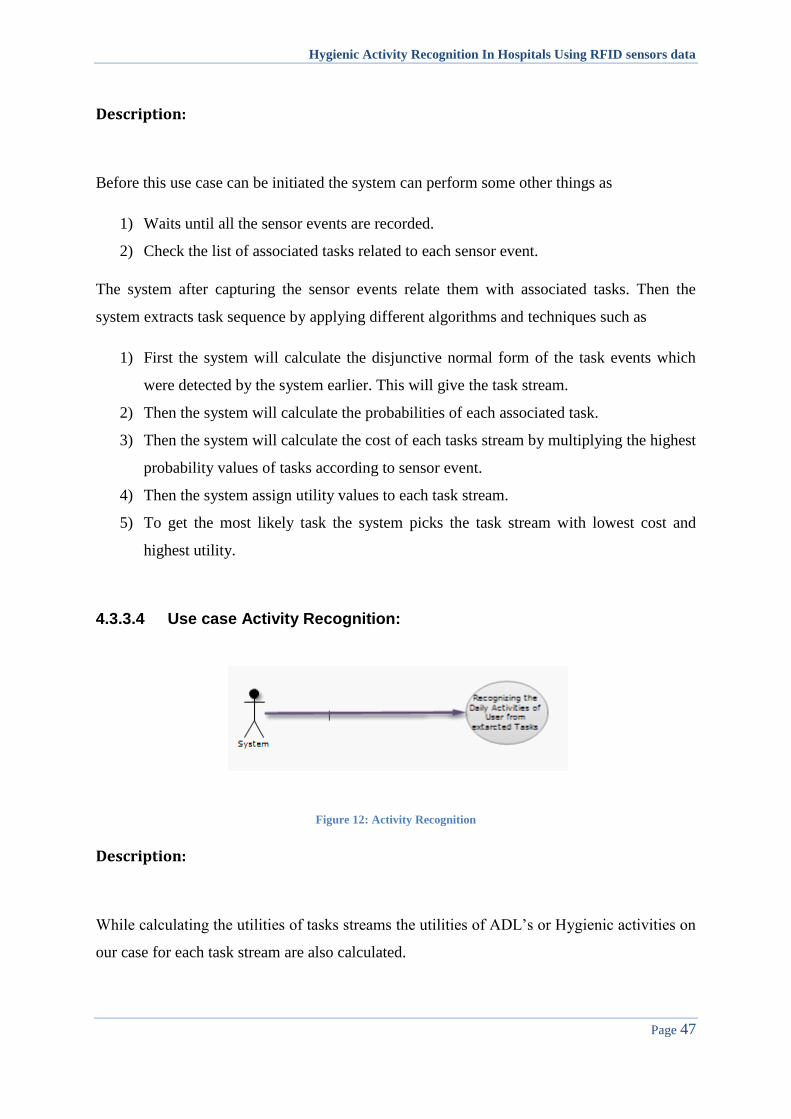
Hygienic Activity Recognition In Hospitals Using RFID sensors data
Page 47
Description:
Before this use case can be initiated the system can perform some other things as
1) Waits until all the sensor events are recorded.
2) Check the list of associated tasks related to each sensor event.
The system after capturing the sensor events relate them with associated tasks. Then the
system extracts task sequence by applying different algorithms and techniques such as
1) First the system will calculate the disjunctive normal form of the task events which
were detected by the system earlier. This will give the task stream.
2) Then the system will calculate the probabilities of each associated task.
3) Then the system will calculate the cost of each tasks stream by multiplying the highest
probability values of tasks according to sensor event.
4) Then the system assign utility values to each task stream.
5) To get the most likely task the system picks the task stream with lowest cost and
highest utility.
4.3.3.4 Use case Activity Recognition:
Figure 12: Activity Recognition
Description:
While calculating the utilities of tasks streams the utilities of ADL’s or Hygienic activities on
our case for each task stream are also calculated.

Hygienic Activity Recognition In Hospitals Using RFID sensors data
Page 48
Then from the selected task stream in previous section the activities with highest utility is the
currently active activity.
4.3.4 Text Files
13 text files are created at the back end which holds the whole data needed for the algorithm
namely.
i. sensor.txt: contains the sensor literals, one per line.
ii. sensor_uid.txt: contains the unique identifier of each sensor.
iii. sensor_desct.txt: contains the description of the sensor.
iv. tasks.txt: contains the task literals, one per line.
v. task_names.txt: contains the description of each task.
vi. task_assoc.txt: contains the tasks associated with the sensor. At the same line as
the sensor in sensor.txt
vii. adl.txt: contains the ADL literals, one per line.
viii. adl_name.txt: contains the description of each ADL.
ix. adl_assoc.txt: contains the ADLs associated with the task. At the same line as the
task in tasks.txt
x. base_u.txt: Base utility of each ADL.
xi. mandatory.txt: Contains task is mandatory part of which ADL.
xii. optional.txt: Contains task is optional part of which ADL.
xiii. input.txt: Contains input sensor stream.

Hygienic Activity Recognition In Hospitals Using RFID sensors data
Page 49
4.3.5 User Interface
Figure 13 show the main screen of user input which provides us the working of the algorithm
and assistance algorithm. A user inputs the sensor stream or is created by the smart
environment in a text file named input.txt. The program will pick stream by stream and apply
algorithm on it. First it will match the associated tasks with each sensor of sensor stream, find
their probability, form a Disjunctive normal form, then calculate the cost of each stream.
After that calculates the utility and find the currently active ADL.
After finding that it will compare the tasks recognized by the algorithm and the actual tasks
of the activity and find the missing mandatory tasks and alert the patient that he is missing a
task.
Figure 13: User Interface 1
Figure 14 will shows how we add new data set manually. For adding new data set, respective
information should be entered in the text fields. In TAG UID the unique Identification
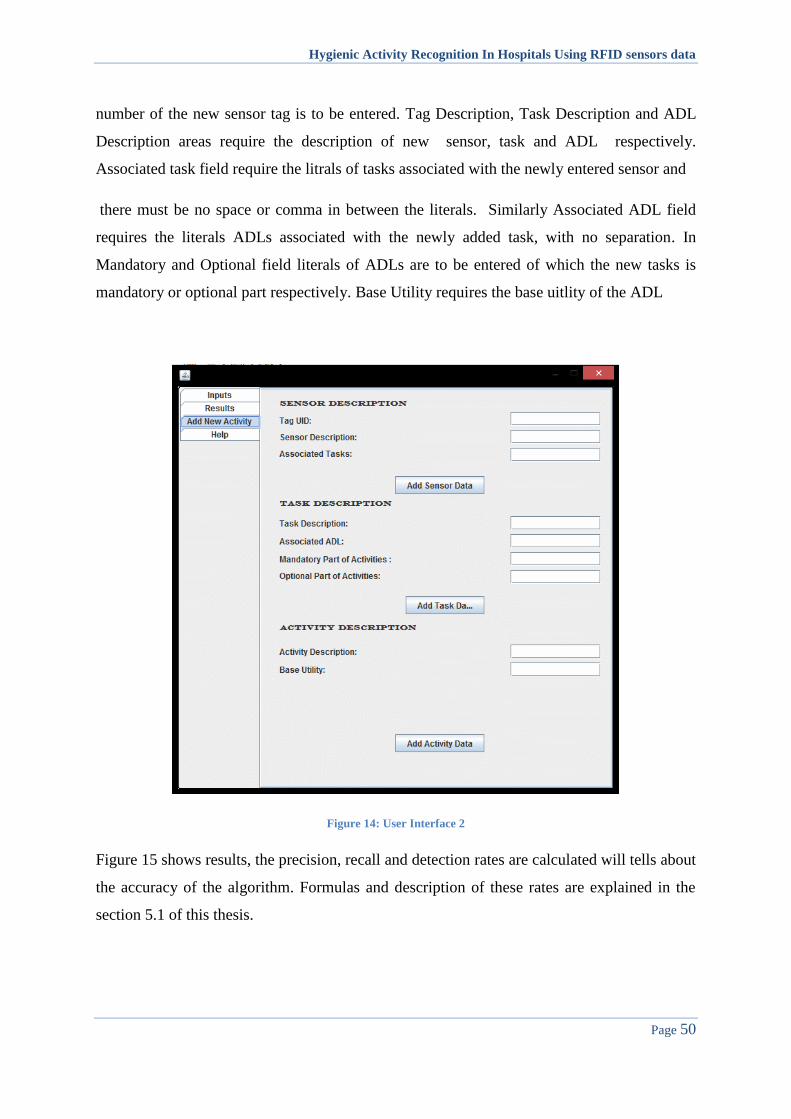
Hygienic Activity Recognition In Hospitals Using RFID sensors data
Page 50
number of the new sensor tag is to be entered. Tag Description, Task Description and ADL
Description areas require the description of new sensor, task and ADL respectively.
Associated task field require the litrals of tasks associated with the newly entered sensor and
there must be no space or comma in between the literals. Similarly Associated ADL field
requires the literals ADLs associated with the newly added task, with no separation. In
Mandatory and Optional field literals of ADLs are to be entered of which the new tasks is
mandatory or optional part respectively. Base Utility requires the base uitlity of the ADL
Figure 14: User Interface 2
Figure 15 shows results, the precision, recall and detection rates are calculated will tells about
the accuracy of the algorithm. Formulas and description of these rates are explained in the
section 5.1 of this thesis.
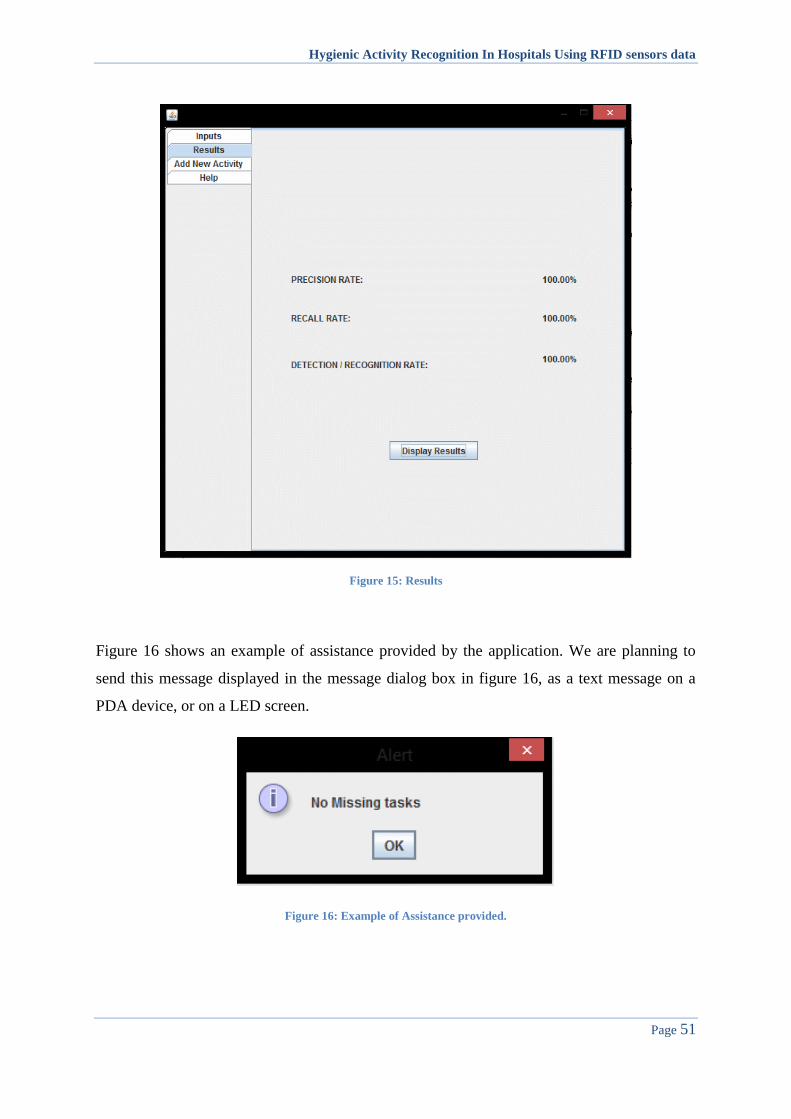
Hygienic Activity Recognition In Hospitals Using RFID sensors data
Page 51
Figure 15: Results
Figure 16 shows an example of assistance provided by the application. We are planning to
send this message displayed in the message dialog box in figure 16, as a text message on a
PDA device, or on a LED screen.
Figure 16: Example of Assistance provided.

Hygienic Activity Recognition In Hospitals Using RFID sensors data
Page 52
In the last tab ”Help” we provided an brief manual of how to use this application. The tab can
be seen in figure 17.
Figure 17: the help tab
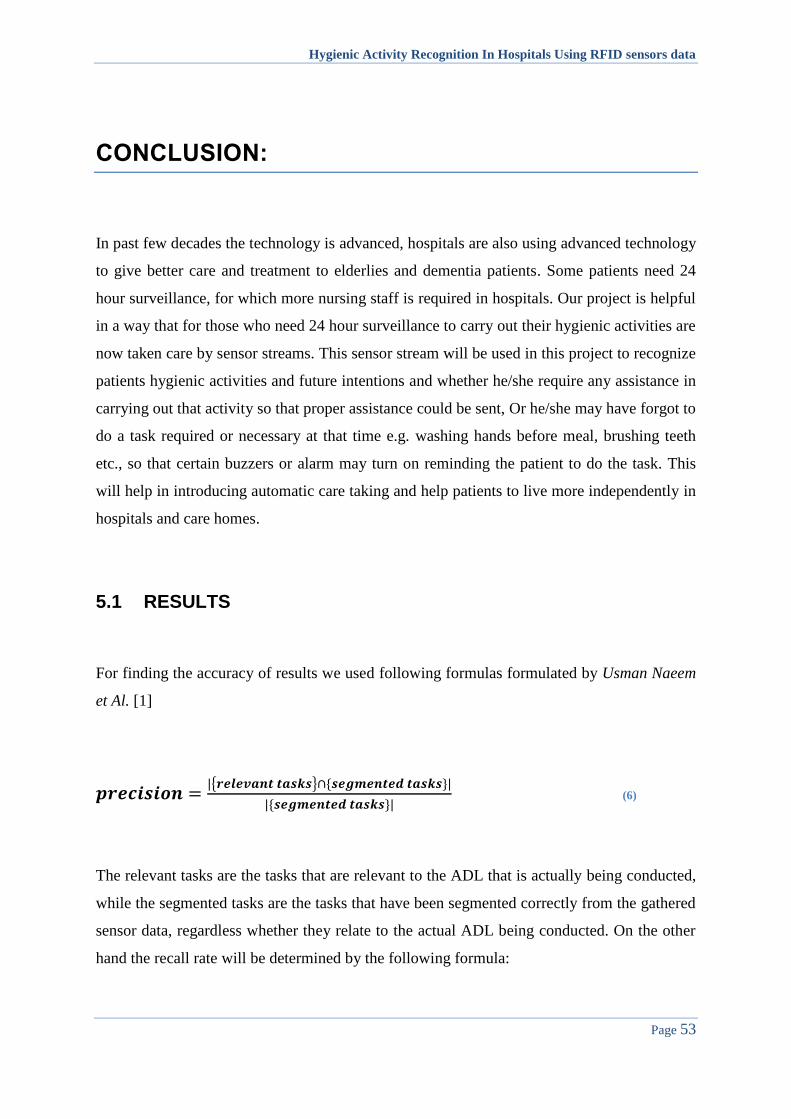
Hygienic Activity Recognition In Hospitals Using RFID sensors data
Page 53
CONCLUSION:
In past few decades the technology is advanced, hospitals are also using advanced technology
to give better care and treatment to elderlies and dementia patients. Some patients need 24
hour surveillance, for which more nursing staff is required in hospitals. Our project is helpful
in a way that for those who need 24 hour surveillance to carry out their hygienic activities are
now taken care by sensor streams. This sensor stream will be used in this project to recognize
patients hygienic activities and future intentions and whether he/she require any assistance in
carrying out that activity so that proper assistance could be sent, Or he/she may have forgot to
do a task required or necessary at that time e.g. washing hands before meal, brushing teeth
etc., so that certain buzzers or alarm may turn on reminding the patient to do the task. This
will help in introducing automatic care taking and help patients to live more independently in
hospitals and care homes.
5.1 RESULTS
For finding the accuracy of results we used following formulas formulated by Usman Naeem
et Al. [1]
{ }
(6)
The relevant tasks are the tasks that are relevant to the ADL that is actually being conducted,
while the segmented tasks are the tasks that have been segmented correctly from the gathered
sensor data, regardless whether they relate to the actual ADL being conducted. On the other
hand the recall rate will be determined by the following formula:
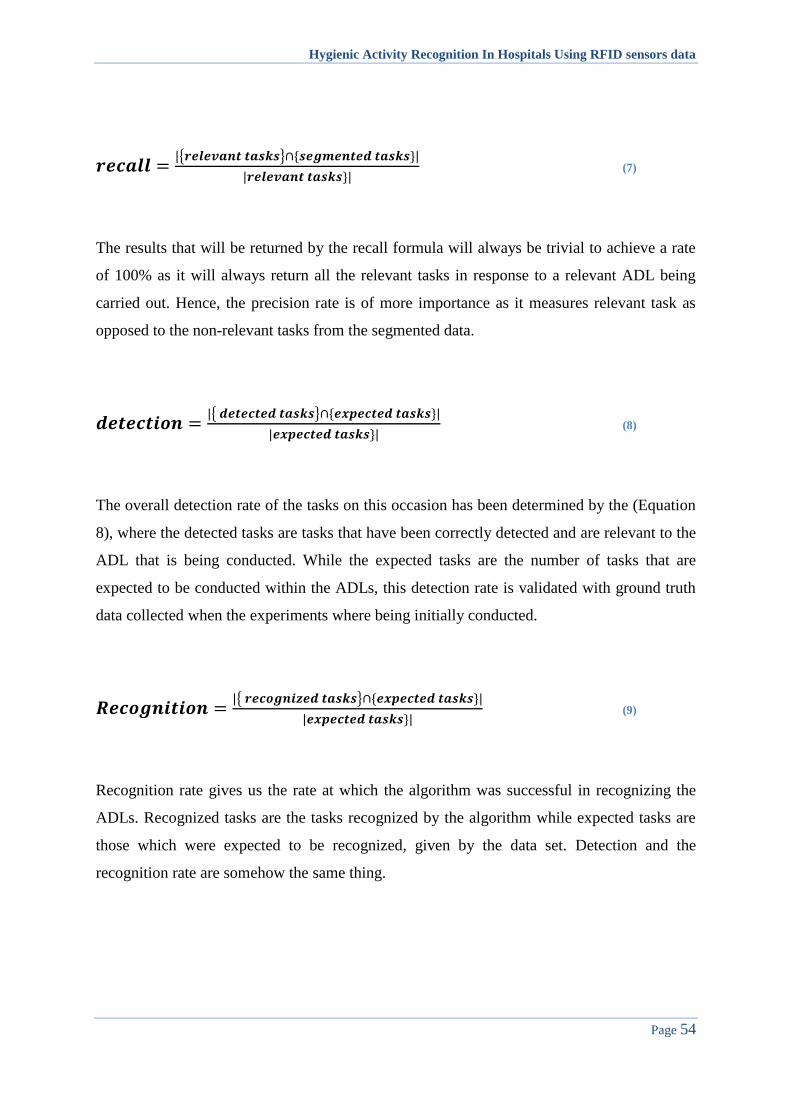
Hygienic Activity Recognition In Hospitals Using RFID sensors data
Page 54
{ }
(7)
The results that will be returned by the recall formula will always be trivial to achieve a rate
of 100% as it will always return all the relevant tasks in response to a relevant ADL being
carried out. Hence, the precision rate is of more importance as it measures relevant task as
opposed to the non-relevant tasks from the segmented data.
{ }
(8)
The overall detection rate of the tasks on this occasion has been determined by the (Equation
8), where the detected tasks are tasks that have been correctly detected and are relevant to the
ADL that is being conducted. While the expected tasks are the number of tasks that are
expected to be conducted within the ADLs, this detection rate is validated with ground truth
data collected when the experiments where being initially conducted.
{ }
(9)
Recognition rate gives us the rate at which the algorithm was successful in recognizing the
ADLs. Recognized tasks are the tasks recognized by the algorithm while expected tasks are
those which were expected to be recognized, given by the data set. Detection and the
recognition rate are somehow the same thing.
Hygienic Activity Recognition In Hospitals Using RFID sensors data
Page 55
5.2 FUTURE ENHANCMENTS:
In future we are planning to update our algorithm such that it has:
Automatic Update function:
In which the system automatically detects new activities or series of sensor stream and
updates its database by adding a new ADL after confirmation of the system operator.
Basically we want our application to detect new combination of sensor stream, if the user or
the patient is triggering the sensors in that manner multiple times and there is no ADL related
to that particular sensor stream in database, then the system asks the system operator that a
new combination is occurred, is it a new combination? Do you want to add a new activity
regarding this stream in database?.
Activity suggestion function:
A function can also be added to the existing application which can by using timing
constraints suggest the patient that which activity should be performed at that time, or what
doctor has suggested. For example a doctor has given a schedule of activities to be performed
by the patients at particular times, like taking bath at 3’o clock in the evening, and the patient
forgot to do that. The program can send an alert to the patient that he missed the Bathing
activity as prescribed by the doctor.

Hygienic Activity Recognition In Hospitals Using RFID sensors data
Page 56
GLOSSARY:
Hygienic Activity Condition related to maintaining health and preventing disease
Alzheimer’s A slow irreversible progressive brain which damages selective part of the
brain associated to memory
Sensor event The event occurring when the object is touched and the information is
recorded.
RFID Radio Frequency Identification
It is the wireless non-contact use of radio-frequency electromagnetic fields
to transfer data
Tags A label attached to something or object for the purpose of identification or to
give other information.
Surveillance close observation
Task Person doing a piece of work to be done or undertaken.
Activity A group of undertaken task collectively taken as activity
Transmitter Transmitter is a device which passes information to system
Dense Sensing
Technique.
Technique used to record sensor events.
Database It is central repository for sharing data. Data is stored in a standardized and
convenient form
Associated Tasks Tasks which are associated to a sensor event.
GATS
Generating Alternative Task Sequences
Disjunctive
Normal form
It is a standardization (or normalization) of a logical formula which is a
disjunction of conjunctive clauses

Hygienic Activity Recognition In Hospitals Using RFID sensors data
Page 57
Probability Probability is used to quantify an attitude of mind towards some proposition
of whose truth we are not certain.
Utility Utility is usefulness, the ability of something to satisfy needs or wants
Hygienic Activity Recognition In Hospitals Using RFID sensors data
Page 58
REFERENCES:
[1] A Hierarchal Framework for Recognising Activities of Daily Life, Usman Naeem,
School of Electronic Engineering and Computer Science Queen Mary, University of
London, 2009
[2] A Hierarchal Approach to Activity Recognition in the Home Environment based on
Object Usage Usman Naeem, John Bigham
School of Electronic Engineering and Computer Science Queen Mary University of
London
[3] Human Activity Recognition for the use in Intelligent Spaces
Preliminary Research for Graduation Project DDSS
Student: M.J. Meinders (531671)
April 2010
[4] Human Activity Recognition with Wearable Sensors, by DUY TAM GILLES
HUYNH.
June 2008
[5] MAYOCLINIC, Alzheimer's disease ,Diseases and Conditions,[ONLINE] JAN 2013,
Available at:
http://www.mayoclinic.org/diseases-conditions/alzheimers
disease/basics/definition/con-20023871
[6] MEDICALNEWSTODAY. What is Alzheimer's disease? Causes, symptoms and
treatment [ONLINE] JULY 2009, Available at:
http://www.medicalnewstoday.com/articles/159442.php
[7] ALZHEIMERS, What is Alzheimer's disease? [ONLINE], Available at:
http://www.alzheimers.org.uk/site/scripts/documents_info.php?documentID=100