84 CUMBERLAND-SHENANDOAH FRUIT WORKERS ...
192
WINCHESTER, VIRGINIA PROCEEDINGS December 4 & 5, 2008 th 84 CUMBERLAND-SHENANDOAH FRUIT WORKERS CONFERENCE
-
Upload
khangminh22 -
Category
Documents
-
view
0 -
download
0
Transcript of 84 CUMBERLAND-SHENANDOAH FRUIT WORKERS ...

WINCHESTER, VIRGINIA
PROCEEDINGS
December 4 & 5, 2008
th84
CUMBERLAND-SHENANDOAH
FRUIT WORKERS CONFERENCE

1
(FOR ADMINISTRATIVE USE ONLY)
Proceedings of the
Cumberland-Shenandoah
Fruit Workers Conference
84th Annual Meeting
December 4th and 5th, 2008 Hampton Inn and Conference Center
Winchester, VA
Conference Chair Arthur M. Agnello Cornell University
New York State Agricultural Experiment Station Geneva, NY

2
Table of Contents
List of Participants ..................................................................................................................... i 2008 Program .......................................................................................................................... iii Business and Financial Business Meeting...................................................................................................................... 2 Treasurer's Report ..................................................................................................................... 4 Submitted Reports Call of the States ..................................................................................................................... 6 New Jersey, New York, Pennsylvania, Virginia, West Virginia General Session Update of CSFWC Scholar Site. Douglas G. Pfeiffer ...............................................................17 Developing a protocol and a marketing niche for EcoApples in NY State. Harvey Reissig .......18 Entomology Evaluations of Puffers and SPLAT pheromone products for mating disruption of tree fruit pests. Arthur Agnello................................................................................................................25 Mating disruption of oriental fruit moth across the apple/peach interface: Testing the "Whole-farm MD" concept. Kris Tollerup, Peter W. Shearer, and Ann Rucker ........................32 Efficacy of Mating Disruption Techniques in North Carolina Apple Orchards. Vonny M. Barlow & James F. Walgenbach ..............................................................................................38 Whole farm mating disruption - Oriental fruit moth case study. Margaret E. Reid and Greg Krawczyk ........................................................................................................................47 Using Area-Wide Mating Disruption in Pennsylvania’s Orchards, an Option for CM and OFM Control. Faruque U. Zaman, Larry A. Hull, Greg Krawczyk, and Eric Bohnenblust........54 Preliminary Evaluation of the Economic Effectiveness of Area-Wide Mating Disruption in Pennsylvania. J.K. Harper, L.F. Kime, L.A. Hull, and G. Krawczyk ........................................63 Japanese beetle (Popillia japonica) Control and Varietal Comparisons in Primocane- Bearing Caneberries. L. M. Maxey, C. A. Laub, D. G. Pfeiffer, and R. S. Mays.........................66 Spatial Distribution of Blueberry Maggot in Commercial Blueberry Fields. Dean Polk, Cesar Rodriguez-Soana, Peter Oudemans................................................................................72

3
Oriental Beetle Mating Disruption: From Research to Commercialization. Cesar Rodriguez-Saona & Dean Polk .................................................................................................................75 Impacts of Reduced Risk IPM Programs on Beneficial and Non-Target Arthropods, Including Native Bees. David Biddinger, Tim Leslie, and Rick Donoval...................................79 Plant Pathology Perspectives on site-specific fungicide use in Northeastern US populations of the apple scab pathogen Venturia inaequalis: fungicide sensitivity profiles and management prospects. Cox, K.D., Villani, S.M., and Köller, W.D. ...............................................................................86 Disease control by experimental fungicides on Golden Delicious, Idared, and York Imperial apples, 2008. (Tables 1-5). K. S. Yoder, A. E. Cochran II, W. S. Royston, Jr., S. W. Kilmer, C. Douglas, and C. Cochran. ...................................................................................................90 Evaluation of experimental fungicides and mixed schedules on Stayman, Idared, and Granny Smith apples, 2008. (Tables 6-10); 15-yr history of fruit scab control with SI+EBDC Stayman apple. (Figures 1 & 2). K. S. Yoder, A. E. Cochran II, W. S. Royston, Jr., S. W. Kilmer, and C. Douglas, and C. Cochran............................................................................96 Broad spectrum disease management with alternating fungicide programs on Red Delicious, Golden Delicious, and Rome apples, 2008. (Tables 11-14). K. S. Yoder, A. E. Cochran II, W. S. Royston, Jr., S. W. Kilmer, C. Douglas, and C. Cochran. ...........................103 Disease control by treatments first applied at petal fall for summer disease control on Idared apples, 2008. (Tables 15-16). K. S. Yoder, A. E. Cochran II, W. S. Royston, Jr., and S. W. Kilmer....................................................................................................................................108 Effects of apple scab “rescue” treatments applied after lesions appeared on Gala and Fuji apples, 2008. (Tables 17-18). K. S. Yoder, A. E. Cochran II, W. S. Royston, Jr., S. W. Kilmer, C. Douglas, and C. Cochran......................................................................................111 Postharvest control of bitter rot and white rot by Scholar on Ginger Gold and Gala apples. (Tables 19-20). K. S. Yoder, A. E. Cochran II, W. S. Royston, Jr., S. W. Kilmer, C. Douglas, and C. Cochran. ....................................................................................................................113 Evaluation of antibiotics for blossom blight suppression on Idared apple. (Table 21). K. S. Yoder, A. E. Cochran II, W. S. Royston, Jr., and S. W. Kilmer. ..............................................114 Blossom blight control by dilute treatments on Golden Delicious and Rome Beauty apples, 2008. (Table 22). K. S. Yoder, A. E. Cochran II, W. S. Royston, Jr., and S. W. Kilmer. ..........115 Control of scab and brown rot by integrated fungicide programs on Redhaven peach and Redgold nectarine, 2008. (Tables 23-24). K. S. Yoder, A. E. Cochran II, W. S. Royston, Jr., S. W. Kilmer, C. Douglas, and C. Cochran. ......................................................116

4
Control of scab and brown rot by Quash in integrated fungicide programs applied airblast to Redhaven and Loring peach and Redgold nectarine, 2008. (Tables 25-28). K. S. Yoder, A. E. Cochran II, W. S. Royston, Jr., S. W. Kilmer, C. Douglas, and C. Cochran....................119 Evaluation of Spray Programs to Control Apple Scab, 2008. Halbrendt, N. O., & Travis, J. W., Ngugi, H.......................................................................................................................122 Assessment of antibiotics and biological control products for management of fire blight. H. K. Ngugi, N. O. Halbrendt, and J.W. Travis.......................................................................125 Evaluation of Summer Disease Programs for Apple, 2008. Halbrendt, N. O., Travis, J. W., Ngugi, H. ..............................................................................................................................127 Evaluation of Experimental Peach Fungicides. N. Lalancette and K. McFarland ...................130 Peach disease control with LEM-17. Alan Biggs ....................................................................140 Peach Disease Management with Organic Fungicides. N. Lalancette and K. McFarland........142 Synergistic interactions among garlic extracts, copper compounds, Captan and kasugamycin for control of bacterial spot of stone fruits. H. K. Ngugi, N. O. Halbrendt and S.J. Bardsley...152 Sensitivity of NY populations of the brown rot pathogen Monilinia fructicola to QoI and DMI fungicides. Villani, S.M., and Cox, K.D. ........................................................................155 Conventional, “soft,” and organic fungicide programs for black rot control in four wine grape cultivars. Anne DeMarsay and David K. Armentrout ....................................................160 Bunch Rot Management on Grapes, 2007-2008. Halbrendt, N.O., Hed, B., Travis, J. W.........162 Horticulture Accuracy of GPS Guidance and its Potential Use in Orchards. A. Leslie, K. Lesser, P. Heinemann, J. Schupp, T. Baugher ........................................................................................167 Evaluation of the perpendicular–V peach orchard training system applicability study for southern Maryland, 1999–2007. R. David Myers....................................................................172 Leaf N and P in different growth habits of peach: Effects of root system morphology and transpiration. T. Tworkoski, R. Scorza, and D.M. Glenn .........................................................175 Economic Evaluation of Alternative Apple Training Systems for Fresh-Market Production in Pennsylvania. J.K. Harper, A.J. Jimenez, R.M. Crassweller, and D.E. Smith......................176

i
List of Participants Name Affiliation Adams, Frank AFRS-ARS-USDA Agnello, Arthur Cornell-NYSAES Barlow, Vonny NCSU Baugher, Tara Penn State Extn Bell, Richard AFRS-ARS-USDA Bergh, Chris VA Tech Biddinger, Dave Penn State Biggs, Alan WVU Bohnenblust, Eric Penn State Breth, Debbie Cornell Coop Extn Brown, Mark AFRS-ARS-USDA Burchard, Erik AFRS-ARS-USDA Carbaugh, David VA Tech Combs, Dave Cornell-NYSAES Cox, Kerik Cornell-NYSAES Crim, Victor L. AFRS-ARS-USDA David, Paul Gowan Co. DeMarsay, Anne UMD Dimock, Mike Certis USA Dripps, James Dow AgroSciences Engelman, Jean VA Tech Erickson, Mary Anne Certis USA Estes, Tony UPI Frank, Daniel VA Tech Frecon, Jerry Rutgers Ganske, Don Dupont Gut, Larry Mich State Haas, Mike Mich State Halbrendt, Noemi Penn State Hancock, Dustin AFRS-ARS-USDA Hancock, Torri AFRS-ARS-USDA Hanlin, Bill NCSU Coop Extn Harper, Jayson Penn State Hed, Bryan Penn State Hott, Chris AFRS-ARS-USDA Hull, Larry Penn State Jordan, Timothy VA Tech Krawczyk, Greg Penn State Kurtz, Alan Arysta LifeScience Lachance, Michael VA Tech Lalancette, Norman Rutgers Leahy, Kathleen Polaris Leskey, Tracy AFRS-ARS-USDA

ii
Name Affiliation Leslie, Alexander Penn State Extn Marine, Sasha VA Tech Maxey, Laura VA Tech Mays, Ryan VA Tech McArtney, Steven NCSU McFarland, Kathleen Rutgers McGhee, Peter Mich State Miller, Stephen AFRS-ARS-USDA Morton, Vince Viva Inc Myers, Clayton AFRS-ARS-USDA Newell, Michael UMD WREC Ngugi, Henry Penn State O'Barr, John BASF Olson, Brian Dow AgroSciences Paddock, Randy Paddock Ag Serv Pfeiffer, Doug VA Tech Pierce, Corrine AFRS-ARS-USDA Polk, Dean Rutgers Reid, Chris Reid Orchards Reid, Margaret Penn State Reissig, Harvey Cornell-NYSAES Rodriguez-Saona, Cesar Rutgers Rogers, Gregory Dupont Rucker, Ann Rutgers Rugh, Tony AFRS-ARS-USDA Shannon, Mark Suterra Short, Brent AFRS-ARS-USDA Stamm, Gregory CBC America Steffel, Jim LABServices Straub, Valen LABServices Thomas, Gar BASF Tiwari, Siddarth VA Tech Tollerup, Kris Rutgers Tworkoski, Tom AFRS-ARS-USDA Villani, Sara Cornell-NYSAES Walgenbach, Jim NCSU Ward, Dan Rutgers Webb, Kevin AFRS-ARS-USDA Wright, Starker AFRS-ARS-USDA Yoder, Keith VA Tech Yuan, Rongcai VA Tech Zaman, Faruque uz Penn State Zuefle, Marion LABServices

iii
84th Annual Cumberland-Shenandoah Fruit Workers Conference December 4–5, 2008
Hampton Inn and Conference Center, Winchester, VA
CONFERENCE AGENDA Thursday, December 4th 8:00 - 9:00 a.m. Registration 9:00 - 9:05 a.m. Call to order — 84th Cumberland-Shenandoah Fruit Workers Conference Washington Room 9:05 - 10:00 a.m. Call of the States 10:00 - 10:15 a.m. Update of CSFWC Scholar Site. Douglas G. Pfeiffer. Virginia Polytechnic
and State University. 10:15 - 10:30 a.m. Break 10:30 - 11:00 a.m. General Session – Developing a protocol and a marketing niche for EcoApples in NY State.
Harvey Reissig. Cornell University. 11:00 - 11:45 a.m. The Mid-Atlantic Young Grower Alliance: For the next generation in
farming. Margaret Reid and Christopher Reid, Pennsylvania State University.
Noon - 1:00 p.m. Lunch — Washington Room 1:00 - 5:00 p.m. Concurrent Sessions Entomology – Washington Room Horticulture – Jefferson Room Plant Pathology – Madison Room 5:30 - 7:15 p.m. Mixer (Sponsored by BASF, Bayer, CBC, Certis, Dow, DuPont, Suterra,
Syngenta, and UPI) Pre-Function Room Friday, December 5th 8:00 - 9:00 Business Meeting – Washington Room 9:00 - Noon Entomology Session

iv
Entomology Session: Washington Room Thursday, December 4th 1:00 – 1:15 Responses of codling moth to resistant apple germplasm and associated fruit
phenolic compounds. Clayton T. Myers. USDA-ARS, AFRS, Kearneysville. 1:15 – 1:30 Woolly Apple Aphid Biocontrol: What Do We Know and What Do We Need
to Know? J.C. Bergh and S. Tiwari. Virginia Polytechnic and State University, Winchester.
1:30 – 1:45 Resistance to European Pear Sawfly in Pear (Pyrus spp.) Germplasm.
Richard L. Bell. USDA-ARS, AFRS, Kearneysville. 1:45 – 2:00 Behavioral and Electrophysiological Activity of the Plum Curculio
Associated with Host Fruit Trees. Tracy C. Leskey, Starker E. Wright, and Aijun Zhang. USDA-ARS, AFRS, Kearneysville.
2:00 – 2:15 A Comparison of Three Mating Disruption Products for Control of Codling
Moth and Oriental Fruit Moth in Pennsylvania. Eric Bohnenblust, Larry A. Hull, Greg Krawczyk. Pennsylvania State University, Biglerville.
2:15 – 2:30 Evaluations of Puffers and SPLAT pheromone products for mating
disruption of tree fruit pests. Arthur Agnello. Cornell University, Geneva. 2:30 – 2:45 New mating disruption approaches and formulations. Larry Gut, Juan Huang,
Peter McGhee and Jim Miller. Michigan State University, E. Lansing. 2:45 – 3:00 Large field cages for quantitative studies of codling moth mating disruption
in orchards. Peter McGhee, Larry Gut, Jim Miller. Michigan State University, E. Lansing.
3:00 – 3:15 BREAK 3:15 – 3:30 Mating disruption of oriental fruit moth across the apple/peach interface:
Testing the "Whole-farm MD" concept. Kris Tollerup, Peter W. Shearer, and Ann Rucker. Rutgers University, Bridgeton.
3:30 – 3:45 Efficacy of Mating Disruption Techniques in North Carolina Apple
Orchards. Vonny M. Barlow & James F. Walgenbach. North Carolina State University, Mills River.
3:45 – 4:00 Whole farm mating disruption - Oriental fruit moth case study. Margaret E.
Reid and Greg Krawczyk. Pennsylvania State University, Biglerville.

v
4:00 – 4:15 Using Area-Wide Mating Disruption in Pennsylvania’s Orchards, an Option for CM and OFM Control. Faruque U. Zaman, Larry A. Hull, Greg Krawczyk, and Eric Bohnenblust. Pennsylvania State University, Biglerville.
4:15 – 4:30 Preliminary Evaluation of the Economic Effectiveness of Area-Wide Mating
Disruption in Pennsylvania. J.K. Harper, L.F. Kime, L.A. Hull, and G. Krawczyk. Pennsylvania State University, University Park.
4:30 – 4:45 Field Residual Toxicity of Altacor and Delegate to Codling Moth Larvae and
Eggs. Jim Walgenbach. North Carolina State University, Mills River. 4:45 – 5:00 Japanese beetle (Popillia japonica) Control and Varietal Comparisons in
Primocane-Bearing Caneberries. L. M. Maxey, C. A. Laub, D. G. Pfeiffer, and R. S. Mays. Virginia Polytechnic and State University, Blacksburg.
Horticulture Session: Jefferson Room Thursday, December 4th 1:00 – 1:15 Effect of Reflective Materials on Growth and Bloom in a Young Apple
Planting. Stephen Miller and Chris Hott. USDA-AR, AFRS, Kearneysville. 1:15 – 1:30 Accuracy of GPS Guidance and its Potential Use in Orchards. A. Leslie, K.
Lesser, P. Heinemann, J. Schupp, T. Baugher. Penn State Cooperative Extension, Gettysburg.
1:30 – 1:45 Evaluation of the perpendicular–V peach orchard training system
applicability study for southern Maryland, 1999–2007. R. David Myers (presented by Anne DeMarsay. University of Maryland, Upper Marlboro.)
1:45 – 2:00 Leaf N and P in different growth habits of peach: Effects of root system
morphology and transpiration. T. Tworkoski, R. Scorza, and D.M. Glenn. USDA-ARS, AFRS, Kearneysville.
2:00 – 2:15 On-tree Fruit bagging for Eastern Peaches and Nectarines. Dan Ward.
Rutgers University, Bridgeton. 2:15 – 2:30 Evaluation of a model for predicting fruit set in apple. McArtney and
Obermiller. North Carolina State University, Mills River. 2:30 – 3:00 Bloom Thinning Apple and Peach with Eugenol or a Eugenol Based
Herbicide. Stephen Miller and Thomas Tworkoski. USDA-ARS, AFRS, Kearneysville.
3:00 – 3:15 BREAK

vi
3:15 – 3:30 Economic Evaluation of Alternative Apple Training Systems for Fresh-Market Production in Pennsylvania. J.K. Harper, A.J. Jimenez, R.M. Crassweller, and D.E. Smith. Pennsylvania State University, University Park.
3:30 – 3:45 Effects of pre- and post-harvest 1-MCP treatments on firmness and internal
ethylene concentration of Rome apple after storage. McArtney and Obermiller. North Carolina State University, Mills River.
3:45 – 4:00 Can PGRs Enhance Return Bloom in Apple? Stephen Miller and Larry Crim.
USDA-ARS, AFRS, Kearneysville. Plant Pathology Session: Madison Room Thursday, December 4th 1:00 – 1:15 Perspectives on site-specific fungicide use in Northeastern US populations of
the apple scab pathogen Venturia inaequalis: fungicide sensitivity profiles and management prospects. Cox, K.D., Villani, S.M., and Köller, W.D. Cornell University, Geneva.
1:15 – 1:30 Highlights of apple fungicide testing in 2008. K. S. Yoder. Virginia Polytechnic
and State University, Winchester. 1:30 – 1:45 Evaluation of Spray Programs to Control Apple Scab, 2008. Halbrendt, N. O.,
& Travis, J. W., Ngugi, H. Pennsylvania State University, Biglerville. 1:45 – 2:00 Fire blight control with antibiotics and SAR candidates in 2008. K. S. Yoder.
Virginia Polytechnic and State University, Winchester. 2:00 – 2:15 Assessment of antibiotics and biological control products for management of
fire blight. H. K. Ngugi, N. O. Halbrendt, and J.W. Travis. Pennsylvania State University, Biglerville.
2:15 – 2:30 Evaluation of Summer Disease Programs for Apple, 2008. Halbrendt, N. O.,
Travis, J. W., Ngugi, H. Pennsylvania State University, Biglerville. 2:30 – 2:45 Quince and cedar-apple rusts- still there after all these years! K. S. Yoder.
Virginia Polytechnic and State University, Winchester. 2:45 – 3:00 Evaluation of Experimental Peach Fungicides. N. Lalancette and K.
McFarland. Rutgers University, Bridgeton. 3:00 – 3:15 BREAK 3:15 – 3:20 Performance of Indar tank-mixed with and without a surfactant against
apple scab. Brian Olson. Dow AgroSciences, Geneva.

vii
3:20 – 3:35 Peach disease control with LEM-17. Alan Biggs. West Virginia University,
Kearneysville. 3:35 – 3:50 Peach Disease Management with Organic Fungicides. N. Lalancette and K.
McFarland. Rutgers University, Bridgeton. 3:50 – 4:05 Synergistic interactions among garlic extracts, copper compounds, Captan
and kasugamycin for control of bacterial spot of stone fruits. H. K. Ngugi, N. O. Halbrendt and S.J. Bardsley. Pennsylvania State University, Biglerville.
4:05 – 4:20 Sensitivity of NY populations of the brown rot pathogen Monilinia fructicola
to QoI and DMI fungicides. Villani, S.M., and Cox, K.D. Cornell University, Geneva.
4:20 – 4:35 Conventional, “soft,” and organic fungicide programs for black rot control in
four wine grape cultivars. Anne DeMarsay (presenter) and David K. Armentrout. University of Maryland, Upper Marlboro.
4:35 – 4:50 Bunch Rot Management on Grapes, 2007-2008. Halbrendt, N.O., Hed, B.,
Travis, J. W. Pennsylvania State University, Biglerville. Entomology – Friday, December 5th 9:00 – 9:15 Contribution of Artificial Stimuli to Control Potential of Apple Maggot
Traps. Starker Wright and Tracy Leskey. USDA-ARS, AFRS, Kearneysville. 9:15 – 9:30 Spatial Distribution of Blueberry Maggot in Commercial Blueberry Fields.
Dean Polk, Cesar Rodriguez-Soana, Peter Oudemans. Rutgers University, Chatsworth.
9:30 – 9:45 Oriental Beetle Mating Disruption: From Research to Commercialization.
Cesar Rodriguez-Saona & Dean Polk. Rutgers University, Chatsworth. 9:15 – 9:30 Influence of peach extrafloral nectar on tufted apple budmoth parasitism.
Mark W. Brown, Clarissa R. Mathews, Greg Krawczyk. USDA-ARS, AFRS, Kearneysville.
10:00 – 10:15 BREAK 10:15 – 10:30 Spatial and temporal dynamics of dogwood borer infestation in a West
Virginia and Virginia orchard. Daniel Frank, Chris Bergh, Tracy Leskey. Virginia Polytechnic and State University, Winchester.

viii
10:30 – 10:45 Control of Various Lepidopteran Pests on Apple with Altacor and Delegate as Affected by Method and Number of Applications. L. A. Hull, N. Joshi and F. Zaman. Pennsylvania State University, Biglerville.
10:45 – 11:00 Impacts of Reduced Risk IPM Programs on Beneficial and Non-Target
Arthropods, Including Native Bees. David Biddinger, Tim Leslie, and Rick Donoval. Pennsylvania State University, Biglerville.
11:00 – 11:15 A synopsis of Risk Avoidance and Mitigation Program in Virginia apples –
2007-08 results. Siddharth Tiwari and Chris Bergh. Virginia Polytechnic and State University, Winchester.
11:15 – Noon Discussion

1
Business and Financial

2
84th Annual Cumberland-Shenandoah Fruit Workers Conference Program Highlights and Business Meeting Minutes, December 5, 2008
Host State – New York/Cornell NYSAES, Geneva Cornell University (New York State Agricultural Experiment Station – Geneva) hosted the 84th Annual Cumberland-Shenandoah Fruit Workers Conference at the Hampton Inn and Conference Center in Winchester, Virginia on December 4-5, 2008. There were 86 registered participants and 50 papers presented. Registration was $60 and was intended to cover the cost of the meeting rooms, Thursday lunch, breaks, and publication of the Proceedings. Art Agnello served as general chair and secretary, assisted by Kate Fello and Dave Combs, while Steve Miller continued his role as treasurer. Art Agnello served as moderator for the Entomology sessions, Kerik Cox and Henry Ngugi moderated the Plant Pathology session; Dan Ward and Steve McArtney served as moderators for the Horticulture Session. Vonny Barlow, Kerik Cox, and Greg Krawczyk provided technical support. The meeting began at 9:00AM on Thursday with a "Call of the States" that included a brief report on the crop, weather, and pest conditions for each state during the 2008 season. This was followed by the General Session, which had no specific theme but comprised three presentations of broad interest to the group. The first was an "Update of the CSFWC Scholar Site", given by Doug Pfeiffer, and reviewed the functions and use of the web-based project-management application used for the first time this year to coordinate email announcements and conference files. There was a discussion session following, during which it was decided that this tool seemed to function smoothly, and that its development for the group's use should be continued and expanded to optimize communications and document management. The next presentation was "Developing a protocol and a marketing niche for EcoApples in NY State", given by Harvey Reissig, describing a multi-year effort to produce and market eco-labeled fruit in the NY and New England region. Finally, Maggie and Christoper Reid gave a presentation on "The Mid-Atlantic Young Grower Alliance: For the next generation in farming", which described the objectives and educational activities of a group of younger specialty crop growers from PA, MD, WV, NJ and MA, who are engaged in field trips, orchard tours, and workshops in order to establish connections and partnerships with others sharing their work and lifestyle in the region. After lunch, concurrent sessions in Entomology, Plant Pathology and Horticulture started, and continued through Friday morning. A Social Mixer was held on Thursday evening, which was sponsored by BASF, Bayer, CBC, Certis, Dow, DuPont, Suterra, Syngenta, and UPI. The business meeting was called to order by Art Agnello on Friday at 8:00AM. There was some brief discussion about the group's general acceptance and impressions of the Scholar site functions, with the overall consensus that, despite a few glitches in the mailing list and some unfamiliarity with using the site to download meeting forms, this method of handling details of the meeting had quite a bit of utility. A good number of people indicated that they had opted to download the 2007 meeting's Proceedings from the Scholar site, as opposed having a hard copy mailed to them. Art Agnello stated that he would do a similar email canvass of the participants' preferences again this year before deciding on how many paper versions of the 2008 Proceedings to print. The organization’s Financial Report was presented by Steve Miller. With the current balance and 82 paid attendees, along with generous contributions from chemical suppliers, the organization is in good standing and will be able to meet all the anticipated bills for 2008.

3
Registration payments from two attendees had not been received at that time (but were forthcoming within the following week). Cost of the social mixer was discussed, but company contributions were able to offset this cost, leaving registration monies available for meeting room, meals and publication costs. Steve Miller announced his resignation as the organization’s Treasurer effective early 2009 and with the approval of those gathered, suggested that Dr. Tracy Leskey be asked to serve as the next Treasurer. Action was accepted. Steve will work with Tracy to transfer the files and bank account to her authority. The entire group expressed their thanks to Steve Miller for his long service as Treasurer. The 2009 CSFWC will be held on November 19-20, again at the Hampton Inn. Virginia will host the meeting, with Rongcai Yuan serving as General Chair. Respectfully submitted, Art Agnello, General Chair & Secretary Steve Miller, Treasurer

4
Treasurer's Report
2007/2008 Cumberland-Shenandoah Fruit Workers Conference
Balance Preceding the 2007 Meeting (11/14/07) $2,337.22 Income (2007)
Receipts from registration (78) $5,055.00 Support for Mixer $3,000.00
Total Assets (Nov. 16, ‘07) $10,392.22 Expenses (Nov. ’07 to Nov. ‘08)
Hampton Inn – room rental Luncheon, breaks, mixer $4,313.82 Laminate covers 103.60 Down payment for ’08 mtg. 100.00 Book of blank checks 12.90 Total Expenses (2007-’08) $4,530.32
Additional Income (2006/2007) Interest on Account (Nov.’07-Nov.’08) 15.07 Sale of Proceedings -----
Balance as of 12/3/08 $5876.97
Paid Registrations, ‘08 (82*) $5,010.00 Donations to CSFWC Mixer** 1,400.00
Balance as of 12/5/08** $12,286.97
*Two registrations paid by university check not yet received; therefore, 84 registered participants **NOTE: Credit to Hampton invoice of $200.00 from sponsor donation paid directly, not shown in account balance

Not For Publication or Citation Without Consent of the Authors
5
Facilities & Food Costs: Year Amount Cost per attendee 1997 1,617.15 23.43
1998 1,624.40 28.00
1999 1,916.78 26.25
2000 2,134.64 31.86
2001 2,453.93 28.53
2002 2,055.61 28.95
2003 1,876.73 36.80
2004 2,297.78 32.83
2005 2,356.91 39.28
2006 3,636.68 46.62
2007 5,063.82 64.92 Reception: $2,969.82 ($227.98 was taxes) CSFWC Registrations Future Meeting Hosts
2008 - 84 2009 – Virginia
2007 - 78 2010 – Maryland/WV
2006 - 78 2011 – North Carolina
2005 - 60 2012 – USDA
2004 - 70 2013 – Pennsylvania
2003 - 50 (snow storm) 2014 – New Jersey/SC
2002 - 71 2015 – New York
2001 - 86
2000 - 67
1999 - 73
1998 - 58
1997 - 69

Not For Publication or Citation Without Consent of the Authors
6
Call of the States

Not For Publication or Citation Without Consent of the Authors
7
NEW JERSEY FRUIT OBSERVATIONS – 2008
Dean Polk, David Schmitt, Atanas Atanassov Rutgers Cooperative Extension, Fruit IPM Program
Bloom and crop condition: Peach – Full bloom was on 4/09 in southern counties. The
bloom was heavy, resulting in a full crop that was difficult to thin. Apple - Full bloom with red delicious was on 4/23. The apple crop was good overall. Red delicious had a light crop due to very hot weather at full bloom. No frost events were observed in 2008.
Late April and early May were hot and dry with highs in mid 80’s. Heavy rain arrived on May 9. A northeaster followed and wet conditions lasted from May 12 to the 17th with highs in the 40’s – 50’s. On May 12 we had high winds and driving rain with very cool temperatures. During this time some apple varieties had a very heavy secondary ,or “rattail” bloom. Fire blight symptoms first appeared about May 15. An epidemic was apparent the following week. Nearly all orchards in southern NJ had moderate to severe infections in susceptible varieties. Some peach varieties developed bacterial spot symptoms on leaves during the following week. Fruit infections appeared about 6 weeks later. The level of fruit infection was light to moderate and never really developed into a full scale epidemic, mainly due to dry conditions which extended into mid-July. In early August brown rot was observed in ripening blocks, most likely a result of blossom blight and latent fruit infections which occurred during the May storms.
Summer was moderately dry with a few timely rains. On Aug 11th widespread hail and severe storms severely damaged the peach crop at the peak of the season. Approximately 95% of the acreage in Gloucester County was hit. Apples were similarly affected but with widespread hail in other growing regions juice demand was good and growers were able to salvage some of the crop.
Current pest control challenges: PC is becoming more of a problem on stone fruit with the loss of effective materials and no inexpensive alternatives. Codling moth continues to be a challenge in some apple orchards. Trap counts have risen on average in most orchards but codling moth is still easily controlled with O.P.’s. In two out of the 19 orchards in the IPM program, O.P.’s no longer provide acceptable control. We have developed a workable control program using some of the results from the RAMP project. Granulosis virus was used on a limited scale in combination with new chemistries and mating disruption. San Jose Scale infestations are also becoming more common in both stone and Pome fruit, including orchards which regularly apply dormant oil.
Controlling fire blight has become very difficult. Epidemics seem to appear more often, and usually are the result of secondary blossoms becoming infected. Most growers are applying several streptomycin sprays at full bloom and do not treat post bloom due to both cost and resistance considerations. In stone fruit peach scab has become more prevalent over the past few years and the disease now drives many of our post bloom fungicide program. We are achieving adequate control but at a much greater cost.

Not For Publication or Citation Without Consent of the Authors
8
In northern counties early season weather conditions were close to normal as defined by the long-term average. Growers had good bloom period and fruit set. There was one exception located in the Delaware Water Gap area where temperatures during apple bloom produced about 80% frost damage. In farms with 2007 fire blight, growers used 1-2 copper sprays before pink and 2-3 antibiotic sprays during bloom and petal fall, controlling the disease. One farm did have heavy fire blight, probably due to insufficient sprays. Mid to late season temperatures were warm and dry, with no significant disease infestations. Some peach brown rot was present where heavy infestations were present during 2007. Only one farm sustained significant hail damage during 2008. A late October snow covered late variety apple fruit for 1-2 days, but no damage was reported. Plum curculio, European apple sawfly, fruit worms (Oriental fruit moth, codling moth), blossom blight/brown rot, peach scab, apple scab and summer apple diseases (rots, sooty blotch and fly speck) are the major pest problem in commercial peach and apple orchards in North Jersey. In general, there was no significant damage from these pests.
In blueberries, there were no significant disease or insect problems. Anthracnose incidence was pressure was less than during 2007, but blueberry maggot pressure was slightly greater. The crop was similar in volume to 2007, with about 54 million lb produced. Prices were slightly less than the record of 2007, although more of a downside in prices came during the first 2 weeks after the NJ season ended. Therefore, lower prices were felt more by MI growers than by NJ growers. The main concern by the industry is that of increased volume brought on by new plantings. At the present time (fall of 2008) there is a 40% volume increase in frozen storage compared to 2007, with a price of $.80 to .90/lb compared to $1.80/lb in 2007. The millions of lb. of additional production coming on during the next few years will present many challenges for the industry.

Not For Publication or Citation Without Consent of the Authors
9
Call of the States – New York Art Agnello, Debbie Breth
Geneva, New York This was a challenging season for growers, mainly because of the repeated hail events (12 or more – which were unprecedented) and the alternating hot & cold spells (which weren't). This translated into more concerns about potential disease consequences than arthropod-related ones, but things were not altogether boring when it came to the insect situation. In general, there were no significant crises stemming from unanticipated or unattended insect or mite infestations. The spring started out rather cooler than "normal" (as defined by the long-term average), until we reached the 3rd week in April, when temperatures reached into the 70s and 80s for more than 10 days. By month's end, we were considerably ahead of normal DD accumulations, and many sites recorded their earliest oriental fruit moth biofix in recent memory (April 24 in Geneva). Macs in many orchards were at full pink bud well before May 1, and in bloom before May 5. The warm weather prompted early plum curculio and European apple sawfly activity, which were in the orchard waiting for fruits to attack days ahead of their developing. By mid-May, a cooling trend settled in, which slowed up the varietal bloom progression, so orchards could be found at anywhere from pink to petal fall around the state. Things moderated through the remainder of May during the fruit set period, bringing the heat unit accumulation back down below normal. Early in June, a hot spell sent temperatures into the 80s and 90s for over a week, which quickly finished off plum curculio egg-laying activities, brought out obliquebanded leafroller right on schedule, and initiated some codling moth emergence. On June 16, the first and most damaging of the season's dozen or so hail strikes traversed the state's fruit regions, throwing everyone's plans into disarray. By the second half of the month, obliquebanded leafroller populations were notable by their scarcity, and summer aphids were beginning to build. Apple maggot emerged just ahead of schedule at the end of June, and, aided by more than adequate moisture from regular rain showers, built to some impressive numbers through July and much of August around the state. Another brief hot spell the week after July 4 raised the prospects of European red mite outbreaks, which never fully materialized. The most problematic insect of the remainder of the summer seemed to be Japanese beetle, which continued emerging until mid-August. Internal leps such as codling moth and oriental fruit moth were trapped at relatively high numbers in various western NY trouble spots, but in most cases were attended to by management programs featuring some good selective insecticides and supplemented by mating disruption. As of this date, local processors report detecting worms in 390 loads, representing more 112 growers; specimens identified were 73% codling moth, 27% oriental fruit moth/lesser appleworm. Some later summer pests that typically show up were not evident this year, including twospotted spider mites, which are often associated with hot and dry weather. Woolly apple aphid was evident in a number of places, again showing up early but not necessarily taking off the way they are capable of doing. Other sporadic summer pests were also to be found, depending on the specific locality: pear psylla and potato leafhopper, stink bugs, and San Jose scale all generated their share of attention in one area of the state or another. We'll be waiting for reports of the last few pests that always occur in some numbers, to get an idea of their importance as the fruit came in for packing: Comstock mealybug, white apple leafhopper and tarnished plant bug.

Not For Publication or Citation Without Consent of the Authors
10
Pennsylvania State Report for CSFWC, 2008 Krawczyk, G., R. C Crasweller*, N. O. Halbrendt, L. A. Hull, and H. K. Ngugi.
Penn State University Fruit Research and Extension Center, Biglerville, PA
* Department of Horticulture, State College, PA Horticulture: the 2008 season had variable weather across the state. The winter was relatively mild with the lowest temperature recorded on January 21 of 9°F. Hail hit several orchards in early June in the central and eastern portions of the state. Full bloom on peaches in the central part of the state occurred during the week of April 24 or about normal for the area. May had several extended periods of rain negatively influencing the efficacy of apple scab control treatments. Temperatures in early June were unusually high resulting in some cases of over thinning. Dry weather in August and September did not significantly affect the size of the peach and apple crop, which was about average in size. Plant pathology: Overall, apple scab pressure was high and powdery mildew pressure was moderate in most orchards. High rainfall (>6 inches between April and May) resulted in severe apple scab pressure early in the season. Between April 10 (Green tip) and May 15, there were 12 severe infection periods that ranged from 1 to 4 continuous days (i.e., May 1-4). However, disease pressure declined later in the season owing to dry weather. Also, the dry weather later in the season resulted in low disease pressure of summer diseases. We continue to receive complaints of potential failures of SI fungicides from growers. Fire blight pressure was also high with 4 infection periods between April 25 and May 10. However, at commercial level, disease incidence was not as high as during the 2007 season. Many growers applied dormant copper bactericides to reduce fire blight infestation level. On peaches, for the second year in a row, all tests for plum pox virus in PA came back negative. If this will continue into the next year then stone fruit planting quarantine may be lifted for the entire state in 2010. In spite of the long wet periods early in the season, only moderate bacterial spot pressure on peaches was observed this year Entomology: The first sustained flight of Oriental fruit moth, OFM, (biofix) was observed on April 04, for codling moth, CM on May 04, tufted apple bud moth, TABM on May 08, and for obliquebanded leafroller, OBLR on May 31. In general, the biofix and other seasonal activities occurred similarly to events observed during previous years. The codling moth remains the only exception with its unexpectedly extended flight of the first generation, which lasted until late June or even during an early part of July. Although no unexpected pest outbreaks were observed during the 2008 season, the increased numbers of fruit injuries associated with the feeding of stink bugs and plant bugs were reported from some orchards. The 2008 season marked the third year of area-wide CM/OFM management project with more than 1,500 acres of fruit orchards using mating disruption as the main tool to control this pest complex. Wide incorporation of MD practices, CM granulosis virus and possibly the availability of new insecticides greatly reduced the number of fruit loads rejected due to the presence of internal fruit feeders (i.e., CM or OFM) inside fruit

Not For Publication or Citation Without Consent of the Authors
11
delivered to our local PA fruit processors (Knouse Food Co. and Mott’s Inc.). Although the presence of codling moth larvae in fruit for the third year in a row remains the main reason for the load rejections, the total number of rejected loads was more than 50 percent lower than during the 2007 season.

Not For Publication or Citation Without Consent of the Authors
12
Call of the States – Virginia, 2008
Chris Bergh, Keith Yoder and Rongcai Yuan Virginia Tech, Alson H. Smith, Jr. Agricultural Research and Extension Center
Winchester, VA PLANT PATHOLOGY Apples Scab and rusts: There was plenty of opportunity for success or failure of commercial scab and rust control programs this year. A total of ten scab infection periods occurred at the AREC in April and May. Scab and cedar-apple rust lesions, from a tight cluster infection period 11-12 Apr, were seen on cluster leaves 1 May. Variable winds early in that infection period brought rust spores from the west, south and east and continued wetting was adequate for all of them to infect. In addition to regular “routine” infection periods in April and May, two very challenging ones occurred 20-22 Apr (primary scab and cedar-apple and quince rusts, 55 hr at 56°F) and 11-13 May (secondary scab, 38 hr at 44°F). Both of these had long wetting periods following heavy rainfall which would have depleted most of the protective EBDC fungicide residue, requiring some post-infection action to provide control. 2008 was our third serious quince rust year in the nine since the alarming outbreak in 2000. Quince rust inoculum is produced in perennial cankers and annual infection is “hit-or-miss” depending on favorable wetting periods near bloom and the critical infection period was during full bloom 20-22 Apr. Cedar-apple rust galls were again plentiful in some areas and inoculum persisted into late May but not much into June as it did in ‘06 and ‘07. Some growers who were depending on EBDCs for rust protection did not to follow up after the 20-22 Apr infection with an effective after-infection (SI) fungicide and got as much as 40% fruit infection. Mildew: Apple mildew spores were present on emerging leaves 29 March. In spite of the numerous wetting periods in this “wet” year, nearly half (27) of the days in April and May were favorable for secondary mildew infection by this dry weather disease. Marginal mildew control efforts in some orchards have favored chronic carryover of primary mildew and the likelihood of substantial annual yield reductions. Both of the rusts and powdery mildew will be increasing threats in the future if growers continue to reduce their timely use of the highly effective SI fungicides due to concerns about resistance in scab. Fire blight:. This was an average year for fire blight with our greatest blossom blight threat occurring with wetting 25-26 Apr. Three other MARYBLYT fire blight infection periods occurred in the Winchester area on later bloom 3 May, 6 May and 8 May. There was some secondary spread from blossom infection by local hail and strong storms. Summer diseases: The cumulative wetting hour (250-hr) threshold for presence of the sooty blotch and flyspeck fungi on non-protected fruit was met 1 July at our AREC instrument location. However sooty blotch and flyspeck were observed the same day on non-protected apples at lower elevations. Sooty blotch and flyspeck were common in marginally protected commercial orchards. Where these were present, rots may also be active. Stone fruits:

Not For Publication or Citation Without Consent of the Authors
13
Brown rot was quite active, due to favorable wetting conditions and, in some cases, hail damage that favored early infection. Bacterial spot was reported on some unusually susceptible (California-bred) cultivars in some commercial Shenandoah Valley orchards. Peach scab was present on non-protected fruit. ENTOMOLOGY Biofix for oriental fruit moth, codling moth and tufted apple budmoth at Winchester occurred within typical ranges, on April 10, April 25 and May 6, respectively. Based on degree-day accumulations from biofix, the dates on which critical timings for 1st (250 DD) and 2nd (1250 DD) generation codling moth management were reached have varied by only two days in the last three seasons (May 20-24 and July 7-9 for 1st and 2nd broods, respectively). The dates of critical timings for oriental fruit moth management have varied somewhat more for 1st brood (350 DD), ranging from May 3 – 11, but have been relatively consistent for 3rd brood (July 27-31). Rosy apple aphid injury appeared to have occurred earlier in 2008 than in some previous years and neonicotinoid treatments applied at pink or petal-fall did not prevent damage. Relatively cool conditions and adequate rainfall during much of the growing season in the northern portions of Virginia precluded significant issues with spider mites. Fourth generation oriental fruit moth populations appeared to be lighter during the latter portion of the season than has been recorded in previous years. Unlike some instances in neighboring states, there were no reports of woolly apple aphid outbreaks in Virginia. Despite shortages and allocations, Delegate was used quite widely for management of first brood codling moth and Altacor was used by many against internal larvae and leafrollers late season. Reports of load rejections at harvest were not abundant, likely due in part to the high demand for both fresh and processing fruit caused by shortages in other production areas. Late season injury from stink bugs was sporadic but caused significant issues in some orchards. HORTICULTURE Cherries were not affected by frost during bloom or excess rainfall during harvest and produced a good crop. Despite cool weather during the fruit thinning period in May, most growers thinned apples well and produced a crop of about 6 million bushels, similar to that in 2007. Unlike growers in many of the other apple producing regions in the eastern US, most Virginia growers experienced no damage or only minor damage from hail in 2008, resulting in a crop that yielded good prices for both fresh and processing apples. In central Virginia, drought conditions from June through August resulted in a problem with sunburn in some orchards. Many growers reported that the cost of labor to harvest fruit increased substantially.

Not For Publication or Citation Without Consent of the Authors
14
CSFWC – WV State Report
Horticultural Comments, submitted by Steve Miller, Research Horticultursit, AFRS The winter of 2007-2008 was relatively mild with limited snow cover. Some injury was observed on young apple tree trunks and was attributed to significant temperature fluctuations that occurred in February. Bloom was delayed compared to the past several years and cool temperatures in April and May contributed to delayed fruit development and probably small fruit size. Apple thinning presented the usual challenges with cool temperatures and extended cloudy conditions, to say nothing of the seemingly constant wind. Cherries never recovered from the delayed growth and matured about a week to 10 days later than in recent years; size was also reduced at harvest. Sugar levels on early maturing sweet cherries were below normal. Rainfall was excessive in April and May, especially around bloom time. Over 13 inches of rainfall was recorded in the growing area between April 1 and May 15. Several light frosts affected peach bloom, but hand thinning was still required. Several orchards experienced severe hail damage, but in general the quality of most fruit crops was good. Yields were normal for this region. Except for a few brief periods of high temperatures, the summer was mild with adequate precipitation. Several perennial weed species have become problematic – an area that deserves renewed research interest and approaches for control. Both early peaches and apples were delayed in maturity, but late maturing cultivars matured more “on schedule”. Some excellent quality Honeycrisp was harvested as late as September 14 (at the AFRS research station!). Temperatures in August were cooler than normal which advanced color development on apples significantly. Rainfall from mid-September thru the first week of November (the apple harvest season) was below normal. Some apple varieties showed excessive pre-harvest drop. Processing prices for juice apples were higher than average and many growers picked up drops and sent grader culls to the processor rather than selling as “deer bait”, as has been the standard practice in recent years. Fall seemed short and winter arrived too soon! Entomology – Dr. Henry W. Hogmire, Jr. Internal worms [codling moth (CM), oriental fruit moth (OFM)] continue to present the greatest management challenge to West Virginia fruit growers. Quite a few growers used the newly registered products, Delegate and Altacor, for internal worm control. In addition, some growers who are participating in an NRCS-EQIP IPM program had their first experience in the use of hand-applied pheromone mating disruption dispensers for management of these pests. Overall, these programs performed very well, especially when considering that many sites were high pressure situations. CM was responsible for almost all of the injury in the various fruit samples that we examined, which occurred from mid-July through early September. Biofix (beginning of moth flight) was 11 and 3 days earlier in 2008 vs. 2007 for OFM and CM, respectively. Despite an earlier biofix, seasonal development of these pests was behind last year by 1-5 days from June 1 to August 1 and 5-8 days on Sept. 1 because of cooler temperatures. Rosy apple aphid was generally well managed by most growers during the prebloom period, with fewer postbloom problems requiring rescue treatments than last year. European red mite populations exceeded threshold and required treatment in only a few orchards. The generally cooler temperatures as compared with last year (9 vs. 30 days >90° F) and more abundant rainfall (28.6 vs. 12.4 inches from April through August) helped to slow build up of mite populations this year. Most of the problem situations occurred earlier in the

Not For Publication or Citation Without Consent of the Authors
15
season, May and June, resulting from a high population of overwintering eggs and lack of oil or other early season preventative acaricide application. Leafrollers [tufted apple bud moth (TABM), redbanded leafroller (RBLR)] were well managed in most orchards, with many growers continuing to use Intrepid during the egg hatching periods. In addition, growers who used Rimon, Delegate or Altacor for internal worm control benefited from good control of leafrollers with these products as well. Japanese beetle populations were generally much lower overall than last year. The drier conditions last year, especially during July (1.8 vs. 6.2 inches of rain), undoubtedly had a negative impact on the establishment and survival of larvae feeding on grass roots, resulting in fewer adults to emerge this year. Stink bug populations of our traditional species (brown, dusky, green stink bugs) were significantly lower than last year, however, the brown marmorated stink bug has become much more abundant. Populations have increased annually since first detected in West Virginia in 2004, and feeding on fruit in commercial apple and peach orchards was observed this year. Plant Pathology – Dr. Alan R. Biggs After three consecutive relatively mild and dry years in West Virginia, 2008 provided a season with some above-normal precipitation, with slightly greater than 25 inches of rain during the April through July period, with some meteorologists saying that May was the second wettest on record. Temperatures in May were slightly cooler than the 30-year average (-1 F departure), and April and June significantly warmer (+3.5 F departures from normal). Green tip on Red Delicious occurred on or about April 1; with seventeen early season infection periods recorded (prior to 1 June) which were followed by 21 additional infection periods from the period June 1 through August 30. Generally cool temperatures were adequate for early season disease development; however, limited overwintering inoculum from drought conditions in 2007 slowed the development of scab in our research plots. Very serious outbreaks of scab occurred in some commercial orchards for varying reasons, including 1) not starting the fungicide program soon enough, and 2) extending the alternate-row-middle interval past 7 days with an SI + protectant program. The very high incidence of primary mildew-infected terminal shoots was quite alarming for many growers. We had three fire blight infections periods during the apple bloom period this year. According to the Maryblyt model, fire blight blossom infections occurred on April 19 - 20, April 25 - 26, and May 4. Fire blight developed to moderate levels of shoot blight in some commercial orchards. Wetting hours accumulated quickly this year, due to several periods of extended wetting. We reached 250 accumulated wetting hours during the week of June 30, about two weeks earlier than last year. Sooty blotch was first observed the week of July 7 at about 315 wetting hours. One grower experienced about 75-90% loss of an Empire block due to bitter rot. Grower assessments of disease incidences at harvest for apples, as part of West Virginia’s NRCS IPM program showed that, for the most part, disease management is excellent.

Not For Publication or Citation Without Consent of the Authors
16
General Session
Not For Publication or Citation Without Consent of the Authors
17
Using Scholar to Manage Information in the Cumberland-Shenandoah Fruit Workers Conference
Douglas G. Pfeiffer Dept. Entomology
Virginia Tech, Blacksburg VA
Scholar is an open-source project management application based on Sakai software, employed at Virginia Tech to manage a wide variety of projects and courses. In the 2007 gathering of the Cumberland-Shenandoah Fruit Workers Conference, the possible use of this application was discussed in a general session, with a consensus to try the approach for a year or two to determine practicality. Consequently the conference Scholar site was further developed. The electronic mailing list from the previous year was used to add participants to this password-protected site. Members are listed as either participant or organizer. In most cases, individuals were listed as participants. The general chair for each year’s conference will be listed as an organizer (along with the site manager). This allows the program chair to post information and send e-mail messages. To enter the site:
• Point your browser to scholar.vt.edu (no www). • Once in the Scholar home page, log in using your e-mail address as user ID and the
automatically generated password received by email after becoming enrolled in the site (Virginia Tech personnel simply use the normal PID and password).
• Once logged into Scholar, you will see a red bar near the top of the screen listing any Scholar projects in which you are enrolled.
• Click on Cumberland Shenandoah Fruit Workers to enter our site. On the left side of the screen in our work space is a tool bar – in this area are links to fruit web sites in the mid-Atlantic area, as well as a public access web site for our conference (as opposed to the password-protected Scholar site). There is also an item called Resources, where most conference files are placed. In this location are materials relating to meeting registration, and conference proceedings. The Scholar site was used for the first time in 2008. In most cases, it functioned smoothly. A few individuals did not get mailings because they were not on the original mailing list. At the final session, some questions arose on the platform issues with Scholar – these will be explored. Please address any Scholar related issues to Doug Pfeiffer at [email protected].

Not For Publication or Citation Without Consent of the Authors
18
Not for Citation or Publication Without Consent of the Author
ECO APPLE: A PROJECT TO PRODUCE CERTIFIED REDUCED-RISK FRUIT FOR
A SPECIALTY MARKET 2007-08
Harvey Reissig and Art Agnello Department of Entomology, NYSAES, Geneva, NY 14456
Organic apple production is nearly impossible in the Northeastern United states because the complex of insect and disease pests is much more formidable than in many other apple production areas of the world. However, recent studies in a multi-state RAMP (Risk Avoidance and Mitigation Program) grant have shown that Northeastern apple growers can adequately control insect pests and diseases using IPM programs that utilize only reduced risk pesticides, which are less toxic to humans and safer for the environment. However, these programs are more expensive than growers’ standard control programs using conventional pesticides. Apple growers in this region would be more likely to adopt these types of IPM programs if they could receive premium prices for apples grown using these techniques to help offset increased costs of materials, and sampling and monitoring programs. In 2007, Cornell University, the University of Massachusetts, and Red Tomato™, a private non-profit corporation, started a research program to determine if a multi-state market niche could be created for Northeastern apples grown under IPM programs using reduced risk pesticides that would provide growers with premium prices and market access that is similar to that currently utilized by organic fruit. Red Tomato was founded in 1996 by Michael Rozyne and is based in Canton, MA. It is a non-profit corporation that is funded through grants and donations. This organization connects farmers with markets and consumers with fresh fruits and vegetables. Red Tomato’s mission is "connecting farmers and consumers through marketing, trade, and education, and through a passionate belief that a family-farm, locally-based, ecological, fair trade food system is the way to a better tomato." This corporation has developed a marketing concept in which “Eco Apples™” are equal to organic apples in prices and access to high quality market outlets. Eco Apples are grown using ecological farming methods by family farms in the Northeastern US. The prototype program was developed in 2003 by Red Tomato in conjunction with the University of Massachusetts, two commercial growers, and New England Fruit Consultants. This group analyzed pest management options and economics, and developed marketing procedures. The goals of this Eco Apple project are: 1) To eliminate or minimize the use of organophosphate and carbamate insecticides; 2) To eliminate or minimize the use of potentially carcinogenic fungicides; 3) To develop a marketing plan that increases revenues sufficient to offset the increased costs of an intensive pest management programs that uses reduced risk pesticides. The program has been refined and expanded from 2004-08. Red Tomato has gradually been expanding sales of Eco Apples since the program began. The following marketing benchmarks have been reached by the company: 2004, Eco Apple sales of $130,000; 2005, sales of $400,000; 2006, sales of $4600,000; and in

Not For Publication or Citation Without Consent of the Authors
19
Jan-June of 2007 sales of $112,858. The acreages and numbers of growers has also expanded from 475 acres of apples and 6 growers in 2005-06 to 771 acres, and 12 growers in 2007. The primary markets for Red Tomato are upscale specialty stores such as Whole Foods, Trader Joe’s and a collection of independent chains throughout the Northeast. Tom Green, Director of the IPM Institute of North America, is responsible for the classification of pesticides that can be used by growers in the program. Pesticides are classified according the their overall hazard rating. "Green" pesticides can be used with justification. "Yellow" pesticides can be used, with justification, when Green list or other alternatives are not adequate, and those pesticides on the "Red" list cannot be used in the program. Pesticides are classified within the program according to the following criteria: acute toxicity to wildlife, fish and birds; acute toxicity to humans; possible/likely/probable carcinogen; reproductive/developmental toxin; toxicity to pollinators, natural enemies, secondary pests; toxicity to wildlife; suspected endocrine disruptor; broad-spectrum pesticide; resistance risk; potential or known groundwater contaminant. Examples of insecticides classified as Green in the program are: Assail (acetamiprid), Dipel (Bacillus thuringiensis, Surround (kaolin clay), oil, Spintor (spinosad), mating disruption, and Esteem (pyriproxyfen). Insecticides classified as Yellow are: Proclaim (emamectin benzoate); Provado (imidacloprid); Intrepid (methoxyfenozide); Sevin (carbaryl) – for thinning only); Calypso (thiacloprid) – only for plum curculio; and Asana (esfenvalerate) – only for RAA, as a special case in PA. Some examples of Red insecticides are: Guthion (azinphosmethyl) – acute toxicity, AChE inhibitor, broad spectrum; Apollo (clofentezine) – possible carcinogen, suspected endocrine disruptor); Savey (hexythiazox) – possible carcinogen, moderate aquatic toxicity; Rimon (novaluron) – acute toxicity; Warrior (lambda cyhalothrin) acute toxicity, beneficials, endocrine disruptor; Actara (thiamethoxam) – likely carcinogen (although now placed in the Yellow category following an EPA review of further toxicology data). Fig. 1 shows where farms with participating growers in the project are located in the Northeast. Currently, NY has 4 participating farms with 62 acres. Two of the NY participating growers are wholesale marketers, and 2 are direct marketers. In New England, 5 farms are participating with a total of 500 acres. The NE cooperators include both direct and wholesale producers.

Not For Publication or Citation Without Consent of the Authors
20
During the two seasons of the project, pest control has been similar to standard growers’ conventional programs both in NY (Fig 2) and in New England (Fig. 3).

Not For Publication or Citation Without Consent of the Authors
21
New England growers have always obtained higher levels of clean fruit than those in NY. Two of the NY orchards (Stone Ridge and Ten Eyck) had lower percentages of clean fruit at harvest than some of the other blocks at harvest in 2007 (Fig. 2), because of ineffective scab control programs. Disease control in all NY blocks was much better in 2008.
It has been somewhat difficult to directly determine the prices of fruit that growers have sold within the program, but growers were surveyed to determine how they perceived the benefits of an association with Red Tomato. Some of the criteria that growers thought were important in their relationships with the marketing group are summarized in Fig. 4. The growers generally agreed that the prices they received were better than that from other apple brokers and that they received the prices promised. They also believed that they had a good relationship with Red Tomato, and that communication in the project was quite transparent. The growers felt that Red Tomato has been understanding when they were unable to reach set targets, and consequently they would not be interested in going elsewhere. They recognized that Red Tomato is interested in working with smaller growers and because of that they didn’t have to market entire tractor-trailer loads of apples. Other brokers were cited as being erratic in their dealings with growers, even when high quality produce was being marketed. Growers were relieved that Red Tomato was doing the “footwork” with potential markets so that growers were not pressured into selling prematurely. They appreciated Red Tomato’s contacts and their ability to deal with logistics. Finally, the growers were satisfied with the added value of the Eco Apple brand, and the dependability of the market even in this niche arena.

Not For Publication or Citation Without Consent of the Authors
22
Despite the relative success of this short-term project, there are still problems and potential limitations to developing a value-added marketing concept such as the “Eco Apple” approach. It is very important for grower participants in this type of program to obtain both access to selective markets and also premium prices. Unfortunately, many selective marketers tend to continually raise the bar of certain criteria that growers must follow to gain access to their markets and sometimes do not raise prices to reimburse growers for additional effort and expenses. If these types of programs are to succeed in the future, it will be necessary to attempt to persuade market outlets to pay premium prices to reimburse growers and, if necessary, to pass on the additional expenses to consumers. Also, in this project, some key new reduced risk pesticides are not approved for use in the current protocol. Certainly, in moving forward in classifying pesticides, it is necessary to be sufficiently flexible to allow the use of certain products in this program that might not be perfect for each classification category, but still have an overall profile that is better than standard materials that are currently used by growers. Even though this project has been gradually expanding, both in terms of sales, and numbers of growers and acreage, it is still a relatively small operation. Often it is inherently difficult to occupy a specialized market niche and expand a program so that large numbers of growers can participate. Currently this project focuses primarily on growers marketing to wholesale outlets, and benefits for growers directly marketing apples in local farm stands have not yet been optimized. Direct-market growers often have long-term clients that already trust their current pest management practices and appreciate the quality of their products. Therefore, the only benefit from participating in a program such as Eco Apple marketing for small direct marketers might be in attracting new customers. However, in adopting a niche marketing program, the direct marketer must put the whole farm in the project to avoid negative perception by his consumers of any non-

Not For Publication or Citation Without Consent of the Authors
23
certified fruit that might be grown on the farm. These growers also run the risk of eroding confidence of long-term customers who might perceive that the adoption of a new program indicates that previous practices were not adequately protecting consumers and the environment. Finally, it is important to continue to promote this project in such a way that other powerful interest groups such as growers using conventional pesticides and organic growers are not threatened by this style of niche marketing. Organic growers have traditionally been opposed to production practices that use non-organic pesticides in spite of their desirable toxicity, selectivity, and safety to the environment. Often, conventional growers have a deep-seated fear that the promotion of a niche market for Eco Apples implies that conventional growing practices are detrimental to the environment and unhealthy for the consumer. Consequently, they feel that promotion of such niche markets could lower the demand and price for their conventional products.

Not For Publication or Citation Without Consent of the Authors
24
Entomology

Not For Publication or Citation Without Consent of the Authors
25
EVALUATIONS OF PUFFERS AND SPLAT PHEROMONE PRODUCTS FOR MATING DISRUPTION OF TREE FRUIT PESTS
Arthur M. Agnello
Dept. of Entomology NYSAES, Geneva, NY 14456
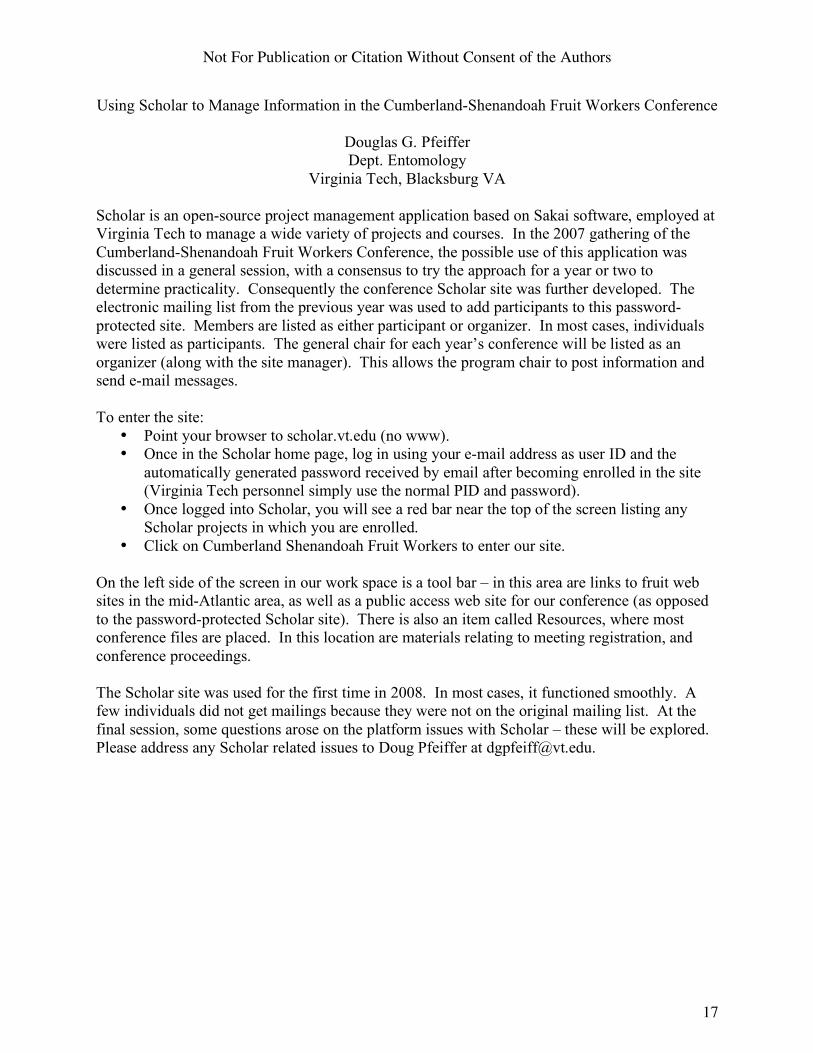
In 2008, internal worm management programs were tested in one "low-risk" and three "high-risk" apple orchards, and one de-fruited peach orchard using one of two different pheromone dispensing technologies, as well as (for the apples) a fruit sampling procedure to assess the need and timing for special pesticide sprays directed against the 2nd and subsequent generations of these species. Additionally, one of these technologies was tested for efficacy against OBLR in a moderate-risk apple orchard. This trial was conducted in mixed plantings of fresh and processing apples on five farms in Wayne, Orleans and Tompkins Counties, NY, to assess the impact on management programs for: 1 – Three internal-feeding Lepidoptera species, codling moth (CM), Cydia pomonella; oriental fruit moth (OFM), Grapholita molesta; and lesser appleworm (LAW), Grapholita prunivora, when applied against the all generations of these pests. 2 – Summer generation obliquebanded leafroller (OBLR), Choristoneura rosaceana. Among the apple varieties included on the five farms were: Idared, Cortland, Red Delicious, Golden Delicious, Empire, Jonamac, McIntosh, and Fortune. The specifics of each of the pheromone products follow: 1) Checkmate Puffer (Suterra LLC, Bend, OR) pheromone dispensers consisted of a plastic cabinet enclosing an aerosol canister containing the CM and OFM pheromone blends. Every 15 min between 5 pm and 5 am each day, a battery-powered timer and plunger were activated, releasing a 40-mg puff containing 7.22 mg of CM and 2.5 mg of OFM active ingredient into the orchard. Puffer cabinets were suspended in the upper one-third of the tree canopies at a rate of 1 per acre, in a regular grid pattern spaced approximately 40 m (132 ft) apart and keeping roughly half that distance between the orchard edge and the nearest puffer unit. Every tree in the perimeter 2 rows (or 2 row-end trees) additionally received a Checkmate CM-OFM Duel membrane dispenser, consisting of a double packet of pheromone-loaded pads behind controlled-release membranes, containing CM and OFM pheromone blends in separate envelopes. 2) SPLAT (ISCA Technologies, Inc, Riverside, CA) formulations consisted of target pest pheromones in a flowable wax emulsion delivered via a piston pump up an extension arm (held above the tree canopy) and into the hub of a centrifugal spinning emitter, which dispersed 0.25-g droplets into the canopy at a rate of ~6–10 droplets per tree or ~3000 droplets/A. The SPLAT formulations tested were: • SPLAT OFM 30M-1, containing 3% a.i. OFM pheromone. • SPLAT Cydia, containing 10% a.i. CM pheromone. • SPLAT Cydia ver. 3.38, containing 6% a.i. CM pheromone plus apple secondary plant compounds (an experimental formulation).

Not For Publication or Citation Without Consent of the Authors
26
• SPLAT OBLR, containing an undisclosed amount of OBLR pheromone (an experimental formulation). The pheromone treatments against the internal-feeding species were all applied slightly before or coincident with the first flights of the respective target species, except for the SPLAT OBLR at the Sodus site, which was delayed approximately 3 wk past the first adult catch because of a miscommunication between the manufacturer and the distributor: • Burnap North, Sodus (10A): SPLAT OFM, 8 May; SPLAT Cydia, 25 May • Burnap South, Sodus (5A): SPLAT OFM, 8 May; SPLAT Cydia ver. 3.38, 25 May • Burnap Peaches, Sodus (20A): SPLAT OFM, 8 May • Fowler Home Farm North, Wolcott (20A): SPLAT Cydia, 2 June • Fowler Home Farm South, Wolcott (18A): SPLAT Cydia ver. 3.38, 2 June • Fowler South Farm, (20A): SPLAT OBLR, 1 July • Hartley, Newfield (23A): Puffer CM/OFM, 7 May • Oakes, Lyndonville (9A): Puffer CM/OFM, 13 May Pheromone product efficacy in depressing adult male trap catch was monitored by using 5–6 Pherocon VI (Large Delta) traps per plot for each target species (including LAW, as this species has a similar pheromone blend to OFM). Traps were located at least 3–5 trees/rows interior to the orchard edges at each corner, plus in center locations as appropriate. Each was baited with a standard 1X lure for the respective target species, and checked weekly from 6 May to 29 August. In addition, a similar grouping of traps in a non-disrupted check plot nearby was also monitored at each farm, to maintain information on background levels of each of these species and for purposes of fruit injury comparison at harvest. Lures in all CM, OFM and LAW traps were changed at the beginning of July, and additionally during the first week of August for CM. The fruit sampling protocol consisted of weekly on-tree fruit inspections conducted from the week of 16 June to the week of 18 August, comprising 300 fruits per plot (20 on each of 15 trees) during the first week and 100 fruits per plot (10 on each of 10 trees) on subsequent weeks, to detect the initial occurrence of any larval fruit damage in time to curtail further infestation. Whenever an inspection session resulted in the detection of at least one damaged fruit, the grower or his consultant was notified so that they could determine whether a special spray of a selective pesticide was needed for control of the target pest. An evaluation of larval fruit-feeding damage at harvest was made by taking random samples of 1000 fruits from each plot (choosing trees from along each plot edge and throughout the plot interior) and examining them for internal and surface injury. Pre-harvest samples were taken between 12–23 Sept. Results Trap catches of adults were generally suppressed to low levels in all pheromone treatment plots during the mid- and late summer, although some breakthrough captures did occur, particularly for codling moth, so trap shutdown was not absolute in all cases (Figs. 1-2). Two SPLAT sites with notable CM catches were the Burnap and Fowler plots, where dissimilar trends were noted between the standard SPLAT Cydia and the experimental Cydia ver. 3.38 formulations. At Burnap, CM adult catches were almost completely suppressed throughout the season in the Cydia ver. 3.38 plot, while in the standard SPLAT Cydia plot, CM were frequently caught at rates of between 5-12 adults per trap per week starting in early June (Fig. 2).

Not For Publication or Citation Without Consent of the Authors
27
Conversely, at Fowler, CM catches in the standard SPLAT Cydia plots generally remained in the range of 0–4 adults per trap while those in the Cydia ver 3.38 plot several times peaked at more than twice those levels. It is not known what factors may have been responsible for these results, although the CM pressure at both of these sites was quite high, so in relative terms the proportional trap shutdown was still fairly good. The trap shutdown of OFM captures in the SPLAT OFM traps was generally adequate under the high pressure situation existing on the Burnap Peach site, with catches remaining below 5 adults per trap per week throughout the season. The fruit on these processing trees was thinned off shortly after bloom, as the grower was only interested in maintaining the trees during a season with no access to an acceptable market outlet. At the Fowler South Farm, the appropriate SPLAT OBLR application timing was unfortunately missed because of a miscommunication that delayed the product's shipment from the factory, so the bulk of the OBLR flight had already taken place by the time the treatment was applied. No difference in trap numbers was evident between the disrupted and non-disrupted plots until the second flight began in early August. The fruit sampling procedure was simple and convenient to implement, requiring 10–15 min per plot, and appeared to effectively allow detection of low-level infestations at a very early stage, so that the growers could be notified of any extra needed control measures in a timely fashion. Incidence of fruit injury was extremely low all season in all blocks until late July, when damage began to show up in the Fowler SPLAT plots, which persisted through most of the August sample dates. Relatively low amounts of fruit damage were seen in the Burnap and Hartley disrupted plots; pressure in the nondisrupted standards was considerable (Table 1). Likewise, very little OBLR damage was detected in the Fowler South Farm SPLAT plot. Fruit damage at harvest caused by internal-feeding Lepidoptera at harvest was very low in all the disruption treatments, and almost always significantly different from that observed in the respective nondisrupted check plots. Levels of total (stings plus internal tunneling) damage at Burnap averaged 0.8–1.5% in the different SPLAT plots, compared with 0.4% in the nondisrupted grower standard, and 15.4% in an adjacent untreated check block. At Fowler Home Farm, total damage averaged 0.7–1.9% in the SPLAT plots, and 6.4% in the nondisrupted grower standard (Table 2). The Hartley Puffer plot had 0.6% total fruit damage, compared with 6.4% in the nondisrupted check (Table 2). Mating disruption has been in use for three years on this farm, and the overall level of damage has progressively diminished each year. No fruit damage occurred at the Oakes Puffer site, compared with just 0.2% in the nondisrupted grower standard block. Finally, the OBLR larval damage to fruit at Fowler South Farm was 0.4% in the SPLAT plot, compared with 2.2% in the nondisrupted standard (Table 2). As the product was not applied until after much of the first generation mating would have likely taken place, it may be inferred that any treatment differences would have been a result of its impact on the second summer generation's mating period. Although it can be argued that the pheromone treatments tested improved the overall control of the lepidopteran management programs in these orchards, some factors, as before, can be identified as being potential contributors to less than perfect control: 1 – Although an effort was made to establish larger plots than in past years' trials, plot size still may not have been large enough to overcome the possibility of immigration by mated

Not For Publication or Citation Without Consent of the Authors
28
females. While this applies to both types of dispenser technology evaluated, it is probably more critical in the case of the Puffers, which are deployed at such low densities that a large number of them (over a correspondingly large area) are required to produce a comprehensively permeated region of orchard canopy space. The results of this year's trials underscores the implication, reflected in the product's label instructions, that the best efficacy using Puffers for mating disruption will be obtained in uses over larger areas (e.g., optimally 40 A or greater). 2 – Operational difficulties in the application and maintenance of the pheromone treatments need to be addressed. The Puffer units are relatively heavy and complex, which means that care should be taken in locating them on tree branches capable of supporting their weight over the entire season, and they should be checked periodically to ensure they are operating properly (again, as the manufacturer recommends). The SPLAT technology also offers great promise as a convenient and effective method of pheromone application over large areas. However, because the customized application equipment is complex and not easy to use, it may be difficult to promote widespread adoption of this technique by growers until some improvements are made along these lines. 3 – The population pressure may sometimes be too high to be completely disrupted by the pheromone treatments. Depending on the success in addressing the first two points noted, there will be the potential for less-than-complete mating disruption in situations of severe population pressure, so these methods will usually need to be supplemented with at least some form of insecticide application, particularly in the case of difficult to control species such as CM and OBLR. The in-season fruit inspection regimen continues to appear effective and reliable, but there remains a difficulty in convincing growers to wait for evidence of even a low level of damage in their orchards before applying a special spray against these pests. In general, considering the overall levels of pest pressure occurring in these orchards, and the economics (considering both materials and labor) of implementing such pheromone treatments, it is possible that many internal worm problems in NY orchards could be adequately and economically addressed by adjusting pesticide spray schedules—and particularly, coverage—or with the use of selective products in a smaller number of designated sprays. Acknowledgments Thanks are due to J.D. Fowler, D. Hartley, M. Maloney, and D. Oakes, for allowing these trials to be conducted on their farms; to J. Eve and J. Misiti, for coordinating the setup and maintenance of the plots and communications with the growers; to Dave Combs, Justin Eveland, Kate Fello, Nicole Gottschall, and James Watt, for field assistance in plot establishment and data collection, and to M. Shannon (Suterra LLC); A. Mafra-Neto, A. Getchell & H. Kotula (ISCA Technologies); and S. Zonneville (Winfield Solutions) for their cooperation in providing the pheromone products. This work was partly funded by the USDA RAMP program (Project No. 2006-51101-03604) and by support from ISCA Technologies.
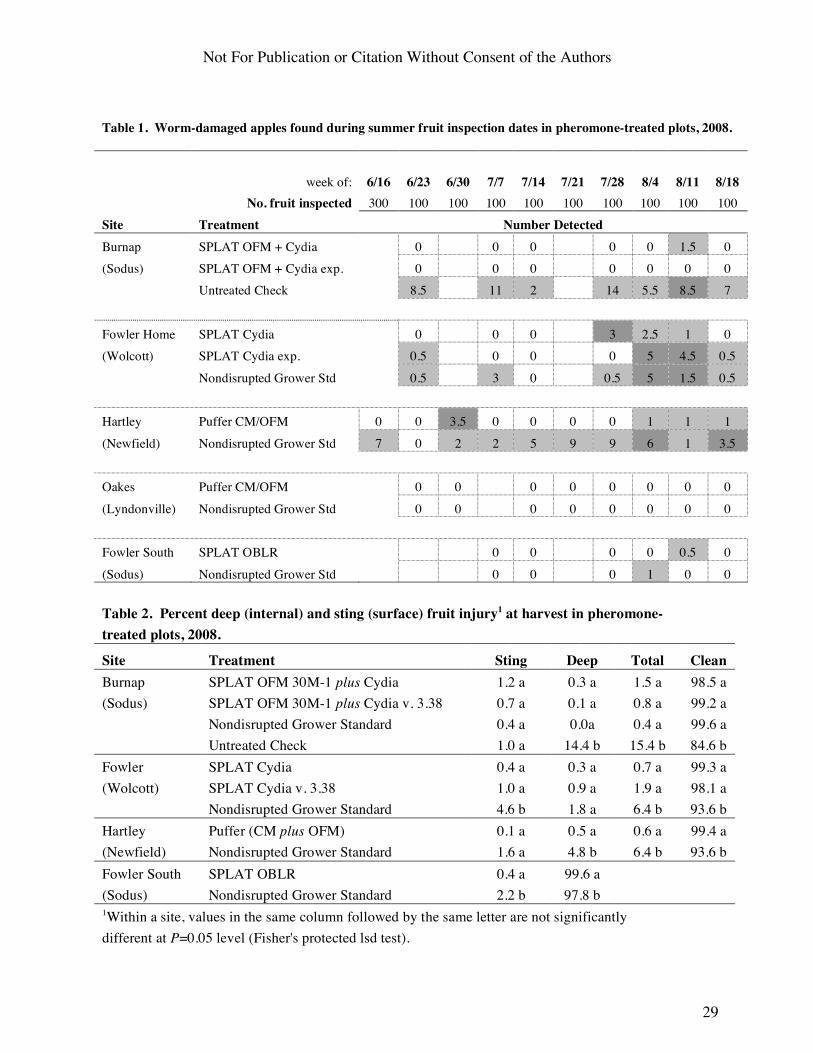
Not For Publication or Citation Without Consent of the Authors
29
Table 1. Worm-damaged apples found during summer fruit inspection dates in pheromone-treated plots, 2008.
week of: 6/16 6/23 6/30 7/7 7/14 7/21 7/28 8/4 8/11 8/18 No. fruit inspected 300 100 100 100 100 100 100 100 100 100 Site Treatment Number Detected Burnap SPLAT OFM + Cydia 0 0 0 0 0 1.5 0 (Sodus) SPLAT OFM + Cydia exp. 0 0 0 0 0 0 0 Untreated Check 8.5 11 2 14 5.5 8.5 7
Fowler Home SPLAT Cydia 0 0 0 3 2.5 1 0 (Wolcott) SPLAT Cydia exp. 0.5 0 0 0 5 4.5 0.5
Nondisrupted Grower Std 0.5 3 0 0.5 5 1.5 0.5 Hartley Puffer CM/OFM 0 0 3.5 0 0 0 0 1 1 1
(Newfield) Nondisrupted Grower Std 7 0 2 2 5 9 9 6 1 3.5 Oakes Puffer CM/OFM 0 0 0 0 0 0 0 0
(Lyndonville) Nondisrupted Grower Std 0 0 0 0 0 0 0 0 Fowler South SPLAT OBLR 0 0 0 0 0.5 0
(Sodus) Nondisrupted Grower Std 0 0 0 1 0 0 Table 2. Percent deep (internal) and sting (surface) fruit injury1 at harvest in pheromone- treated plots, 2008.
Site Treatment Sting Deep Total Clean Burnap SPLAT OFM 30M-1 plus Cydia 1.2 a 0.3 a 1.5 a 98.5 a (Sodus) SPLAT OFM 30M-1 plus Cydia v. 3.38 0.7 a 0.1 a 0.8 a 99.2 a Nondisrupted Grower Standard 0.4 a 0.0a 0.4 a 99.6 a Untreated Check 1.0 a 14.4 b 15.4 b 84.6 b Fowler SPLAT Cydia 0.4 a 0.3 a 0.7 a 99.3 a (Wolcott) SPLAT Cydia v. 3.38 1.0 a 0.9 a 1.9 a 98.1 a Nondisrupted Grower Standard 4.6 b 1.8 a 6.4 b 93.6 b Hartley Puffer (CM plus OFM) 0.1 a 0.5 a 0.6 a 99.4 a (Newfield) Nondisrupted Grower Standard 1.6 a 4.8 b 6.4 b 93.6 b Fowler South SPLAT OBLR 0.4 a 99.6 a (Sodus) Nondisrupted Grower Standard 2.2 b 97.8 b 1Within a site, values in the same column followed by the same letter are not significantly different at P=0.05 level (Fisher's protected lsd test).

Not For Publication or Citation Without Consent of the Authors
30

Not For Publication or Citation Without Consent of the Authors
31

Not For Publication or Citation Without Consent of the Authors
32
MATING DISRUPTION OF ORIENTAL FRUIT MOTH ACROSS THE APPLE/PEACH INTERFACE: TESTING THE “WHOLE-FARM MATING DISRUPTION” CONCEPT
Kris Tollerup1, Peter W. Shearer2, and Ann Rucker1 1Rutgers University, Rutgers Agricultural Research & Extension Center, Bridgeton, New Jersey, USA. 2Oregon State University Mid-Columbia Agricultural Research and Extension Center, Hood River, Oregon USA Introduction
This research is part of a multi-state Risk Avoidance and Mitigation Program (RAMP) grant funded by the USDA-CSREES. The principal objective of the program is to develop effective and economical reduced-risk (RR) pest management programs for apple and peach production in the eastern United States. The codling moth (CM), Cydia pomonella (L.), and oriental fruit moth (OFM), Grapholita molesta (Busck), are internal-feeding Lepidoptera and serious economic pests of apple (CM and OFM) and peach (OFM). These crops are commonly grown on the same farm in the eastern United States and G. molesta readily disperse between them. Mating disruption (MD) is an effective tool for controlling economic populations of C. pomonella (Pfeiffer 1993) and G. molesta (Atanassov et at. 2002). The objective of this research is to determine if MD applied across adjacent apple and peach blocks provides better control of G. molesta collectively than if applied to either crop alone. Materials and Methods
The experiment was conducted on three commercial orchards located in Cumberland County (site 1) and Gloucester County, NJ (sites 2 and 3). Each site had three plots comprised of an adjacent planting of apple and peach. Plots were approximately 10 to 26 A. One of three treatments was applied to each plot: 1) apple and peach, with MD, 2) apple without MD, peach with MD, and 3) apple with MD, peach without MD. CheckMate CM/OFM Duel® and CheckMate OFM® (Suterra LLC. Bend, Oregon) dispensers were applied to apple and peach trees, respectively, at a rate of 100 dispensers per acre. MD was applied before the first flight of C. pomonella in apple and before the second flight of G. molesta in peach. All blocks also received reduced-risk (RR) and/or OP-replacement insecticide treatments.
Delta traps were baited with either C. pomonella or G. molesta sex-pheromone to monitor male moth flight activity. Traps were checked weekly from mid April to early Oct. Damage to peach was assessed at harvest by conducting in situ sampling of 10 fruit/tree on nine trees in each of three transects (tree-rows) per plot. Transects ran perpendicular to the apple/peach interface. Along each transect, fruit were sampled from the 1st, 3rd, and 5th trees nearest the interface edge, three trees in the middle of the plot, and the 1st, 3rd, and 5th trees from the distal edge of each plot. The same scheme was used to assess damage to apple; however, 20 fruit/tree were sampled, 10 in the upper and lower portion of the canopy. Internal worm damage was classified as either a sting (a shallow feeding puncture with no larva), or an entry, (a deeper feeding hole with or without larva). Moth capture data were analyzed as the total number of moths captured per trap using proc mixed (SAS 9.1). All moth capture data are shown as the average cumulative number of moths captured per week. Fruit damage data were analyzed as the proportion of internal worm damaged fruit using analysis of variance (SAS 9.1). Moth capture and proportion damaged fruit data were log and arcsine square root transformed respectively.

Not For Publication or Citation Without Consent of the Authors
33
Results The average cumulative number of C. pomonella captured in traps did not significantly
differ among treatments in 2007 (F = 1.15, df = 2, 4; P = 0.4028) (Fig. 1) or 2008 (F = 4.46, df = 2, 4; P = 0.0899) (Fig. 2). In 2007 verses 2008, the average cumulative number of C. pomonella captured was 73 to 78% lower in MD-treated plots (Figs. 1 and 2).
In 2007, the number of G. molesta captured in traps was significantly lower in MD versus
non-MD blocks (F = 11.12, df = 2, 4; P = 0.0232). The average cumulative number of G. molesta trapped in 2008 was reduced approximately 90% in MD-treated apple and peach plots and up to 73% in non MD-treated apple and peach plots when compared with the number captured in 2007 (Figs 3, 4, 5, 6). There was no difference in G. molesta abundance captured in pheromone traps between treatments in 2008 (F = 3.41, df = 2, 4; P = 0.1366).
The amount of fruit damaged by internal feeders differed significantly among treatments in 2007 (F = 8.85, df = 4,4; P = 0.0288) and 2008 (F = 8.06, df = 4,4; P = 0.0338) (Fig. 7). Essentially, most of the internal worm damage occurred in apple and ranged between 1.2 to 4.5% in 2007 and 0.2 to 2.6% in 2008. Fifteen worms (14 C. pomonella and 1 G. molesta) were identified in 2007. Only two C. pomonella were identified in 2008.
Conclusions
The mating disruption treatment applied to apple in 2007 did not effectively manage C. pomonella. Moths were consistently captured in MD-treated plots and internal worm damage exceeded economic thresholds. The cumulative capture of C. pomonella moths was considerably lower in 2008 than in 2007. This trend was supported by the decrease in internal worm damage to apple observed in MD-treated fruit.
G. molesta was effectively controlled in both years in apple and peach plots treated with MD,. Minimal internal worm damage occurred on peach in 2007 and none was observed in 2008. Based upon the type of internal feeding damage we observed and the relative high proportion of C. pomonella found in damaged apples, this suggests that G. molesta was effectively controlled in apple blocks. The 2007 data collected in peach suggest that the placement of MD in apples inhibited the capture of G. molesta in adjacent peach plots. Insecticide use, MD carry-over effects, and impacts of MD from adjacent plots are likely factors that explain the decrease in C. pomonella and G. molesta abundance and damage between years.
References Cited Atanassov, A., P. W. Shearer, G. Hamilton, and D. Polk. 2002. Development and
implementation of a reduced risk peach arthropod management program in New Jersey. J. Econ. Entomol. 95: 803 - 812.
Pfeiffer DG, Kaakeh W, Killian JC, Lachance MW, Kirsch P. 1993. Mating disruption for control
of damage by codling moth in Virginia apple orchards. Entomol. Exp. Appl. 67: 57-64. Acknowledgement
This project was funded by a USDA-CSREES RAMP project 2006-51101-03604. The authors also thank and acknowledge Suterra LLC for providing the pheromone mating disruption dispensers.

Not For Publication or Citation Without Consent of the Authors
34
Fig. 1. Cumulative number of C. pomonella captured in pheromone traps in apple orchards, 2007. (A = apple, P = peach, + = MD, - = no MD).
Fig. 2. Cumulative number of C. pomonella captured in pheromone traps in apple orchards, 2008. (A = apple, P = peach, + = MD, - = no MD).

Not For Publication or Citation Without Consent of the Authors
35
Fig. 3. Cumulative number of G. molesta captured in pheromone traps in apple orchards, 2007. (A = apple, P = peach, + = MD, - = no MD).
Fig. 4 Cumulative number of G. molesta captured in pheromone traps in peach orchards, 2007. (A = apple, P = peach, + = MD, - = no MD).

Not For Publication or Citation Without Consent of the Authors
36
Fig. 5. Cumulative number of G. molesta captured in pheromone traps in apple orchards, 2008. (A = apple, P = peach, + = MD, - = no MD).
Fig. 6. Cumulative number of G. molesta captured in pheromone traps in peach orchards, 2008. (A = apple, P = peach, + = MD, - = no MD).

Not For Publication or Citation Without Consent of the Authors
37
Fig. 7. Percentage of fruit damaged by internal worms, 2007 (A) and 2008 (B). Numbers and letters on X-axis represents tree location in sample transects (N=near, M=mid, F=far; 3 trees per location, 3 transects per block) in relation to apple/peach interface.
B
A

Not For Publication or Citation Without Consent of the Authors
38
Efficacy of Mating Disruption Techniques in North Carolina Apple Orchards
Vonny Barlow & Jim Walgenbach
MHCREC, NC State University Mills River, NC
Highly diverse orchard plantings interspersed among managed and non-managed habitats preclude the use of an area-wide pest management approach to control the top two lepidopteron pests of eastern US apples ; the codling moth,Cydia pomonella (L.) (Lepidoptera: Tortricidae) and the oriental fruit moth, Grapholita molesta (Busck), Lepidoptera: Tortricidae. In 2007, we began a series of studies to evaluate the efficacy of various mating disruption products on field populations of codling and oriental fruit moths. The products evaluated were Sutera PUFFER® CM/OFM, ISCA Technologies Specialized Pheromone & Lure Application Technology (SPLAT®), Sutera CM/OFM CheckMate Duel, and the industry standard CM/OFM Isomate® TT. All mating disruption treatments were used as a complement to the growers' normal insecticide programs.
Materials & Methods Pheromone Dispensing Systems
Puffer In 2007 two apple orchards (I & II) were selected with existing populations of both
codling moth (CM) and oriental fruit moth (OFM). Orchard I was approximately 69ha of contiguous mixed ‘Rome Beauty’ and ‘Golden Delicious’ variety apple trees with tree size ranging from 2.4 – 4.6m. Orchard II was approximately 4.86ha of ‘Golden Delicious’ variety apple trees with tree size ranging from 4.6 – 6.1m. Treatments to blocks at each of the orchards were randomly assigned in a Randomized Complete Block Design (RCBD) and consisted of Puffer and a conventional treatment control.
Puffer (Suterra LLC, Bend OR) units consisted of aerosol cans containing custom formulations of 69.4g of CM pheromones placed into brown plastic computer controlled “cabinet” emitters. Average weight (± SEM) of aerosol cans when placed into the Puffer cabinets prior to travel into the field was 492.8± 0.5g. In both orchards I & II, Puffers were placed every 61.0 m along the perimeter of orchards in the top 1m of the tree canopy with an additional 4 Puffers placed in the interior of the orchards. Orchard I (5.8ha) used a total of 17 Puffers and orchard II (4.9ha) used a total of 13 Puffers. At the end of the season Puffer cabinets were retrieved and the aerosol cans were removed and weighed to determine the total output in each apple orchard. Orchard I Puffers were in place for 153d and aerosol cans weighed an average of 154.9 ± 1.6 with a mean output of 338.6 ± 2.0g/aerosol can. Orchard II Puffers were in place for 158d and aerosol cans weighed an average of 161.2 ± 4.6g with a mean output of 331.0 ± 4.4g/aerosol can. Mean codling moth pheromone output for both orchards was 0.4± 0.0g ai/day which was sufficient coverage for 154d. Puffers were applied on 20 April.
In 2008, orchard I was again used and a new orchard (Orchard III) replaced orchard II from 2007. Orchard III consisted of approximately 10.0ha of contiguous mixed ‘Rome Beauty’ and ‘Golden Delicious’ variety apple trees with tree size ranging from 2.4 – 4.6m. Puffer aerosol cans contained custom formulations of 24.0g of OFM and 55.5g of CM pheromones. Average

Not For Publication or Citation Without Consent of the Authors
39
weight (± SEM) of aerosol cans when placed into the Puffer cabinets prior to travel into the field was 416.8 ± 0.2g. In both orchards I & III, Puffers were placed every 50.3m in the second row of trees inside of the orchard perimeter in the top 1.0m of the tree canopy. Pheromone dispensers were placed in the outside perimeter of trees at a rate of 200/0.4ha of CM/OFM Isomate TT in the top 1m of the tree canopy. Orchard I (5.8ha) used a total of 18 Puffers and orchard III (4.7ha) used a total of 12 Puffers. At the end of the season Puffer cabinets were retrieved and the aerosol cans were removed and weighed to determine the total output in each apple orchard. Orchard I & III Puffers were in place for 183d and aerosol cans weighed an average of 139.9 ± 7.6 with a mean output of 276.8 ± 7.6g/aerosol can (orchards I & III respectively). Orchard II Puffers were in place for 158d and aerosol cans weighed an average of 131.6± 4.0g with a mean output of 284.8 ± 4.1g/aerosol can. Mean codling moth pheromone output for both orchards was 0.3 ± 0.0g ai/day which was sufficient coverage for 180d. Puffers were applied on 21 April.
SPLAT In 2007 a single apple orchard (Lynch) with existing populations of CM and OFM
populations were used to evaluate SPLAT, which is an amorphous wax polymer matrix for the sustained release of CM and OFM. The orchard located in Polk County consisted of a 10.1ha block of ‘Rome Beauty’ and ‘Red Delicious’ trees with tree size ranging from 5.5-7.6m. The orchard was partitioned into two 2.0ha SPLAT treatments, a 2.0ha non-pheromone control, and a 7.3ha area treated with Isomate CM/OFM TT (200 dispensers/0.4ha). Splat was applied on 26 April and Isomate in early April.
In each of the treatment blocks, tree density per unit area was determined to aid in the proper application rate of the SPLAT product to trees. The two SPLAT treatments consisted of 1) SPLAT CM/OFM (both CM and OFM pheromone was combined in the wax mixture) and 2) SPLAT CM + OFM (separate formulations of each pheromone were applied to trees). The Splat CM/OFM formulation consisted of 3% OFM pheromone (3-component blend) and 10% CM pheromone (codlemone), while SPLAT CM had 10% codlemone and SPLAT OFM had 3% OFM pheromone. Application of SPLAT was made with a metered applicator provided by ISCA Technologies that allowed dollop size to vary from 0.86 – 4.26g. In both SPLAT treatments, CM pheromone was applied at 75 g a.i./0.4ha (750 g formulated product/0.4ha) and OFM pheromone was applied at 22.5 g a.i./0.4ha (750 g formulated product/0.4ha). Splat CM/OFM and SPLAT CM were applied at about 465 droplets/0.4ha, and SPLAT OFM at about 95 droplets/0.4ha.
Isomate TT Twenty-one commercial apple orchards (1.6 – 42.1ha in size) were selected in 2008 for
treatment with CM/OFM Isomate TT pheromone reservoir dispensers. In each of the orchards, tree density per unit area was determined to aid in the proper application rate of the reservoir dispensers to trees. Pheromone reservoir dispensers were applied at a rate of 200/0.4ha to the upper 1m of the tree canopy (58.9g* ai CM pheromone/0.4ha). Six non-mating disruption commercial apple orchards (5.3 – 17.4ha in size) were used as controls and received only insecticide applications for codling moth control. * Data obtained from the federal label.
Checkmate Duel Four commercial apple orchards were selected in 2008 for a paired comparison of
CM/OFM CheckMate Duel with CM/OFM Isomate TT pheromone reservoir dispensers. Each

Not For Publication or Citation Without Consent of the Authors
40
of the orchards was divided into1.6 – 2.0ha blocks. In each of the treatment blocks, tree density per unit area was determined to aid in the proper application rate of the reservoir dispensers to trees. CheckMate pheromone reservoir dispensers were applied at a rate of 170/0.4ha to the upper 1.0m of the tree canopy (45.9g* ai CM pheromone/0.4ha). Isomate pheromone reservoir dispensers were applied at a rate of 200/0.4ha to the upper 1m of the tree canopy (58.9g ai CM pheromone/0.4ha). * Data obtained from the federal label.
Data from commercial apple orchards across Henderson County treated with CheckMate were also pooled to better assess the efficacy. Orchards treated with CM/OFM CheckMate Duel (N = 7) were pooled to allow for the comparison of efficacy against CM/OFM Isomate TT (N = 14) and controls (N = 7) which received only insecticide applications for codling moth control. CheckMate pheromone reservoir dispenser treated apple orchards received 150 - 212/0.4ha to the upper 1m of the tree canopy. Isomate pheromone reservoir dispensers were applied at a rate of 200/0.4ha to the upper 1m of the tree canopy.
A large commercial apple orchard was selected in 2008 for a paired comparison of CM/OFM CheckMate Duel pheromone reservoir dispensers at 150/0.4ha (N = 3) against CM/OFM CheckMate Duel 200/0.4ha (N = 3). The orchard was divided into ≈ 2.0ha blocks. In each of the treatment blocks, tree density per unit area was determined to aid in the proper application rate of the reservoir dispensers to trees. CheckMate dispensers were applied to the upper 1.0m of the tree canopy at rates of 150/0.4ha (40.5g ai CM pheromone/0.4ha) and 200/0.4ha (54.0g ai CM pheromone/0.4ha). Treatment Evaluation
Treatment efficacy was based on male moths captured in pheromone traps and damage to fruit by larvae. At all study sites, CM and OFM male moths were monitored with Delta traps baited with CM-L2 lures OFM-L111, respectively. Traps were placed in each treatment at a density of one CM trap/1.0ha (trap placed in the upper canopy), and one OFM trap/4.0ha (if plot size was <4.0 ha, only one OFM trap was used) at eye level. Attractant lures were replaced at 12-wk intervals to ensure lure potency. Traps were monitored weekly to record the number of moths captured and to clean and service traps. Results & Discussion
Puffer Codling moth pressure was high beginning in April across all orchards with CM seasonal
trap counts ranging from 1 – 305 moths. Oriental fruit moth pressure was uniformly low across all treatments and resulted in no observable treatment differences and as a result was not included in the comparisons.
Puffer-treated orchards at both sites performed better in 2008 than in 2007 (Figs. 1a & 1b). In 2007 little difference in pheromone trap captures were detected between the three treatments (i.e., Isomate TT , Puffer and control), with the difference between treatments being < 7.6 codling moths per trap (Fig. 1a). In 2008, when Isomate TT pheromone dispensers were placed in trees adjacent to trees containing Puffer dispensers, trap suppression of CM was suppressed in comparison to CheckMate and control blocks (Fig. 1b). Season cumulative CM trap capture averaged 122.5 ± 1.1 in controls compared to 33.2 ± 0.4 and 16.0 ± 0.3 in the Isomate TT and Puffer blocks, respectively (Fig. 1b). Differences between trap captures in Puffer and Isomate TT blocks was small, with the greatest differences being 1.1% and 1.9% on

Not For Publication or Citation Without Consent of the Authors
41
Julian dates 118 and 209, respectively (Fig. 1b). Both Puffer and Isomate TT blocks suppressed CM numbers throughout the course of the season compared to the controls (Figs. 1a & 1b). Nearby orchard blocks treated with CheckMate at 170 dispensers per 0.4ha did not suppress capture below the control. The location of the CheckMate treatment in close in proximity to apple bin storage areas may have adversely affected this treatment (Fig. 1b).
Puffer aerosol dispenser can output for both orchards was 0.4 ± 0.0g ai/day in 2007 and 0.3 ± 0.0g ai/day in 2008 (see above) which was sufficient coverage for the 154 and 180d period that Puffers were placed in orchards in 2007 and 2008, respectively. The greatest potential advantage of using Puffers was that they automatically metered out uniform amounts of pheromone regardless of environmental conditions as compared to reservoir dispensers like Isomate TT and CheckMate Duel which that greater amounts of pheromone on hotter days than cooler days (temperature dependant).
SPLAT The SPLAT treated blocks of CM + OFM and CM/OFM both performed better relative
to the control block during the first CM generation (Fig. 2). Peak first generation CM trap captures were 39.8% and 9.7% (CM + OFM and CM/OFM, respectively) less than the control block (Fig. 2). The Isomate treated block had fewer CM trap captures and was 79.0% less than the control treatment, and 76.8% and 65.2% less than CM + OFM and CM/OFM treatments respectively (Fig. 2).
Reduction of trap captures in SPLAT treatments during the second CM generation was less distinct with CM + OFM and CM/OFM treated blocks achieving only 3.13% and 46.09% trap shut-down relative to the control block, respectively. The Isomate-treated block performed the best at the Lynch site with a trap shut-down of >99.0% relative to the control block and either SPLAT treated blocks. It is interesting to note that the CM + OFM blocks performed better than the CM/OFM SPLAT treatment, which suggests that control may be additive between the 2 SPLAT products when used in combination (Fig. 2).
Lab analysis of SPLAT performed as part of M.Sc. dissertation by P. Davis at Western North Carolina University showed that pheromone release from both CM-SPLAT and CM/OFM SPLAT was only effective for the first 6 weeks after initial application (Figs. 3a & 3b). This may help to explain why effective population suppression in SPLAT treated orchards differed between the first and second CM generations in the field (Fig. 2).
Isomate TT Use of CM/OFM Isomate TT compared to non-pheromone treated blocks (without
mating disruption) effectively suppressed trap capture populations during the first CM generation by 90.2% in the conventional insecticide (CNV) program + mating disruption using Isomate TT pheromone reservoir dispensers (Fig. 4). Use of reduced risk insecticide (RR) programs + Isomate TT achieved a 86.3% trap shutdown (a 4.3% difference from CNV program + mating disruption ) compared to controls (Fig. 3). The peak of CM counts for the second generation occurred on 181J (Fig. 4). Conventional and RR insecticide programs + Isomate TT were 98.2% and 86.8% (respectively) less than controls (Fig. 4). Differences over the course of the season between CNV and RR insecticide programs never differed by more than 11.4%, which is an indication of an effective merging of the two insecticide programs that coincides with the introduction of newer RR products like Delegate and Altacor.

Not For Publication or Citation Without Consent of the Authors
42
Information obtained from CBC (America) Corp. showed that CM/OFM Isomate TT pheromone reservoir dispensers released pheromone steadily for 20wk (Fig. 5). During our sampling period of 25wk for CM and OFM it appears that the declining amount of pheromone released from the Isomate TT dispensers in the last 3-4wk did not result in increased CM captures (Fig. 4). Whether this is the result of declining numbers of active CM in the cooler weeks at the end of the season when CM are preparing to overwinter, or the result of continued biological activity of the Isomate TT dispenser on CM is unknown.
CheckMate Duel The use of CheckMate dispensers at 170/0.4ha suppressed first generation CM numbers
by 48.6% on Julian date 125 compared to the control, which was 21.5% less than the Isomate TT treatment with -27.1% (Fig. 6). Thereafter, CheckMate suppression of CM numbers were similar to the conventional controls with the exception of a single mean spike of 24.5 ± 18.3 moths on Julian date 167 (Fig. 6). Reasons for this point increase that exceeded all other treatments is unknown, but may have been due to an influx of CM from outside of the orchards being monitored.
Pooled cumulative weekly moth counts from 28 orchards across Henderson County showed a similar trend of CheckMate dispensers at 170/0.4ha not performing as well as Isomate TT at suppressing CM numbers (Fig. 7). Differences in performance between CheckMate at 170/0.4ha and Isomate at 200/0.4ha are more pronounced when comparing cumulative weekly moth counts against mean weekly counts (Figs. 6&7).
Differences in the effectiveness of Isomate TT and CheckMate Duel dispensers may be the result of CM pheromone that the two dispensers delivered (see above). Isomate TT dispensers released approximately 58.9g ai CM pheromone/0.41ha during every growing season, which is a 1.3 fold increase over the amount that CheckMate released (45.9g ai CM pheromone/0.4ha). This could explain the performance difference between Isomate TT and CheckMate Duel dispensers in the field on CM numbers.
Evaluation of CheckMate at dispenser rates of 150 (40.5g ai CM pheromone) and 200 (54.0g ai CM pheromone) dispensers per 0.4 ha in a replicated experiment showed that there was essentially no difference between the two rates (Fig. 8). The amount of pheromone present in the orchard at any one time supplied by the 150 dispenser rate may be adequate, and the additional pheromone released by the 200 dispenser rate may be unnecessary (Fig. 8).
Summary
These results indicate a clear impact of the amount of pheromone delivered on the effectiveness of the products against CM in the field. The use of SPLAT CM+OFM performed better than SPLAT CM/OFM, but only for the first 6 weeks when nearly all the pheromone present in the wax emulsion of both formulations of SPLAT was released (Fig. 3). This would suggest that a second application of SPLAT may be necessary in the field to suppress CM populations. The use of Puffers with an outer perimeter of Isomate TT provided effective CM suppression that was similar to Isomate TT used alone. The use of Isomate TT provided CM suppression that was better than all of the other treatments evaluated with greater than ≈ 86% trap shutdown. Increasing the rate of CheckMate from150/0.4ha to 200/0.4ha rate did not improve CM suppression. While certain pheromone treatments performed better than others in individual trials, Isomate TT dispensers generally provided the most consistent results.

Not For Publication or Citation Without Consent of the Authors
43
Fig. 1. Mean weekly trap captures of codling moth in Puffer pheromone dispenser treated orchards compared to Isomate CM/OFM TT treated orchards in 2007(a) - 2008(b) Fig. 2. Mean weekly trap captures of codling moth in SPLAT and Puffer pheromone dispenser treated orchards compared to Isomate CM/OFM TT treated orchards in 2008
Comparison of Mean Weekly Codling Moth Trap Counts in
Puffer and CM/OFM Isomate TT Treated Apple Orchards - 2008
0
5
10
15
20
25
30
35
40
45
50
104
118
132
146
160
174
188
202
220
230
244
258
Julian Date
We
ek
ly m
oth
tra
p c
ap
ture
s
(±S
EM
)
CheckMate/170
Cm/OFM Isomate TT
Conventional control
PufferBiofix
April 21
Mean Weekly Codling Moth Trap Counts in Apple orchards Applied with
SPLAT-CM Co-applied with SPLAT-OFM and SPLAT-CM/OFM Blend in Summer 2007
0
10
20
30
40
50
60
70
80
90
92
106
120
134
148
162
176
190
204
218
232
246
260
274
288
302
Julian Date
We
ek
ly c
od
lin
g m
oth
ca
ptu
res
(±S
EM
)
Conventional control
CM/OFM SPLAT
CM+OFM SPLAT
CM/OFM Isomate TT
Comparison of Mean Weekly Codling Moth Trap Counts in
Puffer and CM/OFM Isomate TT Treated Apple Orchards - 2007
0
1
2
3
4
5
6
7
8
9
10
92
106
120
134
148
162
176
188
204
218
232
246
260
Julian Date
We
ek
ly m
oth
tra
p c
ap
ture
s (
±S
EM
)
Puffer
CM/OFM Isomate TT
Conventional control
Biofix
April 23
Comparison of Mean Weekly Codling Moth Trap Counts in
Puffer and CM/OFM Isomate TT Treated Apple Orchards - 2007
0
1
2
3
Comparison of Mean Weekly Codling Moth Trap Counts in
Puffer and CM/OFM Isomate TT Treated Apple Orchards - 2007
0
1
2
3
4
5
6
7
8
9
10
92
106
120
134
148
162
176
188
204
218
232
246
260
Julian Date
We
ek
ly m
oth
tra
p c
ap
ture
s (
±S
EM
)
Puffer
CM/OFM Isomate TT
Conventional control
Biofix
April 23
a b
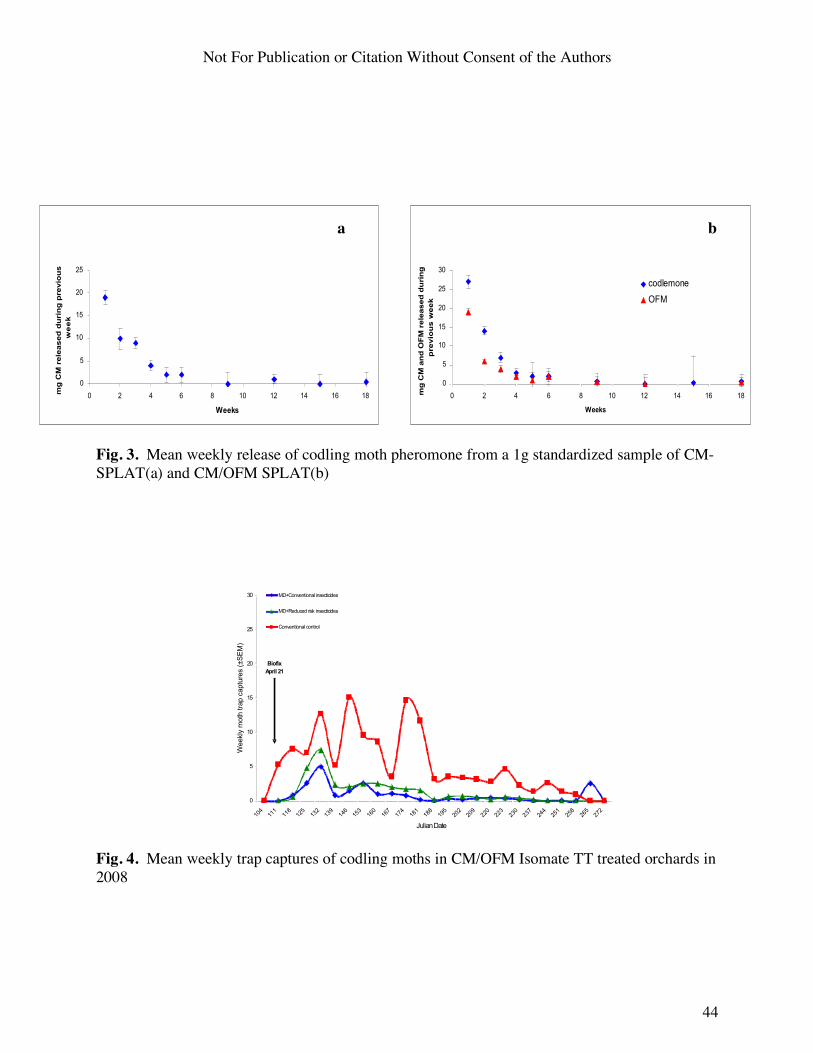
Not For Publication or Citation Without Consent of the Authors
44
Fig. 3. Mean weekly release of codling moth pheromone from a 1g standardized sample of CM-SPLAT(a) and CM/OFM SPLAT(b) Fig. 4. Mean weekly trap captures of codling moths in CM/OFM Isomate TT treated orchards in 2008
SPLAT (CM): Pheromone Release Rate
0
5
10
15
20
25
0 2 4 6 8 10 12 14 16 18
Weeks
mg
CM
rele
ased
du
rin
g p
revio
us
we
ek
SPLAT (CM/OFM): Pheromone Release Rates
0
5
10
15
20
25
30
0 2 4 6 8 10 12 14 16 18
Weeks
mg
CM
an
d O
FM
rele
ased
du
rin
g
pre
vio
us
we
ek
codlemone
OFM
Mean Weekly Codling Moth Trap Counts in both
CM/OFM Isomate TT and Conventional Apple Orchards - 2008
0
5
10
15
20
25
30
104
111
118
125
132
139
146
153
160
167
174
181
188
195
202
209
220
223
230
237
244
251
258
265
272
Julian Date
Weekly
moth
tra
p c
aptu
res (
±S
EM
)
MD+Conventional insecticides
MD+Reduced risk insecticides
Conventional control
Biofix
April 21
a b

Not For Publication or Citation Without Consent of the Authors
45
Fig. 5. Mean weekly release of codling moth pheromone from a CM/OFM Isomate TT dispenser in the field – Pennsylvania - 2006 Fig. 6. Mean weekly trap captures of codling moth in orchards treated with 170/0.41ha CM/OFM CheckMate Duel compared to orchards treated with 200/0.41ha Isomate CM/OFM TT
P h erom o ne Release C urve o f Isom ate-C M /OFM T T - 2006
0
20
40
60
80
100
0 2 4 6 8 10 12 14 16 18 20
Rem
ain
ing
A.I. (
% )
OFM
CM
W e e ks
Comparison of Mean Weekly Codling Moth Trap Counts in
CheckMate and CM/OFM Isomate TT Treated Apple Orchards - 2008
0
5
10
15
20
25
30
104
118
132
146
160
174
188
202
220
230
244
258
272
Julian Date
Weekly
mo
th t
rap
cap
ture
s (
±S
EM
)
CheckMate/170
CM/OFM Isomate TT
Conventional control
Biofix
April 21

Not For Publication or Citation Without Consent of the Authors
46
Fig. 7. Mean cumulative weekly trap captures of codling moths in orchards treated with 150 - 212/0.41ha CM/OFM CheckMate Duel compared to orchards treated with 200/0.41ha Isomate CM/OFM TT in 2008 Fig. 8. Mean weekly trap captures of codling moths in orchards treated with 150/0.41ha CM/OFM CheckMate Duel compared to orchards treated with 200/0.41ha CM/OFM CheckMate Duel in 2008
Pheromone Trap Captures in Orchards with
and without Mating Disruption - 2008
0
20
40
60
80
100
120
140
160
Cu
mu
lati
ve m
oth
s p
er
trap
No Disruption
CheckMate
CM/OFM Isomate -TT
No Disruption
CheckMate
CM/OFM Isomate -TT
APR MAY JUN JUL AUG SEP
Mean Weekly Codling Moth Trap Counts in
CheckMateTreated Apple Orchards - 2008
0
5
10
15
20
25
104
118
132
146
160
174
188
202
220
230
244
Julian Date
We
ek
ly m
oth
tra
p c
ap
ture
s (±
SE
M)
CheckMate/150
CheckMate/200
Biofix
April 21

Not For Publication or Citation Without Consent of the Authors
47
WHOLE FARM MATING DISRUPTION: ORIENTAL FRUIT MOTH CASE STUDY Margaret E. Reid, Greg Krawczyk, Ph.D.
Penn State University Fruit Research and Extension Center Biglerville, PA 17307-0330
BACKGROUND
The whole farm mating disruption (WFMD) program started in 2006 as a part of the PA area-wide mating disruption project supported by the PA Department of Agriculture and State Horticultural Association of Pennsylvania. The main goal of the program was to assist growers in incorporating available mating disruption products with their own individual pest management practices, and to enhance the efficacy of the codling moth Cydia pomonella L. (CM) and Oriental fruit moth Grapholita molesta (Busck) (OFM) control. While growers understand there are possible benefits resulting from the utilization of these new methods, questions generally stem from how to successfully integrate the use of pheromones into their existing pest control programs. During the 2008 season, the WFMD program worked with thirteen growers across the state of Pennsylvania. Each individual grower was responsible for the management of monitoring pheromone traps and weekly recording of moth captures, purchasing most of the MD products, and applying the mating disruption materials into their orchards. As the growing season progressed, decisions related to the insecticide applications within each site were based on locally observed pest pressures from pheromone traps and fruit injury evaluations.
During early summer 2008, a new farm with a very high pressure from OFM was added as a part of the WFMD project described above. With a very heavy OFM pressure in all blocks within the farm, the main goals for this farm were to lower the OFM populations, protect remaining fruit from OFM infestation, and at the same time use this research opportunity to evaluate and compare the practical field efficacies of various OFM mating disruption products applied side-by-side under heavy OFM pressure (Figs. 1 and 2). Despite a continuous, regular insecticide program applied to all blocks, existing problems with the Oriental fruit moth management warranted an unusual, mid-season incorporation of OFM mating disruption programs as an additional treatment on almost the entire area of the farm. MATERIALS AND METHODS
A large, commercial apple/peach orchard located in Northumberland County, PA was utilized for evaluations of various available OFM MD materials. During the week of 03 July, at the grower’s discretion, seven different blocks within the whole farm ranging in size from 5 to 20 acres were identified and treated with various available OFM MD materials (Table 1). At least two pheromone traps were placed within each block utilizing different mating disruption treatments, and checked weekly. The Isomate M-100 dispensers (CBC America) were placed on 6.25 acres at a rate of 100/A. Disrupt OFM mats (Hercon Environmental) were placed on 7 acres at 10 mats/A. CideTrak OFM (Trece Inc.) materials were placed on 6 acres at a rate of 100/A. CheckMate OFM dispensers (Suterra LLC) were placed on 11 acres at a rate of 100/A. CheckMate OFM Puffers (Suterra LLC) were placed in a 9 acre block at a rate of 2 puffers/A. In addition, hand-applied CheckMate OFM dispensers were also placed on the perimeter trees around the puffer block.
The remaining acreage on the farm not utilized for the hand-applied MD systems comparisons was treated with three applications of sprayable CheckMate OFM-F (Suterra LLC) pheromones: on 17 July at a rate of 1.32 oz/A; on 25 July at the rate 3.96 oz/A; and on 16 Aug at a rate 3.96 oz/A. The 17 July application was applied as a complete spray, while the 25 July

Not For Publication or Citation Without Consent of the Authors
48
and 16 Aug applications were applied alternating every third row. Although the CheckMate OFM-F sprayable pheromone was applied to both apple and peach blocks, due to the timing of the project only apple blocks were used for evaluation. A total of ten pheromone traps were placed and monitored throughout 62.5 acres of CheckMate OFM-F sprayable pheromone apple blocks.
Of the entire farm acreage, one small, 6.5 acre block was not treated with the OFM mating disruption materials and was designated as the Control (no MD) block. This block received only the insecticide program. This appointed Control block was surrounded on three sides by peach and apple blocks treated with sprayable OFM pheromones.
The initial fruit injury evaluation was conducted on 22 July to document the pre-existing fruit injury levels in each block. A visual observation of 3000 apples was conducted in each block; 100 fruit per tree, 10 trees per rep, 3 reps per block. A variety of cultivars were sampled in order to represent the entirety of the farm. Only one block treated with sprayable OFM pheromone was used for fruit injury evaluation. A final fruit injury evaluation was conducted in September during harvest using the same methodology as the mid-season July fruit evaluation.
Due to the very high OFM pressure as indicated by the initial fruit injury evaluation conducted in July, the entire farm, including all MD treatments, was treated with an intensive insecticide program (Table 2) through the remainder of the season. RESULTS
Despite placing various forms of OFM mating disruption on almost the entire farm acreage, pheromone traps located in the monitored blocks continued to capture OFM males. The highest cumulative number of OFM moths collected after the application of different mating disruption treatments (from 17 July to 16 October) was 93 OFM per single trap observed in the puffer block (Fig. 3). The cumulative number of moths collected in all other MD treatment blocks was lower than an average of 20 moths per trap/ treatment. Compared to the very high numbers of OFM adults prior to the application of MD programs, the trap data observed during the second part of the season suggests a significant impact of MD materials on the OFM population present in the orchard after the program was implemented. The 22 July fruit evaluation, although conducted after the application of various MD programs, represents the pre-MD injury levels in various parts of the farm. The fruit in the block designated for CideTrak OFM dispensers were the most heavily damaged with 11.7 percent fruit with OFM injuries. The two blocks with hand-applied CheckMate (Puffers and dispensers) materials had about 2.7 percent injured fruit each. Fruit in the remaining four blocks had significantly less OFM injured fruit, with Isomate M-100 having 1.0 percent injured fruit, Disrupt OFM mats 0.8 percent injured fruit, and sprayable CheckMate OFM-F with 0.4 percent injured fruit. The Control block during the July evaluation had 1.2 percent OFM injured fruit. The final harvest fruit injury evaluations were conducted on 22 September. The highest percentage of injured fruit was again observed in the CideTrak block with 8.2 percent injured fruit. The fruit in the CheckMate OFM had 5.8 percent injured fruit while 5.5 percent of fruit were also injured in the CheckMate Puffer OFM block. The fruit in the Isomate M-100 block had 1.7 percent injured fruit, which was similar to the injury levels observed in Disrupt OFM mat block at 1.3 percent injured fruit and sprayable CheckMate OFM-F block at 1.1 percent injured fruit. Similarly, as in all treatment blocks when compared to the initial July evaluations (except the CideTrak block), the OFM injury level in the control bock also increased to 3 percent of fruit. It is important to note that although the CM adults were also present in the orchard, the injury levels from this pest never exceed 0.2 percent and was similar in all evaluated blocks.

Not For Publication or Citation Without Consent of the Authors
49
Since the initial injury levels were different in the various blocks, to determine efficacy of various OFM MD programs the mid-season July evaluation was compared to the final fruit injury evaluation conducted during harvest in September (Fig. 4). Only the CideTrak block showed a decrease in percent injured fruit, with a decrease by 0.3 fold. Despite the presence of MD materials, four blocks observed significant increase in the percentage of injured fruit: CheckMate OFM with a 2 fold increase, CheckMate Puffer with a 1.7 fold increase, sprayable CheckMate OFM-F with a 3 fold increase. In two blocks the increase in fruit injury observed during the September evaluations was not significant: Isomate M-100 had 0.7 fold increase and Disrupt OFM mats had a 0.6 fold increase compared to the July levels. The Control block also had 2.5 fold increase in the level of injured fruit.
When narrowing the observations to a single variety, Golden Delicious, the results of the mid-season and final fruit injury comparisons parallel the multiple-cultivar results (Fig. 5). This suggests that during this project neither the type of cultivar, training system, nor the age of the trees influenced the results.
Although the Control block was not directly treated with mating disruption, pheromones from the three surrounding sprayable pheromone blocks may have drifted into the Control block, thus influencing the OFM population observed in the traps located in this block.
Despite the increase in the number of injured fruit at harvest in all but one of the MD treated blocks, the implementation of OFM MD mid-season still has proved to be an effective tool to lessen the severity of OFM damage. By combining the mating disruption with an intensive pesticide program the grower was able to prevent a greater increase in OFM problems and minimize the OFM injury levels at harvest. As proof of the grower’s acceptance of this project, despite multiple hail storms severely damaging the season’s crops in August the grower continued to follow the outlined WFMD program. The intermediate trap data was an important factor used to document the effects of the program on the OFM population levels. The grower is now planning to continue the use of OFM MD during the 2009 season. Acknowledgements: The authors would like to thank the following for providing assistance with this project: Suterra LLC, Hercon Environmental, CBC America, and Trece, Inc. for providing mating disruption materials, Adam Baugher, Shaun Callahan, Braden Eastman, and Kirsten Snyder for their expertise in data collection, and many thanks to our cooperating grower.

Not For Publication or Citation Without Consent of the Authors
50
Table 1. Mating disruption treatments in evaluated apple orchard blocks. (PSU FREC 2008) *Hand-applied CheckMate OFM dispensers placed on perimeter of puffer block.
Product Company Acres Treated Rate/Acre Isomate M-100 CBC America 6.25 100 dispensers/A
Disrupt OFM mats Hercon Environmental 7 10 mats/A CideTrak OFM Trece, Inc 6 100 dispensers/A
CheckMate Puffer OFM
Suterra LLC 9 2 puffers/A*
CheckMate OFM Suterra LLC 11 100 dispensers/A CheckMate OFM-F
(sprayable) Suterra LLC 62.5
(multiple apple blocks)
July 7- 1.32 oz/A (C) July 25- 3.96 oz/A (x 3rd
row) Aug 16- 3.96 oz/A (x 3rd row)
Control No mating disruption 6.5 Table 2. Schedule of 2008 season insecticide applications in evaluated orchard. (PSU FREC 2008).
Date Pesticide Rate/Acre Application type April 16 Nufos 4E 1 qt ARM April 19 Perm-Up 3.2 EC 6 oz ARM April 24 Assail 30 SG 6 oz ARM May 13 Guthion 50 WP 1.25 lb ARM May 19 Guthion 50 WP 1.25 lb ARM May 27 Guthion 50 WP
Delegate WG 1 lb
5.5 oz ARM
June 4 Guthion 50 WP Delegate WG
1 lb 5.5 oz
ARM
June 13 Guthion 50 WP 1.5 lb ARM June 20 Guthion 50 WP 1.5 lb ARM July 3 Delegate WG 4.5 oz C
July 17 Guthion 50 WP Delegate WG
1.5 lb 4.5 oz
C
Aug 5 Altacor 3 oz C Aug 27 Altacor 3 oz C

Not For Publication or Citation Without Consent of the Authors
51
Figure 1. Cumulative Oriental fruit moth capture in pheromone traps during 2005, 2006, and 2007 seasons. Data from two or three traps located in the various blocks; traps checked weekly by the grower. (FREC 2008).
Figure 2. Cumulative Oriental fruit moth capture in pheromone traps from 21 April to 28 June 28, 2008. Data from single traps located in various blocs and maintained by the grower. (FREC 2008).

Not For Publication or Citation Without Consent of the Authors
52
Figure 3. Cumulative Oriental fruit moth captures in pheromone traps located in blocks treated with various MD products and Control block. The trap data include moths captured from 17 July through 16 Oct, 2008. Two traps per block checked weekly by grower. (FREC 2008).
Figure 4. Change in percent fruit injury between July 22 evaluation and September 22 evaluation, compared by mating disruption treatment. Data collected from 3 reps; 10 trees per rep, 100 fruit per tree. Count includes OFM and CM frass and larva injury. The values for the bars within the same treatment with the same letter are not significantly different (Fisher’s Protected LSD Test, P<0.05). ( PSU FREC 2008).

Not For Publication or Citation Without Consent of the Authors
53
Figure 5. Change in percent fruit injury between July 22 evaluation and September 22 evaluation in Golden Delicious only, compared by mating disruption treatment. The number at the bottom of the bar equals number of evaluated Golden Delicious trees, 100 fruit evaluated per tree. (PSU FREC 2008).

Not For Publication or Citation Without Consent of the Authors
54
USING AREA-WIDE MATING DISRUPTION IN PENNSYLVANIA'S ORCHARDS, AN OPTION FOR CODLING MOTH AND ORIENTAL FRUIT MOTH CONTROL
Faruque U. Zaman, Larry A. Hull, Greg Krawczyk, Eric Bohnenblust and
David Biddinger Penn State University-FREC, 290 University Drive, Biglerville, PA 17307
Abstract
A three year (2006-2008) area-wide mating disruption project (AWMD) was established to evaluate the efficacy of this management approach for reducing the severity of fruit injury caused by both the Oriental fruit moth (OFM) and codling moth (CM) in Pennsylvania’s deciduous tree fruit orchards. Isomate CM/OFM TT® and Suterra Checkmate CM/OFM Duel® pheromone mating dispensers were used to control CM and OFM in apple orchards. Isomate M-100 dispensers were used for OFM control in stone fruit orchards in 2008. Captures of adult CM/OFM in AWMD treated blocks continued to trend mostly downward in 2008 from 2006 levels. Overall fruit injury by CM and OFM in AWMD apple and peach blocks was reduced over the course of the three year study. The majority of apple growers reduced their insecticide inputs for CM and OFM control in 2007, some by 50-70% from 2006 levels. Insecticide use levels are not yet calculated for 2008. Introduction Both the codling moth (CM), Cydia pomonella, and Oriental fruit moth (OFM), Grapholita molesta, have emerged as serious threats to the successful production and sale of apples in Pennsylvania during recent years. Since 1998, over 4,000 loads of apples destined for the processing markets in Adams County, PA were rejected by USDA inspectors for the presence of live CM and OFM worms in the fruit. This is in addition to the thousands of individual fresh fruit rejected for the presence of these two pests. The presence of one live larva in a truckload of fruit (e.g., 150-1,000 bushels) is cause for rejection. These two pest outbreaks have caused and continue to cause untold financial losses to both growers and processors in Pennsylvania and throughout the eastern U.S.
There are a number of reasons cited for this recent outbreak of internal fruit-feeding larvae including insecticide resistance to a number of commonly used insecticides (i.e., organophosphates, the loss of some insecticides and restrictions on others due to the Food Quality Protection Act, alternate row middle spraying, water volume coverage issues, extended intervals between sprays, etc). In order to overcome some of these issues, new approaches in pest management are vitally needed. One management tactic that has succeeded in controlling CM and OFM throughout the U.S. and the rest of the world while minimizing the use of insecticides is mating disruption (MD) using synthetic sex pheromones. Because this technology influences the behavior of the adult moths and eventually their control, it works better over larger, fairly contiguous acreages than on an individual block-by-block basis scattered over a wide geography. For example, area-wide (AW) MD of CM (i.e., 150-1200 acres of contiguous orchards) has achieved tremendous success in controlling this pest on over 80,000 acres of apples and pears in the western U.S, while reducing broad-spectrum insecticide (OPs) use by 60-90%. Similar success has been achieved for OFM in Australia.
Few fruit growing areas in the world have populations of both CM and OFM infesting
apple simultaneously as is presently occurring in Pennsylvania. Pests with multiple hosts like

Not For Publication or Citation Without Consent of the Authors
55
CM in apple and pear and OFM in pome and stone fruits are better controlled if all hosts are disrupted on an area-wide basis rather than allowing one or more crops untreated. Fortunately, a number of MD technologies are available for both species. In the AW project (2006-2008), we have managed both CM and OFM simultaneously with a single dispenser system (i.e., Isomate CM/OFM TT® or Suterra Checkmate Duel®) and found both to be quite effective in managing both species while reducing the need for insecticide input. Materials and methods The area-wide mating disruption (AWMD) project that was established in four large sites of tree fruit crops (apples, cherries, peaches and pears) in Adams County, PA, during 2006 was continued for a third year during the 2008 season. The original four sites established in 2006 were continued with the same number of growers (13) involved at the start of the project, but changes in the number and size of the blocks in the program occurred because either orchard blocks were removed due to age or a number of orchard blocks were added to the project due to the desire of growers to expand the AWMD program. Each site in 2008 ranged in size from 199 - 293 acres and collectively totaled about 1025+ acres. There were slight changes in acreage (-2.86%) in 2008 due to the removal of some old orchards or addition of new blocks in all AWMD sites. All but one site contained mostly contiguous blocks of apples and peaches except Site 2, which had only apple blocks and one cherry block. Also, the Site 1 contained four pear blocks and one apricot block. As in 2006, 2007 during the 2008 season all AWMD orchard blocks within each site were treated with some form of mating disruption for CM and OFM. In addition, within each of these sites there was an adjacent small plot (SP) mating disruption block (i.e., 6-10 acres), which was not connected to any of the AW blocks and one or two conventional (CV) blocks which did not contain any mating disruption and served as the grower standard control program for CM and OFM.
Isomate CM/OFM TT® pheromone mating dispensers from CBC America were placed by the growers in the vast majority of AWMD participating apple and pear orchards during the last week of April and the first 10 days in May at a dispenser density rate ranged from 100 to 200 dispensers per acre based on the observed pest pressure (i.e., moth capture and fruit injury data). One grower chose to use only the Checkmate CM/OFM Duel (Suterra Inc.) mating disruption technology on entire 29 acres of apples participating in the program. Due to the effectiveness of the AWMD program in lowering CM and OFM populations during the first two years, in 2008 we recommended that most AW growers could reduce the required density of Isomate CM/OFM TT dispensers from the standard density of 200 per acre to 100-150 dispensers per acre (i.e., 25-50% reduction). All AWMD growers in 2008 used the Isomate M-100® (CBC America) dispensers for OFM control in stone fruit orchards. These dispensers were placed in all participating orchards at a density ranging from 50 to 100 dispensers per acre.
A grid of sex pheromone traps was again established in each site to monitor CM and OFM. For CM observations three types of monitoring lures: CM Long-Life® (1X), CM Megalure® (10X) and CM DA Combo® (all Trece, Inc) were used in 2006-2008. For OFM, the OFM Long-Life® (1X) lure was used. The OFM and CM traps were placed at a density of one trap per three acres; therefore, each individual type of CM lure was placed at a density of one per nine acres. CM traps were fastened to bamboo poles and placed in the top 20-30% of the tree

Not For Publication or Citation Without Consent of the Authors
56
canopy. All other traps were placed at ≈ 5-6 ft high above the ground. Traps were checked weekly and the trapping data with the pest management message were distributed to the growers each week via email or hand delivery. Intensive injury evaluations were conducted on fruits and shoots in each orchard block at each AW site after the end of the first CM and OFM generation flights (late June and early July) to assess the effectiveness of the AWMD treatments against first brood CM and first and second brood of OFM. Assessments of fruit injuries on various cultivars were done prior to harvest of the fruits. During each assessment 2000 fruits/block/cultivar (20 trees x 100 fruit) were randomly inspected for the presence of injury caused by CM and OFM larvae. Results and Discussion In most of the AWMD apple blocks, captures of adult CM during the seasonal flight period in 2008 (Year 3) were substantially lower than the moth captures recorded during the 2006 flight period (Year 1) for all pheromone lure types (All data not shown - see Fig. 1-2 for Site 2 data). Total captures of adult CM in 2008 AWMD apple blocks were reduced by 30-78% from numbers captured in traps in 2006 despite an overall reduction in pheromone dispenser density per acre by 25 – 50% in 2008 from the 2006/07 levels of 200 dispensers/acre. However, when the CM adult capture data in 2008 is compared to the 2007 data, we observed that adult captures in 2008 were generally either the same or slightly higher than in 2007. Using the Site 2 data as an example (Fig. 1), the cumulative number of CM moths captured in AW blocks in 1X lure baited traps decreased from 60 CM/trap/season in 2006 to around 13 and 20 CM/trap/season for 2007 and 2008, respectively. The cumulative number of CM adult captures in 2008 in CV blocks was still high in comparison to the number of adult captures in 2006 (Fig. 1). Again using the Site 2 as an example (Fig. 2), the cumulative number of moths captured in AW blocks in DAC lure baited traps decreased from 100 CM/trap/season in 2006 to around 27 and 22 CM/trap/season for 2007 and 2008, respectively. Some of the increased adult captures in 2008 could be due to natural variation or more likely due to the reduced density of MD dispensers that were placed in most grower blocks in 2008.
For OFM, adult captures in monitoring traps within the AWMD project continued to
remain very low or non-existent throughout the 2008 season (Fig. 3, Site 2 as an example). For apples in 2008, most AW growers placed the Isomate CM/OFM TT or the CheckMate CM/OFM Duel products in their orchards before the CM biofix which corresponds with the on-going flight of the 1st generation of OFM. For stone fruits, most growers did not place the MD products until the start of the 2nd generation flight of OFM in early to mid-June. The continued low or no OFM adult captures (i.e., most blocks showed zero adult captures) in stone fruit blocks (data not shown) emphasizes how low OFM populations have become in most growers blocks after three years of continuous MD as well as how effective MD is for OFM. This continual reduction in adult captures in the 3rd year of the project has resulted in less injury at harvest across all crops as well and less insecticide use by the growers.
Even though there were some apple blocks in the AWMD program that showed elevated
adult captures in 2008 over the previous year, our fruit injury assessments during the mid-summer and at harvest showed that the elevated adult captures did not translate into increased fruit injury (Fig. 4). When CM/OFM infestation levels were determined for all AW apple blocks

Not For Publication or Citation Without Consent of the Authors
57
in 2006, only 28% of the blocks were free from internal worm injury while the percentage of clean blocks increased to 37 and 44% for 2007 and 2008, respectively. Similarly, the percentage of apple blocks with highly infested (>2.0% infestation) fruit was reduced from 11% in 2006 to 7 and 6% in 2007 and 2008, respectively. One important change to note for 2008 was the introduction and availability of a couple of new reduced risk insecticides – Delegate® and Altacor®, for grower use. From our research efficacy program with these products, both are extremely effective against both CM and OFM. We know from our conversations with some of the AWMD growers, that they used these products for 1st and 2nd generation CM control. The majority of apple growers reduced their insecticide inputs in 2007, some by 50- 70% from 2006 levels. Currently, we are assessing the 2008 insecticide inputs. Based on a preliminary review of 2008 use data, insecticide uses most likely will be further reduced from 2007 levels. We will have a much better understanding about the role of reduced densities of MD dispensers per acre and their interaction after analyzing the supplemental insecticide application schedules at the end of the season. Conclusions
The results from the third year of the project indicate that captures of adult CM/OFM in
AWMD blocks continued to trend mostly downward with 30-78% fewer CM adults and up to 92% fewer OFM adults captured in 2008 from 2006, despite a reduction of dispenser density by 25 – 50% in 2008. Overall, fruit injury by CM and OFM in AWMD apple blocks was reduced from the first year (2006) of the project (for 3 sites) by 38-87% in 2007 and by 66-77% in 2008 from the 2006 levels. In one site (site # 3) fruit injury by CM/OFM was 0.17% in 2006, it increased to 0.25% and 0.56% in 2007 and 2008, respectively. Fruit injury by CM/OFM in the 3 CV blocks increased from 60-246% in 2007 and up to 1545% in 2008 from 2006 levels. Compared to 2006, overall fruit injury by OFM in all AWMD peach blocks also decreased by 66-80% in 2007 and by 61-93% in 2008 (Fig. 5). The majority of apple growers reduced their insecticide inputs in 2007, some by 50-70% from 2006 levels. After three years of continuous use, the area-wide mating disruption approach has drastically reduced CM and OFM populations in apple and peach orchards in Pennsylvania. Acknowledgments The authors would like to thank Andrew May, Elliot Moore, Sarah Pizzuto, Megan Priest, Sharon Scamack, Melanie Schupp, Matthew Wagner, Greg Wenk, Kathy Wholaver for their help with the data collection and subsequent field activities. The authors also offer special thanks to the AWMD project participating growers for their sincere cooperation during the entire project. Funding and support for the project was provided by grants from Pennsylvania Department of Agriculture (PDA – Contract no. ME 445577), State Horticulture Association of Pennsylvania (SHAP), CBC America, and Suterra Inc.

Not For Publication or Citation Without Consent of the Authors
58
Fig. 1. Codling moth adult cumulative trap captures by CM 1X lure from Site 2 - Area-Wide (AW) and conventional (CV) blocks for 2006, 2007 and 2008. See legend for lure type. No. traps/treatment in ( )
0
10
20
30
40
50
60
70
80
30-Apr 20-May 9-Jun 29-Jun 19-Jul 8-Aug 28-Aug 17-Sep 7-Oct
Site 2 AW CM 1X-2006 (22)
Site 2 AW CM 1X-2007 (29)
Site 2 AW CM 1X-2008 (28)
0
20
40
60
80
100
120
140
160
180
30-Apr 20-May 9-Jun 29-Jun 19-Jul 8-Aug 28-Aug 17-Sep 7-Oct
Site 2 CV CM 1X 2006 (6)Site 2 CV CM 1X 2007 (9)
Site 2 CV CM 1X 2008 (8)
Mea
n no
. mot
hs c
aptu
red
per t
rap
Mea
n no
. mot
hs c
aptu
red
per t
rap

Not For Publication or Citation Without Consent of the Authors
59
Fig. 2. Codling moth adult cumulative trap captures by CMDAC and CM 10X lures from Site 2 - Area-Wide (AW) and conventional (CV) blocks for 2006, 2007 and 2008. See legend for lure type. No. traps/treatment in ( )
0
20
40
60
80
100
120
140
30-Apr 20-May 9-Jun 29-Jun 19-Jul 8-Aug 28-Aug 17-Sep 7-Oct
Site 2 AW CM DAC-2006 (21)
Site 2 AW CM DAC-2007 (28)
Site 2 AW CM DAC-2008 (27)
0
20
40
60
80
100
120
140
160
30-Apr 20-May 9-Jun 29-Jun 19-Jul 8-Aug 28-Aug 17-Sep 7-Oct
Site 2 CV CM DAC 2006 (3)
Site 2 CV CM DAC 2007 (5)
Site 2 CV CM DAC-2008 (6)
0
10
20
30
40
50
60
70
80
90
30-Apr 20-May 9-Jun 29-Jun 19-Jul 8-Aug 28-Aug 17-Sep 7-Oct
Site 2 AW CM 10X-2006 (21)
Site 2 AW CM 10X-2007 (23)
Site 2 AW CM 10X-2008 (21)
Mea
n no
. mot
hs c
aptu
red
per t
rap
Mea
n no
. mot
hs c
aptu
red
per t
rap
Mea
n no
. mot
hs c
aptu
red
per t
rap

Not For Publication or Citation Without Consent of the Authors
60
Fig. 3. Oriental fruit moth adult cumulative trap captures from Site 2 - Area-Wide (AW) and conventional (CV) blocks for 2006, 2007 and 2008. No. traps/treatment in ( )
0
20
40
60
80
100
120
140
160
180
10-Apr 30-Apr 20-May 9-Jun 29-Jun 19-Jul 8-Aug 28-Aug 17-Sep 7-Oct
Site 2 CV OFM 2006 (9)
Site 2 CV OFM 2007 (14)
Site 2 CV OFM 2008 (14)
0
20
40
60
80
10-Apr 30-Apr 20-May 9-Jun 29-Jun 19-Jul 8-Aug 28-Aug 17-Sep 7-Oct
Site 2 AW OFM-2006 (65)
Site 2 AW OFM 2007 (76)
Site 2 AW OFM 2008 (77)
Mea
n no
. mot
hs c
aptu
red
per t
rap
Mea
n no
. mot
hs c
aptu
red
per t
rap

Not For Publication or Citation Without Consent of the Authors
61
Fig. 4. Percentage of fruit injury at harvest in the area-wide (AW) and conventional (CV) apple blocks in 2006-2008.
0.0
2.0
4.0
6.0
8.0
10.0
Site 1 Site 2 Site 3 Site 4
AW 2006
AW 2007
AW 2008
0.0
2.0
4.0
6.0
8.0
10.0
Site 1 Site 2 Site 3 Site 4
CV 2006
CV 2007
CV 2008Mea
n pe
rcen
tage
frui
t inj
ury

Not For Publication or Citation Without Consent of the Authors
62
Fig. 5. Percentage of fruit injury at harvest in the area-wide (AW) and conventional (CV) peach blocks in 2006-2008.
0.0
0.2
0.4
0.6
0.8
Site 1 Site 3 Site 4
AW 2006
AW 2007
AW 2008
0.0
0.2
0.4
0.6
0.8
Site 1 Site 3 Site 4
CV 2006
CV 2007
CV 2008
0.00 0.00
Mea
n pe
rcen
tage
frui
t inj
ury
Not For Publication or Citation Without Consent of the Authors
63
Preliminary Evaluation of the Economic Effectiveness of Areawide Mating Disruption for Apples in Pennsylvania
J.K. Harper1, L.F. Kime1, L.A. Hull2, G. Krawczyk2, E. Bohnenblust2, and F. Zaman2 1 Department of Agricultural Economics and Rural Sociology, The Pennsylvania State University, University Park, PA 2 Department of Entomology, Penn State Fruit Research and Extension Center, Biglerville, PA Individual growers have used mating disruption as an insect management practice for several years. Rather than using insecticides to kill the target insect, mating disruption employs synthetic sex pheromones to make it harder for target populations to reproduce. It is generally a very successful, but also more expensive, option to existing insecticide treatments. Areawide mating disruption (AWMD) which involves control of large contiguous acreages rather than by individual orchard block has the potential to both improve the effectiveness of mating disruption and lower the per acre cost of treatment. AWMD has been successfully used for managing codling moth (CM) in the western U.S. and oriental fruit moth (OFM) in Australia. An AWMD project was conducted in Adams Co., Pennsylvania from 2006-2008. Prior to this project (funded by the Pennsylvania Department of Agriculture with additional support from the State Horticulture Association of Pennsylvania), AWMD had not been tested under Mid-Atlantic growing conditions or for both CM and OFM simultaneously. The AWMD program was set up for four sites containing mostly apples (but which also included small acreages of peaches, pears, and apricots). The objective of the project was to test effectiveness of AWMD for both OFM and CM and determine if it can provide a comparable level of control to conventional insecticide programs at a reasonable cost. This paper presents preliminary results of the economic analysis based on data from the first two years of the project. The primary object of the economic analysis was to estimate cost of insect management using areawide tactics (AW) versus the cost of conventional insecticides (CV). Data from a limited number of small-plot mating disruption (SP) sites were also analyzed. Partial budgeting was used to determine the change in profit attributable to changing to AW from either CV or SP. Partial budgeting is a commonly used farm management tool that involves consideration of income or cost items that change (for example insecticide and pheromone use, application costs, and crop yield and quality). Cost estimates are based on grower spray schedules for all insecticides used in each orchard block within the four AW sites and for the comparison CV and SP blocks. Cost data from 13 growers with a total of 136 AW (60 in 2006 and 76 in 2007), 15 CV (7 in 2006 and 8 in 2007), and 8 SP (4 each year) blocks were analyzed. Although the individual cost estimates include the cost of all insecticides used (not only those for CM and OFM control), the partial budget will reflect the change in profit due to only those items that changed (ie. conventional insecticides vs. pheromones for CM and OFM, hand application vs. airblast sprayer, and any quality differences between the systems). Average insect treatment cost for the three management options is presented in Figure 1 for 2006 and 2007. In 2006 the insect management costs for the AW blocks averaged $456/A, compared

Not For Publication or Citation Without Consent of the Authors
64
to $306/A for CV and $427/A for SP. In 2007 the average cost of the AW blocks declined to $418/A, while the cost of the CV increased to $343/A and SP to $436/A. Statistical tests that the difference between sample means for AW and CV insect treatment cost is zero lead to the rejection of the hypothesis in both years. This means that the cost of treatment is higher for the blocks in the AW sites versus CV comparisons. An interesting finding was that the cost of the AW blocks declined in 2007, while at the same time the cost of the CV blocks increased. Because changes in yield are not anticipated because of CM and OFM control tactics, yield samples were not collected as part of this project. Data on percent frass apples collected as part of the project was used in the economic analysis as a proxy for fruit quality. Frass apple data was collected from 186 AW fruit samples (83 in 2006 and 103 in 2007), 26 CV fruit samples (12 in 2006 and 14 in 2007), and 10 SP fruit samples (5 each year). Average percentage of frass apples for the three management options is presented in Figure 2 for 2006 and 2007. In 2006 the average percent frass apples for the AW blocks was 0.67, compared to 0.65 for CV, and 0.08 for SP. In 2007 the average percent frass apples for the AW blocks was 0.40, compared to 0.68 for CV, and 1.98 for SP. Statistical tests that the difference between sample means for AW and CV percent frass apples is zero lead to a failure to reject the hypothesis in both years. This means that the quality (as measured by percent frass apples only) of fruit was the same for the AW and CV management options. On the basis of the statistical tests, the partial budget for the comparison of AW to CV involves a comparison of the costs alone. In this case, the change in profit attributable to adoption of AW for CM and OFM control by a grower who used CV before would be -$150/A in 2006 and -$75/A in 2007. Although AW is currently less profitable than CV, further reduction in cost for AW is possible as experience is gained with large-scale use of pheromones. Increase in the cost of CV is also likely as existing insecticides with declining effectiveness are replaced with more expensive options. Because the economic evaluations have only been conducted for 2006 and 2007, the results presented here are only preliminary. Evaluation of 2008 data will be completed during early 2009.
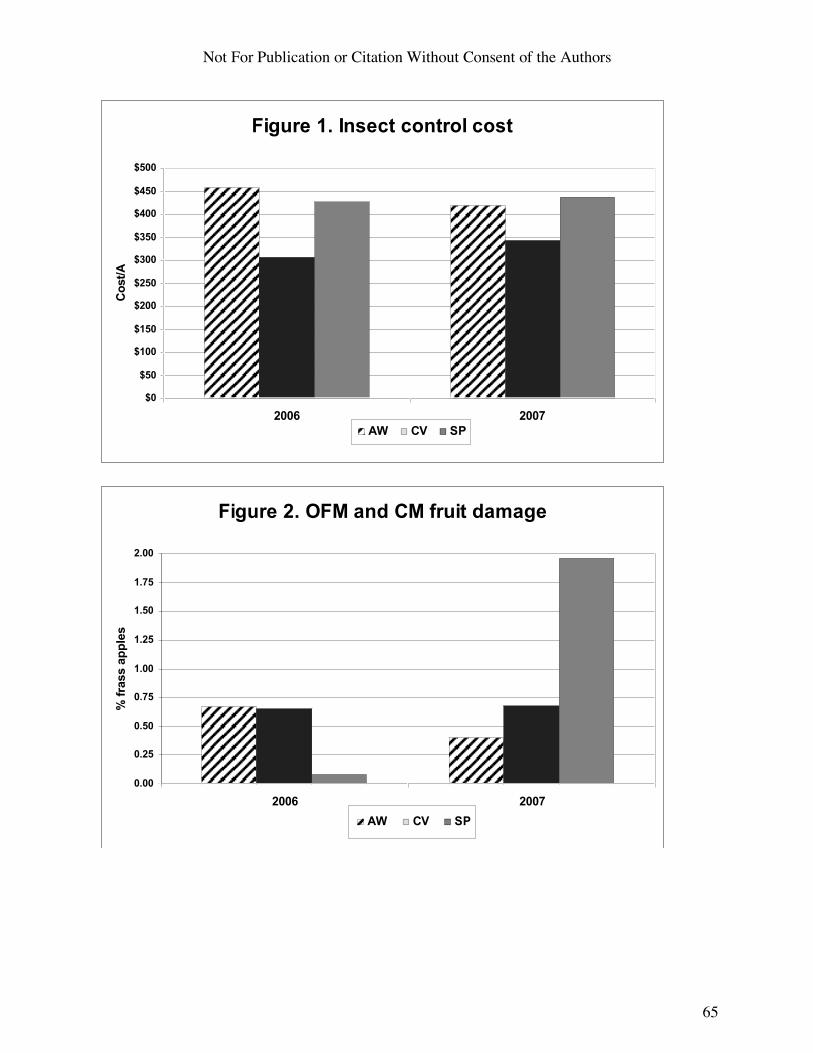
Not For Publication or Citation Without Consent of the Authors
65
Figure 1. Insect control cost
$0
$50
$100
$150
$200
$250
$300
$350
$400
$450
$500
2006 2007
Co
st/A
AW CV SP
Figure 2. OFM and CM fruit damage
0.00
0.25
0.50
0.75
1.00
1.25
1.50
1.75
2.00
2006 2007
% f
rass a
pp
les
AW CV SP

Not For Publication or Citation Without Consent of the Authors
66
Japanese Beetle Control and Varietal Comparisons in Primocane-bearing Raspberries L. M. Maxey1, C. A. Laub1, R. S. Mays1, and D. G. Pfeiffer1
1Department of Entomology, Virginia Tech, Blacksburg, VA 24061 Introduction
Today there is an increasing demand for the production of raspberries due to their nutritional and economical values (Pritts 1989). The fruit contain soluble fiber, vitamins, and minerals and, like other fruits, contain their greatest nutritional value when they are fresh. However, harvesting an aesthetically pleasing fresh fruit is difficult due to the potential of the delicate raspberries to be damaged by insect pests, molds and other diseases and natural decay. Also, due to the highly perishable nature of the fruit it is important to have a control program that provides a short pre-harvest interval to insure that the berries do not decay before they can legally be harvested. Therefore, new treatments that allow for a safe and optimal harvest need to be tested.
The first year shoots in brambles are referred to as primocanes. Primocanes develop from
vegetative buds on roots or from the basal buds of floricanes, which are the second year canes (Galleta and Himelrick 1990). There are two classifications of brambles, based on whether fruit is produced on primocanes or floricanes. Brambles that are classified as summer bearing varieties produce berries only on the floricanes (Demchak et al. 2005). Therefore, fruit production does not take place until the second year of plant development and lasts a short period, usually a few weeks. The other classification of brambles is primocane-bearing or everbearing varieties. These varieties flower and fruit on the first year’s primocane shoot growth. For this experiment only primocane varieties were considered. In most of these varieties the first fruit ripens in August with a few varieties bearing fruit in late July. Fruit ripening continues until late September or until a hard frost or freeze. Weekly yields are somewhat lower on primocane-bearing varieties compared with floricane varieties; however, the lower weekly production is compensated by the primocane varieties’ lengthened fruiting season (Koester and Pritts 2003).
In Virginia one of the most serious pests of brambles is Japanese beetle, Popillia
japonica Newman. This beetle is one of the most polyphagous of plant-feeding insects with the adults consuming foliage, fruits, or flowers of more than 300 species of plants (Potter and Held 2002). In raspberries, adult Japanese beetles chew small holes in the fruit and skeletonize the leaves (Spangler and Agnello 1989, Demchak et al. 2006). In Virginia the adults emerge from the soil during late June or early July and have a life span of 4-6 weeks (Potter and Held 2002). Therefore, adults are present when the primocane-bearing varieties bear fruit in late July. Injury caused by the beetles not only makes fruit unmarketable, it also makes the plants susceptible to diseases. A critical element in controlling Japanese beetle on brambles is the need for a short preharvest interval. Currently, most treatments labeled for Japanese beetle control, such as Sevin, have longer pre-harvest intervals. Testing of new materials with shorter pre-harvest intervals will put us one step closer to providing bramble growers with an effective control for Japanese beetle.
In 2006, low numbers of Japanese beetles were present and there were not significant
differences in beetle populations detected between the treated plots. In order to overcome the

Not For Publication or Citation Without Consent of the Authors
67
problem of low numbers of beetles present, in 2007 the beetles were also confined in mesh bags on individual canes within the treated plots and the percent foliage damage was recorded (Maxey et al. 2007). However, probable human error on estimation of the percent damage in the bagged experiments caused most of the data again to display no significant differences between the treatments. There was only one date in the raspberries in which a significant treatment effect was displayed in 2007. On this date there was significantly less damage present on foliage treated with Battalion. The numbers of beetles present on each treated plot were also recorded in 2007. These counts revealed that the plots treated with Battalion, Capture and Lime-Alum were the only plots that provided control. However, even though the Lime-Alum treatment displayed the most repellency the resulting residue blocked sunlight and left a bad taste on the berries. The spray also clogged spray tips during application.
Treatments that were evaluated in 2008 are Battalion, Azadirachtin, Trilogy, Neemex and
Rynaxypyr. Battalion’s active ingredient is deltamethrin which is a pyrethroid. This pyrethroid is less heat-sensitive than other pyrethoids and offers a fast knock-down of target pests at lower rates than other pyrethroids. Battalion is not yet registered on caneberries and the PHI varies widely on several other horticultural crops (1 day on fruiting vegetables, 3 days on cucurbits, and 21 days on pome fruits).
Azadirachtin is a repellant, antifeedant, and insect growth regulator that allows harvest
the same day as application (Gowan 2008). Azadirachtin is an extract of neem oil that acts through contact or ingestion (Caldwell et al. 2005). Azadirachtin prevents insects from molting by inhibiting production of the molting hormone, ecdysone. The volatile compounds from neem also repel insects from feeding and oviposition. However, 2006 and 2007 data do not indicate any control from this product against Japanese beetles on raspberries or blackberries, which could be an artifact of the formulation used. Therefore, two additional formulations of azadirachtin, Trilogy and Neemex, were evaluated.
Rynaxypyr is the first insecticide from a new class of chemistry, the anthranilic diamides
(DuPont 2007). This pesticide is of interest because it has a new mode of action. Rynaxypyr binds to insect ryanodine receptors in muscle cells, causing a release of calcium ions from internal stores into the cytoplasm. This depletion of calcium from cells results in paralysis and death. Through this specific ion channel binding rynaxypyr controls pests that are resistant to other insecticides. Rynaxypyr has been shown to be harmless to non-target arthropods such as parasitoids, predators and pollinators. Evidence indicates that it has no effect on human cells. Other pesticides will be applied depending on their short pre-harvest intervals and control of Japanese beetle and other bramble pests.
All experiments were conducted to compare the effect of different varieties of raspberries
and blackberries on the number of Japanese beetles present (Maxey et al. 2006, Maxey et al. 2007). In 2006 Autumn Bliss, Dinkum, Fall Gold and Heritage raspberry varieties were evaluated. It was found that there were more beetles present on Autumn Bliss and Fall Gold than on Dinkum and Heritage. In 2007 the following raspberry varieties were evaluated: Anne, Autumn Bliss, Caroline, Dinkum, Fall Gold, Heritage, Himbo Top and Prelude. More beetles were present on Prelude than all other varieties observed. Also, there were significantly fewer

Not For Publication or Citation Without Consent of the Authors
68
beetles found on Caroline, Dinkum, Heritage and Himbo Top varieties. The 2008 experiments were conducted to see if modified experimental procedures would reveal additional differences this year. Materials and Methods
Research was conducted in a three-year-old planting of primocane-bearing raspberries and blackberries at Kentland Farm (College of Agriculture and Life Sciences), Montgomery County. This planting is on an elevated site above the New River in southwestern Virginia (37° 12.417’N, 80° 35.513’W, 2020 ft elev.) There are 11 cultivars of raspberries and two cultivars of blackberries planted in block design. Each cultivar of caneberry is replicated in four randomized replicates of six-eight plants each. The primocane bearing raspberry cultivars include: Anne, Autumn Bliss, Caroline, Dinkum, Fall Gold, Heritage, Himbo Top, Prelude, Autumn Britten, Josephine and Nova. The two cultivars of blackberries are Prim Jim and Prim Jan. This plot is bordered by an apple orchard, trees and pasture.
On 25 June, 3, 10, 17, 24 and 31 July, deltamethrin (Battalion 0.2EC) (12 fl oz/ acre),
rynaxypyr (Altacor WD) (4.5 oz/ acre), azadirachtin (Neemix 4.5) (16 fl oz/acre), azadirachtin (Triology) (64 fl oz/acre) and a control were applied to a 2-meter section of rows, with 8 replications. The raspberry varieties used included Fall Gold, Heritage, Dinkum, Autumn Bliss, Prelude, Caroline, Himbo Top and Anne. All treatments were applied using a CO2-powered backpack sprayer. Due to a low number of Japanese beetles percent defoliation was only analyzed as a seasonal total instead of a weekly percent defoliation. In order to determine if either the treatments or the variety affected the percent defoliation, 35 leaves were randomly digitally photographed from a 1.2-meter section each varietal- treatment combination. These photographs were then analyzed using a computer program (ImageJ) which was downloaded from: http://rsbweb.nih.gov/ij/download.html. The total area of each leaf was measured. Then the area of the damage was measured. The damaged area was divided by the total area to obtain a percent damage. To determine if treatment or variety effects yield, berries were picked within the sprayed or control 1.2-meter section of the row for each variety. All berries collected were divided into marketable and unmarketable yields. A berry was considered marketable if it did not contain damage whereas unmarketable berries contained damage. Yield data was collected twice a week from 22 August to 7 October. Both the percent defoliation data and the yield data were then analyzed using analysis of variance followed by Fisher’s HSD. Results and Discussion
In 2008 Japanese beetle numbers were dramatically reduced due to a severe drought in 2007, during the beetles’ larval developmental period. Japanese beetle larvae need sufficient moisture in order to develop (Fleming 1972). Therefore, the drought prevented most Japanese beetle grubs from reaching the adult stage. There was therefore dramatically reduced pressure and stress imposed on the raspberry plants this year. The results can only be applied to system in which there is low pressure from Japanese beetles. Raspberry yield
Neither the treatments applied nor the variety had an effect the percentage of the fruit that was marketable, the total weight of the yield that was marketable or the total weight of the yield that was unmarketable. The only significant differences found were in the total yield for each variety and for each applied treatment. Plots treated with Battalion and Neemix produced the most yield (Table 1). Also, the control, Altacor and Triology plots produced lower yields in
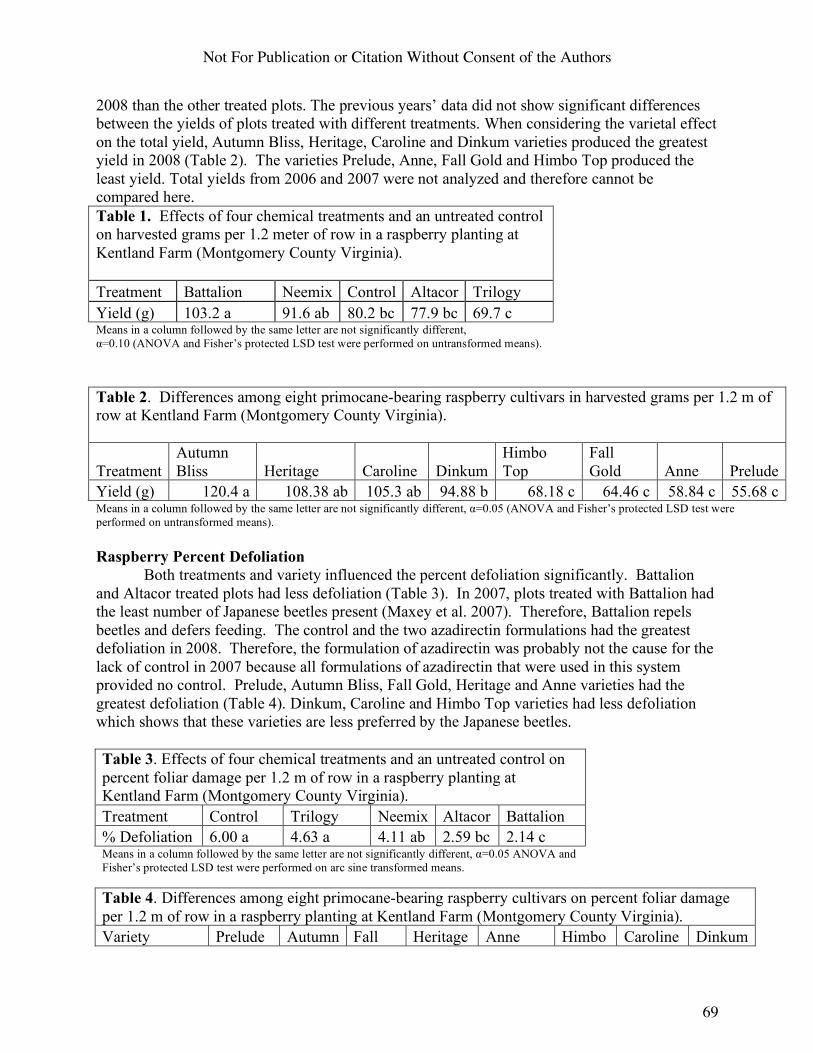
Not For Publication or Citation Without Consent of the Authors
69
2008 than the other treated plots. The previous years’ data did not show significant differences between the yields of plots treated with different treatments. When considering the varietal effect on the total yield, Autumn Bliss, Heritage, Caroline and Dinkum varieties produced the greatest yield in 2008 (Table 2). The varieties Prelude, Anne, Fall Gold and Himbo Top produced the least yield. Total yields from 2006 and 2007 were not analyzed and therefore cannot be compared here. Table 1. Effects of four chemical treatments and an untreated control on harvested grams per 1.2 meter of row in a raspberry planting at Kentland Farm (Montgomery County Virginia). Treatment Battalion Neemix Control Altacor Trilogy Yield (g) 103.2 a 91.6 ab 80.2 bc 77.9 bc 69.7 c Means in a column followed by the same letter are not significantly different, α=0.10 (ANOVA and Fisher’s protected LSD test were performed on untransformed means). Table 2. Differences among eight primocane-bearing raspberry cultivars in harvested grams per 1.2 m of row at Kentland Farm (Montgomery County Virginia).
Treatment Autumn Bliss Heritage Caroline Dinkum
Himbo Top
Fall Gold Anne Prelude
Yield (g) 120.4 a 108.38 ab 105.3 ab 94.88 b 68.18 c 64.46 c 58.84 c 55.68 c Means in a column followed by the same letter are not significantly different, α=0.05 (ANOVA and Fisher’s protected LSD test were performed on untransformed means).
Raspberry Percent Defoliation
Both treatments and variety influenced the percent defoliation significantly. Battalion and Altacor treated plots had less defoliation (Table 3). In 2007, plots treated with Battalion had the least number of Japanese beetles present (Maxey et al. 2007). Therefore, Battalion repels beetles and defers feeding. The control and the two azadirectin formulations had the greatest defoliation in 2008. Therefore, the formulation of azadirectin was probably not the cause for the lack of control in 2007 because all formulations of azadirectin that were used in this system provided no control. Prelude, Autumn Bliss, Fall Gold, Heritage and Anne varieties had the greatest defoliation (Table 4). Dinkum, Caroline and Himbo Top varieties had less defoliation which shows that these varieties are less preferred by the Japanese beetles. Table 3. Effects of four chemical treatments and an untreated control on percent foliar damage per 1.2 m of row in a raspberry planting at Kentland Farm (Montgomery County Virginia). Treatment Control Trilogy Neemix Altacor Battalion % Defoliation 6.00 a 4.63 a 4.11 ab 2.59 bc 2.14 c Means in a column followed by the same letter are not significantly different, α=0.05 ANOVA and Fisher’s protected LSD test were performed on arc sine transformed means. Table 4. Differences among eight primocane-bearing raspberry cultivars on percent foliar damage per 1.2 m of row in a raspberry planting at Kentland Farm (Montgomery County Virginia). Variety Prelude Autumn Fall Heritage Anne Himbo Caroline Dinkum

Not For Publication or Citation Without Consent of the Authors
70
Bliss Gold Top
% Defoliation 5.60 a 5.14 ab 4.96 ab 3.74 abc 3.54 abc 3.26 bc 2.54 c 2.36 c
Means in a column followed by the same letter are not significantly different, α=0.10 ANOVA and Fisher’s protected LSD test were performed on arc sine transformed means.
In the future, with greater pressure from Japanese beetles, the same treatments should be applied to the same varieties. The resulting data will further support or not support these findings. The beetles should be bagged onto the plants and the leaves should be analyzed with the same methods. The bagged experiments will show a better representation of the damage caused by the beetles. Also, bioassays should be conducted to see what happens when the beetles are directly exposed to the treatments. References Caldwell, B., E. Rosen, E. Sideman, A. Shelton and C. Smart. 2005. Resource Guide for
Organic Insect and Disease Management. New York State Agricultural Experiment Station, Geneva, NY, USA.
Demchak, K. (coord.), (PSU) Brittingham-Brant, M., M. Frazier, S. D. Guiser, J. M. Halbrendt,
J. K. Harper, G. Krawczyk, K. M. Richards, E. S. Sánchez, J .W. Travis, (Rutgers) B. W. Majek, P. Nitzsche, P. Oudemans, G. Pavlis, S. Polavarapu, D. Polk, P. R. Probasco, C. Rodriguez-Saona, W. J. Sciarappa, P. W. Shearer, M. Stanghellini, (UDel) D. M. Caron, W. E. Kee, G. C. Johnson, (UMd) B. R. Butler, J. A. Fiola, H. J. Swartz, (Va Tech) A. D. Bratsch, J. F. Derr, J. A. Pattison, D. G. Pfeiffer, K .S. Yoder, (WVA) J. Baniecki, A. Biggs, H. W. Hogmire, R. Zimmerman. 2006. The Mid-Atlantic Berry Guide for Commercial Growers. Pa. State Univ., Agric. Res. Coop. Ext. 205 p.
Demchak, K., J. Harper and L. Kime. 2005. Agricultural Alternatives: Red Raspberry
Production. Retrieved November 9, 2006: http://agalternatives.psu.edu/crops/redraspberry/RedRaspberry.pdf
DuPont. 2007. Rynaxypyr insect control. Technical Bulletin. Retrieved March 16 2008: http://www2.dupont.com/Production_Agriculture/en_US/assets/downloads/pdfs/Rynaxypyr_Tech_Bulletin.pdf
Fleming, W. E. 1972. Biology of the Japanese Beetle. U.S. Dept. Agric. Tech. Bull. 1449. 129 p. Galleta, G. J. and D. G. Himelrick. 1990. Small fruit crop management. Englewood Cliffs, N.J.,
Prentice-Hall. Gowan. 2008. Aza-Direct label. CDMS web site. Retrieved March 16 2008:
http://www.cdms.net/LDat/ld48H007.pdf Koester, K. and M. Pritts. 2003. Greenhouse Raspberry Production Guide. Retrieved November
9, 2006 from the World Wide Web: http://www.fruit.cornell.edu/Berries/ghrasp.pdf Maxey, L. M., C. A. Laub, Z. X. Shen, W. T. Mays, A. K. Wallingford and D. G. Pfeiffer. 2006.
Insect control and varietal comparisons in primocane-bearing caneberries. Proceedings of the 82nd Cumberland- Shenandoah Fruit Workers Conference: 88-93.

Not For Publication or Citation Without Consent of the Authors
71
Maxey, L. M., C. A. Laub, R. S. Mays and D. G. Pfeiffer. 2007. Japanese Beetle Control and Varietal Comparisons in Primocane-bearing Caneberries. Proceedings of the 83rd Cumberland- Shenandoah Fruit Workers Conference.
Potter, D. A. and D. W. Held. 2002. Biology and management of the Japanese beetle. Annu.
Rev. Entomol. 47: 175-205. Pritts, M. 1989. Bramble Production Guide. p. 1-2. In. M. Pritts and D. Handley (eds).
Northeast Regional Agricultural Engineering Services (NRAES). Ithaca, NY. 189 p. Spangler, S. and A. Agnello. 1989. Insect and mite scouting and management. Bramble
Production Guide: 53-64.

Not For Publication or Citation Without Consent of the Authors
72
SPATIAL DISTRIBUTION OF BLUEBERRY MAGGOT IN COMMERCIAL BLUEBERRY FIELDS
Dean Polk, Cesar Rodriguez-Saona, Peter Oudemans
PE Marucci Center for Blueberry and Cranberry Research 125a Lake Oswego Rd., Chatsworth, NJ 08019
A three year project was started in 2006 to assess population levels and spatial distribution of blueberry maggot (BBM). Objectives were to determine if BBM populations could be spatially indentified within a farm site, and to see if grower spray programs could be adapted to spatially managed sites. BBM is commonly found on many wild or abandoned Vaccinium hosts. Since wild blueberries and huckleberries surround or border many commercial fields, it is likely that adult flies disperse into commercial fields from those sites, and that higher populations might be found at field edges. About 1820 acres on 5 farms were monitored twice per week, using 521 traps. Traps were hung in a “V” formation on electrical conduit poles, which were spatially identified with a GPS device and recorded in an Arcview shapefile. Personnel from the blueberry IPM program monitored 4 farm sites, while Atlantic Blueberry Company monitored traps on their farm. Ripe fruit (1 qt each sample) were boiled from all production zones from multiple pickings to examine for the presence of blueberry maggot larvae. Program-wide BBM populations for the Blueberry IPM Program were compared to the spatially identified sites. The monitoring program was structured in order to also complement the Canadian export protocol. Therefore, growers participating in the project would also be certified to export fruit to Canada by the “IPM” or “trapping” method. As such the Canadian protocol requires that a production area be treated with an insecticide when any trap within that production area meets or exceeds 1 fly per trap. In our opinion this action threshold is too low, since if there are multiple traps in a production area, and only one trap is positive, a treatment is required even though the average count is far less than one fly per trap. Our provisional action threshold for maggot fly treatment remains at one fly per trap. By comparison the threshold in Maine for processing berries is 6 flies per trap. Overall BBM populations are usually very low in commercial fields. During the 3 year period they seldom exceeded 1 fly per trap on participating Blueberry IPM Program farms (see Figures 1 and 2). BBM populations were higher in 2008 in both program-wide trap captures and the spatial monitoring project. No BBM larvae were ever found in any fruit samples taken from participating farms. In the spatially monitored farms, higher total seasonal captures seemed to be related to field edges and the proximity to wooded areas during some years (Figures 3-5). In 2008 wild hosts and other sources for blueberry maggot flies were identified from aerial maps, and distance bands were created based on initial work done by Dr. James Barry in 2004. In this work, he found that in a mark-recapture study, a maggot fly adult would fly an average of 21.1 meters in a 24hr period, or about 70 ft. We created 70 ft. distance bands from potential wild and abandoned host sources and linked trap captures with the bands (Figure 6). While some of the highest total trap captures were within the outer bands nearest farm borders, we also found that some trap captures were well within the interior of the farm sites. Therefore, maggot flies on these farms exhibit considerable movement, perhaps helped by wind, represent established populations well within a farm border, or are related to an alternate host site not

Not For Publication or Citation Without Consent of the Authors
73
indentified from aerial maps. This project is being expanded over the next 3 years to further indentify BBM risk areas and include other key blueberry pests.
BBM Trap Catch – 3 Yr History - Atlantic Co.
0
0.2
0.4
0.6
0.8
1
1.2
1.4
1.6
1.8
'06
'07
'08
6/10 6/24 7/8 7/22 8/5
Week Ending
Figures 1 & 2. IPM program-wide BBM trap captures showing average trap captures less than 1 fly per trap, except in some instances in 2008 when populations were generally higher.
BBM Trap Catch – 3 Year History - Burlington Co.
0
0.2
0.4
0.6
0.8
1
1.2
'06
'07
'08
6/10 6/24 7/8 7/22 8/5
Week Ending
#
#
#
#
##
##
#
#
##
#
#
#
#
#
###
## ##
##
##
##
#
##
#
##
#
#
#
###
#
# # # #
#
#
#
##
#
## ###
#
###
###
#
#
#
# # # ##
##
#
#
##
#
# #
##
###
#
##
##
# ##
##
###
##
#
##
##
##
###
#
#
##
#
#
##
##
#
0.5 0 0.5 1 Miles
N
EW
S
0 - 0.90.9 - 11 - 22 - 4
# 0# 1# 2 - 4
#
#
#
#
# #
##
#
#
#
##
#
#
#
#
##
##
###
#
#
#
#
#
#
###
#
##
#
#
#
#
##
#
#
#
#
#
#
#
#
#
# #
#
#
## #
##
###
#
#
0.7 0 0.7 1.4 Miles
#
#
#
#
# #
##
#
#
#
##
#
#
#
#
##
##
###
#
#
#
#
#
#
###
#
##
#
#
#
#
##
#
#
#
#
#
#
#
#
#
# #
#
#
## #
##
###
#
#0 - 0.90.9 - 11 - 22 - 5
# 0# 1 - 2# 3 - 4# 5
Total BBM/TrapTotal BBM/Trap
Surface InterpolationSurface Interpolation
N
EW
SFigures 3, 4, 5. Variety Farms, Macrie Bros., and Atlantic Blueberry, trap totals 2006, showing higher total catches near farm edges. Darker areas have higher total seasonal trap captures. Some interior trap totals are also seen.

Not For Publication or Citation Without Consent of the Authors
74
References: Barry, James D. 2004. Blueberry Maggot Movement, 2004, unpublished data. Acknowledgements: Funded by: The NJ Blueberry Industry Advisory Council,, NJ Blueberry Cranberry Research Council
We thank the following cooperating growers: Atlantic Blueberry Company and Becky Gleason for collecting trap data on their farm and providing pesticide records and computer files; Mill Rock Farms, Variety Farms, Bridge Avenue Farms, and Macrie Brothers for cooperating with the monitoring program and providing all requested records.
Figure 6. Combination of Mill Rock, Variety, and Bridge Avenue Farms – 2006-8, showing BBM source areas (solid red), distance bands from source, and total trap counts 2006-2008 in yellow (larger dots represent higher counts, smallest dots equal “0”.

Not For Publication or Citation Without Consent of the Authors
75
Not for Citation or Publication Without Consent of the Author
ORIENTAL BEETLE MATING DISRUPTION: FROM RESEARCH TO COMMERCIALIZATION
Cesar Rodriguez-Saona and Dean Polk
PE Marucci Center for Blueberry and Cranberry Research and Extension, Rutgers University, Chatsworth, NJ
The oriental beetle, Anomala (=Exomala) orientalis (Waterhouse), is a major pest of
blueberries in New Jersey. The sex pheromone of oriental beetle has been identified as a 9:1 blend of (Z)- and (E)-7-tetradecen-2-one (Zhang et al. 1994). Sex pheromone-mediated mate acquisition and copulation occur at the soil surface, shortly after emergence, and close to the emergence site (Facundo et al. 1999). Previous studies evaluated the feasibility of microencapsulated sprayable formulations of (Z)- and (E)-7-tetradecen-2-one (Polavarapu et al. 2002). Trap captures in blueberry plots treated with the pheromone formulation were reduced by over 90% compared to untreated controls. Mating rates were also lower in treated plots compared to untreated plots. The sprayable formulation of the oriental beetle pheromone, being a ketone, does not qualify for EPA tolerance exemptions on food crops (unlike other arthropod pheromones containing acetate, alcohol, and aldehyde moieties). An alternative formulation is the use of point-source dispensers, which are granted tolerance exemption for use on food crops. Sciarappa et al. (2005) evaluated mating disruption for oriental beetle using 50-75 ChemTica dispensers per ha containing 1g of (Z)-7-tetradecen-2-one per dispenser. It is imperative, however, to determine the minimal effective rate per ha because the cost of the active ingredient pheromone is close to $6,500/kg. Therefore, the main objective of this study was to evaluate a more economically beneficial and effective pheromone rate for oriental beetle mating disruption.
The study was carried out in 2007 on 1-ha plots in commercial blueberry farms in New
Jersey. All mating disruption plots contained plastic ‘bubble’ dispensers (ChemTica Internacional TA, San Jose, Costa Rica), loaded with oriental beetle sex pheromone ((Z)-7-tetradecen-2-one). Plots were designed with 4 treatments of 1) 0.1g ai per dispenser with 25 dispensers per ha (2.5 g ai per ha), 2) 0.05g ai per dispenser with 25 dispensers per ha (1.25 g ai per ha), 3) 0.025g ai per dispenser with 50 dispensers per ha (1.25 g ai per ha), and 4) untreated control (Table 1). Plots were replicated in 3 farms and organized in a randomized complete block design. Dispensers were attached to an outside blueberry cane, within the row orientation, with a garbage bag type wire twist tie, about 20 cm above the soil surface. The adult flight was monitored with Japanese beetle traps (Great Lakes IPM, Vestaburg, MI), baited with 300μg of (Z)-7-tetradecen-2-one lures, placed at 3 traps per plot to monitor trap shutdown. Traps were placed on wire hangers so the bottom of the can was just off ground level. Traps were placed in plots on 4 June with pre-treatment counts taken on 18 June. Pheromone dispensers were placed in plots on 18 June just after traps were monitored. Traps were monitored once per week until 29 August.

Not For Publication or Citation Without Consent of the Authors
76
Table 1. Oriental beetle sexual communication disruption in highbush blueberries, 2007- Treatments
Treatment Rate (AI/D) D/A D/ha AI/ha
A 0.025g 20 50 1.25 g
B 0.05g 10 25 1.25 g
C 0.1g 10 25 2.5 g
D Control - - - AI/D = active ingredient per dispenser; D/A = dispensers per acre; D/ha = dispensers per hectar; AI/ha = active ingredient per hectar. The active ingredient is the major component of the oriental beetle pheromone: (Z)-7-tetradecen-2-one.
Mating rates were assessed in each plot by placing five screened cylinders containing a
virgin female (virgin females were obtained by collecting larvae from infested turf grass and rearing them to adults). Cylinders have been designed to allow males entering but preventing males and females from exiting. These cages were placed in plots for two nights and then retrieved to determine male presence and female mating status (females were placed in 30 ml rearing cups with moist sand and allowed to lay eggs). Cages were placed in plots 4 times, starting at the end of June through the 2nd week in July.
Data on number of beetles in traps, number of males per cage, and percent of mated females were analyzed using ANOVA blocked by farm. If needed, data were log-transformed for number of beetles in traps. Data for percent of mated females were arcsine square-root-transformed to satisfy ANOVA assumptions. Means were separated using Tukey tests. To assess reduction in trap captures, disruption index (DI) was calculated using (C – T)/C × 100, where C = average beetle capture per trap in control plot, and T = average beetle captures per trap in treatment plot.
Trap captures were significantly lower in all plots treated with pheromone dispensers compared to trap captures in untreated control plots. Male oriental beetle captures among various treatment plots were not significantly different prior to placement of disrupters (F = 0.06, df = 2,6; P = 0.939) (Table 2). Post-treatment trap captures were significantly lower in plots treated with pheromone dispensers compared to trap captures in untreated control plots (F = 65.9; df = 3,30; P < 0.001) (Table 2). However, only the treatment with the highest dispenser density (50 dispensers per ha) had a disruption index of > 95%. There was no effect of farm on number of beetles captured (F = 0.12; df =2,30; P =0.88).

Not For Publication or Citation Without Consent of the Authors
77
Table 2. Oriental beetle sexual communication disruption in highbush blueberries, 2007- Trap Counts
Beetles/trap (mean ± SE) Treatment Rate (AI/D) D/ha
Pre-treatment Post-Treatment DI
A 0.025 g 50 113 ± 10 a 45 ± 11 a 95.8
B 0.05 g 25 139 ± 9 a 75 ± 21 a 93.0
C 0.1 g 25 133 ± 11 a 70 ± 9 a 93.5
D Control - 126 ± 19 a 1078 ± 108 b -
AI/D = active ingredient per dispenser; D/ha = dispenser per hectar. Means within a column with the same letter are not significantly different (Tukey Test, P>0.05) Disruptive index (DI) = [(Control-Treatment)/Control]×100; n=3.
Table 3 summarizes the data on female mating success. Female recovery rate from cages
was high (69-87%). Fewer males were found in cages from disrupter treatments loaded with 1.25 g of the pheromone per ha compared to cages in untreated control plots (F = 6.76; df = 3,6; P = 0.024). However, virgin females recovered from disrupter treatments oviposited fewer fertilized eggs only at 50 dispensers per ha compared to females in untreated control plots (F = 6.77; df =3,6; P = 0.024). There was no effect of farm on number of males per cage (F =0.56; df =2,6; P =0.59) or number of females with viable eggs (F = 0.49; df =3,6; P =0.63).
Table 3. Oriental beetle sexual communication disruption in highbush blueberries, 2007- Female Cages
Treatment Rate (AI/D) D/ha Field-Load (g/ha)
# ♀ Placed
# ♀ Recovered # ♂ Present # ♀ with
viable eggs % Mated Females
A 0.025 g 50 1.25 15 13.0 ± 2.0 0.7 ± 0.6 a 0.3 ± 0.6 a 5.3 ± 4.7 a
B 0.05 g 25 1.25 15 11.7 ± 2.1 2.3 ± 1.5 ab 2.3 ± 1.5 ab 18.9 ± 9.3 ab
C 0.1 g 25 2.5 15 10.3 ± 1.5 0.7 ± 0.6 a 1.0 ± 1.0 ab 9.4 ± 10.0 a
D Control 0 0 15 11.0 ± 1.0 6.0 ± 2.6 b 7.7 ± 3.5 b 72.2 ± 25.5 b
AI/D = active ingredient per dispenser; D/ha = dispenser per hectar. Means within a column with the same letter are not significantly different (Tukey Test, P>0.05)
In summary, our data together with Polavarapu et al. (2002) and Sciarappa et al. (2005)
show that mating disruption can be an effective control strategy against oriental beetle in blueberries. This study showed that 1.25 g of pheromone per ha at 50 dispensers per ha was the most effective in shutting down pheromone communication. This treatment also had the lowest number of mating successes. All other treatments had half the number of dispensers per ha, indicating that number of dispenser density is critical for achieving effective mating disruption of oriental beetle. Commercialization of ChemTica dispensers is expected for 2010.

Not For Publication or Citation Without Consent of the Authors
78
References Facundo, H. T., C. E. Linn, Jr., M.G. Villani, and W. L. Roelofs. 1999. J. Insect Behav. 12: 175� 192. Polavarapu, S., M. Wicki, K. Vogel, G. Lonergan, and K. Nielsen. 2002. Environ. Entomol. 31: 1268� 1275. Sciarappa, W. J., S. Polavarapu, R. J. Holdcraft, and J. D. Barry. 2005. Environ. Entomol. 34: 54� 58. Zhang, A., H. T. Facundo, P. S. Robbins, C. E. Linns, Jr., J. L. Hanula, M. G. Cillani, and W. L. Roelofs. 1994. J. Chem. Ecol. 20: 2415� 2427.
Not For Publication or Citation Without Consent of the Authors
79
IMPACT OF REDUCED RISK IPM PROGRAMS ON BENEFICIAL AND NON-TARGET ARTHROPODS
IN APPLE ORCHARDS
David Biddinger – Penn State University Fruit Research & Extension Center, Biglerville, PA Tim Leslie – Department of Biology, Long Island University, New York, NY
L. R. Donovall – Pennsylvania Department of Agriculture, Harrisburg, PA
Integrated Pest Management (IPM) was originally conceived as a way to manage pests through an understanding of their interactions with other organisms and the environment (i.e. agro-ecology). Many consider current IPM practices to have strayed from their ecological roots and have even termed it “Integrated Pesticide Management” because of a tendency to use pesticides as the primary tool for pest control. Missing from many pest management programs has been an understanding the ecological basis for pest infestations and guidelines for ecology-based manipulations of agroecosystems. “Ecologically-based” IPM is considered to be a movement towards sustainability in agriculture and up the so-called “IPM continuum” as defined by the IPM Roadmap. It incorporates ecological and economic factors into agroecosystem design and decision-making in ways that also addresses the public’s concerns about food safety and environmental quality. Ecologically-based IPM strives to lessen pest pressure through the management of biological and ecological processes and interactions rather than mainly through pesticides. The Food Quality Protection Act of 1996 (FQPA) has advanced the protection of human health and the environment from pesticide risks. Additional factors relating to human health are now incorporated in setting pesticide residue tolerances and FQPA has formalized the expedited registration of what are known as “soft” pesticides. These pesticides are supposed to pose a lesser risk to human health and the environment and hence the term “reduced-risk” (RR). RR pesticides have one or more of the following advantages over the older neurotoxic compounds (a) lower risk to human health, b) lower toxicity to non-target organisms (e.g. birds, fish, plants & honey bees), c) lower potential for contamination of groundwater, surface water or other valued environmental resources, d) lower use rates, low pest resistance potential, and e) are supposed to broaden the adoption and effectiveness of IPM strategies by conserving pest natural enemies. There are two types of RR pesticides, conventional chemical pesticides (e.g. Insect Growth Regulators, neonicitinoids etc.) and biopesticides (e.g. Bt products, spinosad and pheromone mating disruption).
For over 45 years, organophosphate (OP) and carbamate (CB) insecticides have been the cornerstone of apple pest management programs in the eastern US. A RAMP project in seven states (Grant 2001: 51101-11084) involving 65 growers over four years found OPs were applied at an average of 5.62 lb active ingredient (ai)/A and CBs at 0.38 lb ai/A, which constituted 91% of the total insecticides/miticide usage (6.60 lb ai/A) (Biddinger, unpublished data). The broad-spectrum activity of these neurotoxic compounds have given excellent control of most pests that feed directly on the fruit and of some of the indirect pests. From a grower viewpoint, OPs and CB simplified a complex orchard ecosystem by economically and reliably killing the majority of pests. From an environmental point of view, they also kill most non-target and beneficial arthropods and have affected wildlife and water quality through spray drift, volatilization, and

Not For Publication or Citation Without Consent of the Authors
80
leaching. Over the decades, only a few beneficial insects (i.e. predatory mites, Stethorus punctum LeConte, some aphid predators) developed resistance to OPs and were incorporated as components in apple IPM programs. Many beneficial arthropods noted in the early days of fruit production have not been seen in significant numbers in eastern orchards since the introduction of DDT in the mid-1940s. These include parasitic wasps and flies, some predatory mites, and many generalist predators such as mirid bugs, assassin bugs, and carabid beetles.
While the eastern USDA-RAMP grant programs have shown a reduction in insecticide active ingredient on a per acre basis of 85-90% in apple, most of the new reduced-risk and OP replacement compounds are much more active and applied at rates of only ounces of product per acre rather than pounds per acre. Calculation of Environmental Injury Quotient (EIQ) field use values for RR IPM in over 60 orchards in 7 states for 4 years programs have shown reductions of up to 15-fold and seem to indicate a general trend toward environmentally safer IPM programs. The utility of using EIQ values as they are currently calculated for measuring specific impacts on IPM programs or non-target arthropods, however, is doubtful. Of the 15 values used to calculate an EIQ value for a specific pesticide, only a value for honey bee toxicity and a very general (and subjective) value for impacts on beneficial arthropods are used in the calculation. The majority of a pesticide’s EIQ value is actually based on human and other vertebrate toxicity, water solubility, and residual activity. Insecticides such as pyrethroids, which are very safe to vertebrates and are used at very low rates, have very low EIQ values (Fig. 1), despite the fact they can completely disrupt biological control and are extremely toxic to non-target arthropods such as honey and solitary bees. In apple IPM, a single pyrethroid application can disrupt biological of mites or aphids for several seasons, and pyrethroids are considered more disruptive of orchard ecosystem than the commonly used OP, Guthion, which has an EIQ field use value 15-fold higher. In contrast, Intrepid and Confirm, (IGR insecticides which are very selective to the ecdysone receptors found only in moth pests), are considered by most tree fruit researchers to be two of the safest products toward non-target and beneficial arthropods, have EIQ values 2-5 times higher than the pyrethroid Warrior.

Not For Publication or Citation Without Consent of the Authors
81
Fig. 1 EIQ Values for RR IPM in Apple
• Intrepid - 33.4
• Rimon - 14.3
• Asana - 39.6
• Warrior - 43.5
• Guthion - 44.9
• Calypso - 31.3
• Actara - 33.3
• Assail - 26.9
• Avaunt - 43.0
• Confirm - 17.8
16 fl oz/A = 113 g ai/A = 8.35
20 fl oz/A = 59 g ai/A = 1.86
12 fl oz/A = 28 g ai/A = 2.45
5 fl oz/A = 18 g ai/A = 1.73
1.5 lb/A = 340 g ai/A = 33.68
4 fl oz/A = 57 g ai/A = 3.92
5.5 oz/A = 39 g ai/A = 2.86
6 oz/A = 51 g ai/A = 3.03
6 oz/A = 51 g ai/A = 4.84
16 fl oz/A = 113 g ai/A = 4.45
EIQ Values EIQ Field Use Value
In the absence of IOBC guidelines and testing of a variety of beneficial arthropods for pesticide registration as is done in Europe, how do we determine if RR IPM programs are moving toward more ecologically-based IPM programs that are also safer to the environment? Efficacy towards key pests are the main concerns to most growers, and biological control to them is generally only missed when previously suppressed pests such as mites or wooly apple aphids flare up and require emergency control with pesticides. Most pesticide companies in the US are not willing to pay for extensive testing of products for impacts on beneficial and non-target arthropods, so IPM researchers do such work as incidental sidelights to efficacy testing of new products for the key pests, and often only after commercial introduction. Such evaluations of the effects on beneficial and non-target arthropods have to be done on a case by case for each insecticide. Changes orchard community structure of both pests and beneficals are inevitable as new pesticides are registered. As expected, the biggest impacts on orchard ecology and non-target arthropods occur from insecticides, but many cases exist also of impacts by fungicides, herbicides and growth retarding compounds such as prohexadione calcium (Apogee).
These changes can be beneficial if they are monitored and IPM programs are adapted. A good example is the current shift of biological mite control in the mid-Atlantic region by the lady beetle, Stethorus punctum, to the even more effective phytoseiid predatory mite, Typhlodromus pyri. The OP resistant S. punctum was one of our most successful biocontrol agents in tree fruit and was estimated to have reduced miticide use by over 50% (2.2 million pounds) during a 20 year period from the late 1970s to the late 1990s. Biological mite control in orchards by S. punctum, however, was disrupted by the introduction of reduced risk and OP replacement insecticides belonging to the neonicotinoid and chitin inhibitor IGR classes, which were very toxic to it.. S. punctum was replaced by the predatory mite, T. pyri, which had never been found in Pennsylvania orchards before, but which was resistant/tolerant to these new compounds. Conserving T. pyri with selective insecticide use and distributing populations throughout the state has been accomplished using state and grower commodity grants, and through the use of
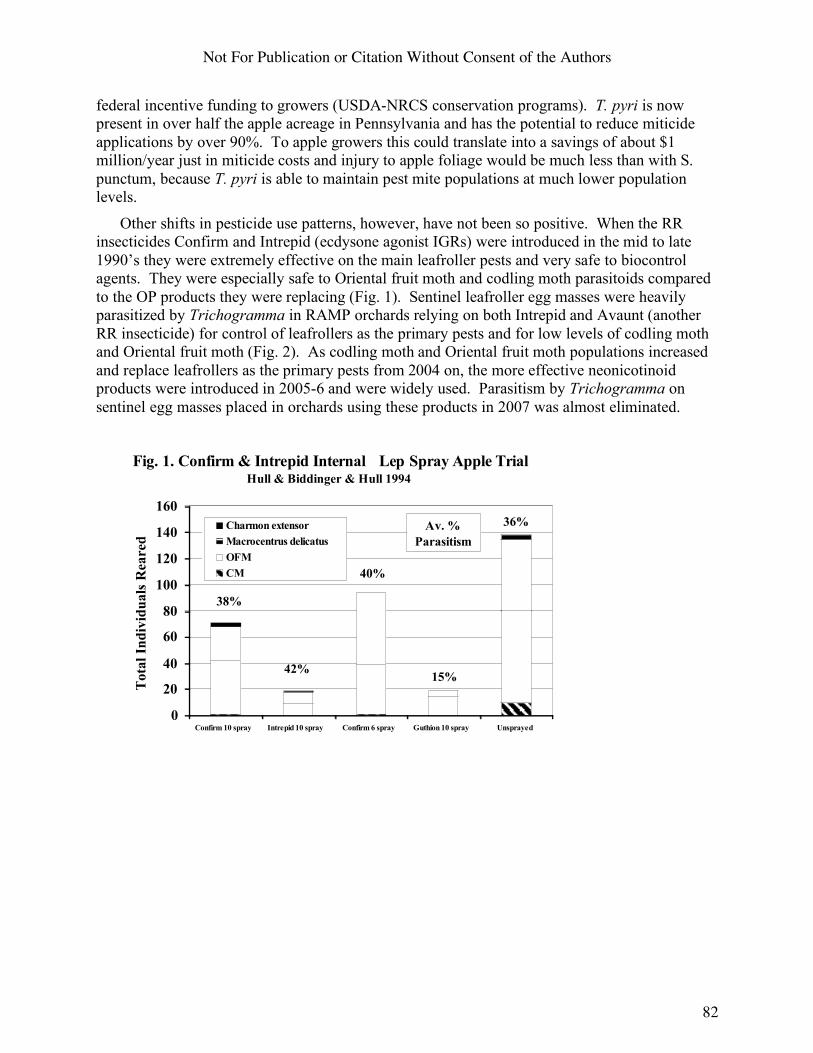
Not For Publication or Citation Without Consent of the Authors
82
federal incentive funding to growers (USDA-NRCS conservation programs). T. pyri is now present in over half the apple acreage in Pennsylvania and has the potential to reduce miticide applications by over 90%. To apple growers this could translate into a savings of about $1 million/year just in miticide costs and injury to apple foliage would be much less than with S. punctum, because T. pyri is able to maintain pest mite populations at much lower population levels.
Other shifts in pesticide use patterns, however, have not been so positive. When the RR insecticides Confirm and Intrepid (ecdysone agonist IGRs) were introduced in the mid to late 1990’s they were extremely effective on the main leafroller pests and very safe to biocontrol agents. They were especially safe to Oriental fruit moth and codling moth parasitoids compared to the OP products they were replacing (Fig. 1). Sentinel leafroller egg masses were heavily parasitized by Trichogramma in RAMP orchards relying on both Intrepid and Avaunt (another RR insecticide) for control of leafrollers as the primary pests and for low levels of codling moth and Oriental fruit moth (Fig. 2). As codling moth and Oriental fruit moth populations increased and replace leafrollers as the primary pests from 2004 on, the more effective neonicotinoid products were introduced in 2005-6 and were widely used. Parasitism by Trichogramma on sentinel egg masses placed in orchards using these products in 2007 was almost eliminated.
0
20
40
60
80
100
120
140
160
Confirm 10 spray Intrepid 10 spray Confirm 6 spray Guthion 10 spray Unsprayed
To
tal
Ind
ivid
ua
ls R
eare
d
Charmon extensor
Macrocentrus delicatus
OFM
CM
Fig. 1. Confirm & Intrepid Internal Lep Spray Apple TrialHull & Biddinger & Hull 1994
38%
42%
40%
15%
36%Av. %
Parasitism

Not For Publication or Citation Without Consent of the Authors
83
0
2
4
6
8
10
12
14
16
18
20
2003 2004 2007
Reduced Risk (RAMP)
Untreated
Grower Standard
Fig. 2. Mortality of Sentinel Leafroller Egg Masses
To Trichogramma In 2003-7 Apple Ramp Trials
% P
ara
siti
zed
Eg
g M
ass
es
*Replicated 4 times by
orchard location and
over 2 different dates:
(8/15 & 8/20). A total
of 128 TABM/OBLR
egg masses were placed
in each treatment.
B
B
A
9X 4X
B
B
A
A A
Neonics
Another way to assess impacts of IPM programs on beneficial and non-target arthropods is to examine the community structure of apple orchards using biodiversity and abundance measures of key taxa (i.e. bioindicators) to determine if we are moving to more ecologically-based IPM systems with RR pesticides or if we are just replacing pesticide classes with those that are less toxic to humans. This is a very time consuming process of sorting through thousands of sample and requires a high level of taxonomic expertise. Detailed analysis of the community structure of orchards managed only with RR IPM programs and those managed with broadspectrum insecticide are in progress and consist of the selected bioindicator groups in Fig. 3. Analysis of abundance and biodiversity data collected from colored pan traps monitored weekly for 2 seasons are being analyzed using principle component analysis to quantify impacts on beneficial and non-target arthropod populations in 5 apple orchards with paired comparisons of both RR and conventional IPM programs. Preliminary data from a single season on solitary bees indicates slightly higher biodiversity in the RR programs. Thousands of samples are still being sorted, identified, data based and will be analyzed in 2009.

Not For Publication or Citation Without Consent of the Authors
84
Bioindicators
Solitary Bees
Bumble Bees
800 in 2007
Over 1000 in 2008
Dolichopodidae
(Long -legged Flies)
Larvae - pred of bark beetles
Adults – pred on small
insects & mites
3,000 in 2007 -8
Sarcophagids
& Tachinids
No. of Cleptoparasites
Parasitic - 10,000+
Parasitic Hymnenoptera (6,000+)
-Braconidae -Aphelinidae
-Ichneumonidae -Trichogrammatidae
-Bethyliidae -Eulophidae
-Diaprididae -Pteromalidae
-Tiphiidae -Mymaridae
Spiders
500 in 2007 - 8
Syrphidae
1,400 in 2007 -8
Pipunculidae
(Big -headed Flies)
Parasitoids of
Leafhoppers (100)
Fig. 3 Bioindicator Groups for Community Analysis
Funding for these studies was provided by the State Horticultural Society of Pennsylvania, the Pennsylvania Department of Agriculture, and by two grants from the USDA-CSREES Risk Assessment and Mitigation Program (RAMP).

Not For Publication or Citation Without Consent of the Authors
85
Plant Pathology

Not For Publication or Citation Without Consent of the Authors
86
PERSPECTIVES ON SITE-SPECIFIC FUNGICIDE USE IN NORTHEASTERN US POPULATIONS OF THE APPLE SCAB PATHOGEN VENTURIA INAEQUALIS:
FUNGICIDE SENSITIVITY PROFILES AND MANAGEMENT PROSPECTS
Kerik D. Cox, Sara M. Villani, and Wolfram D. Köller Cornell University, Department of Plant Pathology and Plant Microbe-Biology
Geneva, NY 14456
The apple scab pathogen, Venturia inaequalis, causes extensive crop loss in all production regions in the northeastern US. In the absence of durable host resistance and because of emerging fungicide resistance, producers make up to 10 applications of fungicides per season (4,5) to avoid fresh market losses. The development of durable scab-resistant cultivars to reduce reliance on fungicides has been a major goal of apple management programs for decades (5). Cultivars fully resistant to scab have been introduced, but both grower and consumer acceptance has been limited to organic production operations due to fruit quality concern (5,6). DMI (Rally 40 WSP) and QoI (Flint) fungicides are some of the safest and most effective fungicides for use against apple diseases. However, because of their single site mode of action, these highly effective fungicide chemistries are prone to resistance development. DMI resistance in northeastern V. inaequalis populations was first confirmed at the turn of the century (2,3), but it wasn’t until 2004 that a region-wide site specific fungicide resistance testing service was established to document the prevalence of apple scab fungicide resistance. With introductions of new DMI chemistries (difenoconazole, flutriafol, and fenbuconazole) for apple scab management imminent, we wished to continue the testing service in 2007 and 2008 to monitor the prevalence of fungicide resistance to single-site fungicide chemistries in northeastern V. inaequalis populations. In addition, we wished to evaluate the performance of forthcoming DMI chemistries in an orchard with practical resistance (3) to DMI fungicides.
From 2007 to 2008, the testing service received samples from 43 and 29 orchard
locations respectively from NY, VT, WV, MA, ME, RI, NH, & CT, which included two baseline sensitive locations and two practical resistant control locations. The aforementioned control locations were also the same ones used to determine the practical resistance threshold values in 2004. A minimum of thirty-three single-leaf discrete lesion samples were evaluated for each collection site. Each lesion sample was evaluated for sensitivity to three fungicide chemistries representing three different classes at discriminatory doses established from 2004 control locations: myclobutanil (DMI) (0.1 µg/ml), trifloxystrobin (QoI) (0.01 µg/ml), and Dodine (0.2 µg/ml). The fungicide sensitivities were determined by subjecting conidia (104 conidia/mL), extracted from lesions, to microscopy-aided mycelium relative growth assays on potato dextrose agar media.
Since 2004, it became evident that DMI resistance was widespread throughout
all major production regions in the Northeastern US. In 2007 and more so in 2008, the majority of the production orchards surveyed exceeded the practical resistance threshold from 2004. Moreover, there were few production orchards in the survey that
Not For Publication or Citation Without Consent of the Authors
87
would be considered “sensitive” to DMI fungicides compared to baseline and practical resistant standard locations. The level of DMI resistance exhibited by most Northeastern orchards is such that one should expect failures using commercially formulated products applied protectively with complete coverage. The use of DMIs in the curative mode against such populations should always result in failure.
In 2007, the first QoI resistant population was detected in NY (1), and several
other the orchards surveyed were at or slightly above (as in the case of New York) the practical resistance threshold level. However, the majority of production orchards surveyed in 2007 were still sensitive to QoI fungicides. In 2008 there were indications that more QoI resistant populations may have developed in NY, but this has yet to be confirmed using molecular techniques. With all 2008 populations that exceeded practical resistant threshold, there was an accompanying reliance on QoI fungicides that season. The orchards surveyed in 2008 in New England, were on average all below the practical resistance threshold.
In 2007 and 2008, all of the orchards locations (including the resistant standards
in 2007 & 2008) in the northeast had populations with dodine sensitivity far below the practical resistance threshold. This may be indication of selection toward population members not possessing dodine resistance due to the prolonged absence of selective pressures in the form of dodine applications.
From 2007 to 2008, field trials were conducted to evaluate the performance of
newly-introduced DMI chemistries difenoconazole, flutriafol, and fenbuconazole on a V. inaequalis population with practical resistance. The orchard site is a mature planting of 33-yr-old 'McIntosh', and 'Cortland' trees on MM.106 rootstocks. Treatments were applied dilute (300 gal/A) to drip using a handgun (200 PSI) at forecasted infection events (April–green tip, April–tight cluster, May-pink/boom, May-petal fall, June-first cover, and June-second cover). Summer cover sprays (3rd through 6th cover) were applied with an airblast sprayer at 3X concentration. With the exception of the untreated control, all treatments were treated with Dithane 75WP (3lbs/100 gal) + Captan 80WDG (2.5lbs/100gal) at green tip, tight cluster, and 2nd cover. Treatments of Myclobutanil (Nova 40W and Rally 40WSP 5 oz./A), flutriafol (Topgard 13floz./A), and difenoconazole (Score SC 4floz./A), and fenbunconazole (Indar 2F 8floz./A) were made bloom, petal fall, and 1st cover. A full protectant program of Dithane 75WP (3lbs/A) + Captan 80WDG (2.5lbs/A) was also included as a standard comparison. The incidence of apple scab symptoms on 'McIntosh' was assessed for cluster leaves and fruit in early June, for terminal leaves mid July, and for mature fruit in late August. The incidence of fruit scab at harvest was expressed as the number of fruit with apple scab lesions out of five collected fruit with 10 collections assessed for four replicate trees. Disease incidence data was subject to analysis of variance (ANOVA) for a randomized block design using accepted statistical procedures and software (e.g. General Linear Model (GLM) procedure of SAS (version 9.1; SAS Institute Inc., Cary, NC). All percentage data was subject to arcsine square root transformation prior to analysis.

Not For Publication or Citation Without Consent of the Authors
88
In 2007, the protectant program was only slightly better than programs with DMIs, which were not statistically different from one another (Fig 1A). In 2008, DMI programs were much less effective compared the protectant standard program suggesting a shift in the population towards the selection of more DMI resistant members (Fig 1B). Of the four DMIs, difenoconazole was the still the best performing chemistry.
FIGURE
Figure 1. Performance of DMI fungicide chemistries in a ‘McIntosh’ orchard with a DMI-resistant population. Values represent means and standard errors of harvest scab incidence of four replicate single-tree plots with 10 samples of 5 five apples per tree. A and B represent trial results from 2007 and 2008 respectively.

Not For Publication or Citation Without Consent of the Authors
89
REFERENCES
1. Cox, K.D., Russo N.L., Villani, S.M., Parker, D.M., Köller, W. 2008. QoI qualitative resistance and CYP51A1 upstream anomalies in NY populations of the apple scab pathogen Venturia inaequalis. Phytopathology 98:S42
2. Köller, W., W. F. Wilcox, and A. L. Jones. 1999. Quantification, persistence and
status of dodine resistance in New York and Michigan orchard populations of Venturia inaequalis. Plant Dis. 83:66-70.
3. Köller, W., W. F. Wilcox, J. Barnard, A. L. Jones, and P. G. Braun. 1997.
Detection and quantification of resistance of Venturia inaequalis populations to sterol demethylation inhibitors. Phytopathology 87:184-190.
4. MacHardy, W. E., D. M. Gadoury, and C. Gessler. 2001. Parasitic and biological
fitness of Venturia inaequalis: Relationship to disease management strategies. Plant Dis. 85:1036-1051.
5. MacHardy, W. E. 1996. Apple Scab - Biology, Epidemiology, and Management.
St. Paul: APS Press.
6. Mervin, I.A., S.K. Brown, D.A. Rosenberger, D.R. Cooley, and Berkett. 1994. Scab-resistant apples for the northeastern United States: New prospects and old problems. Plant Dis. 78:4-10.
ACKNOWLEDGEMENTS This study was supported by contributions from the following agrichemical companies: Bayer, Syngenta, Cheminova, DuPont, and Dow Agrosciences and the Northeast Regional IPM Competitive Grants Program (RIPM).

Not For Publication or Citation Without Consent of the Authors
90
APPLE (Malus domestica ‘Golden Delicious’, ‘Idared’, York’) K. S. Yoder, A. E. Cochran II,
Scab; Venturia inaequalis W. S. Royston, Jr., S. W. Kilmer, Powdery mildew; Podosphaera leucotricha C. Douglas and C. Cochran Cedar-apple rust; Gymnosporangium juniperi-virginianae Virginia Tech Ag. Res. & Ext. Center Quince rust; Gymnosporangium clavipes 595 Laurel Grove Road Sooty blotch; disease complex Winchester, VA 22602 Flyspeck; Zygophiala jamaicensis Brooks spot; Mycosphaerella pomi Rots (unspecified) Fruit finish
Disease control by experimental fungicides on Golden Delicious, Idared, and York Imperial apples, 2008.
Fifteen experimental and combination treatment schedules were compared to registered treatments on 8-yr-old trees. The test was conducted in a randomized block design with four replicates separated by non-treated border rows. Test rows had been non-treated border rows in 2007 which allowed mildew inoculum pressure to stabilize on 2008 test trees. Fungicide treatments were applied to both sides of the tree on each indicated application date with a Swanson Model DA-400 airblast sprayer at 100 gal/A as follows: 16 Apr (York, TC, tight cluster; Golden Delicious TC-OC, tight-open cluster; Idared, P, pink); 24 Apr (York, pink; Idared, petal fall; Golden Delicious, 50% bloom); 14 May (PF, York, petal fall; Golden Delicious and Idared fruit set); first- 5th covers (1C-5C): 28 May, 11 Jun, 25 Jun, 11 Jul, 1 Aug. Maintenance applications applied to the entire test block with the same equipment included Asana, oil, Agri-Mycin, Assail, Fruitone L + Sevin XLR, Lannate LV, Calcium chloride, (Yorks only), Provado, Imidan WSB, Intrepid, and Altacor. Inoculum, placed over each Idared test tree, included cedar rust galls 8 Apr, wild blackberry canes with the sooty blotch and flyspeck fungi and bitter rot mummies 30 Apr. Other diseases developed from inoculum naturally present in the test area, including cedar-apple rust inoculum from red cedars in the vicinity. Foliar data are from counts of ten shoots per tree from each of four reps: 16 Jun (Golden Delicious), 20 Jun (Idared) or 2 Jul (York). Fruit data represent postharvest counts of 25 fruit per replicate tree harvested 22 Sep (Idared), 18 Sep (Golden Delicious), or 8 Oct (York). Percentage data were converted by the square root arcsin transformation for statistical analysis.
Although test schedules were planned toward scab, early season spray weather made it difficult to maintain the intended schedule due to rain and wind, and inoculum conditions were much more favorable for mildew and cedar-apple and quince rust than for scab. Although scab pressure on leaves was relatively light, 75% of non-treated Idared fruit were infected (Table 1). USF 2016A gave strong fruit scab control; other strong treatments were GWN-4616 + Dithane and treatments #2 & 3, which both received Flint + Dithane at petal fall. Under sustained mildew pressure, with 27 days favorable in April and May, superior control was provided by USF 2016A, followed by the highest rate of Topguard (13 fl oz) (Table 2). Control by these treatments was evident on Idared fruit and apparent effect on primary inoculum shoots, as well as the usual assessment of effect on secondary infection on shoot leaves. A16001, Topguard 3.5 fl oz, Rubigan, GWN-4616 and the early schedule of Vangard and Flint + Dithane lacked effective mildew control, sometimes not being significantly different than non-treated trees. All treatments gave excellent control of cedar-apple rust in spite of moderately strong test conditions (Table 3). The only indicated weakness in this test by USF 2016A was for quince rust which occurred 20-22 Apr following a 2-in. rainfall and this may indicate reduced residual of the 16 Apr application or reduced after-infection control by the 24 Apr application, compared to known SI fungicides. Summer diseases developed slowly in this test block, and consistently higher incidence of sooty blotch and flyspeck on treatments #6 and 10 on all three cultivars might be explained by random location of several replications at a lower elevation and likely with more accumulated wetting hours than for most other similar treatments (Table 4). Under delayed rot pressure, and with many treatments receiving Captan +ziram in the late cover sprays, only the low rate of Topguard, applied through third cover, was weak on rot suppression. USF 2016A gave excellent rot control. Although there were differences among treatments, particularly in USDA grade-out of Golden Delicious, there were few deleterious fruit finish effects by any treatment compared to non-treated trees, and all treatments gave a significant reduction of opalescence compared to non-treated trees (Table 5).

Not For Publication or Citation Without Consent of the Authors
91
Table 1. Scab control by experimental fungicides on Golden Delicious, Idared and York apple, 2008. Scab, % fruit or leaves infected or lesions/ fruit G. Del. Idared York Treatment and rate/A Timing fruit ft. lesions leaves fruit ft. lesions leaves fruit ft. lesions leaves
0 No fungicide --- 31 g 0.8 c 7 c 75 g 5.4 c 4 g 47 f 1.3 d 5 e 1 Rally 40WSP 5 oz + Dithane 75DF 3 lb
Captan 80WDG 30 oz + Ziram 76DF 3 lb TC-3C 4C-6C
4 ab <0.1 a 3 b 23 c-f 1.2 ab 1 b-f 9 c-e 0.2 a-c 2 c-e
2 Dithane 75DF 5 lb A16001 336SE 12 fl oz + Dithane 75DF 3 lb Flint 50WG 2 oz + Dithane 75DF 3 lb A16001 336SE 12 fl oz Captan 80WDG 30 oz + Ziram 76DF 3 lb
TC P – Bl
PF 1C-3C 4C-6C
0 a-d 0.1 a <1 a 14 b-d 0.7 ab <1 a-f 3 a-c <0.1 a <1 ab
3 A16001 336SE 12 fl oz + Dithane 75DF 3 lb Flint 50WG 2 oz + Dithane 75DF 3 lb A16001 336SE 12 fl oz Captan 80WDG 30 oz + Ziram 76DF 3 lb
TC -Bl PF
1C-3C 4C-6C
0 a 0 a <1 a 11 ab 0.4 a <1 a-c 2 ab <0.1 a <1 ab
4 A16001336SE 12 fl oz + Dithane 75DF 3 lb Captan 80WDG 30 oz + Ziram 76DF 3 lb
TC-3C 4C-6C
1 ab <0.1 a <1 a 28 ef 1.5 ab <1 ab 0 a 0 a <1 ab
5 A16001 336SE 12 fl oz Captan 80WDG 30 oz + Ziram 76DF 3 lb
TC-3C 4C-6C
2 a-e <0.1 a <1 a 31 f 1.5 ab <1 a-d 1 a 0.1 ab <1 ab
6 Topguard 125SC 3.5 fl oz Captan 80WDG 30 oz + Ziram 76DF 3 lb
TC-3C 4C-6C
8 ef 0.1 ab 2 b 29 ef 1.6 b 2 e-g 2 ab 0.1 ab 2 c-e
7 Topguard 125SC 3.5 fl oz + Dithane 75DF 3 lb Captan 80WDG 30 oz + Ziram 76DF 3 lb
TC-3C 4C-6C
2 a-c 0.1 ab 3 b 22 b-f 0.7 ab 3 fg 2 ab 0.1 a-c 1 b-e
8 Topguard 125SC 7.0 fl oz Captan 80WDG 30 oz + Ziram 76DF 3 lb
TC-3C 4C-6C
2 a-c <0.1 a 4 b 20 b-f 0.9 ab 2 c-f 12 de 0.3 bc <1 a-c
9 Topguard 125SC 7.0 fl oz + Dithane 75DF 3 lb Captan 80WDG 30 oz + Ziram 76DF 3 lb
TC-3C 4C-6C
1 ab <0.1 a 4 b 21 b-f 0.8 ab 1 b-f 14 e 0.3 c <1 a-c
10 Topguard 125SC 13.0 fl oz Captan 80WDG 30 oz + Ziram 76DF 3 lb
TC-3C 4C-6C
6 b-f 0.1 ab 4 b 24 c-f 1.0 ab 2 c-g 4 a-d 0.1 ab 1 b-d
11 Topguard 125SC 13 fl oz+ Dithane 75DF 3 lb Captan 80WDG 30 oz + Ziram 76DF 3 lb
TC-3C 4C-6C
9 f 0.3 b 3 b 18 b-e 0.5 ab <1 a-e 4 a-d 0.1 a-c 1 b-e
12 Rubigan 1E 10 fl oz + Dithane 75DF 3 lb Captan 80WDG 30 oz + Ziram 76DF 3 lb
TC-3C 4C-6C
2 a-e <0.1 a 4 b 19 b-f 0.9 ab 1 b-f 3 a-d 0.1 ab 3 de
13 GWN-4616 10 fl oz + Dithane 75DF 3 lb Captan 80WDG 30 oz + Ziram 76DF 3 lb
TC-3C 4C-6C
6 d-f 0.2 ab 2 b 13 a-c 0.4 a 2 d-g 7 b-e 0.3 bc 3 de
14 Vangard 75WG 5 oz + Dithane 75DF 3 lb Flint 50WG 2 oz + Dithane 75DF 3 lb Rubigan 1E 10 fl oz + Dithane 75DF 3 lb Captan 80WDG 30 oz + Ziram 76DF 3 lb
TC pink
Bl-3C 4C-6C
7
c-f
0.1
ab
5
b
27
d-f
1.1
ab
2
b-f
3
a-d
0.1
a-c
2
b-e
15 USF 2016A 4 fl oz TC-6C 0 a 0 a 0 a 7 a 0.3 a <1 a 1 ab <0.1 a <1 a Mean separation by Waller-Duncan K-ratio t-test (p=0.05). Counts of ten shoots per tree from each of four three-tree replications 16 Jun (Golden Delicious), 20 Jun (Idared) or 2 Jul (York) or postharvest counts of 25 fruit per replication.

Not For Publication or Citation Without Consent of the Authors
92
Table 2. Mildew control by experimental fungicides. Golden Delicious, Idared and York apple, 2008 Mildew, % leaves. leaf area, fruit, or fruit area infected, and suppression of primary inf. Idared Golden Del. primary fruit York Treatment and rate/A Timing leaves lf. area effect* leaves lf. area % inf. % area leaves lf. area
0 No fungicide --- 52 h 11 h 3.2 g 52 h 36 j 20 c 2.4 c 56 f 14 f 1 Rally 40WSP 5 oz + Dithane 75DF 3 lb
Captan 80WDG 30 oz + Ziram 76DF 3 lb TC-3C 4C-6C
30 c-f 4 b-f 5.2 de 39 d-f 10 c-f 5 ab 0.6 ab 34 c-e 5 c-e
2 Dithane 75DF 5 lb A16001 336SE 12 fl oz + Dithane 75DF 3 lb Flint 50WG 2 oz + Dithane 75DF 3 lb A16001 336SE 12 fl oz Captan 80WDG 30 oz + Ziram 76DF 3 lb
TC P – Bl
PF 1C-3C 4C-6C
33 d-g 4 d-g 4.0 fg 42 e-h 12 d-g 1 a 0.2 ab 29 cd 4 b-e
3 A16001 336SE 12 fl oz + Dithane 75DF 3 lb Flint 50WG 2 oz + Dithane 75DF 3 lb A16001 336SE 12 fl oz Captan 80WDG 30 oz + Ziram 76DF 3 lb
TC -Bl PF
1C-3C 4C-6C
34 e-g 5 e-g 3.5 fg 41 e-g 13 e-h 3 ab 0.4 ab 31 c-e 4 b-e
4 A16001336SE 12 fl oz + Dithane 75DF 3 lb Captan 80WDG 30 oz + Ziram 76DF 3 lb
TC-3C 4C-6C
37 fg 5 e-g 4.4 ef 46 f-h 19 g-i 2 a 0.2 ab 35 c-e 6 c-e
5 A16001 336SE 12 fl oz Captan 80WDG 30 oz + Ziram 76DF 3 lb
TC-3C 4C-6C
41 g 5 g 3.3 g 50 gh 26 ij 5 ab 0.6 ab 35 c-e 5 b-e
6 Topguard 125SC 3.5 fl oz Captan 80WDG 30 oz + Ziram 76DF 3 lb
TC-3C 4C-6C
22 bc 3 a-c 5.6 cd 32 c-e 9 b-e 2 ab 0.3 ab 27 bc 4 b-d
7 Topguard 125SC 3.5 fl oz + Dithane 75DF 3 lb Captan 80WDG 30 oz + Ziram 76DF 3 lb
TC-3C 4C-6C
32 d-g 4 d-g 5.0 de 43 f-h 13 e-h 3 ab 0.3 ab 33 c-e 4 b-e
8 Topguard 125SC 7.0 fl oz Captan 80WDG 30 oz + Ziram 76DF 3 lb
TC-3C 4C-6C
26 c-e 3 b-e 5.2 de 30 cd 5 a-d 6 ab 0.9 a-c 25 bc 4 b-e
9 Topguard 125SC 7.0 fl oz + Dithane 75DF 3 lb Captan 80WDG 30 oz + Ziram 76DF 3 lb
TC-3C 4C-6C
25 b-d 3 b-d 5.9 cd 25 bc 5 a-d 4 ab 0.6 ab 25 bc 4 b-e
10 Topguard 125SC 13.0 fl oz Captan 80WDG 30 oz + Ziram 76DF 3 lb
TC-3C 4C-6C
17 b 3 ab 6.5 bc 17 b 3 ab 3 a 0.3 ab 16 b 3 ab
11 Topguard 125SC 13 fl oz+ Dithane 75DF 3 lb Captan 80WDG 30 oz + Ziram 76DF 3 lb
TC-3C 4C-6C
17 b 3 ab 7.1 ab 19 b 3 ab 0 a 0 a 24 bc 3 bc
12 Rubigan 1E 10 fl oz + Dithane 75DF 3 lb Captan 80WDG 30 oz + Ziram 76DF 3 lb
TC-3C 4C-6C
31 d-f 4 c-f 5.6 cd 44 f-h 14 e-h 7 a-c 0.7 a-c 40 de 7 e
13 GWN-4616 10 fl oz + Dithane 75DF 3 lb Captan 80WDG 30 oz + Ziram 76DF 3 lb
TC-3C 4C-6C
36 fg 5 g 4.3 ef 42 e-h 18 f-i 4 ab 0.6 ab 44 ef 6 de
14 Vangard 75WG 5 oz + Dithane 75DF 3 lb Flint 50WG 2 oz + Dithane 75DF 3 lb Rubigan 1E 10 fl oz + Dithane 75DF 3 lb Captan 80WDG 30 oz + Ziram 76DF 3 lb
TC pink
Bl-3C 4C-6C
36 fg 5 fg 5.0 de 48 f-h 22 hi 11 bc 1.0 bc 32 c-e 4 b-e
15 USF 2016A 4 fl oz TC-6C 7 a 2 a 8.0 a 10 a 2 a 0 a 0 a 4 a 1 a Mean separation by Waller-Duncan K-ratio t-test (p=0.05). Counts of ten shoots per tree from each of four three-tree replications 16 Jun (Golden Delicious) 20 Jun (Idared)or 2 Jul (York), or postharvest counts of 25 fruit per rep. * Apparent suppressive treatment effect rated on ten Idared primary mildew shoots per tree 9 Jul: scale 1-10 (1= no effect; 10= excellent suppressive effect).
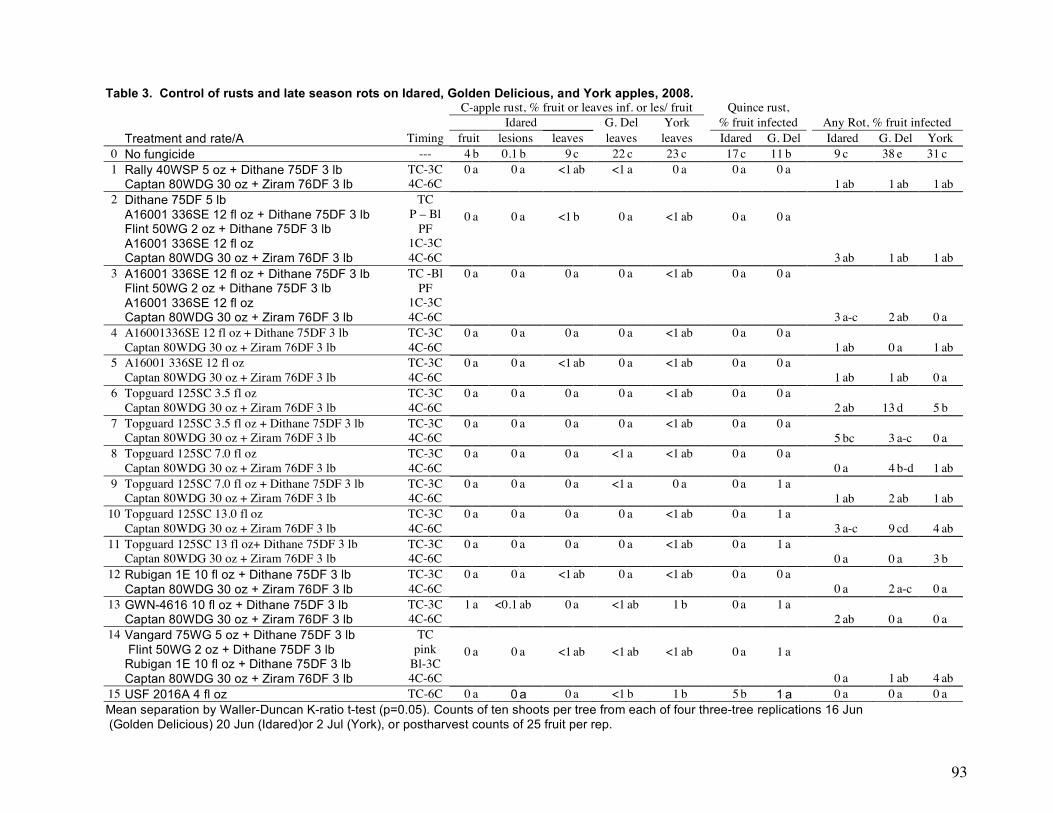
93
Table 3. Control of rusts and late season rots on Idared, Golden Delicious, and York apples, 2008. C-apple rust, % fruit or leaves inf. or les/ fruit Quince rust, Idared G. Del York % fruit infected Any Rot, % fruit infected Treatment and rate/A Timing fruit lesions leaves leaves leaves Idared G. Del Idared G. Del York
0 No fungicide --- 4 b 0.1 b 9 c 22 c 23 c 17 c 11 b 9 c 38 e 31 c 1 Rally 40WSP 5 oz + Dithane 75DF 3 lb
Captan 80WDG 30 oz + Ziram 76DF 3 lb TC-3C 4C-6C
0 a 0 a <1 ab <1 a 0 a 0 a 0 a 1 ab 1 ab 1 ab
2 Dithane 75DF 5 lb A16001 336SE 12 fl oz + Dithane 75DF 3 lb Flint 50WG 2 oz + Dithane 75DF 3 lb A16001 336SE 12 fl oz Captan 80WDG 30 oz + Ziram 76DF 3 lb
TC P – Bl
PF 1C-3C 4C-6C
0 a 0 a <1 b 0 a <1 ab 0 a 0 a
3 ab 1 ab 1 ab 3 A16001 336SE 12 fl oz + Dithane 75DF 3 lb
Flint 50WG 2 oz + Dithane 75DF 3 lb A16001 336SE 12 fl oz Captan 80WDG 30 oz + Ziram 76DF 3 lb
TC -Bl PF
1C-3C 4C-6C
0 a 0 a 0 a 0 a <1 ab 0 a 0 a
3 a-c 2 ab 0 a 4 A16001336SE 12 fl oz + Dithane 75DF 3 lb
Captan 80WDG 30 oz + Ziram 76DF 3 lb TC-3C 4C-6C
0 a 0 a 0 a 0 a <1 ab 0 a 0 a 1 ab 0 a 1 ab
5 A16001 336SE 12 fl oz Captan 80WDG 30 oz + Ziram 76DF 3 lb
TC-3C 4C-6C
0 a 0 a <1 ab 0 a <1 ab 0 a 0 a 1 ab 1 ab 0 a
6 Topguard 125SC 3.5 fl oz Captan 80WDG 30 oz + Ziram 76DF 3 lb
TC-3C 4C-6C
0 a 0 a 0 a 0 a <1 ab 0 a 0 a 2 ab 13 d 5 b
7 Topguard 125SC 3.5 fl oz + Dithane 75DF 3 lb Captan 80WDG 30 oz + Ziram 76DF 3 lb
TC-3C 4C-6C
0 a 0 a 0 a 0 a <1 ab 0 a 0 a 5 bc 3 a-c 0 a
8 Topguard 125SC 7.0 fl oz Captan 80WDG 30 oz + Ziram 76DF 3 lb
TC-3C 4C-6C
0 a 0 a 0 a <1 a <1 ab 0 a 0 a 0 a 4 b-d 1 ab
9 Topguard 125SC 7.0 fl oz + Dithane 75DF 3 lb Captan 80WDG 30 oz + Ziram 76DF 3 lb
TC-3C 4C-6C
0 a 0 a 0 a <1 a 0 a 0 a 1 a 1 ab 2 ab 1 ab
10 Topguard 125SC 13.0 fl oz Captan 80WDG 30 oz + Ziram 76DF 3 lb
TC-3C 4C-6C
0 a 0 a 0 a 0 a <1 ab 0 a 1 a 3 a-c 9 cd 4 ab
11 Topguard 125SC 13 fl oz+ Dithane 75DF 3 lb Captan 80WDG 30 oz + Ziram 76DF 3 lb
TC-3C 4C-6C
0 a 0 a 0 a 0 a <1 ab 0 a 1 a 0 a 0 a 3 b
12 Rubigan 1E 10 fl oz + Dithane 75DF 3 lb Captan 80WDG 30 oz + Ziram 76DF 3 lb
TC-3C 4C-6C
0 a 0 a <1 ab 0 a <1 ab 0 a 0 a 0 a 2 a-c 0 a
13 GWN-4616 10 fl oz + Dithane 75DF 3 lb Captan 80WDG 30 oz + Ziram 76DF 3 lb
TC-3C 4C-6C
1 a <0.1 ab 0 a <1 ab 1 b 0 a 1 a 2 ab 0 a 0 a
14 Vangard 75WG 5 oz + Dithane 75DF 3 lb Flint 50WG 2 oz + Dithane 75DF 3 lb Rubigan 1E 10 fl oz + Dithane 75DF 3 lb Captan 80WDG 30 oz + Ziram 76DF 3 lb
TC pink
Bl-3C 4C-6C
0 a 0 a <1 ab <1 ab <1 ab 0 a 1 a
0 a 1 ab 4 ab 15 USF 2016A 4 fl oz TC-6C 0 a 0 a 0 a <1 b 1 b 5 b 1 a 0 a 0 a 0 a Mean separation by Waller-Duncan K-ratio t-test (p=0.05). Counts of ten shoots per tree from each of four three-tree replications 16 Jun (Golden Delicious) 20 Jun (Idared)or 2 Jul (York), or postharvest counts of 25 fruit per rep.

94
Table 4. Sooty Blotch and Flyspeck Late Summer Disease on Idared, Golden Delicious, and York apples, 2008. Sooty Blotch, % fruit or area infected Fly Speck, % fruit or area infected G. Del. Idared York G. Del. Idared York Treatment and rate/A Timing fruit area fruit area fruit area fruit area fruit area fruit area
0 No fungicide --- 97 c 10.2 c 92 e 7.7 f 100 f 7.2 f 81 c 4.9 b 84 f 4.9 e 100 g 8.1 g 1 Rally 40WSP 5 oz + Dithane 75DF 3 lb
Captan 80WDG 30 oz + Ziram 76DF 3 lb TC-3C 4C-6C 5 a 0.3 a 9 bc 0.5 cd 3 a-c 0.2 a-c 2 a 0.1 a 9 a-c 0.6 bc 29 d 1.8 d
2 Dithane 75DF 5 lb A16001 336SE 12 fl oz + Dithane 75DF 3 lb Flint 50WG 2 oz + Dithane 75DF 3 lb A16001 336SE 12 fl oz Captan 80WDG 30 oz + Ziram 76DF 3 lb
TC P – Bl
PF 1C-3C 4C-6C 0 a 0 a 1 ab 0.1 ab 0 a 0 a 2 a 0.1 a 1 ab 0.2 a-c 1 a 0.1 a
3 A16001 336SE 12 fl oz + Dithane 75DF 3 lb Flint 50WG 2 oz + Dithane 75DF 3 lb A16001 336SE 12 fl oz Captan 80WDG 30 oz + Ziram 76DF 3 lb
TC -Bl PF
1C-3C 4C-6C 0 a 0 a 2 ab 0.1 a-c 1 ab 0.1 ab 1 a 0.1 a 0 a 0 a 2 a 0.1 a
4 A16001336SE 12 fl oz + Dithane 75DF 3 lb Captan 80WDG 30 oz + Ziram 76DF 3 lb
TC-3C 4C-6C 0 a 0 a 0 a 0 a 0 a 0 a 0 a 0 a 0 a 0 a 2 a 0.1 a
5 A16001 336SE 12 fl oz Captan 80WDG 30 oz + Ziram 76DF 3 lb
TC-3C 4C-6C 1 a 0.1 a 3 ab 0.2 a-c 1 ab 0.1 ab 0 a 0 a 0 a 0 a 3 ab 0.2 ab
6 Topguard 125SC 3.5 fl oz Captan 80WDG 30 oz + Ziram 76DF 3 lb
TC-3C 4C-6C 36 b 4.3 b 27 c 2.2 de 40 e 2.6 e 38 b 3.7 b 32 d 1.8 d 63 ef 5.0 ef
7 Topguard 125SC 3.5 fl oz + Dithane 75DF 3 lb Captan 80WDG 30 oz + Ziram 76DF 3 lb
TC-3C 4C-6C 5 a 0.3 a 5 ab 0.3 a-c 15 d 0.8 d 3 a 0.2 a 4 a-c 0.2 a-c 43 de 2.6 de
8 Topguard 125SC 7.0 fl oz Captan 80WDG 30 oz + Ziram 76DF 3 lb
TC-3C 4C-6C 2 a 0.1 a 4 ab 0.2 a-c 5 a-d 0.3 a-d 3 a 0.3 a 6 bc 0.3 bc 22 cd 1.1 cd
9 Topguard 125SC 7.0 fl oz + Dithane 75DF 3 lb Captan 80WDG 30 oz + Ziram 76DF 3 lb
TC-3C 4C-6C 1 a 0.1 a 4 ab 0.2 a-c 1 ab 0.1 ab 4 a 0.2 a 3 a-c 0.2 a-c 29 d 1.7 d
10 Topguard 125SC 13.0 fl oz Captan 80WDG 30 oz + Ziram 76DF 3 lb
TC-3C 4C-6C 59 b 3.8 b 49 d 3.6 e 59 e 3.2 e 58 bc 3.5 b 55 e 3.2 e 84 f 6.9 fg
11 Topguard 125SC 13 fl oz+ Dithane 75DF 3 lb Captan 80WDG 30 oz + Ziram 76DF 3 lb
TC-3C 4C-6C 2 a 0.1 a 4 ab 0.2 a-c 11 cd 0.6 cd 0 a 0 a 2 ab 0.1 ab 19 b-d 1.0 b-d
12 Rubigan 1E 10 fl oz + Dithane 75DF 3 lb Captan 80WDG 30 oz + Ziram 76DF 3 lb
TC-3C 4C-6C 4 a 0.2 a 7 a-c 0.4 a-c 12 b-d 0.6 b-d 2 a 0.1 a 5 a-c 0.3 a-c 39 de 2.5 de
13 GWN-4616 10 fl oz + Dithane 75DF 3 lb Captan 80WDG 30 oz + Ziram 76DF 3 lb
TC-3C 4C-6C 0 a 0 a 2 ab 0.1 a-c 7 b-d 0.4 b-d 0 a 0 a 6 a-c 0.4 a-c 23 cd 1.2 cd
14 Vangard 75WG 5 oz + Dithane 75DF 3 lb Flint 50WG 2 oz + Dithane 75DF 3 lb Rubigan 1E 10 fl oz + Dithane 75DF 3 lb Captan 80WDG 30 oz + Ziram 76DF 3 lb
TC pink
Bl-3C 4C-6C 1 a 0.1 a 10 a-c 0.6 bc 6 a-d 0.3 a-d 1 a 0.1 a 11 c 0.6 cd 32 d 1.9 d
15 USF 2016A 4 fl oz TC-6C 1 a 0.1 a 0 a 0 a 1 ab 0.1 ab 0 a 0 a 2 ab 0.1 ab 11 a-c 0.6 a-c Mean separation by Waller-Duncan K-ratio t-test (p=0.05). Postharvest counts of 25 Idared fruit per replication.

95
Table 5. Brooks Spot and Fruit Ratings on Idared, Golden Delicious, and York apples, 2008. Brooks Spot, Golden Del. USDA grade* % fruit inf, Opalescence* X- X-Fancy Russet rating* Treatment and rate/A Timing Idared Idared York Fancy + Fancy Utility G. Del. Idared York
0 No fungicide --- 6 b 1.4 c 1.3 a 27 d 74 bc 1 a 2.6 bc 1.7 ab 1.8 a 1 Rally 40WSP 5 oz + Dithane 75DF 3 lb
Captan 80WDG 30 oz + Ziram 76DF 3 lb TC-3C 4C-6C
1 a 0.8 a 1.7 a 72 a 95 ab 0 a 1.8 a 1.3 ab 1.6 a
2 Dithane 75DF 5 lb A16001 336SE 12 fl oz + Dithane 75DF 3 lb Flint 50WG 2 oz + Dithane 75DF 3 lb A16001 336SE 12 fl oz Captan 80WDG 30 oz + Ziram 76DF 3 lb
TC P – Bl
PF 1C-3C 4C-6C
3 ab 0.9 ab 1.9 a 64 ab 95 a 0 a 1.8 a 1.4 ab 1.7 a
3 A16001 336SE 12 fl oz + Dithane 75DF 3 lb Flint 50WG 2 oz + Dithane 75DF 3 lb A16001 336SE 12 fl oz Captan 80WDG 30 oz + Ziram 76DF 3 lb
TC -Bl PF
1C-3C 4C-6C
0 a 0.9 ab 1.4 a 59 a-c 90 a-c 0 a 2.1 a-c 1.4 ab 1.4 a
4 A16001336SE 12 fl oz + Dithane 75DF 3 lb Captan 80WDG 30 oz + Ziram 76DF 3 lb
TC-3C 4C-6C
1 a 0.8 a 1.6 a 67 ab 92 ab 0 a 1.8 a 1.3 ab 1.5 a
5 A16001 336SE 12 fl oz Captan 80WDG 30 oz + Ziram 76DF 3 lb
TC-3C 4C-6C
0 a 1.0 ab 1.5 a 45 a-d 84 a-c 0 a 2.3 a-c 1.6 ab 1.6 a
6 Topguard 125SC 3.5 fl oz Captan 80WDG 30 oz + Ziram 76DF 3 lb
TC-3C 4C-6C
1 a 1.0 ab 1.7 a 38 cd 66 c 4 a 2.4 a-c 1.6 ab 1.7 a
7 Topguard 125SC 3.5 fl oz + Dithane 75DF 3 lb Captan 80WDG 30 oz + Ziram 76DF 3 lb
TC-3C 4C-6C
0 a 0.9 ab 1.6 a 47 a-d 88 a-c 0 a 2.2 a-c 1.4 ab 1.6 a
8 Topguard 125SC 7.0 fl oz Captan 80WDG 30 oz + Ziram 76DF 3 lb
TC-3C 4C-6C
0 a 1.2 bc 1.8 a 41 b-d 89 a-c 0 a 2.3 a-c 1.6 ab 1.6 a
9 Topguard 125SC 7.0 fl oz + Dithane 75DF 3 lb Captan 80WDG 30 oz + Ziram 76DF 3 lb
TC-3C 4C-6C
0 a 0.8 a 1.5 a 50 a-d 89 a-c 1 a 2.2 a-c 1.4 ab 1.4 a
10 Topguard 125SC 13.0 fl oz Captan 80WDG 30 oz + Ziram 76DF 3 lb
TC-3C 4C-6C
1 a 1.0 ab 2.0 a 31 d 71 a-c 2 a 2.7 c 1.5 ab 1.9 a
11 Topguard 125SC 13 fl oz+ Dithane 75DF 3 lb Captan 80WDG 30 oz + Ziram 76DF 3 lb
TC-3C 4C-6C
0 a 0.8 a 1.6 a 60 a-c 92 a-c 0 a 1.9 ab 1.4 ab 1.4 a
12 Rubigan 1E 10 fl oz + Dithane 75DF 3 lb Captan 80WDG 30 oz + Ziram 76DF 3 lb
TC-3C 4C-6C
0 a 1.0 ab 1.5 a 51 a-d 87 a-c 0 a 2.0 a-c 1.3 ab 1.4 a
13 GWN-4616 10 fl oz + Dithane 75DF 3 lb Captan 80WDG 30 oz + Ziram 76DF 3 lb
TC-3C 4C-6C
0 a 1.0 ab 1.6 a 66 ab 93 ab 0 a 1.7 a 1.8 b 1.6 a
14 Vangard 75WG 5 oz + Dithane 75DF 3 lb Flint 50WG 2 oz + Dithane 75DF 3 lb Rubigan 1E 10 fl oz + Dithane 75DF 3 lb Captan 80WDG 30 oz + Ziram 76DF 3 lb
TC pink
Bl-3C 4C-6C
0 a 0.8 a 1.5 a 53 a-d 89 a-c 0 a 1.9 ab 1.2 a 1.3 a
15 USF 2016A 4 fl oz TC-6C 0 a 1.0 ab 1.5 a 52 a-d 91 a-c 0 a 2.0 a-c 1.4 ab 1.5 a Mean separation by Waller-Duncan K-ratio t-test (p=0.05). Postharvest counts of 25 fruit per replication. * Fruit finish rated on a scale of 0-5 (0 = perfect finish, 5 = severe russet or opalescence or USDA down-grading by russet.

96
APPLE (Malus domestica ‘Stayman Winesap’, K. S. Yoder, A. E. Cochran II, ‘Idared’, ‘Granny Smith’) W. S. Royston, Jr., S. W. Kilmer, Scab; Venturia inaequalis C. Douglas, and C. Cochran Powdery mildew; Podosphaera leucotricha Virginia Tech Agr. Res. & Ext. Center Cedar-apple rust; Gymnosporangium juniperi-virginianae 595 Laurel Grove Road Quince rust; Gymnosporangium clavipes Winchester, VA 22602 Brooks fruit spot; Mycosphaerella pomi Sooty blotch; disease complex Flyspeck; Zygophiala jamaicensis Rots (unidentified)
Evaluation of experimental fungicides and mixed schedules on Stayman, Idared, and Granny Smith apples, 2008.
Eleven combination treatments directed at fungicide resistance management approaches and broad-spectrum control, including the experimental materials, LEM17 and Omega, were tested on 22-yr-old trees in an area where resistance to SI fungicides has been suspected for several years. The test was conducted in a randomized block design with four three-cultivar replicate tree sets separated by untreated border rows. Treatment rows had been used as non-treated border rows in 2007 to stabilize mildew inoculum pressure for 2008. Tree-row-volume was determined to require a 400 gal/A dilute base for adequate coverage. Fungicide treatments were applied to both sides of the tree on each application date with a Swanson Model DA-400 airblast sprayer at 100 gal/A as follows: 16 Apr (TC, tight cluster, Stayman; open cluster-pink, Idared; open cluster, Granny Smith); 24 Apr (bloom, Stayman; bloom-petal fall, Idared and Granny). First – 8th covers (1C-8C): 13 May, 24 May, 5 Jun, 19 Jun, 2 Jul, 18 Jul, 1 Aug, and 20 Aug. Maintenance materials applied to the entire test block with the same equipment included Asana+ Oil, Fruitone L + Sevin XLR, Assail, Imidan, Provado Intrepid, Delegate, Calypso, and Altacor. Inoculum, placed over each Idared test tree, included: cedar rust galls 8 Apr, wild blackberry canes with the sooty blotch and flyspeck fungi and bitter rot mummies 30 Apr. Other diseases developed from inoculum naturally present in the test area. Foliar data represent averages of counts of ten terminal shoots per tree 11 Jun (Stayman), 27 Jun (Idared) and 16 Jul (Granny Smith). Cedar-apple rust, quince rust and scab were rated on 50 fruit per-tree 1 Jul (Idared) or 16 Jul (Stayman). Postharvest fruit counts are means of 25-fruit samples picked from each of four single-tree reps Idared (22 Sep) or Granny Smith (15 Oct). Stayman were harvested 1 Oct and rated after 19 days storage at 4°C. Percentage data were converted by the square root arcsin transformation for statistical analysis. Over-wintering scab inoculum was moderately high in this test area, and strong infection conditions again led to reduced control by the SI+EBDC standard (Rally 5 oz + Manzate 3lb/A, Table 6) following two years of improved control using Nova + Dithane (Figs. 1 & 2). Test orchard history had earlier shown a decline in control by Nova 4-5 oz/A under consistently heavy disease pressure on foliage (in ‘04-’05), and the variable control illustrates the importance of weather factors and inoculum levels in the perception of “resistance”. Two long wetting periods following heavy rainfall 20-22 Apr and 11-13 May depleted most of the protective EBDC fungicide residue, requiring some post-infection action to provide control and putting more selective pressure on the SI fungicide. In the previous two years (‘06-’07) infection periods occurred only with lighter rainfall through which the EBDC gave adequate protection not requiring after-infection control. LEM17+ Flint was clearly the most effective scab treatment on both leaves and fruit. LEM17 + Manzate was moderately effective. Treatments #9 (Rally + Omega) and #10 (ProPhyt + MicroSulf + Dithane) were adequate for foliar scab control but weaker on fruit scab. Alternating schedules involving an EBDC alone were not reliable for scab or quince rust control (Table 8) under these weather and inoculum conditions. All treatments involving SI fungicides gave excellent quince rust control under heavy test conditions. Treatment #10 (ProPhyt + MicroSulf + Dithane) gave significantly more quince rust control than Manzate alone (Trt. #5) on Idared. Rally + Omega and LEM17 + Flint were the most effective mildew treatments (Table 7). Under heavy disease pressure, the combination of ProPhyt + Captan gave the best control (Table 9). Indar gave good control of flyspeck but was weaker on sooty blotch. No treatment significantly reduced fruit finish compared to non-treated trees; several treatments improved it (Table 10).

97
Table 6. Control of scab and rusts by experimental fungicides on Stayman, Idared, and Granny Smith apples. Scab, % infection Stayman/ fruit Idared Idared fruit Granny fruit
Trt Treatment and formulated rate/acre Timing leaves 16 Jul 20 Oct leaves 1 Jul 25 Sep leaves fruit No fungicide 33 e 94 f 100 g 20 c 82 g 83 f 49 g 100 f
1 LEM17 200SC 14.4 fl oz Manzate 200 75DF 3 lb Captan 80WDG 30 oz + Ziram 76DF 3 lb
Apps 1,3,5 Apps. 2,4,6
5C-8C 20 b-d 32 b-d 19 bc 8 ab 36 cd 26 bc 34 d-f 41 bc
2 LEM17 200SC 20.6 fl oz Manzate 200 75DF 3 lb Captan 80WDG 30 oz + Ziram 76DF 3 lb
Apps 1,3,5 Apps. 2,4,6
5C-8C 22 b-d 35 cd 34 de 11 a-c 35 cd 31 cd 30 de 36 b
3 LEM17 200SC 14.4 fl oz + Manzate 200 75DF 3 lb Captan 80WDG 30 oz + Ziram 76DF 3 lb
TC-4C 5C-8C
14 b 15 ab 10 b 7 ab 20 b 14 ab 13 b 14 a
4 LEM17 200SC 14.4 fl oz + Flint 50WG 1 oz Captan 80WDG 30 oz + Ziram 76DF 3 lb
TC-4C 5C-8C
5 a 12 a 3 a 4 a 6 a 9 a 4 a 6 a
5 Manzate 200 75DF 3 lb Captan 80WDG 30 oz + Ziram 76DF 3 lb
TC-4C 5C-8C
27 de 54 de 36 e 13 bc 56 ef 36 cd 36 e-g 56 cd
6 Rally 40WSP 5 oz + Manzate 75DF 3 lb Captan 80WDG 30 oz + Ziram 76DF 3 lb
TC-4C 5C-8C
21 b-d 39 cd 32 c-e 14 bc 43 c-e 26 b-d 41 e-g 46 b-d
7 Indar 2F 8 fl oz TC-8C 22 cd 38 cd 34 c-e 14 bc 48 de 36 cd 31 de 63 d 8 Indar 2F 8 fl oz + Dithane 75DF 3 lb
Indar 2F 8 fl oz App. 1-1C 2C – 8C
16 bc 28 bc 19 b-d 9 ab 33 c 22 bc 23 cd 44 bc
9 Rally 40WSP 5 oz + Omega 500F 13.8 fl oz Omega 500F 13.8 fl oz
TC-4C 5C-8C
13 b 23 a-c 20 b-e 13 bc 35 cd 25 bc 29 de 28 b
10 ProPhyt 4.2L 2 qt + MicroSulf 3 lb + Dithane 75DF 3 lb ......................................... ProPhyt 4.2L 2 qt + MicroSulf 3 lb+ Captan 80WDG 2 lb ...................................... ProPhyt 4.2L 2 qt + Captan 80WDG 2 lb
TC-1C
2C – 3C 4C – 8C
15 bc 41 cd 35 e 9 ab 50 e 44 d 15 bc 43 bc
11 Rally 40WSP 5 oz (for scab monitoring) Captan 80WDG 30 oz + Ziram 76DF 3 lb
TC-4C 5C-8C
20 b-d 65 e 66 f 12 bc 65 f 63 e 47 f-g 84 e
Mean separation by Waller-Duncan K-ratio t-test (p=0.05). Foliar data based on ten shoots per rep. Stayman counted 11 Jun; Idared, 27 Jun; Granny Smith 16 Jul. Fruit counts involved 50 fruit/tree 1 Jul (Idared) or 16 Jul (Stayman), or postharvest samples of 25-fruit samples picked from each rep Idared (22 Sep) or Granny Smith (15 Oct). Stayman were harvested 1 Oct and rated after 19 days storage at 4°C. Randomized block design with four three-cultivar tree sets separated by untreated border rows. Treatments applied airblast at 100 gpa to both sides of the row on each application date: 16 Apr (TC, tight cluster, Stayman; open cluster-pink, Idared; open cluster, Granny Smith); 24 Apr (bloom, Stayman; bloom-petal fall, Idared and Granny). First – 8th covers (1C-8C): 13 May, 24 May, 5 Jun, 19 Jun, 2 Jul, 18 Jul, 1 Aug, and 20 Aug.

98
Table 7. Mildew control by experimental fungicides on Stayman, Idared and Granny Smith apples, 2008. Mildew, % leaves or leaf area, infected Stayman Granny Smith Idared Mildew % fruit infected
Trt Treatment and formulated rate/acre Timing leaves area leaves area leaves area Stayman Idared Granny 0 No fungicide --- 57 f 21 d 69 f 70 f 64 ef 57 g 20 d 41 e 13 b 1 LEM17 200SC 14.4 fl oz
Manzate 200 75DF 3 lb Captan 80WDG 30 oz + Ziram 76DF 3 lb
Apps 1,3,5 Apps. 2,4,6
5C-8C 51 f 11 c 54 cd 26 c-e 62 d-f 33 d-f
0 a 13 ab 2 a
2 LEM17 200SC 20.6 fl oz Manzate 200 75DF 3 lb Captan 80WDG 30 oz + Ziram 76DF 3 lb
Apps 1,3,5 Apps. 2,4,6
5C-8C 43 de 6 ab 56 c-e 19 b-d 56 b-e 32 d-f
4 c 10 ab 3 a
3 LEM17 200SC 14.4 fl oz + Manzate 200 75DF 3 lb Captan 80WDG 30 oz + Ziram 76DF 3 lb
TC-4C 5C-8C
35 bc 4 a 42 b 11 ab 48 ab 16 a-c
1 ab 10 ab 0 a
4 LEM17 200SC 14.4 fl oz + Flint 50WG 1 oz Captan 80WDG 30 oz + Ziram 76DF 3 lb
TC-4C 5C-8C
27 a 3 a 22 a 4 a 43 a 10 a 0 a 11 ab 0 a
5 Manzate 200 75DF 3 lb Captan 80WDG 30 oz + Ziram 76DF 3 lb
TC-4C 5C-8C
54 f 18 d 66 ef 57 f 64 f 54 g 0 a 28 de 1 a
6 Rally 40WSP 5 oz + Manzate 75DF 3 lb Captan 80WDG 30 oz + Ziram 76DF 3 lb
TC-4C 5C-8C
37 b-d 6 ab 54 cd 15 bc 55 b-d 28 c-e 0 a 12 a-c 0 a
7 Indar 2F 8 fl oz TC-8C 42 c-e 8 bc 59 d-f 35 e 59 c-f 40 ef 3 bc 24 cd 1 a 8 Indar 2F 8 fl oz + Dithane 75DF 3 lb
Indar 2F 8 fl oz App. 1-1C 2C – 8C
43 de 8 bc 57 c-e 34 de 63 ef 45 fg 0 a 18 b-d 3 a
9 Rally 40WSP 5 oz + Omega 500F 13.8 fl oz Omega 500F 13.8 fl oz
TC-4C 5C-8C
27 a 3 a 41 b 8 ab 48 ab 15 ab 1 ab 7 a 0 a
10 ProPhyt 4.2L 2 qt + MicroSulf 3 lb + Dithane 75DF 3 lb ......................................... ProPhyt 4.2L 2 qt + MicroSulf 3 lb+ Captan 80WDG 2 lb ...................................... ProPhyt 4.2L 2 qt + Captan 80WDG 2 lb
TC-1C
2C – 3C 4C – 8C
49 ef 10 c 46 bc 20 b-e 62 c-f 31 de 1 ab 12 ab 2 a
11 Rally 40WSP 5 oz (for scab monitoring) Captan 80WDG 30 oz + Ziram 76DF 3 lb
TC-4C 5C-8C
33 ab 4 a 46 bc 18 b-d 54 bc 22 b-d 0 a 21 b-d 0 a
Mean separation by Waller-Duncan K-ratio t-test (p=0.05). Randomized block design with four three-cultivar tree sets . Foliar counts based on ten shoots per rep. Stayman counted 11 Jun; Idared, 27 Jun; Granny Smith 16 Jul. Fruit counts involved postharvest samples of 25-fruit samples picked from each rep Idared (22 Sep) or Granny Smith (15 Oct). Stayman were harvested 1 Oct and rated after 19 days storage at 4°C.. Treatment rows were used as non-treated border rows in 2007 to stabilize mildew pressure for 2008.

99
Table 8. Control of cedar-apple rust and Quince rust by experimental fungicides on Stayman, Idared, and Granny Smith apples. Cedar-apple rust, % leaves or fruit Quince rust, % fruit infected Stayman Idared Idared fruit Stayman Idared Harvest counts
Trt Treatment and formulated rate/acre Timing fruit 1 Jul leaves 1 Jul 25 Sep 16 Jul 1 Jul Stayman Idared Granny 0 No fungicide --- <1 ab 7 f 9 c 7 b 52 e 80 f 9 b 21 c 6 b 1 LEM17 200SC 14.4 fl oz
Manzate 200 75DF 3 lb Captan 80WDG 30 oz + Ziram 76DF 3 lb
Apps 1,3,5 Apps. 2,4,6
5C-8C 3 b 2 de 1 ab 1 a
22 d 52 e 1 a 7 b 2 ab
2 LEM17 200SC 20.6 fl oz Manzate 200 75DF 3 lb Captan 80WDG 30 oz + Ziram 76DF 3 lb
Apps 1,3,5 Apps. 2,4,6
5C-8C <1 ab 2 c-e 4 b 4 ab
30 d 42 de 6 b 8 b 0 a
3 LEM17 200SC 14.4 fl oz + Manzate 200 75DF 3 lb Captan 80WDG 30 oz + Ziram 76DF 3 lb
TC-4C 5C-8C
1 ab 3 d-f 2 a 1 a 7 bc 16 c 1 a 1 a 1 ab
4 LEM17 200SC 14.4 fl oz + Flint 50WG 1 oz Captan 80WDG 30 oz + Ziram 76DF 3 lb
TC-4C 5C-8C
1 ab 2 b-d <1 a 1 a 12 c 27 cd 2 a 3 ab 1 ab
5 Manzate 200 75DF 3 lb Captan 80WDG 30 oz + Ziram 76DF 3 lb
TC-4C 5C-8C
3 b 5 ef 2 ab 1 a 11 c 24 c 1 a 1 a 0 a
6 Rally 40WSP 5 oz + Manzate 75DF 3 lb Captan 80WDG 30 oz + Ziram 76DF 3 lb
TC-4C 5C-8C
0 a <1 a-c 0 a 0 a <1 a 3 ab 0 a 0 a 0 a
7 Indar 2F 8 fl oz TC-8C 0 a 0 a 0 a 0 a 6 bc 5 ab 0 a 1 a 0 a 8 Indar 2F 8 fl oz + Dithane 75DF 3 lb
Indar 2F 8 fl oz App. 1-1C 2C – 8C
0 a <1 ab 0 a 0 a 2 a 2 ab 0 a 1 a 0 a
9 Rally 40WSP 5 oz + Omega 500F 13.8 fl oz Omega 500F 13.8 fl oz
TC-4C 5C-8C
0 a <1 ab 0 a 0 a 3 ab 0 a 1 a 0 a 0 a
10 ProPhyt 4.2L 2 qt + MicroSulf 3 lb + Dithane 75DF 3 lb ......................................... ProPhyt 4.2L 2 qt + MicroSulf 3 lb+ Captan 80WDG 2 lb ...................................... ProPhyt 4.2L 2 qt + Captan 80WDG 2 lb
TC-1C
2C – 3C 4C – 8C
<1 ab 0 a 0 a 0 a 6 bc 9 b 0 a 0 a 0 a
11 Rally 40WSP 5 oz (for scab monitoring) Captan 80WDG 30 oz + Ziram 76DF 3 lb
TC-4C 5C-8C
0 a 0 a 0 a 0 a <1 a 1 a 0 a 1 a 1 ab
Mean separation by Waller-Duncan K-ratio t-test (p=0.05). Foliar counts based on ten shoots per rep. Stayman counted 11 Jun; Idared, 27 Jun; Granny Smith 16 Jul. Fruit counts involved 50 fruit/tree 1 Jul (Idared) or 16 Jul (Stayman) or postharvest samples of 25-fruit samples picked from each rep Idared (22 Sep) or Granny Smith (15 Oct). Stayman were harvested 1 Oct and rated after 19 days storage at 4°C. Treatments applied airblast at 100 gpa to both sides of the row on each application date: Fungicide applications dates: 16 Apr (TC, tight cluster, Stayman; open cluster-pink, Idared; open cluster, Granny Smith); 24 Apr (bloom, Stayman; bloom-petal fall, Idared and Granny). First – 8th covers (1C-8C): 13 May, 24 May, 5 Jun, 19 Jun, 2 Jul, 18 Jul, 1 Aug, and 20 Aug.
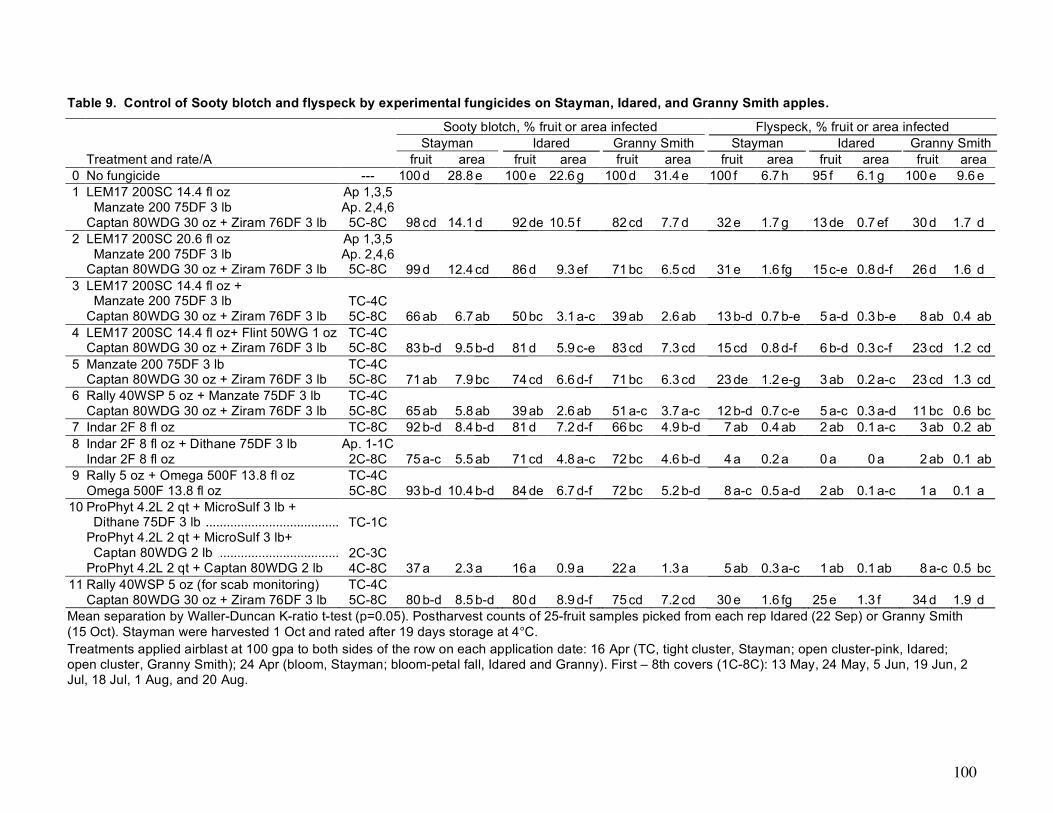
100
Table 9. Control of Sooty blotch and flyspeck by experimental fungicides on Stayman, Idared, and Granny Smith apples.
Sooty blotch, % fruit or area infected Flyspeck, % fruit or area infected Stayman Idared Granny Smith Stayman Idared Granny Smith Treatment and rate/A fruit area fruit area fruit area fruit area fruit area fruit area
0 No fungicide --- 100 d 28.8 e 100 e 22.6 g 100 d 31.4 e 100 f 6.7 h 95 f 6.1 g 100 e 9.6 e 1 LEM17 200SC 14.4 fl oz
Manzate 200 75DF 3 lb Captan 80WDG 30 oz + Ziram 76DF 3 lb
Ap 1,3,5 Ap. 2,4,6
5C-8C 98 cd 14.1 d 92 de 10.5 f 82 cd 7.7 d 32 e 1.7 g 13 de 0.7 ef 30 d 1.7 d 2 LEM17 200SC 20.6 fl oz
Manzate 200 75DF 3 lb Captan 80WDG 30 oz + Ziram 76DF 3 lb
Ap 1,3,5 Ap. 2,4,6
5C-8C 99 d 12.4 cd 86 d 9.3 ef 71 bc 6.5 cd 31 e 1.6 fg 15 c-e 0.8 d-f 26 d 1.6 d 3 LEM17 200SC 14.4 fl oz +
Manzate 200 75DF 3 lb Captan 80WDG 30 oz + Ziram 76DF 3 lb
TC-4C 5C-8C 66 ab 6.7 ab 50 bc 3.1 a-c 39 ab 2.6 ab 13 b-d 0.7 b-e 5 a-d 0.3 b-e 8 ab 0.4 ab
4 LEM17 200SC 14.4 fl oz+ Flint 50WG 1 oz Captan 80WDG 30 oz + Ziram 76DF 3 lb
TC-4C 5C-8C 83 b-d 9.5 b-d 81 d 5.9 c-e 83 cd 7.3 cd 15 cd 0.8 d-f 6 b-d 0.3 c-f 23 cd 1.2 cd
5 Manzate 200 75DF 3 lb Captan 80WDG 30 oz + Ziram 76DF 3 lb
TC-4C 5C-8C 71 ab 7.9 bc 74 cd 6.6 d-f 71 bc 6.3 cd 23 de 1.2 e-g 3 ab 0.2 a-c 23 cd 1.3 cd
6 Rally 40WSP 5 oz + Manzate 75DF 3 lb Captan 80WDG 30 oz + Ziram 76DF 3 lb
TC-4C 5C-8C 65 ab 5.8 ab 39 ab 2.6 ab 51 a-c 3.7 a-c 12 b-d 0.7 c-e 5 a-c 0.3 a-d 11 bc 0.6 bc
7 Indar 2F 8 fl oz TC-8C 92 b-d 8.4 b-d 81 d 7.2 d-f 66 bc 4.9 b-d 7 ab 0.4 ab 2 ab 0.1 a-c 3 ab 0.2 ab 8 Indar 2F 8 fl oz + Dithane 75DF 3 lb
Indar 2F 8 fl oz Ap. 1-1C 2C-8C 75 a-c 5.5 ab 71 cd 4.8 a-c 72 bc 4.6 b-d 4 a 0.2 a 0 a 0 a 2 ab 0.1 ab
9 Rally 5 oz + Omega 500F 13.8 fl oz Omega 500F 13.8 fl oz
TC-4C 5C-8C 93 b-d 10.4 b-d 84 de 6.7 d-f 72 bc 5.2 b-d 8 a-c 0.5 a-d 2 ab 0.1 a-c 1 a 0.1 a
10 ProPhyt 4.2L 2 qt + MicroSulf 3 lb + Dithane 75DF 3 lb .......................................... ProPhyt 4.2L 2 qt + MicroSulf 3 lb+ Captan 80WDG 2 lb ...................................... ProPhyt 4.2L 2 qt + Captan 80WDG 2 lb
TC-1C
2C-3C 4C-8C 37 a 2.3 a 16 a 0.9 a 22 a 1.3 a 5 ab 0.3 a-c 1 ab 0.1 ab 8 a-c 0.5 bc
11 Rally 40WSP 5 oz (for scab monitoring) Captan 80WDG 30 oz + Ziram 76DF 3 lb
TC-4C 5C-8C 80 b-d 8.5 b-d 80 d 8.9 d-f 75 cd 7.2 cd 30 e 1.6 fg 25 e 1.3 f 34 d 1.9 d
Mean separation by Waller-Duncan K-ratio t-test (p=0.05). Postharvest counts of 25-fruit samples picked from each rep Idared (22 Sep) or Granny Smith (15 Oct). Stayman were harvested 1 Oct and rated after 19 days storage at 4°C. Treatments applied airblast at 100 gpa to both sides of the row on each application date: 16 Apr (TC, tight cluster, Stayman; open cluster-pink, Idared; open cluster, Granny Smith); 24 Apr (bloom, Stayman; bloom-petal fall, Idared and Granny). First – 8th covers (1C-8C): 13 May, 24 May, 5 Jun, 19 Jun, 2 Jul, 18 Jul, 1 Aug, and 20 Aug.

101
Table 10. Control of Brooks spot, and rots, and fruit finish effects by fungicides on Stayman, Idared, and Granny Smith apples. % fruit infected, postharvest counts Fruit finish ratings (0-5)* Brooks spot With any rot Russet Opalescence Treatment and rate/A Stayman Idared Stayman Idared Granny Stayman Granny Stayman Granny
0 No fungicide --- 7 c 16 d 8 b 8 c 11 b 2.5 c 1.1 g 1.7 a 1.3 b-d 1 LEM17 200SC 14.4 fl oz
Manzate 200 75DF 3 lb Captan 80WDG 30 oz + Ziram 76DF 3 lb
Apps 1,3,5 Apps. 2,4,6
5C-8C 0 a 0 a 0 a 1 ab 1 a 2.2 a-c 1.0 fg 1.9 a 1.2 a-c
2 LEM17 200SC 20.6 fl oz Manzate 200 75DF 3 lb Captan 80WDG 30 oz + Ziram 76DF 3 lb
Apps 1,3,5 Apps. 2,4,6
5C-8C 0 a 0 a 0 a 0 a 0 a 1.8 ab 0.9 d-g 1.3 a 1.3 a-d
3 LEM17 200SC 14.4 fl oz + Manzate 200 75DF 3 lb Captan 80WDG 30 oz + Ziram 76DF 3 lb
TC-4C 5C-8C 0 a 1 ab 0 a 0 a 0 a
1.6 a 0.3 a 1.3 a 0.9 a
4 LEM17 200SC 14.4 fl oz + Flint 50WG 1 oz Captan 80WDG 30 oz + Ziram 76DF 3 lb
TC-4C 5C-8C 0 a 0 a 0 a 0 a 0 a 1.8 ab 0.5 a-c 1.5 a 0.9 a
5 Manzate 200 75DF 3 lb Captan 80WDG 30 oz + Ziram 76DF 3 lb
TC-4C 5C-8C 0 a 0 a 0 a 0 a 1 a 1.9 ab 1.0 e-g 1.7 a 1.4 cd
6 Rally 40WSP 5 oz + Manzate 75DF 3 lb Captan 80WDG 30 oz + Ziram 76DF 3 lb
TC-4C 5C-8C 1 ab 1 ab 0 a 1 ab 1 a 2.1 a-c 0.5 ab 1.6 a 1.1 a-c
7 Indar 2F 8 fl oz TC-8C 0 a 0 a 0 a 4 bc 0 a 1.8 ab 0.6 a-d 1.3 a 1.0 a-c 8 Indar 2F 8 fl oz + Dithane 75DF 3 lb
Indar 2F 8 fl oz App. 1-1C 2C – 8C 0 a 0 a 0 a 0 a 1 a 1.8 ab 0.7 b-e 1.4 a 1.2 a-d
9 Rally 40WSP 5 oz + Omega 500F 13.8 fl oz Omega 500F 13.8 fl oz
TC-4C 5C-8C 0 a 2 b 0 a 0 a 0 a 2.0 a-c 0.8 c-f 1.9 a 1.6 d
10 ProPhyt 4.2L 2 qt + MicroSulf 3 lb + Dithane 75DF 3 lb .......................................... ProPhyt 4.2L 2 qt + MicroSulf 3 lb+ Captan 80WDG 2 lb ...................................... ProPhyt 4.2L 2 qt + Captan 80WDG 2 lb
TC-1C
2C – 3C 4C – 8C 0 a 0 a 0 a 0 a 1 a 2.0 a-c 0.5 ab 1.4 a 0.9 ab
11 Rally 40WSP 5 oz (for scab monitoring) Captan 80WDG 30 oz + Ziram 76DF 3 lb
TC-4C 5C-8C 3 b 6 c 0 a 1 ab 1 a 2.3 bc 0.7 b-e 1.8 a 1.0 ab
Mean separation by Waller-Duncan K-ratio t-test (p=0.05). Postharvest counts of 25 fruit from each of four replications. Treatments applied airblast at 100 gpa to both sides of the row on each application date: 16 Apr (TC, tight cluster, Stayman; open cluster-pink, Idared; open cluster, Granny Smith); 24 Apr (bloom, Stayman; bloom-petal fall, Idared and Granny). First – 8th covers (1C-8C): 13 May, 24 May, 5 Jun, 19 Jun, 2 Jul, 18 Jul, 1 Aug, and 20 Aug. Postharvest samples of 25-fruit samples picked from each rep Idared (22 Sep) or Granny Smith (15 Oct). Stayman were harvested 1 Oct and rated after 19 days storage at 4°C. * Fruit finish rated on a scale of 0-5 (0=perfect finish; 5=severe opalescence or russet, not presumed to be related to mildew).

102
Figure 1. 15-yr history of foliar scab control with SI+EBDC
Stayman apple, Winchester, VA
0
10
20
30
40
50
60
70
80
90
100%
in
fecti
on
/% c
on
tro
l
'94-
4.5
'95-
4oz
'96-
4oz
'97-
4oz
'98-
4oz
'99-
4oz
'00-
P10
'01-
5oz
'02-
5oz
'03-
5oz
'04-
4oz
'05-
4oz
'05-
5oz
'06-
4.5oz
'07-
4.5oz
'08-
5oz
Test year and SI formulation rate/A
Check (% lvs inf.) Nova+EBDC (% control)
Figure 2. 15-yr history of fruit scab control with SI+EBDC
Stayman apple, Winchester, VA
0
10
20
30
40
50
60
70
80
90
100
% i
nfe
cti
on
/% c
on
tro
l
'94-
4.5
'95-
4oz
'96-
4oz
'97-
4oz
'98-
4oz
'99-
4oz
'00-
P10
'01-
5oz
'02-
5oz
'03-
5oz
'04-
4oz
'05-
4oz
'05-
5oz
'06-
4.5oz
'07-
4.5oz
'08-
5oz
Test year and SI formulation rate/A
Check, % fruit inf. Nova+EBDC (% control)
103
APPLE (Malus domestica ‘Golden Delicious', K. S. Yoder, A. E. Cochran II, 'Red Delicious', and ‘Rome Beauty’) W. S. Royston, Jr., and S. W. Kilmer Scab; Venturia inaequalis C. Douglas and C. Cochran Powdery mildew; Podosphaera leucotricha Virginia Tech Agr. Res. & Ext. Center Cedar-apple rust; Gymnosporangium juniperi-virginianae 595 Laurel Grove Road Quince rust; Gymnosporangium clavipes Winchester, VA 22602 Brooks fruit spot; Mycosphaerella pomi Sooty blotch; disease complex Flyspeck; Zygophiala jamaicensis Rots (unidentified) Fruit finish
Broad-spectrum disease management with alternating fungicide programs on Red Delicious, Golden Delicious, and Rome apples, 2008. Nine treatments, including one experimental and one recently registered materials, were compared for season-long fungal disease control and fruit finish effects on three apple cultivars. Treatments were evaluated on 20-yr-old, three-cultivar tree sets in a four-replicate randomized block design. The Rome trees used in the test had not been treated in 2007 to allow powdery mildew inoculum to stabilize in the 2008 test trees. Dilute treatments were applied to the point of runoff with a single nozzle handgun at 400 psi as follows: 16 Apr (Rome TC, tight cluster; Golden Del. TC-OC, open cluster; Red Del. OC-pink); 24 Apr (Rome and Golden Del. bloom; Red Del. petal fall); first to seventh covers (1C-7C): 13 May, 23 May, 3 Jun, 17 Jun, 1 Jul, 15 Jul and, 5 Aug. Maintenance sprays, applied separately to the entire test block with a commercial airblast sprayer, included Supracide, Imidan, Provado, Intrepid, Lannate LV, Delegate, Calypso, and Altacor. Inoculum, placed over each Golden Delicious test tree, included cedar rust galls 8 Apr, wild blackberry canes with the sooty blotch and flyspeck fungi and bitter rot mummies 30 Apr. Other diseases developed from inoculum naturally present in the test area, including cedar-apple rust inoculum from red cedars in the vicinity. Foliar data represent averages of counts of ten terminal shoots from each of four single-tree reps 9 Jun (Golden Delicious) or 10 Jul (Rome). Quince rust and scab were rated on each Red Delicious tree by counting 50 fruit per-tree 18 Jul. Postharvest fruit counts are means of 25-fruit samples picked from each of four single-tree reps 16 Sep (Red Delicious, 17 Sep (Golden Delicious), or 17 Sep (Rome), placed in cold storage at 4°C and rated. after 33-35 days cold storage. Percentage data were converted by the square root arcsin transformation for statistical analysis.
Early season weather and inoculum conditions were more favorable for mildew, cedar-apple rust and quince rust than for scab. Although scab infection on leaves was light, more occurred on fruit, and evidently increased on non-treated Red Delicious fruit from July to September, while treated fruit showed less increase in incidence in the harvest counts (Table 11). Some treatments gave better scab control on cultivar than others. Flint + Dithane (Trt.#6) and Inspire were most effective overall, while Indar was strong on Romes. MicroSulf + Dithane and Rally + Dithane were the weakest scab treatments. Rally gave the best mildew control under very heavy pressure. Control of rusts under strong test conditions was variable (Table 12). Rally gave excellent control of cedar-apple rust; Indar and Inspire were significantly less effective, followed by Flint and Pristine then ProPhyt+ MicroSulf + Dithane. Treatment applications bracketed a quince rust infection period which occurred 20-22 Apr following a 2-in. rainfall and superior control by Indar (in the July orchard counts) may indicate increased residual of the 16 Apr application or better after-infection control by the 24 Apr application, compared to other SI and strobilurin fungicides. Quince rust was less evident on treated and non-treated fruit in the postharvest counts, either because affected fruit dropped, or because they so stunted that they were not picked in the sample. Pristine gave superior control of sooty blotch and flyspeck which developed slowly in this test block (Table 13). Adding ProPhyt to Captan improved control of flyspeck on Red Delicious. There were few deleterious fruit finish effects by any treatment compared to non-treated trees, and Pristine+Dithane/Pristine improved USDA grade-out of Golden Delicious based on russeting (Table 14).

104
Table 11. Scab and Mildew on Golden Delicious, Red Delicious and Rome apple, 2008.
Scab, % leaves or fruit infected Mildew, % leaves, lf area, fruit, or fruit area Red Del fruit Golden Del Rome Rome Golden Del. Treatment and rate/A Timing 18 Jul 21 Oct leaves fruit lvs fruit lvs lf. area fruit area lvs lf. area
0 Non-treated control --- 24 e 58 d 4 bc 28 e 3 ab 21 b 61 b 57 e 47 c 9.6 c 58 d 17 e 1 Rally 40WSP 1.25 oz + Dithane 75DF 12 oz
Captan 80WDG 7.5 oz + Ziram 76DF 7.5 oz TC-3C
4C – 7C 18 c-e 13 c 5 bc 3 bc 6 ab 7 ab 51 ab 19 ab 0 a 0 a 35 ab 5 a-c
2 Rally 40WSP 1.25 oz + Omega 500F 3.5 fl oz ......................................... Omega 500F 3.5 fl oz
TC-3C
4C – 7C 19 de 4 ab 6 c 2 a-c 6 b 8 ab 44 a 13 a 13 b 2.5 b 34 ab 4 ab
3 Indar 2F 2 fl oz + Dithane 75DF 12 oz Captan 80WDG 7.5 oz + Ziram 76DF 7.5 oz
TC-3C 4C –7C 5 a 7 bc 5 bc 7 cd 2 a 2 a 57 b 48 de 22 b 4.2 b 48 c 9 d
4 Vangard 75WG 1.25 oz + Dithane 75DF 12 oz Rally 40WSP 1.25 oz + Dithane 75DF 12 oz Captan 80WDG 7.5 oz + Ziram 76DF 7.5 oz
TC Bl-3C
4C – 7C
12 b-d 8 bc 6 c 1 ab 7 b 7 ab 54 ab 19 ab 15 b 3.2 b 31 a 4 a
5 Inspire Super MP (1 oz + 1 fl oz, each material) Captan 80WDG 7.5 oz + Ziram 76DF 7.5 oz
TC-3C 4C – 7C
5 ab 5 bc 1 a 0 a 2 a 2 a 60 b 37 cd 14 b 2.6 b 37 b 6 b-d
6 Flint 50WG 0.5 oz + Dithane 75DF 12 oz Captan 80WDG 7.5 oz + Ziram 76DF 7.5 oz
TC-3C 4C – 7C
3 a 0 a 1 a 3 a-c 3 ab 5 a 52 ab 30 bc 12 b 3.3 b 35 ab 6 a-d
7 Pristine 38WG 3.5 oz + Dithane 75DF 12 oz Pristine 38WG 3.5 oz
TC-3C 4C – 7C
8 a-c 6 bc 1 ab 2 a-c 2 a 3 a 55 b 37 cd 12 b 2.7 b 33 ab 5 a-c
8 ProPhyt 4.2L 0.5 pt + MicroSulf 12 oz + Dithane 75DF 12 oz ............................................
ProPhyt 4.2L 0.5 pt + MicroSulf 12 oz + Captan 80WDG 8 oz ..........................................
ProPhyt 4.2L 0.5 pt + Captan 80WDG 8 oz
TC– 1C
2C – 3C 4C – 7C
15 c-e 6 bc 6 c 3 a-c 3 ab 9 ab 56 b 40 cd 14 b 2.8 b
43 c 7 b-d
9 MicroSulf 12 oz + Dithane 75DF 12 oz MicroSulf 12 oz + Captan 80WDG 8 oz ..............
Captan 80WDG 8 oz
TC– 1C 2C – 3C 4C – 7C
16 c-e 4 b 6 c 12 d 3 ab 5 a 59 b 34 cd 16 b 3.3 b 44 c 7 cd
Mean separation by Waller-Duncan K-ratio t-test (p=0.05). Foliar counts of ten terminal shoots from each of four single-tree reps 9 Jun (Golden Delicious), or 10 Jul (Rome). Quince rust and scab were rated on each Red Delicious tree by counting 50 fruit per-tree 18 Jul. Postharvest fruit counts are means of 25-fruit samples picked from each of four single-tree reps 16 Sep (Red Delicious), 17 Sep (Golden Delicious), or 17 Sep (Rome), placed in cold storage at 4°C, and rated after 33-35 days cold storage. Treatments were applied dilute to run-off: 16 Apr (Rome TC, tight cluster; Golden Del. TC-OC, open cluster; Red Del. OC-pink); 24 Apr (Rome and Golden Del. bloom; Red Del. petal fall); first to seventh covers (1C-7C): 13 May, 23 May, 3 Jun, 17 Jun, 1 Jul, 15 Jul, and 5 Aug.

105
Table 12. Rust and Brooks Spot on Golden Delicious, Red Delicious, and Rome apple, 2008.
Cedar-apple rust, % leaves or fruit infected Quince Rust, % fruit infected Brooks spot, Rome G. Del. Red Delicious harvest % fruit inf., Treatment and rate/A Timing leaves fruit leaves 18 Jul 25 Sep G. Del. Rome G. Del.
0 Non-treated control --- 49 d 20 c 37 f 31 e 5 b 14 c 9 b 6 b 1 Rally 40WSP 1.25 oz + Dithane 75DF 12 oz
Captan 80WDG 7.5 oz + Ziram 76DF 7.5 oz TC-3C
4C – 7C 5 a 0 a <1 a 13 bc 0 a 0 a 0 a 0 a
2 Rally 40WSP 1.25 oz + Omega 500F 3.5 fl oz ......................................... Omega 500F 3.5 fl oz
TC-3C
4C – 7C 5 a 2 ab <1 a 18 cd 0 a 0 a 0 a 2 ab
3 Indar 2F 2 fl oz + Dithane 75DF 12 oz Captan 80WDG 7.5 oz + Ziram 76DF 7.5 oz
TC-3C 4C –7C
14 b 0 a 3 bc 6 a 0 a 0 a 0 a 0 a
4 Vangard 75WG 1.25 oz + Dithane 75DF 12 oz Rally 40WSP 1.25 oz + Dithane 75DF 12 oz Captan 80WDG 7.5 oz + Ziram 76DF 7.5 oz
TC Bl-3C
4C – 7C
6 a 0 a <1 a 10 ab 0 a 0 a 0 a 0 a
5 Inspire Super MP (1 oz + 1 fl oz, each material) Captan 80WDG 7.5 oz + Ziram 76DF 7.5 oz
TC-3C 4C – 7C
18 bc 0 a 1 ab 20 d 0 a 0 a 0 a 0 a
6 Flint 50WG 0.5 oz + Dithane 75DF 12 oz Captan 80WDG 7.5 oz + Ziram 76DF 7.5 oz
TC-3C 4C – 7C
24 c 3 ab 8 d 16 cd 0 a 1 ab 0 a 0 a
7 Pristine 38WG 3.5 oz + Dithane 75DF 12 oz Pristine 38WG 3.5 oz
TC-3C 4C – 7C
20 bc 6 ab 5 cd 14 b-d 0 a 0 a 3 ab 0 a
8 ProPhyt 4.2L 0.5 pt + MicroSulf 12 oz + Dithane 75DF 12 oz ............................................
ProPhyt 4.2L 0.5 pt + MicroSulf 12 oz + Captan 80WDG 8 oz ...........................................
ProPhyt 4.2L 0.5 pt + Captan 80WDG 8 oz
TC– 1C
2C – 3C 4C – 7C
40 d 8 bc 30 ef 15 b-d 0 a 2 b 2 a 0 a
9 MicroSulf 12 oz + Dithane 75DF 12 oz MicroSulf 12 oz + Captan 80WDG 8 oz ..............
Captan 80WDG 8 oz
TC– 1C 2C – 3C 4C – 7C
40 d 8 ab 22 e 17 cd 0 a 1 ab 2 a 0 a
Mean separation by Waller-Duncan K-ratio t-test (p=0.05). Foliar counts of ten terminal shoots from each of four single-tree reps 9 Jun (Golden Delicious), or 10 Jul (Rome). Quince rust rated on each Red Delicious tree by counting 50 fruit per-tree 18 Jul. Postharvest fruit counts are means of 25-fruit samples picked from each of four single-tree reps 16 Sep (Red Delicious), 17 Sep (Golden Delicious), or 17 Sep (Rome), placed in cold storage at 4°C, and rated after 33-35 days cold storage. Treatments were applied dilute to run-off: 16 Apr (Rome TC, tight cluster; Golden Del. TC-OC, open cluster; Red Del. OC-pink); 24 Apr (Rome and Golden Del. bloom; Red Del. petal fall); first to seventh covers (1C-7C): 13 May, 23 May, 3 Jun, 17 Jun, 1 Jul, 15 Jul, and 5 Aug.

106
Table 13. Sooty Blotch and Flyspeck on Golden Delicious, Red Delicious, and Rome apple, 2008.
Sooty Blotch, % fruit or area infected Fly Speck, % fruit or area infected Red Del Golden Del Rome Red Del. Golden Del Rome Treatment and rate/A Timing fruit area fruit area fruit area fruit area fruit area fruit area 0 Non-treated control --- 96 d 10.9 e 99 d 13.4 c 95 c 8.2 d 93 d 5.9 d 87 e 4.8 d 39 b 2.1 b 1 Rally 40WSP 1.25 oz + Dithane 75DF 12 oz
Captan 80WDG 7.5 oz + Ziram 76DF 7.5 oz TC-3C
4C – 7C
5 a 0.3 ab 4 a 0.4 a 3 ab 0.1 ab 7 ab 0.4 a 7 ab 0.4 a 3 a 0.1 a 2 Rally 40WSP 1.25 oz +
Omega 500F 3.5 fl oz ......................................... Omega 500F 3.5 fl oz
TC-3C
4C – 7C
28 c 1.8 d 31 c 2.0 b 12 ab 0.8 a-c 26 c 1.7 c 30 d 1.7 c 14 a 0.9 a 3 Indar 2F 2 fl oz + Dithane 75DF 12 oz
Captan 80WDG 7.5 oz + Ziram 76DF 7.5 oz TC-3C 4C –7C
21 bc 1.4 cd 18 bc 1.1 ab 10 ab 0.5 a-c 22 c 1.2 c 20 cd 1.0 bc 4 a 0.2 a 4 Vangard 75WG 1.25 oz + Dithane 75DF 12 oz
Rally 40WSP 1.25 oz + Dithane 75DF 12 oz Captan 80WDG 7.5 oz + Ziram 76DF 7.5 oz
TC Bl-3C
4C – 7C
17 bc 1.4 cd 18 bc 1.0 ab 9 ab 0.5 a-c 20 bc 1.2 bc 16 b-d 0.7 ab 2 a 0.1 a 5 Inspire Super MP (1 oz + 1 fl oz, each material)
Captan 80WDG 7.5 oz + Ziram 76DF 7.5 oz TC-3C
4C – 7C
8 ab 0.4 a-c 9 ab 0.5 a 11 ab 0.6 a-c 11 a-c 0.5 a-c 8 a-c 0.4 ab 4 a 0.2 a 6 Flint 50WG 0.5 oz + Dithane 75DF 12 oz
Captan 80WDG 7.5 oz + Ziram 76DF 7.5 oz TC-3C
4C – 7C
21 bc 1.3 b-d 15 ab 1.3 ab 6 a 0.3 a-c 30 c 1.5 c 17 a-d 0.9 ab 6 a 0.3 a 7 Pristine 38WG 3.5 oz + Dithane 75DF 12 oz
Pristine 38WG 3.5 oz TC-3C
4C – 7C
3 a 0.2 a 7 ab 0.4 a 2 ab 0.1 a 5 ab 0.3 ab 4 a 0.4 a 0 a 0 a 8 ProPhyt 4.2L 0.5 pt + MicroSulf 12 oz +
Dithane 75DF 12 oz ............................................ ProPhyt 4.2L 0.5 pt + MicroSulf 12 oz +
Captan 80WDG 8 oz ........................................... ProPhyt 4.2L 0.5 pt + Captan 80WDG 8 oz
TC– 1C
2C – 3C 4C – 7C
8 ab 0.5 a-c 16 ab 0.9 ab 13 ab 0.7 bc 6 a 0.3 a 8 a-c 0.5 ab 9 a 0.5 a 9 MicroSulf 12 oz + Dithane 75DF 12 oz
MicroSulf 12 oz + Captan 80WDG 8 oz .............. Captan 80WDG 8 oz
TC– 1C 2C – 3C 4C – 7C
17 bc 1.0 b-d 20 bc 1.2 ab 12 b 0.8 c 25 c 1.4 c 16 a-d 0.8 ab 4 a 0.2 a Mean separation by Waller-Duncan K-ratio t-test (p=0.05). Postharvest counts of 25-fruit samples picked from each of four single-tree reps 16 Sep (Red Delicious, 17 Sep (Golden Delicious), or 17 Sep (Rome), placed in cold storage at 4°C and rated. after 33-35 days cold storage. Treatments were applied dilute to run-off: 16 Apr (Rome TC, tight cluster; Golden Del. TC-OC, open cluster; Red Del. OC-pink); 24 Apr (Rome and Golden Del. bloom; Red Del. petal fall); first to seventh covers (1C-7C): 13 May, 23 May, 3 Jun, 17 Jun, 1 Jul, 15 Jul, and 5 Aug.

107
Table 14. Rots and Fruit Finish on Golden Delicious, Red Delicious, and Rome.
Fruit finish ratings* Golden Delicious Rots, % fruit inf Opalescence Russet % fruit finish rating** Treatment and rate/A Timing G.Del. Rome R. Del. Rome R. Del Rome G. Del. X-Fancy X-Fcy /Fcy 0 Non-treated control --- 36 d 17 c 1.1 b 1.2 a 1.5 a 1.1 a 3.0 d 20 b 57 b 1 Rally 40WSP 1.25 oz + Dithane 75DF 12 oz
Captan 80WDG 7.5 oz + Ziram 76DF 7.5 oz TC-3C
4C – 7C
1 ab 3 ab 1.1 ab 1.6 a 1.6 a 0.9 a 2.3 a-c 47 ab 86 ab
2 Rally 40WSP 1.25 oz + Omega 500F 3.5 fl oz .......................................... Omega 500F 3.5 fl oz
TC-3C
4C – 7C
4 bc 4 ab
0.9 ab 1.2 a 1.3 a 1.0 a 2.3 a-c 48 ab 80 ab
3 Indar 2F 2 fl oz + Dithane 75DF 12 oz Captan 80WDG 7.5 oz + Ziram 76DF 7.5 oz
TC-3C 4C –7C
1 ab 10 bc 1.5 c 1.8 a 1.5 a 1.6 a 2.3 a-c 52 ab 82 ab
4 Vangard 75WG 1.25 oz + Dithane 75DF 12 oz Rally 40WSP 1.25 oz + Dithane 75DF 12 oz Captan 80WDG 7.5 oz + Ziram 76DF 7.5 oz
TC Bl-3C
4C – 7C
3 a-c 10 bc
1.5 c 1.7 a 1.6 a 1.1 a 2.2 a-c 42 ab 82 ab
5 Inspire Super MP (1 oz + 1 fl oz, each material) Captan 80WDG 7.5 oz + Ziram 76DF 7.5 oz
TC-3C 4C – 7C
4 bc 2 a
0.8 a 1.7 a 1.2 a 1.3 a 2.8 cd 27 b 64 ab
6 Flint 50WG 0.5 oz + Dithane 75DF 12 oz Captan 80WDG 7.5 oz + Ziram 76DF 7.5 oz
TC-3C 4C – 7C
6 c 3 ab
0.9 ab 1.5 a 1.1 a 1.3 a 2.4 b-d 39 ab 78 ab
7 Pristine 38WG 3.5 oz + Dithane 75DF 12 oz Pristine 38WG 3.5 oz
TC-3C 4C – 7C
2 a-c 9 bc
0.9 ab 1.4 a 1.1 a 1.1 a 1.8 a 64 a 88 a
8 ProPhyt 4.2L 0.5 pt + MicroSulf 12 oz + Dithane 75DF 12 oz ............................................
ProPhyt 4.2L 0.5 pt + MicroSulf 12 oz + Captan 80WDG 8 oz ...........................................
ProPhyt 4.2L 0.5 pt + Captan 80WDG 8 oz
TC– 1C
2C – 3C 4C – 7C
0 a 1 a
1.0 ab 1.4 a 1.3 a 1.3 a 2.1 ab 52 ab 86 ab
9 MicroSulf 12 oz + Dithane 75DF 12 oz MicroSulf 12 oz + Captan 80WDG 8 oz ..............
Captan 80WDG 8 oz
TC– 1C 2C – 3C 4C – 7C
6 c 4 ab
1.1 b 1.6 a 1.4 a 1.4 a 2.4 bc 38 ab 69 ab
Mean separation by Waller-Duncan K-ratio t-test (p=0.05). Postharvest counts of 25-fruit samples picked from each of four single-tree reps 16 Sep (Red Delicious), 17 Sep (Golden Delicious), or 17 Sep (Rome), placed in cold storage at 4°C, and rated after 33-35 days cold storage. Treatments were applied dilute to run-off: 16 Apr (Rome TC, tight cluster; Golden Del. TC-OC, open cluster; Red Del. OC-pink); 24 Apr (Rome and Golden Del. bloom; Red Del. petal fall); first to seventh covers (1C-7C): 13 May, 23 May, 3 Jun, 17 Jun, 1 Jul, 15 Jul, and 5 Aug. * Fruit finish rated on a scale of 0-5 (0=perfect finish; 5=severe russet or opalescence). **USDA Extra fancy and fancy grades after downgrading by russet.

108
APPLE (Malus domestica ‘Idared') K. S. Yoder, A. E. Cochran II, Sooty blotch; disease complex W. S. Royston, Jr., and S. W. Kilmer Flyspeck; Zygophiala jamaicensis Virginia Tech Agr. Res. & Ext. Center Rots 595 Laurel Grove Road Fruit finish Winchester, VA 22602
Disease control by treatments first applied at petal fall for summer disease control on Idared apples, 2008.
Sixteen treatments involving experimental and registered fungicides were compared during the cover spray period on 27-yr-old trees with a 28-ft row spacing. The test was conducted in a randomized block design with four single-tree replicates separated by untreated border rows between treatment rows. Tree-row-volume was determined to require a 400 gal/A dilute base for adequate spray coverage. Pre-test fungicides to suppress early season diseases were applied 8 Apr (Nova 5 oz + Dithane 3 lb). Test treatments were applied as petal fall to eighth cover sprays to both sides of the tree on each application date with a Swanson Model DA-400 airblast sprayer at 100 gal/A as follows: 7 May (petal fall, PF); first- seventh covers (1C-8C): 21 May, 3 Jun, 17 Jun, 2 Jul, 15 Jul, 13 Aug, 2 Sep and 16 Sep. Maintenance insecticides applied to the entire test block with the same equipment included: Lorsban, Imidan, Provado, Intrepid Lannate LV, and Altacor. The bitter rot fungus was inoculated into four fruit in each quadrant of each test tree 29 Jul. Other diseases developed from inoculum naturally present in the test area. Counts were based on ten shoots per replicate tree 29 Jul. A 25-fruit sample from each replicate tree was harvested 16 Sep, two weeks after the 7th cover spray and immediately before 8th cover spray, and rated after 41 days storage at 1° C. The trees were re-sampled 30 Sep and rated 1 Oct. Following ratings, all samples were returned to cold storage to await later rot assessment. All percentage data were converted by the square root arcsin transformation for statistical analysis.
The fungicide application to the entire block suppressed early scab infection but allowed some
infection of fruit not treated later. The later applications of several treatments significantly reduced fruit scab infection, including Captan, Ziram, Omega, Evito, Pristine, Flint, and Indar (Table 15). The delayed application schedule of Rally + Dithane and Flint also reduced the leaf area affected by mildew. Rally most effectively inhibited cedar apple rust infection of foliage. None of the delayed application treatments significantly suppressed quince rust infection which had occurred 20-22 Apr. Sooty blotch and flyspeck pressure was moderately high and incidence of sooty blotch increased between the 16 Sep and 30 Sep samplings (Table 16). All treatments gave significant suppression of both diseases. Pristine alternated with Captan (Trts. #1 &14), gave excellent control of both sooty blotch and flyspeck. Evito and Indar, also alternated with Captan, also gave good sooty blotch and flyspeck suppression. The alternating schedule of Evito and Captan more effectively suppressed sooty blotch, particularly in the 30 Sep sampling, than either Evito or the equivalent Captan rate alone throughout the cover sprays. Control of sooty blotch and flyspeck by Captan and Ziram was generally rate-related but somewhat inconsistent. Including Omega + Stylet Oil had significantly more flyspeck and more apparent mildew fruit infection than Omega alone. Compared to non-treated fruit Omega + Stylet Oil also resulted in a slight increase in opalesence in the first sampling.

109
Table 15. Early season disease control on Idared apples, 2008 Mildew, % fruit, leaves Cedar-apple rust, Scab, % infected or leaf area infected % lvs or fruit inf % fruit inf.16 Sep leaves fruit leaves 29 Jul fruit leaves fruit Quince Brooks Treatment and rate/A Timing 29 Jul 16 Sep % % lf area 16 Sep 29 Jul 16 Sep Rust Spot 0 No fungicide -------------- 0.8 a 9 c 64.6 a 71.3 c 7 bc 15.8 c 1 a 5 a 2 a 1 Rally 40WSP 5 oz + Dithane 75DF 3.0 lb
Captan 80WDG 3.75 lb Pristine 38WG 14.5 oz
PF-2C 3C, 5C, 7C
4C, 6C
0.7 a 3 a-c 62.7 a 45.7 a 6 b 4.6 a 0 a 9 a
0 a 2 Captan 80WDG 1.25 lb PF-7C 0.9 a 5 bc 63.9 a 59.2 a-c 3 ab 6.1 ab 0 a 4 a 0 a 3 Captan 80WDG 2.5 lb PF-7C 0.9 a 5 bc 61.5 a 63.5 a-c 6 bc 8.8 a-c 1 a 14 a 0 a 4 Captan 80WDG 3.75 lb PF-7C 0.9 a 1 ab 68.8 a 62.1 a-c 3 ab 11.0 a-c 1 a 6 a 0 a 5 Captan 80WDG 5.0 lb PF-7C 0.4 a 1 ab 65.3 a 70.6 c 3 ab 8.7 a-c 1 a 1 a 0 a 6 Ziram 76DF 2 lb PF-7C 0.3 a 3 ab 62.4 a 54.3 a-c 2 ab 10.1 a-c 0 a 4 a 0 a 7 Ziram 76DF 4 lb PF-7C 0.2 a 5 bc 64.9 a 64.8 bc 6 b 11.1 a-c 0 a 4 a 0 a 8 Ziram 76DF 6 lb PF-7C 0.9 a 4 a-c 60.8 a 55.1 a-c 2 ab 12.6 a-c 2 a 4 a 0 a 9 Ziram 76DF 8 lb PF-7C 0.2 a 2 ab 62.5 a 59.4 a-c 2 ab 10.5 a-c 1 a 6 a 0 a
10 Omega 500F 13.8 fl oz PF-7C 1.0 a 1 ab 61.7 a 60.9 a-c 3 ab 10.7 a-c 0 a 8 a 1 a 11 Omega 13.8 fl oz + JMS Stylet Oil 1 gal PF-7C 0.7 a 5 bc 61.8 a 52.2 ab 18 c 6.9 a-c 0 a 4 a 2 a 12 Evito 4F 3.8 fl oz/A + LI-700 1 pt/100 gal PF-7C 0.3 a 5 bc 65.0 a 54.8 a-c 0 a 9.0 a-c 1 a 6 a 2 a 13 Evito 4F 3.8 fl oz/A + LI-700 1 pt/100 gal
Captan 80WDG 3.75 lb PF, 2,4,6C 1, 3, 5, 7C
0.6 a 2 ab 62.3 a 59.9 a-c 5 b 13.9 bc 0 a
8 a 1 a
14 Pristine 38WG 14.5 oz Captan 80WDG 3.75 lb
PF, 2,4,6C 1, 3, 5, 7C
0 a 0 a 62.5 a 53.3 a-c 5 ab 10.4 a-c 1 a
9 a 0 a
15 Flint 50WG 2 oz Captan 80WDG 3.75 lb
PF, 2,4,6C 1, 3, 5, 7C
0.4 a 0 a 62.9 a 48.7 ab 3 ab 13.6 bc 1 a
5 a 0 a
16 Indar 2F 8 fl oz Captan 80WDG 3.75 lb
PF, 2,4,6C 1, 3, 5, 7C
0.1 a 0 a 67.0 a 57.3 a-c 2 ab 10.8 a-c 0 a
5 a 0 a
Mean separation by Waller-Duncan K-ratio t-test (p=0.05). Foliar data based on ten shoots per rep, 29 Jul. Randomized block design with four single-tree reps. A 25-fruit sample from each replicate tree was harvested 16 Sep, two weeks after the 7th cover spray, and rated after 41 days storage at 1° C. Treatments applied airblast at 100 gpa to both sides of the row on each application date: 7 May (petal fall); first- seventh covers (1C-7C): 21 May, 3 Jun, 17 Jun, 2 Jul, 15 Jul, 13 Aug, 2 Sep and 16 Sep.

110
Table 16. Sooty blotch and fly speck diseases on Idared apples, 2008 Sooty Blotch, % fruit or area inf. Flyspeck % fruit or area inf. 16 Sep (after 7C) 30 Sep (after 8C) 16 Sep (7C) 30 Sep (8C) Treatment and rate/A Timing fruit area fruit area fruit area fruit area 0 No fungicide -------------- 87 f 9.8 i 98 i 13.0 j 97 g 6.9 f 97 i 7.5 g 1 Rally 40WSP 5 oz + Dithane 75DF 3.0 lb
Captan 80WDG 3.75 lb Pristine 38WG 14.5 oz
PF-2C 3C, 5C, 7C 4C, 6C, 8C 11 ab 0.8 a-c
23 bc 1.7 b-d 6 ab 0.3 ab
6 ab 0.3 ab 2 Captan 80WDG 1.25 lb PF-8C 34 c-e 2.3 c-f 62 gh 4.5 g-i 41 d-f 2.4 de 40 f-h 2.4 d-f 3 Captan 80WDG 2.5 lb PF-8C 19 b-d 1.2 b-e 38 c-f 2.9 d-g 35 d-f 2.0 e 29 e-g 1.8 de 4 Captan 80WDG 3.75 lb PF-8C 31 c-e 1.9 d-g 31 cd 2.0 c-f 34 c-e 1.9 c-e 22 c-f 1.2 cd 5 Captan 80WDG 5.0 lb PF-8C 10 ab 0.6 ab 22 bc 1.4 bc 19 b-d 1.0 b-d 12 b-d 0.6 bc 6 Ziram 76DF 2 lb PF-8C 48 e 3.7 gh 63 gh 4.5 g-i 49 ef 2.6 e 62 h 3.6 f 7 Ziram 76DF 4 lb PF-8C 45 e 3.0 e-h 66 h 5.7 i 49 ef 2.7 e 45 f-h 2.5 d-f 8 Ziram 76DF 6 lb PF-8C 30 c-e 1.8 b-e 50 e-h 4.2 f-i 17 bc 0.9 bc 29 d-g 1.8 de 9 Ziram 76DF 8 lb PF-8C 37 de 2.2 e-h 45 d-g 3.3 e-i 16 b 0.9 b 24 b-f 1.4 c-e
10 Omega 500F 13.8 fl oz PF-8C 45 e 4.0 f-h 55 f-h 5.3 g-i 12 b 0.6 b 7 bc 0.4 bc 11 Omega 500F 13.8 fl oz +
JMS Stylet Oil 1 gal PF-8C 51 e 4.3 h
61 gh 5.3 hi 55 f 3.1 e
48 gh 2.8 ef 12 Evito 4F 3.8 fl oz/A + LI-700 1 pt/100 gal PF-8C 20 b-d 1.3 b-e 36 c-e 2.4 c-e 10 ab 0.5 b 11 b-e 0.6 bc 13 Evito 4F 3.8 fl oz/A + LI-700 1 pt/100 gal
Captan 80WDG 3.75 lb PF, 2,4,6,8C 1, 3, 5, 7C 8 ab 0.4 ab
11 ab 0.6 ab 16 bc 0.8 b
4 ab 0.2 ab
14 Pristine 38WG 14.5 oz Captan 80WDG 3.75 lb
PF, 2,4,6,8C 1, 3, 5, 7C 2 a 0.1 a
2 a 0.1 a 2 a 0.1 a
0 a 0 a
15 Flint 50WG 2 oz Captan 80WDG 3.75 lb
PF, 2,4,6,8C 1, 3, 5, 7C 21 b-d 1.2 b-e
44 d-g 3.1 e-h 12 b 0.6 b
14 b-e 0.7 bc
16 Indar 2F 8 fl oz Captan 80WDG 3.75 lb
PF, 2,4,6,8C 1, 3, 5, 7C 14 a-c 0.8 a-d
27 cd 1.7 c-e 7 ab 0.4 ab
5 ab 0.3 ab
Mean separation by Waller-Duncan K-ratio t-test (p=0.05). Counts based on ten shoots per rep, 29 Jul. Randomized block design with four single-tree reps. Counts were based on ten shoots per replicate tree 29 Jul. A 25-fruit sample from each replicate tree was harvested 16 Sep, two weeks after the 7th cover spray and immediately before 8th cover spray, and rated after 41 days storage at 1° C. The trees were re-sampled 30 Sep and rated 1 Oct. Treatments applied airblast at 100 gpa to both sides of the row on each application date: 7 May (petal fall); first- eighth covers (1C-8C): 21 May, 3 Jun, 17 Jun, 2 Jul, 15 Jul, 13 Aug, 2 Sep and 16 Sep.

111
APPLE (Malus domestica ‘Gala’) K. S. Yoder, A. E. Cochran II, W. S. Royston, Jr., Scab; Venturia inaequalis S. W. Kilmer, C. D. Douglas, and C. A. Cochran Quince rust ; Gymnosporangium clavipes Virginia Tech Agr. Research & Ext. Center 595 Laurel Grove Road Winchester, VA 22602
Effects of apple scab “rescue” treatments applied after lesions appeared on Gala and Fuji apples, 2008. An experiment was conducted to test the effectiveness of selected fungicides applied well after lesions had appeared from earlier infection periods. Scab infection periods had occurred 11-12 Apr, 20-22 Apr, 26-27 Apr, 27-28 Apr, 8-9 May, 9-10 May, 11-13 May, and 15-16 May and the treatments were first applied 21 May. Apple scab lesions were observed on unprotected trees as early as 1 May, likely from the infection period 11-12 Apr. The test was set up as four randomized blocks with two-tree replications and in-row border trees. No fungicides were applied until after scab was present in trees, then treatments were applied dilute to runoff 21 May, 29 May, 12 Jun and 1 Jul. Captan 80WDG 30 oz + Ziram 3 lb/A tank-mixed with insecticides was applied to the entire block with an airblast sprayer 18 Jul and 29 Jul. Captan 5 lb/A was applied alone to the entire Gala test block 13 Aug. Fruit were sampled randomly at the normal commercial harvest date 2 Sep, 25 fruits per replication, and rated for scab incidence and graded by USDA standards for damage due to scab. No fungicides were applied to Fuji until after scab was present in trees, then treatments applied dilute to runoff 21 May, 28 May, 11 Jun. then Captan 80WDG 2.5 lb + Ziram 3 lb/A tank-mixed with insecticides to cover the entire block 1 Jul, 29 Jul, and 13 Aug, 26 Aug, and 16 Sep. Captan 5 lb/A was applied alone to the entire block 15 Jul. A 25-fruit Fuji sample was taken 25 Sep, and rated for scab and other diseases and graded by USDA standards for damage due to scab. Scab pressure was heavier in Gala than in Fuji. Compared to non-treated fruit, all treatments gave significant suppression of scab fruit infection after the delayed application schedule was initiated on Gala but not on Fuji. On Gala (Table 17), Flint, applied alone, was as effective as any treatment but because of a concern for development of resistance, other combinations were tested including combinations with dodine (Syllit). Indar and Indar + Syllit were also highly effective for suppression of % fruit infected and mean lesions/ fruit. Rally, applied alone was the weakest treatment, but addition of Syllit to Rally resulted in the highest number of fruit in the USDA combination X-fancy/fancy grade based on down-grading damage due to scab. (The USDA grade standards allow no scab for Xtra fancy grade and only one 1/4-inch lesion for fancy grade. Virginia packers commonly pack a combination grade). The delayed treatments had no effect on quince rust development which had occurred mostly with a long wetting period 20-22 Apr, a month before the first fungicide application. There was no significant effect on chemical russet due to fungicide treatment. On Fuji (Table 18), applications of Syllit, Indar, Pristine and Inspire, applied alone, gave significant suppression of scab fruit infection, but combinations with Syllit applied at the same rates of both products separately did not give significant suppression (p=0.05) of incidence or lesions per fruit. All treatments on Fuji increased combined grade-out of USDA Fancy/Xtra fancy fruit and reduced percent in utility grade due to scab appearance. On Fuji all treatments involving SI fungicides (Rally, Indar and Inspire) significantly reduced incidence of cedar-apple rust although the first application was not until four weeks after the heaviest rust infection period during full bloom. Sooty blotch developed late in this test block but there was a significant suppression by all treatments, compared to trees which had not been treated prior to the Captan + Ziram cover applied first to the entire block 15 Jul. Non-treated trees had 11% sooty blotch incidence and treatments had no more than 3%. There was no significant increase in Fuji russet due to fungicide treatment, and Syllit and Indar, applied alone, each reduced the amount of russet compared to non-treated fruit.

112
Table 17. Effects of apple scab “rescue” treatments on Gala apples, 2008.
Scab incidence, lesions / fruit and grade* Cedar Russet Treatment and rate/ 100 gal dilute, % fruit lesions % fruit % fruit % fruit rust, % rating applied from 21 May through late covers infected / fruit X-fcy Fcy/x-fcy Utility fruit inf. (0-5)
0 Non-treated control 85 c 5.7 c 16 d 39 d 61 d 3 a 1.8 a 1 Syllit 3.4F 6 fl oz 50 ab 1.9 ab 56 bc 74 bc 26 bc 1 a 1.9 a 2 Rally 40WSP 1.25 oz 66 b 2.2 b 42 c 68 c 32 c 1 a 1.9 a 3 Rally 40WSP 1.25 oz + Syllit 3.4F 6 fl oz 51 ab 1.6 ab 73 ab 90 a 10 a 0 a 1.6 a 4 Indar 2F 2 fl oz 46 a 1.4 ab 67 ab 84 ab 16 ab 0 a 2.0 a 5 Indar 2F 2 fl oz + Syllit 3.4F 6 fl oz 40 a 1.4 ab 80 a 82 ab 18 ab 0 a 1.7 a 6 Flint 50WG 0.5 oz 37 a 1.1 a 71 ab 86 ab 14 ab 2 a 1.6 a 7 Flint 50WG 0.5 oz + Syllit 3.4F 6 fl oz 51 ab 1.9 ab 55 bc 77 bc 23 bc 0 a 1.6 a
Column mean separation by Waller-Duncan K-ratio t-test (p=0.05). Four single tree reps, 25 fruit per rep.. Treatments applied dilute to runoff 21 May, 29 May, 12 Jun and 1 Jul, then Captan 80WDG 30 oz + Ziram 3 lb/A tank-mixed with insecticides to cover the entire block 18 Jul and 29 Jul. Captan 5 lb/A was applied alone to the entire block 13 Aug. * USDA grade standards allow no scab for Xtra Fancy grade and only one 1/4-inch lesion for Fancy grade. Virginia packers commonly pack a combination grade).
Table 18. Effects of apple scab “rescue” treatments on Fuji apples, 2008.
Treatment and rate/100 gal dilute Scab incidence, lesions / fruit and grade* Cedar Sooty Russet applied from 21 May % fruit lesions % fruit % fruit % fruit rust, % blotch, rating through late covers infected / fruit X-fcy Fcy/x-fcy Utility fruit inf. % fruit (0-5) 0 Non-treated control 28 b 0.9 b 72 b 74 c 26 c 27 d 11 b 2.8 c 1 Syllit 3.4F 1.5 pt 9 a 0.2 a 91 a 99 a 1 a 15 b-d 3 a 2.4 ab 2 Rally 40WSP 5 oz 17 ab 0.5 ab 85 ab 91 b 9 b 7 ab 1 a 3.0 c 3 Rally 40WSP 5 oz + Syllit 1.5 pt 18 ab 0.6 ab 82 ab 96 ab 4 ab 0 a 2 a 2.7 bc 4 Indar 2F 8 fl oz 10 a 0.3 a 90 a 99 a 1 a 10 bc 2 a 2.3 a 5 Indar 2F 8 fl oz + Syllit 1.5 pt 14 ab 0.5 ab 86 ab 97 ab 3 ab 5 ab 1 a 2.8 bc 6 Pristine 38WG 14.5 oz 9 a 0.1 a 91 a 95 ab 5 ab 29 d 0 a 2.8 c 7 Pristine 38WG 14.5 oz +
Syllit 3.4F 1.5 pt 13 ab 0.4 ab 87 ab 94 ab 6 ab 19 cd 0 a 2.9 c
8 Inspire Super MP (4 oz + 4 fl oz, each material) 11 a 0.2 a 91 a 97 ab 3 ab 0 a 4 a 2.9 c
9 Inspire Super (4 oz + 4 fl oz) + Syllit 3.4F 1.5 pt 12 ab 0.3 a 88 ab 96 ab 4 ab 0 a 2 a 2.9 c
Column mean separation by Waller-Duncan K-ratio t-test (p=0.05). Four single tree reps, 25 fruit per rep. Treatments applied dilute to runoff 21 May, 28 May, 11 Jun, then Captan 80WDG 2.5 lb + Ziram 3 lb/A tank-mixed with insecticides to cover the entire block 1 Jul, 29 Jul, and 13 Aug, 26 Aug, and 16 Sep. Captan 5 lb/A was applied alone to the entire block 15 Jul. * USDA grade standards allow no scab for Xtra Fancy grade and only one 1/4-inch lesion for Fancy grade. Virginia packers commonly pack a combination grade).

113
APPLE (Malus domestica ‘Ginger Gold’) K. S. Yoder, A. E. Cochran II, W. S. Royston, Jr., Bitter rot; Colletotrichum acutatum S. W. Kilmer, C. D. Douglas, and C. A. Cochran White (Bot) rot ; Botryosphaeria dothidea Virginia Tech Agr. Research & Ext. Center 595 Laurel Grove Road Winchester, VA 22602
Postharvest control of bitter rot and white rot by Scholar on Ginger Gold and Gala apples, 2008. An experiment was conducted to test the effectiveness of fludioxonil (Scholar) SC formulation rates as postharvest dip treatments on Ginger Gold and Gala apples. Test fruit were selected from trees which had been uniformly sprayed with the commercial fungicides during the growing season in 2008. Fruit were picked at optimal commercial harvest time. Fruit without visible rot symptoms were dipped 1 min. in 200 ppm sodium hypochlorite, allowed to dry overnight and randomized into four 20-fruit replications for each fungal inoculation test. Each Ginger Gold fruit was inoculated in three places with the tip of a nail pressed uniformly to a depth of 5 mm after dipping in suspensions of C. acutatum conidia (6X10⁴/ml) or Botryosphaeria dothidea mycelial propagules (8X10⁴/ml) from a PDA culture. Inoculum rates for Gala were: C. acutatum conidia (8X10⁴/ml) or B. dothidea mycelial propagules (3X10⁵/ml) from a PDA culture. One hour after inoculation and wounding, replicated samples were dipped in the indicated treatment for 30 sec, placed on fiber packing trays, allowed to dry 1 hr, then enclosed in plastic bags, and incubated at ambient temperatures (for Ginger Gold), 70-82F (21-28C), mean 76.3F (24.6C), or (for Gala) 60-83F (16-28C), mean 74.8F (23.8C). Treatment dates were 15 Aug for Ginger Gold and 3 Sep for Gala. Fruit were examined and evaluated periodically as needed for progression of each rot. Inoculation and incubation conditions provided strong tests against both test organisms on both cultivars. All treatments gave significant control of B. dothidea, percent fruit and percent wounds infected at 6 and 10 days incubation. Both Scholar test rates also gave excellent control of bitter rot throughout the period of incubation. Mertect + Captan was significantly weaker than Scholar for control of B. dothidea. After initial slight suppression, Mertect + Captan failed to control bitter rot adequately although there was suppression of lesion diameter on both cultivars after 6 days incubation. There was no significant rate difference in control of either rot at the equivalent fludioxonil rate of 180 ppm (Scholar 230SC 10 fl oz/100 gal) or by 300 ppm (16.7 fl oz), suggesting the possibility for further rate reduction. Table 19. Postharvest disease control by Scholar on Ginger Gold apples, 2008. % fruit or wounds infected after 6 or 10 day incubation and les. diam.(mm), 6 d White (Bot) rot Bitter rot Treatment and rate % fruit inf. % wound inf. lesion % fruit inf. % wound inf. lesion / 100 gal dilute 6 day 10 day 6 day 10 day diam. 6 day 10 day 6 days 10 day diam. 1 Check untreated 96 b 100 c 70 b 97 c 14 b 100 c 100 b 100 c 100 c 19 c 2 Scholar 230sc 10 fl oz 0 a 1 ab 0 a <1 ab 0 a 0 a 0 a 0 a 0 a 0 a 3 Scholar 230sc 16.7 fl oz 0 a 0 a 0 a 0 a 0 a 6 a 4 a 3 a 1 a <1 a 4 Mertect 340F 1 pt +
Captan 50W 1 lb 0 a 4 b 0 a 2 b 0 a 75 b 96 b 42 b 79 b 4 b
Column mean separation by Waller-Duncan K-ratio t-test (p=0.05). Four replications of 20 fruit per rot. Table 20. Postharvest disease control by Scholar on Gala apples, 2008. % fruit or wounds infected after 6 or 10 day incubation and les. diam.(mm), 6 d White (Bot) rot Bitter rot Treatment and rate % fruit inf. % wound inf. lesion % fruit inf. % wound inf. lesion / 100 gal dilute 6 day 10 day 6 day 10 day diam. 6 day 10 day 6 days 10 day diam. 1 Check untreated 55 c 88 c 40 c 69 c 8 b 100 c 100 c 96 c 100 c 14 c 2 Scholar 230sc 10 fl oz 0 a 0 a 0 a 0 a 0 a 0 a 0 a 0 a 0 a 0 a 3 Scholar 230sc 16.7 fl oz 0 a 0 a 0 a 0 a 0 a 0 a 0 a 0 a 0 a 0 a 4 Mertect 340F 1 pt +
Captan 50W 1 lb 4 b 10 b 1 b 3 b <1 a 29 b 74 b 15 b 46 b 2 b
Column mean separation by Waller-Duncan K-ratio t-test (p=0.05). Four replications of 20 fruit per rot.

114
APPLE (Malus domestica ‘Idared’) K. S. Yoder, A. E. Cochran II, W. S. Royston, Jr., Fireblight; Erwinia amylovora and S. W. Kilmer Virginia Tech Ag. Research & Extension Center 595 Laurel Grove Road Winchester, VA 22602
Evaluation of antibiotics for blossom blight suppression on Idared apple, 2008. A test of antibiotic formulations for blossom blight control was established in four randomized blocks on 26 yr-old trees. All treatments were applied to both sides of the tree with a Swanson Model DA-400 airblast sprayer at 100 gallons per acre on the morning of 17 Apr (most clusters with king bloom open), repeated 23 Apr (full bloom) and again 30 Apr (all petals off). Test strategy was to inoculate after the first two applications, but to make a third application without follow-up inoculation. Four selected branches per tree, each with 25 to 40 blossom clusters, were inoculated by spraying to wet with a bacterial suspension containing 1X10⁶ E. amylovora cells/ml, in the evening of each treatment day 17 Apr and 23 Apr. Infection data were based on counts of number of clusters at the first inoculation, and number of clusters with any infection on inoculated branches 8 May, and infection which had advanced into cluster leaves by 20 Jun. Maintenance materials, applied to the entire block with a commercial airblast sprayer at 100 gal per acre, included Nova, Dithane, Lorsban + oil, Flint, Imidan WSB, Altacor, Lannate LV, Provado, and Intrepid. Inoculation and weather conditions favored a strong fireblight test. In addition to the inoculations 17 Apr and 23 Apr, natural (MaryBlyt) infection periods occurred near full bloom 25-26 Apr, and with late bloom 3 May and 6 May. Streptomycin (Firewall) performed as expected under these conditions with significant suppression by both rates. The higher streptomycin rate provided the best control at both evaluation times. Kasumin (kasugamycin) and Flameout (oxytetracycline), also gave significant suppression of percent flower cluster infection 8 May. Treatments were relatively less effective at inhibiting infection which had advanced into the cluster leaves by 20 Jun. A tank-mix of ProPhyt + C-O-C-S alternated with Firewall (trt#7), and C-O-C-S as the sole material in the schedule (trt#8), gave significant suppression of cluster infection 8 May, but a comparable treatment without ProPhyt (trt#6) did not give significant suppression. When applied as the sole material in the schedule C-O-C-S (trt#8), also gave significant suppression of cluster infection in the 8 May assessment. No treatment significantly (p=0.05) affected fruit finish compared to non-treated trees. Table 21. Fire blight blossom control by concentrate applications; Idared apple, 2008. % cluster infection and control z Fruit finish Foliar % clusters % cluster lvs rating (0-5) x app.# infected 8 May infected 20 Jun opales
- Treatment and rate/A y 1 2 3 % inf. control % inf. control russet scence 0 No treatment -- -- -- 80 d --- 83 de --- 1.6 a 1.0 ab 1 Firewall 17 12 oz + Regulaid 1 pt** X X X 44 a 46 61 ab 27 1.5 a 0.9 a 2 Firewall 17 1.5 lb + Regulaid 1 pt X X X 39 a 52 50 a 40 1.8 a 1.1 ab 3 Kasumin 2L 3 qt + Regulaid 1 pt X X X 62 bc 23 71 b-d 15 1.8 a 1.4 ab 4 Kasumin 2L 6 qt + Regulaid 1 pt X X X 50 ab 37 57 ab 31 1.9 a 1.5 b 5 Flameout 18.3W 1.5 lb + Regulaid X X X 52 ab 35 72 b-e 14 1.9 a 1.1 ab 6 C-O-C-S 50WDG 4 oz
Firewall 17 12 oz + Regulaid 1 pt X --
-- X
X --
73 cd 9 85 e 0 1.6 a 1.3 ab
7 C-O-C-S 50WDG 4 oz + ProPhyt 4.2L 3 qt Firewall 17 12 oz 17, + Regulaid 1 pt
X --
-- X
X --
58 b 27 78 c-e 6 2.0 a 1.2 ab
8 C-O-C-S 50WDG 4 oz X X X 60 bc 25 67 a-c 20 1.8 a 1.2 ab Mean separation by Waller-Duncan K-ratio t-test (p=0.05). Four single-tree replications with border rows between treatment rows. z Infection data based on counts of number of clusters at inoculation and number of clusters with any
infection on inoculated branches 8 May and infection into cluster leaves 20 Jun. y All treatments applied airblast at 100 gal/acre. Regulaid included with all antibiotic treatments at the rate
of 1 pt /100 gal in tank. x Fruit finish rated on a scale of 0-5 (0=perfect finish; 5=severe russet or opalescence).

115
APPLE (Malus domestica ‘Golden Delicious', K. S. Yoder, A. E. Cochran II, W. S. Royston, Jr., ‘Rome Beauty’) and S. W. Kilmer Fire blight; Erwinia amylovora Virginia Tech Ag. Research & Extension Center 595 Laurel Grove Road Winchester, VA 22602
Blossom blight control by dilute treatments on Golden Delicious and Rome Beauty apples, 2008. Treatment regimes involving phosphite materials, an experimental SAR (specific acquired resistance)
candidate, and/or antibiotics were evaluated for blossom blight control on pairs of adjacent 36 yr-old trees of each cultivar in four randomized blocks. Dilute treatments were applied as indicated to the point of runoff with a single nozzle handgun at 400 psi to both Golden Delicious and Rome. The general strategy for SAR candidates was to apply them at pink (16 Apr, 1 wk pre-bloom trts. #3-6 and 8-10) and 2 wk later (30 Apr, post-bloom follow-up trts #3-6 and 8-10). Antibiotic treatments were applied the morning of 23 Apr (trts #1, 2, 6, 7, 11 & 12, Golden Delicious, full bloom; Rome, early bloom). Trees were inoculated by spraying to wet with a bacterial suspension containing 1X10⁶ E. amylovora cells/ml. Reps A & D of both cultivars were inoculated in the evening 23 Apr, and reps B & C inoculated in early morning 24 Apr. Infection data were based on counts of number of clusters at the first inoculation. A cluster was rated as infected if it had at least one blossom with fire blight symptoms 15 May blossom or one cluster leaf with symptoms 23 Jun. Maintenance materials, applied throughout the season with a commercial airblast sprayer at 100 gal per acre, included: Nova, Flint, Rubigan, Captan, Ziram, Asana + oil, Assail, Imidan, Lannate SP, Altacor, Provado, Delegate, and Calypso.
Inoculation and weather conditions favored a strong fire blight test. In addition to the inoculation 23/24 Apr, natural infection periods (based on MaryBlyt) occurred near full bloom 25-26 Apr, and on late bloom 3 May and 6 May. Cultivar variation in control was likely related to amount of bloom open at time of inoculation. Infection was quite consistent on Golden Delicious, which was near full bloom at the time of inoculation. Blossom blight suppression on Golden Delicious, based on the 15 May ratings, was achieved only by treatments involving antibiotics streptomycin (#1, Agri-Mycin and #6, NNF-9850/Agri-Mycin), kasugamycin (#11, Kasumin), and oxytetracycline (#12, Flameout). Of these treatments, only Flameout significantly suppressed the advance of infection into flower cluster leaves 23 Jun. Rome was at an earlier bloom stage at the time of inoculation, blossom cluster infection was less uniform, and no treatments significantly reduced percent clusters infected in the 8 May assessment. However, in the 23 June assessment of infection into cluster leaves, NNF-9850 (trt #3), Agri-Fos (trt#10) and Kasumin (trt#11) all gave significant suppression. The only significant (p=0.05) fruit finish effects were a slight increase in russet by Kasumin and a slight decrease by ProPhyt.
Table 22. Blossom blight control by dilute treatments on Golden Delicious and Rome Beauty apples. % cluster inf. 15May; % cluster lvs inf. 23Jun, control G. Del. Golden Delicious* Rome Beauty* russet Treatment and 15 May 23 June 15 May 23 June rating rate/100 gal dilute Timing strategy % inf. cont. % inf. cont. % inf. cont. % inf. cont. (0-5)
0 No treatment --- 70 d --- 58 b --- 47 a --- 25 b --- 3.3 b-d 1 Agri-Mycin 17 4 oz 1 app. at bloom 46 a-c 35 42 ab 29 32 a 33 11 ab 55 3.0 a-c 2 Agri-Mycin 17 8 oz 1 app. at bloom 49 b-d 29 41 ab 31 31 a 35 16 ab 37 3.0 a-c 3 NNF-9850 30SC 315 ml 1 wk pre-bl + 2wk later 62 b-d 11 54 b 8 35 a 27 10 a 62 3.5 c-e 4 NNF-9850 30SC 630 ml 1 wk pre-bl; 2wk later 60 b-d 14 54 b 8 36 a 24 13 ab 47 3.5 b-e 5 NNF-9850 30SC 945 ml 1 wk pre-bl + 2wk later 65 cd 6 49 b 15 49 a -4 20 ab 19 3.7 de
6 NNF-9850 30SC 630 ml Agri-Mycin 17 4 oz
1 wk pre-bl; 2wk later 2nd app. Strep at bl 46 a-c 34 37 ab 36 40 a 15 16 ab 36 3.1 a-d
7 NNF-9850 30SC 630 ml 1 app. at bloom 55 b-d 21 49 b 17 36 a 25 17 ab 31 3.4 b-e 8 ProPhyt 4.2L 1 qt 1 wk pre-bl; 2wk later 61 b-d 12 52 b 11 39 a 18 16 ab 35 2.6 a 9 Topaz 1 qt 1 wk pre-bl; 2wk later 68 d 2 55 b 5 32 a 33 17 ab 34 2.9 ab 10 Agri-Fos 1 qt 1 wk pre-bl; 2wk later 63 cd 10 56 b 4 37 a 21 10 a 62 3.2 b-d 11 Kasumin 2L 2 qt 1 app. at bloom 43 ab 39 37 ab 35 35 a 26 9 a 64 3.9 e 12 Flameout 18.3W 1 lb 1 app. at bloom 27 a 61 26 a 55 23 a 51 19 ab 26 3.3 b-d Mean separation by Waller-Duncan k-ratio t-test (p=0.05). Four paired-tree replications. * Infection data and % control based on counts of number of clusters on inoculated branches 20 Apr, and
number of clusters with any infection 15 May, and infection into cluster leaves 23 Jun.

116
PEACH (Prunus persica ‘Redhaven’) K. S. Yoder, A. E. Cochran II, W. S. Royston, Jr., Nectarine: (P. persica var. nucipersica S. W. Kilmer, C. D. Douglas, and C. A. Cochran ‘Redgold’) Virginia Tech Ag. Research & Extension Center Scab; Cladosporium carpophilum 595 Laurel Grove Road Brown rot; Monilinia fructicola Winchester, VA 22602
Control of scab and brown rot by integrated fungicide programs on Redhaven peach and Redgold nectarine, 2008. Two experimental fungicides were compared to registered programs for broad-spectrum disease control on 16-yr-old trees. The test planting is composed of 3-tree sets, each including Loring peach and Redgold nectarine, which were not treated with fungicides in 2006 to allow the buildup of scab inoculum, and Redhaven peach, which were left untreated in 2007. Brown rot inoculum was standardized in the orchard by placing three mummified fruit in each test tree before bloom. Dilute treatments were applied to the point of run-off (approximately 200 gal/A) with a single nozzle handgun at 400 psi in a randomized block design with four replications as follows: 17 Mar (BS, bud swell, trt #1 only); 25 Mar (pink, all treatments); 23 Apr (PF, petal fall-shucks on); 6 May (SS, shuck split) 1st through 4th covers (1C-4C, Redhaven and Redgold, 21 May, 3 Jun, 17 Jun, 1 Jul); 21 Jul 2PH, 2-wk pre-harvest, Redhaven only); 28 Jul (1PH, 1 wk pre-harvest, Redhaven; 2PH, 2 wk preharvest, Redgold); 5 Aug (1PH, 1-wk pre-harvest, Redgold). Actual harvest dates were: Redhaven 4 Aug; Redgold 12 Aug. Commercial insecticides, applied to the entire test block at 2-3 wk intervals with a commercial airblast sprayer, included Asana XL, Imidan, Lannate SP, Provado, and Sevin XLR. Leaf curl severity was rated on a scale of 0-5 for % shoots infected 5 Jun: 0=no infection; 1=1-10%; 2=10-20%; 3=20-50%; 4=50-80%; 5=80-100%. Samples of 40 fruit apparently rot-free per replicate tree were harvested 4 Aug (Redhaven) and 12 Aug (Redgold), rated for scab, fruit were selected for uniform ripeness, grouped into 20-fruit subsamples, and placed on fiber trays. One set was misted with de-ionized water, and the other subsample was inoculated with a suspension containing 25,000 M. fructicola conidia/ml. All fruit were incubated in polyethylene bags at ambient temperatures before rating rot development at the indicated intervals. Incubation temperatures were: Redhaven: 21-28C (mean 25C); Redgold: 21-27C (mean 23C). Early season rains favored leaf curl infection, which was more consistently controlled by Bravo applied 17 Mar than by later timing (Table 23). Scab inoculum level was abundant on the test trees, and weather conditions in the early cover spray period were favorable for scab development and weathering of the test treatments. Under these strong test conditions with 74% of non-treated Redhaven fruit infected, all treatments gave significant suppression of scab. Redgold fruit were also heavily infected with scab but distribution on treated and non-treated was very variable, precluding significant differences among treatments in spite of apparent 50% suppression of incidence and fruit lesions. Brown rot began to build up on the tree in mid-season, likely due to light hail injury. Under these conditions, post-harvest inoculation by misting fruit with conidial suspensions did not greatly increase fruit rot incidence. Pristine and LEM-17 gave superior residual control on Redhaven peach (Table 24). On Redgold nectarine, LEM-17 gave the best control on non-inoculated fruit while Indar was the most effective on inoculated nectarines. Gem (trt#4) had significantly less residual brown rot control on Redhaven peach fruit.

117
Table 23. Control of leaf curl and scab on Redhaven peach and Redgold nectarine, 2008 Leaf curl rating* Scab, % fruit inf. or lesions/fruit % on-tree Treatment and Red- Red- Redhaven Redgold brown rot rate/100 gal dilute Timing haven gold fruit lesions fruit lesions Redgold
0 No fungicide --- 4.8 c 4.0 c 74 b 17 b 76 a 12 a 27 a 1 Bravo Weather Stik 6F 1 pt
Microfine Sulfur 90W 3 lb Indar 2F 3 fl oz+ B-1956 8 fl oz
BS PF-4C
2 & 1PH
1.8 a 1.0 a 28 a 2 a 51 a 7 a
20 a 2 Bravo Weather Stik 6F 1 pt
Quash 50WG 1.25 oz Microfine Sulfur 90W 3 lb Quash 50WG 1.25 oz Indar 2F 3 fl oz+ B-1956 8 fl oz
Pink PF-SS 1C-4C
2 wk PH 1 wk PH
2.8 b 1.8 a
8 a <1 a 37 a 2 a 14 a
3 Bravo Weather Stik 6F 1 pt LEM-17 200SC 7.5 fl oz Microfine Sulfur 90W 3 lb LEM-17 200SC 7.5 fl oz
Pink PF-SS 1C-4C
2 & 1PH
2.8 b 1.0 a 16 a 2 a 49 a 16 a
12 a 4 Bravo Weather Stik 6F 1 pt
Gem 500SC 1.5 fl oz Microfine Sulfur 90W 3 lb Gem 500SC 1.5 fl oz
Pink PF- SS 1C-4C
2 & 1PH
3.0 b 2.5 ab 10 a <1 a 50 a 6 a
19 a 5 Bravo Weather Stik 6F 1 pt
Topsin-M 70W 4 oz + Sulfur 3 lb Microfine Sulfur 90W 3 lb Indar 2F 3 fl oz+ B-1956 8 fl oz
Pink PF- SS 1C-4C
2 & 1PH
3.0 b 2.5 a-c 13 a 1 a 58 a 9 a
11 a 6 Bravo Weather Stik 6F 1 pt
Microfine Sulfur 90W 3 lb Pristine 38WDG 7 oz
Pink-SS 1C-4C
2 & 1PH
3.5 b 3.5 bc 13 a <1 a 58 a 9 a
18 a Four single tree reps. Column mean separation by Waller-Duncan K-ratio t-test (p=0.05). * Leaf curl severity rated (0-5) 5 Jun for % shoots infected: 0=no infection; 1=10%; 2=20%; 3=50%; 4=80%; 5=100%. Treatments applied dilute to runoff at 400 psi as follows: 17 Mar (BS, bud swell, trt.#1 only); 25 Mar (pink, treatments #2-6); 23 Apr (PF, petal fall-shucks on); 6 May (SS, shuck split) 1st through 4th covers (1C-4C, Redhaven and Redgold, 21 May, 3 Jun, 17 Jun, 1 Jul); 21 Jul 2PH, 2-wk pre-harvest, Redhaven only); 28 Jul (1PH, 1 wk pre-harvest, Redhaven; 2PH, 2 wk preharvest, Redgold); 5 Aug (1PH, 1-wk pre-harvest, Redgold). Actual harvest dates: Redhaven 4 Aug; Redgold 12 Aug. Note: Data are aligned with the treatment timing most likely to have affected indicated disease.

118
Table 24. Effects of experimental fungicides on post-harvest brown rot development on Redhaven peach and Redgold nectarine, 2008
% fruit with brown rot after indicated days incubation Redhaven peach, Redgold nectarine Treatment and Non-inoculated fruit Inoculated fruit Non-inoculated fruit Inoculated fruit rate/100 gal dilute Timing 2 days 3 days 4 days 2 days 3 days 4 days 3 days 4 days 6 days 3 days 4 days 6 days
0 No fungicide --- 56 b 93 c 100 d 56 b 94 d 100 e 11 c 24 b 98 c 11 b 23 b 98 c 1 Bravo Weather Stik 6F 1 pt
Microfine Sulfur 90W 3 lb Indar 2F 3 fl oz+ B-1956 8 fl oz
BS PF-4C
2 & 1PH 1 a 4 ab 15 bc 3 a 6 bc 19 c 0 a 0 a 20 b 3 ab 4 a 28 b 2 Bravo Weather Stik 6F 1 pt
Quash 50WG 1.25 oz Microfine Sulfur 90W 3 lb Quash 50WG 1.25 oz Indar 2F 3 fl oz+ B-1956 8 fl oz
Pink PF-SS 1C-4C
2 wk PH 1 wk PH 0 a 0 a 13 b 0 a 3 ab 15 c 1 ab 3 a 10 ab 0 a 1 a 9 a
3 Bravo Weather Stik 6F 1 pt LEM-17 200SC 7.5 fl oz Microfine Sulfur 90W 3 lb LEM-17 200SC 7.5 fl oz
Pink PF-SS 1C-4C
2 & 1PH 1 a 3 ab 4 a 0 a 0 a 6 a 0 a 0 a 4 a 0 a 1 a 20 ab 4 Bravo Weather Stik 6F 1 pt
Gem 500SC 1.5 fl oz Microfine Sulfur 90W 3 lb Gem 500SC 1.5 fl oz
Pink PF- SS 1C-4C
2 & 1PH 0 a 8 b 24 c 0 a 10 c 29 d 3 b 3 a 25 b 3 ab 3 a 35 b 5 Bravo Weather Stik 6F 1 pt
Topsin-M 70W 4 oz + Sulfur 3 lb Microfine Sulfur 90W 3 lb Indar 2F 3 fl oz+ B-1956 8 fl oz
Pink PF- SS 1C-4C
2 & 1PH 3 a 9 b 14 b 0 a 6 bc 14 bc 1 ab 1 a 11 ab 0 a 1 a 21 ab 6 Bravo Weather Stik 6F 1 pt
Microfine Sulfur 90W 3 lb Pristine 38WDG 7 oz
Pink-SS 1C-4C
2 & 1PH 0 a 0 a 3 a 0 a 0 a 8 ab 0 a 0 a 22 b 0 a 0 a 25 b Four single tree replications. Column mean separation by Waller-Duncan K-ratio t-test (p=0.05). Treatments applied dilute to runoff at 400 psi as follows: 17 Mar (BS, bud swell, trt.#1 only); 25 Mar (pink, treatments #2-6); 23 Apr (PF, petal fall-shucks on); 6 May (SS, shuck split); 1st through 4th covers (1C-4C, Redhaven and Redgold, 21 May, 3 Jun, 17 Jun, 1 Jul); 21 Jul 2PH, 2-wk pre-harvest, Redhaven only); 28 Jul (1PH, 1 wk pre-harvest, Redhaven; 2PH, 2 wk preharvest, Redgold); 5 Aug (1PH, 1-wk pre-harvest, Redgold). Actual harvest dates: Redhaven 4 Aug; Redgold 12 Aug.

119
PEACH (Prunus persica ‘Redhaven’) K. S. Yoder, A. E. Cochran II, W. S. Royston, Jr., Nectarine: (P. persica var. nucipersica S. W. Kilmer, C. D. Douglas, and C. A. Cochran ‘Redgold’) Virginia Tech Ag. Research & Extension Center Scab; Cladosporium carpophilum 595 Laurel Grove Road Brown rot; Monilinia fructicola Winchester, VA 22602
Control of scab and brown rot by Quash in integrated fungicide programs applied airblast to Redhaven and Loring peach and Redgold nectarine, 2008. A schedule involving an experimental fungicide, (Quash) was compared to a registered program for broad-spectrum disease control on 16-yr-old trees. The test planting is composed of 3-tree sets, each including Loring peach and Redgold nectarine, which were not treated with fungicides in 2006 to allow the buildup of scab inoculum, and Redhaven peach, which were left untreated in 2007. Brown rot inoculum was standardized in the orchard by placing three mummified fruit in each test tree before bloom. Treatments were applied airblast at 100 gal/A in a randomized block design with four replications as follows: 25 Mar (pink); 23 Apr (PF, petal fall-shucks on); 6 May (SS, shuck split) 1st through 4th covers (1C-4C, Redhaven and Redgold, 21 May, 3 Jun, 17 Jun, 1 Jul); 21 Jul 2PH, 2-wk pre-harvest, Redhaven only); 28 Jul (1PH, 1 wk pre-harvest, Redhaven; 2PH, 2 wk preharvest, Redgold); 5 Aug (1PH, 1-wk pre-harvest, Redgold). Actual harvest dates were: Redhaven 4 Aug; Redgold 12 Aug. Commercial insecticides, applied to the entire test block at 2-3 wk intervals with a commercial airblast sprayer, included Asana XL, Imidan, Lannate SP, Provado, and Sevin XLR. Samples of 40 apparently rot-free fruit per replicate tree were harvested 4 Aug (Redhaven) and 12 Aug (Redgold), rated for scab, fruit were selected for uniform ripeness, grouped into 20-fruit subsamples, and placed on fiber trays. One set was misted with de-ionized water, and the other subsample was inoculated with a suspension containing 25,000 M. fructicola conidia/ml. All fruit were incubated in polyethylene bags at ambient temperatures before rating rot development at the indicated intervals. Incubation temperatures were: Redhaven: 21-28C (mean 25C); Redgold: 21-27C (mean 23C). Early season rains favored leaf curl infection, which was adequately controlled by Bravo when applied at bud swell but was less controlled when delayed until pink as was done in this test. Scab inoculum level was abundant on the test trees, and weather conditions in the early cover spray period were favorable for scab development and weathering of the test treatments. Under these strong test conditions with 61% of non-treated Redhaven fruit infected, both treatments gave significant suppression of scab. Redgold nectarine and Loring peach fruit were also heavily infected with scab but distribution on treated and non-treated trees was more variable than on Redhaven (which had not been treated in 2007), precluding significant differences among treatments in spite of apparent numerical reductions of incidence and fruit lesions. Brown rot began to build up on the tree in mid-season, especially on Redgold, likely due to light hail injury. Under these conditions, post-harvest inoculation by misting fruit with conidial suspensions did not greatly increase fruit rot incidence. Both treatments gave significant postharvest control of brown rot compared to non-treated fruit, but here was no significant difference between the two treatments.

120
Table 25. Control of scab on Redhaven and Loring peach and Redgold nectarine, 2008. Scab, % fruit inf. or lesions/fruit Redhaven Loring Redgold Treatment and rate/A Timing fruit lesions fruit lesions fruit lesions
0 No fungicide --- 61 b 7 a 35 a 3 a 49 a 19 a 1 Bravo Weather Stik 6F 2 pt
Microfine Sulfur 90W 6 lb Indar 2F 6 fl+ B-1956 8 fl oz (/100 gal)
Pink -SS 1C - 4C 2 & 1PH
20 a 2 a 21 a <1 a 53 a 8 a
2 Bravo Weather Stik 6F 2 pt Quash 50WG 2.5 oz Microfine Sulfur 90W 6 lb Quash 50WG 2.5 oz Indar 2F 6 fl+ B-1956 8 fl oz (/100 gal)
Pink PF-1C
2C - 4C 2 wk PHI 1 wk PHI
35 a 3 a 8 a <1 a 42 a 4 a
Four single tree reps. Column mean separation by Waller-Duncan K-ratio t-test (p=0.05). Treatments applied airblast at 100 gal/A as follows: 25 Mar (pink, all treatments); 23 Apr (PF, petal fall-shucks on); 6 May (SS, shuck split) 1st through 4th covers (1C-4C, all cultivars, 21 May, 3 Jun, 17 Jun, 1 Jul); 21 Jul 2PH, 2-wk pre-harvest, Redhaven only); 28 Jul (1PH, 1 wk pre-harvest, Redhaven; 2PH, 2 wk preharvest, Loring and Redgold); 5 Aug (1PH, 1-wk pre-harvest, Loring and Redgold). Actual harvest dates: Redhaven 4 Aug; Loring and Redgold 12 Aug. Note: Data are aligned with the treatment timing most likely to have affected indicated disease. Table 26. Treatment effects on postharvest brown rot development on Redhaven peach, 2008.
% fruit with brown rot after days incubation Non-inoculated fruit Inoculated fruit Treatment and rate/A Timing 2 days 3 days 4 days 2 days 3 days 4 days
0 No fungicide --- 52 b 95 b 95 b 67 b 93 b 100 b 1 Bravo Weather Stik 6F 2 pt
Microfine Sulfur 90W 6 lb Indar 2F 6 fl+ B-1956 8 fl oz (dil)
Pink -SS 1C - 4C 2 & 1PH 5 a 10 a 17 a 3 a 5 a 13 a
2 Bravo Weather Stik 6F 2 pt Quash 50WG 2.5 oz Microfine Sulfur 90W 6 lb Quash 50WG 2.5 oz Indar 2F 6 fl+ B-1956 8 fl oz (dil)
Pink PF-1C
2C - 4C 2 wk PHI 1 wk PHI 0 a 3 a 18 a 0 a 2 a 10 a
Four single tree reps. Column mean separation by Waller-Duncan K-ratio t-test (p=0.05). Treatments applied airblast at 100 gal/A as follows: 25 Mar (pink, all treatments); 23 Apr (PF, petal fall-shucks on); 6 May (SS, shuck split) 1st through 4th covers (1C-4C, Redhaven and Redgold, 21 May, 3 Jun, 17 Jun, 1 Jul); 21 Jul 2PH, 2-wk pre-harvest, Redhaven only); 28 Jul (1PH, 1 wk pre-harvest, Redhaven). Actual harvest date: Redhaven 4 Aug.

121
Table 27. Airblast treatment effects on brown rot development on-tree and post-harvest, 2008.
On-tree brown Redgold nectarine rot counts, % fruit with brown rot, days after incubation % fruit infected non-inoculated fruit inoculated fruit Treatment and rate/A Timing Loring Redgold 3 days 4 days 6 days 3 days 4 days 6 days
0 No fungicide --- 9 a 40 b 5 a 13 b 78 b 13 a 33 b 93 b 1 Bravo Weather Stik 6F 1 pt
Microfine Sulfur 90W 3 lb Indar 2F 3 fl oz+ B-1956 8 fl oz
Pink -SS 1C - 4C 2 & 1PH 5 a 18 a 0 a 2 a 13 a 2 a 5 ab 22 a
2 Bravo Weather Stik 6F 1 pt Quash 50WG 1.25 oz Microfine Sulfur 90W 3 lb Quash 50WG 1.25 oz Indar 2F 3 fl oz+ B-1956 8 fl oz
Pink PF-1C
2C - 4C 2 wk PHI 1 wk PHI 9 a 21 ab 0 a 0 a 23 a 2 a 2 a 35 a
Four single tree reps. Column mean separation by Waller-Duncan K-ratio t-test (p=0.05). Treatments applied airblast at 100 gal/A as follows: 25 Mar (pink, all treatments); 23 Apr (PF, petal fall-shucks on); 6 May (SS, shuck split) 1st through 4th covers (1C-4C, all cultivars, 21 May, 3 Jun, 17 Jun, 1 Jul); 28 Jul (2PH, 2 wk preharvest, Loring and Redgold); 5 Aug (1PH, 1-wk pre-harvest, Loring and Redgold). Actual harvest dates: Loring and Redgold 12 Aug. Table 28. Airblast treatment effects on postharvest brown rot development on Loring peach, 2008.
% fruit with brown rot after days incubation Non-inoculated fruit Inoculated fruit Treatment and rate/A Timing 3 days 4 days 6 days 3 days 4 days 6 days
0 No fungicide --- 5 b 32 b 95 b 5 a 38 b 100 b 1 Bravo Weather Stik 6F 2 pt
Microfine Sulfur 90W 6 lb Indar 2F 6 fl+ B-1956 8 fl oz (dil)
Pink -SS 1C - 4C 2 & 1PH 0 a 3 a 60 a 0 a 2 a 57 a
2 Bravo Weather Stik 6F 2 pt Quash 50WG 2.5 oz Microfine Sulfur 90W 6 lb Quash 50WG 2.5 oz Indar 2F 6 fl+ B-1956 8 fl oz (dil)
Pink PF-1C
2C - 4C 2 wk PHI 1 wk PHI 0 a 0 a 37 a 0 a 3 ab 47 a
Four single tree reps. Column mean separation by Waller-Duncan K-ratio t-test (p=0.05). Treatments applied airblast at 100 gal/A as follows: 25 Mar (pink, all treatments); 23 Apr (PF, petal fall-shucks on); 6 May (SS, shuck split) 1st through 4th covers (1C-4C, Redhaven and Redgold, 21 May, 3 Jun, 17 Jun, 1 Jul); 28 Jul (2PH, 2 wk preharvest, Loring); 5 Aug (1PH, 1-wk pre-harvest, Loring). Actual harvest date: Loring 12 Aug.

122
EVALUATION OF SPRAY PROGRAMS TO CONTROL APPLE SCAB
N. O. Halbrendt, J. W. Travis, and H. K. Ngugi Penn State Fruit Research & Extension Center
Dept. of Plant Pathology Biglerville, Pennsylvania 17307
The project was conducted to evaluate reduced risk fungicide programs (Trts. 2-7 using
sulfur, captan, mancozeb, and copper), full organic (Trt. 8, with MicroSulf, Lime Sulfur, and copper) or reduced organic (Trts. 9-11, copper only at ½” GT followed by summer treatments from 1C-7C) programs compared with four conventional programs using the demethylation inhibitor (DMI) - triazole (Trts. 12-13), DMI – triazole/anilinopyrimidine (Trt. 14) fungicides for season long control of apple scab. The tests were conducted at the Penn State Fruit Research and Extension Center University Drive research orchards on mature ‘Rome Beauty’, ‘Golden Delicious’, and ‘Red Delicious’ trees on M.26 rootstock. Treatments were arranged in a randomized complete block design with four replications. Treatments were applied dilute to both sides of the trees with a boom sprayer at 400 psi, which delivered 100 gal/A. Treatment applications were made on 6 to 15-day intervals from 15 Apr (1/2” green) to 15 Aug (7C). Pristine, Captan, and Topsin were also applied at timings 2C-7C to the conventional treatment plots to control summer diseases. All cultivars received treatments but only ‘Golden Delicious’ was evaluated for apple scab. A maintenance program for insects was also applied to all the treatments with an airblast sprayer at 100 gal/A at 400 psi. Weather data was recorded with an electronic orchard monitoring system (Field Monitor). Apple scab infection periods were calculated using a modified Mill apple scab infection model. Rainfall for Apr, May, Jun, Jul, and Aug was 4.97”, 6.20”, 2.49”, 3.70” and 2.44”, respectively.
Overall, apple scab pressure was high and powdery mildew pressure was moderate in the test orchard. Disease incidence on shoots and fruit was recorded by observing all leaves on 25 shoots and fruit per tree on 4 and 23 Jun and 25 Sep. Data obtained were analyzed by analysis of variance using appropriate transformations and significance between means was determined by the Fisher’s Protected, LSD (P < 0.05). Severe risk of infection persisted during the primary scab period from 15 Mar to 15 Jun. Several scab infection periods occurred during the primary period 15 Mar to 15 Jun. There were 10 moderate scab infection events (over 20 days that ranged from 1-4 continuous days) and 8 severe infection events (over 19 days that ranged from 1-4 continuous days) infection periods. Scab incidence on nontreated ‘Golden Delicious' shoot leaves was 86.0 and 98.0% on 4 Jun and 23 Jun, respectively. Scab infection on nontreated ‘Golden Delicious’ fruit was 85.0 and 93.0%, on 4 Jun and 23 Jun, respectively. Scab incidence on nontreated fruits at harvest (25 Sep) was 73.0% (Table 1). All of the conventional and the reduced-risk programs significantly reduced the incidence of scab on shoots compared to the nontreated check. The organic programs did not significantly reduce apple scab lesions on shoots. However, along with the reduced risk and conventional programs, the full organic (Trt. 8) and one reduced copper only treatment with Cuprofix Ultra (Trt. 11) programs significantly reduced the incidence of scab on fruit on 23 Jun and 25 Sep. The reduced copper organic treatment (Trt. 11) provided 34% control of scab on fruit compared to the nontreated fruits. Most of the reduced risk programs provided comparable results (90.0–98.0% control) to the conventional programs in suppressing scab on shoots and fruits. The full organic (Trt. 8) and reduced risk (Trts. 3, 7) programs provided 77.0-78.0% control on scab on fruit at harvest. None of the treatments caused phytotoxicity to leaves or fruit.
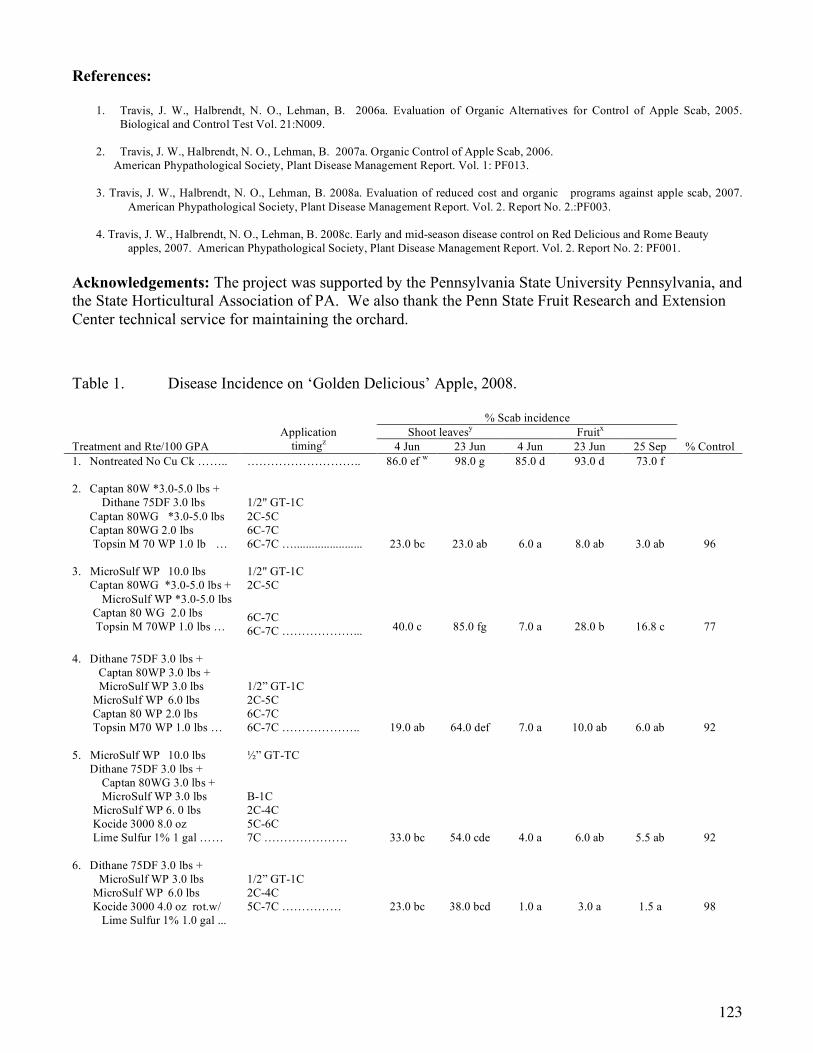
123
References:
1. Travis, J. W., Halbrendt, N. O., Lehman, B. 2006a. Evaluation of Organic Alternatives for Control of Apple Scab, 2005. Biological and Control Test Vol. 21:N009.
2. Travis, J. W., Halbrendt, N. O., Lehman, B. 2007a. Organic Control of Apple Scab, 2006. American Phypathological Society, Plant Disease Management Report. Vol. 1: PF013. 3. Travis, J. W., Halbrendt, N. O., Lehman, B. 2008a. Evaluation of reduced cost and organic programs against apple scab, 2007.
American Phypathological Society, Plant Disease Management Report. Vol. 2. Report No. 2.:PF003. 4. Travis, J. W., Halbrendt, N. O., Lehman, B. 2008c. Early and mid-season disease control on Red Delicious and Rome Beauty
apples, 2007. American Phypathological Society, Plant Disease Management Report. Vol. 2. Report No. 2: PF001. Acknowledgements: The project was supported by the Pennsylvania State University Pennsylvania, and the State Horticultural Association of PA. We also thank the Penn State Fruit Research and Extension Center technical service for maintaining the orchard.
Table 1. Disease Incidence on ‘Golden Delicious’ Apple, 2008. % Scab incidence Shoot leavesy Fruitx Treatment and Rte/100 GPA
Application timingz 4 Jun 23 Jun 4 Jun 23 Jun 25 Sep % Control
1. Nontreated No Cu Ck …….. ……………………….. 86.0 ef w 98.0 g 85.0 d 93.0 d 73.0 f 2. Captan 80W *3.0-5.0 lbs + Dithane 75DF 3.0 lbs Captan 80WG *3.0-5.0 lbs Captan 80WG 2.0 lbs Topsin M 70 WP 1.0 lb …
1/2" GT-1C 2C-5C 6C-7C 6C-7C ….......................
23.0 bc
23.0 ab
6.0 a
8.0 ab
3.0 ab
96 3. MicroSulf WP 10.0 lbs Captan 80WG *3.0-5.0 lbs + MicroSulf WP *3.0-5.0 lbs Captan 80 WG 2.0 lbs Topsin M 70WP 1.0 lbs …
1/2" GT-1C 2C-5C 6C-7C 6C-7C ………………...
40.0 c
85.0 fg
7.0 a
28.0 b
16.8 c
77 4. Dithane 75DF 3.0 lbs + Captan 80WP 3.0 lbs + MicroSulf WP 3.0 lbs MicroSulf WP 6.0 lbs Captan 80 WP 2.0 lbs Topsin M70 WP 1.0 lbs …
1/2” GT-1C 2C-5C 6C-7C 6C-7C ………………..
19.0 ab
64.0 def
7.0 a
10.0 ab
6.0 ab
92 5. MicroSulf WP 10.0 lbs Dithane 75DF 3.0 lbs + Captan 80WG 3.0 lbs + MicroSulf WP 3.0 lbs MicroSulf WP 6. 0 lbs Kocide 3000 8.0 oz Lime Sulfur 1% 1 gal ……
½” GT-TC B-1C 2C-4C 5C-6C 7C …………………
33.0 bc
54.0 cde
4.0 a
6.0 ab
5.5 ab
92 6. Dithane 75DF 3.0 lbs + MicroSulf WP 3.0 lbs MicroSulf WP 6.0 lbs Kocide 3000 4.0 oz rot.w/ Lime Sulfur 1% 1.0 gal ...
1/2” GT-1C 2C-4C 5C-7C ……………
23.0 bc
38.0 bcd
1.0 a
3.0 a
1.5 a
98

124
7. MicroSulf WP 10.0 lbs Dithane 75DF 3.0 lbs + MicroSulf WP 3.0 lbs MicroSulf WP 6.0 lbs Kocide 3000 4.0 oz + MicroSulf WP 6.0 lbs ...
½” GT-TC PF-1C 2C-5C 6C-7C ……………
61.0 d
81.0 fg
14.0 a
13.0 ab
16.5 c
77
ORGANIC PROGRAMS 8. MicroSulf WP 10.0 lbs Lime Sulfur 1.5% 1.5 gals MicroSulf WP 6.0 lbs Cu Cueva 1.5 gals rot. w/ Lime Sulfur 1.5% 1.5 gals
½” GT-TC PF 1C-4C 5C,7C 6C …………………….
41.0 c
75.0 efg
5.0 a
15.0 ab
16.0 c
78 Copper Only at ¼” GT-PF 9. Champion WP Cu 10.0 lbs LS 2% 2.0 gals rot. w/ Kocide 3000 8.0 oz ……
1/4"GT 1C,3C,5C 2C,4C,6C …………….
70.0 de
88.0 fg
47.0 b
62.0 c
70.5 f
3
10. Cueva Cu 2.0 gals LS 2% 2.0 gals rot. w/ Cueva Cu 1.0 gal ..............
1/4"GT 1C,3C,5C 2C,4C,6C……………..
83.0 ef
91.0 g
80.0 cd
78.0 cd
61.0 e
16 11. Cuprofix Cu Ultra 7.0 lbs LS 2% 2.0 gals rot. w/ Kocide 3000 8.0 oz .........
1/4"GT 1C,3C,5C 2C,4C,6C ……………
89.0 f
93.0 g
65.0 bc
58.0 c
48.0 d
34 CONVENT. PROGRAMS 12. Indar 2F 8.0 fl oz + Nufilm 17 0.25 pt + Dithane 75DF 3.0 lbs Captan 80WG *3.0-5.0 lbs Captan 80WG 2.5 lbs Topsin M 70WP 1.0 lb …
½” GT, TC, P-B, PF,1C 2C-5C 6C-7C 6C-7C .....
16.0 ab
12.0 ab
0.0 a
1.0 a
7.0 b
90 13. Nova /Rally 40W 5.0 oz + Dithane 75DF 3.0 lbs Pristine only 14.5 oz
½” GT, TC, P-B, PF,1C 2C,3C,5C,7C. …… ….
27.0 bc
17.0 ab
6.0 a
9.0 ab
6.3 ab
91 14. Inspire Super 12.0 oz + Dithane 75DF 3.0 lbs Pristine 14.5 oz rot. w/ Captan 80WG 2.5 lbs + Topsin M 70WP 1.0 lb …
GT, TC, P, B, PF, 1C 2C,4C,6C 3C,5C,7C …………..
1.0 a
8.0 a
2.0 a
11.0 ab
3.0 ab
96
z Timing: 1 = (1/2” GT) 4/15; 2 = (TC) 4/25; 3 = (Pink-Bloom) 5/5; 4 = (PF) 5/21; 5 = (1C) 5/30; 6 = (2C) 6/13; 7 = (3C) 6/20; 8 = (4C) 6/30; 9 = (5C) 7/16; 10 = (6C) 7/30; 11 = (7C) 8/15. y 25 shoots /tree-replicate x 25 fruit/tree-replicate w Means marked with the same letter(s) within columns are not significantly different, Fisher’s Protected LSD, P < 0.05. * 3.5 lbs from ½” GT-2C, 5.0 lbs from 3C.

125
Not for Citation or Publication without Consent of the Author
Assessment of Antibiotics and Biological Control Products for Management of Fire Blight
H.K. Ngugi, N.O. Halbrendt & J.W. Travis
Penn State University Fruit Research and Extension Center, Biglerville, PA 17307
The test was carried out in a mature Rome Beauty and Red Delicious apple orchard at the Penn State Fruit Research and Extension Center in Biglerville, PA. Trees received insecticide and fungicide applications, including the dormant copper sprays, consistent with standard commercial practice for the northeastern U.S. Experimental treatments included three biological control products (Serenade Plus, Pantoea agglomerans products, or a yeast-containing product) and two antibiotics (mycoshield, or kasugamycin); a streptomycin standard treatment and an untreated check for comparison. The yeast product and P. agglomerans II treatments were applied on April 25, 30 and May 4; all other products were applied only on April, 30 and May 4. Treatments were applied using a commercial air-blast sprayer at a rate of 100 gal/A and 400 psi. The experimental design was a split-plot arrangement with treatments and cultivar as main-plot and sub-plot factors, respectively. Each treatment was replicated four times. Between 27 and 60 (Mean = 34) clusters were tagged on each tree and inoculated on May 2 with a suspension of 1×10⁸ CFUs of Erwinia amylovora strain Ea273. Trees were rated for fire blight incidence and disease severity on a 1-to-5 scale (1=no infection; 5=infection with characteristic shoot wilt symptoms) on May 14. Data were analyzed with PROC GLM of SAS and means separated with Fisher’s protected LSD test (α = 0.05).
Weather was conducive for blossom infection and fire blight development resulting in high levels of infection especially on Rome Beauty. The incidence and severity of blossom infections was significantly affected (P < 0.001) by both treatment and cultivar, and the interaction effects of these factors were also highly significant (0.0039 ≤ P ≤ 0.005). Owing to the very high disease pressure, none of the treatments was observed to be outstanding on the susceptible cv. Rome Beauty. The yeast product and the antibiotics Kasumin and Mycoshield significantly reduced the incidence of flower infection compared with the untreated check. Mycoshield performed particularly well on the the moderately susceptible cultivar Red Delicious. However, none of these treatments performed as well as the streptomycin standard on any of the test cultivars. Additional research is warranted to test these products under low to moderate disease pressure typical of commercial orchards. This is particularly important for the biocontrol products which appear to perform well in the western United States.

126
Rome Beauty*
Red Delicious*
Treatment and rate/A Percent infected clusters ± s.e.
Disease severity ± s.e.**
Percent infected clusters ± s.e.
Disease severity ± s.e.**
Untreated check ................................... 94.8 ± 3.23 a 4.2 ± 0.21 a 32.8 ± 7.32 ab 2.7 ± 0.37 a
Serenade Plus/4qt ................................. 80.6 ± 3.84 ab 3.5 ± 0.27 abc 15.5 ± 4.48 bcd 1.8 ± 0.13 ab
P agglomerans I/380g ........................... 67.5 ± 15.40 abc 2.9 ± 0.17 bcd 24.4 ± 8.08 abc 1.9 ± 0.29 ab
P. agglomerans II/380g......................... 80.2 ± 8.09 ab 3.6 ± 0.21 ab 34.5 ± 6.09 a 2.3 ± 0.11 a
Yeast product/1.34lb ai + 9.35lb buffer mixture....................................... 44.8 ± 7.30 cd 2.5 ± 0.23 ed
21.2 ± 0.98 abcd 2.0 ± 0.09 a
Kasumin 100 ppm ................................ 65.6 ± 13.64 bc 2.8 ± 0.37 cd 22.7 ± 10.18 abc 2.0 ± 0.23 a
Mycoshield 200 ppm ............................ 62.5 ± 11.25 bc 2.9 ± 0.23 bcd 8.0 ± 2.76 cd 1.5 ± 0.17 bc
Streptomycin 100 ppm ......................... 21.7 ± 10.93 d 1.8 ± 0.27 e 3.9 ± 2.91 d 1.2 ± 0.12 c
LSD (α = 0.05) 27.6 0.743 17.4 0.505
* Values are means and standard errors based on four replicate single-tree plots with an average of 34 inoculated flower clusters per tree. Means in the same column followed by same letter(s) are not significantly different according to Fisher's protected LSD test (α = 0.05). **Rated on a 1-5 scale where 1 = no disease and 5 = severe infection with shoot wilt symptoms.

127
EVALUATION OF SUMMER DISEASE PROGRAMS FOR APPLE
N. O. Halbrendt, J. W. Travis, and H. K. Ngugi Penn State Fruit Research & Extension Center
Dept. of Plant Pathology Biglerville, Pennsylvania 17307
Five reduced risk treatments (with captan, mancozeb, sulfur, lime sulfur, copper), four organic
(one full, three reduced copper treatments), and three conventional programs were evaluated for sooty blotch, flyspecks, bitter rot, and Bot rot in a mature three-cultivar research orchard at Pennsylvania State University Fruit Research and Extension Center, Biglerville, PA. The three-cultivar (‘Rome Beauty’, ‘Red Delicious’, ‘Golden Delicious’) tree plots were arranged in a randomized complete block design with 4 replications. Sprays were applied dilute with a Bean boom sprayer at 400 psi, which delivered 100 gal/A. Treatment applications were made on 6-15 day intervals, from 15 Apr (1/2” green) to 15 Sep (7C). Maintenance programs for insects were applied with an airblast sprayer at 100 gal/A at 400 psi. Weather monitoring was recorded with a Field Monitor Weather System. Overall, summer disease pressure was light in the test orchard due to dry weather towards the end of the season. Rainfall for Apr, May, Jun, Jul, and Aug was 4.97”, 6.20”, 2.49”, 3.70”, and 2.44”, respectively.
Fruits were harvested on 25 Sep and held at 4o C room for 3 weeks before being evaluated. Disease incidence was determined on 50 ‘Golden Delicious’ fruits on 20 Oct. Data obtained was analyzed by analysis of variance using appropriate transformations and significance between means was determined by the Fisher's Protected LSD Test (P < 0.05). Incidence of sooty blotch, flyspeck, bitter rot, and Bot rot on nontreated ‘Golden Delicious’ fruits three weeks after harvest was 5.5, 3.0, 5.0, and 4.5%, respectively (Table 1). All treatments provided significant control on flyspeck and sooty blotch compared with the nontreated control treatment. Also, all conventional and reduced risk programs, full organic Trt. 7 and reduced organic Champion Trt. 8 showed significant control on Bot rot compared to the nontreated fruits. All conventional, four reduced risk, full organic and two reduced organic Champion and Cuprofix programs controlled bitter rot. Of the five reduced risk programs, Trt. 6 with Kocide + MicroSulf at 6C-7C did not significantly suppress bitter rot compared to the other treatments. The reduced risk Trt. 7 with Kocide + Lime Sulfur from 5C-7C provided better bitter rot control than Trt 6. There were no significant differences in fruit russet severity (1.3–1.9%) on most of the treatments excluding the two reduced organic Champion and Cuprofix programs which resulted in the highest fruit russet severity at 2.3 and 2.6%, respectively. No phytotoxicity was observed.
References:
3. Travis, J. W., Halbrendt, N. O., Lehman, B. 2006b. Evaluation of alternative fungicide programs to control fly speck and sooty
blotch on Golden Delicious and Cortland apples in PA, 2005. Biological and Control Test Vol. 21:N0011. 4. Travis, J. W., Halbrendt, N. O., Lehman, B. 2007b. Evaluation of Captan/Topsin
Program and the Experimental Difenoconazole for the Control of Sooty Blotch, Fly Speck and Rots, 2006. American Phypathological Society, Plant Disease Management Report. Vol. 1: PF010.
3. Travis, J. W., Halbrendt, N. O., Lehman, B. 2008b. Evaluation of organic and reduced programs on sooty blotch, flyspeck and
rots, 2007. American Phypathological Society, Plant Disease Management Report. Vol. 2. Report No. 2: PF002. 4. Travis, J. W., Halbrendt, N. O., Lehman, B. 2008c. Early and mid-season disease control on Red Delicious and Rome Beauty
apples, 2007. American Phypathological Society, Plant Disease Management Report. Vol. 2. Report No. 2: PF001.

128
Acknowledgements: The project was supported by the Pennsylvania State University Pennsylvania, and the State Horticultural Association of PA. We also thank the Penn State Fruit Research and Extension Center technical service for maintaining the orchard.
Table 1. Disease Incidence on ‘Golden Delicious’ Apple, University Dr., 2008. % Incidence y Application Sooty Bitter Bot Treatment and Rate/100 GPA
timingz blotch Flyspeck rot rot Russet
1. Nontreated No Cu Ck ……………. ……………………. 5.5b x 3.0 c 5.0 cd 4.5 cd 1.9 de REDUCED RISK PROGRAMS 2. Captan 80W *3.0-5.0 lbs + Dithane 75DF 3.0 lbs Captan 80 WG *3.0-5.0 lbs Captan 80WG 2.0 lbs Topsin M 70 WP 1.0 lb ………….
½” GT-1C 2C-5C 6C-7C 6C-7C ……………...
0.0 a
0.0 a
0.0 a
1.3 a
1.3 ab 3. MicroSulf WP 10.0 lbs Captan 80WG *3.0-5.0 l bs+ MicroSulf WP *3.0-5.0 lbs Captan 80 WG 2.0 lbs Topsin M 70WP 1.0 lbs …………..
½” GT-1C 2C-5C 6C-7C 6C-7C ……………..
0.0 a
0.0 a
0.0 a
0.8 a
1.4 abc
4. MicroSulf WP 10.0 lbs Dithane 75DF 3.0 lbs + Captan 80WG 3.0 lbs + MicroSulf WP 3.0 lbs MicroSulf WP 6. 0 lbs Kocide 3000 8.0 oz Lime Sulfur 1% 1.0 gal …………..
½” GT-1C B-1C 2C-4C 5C-6C 7C ………………….
0.0 a
0.0 a
0.5 ab
0.0 a
1.4 abc 5. Dithane 75DF 3.0 lbs + MicroSulf WP 3.0 lbs MicroSulf WP 6.0 lbs Kocide 3000 4.0 oz rot.w/ Lime Sulfur 1% 1.0 gal ………..
½” GT-1C 2C-4C 5C-7C ……………………..
0.0 a
0.0 a
0.0 a
0.0 a
1.3 ab 6. MicroSulf WP 10.0 lbs Dithane 75DF 3.0 lbs + MicroSulf WP 3.0 lbs MicroSulf WP 6.0 lbs Kocide 3000 4.0 oz + MicroSulf WP 6.0 lbs …………
½” GT-TC PF-1C 2C-5C 6C-7C ……………..
0.0 a
0.0 a
2.5 bc
2.0 ab
1.5 a-d ORGANIC PROGRAMS 7. MicroSulf WP 10.0 lbs Lime Sulfur 1.5% 1.5 gals MicroSulf WP 6.0 lbs Cu Cueva 1.5 gals rot. w/ Lime Sulfur 1.5% 1.5 gals …….
½” GT-TC PF 1C-4C 5C,7C 6C …………………
0.5 a
1.0 b
1.0 ab
1.0 a
1.8 cd 8. Champion WP Cu 10.0 lbs LS 2% 2.0 gals rot. w/ Kocide 3000 8.0 oz …………….
¼” GT 1C,3C,5C 2C,4C,6C …………..
0.3 a
0.0 a
1.3 ab
1.8 ab
2.3 ef

129
9. Cueva Cu 2.0 gals LS 2% 2.0 gals rot. w/ Cueva Cu 1.0 gal ……………….
¼” GT 1C,3C,5C 2C,4C,6C …………..
0.0 a
0.0 a
6.5 d
5.5 d
1.8 bcd 10. Cuprofix Cu Ultra 7.0 lbs LS 2% 2.0 gals rot. w/ Kocide 3000 8.0 oz ……………
¼” GT 1C,3C,5C 2C,4C,6C …………..
0.3 a
0.0 a
2.3 b
3.0 bc
2.6 f
CONVENTIONAL PROGRAM 11. Indar 2F 8.0 fl oz + Nufilm 17 0.25 pt + Dithane 75DF 3.0 lbs Captan 80WG *3.0-5.0 lbs Captan 80WG 2.5 lbs Topsin M 70WP 1.0 lb …………
½” GT,TC,P-B,PF,1C 2C-5C 6C,7C 6C,7C ……………….
0.5 a
0.0 a
0.3 a
1.0 a
1.8 cd 12. Nova /Rally 40W 5.0 oz + Dithane 75DF 3.0 lbs Pristine only 14.5 oz ……………
½” GT.TC.P-B,PF,1C 2C,3C,5C,7C ……….
0.0 a
0.0 a
0.0 a
0.3 a
1.5 abc 13. Inspire Super12.0 oz + Dithane 75DF 3.0 lbs Pristine 14.5 oz rot. w/ Captan 80WG 2.5 lbs + Topsin M 70WP 1.0 lb ………
GT,TC,P,B,PF,1C 2C.4C,6C 3C,5C,7C ……………………….
0.0 a
0.0 a
0.0 a
0.5 a
1.4 ab 14. Inspire Super 12.0 oz + Dithane 75DF 3.0 lbs Pristine 14.5 oz rot. w/ Captan 80WG 2.5 lbs + Topsin M 70WP 1.0 lb w/ Harvista ……………………….
GT,TC,P,B,PF,1C 2C.4C,6C 3C,5C,7C ……………………….
0.0 a
0.0 a
0.0 a
0.5 a
1.3 ab z Timing: 1 = (1/2” GT) 4/15; 2 = (TC) 4/25; 3 = (Pink-Bloom) 5/5; 4 = (PF) 5/21; 5 = (1C) 5/30; 6 = (2C) 6/13; 7 = (3C) 6/20; 8 = (4C) 6/30; 9 = (5C) 7/16; 10 = (6C) 7/30; 11 = (7C) 8/15. y 25 fruit/tree-replicate x Means marked with the same letter(s) within columns are not significantly different, Fisher’s Protected LSD, P < 0.05. * 3.5 lbs from ½” GT-2C, 5.0 lbs from 3C.

130
Evaluation of Experimental Peach Fungicides
Norman Lalancette and Kathleen McFarland Rutgers University, Agricultural Research and Extension Center
Bridgeton, NJ 08302
The experimental fungicides DPX-LEM17 and USF2016A (trifloxystrobin + unknown) were tested for efficacy against peach diseases. DPX-LEM17 treatment timings focused on brown rot blossom blight and fruit rot control, while USF2016A was applied full season to examine control of all diseases. The newly registered DMI fungicide, Quash (metconazole), was also examined full season.
MATERIALS AND METHODS
Treatments. The experiment was conducted during the spring and summer of the 2008 growing season. The test block consisted of a mixed-cultivar orchard of 13-year-old ‘Autumnglo’ peach, ‘Suncrest’ peach, and ‘Redgold’ nectarine. Trees of each cultivar alternated within the rows and were planted at 20 ft x 25 ft spacing. ‘Autumnglo’ trees were used in the experiment. Treatments were replicated four times in a randomized complete block design with single tree plots (Autumnglo). Treatment trees were surrounded on all sides by non-sprayed buffer trees. A Rears Pak-Blast-Plot airblast sprayer calibrated to deliver 100 gal/A at 100 psi traveling at 2.1 mph was used for applications. Fungicide applications were made on the following dates and tree growth stages: 9 Apr (B, bloom); 23 Apr (PF, petal fall); 6 May (SS, shuck split); 21 May, 5, 20 Jun, 2, 17, and 30 Jul (1C-6C, 1st through 6th cover). During the ripening period in late August and early September, three spays for fruit rot control were applied on 15, 25 Aug and 2 Sep (19, 9, and 1 DPH, days pre-harvest). All trees in the block received Ziram at 4 lb/A on 25 Mar for leaf curl control. Insecticides and miticides were applied as needed to the entire block using a commercial airblast sprayer. Environment. Overall the growing season was dry (Figure 1). Rainfall in May and June
was 4.36 and 3.17 in, respectively and was close to the 30 year average. However, rainfall in April, July, and August was well below the 30 year average with 2.4, 2.42, and 0.97 in, respectively (vs. 3.58, 4.3, and 4.18 in). There was no rain in September prior to harvest. Average temperatures this growing season were: Apr 54.2ºF; May 59.8ºF, Jun 74ºF; Jul 76.3ºF; and Aug 71.8ºF.
Conditions were extremely favorable for blossom blight development. Much overwintering
inoculum (mummies) was present and several rainy periods with above average temperatures occurred during pink and bloom. The warm weather and long dry periods from the susceptible stages of PF through 2C were favorable for rusty spot development. Although the rainfall for the growing season was below average, high inoculum levels in the form of twig lesions and several rain periods between SS and 40 days pre-harvest created very favorable conditions for scab. The number of rain days with over 0.10 inch accumulation following each spray were: B, 1; PF, 2; SS, 5; 1C, 3; 2C, 0; 3C, 1; 4C, 5; 5C, 3; 6C, 2. Conditions were very unfavorable for brown rot and other rots due to the dry

131
weather in August and early September. No rain occurred after any of the pre-harvest sprays. Trees were overhead irrigated on 26 Aug to promote brown rot development.
Assessment. Blossom blight (Monilinia fructicola) was evaluated on 2 May by examining
all the flowers on 10 twigs per tree. The percentage of infected flowers was recorded as well as the number of cankers on each twig. Rusty spot (Podosphaera leucotricha) was evaluated on 30 Jun by examining 40 fruit per tree. Scab (Fusicladosporium carpophilum) was evaluated on 18 Aug by examining 50 fruit per tree. Brown rot (M. fructicola) was evaluated at harvest on 3 Sep by examining all fruit on four or more branches per replicate tree (minimum of 100 fruit per tree). For postharvest evaluations, 40 asymptomatic fruit were harvested from each tree and placed on benches in a greenhouse (ave. air temp. = 25.6ºC). Brown rot, Rhizopus rot, and other postharvest rots were evaluated at 3 and 6 days postharvest (dph).
RESULTS AND DISCUSSION Blossom Blight. Blossom blight incidence was very high compared to previous years.
Non-treated control trees had 7.7% infected flowers and 57.5% of examined shoots had at least one canker (Table 1). All treatments except Vangard/Nova significantly reduced the percentage of infected flowers from that of the non-treated control trees and did not differ from one another. All treated trees had significantly fewer shoots with cankers than the non-treated trees. Both rates of USF2016A, and DPX-LEM17 + Elite/Nova provided the best control of shoot cankers (100%, 91.3%, and 91.3% control, respectively). Quash, Vangard, and both rates of DPX-LEM17 provided control ranging from 52.2% to 82.6%.
Rusty Spot. Rusty spot disease pressure was high. Non-sprayed control trees had 66.3%
rusty spot incidence with an average of 1.5 lesions per fruit (Table 2). All treatments provided significant control of rusty spot incidence and severity. The standard Nova treated fruit had 74.5% to 82.1% less incidence and 86.7% to 93.3% fewer lesions per fruit than the non-sprayed fruit. Both rates of USF2016A provided equivalent control to the standard for both rusty spot incidence and severity. Quash was less effective than the standard Nova, providing only 39.7% control.
Scab. Disease pressure for scab was extremely high in the block. Nearly 100% of fruit on
non-sprayed control trees were infected with greater than 70% of infected fruit having 10 or more lesions (Table 3).
All treatments significantly reduced scab incidence. The standard Bravo/Captan treatments
provided between 67.4% and 82.9% control. In general, USF2016A provided control equivalent to the standards. Quash was the least effective, while all other treatments provided an intermediate level of control.
USF2016A @ 4 fl oz and 5 fl oz provided excellent control of scab severity and reduced the
number of fruit with over 10 lesions from the non-treated control by 97.2% and 98.6%, respectively. They were equivalent to the standard Bravo/Captan treatments which provided an 82.4%-95.8% reduction in fruit with over 10 lesions.
132
Brown Rot. The lack of rain was unfavorable for brown rot development. Irrigation close to harvest and inoculum from earlier ripening trees adjacent to the treatment trees made conditions slightly more favorable for brown rot development for the treatment trees.
At harvest, the non-treated control trees had 14.4% fruit infected with brown rot (Table 4).
All of the treatments significantly reduced brown rot levels. USF2016A @ 4 fl oz provided the highest level of control (98.6%). All other treatments were equivalent to USF2016A @ 4 fl oz except Elite and the low rate of DPX-LEM17 (14.4 fl oz), which provided the least control (68.8% and 72.9%, respectively).
At 3-dph and 6-dph, brown rot levels reached 18.8% and 48.1% on the non-treated control,
respectively. All treatments significantly reduced the level of brown rot during the postharvest period. At 3-dph, treatments provided between 60.1% and 83.5% control with no significant differences among them. At 6 dph, USF2016A @ 4 fl oz and DPX-LEM17 + Elite provided the best control (78% and 76.5%, respectively). Elite and the low rate of DPX-LEM17 (14.4 fl oz) were the least effective, while all other treatments provided an intermediate level of control.
Very few fruit from any of the treatments had Rhizopus or Anthracnose rots at harvest and
during the postharvest period. CONCLUSIONS
USF2016A provided control equivalent to the standard for all diseases tested. In the case of blossom blight, USF2016A significantly reduced the percentage of infected flowers and shoots with cankers from that of the standard Vangard. There were no significant differences between the 4 fl oz and 5 fl oz rates for any of the diseases.
Quash provided good control of blossom blight. It provided equivalent control to the
standard for percent shoots infected and provided significantly more control than the standard for flower infection. Quash treated fruit had significantly lower rusty spot incidence and severity than the non-treated control trees, but still had significantly higher levels of rusty spot than fruit treated with Nova. Quash significantly reduced levels of scab incidence from those of the non-treated control trees, but was significantly less effective than the standard Bravo/Captan. It was equivalent to 2 of the 4 standards for the percentage of fruit with over 10 lesions (and higher than the other 2). Quash significantly reduced brown rot from the non-treated control. At harvest and during the post harvest period, Quash treated fruit had intermediate levels of brown rot and were equivalent to both the most and least effective treatments.
Surprisingly, Vangard applied at bloom did not significantly reduce the percentage of
infected flowers. Although Vangard did significantly reduce shoot infection (% shoots with cankers) by 52.2%, its disease level was still more than double that of the next highest treatment. These results indicate that higher rates of Vangard may be required for adequate control when disease pressure is very high.
The combination of DPX-LEM17 and Elite generally provided better control than either
material alone, although the difference in control was not always significant. DPX-LEM17 alone provided 78.3% and 82.6% control of shoots with blossom blight cankers,

133
respectively, for the 14.4 fl oz and the 20.6 fl oz rates while DPX-LEM17 + Elite provided 91.3% control. At harvest and throughout the postharvest period, fruit treated with DPX-LEM17 + Elite had numerically lower levels of brown rot than fruit treated with either Elite alone or DPX-LEM17@ 14.4 fl oz alone. At 6-dph, DPX-LEM17 + Elite provided significantly more brown rot control than either material alone. There was a slight rate effect between the 14.4 fl oz and 20.6 fl oz rates of DPX-LEM17. Although there were no significant differences between these treatments, the numerical values for blossom blight and brown rot were always lower on trees treated with the higher rate.

134
Disease Pressure % Infected Fruit on Non-treated Control Brown Rot Blossom
Blight* Rusty
Spot Scab Harvest 3-dph 6-dph
57.5 66.3 96.5 14.4 18.8 48.1 * % shoots with cankers.
% Disease Control* Brown Rot Fungicides
Blossom Blight
Rusty Spot Scab Harvest 3-dph 6-dph
Vangard / Nova 52 DPX-LEM17 14.4 fl oz / Nova 78 DPX-LEM17 20.6 fl oz / Nova 83 (DPX-LEM17 + Elite) / Nova 91 Nova 79 Bravo / Captan 78 Elite 69 60 42 DPX-LEM17 14.4 fl oz 73 73 40 DPX-LEM17 20.6 fl oz 77 77 53 DPX-LEM17 + Elite 89 80 77 USF2016A 4 fl oz 100 73 80 99 84 78 USF2016A 5 fl oz 91 76 90 85 77 69 Quash 78 40 28 85 63 66 * Blossom blight control values based on canker incidence; rusty spot, scab, and brown rot control values
based on % infected fruit. All treatment means were significantly different from NTC. Treatment Rank* Brown Rot Fungicides
Blossom Blight
Rusty Spot Scab Harvest 3-dph 6-dph
Vangard / Nova 5 DPX-LEM17 14.4 fl oz / Nova 4 DPX-LEM17 20.6 fl oz / Nova 3 (DPX-LEM17 + Elite) / Nova 2 Nova 1 Bravo / Captan 3 Elite 6 6 6 DPX-LEM17 14.4 fl oz 5 4 7 DPX-LEM17 20.6 fl oz 4 3 5 DPX-LEM17 + Elite 2 2 2 USF2016A 4 fl oz 1 3 2 1 1 1 USF2016A 5 fl oz 2 2 1 3 3 3 Quash 4 4 4 3 5 4 * 1 = provided highest level of control
Summary

135
TABLE 1. Blossom Blight Incidence and Severity 1
Treatment Rate / A Timing % Infected Flowers2
% Shoots w. Cankers 2
Nontreated Control
-----------------
-----------------
7.7 a
57.5 a
Vangard 75WG Nova 40WP Nova 40WP + Bravo Ultrex 82.5 WDG Nova 40WP + Captan 80WDG Captan 80WDG Elite 45WP
5 oz 5 oz 5 oz + 3.8 lb 5 oz + 3.75 lb 3.75 lb 6 oz
B PF SS 1C, 2C 3C-6C 19, 9, 1 DPH
6.5 a
27.5 b
USF2016A 4 fl oz B, PF, SS, 1C, 2C, 3C-6C, 19, 9, 1 DPH
0.4 b
0.0 d
USF2016A 5 fl oz B, PF, SS, 1C, 2C, 3C-6C, 19, 9, 1 DPH
1.4 b
5.0 cd
Quash 50WG 2.5 oz B, PF, SS, 1C, 2C, 3C-6C, 19, 9, 1 DPH
2.0 b
12.5 bc
DPX-LEM17 1.67 SC
Nova 40WP Nova 40WP + BravoUltrex 82.5WDG Nova 40WP + Captan 80WDG Captan 80WDG DPX-LEM17 1.67SC
14.4 fl oz 5 oz 5 oz + 3.8 lb 5 oz + 3.75 lb 3.75 lb 14.4 fl oz
B PF SS 1C, 2C 3C-6C 19, 9, 1 DPH
1.8 b
12.5 bc
DPX-LEM17 1.67 SC
Nova 40WP Nova 40WP + BravoUltrex 82.5 WDG Nova 40WP + Captan 80WDG Captan 80WDG DPX-LEM17 1.67 SC
20.6 fl oz 5 oz 5 oz + 3.8 lb 5 oz + 3.75 lb 3.75 lb 20.6 fl oz
B PF SS 1C, 2C 3C-6C 19, 9, 1 DPH
1.5 b
10.0 bc
DPX-LEM17 1.67 SC + Elite 45WP Nova 40WP Nova 40WP + BravoUltrex 82.5WDG Nova 40WP + Captan 80WDG Captan 80WDG DPX-LEM17 1.67SC + Elite 45WP
14.4 fl oz + 3 oz 5 oz 5 oz + 3.8 lb 5 oz + 3.75 lb 3.75 lb 14.4 fl oz + 3 oz
B PF SS 1C, 2C 3C-6C 19, 9, 1 DPH
2.3 b
5.0 cd 1 Blossom blight treatments, rates, and application timings in boldface. 2 Means in the same column with the same letter do not differ significantly according to the Waller-Duncan K-ratio t-test (α=0.05, K=100).

136
TABLE 2. Peach Rusty Spot Incidence and Severity 1
Treatment Rate / A Timing % Inf. Fruit2
# Lesions/Fruit2
Nontreated Control
-----------------
-----------------
66.3 a
1.5 a
Vangard 75WG Nova 40WP Nova 40WP + Bravo Ultrex 82.5 WDG Nova 40WP + Captan 80WDG Captan 80WDG Elite 45WP
5 oz 5 oz 5 oz + 3.8 lb 5 oz + 3.75 lb 3.75 lb 6 oz
B PF SS 1C, 2C 3C-6C 19, 9, 1 DPH
12.5 c
0.1 c
USF2016A 4 fl oz B, PF, SS, 1C, 2C, 3C-6C, 19, 9, 1 DPH
18.1 c
0.2 c
USF2016A 5 fl oz B, PF, SS, 1C, 2C, 3C-6C, 19, 9, 1 DPH
15.6 c
0.2 c
Quash 50WG 2.5 oz B, PF, SS, 1C, 2C, 3C-6C, 19, 9, 1 DPH
40.0 b
0.6 b
DPX-LEM17 1.67 SC
Nova 40WP Nova 40WP + BravoUltrex 82.5WDG Nova 40WP + Captan 80WDG Captan 80WDG DPX-LEM17 1.67SC
14.4 fl oz 5 oz 5 oz + 3.8 lb 5 oz + 3.75 lb 3.75 lb 14.4 fl oz
B PF SS 1C, 2C 3C-6C 19, 9, 1 DPH
15.0 c
0.2 c
DPX-LEM17 1.67 SC
Nova 40WP Nova 40WP + BravoUltrex 82.5 WDG Nova 40WP + Captan 80WDG Captan 80WDG DPX-LEM17 1.67 SC
20.6 fl oz 5 oz 5 oz + 3.8 lb 5 oz + 3.75 lb 3.75 lb 20.6 fl oz
B PF SS 1C, 2C 3C-6C 19, 9, 1 DPH
11.9 c
0.1 c
DPX-LEM17 1.67 SC + Elite 45WP Nova 40WP Nova 40WP + BravoUltrex 82.5WDG Nova 40WP + Captan 80WDG Captan 80WDG DPX-LEM17 1.67SC + Elite 45WP
14.4 fl oz + 3 oz 5 oz 5 oz + 3.8 lb 5 oz + 3.75 lb 3.75 lb 14.4 fl oz + 3 oz
B PF SS 1C, 2C 3C-6C 19, 9, 1 DPH
16.9 c
0.2 c
1 Rusty spot treatments, rates, and application timings in boldface. 2 Means in the same column with the same letter do not differ significantly according to the Waller-Duncan K-ratio t-test (α=0.05, K=100).

137
TABLE 3. Scab Incidence and Severity 1 % Fruit 2
Treatment Rate / A Timing Infected 1-10 lesions
>10 lesions
Nontreated Control
-----------------
-----------------
96.5 a
25.5 b
71.0 a
Vangard 75WG Nova 40WP Nova 40WP + Bravo Ultrex 82.5 WDG Nova 40WP + Captan 80WDG Captan 80WDG Elite 45WP
5 oz 5 oz 5 oz + 3.8 lb 5 oz + 3.75 lb 3.75 lb 6 oz
B PF SS 1C, 2C 3C, 4C, 5C, 6C 19, 9, 1 DPH
31.5 c
19.0 bc
12.5 bc
USF2016A 4 fl oz B, PF, SS, 1C-4C, 5C, 6C, 19, 9, 1 DPH
19.5 cd
17.5 bc
2.0 c
USF2016A 5 fl oz B, PF, SS, 1C-4C, 5C, 6C, 19, 9, 1 DPH
10.0 d
9.0 c
1.0 c
Quash 50WG 2.5 oz B, PF, SS, 1C-4C, 5C, 6C, 19, 9, 1 DPH
69.5 b
51.0 a
18.5 b
DPX-LEM17 1.67 SC
Nova 40WP Nova 40WP + BravoUltrex 82.5WDG Nova 40WP + Captan 80WDG Captan 80WDG DPX-LEM17 1.67SC
14.4 fl oz 5 oz 5 oz + 3.8 lb 5 oz + 3.75 lb 3.75 lb 14.4 fl oz
B PF SS 1C, 2C 3C, 4C, 5C, 6C 19, 9, 1 DPH
18.0 cd
11.5 bc
6.5 bc
DPX-LEM17 1.67 SC
Nova 40WP Nova 40WP + BravoUltrex 82.5 WDG Nova 40WP + Captan 80WDG Captan 80WDG DPX-LEM17 1.67 SC
20.6 fl oz 5 oz 5 oz + 3.8 lb 5 oz + 3.75 lb 3.75 lb 20.6 fl oz
B PF SS 1C, 2C 3C, 4C, 5C, 6C 19, 9, 1 DPH
16.5 cd
13.5 bc
3.0 c
DPX-LEM17 1.67 SC + Elite 45WP Nova 40WP Nova 40WP + BravoUltrex 82.5WDG Nova 40WP + Captan 80WDG Captan 80WDG DPX-LEM17 1.67SC + Elite 45WP
14.4 fl oz + 3 oz 5 oz 5 oz + 3.8 lb 5 oz + 3.75 lb 3.75 lb 14.4 fl oz + 3 oz
B PF SS 1C, 2C 3C, 4C, 5C, 6C 19, 9, 1 DPH
19.5 cd
16.0 bc
3.5 c 1 Scab treatments, rates, and application timings in boldface. 2 Means in the same column with the same letter do not differ significantly according to the Waller-Duncan K-ratio t-test (α=0.05, K=100).

138
TABLE 4. Brown Rot Harvest and Post-harvest Incidence1 % Fruit Infected 2
Treatment Rate / A Timing Harvest 3-dph 6-dph Nontreated Control
-----------------
-----------------
14.4 a
18.8 a
48.1 a
Vangard 75WG Nova 40WP Nova 40WP + Bravo Ultrex 82.5 WDG Nova 40WP + Captan 80WDG Captan 80WDG Elite 45WP
5 oz 5 oz 5 oz + 3.8 lb 5 oz + 3.75 lb 3.75 lb 6 oz
B PF SS 1C, 2C 3C-6C 19, 9, 1 DPH
4.5 b
7.5 b
28.1 b
USF2016A 4 fl oz B, PF, SS, 1C, 2C, 3C-6C, 19, 9, 1 DPH
0.2 c
3.1 b
10.6 c
USF2016A 5 fl oz B, PF, SS, 1C, 2C, 3C-6C, 19, 9, 1 DPH
2.1 bc
4.4 b
15.0 bc
Quash 50WG 2.5 oz B, PF, SS, 1C, 2C, 3C-6C, 19, 9, 1 DPH
2.1 bc
6.9 b
16.3 bc
DPX-LEM17 1.67 SC
Nova 40WP Nova 40WP + BravoUltrex 82.5WDG Nova 40WP + Captan 80WDG Captan 80WDG DPX-LEM17 1.67SC
14.4 fl oz 5 oz 5 oz + 3.8 lb 5 oz + 3.75 lb 3.75 lb 14.4 fl oz
B PF SS 1C, 2C 3C-6C 19, 9, 1 DPH
3.9 b
5.0 b
28.8 b
DPX-LEM17 1.67 SC
Nova 40WP Nova 40WP + BravoUltrex 82.5 WDG Nova 40WP + Captan 80WDG Captan 80WDG DPX-LEM17 1.67 SC
20.6 fl oz 5 oz 5 oz + 3.8 lb 5 oz + 3.75 lb 3.75 lb 20.6 fl oz
B PF SS 1C, 2C 3C-6C 19, 9, 1 DPH
3.3 bc
4.4 b
22.5 bc
DPX-LEM17 1.67 SC + Elite 45WP Nova 40WP Nova 40WP + BravoUltrex 82.5WDG Nova 40WP + Captan 80WDG Captan 80WDG DPX-LEM17 1.67SC + Elite 45WP
14.4 fl oz + 3 oz 5 oz 5 oz + 3.8 lb 5 oz + 3.75 lb 3.75 lb 14.4 fl oz + 3 oz
B PF SS 1C, 2C 3C-6C 19, 9, 1 DPH
1.6 bc
3.8 b
11.3 c 1Brown rot treatments, rates, and application timings in boldface. 2 Means in the same column with the same letter do not differ significantly according to the Waller-Duncan K-ratio t-test (α=0.05, K=100).

139
0.0
0.5
1.0
1.5
2.0
2.5
3.0
1-A
pr
16-A
pr
1-M
ay
16-M
ay
31-M
ay
15-J
un
30-J
un
15-J
ul
30-J
ul
14-A
ug
29-A
ug
Date
Rai
nfal
l (in
)
0
10
20
30
40
50
60
70
80
90
Ave
rage
Air
Tem
pera
ture
(F
)
Rainfall / Irrigation
Bloom Sprays
Cover Sprays
Preharvest Sprays
Air Temp
Figure 1. Rainfall, air temperature, and fungicide application timing on ‘Autumnglo’ peach during the 2008 growing season, Rutgers Agricultural Research and Extension Center, Bridgeton, NJ. X, diamond, and + symbols represent application timing for bloom (B, PF), shuck-split through sixth cover (SS-6C), and pre-harvest (PH) fungicide sprays, respectively.

140
Not for Citation or Publication Without Consent of the Author
PEACH DISEASE CONTROL WITH DPX-LEM17, 2008
Alan R. Biggs West Virginia University
Tree Fruit Research and Education Center P. O. Box 609
Kearneysville, WV 25430 DPX-LEM17 1.67SC was evaluated for disease control in a 6-yr-old research orchard spaced 16 ft x 24 ft. The test was conducted in a completely randomized design with four single-tree replications per treatment. Two rates of DPX-LEM17 were included in the test, as well as one rate of DPX-LEM17 combined with Elite 45 DF, Elite 45 DF alone, and a nonsprayed treatment. Nonsprayed buffer trees were placed between treated trees in the row and between rows. Treatments were applied from both sides of the row with a Swanson model DA-500 airblast sprayer (100 gal/A) as follows: 30 Apr (shuck-split/shuck-fall; SS/SF), 14 May (first cover; 1C), 24 Jul (sixth cover; 6C), and 1 Aug (pre-harvest; PH). Additional cover sprays were applied and utilized Microthiol Disperss 80DF at 9 lb/A from 2C through 5C on the following dates: 29 May; 12 and 26 Jun; and 11 Jul. Maintenance insecticide sprays were applied separately with the same equipment. Thirty-seven wetting periods initiated by rain occurred on 31 Mar-Apr 1, 3-4 Apr, 11-12 Apr, 20-21 Apr, 25-26 Apr, 28 Apr, 4 May, 8-9 May, 9-10 May, 11-13 May, 15-16 May, 17-18 May, 20 May, 21-22 May, 26-27 May, 31 May, 4–5 Jun, 6-7 Jun, 10-11 Jun, 14-15, 16 Jun, 16-17 Jun, 28-29 Jun, 29-30 Jun, 30 Jun-Jul 1, 4 Jul, 4-5 Jul, 5-6 Jul, 6-7 Jul, 7-8 Jul, 13-14 Jul, 22 Jul, 23 Jul, 30 Jul, and 2 Aug. Total precipitation in April, May, June, July, and August was 8.6, 6.2, 4.4, 6.2 and 0.8 inches (to August 4th), respectively. Overwintering levels of brown rot inoculum were low; however, weather conditions were very favorable for disease development in the field. Fruit were assessed for scab, rusty spot, anthracnose and brown rot on 4 Aug by examining visually 25 fruit from each tree and then calculating the percent of infected fruit. On 5 Aug, 20 fruit per tree were harvested, placed on paper fruit trays in plastic containers, and inoculated with 1 x 10⁵ conidia/ml of Monilinia fructicola and then sealed in plastic bags for 3 days. The containers were kept indoors under ambient conditions (approximately 75 to 82° F). Fruit were assessed for percent of brown-rotted fruit on 8 Aug. Data were analyzed with analysis of variance after using the arcsine transformation.
All treatments had lower incidence of scab than the nonsprayed trees. LEM17 at the 15
oz rate provided control of scab that was similar to the 21.5 oz rate. All treatments had lower incidence of rusty spot than the nonsprayed trees. Incidence of rusty spot was lower with LEM17 at the 21.5 oz rate compared to the 15 oz rate. Among treatments, those treated with DPX-LEM 17 + Elite and Elite alone had the highest incidence of rusty spot, along with LEM17 at the lower rate. Natural incidence of brown rot was 31.2% in the control plots; however, there were few differences among the treatments, the most notable being the low levels of brown rot at the 21.5 oz rate of LEM17. Anthracnose at harvest was 5.5% in the control plots, with treatments 1 and 3 showing less anthracnose than the control. In the postharvest test with inoculated fruit, all treated fruits exhibited less brown rot than the nontreated fruits. Brown rot incidence was lowest on fruit treated with DPX-LEM 17 + Elite, although this treatment was not
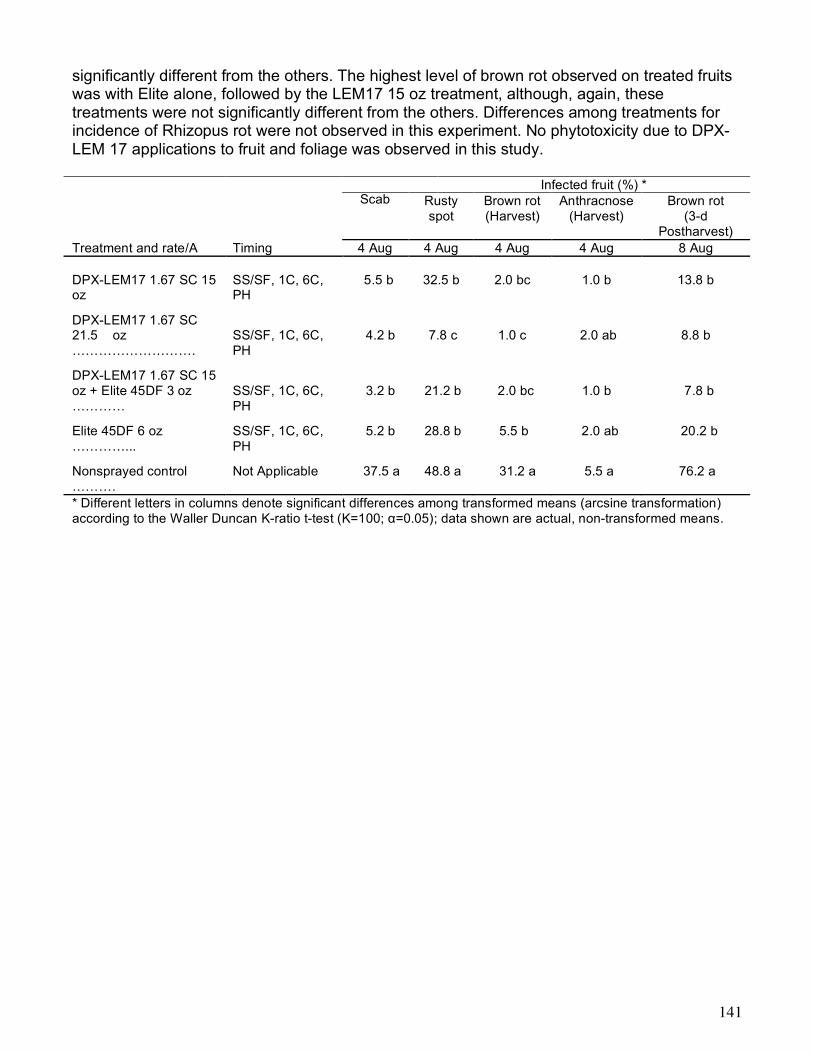
141
significantly different from the others. The highest level of brown rot observed on treated fruits was with Elite alone, followed by the LEM17 15 oz treatment, although, again, these treatments were not significantly different from the others. Differences among treatments for incidence of Rhizopus rot were not observed in this experiment. No phytotoxicity due to DPX-LEM 17 applications to fruit and foliage was observed in this study.
Infected fruit (%) *
Scab Rusty
spot Brown rot (Harvest)
Anthracnose (Harvest)
Brown rot (3-d
Postharvest) Treatment and rate/A Timing 4 Aug 4 Aug 4 Aug 4 Aug 8 Aug DPX-LEM17 1.67 SC 15 oz
SS/SF, 1C, 6C, PH
5.5 b
32.5 b
2.0 bc
1.0 b
13.8 b
DPX-LEM17 1.67 SC 21.5 oz ……………………….
SS/SF, 1C, 6C, PH
4.2 b
7.8 c
1.0 c
2.0 ab
8.8 b
DPX-LEM17 1.67 SC 15 oz + Elite 45DF 3 oz …………
SS/SF, 1C, 6C, PH
3.2 b
21.2 b
2.0 bc
1.0 b
7.8 b
Elite 45DF 6 oz …………...
SS/SF, 1C, 6C, PH
5.2 b
28.8 b
5.5 b
2.0 ab
20.2 b
Nonsprayed control ……….
Not Applicable
37.5 a
48.8 a
31.2 a
5.5 a
76.2 a
* Different letters in columns denote significant differences among transformed means (arcsine transformation) according to the Waller Duncan K-ratio t-test (K=100; α=0.05); data shown are actual, non-transformed means.

142
Peach Disease Management with Organic Fungicides
Norman Lalancette and Kathleen McFarland Rutgers University, Agricultural Research and Extension Center
Bridgeton, NJ 08302 Several organic fungicides were examined full season for their efficacy against the full
spectrum of peach diseases. The majority of these fungicides are not currently labeled for any particular disease of peach. The OMRI approved fungicides tested were Kumulus (sulfur), BSP Lime-Sulfur solution (calcium polysulfide), Serenade Max (Bacillus subtilis), Sonata (Bacillus pumilus), KeyPlex OR (yeast extract hydrolysate from Saccharomyces cerevisiae), Kaligreen (potassium bicarbonate), Oxidate (hydrogen dioxide), and Trilogy (hydrophobic extract of neem oil).
MATERIALS AND METHODS Treatments. The experiment was conducted during the spring and summer of the 2008
growing season. The test block consisted of a 12-year-old ‘Encore’ peach orchard planted at 25 ft x 25 ft spacing.
Treatments were replicated four times in a randomized complete block design with single
tree plots. Treatment trees were surrounded on all sides by non-sprayed buffer trees. A Rears Pak-Blast-Plot airblast sprayer calibrated to deliver 100 gal/A at 100 psi traveling at 2.1 mph was used for applications.
Fungicide applications were made on the following dates and tree growth stages: 3 Apr (P,
pink); 10 Apr (B, bloom); 18 Apr (PF, petal fall); 30 Apr (SS, shuck split); and 14, 28 May 11, 25 Jun 8, 23 Jul and 6 Aug (1C-7C, 1st through 7th cover). During the ripening period in late August and early September, three pre-harvest sprays for fruit rot control were applied on 19, 29 Aug and 4 Sep (16, 7, and 1 DPH, days preharvest). Insecticides and miticides (non-organic) were applied as needed to the entire block using a commercial airblast sprayer.
Environment. Overall the growing season was dry. Rainfall in May and June was 4.36
and 3.17 in, respectively and was close to the 30 year average. However, rainfall in April, July, and August fell well below the 30 year average with 2.4, 2.42, and 0.97 in, respectively (vs. 3.58, 4.3, and 4.18 in). There was no rain in September before harvest. Average temperatures this growing season were: Apr 54.2ºF; May 59.8ºF, Jun 74ºF; Jul 76.3ºF; and Aug 71.8ºF.
Conditions were extremely favorable for blossom blight development due to several rainy
periods and above average temperatures during pink and bloom. The warm weather and long dry periods from the susceptible stages of PF through 2C were favorable for rusty spot development. Although the rainfall for the growing season was below average, high inoculum levels in the form of twig lesions and several rain periods between SS and 40 days pre-harvest created very favorable conditions for scab. The number of rain days with over 0.10 inch accumulation following each spray were: P, 3: B, 1; PF, 2; SS, 2; 1C, 3; 2C, 3; 3C, 0; 4C, 5; 5C, 1; 6C, 1; 7C, 1. Conditions were very unfavorable for brown rot and other rots due to the dry weather in August and early September. No rain occurred after

143
any of the pre-harvest sprays. Trees were irrigated on 25 Aug to promote brown rot development.
Assessment. Blossom blight (Monilinia fructicola) was evaluated on 7 Jul by examining 20
fruiting shoots per tree for the presence of cankers. Rusty spot (Podosphaera leucotricha) was evaluated on 24 Jun by examining 40 fruit per tree. Scab (Fusicladosporium carpophilum) was evaluated on 27 Aug by examining 50 fruit per tree. Brown rot (Monilinia fructicola), Rhizopus rot (Rhizopus spp.), Anthracnose rot (Colletotrichum gleoeosporioides / acutatum), and other rots were evaluated on 5 Sep by examining all fruit on four or more branches per replicate tree (minimum of 100 fruit/tree). For post harvest evaluations, 40 asymptomatic mature fruit were harvested from each tree and placed on benches in two greenhouses (average air temp = 24.1ºC and 24.2ºC). Fruit were lightly misted with water immediately after harvest and the following day to promote rot. Brown rot, Rhizopus rot, and other rots were assessed at 3 and 6 days postharvest (dph).
RESULTS AND DISCCUSION Blossom Blight. Blossom blight incidence was very high compared to previous years.
Non-treated control trees had 18.8% of twigs infected (at least one canker) and an average of 5.3 cankers per tree (Table 1). All treatments provided significant control of blossom blight. Serenade Max and the standard Vangard provided 100% control. Sonata, Kumulus, Kaligreen, and Trilogy provided between 73.4% and 86.7% control and were equivalent to the standard. The remaining treatments resulted in a significantly higher percentage of infected twigs than the trees treated with the standard. There were no differences among the treatments for number of cankers per tree.
Rusty Spot. Disease pressure from rusty spot was low. Non-sprayed control trees had
31.3% infected fruit with an average of 0.56 lesions per fruit (Table 2). The standard Nova provided 98.1% control of rusty spot incidence, significantly more than
any other treatment. Serenade Max, which has been shown to be effective against rusty spot in other studies, and Kumulus were the only organic treatments that provided significant control of rusty spot incidence. Serenade Max provided 66.1% control and Kumulus provided 70% control. The remaining treatments were equivalent to both Serenade Max and the non-treated control. Only Nova, Kumulus, and Serenade Max significantly reduced the number of lesions per fruit.
Scab. The orchard had a high amount of inoculum (twig lesions) which resulted in nearly
100% infection on the non-treated control trees with the majority of the fruit having over 10 lesions (Table 3). The standard Bravo/Captan and Kumulus were the only treatments that significantly reduced the level of scab incidence and severity, providing 45.2% and 49.2% control, respectively.
Bravo/Captan and Kumulus provided 75.6% and 77.8% reduction in fruit with over 10
lesions, respectively and were not significantly different. Brown Rot. Disease pressure at harvest was light due to a lack of rain fall during the
pre-harvest period. The non-treated control had only 7.4% fruit infected at harvest (Table 4) and no significant differences were observed among the treatments at this time. At 3

144
dph, brown rot levels remain fairly low with 11.3% fruit infection on the non-treated control. The standard Elite/Pristine/Indar was the only treatment that provided significant control. At 6 dph, brown rot increased to 38.1% on the non-treated fruit. None of the treated fruit had significantly different levels of brown rot than the non-treated fruit.
Although no single treatment was able to significantly control brown rot at harvest and
throughout the postharvest period, several treatments had lower numerical values than the non-treated control at all three assessments. This may indicate that these treatments provide brown rot suppression.
Rhizopus Rot. Rhizopus rot levels were very low at harvest and there were no
significant differences among the treatments (Table 5). At 6 dph, fruit from the non-treated control and all treatments had between 1.9% and 7.5% infection with no significant differences. Anthracnose and other rots were evaluated, but had very low levels at harvest and during the postharvest period.
CONCLUSION While none of the organic treatments provided satisfactory control of all the peach diseases
alone, several of the treatments showed some effect on one or more diseases. The next step is to integrate the organic materials that have proven effective with conventional fungicides. Such programs should provide less environmental impact and a reduced chance of pathogen resistance development to certain standard materials.
• Serenade Max provided 100% blossom blight control and was one of only two organic
materials tested that significantly reduced rusty spot levels from those of the non-treated control. It was ineffective in reducing scab incidence or severity. Serenade Max did not significantly reduce brown rot levels from those of the non-treated control; however Serenade Max treated fruit had numerically less brown rot at harvest and both postharvest assessments. This may indicate it has a suppressive effect on brown rot.
• Kumulus provided significant control of blossom blight, rusty spot, and scab. Like
Serenade Max, Kumulus did not significantly reduce brown rot levels from those of the non-treated control, but Kumulus treated fruit had numerically lower levels of brown rot at the harvest and postharvest assessments.
• Kaligreen, which has provided significant control of rusty spot in previous experiments,
failed to do so in this study. Like several other treatments, Kaligreen did not significantly lower the level of brown rot from the non-treated control, but had fewer fruit with brown rot than the non-sprayed treatment for all three assessments.
• BSP Lime Sulfur, Sonata, Keyplex OR, Oxidate, and Trilogy reduced blossom blight
significantly, but didn’t provide significant reductions for any other disease.

145
Disease Pressure % Infected Fruit on Non-treated Control Brown Rot Blossom
Blight* Rusty
Spot Scab Harvest 3-dph 6-dph
18.8 31.3 98.5 7.4 11.3 38.1 * % shoots with cankers.
% Disease Control*
Brown Rot Fungicides
Blossom Blight Rusty Spot Scab
Harvest 3-dph 6-dph Vangard/Nova 100 Nova 98 Bravo/Captan 45 Elite/Pristine/Indar 78ns 83 34ns Kumulus 87 70 49 74ns 50ns 15ns BSP Lime Sulfur 60 26ns 6ns 68ns 12ns 15ns Serenade Max 100 66 3ns 68ns 39ns 24ns Sonata 80 34ns 0ns 0ns 22ns 0ns Keyplex 47 32ns 0ns 0ns 50ns 0ns Kaligreen 73 28ns 0ns 45ns 28ns 38ns Oxidate 60 36ns 0ns 51ns 12ns 7ns Trilogy 87 24ns 0ns 55ns 0ns 0ns * Blossom blight control values based on canker incidence; rusty spot, scab, and brown rot control values
based on % infected fruit. Treatment means not significantly different from non-treated control indicated by ns.
Treatment Rank*
Brown Rot Fungicides
Blossom Blight Rusty Spot Scab
Harvest 3-dph 6-dph Vangard/Nova 1 Nova 1 Bravo/Captan 2 Elite/Pristine/Indar 1 1 2 Kumulus 2 2 1 2 2 4 BSP Lime Sulfur 5 8 3 3 6 4 Serenade Max 1 3 4 3 3 3 Sonata 3 5 5 7 5 6 Keyplex 6 6 5 7 2 6 Kaligreen 4 7 5 6 4 1 Oxidate 5 4 5 5 6 5 Trilogy 2 9 5 4 7 6 * 1 = provided highest level of control
Summary

146
TABLE 1. Blossom Blight Incidence and Severity 1
Treatment Rate / A Timing % Shoots with canker2
# Cankers/Tree2
Nontreated Control
-----------------
-----------------
18.8 a
5.3 a
Vangard 75WG Nova 40WP Nova 40WP + BravoUltrex 82.5 WDG Nova 40WP + Captan 80WDG Captan 80WDG Elite 45WP Pristine 38WG Indar 75WSP + Latron B-1956
5 oz 4 oz 4 oz + 3.8 lb 4 oz + 3.75 lb 3.75 lb 6 oz 14.5 oz 2 oz + 8 fl oz
P, B PF SS 1C, 2C 3C-7C 16 DPH 7 DPH 1 DPH
0.0 d
0.0 b
Kumulus 80DF 10 lb 15 lb 10 lb 20 lb
P, B PF, SS, 1C 2C, 3C-7C 16, 7, 1 DPH
2.5 cd
0.5 b
BSP Lime-Sulfur Solution 2 qt 4 qt 1.5 qt 4 qt
P, B PF, SS, 1C 2C, 3C-7C 16, 7, 1 DPH
7.5 bc
1.5 b
Serenade Max 14.6WP + Latron B-1956 3 lb + 8 fl oz P, B, PF, SS, 1C, 2C, 3C-7C, 16, 7, 1 DPH
0.0 d
0.0 b
Sonata + Latron B-1956 4 qt + 8 fl oz P, B, PF, SS, 1C, 2C, 3C-7C, 16, 7, 1 DPH
3.8 bcd
0.8 b
KeyPlex 350 OR 3 qt P, B, PF, SS, 1C, 2C, 3C-7C, 16, 7, 1 DPH
10.0 b
2.3 b
Kaligreen 3 lb P, B, PF, SS, 1C, 2C, 3C-7C, 16, 7, 1 DPH
5.0 bcd
1.0 b
Oxidate 4 qt P, B, PF, SS, 1C, 2C, 3C-7C, 16, 7, 1 DPH
7.5 bc
2.5 b
Trilogy 4 qt P, B, PF, SS, 1C, 2C, 3C-7C, 16, 7, 1 DPH
2.5 cd
0.8 b
1 Blossom blight treatments, rates, and application timings in boldface. 2 Means in the same column with the same letter do not differ significantly according to the Waller-Duncan K-ratio t-test (α=0.05, K=100).

147
TABLE 2. Peach Rusty Spot Incidence and Severity 1
Treatment Rate / A Timing % Inf. Fruit2
# Lesions/Fruit2
Nontreated Control
-----------------
-----------------
31.3 a
0.56 a
Vangard 75WG Nova 40WP Nova 40WP + BravoUltrex 82.5 WDG Nova 40WP + Captan 80WDG Captan 80WDG Elite 45WP Pristine 38WG Indar 75WSP + Latron B-1956
5 oz 4 oz 4 oz + 3.8 lb 4 oz + 3.75 lb 3.75 lb 6 oz 14.5 oz 2 oz + 8 fl oz
P, B PF SS 1C, 2C 3C-7C 16 DPH 7 DPH 1 DPH
0.6 d
0.01 b
Kumulus 80DF 10 lb 15 lb 10 lb 20 lb
P, B PF, SS, 1C 2C, 3C-7C 16, 7, 1 DPH
9.4 c
0.11 b
BSP Lime-Sulfur Solution 2 qt 4 qt 1.5 qt 4 qt
P, B PF, SS, 1C 2C, 3C-7C 16, 7, 1 DPH
23.1 abc
0.28 ab
Serenade Max 14.6WP + Latron B-1956 3 lb + 8 fl oz P, B, PF, SS, 1C, 2C, 3C-7C, 16, 7, 1 DPH
10.6 bc
0.11 b
Sonata + Latron B-1956 4 qt + 8 fl oz P, B, PF, SS, 1C, 2C, 3C-7C, 16, 7, 1 DPH
20.6 abc
0.39 ab
KeyPlex 350 OR 3 qt P, B, PF, SS, 1C, 2C, 3C-7C, 16, 7, 1 DPH
21.3 abc
0.25 ab
Kaligreen 3 lb P, B, PF, SS, 1C, 2C, 3C-7C, 16, 7, 1 DPH
22.5 ab
0.28 ab
Oxidate 4 qt P, B, PF, SS, 1C, 2C, 3C-7C, 16, 7, 1 DPH
20.0 abc
0.39 ab
Trilogy 4 qt P, B, PF, SS, 1C, 2C, 3C-7C, 16, 7, 1 DPH
23.8 ab
0.34 ab
1 Rusty spot treatments, rates, and application timings in boldface. 2 Means in the same column with the same letter do not differ significantly according to the Waller-Duncan K-ratio t-test (α=0.05, K=100).

148
TABLE 3. Scab Incidence and Severity 1 % Fruit 2
Treatment Rate / A Timing Infected 1-10 lesions
>10 lesions
Nontreated Control
-----------------
-----------------
98.5 a
10.5 b
88.0 a
Vangard 75WG Nova 40WP Nova 40WP + BravoUltrex 82.5 WDG Nova 40WP + Captan 80WDG Captan 80WDG Elite 45WP Pristine 38WG Indar 75WSP + Latron B-1956
5 oz 4 oz 4 oz + 3.8 lb 4 oz + 3.75 lb 3.75 lb 6 oz 14.5 oz 2 oz + 8 fl oz
P, B PF SS 1C, 2C 3C-5C, 6C, 7C 16 DPH 7 DPH 1 DPH
54.0 b
32.5 a
21.5 b
Kumulus 80DF 10 lb 15 lb 10 lb 20 lb
P, B PF, SS, 1C 2C-5C, 6C, 7C 16, 7, 1 DPH
50.0 b
30.5 a
19.5 b
BSP Lime-Sulfur Solution 2 qt 4 qt 1.5 qt 4 qt
P, B PF, SS, 1C 2C-5C, 6C, 7C 16, 7, 1 DPH
93.0 a
7.5 b
85.5 a
Serenade Max 14.6WP + Latron B-1956 3 lb + 8 fl oz P, B, PF, SS, 1C- 5C, 6C, 7C, 16, 7, 1 DPH
95.5 a
11.5 b
84.0 a
Sonata + Latron B-1956 4 qt + 8 fl oz P, B, PF, SS, 1C- 5C, 6C, 7C, 16, 7, 1 DPH
100.0 a
2.5 b
97.5 a
KeyPlex 350 OR 3 qt P, B, PF, SS, 1C- 5C, 6C, 7C, 16, 7, 1 DPH
100.0 a
9.5 b
90.5 a
Kaligreen 3 lb P, B, PF, SS, 1C- 5C, 6C, 7C, 16, 7, 1 DPH
98.5 a
10.0 b
88.5 a
Oxidate 4 qt P, B, PF, SS, 1C- 5C, 6C, 7C, 16, 7, 1 DPH
99.5 a
6.5 b
93.0 a
Trilogy 4 qt P, B, PF, SS, 1C- 5C, 6C, 7C, 16, 7, 1 DPH
100.0 a
2.0 b
98.0 a
1 Scab treatments, rates, and application timings in boldface. 2 Means in the same column with the same letter do not differ significantly according to the Waller-Duncan K-ratio t-test (α=0.05, K=100).

149
TABLE 4. Brown Rot Harvest and Postharvest Incidence1 % Infected Fruit 2
Treatment Rate / A Timing Harvest 3-dph 6-dph Nontreated Control
-----------------
-----------------
7.4 ab
11.3 ab
38.1 ab
Vangard 75WG Nova 40WP Nova 40WP + BravoUltrex 82.5 WDG Nova 40WP + Captan 80WDG Captan 80WDG Elite 45WP Pristine 38WG Indar 75WSP + Latron B-1956
5 oz 4 oz 4 oz + 3.8 lb 4 oz + 3.75 lb 3.75 lb 6 oz 14.5 oz 2 oz + 8 fl oz
P, B PF SS 1C, 2C 3C-5C, 6C, 7C 16 DPH 7 DPH 1 DPH
1.6 b
1.9 c
25.0 ab
Kumulus 80DF 10 lb 15 lb 10 lb 20 lb
P, B PF, SS, 1C 2C-5C, 6C, 7C 16, 7, 1 DPH
1.9 b
5.6 bc
32.5 ab
BSP Lime-Sulfur Solution 2 qt 4 qt 1.5 qt 4 qt
P, B PF, SS, 1C 2C-5C, 6C, 7C 16, 7, 1 DPH
2.4 b
10.0 ab
32.5 ab
Serenade Max 14.6WP + Latron B-1956 3 lb + 8 fl oz P, B, PF, SS, 1C- 7C, 16, 7, 1 DPH
2.4 b
6.9 abc
28.8 ab
Sonata + Latron B-1956 4 qt + 8 fl oz P, B, PF, SS, 1C- 7C, 16, 7, 1 DPH
9.7 a
8.8 abc
45.0 a
KeyPlex 350 OR 3 qt P, B, PF, SS, 1C- 7C, 16, 7, 1 DPH
9.8 a
5.6 bc
43.1 ab
Kaligreen 3 lb P, B, PF, SS, 1C- 7C, 16, 7, 1 DPH
4.1 ab
8.1 abc
23.8 b
Oxidate 4 qt P, B, PF, SS, 1C- 7C, 16, 7, 1 DPH
3.6 ab
10.0 ab
35.6 ab
Trilogy 4 qt P, B, PF, SS, 1C- 7C, 16, 7, 1 DPH
3.3 ab
16.3 a
44.4 a
1 Brown rot treatments, rates, and application timings in boldface. 2 Means in the same column with the same letter do not differ significantly according to the Waller-Duncan K-ratio t-test (α=0.05, K=100).

150
TABLE 5. Rhizopus Harvest and Postharvest Incidence 1 % Infected Fruit 2
Treatment Rate / A Timing Harvest 3-dph 6-dph Nontreated Control
-----------------
-----------------
0.2 a
3.1 a
3.8 b
Vangard 75WG Nova 40WP Nova 40WP + BravoUltrex 82.5 WDG Nova 40WP + Captan 80WDG Captan 80WDG Elite 45WP Pristine 38WG Indar 75WSP + Latron B-1956
5 oz 4 oz 4 oz + 3.8 lb 4 oz + 3.75 lb 3.75 lb 6 oz 14.5 oz 2 oz + 8 fl oz
P, B PF SS 1C, 2C 3C-5C, 6C, 7C 16 DPH 7 DPH 1 DPH
0.2 a
1.3 a
2.5 b
Kumulus 80DF 10 lb 15 lb 10 lb 20 lb
P, B PF, SS, 1C 2C-5C, 6C, 7C 16, 7, 1 DPH
0.0 a
3.1 a
7.5 b
BSP Lime-Sulfur Solution 2 qt 4 qt 1.5 qt 4 qt
P, B PF, SS, 1C 2C-5C, 6C, 7C 16, 7, 1 DPH
0.0 a
4.4 a
7.5 b
Serenade Max 14.6WP + Latron B-1956 3 lb + 8 fl oz P, B, PF, SS, 1C- 7C, 16, 7, 1 DPH
0.0 a
1.3 a
3.8 b
Sonata + Latron B-1956 4 qt + 8 fl oz P, B, PF, SS, 1C- 7C, 16, 7, 1 DPH
0.0 a
3.8 a
5.6 b
KeyPlex 350 OR 3 qt P, B, PF, SS, 1C- 7C, 16, 7, 1 DPH
0.2 a
3.1 a
1.9 b
Kaligreen 3 lb P, B, PF, SS, 1C- 7C, 16, 7, 1 DPH
0.0 a
3.8 a
5.0 b
Oxidate 4 qt P, B, PF, SS, 1C- 7C, 16, 7, 1 DPH
0.0 a
0.6 a
1.9 b
Trilogy 4 qt P, B, PF, SS, 1C- 7C, 16, 7, 1 DPH
0.0 a
4.4 a
6.9 b
1 Rhizopus rot treatments, rates, and application timings in boldface. 2 Means in the same column with the same letter do not differ significantly according to the Waller-Duncan K-ratio t-test (α=0.05, K=100).

151
0.0
0.2
0.4
0.6
0.8
1.0
1.2
1.4
1.6
1.8
2.0
1-A
pr
16
-Ap
r
1-M
ay
16-M
ay
31-M
ay
15-J
un
30-J
un
15-J
ul
30-J
ul
14-A
ug
29-A
ug
Date
Rain
fall
(in)
0
10
20
30
40
50
60
70
80
90
Ave
rage A
ir T
em
pera
ture
(F
)
Rainfall
Bloom Sprays
Cover Sprays
Preharvest Sprays
Air Temp
Figure 1. Rainfall, air temperature, and fungicide application timing on ‘Encore’ peach during the 2008 growing season, Rutgers University, Agricultural Research and Extension Center, Bridgeton, NJ. X, diamond, and + symbols represent application timing for bloom (P, B, PF), shuck-split through seventh cover (SS-7C), and pre-harvest (PH) fungicide sprays, respectively.

152
Not for citation or publication without consent o f the author
Synergistic Interactions Among Garlic Extracts, Copper Compounds, Captan and Kasugamycin for Control of Bacterial Spot of Stone Fruits
H.K. Ngugi, N.O. Halbrendt and S.J. Bardsley
Penn State University, Fruit Research and Extension Center, Biglerville, PA 17307
INTRODUCTION
Synergistic activity in mixtures of agrichemicals allows disease control with reduced rates of the mixture components or considerably better control with standard rates of both ingredients (Gisi 1996). These attributes, along with the reduced risk of resistance development, make the use of mixtures with synergistic activity a very attractive tool for disease management. A mixture of chemicals is said to act synergistically when control with the mixture is greater than that expected from the sum of its individual components (Gisi, 1996). For example, if compounds A and B reduce pathogen growth by, respectively, 40 and 30% when used alone, the expected growth reduction with the A+B mixture is 58% if the two mixture components act additively (= 40% + 30% of the remaining 60%). Any decrease in growth beyond this theoretically expected value is due to synergism. Thus, if the observed growth reduction with the A+B mixture is in fact 75%, the 17% difference between observed and expected inhibition is due to synergism (Sherm, H. personal communication). In general, if the ratio between the experimentally observed efficacy and the theoretically expected efficacy of the mixture is greater than 1, synergistic interactions are deemed to have occurred. PROCEDURES, RESULTS AND DISCUSSION
In Vitro Experiments: Experiments were carried out in Dr. Ngugi’s lab to evaluate the synergistic effects of mixtures of the antibiotic Kasugamycin with copper or the fungicide Captan for inhibiting the growth of Xanthomonas arboricola pv pruni in vitro. Bacterial growth inhibition assays were carried out with 48h old cultures of X. arboricola pv pruni isolates Dslb-Xap1, Xap-42, and Xcp 88-301 grown on sucrose peptone agar. For each isolate, a 100 µl of bacterial suspension in water (OD = 0.60) was used to inoculate 10 ml total volume of nutrient broth amended with Kasugamycin and either a Captan or copper sulfate solution. Kasugamycin was tested at a concentration of 75 ppm or 50 ppm, respectively, in mixtures with copper or Captan. Copper concentration was 0.1mM of analytical grade copper sulfate while, Captan was tested at a rate of 1lb/100 gallons of water/acre (equivalent to 1.2mg/mL) of commercial grade Captan 50WP product. Copper and Kasugamycin rates were selected to individually provide between 40 and 70% growth inhibition. Cultures were incubated at room temperature (ca.25 C) on a rotary shaker. Bacterial growth was determined by drawing 1 mL aliquots every 12h and measuring optical density at 600nm with a HACH DR4000 spectrophotometer (HACH Company, Loveland Colorado). Mixture inhibition effects were calculated based on bacterial growth in non-amended nutrient broth. All calculations are based on optical density values recorded 48h after incubation. Mixtures of Kasugamycin with copper or Captan resulted in a highly synergistic inhibition of all three strains of X. arboricola pv pruni tested (Table 1; Fig. 1). In this study, all mixtures resulted in a ratio greater than 1.2 with Captan-based mixtures showing the strongest interactions (ratios >2; Table 1). Further research is warranted to determine whether this effect of Captan is extended to other antibiotics and to confirm the disease control potential of mixtures of Captan and Kasugamycin under field conditions. Preliminary results of such studies are included in this report.

153
Table 1. Synergism in mixtures of the antibiotic Kasugamycin and Captan or Copper sulfate against three isolates of Xanthomonas arboricola pv. pruni in the laboratory.
Percent inhibition
Dslb-Xap1 Xap-42 Xcp 88-301
Mixturea Expectedb Observed Expectedb Observed Expectedb Observed Copper + Kasugamycin 60.9 92.3 76.9 97.7 86.4 99.0 Captan + Kasugamycin 46.6 99.5 33.0 100.0 48.3 100.0 aCopper used at 0.1mM of Copper sulfate, Kasugamycin used at 75ppm or 50ppm in mixtures with Copper and Captan, respectively. bBased on the assumption that the two mixture components would act additively.
Field Experiments: The test was carried out in three-year-old, 4-cultivar (Easternglo, Beekman, Snow King and Sweet Dream) peach and nectarine orchard at the Penn State Fruit Research and Extension Center, Biglerville, PA. Trees received fungicide and insecticide applications according to standard commercial practice for the northeastern U.S., but early-season (dormant through bloom) copper sprays were omitted to allow build-up of bacterial inoculum for the test. The plots were inoculated at shuck-split with a suspension of 1× 10⁷ CFUs of X. arboricola pv. pruni consisting of a mixture of strains Xap 42 and Xcp 88301. Treatments included: a garlic product (diallyl sulfides) applied solely or in a mixture with a low concentration of Kocide 3000; the antibiotic Kasumin applied in a mixtures either with Kocide 3000 or the fungicide Captan; a Mycoshield-only treatment, and an untreated check for comparison. The experimental design was a four replicate split-plot arrangement with treatment and cultivar assigned to main-plots and sub-plots, respectively. Treatments were applied using a covered-boom dilute sprayer at a rate of 100 gal/A and 200 psi on 29 May, 6, 18, 27 Jun, and 6, 15 Jul. Plots were rated for disease severity (percent area covered based on a sample of 15 leaves per replicate tree). Upon harvest, ten
Fig 1. Synergistic effects of mixtures of Captan and Kasugamycin at inhibiting the growth of strain Xcp 88-301 of Xanthomonas arboricola pv pruni in vitro. Tube labels indicate Captan/Kasugamycin components in the mixtures whereby 0.5 Captan is equivalent to 1.2 mg/mL and rates of Kasugamycin are in ppm (e.g. 0/75 = no Captan and 75ppm of Kasugamycin).

154
infected fruit from each sub-plot were rated for percent area covered with spots and scored for disease severity on a 1-to-5 scale whereby, 1= no disease and 5=severe infection.
Weather was conducive for bacterial spot development and moderately high levels of leaf infections occurred at the trial site. Statistical analysis of leaf spot severity data revealed that the effects of both treatment and cultivar and the interaction between these factors were highly significant (P < 0.0001). Surprisingly, the untreated plots developed lower disease levels than nearly all the treatments including the standard Mycoshield treatment (data not presented). This intriguing result is probably an artifact obtained because heavily diseased leaves in the untreated and garlic-only plots abscised in between disease assessment dates leaving leaves with lower disease levels.
Analysis of data on fruit disease levels revealed that the effects of treatment and cultivar were highly significant (P < 0.0001), while the interaction between these factors were only marginally significant (P = 0.0492) for the percent area covered with bacterial spots but not for the disease severity scores (data not presented). Except for the garlic product applied alone, all treatments were effective at reducing disease severity on fruits across all cultivars. Kocide 3000 treatments resulted in numerically better fruit protection in all cultivars except for the highly susceptible cv Snow King. These results suggest that copper compounds and the fungicide Captan may have a synergistic activity on Kasumin since this antibiotic is generally not effective on bacterial spot.
Table 2: Effects of mixtures of kasugamycin, or copper hydroxide with garlic compounds or the fungicide Captan on severity of bacterial spot on peach and nectarine fruits, Biglerville, PA 2008.
Percent fruit area covered with bacterial spots
Treatment and rate/A Easternglo Beekman Snow King Sweet Dream
Mycoshield 17WP 12 oz..................... 8.4 ± 3.64 12.2 ± 6.06 14.8 ± 2.32 6.1 ± 2.04
Kocide 3000 DF 1.667 oz................... 7.4 ± 0.89 5.7 ± 3.81 14.0 ± 2.68 4.47 ± 1.60
Kocide 3000 30DF 1.667 oz + 0.1% solution of Garlic product ................... 4.68 ± 1.13 5.0 ± 3.04 19.47 ± 5.19 2.4 ± 0.63
Garlic product 0.1% solution.............. 38.3 ± 3.17 39.6 ±7.28 56.0 ± 4.00 50.4 ± 3.60
Kasumin 2qts/100gal +3lb Captan 80 WP................................................... 14.6 ± 5.82 4.2 ± 1.09 8.8 ± 2.32 3.6 ± 0.69
Kasumin 2qts/100gal + Kocide 3000 DF 1.667oz ................................. 6.8 ± 2.25 2.5 ± 0.98 12.9 ± 4.94 2.7 ± 1.64
Untreated check................................... 47.1 ± 3.81 38.7 ± 8.26 49.2 ± 2.59 47.9 ± 4.12
LSD* 10.02 (9.16)
*Value in parenthesis for comparing means with the same level of treatment
REFERENCES Gisi, U. 1996. Synergistic interaction of fungicides in mixtures. Phytopathology 86:1273-1279.

155
SENSITIVITY OF NEW YORK POPULATIONS TO THE BROWN ROT PATHOGEN MONILINIA FRUCTICOLA TO QOI AND DMI FUNGICIDES
Sara M. Villani and Kerik D. Cox
Cornell University, Department of Plant Pathology and Plant Microbe-Biology Geneva, NY 14456
Throughout the state of New York, in particular the more moderate climate regions such
as the Finger Lakes, Great Lakes shorelines, and Long Island, apple producers are increasingly incorporating high value stone fruit crops (i.e. apricots, nectarines, sweet cherries) into their apple production systems. Due to an increase in total stone fruit acreage and the trend towards warmer and wetter winters and growing seasons, the threat of losing these crops to the devastating fruit rot stage of brown rot is of primary concern to producers and other stakeholders. Historically fungicides using single-site specific fungicide chemistries such as the demethylation inhibitor (DMI) fungicides and Quinone outside inhibitor (QoI) fungicides have provided the most effective preventative and post-infection (“kick-back”) activity against brown fruit rot. Unfortunately, because of their highly specific mode of action, repetitive use of these fungicides strongly selects for the emergence of resistant Monilinia fructicola populations (1,6). Prior to the introduction of DMI fungicides into brown rot management programs for New York orchards, baseline sensitivities for various DMI fungicides were established in 1992. Historical half maximal effective concentration (EC50) values for the preferred DMIs used to control brown rot, fenbuconazole and propiconazole, were determined to be 0.003 µg/ml and 0.009 µg/ml respectively (5). Currently, there is no published baseline EC50 value for the QoI component of the fungicide Pristine. In 2005, the first reports of potential DMI resistance emerged from two commercial orchards in western New York (4). The sensitivity of current M. fructicola populations to DMI and QoI fungicide sensitivities, however, remains largely unknown. The main objectives in our study were to: 1) evaluate the present range of sensitivities to the DMI fungicides Indar (fenbuconazole) and Orbit (propiconazole) of New York M. fructicola populations from both control failure orchards and from a “baseline” population that had never been directly exposed to DMI fungicides, 2) determine the prevalence of the DMI resistance determinant “Mona” (2,3) across New York state and confirm its relationship to DMI-resistant phenotypes characterized by mycelial growth assays, and 3) determine sensitivity profiles for New York M. fructicola control-failure or baseline populations for the fungicide Pristine, and its individual components, boscalid and pyraclostrobin.
Between 2005-2007, 186 M. fructicola isolates from six different counties located
throughout New York state were examined. The widespread adoption of DMI and QoI fungicides made it challenging to locate a baseline population that was never directly exposed in the nursery or field. Thus, with the exception of one orchard meeting “baseline” criteria in 2006, all other orchards surveyed represented control failures, in effect restricting evaluation to the more resistant M. fructicola populations as efforts to collect from managed orchards were unsuccessful. To accurately represent fungicide sensitivities for an entire orchard or county the number of isolates per tree per orchard was restricted. Hence, in any one collection year, different numbers of isolates and orchards were evaluated.
To evaluate the current state of DMI fungicide sensitivity, mycelial relative growth assays
were conducted on potato dextrose agar (PDA) medium amended at discriminatory doses of 10 times and 100 times the historical baseline concentrations of fenbuconazole and propiconazole for New York state. Dose response curves were constructed to determine mean EC50 values of
156
the components of Pristine fungicide – boscalid and pyraclostrobin, and to both components combined at the ratios used in the formulated product. Prior to in vitro testing, single conidia were isolated from each M. fructicola sample removed from the field. Agar plugs (5mm in diameter) derived from single spore colonies were used in traditional mycelial growth assays on PDA media for all sensitivity testing. PCR-RFLP analysis was conducted on all 186 M. fructicola isolates to determine the prevalence of the DMI resistance “Mona.” Briefly, “Mona” is a 65-bp insert located in the promoter region of the CYP51A1 gene in M. fructicola (2). The presence of this insert has been strongly associated with a high level of resistance to DMI fungicides, whereas isolates lacking the insert have displayed DMI-sensitive (% relative growth < 30) or DMI-shifted phenotypes (30 < % relative growth < 70).
All fifty-nine isolates from the 2006 M. fructicola baseline population displayed a DMI-
sensitive phenotype, exhibiting relative growth (RG) values at or below 20% on PDA amended with 0.03 µg/ml fenbuconazole (Fig 1-i.). This level of sensitivity to fenbuconazole at 0.03 µg/ml was not significantly different from that of the original NY baseline population in 1992 (P < 0.0001) for the same concentration (5). Thus, it was affirmed that not only had we located a legitimate new baseline orchard, but also that the inherent efficacy of fenbuconazole had not diminished in the past fifteen years. When subjected to PCR-RFLP analysis, all baseline isolates displayed the wild-type genotype in the CYP51A1 promoter region.
Despite considerable exposure to DMI fungicides since their introduction in the early
1990s, the majority of the 2005 control failure isolates collected from the two western NY commercial peach orchards still exhibited DMI-sensitive phenotypes (Fig 1-ii.). However, unlike the baseline population, the spectrum of DMI sensitivities at 0.03 µg/ml fenbuconazole was much more dispersed, as a “DMI-shifted” phenotype began to emerge. Although two isolates from the 2005 population displayed % RGs characteristic of DMI resistance, none of the isolates tested positive for the genetic resistance determinant Mona. Subsequent testing of these outliers showed evidence that these particular isolates were not particularly virulent, as they failed to grow well even on control (non-amended) media.
In 2006 the first New York M. fructicola population displaying a DMI-resistant phenotype
and DMI-resistant genotype was discovered in a single orchard in the Finger Lakes region. Historically, this commercial orchard had also relied primarily on DMIs for brown fruit rot control for over ten years. While several of the isolates collected from this site could still be characterized as “DMI-sensitive,” a much greater proportion of the isolates were shifted toward a more DMI-resistant phenotype, or actually displayed the DMI resistant phenotype (Fig 1-iii.). Further, all isolates exhibiting relative growths greater than 70%, contained the 65-bp insert, “Mona,” and were thus categorized as “DMI-resistant.” The 2007 collection demonstrated the first year of substantial statewide shift toward a more DMI- resistant M. fructicola population (Fig 1-iv.). Unfortunately, the DMI-resistant orchard from 2006 was not represented in 2007, as DMI-fungicides were temporarily eliminated from their management program, which was successful. Both orchards from the 2005 collection once again contained control failures and were included in the 2007 testing. Overall, these orchards along with several others were shifted more towards DMI resistance when compared to 2005 and 2006. A small percentage of tested isolates in 2007 were characterized as “DMI-resistant” displaying both the resistant phenotype and genotype. These DMI-resistant M. fructicola isolates all came from one orchard, approximately 100 miles west of the 2006 DMI-resistant site.
Statewide, there was a similar trend in DMI sensitivity when M. fructicola isolates were
subjected in vitro to 100 times the historical baseline EC50 value of fenbuconazole (0.3 µg/ml) and to 10 times and 100 times the historical baseline EC50 value of propiconazole (EC50 = 0.009

157
µg/ml). While collectively New York M. fructicola populations are shifted towards DMI resistance, there are still several isolates within individual orchards that remain at or near baseline sensitivities. Our observation that isolates exhibiting a wide range of sensitivities to DMI fungicides (%RG < 70) lack the “mona” insert suggests that there are a number of components within the genome of M. fructicola that account for reduced sensitivity to DMI fungicides.
The mean EC50 value for the 2006 New York baseline M. fructicola isolates was
determined to be 0.011 µg/ml for the components of Pristine fungicide combined at its formulated ratio. Sensitivity of our 2005 commercial isolates was at or slightly shifted from the 2006 baseline, while the 2006 commercial population all possessed baseline level sensitivity to Pristine. The high degree of sensitivity of the 2006 population to Pristine was not surprising given its history of DMI fungicide exposure that had resulted in DMI-resistant M. fructicola isolates. As with the decreasing trend of DMI fungicide sensitivity across the three-year study, in 2007 a dramatic shift towards reduced sensitivity of M. fructicola to QoI fungicides was also observed. The individual active ingredients of Pristine (boscalid and pyraclostrobin) had EC50 distributions similar in trend to the formulated ratio combination. The overall decrease in vulnerability toward QoI fungicides is alarming and must continue to be monitored as 2007 marked only the second year of widespread Pristine use in New York.

158
FIGURE 1
Figure 1. Percent relative growth (%RG) distributions of 2006 baseline (i) and control failure M. fructicola commercial isolates from 2005-2007 (ii-iv respectively) on agar medium amended with 0.03µg/ml fenbuconazole. Percent relative growth was calculated by dividing the mycelial growth (diametral length) of an M. fructicola colony on the amended medium with that on a non-amended medium (control) and multiplying by 100. Three DMI sensitivity phenotypes were arbitrarily defined from the tested populations as: DMI-sensitive (%RG<30), DMI-shifted (30<%RG<70), and DMI-resistant (%RG>70).
159
REFERENCES
7. Köller, W., Wilcox, W.F., Barnard, J., Jones, A.L., and Braun, P.G. 1997. Detection and
Quantification of resistance of Venturia inaequalis Populations to Sterol Demethylation Inhibitors. Phytopathology. 87:184-190.
8. Luo, C-X., Cox, K.D., Amiri, A., and Schnabel, G. 2008. Occurrence and Detection of the
DMI Resistance-Associated Genetic Element ‘Mona’ in Monilinia fructicola. Plant Disease 92: 1099-1103.
9. Luo, C-X., Schnabel, G. 2008. The Cytochrome P450 Lanosterol 14α-Demethylase
Gene is a Demethylation Inhibitor Fungicide Resistance Determinant in Monilinia fructicola Field Isolates from Georgia. Appl. Environ. Microbiol. 74:359-366.
10. Parker, D. M., Zhang, N., Smart, C. D., and Koeller, W. D. 2006. Polymorphism of 14
alpha-demethylase gene (CYP51) in brown rot pathogen Monilinia fructicola from a resistant orchard in New York State. (Abstr.) Phytopathology 96:S90
11. Wilcox, W.F., and J. A. Burr. 1994. Base-line sensitivity of Monilinia fructicola to six DMI
fungicides. Phytopathology 84:1078.
12. Zehr, E.I., Luszcz, L.A., Olien, W.C., Newall, W.C., and Toler J.E. 1999. Reduced Sensitivity in Monilinia fructicola to Propiconazole Following Prolonged Exposure in Peach Orchards.
ACKNOWLEDGEMENTS We would like to thank Meg McCarthy, Rachel Jordan, Maren Reisch, and Jenny O’Brien for their commendable assistance and contributions to this project and Diana Parker and Wolfram Koeller for providing us with 2005 M. fructicola isolates.

160
CONVENTIONAL, “SOFT,” AND ORGANIC FUNGICIDE PROGRAMS FOR BLACK ROT CONTROL IN FOUR WINE GRAPE CULTIVARS, 2008
A. DeMarsay and D. K. Armentrout
University of Maryland Central Maryland Research and Education Center, Upper Marlboro, MD 20774;
University of Maryland Lower Eastern Shore Research and Education Center, Salisbury, MD 21801
A trial of four spray programs for control of black rot in wine grapes was conducted on 7-year-old, Vertical Shoot Position-trained grapevines in a research vineyard at the University of Maryland’s Lower Eastern Shore Research and Education Center (LESREC), Salisbury. The trial was a split-block design with four replicates. The five main plot (row) treatments comprised: (1) an optimal program incorporating newer fungicides and frequent rotations among fungicide classes; (2) a “soft” program relying on wettable sulfur, potassium bicarbonate, and season-long applications of a phosphite (ProPhyt); (3) a similar “soft” program incorporating one application of a conventional protectant fungicide (Manzate); (4) an organic program of lime sulfur, copper + lime, and wettable sulfur; and (5) a control. Treatments were timed to the phenology of Chardonnay, the earliest cultivar, and applied as follows: 1 = 18 Apr (0–1 in. shoot), 2 = 25 Apr (3–5 in. shoot), 3 = 2 May (10–12 in. shoot), 4 = 9 May (12–17 in. shoot), 5 = 14 May (pre-bloom), 6 = 22 May (pre-bloom), 7 = 29 May (bloom), 8 = 3 Jun (post-bloom), 9 = 11 Jun (1st cover), 10 = 18 Jun (2nd cover), 11 = 25 Jun (3rd cover), 12 = 3 Jul (4th cover/bunch closing), 13 = 14 Jul (5th cover), 14 = 24 Jul (6th cover/veraison), 15 = 4 Aug (7th cover), 16 = 14 Aug (8th cover), 17 = 26 Aug (9th cover), 18 = 9 Sep (pre-harvest). The control row was treated late in the season (sprays 12–18), after fruit were immune to black rot infection, to avoid severe defoliation by grape downy mildew. Two border rows and an unused row in the trial area received a different but complete fungicide program to manage all diseases. Fungicide treatments were applied with an over-the-row shielded boom sprayer using six TeeJet Twin Flat Spray 60-8004VS tips delivering 40 gpa at 45 psi. Subplots consisted of 3-vine panels of four standard wine grape cultivars—Cabernet Franc, Cabernet Sauvignon, Chardonnay, and Merlot—arranged in a randomized complete block design. The entire vineyard received a season-long maintenance program for weed control and was treated with Sevin XLR (1qt/A) on 27 Jun, 1 Jul, 10 Jul, and 22 Jul for Japanese beetle control. Disease severity ratings were made on 1 Jul for shoots and 19–20 Aug for fruit clusters. In each subplot, visual evaluations were made of the percentage of leaf area infected on each of three shoots and the percentage of fruit infected on each of three clusters. Rainfall amounts at LESREC were 4.88, 5.93, 4.17, 3.71, 1.14, and 4.38 in. for Apr, May, Jun, Jul, Aug, and Sep, respectively. Favorable spring weather and overwintering infections created a high level of disease pressure from budbreak until developing fruit became immune to infection in mid-July. Black rot losses on untreated fruit clusters of all cultivars approached 100 percent. Because there was a significant interaction between cultivar and treatment, cultivars were analyzed separately for treatment effects. Only the optimal program, which included a fungicide known to be effective against black rot in every spray from budbreak through post-bloom and at 2nd and 3rd cover (Manzate, Captan, Nova, or Pristine), was significantly more effective (P =0.05) than no treatment in reducing disease severity on shoots and fruit clusters of all cultivars. Chardonnay developed very high levels of black rot on fruit; even the optimal program did not provide a commercially acceptable level of protection. “Soft” program I, which included only ProPhyt for black rot, significantly reduced disease severity only on Cabernet Franc fruit clusters compared to untreated clusters. “Soft” program II, which included one application of Manzate at 3–5 in. shoot length, significantly reduced disease severity on Cabernet Franc, Cabernet Sauvignon, and Merlot fruit clusters compared to untreated clusters, but not on Chardonnay fruit clusters. “Soft” program II was also numerically superior to “Soft” program I in reducing disease severity on Cabernet Franc, Cabernet Sauvignon, and Merlot fruit clusters, though there were few statistical differences. “Soft” program II

161
performed as well statistically as the optimal program in reducing black rot severity on Cabernet Franc fruit clusters, and control approached a commercially acceptable level. The organic program modestly reduced disease severity on Cabernet Franc fruit clusters compared to untreated clusters. However, there was no statistical difference between the organic treatment and the control in reducing black rot severity on shoots or on fruit clusters of other cultivars. Severity (%) of black rot by cultivar
Cabernet Franc
Cabernet Sauvignon
Chardonnay
Merlot
Treatment and rate/A Timingz Shooty Fruitx Shoot Fruit Shoot Fruit Shoot Fruit Optimal program Yellow Jacket Wettable Dusting Sulfur II 90% 4.0 lb
1–4, 6–7, 9–14
Manzate ProStick 75WDG 4.0 lb 1–4, 7 Manzate ProStick 75WDG 3.0 lb 5, 8 Captan 50WP 3.0 lb 6, 14 Nova 40W 5.0 oz 5, 8 Quintec 2.08SC 4.0 fl oz 7, 9 Pristine 38WG 12.5 oz 10, 11 ProPhyt 4.2L 2.5 pt/100 gal 5–13, 15–18 Elevate 50WDG 1.0 lb 5, 7, 14 Vangard 75WG 10.0 oz....................... 12, 18 0.0 cw 0.8 d 0.0 b 2.2 c 0.0 b 22.8 b 0.0 c 3.3 c Organic program BSP Lime-Sulfur Solution 2% 1–6 Champion 77WP 2.0 lb 3–14 Hydrated lime 4.0 lb 3–14 Micro-Sulf Micronized Wettable Sulfur 80% 5.0 lb ..............................
7–14
1.9
ab
78.9
b
1.4
ab
90.7
ab
4.7
a
100.0
a
3.3
ab
91.8
ab
“Soft” program I Yellow Jacket Wettable Dusting Sulfur II 90% 5.0 lb
1–14
Armicarb 100 85% 5.0 lb/100 gal 5–8, 15–18 ProPhyt 4.2L 2.5 pt/100 gal ................ 1–18 0.3 c 43.6 c 0.5 ab 89.9 ab 2.5 a 99.7 a 1.6 b 80.0 ab “Soft” program II Yellow Jacket Wettable Dusting Sulfur II 90% 5.0 lb
1–14
Manzate ProStick 75WDG 4.0 lb 2 Armicarb 100 85% 5.0 lb/100 gal 5–8, 15–18 ProPhyt 4.2L 2.5 pt/100 gal ................ 5–18 0.4 bc 12.2 d 0.6 ab 70.3 b 1.9 a 100.0 a 1.0 bc 55.7 b Control ProPhyt 4.2L 2.5 pt/100 gal ................ 12–18 3.8 a 99.3 a 3.1 a 99.6 a 6.9 a 100.0 a 5.8 a 100.0 a z Dates and phenological stages of Chardonnay for spray applications: 1 = 18 Apr (0–1 in. shoot), 2 = 25 Apr (3–5 in. shoot), 3 = 2 May (10–12 in. shoot), 4 = 9 May (12–17 in. shoot), 5 = 14 May (pre-bloom), 6 = 22 May (pre-bloom), 7 = 29 May (bloom), 8 = 3 Jun (post-bloom), 9 = 11 Jun (1st cover), 10 = 18 Jun (2nd cover), 11 = 25 Jun (3rd cover), 12 = 3 Jul (4th cover/bunch closing), 13 = 14 Jul (5th cover), 14 = 24 Jul (6th cover/veraison), 15 = 4 Aug (7th cover), 16 = 14 Aug (8th cover), 17 = 26 Aug (9th cover), 18 = 9 Sept (pre-harvest). y Percentage of leaf area infected on 1 Jul. Three shoots rated in each 3-vine subplot; 4 replicate subplots per cv. and treatment. x Percentage of fruit infected on 19–20 Aug. Three fruit clusters rated in each 3-vine subplot; 4 replicate subplots per cv. and treatment. w Data were arcsin-transformed before analysis of variance and means separation; actual data are shown. Column means followed by the same letter are not significantly different at P=0.05 according to the Bonferroni (Dunn) t-test, which controls for experimentwise error.
162
BUNCH ROT DISEASE MANAGEMENT ON GRAPES
Bryan Hed1, Noemi Halbrendt2, and Jim Travis2 Dept. Plant Pathology, Penn State University, (1) North East, Pennsylvania 16428; (2) Biglerville,
Pennsylvania 17307. Bunch rot of wine grape clusters is caused by a number of microorganisms, most notably Botrytis cinerea. In wet harvest seasons, a sour bunch rot complex can develop that may include other opportunistic fungi like Penicillium spp., Aspergillus spp., Rhizopus spp., and others as well as various types of bacteria for which there are few, if any, chemical control options. Bunch compactness plays a major role in susceptibility to bunch rots. Warm, wet summers and the extreme susceptibility of wine grape varieties, like ‘Chardonnay’, ‘Pinot Noir’, ‘Riesling’, and ‘Vignoles’ that produce compact bunches, make bunch rot control and the production of high quality wine grapes a perennial challenge for Pennsylvania wine grape growers. Bunch rot management programs that rely primarily on fungicides are more apt to fail than integrated approaches that reduce bunch compactness and humidity in the fruit zone. Leaf removal (LR) in the fruit zone, exposes bunches to drying wind and sunlight, and reduces the development of harvest rots in eastern vineyards (Ferree et al., 2003; Zoecklein et al., 1992). This strategy is generally applied after fruit set to minimize impact on yield. However, when leaf removal is applied just before bloom (trace bloom), fruit set and bunch compactness are reduced, and bunch rot control is enhanced (Howell and Clearwater, 2003). Applications of gibberellic acid (GA) have also reduced cluster compactness and bunch rots on ‘Vignoles’ and ‘Pinot gris’ in eastern vineyards (Ferree et al., 2003). However, the effects of GA, negative and positive, depend on variety, rate, and timing, and require clarification. This report briefly summarizes the results of several field trials in Pennsylvania over the past 3 years. The objectives were to determine the effects of leaf removal and canopy separation timing and gibberellic acid rates and timing, on bunch rot control of wines grapes. Trial 1 and 2 were conducted at the Lake Erie Regional Grape Research and Extension Center in North East, PA. Trial 3 and 4 were conducted at the Penn State Fruit Research & Extension Center in Biglerville PA.
Trial 1: Evaluation of fungicides and gibberellic acid for management of Botrytis bunch rot of Chardonnay and Vignoles grapes, 2006-2008 (Hed and Travis, 2006 a, b, 2007 b, c, 2008 (in press)). Treatments were applied to single-vine plots of Vitis interspecific hybrid ‘Vignoles’ (8 replications) and Vitis vinifera ‘Chardonnay’ (5 replications) in a randomized complete block design. Botrytis-specific fungicides (Vangard 75 WG 10 oz/A and Elevate 50 WDG 1 lb/A) were applied with a Friend covered-boom plot sprayer at 100 psi and 100 gallons/A. Gibberellic acid (ProGibb, Valent Corp.) was applied to runoff with a backpack sprayer at 5, 10, 25, or 40 parts per million (ppm), either two weeks pre bloom or at full bloom. Applications were aimed at reducing cluster compactness either by increasing cluster length (pre bloom application) or reducing fruit set (bloom application). The incidence (percent infected) and severity (percent area infected) of Botrytis bunch rot and total rot (complex of Botrytis cinerea, Penicillium spp., Aspergillus spp., and Rhizopus spp.) were determined just before harvest from 25 clusters per plot. Data was analyzed using analysis of variance and mean separation was determined by Fisher’s Protected LSD test. Ten treatments were arranged as follows:

163
1. Unsprayed (no GA, no Botrytis fungicides) 2. Core fungicide program - 2 Botrytis fungicides (at pre-closure and veraison), no GA. 3. Core fungicide program amended with a single GA application at pre bloom (5, 10, or 25 ppm) or bloom (5, 10, 25, or 40 ppm). *40 ppm at bloom was only applied to ‘Vignoles’. 4. Core fungicide program amended with 2 additional Botrytis fungicides (bloom and pre- harvest), no GA amendment. Results: On ‘Chardonnay’, Botrytis was responsible for nearly all harvest bunch rot. Botrytis was significantly reduced in 2006 by GA bloom applications at 5 and 25 ppm; in 2007 by a pre bloom GA application at 25 ppm and all bloom GA applications; and in 2008 by bloom GA application at 5 ppm and pre bloom GA at 5 and 25 ppm, when compared to two fungicides alone. Likewise, two additional Botrytis fungicide applications to the core program significantly improved Botrytis control over the core program alone in all 3 years, but were never more effective than the core program amended with 5 ppm GA at bloom. On ‘Vignoles’, other bunch rot organisms accounted for 8 to 58 % of the total rot, being lowest in treatments receiving bloom applications of gibberellic acid (GA) and highest in treatments relying solely on fungicides. On ‘Vignoles’, total rot was significantly reduced in 2006 by pre bloom GA applications at 5 and 25 parts per million and by all bloom GA applications; in 2007 by pre bloom or bloom GA applications at 25 parts per million; and in 2008, by all bloom GA applications, when compared to two fungicides alone. The most effective amendment was 25 ppm GA at bloom which significantly improved total rot control over 2 and 4 fungicides alone in every year. Trial 2: Evaluation of leaf removal, gibberellic acid and fungicides for control of Botrytis bunch rot of Chardonnay grapes, 2007, 2008 (Hed and Travis, 2007 a, 2008 (in press)). Treatments were applied to twelve-vine plots in a randomized complete block design with 4 replications. Botrytis-specific fungicides (same as in trial 1) and ProGibb (gibberellic acid (GA)) were applied with a Friend covered-boom plot sprayer at 100 psi and 100 gallons/A. Leaf removal (2-4 leaves removed from the cluster zone) was performed by hand or by Gallagher leaf blower (mechanical). The incidence (percent infected) and severity (percent area infected) of Botrytis bunch rot were determined just before harvest from 50 clusters per plot. Data was analyzed using analysis of variance and mean separation was determined by Fisher’s Protected LSD test. Ten treatments were arranged as follows: 1. Unsprayed (no gibberellic acid (GA), no leaf removal (LR), no Botrytis fungicides) 2. Core fungicide program - 2 Botrytis fungicides (at pre-closure and veraison), no GA, no LR 3. Core fungicide program amended with a single GA application at bloom (5 or 10 ppm). 4. Core fungicide program amended with hand LR (trace bloom, 2-3 weeks post bloom, or veraison) or mechanical LR (2-3 weeks post bloom or veraison). 5. Core fungicide program amended with 2 additional Botrytis fungicides (bloom and pre- harvest), no GA, no LR amendment. Results: Botrytis was responsible for nearly all harvest bunch rot. In 2007, amendments to the two fungicide core program did not significantly improve Botrytis control over the core program alone. In 2008, bloom GA application at 5 ppm, and LR at trace bloom (by hand) or 2-3 weeks

164
post bloom (mechanical) significantly improved Botrytis control when compared to 2 fungicides alone. Trial 3: Effect of canopy separation and leaf removal timing on Botrytis bunch rot, 2007 (Travis et al., 2007). Treatment plots consisted of ‘White Riesling’, ‘Chardonnay’, ‘Pinot Noir’, and ‘Cabernet Franc’ grapevines (one of each variety) randomly planted between posts within the plots. The treatments were arranged in a randomized complete block design with six replications. Vines were trained to vertical shoot positioning, Smart-Dyson, or Scott Henry trellising systems. Early canopy separation was completed at approximately 3 ft shoot length and late canopy separation was completed 3 weeks later. Early leaf removal was completed approximately 3 weeks after bloom and late leaf removal was 6 weeks after bloom. Botrytis incidence and severity was evaluated on ten fruit clusters on each vine. Data was analyzed using analysis of variance and mean separation was determined by Fisher’s Protected LSD test. Results: Early canopy separation/early leaf removal was statistically superior to late canopy separation/late leaf removal at reducing Botrytis severity on Chardonnay, Pinot Noir, and Riesling. However, there were no significant differences on any variety between early canopy separation/late leaf removal and late canopy separation/late leaf removal, suggesting that the timing of leaf removal may have been more critical than canopy separation in this trial. When comparing training systems, Botrytis severity was typically lower on the vertical shoot positioning system than on the Smart-Dyson or Scott Henry training systems. Trial 4: Evaluation of fungicides and gibberellic acid for management of Botrytis rot on grapes, 2008. Treatment plots (same as in Trial 3) were arranged in a randomized complete block design with 4 replications. Each replication contained two vines of each cultivar. Organic programs consisted of 2 % lime sulfur, sulfur (MicroSulf WP 8lb/A), copper hydroxide (Champion WP 1 lb/A), and NuFilm P (1 qt/A). The incidence (percent cluster infected) and severity (percent fruit cluster area infected) of Botrytis bunch rot were determined shortly before harvest. Data were analyzed using analysis of variance and mean separation was determined by the Fisher’s Protected LSD test (P < 0.05). Treatments were as follows: 1. Unsprayed (no gibberellic acid (GA), no Botrytis fungicides). 2. Two Botrytis fungicides (Vangard 75 WG 10 oz/A at pre close and veraison) amended with a single GA application at bloom (10 or 20 ppm). 3. Four Botrytis fungicides (Vangard 10 oz/A at bloom, pre close, veraison, and pre-harvest). 4. Organic 1: Lime sulfur (bloom) then Champion/NuFilm P (pre close, veraison, pre-harvest). 5. Organic 2: MicroSulf (bloom) then Champion/NuFilm P (pre close, veraison, pre-harvest). 6. Organic 3: Champion (bloom, pre close, veraison, pre-harvest). 7. Organic 4: Champion (bloom, veraison), MicroSulf/NuFilm P (pre close, pre-harvest). Results: Four Botrytis fungicides and treatments of 2 Botrytis fungicides amended with GA (10 or 20 ppm), significantly reduced the severity of Botrytis bunch rot on Chardonnay, Pinot Noir, and Riesling, when compared to the unsprayed treatment. The Organic 4 program significantly reduced Botrytis only on Chardonnay, and the Organic 1 treatment, significantly reduced Botrytis only on Pinot Noir, when compared to the unsprayed treatment.

165
Literature Cited Ferree D.C., M.A. Ellis, S.J. McArtney, M.V. Brown, and D.M. Scurlock. 2003. Comparison of fungicide, leaf removal and gibberellic acid on development of grape cluster and Botrytis bunch rot of ‘Vignoles’ and ‘Pinot Gris’. Small Fruits Review 2 (4):3-18. 2003. B. Hed and J.W. Travis. Evaluation of fungicides and gibberellic acid for management of Botrytis bunch rot of Chardonnay grapes, 2006 (a). Plant Disease Management Reports Vol 1: SMF011 B. Hed and J.W. Travis. Evaluation of fungicides, gibberellic acid, and cultural control for management of Botrytis bunch rot of grapes, 2006 (b). Plant Disease Management Reports Vol 1: SMF012 B. Hed and J.W. Travis. Evaluation of leaf removal, gibberellic acid and fungicides for control of Botrytis bunch rot of grapes, 2007 (a). Plant Disease Management Reports Vol 2: SMF006 B. Hed and J.W. Travis. Evaluation of fungicides and gibberellic acid for management of Botrytis bunch rot of grapes, 2007 (b). Plant Disease Management Reports Vol 2: SMF007 B. Hed and J.W. Travis. Evaluation of fungicides and gibberellic acid for management of Botrytis bunch rot of grapes, 2007 (c). Plant Disease Management Reports Vol 2: SMF008 Howell G.S., and L. Clearwater. 2003 Viticulture Consortium East; NYSAES reports. Controlled cultural reduction in fruit set and subsequent harvest season Botrytis cluster rot complex. Travis J.W., N.O. Halbrendt, B.L. Lehman, B. Hed, and B. Jarjour, 2007. Effect of canopy separation and leaf removal timing on Botrytis bunch rot, 2007. Plant Disease Management Reports Vol 2: SMF024 Zoecklein B.W., T.K. Wolf, N.W. Duncan, J.W. Judge, and M.K. Cook. 1992. Effects of fruit zone leaf removal on yield, fruit composition, and fruit rot incidence of Chardonnay and White Riesling grapes. Amer. J. Enol. Vitic. 43:2,139-148. Acknowledgments: We would like to thank Bashar Jarjour, John Griggs, Mark Wheeler, and Lara Collins for technical assistance in this project.

166
Horticulture

167
Not for Citation or Publication without Consent of the Authors
Accuracy of GPS Guidance and its Potential Use in Orchards
A. Leslie*, K. Lesser, P. Heinemann, J. Schupp, T. Baugher
Penn State Department of Agricultural and Biological Engineering and Penn State Cooperative Extension Ag Innovations Program
670 Old Harrisburg Rd., Gettysburg, PA 17325
Abstract
With labor issues becoming more of a concern for fruit growers, the drive toward mechanization has grown substantially. Mechanical solutions for jobs currently performed by hand are best adapted in areas that offer uniformity. In the tree fruit industry, efforts have been made to implement new methods and technology that will increase uniformity. The purpose of this study was to determine the accuracy of a GPS guidance system and its capability to provide the necessary uniformity when planting fruit trees. A tractor equipped with a GPS steering system was used to mark tree rows with a subsoiler. Rows were made on 16 ft centers at speeds of 1.2, 2.0, and 3.0 mph as well as on slopes of 0-3%, 8-16%, and 16-21%. It was determined that the average deviation from the center at points within the rows is 4.2 inches. There is no difference in accuracy at different speeds, but the system is less accurate on steeper slopes and at the beginning of each row. Introduction
Rising costs of labor and fuel as well as competition for use of agricultural lands have brought about a need to improve efficiency in fruit production and begin to mechanize the laborious tasks performed by hand. One answer to this concern is the use of high-density orchard systems. High-density orchards allow for more productive trees, more efficient operations, and the introduction of new technologies. With these systems, the ability to incorporate mechanical solutions to time consuming tasks becomes more realistic. The uniformity and narrow width of high-density trees present opportunities for the mechanization of thinning and harvesting, two of the most labor-intensive orchard operations. A string peach blossom thinner and a work platform, for example, have been tested and shown to significantly decrease the amount of labor required for these tasks (Lewis et al., 2008; Schupp et al., 2008). However, such mechanization relies heavily on uniformity. The purpose of this study was to test the ability of a new technology to provide this necessary accuracy and uniformity.
Global Positioning System (GPS) technology has become increasingly popular in agriculture. GPS systems have been developed for tractor guidance, livestock tracking, precision spray application, yield monitoring, and other applications. As technology continues to develop, so does the accuracy of these GPS systems. Currently, differential GPS systems, depending on their quality, have accuracy from within a few feet to a few inches. More expensive real-time kinematic (RTK) systems are accurate within 1-2 inches (Gan-Mor et al., 2005; Stephens et al., 2005). With the development of this kind of accuracy, GPS is used in an increasing number of applications, one being the layout of orchards.
A tractor equipped with GPS guided steering will automatically follow a predetermined path, allowing the driver to concentrate on the implement rather than on steering. This technology would eliminate the lengthy process of staking or flagging the rows beforehand by using a computer screen and an automatic steering device to guide the tractor. High-density orchards are set up using the same method as traditional orchards, but some of their advantages rely on straight, uniform rows. Often, rows marked and planted by hand are not perfectly straight, regardless of the tractor driver’s skill. This is where GPS
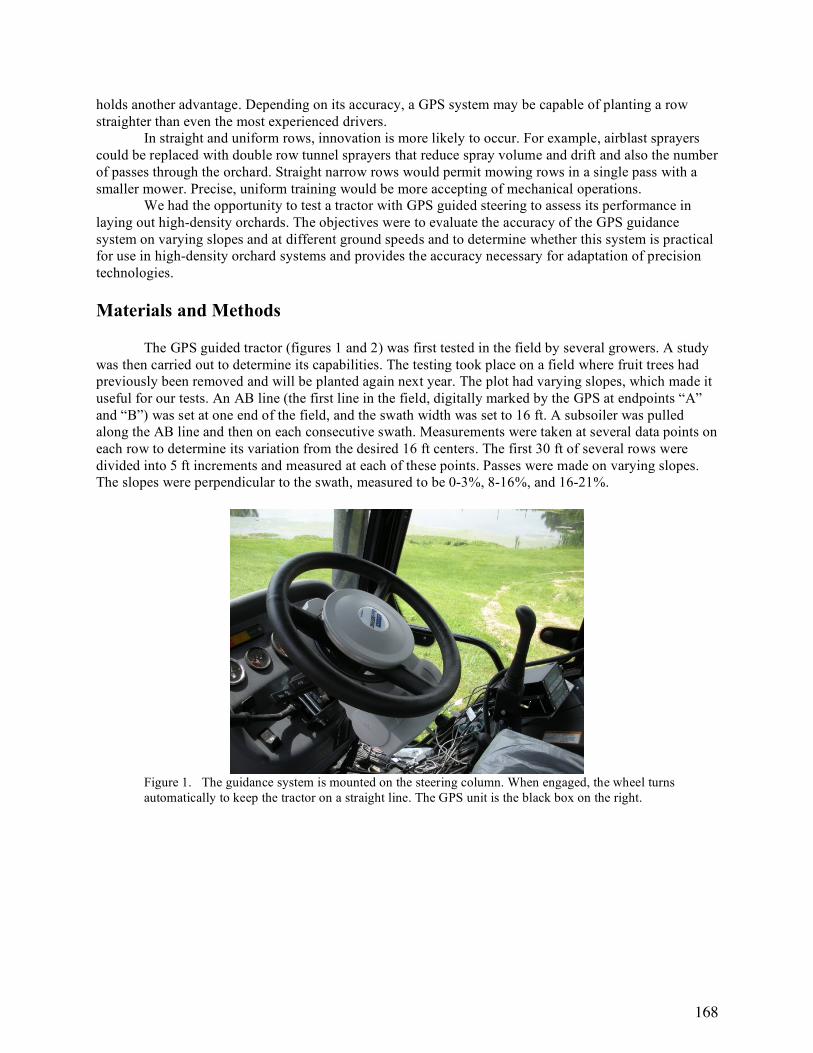
168
holds another advantage. Depending on its accuracy, a GPS system may be capable of planting a row straighter than even the most experienced drivers.
In straight and uniform rows, innovation is more likely to occur. For example, airblast sprayers could be replaced with double row tunnel sprayers that reduce spray volume and drift and also the number of passes through the orchard. Straight narrow rows would permit mowing rows in a single pass with a smaller mower. Precise, uniform training would be more accepting of mechanical operations.
We had the opportunity to test a tractor with GPS guided steering to assess its performance in laying out high-density orchards. The objectives were to evaluate the accuracy of the GPS guidance system on varying slopes and at different ground speeds and to determine whether this system is practical for use in high-density orchard systems and provides the accuracy necessary for adaptation of precision technologies. Materials and Methods
The GPS guided tractor (figures 1 and 2) was first tested in the field by several growers. A study was then carried out to determine its capabilities. The testing took place on a field where fruit trees had previously been removed and will be planted again next year. The plot had varying slopes, which made it useful for our tests. An AB line (the first line in the field, digitally marked by the GPS at endpoints “A” and “B”) was set at one end of the field, and the swath width was set to 16 ft. A subsoiler was pulled along the AB line and then on each consecutive swath. Measurements were taken at several data points on each row to determine its variation from the desired 16 ft centers. The first 30 ft of several rows were divided into 5 ft increments and measured at each of these points. Passes were made on varying slopes. The slopes were perpendicular to the swath, measured to be 0-3%, 8-16%, and 16-21%.
Figure 1. The guidance system is mounted on the steering column. When engaged, the wheel turns automatically to keep the tractor on a straight line. The GPS unit is the black box on the right.

169
Figure 2. The computer screen shows how close the tractor is to the path. The arrow shows the orientation of the tractor while the number on the top right shows the distance from the line.
Results and Discussion
The average deviation at points within a row was 4.2 inches. During the first 30 ft of a row, the equipment took some distance to center itself on the row. This number was affected by the original distance from the center. When the tractor started its pass 12 inches from the center, it was much less accurate in the first 30 ft than if it started within 4 inches of the center (figure 3). There was a significant difference (P < 0.05) in accuracy between the 0-3% grade, having an average deviation of 3.6 inches, and the two steeper grades, measured at 6.1 and 7.1 inches (figure 4). There was no significant difference in accuracy at speeds up to 3.0 mph (figure 5). Passes were made at speeds of 1.2 (the slowest that the GPS unit registered), 2.0, and 3.0 mph. The final test measured the recovery distance after striking an obstacle such as a large rock. The average distance measured was 21 ft.
Figure 3. Average deviation from center within first 30 ft of each row, evaluated at varying starting distances from center. Measured at 2 mph on 0-3% slope.

170
Figure 4. Average deviation from center, evaluated at varying grades of slope. Measured at 2 mph.
Figure 5. Average deviation from center, evaluated at varying tractor speeds. Measured on a 0-3% slope.
* Mean separation by Fisher’s protected least significant difference at P ≤ 0.05
When comparing this method to the conventional method of marking each row by hand, the GPS
guided tractor significantly cuts down the time taken to lay out an orchard block. Growers who have used this equipment themselves were interviewed about the differences between the two methods. They said it can take more than an hour just to lay out the first row by hand. Then, unless they are utilizing a marking system, each consecutive row must be marked. The entire process can take several hours, depending on the size of the block. Using GPS, the tractor is stopped at the beginning and end of the first row (the “A” and “B” points) and the computer records the location of these two points. From these two points, the computer creates the AB line, on which all other lines are based. Once the swath width is set, the computer generates an infinite number of swaths to both the left and right of the AB line. The entire field

171
can be done from this single line, which takes less than ten minutes to set up. Growers can potentially save hours of labor as well as remove human error by using this system.
Using this system, however, is not as simple as it may seem. The original goal of this project was
to utilize this system to plant trees. One grower attempted to do this, but the tractor must be moving at a minimum of 1.2 mph, which is too fast to keep up with the planter. It can, however, be used to mark blocks with a subsoiler. Once they are marked, it is simply a matter of going back over with the transplanter. Our research experience indicated that this equipment can be temperamental at times. It takes some time to acquire experience to properly handle the equipment.
On any given row, there may be places that the deviation is more severe than others. Solving this
problem is not an issue. Since a pass can be started at any point along the line, backing up 30 ft and starting the pass again to correct the mistake is not a problem. One grower noted that if two passes are made on each row, any mistakes even themselves out. There are more expensive GPS units, such as the RTK mentioned above, that boast even more accuracy. This brings up one more potential problem: the cost of this equipment. Currently, growers may not be able to justify the cost, but as this technology is more widely used, the cost may drop. There are also the possibilities of new businesses developed for custom planting operations or opportunities to rent the equipment. Implications for Growers
Our field trials with laying out high-density orchards show that the average deviation is less than 5 inches. Based on these results, growers would be able to use GPS to mark their blocks and count on their rows being straight, a change that would save hours each time a block is planted. In the drive to mechanize the industry, precise training and planting become more important. GPS is able to provide the necessary accuracy, perhaps more so than by hand. This system is a practical way to increase efficiency by reducing the amount of labor required and is more conducive to the development of new engineering solutions for specialty crops.
Acknowledgements Appreciation is extended to GVM Inc., Joy Cline, Brian Knouse, Chris Baugher, Ben Dufendach, and John Lesser.
References Baugher, T. Auxt, J. Schupp, M. Harsh, K. Lesser, L. Kime, B. Wenk, D. Rice, S. Waybright, J.
Van Pelt, M. Armand, K. Reichard, M. Tindall, R. Musselman, E. Moore. 2007. The Penn State Ag Innovations Project: A systems approach for retooling Eastern orchards. Proc. New England Vegetable & Fruit Conference and Tradeshow.
Baugher, T. Auxt, K. Lewis, J. Schupp, K. Lesser, M. Harsh, C. Seavert, T. Auvil. 2008. Mobile
platforms increase orchard management efficiency and profitability. ACTA Horticulturae, in press.
Gan-Mor, S., R. Clark, B.Upchurch. 2005. Implement lateral position accuracy under RTK-GPS tractor
guidance. Computers and Electronics in Agriculture 54(2007):31-38. Schupp, J., T. Auxt Baugher, S. Miller, R.M. Harsh, K. Lesser, K. Reichard. 2008. Mechanical
thinning of peach trees reduces labor inputs and increases fruit size. HortTechnology 18:660-670. Stephens, S. Chod, G. Searle, R. Smith, R. Daines, J. Payne, P. Rasmussen. 2005. High-end DGPS and
RTK systems. USU/NASA Space Grant/Land Grant Geospatial Extension Program Periodic Report, Utah State University.

172
EVALUATION OF THE PERPENDICULAR-V PEACH ORCHARD TRAINING SYSTEM APPLICABILITY STUDY FOR SOUTHERN MARYLAND, 1999-2007
R. David Myers
University of Maryland Extension 7320 Ritchie Highway, Suite 210
Glen Burnie, MD 21061
Introduction/Situation On March 4, 1999, at the Anne Arundel and Prince George’s Fruit Producers Breakfast, area orchardists expressed an interest in the development of peach training system production research and demonstration project conducted at the University of Maryland Central Maryland Research and Education Center (CMREC), Upper Marlboro Facility. The producers also stated that orchard training system evaluations, and pest management spray research programs were needed in the Southern Maryland region. Fruit production for fresh market sales as well as wholesale sales would certainly be a viable alternative agriculture enterprise for farmers seeking to transition out of tobacco production. Objectives A decision was made to proceed forward with a peach orchard establishment at CMREC, Upper Marlboro facility in order to accommodate grower requests, also to provide an education tool for a viable alternative for southern Maryland tobacco farmers. The research orchard consisted of seven peach varieties in a training system comparison of the traditional open center to the perpendicular–V training system. For eight years from 1999 to 2006 this research orchard was instrumental in promoting fruit production in Southern Maryland, alleviating grower apprehension to fruit crop adoption by providing hands-on pruning clinics, field-days, twilights, lectures and demonstratable production data. Experimental Procedure The CMREC, Upper Marlboro facility peach research and demonstration orchard was planted on April 14, 1999 on a Monmouth fine sandy loam soil with a warm southern aspect exposure and orchard rows oriented north to south. The two training systems compared consisted of the traditional open center on 20 foot between row by 16 foot in row spacing verses the perpendicular-V on 20 foot between row by 8 foot in row spacing. Seven varieties were evaluated consisting of two early maturity varieties Candor and Garnet Beauty; three mid maturity varieties Red Haven, Flamin’ Fury PF15 and Bounty; and two late maturity varieties Crest Haven and Fantasia (nectarine). The orchard was an arranged complete block with three replications. Each replication consisted of two trees for each variety, hence 42 trees for each training system. The varieties were purposely non-randomized but positioned according to maturity groups to facilitate the orchard use as a hands-on teaching tool. At planting of the two year whips a 24 inch heading cut was made to the open center trees and a 20 inch heading cut was made to the perpendicular-V trees. Tall fescue was drilled into the alleyways and herbicides were used throughout the study to maintain a 6 foot weed free root zone. Fruit cover sprays were adhered to utilizing a calendar approach with IPM scouting. In March 2000, prior to 2nd leaf the open center trees were pruned to develop 3 to 4 scaffolds, whereas the perpendicular-V trees were cut to two opposite limbs with the limb selection for branch angles between 25 to 45 degrees from the trunk center line using a scaffold gauge. All of the fruit was removed on the 2nd leaf year. The trees were summer pruned to balance growth; this was especially important for the perpendicular-V tree scaffold development.

173
Observations At 3rd leaf in May 2001 there was no significant difference in the average trunk diameter as measured at 12 inches from the ground for the open center trees verses the perpendicular-V trees, measuring 3.4 and 3.2 inches, respectively (Graph 1). This correlation of trunk diameter to yield is also apparent when examining the early yield per tree for combined years 2001 and 2003; (at 3rd and 4th leaf) the open center and perpendicular-V trees yielded an average fruit weight of 45.9 and 42.1 pounds per tree, respectively (Graph 4). When examining early fruit quality parameters the average peach disease rating of score of 1-10 was implemented, where a score of 1 represents complete disease loss and 10 represents no disease present, for the 3rd and 4th leaf combined were good to excellent for the open center trees and fair for the perpendicular-V trees scoring 8.8 and 7.5, respectively (Graph 2). Peach scab and brown rot were the most problematic diseases. By the 4th leaf the perpendicular-V scaffold limbs were already a challenge in regards to managing growth. The orchard site was a fertile agricultural soil, irrigation was only required in the establishment year and very little fertilization was necessary. Excessive growth of the perpendicular-V scaffolds made pruning, thinning, spraying and harvesting more time consuming. By the 4th leaf it was necessary to use a ladder for harvest. The loss of good disease control in the perpendicular-V trees was namely due to inadequate engineering of the sprayer to obtain thorough coverage in the center of the tree canopy. The average fruit size was also impacted by improper thinning of the perpendicular-V trees due to excessive tree height. This is reflected in the fruit size rating score for the open center trees verses the perpendicular-V trees of 2.5 and 2.0, respectively; where 1 is small 2 medium and 3 large (Graph 3). The notable advantage of the perpendicular-V is apparent when examining the average pounds of fruit per acre yield for the open center trees verses the perpendicular-V trees of 6,202 and 11,461 pounds, respectively (Graph 5). This is a reflection of tree density for the two training systems. The open center block has 136 trees per acre and the perpendicular-V block has 272 trees per acre, twice as many. By the 5th leaf it was necessary to head cut and branch the perpendicular-V trees in order to successfully manage the canopy. The average six year fruit production 2001-2006 for the open center and perpendicular-V trees was 65.5 and 51.5 average pounds per tree, respectively (Graph 6); and 8,908 and 14,008 average pounds per acre, respectively (Graph 7). There was a dramatic yield depression in 2004 and 2005 due to late spring freeze events. The southern aspect exposure induced an average annual early full bloom date of April 5th and late freezes are still problematic in most of southern Maryland until April 28th. Conclusions The perpendicular-V peach training system produces heavy early yields in a very compact orchard. The system offers the advantage of bringing new varieties to market quickly while occupying half of the acreage. The input costs are also reduced by maximizing the number of trees per acre. However, the perpendicular-V peach training system is much more labor intensive when compared to the standard open center training system. Scaffold development and pruning is laborious. Hand fruit thinning is very difficult on the Perpendicular-V trees, chemical or mechanical pruning equipment would be better suited for this system. The orchard sprayer design would also have to be modified specifically for spraying a Perpendicular-V tree orchard to ensure adequate spray coverage in the tree centers. The difficulty in maintaining size control of peach is exacerbated in the Southern Maryland region by a long growing season with continuous rainfall on productive agricultural soils. This is even more apparent when trying to manage the perpendicular-V tree training system. Therefore, this system is should not be recommended except for on a trial basis by experienced growers in the southern Maryland region. Growers should be encouraged to continue utilizing the traditional open center peach training system when establishing an orchard.

174

175
EFFECTS OF PEACH TREE ROOT SYSTEM MORPHOLOGY AND TRANSPIRATION ON LEAF NITROGEN AND PHOSPHORUS
T.J. Tworkoski, R. Scorza, and D.M. Glenn
USDA-ARS, Appalachian Fruit Research Station Kearneysville, WV 25430
Adequate mineral nutrition is critical for high fruit quality and sustained yield of fruit trees. It is
likely that nutritional competence of a fruit tree depends on several physiological and morphological traits that affect nutrient uptake. Fruit trees with improved root systems (own-rooted or as rootstocks) may be beneficial on infertile soils and for efficient use of fertilizer. Experiments were conducted in the greenhouse and field with the objectives to (1) determine root system morphology of selected growth habits of peach trees (Prunus persica L. (Batch)) in the field and (2) determine if root and shoot growth habit traits affected leaf concentrations of nitrogen (N) and phosphorus (P). Peach trees with different shoot and root growth habits were evaluated for leaf N & P concentrations after fertilizer applications in the greenhouse and field. In the greenhouse, one-year-old Compact, Pillar, and Standard peach trees were fertilized once or ten times during a single growing season and photosynthesis, transpiration, N and P concentrations were measured in leaves. The same growth habits of peach were planted in the field and grown for 10 years when fertilizer was applied in two consecutive years after the ninth and tenth growing seasons and roots and leaf N and P concentrations were measured. In the greenhouse and field, Compact trees had higher leaf P but the same N as Standard and Pillar trees when fertilizer was applied once. Field measurements of peach root number and length showed that Compact trees had a more fibrous root system than the other growth habits. The Compact tree root system morphology could support exploitation of the soil volume to enable uptake of nutrients, such as P, that move from soil to root surfaces primarily by diffusion. After more than one fertilizer application in the greenhouse and field, Pillar trees had the greatest increase in leaf N and P. Higher transpiration rates in Pillar trees may have increased movement of nutrients to Pillar roots by mass flow. The data indicate that peach trees with fibrous roots systems may have an advantage to absorb nutrients such as P that move primarily by diffusion when the nutrient is present in low concentrations in the soil. However, under conditions of high soil fertility, fibrous root systems did not improve nutrient uptake and trees with greater transpiration rates had greater absorptive capacity of nutrients. Different growth habits of peach have diverse root systems and transpiration rates that affect nutrient uptake and, consequently, the selection of tree growth habit should be included in soil management plans. Growth habits with more fibrous root systems may require reduced inputs of nutrients with low diffusion coefficients.

176
Economic Evaluation of Alternative Apple Training Systems for Fresh-Market Production in Pennsylvania
J.K. Harper1, A.J. Jimenez1, R.M. Crassweller2, and D.E. Smith2
1 Department of Agricultural Economics and Rural Sociology, The Pennsylvania State University, University Park, PA 2 Department of Horticulture, The Pennsylvania State University, University Park, PA Selecting a profitable apple production system involves more than simply comparing the average net returns generated by each alternative and selecting the highest one. Maximizing net return overlooks the variability of returns and ignores the role that the attitude of the individual fruit producer towards risk plays in the selection of a production system. A better way to evaluate this type of decision making process is to employ procedures which take into account the distribution and variability of net returns and rank alternatives based on different assumptions about producer attitudes towards risk. Stochastic dominance is a risk analysis technique that chooses between a set of risky alternatives by comparing the distribution of possible incomes for each alternative, selecting preferred alternatives based on risk preferences. Stochastic dominance compares cumulative distributions of outcomes based on two observations about human nature: (i) most people prefer more to less, and (ii) most people prefer to avoid low value outcomes (Lambert and Lowenberg-DeBoer, 2003). Observation (ii) implies that humans are generally risk-averse, but is not the same as saying that individuals avoid variability. Most people enjoy upside variability so long as they benefit from the outcomes (e.g., higher yields, higher crop prices, higher profits), but are risk averse to downside variability. Those preferring more to less, but who do not seek to avoid variability are characterized as risk neutral. Generalized stochastic dominance (also known as stochastic dominance with respect to a function) is a flexible evaluative tool grounded in the expected utility hypothesis (Meyer 1977). It ranks risky alternatives for selected risk preference intervals defined by the Pratt-Arrow absolute risk aversion coefficient. Within this interval, the utility function with the highest probability of not preferring action H to action G is identified. If, for this utility function, the expected utility of H is still greater than the expected utility of G, then action H is said to be preferred to action G for all decision makers in the selected class of risk preferences. The flexibility to choose the intervals allows the researcher to control the trade-off between accuracy and discriminatory power (King and Robinson, 1981; Cochran 1986). The wider the interval, the greater the accuracy, but the lower the discrimination power. An attractive featured of generalized stochastic dominance for the researcher is that it does not require specific knowledge of an individual’s utility function. Another advantage is its ability to evaluate the full range of risk preferences, from risk preferring to risk averse. Orchard Materials and Methods An orchard consisting of three cultivars, ‘Crimson Gala’, ‘Ginger Gold’ and ‘Fuji’ (BC#2) was established in 1997 at the Horticultural Research Farm at Rock Springs, PA in north to south rows. Each cultivar has a distinctive growth-fruiting pattern. ‘Ginger Gold’ is characterized as having a tip bearing or Type IV type of growth and fruiting. ‘Fuji’ is characterized as having a Type 3 growth habit and the particular clone of ‘Gala’ has a Type II growth habit. All the trees were propagated on M.9 NAKB T337 and obtained from Adams County Nursery, (Aspers, PA). Four training systems were selected and established, vertical axe (A), slender spindle (S), 4-wire low trellis (T) and an offset V-axe (V). Trees in the A, S and T systems were set at 1.8 x 3.6 m

177
(1,495 trees/ha). The V was planted at 0.9 x 4.9 m (2,241 trees/ha) with every other tree oriented at 60o to the east or west. For the A, a single wire was set at 2.7 m above the ground and a metal conduit attached to the wire. The S had a single wire set at 1.8 m with a metal conduit. The T consisted of four wires spaced 18 inches apart. The V had a “T” support system with the top wires set at 2.7 m above the ground and the arms of the “T” extend 1.4 m into the drive row on either side. The overall design of the planting was a randomized complete block with split plots. Main plots consisted of each system with 5 tree subplots of each cultivar with 6 overall replications. Data collected or calculated each year included trunk cross sectional area (TCA) annual increase in growth of TCA, number of fruit per tree, yield per tree (kg), fruit size and quality, efficiency (g/cm2), crop load (#/cm2), and yield per ha (kg). In year 1998 and 1999 the number of flowers per tree and the flower density (#/cm2) were also measured. Economic Analysis Annual cash flow estimates were developed for each cultivar/training system combination. This includes estimating the cost of establishment (for trees, support system, and labor; see Table 1) and annual costs for non-bearing and bearing years (including those for pruning, training, pest management, fertilization, machinery usage, and harvest). Cumulative density functions were developed from each of these annual cash flow streams were used in the SDRF analysis. For SDRF, preferred alternatives are identified by comparing the cumulative density function of net returns from each alternative for the risk categories of interest. Harper and Greene (1998) applied a similar analysis framework to the selection of peach rootstocks.
Descriptive statistics for the apple training systems for fresh market production in Pennsylvania are given in Table 2. Estimated tree densities varied from a 605 trees/acre for the S, A, and T systems to a 908 tress/acre for the V systems. Yield, pruning and harvest costs were calculated based on the eight-year bearing period (1999-2006); net returns include the establishment and non-bearing years. Average yield per acre varied from a low of 426 bu/A for Ginger Gold-T to a high of 747 bu/A for the Fuji-A system. Annual yield per acre was calculated by multiplying the estimated tree density by the average yield for each cultivar/support system combination. Net returns were calculated by subtracting the appropriate production, planting, pruning, and harvest costs from gross returns. In most cases, variability as indicated by the standard deviation increased as net returns increased. Harvest costs depend on the support system and the yield. Data on picking times were collected for each support system in 2005 and 2006. Fuji-A had the highest average harvest cost per acre. Average pruning costs varied from $261/A for Gala-A to $631/A for Ginger Gold-T. Harvest and pruning costs were based on labor costs of $12.50/hour.
Table 1. Cost of establishment for four training systems Offset-V Slender Spindle Vertical Axe Low Trellis Trees $6,310.60 $4,204.75 $4,204.75 $4,204.75 Support System 5,687.74 2,564.00 3,520.00 2,086.00 Labor 1,321.25 921.25 961.25 1,336.25 Total $13,319.59 $7,690.00 $8,686.00 $7,627.00

178
The difficulty in picking a cultivar/support system combination is readily apparent when looking not only at the average net return, but also when considering the standard deviations. Often higher net returns are also accompanied by high variability. In addition, the data masks extreme highs and lows in the data which are of interest to some decision makers. In such cases, SDRF is a useful tool for evaluating production alternatives under risk. When applied to the economic evaluation of alternative apple cultivars and training systems, the ability of SDRF to rank alternatives provides the producer with differing attitudes towards risk with better information as to the preferred cultivar/support system combination than simply considering net returns alone.
The results of the SDRF analysis are summarized in Table 3. The top three apple training and cultivar combinations are ranked for each risk attitude interval. Growers who are willing to accept moderate amounts of risk would select the Fuji-V as their top apple cultivar/support combination. Fuji-V had the third highest average net return, but also the highest standard deviation. For slightly risk preferring growers, either Fuji-V or Fuji-A would be a good choice. Fuji-A had the highest average net return and the second highest standard deviation of all cultivar/support combinations. For risk neutral growers, Fuji-S also becomes part of the preferred choice set because of its slightly lower net return and lower variability. For slightly risk averse growers, Fuji-V is not a good choice and is replaced by Fuji-T and its lower net return and much lower variability. This means that these growers would be willing to give up some net returns for lower variability. For moderately or highly risk averse growers, Fuji-T is the only preferred alternative. In general, SDRF analysis showed that 'Fuji' was the preferred cultivar among all growers risk attitude categories. The ranking of alternatives under SDRF provides the decision-maker with additional information on alternatives, which may be valuable if the preferred cultivar/support combination is unavailable.
Table 2. Estimated tree densities, average yield, net returns, pruning and harvest costs Cultivar/Support Estimated Average Average S.D. for Average Average
Combination Tree Density Yield Net Return Net Return Pruning Cost Harvest Cost
(trees/acre) (bu/acre) ($/acre) ($/acre) ($/acre) ($/acre)
Fuji-V 908 708 8,495 11,114 363 1,022
Fuji-S 605 679 9,172 8,885 363 920
Fuji-A 605 747 9,901 10,611 313 1,145
Fuji-T 605 599 7,512 7,169 581 714
Gala-V 908 672 5,871 8,474 285 969
Gala-S 605 490 4,786 6,196 285 664
Gala-A 605 632 6,132 7,320 261 968
Gala-T 605 468 4,064 5,447 443 558
Ginger Gold-V 908 681 6,911 8,919 462 982
Ginger Gold-S 605 487 5,223 5,733 471 660
Ginger Gold-A 605 609 6,510 7,259 415 934
Ginger Gold-T 605 426 4,204 5,386 631 508

179
Table 3. Ranking of top three apple cultivar/training systems combinations by general classes of grower risk preference Range of Pratt-Arrow Ranking alternative apple cultivars + support system
Approximate risk attitude risk aversion coefficient First Second Third moderately risk preferring (-.001 to -.0004) Fuji-V Fuji-A Fuji-S slightly risk preferring (-.0004 to 0.0) Fuji-V or A Fuji-V or A Fuji-S risk neutral (-.0002 to +.0002) Fuji-V, A, or S Fuji-V, A, or S Fuji-V, A, or S slightly risk averse (0.0 to +.0004) Fuji-A, S, or T Fuji-A, S, or T Fuji-A, S, or T moderately risk averse (+.0004 to +.001) Fuji-T Ginger G-T Fuji-S or Gala-T highly risk averse (+.001 to +.002) Fuji-T Ginger G-T Gala-T
The results of the preferred support system by cultivar are given in Table 4. The results are similar to those when all cultivars were considered together, except that the A system would be acceptable to a wider range of growers when growing ‘Crimson Gala’ and V would be accepted to a wider range of growers when growing ‘Ginger Gold’. Table 4. Preferred support system by cultivar based on general classes of grower risk preference Range of Pratt-Arrow Preferred alternative support by cultivar
Approximate risk attitude risk aversion coefficient Fuji Gala Ginger Gold moderately risk preferring (-.001 to -.0004) V V or A V slightly risk preferring (-.0004 to 0.0) V or A V or A V risk neutral (-.0002 to +.0002) V, A, or S V, A, or S V, A, or S slightly risk averse (0.0 to +.0004) A, S, or T A, S, or T V, A, S, or T moderately risk averse (+.0004 to +.001) T T T highly risk averse (+.001 to +.002) T T T
References Cochran, M. J. 1986. “Stochastic Dominance: The State of the Art in Agricultural Economics.”
In An Economic Risk Management Strategies for Agricultural Production Firms. Proceedings of a seminar sponsored by Southern Regional Project S-180. Pullman, WA.: Washington State University.
Harper, J. K. and G.M. Greene. 1998. “Impact of Production Risk on the Selection of Peach
Rootstocks”. Fruit Varieties J. 52(1):41-46. King, R. P. and L.J. Robison. 1981. “An Interval Approach to Measuring Decision Maker
Preferences.” Amer. J. Agr Econ. 65:510-20. Lambert, D. M. and J. Lowenberg-DeBoer. 2003. “Economic Analysis of Row Spacing for Corn
and Soybean.” Agronomy J. 95:564-573. Meyer, J. 1977. “Choice among Distributions.” J. Econ. Theory 14: 326-36. Art Agnello <[email protected]>


![308 PARTS 83–84 [RESERVED] - GovInfo.gov](https://static.fdokumen.com/doc/165x107/631ee2ee17cd32be4e046b9b/308-parts-8384-reserved-govinfogov.jpg)