Socio-economic disparities in the consumption of vegetables, fruit and energy-dense foods: the role...
10
Public Health Nutrition: page 1 of 10 doi:10.1017/S1368980012003540 Socio-economic disparities in the consumption of vegetables, fruit and energy-dense foods: the role of motive priorities Hanna Konttinen 1, *, Sirpa Sarlio-La ¨hteenkorva 2 , Karri Silventoinen 1 , Satu Ma ¨nnisto ¨ 3 and Ari Haukkala 1 1 Department of Social Research, University of Helsinki, PO Box 54, 00014 University of Helsinki, Helsinki, Finland: 2 Department of Public Health, University of Helsinki, Helsinki, Finland: 3 Department of Chronic Disease Prevention, National Institute for Health and Welfare, Helsinki, Finland Submitted 16 June 2011: Final revision received 8 March 2012: Accepted 17 June 2012 Abstract Objective: A low socio-economic status (SES) is related to less healthy dietary habits, but the reasons for this remain unclear. We examined whether the absolute or relative importance of various food choice motives contributed to SES disparities in vegetable/fruit and energy-dense food intake. Design: We analysed cross-sectional data from the FINRISK Study 2007 by means of structural equation modelling and used a shortened version of the Food Choice Questionnaire to assess the absolute importance of health, pleasure, convenience, price, familiarity and ethicality motives. We calculated the relative importance of each motive by dividing the participant’s rating of it by his/her mean score on all motives. Dietary intake was measured with an FFQ. Setting: A population-based survey in Finland. Subjects: Men (n 1691) and women (n 2059) aged 25–64 years. Results: Higher education and income were related to a greater vegetable/fruit intake (b 5 0?12, P , 0?001), while education was associated negatively with the consumption of energy-dense foods (b 520?09, P , 0?001). Socio-economically disadvantaged individuals considered price and/or familiarity more important in their food choices in both absolute and relative terms. A higher income was related to a greater relative importance of health considerations. Relative motives were more strongly associated with vegetable/fruit and energy-dense food con- sumption than absolute motives and the relative importance of price, familiarity and health partly mediated the effects of the SES indicators on the consumption of these food items. Conclusions: Individual priorities in food choice motives, rather than the absolute importance of single motives, play a role in producing SES disparities in diet. Keywords Food choice motives Socio-economic Diet FFQ Numerous studies have shown that socio-economically disadvantaged individuals have less healthy dietary habits (1,2) , which may contribute to a higher prevalence of obesity and consequently diet-related chronic dis- eases (3) . Individuals with a lower socio-economic status (SES) tend to consume energy-dense foods more fre- quently, including energy-dense takeaway options, fatty meats and fried foods (2,4–7) , compared with their higher socio-economic counterparts who consume more fruit and vegetables (1,2) . However, the mechanisms explaining the SES inequalities in dietary intake are not fully understood. Food choice is a complex process and various individual, social and environmental factors are likely to contribute to socio-economic inequalities in food intakes. It has been proposed that motives underlying food selection play a role in explaining SES variations in diet, but few studies have tested this empirically (8–10) . Previous research conducted in Europe and the USA has revealed that the most important food choice motives among adults are taste, health, price, and convenience of purchasing and preparation (11–13) . There is evidence that individuals with a low income or education place more importance on price and less importance on health in their food selection compared with their more educated or affluent counterparts (9,14,15) . Education may make individuals better able to process nutrition-related infor- mation and may socialize them to adopting healthy dietary habits. Furthermore, it has been shown that the cost of food is related to its nutritional quality, with lower priced products being nutritionally poor and energy- dense (16) . Thus, by implication, it may be more difficult for individuals with fewer financial resources to take health aspects into account in their food purchasing decisions. Nevertheless, only one previous study has Public Health Nutrition *Corresponding author: Email hanna.konttinen@helsinki.fi r The Authors 2012
-
Upload
independent -
Category
Documents
-
view
0 -
download
0
Transcript of Socio-economic disparities in the consumption of vegetables, fruit and energy-dense foods: the role...

Public Health Nutrition: page 1 of 10 doi:10.1017/S1368980012003540
Socio-economic disparities in the consumption of vegetables,fruit and energy-dense foods: the role of motive priorities
Hanna Konttinen1,*, Sirpa Sarlio-Lahteenkorva2, Karri Silventoinen1, Satu Mannisto3
and Ari Haukkala1
1Department of Social Research, University of Helsinki, PO Box 54, 00014 University of Helsinki, Helsinki, Finland:2Department of Public Health, University of Helsinki, Helsinki, Finland: 3Department of Chronic Disease Prevention,National Institute for Health and Welfare, Helsinki, Finland
Submitted 16 June 2011: Final revision received 8 March 2012: Accepted 17 June 2012
Abstract
Objective: A low socio-economic status (SES) is related to less healthy dietaryhabits, but the reasons for this remain unclear. We examined whether theabsolute or relative importance of various food choice motives contributed to SESdisparities in vegetable/fruit and energy-dense food intake.Design: We analysed cross-sectional data from the FINRISK Study 2007 by meansof structural equation modelling and used a shortened version of the FoodChoice Questionnaire to assess the absolute importance of health, pleasure,convenience, price, familiarity and ethicality motives. We calculated the relativeimportance of each motive by dividing the participant’s rating of it by his/hermean score on all motives. Dietary intake was measured with an FFQ.Setting: A population-based survey in Finland.Subjects: Men (n 1691) and women (n 2059) aged 25–64 years.Results: Higher education and income were related to a greater vegetable/fruitintake (b 5 0?12, P , 0?001), while education was associated negatively with theconsumption of energy-dense foods (b 5 20?09, P , 0?001). Socio-economicallydisadvantaged individuals considered price and/or familiarity more important intheir food choices in both absolute and relative terms. A higher income wasrelated to a greater relative importance of health considerations. Relative motiveswere more strongly associated with vegetable/fruit and energy-dense food con-sumption than absolute motives and the relative importance of price, familiarityand health partly mediated the effects of the SES indicators on the consumption ofthese food items.Conclusions: Individual priorities in food choice motives, rather than the absoluteimportance of single motives, play a role in producing SES disparities in diet.
KeywordsFood choice motives
Socio-economicDietFFQ
Numerous studies have shown that socio-economically
disadvantaged individuals have less healthy dietary
habits(1,2), which may contribute to a higher prevalence
of obesity and consequently diet-related chronic dis-
eases(3). Individuals with a lower socio-economic status
(SES) tend to consume energy-dense foods more fre-
quently, including energy-dense takeaway options, fatty
meats and fried foods(2,4–7), compared with their higher
socio-economic counterparts who consume more fruit
and vegetables(1,2). However, the mechanisms explaining
the SES inequalities in dietary intake are not fully
understood. Food choice is a complex process and
various individual, social and environmental factors are
likely to contribute to socio-economic inequalities in food
intakes. It has been proposed that motives underlying
food selection play a role in explaining SES variations in
diet, but few studies have tested this empirically(8–10).
Previous research conducted in Europe and the USA
has revealed that the most important food choice motives
among adults are taste, health, price, and convenience of
purchasing and preparation(11–13). There is evidence that
individuals with a low income or education place more
importance on price and less importance on health in
their food selection compared with their more educated
or affluent counterparts(9,14,15). Education may make
individuals better able to process nutrition-related infor-
mation and may socialize them to adopting healthy
dietary habits. Furthermore, it has been shown that the
cost of food is related to its nutritional quality, with lower
priced products being nutritionally poor and energy-
dense(16). Thus, by implication, it may be more difficult
for individuals with fewer financial resources to take
health aspects into account in their food purchasing
decisions. Nevertheless, only one previous study has
Public
Hea
lth
Nutr
itio
n
*Corresponding author: Email [email protected] r The Authors 2012
examined whether various health- and non-health-related
motives contribute to SES disparities in food intake.
That study found that a lower fibre intake among less
educated individuals was partly attributable to the higher
importance they placed on familiarity and sensory appeal
of the food(8).
A limitation of earlier studies is that they focus only on
the absolute importance of food-related motives. Con-
flicts between personally relevant motives are common in
specific food choice situations, making it necessary for
individuals to prioritize them(17,18). Price, taste and con-
venience can act as barriers to buying healthy food items,
for example(19). It would therefore be pertinent to
explore the relative importance of each motive. Beydoun
and Wang investigated the ratio of the importance of price
relative to healthiness and found that low-SES individuals
considered them both equally important, whereas those
with a high SES put more emphasis on healthiness(20).
The ratio also partly explained the SES disparities in
energy, fat, sodium and sugar intake. The conflict between
price and health considerations is not the only one that can
arise in relation to food choice, however, and thus it would
be relevant to examine all motives relative to each other.
The research emphasis in the related area of personal
values has long been on individuals’ value priorities
(analysed by dividing respondents’ scores on a single value
by their mean ratings of all values) rather than on absolute
ratings(21). A similar approach could be adopted to inves-
tigate individual priorities in food choice motives, but we
are not aware of any study that has done this.
The aim of the current study was to examine whether
the absolute or relative importance of various food
choice motives contributed to the education and income
inequalities in dietary intake in a population-based sample
of Finnish men and women. With respect to dietary intake,
the focus was on the consumption of vegetables/fruit and
energy-dense foods because (i) SES disparities are most
consistently observed in the consumption of vegetables/
fruit(1) and (ii) energy-dense food items represent less
healthy options that are typically affordable and purchased
as pre-prepared food.
Methods
Participants and setting
The participants of the current study took part in two
phases of the National Cardiovascular Risk Factor Survey
(the FINRISK Study) conducted in 2007(22). The ethical
committee of the National Institute for Health and Welfare
and the hospital districts gave their approval of the study
protocols, and all participants gave their informed consent.
For the FINRISK Study 2007, a random sample of 10 000
people aged 25–74 years was drawn from the Finnish
population register (representing all Finnish residents) in
five geographic areas. The sample was stratified by gender,
10-year age groups and area. The first study phase
took place from January to March 2007 and involved a
total of 6258 individuals (a response rate of 63 %). The
participants received by mail an invitation to undergo a
health examination, together with a self-administered
health questionnaire that yielded information on socio-
demographic factors, health behaviour, and medical and
disease history. They filled in the questionnaire at home
and brought it with them when they came to the health
centre for the examination.
All of the individuals who participated in the first study
phase (n 6258) were invited to continue in the second
phase conducted from April to June 2007, the aim of
which was to investigate the dietary, lifestyle and genetic
determinants of obesity and metabolic syndrome (the
DILGOM sub-study). The response rate for this phase was
80 % (2325 men and 2699 women). It comprised a further
health examination at the health centre during which
research nurses measured the weight and height of the
participants and the participants completed a 132-item
FFQ and questionnaires covering psychosocial (e.g. food
choice motives) and lifestyle (e.g. physical activity) factors.
The sample for the present study consisted of all
25–64-year-old men (n 1691) and women (n 2059;
i.e. working-age population) who participated in both
study phases. Information on sociodemographic factors
(years of education, gross household income, marital
status and presence of children in the household) was
derived from the first phase, whereas information related
to other variables (food choice motives, dietary intake,
weight, height and physical activity) was based on the
second phase.
Measures
Food choice motives
Food choice motives were measured with a shortened
version of the Food Choice Questionnaire (FCQ)(11). The
original FCQ includes thirty-six items and is intended to
measure nine different motivational dimensions under-
lying the selection of food (health, mood, convenience,
sensory appeal, natural content, price, weight control,
familiarity and ethical concern). Respondents are asked to
endorse the statement ‘It is important to me that the food
I eat on a typical dayy’ for each item, on a four-point
scale (ranging from 1 5 not at all important to 4 5 very
important). However, the factor structure of the FCQ has
not been well replicated in other studies(23,24), and
Fotopoulos et al. suggest reducing the number of moti-
vational dimensions and using fewer items to measure
each one(24). We excluded thirteen items that had content
overlap with other items, and added three items mea-
suring ethical/political aspects of food purchasing (items
20, 22 and 26 in Appendix), which are currently relevant
in the Finnish context. Confirmatory factor analysis
implied that the original nine-factor structure had a poor
Public
Hea
lth
Nutr
itio
n2 H Konttinen et al.

fit with the data (x2 5 3781?08, df 5 265, P , 0?001;
CFI (comparative fit index) 5 0?89; TLI (Tucker–Lewis
index) 5 0?87; RMSEA (root mean square error of
approximation) 5 0?06; SRMR (standardized root mean
square residual) 5 0?06) according to cut-off points sug-
gested by Hu and Bentler(25). A series of exploratory factor
analyses (maximum likelihood extraction with oblimin
with Kaiser normalization oblique rotation) clearly sup-
ported the four-factor structure (the scree plot(26) indicated
that adding a fifth or more factors would not significantly
increase the total variance explained in the items). These
four factors were interpreted as health, pleasure, con-
venience and ethicality (Appendix). Three items did not
clearly load on any of the factors (all loadings ,0?35).
We excluded one of them (‘is high in protein’) from the
present analyses and analysed the other two as separate
variables because they were the only items measuring the
familiarity (‘is what I usually eat’) and price (‘is cheap’)
dimensions of the original FCQ. All in all, we measured the
health dimension on eight items, convenience on three
items, pleasure on five items, ethicality on seven items and
both familiarity and price on one item.
We derived the absolute importance of health, pleasure,
convenience and ethicality by calculating the mean score
of the items belonging to the respective factors, whereas
the participant’s rating of price and familiarity reflected the
absolute importance of these two motives. We computed
the relative importance of each motive by dividing the
participant’s absolute rating of it by his/her mean score on
all twenty-five motive items. The same method has been
used to calculate individuals’ value priorities in studies on
personal values(27,28).
Consumption of vegetables/fruit and energy-dense foods
Vegetable/fruit and energy-dense food consumption was
assessed with the validated FFQ, which inquires into the
average use frequencies of 132 food items common in the
current Finnish diet during the previous 12 months(29,30).
There are nine possible frequency categories for all of the
items, ranging from never or seldom to more than six
times a day. The portion size was fixed for each one and if
possible specified in natural units (e.g. glass, slice). The
average intakes of fresh vegetables/fruit (sixteen items,
potatoes were not included) and energy-dense foods
(eight items including savoury pasties, pizza, hamburgers,
fried potatoes, sausages and mayonnaise salads) were the
food consumption variables of interest in the present
analyses. We used the Finnish national food composition
database (Fineli) of the National Institute for Health and
Welfare to calculate the average daily consumption of
vegetables (g), fruit (g) and energy-dense foods (g) and
total energy intake (kJ) from the FFQ(31).
Sociodemographic factors
Self-reported total years of schooling were used to
measure education on a continuous scale. Participants
were asked to report their previous year’s gross house-
hold income on a nine-point scale ranging from less than
h10 000 to more than h80 000. Household income was
subsequently divided by the weighted sum of the number
of household adult and child members (a weight of 1?0
was given for the first adult of the household, 0?7 for
all other adults and 0?5 for children under the age of
17 years), as recommended by the Organisation for
Economic Co-operation and Development(32).
Age, marital status, having children in the household,
BMI and physical activity were included as covariates in
the analyses. Age was used as a continuous variable and
marital status was dichotomized into married/cohabiting
v. single. Households were categorized into those with
children under the age of 17 years and those without
children. BMI was calculated as weight in kilograms
(measured to the nearest 100 g in light clothing without
shoes) divided by the square of height in metres (mea-
sured to the nearest 0?5 cm). Two questions derived from
the validated short form of the International Physical
Activity Questionnaire (IPAQ)(33) were used to assess the
number of days during the previous week on which the
participants engaged in vigorous (e.g. running or lifting
heavy weights) or moderate (e.g. light jogging) physical
activity for at least 10 min.
Statistical methods
We analysed the bivariate associations between the study
variables by means of age-adjusted partial Pearson’s
correlations using the SPSS statistical software package
version 15?0. The next stage was to test the hypothesized
mediation model between SES, food choice motives and
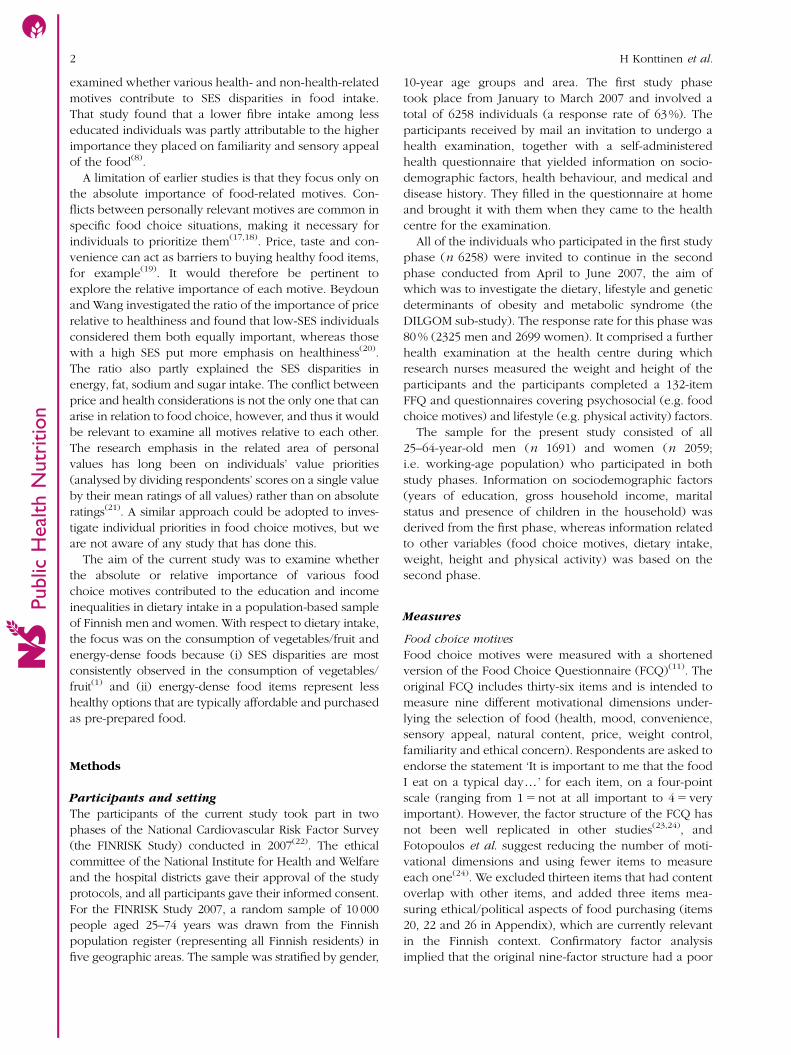
dietary intake (Fig. 1) by means of structural equation
modelling and using Mplus statistical software version
6?0(34). We estimated the mediation model separately for
all SES indicators (education and income), the food
choice motives (absolute and relative) and the food
consumption variables (intake of vegetables/fruit and
energy-dense foods). The models were adjusted for
gender, age, marital status, having children in the
household, BMI, physical activity and total energy intake.
However in order to avoid over-adjustment, we did not
adjust the analyses of energy-dense foods for energy
intake because such foods have high energy content by
definition. We used Mplus(34) to derive the total, direct
and indirect (through each absolute and relative food
choice motive) effects of the SES indicators on the food
consumption variables and their respective standard
errors (see Fig. 1). Maximum likelihood robust (MLR) was
used as an estimation method given that the distributions
of the study variables deviated from normality to some
extent. MLR produces standard errors (by means of a
sandwich estimator) and a x2 test statistic that are robust
for non-normality(34). We did not evaluate the model fit
because the estimated mediation models had zero degrees
of freedom and thus, by definition, fitted the data perfectly.
Public
Hea
lth
Nutr
itio
nSocio-economic status and food choice motives 3

The correlations and descriptive characteristics of the
study sample are shown by gender because men and
women differ considerably with respect to dietary intake
and motives for food choices(11,35). However, we carried
out multi-group analyses in order to formally test gender
differences related to the mediation models: the x2 statistic
of the constrained models (the regression paths a, b and c
shown in Fig. 1 were forced to be similar between
genders) was compared with that of the unconstrained
models (the three paths were allowed to vary freely)
using x2 difference tests (taking into account the MLR
scaling-correction factor). If the x2 statistic of the con-
strained model was significantly different from that of the
unconstrained model, the gender-stratified total, direct
and indirect effects are shown. We used an a level of
P , 0?01 instead of P , 0?05, given the sensitivity of the
x2 difference test to sample size that makes small differ-
ences statistically significant in large samples(36).
Results
Table 1 presents the descriptive characteristics of the study
sample. Both men and women rated health and pleasure as
the two most important food choice motives, followed
by convenience and price, irrespective of whether absolute
or relative motives were analysed. Women placed more
importance on health, pleasure, ethicality, convenience and
price in their daily food choice than men, whereas men
scored more highly on familiarity (Table 1). In contrast,
health and familiarity were the only relative motives
showing significant gender differences.
All six absolute food choice motives correlated
positively with each other, the strongest correlation being
between health and ethicality (r 5 0?55 in men and
r 5 0?48 in women; Table 2). When the relative impor-
tance of the motives was analysed, the associations
changed substantially in both genders: health, pleasure
and ethicality correlated negatively with almost all of the
other motives, whereas convenience, familiarity and price
were positively related. However, each relative motive
had a positive and high correlation with its absolute
counterpart, ranging from 0?67 to 0?87 among men and
from 0?60 to 0?92 among women.
As the age-adjusted correlation coefficients in Table 3
show, participants with a higher education and income
rated price and familiarity as less important in both
absolute and relative terms. A minor gender difference was
observed here: the relationship between education and
price was significant only among women. A higher income
was related to the greater relative importance of health
considerations in food selection. On the relative level, all of
the motives were significantly associated with the food
consumption variables: pleasure, convenience, price and
familiarity were associated with a lower consumption of
vegetables/fruit and a higher consumption of energy-dense
foods, whereas the opposite was the case with health
and ethicality (Table 3). On the absolute level, all of the
motives except health and ethicality correlated weakly with
vegetable/fruit and energy-dense food intake (r #|0?10|).
Tables 4 and 5 show the standardized total, direct and
indirect effects of respectively education and income on
vegetable/fruit and energy-dense food intake from the
mediation models. Education (total effect b 5 0?12,
P , 0?001) and income (total effect b 5 0?12, P , 0?001)
were related to a higher consumption of vegetables/fruit,
whereas education had an inverse association with
energy-dense food intake (total effect b 5 20?09,
Public
Hea
lth
Nutr
itio
n
c
baSocio-economicstatus Dietary intakeFood choice
motive
BMIChildren inthe householdMarital statusAge Physical
activityGender
Fig. 1 The mediation model used to estimate the effects of socio-economic indicators on dietary intake. The model was estimatedseparately for each socio-economic indicator (education and income), absolute and relative food choice motive and foodconsumption variable (vegetables/fruit and energy-dense foods). All models were adjusted for age, gender, marital status, childrenin the household, BMI and physical activity. The models for vegetables/fruit were also adjusted for total energy intake. Rectanglesrepresent the measured variables and arrows the regression paths between the variables. a 5 Direct effect of socio-economicindicator on food choice motive; b 5 direct effect of food choice motive on dietary intake; c 5 direct effect of socio-economicindicator on dietary intake; a 3 b 5 indirect effect of the socio-economic indicator on dietary intake through the food choice motive.Total effect of the socio-economic indicator on dietary intake 5 direct effect c 1 indirect effect a 3 b
4 H Konttinen et al.

P , 0?001). The absolute importance of price, familiarity
and ethicality significantly mediated the effects of the
SES indicators on the intake of vegetables/fruit and/or
energy-dense foods, but all of these indirect effects
were very small in magnitude (b # |0?010|). The sizes of
the indirect effects were larger in the models including
relative motives, and health, price and familiarity partly
attenuated the associations between the SES indicators
and the food consumption variables. Multi-group analyses
indicated significant (P # 0?01) gender differences in the
associations between education, price and food consump-
tion variables: the indirect effects of education through
price (absolute and relative importance) on vegetable/fruit
and energy-dense food intake were significant only among
women (Table 4).
Discussion
The purpose of the current study was to increase under-
standing of the underlying reasons for SES inequalities in
dietary intake. We concentrated on the role of food choice
motives and, more specifically, considered whether indi-
viduals’ motive priorities (i.e. relative motives) should be
analysed rather than their absolute ratings of single motives
(i.e. absolute motives). We identified six distinctive food
choice motives, including health, pleasure, convenience,
price, familiarity and ethicality. Participants with low levels
of education and income placed more importance on price
and familiarity of the food than their more educated and
affluent counterparts in both absolute and relative terms. A
minor gender difference was that education was associated
with price motive (absolute and relative) only among
women. Furthermore, a higher income was related to the
greater relative importance of health considerations in both
genders. The relative rather than the absolute importance
of price, health and familiarity partly explained the SES
gradient in the intake of vegetables/fruit and/or energy-
dense foods.
The well-established positive relationship between SES
and vegetable/fruit consumption(1,2) was replicated in the
present study with respect to both educational attainment
and household income. In contrast, only education
showed a negative association with energy-dense food
intake, which is consistent with results from a recent study
on SES differences in takeaway food consumption(5). The
finding that the importance of price, familiarity and health
motives varied among the SES groups supports the results
of previous studies on this issue(8–10,14,15), although for the
health motive we observed this only on the relative level.
As expected, the relationship between income and price
was the strongest of all the associations between the
motives and the SES indicators. It is reasonable for indivi-
duals with fewer financial resources to emphasize price
in their food purchasing decisions and there is evidence
that price is a barrier to purchasing healthy food items
Public
Hea
lth
Nutr
itio
n
Table 1 Characteristics of the study participants by gender: sub-sample of men and women aged 25–64 years,FINRISK Study 2007
Men (n 1616–1691) Women (n 1946–2059)
Mean or % SD Mean or % SD
Age (years) 47?6* 10?8 46?6 11?1Education (years) 13?0* 3?7 13?8 3?7Household income (h) 26 133?4* 14 468?7 25 057?9 13 391?3Married (%) 74?7 – 72?3 –Children in the household (%) 32?7 – 35?4 –Physical activity (times/week) 4?3* 3?6 3?7 3?1BMI (kg/m2) 27?0* 4?3 26?4 5?4Vegetables/fruit (g/d) 338?6* 258?1 485?5 321?5Energy-dense foods (g/d) 122?4* 87?6 66?7 51?5Total energy intake (kJ/d) 11 566?8* 3854?9 9338?1 3087?7Absolute food choice motives-
Health 2?82* 0?51 3?10 0?48Pleasure 2?83* 0?51 3?03 0?52Ethicality 2?36* 0?55 2?52 0?57Convenience 2?62* 0?59 2?81 0?59Familiarity 2?34* 0?68 2?26 0?75Price 2?63* 0?71 2?79 0?70
Relative food choice motives-
-
Health 1?06* 0?12 1?09 0?11Pleasure 1?08 0?17 1?07 0?16Ethicality 0?89 0?14 0?88 0?14Convenience 1?00 0?24 1?00 0?22Familiarity 0?89* 0?26 0?80 0?25Price 1?00 0?27 0?99 0?25
Mean values were significantly different from those of women (ANOVA): *P , 0?05.-Values vary from 1 to 4.-
-
Values vary from 0?27 to 2?86.
Socio-economic status and food choice motives 5

among socio-economically disadvantaged groups(37–40).
The greater importance attached to familiarity among
individuals with lower levels of education and income
could result in a more monotonous dietary intake. Trying
new food may, for example, represent a risk of waste
that less affluent individuals cannot afford to take(41).
Moreover, a higher education may increase the will-
ingness to experiment with new foods, thereby leading
to a lower appreciation of food-related traditions and
familiar dietary practices(39). The finding that considera-
tions related to weight control and health were relatively
more salient to individuals with higher incomes could, to
some extent, reflect the fact that more affluent individuals
have the financial freedom to take health aspects into
account in their food purchasing, given the higher cost of
healthy foods(16).
The present study is the first one to show that the
relative importance of price, health and familiarity
motives contributes to SES disparities in the consumption
of vegetables/fruit and/or energy-dense foods. The
mediated effects of the absolute motives were very small,
however, although there were some significant indirect
effects. The difference between the absolute and relative
price and familiarity motives can be attributed to the fact
that they were associated with a lower vegetable/fruit
intake and a higher energy-dense food intake on the
relative level, whereas on the absolute level their asso-
ciations with these food consumption variables were
weak. Similarly, a previous study (analysing motives in
absolute terms) found that education groups differed in
the importance they placed on four motives (price,
familiarity, mood control and sensory appeal), but only
familiarity contributed to the educational gradient in total
fibre and fruit/vegetable intake(8). The findings from the
present study extend those obtained by Beydoun and
Wang concerning the importance of price relative to
healthiness as a contributor to SES disparities in diet(20) in
indicating a need to analyse other food choice motives
relative to each other. It should be noted, however,
that the relative motives explained only part of the SES
variations in dietary intake, implying that other factors are
also relevant. Factors related to the food environment,
such as access and availability, have recently attracted
a lot of research interest and poorer access to healthy
foods has been observed in socio-economically deprived
areas in the USA(42). For other high-income countries
including the UK, Canada and Australia, the evidence for
poorer access to healthy foods in disadvantaged areas is
equivocal(42,43).
Another discrepancy between absolute and relative
motives was that all of the absolute motives correlated
positively with each other, in accordance with findings
reported in previous studies(11,44), but convenience,
familiarity and price were the only relative ones that
were positively associated. The occurrence of negative as
well as positive correlations on the relative level is
Public
Hea
lth
Nutr
itio
n
Tab
le2
Age-a
dju
ste
dcorr
ela
tions
betw
een
absolu
teand
rela
tive
food
choic
em
otives
by
gender:
sub-s
am
ple
of
men
and
wom
en
aged
25–64
years
,F
INR
ISK
Stu
dy
2007
Absolu
tem
otives
Rela
tive
motives
Health
Ple
asure
Eth
icalit
yC
onvenie
nce
Price
Fam
iliarity
Health
Ple
asure
Eth
icalit
yC
onvenie
nce
Price
Fam
iliarity
Absolu
tem
otiv
es
Health
1?0
00
?35**
*0
?48**
*0
?10**
*0
?17**
*0
?11**
*0
?60**
*2
0?2
8**
*0
?07**
20
?38**
*2
0?2
5**
*2
0?2
1**
*P
leasure
0?3
5**
*1
?00
0?3
0**
*0
?06**
0?1
5**
*0
?16**
*2
0?2
5**
*0
?69**
*2
0?0
7**
20
?31**
*2
0?1
7**
*2
0?0
8**
*E
thic
alit
y0
?55**
*0
?33**
*1
?00
0?0
7**
0?1
0**
*0
?18**
*2
0?2
3**
*2
0?3
2**
*0
?85**
*2
0?3
9**
*2
0?2
9**
*2
0?1
2**
*C
onvenie
nce
0?0
7**
0?0
30
?03
1?0
00
?25**
*0
?30**
*2
0?2
8**
*2
0?2
4**
*2
0?1
7**
*0
?81**
*0
?08**
*0
?18**
*P
rice
0?1
5**
*0
?13**
*0
?14**
*0
?32**
*1
?00
0?1
6**
*2
0?1
3**
*2
0?0
9**
*0
?10**
*0
?08**
0?8
6**
*0
?04
Fam
iliarity
0?1
2**
*0
?18**
*0
?20**
*0
?32**
*0
?15**
*1
?00
20
?26**
*2
0?0
9**
*2
0?0
10
?11**
*2
0?0
20
?92**
*R
ela
tive
motiv
es
Health
0?6
7**
*2
0?2
0**
*2
0?0
8**
20
?28**
*2
0?1
6**
*2
0?2
4**
*1
?00
20
?32**
*2
0?3
3**
*2
0?2
9**
*2
0?1
4**
*2
0?2
8**
*P
leasure
20
?34**
*0
?67**
*2
0?3
2**
*2
0?2
4**
*0
?13**
*2
0?0
8**
20
?39**
*1
?00
20
?40**
*2
0?1
7**
*2
0?0
42
0?0
5*
Eth
icalit
y0
?12**
*2
0?0
40
?83**
*2
0?2
3**
*2
0?0
6*
20
?01
20
?22**
*2
0?3
6**
*1
?00
20
?38**
*2
0?2
7**
*2
0?1
4**
*C
onvenie
nce
20
?43**
*2
0?3
4**
*2
0?4
4**
*0
?81**
*0
?12**
*0
?12**
*2
0?3
7**
*2
0?1
5**
*2
0?4
3**
*1
?00
0?2
2**
*0
?22**
*P
rice
20
?27**
*2
0?1
8**
*2
0?2
6**
*0
?17**
*0
?86**
*2
0?0
22
0?2
4**
*2
0?0
6*
20
?24**
*0
?28**
*1
?00
0?0
7**
Fam
iliarity
20
?29**
*2
0?1
1**
*2
0?1
9**
*0
?19**
*2
0?0
00
?87**
*2
0?3
3**
*0
?00
20
?18**
*0
?28**
*0
?07**
1?0
0
Men
(n1616–1686)
are
belo
wand
wom
en
(n1946–2047)
are
above
the
dia
gonal.
Sig
nifi
cance
of
corr
ela
tion:
*P,
0?0
5,
**P
,0
?01,
***P
,0
?001.
6 H Konttinen et al.

understandable in that each motive was divided by the
individual mean ratings across all motives in order to
determine its relative importance. People commonly
prioritize food choice motives, given that it is rare for
all personally important motives to be fully satisfied in
any particular eating situation(17,18), and relative motive
variables produce the prioritizing mathematically. One
problem related to relative motives is that they do not
capture individual differences in the level of involvement
with food, some consumers being enthusiastic about every
aspect of it and others being extremely uninvolved(45).
However, analysing motive priorities instead of absolute
ratings of single motives may better reflect the complexity
of the motive structure in that relatively unimportant
motives might not affect food choices even though their
absolute importance is high(46).
One of the strengths of the current study was that we
used a large population-based sample incorporating
Public
Hea
lth
Nutr
itio
n
Table 3 Age-adjusted correlations between absolute and relative food choice motives, socio-economic indicators and food consumptionvariables by gender: sub-sample of men and women aged 25–64 years, FINRISK Study 2007
Men (n 1616–1686) Women (n 1946–2047)
Education IncomeVegetables/
fruit-Energy-dense
foods- Education IncomeVegetables/
fruit-Energy-dense
foods-
Absolute motivesHealth 0?04 0?03 0?25*** 20?19*** 20?01 0?02 0?23*** 20?23***Pleasure 20?02 20?02 0?05* 0?06* 20?08*** 20?02 0?04 0?00Ethicality 20?01 20?06* 0?15*** 20?14*** 0?01 20?05* 0?14*** 20?11***Convenience 0?01 20?08** 20?06* 0?10*** 0?04 0?00 20?06* 0?08***Price 0?01 20?26*** 20?06* 0?02 20?15*** 20?32*** 20?08** 0?06*Familiarity 20?13*** 20?11*** 20?08** 0?03 20?19*** 20?11*** 20?01 0?07**
Relative motivesHealth 0?07** 0?14*** 0?20*** 20?19*** 0?04 0?10*** 0?19*** 20?22***Pleasure 20?04 0?02 20?09*** 0?17*** 20?06** 0?03 20?09*** 0?12***Ethicality 20?00 20?04 0?09*** 20?12*** 0?06** 20?03 0?09*** 20?07**Convenience 0?00 0?04 20?16*** 0?15*** 0?06* 0?03 20?17*** 0?16***Price 20?01 20?24*** 20?15*** 0?08** 20?13*** 20?30*** 20?17*** 0?12***Familiarity 20?13*** 20?08** 20?17*** 0?09** 20?19*** 20?09*** 20?09*** 0?13***
Significance of correlation: *P , 0?05, **P , 0?01, ***P , 0?001.-The food consumption variables were square-root transformed in order to improve the normality of the distributions.
Table 4 Results from the structural equation models: standardized total, direct and indirect (through food choice motives) effects ofeducation on the consumption of vegetables/fruit and energy-dense foods among a sub-sample of men and women aged 25–64 years,FINRISK Study 2007
Models with absolute food choice motives Models with relative food choice motives
Total effect ofeducation-
Direct effect ofeducation
Specific indirecteffects
Direct effect ofeducation
Specific indirecteffects
b SE b SE b SE b SE b SE
Vegetables/fruity (n 3565)Health 0?12*** 0?02 0?11*** 0?02 0?005 0?004 0?11*** 0?02 0?010** 0?004Pleasure 0?12*** 0?02 0?12*** 0?02 20?001 0?001 0?11*** 0?02 0?004* 0?002Ethicality 0?12*** 0?02 0?11*** 0?02 0?001 0?002 0?11*** 0?02 0?002 0?001Convenience 0?12*** 0?02 0?12*** 0?02 20?002 0?001 0?12*** 0?02 20?006* 0?003Price-
-
Men 0?15*** 0?03 0?15*** 0?03 0?000 0?002 0?14*** 0?03 0?003 0?004Women 0?09*** 0?02 0?08*** 0?02 0?009* 0?003 0?07** 0?02 0?019*** 0?004
Familiarity 0?12*** 0?02 0?11*** 0?02 0?005* 0?003 0?10*** 0?02 0?017*** 0?003Energy-dense foodsy (n 3620)
Health 20?09*** 0?02 20?09*** 0?02 20?004 0?004 20?08*** 0?02 20?010** 0?004Pleasure 20?09*** 0?02 20?09*** 0?02 20?001 0?001 20?08*** 0?02 20?006* 0?003Ethicality 20?09*** 0?02 20?09*** 0?02 0?000 0?002 20?09*** 0?02 20?002 0?002Convenience 20?09*** 0?02 20?09*** 0?02 0?003 0?002 20?10*** 0?02 0?006* 0?003Price-
-
Men 20?06* 0?03 20?06* 0?03 0?000 0?001 20?06* 0?03 20?002 0?002Women 20?14*** 0?03 20?13*** 0?03 20?004 0?004 20?12*** 0?03 20?013** 0?004
Familiarity 20?09*** 0?02 20?09*** 0?02 20?005 0?003 20?08*** 0?02 20?014*** 0?003
Significance of coefficient: *P , 0?05, **P , 0?01, ***P , 0?001.-Total effect 5 direct effect 1 indirect effect.-
-
Gender-stratified results are shown because the multi-group analyses indicated significant (P # 0?01) gender differences in the associations betweeneducation, price and the food consumption variables.yThe food consumption variables were square-root transformed in order to improve the normality of the distributions.
Socio-economic status and food choice motives 7

detailed information on sociodemographic factors, diet-
ary habits and food choice motives in order to enhance
understanding of SES inequalities in dietary intake.
Applying structural equation modelling allowed us to
explicitly test the direct and indirect effects among the
variables of interest, and we took a novel analytical
approach in terms of food choice motives. There are also
limitations that should be taken into account in inter-
preting the results, however. The analyses were based
on cross-sectional data, which does not allow for the
ascertainment of causality or its direction. Nevertheless,
SES is more likely to have an influence on food intake and
food choice motives than vice versa. In addition, moti-
vational factors are often considered to be determinants
of behaviour rather than consequences. Assessing food
consumption on a self-report FFQ allowed us to estimate
longer-term intake, but all self-report dietary assessment
methods are vulnerable to under- and over-reporting(47).
In order to take account of this, we adjusted the analyses
for total energy intake and for several variables known to
be related to reporting bias(30,48). We measured two food
choice motives, price and familiarity, on only one item
(‘is cheap’ and ‘is what I usually eat’, respectively). This
may not capture their nature comprehensively, but the
associations were still consistent with those reported in
previous studies assessing price and familiarity on more
items(8,11). The present sample was initially representative
of the Finnish population, but the attrition rate was
relatively high due to the demanding study protocol.
Non-participant analyses conducted in the context of
previous FINRISK studies have shown that non-participants
are more likely to have a low SES(49) and this could have
made our estimates more conservative.
Conclusions
The present results suggest that the less healthy dietary
habits among individuals with a low SES are partly attri-
butable to the higher priority they place on price and
familiarity and the lower priority they give to health
motives. Although differences between SES groups in the
importance of food price and healthfulness have fre-
quently been observed, the current findings imply that
familiarity is another relevant motive that deserves further
research. Furthermore, it is useful to analyse individuals’
motive priorities rather than their absolute ratings of
single motives, given that they may better reflect the
complexity of the motive structure. On the practical level,
reducing the price of healthy food could be an effective
strategy for improving the diets of low-SES groups.
A recent study conducted in real-life settings provided
evidence that giving price discounts on healthier foods
increased their purchasing irrespective of education or
income level(50). However, as Ni Mhurchu(51) notes, more
research is needed in order to evaluate the exact effects of
a range of pricing strategies on food consumption, health
and inequalities.
Acknowledgements
This study was supported by the Academy of Finland
(grant numbers 118139, 136895 and 141005) and the
Finnish Doctoral Program for Social Sciences (SOVAKO).
The authors have no conflicts of interest to declare.
H.K., S.M. and A.H. were involved in data collection.
H.K. conceptualized the research questions, conducted
Public
Hea
lth
Nutr
itio
n
Table 5 Results from the structural equation models: standardized total, direct and indirect (through food choice motives) effects of incomeon the consumption of vegetables/fruit and energy-dense foods among a sub-sample of men and women aged 25–64 years, FINRISKStudy 2007
Models with absolute food choice motives Models with relative food choice motives
Total effect ofincome-
Direct effect ofincome
Specific indirecteffects
Direct effect ofincome
Specific indirecteffects
b SE b SE b SE b SE b SE
Vegetables/fruit-
-
(n 3565)Health 0?12*** 0?02 0?11*** 0?02 0?005 0?004 0?10*** 0?02 0?020*** 0?004Pleasure 0?12*** 0?02 0?12*** 0?02 0?000 0?001 0?12*** 0?02 20?003 0?002Ethicality 0?12*** 0?02 0?13*** 0?02 20?007** 0?002 0?12*** 0?02 20?003* 0?002Convenience 0?12*** 0?02 0?12*** 0?02 0?000 0?001 0?12*** 0?02 20?004 0?003Price 0?12*** 0?02 0?11*** 0?02 0?010* 0?005 0?09*** 0?02 0?033*** 0?005Familiarity 0?12*** 0?02 0?12*** 0?02 0?004* 0?002 0?11*** 0?02 0?009*** 0?002
Energy-dense foods-
-
(n 3620)Health 20?03* 0?02 20?03 0?02 20?004 0?004 20?01 0?02 20?021*** 0?004Pleasure 20?03* 0?02 20?03* 0?02 20?001 0?001 20?04* 0?02 0?004 0?003Ethicality 20?04* 0?02 20?04* 0?02 0?007** 0?002 20?04* 0?02 0?004* 0?002Convenience 20?03* 0?02 20?03* 0?02 0?000 0?002 20?04* 0?02 0?004 0?003Price 20?03* 0?02 20?03 0?02 20?007 0?005 20?01 0?02 20?023*** 0?005Familiarity 20?03* 0?02 20?03 0?02 20?005* 0?002 20?03 0?02 20?008*** 0?002
Significance of coefficient: *P , 0?05, **P , 0?01, ***P , 0?001.-Total effect 5 direct effect 1 indirect effect.-
-
The food consumption variables were square-root transformed in order to improve the normality of the distributions.
8 H Konttinen et al.

statistical analyses and drafted the manuscript. S.S.-L.,
K.S., S.M. and A.H. helped to draft the manuscript and
advised on issues related to socio-economic factors, food
choice motives and dietary intake. All authors were
involved in the planning of the study and read and
approved the final manuscript.
References
1. Giskes K, Avendano M, Brug J et al. (2010) A systematicreview of studies on socioeconomic inequalities in dietaryintakes associated with weight gain and overweight/obesity conducted among European adults. Obes Rev 11,413–429.
2. Darmon N & Drewnowski A (2008) Does social classpredict diet quality? Am J Clin Nutr 87, 1107–1117.
3. James WP, Nelson M, Ralph A et al. (1997) Socioeconomicdeterminants of health. The contribution of nutrition toinequalities in health. BMJ 314, 1545–1549.
4. Galobardes B, Morabia A & Bernstein MS (2001) Diet andsocioeconomic position: does the use of different indica-tors matter? Int J Epidemiol 30, 334–340.
5. Miura K, Giskes K & Turrell G (2012) Socio-economicdifferences in takeaway food consumption among adults.Public Health Nutr 15, 218–226.
6. Thornton LE, Bentley RJ & Kavanagh AM (2011) Individualand area-level socioeconomic associations with fast foodpurchasing. J Epidemiol Community Health 65, 873–880.
7. Pereira MA, Kartashov AI, Ebbeling CB et al. (2005) Fast-food habits, weight gain, and insulin resistance (the CARDIAstudy): 15-year prospective analysis. Lancet 365, 36–42.
8. Steptoe A & Wardle J (1999) Motivational factors asmediators of socioeconomic variations in dietary intakepatterns. Psychol Health 14, 391–402.
9. Hupkens CLH, Knibbe RA & Drop MJ (2000) Social classdifferences in food consumption. The explanatory valueof permissiveness and health and cost considerations.Eur J Public Health 10, 108–113.
10. Ball K, Crawford D & Mishra G (2006) Socio-economicinequalities in women’s fruit and vegetable intakes: amultilevel study of individual, social and environmentalmediators. Public Health Nutr 9, 623–630.
11. Steptoe A, Pollard TM & Wardle J (1995) Development of ameasure of the motives underlying the selection of food:the food choice questionnaire. Appetite 25, 267–284.
12. Glanz K, Basil M, Maibach E et al. (1998) Why Americanseat what they do: taste, nutrition, cost, convenience, andweight control concerns as influences on food consump-tion. J Am Diet Assoc 98, 1118–1126.
13. Connors M, Bisogni CA, Sobal J et al. (2001) Managingvalues in personal food systems. Appetite 36, 189–200.
14. Lennernas M, Fjellstrom C, Becker W et al. (1997)Influences on food choice perceived to be important bynationally-representative samples of adults in the EuropeanUnion. Eur J Clin Nutr 51, Suppl. 2, S8–S15.
15. Bowman SA (2006) A comparison of the socioeconomiccharacteristics, dietary practices, and health status ofwomen food shoppers with different food price attitudes.Nutr Res 26, 318–324.
16. Drewnowski A (2010) The cost of US foods as related totheir nutritive value. Am J Clin Nutr 92, 1181–1188.
17. Sobal J, Bisogni CA, Devine CM et al. (2006) A conceptualmodel of the food choice process over the life course. InThe Psychology of Food Choice, pp. 1–18 [R Shepherd andM Raats, editors]. Wallingford: CABI.
18. Sobal J & Bisogni CA (2009) Constructing food choicedecisions. Ann Behav Med 38, Suppl. 1, S37–S46.
19. Lappalainen R, Saba A, Holm L et al. (1997) Difficulties intrying to eat healthier: descriptive analysis of perceivedbarriers for healthy eating. Eur J Clin Nutr 51, Suppl. 2,S36–S40.
20. Beydoun MA & Wang Y (2008) How do socio-economicstatus, perceived economic barriers and nutritional benefitsaffect quality of dietary intake among US adults? Eur J ClinNutr 62, 303–313.
21. Schwartz SH (1992) Universals in the content andstructure of values: theoretical advances and empiricaltests in 20 countries. In Advances in ExperimentalSocial Psychology, pp. 1–65 [M Zanna, editor]. New York:Academic Press.
22. Vartiainen E, Laatikainen T, Peltonen M et al. (2010) Thirty-five-year trends in cardiovascular risk factors in Finland.Int J Epidemiol 39, 504–518.
23. Eertmans A, Victoir A, Notelaers G et al. (2006) The FoodChoice Questionnaire: factorial invariant over westernurban populations? Food Qual Prefer 17, 344–352.
24. Fotopoulos C, Krystallis A, Vassallo M et al. (2009) FoodChoice Questionnaire (FCQ) revisited. Suggestions for thedevelopment of an enhanced general food motivationmodel. Appetite 52, 199–208.
25. Hu L-T & Bentler PM (1999) Cutoff criteria for fit indexes incovariance structure analysis: conventional criteria versusnew alternatives. Struct Equ Modeling 6, 1–55.
26. Cattell RB (1966) The scree test for the number of factors.Multivariate Behav Res 1, 245–276.
27. Verkasalo M, Tuomivaara P & Lindeman M (1996) 15-year-oldpupils’ and their teachers’ values, and their beliefs about thevalues of an ideal pupil. Educ Psychol 16, 35–47.
28. Schwartz SH & Rubel T (2005) Sex differences in valuepriorities: cross-cultural and multimethod studies. J Pers SocPsychol 89, 1010–1028.
29. Mannisto S, Virtanen M, Mikkonen T et al. (1996)Reproducibility and validity of a food frequency ques-tionnaire in a case–control study on breast cancer. J ClinEpidemiol 49, 401–409.
30. Paalanen L, Mannisto S, Virtanen MJ et al. (2006) Validity ofa food frequency questionnaire varied by age and bodymass index. J Clin Epidemiol 59, 994–1001.
31. Reinivuo H, Hirvonen T, Ovaskainen ML et al. (2010)Dietary survey methodology of FINDIET 2007 witha risk assessment perspective. Public Health Nutr 13,915–919.
32. Organisation for Economic Co-operation and Development(1982) The OECD List of Social Indicators. Paris: OECDSocial Indicator Development Programme.
33. Craig CL, Marshall AL, Sjostrom M et al. (2003) Internationalphysical activity questionnaire: 12-country reliability andvalidity. Med Sci Sports Exerc 35, 1381–1395.
34. Muthen LK & Muthen BO (1998–2009) Mplus User’s Guide,5th ed. Los Angeles, CA: Muthen & Muthen.
35. Westenhoefer J (2005) Age and gender dependent profileof food choice. Forum Nutr 57, 44–51.
36. Cheung GW & Rensvold RB (2002) Evaluating goodness-of-fit indexes for testing measurement invariance. StructEqu Modeling 9, 233–255.
37. Giskes K, Turrell G, Patterson C et al. (2002) Socio-economic differences in fruit and vegetable consumptionamong Australian adolescents and adults. Public HealthNutr 5, 663–669.
38. Dibsdall LA, Lambert N, Bobbin RF et al. (2003) Low-income consumers’ attitudes and behaviour towardsaccess, availability and motivation to eat fruit andvegetables. Public Health Nutr 6, 159–168.
39. Inglis V, Ball K & Crawford D (2005) Why do women oflow socioeconomic status have poorer dietary behavioursthan women of higher socioeconomic status? A qualitativeexploration. Appetite 45, 334–343.
Public
Hea
lth
Nutr
itio
nSocio-economic status and food choice motives 9

40. Waterlander WE, de Mul A, Schuit AJ et al. (2010)Perceptions on the use of pricing strategies to stimulatehealthy eating among residents of deprived neighbour-hoods: a focus group study. Int J Behav Nutr Phys Act 7, 44.
41. Barker M, Lawrence WT, Skinner TC et al. (2008)Constraints on food choices of women in the UK withlower educational attainment. Public Health Nutr 11,1229–1237.
42. Beaulac J, Kristjansson E & Cummins S (2009) A systematicreview of food deserts, 1966–2007. Prev Chronic Dis 6,A105.
43. Macintyre S (2007) Deprivation amplification revisited; or,is it always true that poorer places have poorer access toresources for healthy diets and physical activity? Int J BehavNutr Phys Act 4, 32.
44. Pollard TM, Steptoe A &Wardle J (1998) Motives underlyinghealthy eating: using the Food Choice Questionnaire toexplain variation in dietary intake. J Biosoc Sci 30, 165–179.
45. Grunert KG, Baadsggaard A, Larsen HH et al. (1996) MarketOrientation in Food and Agriculture. Norwell, MA: KluwerAcademic Publishers.
46. Scheibehenne B, Miesler L & Todd PM (2007) Fastand frugal food choices: uncovering individual decisionheuristics. Appetite 49, 578–589.
47. Maurer J, Taren DL, Teixeira PJ et al. (2006) Thepsychosocial and behavioral characteristics related toenergy misreporting. Nutr Rev 64, 53–66.
48. Hirvonen T, Mannisto S, Roos E et al. (1997) Increasingprevalence of underreporting does not necessarily distortdietary surveys. Eur J Clin Nutr 51, 297–301.
49. Harald K, Salomaa V, Jousilahti P et al. (2007) Non-participation and mortality in different socioeconomicgroups: the FINRISK population surveys in 1972–92.J Epidemiol Community Health 61, 449–454.
50. Blakely T, Ni Mhurchu C, Jiang Y et al. (2011) Do effects ofprice discounts and nutrition education on food purchasesvary by ethnicity, income and education? Results froma randomised, controlled trial. J Epidemiol CommunityHealth 65, 902–908.
51. Ni Mhurchu C (2010) Food costs and healthful diets: theneed for solution-oriented research and policies. Am J ClinNutr 92, 1007–1008.
Appendix
Public
Hea
lth
Nutr
itio
n The four-factor structure of the shortened Food Choice Questionnaire
Health Convenience Pleasure Ethicality
1. Is low in fat- 0?81 20?102. Helps me control my weight- 0?783. Is low in calories- 0?764. Is high in fibre and roughage-
-
0?66 0?165. Keeps me healthy-
-
0?49 0?12 0?156. Contains a lot of vitamins and minerals-
-
0?46 0?11 0?317. Keeps me awake/alerty 0?43 0?318. Is good for my skin/teeth/hair/nails etc.-
-
0?43 0?19 0?239. Is high in protein-
-
0?30 0?15 0?2110. Takes no time to prepareJ 0?92 20?1411. Is easy to prepareJ 0?80 20?11 20?1612. Can be bought in shops close to where I live or workJ 0?38 0?1413. Is cheapz 0?3014. Is what I usually eat-- 0?20 0?2015. Smells nice-
-
-
-
0?8616. Makes me feel goody 0?7417. Looks nice-
-
-
-
0?6118. Tastes good-
-
-
-
0?57 20?1219. Helps me cope with stressy 0?5220. Is organically grown 0?7421. Is packaged in an environmentally friendly wayyy 0?7422. Carries the Fairtrade mark 0?6923. Comes from countries I approve of politicallyyy 0?6824. Contains no artificial ingredientsJJ 0?16 20?10 0?6525. Contains no additivesJJ 0?25 0?5226. Is domestically produced 0?10 0?50
Cronbach’s a 0?87 0?67 0?79 0?86
Total variance explained 45?1 %. Factor loadings $|0?10| are shown and items with factor loadings .|0?35| are considered to belong to the respective factor.-Item is part of the weight control factor of the original Food Choice Questionnaire(11).-
-
Item is part of the health factor.yItem is part of the mood factor.JItem is part of the convenience factor.zItem is part of the price factor.--Item is part of the familiarity factor.-
-
-
-
Item is part of the sensory appeal factor.yyItem is part of the ethical concern factor.JJItem is part of the natural content factor.
10 H Konttinen et al.