An alternative method for the industrial monitoring of osmotic solution during dehydration of fruit...
7
An alternative method for the industrial monitoring of osmotic solution during dehydration of fruit and vegetables: A test-case for tomatoes A. Cataldo a,⇑ , G. Cannazza a , E. De Benedetto a , C. Severini b , A. Derossi b a Department of Engineering for Innovation, University of Salento, Complesso Ecotekne – Edificio Corpo O, via Monteroni, 73100 Lecce, Italy b Department of Food Science, University of Foggia, via Napoli 25, 71100 Foggia, Italy article info Article history: Received 7 October 2010 Received in revised form 3 February 2011 Accepted 12 February 2011 Available online 18 February 2011 Keywords: Dielectric properties Food industry Microwave reflectometry Osmotic dehydration Quality control Time domain reflectometry abstract In this paper, an alternative procedure for in situ and continuous monitoring of the status of the hyper- tonic solutions used in industrial osmotic dehydration (OD) process of fruit and vegetables is presented and validated. The proposed method, which is based on microwave reflectometry technique, circumvents the limitation of traditional control methods, since it discovers the relation between the characteristic parameters of osmotic solutions and the corresponding measured reflection coefficients. In fact, as the OD proceeds, the dielectric characteristics of the solution, associated to the reflectometry measurements, can be directly related to the variation of the water activity (a w ), which is the parameter that is typically considered to assess the dewatering capacity of the solution. As a result, through the method presented herein, a continuous monitoring of the dewatering capacity of the osmotic solution, associated to its qual- itative status, is possible, which, in turn, is useful also for optimizing the OD industrial process. The pro- posed method was preliminarily validated on reference aqueous solutions of sucrose. Successively, the method was tested also in a typical industrial application, involving the OD process of tomatoes. Ó 2011 Elsevier Ltd. All rights reserved. 1. Introduction Osmotic dehydration (OD) is an effective technique for the par- tial removal of water from fruit and vegetables obtaining a signif- icant increase of their shelf-life; in fact, by reducing water content, the growth of microorganisms is inhibited and the rate of degrada- tion reactions is reduced. OD used as pretreatment to conventional air drying not only removes water from the food, but also reduces aroma losses (Warczok et al., 2007) and lowers energy consump- tion (Derossi et al., 2008, 2010; Hui et al., 2007; Torreggiani and Bertolo, 2001). In the OD process, the product is immersed in a hypertonic solu- tion, thus promoting two counter-current flows: (1) Water motion from biological tissues to hypertonic solution; (2) Osmotic agents flow toward the product. OD has been extensively used for pre- dehydration of pineapples (Lombard et al., 2008), mushrooms (Torringa et al., 2001), melons (Rodrigues and Fernandes, 2007), bananas (Fernandes et al., 2006) and many other perishable goods in general. Nevertheless, as reported in Dalla Rosa and Giroux (2001), the adoption of OD in industrial production processes is hindered by problems with the overall management of the concen- trated solutions. In fact, there are still some practical aspects that make managing and controlling the osmotic solution the bottleneck of the OD process. In particular, there are still some major concerns regarding the appropriate individuation of the loss in dewatering capacity and the possibility of re-using the spent solution, so as to make the process more economically advanta- geous (Warczok et al., 2007). On such bases, problems related to the osmotic dehydration control and osmotic solution management are still unsolved and, currently, no methodologies can successfully and rapidly represent the solution to the aforementioned needs. As a matter of fact, the osmotic pressure (p) might represent the primary parameter whose estimation would lead to the identification of the quality status of the osmotic solution. However, many food-industry pro- cesses typically involve osmotic solutions with high value of p (up to 250–300 bar), which, in practice, seriously limits the possi- bility of realizing specific devices for measurements. Additionally, the high uncertainties and the long times needed for measurement are other drawbacks that make the direct measurement of p extre- mely difficult. On the other hand, water activity (a w ) is a reliable indicator of the status of the osmotic solution, since it is strictly related to the dewatering capacity of the solution. In fact, the OD proceeds until the osmotic solution and the food product have reached the same a w value (Barbosa-Canovas and Vega-Mercado, 1996). Never- theless, although this parameter can be a suitable indicator in the OD management, not only the instrumentation for measuring it is quite costly, but also measurements usually have to be performed 0260-8774/$ - see front matter Ó 2011 Elsevier Ltd. All rights reserved. doi:10.1016/j.jfoodeng.2011.02.026 ⇑ Corresponding author. Tel.: +39 0832 297823; fax: +39 0832 297733. E-mail address: [email protected] (A. Cataldo). Journal of Food Engineering 105 (2011) 186–192 Contents lists available at ScienceDirect Journal of Food Engineering journal homepage: www.elsevier.com/locate/jfoodeng
Transcript of An alternative method for the industrial monitoring of osmotic solution during dehydration of fruit...
Journal of Food Engineering 105 (2011) 186–192
Contents lists available at ScienceDirect
Journal of Food Engineering
journal homepage: www.elsevier .com/locate / j foodeng
An alternative method for the industrial monitoring of osmotic solution duringdehydration of fruit and vegetables: A test-case for tomatoes
A. Cataldo a,⇑, G. Cannazza a, E. De Benedetto a, C. Severini b, A. Derossi b
a Department of Engineering for Innovation, University of Salento, Complesso Ecotekne – Edificio Corpo O, via Monteroni, 73100 Lecce, Italyb Department of Food Science, University of Foggia, via Napoli 25, 71100 Foggia, Italy
a r t i c l e i n f o
Article history:Received 7 October 2010Received in revised form 3 February 2011Accepted 12 February 2011Available online 18 February 2011
Keywords:Dielectric propertiesFood industryMicrowave reflectometryOsmotic dehydrationQuality controlTime domain reflectometry
0260-8774/$ - see front matter � 2011 Elsevier Ltd. Adoi:10.1016/j.jfoodeng.2011.02.026
⇑ Corresponding author. Tel.: +39 0832 297823; faxE-mail address: [email protected] (A. C
a b s t r a c t
In this paper, an alternative procedure for in situ and continuous monitoring of the status of the hyper-tonic solutions used in industrial osmotic dehydration (OD) process of fruit and vegetables is presentedand validated. The proposed method, which is based on microwave reflectometry technique, circumventsthe limitation of traditional control methods, since it discovers the relation between the characteristicparameters of osmotic solutions and the corresponding measured reflection coefficients. In fact, as theOD proceeds, the dielectric characteristics of the solution, associated to the reflectometry measurements,can be directly related to the variation of the water activity (aw), which is the parameter that is typicallyconsidered to assess the dewatering capacity of the solution. As a result, through the method presentedherein, a continuous monitoring of the dewatering capacity of the osmotic solution, associated to its qual-itative status, is possible, which, in turn, is useful also for optimizing the OD industrial process. The pro-posed method was preliminarily validated on reference aqueous solutions of sucrose. Successively, themethod was tested also in a typical industrial application, involving the OD process of tomatoes.
� 2011 Elsevier Ltd. All rights reserved.
1. Introduction
Osmotic dehydration (OD) is an effective technique for the par-tial removal of water from fruit and vegetables obtaining a signif-icant increase of their shelf-life; in fact, by reducing water content,the growth of microorganisms is inhibited and the rate of degrada-tion reactions is reduced. OD used as pretreatment to conventionalair drying not only removes water from the food, but also reducesaroma losses (Warczok et al., 2007) and lowers energy consump-tion (Derossi et al., 2008, 2010; Hui et al., 2007; Torreggiani andBertolo, 2001).
In the OD process, the product is immersed in a hypertonic solu-tion, thus promoting two counter-current flows: (1) Water motionfrom biological tissues to hypertonic solution; (2) Osmotic agentsflow toward the product. OD has been extensively used for pre-dehydration of pineapples (Lombard et al., 2008), mushrooms(Torringa et al., 2001), melons (Rodrigues and Fernandes, 2007),bananas (Fernandes et al., 2006) and many other perishable goodsin general. Nevertheless, as reported in Dalla Rosa and Giroux(2001), the adoption of OD in industrial production processes ishindered by problems with the overall management of the concen-trated solutions. In fact, there are still some practical aspects thatmake managing and controlling the osmotic solution the
ll rights reserved.
: +39 0832 297733.ataldo).
bottleneck of the OD process. In particular, there are still somemajor concerns regarding the appropriate individuation of the lossin dewatering capacity and the possibility of re-using the spentsolution, so as to make the process more economically advanta-geous (Warczok et al., 2007).
On such bases, problems related to the osmotic dehydrationcontrol and osmotic solution management are still unsolved and,currently, no methodologies can successfully and rapidly representthe solution to the aforementioned needs. As a matter of fact, theosmotic pressure (p) might represent the primary parameterwhose estimation would lead to the identification of the qualitystatus of the osmotic solution. However, many food-industry pro-cesses typically involve osmotic solutions with high value of p(up to 250–300 bar), which, in practice, seriously limits the possi-bility of realizing specific devices for measurements. Additionally,the high uncertainties and the long times needed for measurementare other drawbacks that make the direct measurement of p extre-mely difficult.
On the other hand, water activity (aw) is a reliable indicator ofthe status of the osmotic solution, since it is strictly related tothe dewatering capacity of the solution. In fact, the OD proceedsuntil the osmotic solution and the food product have reached thesame aw value (Barbosa-Canovas and Vega-Mercado, 1996). Never-theless, although this parameter can be a suitable indicator in theOD management, not only the instrumentation for measuring it isquite costly, but also measurements usually have to be performed

Fig. 1. Schematic diagram of the used probe (a). Zoom of the open-end terminationof the probe (b).
A. Cataldo et al. / Journal of Food Engineering 105 (2011) 186–192 187
in laboratory (i.e., samples of the solutions should be taken andsubsequently analyzed off-line), thus limiting the possibility ofcontinuous and in situ monitoring.
To overcome this limitation, in this work an alternative micro-wave reflectometry-based method for monitoring the status ofthe osmotic solution during the OD process is proposed. As wellknown, thanks to its high versatility, microwave reflectometry rep-resents an appealing solution in several industrial monitoringapplications, such as quantitative control of liquids (Nemarich,2001), qualitative control of agro-foods (Cataldo et al., 2010),dielectric spectroscopy of materials, etc. Basically, this techniquerequires to stimulate the sample under test (SUT) with an appro-priate electromagnetic signal and, consequently, to analyze the re-sponse (i.e., the reflected signal), which implicitly contains usefulinformation on the chemico-physical characteristics of the SUT it-self. More specifically, the reflected signal is strictly associated tothe dielectric properties of the SUT and to the frequency-depen-dent impedance of the system (i.e., the SUT contained in the mea-surement probe); therefore, it represents an identifying signatureof the system under investigation.
Microwave reflectometry can be performed either in time do-main (TD) or in frequency domain (FD); often, combining thetwo approaches can help disclose a larger amount of information,yet preserving low cost of the instrumentation and very high accu-racy (Heimovaara et al., 1994; Nguyen et al., 1999).
In general, by using a typical time-domain reflectometry (TDR)instrument generating an electromagnetic step-like signal, thereflection coefficient, q, as a function of the apparent (or electrical)distance can be measured. From the TDR waveform, it is possible toretrieve useful qualitative information associated to the dielectriccharacteristics (such as, the dielectric constant of the consideredmaterial and the static electrical conductivity). An exhaustive over-view of the methods for accurately evaluating the dielectric char-acteristics from TDR waveforms can be found in Cataldo and DeBenedetto (2011).
As a matter of fact, dielectric properties of foods are a useful toolfor controlling the quality of food products (Miura et al., 2003). Forexample, knowing the dielectric characteristics of the product isimportant for allowing the optimization of several industrial pro-cessing, in terms of power absorption during microwave dryingprocess (Changrue et al., 2008; Datta and Anantheswaran, 2001);or in terms of effectiveness of radiofrequency heating for disinfes-tations of fruit (Birla et al., 2008) or for the microwave dielectricheating during honey pasteurization processing (Guo et al.,2011); for controlling the salting process of pork meat (Castro-Giráldez and Fito, 2010), just to name a few applications.
Starting from these considerations, the main aim of this workis focused on the possibility of developing and validating an alter-native and viable procedure, based on microwave reflectometry,for identifying the status of the industrial osmotic solutions forcontrol and management purposes. It will be shown that thereis a specific linear relationship between characteristic parametersof the solution (i.e., aw, degree Brix, and consequently, p) and thecorresponding reflection measurement. As a direct practical con-sequence, once the functional relationship is individuated forthe specific OD process, it can be used for the subsequent onlinemonitoring in the process line, or for the optimization of the in-volved process parameters. The clear advantage of resorting tomicrowave reflectometry is that measurements can be performedin situ and, most importantly, can provide results in real-time,thus allowing to promptly intervene on the process. Additionally,the implementation costs of microwave reflectometry-based sys-tems are relatively low and, as will be shown, a high measure-ment accuracy can be obtained through the adoption of thespecifically designed setup in conjunction with the proposedmeasurement procedure.
The feasibility of the methodology was first validated on somesimple reference aqueous solutions of sucrose. This preliminarytest confirmed that, as the mass fraction of sucrose increases,and consequently the aw value decreases, the corresponding mea-sured reflection coefficient varies accordingly. Successively, theproposed methodology was adopted also in a real test-case involv-ing the OD of tomatoes, which is a typical application of foodindustry. In this case, the most appropriate reflectometric parame-ter was found to be the so-called steady-state reflection coefficient,q1, which is associated to the corresponding of aw and of degreeBrix. The experimental cases and the related results confirm thesuitability of the proposed method as a powerful tool for control-ling the status of the osmotic solution, thus paving the way for aprompt management of the hypertonic solution in OD processesin the field of food industry.
2. Materials and methods
The TDR measurements were performed through the HL1500TDR unit, which generates a step-like signal with a rise time ofapproximately 200 ps (which corresponds to a frequency contentof 1.7 GHz). The used instrument is a low-cost portable unit and,therefore, it is suitable for in situ applications.
Fig. 1 shows the schematization of the stainless steel coaxialprobe that was specifically designed and realized for applicationson liquid materials. It is worth mentioning that the characteristicimpedance (Z) is the pivotal parameter that should be taken intoaccount when designing a probe (Cataldo et al., 2009). In this re-gard, coaxial probes are the most convenient choice for liquidmaterials, since Z can be accurately evaluated from the transmis-sion line theory through the following equation (Chen et al., 2004):
Z ¼ 60ffiffiffiffierp lnðD=dÞ ð1Þ
where D is the inner diameter of the outer conductor, d is the outerdiameter of the inner conductor, and er is the relative dielectric per-mittivity of the material filling the probe (for air, er ffi 1:0006) (Min-ges, 1989). The diameters of the conductors (d = 9 mm andD = 21 mm) were chosen to guarantee a 50 X-matched characteris-tic impedance, according to Eq. (1). As can be seen from Fig. 1, theouter conductor is perforated so as to facilitate the circulation ofthe fluid; the end of the probe is an open circuit.

188 A. Cataldo et al. / Journal of Food Engineering 105 (2011) 186–192
The TDR waveforms were also used for extrapolating the corre-sponding FD information. The used TD/FD transformation algo-rithm, which is based on the fast Fourier transform (FFT), isdescribed in detail in Cataldo et al. (2007); this algorithm allowsextracting the reflection scattering parameter, S11(f), which de-scribes the spectral signature of the considered material. It is worthmentioning that, as reported in Cataldo et al. (2007), the accuracyof the evaluated S11(f) is comparable to the accuracy obtainable bymeasuring the S11(f) directly in FD, through a vector network ana-lyzer. In fact, the aforementioned algorithm also includes an errorcorrection model that allows strongly reducing the effect ofsystematic errors. This model resorts to the well-known short-open-load (SOL) calibration procedure, which requires that threestandard impedances be connected at the section where theS11(f) is being calculated (i.e., in this case, section A in Fig. 1). Forthis purpose, a calibration structure reproducing the probe-headwas reproduced and the SOL calibration was performed at thepoint corresponding to section A. It is worth pointing out thatthe adopted TD/FD combined approach, which simultaneously per-mits to perform the SOL calibration, is a successful key for signifi-cantly enhancing the final measurement accuracy.
To preliminarily verify the feasibility of the proposed method,TDR measurements were performed on six aqueous solutions, dif-fering in mass fraction of sucrose. The aqueous solutions, whosemass fraction of sucrose ranged from 32% to 53%, were prepareddissolving commercial sucrose (Dimeglio, Italy) in tap water, whichshowed an initial electrical conductivity of 250 lS/cm at 25 �C; thisvalue was independently measured through a pH/TDS/EC/temper-ature portable meter (HI 9811-5 Hanna Instruments, equippedwith HI 1285-5 probe). Moreover, all solutions were maintainedat room temperature.
For comparison, reference measurements of aw were performedon each sample of the same set of sucrose solutions, using an Aqua-Lab models Series 3TE hygrometer, Decagon, Device, USA, whichguarantees a maximum uncertainty of 0.003 in the consideredmeasurement range. Each evaluated value of aw is the average ofthree independent measurements performed on different samplesof the same solution.
Subsequently, to investigate the method performance also in areal industrial case, the dehydration process of tomatoes per-formed by a local company was investigated. The considered solu-tion consists of glucose syrup (Glucosweet 62, ADEA, Italia) mixedwith an aqueous solution of NaCl. To preserve industrial secret, nofurther detail on the composition of the osmotic solution can be re-vealed. The sliced tomatoes were immersed in the solution (massratio 5:1), which was agitated through a recirculation pump (IDRA,Hi-Tech Line SICCE S.p.A., 1300 l/h), to accelerate the dehydrationprocess.
TDR waveforms were acquired at eight different prefixed timeintervals (m1, m2, . . ., m8), during a total observation time of24 h. Simultaneously, the TDR waveforms at short distance andat long distance were acquired, as detailed in Section 3.2. For com-parison, measurements of temperature and of electrical conductiv-ity were also performed, independently of the TDR waveforms,through the HI 9811-5 conductivity meter (from specifications,the maximum uncertainty in the measurement of the electricalconductivity is 120 lS/cm).
For all the considered samples, water activity was measured byusing the aforementioned AquaLab hygrometer, previously cali-brated with standard solution at aw = 0.984 (Decaong, Device,USA).
Additionally, the concentration of soluble solids of the solutionswas measured by using a refractometer mod. Digital Hand-heldPocket Refractometer (ATAGO, Japan), whose specifications indi-cate a maximum uncertainty of 0.2 �Bx, for the considered mea-surement range.
2.1. A key-note on the adopted metrological assessment and statisticalanalysis
As well known, measurements are typically affected by bothsystematic and random errors. The effects of systematic errorscan be compensated for through appropriate calibration proce-dures (ISO, 1995). In this regard, it is important to underline that,for the specific measurement method, a substantial accuracyenhancement was obtained through the implementation of the‘‘ad hoc’’ probe-head fixture that allowed performing an efficientSOL calibration of the FD-extrapolated measurement data. This ishighly regarded as an essential strategy to minimize the effect ofsystematic errors. On the other hand, the residual random mea-surement fluctuations (essentially due the environmental andoperating conditions, noise, etc.) can be suitably taken into accountthrough a statistical analysis performed on a series of repeatedmeasurements. To this purpose, the so-called type A evaluationof the uncertainty (i.e., experimental uncertainty) was associatedto the measurements, as recommended by ISO (1995).
The results related to the aqueous solutions of sucrose were ob-tained through 128 averaged measurements. As a matter of fact,for these experiments, a rigorous statistical analysis is not fully ad-dressed since these measurements were only intended to providethe preliminary validation of the proposed method; nevertheless,the experimental results confirmed an adequate overall metrolog-ical performance (in terms of repeatability, sensitivity and accu-racy). In order to clearly discover the dependence of thereference water activity on the measured reflectometric parame-ters, the obtained experimental data were fitted through thewell-known regression curve method, which is considered suffi-ciently robust for the considered purpose.
As for the results obtained on the industrial dehydration pro-cess of tomatoes, due to the actual need to metrologically assessthe method for the intended practical application, in addition tothe aforementioned adopted strategies, also a statistical analysiswas conducted. To this purpose, in order to identify a figure of mer-it for the metrological performance of the entire measurementprocedure, the type A evaluation of the uncertainty (uA), was con-ducted for each measurement at each pre-established acquisitiontime, according to the following expression (ISO, 1995):
uA ¼
ffiffiffiffiffiffiffiffiffiffiffiffiffiffiffiffiffiffiffiffiffiffiffiffiffiffiffiffiffiffiffiffiffiffiffiffiffiffiffiffiffiffiffiffi1
nðn� 1ÞXn
i¼1
ðxi � �xÞ2vuut ð2Þ
where n is the number of measurements, xi is the result of thereflectometry measurement, and �x is the average of the n repeti-tions. Measurements were performed through the considerationof 10 repetitions of 100 averaged reflectometry measurements. Alsoin this case, through the extrapolation of specific regression curves,the reflectometric measurements (with the corresponding uncer-tainty) can be related to the reference parameters, thus serving asan effective monitoring tool for the specific practical application.
3. Results and discussion
3.1. Preliminary validation of the method: results on reference aqueoussolutions of sucrose
As mentioned in Section 2, the experimental procedure startedwith the preliminary validation of the proposed method on the sixaqueous solutions with different mass fractions of sucrose. TDRmeasurements were performed by immersing the probe in thesolution.
Fig. 2a shows the TDR-measured results obtained for an acqui-sition distance interval (which, equivalently, corresponds to the

Fig. 2. TDR signals of aqueous solutions with different mass fraction of sucrose (a).First reflection (b). Long-distance TDR waveforms (c). For higher concentration ofsucrose, the steady-state reflection coefficient, q1, increases (hence, electricalconductivity decreases).
Fig. 3. Magnitude of the reflection scattering parameter, S11(f), for the aqueoussolutions of sucrose.
A. Cataldo et al. / Journal of Food Engineering 105 (2011) 186–192 189
time) equal to 60 m. This observation window contains the overallreflectometric picture of the reflected signal, for each consideredsolution. It can be seen that, after the first two significant reflec-tions occurring at the beginning and at the end of the probe,respectively, a series of typical multiple reflections can be ob-served, caused by the signal traveling back and forth from theprobe-end up to the TDR output. From Fig. 2, it is clear that whenthe fraction mass of sucrose increases, the corresponding TDR sig-nal varies accordingly, with a good capacity to distinguish betweentwo solutions differing in less than 3% of the mass fraction ofsucrose.
To clearly discover the reflectometric behavior of the consid-ered SUTs, both at short and long distances, Fig. 2b and c highlights
these measurement ranges, respectively. In Fig. 2b, besidesthe clear identification of the reflection point correspondingto the beginning of the probe (occurring approximately at 5.5 m),the portion corresponding to the signal reflected at the end ofthe probe is also highlighted. As expected, it can be seen that,although the reflection coefficient values corresponding to thedifferent solutions do not vary significantly (the measured valuessettled at around �0.75), as the sucrose concentration is increased,the inflection point (corresponding to the end of the probe) shiftsaccordingly toward lower distances.
As well known from TDR theory, for a fixed length of the probe(which in this case is 44 cm) and for a constant propagation veloc-ity, an increase of the dielectric constant of the SUT corresponds toa proportional increase of the measured apparent distance. InFig. 2b, it is observed that when the mass fraction of sucrose in-creases the corresponding apparent length and, consequently, thedielectric constant of the solutions decrease proportionally (thisis due to the decreasing predominance of the dielectric contribu-tion of water, which at its pure state presents a dielectric constantvalue approximately equal to 80).
Fig. 2c shows the long-distance behavior of TDR responses. Asreported in related literature (Huisman et al., 2008; Lin et al.,2007), the so called steady-state reflection coefficient, q1 (mea-sured in the long-distance range 400–800 m, for the used probe),is intrinsically related to the static electrical conductivity, r0, ofthe SUT. This parameter is regarded as one of the most significantidentifying dielectric parameter, especially for saline and sugarysolutions. For the considered variation range of the mass fractionof sucrose, Fig. 2c highlights a significant variation of q1. As the su-crose content increases, the corresponding q1 increases, from�0.21 to 0.45; this is due to the fact that the value of r0 of the solu-tion lowers (Castiglione and Shouse, 2003). This effect is associatedto the fact that the increase of sucrose concentration led to a signif-icant decrease of water mobility of the solution as a consequenceof the high number of hydrogen bounds between sucrose andwater molecules.
These preliminary results demonstrate that the TDR technique,in conjunction with suitable probe design, is an appealing suitablecandidate for associating the dielectric characteristics of differentaqueous solutions to the corresponding qualitative status.
Through the aforementioned FFT-based algorithm, startingfrom the presented TDR waveforms, the corresponding FD infor-mation was extrapolated in terms of S11(f). Fig. 3 shows the magni-tude of the reflection scattering parameter in the 110–230 MHzfrequency range, which is the range where changes in the |S11(f)|behavior are more evident. It can be seen that the |S11(f)| curvesexhibit the typical minima: for each sample, the difference in fre-quency between two consecutive minima (Df) is directly associ-ated to the change in the apparent distance the probe immersedin the liquid, as previously discussed (Cataldo et al., 2007). Fig. 3
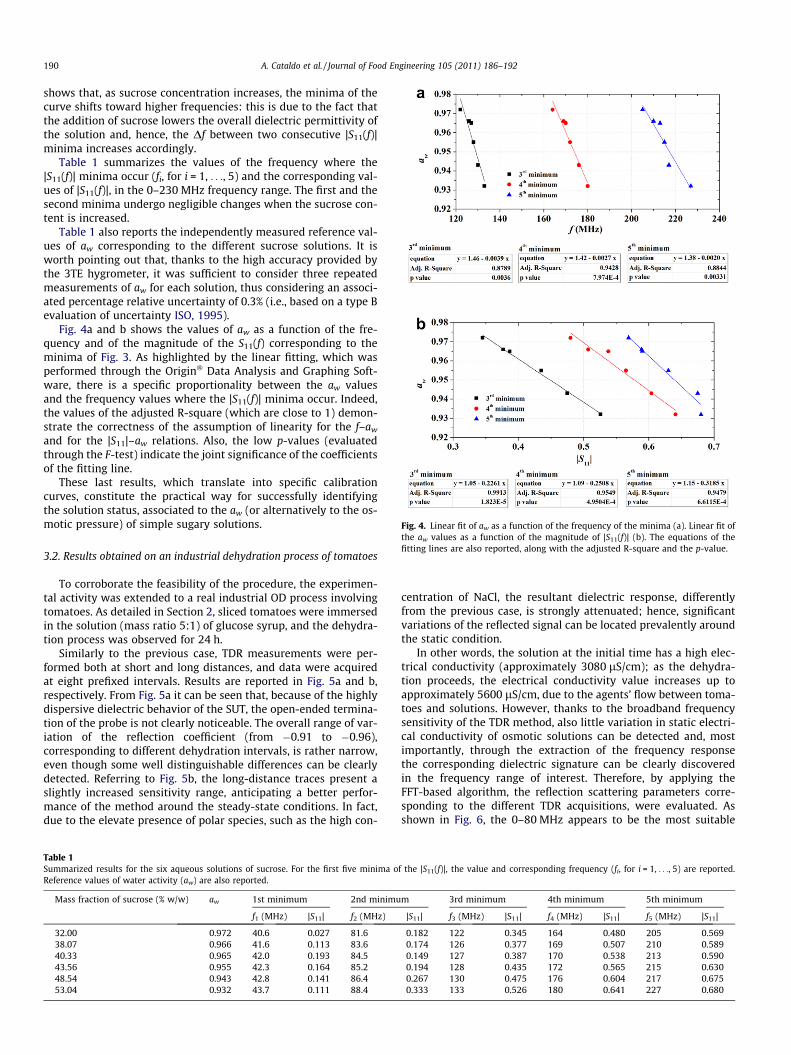
Fig. 4. Linear fit of aw as a function of the frequency of the minima (a). Linear fit ofthe aw values as a function of the magnitude of |S11(f)| (b). The equations of thefitting lines are also reported, along with the adjusted R-square and the p-value.
190 A. Cataldo et al. / Journal of Food Engineering 105 (2011) 186–192
shows that, as sucrose concentration increases, the minima of thecurve shifts toward higher frequencies: this is due to the fact thatthe addition of sucrose lowers the overall dielectric permittivity ofthe solution and, hence, the Df between two consecutive |S11(f)|minima increases accordingly.
Table 1 summarizes the values of the frequency where the|S11(f)| minima occur (fi, for i = 1, . . ., 5) and the corresponding val-ues of |S11(f)|, in the 0–230 MHz frequency range. The first and thesecond minima undergo negligible changes when the sucrose con-tent is increased.
Table 1 also reports the independently measured reference val-ues of aw corresponding to the different sucrose solutions. It isworth pointing out that, thanks to the high accuracy provided bythe 3TE hygrometer, it was sufficient to consider three repeatedmeasurements of aw for each solution, thus considering an associ-ated percentage relative uncertainty of 0.3% (i.e., based on a type Bevaluation of uncertainty ISO, 1995).
Fig. 4a and b shows the values of aw as a function of the fre-quency and of the magnitude of the S11(f) corresponding to theminima of Fig. 3. As highlighted by the linear fitting, which wasperformed through the Origin� Data Analysis and Graphing Soft-ware, there is a specific proportionality between the aw valuesand the frequency values where the |S11(f)| minima occur. Indeed,the values of the adjusted R-square (which are close to 1) demon-strate the correctness of the assumption of linearity for the f–aw
and for the |S11|–aw relations. Also, the low p-values (evaluatedthrough the F-test) indicate the joint significance of the coefficientsof the fitting line.
These last results, which translate into specific calibrationcurves, constitute the practical way for successfully identifyingthe solution status, associated to the aw (or alternatively to the os-motic pressure) of simple sugary solutions.
3.2. Results obtained on an industrial dehydration process of tomatoes
To corroborate the feasibility of the procedure, the experimen-tal activity was extended to a real industrial OD process involvingtomatoes. As detailed in Section 2, sliced tomatoes were immersedin the solution (mass ratio 5:1) of glucose syrup, and the dehydra-tion process was observed for 24 h.
Similarly to the previous case, TDR measurements were per-formed both at short and long distances, and data were acquiredat eight prefixed intervals. Results are reported in Fig. 5a and b,respectively. From Fig. 5a it can be seen that, because of the highlydispersive dielectric behavior of the SUT, the open-ended termina-tion of the probe is not clearly noticeable. The overall range of var-iation of the reflection coefficient (from �0.91 to �0.96),corresponding to different dehydration intervals, is rather narrow,even though some well distinguishable differences can be clearlydetected. Referring to Fig. 5b, the long-distance traces present aslightly increased sensitivity range, anticipating a better perfor-mance of the method around the steady-state conditions. In fact,due to the elevate presence of polar species, such as the high con-
Table 1Summarized results for the six aqueous solutions of sucrose. For the first five minima oReference values of water activity (aw) are also reported.
Mass fraction of sucrose (% w/w) aw 1st minimum 2nd minimu
f1 (MHz) |S11| f2 (MHz)
32.00 0.972 40.6 0.027 81.638.07 0.966 41.6 0.113 83.640.33 0.965 42.0 0.193 84.543.56 0.955 42.3 0.164 85.248.54 0.943 42.8 0.141 86.453.04 0.932 43.7 0.111 88.4
centration of NaCl, the resultant dielectric response, differentlyfrom the previous case, is strongly attenuated; hence, significantvariations of the reflected signal can be located prevalently aroundthe static condition.
In other words, the solution at the initial time has a high elec-trical conductivity (approximately 3080 lS/cm); as the dehydra-tion proceeds, the electrical conductivity value increases up toapproximately 5600 lS/cm, due to the agents’ flow between toma-toes and solutions. However, thanks to the broadband frequencysensitivity of the TDR method, also little variation in static electri-cal conductivity of osmotic solutions can be detected and, mostimportantly, through the extraction of the frequency responsethe corresponding dielectric signature can be clearly discoveredin the frequency range of interest. Therefore, by applying theFFT-based algorithm, the reflection scattering parameters corre-sponding to the different TDR acquisitions, were evaluated. Asshown in Fig. 6, the 0–80 MHz appears to be the most suitable
f the |S11(f)|, the value and corresponding frequency (fi, for i = 1, . . ., 5) are reported.
m 3rd minimum 4th minimum 5th minimum
|S11| f3 (MHz) |S11| f4 (MHz) |S11| f5 (MHz) |S11|
0.182 122 0.345 164 0.480 205 0.5690.174 126 0.377 169 0.507 210 0.5890.149 127 0.387 170 0.538 213 0.5900.194 128 0.435 172 0.565 215 0.6300.267 130 0.475 176 0.604 217 0.6750.333 133 0.526 180 0.641 227 0.680
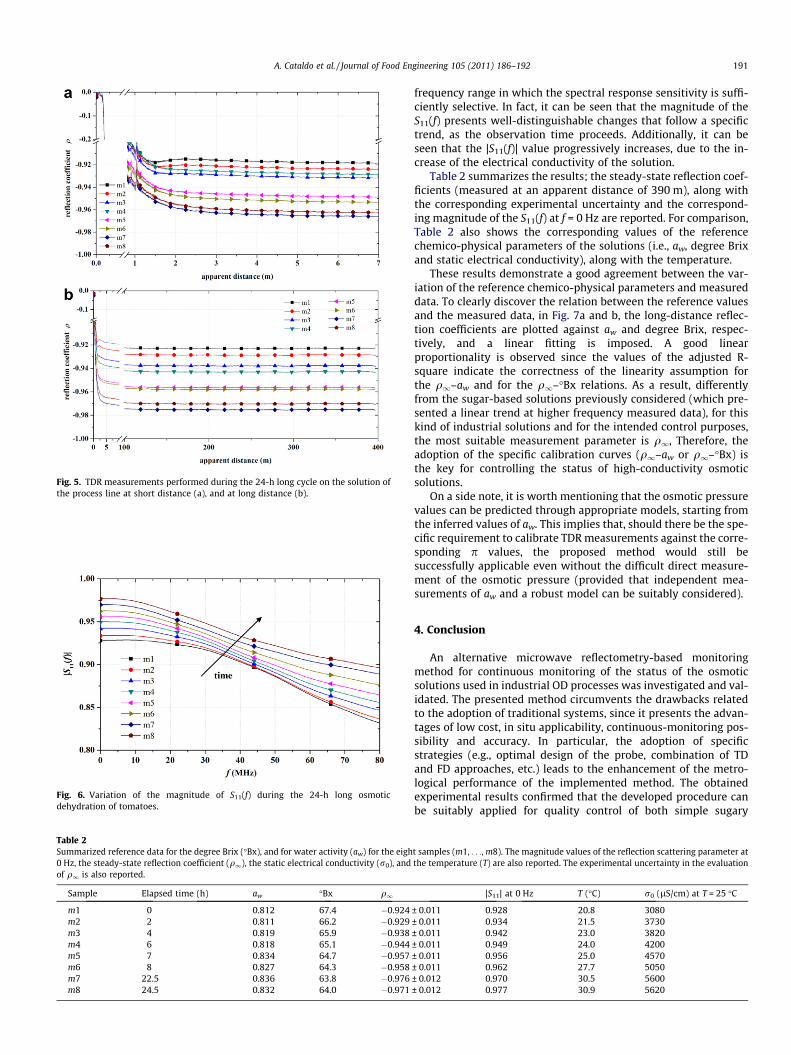
Fig. 5. TDR measurements performed during the 24-h long cycle on the solution ofthe process line at short distance (a), and at long distance (b).
Fig. 6. Variation of the magnitude of S11(f) during the 24-h long osmoticdehydration of tomatoes.
Table 2Summarized reference data for the degree Brix (�Bx), and for water activity (aw) for the eigh0 Hz, the steady-state reflection coefficient (q1), the static electrical conductivity (r0), andof q1 is also reported.
Sample Elapsed time (h) aw �Bx q1
m1 0 0.812 67.4 �0.924m2 2 0.811 66.2 �0.929m3 4 0.819 65.9 �0.938m4 6 0.818 65.1 �0.944m5 7 0.834 64.7 �0.957m6 8 0.827 64.3 �0.958m7 22.5 0.836 63.8 �0.976m8 24.5 0.832 64.0 �0.971
A. Cataldo et al. / Journal of Food Engineering 105 (2011) 186–192 191
frequency range in which the spectral response sensitivity is suffi-ciently selective. In fact, it can be seen that the magnitude of theS11(f) presents well-distinguishable changes that follow a specifictrend, as the observation time proceeds. Additionally, it can beseen that the |S11(f)| value progressively increases, due to the in-crease of the electrical conductivity of the solution.
Table 2 summarizes the results; the steady-state reflection coef-ficients (measured at an apparent distance of 390 m), along withthe corresponding experimental uncertainty and the correspond-ing magnitude of the S11(f) at f = 0 Hz are reported. For comparison,Table 2 also shows the corresponding values of the referencechemico-physical parameters of the solutions (i.e., aw, degree Brixand static electrical conductivity), along with the temperature.
These results demonstrate a good agreement between the var-iation of the reference chemico-physical parameters and measureddata. To clearly discover the relation between the reference valuesand the measured data, in Fig. 7a and b, the long-distance reflec-tion coefficients are plotted against aw and degree Brix, respec-tively, and a linear fitting is imposed. A good linearproportionality is observed since the values of the adjusted R-square indicate the correctness of the linearity assumption forthe q1–aw and for the q1–�Bx relations. As a result, differentlyfrom the sugar-based solutions previously considered (which pre-sented a linear trend at higher frequency measured data), for thiskind of industrial solutions and for the intended control purposes,the most suitable measurement parameter is q1, Therefore, theadoption of the specific calibration curves (q1–aw or q1–�Bx) isthe key for controlling the status of high-conductivity osmoticsolutions.
On a side note, it is worth mentioning that the osmotic pressurevalues can be predicted through appropriate models, starting fromthe inferred values of aw. This implies that, should there be the spe-cific requirement to calibrate TDR measurements against the corre-sponding p values, the proposed method would still besuccessfully applicable even without the difficult direct measure-ment of the osmotic pressure (provided that independent mea-surements of aw and a robust model can be suitably considered).
4. Conclusion
An alternative microwave reflectometry-based monitoringmethod for continuous monitoring of the status of the osmoticsolutions used in industrial OD processes was investigated and val-idated. The presented method circumvents the drawbacks relatedto the adoption of traditional systems, since it presents the advan-tages of low cost, in situ applicability, continuous-monitoring pos-sibility and accuracy. In particular, the adoption of specificstrategies (e.g., optimal design of the probe, combination of TDand FD approaches, etc.) leads to the enhancement of the metro-logical performance of the implemented method. The obtainedexperimental results confirmed that the developed procedure canbe suitably applied for quality control of both simple sugary
t samples (m1, . . ., m8). The magnitude values of the reflection scattering parameter atthe temperature (T) are also reported. The experimental uncertainty in the evaluation
|S11| at 0 Hz T (�C) r0 (lS/cm) at T = 25 �C
± 0.011 0.928 20.8 3080± 0.011 0.934 21.5 3730± 0.011 0.942 23.0 3820± 0.011 0.949 24.0 4200± 0.011 0.956 25.0 4570± 0.011 0.962 27.7 5050± 0.012 0.970 30.5 5600± 0.012 0.977 30.9 5620

Fig. 7. Behavior of aw (a) and of �Bx (b) as a function of the steady-state reflectioncoefficient value, q1.
192 A. Cataldo et al. / Journal of Food Engineering 105 (2011) 186–192
solutions and more complex industrial solutions. More specifically,it was demonstrated that, for the first case the measured reflectioncoefficient corresponding to a frequency range of 110–230 MHz isthe most sensitive control parameter. On the other hand, for high-conductivity industrial osmotic solutions, as those typically used inthe OD of tomatoes, the most suitable control parameter is thestatic reflection coefficient. Additionally, a direct proportionalitybetween some reference parameters of solutions (such as wateractivity and degrees Brix) and the measured data was discovered.As a result, in view of practical applications, specific calibrationcurves can be preliminary individuated and subsequently adoptedto monitor in real-time and in situ the evolution of the process,along with the correspondence to a standard quality status. Theimplementation of such a system (versatile, low-cost, remotelycontrollable, and metrologically accurate) would allow the optimi-zation of the production process, thus enhancing the overallquality of the final product and reducing the production costs.
Acknowledgment
This work was financially supported by the company FiordelisiSRL (Stornarella (FG), Italy), by means of the Programma OperativoNazionale (POR) Puglia 2007-2013, under the project ‘‘Sviluppo diuna tecnologia innovativa per la produzione di nuovi derivati delpomodoro minimamente trattati’’ (‘‘Development of an innovativetechnology for the production of minimally-treated tomatoderivates’’).
References
Barbosa-Canovas, G.V., Vega-Mercado, H., 1996. Dehydration of Food. Chapman &Hall, New York.
Birla, S.L., Wang, S., Tang, J., Tiwari, G., 2008. Characterization of radio frequencyheating of fresh fruits influenced by dielectric properties. Journal of FoodEngineering 89, 390–398.
Castiglione, P., Shouse, P.J., 2003. The effect of ohmic cable losses on time-domainreflectometry measurements of electrical conductivity. Soil Science Society ofAmerica Journal 67, 414–424.
Castro-Giráldez, M., Fito, P.J., 2010. Application of microwaves dielectricspectroscopy for controlling pork meat (Longissimus dorsi) salting process.Journal of Food Engineering 97, 484–490.
Cataldo, A., Catarinucci, L., Tarricone, L., Attivissimo, F., Trotta, A., 2007. A frequency-domain method for extending TDR performance in quality determination offluids. Measurement Science and Technology 18, 675–688.
Cataldo, A., Piuzzi, E., Cannazza, G., De Benedetto, E., 2009. Dielectric spectroscopyof liquids through a combined approach: evaluation of the metrologicalperformance and feasibility study on vegetable oils. IEEE Sensors Journal 9,1226–1233.
Cataldo, A., Tarricone, L., Vallone, M., Cannazza, G., Cipressa, M., 2010. TDR moisturemeasurements in granular materials: from the siliceous sand test case to theapplications for agro-food industrial monitoring. Computer Standards andInterfaces 32, 86–95.
Cataldo, A., De Benedetto, E., 2011. Broadband reflectometry for diagnostics andmonitoring applications. IEEE Sensors Journal 11, 451–459.
Changrue, V., Orsat, V., Raghavan, G., Lyew, D., 2008. Effect of osmotic dehydrationon the dielectric properties of carrots and strawberries. Journal of FoodEngineering 88, 280–286.
Chen, L.F., Ong, C.K., Neo, C.P., Varadan, V.V., Varadan, V.K., 2004. MicrowaveElectronics: Measurement and Materials Characterization. John Wiley & SonsLtd., Chichester, UK.
Derossi, A., De Pilli, T., Severini, C., McCarthy, M.J., 2008. Mass transfer duringosmotic dehydration of apples. Journal of Food Engineering 86, 519–528.
Derossi, A., De Pilli, T., Giuliani, R., Orlando, I., Palmieri, L., Severini, C., 2010. Studyon prestabilization of pumpkin (Cucurbita moschata) by osmotic dehydration inquaternari complex solution. Journal of Food Process Engineering doi:10.1111/j.174530.2009.00364x.
Datta, A.K., Anantheswaran, R.C., 2001. Handbook of Microwave Technology forFood Applications. Marcel Dekker Inc., New York.
Dalla Rosa, M., Giroux, F., 2001. Osmotic treatments (OT) and problems related tothe solution management. Journal of Food Engineering 49, 223–236.
Fernandes, F.A.N., Rodrigues, S., Gaspareto, O.C.P., Oliveira, E.L., 2006. Optimizationof osmotic dehydration of bananas followed by air-drying. Journal of FoodEngineering 77, 188–193.
ISO, 1995. Guide to Expression of Uncertainty in Measurement (GUM).Guo, W., Liu, Y., Zhu, X., Wang, S., 2011. Temperature-dependent dielectric
properties of honey associated with dielectric heating. Journal of FoodEngineering 102, 209–216.
Heimovaara, T.J., Bouten, W., Verstraten, J.M., 1994. Frequency domain analysis oftime domain reflectometry waveforms: 2. A four-component complex dielectricmixing model for soils. Water Resources Research 30, 201–209.
Hui, Y.H., Clary, C., Farid, M., Fasina, O., Noomhorm, A., Welti-Chanes, J., 2007. FoodDrying Science and Technology. Destech Publications Inc..
Huisman, J.A., Lin, C.P., Weihermüller, L., Vereecken, H., 2008. Accuracy of bulkelectrical conductivity measurements with time domain reflectometrymeasurements. Vadose Zone Journal 7, 426–433.
Lin, C.P., Chung, C.C., Tang, S.H., 2007. Accurate time domain reflectometrymeasurement of electrical conductivity accounting for cable resistance andrecording time. Soil Science Society of America Journal 71, 1278–1287.
Lombard, G.E., Oliveira, J.C., Fito, P., Andres, A., 2008. Osmotic dehydration ofpineapple as a pre-treatment for further drying. Journal of Food Engineering 85,277–284.
Minges, M.L., 1989. Electronic Materials Handbook: Packaging, first ed., vol. I. ASMInternational, pp. 30–31.
Miura, N., Yagihara, S., Mashimo, S., 2003. Microwave dielectric properties of solidand liquid foods investigated by time-domain reflectometry. Journal of FoodScience 68 (4), 1396–1403.
Nemarich, C.P., 2001. Time domain reflectometry liquid level sensors. IEEEInstrumentation and Measurement Magazine 4, 40–44.
Nguyen, B., Geels, A.M., Bruining, J., Slob, E.C., 1999. Calibration measurements ofdielectric properties of porous media. SPE Journal 4 (4), 353–359.
Rodrigues, S., Fernandes, F.A.N., 2007. Dehydration of melons in a ternary systemfollowed by air-drying. Journal of Food Engineering 80, 678–687.
Torreggiani, D., Bertolo, F., 2001. Osmotic pre-treatments in fruit processing:chemical, physical and structural effects. Journal of Food Engineering 49, 247–253.
Torringa, E., Esveld, E., Scheewe, I., van den Berg, R., Bartels, P., 2001. Osmoticdehydration as a pre-treatment before combined microwave-hot-air drying ofmushrooms. Journal of Food Engineering 49, 185–191.
Warczok, J., Ferrando, M., Lopez, F., Pihlajamaki, A., Guell, C., 2007. Reconcentrationof spent solutions from osmotic dehydration using direct osmosis in twoconfigurations. Journal of Food Engineering 80, 317–326.