Dehydration changes affective responses to visual stimulation
Upload
khangminh22Category
view
4download
0
ABSTRACT
THE EFFECT OF DEHYDRATION, HYPERTHERMIA, AND FATIGUE ON LANDING ERROR SCORING
SYSTEM SCORES
Purpose: To examine the effects of exercise-induced dehydration,
hyperthermia, and fatigue on Landing Error Scoring System (LESS) scores during
a jump-landing task, and the effectiveness of a personalized hydration plan.
Methods: Five recreationally active heat-acclimatized males 25.4 y (SD=5.7)
completed two trials: with fluid replacement, (EXP) and without fluid (CON), in a
counterbalanced, randomized, cross-over fashion. Exercise was terminated when
gastrointestinal temperature (Tgi) = 39.5°C and fatigue ≥ 7/10, or 90 min of
exercise. Percent dehydration was determined by body mass change from pre-
exercise (PRE) and post-exercise (POST). Tgi, heart rate (HR), and perceived
fatigue were measured PRE, during exercise, and POST. Three jump-landing tasks
were filmed in the frontal and sagittal planes. An experienced grader evaluated
jump-landing tasks using the LESS. Statistical Analysis: Repeated measures
ANOVA assessed primary dependent and independent variables while a priori
dependent t-tests evaluated pairwise comparisons. Results: No interaction, group,
or time main effects were observed for LESS scores (p=0.437). POST dehydration
(%) was greater in CON (M=2.59, SD=0.52) vs. EXP (M=0.92, SD=0.41;
p<0.001), whereas hyperthermia (°C) (CON, M=39.29, SD=0.31, EXP, M=39.03,
SD=0.61; p=0.425), and fatigue (CON, M=9, SD=1, EXP, M=9, SD=2; p=0.424)
were similar. Conclusion: LESS scores were not affected by exercise-induced
dehydration, hyperthermia, and fatigue, nor by a personal hydration plan.
Alexandria Brooklyn Gregory May 2017


THE EFFECT OF DEHYDRATION, HYPERTHERMIA, AND
FATIGUE ON LANDING ERROR SCORING
SYSTEM SCORES
by
Alexandria Brooklyn Gregory
A thesis
submitted in partial
fulfillment of the requirements for the degree of
Master of Arts in Kinesiology
in College of Health and Human Services
California State University, Fresno
May 2017
APPROVED
For the Department of Kinesiology:
We, the undersigned, certify that the thesis of the following student meets the required standards of scholarship, format, and style of the university and the student's graduate degree program for the awarding of the master's degree. Alexandria Brooklyn Gregory
Thesis Author
Stephanie Moore-Reed (Chair) Kinesiology
J. Luke Pryor Kinesiology
Riana R. Pryor Kinesiology
For the University Graduate Committee:
Dean, Division of Graduate Studies

AUTHORIZATION FOR REPRODUCTION
OF MASTER’S THESIS
X I grant permission for the reproduction of this thesis in part or in
its entirety without further authorization from me, on the
condition that the person or agency requesting reproduction
absorbs the cost and provides proper acknowledgment of
authorship.
Permission to reproduce this thesis in part or in its entirety must
be obtained from me.
Signature of thesis author:
ACKNOWLEDGMENTS
I would like to thank the individuals who participated in this study for
volunteering their time and hard effort for research in exercise science.
I would also like to thank the several undergraduate students who
volunteered their time to assist in collecting data. As well as, my fellow graduate
students who supported me through each step of the research process.
Specifically, I would like to thank Tony Wolf, Megan Webb, and Sam
Bracksieck for all your hard work and continued supported through during this
study. Research was truly a learning experience for all of us and I am glad we
experienced the journey together.
I am extremely thankful for Dr. J. Luke Pryor and Dr. Riana Pryor for your
guidance during this entire process. From developing the research study design to
the countless hours of helping me with my writing. You have challenged me on so
many levels making me a better researcher and prepared me for the next step in
my career.
Also, I would like to thank Dr. Stephanie Moore-Reed for being the chair
of my study. Your statistic knowledge challenged me to develop further
understanding of statistics and your continued support has allowed me to continue
to prepare for my future.
Thank you to the Graduate Research Fellowship and the Graduate Student
Research and Creative Activities Support Award for your support of this research
study.
Last, but not least I want to thank my parents for their continued support
throughout my educational journey. You have been there every step of the way
and I could not be more grateful.

TABLE OF CONTENTS
Page
LIST OF TABLES ................................................................................................. vii
LIST OF FIGURES ............................................................................................... viii
CHAPTER 1: INTRODUCTION ............................................................................ 1
Purpose .............................................................................................................. 4
Research Questions and Hypotheses ................................................................. 4
Significance ....................................................................................................... 4
Delimitations ..................................................................................................... 5
Limitations ........................................................................................................ 5
Assumptions ...................................................................................................... 6
Definitions of Terms ......................................................................................... 7
CHAPTER 2: REVIEW OF LITERATURE ........................................................... 8
Assessment of Lower Extremity Biomechanics ............................................... 8
Exercise-Induced Dehydration ........................................................................ 11
Exercise-induced Hyperthermia ...................................................................... 14
Fatigue ............................................................................................................. 17
The Combination of Dehydration, Hyperthermia, and Fatigue ...................... 19
Summary ......................................................................................................... 20
CHAPTER 3: METHODS ..................................................................................... 21
Experimental Design ....................................................................................... 21
Participants ...................................................................................................... 22
Procedures ....................................................................................................... 22
CHAPTER 4: RESULTS ....................................................................................... 30
Demographics ................................................................................................. 30
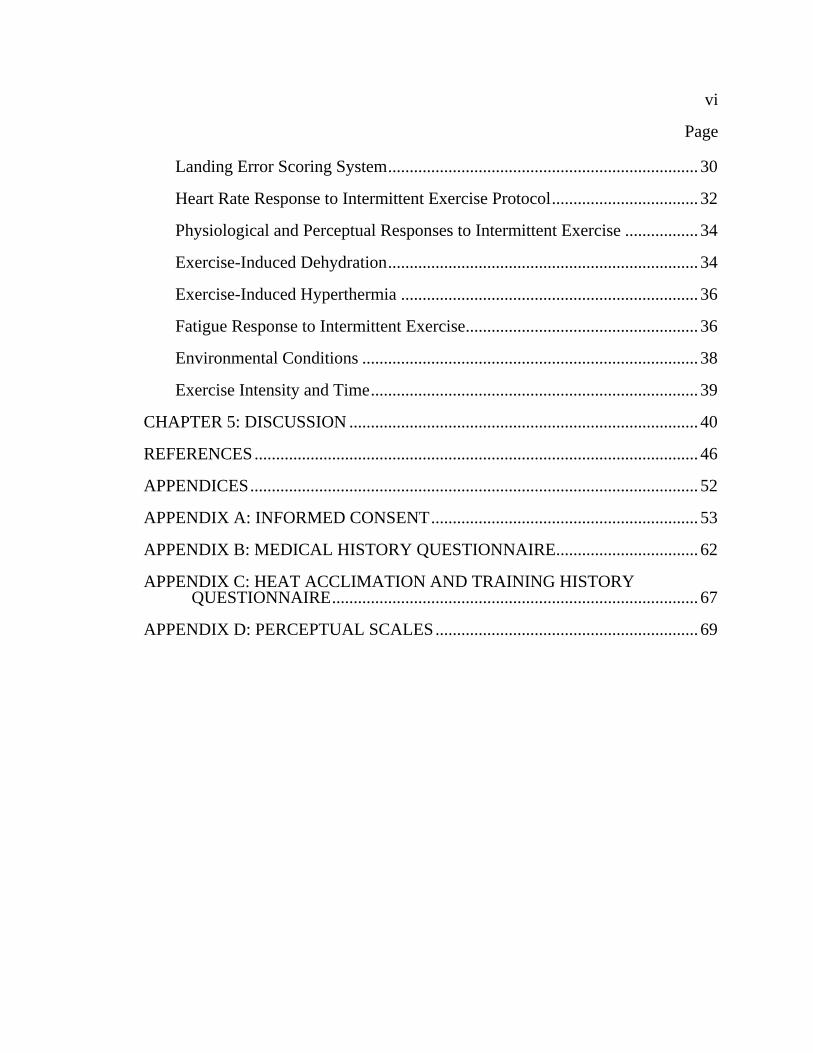
Page
vi vi
Landing Error Scoring System ........................................................................ 30
Heart Rate Response to Intermittent Exercise Protocol .................................. 32
Physiological and Perceptual Responses to Intermittent Exercise ................. 34
Exercise-Induced Dehydration ........................................................................ 34
Exercise-Induced Hyperthermia ..................................................................... 36
Fatigue Response to Intermittent Exercise ...................................................... 36
Environmental Conditions .............................................................................. 38
Exercise Intensity and Time ............................................................................ 39
CHAPTER 5: DISCUSSION ................................................................................. 40
REFERENCES ....................................................................................................... 46
APPENDICES ........................................................................................................ 52
APPENDIX A: INFORMED CONSENT .............................................................. 53
APPENDIX B: MEDICAL HISTORY QUESTIONNAIRE ................................. 62
APPENDIX C: HEAT ACCLIMATION AND TRAINING HISTORY QUESTIONNAIRE ..................................................................................... 67
APPENDIX D: PERCEPTUAL SCALES ............................................................. 69

LIST OF TABLES
Page
Table 1 Demographic Data ................................................................................... 30
Table 2 Top 4 Individual Movement Errors out of 22 Evaluated That Appeared Most Frequency Among Participants ...................................... 32
Table 3 Physiological & Perceptual Responses from Intermittent Exercise Protocol .................................................................................................... 35
Table 4 Environmental Conditions During Intermittent Exercise. ....................... 38

LIST OF FIGURES
Page
Figure 1. Experimental design. .............................................................................. 21
Figure 2. Landing error scoring system standardized jump-landing task set-up ... 24
Figure 3. Intermittent Exercise Protocol: Following each run or sprint the participant walked and after completing all three runs a recovery jog (200m-jog) was completed. .................................................................... 26
Figure 4. Mean LESS scores pre-exercise (PRE) and post-exercise (POST) between trials, with each participant’s individual LESS score. * P < 0.05 for PRE to POST; † P < 0.05 for between trials. ............................ 31
Figure 5. Heart rate response during exercise to immediately post-exercise (IPE), and prior to performing completing jump-landing tasks after exercise (Pre-LESS). * P < 0.05 for pre-exercise (PRE) to post-exercise (POST); ** P < 0.05 for IPE to Pre-LESS; † P <0.05 for between trials. ......................................................................................... 33
Figure 6. Gastrointestinal temperature throughout exercise to immediately post-exercise (IPE) to prior to performing jump-landing tasks after exercise (Pre-LESS). ............................................................................... 37
Figure 7. Rating of fatigue at pre-exercise (PRE), post-exercise (POST) and prior to performing jump-landing tasks (Pre-LESS). ............................. 37

CHAPTER 1: INTRODUCTION
During physical activity in hot conditions athletes can become dehydrated,
hyperthermic, and fatigued especially as exercise prolongs. Dehydration occurs
during exercise due to the loss of total body water via sweat in an attempt to lower
core body temperature (Armstrong, 2007). This loss of fluid through sweat can
lead to dehydration if proper fluid replacement is not attempted during exercise
(Armstrong, 2007). In return, dehydration further increases core temperature
leading to exercise-induced hyperthermia (Armstrong et al., 1997). Exercise-
induced hyperthermia commonly occurs in long distance exercise bouts in which
individuals experience dehydration, thus, triggering cardiovascular drift causing a
decrease in muscular blood flow (Gonzalez-Alonso, 2007). In addition, fatigue is
a common factor that affects exercise performance. Individually dehydration,
hyperthermia, and fatigue display consequences in physical activity performance.
But, all three-combined present a complex condition and could display even more
detrimental consequences during physical activity.
Dehydration, hyperthermia, and fatigue can occur in individuals who
exercise in the heat. But, little research has focused on how these physiological
insults specifically affect lower extremity movement behavior and injury
prevention. Poor neuromuscular control and movement technique has been
recognized to influence the risk of a lower extremity injury, such as anterior
cruciate ligament (ACL) tear (Hewett et al., 2005).
An ACL injury is one of the most common injuries associated with poor
lower extremity neuromuscular control (Padua et al., 2015). Over 100,000 ACL
injuries occur in the United States every year (Brown, Johnston, Saltzman, Marsh,
& Buckwalter, 2006) and most ACL injuries occur when athletes are performing

2 2
cutting and jumping movements (Griffin et al., 2000). These types of movements
are commonly seen in soccer and other sports, which often occur in dehydrated,
hyperthermic, and fatigued conditions. In addition, ACL injuries are more
common during games and competition than during practice (Dragoo, Braun,
Durham, Chen, & Harris, 2012).
Individually several factors can increase the risk for a lower extremity
injury, such as dehydration, hyperthermia, and fatigue. Dehydration during
exercise reduces plasma volume in the body, which can decrease the delivery of
oxygen to the working muscles and reduces neuromuscular performance in the
lower extremity (Minshull & James, 2013). Hyperthermia reduces optimal
function of the central nervous system which may reduce body awareness and
judgement, and therefore may increase risk for lower extremity injuries
(Gonzalez-Alonso, 2007). Nybo and Nielsen (2001) found that hyperthermia can
lead to a decrease in neuromuscular control, which increases the risk for injury.
Fatigue has shown to affect lower extremity neuromuscular control by altering the
ability of muscle fibers to absorb energy (Chappell et al., 2005). Individually,
dehydration, hyperthermia, and fatigue display decrements in lower extremity
neuromuscular control, but little research has focused on all three factors at once.
One study found a decrease in lower extremity neuromuscular control in a
hypohydrated, hyperthermic, and fatigued condition after exercise (DiStefano et
al., 2013). The study investigated this effect with the use of the Landing Error
Scoring System (LESS). The LESS is a validated field-assessment tool used for
recognizing high-risk movement patterns during a jump-landing task (Padua et al.,
2015). The results showed that movement control decreased significantly,
resulting in increased LESS scores from pre- (M = 3.72, SD = 1.73) to post-test (M
= 4.42, SD = 1.75) (DiStefano et al., 2013). The increase in LESS scores

3 3
demonstrates increased lower extremity movement errors in a hypohydrated,
hyperthermic, and fatigued condition. This presents the need for injury prevention
and a plan to reduce this risk for lower extremity injuries.
A personalized hydration plan could reduce dehydration seen in long bouts
of exercise. The personal hydration plan could reduce cardiovascular strain by
minimizing the decrease in blood volume seen due to increased sweat rate during
exercise. By preventing this reduction in plasma volume, stroke volume will be
maintained, allowing heart rate (HR) to remain lower while maintaining cardiac
output steady during exercise. Hence, cardiovascular strain will not be
significantly increased during long bouts of exercise.
Furthermore, a personalized hydration plan could prevent the early onset
exercise-induced hyperthermia as exercise prolongs. Hydration during exercise
will mitigate the decrease in plasma volume due to increased sweat rate from
exercising in the heat. Thus, the body continues to dissipate heat through sweat,
preventing drastic hyperthermia during exercise and decreases the negative effects
of reduced lower extremity neuromuscular control. By developing a personalized
hydration plan we may be able to prevent athletes from developing an ACL injury
or other lower extremity injures.
Dehydration, hyperthermia, and fatigue may show decrements in lower
extremity neuromuscular control and may increase chances for injuries. Thus,
understanding these physiological insults may provide a way to prevent these
injuries. Therefore, the purposes of this study were to determine if exercise-
induced dehydration, hyperthermia, and fatigue affect LESS scores during a jump-
landing task and to determine if implementing a personalized hydration plan
during exercise affects LESS scores during a post-exercise (POST) jump-landing
task.

4 4
Purpose
The primary purpose of this study was to determine if exercise-induced
dehydration, hyperthermia, and fatigue affect LESS scores during a jump-landing
task.
The second purpose of this study was to determine if implementing a
personalized hydration plan during exercise affects LESS scores during a post-
exercise jump-landing task.
Research Questions and Hypotheses
Question 1: Do exercise-induced dehydration, hyperthermia, and fatigue
affect LESS scores during a jump landing task?
Hypothesis 1: Exercise-induced dehydration, hyperthermia, and fatigue will
increase LESS scores during a jump landing task.
Question 2: Does a personalized hydration plan during exercise affect
LESS scores during a jump landing task in an exercise-induced in an exercise-
induced hyperthermic and fatigued individual?
Hypothesis 2: A personalized hydration plan during exercise will decrease
LESS scores during a jump landing task in a hyperthermic and fatigued individual.
Significance
Lower extremity neuromuscular injuries occur frequently during physical
activity and competitions (Hootman et al., 2002). These injuries can lead to long
term consequences and can be career ending in sports (Lohmander, Ostenberg,
Englund, & Roos, 2004). Due to how frequently these injuries occur, an injury
prevention plan is needed. Research demonstrates that dehydration, hyperthermia,
and fatigue each negatively affect neuromuscular control individually.
Dehydration decreases neuromuscular control by decreasing muscular strength

5 5
during exercise (Bosco, Terjung, & Greenleaf, 1968). Hyperthermia decreases
muscle function, decreasing neuromuscular control, thus may increase injury risk
(Gonzalez-Alonso, 2007). Fatigue may significantly increase risk of injury as
shown by higher injury rates late in games (Hawkins, Hulse, Wilkinson, Hodson,
& Gibson, 2001). However, dehydration, hyperthermia, and fatigue are
commonly present together during physical activity (Armstrong, 2000). Distefano
et al. (2013) found that in a hypohydrated, hyperthermic, and fatigued individual,
lower extremity control and performance decreases, which may lead to an
increased chance of an injury. To our knowledge, research has not examined
interventions such as a personalized hydration plan to reduce these performance
decrements.
Delimitations
1. Females were not included in this study.
2. Gastrointestinal temperature (Tgi) was used, introducing possible error if the
pill was not consumed 8-10 hours prior to testing or the pill was damaged.
3. Data was collected outside, not in a temperature-controlled environment.
Therefore, each trial was performed under slightly different temperate
conditions.
4. Tgi cutoff was limited to 39.5°C. If possible higher core temperatures could
have displayed a greater influence on neuromuscular control.
5. POST measures were performed in an air-conditioned lab, which resulted
participants’ Tgi to decrease prior to performing jump-landing task.
Limitations
1. Participants were not as dehydrated (2.6%) in CON, or euhydrated (0.9%)
in EXP, as intended.

6 6
2. Variability was found between environmental conditions between testing
sessions. Participants were scheduled at the same time of day on days with
similar conditions to control for this variability.
3. Ambient temperature was not high enough during testing, therefore making
it more difficult for participants to reach the target Tgi of 39.5°C. Some
participants did not reach 39.5°C.
4. Variability in the exercise heat stress time, Tgi and/or fatigue between EXP
and CON. Exercise duration, intensity, and Tgi were matched as well as
possible between sessions to control for variability.
5. The air-conditioned lab caused increased body heat dissipation and reduced
heat stress during POST jump-landing task.
6. Time from exercise to performance of jump-landing allowed for reductions
in Tgi and fatigue.
7. The study was underpowered, n = 5.
Assumptions
1. Participants abided by the pre-test instructions; no alcohol or strenuous
exercise performed within 24 hours of testing, no caffeine consumption
within 8 hours, consumption of similar diet on the day prior to each testing
session, and gastrointestinal pill taken 8-10 hours prior to testing.
2. Participants did not have any prior ACL injury, chronic ankle instability,
and lower extremity injury that occurred within the past six months.
3. Participants gave full effort during the intermittent exercise protocol.
4. Participants were heat-acclimatized, due to testing occurring at the end of
summer.

7 7
Definitions of Terms
Hyperthermic: A Tgi greater or equal to 39.5°C (Casa et al., 2015).
Dehydration: A body mass loss that is greater or equal to 2% (L. E.
Armstrong et al., 1997).
Fatigue: A rating greater or equal to 7 out of 10 on the perceived fatigue
scale.

CHAPTER 2: REVIEW OF LITERATURE
Many athletes compete and perform in a dehydrated, hyperthermic, and
fatigued condition which may alter lower extremity neuromuscular control and
increase injury risk. Commonly, exercising in the heat leads to dehydration due to
lack of adequate fluid replacement, which increases core body temperature. This
increase in core body temperature can lead to hyperthermic conditions. In
addition, most athletes become fatigued as they exercise. Therefore, an
intervention of how to reduce these decrements under these conditions is needed.
This review of literature addresses the effects of exercise-induced dehydration,
hyperthermia, and fatigue on lower extremity neuromuscular control. Sections of
this literature review include: assessment of lower extremity biomechanics,
exercise-induced dehydration, exercise-induced hyperthermia, fatigue and a
combination of dehydration, hyperthermia, and fatigue.
Assessment of Lower Extremity Biomechanics
ACL and lower extremity injuries occur due to irregular movement patterns
of loading and forces placed on the knee ligaments (Padua et al., 2009, 2015).
These irregular movements can include knee-extension movement, proximal
anterior tibial shear force, knee valgus-varus movement, and knee internal-
external rotation movement (Padua et al., 2015). In addition, low knee flexion
angles from 0° to 30° can greatly affect anterior tibial shear forces, therefore
increasing the amount of ACL loading (DeMorat, Weinhold, Blackburn, Chudik,
& Garrett, 2004; Draganich, Jaeger, & Kralj, 1989). Furthermore, isolated knee
valgus and tibial rotation increase ACL loading and when combined with anterior
tibial shear force the loading is magnified, increasing the risk of developing an

9 9
ACL injury (Bell, Smith, Pennuto, Stiffler, & Olson, 2014; Kanamori et al., 2000,
2002; Markolf et al., 1995).
Thus, a tool was developed called the LESS to identify athletes’ movement
patterns of the lower extremity that could increase the risk of developing ACL
injuries. The LESS is an inexpensive clinical assessment tool that Padua and
colleagues (2009) developed to provide standardized assessment of lower
extremity neuromuscular control. Additionally, the LESS is a tool that has been
used to predict noncontact ACL injuries (Padua et al., 2011, 2015). The LESS
uses two standard video cameras in the frontal and sagittal planes for identifying
potentially high-risk movement patterns during a jump-landing task (Padua et al.,
2009). The jump-landing task incorporates vertical and horizontal movements as
the participants jump from a 30-cm high box to a distance 50% of the subject’s
height away from the box and immediately rebounded for maximal vertical jump
up on landing (Padua et al., 2009).
The recorded jump-landing tasks are then reviewed by a blinded rater to
evaluate movement patterns. The rater uses a 17-point LESS scale to evaluate
landing technique in the sagittal and frontal planes. The 17-point scale is divided
into four separate sections. The first section examines the lower extremity and
trunk positioning at initial contact (1-6) while the second section examines the
positioning of the feet (7-11). The third section examines the lower extremity and
trunk movements between initial contact and moment of maximal knee flexion
(12-15). The final section assesses the rater’s perception of the landing technique
in the sagittal plane (16-17) (Padua et al., 2009). A LESS score is simply a count
of landing technique “errors” on a range of readily observable items of human
movement (Padua et al., 2009). A higher LESS score indicates poor landing
technique and a lower LESS score displays good landing technique.

10 10
Padua et al. (2011) found that interclass correlation coefficient (ICC) and
standard error of the mean (SEM) between raters (1 and 2) were 0.81 (95%
confidence interval = 0.56-0.92) and 0.69, respectively. Looking at raters 1 and 3
similar values were found, ICC=0.72 (95% confidence interval = 0.42-0.88), and
SEM=0.79. These results show that the LESS is a reliable clinical assessment tool
that can be used by researchers to identify individuals that may be at risk for lower
extremity injuries (Padua et al., 2011).
In addition, Padua et al. (2009) compared the LESS to a laboratory based
motion analysis system and found a ICC (0.84) and a SEM (0.71), revealing that
the LESS has good interrater reliability, meaning that between different trained
raters. Also, intrarater reliability values were found as excellent for the LESS,
ICC (0.91) and SEM (0.42) (Padua et al., 2009). These results display that the
LESS is an accurate and reliable tool when compared to the motion capture
analysis software. Thus, the LESS is a valid and reliable tool for identifying
potential high-risk movement patterns during a jump-landing task and potential
noncontact ACL injury (Padua et al., 2009).
Due to the good reliability between motion capture software and the LESS,
this simple to implement tool has been used in research to assess lower extremity
movement. A study by DiStefano and colleagues (2013) looked at recreationally
active males performing a standardized jump-landing task pre-exercise (PRE) and
POST to evaluate lower extremity movement with the LESS. The exercise
consisted of a 90-minute treadmill protocol to implement exercise-induced
hyperthermia. Distefano et al. (2013) showed that under a hypohydrated (M =
1052 mOsm kg-1, SD = 72) and hyperthermic (M = 39.33°C, SD = 0.45) condition,
LESS scores significantly increased from PRE (M = 3.72, SD = 1.73) to POST (M
= 4.42, SD = 1.75) (DiStefano et al., 2013). These data indicate that lower

11 11
extremity neuromuscular control can be evaluated with the LESS and was
impaired in a hypohydrated and hyperthermic state.
Lower extremity neuromuscular control is negatively altered during
exercise. Therefore, research is needed to learn how to decrease poor lower
extremity neuromuscular control during prolonged exercise. In addition, if the
athletes are exercise-induced dehydrated, hyperthermic, and/or fatigued during
exercise poor lower extremity neuromuscular control may further increase. Thus,
if athletes are provided with a personalized hydration plan this may improve these
physiological decrements to lower extremity neuromuscular control. But, first we
must understand how exercise-induced dehydration, hyperthermia, and fatigue
affect lower extremity neuromuscular control independently.
Exercise-Induced Dehydration
Hydration status is an important factor that can affect exercise performance.
There are different levels at which an athlete can be hydrated: euhydrated,
hypohydrated, and dehydrated. Euhydration is defined as a normal or balanced
body water content; hypohydration is described as chronic total body water loss;
and dehydration is a state of acute body water loss (Armstrong, 2007; Sawka et al.,
2007). Each different level of hydration affects the body and exercise
performance differently.
Hypohydration occurs through fluid restriction prior to an exercise session
(DiStefano et al., 2013). Total body water loss due to hypohydration is primarily
from the extracellular space; however, under conditions of high total body water
loss, fluid is lost more from the intracellular space (Sawka et al., 2001).
Hypohydration specifically affects fluid loss at the cell and how the cell functions.

12 12
Hypohydration has shown to reduce muscular strength, muscular endurance, and
aerobic performance (Sawka et al., 2001).
On the other hand, dehydration occurs with uncompensated total body
water loss via urine, sweat, and respiratory vapor during exercise (Armstrong,
2007). Dehydration total body water loss is primarily from sweat via exercise.
The fluid is lost from the blood, reducing the athlete’s plasma volume.
Dehydration can increase if the athlete has a high sweat rate and participates in
exercise in a hot, humid environment (Casa et al., 2000). A reduction in total
body weight by 1-2% via dehydration begins to impair physiological function and
negatively impacts athletic performance (Casa et al., 2000).
The “elusive gold standard” for assessing hydration status is plasma
osmolality, but a combination of percent body mass loss, urine color (Ucol), and
urine specific gravity (Usg) is an acceptable way to determine hydration status
(Armstrong, 2007). In addition to measuring dehydration, it is important for an
athlete to know his or her sweat rate. Armstrong (2000) has found that mild to
moderate work can result in whole-body sweat losses of 0.8-1.4L·h-1. Therefore,
knowing one’s sweat rate can reduce fluid loss during exercise. High intensity
exercise can result in sweat rates over 3L·h-1.
One way to reduce total body water loss during exercise is to determine an
individual’s sweat rate. By determining sweat rate the athlete can determine how
much fluid to consume while exercising to reduce dehydration throughout exercise
preventing performance decrements (Casa et al., 2000). An individual’s sweat rate
can be determined by measuring PRE nude body mass then exercising for a
specific time followed by an immediate POST nude body mass. In addition, the
researcher must account for fluid intake and urine output. The individual’s sweat
rate is then determined by taking total body mass loss during exercise divided by

13 13
exercise time. This is the amount of fluid the athlete should consume during
exercise to replenish sweat lost. Knowing one’s sweat rate allows the athlete to
accurately replace fluids throughout exercise to reduce dehydration.
Furthermore, it is important to consider the environment where the exercise
is performed because the sweat rate may increase or decrease depending on the
environment’s temperature. If exercising in a hot environment sweat rate will
increase due to the increased skin blood flow in an the attempt to dissipate heat via
evaporation (Casa et al., 2000). The reduction in fluid causes a decrease in plasma
volume. This reduction leads to a decreased delivery of oxygen to muscles
causing a potential decrease in performance.
Additionally, a greater total body water loss leads to a greater decrease in
overall athletic performance (Bosco et al., 1968; Casa et al., 2000). With aerobic
performance it has been found that if an athlete loses water ≥ 3% of body weight
in a cool environment, maximal oxygen uptake (VO2max) declines (Armstrong,
2000). These alterations in athletic performance due to dehydration suggest that
dehydration may alter neuromuscular control at the lower extremity.
Minshull and James (2013) examined the effects of hypohydration by fluid
restriction on indices of voluntary and magnetically evoked neuromuscular
performance of the lower extremity in 10 healthy males. Static volitional peak
force, evoked peak twitch force and rate of force were measured at the knee
extensors in two isokinetic conditions. The study reported a reduction of 7.8% in
volitional peak force (P < 0.05) in the hypohydrated condition (2.1% body mass
loss) compared to a euhydrated condition. These decrements in neuromuscular
performance due to hypohydration could lead to a decrease in knee joint stability
and increased risk for lower extremity injury (Minshull & James, 2013).

14 14
In contrast, Stewart et al. (2014) observed how dehydration (~4%)
independently affected the performance of a 5-km cycling time trial and
neuromuscular drive. Neuromuscular drive was assessed by measuring the
maximal voluntary torque (MVT), MVT development, surface electromyography
amplitude, and superimposed maximal torque. Seven male subjects were tested
before exercise, after exercise, and after fluid replenishment. Results showed that
dehydration (~4%) did not independently affect neuromuscular drive nor
performance in a 5-km cycling time trial. Although, dehydration alone did not
significantly affect performance it is common that exercise-induced dehydration
occurs in a hot environment. Thus, under a hot and dehydrated condition neural
drive to the muscle may be affected, impacting performance (Stewart, Whyte,
Cannon, Wickham, & Marino, 2014).
Research suggests that dehydration independently affects lower extremity
neuromuscular control. But, research implies that exercise-induced dehydration is
commonly seen in a hot environment. Thus, it is important to understand how
lower extremity neuromuscular control is affecting in a hyperthermic environment.
Exercise-induced Hyperthermia
Exercise-induced hyperthermia is when body temperature rises above
resting ranges (36.5- 37.5 °C). Some have defined hyperthermia as a minimum of
39.0°C (Morrison, Sleivert, & Cheung, 2004) while others define hyperthermia as
39.5°C (Casa et al., 2015). Hyperthermia more often occurs while exercising in a
hot environment because the body struggles with keeping the core temperature at
normal temperatures. Exercise-induced hyperthermia is commonly found in long
distance events such as cycling, running, and soccer tournaments because of the
reduction in plasma volume due to constant sweating (Armstrong, 2000).

15 15
Exercising in a hot environment increases blood flow to the skins surface to
dissipate heat through sweating. Therefore, less blood is available to transport
oxygen to the muscles during exercise. This situation creates a competition for
blood flow in the body. This competition can lead to a decrease in stroke volume
leading to a decreased cardiac output and increased perceived exertion, which
reduces overall aerobic performance (Gonzalez-Alonso, 2007). Furthermore, a
rise in body temperature reduces leg blood flow which may lead to reduced
oxygen delivery to muscles and reduce removal of metabolic waste (Gonzalez-
Alonso, 2007). This decrease in leg blood flow is due to the increased blood flow
to the skin to dissipate heat. Thus, exercising in the heat may alter lower
extremity neuromuscular control increasing risk for injury due to the decrease
blood flow at the lower extremity.
Research by Morrison et al. (2004) examined the effect of passive whole
body heating (without exercise-induced fatigue) on measures of lower extremity
neuromuscular control including the maximal isometric force production and
voluntary activation (VA) of the quadriceps femoris. The results showed that
heating decreased maximal isometric force production by 13% and VA by 11%,
which indicates that increased rectal temperature was related to VA during a MVC
(Morrison et al., 2004). This suggests that hyperthermia alone may alter extremity
lower extremity neuromuscular control.
In addition to an increase in core body temperature, the exercise duration is
also important to neuromuscular control. An increase in muscle temperature
during a warm-up improves power production during short-duration exercise, but
as the duration continues power production decreases (Racinais & Oksa, 2010).
Therefore, how hyperthermia affects anaerobic performance is dependent upon the
duration (Racinais & Oksa, 2010).

16 16
For example, Lars, Nybo, and Nielsen (2001) found that in prolonged
exercise duration with hyperthermia decreases maximal voluntary contraction
(MVC) and aerobic performance. Fourteen men exercised at 60% VO2max on a
cycle ergometer under either a hot or thermoneutral environment. Immediately
after exercise participants performed two minutes of sustained MVC with either a
knee extension or with a hand grip. This study found that MVC decreased with
hyperthermia (M = 40.0°C, SD = 0.1) and voluntary activation percentage
displayed a decrease in central activation (M = 54%, SD = 7) in both groups (Nybo
& Nielsen, 2001). In conclusion, this study demonstrated that the ability to
generate force is attenuated with hyperthermia and impairs performance due to the
reduction voluntary activation percentage (Nybo & Nielsen, 2001).
Many studies examined the effects of physiological decrements on
neuromuscular control. However, neuromuscular control has historically been
evaluated using isolated single muscle performance on isokinetic dynamometers
and may not be practical to sport specific motions. Hence, more research needs to
assess more sport like motions such as a jump-landing task. To my knowledge
only one study examined the effects of exercise-induced hyperthermia on jump-
landing technique using the LESS (DiStefano et al., 2013). Recreationally active
males completed a 90-minute exercise protocol on a treadmill. The LESS scores
increased from PRE to POST under an exercise-induced hyperthermic
environment. The highest LESS score difference was observed at PRE (M = 3.72,
SD = 1.73) to POST (M = 4.42, SD = 1.75) in the hypohydrated and hot condition
(DiStefano et al., 2013). These findings demonstrate that under a hyperthermic
and hypohydrated condition lower extremity neuromuscular control is reduced.
Therefore, it is important to examine the effects on lower extremity neuromuscular
control in more complex conditions.

17 17
Thus, exercising in a hyperthermic and dehydrated condition often leads to
an increased level of fatigue. Past studies have found that dehydration and
prolonged exercise in the heat can cause early onset of fatigue (Gonzalez-Alonso,
Calbet, & Nielsen, 1999). Consequently, it is important to understand how fatigue
independently affects lower extremity neuromuscular control.
Fatigue
Neuromuscular fatigue is a type of fatigue that influences of lower-limb
control and can lead to injury risk. The ability of muscle fibers to absorb energy is
decreased when fatigued which can alter neuromuscular function. There is
decrease in shock absorption and knee stabilization in landing, which could
potentially lead to non-contact lower extremity injuries (Chappell et al., 2005).
Chappell et al. (2005) researched the effects of neuromuscular fatigue by
evaluating three different jump-landing tasks. The results showed that both males
and females demonstrated altered motor control strategies when fatigued, which
may increase anterior tibial shear force, strain on the ACL, and risk of injury
(Chappell et al., 2005). This study supports that fatigue can independently affect
landing technique and increase risk of injury.
Furthermore, a study using the LESS examined the effect of fatigue on
landing technique. The study consisted of 12 anterior cruciate ligament
reconstruction (ACLR) and 10 uninjured male and female subjects (Gokeler et al.,
2014). Landing technique was altered after a CMJ and squat based fatigue
protocol in both uninjured and ACLR individuals (Gokeler et al., 2014). The
altered landing technique demonstrates that under a fatigued condition there is a
decrease in lower extremity neuromuscular control and an increased risk for
18 18
injury. To my knowledge this is the only study to specifically examine only
fatigue and lower extremity neuromuscular control with the LESS.
One study examined the relationship between hydration status and lower
extremity neuromuscular control during a jump-landing task. Using the LESS, 12
healthy males performed a standardized jump-landing task in both a hypohydrated
temperate (HYT) and euhydrated temperate environment (EUT). The results
showed no significant change in LESS scores between EUT and HYT at PRE, but
there was a small difference found at POST, EUT (M = 3.47, SD = 2.05) and HYT
(M = 3.75, SD = 1.76). Therefore, it was concluded that the increase movement
errors during the LESS was due to the fatigue developed from the exercise
protocol.
Mclean and associates examined the effects of fatigue on a drop landing
task on NCAA Division I athletes. The subjects completed 10 drop landing tasks
PRE and POST. The exercise included several game-like drills performed under a
specific fatigue protocol. Females had a greater increase in lower extremity
movements compared to the males after completing the fatigue protocol.
Additionally, there was an increase in lower extremity movements in males,
therefore it was concluded that there is an increased chance of non-contact knee
injury after fatiguing exercise (McLean et al., 2007).
In contrast, another study found that an intermittent exercise protocol that
stimulated a ‘game-like’ situation did not induce fatigue nor showed a significant
reduction in lower extremity performance (Shultz et al., 2015). But, fatigue may
occur sooner with an intermittent exercise protocol when combined with
dehydration and hyperthermia. Therefore, it is important to examine fatigue under
more complex situations.

19 19
One study examined the effects of voluntary and magnetically evoked
neuromuscular performance with acute fatigue and hypohydration (Minshull &
James, 2013). Minshull and James concluded that the decrease in neuromuscular
performance at the knee following the fatigue protocol could lead to decreased
joint stability and increased risk for injury late in competition or training. Thus, it
can be concluded that under a more complex situation, like the combination of
dehydration, hyperthermia, and fatigue may alter movement control at the lower
extremity, increasing injury risk.
The Combination of Dehydration, Hyperthermia, and Fatigue
Prolonged physical activity commonly leads to dehydration, which may
cause hyperthermia, and therefore cause an increase in fatigue. The reduction of
blood flow due to dehydration causes an increase in HR, which in return causes a
decreased stroke volume, and prompts a decreased delivery of oxygen to working
muscles creating cardiac drift (Gonzalez-Alonso, 2007; Nybo, 2008). In addition
these effects trigger an increase in perceived exertion, which prompts poor
performance (Gonzalez-Alonso, 2007). Dehydration, hyperthermia, and fatigue
all significantly impact the performance of an athlete. Therefore, it is important to
examine movement under all three of these circumstances and the effects on lower
extremity neuromuscular control.
A study by DiStefano and colleagues (2013) assessed the effects of
exercise-induced hyperthermia and hypohydration on jump landing technique
using the LESS. Jump-landing tasks where performed in four different exercising
conditions euhydrated hot (EUH) and hypohydrated hot (HYH), as well as, EUT
and HYT. The results from the HYH condition (PRE, M = 3.72, SD = 1.73,
POST, M = 4.42, SD = 1.75) compared to POST HYT (M = 3.75, SD = 1.76) and
20 20
POST EUH (M = 3.61, SD = 1.47) (P< 0.05) showed an increase in movement
errors, reducing neuromuscular control. DiStefano and colleagues concluded that
hypohydration (M = 1052mOsm·kg-1, SD = 72) and hyperthermia (M = 39.33°C,
SD = 0.45) during exercise impairs neuromuscular function of the lower extremity
during a jump-landing task, therefore increasing risk of injury.
Due to lack of literature, it is important for researchers to examine lower
extremity neuromuscular control in this complex situation of hyperthermia,
dehydration, and fatigue to prevent future injury and increase performance.
Furthermore, researchers need to examine ways to help athletes better prevent
these decrements from occurring during exercise.
Summary
Dehydration, hyperthermia, and fatigue independently affect lower
extremity movements by decreasing neuromuscular control. In addition, the LESS
has shown to accurately assess landing technique and decreases in neuromuscular
control of the lower extremity. An intervention plan should be implemented to
reduce these decrements in neuromuscular control. Therefore, a personalized
hydration plan may mitigate poor movement patterns and prevention of lower
extremity injuries.

CHAPTER 3: METHODS
Experimental Design
After a familiarization trial, participants completed two test sessions in a
randomized controlled crossover counterbalanced design. One test session being
control (CON) with minimal fluid replacement and the other experimental (EXP)
with fluid replacement equal to the participants’ specific sweat rate (Figure 1).
Each test session was separated by at least 48 hours to allow participants to
recover from the previous test session. All test sessions took place outdoors in a
warm environment (> 35°C) where air quality was ranged from the white to green
flag categories (Sawka et al., 2003).
Figure 1. Experimental design. Note: Prior to intermittent exercise protocol (Pre-exercise) participants’ gastrointestinal
temperature (Tgi) is cool (36-37.5°C), euhydrated with a urine specific gravity (Usg) ≤
1.025 and urine color Ucol ≤ 4 and not fatigued (< 7/10). After exercise (Post-exercise)
participants are hot (Tgi = 39.5°C), dehydrated (Usg ≥ 1.025, Ucol ≥ 4) and fatigued (≥
7/10). Participants then return ≥ 48 hours later to perform the alternate trial.

22 22
Participants
Healthy, heat-acclimatized, and recreationally active males between the
ages of 18-35 y were recruited to participate in the study. Participants were
assumed to be heat acclimated due to testing being completed in late summer. A
heat acclimation questionnaire confirmed acclimatization status. Recreationally
active was defined as ≥ 30 minutes of exercise a day, 3-5 days a week, and a
VO2max that ranged from 45-55 mL·kg-1·min-1. Participants were excluded from
the study if they had: any chronic health problems, a history of cardiovascular,
metabolic, and/or respiratory disease, a fever or an injury that would affect
physical activity during testing. Participants were also excluded from the study if
they had previously experienced exertional heat stroke within the past 3 years. If
they had a prior ACL injury, chronic ankle instability, or lower extremity injury
that occurred within the past six months. All participants provided informed
consent (Appendix A) prior to participation. The study protocol was approved by
the University’s Institutional Review Board.
Procedures
Familiarization Session
Participants attended a familiarization session at least 48 hours before the
first test session to determine the participant’s body composition, VO2max, and
sweat rate. Participants completed a medical history form (Appendix B) and a
heat acclimation questionnaire (Appendix C) to ensure that the participant was
cleared for testing.
Height was measured before measuring body weight and body composition.
After determining percent body fat, the participants completed a VO2max test.

23 23
During the VO2max test HR, VO2, respiratory exchange ratio (RER), and rating of
perceived exertion (RPE) were measured to confirm VO2max.
Prior to beginning the sweat rate test, participants provided a urine sample
to measure Usg and Ucol to ensure euhydration. If a Usg > 1.025 or Ucol ≥ 4 the
participant was provided 500mL of water and waited 30 minutes until starting the
sweat rate test.
The sweat rate test was performed in the same location and under similar
environmental conditions as the test sessions. Participant’s PRE nude body mass
was measured prior to beginning the sweat rate test. Ambient air temperature (°C),
percent relative humidity (%RH), and wet bulb globe temperature (WBGT) (°C)
were recorded before and after the sweat rate test. The intermittent exercise
protocol performed for all sessions included walking, jogging, running, and
sprinting. Participants wore a HR monitor and a global positioning system (GPS)
watch to record, exercise intensity, time, speed, and distance.
Sweat rate was determined by subtracting the participant’s PRE nude body
mass from their POST nude body mass divided by the exercise time completed (L.
E. Armstrong, 2007; Casa et al., 2000). Water consumption was accounted for
during the sweat rate determination. Urine loss was added to total body mass lost
and water consumption was subtracted from total body mass. Participants were
instructed to keep a 24-hour dietary log before each test session to ensure that
calorie intake was the same before each test session controlling for the effects of
hydration and substrate depletion induced fatigue.
Test Sessions
Upon arrival to the lab participants confirmed that no alcohol had been
consumed in the past 24 hours and no caffeine had been consumed in the past 8

24 24
hours to control for the effect on performance. Participants confirmed taking the
Tgi pill and researchers checked to ensure that the pill was working properly.
The participants then provided a urine sample to measure PRE Usg and Ucol
to ensure euhydration. If a Usg > 1.025 or Ucol ≥ 4 the participant was provided
500mL of water and waited 30 minutes until beginning the test session. Then the
participant’s PRE-nude body mass was measured in a private room. A HR
monitor was then applied to the participant’s chest. Perceptual scales (thirst,
thermal, fatigue, and RPE; Appendix D) were then explained to the participant and
recorded. The participant’s baseline HR and Tgi were recorded before beginning
lower-extremity movement assessment.
Lower-extremity movement assessment required participants to perform
three standardized jump-landing tasks that were video-recorded. Video cameras
were placed on tripods at a height of 48 inches from the floor and 136 inches in
front and to the side of the participant in the frontal and sagittal plane (Padua et al.,
2009). The participants jumped from a 30 cm high box that was placed at a
distance that was 50% of the participants height, landing on a force platform, and
immediately rebounded for a maximal vertical jump (Padua et al., 2009) (Figure
2).
Figure 2. Landing error scoring system standardized jump-landing task set-up

25 25
Participants practiced until one successful jump landing task was
completed. A successful jump was characterized by (1) jumping off with both feet;
(2) jumping forward, but not vertically, to land on the force plates; (3) landing
with both feet inside the force plates; and (4) completing the task in a fluid motion
(Padua et al., 2009). Participants were asked to rebound as high as possible and
were not given feedback regarding landing technique unless the task was
performed incorrectly (Padua et al., 2009). The LESS is a field-based motion
analysis in which the jump-landing tasks are evaluated for an overall LESS score
(Padua et al., 2009). A LESS score is a count of landing technique “errors” that
are commonly seen in human movement (Padua et al., 2009). The LESS examines
17 items at the knee, trunk, and feet (Padua et al., 2009). A higher LESS score
means there is a greater number of landing errors committed, meaning that the
participant had “poor” jumping technique (DiStefano et al., 2013). A lower LESS
scores means that the participant has “good” landing technique (Padua et al.,
2009).
As part of a larger study, following the jump-landing tasks a repeated box
lifting task (RBL) and countermovement jump (CMJ) were completed. After all
the tasks were completed the participants went outside to begin exercise.
Prior to beginning the exercise outdoors, environmental conditions,
physiological, and perceptual measures were recorded. The intermittent exercise
protocol is thought to represent a ‘game-like’ situation that involves different
levels of running from sprinting to jogging to walking, simulating the
biomechanical and physiological demands of high-intensity intermittent sport
(Shultz et al., 2015) (Figure 3). The participants ran for 90 minutes that included
various speeds and distances of running. Intermittent exercise protocol consisted

26 26
of a 50-meter sprint, 25-meter 80% run, 15-meter 60% run, and 200-meter 50%
jog with walking in between each run (Figure 3).
Figure 3. Intermittent Exercise Protocol: Following each run or sprint the
participant walked and after completing all three runs a recovery jog (200m-jog)
was completed.
During exercise, physiological and perceptual measures were recorded
every 10 minutes. In CON, participants received 100mL of water every 30
minutes. In EXP, participants received water in small doses every 10 minutes to
fully replace fluid lost through sweat as determined during sweat rate testing.
Exercise was stopped if the participant Tgi ≥ 39.5°C, a fatigue score of ≥
7/10 scale was reached, or participant volition. Exercise was also stopped if signs
of exertional heat illness were observed for subject safety. Immediate post-
exercise (IPE) environmental conditions, physiological, and perceptual measures
were recorded.
Participants immediately returned to the lab POST, where pre-performance
physiological and perceptual measures were recorded. The participants then

27 27
performed three successful jump-landing tasks followed by the RBL and CMJ.
POST post-performance physiological and perceptual measures were then
recorded followed by a final POST nude body mass. Lastly, the participants
provided a urine sample to measure their POST Usg and Ucol and were given fluids
to rehydrate.
Instrumentation
Participants height was measured in centimeters with a wall mounted Stadi-
O-Meter (Novel Products Inc., Rockton, Illinois). The weight and body fat
percent of each participant was determined using air displacement
plythemosgraphy in a BODPOD (Cosmend, Roma, Italy). The VO2max test took
place in a thermoneutral environment where subjects completed a 5-minute warm-
up on a treadmill walking at 1% grade. The test continued with a treadmill
ramping protocol which increases speed every 2 minutes until voluntary
exhaustion. The expired gases where collected and recorded with the
ParvoMedics True One 2400 Metabolic Measurement System (Sandy, Utah) and
connected by a hose to a 2-way Hans-Rudolph Valve (Shawnee, Kansas). VO2max
was confirmed if the following criteria were met: plateau in VO2, reached 90% of
age-predicted HR maximum, plateau in HR, and RER ≥ 1.15.
The participants PRE and POST nude body mass was measured to the tenth
of a kilogram on a scale (Gmbh & co., Seca, Germany). Volume fluid intake was
measured with a digital scale (Ohaus Co., CSSeries, Parsippany, NJ). Urine
specific gravity (Usg) was measured with a refractometer (Atago inc, URC-Ne,
Believue, Washington) and urine color (Ucol) was measured on a urine color chart
rated from 1-7 (L. E. Armstrong, 2007) to ensure euhydration.

28 28
Environmental conditions were measured using a WBGT device on a tripod
(Kestrel Inc., 4400 Heat Stress Tracker, Bootwyn, Pennsylvania).
Internal temperature data was recorded with a Tgi pill (HQ, Inc. CorTemp
Temperature Sensor, Palmetto, Florida) that was ingested eight hours prior to test
to defend against recording an invalid Tgi.
Thirst sensation was rated on a scale from 1 being not thirsty at all to 9
very, very thirsty following 1 unit increments (Armstrong, 2007). Thermal
sensation was rated on a scale from 1 unbearable cold to 8 unbearably hot
following 0.5 increments. Fatigue was rated on a scale from 0 being no fatigue at
all to 10 completely fatigued following 1 unit increments. Rating of perceived
exertion was rated on the Borg scale from 6 to no exertion at all to 20 to maximal
exertion following 1 unit increments (Borg & Kaijser, 2006).
HR was monitored using a HR monitor (Polar, Model H7, Lake Success,
NY). A wrist mounted GPS device recorded distance and run velocity
(Runtrainer, Timex, Middlebury, CT).
Jump-landing tasks were recorded on video cameras (Canon, Vixia HF
R700, Irvine, California).
Data Management
Jump-landing video data was clipped (Apple Inc., iMovie 10.1.4, USA) and
sent to an experienced rater to be evaluated for LESS errors. The rater, was
blinded to the condition and time.
Statistical analysis was performed using IBM SPSS V23.0 (IBM
Corporation, Armonk, NY, USA) with an alpha level of 0.05 to determine
significance.
29 29
Statistical Analysis
Descriptive statistics were computed for demographic information.
Independent t-tests were performed to compare environmental conditions.
Dependent t-test evaluated exercise time, distance, and speed between trials.
Additionally, dependent t-test were performed for Tgi, percent body mass loss, HR,
and fatigue for PRE to POST, as well as IPE to prior to performing the jump-
landing tasks after exercise (Pre-LESS). Data was examined as to whether it met
assumptions for ANOVA; independence of cases, homoscedasticity, sphercity,
and normality. A trial (CON vs EXP) by time (PRE vs POST) two-way repeated
measures ANOVA was computed to examine changes in LESS scores, Tgi, HR,
perceptual measures (fatigue, RPE, thirst, and thermal sensation). If sphericity
was violated, Greenhouse-Geisser correction was applied. Pairwise comparisons
were examined to assess time effects and trial effects.
The dependent variables for this study was LESS scores, % dehydration,
Tgi, HR, and perceptual ratings. Independent variables were Tgi, body mass loss,
fatigue, environmental conditions, and exercise time, distance, and run speed.
Effect size was calculated using partial eta squared for ANOVA and Cohen’s d for
pairwise comparison.

CHAPTER 4: RESULTS
Demographics
Five participants (n = 5) completed both CON and EXP trials (Table 1).
Participants were recreationally active by displaying a VO2max that ranged from
45-55 mL·kg-1·min-1 and healthy with a low percent body fat (Table 1).
Table 1
Demographic Data
Variable Measure
Age (y) 25.40 ± 5.73
Height (cm) 175.74 ± 8.19
Weight (kg) 78.70 ± 16.79
Body Fat (%) 13.80 ± 6.42
VO2max (mL·kg-1·min-1) 60.10 ± 6.18
Sweat Rate (L·min-1) 2.07 ± 0.51
Landing Error Scoring System
No time by trial interaction effect was seen in LESS scores, F (1,8) = 0.669,
p = 0.437, ηp2=0.077 nor main effects F (1,8) = 0.448, p = 0.522, ηp
2 =0.053. No
group difference was seen between trials for LESS scores before exercise (CON,
M = 3.80, SD = 1.69; EXP, M = 4.53, SD = 1. 69), t (4) = -0.626, p = 0.565, d = -
0.43 and for LESS scores after exercise (CON, M = 4.47, SD = 0.45; EXP, M =
4.47, SD = 0.77), t (4) = 0.00, p = 1.00, d = 0.00.
Although not statistically significant, LESS scores increased from PRE to
POST in both trials, but a greater increase in movement errors was seen in CON
(Mpre-post = -0.667) when compared to the EXP (Mpre-post = 0.0667) (Figure 4).

31 31
Furthermore, changes in specific movement errors were observed with heel toe
contact, narrow stance, external rotation, and joint displacement occurring the
most often during a jump-landing task (Table 2). Heel toe contract errors for CON
(PRE, M = 2; POST, M = 3) increased by 50% and decreased by 25% for EXP
(PRE, M = 4; POST, M = 3). Narrow stance errors did not change in CON and
increased by 100% for EXP (PRE, M = 1; POST, M = 2). External rotation errors
increased in both CON (PRE, M = 3; POST, M = 4) (-33%) and EXP (PRE, M =
4; POST, M = 5) (-25%). No change in joint displacement errors were observed in
CON, but decreased by 25% in the EXP (PRE, M = 4; POST, M = 3).
Figure 4. Mean LESS scores pre-exercise (PRE) and post-exercise (POST)
between trials, with each participant’s individual LESS score. * P < 0.05 for PRE
to POST; † P < 0.05 for between trials.

32 32
Table 2
Top 4 Individual Movement Errors out of 22 Evaluated That Appeared Most
Frequency Among Participants
Note: Number of participants that performed that movement error during that time point and trial. Percent
change was calculated from pre-exercise (PRE) to post-exercise (POST) out of 5. (PRE-POST)/PRE] • 100
= percent change
Heart Rate Response to Intermittent Exercise Protocol
There was no interaction effect for HR F(2,8) = 1.60, p = 0.242, ηp2 =
0.167. A main effect for time was observed F(2,8) = 346.86, p < 0.001, ηp2 =
0.977. HR increased steadily during the first 10 minutes and then plateaued after
minute 10 throughout exercise for both trials F(2,8) = 284.2, p < 0.001, ηp2 = 0.973
(Figure 5). HR for both trials increased from minute zero (CON, M = 107.40, SD
= 16.50; EXP, M = 102.0, SD = 8.69) to IPE (CON, M = 177.40, SD = 20.38;
EXP, M = 182.2, SD = 13.83), p < 0.001 (Figure 5). HR decreased for both trials
from IPE (CON, M = 172.50, SD = 19.84; EXP, M = 182.2, SD = 13.83) to Pre-
LESS (CON, M = 134.00, SD = 18.22; EXP, M = 116.8, SD = 14.75), p < 0.001
(Figure 5). A group difference was observed for HR at Pre-LESS (CON, M =
134.0, SD = 18.22; EXP, M = 116.5, SD = 17.02), t (4) = 3.302, p = 0.046, d =
0.993.
Landing Error
Scoring System
Item
Trial
PRE (n = 5)
POST (n = 5)
% Change
Heel Toe
Contact
CON
EXP
2
4
3
3
- 50
+25
Narrow Stance CON
EXP
2
1
2
2
0
-100
External
Rotation
CON
EXP
3
4
4
5
-33
-25
Joint
Displacement
CON
EXP
2
4
2
3
0
+25

33 33
Figure 5. Heart rate response during exercise to immediately post-exercise (IPE),
and prior to performing completing jump-landing tasks after exercise (Pre-LESS).
* P < 0.05 for pre-exercise (PRE) to post-exercise (POST); ** P < 0.05 for IPE to
Pre-LESS; † P <0.05 for between trials.

34 34
Physiological and Perceptual Responses to Intermittent Exercise
RPE increased from minute zero (CON, M = 8, SD = 3; EXP, M = 9, SD =
2) to IPE in both groups (CON, M = 19, SD = 1; EXP, M = 18, SD = 3), F(2,8) =
128.59, p < 0.001, ηp2 = 0.941 (Table 3). Additionally, RPE did not increase from
IPE in CON (M = 19, SD = 1) to Pre-LESS (M = 13, SD = 3), t (3) = 2.60, p =
0.080, d = 2.68. Whereas, RPE increased from IPE in EXP (M = 18, SD = 3) to
Pre-LESS (M = 12, SD = 6), t (4) = 3.80, p = 0.019, d = 1.26. An interaction
effect was observed for rating of thirst sensation from minute zero (CON, M = 4,
SD = 1; EXP, M = 4, SD = 2) to IPE (CON, M = 8, SD = 1; EXP, M = 5, SD = 3),
F(2,8) = 7.85, p = 0.023, ηp2 = 0.495 between groups. Rating of thermal sensation
increased from PRE (CON, M = 4.8, SD = 0.75; EXP, M = 4.5, SD = 0.50) to IPE
(CON, M = 7.0, SD = 0.79; EXP, M = 7.0, SD = 0.72), F(2,8) = 65.11, p < 0.001,
ηp2 = 0.891. An interaction was observed for body mass from PRE (CON, M =
77.88, SD = 16.68; EXP, M = 78.56, SD = 16.31) to IPE (CON, M = 75.92, SD =
15.97; EXP, M = 76.86, SD = 15.37), F(2,8) = 25.62, p = 0.001, ηp2 = 0.762
between groups. Usg changed from PRE (CON, M = 1.009, SD = 0.01; EXP, M =
1.01, SD = 0.01) to POST (CON, M = 1.01, SD = 0.00; EXP, M = 1.02, SD =
0.05), F(2,8) = 6.83, p = 0.035, ηp2 = 0.494. An interaction was observed for Ucol
from PRE (CON, M = 1.01, SD = 0.007; EXP, M = 1.01, SD = 0.008) to POST
(CON, M = 1.02, SD = 0.004; EXP, M = 1.02, SD = 0.007), F(2,6) = 6.40, p =
0.045, ηp2 = 0.516 between groups.
Exercise-Induced Dehydration
CON was more dehydrated than the EXP from PRE to POST (CON, M =
2.59, SD = 0.52; EXP, M = 0.92, SD = 0.41), t (4) = 10.55, p < 0.001, d = 3.57
(Table 3).

35 35
Table 3
Physiological & Perceptual Responses from Intermittent Exercise Protocol
Variable Trial PRE POST
Perceptual
Rating of Perceived Exertion
(RPE)
CON
EXP
8 ± 3
8 ± 2
19 ± 1*
18 ± 3*
Rating of Thirst Sensation CON
EXP
4 ± 1
4 ± 2
8 ± 1*†
5 ± 3*†
Rating of Thermal Sensation CON
EXP
5.0 ± 1.0
4.5 ± 0.5
7.0 ± 1.0*
7.0 ± 1.0*
Hydration
Body Mass Loss (kg)
CON
EXP
77.88 ± 16.68
78.56 ± 16.31
75.92 ±
16.56*†
77.80 ±
15.97*†
Urine Specific Gravity CON
EXP
1.01 ± 0.007
1.01 ± 0.008
1.01 ± 0.004*
1.02 ± 0.007*
Urine Color CON
EXP
3 ± 1
3 ± 2
6 ± 1*†
4 ± 1*†
Note: * P < 0.05 for pre-exercise (PRE) to post-exercise (POST); † P < 0.05 for between trials: control
(CON) and experimental (EXP).
36 36
Exercise-Induced Hyperthermia
No interaction effect was observed for Tgi F (1,5) = 1.65, p = 0.234, ηp2 =
0.171. But, a main effect for time was seen for Tgi F (1,5) = 11.97, p = 0.009, ηp2 =
0.599. Tgi was similar at minute zero (CON, M = 37.84, SD = 0.25; EXP, M =
37.83, SD = 0.23), t (3) = -0.073, p = 0.946, d = 0.04 and increased steadily for 30
mins for both trials (Figure 6). Tgi in EXP plateaued after minute 40, while CON
Tgi continued to rise (Figure 6). Although, not significantly different between
groups, Tgi at minute 60 (CON, M = 39.29, SD = 0.18; EXP, M = 38.88, SD =
0.60), t (2) = 1.65, p = 0.241, d = 0.926 and IPE (CON, M = 39.22, SD = 0.32;
EXP, M = 39.03, SD = 0.61), t (4) = .592, p = 0.592, d = 0.390) was greater
(Figure 6). Tgi for both trials increased from minute zero (CON, M = 37.83, SD =
0.21; EXP, M = 37.83, SD = 0.23) to IPE (CON, M = 39.17, SD = 0.45; EXP, M =
39.03, SD = 0.61) (p < 0.05) (Figure 6) due to the effect of exercise-heat stress.
Tgi was similar between trials at IPE (CON, M = 39.29, SD = 0.31; EXP, M =
39.03, SD = 0.61), t(7) = 2.64, p = 0.425. Tgi for both trials did not significantly
decrease from IPE (CON, M = 39.17, SD = 0.37, EXP, M = 39.03, SD = 0.61) to
Pre-LESS (CON, M = 38.81, SD = 0.26, EXP, M = 38.68, SD = 1.11) (p > 0.05)
(Figure 6). Tgi were similar at Pre-LESS (CON, M = 38.81, SD = 0.26; EXP, M =
39.02, SD = 1.07), t (2) = -0.303, p = 0.790, d = -0.269.
Fatigue Response to Intermittent Exercise
No interaction effect for rating of fatigue was observed F(2,8) = 0.853, p =
0.383, ηp2 = 0.096. But, a main effect for time was observed F(2,8) = 189.11, p <
0.001, ηp2 = 0.952. No difference between groups for fatigue was seen at minute
zero (CON, M = 2.6, SD = 1; EXP, M = 2.80, SD = 1), t (4) = -0.250, p = 0.815, d
= -0.02. Fatigue increased from minute zero (CON, M = 3, SD = 1; EXP, M = 3,
SD = 2) to IPE (CON, M = 9, SD = 1, EXP, M = 9, SD = 2), p < 0.001 (Figure 7).

37 37
Figure 6. Gastrointestinal temperature throughout exercise to immediately post-
exercise (IPE) to prior to performing jump-landing tasks after exercise (Pre-
LESS). Note: * P < 0.05 for minute 0 to IPE; ** P < 0.05 for IPE to Pre-LESS; † P <0.05 for between
control (CON) and experimental (EXP) trials.
Figure 7. Rating of fatigue at pre-exercise (PRE), post-exercise (POST) and prior
to performing jump-landing tasks (Pre-LESS). Note: * P < 0.05 for PRE to POST; ** P < 0.05 for IPE to Pre-LESS; † P < 0.05 for between
groups.

38 38
At IPE, no difference between trials was seen (CON, M = 9, SD = 1; EXP,
M = 9, SD = 2; t(4) = 0.742, p = 0.499, d = 0.00). Furthermore, a difference
between trials was not observed at Pre-LESS (CON, M = 8, SD = 2; EXP, M = 7,
SD = 2, t(3) =0.302, p = 0.783, d = 0.50). No change in fatigue was observed from
IPE (M = 9, SD = 1) to Pre-LESS (M = 8, SD = 2), t(3) = 4.02, 2.32, p = 0.103, d =
0.632, whereas for EXP rating of fatigue changed from IPE (M = 9, SD = 2) to
Pre-LESS CON (M = 6, SD = 3), t(4) = 3.10, p = 0.036, d = 1.18.
Environmental Conditions
There were no differences in environmental conditions between groups (p >
0.05) (Table 4), except for a difference in percent relative humidity from pre-
(CON, M = 30.08, SD = 3.73; EXP, M = 32.3, SD = 8.06) to POST (CON, M =
26.94, SD = 2.82; EXP, M = 28.63, SD = 5.53), F (2,8) = 5.80, p = 0.047, ηp2 =
0.4530. The environmental conditions were warm and mild, ranging from the
white to green flag categories (Sawka et al., 2003).
Table 4
Environmental Conditions During Intermittent Exercise.
Variable Trial PRE POST
Ambient Air
Temperature
(°C)
CON
EXP
32.6 ± 1.08
31.2 ± 1.39
31.8 ± 1.67
31.64 ± 0.79
Humidity (%) CON
EXP
30.08 ± 3.73
30.66 ± 7.89
26.94 ± 2.82*
27. 88 ± 5.07*
WBGT (°C) CON
EXP
26.52 ± 2.53
27.46 ± 2.09
24.50 ± 2.45
26.92 ± 3.10
Note: Values presented are Mean and Standard Deviations. * P < 0.05 for pre-exercise (PRE) to post-
exercise (POST); † P < 0.05 for between control (CON) and experimental (EXP).

39 39
Exercise Intensity and Time
Exercise time completed by participants was alike between CON (M =
59.25, SD = 13.61) and EXP (M = 64.86, SD = 7.93, t (8) = 0.46, p = 0.456, d =
0.50). Distance covered was similar between trials (CON, M =9.01, SD= 0.50;
EXP, M = 9.35 km, SD =1.39), t(7) = 3.01 p = 0.734 d =0.25. No significant
difference was found in exercise velocity between CON (M = 8.30 km·h-1, SD =
0.61) and EXP (M = 8.62, SD = 0.95, t (7) = 0.85, p = 0. 577, d = 0.040.

CHAPTER 5: DISCUSSION
To our knowledge, the current study is the first to examine the effect of a
personalized hydration plan during exercise on neuromuscular control. The
current investigation hypothesized that exercise-induced dehydration,
hyperthermia, and fatigue would worsen LESS scores during a jump-landing task
and that a personalized hydration plan would mitigate this worsening of LESS
scores. We found that the combination of dehydration, hyperthermia, and fatigue
did not affect POST LESS scores during a jump-landing task (Figure 1).
Our findings contradict past research that observed that neuromuscular
control was negatively affected by a hyperthermic, hypohydrated state (DiStefano
et al., 2013). This discrepancy may be due to the present study having lower Tgi
(CON, M = 38.81, SD = 0.26, EXP, M = 38.68, SD = 1.11) than DiStefano et al.
(M = 39.33, SD = 0.45) in the hypohydrated and hyperthermic trial which found a
reduced POST LESS scores. Additionally, the exercise bouts varied from 60-70
minutes, whereas DiStefano et al. exercise protocol consisted of 90 minutes. The
varying lengths of exercise time and environmental conditions in the present study
may explain the lower Tgi, not allowing for adequate hyperthermia and
dehydration to occur. Thus, if the current study would have displayed similar Tgi
to DiStefano et. al (2013) we may have seen similar results.
The exercise protocol in the current study resulted in 2.6% body mass loss
in CON, whereas DiStefano et al. (2013) induced 5.7% body mass loss. This
difference in body mass loss may explain why the present study did not see a
reduction in LESS scores when performing a jump-landing task. Additionally, the
previous study induced hypohydration through water restriction before exercise
plus sweat induced water loss via exercise in the heat, while in the current study

41 41
body mass loss was done via dehydration through sweat losses only. Furthermore,
DiStefano et al. reported that LESS scores were not altered in a euhydrated
hyperthermic condition. This indicates the importance of hydration during
exercise to reduce the effects on neuromuscular control and that a 5% reduction in
body mass loss plus hyperthermia (Tgi > 39.3°C) would suggest neuromuscular
control impairment at the lower extremity.
We observed that the hydration plan did not affect LESS scores, likely
because CON may not have been dehydrated enough to display an increase in
LESS scores. Dehydration greater than 3-4% has reduced muscular strength,
power, and high-intensity endurance which may reduce overall athletic
performance (Judelson et al., 2007). Furthermore, decrements in neuromuscular
control have been seen in hydration levels resulting in 3-6% body mass loss
(DiStefano et al., 2013; Stewart et al., 2014). Therefore, if the current study would
have shown a greater percent body mass loss to match previous studies, lower
extremity neuromuscular control may have been similarly reduced. The
dehydration level in CON (2.6%) was greater than EXP (0.92%) but did not result
in a change in LESS scores. These results show similar percent body loss mass as
Minshull and James (2013) who observed a 2.1% body mass loss impaired
neuromuscular control, however, our study did not mirror their decrements. This
could be due to hypohydration affecting the cell’s ability to perform, whereas with
dehydration the reduction of fluid is affecting the blood plasma volume. This may
be the reason why the current study did not show decrements.
While dehydration did not affect LESS scores between groups, HR
increased significantly in CON compared to EXP. We found that Pre-LESS HR
after exercise was significantly higher in CON (M = 134.0, SD =18.22 bpm)
compared to EXP (M = 116.5, SD = 17.02 bpm). These data support a review that

42 42
found that for every 1% body mass loss HR increased additional 3 - 5 bpm (Casa
et al., 2015). This demonstrates an increase in cardiovascular strain due to the
sweat-induced reduction in total blood volume, consequently, altering the heart’s
ability to pump blood to the skin to dissipate heat, deliver oxygen and substrate,
and remove metabolic byproducts (Casa et al., 2000). To compensate for the
reduction in plasma volume and subsequent decrease in stroke volume, HR must
increase to maintain cardiac output. Additionally, dehydration may induce
hyperthermia affecting cardiac output by increasing fluid loss through an increased
sweat rate. Therefore, the combination of dehydration and hyperthermia may
further exacerbate cardiovascular strain, and perhaps affect neuromuscular control.
Many studies have observed that hyperthermia affects lower extremity
neuromuscular control (DiStefano et al., 2013; Morrison et al., 2004; Nybo &
Nielsen, 2001). Reductions to neuromuscular control were found at Tgi ranging
between 37-39.5°C (DiStefano et al., 2013; Morrison et al., 2004). Our target Tgi
was 39.5°C, however, exercise was conducted under moderate environmental
conditions (29.7-33.7°C; humidity = 22.0-39.2%; WBGT = 23.7-33.7°C). Thus,
the target Tgi was not reached IPE (CON, M = 39.29, SD = 0.31°C; EXP, M =
39.03, SD = 0.61°C). Furthermore, Tgi (CON, M = 38.81, SD = 0.26°C; EXP, M =
38.68, SD = 1.11°C) decreased as participants returned the lab (22.7°C; humidity,
41.5%; WBGT, 17.6°C) for POST LESS testing for both trials. Tgi observed in
the present study was lower than past studies that have found a relationship
between hyperthermia and neuromuscular control (DiStefano et al., 2013;
Morrison et al., 2004). Moreover, our current study may have observed
neuromuscular impairments during a jump-landing task if conducted under similar
conditions in past studies, inducing higher percent body mass loss and higher core
temperatures.

43 43
In contrast, the cooler POST Tgi supports DiStefano et al., who found that
LESS scores did not increase in the euhydrated hyperthermic (M = 38.35, SD =
0.63°C) condition. But, neuromuscular control was found to be affected greater
by the combination hypohydration and hyperthermia, which was observed by
DiStefano and colleagues (2013). Hypohydration has shown to reduce
neuromuscular control, but dehydration through exercise did not affect
neuromuscular control. Therefore, it is still unknown if dehydration through
exercise affects neuromuscular control. Additionally, dehydration through
exercise brings in another factor, fatigue, which presents an even more complex
condition to the athlete.
Multiple studies have found that fatigue can negatively affect
neuromuscular control, increasing risk for injury (Chappell et al., 2005; Gokeler et
al., 2014; McLean et al., 2007). Participants were fatigued after the intermittent
exercise protocol, per rating of fatigue from PRE (CON, M = 3, SD = 1; EXP, M =
3, SD = 2) to IPE (CON, M = 9, SD = 1; EXP, M = 9, SD = 2). Also, rating of
fatigue was similar from POST (M =9, SD = 1) to Pre-LESS (M = 8, SD = 2) in
CON. However, fatigue in EXP from IPE (M = 9, SD = 2) to Pre-LESS (M = 6,
SD = 2) did significantly decrease. This observation shows that EXP was still
fatigued (6/10) when performing POST jump-landing task, just not as fatigued as
CON (9/10). This demonstrates that hydration during exercise allowed for faster
cardiovascular recovery and perceptual feelings of fatigue from the intermittent
exercise protocol. This is important because the personalized hydration plan may
allow for adequate recovery reducing risk for injury.
Additionally, an increase in RPE from PRE (CON, M = 8, SD = 3; EXP, M
= 8, SD= 2) to POST (CON, M= 19, SD = 1; EXP, M = 18, SD = 3) was observed
indicating that the participants’ effort during exercise was enough to reach fatigue.

44 44
Past studies have used the RPE (≥ 18) to measure fatigue (DiStefano et al., 2013;
Gokeler et al., 2014). In the present study, CON displayed no significant increase
in movement errors even when fatigued at POST. This supports the findings of
Distefano et al. (2013) that fatigue could not independently affect LESS scores
without regards to percent body mass loss and core temperature, but contradicts
other studies that have found that fatigue alone can impact neuromuscular control
(Chappell et al., 2005; Gokeler et al., 2014; McLean et al., 2007). Although, in
the present study participants were fatigued at POST, fatigue did not
independently affect LESS scores without regards to hydration level and core
temperature.
The current study was limited to mild dehydration and hyperthermia, while
perceived fatigue level was significant when performing a jump-landing task at
POST. Although the dehydration level reached in CON was 2.6% this was not
enough to show decrements in LESS scores. If dehydration was > 5% maybe
more movement errors may have occurred during the POST jump-landing task.
Furthermore, target Tgi was intended to be 39.5°C, which was not achieved
immediately POST. If data collection would have been conducted earlier in the
summer and under a greater heat stress participants may have displayed a higher
increase in Tgi resulting in a more extreme hyperthermic condition. Last, a greater
perceived rating of fatigue may have been needed to negatively affect LESS after
exercise. The moderate levels of hyperthermia and fatigue could be due, in part,
to the cool environmental condition of lab and the delay from IPE to LESS testing.
Another explanation of the lack of change in LESS scores could be due to
the current study being underpowered (n = 5). Given the non-significant p-value
(0.437) for the interaction effect in LESS scores, a post hoc power analysis (G-
power) was conducted to determine sample size needed to achieve statistical

45 45
power. Using partial eta squared of the POST LESS scores for both groups, to
achieve power using repeated measures ANOVA with an alpha level set at 0.05 it
is estimated a total of 26, or an additional 21 participants would be needed to
achieve a power of 0.8.
In conclusion, exercise-induced dehydration, hyperthermia and fatigue to
the extent achieved in this study did not affect LESS scores. Similarly, a personal
hydration plan during exercise did not mitigate changes in POST LESS scores.
However, the increase in HR observed in CON may provide evidence that during
prolonged exercise under these conditions increases cardiovascular strain, and
therefore increase risk for injury. However, the personalized hydration plan
allowed for a faster recovery of HR and perception of fatigue from IPE to POST
LESS testing (approximately 5 min) suggesting hydration is an important
consideration to a speedy recovery. These findings are important for recreational
or occupational athletes completing multiple bouts of exercise per day.
Further research should seek to induce greater levels of dehydration,
hyperthermia, and fatigue commonly seen in long bouts of exercise. Additionally,
future research should focus on dehydration compared to hypohydration because
most elite athletes begin exercise or competition hydrated. Therefore, it is
important to continue to understand how dehydration specifically effects
neuromuscular control. Understanding how lower extremity neuromuscular
control is affected under various conditions could help prevent future lower
extremity injuries often seen in prolonged exercise bouts.

REFERENCES

REFERENCES
Armstrong, L. (2000). Heat and humidity. In M. Bahrke & Rebecca Crist (Eds.),
Performing in extreme environments (pp. 15-71), Champaign, IL: Human
Kinetics.
Armstrong, L. E. (2007). Assessing hydration status: The elusive gold standard.
Journal of American College Nutrition, 26(5), 575S-584S.
Armstrong, L., Maresh, C., Gabaree, C., Hoffman, J., Kavouras, S., et al. (1997).
Thermal and circulatory responses during exercise: Effects of hypohydration,
dehydration, and water intake. Journal of Applied Physiology, 82(6), 2028-
2035.
Bell, D., Smith, M., Pennuto, A., Stiffler, M., & Olson, M. (2014). Jump-landing
mechanics after anterior cruciate ligament reconstruction: a landing error
scoring system study. Journal of Athletic Training, 49(4), 435-441.
Borg, E., & Kaijser, L. (2006). A comparison between three rating scales for
perceived exertion and two different work tests. Scandinavian Journal of
Medicine and Science in Sports, 16(1), 57-69.
Bosco, J., Terjung, R., & Greenleaf, J. (1968). Effects of progressive
hypohydration on maximal isometric muscular strength. Journal of Sports
Medicine and Physical Fitness, 8(2), 81-86.
Brown, T., Johnston, R., Saltzman, C., Marsh, J., & Buckwalter, J. (2006).
Posttraumatic osteoarthritis: A first estimate of incidence, prevalence, and
burden of disease. Journal of Orthopaedic Trauma, 20(10), 739-744.
Casa, D., Armstrong, L., Hillman, S., Montain, S., Reiff, R., et al. V., (2000).
National athletic trainers' association position statement: Fluid replacement
for athletes. Journal of Athletic Training, 35(2), 212.
Casa, D., DeMartini, J., Bergeron, M., Csillan, D., Eichner, E. R., Lopez, et al.
(2015). National Athletic Trainers' Association Position Statement:
Exertional Heat Illnesses. Journal of Athletic Training, 50(9), 986-1000.
Chappell, J., Herman, D., Knight, B., Kirkendall, D., Garrett, W., & Yu, B.
(2005). Effect of fatigue on knee kinetics and kinematics in stop-jump tasks.
American Journal of Sports Medicine, 33(7), 1022-1029.
48 48
Cohen, J. (1977). Statistical power analysis for the behavioral sciences. New
York, NY: Academic Press.
DeMorat, G., Weinhold, P., Blackburn, T., Chudik, S., & Garrett, W. (2004).
Aggressive quadriceps loading can induce noncontact anterior cruciate
ligament injury. The American Journal of Sports Medicine, 32(2), 477-483.
DiStefano, L., Casa, D., Vansumeren, M., Karslo, R., Huggins, R., et al. (2013).
Hypohydration and hyperthermia impair neuromuscular control after
exercise. Medicine and Science in Sports and Exercise, 45(6), 1166-1173.
Draganich, L., Jaeger, R., & Kralj, A. (1989). Coactivation of the hamstrings and
quadriceps during extension of the knee. Journal of Bone and Joint Surgery,
71(7), 1075-1081.
Dragoo, J., Braun, H., Durham, J., Chen, M., & Harris, A. (2012). Incidence and
risk factors for injuries to the anterior cruciate ligament in National
Collegiate Athletic Association football: Data from the 2004-2005 through
2008-2009 National Collegiate Athletic Association Injury Surveillance
System. American Journal of Sports Medicine, 40(5), 990-995.
Gokeler, A., Eppinga, P., Dijkstra, P., Welling, W., Padua, D., Otten, E., &
Benjaminse, A. (2014). Effect of fatigue on landing performance assessed
with the landing error scoring system (less) in patients after ACL
reconstruction. A pilot study. International Journal of Sports Physical
Therapy, 9(3), 302-311.
Gonzalez-Alonso, J. (2007). Hyperthermia impairs brain, heart and muscle
function in exercising humans. Sports Medicine, 37(4-5), 371-373.
Gonzalez-Alonso, J., Calbet, J., & Nielsen, B. (1999). Metabolic and
thermodynamic responses to dehydration-induced reductions in muscle blood
flow in exercising humans. Journal of Physiology, 520(2), 577-589.
Griffin, L., Agel, J., Albohm, M., Arendt, E., Dick, R., Garrett, W. et al. (2000).
Noncontact anterior cruciate ligament injuries: risk factors and prevention
strategies. Journal of American Academy of Orthopadic Surgeons, 8(3), 141-
150.
Hawkins, R., Hulse, M., Wilkinson, C., Hodson, A., & Gibson, M. (2001). The
association football medical research programme: An audit of injuries in
professional football. British Journal of Sports Medicine, 35(1), 43-47.

49 49
Hewett, T., Myer, G. , Ford, K., Heidt, R., Jr., Colosimo, A., McLean, S. et all.
(2005). Biomechanical measures of neuromuscular control and valgus
loading of the knee predict anterior cruciate ligament injury risk in female
athletes: A prospective study. American Journal of Sports Medicine, 33(4),
492-501.
Hootman, J., Macera, C., Ainsworth, B., Addy, C., Martin, M., & Blair, S. (2002).
Epidemiology of musculoskeletal injuries among sedentary and physically
active adults. Medicine and Science in Sports & Exercise, 34(5), 838-844.
Judelson, D., Maresh, C., Anderson, J., Armstrong, L., Casa, D., et al. (2007).
Hydration and muscular performance: Does fluid balance affect strength,
power and high-intensity endurance? Sports Medicine, 37(10), 907-921.
Kanamori, A., Woo, S., Ma, C., Zeminski, J., Rudy, T., Li, G., & Livesay, G.
(2000). The forces in the anterior cruciate ligament and knee kinematics
during a simulated pivot shift test: A human cadaveric study using robotic
technology. Arthroscopy: The Journal of Arthroscopic and Related Surgery
16(6), 633-639.
Kanamori, A., Zeminski, J., Rudy, T., Li, G., Fu, F. , & Woo, S. (2002). The effect
of axial tibial torque on the function of the anterior cruciate ligament: a
biomechanical study of a simulated pivot shift test. Arthroscopy: The Journal
of Arthroscopic and Related Surgery, 18(4), 394-398.
Lohmander, L., Ostenberg, A., Englund, M., & Roos, H. (2004). High prevalence
of knee osteoarthritis, pain, and functional limitations in female soccer
players twelve years after anterior cruciate ligament injury. Arthritis and
Rheumumatism, 50(10), 3145-3152.
Markolf, K., Burchfield, D., Shapiro, M., Shepard, M., Finerman, G., &
Slauterbeck, J. (1995). Combined knee loading states that generate high
anterior cruciate ligament forces. Journal of Orthopaedic Research, 13(6),
930-935.
McLean, S., Fellin, R., Suedekum, N., Calabrese, G., Passerallo, A., & Joy, S.
(2007). Impact of fatigue on gender-based high-risk landing strategies.
Medicine and Scince Sports Exercise, 39(3), 502-514.
Minshull, C., & James, L. (2013). The effects of hypohydration and fatigue on
neuromuscular activation performance. Applied Physiology Nutrition and
Metabolism, 38(1), 21-26.

50 50
Morrison, S., Sleivert, G., & Cheung, S. (2004). Passive hyperthermia reduces
voluntary activation and isometric force production. European Journal of
Applied Physiology, 91(5-6), 729-736.
Nybo, L. (2008). Hyperthermia and fatigue. Journal of Applied Physiology,
104(3), 871-878.
Nybo, L., & Nielsen, B. (2001). Hyperthermia and central fatigue during
prolonged exercise in humans. Journal of Applied Physiology, 91(3), 1055-
1060.
Padua, D., Boling, M., Distefano, L., Onate, J., Beutler, A., & Marshall, S. (2011).
Reliability of the Landing Error Scoring System-real time, a clinical
assessment tool of jump-landing biomechanics. Journal of Sport
Rehabilitation, 20(2), 145-156.
Padua, D., DiStefano, L., Beutler, A., De La Motte, S., DiStefano, M. J., &
Marshall, S. W. (2015). The Landing Error Scoring System as a Screening
Tool for an Anterior Cruciate Ligament Injury-Prevention Program in Elite-
Youth Soccer Athletes. Journal of Athletic Training, 50(6), 589-595.
Padua, D., Marshall, S., Boling, M., Thigpen, C., Garrett, W., et al. (2009). The
Landing Error Scoring System (LESS) is a valid and reliable clinical
assessment tool of jump-landing biomechanics: The JUMP-ACL study.
American Journal of Sports Medicine, 37(10), 1996-2002.
Racinais, S., & Oksa, J. (2010). Temperature and neuromuscular function.
Scandinavian Journal of Medicine and Science in Sports, 20(3), 1-18.
Sawka, M., Burke, L., Eichner, E., Maughan, R., Montain, S., et al. (2007).
Exercise and fluid replacement. Medicine and Science in Sports and
Exercise, 39(2), 377-390
Sawka, M., Montain, S., & Latzka, W. (2001). Hydration effects on
thermoregulation and performance in the heat. Comparative Biochemistry
Physiology, 128(4), 679-690.
Sawka, M., Wenger, C., Montain, S., Kolka, M., Bettencourt, B., et al. (2003).
Heat stress control and heat casualty management. (No. MISC-04-13).
Natick, MA: Army Research Institute of Environmental Medicine.
Shultz, S., Schmitz, R., Cone, J., Henson, R., Montgomery, et al. (2015). Changes
in fatigue, multiplanar knee laxity, and landing biomechanics during
intermittent exercise. Journal of Athletic Training, 50(5), 486-497.

51 51
Stewart, C. J., Whyte, D. G., Cannon, J., Wickham, J., & Marino, F. E. (2014).
Exercise-induced dehydration does not alter time trial or neuromuscular
performance. International Journal of Sports Medicine, 35(9), 725-730.

APPENDICES

APPENDIX A: INFORMED CONSENT

54
Department of Kinesiology
Human Performance Laboratory
Consent Form for Participation in a Research Study Principal Investigator: J. Luke Pryor, PhD, ATC, CSCS
Co-Investigators: Riana R. Pryor, PhD, ATC, Bhupinder Singh, PhD, ATC
Student Researchers: Stephen Wolf, Megan Buettner, Alexandria Gregory
Study Title: The Effects of Hydration on Neuromuscular Control in a Hyperthermic, Dehydrated, and Fatigued Condition
Introduction You are invited to participate in a study conducted by Dr. J. Luke Pryor at California State University, Fresno. We hope to learn about the effects of high body temperature, dehydration, and fatigue on various performance tasks (repetitive box lifting, landing from a jump, and vertical jumping). A second aim of the proposed study is to evaluate the effectiveness hydration in restoring performance in individuals who are dehydrated, fatigued, and have a high body temperature. You were selected as a possible participant in this study because you are a recreationally active, healthy male, aged 18-35, with above average fitness. This consent form will give you the information you will need to understand why this study is being done and why you are being invited to participate. It will also describe what you will need to do to participate and any known risks, inconveniences or discomforts that you may have while participating. We encourage you to ask questions now and at any time. If you decide to participate, you will be asked to sign this form and it will be a record of your agreement to participate. You will be given a copy of this form.
Why is this study being done? We hope to understand the effect of hyperthermia, dehydration, and fatigue, a common physiological condition during sports, on how body movement control during a jump-landing, continuous vertical jumping, and box-lifting task. We are also interested in exploring the effectiveness of a hydration plan to lessen poor

55
neuromuscular control as a result of being hot, dehydrated, and fatigued. This information can help sports medicine professionals, coaching staffs, and physicians protect physically active persons by understanding how movement control changes under these conditions and the effectiveness of the proposed prevention strategy.
What are the study procedures? What will I be asked to do? If you decide to participate, you will sign this form and complete a medical history questionnaire to ensure that you meet the inclusion criteria for the study. We expect to complete data collection from August 2016 – October 2017. To allow you to understand the commitment required to participate in this study, below is a figure illustrating the study timeline and laboratory testing days. The study consists of three lab visits totaling 5-6 hours. The lab visits will be a familiarization session followed by two exercise trials termed “control” and “experimental” completed in a randomized order.
Prior to all laboratory visits, you will be instructed to avoid alcohol and strenuous exercise for 24 hours and caffeine for 8 hours before testing. You will also be asked to drink 500 mL (2 cups) of water 3 hours before and 250 mL (1 cup) 1 hour before the lab visit to ensure normal hydration upon arrival to the lab. You may bring a hat and/or long sleeved athletic shirt to wear during exercise. Baseline Testing and Familiarization visit If you meet the inclusion criteria, we will schedule a familiarization session which will be approximately 90 minutes in duration. This lab visit will occur in the Human Performance Lab (HPL; located at South Gym 139). The familiarization visit procedures include the following: 1. Complete a training history questionnaire and heat acclimatization questionnaire 2. Height, body mass, hydration, and body fat percentage determined with Bod Pod 3. Maximal aerobic capacity (VO2max) 4. 30 minute run in the heat to determine sweat rate 5. Repeated box lifting 6. Jump-landing task 7. Countermovement jump Height will be measured with a stadiometer without shoes and hydration via urine sample provided in clean cup. Body fat percentage will be measured with the Bod Pod where you will sit quietly in an enclosed egg shaped apparatus for approximately 90 seconds. Please wear tight fitting

56
clothes such as biking shorts or Under Armor type apparel to increase measurement accuracy. We will determine your maximal aerobic capacity (VO2max) with a graded exercise test on a treadmill in a temperate environment. After a 5 minute warm-up period, you will begin walking at 1% grade. Treadmill speed and/or grade will increase each 2 minute stage until you decide you are exhausted while we collect expired gases. Next, you will record nude body mass behind a closed door to maintain privacy. After running on a treadmill or outdoors for 30 minute in the heat (~95°F) you will once again be weighed nude behind a door to maintain privacy. Water will be provided during the test. You will be introduced to the repeated box-lifting task where you will continually lift a 40 pound box to a height of 4.3 feet. Next, you will practice the countermovement vertical jumping task. For 20 seconds, you will continually jump in the air as high as possible with your hands on your hips. Finally, you will complete the jump-landing task by jumping forward a distance approximately ½ the distance of your height from a 12 inch wooden box. Upon landing, you will immediately jump up for maximal height. After the familiarization protocol, you will return to the HPL on two other separate occasions before the exercise trials and provide a urine sample and nude body mass measurement. After completing baseline testing, you will be randomly assigned to complete either the control trial or experimental trial first. You will be given a 24 hour diet log to record you food and fluid intake 24 hours prior to your first exercise trial. You will be given a copy of this log to repeat the day before the second exercise trial.
Exercise Trials
Exercise trials (control and experimental) will occur next to and in the Gait Analysis and Movement Evaluation Lab (GAME; located at McLane 103). After completing the first trial, you will complete the alternate trial with a minimum of 48 hours between each trial. The two exercise trials should take approximately 2 hours each. Both exercise trials will be carried out at the same time of day. Outdoor exercise will not occur on purple air quality days. Approximately 8 hours before both exercise trials, you will ingest a small pill (about the size of a multi-vitamin) that will record internal body temperature.

57
Control Trial Upon arrival for the control trial, nude body mass will be measured. In order to measure hydration status, you will be asked to urinate into a clean cup. If you are hypohydrated, you will be provided 500 mL of water and allowed to sit for 30 minutes, then retested. You will wear a heart rate monitor during all testing. Heart rate, core temperature, perceptuals, and skin temperature will be measured at baseline and throughout testing. Skin temperature will be measured by temporarily placing a small thermistor on your right calf, thigh, shoulder, and chest. You will perform three jump-landing attempts, 5 minutes of repeated box lifting, a 4-minute period of rest, and the 20 second countermovement vertical jump task. Before and after the box-lifting task, blood lactate will be measured by a finger or earlobe prick following aseptic techniques. After baseline measures are complete, you will undergo continuous interval (walk, jog, run) outdoor exercise in the heat. We expect an exercise duration of 45-90 minutes depending upon your fitness level, exercise intensity, and ambient conditions. Outdoor exercise time will not exceed 90 minutes. Exercise duration and intensity during the first exercise trial will be recorded and repeated during the second exercise trial. To do this you will wear a wrist mounted GPS watch. We will consistently overlook and record physiological and perceptual variables throughout exercise in the heat and post-exercise testing to increase safety and adjust exercise intensity if necessary. Water will be provided every 30 minutes in 100 mL increments to ensure dehydration during this trial. Exercise will terminate if gastrointestinal temperature reaches 103.1°F and perceptual fatigue is ≥7/10, signs or symptoms of exertional heat illness, unsteady walking gait, or subject request.
Once exercise termination criteria are met, you will enter the GAME lab and record a nude body mass after wiping off excess sweat in private room. The testing protocol of jump-landing, box-lifting, 4 minutes of rest and countermovement jump repeated. Before and after the box-lifting task, your blood lactate will be measured. After completing the post-exercise performance tasks, you will remove the heart rate monitor, GPS watch, provide another nude body mass in a private room, and provide a urine sample to evaluate hydration status. As much water as you desire will be given to you so you can rehydrate. Experimental Trial For the experimental trial, the procedures will be similar with the following exceptions:
58
1. During the running protocol, you will consume water to match your fluid loss through sweat as determined at the familiarization visit.
What are the risks or inconveniences of the study?
Risk/Inconvenience Risk Prevention and Mitigation
Delayed onset
muscle soreness
You are a young, healthy, active person so the likelihood of developing soreness is lessened.
A fall during
running
You are a young, healthy, active person so the likelihood of
falling while running is lessened.
Musculoskeletal injury (muscle strain, ligament sprain, bone fracture)
You are a young, healthy, active person so the likelihood of
developing a strain, sprain, or fracture is lessened. We will
also provide you detailed instructions of the tasks before
you exercise.
Exertional heat illness
You are a young, healthy, active person who has not
experienced a heat illness in the recent past so the
likelihood of developing a heat illness is only moderate. We
will educate you about the symptoms and signs of
exertional heat illnesses and you will notify one of the
researchers if you experience any of the symptoms or
signs. Signs and symptoms may include: weakness,
dizziness, feeling hot, cramping, vomiting, headache,
nausea, tired, disorientation, or low blood pressure. Trained
researchers will monitor your heart rate, body temperature,
and signs and symptoms of exertional heat illness. If
deemed necessary, the researchers will immediately cold
water immerse you to decrease your body temperature.
A disturbance of heart rhythm
You are a young, healthy, active person so the likelihood of
developing a heart rhythm disturbance is very low. You
have been screened for contraindications to vigorous
exercise. At least one of the researchers is certified in
CPR/AED will be present during all exercise sessions. In
the unlikely event of a cardiac event, EMS will be activated.
Infection from finger or earlobe prick
Researchers will cleanse the area with alcohol, allow to dry,
and with gloves donned execute the prick.

59
What are the benefits of the study? You will benefit from having information regarding your general fitness and health such as body fat percentage and maximal oxygen consumption (typically ~$200 value). This study will increase knowledge of how being hot, tired, and dehydrated affects how we move. Also, we will better understand how proper hydration and body cooling influences poor neuromuscular control. These results will help medical professionals and coaching staffs mitigate the musculoskeletal injuries during similar tasks and conditions. The results of this study may influence and encourage further education and research on the topic. We cannot guarantee, however that you will receive any direct benefits from this study.
How will my personal information be protected? Any information that is obtained in connection with this study and that can be identified with you will remain confidential and will be disclosed only with your permission or as required by law. All recorded information will remain secured in a locked office for 3 years after all publications are written. When information is entered into computer databases the information will not include your identifiable information. You will only be identified by an anonymous participant number on data sheets. There will only be one master list of these participant numbers that will be stored in the primary investigator’s office. Information will be accessible only by the principal investigator and the student researchers. At the conclusion of this study, the researchers may publish their findings. Information will be presented in summary format and you will not be identified in any publications or presentations.
Will I receive payment for participation? Are there costs to participate? If you complete the study, you will be compensated $75. If subjects do not meet VO2max criteria and are not eligible to participant, they may not receive monetary compensation but could receive fitness assessment information, if requested, valued at $100. If you decide not to continue participation after the familiarization and first exercise trial, compensation will be prorated ($50). If you complete any portion of a single data collection session you will receive the appropriate payment. You are free to leave the study at any time, without retribution, prejudice, or negative consequences. What happens if I am injured or sick because I took part in the study? In the event you become sick or injured during the course of the research study, immediately notify the principal investigator or a member of the research team. If you require medical care for such sickness or injury, you will be referred to the campus health center or your primary care physician. Your care will be billed to

60
you or to your insurance company in the same manner as your other medical needs are addressed. There is no monetary compensation for injury; each subject is responsible for all medical costs related to her or his care. Can I stop being in the study and what are my rights? You do not have to be in this study if you do not want to. Your decision whether or not to participate will not prejudice your future relations with California State University, Fresno nor the Central California Sports Sciences Institute. If you decide to participate, you are free to withdraw your consent and drop out at any time without penalty. You will be notified of all significant new findings during the course of the study that may affect your willingness to continue. If necessary, you may be withdrawn from the study at any time. Examples of withdrawal considerations are safety/medical concerns, missed appointments, non-adherence to procedures, disruptive behavior during study procedures, and/or adverse reactions. Committee on the Protection of Human Subjects at California State University, Fresno has reviewed and approved the present research. Whom do I contact if I have questions about the study? If you have any questions, please email the principal investigator, Dr. Luke Pryor ([email protected]) or call (559) 278-2990. I will be happy to answer them. The Institutional Review Board, at California State University, Fresno, has reviewed and approved the present research. Questions regarding the rights of research subjects may be directed to Kris Clarke, Chair, CSUF Committee on the Protection of Human Subjects, (559) 278-4468.

61
YOU ARE MAKING A DECISION WHETHER OR NOT TO PARTICIPATE. YOUR SIGNATURE INDICATES THAT YOU HAVE DECIDED TO
PARTICIPATE, HAVING READ THE INFORMATION PROVIDED ABOVE.
Consent Form for Participation in a Research Study
Principal Investigator: J. Luke Pryor, PhD, ATC, CSCS
Study Title: The Effects of Hydration on Neuromuscular Control and Power in a Hyperthermic, Dehydrated, and Fatigued Condition
Documentation of Permission: You are making a decision whether or not to participate in this study. Your signature indicates that you have decided to participate, having read the information provided above. Its general purposes, the particulars of my involvement and possible risks and inconveniences have been explained to my satisfaction. I understand that I can withdraw at any time. My signature also indicates that I have received a copy of this permission form. Please return this form to the principal investigator.
__________________ __________________ _________
Signature: Print Name: Date:
__________________ __________________ _________
Signature of Person Print Name: Date:
Obtaining Consent (Research Assistant)

62
APPENDIX B: MEDICAL HISTORY QUESTIONNAIRE

63
Medical History Questionnaire
Study The Effects of Hydration on Neuromuscular Control in a Hyperthermic, Dehydrated,
Fatigued State
Name
Sex
Age
DOB
Street
City
State
Zip
Phone
PLEASE ANSWER ALL OF THE FOLLOWING QUESTIONS AND PROVIDE DETAILS FOR ALL "YES" ANSWERS IN THE SPACES AT THE BOTTOM OF THE FORM.
YES
NO
1. Has your doctor ever said that you have a heart condition and that you should only do physical activity recommended by a doctor?
2. Has your doctor ever denied or restricted your participation in sports or exercise for any reason?
3. Do you ever feel discomfort, pressure, or pain in your chest when you do physical activity?
4. In the past month, have you had chest pain when you were not doing physical activity?
5. Do you lose your balance because of dizziness or do you ever lose consciousness?
6. Does your heart race or skip beats during exercise?
7. Has a doctor ever ordered a test for you heart? (i.e. EKG, echocardiogram)
8. Has anyone in your family died for no apparent reason or died from heart problems or sudden death before the age of 50?
9. Have you ever had to spend the night in a hospital?
10. Have you ever had surgery?
If you answered YES to any of the above questions, please explain in the space below.

64 64
11. Please check the box next to any of the following for which you were ever diagnosed or treated.
High blood
pressure
High cholesterol
Diabetes
Asthma
Epilepsy (seizures)
Kidney
problems
Bladder Problems
Anemia
Heart
problems
Coronary artery
disease
Lung problems
Chronic
headaches
YES NO
12. Have you ever gotten sick because of exercising in the heat? (cramps, heat exhaustion, heat stroke)
13. Have you had any other significant illnesses not listed above?
14. Do you currently have any illness?
15. Do you know of any other reason why you should not do physical activity?
If you answered YES to any of the above questions, please explain in the space below.
65 65
16. Please list all medications you are currently taking. Make sure to include over-the-
counter medications and supplements.
Drugs/Supplements/Vitamins Dose Frequency (daily, 2x/day)
17. Please list all allergies you have.
Substance Reaction
YES NO 18. Have you smoked? If yes, #/day
Age Started
If you quit, at what age?
Cigarettes
Cigars
Pipes
19. Do you have a family history of any of the following problems? If yes, note whom in
the space.
High blood pressure
Heart disease
High cholesterol
Kidney disease
Diabetes
Thyroid disease
20. Please check the box next to any of the following body parts you have injured in the
past and provide details.
Head
Hip
Calf Shin
Neck Thigh Shoulder
Upper back Knee Upper arm
Lower back Ankle Elbow
Chest
Foot
Hand fingers

66 66
YES NO
21.
Have you ever had a stress fracture?
22.
Have you ever had a disc injury in your back?
23. Has a doctor ever restricted your exercise because of an injury?
24.
Do you currently have any injuries that are bothering you?
25.
Have you been diagnosed with any of the following: hemorrhoids, colitis, diverticulitis, or irritable bowel syndrome
If you answered YES to any of questions 21-25, please explain in the space below.
26. How would you consider your lifestyle?
Sedentary (no exercise)
Inactive-occasional light activity (walking)
Active-regular light activity and/or occasional vigorous activity (heavy lifting, running)
Heavy work-regular vigorous activity
27. Please list your regular physical activities.
Activity
How often do you
do it? How long do
you do it? How long ago did you start?
ADDITIONAL DETAILS:

67
APPENDIX C: HEAT ACCLIMATION AND TRAINING HISTORY QUESTIONNAIRE

68
Heat Acclimation and Training History Questionnaire
1. Have you recently noticed any salt or white particulate on your face or clothing after
working out? If so, please provide the date.
2. For the past month, describe your typical weekly endurance training routine:
Days/week Duration (miles or time) Intensity (min/mi or speed) Typically, what time of day do you complete this endurance training? What percentage of this activity is conducted outdoors? For how many years have you been endurance training? 3. List any recreational activities or sports that you devote time to on a weekly basis
Activity Times per
week Session Duration
(min)
Other Notes (Denote if Intramural Sport, Club Sport, Rec-League, etc.)

69 69
APPENDIX D: PERCEPTUAL SCALES
70 70
Fatigue Scale
0 No Fatigue At All
1 Very Small Amount of Fatigue
2 Small Amount of Fatigue
3 Moderately Fatigued
4 Somewhat Fatigued
5 Fatigued
6
7 Very Fatigued
8
9 Extremely Fatigued
10 Completely Fatigued
71 71
RPE Scale
6 No Exertion At All 7 Extremely Light 8 9 Very Light 10 11 Light 12 13 Somewhat Hard 14 15 Hard (Heavy) 16 17 Very Hard 18 19 Extremely Hard 20 Maximal Exertion

72 72
Rate Your Level of Thirst
1 Not Thirsty At All
2
3 A Little Thirsty
4
5 Moderately Thirsty
6
7 Very Thirsty
8
9 Very, Very Thirsty

73 73
Thermal Scale
0 Unbearably Cold
0.5
1 Very Cold
1.5
2 Cold
2.5
3 Cool
3.5
4 Comfortable
4.5
5 Warm
5.5
6 Hot
6.5
7 Very Hot
7.5
8 Unbearably Hot
Copyright © 2022 FDOKUMEN