Vegetables and Pulses Outlook: November 2021 - USDA ERS
52
Approved by USDA’s World Agricultural Outlook Board Vegetables and Pulses Outlook: November 2021 Wilma V. Davis and Gary Lucier Fresh Farm Prices Lower in 2021 According to data from USDA’s National Agricultural Statistics Service, shipping-point prices for fresh vegetables averaged 18 percent below the previous year’s average during the first 9 months of 2021. Despite hot, dry growing conditions, water shortages in western States, fluctuating truck availability, and high input prices, specialty crops partially offset the substantial national price gains in other farm commodities in 2021. Farm prices for feed grains, oilseeds, and poultry and eggs each jumped by more than a third from pandemic-influenced 2020 levels. However, prices for vegetables are expected to shift during the last quarter of 2021 to register moderate gains over the previous year largely due to drought and heat- related impacts on yields. Higher prices are expected to linger through at least early December for fresh vegetables but will extend well into 2022 for potatoes, processed tomato products, and pulse crops. Economic Research Service | Situation and Outlook Report Next release is April 29, 2022 In this report: Overview Commodity Highlights Fresh Market Vegetables Processing Vegetables Mushrooms Potatoes Dry Edible Beans Dry Peas, Lentils, and Chickpeas Special Articles VGS-367 | November 19, 2021 Economic Research Service | Situation and Outlook Report -20 -10 0 10 20 30 40 50 60 Meat animals Dairy Poultry-egg Feed grains Food grains Oilseeds Fruit-tree nuts Vegetables 2021 2020 Farm prices: Change from year earlier, January–September index average 1 1 Percent change from previous year in January–September average prices received indexes. Source: USDA, Economic Research Service calculations using USDA, National Agricultural Statistics Service data. Commodity group
-
Upload
khangminh22 -
Category
Documents
-
view
1 -
download
0
Transcript of Vegetables and Pulses Outlook: November 2021 - USDA ERS
Approved by USDA’s World Agricultural Outlook Board
Vegetables and Pulses Outlook: November 2021 Wilma V. Davis and Gary Lucier
Fresh Farm Prices Lower in 2021
According to data from USDA’s National Agricultural Statistics Service,
shipping-point prices for fresh vegetables averaged 18 percent below the
previous year’s average during the first 9 months of 2021. Despite hot, dry
growing conditions, water shortages in western States, fluctuating truck availability, and high input
prices, specialty crops partially offset the substantial national price gains in other farm commodities in
2021. Farm prices for feed grains, oilseeds, and poultry and eggs each jumped by more than a third
from pandemic-influenced 2020 levels. However, prices for vegetables are expected to shift during the
last quarter of 2021 to register moderate gains over the previous year largely due to drought and heat-
related impacts on yields. Higher prices are expected to linger through at least early December for fresh
vegetables but will extend well into 2022 for potatoes, processed tomato products, and pulse crops.
Economic Research Service | Situation and Outlook Report
Next release is April 29, 2022
In this report:
Overview Commodity Highlights Fresh Market Vegetables Processing Vegetables Mushrooms Potatoes Dry Edible Beans Dry Peas, Lentils, and Chickpeas Special Articles
VGS-367 | November 19, 2021
Economic Research Service | Situation and Outlook Report
-20 -10 0 10 20 30 40 50 60
Meat animals
Dairy
Poultry-egg
Feed grains
Food grains
Oilseeds
Fruit-tree nuts
Vegetables 2021 2020
Farm prices: Change from year earlier, January–September index average1
1 Percent change from previous year in January–September average prices received indexes.
Source: USDA, Economic Research Service calculations using USDA, National Agricultural Statistics Service data.
Commodity group
2 Vegetables and Pulses Outlook: November 2021, VGS-367, November 19, 2021
USDA, Economic Research Service
Industry Overview Drought Impacts Widespread in 2021
In addition to the ongoing coronavirus (COVID-19) pandemic, extreme heat and dry weather
reduced production of several key crops this year. The extreme heat negatively impacted crop
yields for potatoes, tomatoes, and pulse crops, whereas shortages of irrigation water
(particularly in California) caused growers to reduce acreage for crops such as processing
tomatoes. The supply chain issues affecting parts of agriculture and the rest of the economy
have not been as severe for fresh vegetables. Fresh vegetable supply has been hindered at
times this year by truck and/or driver shortages, field and packing-house labor availability, and
problems obtaining pallets and packing materials. Since vegetable imports and exports are
heavily centered within North American markets, port backups have been less of an issue with
most delays originating with trucking issues or railyard loading delays.
USDA’s National Agricultural Statistics Service (NASS) domestic vegetable prices received
index declined by 18 percent from (January – September) of 2020. The largest free on board
(f.o.b.) price declines in non-organic vegetables were for crown-cut broccoli and green bell
peppers with declines of 29 and 25 percent, respectively. The largest 2021 organic f.o.b. price
declines were for crown-cut broccoli (34 percent), green leek onions (33 percent), and red
cabbage (32 percent) in comparison with the previous year.
Fresh market vegetable shipments (domestic and imports) rose 7 percent from a year earlier
during January–September 2021. Most of the increase in market shipment volume was due to
greater imports and kept total shipment volumes increasing over 2020. Fresh vegetable import
volumes increased by 10 percent from January–September 2021 in comparison to January–
September 2020. Lettuce imports increased 23 percent from 560 to 686 million pounds, which
contributed to the overall increase in imports from 2020 to 2021.
Supplies of processed tomato products are lower than a year earlier because 2021 area
planted, yields, and production were less than anticipated and carryover stocks are low. With
domestic demand and exports remaining relatively strong, wholesale prices for tomato products
have risen. According to the latest publicly available data from August 2021, the price for 31
percent natural tomato soluble solids (NTSS) industrial tomato paste—the base ingredient
required to manufacture most sauces, soups, and ketchup)—was 28 percent higher than the
3 Vegetables and Pulses Outlook: November 2021, VGS-367, November 19, 2021
USDA, Economic Research Service
previous year. This was the highest nominal paste price since January 2009 and the highest for
August since 1989.
Mushroom farm value during the 2020/21 marketing year (MY) decreased 8 percent from the
2019/20 MY. Total mushroom sales fell by 7 percent to 758 million pounds, reflecting
interruptions and slowdowns in both the production cycle and foodservice demand during the
height of the COVID-19 pandemic. A 3-percent drop in the total area of Agaricus mushrooms
was additionally reinforced by a 5-percent decline in yield per square foot. The average reported
price for all mushroom sales in MY 2020/21 was $1.40 per pound, down about 1 percent from
the 2019/20 MY.
Supply and demand factors are in place to promote higher U.S. potato prices in the 2021/22
MY. Factors include a smaller U.S. crop, strong North American processing demand, and post-
pandemic surging international demand boosting both U.S. export demand and prices for
imported potato products. As a result, the 2021/22 MY U.S. season-average potato price is
expected to reach a nominal dollar record high—exceeding $10.00 per hundredweight (cwt) for
the first time—as potato supplies tighten and processors siphon volume from the fresh market.
In September 2021, the all-potato price (fresh and processing) was reported to be $14.00/cwt,
up 17 percent from September 2020.
Dry bean production in the September 2020 – August 2021 marketing year is down by 31
percent from the 2019/20 MY as nearly every dry bean producing State reported production
declines with the most significant production declines within the top 3 dry bean producing
States, North Dakota, Michigan, and Minnesota reflecting both lower acreage and generally
lower yields. Dry pea, lentil, and chickpea yields were down for the 2020/21 marketing year due
to drought. Dry pea yield is down 41 percent, lentil yield is down 47 percent, large chickpea yield
is down 48 percent, and small chickpea yield is down 57 percent from 2020.
September 2021 pulse (dry bean, dry pea, lentil, and chickpea) prices are all significantly up
from September 2020 prices. The September 2021 dry bean price is up 26 percent at
$37.80/cwt, the chickpea all class price at $29.20/cwt is up by 57 percent, the lentil price at
$31.80/cwt is up by 73 percent, and the dry pea price at $15.00/cwt is 66 percent above the
from September 2020 price. Prices for all pulses for the 2021/22 MY are expected to continue
increasing as harvested acreage and drought-reduced yields have reduced supplies. Higher
prices are likely to encourage pulse producers to increase planted acreage for the 2022/23
marketing year.
4 Vegetables and Pulses Outlook: November 2021, VGS-367, November 19, 2021
USDA, Economic Research Service
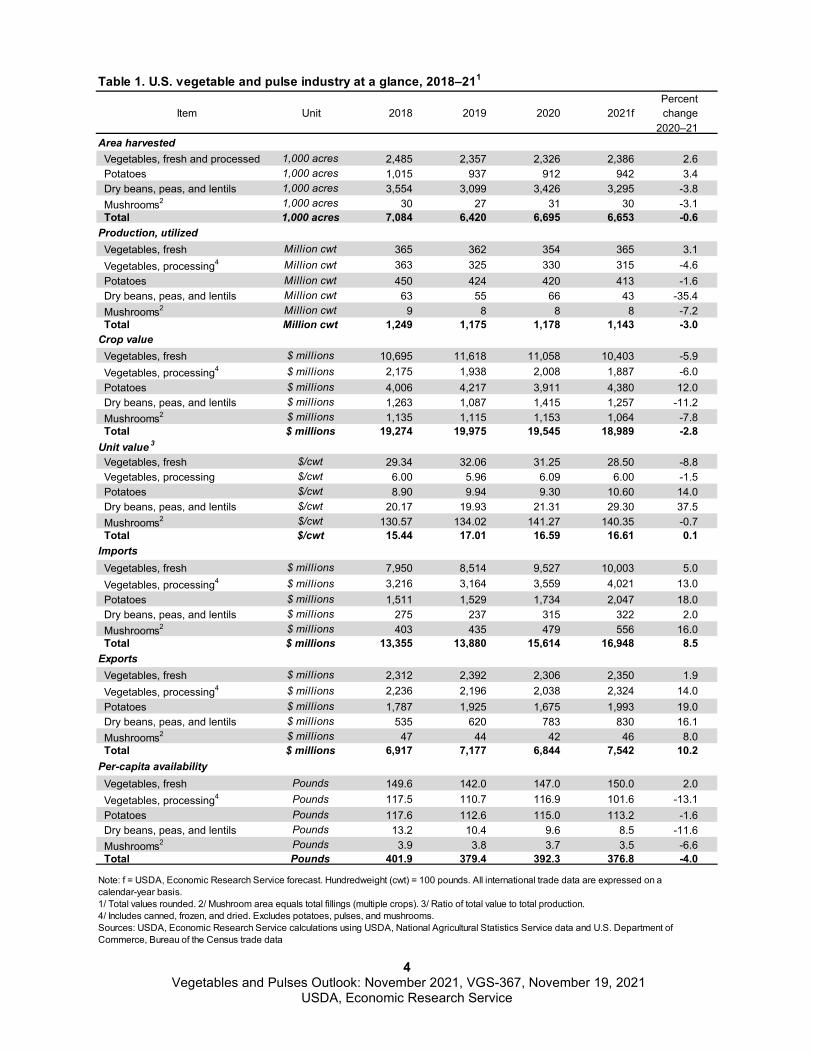
Table 1. U.S. vegetable and pulse industry at a glance, 2018–211
PercentItem Unit 2018 2019 2020 2021f change
2020–21Area harvested Vegetables, fresh and processed 1,000 acres 2,485 2,357 2,326 2,386 2.6 Potatoes 1,000 acres 1,015 937 912 942 3.4 Dry beans, peas, and lentils 1,000 acres 3,554 3,099 3,426 3,295 -3.8 Mushrooms2 1,000 acres 30 27 31 30 -3.1 Total 1,000 acres 7,084 6,420 6,695 6,653 -0.6Production, utilized Vegetables, fresh Million cwt 365 362 354 365 3.1 Vegetables, processing4 Million cwt 363 325 330 315 -4.6 Potatoes Million cwt 450 424 420 413 -1.6 Dry beans, peas, and lentils Million cwt 63 55 66 43 -35.4 Mushrooms2 Million cwt 9 8 8 8 -7.2 Total Million cwt 1,249 1,175 1,178 1,143 -3.0Crop value Vegetables, fresh $ millions 10,695 11,618 11,058 10,403 -5.9 Vegetables, processing4 $ millions 2,175 1,938 2,008 1,887 -6.0 Potatoes $ millions 4,006 4,217 3,911 4,380 12.0 Dry beans, peas, and lentils $ millions 1,263 1,087 1,415 1,257 -11.2 Mushrooms2 $ millions 1,135 1,115 1,153 1,064 -7.8 Total $ millions 19,274 19,975 19,545 18,989 -2.8Unit value 3
Vegetables, fresh $/cwt 29.34 32.06 31.25 28.50 -8.8 Vegetables, processing $/cwt 6.00 5.96 6.09 6.00 -1.5 Potatoes $/cwt 8.90 9.94 9.30 10.60 14.0 Dry beans, peas, and lentils $/cwt 20.17 19.93 21.31 29.30 37.5 Mushrooms2 $/cwt 130.57 134.02 141.27 140.35 -0.7 Total $/cwt 15.44 17.01 16.59 16.61 0.1Imports Vegetables, fresh $ millions 7,950 8,514 9,527 10,003 5.0 Vegetables, processing4 $ millions 3,216 3,164 3,559 4,021 13.0 Potatoes $ millions 1,511 1,529 1,734 2,047 18.0 Dry beans, peas, and lentils $ millions 275 237 315 322 2.0 Mushrooms2 $ millions 403 435 479 556 16.0 Total $ millions 13,355 13,880 15,614 16,948 8.5Exports Vegetables, fresh $ millions 2,312 2,392 2,306 2,350 1.9 Vegetables, processing4 $ millions 2,236 2,196 2,038 2,324 14.0 Potatoes $ millions 1,787 1,925 1,675 1,993 19.0 Dry beans, peas, and lentils $ millions 535 620 783 830 16.1 Mushrooms2 $ millions 47 44 42 46 8.0 Total $ millions 6,917 7,177 6,844 7,542 10.2Per-capita availability Vegetables, fresh Pounds 149.6 142.0 147.0 150.0 2.0 Vegetables, processing4 Pounds 117.5 110.7 116.9 101.6 -13.1 Potatoes Pounds 117.6 112.6 115.0 113.2 -1.6 Dry beans, peas, and lentils Pounds 13.2 10.4 9.6 8.5 -11.6 Mushrooms2 Pounds 3.9 3.8 3.7 3.5 -6.6 Total Pounds 401.9 379.4 392.3 376.8 -4.0
Note: f = USDA, Economic Research Service forecast. Hundredweight (cwt) = 100 pounds. All international trade data are expressed on a calendar-year basis. 1/ Total values rounded. 2/ Mushroom area equals total fillings (multiple crops). 3/ Ratio of total value to total production. 4/ Includes canned, frozen, and dried. Excludes potatoes, pulses, and mushrooms. Sources: USDA, Economic Research Service calculations using USDA, National Agricultural Statistics Service data and U.S. Department of Commerce, Bureau of the Census trade data
5 Vegetables and Pulses Outlook: November 2021, VGS-367, November 19, 2021
USDA, Economic Research Service
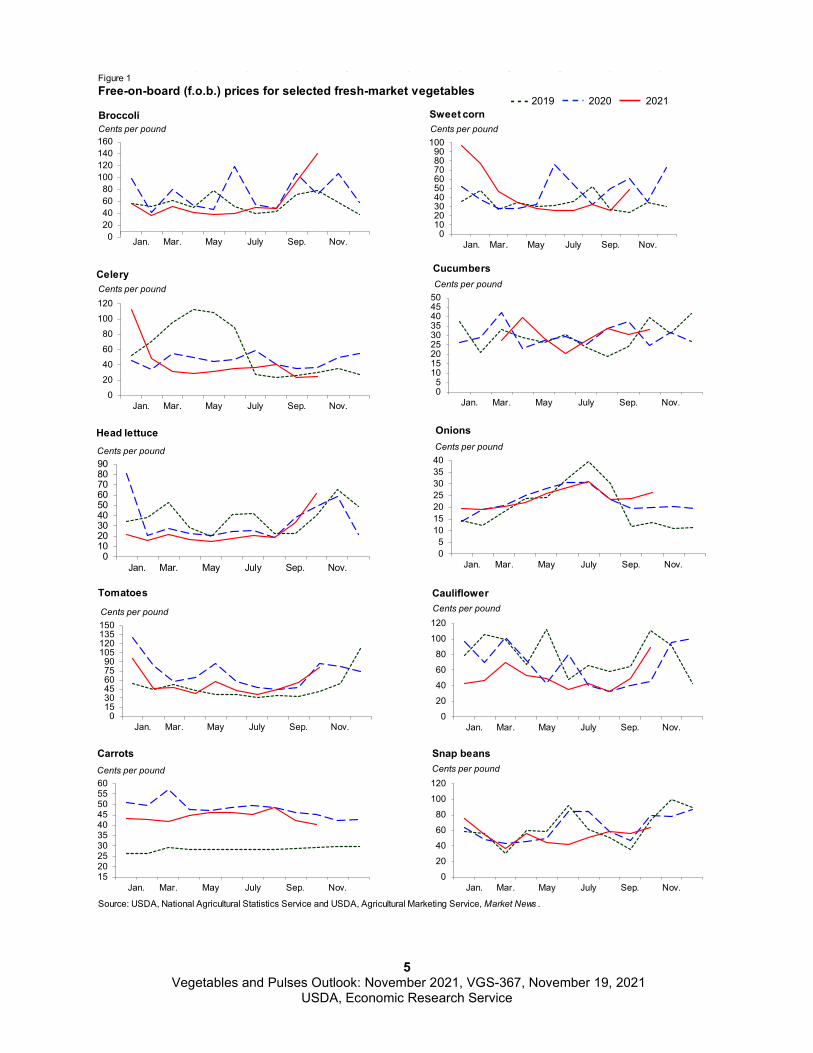
Figure 1Free-on-board (f.o.b.) prices for selected fresh-market vegetables
Source: USDA, National Agricultural Statistics Service and USDA, Agricultural Marketing Service, Market News .
020406080
100120140160
Jan. Mar. May July Sep. Nov.
BroccoliCents per pound
0102030405060708090
100
Jan. Mar. May July Sep. Nov.
Sweet cornCents per pound
020406080
100120
Jan. Mar. May July Sep. Nov.
CeleryCents per pound
0102030405060708090
Jan. Mar. May July Sep. Nov.
Head lettuceCents per pound
05
10152025303540
Jan. Mar. May July Sep. Nov.
OnionsCents per pound
0153045607590
105120135150
Jan. Mar. May July Sep. Nov.
Tomatoes
Cents per pound
020406080
100120
Jan. Mar. May July Sep. Nov.
CauliflowerCents per pound
15202530354045505560
Jan. Mar. May July Sep. Nov.
CarrotsCents per pound
- - - 2019 2020 2021
020406080
100120
Jan. Mar. May July Sep. Nov.
Snap beansCents per pound
05
101520253035404550
Jan. Mar. May July Sep. Nov.
CucumbersCents per pound
6 Vegetables and Pulses Outlook: November 2021, VGS-367, November 19, 2021
USDA, Economic Research Service
Commodity Highlights Fresh-Market Carrots
Cultivated carrots first arrived in North America with the early Virginia colonists, spawning fresh-
market production with a farm value of more than $670 million annually in the United States
during 2018–20. A member of the Umbelliferae/Apiaceae (parsley) family—along with celery,
parsley, parsnips, and dill—carrots are thought to be native to central or western Asia (likely
Afghanistan). In addition to its use as a cooking vegetable, salad item, snack food, and raw
vegetable, carrots can also be thought of as a functional food. This is largely due to their beta
carotene—a precursor to the antioxidant, Vitamin A—content, which makes carrots an important
source of Vitamin A for consumers in the United States. Carrots also provide vitamin C,
thiamine, riboflavin, potassium, minerals, and dietary fiber.
Over the past 35 years, the U.S. carrot industry has markedly changed, having been
transformed by the introduction of fresh-cut technology. In 1986, a prominent California carrot
grower invented the fresh-cut baby carrot to gain more value from some of the broken and
misshapen carrots culled from the fresh carrot packing line. Although more expensive than the
traditional cellophane-wrapped carrot pack, baby and other fresh-cut carrot products eventually
earned widespread appeal by the early 1990s. Consumers recognized the convenience of these
new products, which broadened the carrot market by making them more portable, convenient,
and tasty.
02468
10121416
1919 1926 1933 1940 1947 1954 1961 1968 1975 1982 1989 1996 2003 2010 2017
Pounds per person
Source: USDA, Economic Research Service calculations using USDA, National Agricultural Statistics Service and U.S. Department ofCommerce, Bureau of the Census data.
U.S. fresh carrot per capita domestic availability, 1919–2022 Figure 2
7 Vegetables and Pulses Outlook: November 2021, VGS-367, November 19, 2021
USDA, Economic Research Service
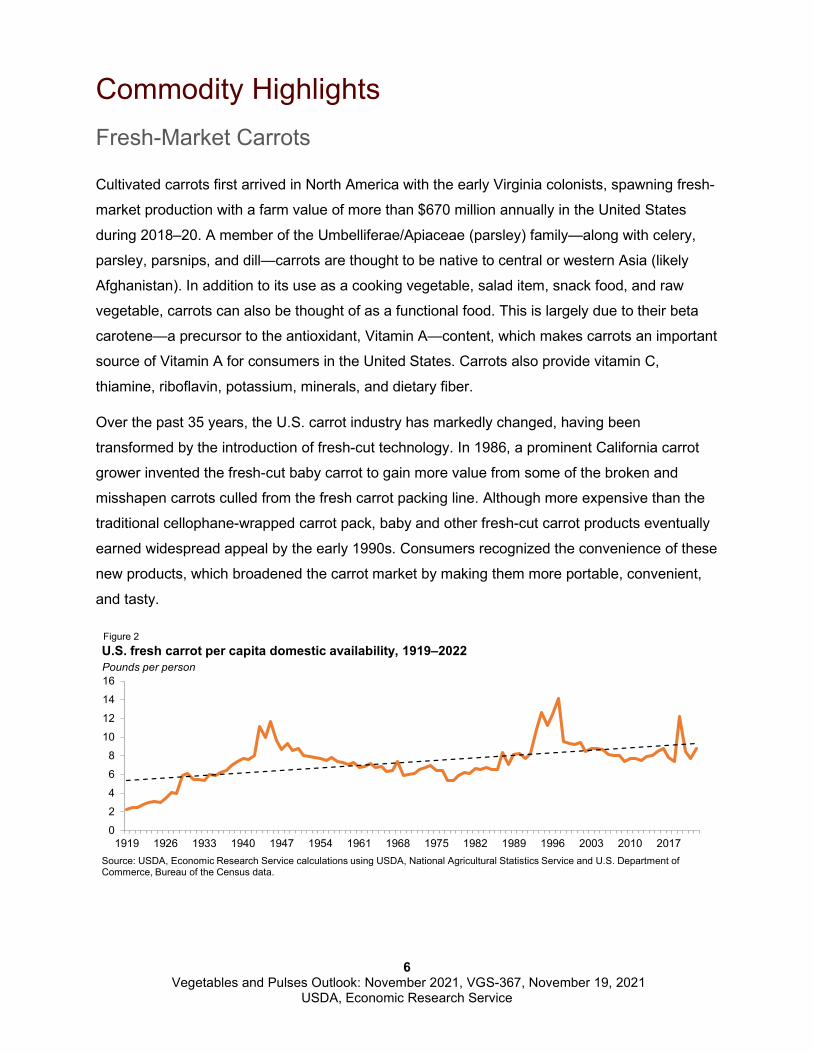
Fresh carrot per capita availability has trended upward over the past century (figure 2). Driven
by fresh-market use, long-run consumer interest in carrots has been strong in the United States,
used in soups, stews, snacks, and desserts.
Per capita availability of fresh carrots peaked in 1997 at 14.1 pounds during the initial
introductory period of fresh-cut products. Despite the widespread appeal and convenience of
fresh-cut products, availability of all fresh carrots then trended downward from the 1997 peak.
This drop may have simply reflected reduced demand for whole (heavier-weight) carrots as
lighter pre-packaged fresh-cut products shifted demand. However, it is also plausible that the
maturation of the fresh-cut industry fostered increased production and processing efficiency
within the industry, reducing packing house waste and requiring fewer acres and raw carrot
production.
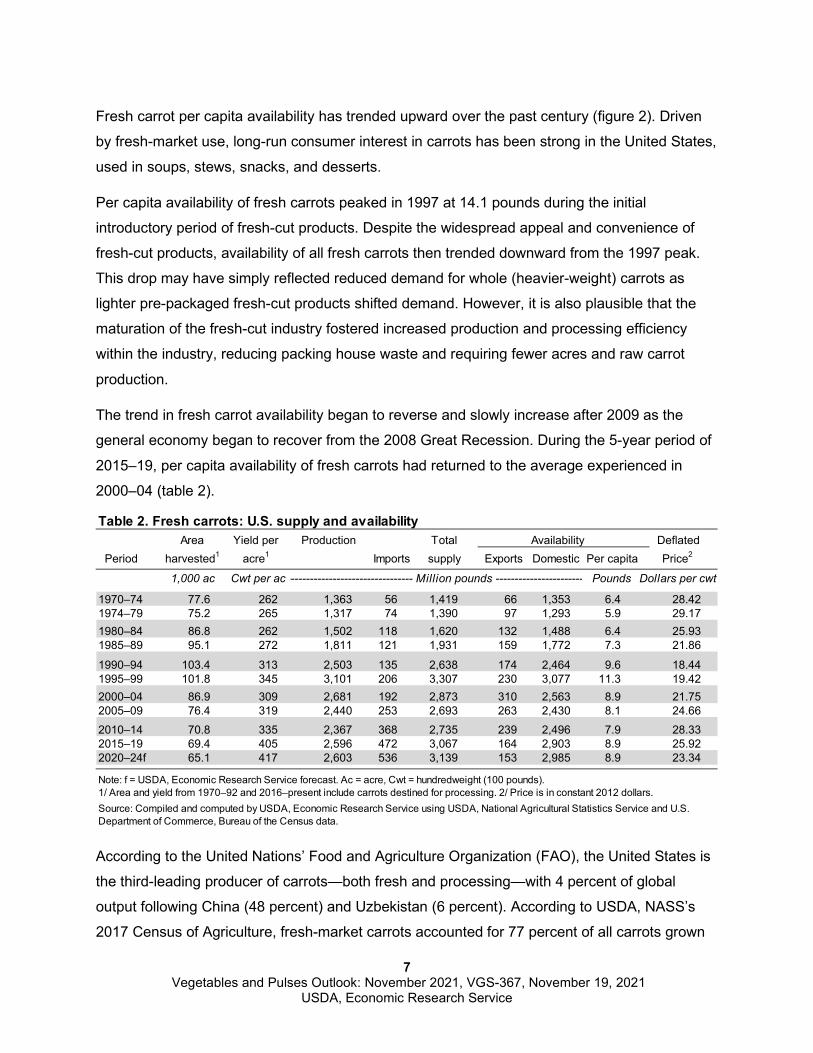
The trend in fresh carrot availability began to reverse and slowly increase after 2009 as the
general economy began to recover from the 2008 Great Recession. During the 5-year period of
2015–19, per capita availability of fresh carrots had returned to the average experienced in
2000–04 (table 2).
According to the United Nations’ Food and Agriculture Organization (FAO), the United States is
the third-leading producer of carrots—both fresh and processing—with 4 percent of global
output following China (48 percent) and Uzbekistan (6 percent). According to USDA, NASS’s
2017 Census of Agriculture, fresh-market carrots accounted for 77 percent of all carrots grown
Table 2. Fresh carrots: U.S. supply and availability Area Yield per Production Total Availability Deflated
Period harvested1 acre1 Imports supply Exports Domestic Per capita Price2
1,000 ac Cwt per ac --------------------------------- Million pounds ----------------------- Pounds Dollars per cwt
1970–74 77.6 262 1,363 56 1,419 66 1,353 6.4 28.421974–79 75.2 265 1,317 74 1,390 97 1,293 5.9 29.171980–84 86.8 262 1,502 118 1,620 132 1,488 6.4 25.931985–89 95.1 272 1,811 121 1,931 159 1,772 7.3 21.86
1990–94 103.4 313 2,503 135 2,638 174 2,464 9.6 18.441995–99 101.8 345 3,101 206 3,307 230 3,077 11.3 19.422000–04 86.9 309 2,681 192 2,873 310 2,563 8.9 21.752005–09 76.4 319 2,440 253 2,693 263 2,430 8.1 24.662010–14 70.8 335 2,367 368 2,735 239 2,496 7.9 28.332015–19 69.4 405 2,596 472 3,067 164 2,903 8.9 25.922020–24f 65.1 417 2,603 536 3,139 153 2,985 8.9 23.34
Note: f = USDA, Economic Research Service forecast. Ac = acre, Cwt = hundredweight (100 pounds). 1/ Area and yield from 1970–92 and 2016–present include carrots destined for processing. 2/ Price is in constant 2012 dollars.Source: Compiled and computed by USDA, Economic Research Service using USDA, National Agricultural Statistics Service and U.S. Department of Commerce, Bureau of the Census data.
8 Vegetables and Pulses Outlook: November 2021, VGS-367, November 19, 2021
USDA, Economic Research Service
on U.S. farms—up from 71 percent in 2012. Fresh-market carrots are grown in each of the 50
States. Based on reported area and yields, commercial output occurs primarily in California (79
percent), Arizona (4 percent), Texas (2 percent), and Washington (1 percent). According to
annual estimates by USDA, NASS, over the 2015–19 period, U.S. commercial growers
produced an annual average of 2.6 billion pounds of fresh carrots—10 percent more than during
2010-–14, but 16 percent less than the 1995–99 peak (table 2). As with many vegetable crops,
U.S. carrot commercial production is highly concentrated among few farms. In 2017, 91 percent
of national area was harvested by less than 2 percent of the 8,106 farms that had reported
growing fresh-market carrots. About 89 percent of farms reporting harvested less than an acre
in 2017, likely selling at farmers markets, roadside stands, and other local venues. an acre of
carrots is about 22 tons.
Carrots have taken hold in the expanding organic vegetable market. Total U.S. organic
vegetable sales were valued at $2.1 billion in 2019 of which carrots accounted for $132 million.
About 12 percent of domestic carrot acreage (fresh and processing) was found to be produced
organically. According to the 2019 Organic Vegetable Survey, certified organic carrot area
(fresh and processing) totaled 11,959 acres—third only to potatoes and spinach among
individual commodities grown organically and 5 percent of all certified organic vegetable area.
As in conventionally produced carrots, California farms account for the vast majority (79
percent) of organic carrot production.
As with most fresh-market vegetables, the import share of availability of fresh carrots has
trended higher with greater import volume over time. Imports accounted for 16 percent of
domestic availability during 2015–19, more than double that of 2000–05. The leading suppliers
of fresh carrots to the U.S. market are Mexico (46 percent), Canada (43 percent), and Israel (8
percent).The COVID-19 pandemic slowed fresh carrot imports in 2020 but a combination of
recovering demand and the California drought has 2021 volume running 11 percent above a
year earlier through September.
U.S. exports of fresh carrots have declined since peaking during 2000–04. During 2015–19, 5
percent of fresh carrot supplies were exported—less than half than in the 2000–04 period. The
top U.S. markets for fresh carrot exports are Canada (90 percent) and Mexico (8 percent).
Export volume was running 1 percent below a year earlier through September.
9 Vegetables and Pulses Outlook: November 2021, VGS-367, November 19, 2021
USDA, Economic Research Service
Fresh Market Vegetables
Domestic Vegetable Shipments Down as Drought Continues
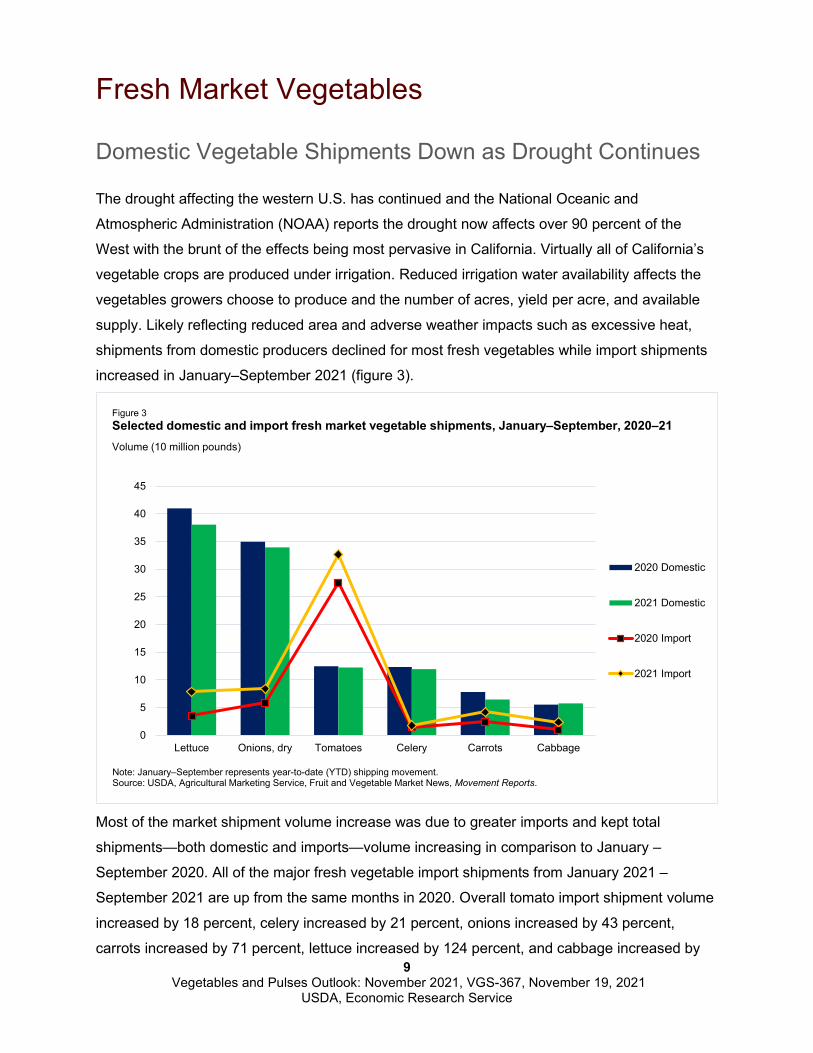
The drought affecting the western U.S. has continued and the National Oceanic and
Atmospheric Administration (NOAA) reports the drought now affects over 90 percent of the
West with the brunt of the effects being most pervasive in California. Virtually all of California’s
vegetable crops are produced under irrigation. Reduced irrigation water availability affects the
vegetables growers choose to produce and the number of acres, yield per acre, and available
supply. Likely reflecting reduced area and adverse weather impacts such as excessive heat,
shipments from domestic producers declined for most fresh vegetables while import shipments
increased in January–September 2021 (figure 3).
Most of the market shipment volume increase was due to greater imports and kept total
shipments—both domestic and imports—volume increasing in comparison to January –
September 2020. All of the major fresh vegetable import shipments from January 2021 –
September 2021 are up from the same months in 2020. Overall tomato import shipment volume
increased by 18 percent, celery increased by 21 percent, onions increased by 43 percent,
carrots increased by 71 percent, lettuce increased by 124 percent, and cabbage increased by
0
5
10
15
20
25
30
35
40
45
Lettuce Onions, dry Tomatoes Celery Carrots Cabbage
2020 Domestic
2021 Domestic
2020 Import
2021 Import
Figure 3 Selected domestic and import fresh market vegetable shipments, January–September, 2020–21Volume (10 million pounds)
Note: January–September represents year-to-date (YTD) shipping movement.Source: USDA, Agricultural Marketing Service, Fruit and Vegetable Market News, Movement Reports.
10 Vegetables and Pulses Outlook: November 2021, VGS-367, November 19, 2021
USDA, Economic Research Service
141 percent from the previous year. In contrast, nearly all domestic shipments from the previous
year declined except for the 4 percent increase in cabbage. Among the six major fresh
vegetables, the largest decline in domestic shipments were with carrots shipments (down 17
percent) and lettuce (down 7 percent) in comparison to January–September 2020.
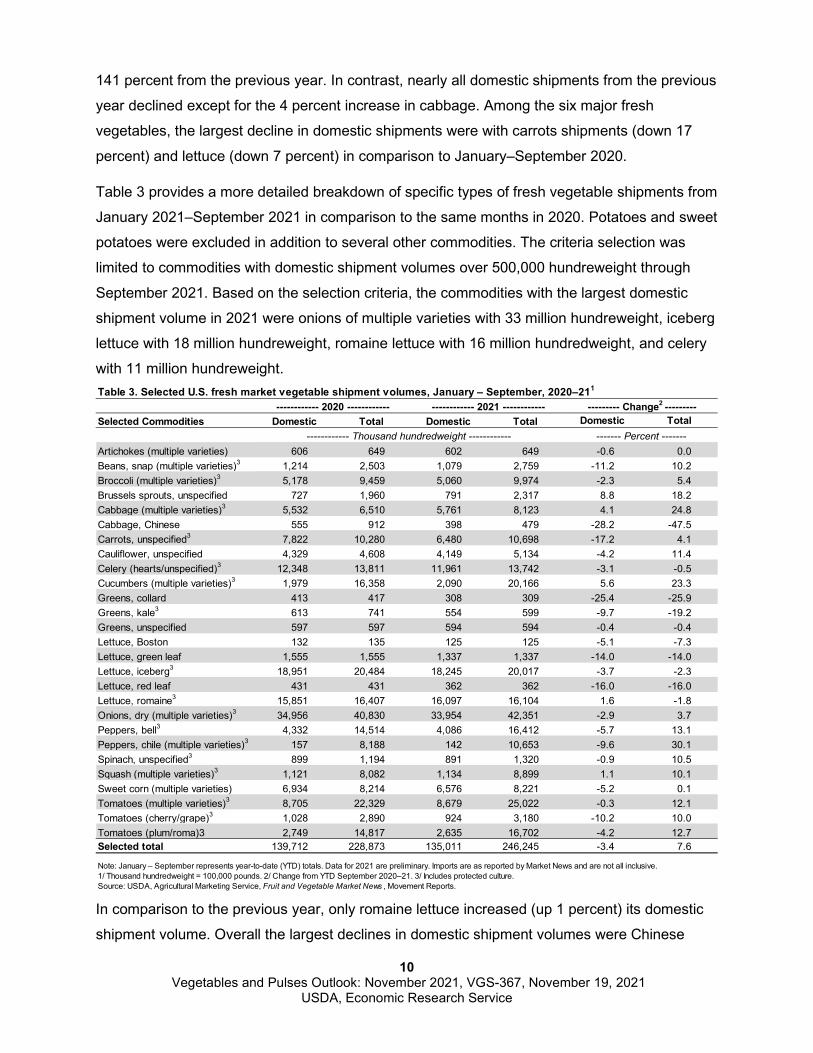
Table 3 provides a more detailed breakdown of specific types of fresh vegetable shipments from
January 2021–September 2021 in comparison to the same months in 2020. Potatoes and sweet
potatoes were excluded in addition to several other commodities. The criteria selection was
limited to commodities with domestic shipment volumes over 500,000 hundreweight through
September 2021. Based on the selection criteria, the commodities with the largest domestic
shipment volume in 2021 were onions of multiple varieties with 33 million hundreweight, iceberg
lettuce with 18 million hundreweight, romaine lettuce with 16 million hundredweight, and celery
with 11 million hundreweight.
In comparison to the previous year, only romaine lettuce increased (up 1 percent) its domestic
shipment volume. Overall the largest declines in domestic shipment volumes were Chinese
Table 3. Selected U.S. fresh market vegetable shipment volumes, January – September, 2020–211
------------ 2020 ------------ ------------ 2021 ------------ --------- Change2 --------- Selected Commodities Domestic Total Domestic Total Domestic Total
------------ Thousand hundredweight ------------ ------- Percent -------Artichokes (multiple varieties) 606 649 602 649 -0.6 0.0Beans, snap (multiple varieties)3 1,214 2,503 1,079 2,759 -11.2 10.2Broccoli (multiple varieties)3 5,178 9,459 5,060 9,974 -2.3 5.4Brussels sprouts, unspecified 727 1,960 791 2,317 8.8 18.2Cabbage (multiple varieties)3 5,532 6,510 5,761 8,123 4.1 24.8Cabbage, Chinese 555 912 398 479 -28.2 -47.5Carrots, unspecified3 7,822 10,280 6,480 10,698 -17.2 4.1Cauliflower, unspecified 4,329 4,608 4,149 5,134 -4.2 11.4Celery (hearts/unspecified)3 12,348 13,811 11,961 13,742 -3.1 -0.5Cucumbers (multiple varieties)3 1,979 16,358 2,090 20,166 5.6 23.3Greens, collard 413 417 308 309 -25.4 -25.9Greens, kale3 613 741 554 599 -9.7 -19.2Greens, unspecified 597 597 594 594 -0.4 -0.4Lettuce, Boston 132 135 125 125 -5.1 -7.3Lettuce, green leaf 1,555 1,555 1,337 1,337 -14.0 -14.0Lettuce, iceberg3 18,951 20,484 18,245 20,017 -3.7 -2.3Lettuce, red leaf 431 431 362 362 -16.0 -16.0Lettuce, romaine3 15,851 16,407 16,097 16,104 1.6 -1.8Onions, dry (multiple varieties)3 34,956 40,830 33,954 42,351 -2.9 3.7Peppers, bell3 4,332 14,514 4,086 16,412 -5.7 13.1Peppers, chile (multiple varieties)3 157 8,188 142 10,653 -9.6 30.1Spinach, unspecified3 899 1,194 891 1,320 -0.9 10.5Squash (multiple varieties)3 1,121 8,082 1,134 8,899 1.1 10.1Sweet corn (multiple varieties) 6,934 8,214 6,576 8,221 -5.2 0.1Tomatoes (multiple varieties)3 8,705 22,329 8,679 25,022 -0.3 12.1Tomatoes (cherry/grape)3 1,028 2,890 924 3,180 -10.2 10.0Tomatoes (plum/roma)3 2,749 14,817 2,635 16,702 -4.2 12.7Selected total 139,712 228,873 135,011 246,245 -3.4 7.6
Note: January – September represents year-to-date (YTD) totals. Data for 2021 are preliminary. Imports are as reported by Market News and are not all inclusive.1/ Thousand hundredweight = 100,000 pounds. 2/ Change from YTD September 2020–21. 3/ Includes protected culture.Source: USDA, Agricultural Marketing Service, Fruit and Vegetable Market News , Movement Reports.
11 Vegetables and Pulses Outlook: November 2021, VGS-367, November 19, 2021
USDA, Economic Research Service
cabbage (down 28 percent), collard greens (down 25 percent), carrots (down 17 percent), and
red leaf lettuce (down 16 percent).
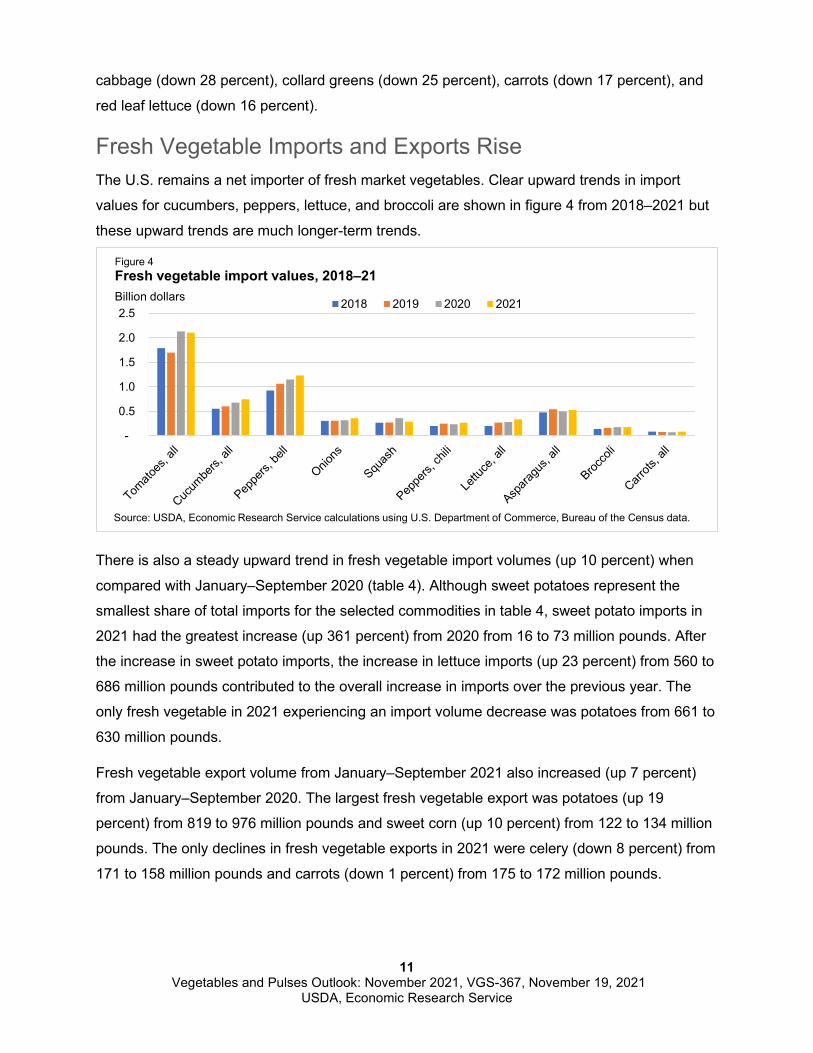
Fresh Vegetable Imports and Exports Rise The U.S. remains a net importer of fresh market vegetables. Clear upward trends in import
values for cucumbers, peppers, lettuce, and broccoli are shown in figure 4 from 2018–2021 but
these upward trends are much longer-term trends.
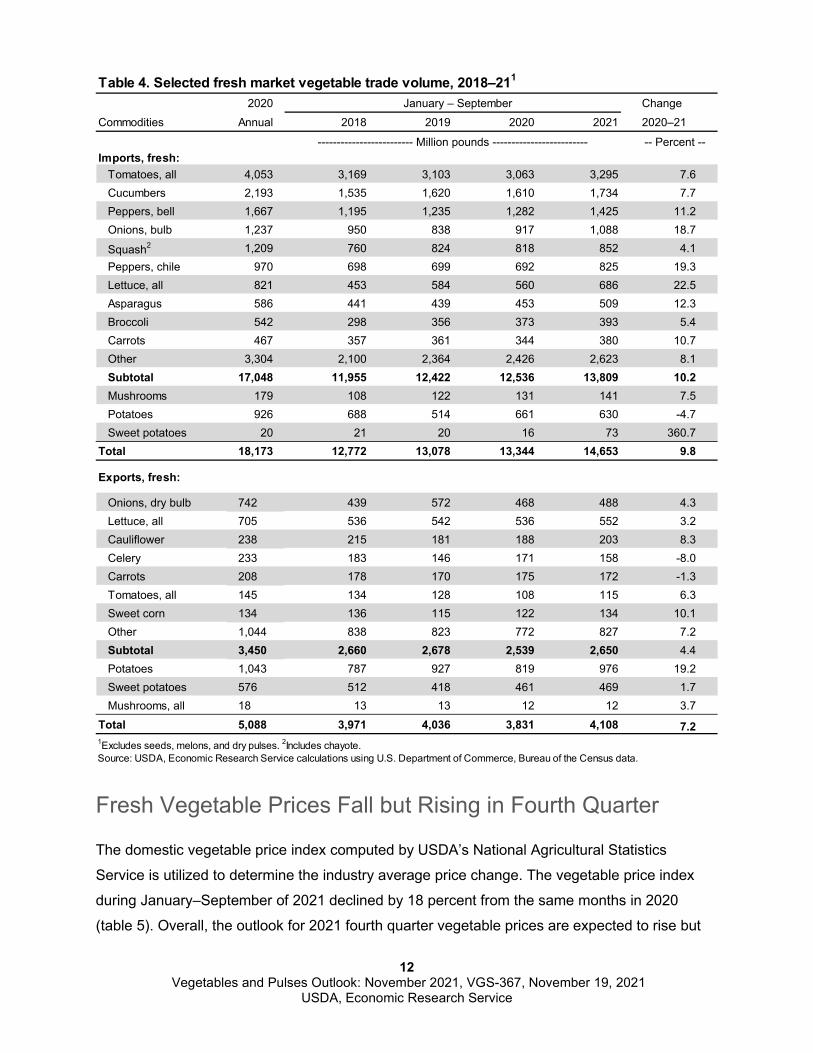
There is also a steady upward trend in fresh vegetable import volumes (up 10 percent) when
compared with January–September 2020 (table 4). Although sweet potatoes represent the
smallest share of total imports for the selected commodities in table 4, sweet potato imports in
2021 had the greatest increase (up 361 percent) from 2020 from 16 to 73 million pounds. After
the increase in sweet potato imports, the increase in lettuce imports (up 23 percent) from 560 to
686 million pounds contributed to the overall increase in imports over the previous year. The
only fresh vegetable in 2021 experiencing an import volume decrease was potatoes from 661 to
630 million pounds.
Fresh vegetable export volume from January–September 2021 also increased (up 7 percent)
from January–September 2020. The largest fresh vegetable export was potatoes (up 19
percent) from 819 to 976 million pounds and sweet corn (up 10 percent) from 122 to 134 million
pounds. The only declines in fresh vegetable exports in 2021 were celery (down 8 percent) from
171 to 158 million pounds and carrots (down 1 percent) from 175 to 172 million pounds.
-
0.5
1.0
1.5
2.0
2.52018 2019 2020 2021
Figure 4Fresh vegetable import values, 2018–21Billion dollars
Source: USDA, Economic Research Service calculations using U.S. Department of Commerce, Bureau of the Census data.
12 Vegetables and Pulses Outlook: November 2021, VGS-367, November 19, 2021
USDA, Economic Research Service
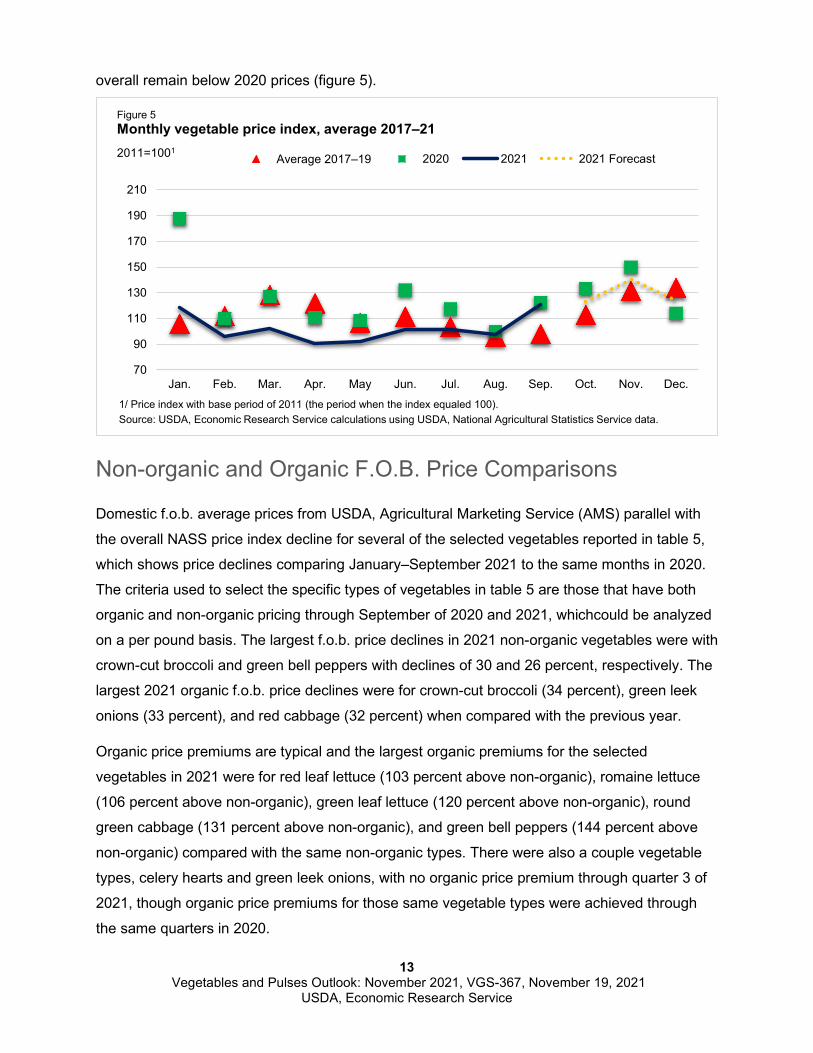
Fresh Vegetable Prices Fall but Rising in Fourth Quarter
The domestic vegetable price index computed by USDA’s National Agricultural Statistics
Service is utilized to determine the industry average price change. The vegetable price index
during January–September of 2021 declined by 18 percent from the same months in 2020
(table 5). Overall, the outlook for 2021 fourth quarter vegetable prices are expected to rise but
Table 4. Selected fresh market vegetable trade volume, 2018–211
2020 January – September ChangeCommodities Annual 2018 2019 2020 2021 2020–21
------------------------- Million pounds ------------------------- -- Percent --Imports, fresh:
Tomatoes, all 4,053 3,169 3,103 3,063 3,295 7.6Cucumbers 2,193 1,535 1,620 1,610 1,734 7.7Peppers, bell 1,667 1,195 1,235 1,282 1,425 11.2Onions, bulb 1,237 950 838 917 1,088 18.7
Squash2 1,209 760 824 818 852 4.1Peppers, chile 970 698 699 692 825 19.3Lettuce, all 821 453 584 560 686 22.5Asparagus 586 441 439 453 509 12.3Broccoli 542 298 356 373 393 5.4Carrots 467 357 361 344 380 10.7Other 3,304 2,100 2,364 2,426 2,623 8.1Subtotal 17,048 11,955 12,422 12,536 13,809 10.2Mushrooms 179 108 122 131 141 7.5Potatoes 926 688 514 661 630 -4.7Sweet potatoes 20 21 20 16 73 360.7
Total 18,173 12,772 13,078 13,344 14,653 9.8
Exports, fresh:
Onions, dry bulb 742 439 572 468 488 4.3Lettuce, all 705 536 542 536 552 3.2Cauliflower 238 215 181 188 203 8.3Celery 233 183 146 171 158 -8.0Carrots 208 178 170 175 172 -1.3Tomatoes, all 145 134 128 108 115 6.3Sweet corn 134 136 115 122 134 10.1Other 1,044 838 823 772 827 7.2Subtotal 3,450 2,660 2,678 2,539 2,650 4.4Potatoes 1,043 787 927 819 976 19.2Sweet potatoes 576 512 418 461 469 1.7Mushrooms, all 18 13 13 12 12 3.7
Total 5,088 3,971 4,036 3,831 4,108 7.21Excludes seeds, melons, and dry pulses. 2Includes chayote.Source: USDA, Economic Research Service calculations using U.S. Department of Commerce, Bureau of the Census data.
13 Vegetables and Pulses Outlook: November 2021, VGS-367, November 19, 2021
USDA, Economic Research Service
overall remain below 2020 prices (figure 5).
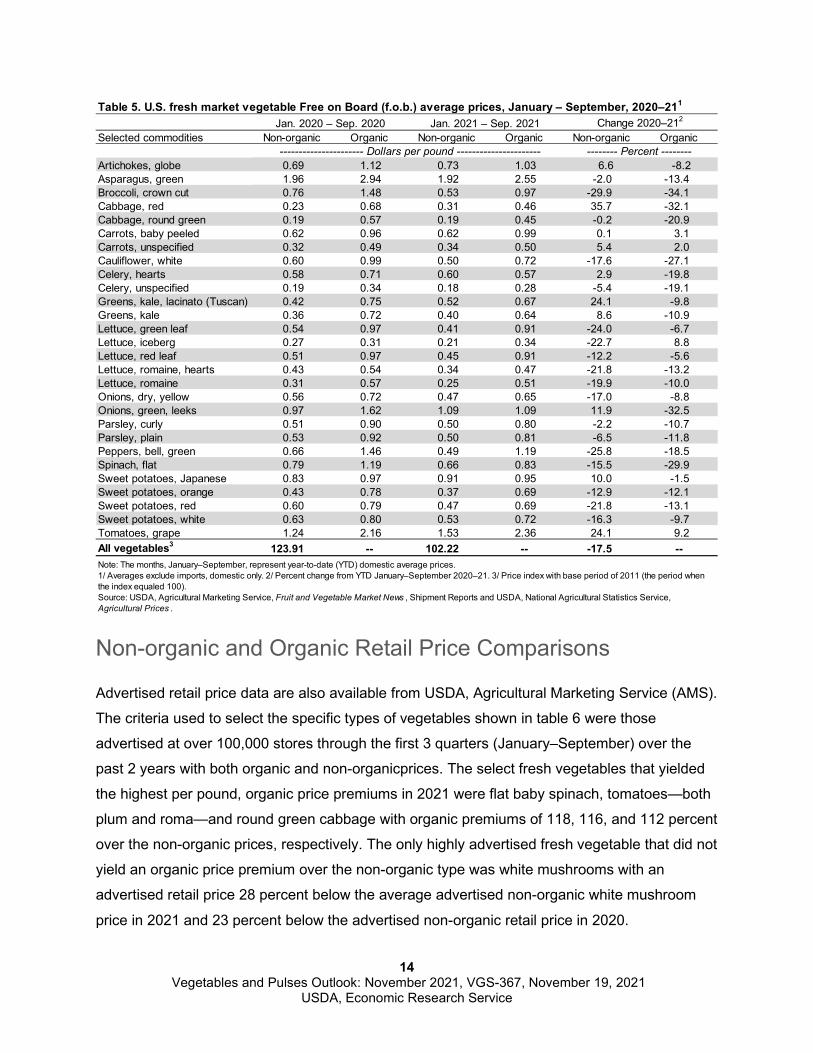
Non-organic and Organic F.O.B. Price Comparisons
Domestic f.o.b. average prices from USDA, Agricultural Marketing Service (AMS) parallel with
the overall NASS price index decline for several of the selected vegetables reported in table 5,
which shows price declines comparing January–September 2021 to the same months in 2020.
The criteria used to select the specific types of vegetables in table 5 are those that have both
organic and non-organic pricing through September of 2020 and 2021, whichcould be analyzed
on a per pound basis. The largest f.o.b. price declines in 2021 non-organic vegetables were with
crown-cut broccoli and green bell peppers with declines of 30 and 26 percent, respectively. The
largest 2021 organic f.o.b. price declines were for crown-cut broccoli (34 percent), green leek
onions (33 percent), and red cabbage (32 percent) when compared with the previous year.
Organic price premiums are typical and the largest organic premiums for the selected
vegetables in 2021 were for red leaf lettuce (103 percent above non-organic), romaine lettuce
(106 percent above non-organic), green leaf lettuce (120 percent above non-organic), round
green cabbage (131 percent above non-organic), and green bell peppers (144 percent above
non-organic) compared with the same non-organic types. There were also a couple vegetable
types, celery hearts and green leek onions, with no organic price premium through quarter 3 of
2021, though organic price premiums for those same vegetable types were achieved through
the same quarters in 2020.
70
90
110
130
150
170
190
210
Jan. Feb. Mar. Apr. May Jun. Jul. Aug. Sep. Oct. Nov. Dec.
Average 2017–19 2020 2021 2021 Forecast
Figure 5Monthly vegetable price index, average 2017–212011=1001
1/ Price index with base period of 2011 (the period when the index equaled 100).Source: USDA, Economic Research Service calculations using USDA, National Agricultural Statistics Service data.
14 Vegetables and Pulses Outlook: November 2021, VGS-367, November 19, 2021
USDA, Economic Research Service
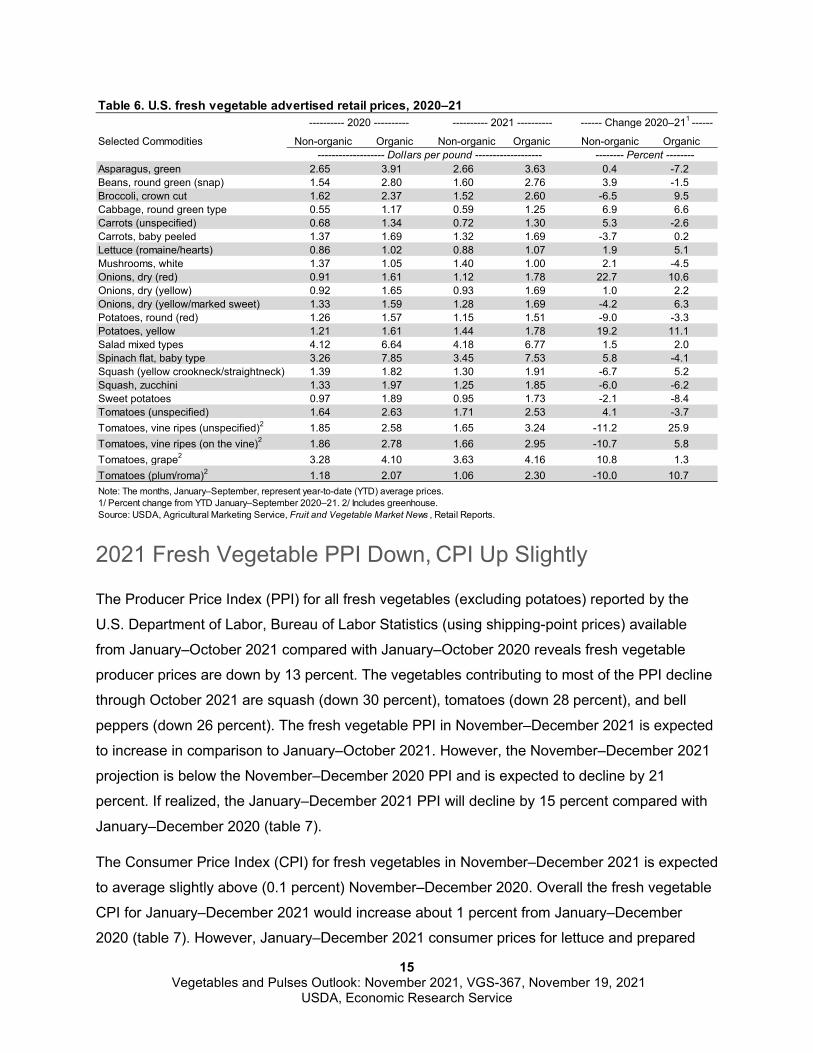
Non-organic and Organic Retail Price Comparisons
Advertised retail price data are also available from USDA, Agricultural Marketing Service (AMS).
The criteria used to select the specific types of vegetables shown in table 6 were those
advertised at over 100,000 stores through the first 3 quarters (January–September) over the
past 2 years with both organic and non-organicprices. The select fresh vegetables that yielded
the highest per pound, organic price premiums in 2021 were flat baby spinach, tomatoes—both
plum and roma—and round green cabbage with organic premiums of 118, 116, and 112 percent
over the non-organic prices, respectively. The only highly advertised fresh vegetable that did not
yield an organic price premium over the non-organic type was white mushrooms with an
advertised retail price 28 percent below the average advertised non-organic white mushroom
price in 2021 and 23 percent below the advertised non-organic retail price in 2020.
Table 5. U.S. fresh market vegetable Free on Board (f.o.b.) average prices, January – September, 2020–211
Jan. 2020 – Sep. 2020 Jan. 2021 – Sep. 2021 Change 2020–212
Selected commodities Non-organic Organic Non-organic Organic Non-organic Organic---------------------- Dollars per pound ---------------------- -------- Percent --------
Artichokes, globe 0.69 1.12 0.73 1.03 6.6 -8.2Asparagus, green 1.96 2.94 1.92 2.55 -2.0 -13.4Broccoli, crown cut 0.76 1.48 0.53 0.97 -29.9 -34.1Cabbage, red 0.23 0.68 0.31 0.46 35.7 -32.1Cabbage, round green 0.19 0.57 0.19 0.45 -0.2 -20.9Carrots, baby peeled 0.62 0.96 0.62 0.99 0.1 3.1Carrots, unspecified 0.32 0.49 0.34 0.50 5.4 2.0Cauliflower, white 0.60 0.99 0.50 0.72 -17.6 -27.1Celery, hearts 0.58 0.71 0.60 0.57 2.9 -19.8Celery, unspecified 0.19 0.34 0.18 0.28 -5.4 -19.1Greens, kale, lacinato (Tuscan) 0.42 0.75 0.52 0.67 24.1 -9.8Greens, kale 0.36 0.72 0.40 0.64 8.6 -10.9Lettuce, green leaf 0.54 0.97 0.41 0.91 -24.0 -6.7Lettuce, iceberg 0.27 0.31 0.21 0.34 -22.7 8.8Lettuce, red leaf 0.51 0.97 0.45 0.91 -12.2 -5.6Lettuce, romaine, hearts 0.43 0.54 0.34 0.47 -21.8 -13.2Lettuce, romaine 0.31 0.57 0.25 0.51 -19.9 -10.0Onions, dry, yellow 0.56 0.72 0.47 0.65 -17.0 -8.8Onions, green, leeks 0.97 1.62 1.09 1.09 11.9 -32.5Parsley, curly 0.51 0.90 0.50 0.80 -2.2 -10.7Parsley, plain 0.53 0.92 0.50 0.81 -6.5 -11.8Peppers, bell, green 0.66 1.46 0.49 1.19 -25.8 -18.5Spinach, flat 0.79 1.19 0.66 0.83 -15.5 -29.9Sweet potatoes, Japanese 0.83 0.97 0.91 0.95 10.0 -1.5Sweet potatoes, orange 0.43 0.78 0.37 0.69 -12.9 -12.1Sweet potatoes, red 0.60 0.79 0.47 0.69 -21.8 -13.1Sweet potatoes, white 0.63 0.80 0.53 0.72 -16.3 -9.7Tomatoes, grape 1.24 2.16 1.53 2.36 24.1 9.2All vegetables3 123.91 -- 102.22 -- -17.5 --Note: The months, January–September, represent year-to-date (YTD) domestic average prices.1/ Averages exclude imports, domestic only. 2/ Percent change from YTD January–September 2020–21. 3/ Price index with base period of 2011 (the period when the index equaled 100).Source: USDA, Agricultural Marketing Service, Fruit and Vegetable Market News , Shipment Reports and USDA, National Agricultural Statistics Service, Agricultural Prices .
15 Vegetables and Pulses Outlook: November 2021, VGS-367, November 19, 2021
USDA, Economic Research Service
2021 Fresh Vegetable PPI Down, CPI Up Slightly
The Producer Price Index (PPI) for all fresh vegetables (excluding potatoes) reported by the
U.S. Department of Labor, Bureau of Labor Statistics (using shipping-point prices) available
from January–October 2021 compared with January–October 2020 reveals fresh vegetable
producer prices are down by 13 percent. The vegetables contributing to most of the PPI decline
through October 2021 are squash (down 30 percent), tomatoes (down 28 percent), and bell
peppers (down 26 percent). The fresh vegetable PPI in November–December 2021 is expected
to increase in comparison to January–October 2021. However, the November–December 2021
projection is below the November–December 2020 PPI and is expected to decline by 21
percent. If realized, the January–December 2021 PPI will decline by 15 percent compared with
January–December 2020 (table 7).
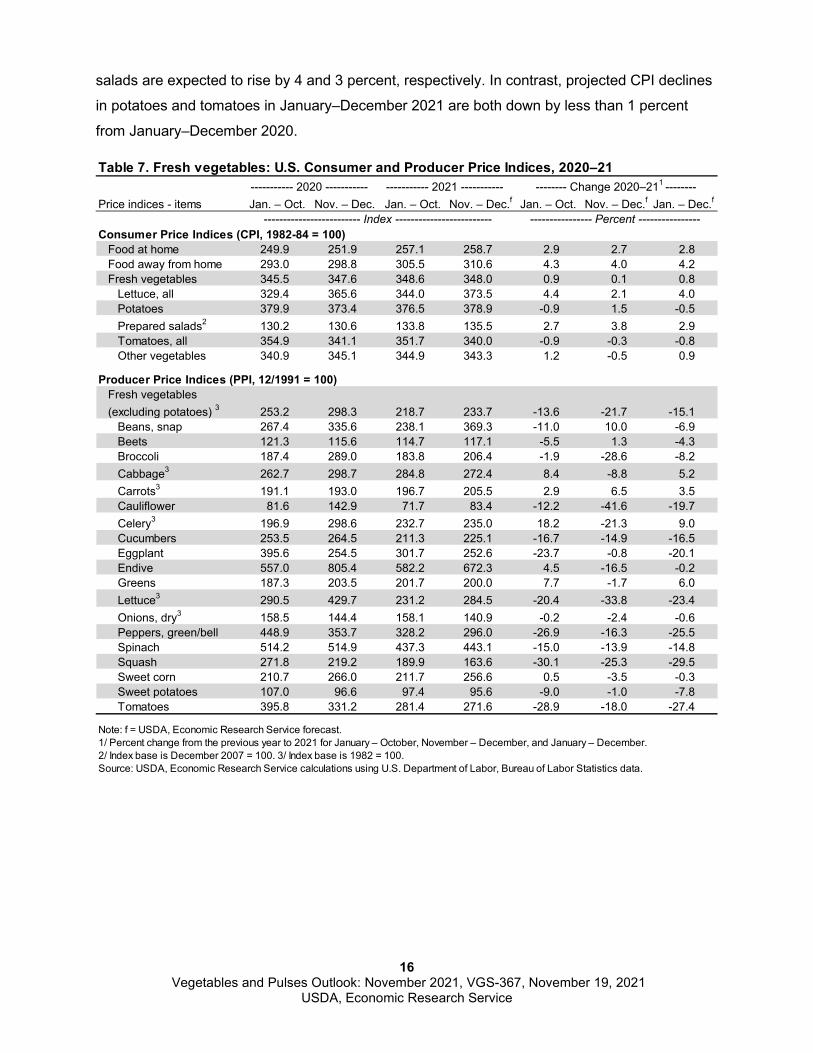
The Consumer Price Index (CPI) for fresh vegetables in November–December 2021 is expected
to average slightly above (0.1 percent) November–December 2020. Overall the fresh vegetable
CPI for January–December 2021 would increase about 1 percent from January–December
2020 (table 7). However, January–December 2021 consumer prices for lettuce and prepared
Table 6. U.S. fresh vegetable advertised retail prices, 2020–21 ---------- 2020 ---------- ---------- 2021 ---------- ------ Change 2020–211 ------
Selected Commodities Non-organic Organic Non-organic Organic Non-organic Organic------------------- Dollars per pound ------------------- -------- Percent --------
Asparagus, green 2.65 3.91 2.66 3.63 0.4 -7.2Beans, round green (snap) 1.54 2.80 1.60 2.76 3.9 -1.5Broccoli, crown cut 1.62 2.37 1.52 2.60 -6.5 9.5Cabbage, round green type 0.55 1.17 0.59 1.25 6.9 6.6Carrots (unspecified) 0.68 1.34 0.72 1.30 5.3 -2.6Carrots, baby peeled 1.37 1.69 1.32 1.69 -3.7 0.2Lettuce (romaine/hearts) 0.86 1.02 0.88 1.07 1.9 5.1Mushrooms, white 1.37 1.05 1.40 1.00 2.1 -4.5Onions, dry (red) 0.91 1.61 1.12 1.78 22.7 10.6Onions, dry (yellow) 0.92 1.65 0.93 1.69 1.0 2.2Onions, dry (yellow/marked sweet) 1.33 1.59 1.28 1.69 -4.2 6.3Potatoes, round (red) 1.26 1.57 1.15 1.51 -9.0 -3.3Potatoes, yellow 1.21 1.61 1.44 1.78 19.2 11.1Salad mixed types 4.12 6.64 4.18 6.77 1.5 2.0Spinach flat, baby type 3.26 7.85 3.45 7.53 5.8 -4.1Squash (yellow crookneck/straightneck) 1.39 1.82 1.30 1.91 -6.7 5.2Squash, zucchini 1.33 1.97 1.25 1.85 -6.0 -6.2Sweet potatoes 0.97 1.89 0.95 1.73 -2.1 -8.4Tomatoes (unspecified) 1.64 2.63 1.71 2.53 4.1 -3.7Tomatoes, vine ripes (unspecified)2 1.85 2.58 1.65 3.24 -11.2 25.9Tomatoes, vine ripes (on the vine)2 1.86 2.78 1.66 2.95 -10.7 5.8Tomatoes, grape2 3.28 4.10 3.63 4.16 10.8 1.3Tomatoes (plum/roma)2 1.18 2.07 1.06 2.30 -10.0 10.7Note: The months, January–September, represent year-to-date (YTD) average prices.1/ Percent change from YTD January–September 2020–21. 2/ Includes greenhouse.Source: USDA, Agricultural Marketing Service, Fruit and Vegetable Market News , Retail Reports.
16 Vegetables and Pulses Outlook: November 2021, VGS-367, November 19, 2021
USDA, Economic Research Service
salads are expected to rise by 4 and 3 percent, respectively. In contrast, projected CPI declines
in potatoes and tomatoes in January–December 2021 are both down by less than 1 percent
from January–December 2020.
Table 7. Fresh vegetables: U.S. Consumer and Producer Price Indices, 2020–21 ----------- 2020 ----------- ----------- 2021 ----------- -------- Change 2020–211 --------
Price indices - items Jan. – Oct. Nov. – Dec. Jan. – Oct. Nov. – Dec.f Jan. – Oct. Nov. – Dec.f Jan. – Dec.f
------------------------- Index ------------------------- ---------------- Percent ----------------Consumer Price Indices (CPI, 1982-84 = 100)
Food at home 249.9 251.9 257.1 258.7 2.9 2.7 2.8Food away from home 293.0 298.8 305.5 310.6 4.3 4.0 4.2Fresh vegetables 345.5 347.6 348.6 348.0 0.9 0.1 0.8
Lettuce, all 329.4 365.6 344.0 373.5 4.4 2.1 4.0Potatoes 379.9 373.4 376.5 378.9 -0.9 1.5 -0.5Prepared salads2 130.2 130.6 133.8 135.5 2.7 3.8 2.9Tomatoes, all 354.9 341.1 351.7 340.0 -0.9 -0.3 -0.8Other vegetables 340.9 345.1 344.9 343.3 1.2 -0.5 0.9
Producer Price Indices (PPI, 12/1991 = 100)Fresh vegetables (excluding potatoes) 3 253.2 298.3 218.7 233.7 -13.6 -21.7 -15.1
Beans, snap 267.4 335.6 238.1 369.3 -11.0 10.0 -6.9Beets 121.3 115.6 114.7 117.1 -5.5 1.3 -4.3Broccoli 187.4 289.0 183.8 206.4 -1.9 -28.6 -8.2Cabbage3 262.7 298.7 284.8 272.4 8.4 -8.8 5.2Carrots3 191.1 193.0 196.7 205.5 2.9 6.5 3.5Cauliflower 81.6 142.9 71.7 83.4 -12.2 -41.6 -19.7Celery3 196.9 298.6 232.7 235.0 18.2 -21.3 9.0Cucumbers 253.5 264.5 211.3 225.1 -16.7 -14.9 -16.5Eggplant 395.6 254.5 301.7 252.6 -23.7 -0.8 -20.1Endive 557.0 805.4 582.2 672.3 4.5 -16.5 -0.2Greens 187.3 203.5 201.7 200.0 7.7 -1.7 6.0Lettuce3 290.5 429.7 231.2 284.5 -20.4 -33.8 -23.4Onions, dry3 158.5 144.4 158.1 140.9 -0.2 -2.4 -0.6Peppers, green/bell 448.9 353.7 328.2 296.0 -26.9 -16.3 -25.5Spinach 514.2 514.9 437.3 443.1 -15.0 -13.9 -14.8Squash 271.8 219.2 189.9 163.6 -30.1 -25.3 -29.5Sweet corn 210.7 266.0 211.7 256.6 0.5 -3.5 -0.3Sweet potatoes 107.0 96.6 97.4 95.6 -9.0 -1.0 -7.8Tomatoes 395.8 331.2 281.4 271.6 -28.9 -18.0 -27.4
Note: f = USDA, Economic Research Service forecast.1/ Percent change from the previous year to 2021 for January – October, November – December, and January – December. 2/ Index base is December 2007 = 100. 3/ Index base is 1982 = 100.Source: USDA, Economic Research Service calculations using U.S. Department of Labor, Bureau of Labor Statistics data.
17 Vegetables and Pulses Outlook: November 2021, VGS-367, November 19, 2021
USDA, Economic Research Service
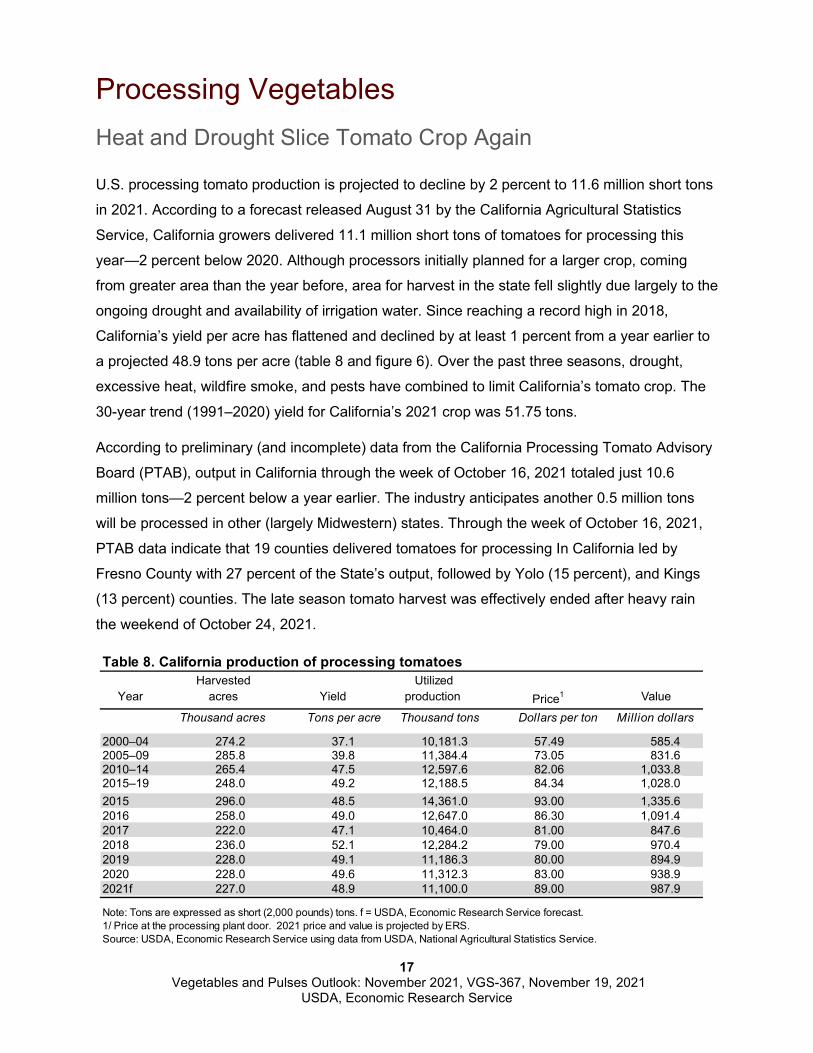
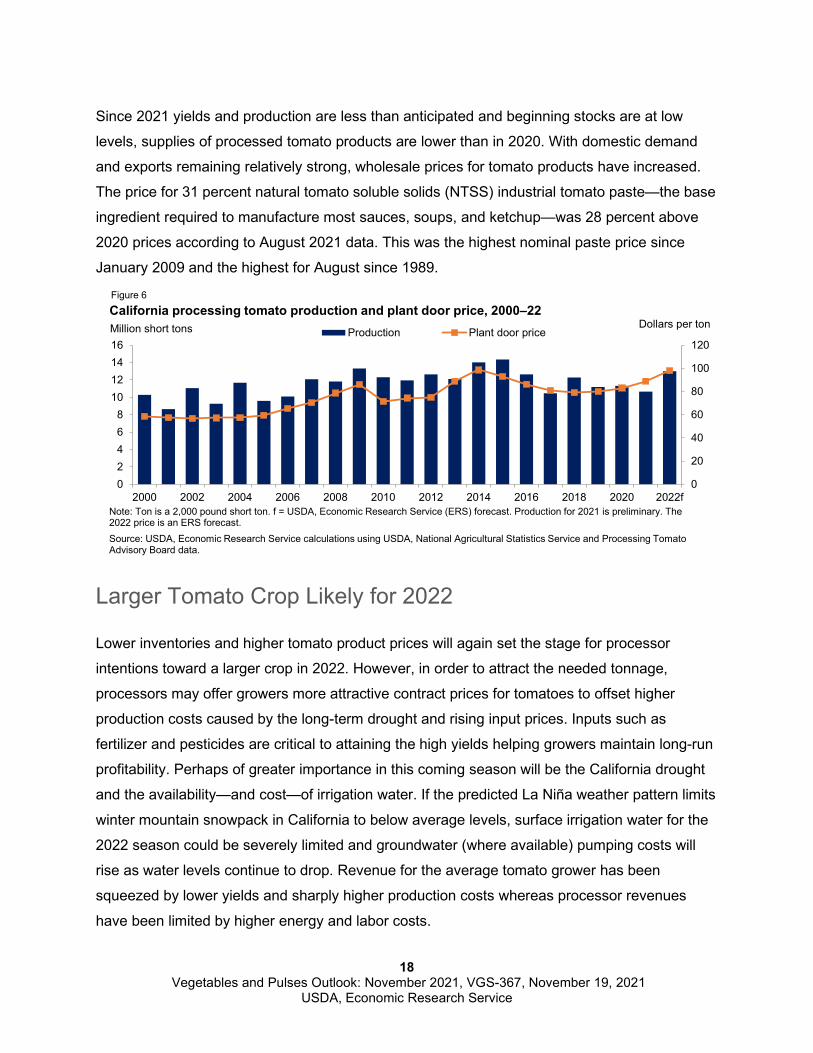
Processing Vegetables Heat and Drought Slice Tomato Crop Again
U.S. processing tomato production is projected to decline by 2 percent to 11.6 million short tons
in 2021. According to a forecast released August 31 by the California Agricultural Statistics
Service, California growers delivered 11.1 million short tons of tomatoes for processing this
year—2 percent below 2020. Although processors initially planned for a larger crop, coming
from greater area than the year before, area for harvest in the state fell slightly due largely to the
ongoing drought and availability of irrigation water. Since reaching a record high in 2018,
California’s yield per acre has flattened and declined by at least 1 percent from a year earlier to
a projected 48.9 tons per acre (table 8 and figure 6). Over the past three seasons, drought,
excessive heat, wildfire smoke, and pests have combined to limit California’s tomato crop. The
30-year trend (1991–2020) yield for California’s 2021 crop was 51.75 tons.
According to preliminary (and incomplete) data from the California Processing Tomato Advisory
Board (PTAB), output in California through the week of October 16, 2021 totaled just 10.6
million tons—2 percent below a year earlier. The industry anticipates another 0.5 million tons
will be processed in other (largely Midwestern) states. Through the week of October 16, 2021,
PTAB data indicate that 19 counties delivered tomatoes for processing In California led by
Fresno County with 27 percent of the State’s output, followed by Yolo (15 percent), and Kings
(13 percent) counties. The late season tomato harvest was effectively ended after heavy rain
the weekend of October 24, 2021.
Table 8. California production of processing tomatoesHarvested Utilized
Year acres Yield production Price1 Value
Thousand acres Tons per acre Thousand tons Dollars per ton Million dollars
2000–04 274.2 37.1 10,181.3 57.49 585.42005–09 285.8 39.8 11,384.4 73.05 831.62010–14 265.4 47.5 12,597.6 82.06 1,033.82015–19 248.0 49.2 12,188.5 84.34 1,028.02015 296.0 48.5 14,361.0 93.00 1,335.62016 258.0 49.0 12,647.0 86.30 1,091.42017 222.0 47.1 10,464.0 81.00 847.62018 236.0 52.1 12,284.2 79.00 970.42019 228.0 49.1 11,186.3 80.00 894.92020 228.0 49.6 11,312.3 83.00 938.92021f 227.0 48.9 11,100.0 89.00 987.9
Note: Tons are expressed as short (2,000 pounds) tons. f = USDA, Economic Research Service forecast.1/ Price at the processing plant door. 2021 price and value is projected by ERS.Source: USDA, Economic Research Service using data from USDA, National Agricultural Statistics Service.
18 Vegetables and Pulses Outlook: November 2021, VGS-367, November 19, 2021
USDA, Economic Research Service
Since 2021 yields and production are less than anticipated and beginning stocks are at low
levels, supplies of processed tomato products are lower than in 2020. With domestic demand
and exports remaining relatively strong, wholesale prices for tomato products have increased.
The price for 31 percent natural tomato soluble solids (NTSS) industrial tomato paste—the base
ingredient required to manufacture most sauces, soups, and ketchup—was 28 percent above
2020 prices according to August 2021 data. This was the highest nominal paste price since
January 2009 and the highest for August since 1989.
Larger Tomato Crop Likely for 2022
Lower inventories and higher tomato product prices will again set the stage for processor
intentions toward a larger crop in 2022. However, in order to attract the needed tonnage,
processors may offer growers more attractive contract prices for tomatoes to offset higher
production costs caused by the long-term drought and rising input prices. Inputs such as
fertilizer and pesticides are critical to attaining the high yields helping growers maintain long-run
profitability. Perhaps of greater importance in this coming season will be the California drought
and the availability—and cost—of irrigation water. If the predicted La Niña weather pattern limits
winter mountain snowpack in California to below average levels, surface irrigation water for the
2022 season could be severely limited and groundwater (where available) pumping costs will
rise as water levels continue to drop. Revenue for the average tomato grower has been
squeezed by lower yields and sharply higher production costs whereas processor revenues
have been limited by higher energy and labor costs.
0
20
40
60
80
100
120
02468
10121416
2000 2002 2004 2006 2008 2010 2012 2014 2016 2018 2020 2022f
Production Plant door priceMillion short tons Dollars per ton
Note: Ton is a 2,000 pound short ton. f = USDA, Economic Research Service (ERS) forecast. Production for 2021 is preliminary. The 2022 price is an ERS forecast.Source: USDA, Economic Research Service calculations using USDA, National Agricultural Statistics Service and Processing Tomato Advisory Board data.
California processing tomato production and plant door price, 2000–22Figure 6
19 Vegetables and Pulses Outlook: November 2021, VGS-367, November 19, 2021
USDA, Economic Research Service
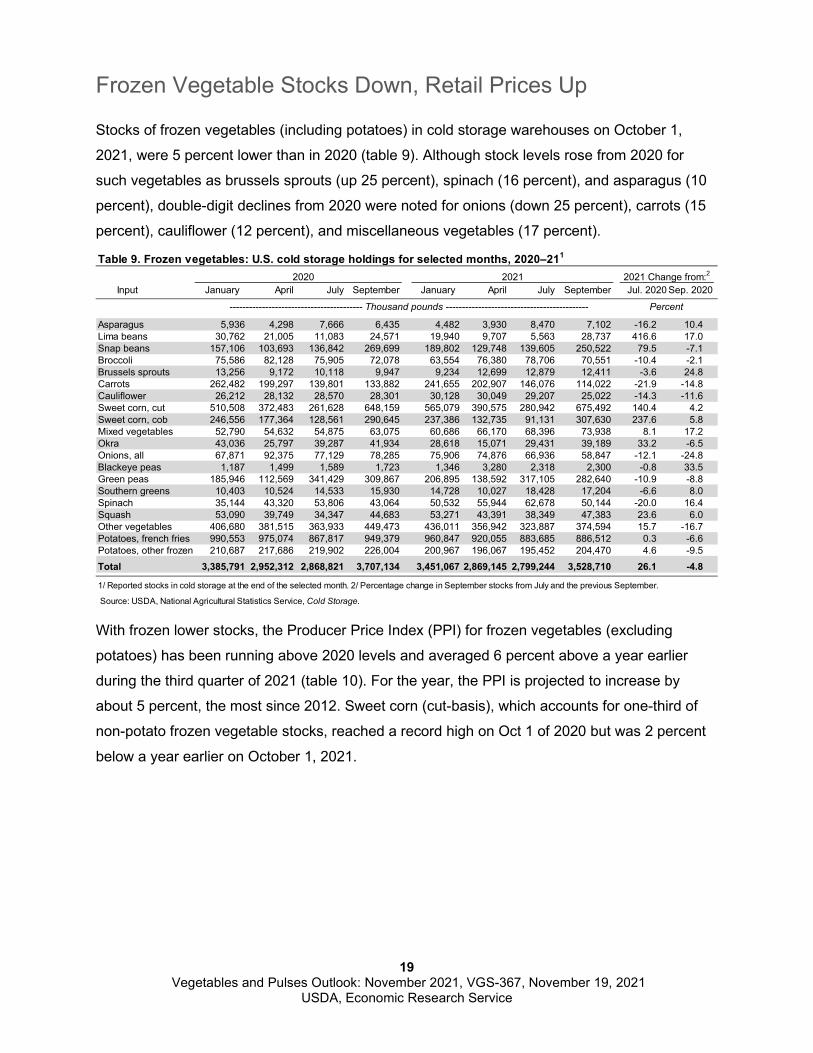
Frozen Vegetable Stocks Down, Retail Prices Up
Stocks of frozen vegetables (including potatoes) in cold storage warehouses on October 1,
2021, were 5 percent lower than in 2020 (table 9). Although stock levels rose from 2020 for
such vegetables as brussels sprouts (up 25 percent), spinach (16 percent), and asparagus (10
percent), double-digit declines from 2020 were noted for onions (down 25 percent), carrots (15
percent), cauliflower (12 percent), and miscellaneous vegetables (17 percent).
With frozen lower stocks, the Producer Price Index (PPI) for frozen vegetables (excluding
potatoes) has been running above 2020 levels and averaged 6 percent above a year earlier
during the third quarter of 2021 (table 10). For the year, the PPI is projected to increase by
about 5 percent, the most since 2012. Sweet corn (cut-basis), which accounts for one-third of
non-potato frozen vegetable stocks, reached a record high on Oct 1 of 2020 but was 2 percent
below a year earlier on October 1, 2021.
Table 9. Frozen vegetables: U.S. cold storage holdings for selected months, 2020–211
2020 2021 2021 Change from:2
Input January April July September January April July September Jul. 2020 Sep. 2020
----------------------------------------- Thousand pounds -------------------------------------------- Percent
Asparagus 5,936 4,298 7,666 6,435 4,482 3,930 8,470 7,102 -16.2 10.4Lima beans 30,762 21,005 11,083 24,571 19,940 9,707 5,563 28,737 416.6 17.0Snap beans 157,106 103,693 136,842 269,699 189,802 129,748 139,605 250,522 79.5 -7.1Broccoli 75,586 82,128 75,905 72,078 63,554 76,380 78,706 70,551 -10.4 -2.1Brussels sprouts 13,256 9,172 10,118 9,947 9,234 12,699 12,879 12,411 -3.6 24.8Carrots 262,482 199,297 139,801 133,882 241,655 202,907 146,076 114,022 -21.9 -14.8Cauliflower 26,212 28,132 28,570 28,301 30,128 30,049 29,207 25,022 -14.3 -11.6Sweet corn, cut 510,508 372,483 261,628 648,159 565,079 390,575 280,942 675,492 140.4 4.2Sweet corn, cob 246,556 177,364 128,561 290,645 237,386 132,735 91,131 307,630 237.6 5.8Mixed vegetables 52,790 54,632 54,875 63,075 60,686 66,170 68,396 73,938 8.1 17.2Okra 43,036 25,797 39,287 41,934 28,618 15,071 29,431 39,189 33.2 -6.5Onions, all 67,871 92,375 77,129 78,285 75,906 74,876 66,936 58,847 -12.1 -24.8Blackeye peas 1,187 1,499 1,589 1,723 1,346 3,280 2,318 2,300 -0.8 33.5Green peas 185,946 112,569 341,429 309,867 206,895 138,592 317,105 282,640 -10.9 -8.8Southern greens 10,403 10,524 14,533 15,930 14,728 10,027 18,428 17,204 -6.6 8.0Spinach 35,144 43,320 53,806 43,064 50,532 55,944 62,678 50,144 -20.0 16.4Squash 53,090 39,749 34,347 44,683 53,271 43,391 38,349 47,383 23.6 6.0Other vegetables 406,680 381,515 363,933 449,473 436,011 356,942 323,887 374,594 15.7 -16.7Potatoes, french fries 990,553 975,074 867,817 949,379 960,847 920,055 883,685 886,512 0.3 -6.6Potatoes, other frozen 210,687 217,686 219,902 226,004 200,967 196,067 195,452 204,470 4.6 -9.5Total 3,385,791 2,952,312 2,868,821 3,707,134 3,451,067 2,869,145 2,799,244 3,528,710 26.1 -4.8
1/ Reported stocks in cold storage at the end of the selected month. 2/ Percentage change in September stocks from July and the previous September.
Source: USDA, National Agricultural Statistics Service, Cold Storage.
20 Vegetables and Pulses Outlook: November 2021, VGS-367, November 19, 2021
USDA, Economic Research Service
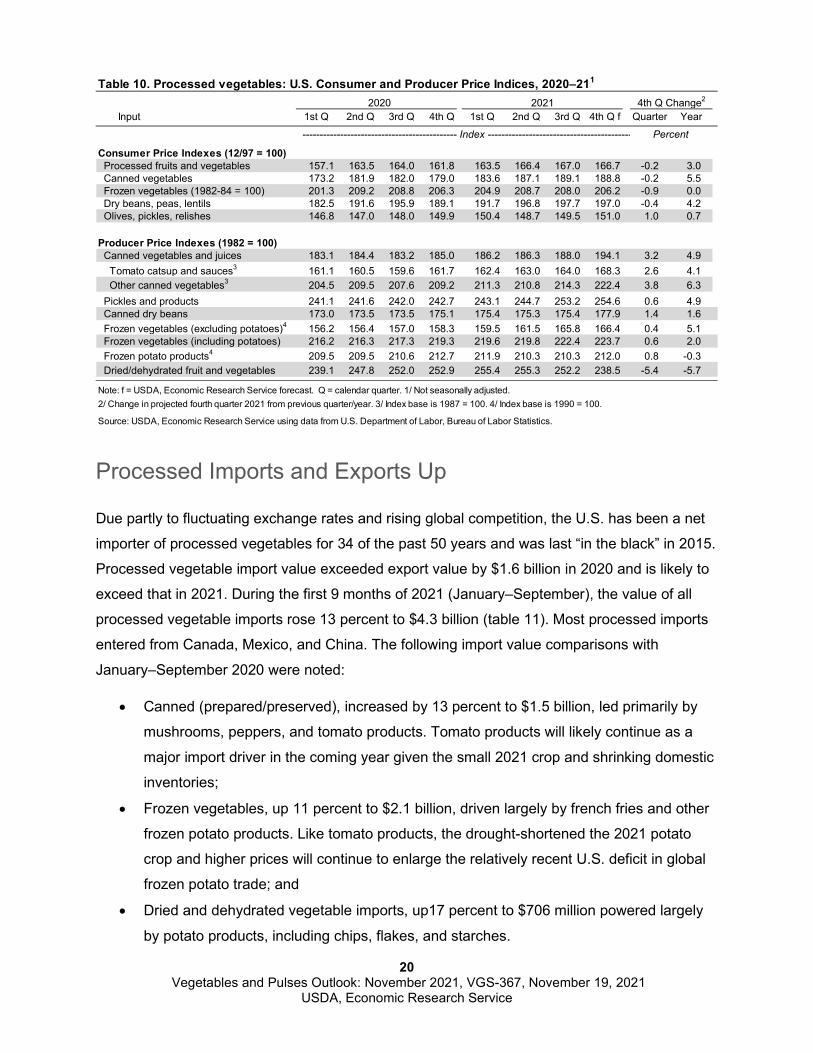
Processed Imports and Exports Up
Due partly to fluctuating exchange rates and rising global competition, the U.S. has been a net
importer of processed vegetables for 34 of the past 50 years and was last “in the black” in 2015.
Processed vegetable import value exceeded export value by $1.6 billion in 2020 and is likely to
exceed that in 2021. During the first 9 months of 2021 (January–September), the value of all
processed vegetable imports rose 13 percent to $4.3 billion (table 11). Most processed imports
entered from Canada, Mexico, and China. The following import value comparisons with
January–September 2020 were noted:
• Canned (prepared/preserved), increased by 13 percent to $1.5 billion, led primarily by
mushrooms, peppers, and tomato products. Tomato products will likely continue as a
major import driver in the coming year given the small 2021 crop and shrinking domestic
inventories;
• Frozen vegetables, up 11 percent to $2.1 billion, driven largely by french fries and other
frozen potato products. Like tomato products, the drought-shortened the 2021 potato
crop and higher prices will continue to enlarge the relatively recent U.S. deficit in global
frozen potato trade; and
• Dried and dehydrated vegetable imports, up17 percent to $706 million powered largely
by potato products, including chips, flakes, and starches.
Table 10. Processed vegetables: U.S. Consumer and Producer Price Indices, 2020–211
2020 2021 4th Q Change2
Input 1st Q 2nd Q 3rd Q 4th Q 1st Q 2nd Q 3rd Q 4th Q f Quarter Year
--------------------------------------------- Index ------------------------------------------ Percent
Consumer Price Indexes (12/97 = 100) Processed fruits and vegetables 157.1 163.5 164.0 161.8 163.5 166.4 167.0 166.7 -0.2 3.0 Canned vegetables 173.2 181.9 182.0 179.0 183.6 187.1 189.1 188.8 -0.2 5.5 Frozen vegetables (1982-84 = 100) 201.3 209.2 208.8 206.3 204.9 208.7 208.0 206.2 -0.9 0.0 Dry beans, peas, lentils 182.5 191.6 195.9 189.1 191.7 196.8 197.7 197.0 -0.4 4.2 Olives, pickles, relishes 146.8 147.0 148.0 149.9 150.4 148.7 149.5 151.0 1.0 0.7
Producer Price Indexes (1982 = 100) Canned vegetables and juices 183.1 184.4 183.2 185.0 186.2 186.3 188.0 194.1 3.2 4.9 Tomato catsup and sauces3 161.1 160.5 159.6 161.7 162.4 163.0 164.0 168.3 2.6 4.1 Other canned vegetables3 204.5 209.5 207.6 209.2 211.3 210.8 214.3 222.4 3.8 6.3 Pickles and products 241.1 241.6 242.0 242.7 243.1 244.7 253.2 254.6 0.6 4.9 Canned dry beans 173.0 173.5 173.5 175.1 175.4 175.3 175.4 177.9 1.4 1.6 Frozen vegetables (excluding potatoes)4 156.2 156.4 157.0 158.3 159.5 161.5 165.8 166.4 0.4 5.1 Frozen vegetables (including potatoes) 216.2 216.3 217.3 219.3 219.6 219.8 222.4 223.7 0.6 2.0 Frozen potato products4 209.5 209.5 210.6 212.7 211.9 210.3 210.3 212.0 0.8 -0.3 Dried/dehydrated fruit and vegetables 239.1 247.8 252.0 252.9 255.4 255.3 252.2 238.5 -5.4 -5.7
Note: f = USDA, Economic Research Service forecast. Q = calendar quarter. 1/ Not seasonally adjusted. 2/ Change in projected fourth quarter 2021 from previous quarter/year. 3/ Index base is 1987 = 100. 4/ Index base is 1990 = 100.
Source: USDA, Economic Research Service using data from U.S. Department of Labor, Bureau of Labor Statistics.
21 Vegetables and Pulses Outlook: November 2021, VGS-367, November 19, 2021
USDA, Economic Research Service
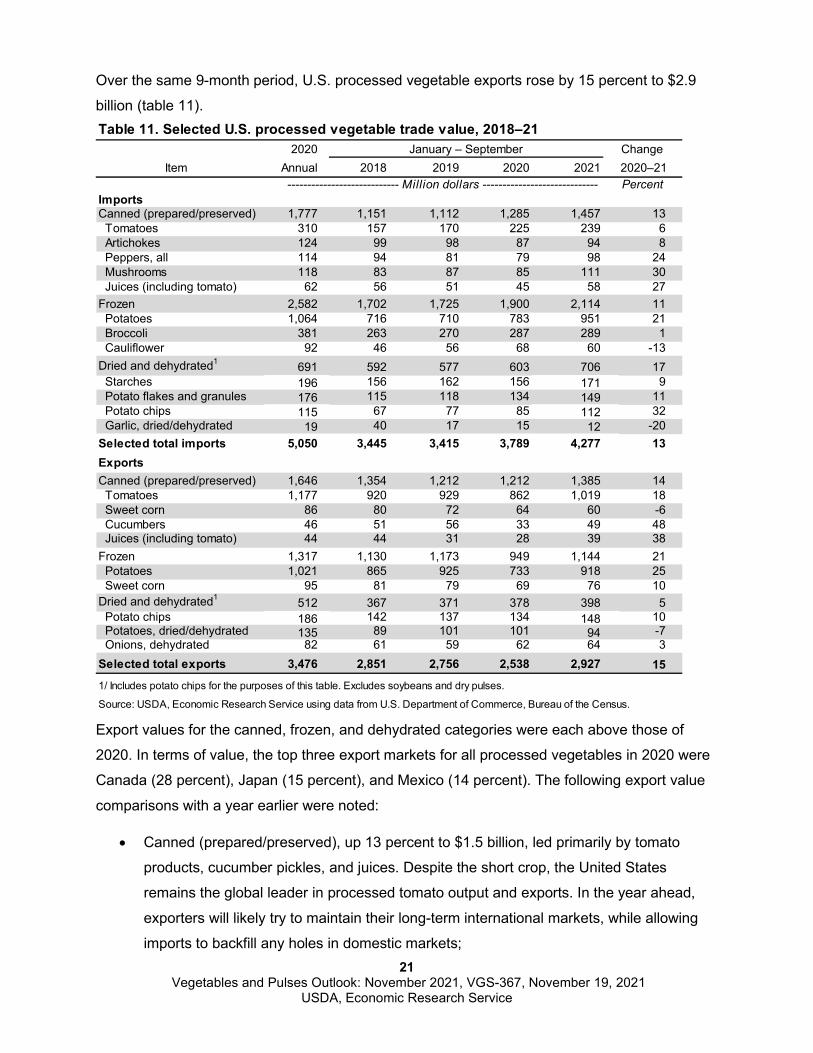
Over the same 9-month period, U.S. processed vegetable exports rose by 15 percent to $2.9
billion (table 11).
Export values for the canned, frozen, and dehydrated categories were each above those of
2020. In terms of value, the top three export markets for all processed vegetables in 2020 were
Canada (28 percent), Japan (15 percent), and Mexico (14 percent). The following export value
comparisons with a year earlier were noted:
• Canned (prepared/preserved), up 13 percent to $1.5 billion, led primarily by tomato
products, cucumber pickles, and juices. Despite the short crop, the United States
remains the global leader in processed tomato output and exports. In the year ahead,
exporters will likely try to maintain their long-term international markets, while allowing
imports to backfill any holes in domestic markets;
Table 11. Selected U.S. processed vegetable trade value, 2018–212020 January – September Change
Item Annual 2018 2019 2020 2021 2020–21 ---------------------------- Million dollars ----------------------------- Percent
ImportsCanned (prepared/preserved) 1,777 1,151 1,112 1,285 1,457 13 Tomatoes 310 157 170 225 239 6 Artichokes 124 99 98 87 94 8 Peppers, all 114 94 81 79 98 24 Mushrooms 118 83 87 85 111 30 Juices (including tomato) 62 56 51 45 58 27Frozen 2,582 1,702 1,725 1,900 2,114 11 Potatoes 1,064 716 710 783 951 21 Broccoli 381 263 270 287 289 1 Cauliflower 92 46 56 68 60 -13Dried and dehydrated1 691 592 577 603 706 17 Starches 196 156 162 156 171 9 Potato flakes and granules 176 115 118 134 149 11 Potato chips 115 67 77 85 112 32 Garlic, dried/dehydrated 19 40 17 15 12 -20Selected total imports 5,050 3,445 3,415 3,789 4,277 13ExportsCanned (prepared/preserved) 1,646 1,354 1,212 1,212 1,385 14 Tomatoes 1,177 920 929 862 1,019 18 Sweet corn 86 80 72 64 60 -6 Cucumbers 46 51 56 33 49 48 Juices (including tomato) 44 44 31 28 39 38Frozen 1,317 1,130 1,173 949 1,144 21 Potatoes 1,021 865 925 733 918 25 Sweet corn 95 81 79 69 76 10Dried and dehydrated1 512 367 371 378 398 5 Potato chips 186 142 137 134 148 10 Potatoes, dried/dehydrated 135 89 101 101 94 -7 Onions, dehydrated 82 61 59 62 64 3Selected total exports 3,476 2,851 2,756 2,538 2,927 151/ Includes potato chips for the purposes of this table. Excludes soybeans and dry pulses.
Source: USDA, Economic Research Service using data from U.S. Department of Commerce, Bureau of the Census.
22 Vegetables and Pulses Outlook: November 2021, VGS-367, November 19, 2021
USDA, Economic Research Service
• Frozen vegetables, increased by 21 percent to $1.1 billion, driven largely by french fries
and sweet corn. Like tomato marketers, potato-product exporters will serve their
international markets, while imports continue to fill in for the drought-shortened 2021
potato crop. Through September of 2021, exports to Japan, which accounted for 23
percent of U.S. frozen vegetable exports, rose by 4 percent. Frozen exports were also
higher for the second and third most important markets, Mexico (up 90 percent from
2020) and Canada (up 3 percent from 2020). Mexico’s import surge reflects increased
french fry and other frozen potato product purchases; and
• Dried and dehydrated vegetables, up 5 percent to $398 million has been largely
powered by potato chips and dehydrated onion powder and flakes. Among the top three
U.S. markets for dried and dehydrated vegetables so far in 2021, the value of U.S.
products shipped to Canada were unchanged, while exports to Japan—the second
leading market—declined by 2 percent. The value of dried and dehydrated exports to
Mexico—the third leading market—rose by 15 percent largely due to gains in potato
flakes and starches.
23 Vegetables and Pulses Outlook: November 2021, VGS-367, November 19, 2021
USDA, Economic Research Service
Mushrooms Sales Value and Volume Decline in 2020/21
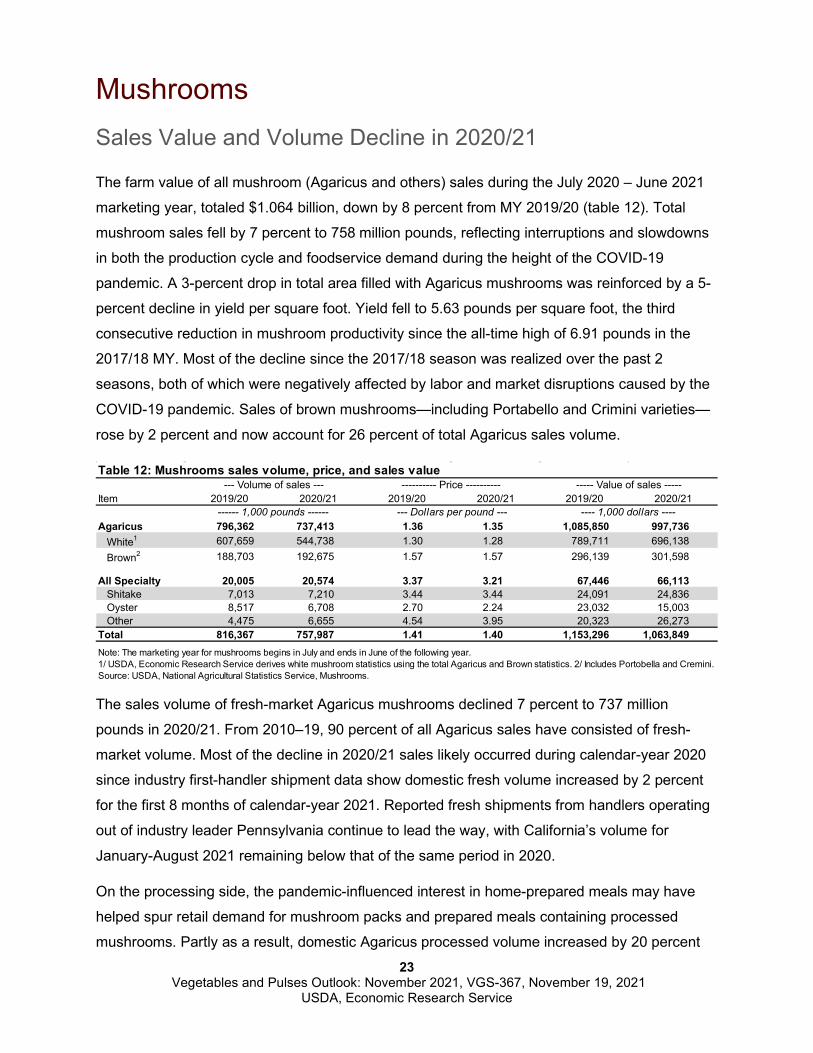
The farm value of all mushroom (Agaricus and others) sales during the July 2020 – June 2021
marketing year, totaled $1.064 billion, down by 8 percent from MY 2019/20 (table 12). Total
mushroom sales fell by 7 percent to 758 million pounds, reflecting interruptions and slowdowns
in both the production cycle and foodservice demand during the height of the COVID-19
pandemic. A 3-percent drop in total area filled with Agaricus mushrooms was reinforced by a 5-
percent decline in yield per square foot. Yield fell to 5.63 pounds per square foot, the third
consecutive reduction in mushroom productivity since the all-time high of 6.91 pounds in the
2017/18 MY. Most of the decline since the 2017/18 season was realized over the past 2
seasons, both of which were negatively affected by labor and market disruptions caused by the
COVID-19 pandemic. Sales of brown mushrooms—including Portabello and Crimini varieties—
rose by 2 percent and now account for 26 percent of total Agaricus sales volume.
The sales volume of fresh-market Agaricus mushrooms declined 7 percent to 737 million
pounds in 2020/21. From 2010–19, 90 percent of all Agaricus sales have consisted of fresh-
market volume. Most of the decline in 2020/21 sales likely occurred during calendar-year 2020
since industry first-handler shipment data show domestic fresh volume increased by 2 percent
for the first 8 months of calendar-year 2021. Reported fresh shipments from handlers operating
out of industry leader Pennsylvania continue to lead the way, with California’s volume for
January-August 2021 remaining below that of the same period in 2020.
On the processing side, the pandemic-influenced interest in home-prepared meals may have
helped spur retail demand for mushroom packs and prepared meals containing processed
mushrooms. Partly as a result, domestic Agaricus processed volume increased by 20 percent
Item 2019/20 2020/21 2019/20 2020/21 2019/20 2020/21
Agaricus 796,362 737,413 1.36 1.35 1,085,850 997,736White1 607,659 544,738 1.30 1.28 789,711 696,138Brown2 188,703 192,675 1.57 1.57 296,139 301,598
All Specialty 20,005 20,574 3.37 3.21 67,446 66,113Shitake 7,013 7,210 3.44 3.44 24,091 24,836Oyster 8,517 6,708 2.70 2.24 23,032 15,003Other 4,475 6,655 4.54 3.95 20,323 26,273
Total 816,367 757,987 1.41 1.40 1,153,296 1,063,849Note: The marketing year for mushrooms begins in July and ends in June of the following year. 1/ USDA, Economic Research Service derives white mushroom statistics using the total Agaricus and Brown statistics. 2/ Includes Portobella and Cremini.Source: USDA, National Agricultural Statistics Service, Mushrooms.
Table 12: Mushrooms sales volume, price, and sales value--- Volume of sales --- ---------- Price ---------- ----- Value of sales -----
------ 1,000 pounds ------ --- Dollars per pound --- ---- 1,000 dollars ----
24 Vegetables and Pulses Outlook: November 2021, VGS-367, November 19, 2021
USDA, Economic Research Service
from 2019/20 to nearly 67 million pounds. Despite the slight resurgence in 2020/21 marketing
year, the long-run trend in domestic mushroom processing likely remains on a downward slope.
With fresh market demand picking up as COVID-19 pandemic restrictions receded, gaps in
domestic output were filled in by a 6-percent gain in import volume. The gain in fresh imports
consisted of Agaricus (up 9 percent) as specialty volume—a commodity popular within the
pandemic-embattled restaurant industry—declined by 13 percent. Canada accounted for 70
percent of the fresh mushroom import volume, followed by Mexico (18 percent), and China (6
percent). Imports of processed mushrooms continued to trend higher in 2020/21 MY as frozen
volume rose 6 percent, canned imports rose 18 percent, and dried/dehydrated import volume
(largely from China) increased 36 percent.
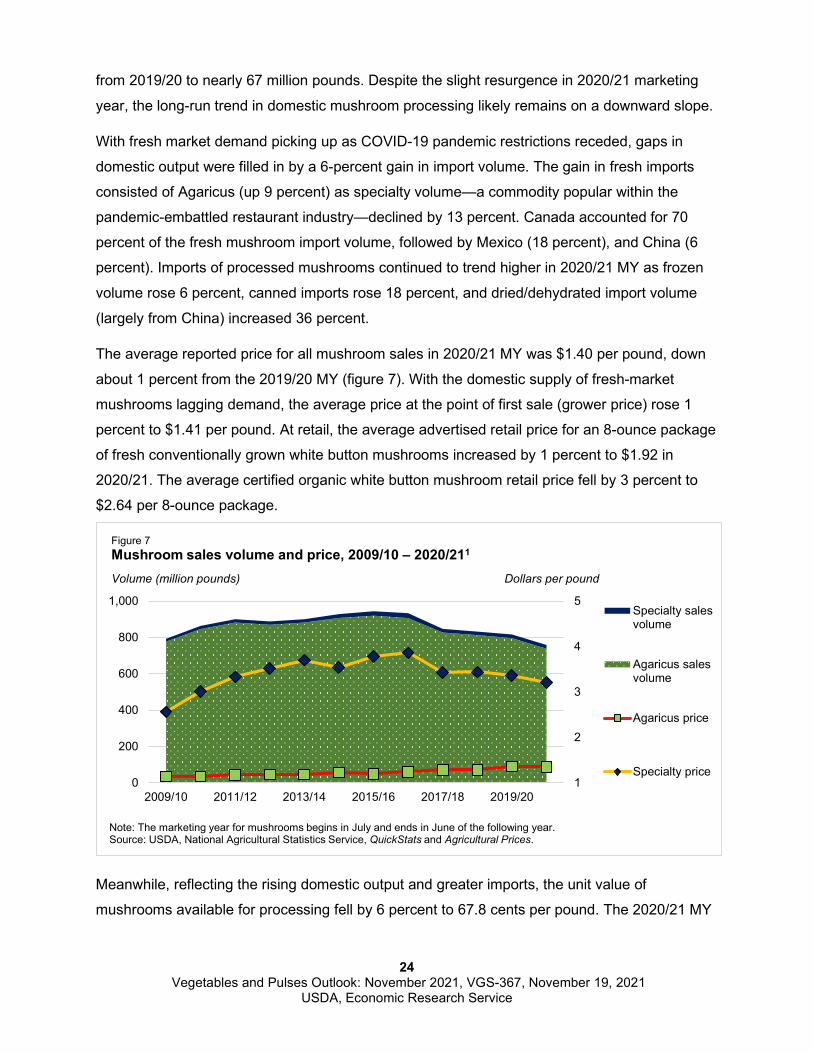
The average reported price for all mushroom sales in 2020/21 MY was $1.40 per pound, down
about 1 percent from the 2019/20 MY (figure 7). With the domestic supply of fresh-market
mushrooms lagging demand, the average price at the point of first sale (grower price) rose 1
percent to $1.41 per pound. At retail, the average advertised retail price for an 8-ounce package
of fresh conventionally grown white button mushrooms increased by 1 percent to $1.92 in
2020/21. The average certified organic white button mushroom retail price fell by 3 percent to
$2.64 per 8-ounce package.
1
2
3
4
5
0
200
400
600
800
1,000
2009/10 2011/12 2013/14 2015/16 2017/18 2019/20
Specialty salesvolume
Agaricus salesvolume
Agaricus price
Specialty price
Figure 7 Mushroom sales volume and price, 2009/10 – 2020/211
Volume (million pounds) Dollars per pound
Note: The marketing year for mushrooms begins in July and ends in June of the following year.Source: USDA, National Agricultural Statistics Service, QuickStats and Agricultural Prices.
Meanwhile, reflecting the rising domestic output and greater imports, the unit value of
mushrooms available for processing fell by 6 percent to 67.8 cents per pound. The 2020/21 MY
25 Vegetables and Pulses Outlook: November 2021, VGS-367, November 19, 2021
USDA, Economic Research Service
price reduction was a return to the longer-run nominal price trend after the pandemic-inspired
surge in 2019/20 MY.
The volume of mushrooms produced as certified organic in 2020/21 increased by 3 percent to
131 million pounds. Certified organic mushroom supply continues to far outstrip demand with
just 55 percent of available organic volume sold as organic mushrooms—with the USDA
certified organic label—down from 62 percent a year earlier. Specialty (non-Agaricus)
mushrooms accounted for 8 percent of certified organic sales, with the remainder being
Agaricus. The share of all mushroom sales volumes consisting of certified organic products
remained just under 10 percent in 2020/21.
In line with reduced production and still-recovering foodservice demand, per capita availability of
all mushrooms declined by 6 percent to 3.53 pounds in 2020/21. Fresh-market use fell by 7
percent to 2.58 pounds per person—13 percent below the 2015/16 record high. Per capita
availability of processing mushrooms remained flat at 0.95 pounds but are expected to continue
trending lower from the 1994/95 peak of 2.00 pounds as consumers continue to move away
from processed products.
26 Vegetables and Pulses Outlook: November 2021, VGS-367, November 19, 2021
USDA, Economic Research Service
Potatoes Heat and Drought Reduce Output
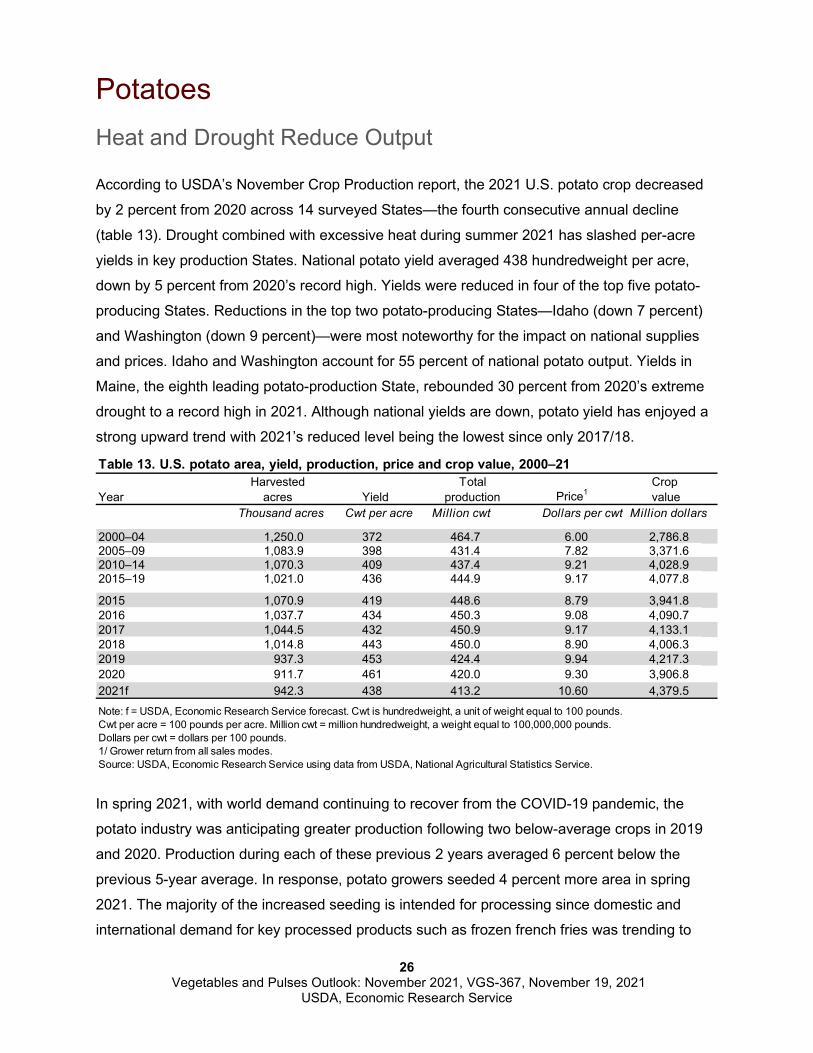
According to USDA’s November Crop Production report, the 2021 U.S. potato crop decreased
by 2 percent from 2020 across 14 surveyed States—the fourth consecutive annual decline
(table 13). Drought combined with excessive heat during summer 2021 has slashed per-acre
yields in key production States. National potato yield averaged 438 hundredweight per acre,
down by 5 percent from 2020’s record high. Yields were reduced in four of the top five potato-
producing States. Reductions in the top two potato-producing States—Idaho (down 7 percent)
and Washington (down 9 percent)—were most noteworthy for the impact on national supplies
and prices. Idaho and Washington account for 55 percent of national potato output. Yields in
Maine, the eighth leading potato-production State, rebounded 30 percent from 2020’s extreme
drought to a record high in 2021. Although national yields are down, potato yield has enjoyed a
strong upward trend with 2021’s reduced level being the lowest since only 2017/18.
In spring 2021, with world demand continuing to recover from the COVID-19 pandemic, the
potato industry was anticipating greater production following two below-average crops in 2019
and 2020. Production during each of these previous 2 years averaged 6 percent below the
previous 5-year average. In response, potato growers seeded 4 percent more area in spring
2021. The majority of the increased seeding is intended for processing since domestic and
international demand for key processed products such as frozen french fries was trending to
Table 13. U.S. potato area, yield, production, price and crop value, 2000–21Harvested Total Crop
Year acres Yield production Price1 value Thousand acres Cwt per acre Million cwt Dollars per cwt Million dollars
2000–04 1,250.0 372 464.7 6.00 2,786.82005–09 1,083.9 398 431.4 7.82 3,371.62010–14 1,070.3 409 437.4 9.21 4,028.92015–19 1,021.0 436 444.9 9.17 4,077.8 2015 1,070.9 419 448.6 8.79 3,941.82016 1,037.7 434 450.3 9.08 4,090.72017 1,044.5 432 450.9 9.17 4,133.12018 1,014.8 443 450.0 8.90 4,006.32019 937.3 453 424.4 9.94 4,217.32020 911.7 461 420.0 9.30 3,906.82021f 942.3 438 413.2 10.60 4,379.5Note: f = USDA, Economic Research Service forecast. Cwt is hundredweight, a unit of weight equal to 100 pounds. Cwt per acre = 100 pounds per acre. Million cwt = million hundredweight, a weight equal to 100,000,000 pounds. Dollars per cwt = dollars per 100 pounds. 1/ Grower return from all sales modes.Source: USDA, Economic Research Service using data from USDA, National Agricultural Statistics Service.
27 Vegetables and Pulses Outlook: November 2021, VGS-367, November 19, 2021
USDA, Economic Research Service
pre-pandemic levels. According to the USDA, NASS 2017 Census of Agriculture, States
currently excluded from the national potato estimates program account for an additional 9
percent of harvested area. About two-thirds of this excluded area is earmarked for processing,
with chipping plants a likely major destination. Thus, assuming an average yield close to 2021’s
projection, an additional 40–50 million hundredweight of potatoes—in addition to the States
surveyed by USDA, NASS—may be available to various local markets, with a third of this
volume available as table stock.
Record High Prices Expected in 2021/22
In the September 2020–August 2021 marketing year, the season-average price was $9.30 per
hundredweight, down 6 percent from MY 2019/20. For MY 2021/22, supply and demand factors
are in place for higher U.S. potato prices. Factors include a smaller U.S. crop, strong North
American processing demand, and surging international demand boosting both U.S. export
demand and prices for imported potato products. As a result, the 2021/22 U.S. season-average
potato price is expected to reach a nominal dollar record high—exceeding $10.00 per
hundredweight for the first time—as potato supplies tighten and processors siphon volume from
the fresh market.
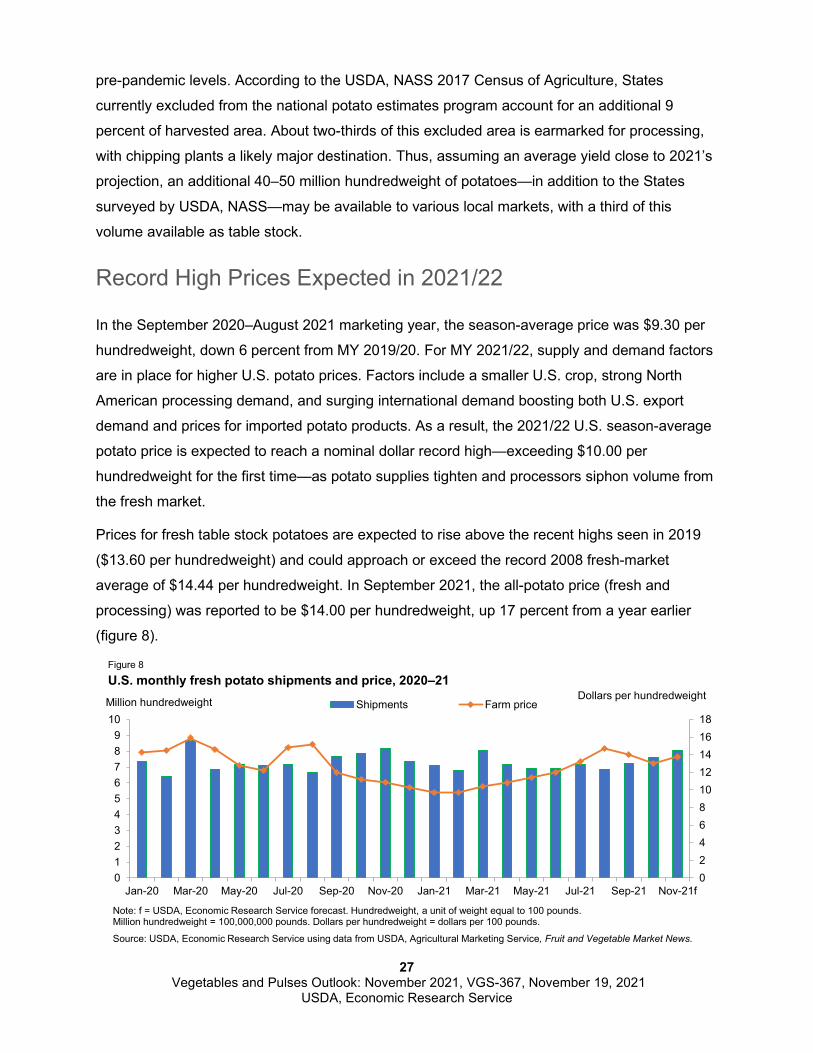
Prices for fresh table stock potatoes are expected to rise above the recent highs seen in 2019
($13.60 per hundredweight) and could approach or exceed the record 2008 fresh-market
average of $14.44 per hundredweight. In September 2021, the all-potato price (fresh and
processing) was reported to be $14.00 per hundredweight, up 17 percent from a year earlier
(figure 8).
024681012141618
0123456789
10
Jan-20 Mar-20 May-20 Jul-20 Sep-20 Nov-20 Jan-21 Mar-21 May-21 Jul-21 Sep-21 Nov-21f
Shipments Farm priceMillion hundredweight Dollars per hundredweight
Note: f = USDA, Economic Research Service forecast. Hundredweight, a unit of weight equal to 100 pounds. Million hundredweight = 100,000,000 pounds. Dollars per hundredweight = dollars per 100 pounds.
Source: USDA, Economic Research Service using data from USDA, Agricultural Marketing Service, Fruit and Vegetable Market News.
U.S. monthly fresh potato shipments and price, 2020–21Figure 8

28 Vegetables and Pulses Outlook: November 2021, VGS-367, November 19, 2021
USDA, Economic Research Service
Some offset to this price strength is expected from rising imports from Canada as ideal growing
weather in eastern provinces offset drought-reduced output in the west, leading to a record crop
in Canada. The smaller U.S. crop is expected to result in higher retail prices, especially for
russets (table 14).
Prices for processing potatoes have long exhibited slow, steady growth, and provided growers
with a strong foundation for potato demand and pricing. However, given the pre-determined
nature of processing pricing—largely set by contract—prices for potatoes destined for
processing have frequently stood in stark contrast to those for fresh open-market pricing, which
have shown more variation.
In marketing years such as 2021/22, when processors have found themselves with fewer
potatoes than required to satisfy demand, they may purchase fresh potatoes from the open
market—focusing largely on varieties which suit their processing need—to supplement potatoes
under contract. Processors buying from the open market can result in upward pressure on fresh
table stock prices. This is the scenario expected in 2021/22 MY assuming no widespread
resurgence of pandemic restrictions impacting demand. In other years, processors may have
too many potatoes under contract, so they sell some of their stored potatoes for use as table
stock. Depending on the volume, this can have a negative effect on fresh market prices.
Table 14. Potatoes: U.S. Consumer and Producer Price Indices and advertised retail prices, 2020–211
2020 2021 4th Q Change2
Item 1st Q 2nd Q 3rd Q 4th Q 1st Q 2nd Q 3rd Q 4th Q f Quarter Year
--------------------------------------------- Index ----------------------------------------- Percent
Producer Price Indexes Fresh tablestock (2011=100) 139.8 122.1 128.1 106.6 100.7 99.9 132.5 131.6 -0.7 23.5 Fresh, russet (1991=100) 229.8 192.1 221.6 169.7 154.5 160.0 209.6 220.9 5.4 30.1 Fresh, red (1991=100) 265.8 261.5 213.9 196.5 181.7 174.8 216.4 196.8 -9.0 0.1 Fresh, round white (1991=100) 229.4 248.6 161.4 250.6 239.8 189.6 259.9 206.0 -20.7 -17.8 Fresh, round yellow (9/2015=100) 159.2 -- 128.6 155.9 136.8 135.2 136.8 110.0 -19.6 -29.4 Frozen products (1982=100) 263.8 263.8 265.1 267.8 266.8 264.8 264.8 267.0 0.8 -0.3 Potato chips and sticks (2007=100) 125.4 125.3 125.3 125.7 126.7 126.9 127.3 131.3 3.1 4.5
Consumer Price Indexes Fresh tablestock (1982–84=100) 371.1 392.9 390.7 360.7 374.4 377.7 388.7 370.8 -4.6 2.8
Retail Prices 4
Fresh potatoes, white 0.79 0.85 0.84 0.77 0.78 0.77 0.79 0.79 0.3 3.1 Potato chips 4.57 4.98 5.07 5.07 5.01 5.01 5.06 5.30 4.8 4.6
Retail Prices (advertised)5
Fresh, russet 0.486 0.504 0.502 0.468 0.506 0.477 0.479 0.460 -4.0 -1.6 Fresh, red 0.688 0.706 0.683 0.630 0.639 0.647 0.651 0.640 -1.7 1.7 Fresh, yellow 0.645 0.733 0.688 0.640 0.689 0.655 0.662 0.620 -6.4 -3.0 Fresh, round white 0.549 0.597 0.565 0.536 0.529 0.706 0.563 0.540 -4.0 0.7
Note: Q = calendar quarter. f = USDA, Economic Research Service forecast. 1/ Not seasonally adjusted. 2/ Change in projected fourth quarter 2021 from the previous quarter/year. 3/ Index base year is 1982 = 100. 4/ As reported by the U.S. Department of Labor, Bureau of Labor Statistics. 5/ Average of weekly advertised retail prices as reported by Market News per pound for 5-lb bags (non-organic).Source: USDA, Economic Research Service using data from USDA, Agricultural Marketing Service, Market News Service and U.S. Department of Labor, Bureau of Labor Statistics.
29 Vegetables and Pulses Outlook: November 2021, VGS-367, November 19, 2021
USDA, Economic Research Service
Outlook for 2022/23 Points to Increased Area
Expectations for strong potato prices in the 2021/22 MY will serve as a driver of projected
planted area for the 2022/23 potato crop to be planted in the spring of 2022. As seen in MY
2021/22, even with a modest increase in planted area, weather ultimately plays the key role in
crop determination. Assuming average weather in 2022 and favorable irrigation water supplies,
the 30-year national trend yield would be close to the record-high 461 hundredweight per acre
returned for the 2021/22 crop. Given trend yields, lower competing field-crop prices, and a
positive acreage response to higher 2021/22 potato prices, the outlook for 2022/23 points to a
larger crop and easing table potato prices.
Price negotiations with processors have already commenced and will likely be another key
driver for the 2022 crop. Three factors driving contract pricing for the 2022/23 MY are the short
2021/22 crop—resulting in lower beginning inventories of finished products—strength in
domestic and international demand, and agricultural input price inflation. Given large price
increases for energy-based inputs (i.e., fuel, fertilizer, and agricultural chemicals), labor, and
most other inputs as well as the subsequent effect on producing an acre of potatoes, potato
growers are seeking a substantial escalation in contract prices for raw potatoes. Thus, the
average price of potatoes destined for processing could potentially see the strongest year-to-
year gain since 2009.
Export and Import Value Each Record High
During the September 2020 – August 2021 marketing year, U.S. exports of all potatoes and
potato products (including starch but excluding dextrins) totaled a nominal dollar record $1.89
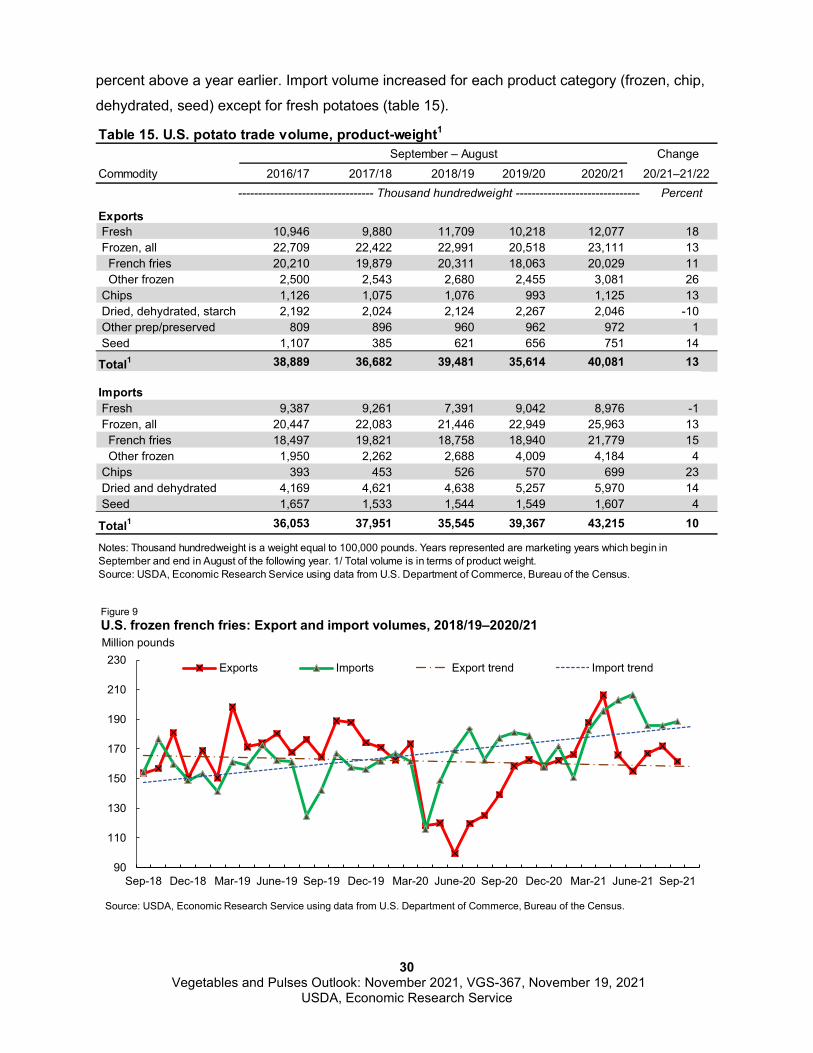
billion—up 9 percent from a year earlier. Export volume increased for each product category
(frozen, chip, dehydrated, seed) except for dried/dehydrated potatoes (table 15). With a surge in
frozen potato demand, Mexico (21 percent of potato export value) supplanted Japan as the top
export market for U.S. potato products in MY 2020/21. The volume of U.S. frozen potato exports
to Mexico doubled in MY 2020/21, with value rising by 89 percent to $263 million and
accounting for 67 percent of all potato product exports to Mexico. The other top potato export
markets for MY 2020/21 were Japan (19 percent of export value), Canada (17 percent), South
Korea (7 percent), and the Philippines (5 percent).
Despite strong export growth, the United States remained a net potato importer in 2020/21 in
terms of both volume and value. During the September–August 2020/21 marketing year, U.S.
imports of all potatoes and potato products totaled a nominal dollar record $1.96 billion—15
30 Vegetables and Pulses Outlook: November 2021, VGS-367, November 19, 2021
USDA, Economic Research Service
percent above a year earlier. Import volume increased for each product category (frozen, chip,
dehydrated, seed) except for fresh potatoes (table 15).
September – August ChangeCommodity 2016/17 2017/18 2018/19 2019/20 2020/21 20/21–21/22
---------------------------------- Thousand hundredweight -------------------------------- Percent
Exports Fresh 10,946 9,880 11,709 10,218 12,077 18 Frozen, all 22,709 22,422 22,991 20,518 23,111 13 French fries 20,210 19,879 20,311 18,063 20,029 11 Other frozen 2,500 2,543 2,680 2,455 3,081 26 Chips 1,126 1,075 1,076 993 1,125 13 Dried, dehydrated, starch 2,192 2,024 2,124 2,267 2,046 -10 Other prep/preserved 809 896 960 962 972 1 Seed 1,107 385 621 656 751 14
Total1 38,889 36,682 39,481 35,614 40,081 13
Imports Fresh 9,387 9,261 7,391 9,042 8,976 -1 Frozen, all 20,447 22,083 21,446 22,949 25,963 13 French fries 18,497 19,821 18,758 18,940 21,779 15 Other frozen 1,950 2,262 2,688 4,009 4,184 4 Chips 393 453 526 570 699 23 Dried and dehydrated 4,169 4,621 4,638 5,257 5,970 14 Seed 1,657 1,533 1,544 1,549 1,607 4
Total1 36,053 37,951 35,545 39,367 43,215 10
Table 15. U.S. potato trade volume, product-weight1
Notes: Thousand hundredweight is a weight equal to 100,000 pounds. Years represented are marketing years which begin in September and end in August of the following year. 1/ Total volume is in terms of product weight.Source: USDA, Economic Research Service using data from U.S. Department of Commerce, Bureau of the Census.
90
110
130
150
170
190
210
230
Sep-18 Dec-18 Mar-19 June-19 Sep-19 Dec-19 Mar-20 June-20 Sep-20 Dec-20 Mar-21 June-21 Sep-21
Figure 9U.S. frozen french fries: Export and import volumes, 2018/19–2020/21
Exports Imports Export trend Import trend
Million pounds
Source: USDA, Economic Research Service using data from U.S. Department of Commerce, Bureau of the Census.
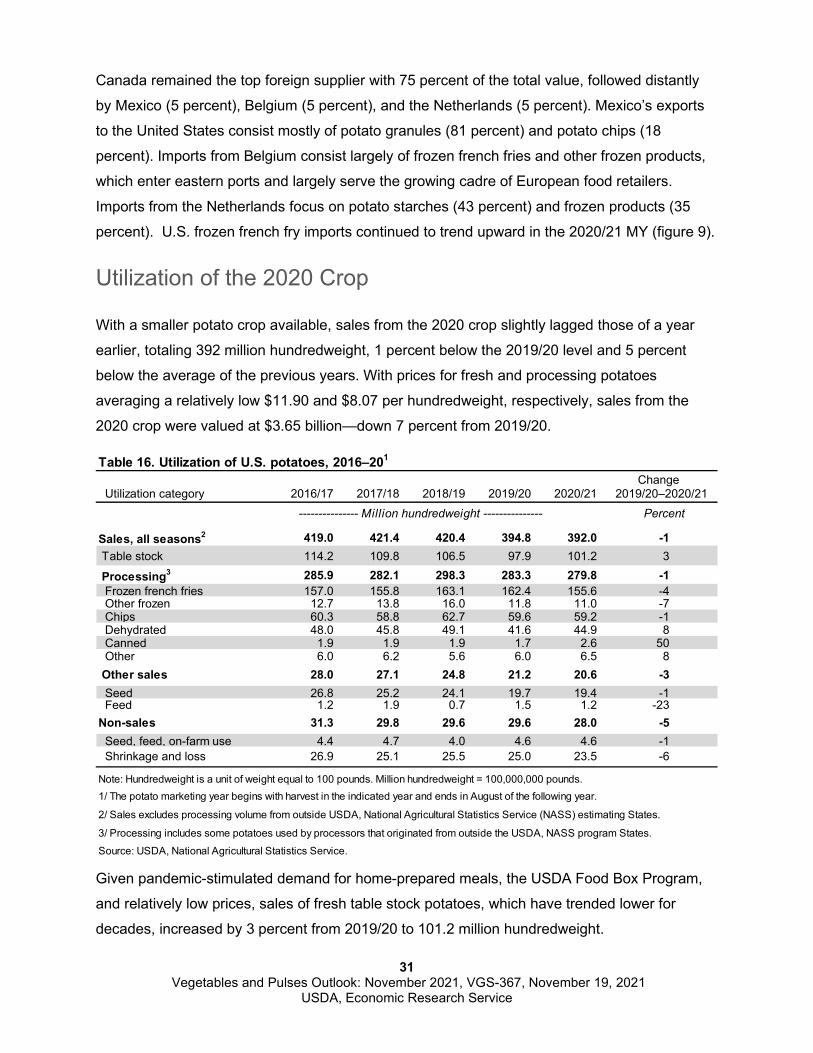
31 Vegetables and Pulses Outlook: November 2021, VGS-367, November 19, 2021
USDA, Economic Research Service
Canada remained the top foreign supplier with 75 percent of the total value, followed distantly
by Mexico (5 percent), Belgium (5 percent), and the Netherlands (5 percent). Mexico’s exports
to the United States consist mostly of potato granules (81 percent) and potato chips (18
percent). Imports from Belgium consist largely of frozen french fries and other frozen products,
which enter eastern ports and largely serve the growing cadre of European food retailers.
Imports from the Netherlands focus on potato starches (43 percent) and frozen products (35
percent). U.S. frozen french fry imports continued to trend upward in the 2020/21 MY (figure 9).
Utilization of the 2020 Crop
With a smaller potato crop available, sales from the 2020 crop slightly lagged those of a year
earlier, totaling 392 million hundredweight, 1 percent below the 2019/20 level and 5 percent
below the average of the previous years. With prices for fresh and processing potatoes
averaging a relatively low $11.90 and $8.07 per hundredweight, respectively, sales from the
2020 crop were valued at $3.65 billion—down 7 percent from 2019/20.
Given pandemic-stimulated demand for home-prepared meals, the USDA Food Box Program,
and relatively low prices, sales of fresh table stock potatoes, which have trended lower for
decades, increased by 3 percent from 2019/20 to 101.2 million hundredweight.
Table 16. Utilization of U.S. potatoes, 2016–201
Change Utilization category 2016/17 2017/18 2018/19 2019/20 2020/21 2019/20–2020/21
--------------- Million hundredweight --------------- Percent
Sales, all seasons2 419.0 421.4 420.4 394.8 392.0 -1 Table stock 114.2 109.8 106.5 97.9 101.2 3
Processing3 285.9 282.1 298.3 283.3 279.8 -1 Frozen french fries 157.0 155.8 163.1 162.4 155.6 -4 Other frozen 12.7 13.8 16.0 11.8 11.0 -7 Chips 60.3 58.8 62.7 59.6 59.2 -1 Dehydrated 48.0 45.8 49.1 41.6 44.9 8 Canned 1.9 1.9 1.9 1.7 2.6 50 Other 6.0 6.2 5.6 6.0 6.5 8 Other sales 28.0 27.1 24.8 21.2 20.6 -3 Seed 26.8 25.2 24.1 19.7 19.4 -1 Feed 1.2 1.9 0.7 1.5 1.2 -23Non-sales 31.3 29.8 29.6 29.6 28.0 -5 Seed, feed, on-farm use 4.4 4.7 4.0 4.6 4.6 -1 Shrinkage and loss 26.9 25.1 25.5 25.0 23.5 -6
Note: Hundredweight is a unit of weight equal to 100 pounds. Million hundredweight = 100,000,000 pounds. 1/ The potato marketing year begins with harvest in the indicated year and ends in August of the following year.
2/ Sales excludes processing volume from outside USDA, National Agricultural Statistics Service (NASS) estimating States.
3/ Processing includes some potatoes used by processors that originated from outside the USDA, NASS program States.Source: USDA, National Agricultural Statistics Service.
32 Vegetables and Pulses Outlook: November 2021, VGS-367, November 19, 2021
USDA, Economic Research Service
According to the U.S. Department of Labor, Bureau of Labor Statistics, retail prices for all fresh
potatoes sold for an average of 77.6 cents per pound during marketing year 2020/21, 5 percent
below the 2019/20 marketing year. Nearly two-thirds of the 2020 potato crop was used for
processing—similar to the previous years. Some key observations on 2020/21 processing
utilization include:
• Utilization as frozen french fries declined by 4 percent but still accounted for 56 percent
of all potatoes processed in 2020 despite reduced domestic and international
foodservice sales;
• The 90 U.S. manufacturing plants making traditional potato chips and shoestring
potatoes utilized 1-percent fewer potatoes in 2020/21 than in 2019/20;
• Utilization for dehydration rose by 8 percent partly because of pandemic-influenced
hoarding of shelf-stable products like dehydrated mashed potatoes and increased potato
chip demand from home-bound consumers (many chip products are made from
reconstituted dehydrated potatoes);
• Canning utilization has been trending downward for decades but registered a sharp 50-
percent gain in 2020 as renewed demand for shelf-stable soups and stews emptied
store shelves and exhausted pipeline inventories; and
• Another indication of the quality issues experienced with the 2020/21 fall potato crop
was the 6.5 million hundredweight sold as feed. During the last 2decades, around 3
million hundredweight of potatoes have been annually sold for feed.
Coronavirus Food Assistance Program Payments
USDA’s Farm Service Agency is administering the Coronavirus Food Assistance Program
(CFAP) to provide direct relief to producers who faced price declines and additional marketing
costs due to COVID-19. CFAP provides vital financial assistance to producers of agricultural
commodities with financial assistance that gives them the ability to absorb sales losses and
increased marketing costs associated with the COVID-19 pandemic. Under the initial CFAP
implementation known as CFAP 1, U.S. potato growers have received $142.4 million in direct
payments through mid-November broken out as follows:
• russet potatoes, $96.2 million;
• other fresh potatoes, $11.8 million;
• processing potatoes, $18.4 million; and
• seed potatoes, $16.0 million.
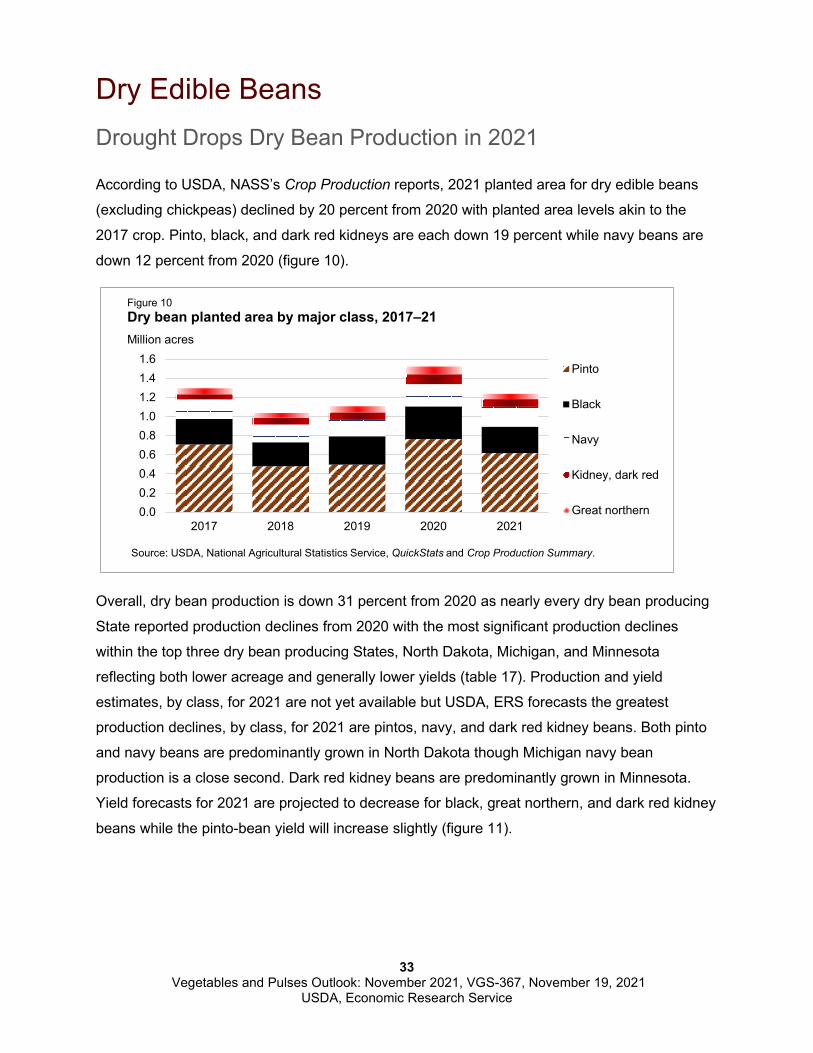
33 Vegetables and Pulses Outlook: November 2021, VGS-367, November 19, 2021
USDA, Economic Research Service
Dry Edible Beans Drought Drops Dry Bean Production in 2021
According to USDA, NASS’s Crop Production reports, 2021 planted area for dry edible beans
(excluding chickpeas) declined by 20 percent from 2020 with planted area levels akin to the
2017 crop. Pinto, black, and dark red kidneys are each down 19 percent while navy beans are
down 12 percent from 2020 (figure 10).
Overall, dry bean production is down 31 percent from 2020 as nearly every dry bean producing
State reported production declines from 2020 with the most significant production declines
within the top three dry bean producing States, North Dakota, Michigan, and Minnesota
reflecting both lower acreage and generally lower yields (table 17). Production and yield
estimates, by class, for 2021 are not yet available but USDA, ERS forecasts the greatest
production declines, by class, for 2021 are pintos, navy, and dark red kidney beans. Both pinto
and navy beans are predominantly grown in North Dakota though Michigan navy bean
production is a close second. Dark red kidney beans are predominantly grown in Minnesota.
Yield forecasts for 2021 are projected to decrease for black, great northern, and dark red kidney
beans while the pinto-bean yield will increase slightly (figure 11).
0.00.20.40.60.81.01.21.41.6
2017 2018 2019 2020 2021
Pinto
Black
Navy
Kidney, dark red
Great northern
Figure 10Dry bean planted area by major class, 2017–21Million acres
Source: USDA, National Agricultural Statistics Service, QuickStats and Crop Production Summary.
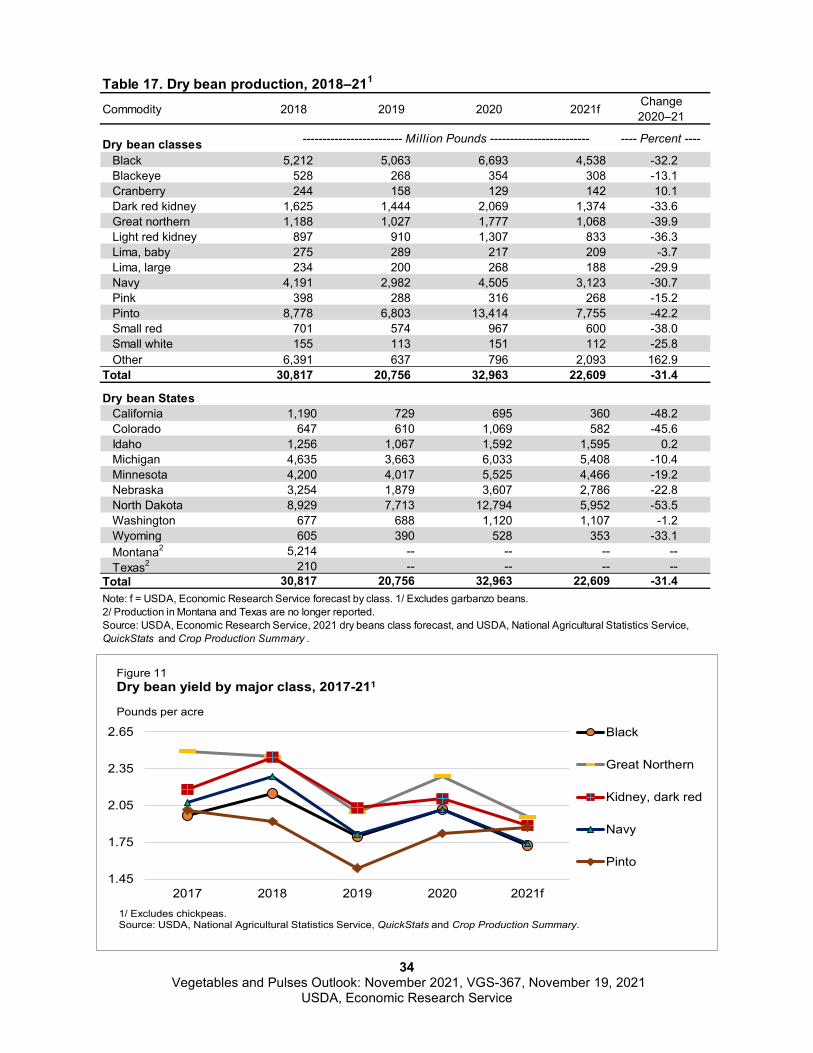
34 Vegetables and Pulses Outlook: November 2021, VGS-367, November 19, 2021
USDA, Economic Research Service
Table 17. Dry bean production, 2018–211
Commodity 2018 2019 2020 2021f Change2020–21
Dry bean classes ------------------------- Million Pounds ------------------------- ---- Percent ----
Black 5,212 5,063 6,693 4,538 -32.2Blackeye 528 268 354 308 -13.1Cranberry 244 158 129 142 10.1Dark red kidney 1,625 1,444 2,069 1,374 -33.6Great northern 1,188 1,027 1,777 1,068 -39.9Light red kidney 897 910 1,307 833 -36.3Lima, baby 275 289 217 209 -3.7Lima, large 234 200 268 188 -29.9Navy 4,191 2,982 4,505 3,123 -30.7Pink 398 288 316 268 -15.2Pinto 8,778 6,803 13,414 7,755 -42.2Small red 701 574 967 600 -38.0Small white 155 113 151 112 -25.8Other 6,391 637 796 2,093 162.9
Total 30,817 20,756 32,963 22,609 -31.4
Dry bean StatesCalifornia 1,190 729 695 360 -48.2Colorado 647 610 1,069 582 -45.6Idaho 1,256 1,067 1,592 1,595 0.2Michigan 4,635 3,663 6,033 5,408 -10.4Minnesota 4,200 4,017 5,525 4,466 -19.2Nebraska 3,254 1,879 3,607 2,786 -22.8North Dakota 8,929 7,713 12,794 5,952 -53.5Washington 677 688 1,120 1,107 -1.2Wyoming 605 390 528 353 -33.1Montana2 5,214 -- -- -- --Texas2 210 -- -- -- --
Total 30,817 20,756 32,963 22,609 -31.4Note: f = USDA, Economic Research Service forecast by class. 1/ Excludes garbanzo beans. 2/ Production in Montana and Texas are no longer reported.Source: USDA, Economic Research Service, 2021 dry beans class forecast, and USDA, National Agricultural Statistics Service, QuickStats and Crop Production Summary .
1.45
1.75
2.05
2.35
2.65
2017 2018 2019 2020 2021f
Black
Great Northern
Kidney, dark red
Navy
Pinto
Figure 11Dry bean yield by major class, 2017-211
Pounds per acre
1/ Excludes chickpeas.Source: USDA, National Agricultural Statistics Service, QuickStats and Crop Production Summary.
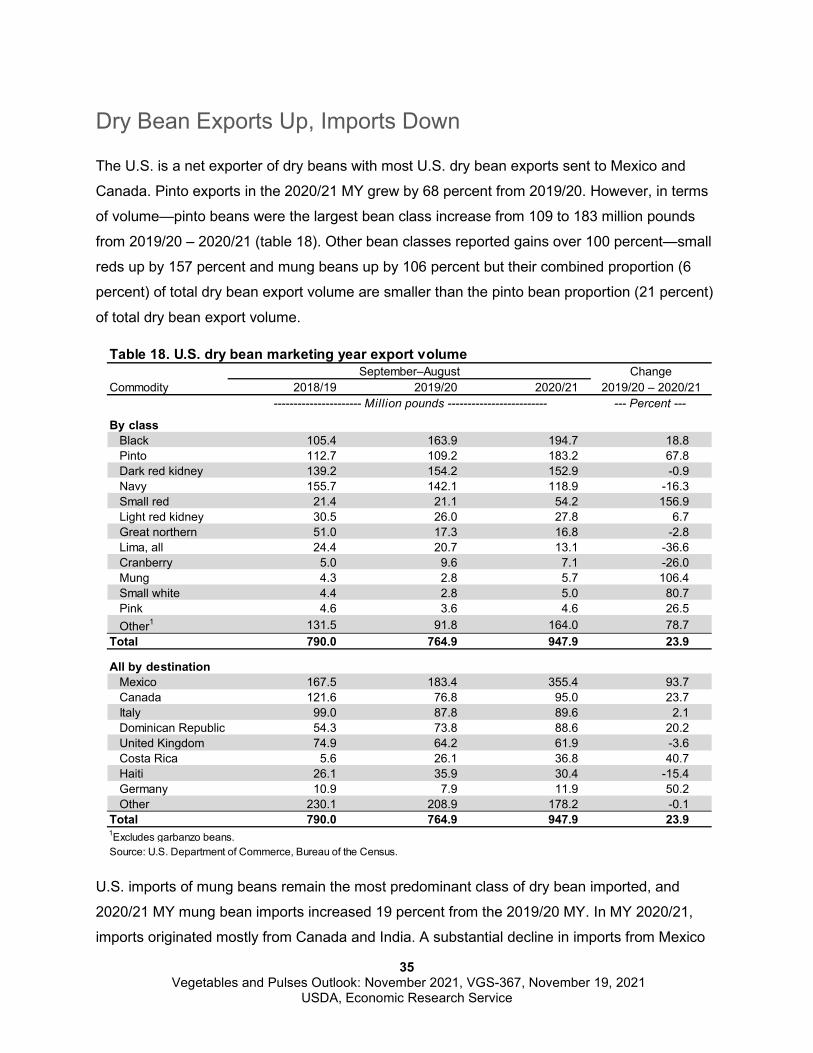
35 Vegetables and Pulses Outlook: November 2021, VGS-367, November 19, 2021
USDA, Economic Research Service
Dry Bean Exports Up, Imports Down
The U.S. is a net exporter of dry beans with most U.S. dry bean exports sent to Mexico and
Canada. Pinto exports in the 2020/21 MY grew by 68 percent from 2019/20. However, in terms
of volume—pinto beans were the largest bean class increase from 109 to 183 million pounds
from 2019/20 – 2020/21 (table 18). Other bean classes reported gains over 100 percent—small
reds up by 157 percent and mung beans up by 106 percent but their combined proportion (6
percent) of total dry bean export volume are smaller than the pinto bean proportion (21 percent)
of total dry bean export volume.
U.S. imports of mung beans remain the most predominant class of dry bean imported, and
2020/21 MY mung bean imports increased 19 percent from the 2019/20 MY. In MY 2020/21,
imports originated mostly from Canada and India. A substantial decline in imports from Mexico
Table 18. U.S. dry bean marketing year export volumeSeptember–August Change
Commodity 2018/19 2019/20 2020/21 2019/20 – 2020/21 ---------------------- Million pounds ------------------------- --- Percent ---
By classBlack 105.4 163.9 194.7 18.8Pinto 112.7 109.2 183.2 67.8Dark red kidney 139.2 154.2 152.9 -0.9Navy 155.7 142.1 118.9 -16.3Small red 21.4 21.1 54.2 156.9Light red kidney 30.5 26.0 27.8 6.7Great northern 51.0 17.3 16.8 -2.8Lima, all 24.4 20.7 13.1 -36.6Cranberry 5.0 9.6 7.1 -26.0Mung 4.3 2.8 5.7 106.4Small white 4.4 2.8 5.0 80.7Pink 4.6 3.6 4.6 26.5Other1 131.5 91.8 164.0 78.7
Total 790.0 764.9 947.9 23.9
All by destinationMexico 167.5 183.4 355.4 93.7Canada 121.6 76.8 95.0 23.7Italy 99.0 87.8 89.6 2.1Dominican Republic 54.3 73.8 88.6 20.2United Kingdom 74.9 64.2 61.9 -3.6Costa Rica 5.6 26.1 36.8 40.7Haiti 26.1 35.9 30.4 -15.4Germany 10.9 7.9 11.9 50.2Other 230.1 208.9 178.2 -0.1
Total 790.0 764.9 947.9 23.91Excludes garbanzo beans. Source: U.S. Department of Commerce, Bureau of the Census.
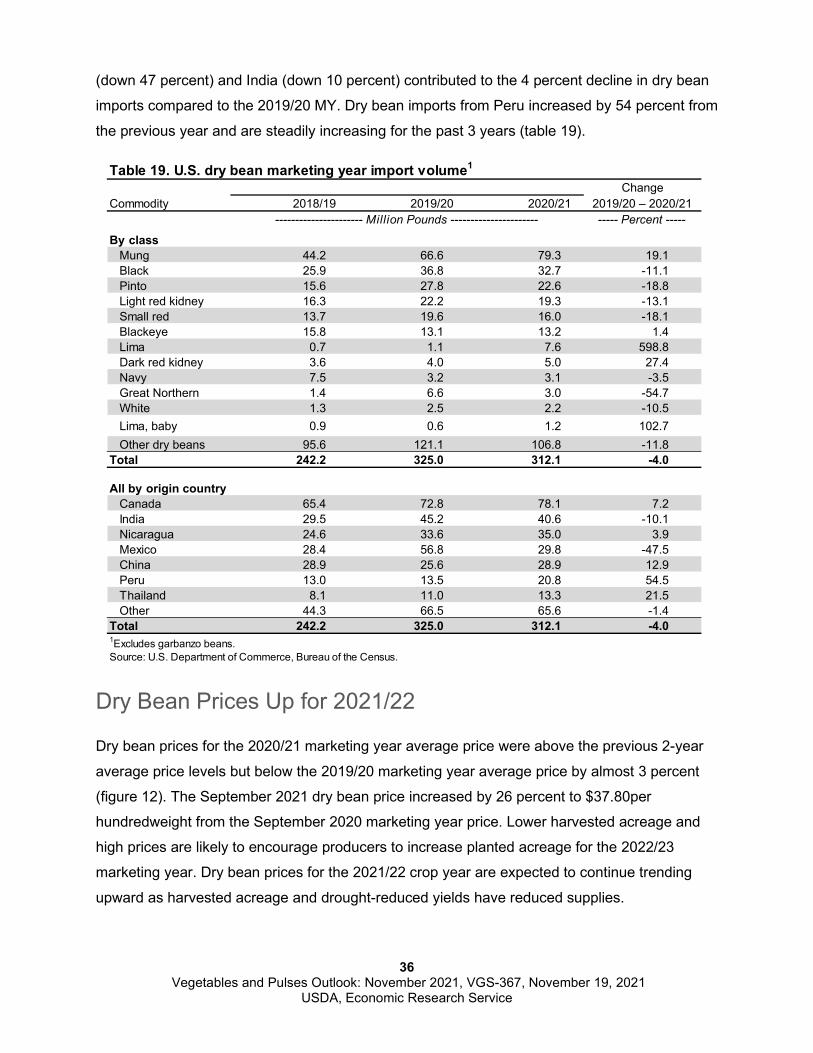
36 Vegetables and Pulses Outlook: November 2021, VGS-367, November 19, 2021
USDA, Economic Research Service
(down 47 percent) and India (down 10 percent) contributed to the 4 percent decline in dry bean
imports compared to the 2019/20 MY. Dry bean imports from Peru increased by 54 percent from
the previous year and are steadily increasing for the past 3 years (table 19).
Dry Bean Prices Up for 2021/22
Dry bean prices for the 2020/21 marketing year average price were above the previous 2-year
average price levels but below the 2019/20 marketing year average price by almost 3 percent
(figure 12). The September 2021 dry bean price increased by 26 percent to $37.80per
hundredweight from the September 2020 marketing year price. Lower harvested acreage and
high prices are likely to encourage producers to increase planted acreage for the 2022/23
marketing year. Dry bean prices for the 2021/22 crop year are expected to continue trending
upward as harvested acreage and drought-reduced yields have reduced supplies.
Table 19. U.S. dry bean marketing year import volume1
ChangeCommodity 2018/19 2019/20 2020/21 2019/20 – 2020/21
---------------------- Million Pounds ---------------------- ----- Percent -----
By classMung 44.2 66.6 79.3 19.1Black 25.9 36.8 32.7 -11.1Pinto 15.6 27.8 22.6 -18.8Light red kidney 16.3 22.2 19.3 -13.1Small red 13.7 19.6 16.0 -18.1Blackeye 15.8 13.1 13.2 1.4Lima 0.7 1.1 7.6 598.8Dark red kidney 3.6 4.0 5.0 27.4Navy 7.5 3.2 3.1 -3.5Great Northern 1.4 6.6 3.0 -54.7White 1.3 2.5 2.2 -10.5Lima, baby 0.9 0.6 1.2 102.7Other dry beans 95.6 121.1 106.8 -11.8
Total 242.2 325.0 312.1 -4.0
All by origin countryCanada 65.4 72.8 78.1 7.2India 29.5 45.2 40.6 -10.1Nicaragua 24.6 33.6 35.0 3.9Mexico 28.4 56.8 29.8 -47.5China 28.9 25.6 28.9 12.9Peru 13.0 13.5 20.8 54.5Thailand 8.1 11.0 13.3 21.5Other 44.3 66.5 65.6 -1.4
Total 242.2 325.0 312.1 -4.01Excludes garbanzo beans. Source: U.S. Department of Commerce, Bureau of the Census.
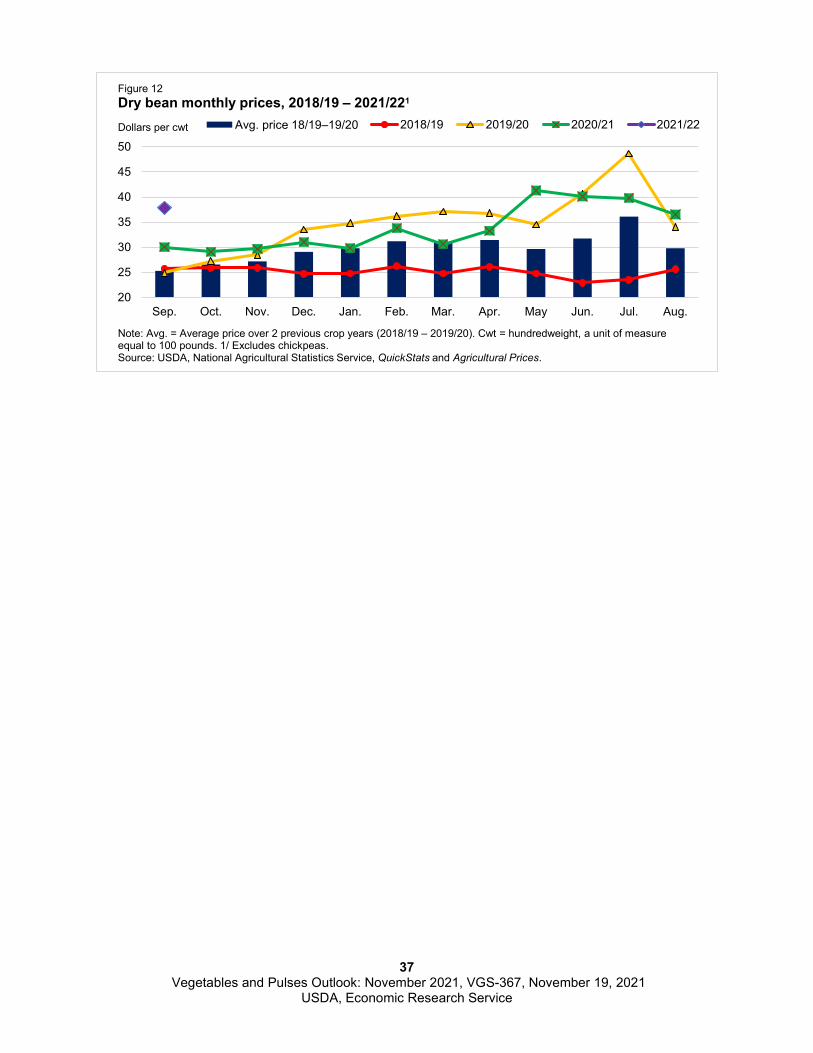
37 Vegetables and Pulses Outlook: November 2021, VGS-367, November 19, 2021
USDA, Economic Research Service
20
25
30
35
40
45
50
Sep. Oct. Nov. Dec. Jan. Feb. Mar. Apr. May Jun. Jul. Aug.
Avg. price 18/19–19/20 2018/19 2019/20 2020/21 2021/22
Note: Avg. = Average price over 2 previous crop years (2018/19 – 2019/20). Cwt = hundredweight, a unit of measure equal to 100 pounds. 1/ Excludes chickpeas. Source: USDA, National Agricultural Statistics Service, QuickStats and Agricultural Prices.
Figure 12Dry bean monthly prices, 2018/19 – 2021/221
Dollars per cwt
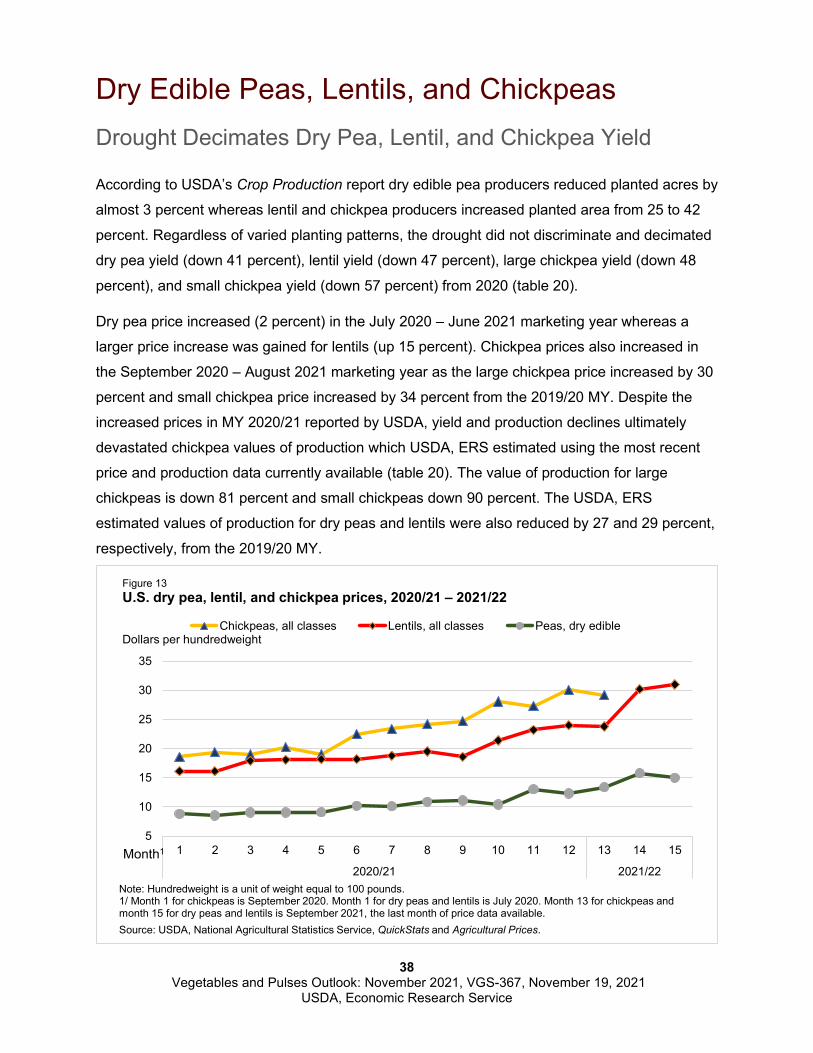
38 Vegetables and Pulses Outlook: November 2021, VGS-367, November 19, 2021
USDA, Economic Research Service
Dry Edible Peas, Lentils, and Chickpeas Drought Decimates Dry Pea, Lentil, and Chickpea Yield
According to USDA’s Crop Production report dry edible pea producers reduced planted acres by
almost 3 percent whereas lentil and chickpea producers increased planted area from 25 to 42
percent. Regardless of varied planting patterns, the drought did not discriminate and decimated
dry pea yield (down 41 percent), lentil yield (down 47 percent), large chickpea yield (down 48
percent), and small chickpea yield (down 57 percent) from 2020 (table 20).
Dry pea price increased (2 percent) in the July 2020 – June 2021 marketing year whereas a
larger price increase was gained for lentils (up 15 percent). Chickpea prices also increased in
the September 2020 – August 2021 marketing year as the large chickpea price increased by 30
percent and small chickpea price increased by 34 percent from the 2019/20 MY. Despite the
increased prices in MY 2020/21 reported by USDA, yield and production declines ultimately
devastated chickpea values of production which USDA, ERS estimated using the most recent
price and production data currently available (table 20). The value of production for large
chickpeas is down 81 percent and small chickpeas down 90 percent. The USDA, ERS
estimated values of production for dry peas and lentils were also reduced by 27 and 29 percent,
respectively, from the 2019/20 MY.
5
10
15
20
25
30
35
1 2 3 4 5 6 7 8 9 10 11 12 13 14 15
2020/21 2021/22Month1
Chickpeas, all classes Lentils, all classes Peas, dry edible
Figure 13U.S. dry pea, lentil, and chickpea prices, 2020/21 – 2021/22
Dollars per hundredweight
Note: Hundredweight is a unit of weight equal to 100 pounds. 1/ Month 1 for chickpeas is September 2020. Month 1 for dry peas and lentils is July 2020. Month 13 for chickpeas and month 15 for dry peas and lentils is September 2021, the last month of price data available. Source: USDA, National Agricultural Statistics Service, QuickStats and Agricultural Prices.
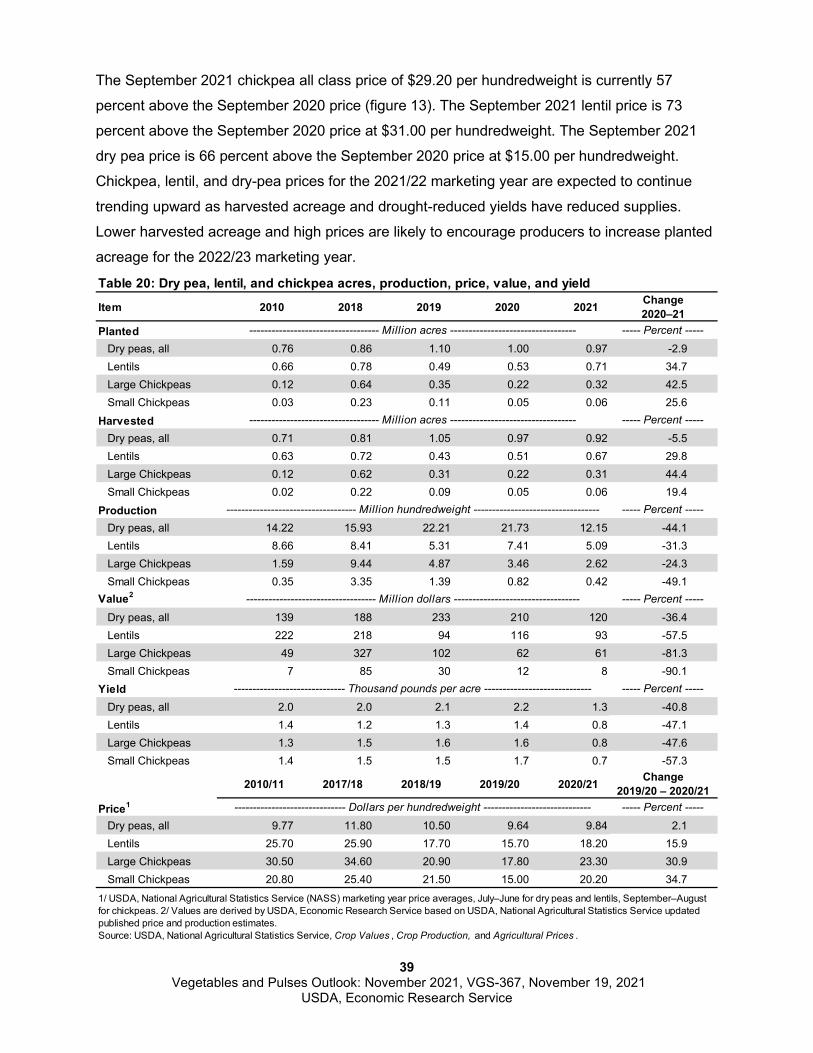
39 Vegetables and Pulses Outlook: November 2021, VGS-367, November 19, 2021
USDA, Economic Research Service
The September 2021 chickpea all class price of $29.20 per hundredweight is currently 57
percent above the September 2020 price (figure 13). The September 2021 lentil price is 73
percent above the September 2020 price at $31.00 per hundredweight. The September 2021
dry pea price is 66 percent above the September 2020 price at $15.00 per hundredweight.
Chickpea, lentil, and dry-pea prices for the 2021/22 marketing year are expected to continue
trending upward as harvested acreage and drought-reduced yields have reduced supplies.
Lower harvested acreage and high prices are likely to encourage producers to increase planted
acreage for the 2022/23 marketing year.
Table 20: Dry pea, lentil, and chickpea acres, production, price, value, and yield
Item 2010 2018 2019 2020 2021 Change 2020–21
Planted ----------------------------------- Million acres ---------------------------------- ----- Percent -----
Dry peas, all 0.76 0.86 1.10 1.00 0.97 -2.9Lentils 0.66 0.78 0.49 0.53 0.71 34.7Large Chickpeas 0.12 0.64 0.35 0.22 0.32 42.5Small Chickpeas 0.03 0.23 0.11 0.05 0.06 25.6
Harvested ----------------------------------- Million acres ---------------------------------- ----- Percent -----
Dry peas, all 0.71 0.81 1.05 0.97 0.92 -5.5Lentils 0.63 0.72 0.43 0.51 0.67 29.8Large Chickpeas 0.12 0.62 0.31 0.22 0.31 44.4Small Chickpeas 0.02 0.22 0.09 0.05 0.06 19.4
Production ----------------------------------- Million hundredweight ---------------------------------- ----- Percent -----
Dry peas, all 14.22 15.93 22.21 21.73 12.15 -44.1Lentils 8.66 8.41 5.31 7.41 5.09 -31.3Large Chickpeas 1.59 9.44 4.87 3.46 2.62 -24.3Small Chickpeas 0.35 3.35 1.39 0.82 0.42 -49.1
Value2 ----------------------------------- Million dollars ---------------------------------- ----- Percent -----
Dry peas, all 139 188 233 210 120 -36.4Lentils 222 218 94 116 93 -57.5Large Chickpeas 49 327 102 62 61 -81.3Small Chickpeas 7 85 30 12 8 -90.1
Yield ------------------------------ Thousand pounds per acre ----------------------------- ----- Percent -----
Dry peas, all 2.0 2.0 2.1 2.2 1.3 -40.8Lentils 1.4 1.2 1.3 1.4 0.8 -47.1Large Chickpeas 1.3 1.5 1.6 1.6 0.8 -47.6Small Chickpeas 1.4 1.5 1.5 1.7 0.7 -57.3
2010/11 2017/18 2018/19 2019/20 2020/21 Change2019/20 – 2020/21
Price1 ------------------------------ Dollars per hundredweight ----------------------------- ----- Percent -----
Dry peas, all 9.77 11.80 10.50 9.64 9.84 2.1Lentils 25.70 25.90 17.70 15.70 18.20 15.9Large Chickpeas 30.50 34.60 20.90 17.80 23.30 30.9Small Chickpeas 20.80 25.40 21.50 15.00 20.20 34.7
1/ USDA, National Agricultural Statistics Service (NASS) marketing year price averages, July–June for dry peas and lentils, September–August for chickpeas. 2/ Values are derived by USDA, Economic Research Service based on USDA, National Agricultural Statistics Service updated published price and production estimates.Source: USDA, National Agricultural Statistics Service, Crop Values , Crop Production, and Agricultural Prices .
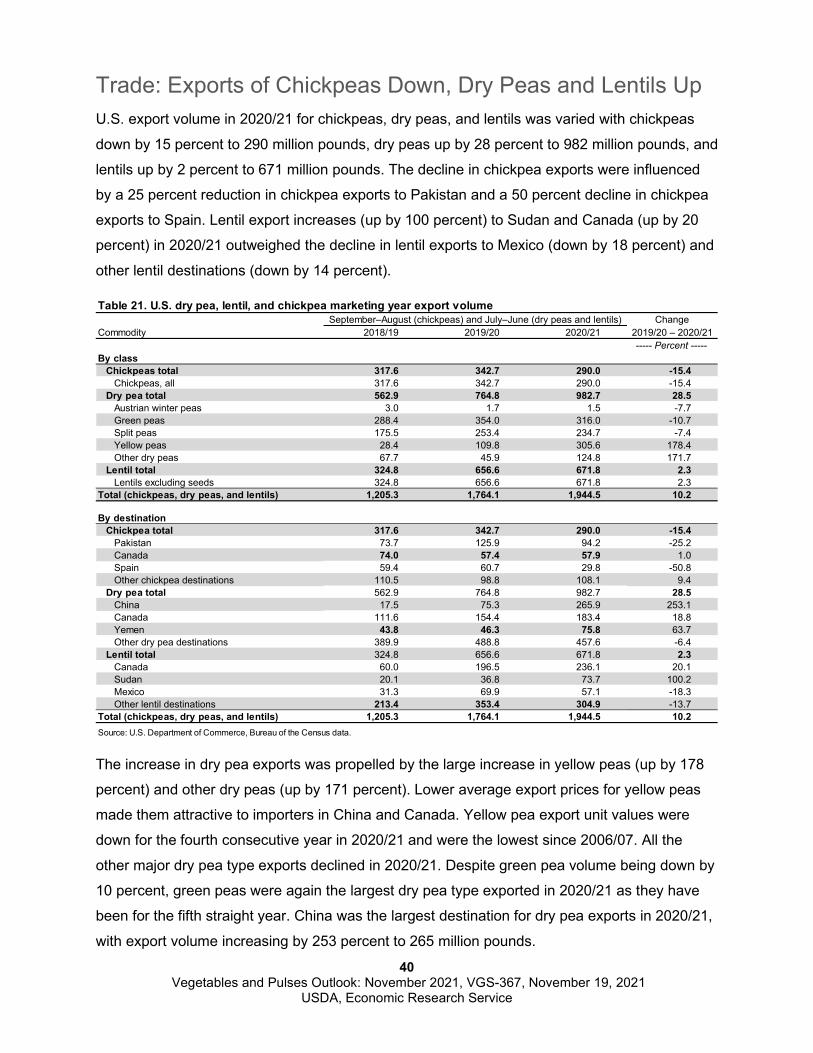
40 Vegetables and Pulses Outlook: November 2021, VGS-367, November 19, 2021
USDA, Economic Research Service
Trade: Exports of Chickpeas Down, Dry Peas and Lentils Up U.S. export volume in 2020/21 for chickpeas, dry peas, and lentils was varied with chickpeas
down by 15 percent to 290 million pounds, dry peas up by 28 percent to 982 million pounds, and
lentils up by 2 percent to 671 million pounds. The decline in chickpea exports were influenced
by a 25 percent reduction in chickpea exports to Pakistan and a 50 percent decline in chickpea
exports to Spain. Lentil export increases (up by 100 percent) to Sudan and Canada (up by 20
percent) in 2020/21 outweighed the decline in lentil exports to Mexico (down by 18 percent) and
other lentil destinations (down by 14 percent).
The increase in dry pea exports was propelled by the large increase in yellow peas (up by 178
percent) and other dry peas (up by 171 percent). Lower average export prices for yellow peas
made them attractive to importers in China and Canada. Yellow pea export unit values were
down for the fourth consecutive year in 2020/21 and were the lowest since 2006/07. All the
other major dry pea type exports declined in 2020/21. Despite green pea volume being down by
10 percent, green peas were again the largest dry pea type exported in 2020/21 as they have
been for the fifth straight year. China was the largest destination for dry pea exports in 2020/21,
with export volume increasing by 253 percent to 265 million pounds.
Table 21. U.S. dry pea, lentil, and chickpea marketing year export volumeSeptember–August (chickpeas) and July–June (dry peas and lentils) Change
Commodity 2018/19 2019/20 2020/21 2019/20 – 2020/21 ----- Percent -----
By classChickpeas total 317.6 342.7 290.0 -15.4
Chickpeas, all 317.6 342.7 290.0 -15.4Dry pea total 562.9 764.8 982.7 28.5
Austrian winter peas 3.0 1.7 1.5 -7.7Green peas 288.4 354.0 316.0 -10.7Split peas 175.5 253.4 234.7 -7.4Yellow peas 28.4 109.8 305.6 178.4Other dry peas 67.7 45.9 124.8 171.7
Lentil total 324.8 656.6 671.8 2.3Lentils excluding seeds 324.8 656.6 671.8 2.3
Total (chickpeas, dry peas, and lentils) 1,205.3 1,764.1 1,944.5 10.2
By destinationChickpea total 317.6 342.7 290.0 -15.4
Pakistan 73.7 125.9 94.2 -25.2Canada 74.0 57.4 57.9 1.0Spain 59.4 60.7 29.8 -50.8Other chickpea destinations 110.5 98.8 108.1 9.4
Dry pea total 562.9 764.8 982.7 28.5China 17.5 75.3 265.9 253.1Canada 111.6 154.4 183.4 18.8Yemen 43.8 46.3 75.8 63.7Other dry pea destinations 389.9 488.8 457.6 -6.4
Lentil total 324.8 656.6 671.8 2.3Canada 60.0 196.5 236.1 20.1Sudan 20.1 36.8 73.7 100.2Mexico 31.3 69.9 57.1 -18.3Other lentil destinations 213.4 353.4 304.9 -13.7
Total (chickpeas, dry peas, and lentils) 1,205.3 1,764.1 1,944.5 10.2Source: U.S. Department of Commerce, Bureau of the Census data.
41 Vegetables and Pulses Outlook: November 2021, VGS-367, November 19, 2021
USDA, Economic Research Service
Trade: Chickpea Imports Up, Dry Pea and Lentils Down
U.S. import volume for dry peas, lentils, and chickpeas in the 2020/21 marketing year declined 7
percent with reduced imports for dry peas (down 20 percent) and lentils (down 7 percent)
outweighing a 20-percent gain in chickpea import volume. The decline in dry pea imports reflect
high U.S. stocks and low prices. Chickpea imports were up due to shrinking U.S. stocks caused
by the short 2020/21 crop. Most of the additional chickpea volume entered from Canada and
Turkey.
42 Vegetables and Pulses Outlook: November 2021, VGS-367, November 19, 2021
USDA, Economic Research Service
Special Article
Food-Safety Practices Among Post-Harvest Handlers of Fresh Produce Gregory Astill and D. Adeline Yeh Even before implementation of new U.S. food safety legislation in 2015, many firms that handle
fresh fruits and vegetables in the U.S. supply chain reported using food-safety practices.
Specialized firms generally reported higher rates of food-safety practice use compared with
diversified firms. The most used practice among all firm types is having a food-safety plan with
78 percent of nonfarm facilities having one. Among all firm types, rates of use exceeded 50
percent for about one-quarter of food-safety practices.
In 2011, the United States Congress passed the Food Safety Modernization Act (FSMA)
covering the entire U.S. food supply chain. As part of FSMA, the U.S. Food and Drug
Administration (FDA) implemented rules covering fresh fruits and vegetables as they are grown,
harvested, and packed on farms and as they are processed after harvest in food facilities. The
Standards for the Growing, Harvesting, Packing, and Holding of Produce for Human
Consumption (also known as the Produce Safety Rule) covers farms; the Current Good
Manufacturing Practice, Hazard Analysis, and Risk-Based Preventive Controls for Human Food
(also known as the Preventive Controls Rule) covers food facilities. Generally, the Preventive
Controls Rule carries more stringent requirements than the Produce Safety Rule.
The fresh produce supply chain is diverse with many variations in activities performed and
ownership structure. The FDA determines whether a firm is considered a farm and covered
under the Produce Safety Rule or whether the firm is considered a facility and covered under
the Preventive Controls Rule based on (1) the post-harvest fresh produce activities the firm
performs, and (2) whether the firm is owned by a farm that grows fresh produce. Different post-
harvest activities carry different risks of introducing microbial contamination that can lead to
foodborne illness like Salmonella or Listeria. Certain post-harvest activities like packing or
packaging whole pieces of fresh produce carry lower risk of introducing foodborne pathogens.
Other post-harvest activities like cutting, chopping, and coring fresh produce, or further
processing like canning or freezing carry higher risk of introducing foodborne pathogens. The
FDA determined that any firm that performs certain higher-risk post-harvest activities is covered
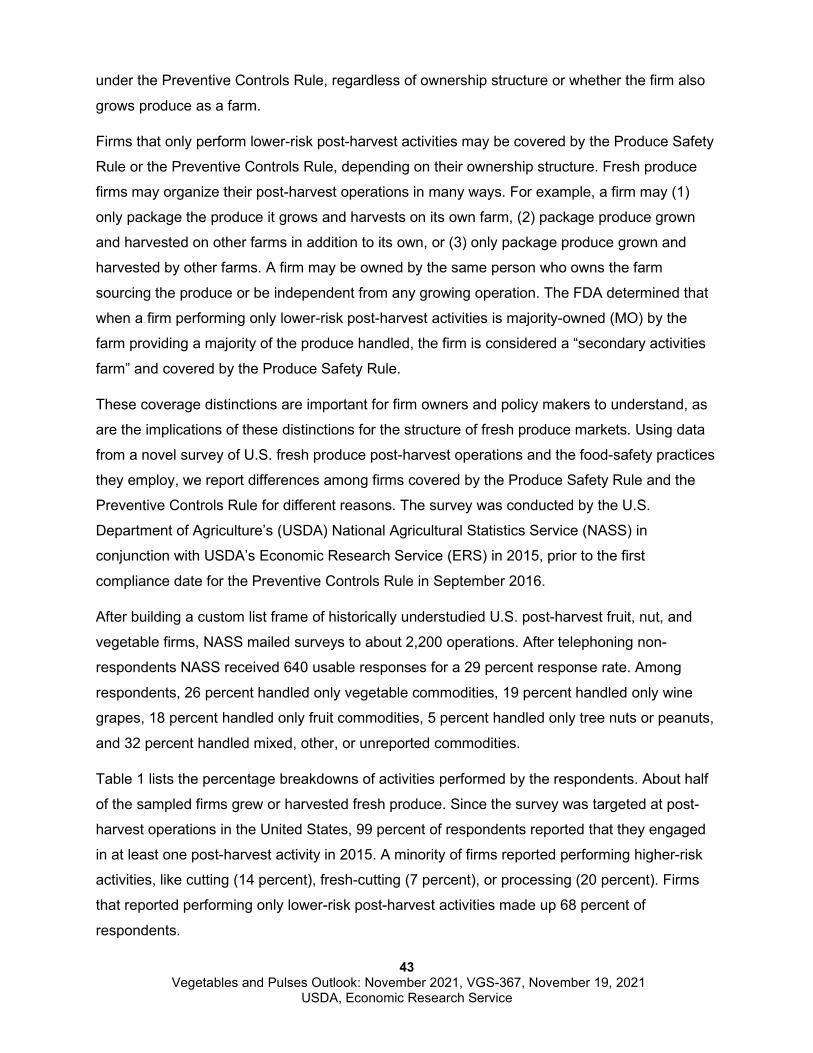
43 Vegetables and Pulses Outlook: November 2021, VGS-367, November 19, 2021
USDA, Economic Research Service
under the Preventive Controls Rule, regardless of ownership structure or whether the firm also
grows produce as a farm.
Firms that only perform lower-risk post-harvest activities may be covered by the Produce Safety
Rule or the Preventive Controls Rule, depending on their ownership structure. Fresh produce
firms may organize their post-harvest operations in many ways. For example, a firm may (1)
only package the produce it grows and harvests on its own farm, (2) package produce grown
and harvested on other farms in addition to its own, or (3) only package produce grown and
harvested by other farms. A firm may be owned by the same person who owns the farm
sourcing the produce or be independent from any growing operation. The FDA determined that
when a firm performing only lower-risk post-harvest activities is majority-owned (MO) by the
farm providing a majority of the produce handled, the firm is considered a “secondary activities
farm” and covered by the Produce Safety Rule.
These coverage distinctions are important for firm owners and policy makers to understand, as
are the implications of these distinctions for the structure of fresh produce markets. Using data
from a novel survey of U.S. fresh produce post-harvest operations and the food-safety practices
they employ, we report differences among firms covered by the Produce Safety Rule and the
Preventive Controls Rule for different reasons. The survey was conducted by the U.S.
Department of Agriculture’s (USDA) National Agricultural Statistics Service (NASS) in
conjunction with USDA’s Economic Research Service (ERS) in 2015, prior to the first
compliance date for the Preventive Controls Rule in September 2016.
After building a custom list frame of historically understudied U.S. post-harvest fruit, nut, and
vegetable firms, NASS mailed surveys to about 2,200 operations. After telephoning non-
respondents NASS received 640 usable responses for a 29 percent response rate. Among
respondents, 26 percent handled only vegetable commodities, 19 percent handled only wine
grapes, 18 percent handled only fruit commodities, 5 percent handled only tree nuts or peanuts,
and 32 percent handled mixed, other, or unreported commodities.
Table 1 lists the percentage breakdowns of activities performed by the respondents. About half
of the sampled firms grew or harvested fresh produce. Since the survey was targeted at post-
harvest operations in the United States, 99 percent of respondents reported that they engaged
in at least one post-harvest activity in 2015. A minority of firms reported performing higher-risk
activities, like cutting (14 percent), fresh-cutting (7 percent), or processing (20 percent). Firms
that reported performing only lower-risk post-harvest activities made up 68 percent of
respondents.
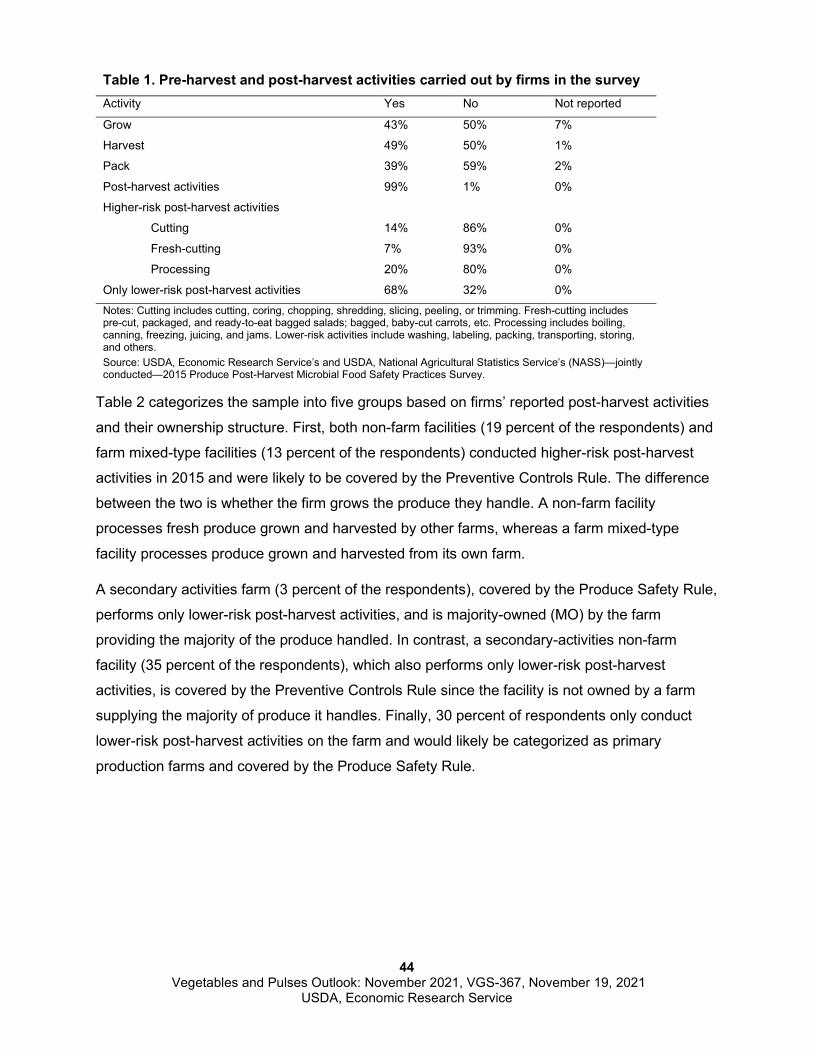
44 Vegetables and Pulses Outlook: November 2021, VGS-367, November 19, 2021
USDA, Economic Research Service
Table 1. Pre-harvest and post-harvest activities carried out by firms in the survey Activity Yes No Not reported
Grow 43% 50% 7%
Harvest 49% 50% 1%
Pack 39% 59% 2%
Post-harvest activities 99% 1% 0%
Higher-risk post-harvest activities
Cutting 14% 86% 0%
Fresh-cutting 7% 93% 0%
Processing 20% 80% 0%
Only lower-risk post-harvest activities 68% 32% 0% Notes: Cutting includes cutting, coring, chopping, shredding, slicing, peeling, or trimming. Fresh-cutting includes pre-cut, packaged, and ready-to-eat bagged salads; bagged, baby-cut carrots, etc. Processing includes boiling, canning, freezing, juicing, and jams. Lower-risk activities include washing, labeling, packing, transporting, storing, and others. Source: USDA, Economic Research Service’s and USDA, National Agricultural Statistics Service’s (NASS)—jointly conducted—2015 Produce Post-Harvest Microbial Food Safety Practices Survey.
Table 2 categorizes the sample into five groups based on firms’ reported post-harvest activities
and their ownership structure. First, both non-farm facilities (19 percent of the respondents) and
farm mixed-type facilities (13 percent of the respondents) conducted higher-risk post-harvest
activities in 2015 and were likely to be covered by the Preventive Controls Rule. The difference
between the two is whether the firm grows the produce they handle. A non-farm facility
processes fresh produce grown and harvested by other farms, whereas a farm mixed-type
facility processes produce grown and harvested from its own farm.
A secondary activities farm (3 percent of the respondents), covered by the Produce Safety Rule,
performs only lower-risk post-harvest activities, and is majority-owned (MO) by the farm
providing the majority of the produce handled. In contrast, a secondary-activities non-farm
facility (35 percent of the respondents), which also performs only lower-risk post-harvest
activities, is covered by the Preventive Controls Rule since the facility is not owned by a farm
supplying the majority of produce it handles. Finally, 30 percent of respondents only conduct
lower-risk post-harvest activities on the farm and would likely be categorized as primary
production farms and covered by the Produce Safety Rule.
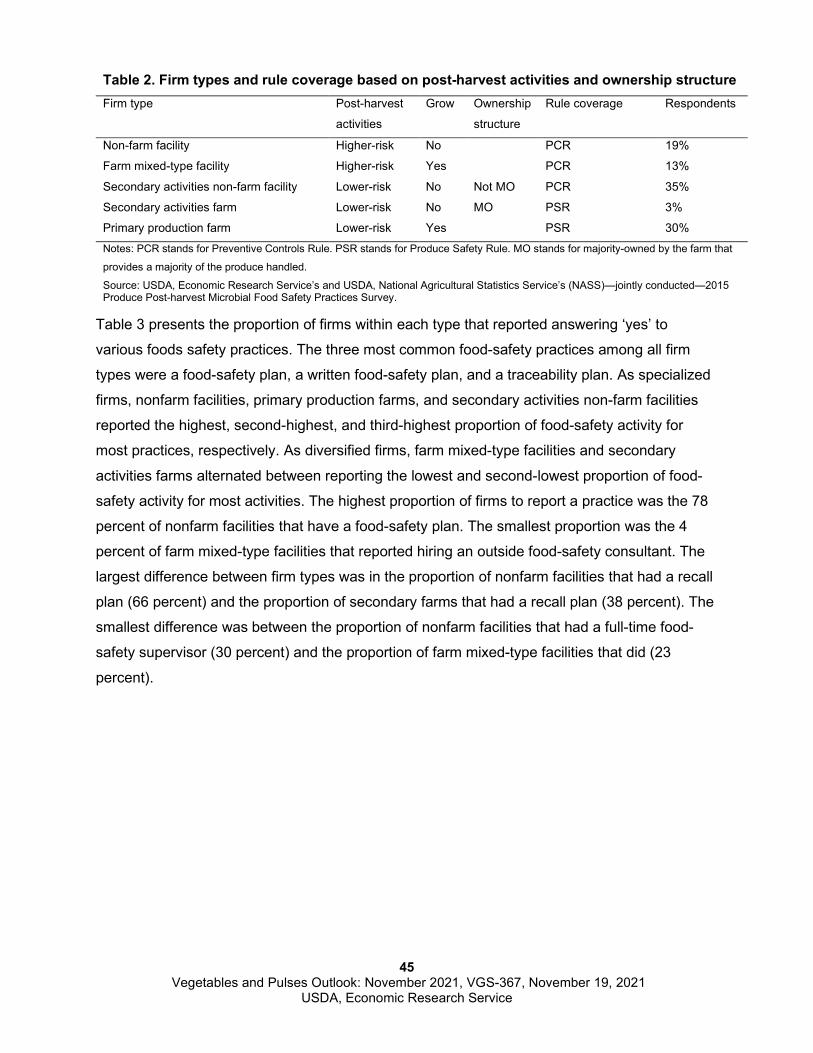
45 Vegetables and Pulses Outlook: November 2021, VGS-367, November 19, 2021
USDA, Economic Research Service
Table 2. Firm types and rule coverage based on post-harvest activities and ownership structure Firm type Post-harvest
activities
Grow Ownership
structure
Rule coverage Respondents
Non-farm facility Higher-risk No PCR 19%
Farm mixed-type facility Higher-risk Yes PCR 13%
Secondary activities non-farm facility Lower-risk No Not MO PCR 35%
Secondary activities farm Lower-risk No MO PSR 3%
Primary production farm Lower-risk Yes PSR 30% Notes: PCR stands for Preventive Controls Rule. PSR stands for Produce Safety Rule. MO stands for majority-owned by the farm that
provides a majority of the produce handled.
Source: USDA, Economic Research Service’s and USDA, National Agricultural Statistics Service’s (NASS)—jointly conducted—2015 Produce Post-harvest Microbial Food Safety Practices Survey.
Table 3 presents the proportion of firms within each type that reported answering ‘yes’ to
various foods safety practices. The three most common food-safety practices among all firm
types were a food-safety plan, a written food-safety plan, and a traceability plan. As specialized
firms, nonfarm facilities, primary production farms, and secondary activities non-farm facilities
reported the highest, second-highest, and third-highest proportion of food-safety activity for
most practices, respectively. As diversified firms, farm mixed-type facilities and secondary
activities farms alternated between reporting the lowest and second-lowest proportion of food-
safety activity for most activities. The highest proportion of firms to report a practice was the 78
percent of nonfarm facilities that have a food-safety plan. The smallest proportion was the 4
percent of farm mixed-type facilities that reported hiring an outside food-safety consultant. The
largest difference between firm types was in the proportion of nonfarm facilities that had a recall
plan (66 percent) and the proportion of secondary farms that had a recall plan (38 percent). The
smallest difference was between the proportion of nonfarm facilities that had a full-time food-
safety supervisor (30 percent) and the proportion of farm mixed-type facilities that did (23
percent).
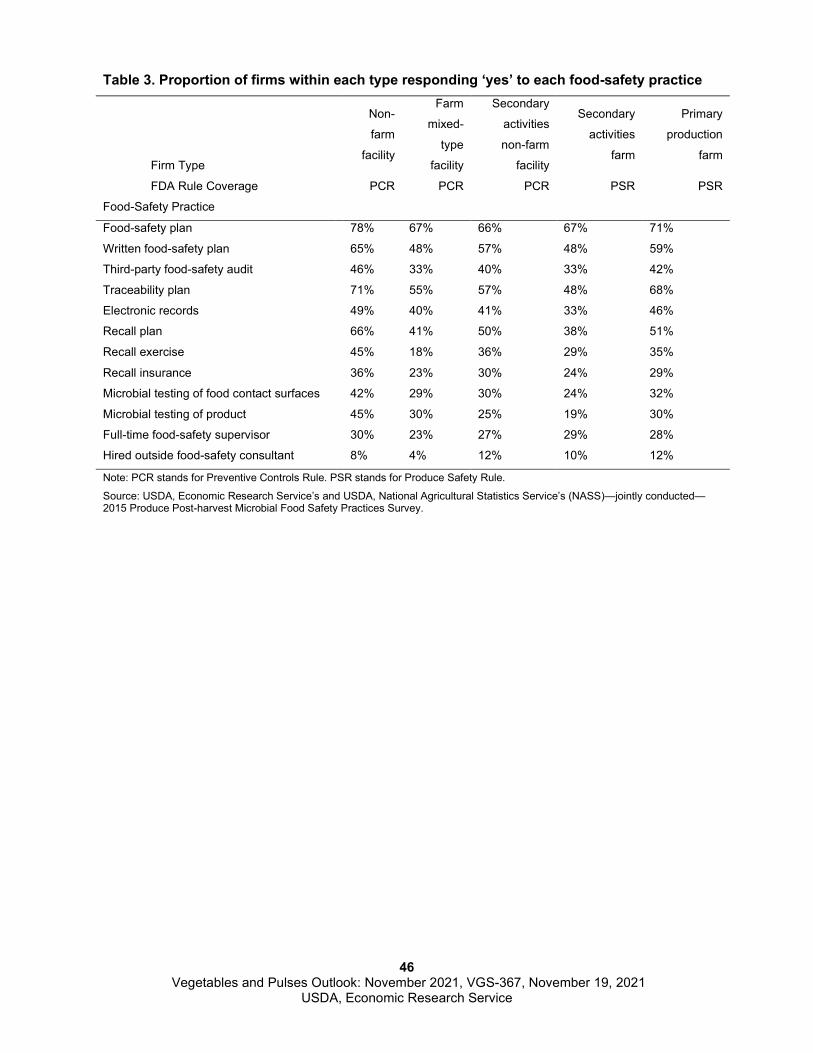
46 Vegetables and Pulses Outlook: November 2021, VGS-367, November 19, 2021
USDA, Economic Research Service
Table 3. Proportion of firms within each type responding ‘yes’ to each food-safety practice
Firm Type
Non-
farm
facility
Farm
mixed-
type
facility
Secondary
activities
non-farm
facility
Secondary
activities
farm
Primary
production
farm
FDA Rule Coverage PCR PCR PCR PSR PSR
Food-Safety Practice
Food-safety plan 78% 67% 66% 67% 71%
Written food-safety plan 65% 48% 57% 48% 59%
Third-party food-safety audit 46% 33% 40% 33% 42%
Traceability plan 71% 55% 57% 48% 68%
Electronic records 49% 40% 41% 33% 46%
Recall plan 66% 41% 50% 38% 51%
Recall exercise 45% 18% 36% 29% 35%
Recall insurance 36% 23% 30% 24% 29%
Microbial testing of food contact surfaces 42% 29% 30% 24% 32%
Microbial testing of product 45% 30% 25% 19% 30%
Full-time food-safety supervisor 30% 23% 27% 29% 28%
Hired outside food-safety consultant 8% 4% 12% 10% 12%
Note: PCR stands for Preventive Controls Rule. PSR stands for Produce Safety Rule.
Source: USDA, Economic Research Service’s and USDA, National Agricultural Statistics Service’s (NASS)—jointly conducted—2015 Produce Post-harvest Microbial Food Safety Practices Survey.
47 Vegetables and Pulses Outlook: November 2021, VGS-367, November 19, 2021
USDA, Economic Research Service
Special Article
Countercyclical Pricing Observed in the Collard Greens Market
By Gregory Astill and Shiona Deliozar The market phenomenon known as “countercyclical pricing”—where retail prices decrease in
times of increased consumer demand—has been observed by economists in goods like tuna
during Lent or canned soup during winter. This analysis provides another example of
countercyclical pricing in a different commodity—fresh collard greens.
Collard greens are a staple of Southern cuisine and associated with good luck when eaten on
the first day of the New Year. From 2011 to 2020, annual per capita availability of collard greens
increased by 43 percent from 0.88 pounds to 1.26 pounds (Lucier and Davis, 2021). The
Information Resources, Incorporated (IRI) InfoScan retail scanner data contains billions of
weekly retail food transactions from large portions of the United States including transactions for
collard greens (Muth et al., 2016).1 Using IRI data from 2013 to 2018, we observe annual
dramatic and consistent surges in collard green purchases during the weeks of Thanksgiving,
Christmas, and New Year’s Day accompanied by a smaller spike around Easter (figure 1).
1 Disclaimer: The analysis, findings, and conclusions expressed in this report should not be attributed to IRI.
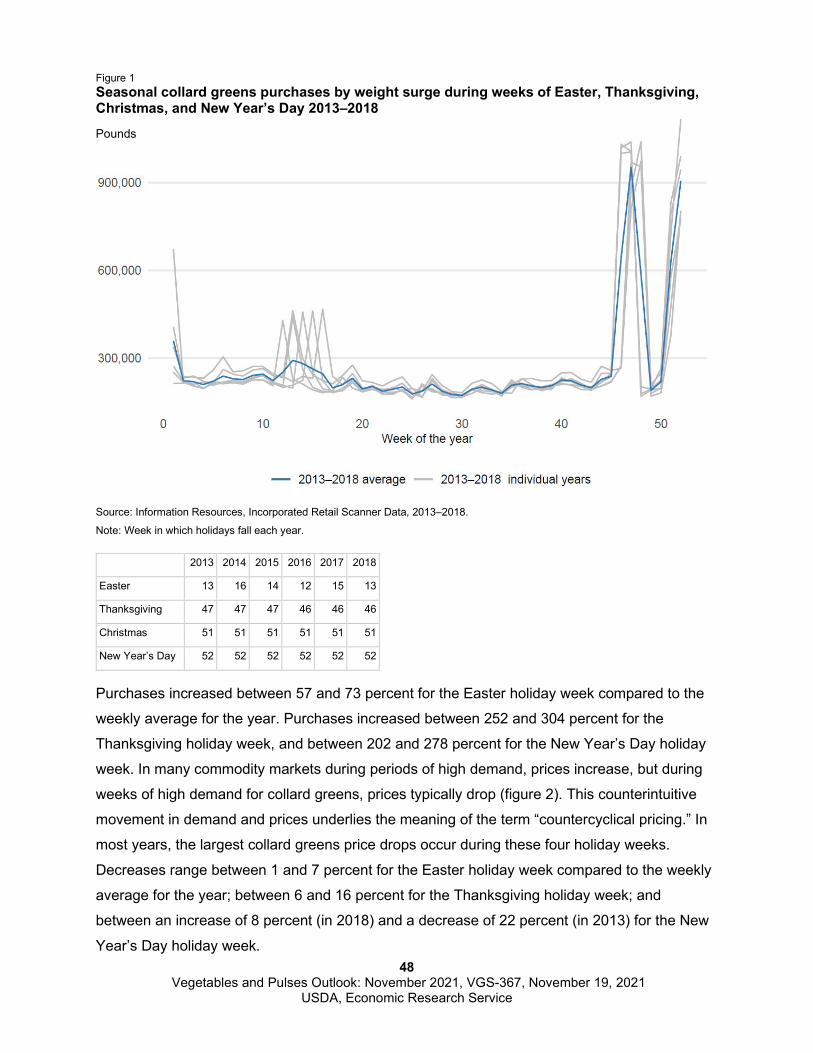
48 Vegetables and Pulses Outlook: November 2021, VGS-367, November 19, 2021
USDA, Economic Research Service
Figure 1 Seasonal collard greens purchases by weight surge during weeks of Easter, Thanksgiving, Christmas, and New Year’s Day 2013–2018 Pounds
Source: Information Resources, Incorporated Retail Scanner Data, 2013–2018.
Note: Week in which holidays fall each year.
2013 2014 2015 2016 2017 2018
Easter 13 16 14 12 15 13
Thanksgiving 47 47 47 46 46 46
Christmas 51 51 51 51 51 51
New Year’s Day 52 52 52 52 52 52
Purchases increased between 57 and 73 percent for the Easter holiday week compared to the
weekly average for the year. Purchases increased between 252 and 304 percent for the
Thanksgiving holiday week, and between 202 and 278 percent for the New Year’s Day holiday
week. In many commodity markets during periods of high demand, prices increase, but during
weeks of high demand for collard greens, prices typically drop (figure 2). This counterintuitive
movement in demand and prices underlies the meaning of the term “countercyclical pricing.” In
most years, the largest collard greens price drops occur during these four holiday weeks.
Decreases range between 1 and 7 percent for the Easter holiday week compared to the weekly
average for the year; between 6 and 16 percent for the Thanksgiving holiday week; and
between an increase of 8 percent (in 2018) and a decrease of 22 percent (in 2013) for the New
Year’s Day holiday week.
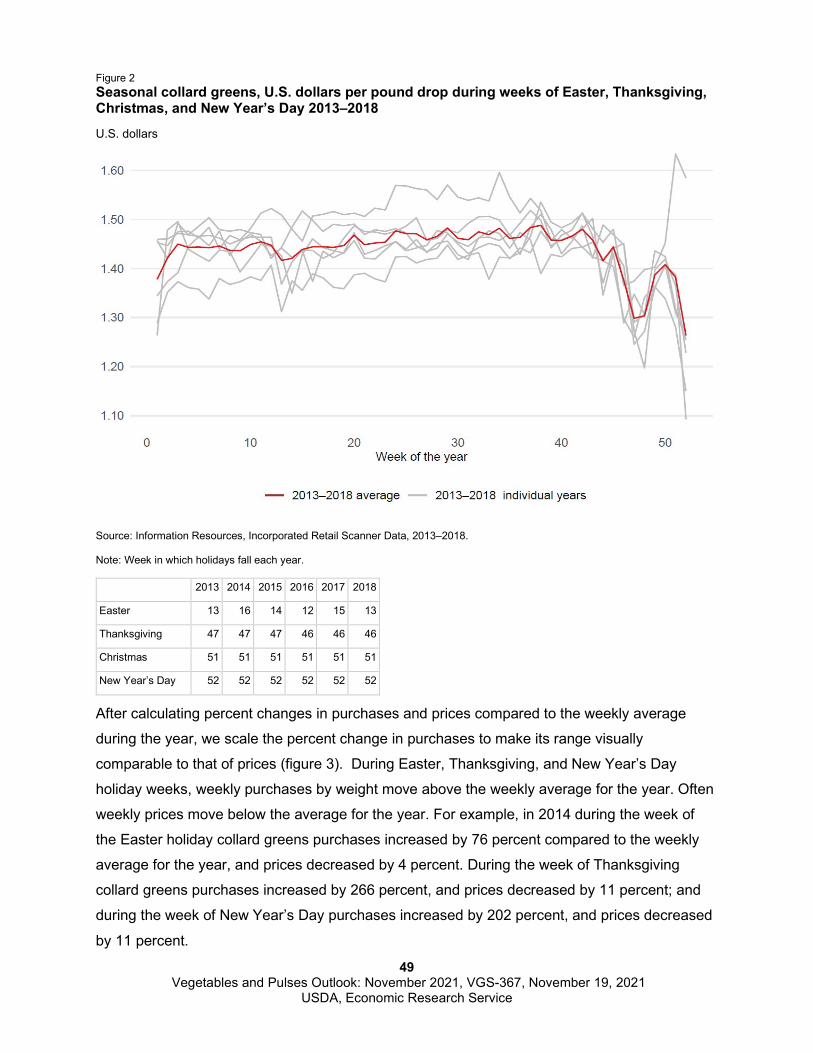
49 Vegetables and Pulses Outlook: November 2021, VGS-367, November 19, 2021
USDA, Economic Research Service
Figure 2 Seasonal collard greens, U.S. dollars per pound drop during weeks of Easter, Thanksgiving, Christmas, and New Year’s Day 2013–2018 U.S. dollars
Source: Information Resources, Incorporated Retail Scanner Data, 2013–2018.
Note: Week in which holidays fall each year.
2013 2014 2015 2016 2017 2018
Easter 13 16 14 12 15 13
Thanksgiving 47 47 47 46 46 46
Christmas 51 51 51 51 51 51
New Year’s Day 52 52 52 52 52 52
After calculating percent changes in purchases and prices compared to the weekly average
during the year, we scale the percent change in purchases to make its range visually
comparable to that of prices (figure 3). During Easter, Thanksgiving, and New Year’s Day
holiday weeks, weekly purchases by weight move above the weekly average for the year. Often
weekly prices move below the average for the year. For example, in 2014 during the week of
the Easter holiday collard greens purchases increased by 76 percent compared to the weekly
average for the year, and prices decreased by 4 percent. During the week of Thanksgiving
collard greens purchases increased by 266 percent, and prices decreased by 11 percent; and
during the week of New Year’s Day purchases increased by 202 percent, and prices decreased
by 11 percent.
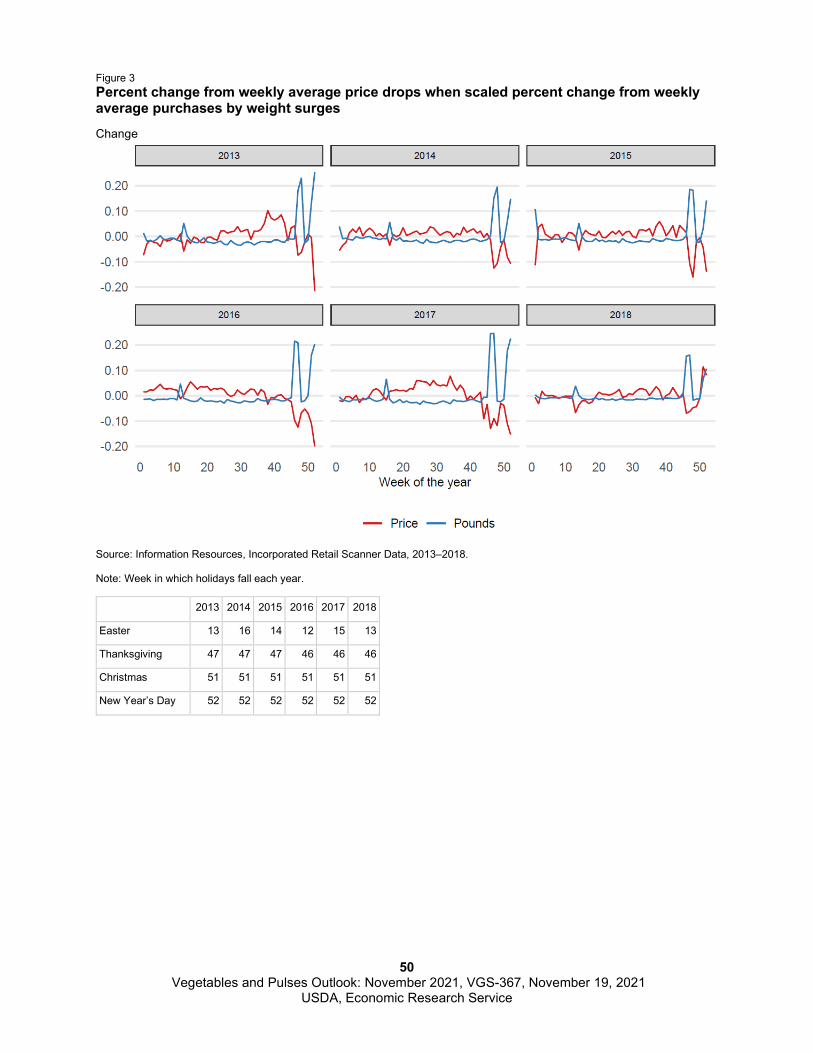
50 Vegetables and Pulses Outlook: November 2021, VGS-367, November 19, 2021
USDA, Economic Research Service
Figure 3 Percent change from weekly average price drops when scaled percent change from weekly average purchases by weight surges Change
Source: Information Resources, Incorporated Retail Scanner Data, 2013–2018.
Note: Week in which holidays fall each year.
2013 2014 2015 2016 2017 2018
Easter 13 16 14 12 15 13
Thanksgiving 47 47 47 46 46 46
Christmas 51 51 51 51 51 51
New Year’s Day 52 52 52 52 52 52
51 Vegetables and Pulses Outlook: November 2021, VGS-367, November 19, 2021
USDA, Economic Research Service
References
Lucier. G., and W. V. Davis. 2021. Vegetables and Pulses Machine Readable Data, VGS-366, U.S. Department of Agriculture, Economic Research Service. Muth, M.K., M. Sweitzer, D. Brown, K. Capogrossi, S. Karns, D. Levin, A. Okrent, P. Siegel, and C. Zhen. 2016. Understanding IRI Household Based and Store-Based Scanner Data, TB-1942, U.S. Department of Agriculture, Economic Research Service.
52 Vegetables and Pulses Outlook: November 2021, VGS-367, November 19, 2021
USDA, Economic Research Service
Suggested Citation Davis, Wilma V., and Gary Lucier. 2021. Vegetable and Pulses Outlook: November 2021, VGS-367, U.S. Department of Agriculture, Economic Research Service, November 19, 2021.
Use of commercial and trade names does not imply approval or constitute endorsement by USDA.
To ensure the quality of its research reports and satisfy governmentwide standards, ERS requires that all research reports with substantively new material be reviewed by qualified technical research peers. This technical peer review process, coordinated by ERS' Peer Review Coordinating Council, allows experts who possess the technical background, perspective, and expertise to provide an objective and meaningful assessment of the output’s substantive content and clarity of communication during the publication’s review.
In accordance with Federal civil rights law and U.S. Department of Agriculture (USDA) civil rights regulations and policies, the USDA, its Agencies, offices, and employees, and institutions participating in or administering USDA programs are prohibited from discriminating based on race, color, national origin, religion, sex, gender identity (including gender expression), sexual orientation, disability, age, marital status, family/parental status, income derived from a public assistance program, political beliefs, or reprisal or retaliation for prior civil rights activity, in any program or activity conducted or funded by USDA (not all bases apply to all programs). Remedies and complaint filing deadlines vary by program or incident.
Persons with disabilities who require alternative means of communication for program information (e.g., Braille, large print, audiotape, American Sign Language, etc.) should contact the responsible Agency or USDA's TARGET Center at (202) 720-2600 (voice and TTY) or contact USDA through the Federal Relay Service at (800) 877-8339. Additionally, program information may be made available in languages other than English.
To file a program discrimination complaint, complete the USDA Program Discrimination Complaint Form, AD-3027, found online at How to File a Program Discrimination Complaint and at any USDA office or write a letter addressed to USDA and provide in the letter all of the information requested in the form. To request a copy of the complaint form, call (866) 632-9992. Submit your completed form or letter to USDA by: (1) mail: U.S. Department of Agriculture, Office of the Assistant Secretary for Civil Rights, 1400 Independence Avenue, SW, Washington, D.C. 20250-9410; (2) fax: (202) 690-7442; or (3) email: [email protected].
USDA is an equal opportunity provider, employer, and lender.