A proteomic view ofDesulfovibrio vulgaris metabolism as determined by liquid chromatography coupled...
14
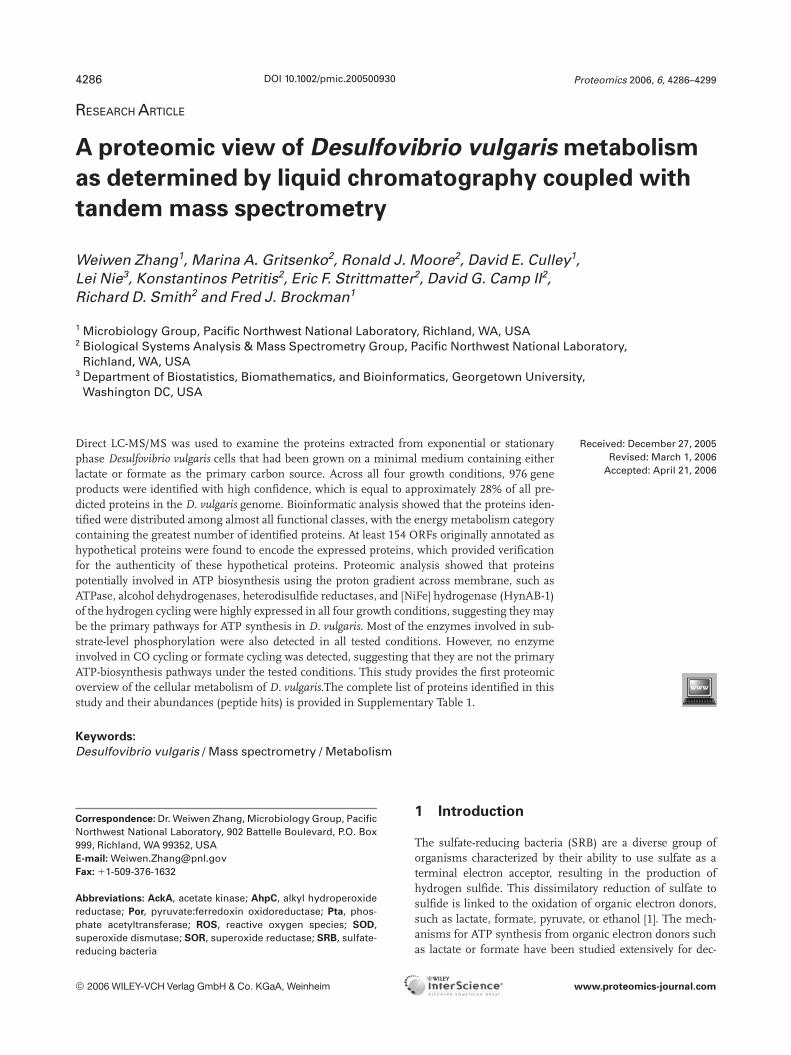
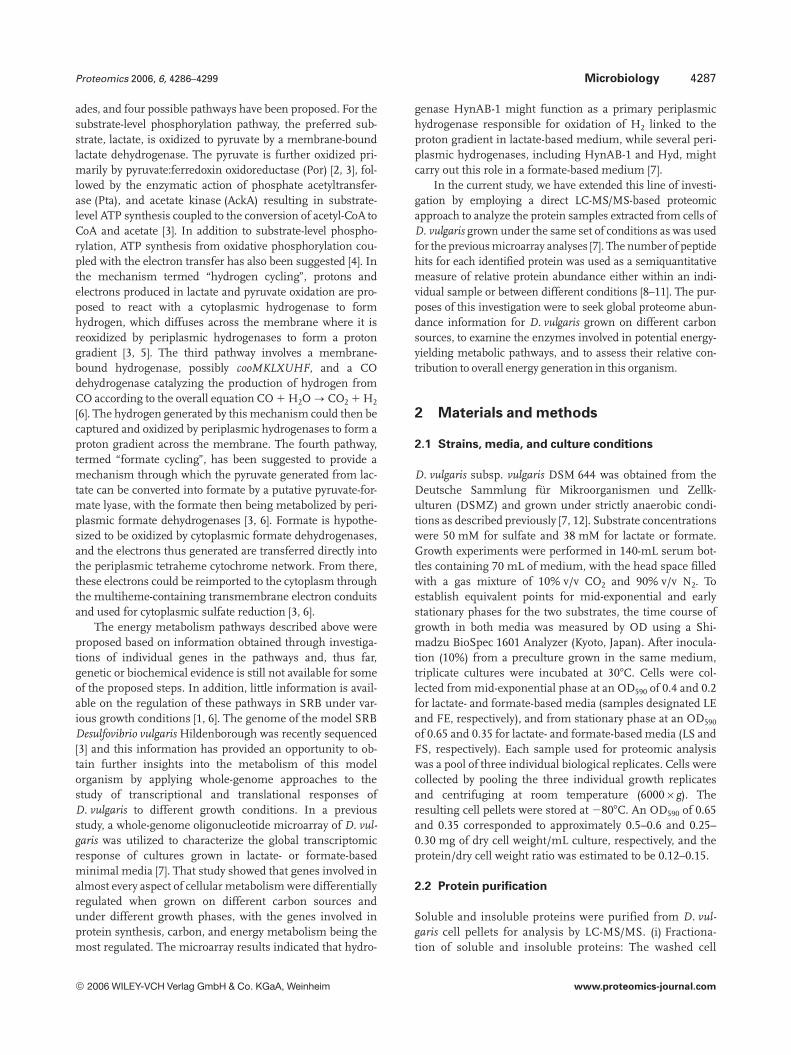
RESEARCH ARTICLE A proteomic view of Desulfovibrio vulgaris metabolism as determined by liquid chromatography coupled with tandem mass spectrometry Weiwen Zhang 1 , Marina A. Gritsenko 2 , Ronald J. Moore 2 , David E. Culley 1 , Lei Nie 3 , Konstantinos Petritis 2 , Eric F. Strittmatter 2 , David G. Camp II 2 , Richard D. Smith 2 and Fred J. Brockman 1 1 Microbiology Group, Pacific Northwest National Laboratory, Richland, WA, USA 2 Biological Systems Analysis & Mass Spectrometry Group, Pacific Northwest National Laboratory, Richland, WA, USA 3 Department of Biostatistics, Biomathematics, and Bioinformatics, Georgetown University, Washington DC, USA Direct LC-MS/MS was used to examine the proteins extracted from exponential or stationary phase Desulfovibrio vulgaris cells that had been grown on a minimal medium containing either lactate or formate as the primary carbon source. Across all four growth conditions, 976 gene products were identified with high confidence, which is equal to approximately 28% of all pre- dicted proteins in the D. vulgaris genome. Bioinformatic analysis showed that the proteins iden- tified were distributed among almost all functional classes, with the energy metabolism category containing the greatest number of identified proteins. At least 154 ORFs originally annotated as hypothetical proteins were found to encode the expressed proteins, which provided verification for the authenticity of these hypothetical proteins. Proteomic analysis showed that proteins potentially involved in ATP biosynthesis using the proton gradient across membrane, such as ATPase, alcohol dehydrogenases, heterodisulfide reductases, and [NiFe] hydrogenase (HynAB-1) of the hydrogen cycling were highly expressed in all four growth conditions, suggesting they may be the primary pathways for ATP synthesis in D. vulgaris. Most of the enzymes involved in sub- strate-level phosphorylation were also detected in all tested conditions. However, no enzyme involved in CO cycling or formate cycling was detected, suggesting that they are not the primary ATP-biosynthesis pathways under the tested conditions. This study provides the first proteomic overview of the cellular metabolism of D. vulgaris.The complete list of proteins identified in this study and their abundances (peptide hits) is provided in Supplementary Table 1. Received: December 27, 2005 Revised: March 1, 2006 Accepted: April 21, 2006 Keywords: Desulfovibrio vulgaris / Mass spectrometry / Metabolism 4286 Proteomics 2006, 6, 4286–4299 1 Introduction The sulfate-reducing bacteria (SRB) are a diverse group of organisms characterized by their ability to use sulfate as a terminal electron acceptor, resulting in the production of hydrogen sulfide. This dissimilatory reduction of sulfate to sulfide is linked to the oxidation of organic electron donors, such as lactate, formate, pyruvate, or ethanol [1]. The mech- anisms for ATP synthesis from organic electron donors such as lactate or formate have been studied extensively for dec- Correspondence: Dr. Weiwen Zhang, Microbiology Group, Pacific Northwest National Laboratory, 902 Battelle Boulevard, P.O. Box 999, Richland, WA 99352, USA E-mail: [email protected] Fax: 11-509-376-1632 Abbreviations: AckA, acetate kinase; AhpC, alkyl hydroperoxide reductase; Por , pyruvate:ferredoxin oxidoreductase; Pta, phos- phate acetyltransferase; ROS, reactive oxygen species; SOD, superoxide dismutase; SOR, superoxide reductase; SRB, sulfate- reducing bacteria DOI 10.1002/pmic.200500930 © 2006 WILEY-VCH Verlag GmbH & Co. KGaA, Weinheim www.proteomics-journal.com
-
Upload
independent -
Category
Documents
-
view
0 -
download
0
Transcript of A proteomic view ofDesulfovibrio vulgaris metabolism as determined by liquid chromatography coupled...
RESEARCH ARTICLE
A proteomic view of Desulfovibrio vulgaris metabolism
as determined by liquid chromatography coupled with
tandem mass spectrometry
Weiwen Zhang1, Marina A. Gritsenko2, Ronald J. Moore2, David E. Culley1,Lei Nie3, Konstantinos Petritis2, Eric F. Strittmatter2, David G. Camp II2,Richard D. Smith2 and Fred J. Brockman1
1 Microbiology Group, Pacific Northwest National Laboratory, Richland, WA, USA2 Biological Systems Analysis & Mass Spectrometry Group, Pacific Northwest National Laboratory,
Richland, WA, USA3 Department of Biostatistics, Biomathematics, and Bioinformatics, Georgetown University,
Washington DC, USA
Direct LC-MS/MS was used to examine the proteins extracted from exponential or stationaryphase Desulfovibrio vulgaris cells that had been grown on a minimal medium containing eitherlactate or formate as the primary carbon source. Across all four growth conditions, 976 geneproducts were identified with high confidence, which is equal to approximately 28% of all pre-dicted proteins in the D. vulgaris genome. Bioinformatic analysis showed that the proteins iden-tified were distributed among almost all functional classes, with the energy metabolism categorycontaining the greatest number of identified proteins. At least 154 ORFs originally annotated ashypothetical proteins were found to encode the expressed proteins, which provided verificationfor the authenticity of these hypothetical proteins. Proteomic analysis showed that proteinspotentially involved in ATP biosynthesis using the proton gradient across membrane, such asATPase, alcohol dehydrogenases, heterodisulfide reductases, and [NiFe] hydrogenase (HynAB-1)of the hydrogen cycling were highly expressed in all four growth conditions, suggesting they maybe the primary pathways for ATP synthesis in D. vulgaris. Most of the enzymes involved in sub-strate-level phosphorylation were also detected in all tested conditions. However, no enzymeinvolved in CO cycling or formate cycling was detected, suggesting that they are not the primaryATP-biosynthesis pathways under the tested conditions. This study provides the first proteomicoverview of the cellular metabolism of D. vulgaris.The complete list of proteins identified in thisstudy and their abundances (peptide hits) is provided in Supplementary Table 1.
Received: December 27, 2005Revised: March 1, 2006
Accepted: April 21, 2006
Keywords:
Desulfovibrio vulgaris / Mass spectrometry / Metabolism
4286 Proteomics 2006, 6, 4286–4299
1 Introduction
The sulfate-reducing bacteria (SRB) are a diverse group oforganisms characterized by their ability to use sulfate as aterminal electron acceptor, resulting in the production ofhydrogen sulfide. This dissimilatory reduction of sulfate tosulfide is linked to the oxidation of organic electron donors,such as lactate, formate, pyruvate, or ethanol [1]. The mech-anisms for ATP synthesis from organic electron donors suchas lactate or formate have been studied extensively for dec-
Correspondence: Dr. Weiwen Zhang, Microbiology Group, PacificNorthwest National Laboratory, 902 Battelle Boulevard, P.O. Box999, Richland, WA 99352, USAE-mail: [email protected]: 11-509-376-1632
Abbreviations: AckA, acetate kinase; AhpC, alkyl hydroperoxidereductase; Por, pyruvate:ferredoxin oxidoreductase; Pta, phos-phate acetyltransferase; ROS, reactive oxygen species; SOD,superoxide dismutase; SOR, superoxide reductase; SRB, sulfate-reducing bacteria
DOI 10.1002/pmic.200500930
© 2006 WILEY-VCH Verlag GmbH & Co. KGaA, Weinheim www.proteomics-journal.com
Proteomics 2006, 6, 4286–4299 Microbiology 4287
ades, and four possible pathways have been proposed. For thesubstrate-level phosphorylation pathway, the preferred sub-strate, lactate, is oxidized to pyruvate by a membrane-boundlactate dehydrogenase. The pyruvate is further oxidized pri-marily by pyruvate:ferredoxin oxidoreductase (Por) [2, 3], fol-lowed by the enzymatic action of phosphate acetyltransfer-ase (Pta), and acetate kinase (AckA) resulting in substrate-level ATP synthesis coupled to the conversion of acetyl-CoA toCoA and acetate [3]. In addition to substrate-level phospho-rylation, ATP synthesis from oxidative phosphorylation cou-pled with the electron transfer has also been suggested [4]. Inthe mechanism termed “hydrogen cycling”, protons andelectrons produced in lactate and pyruvate oxidation are pro-posed to react with a cytoplasmic hydrogenase to formhydrogen, which diffuses across the membrane where it isreoxidized by periplasmic hydrogenases to form a protongradient [3, 5]. The third pathway involves a membrane-bound hydrogenase, possibly cooMKLXUHF, and a COdehydrogenase catalyzing the production of hydrogen fromCO according to the overall equation CO 1 H2O ? CO2 1 H2
[6]. The hydrogen generated by this mechanism could then becaptured and oxidized by periplasmic hydrogenases to form aproton gradient across the membrane. The fourth pathway,termed “formate cycling”, has been suggested to provide amechanism through which the pyruvate generated from lac-tate can be converted into formate by a putative pyruvate-for-mate lyase, with the formate then being metabolized by peri-plasmic formate dehydrogenases [3, 6]. Formate is hypothe-sized to be oxidized by cytoplasmic formate dehydrogenases,and the electrons thus generated are transferred directly intothe periplasmic tetraheme cytochrome network. From there,these electrons could be reimported to the cytoplasm throughthe multiheme-containing transmembrane electron conduitsand used for cytoplasmic sulfate reduction [3, 6].
The energy metabolism pathways described above wereproposed based on information obtained through investiga-tions of individual genes in the pathways and, thus far,genetic or biochemical evidence is still not available for someof the proposed steps. In addition, little information is avail-able on the regulation of these pathways in SRB under var-ious growth conditions [1, 6]. The genome of the model SRBDesulfovibrio vulgaris Hildenborough was recently sequenced[3] and this information has provided an opportunity to ob-tain further insights into the metabolism of this modelorganism by applying whole-genome approaches to thestudy of transcriptional and translational responses ofD. vulgaris to different growth conditions. In a previousstudy, a whole-genome oligonucleotide microarray of D. vul-garis was utilized to characterize the global transcriptomicresponse of cultures grown in lactate- or formate-basedminimal media [7]. That study showed that genes involved inalmost every aspect of cellular metabolism were differentiallyregulated when grown on different carbon sources andunder different growth phases, with the genes involved inprotein synthesis, carbon, and energy metabolism being themost regulated. The microarray results indicated that hydro-
genase HynAB-1 might function as a primary periplasmichydrogenase responsible for oxidation of H2 linked to theproton gradient in lactate-based medium, while several peri-plasmic hydrogenases, including HynAB-1 and Hyd, mightcarry out this role in a formate-based medium [7].
In the current study, we have extended this line of investi-gation by employing a direct LC-MS/MS-based proteomicapproach to analyze the protein samples extracted from cells ofD. vulgaris grown under the same set of conditions as was usedfor the previous microarray analyses [7]. The number of peptidehits for each identified protein was used as a semiquantitativemeasure of relative protein abundance either within an indi-vidual sample or between different conditions [8–11]. The pur-poses of this investigation were to seek global proteome abun-dance information for D. vulgaris grown on different carbonsources, to examine the enzymes involved in potential energy-yielding metabolic pathways, and to assess their relative con-tribution to overall energy generation in this organism.
2 Materials and methods
2.1 Strains, media, and culture conditions
D. vulgaris subsp. vulgaris DSM 644 was obtained from theDeutsche Sammlung für Mikroorganismen und Zellk-ulturen (DSMZ) and grown under strictly anaerobic condi-tions as described previously [7, 12]. Substrate concentrationswere 50 mM for sulfate and 38 mM for lactate or formate.Growth experiments were performed in 140-mL serum bot-tles containing 70 mL of medium, with the head space filledwith a gas mixture of 10% v/v CO2 and 90% v/v N2. Toestablish equivalent points for mid-exponential and earlystationary phases for the two substrates, the time course ofgrowth in both media was measured by OD using a Shi-madzu BioSpec 1601 Analyzer (Kyoto, Japan). After inocula-tion (10%) from a preculture grown in the same medium,triplicate cultures were incubated at 307C. Cells were col-lected from mid-exponential phase at an OD590 of 0.4 and 0.2for lactate- and formate-based media (samples designated LEand FE, respectively), and from stationary phase at an OD590
of 0.65 and 0.35 for lactate- and formate-based media (LS andFS, respectively). Each sample used for proteomic analysiswas a pool of three individual biological replicates. Cells werecollected by pooling the three individual growth replicatesand centrifuging at room temperature (60006g). Theresulting cell pellets were stored at 2807C. An OD590 of 0.65and 0.35 corresponded to approximately 0.5–0.6 and 0.25–0.30 mg of dry cell weight/mL culture, respectively, and theprotein/dry cell weight ratio was estimated to be 0.12–0.15.
2.2 Protein purification
Soluble and insoluble proteins were purified from D. vul-garis cell pellets for analysis by LC-MS/MS. (i) Fractiona-tion of soluble and insoluble proteins: The washed cell
© 2006 WILEY-VCH Verlag GmbH & Co. KGaA, Weinheim www.proteomics-journal.com
4288 W. Zhang et al. Proteomics 2006, 6, 4286–4299
pellet (100–200 mL packed cells) was resuspended in200 mL of 100 mM NH4HCO3 (pH 8.4) and transferred to asiliconized 0.6-mL microcentrifuge tube. Zirconia/silicabeads (0.1 mm) were added and the tube homogenized for3 min in a Mini-Bead-Beater-8 cell disruptor (BiospecProducts, Bartlesville, OK) at maximum speed (4500 rpm).All subsequent steps were performed at 47C unless other-wise noted. The resulting solution was recovered by cen-trifugation and the pellet was back-extracted once with100 mL of 100 mM NH4HCO3 (pH 8.4) buffer. The hom-genate and wash solutions were pooled (,250 mL) and themembrane fraction was pelleted by centrifugation at356 0006g for 10 min at 47C in a Beckman TLA100 rotor.The supernatant was transferred to a siliconized tube andfrozen at 2807C for soluble (periplamic and cytosolic) pro-tein preparation as described below. Residual soluble pro-teins were removed from the membrane pellet by threecycles of resuspending in 300 mL of 100 mM NH4HCO3
(pH 8.4) buffer using sonication, recentrifuging at356 0006g for 10 min and discarding the supernatant.(ii) Insoluble protein solubilization and tryptic digest: Themembrane pellet was solubilized by sonicating for 30 minin 250 mL of 7 M urea, 2 M thiourea, 1% CHAPS, and10 mM DTT in 50 mM NH4HCO3, at pH 7.8, followed byincubation at 607C for 45 min. The sample was then dilut-ed ten-fold with 2.25 mL of 50 mM NH4HCO3 (pH 7.8),and CaCl2 was added to a concentration of 1 mM. Se-quencing-grade trypsin was added to the protein at a ratioof 1:50 w/w, and the sample was digested for 5 h at 377C.Rapid freezing of the sample in liquid nitrogen was used tostop the digestion. The peptide sample was loaded onto a1-mL SCX SPE column (Supelco, Bellefonte, PA, USA)equilbrated with 10 mM ammonium formate in 25% ACN,pH 3.0. The bound peptides were eluted with 80% metha-nol, 15% ammonium hydroxide solution. The sampleswere concentrated to 50 mL in a SpeedVac vacuum con-centrator (Savant Instruments, Holbrook, NY, USA) andthe concentration was determined using a BCA proteinassay (Pierce, Rockford, IL, USA). The peptides were storedat 2807C until needed for analysis. (iii) Tryptic digests ofsoluble protein fraction: The soluble fraction was dena-tured by adding urea and thiourea to concentrations of 7and 2 M, respectively. DTT was added to a concentration of5 mM, and the sample was incubated at 607C for 30 min.The sample was diluted ten-fold with 100 mM NH4HCO3
(pH 8.4), and CaCl2 was added to obtain a sample con-centration of 1 mM. Sequencing-grade trypsin was addedto the protein at a ratio of 1:50 w/w, and the sample wasdigested for 5 h at 377C. The resulting peptides were boundto a 1-mL C18 SPE column (Supelco) equilbrated with0.1% TFA. The peptides were eluted with 1 mL of 80:20ACN:H2O containing 0.1% TFA. The samples were con-centrated to 50 mL in a SpeedVac vacuum concentrator(Savant Instruments) and the concentration was deter-mined using a BCA protein assay (Pierce). The peptideswere stored at 2807C until needed for analysis.
Chemicals used were obtained from the following com-panies. Methanol, ammonium hydroxide and NH4HCO3
were purchased from Fisher Scientific (Fair Lawn, NJ, USA);sodium carbonate, urea, CHAPS, DTT, calcium chloridefrom Sigma-Aldrich (St. Louis, MO, USA); thiourea, TFA,and ACN from Aldrich Chemical Company (Milwaukee, WI,USA); sequencing-grade modified trypsin from Promega(Madison, WI, USA); ammonium formate from Fluka(St. Louis, MO, USA); BCA assay reagents and standardswere purchased from Pierce. Water was purified using aBarnstead Nanopure Infinity water purification system(Dubuque, IA, USA).
2.3 Capillary LC-MS/MS analysis
The D. vulgaris samples were analyzed by LC-MS/MS on aFinnigan model LTQ IT mass spectrometer (ThermoQuest,San Jose, CA, USA). RP capillary HPLC columns weremanufactured in-house by slurry packing 5-mm Jupiter C18
stationary phase (Phenomenex, Torrence, CA, USA) into a60-cm length of 360 mm od6150 mm id fused-silica capil-lary tubing (Polymicro Technologies, Phoenix, AZ, USA)incorporating a 2-mm retaining screen in a 1/16” capillary-bore union (Valco Intruments, Houston, TX, USA). Themobile phase solutions consisted of 0.2% acetic acid and0.05% TFA in water (A) and 0.1% TFA in 90% ACN/10% water (B). The mobile phase was degassed with an in-line Alltech vacuum degasser (Alltech Associates, Deerfield,IL, USA). The HPLC system was equilibrated at 5000 psiwith 100% mobile phase A for initial starting conditions.Each sample injection contained 10 mg of peptide per sam-ple. The mobile phase selection valve was switched fromposition A to B 20 min after injection, creating an exponen-tial gradient as mobile phase B displaced A in the mixer. A,5-cm length of 360 id fused silica tubing packed with5 mm C18 was used to split ,25 mL/min of flow before theinjection valve. The split flow controls the gradient speedunder conditions of constant pressure operation. Flowthrough the capillary HPLC column was ,1.8 mL/minwhen equilibrated to 100% mobile phase A. MS analysiswas performed using a Finnigan model LTQ IT (Thermo-Quest) with ESI. The HPLC column was coupled to themass spectrometer using an in-house manufactured inter-face. No sheath gas or make-up liquid was used. The heatedcapillary temperature and spray voltage were 2007C and2.2 kV, respectively. Eluent from the HPLC was scannedover the mass (m/z) range 400–2000 (1 mm scan, max iontime 10 ms), followed by MS/MS scans (1 mm scan, max iontime 100 ms) of the ten most abundant ions from the MSscan using a collision energy setting of 35%. Dynamicexclusion software settings allowed for data dependent dis-crimination against previously analyzed ions by exclusion ofions falling within 20.5 or 11.5 m/z units of the analyzedion for 1 min. Three replicate LC-MS/MS analyses were runfor each peptide sample.
© 2006 WILEY-VCH Verlag GmbH & Co. KGaA, Weinheim www.proteomics-journal.com
Proteomics 2006, 6, 4286–4299 Microbiology 4289
2.4 Proteomics data analysis
Peptide identification was performed using SEQUEST Ver-sion 2.7 (ThermoFinnigan, San Jose, CA) [13, 14] to searchthe D. vulgaris protein sequence database [3]. The peptideswere filtered using Xcorr criteria of .1.8 for peptide withcharge state of 11 full or partial tryptic peptides, .2.5 forpeptides with charge state of 12 full or partial tryptic pep-tides, and .3.5 for peptides with charge state of 13 full orpartial tryptic peptides. In addition, the DelCn (Delta Corre-lation value) cutoff value of . = 0.1 was used to furtherincrease the confidence levels of protein identification [15,16]. In order to minimize false positives, the peptides detect-ed in only one of the three separate LC-MS/MS measure-ments were excluded from the analysis. The relative proteinabundance was estimated based on the number of timespeptides (spectral) were detected for each given protein(peptide hits). This semiquantitative abundance index hasalso been referred to as spectral count or peptide count inprevious literature [8–11]. The peptide hits for a given proteinwere the average of three replicate LC-MS/MS measure-ments. If the peptides matching one protein were detected in
both soluble and membrane-bound fractions, the combinednumber of average peptide hits from both fractions wasused.
For calculation of “Codon Adaptation Index” (CAI), ameasure of the expressivity of a given gene based on its codonusage [17–19], the genome sequence of D. vulgaris wasdownloaded from the Institute for Genomic Research (TIGR)and CAI values for each ORF were computed with CAI Cal-culator 2 (http://www.evolvingcode.net/codon/cai/cais.php)[19] using ribosomal protein genes as the reference set.
3 Results
3.1 Assessing the reproducibility of LC-MS/MS
analysis
The reproducibility of LC-MS/MS analysis was first evaluatedby comparing triplicate analyses of the same peptide sample.The analysis of triplicate LC-MS/MS measurements of apeptide sample from lactate grown cells in exponential phaseis exemplified in Fig. 1A–C. The percentage of proteins that
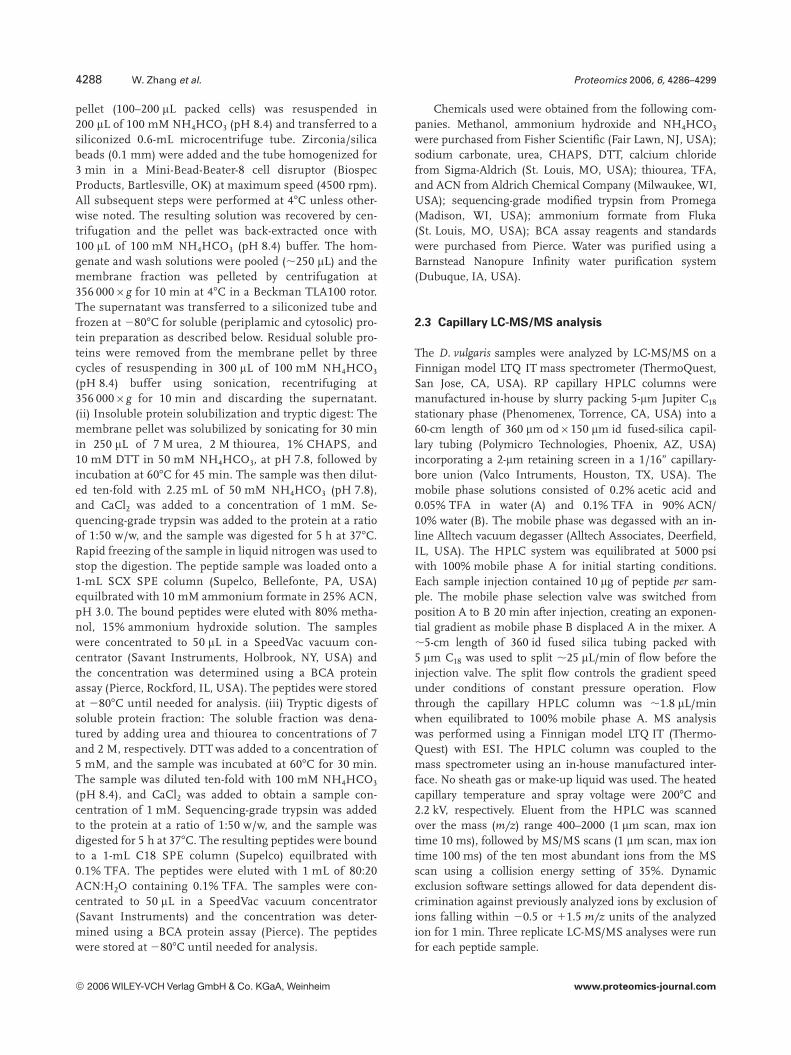
Figure 1. Reproducibility of LC-MS/MS data. I) Comparison of peptide hits for each protein between three independent LC-MS/MS meas-urements. Each spot represents one protein with the number of peptide hits from: A) the first and second measurements shown on the x-axis and the y-axis, respectively. The inset is a zoom-in view of peptide hits in the 0–60 region for both the x- and y-axes; B) from the secondand third measurements shown on the x-axis and the y-axis, respectively. The inset is a zoom-in view of peptide hits in the 0–60 region forboth the x- and y-axes; and C) from the first and third measurements shown on the x-axis and the y-axis, respectively. The inset is a zoom-inview of peptide hits in the 0–60 region for both the x- and y-axes. A total of 455 proteins identified from control sample were plotted, withthe majority of spots overlapped in the low peptide hits region. II) D) Comparison of peptide hits for each protein between two biologicalreplicates (two samples prepared from lactate medium in exponential phase). Each spot represents one protein with the number of peptidehits from the first and second biological replicates shown on the x-axis and the y-axis, respectively. The peptide hits were averaged fromthree individual analytical replicates. The inset is a zoom-in view of peptide hits in the 0–60 region for both the x- and y-axis. A total of643 proteins were plotted, with the majority of spots overlapped in the low peptide hits region. Correlation coefficients of each pair ofdataset (Pearson and Spearman coefficients) were computed and indicated inside the plots.
© 2006 WILEY-VCH Verlag GmbH & Co. KGaA, Weinheim www.proteomics-journal.com
4290 W. Zhang et al. Proteomics 2006, 6, 4286–4299
are common to any two replicate measurements is 90–92%,and the percentage of proteins that are common to all threemeasurements is 80%. All nonoverlapping proteins hadthree or fewer peptide hits per protein, indicating the rela-tively low abundance of these proteins. Plotting of peptidehits across different independent measurements showedstrongly linear patterns, indicating high measurement re-producibility. The data reproducibility was also demonstratedby statistical analyses by Pearson and Spearman correlationcoefficients (Fig. 1A–C).
The reproducibility of the LC-MS/MS results was furtherevaluated by comparing results from two growth and extrac-tion replicates prepared independently from mid-exponen-tial phase cells that had been grown on lactate. In this case,the average peptide hits from the three measurements persample were used for comparison. A total of 643 proteinswere identified to be present in both replicates. This corre-sponds to 88 and 85% of total proteins identified in these twogrowth and extraction duplicates. Furthermore, all non-overlapping proteins had three or fewer peptide hits per pro-tein, indicating the relatively low abundance of these pro-teins. Figure 1D shows the comparison of peptide hits be-tween the two samples that had been preparedindependently from lactate grown cells harvested at the mid-exponential growth phase. Statistical analyses showed thatthe Pearson and Spearman correlation coefficients for thetwo datasets are 0.9473 and 0.8473, respectively, indicatinghigh reproducibility in the cell growth and peptide samplepreparation. Overall, the results show consistent reproduci-bility in terms of total peptide hits, the number of differentpeptides, and the number of different proteins identified be-tween the three technical replicates and two biological repli-cates.
3.2 Overview of proteomic analysis
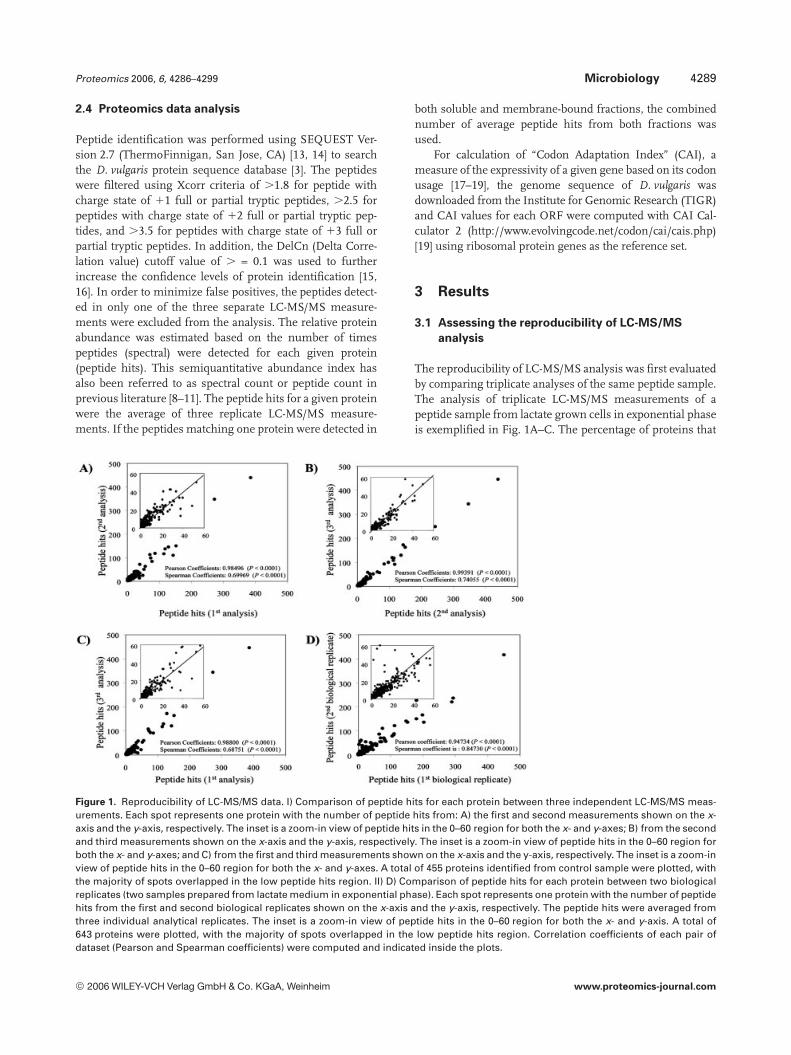
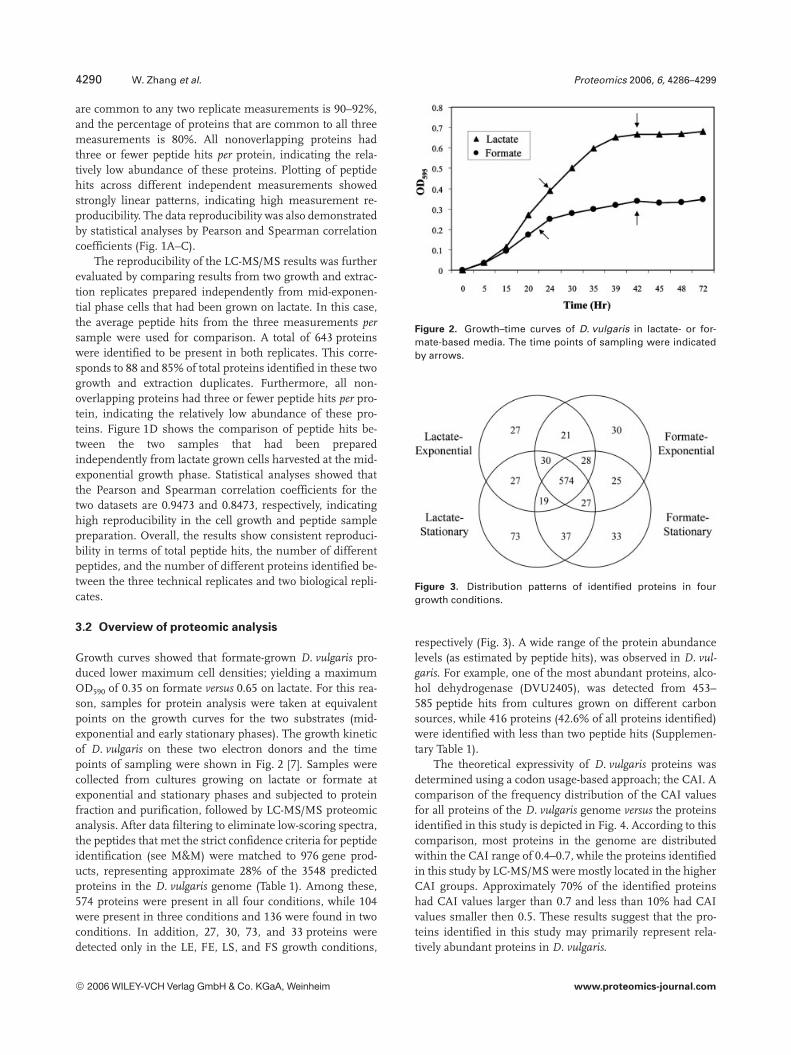
Growth curves showed that formate-grown D. vulgaris pro-duced lower maximum cell densities; yielding a maximumOD590 of 0.35 on formate versus 0.65 on lactate. For this rea-son, samples for protein analysis were taken at equivalentpoints on the growth curves for the two substrates (mid-exponential and early stationary phases). The growth kineticof D. vulgaris on these two electron donors and the timepoints of sampling were shown in Fig. 2 [7]. Samples werecollected from cultures growing on lactate or formate atexponential and stationary phases and subjected to proteinfraction and purification, followed by LC-MS/MS proteomicanalysis. After data filtering to eliminate low-scoring spectra,the peptides that met the strict confidence criteria for peptideidentification (see M&M) were matched to 976 gene prod-ucts, representing approximate 28% of the 3548 predictedproteins in the D. vulgaris genome (Table 1). Among these,574 proteins were present in all four conditions, while 104were present in three conditions and 136 were found in twoconditions. In addition, 27, 30, 73, and 33 proteins weredetected only in the LE, FE, LS, and FS growth conditions,
Figure 2. Growth–time curves of D. vulgaris in lactate- or for-mate-based media. The time points of sampling were indicatedby arrows.
Figure 3. Distribution patterns of identified proteins in fourgrowth conditions.
respectively (Fig. 3). A wide range of the protein abundancelevels (as estimated by peptide hits), was observed in D. vul-garis. For example, one of the most abundant proteins, alco-hol dehydrogenase (DVU2405), was detected from 453–585 peptide hits from cultures grown on different carbonsources, while 416 proteins (42.6% of all proteins identified)were identified with less than two peptide hits (Supplemen-tary Table 1).
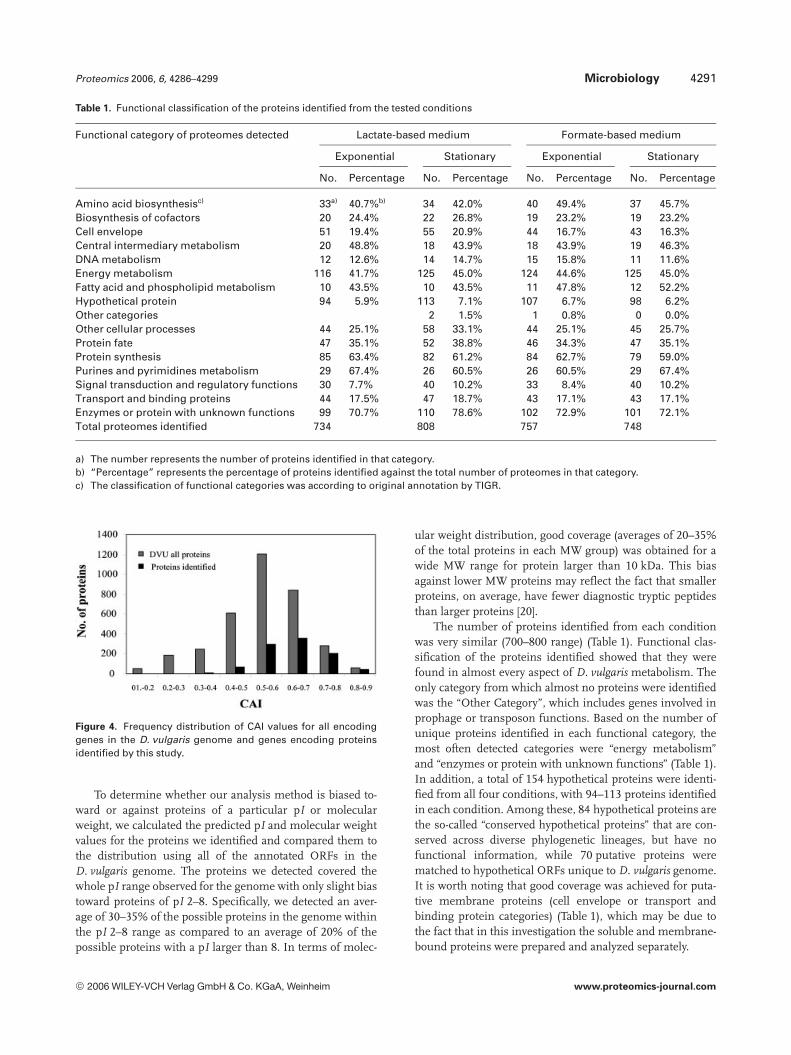
The theoretical expressivity of D. vulgaris proteins wasdetermined using a codon usage-based approach; the CAI. Acomparison of the frequency distribution of the CAI valuesfor all proteins of the D. vulgaris genome versus the proteinsidentified in this study is depicted in Fig. 4. According to thiscomparison, most proteins in the genome are distributedwithin the CAI range of 0.4–0.7, while the proteins identifiedin this study by LC-MS/MS were mostly located in the higherCAI groups. Approximately 70% of the identified proteinshad CAI values larger than 0.7 and less than 10% had CAIvalues smaller then 0.5. These results suggest that the pro-teins identified in this study may primarily represent rela-tively abundant proteins in D. vulgaris.
© 2006 WILEY-VCH Verlag GmbH & Co. KGaA, Weinheim www.proteomics-journal.com
Proteomics 2006, 6, 4286–4299 Microbiology 4291
Table 1. Functional classification of the proteins identified from the tested conditions
Functional category of proteomes detected Lactate-based medium Formate-based medium
Exponential Stationary Exponential Stationary
No. Percentage No. Percentage No. Percentage No. Percentage
Amino acid biosynthesisc) 33a) 40.7%b) 34 42.0% 40 49.4% 37 45.7%Biosynthesis of cofactors 20 24.4% 22 26.8% 19 23.2% 19 23.2%Cell envelope 51 19.4% 55 20.9% 44 16.7% 43 16.3%Central intermediary metabolism 20 48.8% 18 43.9% 18 43.9% 19 46.3%DNA metabolism 12 12.6% 14 14.7% 15 15.8% 11 11.6%Energy metabolism 116 41.7% 125 45.0% 124 44.6% 125 45.0%Fatty acid and phospholipid metabolism 10 43.5% 10 43.5% 11 47.8% 12 52.2%Hypothetical protein 94 5.9% 113 7.1% 107 6.7% 98 6.2%Other categories 2 1.5% 1 0.8% 0 0.0%Other cellular processes 44 25.1% 58 33.1% 44 25.1% 45 25.7%Protein fate 47 35.1% 52 38.8% 46 34.3% 47 35.1%Protein synthesis 85 63.4% 82 61.2% 84 62.7% 79 59.0%Purines and pyrimidines metabolism 29 67.4% 26 60.5% 26 60.5% 29 67.4%Signal transduction and regulatory functions 30 7.7% 40 10.2% 33 8.4% 40 10.2%Transport and binding proteins 44 17.5% 47 18.7% 43 17.1% 43 17.1%Enzymes or protein with unknown functions 99 70.7% 110 78.6% 102 72.9% 101 72.1%Total proteomes identified 734 808 757 748
a) The number represents the number of proteins identified in that category.b) “Percentage” represents the percentage of proteins identified against the total number of proteomes in that category.c) The classification of functional categories was according to original annotation by TIGR.
Figure 4. Frequency distribution of CAI values for all encodinggenes in the D. vulgaris genome and genes encoding proteinsidentified by this study.
To determine whether our analysis method is biased to-ward or against proteins of a particular pI or molecularweight, we calculated the predicted pI and molecular weightvalues for the proteins we identified and compared them tothe distribution using all of the annotated ORFs in theD. vulgaris genome. The proteins we detected covered thewhole pI range observed for the genome with only slight biastoward proteins of pI 2–8. Specifically, we detected an aver-age of 30–35% of the possible proteins in the genome withinthe pI 2–8 range as compared to an average of 20% of thepossible proteins with a pI larger than 8. In terms of molec-
ular weight distribution, good coverage (averages of 20–35%of the total proteins in each MW group) was obtained for awide MW range for protein larger than 10 kDa. This biasagainst lower MW proteins may reflect the fact that smallerproteins, on average, have fewer diagnostic tryptic peptidesthan larger proteins [20].
The number of proteins identified from each conditionwas very similar (700–800 range) (Table 1). Functional clas-sification of the proteins identified showed that they werefound in almost every aspect of D. vulgaris metabolism. Theonly category from which almost no proteins were identifiedwas the “Other Category”, which includes genes involved inprophage or transposon functions. Based on the number ofunique proteins identified in each functional category, themost often detected categories were “energy metabolism”and “enzymes or protein with unknown functions” (Table 1).In addition, a total of 154 hypothetical proteins were identi-fied from all four conditions, with 94–113 proteins identifiedin each condition. Among these, 84 hypothetical proteins arethe so-called “conserved hypothetical proteins” that are con-served across diverse phylogenetic lineages, but have nofunctional information, while 70 putative proteins werematched to hypothetical ORFs unique to D. vulgaris genome.It is worth noting that good coverage was achieved for puta-tive membrane proteins (cell envelope or transport andbinding protein categories) (Table 1), which may be due tothe fact that in this investigation the soluble and membrane-bound proteins were prepared and analyzed separately.
© 2006 WILEY-VCH Verlag GmbH & Co. KGaA, Weinheim www.proteomics-journal.com
4292 W. Zhang et al. Proteomics 2006, 6, 4286–4299
3.3 Expression of proteins involved in protein
biosynthesis
Ribosomal proteins, which are considered to be the mostabundantly expressed proteins in most bacterial cells,were also expected to be detected in high numbers [21,22]. In agreement with this prediction, we identified52 ribosomal proteins with high confidence using the LC-MS/MS approach (representing 95% of the total numberof ribosomal proteins). In our previous study, microarrayanalysis indicated that 42 out of 55 genes encodingD. vulgaris ribosomal proteins were down-regulated inpairwise comparisons of formate versus lactate or sta-tionary versus exponential phases [7], suggesting a pro-found decrease in overall protein biosynthesis in re-sponse to reaching the stationary growth phase or utiliz-ing formate as the sole carbon source. The generalpattern of protein abundance was similar to thatobserved for gene expression when comparing stationaryversus exponential phases using proteomic data (Supple-mentary Table 1). In terms of the number of ribosomalproteins detected at stationary phase, 46 and 42 riboso-mal proteins were identified in lactate- or formate-basedmedia, respectively, compared to 51 and 48 ribosomalprotein identified at exponential phase in lactate- or for-mate-based media, respectively. In terms of the peptidehits for ribosomal proteins identified in this study, thesame trends were also observed in that ribosomal pro-teins at stationary phases were less abundant than thoseat exponential phases. However, when comparing sam-ples grown on lactate versus formate at exponential phase,no obvious differences were observed (SupplementaryTable 1).
A total of 25 genes encoding putative amino-acyltRNA synthases have been found in the D. vulgaris ge-nome [3]. Amino-acyl tRNA synthetases are generallynot identified as highly abundant genes in many bac-teria. For example, the results of a computationalapproach indicate that in Synechocystis only the genesencoding S-adenosylmethionine synthetase (metX) andaspartyl-tRNA synthetase (aspS) would be predicted tobe highly expressed [23]. Similarly, in Escherichia coli,only three amino-acyl tRNA synthetases were predictedto have moderate expression levels [24]. However, pro-teomic analysis showed that all 25 amino-acyl tRNAsynthases were identified from the tested conditions,with average peptide hits of about 4–5 (SupplementaryTable 1).
Consistent with the high abundance of ribosomalproteins and amino-acyl tRNA synthases, seven transla-tion elongation factors (factor G, P, Tu, and Ts), threetranslation initiation factors (InfB and InfC) and a pep-tide chain release factor I (PrfA) were also identified.However, no obvious differences were observed in termsof their relative abundances across all four conditions(Supplementary Table 1).
3.4 Expression of proteins involved in stress
resistance
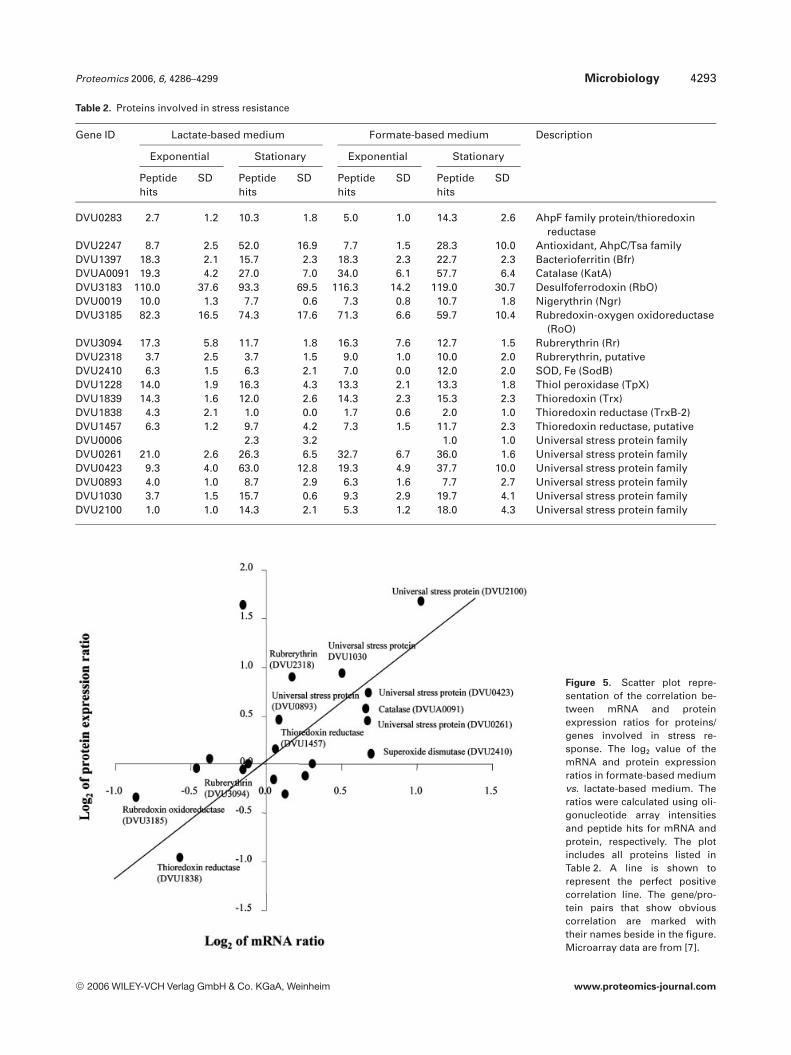
Although the SRB are classified as strict anaerobes, recentstudies have shown that many species are aero-tolerant andsome species have been shown to accumulate at oxic–anoxicinterfaces. Several mechanisms of oxygen resistance havebeen described in D. vulgaris, including the catalytic elim-ination of superoxide and hydrogen peroxide by superoxidedismutase (SOD) and catalase, as well as the superoxide-scavenging activities of superoxide reductase (SOR) andrubrerythrin [25]. In D. vulgaris, it has been proposed thatSOR might play a key role in oxygen defense [26], and thatSOD is thought to remove the periplasmic-generated super-oxide that could oxidatively damage sensitive iron–sulfurenzymes [25]. In addition, our recent microarray analysisshowed that the rubrerythrin and thioredoxin reductase sys-tems were responsive to 1 h oxygen exposure (Zhang et al.,unpublished data). All of the above gene products exceptSOR were detected at relatively high abundance in our pro-teomic analysis (Table 2). Among these, two rubredoxin oxi-doreductases are the most abundant proteins, suggestingthey may be the major defense system against reactive oxy-gen species (ROS) generated during cellular metabolism inD. vulgaris. In addition, several other enzymes that protectorganisms from damage by ROS, alkyl hydroperoxidereductase (AhpC) (DVU2247), thiol-specific peroxidase (Tpx)(DVU1228) and bacterioferritin (DVU1397) were also iden-tified. The AhpC protein was found to be more abundant atstationary phase in both media, which is consistent withprevious study in Bacillus subtilis where AhpCF were inducedupon entry into stationary phase under conditions of ironand manganese limitation [27]. Six universal stress proteinswere also detected and comparative analysis showed allincreased in abundance at stationary phase (Table 2), sug-gesting they may play important roles during cell aging [28].In addition, a slight increase in the abundances of these fiveuniversal stress proteins was also found in formate-basedmedium, which is consistent with the growth measurementsshowing that D. vulgaris grows poorly on formate. In a for-mate versus lactate comparison of these stress related pro-teins, a scatter plot representation of the mRNA abundanceratio versus protein abundance ratio suggested a good corre-lation. It is interesting to note that while SOD, catalase,thioredoxin reductase (DVU1457) and the five universalstress proteins were all up-regulated, rubredoxin oxido-reductase and another thioredoxin reductase (DVU1838) weredown-regulated at both mRNA and protein levels (Fig. 5) [7].
3.5 Expression of proteomes involved in energy
metabolism and sulfate reduction
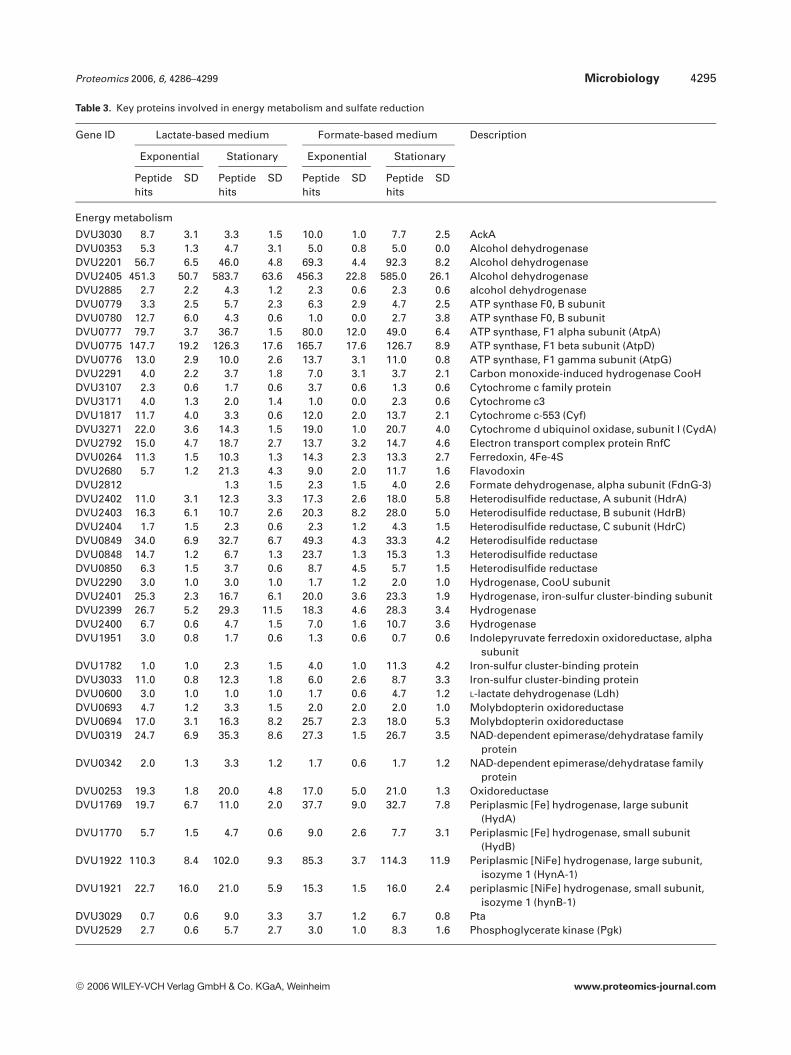
The key proteins of energy metabolism and sulfate reductionthat were identified in this investigation are listed in Table 3.A comparison between mRNA and protein expression ratioswas also plotted for formate versus lactate (Fig. 6A), and for
© 2006 WILEY-VCH Verlag GmbH & Co. KGaA, Weinheim www.proteomics-journal.com
Proteomics 2006, 6, 4286–4299 Microbiology 4293
Table 2. Proteins involved in stress resistance
Gene ID Lactate-based medium Formate-based medium Description
Exponential Stationary Exponential Stationary
Peptidehits
SD Peptidehits
SD Peptidehits
SD Peptidehits
SD
DVU0283 2.7 1.2 10.3 1.8 5.0 1.0 14.3 2.6 AhpF family protein/thioredoxinreductase
DVU2247 8.7 2.5 52.0 16.9 7.7 1.5 28.3 10.0 Antioxidant, AhpC/Tsa familyDVU1397 18.3 2.1 15.7 2.3 18.3 2.3 22.7 2.3 Bacterioferritin (Bfr)DVUA0091 19.3 4.2 27.0 7.0 34.0 6.1 57.7 6.4 Catalase (KatA)DVU3183 110.0 37.6 93.3 69.5 116.3 14.2 119.0 30.7 Desulfoferrodoxin (RbO)DVU0019 10.0 1.3 7.7 0.6 7.3 0.8 10.7 1.8 Nigerythrin (Ngr)DVU3185 82.3 16.5 74.3 17.6 71.3 6.6 59.7 10.4 Rubredoxin-oxygen oxidoreductase
(RoO)DVU3094 17.3 5.8 11.7 1.8 16.3 7.6 12.7 1.5 Rubrerythrin (Rr)DVU2318 3.7 2.5 3.7 1.5 9.0 1.0 10.0 2.0 Rubrerythrin, putativeDVU2410 6.3 1.5 6.3 2.1 7.0 0.0 12.0 2.0 SOD, Fe (SodB)DVU1228 14.0 1.9 16.3 4.3 13.3 2.1 13.3 1.8 Thiol peroxidase (TpX)DVU1839 14.3 1.6 12.0 2.6 14.3 2.3 15.3 2.3 Thioredoxin (Trx)DVU1838 4.3 2.1 1.0 0.0 1.7 0.6 2.0 1.0 Thioredoxin reductase (TrxB-2)DVU1457 6.3 1.2 9.7 4.2 7.3 1.5 11.7 2.3 Thioredoxin reductase, putativeDVU0006 2.3 3.2 1.0 1.0 Universal stress protein familyDVU0261 21.0 2.6 26.3 6.5 32.7 6.7 36.0 1.6 Universal stress protein familyDVU0423 9.3 4.0 63.0 12.8 19.3 4.9 37.7 10.0 Universal stress protein familyDVU0893 4.0 1.0 8.7 2.9 6.3 1.6 7.7 2.7 Universal stress protein familyDVU1030 3.7 1.5 15.7 0.6 9.3 2.9 19.7 4.1 Universal stress protein familyDVU2100 1.0 1.0 14.3 2.1 5.3 1.2 18.0 4.3 Universal stress protein family
Figure 5. Scatter plot repre-sentation of the correlation be-tween mRNA and proteinexpression ratios for proteins/genes involved in stress re-sponse. The log2 value of themRNA and protein expressionratios in formate-based mediumvs. lactate-based medium. Theratios were calculated using oli-gonucleotide array intensitiesand peptide hits for mRNA andprotein, respectively. The plotincludes all proteins listed inTable 2. A line is shown torepresent the perfect positivecorrelation line. The gene/pro-tein pairs that show obviouscorrelation are marked withtheir names beside in the figure.Microarray data are from [7].
© 2006 WILEY-VCH Verlag GmbH & Co. KGaA, Weinheim www.proteomics-journal.com
4294 W. Zhang et al. Proteomics 2006, 6, 4286–4299
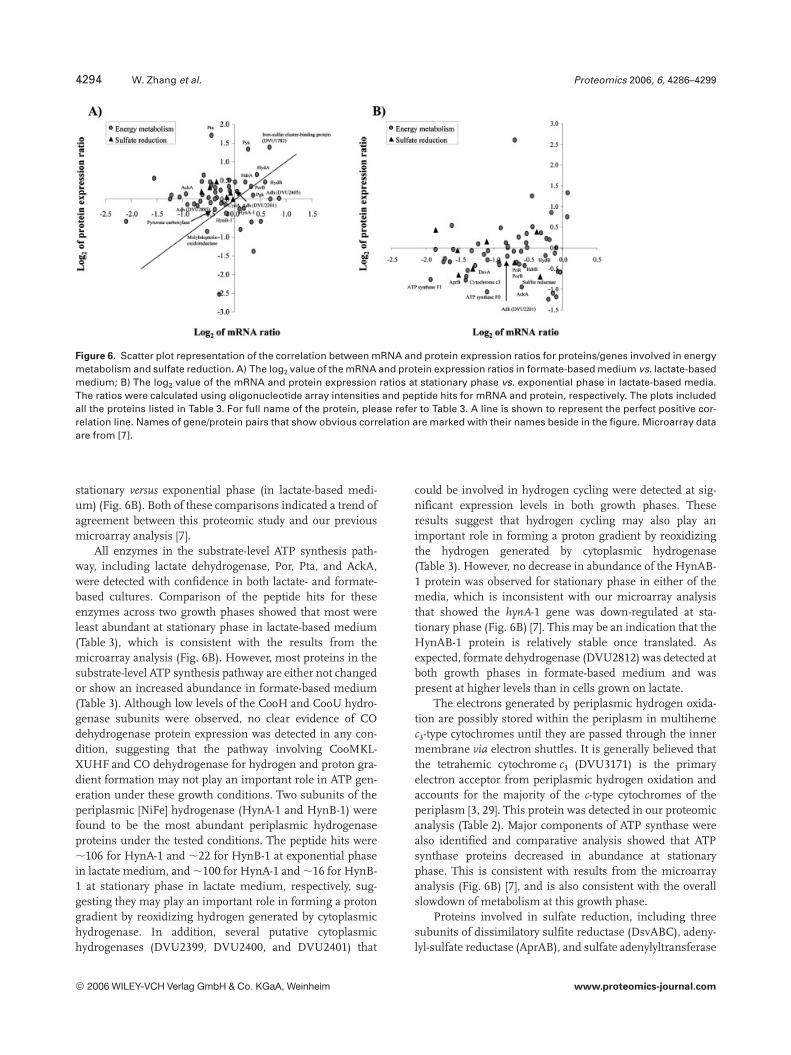
Figure 6. Scatter plot representation of the correlation between mRNA and protein expression ratios for proteins/genes involved in energymetabolism and sulfate reduction. A) The log2 value of the mRNA and protein expression ratios in formate-based medium vs. lactate-basedmedium; B) The log2 value of the mRNA and protein expression ratios at stationary phase vs. exponential phase in lactate-based media.The ratios were calculated using oligonucleotide array intensities and peptide hits for mRNA and protein, respectively. The plots includedall the proteins listed in Table 3. For full name of the protein, please refer to Table 3. A line is shown to represent the perfect positive cor-relation line. Names of gene/protein pairs that show obvious correlation are marked with their names beside in the figure. Microarray dataare from [7].
stationary versus exponential phase (in lactate-based medi-um) (Fig. 6B). Both of these comparisons indicated a trend ofagreement between this proteomic study and our previousmicroarray analysis [7].
All enzymes in the substrate-level ATP synthesis path-way, including lactate dehydrogenase, Por, Pta, and AckA,were detected with confidence in both lactate- and formate-based cultures. Comparison of the peptide hits for theseenzymes across two growth phases showed that most wereleast abundant at stationary phase in lactate-based medium(Table 3), which is consistent with the results from themicroarray analysis (Fig. 6B). However, most proteins in thesubstrate-level ATP synthesis pathway are either not changedor show an increased abundance in formate-based medium(Table 3). Although low levels of the CooH and CooU hydro-genase subunits were observed, no clear evidence of COdehydrogenase protein expression was detected in any con-dition, suggesting that the pathway involving CooMKL-XUHF and CO dehydrogenase for hydrogen and proton gra-dient formation may not play an important role in ATP gen-eration under these growth conditions. Two subunits of theperiplasmic [NiFe] hydrogenase (HynA-1 and HynB-1) werefound to be the most abundant periplasmic hydrogenaseproteins under the tested conditions. The peptide hits were,106 for HynA-1 and ,22 for HynB-1 at exponential phasein lactate medium, and ,100 for HynA-1 and ,16 for HynB-1 at stationary phase in lactate medium, respectively, sug-gesting they may play an important role in forming a protongradient by reoxidizing hydrogen generated by cytoplasmichydrogenase. In addition, several putative cytoplasmichydrogenases (DVU2399, DVU2400, and DVU2401) that
could be involved in hydrogen cycling were detected at sig-nificant expression levels in both growth phases. Theseresults suggest that hydrogen cycling may also play animportant role in forming a proton gradient by reoxidizingthe hydrogen generated by cytoplasmic hydrogenase(Table 3). However, no decrease in abundance of the HynAB-1 protein was observed for stationary phase in either of themedia, which is inconsistent with our microarray analysisthat showed the hynA-1 gene was down-regulated at sta-tionary phase (Fig. 6B) [7]. This may be an indication that theHynAB-1 protein is relatively stable once translated. Asexpected, formate dehydrogenase (DVU2812) was detected atboth growth phases in formate-based medium and waspresent at higher levels than in cells grown on lactate.
The electrons generated by periplasmic hydrogen oxida-tion are possibly stored within the periplasm in multihemec3-type cytochromes until they are passed through the innermembrane via electron shuttles. It is generally believed thatthe tetrahemic cytochrome c3 (DVU3171) is the primaryelectron acceptor from periplasmic hydrogen oxidation andaccounts for the majority of the c-type cytochromes of theperiplasm [3, 29]. This protein was detected in our proteomicanalysis (Table 2). Major components of ATP synthase werealso identified and comparative analysis showed that ATPsynthase proteins decreased in abundance at stationaryphase. This is consistent with results from the microarrayanalysis (Fig. 6B) [7], and is also consistent with the overallslowdown of metabolism at this growth phase.
Proteins involved in sulfate reduction, including threesubunits of dissimilatory sulfite reductase (DsvABC), adeny-lyl-sulfate reductase (AprAB), and sulfate adenylyltransferase
© 2006 WILEY-VCH Verlag GmbH & Co. KGaA, Weinheim www.proteomics-journal.com
Proteomics 2006, 6, 4286–4299 Microbiology 4295
Table 3. Key proteins involved in energy metabolism and sulfate reduction
Gene ID Lactate-based medium Formate-based medium Description
Exponential Stationary Exponential Stationary
Peptidehits
SD Peptidehits
SD Peptidehits
SD Peptidehits
SD
Energy metabolism
DVU3030 8.7 3.1 3.3 1.5 10.0 1.0 7.7 2.5 AckADVU0353 5.3 1.3 4.7 3.1 5.0 0.8 5.0 0.0 Alcohol dehydrogenaseDVU2201 56.7 6.5 46.0 4.8 69.3 4.4 92.3 8.2 Alcohol dehydrogenaseDVU2405 451.3 50.7 583.7 63.6 456.3 22.8 585.0 26.1 Alcohol dehydrogenaseDVU2885 2.7 2.2 4.3 1.2 2.3 0.6 2.3 0.6 alcohol dehydrogenaseDVU0779 3.3 2.5 5.7 2.3 6.3 2.9 4.7 2.5 ATP synthase F0, B subunitDVU0780 12.7 6.0 4.3 0.6 1.0 0.0 2.7 3.8 ATP synthase F0, B subunitDVU0777 79.7 3.7 36.7 1.5 80.0 12.0 49.0 6.4 ATP synthase, F1 alpha subunit (AtpA)DVU0775 147.7 19.2 126.3 17.6 165.7 17.6 126.7 8.9 ATP synthase, F1 beta subunit (AtpD)DVU0776 13.0 2.9 10.0 2.6 13.7 3.1 11.0 0.8 ATP synthase, F1 gamma subunit (AtpG)DVU2291 4.0 2.2 3.7 1.8 7.0 3.1 3.7 2.1 Carbon monoxide-induced hydrogenase CooHDVU3107 2.3 0.6 1.7 0.6 3.7 0.6 1.3 0.6 Cytochrome c family proteinDVU3171 4.0 1.3 2.0 1.4 1.0 0.0 2.3 0.6 Cytochrome c3DVU1817 11.7 4.0 3.3 0.6 12.0 2.0 13.7 2.1 Cytochrome c-553 (Cyf)DVU3271 22.0 3.6 14.3 1.5 19.0 1.0 20.7 4.0 Cytochrome d ubiquinol oxidase, subunit I (CydA)DVU2792 15.0 4.7 18.7 2.7 13.7 3.2 14.7 4.6 Electron transport complex protein RnfCDVU0264 11.3 1.5 10.3 1.3 14.3 2.3 13.3 2.7 Ferredoxin, 4Fe-4SDVU2680 5.7 1.2 21.3 4.3 9.0 2.0 11.7 1.6 FlavodoxinDVU2812 1.3 1.5 2.3 1.5 4.0 2.6 Formate dehydrogenase, alpha subunit (FdnG-3)DVU2402 11.0 3.1 12.3 3.3 17.3 2.6 18.0 5.8 Heterodisulfide reductase, A subunit (HdrA)DVU2403 16.3 6.1 10.7 2.6 20.3 8.2 28.0 5.0 Heterodisulfide reductase, B subunit (HdrB)DVU2404 1.7 1.5 2.3 0.6 2.3 1.2 4.3 1.5 Heterodisulfide reductase, C subunit (HdrC)DVU0849 34.0 6.9 32.7 6.7 49.3 4.3 33.3 4.2 Heterodisulfide reductaseDVU0848 14.7 1.2 6.7 1.3 23.7 1.3 15.3 1.3 Heterodisulfide reductaseDVU0850 6.3 1.5 3.7 0.6 8.7 4.5 5.7 1.5 Heterodisulfide reductaseDVU2290 3.0 1.0 3.0 1.0 1.7 1.2 2.0 1.0 Hydrogenase, CooU subunitDVU2401 25.3 2.3 16.7 6.1 20.0 3.6 23.3 1.9 Hydrogenase, iron-sulfur cluster-binding subunitDVU2399 26.7 5.2 29.3 11.5 18.3 4.6 28.3 3.4 HydrogenaseDVU2400 6.7 0.6 4.7 1.5 7.0 1.6 10.7 3.6 HydrogenaseDVU1951 3.0 0.8 1.7 0.6 1.3 0.6 0.7 0.6 Indolepyruvate ferredoxin oxidoreductase, alpha
subunitDVU1782 1.0 1.0 2.3 1.5 4.0 1.0 11.3 4.2 Iron-sulfur cluster-binding proteinDVU3033 11.0 0.8 12.3 1.8 6.0 2.6 8.7 3.3 Iron-sulfur cluster-binding proteinDVU0600 3.0 1.0 1.0 1.0 1.7 0.6 4.7 1.2 L-lactate dehydrogenase (Ldh)DVU0693 4.7 1.2 3.3 1.5 2.0 2.0 2.0 1.0 Molybdopterin oxidoreductaseDVU0694 17.0 3.1 16.3 8.2 25.7 2.3 18.0 5.3 Molybdopterin oxidoreductaseDVU0319 24.7 6.9 35.3 8.6 27.3 1.5 26.7 3.5 NAD-dependent epimerase/dehydratase family
proteinDVU0342 2.0 1.3 3.3 1.2 1.7 0.6 1.7 1.2 NAD-dependent epimerase/dehydratase family
proteinDVU0253 19.3 1.8 20.0 4.8 17.0 5.0 21.0 1.3 OxidoreductaseDVU1769 19.7 6.7 11.0 2.0 37.7 9.0 32.7 7.8 Periplasmic [Fe] hydrogenase, large subunit
(HydA)DVU1770 5.7 1.5 4.7 0.6 9.0 2.6 7.7 3.1 Periplasmic [Fe] hydrogenase, small subunit
(HydB)DVU1922 110.3 8.4 102.0 9.3 85.3 3.7 114.3 11.9 Periplasmic [NiFe] hydrogenase, large subunit,
isozyme 1 (HynA-1)DVU1921 22.7 16.0 21.0 5.9 15.3 1.5 16.0 2.4 periplasmic [NiFe] hydrogenase, small subunit,
isozyme 1 (hynB-1)DVU3029 0.7 0.6 9.0 3.3 3.7 1.2 6.7 0.8 PtaDVU2529 2.7 0.6 5.7 2.7 3.0 1.0 8.3 1.6 Phosphoglycerate kinase (Pgk)
© 2006 WILEY-VCH Verlag GmbH & Co. KGaA, Weinheim www.proteomics-journal.com
4296 W. Zhang et al. Proteomics 2006, 6, 4286–4299
Table 3. Continued
Gene ID Lactate-based medium Formate-based medium Description
Exponential Stationary Exponential Stationary
Peptidehits
SD Peptidehits
SD Peptidehits
SD Peptidehits
SD
DVU1834 9.7 1.5 9.7 1.5 7.3 2.1 10.3 1.9 Pyruvate carboxylaseDVU1569 10.3 4.3 7.7 3.5 17.0 1.6 16.3 1.8 PorADVU1570 5.0 1.0 3.3 1.5 7.0 1.0 8.7 1.2 PorBDVU3347 3.3 1.2 1.0 1.0 3.3 1.2 1.7 1.2 Pyruvate ferredoxin/flavodoxin oxidoreductase
family proteinsDVU3349 7.7 0.8 9.3 2.3 9.3 2.5 7.7 1.3 Pyruvate flavodoxin/ferredoxin oxidoreductaseDVU2514 5.3 1.6 18.3 9.5 20.0 1.7 39.3 7.6 Pyruvate kinase (Pyk)DVU3025 53.0 6.3 37.3 5.5 47.3 6.9 46.0 6.1 Por
Sulfate reduction
DVU0847 294.3 25.6 276.3 19.5 307.7 15.0 247.7 22.8 Adenylyl-sulfate reductase, alpha subunit (AprA)DVU0846 68.3 11.7 35.7 9.4 62.3 7.4 51.0 4.4 Adenylylsulfate reductase, beta subunit (AprB)DVU0402 180.7 17.7 109.3 10.4 192.0 14.9 186.0 9.3 Dissimilatory sulfite reductase alpha subunit
(DsvA)DVU0404 36.3 8.4 25.3 4.5 44.7 6.7 60.0 8.6 Dissimilatory sulfite reductase BDVU0403 152.7 17.1 177.7 41.3 181.0 45.1 207.0 59.1 Dissimilatory sulfite reductase beta subunit
(DvsB)DVU2776 25.7 4.9 38.0 4.3 35.3 2.9 28.0 3.7 Dissimilatory sulfite reductase, gamma subunit
(DsvC)DVU1295 180.3 19.6 278.3 35.7 291.3 38.8 331.3 46.8 Sulfate adenylyltransferase (Sat)DVU1597 6.0 3.6 3.0 1.0 6.0 1.7 7.0 1.7 Sulfite reductase, assimilatory-type
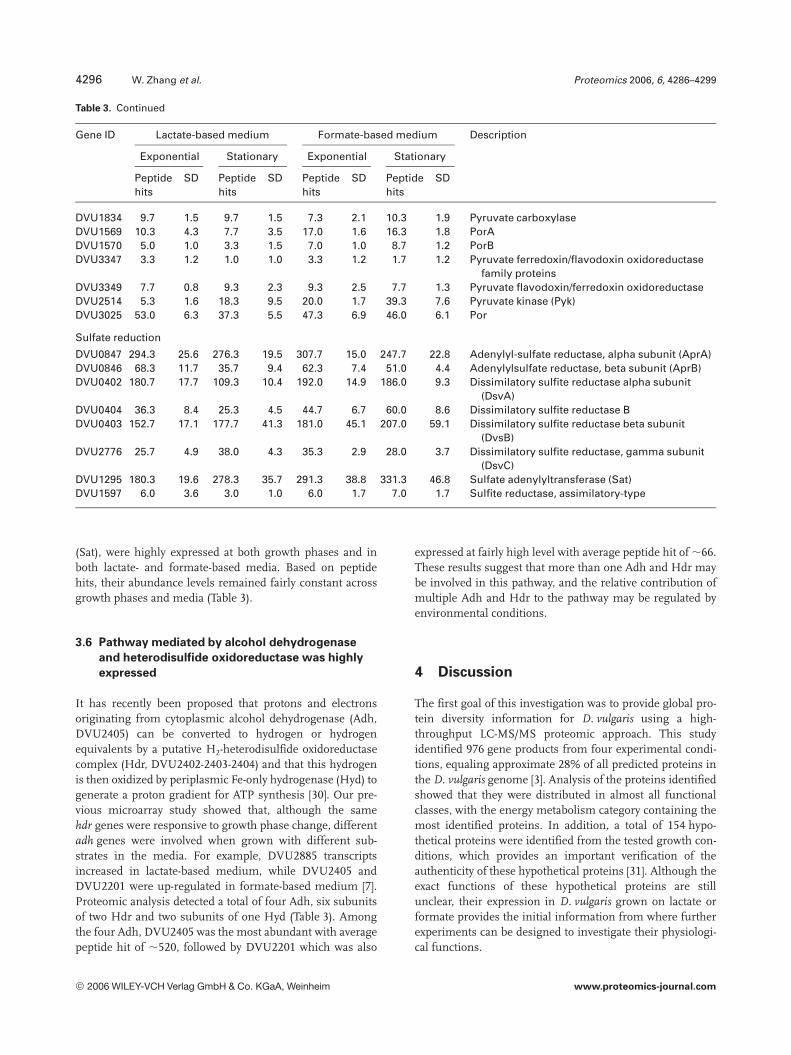
(Sat), were highly expressed at both growth phases and inboth lactate- and formate-based media. Based on peptidehits, their abundance levels remained fairly constant acrossgrowth phases and media (Table 3).
3.6 Pathway mediated by alcohol dehydrogenase
and heterodisulfide oxidoreductase was highly
expressed
It has recently been proposed that protons and electronsoriginating from cytoplasmic alcohol dehydrogenase (Adh,DVU2405) can be converted to hydrogen or hydrogenequivalents by a putative H2-heterodisulfide oxidoreductasecomplex (Hdr, DVU2402-2403-2404) and that this hydrogenis then oxidized by periplasmic Fe-only hydrogenase (Hyd) togenerate a proton gradient for ATP synthesis [30]. Our pre-vious microarray study showed that, although the samehdr genes were responsive to growth phase change, differentadh genes were involved when grown with different sub-strates in the media. For example, DVU2885 transcriptsincreased in lactate-based medium, while DVU2405 andDVU2201 were up-regulated in formate-based medium [7].Proteomic analysis detected a total of four Adh, six subunitsof two Hdr and two subunits of one Hyd (Table 3). Amongthe four Adh, DVU2405 was the most abundant with averagepeptide hit of ,520, followed by DVU2201 which was also
expressed at fairly high level with average peptide hit of ,66.These results suggest that more than one Adh and Hdr maybe involved in this pathway, and the relative contribution ofmultiple Adh and Hdr to the pathway may be regulated byenvironmental conditions.
4 Discussion
The first goal of this investigation was to provide global pro-tein diversity information for D. vulgaris using a high-throughput LC-MS/MS proteomic approach. This studyidentified 976 gene products from four experimental condi-tions, equaling approximate 28% of all predicted proteins inthe D. vulgaris genome [3]. Analysis of the proteins identifiedshowed that they were distributed in almost all functionalclasses, with the energy metabolism category containing themost identified proteins. In addition, a total of 154 hypo-thetical proteins were identified from the tested growth con-ditions, which provides an important verification of theauthenticity of these hypothetical proteins [31]. Although theexact functions of these hypothetical proteins are stillunclear, their expression in D. vulgaris grown on lactate orformate provides the initial information from where furtherexperiments can be designed to investigate their physiologi-cal functions.
© 2006 WILEY-VCH Verlag GmbH & Co. KGaA, Weinheim www.proteomics-journal.com
Proteomics 2006, 6, 4286–4299 Microbiology 4297
The second goal of this investigation was to identifyglobal protein abundance changes for D. vulgaris whengrown on different carbon sources to gain insights into thepathways of energy metabolism operating in this organism.For this purpose, the total number of peptide identifications(peptide hits) from each protein was used as a semi-quantitative means of assessing both the direction (increasevs. decrease) and significance of change in protein abun-dance. The successful application of peptide hits as an indexof protein abundance has been demonstrated in several pre-vious studies [8–11]. In one of these studies, a list of 74 pro-teins identified in human plasma, along with their con-centrations in plasma as previously documented in the liter-ature, was used to evaluate the correlation between thenumber of peptide hits for each protein and protein con-centrations. The result showed that peptide hit score in gen-eral reflected the abundance of the respective proteins, how-ever, low reproducibility in peptide hits for low abundantproteins (especially those with peptide hits of 0–3) from dif-ferent measurements was observed. These results suggestthat caution is required when using peptide hits as an indexof abundance for proteins with a low number of peptide hits[11]. In this investigation, several attempts were made toimprove the estimation of protein abundance by peptide hits;first, the sample from any given condition was a pool of threebiological replicates prepared independently; second, allpeptide samples were independently measured three timesand the average peptide hit was calculated for a given pro-tein. In addition, proteins that were detected in only one outof three independent measurements were excluded from theanalysis.
The results of this direct LC-MS/MS-based proteomicapproach suggests a huge range of protein abundance levelspresent in D. vulgaris. For example, highly abundant pro-teins, such as alcohol dehydrogenase, OmpA protein and60 kDa chaperonin (GroEL), were detected with peptide hitsof 222–585, while 42.6% of the proteins were identified withpeptide hits less than 2 (Supplementary Table 1). This is,however, not uncommon for bacteria since a large range inthe cellular protein concentrations has been reported formany organisms. For example, in E. coli the ribosomal pro-teins may exist at ,70 000 copies per cell, whereas the LacIregulatory protein may be present in as few as 20 copies percell [32].
Although several ATP-biosynthesis pathways have beenproposed in D. vulgaris, the relative contributions of thesepotential pathways are still unknown. To address this ques-tion, an attempt was made to utilize protein abundance datato provide information on the relative contributions of var-ious energy-yielding metabolic pathways to overall energygeneration in D. vulgaris. The results showed that HynAB-1was the most abundant protein known to be involved in ATPsynthesis, suggesting that hydrogen cycling may be one ofthe primary energy-generating pathways in D. vulgaris underthe tested conditions. Most of the enzymes in the substrate-level phosphorylation were also present in all tested condi-
tions. In addition, the results of this study also indicated thatthe proton gradient pathway catalyzed by alcohol dehy-drogenases and heterodisulfide reductases might be activelyfunctioning for ATP synthesis in D. vulgaris. However, noneof the enzymes involved in CO cycling and formate cyclingwere detected, suggesting that these may not be the primarypathways for ATP biosynthesis under the tested conditions.The results on energy metabolism in D. vulgaris using lactateas electron donor were summarized in Fig. 7. In a recentstudy, 2-D protein gel electrophoresis was used to evaluatethe changes occurring at the protein level following exposureof the anaerobic sulfate-reducing bacterium D. vulgaris tooxygen. Forty-two proteins with significantly differentialexpression were identified, among them the cellular con-centration of 25 proteins decreased while that of 17 proteinsincreased as a specific consequence of oxidative conditions[33]. Comparison showed that 30 out of the 42 proteins werealso identified in our study. Interestingly, 15 of the proteinsdown-regulated after oxidative stress were also found to bedown-regulated following the change from exponential tostationary growth phases in our study (SupplementaryTable 1). These proteins can be classified into several groups,with the first group including proteins directly involved inprotein and nucleic acid synthesis, such as DNA gyrase(DVU0259 and DVU0745) adenine deaminase (DVU0441),asparaginyl-tRNA synthetase (DVU1941) and dihydrooratase(DVU2902). The second group contains proteins involved inessential cellular processes such as cell division or in proteinfate. This group contains both the essential cell division pro-tein FtsZ (DVU2499) that forms the cytokinetic Z-ring andrecruits the other components of the septosome [34], and, apeptidyl-prolyl cis-trans isomerase (PPIase) (DVU1470)involved in protein folding and stabilization. The lowerabundance of this latter enzyme might result in mis-foldingof newly synthesized proteins, which would lead to theirrapid degradation [34]. The third group includes nigerythrin(DVU2103) and the universal stress protein (DVU1636)involved in ROS detoxification and other stress defenses.This comparative analysis suggests that the stress response(i.e., oxidative stress) and cellular aging may share somecommon regulatory mechanisms.
The results from proteomic analysis were in generalconsistent with our previous study using DNA microarraysto determine transcript abundance (Figs. 4, 5) [7]. However,we did find that when crosscondition comparisons (sta-tionary vs. exponential or formate vs. lactate) were performed,the abundances of most of the proteins corresponding tomRNAs that had shown changes in the microarray studywere not significantly changed at the protein level (undertwo-fold change of peptide hits). This result might beexplained by the fundamental biological differences betweenthe transcription and translation processes, such as differ-ential RNA and protein turnover and PTMs [34]. This differ-ence may also be a result of technological limitations, such asthe semiqualitative nature of the proteomics data. Never-theless, this study provides the first global snapshot of pro-
© 2006 WILEY-VCH Verlag GmbH & Co. KGaA, Weinheim www.proteomics-journal.com

4298 W. Zhang et al. Proteomics 2006, 6, 4286–4299
Figure 7. Scheme of energy metabolism pathway in D. vulgaris when using lactate as electron donor.
tein diversity and abundance in D. vulgaris, which hopefully,along with our recent microarray study [7], will provide gui-dance for further quantitative investigations.
We would like to thank the Environmental Molecular Sci-ences Laboratory (EMSL) at the Pacific Northwest NationalLaboratory (PNNL) for use of the proteomic instrumentationapplied in this research (EMSL proposal 15891). The EMSL is anational scientific user facility sponsored by the Department ofEnergy’s Office of Biological and Environmental Research. Wewould also like to thank Mr. Gang Wu of Department of Biologi-cal Sciences, University of Maryland at Baltimore County for hishelp on the CAI calculations for the D. vulgaris genome, andDr. Weijun Qian of Biological Systems Analysis & Mass Spec-trometry Group of PNNL for a critical reading of the manuscript.The research described in this paper was conducted under theLaboratory Directed Research and Development Program at thePacific Northwest National Laboratory (PNNL), a multi-program national laboratory operated by Battelle for the USDepartment of Energy under Contract DE-AC05-76RLO1830.
5 References
[1] Voordouw, G., Appl. Environ. Microbiol. 1995, 61, 2813–2819.
[2] Pieulle, L., Magro, V., Hatchikian, E. C., J. Bacteriol. 1997, 179,5684–5692.
[3] Heidelberg, J. F., Seshadri, R., Haveman, S. A., Hemme, C. L.et al., Nat. Biotechnol. 2004, 22, 554–559.
[4] Peck, H. D., Jr., Biochem. Biophys. Res. Comm. 1966, 22,112–118.
[5] Odom, J. M., Peck, H. D., Jr., FEMS Microbiol. Lett. 1981, 12,47–50.
[6] Voordouw, G., J. Bacteriol. 2002, 184, 5903–5911.
[7] Zhang, W., Culley, D. E., Scholten, J. C., Hogan, M. et al.,Antonie van Leeuwenhoek 2006, 89, 221–237.
[8] Gao, J., Opiteck, G. J., Friedrichs, M. S., Dongre, A. R. et al.,J. Proteome Res. 2003, 2, 643–649.
[9] Lee, C. L., Hsiao, H. H., Lin, C. W., Wu, S. P. et al., Proteomics2003, 3, 2472–2486.
[10] Liu, H., Sadygov, R. G., Yates, J. R. III, Anal. Chem. 2004, 76,4193–4201.
[11] Qian, W. J., Jacobs, J. M., Camp, D. G. II, Monroe, M. E. et al.,Proteomics 2005a, 5, 572–584.
[12] Keon, R. G., Fu, R., Voordouw, G., Arch. Microbiol. 1997, 167,376–383.
[13] Eng, J. K., McCormack, A. L., Yates, J. R. III, J. Am. Soc.Mass. Spectrom. 1994, 5, 976–979.
[14] Yates, J. R. III, Eng, J. K., McCormack, A. L., Schieltz, D., Anal.Chem. 1995, 67, 1426–1436.
[15] Washburn, M. P., Wolters, D., Yates, J. R. III., Nat Biotechnol2003, 19, 242–247.
[16] Qian, W. J., Liu, T., Monroe, M. E., Strittmatter, E. F. et al., J.Proteome Res. 2005b, 4, 53–62.
[17] Sharp, P. M., Li, W. H., Nucleic Acids Res. 1987, 15, 1281–1295.
© 2006 WILEY-VCH Verlag GmbH & Co. KGaA, Weinheim www.proteomics-journal.com
Proteomics 2006, 6, 4286–4299 Microbiology 4299
[18] Martin-Galiano, A. J., Wells, J. M., de la Campa, A. G.,Microbiology 2004, 150, 2313–2325.
[19] Wu, G., Culley, D. E., Zhang, W., Microbiology 2005, 151,2175–2187.
[20] Champion, M. M., Campbell, C. S., Siegele, D. A., Russell, D.H. et al., Mol. Microbiol. 2003, 47, 383–396.
[21] Tao, H., Bausch, C., Richmond, C., Blattner, F. R. et al., J.Bacteriol. 1999, 181, 6425–6440.
[22] Martin, J. F., Barreiro, C., Gonzalez-Lavado, E., Barriuso, M.,J. Biotechnol. 2003, 104, 41–53.
[23] Mrazek, J., Bhaya, D., Grossman, A. R., Karlin, S., NucleicAcids Res. 2001, 29, 1590–1601.
[24] Karlin, S., Mrazek, J., Campbell, A., Kaiser, D., J. Bacteriol.2001, 183, 5025–5040.
[25] Fournier, M., Zhang, Y., Wildschut, J. D., Dolla, A. et al., J.Bacteriol. 2003, 185, 71–79.
[26] Lumppio, H. L., Shenvi, N. V., Summers, A. O., Voordouw, G.et al., J. Bacteriol. 2001, 183, 101–108.
[27] Bsat, N., Chen, L., Helmann, J. D., J. Bacteriol. 1996, 178,6579–6586.
[28] Freestone, P., Nystrom, T., Trinei, M., Norris, V., J. Mol. Biol.1997, 274, 318–324.
[29] Aubert, C., Leroy, G., Bianco, P., Forest, E. et al., Biochem.Biophys. Res. Commun. 1998, 242, 213–218.
[30] Haveman, S. A., Brunelle, V., Voordouw, J. K., Voordouw, G.et al., J. Bacteriol. 2003, 185, 4345–4353.
[31] Kolker, E., Makarova, K. S., Shabalina, S., Picone, A. F. et al.,Nucleic Acids Res. 2004, 32, 2353–2361.
[32] Birch, R. M., O’Byrne, C., Booth, I. R., Cash, P., Proteomics2003, 3, 764–776.
[33] Fournier, M., Aubert, C., Dermoun, Z., Durand, M. et al., Bio-chimie 2006, 88, 85–94.
[34] Hegde, P. S., White, I. R., Debouck, C., Curr. Opin. Biotechnol.2003, 14, 647–651.
© 2006 WILEY-VCH Verlag GmbH & Co. KGaA, Weinheim www.proteomics-journal.com