High‐Performance Tandem Organic Solar Cells Using HSolar ...
Upload
khangminh22Category
view
1download
0
ULTRA: A Model Based Tool to Detect Tandem Repeats
Daniel Olson* andUniversity of Montana, Missoula, Montana [email protected]
Travis WheelerUniversity of Montana, Missoula, Montana [email protected]
Abstract
In biological sequences, tandem repeats consist of tens to hundreds of residues of a repeated
pattern, such as atgatgatgatgatg (‘atg’ repeated), often the result of replication slippage. Over time,
these repeats decay so that the original sharp pattern of repetition is somewhat obscured, but even
degenerate repeats pose a problem for sequence annotation: when two sequences both contain
shared patterns of similar repetition, the result can be a false signal of sequence homology. We
describe an implementation of a new hidden Markov model for detecting tandem repeats that
shows substantially improved sensitivity to labeling decayed repetitive regions, presents low and
reliable false annotation rates across a wide range of sequence composition, and produces scores
that follow a stable distribution. On typical genomic sequence, the time and memory requirements
of the resulting tool (ULTRA) are competitive with the most heavily used tool for repeat masking
(TRF). ULTRA is released under an open source license and lays the groundwork for inclusion of
the model in sequence alignment tools and annotation pipelines.
Keywords
Sequence Alignment; Annotation Error; Tandem Repeats
1 INTRODUCTION
Tandem repeats (TRs) such as catcatcatcatcatcat (a ‘cat’ subunit, repeated six times) make
up more than 3% of the human genome and are found in over 25% of human proteins [6].
Identification of TRs is key to characterizing their role in evolution [8, 11, 12], function [2,
3, 13, 14] and disease [22], though the primary motivation for development of TR–detecting
software has long been avoidance of false positive matches during sequence annotation [18,
19, 24]. These false matches arise because TRs are widespread and deviate from the random
nature assumed in the scoring systems of all sequence alignment software. As a concrete
example, consider the ‘cat’ repeat sequence above; in a truly random genome of 3 billion
nucleotides, we expect to see zero copies of this sequence, but the current release of the
human genome (hg38) contains more than 700 non–overlapping exact copies, and more than
Permission to make digital or hard copies of part or all of this work for personal or classroom use is granted without fee provided that copies are not made or distributed for profit or commercial advantage and that copies bear this notice and the full citation on the first page. Copyrights for third-party components of this work must be honored. For all other uses, contact the owner/author(s).*Author to whom correspondence should be addressed.
HHS Public AccessAuthor manuscriptACM BCB. Author manuscript; available in PMC 2019 May 09.
Published in final edited form as:ACM BCB. 2018 ; 2018: 37–46. doi:10.1145/3233547.3233604.
Author M
anuscriptA
uthor Manuscript
Author M
anuscriptA
uthor Manuscript
1200 instances with a single mutation from the perfect length–18 repeat pattern. These exact
and inexact copies, owing their existence to replication slippage [21] and subsequent
mutation, are not homologous to each other, yet would be considered significant matches by
typical sequence alignment software such as BLAST [1] and HMMER [7].
A common strategy for avoiding false annotation due to repetitive sequence is to somehow
identify repeat regions, then “mask” (hide) them away from sequence alignment tools, for
example by changing a masked region in a genome to a sequence of Ns; alignment software
assigns no score to alignments in such masked regions. An alternative strategy, soft masking,
marks characters so that they will not serve as alignment seeds, but allows them to be used in
scoring after seeding is complete. Numerous tools have been developed over the years to
detect tandem repeats and mask them in sequence annotation pipelines (for review see [15–
17]). Early approaches [19, 25] were superseded at the turn of the century by Tandem
Repeats Finder (TRF [4]), which remains the most heavily used DNA repeat detector to
date. TRF models repetitive regions as a series of Bernoulli trials, dependent on the
identification of pairs of nearby identical length–k runs. TRF is reasonably fast and
considered effective at recognizing repetitive regions and can report a repeat’s consensus
subunit, but it does not provide estimates of the statistical significance of its annotated
repeats and suffers from unstable score distribution on random sequence (see Section 2.3).
A more recent approach in the software TANTAN [9] utilizes a simple hidden Markov
model (HMM) to quickly compute the probability that each residue is part of a tandem
repeat. The generative model includes a state for non–repetitive sequence, with transitions
into states for repeats of various periodicity. While much more sensitive than TRF,
TANTAN is prone to either entirely missing repeat regions containing insertions or deletions
(indels) or breaking them into small islands, and is designed only for masking (i.e. it does
not report a repeat’s consensus subunit).
Though masking with these tools often restricts alignment software from finding a high–
scoring alignment to the masked sequence, false matches are still frequently observed in
sequences with decayed repeat regions that are missed by repeat–masking software [10]. For
example, when annotating the human genome with models of transposable element families,
we found many thousands of examples of high–scoring false matches caused by decayed
repeats missed by TRF [23]; overcoming these false annotations required significant semi–
manual masking of the transposable element family models.
These unmasked repeats are typically the result of insertions and deletions relative to the
consensus subunit (e.g. Figure 1, third line), which complicate their detection. It is a
straightforward process to identify a repeat consisting of perfect copies of a subunit,
however such perfect repeats typically decay over time, due to substitution mutations and
short indels. Substitution mutations are relatively straightforward to model: for a subunit of
length k, assign some score or probability to the character observed at a position i by
comparing that character with the character offset k positions earlier in the sequence, and
accumulate these scores/probabilities over a run of positions — repetitive sequence will
accumulate higher score/probability than nonrepetitive sequence. Indels pose the more
challenging problem. In the case of a single–letter insertion relative to the length–k
Olson and Wheeler Page 2
ACM BCB. Author manuscript; available in PMC 2019 May 09.
Author M
anuscriptA
uthor Manuscript
Author M
anuscriptA
uthor Manuscript

consensus subunit, each of the following k letters should be compared to the character k+1
positions earlier. The difficulty in identifying decayed repeat regions lies in tracking this sort
of offset from the standard frame across various lengths of potential insertion and deletion.
The models underlying TRF and TANTAN both focus on core indel–free runs with
secondary accommodation of indels. Others have explicitly incorporated indels into their
model, most notably the “sunflower” model of Nánási et. al. [20]; this approach, though able
to effectively model complex inexact repeat patterns, results in models too large and slow to
apply at genomic scale.
Here, we describe an approach based on an HMM that fills the gap between the simple
model of [9] and the highly expressive model of [20]. The result is a new tool that we call
ULTRA (‘ULTRA Locates Tandemly Repetitive Areas’) that models repeats of various
offset length and includes numerous states for indels at each offset. ULTRA finds degenerate
TRs missed by other software, maintains low false annotation rates across a broad range of
sequence composition, demonstrates a stable distribution of scores on random sequence,
reports contiguous repeat regions, and runs at speed comparable to other TR detection
software. Though it does not currently report consensus subunits or P–values, the framework
supports such future improvements as relatively straightforward enhancements. While
ULTRA is initially released as a standalone tool used to detect and mask TRs, it will
eventually be incorporated directly into sequence alignment tools as an improved model of
“random” sequence.
In the following sections, we demonstrate ULTRA’s efficacy in labeling approximately
repetitive sequence regions of various composition (in terms of both coverage and expected
false annotation), discuss labeling overlap among three tools, describe score distributions,
and analyze ULTRA’s performance characteristics. We then describe the model, along with
implementation strategies used to improve speed and space requirements. We focus our
attention on DNA sequence, as this is the most pressing need. We leave as future work a
variety of natural extensions: subunit consensus reporting, statistics, incorporation into
alignment pipelines, application to proteins, and characterization of repeats made possible
by the new model.
Unlike TRF, ULTRA is released under an open source license. This enables incorporation at
the source level into other software and analysis pipelines, and provides an opportunity for
feature enhancement from the community.
2 RESULTS
Measuring the efficacy of repeat annotation tools is complicated by the fact that there are no
reliable “true repeat” benchmarks. Though there exist advanced methods for simulating
plausibly complex genomic sequence containing regions of varying sequence bias
(isochores) and a distribution of transposable elements (e.g. [5]), modeling of tandem
repeats is less advanced — even in these tools, tandem repeats are simply injected into
simulated sequence based on the distribution of known tandem repeats. The circularity of
testing with such simulated sequence limits utility.
Olson and Wheeler Page 3
ACM BCB. Author manuscript; available in PMC 2019 May 09.
Author M
anuscriptA
uthor Manuscript
Author M
anuscriptA
uthor Manuscript

We approach the problem of assessing the efficacy of tandem repeat detecting tools in three
ways. First, we assess sensitivity to decayed repeats by considering coverage (the number of
residues labeled as repetitive) of real genomic sequence; this includes analysis of sequence
with high composition bias. Because increased sensitivity can be achieved simply by
parameterizing in a way that increases labeling of non–repetitive sequence, we also test the
extent of false labeling using shuffled genomic sequence. Second, we explore the extent to
which the tools agree or disagree in their labeling. This includes both quantitative inspection
of overlapping coverage and a qualitative consideration of the sort of repeats found by one
tool that are missed by others. Finally, because a stable distribution of scores is necessary for
reliable incorporation into annotation pipelines, we explore the distribution of scores on
non–repetitive sequence.
2.1 Sensitivity of Repeat Labeling
We tested the labeling performance of ULTRA, TANTAN, and TRF. To understand how
well each tool labels decayed repetitive regions in genomic sequence, we applied the tools to
(i) the human genome (chromosome 18; this has AT content of 60%, representative of the
entire human genome), and (ii) two AT–rich genomes (Plasmodium falciparum &
Dictyostelium discoideum; results averaged over both genomes, which are each 80% AT).
For each tool, we used a pair of parameterizations, one “sensitive” (higher coverage, at the
cost of higher rate of false labeling), and one “conservative” (lower false labeling rate, with
accompanying lower coverage). Sensitivity was assessed based on the coverage of genomic
sequence (the number of nucleotides labeled as being part of a repetitive region), while
expected false labeling was determined by using each tool to mask window–shuffled
sequence (chromosomal sequence mononucleotide shuffled in blocks of 10Kb, with the goal
of preserving the potentially confounding effects of isochore composition variability; see
Section 3.4). Figure 2 shows the results of these experiments.
Under both sensitive and conservative settings, and on genomes with both moderate and
biased composition, ULTRA labels substantially more genomic sequence as repetitive than
TANTAN. This increased coverage does not come at the cost of false annotation: in all
cases, ULTRA’s estimated false annotation rate is somewhat lower than that of TANTAN,
and its False Discovery Rate (FDR) is much lower.
The picture for TRF is somewhat more complex. On relatively neutral composition (the
human genome), ULTRA is clearly much more sensitive, and and less prone to false
labeling. On AT-rich genomes, the sensitive parameterization of TRF labels ~10% more of
the genome as repetitive than does ULTRA, but nearly all of that increased coverage appears
to be the result of false labeling — more than 30% of TRF’s labeled repeats are expected to
be false. Similar results are seen with the conservative parameterization of TRF, which
compare unfavorably even to the conservative parameterization of ULTRA.
TRF’s high false labeling rate on sequences with highly–biased composition is due to the
fact that the model of TRF does not account for sequence composition, and that such biased
sequence naturally produces regions that looks vaguely repetitive if the context is ignored.
Another concern is the risk of overextension in AT–rich sequence: when a correctly–labeled
AT–rich repeat is flanked by more AT–rich non–repetitive sequence, some of that flanking
Olson and Wheeler Page 4
ACM BCB. Author manuscript; available in PMC 2019 May 09.
Author M
anuscriptA
uthor Manuscript
Author M
anuscriptA
uthor Manuscript

sequence may be incorrectly pulled in as part of the repeat, simply because it slightly helps
the scoring of the true repeat. Our false labeling test does not identify this sort of problem,
but manual inspection of sensitive TRF’s annotation of AT–rich sequence suggests that this
may be a common phenomenon (i.e. is a possible hidden source of additional false labeling).
2.2 Comparing Repeats Labeled by Each Tool
While coverage and false labeling numbers provide summary statistics useful for comparing
tools and parameterizations, we have found it enlightening to consider how these tools
overlap in coverage. Figure 3 (top) shows, of all nucleotides labeled by at least one tool, the
fraction labeled by each collection of tools. It also shows the reciprocal shared coverage of
nucleotides (bottom). We find it particularly striking that even though ULTRA demonstrates
much greater coverage, each other tool labels a large number of repeats not labeled by
ULTRA, much larger than the expected false labeling.
We have manually inspected the collection of tool–unique repeats, and find that when TRF and/or TANTAN label a region that is not labeled by ULTRA, the region is typically fairly
short (under 40 nucleotides in length; see Figure 4 for overall length distribution).
TANTAN–unique repeats frequently look to us more like low–complexity sequence (high
levels of AT or CG, often as bursts of mononucleotide strings) than degenerate repeats (see
Figure 6A&B). Meanwhile, regions labeled by ULTRA and not the others are often longer,
with more complex patterns of insertion and deletion that, once visualized, suggest the
repetitive nature of the sequence (see 6C). While we have tried to present an unbiased
sampling of representative unique matches, we make available our datasets so that others
may review them and develop their own impression (see Section 4.4).
2.3 Score Distribution
The most common use of tandem repeat detection is to mask a sequence prior to annotation
of other elements (e.g. genes or transposable elements) based on sequence alignment score.
An alternative is to compete putative alignment matches with putative repeat regions,
selecting the annotation with greatest significance. In development of [23] we devised an
approach that converts TRF scores to P–values, assuming a mixture of Gumbel distributions.
The method enables comparison of matches in the annotation pipeline by comparing P-
values for TRF matches to E–values for homology search tool hits, but the choice of fat–
tailed distribution is not well supported. This is in part because we don’t know how the
distribution decays (we selected the Gumbel for simplicity), but primarily because TRF score frequencies vacillate wildly (Figure 5A — frequently showing a 10-fold difference in
counts between two neighboring integer scores). Furthermore, reasonably high–scoring
repeats found in non–repetitive sequence are much more likely to be labeled as a high–
period repeat than a low–period repeat (e.g. for TRF hits with score >30, the number of
period–10 repeats is ~200× larger than the number of period–4 repeats).
This instability of score and period distributions was a primary motivator in the development
of ULTRA. To understand stability of score distribution, we used TRF and ULTRA to label
large volumes of non–repetitive sequence (uniform nucleotide distribution), and captured the
frequency of scores. TRF scores are reported as integers, so no additional binning is
Olson and Wheeler Page 5
ACM BCB. Author manuscript; available in PMC 2019 May 09.
Author M
anuscriptA
uthor Manuscript
Author M
anuscriptA
uthor Manuscript

required. ULTRA scores are floating point; we binned in increments of 0.3 bits to gain
granular insight. ULTRA’s score distribution shows a much more stable decay (Figure 5B).
TANTAN was not considered in this analysis, as repeat regions are not scored — the only
provided metric is a per–residue measure of TANTAN’s confidence that the labeled residue
is part of a repeat. This supports masking, but not a more nuanced comparison of candidate
annotations.
2.3.1 Performance.—We measured the computational performance of ULTRA, TRF,
and TANTAN on Human and AT rich sequences (Table 1). TRF runs reasonably quickly on
sequences with few repeats, but slows with high repeat density. Human centromeres in hg38
contain simulated repetitive sequence, which leads to a dramatic increase in run time for
TRF, but not ULTRA or TANTAN. Since labeling simulated sequence is not an appropriate
use of TRF, we masked centromeres before this test. TANTAN demonstrates excellent
runtime and memory usage across a broad range of sequences. We found that ULTRA runs
comparably to TRF in sequences with few repeats, and significantly faster in more repetitive
sequences. ULTRA’s memory requirements are modest.
3 METHODS
3.1 A Hidden Markov Model for Random Sequence Including Tandem Repeats
ULTRA is based on a model of repetitive sequence interspersed within a background of
non–repetitive sequence. A hidden Markov model (HMM) is a probabilistic model capable
of generating sequences that “look like” the modeled sequence, and also of labeling new,
unlabeled sequence so that regions may be said to have been generated by one state (e.g. the
non–repetitive state) or another (e.g. the period 3 state, meaning that the sequence consists
of multiple copies of a three–letter subunit). A high–level representation of the model is
shown in Figure 7.
3.1.1 A state for non–repetitive sequence.—The central state in ULTRA’s model
generates non–repetitive sequence. This is a memoryless 0th order state that repeatedly
emits a single character from a fixed distribution without regard for what has been
previously emitted. This is effectively the model of background sequence assumed by
alignment tools based on both score matrices (e.g. BLAST [1]) and profile HMMs (e.g.
HMMER [7]).
3.1.2 States for repetitive sequence.—ULTRA’s model includes state–sets
responsible for generating repeats with subunit size (periodicity) of 1 (mono–residue
repeats) through an arbitrary cap (default in our experiments is 25). Each repeat–period state
set consists of (i) a core state that produces letters based on previously–observed letters, and
(ii) a collection of auxiliary states that allow for decay of perfectly periodic repetition
resulting from insertions and deletions.
There is one core repeat state for each subunit length. The 1st–order state emits (possibly
degenerate) mono–residue runs, the 2nd–order state emits di–residue repeats, and so forth.
In a repeat state of order k, the probability of emitting a certain letter at position i, depends
Olson and Wheeler Page 6
ACM BCB. Author manuscript; available in PMC 2019 May 09.
Author M
anuscriptA
uthor Manuscript
Author M
anuscriptA
uthor Manuscript

on the letter observed at position (i−k). As an example, the letter emission distribution for a
3rd–order−state (for a repeat with period 3) depends on the letter observed three positions
earlier. In typical HMMs, a kth–order state has an emission distribution that depends on all k
most–recently observed letters; our model simplifies this to consider only the letter found k
positions back, allowing even high–order states to have small emission probability tables.
The core repeat states are part of the state set pictured in Figure 7, and shown in detail in
Figure 8.
In addition to the core repeat state, ULTRA’s model contains a collection of states designed
to allow insertions or deletions (Figure 8). Ideally, these would allow insertions and
deletions at arbitrary locations in the pattern (as in [20]), but for simplicity, the model only
allows consecutive insertions or deletions. For example, for a subunit ATCGT, the repeat
ATCGTATTCGGTATCGT contains two discontinuous insertions; ULTRA will seek identify
two consecutive insertions instead, e.g. ATCGTATTCGGTATCGT, causing a small number
of additional offset mismatches. The speed enabled by this simplification appears to be
worth the dependency on nonconsecutive insertions. In experiments presented here, we
limited the maximum length of consecutive insertion or deletion to 5 (no apparent loss in
sensitivity). This limits growth of the number of states in the HMM, which keeps run time at
an acceptable level.
3.1.3 Scoring a repeat region depends on a non–repetitive model.—With an
HMM, an observed sequence of letters can be explained as having been generated by any
sequence of states; the probability of the observed sequence and one particular sequence of
responsible states is simply the product of the probabilities of transitioning between those
states and the probabilities of the observed sequence being emitted by those states. Given a
short sequence S, the ULTRA HMM computes the most–probable state path for S using the
Viterbi algorithm, based on emission and transition probabilities from Figures 7 and 8.
The score of a repeat region is computed as the log of the ratio of this probability (due to the
repetitive model) and the probability under a simple model of non–repetitive sequence. The
non–repetitive model is a single state identical to that described in Section 3.1.1.
3.1.4 Parameterization.—For the current study, we have hand selected apparently–
reasonable parameters. In the future, it may prove valuable to train the parameters of our
model on trustworthy repeat sequences (though results from [9] suggest that this may not be
fruitful). Though the model is general, all tests were performed on DNA only; parameters
have thus only been tested for DNA.
The non–repetitive state (and background) emission probabilities are determined from the
composition of the sequence to be labeled. To account for composition variability due to
isochores, ULTRA considers the composition of a large (default 100Kb) window centered
around each labeled residue. By including this background model, ULTRA effectively
avoids spurious labeling due to simple sequence composition bias.
Repetitive states have a probability of emitting a letter that matches the previous letter
(based on appropriate periodicity). In non–repetitive DNA with uniform letter distribution,
Olson and Wheeler Page 7
ACM BCB. Author manuscript; available in PMC 2019 May 09.
Author M
anuscriptA
uthor Manuscript
Author M
anuscriptA
uthor Manuscript

the expected probability of matching a previous letter is 25%; that number rises as
composition becomes increasingly biased. To offset this background expectation of
matching, we employ a simple ad-hoc strategy for setting the expected frequency of emitting
a match in a repetitive state: if μ is the expected frequency of a match in non–repetitive
sequence, then the repetitive match probability M = min(1.0, 0.1+2μ). This leads to a match
probability of 0.61 in human chromosome 18, and 0.78 in 80% AT–rich sequence. The
probability of each of the three mismatched letters in repetitive states is simply a uniform
division of the remaining probability, (1−M)/3.
The probability of transitioning from non–repetitive) sequence to repetitive sequence (α)
was set to 1%. Though higher–period repeats may be less common than lower ones, we
adopted a flat prior for these tests: each subunit length was considered equally likely. The
probability of beginning an insertion (λ) or deletion (δ) was set to 5%. The probability of
extending either was set to 50%. The probability of ending the repeat (ϵ) was set to 4%. We
have no reason to expect that these are optimal parameters.
3.2 Traceback and score derivation
Repeats are found in a two pass process. In the first pass, a full dynamic programming
Viterbi matrix is filled in for a sequence block of default size 10Kb, using the model and
parameters described above. The 10Kb windows are overlapped to ensure traceback quality.
In the second pass, the standard Viterbi traceback is performed, starting (at the end of the
matrix) from the state with highest score; this recovers the most–probable assignment of all
letters in the window to their emitting states. In regions in which the traceback passes
through repetitive states, the scores at the beginning and end of the repeat–labeled sequence
are captured; this is the score of the repeat region. If that score is greater than reporting
threshold, the region is reported as a TR. At present, the distribution of scores is not
sufficiently characterized to convert these scores to meaningful E–values.
3.3 Collapsing Calculation on the Insert and Delete Paths
ULTRA’s model consists of numerous insertion and deletion (indel) state paths. These are
key to ULTRA’s improved modeling of the indels that are common in degenerate repeat
regions, but they also cause a large increase in the state space within which HMM Viterbi
calculations are made. Here, we describe an optimization that allows ULTRA to include a
large number of state paths without incurring a significant performance penalty.
All states within insertion and deletion paths have a single parent from which they are
reached. Additionally, when a length–n insert is found in an order–k repeat state–set, an
insertion path will consist of a contiguous block of n 0th order states (the insertions relative
to the repeat) followed directly by a contiguous block of k states with the order k +n.
(Similarly, in a given deletion path there is a contiguous block of k − n order states followed
directly by a contiguous block of 2k − n order states.) These properties enable a significant
reduction in required calculations, demonstrated here in the context of an insertion. After
having calculated the score for the final state of an insertion path once at position t of the
target sequence, we can calculate the score for the final state of an alternate indel path at
position t + 1 by reusing redundant calculations shared by the two paths, and computing the
Olson and Wheeler Page 8
ACM BCB. Author manuscript; available in PMC 2019 May 09.
Author M
anuscriptA
uthor Manuscript
Author M
anuscriptA
uthor Manuscript

small number of non–redundant calculations. This reduction in calculation is analogous to
calculating a moving average by only computing values that been removed/added since the
last time the moving average was computed.
As an example, let Ik,n,k (t) be the final state in the path coming out of a length n insertion
within the repetitive period–k state set, when emitting the nucleotide at position t. Let θk (t) represent the kth order emission score for the letter at position(t). Instead of recalculating the
entire insertion path, we can perform the following calculation:
Ik, n, k t + 1 =Ik, n, k t θk t − m − n θ0 t − m + 1 θk + n t + 1
θk t − m − n − 1 θ0 t − m − n θk + n t − m
Figure 9 demonstrates with a concrete example of this reduction applied to three consecutive
insertions within a period–4 repetitive state. The calculation reduction effectively reduces
the number of states needed from O(K2) to O(K), where K is the maximum periodicity.
3.4 Sensitivity experiments
Experiments were performed using human chromosome 18 (version hg38), Plasmodium
falciparum (EPr1), and Dictyostelium discoideum (2.7). False annotation experiments were
performed by block–shuffling: genomic sequence was broken into contiguous 10Kb blocks,
and each block was mononucleotide shuffled. This breaks apart all actual repetitive
sequence, but preserving the potentially confounding effects of composition variability due
to genetic isochores.
TRF version 4.09 was tested with conservative settings (default from TRF documentation:
match=2 mismatch=7 indel=7 pm=80 pi=10 minscore=30 maxperiod=25) and sensitive
changes to those settings recommended in [9] (mismatch=5 indel=5).
TANTAN version 13 was run on the human genome with default settings, constrained to
maximum period of 25 (–w 25). For AT–rich genomes, we used the ATMask matrix
provided on the TANTAN website, and increased the probability of starting a repeat as
recommended (–r 0.01). TANTAN determines which nucleotides to report as repetitive by
computing labeling confidence. In default settings, it reports all nucleotides for which it is at
least 50% confident in the annotation — this is the sensitive variant of TANTAN in our
experiments. To achieve lower false discovery rate, our conservative variant of TANTAN used a confidence threshold of >85%.
ULTRA was run with default settings: enter–repeat=0.01 exit–repeat=0.04 insertion=0.05
deletion=0.05 maxinsertions=5 maxdeletions=5 rolling–window=100,000. ULTRA score
thresholds were selected based on expected false positive levels (chosen to be integer values
with false annotation no worse than TANTAN for the corresponding search) — on human
sequence the resulting score thresholds were 9 (sensitive) and 13 (conservative); on AT–rich
genomes, 12 (sensitive) and 16 (conservative). At time of manuscript submission, these
thresholds were set manually, but predicted false labeling from block–shuffled sequence will
support automatic thresholds upon software release.
Olson and Wheeler Page 9
ACM BCB. Author manuscript; available in PMC 2019 May 09.
Author M
anuscriptA
uthor Manuscript
Author M
anuscriptA
uthor Manuscript

3.5 Complexity and performance
Let K be the maximum periodicity of repeat states, and Φ be the maximum number of
allowed contiguous insertions, and Δ be the maximum number of allowed contiguous
deletions (both Φ and Δ are set to 5 by default). Then the total number of states in our
model, including indel recovery states, is O(K2(Φ+Δ)). The removal of redundant
calculations described in Section 3.3, reduces the number of computed values for each
labeled letter to be reduced by a factor of K, so that labeling a sequence of length m requires
time O(mK(Φ + Δ)).
Testing was performed on a 4.2 GHz Intel Core i7 iMac with 16 GB available RAM running
MacOS 10.13.4. Custom python and bash scripts were written to run and analyze
experiments.
4 DISCUSSION
We have developed an HMM–based tool, ULTRA, that efficiently detects tandem repeats
within a background of non–repetitive sequence. It is effective even in the face of repeats
decayed by insertions and deletions relative to the repeat subunit. Due to optimizations in
indel state calculations, the speed and memory requirements of ULTRA are competitive with
the most used repeat labeling tool, TRF. In both sensitive and conservative modes, ULTRA shows excellent sensitivity and false labeling performance on genomes with a variety of
sequence composition.
At present, ULTRA reports score and subunit size (periodicity) for each repeat, but not
consensus pattern. Recovering and reporting the consensus will come in the future.
4.1 Parameterization
We acknowkedge that ULTRA utilizes hand-optimized parameters, which may have resulted
in an over-fitting of the tool to particular inputs. We have tried to avoid this by testing across
a range of input sequences, and depending on FDR to guide score thresholds. More careful
consideration of parameterization is called for. In addition, ULTRA has been tested only on
DNA; while it uses a general model that should apply in straightforward fashion to protein
repeat annotation, additional parameterization will be required.
4.2 Statistics
The score distributions produced by ULTRA are more stable than the score distributions
produced by TRF, but statistics of these scores are not yet understood. Reliable statistics will
improve the value of repeat annotation — rather than simple masking of sequence, the
significance of a repeat annotation can be held in contrast to the significance of a homology
search tool hit containing that repeat.
4.3 Non–overlapping Tool Results
The substantial independence of repeat regions labeled by various tools is surprising. Based
on experience with false sequence homology annotation due to degenerate repeats, we
expect the the repeats unique to ULTRA will prove more valuable for annotation
Olson and Wheeler Page 10
ACM BCB. Author manuscript; available in PMC 2019 May 09.
Author M
anuscriptA
uthor Manuscript
Author M
anuscriptA
uthor Manuscript

correctness, as current homology tools have reasonably effective ways to deal with simple
(non–repetitive) biased composition. Also, the increased abundance of longer and more
complex repeats found by ULTRA is important because longer repeats are more likely to
supply enough support in sequence homology tools to bring a false hit above annotation
threshold for a sequence search tool.
Looking to future applications of the ULTRA model, in which the model is incorporated into
homology software, and probability/score of repetitiveness is used to offset the score of a
homology hit: the regions labeled exclusively by TRF and TANTAN in these tests aren’t
ignored by ULTRA -, their scores simply do not rise above ULTRA’s reporting threshold. In
the context of annotation, those sub–threshold values for short sequences will still be useful
for offsetting the scores of false homlogy matches.
4.4 Availability
ULTRA is released under the BSD–3–Clause open source license. Software and
documentation are available at https://github.com/TravisWheelerLab/ULTRA.
All benchmarks are available at https://wheelerlab.org/publications/Olson18/
Olson18.suplement.tar.gz.
ACKNOWLEDGMENTS
Funding by NIH P20GM103546. Conflicts of interest: none declared.
REFERENCES
[1]. Altschul Stephen F, Madden Thomas L, Schäffe Alejandro A, Zhang Jinghui, Zhang Zheng, Miller Webb, and Lipman David J. 1997 Gapped BLAST and PSI-BLAST: a new generation of protein database search programs. Nucleic Acids Research 25, 17 (1997), 3389–3402. [PubMed: 9254694]
[2]. AL Armour John. 2006 Tandemly repeated DNA: why should anyone care? Mutation Research/Fundamental and Molecular Mechanisms of Mutagenesis 598, 1 (2006), 6–14. [PubMed: 16504217]
[3]. Bacolla Albino, Larson Jacquelynn E, Collins Jack R, Li Jian, Milosavljevic Aleksandar, Stenson Peter D, Cooper David N, and Wells Robert D. 2008 Abundance and length of simple repeats in vertebrate genomes are determined by their structural properties. Genome Research 18, 10 (2008), 1545–1553. [PubMed: 18687880]
[4]. Benson Gary. 1999 Tandem repeats finder: a program to analyze DNA sequences. Nucleic Acids Research 27, 2 (1999), 573. [PubMed: 9862982]
[5]. Caballero Juan, Arian FA Smit Leroy Hood, and Glusman Gustavo. 2014 Realistic artificial DNA sequences as negative controls for computational genomics. Nucleic Acids Research 42, 12 (2014), e99–e99. [PubMed: 24803667]
[6]. International Human Genome Sequencing Consortium. 2001 Initial sequencing and analysis of the human genome. Nature 409, 6822 (2001), 860. [PubMed: 11237011]
[7]. Eddy Sean R. 2009 A new generation of homology search tools based on probabilistic inference. Genome Informatics 23 (2009), 205–211. [PubMed: 20180275]
[8]. Marta Farré Montserrat Bosch, López-Giráldez Francesc, Ponsà Montserrat, and Ruiz-Herrera Aurora. 2011 Assessing the role of tandem repeats in shaping the genomic architecture of great apes. PLoS One 6, 11 (2011), e27239. [PubMed: 22076140]
[9]. Frith Martin C. 2010 A new repeat-masking method enables specific detection of homologous sequences. Nucleic Acids Research 39, 4 (2010), e23–e23. [PubMed: 21109538]
Olson and Wheeler Page 11
ACM BCB. Author manuscript; available in PMC 2019 May 09.
Author M
anuscriptA
uthor Manuscript
Author M
anuscriptA
uthor Manuscript
[10]. Frith Martin C, Hamada Michiaki, and Horton Paul. 2010 Parameters for accurate genome alignment. BMC Bioinformatics 11, 1 (2010), 80. [PubMed: 20144198]
[11]. Gemayel Rita, Vinces Marcelo D, Legendre Matthieu, and Verstrepen Kevin J. 2010 Variable tandem repeats accelerate evolution of coding and regulatory sequences. Annual Review of Genetics 44 (2010), 445–477.
[12]. Jansen An, Gemayel Rita, and Verstrepen KJ. 2012 Unstable microsatellite repeats facilitate rapid evolution of coding and regulatory sequences. Repetitive DNA 7 (2012), 108–125.
[13]. Kashi Yechezkel and King David G. 2006 Simple sequence repeats as advantageous mutators in evolution. TRENDS in Genetics 22, 5 (2006), 253–259. [PubMed: 16567018]
[14]. Kolb Jessica, Chuzhanova Nadia A, Högel Josef, Vasquez Karen M, Cooper David N, Bacolla Albino, and Kehrer-Sawatzki Hildegard. 2009 Cruciform-forming inverted repeats appear to have mediated many of the microinversions that distinguish the human and chimpanzee genomes. Chromosome Research 17, 4 (2009), 469–483. [PubMed: 19475482]
[15]. Leclercq Sébastien, Rivals Eric, and Jarne Philippe. 2007 Detecting microsatellites within genomes: significant variation among algorithms. BMC Bioinformatics 8, 1 (2007), 125. [PubMed: 17442102]
[16]. Guan Lim Kian, Keong Kwoh Chee, Yang Hsu Li, and Wirawan Adrianto. 2012 Review of tandem repeat search tools: a systematic approach to evaluating algorithmic performance. Briefings in Bioinformatics 14, 1 (2012), 67–81. [PubMed: 22648964]
[17]. Merkel Angelika and Gemmell Neil. 2008 Detecting short tandem repeats from genome data: opening the software black box. Briefings in Bioinformatics 9, 5 (2008), 355–366. [PubMed: 18621747]
[18]. Mistry Jaina, Finn Robert D, Eddy Sean R, Bateman Alex, and Punta Marco. 2013 Challenges in homology search: HMMER3 and convergent evolution of coiled-coil regions. Nucleic Acids Research 41, 12 (2013), e121–e121. [PubMed: 23598997]
[19]. Morgulis Aleksandr, Gertz E Michael, Schäffer Alejandro A, and Agarwala Richa. 2006 A fast and symmetric DUST implementation to mask low-complexity DNA sequences. Journal of Computational Biology 13, 5 (2006), 1028–1040. [PubMed: 16796549]
[20]. Nánási Michal, Vinař Tomáš, and Brejová Broňa. 2014 Probabilistic approaches to alignment with tandem repeats. Algorithms for Molecular Biology 9, 1 (2014),3. [PubMed: 24580741]
[21]. Pumpernik Danilo, Oblak Borut, and Borštnik Branko. 2008 Replication slippage versus point mutation rates in short tandem repeats of the human genome. Molecular Genetics and Genomics 279, 1 (2008), 53–61. [PubMed: 17926066]
[22]. Usdin K and Grabczyk E. 2000 DNA repeat expansions and human disease. Cellular and Molecular Life Sciences 57, 6 (2000), 914–931. [PubMed: 10950307]
[23]. Wheeler Travis J, Clements Jody, Eddy Sean R, Hubley Robert, Jones Thomas A, Jurka Jerzy, Smit Arian FA, and Finn Robert D. 2012 Dfam: a database of repetitive DNA based on profile hidden Markov models. Nucleic Acids Research 41, D1 (2012), D70–D82. [PubMed: 23203985]
[24]. Wong Wing-Cheong, Maurer-Stroh Sebastian, Eisenhaber Frank. 2010 More than 1,001 problems with protein domain databases: transmembrane regions, signal peptides and the issue of sequence homology. PLoS Computational Biology 6, 7 (2010), e1000867. [PubMed: 20686689]
[25]. Wootton John C and Federhen Scott. 1996 [33] Analysis of compositionally biased regions in sequence databases. Computer Methods for Macromolecular Sequence Analysis 266 (1996), 554–571.
Olson and Wheeler Page 12
ACM BCB. Author manuscript; available in PMC 2019 May 09.
Author M
anuscriptA
uthor Manuscript
Author M
anuscriptA
uthor Manuscript

CCS CONCEPTS
• Applied computing → Molecular sequence analysis; Recognition of genes and regulatory elements;
Olson and Wheeler Page 13
ACM BCB. Author manuscript; available in PMC 2019 May 09.
Author M
anuscriptA
uthor Manuscript
Author M
anuscriptA
uthor Manuscript

ACM Reference Format:
Daniel Olson and Travis Wheeler. 2018. ULTRA: A Model Based Tool to Detect Tandem
Repeats. In ACM-BCB’18: 9th ACM International Conference on Bioinformatics, Computational Biology and Health Informatics, August 29-September 1, 2018, Washington, DC, USA. ACM, New York, NY, USA, 10 pages. https://doi.org/
10.1145/3233547.3233604
Olson and Wheeler Page 14
ACM BCB. Author manuscript; available in PMC 2019 May 09.
Author M
anuscriptA
uthor Manuscript
Author M
anuscriptA
uthor Manuscript

Figure 1: Example of a Tandem Repeat consisting of four perfect CATG copies (first line),
degenerated by substitution mutations (second line), then insertions and deletions (third
line). All deviations from the perfect repeat are shown in a gray font.
Olson and Wheeler Page 15
ACM BCB. Author manuscript; available in PMC 2019 May 09.
Author M
anuscriptA
uthor Manuscript
Author M
anuscriptA
uthor Manuscript

Figure 2: Repeat labeling of the human genome (chromosome 18, 60% AT–rich) and two AT–rich
eukaryotes (Plasmodium falciparum and Dictyostelium discoideum). The length of the bar
(blue + red) gives the total percent of the genome that is labeled as repetitive by the
corresponding tool/setting. The length of the red bar is an estimate of the extent of expected
false labeling. Thus, the blue bar shows the proportion of the labeling that is expected to be
correct. For each dataset and each tool, an estimated False Discovery Rate (FDR) is
computed as the ration of estimated false coverage to total coverage.
Olson and Wheeler Page 16
ACM BCB. Author manuscript; available in PMC 2019 May 09.
Author M
anuscriptA
uthor Manuscript
Author M
anuscriptA
uthor Manuscript

Figure 3: Overlap between the set of nucleotides labeled by three tools. Each tool was run with
sensitive settings. The Venn diagrams show, among all nucleotides labeled as repetitive by at
least one tool, the fraction that were labeled by each tool or set of tools. The tables on
bottom show what percent of nucleotides called repetitive by the top tool were also called
repetitive by the left tool. For example, in the human sequence, ULTRA labels as repetitive
52% of the nucleotides labeled repetitive by TANTAN, while TANTAN labels as repetitive
only 38% of the nucleotides labeled repetitive by ULTRA. Target sequences are the same as
in Figure 2.
Olson and Wheeler Page 17
ACM BCB. Author manuscript; available in PMC 2019 May 09.
Author M
anuscriptA
uthor Manuscript
Author M
anuscriptA
uthor Manuscript

Figure 4: Number of nucleotides labeled in repeats, by length. We considered the repeats labeled on
human chromosome 18, using each tool at sensitive setting. We counted all nucleotides
labeled as repetitive, binned according to the length of the repeat.
Olson and Wheeler Page 18
ACM BCB. Author manuscript; available in PMC 2019 May 09.
Author M
anuscriptA
uthor Manuscript
Author M
anuscriptA
uthor Manuscript

Figure 5: Score distribution on non–repetitive sequence. TRF was used to label 400GB of non–
repetitive sequence, and demonstrates dramatic swings in score (e.g. on random sequence,
10× more hits with score 34 than score 33). ULTRA was used to label 144GB of non–
repetitive sequence, and produces scores with a more stable distribution.
Olson and Wheeler Page 19
ACM BCB. Author manuscript; available in PMC 2019 May 09.
Author M
anuscriptA
uthor Manuscript
Author M
anuscriptA
uthor Manuscript

Figure 6: A qualitative survey of repeat regions labeled by one tool but not others. (A) TRF–labeled
repeats not found by ULTRA are typically made up 2–3 copies of a modest–length subunit.
We have broken the examples into multiple rows to highlight the repeat (implied insertions
are selected by hand). (B) TANTAN-labeled repeats not found by ULTRA are usually of the
form shown here: frequently short, often composed of degenerate mono- or di-nucleotide
repeats. Because of the simplicity of these repeats, they are not broken out across multiple
lines. (C) ULTRA–labeled repeats not found by the other tools often match this form: a
fairly long period with repeats containing non–trivial insertion or deletion structure. As with
TRF repeats, the examples are broken across multiple lines to show the repetitive structure.
In the case of the ULTRA “alignment” of repeats, the gap structure matches that used by the
model to identify the repeat (i.e. it allows only consecutive insertions or deletions, and has
not been optimized).
Olson and Wheeler Page 20
ACM BCB. Author manuscript; available in PMC 2019 May 09.
Author M
anuscriptA
uthor Manuscript
Author M
anuscriptA
uthor Manuscript
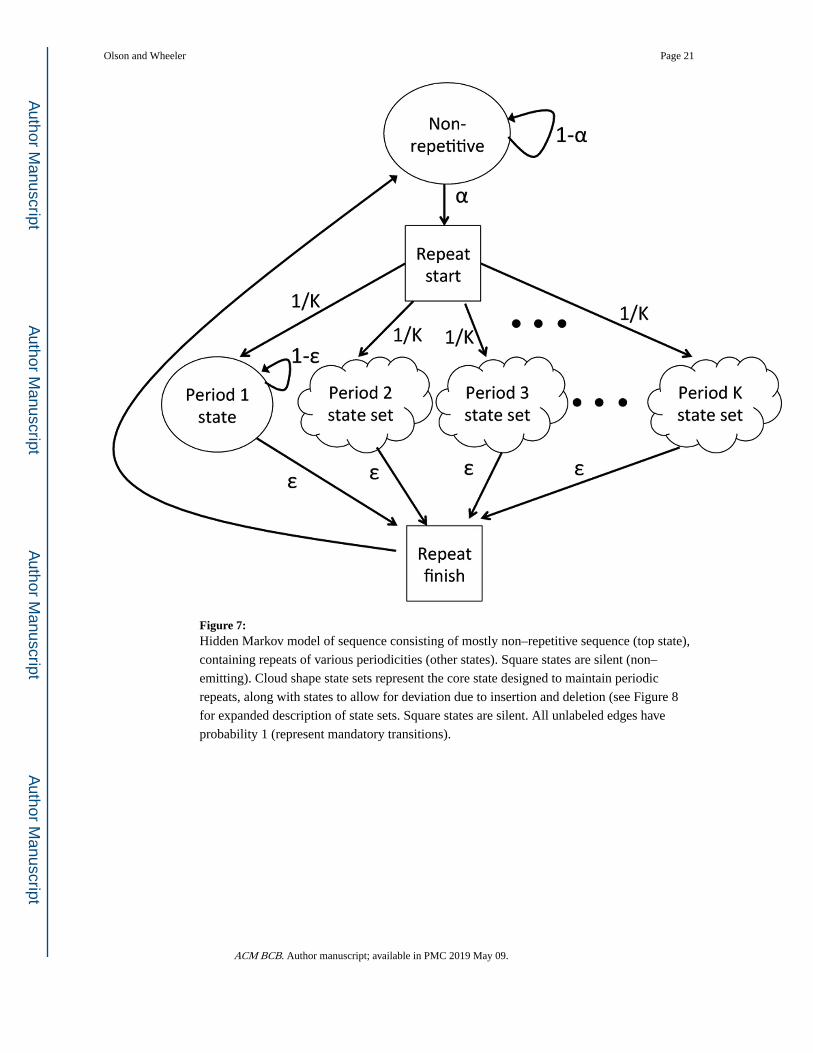
Figure 7: Hidden Markov model of sequence consisting of mostly non–repetitive sequence (top state),
containing repeats of various periodicities (other states). Square states are silent (non–
emitting). Cloud shape state sets represent the core state designed to maintain periodic
repeats, along with states to allow for deviation due to insertion and deletion (see Figure 8
for expanded description of state sets. Square states are silent. All unlabeled edges have
probability 1 (represent mandatory transitions).
Olson and Wheeler Page 21
ACM BCB. Author manuscript; available in PMC 2019 May 09.
Author M
anuscriptA
uthor Manuscript
Author M
anuscriptA
uthor Manuscript

Figure 8: (A) This diagram shows the handling of insertions and deletions within a sample state set
(for subunit of size 3). For example, after an insert of length 1 (state I1,1, which emits a letter
from background), there will be three emissions that must look back to an offset of 4, after
which the model returns to the default offset of 3. After an insert of length 2 (state I1,2), the
three following letters will depend on an offset of 5. Deletions begin with d ≥ 1 silent states,
followed by (3−d) emitted letters at offset (3−d), followed by d letters at an offset of (3*2−d)
— comparing to the last appropriate match before the deletion. Square states are silent. All
unlabeled edges have probability 1 (represent mandatory transitions).
Olson and Wheeler Page 22
ACM BCB. Author manuscript; available in PMC 2019 May 09.
Author M
anuscriptA
uthor Manuscript
Author M
anuscriptA
uthor Manuscript
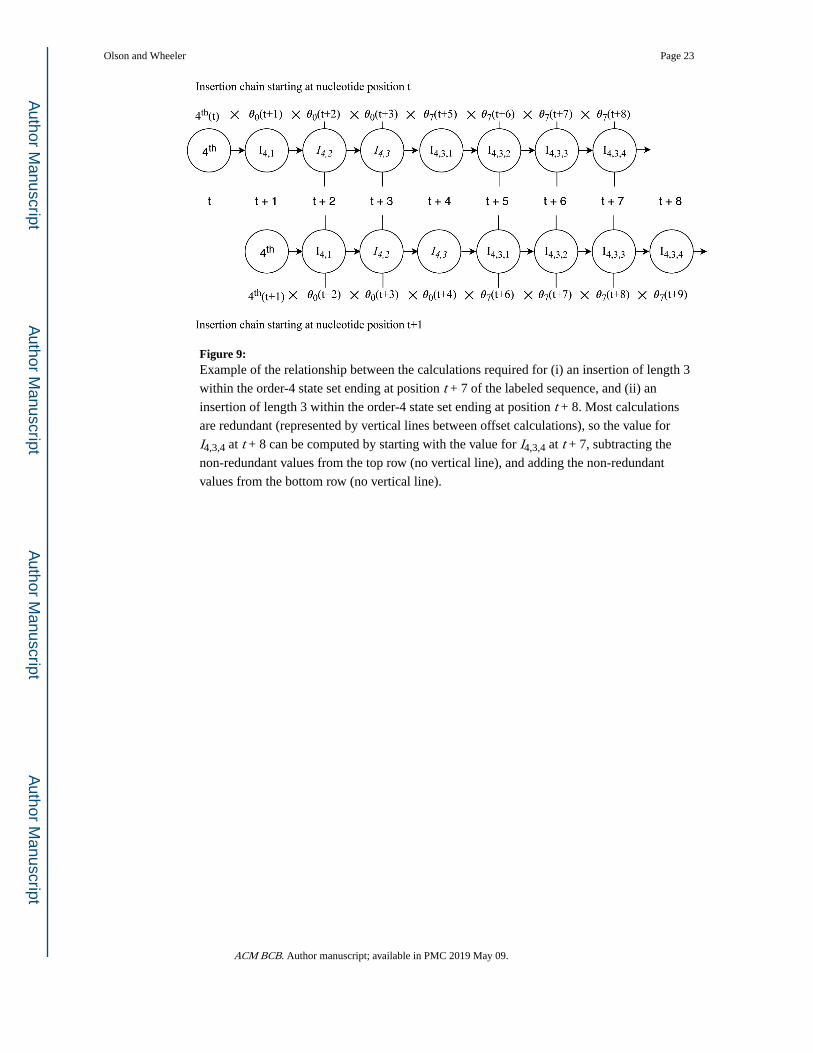
Figure 9: Example of the relationship between the calculations required for (i) an insertion of length 3
within the order-4 state set ending at position t + 7 of the labeled sequence, and (ii) an
insertion of length 3 within the order-4 state set ending at position t + 8. Most calculations
are redundant (represented by vertical lines between offset calculations), so the value for
I4,3,4 at t + 8 can be computed by starting with the value for I4,3,4 at t + 7, subtracting the
non-redundant values from the top row (no vertical line), and adding the non-redundant
values from the bottom row (no vertical line).
Olson and Wheeler Page 23
ACM BCB. Author manuscript; available in PMC 2019 May 09.
Author M
anuscriptA
uthor Manuscript
Author M
anuscriptA
uthor Manuscript

Author M
anuscriptA
uthor Manuscript
Author M
anuscriptA
uthor Manuscript
Olson and Wheeler Page 24
Table 1:
Run time and memory requirements for each tool, using human chromosome 18 (75.0 megabases) and AT rich
sequences (47.7 megabases) as described in Figure 2.
sequence ULTRA TANTAN TRF
Run timeHuman chrl8 6m58s 29s 3m43s
AT-rich 5ml9s 26s 20m31s
Memory (Mb)Human chrl8 315 486 177
AT-rich 263 337 1,200
ACM BCB. Author manuscript; available in PMC 2019 May 09.
Copyright © 2022 FDOKUMEN