Learning to detect spyware using end user license agreements
23
Knowl Inf Syst DOI 10.1007/s10115-009-0278-z REGULAR PAPER Learning to detect spyware using end user license agreements Niklas Lavesson · Martin Boldt · Paul Davidsson · Andreas Jacobsson Received: 11 February 2009 / Revised: 5 November 2009 / Accepted: 13 November 2009 © Springer-Verlag London Limited 2009 Abstract The amount of software that hosts spyware has increased dramatically. To avoid legal repercussions, the vendors need to inform users about inclusion of spyware via end user license agreements (EULAs) during the installation of an application. However, this infor- mation is intentionally written in a way that is hard for users to comprehend. We investigate how to automatically discriminate between legitimate software and spyware associated soft- ware by mining EULAs. For this purpose, we compile a data set consisting of 996 EULAs out of which 9.6% are associated to spyware. We compare the performance of 17 learning algorithms with that of a baseline algorithm on two data sets based on a bag-of-words and a meta data model. The majority of learning algorithms significantly outperform the baseline regardless of which data representation is used. However, a non-parametric test indicates that bag-of-words is more suitable than the meta model. Our conclusion is that automatic EULA classification can be applied to assist users in making informed decisions about whether to install an application without having read the EULA. We therefore outline the design of a spyware prevention tool and suggest how to select suitable learning algorithms for the tool by using a multi-criteria evaluation approach. Keywords End user license agreement · Document classification · Spyware 1 Introduction The amount of spyware has increased dramatically due to the high value for marketing com- panies of the information that is collected. Spyware is designed to collect user information for marketing campaigns without the informed consent of the user. This type of software is commonly spread by bundling it with popular applications available for free download. N. Lavesson (B ) · M. Boldt · P. Davidsson School of Computing, Blekinge Institute of Technology, Ronneby 371 25, Sweden e-mail: [email protected] P. Davidsson · A. Jacobsson School of Technology, Malmö University, Malmö, Sweden 123
-
Upload
khangminh22 -
Category
Documents
-
view
2 -
download
0
Transcript of Learning to detect spyware using end user license agreements

Knowl Inf SystDOI 10.1007/s10115-009-0278-z
REGULAR PAPER
Learning to detect spyware using end user licenseagreements
Niklas Lavesson · Martin Boldt · Paul Davidsson ·Andreas Jacobsson
Received: 11 February 2009 / Revised: 5 November 2009 / Accepted: 13 November 2009© Springer-Verlag London Limited 2009
Abstract The amount of software that hosts spyware has increased dramatically. To avoidlegal repercussions, the vendors need to inform users about inclusion of spyware via end userlicense agreements (EULAs) during the installation of an application. However, this infor-mation is intentionally written in a way that is hard for users to comprehend. We investigatehow to automatically discriminate between legitimate software and spyware associated soft-ware by mining EULAs. For this purpose, we compile a data set consisting of 996 EULAsout of which 9.6% are associated to spyware. We compare the performance of 17 learningalgorithms with that of a baseline algorithm on two data sets based on a bag-of-words and ameta data model. The majority of learning algorithms significantly outperform the baselineregardless of which data representation is used. However, a non-parametric test indicates thatbag-of-words is more suitable than the meta model. Our conclusion is that automatic EULAclassification can be applied to assist users in making informed decisions about whether toinstall an application without having read the EULA. We therefore outline the design of aspyware prevention tool and suggest how to select suitable learning algorithms for the toolby using a multi-criteria evaluation approach.
Keywords End user license agreement · Document classification · Spyware
1 Introduction
The amount of spyware has increased dramatically due to the high value for marketing com-panies of the information that is collected. Spyware is designed to collect user informationfor marketing campaigns without the informed consent of the user. This type of softwareis commonly spread by bundling it with popular applications available for free download.
N. Lavesson (B) · M. Boldt · P. DavidssonSchool of Computing, Blekinge Institute of Technology, Ronneby 371 25, Swedene-mail: [email protected]
P. Davidsson · A. JacobssonSchool of Technology, Malmö University, Malmö, Sweden
123
N. Lavesson et al.
A spyware application is typically difficult to remove once it has been installed on a computersystem and it can seriously degrade system performance and compromise the privacy of theuser [2,5,31]. This paper presents a novel approach based on data mining, aimed at stoppingspyware at the door.
From now on, we are going to use the terms bad and good to signify applications thathost spyware and legitimate applications, respectively. Distributors of bad software usuallytry to disguise it as good in an attempt to reach as many users as possible. However, to avoidlegal repercussions, these distributors are required to mention in the end user license agree-ment (EULA) that spyware will indeed be installed. Yet, this information is given in a waymost users find difficult to understand. Even EULAs for legitimate software can be hard tocomprehend due to their length and their extensive use of legal terminology [19].
Consequently, we recognize the need for an efficient method for helping users to distin-guish between good and bad software during the installation process. If spyware is detectedthrough such a method, it could assist users in keeping their computers clean from badsoftware by warning them about the application they are about to install.
1.1 Background
Definitions of spyware exist on two different abstraction levels, were the low level definitionfocuses on the concept of information theft while the high-level definition also includes othernegative consequences associated with spyware. At the low level, spyware can be defined byusing Steve Gibson’s original definition from early 2000:1
Spyware is any software which employs a user’s Internet connection in the background(the so-called backchannel) without their knowledge or explicit permission.
This definition was valid in the beginning of the spyware evolution, but as the spywareconcept evolved it attracted new kinds of behaviors. From originally just gathering privateinformation spyware programs now also began to modify network traffic, such as competi-tors’ advertisements, and degrading user experience by altering system configurations, suchas browser start pages. As these behaviors grew both in number and in diversity, the termspyware became hollowed out, which in turn resulted in that a great number of synonymswere employed, e.g., thiefware, trackware, evilware, scumware, and badware.
Due to this development, the Anti-Spyware Coalition, which consists of leading partiesfrom both academia and industry, defined spyware using a wider approach that incorpo-rated all negative consequences associated with such software.2 Our view of spyware alsocoincides with this definition:
Technologies deployed without appropriate user consent and/or implemented in waysthat impair user control over:
– Material changes that affect their user experience, privacy, or system security;– Use of their system resources, including what programs are installed on their com-
puters; and/or– Collection, use, and distribution of their personal or other sensitive information.
To further clarify the concept of spyware, Boldt [3] defined a categorization of vari-ous types of spyware programs that relied on a three-by-three matrix where the two axis
1 Gibson Research Corporation,www.grc.com/optout.htm.2 Anti-Spyware Coalition, http://www.antispywarecoalition.org.
123
Learning to detect spyware using end user license agreements
represent the level of user consent and the amount of negative consequences associated witheach software type. Given these two dimensions, Boldt [3] provides a more structured viewof spyware under the term privacy-invasive software. The increase of spyware has resulted invast numbers of users experiencing loss of control over personal information and decreasedcomputer performance [36]. Anti-virus techniques are used for removing malicious software(such as: computer viruses and worms). Malicious software is undoubtedly illegal in mostcountries but this is not necessarily true for spyware since it resides in a gray zone betweenwhat is considered to be legal and illegal. Thus, the techniques used by spyware can beinterpreted as either legal or illegal depending on who is asked; what one individual regardsas spyware could be considered a legitimate business application by another.
McFedries [25] explores the purposes behind spyware as well as its commercial impact.The main conclusion is that spyware is a very good means to gain revenue for online market-ing companies, since it provides them with personal user information that can be exploitedin order to deliver targeted advertisements.
Zhang [38] makes visible the urgent need for user education to raise awareness about thespyware threats and the methods available for addressing these threats. This is important,Zhang [38] argues, since most computer users cannot keep up with the rapid development ofnew spyware that affect their computer systems, personal data, and ultimately their privacy.
Moshchuk et al. [27] introduce methods for measuring spyware activity on the Internet.In 2005, they performed an automatic analysis of 18 million Internet addresses (URLs) forexecutable files. Out of the 21,200 applications an astonishing 13.4% were identified asspyware.
Fox [18] presents a report on how user behavior is affected by the occurrence of spyware inhome and work computers based on performing a telephone interview survey, which featureda nationally representative sample of 2,001 adults living in continental US telephone house-holds. The report states that “only about one in ten internet users say the current practice ofclicking through a user agreement or disclaimer is adequate consent to install adware on aperson’s computer”. Townsend [33] elaborates on how spyware infected applications mayviolate corporate security policies and procedures, explaining that spyware could circumventexisting security mechanisms used by the corporations, thus enabling the extraction of sen-sitive and/or classified information. Moreover, Good et al. [19] point out the fact that usersagree to accept spyware as part of a software bundle as a cost associated with gaining thefunctionality they desire and demonstrate that interface design can be a significant factor ineliciting informed consent to software installation.
1.2 Related work
In a pilot study [24], we investigated whether it was possible to take advantage of the factthat the installation of bad software is mentioned in the EULA. We addressed this prob-lem by applying supervised learning algorithms to classify EULAs of both good and badapplications in order to detect if the associated software hosts spyware. The results indicatethat the approach is feasible, however, the amount of data was scarce (the data set fea-tured 100 EULAs in total). EULA classification, as a problem, is quite analogous to that ofspam classification, i.e., to distinguish between unsolicited commercial emails (spam) andlegitimate emails. Much work has been done in the area of spam classification, e.g., usingdifferent learning algorithms, such as: rule learners, support vector machines, instance-basedlearners, decision trees, and stacking [1,7,9,13,29]. More recently, Koprinska et al. [22]investigate the performance of the random forest algorithm for the same type of problem,claiming that it outperforms some of the earlier mentioned algorithms on several problems.
123
N. Lavesson et al.
Kang et al. [20] also study the spam classification problem and applies an unsupervisedfeature selection algorithm and clustering to classify unlabeled documents. The results fromthe analysis can be interpreted as follows: the absence of a certain term is a characteristicshared across the emails of a given category; whereas, the presence of certain keywordsshows a larger variability across emails of a given category.
1.3 Scope and aim
The aim of this paper is to further investigate EULA classification as a means for categorizingsoftware as good (legitimate) or bad (associated with spyware). For this purpose, we havecollected a set of 996 EULAs (out of which 9.6% are associated with software that includesspyware). We will investigate different ways to represent these documents in order to be ableto use supervised learning as an approach to solve the EULA classification problem.
1.4 Outline
The remainder of this paper is organized as follows: we begin by presenting the EULAclassification problem in Sect. 2. Next, we describe the data collection process and the repre-sentation of data in Sect. 3. We then describe the experiments in Sect. 4. This is followed by apresentation of the results in Sect. 5. In Sect. 6, we analyze the results and outline the designof a spyware prevention tool based on EULA classification. Finally, we draw conclusionsand give some pointers to future work in the last section.
2 EULA classification
We want to investigate whether or not it is possible to classify software applications as legiti-mate (good) or associated with spyware (bad) based on their EULA. Intuitively, we can lookupon this problem as a text classification (TC) task, for which there are two main approaches,knowledge engineering and machine learning.
Knowledge engineering systems have been known to often outperform machine learn-ing systems on the TC task, although according to [16], the gap in performance steadilyshrinks. The main drawback of the former approach is the amount of skilled labor and expertknowledge required to generate and maintain the knowledge–encoding rules.
In contrast, the latter approach requires only a set of labeled (classified) training instances,which are less costly to produce. As a consequence, most of the recent work on categorizationis concentrated on the machine learning approach and our study is no exception. We willnow present the TC task more formally with regard to EULA classification.
2.1 The EULA classification task
Suppose that we have a collection, I , of EULAs, each labeled as either good or bad, depend-ing on whether or not it is associated with legitimate software or spyware. The set of allpossible classes can thus be defined as C = {good, bad}. We would like to approximate theunknown target function, F : I × C = {1, 0}. The value of f (i, c) is equal to one if theEULA, i , belongs to the class c or zero otherwise.
It is now possible to define a classifier as an approximation function, M : I × C = {1, 0}.The objective of the learning task is to generate a classifier that produces results as close tothat of F as possible.
123

Learning to detect spyware using end user license agreements
2.2 Supervised learning
The machine learning approach to automatically build a classifier by learning the propertiesof the classes from a set of pre-classified training instances is known as supervised learning.
Most supervised learning algorithms cannot process text documents in their original form[16], hence they will not be able to process the EULAs. Consequently, we need to preprocessthe EULAs by converting them to a manageable representation.
2.3 Representation
The choice of representation depends on what one regards as meaningful units of text and themeaningful natural language rules for combining these units, i.e., the problem of lexical andcompositional semantics, respectively. The problem of compositional semantics has oftenbeen disregarded in TC [30], however, exceptions exist, see for example [12]. One approachthat addresses the problem of lexical semantics is to represent each EULA as a feature vector.We now describe two quite different feature vector representations of EULAs.
2.3.1 The bag-of-words model
The bag-of-words model is a common approach to represent documents as feature vectors[16]. In fact, it has been found in several experiments that more sophisticated representationsdo not yield any significant effectiveness [30], although there are some recent approachesthat have shown promising results. For example, Wang et al. [34] automatically constructeda thesaurus of concepts from Wikipedia and introduced a unified framework to expand thebag-of-words representation with semantic relations. More research is needed in order toestablish whether this type of expansion really increases performance significantly over thetraditional model.
In the bag-of-words model, each word in a document is used as a feature. Thus, a com-plete document is represented by a vector with one feature for each word that occurs in thedocument. A collection of documents is then represented by a set of feature vectors and thedimension of the feature space is equal to the number of different words in all of the doc-uments. Some studies have used phrases, rather than individual words, as terms. However,their experimental results have not been as encouraging as those of studies that use words asterms [30]. More recently, Metzler and Croft [26] review several attempts to go beyond thebag-of-words representation but few show consistent improvements in retrieval effectiveness.
There are basically two methods for associating weights to features. The simplest is thebinary method, which either assigns a value of one if the word is present in the document or avalue of zero otherwise. The binary method can be used if the chosen learning algorithm canonly handle nominal attributes. However, what appears to be a more common method is totake the frequency of the word into account. We adopt this method and calculate frequenciesusing the standard Term Frequency-Inverse Document Frequency (TF IDF) scheme [16]. TheTF IDF function embodies the intuitions that: the more often a term occurs in a document,the more it is representative of its content, and the more documents a term occurs in, the lessdiscriminating it is [30]. There exist several versions of TF IDF that differ from each otherin terms of logarithms, normalization or other factors.
We use Weka’s implemented version of TF IDF. Thus, given a word, w, in a EULA, d ,the TF IDF weight is calculated as follows:
weight(w, d) = TermFreq(w, d) · logN
DocFreq(w), (1)
123
N. Lavesson et al.
where N is the total number of EULAs, DocFreq is the number of EULAs containing theword and TermFreq represents the frequency of the word in the particular EULA.
2.3.2 The meta EULA model
FaceTime Security Labs3 has created the EULA Analyzer,4 which is a web-based tool, forassisting people in better understanding the EULAs of software downloadable on the Inter-net. This tool requires a user to copy the EULA from the pop-up window that appears whena software application is to be installed on a computer. The EULA is analyzed and the resultsare given as scores according to ten different metrics. The user is then able to consider themetric scores to make a decision about whether or not to proceed with the software instal-lation. However, EULA Analyzer does not provide a classification of the analyzed EULAs,instead this task is left to the user. Since EULA Analyzer is a proprietary service, its designand inner workings are not publicly available.
Since the objective of EULA Analyzer is to assist people in better understanding EULAsby supplying meta models of the EULAs, we hypothesize that this meta EULA model canbe used as an alternative means for representing the EULAs as feature vectors.
EULA Analyzer calculates the number of flagged, or suspicious, sentences. In addition,it calculates some basic statistics, such as the number of characters, words, sentences, andthe average number of words per sentence. EULA Analyzer also performs more advancedcalculations of readability metrics. For example, Flesch score and Gunning-Fog index useword and sentence lengths to indicate how difficult it is to comprehend a certain text, wherelow scores represent difficult texts [17]. The Flesch grade is calculated based on the samemeasures but instead gives the number of years of education that is needed to understandthe text [17]. Automated readability and Coleman–Liau are two other readability tests thatindicate the required level of education needed to comprehend a text [10,32]. Both of thesetests differ from the earlier mentioned metrics by relying on a factor of characters per wordinstead of syllabus per word.
Our approach is to use the aforementioned EULA Analyzer metrics as attributes for ameta EULA data set. Thus, each EULA is described as a vector of 10 values and it has thesame class label as the corresponding bag-of-words instance.
3 Data Sets
We now describe the data collection and the representation of the data. The collection, andlabeling, of EULAs can be carried out in several ways. Our primary objective was to collecta large set of EULAs and at the same time allow for an automatic or semi-automatic labelingof EULA instances.
3.1 Data collection
One of the contributions of this study is the collection of a large data set of labeled EULAs.The raw data set and different representations are available on the web.5 We strived to col-lect approximately 1,000 EULAs (compared to 100 as featured in the aforementioned pilot
3 http://www.facetime.com.4 http://www.spywareguide.com/analyze.5 http://www.bth.se/com/nla.nsf/sidor/resources.
123

Learning to detect spyware using end user license agreements
study). The prerequisite was that each application should be easily downloaded from theInternet and present the user with a EULA that can be copied and pasted as ASCII text. Wecollected the good instances from Download.com6 and the bad instances from links obtainedfrom SpywareGuide.com.7 The software programs in the SpywareGuide.com database aredivided into nine categories; adware, data-miners, dialers, loyaltyware, miscellaneous secu-rity, password crackers, trojans, viruses, and worms. None of the virus or worm programsinclude EULAs, hence the programs from these categories were omitted. We chose to labelall programs from the remaining seven categories as spyware since we target the generalconcept of spyware. Additionally, we wanted to avoid multiple spyware classes (since thetotal number of available spyware programs was small) in order to maximize the amount oftraining data for each category. Thus, our collection consists of EULAs from two categories;legitimate (good) and spyware (bad). Based on the number of applications downloadablefrom both of these locations we hypothesized that a ratio of 1:10 would serve as a sufficientmodel of the real world, i.e., that spyware accounts for approximately 10% of all freely avail-able applications. This is not too far from the figure reported by Moshchuk et al. [27] (13.4%).Thus, we aimed to collect 900 good and 100 bad EULAs. The collection was systematicallyperformed:
– for the good EULAs, the first 900 applications were downloaded,– for the bad EULAs, every working web link was followed.
In both cases, we omitted applications that did not have a EULA. Additionally, we alsoomitted applications for which the EULA could not be extracted, e.g., the text could not becopied as ASCII text. Even though this only applies to 0.5% of the downloaded softwarewe note that this (dys)function could possibly be used by the spyware vendors to preventEULA analysis. For each software application, we collected the associated EULA togetherwith basic information such as software title, version, and vendor. The result is a collectionfeaturing 900 good and 96 bad instances of real-world EULAs.
3.2 Data representation
The raw data set, which consists of 996 text documents, must be converted to a manage-able format. We perform the conversion into two different feature vector representations, asdescribed in Sect. 2.2. We now describe how the two data sets are generated from the rawdata set and highlight some characteristics for each of the generated sets of data.
3.2.1 Bag-of-words data set
The total number of words, contained in all of the EULAs, is close to 10,000 but experimentalevidence suggests that this number can be reduced to around 10% without reducing classi-fier performance [16]. In order to reduce the number of features, we convert all charactersto lowercase and consider only alphabetic tokens. Furthermore, we remove stop words andwords that occur only once (hapax legomena), and store a maximum of 1,000 words perclass. Finally, we apply Weka’s iterated Lovins stemmer to be able to store only the stemsof the remaining words. The result is a data set with 1,269 numeric features and a nominaltarget feature that indicates if the EULA is bad or good.
6 http://www.download.com.7 http://www.spywareguide.com.
123

N. Lavesson et al.
Table 1 EULA Analyzer resultsfor the complete data set
Metric Min Mean (SD) Max
Flagged Sentences 0 2.14 (5.89) 84
Number of characters 72 7308 (6880) 70566
Number of words 15 1262 (1160) 11649
Number of sentences 1 42.53 (34.9) 376
Average words per sentence 3.75 29.00 (8.83) 79.35
Flesch score −36.87 24.56 (12.0) 95.87
Flesch grade 1 17.05 (3.54) 37
Automated readability index 3 19.97 (4.68) 47
Coleman–Liau index 6 19.71 (3.20) 29
Gunning–Fog index 12 43.95 (8.77) 93
3.2.2 Meta EULA data set
The processing of EULAs through EULA Analyzer is carried out by custom-made Unix shellscripts and Apple Automator programs. This setup allows us to automatically fetch the textfrom each of the 996 EULAs, paste it into the text field on the EULA Analyzer website, sendthe text for analysis, and finally retrieve the scores of the 10 metrics that represent the resultsof the analysis. Using the results according to these metrics, for each EULA, we generate ameta EULA data set and convert it to the Weka ARFF format. Table 1 shows the minimum,maximum, and mean value for each EULA Analyzer metric. As can be seen in the table,the Flesch score can be negative. Unfortunately, some algorithms cannot handle negativenumeric attributes. For example, Naive Bayes Multinomial, which outperformed all otheralgorithms in the pilot study of EULA classification, is one such algorithm. Consequently,we opt to remove the Flesch score attribute from the meta EULA data set to resolve this issue.
For our data set of 996 instances, the number of flagged sentences attribute values rangefrom 0 to 84 but most EULAs are assigned a value close to zero. In analyzing the distribu-tion of good and bad EULAs across the range of the flagged sentences attribute, we observethat this attribute can be used to achieve a linear separation between a cluster of 25 badinstances and the rest of the EULAs. Approximately, 30 additional bad instances can be iso-lated together with a small number of good instances. In total, this amounts to a separation ofapproximately 55 bad instances from the rest of the instances. In this case, there are still 41bad instances classified as good. In analyzing the distributions for the remaining attributes,we do not observe any trivial ways to separate good and bad instances.
4 Experiments
In this section, we discuss the choice of algorithms and algorithm configurations. In addition,we discuss the metrics we use to evaluate classifier performance and present our experimentalapproach.
4.1 Algorithm selection and configuration
We want to determine if it is feasible to apply supervised learning algorithms to solve theEULA classification problem. In order to investigate the usefulness of different learning
123
Learning to detect spyware using end user license agreements
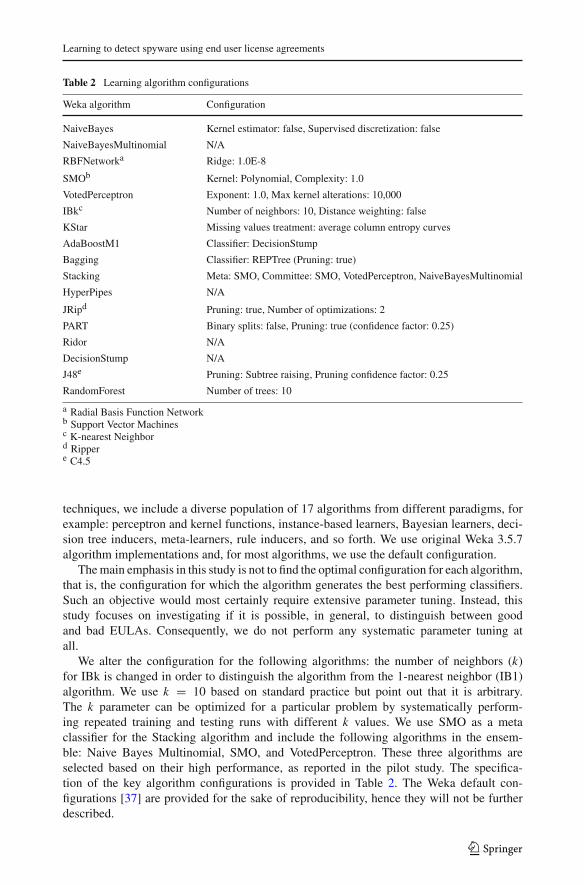
Table 2 Learning algorithm configurations
Weka algorithm Configuration
NaiveBayes Kernel estimator: false, Supervised discretization: false
NaiveBayesMultinomial N/A
RBFNetworka Ridge: 1.0E-8
SMOb Kernel: Polynomial, Complexity: 1.0
VotedPerceptron Exponent: 1.0, Max kernel alterations: 10,000
IBkc Number of neighbors: 10, Distance weighting: false
KStar Missing values treatment: average column entropy curves
AdaBoostM1 Classifier: DecisionStump
Bagging Classifier: REPTree (Pruning: true)
Stacking Meta: SMO, Committee: SMO, VotedPerceptron, NaiveBayesMultinomial
HyperPipes N/A
JRipd Pruning: true, Number of optimizations: 2
PART Binary splits: false, Pruning: true (confidence factor: 0.25)
Ridor N/A
DecisionStump N/A
J48e Pruning: Subtree raising, Pruning confidence factor: 0.25
RandomForest Number of trees: 10
a Radial Basis Function Networkb Support Vector Machinesc K-nearest Neighbord Rippere C4.5
techniques, we include a diverse population of 17 algorithms from different paradigms, forexample: perceptron and kernel functions, instance-based learners, Bayesian learners, deci-sion tree inducers, meta-learners, rule inducers, and so forth. We use original Weka 3.5.7algorithm implementations and, for most algorithms, we use the default configuration.
The main emphasis in this study is not to find the optimal configuration for each algorithm,that is, the configuration for which the algorithm generates the best performing classifiers.Such an objective would most certainly require extensive parameter tuning. Instead, thisstudy focuses on investigating if it is possible, in general, to distinguish between goodand bad EULAs. Consequently, we do not perform any systematic parameter tuning atall.
We alter the configuration for the following algorithms: the number of neighbors (k)for IBk is changed in order to distinguish the algorithm from the 1-nearest neighbor (IB1)algorithm. We use k = 10 based on standard practice but point out that it is arbitrary.The k parameter can be optimized for a particular problem by systematically perform-ing repeated training and testing runs with different k values. We use SMO as a metaclassifier for the Stacking algorithm and include the following algorithms in the ensem-ble: Naive Bayes Multinomial, SMO, and VotedPerceptron. These three algorithms areselected based on their high performance, as reported in the pilot study. The specifica-tion of the key algorithm configurations is provided in Table 2. The Weka default con-figurations [37] are provided for the sake of reproducibility, hence they will not be furtherdescribed.
123

N. Lavesson et al.
4.2 Evaluation of Classifier Performance
4.2.1 Classification Accuracy
We need to select relevant evaluation metrics in order to measure classifier performance.Traditionally, the accuracy metric (the number of correct classifications divided by the totalnumber of classifications) has been widely used. However, several issues have been raisedagainst the use of this particular metric as the only means to measure performance [28].However, when used in conjunction with other metrics, we believe that accuracy is still auseful metric to consider.
4.2.2 The area under the ROC curve
In addition to accuracy, we therefore need to select metrics that are suitable for our particularapplication. For the purpose of EULA classification, we argue that the cost of misclassifi-cation is different for the two classes (good and bad). For example, classifying a bad EULAas good is sometimes far worse than the opposite and this is particularly true if the classifi-cation should be the basis for a decision support system that should aid the user in makingthe decision to install an application or to abort the installation.
If a good EULA is classified as bad, the user might think twice before installing the asso-ciated application and instead will try to find alternative applications. If, on the other hand, abad EULA is classified as good, the user might install an application that contains spyware,believing that the application is legitimate. This is actually worse than not using any EULAclassification at all, since the user is under the (false) impression of being informed aboutthe legitimacy of the application. Consequently, EULA classification represents a problemin which different types of misclassification errors have asymmetric costs. This is impor-tant to keep in mind if one intends to develop a EULA-based anti-spyware application. Zhaoet al. [39] reviews this problem in detail and compares two cost-sensitive learning approaches,instance weighting and post hoc threshold adjusting. The results indicate that both approachesare suitable, but for different types of learners. Additionally, the author concludes that sym-bolic learners are affected by cost-ratio changes to a larger extent than methods that producecontinuous probability estimates.
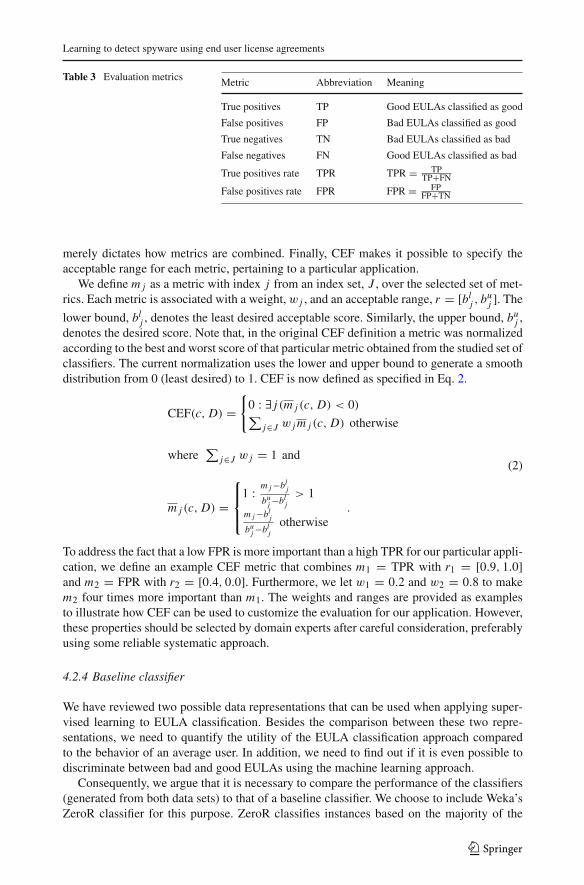
In order to address the misclassification cost issue in this study, we consider four importantmetrics; true/false positives and true/false negatives, as documented in Table 3. In particular,we will use the Area under the ROC curve (AUC), which is based on the true positives rate(TPR) and the false positives rate (FPR) since it does not depend on equal class distributionor misclassification costs [37]. The calculation of, and motivation for, AUC is described indetail by Fawcett [15].
4.2.3 Multi-criteria evaluation
In addition to the ACC and AUC metrics we will evaluate each algorithm using the CandidateEvaluation Function (CEF) [23]. The purpose of CEF is to capture application-specific trade-offs by combining multiple relevant metrics. We shall now demonstrate how multi-criteriametrics can be used as an approach to trade-off some of the important aspects of EULAclassification. CEF normalizes the metrics in order to get a uniform output domain and it isalso possible to specify explicit weights for each metric to ensure that application-specifictrade-offs can be properly represented. CEF itself does not dictate which metrics to use, it
123
Learning to detect spyware using end user license agreements
Table 3 Evaluation metrics Metric Abbreviation Meaning
True positives TP Good EULAs classified as good
False positives FP Bad EULAs classified as good
True negatives TN Bad EULAs classified as bad
False negatives FN Good EULAs classified as bad
True positives rate TPR TPR = TPTP+FN
False positives rate FPR FPR = FPFP+TN
merely dictates how metrics are combined. Finally, CEF makes it possible to specify theacceptable range for each metric, pertaining to a particular application.
We define m j as a metric with index j from an index set, J , over the selected set of met-rics. Each metric is associated with a weight, w j , and an acceptable range, r = [bl
j , buj ]. The
lower bound, blj , denotes the least desired acceptable score. Similarly, the upper bound, bu
j ,denotes the desired score. Note that, in the original CEF definition a metric was normalizedaccording to the best and worst score of that particular metric obtained from the studied set ofclassifiers. The current normalization uses the lower and upper bound to generate a smoothdistribution from 0 (least desired) to 1. CEF is now defined as specified in Eq. 2.
CEF(c, D) ={
0 : ∃ j (m j (c, D) < 0)∑j∈J w j m j (c, D) otherwise
where∑
j∈J w j = 1 and
m j (c, D) =
⎧⎪⎨⎪⎩
1 : m j −blj
buj −bl
j> 1
m j −blj
buj −bl
jotherwise
.
(2)
To address the fact that a low FPR is more important than a high TPR for our particular appli-cation, we define an example CEF metric that combines m1 = TPR with r1 = [0.9, 1.0]and m2 = FPR with r2 = [0.4, 0.0]. Furthermore, we let w1 = 0.2 and w2 = 0.8 to makem2 four times more important than m1. The weights and ranges are provided as examplesto illustrate how CEF can be used to customize the evaluation for our application. However,these properties should be selected by domain experts after careful consideration, preferablyusing some reliable systematic approach.
4.2.4 Baseline classifier
We have reviewed two possible data representations that can be used when applying super-vised learning to EULA classification. Besides the comparison between these two repre-sentations, we need to quantify the utility of the EULA classification approach comparedto the behavior of an average user. In addition, we need to find out if it is even possible todiscriminate between bad and good EULAs using the machine learning approach.
Consequently, we argue that it is necessary to compare the performance of the classifiers(generated from both data sets) to that of a baseline classifier. We choose to include Weka’sZeroR classifier for this purpose. ZeroR classifies instances based on the majority of the
123

N. Lavesson et al.
class distribution. For our particular case, this means that ZeroR will classify all instancesas good. Our model of an average user assumes that the user does not read the EULA butinstead continues with the installation. Thus, the behavior of this model is equivalent to thatof ZeroR. We use AUC for all statistical comparisons. There are several rationales for thisdecision:
– the class distribution is skewed, which suggests that AUC is more appropriate than accu-racy [28],
– the weights and ranges of the CEF metric are provided as examples and thus there is littlesense in using the CEF results for statistical tests of significance, and
– no learned classifier should have an AUC less than 0.5 [14] and ZeroR always achievesan AUC score of 0.5, which makes ZeroR a simple and meaningful baseline if AUC isused.
ZeroR, which has no predictive power, can thus be used as a baseline to determine if aparticular classifier has predictive power, i.e., if it can discriminate between good and badEULAs. If, for a certain data set, at least one classifier is shown to have predictive powerwe can also assume more generally that it is possible to discriminate between bad and goodEULAs using that data set.
4.3 Experimental procedure
Since we have a limited amount of data for training and testing (996 instances), we chooseto estimate performance using the average of ten stratified tenfold cross validation tests. Weuse Weka for all experiments and train the 17 learning algorithms on our two data sets.
Moreover, we let X represent the set of performance results obtained from the bag-of-words set. Similarly, Y represents the set of performance results obtained from the metaEULA set. We formulate the following null hypotheses:
– hx0: x = 0.5
– hy0: y = 0.5
hx0 is tested for each x ∈ X and hy
0 is tested for each y ∈ Y . Both of the main hypothesesare tested using the corrected resampled t- test as recommended by Witten and Frank [37] forcomparisons of two algorithms on the data set and using ten tenfold cross-validation tests.Thus, we use 99 degrees of freedom and two-sided probability values. We are aware of theissues related to multiple hypothesis testing, cf. [11]. Thus, since we test 17 hypotheses foreach data set, the family-wise error can be elevated. The Bonferroni correction can be appliedto maintain the family-wise error but, as [11] notes, it is overly radical. We will thereforepresent results using both the regular probability value (p < 0.05) and the Bonferroni cor-rected value (p < 0.001), which is calculated by dividing the regular p value by the numberof tested hypothesis for each data set.
The third null hypothesis, hz0, is that there is no difference in performance between the
bag-of-words and the meta EULA generated classifiers. This null hypothesis is tested usingthe two-sided Wilcoxon signed rank test. In this test, we compare the AUC result for eachclassifier on the bag-of-words data set to that of the corresponding classifier on the metaEULA data set. We reject hz
0 if the results for one data set are significantly better than thoseobtained from the other. The rationale for using a non-parametric test instead of, e.g., thepaired t test is that the latter assumes normality, which might be violated in our test [11]. Intesting this hypothesis, we are aware that the results can only apply for the selected algorithmsand configurations.
123
Learning to detect spyware using end user license agreements
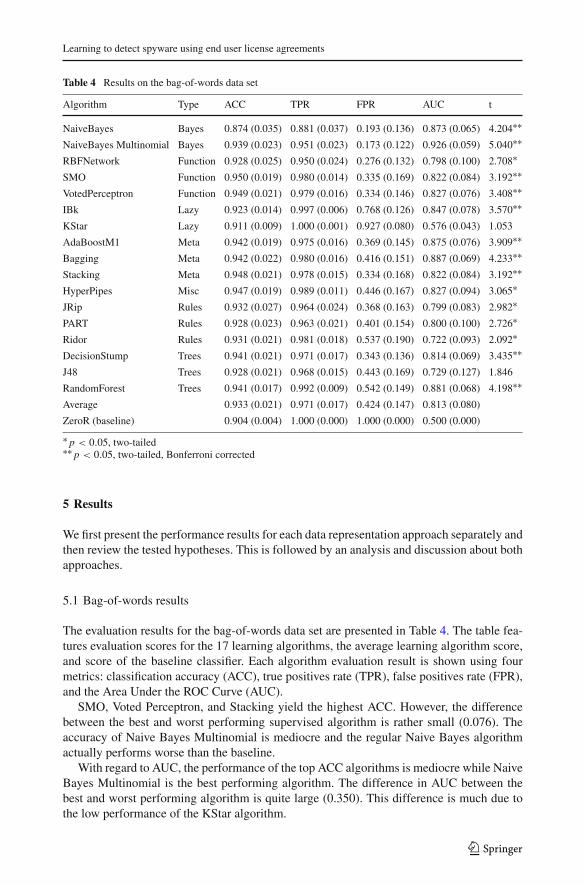
Table 4 Results on the bag-of-words data set
Algorithm Type ACC TPR FPR AUC t
NaiveBayes Bayes 0.874 (0.035) 0.881 (0.037) 0.193 (0.136) 0.873 (0.065) 4.204∗∗NaiveBayes Multinomial Bayes 0.939 (0.023) 0.951 (0.023) 0.173 (0.122) 0.926 (0.059) 5.040∗∗RBFNetwork Function 0.928 (0.025) 0.950 (0.024) 0.276 (0.132) 0.798 (0.100) 2.708∗SMO Function 0.950 (0.019) 0.980 (0.014) 0.335 (0.169) 0.822 (0.084) 3.192∗∗VotedPerceptron Function 0.949 (0.021) 0.979 (0.016) 0.334 (0.146) 0.827 (0.076) 3.408∗∗IBk Lazy 0.923 (0.014) 0.997 (0.006) 0.768 (0.126) 0.847 (0.078) 3.570∗∗KStar Lazy 0.911 (0.009) 1.000 (0.001) 0.927 (0.080) 0.576 (0.043) 1.053
AdaBoostM1 Meta 0.942 (0.019) 0.975 (0.016) 0.369 (0.145) 0.875 (0.076) 3.909∗∗Bagging Meta 0.942 (0.022) 0.980 (0.016) 0.416 (0.151) 0.887 (0.069) 4.233∗∗Stacking Meta 0.948 (0.021) 0.978 (0.015) 0.334 (0.168) 0.822 (0.084) 3.192∗∗HyperPipes Misc 0.947 (0.019) 0.989 (0.011) 0.446 (0.167) 0.827 (0.094) 3.065∗JRip Rules 0.932 (0.027) 0.964 (0.024) 0.368 (0.163) 0.799 (0.083) 2.982∗PART Rules 0.928 (0.023) 0.963 (0.021) 0.401 (0.154) 0.800 (0.100) 2.726∗Ridor Rules 0.931 (0.021) 0.981 (0.018) 0.537 (0.190) 0.722 (0.093) 2.092∗DecisionStump Trees 0.941 (0.021) 0.971 (0.017) 0.343 (0.136) 0.814 (0.069) 3.435∗∗J48 Trees 0.928 (0.021) 0.968 (0.015) 0.443 (0.169) 0.729 (0.127) 1.846
RandomForest Trees 0.941 (0.017) 0.992 (0.009) 0.542 (0.149) 0.881 (0.068) 4.198∗∗Average 0.933 (0.021) 0.971 (0.017) 0.424 (0.147) 0.813 (0.080)
ZeroR (baseline) 0.904 (0.004) 1.000 (0.000) 1.000 (0.000) 0.500 (0.000)
∗ p < 0.05, two-tailed∗∗ p < 0.05, two-tailed, Bonferroni corrected
5 Results
We first present the performance results for each data representation approach separately andthen review the tested hypotheses. This is followed by an analysis and discussion about bothapproaches.
5.1 Bag-of-words results
The evaluation results for the bag-of-words data set are presented in Table 4. The table fea-tures evaluation scores for the 17 learning algorithms, the average learning algorithm score,and score of the baseline classifier. Each algorithm evaluation result is shown using fourmetrics: classification accuracy (ACC), true positives rate (TPR), false positives rate (FPR),and the Area Under the ROC Curve (AUC).
SMO, Voted Perceptron, and Stacking yield the highest ACC. However, the differencebetween the best and worst performing supervised algorithm is rather small (0.076). Theaccuracy of Naive Bayes Multinomial is mediocre and the regular Naive Bayes algorithmactually performs worse than the baseline.
With regard to AUC, the performance of the top ACC algorithms is mediocre while NaiveBayes Multinomial is the best performing algorithm. The difference in AUC between thebest and worst performing algorithm is quite large (0.350). This difference is much due tothe low performance of the KStar algorithm.
123
N. Lavesson et al.
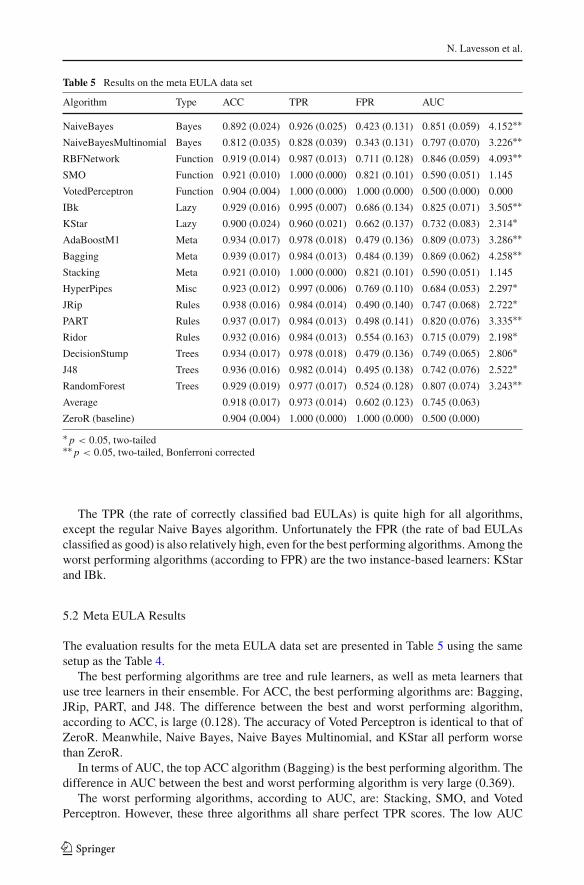
Table 5 Results on the meta EULA data set
Algorithm Type ACC TPR FPR AUC
NaiveBayes Bayes 0.892 (0.024) 0.926 (0.025) 0.423 (0.131) 0.851 (0.059) 4.152∗∗NaiveBayesMultinomial Bayes 0.812 (0.035) 0.828 (0.039) 0.343 (0.131) 0.797 (0.070) 3.226∗∗RBFNetwork Function 0.919 (0.014) 0.987 (0.013) 0.711 (0.128) 0.846 (0.059) 4.093∗∗SMO Function 0.921 (0.010) 1.000 (0.000) 0.821 (0.101) 0.590 (0.051) 1.145
VotedPerceptron Function 0.904 (0.004) 1.000 (0.000) 1.000 (0.000) 0.500 (0.000) 0.000
IBk Lazy 0.929 (0.016) 0.995 (0.007) 0.686 (0.134) 0.825 (0.071) 3.505∗∗KStar Lazy 0.900 (0.024) 0.960 (0.021) 0.662 (0.137) 0.732 (0.083) 2.314∗AdaBoostM1 Meta 0.934 (0.017) 0.978 (0.018) 0.479 (0.136) 0.809 (0.073) 3.286∗∗Bagging Meta 0.939 (0.017) 0.984 (0.013) 0.484 (0.139) 0.869 (0.062) 4.258∗∗Stacking Meta 0.921 (0.010) 1.000 (0.000) 0.821 (0.101) 0.590 (0.051) 1.145
HyperPipes Misc 0.923 (0.012) 0.997 (0.006) 0.769 (0.110) 0.684 (0.053) 2.297∗JRip Rules 0.938 (0.016) 0.984 (0.014) 0.490 (0.140) 0.747 (0.068) 2.722∗PART Rules 0.937 (0.017) 0.984 (0.013) 0.498 (0.141) 0.820 (0.076) 3.335∗∗Ridor Rules 0.932 (0.016) 0.984 (0.013) 0.554 (0.163) 0.715 (0.079) 2.198∗DecisionStump Trees 0.934 (0.017) 0.978 (0.018) 0.479 (0.136) 0.749 (0.065) 2.806∗J48 Trees 0.936 (0.016) 0.982 (0.014) 0.495 (0.138) 0.742 (0.076) 2.522∗RandomForest Trees 0.929 (0.019) 0.977 (0.017) 0.524 (0.128) 0.807 (0.074) 3.243∗∗Average 0.918 (0.017) 0.973 (0.014) 0.602 (0.123) 0.745 (0.063)
ZeroR (baseline) 0.904 (0.004) 1.000 (0.000) 1.000 (0.000) 0.500 (0.000)
∗ p < 0.05, two-tailed∗∗ p < 0.05, two-tailed, Bonferroni corrected
The TPR (the rate of correctly classified bad EULAs) is quite high for all algorithms,except the regular Naive Bayes algorithm. Unfortunately the FPR (the rate of bad EULAsclassified as good) is also relatively high, even for the best performing algorithms. Among theworst performing algorithms (according to FPR) are the two instance-based learners: KStarand IBk.
5.2 Meta EULA Results
The evaluation results for the meta EULA data set are presented in Table 5 using the samesetup as the Table 4.
The best performing algorithms are tree and rule learners, as well as meta learners thatuse tree learners in their ensemble. For ACC, the best performing algorithms are: Bagging,JRip, PART, and J48. The difference between the best and worst performing algorithm,according to ACC, is large (0.128). The accuracy of Voted Perceptron is identical to that ofZeroR. Meanwhile, Naive Bayes, Naive Bayes Multinomial, and KStar all perform worsethan ZeroR.
In terms of AUC, the top ACC algorithm (Bagging) is the best performing algorithm. Thedifference in AUC between the best and worst performing algorithm is very large (0.369).
The worst performing algorithms, according to AUC, are: Stacking, SMO, and VotedPerceptron. However, these three algorithms all share perfect TPR scores. The low AUC
123
Learning to detect spyware using end user license agreements
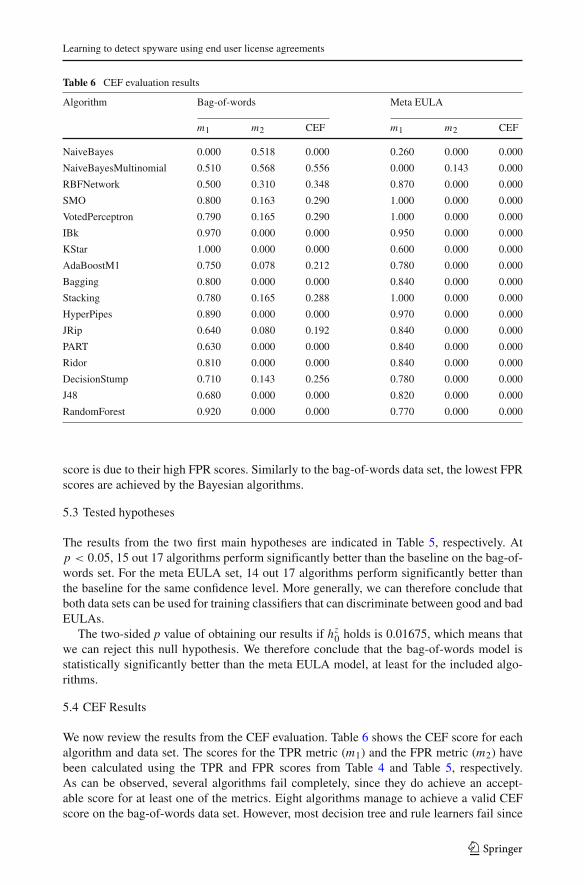
Table 6 CEF evaluation results
Algorithm Bag-of-words Meta EULA
m1 m2 CEF m1 m2 CEF
NaiveBayes 0.000 0.518 0.000 0.260 0.000 0.000
NaiveBayesMultinomial 0.510 0.568 0.556 0.000 0.143 0.000
RBFNetwork 0.500 0.310 0.348 0.870 0.000 0.000
SMO 0.800 0.163 0.290 1.000 0.000 0.000
VotedPerceptron 0.790 0.165 0.290 1.000 0.000 0.000
IBk 0.970 0.000 0.000 0.950 0.000 0.000
KStar 1.000 0.000 0.000 0.600 0.000 0.000
AdaBoostM1 0.750 0.078 0.212 0.780 0.000 0.000
Bagging 0.800 0.000 0.000 0.840 0.000 0.000
Stacking 0.780 0.165 0.288 1.000 0.000 0.000
HyperPipes 0.890 0.000 0.000 0.970 0.000 0.000
JRip 0.640 0.080 0.192 0.840 0.000 0.000
PART 0.630 0.000 0.000 0.840 0.000 0.000
Ridor 0.810 0.000 0.000 0.840 0.000 0.000
DecisionStump 0.710 0.143 0.256 0.780 0.000 0.000
J48 0.680 0.000 0.000 0.820 0.000 0.000
RandomForest 0.920 0.000 0.000 0.770 0.000 0.000
score is due to their high FPR scores. Similarly to the bag-of-words data set, the lowest FPRscores are achieved by the Bayesian algorithms.
5.3 Tested hypotheses
The results from the two first main hypotheses are indicated in Table 5, respectively. Atp < 0.05, 15 out 17 algorithms perform significantly better than the baseline on the bag-of-words set. For the meta EULA set, 14 out 17 algorithms perform significantly better thanthe baseline for the same confidence level. More generally, we can therefore conclude thatboth data sets can be used for training classifiers that can discriminate between good and badEULAs.
The two-sided p value of obtaining our results if hz0 holds is 0.01675, which means that
we can reject this null hypothesis. We therefore conclude that the bag-of-words model isstatistically significantly better than the meta EULA model, at least for the included algo-rithms.
5.4 CEF Results
We now review the results from the CEF evaluation. Table 6 shows the CEF score for eachalgorithm and data set. The scores for the TPR metric (m1) and the FPR metric (m2) havebeen calculated using the TPR and FPR scores from Table 4 and Table 5, respectively.As can be observed, several algorithms fail completely, since they do achieve an accept-able score for at least one of the metrics. Eight algorithms manage to achieve a valid CEFscore on the bag-of-words data set. However, most decision tree and rule learners fail since
123
N. Lavesson et al.
they cannot achieve an acceptable FPR. The Bayesian learners are exceptionally strongwith regard to FPR but the Naive Bayes algorithm fails to achieve an acceptable TPR.For the meta EULA data set, all algorithms fail. The only algorithm that achieves a goodenough FPR is Naive Bayes Multinomial, however, it fails because of the unacceptable TPRscore.
6 Discussion
The experiment raises several interesting issues which will now be discussed. We first reviewsome technical aspects related to the featured algorithms and their performance on EULAclassification.
The best performing algorithms for the bag-of-words data set, according to ACC, arepredominantly kernel function based. SMO, especially, is known to perform well accordingto ACC on large text classification data sets [21]. However, in terms of AUC, both VotedPerceptron and SMO are outperformed by Naive Bayes Multinomial and Bagging.
Caruana and Niculescu-Mizil [8] note that support vector machines are not designedto predict probabilities and explain that their predictions can be calibrated with, e.g.: PlattScaling or Isotonic Regression. We perform no such calibration and thus this could be relatedto the poor SMO performance according to AUC.
Several studies have reported on the poor performance of Naive Bayes Multinomial com-pared to that of, e.g., SMO on text classification tasks. However, Kibriya et al. [21] argued thatthe performance, especially in terms of AUC, of Naive Bayes Multinomial can be dramati-cally improved by applying TF IDF during preprocessing. Our results on the bag-of-wordsdata set indicate that this claim is valid. Consequently, the obtained results seem to be alignedwith related studies of these algorithms for similar domains.
The case is different for the meta EULA data set, which has a small number of attributescompared to the bag-of-words set. Few algorithms seem to perform well on this data set witha notable exception in Bagging.
Bagging seems to be quite suitable for our problem. It is the superior algorithm for bothACC and AUC on the meta EULA data set. In addition, it is the second best algorithm,according to AUC, on the bag-of-words data set and it is positioned in the upper eche-lon of algorithms for the ACC metric on this data set as well. However, compared to theBayesian learners it performs poorly with respect to FPR, which is an important metric forthis application.
The default configuration of Bagging uses REP trees as base classifiers. In analyzing theREP trees generated from the complete meta EULA set we observe that they seem to be verydiverse in structure but most are rather complex in terms of tree size (most of them use morethan 30 nodes). The aggregated Bagging classifier can thus be described as a quite complexmodel. This seems to be aligned with the essential property of Bagging as [6] concludes: ifperturbing the learning set can cause significant changes in the constructed classifier, thenBagging can improve performance. Consequently, the REP trees learned from the differentbootstrap generated sub sets of data are diverse and this may contribute to the overall goodperformance.
As stated earlier, most algorithms perform poorly on the meta EULA set and this is espe-cially true for Voted Perceptron and SMO. The former performs identically to that of ZeroRand SMO is only slightly better. Moreover, all algorithms perform poorly according to FPRon the meta EULA set, which suggests that it is difficult to find structural patterns in datacompiled from the EULA Analyzer metrics.
123
Learning to detect spyware using end user license agreements
Table 7 Rule-based classifiersgenerated using the completebag-of-words data set
Algorithm Classifier
JRip (search ≥ 1.67) AND (upgrad ≥ 1.01) THEN bad
(web ≥ 2.10) AND (uninst ≥ 1.42) THEN bad
(opportun ≥ 1.89) AND (adver ≥ 1.34) THEN bad
ELSE good
PART (visit ≤ 1.48) AND (search ≤ 0) AND (opportun ≤ 0) AND
ad ≤ 1.19) AND (graph ≤ 0) AND (definit ≤ 0) AND
(view ≤ 0) THEN good
(contextu > 0) THEN bad
(redirect ≤ 0) AND (panel > 0) AND (fraud ≤ 0) THEN
bad (redirect ≤ 0) AND (cook ≤ 0) AND (vi ≤ 1.50) AND
(timel ≤ 0) AND (patch ≤ 0) AND (pc ≤ 0) AND
(tot ≤ 0) THEN good
(redirect ≤ 0) AND (zip ≤ 0) AND (accru ≤ 0) AND
(explicit ≤ 1.61) AND (adver ≤ 3.10) AND (detect ≤ 0)
AND (asser ≤ 0) AND (injunct ≤ 0) AND (encour ≤ 0)
AND (born ≤ 0) THEN good
(charg ≤ 0.99) AND (rever ≤ 0.21) THEN bad
(tort ≤ 0) AND (pop ≤ 0) THEN good
ELSE bad
Ridor (search > 0.84) AND (upgrad > 0.50) AND (vulgar ≤ 1.24)
THEN bad
(inform > 0.93) AND (download > 1.88) THEN bad
(pol > 0.49) AND (visit > 1.91) AND (whichever ≤ 0.93)
THEN bad
ELSE good
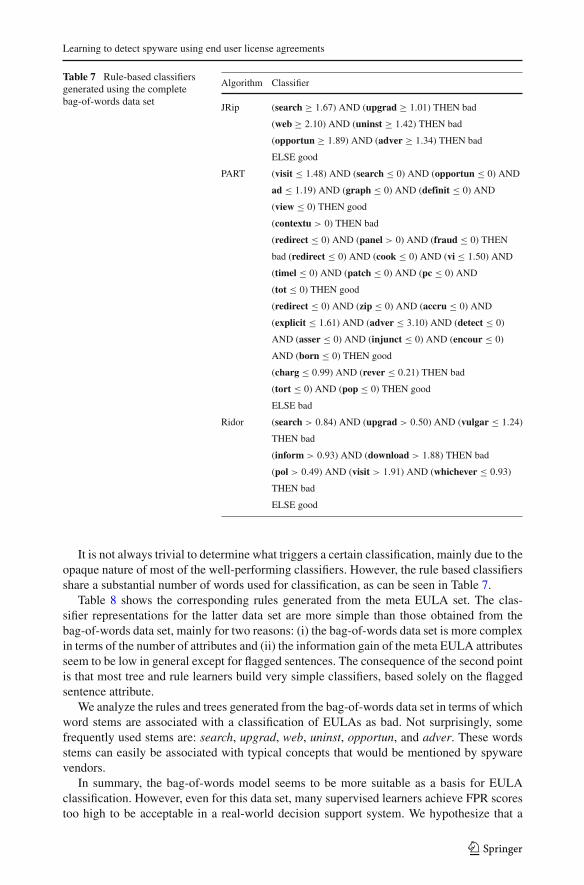
It is not always trivial to determine what triggers a certain classification, mainly due to theopaque nature of most of the well-performing classifiers. However, the rule based classifiersshare a substantial number of words used for classification, as can be seen in Table 7.
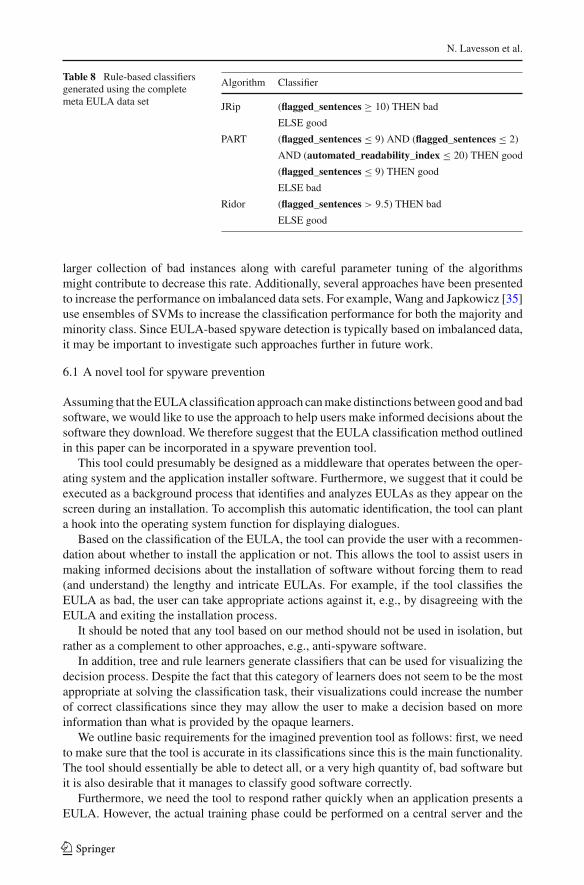
Table 8 shows the corresponding rules generated from the meta EULA set. The clas-sifier representations for the latter data set are more simple than those obtained from thebag-of-words data set, mainly for two reasons: (i) the bag-of-words data set is more complexin terms of the number of attributes and (ii) the information gain of the meta EULA attributesseem to be low in general except for flagged sentences. The consequence of the second pointis that most tree and rule learners build very simple classifiers, based solely on the flaggedsentence attribute.
We analyze the rules and trees generated from the bag-of-words data set in terms of whichword stems are associated with a classification of EULAs as bad. Not surprisingly, somefrequently used stems are: search, upgrad, web, uninst, opportun, and adver. These wordsstems can easily be associated with typical concepts that would be mentioned by spywarevendors.
In summary, the bag-of-words model seems to be more suitable as a basis for EULAclassification. However, even for this data set, many supervised learners achieve FPR scorestoo high to be acceptable in a real-world decision support system. We hypothesize that a
123
N. Lavesson et al.
Table 8 Rule-based classifiersgenerated using the completemeta EULA data set
Algorithm Classifier
JRip (flagged_sentences ≥ 10) THEN bad
ELSE good
PART (flagged_sentences ≤ 9) AND (flagged_sentences ≤ 2)
AND (automated_readability_index ≤ 20) THEN good
(flagged_sentences ≤ 9) THEN good
ELSE bad
Ridor (flagged_sentences > 9.5) THEN bad
ELSE good
larger collection of bad instances along with careful parameter tuning of the algorithmsmight contribute to decrease this rate. Additionally, several approaches have been presentedto increase the performance on imbalanced data sets. For example, Wang and Japkowicz [35]use ensembles of SVMs to increase the classification performance for both the majority andminority class. Since EULA-based spyware detection is typically based on imbalanced data,it may be important to investigate such approaches further in future work.
6.1 A novel tool for spyware prevention
Assuming that the EULA classification approach can make distinctions between good and badsoftware, we would like to use the approach to help users make informed decisions about thesoftware they download. We therefore suggest that the EULA classification method outlinedin this paper can be incorporated in a spyware prevention tool.
This tool could presumably be designed as a middleware that operates between the oper-ating system and the application installer software. Furthermore, we suggest that it could beexecuted as a background process that identifies and analyzes EULAs as they appear on thescreen during an installation. To accomplish this automatic identification, the tool can planta hook into the operating system function for displaying dialogues.
Based on the classification of the EULA, the tool can provide the user with a recommen-dation about whether to install the application or not. This allows the tool to assist users inmaking informed decisions about the installation of software without forcing them to read(and understand) the lengthy and intricate EULAs. For example, if the tool classifies theEULA as bad, the user can take appropriate actions against it, e.g., by disagreeing with theEULA and exiting the installation process.
It should be noted that any tool based on our method should not be used in isolation, butrather as a complement to other approaches, e.g., anti-spyware software.
In addition, tree and rule learners generate classifiers that can be used for visualizing thedecision process. Despite the fact that this category of learners does not seem to be the mostappropriate at solving the classification task, their visualizations could increase the numberof correct classifications since they may allow the user to make a decision based on moreinformation than what is provided by the opaque learners.
We outline basic requirements for the imagined prevention tool as follows: first, we needto make sure that the tool is accurate in its classifications since this is the main functionality.The tool should essentially be able to detect all, or a very high quantity of, bad software butit is also desirable that it manages to classify good software correctly.
Furthermore, we need the tool to respond rather quickly when an application presents aEULA. However, the actual training phase could be performed on a central server and the
123

Learning to detect spyware using end user license agreements
generated classifier(s) could then be downloaded by the tool periodically. Thus, there are nospecific requirements related to classifier training time. Finally, it is desirable that the toolcan visualize what element(s) in the EULA triggered a certain classification.
6.2 Potential problems
It could be argued that, if the prevention tool is made available, the spyware authors wouldtailor their EULA around it. We believe that this argument does not hold since, in order toavoid legal repercussions, the spyware authors are in most countries required to mention inthe EULA that spyware will be installed. We exploit this fact and use it against the spywaredistributors.
Another argument against the tool is that there are already quite sophisticated tools forprevention and removal of spyware (e.g.: Ad-Aware8). However, the idea is not to create areplacement for such products. Essentially, the spyware prevention tool should work as acomplement that could be used to detect spyware that has not yet been classified by anti-spy-ware software.
6.3 Comparison to Ad-Aware
In an earlier experiment, Boldt and Carlsson [4] analyzed the accuracy of Ad-Aware overa four year period. By manually analyzing spyware infested systems using a leading com-mercial computer forensic tool Boldt and Carlsson [4] tracked down every change in theinfected system. By comparing these changes with the detected spyware components foundby Ad-Aware it was possible to quantify the accuracy development of the tool between 2002and 2005.
The results show that Ad-Aware failed to report 30% of the spyware programs. New ver-sions would mark earlier discovered spyware programs as legitimate programs, or wronglyclassified traces of spyware as fully functioning spyware programs. However, the manualforensic method managed to find all added executable files and also to differentiate traces ofspyware from executable files. The conclusion is that the problem of identifying and remov-ing spyware programs while at the same time keeping/protecting legitimate files, is difficultto solve for anti-spyware vendors. Not only do these vendors have to cope with technicalproblems, but they also need to consider legal aspects, which is a major distinction betweenanti-spyware and anti-virus tools.
When it comes to comparing the accuracy of our novel technique with existing anti-spy-ware tools some complicating factors emerge. We have used already known spyware programsincluded in SpywareGuide.com. To enable a fair comparison between our proposed tool andalready available anti-spyware tools we need to obtain data from the shared repositories ofthe leading anti-virus companies. It is presently unclear whether the data available in theserepositories would be made available to researchers for the purpose of conducting theseexperimental comparisons.
7 Conclusions and future work
We have investigated the relationship between the contents of EULAs and the legitimacy ofthe associated software applications. For this purpose, we collected a data set that features996 EULA instances of legitimate (good) and spyware associated (bad) software. This is a
8 http://www.lavasoft.com.
123

N. Lavesson et al.
text classification task and we argue that supervised learning is a suitable approach to theproblem. Since most supervised learning algorithms cannot handle unstructured text input,we had to convert the data set to a manageable format. We therefore opted to use the bag-of-words model, in which text documents are converted to feature vectors. We compared thismodel to a meta EULA model that describes each EULA using several text analysis metrics.
We applied 17 supervised learning algorithms from several algorithm categories, suchas: kernel functions, instance-based learners, tree and rule inducers, and Bayesian learners.The main objective was to investigate the possibility to classify software as good or bad bytraining classifiers on the associated EULAs.
For both data models, the experimental results show that a majority of the featured algo-rithms significantly outperformed a baseline classifier based on majority class decision.However, the results indicate that the bag-of-words model was more suitable than the metaEULA model, at least for the studied algorithms.
The results support our hypothesis that EULAs can indeed be used as a basis for classifyingthe corresponding software as good or bad. Based on this, we conclude that it would be quitepossible to use the EULA classification method in a spyware prevention tool that classifiesthe EULA when it is shown to the user during an application installation. The result fromsuch an analysis gives the user a recommendation about the legitimacy of the applicationbefore the installation continues. There are several directions for future work. For example,we intend to:
– gather a data set that includes both the EULAs and binaries of spyware and legitimate soft-ware in order to perform a fair comparison between our spyware detection approach andthe detection approaches provided by the leading commercial anti-virus and anti-spywaretools,
– extend the EULA classification problem from two classes into a more fine-grained multi-class approach, thus enabling not only the distinction between spyware and legitimatesoftware but also the detection of specific types of spyware,
– select metrics, weights, and ranges for CEF in a more informed manner, e.g., by inter-viewing experts and potential users,
– develop a spyware prevention tool, based on EULA classification, that can help users tomake informed decisions about the software they install,
– investigate metric-based algorithms and other approaches to optimize the CEF metric,including to minimize the false positives rate,
– select a subset of the best performing learning algorithms in order to perform parametertuning for the purpose of improving classification performance even further,
– merge the meta EULA and the bag-of-words data sets to find out if the classificationperformance can be improved by having access to both the term frequencies and the metainformation,
– compare the contents of the flagged sentences with the words discovered for EULAsclassified as bad in the bag-of-words.
Acknowledgments We thank the anonymous reviewers for their useful comments and suggestions. Thiswork was funded by Blekinge Institute of Technology.
References
1. Androutsopoulos I, Paliouras G, Karkaletsis V, Sakkis G, Spyropoulos CD, Stamatopoulos P (2000)Learning to filter spam E-mail: a comparison of a naive bayesian and a memory-based approach.
123

Learning to detect spyware using end user license agreements
In: 4th European conference on principles and practice of knowledge discovery in databases: workshopon machine learning and textual information access, Springer, Berlin, pp 1–13
2. Arnett KP, Schmidt MB (2005) Busting the ghost in the machine. Communications of the ACM 48(8)3. Boldt M (2007) Privacy-invasive software—exploring effects and countermeasures, Licentiate Thesis
Series, No 2007:01, Blekinge Institute of Technology4. Boldt M, Carlsson B (2006) Analysing countermeasures against privacy-invasive software. In: 1st IEEE
international conference on systems and networks communications5. Boldt M, Carlsson B, Jacobsson A (2004) Exploring spyware effects. In: Eight nordic workshop on
secure IT systems, Helsinki University of Technology, Espoo, Finland, no. TML-A10 in publications intelecommunication and software multimedia, pp 23–30
6. Breiman L (1996) Bagging predictors. Mach Learn 24(2):123–1407. Carreras X, Màrquez L (2001) Boosting trees for anti-spam email filtering. In: Mitkov R, Angelova G,
Bontcheva K, Nicolov N, Nikolov N (eds) European conference on recent advances in natural languageprocessing. Tzigov Chark, Bulgaria, pp 58–64
8. Caruana R, Niculescu-Mizil A (2006) An empirical comparison of supervised learning algorithms. In:23rd international conference on machine learning. ACM Press, New York City, pp 161–168
9. Cohen W (1996) Learning Rules that Classify E-Mail. In: Advances in inductive logic programming. IOSPress, Amsterdam
10. Coleman M, Liau TL (1975) A computer readability formula designed for machine scoring. J Appl Psy-chol 60:283–284
11. Demzar J (2006) Statistical comparisons of classifiers over multiple data sets. Mach Learn Res 7:1–3012. Denoyer L, Zaragoza H, Gallinari P (2001) HMM-based passage models for document classification and
ranking. In: 23rd European colloquium on information retrieval research13. Drucker H, Wu D, Vapnik V (1999) Support vector machines for spam categorization. IEEE Trans Neural
Netw 10(5):1048–105414. Fawcett T (2001) Using rule sets to maximize ROC performance. In: IEEE international conference on
data mining. IEEE Press, New York City, pp 131–13815. Fawcett T (2003) ROC graphs—notes and practical considerations for data mining researchers. Tech.
Rep. HPL-2003-4, Intelligent enterprise technologies laboratories, Palo Alto16. Feldman R, Sanger J (2007) The text mining handbook. Cambridge University Press, Cambridge17. Flesch R (1948) A new readability yardstick. J Appl Psychol 32:221–23318. Fox S (2005) Spyware—the threat of unwanted software programs is changing the way people use the
Internet. http://www.pewinternet.org/pdfs/PIP_Spyware_Report_July_05.pdf19. Good N, Grossklags J, Thaw D, Perzanowski A, Mulligan DK, Konstan J (2006) User choices and regret:
understanding users’ decision process about consensually acquired spyware. I/S Law Policy Inf Soc2(2):283–344
20. Kang N, Domeniconi C, Barbara D (2005) Categorization and keyword identification of unlabeled docu-ments. In: Fifth IEEE international conference on data mining. IEEE Press, New York City, pp 677–680
21. Kibriya AM, Frank E, Pfahringer B, Holmes G (2004) Multinomial naive bayes for text categorizationrevisited. In: Seventh Australian joint conference on artificial intelligence, Springer, Berlin, pp 488–499
22. Koprinska I, Poon J, Clark J, Chan J (2007) Learning to classify E-mail. Inf Sci 177:2167–218723. Lavesson N, Davidsson P (2008) Generic methods for multi-criteria evaluation. In: Eighth SIAM inter-
national conference on data mining. SIAM Press, Philadelphia, pp 541–54624. Lavesson N, Davidsson P, Boldt M, Jacobsson A (2008) Spyware Prevention by Classifying End User
License Agreements. In: New challenges in applied intelligence technologies, studies in computationalintelligence, vol 134. Springer, Berlin
25. McFedries P (2005) The spyware nightmare. IEEE Spectr 42(8):72–7226. Metzler D, Croft WB (2005) A markov random field model for term dependencies. In: 28th ACM SIGIR
conference on research and development in information retrieval, pp 472–47927. Moshchuk A, Bragin T, Gribble SD, Levy HM (2006) A crawler-based study of spyware on the web. In:
13th annual symposium on network and distributed systems security, Internet Society, Reston28. Provost F, Fawcett T, Kohavi R (1998) The case against accuracy estimation for comparing induction
algorithms. In: 15th international conference on machine learning. Morgan Kaufmann Publishers, SanFrancisco, pp 445–453
29. Sakkis G, Androutsopoulos I, Paliouras G, Karkaletsis V, Spyropoulos CD, Stamatopoulos P (2001)Stacking classifiers for anti-spam filtering of E-mail. In: Sixth conference on empirical methods in natu-ral language processing, Carnegie Mellon University, Pittsburgh
30. Sebastiani F (2002) Machine learning in automated text categorization. ACM Comput Surv 34(1):1–4731. Shukla S, Nah F (2005) Web browsing and spyware intrusion. Communications of the ACM 48(8)
123
N. Lavesson et al.
32. Smith EA, Kincaid P (1970) Derivation and validation of the automated readability index for use withtechnical materials. Human Factors 12:457–464
33. Townsend K (2003) Spyware, Adware, and Peer-to-Peer networks—the hidden threat to corporate secu-rity, Technical White Paper, Pest Patro
34. Wang P, Hu J, Zeng H-J, Chen Z (2009) Using wikipedia knowledge to improve text classification. KnowlInf Syst 19:265–281
35. Wang BX, Japkowicz N (2009) Boosting support vector machines for imbalanced data Sets. Knowl InfSyst (Online First)
36. Weiss A (2005) Spyware be gone. ACM Netw 9(1):18–2537. Witten IH, Frank E (2005) Data mining: practical machine learning tools and techniques. Morgan Kauf-
mann Publishers, San Francisco38. Zhang X (2005) What do consumers really know about spyware. Commun ACM 48(8):44–4839. Zhao H (2008) Instance weighting versus threshold adjusting for cost-sensitive classification. Knowl Inf
Syst 15:321–334
Author Biographies
Niklas Lavesson is assistant professor of Computer Science at Blekin-ge Institute of Technology, Sweden. He received his M.Sc. in SoftwareEngineering and Ph.D. in Computer Science, in 2003 and 2008 respec-tively, from Blekinge Institute of Technology. His main area of researchis Machine Learning with a special focus on evaluation of supervisedlearning algorithms. Current research interests involve the applicationof supervised learning to data mining problems in the healthcare andsecurity engineering domains. He is the Director of a Bachelor’s pro-gram in Security Engineering and the Coordinator for Ph.D. studies,both at Blekinge Institute of Technology.
Martin Boldt is a Ph.D. student at Blekinge Institute of Technology inSweden. His research focuses on collaborative countermeasures againstmalicious software, which involves reputation systems and auto-matic analysis of end user license agreements using machine learningalgorithms. Boldt is also director of the M.Sc. program in SecurityEngineering (120 ECTS) at Blekinge Institute of Technology.
123
Learning to detect spyware using end user license agreements
Paul Davidsson is professor of Computer Science at BlekingeInstitute of Technology and Malmö University, both situated in Swe-den. He received his Ph.D. in Computer Science in 1996 from LundUniversity, Sweden. Davidsson is the founder and manager of the Dis-tributed and Intelligent Systems Laboratory which currently consistsof nine senior researchers and ten Ph.D. students. His research inter-ests include the theory and application of agent technology, informationsystems, and data mining. The results of this work have been reportedin more than 120 peer-reviewed scientific articles published in interna-tional journals, conference proceedings, and books. He is member ofthe editorial boards of three international journals and has been mem-ber of the program committee for more than 80 scientific conferencesand workshops. He is currently in the management committee of theEU COST action on Agreement Technologies.
Andreas Jacobsson is Assistant Professor in Computer Scienceat Malmö University. He received his Ph.D. in Computer Sciencefrom Blekinge Institute of Technology in 2008 in the fields of secu-rity and interoperability of information systems. His current researchinterests include agreement technologies for negotiation and interoper-ability methods for collaboration between enterprise information sys-tems. Moreover, Jacobsson is the Director of the educational programsin Information Architectures (180 ECTS) and Enterprise ResourcePlanning: Technology and Management (180 ECTS).
123