Data-controlled automation of liquid chromatography/tandem ...
Upload
independentCategory
view
1download
0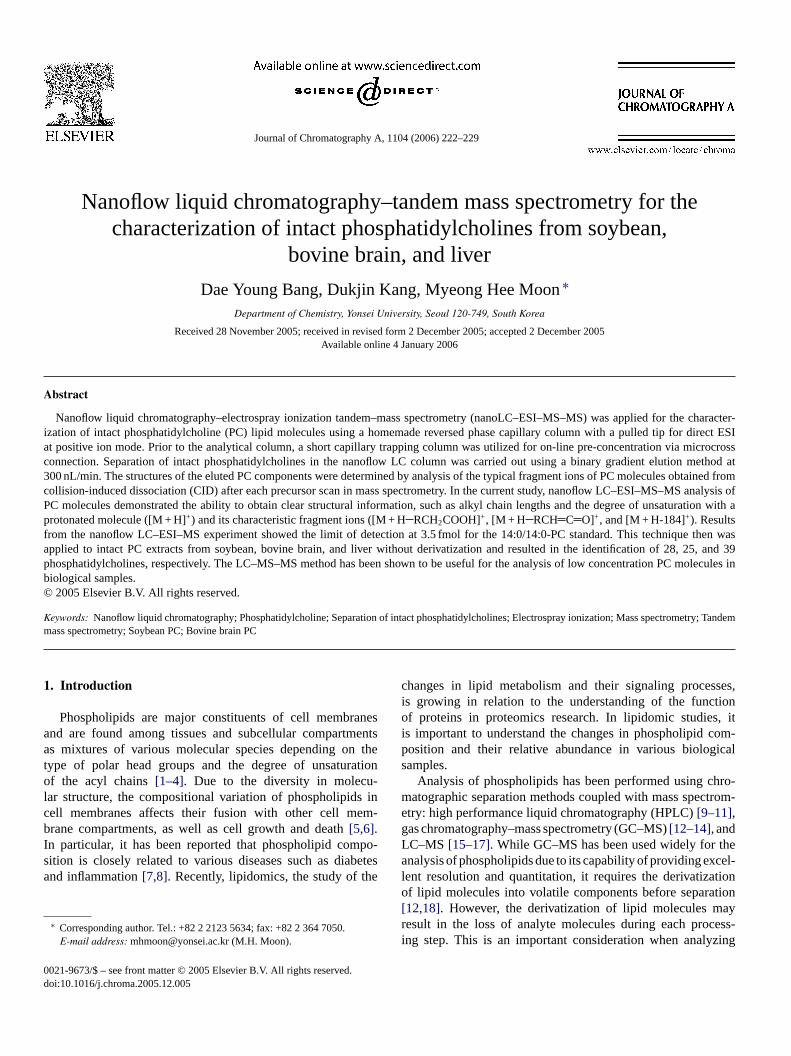
Journal of Chromatography A, 1104 (2006) 222–229
Nanoflow liquid chromatography–tandem mass spectrometry for thecharacterization of intact phosphatidylcholines from soybean,
bovine brain, and liver
Dae Young Bang, Dukjin Kang, Myeong Hee Moon∗Department of Chemistry, Yonsei University, Seoul 120-749, South Korea
Received 28 November 2005; received in revised form 2 December 2005; accepted 2 December 2005Available online 4 January 2006
Abstract
Nanoflow liquid chromatography–electrospray ionization tandem–mass spectrometry (nanoLC–ESI–MS–MS) was applied for the character-ization of intact phosphatidylcholine (PC) lipid molecules using a homemade reversed phase capillary column with a pulled tip for direct ESIat positive ion mode. Prior to the analytical column, a short capillary trapping column was utilized for on-line pre-concentration via microcrossc method at3 tained fromc analysis ofP ation with apf then wasa 5, and 39p olecules inb©
K ry;m
1
aatolcbIsa
ses,tion, it
com-ical
hro-trom-
thecel-tiontionay
cess-zing
0d
onnection. Separation of intact phosphatidylcholines in the nanoflow LC column was carried out using a binary gradient elution00 nL/min. The structures of the eluted PC components were determined by analysis of the typical fragment ions of PC molecules obollision-induced dissociation (CID) after each precursor scan in mass spectrometry. In the current study, nanoflow LC–ESI–MS–MSC molecules demonstrated the ability to obtain clear structural information, such as alkyl chain lengths and the degree of unsaturrotonated molecule ([M + H]+) and its characteristic fragment ions ([M + HRCH2COOH]+, [M + H RCH C O]+, and [M + H-184]+). Results
rom the nanoflow LC–ESI–MS experiment showed the limit of detection at 3.5 fmol for the 14:0/14:0-PC standard. This techniquepplied to intact PC extracts from soybean, bovine brain, and liver without derivatization and resulted in the identification of 28, 2hosphatidylcholines, respectively. The LC–MS–MS method has been shown to be useful for the analysis of low concentration PC miological samples.2005 Elsevier B.V. All rights reserved.
eywords: Nanoflow liquid chromatography; Phosphatidylcholine; Separation of intact phosphatidylcholines; Electrospray ionization; Mass spectrometTandemass spectrometry; Soybean PC; Bovine brain PC
. Introduction
Phospholipids are major constituents of cell membranesnd are found among tissues and subcellular compartmentss mixtures of various molecular species depending on the
ype of polar head groups and the degree of unsaturationf the acyl chains[1–4]. Due to the diversity in molecu-
ar structure, the compositional variation of phospholipids inell membranes affects their fusion with other cell mem-rane compartments, as well as cell growth and death[5,6].
n particular, it has been reported that phospholipid compo-ition is closely related to various diseases such as diabetesnd inflammation[7,8]. Recently, lipidomics, the study of the
∗ Corresponding author. Tel.: +82 2 2123 5634; fax: +82 2 364 7050.E-mail address: [email protected] (M.H. Moon).
changes in lipid metabolism and their signaling procesis growing in relation to the understanding of the funcof proteins in proteomics research. In lipidomic studiesis important to understand the changes in phospholipidposition and their relative abundance in various biologsamples.
Analysis of phospholipids has been performed using cmatographic separation methods coupled with mass specetry: high performance liquid chromatography (HPLC)[9–11],gas chromatography–mass spectrometry (GC–MS)[12–14], andLC–MS [15–17]. While GC–MS has been used widely foranalysis of phospholipids due to its capability of providing exlent resolution and quantitation, it requires the derivatizaof lipid molecules into volatile components before separa[12,18]. However, the derivatization of lipid molecules mresult in the loss of analyte molecules during each proing step. This is an important consideration when analy
021-9673/$ – see front matter © 2005 Elsevier B.V. All rights reserved.oi:10.1016/j.chroma.2005.12.005
D.Y. Bang et al. / J. Chromatogr. A 1104 (2006) 222–229 223
phospholipids in small amounts of cells and tissues. For thesereasons, analysis of intact phospholipids using LC methods hasattracted more interest since the advent of electrospray ion-ization (ESI) in MS [17,19,20]. Since ESI offers improvedsensitivity, low spectral background signals, and good compat-ibility with LC, the LC–ESI–MS technique is being utilizedwidely [4,21–24]. In addition, tandem mass spectrometricanalysis using collision-induced dissociation (CID) of lipidmolecules has provided a useful means to characterize molec-ular structure by examining fragment ions with[25] or withoutHPLC separation[20,26–30]. While each method (LC–MS orGC–MS or direct ESI–MS–MS) is useful for analysis of aspecific phospholipid when the target is limited, it is difficultto obtain information on compositional changes of phospho-lipids in biological samples simultaneously. Since phospho-lipids are so diverse in structure, high resolution and highsensitivity chromatographic separation of intact phospholipidswith high through-put must be assured prior to the MS anal-ysis. This is particularly important for the simultaneous pro-filing of complex mixtures of phospholipids in small amountof cells and tissues. However, performance of HPLC sepa-ration of intact phospholipids is still behind the level thatis sufficient to carry out the simultaneous profiling of lipidmixtures.
In this study, a nanoflow LC–ESI–MS–MS technique wasapplied for the separation of intact phosphatidylcholine (PC)s asss eousi wascp de,a r toa fulla enti-fi andl
2. Materials and methods
2.1. Phosphatidylcholine standards:
1,2-Dilauroyl-phosphatidylcholine (12:0-12:0 PC), 1,2-dimyristoyl-PC (14:0-14:0, PC), 1-oleoyl-2-palmitoyl-PC(18:1-16:0 PC), 1-stearoyl-2-oleoyl-PC (18:0-18-1 PC), 1,2-distearoyl-PC (18:0-18:0 PC), 1,2-diarachidoyl-PC (20:0-20:0PC) were purchased from Sigma–Aldrich (St. Louis, MO, USA).Phosphatidylcholine mixtures from soybean, bovine brain andliver also were obtained from Sigma–Aldrich. All sampleswere prepared initially in 30/60/10 CH3OH/CHCl3/CH3CNcontaining 0.1% formic acid (FA); and for further dilution90/10 CH3OH/CH3CN containing 0.1% FA was used. Allsolvents used were HPLC grade.
2.2. Nanoflow LC/electrospray ionization tandem massspectrometry (nanoflow LC–ESI–MS–MS)
The schematics of an automatic nanoflow LC system withon-line sample trapping column is illustrated inFig. 1. Theanalytical column (150 mm× 75�m) and trapping column(5 mm× 100�m) were prepared in-house. The tip at the endof capillary tubing (75�m I.D., 360�m O.D.) from PolymicroTechnology (Phoenix, AZ, USA) was pulled by flame result-ing in a tip diameter of approximately 10�m and about 1 mmi edp spM res-s ilicati itiallyw dt rossa ode
F ema w the tip oc
pecies at a very low concentration level with tandem mpectrometric analysis (or CID) to achieve the simultandentification of the molecular structure of PCs. Separationarried out using a homemade capillary column (C18 reversedhase) with a pulled tip for direct ESI at positive ion mond a short capillary trapping column was utilized prion analytical column for on-line sample clean-up and forutomation. This technique allowed us to enlarge the ided number of intact PCs from soybean, bovine brain,iver.
ig. 1. System configuration of nanoflow LC–ESI–MS–MS using the homolumns filled with frit implemented by sol–gel process.
n length of the tip was filled with a sol–gel frit as describreviously[31]. The pulled tip capillary with an end frit waacked with methanol slurry of 5�m 100A Magic C18 fromichrom BioResources (Auburn, CA, USA) at a constant p
ure (1000 psi) of He. The trapping column was made with subing (100�m I.D., 360�m O.D.) in which the end frit (2 mmn length) was prepared in the same way and was packed inith 5�m 200A Magic C18 for 5 mm. The trapping column an
he analytical column were connected via a PEEK microcs shown inFig. 1and a platinum wire was used as an electr
de capillary column and the trapping column. The enlarged pictures shof
224 D.Y. Bang et al. / J. Chromatogr. A 1104 (2006) 222–229
to supply an electrospray ionization voltage as described in theliterature[31–33].
Nanoflow LC separation was carried out using the model1100 HPLC system from Agilent Technologies (Palo Alto, CA,USA). A binary gradient elution for RPLC was utilized for theseparation of phosphatidylcholine samples with the followingmobile phases: A: 50/30/20 CH3CN/H2O/isopropanol (IPA), B:90/10 IPA/CH3CN. Both mobile phase solutions contained 0.1%formic acid. Sample was loaded from an autosampler at a flowrate of 4�L/min with a six-way valve configuration of A shownin Fig. 1using mobile phase A. Injection volume was set as lessthan 1�L for all runs. During the sample loading, the end of thevent tubing was open so that sample could be delivered to thetrapping column at a relatively high speed. After loading, thevalve configuration was changed to 60◦ so that the split tubingend was open with the vent tubing closed, and then RPLC sep-aration began with a gradient elution. During separation mode,a flow rate of 7�L/min was delivered from the binary pump,but the final flow rate at the analytical column was adjustedto be 300 nL/min by controlling the length of the split tubing(capillary I.D. 25�m). After finishing each gradient elution, thecolumn was re-equilibrated for at least 20 min with solvent A.
For mass spectrometric analysis, an LCQ Deca ion trap massspectrometer from Thermo Finnigan (San Jose, CA, USA) was
utilized. Electrospray ionization was carried out at a potentialof 2.0 kV applied via Pt wire and at a capillary temperatureof 180◦C. Phosphatidylcholine ions were detected in a data-dependent analysis mode. The acquisition method involvedone MS precursor scan from 600 to 900 u followed by data-dependent MS–MS scans (40% normalized collision energy)throughout the study. The mass tolerance between the measuredmono-isotopic mass and the calculated mass was 1.0 Da for themolar mass of a precursor and 1.0 Da for the mass of fragmentions. The acquired MS–MS spectra were analyzed manually.
3. Results and discussion
3.1. Nanoflow LC–MS–MS of phosphatidylcholinestandards
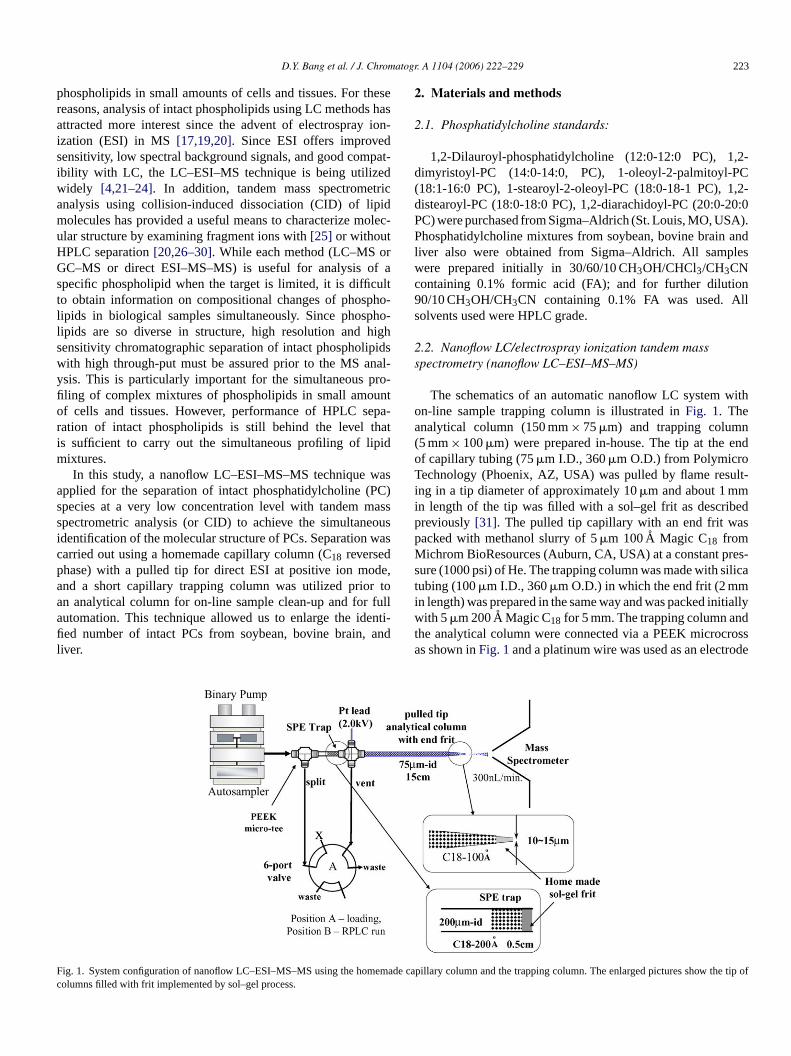
Prior to the nanoflow LC–MS–MS analysis of phosphatidyl-choline standards, the tandem mass spectrum of each standardmolecule was obtained with direct infusion and the collectedMS–MS spectra were utilized for the recognition of frag-mentation pattern of PC molecules.Fig. 2 shows the basepeak chromatogram (BPC) of the separation of six PC stan-dards (12:0/12:0-PC, 14:0/14:0-PC, 18:1/16:0-PC, 18:0/18:1-PC, 18:0/18:0-PC, and 20:0/20:0-PC in an order of increasing
F1P5
ig. 2. Base peak chromatogram (BPC) of intact phosphatidylcholine stand8:0/18:1-PC, No. 5: 18:0/18:0-PC, and No. 6: 20:0/20:0-PC) by nanoflow LC) (the lower left), and the resulting MS–MS spectra of the protonated 1-o0/30/20 CH3CN/H2O/IPA for A and 90/10 IPA/CH3CN for B (Both solvents conta
ards (top) (No. 1: 12:0/12:0-PC, No. 2: 14:0/14:0-PC, No. 3: 18:1/16:0-PC,No. 4:C–ESI–MS spectra of the precursor ion of the peak No. 3 (1-oleoyl-2-palmitoyl-leoyl-2-palmitoyl-PC. Mobile phase compositions for binary gradient elution wereined 0.1% formic acid). For gradient elution conditions, see Section3.1.
D.Y. Bang et al. / J. Chromatogr. A 1104 (2006) 222–229 225
peak number) using the homemade nanoflow LC columndescribed in this study. The binary gradient RPLC separationwas carried out by varying the mobile phase composition of (A)50/30/20 CH3CN/H2O/IPA and (B) 90/10 IPA/CH3CN. Bothmobile phases contained 0.1% (v/v) formic acid. After finish-ing sample loading in solvent A, the gradient was changed to80% B for 30 s and was maintained for 10 min. The gradi-ent then was increased to 90% B for 5 min and maintaineduntil the end of the run. After finishing a run, the gradientwas decreased to 0% B for 1 min and maintained for at least20 min for column re-conditioning. A similar separation couldbe achieved using isocratic elution with 80% mobile phase Bbut in this case, the last PC molecule (20:0/20:0-PC) was notresolved well (data not shown). The flow rate during the gra-dient separation was kept at 300 nL/min and the eluted PCswere analyzed by ESI–MS–MS with the precursor scan anddata-dependent MS–MS scan in sequence. Each precursor scanshowed a clear protonated molecular peak along with a sodiumadduct molecular ion peak, simultaneously. In case of the peaknumber 3 (1-oleoyl-2-palmitoyl-PC (18:1-16:0 PC)), [M + H]+
along with [M + Na]+ peaks were shown exclusively atm/z761.0 and 782.5, respectively. The MS–MS spectrum of theselectedmolecule (m/z: 761.0) (lower right side ofFig. 1) con-tained fragment ions atm/z 496.5 and 522.5, correspondingto the neutral loss of the fatty acid group as a ketene atsn-1 ([M + H R CH C O]+) andsn-2 ([M + H R CH C O]+),r rmer,w pro-c nt cha-nP ossos( larh n.T ins ac ceo s oft d byd trall ulari ya fromm g-l7 ren ents1 etali g LCs
3
cteri entn dard
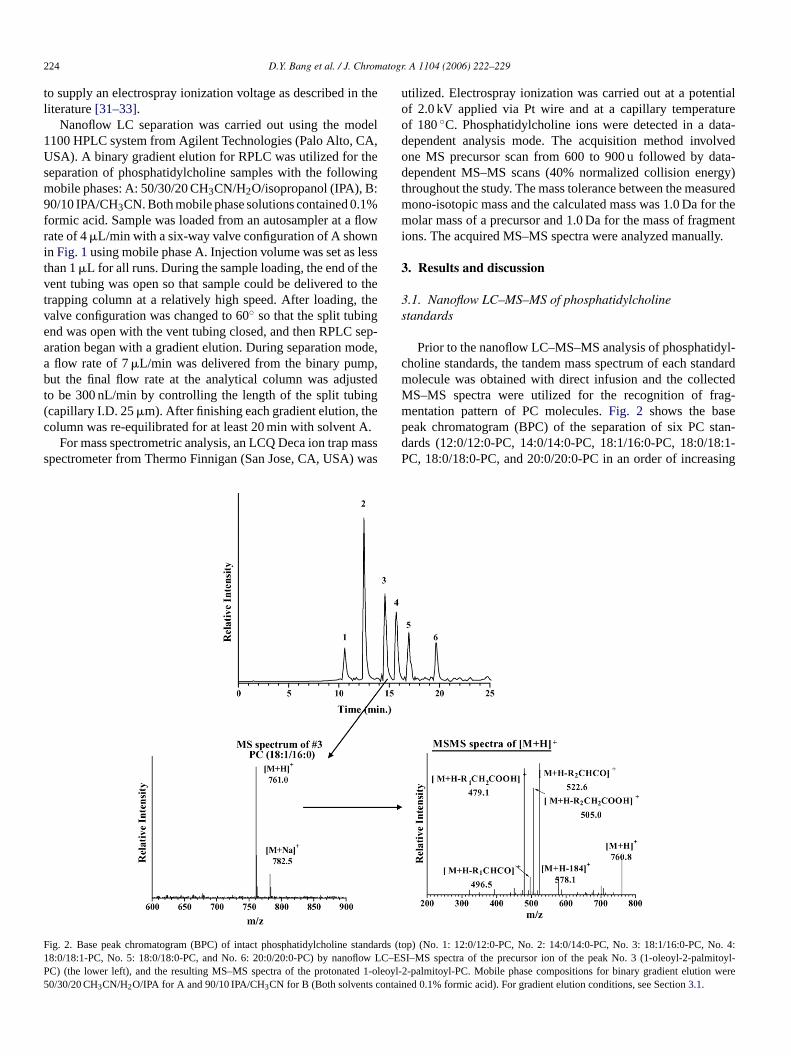
Fig. 3. Ion chromatograms of 14:0/14:0-PC standard by selected ion monitoringmode atm/z 679. Runs were made sequentially by decreasing injection amountat an isocratic elution of 80% B mobile phase used inFig. 2 at a flow rate of300 nL/min. This figure shows only three chromatograms (10, 5, and 3.5 fmol).From peak area calibration, LOD was calculated as 3.5 fmol at S/N = 3 with RSDof 0.6% (n = 3).
was tested by decreasing its concentration and running it at thesame flow rate (300 nL/min.) with an isocratic elution of 80%B mobile phase. The MS detection was made in the selectedion monitoring (SIM) mode atm/z 679 by lowering injectionamount from 1.5 pmol to 3.5 fmol and the ion chromatogramswere shown inFig. 3. Injections were made by sequentially andrepeated for three times. Based on calibration of the peak areavs. concentration (r2 = 0.999), LOD was calculated as 3.5 fmol(2.4 pg) at a signal-to-noise ratio of 3. The result showed agood linear relationship between the peak area and the rangeof injected amounts (3.5 fmol∼ 1.5 pmol) and the RSD was lessthan 0.6% (n = 3). The LOD value in this study was lower thanthat (8 fmol) obtained with capillary LC–ESI–MS method[24].
3.3. Nanoflow LC–MS–MS of natural phosphatidylcholineextracts
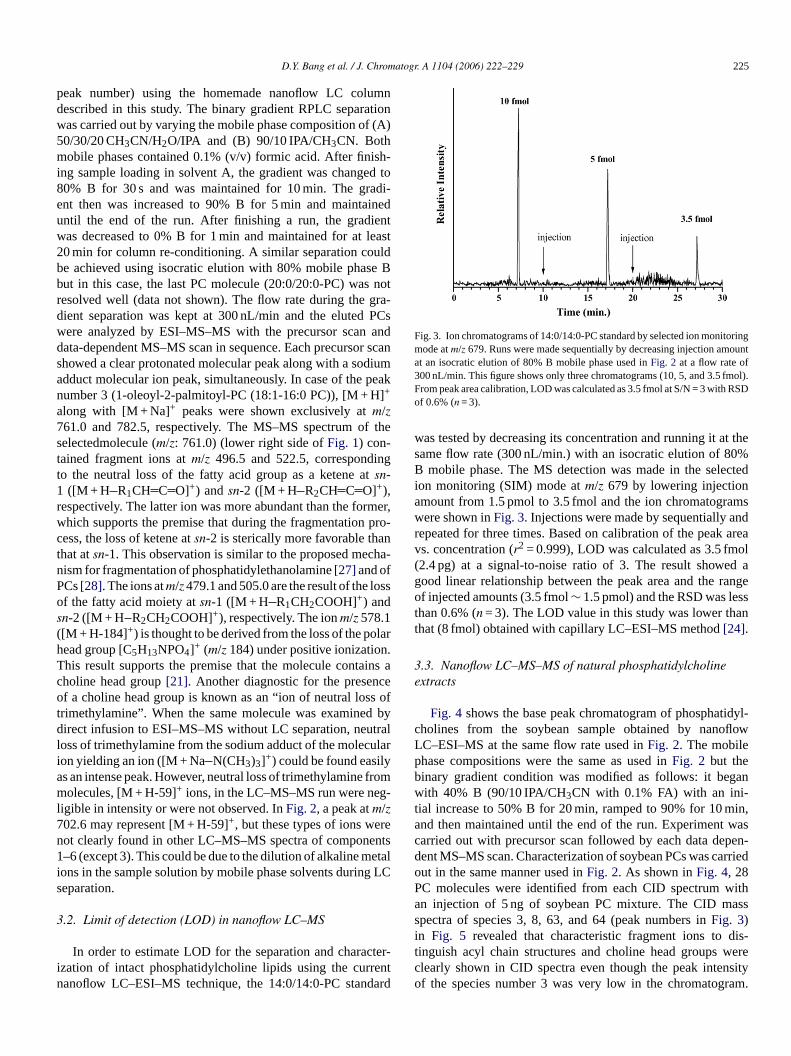
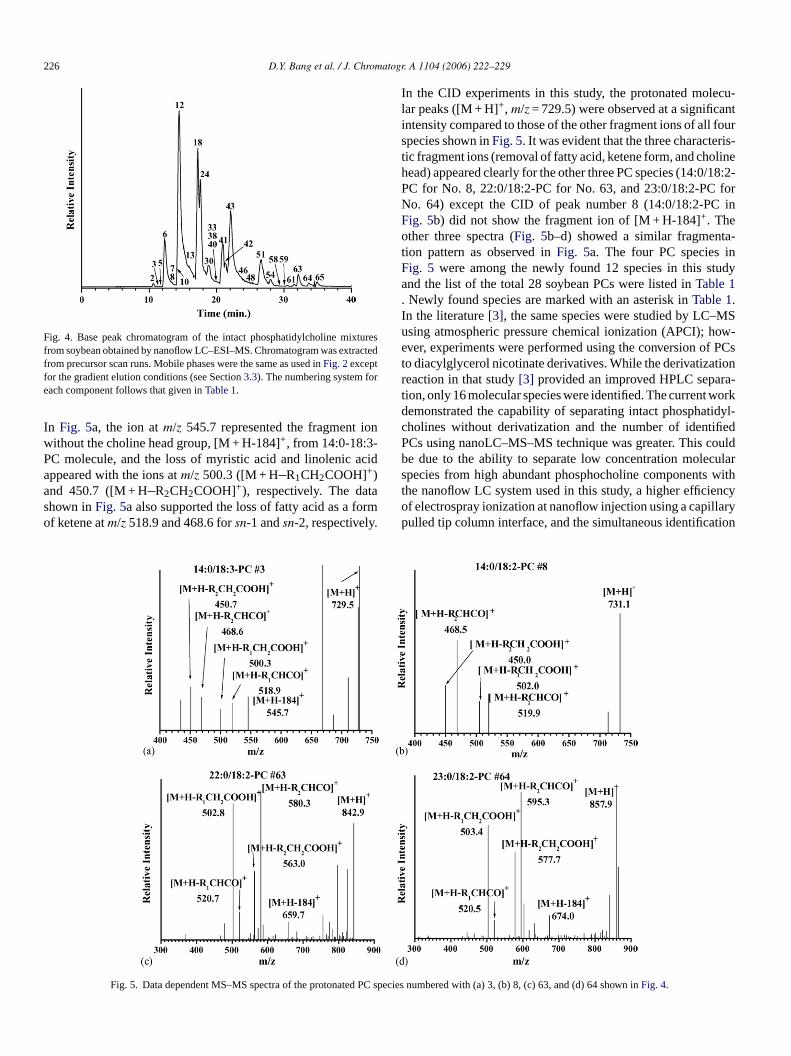
Fig. 4 shows the base peak chromatogram of phosphatidyl-cholines from the soybean sample obtained by nanoflowLC–ESI–MS at the same flow rate used inFig. 2. The mobilephase compositions were the same as used inFig. 2 but thebinary gradient condition was modified as follows: it beganwith 40% B (90/10 IPA/CH3CN with 0.1% FA) with an ini-tial increase to 50% B for 20 min, ramped to 90% for 10 min,and then maintained until the end of the run. Experiment wasc pen-d arriedoP witha asssi dis-t werec nsityo ram.
1 2espectively. The latter ion was more abundant than the fohich supports the premise that during the fragmentationess, the loss of ketene atsn-2 is sterically more favorable thahat atsn-1. This observation is similar to the proposed meism for fragmentation of phosphatidylethanolamine[27] and ofCs[28]. The ions atm/z 479.1 and 505.0 are the result of the lf the fatty acid moiety atsn-1 ([M + H R1CH2COOH]+) andn-2 ([M + H R2CH2COOH]+), respectively. The ionm/z 578.1[M + H-184]+) is thought to be derived from the loss of the poead group [C5H13NPO4]+ (m/z 184) under positive ionizatiohis result supports the premise that the molecule contaholine head group[21]. Another diagnostic for the presenf a choline head group is known as an “ion of neutral los
rimethylamine”. When the same molecule was examineirect infusion to ESI–MS–MS without LC separation, neu
oss of trimethylamine from the sodium adduct of the molecon yielding an ion ([M + Na N(CH3)3]+) could be found easils an intense peak. However, neutral loss of trimethylamineolecules, [M + H-59]+ ions, in the LC–MS–MS run were ne
igible in intensity or were not observed. InFig. 2, a peak atm/z02.6 may represent [M + H-59]+, but these types of ions weot clearly found in other LC–MS–MS spectra of compon–6 (except 3). This could be due to the dilution of alkaline m
ons in the sample solution by mobile phase solvents durineparation.
.2. Limit of detection (LOD) in nanoflow LC–MS
In order to estimate LOD for the separation and charazation of intact phosphatidylcholine lipids using the curranoflow LC–ESI–MS technique, the 14:0/14:0-PC stan
-
arried out with precursor scan followed by each data deent MS–MS scan. Characterization of soybean PCs was cut in the same manner used inFig. 2. As shown inFig. 4, 28C molecules were identified from each CID spectrumn injection of 5 ng of soybean PC mixture. The CID mpectra of species 3, 8, 63, and 64 (peak numbers inFig. 3)n Fig. 5 revealed that characteristic fragment ions toinguish acyl chain structures and choline head groupslearly shown in CID spectra even though the peak intef the species number 3 was very low in the chromatog
226 D.Y. Bang et al. / J. Chromatogr. A 1104 (2006) 222–229
Fig. 4. Base peak chromatogram of the intact phosphatidylcholine mixturesfrom soybean obtained by nanoflow LC–ESI–MS. Chromatogram was extractedfrom precursor scan runs. Mobile phases were the same as used inFig. 2exceptfor the gradient elution conditions (see Section3.3). The numbering system foreach component follows that given inTable 1.
In Fig. 5a, the ion atm/z 545.7 represented the fragment ionwithout the choline head group, [M + H-184]+, from 14:0-18:3-PC molecule, and the loss of myristic acid and linolenic acidappeared with the ions atm/z 500.3 ([M + H R1CH2COOH]+)and 450.7 ([M + H R2CH2COOH]+), respectively. The datashown inFig. 5a also supported the loss of fatty acid as a formof ketene atm/z 518.9 and 468.6 forsn-1 andsn-2, respectively.
In the CID experiments in this study, the protonated molecu-lar peaks ([M + H]+, m/z = 729.5) were observed at a significantintensity compared to those of the other fragment ions of all fourspecies shown inFig. 5. It was evident that the three characteris-tic fragment ions (removal of fatty acid, ketene form, and cholinehead) appeared clearly for the other three PC species (14:0/18:2-PC for No. 8, 22:0/18:2-PC for No. 63, and 23:0/18:2-PC forNo. 64) except the CID of peak number 8 (14:0/18:2-PC inFig. 5b) did not show the fragment ion of [M + H-184]+. Theother three spectra (Fig. 5b–d) showed a similar fragmenta-tion pattern as observed inFig. 5a. The four PC species inFig. 5 were among the newly found 12 species in this studyand the list of the total 28 soybean PCs were listed inTable 1. Newly found species are marked with an asterisk inTable 1.In the literature[3], the same species were studied by LC–MSusing atmospheric pressure chemical ionization (APCI); how-ever, experiments were performed using the conversion of PCsto diacylglycerol nicotinate derivatives. While the derivatizationreaction in that study[3] provided an improved HPLC separa-tion, only 16 molecular species were identified. The current workdemonstrated the capability of separating intact phosphatidyl-cholines without derivatization and the number of identifiedPCs using nanoLC–MS–MS technique was greater. This couldbe due to the ability to separate low concentration molecularspecies from high abundant phosphocholine components withthe nanoflow LC system used in this study, a higher efficiencyo llaryp tion
Fig. 5. Data dependent MS–MS spectra of the protonated PC s
f electrospray ionization at nanoflow injection using a capiulled tip column interface, and the simultaneous identifica
pecies numbered with (a) 3, (b) 8, (c) 63, and (d) 64 shown inFig. 4.
D.Y. Bang et al. / J. Chromatogr. A 1104 (2006) 222–229 227
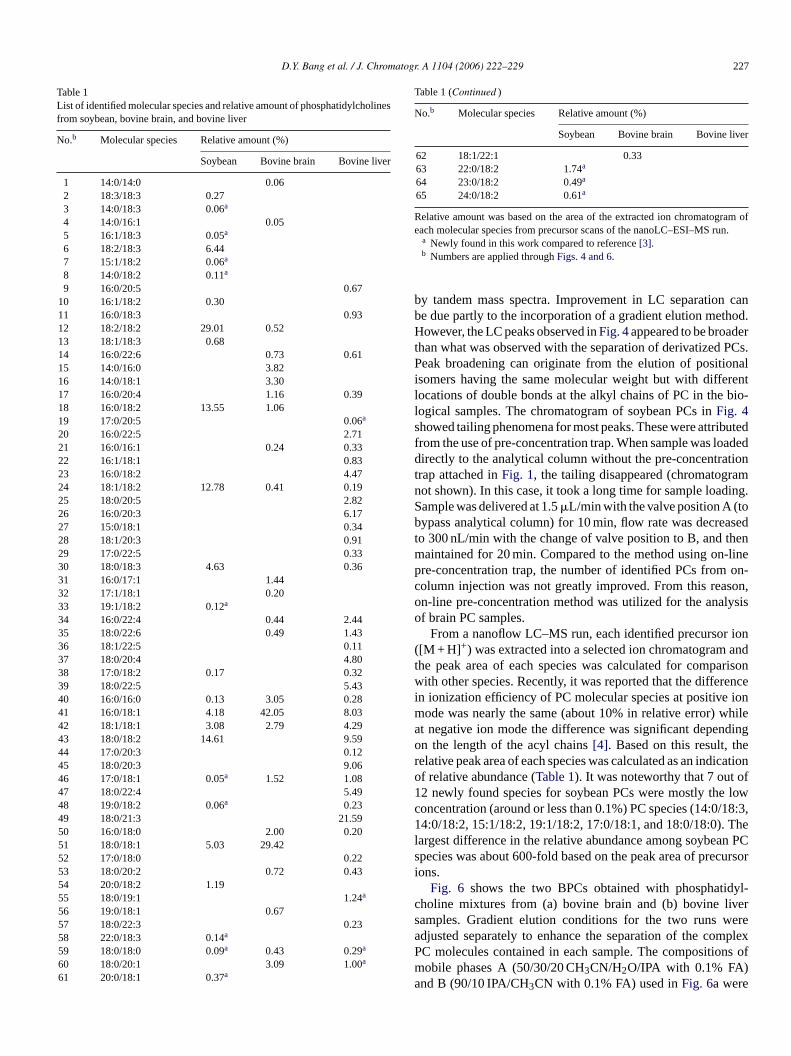
Table 1List of identified molecular species and relative amount of phosphatidylcholinesfrom soybean, bovine brain, and bovine liver
No.b Molecular species Relative amount (%)
Soybean Bovine brain Bovine liver
1 14:0/14:0 0.062 18:3/18:3 0.273 14:0/18:3 0.06a
4 14:0/16:1 0.055 16:1/18:3 0.05a
6 18:2/18:3 6.447 15:1/18:2 0.06a
8 14:0/18:2 0.11a
9 16:0/20:5 0.6710 16:1/18:2 0.3011 16:0/18:3 0.9312 18:2/18:2 29.01 0.5213 18:1/18:3 0.6814 16:0/22:6 0.73 0.6115 14:0/16:0 3.8216 14:0/18:1 3.3017 16:0/20:4 1.16 0.3918 16:0/18:2 13.55 1.0619 17:0/20:5 0.06a
20 16:0/22:5 2.7121 16:0/16:1 0.24 0.3322 16:1/18:1 0.8323 16:0/18:2 4.4724 18:1/18:2 12.78 0.41 0.1925 18:0/20:5 2.8226 16:0/20:3 6.1727 15:0/18:1 0.3428 18:1/20:3 0.9129 17:0/22:5 0.3330 18:0/18:3 4.63 0.3631 16:0/17:1 1.4432 17:1/18:1 0.2033 19:1/18:2 0.12a
34 16:0/22:4 0.44 2.4435 18:0/22:6 0.49 1.4336 18:1/22:5 0.1137 18:0/20:4 4.8038 17:0/18:2 0.17 0.3239 18:0/22:5 5.4340 16:0/16:0 0.13 3.05 0.2841 16:0/18:1 4.18 42.05 8.0342 18:1/18:1 3.08 2.79 4.2943 18:0/18:2 14.61 9.5944 17:0/20:3 0.1245 18:0/20:3 9.0646 17:0/18:1 0.05a 1.52 1.0847 18:0/22:4 5.4948 19:0/18:2 0.06a 0.2349 18:0/21:3 21.5950 16:0/18:0 2.00 0.2051 18:0/18:1 5.03 29.4252 17:0/18:0 0.2253 18:0/20:2 0.72 0.4354 20:0/18:2 1.1955 18:0/19:1 1.24a
56 19:0/18:1 0.6757 18:0/22:3 0.2358 22:0/18:3 0.14a
59 18:0/18:0 0.09a 0.43 0.29a
60 18:0/20:1 3.09 1.00a
61 20:0/18:1 0.37a
Table 1 (Continued )
No.b Molecular species Relative amount (%)
Soybean Bovine brain Bovine liver
62 18:1/22:1 0.3363 22:0/18:2 1.74a
64 23:0/18:2 0.49a
65 24:0/18:2 0.61a
Relative amount was based on the area of the extracted ion chromatogram ofeach molecular species from precursor scans of the nanoLC–ESI–MS run.
a Newly found in this work compared to reference[3].b Numbers are applied throughFigs. 4 and 6.
by tandem mass spectra. Improvement in LC separation canbe due partly to the incorporation of a gradient elution method.However, the LC peaks observed inFig. 4appeared to be broaderthan what was observed with the separation of derivatized PCs.Peak broadening can originate from the elution of positionalisomers having the same molecular weight but with differentlocations of double bonds at the alkyl chains of PC in the bio-logical samples. The chromatogram of soybean PCs inFig. 4showed tailing phenomena for most peaks. These were attributedfrom the use of pre-concentration trap. When sample was loadeddirectly to the analytical column without the pre-concentrationtrap attached inFig. 1, the tailing disappeared (chromatogramnot shown). In this case, it took a long time for sample loading.Sample was delivered at 1.5�L/min with the valve position A (tobypass analytical column) for 10 min, flow rate was decreasedto 300 nL/min with the change of valve position to B, and thenmaintained for 20 min. Compared to the method using on-linepre-concentration trap, the number of identified PCs from on-column injection was not greatly improved. From this reason,on-line pre-concentration method was utilized for the analysisof brain PC samples.
From a nanoflow LC–MS run, each identified precursor ion([M + H] +) was extracted into a selected ion chromatogram andthe peak area of each species was calculated for comparisonwith other species. Recently, it was reported that the differencein ionization efficiency of PC molecular species at positive ionm hilea dingo er icationo of1 lowc /18:3,1 Thel n PCs cursori
dyl-c vers erea mplexP ns ofma
ode was nearly the same (about 10% in relative error) wt negative ion mode the difference was significant depenn the length of the acyl chains[4]. Based on this result, thelative peak area of each species was calculated as an indf relative abundance (Table 1). It was noteworthy that 7 out2 newly found species for soybean PCs were mostly theoncentration (around or less than 0.1%) PC species (14:04:0/18:2, 15:1/18:2, 19:1/18:2, 17:0/18:1, and 18:0/18:0).
argest difference in the relative abundance among soybeapecies was about 600-fold based on the peak area of preons.
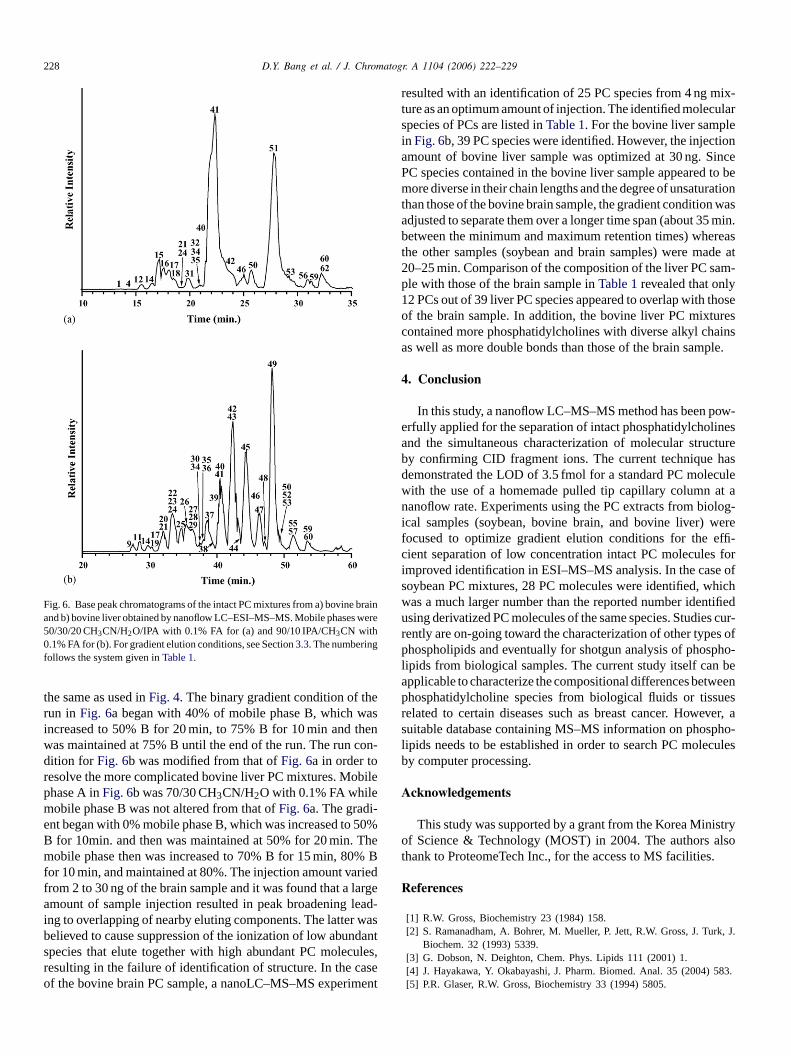
Fig. 6 shows the two BPCs obtained with phosphatiholine mixtures from (a) bovine brain and (b) bovine liamples. Gradient elution conditions for the two runs wdjusted separately to enhance the separation of the coC molecules contained in each sample. The compositioobile phases A (50/30/20 CH3CN/H2O/IPA with 0.1% FA)nd B (90/10 IPA/CH3CN with 0.1% FA) used inFig. 6a were
228 D.Y. Bang et al. / J. Chromatogr. A 1104 (2006) 222–229
Fig. 6. Base peak chromatograms of the intact PC mixtures from a) bovine braiand b) bovine liver obtained by nanoflow LC–ESI–MS–MS. Mobile phases were50/30/20 CH3CN/H2O/IPA with 0.1% FA for (a) and 90/10 IPA/CH3CN with0.1% FA for (b). For gradient elution conditions, see Section3.3. The numberingfollows the system given inTable 1.
the same as used inFig. 4. The binary gradient condition of therun in Fig. 6a began with 40% of mobile phase B, which wasincreased to 50% B for 20 min, to 75% B for 10 min and thenwas maintained at 75% B until the end of the run. The run con-dition for Fig. 6b was modified from that ofFig. 6a in order toresolve the more complicated bovine liver PC mixtures. Mobilephase A inFig. 6b was 70/30 CH3CN/H2O with 0.1% FA whilemobile phase B was not altered from that ofFig. 6a. The gradi-ent began with 0% mobile phase B, which was increased to 50%B for 10min. and then was maintained at 50% for 20 min. Themobile phase then was increased to 70% B for 15 min, 80% Bfor 10 min, and maintained at 80%. The injection amount variedfrom 2 to 30 ng of the brain sample and it was found that a largeamount of sample injection resulted in peak broadening leading to overlapping of nearby eluting components. The latter wasbelieved to cause suppression of the ionization of low abundanspecies that elute together with high abundant PC moleculesresulting in the failure of identification of structure. In the caseof the bovine brain PC sample, a nanoLC–MS–MS experimen
resulted with an identification of 25 PC species from 4 ng mix-ture as an optimum amount of injection. The identified molecularspecies of PCs are listed inTable 1. For the bovine liver samplein Fig. 6b, 39 PC species were identified. However, the injectionamount of bovine liver sample was optimized at 30 ng. SincePC species contained in the bovine liver sample appeared to bemore diverse in their chain lengths and the degree of unsaturationthan those of the bovine brain sample, the gradient condition wasadjusted to separate them over a longer time span (about 35 min.between the minimum and maximum retention times) whereasthe other samples (soybean and brain samples) were made at20–25 min. Comparison of the composition of the liver PC sam-ple with those of the brain sample inTable 1revealed that only12 PCs out of 39 liver PC species appeared to overlap with thoseof the brain sample. In addition, the bovine liver PC mixturescontained more phosphatidylcholines with diverse alkyl chainsas well as more double bonds than those of the brain sample.
4. Conclusion
In this study, a nanoflow LC–MS–MS method has been pow-erfully applied for the separation of intact phosphatidylcholinesand the simultaneous characterization of molecular structureby confirming CID fragment ions. The current technique hasdemonstrated the LOD of 3.5 fmol for a standard PC moleculewith the use of a homemade pulled tip capillary column at an log-i weref effi-c s fori e ofs hichw tifiedu s cur-r es ofp pho-l bea weenp uesr ver, as pho-l culesb
A
istryo alsot .
R
rk, J.
583.
n
-
t,
t
anoflow rate. Experiments using the PC extracts from biocal samples (soybean, bovine brain, and bovine liver)ocused to optimize gradient elution conditions for theient separation of low concentration intact PC moleculemproved identification in ESI–MS–MS analysis. In the casoybean PC mixtures, 28 PC molecules were identified, was a much larger number than the reported number idensing derivatized PC molecules of the same species. Studieently are on-going toward the characterization of other typhospholipids and eventually for shotgun analysis of phos
ipids from biological samples. The current study itself canpplicable to characterize the compositional differences bethosphatidylcholine species from biological fluids or tisselated to certain diseases such as breast cancer. Howeuitable database containing MS–MS information on phosipids needs to be established in order to search PC moley computer processing.
cknowledgements
This study was supported by a grant from the Korea Minf Science & Technology (MOST) in 2004. The authors
hank to ProteomeTech Inc., for the access to MS facilities
eferences
[1] R.W. Gross, Biochemistry 23 (1984) 158.[2] S. Ramanadham, A. Bohrer, M. Mueller, P. Jett, R.W. Gross, J. Tu
Biochem. 32 (1993) 5339.[3] G. Dobson, N. Deighton, Chem. Phys. Lipids 111 (2001) 1.[4] J. Hayakawa, Y. Okabayashi, J. Pharm. Biomed. Anal. 35 (2004)[5] P.R. Glaser, R.W. Gross, Biochemistry 33 (1994) 5805.
D.Y. Bang et al. / J. Chromatogr. A 1104 (2006) 222–229 229
[6] M.E. Surrete, J.D. Winker, A.N. Fontech, F.H. Chilton, Biochemistry 35(1996) 9187.
[7] J.H. Kabarowski, Y. Xu, O.N. Witte, Biochem. Pharmacol. 64 (2002)161.
[8] K. Sonoki, M. Iwase, K. Iino, K. Ichikawa, S. Ohdo, S. Higuchi, M.Yoshinari, M. Iida, Metabolism 52 (2003) 308.
[9] T.L. Kaduce, K.C. Norton, A.A. Spector, J. Lipid Res. 24 (1983) 1398.[10] W.W. Christie, J. Lipid Res. 26 (1985) 507.[11] D.E. Miguel, A. Roueche, D. Betbeder, J. Chromatogr. A 840 (1999)
31.[12] A. Kuksis, J.J. Myher, L. marai, J. Am. Oil. Chem. Soc. 61 (1984) 1582.[13] D.N. Heller, C.M. Murphy, R.J. Cotter, C. Fenselau, O.M. Uy, Anal.
Chem. (1988) 2787.[14] F.H. Chilton, F.J. Averill, W.C. Hubbard, A.N. Fontech, M. Triggiani,
M.C. Liu, J. Exp. Med. 183 (1996) 2235.[15] S. Pind, A. Kuksis, J.J. Myher, L. Marai, Can. J. Biochem. Cell Biol.
62 (1984) 301.[16] H.-Y. Kim, N. Salem, Anal. Chem. 58 (1986) 9.[17] H.-Y. Kim, T.-C.L. Wang, Y.-C. Ma, Anal. Chem. 66 (1994) 3977.[18] S.K. Haack, H. Garchow, D.A. Odelson, L.J. Forney, M.J. Klug, Appl.
Environ. Microbiol. 60 (1993) 2483.[19] P.B.W. Smith, A.P. Snyder, C.S. Harden, Anal. Chem. 67 (1995) 1824.[20] X. Han, R.W. Gross, J. Am. Soc. Mass Spectrom. 6 (1995) 1202.
[21] J. Fang, M.J. Barcelona, J. Microbiol. Methods 33 (1998) 23.[22] C.A. Lytle, Y.D. Gan, D.C. White, J. Microbiol. Methods 41 (2000)
227.[23] R. Taguchi, J. Hayakawa, Y. Takeuchi, M. Ishida, J. Mass Spectrom. 35
(2000) 953.[24] G. Isaac, D. Bylund, J.-E. Mansson, K.E. Markides, J. Borgquist, J.
Neurosci. Methods 128 (2003) 111.[25] T. Houjou, K. Yamatani, M. Imagawa, T. Shimizu, R. Taguchi, Rapid
Commun. Mass Spectrom. 19 (2005) 654–666.[26] F.-F. Hsu, A. Bohrer, J. Turk, J. Am. Soc. Mass Spectrom. 9 (1988)
516.[27] F.-F. Hsu, J. Turk, J. Am. Soc. Mass Spectrom. 11 (2000) 892.[28] F.-F. Hsu, J. Turk, J. Am. Sco. Mass Spectrom. 14 (2003) 352.[29] M. Pulfer, R.C. Murphy, Mass Spectrom. Rev. 22 (2003) 332.[30] T. Houjou, K. Yamatani, H. Nakanishi, M. Imagawa, T. Shimizu, R.
Taguchi, Rapid Commun. Mass Spectrom. 18 (2004) 3123.[31] D. Kang, H. Nam, Y.-S. Kim, M.H. Moon, J. Chromatogr. A. 1070
(2005) 193.[32] C.L. Gatlin, G.R. Kleeman, L.G. Hays, A.J. Link, J.R. Yates III, Anal.
Biochem. 263 (1998) 93.[33] M.H. Moon, S. Myung, M. Plasencia, A.E. Hilderbrand, D.E. Clemmer,
J. Proteome Res. 2 (2003) 589.
Copyright © 2022 FDOKUMEN