PR-758: 2018 Kentucky Soybean Performance Tests
26
PR-758 T he Kentucky Soybean Variety Perfor- mance Tests are conducted to provide an unbiased and objective estimate of the relative performance of soybean varieties commercially available in Kentucky. is information may be used by growers and seed producers to aid in selecting varieties that will give the highest total production in a specific situation. Soybean cultivars in the 2018 tests were entered by soybean growers, commercial companies, and state and federal institutions. Forty soybean tests were planted in 2018 in Kentucky at the eight test loca- tions shown below. However, due to weed pressure, two sites were discontinued. Test locations, planting, and harvest dates are shown in Table 1. Methods All tests were planted in a random- ized complete block design by maturity group with a no-till plot planter (Haldrup SNT-25, 6-rows—Haldrup USA). e tests (Tables 6-11) had three replications (plots) for each variety. e individual plots were 20 feet long and six rows wide with 15 inches between rows. e seeding rate was four to five viable seeds per foot of row, at a planting depth of 1.5 inch. Table 2 is a seeding rate planting guide for full-season and double-crop soybeans. For additional research on seeding rates, see the Corn & Soybean News, Volume 6, Issue 2 (“Soy- bean Population and Yield”), and Volume 7, Issue 4 (“Soybean Seed Rates”). e most recent research suggests that a final stand of 100,000 plants per acre is adequate for maxi- mum yields in full-season soybeans in most situations. Seeding rates should be adjusted on standard germination rates as well as expected stand losses. Stand losses are typi- cally more severe in damp, cool conditions with heavy residues or with soil crusting. Stand losses are typically less with warm conditions and adequate soil moisture. All test sites were treated with fertilizers, lime, and herbicides before planting following current IPM and fertilizer/lime recommen- dations (UK ID-249: A comprehensive Guide to Soybean Management in Kentucky). Seed source and varietal information are located on Page 5. Companies nominated their va- rieties and could choose to treat their seed with fungicides, insecticides, nematicides, beneficial organisms, and/or germination/ growth/systemic acquired resistance en- hancers (Table 3). e treatment codes are provided in Table 4. e plots were main- tained as weed-free as possible during the growing season. All plots were chemically end-trimmed to 16 feet. Harvesting was done with a small plot combine (Wintersteiger Delta plot com- bine—Wintersteiger, USA) according to maturity. Sixteen feet of the four center rows were harvested from the plots. Yield is reported in bushels (60 pounds) per acre adjusted to 13 percent moisture. An electronic weight and moisture moni- tor (HarvestMaster HM800 GrainGage system, Juniper Systems, Inc., USA) lo- cated on the combine was used for record weight and moisture readings for each plot. Data were collected with a field computer (Mirus Harvest Software, Juniper System Inc., USA) connected to the monitor, and analyzed with Agrobase GEN II statisti- cal software (Agronomix Software Inc., Canada). 2018 Kentucky Soybean Variety Performance Tests Claire M.-P. Venard and Brandon Roberts, Plant and Soil Sciences Location of the 2018 Kentucky Soybean Variety Performance Tests 1. Caldwell County (Pennyrile Region) 2. Calloway County (Purchase Region) 3. Fayette County (Bluegrass Region) 4. Henderson County (Green River Region) 2 3 6 1 4 5 5. Logan County (Mammoth Cave Region) 6. Meade County (Lincoln Trail Region) Table 1. Locations, planting, and harvest dates for the 2018 Kentucky Soybean Variety Performance Tests. TEST SITE REGION COLLABORATORS PLANTING DATE(S) AG. PRACTICE HARVEST DATES Caldwell County Pennyrile Scott Peek: Farm Superinten- dent at the UK Reseach and Education Center, Princeton KY MG II, III, IV Early, and V: 05/23 MG IV Late: 05/24 No-till MG II & III: 10/18 MG IV: 10/22 MG V: 10/23 Calloway County Purchase Dr. Ferguson: Professor of Agronomy, Murray State University 05/22 No-till MG II & III: 10/09 MG IV & V: 10/12 Fayette County Bluegrass C. Venard and B. Roberts: UK Spindletop North farm 05/09 No-till MG II & III: 11/05 MG IV Early: 11/21 MG IV Late & V: 11/29 Hen- derson County Green River Mr. McIndoo: Soybean producer Camille Lambert: UK County Extension Agent for ANR 05/25 Vertical tillage MG II, III & IV Early: 10/25 MG IV Late & V: 10/30 Logan County Mammoth Cave Ms. Halcomb: Soybean producer Leann Martin: UK County Exten- sion Agent for ANR 06/04 Vertical tillage MG II & III: 10/23 MG IV &V: 10/24 Meade County Lincoln Trail Mr. Hager: Soybean producer Harry (Andy) Mills: UK County Extension Agent for ANR 05/21 No-till All MG: 11/8 Tables page Table 1. Test site information......................................... 1 Table 2. Seed rate planting guide for full-season soybeans (A) and double-crop (B) soybeans .............................. 4 Table 3. Company specifications for entries ............ 6 Table 4. Seed treatments ................................................ 9 Performance Tests: Table 5. State Summary—Recommended Table..10 Table 6. Caldwell County............................................... 14 Table 7. Calloway County .............................................. 16 Table 8. Fayette County ................................................. 18 Table 9. Henderson County.......................................... 20 Table 10. Logan County ................................................... 22 Table 11. Meade County .................................................. 24 University of Kentucky College of Agriculture, Food and Environment Agricultural Experiment Station Kentucky Tobacco Research and Development Center | Veterinary Diagnostic Laboratory | Division of Regulatory Services | Research and Education Center Robinson Forest | Robinson Center for Appalachian Resource Sustainability | University of Kentucky Superfund Research Center | Equine Programs Agricultural Experiment Station
-
Upload
khangminh22 -
Category
Documents
-
view
2 -
download
0
Transcript of PR-758: 2018 Kentucky Soybean Performance Tests

PR-758
The Kentucky Soybean Variety Perfor-mance Tests are conducted to provide
an unbiased and objective estimate of the relative performance of soybean varieties commercially available in Kentucky. This information may be used by growers and seed producers to aid in selecting varieties that will give the highest total production in a specific situation. Soybean cultivars in the 2018 tests were entered by soybean growers, commercial companies, and state and federal institutions. Forty soybean tests were planted in 2018 in Kentucky at the eight test loca-tions shown below. However, due to weed pressure, two sites were discontinued. Test locations, planting, and harvest dates are shown in Table 1.
Methods All tests were planted in a random-ized complete block design by maturity group with a no-till plot planter (Haldrup SNT-25, 6-rows—Haldrup USA). The tests (Tables 6-11) had three replications (plots) for each variety. The individual plots were 20 feet long and six rows wide with 15 inches between rows. The seeding rate was four to five viable seeds per foot of row, at a planting depth of 1.5 inch. Table 2 is a seeding rate planting guide for full-season and double-crop soybeans. For additional research on seeding rates, see the Corn & Soybean News, Volume 6, Issue 2 (“Soy-
bean Population and Yield”), and Volume 7, Issue 4 (“Soybean Seed Rates”). The most recent research suggests that a final stand of 100,000 plants per acre is adequate for maxi-mum yields in full-season soybeans in most situations. Seeding rates should be adjusted on standard germination rates as well as expected stand losses. Stand losses are typi-cally more severe in damp, cool conditions with heavy residues or with soil crusting. Stand losses are typically less with warm conditions and adequate soil moisture. All test sites were treated with fertilizers, lime, and herbicides before planting following current IPM and fertilizer/lime recommen-dations (UK ID-249: A comprehensive Guide to Soybean Management in Kentucky). Seed source and varietal information are located on Page 5. Companies nominated their va-rieties and could choose to treat their seed with fungicides, insecticides, nematicides, beneficial organisms, and/or germination/growth/systemic acquired resistance en-
hancers (Table 3). The treatment codes are provided in Table 4. The plots were main-tained as weed-free as possible during the growing season. All plots were chemically end-trimmed to 16 feet. Harvesting was done with a small plot combine (Wintersteiger Delta plot com-bine—Wintersteiger, USA) according to maturity. Sixteen feet of the four center rows were harvested from the plots. Yield is reported in bushels (60 pounds) per acre adjusted to 13 percent moisture. An electronic weight and moisture moni-tor (HarvestMaster HM800 GrainGage system, Juniper Systems, Inc., USA) lo-cated on the combine was used for record weight and moisture readings for each plot. Data were collected with a field computer (Mirus Harvest Software, Juniper System Inc., USA) connected to the monitor, and analyzed with Agrobase GEN II statisti-cal software (Agronomix Software Inc., Canada).
2018 Kentucky Soybean Variety Performance TestsClaire M.-P. Venard and Brandon Roberts, Plant and Soil Sciences
Location of the 2018 Kentucky Soybean Variety Performance Tests 1. Caldwell County (Pennyrile Region)2. Calloway County (Purchase Region)3. Fayette County (Bluegrass Region)4. Henderson County (Green River Region)
2
36
1
4
5
5. Logan County (Mammoth Cave Region)6. Meade County (Lincoln Trail Region)
Table 1. Locations, planting, and harvest dates for the 2018 Kentucky Soybean Variety Performance Tests.TEST SITE REGION COLLABORATORS PLANTING DATE(S)
AG. PRACTICE HARVEST DATES
Caldwell County
Pennyrile Scott Peek: Farm Superinten-dent at the UK Reseach and Education Center, Princeton KY
MG II, III, IV Early, and V: 05/23 MG IV Late: 05/24
No-till MG II & III: 10/18 MG IV: 10/22 MG V: 10/23
Calloway County
Purchase Dr. Ferguson: Professor of Agronomy, Murray State University
05/22 No-till MG II & III: 10/09 MG IV & V: 10/12
Fayette County
Bluegrass C. Venard and B. Roberts: UK Spindletop North farm
05/09 No-till MG II & III: 11/05 MG IV Early: 11/21MG IV Late & V: 11/29
Hen-derson County
Green River
Mr. McIndoo: Soybean producer Camille Lambert: UK County Extension Agent for ANR
05/25 Vertical tillage
MG II, III & IV Early: 10/25 MG IV Late & V: 10/30
Logan County
Mammoth Cave
Ms. Halcomb: Soybean producer Leann Martin: UK County Exten-sion Agent for ANR
06/04 Vertical tillage
MG II & III: 10/23 MG IV &V: 10/24
Meade County
Lincoln Trail
Mr. Hager: Soybean producer Harry (Andy) Mills: UK County Extension Agent for ANR
05/21 No-till All MG: 11/8
Tables pageTable 1. Test site information ......................................... 1Table 2. Seed rate planting guide for
full-season soybeans (A) and double-crop (B) soybeans .............................. 4
Table 3. Company specifications for entries ............ 6Table 4. Seed treatments ................................................ 9Performance Tests:Table 5. State Summary—Recommended Table ..10Table 6. Caldwell County ...............................................14Table 7. Calloway County ..............................................16Table 8. Fayette County .................................................18Table 9. Henderson County ..........................................20Table 10. Logan County ...................................................22Table 11. Meade County ..................................................24
University of KentuckyCollege of Agriculture,Food and EnvironmentAgricultural Experiment Station
Kentucky Tobacco Research and Development Center | Veterinary Diagnostic Laboratory | Division of Regulatory Services | Research and Education CenterRobinson Forest | Robinson Center for Appalachian Resource Sustainability | University of Kentucky Superfund Research Center | Equine Programs
Agricultural Experiment Station

2
Lodging was recorded at harvest at all test sites. Lodging was rated on a scale of 1 to 5, where:1 = almost all plants erect; 2 = all plants over slightly, or a few down; 3 = all plants over moderately, or 25% down; 4 = all plants over considerably, or 50% to 80%
down; 5 = all plants down.
Maturity date. Maturity dates were recorded at the Fayette County location. A variety was considered mature when 99 percent of the pods have turned their nor-mal mature color. One to two weeks of good drying weather may be needed beyond the date given before ready to combine. Plant height was measured in inches from the soil surface to the tip of the main stem. Plant height was recorded at the Fayette County location, at harvest. Disease ratings. Diseases may cause yield loss if soybean plants are infected prior to flowering. Planting disease-resistant or disease-tolerant varieties will help eliminate this possible yield loss. Growers should review Table 3, “Company Specifications,” for disease resistance/tolerance ratings. In addition to the company specifications, the test plot fields were scouted every other week during the soybean growing season for diseases. During the 2018 season, frog-eye leaf spot (FLS) was observed at all of the Kentucky Soybean Variety Performance Test sites, passed August 15. Stem canker (not formally confirmed) and Cercopsora leaf blight were also observed sporadically at the Fayette County location. Due to warm and wet conditions in September and early October, seed decay, including Phomopsis seed disease, was observed at all test sites except for Calloway County. Protein, oil. Variety protein and oil concentrations are reported on the basis of 13 percent moisture. The 2018 samples were collected at the Fayette County, Caldwell County, and Calloway County, and analyzed with a NIR spectropho-tometer (DA 7250, Perten Instruments, Sweden). The data were analyzed with Agrobase GEN II statistical software.
Interpretation An important step in profitable soybean production is selecting the best varieties for each management system. The Kentucky Soybean Variety Performance Tests are conducted to provide information useful in making this selection. Performance of soybean varieties is affected by many factors, including year, location, soil type, and time of planting. A
particular soybean variety is adapted for full-season growth in a band approximately 100 miles wide from north to south. Thus, the best variety in Northern Kentucky may not be the best in southern areas. For this reason, the Kentucky Soybean Variety Performance Tests are conducted at several locations in the major soybean-producing areas of the state. The yields as reported in this publication should be used for relative comparisons; actual yields on a grower’s farm may be different. Performance of soybean varieties will vary from year to year and from location to location depending on adaptability, weath-er conditions, and management practices. Performance of a variety across a period of years and at several locations in the state is the best indicator of its production potential (see the University of Kentucky publication Agronomy Notes, Volume 21, No. 3, “Using Performance Test Results in Soybean Variety Selection in Kentucky," and UK ID-249). The data presented in Table 5, State Summary—Recommended Table, have been averaged across 2016-2018 full-season years and locations, and are recommended to evaluate variety relative performances. This table is also recommended for selecting varieties for maximum yield in double-crop systems in Kentucky. Better yielding full-season varieties are also the better-yielding double-crop varieties (Pfeiffer, Todd 1987. Applied Agricultural Research, Vol. 2, No. 3, pages 141-145). The full-season environment that maximizes yield is a better indicator of per-formance than late-planted soybeans that have reduced yields. The data from three full-season tests, analyzed across years and locations, predict performance of a variety more accurately than a single, full-season, or double-crop test. Small differences in yield are usually of little importance. The yield of two varieties at a single location can differ because of chance factors (difference in soil character-istics, fertility, or availability of moisture), although the inherent yielding ability is the same. To decide if an observed yield difference is real, the least significant dif-ference (LSD) values cited at the bottom of each maturity group should be used. The significance level in the tables 5-13 is 0.10. If the difference in yield between two varieties is greater than the LSD value, it is reasonable to assume that the varieties do differ in yielding ability. Yield is only one factor to consider in selecting a variety for a production system. Oil and protein contents, date of maturity,
lodging resistance, disease resistance, avail-ability of time and equipment, economic management and weed control costs need to be considered as well. Varieties with oil and protein levels that are eligible for premium prices are available in some markets. Oil and protein levels are influenced by variety and weather (primar-ily temperature) during seed filling (see UK’s Corn & Soybean Newsletter, Volume 6, Issue 1, “Soybean Oil and Protein," and UK ID-249). We recommend that grow-ers create a list of varieties that meet their needs for agronomic characteristics: yield, maturity group, soybean cyst nematode resistance, etc. Then, using the protein and oil data from Table 5, they should remove from consideration the varieties with below-average oil and protein percentages from their list, and select from the remain-ing ones those that have the highest average concentrations. This approach should help selecting varieties that have the best chance of producing acceptable yield and meets the oil and protein standards. The data provided have been divided into maturity groups based on the informa-tion provided by the seed sources (Table 3). Due to weather patterns at a location, maturity alone can affect yield; this impact will be reflected by large differences in the maturity group averages. Selecting varieties from several maturity groups can reduce the impact of these maturity group fluctuations (see UK’s Agronomy Notes, Volume 25, No. 3, “Growing Soybean Varieties from Mul-tiple Maturity Groups Can Reduce Yearly Yield Volatility," and UK ID-249). The date of a 50 percent chance of a fall killing frost is important in determining which variety should be planted. The dates, presented along with tables 6 to 13, are average dates over a long term. Actual dates will vary from year to year. For the dates of a one-year-out-of-10 chance of a fall killing frost, subtract 13 to 18 days from the average dates. For maximum yield, a variety must mature before the first killing frost in the fall. In case of known soybean cyst nema-tode (SCN) problems, a resistant variety should be used in the production system with a recommended crop rotation pro-gram. Planting resistant varieties should be considered as the number of acres affected by SCN in Kentucky has increased. SCN occurs in at least 51 Western Kentucky counties. Low levels of SCN show few vis-ible symptoms but can cause yield losses of up to 25 percent. Fields should be tested for SCN. Producers should contact their local University of Kentucky County Extension

3
office for more information on collecting and submitting samples (https://plantpa-thology.ca.uky.edu/extension/soybean-cyst-nematode).
Growing Conditions and Special Circumstances—2018 February 2018 was a volatile month with everything from temperatures in the teens to temperatures in the 80s; snow; torna-does; and a major flood. Most of the first 12 days of the month were colder than nor-mal. Several snow storms passed quickly through the region early in the month, but amounts were generally under an inch for each one. The rest of the month was warmer than normal. Warm temperatures came in two waves, one from the 14th to the 16th with temperatures climbing in the 60s and 70s, and one from the 19th to the 25th with widespread rain, from the 21st to the 25th. By the end of the month, the region had ac-cumulated more than twice the amount of normal precipitation. This led to significant flooding. The powerful storm on the night of the 24th brought copious amounts of rain and seven tornadoes to Central Kentucky. A cold, wet pattern persisted for much of March, which resulted in several snowy sys-tems passing through the region. The most significant snows fell from the 11th to the 13th, with 6 to 10 inches falling of snow in the Bluegrass on the 12th. Another snowy system came through on the 20th-21st. Then on the 24th, a stripe of snow stretched from North Dakota to the Appalachians. In addition to the cold, flooding that peaked in February lingered into the first few days of March, and minor flooding returned by the end of the month. In Western Kentucky, temperature averages were 1 to 3 degrees cooler than normal and precipitation was generally near to slightly wetter than nor-mal. Precipitation varied with heavy rain during the last week of the month. Overall, April 2018 was not particularly active. The evening of the April 3, 2018, brought the only active weather event of the month. A cold front brought several rounds of showers and storms to the Louisville re-gion. Straight-line winds of 75-95mph felled trees and damaged structures in the coun-ties of Grayson, Hardin, Edmonson, and LaRue. Two small, brief EF1 tornadoes were recorded in Grayson County and in Boyle County, and 11 tornadoes were recorded in the Paducah region. Hail fell from some of the strongest storms, with hailstones the size of golf balls reported in several locations. Temperature were much cooler than normal. Every day from the 4th to the
11th was colder than normal. On the 6th, a cold front passed through the region from north to south. The next day low pressure and cold air behind the front resulted in snowfall for southern Indiana and Central Kentucky. The next cold wave came mid-month and brought more snow with it. On the 16th snowflakes flew, though most of them melted when they came in contact with the warm ground. The 16th was also significant as the average daily temperature was 18 to 23 degrees below normal. April was wetter than normal across the Jackson Purchase area of Western Kentucky. Heavy rain occurred from the night of April 22 into the day of April 24, resulting in amounts of 3 to 5 inches across much of the Jackson Purchase area of Western Kentucky into far southern Illinois. In May, every single day of this month was warmer than normal in Louisville, Lexington, Bowling Green, and Frankfort, resulting in the warmest May this area has ever recorded. After a chilly April that felt more like March at times, the switch was flipped on May 1. Temperatures were well above normal, ranging from 7 to 8 degrees above normal across the region. Temperatures were more reminiscent of June with high temperatures consistently in the mid-80s to around 90 degrees. As for rainfall, it varied quite a bit across the region due to the nature of warm season precipitation. Some locations would get dumped on while a couple miles down the road observed very little from an individual shower or storm. Generally though, more areas experienced wetter than normal conditions for May. This was especially true across large sections of Western Kentucky. There were several days in which scattered thunderstorms resulted in a few large hail or damaging wind reports. The remnants of Tropical Storm Alberto impacted the region from May 28 to 30, a rare occurrence for so early in the season. However, the only really active day came on May 31, with the storms causing widespread damaging winds and flash flooding as they moved into southwest Indiana and northwest Kentucky during the morning and early afternoon hours. Several more waves of storms dur-ing the afternoon and evening hours were accompanied by large hail, damaging winds, flooding, and a few tornadoes. June was a very warm month in Central Kentucky and southern Indiana. Tempera-tures were slightly above normal on any given day, through most of the month. No significant heat waves struck and no record highs were met. The warmest temperatures
were from the 17th to the 19th when daily average temperatures were about 8 to 10 degrees above normal. Scattered summer-time thunderstorms delivered rainfall to the region. With those scattered storms came occasional severe weather, usually in the form of gusty winds. The most significant thunderstorms came on the 25th and 26th as several rounds of intense storms rolled through the region, with tornadoes touch-ing down in Ohio, Edmonson, and Jefferson counties. July was marked by a very lengthy and widespread severe weather event lasting from the 20th to the early morning hours of the following day as multiple rounds of storms pushed through the region. There were dozens of reports of strong winds and large hail. Four tornadoes touched down between 2pm and 10pm on the 20th. The rest of the month was fairly quiet with regards to severe weather. The only other significant event was on the 5th when thunderstorms developed in a very unstable atmosphere and generated locally gusty winds south of the Ohio River. There were few extreme temperatures during the month. The hottest days were the 4th and 5th when the mercury reached the middle and upper 90s. Humidity levels were quite high this summer, especially during June and July. August was warm and wet, though there was very little severe weather. As is com-mon with summertime precipitation it varied quite a bit across the region. This is largely due to the scattered nature of con-vective precipitation in the warm season. The strongest storms came on the evening of the 15th when a small squall line moved up the Ohio River. A drier than normal summer was observed across much of the Jackson Purchase area of western Kentucky, portions of southeast Illinois, and western portions of southwest Indiana. The most pronounced dryness was across portions of Carlisle, McCracken, Graves, and Hickman counties, where radar estimates showed less than 7 inches occurring for the entire summer. Though the month ended up on the warm side of normal, no individual day was more than 9 degrees warmer or cooler than normal. September 2018 was the third wettest September on record for the Bluegrass State. The state averaged 8.12 inches, which was almost five inches above normal. The Bluegrass Region itself averaged 10.33 inches. The intense rainfall started with the remnants of Tropical Storm Gordon working through the area between Septem-

4
Table 2. Planting guide for full-season and double-crop soybeans.Full-season soybeans
Target stand plant/acre
Germination rate
Assumed stand loss
Final seeding rate (seeds/
acre)
Row spacing (in.)7.5 15 30
seeds per foot100,000 95% 5% 110,803 1.6 3.2 6.4
10% 116,959 1.7 3.4 6.720% 131,579 1.9 3.8 7.630% 150,376 2.2 4.3 8.6
90% 5% 116,959 1.8 3.4 6.710% 123,457 1.8 3.5 7.120% 138,889 2.0 4.0 8.030% 158,730 2.3 4.6 9.1
85% 5% 123,839 1.8 3.6 7.110% 130,719 1.9 3.8 7.520% 147,059 2.1 4.2 8.430% 168,067 2.4 4.8 9.6
Double-crop soybeans
Target stand plant/acre
Germination rate
Assumed stand loss
Final seeding rate (seeds/
acre)
Row spacing (in.)7.5 15 30
seeds per foot140,000 95% 5% 155,125 2.2 4.5 8.9
10% 163,743 2.3 4.7 9.420% 184,211 2.6 5.3 10.630% 210,526 3.0 3.0 12.1
90% 5% 163,743 2.3 7.4 9.410% 172,840 2.5 5.0 9.920% 194,444 2.8 5.6 11.230% 222,222 3.2 6.4 12.8
85% 5% 173,375 2.5 5.0 10.010% 183,007 2.6 5.3 10.520% 205,882 3.0 5.9 11.830% 235,294 3.4 6.8 13.5
ber 5th and 9th. Widespread showers and storms led to several bouts of flash flooding and rivers rising into the minor flood stages. Gordon was followed by another tropical system a week later as Florence worked through Eastern Kentucky. Rainfall was less widespread and confined mainly to eastern half of the state. An active pattern remained for the second half of the month. Thun-derstorms developed within an unstable atmosphere on the 21st with the passage of a cold front, producing heavy rain and signaling the start of a very active week with daily rounds of rainfall. Between the 21st and 27th, the state averaged over four inches. Already saturated grounds led to continued flooding issues, especially across the southern Bluegrass and northeastern Kentucky. After an exceptionally wet September, in October the axis of the heavy rains shifted south. Greater than normal rainfall amounts were reported from the region east to Lake Cumberland and northeast into the southern Bluegrass counties. On the 4th a localized downpour dropped almost three and a half inches of rain. The first week and a half of the month was unusually warm, especially at night with temperatures almost feeling like August during the first 10 days. Each day from the 1st to the 10th was 10-20 degrees warmer than normal. On the 11th a cold front swept through the region and ushered in a much cooler than normal regime, making it feel more like November during the middle of the month, before finally warming up some during the last week. Though strong storm systems affected other parts of the country during Novem-ber, conditions were fairly quiet in southern Indiana and Central Kentucky. Thunder-storms took place before dawn on the 6th as a broken line of storms moved through with 40-50mph winds. The first and last weeks of the month were warm, with seasonable temperatures in between. The coldest days of the month started on the 22nd when lows were in the 20s with highs generally in the 30s. That cold air brought the region the first flurries of the month. More detailed precipitation and tem-perature information for each test loca-tion is provided next to tables 6-11, in the sections Agronomic Information. Sources: UKAg Weather Center (http://weather.uky.edu/ky/climate.php and /annuals.shtml); KY Mesonet (http://www.kymesonet.
org/historical_data.php); and the National Weather Service (https://www.weather.gov).
Soybean Production Information This is publication PR-758 of the Kentucky Agricultural Experiment Station and is published with the approval of the Director. The University of Kentucky and its Cooperative Exten-sion Service offers a series of publications, blogs, websites which contains a more detailed information for soybean and grain production practices:• KyGrains.info—The Farm-
er’s Resource for Grain pro-duction in Kentucky
• UK ID-249—A Compre-hensive Guide to Soybean Management in Kentucky
• UK soybean Variety Per-formance Trials: http://pss.ca.uky.edu/extension/soybean-variety-trials
• Kentucky Pest Newslet-ter: http://plantpathology.ca.uky.edu/extension/kpn
As of November 8, 2018, soybean pro-duction for Kentucky was forecast at 107 million bushels, up 5 percent from 2017. Yield was estimated at 54 bushels per acre. Acreage for harvest was estimated at 1.99 million acres, up 50,000 acres from 2017. (Source: November Crop Production—News Release USDA, NASS, Kentucky Field Office, November 8th, 2018).
Kentucky State Seed Law The Kentucky State Seed Law requires all seed exposed, offered for sale, or sold in Kentucky to be labeled as to a) kind and variety for each agricultural seed compo-nent present in excess of 5 percent of the whole, and b) the percentage by weight of each component. All soybean seed blends should be labeled as to the percentage of each variety that makes up the mixture. All soybean seed must be labeled by variety name; the term “variety unknown” may no longer be used in place of a variety designa-tion for soybeans.
Acknowledgments In addition to the collaborators men-tioned in Table 1, the authors would also like to thank:• The Kentucky Soybean Promotion
Board for funding the KY Soybean Vari-ety Performance Test program’s projects
• This work is also supported by the Na-tional Institute of Food and Agriculture, US Department of Agriculture, Hatch Project KY006099 under accession number 101341
• Seed nominators for their continuous interest in our program, which provides unbiased and objective information to Kentucky soybean producers
• University of Kentucky:• John Stanhope and the Service Cen-
ter crew at Spindletop North Farm in Lexington, KY for their services all year long
• Matt Peake and the farm crews at the UK Spindletop North farm, and Shannon Rudd, C. Oran Little Research Center, for their help with agronomic management at the Fay-ette Co. test site
• James Roberts, Dr. McCulley, and Dr. Pfeiffer for their support and help during the 2018 growing season

5
• Scott Peek and the farm crew at the UK Research and Education Center in Princeton, KY, for their help with agronomic management and harvest at the Caldwell Co. location.
• Jackie Harper, for his help with equip-ment repairs at the Caldwell Co. and Logan Co. locations
• Maggie Maynard, Lauren McMa-han, Vicki Pendleton, Kim Hall, Colette Laurent, Lois Thomas, and Dr. S. Ritchey for their help with staff, funds, and grant management
• Dr. Chad Lee and Dr. JD Green for their help with agronomic advising. Dr. Chad Lee also reviewed grant proposal.
• Jay Stone, Matt Furell, UK Coop-erative Extension Office, and Mr. Garnett, soybean producer in Chris-tian County; Chelsey Pickens, UK Extension Agent for Ag. & Natural Resources, and Mr. K. Mims, soybean producer in Cumberland County for hosting the tests. Unfortunately the Christian Co. and the Cumberland Co. test sites had to be discontinued over the course of the season
• Murray State University: Jason Robert-son and the farm crew for their help with agronomic management and harvest at the Calloway County location.
Sources of Seeds The seeds planted in the 2018 Soybean Variety Performance Tests were acquired from the following sources:
AgriGold Hybrids Justin Warren ................................................618-292-58445381 Akin Rd, St Francisville IL [email protected]
AGRIGOLD G2900RX AGRIGOLD G4440RXAGRIGOLD G3520RX AGRIGOLD G4579RXAGRIGOLD G3722RX AGRIGOLD G4685RXAGRIGOLD G4190RX AGRIGOLD G4705RXAGRIGOLD G4380RX AGRIGOLD G4995RXArmor Seed Chris Ouzts .....................................................662-719-31572532 Alexander Drive, Suite [email protected]
ARMOR 35-D20 ARMOR X35D92 ARMOR 45-D50ARMOR 39-D39 ARMOR X40D85 ARMOR X46D63ARMOR 42-D27 ARMOR X41D47 ARMOR 47-D22ARMOR 29-D11 ARMOR 45-D43 ARMOR 49-D13ARMOR X30D53 ARMOR X44D36 ARMOR X51D77
BASF Agriculture (formerly Bayer Crop Science)Lucas Owen ...................................................731-793-3530lucas.owen@agro.basf-se.com
CZ 3601 LL CZ 4308 LL CZ 4918 LLCZ 3841 LL CZ 4548 LL CZ 4938 LLCZ 4105 LL CZ 4748 LL HBK LL4950CZ 4222 LL CZ 4820 LL HBK LL4953
Bayer (formerly Monsanto)Dr. Glen Murphy ...........................................502-377-5053264 Persimmon Ridge Drive, Louisville, KY [email protected]
ASGROW AG28X9 ASGROW AG43X7ASGROW AG29X8 ASGROW AG44X6ASGROW AG36X6 ASGROW AG46X6ASGROW AG37X9 ASGROW AG47X6ASGROW AG38X8 ASGROW AG47X9ASGROW AG39X7 ASGROW AG48X9ASGROW AG41X8 ASGROW AG49X9ASGROW AG42X9
Brodbeck Seeds LLC Dennis A Wickham ......................................614-753-021515 Ringel Ave., Wabash, IN [email protected]
BRODBECK 368R2 BRODBECK 446R2BRODBECK 388R2
Caverndale Farms Brand Seed Barry Welty ....................................................859-236-21501921 Bluegrass Pike, Danville KY 40422bwelty@kywimax CAVERNDALE CF 364 STSnCAVERNDALE CF 387 HT-GLYnCAVERNDALE CF 427 HT-GLY/STSnCAVERNDALE CF 478 RR2Y/STSn
Channel Seed Whitney Monin ............................................ 515-314-8834250 Dogwood Drive, Beaver Dam, KY [email protected] 3718R2X CHANNEL 4517R2XCHANNEL 4218R2X CHANNEL 4717R2X
Corteva™ agricscience / DowDuPont-Pioneer™George Stabler .............................................803-308-1003425 Abbeydale Way, Columbia, SC [email protected]
PIONEER P36T36X PIONEER P46A16RPIONEER P37A78X PIONEER P46A57BXPIONEER P40A47X PIONEER P47A76LPIONEER P42A96X PIONEER P48A60XPIONEER P44A08L PIONEER P50A85XPIONEER P44A72BX
Dyna Gro Seed Mick Schonauer ...........................................614-620-5008615 Hillliard Rome, Columbus OH [email protected]
DYNA-GRO S39XT08 DYNA-GRO S44XS68DYNA-GRO S39XT68 DYNA-GRO S46XS87DYNA-GRO S41XS98 DYNA-GRO S48XS78DYNA-GRO S4209N DYNA-GRO S48XT56DYNA-GRO S43XS27
Growmark, Inc. Eric West ..........................................................309-557-63991701 Towanda Avenue, Bloomington, IL [email protected]
HS 45X80 HS 48X70HS 46X60 HS 49X60
Hoegemeyer Hybrids Jeremiah Horvatich.....................................402-654-33991755 Hoegemeyer Road, Hopper, NE [email protected] HOEGEMEYER HPT 4211 NXHOEGEMEYER HPT 4511 NXHOEGEMEYER HPT 4522 NRHOEGEMEYER HPT 4922 NRB
LG Seeds Dan Mitchell ..................................................812-457-323222827 Shissler Rd, Elmwood, IL [email protected]
LG SEEDS C4227RX LG SEEDS LGS4597RXLG SEEDS C4710RX LG SEEDS LGS4624RXLG SEEDS C4845RX LG SEEDS LGS4989RX
Mission Seed Solutions Will Scott .........................................................662-822-9926Bryan Olivi ......................................................662-719-8685516 N. Sharpe Avenue, Cleveland, MS [email protected]@pinnacleag.com
A4447NSXR2 MISSION A4608XA4637NSXR2 MISSION A4950X
NK Seed Chuck Leonard .............................................270-519-960011055 Wayzata Blvd, Minnetonka MN [email protected] S35-K9X S42-B9XS S45-Z5XS
Progeny Ag ProductsJohn Rocconi .................................................979-587-99681529 HWY 193, Wynne AR [email protected]
PROGENY 4255 RX PROGENY 4851 RXPROGENY 4318 RX PROGENY 4955 RXPROGENY 4444 RXS PROGENY 4994 RXPROGENY 4570 RXS PROGENY 5016 RXSPROGENY 4620 RXS PROGENY 5018 RXPROGENY 4757 RY PROGENY 5157 RXSPROGENY 4799 RXS PROGENY 5226 RYSPROGENY 4816 RX PROGENY 5252 RXPROGENY 4821 RX PROGENY 5279 RXS
Seed Consultants, Inc. Bill McDonald ................................................800-708-2676648 Miami Trace Road, Washington Court House, OH [email protected] CONSULTANTS SC 8379X™SEED CONSULTANTS SC 8399X™SEED CONSULTANTS SC 8439X™SEED CONSULTANTS SCS 9385RR™SEED CONSULTANTS SCS 9393RR™SEED CONSULTANTS SCS 9469BR™
ContactClaire Venard, PhD, CCAN-122 Ag Science Center NorthUniversity of KentuckyLexington, KY 40546-0091email: [email protected]: 859-257-2993 (office) 859-492-1135 (cell)
Variety Performance Tests WebsiteThe University of Kentucky Grain Crops website (http://graincrops.ca.uky.edu/) provides links to all Kentucky variety test publications and related resources (http://graincrops.ca.uky.edu/variety-testing). This site includes a link to the Soybean Variety Performance Tests website (http://pss.ca.uky.edu/exten-sion/soybean-variety-trials).

6
Stewart Seeds Justin Petrosino ............................................800-365-SEED2230 E CR 300 N, Greensburg, IN [email protected]
STEWART 4029R2X STEWART 4527R2XSTEWART 4228R2X STEWART 4619R2XSTEWART 4327R2X STEWART 4927R2XSTEWART 4339R2X STEWART 4939R2XSTEWART 4438R2X
Stine Seed Company Jason Green ...................................................618-554-877322555 Laredo Trail, adel IA [email protected]
STINE 40BA02 STINE 48BA23
Stratton Seed Company Heath North ...................................................800-264-44331530 Hwy 79 South Stuttgart, AR [email protected]
AGS GS46X17 GO SOY 43C17S GO SOY E4510SAGS GS48X18 GO SOY 49G16 GO SOY IREANE
Terral Seed Inc. Marty Hale ......................................................318-341-8814117 ellington Drive, Rayville, LA [email protected];
REV® 4168X™ REV® 47L38™ REV® 4927X™REV® 4679X™ REV® 4857X™ REV® 49L88™REV® 46L99™
UniSouth GeneticsStacy Burwick ................................................931-996-41643205 Hwy 46 South, Dickson TN [email protected]
USG 7447XTS USG 7489XTUSG 7487XTS USG 7496XTS
Warren Seed and Agronomy Service LLC Lanny Warren ................................................731-234-2921208 Thompson St, Union City TN [email protected] WARREN SEED BG 3821 RR2XWARREN SEED BG 4210 RR2XWARREN SEED BG 4322 RR2XWARREN SEED BG 4510 RR2XWARREN SEED BG 4842 RR2XWARREN SEED BG 4911 RR2XWARREN SEED BG 4922 RR2X
University of Missouri Dr. Pengyin Chen .........................................573-379-5431PO Box 160, 147 St Hwy T, Portageville, MO [email protected] UNIVERSITY OF MISSOURI MO5201D CONVUNIVERSITY OF MISSOURI S11-20242CUNIVERSITY OF MISSOURI S13-10590CUNIVERSITY OF MISSOURI S13-10592CUNIVERSITY OF MISSOURI S13-1955CUNIVERSITY OF MISSOURI S13-2743CUNIVERSITY OF MISSOURI S13-3851CUNIVERSITY OF MISSOURI S14-15138RUNIVERSITY OF MISSOURI S14-15146RUNIVERSITY OF MISSOURI S14-9017RUNIVERSITY OF MISSOURI S14-9051RUNIVERSITY OF MISSOURI S15-10434C
University of Kentucky Dr. Todd Pfeiffer, Dr. Claire Venard .........859-257-2993N122 Ag. Science Center North, Lexington KY [email protected] ESSEX (long term check-release 1974)PENNYRILE (long term check-release 1987)
Table 3. Company specifications for entries in the 2018 Kentucky Soybean Variety Performance Tests.A
Variety/Brand Name
Realtive Maturity
Group Type
Disease Resistance TraitsC
Soybean Cyst
Nematode
Phytophtora SojaeD Sudden Death
Symdrome
Soybean Mosaic
VirusStem
Canker
Other Resistance
Traits Seed TreamentsR gene
RpsField
ToleranceA4447NSXR2 4.4 R2Y, Xtend, STS R3, MR14 Rps 1c 2.0 MR R MR2 Column3 23A4637NSXR2 4.6 R2Y, Xtend R3, MR14 Rps 1c 1.8 MR R MR 23AGRIGOLD G2900RX 2.9 R3, MR14, PI88 1c 9 9 unknown 2, 15, inoculantAGRIGOLD G3520RX 3.5 R3, MR14, PI88 1c 9 9 R 2, 15, inoculantAGRIGOLD G3722RX 3.7 R3, MR14, PI88 1c 8 7 unknown 2, 15, inoculantAGRIGOLD G4190RX 4.1 R3, MR14, PI88 none 8 8 MR 2, 15, inoculantAGRIGOLD G4380RX 4.3 R3, MR14, PI88 1c 7 8 R 2, 15, inoculantAGRIGOLD G4440RX 4.4 R3, MR14, PI88 1c 9 8 S 2, 15, inoculantAGRIGOLD G4579RX 4.5 R3, MR14, PI88 1c 8 9 R 2, 15, inoculantAGRIGOLD G4685RX 4.6 R3, MR14, PI88 1c 8 7 R 2, 15, inoculantAGRIGOLD G4705RX 4.7 R3, MR14, PI88 1c 8 9 R 2, 15, inoculantAGRIGOLD G4995RX 4.9 R3, MR14, PI88 none 9 9 R 2, 15, inoculantAGS GS46X17 4.6 X 3, 14 MT MR R 3, 6, 21, 27AGS GS48X18 4.8 X 3, 14 MT MS R 3, 6, 21, 27ARMOR 35-D20 3.5 Xtend 9ARMOR 39-D39 3.9 Xtend 9ARMOR 42-D27 4.2 Xtend 9ARMOR 29-D11 2.9 Xtend 9ARMOR X30D53 3.0 Xtend 9ARMOR X35D92 3.5 Xtend 9ARMOR X40D85 4.0 Xtend 9ARMOR X41D47 4.1 Xtend 9ARMOR 45-D43 4.3 Xtend 9ARMOR X44D36 4.4 Xtend 9ARMOR 45-D50 4.5 Xtend 9ARMOR X46D63 4.6 Xtend 9ARMOR 47-D22 4.7 Xtend 9ARMOR 49-D13 5.0 Xtend 9ARMOR X51D77 5.1 Xtend 9ASGROW AG28X9 2.8 RR2X R3 C T MR 1ASGROW AG29X8 2.9 RR2X R3 C MT MR 1ASGROW AG36X6 3.6 RR2X R3 C T MR R 1ASGROW AG37X9 3.7 RR2X R3 A T MR R 1ASGROW AG38X8 3.8 RR2X R3 C T MR R 1ASGROW AG39X7 3.9 RR2X/SR R3 C MT MR MR 1ASGROW AG41X8 4.1 RR2X/SR R3 C MT MR R 1ASGROW AG42X9 4.2 RR2X R3 A T MR R 1ASGROW AG43X7 4.3 RR2X/SR R3 A MT MS R 1ASGROW AG44X6 4.4 RR2X R3 C MT MR R 1ASGROW AG46X6 4.6 RR2X R3 A T MS MR 1ASGROW AG47X6 4.7 RR2X/SR R3 C MT MS R 1ASGROW AG47X9 4.7 RR2X R3 A MS MS R 1ASGROW AG48X9 4.8 RR2X/SR R3 C T MS R 1ASGROW AG49X9 4.9 RR2X/SR R3 C T MS R 1BRODBECK 368R2 3.6 RR2Y MR3, MR14 1c MR MS 14, 12, 15, 16, 17
continued

7
continued
Table 3. Company specifications for entries in the 2018 Kentucky Soybean Variety Performance Tests.A
Variety/Brand Name
Realtive Maturity
Group Type
Disease Resistance TraitsC
Soybean Cyst
Nematode
Phytophtora SojaeD Sudden Death
Symdrome
Soybean Mosaic
VirusStem
Canker
Other Resistance
Traits Seed TreamentsR gene
RpsField
ToleranceBRODBECK 388R2 3.8 RR2Y MR3, MR14 T MT 14, 12, 15, 16, 17BRODBECK 446R2 4.4 RR2Y MR3, MR14 1c T MT 14, 12, 15, 16, 17CAVERNDALE CF 364 STSn 3.6 CONV 3, 14 1k T MR MR MR-FELS 9, 25, 19CAVERNDALE CF 387 HT-GLYn 3.8 RR 3, 14 1c T MR MR MR-FELS 9, 25, 19CAVERNDALE CF 427 HT-GLY/STSn 4.2 RR 3, 14 1c T MR MR MR-FELS 9, 25, 19CAVERNDALE CF 478 RR2Y/STSn 4.7 RR2Y 3, 14 1c T MR MR MR-FELS 9, 25, 19CHANNEL 3718R2X 3.7 RR2X R3 T MT MT 3, 1, 21, 5CHANNEL 4218R2X 4.2 RR2X R3 MS MT MT 3, 1, 21, 5CHANNEL 4517R2X 4.5 RR2X R3 T MT T 3, 1, 21, 5CHANNEL 4717R2X 4.7 RR2X R3 T MT MT 3, 1, 21, 5CZ 3601 LL 3.6 LL 4 Rps1a MR T T 21, 15CZ 3841 LL 3.8 LL 2 Rps1a MR MR R 21, 15CZ 4105 LL 4.1 LL 3 Rps1a MR MR T 21, 15CZ 4222 LL 4.2 LL/STS 3 Rps1a MR T T 21, 15CZ 4308 LL 4.3 LL 3 Rps1k T T 21, 15CZ 4548 LL 4.5 LL/STS 3 Rps1k T MT 21, 15CZ 4748 LL 4.7 LL 3 Rps1a T MR R 21, 15CZ 4820 LL 4.8 LL 2 Rps1a T T 21, 15CZ 4918 LL 4.9 LL 3 Rps1a T T T 21, 15CZ 4938 LL 4.9 LL Rps1k T MR T 21, 15DYNA-GRO S39XT08 3.9 Xtend MR3, MR14 Rps 1c MT MR MR Frogeye - MR 12, 6DYNA-GRO S39XT68 3.9 Xtend MR3, MR14 None MT MR R 12, 6DYNA-GRO S41XS98 4.1 XT/STS MR3, MR14 None MT R MR 12, 6DYNA-GRO S4209N 4.2 CONV MR3, MR14 Rps 1c MT MR R 12, 6DYNA-GRO S43XS27 4.3 XT/STS MR3, MR14 Rps 1c MT MR MS Frogeye - MR 12, 6DYNA-GRO S44XS68 4.4 XT/STS MR3, MR14 Rps 1c MS MR R Frogeye - R 12, 6DYNA-GRO S46XS87 4.6 XT/STS MR3, MR14 Rps 1c MT MR R Frogeye - MR 12, 6DYNA-GRO S48XS78 4.8 XT/STS MR3, MR14 Rps 1c MT MS MS Frogeye - R 12, 6DYNA-GRO S48XT56 4.8 XT/STS MR3, MR14 Rps 1a MT R R Froegeye
- MR12, 6
ESSEX (long term check-release 1974) 5.0 CONV-PUBGO SOY 43C17S 4.3 CONV/STS 3, 14 MT MR R 4, 7, 26, 27GO SOY 49G16 4.9 GT 1, 3, 5, 14 MT MR R 4, 7, 26, 27GO SOY E4510S 4.5 CONV/STS 3, 14 MT MR R 4, 7, 26, 27GO SOY IREANE 4.9 CONV 2, 5 MT R R 4, 7, 26, 27HBK LL4950 4.9 LL 2 Rps1c T MS R 21, 15HBK LL4953 4.9 LL 1 Rps1k T MT R 21, 15HOEGEMEYER HPT 4211 NX 4.2 Xtend PI88788 1k MS MT NA NA 14, 12, 20, 16HOEGEMEYER HPT 4511 NX 4.5 Xtend PI88788 none S MT NA NA 14, 15, 12, 20, 16HOEGEMEYER HPT 4522 NR 4.5 RR PI88788 1k MS MT NA NA 14, 12, 20, 16HOEGEMEYER HPT 4922 NRB 4.9 RR/STS PI88788 1k S MT NA NA 14, 15, 12, 20, 16HS 45X80 4.5 RR2 Xtend 3, 14 Rps 1c MT MT NR R 1, 15HS 46X60 4.6 RR2 Xtend 3, 14 Rps 1c MT MR NR R 1, 15HS 48X70 4.8 RR2 Xtend 3, 14 Rps 1c MT MR NR R 1, 15HS 49X60 4.9 RR2 Xtend 3, 14 Rps 1a MT MR NR R 1, 15LG SEEDS C4227RX 4.2 Xtend, STS M3, MR14 none T R MR 6, 27LG SEEDS C4710RX 4.7 Xtend M3, MR17 1c TOL MS R 6, 27LG SEEDS C4845RX 4.8 Xtend M3, MR18 1c TOL R R 6, 27LG SEEDS LGS4597RX 4.5 Xtend M3, MR15 1c TOL MR R 6, 27LG SEEDS LGS4624RX 4.6 Xtend M3, MR16 1a TOL MR MR 6, 27LG SEEDS LGS4989RX 4.9 Xtend M3, MR19 1a TOL N/A R 6, 27MISSION A4608X 4.6 R2Y, Xtend, STS R3, MR14 Rps 1a 2.0 R R MR 23MISSION A4950X 4.9 R2Y, Xtend R3, MR14 NG 1.5 R R R 23PENNYRILE (long term check-release 1987) 4.7 CONV-PUBPIONEER P36T36X 3.6 RR2X 3, 14 1c MT-5 MR-8 FLS - MT - 5 2, 14PIONEER P37A78X 3.8 RR2X 3, 14 1a MT-6 MT-7 2, 14PIONEER P40A47X 4.0 RR2X 3, 14 1k MT-5 MT-6 2, 14PIONEER P42A96X 4.2 RR2X 3, 14 1c MT-5 MT-6 FLS - MT - 6 2, 14PIONEER P44A08L 4.4 LL 3, 14 MT-7 MT-5 FLS - MT - 5 2, 14PIONEER P44A72BX 4.4 Bolt, RR2X 3, 14 MT-5 MT-5 FLS - MR - 7 2, 14PIONEER P46A16R 4.6 RR 3, 14 MS-4 MT-6 2, 14PIONEER P46A57BX 4.6 Bolt, RR2X 3, 14 MS-4 MT-6 2, 14PIONEER P47A76L 4.7 LL 3, 14 MS-4 MT-5 FLS - MR - 8 2, 14PIONEER P48A60X 4.8 RR2X 3, 14 MS-4 MT-7 2, 14PIONEER P50A85X 5.0 RR2X 3, 14 MT-5 MT-5 FLS - MT - 5 2, 14PROGENY 4255 RX 4.2 R2X R-3, MR-14 Field Toler-
anceMR/MS Suscep-
tible21, 26, 15
PROGENY 4318 RX 4.3 R2X unknown 1c R 21, 26, 15PROGENY 4444 RXS 4.4 R2X, STS R-3, MR-14 HRps 1c MR/MS R 21, 26, 15PROGENY 4570 RXS 4.5 R2X, STS R-3, MR-14 1c MR R 21, 26, 15PROGENY 4620 RXS 4.6 R2X. STS R-3, MR-14 Hrps 1a MR R 21, 26, 15PROGENY 4757 RY 4.7 RR2 R-3, MR-14 1a MR R 21, 26, 15PROGENY 4799 RXS 4.7 R2X. STS R-3 HRps 1c MR R 21, 26, 15PROGENY 4816 RX 4.8 R2X R-3 1a MR R 21, 26, 15

8
Table 3. Company specifications for entries in the 2018 Kentucky Soybean Variety Performance Tests.A
Variety/Brand Name
Realtive Maturity
Group Type
Disease Resistance TraitsC
Soybean Cyst
Nematode
Phytophtora SojaeD Sudden Death
Symdrome
Soybean Mosaic
VirusStem
Canker
Other Resistance
Traits Seed TreamentsR gene
RpsField
TolerancePROGENY 4821 RX 4.8 R2X R-3, MR-14 1c MR MR 21, 26, 15PROGENY 4851 RX 4.8 R2X R-3, MR-14 1c MR/MS R 21, 26, 15PROGENY 4955 RX 4.9 R2X unknown 1a unknown R 21, 26, 15PROGENY 4994 RX 4.9 R2X unknown 1k MR R 21, 26, 15PROGENY 5016 RXS 5.0 R2X, STS R-3, MR-14 1a MR R 21, 26, 15PROGENY 5018 RX 5.0 R2X R-3, MR-14 unknown MR R 21, 26, 15PROGENY 5157 RXS 5.1 R2X, STS Susceptible unknown unknown R 21, 26, 15PROGENY 5226 RYS 5.2 RR2, STS R-3, MR-14 HRps 1c MR R 21, 26, 15PROGENY 5252 RX 5.2 R2X unknown 1k unknown R 21, 26, 15PROGENY 5279 RXS 5.2 R2X Susceptible 1c R R 21, 26, 15REV® 4168X™ 4.1 RR2X 9/3, 7/14 rps1k 6 7 8 3, 13, 14, 22 REV® 4679X™ 4.6 RR2X 9/3, 8/14 none 5 5 9 3, 13, 14, 22 REV® 46L99™ 4.6 LL 8/3, 8/14 none 8 7 3, 13, 14, 22 REV® 47L38™ 4.7 LL 9/3, 8/14 none 4 5 8 3, 13, 14, 22 REV® 4857X™ 4.8 RR2X 9/3, 9/14 rps1a 5 5 7 3, 13, 14, 22 REV® 4927X™ 4.9 RR2X 9/3, 6/14 rps1k 5 6 9 3, 13, 14, 22 REV® 49L88™ 4.9 LL 8/3, 4/14 rps1k 4 6 8 3, 13, 14, 22 S35-K9X 3.5 Xtend R3 Susc. MT MR MR 5S42-B9XS 4.2 Xtend/STS R3 1c MR MR MR 5S45-Z5XS 4.5 Xtend/STS R3 1a MR MR MR 5SEED CONSULTANTS SC 8379X™ 3.7 Xtend 11SEED CONSULTANTS SC 8399X™ 3.9 Xtend 11SEED CONSULTANTS SC 8439X™ 4.3 XTend 11SEED CONSULTANTS SCS 9385RR™ 3.8 R2Y P188788 MT MT 11SEED CONSULTANTS SCS 9393RR™ 3.9 R2Y P188788 1k MT MT 11SEED CONSULTANTS SCS 9469BR™ 4.6 STS/RR 11STEWART 4029R2X 4.0 Xtend R3 1c MR MS MR 1STEWART 4228R2X 4.2 Xtend R3 1c MS MR MR 1STEWART 4327R2X 4.3 Xtend R3 1c MR NR MS 1STEWART 4339R2X 4.3 Xtend R3 1c MR MR MR 1STEWART 4438R2X 4.4 Xtend R3 1c MR MS MR 1STEWART 4527R2X 4.5 Xtend R3 1c MR MR R 1STEWART 4619R2X 4.6 Xtend R3 1c MR MS MR 1STEWART 4927R2X 4.9 Xtend R3 1c MR MR MR 1STEWART 4939R2X 4.9 Xtend R3 Susc. MR NS MR 1STINE 40BA02 4.0 Stine GTSTINE 48BA23 4.8USG 7447XTS 4.4 XT R3, MR14 1c 1.9 MR MS FELS-MS 3, 14, 24, 19USG 7487XTS 4.8 XT R3, MR14 1c 2.0 MR R 3, 14, 24, 19USG 7489XT 4.8 XT R3, MR14 1a 1.5 MR R Cercospora
- MR3, 14, 24, 19
USG 7496XTS 4.9 XT R3, MR14 1a 2.2 MR R SRK - MR 3, 14, 24, 19UNIVERSITY OF MISSOURI MO5201D CONV 5.3 CONV 3, 14 X MR R FLS 3, 6, 26, 15, 18UNIVERSITY OF MISSOURI S11-20242C 5.1 CONV 2, 3, 5, 14 X R FLS 3, 6, 26, 15, 18UNIVERSITY OF MISSOURI S13-10590C 4.3 CONV 5 X R R FLS 3, 6, 26, 15, 18UNIVERSITY OF MISSOURI S13-10592C 4.5 CONV X R R FLS 3, 6, 26, 15, 18UNIVERSITY OF MISSOURI S13-1955C 5.5 CONV 3, 14 X MR FLS, RKNT 3, 6, 26, 15, 18UNIVERSITY OF MISSOURI S13-2743C 4.1 CONV 3, 14 X R 3, 6, 26, 15, 18UNIVERSITY OF MISSOURI S13-3851C 4.4 CONV X R 3, 6, 26, 15, 18UNIVERSITY OF MISSOURI S14-15138R 4.8 RR1/STS 3, 14 X R FLS 3, 6, 26, 15, 18UNIVERSITY OF MISSOURI S14-15146R 4.6 RR1/STS X R FLS 3, 6, 26, 15, 18UNIVERSITY OF MISSOURI S14-9017R 5.3 RR1 1, 3, 5 X R FLS 3, 6, 26, 15, 18UNIVERSITY OF MISSOURI S14-9051R 4.7 RR1 5 X R FLS 3, 6, 26, 15, 18UNIVERSITY OF MISSOURI S15-10434C 5.5 CONV 1, 2, 3, 5, 14 X RN 3, 6, 26, 15, 18WARREN SEED BG 3821 RR2X 3.8 Xtend 3, 14 1c MT MR 8WARREN SEED BG 4210 RR2X 4.2 Xtend 3, 14 1c MT MR 8WARREN SEED BG 4322 RR2X 4.3 Xtend 3, 14 1c MT MR 8WARREN SEED BG 4510 RR2X 4.5 Xtend 3, 14 1c MT MR 8WARREN SEED BG 4842 RR2X 4.8 Xtend 3, 14 1c MT MR 8WARREN SEED BG 4911 RR2X 4.9 Xtend 3, 14 1c MT MR 8WARREN SEED BG 4922 RR2X 4.9 Xtend 3, 14 1c MT MR 8
A This information is provided by the seed nominators and has not been verified by the soybean variety performance test programB Bolt: variety with enhanced tolerance to PuPont™ LeadOff® and DuPont™ Basis® Blend herbicides; CONV, Conv: conventional soybean variety; Experimental Public: experimental public variety; LL: Liberty
Link herbicide (glufosinate ammonium) tolerant soybean variety (introduced in 2009); PUB, Public Release: public variety; RR, RR1: Roundup Ready soybean variety (first generation - original trait, intro-duced in 1996); RR2, R2Y: Roundup Ready 2 Yield soybean variety (2nd generation - introduced in 2008); SR: Sulfonylurea herbicide tolerant soybean variety; STS: sulfonylurea-tolerant soybean variety; X, Xtend, XT, Extend, XTEND: dicamba-tolerant soybean variety
C S: susceptible; MS: moderately susceptible; MT: moderately tolerant; T: tolerant; MR: moderately resistant; R: resistant ; blank space: no information provided or information unknownD All races of Phytophtora sojae identified so far in Kentucky can be controlled with varieties in the Rps 1c or 1k. Race-specific resistance is highly effective but requires a proper match between pathogen race
and soybean variety. Field tolerance is a lower level of protection that will provide good control against all races. Seed and yound seedlings of tolerant soybean varieties must be protected with a fungicde since field tolerance develops after early seedling growh stages.

9
Table 4. Seed Treatments. Code Name Treatment Chemical class/use LD50 oral/derm A LC50B
1 Acceleron Metalaxyl, Imidacloprid, Pyraclostrobin systemic & non-systemic fungicide, systemic insecticide NA NA2 AgriShield® Fungicide + Insecticide nematicide,fungicide & insecticide NA NA3 Apron Maxx Mefenoxam, Fludioxonil systemic & non-systemic fungicide 5,000/5,050 5.42 - 4hrs4 Apron XL Mefenoxam systemic fungicide 862/2,020 2.52 - 4hrs5 B2000SAT biological component NA NA6 Clariva™ Complete Beans Pasteuria nishizawae, Mefenoxam, Thiameth-
oxam, Fluodioxinil, Sedaxanenematicide, systemic & non-systemic fungicide, systemic insecticide
NA NA
7 Cruiser Maxx Mefenoxam, Thiamethoxam, Fluodioxinil systemic & non-systemic fungicide, systemic insecticide 5,000/ 5,000 2.5 - 4hrs8 Cruiser Extrem Mefenoxam, Thiamethoxam, Fluodioxinil,
Azoxystrobinsystemic & non-systemic fungicide, systemic insecticide 5,000/ 5,000 NA
9 Defend Extra11 Eclipse TEN Metalaxyl, Fludioxonil, Thiabendazole, Imida-
clopridsystemic & non-systemic fungicide NA NA
12 Equity® VIP Thiamethoxam, Mefenoxam, Fludioxonil, Thiaben-dazole, Sedaxane
systemic insecticide and fungicide 3758/>5,000 >2.60 - 4 hrs
13 EverGol™ Energy Prothioconazole, Penflufen, Metalaxyl, Polyethyl-ene-polypropylene copolymer, 1,2-Propanediol
fungicide 2,000/2,000 2,205 - 4hrs
14 Gaucho Imidacloprid systemic insecticide 643/ 2,000 8.1 to 10.0 - 1hr15 ILeVO® Fluopyram fungicide, nematicide 1,750/5,000 2.0 - 96hrs16 DuPont Lumisena Oxathiapiprolin fungicide >5,000/>5,000 >0.69 - 96 hrs17 Marauder® inoculant NA NA18 Maxim® Fludioxonil fungicide NA NA19 N-Hibit™ CST Harpin protein activates a natural defense mechanism in plants, referred
to as systemic acquired resistanceNA NA
20 PA2030 biological component NA NA21 Poncho® VOTiVO® Clothiandin, Bacillus firmus systemic insecticide and nematicide 2,000/5,000 2.62 - 4hrs22 PPST 2030 biological component and polymer NA NA23 Revize® PBI Imidacloprid systemic insecticide NA NA24 Rancona 3.8 FS Ipconazole systemic broad spectrum fungicide 5,000/slight 2.59-4hrs25 TagTeam® LCO liquid Penicillium bilaii, Bradyrhizobium japonicum beneficial microorganisms NA NA26 Trilex® 2000 Trifloxystrobin, Metalaxyl, Glycerine systemic fungicide 2,000/5,000 2.6 - 4hrs27 VibranceTM Sedaxane fungicide 2,975/5,050 2.56 - 4hrs
A/B The LD50 and LC50 are standardized measures for expressing and comparing the toxicity of chemicals. A The LD50 is expressed as mg of chemical per kg (2.2 lbs.) body weight of test animal.B The LC50 is expressed as mg of chemical per liter of air inhaled by test animal.
The LD50 and LC50 are the doses that kill half (50%) of the animals tested (LD = “lethal dose”, LC = “lethal concentration”). The LD50 and LC50 data are from MSDS (Material Saftey Data Sheet).

10
R E C O M M E N D E D T A B L E
continued
Table 5. 2018 Kentucky Soybean Variety Performance Tests, State Summary - Recommended Table.
BRAND VARIETYYIELD (BU/AC)A/B LODGING
2018OILA/C PROTEINA/C
2018 2017-18 2016-18 2018 2017-18 2016-18 2018 2017-18 2016-18MATURITY GROUP II (relative MG 2.0-2.9)AGRIGOLD G2900RX 42.4 2.6 19.3 36.3ARMOR 29-D11 40.8 2.6 18.5 35.6ASGROW AG28X9 40.8 2.4 18.8 36.3ASGROW AG29X8 40.7 52.2 2.1 18.9 18.2 37.2 36.4
GROUP II AVERAGE 41.2 52.2 2.4 18.9 36.4LSD (0.10) 2.1 1.8 0.5 1.0C.V. 4.9 5.4 2.2 2.5
MATURITY GROUP III (relative MG 3.0-3.9)SEED CONSULTANTS SCS 9385RR™ 60.0 65.6 63.1 2.4 20.5 19.8 20.1 34.2 34.0 33.8SEED CONSULTANTS SC 8399X™ 59.1 2.2 20.0 34.6ASGROW AG38X8 55.3 61.6 2.6 19.6 18.9 35.3 34.7SEED CONSULTANTS SCS 9393RR™ 54.6 63.5 60.7 1.9 21.0 20.2 20.5 34.6 34.0 33.8ASGROW AG39X7 54.5 61.1 59.1 2.5 19.1 18.3 18.6 35.3 34.6 34.7ARMOR 35-D20 53.8 2.7 19.6 36.0ASGROW AG37X9 53.6 2.8 19.4 35.1PIONEER P36T36X 53.5 2.6 19.9 35.2AGRIGOLD G3722RX 52.8 2.8 19.6 36.1DYNA-GRO S39XT68 52.6 59.6 2.6 19.1 18.5 35.1 34.8ARMOR 39-D39 51.5 57.9 2.3 19.1 18.5 35.3 34.8S35-K9X 51.4 3.2 20.1 34.3CAVERNDALE CF 387 HT-GLYn 51.4 58.0 59.3 2.4 20.2 19.7 20.0 35.1 34.3 34.2BRODBECK 388R2 51.1 58.9 2.5 20.0 19.3 34.8 34.2CZ 3601 LL 50.6 2.4 20.2 34.5BRODBECK 368R2 50.5 56.2 2.3 19.5 18.9 36.0 35.8AGRIGOLD G3520RX 50.2 56.2 2.2 19.7 19.0 35.9 35.5SEED CONSULTANTS SC 8379X™ 49.6 2.5 19.1 36.6CZ 3841 LL 48.0 54.7 54.6 2.9 19.8 19.1 19.4 35.4 35.1 34.9PIONEER P37A78X 47.9 3.0 20.1 35.1CHANNEL 3718R2X 47.7 2.6 20.0 35.3WARREN SEED BG 3821 RR2X 46.6 2.8 19.1 35.4ARMOR X35D92 46.6 3.1 20.0 35.6ASGROW AG36X6 46.2 2.5 19.6 35.4CAVERNDALE CF 364 STSn 45.8 2.7 19.0 36.4DYNA-GRO S39XT08 45.0 54.6 2.9 19.6 18.9 37.0 36.4ARMOR X30D53 38.4 3.4 20.7 34.5
GROUP III AVERAGE 50.7 59.0 59.4 2.6 19.8 19.1 19.7 35.3 34.8 34.3LSD (0.10) 3.0 3.2 2.4 0.3 0.2 0.5 0.4 0.3 0.9C.V. 5.6 7.8 7.2 1.4 1.3 4.1 1.1 1.0 4.1
MATURITY GROUP IV EARLY (relative MG 4.0-4.5)STEWART 4339R2X 68.8 2.2 19.1 34.4PIONEER P42A96X 66.5 1.7 20.0 34.6STEWART 4527R2X 65.5 67.5 62.7 2.1 19.3 18.9 19.1 34.3 33.7 33.8AGRIGOLD G4380RX 64.5 69.3 2.1 18.8 18.3 34.8 34.8STEWART 4438R2X 63.5 69.2 2.0 19.2 18.9 34.6 34.0USG 7447XTS 62.9 2.4 18.8 34.9WARREN SEED BG 4510 RR2X 62.2 67.5 2.5 18.7 18.4 35.2 34.6CHANNEL 4517R2X 61.9 2.2 19.4 34.3ARMOR 42-D27 61.7 63.1 2.3 19.7 18.7 34.9 34.8PIONEER P44A72BX 61.7 2.2 19.6 34.7DYNA-GRO S4209N 61.2 2.2 19.8 35.4PROGENY 4570 RXS 61.2 2.3 19.4 34.9ARMOR 45-D50 61.1 2.4 18.8 35.5AGRIGOLD G4579RX 60.8 1.8 19.4 34.9ASGROW AG41X8 60.8 66.4 2.3 19.4 18.8 34.8 34.3HS 45X80 60.4 2.1 19.5 34.5A4447NSXR2 60.0 2.4 19.1 34.8DYNA-GRO S41XS98 59.9 63.7 2.4 19.6 19.0 35.1 34.3ASGROW AG44X6 59.6 63.0 60.8 2.7 19.0 18.5 18.6 35.4 35.0 35.0

11
continued
Table 5. 2018 Kentucky Soybean Variety Performance Tests, State Summary - Recommended Table.
BRAND VARIETYYIELD (BU/AC)A/B LODGING
2018OILA/C PROTEINA/C
2018 2017-18 2016-18 2018 2017-18 2016-18 2018 2017-18 2016-18PIONEER P44A08L 59.4 2.3 19.6 34.8PIONEER P40A47X 59.4 66.0 1.8 19.3 18.8 35.2 34.2S45-Z5XS 59.4 1.7 19.8 34.1CAVERNDALE CF 427 HT-GLY/STSn 59.1 63.9 2.1 19.8 19.5 35.3 34.8UNIVERSITY OF MISSOURI S13-2743C 59.1 61.2 2.9 19.9 19.3 34.5 34.4HOEGEMEYER HPT 4511 NX 58.9 2.4 18.8 35.0PROGENY 4444 RXS 58.8 64.9 3.2 19.3 18.9 35.1 34.3DYNA-GRO S44XS68 58.7 65.8 1.9 19.4 18.6 34.2 34.5CZ 4548 LL 58.4 2.9 20.1 35.5STEWART 4039R2X 58.4 1.9 19.4 35.6BRODBECK 446R2 58.3 65.8 61.9 3.1 19.5 19.2 19.5 34.7 34.0 33.8STEWART 4228R2X 58.2 65.6 1.9 19.3 18.4 34.8 34.6SEED CONSULTANTS SC 8439X™ 57.6 2.2 19.4 35.5LG SEEDS LGS4597RX 57.4 2.0 19.3 34.9UNIVERSITY OF MISSOURI S13-10592C 57.3 3.2 19.8 35.6ARMOR X41D47 56.7 3.6 19.7 34.8ASGROW AG43X7 56.7 64.6 61.7 2.7 19.3 18.7 18.8 34.8 34.1 33.9ASGROW AG42X9 56.7 2.8 19.7 34.2S42-B9XS 56.0 1.8 19.6 35.0HOEGEMEYER HPT 4522 NR 55.8 67.6 1.9 19.6 19.2 34.4 33.7DYNA-GRO S43XS27 55.6 65.9 61.1 2.8 18.7 18.1 18.6 34.7 34.6 34.4PROGENY 4318 RX 55.5 3.4 19.5 34.5UNIVERSITY OF MISSOURI S13-3851C 55.5 62.3 2.8 19.4 19.1 34.7 34.2REV® 4168X™ 55.3 2.1 19.8 35.2AGRIGOLD G4190RX 55.3 2.2 19.5 34.9CZ 4105 LL 55.0 63.5 59.5 2.2 19.6 19.0 19.1 36.0 35.1 35.2GO SOY E4510S 54.7 1.9 20.0 35.6CHANNEL 4218R2X 54.5 2.3 18.3 35.4UNIVERSITY OF MISSOURI S13-10590C 54.5 59.3 2.1 20.2 19.6 34.9 34.2HOEGEMEYER HPT 4211 NX 54.3 3.4 19.3 35.9CZ 4308 LL 54.1 2.9 20.4 35.3STEWART 4327R2X 54.0 64.9 60.9 2.8 18.7 18.5 18.9 34.9 33.9 33.8AGRIGOLD G4440RX 53.6 60.6 2.3 19.1 18.5 34.3 34.2STINE 40BA02 53.1 2.1 20.1 33.4ARMOR 45-D43 53.0 3.0 19.2 34.8WARREN SEED BG 4322 RR2X 52.9 3.3 18.5 35.4CZ 4222 LL 52.3 57.5 54.0 2.6 19.5 19.3 19.5 34.8 33.6 33.4GO SOY 43C17S 51.9 1.9 20.1 34.5LG SEEDS C4227RX 51.7 61.0 2.0 19.6 19.0 35.2 34.3PROGENY 4255 RX 50.9 58.3 2.7 19.3 18.8 34.2 33.8WARREN SEED BG 4210 RR2X 50.9 61.7 2.4 19.7 18.8 35.1 34.7ARMOR X40D85 49.3 2.9 20.0 35.4ARMOR X44D36 48.2 2.2 19.5 34.5
GROUP IV EARLY AVERAGE 57.6 64.1 60.3 2.4 19.4 18.9 19.0 34.9 34.3 34.2LSD (0.10) 3.2 3.2 2.4 0.3 0.2 0.2 0.4 0.3 0.2C.V. 5.3 7.0 6.5 1.3 1.3 1.3 1.0 1.0 1.0
MATURITY GROUP IV LATE (relative MG 4.6-4.9)PROGENY 4757 RY 64.9 68.9 63.7 3.0 19.9 19.1 19.3 33.9 33.5 33.2PIONEER P46A16R 63.1 69.4 2.3 19.7 19.3 33.9 33.4PIONEER P48A60X 63.0 2.4 19.0 34.5PROGENY 4816 RX 62.5 65.3 1.9 18.7 18.3 34.7 34.6ASGROW AG48X9 62.3 2.4 19.5 34.8REV® 49L88™ 62.2 65.4 2.8 19.2 19.1 34.8 34.2STEWART 4619R2X 61.5 2.6 19.4 34.4UNIVERSITY OF MISSOURI S14-15146R 61.3 63.6 2.1 19.6 19.3 34.4 33.6ASGROW AG47X9 61.2 2.3 19.6 34.1ASGROW AG47X6 61.1 66.5 63.2 2.5 19.5 18.6 18.9 34.3 34.1 33.9HOEGEMEYER HPT 4922 NRB 60.8 2.8 19.6 34.7USG 7487XTS 60.7 64.9 1.8 19.2 18.7 34.6 33.4CAVERNDALE CF 478 RR2Y/STSn 60.7 63.8 59.4 2.4 18.8 18.4 18.4 34.3 33.9 34.1STINE 48BA23 60.5 3.2 19.5 34.7
R E C O M M E N D E D T A B L E

12
continued
Table 5. 2018 Kentucky Soybean Variety Performance Tests, State Summary - Recommended Table.
BRAND VARIETYYIELD (BU/AC)A/B LODGING
2018OILA/C PROTEINA/C
2018 2017-18 2016-18 2018 2017-18 2016-18 2018 2017-18 2016-18PROGENY 4994 RX 60.4 2.8 19.2 34.6ASGROW AG46X6 60.3 64.8 61.8 2.2 19.4 19.0 19.1 34.8 34.2 34.1CZ 4820 LL 60.3 68.3 2.4 19.5 19.2 34.1 33.3MISSION A4950X 60.2 2.9 18.9 34.5CZ 4918 LL 59.5 2.6 19.5 34.6HS 49X60 59.1 69.3 63.8 1.7 19.0 18.4 18.5 34.8 34.7 34.6ARMOR 47-D22 59.1 3.2 19.6 34.4CZ 4748 LL 59.0 65.9 62.2 2.2 19.7 19.1 19.3 33.7 33.4 33.5ASGROW AG49X9 58.9 3.0 19.2 34.8GO SOY Ireane 58.4 61.5 58.8 2.6 18.6 18.0 18.3 34.9 34.7 34.5AGRIGOLD G4685RX 58.3 66.8 2.0 19.6 19.0 33.9 33.2WARREN SEED BG 4922 RR2X 57.9 1.6 19.3 34.6AGRIGOLD G4995RX 57.9 2.6 18.9 34.0USG 7496XTS 57.8 66.0 63.0 2.3 19.3 18.8 18.8 34.7 34.2 34.3PROGENY 4620 RXS 57.5 64.4 3.1 19.0 18.5 34.6 34.3MISSION A4608X 57.5 3.0 19.7 34.4CHANNEL 4717R2X 57.5 2.2 19.1 34.7DYNA-GRO S48XS78 57.3 66.5 2.3 19.4 18.9 35.0 34.7UNIVERSITY OF MISSOURI S14-9051R 57.3 2.8 19.5 34.6UNIVERSITY OF MISSOURI S14-15138R 57.2 2.4 19.3 34.3WARREN SEED BG 4842 RR2X 56.9 2.1 19.5 34.2PIONEER P46A57BX 56.9 2.6 20.0 34.0REV® 47L38™ 56.8 2.6 19.6 34.5HBK LL4953 56.7 67.3 2.1 19.4 19.2 34.4 33.3PIONEER P47A76L 56.6 2.6 20.0 34.2STEWART 4927R2X 56.2 65.9 60.1 2.3 19.4 18.8 18.9 34.3 33.4 33.3HS 46X60 56.2 65.9 60.9 2.4 19.3 18.6 18.7 34.7 34.1 34.0LG SEEDS C4710RX 56.1 61.1 2.9 19.3 19.2 34.4 33.3LG SEEDS C4845RX 56.1 65.2 61.7 1.7 19.2 18.5 18.5 34.7 34.6 34.7USG 7489XT 56.0 1.7 19.7 34.7REV® 4679X™ 55.5 2.9 19.7 34.5DYNA-GRO S48XT56 55.4 65.4 61.1 1.8 19.1 18.6 18.7 35.0 34.0 34.0PROGENY 4955 RX 55.3 3.0 19.6 34.0REV® 46L99™ 55.1 2.2 20.8 35.0WARREN SEED BG 4911 RR2X 55.0 62.5 2.7 19.2 18.9 34.5 33.8AGS GS48X18 54.8 2.4 19.6 33.9PROGENY 4799 RXS 54.8 63.5 2.3 18.8 18.2 35.0 34.6SEED CONSULTANTS SCS 9469BR™ 54.7 2.0 19.7 34.3DYNA-GRO S46XS87 54.6 61.6 59.0 1.9 19.5 19.0 19.0 34.4 33.5 33.6REV® 4927X™ 54.3 61.3 3.7 19.6 19.2 34.0 33.2LG SEEDS LGS4624RX 54.2 2.9 19.9 33.6AGRIGOLD G4705RX 53.9 3.2 19.7 34.0CZ 4938 LL 53.9 2.6 19.2 34.1A4637NSXR2 53.7 3.2 19.2 34.6REV® 4857X™ 53.7 60.9 3.1 19.3 19.0 34.9 34.3AGS GS46X17 53.6 1.9 19.9 34.4STEWART 4939R2X 53.5 2.3 19.3 34.4HS 48X70 53.3 64.7 2.1 19.0 18.3 34.8 34.4ARMOR X46D63 53.2 2.3 19.5 34.6LG SEEDS LGS4989RX 52.5 2.1 19.7 33.7PROGENY 4851 RX 50.7 60.1 3.9 19.2 18.8 34.6 34.1GO SOY 49G16 50.2 51.0 49.2 3.9 19.8 18.8 19.0 33.9 34.0 33.9HBK LL4950 49.8 2.7 19.3 34.7PENNYRILE (long term check-released 1987)
41.7 48.2 45.7 2.9 20.0 19.4 19.4 35.4 35.0 35.4
GROUP IV LATE AVERAGE 57.0 63.9 59.6 2.5 19.4 18.8 18.9 34.4 34.0 34.1LSD (0.10) 2.9 2.6 2.0 0.4 0.3 0.2 0.5 0.3 0.2C.V. 4.9 5.8 5.6 2.2 1.8 1.6 1.5 1.3 1.2
MATURITY GROUP V (relative MG 5.0-5.9)PROGENY 5016 RXS 62.6 66.8 3.0 18.6 18.3 35.3 34.7UNIVERSITY OF MISSOURI S14-9017R 58.5 65.8 2.3 19.6 19.7 34.3 33.1
R E C O M M E N D E D T A B L E

13
Table 5. 2018 Kentucky Soybean Variety Performance Tests, State Summary - Recommended Table.
BRAND VARIETYYIELD (BU/AC)A/B LODGING
2018OILA/C PROTEINA/C
2018 2017-18 2016-18 2018 2017-18 2016-18 2018 2017-18 2016-18PIONEER P50A85X 58.4 2.8 19.3 34.3ARMOR 49-D13 57.5 3.5 18.7 34.5PROGENY 5018 RX 56.7 3.4 18.8 34.7UNIVERSITY OF MISSOURI MO5201D CONV 55.3 2.9 19.3 34.5ARMOR X51D77 54.8 3.2 18.6 35.7PROGENY 5279 RXS 54.3 2.5 18.2 35.5PROGENY 5252 RX 52.5 3.4 18.7 35.6PROGENY 5226 RYS 49.3 2.7 19.1 35.6ESSEX (long term check-released 1974) 46.3 51.9 48.8 3.1 19.1 18.9 18.8 35.9 35.2 35.9UNIVERSITY OF MISSOURI S15-10434C 46.2 3.7 18.5 35.4UNIVERSITY OF MISSOURI S11-20242C 45.5 4.3 19.0 34.4UNIVERSITY OF MISSOURI S13-1955C 44.5 49.7 4.3 19.1 18.8 34.8 33.6
GROUP V AVERAGE 53.0 58.5 3.2 18.9 18.9 18.8 35.0 34.2 35.9LSD (0.10) 2.5 2.3 0.2 0.2 0.1 0.4 0.3 0.2C.V. 4.5 5.5 1.2 1.2 1.2 1.0 1.0 1.0A Within a maturity group, shaded yield are not significantly different (0.10) from the highest yielding cultivar (bold) of that maturity group and year column.B The 2018 yield data were collected at the Caldwell Co., Calloway Co., Caldwell Co., Fayette Co., Henderson Co., Logan Co., and Meade Co. locations. 2017 yield data were col-
lected at the Breckinridge Co., Butler Co., Caldwell Co., Calloway Co., Cumberland Co., Fayette Co., Hancock Co., and Pulaski Co. locations. The 2016 yield data were collected at the Breckinridge Co., Butler Co., Caldwell Co., Calloway Co.,Cumberland Co., Fayette Co., Hancock Co., and Russel Co. locations.
C The 2018 and 2017 oil and protein samples were collected at the Caldwell Co., Calloway Co., and Fayette Co. locations. The 2016 samples were collected at the Calloway Co. (except for MG IV Early and Late samples), Hancock Co., and Fayette Co. locations.
R E C O M M E N D E D T A B L E
14
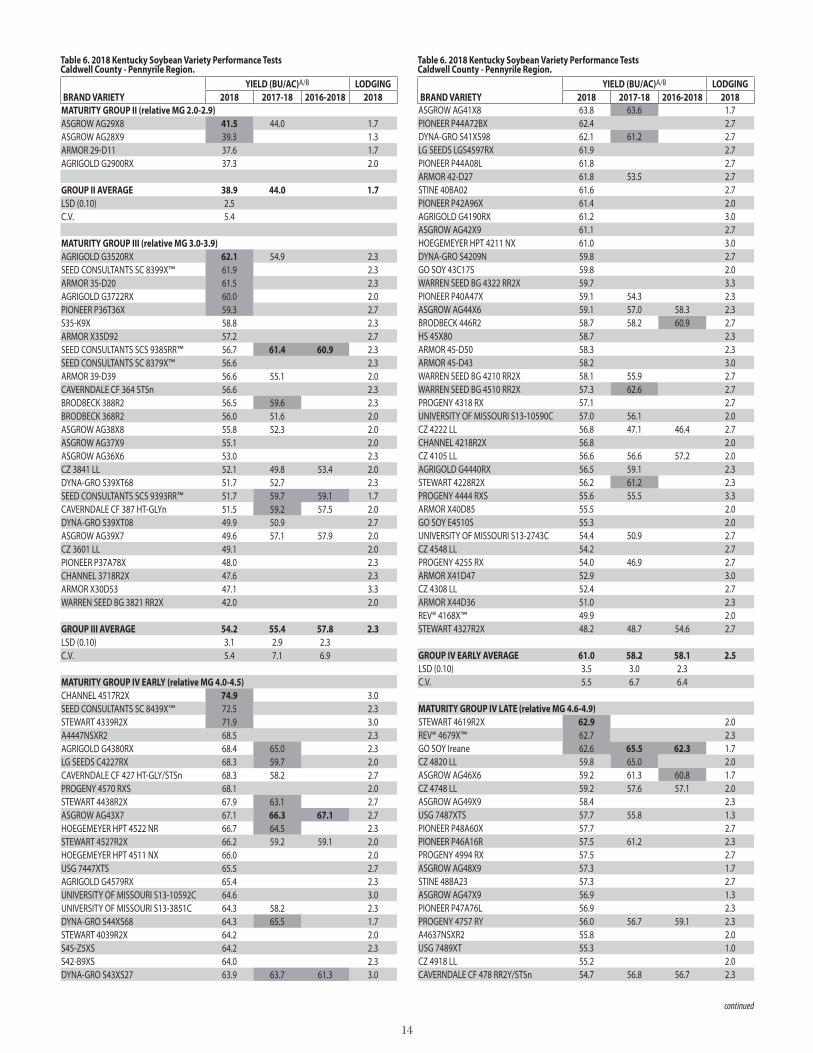
continued
Table 6. 2018 Kentucky Soybean Variety Performance TestsCaldwell County - Pennyrile Region.
BRAND VARIETYYIELD (BU/AC)A/B LODGING
2018 2017-18 2016-2018 2018MATURITY GROUP II (relative MG 2.0-2.9)ASGROW AG29X8 41.5 44.0 1.7ASGROW AG28X9 39.3 1.3ARMOR 29-D11 37.6 1.7AGRIGOLD G2900RX 37.3 2.0
GROUP II AVERAGE 38.9 44.0 1.7LSD (0.10) 2.5C.V. 5.4
MATURITY GROUP III (relative MG 3.0-3.9)AGRIGOLD G3520RX 62.1 54.9 2.3SEED CONSULTANTS SC 8399X™ 61.9 2.3ARMOR 35-D20 61.5 2.3AGRIGOLD G3722RX 60.0 2.0PIONEER P36T36X 59.3 2.7S35-K9X 58.8 2.3ARMOR X35D92 57.2 2.7SEED CONSULTANTS SCS 9385RR™ 56.7 61.4 60.9 2.3SEED CONSULTANTS SC 8379X™ 56.6 2.3ARMOR 39-D39 56.6 55.1 2.0CAVERNDALE CF 364 STSn 56.6 2.3BRODBECK 388R2 56.5 59.6 2.3BRODBECK 368R2 56.0 51.6 2.0ASGROW AG38X8 55.8 52.3 2.0ASGROW AG37X9 55.1 2.0ASGROW AG36X6 53.0 2.3CZ 3841 LL 52.1 49.8 53.4 2.0DYNA-GRO S39XT68 51.7 52.7 2.3SEED CONSULTANTS SCS 9393RR™ 51.7 59.7 59.1 1.7CAVERNDALE CF 387 HT-GLYn 51.5 59.2 57.5 2.0DYNA-GRO S39XT08 49.9 50.9 2.7ASGROW AG39X7 49.6 57.1 57.9 2.0CZ 3601 LL 49.1 2.0PIONEER P37A78X 48.0 2.3CHANNEL 3718R2X 47.6 2.3ARMOR X30D53 47.1 3.3WARREN SEED BG 3821 RR2X 42.0 2.0
GROUP III AVERAGE 54.2 55.4 57.8 2.3LSD (0.10) 3.1 2.9 2.3C.V. 5.4 7.1 6.9
MATURITY GROUP IV EARLY (relative MG 4.0-4.5)CHANNEL 4517R2X 74.9 3.0SEED CONSULTANTS SC 8439X™ 72.5 2.3STEWART 4339R2X 71.9 3.0A4447NSXR2 68.5 2.3AGRIGOLD G4380RX 68.4 65.0 2.3LG SEEDS C4227RX 68.3 59.7 2.0CAVERNDALE CF 427 HT-GLY/STSn 68.3 58.2 2.7PROGENY 4570 RXS 68.1 2.0STEWART 4438R2X 67.9 63.1 2.7ASGROW AG43X7 67.1 66.3 67.1 2.7HOEGEMEYER HPT 4522 NR 66.7 64.5 2.3STEWART 4527R2X 66.2 59.2 59.1 2.0HOEGEMEYER HPT 4511 NX 66.0 2.0USG 7447XTS 65.5 2.7AGRIGOLD G4579RX 65.4 2.3UNIVERSITY OF MISSOURI S13-10592C 64.6 3.0UNIVERSITY OF MISSOURI S13-3851C 64.3 58.2 2.3DYNA-GRO S44XS68 64.3 65.5 1.7STEWART 4039R2X 64.2 2.0S45-Z5XS 64.2 2.3S42-B9XS 64.0 2.3DYNA-GRO S43XS27 63.9 63.7 61.3 3.0
Table 6. 2018 Kentucky Soybean Variety Performance TestsCaldwell County - Pennyrile Region.
BRAND VARIETYYIELD (BU/AC)A/B LODGING
2018 2017-18 2016-2018 2018ASGROW AG41X8 63.8 63.6 1.7PIONEER P44A72BX 62.4 2.7DYNA-GRO S41XS98 62.1 61.2 2.7LG SEEDS LGS4597RX 61.9 2.7PIONEER P44A08L 61.8 2.7ARMOR 42-D27 61.8 53.5 2.7STINE 40BA02 61.6 2.7PIONEER P42A96X 61.4 2.0AGRIGOLD G4190RX 61.2 3.0ASGROW AG42X9 61.1 2.7HOEGEMEYER HPT 4211 NX 61.0 3.0DYNA-GRO S4209N 59.8 2.7GO SOY 43C17S 59.8 2.0WARREN SEED BG 4322 RR2X 59.7 3.3PIONEER P40A47X 59.1 54.3 2.3ASGROW AG44X6 59.1 57.0 58.3 2.3BRODBECK 446R2 58.7 58.2 60.9 2.7HS 45X80 58.7 2.3ARMOR 45-D50 58.3 2.3ARMOR 45-D43 58.2 3.0WARREN SEED BG 4210 RR2X 58.1 55.9 2.7WARREN SEED BG 4510 RR2X 57.3 62.6 2.7PROGENY 4318 RX 57.1 2.7UNIVERSITY OF MISSOURI S13-10590C 57.0 56.1 2.0CZ 4222 LL 56.8 47.1 46.4 2.7CHANNEL 4218R2X 56.8 2.0CZ 4105 LL 56.6 56.6 57.2 2.0AGRIGOLD G4440RX 56.5 59.1 2.3STEWART 4228R2X 56.2 61.2 2.3PROGENY 4444 RXS 55.6 55.5 3.3ARMOR X40D85 55.5 2.0GO SOY E4510S 55.3 2.0UNIVERSITY OF MISSOURI S13-2743C 54.4 50.9 2.7CZ 4548 LL 54.2 2.7PROGENY 4255 RX 54.0 46.9 2.7ARMOR X41D47 52.9 3.0CZ 4308 LL 52.4 2.7ARMOR X44D36 51.0 2.3REV® 4168X™ 49.9 2.0STEWART 4327R2X 48.2 48.7 54.6 2.7
GROUP IV EARLY AVERAGE 61.0 58.2 58.1 2.5LSD (0.10) 3.5 3.0 2.3C.V. 5.5 6.7 6.4
MATURITY GROUP IV LATE (relative MG 4.6-4.9)STEWART 4619R2X 62.9 2.0REV® 4679X™ 62.7 2.3GO SOY Ireane 62.6 65.5 62.3 1.7CZ 4820 LL 59.8 65.0 2.0ASGROW AG46X6 59.2 61.3 60.8 1.7CZ 4748 LL 59.2 57.6 57.1 2.0ASGROW AG49X9 58.4 2.3USG 7487XTS 57.7 55.8 1.3PIONEER P48A60X 57.7 2.7PIONEER P46A16R 57.5 61.2 2.3PROGENY 4994 RX 57.5 2.7ASGROW AG48X9 57.3 1.7STINE 48BA23 57.3 2.7ASGROW AG47X9 56.9 1.3PIONEER P47A76L 56.9 2.3PROGENY 4757 RY 56.0 56.7 59.1 2.3A4637NSXR2 55.8 2.0USG 7489XT 55.3 1.0CZ 4918 LL 55.2 2.0CAVERNDALE CF 478 RR2Y/STSn 54.7 56.8 56.7 2.3

15
Table 6. 2018 Kentucky Soybean Variety Performance TestsCaldwell County - Pennyrile Region.
BRAND VARIETYYIELD (BU/AC)A/B LODGING
2018 2017-18 2016-2018 2018STEWART 4939R2X 54.7 2.0HS 49X60 54.4 60.0 58.4 1.3USG 7496XTS 54.4 57.1 59.5 2.0ARMOR 47-D22 54.0 2.3WARREN SEED BG 4842 RR2X 54.0 1.7PROGENY 4620 RXS 53.9 55.0 2.7UNIVERSITY OF MISSOURI S14-15146R 53.9 59.9 2.0LG SEEDS C4710RX 53.7 50.9 2.3PROGENY 4955 RX 53.4 2.3PROGENY 4816 RX 53.2 49.9 1.0CZ 4938 LL 53.0 1.7LG SEEDS LGS4989RX 52.4 1.3ARMOR X46D63 52.2 2.0AGS GS46X17 52.2 1.3PIONEER P46A57BX 52.1 2.7AGS GS48X18 51.7 1.7REV® 47L38™ 51.5 1.7WARREN SEED BG 4922 RR2X 51.5 1.0REV® 4857X™ 51.0 53.1 2.0REV® 49L88™ 51.0 57.3 2.3DYNA-GRO S48XS78 50.6 60.0 1.3HBK LL4953 50.5 60.9 1.7HOEGEMEYER HPT 4922 NRB 50.2 2.7DYNA-GRO S46XS87 50.2 55.6 57.1 2.0MISSION A4950X 50.2 3.0HS 46X60 49.9 51.3 53.1 1.7SEED CONSULTANTS SCS 9469BR™ 49.9 2.0ASGROW AG47X6 49.9 51.5 55.6 1.7AGRIGOLD G4685RX 49.7 50.9 1.0LG SEEDS LGS4624RX 49.6 2.3AGRIGOLD G4705RX 49.3 3.3UNIVERSITY OF MISSOURI S14-9051R 48.9 2.0REV® 46L99™ 48.8 1.3HS 48X70 48.7 58.6 1.7CHANNEL 4717R2X 48.6 2.7WARREN SEED BG 4911 RR2X 48.6 55.1 2.0MISSION A4608X 48.5 2.7
Table 6. 2018 Kentucky Soybean Variety Performance TestsCaldwell County - Pennyrile Region.
BRAND VARIETYYIELD (BU/AC)A/B LODGING
2018 2017-18 2016-2018 2018UNIVERSITY OF MISSOURI S14-15138R 48.2 1.3REV® 4927X™ 47.9 48.7 3.0PROGENY 4799 RXS 46.9 48.0 2.0LG SEEDS C4845RX 46.6 49.8 54.0 1.0AGRIGOLD G4995RX 46.4 2.3STEWART 4927R2X 46.2 52.3 55.1 2.0HBK LL4950 45.6 2.0GO SOY 49G16 44.4 44.8 47.7 2.0PROGENY 4851 RX 44.0 60.3 3.7DYNA-GRO S48XT56 43.9 45.3 48.8 1.7PENNYRILE (long term check-released 1987) 39.6 42.5 43.3 2.0
GROUP IV LATE AVERAGE 52.4 54.9 55.2 2.0LSD (0.10) 3.0 2.6 2.0C.V. 5.4 6.4 6.2
MATURITY GROUP V (relative MG 5.0-5.9)PROGENY 5016 RXS 74.0 62.7 2.7PIONEER P50A85X 65.4 2.7PROGENY 5279 RXS 64.6 2.3PROGENY 5018 RX 61.2 4.0ARMOR X51D77 60.8 2.3UNIVERSITY OF MISSOURI MO5201D CONV
58.7 2.0
ARMOR 49-D13 57.7 3.3ESSEX (long term check-released 1974) 56.7 52.6 2.3UNIVERSITY OF MISSOURI S15-10434C 56.0 2.7UNIVERSITY OF MISSOURI S11-20242C 55.9 3.3PROGENY 5252 RX 54.6 3.7UNIVERSITY OF MISSOURI S13-1955C 54.3 53.9 4.3PROGENY 5226 RYS 53.9 2.7UNIVERSITY OF MISSOURI S14-9017R 42.5 48.7 2.7
GROUP V AVERAGE 58.3 54.5 2.9LSD (0.10) 2.5 2.9C.V. 3.9 6.7A Within a maturity group, shaded yield are not significantly different (0.10) from the highest yield-
ing cultivar (bold) of that maturity group and year column.B 2018, 2017, and 2016 data were collected in Caldwell Co.
Agronomic Information – Caldwell County, Pennyrile Region.GPS coordinates 37°05’47.4”N
87°51’46.2”WSoil type Crider silt loamSlopes 0-6 %, erodedPrevious crop Tobacco, winter wheat (cover crop)Soil test pH 6.82, P 64, K 313SCN test 1,125Fertilizer/lime applied NAAgricultural practice no-tillPre-planting herbicides NAPlanting dates MG II, III, IV Early and V: 05/23/2018
MG IV Late: 05/24/2018Harvest dates MG II and III: 10/18
MG IV Early and Late: 10/22MG V: 10/23
50% frost killing 10/21
Caldwell County (Princeton).
Month
Total Monthly Precipitation
(in.)
TemperaturesMonthly Average
(⁰F)
Highest recorded
(⁰F)
Lowest recorded
(⁰F)March 3.51 46.0 73.4 22.2April 4.86 50.9 79.9 25.3May 4.69 73.2 88.7 45.7June 7.79 77.5 92.6 55.4July 2.84 77.8 94.0 61.4
August 2.41 76.6 91.7 52.1September 5.61 73.9 95.4 48.6
October (10/23)
1.48 61.6 88.7 27.8

16
continued
Table 7. 2018 Kentucky Soybean Variety Performance TestsCalloway County - Purchase Region.
BRAND VARIETYYIELD (BU/AC)A/B LODGING
20182018 2017-18 2016-2018MATURITY GROUP II (relative MG 2.0-2.9)ARMOR 29-D11 40.8 1.0ASGROW AG28X9 39.3 1.0AGRIGOLD G2900RX 38.8 1.0ASGROW AG29X8 37.0 49.2 2.0
GROUP II AVERAGE 39.0 1.3LSD (0.10) 2.1C.V. 4.2
MATURITY GROUP III (relative MG 3.0-3.9)SEED CONSULTANTS SCS 9385RR™ 61.0 65.0 63.9 2.3CAVERNDALE CF 387 HT-GLYn 60.1 65.6 64.9 1.3SEED CONSULTANTS SCS 9393RR™ 59.4 63.9 58.3 1.0SEED CONSULTANTS SC 8399X™ 58.0 1.0CZ 3841 LL 56.1 55.3 51.2 2.3ASGROW AG36X6 55.4 2.3ARMOR X35D92 55.1 1.7CHANNEL 3718R2X 55.0 2.0DYNA-GRO S39XT68 54.6 56.9 1.3WARREN SEED BG 3821 RR2X 54.5 1.7ARMOR 39-D39 53.9 53.8 1.3SEED CONSULTANTS SC 8379X™ 52.4 1.7ASGROW AG38X8 52.0 61.9 2.0BRODBECK 368R2 51.6 59.6 2.0CZ 3601 LL 51.2 1.3ASGROW AG39X7 51.1 57.9 54.6 2.0S35-K9X 50.3 2.7PIONEER P36T36X 50.2 2.0CAVERNDALE CF 364 STSn 50.0 2.0AGRIGOLD G3722RX 48.2 2.7AGRIGOLD G3520RX 47.5 55.9 1.3ARMOR 35-D20 46.2 1.7ASGROW AG37X9 46.1 1.7PIONEER P37A78X 45.3 1.7DYNA-GRO S39XT08 43.6 47.4 1.3BRODBECK 388R2 42.9 53.9 1.3ARMOR X30D53 37.3 3.0
GROUP III AVERAGE 51.4 58.1 58.6 1.8LSD (0.10) 4.5 3.4 2.6C.V. 8.3 8.3 7.7
MATURITY GROUP IV EARLY (relative MG 4.0-4.5)USG 7447XTS 65.5 2.0CHANNEL 4517R2X 65.3 1.3DYNA-GRO S4209N 64.0 1.7STEWART 4527R2X 63.2 56.2 58.1 1.0WARREN SEED BG 4322 RR2X 62.4 3.7PIONEER P42A96X 62.0 1.0PIONEER P44A72BX 61.8 2.0S45-Z5XS 60.8 1.0ARMOR 45-D50 59.7 2.0ASGROW AG44X6 59.3 56.2 59.8 2.7STEWART 4339R2X 58.2 1.0UNIVERSITY OF MISSOURI S13-2743C 58.2 2.0STEWART 4327R2X 58.1 55.8 60.9 1.7GO SOY E4510S 57.8 1.3HS 45X80 57.4 1.7UNIVERSITY OF MISSOURI S13-3851C 57.3 1.0DYNA-GRO S43XS27 56.9 53.0 57.2 2.0PROGENY 4444 RXS 56.5 2.7HOEGEMEYER HPT 4211 NX 56.0 3.0DYNA-GRO S41XS98 56.0 1.0A4447NSXR2 55.7 1.0STEWART 4438R2X 55.6 1.3
Table 7. 2018 Kentucky Soybean Variety Performance TestsCalloway County - Purchase Region.
BRAND VARIETYYIELD (BU/AC)A/B LODGING
20182018 2017-18 2016-2018PROGENY 4255 RX 55.3 1.7CZ 4548 LL 55.0 1.7UNIVERSITY OF MISSOURI S13-10590C 54.9 1.0HOEGEMEYER HPT 4511 NX 54.7 1.7HOEGEMEYER HPT 4522 NR 54.6 1.0CZ 4308 LL 54.3 2.0WARREN SEED BG 4510 RR2X 54.1 1.3PROGENY 4318 RX 53.9 2.0ARMOR X41D47 53.8 3.0AGRIGOLD G4190RX 53.7 1.3PROGENY 4570 RXS 53.5 1.3LG SEEDS LGS4597RX 53.4 2.0DYNA-GRO S44XS68 53.1 1.0ARMOR 42-D27 53.0 1.3ASGROW AG41X8 53.0 1.7BRODBECK 446R2 52.8 54.7 60.8 1.3AGRIGOLD G4380RX 52.3 1.7UNIVERSITY OF MISSOURI S13-10592C 52.2 1.7STEWART 4228R2X 51.6 1.3STINE 40BA02 51.1 1.0CHANNEL 4218R2X 50.2 1.0ASGROW AG43X7 50.1 55.3 55.4 1.0STEWART 4039R2X 49.8 1.3WARREN SEED BG 4210 RR2X 49.6 1.7CAVERNDALE CF 427 HT-GLY/STSn 49.6 1.3SEED CONSULTANTS SC 8439X™ 49.5 2.0AGRIGOLD G4440RX 49.2 2.0S42-B9XS 48.5 1.0ARMOR 45-D43 47.9 3.0PIONEER P40A47X 47.5 1.3AGRIGOLD G4579RX 47.3 1.0LG SEEDS C4227RX 47.0 1.3PIONEER P44A08L 46.8 1.7ASGROW AG42X9 46.2 1.7REV® 4168X™ 46.0 1.3ARMOR X44D36 45.8 1.3CZ 4105 LL 45.7 51.3 53.7 1.3CZ 4222 LL 42.9 40.3 47.1 1.7ARMOR X40D85 42.9 2.0GO SOY 43C17S 40.5 1.0
GROUP IV EARLY AVERAGE 53.6 52.8 56.6 1.6LSD (0.10) 3.6 2.6 2.7C.V. 6.4 6.6 8.1
MATURITY GROUP IV LATE (relative MG 4.6-4.9)PIONEER P48A60X 69.7 4.0UNIVERSITY OF MISSOURI S14-9051R 69.1 2.3USG 7496XTS 65.7 59.6 57.6 3.0UNIVERSITY OF MISSOURI S14-15146R 65.5 64.8 2.3ASGROW AG47X6 65.5 69.0 64.9 3.0AGRIGOLD G4685RX 64.8 64.6 2.3AGS GS46X17 64.3 1.7MISSION A4950X 64.3 3.3DYNA-GRO S48XT56 64.1 70.2 62.5 1.7STINE 48BA23 64.1 4.3HS 49X60 63.9 71.2 63.5 2.3PIONEER P46A16R 63.6 68.5 2.0CZ 4820 LL 63.3 68.4 3.0REV® 46L99™ 63.1 2.7ASGROW AG46X6 62.6 65.7 62.1 2.3CZ 4748 LL 62.3 62.9 60.4 2.0REV® 49L88™ 61.2 62.6 3.3PROGENY 4757 RY 60.4 66.2 66.3 3.0STEWART 4619R2X 59.9 2.0GO SOY Ireane 59.7 62.3 59.5 3.0

17
Table 7. 2018 Kentucky Soybean Variety Performance TestsCalloway County - Purchase Region.
BRAND VARIETYYIELD (BU/AC)A/B LODGING
20182018 2017-18 2016-2018HOEGEMEYER HPT 4922 NRB 59.5 2.7REV® 4857X™ 59.3 52.4 3.3REV® 4679X™ 59.0 3.3PROGENY 4816 RX 58.9 60.0 2.0USG 7487XTS 58.7 57.8 1.7PROGENY 4955 RX 58.0 4.0PIONEER P46A57BX 57.9 1.7WARREN SEED BG 4922 RR2X 57.6 1.7REV® 4927X™ 57.5 56.3 3.7LG SEEDS C4710RX 57.3 53.9 3.3WARREN SEED BG 4842 RR2X 56.8 2.0ASGROW AG48X9 56.4 2.3HS 48X70 56.2 60.7 3.3PROGENY 4620 RXS 56.0 61.2 2.3A4637NSXR2 55.9 2.3AGRIGOLD G4705RX 55.9 2.3PIONEER P47A76L 55.3 2.0DYNA-GRO S48XS78 55.2 54.3 3.3WARREN SEED BG 4911 RR2X 55.0 55.1 2.7ASGROW AG49X9 54.9 3.3CAVERNDALE CF 478 RR2Y/STSn 54.0 55.7 52.1 2.3HS 46X60 53.9 54.8 51.1 3.3CZ 4938 LL 53.5 2.7STEWART 4927R2X 53.2 59.8 52.4 2.7ASGROW AG47X9 52.9 2.3UNIVERSITY OF MISSOURI S14-15138R 52.8 2.7REV® 47L38™ 52.7 3.0PROGENY 4851 RX 52.6 59.0 4.0AGS GS48X18 51.9 1.7CHANNEL 4717R2X 51.8 2.0LG SEEDS LGS4624RX 51.8 2.3ARMOR 47-D22 51.6 3.0GO SOY 49G16 51.5 47.9 49.7 4.3HBK LL4953 51.4 66.1 1.7USG 7489XT 51.3 2.0AGRIGOLD G4995RX 50.2 1.7HBK LL4950 50.1 3.3
Table 7. 2018 Kentucky Soybean Variety Performance TestsCalloway County - Purchase Region.
BRAND VARIETYYIELD (BU/AC)A/B LODGING
20182018 2017-18 2016-2018LG SEEDS C4845RX 49.9 64.2 60.8 2.0MISSION A4608X 49.0 2.3CZ 4918 LL 48.3 1.7ARMOR X46D63 48.2 2.0LG SEEDS LGS4989RX 47.5 2.7PROGENY 4994 RX 46.8 1.7SEED CONSULTANTS SCS 9469BR™ 46.7 2.0PROGENY 4799 RXS 46.4 54.4 1.3STEWART 4939R2X 43.5 1.7DYNA-GRO S46XS87 43.2 47.3 46.7 1.3PENNYRILE (long term check-released 1987) 35.2 40.2 39.7 2.7
GROUP IV LATE AVERAGE 56.0 59.9 56.6 2.5LSD (0.10) 2.9 2.8 2.1C.V. 4.9 6.5 6.1
MATURITY GROUP V (relative MG 5.0-5.9)PIONEER P50A85X 70.5 3.0PROGENY 5016 RXS 69.5 68.6 4.0UNIVERSITY OF MISSOURI MO5201D CONV 68.9 3.7PROGENY 5018 RX 68.0 3.7UNIVERSITY OF MISSOURI S14-9017R 65.8 62.3 2.7PROGENY 5252 RX 64.4 4.3PROGENY 5226 RYS 63.3 3.3ARMOR 49-D13 61.4 4.0PROGENY 5279 RXS 60.5 3.3UNIVERSITY OF MISSOURI S11-20242C 55.9 5.0UNIVERSITY OF MISSOURI S13-1955C 53.6 52.2 4.3UNIVERSITY OF MISSOURI S15-10434C 53.1 4.0ARMOR X51D77 53.1 4.3ESSEX (long term check-released 1974) 52.0 50.0 4.0
GROUP V AVERAGE 61.4 58.3 3.8LSD (0.10) 2.3 2.6C.V. 3.5 5.7A Within a maturity group, shaded yield are not significantly different (0.10) from the highest yield-
ing cultivar (bold) of that maturity group and year column.B 2018, 2017, and 2016 data were collected in Calloway Co.
Agronomic Information – Calloway County, Purchase Region.GPS coordinates 36°36’43.9”N
88°20’57.8”WSoil type Grenada silt loamSlopes 0-2%Previous crop Tobacco, winter wheat (cover crop)Soil test pH 6.8, P 114, K 187SCN test 938Agricultural practice no-tillPre-planting herbicides NAPlanting date 05/22/2018Post-planting herbicides Reflex, FirstRate: 06/07/2018Harvest date MG II and II: 10/09
MG IV and V: 10/1250% frost killing 10/21
Calloway County (Murray).
Month
Total Monthly Precipitation
(in.)
TemperaturesMonthly Average
(⁰F)
Highest recorded
(⁰F)
Lowest recorded
(⁰F)March 4.61 47.7 73.6 26.3April 5.84 52.2 81.0 27.8May 3.75 73.6 89.3 49.1June 6.11 77.7 91.7 59.6July 1.49 78.4 93.6 63.5
August 3.29 78.0 94.3 53.8September 5.03 74.6 96.1 49.4
October (10/12)
0.21 73.0 89.5 40.4

18
Table 8. 2018 Kentucky Soybean Variety Performance TestsFayette County - Bluegrass Region.
BRAND VARIETY
YIELD (BU/AC)A/B
LODGING2018
PLANT HEIGHT
(IN.) 2018MATURITY DATE 20182018 2017-18
2016-2018
MATURITY GROUP II (relative MG 2.0-2.9)AGRIGOLD G2900RX 50.5 3.0 36 21ARMOR 29-D11 48.9 2.7 32 30ASGROW AG28X9 43.3 2.0 32 21ASGROW AG29X8 36.0 53.5 1.3 36 21
GROUP II AVERAGE 44.7 2.3 34 Sept. 23LSD (0.10) 3.7C.V. 6.5
MATURITY GROUP III (relative MG 3.0-3.9)SEED CONSULTANTS SC 8399X™
65.7 2.3 47 40
SEED CONSULTANTS SCS 9385RR™
65.1 67.4 66.0 3.0 43 40
ASGROW AG39X7 64.3 67.1 64.9 2.0 43 40ASGROW AG38X8 63.0 63.2 3.0 38 42ASGROW AG37X9 62.4 2.7 48 40SEED CONSULTANTS SCS 9393RR™
61.3 66.4 63.0 2.7 44 40
BRODBECK 368R2 59.8 65.7 2.0 42 35PIONEER P37A78X 58.9 1.7 43 35BRODBECK 388R2 58.8 65.7 2.3 39 35PIONEER P36T36X 56.5 3.0 40 40S35-K9X 54.4 3.0 42 35CAVERNDALE CF 387 HT-GLYn
54.0 59.6 60.6 2.3 41 39
AGRIGOLD G3722RX 53.6 3.0 44 40DYNA-GRO S39XT68 52.7 59.7 2.3 45 38CHANNEL 3718R2X 52.4 2.3 38 35ARMOR 35-D20 52.2 2.7 39 40CZ 3601 LL 51.6 2.0 48 35CAVERNDALE CF 364 STSn 51.5 2.3 32 35SEED CONSULTANTS SC 8379X™
50.0 2.7 44 42
CZ 3841 LL 49.1 60.6 60.4 2.0 43 35ASGROW AG36X6 48.8 2.3 37 40DYNA-GRO S39XT08 48.6 55.8 2.7 40 35ARMOR 39-D39 46.4 62.1 2.0 36 40AGRIGOLD G3520RX 43.9 59.4 2.0 37 40ARMOR X35D92 41.4 2.3 36 40WARREN SEED BG 3821 RR2X
41.1 2.3 38 40
ARMOR X30D53 38.7 2.7 34 35
GROUP III AVERAGE 53.6 62.7 63.0 2.4 41 Oct. 8th LSD (0.10) 2.9 3.5 2.5C.V. 5.1 7.9 7.0
MATURITY GROUP IV EARLY (relative MG 4.0-4.5)DYNA-GRO S4209N 83.5 2.7 44 45AGRIGOLD G4380RX 79.6 79.9 2.0 44 40STEWART 4339R2X 79.1 2.3 40 32STEWART 4527R2X 77.8 81.1 71.4 2.0 43 46PIONEER P42A96X 77.5 2.7 46 45CAVERNDALE CF 427 HT-GLY/STSn
75.9 74.1 2.3 36 42
STEWART 4438R2X 75.9 77.3 1.3 43 45PROGENY 4570 RXS 75.6 3.0 46 42CZ 4105 LL 74.5 73.1 64.7 2.3 44 42ASGROW AG44X6 74.5 69.1 63.2 2.0 42 42PROGENY 4444 RXS 74.1 73.9 3.7 44 45PIONEER P44A08L 73.4 2.7 42 45ASGROW AG42X9 71.4 2.3 39 48AGRIGOLD G4579RX 71.2 2.3 40 45ARMOR 45-D50 71.1 2.0 46 45WARREN SEED BG 4510 RR2X
70.6 72.1 2.3 50 45
Table 8. 2018 Kentucky Soybean Variety Performance TestsFayette County - Bluegrass Region.
BRAND VARIETY
YIELD (BU/AC)A/B
LODGING2018
PLANT HEIGHT
(IN.) 2018MATURITY DATE 20182018 2017-18
2016-2018
CHANNEL 4218R2X 70.1 3.0 44 44DYNA-GRO S41XS98 67.9 70.7 3.0 45 46HS 45X80 67.1 2.3 50 48USG 7447XTS 66.0 2.0 46 43ARMOR X44D36 65.9 2.3 40 42ARMOR 42-D27 65.5 63.5 2.7 39 40UNIVERSITY OF MISSOURI S13-2743C
65.3 60.0 2.7 46 42
ASGROW AG41X8 64.9 73.3 2.3 46 42PIONEER P44A72BX 64.6 2.0 42 45LG SEEDS LGS4597RX 64.4 2.3 46 45CZ 4222 LL 63.5 61.9 58.1 2.3 39 42GO SOY 43C17S 63.3 3.0 42 42STEWART 4039R2X 63.1 2.0 42 43UNIVERSITY OF MISSOURI S13-10592C
63.0 4.7 46 40
PIONEER P40A47X 62.9 67.9 1.7 42 42UNIVERSITY OF MISSOURI S13-3851C
62.7 69.5 3.7 34 43
REV® 4168X™ 62.7 2.3 42 40GO SOY E4510S 62.6 2.0 36 45ASGROW AG43X7 62.2 72.7 64.7 3.3 44 40CZ 4548 LL 61.6 3.0 42 45SEED CONSULTANTS SC 8439X™
61.5 2.0 42 45
PROGENY 4318 RX 61.1 3.7 45 45DYNA-GRO S44XS68 60.6 68.3 2.0 44 42HOEGEMEYER HPT 4511 NX 59.9 1.7 48 45WARREN SEED BG 4322 RR2X
59.6 2.0 43 45
STEWART 4228R2X 59.3 62.1 2.3 42 42AGRIGOLD G4440RX 59.0 61.2 2.3 46 45CZ 4308 LL 58.9 3.3 43 40CHANNEL 4517R2X 57.9 2.3 40 42DYNA-GRO S43XS27 57.8 69.0 62.5 2.3 42 45BRODBECK 446R2 57.7 67.4 61.8 4.0 48 42STEWART 4327R2X 57.5 70.5 65.4 2.0 44 45A4447NSXR2 56.7 2.3 44 42UNIVERSITY OF MISSOURI S13-10590C
56.7 64.2 2.7 42 40
PROGENY 4255 RX 56.5 61.3 2.0 41 45S42-B9XS 56.5 1.7 39 38ARMOR X41D47 56.4 3.0 42 40HOEGEMEYER HPT 4211 NX 56.3 3.7 46 42S45-Z5XS 56.1 2.0 38 42HOEGEMEYER HPT 4522 NR 55.8 62.7 2.0 42 42WARREN SEED BG 4210 RR2X
55.0 62.0 2.3 42 45
STINE 40BA02 53.6 2.0 40 45ARMOR X40D85 52.3 3.0 40 42ARMOR 45-D43 52.2 3.0 40 42AGRIGOLD G4190RX 51.6 2.3 39 42LG SEEDS C4227RX 44.0 55.2 2.7 45 42
GROUP IV EARLY AVERAGE 64.0 68.3 64.0 2.5 43 Oct. 13th LSD (0.10) 3.3 3.2 2.3C.V. 5.0 6.5 5.9
MATURITY GROUP IV LATE (relative MG 4.6-4.9)PROGENY 4757 RY 77.5 73.6 64.9 2.7 50 43UNIVERSITY OF MISSOURI S14-15146R
76.7 72.7 3.0 48 45
PIONEER P46A16R 76.1 77.1 2.7 47 42CHANNEL 4717R2X 74.5 2.7 48 45AGRIGOLD G4995RX 74.4 2.7 44 45LG SEEDS C4845RX 74.0 78.5 69.3 2.0 48 45ASGROW AG47X9 73.9 2.7 48 45HBK LL4953 73.8 76.5 2.7 47 43
continued

19
Fayette County (Lexington).
Month
Total Monthly Precipitation
(in.)
TemperaturesMonthly Average
(⁰F)
Highest recorded
(⁰F)
Lowest recorded
(⁰F)March 4.62 41.9 66.4 20.7April 4.48 49.7 78.1 26.0May 8.87 71.5 86.8 44.7June 4.67 74.5 90.2 56.6July 4.69 75.6 92.2 59.7
August 4.34 74.8 88.5 55.1September 10.85 71.8 89.9 50.2
October 5.39 58.0 85.5 30.3November
(11/29)4.19 40.7 65.0 19.3
Agronomic Information – Fayette County, Bluegrass region.GPS coordinates 38°07’22.9”N 84°29’23.5”WSoil type Lanton silty clay, dunning, eroded, occasionally
floodedSlopes 0%Previous crop cornSoil test pH 6.73, P 276, K 261SCN test 0Fertilizer/lime applied noneAgricultural practice no-tillPre-planting herbicides Sharpen, Mad Dog (Glyphosate) 04/20/2018; Mad
Dog, Dual II Magnum, Authority XL 05/02/2018Planting date 05/09/2018Post-planting herbicides: noneHarvest dates MG II and III: 11/05
MG IV Early: 11/21MG IV Late and V:11/29
50% frost killing 10/26
Table 8. 2018 Kentucky Soybean Variety Performance TestsFayette County - Bluegrass Region.
BRAND VARIETY
YIELD (BU/AC)A/B
LODGING2018
PLANT HEIGHT
(IN.) 2018MATURITY DATE 20182018 2017-18
2016-2018
PROGENY 4994 RX 73.1 2.7 42 45USG 7487XTS 72.9 72.9 2.3 57 45MISSION A4608X 72.9 4.3 52 45CAVERNDALE CF 478 RR2Y/STSn
71.9 74.1 66.4 3.0 52 55
CZ 4918 LL 71.1 3.0 41 45STEWART 4927R2X 70.5 71.8 64.5 3.0 42 45MISSION A4950X 70.4 3.0 45 55REV® 49L88™ 69.5 66.2 3.3 48 48CZ 4820 LL 68.6 68.4 2.7 47 45REV® 46L99™ 67.5 2.7 48 42ASGROW AG48X9 67.3 3.3 42 45ASGROW AG47X6 65.8 68.6 63.0 2.7 39 40DYNA-GRO S48XS78 65.3 73.2 2.3 48 48AGRIGOLD G4705RX 65.0 4.0 53 48REV® 4857X™ 64.8 71.1 2.3 49 48PROGENY 4816 RX 64.3 70.8 2.0 52 50UNIVERSITY OF MISSOURI S14-15138R
64.0 3.0 51 45
STINE 48BA23 63.8 3.3 44 40REV® 47L38™ 63.7 3.0 48 45HS 46X60 63.4 71.3 64.4 2.3 48 40CZ 4748 LL 63.3 67.2 63.8 2.0 46 45CZ 4938 LL 63.3 3.0 46 48ASGROW AG49X9 63.2 2.7 42 46DYNA-GRO S48XT56 62.9 68.0 61.9 2.3 50 55PIONEER P48A60X 62.7 2.7 45 42PROGENY 4799 RXS 62.7 70.0 3.3 43 40LG SEEDS LGS4624RX 62.6 3.7 53 45WARREN SEED BG 4922 RR2X
62.6 2.7 42 48
HOEGEMEYER HPT 4922 NRB
62.4 3.0 47 45
ARMOR X46D63 61.9 2.7 47 43WARREN SEED BG 4842 RR2X
61.5 2.7 56 45
A4637NSXR2 61.4 3.3 48 45HBK LL4950 61.3 2.7 54 55LG SEEDS C4710RX 60.6 67.9 3.0 50 48HS 49X60 60.1 70.3 62.9 2.7 44 48STEWART 4619R2X 60.1 3.3 48 43DYNA-GRO S46XS87 60.0 65.7 60.7 2.3 46 48STEWART 4939R2X 59.9 2.7 50 45ASGROW AG46X6 59.6 63.6 58.7 2.0 46 48ARMOR 47-D22 59.0 2.3 50 45GO SOY Ireane 58.4 61.0 55.4 3.3 40 55USG 7496XTS 58.1 68.8 62.8 2.7 54 58PROGENY 4620 RXS 57.9 66.8 3.7 50 45PROGENY 4955 RX 57.2 3.3 44 48AGS GS48X18 56.9 4.0 48 43
Table 8. 2018 Kentucky Soybean Variety Performance TestsFayette County - Bluegrass Region.
BRAND VARIETY
YIELD (BU/AC)A/B
LODGING2018
PLANT HEIGHT
(IN.) 2018MATURITY DATE 20182018 2017-18
2016-2018
REV® 4927X™ 56.4 68.6 3.3 51 42WARREN SEED BG 4911 RR2X
56.1 66.7 2.7 44 45
UNIVERSITY OF MISSOURI S14-9051R
55.7 3.7 42 45
HS 48X70 55.3 63.9 1.7 48 42USG 7489XT 54.6 2.3 46 48AGRIGOLD G4685RX 53.5 64.9 2.3 49 43GO SOY 49G16 53.1 53.0 48.3 4.0 46 45PROGENY 4851 RX 51.7 55.1 4.3 58 45PIONEER P46A57BX 51.5 2.0 46 40SEED CONSULTANTS SCS 9469BR™
50.7 2.0 55 45
LG SEEDS LGS4989RX 47.0 2.3 44 42PENNYRILE (long term check-released 1987)
46.2 52.7 49.9 3.0 54 42
PIONEER P47A76L 46.2 2.7 45 45REV® 4679X™ 44.8 3.3 42 42AGS GS46X17 40.6 3.0 48 40
GROUP IV LATE AVERAGE 62.3 68.2 61.1 2.9 48.0 Oct. 16LSD (0.10) 2.3 2.7 2.0C.V. 3.6 5.6 5.3
MATURITY GROUP V (relative MG 5.0-5.9)UNIVERSITY OF MISSOURI S14-9017R
56.6 63.0 2.3 47 60
ARMOR X51D77 55.3 3.3 50 60PROGENY 5016 RXS 53.4 66.0 3.3 52 55PROGENY 5018 RX 52.3 2.3 45 55PROGENY 5279 RXS 49.8 2.0 54 50ARMOR 49-D13 48.8 3.3 45 55UNIVERSITY OF MISSOURI S15-10434C
47.5 4.7 52 48
UNIVERSITY OF MISSOURI S11-20242C
46.6 5.0 36 55
PROGENY 5226 RYS 46.3 3.3 52 45PIONEER P50A85X 45.7 3.0 49 50PROGENY 5252 RX 42.7 3.0 44 60UNIVERSITY OF MISSOURI MO5201D CONV
41.2 4.7 50 48
ESSEX (long term check-released 1974)
35.2 48.4 46.0 4.3 34 45
UNIVERSITY OF MISSOURI S13-1955C
31.0 46.8 4.7 36 58
GROUP V AVERAGE 46.6 56.0 3.5 46 Oct. 23rdLSD (0.10) 2.4 2.8C.V. 4.9 7.4A Within a maturity group, shaded yield are not significantly different (0.10) from the highest yield-
ing cultivar (bold) of that maturity group and year column.B 2018, 2017, and 2016 data were collected in Fayette Co.

20
continued
Table 9. 2018 Kentucky Soybean Variety Performance TestsHenderson County - Green River Region.
BRAND VARIETYYIELD (BU/AC)A/B LODGING
20182018 2017-18 2016-2018MATURITY GROUP II (relative MG 2.0-2.9)AGRIGOLD G2900RX 30.4 4.0ARMOR 29-D11 28.0 4.0ASGROW AG29X8 25.5 61.1 4.0ASGROW AG28X9 21.3 4.0
GROUP II AVERAGE 26.3 61.1 4.0LSD (0.10) 2.0 2.7C.V. 6.3 8.3
MATURITY GROUP III (relative MG 3.0-3.9)SEED CONSULTANTS SCS 9385RR™ 56.4 72.6 67.9 2.3BRODBECK 388R2 50.9 62.8 3.0ASGROW AG38X8 47.0 76.6 2.3ASGROW AG39X7 45.7 63.2 61.3 2.7ASGROW AG37X9 45.4 3.0PIONEER P36T36X 43.9 2.0CZ 3601 LL 43.4 2.7SEED CONSULTANTS SCS 9393RR™ 43.4 68.7 64.6 1.7SEED CONSULTANTS SC 8399X™ 41.7 2.3CAVERNDALE CF 364 STSn 41.1 2.7CHANNEL 3718R2X 41.0 2.7DYNA-GRO S39XT68 40.6 62.3 3.3WARREN SEED BG 3821 RR2X 39.6 3.3ARMOR 35-D20 37.4 2.7CAVERNDALE CF 387 HT-GLYn 36.8 57.8 59.1 3.0BRODBECK 368R2 36.6 62.0 2.3ARMOR 39-D39 35.8 60.7 2.7CZ 3841 LL 33.5 57.4 57.4 3.3DYNA-GRO S39XT08 32.8 55.0 3.7S35-K9X 31.2 4.0PIONEER P37A78X 31.1 4.0AGRIGOLD G3722RX 30.1 3.0ASGROW AG36X6 27.9 1.7ARMOR X35D92 27.0 3.3AGRIGOLD G3520RX 26.4 59.9 2.3ARMOR X30D53 24.9 3.7SEED CONSULTANTS SC 8379X™ 17.4 2.0
GROUP III AVERAGE 37.4 63.3 62.1 2.8LSD (0.10) 2.4 4.6 3.3C.V. 6.1 11.8 10.2
MATURITY GROUP IV EARLY (relative MG 4.0-4.5)CHANNEL 4517R2X 60.1 1.7AGRIGOLD G4579RX 58.3 1.3STEWART 4228R2X 57.6 73.6 1.7WARREN SEED BG 4510 RR2X 56.7 69.8 2.3UNIVERSITY OF MISSOURI S13-2743C 55.8 62.8 2.7PIONEER P42A96X 55.3 1.0STEWART 4527R2X 54.5 66.2 63.9 2.7CZ 4548 LL 54.3 4.3USG 7447XTS 54.1 3.0HS 45X80 54.0 1.0PIONEER P44A08L 53.6 2.0STEWART 4339R2X 53.5 2.3DYNA-GRO S44XS68 53.1 60.3 2.3PROGENY 4318 RX 52.9 3.7ARMOR X41D47 52.0 3.7CHANNEL 4218R2X 51.9 2.3PIONEER P44A72BX 50.1 1.3ASGROW AG43X7 49.5 59.3 57.6 2.7CZ 4308 LL 49.5 4.7S45-Z5XS 49.3 1.0ARMOR 42-D27 48.6 67.4 2.7ASGROW AG42X9 47.8 3.3
Table 9. 2018 Kentucky Soybean Variety Performance TestsHenderson County - Green River Region.
BRAND VARIETYYIELD (BU/AC)A/B LODGING
20182018 2017-18 2016-2018REV® 4168X™ 47.5 2.3PROGENY 4570 RXS 47.0 1.7STEWART 4327R2X 46.7 66.0 63.1 4.7ASGROW AG44X6 46.6 59.4 59.9 3.3STEWART 4438R2X 46.5 67.1 1.7PIONEER P40A47X 46.5 74.5 1.7HOEGEMEYER HPT 4511 NX 46.2 3.0ARMOR 45-D50 46.1 2.7BRODBECK 446R2 45.9 59.6 57.1 3.3A4447NSXR2 45.6 3.3PROGENY 4444 RXS 45.5 64.0 2.7ARMOR 45-D43 45.0 1.7CAVERNDALE CF 427 HT-GLY/STSn 44.8 67.6 1.3LG SEEDS LGS4597RX 44.3 1.3UNIVERSITY OF MISSOURI S13-3851C 44.1 63.1 3.7UNIVERSITY OF MISSOURI S13-10590C 44.1 59.0 1.0AGRIGOLD G4380RX 43.9 60.2 2.7HOEGEMEYER HPT 4211 NX 43.4 4.3DYNA-GRO S43XS27 43.3 64.2 60.8 4.7SEED CONSULTANTS SC 8439X™ 43.1 2.0DYNA-GRO S4209N 42.4 1.0S42-B9XS 42.4 1.3ASGROW AG41X8 42.4 59.8 2.7STINE 40BA02 42.4 2.0UNIVERSITY OF MISSOURI S13-10592C 42.2 3.0HOEGEMEYER HPT 4522 NR 41.7 69.9 1.7CZ 4105 LL 41.6 63.2 61.8 1.7DYNA-GRO S41XS98 40.9 61.8 2.7AGRIGOLD G4440RX 39.8 55.7 3.3STEWART 4039R2X 39.5 1.7WARREN SEED BG 4322 RR2X 38.3 4.7PROGENY 4255 RX 37.6 60.8 4.0ARMOR X44D36 37.5 2.3GO SOY E4510S 35.9 1.3CZ 4222 LL 34.8 59.8 57.6 2.3AGRIGOLD G4190RX 34.7 2.0WARREN SEED BG 4210 RR2X 32.6 56.0 2.3GO SOY 43C17S 29.8 1.3LG SEEDS C4227RX 27.3 52.3 1.0ARMOR X40D85 25.5 4.0
GROUP IV EARLY AVERAGE 45.6 63.1 60.2 2.5LSD (0.10) 3.9 4.4 3.1C.V. 8.1 10.5 9.2
MATURITY GROUP IV LATE (relative MG 4.6-4.9)ARMOR 47-D22 73.0 4.3ASGROW AG46X6 66.2 69.8 65.7 2.7PROGENY 4757 RY 66.2 71.8 64.5 4.3PROGENY 4620 RXS 65.2 68.0 3.3DYNA-GRO S46XS87 65.1 68.6 63.5 2.0GO SOY Ireane 65.1 63.4 60.4 2.0STINE 48BA23 64.4 3.3PIONEER P46A16R 63.5 69.7 1.3PROGENY 4816 RX 63.0 70.3 3.0REV® 49L88™ 62.9 64.2 3.3CAVERNDALE CF 478 RR2Y/STSn 62.3 65.2 59.1 2.7PROGENY 4851 RX 62.2 65.0 3.3HOEGEMEYER HPT 4922 NRB 62.0 3.3WARREN SEED BG 4922 RR2X 62.0 1.0ASGROW AG48X9 61.5 3.3HBK LL4953 60.5 69.2 2.7CHANNEL 4717R2X 59.8 1.0CZ 4748 LL 59.4 66.7 61.2 3.7DYNA-GRO S48XT56 59.3 74.7 69.5 1.7AGS GS48X18 58.4 2.0

21
Table 9. 2018 Kentucky Soybean Variety Performance TestsHenderson County - Green River Region.
BRAND VARIETYYIELD (BU/AC)A/B LODGING
20182018 2017-18 2016-2018USG 7489XT 58.4 1.3STEWART 4619R2X 58.2 3.0ASGROW AG47X6 58.2 67.9 62.7 2.0AGRIGOLD G4685RX 57.9 66.7 2.0WARREN SEED BG 4842 RR2X 57.9 1.3PIONEER P48A60X 57.7 1.3PIONEER P47A76L 57.6 2.7CZ 4918 LL 57.5 3.7UNIVERSITY OF MISSOURI S14-15138R 57.5 2.3LG SEEDS C4710RX 57.4 65.7 3.3ARMOR X46D63 57.0 2.0DYNA-GRO S48XS78 56.4 66.7 2.3PROGENY 4799 RXS 56.2 66.9 2.3ASGROW AG49X9 56.2 3.7MISSION A4608X 56.0 2.3LG SEEDS LGS4624RX 56.0 3.0REV® 4679X™ 56.0 2.7STEWART 4927R2X 55.7 68.6 62.4 1.3AGRIGOLD G4995RX 55.6 4.0MISSION A4950X 55.3 3.3USG 7487XTS 55.1 65.8 2.0REV® 47L38™ 55.0 3.0PIONEER P46A57BX 54.9 3.7ASGROW AG47X9 54.9 2.7HS 48X70 54.3 66.1 1.0REV® 4927X™ 53.8 57.3 4.3AGS GS46X17 53.7 2.3PROGENY 4994 RX 53.7 4.3CZ 4820 LL 53.5 65.9 2.7PROGENY 4955 RX 53.5 1.7SEED CONSULTANTS SCS 9469BR™ 53.3 1.7UNIVERSITY OF MISSOURI S14-9051R 53.3 3.3CZ 4938 LL 52.8 3.3HS 46X60 52.7 65.7 58.8 2.3USG 7496XTS 52.6 64.1 61.1 1.7AGRIGOLD G4705RX 52.5 3.7HBK LL4950 52.5 3.0STEWART 4939R2X 52.4 2.0
Table 9. 2018 Kentucky Soybean Variety Performance TestsHenderson County - Green River Region.
BRAND VARIETYYIELD (BU/AC)A/B LODGING
20182018 2017-18 2016-2018LG SEEDS C4845RX 51.4 70.5 65.7 2.0REV® 4857X™ 49.7 63.8 3.3GO SOY 49G16 49.1 50.4 49.0 5.0REV® 46L99™ 48.3 1.7UNIVERSITY OF MISSOURI S14-15146R 48.2 54.9 1.7LG SEEDS LGS4989RX 47.2 2.3A4637NSXR2 45.6 5.0WARREN SEED BG 4911 RR2X 44.2 62.8 3.7HS 49X60 44.0 69.1 64.0 1.3PENNYRILE (long term check-released 1987)
36.6 47.0 43.1 4.0
GROUP IV LATE AVERAGE 56.3 65.4 60.7 2.7LSD (0.10) 3.5 3.0 2.3C.V. 6.0 6.6 6.3
MATURITY GROUP V (relative MG 5.0-5.9)PROGENY 5016 RXS 65.8 70.0 2.7UNIVERSITY OF MISSOURI S14-9017R 65.1 72.4 2.0PIONEER P50A85X 64.8 3.3UNIVERSITY OF MISSOURI MO5201D CONV
60.2 2.7
PROGENY 5018 RX 59.4 4.0ARMOR 49-D13 57.5 3.7ARMOR X51D77 56.8 3.3PROGENY 5252 RX 54.5 4.0PROGENY 5226 RYS 54.2 1.7UNIVERSITY OF MISSOURI S11-20242C 50.1 5.0PROGENY 5279 RXS 49.8 3.7UNIVERSITY OF MISSOURI S13-1955C 44.3 49.1 5.0UNIVERSITY OF MISSOURI S15-10434C 42.5 3.7ESSEX (long term check-released 1974) 42.4 49.7 3.0
GROUP V AVERAGE 54.8 60.3 3.4LSD (0.10) 3.6 2.4C.V. 6.2 5.7A Within a maturity group, shaded yield are not significantly different (0.10) from the highest yield-
ing cultivar (bold) of that maturity group and year column.B Data were collected in Henderson Co. in 2018, and in Hancock Co. in 2017 and 2016.
Agronomic Information – Henderson County, Green River Region.GPS coordinates 37°47’44.7”N
87°29’36.3”WSoil type Hensthraw silt loamSlopes 0%Previous crop Corn Soil test pH 7.04, P 27, K 113SCN test 938Fertilizer/lime applied NAAgricultural practice vertical tillage to smooth the field surfacePre-planting herbicides NAPlanting date 05/25/2018Post-planting herbicides Reflex, FirstRate, Intensity One: 06/14/2018Harvest dates MG II, III, and IV Early: 10/25
MG IV Late and V: 10/3050% frost killing 10/20
Henderson County (Henderson).
Month
Total Monthly Precipitation
(in.)
TemperaturesMonthly Average
(⁰F)
Highest recorded
(⁰F)
Lowest recorded
(⁰F)March 3.82 43.8 65.7 22.5April 3.56 50.0 79.8 26.7May 9.21 73.4 92.7 44.1June 6.83 77.2 92.6 58.2July 3.99 75.9 93.1 55.0
August 1.35 75.3 95.6 50.0September 7.26 73.4 96.8 46.7
October (10/30)
1.10 58.4 91.4 25.5

22
continued
Table 10. 2018 Kentucky Soybean Variety Performance TestsLogan County - Mammoth Cave Region.
BRAND VARIETYYIELD (BU/AC)A/B LODGING
20182018 2017-18 2016-2018MATURITY GROUP II (relative MG 2.0-2.9)ARMOR 29-D11 58.1 1.7AGRIGOLD G2900RX 55.4 1.3ASGROW AG28X9 54.8 1.0ASGROW AG29X8 51.0 56.1 1.0
GROUP II AVERAGE 54.9 1.3LSD (0.10) 3.0C.V. 4.6
MATURITY GROUP III (relative MG 3.0-3.9)SEED CONSULTANTS SCS 9385RR™ 73.3 74.7 72.5 1.7PIONEER P37A78X 72.0 3.3SEED CONSULTANTS SC 8399X™ 70.9 1.0CZ 3841 LL 70.2 58.5 59.3 3.0DYNA-GRO S39XT68 69.8 65.9 2.3CZ 3601 LL 69.3 2.0WARREN SEED BG 3821 RR2X 69.3 2.7S35-K9X 68.4 2.7ARMOR 35-D20 67.5 2.7ASGROW AG38X8 67.0 63.4 2.0ASGROW AG37X9 66.2 2.7PIONEER P36T36X 65.7 1.7CAVERNDALE CF 387 HT-GLYn 64.0 62.0 62.9 2.3AGRIGOLD G3520RX 63.5 52.2 2.0ASGROW AG39X7 62.7 58.6 60.5 2.3ARMOR X35D92 62.6 3.7BRODBECK 368R2 61.6 62.4 1.3BRODBECK 388R2 60.5 61.2 1.7SEED CONSULTANTS SC 8379X™ 60.3 1.7AGRIGOLD G3722RX 60.3 1.3ARMOR 39-D39 59.2 59.7 1.3SEED CONSULTANTS SCS 9393RR™ 57.3 65.5 64.4 1.0DYNA-GRO S39XT08 57.2 60.7 2.3ASGROW AG36X6 56.1 1.7CHANNEL 3718R2X 55.7 1.3CAVERNDALE CF 364 STSn 51.0 2.0ARMOR X30D53 49.6 3.3
GROUP III AVERAGE 63.4 62.1 63.9 2.1LSD (0.10) 3.1 2.6 2.1C.V. 4.6 5.6 5.4
MATURITY GROUP IV EARLY (relative MG 4.0-4.5)ARMOR 42-D27 77.9 74.3 1.3STEWART 4339R2X 77.7 1.0PIONEER P40A47X 75.9 70.9 1.0PIONEER P42A96X 73.9 1.0HOEGEMEYER HPT 4211 NX 72.9 1.7AGRIGOLD G4380RX 69.7 73.9 1.7STEWART 4527R2X 69.3 73.7 72.0 2.0A4447NSXR2 68.7 1.7STEWART 4039R2X 67.6 1.0ASGROW AG41X8 67.4 68.5 2.3STEWART 4438R2X 67.2 75.5 1.0AGRIGOLD G4190RX 67.1 1.3ARMOR 45-D50 66.9 2.3DYNA-GRO S4209N 66.6 1.0USG 7447XTS 66.0 1.0STEWART 4327R2X 65.9 72.5 68.3 2.3BRODBECK 446R2 65.3 64.9 65.0 3.0PIONEER P44A72BX 64.9 2.7AGRIGOLD G4440RX 64.4 69.6 1.0ARMOR X40D85 64.1 2.7WARREN SEED BG 4510 RR2X 63.9 64.1 3.0UNIVERSITY OF MISSOURI S13-10592C 63.8 2.7
Table 10. 2018 Kentucky Soybean Variety Performance TestsLogan County - Mammoth Cave Region.
BRAND VARIETYYIELD (BU/AC)A/B LODGING
20182018 2017-18 2016-2018HOEGEMEYER HPT 4511 NX 62.5 2.0CZ 4222 LL 61.7 63.0 60.5 3.3ARMOR X41D47 61.5 4.7STEWART 4228R2X 61.5 70.5 1.3CZ 4548 LL 61.4 2.0UNIVERSITY OF MISSOURI S13-2743C 61.4 62.4 3.3DYNA-GRO S43XS27 60.4 71.5 68.0 1.3GO SOY E4510S 59.9 1.3S42-B9XS 59.8 1.7DYNA-GRO S41XS98 59.7 62.2 1.7LG SEEDS LGS4597RX 59.6 1.3GO SOY 43C17S 59.5 1.7S45-Z5XS 59.2 1.7CZ 4105 LL 59.2 66.8 66.9 1.7ASGROW AG42X9 58.8 3.0UNIVERSITY OF MISSOURI S13-3851C 58.8 61.8 2.3PROGENY 4570 RXS 58.2 1.3PROGENY 4318 RX 57.6 4.0WARREN SEED BG 4210 RR2X 56.6 68.4 1.3LG SEEDS C4227RX 56.5 65.4 1.3ASGROW AG43X7 56.5 67.8 66.6 2.0PROGENY 4444 RXS 55.5 54.0 2.3ASGROW AG44X6 55.3 59.0 61.5 2.0HS 45X80 55.1 1.7ARMOR 45-D43 55.0 3.3AGRIGOLD G4579RX 54.8 1.3CZ 4308 LL 54.8 1.0CHANNEL 4517R2X 54.5 1.3STINE 40BA02 53.8 1.0SEED CONSULTANTS SC 8439X™ 53.7 1.0PIONEER P44A08L 53.4 1.7CHANNEL 4218R2X 53.4 2.0HOEGEMEYER HPT 4522 NR 52.3 64.0 1.0PROGENY 4255 RX 52.3 54.1 1.7UNIVERSITY OF MISSOURI S13-10590C 52.2 58.7 1.3REV® 4168X™ 51.7 1.0CAVERNDALE CF 427 HT-GLY/STSn 50.4 53.9 2.0WARREN SEED BG 4322 RR2X 44.5 1.7DYNA-GRO S44XS68 42.3 53.3 1.3ARMOR X44D36 40.0 1.0
GROUP IV EARLY AVERAGE 60.4 65.4 66.1 1.8LSD (0.10) 3.3 2.6 2.0C.V. 5.2 5.5 5.2
MATURITY GROUP IV LATE (relative MG 4.6-4.9)UNIVERSITY OF MISSOURI S14-15146R 71.9 66.0 1.0ASGROW AG48X9 69.9 1.3STEWART 4619R2X 69.7 1.7PROGENY 4816 RX 69.0 68.8 1.0PIONEER P48A60X 68.0 1.0WARREN SEED BG 4911 RR2X 67.6 68.8 1.3AGRIGOLD G4685RX 67.3 73.1 1.7HS 49X60 65.8 65.8 66.9 1.0GO SOY 49G16 65.3 61.7 57.9 3.0PROGENY 4757 RY 64.5 68.7 67.2 1.7CAVERNDALE CF 478 RR2Y/STSn 64.1 63.2 62.2 1.7HOEGEMEYER HPT 4922 NRB 63.8 2.0STINE 48BA23 63.7 1.7REV® 4927X™ 63.4 63.5 3.0MISSION A4608X 62.2 2.0ASGROW AG47X6 62.2 64.5 64.1 2.0ASGROW AG49X9 61.9 2.0CZ 4918 LL 60.9 1.7ARMOR 47-D22 60.3 3.0PIONEER P47A76L 60.1 2.0

23
Table 10. 2018 Kentucky Soybean Variety Performance TestsLogan County - Mammoth Cave Region.
BRAND VARIETYYIELD (BU/AC)A/B LODGING
20182018 2017-18 2016-2018UNIVERSITY OF MISSOURI S14-15138R 59.9 1.0USG 7489XT 59.3 1.0USG 7487XTS 59.0 62.5 1.0HS 46X60 58.8 66.4 67.2 1.0USG 7496XTS 58.8 74.4 73.1 1.0UNIVERSITY OF MISSOURI S14-9051R 58.3 2.0AGS GS48X18 57.8 1.0CHANNEL 4717R2X 57.7 2.0REV® 47L38™ 56.9 1.3WARREN SEED BG 4842 RR2X 56.9 1.0ASGROW AG46X6 56.6 64.3 63.3 1.0PIONEER P46A57BX 56.2 1.0ASGROW AG47X9 56.1 1.0STEWART 4939R2X 56.1 1.3CZ 4820 LL 56.1 65.4 1.7DYNA-GRO S46XS87 56.0 67.6 67.2 1.3DYNA-GRO S48XS78 56.0 69.8 1.3SEED CONSULTANTS SCS 9469BR™ 55.7 1.0WARREN SEED BG 4922 RR2X 55.6 1.0LG SEEDS LGS4989RX 55.1 1.0PIONEER P46A16R 54.9 64.6 1.3AGS GS46X17 54.0 1.0MISSION A4950X 53.6 1.0PROGENY 4620 RXS 53.5 62.1 2.0STEWART 4927R2X 53.3 64.7 62.1 1.3PROGENY 4799 RXS 52.9 63.0 1.0REV® 4857X™ 52.9 55.5 2.7AGRIGOLD G4995RX 52.9 1.0A4637NSXR2 52.8 2.0CZ 4748 LL 52.3 59.9 61.8 1.0PROGENY 4955 RX 52.3 2.3PROGENY 4994 RX 52.3 1.7LG SEEDS C4845RX 52.2 58.5 59.4 1.0REV® 49L88™ 51.9 65.4 1.3LG SEEDS C4710RX 51.3 65.3 1.7HS 48X70 50.8 70.1 1.3HBK LL4953 50.4 67.1 1.0PROGENY 4851 RX 50.0 57.9 3.3
Table 10. 2018 Kentucky Soybean Variety Performance TestsLogan County - Mammoth Cave Region.
BRAND VARIETYYIELD (BU/AC)A/B LODGING
20182018 2017-18 2016-2018GO SOY Ireane 49.3 58.0 60.1 1.0CZ 4938 LL 48.8 2.3REV® 4679X™ 48.3 1.7PENNYRILE (long term check-released 1987) 47.7 50.1 52.1 1.7REV® 46L99™ 46.9 1.3AGRIGOLD G4705RX 46.6 2.0ARMOR X46D63 45.3 1.0LG SEEDS LGS4624RX 43.4 1.3DYNA-GRO S48XT56 42.2 57.0 59.6 1.0HBK LL4950 41.7 1.3
GROUP IV LATE AVERAGE 56.6 64.2 62.9 1.5LSD (0.10) 3.1 2.7 2.1C.V. 5.2 5.9 5.6
MATURITY GROUP V (relative MG 5.0-5.9)UNIVERSITY OF MISSOURI S14-9017R 71.1 75.9 1.0UNIVERSITY OF MISSOURI MO5201D CONV 62.7 2.0ARMOR X51D77 62.4 2.0ARMOR 49-D13 62.1 3.0PROGENY 5016 RXS 59.5 71.0 1.7PROGENY 5252 RX 57.4 1.7ESSEX (long term check-released 1974) 54.9 58.7 1.3PIONEER P50A85X 54.2 1.3UNIVERSITY OF MISSOURI S13-1955C 52.9 61.6 2.3PROGENY 5279 RXS 52.6 1.3UNIVERSITY OF MISSOURI S15-10434C 51.8 2.7PROGENY 5018 RX 47.0 2.3UNIVERSITY OF MISSOURI S11-20242C 35.7 2.3PROGENY 5226 RYS 35.7 1.3
GROUP V AVERAGE 54.3 66.8 1.9LSD (0.10) 2.2 2.3C.V. 3.7 5.2A Within a maturity group, shaded yield are not significantly different (0.10) from the highest yield-
ing cultivar (bold) of that maturity group and year column.B Data data were collected in Logan Co. in 2018, and in Butler Co. in 2017 and 2016.
Agronomic Information – Logan County, Mammoth Cave Region.GPS coordinates 36°77’47.3”N
86°52’41.5”WSoil type Pembroke silt loamSlopes 0%Previous crop double-crop soybeanSoil test pH 7.19, P 94, K 374SCN test 4,500Fertilizer/lime applied NAAgricultural practice no-tillPre-planting herbicides 2,4-D, ValorPlanting date 06/04/2018Post-planting herbicides Reflex, FirstRate, Intensity One: 06/14/2018Harvest dates MG II and III: 10/23
MG IV Early and Late and V: 10/2450% frost killing 10/22
Logan County (Russellville).
Month
Total Monthly Precipitation
(in.)
TemperaturesMonthly Average
(⁰F)
Highest recorded
(⁰F)
Lowest recorded
(⁰F)March 5.50 46.1 76.3 21.2April 3.79 51.7 81.8 26.1May 5.74 73.1 89.6 48.3June 6.08 76.8 92.6 55.9July 2.83 77.6 93.9 59.3
August 5.86 76.9 92.9 54.5September 5.41 73.3 93.4 48.4
October (10/24)
4.51 61.9 88.6 28.7

24
continued
Table 11. 2018 Kentucky Soybean Variety Performance TestsMeade County - Lincoln Trail Region.
BRAND VARIETYYIELD (BU/AC)A/B LODGING
20182018 2017-18 2016-2018MATURITY GROUP II (relative MG 2.0-2.9)ASGROW AG29X8 53.2 59.6 3.7ASGROW AG28X9 46.7 4.3AGRIGOLD G2900RX 42.0 4.0ARMOR 29-D11 31.6 4.7
GROUP II AVERAGE 43.4 4.2LSD (0.10) 2.7C.V. 5.2
MATURITY GROUP III (relative MG 3.0-3.9)AGRIGOLD G3722RX 64.6 5.0SEED CONSULTANTS SC 8379X™ 60.9 4.7ARMOR 35-D20 58.2 4.0AGRIGOLD G3520RX 57.8 60.0 3.0ARMOR 39-D39 57.3 56.7 4.3SEED CONSULTANTS SC 8399X™ 56.4 4.0SEED CONSULTANTS SCS 9393RR™ 54.4 65.8 60.7 3.3ASGROW AG39X7 53.6 63.2 57.0 4.0SEED CONSULTANTS SCS 9385RR™ 47.3 59.3 57.2 2.7ASGROW AG38X8 47.0 57.9 4.0ASGROW AG37X9 46.2 4.7DYNA-GRO S39XT68 46.0 61.3 4.0S35-K9X 45.6 4.7PIONEER P36T36X 45.3 4.3CAVERNDALE CF 387 HT-GLYn 42.1 54.3 55.4 3.7CZ 3601 LL 39.2 4.7DYNA-GRO S39XT08 37.6 53.8 4.7BRODBECK 368R2 37.2 45.6 4.0BRODBECK 388R2 36.9 48.2 4.3ARMOR X35D92 36.3 5.0ASGROW AG36X6 35.8 4.7CHANNEL 3718R2X 34.7 4.7WARREN SEED BG 3821 RR2X 33.2 4.7ARMOR X30D53 33.1 4.7PIONEER P37A78X 31.9 5.0CZ 3841 LL 27.1 46.2 48.3 4.7CAVERNDALE CF 364 STSn 24.8 4.7
GROUP III AVERAGE 44.1 56.0 55.7 4.3LSD (0.10) 3.3 3.7 2.7C.V. 7.0 9.7 8.7
MATURITY GROUP IV EARLY (relative MG 4.0-4.5)DYNA-GRO S44XS68 78.8 75.5 3.0REV® 4168X™ 74.2 3.7AGRIGOLD G4380RX 73.2 72.7 2.3ASGROW AG41X8 73.0 76.3 3.3DYNA-GRO S41XS98 72.9 70.1 3.7STEWART 4339R2X 72.3 3.3WARREN SEED BG 4510 RR2X 70.6 73.6 3.3HS 45X80 70.0 3.7BRODBECK 446R2 69.4 72.5 65.2 4.3PIONEER P42A96X 68.6 2.3STEWART 4438R2X 67.9 71.4 4.0AGRIGOLD G4579RX 67.5 2.7PIONEER P44A08L 67.4 3.3LG SEEDS C4227RX 67.0 66.5 3.7S45-Z5XS 66.6 2.3PIONEER P44A72BX 66.4 2.7PROGENY 4444 RXS 65.9 70.5 4.7STEWART 4039R2X 65.9 3.3CAVERNDALE CF 427 HT-GLY/STSn 65.7 71.7 3.0SEED CONSULTANTS SC 8439X™ 65.0 4.0PROGENY 4570 RXS 64.9 4.3ARMOR 45-D50 64.7 3.0
Table 11. 2018 Kentucky Soybean Variety Performance TestsMeade County - Lincoln Trail Region.
BRAND VARIETYYIELD (BU/AC)A/B LODGING
20182018 2017-18 2016-2018A4447NSXR2 64.7 3.7S42-B9XS 64.6 3.0PIONEER P40A47X 64.3 68.3 2.7CZ 4548 LL 64.1 4.0HOEGEMEYER HPT 4511 NX 64.0 4.3HOEGEMEYER HPT 4522 NR 64.0 74.4 3.3ARMOR X41D47 63.7 4.0ARMOR 42-D27 63.6 64.3 3.3AGRIGOLD G4190RX 63.2 3.3STEWART 4228R2X 63.2 72.3 2.7ASGROW AG44X6 63.0 67.1 66.5 3.7UNIVERSITY OF MISSOURI S13-10590C 62.1 60.3 4.7STEWART 4527R2X 62.0 67.4 60.3 3.0LG SEEDS LGS4597RX 60.8 2.3USG 7447XTS 60.3 3.7ARMOR 45-D43 59.8 4.0UNIVERSITY OF MISSOURI S13-2743C 59.2 68.7 4.3CHANNEL 4517R2X 58.7 3.7GO SOY 43C17S 58.6 2.7UNIVERSITY OF MISSOURI S13-10592C 58.0 4.3GO SOY E4510S 56.7 3.7STINE 40BA02 56.3 3.7ARMOR X40D85 55.7 3.7ASGROW AG42X9 54.8 4.0CZ 4308 LL 54.7 4.0ASGROW AG43X7 54.6 68.3 63.1 4.7CZ 4222 LL 53.8 60.0 55.2 3.0WARREN SEED BG 4210 RR2X 53.8 61.6 4.0WARREN SEED BG 4322 RR2X 52.9 4.3CZ 4105 LL 52.5 65.0 57.7 4.0AGRIGOLD G4440RX 52.4 61.5 3.0DYNA-GRO S43XS27 51.3 60.1 60.6 3.7DYNA-GRO S4209N 51.1 4.3PROGENY 4318 RX 50.5 4.7PROGENY 4255 RX 50.0 56.9 4.3ARMOR X44D36 49.3 4.0STEWART 4327R2X 47.7 58.2 57.8 3.3UNIVERSITY OF MISSOURI S13-3851C 45.6 59.4 3.7CHANNEL 4218R2X 44.7 3.7HOEGEMEYER HPT 4211 NX 36.1 4.7
GROUP IV EARLY AVERAGE 61.0 67.2 60.8 3.6LSD (0.10) 3.5 4.1 3.0C.V. 5.4 8.7 7.8
MATURITY GROUP IV LATE (relative MG 4.6-4.9)PROGENY 4994 RX 79.0 3.7REV® 49L88™ 76.8 64.5 3.3ASGROW AG47X9 72.9 4.0SEED CONSULTANTS SCS 9469BR™ 71.8 3.3PIONEER P46A57BX 68.7 4.3AGRIGOLD G4995RX 67.7 4.0MISSION A4950X 67.7 4.0HOEGEMEYER HPT 4922 NRB 66.7 3.3HS 49X60 66.5 63.1 62.3 1.7PROGENY 4816 RX 66.3 60.2 2.7LG SEEDS LGS4989RX 65.9 2.7ASGROW AG47X6 65.1 69.5 63.2 3.7PROGENY 4757 RY 64.9 64.9 58.9 4.0CZ 4918 LL 63.8 3.7PROGENY 4799 RXS 63.7 65.3 3.7PIONEER P47A76L 63.2 3.7PIONEER P46A16R 62.9 66.6 4.0LG SEEDS C4845RX 62.4 61.6 59.3 2.0PIONEER P48A60X 62.3 3.0LG SEEDS LGS4624RX 62.2 4.7

25
Table 11. 2018 Kentucky Soybean Variety Performance TestsMeade County - Lincoln Trail Region.
BRAND VARIETYYIELD (BU/AC)A/B LODGING
20182018 2017-18 2016-2018REV® 4679X™ 61.9 4.3ASGROW AG48X9 61.4 2.7REV® 47L38™ 61.2 3.3USG 7487XTS 60.9 62.1 2.3UNIVERSITY OF MISSOURI S14-15138R 60.6 4.0CZ 4820 LL 60.5 65.7 2.7DYNA-GRO S48XS78 60.4 62.7 3.0DYNA-GRO S48XT56 59.9 63.1 59.8 2.3ASGROW AG49X9 58.9 4.0PROGENY 4620 RXS 58.7 59.6 4.7WARREN SEED BG 4922 RR2X 58.4 2.0STEWART 4927R2X 58.3 63.3 59.0 3.3STEWART 4619R2X 58.2 3.3UNIVERSITY OF MISSOURI S14-9051R 58.2 3.3HS 46X60 58.2 70.8 63.4 3.7WARREN SEED BG 4911 RR2X 58.1 54.4 3.7CZ 4748 LL 57.7 65.6 62.2 2.7ASGROW AG46X6 57.5 54.5 57.8 3.3PROGENY 4955 RX 57.5 4.3USG 7496XTS 57.3 59.7 60.8 3.7CAVERNDALE CF 478 RR2Y/STSn 57.1 59.6 57.5 2.3USG 7489XT 57.1 2.3ARMOR 47-D22 56.8 4.3AGS GS46X17 56.6 2.3AGRIGOLD G4685RX 56.3 63.1 2.7LG SEEDS C4710RX 56.3 52.5 4.0MISSION A4608X 56.3 4.3REV® 46L99™ 56.3 3.7GO SOY Ireane 55.4 59.1 60.5 4.3ARMOR X46D63 54.7 4.0HS 48X70 54.6 53.7 3.3STEWART 4939R2X 54.5 4.0WARREN SEED BG 4842 RR2X 54.4 3.7AGRIGOLD G4705RX 54.3 4.0HBK LL4953 53.5 61.9 2.7DYNA-GRO S46XS87 53.3 50.8 53.3 2.3AGS GS48X18 52.4 4.3
Table 11. 2018 Kentucky Soybean Variety Performance TestsMeade County - Lincoln Trail Region.
BRAND VARIETYYIELD (BU/AC)A/B LODGING
20182018 2017-18 2016-2018CHANNEL 4717R2X 52.3 2.7CZ 4938 LL 51.8 2.7UNIVERSITY OF MISSOURI S14-15146R 51.4 60.1 2.7A4637NSXR2 50.7 4.3STINE 48BA23 49.9 3.7HBK LL4950 47.3 4.0REV® 4927X™ 46.8 56.3 5.0PENNYRILE (long term check-released 1987) 44.7 45.9 47.3 4.0REV® 4857X™ 44.5 56.4 4.7PROGENY 4851 RX 43.9 55.6 5.0GO SOY 49G16 37.6 43.0 44.1 5.0
GROUP IV LATE AVERAGE 58.6 59.8 58.0 3.5LSD (0.10) 3.6 2.8 2.3C.V. 5.8 6.4 6.5
MATURITY GROUP V (relative MG 5.0-5.9)ARMOR 49-D13 57.2 3.7PROGENY 5016 RXS 53.4 58.0 3.7PROGENY 5018 RX 52.7 4.0UNIVERSITY OF MISSOURI S14-9017R 49.7 57.6 3.0PIONEER P50A85X 49.7 3.7PROGENY 5279 RXS 48.6 2.3PROGENY 5226 RYS 42.4 3.7PROGENY 5252 RX 41.2 3.7ARMOR X51D77 40.1 4.0UNIVERSITY OF MISSOURI MO5201D CONV 40.1 2.3ESSEX (long term check-released 1974) 36.6 43.2 3.7UNIVERSITY OF MISSOURI S13-1955C 31.0 33.9 5.0UNIVERSITY OF MISSOURI S11-20242C 28.6 5.0UNIVERSITY OF MISSOURI S15-10434C 26.4 4.7
GROUP V AVERAGE 42.7 48.2 3.8LSD (0.10) 3.0 2.2C.V. 6.5 6.6A Within a maturity group, shaded yield are not significantly different (0.10) from the highest yield-
ing cultivar (bold) of that maturity group and year column.B Data were collected in Meade Co. in 2018, and in Breckinridge Co. in 2017 and 2016.
Meade County (Brandenburg).
Month
Total Monthly Precipitation
(in.)
TemperaturesMonthly Average
(⁰F)
Highest recorded
(⁰F)
Lowest recorded
(⁰F)March 5.43 42.4 67.7 19.4April 3.04 49.7 79.1 23.1May 3.76 71.4 88.4 37.2June 7.72 75.3 92.1 52.3July 3.87 75.3 93.2 55.9
August 6.93 74.8 89.9 51.6September 6.76 71.5 91.8 49.6
October 3.50 57.6 87.7 27.6November
(11/8)3.02 49.1 64.9 33.0
Agronomic Information – Meade County, Lincoln Trail Region.GPS coordinates 37°48’29.0”N
86°8’23.7”WSoil type Crider silt loamSlopes 0%Previous crop Corn Soil test pH 6.84, P 47, K 163SCN test 0Agricultural practice no-tillPre-planting herbicides NAPlanted date 05/21/2018Post-planting herbicides noneHarvest date 11/850% frost killing 10/13

The College of Agriculture, Food and Environment is an Equal Opportunity Organization.12-2018
Mention or display of a trademark, proprietary product, or firm in text or figures does not constitute an en-dorsement and does not imply approval to the exclusion of other suitable products or firms.