The role of AMPA receptor GluA2 subunit Q/R site RNA editing ...

RAPID COMMUNICATIONS IN MASS SPECTROMETRY
Rapid Commun. Mass Spectrom. 2009; 23: 1029–1034
) DOI: 10.1002/rcm.3960
Published online in Wiley InterScience (www.interscience.wiley.comAn alternative and fast method for determination of
glyphosate and aminomethylphosphonic acid (AMPA)
residues in soybean using liquid chromatography
coupled with tandem mass spectrometry
Helio A. Martins-Junior1, Daniel T. Lebre2, Alexandre Y. Wang3, Maria A. F. Pires1
and Oscar V. Bustillos1*1Instituto de Pesquisas Energeticas e Nucleares, Av. Prof. Lineu Prestes 2242, Cidade Universitaria, Sao Paulo, Brazil2Applied Biosystems/MDS Analytical Technologies, 71 Four Valley Drive, Concord, Ontario, Canada3Applied Biosystems Brazil, Av. do Cafe, 277, 1o andar, Torre A, Sao Paulo, Brazil
Received 8 April 2008; Revised 21 January 2009; Accepted 22 January 2009
*Correspogeticas eversitariaE-mail: oContract/
A simple and specific method using reversed-phase liquid chromatography coupled with electro-
spray ionization tandem mass spectrometry (LC/ESI-MS/MS) was investigated, which allowed the
determination of residues of glyphosate and its metabolite, aminomethylphosphonic acid (AMPA),
in soybean samples. An aqueous extraction with liquid-liquid partition followed by protein
precipitation was performed before the LC/MS/MS determination. The quantitation of glyphosate
and AMPA was performed in positive and negative ESI mode, respectively, using the multiple
reactionmonitoring (MRM)mode with three transitions for each analyte to enhance the specificity of
the method and avoid false positives. The methodology reported in this work is capable of detecting
residues of glyphosate and AMPA in soybean samples with limits of quantification of 0.30 and
0.34mgkgS1, respectively. This alternative method has throughput advantages such as
simpler sample preparation and faster chromatographic analysis. Copyright # 2009 John Wiley &
Sons, Ltd.
Glyphosate (N-phosphonomethyl glycine) is a widely used
herbicide, which rapidly degrades into its aminomethylpho-
sphonic acid (AMPA) metabolite.1 It has a broad spectrum of
activity, and it is very effective, even on plant roots, with little
harmful effects on mammals. Its high efficacy, low toxicity
and low cost, compared with those of other herbicides, have
led to its wide utilization in several crops. Due to its low
toxicity, the maximum residues levels (MRLs) for glyphosate
established around theworld are generally greater than those
set for other pesticides. For example, the Codex Alimentarius
Commission2 established the MRL as 0.2mgkg�1 for
glyphosate in soybean, and the National Health Surveillance
Agency (ANVISA) in Brazil3 set the MRL as 10mgkg�1.
The physical and chemical properties of glyphosate and
AMPA, such as their involatility, high water solubility and
absence of chromophores, make them very difficult to
analyze without derivatization using gas or liquid chroma-
tography with traditional detectors. They may, however, be
analyzed by mass spectrometry (MS) or tandem mass
spectrometry (MS/MS), especially using electrospray ioniz-
ation (ESI), because they are very polar and thus easily
ionized by this technique. Only a few methods using MS or
ndence to: O. V. Bustillos, Instituto de Pesquisas Ener-Nucleares, Av. Prof. Lineu Prestes 2242, Cidade Uni-, Sao Paulo, [email protected] sponsor: CAPES.
MS/MS coupled with liquid chromatography have been
reported for glyphosate analysis. In most reported methods,
pre- and post-column derivatization procedures were
employed to produce derivatives suitable for fluorescence
detection.4,5 Vreeken and co-workers analyzed glyphosate,
AMPA, and glufosinate in water using reversed-phase liquid
chromatography (LC) separation after pre-column derivati-
zation with 9-fluorenylmethoxycarbonyl chloride and detec-
tion by MS/MS.6 Bauer et al.7 determined glyphosate and
AMPA inwater samples using ion chromatography followed
by ESI-MS detection with a single quadrupole mass spec-
trometer. Ion chromatography separation without deriva-
tization was also used by Granby and co-workers after clean-
up on a reversed-phase column to analyze glyphosate and
AMPA through ESI-MS/MS.8,9 Goodwin and co-workers10,11
studied the fragmentation pathway of glyphosate and
AMPA using an ion trap mass spectrometer. Other reported
methods for the analysis of glyphosate include capillary
electrophoresis,12–14 ion chromatography with conductivity,15
ion chromatography with fluorescence,16–18 gas chromatog-
raphy,19–21 immunoassays,22,23 nuclear magnetic reson-
ance,24 and integrated pulse amperometry.25
In this work, we investigated the potential of reversed-
phase LC/MS/MS for the quantification of glyphosate and
AMPA in spiked soybean samples. The compounds were
analyzed without derivatization using calibration curves
prepared in the matrix after a simple protein precipitation
Copyright # 2009 John Wiley & Sons, Ltd.

Table 1. Optimized MRM detection parameters
Analyte Transition (m/z) DP (V) CE (eV) CXP (V)
110> 63 �41 �26 �1
1030 H. A. Martins-Junior et al.
step to minimize the complexity of the sample. The mobile
phase composition and the matrix effects were also inves-
tigated to validate the method using a high-flow gradient
program in a total run time of 4min for each analyte.
AMPA 110> 79 �41 �38 �3110> 81 �41 �18 �3170> 42 50 37 8
Glyphosate 170> 60 50 25 10170> 88 50 15 14
Table 2. Results of glyphosate in spiked soybean samples
Batch/DaySpike level(mgkg�1)
Recovery(%)
SD(%)
RSD(%) n
0.2 88.1 11.5 13.0 60.4 93.0 8.3 9.0 6
1 0.6 94.9 5.7 6.0 60.8 102.4 — — 12.0 91.6 — — 10.2 76.9 9.9 12.9 60.4 89.2 8.1 9.0 6
2 0.6 85.8 6.1 7.1 60.8 89.7 — — 12.0 89.9 — — 10.2 73.9 7.9 10.8 60.4 80.9 7.4 9.2 6
3 0.6 85.1 4.5 5.3 60.8 84.2 — — 12.0 85.7 — — 1
4 0.4 109.1 6.6 6.1 10
EXPERIMENTAL
Chemicals and standardsGlyphosate and AMPA standards were obtained from
Sigma-Aldrich (Steinheim, Germany). Methanol and dichlor-
omethane (HPLC-grade) were purchased from J. T. Baker
(Deventer, The Netherlands) and ammonium carbonate P.A.
was obtained from Merck (Darmstadt, Germany). Purified
waterwas obtained on an EASYpure RF system fromBarnstead
(Dubuque, IA, USA).
The stock solutions of glyphosate and AMPA at 500mgL�1
were prepared by dissolution of the standards in water. The
solutions were maintained at 48C protected from light and
kept in polypropylene tubes to avoid adsorption to glass. The
calibration standards were diluted in water or blank soybean
extracts for the calibration curves.
High-performance liquid chromatography(HPLC)An Agilent 1100 series (Agilent Technologies, Waldbronn,
Germany) liquid chromatography systemwas operated at flow
rate of 1.2mLmin�1 without split using a Zorbax Eclipse1RDB
C8 (Agilent Technologies) analytical column (150mm� 4.6mm
(i.d.), 5mm particle size), maintained at 258C during the
experiments. The volume injected into the LC/MS/MS
systemwas 40mL. The binary mobile phase consisted of water
with 1.5mmol L�1 of ammonium carbonate (phase A) and
methanol/water (95/5%) with 1.5mmol L�1 of ammonium
carbonate (phase B). The initial composition of 65% A and
35% B (v/v) was held for 0.5min, followed by linear ramping
to 90% of B over 1.75min. After ramping, the mobile phase
was returned to the initial composition, and this was held for
1.75min. The total chromatographic run time was 4.0min.
Mass spectrometryThe experiments were performed using an API 4000TM
(Applied Biosystems/MDS Sciex, Concord, Canada) triple
quadrupole mass spectrometer with a TurboIonSpray1
(electrospray) ionization source. The capillary voltage was
maintained at 5500 and�4500V for positive and negative ion
modes, respectively, and the temperature of the turbo heaters
was set at 7508C. Air was used as the nebulizer gas (GS1) at a
pressure of 55 psi and the heater gas (GS2) was also at 55 psi.
Nitrogen was used as the curtain gas at a pressure of 12 psi in
the interface and as the collision gas (CAD Gas) at 10
arbitrary units in the collision cell (Q2). The declustering
potential (DP), collision energy (CE), and collision cell exit
potential (CXP) parameters used in the multiple reaction
monitoring (MRM)mode are presented in Table 1. The dwell
time was set at 150ms and the pause time at 5ms. The data
were acquired using Analyst1 software (Applied Biosystems).
Sample preparationOrganic soybeans were purchased from a local market in Sao
Paulo City and used as blank samples. The soybean samples
Copyright # 2009 John Wiley & Sons, Ltd.
were blended and extracted immediately or stored at �48C.The blended sample (2.0 g) was weighed in a 50mL
polypropylene tube and extraction was carried out with
20.0mL of water and 5.0mL of dichloromethane by
mechanical agitation with a shaker for 60min. After the
extraction, the samplewas centrifuged for 15min at 3000 rpm
and an aliquot of 1.0mL was transferred into a 15mL
polypropylene tube followed by addition of 1.0mL of
methanol for protein precipitation. The contents of the tube
were mixed by vortex for 1min and centrifuged at 3000 rpm
for 15min. Prior to analysis, the samples were diluted
50-times by mixing 20mL of the extract into a 2mL
chromatographic vial with 980mL of water. Then, 40mL of
sample was injected into the LC/MS/MS system.
Validation of the methodThe method was validated according to 2002/657/EC.26
Four batches of spiked and blank samples were analyzed to
evaluate the performance of the method. These batches were
analyzed on four consecutive days using a total of 83 soybean
samples. The spiked levels were 0.2 and 0.6mgkg�1 (n¼ 18),
0.4mgkg�1 (n¼ 28) and 0.8 and 2.0mgkg�1 (n¼ 3). Thirteen
blank samples were also analyzed. The intraday results for
glyphosate and AMPA are shown in Tables 2 and 3,
respectively. In Table 4, the results from the four validation
days were pooled to evaluate the interday recovery and
precision.
Rapid Commun. Mass Spectrom. 2009; 23: 1029–1034
DOI: 10.1002/rcm
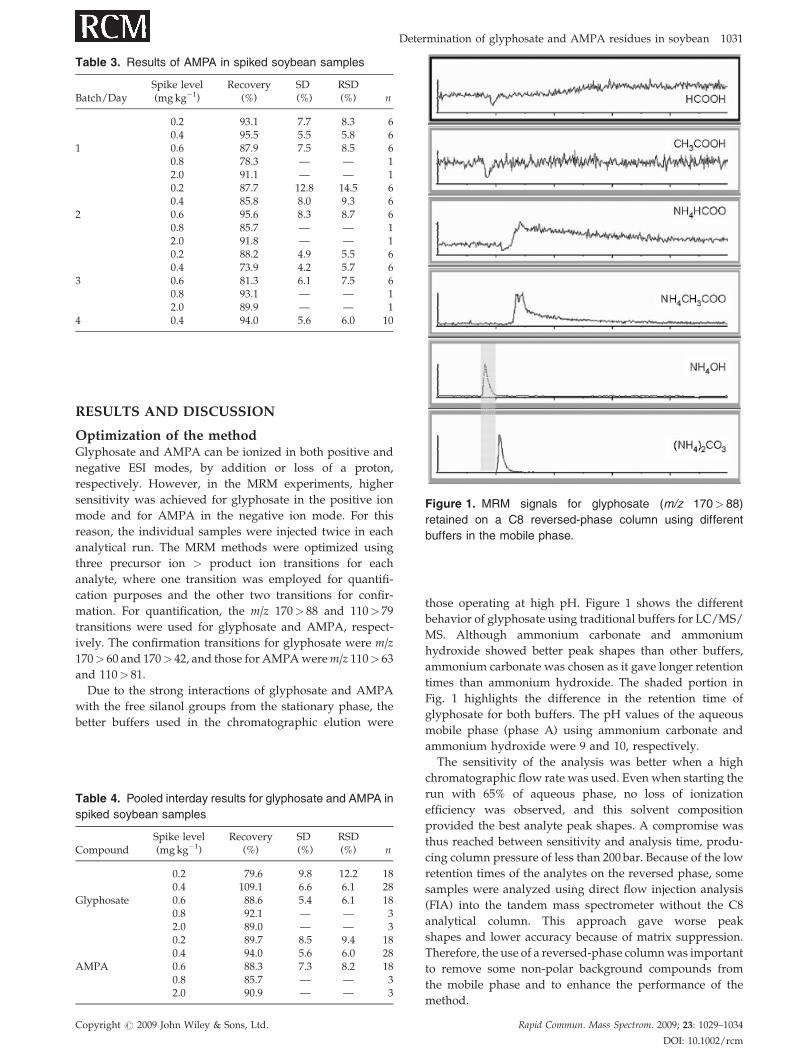
Table 3. Results of AMPA in spiked soybean samples
Batch/DaySpike level(mgkg�1)
Recovery(%)
SD(%)
RSD(%) n
0.2 93.1 7.7 8.3 60.4 95.5 5.5 5.8 6
1 0.6 87.9 7.5 8.5 60.8 78.3 — — 12.0 91.1 — — 10.2 87.7 12.8 14.5 60.4 85.8 8.0 9.3 6
2 0.6 95.6 8.3 8.7 60.8 85.7 — — 12.0 91.8 — — 10.2 88.2 4.9 5.5 60.4 73.9 4.2 5.7 6
3 0.6 81.3 6.1 7.5 60.8 93.1 — — 12.0 89.9 — — 1
4 0.4 94.0 5.6 6.0 10
Figure 1. MRM signals for glyphosate (m/z 170> 88)
retained on a C8 reversed-phase column using different
buffers in the mobile phase.
Determination of glyphosate and AMPA residues in soybean 1031
RESULTS AND DISCUSSION
Optimization of the methodGlyphosate and AMPA can be ionized in both positive and
negative ESI modes, by addition or loss of a proton,
respectively. However, in the MRM experiments, higher
sensitivity was achieved for glyphosate in the positive ion
mode and for AMPA in the negative ion mode. For this
reason, the individual samples were injected twice in each
analytical run. The MRM methods were optimized using
three precursor ion > product ion transitions for each
analyte, where one transition was employed for quantifi-
cation purposes and the other two transitions for confir-
mation. For quantification, the m/z 170> 88 and 110> 79
transitions were used for glyphosate and AMPA, respect-
ively. The confirmation transitions for glyphosate were m/z
170> 60 and 170> 42, and those for AMPAwerem/z 110> 63
and 110> 81.
Due to the strong interactions of glyphosate and AMPA
with the free silanol groups from the stationary phase, the
better buffers used in the chromatographic elution were
Table 4. Pooled interday results for glyphosate and AMPA in
spiked soybean samples
CompoundSpike level(mgkg�1)
Recovery(%)
SD(%)
RSD(%) n
0.2 79.6 9.8 12.2 180.4 109.1 6.6 6.1 28
Glyphosate 0.6 88.6 5.4 6.1 180.8 92.1 — — 32.0 89.0 — — 30.2 89.7 8.5 9.4 180.4 94.0 5.6 6.0 28
AMPA 0.6 88.3 7.3 8.2 180.8 85.7 — — 32.0 90.9 — — 3
Copyright # 2009 John Wiley & Sons, Ltd.
those operating at high pH. Figure 1 shows the different
behavior of glyphosate using traditional buffers for LC/MS/
MS. Although ammonium carbonate and ammonium
hydroxide showed better peak shapes than other buffers,
ammonium carbonate was chosen as it gave longer retention
times than ammonium hydroxide. The shaded portion in
Fig. 1 highlights the difference in the retention time of
glyphosate for both buffers. The pH values of the aqueous
mobile phase (phase A) using ammonium carbonate and
ammonium hydroxide were 9 and 10, respectively.
The sensitivity of the analysis was better when a high
chromatographic flow rate was used. Even when starting the
run with 65% of aqueous phase, no loss of ionization
efficiency was observed, and this solvent composition
provided the best analyte peak shapes. A compromise was
thus reached between sensitivity and analysis time, produ-
cing column pressure of less than 200 bar. Because of the low
retention times of the analytes on the reversed phase, some
samples were analyzed using direct flow injection analysis
(FIA) into the tandem mass spectrometer without the C8
analytical column. This approach gave worse peak
shapes and lower accuracy because of matrix suppression.
Therefore, the use of a reversed-phase columnwas important
to remove some non-polar background compounds from
the mobile phase and to enhance the performance of the
method.
Rapid Commun. Mass Spectrom. 2009; 23: 1029–1034
DOI: 10.1002/rcm

Figure 3. MRM signals obtained from standard samples at
concentrations of 0.2mgL�1 (0.2mgkg�1) for glyphosate
(m/z 170> 88) (top) and AMPA (m/z 110> 79) (bottom).
Figure 2. MRM signals obtained for post-column infusion of glyphosate (left) and AMPA (right). The shaded portion shows
the signal suppression for the compounds at their retention times.
1032 H. A. Martins-Junior et al.
Matrix effectThree different solvents were applied for the protein
precipitation of the dirty extracts obtained from the soybean
aqueous extract: acetone, acetonitrile and methanol. The use
of acetone and acetonitrile as solvents reduced the recovery
of the analytes because of co-precipitation with the proteins
in the samples. The best recoveries for glyphosate andAMPA
were obtained using methanol as a solvent; however, the use
of protein precipitation did not eliminate the matrix
interference, and some signal suppression was observed
for both analytes. Solid-phase extraction and liquid-liquid
partition were also used to purify the samples, but ion
suppression could not be completely avoided. Figure 2
shows the chromatograms obtained using the post-column
infusion method for the evaluation of the matrix effects.
Although glyphosate and AMPA detection showed
noticeable signal suppression effects even after liquid-liquid
partition and protein precipitation, as shown in Fig. 2, the
large dilution volume applied to the samples was effective in
minimizing this effect in the ESI source. In order to overcome
interference caused by the matrix effect, the analytes were
quantified using matrix-matched calibration standards. The
standards of the compounds were prepared by dilution of
the analytes in soybean blank sample extracts at concen-
trations of 0.1, 0.2, 0.5, 1.0, 1.5 and 3.0mgL�1.
SensitivityAlthough glyphosate and AMPA, with their low molecular
weight and high polarity, are less sensitive in ESI-MS/MS
than other pesticide compounds, low limits of detection were
obtained. The limit of detection (LOD) and the limit of
quantification (LOQ) were defined as signal-to-noise (S/N)
ratios of 3:1 and 10:1, respectively. For the quantification
transitions, the LOD and LOQwere 0.09 and 0.30mgkg�1 for
glyphosate, and 0.1 and 0.34mgkg�1 for AMPA, respect-
ively; they were calculated using a matrix-matched standard
solution at a concentration of 0.2mgL�1 (Fig. 3).
Because of the low retention time of the compounds in
reversed-phase columns, three MS/MS transitions were
monitored to enhance the reliability of the data and to avoid
Copyright # 2009 John Wiley & Sons, Ltd.
false positives. Figures 4 and 5 show the S/N ratios obtained
for the analytes at three transitions in a sample spiked at
0.4mgkg�1.
The calibration was performed using external matrix-
matched calibration solutions ranging from 0.1 to 3.0mgL�1.
For glyphosate (m/z 170> 88) and AMPA (m/z 110> 79), the
correlation coefficients (r2) calculated byweighted regression
(1/x) were 0.9991 and 0.9998 and the slopes of the
calibrations performed on the matrix-matched standards
were less than those obtained on the solvent standards.
Recovery and performanceAs glyphosate and AMPA have high solubility in water (up
to 12mgL�1), aqueous extraction was successfully applied to
recover these analytes from the soybean spiked samples.
Liquid-liquid partitioning with dichloromethane and protein
precipitation were used to purify the extract, yielding the
recovery results presented in Tables 2, 3 and 4.
Rapid Commun. Mass Spectrom. 2009; 23: 1029–1034
DOI: 10.1002/rcm

Figure 4. MRM signals of sample spiked with glyphosate at a
concentration of 0.4mgkg�1.
Determination of glyphosate and AMPA residues in soybean 1033
The pooled results presented in the Table 4 show that
the recoveries for spiked concentrations of 0.2, 0.4 and
0.6mgkg�1 were between 79.6 and 109.1% with relative
standard deviation (RSD) of less than 12.2% for both
analytes. According to the European Community Directive
657/2002/EC,26 for concentrations higher than 0.01mgkg�1,
Figure 5. MRM signals of sample spiked with AMPA at a
concentration of 0.4mgkg�1.
Copyright # 2009 John Wiley & Sons, Ltd.
the trueness (measured through recovery) of quantitative
methods should be between 80 and 110%.
The decision limit (CCa) and detection capability (CCb)
established by the European Community through the
Directive 657/2002/EC were, respectively, 0.03 and
0.05mgkg�1 for glyphosate and 0.03 and 0.06mgkg�1 for
AMPA. The curves for the control samples showed
correlation coefficients higher than 0.9885 for both analytes
at the studied spike levels.
CONCLUSIONS
An alternative methodology for the determination of
glyphosate and AMPA residues in soybean with simpler
sample preparation, fast chromatographic analysis and
sensitive detection was presented. The sensitivity and
specificity of the method are suitable to meet the residue
limits established in most countries for evaluating the
presence of glyphosate and its major metabolite in soybean
samples. The method was developed and validated using
spiked organic soybean samples according to the Directive
EC/2002/657. The presented methodology improves and
simplifies routine glyphosate quantitative analysis through-
put, by combining the power of liquid chromatography with
the sensitivity and specificity provided by tandem mass
spectrometry. The presented results suggest that this
technique may also be used to analyze residues of these
compounds in other crop matrices, such as corn and cotton,
where glyphosate is widely used.
AcknowledgementsThe authors thank the researchers from the Center of Chem-
istry and the Environment of the Institute of Energy and
Nuclear Research for collaboration on this project. Very
special thanks are extended to Dr. Gary Impey, senior mass
spectrometry specialist from Applied Biosystems, and
Nazima Kamalia from MDS Analytical Technologies, who
reviewed this work. We are grateful to CAPES for scholar-
ship and financial support.
REFERENCES
1. Franz JE, Mao MK, Sikorski JA. ACS Monograph 1997; 189:143.
2. Codex Alimentarius Commission Maximum Residue Limitsfor Pesticides – CAC/MRL, 1 (2001). Available: http://www.codexalimentarius.net/web/standard_list.do?lang¼en.
3. National Health Surveillance Agency (ANVISA) website.Available: http://www.anvisa.gov.br.
4. Sancho JV, Hernandez F, Lopez FJ, Hogendoom EA, Dijk-man E, van Zoonen P. J. Chromatogr. A 1996; 737: 75.
5. Hogendoom EA, Ossendrijver FM, Dikman E, Baumann RA.J. Chromatogr. A 1999; 833: 67.
6. Vreeken RJ, Speksnijder P, Bobeldijk-Pastorova I, NoijThHM. J. Chromatogr. A 1998; 794: 187.
7. Bauer KH, Knepper TP, Maes A, Schatz V, Voihsel M.J. Chromatogr. A 1999; 837: 117.
8. Granby K, Johannesen S, Vahl M. Food Addit. Contam. 2003;20: 692.
9. Granby K, Vahl M. Food Addit. Contam. 2001; 18: 898.10. Goodwin L, Startin JR, Goodall DM, Keely BJ. Rapid Com-
mun. Mass Spectrom. 2003; 17: 963.11. Goodwin L, Startin JR, Goodall DM, Keely BJ. Rapid
Commun. Mass Spectrom. 2004; 18: 37.
Rapid Commun. Mass Spectrom. 2009; 23: 1029–1034
DOI: 10.1002/rcm

1034 H. A. Martins-Junior et al.
12. CikaloMG, Goodall DM,MatthewsW. J. Chromatogr. A 1996;745: 189.
13. Chang SY, Liao CH. J. Chromatogr. A 2002; 959: 309.14. Goodwin L, Startin JR, Keely BJ, Goodall DM.
J. Chromatogr. A 2003; 1004: 107.15. Zhu Y, Zhang F, Tong C, Liu W. J. Chromatogr. A 1999; 850:
297.16. Abdullah MP, Daud J, Hong KS, Yew CH. J. Chromatogr. A
1995; 697: 363.17. Mallat E, Barcelo D. J. Chromatogr. A 1998; 823: 129.18. Patsias J, Papadopoulou A, Papadopoulou-Mourkidou E.
J. Chromatogr. A 2001; 932: 83.19. Kataoka H, Ryu S, Sakiyama N, Makita M. J. Chromatogr. A
1996; 726: 253.
Copyright # 2009 John Wiley & Sons, Ltd.
20. Hudzin ZH, Gralak DK, Drabowicz J, Luczak J.J. Chromatogr. A 2002; 947: 129.
21. Borjesson E, Torstensson L. J. Chromatogr. A 2000; 886:207.
22. Lee EA, Zimmerman LR, Bhullar BS, Thurman EM. Anal.Chem. 2002; 74: 4937.
23. Gonzalez-Martinez MA, Brun EM, Puchades R, MaquieiraA, Ramsey K, Rubio F. Anal. Chem. 2005; 77: 4219.
24. Deen TSA, Hibbert DB, Hook JM, Wells RJ. Anal. Chim. Acta2002; 474: 125.
25. Sato K, Jin J-Y, Takeuchi T, Miwa T, Suenami K, Takekoshi Y,Kanno S. J. Chromatogr. A 2001; 919: 313.
26. EEC Council Directive 2002/657/EC, OJ L 221 17.8.2002;8–36.
Rapid Commun. Mass Spectrom. 2009; 23: 1029–1034
DOI: 10.1002/rcm
Copyright © 2022 FDOKUMEN