The role of AMPA receptor GluA2 subunit Q/R site RNA editing ...
290
The role of AMPA receptor GluA2 subunit Q/R site RNA editing in the normal and Alzheimer’s diseased brain Amanda Lorraine Wright A thesis submitted in partial fulfillment of the requirements for the degree of Doctor of Philosophy St Vincent Clinical School Faculty of Medicine April 2014
-
Upload
khangminh22 -
Category
Documents
-
view
0 -
download
0
Transcript of The role of AMPA receptor GluA2 subunit Q/R site RNA editing ...
The role of AMPA receptor GluA2 subunit Q/R site RNA editing in the
normal and Alzheimer’s diseased brain
Amanda Lorraine Wright
A thesis submitted in partial fulfillment of the requirements for the degree of Doctor of Philosophy
St Vincent Clinical School
Faculty of Medicine
April 2014
ii
Abstract
Alzheimer’s disease (AD) is described by the build up of amyloid beta plaques in
addition to neuronal loss and chronic neuroinflammation. Mouse models of AD, such as
the hAPP-J20 mouse model, are valuable tools for investigating neuroprotective
treatments. In the present thesis, the hAPP-J20 mouse model of AD was extensively
characterised to show neurodegeneration, early inflammation, late amyloid beta plaque
formation and memory and learning deficits. One of the most striking findings of this
study showed neurodegeneration to occur very early in the disease progression.
Therefore we investigated potential mechanisms of cell death.
Modulation to RNA editing of GluA2 is a process known to cause excitotoxic cell death
in diseases such as ischemia. The GluA2 subunit is responsible for gating calcium (Ca2+)
influx through AMPA receptors. When the GluA2 subunit is present, the process of
RNA editing is essential for the receptor to be Ca2+-impermeable. Specifically, editing of
GluA2 by the ADAR2 enzyme, converts a glutamine (Q), that is present in the DNA, to
an arginine (R) codon present in the mRNA. In this thesis, unedited GluA2 at the Q/R
site was found in the CA1 hippocampal region of hAPP-J20 mice, causing potential cell
death.
To investigate the role of GluA2 RNA editing in health and disease we characterised
mice with increased unedited GluA2. These mice showed neurodegeneration, increased
inflammation and alteration to dendritic length and spine density, further indicating the
functional need for GluA2 RNA editing within the CA1 hippocampal region.
Finally, we crossed the hAPP-J20 line with a mouse line that expresses only edited
GluA2, termed the GluA2R/R mice. These mice were generated by inserting an arginine
within the DNA, thus alleviating the need for RNA editing at this site. By crossing this
line with the hAPP-J20 line, neuroprotection within the CA1, increased spine density
and improvements to memory tasks were observed, showing a functional role of GluA2
RNA editing in AD.

iii
In sum, this thesis revealed neurodegeneration in the hAPP-J20 mouse model of AD as
well as a mouse model with increased unedited GluA2. Furthermore, the spine density
deficits, neurodegeneration and behavioural abnormalities in the hAPP-J20 mouse model
were in part rescued through the expression of forced edited GluA2. Thus, modulation to
the GluA2 RNA editing processes may be a viable therapeutic approach for neuronal
protection in a variety of CNS disorders including AD.
iv
Table of Contents
Acknowledgements 1
Publications 4
Abbreviations 5
1.0 Introduction 7
1.1 Alzheimer’s disease 8
1.1.1 Overview of Alzheimer’s disease 8
1.1.2 Clinical symptoms and detection of Alzheimer’s disease 8
1.2 Neuropathological hallmarks of AD 9
1.2.1 Amyloid-beta containing plaques 9
1.2.2 Neurofibrillary tangles 13
1.2.3 Neuroinflammation 14
1.2.4 Neuronal cell loss and synaptic dysfunction 17
1.3 The hippocampus 18
1.3.1 Hippocampal anatomy 18
1.3.2 Hippocampal-dependent behavioural testing 19
1.4 Mouse models of AD 20
1.4.1 APP transgenic mice 20
1.4.2 Tau transgenic mice 22
1.4.3 Multi-mutation transgenic mice 22
1.4.4 hAPP-J20 mouse model of AD 23
1.5 Excitotoxicity in AD 25
1.6 AMPA receptors 27
1.6.1 AMPA receptor formation 27
1.6.2 Calcium-permeable AMPA receptors 28
1.6.3 Alteration to AMPA receptors in AD 29
1.7 AMPA receptor GluA2 subunit RNA editing 31
1.7.1 Discovery of GluA2 RNA editing 32
1.7.2 ADAR2 and the editing complementary sequence 33
1.7.3 Physiological effects of modified GluA2 RNA editing 34
1.7.4 Excitotoxicity and GluA2 RNA editing 35
v
1.7.5 Regulation of GluA2 RNA editing 36
1.7.6 GluA2 RNA editing in disease 37
1.8 GluA2 RNA editing in Alzheimer’s disease 39
1.9 Hypothesis 39
2.0 Materials and Methods 42
2.1 Animals 43
2.1.1 hAPP-J20 mice 43
2.1.2 GluA2+/ECS(CG)mice 43
2.1.3 GluA2R/R mice 44
2.2 Genotyping and DNA sequencing 44
2.2.1 DNA extraction 44
2.2.1 Genotyping of hAPP-J20 mice 44
2.2.2 Genotyping of GluA2+/ECS(CG) and GluA2R/R mice 45
2.2.2 Sequencing of GluA2+/ECS(CG) and GluA2R/R mice 45
2.3 Tissue Staining and Stereological Analysis 46
2.3.1 Tissue preparation 46
2.3.2. Immunohistochemistry 47
2.3.3 Stereology 48
2.4 Analysis of Aβ 49
2.4.1 Immunofluorescence of Aβ oligomers 49
2.4.2 Aβ immunohistochemistry and quantification of total Aβ 50
2.4.3 Quantification of Aβ plaque load 51
2.4.4 Dot blot of oligomeric Aβ 51
2.4.5 Quantification of Aβ by ELISAs 52
2.5 Golgi Staining 52
2.5.1 Golgi impregnation 52
2.5.2 Analysis of Golgi staining 53
2.6 Quantification of inflammatory cytokines 53
2.7 Western Blots 54
2.7.1 Hippocampal isolation and protein extraction 54
2.7.2 Protein quantification and sample preparation 54
2.7.3 SDS gel electrophoresis and protein transfer 55

vi
2.7.4 Immunoblotting 55
2.7.5 Stripping membrane 56
2.8 Co-immunoprecipitation Analysis 56
2.8.1 Hippocampal isolation and protein extraction 56
2.8.2 Co-immunoprecipitation procedure 57
2.8.3 SDS gel electrophoresis and protein transfer 58
2.8.4 Immunoblotting and analysis 58
2.9 Protein crosslinking assay 59
2.8.1 Brain isolation and vibratome preparation 59
2.8.2 BS3 crosslinking 59
2.8.3 SDS gel electrophoresis and protein transfer 59
2.8.4 Immunoblotting and quantification 60
2.10 RNA editing assay 60
2.10.1 RNA editing assay of plasmids 60
2.10.1.1 Plasmids 60
2.10.1.2 Mixing protocol 60
2.10.1.3 PCR and gel electrophoresis 61
2.10.1.4 Gel extraction 61
2.10.1.5 Bbv1 digestion 61
2.10.1.6 Gel analysis 62
2.10.1.7 Sequencing 62
2.10.2 RNA editing assay of hippocampal extractions 62
2.10.2.1 Brain collection 62
2.10.2.2 RNA isolation 62
2.10.2.3 DNAse treatment 63
2.10.3.4 First strand cDNA synthesis 63
2.10.3.5 PCR amplification and gel electrophoresis 63
2.10.3.6 Gel extraction 64
2.10.3.7 Bbv1 digestion and analysis 64
2.10.3.8 Silver staining 64
2.10.3 RNA editing assay of laser captured cells 64
2.10.3.1 Brain collection 64
vii
2.10.3.2 Tissue preparation 64
2.10.3.3 Laser capture microdissection 65
2.10.3.4 RNA isolation 65
2.10.3.5 DNAse treatment 65
2.10.3.6 cDNA synthesis 65
2.10.3.7 Nested PCR 66
2.10.3.8 Gel extraction 66
2.10.3.9 Sequencing 66
2.11 Electrophysiology 70
2.11.1 Slice preparation 70
2.11.2 Electrophysiology 70
2.11.3 Drugs 71
2.11.4 Data Analysis 71
2.12 Behavioural analysis 71
2.12.1 Open field test 72
2.12.2 Rotorod 72
2.12.3 Elevated plus maze 72
2.12.4 Object recognition test. 73
2.12.5 Y-maze 73
2.12.6 Radial arm maze. 74
2.12.6.1 Reference memory test 74
2.12.6.1.1 Habituation 74
2.12.6.1.2 Training 75
2.12.6.1.3 Retention 75
2.12.6.2 Working memory test 75
2.12.6.2.1 Habituation 75
2.12.6.1.2 Training 76
2.13 Statistical analysis 76
3.0 Pathological and behavioural characterisation of the hAPP-J20 mouse
model of Alzheimer’s disease during disease progression 77
Background 78
viii
3.1 Amyloid-beta expression and plaque formation occurs in an age-
dependent manner in the hAPP-J20 model of Alzheimer’s disease 81
3.2 hAPP-J20 mice exhibit loss of neurons in the CA1, but not CA3, region
of the hippocampus prior to plaque deposition. 88
3.3 hAPP-J20 mice exhibit increased astrocyte populations, plateauing at
24 weeks 91
3.4 Microglial activation precedes amyloid plaque deposition 94
3.5 Assessment of inflammatory cytokines in hAPP-J20 mice 97
3.6 Phenotypical characterisation of the hAPP-J20 mice 102
3.7 hAPP-J20 mice exhibit hyperactivity, but no differences in anxiety 104
3.8 hAPP-J20 mice show spatial reference memory deficits at 16 and 24
weeks of age 107
Discussion 111
4.0 Hippocampal dysfunction in mice expressing a single point mutation to
the editing complementary sequence of the Gria2 gene 115
Background 116 4.1 Generation and confirmation of the ECS mutation in GluA2+/ECS(CG)
mice 120
4.2 Phenotypic characterisation of GluA2+/ECS(CG) mice 122
4.3 Significant increase to the percentage of unedited GluA2 in the
hippocampus of GluA2+/ECS(CG) mice 124
4.4 AMPA receptor subunit expression in GluA2+/ECS(CG) mice 129
4.5 AMPA receptor GluA2 subunit expression at the surface in the
GluA2+/ECS(CG) mice 131
4.5 Examining AMPA receptor formation and complexes in the
GluA2+/ECS(CG) mice 135
4.7 GluA2+/ECS(CG) mice exhibit inward rectifying currents that are blocked
by Naspm 140
ix
4.8 GluA2+/ECS(CG) mice display CA1, but not CA3, hippocampal neuronal
cell loss 143
4.9 GluA2+/ECS(CG) mice show alterations to dendritic branching and loss of
spines in the CA1 hippocampal region 145
4.10 Increase to astrocyte, though not microglial populations, in the
hippocampus of GluA2+/ECS(CG) 148
Discussion 152
5.0 The expression of forced edited GluA2 at the Q/R site alters
hippocampal dysfunction in the hAPP-J20 mouse model of Alzheimer’s
disease 155
Background 156
5.1 Increased unedited GluA2 in the CA1 region of the hippocampus of
hAPP-J20 mice 159
5.2 Generation and confirmation of the mutation at the Q/R site in GluA2R/R
mice 164
5.3 AMPA receptor subunits expression is unaltered in hAPP-J20 mice and
mice expressing force edited GluA2. 168
5.4 AMPA receptor complexes are unaltered in hAPP-J20 mice and mice
expressing force edited GluA2. 170
5.5 AMPA receptor surface and intracellular expression is unchanged in
hAPP-J20 mice and mice expressing force edited GluA2. 175
5.6 Phenotypic characterisation of GluA2R/R and GluA2R/R/hAPP-J20 mice 178
5.7 Amyloid-beta expression and plaque formation is not altered in the force
edited hAPP-J20 mouse model 180
5.8 The expression of forced GluA2 RNA editing at the Q/R site rescues
neuronal deficits in the hAPP-J20 mouse model. 185
5.9 Alteration to dendritic morphology and spine density through the
expression of forced edited GluA2 in the hAPP-J20 mouse model of AD 187
5.10 The expression of forced edited GluA2 does not alter hippocampal
inflammation in the hAPP-J20 mouse model of AD 192
Discussion 198

x
6.0 Forced edited GluA2 at the Q/R site rescues behavioural, memory and
learning deficits in the hAPP-J20 mouse model of Alzheimer’s disease 202
6.1 Alteration to hyperactivity in the OFT and rotorod performance in
hAPP-J20 mice and its modulation by forced edited GluA2 207
6.2 Mice expressing hAPP have reduced anxiety-like behaviour, which is
altered through the expression of forced edited GluA2 213
6.3 Novel object discrimination is not altered in hAPP-J20 expressing mice
or in mice with forced edited GluA2 219
6.4 Working memory is impaired in the hAPP-J20 mouse model and is, in
part, rescued through the expression of forced edited GluA2 221
6.5 Spatial reference memory is impaired in hAPP-J20 mice and is rescued
through the expression of forced edited GluA2 RNA 226
Discussion 230
7.0 Discussion 235
7.1 Summary of findings 236
7.2 hAPP J20 mouse model exhibits cell loss prior to plaque load 237
7.3 Unedited GluA2 RNA editing plays a role in neuronal cell death 239
7.4 A potential role of GluA2 RNA editing in the healthy brain 240
7.5 Forced edited GluA2 at the Q/R site rescues neurodegeneration in the
hAPP-J20 mouse model. 241
7.6 Future directions 243
7.8 Conclusion and significance 244
Appendix 1 246
Appendix 2 250
Appendix 3 252
References 258

xi
List of Figures Chapter 1 Figure 1.1 APP processing by the ‘non-amyloidogenic’ and ‘amyloidogenic’ pathways.
Figure 1.2. Formation of amyloid-β-containing plaques.
Figure 1.3 Inflammation in Alzheimer’s disease.
Figure 1.4 A transverse diagram of the rodent hippocampus.
Figure 1.5. Summary of the hAPP-J20 mouse model.
Figure 1.6. AMPA receptor subunit structure.
Figure 1.7. AMPA receptors containing GluA2 are Ca2+-impermeable due to editing at
the Q/R site.
Figure 1.8 GluA2 sequence showing the location of the ECS and Q/R site.
Chapter 2.
Figure 2.1. Schematic representation of GluA2 RNA editing assay.
Figure 2.2 Cohorts of mice utilised in behavioural studies.
Chapter 3
Figure 3.1.1 Age-dependent Aβ expression in the hAPP-J20 mice.
Figure 3.1.2 Age-dependent oligomeric Aβ expression in the hAPP-J20 mice.
Figure 3.1.3 Age-dependent plaque Aβ expression in the hAPP-J20 mice.
Figure 3.2 Quantification of hippocampal neuronal populations in the hAPP-J20 mice.
Figure 3.3. Quantification of GFAP-positive astrocytes in hAPP-J20 mice.
Figure 3.4 Quantification of CD68-positive activated microglia in hAPP-J20 mice.
Figure 3.5 Quantification of cytokine levels in hAPP-J20 mice.
Figure 3.6. Phenotypical characterisation of the hAPP-J20 mouse model.
Figure 3.7 hAPP-J20 mice exhibit hyperactivity.
Figure 3.8 Spatial learning and memory deficits in hAPP-J20 mice.
Chapter 4
Figure 4.1 Validation of the cytosine to guanine mutation to heterozygous mice.
Figure 4.2 Phenotypical characterisation of mice expressing single point mutation to
the ECS of Gria2.
xii
Figure 4.3.1 Establishing the BbV1 digestion protocol for detection of unedited GluA2
at the Q/R site.
Figure 4.3.2 The extent of GluA2 RNA editing at the Q/R site in GluA2+/ECS(CG) mice
Figure 4.3.3. ADAR2 expression of WT and GluA2+/ECS(CG) mice.
Figure 4.4. AMPA receptor subunit expression of WT and GluA2+/ECS(CG) mice.
Figure 4.5.1 Establishing a protocol to detect surfacing and intracellular expression of
AMPA receptor subunits.
Figure 4.5.2 Surface, intracellular and total expression of GluA2 in GluA2+/ECS(CG)
mice.
Figure 4.6.1 Establishing a co-immunoprecipitation protocol to detect AMPA receptor
subunit formation in the hippocampus.
Figure 4.6.2 Co-immunoprecipitation of AMPA receptor subunits in WT and
GluA2+/ECS(CG) mice.
Figure 4.7 Reduction in GluA2 editing alters AMPA receptor mediated excitatory
synaptic transmission.
Figure 4.8 Quantification of hippocampal neuronal populations in GluA2+/ECS(CG) and
WT littermate control mice.
Figure 4.9.1 Golgi staining and Sholl analysis of hippocampal CA1 neurons in the
GluA2+/ECS(CG) and WT littermate control mice.
Figure 4.9.2 Dendritic spine density of hippocampal CA1 neurons in the
GluA2+/ECS(CG) and WT littermate control mice.
Figure 4.10.1 Quantification of hippocampal GFAP-positive astrocytes in
GluA2+/ECS(CG) and WT littermates.
Figure 4.10.2 Quantification of hippocampal Iba-1-positive microglia in
GluA2+/ECS(CG) and WT littermate control mice.
Chapter 5
Figure 5.1.1 Chromatogram of direct sequencing and quantification of edited and
unedited mixed GluA2 plasmids.
Figure 5.1.2 The extent of GluA2 RNA editing at the Q/R site in hAPP-J20 mice
Figure 5.2 Generation of GluA2R/R mice.
Figure 5.3 AMPA receptor subunit expression in forced GluA2 edited hAPP-J20 mice.
xiii
Figure 5.4 Co-immunoprecipitation of AMPA receptor subunits in WT/WT,
GluA2R/R/WT, WT/hAPP-J20 and GluA2R/R/hAPP-J20 mice.
Figure 5.5.1 Surface, intracellular and total GluA1 expression in forced edited hAPP-
J20 mice.
Figure 5.5.2 Surface, intracellular and total GluA2 expression in forced edited hAPP-
J20 mice.
Figure 5.6 Body weight analysis of forced edited hAPP-J20 mice.
Figure 5.7.1 No alteration to Aβ 40 and 42 expression in hAPP-J20 mice expressing
forced edited GluA2.
Figure 5.7.2 No alteration to total Aβ expression in hAPP-J20 mice expressing forced
edited GluA2.
Figure 5.7.3 Thioflavin S-positive plaques are unaltered in hAPP-J20 mice expressing
forced edited GluA2.
Figure 5.8 Quantification of NeuN-positive neurons in forced edited hAPP-J20 mice.
Figure 5.9.1 Golgi staining and Sholl analysis of hippocampal CA1 neurons in
WT/WT, GluA2R/R/WT, WT/hAPP-J20 and GluA2R/R/hAPP-J20 mice.
Figure 5.9.2 Dendritic spine density of hippocampal CA1 neurons in WT/WT,
GluA2R/R/WT, WT/hAPP-J20 and GluA2R/R/hAPP-J20 mice.
Figure 5.10.1 Quantification of GFAP-positive astrocytes in forced edited hAPP-J20
mice.
Figure 5.10.2 Quantification of CD68-positive microglia in forced edited hAPP-J20
mice.
Figure 5.10.3 Quantification of cytokine levels microglia in forced edited hAPP-J20
mice.
Chapter 6
Figure 6.0 Cohorts of mice utilised in behavioural studies.
Figure 6.1.1 Open field test in hAPP-J20 mice expressing forced edited GluA2.
Figure 6.1.2 Rotorod training in hAPP-J20.
Figure 6.2.1 Forced GluA2 RNA editing rescues alterations to anxiety-like behaviour in
the elevated plus maze.
xiv
Figure 6.2.2 No alteration to time spent in the middle of the open field test in forced
edited GluA2 and hAPP-J20 mice.
Figure 6.3 Object recognition testing in hAPP-J20 mice with forced edited GluA2.
Figure 6.4.1 Forced GluA2 RNA editing rescues short term working memory in Y-
maze.
Figure 6.4.2 Win-Shift radial arm maze working memory test in hAPP-J20 mice
expressing forced edited GluA2.
Figure 6.5 Win-Stay radial arm maze reference memory test reveals recovery of spatial
reference memory in hAPP-J20 mice expressing forced edited GluA2.
xv
List of Tables
Table 2.3.1. Summary of antibodies utilised for immunohistochemistry and immunofluorescence.
Table 2.7.4. Summary of primary and secondary antibodies used for immunoblotting
Table 2.8.2.1 Summary of antibodies used in co-immunoprecipitations analysis
Table 2.8.2.2 Summary of antibodies tested but found not to be useful in co-
immunoprecipitation analysis.
1
Acknowledgements
There are many people who have both professionally and personally contributed to the
writing of this thesis. Firstly, my deepest thank you goes out to my Supervisor Dr.
Bryce Vissel for supporting me through the four years of my thesis. Bryce has given me
the guidance and freedom to pursue this challenging project and I strongly value his
support in chasing my dream for a career in neuroscience.
I would like to thank my Co-Supervisor Dr. Andrea Cowley for guidance and support
during this four year PhD, as well as experimental assistance and editorial revision.
I would like to express my gratitude to a variety of collaborations and support teams
that have contributed techniques, services and advice. Firstly, I would like to thank Dr.
Gordon Royle for contribution to establishing the RNA editing assays utilised in this
thesis. In particular I would like to thank Professor Cliff Abraham and Owen Jones for
welcoming me into their New Zealand laboratory and guiding me through
electrophysiological techniques. Furthermore, to Dr. Benjamin Lau and Dr. Chris
Vaughan for their contribution of electrophysiological experiments to this thesis. To
Associate Professor David Finkelstein for advice and guidance for Golgi staining. To
Dr. Louise Cole and the Advanced Microscopy Facility at University of Sydney for
guidance and use of the Laser Capture Microscope. Finally, to the support and service
teams at the Garvan Institute of Medical Research including the Biological Testing
Facility and ACRF staff for their friendly advice and support.
I would also like to thank the past and present members of the Vissel Lab. In particular,
to Lyndsey Konen, Monica Hoang and Barbara Hohensinn, for their contribution and
dedication to this project by offering their scientific skills and intellectual feedback. In
addition, Sandy Stayte, Sarah Beynon, Richard Tan, Raphael Zinn, Gary Morris, Peggy
Rentsch, Jessica Leake and Shelley Yin. Professionally, thank you for the consistent
support, your contribution to experiments and your editing of papers and this thesis.
Personally, thanks for making every day fun, the terrific lab dance parties, the daily
crossword contributions and the many of epic nights out! The relationships we have
built will last a lifetime.

2
To Teresa Margaret Mary Harris, Samantha Hollings, Pippa Kern and Amelia Berenice
Swan for your eternal friendship. Despite being located all over the world, you are
always here when I need you. You are my rocks.
Of course a huge thank you goes out to my parents, Keith Wright and Lee Stacey. This
thesis would not have been possible without your continuous support and life long
dedication to my education. I love you both. To my grandparents Reg and Janet Wright
and Bob and Lorraine Carroll and my extremely extended family The Wright’s, The
Stacey’s, The Carroll’s and The Chapman’s. Thank you all for offering unconditional
love and encouragement in my biggest times of need.
To my biggest competition, and yet greatest supporter, my big brother Steven Wright.
You have motivated me to aim higher, run faster, and be stronger every day.
Finally, but by far my biggest thank you, is to my life long partner Tom Chapman. You
inspire and challenge me daily. I can’t wait to start our next exciting adventures!

3
This thesis is dedicated to my horses Lockie, Misty and Tango. You have been my best
friends. This thesis is undoubtedly impossible without you.

4
Publications arising from this thesis:
• Wright, A.L., Vissel, B. 2012. The essential role of AMPA receptor GluA2
subunit RNA editing in the normal and diseased brain. Frontiers in Molecular
Neuroscience 5:34.
• Wright, A.L., Zinn, R., Hohensinn, B., Konen, L.M., Beynon, S., Tan, R.P.,
Clark, I.A., Abdipranoto, A., Vissel, B. 2013. Neuroinflammation and neuronal
loss precede Aβ plaque deposition in the hAPP-J20 mouse model of
Alzheimer’s disease 8, e59586.
5
Abbreviations
Aβ Amyloid-β
ΑΒC Avidin-biotin enzyme solution
ACSF Artificial cerebral spinal fluid
AD Alzheimer’s disease
ADAR Adenosine acting on RNA
AICD APP intracellular domain
AMPA α-Amino-3-hydroxy-5-methyl-4-isoxazolepropionic acid
APP Amyloid precursor protein
BS3 Bis(sulfosuccinimidyl)suberate
CA1 Cornu ammonis 1
CA3 Cornu ammonis 3
CD68 Cluster of differentiation-68
CNQX 6-cyano-7-nitroquinoxaline-2,3-dione
CNS Central nervous system
COX-1 Cyclooxygenase 1
COX-2 Cyclooxygenase 2
CSF Cerebral spinal fluid
CTFα C-terminal fragment α
DAB 3,3’-diaminobenzidine
DG Dentate gyrus
DNA Deoxyribonucleic acid
DNQX 6,7-dinitroquinoxaline-2,3-dione
ECS Editing complementary sequence
ELISA Enzyme linked immunosorbent assay
EPM Elevated plus maze
GFAP Glial fibrillary acid protein
GSK3β Glycogen synthase kinase 3
HRP Horse radish peroxidase
Iba-1 Ionised calcium binding adapter molecule-1
IL-6 Interleukin-6
6
IL-1β Interleukin-1β
JNK c-Jun N-terminal kinase
KA Kainic acid
LTD Long term depression
LTP Long term potentiation
MCI Mild cognitive impairment
mEPSC Miniature excitatory postsynaptic current
MMSE Mini-Mental State Examination
MWM Morris water maze
NBQX 2,3-dihydroxy-6-nitro-7-sulfamoyl-benzo[f]quinoxaline-2,3-dione
NMDA N-methyl-D-aspartate
NO Nitric oxide
NSAIDs Non-steroidal anti-inflammatory drugs
OFT Open field test
PCR Polymerase chain reactoin
PDGF-β Platelet-derived growth factor β chain
PKA Protein kinase A
PKC Protein kinase C
PS1 Presenilin 1
PS2 Presenilin 2
RAM Radial arm maze
RNA Ribonucleic acid
ROS Reactive oxygen species
sAPPα soluble APP α
TNF-α Tumor necrosis factor α
TNFR1 Tumor necrosis death receptor

7
Chapter 1
Introduction
Chapter 1: Introduction ____________________________________________________________________________________
8
Introduction With the predicted exponential growth rate of Alzheimer’s disease (AD) worldwide,
there is now an eager need for a deeper understanding of AD pathology. Investigations
into cell death mechanisms are essential for determining the causes of AD and for
creating therapies that prevent this neuronal degradation. This thesis outlines the role of
a particular mechanism, known as GluA2 RNA editing, as a driving force behind cell
death in an AD mouse model. This study has important implications for understanding
excitotoxic cell death in AD and reveals a novel neural protective mechanism that could
potentially be targeted in a variety of CNS disorders, including AD. Here, we will give
an overview of the recognised hallmarks of AD and the subsequent development of AD
mouse models based on such pathology. We will further discuss excitotoxicity in AD
and outline what is known about GluA2 RNA editing and its contribution to neuronal
cell fate in health and disease. This thesis aims to determine how GluA2 RNA editing at
the Q/R site modulates hippocampal integrity in health and in AD.
1.1 Alzheimer’s disease
1.1.1 Overview of Alzheimer’s disease
AD, the most common form of dementia, is a debilitating neurodegenerative disorder
expected to affect over 100 million people worldwide by the year 2050
(www.alzheimer.org). Alois Alzheimer first described alterations to personality and
memory dysfunction in a 51-year-old female patient (Alzheimer 1907). Following her
death, Alzheimer revealed two abnormal deposits in her brain that are today known as
senile plaques and neurofibrillary tangles. More than a century after Alzheimer’s initial
discovery, the underlying mechanisms of the disorder are being unraveled. However,
there is still much unknown about this devastating disease.
1.1.2 Clinical symptoms and detection of Alzheimer’s disease
AD is characterised by a decline in memory and cognitive deficits, impaired judgment
and decision-making and alteration to visuospatial skills (Fernandez et al 2010). AD
patients often present with mild cognitive impairment (MCI) characterised by short-
term memory loss. Furthermore, studies have also described an alteration to personality,
Chapter 1: Introduction ____________________________________________________________________________________
9
which may include mood changes, elevated anxiety, hallucinations, aggression and
depression in AD patients (Galton et al 2000, Wilson et al 2000). As the disease
progresses, patients often present with orientation impairments, language deficits and
further cognitive difficulties.
In order to diagnose patients with MCI and AD, screening instruments such as short
cognitive tests have been implemented. The Mini-Mental State Examination (MMSE) is
the most commonly used test for memory problem complaints. This test involves a
series of questions focusing on areas of attention, language and memory (Lyness et al
2014). However, despite being widely used, the MMSE is insensitive to mild cases of
AD (Brown et al 2014). Other cognitive tests such as the clock drawing test and
Montreal Cognitive Assessment are potentially more suitable screens for cognitive
dysfunction (Cameron et al 2013, Matsuoka et al 2011). Ultimately, cognitive testing in
conjunction with biomarker screening may be required for the early detection and
treatment of AD (Jack Jr & Holtzman 2013). Early detection will be crucial for
implementing new treatment strategies to halt disease progression prior to cognitive
impairment.
1.2 Neuropathological hallmarks of AD
1.2.1 Amyloid-beta containing plaques
Genetic studies have revealed that mutations to amyloid precursor protein (APP),
presenilin-1 (PS1) or presenilin-2 (PS2) are causes of the familial forms of AD (FAD)
(Sisodia & St George-Hyslop 2002). Such mutations account for approximately 5% of
all AD cases (Murphy & LeVine 2010, Robakis 2014). Mutations to each of these genes
can increase the production of, or promote the aggregation of, amyloid-beta (Aβ) into
plaques. Arguably, Aβ-containing plaques are one of the most well established
pathological hallmarks of AD.
Aβ is derived from the abnormal cleavage of APP. The APP gene is located on
chromosome 21 and consists of 19 exons that are alternatively spliced to give rise to
proteins that are 695, 751 and 770 amino acids in length (Walsh & Teplow 2012). These
Chapter 1: Introduction ____________________________________________________________________________________
10
proteins undergo processing via two distinct pathways known as the ‘amyloidogenic’
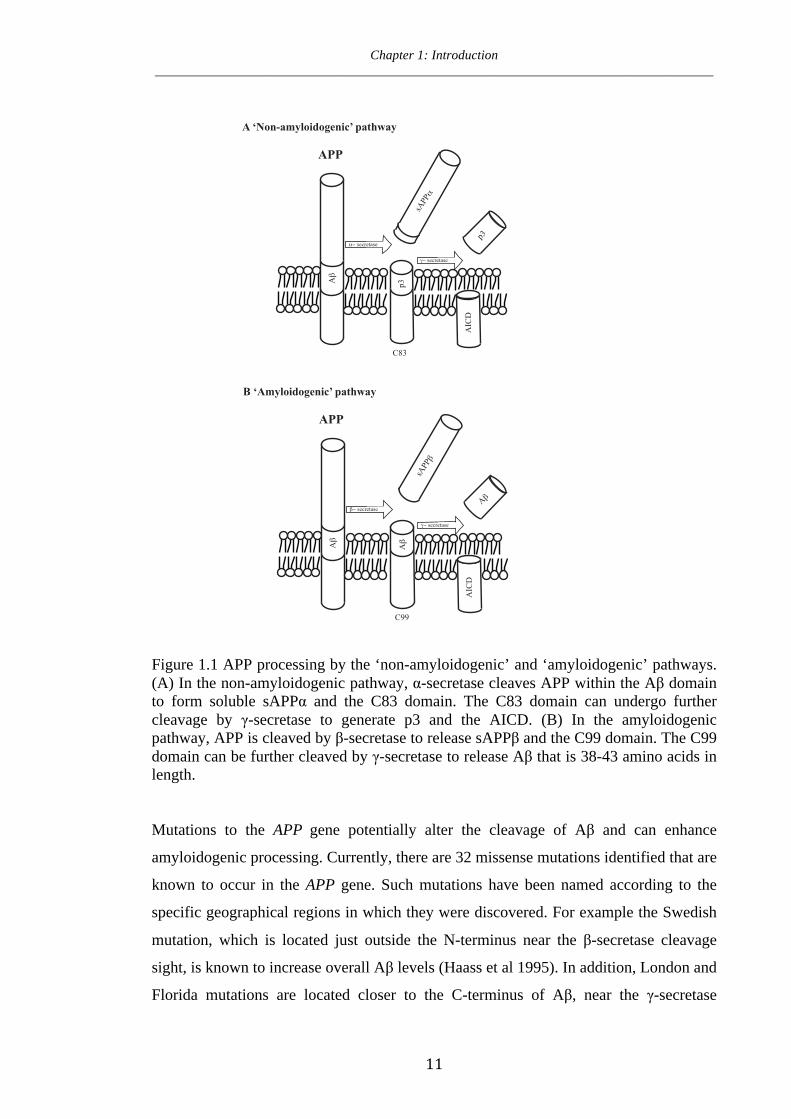
and the ‘non-amyloidogenic’ pathways (Figure 1.1). The non-amyloidogenic processing
occurs via α-secretase cleavage of APP to generate soluble APP (sAPPα) as well as the
C-terminal fragment (CTFα) that is 83 amino acids in length (C83) (Palop & Mucke
2010). The CTFα fragment is then further processed by γ-secretase to release a short
fragment termed p3 and the APP intracellular domain (AICD) (Palop & Mucke 2010).
This particular pathway is thought to be critical for neural progenitor cell proliferation
and neural survival.
Amyloidogenic processing occurs by the cleaving of APP by β-secretase to generate the
soluble sAPPβ and a 99 amino acid long c-terminal fragment (C99; Figure 1.1). The
C99 fragment is further cleaved by γ-secretase to produce Aβ peptides that vary from 38
to 43 amino acids in length (Murphy & LeVine 2010). The physiological role of Aβ in a
non-diseased state is unclear. In the healthy brain, cleavage of APP generally results in
a 40 amino acid fragment termed Aβ40. However, in AD, APP is often cleaved into the
42 amino acid fragment, Aβ42, which is more fibrillogenic (Holtzman et al 2011). This
fibrillogenic form is often what results in the formation of Aβ-containing plaques.
Chapter 1: Introduction ____________________________________________________________________________________
11
Figure 1.1 APP processing by the ‘non-amyloidogenic’ and ‘amyloidogenic’ pathways. (A) In the non-amyloidogenic pathway, α-secretase cleaves APP within the Aβ domain to form soluble sAPPα and the C83 domain. The C83 domain can undergo further cleavage by γ-secretase to generate p3 and the AICD. (B) In the amyloidogenic pathway, APP is cleaved by β-secretase to release sAPPβ and the C99 domain. The C99 domain can be further cleaved by γ-secretase to release Aβ that is 38-43 amino acids in length. Mutations to the APP gene potentially alter the cleavage of Aβ and can enhance
amyloidogenic processing. Currently, there are 32 missense mutations identified that are
known to occur in the APP gene. Such mutations have been named according to the
specific geographical regions in which they were discovered. For example the Swedish
mutation, which is located just outside the N-terminus near the β-secretase cleavage
sight, is known to increase overall Aβ levels (Haass et al 1995). In addition, London and
Florida mutations are located closer to the C-terminus of Aβ, near the γ-secretase
A`
APP
sAPP_
p3
C83
p3_<�secretase
a<�secretase
AICD
A ‘Non-amyloidogenic’ pathway
A`
APPsAPP`
C99
A``<�secretase
a<�secretase
AICD
B ‘Amyloidogenic’ pathwayA`

Chapter 1: Introduction ____________________________________________________________________________________
12
cleavage site thus leading to a preference of Aβ42 cleaving over Aβ40 (Goate et al 1991).
Numerous other mutations have also been shown to occur including mutations within
the Aβ sequence, such as the Dutch and Arctic mutations that increase aggregations of
Aβ (Fraser et al 1992, Nilsberth et al 2001).
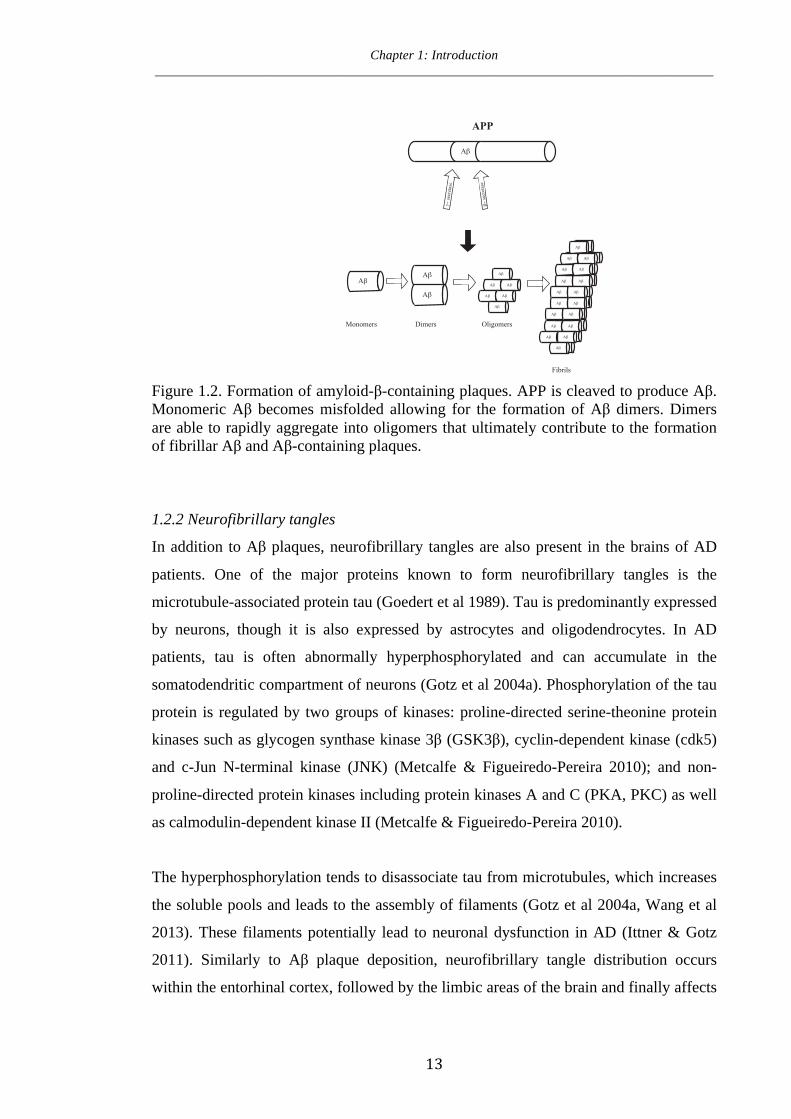
Aβ occurs in the brain in a variety of natures, including monomeric, oligomeric and
fibrillar formations (Figure 1.2). The monomeric form of Aβ is mainly composed of α-
helical structures and does not appear to lead to synaptic deficits (Giuffrida et al 2009).
However the misfolding and self-association of monomeric Aβ can lead to the
formation of Aβ oligomers (Klyubin et al 2012, Kuma & Walter 2011). These
oligomers are soluble in an aqueous buffer, though are believed to be a more toxic form
of Aβ. In particular, oligomeric Aβ has shown to alter long-term potentiation (LTP) and
enhance long-term depression (LTD) in hippocampal slices, as well as induce memory
and cognitive deficits in rodents (Benilova et al 2012).
Once oligomeric Aβ species are established, larger aggregates are able to form into Aβ
fibrils. These form the senile (neuritic) plaques observed in the brains of AD patients
(Kuma & Walter 2011). These neuritic plaques can range from 10 to 120 µm in cross-
sectional diameter. Plaque deposition occurs in five main stages, by first accumulating
in the neocortex, and secondly within the hippocampus and entorhinal regions (Thal et
al 2002). Thirdly, plaque accumulation occurs in the amygdala, basal forebrain,
hypothalamus and striatum. The fourth stage is defined as accumulation within the
substantia nigra and finally, the fifth stage consists of plaque accumulation within the
cerebellum (Thal et al 2002). Despite being the most distinct hallmark of AD, multiple
studies have revealed that the appearance of plaque does not correlate with cognitive
impairments in AD patients (Perrin et al 2009). Furthermore, plaques can be detected in
people without cognitive deficits (Bennett et al 2006, Knopman et al 2003). These
studies indicate that plaque load may not be the most precise biomarker for AD.
Chapter 1: Introduction ____________________________________________________________________________________
13
Figure 1.2. Formation of amyloid-β-containing plaques. APP is cleaved to produce Aβ. Monomeric Aβ becomes misfolded allowing for the formation of Aβ dimers. Dimers are able to rapidly aggregate into oligomers that ultimately contribute to the formation of fibrillar Aβ and Aβ-containing plaques.
1.2.2 Neurofibrillary tangles
In addition to Aβ plaques, neurofibrillary tangles are also present in the brains of AD
patients. One of the major proteins known to form neurofibrillary tangles is the
microtubule-associated protein tau (Goedert et al 1989). Tau is predominantly expressed
by neurons, though it is also expressed by astrocytes and oligodendrocytes. In AD
patients, tau is often abnormally hyperphosphorylated and can accumulate in the
somatodendritic compartment of neurons (Gotz et al 2004a). Phosphorylation of the tau
protein is regulated by two groups of kinases: proline-directed serine-theonine protein
kinases such as glycogen synthase kinase 3β (GSK3β), cyclin-dependent kinase (cdk5)
and c-Jun N-terminal kinase (JNK) (Metcalfe & Figueiredo-Pereira 2010); and non-
proline-directed protein kinases including protein kinases A and C (PKA, PKC) as well
as calmodulin-dependent kinase II (Metcalfe & Figueiredo-Pereira 2010).
The hyperphosphorylation tends to disassociate tau from microtubules, which increases
the soluble pools and leads to the assembly of filaments (Gotz et al 2004a, Wang et al
2013). These filaments potentially lead to neuronal dysfunction in AD (Ittner & Gotz
2011). Similarly to Aβ plaque deposition, neurofibrillary tangle distribution occurs
within the entorhinal cortex, followed by the limbic areas of the brain and finally affects
A`
APP
A`
`<�secretase
a<�secretase
A`
A`
A`
A`
A`
A`
A`
A`
A`
A`
A`
A`
A`
A`
A`
A`
A`
A`
A`
A`
A`
A`
A`
A`
A`
A`
A`
A`
A`
A`
A`
A`
A`
A`
A`
A`
A`
A`
A`
A`
A`
A`
A`
A`
A`
A`
A`
A`
Monomers Dimers Oligomers
Fibrils
Chapter 1: Introduction ____________________________________________________________________________________
14
the cortex (Braak & Braak 1991). Interestingly, tangle formation correlates closely to
cognitive impairments in AD, more so than Aβ plaque deposition (Braak & Braak
1995).
1.2.3 Neuroinflammation
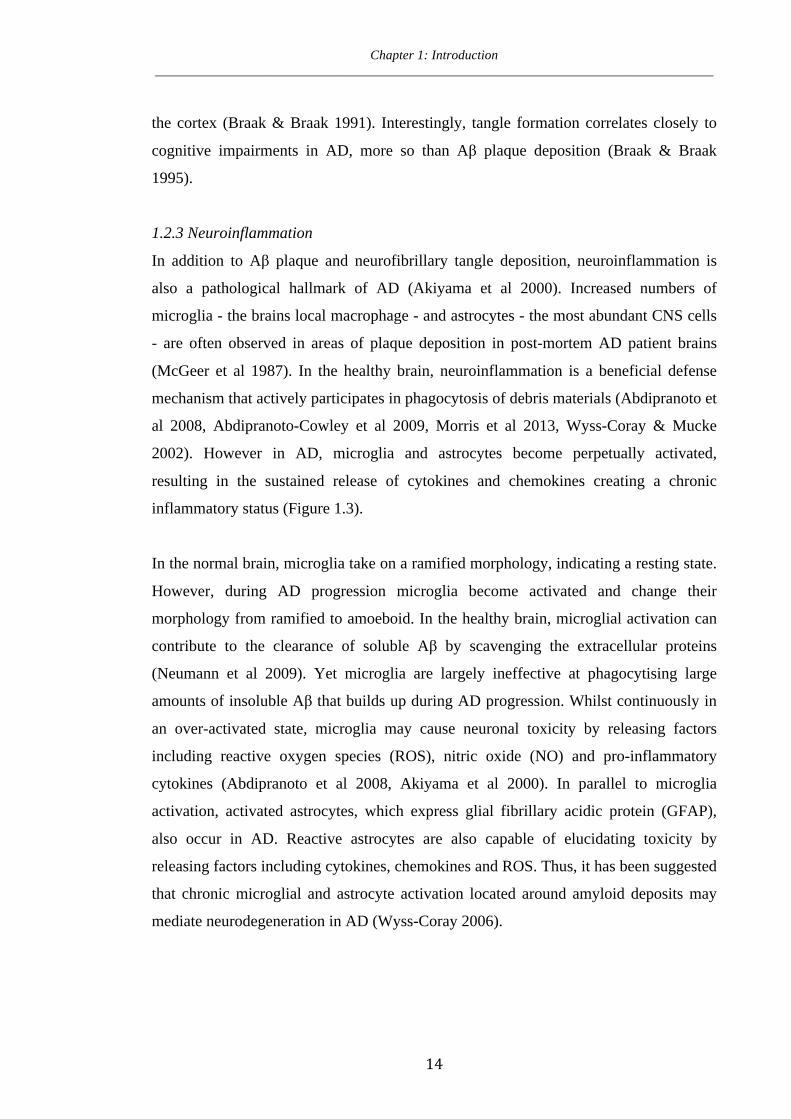
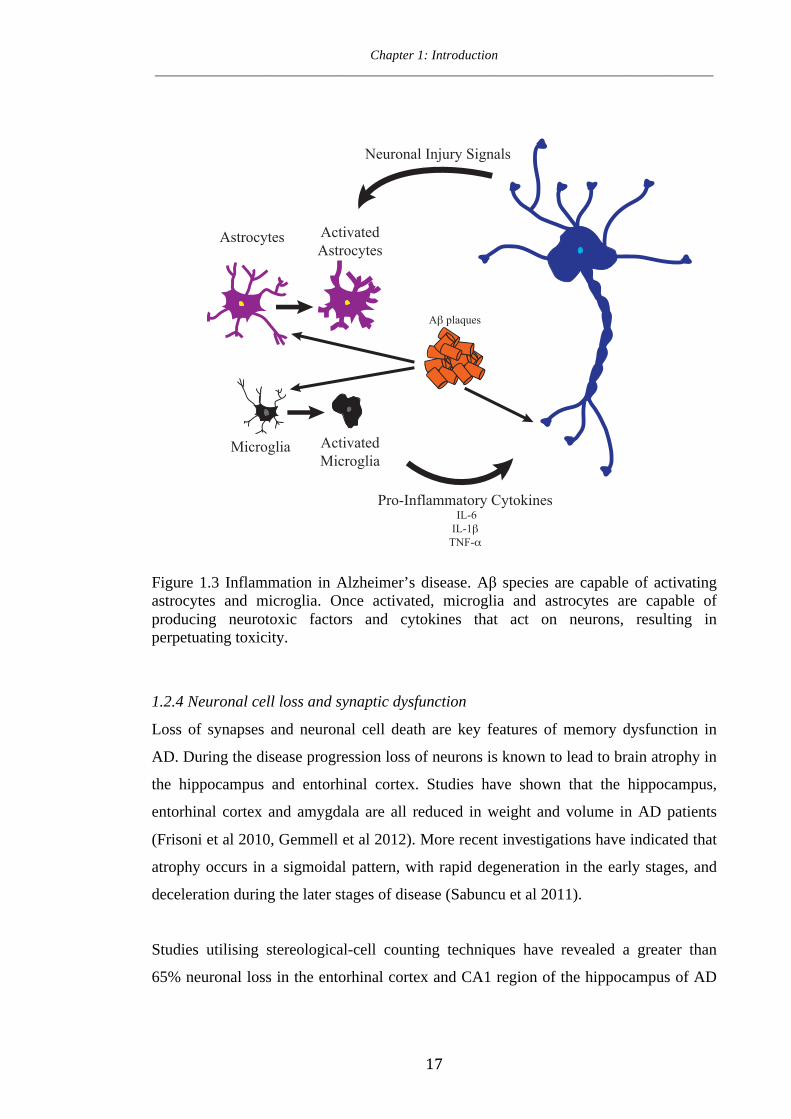
In addition to Aβ plaque and neurofibrillary tangle deposition, neuroinflammation is
also a pathological hallmark of AD (Akiyama et al 2000). Increased numbers of
microglia - the brains local macrophage - and astrocytes - the most abundant CNS cells
- are often observed in areas of plaque deposition in post-mortem AD patient brains
(McGeer et al 1987). In the healthy brain, neuroinflammation is a beneficial defense
mechanism that actively participates in phagocytosis of debris materials (Abdipranoto et
al 2008, Abdipranoto-Cowley et al 2009, Morris et al 2013, Wyss-Coray & Mucke
2002). However in AD, microglia and astrocytes become perpetually activated,
resulting in the sustained release of cytokines and chemokines creating a chronic
inflammatory status (Figure 1.3).
In the normal brain, microglia take on a ramified morphology, indicating a resting state.
However, during AD progression microglia become activated and change their
morphology from ramified to amoeboid. In the healthy brain, microglial activation can
contribute to the clearance of soluble Aβ by scavenging the extracellular proteins
(Neumann et al 2009). Yet microglia are largely ineffective at phagocytising large
amounts of insoluble Aβ that builds up during AD progression. Whilst continuously in
an over-activated state, microglia may cause neuronal toxicity by releasing factors
including reactive oxygen species (ROS), nitric oxide (NO) and pro-inflammatory
cytokines (Abdipranoto et al 2008, Akiyama et al 2000). In parallel to microglia
activation, activated astrocytes, which express glial fibrillary acidic protein (GFAP),
also occur in AD. Reactive astrocytes are also capable of elucidating toxicity by
releasing factors including cytokines, chemokines and ROS. Thus, it has been suggested
that chronic microglial and astrocyte activation located around amyloid deposits may
mediate neurodegeneration in AD (Wyss-Coray 2006).

Chapter 1: Introduction ____________________________________________________________________________________
15
Broad spectrum drugs that target most inflammatory pathways have been explored in
AD. It was first noted by McGeer et al. (1990) that patients with arthritis treated with
non-steroidal anti-inflammatory drugs (NSAIDs) had four times less chance of
developing AD (McGeer et al 1990). NSAIDs exert their effects by inhibiting
cyclooxygenase (COX)-1 and COX-2, leading to a reduction of pro-inflammatory
prostaglandins (Imbimbo et al 2010, Trepanier & Milgram 2010). Further studies have
found that NSAID treatment may reduce plaque pathology and improve memory and
learning deficits in mouse models of AD (Lim et al 2000, McGeer & McGeer 2007).
However, when taken into clinical trials, NSAIDs largely failed possibly due to off-
target effects, genetic factors and/or mistiming of treatment. Thus, treatments aimed at
more specific mechanisms that are altered in neurodegenerative disorders may be
beneficial for halting disease progression.
Multiple cytokines are known to be elevated in AD post-mortem brains and are thought
to contribute to the progression of AD. In particular, tumor necrosis‐α (TNF‐α) is
upregulated in the cerebral spinal fluid (CSF) and brains of AD patients (Tarkowski et
al 2003). TNF‐α is capable of binding to receptors expressed on neurons, microglia and
astrocytes and leads to a cascade of inflammatory events. In turn, these inflammatory
events can lead to neuronal cell injury that ultimately recruits further inflammation
leading to a self-propelling cycle of neuronal damage (Figure 1.3) (Apelt & Schliebs
2001). Studies in mice models of AD have revealed that the deletion of the TNF death
receptor (TNFR1) is capable of reducing Aβ plaque deposition and improving memory
and learning deficits (He et al 2007). Furthermore, the administration of anti-TNF‐α
antibodies has shown to reduce Aβ, tau phosphorylation and astrocyte and microglial
activation in transgenic mouse models of AD (He et al 2013, Shi et al 2011, Tweedie et
al 2012). In a pilot study, inhibition of TNF‐α in AD patients gradually improved
MMSE results over a course of six months (Tobinick et al 2006). Furthermore,
perispinal administration of the TNF‐α antagonist, etanercept, was reported to lead to
rapid cognitive improvements in a patient with late onset AD (Tobinick & Gross 2008).
Thus, it is clear that TNF‐α release from activated microglia and astrocytes may
contribute to cell death in AD.

Chapter 1: Introduction ____________________________________________________________________________________
16
Other pro-inflammatory cytokines, such as interleukin-1β (IL-1β), are released from
microglia and astrocytes and have also been strongly implicated in AD (Birch et al
2014, Craft et al 2005). Indeed, several polymorphisms to the IL-1β gene are associated
with increased risks of developing AD (Nicoll et al 2000) as IL-1β is known to
stimulate the expression of APP and promote tau hyperphosphorylation. However,
somewhat surprisingly, studies in AD mouse models overexpressing inducible IL-1β
showed reduced insoluble Aβ40 and Aβ42 as well as reduced plaque load as compared to
non-overexpressing AD mice (Shaftel et al 2007). More recently, however, neural
precursors cells that over-express an IL-1β receptor antagonist were implanted into an
AD mouse model and showed rescue of the observed cognitive deficits (Ben
Menachem-Zidon et al 2014). Thus, these studies suggest that the role of IL-1β in AD
may be both beneficial and detrimental.
From numerous investigations, it is now known that neuroinflammation is a common
pathological hallmark of AD. However, the advantageous and detrimental effects of
increased microglia and astrocyte populations and the subsequent elevated cytokines are
still controversial.
Chapter 1: Introduction ____________________________________________________________________________________
17
Figure 1.3 Inflammation in Alzheimer’s disease. Aβ species are capable of activating astrocytes and microglia. Once activated, microglia and astrocytes are capable of producing neurotoxic factors and cytokines that act on neurons, resulting in perpetuating toxicity.
1.2.4 Neuronal cell loss and synaptic dysfunction
Loss of synapses and neuronal cell death are key features of memory dysfunction in
AD. During the disease progression loss of neurons is known to lead to brain atrophy in
the hippocampus and entorhinal cortex. Studies have shown that the hippocampus,
entorhinal cortex and amygdala are all reduced in weight and volume in AD patients
(Frisoni et al 2010, Gemmell et al 2012). More recent investigations have indicated that
atrophy occurs in a sigmoidal pattern, with rapid degeneration in the early stages, and
deceleration during the later stages of disease (Sabuncu et al 2011).
Studies utilising stereological-cell counting techniques have revealed a greater than
65% neuronal loss in the entorhinal cortex and CA1 region of the hippocampus of AD
Pro-Inflammatory Cytokines IL-6IL-1`
TNF-_
Neuronal Injury Signals
Microglia ActivatedMicroglia
Astrocytes ActivatedAstrocytes
A`A`A`
A`
A`
A`A`A`
A`A`
A`
A`
A`A`
A`
A`�plaques
Chapter 1: Introduction ____________________________________________________________________________________
18
patients, as compared to non-demented patients (Bobinski et al 1997, Gómez-Isla et al
1997, West et al 1994). In addition, neuronal loss has also been described in the
olfactory bulb, amygdala, substantia nigra and locus coeruleus with varying degrees
between the regions (Hoogendijk et al 1995, Lyness et al 2003, Zarow et al 2003).
Interestingly, the amount of neuronal loss in AD brains far precedes the amount of
neurofibrillary tangles and Aβ plaque burden (Gómez-Isla et al 1997). This suggests
that neuronal loss may be an early event in AD and contributes directly to cognitive
impairment.
In addition to cell loss, synaptic loss also occurs in AD. Synaptic loss correlates closely
with cognitive function, suggesting that it is a critical event in disease progression
(DeKosky & Scheff 1990). Recent studies have indicated as much as 55% synaptic loss
in the CA1 hippocampal region of AD patients (Scheff et al 2007). The underlying
mechanisms leading to synaptic loss are largely unknown, however it is presumed that
toxic Aβ species are capable of impairing LTP, and inducing LTD promoting synapse
loss (Ittner & Gotz 2011, Palop & Mucke 2010). In particular, oligomeric Aβ can
reduce glutamatergic synaptic transmission leading to synaptic loss (Palop & Mucke
2010), potentially through the process of ‘excitotoxicity’ (described in section 1.5).
Thus, synaptic loss and neuronal cell loss are prominent features of AD with strong
correlations to cognitive dysfunction and are potential targets for AD drug therapies.
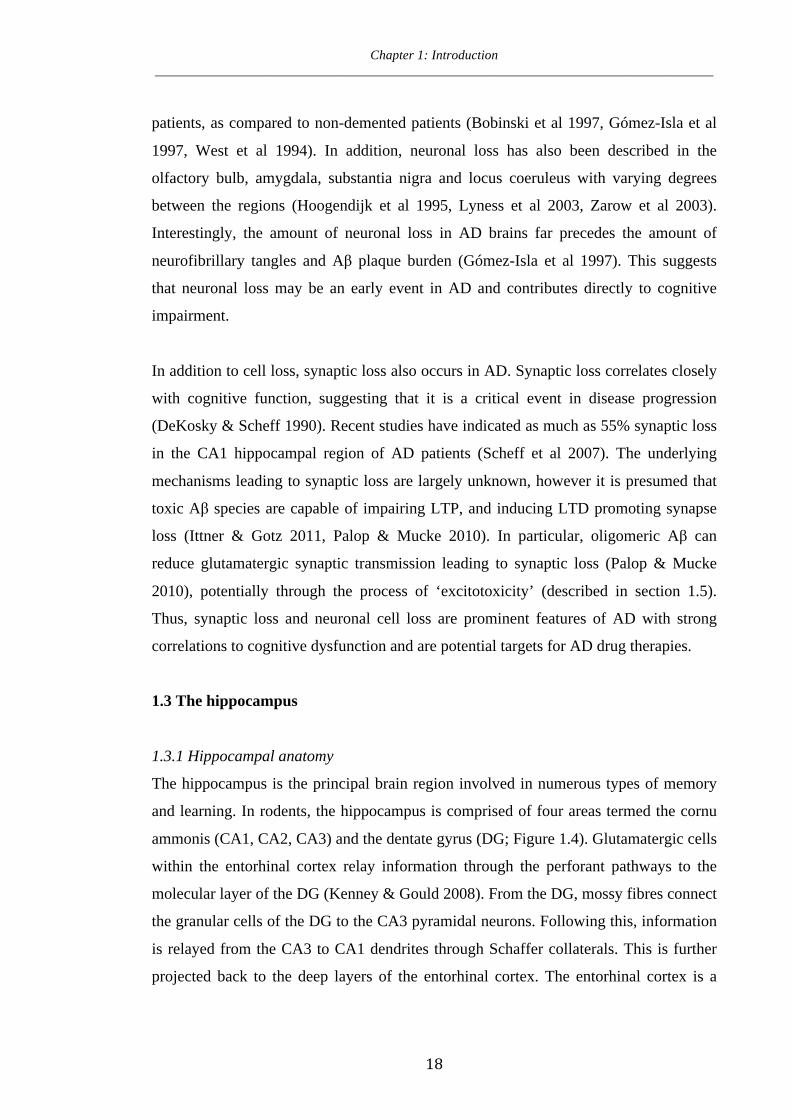
1.3 The hippocampus
1.3.1 Hippocampal anatomy
The hippocampus is the principal brain region involved in numerous types of memory
and learning. In rodents, the hippocampus is comprised of four areas termed the cornu
ammonis (CA1, CA2, CA3) and the dentate gyrus (DG; Figure 1.4). Glutamatergic cells
within the entorhinal cortex relay information through the perforant pathways to the
molecular layer of the DG (Kenney & Gould 2008). From the DG, mossy fibres connect
the granular cells of the DG to the CA3 pyramidal neurons. Following this, information
is relayed from the CA3 to CA1 dendrites through Schaffer collaterals. This is further
projected back to the deep layers of the entorhinal cortex. The entorhinal cortex is a

Chapter 1: Introduction ____________________________________________________________________________________
19
critical point for transfer of information between the hippocampus and the limbic cortex
(Kenney & Gould 2008).
The unidirectional neuronal circuit of the hippocampus permits a finely tuned and
intricate flow of information that allows for memory formation and retrieval. As
described previously in section 1.2.4, the CA1 and entorhinal cortex are often
extensively damaged in AD (West et al 1994). Thus, neuronal and spine deficits in these
areas lead to disruptions in the flow of information resulting in anterograde amnesia.
However, the mechanisms leading to neuronal loss are poorly understood, and thus
require further research utilising human information and mouse models of AD.
Figure 1.4 A transverse diagram of the rodent hippocampus. Information is relayed from the entorhinal cortex along the perforant pathway, to the dentate gyrus. Mossy fibres relay information to the CA3, followed by Schaffer collateral firing to the CA1. Dentate gyrus (DG), cornu ammonis 1 (CA1), cornu ammonis 3 (CA3), fimbria fornix (FF), entorhinal cortex (EC).
1.3.2 Hippocampal-dependent behavioural testing
The hippocampus is crucial for various forms of learning and memory, including spatial
navigation. In animals, learning and memory of food sources and escape routes is a
cognitive function critical for survival. Mechanistically, this ability to spatially learn
requires site-specific neuronal firing in the hippocampal circuitry. In particular, the
neurons involved in environmentally-dependent signalling and response to object
DGCA3
CA1
From EC
to EC
Schaffer collaterals
mossy fibers
FF
Perefront Pathway

Chapter 1: Introduction ____________________________________________________________________________________
20
relations within the surroundings are often referred to as ‘place cells’ (Bird & Burgess
2008, Kenney & Gould 2008).
In order to study and evaluate spatial learning and memory formation in animals, a
variety of behavioural testing mazes have been developed. The two most commonly
used spatial navigation mazes include the Morris water maze (MWM) and the radial
arm maze (RAM) (Morris 1981, Olton & Samuelson 1976). For successful and efficient
performance in these mazes, the animals must learn, integrate and remember
environmental cues over the course of training. These tests are often referred to as
hippocampal-dependent tasks and require robust synaptic plasticity for optimum
performance (Wenk 2001). Damage to any hippocampal region - though particularly the
CA1 region - can lead to alterations to spatial memory retrieval (Kenney & Gould
2008). Thus, these tests are useful for testing the hippocampal integrity of mouse
models in order to assess new therapeutics for the treatment of AD.
1.4 Mouse models of AD
In order to study pathological hallmarks and possible therapeutics, a variety of mouse
models of AD have been established. Such models have provided insight into the
mechanisms of neural dysfunction and cognitive impairment in AD. The majority of
these mouse models have been based on the overexpression and mutations to four main
genes: APP, PS1 and PS2, and tau (Bilkei-Gorzo 2014). In general, these models show
neuropathological and behavioural features that parallel AD patients including the build
up of Aβ-containing plaques, neuroinflammation, alteration to synapses and neuronal
numbers and impairment to memory and learning (Lee & Han 2013, Wirths & Bayer
2010). However, these models often differ in the genes and mutations that they
expressed.
1.4.1 APP transgenic mice
Games et al. (1995) developed the first mouse model of AD that over-expressed the
human APP (hAPP) sequence with the Indiana mutation V717F. This mouse model,
known as the PDAPP model, exhibited an 18-fold increase in hAPP levels and, thus,
Chapter 1: Introduction ____________________________________________________________________________________
21
endured an accumulation of Aβ-containing plaques by 6 months of age (Games et al
1995). Histological analysis of PDAPP transgenic mice also revealed severe
neuroinflammation and synaptic loss during disease progression (Kobayashi & Chen
2005). In addition, PDAPP mice demonstrate alteration to memory, learning and
cognitive function in behavioural testing paradigms including the MWM, the open field
test (OFT), and RAM (Chen et al 2000b, Dodart et al 1999). These studies were the first
to show that over-expression of APP could lead to synaptic alteration and behavioural
dysfunction and gave emphasis to the hypothesis that APP drives AD progression.
Following the development of the PDAPP mouse, the Tg2576 mouse model was
developed. In contrast to the Indiana mutation expressed by the PDAPP mouse model,
the Tg2576 mouse model expresses the Swedish double mutations K670N and M671L
(Hsiao et al 1996). Similarly to the PDAPP mouse model, the Tg2576 model exhibits
increased Aβ production (Hsiao et al 1996, Shirvan et al 2009), Aβ-containing plaques,
neuroinflammation (Nichol et al 2008) and poor contextual and spatial memory
retention (Corcoran et al 2002). However unlike the PDAPP mouse model of AD, the
Tg2576 model did not exhibit synaptic loss or reductions to hippocampal size. Despite
these limitations, the Tg2756 mouse model has been utilised to show modulation to Aβ
processing, alteration to inflammatory pathways and modulators of the glutamatergic
system are able to reduce AD-like pathology (Ashe 2001, Bilkei-Gorzo 2014, Hall &
Roberson 2012).
Subsequent to the formation of these two key mouse lines, several other mouse models
have been created that are based on the overexpression of hAPP bearing various
mutations. These mouse models include the TgAPP23, TgCRND8, TgAPP(Sw,V717F)
and hAPP-J20 model (described in section 1.4.4). Many of these transgenic models
differ in the timing of Aβ accumulation, plaque deposition, neuroinflammation, tau
pathology and memory and learning deficits (Gotz et al 2004b). Interestingly, neuronal
cell loss has not been shown to occur in many APP mutant models including the
PDAPP, Tg2576 and TgCRND8 models (Irizarry et al 1997). However, the TgAPP23
mouse, that expresses hAPP with the Swedish mutations K670N and M671L under the
control of the murine Thy-1 promoter, does show significant neuronal cell loss in the
Chapter 1: Introduction ____________________________________________________________________________________
22
CA1 region of the hippocampus (Boncristiano et al 2005). Further, this 14% reduction
in CA1 neurons is directly correlative to hippocampal plaque load (Boncristiano et al
2005). Despite the fact that mouse models based on hAPP mutations do not fully
representing AD pathology, these models have nonetheless been important in divulging
the underlying mechanisms of AD.
1.4.2 Tau transgenic mice
Mouse models that are derived from the over-expression of APP alone tend not to show
hyperphosphorylated tau. Thus, to determine the effects of hyperphosphorylated tau and
neurofibrillary tangle pathology of AD, mouse models have been developed to express
the human tau protein. The original mouse models based on the overexpression of tau
showed motor deficits, though interestingly they did not develop neurofibrillary tangles
(Gotz et al 1995). However, mice that exhibit mutations to the tau gene have reported
neurofibrillary tangle formation and cell loss. In particular, the rTg(tauP301L) mouse,
that expresses human P301L tau under the control of the murine PrP promoter, exhibit
neurofibrillary tangles and neuronal loss in the hippocampus as well as memory and
learning deficits in the MWM at four months of age (Götz et al 2001, Lewis et al 2000).
Mouse lines over-expressing mutations to tau have been critical for understanding not
only AD, but also for understanding a variety of tauopathies such as frontotemporal
dementia and Pick’s disease (Gotz et al 2004b).
1.4.3 Multi-mutation transgenic mice
Following the generation of APP and tau mutated mice, bi-, tri- and even quin-
transgenic mouse models have been developed. In an attempt to mimic the tau and
plaque pathology of AD, Lewis et al. (2000) crossed the Tg2576 transgenic mouse
model with the rTg(tauP301L) transgenic model of tau phosphorylation (Lewis et al
2001). These mice revealed a seven-fold increase in neurofibrillary tangle formation, as
compared to the single transgenic lines. Following the development of the bi-transgenic
mouse model, Oddo et al. (2003) developed the first tri-transgenic mouse model. This
model, known as the 3x Tg-AD mouse model, exhibited mutations to APP (K670N),
PS1 (M146V) and tau (P301L). The 3x Tg-AD model was the first line to show
hyperphosphorylated tau, plaque deposition and neurofibrillary tangle formation in the

Chapter 1: Introduction ____________________________________________________________________________________
23
same animal. Furthermore, the 3x Tg-AD model showed severe synaptic failure,
neuronal cell loss, neuroinflammation and cognitive dysfunction (Oddo et al 2003) and
therefore closely resembled the pathology of human AD.
Finally, to extend upon the findings of the tri-transgenic mouse model, Oakley et al.
(2006) developed the ‘5XFAD’ model of AD. This model co-expresses three mutations
to APP (K670N, M671L and V717I) as well as two mutations to PS1 (M146L and
L286V). Consequently, these mice show very early Aβ plaque deposition beginning at 2
months of age, memory deficits by 4 months of age and neuron loss by nine months of
age (Eimer & Vassar 2013, Oakley et al 2006).
In summary, a variety of mouse models have been developed in order to investigate
AD. Many of these mouse models differ in the promoters driving expression, the genes
expressed, the mutations present and the background strain utilised. As such,
differences occur in the timing of onset, and degree of, Aβ pathology. In addition, these
models vary in the status of tau phosphorylation, the degree of neuronal cell loss, as
well as the onset of cognitive alteration. The various mouse models have allowed for
mechanistic investigations of AD and have the potential to aid in the development of
cutting-edge therapeutic drugs to curb disease progression.
1.4.4 hAPP-J20 mouse model of AD
The hAPP-J20 mouse model of AD over expresses mutated hAPP and is a useful model
for investigating mechanisms underlying AD. In this model, the platelet-derived growth
factor β chain (PDGF-β) promoter is utilised to drive a hAPP minigene harboring the
Swedish (K670N/M671L) and the Indiana (V717F) mutations (Figure 1.5) (Mucke et al
2000). The PDGF-β promoter directs expression of hAPP primarily in the brain, and
predominantly within neurons. The hybrid minigene contains the introns around exons 7
and 8 of APP, unlike many other APP transgenic models (Mucke et al 2000). This is
important as APP mRNA normally undergoes alternative splicing, resulting in three
isoforms termed APP695, APP751 and APP770. Within the two longer isoforms, a
domain known as the Kunitz protease inhibitor (KPI) exists. The KPI domain mediates
protein-protein interactions with APP, such as the interaction with the TNF‐α-
Chapter 1: Introduction ____________________________________________________________________________________
24
converting enzyme (Hall & Roberson 2012). The normal ratio of
APP695:APP751:APP770 is 20:10:1 in the human brain (Belyaev et al 2010). However,
KPI-positive APP isoforms are more prevalent in AD patients. Thus, the expression of
APP in the hAPP-J20 model allows for alternative splicing of APP and more
realistically mimics APP expression in the human brain.
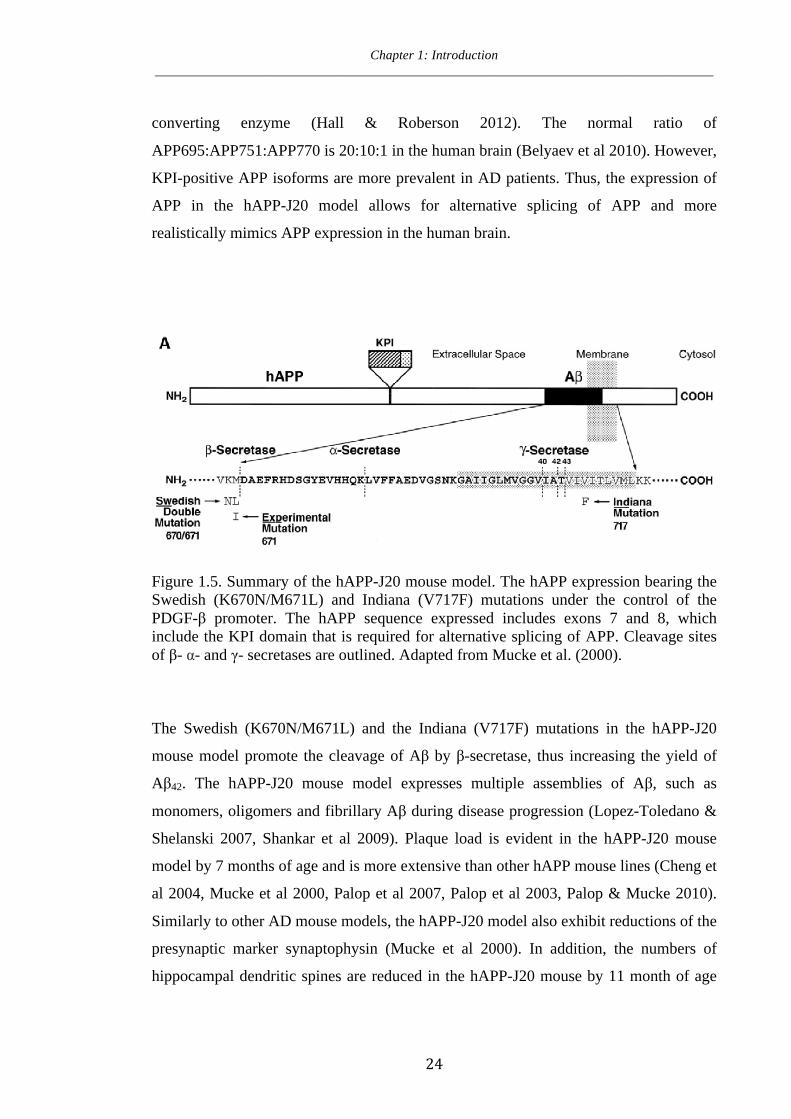
Figure 1.5. Summary of the hAPP-J20 mouse model. The hAPP expression bearing the Swedish (K670N/M671L) and Indiana (V717F) mutations under the control of the PDGF-β promoter. The hAPP sequence expressed includes exons 7 and 8, which include the KPI domain that is required for alternative splicing of APP. Cleavage sites of β- α- and γ- secretases are outlined. Adapted from Mucke et al. (2000).
The Swedish (K670N/M671L) and the Indiana (V717F) mutations in the hAPP-J20
mouse model promote the cleavage of Aβ by β-secretase, thus increasing the yield of
Aβ42. The hAPP-J20 mouse model expresses multiple assemblies of Aβ, such as
monomers, oligomers and fibrillary Aβ during disease progression (Lopez-Toledano &
Shelanski 2007, Shankar et al 2009). Plaque load is evident in the hAPP-J20 mouse
model by 7 months of age and is more extensive than other hAPP mouse lines (Cheng et
al 2004, Mucke et al 2000, Palop et al 2007, Palop et al 2003, Palop & Mucke 2010).
Similarly to other AD mouse models, the hAPP-J20 model also exhibit reductions of the
presynaptic marker synaptophysin (Mucke et al 2000). In addition, the numbers of
hippocampal dendritic spines are reduced in the hAPP-J20 mouse by 11 month of age

Chapter 1: Introduction ____________________________________________________________________________________
25
(Moolman et al 2004, Pozueta et al 2013). Somewhat uniquely, the hAPP-J20 mouse
model are susceptible to seizure activity, similar to that observed in AD patients (Palop
et al 2007). Investigations into cell populations in the hAPP-J20 mouse model have
shown no alteration in the hippocampus (Jin et al 2004). However, these studies were
based on visual histology results and may not accurately depict total cell numbers.
Memory and learning studies in the hAPP-J20 mouse model have often been
controversial. hAPP-J20 mice have shown deficits though others have also found intact
spatial reference memory in the MWM (Galvan et al 2006, Palop et al 2003, Roberson
et al 2007, Sanchez-Mejia et al 2008). The potential confounds in results may be due to
an increase in floating behaviour and increased thigmotaxis. Furthermore, no alteration
to associative memory and learning was found when tested in a fear-conditioning
paradigm (Karl et al 2012). However, hAPP-J20 mice have shown impairments in other
spatial reference memory tests including the cheeseboard and the spontaneous
alternation version of the Y maze (Galvan et al 2006, Karl et al 2012). In addition to
memory and learning, cognitive alteration has been observed in the hAPP-J20 model
including hyperactivity in the OFT and increased open arm entries in the elevated plus
maze (EPM) (Harris et al 2010).
In summary, the hAPP-J20 mouse model of AD has a unique expression of APP that is
capable of alternative splicing; are uniquely susceptible to seizure activity; show
marked loss of spines and synapses; and show cognitive deficits in a myriad of
behavioural tests. However, neuroinflammation and neuronal cell loss are not
extensively characterised in the hAPP-J20 mouse model of AD. Further investigation is
required into the precise timing of onset of pathological and behavioural deficits in the
hAPP-J20 mouse model of AD.
1.5 Excitotoxicity in AD
Of all pathological hallmarks, loss of synapses and neuronal cell death are the closest
correlates of cognitive dysfunction in AD. As such, mechanisms of cell death,
particularly ‘excitotoxicity’ have been investigated in AD mouse models and patients.
Chapter 1: Introduction ____________________________________________________________________________________
26
In the healthy brain, L-glutamate is a major excitatory neurotransmitter acting on two
major receptor subdivisions termed ionotropic and metabotropic glutamate receptors.
Ionotropic glutamate receptors are characterised by their affinity to specific agonists N-
methyl-D-aspartate (NMDA), α-amino-3-hydroxy-5-methylisoxazole-4-propionic acid
(AMPA) and kainic acid (KA). These receptors are able to flux Na+ and K+ ions and
under certain conditions flux Ca2+ ions. This is important for the maintenance of LTP
and LTD and thus is essential for the formation of memory and learning.
In neurological disorders such as AD, excessive L-glutamate results in a large
deregulated influx of Ca2+ through ionotropic glutamate receptors, causing neuronal
dysfunction and activation of cell death pathways (Camandola & Mattson 2011,
Esposito et al 2013, Hynd et al 2004, Ong et al 2013). This process is known as
excitotoxicity. It is postulated that the overstimulation of NMDA receptors by Aβ
oligomers can lead to an excessive influx of Ca2+, which in turn activates intracellular
signalling cascades resulting in synapse loss and cell death. In particular, a direct influx
of Ca2+ can impair proteasome function and cause autophagy. Studies of APP mutant
mouse models have revealed elevated intraneuronal Ca2+ levels and elevated levels of
Ca2+-dependent proteases (Ferreira 2012). In addition, glutamate-receptor-mediated
increases to Ca2+ have been shown to result in an alteration to tau phosphorylation
(Mattson 1990). These studies indicate that glutamate receptors and alterations to
intracellular Ca2+ levels play a critical role in AD neurodegeneration.
The theory of excitotoxic neurodegeneration is supported by the widespread use of
memantine, a non-competitive inhibitor of NMDA receptors, as a therapy for AD.
Research studies have shown that the application of memantine to hippocampal sections
is able to reverse LTP deficiencies in the CA1 and DG of the hippocampus (Klyubin et
al 2011). Furthermore, in mouse models of AD, memantine has been demonstrated to
reduce Aβ plaque burden and increase synaptic density in the hippocampus (Lacor et al
2007). Within the clinic, a recent randomised, double blind, placebo-controlled study
revealed treatment with memantine can reduce the incidences of clinical worsening in
patients suffering moderate to severe AD (Wilkinson et al 2014). However, despite
these positive effects memantine shows little effect when given to early stage AD
Chapter 1: Introduction ____________________________________________________________________________________
27
patients (Herrmann et al 2011). In addition, there are a number of unwanted side effects
of memantine including dizziness; headaches; fainting; seizure and convulsions; anxiety
and aggression (Stone et al 2010). Thus, further investigation into early cell death
mechanisms in AD may aid in the development of drugs that act specifically on injured
neurons in order to prevent further disease progression and limit off-target effects
1.6 AMPA receptors
1.6.1 AMPA receptor formation
In addition to NMDA receptors, AMPA receptors are also play a role in synaptic
plasticity. In some cases, AMPA receptors are inserted into the postsynaptic membrane
during LTP, and are essential for fast excitatory neurotransmission. During LTD,
AMPA receptors are removed from the postsynaptic membrane. AMPA receptors are
tetrameric assemblies of different combinations of four subunits designated as GluA1-
GluA4 (alternatively known as GluR1-R4 and GluR-A to GluR-D) (Dingledine et al
1999, Hollmann & Heinemann 1994, Sobolevsky et al 2009)). The four subunits of
AMPA receptors share 68-73% sequence identity. Each subunit consists of a large
extracellular N-terminus domain, an intracellular C-domain and three transmembrane
domains (M1, M3 and M4). The putative second membrane domain (M2) consists of a
hairpin structure, which changes direction within the membrane and returns to the
intracellular side of the cell (Figure 1.6). Each subunit exists in two forms created by
alternative splicing, termed ‘flop’ and ‘flip’, of an interchangeable sequence consisting
of 38-amino acids found prior to the fourth membrane domain. Each form is expressed
preferentially in different regions of the brain (Cull-Candy et al 2006, Hollmann &
Heinemann 1994).
Chapter 1: Introduction ____________________________________________________________________________________
28
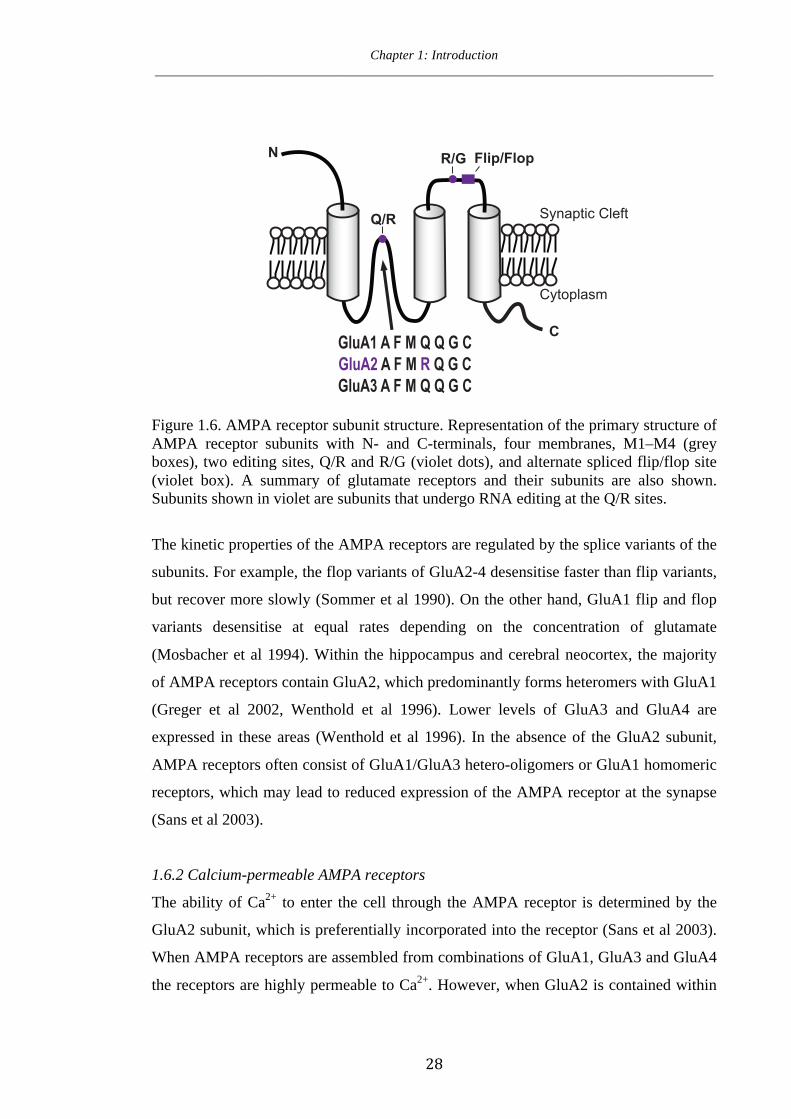
Figure 1.6. AMPA receptor subunit structure. Representation of the primary structure of AMPA receptor subunits with N- and C-terminals, four membranes, M1–M4 (grey boxes), two editing sites, Q/R and R/G (violet dots), and alternate spliced flip/flop site (violet box). A summary of glutamate receptors and their subunits are also shown. Subunits shown in violet are subunits that undergo RNA editing at the Q/R sites.
The kinetic properties of the AMPA receptors are regulated by the splice variants of the
subunits. For example, the flop variants of GluA2-4 desensitise faster than flip variants,
but recover more slowly (Sommer et al 1990). On the other hand, GluA1 flip and flop
variants desensitise at equal rates depending on the concentration of glutamate
(Mosbacher et al 1994). Within the hippocampus and cerebral neocortex, the majority
of AMPA receptors contain GluA2, which predominantly forms heteromers with GluA1
(Greger et al 2002, Wenthold et al 1996). Lower levels of GluA3 and GluA4 are
expressed in these areas (Wenthold et al 1996). In the absence of the GluA2 subunit,
AMPA receptors often consist of GluA1/GluA3 hetero-oligomers or GluA1 homomeric
receptors, which may lead to reduced expression of the AMPA receptor at the synapse
(Sans et al 2003).
1.6.2 Calcium-permeable AMPA receptors
The ability of Ca2+ to enter the cell through the AMPA receptor is determined by the
GluA2 subunit, which is preferentially incorporated into the receptor (Sans et al 2003).
When AMPA receptors are assembled from combinations of GluA1, GluA3 and GluA4
the receptors are highly permeable to Ca2+. However, when GluA2 is contained within
N
C
Q/R
R/G Flip/Flop
Synaptic Cleft
Cytoplasm
GluA1 A F M Q Q G CGluA2 A F M R Q G CGluA3 A F M Q Q G C
Chapter 1: Introduction ____________________________________________________________________________________
29
the AMPA receptor, the Ca2+ permeability is profoundly decreased (Hollmann et al
1991). Thus, since the vast majority of AMPA receptors are hetero-oligomers consisting
of GluA1/GluA2 or GluA2/GluA3 subunits, they are Ca2+-impermeable (Wenthold et al
1996). Importantly, when the GluA2 subunit is present, it must undergo GluA2 RNA
editing for the AMPA receptor to be Ca2+-impermeable (described in more detail in
section 1.7).
The subunit composition of AMPA receptors is important as it affects not only Ca2+
permeability, but also the trafficking of the receptors (Malinow & Malenka 2002).
AMPA receptors are assembled in the endoplasmic reticulum (ER) and are trafficked to
the plasma membrane and their presence at the synapse is in a dynamic equilibrium
between insertion (exocytosis) and removal (endocytosis) (Keifer & Zheng 2010,
Malinow & Malenka 2002, Man 2011). The presence of the GluA2 subunit is important
for the stability and trafficking of AMPA receptors within the synapse, though it is not
essential (Biou et al 2008, Panicker et al 2008). The C-terminus of GluA2 binds with,
among other proteins, N-ethylmaleimide-sensitive factor (NSF), an ATPase, which is
involved in the insertion of the AMPA receptor into the synapse and synaptic activation
of the receptor (reviewed in (Bassani et al 2009)). In fact, a synchrony of complex
intracellular mechanisms drives AMPA receptor trafficking (Jackson & Nicoll 2011,
Kessels & Malinow 2009, Ziff 2007).
1.6.3 Alteration to AMPA receptors in AD
It is widely accepted that the induction of LTP is often due to increased insertion of
AMPA receptors in the postsynaptic membrane. However, in AD mouse models and
patients, AMPA receptor subunit expression is often altered (Hu et al 2012). Several
studies have indicated that Aβ leads to AMPA receptor internalisation and can thus
reduce LTP. Importantly, the addition of Aβ42 was shown to decrease AMPA receptor-
mediated neuronal firing in the CA1 hippocampal region of Wistar rats (Szegedi et al
2005). Furthermore, an elegant study by Hsieh et al. (2006) revealed that Aβ is capable
of driving endocytosis of synaptic AMPA receptors, leading to sustained LTD (Hsieh et
al 2006). This observed endocytosis might be due to enhanced caspase-3 activity in AD,
which leads to GluA1 dephosphorylation and the removal of synaptic AMPA receptors
Chapter 1: Introduction ____________________________________________________________________________________
30
(D'Amelio et al 2011, Minano-Molina et al 2011). This synaptic removal of AMPA
receptors and prolonged LTD may lead to the loss of dendritic spines, and thus disrupt
memory and learning.
Evidence has suggested that Aβ interaction with AMPA receptors may lead to excessive
stimulation and contribute to alterations of neuronal circuitries in AD. Indeed, the
blockade of AMPA receptors in AD models has been shown to be effective in restoring
normal synaptic transmission. In the presence of Aβ, AMPA receptor-mediated
spontaneous excitatory postsynaptic currents (EPSCs) are largely increased (Wang et al
2010). The AMPA receptor antagonists, CNQX and NBQX, have been shown to reduce
the Ca2+ influx caused by the presence of Aβ42 (Alberdi et al 2010). Furthermore, in
vitro investigations have further revealed that the AMPA receptor antagonist, DNQX,
reduced Aβ-induced neurotoxicity and significantly improved cell viability of primary
chick retinal neurons (Louzada Jr et al 2001). In AD mouse models, the AMPA receptor
antagonist, CNQX, blocked neuronal hyperactivity and correlated to cognitive recovery
(Busche et al 2008). Combined, these studies suggest that AMPA receptors are critical
for synaptic function and are potentially contributing to synaptic alteration and cell
death in AD.
In addition to endocytosis, downregulation of total AMPA receptor subunits also occurs
in AD. For example, immunoreactivity of GluA1 is decreased in the entorhinal cortex
and the CA1 region of the hippocampus in AD patients as compared to age-matched
controls (Ikonomovic et al 1995). This downscaling of AMPA receptor subunit
expression has been further observed in single- and double-transgenic mouse models of
AD (Almeida et al 2005, Cha et al 2001, Chang et al 2006) as well as Aβ-treated
primary hippocampal neurons (Liu et al 2010). These studies indicate that alterations to
synaptic plasticity through changes to postsynaptic AMPA receptor function and
numbers may play a role in AD pathogenesis.
Most importantly, studies have indicated that Aβ can lead to increases to Ca2+-
permeable AMPA receptors. Firstly, GluA2/3 downscaling occurs in the entorhinal
cortex and the CA1 region of the hippocampus in the AD brain and correlates to MMSE
Chapter 1: Introduction ____________________________________________________________________________________
31
scores (Ikonomovic et al 1997, Mohamed et al 2011) (caveat that GluA2
downregulation does not always correlate with an increase in Ca2+-permeable AMPA
receptors). Most interestingly, this downregulation of AMPA receptors precedes the
formation of neurofibrillary tangles, indicating that synaptic alterations are an early
marker of AD (Ikonomovic et al 1997). As these regions are most vulnerable to cell
death in AD, this therefore gives rise to the idea that Ca2+-permeable AMPA receptors
are an early physiological effect in AD, leading to excitotoxic neuronal cell death. It has
further been revealed that Aβ can bind to GluA2-containing AMPA channels, leading to
endocytosis of AMPA receptors (Zhao et al 2010). Indeed, the addition of fibrillary Aβ
can activate Ca2+-permeable AMPA receptors in neuronal cell lines, and is blocked by
the AMPA antagonists, CNQX and NBQX (Blanchard et al 2004). Therefore, Ca2+-
permeable AMPA receptors may contribute to excitotoxic cell death in AD and are a
potential therapeutic target for halting disease progression
1.7 AMPA receptor GluA2 subunit RNA editing
As previously described in section 1.6.2, the Ca2+ permeability of AMPA receptors
varies depending on whether the GluA2 subunit is present within the tetramer. In
addition, the ability of the GluA2 subunit to regulate Ca2+ permeability of AMPA
receptors depends on RNA editing. RNA editing is a post-transcriptional modification
that alters a codon encoding glutamine (Gln; Q) to a codon encoding arginine (Arg; R)
in the GluA2 mRNA. AMPA receptors are Ca2+-impermeable if they contain the edited
GluA2(R) subunit. Conversely, AMPA receptors are Ca2+-permeable if they are GluA2-
lacking or if they contain the unedited GluA2(Q) subunit (Figure 1.7).
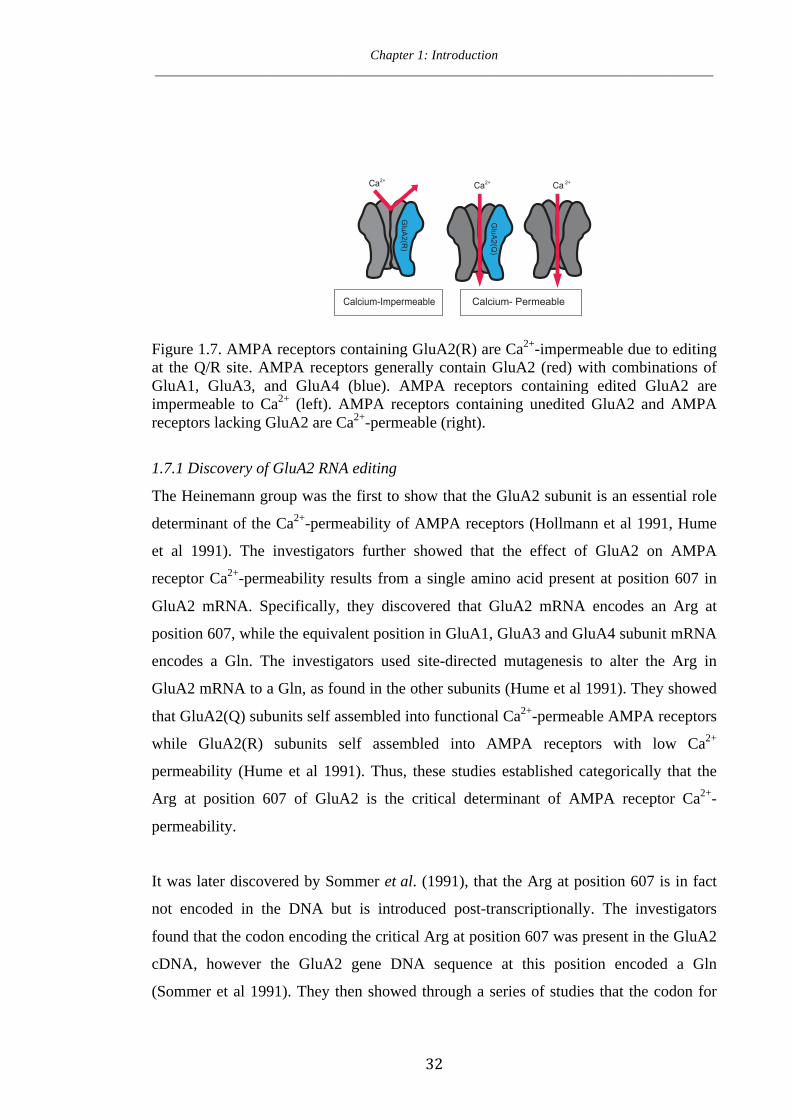
Chapter 1: Introduction ____________________________________________________________________________________
32
Figure 1.7. AMPA receptors containing GluA2(R) are Ca2+-impermeable due to editing at the Q/R site. AMPA receptors generally contain GluA2 (red) with combinations of GluA1, GluA3, and GluA4 (blue). AMPA receptors containing edited GluA2 are impermeable to Ca2+ (left). AMPA receptors containing unedited GluA2 and AMPA receptors lacking GluA2 are Ca2+-permeable (right).
1.7.1 Discovery of GluA2 RNA editing
The Heinemann group was the first to show that the GluA2 subunit is an essential role
determinant of the Ca2+-permeability of AMPA receptors (Hollmann et al 1991, Hume
et al 1991). The investigators further showed that the effect of GluA2 on AMPA
receptor Ca2+-permeability results from a single amino acid present at position 607 in
GluA2 mRNA. Specifically, they discovered that GluA2 mRNA encodes an Arg at
position 607, while the equivalent position in GluA1, GluA3 and GluA4 subunit mRNA
encodes a Gln. The investigators used site-directed mutagenesis to alter the Arg in
GluA2 mRNA to a Gln, as found in the other subunits (Hume et al 1991). They showed
that GluA2(Q) subunits self assembled into functional Ca2+-permeable AMPA receptors
while GluA2(R) subunits self assembled into AMPA receptors with low Ca2+
permeability (Hume et al 1991). Thus, these studies established categorically that the
Arg at position 607 of GluA2 is the critical determinant of AMPA receptor Ca2+-
permeability.
It was later discovered by Sommer et al. (1991), that the Arg at position 607 is in fact
not encoded in the DNA but is introduced post-transcriptionally. The investigators
found that the codon encoding the critical Arg at position 607 was present in the GluA2
cDNA, however the GluA2 gene DNA sequence at this position encoded a Gln
(Sommer et al 1991). They then showed through a series of studies that the codon for
GluA2(R
)
GluA2(Q
)
Ca2+Ca2+Ca 2+
Calcium-Impermeable Calcium- Permeable
Chapter 1: Introduction ____________________________________________________________________________________
33
Arg is introduced into the mRNA by RNA editing. Specifically, RNA editing converts
an adenosine (A) in the critical CAG codon (encoding Gln) found in the pre-mRNA to
an inosine (I), which creates a CIG codon (encoding Arg) in the mRNA (Melcher et al
1996). Since ribosomes read the inosine as a guanosine (G), the editing effectively alters
the CAG codon (encoding Gln) to a CGG codon (encoding Arg). The resulting edited
GluA2(R) subunit prevents Ca2+ influx when it is incorporated into the AMPA receptor.
Conversely, AMPA receptors containing unedited GluA2(Q) are highly permeable to
Ca2+. Unedited GluA2 at the Q/R site can cause AMPA receptor-mediated
excitotoxicity (discussed in section 1.7.3).
1.7.2 ADAR2 and the editing complementary sequence
Notably, GluA2 RNA editing at the Q/R site occurs in ~99% of cases where GluA2 is
present. The editing process is reliant upon an intronic sequence called the editing
complementary sequence (ECS), which is located in intron 11 downstream of the
editing site (Figure 1.8) (Higuchi et al 1993). This ECS forms a dsRNA structure with
the editing site in the pre-mRNA. The primary RNA editing enzyme, adenosine
deaminase acting on RNA (ADAR), identifies this dsRNA structure and alters the CAG
codon encoding Gln to a CIG codon encoding Arg, though it is still unclear how this
site recognition occurs (Dabiri et al 1996). Currently, three ADAR family members
have been identified (ADAR1-3), in which ADAR2 is the primary modifier of the
GluA2 Q/R site (Bass 2002, Melcher et al 1996). All three ADARs are preferentially
expressed in the nervous system. Interestingly, ADAR3 is exclusively expressed in the
brain, however its function remains unknown and it may play a regulatory role in RNA
editing (Chen et al 2000a).

Chapter 1: Introduction ____________________________________________________________________________________
34
Figure 1.8 GluA2 sequence showing the location of the ECS and Q/R site. Dark yellow represent exon 11, including the Q/R site (purple). Light yellow represents intron 11 including the editing complementary sequence (ECS). Black boxes represent the dsRNA formed between intron and exon 11 for the recognition by the ADAR2 enzyme.
1.7.3 Physiological effects of modified GluA2 RNA editing
Mice engineered with reduced RNA editing often present with severe synaptic
alteration. For example, Brusa et al. (1995) revealed that the replacement of the ECS
with a loxP sequence in mice leads to severe seizures and premature death. These mice,
known as GluA2∆ECS/+ mice, exhibit approximately 25% unedited GluA2 mRNA at the
Q/R site (as opposed to ~1% in WT mice) and present with severe synaptic deficits.
Furthermore, Feldmeyer et al. (1999) developed mice with varying amounts of unedited
GluA2 and revealed that this correlated with the degree of synaptic dysfunction and the
corresponding phenotype. Thus, these studies were the first to indicate that modulation
to GluA2 RNA editing could lead to severe hippocampal dysfunction.
Although reducing RNA editing efficiency results in lethality, the ~1% of unedited
GluA2 present in the brain is not essential for survival. Kask et al. (1998) used gene
targeting to generate mice in which the codon for Arg was encoded in the GluA2 gene
(GluA2R/R). These mice were essentially ‘force-edited’ as the Arg was encoded in the
exon and there was no requirement for RNA editing to post-transcriptionally alter
GluA2 at the Q/R site, therefore there was no GluA2(Q) present in these mice. The
authors noted that these GluA2R/R mice were fundamentally normal with no obvious
deficiencies. This suggests that there is no essential functional requirement of the
GluA2(R) allele.
Chapter 1: Introduction ____________________________________________________________________________________
35
As described earlier, ADAR2 is essential for GluA2 RNA editing. Interestingly, mice
engineered with ADAR2 ablation (ADAR2-/-) (Higuchi et al 2000) are phenotypically
comparable to GluA2∆ECS/+ mice (Brusa et al 1995). ADAR2-/- mice show fully unedited
GluA2 and display a 30-fold increase in Ca2+-permeability of AMPA receptors,
resulting in lethality at just several weeks of age (Higuchi et al 2000). In addition,
knockdown of hippocampal ADAR2 levels using viral vectors expressing siRNA
increased Ca2+-permeability of AMPA receptors by approximately 15-fold and
increased cell death (Peng et al 2006).
Notably, when ADAR2-/- mice were crossed with GluA2R/R mice, the lethal phenotype
observed in the ADAR2-/- mice was rescued and survival rates were significantly
increased to several months of age (Higuchi et al 2000). Therefore, if the GluA2 gene is
artificially ‘force-edited’, then ADAR2 is no longer essential for survival. This
remarkable experiment revealed that ADAR2 is essential for survival because of its role
in editing GluA2 at the Q/R site. Thus, although other roles have been explored (Horsch
et al 2011), it appears that RNA editing at the Q/R site of GluA2 is the essential target
substrate of ADAR2.
Combined, the aforementioned studies make it clear that alterations to RNA editing by
modifying the ECS, or by ablation of ADAR2, is detrimental to cell survival, leading to
the hypothesis that these mechanisms could possibly contribute to excitotoxicity in
diseases such as AD.
1.7.4 Excitotoxicity and GluA2 RNA editing
ADAR2 degradation would be expected to play a role in many diseases where Q/R site
editing is compromised. Mahajan et al. (2011) have demonstrated that high
concentrations of glutamate can activate processes that induce cleavage of the ADAR2
enzyme in vitro. This glutamate-induced cleavage is both dose- and time-dependent and
is reliant upon the activation of NMDA receptors. However, when calpain inhibitors
were applied to glutamate-stimulated neurons that virally expressed ADAR2, no
cleavage of the enzyme was observed. Proteasome inhibitors and caspase inhibitors
Chapter 1: Introduction ____________________________________________________________________________________
36
were unable to prevent ADAR2 degradation thus proving calpain mediates ADAR2
cleavage when in the presence of excessive glutamate (Mahajan et al 2011). Thus,
Mahajan et al. (2011) has provided insights into a direct mechanism in which
neurological catastrophes may potentially cause GluA2 RNA editing deficiencies.
1.7.5 Regulation of GluA2 RNA editing
The molecular mechanisms that regulate GluA2 RNA editing are beginning to emerge.
Peng et al. (2006) showed that altered cAMP response element-binding (CREB)-
transcriptional regulation leads to a reduction in ADAR2 expression. By virally
expressing CREB following transient global ischemia, ADAR2 production was
restored, thereby increasing GluA2 Q/R RNA editing back to levels over 90% and
resulting in neuroprotection. This study was the first to show a mechanism by which
GluA2 RNA editing deficiencies occur in the diseased brain. More recently, other
transcriptional regulators have been shown to play a role in ADAR2 expression. In the
absence of peptidyl-prolyl isomerase NIMA-interacting protein 1 (Pin1), which is
responsible for phosphorylation of ser/thr-pro motifs, editing efficiency at the Q/R site
is reduced (Marcucci et al 2011). By co-transfecting a plasmid encoding ADAR2 with a
GluA2 minigene, an RNA editing level of 100% was achieved. However, when Pin1
was blocked by siRNA, the editing efficiency dramatically fell to 53%. Similar levels of
Q/R site editing were seen when co-transfection was conducted with the GluA2
minigene and ADAR2 into immortalised mouse fibroblast cell lines derived from Pin1-/-
mice. In addition, the mislocalisation of ADAR2 in the absence of Pin1 also reduced
editing at the R/G site highlighting the necessity of ADAR2 for editing at this site.
Furthermore, in the absence of Pin1 the authors observed the mislocalisation of ADAR2
into the cytoplasm, rendering it unable to efficiently edit GluA2 (Marcucci et al 2011).
Within the cytoplasm WWP2, which possesses ubiquitin-protein ligase activity, is able
to degrade ADAR2 and is therefore a negative regulator of the protein (Marcucci et al
2011). These sophisticated studies show that there is regulation of ADAR2 and raises
significant excitement about the potential for understanding the regulation of RNA
editing.
Chapter 1: Introduction ____________________________________________________________________________________
37
1.7.6 GluA2 RNA editing in diseases
It has been suggested that Ca2+-permeable AMPA receptors resulting from GluA2
downregulation occurs in various neurological diseases such as ischemia, epilepsy and
AD (as previously described) (Gorter et al 1997, Pellegrini-Giampietro et al 1992,
Pollard et al 1993). In addition, reduced GluA2 Q/R-site RNA editing also results in the
formation of Ca2+-permeable GluA2(Q)-containing AMPA receptors in ischemia.
Historically, numerous attempts were made to identify unedited GluA2 RNA and little,
if any, was ever found to be present in both the healthy and diseased brain (Akbarian et
al 1995, Kortenbruck et al 2001, Rump et al 1996). This led to the widely held concept
that the presence or absence of the GluA2 subunit, rather than RNA editing, is the main
process for regulating Ca2+-permeability of AMPA receptors in disease. As such, the
role of unedited GluA2 in many neurological disorders has never been investigated on a
cellular level as was recently done for ischemia (Peng et al 2006).
RNA editing deficits have been shown in motor neurons of patients with Amyotrophic
lateral sclerosis (ALS) (Kawahara et al 2004a, Takuma et al 1999). No alteration to
GluA2 mRNA expression was observed, however, spinal motor neurons showed a
GluA2 RNA editing efficiency ranging from 0% to 100% in individual neurons
(Kawahara et al 2004a). Within the same patients, GluA2 RNA editing in Purkinje cells
was unaltered, indicating that the deficiency is motor neuron specific. While the work
by Kawahara et al. (2004) does not prove that unedited GluA2 is a cause of cell loss in
ALS, the results are highly important when put in the context of the work conducted by
Brusa et al. (1995) and Feldmeyer et al. (1999), which showed that the process of RNA
editing at the GluA2 Q/R site is essential for cell survival.
It is perhaps interesting, however, that in mice transgenic for mutant human Cu/Zn-
superoxide dismutase (SOD1), a classic model of familial ALS, RNA editing
deficiencies at the Q/R site were not observed (Kawahara et al 2006). This highlights
the possibility that mouse models of familial ALS may not fundamentally represent the
disease pathogenesis in humans and/or suggests that unedited GluA2 mRNA at the Q/R
site is not needed for the ALS phenotype. Despite this, studies have shown that crossing
SOD1 mice with mice that express Ca2+-permeable AMPA receptors (generated by

Chapter 1: Introduction ____________________________________________________________________________________
38
inserting an asparagine codon at the Q/R site) accelerates motor deterioration and
disease onset when compared to age-matched SOD1 mice (Kuner et al 2005). It is likely
that GluA2 RNA editing deficiencies occur in ALS due to the downregulation of
ADAR2, which has decreased expression in the spinal cords of patients with sporadic
ALS (Hideyama et al 2010, Kawahara & Kwak 2005). In fact, the ablation of ADAR2
expression in mice results in a phenotype very similar to ALS patients including the
progressive death of motor neurons and a decline in motor function (Hideyama et al
2010). ADAR2 downregulation in ALS correlates with phosphorylated TDP-43, an
RNA binding protein whose mutations are associated with ALS (Aizawa et al 2010).
These studies could suggest that GluA2 RNA editing deficiencies may be an important
event in ALS, though the cellular mechanisms that regulate RNA editing deficiencies in
ALS remain unsolved.
Recent evidence has indicated that GluA2 RNA editing deficiencies also occur in
ischemia. In a model of transient global ischemia, the GluA2 RNA editing efficiency of
individual neurons at the Q/R site in the CA1 region of the hippocampus was
dramatically decreased (Peng et al 2006). Using electrophysiology and single cell RT-
PCR, the authors correlated the GluA2 RNA editing efficiency of individual neurons to
their Ca2+ permeability. RNA editing at the Q/R site showed extremely high variability
(7%-98%) in editing efficiency following ischemic insult within neurons of the CA1
region of the hippocampus. This editing efficiency correlated closely to the Ca2+
permeability of the neurons. Neither cell death nor GluA2 RNA editing deficiencies
were seen in the CA3 region, indicating that the CA1 region is most vulnerable to
editing changes and ischemic insult. Interestingly, this cellular death closely correlated
with the downregulation of ADAR2 (Peng et al 2006). The authors demonstrated that
by virally-mediated expression of ADAR2 in vivo, the RNA editing efficiency at the
GluA2 Q/R site was adequately enhanced to over 95% post-ischemic insult and
consequently led to neuroprotection. These experiments provide substantial evidence
that GluA2 RNA editing plays a vital role in mediating excitotoxic neuronal death
during ischemia.
Chapter 1: Introduction ____________________________________________________________________________________
39
Since Ca2+-permeable AMPA receptors appear to occur due to the presence of unedited
GluA2 and also from GluA2-lacking receptors in ischemia, the question arises as to
which of these two types of AMPA receptors are expressed at the synapse and whether
only one type, or both, contribute to cell death. Given the astonishing results by Peng et
al. (2006), which showed that the over-expression of ADAR2 is able to rescue cell loss
following ischemic insult, it is possible that despite GluA2-lacking receptors being
present, the unedited GluA2 is critical in cell death.
1.8 GluA2 RNA editing in Alzheimer’s disease
The role of GluA2 RNA editing in AD is not extensively characterised. Akbarian et al.
(1995) first discovered a significant increase in unedited GluA2 in the prefrontal cortex
of post mortem AD patients, as compared to age-matched controls. Furthermore, during
the production of this thesis, recent literature has shown an increase to unedited GluA2
in the CA1 region to the hippocampus of post-mortem AD patients (Gaisler-Salomon et
al 2014). However, the extent of unedited GluA2 RNA editing and its role in AD
disease progression remains uninvestigated.
1.9 Hypothesis
Synaptic loss and consequential neurodegeneration are the critical hallmarks of AD that
ultimately lead to memory loss and behavioural changes. However, the mechanisms that
regulate cell loss in AD are largely unknown. It is now clear that unedited GluA2
contributes to cell death in ischemia and ALS. Thus, we hypothesise that increased
levels of unedited GluA2 are able to result in cell death, and are contributing to
neurodegeneration and behavioural changes in AD.
In order to address this hypothesis the aims of this thesis are as follows:
1. Characterise an AD mouse model for common pathological hallmarks and
behavioural decline
In order to assess the effects of GluA2 RNA editing in AD, we first aimed to
deeply characterise the hAPP-J20 mouse model for the common pathological
hallmarks of AD. This was required in order to gain an understanding of
Chapter 1: Introduction ____________________________________________________________________________________
40
degeneration over time, and to select an appropriate age to investigate GluA2
RNA editing changes in AD. In particular, we aimed to assess Aβ deposition,
neuronal populations, inflammation, physiology, and learning and memory in
the hAPP-J20 mouse model at 6, 12, 24 and 36 weeks of age.
2. Determine if the expression of unedited GluA2 in mice is able to lead to
neuronal cell loss and spine changes
Prior to understanding the role of GluA2 RNA editing in AD, we aimed to
assess how an increase in unedited GluA2 could affect hippocampal integrity.
This study was required to (1) establish paradigms that are required to
investigate GluA2 RNA editing and (2) determine if unedited GluA2 can
modulate the hippocampal circuitry. Specifically, we established a genetic
mouse model to increase unedited GluA2 in the hippocampus. We aimed to
characterise this mouse model for unedited GluA2 abundance, AMPA receptor
expression and composition, the presence of Ca2+-permeable AMPA receptors,
hippocampal neuronal numbers, dendritic spines, and inflammation. Thus, we
aimed to determine how increased unedited GluA2 affects synaptic plasticity in
a non-diseased state.
3. Determine if blocking unedited GluA2 by genetic mutation can rescue AD
pathology
Following the characterisation of the hAPP-J20 mouse model, we aimed to
assess if abundant unedited GluA2 is present in the CA1 region of the
hippocampus. Furthermore, we assessed if crossing this mouse model with a
mouse model that only expresses edited GluA2 could rescue the hippocampal
deficits assessed in Aim 1. We assessed GluA2 RNA editing efficiency, AMPA
receptor expression and composition, Aβ deposition, hippocampal neuronal
numbers, dendritic spines, and inflammation. We aimed to characterise how
forced edited GluA2 modulates synaptic plasticity and AD pathogenesis in the
healthy and AD brain.

Chapter 1: Introduction ____________________________________________________________________________________
41
4. Determine if blocking unedited GluA2 by genetic mutation can rescue
behavioural deficits in an AD mouse model
Finally, we aimed to determine whether the expression of forced edited GluA2
in the hAPP-J20 mouse model could rescue behavioural memory and learning
deficits. These discrepancies, including alteration to anxiety, locomotion,
balance, non-spatial and spatial memory and learning were assessed through a
myriad of behavioural tests. Therefore, the aim of this chapter was to assess the
functional effects of GluA2 RNA editing modulation in the healthy and AD
brain.

42
Chapter 2
Materials and Methods
Chapter 2: Materials and Methods ____________________________________________________________________________________
43
2.1 Animals
All animal experiments were performed with the approval of the Garvan Institute and
St. Vincent’s Hospital Animal Ethics Committee, in accordance with National Health
and Medical Research Council animal experimentation guidelines and the Australian
Code of Practice for the Care and Use of Animals for Scientific Purposes (2004). For all
studies, mice were kept on a 12h light/dark cycle (lights on at 7:00am). A description of
all mice utilised in this study can be found in Appendix 1-3.
2.1.1 hAPP-J20 mice
Male hemizygous transgenic (hAPP-J20) and non-transgenic littermates (WT) were
from the B6.Cg-Tg(PDGFB-APPSwInd)20Lms/2J (J20) line, which express hAPP
containing both the Swedish and Indiana mutations, under a PDGF-β chain promoter.
This mouse model is designed to mimic sporadic AD. Mice were maintained on a
C57Bl6 backcross. Mice were housed at a maximum five mice per cage. For
behavioural studies, mice were housed individually. Food and water were available ad
libitum until dietary restrictions began, for those mice undergoing radial arm maze
(RAM) testing.
2.1.2 GluA2+/ECS(CG) mice
The GluA2+/ECS(CG) mice were generated by Dr. Bryce Vissel and colleagues
(unpublished). This mouse model was designed to increase the percentage of unedited
GluA2 mRNA in the brain. Briefly, the targeting construct was generated from DNA
cloned from a 129 SvEv DNA genomic library. A neomycin gene, surrounded by loxP
sites, was placed downstream of exon 11. In addition, a single base pair guanine to
cytosine mutation was created within the editing complementary sequence (ECS). This
altered the endogenous ECS sequence 5’-TTTGCTGCATA-3’ to the mutated sequence
5’-TTTGCTGGATA-3’. The construct was electroporated into CCE embryonic stem
cells, which were derived from 129SvEv mice. Colonies resistant to G418 were
isolated. An ES cell colony that contained the allele was identified. This ES cell colony
was electroporated with a Cre-expressing plasmid and replated in the absence of G418,
thus excising the neomycin and leaving a single loxP site. ES cell colonies containing
the allele were chosen for blastocyst injection.
Chapter 2: Materials and Methods ____________________________________________________________________________________
44
2.1.3 GluA2R/R mice
The GluA2R/R mice were generated by Dr. Bryce Vissel and colleagues (unpublished).
These mice eliminate the need for GluA2 RNA editing. Briefly, the targeting construct
was generated from DNA cloned from a 129 SvEv DNA genomic library. A neomycin
gene, surrounded by loxP sites, was placed downstream of exon 11. In addition, a single
point arginine to guanine mutation was made at the Q/R editing site of intron 11. The
construct was electroporated into CCE embryonic stem cells, which were derived from
129SvEv mice. Colonies resistant to G418 were isolated. An ES cell colony that
contained the allele was identified. This ES cell colony was electroporated with Cre-
expressing plasmid and replated in the absence of G418, thus excising the neomycin
and leaving a single LoxP site. Mice were maintained on a C57Bl6 backcross. Mice
were housed at a maximum five mice per cage. For behavioural studies, mice were
housed individually. Food and water were available ad libitum until dietary restrictions
began, for those mice undergoing radial arm maze (RAM) testing.
2.2 Genotyping and DNA sequencing
2.2.1 DNA extraction
Genomic DNA from tail biopsies was extracted for genotype analysis. Tail samples
were incubated in lysis buffer (25mM NaOH, 0.2mM EDTA) for 30 min at 95°C before
being cooled at 4°C. 50mL of Tris-HCl (pH 11) was added and samples were spun at
14,0000 x g for 10 min. The supernatant containing the DNA was extracted.
2.2.2 Genotyping of hAPP-J20 mice
DNA was extracted from tail biopsies as described in section 2.2.1. PCR amplification
was performed with genomic DNA using specific oligonucleotide primers for the target
hAPP allele and internal control allele. Primers for the target allele were as follows:
forward- 5′-GGT GAG TTT GTA AGT GAT GCC-3′; and reverse- 5′-TCT TCT TCT
TCC ACC TCA GC -3′. For the internal control allele, primers included Forward: 5′-
CAA ATG TTG CTT GTC TGG TG-3′ and Reverse: 5′-GTC AGT CGA GTG CAC
AGT TT-3′. The four primers were used in a multiplex PCR with LA Taq master mix
Chapter 2: Materials and Methods ____________________________________________________________________________________
45
(Takara, Mountain View, CA, USA) with the following amplification conditions: 94°C
for 1.5 min and 35 cycles of 94°C for 30 s, 62°C for 1 min, 72°C for 45 sec and a 2 min
incubation at 72°C at the end of the run. Amplification products were resolved on a 4%
agarose gel in 1X Tris-Acetate EDTA (TAE) buffer. Gels were pre-stained with
ethidium bromide (0.5 µg/ml) and bands were visualised by UV transillumination
(Foto/UV21, Fotodyne transilluminator), and sized against DNA molecular weight
markers (New England Bioscience, Ipswich, MA, USA). For the internal control allele a
200bp product was produced and for the hAPP allele a 360bp allele was produced.
2.2.3 Genotyping of GluA2+/ECS(CG) and GluA2R/R mice
DNA was extracted from tail biopsies as described in section 2.2.1. Genotyping was
performed through PCR amplification of genomic DNA. Specific oligonucleotide
primers for the GluA2 wild-type allele were: forward- 5′-GTG TCT CTT GGG GAA
GTT CAA T-3′; and reverse- 5′- TGA TAT ATT TCC CTC TTC TCA GCC AGT GG -
3′. For the targeted allele, a primer was designed from within the loxP sequence as
follows: reverse- 5′-TGC CCA CAT CTA AGA TTG TTG GAC-3′. The three primers
were used in a multiplex PCR with LA Taq master mix (Takara, Mountain View, CA,
USA) using the following amplification conditions: 94°C for 1 min and 30 cycles of
98°C for 20 s, 60°C for 1 min, and a 2 min incubation at 72°C at the end of the run. The
amplification products were resolved on a 4% agarose gel in 1x TAE buffer. Gels were
pre-stained with ethidium bromide (0.5 µg/ml) and bands were visualised by UV
transillumination (Foto/UV21, Fotodyne transilluminator), and sized against DNA
molecular weight markers (New England Biolabs, Ipswich, MA, USA). For the internal
control allele a 200bp product was produced and for the target allele a 250bp allele was
produced.
2.2.4 Sequencing of GluA2+/ECS(CG) and GluA2R/R mice
DNA was extracted from tail biopsies using as described above in section 2.2.1. A
single-step multiplex PCR targeted at amplifying intron and exon 11 of GluA2 was
utilised for confirmation of the mutations of the GluA2+/ECS(CG) and GluA2R/R mouse
lines. Primers used were forward: 5’-TGG CAC ACT GAG GAA TTT GA-3’; and
reverse: 5’- TCA CAA ACA CAC CCA TTT CCA-3’. The PCR assay was carried out

Chapter 2: Materials and Methods ____________________________________________________________________________________
46
in a final volume of 50µl containing 1 x Reaction buffer (New England Biolabs,
Ipswich, MA, USA), 200mM dNTPs (Invitrogen, Grand Island, NY, USA), 2.5mM of
each primer, 0.01 U of Q5 Hot Start High Fidelity DNA Polymerase (New England
Biolabs, Ipswich, MA, USA) and 1µL of DNA template. The following thermocycling
conditions were used: initial denaturation at 98°C for 30s, 33 cycles of 98°C for 10s,
60°C for 30s, 72°C for 30s and a final elongation step at 72°C for 10 min.
PCR products were purified using QIAquick PCR purification kit (Qiagen, Venlo,
Limburg, Netherlands). Briefly, 125µl of Buffer PB was added to 25µL of the PCR
product. The product was added to the QIAquick spin column and centrifuged for 60
sec at 13,000 x g. The columns were washed with 750µL of Buffer PE and the final
DNA was eluted in 50µL of elution buffer. Samples were diluted to 10 ng/mL and dried
with 3.2pmol of forward or reverse primers.
Samples were sequenced at the Garvan Institute of Medical Research Australian Cancer
Research Foundation (ACRF) Facility using an ABI 3130XL Genetic Analyzer
(Applied Biosystems) with Big Dye 3.0 chemistry, after which sequences were
assembled and analysed using Finch TV (Geospiza Inc.).
2.3 Tissue Staining and Stereological Analysis
Tissue staining and stereological quantification was used to analysis cell populations
(Chapters 3, 4 and 5).
2.3.1 Tissue preparation
Mice were anesthetised with a cocktail of ketamine (8.7mg/mL) and xylazine
(2mg/mL). Mice were transcardially perfused at a pump rate of 10mL/min with ice-cold
0.9% sodium chloride (NaCl) solution, followed by perfusion with 4%
paraformaldehyde (PFA; Sigma-Aldrich; St Louis, MO) dissolved in 1x phospho-
buffered saline (PBS; pH 7.4) for 10 min. Brain tissue was harvested and post-fixed in
4% PFA for 6 hrs before being cryoprotected in 30% sucrose in 1x PBS for 2-3 days.
Brains were prepared for cryosectioning by placing in a mold containing optimum
cutting temperature (OCT) formulation (Tissue-Tek®; Sakura, Torrence, CA, USA) and
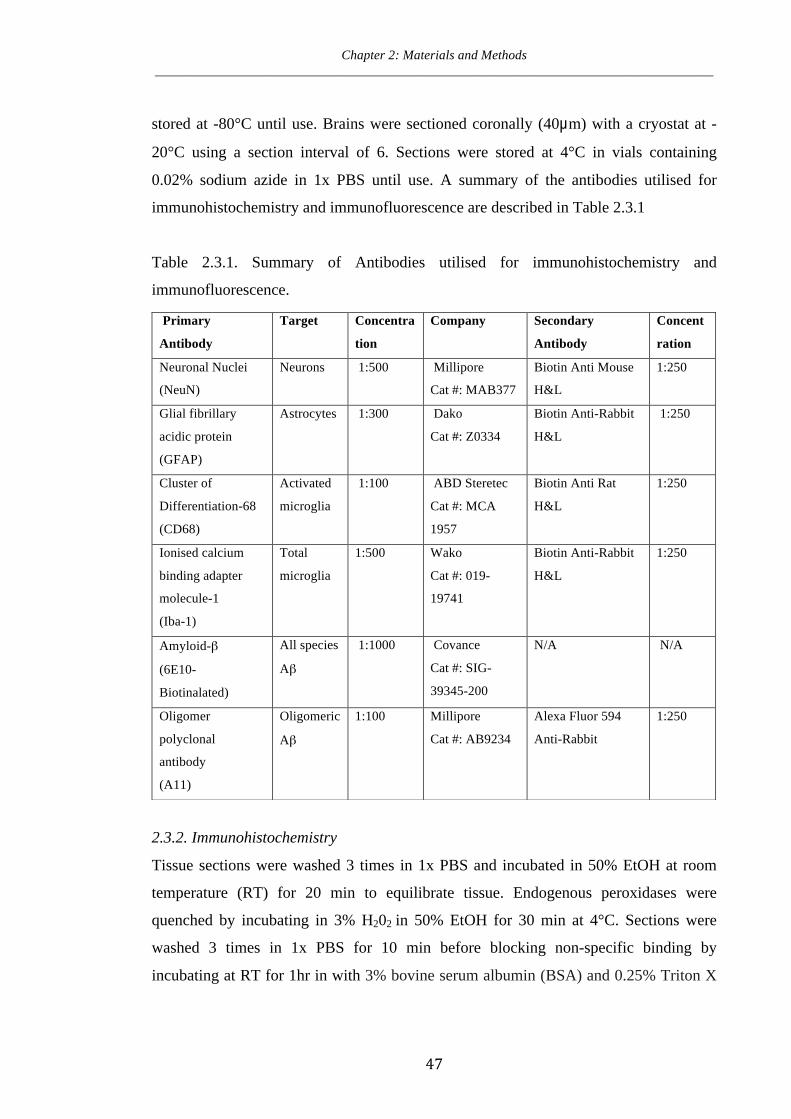
Chapter 2: Materials and Methods ____________________________________________________________________________________
47
stored at -80°C until use. Brains were sectioned coronally (40µm) with a cryostat at -
20°C using a section interval of 6. Sections were stored at 4°C in vials containing
0.02% sodium azide in 1x PBS until use. A summary of the antibodies utilised for
immunohistochemistry and immunofluorescence are described in Table 2.3.1
Table 2.3.1. Summary of Antibodies utilised for immunohistochemistry and
immunofluorescence.
2.3.2. Immunohistochemistry
Tissue sections were washed 3 times in 1x PBS and incubated in 50% EtOH at room
temperature (RT) for 20 min to equilibrate tissue. Endogenous peroxidases were
quenched by incubating in 3% H202 in 50% EtOH for 30 min at 4°C. Sections were
washed 3 times in 1x PBS for 10 min before blocking non-specific binding by
incubating at RT for 1hr in with 3% bovine serum albumin (BSA) and 0.25% Triton X
Primary
Antibody
Target Concentra
tion
Company Secondary
Antibody
Concent
ration
Neuronal Nuclei
(NeuN)
Neurons 1:500 Millipore
Cat #: MAB377
Biotin Anti Mouse
H&L
1:250
Glial fibrillary
acidic protein
(GFAP)
Astrocytes 1:300 Dako
Cat #: Z0334
Biotin Anti-Rabbit
H&L
1:250
Cluster of
Differentiation-68
(CD68)
Activated
microglia
1:100 ABD Steretec
Cat #: MCA
1957
Biotin Anti Rat
H&L
1:250
Ionised calcium
binding adapter
molecule-1
(Iba-1)
Total
microglia
1:500 Wako
Cat #: 019-
19741
Biotin Anti-Rabbit
H&L
1:250
Amyloid-β
(6E10-
Biotinalated)
All species
Aβ
1:1000 Covance
Cat #: SIG-
39345-200
N/A N/A
Oligomer
polyclonal
antibody
(A11)
Oligomeric
Aβ
1:100 Millipore
Cat #: AB9234
Alexa Fluor 594
Anti-Rabbit
1:250
Chapter 2: Materials and Methods ____________________________________________________________________________________
48
(TX-100) in 1x PBS. Following this, sections were incubated in primary antibodies
diluted in 3% BSA + 0.25% TX-100 in PBS for 72 hrs at 4°C. Tissue was washed 3
times in 1x PBS before incubation in biotinylated secondary antibody diluted in 3%
BSA and 0.25% TX-100 in PBS for 24 hrs. Avidin-biotin enzyme solution (ABC kit,
Vector Labs, Burlingame, CA, USA) was prepared according to manufacturer
instructions and left to complex for 30 min at RT. Sections were washed 3 times in 1x
PBS and then incubated in ABC solution for 1 hr. Next, sections were washed 3 times
in 1x PBS and incubated at RT in 3,3’-diaminobenzidine (DAB) peroxidase substrate
solution for 5 min (Vectastain DAB substrate kit, Vector Labs, Burlingame, CA, USA).
DAB solution was prepared by mixing 2 drops of buffer solution to 5mLs of milliQ
H20, then mixing 4 drops of DAB solution, and finally mixing 2 drops of hydrogen
peroxide (H202) solution. Tissue was washed 3 times for 10 min in 1x PBS before
incubation in DAB solution at RT for 5 min. Tissue was washed 3 times for 10 min with
1x PBS.
For tissue immunostained with anti- CD68, Iba-1 and GFAP antibodies, sections were
first processed for NeuN and the protocol was repeated using the appropriate antibody,
as described above. Sections were processed for NeuN using NovaRED peroxidase
solution (Vector Labs, Burlingame, CA, USA) to stain NeuN positive cells red.
NovaRED solution was prepared according to the manufacture’s instructions by mixing
3 drops of reagent 1, 2 drops of reagent 2, 2 drops of reagent 3 and 2 drops of H202
solution to 5mL of milliQ H20. Sections were then processed for CD68, Iba-1or GFAP
using DAB, with the addition of 2 drops of Nissel to stain positive cells black. Sections
were mounted onto SuperFrost-plus slides (Menzel-Glaser, Waltham, MA, USA) and
coverslipped with Kaiser’s glycerol-gelatin mounting medium (Merck; Billerica, MA,
US).
2.3.3 Stereology
Stereological quantification allows for sampling of cell populations in a statistically
unbiased method. Stereology, particularly the optical fractionator method, is an accurate
way to quantify densely packed regions such as that as the hippocampus. Stereology
Chapter 2: Materials and Methods ____________________________________________________________________________________
49
was performed in this thesis as per Abdipranoto et al. (2009), with some modification
based on markers of interest.
Quantification of cell population estimates were made using a brightfield microscope
(Zeiss Axo Imager A1) Stereo Investigator 7 (MBF Bioscience, Grand Rapids, MI,
USA) as previously described (Abdipranoto-Cowley et al 2009). Estimates were
conducted on the dorsal hippocampus at the antero-posterior (AP) positions from
bregma between -1.34mm and -2.3mm. For all cell population estimates the optical
fractionator probe method was used.
For NeuN-positive neuronal population estimates, a minimum 25 sampling sites were
sampled per section on a grid size of 84µm x 60µm and a counting frame size of 30µm
x 30µm. For GFAP-positive astrocyte population estimates, a minimum of 30 sampling
sites were sampled per section on a grid size of 68µm x 68µm and a counting frame size
of 30µm x 30µm. For CD68-positive activated microglial population estimates, a
minimum of 40 sampling sites were sampled per section on a grid size of 114µm x
68µm and a counting frame size of 65µm x 65µm. For Iba-1-positive microglial
population estimates, a minimum of 40 sampling sites were sampled per section on a
grid size of 45µm x 45µm and a counting frame size of 65µm x 45µm. For all cell
population estimates, a guard zone of 5µm and a dissector height of 10µm were used.
The average section thickness of the first and last sections of each brain was measured
within the region of interest. Each marker was assessed at one in every sixth section,
with a total of five sections being sampled. The regions sampled included the CA3 and
CA1 regions of the hippocampus for neuronal, astrocyte and Iba-1 positive microglia
populations. CD68-positive microglia populations were sampled within the borders of
the CA1, CA3 and dentate gyrus (DG) regions of the hippocampus. All stereological
cell counts were performed blind to genotype and age.
2.4 Analysis of Aβ
Aβ analysis was utilised to quantify varies Aβ species amongst various ages and
genotypes (Chapters 3 and 5).
Chapter 2: Materials and Methods ____________________________________________________________________________________
50
2.4.1 Immunofluorescence of Aβ oligomers
Sections were washed 3 times with 1x PBS and incubated for 1hr at RT in blocking
solution containing 15% fetal bovine serum (FBS) + 0.1% TX-100 blocking solution.
Sections were incubated overnight at 4°C in anti-Aβ oligomer antibody, A11
(Millipore, Billerica, MA, USA) in blocking soluiton. Sections were washed 3 times in
1x PBS and incubated in Alexa Fluor 594 Goat anti-rabbit IgG (1:250, Invitrogen,
Grand Island, NY, USA) for 3 hrs at RT. Sections were mounted onto superfrost-plus
slides (Menzel-Glaser, Waltham, MA, USA) and coverslipped with Kaiser glycerol-
gelatin mounting medium (Merck, Billerica, MA, US). Slides were imaged using a
Zeiss Axioplan upright fluorescence microscope with Zeiss Axiocam MRm digital
camera. Digital images were captured using Axiovision V 4.8.1.0 software.
2.4.2 Aβ immunohistochemistry and quantification of total Aβ
Sections were washed 3 times in 1x PBS and incubated in 50% EtOH at RT for 20 min.
Endogenous peroxidases were quenched using 3% H202 in 50% EtOH for 30 min at
4°C. Sections were washed 3 times for 10 min and were subjected to blocking with 3%
BSA + 0.25% TX-100 in 1x PBS for 1 hr. Sections were incubated in biotynilated 6E10
antibody (1:1000; Covance, Sydney, Australia) diluted in 3% BSA + 0.25% TX-100 in
1x PBS for 24 hrs at 4°C. Sections were washed 3 times in 1x PBS and then incubated
in Avidin-biotin enzyme solution (ABC kit, Vector labs, Burlingame, CA, USA) for 1
hr. Sections were washed and incubated at RT in DAB solution (Vectastain DAB
substrate kit, Vector Labs, Burlingame, CA, USA). DAB solution was prepared by
mixing 2 drops of buffer solution to 5ml of milliQ water, then mixing 4 drops of DAB
solution, and finally mixing 2 drops of H202 solution. Tissue was washed 3 times for 10
min in 1x PBS before incubation in DAB solution at RT for 5 min. Tissue was washed 3
times for 10 min with 1x PBS.
Quantification of 6E10 staining was performed using the Image-Pro Plus v.6.0 (Media
Cybernetics) image analysis system to analyse the percent area occupied by positive
staining. Images from the hippocampal region subfield at the antero-posterior (AP)
positions from bregma between -1.34mm and -2.3mm were collected at 10x
magnification (five sections per animal, using a section interval of 6). Images were

Chapter 2: Materials and Methods ____________________________________________________________________________________
51
imported into Image-Pro Plus and an intensity threshold level was set to allow for the
discrimination between 6E10 positive staining and background. The percentage of
positive staining was calculated as the total Aβ deposition load.
2.4.3 Quantification of Aβ plaque load
Thioflavine S staining was used to determine fibrillar Aβ plaque deposition. Sections
were slide mounted and allowed to dry, prior to being washed with distilled H20 and
treated with 70% followed 80% EtOH for 5 min each. Slides were incubated for 15 min
with 1% thioflavine S (Sigma-Aldrich; St Louis, MO) in 80% EtOH. Plaque
quantification was conducted in the hippocampal region subfield from five sections per
animal (using a section interval of 6) at the antero-posterior (AP) positions from bregma
between -1.34mm and -2.3mm. All plaque counts were conducted manually and were
blind to genotype and age. Slides were imaged using a Zeiss Axioplan upright
fluorescence microscope with Zeiss Axiocam MRm digital camera. Digital images were
captured using Axiovision V 4.8.1.0 software.
2.4.4 Dot blot of oligomeric Aβ
Mice were cervically dislocated and the hippocampus was rapidly dissected from the
brain and frozen at -80°C until use. Tissue was homogenised in 500µL Radio-
Immunoprecipitation Assay (RIPA) buffer (Sigma-Aldrich; St Louis, MO)
supplemented with a protease inhibitor cocktail (1:100, Sigma-Aldrich, St Louis, MO).
Protein concentrations of the supernatant were measured using a Bradford assay and
samples were adjusted to the same concentrations with the addition of RIPA buffer.
20µg of extract was applied to a nitrocellulose membrane and air-dried. Membranes
were incubated for 1hr at RT in a 10% solution of nonfat dry milk prior to overnight
incubation at 4°C in A11 antibody (1:1000, Millipore, Billerica, MA, USA). Following
primary antibody incubation, the membranes were washed six times for 10 min with
Tris-buffered saline (TBS)/0.1% Tween 20 and incubated for 1 hr with the appropriate
horseradish peroxidase (HRP) conjugated secondary followed by another six washes for
10 min with TBS/0.1% Tween 20. Signals were developed with chemoluminescence
(Invitrogen, Grand Island, NY, USA) by adding equal amounts of solution A and
solution B to the membranes. Films were scanned and Aβ oligomer levels were

Chapter 2: Materials and Methods ____________________________________________________________________________________
52
quantified using Image J Software. For quantification of dot blots, the raw values
obtained from hAPP-J20 mice were adjusted with the values obtained from the WT
mice.
2.4.5 Quantification of Aβ by ELISAs
Mice were cervically dislocated and the hippocampus was rapidly dissected, weighed
and homogenised in 5vol/wt of TBS (Tris-HCL 50mM pH 7.6; NaCl 150mM; EDTA
2mM) containing a cocktail of protease inhibitors (Sigma-Aldrich, St Louis, MO).
Samples were then suspended in 2% Sodium dodecyl sulfate (SDS) containing protease
inhibitors (1:100, Sigma-Aldrich, St Louis, MO) and centrifuged at 100,000 x g for 1hr
at 4°C. The supernatant containing the soluble Aβ fraction was collected. The
remaining pellet was resuspended in 20µl of 70% formic acid, homogenised and
centrifuged at 100, 000 x g for 1hr. Following centrifugation, 180µL of Tris-HCL (1M,
pH 11) was added to neutralise the sample. This supernatant containing the insoluble
Aβ fraction was collected.
The Aβ levels were determined by using the BetaMark™ Total Beta-Amyloid
Chemiluminescent ELISA Kit (Cat #: SIG-38966-kit; Covance, Sydney, Australia),
BetaMark™ Beta-Amyloid x-40 Chemiluminescent ELISA Kit (Cat #: SIG-38950;
Covance, Sydney, Australia) and BetaMark™ Beta-Amyloid x-42 Chemiluminescent
ELISA Kits (Cat #: SIG-38952; Covance, Sydney, Australia). Briefly, the pre-coated
plates were washed with the provided wash buffer prior to adding 100µl of the sample
that contained the HRP Aβ specific antibody, in duplicates. The plate was incubated at
4°C for 16 hrs. The plate was washed with wash buffer and the chemiluminescent
substrate was added. The luminescence was measured using a SpectraMax 5
luminometer/plate reader, within 5 min of adding the substrate. Readings were adjusted
to total protein levels, as measured by a Bradford assay.
2.5 Golgi Staining
Golgi staining was utilised to determine dendritic morphology and spine density
(Chapters 4 and 5).

Chapter 2: Materials and Methods ____________________________________________________________________________________
53
2.5.1 Golgi impregnation
Mice were anethetised with isoflurane, cervically dislocated and brains were stained
using the FD Rapid GolgiStain™ kit (FD NeuroTechnologies, INC, Columbia, MD,
USA) as per the manufactures recommendations, with some modifications. The brains
were impregnanted in 2mL of equal parts solution A and solution B for 14 days.
Following this, brains were transferred to 2mL of solution C for 3 days. Brains were
mounted on to a chuck with distilled H20 and sectioned at 100µm on a cryostat set at -
21°C. Sections were mounted onto gelatin-coated SuperFrost-plus slides (Menzel-
Glaser, Waltham, MA, USA) and subjected to a the following staining procedure: 2
times 2 min washes in Milli-Q H20, 10 min incubation in equal parts of solutions D and
E, 2 times 4 min incubations in Milli-Q H20 then 4 min incubations in 50%, 75% and
95% EtOH, 4 times 4 min incubations in 100% EtOH and 3 times 4 min incubation in
xylene. Sections were coverslipped with Permount™ (Fisher Scientific; Waltham, MA,
USA) and allowed to dry for 24 hrs prior to analysis.
2.5.2 Analysis of Golgi staining
To analyse dendritic morphology, Golgi-stained CA1 neurons were manually traced
using a brightfield microscoepe (Zeiss Axio Imager A1) at 100x magnification with
Neurolucida (MBF Bioscience, Grand Rapids, MI, USA) and Scholl analysis was
performed using Neurolucida Explorer (MBF Bioscience, Grand Rapids, MI, USA). In
order for a neuron to be selected for tracing, the following four criteria were met: (1) the
neuron was in the area of interest, (2) the neuron was distinct from other neurons to
allow for the identification of the dendrites, (3) the neurons were not truncated, and (4)
neurons were well stained throughout the entire dendritic length. For each brain, 5
neurons from the hippocampal CA1 pyramidal layer were traced.
Spine density was assessed by counting the number of spines in 3 branches per neuron
(5 neurons/brain) of branch orders 2-4. All protrusions no longer than 2µm were
counted as spines if they were continuous with the dendritic shaft. The spine density
was defined as the number of spines on 10µm of dendritic length.
2.6 Quantification of inflammatory cytokines
Chapter 2: Materials and Methods ____________________________________________________________________________________
54
Quantification of inflammatory cytokines was utilised to analysis the
neuroinflammatory response amongst various ages and genotypes (Chapters 3 and 5).
Quantification of inflammatory cytokines was conducted via antibody specific ELISAs.
Mice were anthetised with isoflurane, cervically dislocated, the hippocampus was
removed, snap frozen and stored at -80°C until use. The tissue was homogenised in
50mM Tris-HCl, pH 7.2, 50mM NaCl, 1% TX-100 and 50mM Sodium Fluride (NaF)
containing protease inhibitors (1:1000, Sigma-Aldrich, St Louis, MO). Samples were
centrifuged at 14,000 x g for 10 min at 4°C. The supernatant was removed and total
protein concentration was determined using the Bradford Assay. IL-1β (Cat #: 432601),
IL-6 (Cat #: 431301) and TNF-α (Cat #: 430901) concentrations were quantified by
ELISA kits (Biolegend, San Diego, CA) in accordance with the manufacturer’s
instructions. Briefly, 100µl of the capture antibody was added to the provided 96 well
plate and incubated overnight at 4°C. The plates were washed four times with the
provided wash buffer and blocked using 100µl of the Assay diluent A for 1 hr. The
plate was washed four times with wash buffer and 100µl of the samples were added and
incubated for 2 hrs. The plate was washed four times and the detection antibody was
added for 1 hr, then washed four times and incubated with the Avidin-HRP solution.
The substrate solution was added for 15 min in the dark prior to the stop solution (2N
H2SO4). The absorbance was read with a spectrophotometer at 450nm and the 570nm
reading was subtracted. Results were adjusted for total protein levels.
2.7 Western Blots
Western blot analysis was used to quantify AMPA receptor and ADAR2 expression
amongst various genotypes (Chapters 4 and 5).
2.7.1 Hippocampal isolation and protein extraction
Mice were anesthetised with isoflurane, cervically dislocated and the hippocampus was
rapidly dissected and frozen at -80°C until use. Tissue was homogenised by sonication
in 500µL RIPA buffer (Sigma-Aldrich; St Louis, MO), supplemented with a protease
inhibitor cocktail (1:100, Sigma-Aldrich; St Louis, MO).
Chapter 2: Materials and Methods ____________________________________________________________________________________
55
2.7.2 Protein quantification and sample preparation
Protein concentration was determined by using a Bradford reagent (Sigma-Aldrich; St
Louis, MO). Briefly, 159µl of Milli-Q H20 was added to 40µl Bradford reagent and 1µl
of sample in triplicates in a 96 well plate. Serial dilutions of BSA were used for
standard preparations and protein was calculated based on the BSA standard curve. The
plate was read on a spectrophotometer at 595nm. Following protein calculation,
Samples were diluted with 4X NuPAGE® LDS Sample Buffer (Life Technologies,
Grand Island, NY, USA), 10X NuPAGE® Sample Reducing Agent (Life Technologies,
Grand Island, NY, USA) and H20 to 10µg/µL. Samples were boiled to 70°C for 10 min
in order to denature proteins.
2.7.3 SDS gel electrophoresis and protein transfer
Proteins were resolved by SDS-PAGE electrophoresis on NuPAGE® 4-12% Bis-tris
gels (Life Technologies, Grand Island, NY, USA) in 1X NuPAGE® MES SDS running
buffer (Life Technologies, Grand Island, NY, USA). For all western blots, 10µl or 20µl
of the 10µg/µL sample was added to each well. Electrophoresis was carried out at 180
V for 50 min or until the running front reached the end. BenchMark™ Pre-stained
Protein Ladder (Life Technologies, Grand Island NY, USA) was used as a molecular
weight standard. Following electrophoresis, proteins were transferred to polyvinylide
difluroide (PVDF) membranes (0.2µm pore size; Life Technologies, Grand Island NY,
USA) using the iBlot® Gel Transfer device (Life Technologies, Grand Island, NY,
USA).
2.7.4 Immunoblotting
PVDF membranes were incubated with 5% skim milk powder for 1 hr, followed by
exposure to the primary antibody diluted in 0.1% BSA overnight at 4°C. The antibodies
used within this study are outlined in Table 2.7.4. Following primary antibody
incubation, membranes were washed six times for 10 min each with 1X Tris-buffered
saline (TBS)/0.1% Tween 20 and incubated for 1hr with the appropriate horseradish
peroxidase (HRP)-conjugated secondary followed by another six washes for 10 min
each with 1X TBS/0.1% Tween 20. Signals were developed with Novex® ECL
chemoluminescence (Life Technologies, Grand Island, NY, USA) by adding equal

Chapter 2: Materials and Methods ____________________________________________________________________________________
56
amounts of solution A and solution B to the membranes. The probed bands were
detected by luminescence and developed onto film (Fuji).
Table 2.7.4. Summary of primary and secondary antibodies used for immunoblotting
2.7.5 Stripping membrane
Antibodies were removed by stripping the membranes with 100mM 2-
mercaptoethanol/2% SFS/62.5mM Tris-HCl, pH. 6.7) at 50°C for 30 min, followed by
washing with H20 for 1 hr. PBS/0.1%Tween 20. The membranes were reprobed with β-
tubulin for loading controls following the protocol described in section 2.7.4. The
resulting bands were developed onto film, scanned and analysed with Image J software.
2.8 Co-immunoprecipitation Analysis
Co-immunoprecipitations were utilised to investigate AMPA receptor complex
formations (Chapters 4 and 5).
2.8.1 Hippocampal isolation and protein extraction
Primary
Antibody
Concentration Company Secondary Antibody Concentration
GluA1 1:1000 Millipore
Cat. # AB1504
Anti-Rabbit (HRP)
Millipore Cat. # AP132P
1:5000
GluA2 1:1000 Millipore
Cat. #:
AB20673
Anti-Rabbit (HRP)
Millipore Cat. # AP132P
1:5000
GluA2/3 1:1000 Millipore
Cat. #: 07-598
Anti-Rabbit (HRP)
Millipore Cat. # AP132P
1:5000
GluA3 1:1000 Cell Signaling
Cat. #: 3437
Anti-Rabbit (HRP)
Millipore Cat. # AP132P
1:5000
ADAR2 1:1000 Sigma-Aldrich
Cat. #: sc-33180
Anti-Rabbit (HRP)
Millipore Cat. # AP132P
1:5000
β-tubulin
1:1000 Promega
Cat. #: G712A
Anti-Mouse (HRP)
Millipore Cat. # AP124P
1:5000
Chapter 2: Materials and Methods ____________________________________________________________________________________
57
Co-immunoprecipitation experiments were conducted as previously described (Conrad
et al 2008, Sans et al 2003) with modification. Mice were decapitated and the
hippocampus was isolated and frozen at -80°C until use. Tissue was homogenised with
a 25-gauge needle in 50mM Tris-HCl pH 7.4 containing protease inhibitor cocktail
(Sigma-Aldrich; St Louis, MO). The membranes were sedimented by centrifugation at
1000,000 x g for 30 min at 4°C. The supernatant was removed and the pellet was
solubilised in 1% TX-100 in 50mM Tris-HCl pH 7.4 containing 1mM EDTA and
incubated at 37°C for 45 min. Insoluble material was removed by centrifugation at
100,000 x g for 30 min at 4°C.
2.8.2 Co-immunoprecipitation procedure
Co-immunoprecipitations were performed by utilising the Dynabead® protein A
Immunoprecipitation kit (Invitrogen, Grand Island, NY, USA). Briefly, 10µg of
antibody (GluA1, GluA2, GluA2/3, GluA4 or IgG) was incubated at RT in 50µL of the
Dynabead protein A provided and allowed to bind for 20 min with gentle agitation.
Details of the antibodies are provided in Table 2.8.2.1. Numerous antibodies were
trialed to develop the co-immunoprecipitation protocol. Details of antibodies that were
unsuccessful are described in Table 2.8.2.2 Following washing, protein sample was
added and incubated at RT for 30 min with gentle agitation. The sample was removed
via the provided magnet and analysed as the unbound fraction. The bound fraction was
eluted with the provided elution buffer. The unbound fraction was subjected to two
rounds of immunoprecipitations prior to SDS gel electrophoresis.

Chapter 2: Materials and Methods ____________________________________________________________________________________
58
Table 2.8.2.1 Summary of antibodies used in co-immunoprecipitations analysis
Table 2.8.2.2 Summary of antibodies tested but found not to be useful in co-
immunoprecipitation analysis.
2.8.3 SDS gel electrophoresis and protein transfer
Following the final round of co-immunoprecipitation, the unbound fraction was mixed
with 4X NuPAGE® LDS buffer (Life Technologies, Grand Island, NY, USA), 10X
NuPAGE® Sample Reducing Agent (Life Technologies, Grand Island, NY, USA) and
H20 and heated to 70°C for 10 min. For Western blot analysis, samples were run on
NuPAGE® 4-12% Bis-tris gels (Life Technologies, Grand Island, NY, USA) and
transferred to PVDF membranes as described in section 2.7.3.
2.8.4 Immunoblotting and analysis
Membranes were processed as described in section 2.7.4. Membranes were incubated
with subunit-specific antibodies: GluA1 (1:1000, Millipore, Billerica, MA, USA),
GluA2/3 (1:1000, Millipore, Billerica, MA, USA), GluA2 (1:1000, Millipore, Billerica,
MA, USA) and GluA3 (1:1000, Cell Signaling, Danvers, MA, USA) as described in
Primary Antibody Concentration Company
GluA1 10µg Millipore Cat. # AB1504
GluA2 10µg Millipore Cat. #: AB1768-I
GluA2/3 10µg Millipore Cat. #: 07-598
GluA4 10µg Cell Signalling Cat. #: 2299
IgG 3µg Chemicon Cat. #: PP100
Primary Antibody Company Failed due to:
GluA2 Millipore: Cat. #: AB20673
Confounding low molecular weight band
GluA2 Millipore: Cat. #: AB10529
Produced high background on blot
GluA2 Invitrogen: Cat. #: 320300 Produced multiple bands on blot
GluA2 Thermo Scientific: Cat #
PA1-4659
Produced same size band as WT in
GluA2 KO mice (mice from Wiltgen et
al. (2010))

Chapter 2: Materials and Methods ____________________________________________________________________________________
59
Table 2.7.4. The percent of total AMPA receptor subunit remaining in the unbound
fraction was calculated based on a standard curve created from control IgG
immunoprecipitated tissue that was diluted with buffer to 5%, 25%, 50%, 75% and
100% of the total sample.
2.9 Protein crosslinking assay
Protein crosslinking assays were used to assess the amount of intracellular and surface
expression of AMPA receptors (Chapters 4 and 5).
2.8.1 Brain isolation and vibratome preparation
Mice were cervically dislocated, the brain was rapidly removed and the tissue was
immediately mounted onto a vibratome. Coronal sections of 400µm were taken from
AP positions from bregma between -1.34mm and -2.3mm. The hippocampus was then
manually isolated from the slice, under a dissecting microscope.
2.8.2 BS3 crosslinking
Hippocampal sections were added to 500µL of ice-cold artificial cerebral spinal fluid
(ACSF) that was immediately spiked with 2mM of bis(sulfosuccinymidal)suberate
(BS3; Thermo-Scientific, Waltham, MA, USA). Samples were incubated with agitation
at 4°C for 30 min, prior to the addition of 100mM glycine for 10 min at 4°C to
terminate the reaction. Following crosslinking, tissue was centrifuged for 2 min at
17,000 x g to pellet the sample. The pellet was resuspended in 200µL of RIPA buffer
(Sigma-Aldrich; St Louis, MO) containing protease inhibitors (Sigma-Aldrich; St
Louis, MO) and homogenised by sonication. Samples were centrifuged at 17,000 x g.
Samples were stored at -80°C until use, or used immediately for SDS gel
electrophoresis.
2.8.3 SDS gel electrophoresis and protein transfer
Following crosslinking, the samples was mixed with 4X NuPAGE® LDS buffer (Life
Technologies, Grand Island, NY, USA), 10X NuPAGE® Sample Reducing Agent (Life
Technologies, Grand Island, NY, USA) and H20 and heated to 70°C for 10min. For
Western blot analysis, samples were run on NuPAGE® 4-12% Bis-tris gels (Life
Chapter 2: Materials and Methods ____________________________________________________________________________________
60
Technologies, Grand Island, NY, USA) and transferred to PVDF membranes as
described in section 2.7.3.
2.8.4 Immunoblotting and quantification
Membranes were processed as described in section 2.7.4. Membranes were incubated
with subunit-specific antibodies GluA1 (1:1000, Millipore, Billerica, MA, USA) and
GluA2 (1:1000, Millipore, Billerica, MA, USA). The resulting bands were scanned and
analysed with Image J software. The surface/intracellular ratio was calculated by the
density of the high molecular weight surface band divided by the density of the lower
molecular weight intracellular band for each sample.
2.10 RNA editing assay
RNA editing assays were utilised to determine the efficiency of GluA2 RNA editing at
the Q/R site (Chapters 4 and 5). A schematic of the editing assay utilised is shown in
Figure 2.10
2.10.1 RNA editing assay of plasmids
The following described below details the protocol used for evaluating RNA editing
within plasmids
2.10.1.1 Plasmids
Plasmids containing the edited and unedited GluA2 sequence were a kind donation from
Stephen Heinemann at the Salk Institute and published in (Hume et al 1991)
2.10.1.2 Mixing protocol
The DNA concentrations of the plasmids containing the edited and unedited site were
measured on a Nano drop. Samples were diluted to an equal DNA concentration prior to
mixing. Plasmids were mixed to 0%, 0.5%, 1%, 5%, 30% and 50% of the unedited
plasmid.
Chapter 2: Materials and Methods ____________________________________________________________________________________
61
2.10.1.3 PCR and gel electrophoresis
PCR amplification was performed across the editing region of Gria2. The PCR assay
was carried out in a final volume of 50µl containing 1X reaction buffer, 200mM dNTPs,
2.5mM of each primer, 0.01 U of Q5 Hot start High Fidelity DNA Polymerase (New
England Biolabs, Ipswich, MA, USA) and 1µL of DNA template. The primer sequence
were forward: 5’-TTC CTG GTC AGC AGA TTT AGC C-3’ and reverse: 5’-AGA
TCC TCA GCA CTT TCG-3’. The following thermocycling conditions were used:
initial denaturation at 98°C for 30s, 33 cycles of 98°C for 10s, 60°C for 30s, 72°C for
30s and a final elongation step at 72°C for 10 min.
PCR products were mixed with loading dye and electrophoresed in agarose gels (1.8%)
using a TAE buffer system. Gels were pre-stained with ethidium bromide (0.5 µg/ml)
and bands were visualised by UV transillumination (Foto/UV21, Fotodyne
transilluminator), and sized against DNA molecular weight markers (New England
Biolabs, Ipswich, MA, USA).
2.10.1.4 Gel extraction
DNA was extracted from the agarose gels using the QIAquick gel extraction kit
(Qiagen, Venlo, Limburg, Netherlands). The appropriate bands were excised under UV
light and incubated in the provided 3 volumes of QG Buffer at 50°C for 10 min.
Following incubation, 1 volume of isopropranol was added to the samples and
centrifuged in the provided column for 1 min at 17,000 x g. The samples were washed
with Buffer PE and columns were placed in a fresh eppendorf tube. 50µL of Elution
Buffer was added and centrifuged at 17,000 x g for 1 min to elute the DNA.
2.10.1.5 Bbv1 digestion
Samples were incubated with the Bbv1 restriction enzyme (New England Biolabs,
Ipswich, MA, USA). The Bbv1 restriction enzyme recognises the sequence CG(A/T)GC
and cuts the DNA strand 8 bases downstream of the recognition site. 15µl of DNA was
incubated with 1 U of Bbv1 and 2µL of 1X reaction buffer in a total volume of 20µL.
The incubation was carried out for 6hrs at 37°C. The Bbv1 was added in three equal
amounts, every 2hrs. The incubation was terminated at 65°C for 20 min.

Chapter 2: Materials and Methods ____________________________________________________________________________________
62
2.10.1.6 Gel analysis
For analysis, 8µL of the digested samples were mixed with 2µL Novex® TBE Hi-
Density Sample Buffer (Invitrogen, Grand Island, NY, USA) and run on Novex® TBE
Gels (Invitrogen, Grand Island, NY, USA) at 180 V for 50 min, or until the dye front
had reached the end. The gels were incubated with 2µL of ethidium bromide in 100mL
of H20 for 10 min. Bands were visualised by UV transillumination (Foto/UV21,
Fotodyne transilluminator), and sized against DNA molecular weight markers (New
England Biolabs, Ipswich, MA, USA).
2.10.1.7 Sequencing
Following gel extraction, samples were diluted to 3 ng/mL and dried with 3.2pmol of
forward and reverse primers outlined in section 2.10.1.3. Samples were sequenced at the
Garvan Institute of Medical Research ACRF using an ABI 3130XL Genetic Analyzer
(Applied Biosystems) with Big Dye 3.0 chemistry, after which sequences were edited
and assembled using Finch TV (Geospiza Inc.).
2.10.2 RNA editing assay of hippocampal extractions
The following described below details the protocol used for evaluating RNA editing
within tissue samples
2.10.2.1 Brain collection
Mice were anesthetised with isoflurane and cervically dislocated. The brain was rapidly
removed and the hippocampus was isolated. Hippocampal dissections were snap frozen
using a mixture of isopentane and dry ice.
2.10.2.2 RNA isolation
RNA was isolated using TRIzol® reagent (Life Technologies, Grand Island, NY, USA)
following the manufacture’s instructions. Tissue was homogenised in 1mL of TRIzol/
50mg of tissue using a 25-gauge needle. Following homogenisation, 0.2mL of
chloroform was added per 1mL TRIzol. Samples were mixed vigorously for 15 seconds
and centrifuged at 12, 000 x g for 15 min. The aqueous phase of the solution was
transferred to a fresh tube as the RNA fraction. RNA was precipitated with the addition

Chapter 2: Materials and Methods ____________________________________________________________________________________
63
of 0.5mL of isopropyl acid to every 1mL of TRIzol reagent and incubated for 10 min at
RT prior to centrifugation at 12,000 x g for 10 min. The resulting RNA pellet was
washed with 75% EtoH and centrifuged at 7,500 x g for 5 min. EtOH was removed and
the remaining pellet was air dried for 10 min prior to resuspension in 20µL of
RNAse/DNAse free H20. The concentration of RNA was measured on a Nano drop at
260nm and sample purity was determined by the 260/280 nm ratio reading. RNA was
stored at -80°C until use or used immediately.
2.10.2.3 DNAse treatment
To ensure no genomic DNA contamination occured, samples were subjected to DNAse
Treatment with DNA-Free DNase I (Ambion, Grand Island, NY, USA). 10µL of
isolated RNA was incubated with DNAse I (2 units) and 10X DNase buffer for 30 min
at 37°C. Following incubation, 2µL of DNase Inactivation reagent was added and
incubated for 2 min at RT. Samples were centrifuged at 17,000 x g for 1 min. The
supernatant was transferred to a new eppendorf. DNAsed samples were stored at -80°C
until use, or used immediately for first strand cDNA synthesis.
2.10.3.4 First strand cDNA synthesis
cDNA was synthesised utilising the SuperScript® III First Strand Synthesis System
(Life Technologies, Grand Island, NY, USA). 5µg of RNA was mixed with 50µM of
Oligo(dT) primer and 10mM dNTPs and incubated at 65°C for 5 min. Following
incubation, cDNA synthesis mix comprising of 2µL of 10X RT buffer, 4µL of 25mM
MgCl2, 2µL of 0.1M DTT, 1µL of RNaseOUT (40U/µL) and 1µL of Superscript III RT
(200 U/µL) was added to each sample and incubated at 50°C for 50 min. The reaction
was terminated at 85°C for 5 min and samples were cooled on ice. 1µL of RNAse H
was added to each sample and incubated at 37°C. cDNA was stored at -20°C or used
immediately for PCR analysis.
2.10.3.5 PCR amplification and gel electrophoresis
PCR amplification and electrophoresis was carried out as described in section 2.10.1.3
Chapter 2: Materials and Methods ____________________________________________________________________________________
64
2.10.3.6 Gel extraction
DNA was excised from the gel using the QIAquick Gel Extraction Kit (Qiagen, Venlo,
Limburg, Netherlands) as described in section 2.10.1.4.
2.10.3.7 Bbv1 digestion and analysis
Samples were digested with the Bbv1 enzyme as described above in section 2.10.1.5
2.10.3.8 Silver staining
Silver staining was performed using the Silver Express® Silver Staining Kit (Life
Technologies, Grand Island, NY, USA). Gels were fixed in 200mL of trichloroacetic
acid (TCA) and sulphosalicylic acid solution for 10 min prior to sensitising with the
provided sensitiser solution for 10 min. Following washing, gels were incubated in
equal parts Stainer A and Stainer B for 30 min and developed in the provided developer
solution for 3-15 min. Developing was stopped by the adding 5mL of the provided stop
solution for 10min. Gels were imaged and analysed with Image J.
2.10.3 RNA editing assay of laser captured cells
The following described below details the protocol used for evaluating RNA editing
within laser captured cells
2.10.3.1 Brain collection
Mice were anethetised with isoflurane and cervically dislocated. The brains were
rapidly isolated and washed briefly with ice-cold PBS then embedded in OCT
compound and snap frozen in dry ice containing isopentane. Brains were stored at -
80°C until use.
2.10.3.2 Tissue preparation
Brains were sectioned coronally on a cryostat (-20°C) at 10µm thick at the AP positions
from bregma between -1.34mm and -2.3mm. Sections were directly slide mounted onto
PEN Membrane glass slides (Arcturus).
Chapter 2: Materials and Methods ____________________________________________________________________________________
65
Sections were stained using the Histogene® Frozen Section Staining Kit (Life
Technologies, Grand Island, NY, USA). Slides were incubated in 70% EtOH for 30 sec
followed by H20 for 30 sec and then stained with the Histogene® Staining solution.
Following staining, slides were incubated in 70% EtOH for 30 sec, 95% EtOH for 30
sec, 100% EtOH for 30 sec and finally incubated in xylene for 5 min. Slides were stored
at -20°C prior to use.
2.10.3.3 Laser capture microdissection
The PALM Laser MicroBeam System (P.A.L.M Microlaser Technologies GmbH,
Bernried, Germany) was used for isolation of CA1 neurons. This system employs a
high-energy laser beam to microdissect along a precise, predefined line and to catapult
the neurons into an opaque adhesive collection cap (Zeiss). The following settings were
used: aperture 10, intensity 45, speed 6, and offset 39 and captured at 20x magnification
power. Samples were captured into 200µl adhesive caps (Zeiss).
2.10.3.4 RNA isolation
RNA isolation was performed using the Arcturus® PicoPure® RNA Isolation Kit (Life
Technologies, Grand Island, NY, USA). 50µL of the provided extraction buffer was
added to the samples and incubated at 42°C for 30 min. 50µL of 70% EtOH was added
to the sample and transferred to the pre conditioned column. The sample was
centrifuged for 2 min at 100 x g to bind RNA followed by centrifugation at 16,000 x g
for 30 seconds. Columns were washed three times with the provided buffers. Columns
were transferred to a fresh 0.5mL eppendorf tube and RNA was eluted in 11µL of
Elution Buffer.
2.10.3.5 DNAse treatment
Samples were DNased treated with DNA-free DNAse I (Ambion, Grand Island, NY,
USA) as described in section 2.10.2.3
2.10.3.6 cDNA synthesis
cDNA was synthesised using the SuperScript® III First Strand Synthesis System
(Invitrogen, Grand Island, NY, USA) as described above in section 2.10.3.4.

Chapter 2: Materials and Methods ____________________________________________________________________________________
66
2.10.3.7 Nested PCR
PCR amplification was performed across the editing region of GluA2 using the cDNA
template. The PCR assay was carried out in a final volume of 50µl containing 1 x
Reaction buffer, 200mM dNTPs, 2.5mM of each primer, 0.01 U of Q5 Hot start High
Fidelity DNA Polymerase (New England Biolabs, Ipswich, MA, USA) and 5µL of
DNA template. The primer sequence were forward: 5’-CAG CAG ATT TAG CCC
CTA GC-3’ and reverse: 5’-AGC CGT GTA GGA GGA GAT GA -3’. For the second
round of PCR 5µL of the first PCR was added with 1X Reaction buffer, 200mM
dNTPs, 2.5mM of each primer, and 0.01 U of Q5 Hot start High Fidelity DNA
Polymerase (New England Biolabs, Ipswich, MA, USA). The primer sequence for the
second PCR were forward: 5’-CGA GTG GCA CAC TGA GGA A-3’ and reverse: 5’-
GCG CCC AGA GAG AGA TCT TG -3’. The following thermocycling conditions
were used for both the first and second PCR: initial denaturation at 98°C for 30s, 38
cycles of 98°C for 10s, 60°C for 30s, 72°C for 30s and a final elongation step at 72°C
for 10 min.
Nested PCR products were mixed with loading dye and electrophoresed in agarose gels
(1.8%) using a TAE buffer system. Gels were pre-stained with ethidium bromide (0.5
µg/ml) and bands were visualised by UV transillumination (Foto/UV21, Fotodyne
transilluminator), and sized against DNA molecular weight markers (New England
Biolabs, Ipswich, MA, USA).
2.10.3.8 Gel extraction
DNA was excised from the gel using the QIAquick Gel Extraction Kit (Qiagen, Venlo,
Limburg, Netherlands) as described in section 2.10.1.4.
2.10.3.9 Sequencing
Following gel extraction, samples were diluted to 3ng/mL and dried with 3.2pmol of
forward or reverse primers. Primers included forward: 5’-CGA GTG GCA CAC TGA
GGA A-3’ and reverse: 5’-GCG CCC AGA GAG AGA TCT TG -3’. Samples were
sequenced at the Garvan Institute of Medical Research ACRF using an ABI 3130XL

Chapter 2: Materials and Methods ____________________________________________________________________________________
67
Genetic Analyzer (Applied Biosystems) with Big Dye 3.0 chemistry, after which
sequences were edited and assembled using Finch TV (Geospiza Inc.).

Chapter 2: Materials and Methods ____________________________________________________________________________________
68
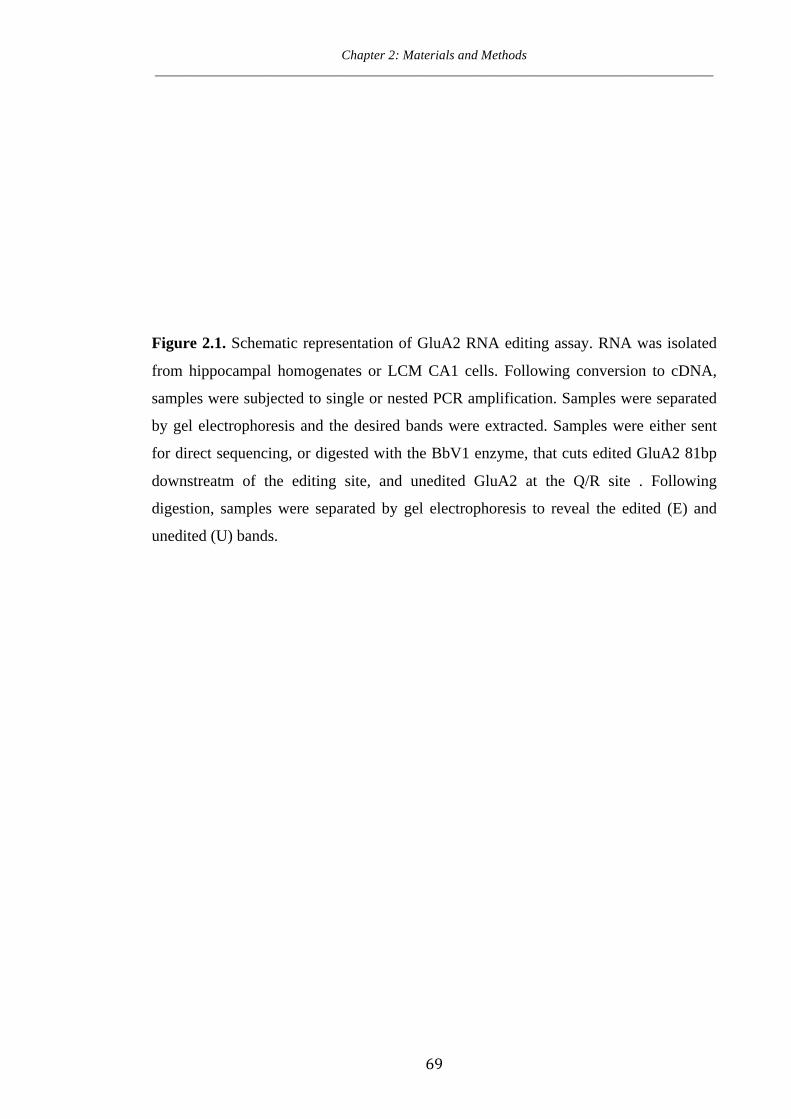
Chapter 2: Materials and Methods ____________________________________________________________________________________
69
Figure 2.1. Schematic representation of GluA2 RNA editing assay. RNA was isolated
from hippocampal homogenates or LCM CA1 cells. Following conversion to cDNA,
samples were subjected to single or nested PCR amplification. Samples were separated
by gel electrophoresis and the desired bands were extracted. Samples were either sent
for direct sequencing, or digested with the BbV1 enzyme, that cuts edited GluA2 81bp
downstreatm of the editing site, and unedited GluA2 at the Q/R site . Following
digestion, samples were separated by gel electrophoresis to reveal the edited (E) and
unedited (U) bands.
Chapter 2: Materials and Methods ____________________________________________________________________________________
70
2.11 Electrophysiology
Electrophysiological experiments were conducted in conjunction with Dr. Ben Lau and
Chris Vaughan at the Kolling Institute of Medical Research at Royal North Shore
Hospital, Sydney, Australia. These experiments were used to detect Ca2+-permeable
AMPA receptors (Chapter 4).
2.11.1 Slice preparation
For electrophysiological experiments, hippocampal brain slices were prepared from
mice aged 28-36 days old. Specifically, animals were anaesthetised, decapitated, the
brain rapidly removed and horizontal slices (300 µm) containing hippocampal tissue
were cut in an ice-cold, sucrose-based artificial cerebrospinal fluid (ACSF) solution of
the following composition: 240mM sucrose, 11 mM glucose, 3.3 mM KCl, 1.4 mM
NaH2PO4, 7.0 mM MgCl2, 0.2 mM CaCl2 and 28 mM NaHCO3. Slices were then
maintained at 34°C in a submerged chamber containing ACSF of the following
composition: 126 mM NaCl, 2.5 mM KCl, 1.4 mM NaH2PO4, 1.2 mM MgCl2, 2.4 mM
CaCl2, 11 mM glucose, 25 mM NaHCO3, and equilibrated with 95% O2/5% CO2 Prior
to recording, each slice was individually transferred to a recording chamber, where it
was continually superfused with ACSF at a rate of 1.8-2.0 ml/min.
2.11.2 Electrophysiology
Hippocampal CA1 neurons were visualised using infra-red Dodt gradient contrast optics
on an upright microscope (Olympus BX50; Olympus, Sydney, Australia). Whole-cell
voltage-clamp recordings were conducted via an Axopatch 700B patch clamp amplifier
(Molecular Devices, Sunnyvale, CA, USA), using an internal solution of the following
composition: 125 mM CsMeSO3, 10 mM CsCl, 5 mM HEPES, 0.4 mM EGTA, 4 mM
NaCl, 1 mM MgCl2, 2 mM MgATP, 0.3 mM NaGTP, 3 mM QX314 and 0.1 mM
spermine (pH = 7.3; osmolarity ~ 280-285 mOsM). Series resistance (<25 MΩ) was
compensated by 80% and continuously monitored during experiments. Liquid junction
potentials of –10 mV were corrected.
Electrically evoked synaptic currents were elicited in hippocampal CA1 neurons via a
unipolar glass stimulating electrode, placed ~ 100-200 µm from the recording electrode
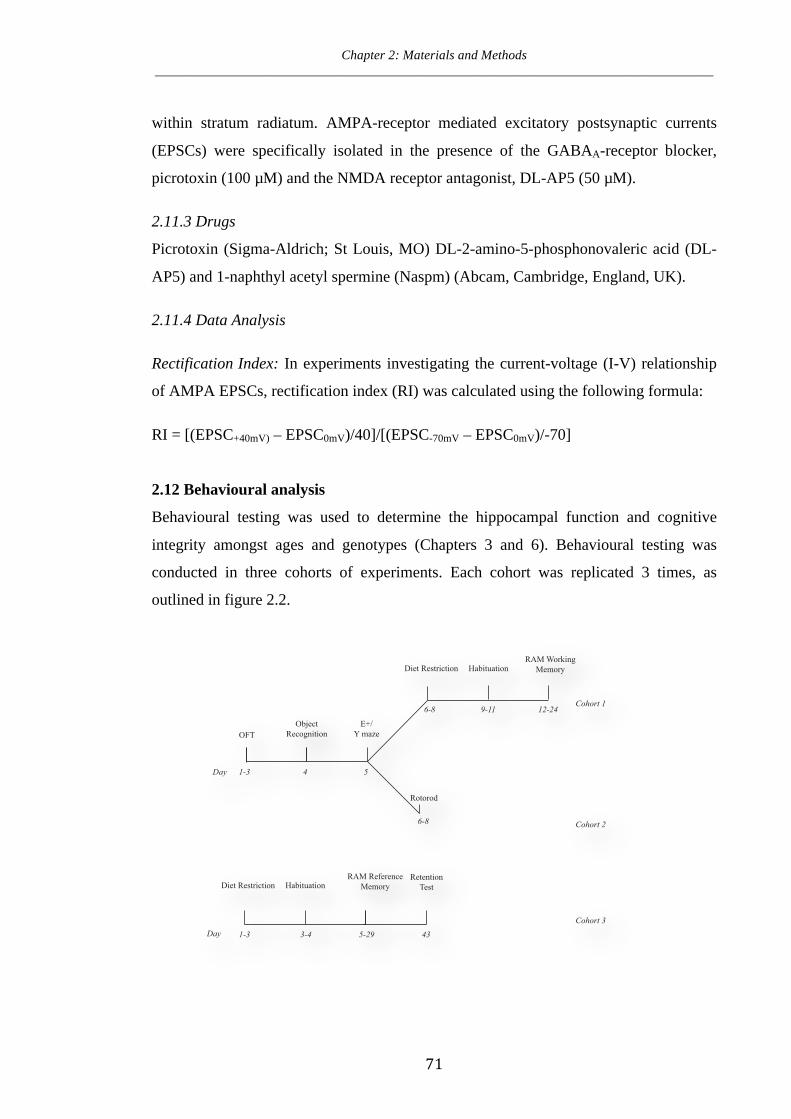
Chapter 2: Materials and Methods ____________________________________________________________________________________
71
within stratum radiatum. AMPA-receptor mediated excitatory postsynaptic currents
(EPSCs) were specifically isolated in the presence of the GABAA-receptor blocker,
picrotoxin (100 µM) and the NMDA receptor antagonist, DL-AP5 (50 µM).
2.11.3 Drugs
Picrotoxin (Sigma-Aldrich; St Louis, MO) DL-2-amino-5-phosphonovaleric acid (DL-
AP5) and 1-naphthyl acetyl spermine (Naspm) (Abcam, Cambridge, England, UK).
2.11.4 Data Analysis
Rectification Index: In experiments investigating the current-voltage (I-V) relationship
of AMPA EPSCs, rectification index (RI) was calculated using the following formula:
RI = [(EPSC+40mV) – EPSC0mV)/40]/[(EPSC-70mV – EPSC0mV)/-70]
2.12 Behavioural analysis
Behavioural testing was used to determine the hippocampal function and cognitive
integrity amongst ages and genotypes (Chapters 3 and 6). Behavioural testing was
conducted in three cohorts of experiments. Each cohort was replicated 3 times, as
outlined in figure 2.2.
1-3 4 5
6-8
E+/Y maze
Diet Restriction
9-11
HabituationRAM Working
Memory
OFTObject
Recognition
12-24
Rotorod
6-8
Diet Restriction HabituationRAM Reference
Memory
Cohort 1
Cohort 2
Cohort 3
1-3 3-4 5-29 43
RetentionTest
Day
Day
Chapter 2: Materials and Methods ____________________________________________________________________________________
72
Figure 2.2 Cohorts of mice utilised in behavioural studies. Mice were separated into
three cohorts; Cohort 1 was tested in the open field test, object recognition test,
elevated plus maze, Y-maze, and radial arm working memory test. Cohort 2 was
tested in the open field test, object recognition, elevated plus maze, Y-maze and
rotorod testing. Cohort 3 was tested in the radial arm reference memory test.
2.12.1 Open field test
The open field test arena (40 x 40cm) was situated in a large box with clear plexiglass
walls, no ceiling, and a white floor. Each chamber was set inside a larger sound-
attenuating cubicle with lights illuminating the arena and a fan to eliminate background
noise. Mice were placed into the centre of the arena and allowed to explore the test box
for 10 min, while a computer software program (Activity Monitor; Med Associates)
recorded activity via photobeam detection inside the testing chambers. The total
distance traveled over the course of the 10 min was recorded as a measure of general
activity levels. The arena was cleaned with 70% EtOH between each mouse. Where a
three-day protocol is described, the protocol was repeated once per day for three
consecutive days.
2.12.2 Rotorod
Mice were placed on the suspended beam of the rotorod facing away from the viewer
for 5 min. The rotorod was started once all mice were placed on the beams and rotated
at a rate of 4 rpm and increased to 40 rpm over the course of 5 min. Animals were taken
off the rotorod once they fell to the catch tray below or after 5 min had elapsed. The
total time spent on the beam was recorded. Animals were exposed to the test three times
a day for three consecutive days. The device was cleaned with 70% EtOH between each
mouse.
2.12.3 Elevated plus maze.
The elevated plus-maze consists of four arms (77 x 10cm) elevated (70cm) above the
floor. Two of the arms contained 15cm-high walls (enclosed arms) and the other two
consisted of no walls (open arms). Each mouse was placed in the middle of the maze
Chapter 2: Materials and Methods ____________________________________________________________________________________
73
facing a closed arm and allowed to explore the maze for 5 min. A video camera
recorded the mouse and a computer software program (Limelight; Med Associates) was
used to measure the time spent in the open arms, as an indication of anxiety-like
behaviour. The maze was cleaned with 70% EtOH between each mouse.
2.12.4 Object recognition test.
The Object recognition test was performed as per Heneka et al. (2012), with
modification. The apparatus consisted of a black plexus rectangular arena (50 x 30cm),
with 35cm high walls. Two identical objects were placed symmetrically approximately
5 cm away from the walls, and 15 cm away from each other. A testing session
comprised of two trials. In the first trial the apparatus contained two identical objects.
The objects were wooden red blocks (6 x 4 x 3cm). The mice were placed in the
apparatus and allowed to explore for 10 min. Mice were placed back in its home cages
and exactly 4 hours later, the mice were put back in the apparatus for the second trial. In
this trial one of the red wooden blocks was replaced with a novel yellow arch (8 x 5 x
3cm). The mice were allowed to explore the environment for 5 min.
The time spent exploring each object during the two trials was recorded manually.
Exploration was defined as directing the nose to the object at a distance of no more than
1cm and/or touching the object with the nose. In order to avoid the presence of olfactory
cues the objects and apparatus were thoroughly cleaned with 70% EtOH between each
mouse. Data was analysed as the time spent exploring the novel object was expressed as
a ratio of the time spent exploring the old object.
2.12.5 Y-maze
The Y-maze was performed as per Heneka et al. (2012), with modification. Testing was
conduced in an opaque Plexiglas Y maze consisting of three arms (40 x 4 x 17cm high)
diverging at a 120-degree angle. Each mouse was placed in the centre of the Y-maze
and allowed to explore freely through the maze during a 5 min session. The sequence
and total number of arms entered was recorded. Arm entry was counted when the hind
paws of the mouse had been completely placed in the arm. Percentage alternation was
calculated as the number of triads containing entries into all three arms divided by the
Chapter 2: Materials and Methods ____________________________________________________________________________________
74
maximum possible alternations (the total number of arms entered minus 2) × 100. The
maze was cleaned between each mouse with 70% EtOH.
2.12.6 Radial arm maze.
The radial arm maze (RAM) consists of eight arms (65 x 9cm), extending radially from
a central arena (35 cm diameter), elevated (90cm) above the ground. Each arm and the
central arena were made of plexiglass, with enclosing walls made of clear plexiglass. To
minimise anxiety, the platform was not elevated, but placed directly on a table in the
testing room (2.6 x 5.1 m). The RAM was performed as per Wenk et al. (2001), with
modification.
Visual cues were located around the room to enable the mice to navigate through the
maze. Larger, extra-maze room cues included the experimenter who was present during
testing and remained in the same position for all trials, and fixed furniture within the
room. After all mice had completed the trials for the day the apparatus was rotated 45°
to ensure that mice were not using intra-maze cues during training and were relying on
the extra-maze cues to locate the food reward. To avoid the presence of olfactory cues,
each food reward container was wiped with a small amount of sweetened condensed
milk prior to the commencement of each trial.
The RAM was cleaned with 70% EtOH between each mouse. Mice were individually
housed and restricted to 85% of their original body weight for one week prior to the
commencement of RAM testing.
2.12.6.1 Reference memory test
2.12.6.1.1 Habituation
Mice were habituated to the sweetened condensed milk, by being fed in their cage for 3
days prior to training. Mice were fed approximately 0.1mL of sweetened condensed
milk per day and were monitored till complete consumption. Mice were eliminated from
the study if proper habituation had not occurred after three days. On the first and second
day of training, mice were habituated to the maze by being placed into the central arena,
Chapter 2: Materials and Methods ____________________________________________________________________________________
75
with each of the eight arms baited with sweetened condensed milk, and were allowed to
explore the maze for 10 min.
2.12.6.1.2 Training
Starting on the third day, and continuing for 24 days twice a day, mice were subjected
to a reference memory task, where the same three of the eight arms were baited with
sweetened condensed milk. Each mouse was assigned three baited arms that remained
constant throughout testing, with non-consecutive arms (e.g., 1-4-6, but not 1-2-6)
baited for each mouse. The training trial continued until all three baits were retrieved or
until 5 min had elapsed. A trial ended after the animal had entered all three baited arms,
or 5 min had passed, whichever came first.
An investigator recorded measures, with the number of successful entries into the baited
arms (where the sweetened condensed milk was consumed) being divided by the total
number of entries made. Data is presented as “Session”, consisting of two days (a total
of four trials).
2.12.6.1.3 Retention
After a 14-day rest period mice were presented to a retention trial where the same arms
were baited with sweetened condensed milk. Following testing, the mice were returned
to their home cage.
2.12.6.2 Working memory test
2.12.6.2.1 Habituation
Mice were habituated to the sweetened condensed milk, by being fed in their cage for 3
days prior to training. Mice were fed approximately 0.1mL of sweetened condensed
milk per day and were monitored till complete consumption. Mice were eliminated from
the study if proper habituation had not occurred after three days. On the first, second
and third day, mice were habituated to the maze by being placed into the central arena,
with one arm open and baited with sweetened condensed milk.

Chapter 2: Materials and Methods ____________________________________________________________________________________
76
2.12.6.1.2 Training
Starting on the fourth day, and continuing for 12 days once a day, mice were subjected
to a working memory task, where eight of the eight arms were baited with sweetened
condensed milk. The training trial continued until all eight baits were retrieved or until 8
min had elapsed. Following testing, the mice were returned to their home cage.
An investigator recorded the number of successful entries into the baited arms (where
the sweetened condensed milk was consumed). An error was marked when the mice re-
entered an already retrieved arm within the one trial.
2.13 Statistical analysis
All statistical analysis was performed using the statistical package Prism 6 (GraphPad).
For normally distributed data, differences between means were assessed, as appropriate,
by one- or two- way ANOVA with or without repeated measures, followed by
Bonferroni post hoc analysis. To assess differences between two groups, a student t-test
was used. For non-parametric data, Kruskal-Wallis ANOVA was used, followed by
Wilcoxon matched pairs signed-rank test. Correlations were assessed by simple linear
regression. For survival curves, Kaplan-Meier survival tests were conducted. All data is
presented as mean ± SEM. For all statistical tests, a p value of ≤ 0.05 was assumed to be
significant.
77
Chapter 3
Pathological and behavioural
characterisation of the hAPP-J20 mouse
model of Alzheimer’s disease during
disease progression

Chapter 3: Characterisation of the hAPP-J20 mouse model ____________________________________________________________________________________
78
3.0 Background A variety of transgenic mouse models of Alzheimer’s disease (AD) have been
developed, utilising familial AD mutations as a basis. Mouse models, in particular, are
an attractive system as they are relatively easy to genetically manipulate, they breed in
abundance, and they have a moderately short life span. In addition, mice have a high
degree of conservation with humans in the architecture and function of the hippocampal
and entorhinal cortex circuits; areas that are highly dysfunctional in AD.
The most common AD mouse models are based on mutations to autosomal dominant
AD genes including the amyloid precursor protein (APP) and the presenilin genes
(PSEN1 and PSEN2). The primary functions of these mutations are to trigger over-
expression of amyloid-β (Aβ). The oldest and most widely use mouse models are based
on the over-expression of the human APP (hAPP) gene (Hall & Roberson 2012). In
general, models such as the PDAPP, hAPP-J20, Tg2756, APP23 and TgCRND8 models
elicit robust Aβ overproduction yielding synaptotoxicity and subsequent memory and
learning deficits (Ashe 2001, Bilkei-Gorzo 2014, Dudal et al 2004, Hall & Roberson
2012). However, these mouse models differ greatly in the promoters driving hAPP
expression, the hAPP isoform(s) and mutation(s) expressed and the background strain
utilised. These differences create major variations in pathology and cognitive
impairments during disease progression.
The mouse model used in our study is the hAPP-J20 model. The hAPP-J20 mouse
model harbors both the Swedish (K595N) and Indiana (M596L) mutations, under the
control of the neuron specific platelet-derived growth factor- β (PDGF-β) promoter.
Somewhat uniquely, the hAPP-J20 model expresses a hybrid minigene containing the
introns around exons 7 and 8 of the APP gene, allowing for alternative splicing, similar
to that observed in the human brain (Mucke et al 2000, Palop et al 2007). Mucke et al.
(2000) first described these mice, showing synaptic failure and plaque deposition by
seven months of age. Furthermore, dissimilar to other models, the hAPP-J20 model is
susceptible to seizure activity, a characteristic often observed in AD patients (Palop et al
2003, Palop & Mucke 2010). Thus, the unique design of the hAPP-J20 model allows for

Chapter 3: Characterisation of the hAPP-J20 mouse model ____________________________________________________________________________________
79
more aggressive Aβ accumulation than other AD models, such as PDAPP and Tg2576
mice (Mucke et al 2000), therefore making it an attractive system to utilise.
While the pathognomonic hallmarks of AD include Aβ overproduction, AD is also
associated with neuronal cell loss and neuroinflammation. Neuronal loss is
predominantly localised to the hippocampus, especially the CA1 region, and is further
detected throughout the cerebral cortex, increasing with disease advancement in AD
patients (Brun & Englund 1981). In addition, postmortem studies have revealed
significant neuroinflammatory changes in brain tissue from AD patients (Akiyama et al
2000). Microglia and astrocytes, two key neuroinflammatory cells of the brain, are
known to produce pro-inflammatory cytokines such as tumor necrosis factor-alpha
(TNF-α) and interleukin-6 (IL-6) when activated (Hanisch 2002). These, and other,
cytokines have been implicated in the progression of neurodegeneration and plaque
formation. However, while there is an understanding that neuroinflammation and
neuronal loss contribute to disease progression, the timing of these pathological events
is poorly understood, and remains uncharacterised in the hAPP-J20 mouse model.
In this chapter we describe an in depth investigation into the time course of common
AD pathological hallmarks and events in the hAPP-J20 mouse model as well as
alterations to behaviour, memory and learning. This study forms the foundation for our
work, which utilises this mouse model to investigate neuroprotection through alterations
to GluA2 RNA editing.
Aims:
• Investigate progression of total Aβ, Aβ oligomer and Aβ plaque deposition
overtime in the hAPP-J20 model
• Analyse changes in hippocampal neuronal populations over disease progression
in the hAPP-J20 model throughout disease progression
• Investigate neuroinflammatory changes in the hAPP-J20 mouse model
throughout disease progression
• Characterise the hAPP-J20 mouse model phenotype

Chapter 3: Characterisation of the hAPP-J20 mouse model ____________________________________________________________________________________
80
• Investigate cognitive deficits in the hAPP-J20 mouse model throughout disease
progression

Chapter 3: Characterisation of the hAPP-J20 mouse model ____________________________________________________________________________________
81
Results
3.1 Amyloid-beta expression and plaque formation occurs in an age-dependent
manner in the hAPP-J20 model of Alzheimer’s disease
An important characteristic of AD is the accumulation of the Aβ protein and the
subsequent formation of Aβ-containing plaques throughout the brain. Aβ is derived
from the abnormal cleavage of APP; a transmembrane protein that is highly expressed
in synapses of neurons (Ly et al 2011), though its function is unknown. In mouse
models of AD, including the 5XFAD, Tg2576, and TgCRND8 models, intracellular
accumulation of Aβ within neurons precedes extracellular Aβ plaque formation
(Billings et al 2005, Jawhar et al 2012, LaFerla et al 2007, Oakley et al 2006). In the
hAPP-J20 model, studies have shown plaque formation in the hippocampus by 28
weeks (Mucke et al 2000), however the progression of Aβ accumulation over time has
not yet been examined. To investigate this, we quantified species of Aβ including
monomeric, oligomeric and Aβ-containing plaques at 6, 12, 24 and 36 weeks of age in
the hAPP-J20 mouse model. These ages were selected to encompass a broad range of
time points both pre- and post-plaque deposition.
To determine whether hAPP-J20 mice exhibit age-dependent accumulation of cellular
and extracellular Aβ, we measured total Aβ in the hippocampus of hAPP-J20 mice and
wildtype (WT) controls at 6, 12, 24 and 36 weeks of age. This was performed using
immunohistochemistry and bright field microscopy with the 6E10 antibody, which
recognises Aβ residues 3-8 as well as full length human APP, thus providing a total
estimate of both soluble (i.e. monomeric and oligomeric) and insoluble (i.e. Aβ plaques)
APP and Aβ in hAPP-J20 mice. The results showed APP/Aβ staining throughout the
CA1 and CA3 neuronal layers of the hippocampus at 6, 12, 24, and 36 weeks in hAPP-
J20 mice (Figure 3.1.1A). As expected, no detection of APP/Aβ occurred in WT mice,
further confirming the presence of APP/Aβ in the hAPP-J20 mice. Extracellular
accumulation of Aβ plaques were apparent in 36-week-old hAPP-J20 mice (Figure
3.1.1A). Quantification of 6E10 immunoreactivity was performed using Image-Pro
software to analyse the amount of positive staining in the hippocampus. This revealed a
significant increase in total APP/Aβ levels with age (Figure 3.1.1B; F(3,24)=23.14
Chapter 3: Characterisation of the hAPP-J20 mouse model ____________________________________________________________________________________
82
p<0.001). A Bonferroni post-hoc analysis revealed a significant increase in Aβ at 12
(p<0.05), 24 (p<0.05), and 36 weeks (p<0.001) when compared to 6 weeks (Figure
3.1.1B). Thus, as expected, APP/Aβ increases with age in the hAPP-J20 mouse model
of AD, similar to that of a variety of other transgenic models of AD.
As noted above, one of the limitations of the 6E10 antibody is the detection of APP and
thus does not give an accurate quantification of Aβ alone. Therefore, in order to
determine if soluble Aβ increased in the hAPP-J20 mice hippocampi were isolated from
hAPP-J20 mice at 6, 12, 24, and 36 weeks of age and homogenised in Triton-X buffer
and analysed using a total Aβ sandwich ELISA. This allows for the sensitive detection
of all Aβ isoforms including Aβ1-38, Aβ1-40, and Aβ1-46. Our results indicate that total
soluble Aβ levels increased with age in the hAPP-J20 mice (Figure 3.1.1C; F(3,24)=7.761
p<0.001). A Bonferroni post-hoc analysis revealed a significant difference between 6
(p<0.001) and 12 (p<0.05) when compared to 36 weeks of age. Combined, these results
demonstrate age-dependent expression of soluble Aβ in the hippocampus of hAPP-J20
mice.
Oliogmeric Aβ are small assemblies of the Aβ protein that have more recently been
regarded as one of the major toxic forms of Aβ (Lesne et al 2013). Such oligomeric
species vary in size, ranging from two Aβ monomers (known as Aβ dimers) up to the
congregation of 36 monomer species (known as annular protofibrils) (Benilova et al
2012). It is now known that a strong correlation exists between the amount of Aβ-
oligomers and Mini-Mental Status exam scores in AD patients, potentially indicating a
major role of Aβ oligomers in AD progression (Santos et al 2012). Furthermore,
oligomeric Aβ is known to cause synaptotoxicity leading to cognitive impairment in the
5XFAD model of AD (Eimer & Vassar 2013). In this study we aimed to determine if
oligomeric species of Aβ occurred in the hAPP-J20 mouse model and if these increased
in an age dependent manner. Hippocampal sections from hAPP-J20 mice at 6, 12, 24,
and 36 weeks of age were fluorescently tagged with the A11 antibody, which recognises
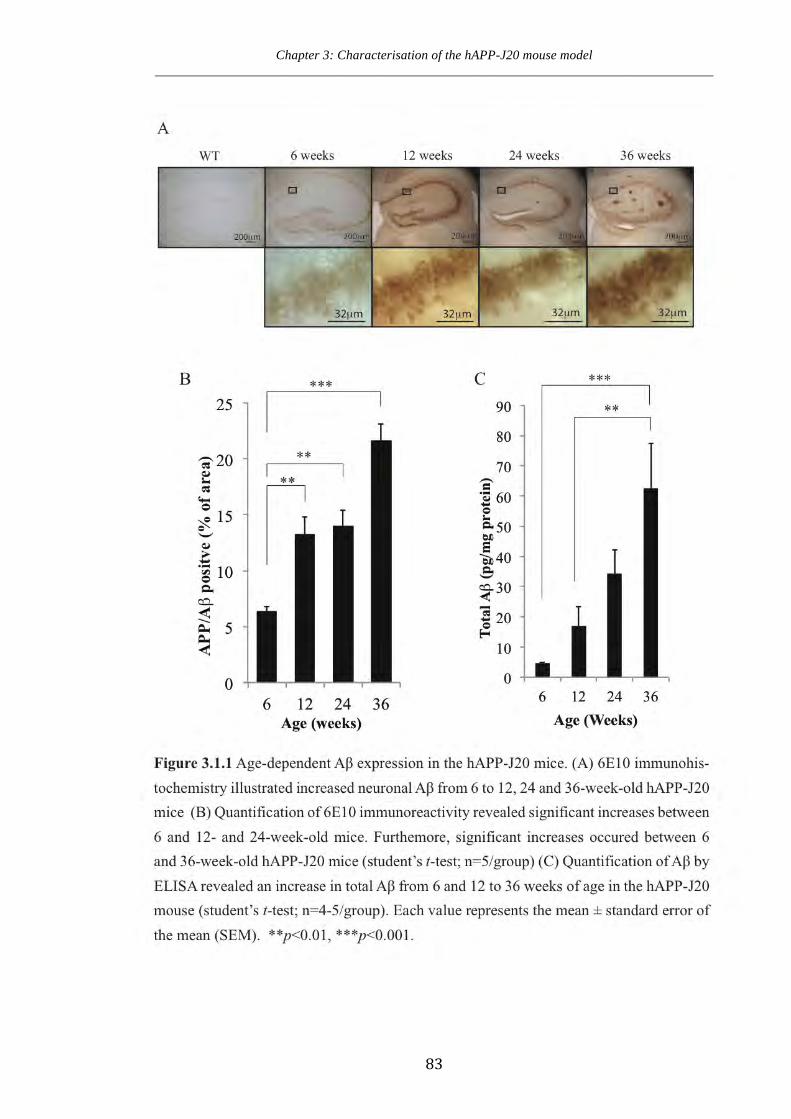
Chapter 3: Characterisation of the hAPP-J20 mouse model ____________________________________________________________________________________
83
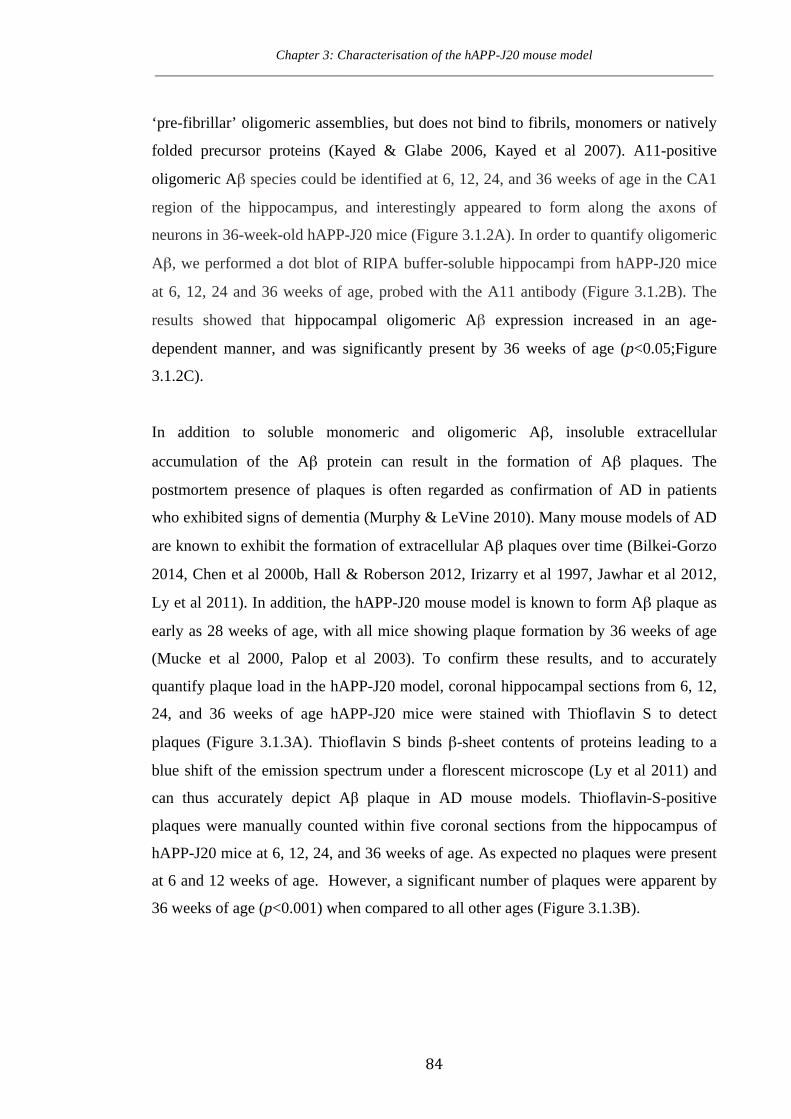
Chapter 3: Characterisation of the hAPP-J20 mouse model ____________________________________________________________________________________
84
‘pre-fibrillar’ oligomeric assemblies, but does not bind to fibrils, monomers or natively
folded precursor proteins (Kayed & Glabe 2006, Kayed et al 2007). A11-positive
oligomeric Aβ species could be identified at 6, 12, 24, and 36 weeks of age in the CA1
region of the hippocampus, and interestingly appeared to form along the axons of
neurons in 36-week-old hAPP-J20 mice (Figure 3.1.2A). In order to quantify oligomeric
Aβ, we performed a dot blot of RIPA buffer-soluble hippocampi from hAPP-J20 mice
at 6, 12, 24 and 36 weeks of age, probed with the A11 antibody (Figure 3.1.2B). The
results showed that hippocampal oligomeric Aβ expression increased in an age-
dependent manner, and was significantly present by 36 weeks of age (p<0.05;Figure
3.1.2C).
In addition to soluble monomeric and oligomeric Aβ, insoluble extracellular
accumulation of the Aβ protein can result in the formation of Aβ plaques. The
postmortem presence of plaques is often regarded as confirmation of AD in patients
who exhibited signs of dementia (Murphy & LeVine 2010). Many mouse models of AD
are known to exhibit the formation of extracellular Aβ plaques over time (Bilkei-Gorzo
2014, Chen et al 2000b, Hall & Roberson 2012, Irizarry et al 1997, Jawhar et al 2012,
Ly et al 2011). In addition, the hAPP-J20 mouse model is known to form Aβ plaque as
early as 28 weeks of age, with all mice showing plaque formation by 36 weeks of age
(Mucke et al 2000, Palop et al 2003). To confirm these results, and to accurately
quantify plaque load in the hAPP-J20 model, coronal hippocampal sections from 6, 12,
24, and 36 weeks of age hAPP-J20 mice were stained with Thioflavin S to detect
plaques (Figure 3.1.3A). Thioflavin S binds β-sheet contents of proteins leading to a
blue shift of the emission spectrum under a florescent microscope (Ly et al 2011) and
can thus accurately depict Aβ plaque in AD mouse models. Thioflavin-S-positive
plaques were manually counted within five coronal sections from the hippocampus of
hAPP-J20 mice at 6, 12, 24, and 36 weeks of age. As expected no plaques were present
at 6 and 12 weeks of age. However, a significant number of plaques were apparent by
36 weeks of age (p<0.001) when compared to all other ages (Figure 3.1.3B).
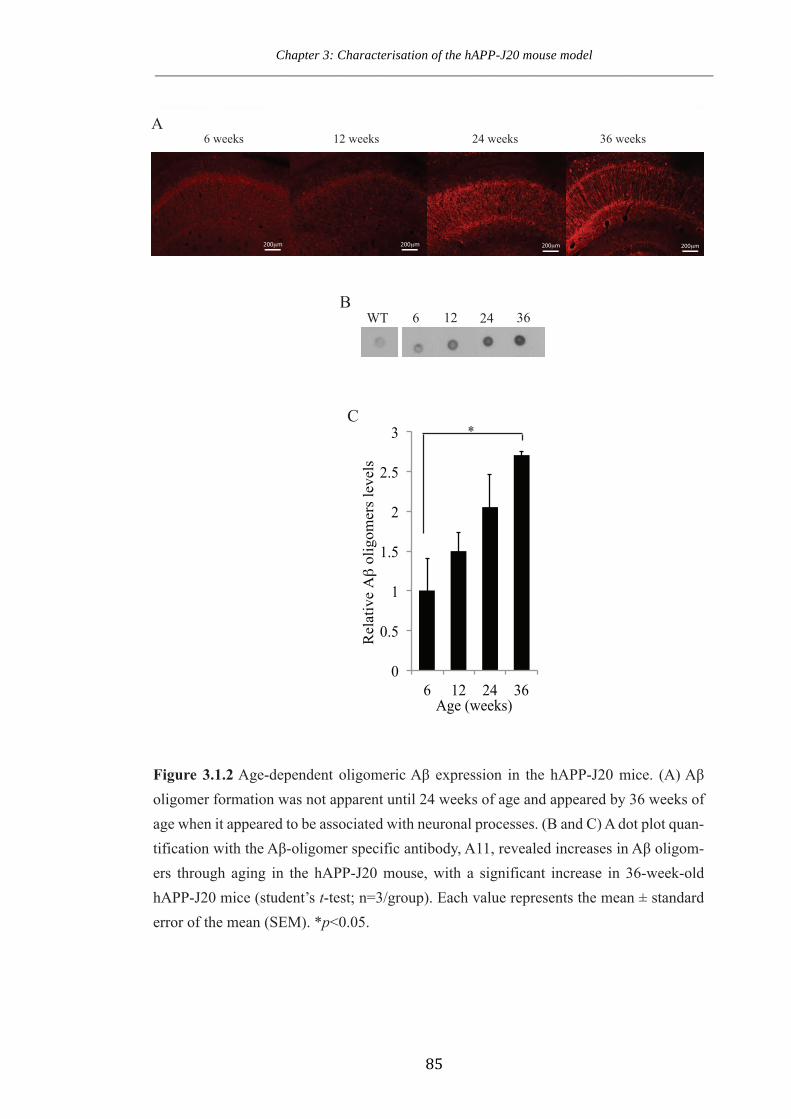
Chapter 3: Characterisation of the hAPP-J20 mouse model ____________________________________________________________________________________
85
WT 6 12 24 36
0
0.5
1
1.5
2
2.5
3
6 12 24 36
Rel
ativ
e A`
olig
omer
s le
vels
Age (weeks)
*
12 weeks 24 weeks 36 weeks6 weeksA
B
C
200+m 200+m 200+m
200+m
Figure 3.1.2�$JH�GHSHQGHQW� ROLJRPHULF�$ȕ�H[SUHVVLRQ� LQ� WKH�K$33�-���PLFH�� �$��$ȕ�oligomer formation was not apparent until 24 weeks of age and appeared by 36 weeks of DJH�ZKHQ�LW�DSSHDUHG�WR�EH�DVVRFLDWHG�ZLWK�QHXURQDO�SURFHVVHV���%�DQG�&��$�GRW�SORW�TXDQ-WLILFDWLRQ�ZLWK�WKH�$ȕ�ROLJRPHU�VSHFLILF�DQWLERG\��$����UHYHDOHG�LQFUHDVHV�LQ�$ȕ�ROLJRP-HUV� WKURXJK� DJLQJ� LQ� WKH� K$33�-���PRXVH��ZLWK� D� VLJQLILFDQW� LQFUHDVH� LQ� ���ZHHN�ROG�K$33�-���PLFH�(student’s t-test; n=3/group)��(DFK�YDOXH�UHSUHVHQWV�WKH�PHDQ���VWDQGDUG�HUURU�RI�WKH�PHDQ��6(0��� p<0.05.
200+m
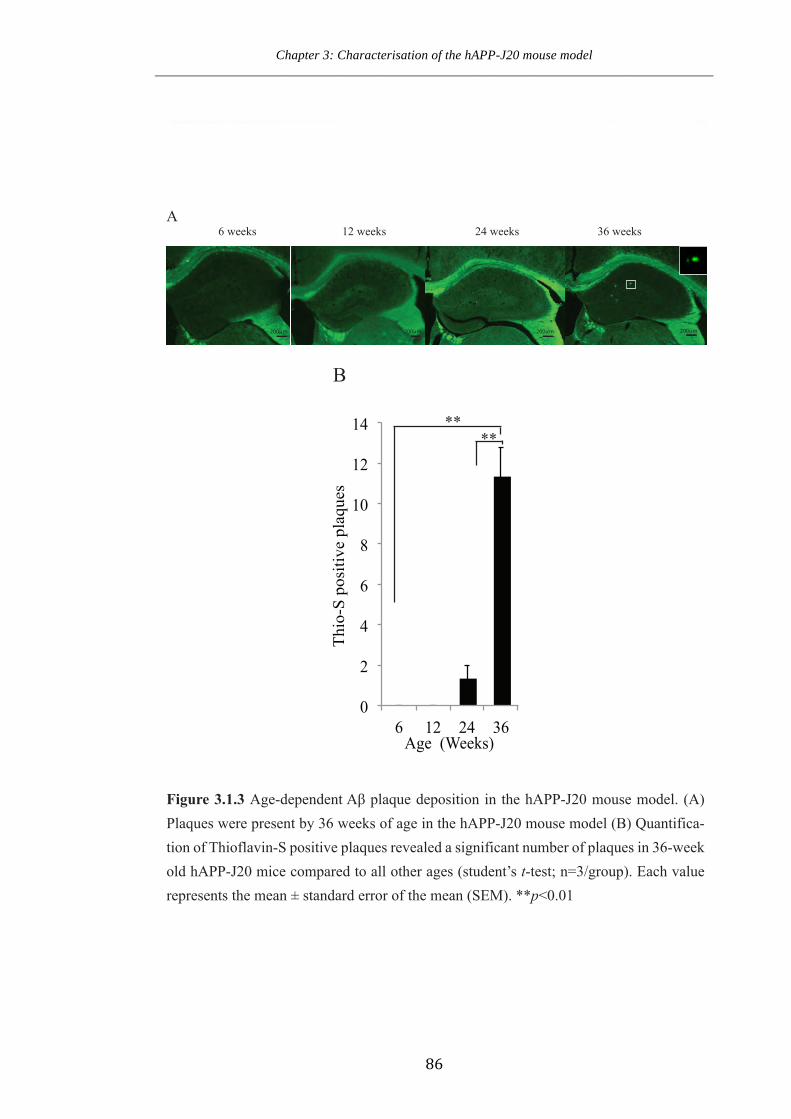
Chapter 3: Characterisation of the hAPP-J20 mouse model ____________________________________________________________________________________
86
0
2
4
6
8
10
12
14
6 12 24 36
Thio
-S p
ositi
ve p
laqu
es
Age (Weeks)
****
B
12 weeks 24 weeks 36 weeks6 weeksA
200+m 200+m 200+m 200+m
Figure 3.1.3 $JH�GHSHQGHQW�$ȕ�SODTXH�GHSRVLWLRQ�LQ�WKH�K$33�-���PRXVH�PRGHO���$��3ODTXHV�ZHUH�SUHVHQW�E\����ZHHNV�RI�DJH�LQ�WKH�K$33�-���PRXVH�PRGHO��%��4XDQWLILFD-WLRQ�RI�7KLRIODYLQ�6�SRVLWLYH�SODTXHV�UHYHDOHG�D�VLJQLILFDQW�QXPEHU�RI�SODTXHV�LQ����ZHHN�ROG�K$33�-���PLFH�FRPSDUHG�WR�DOO�RWKHU�DJHV�(student’s t�WHVW��Q ��JURXS���(DFK�YDOXH�UHSUHVHQWV�WKH�PHDQ���VWDQGDUG�HUURU�RI�WKH�PHDQ��6(0��� p�����
Chapter 3: Characterisation of the hAPP-J20 mouse model ____________________________________________________________________________________
87
Combined, these results demonstrate age-dependent expression of monomeric and
oligomeric Aβ that is followed by plaque formation at the later stages in the
hippocampus of hAPP-J20 mice. Thus, similar to other mouse models of AD,
monomeric and oligomeric Aβ precedes plaque formation by a significant margin in the
hAPP-J20 model.
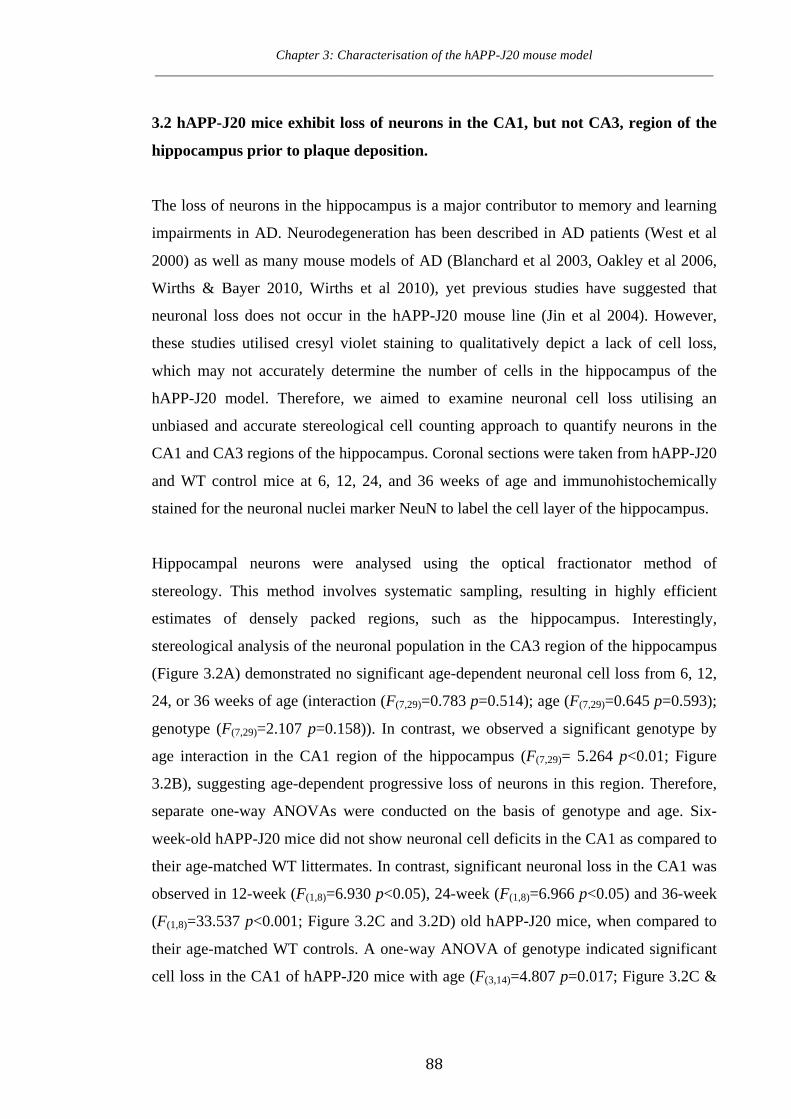
Chapter 3: Characterisation of the hAPP-J20 mouse model ____________________________________________________________________________________
88
3.2 hAPP-J20 mice exhibit loss of neurons in the CA1, but not CA3, region of the
hippocampus prior to plaque deposition.
The loss of neurons in the hippocampus is a major contributor to memory and learning
impairments in AD. Neurodegeneration has been described in AD patients (West et al
2000) as well as many mouse models of AD (Blanchard et al 2003, Oakley et al 2006,
Wirths & Bayer 2010, Wirths et al 2010), yet previous studies have suggested that
neuronal loss does not occur in the hAPP-J20 mouse line (Jin et al 2004). However,
these studies utilised cresyl violet staining to qualitatively depict a lack of cell loss,
which may not accurately determine the number of cells in the hippocampus of the
hAPP-J20 model. Therefore, we aimed to examine neuronal cell loss utilising an
unbiased and accurate stereological cell counting approach to quantify neurons in the
CA1 and CA3 regions of the hippocampus. Coronal sections were taken from hAPP-J20
and WT control mice at 6, 12, 24, and 36 weeks of age and immunohistochemically
stained for the neuronal nuclei marker NeuN to label the cell layer of the hippocampus.
Hippocampal neurons were analysed using the optical fractionator method of
stereology. This method involves systematic sampling, resulting in highly efficient
estimates of densely packed regions, such as the hippocampus. Interestingly,
stereological analysis of the neuronal population in the CA3 region of the hippocampus
(Figure 3.2A) demonstrated no significant age-dependent neuronal cell loss from 6, 12,
24, or 36 weeks of age (interaction (F(7,29)=0.783 p=0.514); age (F(7,29)=0.645 p=0.593);
genotype (F(7,29)=2.107 p=0.158)). In contrast, we observed a significant genotype by
age interaction in the CA1 region of the hippocampus (F(7,29)= 5.264 p<0.01; Figure
3.2B), suggesting age-dependent progressive loss of neurons in this region. Therefore,
separate one-way ANOVAs were conducted on the basis of genotype and age. Six-
week-old hAPP-J20 mice did not show neuronal cell deficits in the CA1 as compared to
their age-matched WT littermates. In contrast, significant neuronal loss in the CA1 was
observed in 12-week (F(1,8)=6.930 p<0.05), 24-week (F(1,8)=6.966 p<0.05) and 36-week
(F(1,8)=33.537 p<0.001; Figure 3.2C and 3.2D) old hAPP-J20 mice, when compared to
their age-matched WT controls. A one-way ANOVA of genotype indicated significant
cell loss in the CA1 of hAPP-J20 mice with age (F(3,14)=4.807 p=0.017; Figure 3.2C &

Chapter 3: Characterisation of the hAPP-J20 mouse model ____________________________________________________________________________________
89
D). A Bonferroni post-hoc analysis revealed a significant difference in neuronal cell
population between 6-week and 36-week old hAPP-J20 mice (p<0.001).
Thus, in this study, we revealed progressive, age-dependent neurodegeneration in the
CA1 region, beginning at 12 weeks and reaching a 32% loss by 36 weeks. Interestingly,
cell loss did not occur in the CA3 region. This selective loss of CA1 neurons parallels
studies of human AD patients that show greater neuron loss in the CA1 compared to the
CA3 region (Bobinski et al 1997, West et al 1994). Although the exact reasons for this
regional difference in neurodegeneration are unknown, it is thought to involve
differential expression of both NMDA and AMPA receptor subunits, rendering the CA1
neurons more susceptible to excitotoxic cell death (Coultrap et al 2005, Mulholland &
Prendergast 2003).

Chapter 3: Characterisation of the hAPP-J20 mouse model ____________________________________________________________________________________
90
Figure 3.2. Quantification of hippocampal neuronal populations in hAPP-J20 mice. (A) No
cell loss was detected in the CA3 region of the hippocampus of hAPP-J20 mice at 6, 24 and
36 weeks of age (Two-Way ANOVA; n=5/group). (B) No cell loss in the CA1 region was
detected at 6 weeks, however, 12, 24 and 36-week-old mice showed significant cell loss
when compared to aged-matched WT controls. Moreover, cell loss was significantly differ-
ent between 6 and 36-week-old hAPP-J20 mice (Two-Way ANOVA; n=5/group). Cell loss
in the CA1 region can be qualitatively seen between (C) WT and (D) 36-week-old hAPP-J20
mice. Each value represents the mean ± standard error of the mean (SEM). *p<0.05,
***p<0.001.
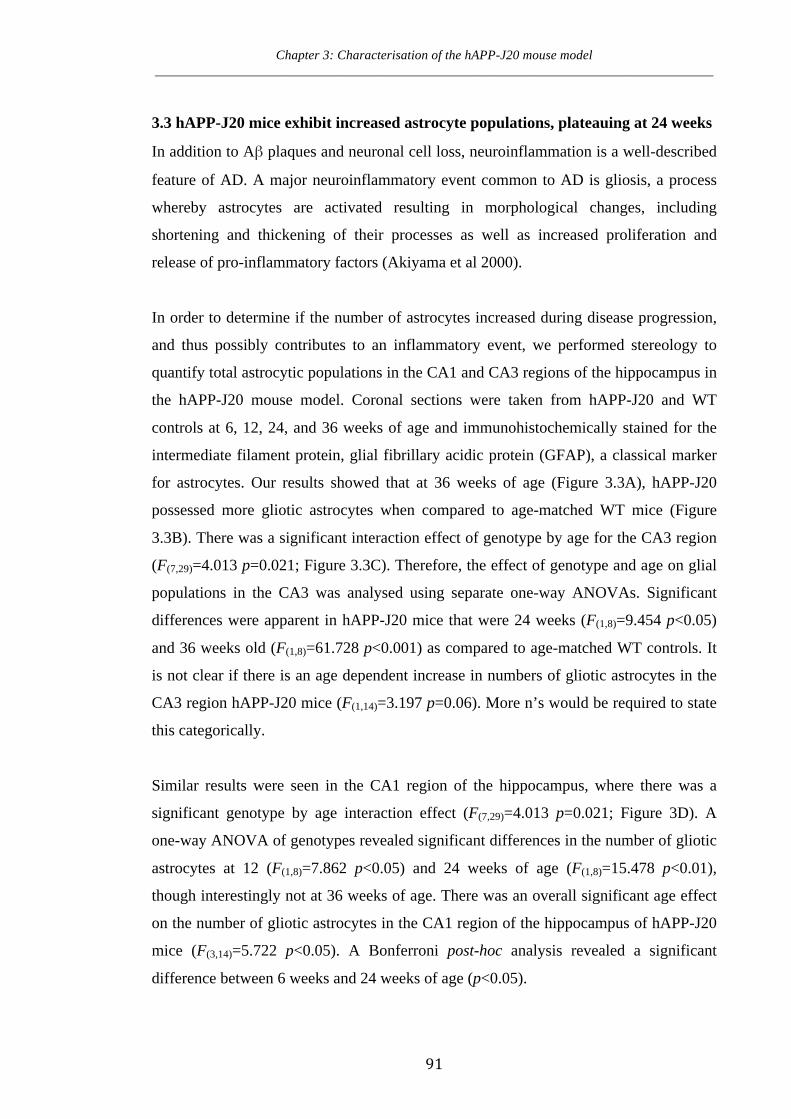
Chapter 3: Characterisation of the hAPP-J20 mouse model ____________________________________________________________________________________
91
3.3 hAPP-J20 mice exhibit increased astrocyte populations, plateauing at 24 weeks
In addition to Aβ plaques and neuronal cell loss, neuroinflammation is a well-described
feature of AD. A major neuroinflammatory event common to AD is gliosis, a process
whereby astrocytes are activated resulting in morphological changes, including
shortening and thickening of their processes as well as increased proliferation and
release of pro-inflammatory factors (Akiyama et al 2000).
In order to determine if the number of astrocytes increased during disease progression,
and thus possibly contributes to an inflammatory event, we performed stereology to
quantify total astrocytic populations in the CA1 and CA3 regions of the hippocampus in
the hAPP-J20 mouse model. Coronal sections were taken from hAPP-J20 and WT
controls at 6, 12, 24, and 36 weeks of age and immunohistochemically stained for the
intermediate filament protein, glial fibrillary acidic protein (GFAP), a classical marker
for astrocytes. Our results showed that at 36 weeks of age (Figure 3.3A), hAPP-J20
possessed more gliotic astrocytes when compared to age-matched WT mice (Figure
3.3B). There was a significant interaction effect of genotype by age for the CA3 region
(F(7,29)=4.013 p=0.021; Figure 3.3C). Therefore, the effect of genotype and age on glial
populations in the CA3 was analysed using separate one-way ANOVAs. Significant
differences were apparent in hAPP-J20 mice that were 24 weeks (F(1,8)=9.454 p<0.05)
and 36 weeks old (F(1,8)=61.728 p<0.001) as compared to age-matched WT controls. It
is not clear if there is an age dependent increase in numbers of gliotic astrocytes in the
CA3 region hAPP-J20 mice (F(1,14)=3.197 p=0.06). More n’s would be required to state
this categorically.
Similar results were seen in the CA1 region of the hippocampus, where there was a
significant genotype by age interaction effect (F(7,29)=4.013 p=0.021; Figure 3D). A
one-way ANOVA of genotypes revealed significant differences in the number of gliotic
astrocytes at 12 (F(1,8)=7.862 p<0.05) and 24 weeks of age (F(1,8)=15.478 p<0.01),
though interestingly not at 36 weeks of age. There was an overall significant age effect
on the number of gliotic astrocytes in the CA1 region of the hippocampus of hAPP-J20
mice (F(3,14)=5.722 p<0.05). A Bonferroni post-hoc analysis revealed a significant
difference between 6 weeks and 24 weeks of age (p<0.05).
Chapter 3: Characterisation of the hAPP-J20 mouse model ____________________________________________________________________________________
92
Combined, these results indicate that increases in reactive astrocyte numbers in the
hAPP-J20 mouse model is progressive with age, eventually plateauing at 24 weeks of
age. This is similar to previous studies, demonstrating both astrogliosis and astroglial
atrophy in the 5XFAD model of AD. In this study, the authors indicated that a
significant reduction in GFAP-labeled astrocytes occurs following plaque deposition,
leading to inadequate support for neurons (Rodriguez et al 2009). Hence, it is plausible
that the same phenomena may be occurring the hAPP-J20 mouse model, given that
astrocyte populations were significantly increased at 24 weeks of age, though not 36
weeks of age in the CA1 region of the hippocampus.
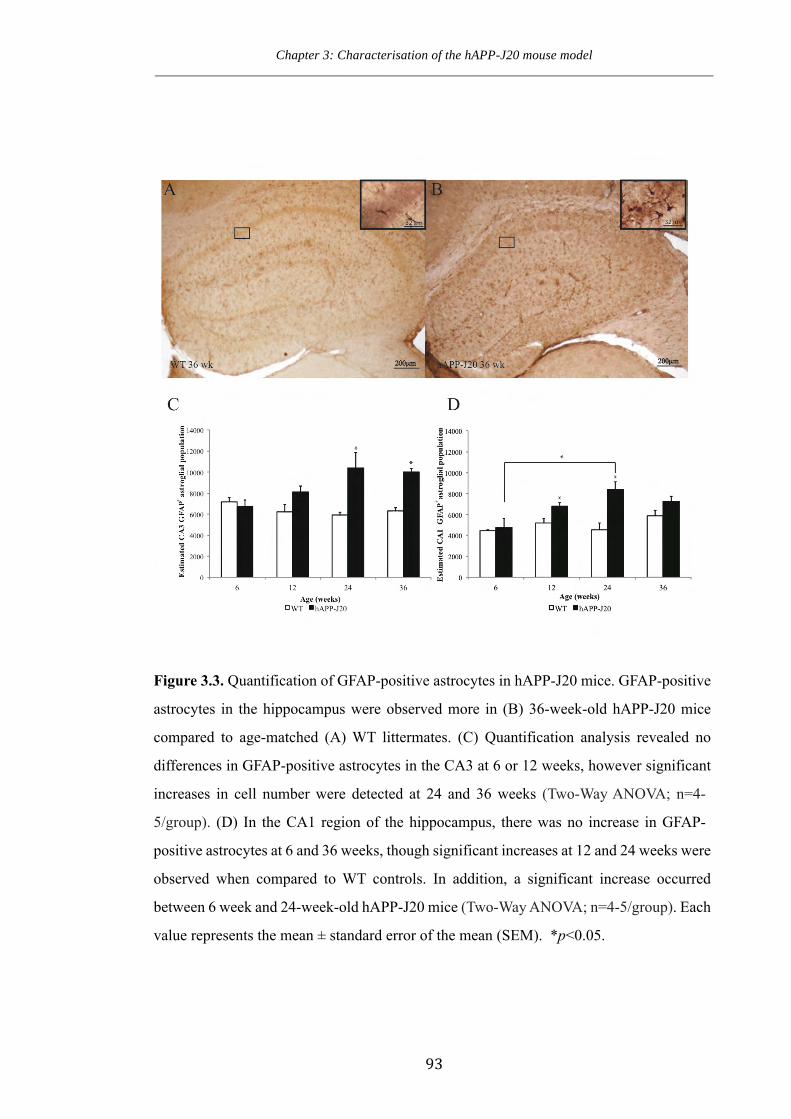
Chapter 3: Characterisation of the hAPP-J20 mouse model ____________________________________________________________________________________
93
Figure 3.3. Quantification of GFAP-positive astrocytes in hAPP-J20 mice. GFAP-positive
astrocytes in the hippocampus were observed more in (B) 36-week-old hAPP-J20 mice
compared to age-matched (A) WT littermates. (C) Quantification analysis revealed no
differences in GFAP-positive astrocytes in the CA3 at 6 or 12 weeks, however significant
increases in cell number were detected at 24 and 36 weeks (Two-Way ANOVA; n=4-
5/group). (D) In the CA1 region of the hippocampus, there was no increase in GFAP-
positive astrocytes at 6 and 36 weeks, though significant increases at 12 and 24 weeks were
observed when compared to WT controls. In addition, a significant increase occurred
between 6 week and 24-week-old hAPP-J20 mice (Two-Way ANOVA; n=4-5/group). Each
value represents the mean ± standard error of the mean (SEM). *p<0.05.
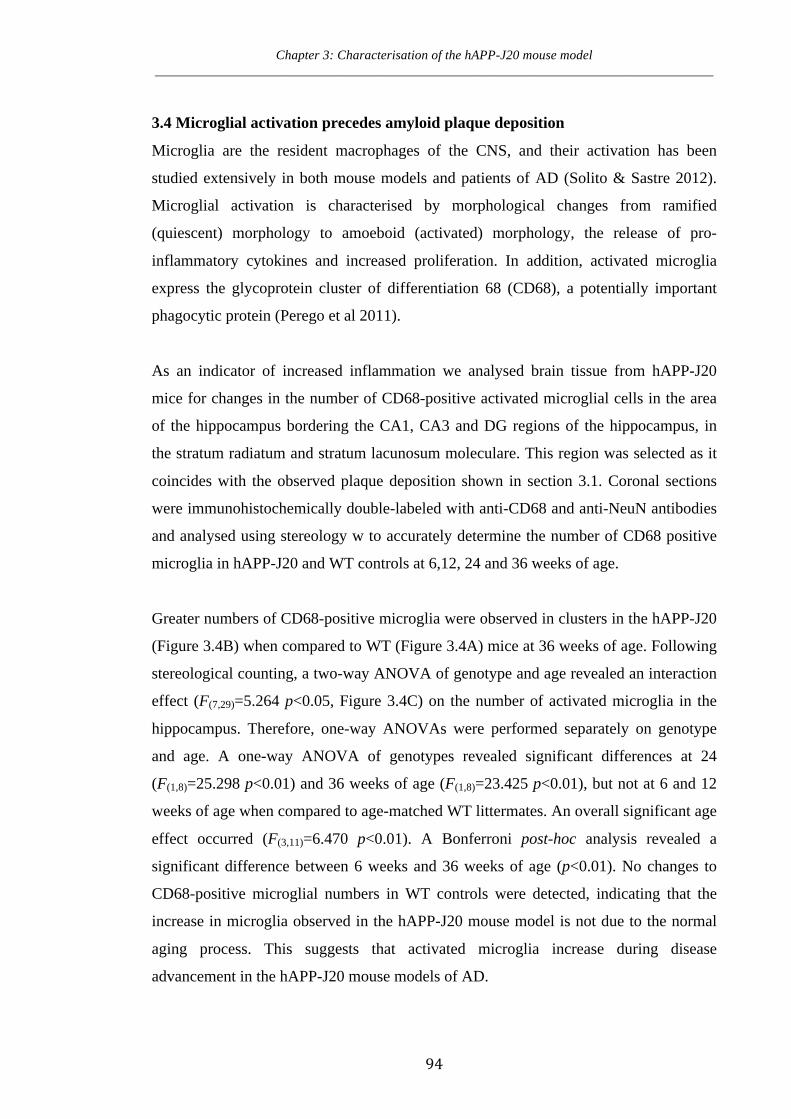
Chapter 3: Characterisation of the hAPP-J20 mouse model ____________________________________________________________________________________
94
3.4 Microglial activation precedes amyloid plaque deposition
Microglia are the resident macrophages of the CNS, and their activation has been
studied extensively in both mouse models and patients of AD (Solito & Sastre 2012).
Microglial activation is characterised by morphological changes from ramified
(quiescent) morphology to amoeboid (activated) morphology, the release of pro-
inflammatory cytokines and increased proliferation. In addition, activated microglia
express the glycoprotein cluster of differentiation 68 (CD68), a potentially important
phagocytic protein (Perego et al 2011).
As an indicator of increased inflammation we analysed brain tissue from hAPP-J20
mice for changes in the number of CD68-positive activated microglial cells in the area
of the hippocampus bordering the CA1, CA3 and DG regions of the hippocampus, in
the stratum radiatum and stratum lacunosum moleculare. This region was selected as it
coincides with the observed plaque deposition shown in section 3.1. Coronal sections
were immunohistochemically double-labeled with anti-CD68 and anti-NeuN antibodies
and analysed using stereology w to accurately determine the number of CD68 positive
microglia in hAPP-J20 and WT controls at 6,12, 24 and 36 weeks of age.
Greater numbers of CD68-positive microglia were observed in clusters in the hAPP-J20
(Figure 3.4B) when compared to WT (Figure 3.4A) mice at 36 weeks of age. Following
stereological counting, a two-way ANOVA of genotype and age revealed an interaction
effect (F(7,29)=5.264 p<0.05, Figure 3.4C) on the number of activated microglia in the
hippocampus. Therefore, one-way ANOVAs were performed separately on genotype
and age. A one-way ANOVA of genotypes revealed significant differences at 24
(F(1,8)=25.298 p<0.01) and 36 weeks of age (F(1,8)=23.425 p<0.01), but not at 6 and 12
weeks of age when compared to age-matched WT littermates. An overall significant age
effect occurred (F(3,11)=6.470 p<0.01). A Bonferroni post-hoc analysis revealed a
significant difference between 6 weeks and 36 weeks of age (p<0.01). No changes to
CD68-positive microglial numbers in WT controls were detected, indicating that the
increase in microglia observed in the hAPP-J20 mouse model is not due to the normal
aging process. This suggests that activated microglia increase during disease
advancement in the hAPP-J20 mouse models of AD.
Chapter 3: Characterisation of the hAPP-J20 mouse model ____________________________________________________________________________________
95
Therefore, in this study we have shown that a progressive increase in activated
microglia occurs in the hAPP-J20 mouse model. Importantly, the quantification of
CD68-positive microglia revealed significant increases in microglial populations prior
to the formation of Aβ containing plaques. This is consistent with some studies which
show that activated microglia contribute to neurodegeneration in AD and also have been
implicated in the formation of Aβ plaques (Hickman et al 2008, Jaworski et al 2011,
Solito & Sastre 2012).
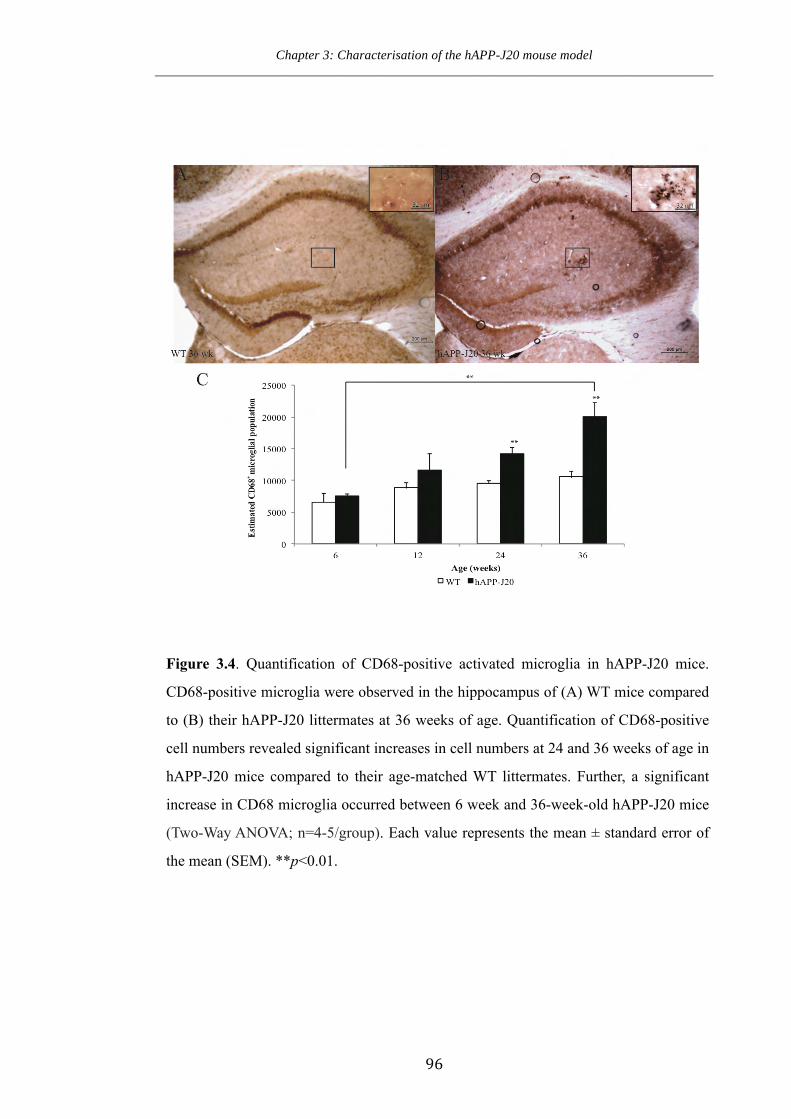
Chapter 3: Characterisation of the hAPP-J20 mouse model ____________________________________________________________________________________
96
Figure 3.4. Quantification of CD68-positive activated microglia in hAPP-J20 mice.
CD68-positive microglia were observed in the hippocampus of (A) WT mice compared
to (B) their hAPP-J20 littermates at 36 weeks of age. Quantification of CD68-positive
cell numbers revealed significant increases in cell numbers at 24 and 36 weeks of age in
hAPP-J20 mice compared to their age-matched WT littermates. Further, a significant
increase in CD68 microglia occurred between 6 week and 36-week-old hAPP-J20 mice
(Two-Way ANOVA; n=4-5/group). Each value represents the mean ± standard error of
the mean (SEM). **p<0.01.
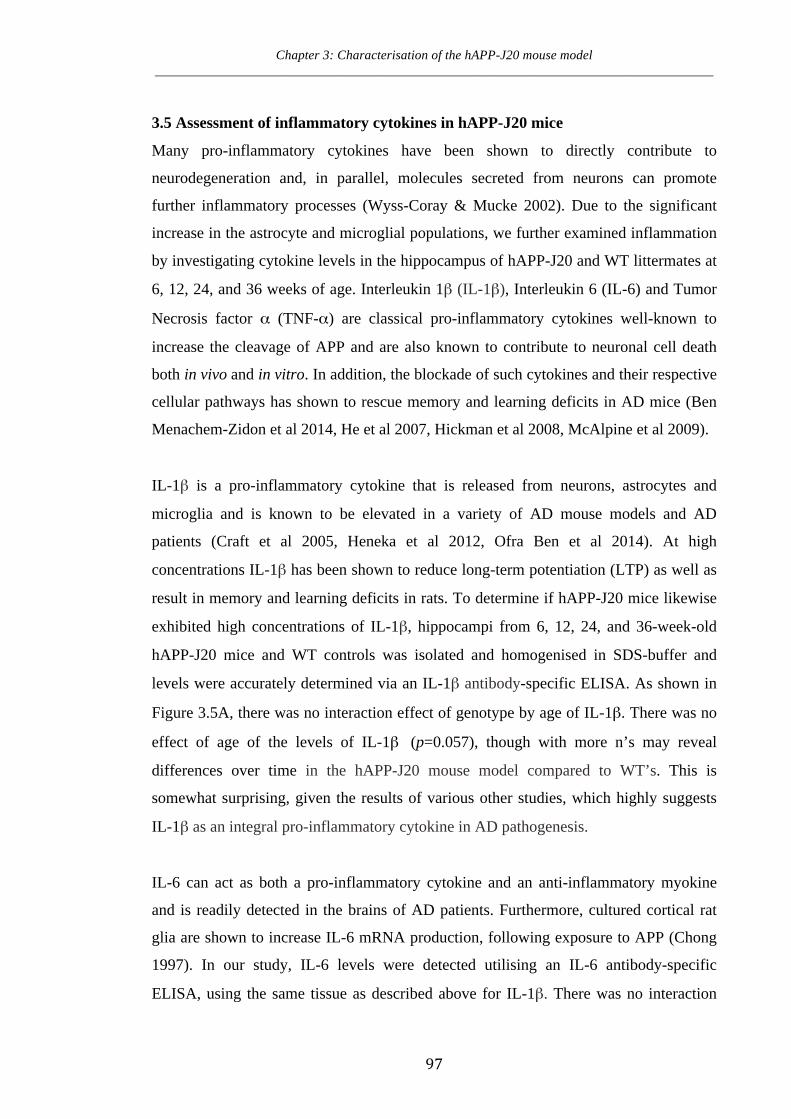
Chapter 3: Characterisation of the hAPP-J20 mouse model ____________________________________________________________________________________
97
3.5 Assessment of inflammatory cytokines in hAPP-J20 mice
Many pro-inflammatory cytokines have been shown to directly contribute to
neurodegeneration and, in parallel, molecules secreted from neurons can promote
further inflammatory processes (Wyss-Coray & Mucke 2002). Due to the significant
increase in the astrocyte and microglial populations, we further examined inflammation
by investigating cytokine levels in the hippocampus of hAPP-J20 and WT littermates at
6, 12, 24, and 36 weeks of age. Interleukin 1β (IL-1β), Interleukin 6 (IL-6) and Tumor
Necrosis factor α (TNF-α) are classical pro-inflammatory cytokines well-known to
increase the cleavage of APP and are also known to contribute to neuronal cell death
both in vivo and in vitro. In addition, the blockade of such cytokines and their respective
cellular pathways has shown to rescue memory and learning deficits in AD mice (Ben
Menachem-Zidon et al 2014, He et al 2007, Hickman et al 2008, McAlpine et al 2009).
IL-1β is a pro-inflammatory cytokine that is released from neurons, astrocytes and
microglia and is known to be elevated in a variety of AD mouse models and AD
patients (Craft et al 2005, Heneka et al 2012, Ofra Ben et al 2014). At high
concentrations IL-1β has been shown to reduce long-term potentiation (LTP) as well as
result in memory and learning deficits in rats. To determine if hAPP-J20 mice likewise
exhibited high concentrations of IL-1β, hippocampi from 6, 12, 24, and 36-week-old
hAPP-J20 mice and WT controls was isolated and homogenised in SDS-buffer and
levels were accurately determined via an IL-1β antibody-specific ELISA. As shown in
Figure 3.5A, there was no interaction effect of genotype by age of IL-1β. There was no
effect of age of the levels of IL-1β (p=0.057), though with more n’s may reveal
differences over time in the hAPP-J20 mouse model compared to WT’s. This is
somewhat surprising, given the results of various other studies, which highly suggests
IL-1β as an integral pro-inflammatory cytokine in AD pathogenesis.
IL-6 can act as both a pro-inflammatory cytokine and an anti-inflammatory myokine
and is readily detected in the brains of AD patients. Furthermore, cultured cortical rat
glia are shown to increase IL-6 mRNA production, following exposure to APP (Chong
1997). In our study, IL-6 levels were detected utilising an IL-6 antibody-specific
ELISA, using the same tissue as described above for IL-1β. There was no interaction
Chapter 3: Characterisation of the hAPP-J20 mouse model ____________________________________________________________________________________
98
effect (p>0.05) for the levels of IL-6, and no effect of genotype (p>0.05), however an
effect of age did occur (F(3,7)=9.11, p<0.01; Figure 3.7B). A post hoc analysis revealed a
significant difference between 36-week and 6 (p<0.001), 12 (p< 0.05) and 24-week
(p<0.05) old hAPP-J20 mice. These results indicated that IL-6 increases during aging in
both hAPP-20 mice and WT littermates.
TNF-α is synthesised and released in the brain from several cell types including
astrocytes, microglia and neurons, and is known to be involved in a wide range of
cellular processes including inflammation, cellular differentiation and apoptosis. TNF-α
is vastly studied in AD, and is thought to account for most of the neurotoxic activity
effected by microglia. In order to investigate TNF-α production in the hAPP-J20 mice,
we utilised the same tissue as described above for IL-1β and IL-6, with a TNF-α
antibody-specific ELISA. A two-way ANOVA was performed on TNF-α production
and revealed a significant interaction effect of genotype by age. Therefore, the effect of
genotype and age on TNF-α levels in the hippocampus were analysed separately, using
a one-way ANOVA. There were no significant differences between 6, 12, and 24-week-
old hAPP-J20 mice and WT littermates, however a significant difference did occur at 36
weeks (p=0.013). There was an overall significant age difference between hAPP-J20
mice. A post hoc analysis revealed a significant difference between 6- and 24-week old
hAPP-J20 mice (p<0.01). Further, there was a significant increase in TNF-α levels
between 6 week- (p<0.01) and 12 week- (p<0.05) when compared to 36-week old
hAPP-J20 mice. These results indicate a significant increase in TNF-α levels during
aging in the hAPP-J20 mice model.
In summary, our study indicates that similar to other investigations of AD patients and
mouse models, TNF-α levels increase during disease progression in the hAPP-J20
mouse model of AD. However, rather unexpectedly, no significant changes were
observed in IL-1β levels, though more n’s may reveal a difference over time in hAPP-
J20 mice as compared to WT’s. In addition, IL-6 levels appear to increase during
natural aging as indicated by increases in WT levels over time, though there were also
significantly elevated in hAPP-J20 mice. Overall, the data reported in this study adds to
evidence that deregulated microglial and astrocyte activation, in addition to

Chapter 3: Characterisation of the hAPP-J20 mouse model ____________________________________________________________________________________
99
simultaneous pro-inflammatory cytokine production, are early pathophysiologic
mechanisms that could be potentially contributing to AD progression.

Chapter 3: Characterisation of the hAPP-J20 mouse model ____________________________________________________________________________________
100
0
20
40
60
80
100
120
6 12 24 36
IL-1`
(pg/
mL
prot
ein)
Age (Weeks) WT hAPP-J20
0
1
2
3
4
5
6
7
8
6 12 24 36
IL-6
(pg/
mL
prot
ein)
Age (Weeks) WT hAPP-J20
0
0.5
1
1.5
2
2.5
3
3.5
4
6 12 24 36
TNF-_
(pg/
mL
prot
ein)
Age (Weeks)
WT hAPP-J20
A
B
C***
**
*****
**

Chapter 3: Characterisation of the hAPP-J20 mouse model ____________________________________________________________________________________
101
Figure 3.5 Quantificaiation of cytokine levels in hAPP-J20 mice. (A) No changes were
detetected in IL-1`� levels at any time point (Two-Way ANOVA; n=4-5/group). (B)
Significant increases to IL-6 levels occured between 6, 12, and 24 week of age hAPP-J20
mice, when compared to 36-week old hAPP-J20 mice (Two-Way ANOVA; n=4-
5/group). (C) Significant increases to TNF-_ levels occured between 6 and 12 weeks as
compared 36-week old hAPP-J20 mice. Moreover, TNF-_ levels were elevated in
hAPP-J20 mice at 36-weeks old as compared to WT controls (Two-Way ANOVA; n=4-
5/group). Each value represents the mean ± standard error of the mean (SEM). **p<0.05
Chapter 3: Characterisation of the hAPP-J20 mouse model ____________________________________________________________________________________
102
3.6 Phenotypical characterisation of the hAPP-J20 mice
Mouse models of AD, particularly those based on hAPP mutations, often present with a
range of pathological phenotypes. Similar to other hAPP transgenic lines, the hAPP-J20
mice are known to exhibit early mortality rates, potentially caused by epileptic seizures
(Palop et al 2007, Roberson et al 2007) and/or alterations to the glutamate
neurotransmitter system. To confirm this, we monitored hAPP-J20 mice and WT
controls for 35 weeks. This revealed that 2.7% of WT mice died as opposed to 29.93%
of hAPP-J20 mice (Figure 3.7A). A Kaplan-Meier survival curve revealed hAPP-J20
mice die significantly earlier than WT littermates (p<0.001, Mantel-Cox test). This
confirms the results of other studies and shows the phenotype to be maintained within
our laboratory.
AD is often associated with fluctuations in body weight. Furthermore, several clinical
studies have shown a relationship between AD and type II diabetes, and patients with
AD are more vulnerable to develop type II diabetes. We therefore investigated body
weight in the hAPP-J20 mice and WT controls. hAPP-J20 mice showed a reduced body
weight when compared with WT littermates at 24 weeks of age (p<0.05; Figure 3.7B).
We therefore hypothesised that due to lower body weights observed in the hAPP-J20
mice, alterations to functional homeostasis may also occur in these mice. Therefore we
aimed to characterise AD mice for baseline glucose homeostasis. To do this, mice were
fasted for 16 hours prior to an injection of glucose. Following injection, blood glucose
levels were determined every 15 minutes for a total of two hours in mice at 24 weeks of
age. hAPP-J20 mice did not present altered glucose tolerance sensitivity as compared to
WT controls.
Therefore, similar to other investigations, we have shown that the hAPP-J20 mouse
model has an early mortality rate. In addition, we have shown these mice have a lower
adult weight, though suggest that increased hippocampal Aβ overproduction per se does
not alter glucose homeostasis.
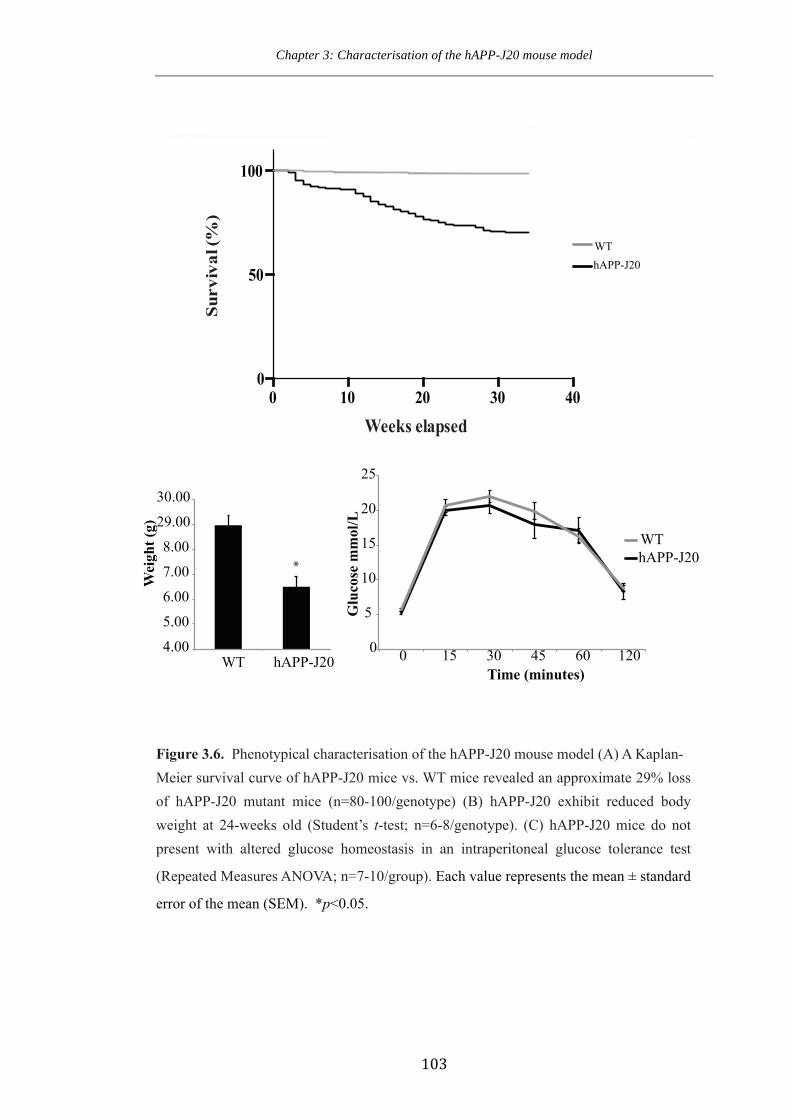
Chapter 3: Characterisation of the hAPP-J20 mouse model ____________________________________________________________________________________
103
hAPP-J20
WT
24.00
25.00
26.00
27.00
28.00
29.00
30.00
WT hAPP-J20
Wei
ght (
g)
0
5
10
15
20
25
0 15 30 45 60 120
Glu
cose
mm
ol/L
Time (minutes)
hAPP-J20 *
Weeks elapsed
Surv
ival
(%)
0 10 20 30 400
50
100
Figure 3.6. Phenotypical characterisation of the hAPP-J20 mouse model (A) A Kaplan-
Meier survival curve of hAPP-J20 mice vs. WT mice revealed an approximate 29% loss
of hAPP-J20 mutant mice (n=80-100/genotype) (B) hAPP-J20 exhibit reduced body
weight at 24-weeks old (Student’s t-test; n=6-8/genotype). (C) hAPP-J20 mice do not
present with altered glucose homeostasis in an intraperitoneal glucose tolerance test
(Repeated Measures ANOVA; n=7-10/group). Each value represents the mean ± standard
error of the mean (SEM). *p<0.05.
WT
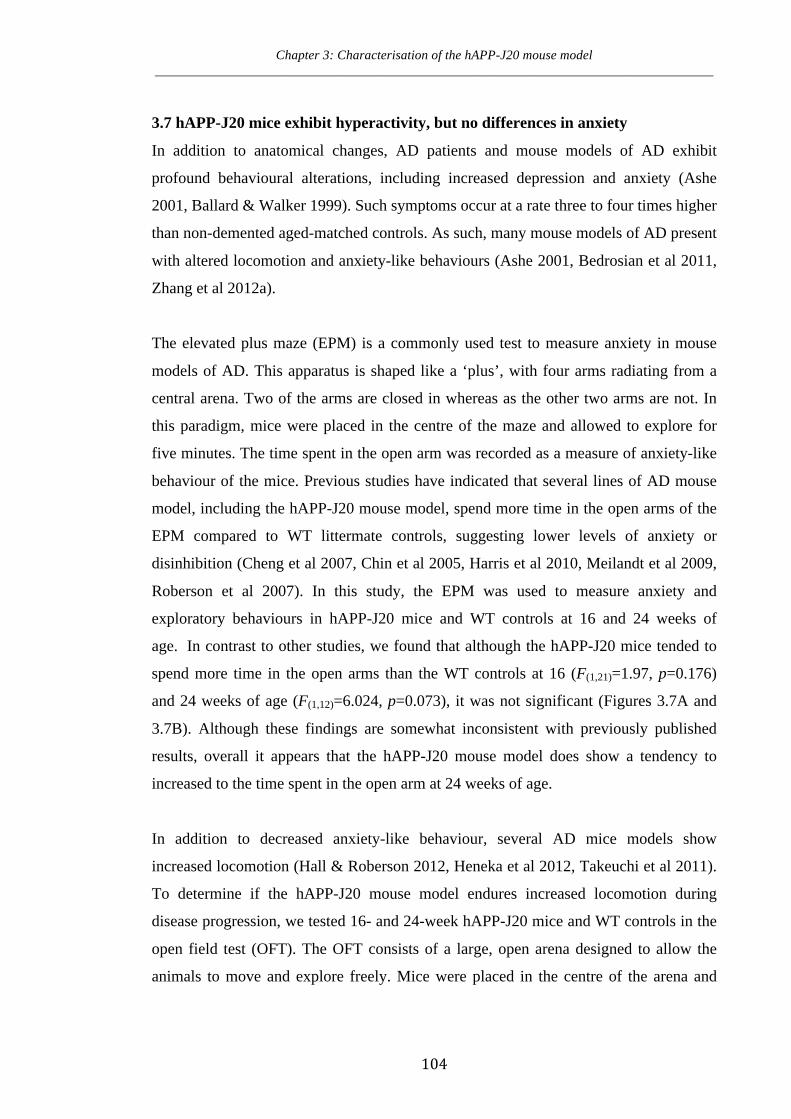
Chapter 3: Characterisation of the hAPP-J20 mouse model ____________________________________________________________________________________
104
3.7 hAPP-J20 mice exhibit hyperactivity, but no differences in anxiety
In addition to anatomical changes, AD patients and mouse models of AD exhibit
profound behavioural alterations, including increased depression and anxiety (Ashe
2001, Ballard & Walker 1999). Such symptoms occur at a rate three to four times higher
than non-demented aged-matched controls. As such, many mouse models of AD present
with altered locomotion and anxiety-like behaviours (Ashe 2001, Bedrosian et al 2011,
Zhang et al 2012a).
The elevated plus maze (EPM) is a commonly used test to measure anxiety in mouse
models of AD. This apparatus is shaped like a ‘plus’, with four arms radiating from a
central arena. Two of the arms are closed in whereas as the other two arms are not. In
this paradigm, mice were placed in the centre of the maze and allowed to explore for
five minutes. The time spent in the open arm was recorded as a measure of anxiety-like
behaviour of the mice. Previous studies have indicated that several lines of AD mouse
model, including the hAPP-J20 mouse model, spend more time in the open arms of the
EPM compared to WT littermate controls, suggesting lower levels of anxiety or
disinhibition (Cheng et al 2007, Chin et al 2005, Harris et al 2010, Meilandt et al 2009,
Roberson et al 2007). In this study, the EPM was used to measure anxiety and
exploratory behaviours in hAPP-J20 mice and WT controls at 16 and 24 weeks of
age. In contrast to other studies, we found that although the hAPP-J20 mice tended to
spend more time in the open arms than the WT controls at 16 (F(1,21)=1.97, p=0.176)
and 24 weeks of age (F(1,12)=6.024, p=0.073), it was not significant (Figures 3.7A and
3.7B). Although these findings are somewhat inconsistent with previously published
results, overall it appears that the hAPP-J20 mouse model does show a tendency to
increased to the time spent in the open arm at 24 weeks of age.
In addition to decreased anxiety-like behaviour, several AD mice models show
increased locomotion (Hall & Roberson 2012, Heneka et al 2012, Takeuchi et al 2011).
To determine if the hAPP-J20 mouse model endures increased locomotion during
disease progression, we tested 16- and 24-week hAPP-J20 mice and WT controls in the
open field test (OFT). The OFT consists of a large, open arena designed to allow the
animals to move and explore freely. Mice were placed in the centre of the arena and
Chapter 3: Characterisation of the hAPP-J20 mouse model ____________________________________________________________________________________
105
allowed to explore, whilst being monitored by tracking software that measured the total
distance travelled over a ten-minute period. As shown in Figures 3.7C and 3.7D,
locomotor activity in hAPP-J20 was significantly increased at 16 weeks (F(1,21)=13.91,
p<0.001) and 24 weeks of age (F(1,12)=6.024, p<0.05) compared to WT controls.
Combined, these results indicate that hAPP-J20 mice exhibit significantly increased
levels of locomotor activity and no changes in anxiety during later stages of AD
progression.
Chapter 3: Characterisation of the hAPP-J20 mouse model ____________________________________________________________________________________
106
Figure 3.7 hAPP-J20 mice exhibit hyperactivity. hAPP-J20 mice did not spend signifi-
cantly more time in the open arm of the elevated plus maze at (A) 16 or (Student’s t-test;
n=11-12/group) (B) 24 weeks of age (Student’s t-test; n=7/group) indicating no differ-
ence in anxiety levels compared to age-matched WT littermates. However, hAPP-J20
mice did show hyperactivity at (C) 16 and (Student’s t-test; n=11-12/group) (D) 24 weeks
of age (Student’s t-test; n=7/group) as indicated by the total distance traveled in the open
field test. Each value represents the mean ± standard error of the mean (SEM). *p<0.05,
***p<0.001.
Chapter 3: Characterisation of the hAPP-J20 mouse model ____________________________________________________________________________________
107
3.8 hAPP-J20 mice show spatial reference memory deficits at 16 and 24 weeks of
age
AD is an amnesic disorder and is often associated with profound memory loss (Ballard
& Walker 1999). Individuals affected by AD often begin with deficits in episodic
memory, followed by working memory and eventually long term memory (Backman et
al 2001). It has been shown that in hAPP-J20 mice deficits in spatial memory and
learning appear as the mice age (Galvan et al 2006, Galvan et al 2008, Harris et al 2010,
Karl et al 2012). Previous studies have characterised the hAPP-J20 mouse model using
the Morris Water Maze (MWM) (Galvan et al 2006, Galvan et al 2008, Harris et al
2010, Poirier et al 2006), however interpretation has been confounded by variable
results in the cued version of the MWM (Roberson et al 2007, Sanchez-Mejia et al
2008).
In this study, spatial reference memory and learning was investigated using the Win-
Shift version of the radial arm maze (RAM). The eight arm RAM is a classic test used
to investigate hippocampal-dependent memory and learning in rodents. In order to
determine spatial learning and memory deficits in the hAPP-J20 mouse model, three of
the eight arms of the RAM were baited with sweetened condensed milk as a food
reward (Figure 3.8A). The mouse was placed in the centre of the maze twice a day for
twenty-four consecutive days. Once within the RAM, mice use spatial cues to find the
hidden food reward. An error was marked when a mouse entered a non-baited arm. The
data is presented as percentage of correct arm entries. Mice were allowed to explore the
maze until all three baited arms had been retrieved, or until five minutes had elapsed.
By using a reference memory version of the RAM, we determined whether hAPP-J20
mice exhibit spatial memory and learning deficits at 16 (Figure 3.8B-C) and 24 weeks
of age (Figure 3.8D-E). An ANOVA with repeated measures of 16-week-old hAPP-J20
mice and WT mice revealed a significant genotype effect, trial, and a genotype by trial
interaction in reference memory (p<0.05; Figure 3.8B). These results indicate that 16-
week-old hAPP-J20 mice demonstrate spatial reference memory deficits. As expected,
we observed similar deficits in spatial reference memory in 24-week-old hAPP-J20
mice (p<0.05; Figure 3.8D).

Chapter 3: Characterisation of the hAPP-J20 mouse model ____________________________________________________________________________________
108
Following a 14-day rest period, a retention test was performed whereby mice were
placed back in the RAM for a one trial probe test. Deficits in retention were detected in
both 16-week-old (Figure 3.8C; F(1,11)=8.22, p<0.05) and 24-week-old (Figure 6E;
F(1,16)=4.65, p<0.05) hAPP-J20 mice as compared to age-matched WT controls. These
results demonstrate that hAPP-J20 mice exhibit long-term spatial memory and learning
deficits.
In conclusion, both 16-week and 24-week hAPP-J20 mice showed profound deficits in
the RAM during both the test and retention trials. These learning deficits seen in our
study could not be due to increased motor activity, since hyperactivity would
correspond to a decrease in the percentage of arms correct from the first session. As the
percentage of correct arms was the same for both hAPP-J20 and WT at 16 and 24-
weeks of age, this indicates that there is no correlation between hyperactivity and
movement within the RAM. Importantly, vision is not affected in the hAPP-J20 model
(DeIpolyi et al 2008). Therefore, memory impairments presented during the period that
extensive cell loss and neuroinflammation occurs, but well before the onset of plaques.
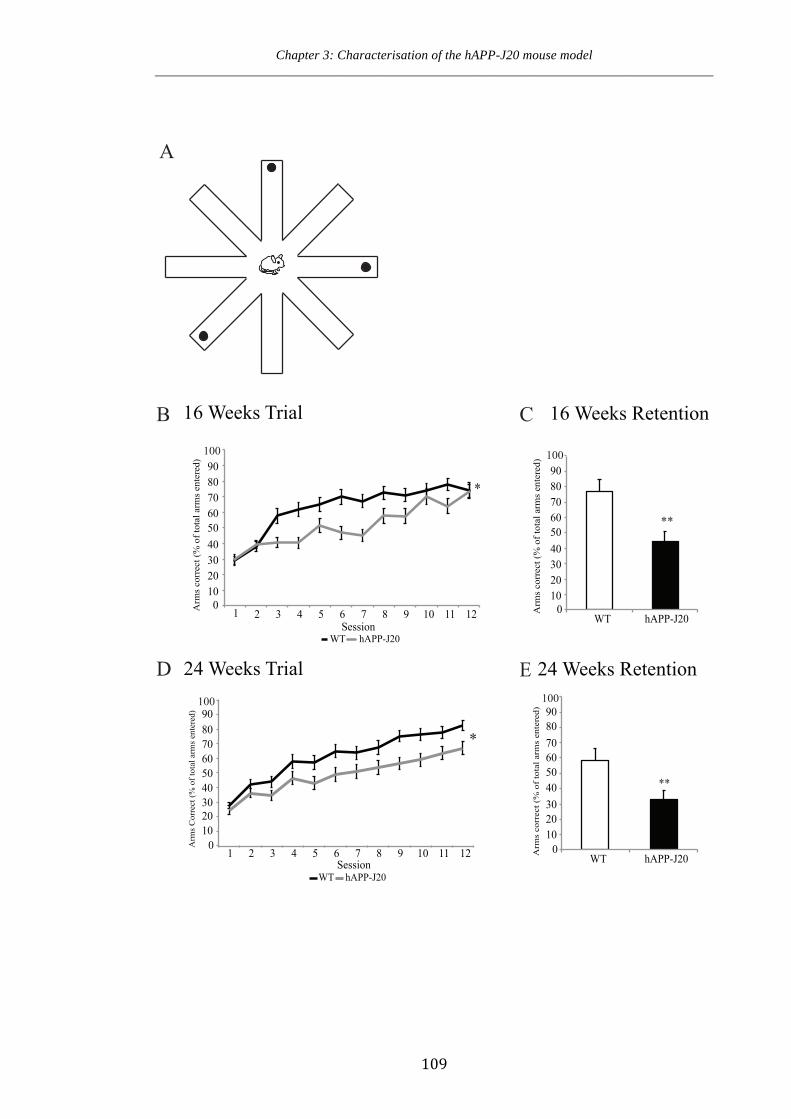
Chapter 3: Characterisation of the hAPP-J20 mouse model ____________________________________________________________________________________
109
010 2030 40 50 60 70 80 90
1 2 3 4 5 6 7 8 9 10 11 12 Arm
s co
rrec
t (%
of t
otal
arm
s en
tere
d)
Session WT hAPP-J20
1 2 3 4 5 6 7 8 9 10 11 12
Arm
s C
orre
ct (%
of t
otal
arm
s en
tere
d)
Session WT hAPP-J20
*
*
B
D
WT hAPP-J20
Arm
s co
rrec
t (%
of t
otal
arm
s en
tere
d)
C
WT hAPP-J20 Arm
s co
rrec
t (%
of
tota
l arm
s en
tere
d)
E
**
**
A
16 Weeks Trial 16 Weeks Retention
24 Weeks Trial
100
010 2030 40 50 60 70 80 90
100
010 2030 40 50 60 70 80 90
100
010 2030 40 50 60 70 80 90
100
24 Weeks Retention

Chapter 3: Characterisation of the hAPP-J20 mouse model ____________________________________________________________________________________
110
Figure 3.8. Spatial learning and memory deficits in hAPP-J20 mice. (A) Schematic
representation of the radial arm maze. Filled circles represent the baited arms (B) hAPP-
J20 mice had significantly impaired spatial reference memory and learning at 16 weeks
of age when compared to age-matched WT littermates (Repeated measures ANOVA;
n=7-8/group). (C) 16-week-old hAPP-J20 mice had significant deficits in spatial refer-
ence memory and learning retention when compared to age-matched WT littermates
(Student’s t-test; n=7-8/group). (D) 24-week-old hAPP-J20 mice also showed signifi-
cantly impaired spatial reference memory and learning when compared to age-matched
WT littermates (Repeated measures ANOVA; n=11-12/group). (E) Spatial reference
memory and learning retention was significantly impaired in 24-week-old hAPP-J20
mice (Student’s t-test; n=11-12/group). Each value represents the mean ± standard error
of the mean (SEM). *p<0.05, **p<0.01.
Chapter 3: Characterisation of the hAPP-J20 mouse model ____________________________________________________________________________________
111
Discussion
In this chapter, we aimed to identify cellular and behavioural correlates of early AD in
an APP overexpressing mouse, known as the hAPP-J20 mouse model. These mice have
previously been characterised to show plaque formation by seven months of age but,
interestingly, no tau hyperphosphorylation at any of the major phosphorylation sites
(Mucke et al 2000, Roberson et al 2007). However, despite the hAPP-J20 mouse model
being used extensively across the literature, little is known about the timing of
pathological hallmarks and behavioural decline in this model. In this study, we therefore
aimed to deeply characterise the hAPP-J20 model for common AD hallmarks. Here, we
showed that neuronal loss, inflammation and behavioural impairments all occur well
before the formation of Aβ plaques, indicating that plaque load is not the first hallmark
of the disease.
As expected in the hAPP-J20 mouse model, we have shown that Aβ accumulation
occurs in an age-dependent manner. Previous investigations have indicated that Aβ
plaque deposition occurs between 7-9 months, however age-associated dynamic
changes in Aβ species has never been investigated in this model. Therefore, we
investigated soluble (monomeric and oligomeric) and insoluble (i.e. plaques) Aβ at four
different ages. We utilised a variety of antibodies and protocols to show an age
dependent accumulation of APP/Aβ as well as soluble Aβ, which is later followed by
the accumulation of Aβ plaques that occurred significantly by 36 weeks. Our data
indicates that Aβ is present as early as 6 weeks of age and that this is most likely to be
monomeric Aβ. Oligomeric Aβ formation appears at 24 weeks of age, and is
significantly present by 36 weeks, forming along axons of neurons. Most importantly,
plaque formation did not occur significantly until 36 weeks of age, indicating that
plaque load is not the major driver of cell loss in this model of AD.
Neuronal cell loss is one of the major neuropathological hallmarks of AD patients, and
correlates with the severity of the disease (Bobinski et al 1997, Gómez-Isla et al 1996,
West et al 1994). Previous investigations have stated that neuronal cell loss does not
occur in the hAPP-J20 mouse model, however this has not appropriately been
quantified. For this reason, we utilised designed-based stereology to quantify the
Chapter 3: Characterisation of the hAPP-J20 mouse model ____________________________________________________________________________________
112
neurons in the CA3 and CA1 regions of the hippocampus. Through this, we showed a
32% reduction in the CA1 region by 36 weeks of age in the hAPP-J20 mice as
compared to WT controls. Interestingly, a correlation occurred between cell death in the
CA1 region of the hippocampus and total Aβ expression, suggesting that Aβ may be
contributing directly or indirectly to cell death in this region. Importantly, while
neurodegeneration occurred in an age-dependent manner, and correlated strongly with
the expression of total Aβ, cell loss was observed at least 12 weeks before the onset of
plaques.
Inflammation is implicated in the etiology of AD. Many studies indicate that the release
of pro-inflammatory cytokines from microglia and astrocytes can cause direct cell death
of neurons both in vivo and in vitro (Combs et al 2001, Meda et al 1994). Through the
quantitative analysis of microglia, we revealed that the numbers of CD68-positive
microglia were significantly increased early in the hAPP-J20 mouse model. The data
also shows that accumulation of microglia correlates with cell death in the CA1 region
of the hippocampus. Microglial accumulation around plaques has been extensively
described in both AD patients and transgenic mouse models of AD and this is
associated with elevation in cytokine levels (Akiyama et al 2000, McGeer et al 1990,
Wyss-Coray 2006, Wyss-Coray & Mucke 2002). The quantitative stereological analysis
performed in this chapter revealed significant increases in activated (CD68-positive)
microglia prior to Aβ plaque deposition. In addition, the change in CD68-positive
microglia significantly correlated with the extent of CA1 neuronal cell loss.
Interestingly, astrogliosis also occurs in these mice, starting at 12 weeks of age, though
plateaus later in the disease progress. These results are consistent with recent patient
data, which showed no correlation between microgliosis and astrogliosis with plaque
load (Serrano-Pozo et al 2011). This study is the first to investigate inflammatory
correlates over disease progression in the hAPP-J20 mice models and shows for the first
time that inflammation occurs well in advance of plaque load in this model.
Memory and learning impairments as well as non-cognitive neuropsychiatric changes
are major constituents of AD and are readily described in mouse models of AD (Ashe
2001, Eimer & Vassar 2013, Jawhar et al 2012, Karl et al 2012, Stepanichev et al 2004,
Chapter 3: Characterisation of the hAPP-J20 mouse model ____________________________________________________________________________________
113
Zhang et al 2012a). Our study analysed anxiety and locomotion using the EPM and the
OFT respectively. This revealed no changes to disinhibition behaviour, and increases in
locomotion. Investigations into behavioural learning and memory in the hAPP-J20
mouse model have often been confounding, as many studies analyse spatial memory
using the MWM. For this reason, our study utilised the RAM. The RAM provides an
advantage over the MWM as the hAPP-J20 mouse model has a high tendency to float
and trend for thigmotactic swimming (Galvan et al 2008, Karl et al 2012). In addition,
the MWM can result in physical fatigue and hypothermia. Furthermore, the RAM takes
advantage of the animals’ natural food exploratory behaviour. Our analysis of learning
and memory by RAM revealed that the hAPP-J20 mice display decreased learning and
memory in a hippocampal-dependent spatial memory task. Specifically, we have
revealed that spatial reference memory deficits occur in the RAM at 16 and 24 weeks of
age in the hAPP-J20 mouse model. Moreover, impairments in long-term memory
occurred 14 days following the RAM training. In conclusion, the current study
demonstrates for the first time the hAPP-J20 mice have spatial memory and learning
impairments beginning as early as 16 weeks.
The consistent conclusion of our study, taken together with other studies (Dudal et al
2004, Ferretti et al , Oakley et al 2006, Zhang et al 2012b), is that behavioural decline,
neuronal cell death and inflammatory cell activation precede plaque deposition.
Fundamentally this means that AD progressive decline may occur well before plaque
deposition in patients. At present, the Aβ protein is often regarded as a central
component to brain degradation in AD. As such, imaging studies and therapeutic targets
(Lobello et al 2012, Miners et al 2011, Quigley et al 2011) are largely based around
decreasing Aβ deposition in the brain and new techniques such as MRI and PET
scanning for Aβ can only detect fibrillar forms, and are mostly directed at imaging
plaques (Quigley et al 2011, Small et al 2006). Therefore, according to our results, these
techniques would largely be limited to identifying and/or treating later stages of disease
progression.
One of the most profound findings in this chapter is that hippocampal cell death in the
CA1 region is occurring early in the disease progression. This study is consistent with

Chapter 3: Characterisation of the hAPP-J20 mouse model ____________________________________________________________________________________
114
previous literature, which shows abundant CA1 cell death in AD patients and mouse
models. Thus, in our following chapters we aimed to determine a viable mechanism by
which we could block neuronal cell death in the hAPP-J20 mouse model.
115
Chapter 4
Hippocampal dysfunction in mice
expressing a single point mutation to the
editing complementary sequence of the
Gria2 gene
Chapter 4: Hippocampal dysfunction in ECS mutated mice __________________________________________________________________________________
116
4.0 Background
In Chapter 3, we showed significant neurodegeneration in the hAPP-J20 mouse model
of AD during disease progression. In this chapter, we investigate a mechanism that
could potentially be causing hippocampal cell death, known as GluA2 RNA editing.
This mechanism is investigated in the hAPP-J20 mouse model in Chapter 5.
AMPA receptors are tetrameric assemblies comprised of four subunits, denoted GluA1-
GluA4. The GluA2 subunit is responsible for the Ca2+ permeability of the receptors.
AMPA receptors that lack GluA2 are Ca2+-permeable, whereas if the GluA2 subunit is
present within the tetrameric assembly, AMPA receptors are impermeable to Ca2+
(Hollmann et al 1991, Hollmann & Heinemann 1994). Importantly, if the GluA2
subunit is present then it must undergo the process of RNA editing in order for the
receptor to be Ca2+-impermeable (Sommer et al 1991). Specifically, RNA editing by the
adenosine deaminase acting on RNA 2 (ADAR2) enzyme alters a codon encoding
glutamine (Q) in the DNA to a codon encoding arginine (R) in the mRNA (Horsch et al
2011, Kwak & Weiss 2006). Edited GluA2(R)-containing AMPA receptors form Ca2+-
impermeable channels, whereas unedited GluA2(Q)–containing AMPA receptors are
permeable to Ca2+ flow (Figure 1.7, Introduction).
Previous literature has indicated that GluA2 RNA editing at the Q/R site is altered in the
cortex of AD patients (Akbarian et al 1995). Furthermore, more recent literature has
revealed alterations to GluA2 RNA editing at the Q/R site in the hippocampus of AD
patients (Gaisler-Salomon et al 2014). An increase in unedited GluA2 at the Q/R site is
known to lead to excitotoxic cell death in disorders such as ischemia and amyotrophic
lateral sclerosis (ALS) and alteration to this process has been shown to rescue ischemia-
induced cell death (Kwak & Kawahara 2005, Peng et al 2006). Thus, we hypothesise
that abundant unedited GluA2 is playing a role in cell death in AD. Prior to
investigating GluA2 RNA editing in the AD mouse model (Chapter 5), we first
investigated a mouse model that was engineered to express increased amounts of
unedited GluA2. This study aimed to determine if increased unedited GluA2 at the Q/R
site could lead to hippocampal neurodegeneration.

Chapter 4: Hippocampal dysfunction in ECS mutated mice __________________________________________________________________________________
117
In the healthy brain, GluA2 RNA editing occurs by the formation of a dsRNA structure
between the editing site in the GluA2 pre-mRNA and a down stream intronic sequence,
known as the editing complementary sequence (ECS). This dsRNA structure is
identified by the ADAR2 enzyme and converts the CAG codon to a CIG codon at the
GluA2 RNA editing site (Figure 1.8, Introduction). This converts the Gln codon to a
Arg codon, rendering the AMPA receptor impermeable to Ca2+. Higuchi et al. (1993)
demonstrated the effects a variety of mutations to the ECS have on GluA2 Q/R site
RNA editing efficiency in vitro. The authors firstly transfected a rat neuroendocrine cell
line, PC12, with various minigenes that expressed different regions between the distal
half of exon 10 to the proximal part of exon 12 of Gria2. By determining the percentage
of GluA2 Q/R site RNA editing, the authors were able to delineate the precise location
of the ECS. Following this, the authors introduced sequence changes to the ECS to
determine their effects on the percentage of GluA2 RNA editing at the Q/R site. One of
the most dramatic alterations observed in this study was a single point cytosine to
guanine mutation within the ECS, which was able to reduce GluA2 RNA editing by
greater than 35% (Higuchi et al 1993).
Most importantly, alteration to GluA2 RNA editing efficiency, by modulation to the
ECS, can cause dramatic phenotypic effects in mice. Brusa et al. (1995) engineered
mice in which the ECS was replaced with a loxP sequence (GluA2ΔECS/+ mice) and
found that the lack of the ECS in the intron impaired GluA2 Q/R RNA editing. This
resulted in approximately 25% unedited GluA2 mRNA at the Q/R site compared to age-
matched wild-type littermates, which have <1% unedited GluA2 mRNA. The presence
of an increased number of unedited GluA2 containing AMPA receptors in mice lead to
seizures and premature death by several weeks of age (Brusa et al 1995).
In addition to the GluA2ΔECS/+ mice engineered by Brusa et al. (1995), Feldmeyar et al.
(1999) developed mice with varying degrees of GluA2 Q/R RNA editing. These mice
included the GluA2ΔECS/+ mouse, and an additional strain in which the loxP-flanked
neomycin gene was left in the gene, replacing the ECS site (GluA2neo/neo). The practical
result of this was that the most unedited GluA2 RNA was observed in GluA2neo/neo mice
(98% unedited GluA2 mRNA), slightly less was observed in GluA2ΔECS/+ mice (~27%

Chapter 4: Hippocampal dysfunction in ECS mutated mice __________________________________________________________________________________
118
unedited GluA2 mRNA) and less again was observed in GluA2+/neo mice (8.7% unedited
GluA2 mRNA). The reduced editing efficiency in each of the mice strains correlated
with the Ca2+-permeability of the AMPA receptor and the phenotype.
GluA2neo/neo which expressed 98% unedited GluA2(Q) mRNA showed severe dendritic
deficits and early death by postnatal day 20. In comparison, GluA2neo/+ mice had 8.7%
expression of GluA2(Q), showing less dramatic increases in AMPA receptor Ca2+-
permeability and a 20% death rate (Feldmeyer et al 1999).
As described above, Higuchi et al. (1993) established that a single point mutation to the
ECS can dramatically alter GluA2 RNA editing efficiency in vitro. Therefore, in order
to determine the effects of unedited GluA2 in vivo, we developed mice with the same
cytosine to guanine mutation within the ECS. These mice were generated by targeting
intron 11 of Gria2 that included the neomycin gene, flanked by loxP sites. Cells were
electroporated with Cre-expressing plasmid to excise the neomycin, leaving a single
loxP site. Correctly engineered cells were chosen for blastocyst injection. We termed
these mice the GluA2+/ECS(CG) mice.
In contrast to the mice developed by Brusa et al. (1995) and Feldmeyer et al. (1995), the
present study sought to investigate the phenotypic characteristics of mice possessing
increased levels of unedited GluA2 via a single point mutation to the ECS. This study is
the first to characterise a single base pair mutation to the ECS and determine its effect
on GluA2 expression and synaptic properties and examine the consequential effects on
neuronal number, dendritic morphology and neuroinflammation. Thus, this study is
important for understanding the neuroanatomical significances of unedited GluA2 at the
Q/R site.
Aims:
• To verify the mutation to the ECS of GluA2+/ECS(CG) mice and determine its
physiological effects
• To establish a protocol to determine unedited GluA2 at the Q/R site and, further,
quantify the extent of unedited GluA2 in mice expressing a single point mutation to
the ECS
Chapter 4: Hippocampal dysfunction in ECS mutated mice __________________________________________________________________________________
119
• To determine if AMPA receptor subunit expression and composition is altered in
GluA2+/ECS(CG) mice
• To determine if GluA2 subunit expression is altered at the synapse in
GluA2+/ECS(CG) mice
• To determine if GluA2+/ECS(CG) mice exhibit Ca2+-permeable AMPA receptors at
the synapse
• To determine if GluA2+/ECS(CG) mice exhibit alterations to neuronal numbers,
dendritic morphology, and spines within the hippocmapus
• To determine if GluA2+/ECS(CG) mice exhibit alterations to microglia and astrocyte
populations within the hippocampus
Chapter 4: Hippocampal dysfunction in ECS mutated mice __________________________________________________________________________________
120
Results
4.1 Generation and confirmation of the ECS mutation in GluA2+/ECS(CG) mice
Dr. Bryce Vissel and colleagues developed the mice utilised in this study in which a
cytosine in the ECS of Gria2 intron 11 was replaced with a guanine (see Methods).
Briefly, WT mice express the ECS sequence 5’-TTGCTGCATA-3’ in intron 11 of
Gria2, downstream of the exonic Q/R site (Figure 4.1A(i)). A construct was generated
that expressed a single point mutation in the 6th nt of the 10 nt long ECS sequence (5’-
3’). Thus, the ECS was altered from the endogenous ECS 5’-TTGCTGCATA-3’ to the
mutated sequence 5’-TTGCTGGATA-3’. The construct further contained a neomycin
gene flanked by loxP sites downstream of the ECS (Figure 4.1A(ii)). This construct was
electroporated into embryonic stem cells, which are derived from 129SvEv mice.
Neomycin resistant embryonic stem cells were electroporated with the Cre-expressing
plasmid to excise the neomycin gene. A single loxP site remained downstream of the
ECS in intron 11 of Gria2 (Figure 4.1A(iii)). Correctly engineered embryonic stem cells
were injected into blastocysts to create the GluA2+/ECS(CG) mice.
In order to confirm the single point mutation, genomic DNA from heterozygous and
WT littermates was sequenced. DNA was extracted from tail samples and subjected to
PCR with primers surrounding the ECS in intron 11 of Gria2. Sequencing confirmed a
cytosine residue in the ECS of GluA2+/ECS(CG) mice, where a guanine residue occurs in
WT littermates (Figure 4.1B), thus confirming correct mutation to the GluA2+/ECS(CG)
mice.
For genotype confirmation, the WT and heterozygous alleles were discriminated by
PCR amplification with specific primers recognising the GluA2 sequence as well as
primers around the residual intronic loxP sequence. The location of the primers are
shown in Figure 4.1A(iii), as indicated by the unfilled arrows. Following the PCR
amplification, products were separated by gel electrophoresis. This resulted in one band
at 200bp for the WT genotype and two bands at 200bp and 250bp for the heterozygous
genotype (Figure 4.1C). Therefore, this protocol was used to discriminate WT and
GluA2+/ECS(CG) mice.

Chapter 4: Hippocampal dysfunction in ECS mutated mice __________________________________________________________________________________
121
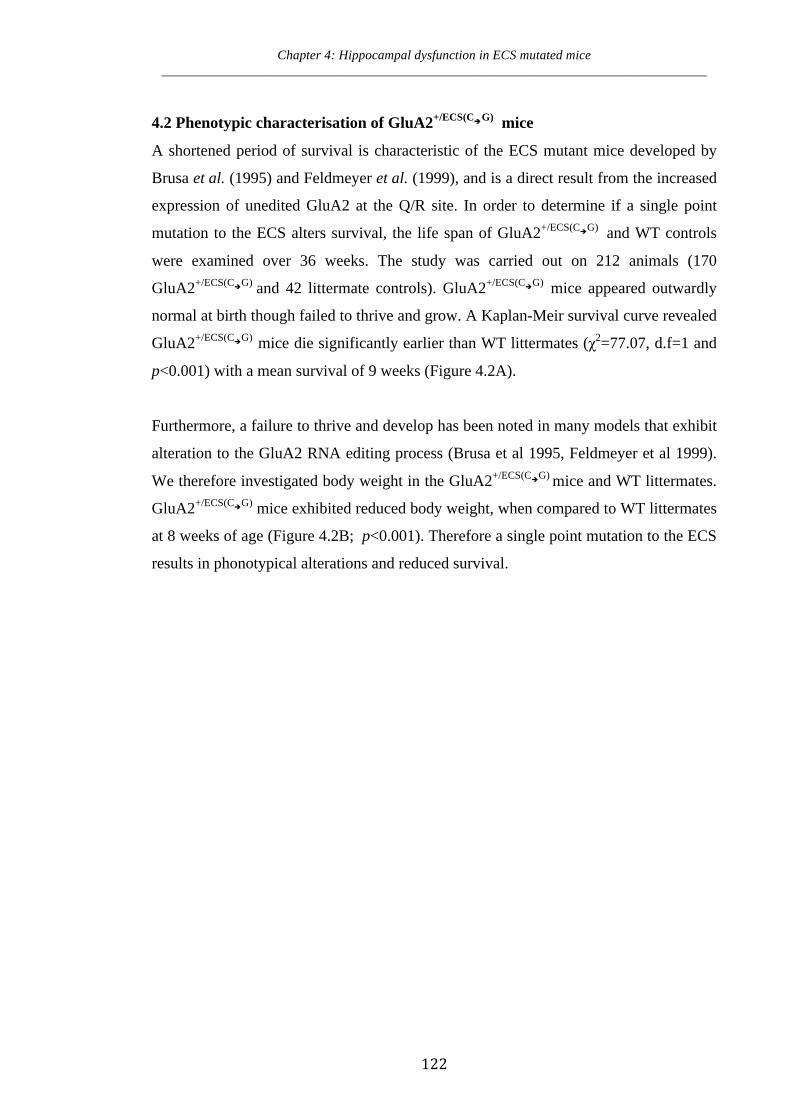
Chapter 4: Hippocampal dysfunction in ECS mutated mice __________________________________________________________________________________
122
4.2 Phenotypic characterisation of GluA2+/ECS(CG) mice
A shortened period of survival is characteristic of the ECS mutant mice developed by
Brusa et al. (1995) and Feldmeyer et al. (1999), and is a direct result from the increased
expression of unedited GluA2 at the Q/R site. In order to determine if a single point
mutation to the ECS alters survival, the life span of GluA2+/ECS(CG) and WT controls
were examined over 36 weeks. The study was carried out on 212 animals (170
GluA2+/ECS(CG) and 42 littermate controls). GluA2+/ECS(CG) mice appeared outwardly
normal at birth though failed to thrive and grow. A Kaplan-Meir survival curve revealed
GluA2+/ECS(CG) mice die significantly earlier than WT littermates (χ2=77.07, d.f=1 and
p<0.001) with a mean survival of 9 weeks (Figure 4.2A).
Furthermore, a failure to thrive and develop has been noted in many models that exhibit
alteration to the GluA2 RNA editing process (Brusa et al 1995, Feldmeyer et al 1999).
We therefore investigated body weight in the GluA2+/ECS(CG) mice and WT littermates.
GluA2+/ECS(CG) mice exhibited reduced body weight, when compared to WT littermates
at 8 weeks of age (Figure 4.2B; p<0.001). Therefore a single point mutation to the ECS
results in phonotypical alterations and reduced survival.

Chapter 4: Hippocampal dysfunction in ECS mutated mice __________________________________________________________________________________
123
0 10 20 30 400
50
100
Weeks elapsed
Perc
ent s
urvi
val
WTGluA2+/ECS(C>G)
A
B
Figure 4.2. Phenotypical characterisation of mice expressing a single point mutation to the ECS of Gria2. (A) A Kaplan–Meier survival curve of GluA2+/ECS(C>G) mice vs. WT littermates revealed premature death and an approximate average survival of 9 weeks in GluA2+/ECS(C>G) mice (n=42 WT, 170 GluA2+/ECS(C>G) mice). (B) GluA2+/ECS(C>G) exhibit reduced body weight at 8 weeks old, as compated to WT littermates (Student t-test; n=6-9/genotype). Each value represents the mean ± standard error of the mean (SEM). ***p<0.001
0
2
4
6
8
10
12
14
16
18
20
WT
Wei
ght (
g)
GluA2+/ECS(C>G)
***
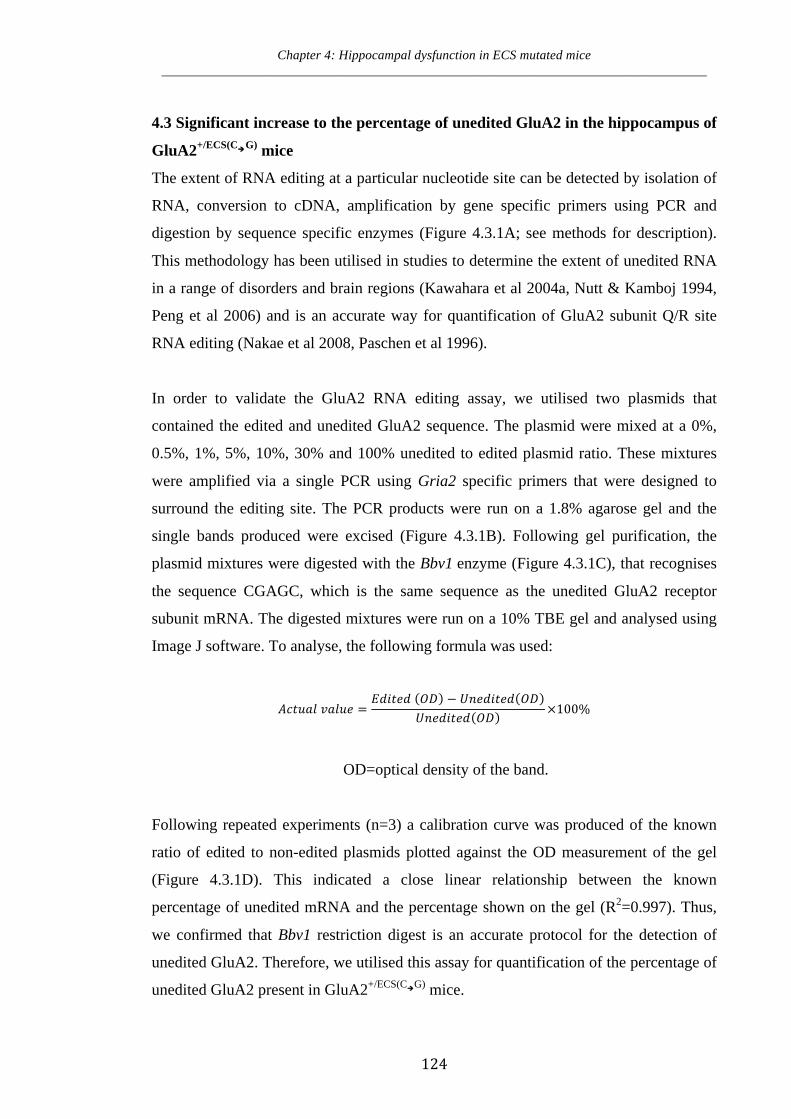
Chapter 4: Hippocampal dysfunction in ECS mutated mice __________________________________________________________________________________
124
4.3 Significant increase to the percentage of unedited GluA2 in the hippocampus of
GluA2+/ECS(CG) mice
The extent of RNA editing at a particular nucleotide site can be detected by isolation of
RNA, conversion to cDNA, amplification by gene specific primers using PCR and
digestion by sequence specific enzymes (Figure 4.3.1A; see methods for description).
This methodology has been utilised in studies to determine the extent of unedited RNA
in a range of disorders and brain regions (Kawahara et al 2004a, Nutt & Kamboj 1994,
Peng et al 2006) and is an accurate way for quantification of GluA2 subunit Q/R site
RNA editing (Nakae et al 2008, Paschen et al 1996).
In order to validate the GluA2 RNA editing assay, we utilised two plasmids that
contained the edited and unedited GluA2 sequence. The plasmid were mixed at a 0%,
0.5%, 1%, 5%, 10%, 30% and 100% unedited to edited plasmid ratio. These mixtures
were amplified via a single PCR using Gria2 specific primers that were designed to
surround the editing site. The PCR products were run on a 1.8% agarose gel and the
single bands produced were excised (Figure 4.3.1B). Following gel purification, the
plasmid mixtures were digested with the Bbv1 enzyme (Figure 4.3.1C), that recognises
the sequence CGAGC, which is the same sequence as the unedited GluA2 receptor
subunit mRNA. The digested mixtures were run on a 10% TBE gel and analysed using
Image J software. To analyse, the following formula was used:
𝐴𝑐𝑡𝑢𝑎𝑙 𝑣𝑎𝑙𝑢𝑒 =𝐸𝑑𝑖𝑡𝑒𝑑 𝑂𝐷 − 𝑈𝑛𝑒𝑑𝑖𝑡𝑒𝑑 𝑂𝐷
𝑈𝑛𝑒𝑑𝑖𝑡𝑒𝑑 𝑂𝐷×100%
OD=optical density of the band.
Following repeated experiments (n=3) a calibration curve was produced of the known
ratio of edited to non-edited plasmids plotted against the OD measurement of the gel
(Figure 4.3.1D). This indicated a close linear relationship between the known
percentage of unedited mRNA and the percentage shown on the gel (R2=0.997). Thus,
we confirmed that Bbv1 restriction digest is an accurate protocol for the detection of
unedited GluA2. Therefore, we utilised this assay for quantification of the percentage of
unedited GluA2 present in GluA2+/ECS(CG) mice.

Chapter 4: Hippocampal dysfunction in ECS mutated mice __________________________________________________________________________________
125
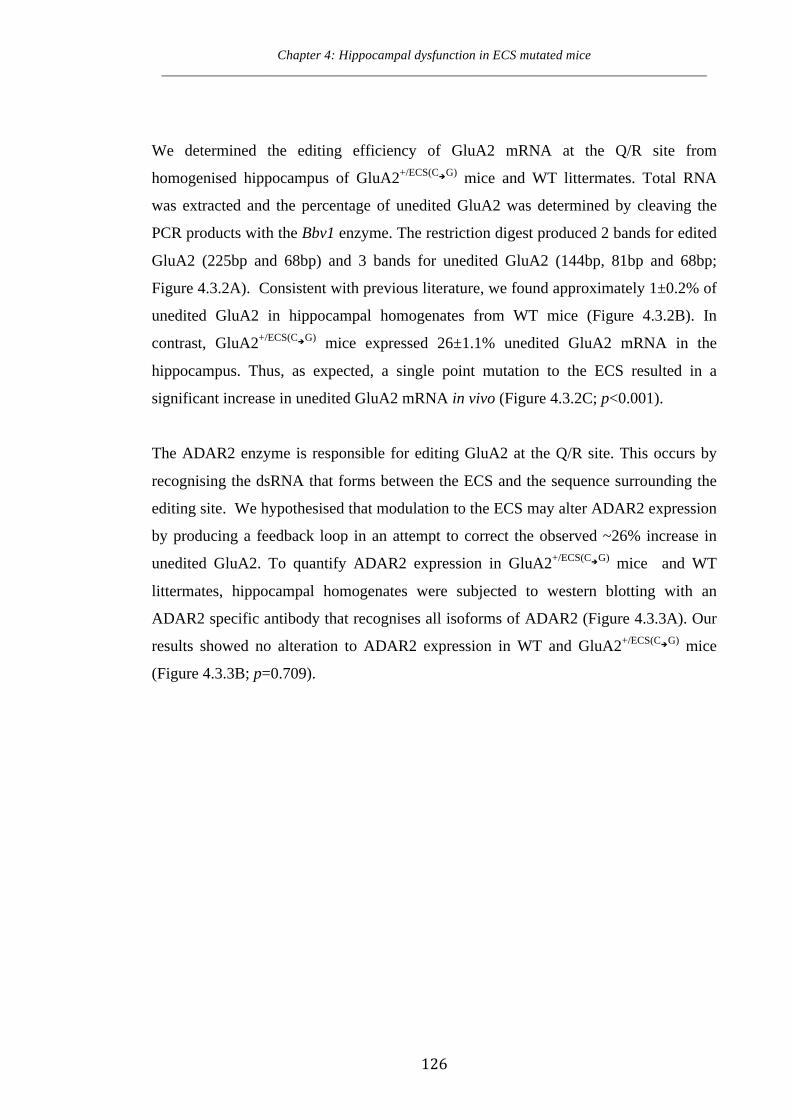
Chapter 4: Hippocampal dysfunction in ECS mutated mice __________________________________________________________________________________
126
We determined the editing efficiency of GluA2 mRNA at the Q/R site from
homogenised hippocampus of GluA2+/ECS(CG) mice and WT littermates. Total RNA
was extracted and the percentage of unedited GluA2 was determined by cleaving the
PCR products with the Bbv1 enzyme. The restriction digest produced 2 bands for edited
GluA2 (225bp and 68bp) and 3 bands for unedited GluA2 (144bp, 81bp and 68bp;
Figure 4.3.2A). Consistent with previous literature, we found approximately 1±0.2% of
unedited GluA2 in hippocampal homogenates from WT mice (Figure 4.3.2B). In
contrast, GluA2+/ECS(CG) mice expressed 26±1.1% unedited GluA2 mRNA in the
hippocampus. Thus, as expected, a single point mutation to the ECS resulted in a
significant increase in unedited GluA2 mRNA in vivo (Figure 4.3.2C; p<0.001).
The ADAR2 enzyme is responsible for editing GluA2 at the Q/R site. This occurs by
recognising the dsRNA that forms between the ECS and the sequence surrounding the
editing site. We hypothesised that modulation to the ECS may alter ADAR2 expression
by producing a feedback loop in an attempt to correct the observed ~26% increase in
unedited GluA2. To quantify ADAR2 expression in GluA2+/ECS(CG) mice and WT
littermates, hippocampal homogenates were subjected to western blotting with an
ADAR2 specific antibody that recognises all isoforms of ADAR2 (Figure 4.3.3A). Our
results showed no alteration to ADAR2 expression in WT and GluA2+/ECS(CG) mice
(Figure 4.3.3B; p=0.709).

Chapter 4: Hippocampal dysfunction in ECS mutated mice __________________________________________________________________________________
127
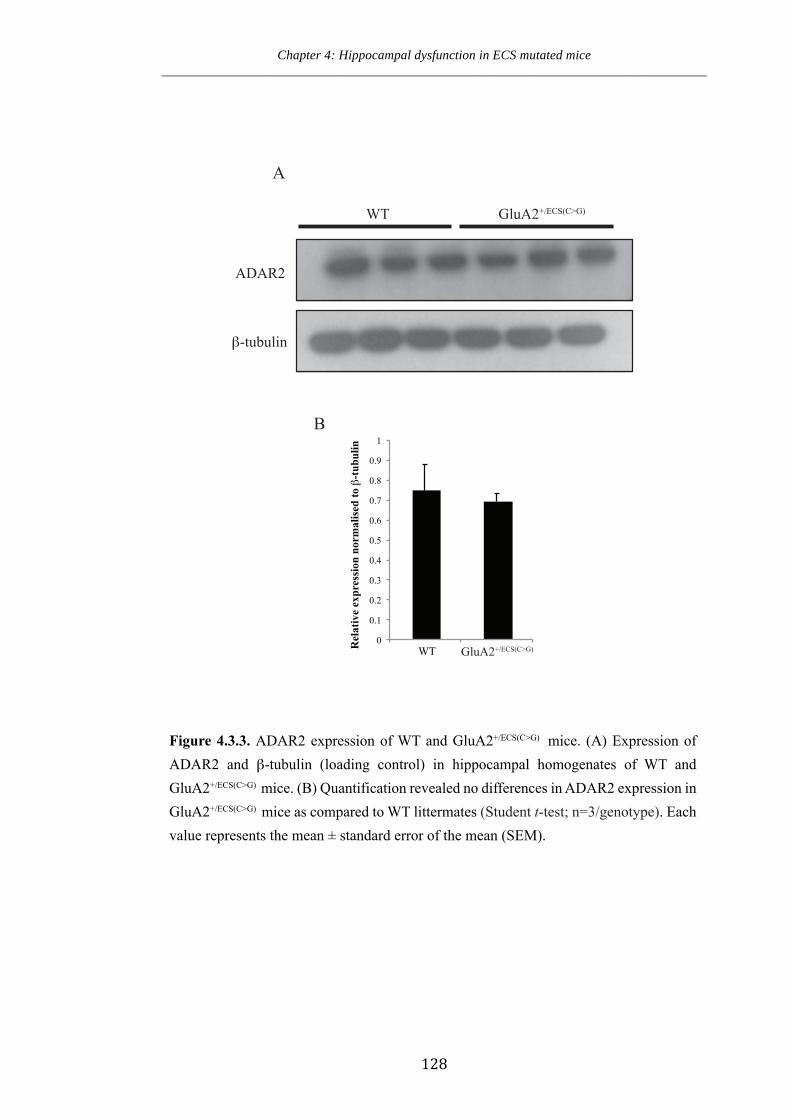
Chapter 4: Hippocampal dysfunction in ECS mutated mice __________________________________________________________________________________
128
WT GluA2+/ECS(C>G)
ADAR2
0
0.1
0.2
0.3
0.4
0.5
0.6
0.7
0.8
0.9
1
WT GluA2+/ECS(C>G) Rel
ativ
e ex
pres
sion
nor
mal
ised
to `
-tubu
lin
`-tubulin
Figure 4.3.3. ADAR2 expression of WT and GluA2+/ECS(C>G) mice. (A) Expression of ADAR2 and `-tubulin (loading control) in hippocampal homogenates of WT and GluA2+/ECS(C>G) mice. (B) Quantification revealed no differences in ADAR2 expression in GluA2+/ECS(C>G) mice as compared to WT littermates (Student t-test; n=3/genotype). Each value represents the mean ± standard error of the mean (SEM).
A
B
Chapter 4: Hippocampal dysfunction in ECS mutated mice
_______________________________________________________________________
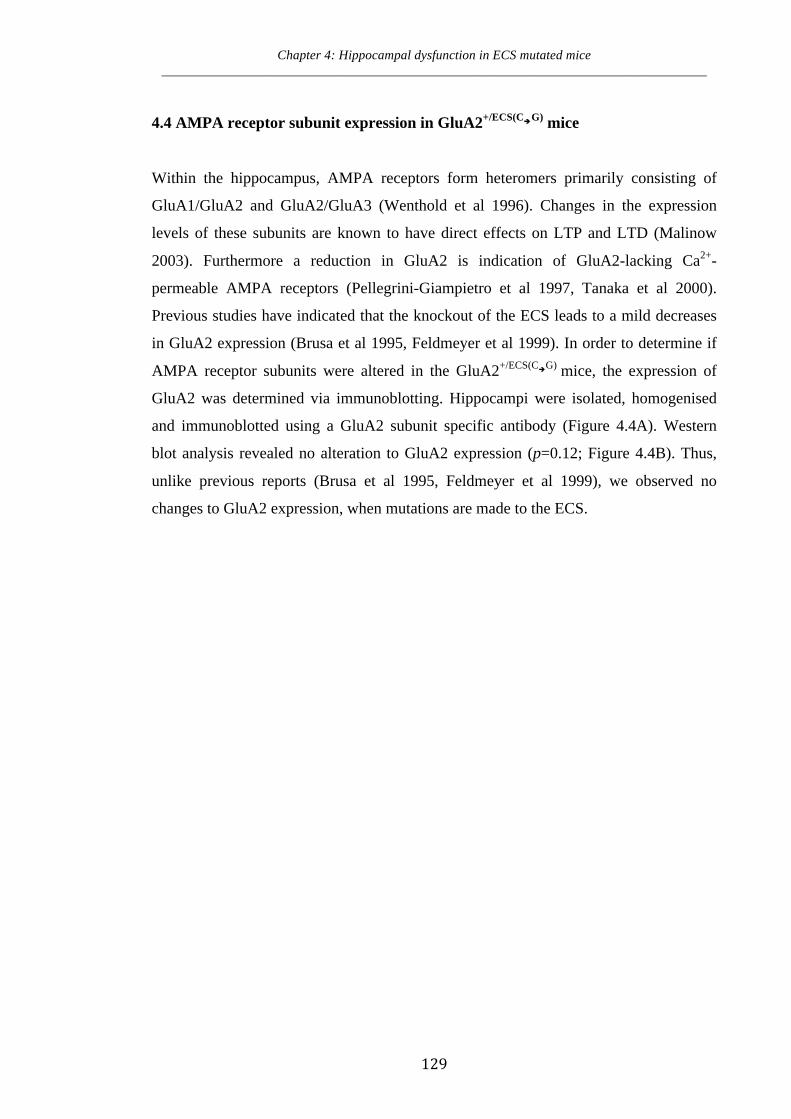
Chapter 4: Hippocampal dysfunction in ECS mutated mice __________________________________________________________________________________
129
4.4 AMPA receptor subunit expression in GluA2+/ECS(CG) mice
Within the hippocampus, AMPA receptors form heteromers primarily consisting of
GluA1/GluA2 and GluA2/GluA3 (Wenthold et al 1996). Changes in the expression
levels of these subunits are known to have direct effects on LTP and LTD (Malinow
2003). Furthermore a reduction in GluA2 is indication of GluA2-lacking Ca2+-
permeable AMPA receptors (Pellegrini-Giampietro et al 1997, Tanaka et al 2000).
Previous studies have indicated that the knockout of the ECS leads to a mild decreases
in GluA2 expression (Brusa et al 1995, Feldmeyer et al 1999). In order to determine if
AMPA receptor subunits were altered in the GluA2+/ECS(CG) mice, the expression of
GluA2 was determined via immunoblotting. Hippocampi were isolated, homogenised
and immunoblotted using a GluA2 subunit specific antibody (Figure 4.4A). Western
blot analysis revealed no alteration to GluA2 expression (p=0.12; Figure 4.4B). Thus,
unlike previous reports (Brusa et al 1995, Feldmeyer et al 1999), we observed no
changes to GluA2 expression, when mutations are made to the ECS.
Chapter 4: Hippocampal dysfunction in ECS mutated mice __________________________________________________________________________________
130
WT GluA2+/ECS(C>G)
GluA2
`-tubulin
Figure 4.4. AMPA receptor subunit expression of WT and GluA2+/ECS(C>G) mice. (A) Expression of GluA2 and `-tubulin (loading control) in hippocampal homogenates of WT and GluA2+/ECS(C>G) mice. (B) Quantification of GluA2 expression revealed a trend for less GluA2 expression in GluA2+/ECS(C>G) mice (p=0.12) as compared to WT litter-mates (Student t-test; n=3/genotype). Each value represents the mean ± standard error of the mean (SEM).
A
B
0
0.1
0.2
0.3
0.4
0.5
0.6
0.7
0.8
0.9
1
WT
Rel
ativ
e E
xpre
ssio
n no
rmal
ised
to `
-tubu
lin
GluA2+/ECS(C>G)
Chapter 4: Hippocampal dysfunction in ECS mutated mice __________________________________________________________________________________
131
4.5 AMPA receptor GluA2 subunit expression at the surface in the GluA2+/ECS(CG)
mice
AMPA receptors occur in the cytosolic vesicles and on the plasma membranes of
synapses. Such receptors are a major determinant of postsynaptic excitability and
changes to total expression at the synapse as well as modulation to the subunit
composition at the synapse affects LTP and LTD (Malinow 2003, Malinow & Malenka
2002). In order to determine surface and intracellular expression of GluA1 and GluA2,
we adapted a crosslinking assay that utilises bis(sulfosuccinimidyl)suberate (BS3) as a
crosslinking agent (Boudreau et al 2012, Conrad et al 2008). BS3 covalently crosslinks
surface expressed proteins, thus causing a higher molecular weight band when subjected
to SDS-PAGE and immunoblotting. This protocol allows for the accurate quantification
of surface to intracellular ratios of AMPA receptor subunits in various brain regions
(Boudreau et al 2012).
In order to validate this protocol, we performed the assay on hippocampal sections with
and without the addition of the BS3 reagent (Figure 4.5.1). Briefly, mice were sacrificed
and brains were rapidly dissected prior to being cut on a vibratome at 400µm.
Hippocampal sections from the slices were manually isolated and each hemisphere was
added to cold artificial cerebral spinal fluid (ACSF) that did or did not contain BS3.
Following homogenisation, samples were separated by SDS-PAGE and immuno-blotted
with antibodies against GluA2 and β-tubulin. Samples containing BS3 showed a high
molecular weight band when probed with GluA2 antibodies, however no high
molecular weight band was apparent in non cross-linked samples. Furthermore, as β-
tubulin is an intracellular protein, no high molecular weight band occurred in both
cross-linked and non cross-linked samples (Figure 4.5.1). Therefore, we confirmed the
ability of BS3 to crosslink surface expressed AMPA receptor subunits, and thus, this
approach was utilised to determine surface and intracellular expression of GluA2 in
GluA2+/ECS(CG) mice.
In order to determine the surface to intracellular ratio of GluA2 in WT and
GluA2+/ECS(CG) mice, hippocampal homogenates were cross-linked with BS3 utilising
Chapter 4: Hippocampal dysfunction in ECS mutated mice __________________________________________________________________________________
132
the above procedure (Figure 4.5.2A). Our results indicate that the GluA2 intracellular to
surface expression was not significantly altered in GluA2+/ECS(CG) mice as compared to
WT littermates (p=0.290; Figure 4.5.2B).
The total intracellular, total surface and total GluA2 protein expression was determined.
In order to do this, immunoblots were stripped and reprobed for β-tubulin, as a loading
control. These results indicated no differences in the total surface (p=0.616), total
intracellular (p=0.211) and total expression (p=0.556) of GluA2 between
GluA2+/ECS(CG) mice and WT littermate controls (Figure 4.5.2B). These results,
combined with the total subunit expression results in figure 4.4, suggest that a single
point mutation to the ECS does not alter GluA2 expression at the surface.
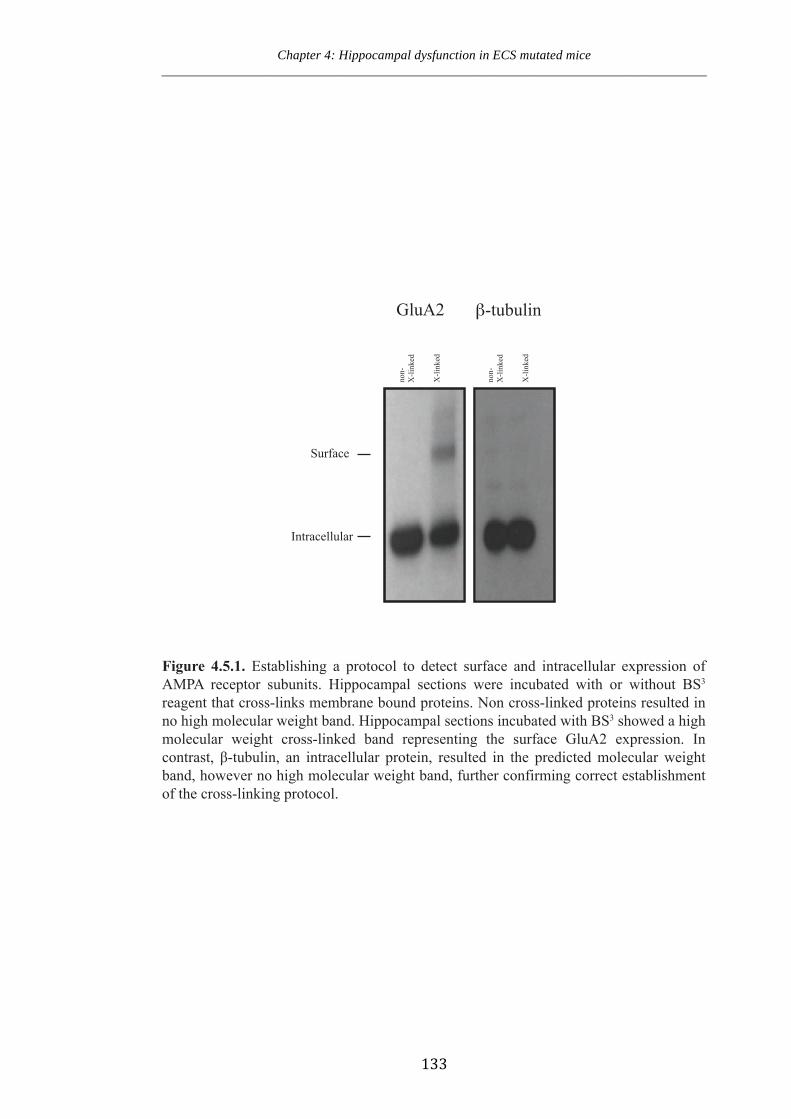
Chapter 4: Hippocampal dysfunction in ECS mutated mice __________________________________________________________________________________
133
GluA2 `-tubulin
X-li
nk
ed
no
n-
X-li
nk
ed
X-li
nk
ed
no
n-
X-li
nk
ed
Figure 4.5.1. Establishing a protocol to detect surface and intracellular expression of
AMPA receptor subunits. Hippocampal sections were incubated with or without BS3
reagent that cross-links membrane bound proteins. Non cross-linked proteins resulted in
no high molecular weight band. Hippocampal sections incubated with BS3 showed a high
molecular weight cross-linked band representing the surface GluA2 expression. In
FRQWUDVW�� ȕ�WXEXOLQ�� DQ� LQWUDFHOOXODU� SURWHLQ�� UHVXOWHG� LQ� WKH� SUHGLFWHG�PROHFXODU�ZHLJKW�band, however no high molecular weight band, further confirming correct establishment
of the cross-linking protocol.
Surface
Intracellular
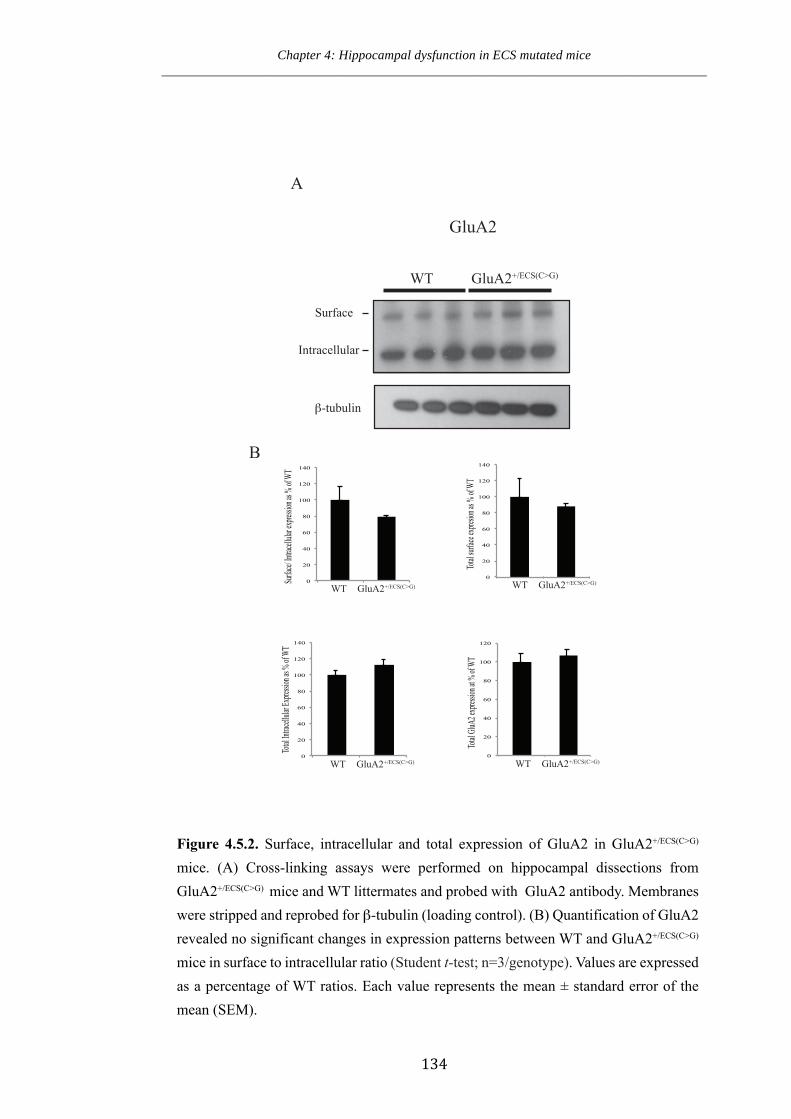
Chapter 4: Hippocampal dysfunction in ECS mutated mice __________________________________________________________________________________
134
WT GluA2+/ECS(C>G)
Surface
Intracellular
GluA2
A
B
`-tubulin
0
20
40
60
80
100
120
140
Surfa
ce/ In
tracel
lular e
xpress
ion as
% of
WT
0
20
40
60
80
100
120
140
0
20
40
60
80
100
120
140
0
20
40
60
80
100
120
Total G
luA2 e
xpress
ion at
% of
WT
Total I
ntrace
llular
Expre
ssion
as %
of WT
Total s
urface
expre
sion a
s % of
WT
WT GluA2+/ECS(C>G) WT GluA2+/ECS(C>G)
WT GluA2+/ECS(C>G) WT GluA2+/ECS(C>G)
Figure 4.5.2. Surface, intracellular and total expression of GluA2 in GluA2+/ECS(C>G) mice. (A) Cross-linking assays were performed on hippocampal dissections from GluA2+/ECS(C>G) mice and WT littermates and probed with GluA2 antibody. Membranes were stripped and reprobed for `-tubulin (loading control). (B) Quantification of GluA2 revealed no significant changes in expression patterns between WT and GluA2+/ECS(C>G) mice in surface to intracellular ratio (Student t-test; n=3/genotype). Values are expressed as a percentage of WT ratios. Each value represents the mean ± standard error of the mean (SEM).
Chapter 4: Hippocampal dysfunction in ECS mutated mice __________________________________________________________________________________
135
4.6 Examining AMPA receptor formation and complexes in the GluA2+/ECS(CG)
mice
Ca2+-permeable AMPA receptors are formed by either GluA2-lacking receptors or by
receptors containing unedited GluA2 at the Q/R site. In order to investigate AMPA
receptor composition in the hippocampus and determine if AMPA receptors are forming
with GluA2 within the complex, we adopted a previously established quantitative co-
immunoprecipitation paradigm, using AMPA receptor subunit-specific antibodies.
Previous studies have indicated 75-85% solubilisation of AMPA receptors with Triton-
X, and a greater than 95% binding, when two rounds of precipitations are performed
(Conrad et al 2008, Reimers et al 2011, Sans et al 2003, Wenthold et al 1996). Thus we
utilised these properties to determine AMPA receptor composition in WT and
GluA2+/ECS(CG) mice.
To establish the protocol and determine the binding ability of commercially available
antibodies we analysed Triton-X solubilised hippocampal dissections for various
AMPA receptor subunits. Firstly, the antibody to the subject of interest was bound to
the beads prior to the addition of the hippocampal homogenates. Following incubation,
the unbound fraction was analysed. This fraction theoretically should contain little of
the subunit of interest, though contain subunits that are in association. After elution,
analysis of the bound fraction was performed to determine if the subunit of interest is
indeed being pulled down by the commercial antibodies utilised (Figure 4.6.1A).
Furthermore, due to the elution conditions the bound fraction also contained the utilised
antibody. This experiment was performed to guarantee that greater than 95% binding is
achieved after two rounds of precipitation, as previously described (Conrad et al 2008,
Reimers et al 2011, Sans et al 2003, Wenthold et al 1996).
Our results showed minimal GluA1 in the unbound fraction following one and two
rounds of immunoprecipitation with the GluA1 antibody (Figure 4.6.1B). Furthermore,
results were similar for GluA2 and GluA2/3 immunoprecipitation, which showed
minimal GluA2/3 remaining in the unbound fraction following one and two rounds of
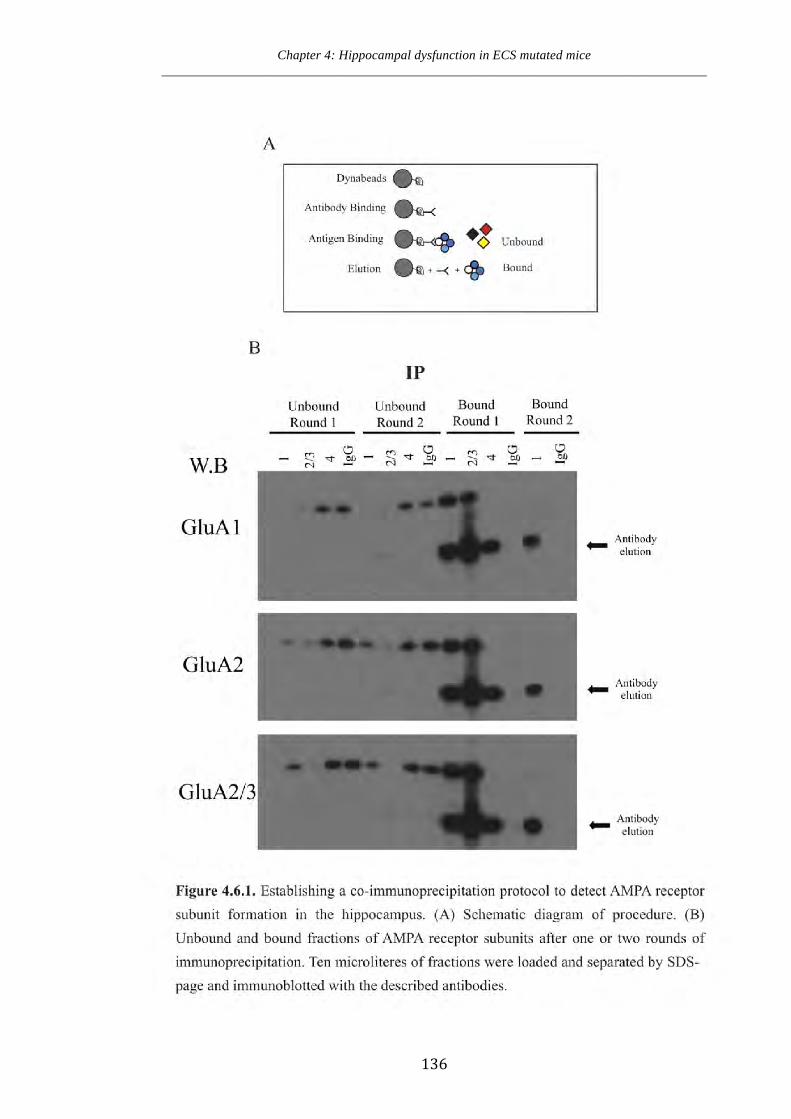
Chapter 4: Hippocampal dysfunction in ECS mutated mice __________________________________________________________________________________
136

Chapter 4: Hippocampal dysfunction in ECS mutated mice __________________________________________________________________________________
137
immunoprecipitation with the respective antibodies. Additionally, the majority of
GluA1 was detected in the bound fraction following one round of immunoprecipitation,
with minimal detected in the second round, when blotted with GluA1 (Figure 4.6.1B).
No protein was observed in the bound IgG control precipitant, indicating antibody
specific binding. These results suggest strong antibody specific binding, and establishes
a paradigm to detect AMPA receptor subunit formation in the GluA2+/ECS(CG) mice.
In order to determine the AMPA receptor subunit composition in GluA2+/ECS(CG) mice
and WT littermates, hippocampal extracts were solubilised with Triton X-100 and
subjected to co-immunoprecipitations with GluA1, GluA2, GluA2/3, GluA4,
GluA1+2/3 and GluA2/3+4 antibodies and IgG control antibodies (Figure 4.6.2). A
standard curve was formulated with the IgG control co-immunoprecipitation, by
diluting this sample to 5%, 25%, 75% and 100% of total sample, with the homogenising
buffer. The unbound fraction was analysed for the percentage remaining after the co-
immunoprecipitation, when blotted with antibodies against GluA1, GluA2, GluA2/3
and GluA3.
We detected no alteration to the expression of GluA2 within the AMPA receptor
complex. This was identified by firstly; when blotting with GluA2, the
immunoprecipitation of GluA1 resulted in 55±7% and 52±7% remaining GluA2 in WT
and GluA2+/ECS(CG) mice, respectively (Figure 4.6.2). Secondly; immunoprecipitation
with the GluA1 antibody resulted in 52±6% and 46±6%, when blotted with GluA2/3 in
WT and GluA2+/ECS(CG) mice, respectively. Combined, these results indicate no
alteration to the amount of GluA1 associated with GluA2 following increases to
unedited GluA2. These results indicate that a single point mutation to the ECS does not
alter AMPA receptor complex formation and, most importantly, does not modulate
GluA2 expression within the complex.
In addition, no alterations to GluA1/3 complexes or homomeric GluA1 complexes were
observed. This was observed since following GluA2 immunoprecipitation, there were
no changes to GluA1 remaining between genotypes (10±5% vs. 5±1% in WT and
GluA2+/ECS(CG) mice, respectively). Furthermore, immunoprecipitation with the
Chapter 4: Hippocampal dysfunction in ECS mutated mice __________________________________________________________________________________
138
GluA2/3 antibody led to 13±6% and 7±2% of GluA1 remaining in WT and
GluA2+/ECS(CG) mice, respectively (Figure 4.6.2). Finally, immunoprecipitation with
GluA2/3+4 indicated 8±4% and 6±2% of GluA1 remaining in the unbound fraction of
WT and GluA2+/ECS(CG) mice, respectively. These results further indicate that
homomeric GluA1 and GluA1/3 complexes are unaltered following modulation to the
ECS and the resulting increased expression of unedited GluA2. Therefore, AMPA
receptor complexes are unchanged in GluA2+/ECS(CG) mice, indicating normal
expression of GluA2 at the surface and within the complex.
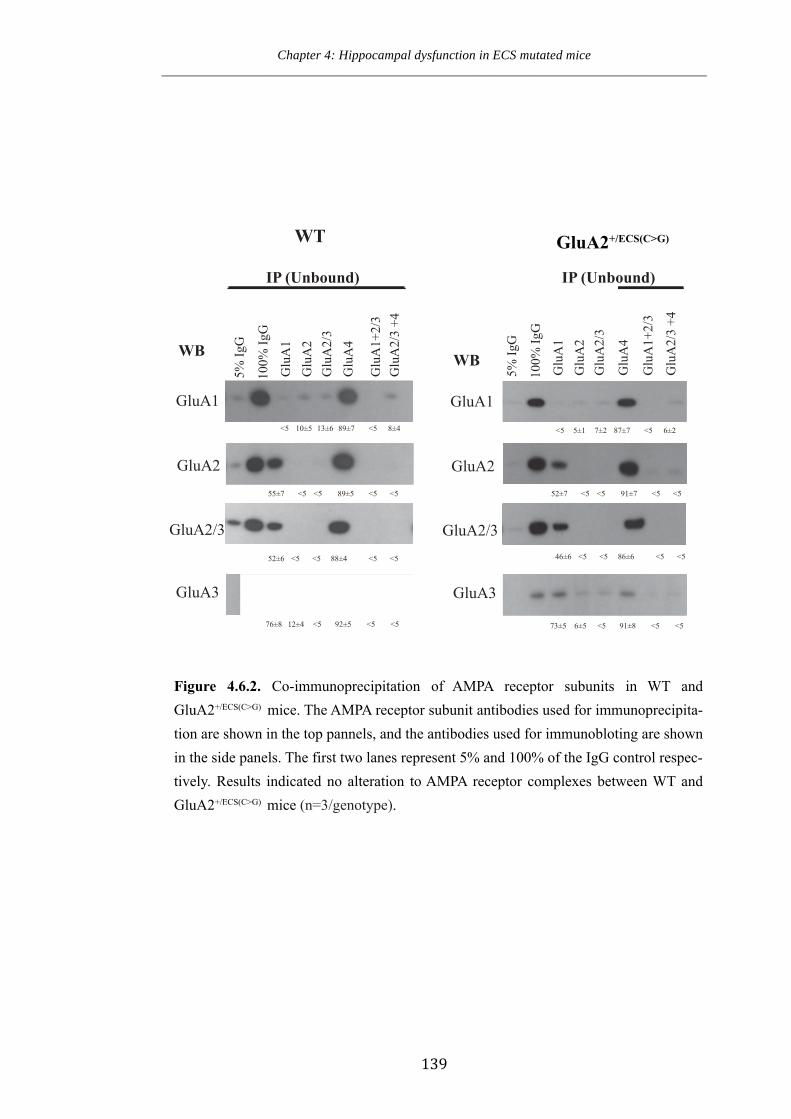
Chapter 4: Hippocampal dysfunction in ECS mutated mice __________________________________________________________________________________
139
GluA1
GluA2
GluA2/3
GluA3
Glu
A1
Glu
A2
Glu
A2/
3G
luA
4
100%
IgG
Glu
A1+
2/3
Glu
A2/
3 +4
GluA1
GluA2
GluA2/3
GluA3
IP (Unbound)
WB WB
WT GluA2+/ECS(C>G)
<5 <5
<5 <5 <5 <5
<5 <5 <5 <5
<5 <5 <5
5% Ig
G
Glu
A1
Glu
A2
Glu
A2/
3
Glu
A4
100%
IgG
Glu
A1+
2/3
Glu
A2/
3 +4
5% Ig
G
IP (Unbound)
10±5 13±6 89±7 8±4
55±7 89±5
52±6 88±4
92±5 76±8
<5 <5 5±1 7±2 87±7 6±2
<5 <5 <5 <5 52±7 91±7
<5 <5 <5 <5 46±6 86±6
<5 <5 <5 91±8 73±512±4 6±5
Figure 4.6.2. Co-immunoprecipitation of AMPA receptor subunits in WT and GluA2+/ECS(C>G) mice. The AMPA receptor subunit antibodies used for immunoprecipita-tion are shown in the top pannels, and the antibodies used for immunobloting are shown in the side panels. The first two lanes represent 5% and 100% of the IgG control respec-tively. Results indicated no alteration to AMPA receptor complexes between WT and GluA2+/ECS(C>G) mice (n=3/genotype).
Chapter 4: Hippocampal dysfunction in ECS mutated mice __________________________________________________________________________________
140
4.7 GluA2+/ECS(CG) mice exhibit inward rectifying currents that are blocked by
Naspm Please Note: Electrophysiology experiments in this chapter were conducted in conjunction with Dr. Benjamin Lau and Dr. Chris Vaughan. They have been included here for complete interpretation of the study.
AMPA receptors have the same characteristics whether they are GluA2-lacking or
whether they contain the unedited GluA2(Q) subunit: first, they are Ca2+-permeable.
Second, the AMPA receptors exhibit inward rectification (decreased conductance of
EPSCs through AMPA receptors at membrane potentials from positive to 0 mV) when
the polyamine, spermine, is diffused into the cell from the recording electrode; this is
measured as an altered rectification index. Third, Ca2+-permeable AMPA receptors
become selectively blocked by Joro spider toxin (JSTX) and to related drugs such as 1-
naphthylacetyl spermine (Naspm).
We have established that total GluA2 expression at the synapse is normal in
GluA2+/ECS(CG) mice. However, in order to determine if Ca2+-permeable AMPA
receptors are present at the synapse, we investigated AMPA receptor-mediated EPSCs
in CA1 pyramidal neurons from GluA2+/ECS(CG) mice and WT littermate controls.
Specifically, the I-V relationship of EPSCs was examined to determine the change in
AMPA receptor subunit composition. In WT mice, AMPA EPSCs were readily evoked
at -70, 0 and +40 mV, displaying a linear I-V relationship (Figure 4.7A and B). By
contrast, in GluA2+/ECS(CG) mice, EPSC amplitude was reduced at +40 mV (relative to
0 and -70 mV), indicating inward rectification of the AMPA receptor current (Figure
4.7A and B). On average, the rectification index (RI) was 0.56 ± 0.06 in GluA2+/ECS(CG)
mice, compared to 1.14 ± 0.09 in WT littermate controls. This inwardly rectifying I-V
relation in GluA2+/ECS(CG) mice was significantly different from the linear I-V observed
in WT mice (p< 0.01).
In addition, AMPA EPSCs in mutant mice were found to be sensitive to Naspm, a
synthetic analogue of Joro spider toxin (JSTX), which selectively blocks Ca2+-
permeable AMPA receptors. On average, Naspm (50 µM) inhibited evoked EPSC
amplitude by 41 ± 3% in GluA2+/ECS(CG) mice , which significantly differed to the 3 ±
Chapter 4: Hippocampal dysfunction in ECS mutated mice __________________________________________________________________________________
141
4% inhibition observed in WT littermate controls (p<0.01; figure 4.7C and D).
Combined, these results indicate the presence of Ca2+-permeable AMPA receptors in
GluA2+/ECS(CG) mice. Given our previous results that indicated abundant unedited
GluA2 mRNA, in addition to our results indicating normal GluA2 expression, these
results indicate that it is the unedited GluA2 subunit that is expressed and contributing
to the inward rectifying currents.
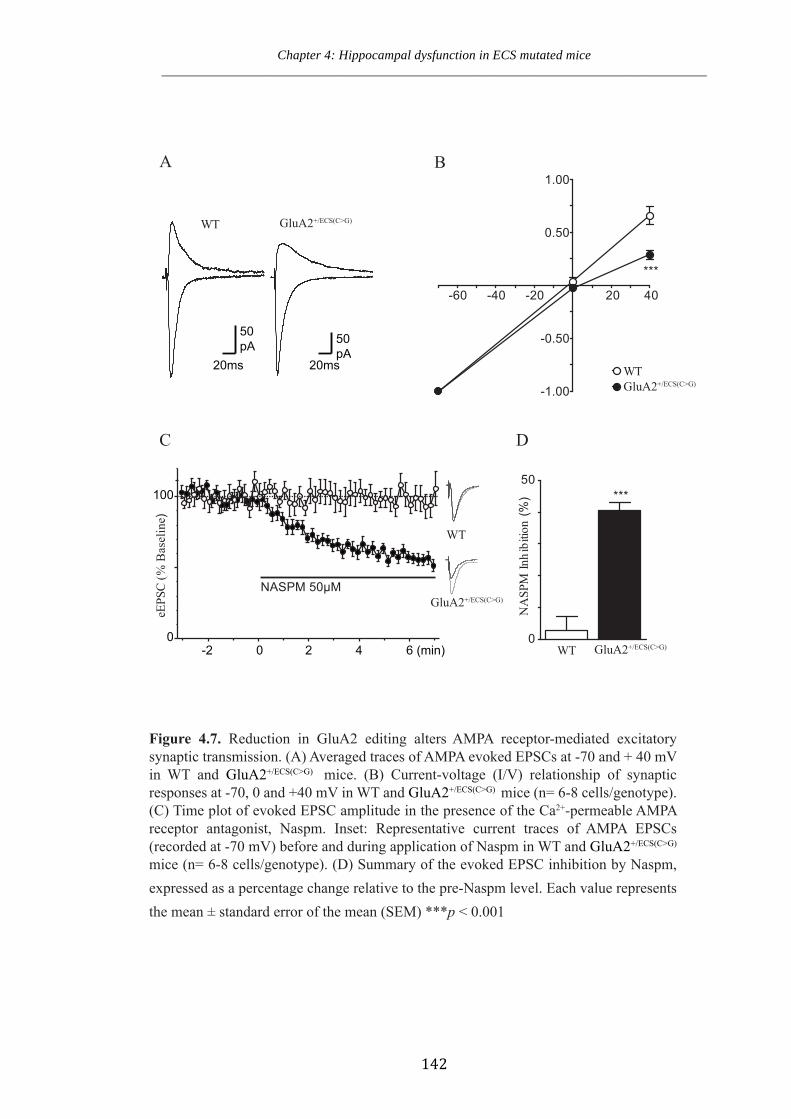
Chapter 4: Hippocampal dysfunction in ECS mutated mice __________________________________________________________________________________
142
-60 -40 -20 20 40
-1.00
-0.50
0.50
1.00
WT
50pA
20ms
WT
50pA
20ms
***
WT0
50
NA
SPM
Inhi
bitio
n (%
)
-2 0 2 4 6 (min)0
100
eEPS
C (%
Bas
elin
e)
NASPM 50µM
WT
***
GluA2+/ECS(C>G)
GluA2+/ECS(C>G)
GluA2+/ECS(C>G)
GluA2+/ECS(C>G)
A B
C D
Figure 4.7. Reduction in GluA2 editing alters AMPA receptor-mediated excitatory synaptic transmission. (A) Averaged traces of AMPA evoked EPSCs at -70 and + 40 mV in WT and GluA2+/ECS(C>G) mice. (B) Current-voltage (I/V) relationship of synaptic responses at -70, 0 and +40 mV in WT and GluA2+/ECS(C>G) mice (n= 6-8 cells/genotype). (C) Time plot of evoked EPSC amplitude in the presence of the Ca2+-permeable AMPA receptor antagonist, Naspm. Inset: Representative current traces of AMPA EPSCs (recorded at -70 mV) before and during application of Naspm in WT and GluA2+/ECS(C>G) mice (n= 6-8 cells/genotype). (D) Summary of the evoked EPSC inhibition by Naspm, expressed as a percentage change relative to the pre-Naspm level. Each value represents the mean ± standard error of the mean (SEM) ***p < 0.001
Chapter 4: Hippocampal dysfunction in ECS mutated mice __________________________________________________________________________________
143
4.8 GluA2+/ECS(CG) mice display CA1, but not CA3, hippocampal neuronal cell loss
Unedited GluA2 is hypothesised to be a cause of cell death in disorders such as ALS
and ischemia (Kawahara et al 2004b, Peng et al 2006). Here, we investigated if the
observed increase of unedited GluA2 through modification to the ECS resulted in
endogenous cell death. To examine whether GluA2+/ECS(CG) mice endure hippocampal
cell death, we performed unbiased stereological quantification of NeuN-labeled neurons
in the CA3 and CA1 regions of the hippocampus under brightfield microscopy. Coronal
sections were taken from WT and GluA2+/ECS(CG) mice at 8 and 36 weeks of age and
immunohistochemically stained for the neuronal nuclei marker, NeuN, to label the cell
layer of the hippocampus (Figure 4.8A).
Stereological analysis of the neuronal population in the CA3 region of the hippocampus
demonstrated no significant cell changes between WT and GluA2+/ECS(CG) mice at both
8 and 36 weeks of age (Figure 4.8B; interaction (F(1,8)=1.616 p=0.239); age
(F(1,8)=1.934 p=0.201); genotype (F(1,8)=0.3138 p=0.5907)). In contrast, significant cell
loss was observed in the CA1 region between WT and GluA2+/ECS(CG) mice (Figure
4.8C). There was no interaction effect (F(1,8)=0.4204 p=0.5349) therefore the main
effects were assessed. No significant changes were observed over time (F(1,8)=0.0357
p=0.8549), indicating no age dependent cell loss in WT and GluA2+/ECS(CG) mice.
However, a significant difference did occur between genotypes (F(1,8)=22.40 p=0.0015)
suggesting alteration to neuron numbers by expression of unedited GluA2 at the Q/R
site. Post hoc analysis with Bonferroni corrections revealed a significant difference
between WT and GluA2+/ECS(CG) mice at both 8 weeks (p<0.05) and 36 weeks
(p<0.001) of age. Thus, approximately 39% cell loss was observed in GluA2+/ECS(CG)
mice at 36 weeks of age, indicating a role of GluA2 RNA editing in cell survival. This
is consistent with the idea that an abundance of unedited GluA2 causes cell death in the
CA1 region of the hippocampus, without altering the CA3 region (Peng et al 2006).
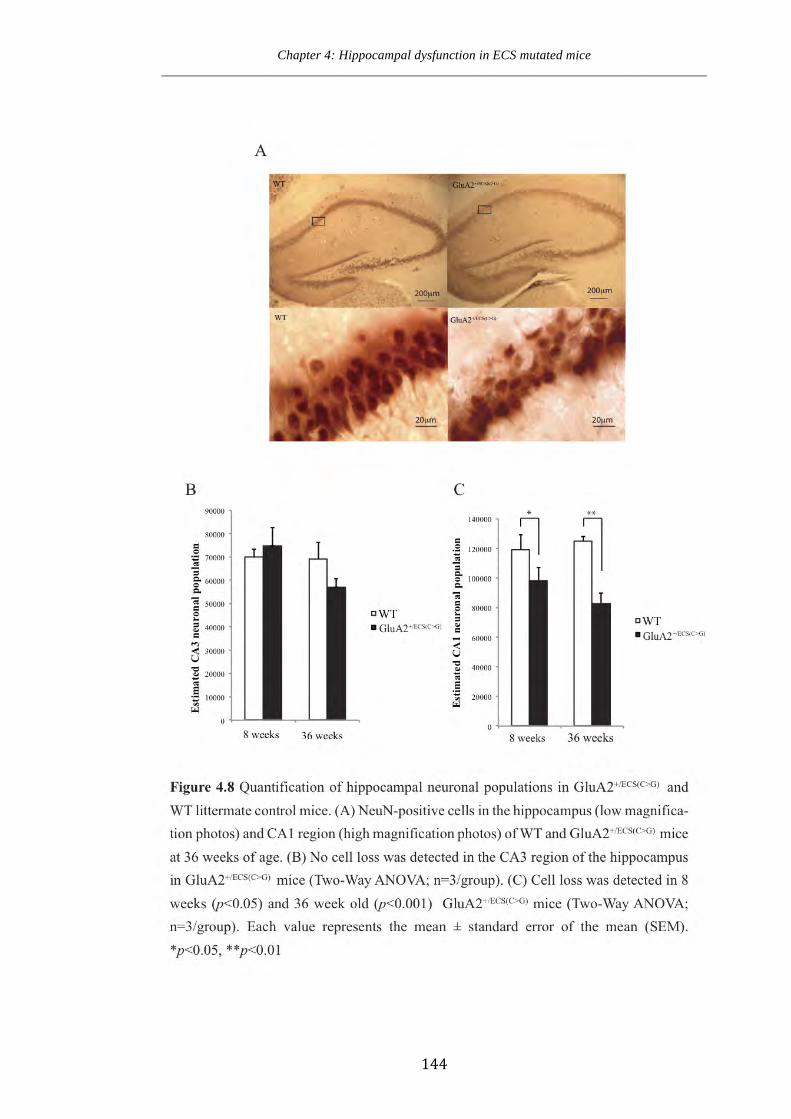
Chapter 4: Hippocampal dysfunction in ECS mutated mice __________________________________________________________________________________
144
Chapter 4: Hippocampal dysfunction in ECS mutated mice __________________________________________________________________________________
145
4.9 GluA2+/ECS(CG) mice show alterations to dendritic branching and loss of spines
in the CA1 hippocampal region
Having established that GluA2+/ECS(CG) mice exhibit neuronal cell loss, we next
investigated dendritic branching of hippocampal neurons. Brains from GluA2+/ECS(CG)
and WT littermate controls were subjected to Golgi impregnation, and hippocampal
neurons from the CA1 region were traced. Traced neurons were analysed by Sholl
analysis. The Sholl analysis is performed by counting the number of dendritic
intersections for concentric circles from the cell body. In this study, the radius interval
between circles was set at 10µm per step from the neuronal soma (Figure 4.9.1A). We
observed significantly fewer dendritic intersections in GluA2+/ECS(CG) mice as
compared to WT littermate controls at the proximal 160-220µm region from the cell
body (Figure 4.9.1B; p<0.05). These results suggest alteration to neuronal branching
and the shortening of length as a result of an abundant increase in unedited GluA2 at the
Q/R site.
In addition to neuronal branching, we also assessed spine density for apical dendritic
trees of CA1 pyramidal neurons. Spines were assessed on second order apical dendrites
located in the stratum radiatum of the hippocampus. Spines were expressed as the
number of spines per 10µm of dendritic length (Figure 4.9.2A). A two-tailed t-test of
spine density revealed a significant reduction in the number of spines in GluA2+/ECS(CG)
mice as compared to WT littermate controls (Figure 4.9.2B; p<0.001). Therefore, in
addition to neuronal cell loss in the CA1 region, GluA2+/ECS(CG) mice also exhibit
dendritic shortening and loss of spines.
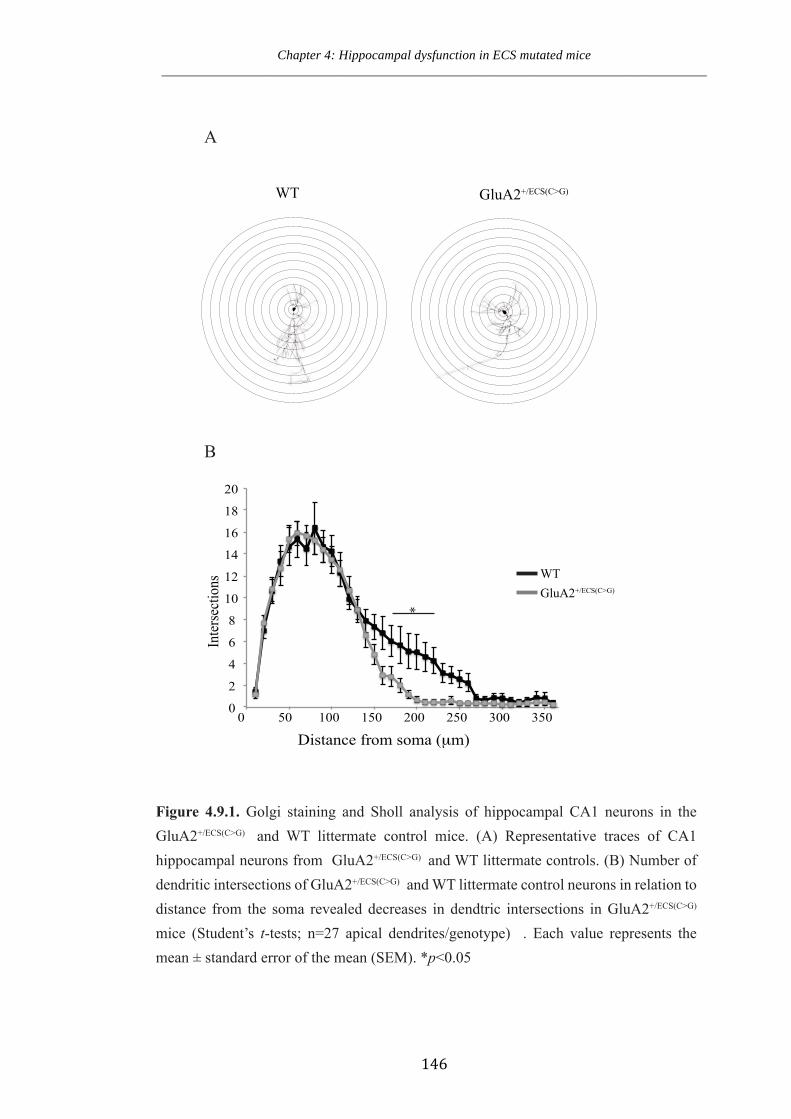
Chapter 4: Hippocampal dysfunction in ECS mutated mice __________________________________________________________________________________
146
0
2
4
6
8
10
12
14
16
18
20
0 50 100 150 200 250 300 350 400
Inte
rsec
tions
Distance from soma (+m)
WT GluA2+/ECS(C>G)
*
WTGluA2+/ECS(C>G)
Figure 4.9.1. Golgi staining and Sholl analysis of hippocampal CA1 neurons in the GluA2+/ECS(C>G) and WT littermate control mice. (A) Representative traces of CA1 hippocampal neurons from GluA2+/ECS(C>G) and WT littermate controls. (B) Number of dendritic intersections of GluA2+/ECS(C>G) and WT littermate control neurons in relation to distance from the soma revealed decreases in dendtric intersections in GluA2+/ECS(C>G) mice (Student’s t-tests; n=27 apical dendrites/genotype) . Each value represents the mean ± standard error of the mean (SEM). *p<0.05
A
B
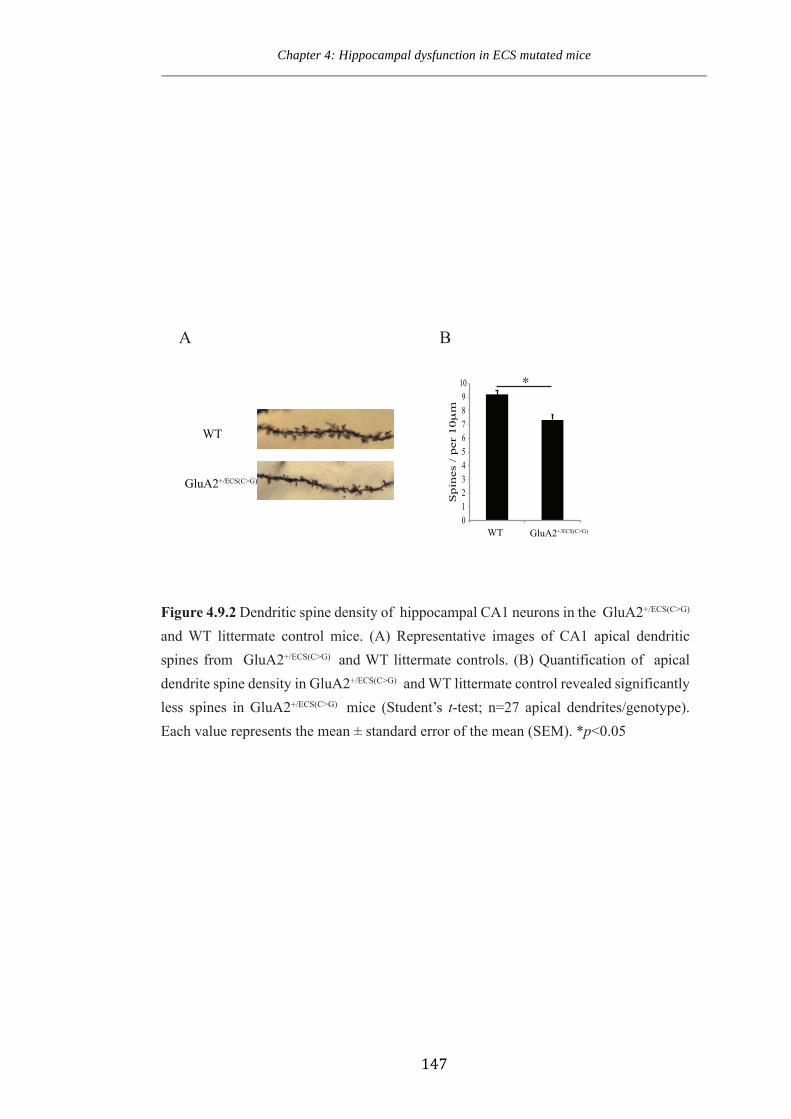
Chapter 4: Hippocampal dysfunction in ECS mutated mice __________________________________________________________________________________
147
0 1 2 3 4 5 6 7 8 9
10
Sp
ines
/ p
er 1
0+
m
WT
GluA2+/ECS(C>G)
�
GluA2+/ECS(C>G) WT
Figure 4.9.2 Dendritic spine density of hippocampal CA1 neurons in the GluA2+/ECS(C>G) and WT littermate control mice. (A) Representative images of CA1 apical dendritic spines from GluA2+/ECS(C>G) and WT littermate controls. (B) Quantification of apical dendrite spine density in GluA2+/ECS(C>G) and WT littermate control revealed significantly less spines in GluA2+/ECS(C>G) mice (Student’s t-test; n=27 apical dendrites/genotype). Each value represents the mean ± standard error of the mean (SEM). *p<0.05
A B
Chapter 4: Hippocampal dysfunction in ECS mutated mice __________________________________________________________________________________
148
4.10 Increase to astrocyte, though not microglial populations, in the hippocampus
of GluA2+/ECS(CG)
Excitotoxic injury is often associated with an increase to neuroinflammatory processes
within the brain. In particular, models of excitotoxic injury often present with increased
number of astrocytes and microglia (Abdipranoto-Cowley et al 2009). Given that
increased unedited GluA2 lead to cell loss and dendritic shortening, we predicted that
this would coincide with an increase in inflammation in GluA2+/ECS(CG) mice. We
utilised stereology to quantify astrocytes and microglia in the CA1 and CA3 regions of
the hippocampus of GluA2+/ECS(CG) mice and WT littermates at 8 and 36 weeks of age.
We performed unbiased stereological quantification to determine astrocytes expressing
the typical marker GFAP within the CA3 and CA1 region of the hippocampus of
GluA2+/ECS(CG) mice and WT littermates, as described in Chapter 3 (Figure 4.10.1A).
Within the CA3 region, a significant interaction occurred between genotype and age
(F(1,4)=11.87 p=0.026), indicating age-dependent alterations to GFAP-positive
astrocytes (Figure 4.10.1B). Therefore, separate one-way ANOVAs were conducted on
genotype and age. No significant difference occurred at 8 weeks of age between
GluA2+/ECS(CG) mice and WT littermate controls (p=0.51). In contrast, GluA2+/ECS(CG)
mice exhibited increased GFAP-positive astrocytes within the CA3 hippocampal region
as compared to WT littermate controls (p<0.05). Furthermore, a significant age effect
occurred (p<0.05), indicating age-dependent increases of GFAP-positive astrocytes in
the CA3 region of GluA2+/ECS(CG) mice.
For GFAP-positive astrocytes within the CA1 region, we also found a significant
interaction occurred between genotype and age (Figure 4.10.1C; F(1,4)=9.197 p=0.039).
Therefore, the effect of genotype and age on astrocyte populations in the CA1 was
analysed separately using one-way ANOVAs. No significant difference occurred
between GluA2+/ECS(CG) mice and WT littermates at 8-weeks of age (p=0.791),
however GluA2+/ECS(CG) mice exhibited more GFAP-positive astrocytes compared to
WT littermate controls at 36-weeks of age (p=0.026). A significant age effect in the
CA1 region also occurred (p<0.05) demonstrating age-dependent increase in GFAP-
Chapter 4: Hippocampal dysfunction in ECS mutated mice __________________________________________________________________________________
149
positive astrocytes in the GluA2+/ECS(CG) mice. Combined, these results show that
significantly increased astrocytic populations occur in the hippocampus well after cell
loss has been established, and indicates that the inflammatory process is a response to,
rather than the cause of, cell loss.
To quantify the microglial populations within GluA2+/ECS(CG) mice and WT littermates,
Iba-1-positive microglia were stereologically counted within the CA3 and CA1 regions
of the hippocampus (Figure 4.10.2A). Iba-1 is expressed by microglia and macrophages
and is used as a marker of total (both resting and activated) microglia. Analysis of Iba-1
positive microglia within the CA3 region demonstrated no significant age-dependent
microglial changes between GluA2+/ECS(CG) mice and WT littermates at 8 and 36 weeks
of age (Figure 4.10.2B; interaction (F(1,4)=0.813 p=0.418); age (F(1,4)=0.026 p=0.880);
genotype (F(1,4)=3.54 p=0.133)). Similarly, for the CA1 region, no interaction was
detected between age and genotype (F(1,4)=2.187 p=0.213), therefore the main affects
were assessed (Figure 4.9.2C). No genotype effect was detected (F(1,4)=1.57 p=0.279)
indicating no differences between GluA2+/ECS(CG) mice and WT littermate controls at 8
or 36 weeks. However, an age effect was detected (F(1,4)=9.827 p=0.0.350)
demonstrating increases to Iba-1-positive microglia in the CA1 region of the
hippocampus during natural aging.
Combined, these results indicate significant age-dependent increases to GFAP-positive
astrocytes in GluA2+/ECS(CG) mice in both the CA3 and CA1 region of the
hippocampus. Furthermore, both GFAP-positive astrocytes and Iba-1 positive microglia
increased from 8 to 36 weeks of age indicating alteration to inflammatory cells during
natural aging.
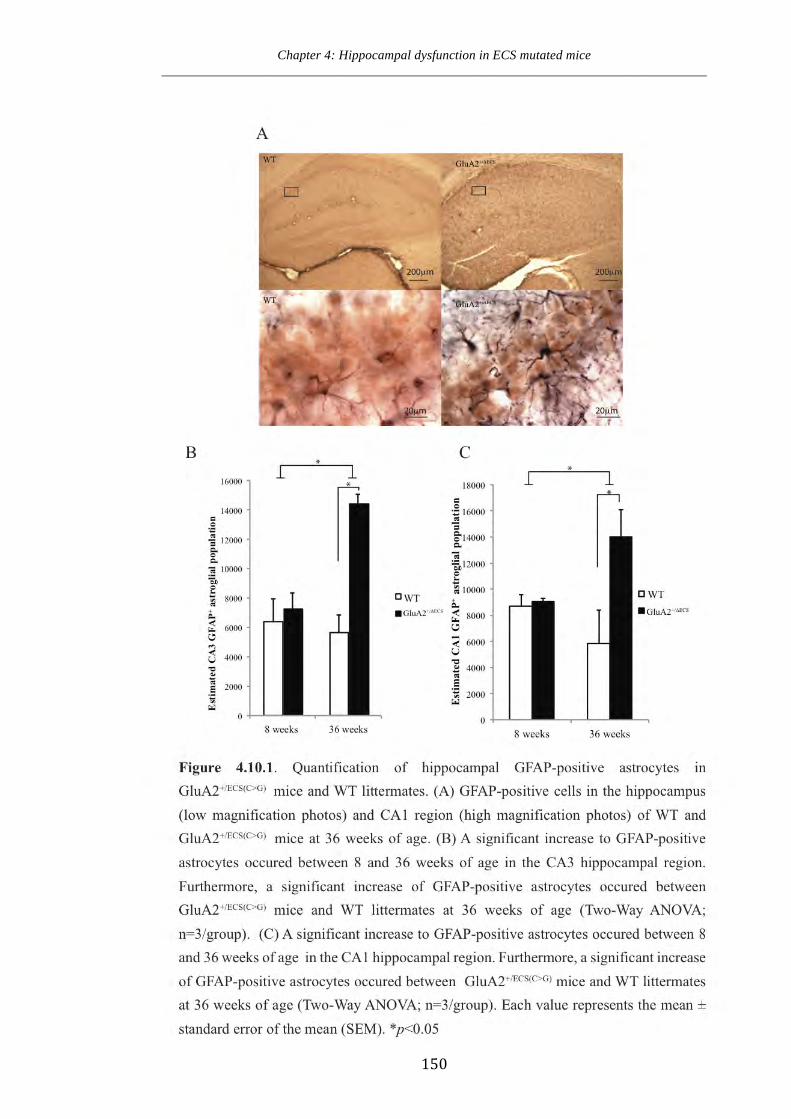
Chapter 4: Hippocampal dysfunction in ECS mutated mice __________________________________________________________________________________
150

Chapter 4: Hippocampal dysfunction in ECS mutated mice __________________________________________________________________________________
151
20+m 20+m
200+m 200+m
GluA2+/ΔECS WT
GluA2+/ΔECS WT
0
500
1000
1500
2000
2500
3000
3500
8 weeks 36 weeks
Est
imat
ed C
A3
Iba1
+ mic
rogl
ial p
opul
atio
n
WT
0
500
1000
1500
2000
2500
3000
3500
4000
4500
8 weeks 36 weeks
Est
imat
ed C
A1
Iba1
+ mic
rogl
ial p
opul
atio
n
WT
A
B C
GluA2+/ECS(C>G) GluA2+/ECS(C>G)
*
Figure 4.10.2. Quantification of hippocampal Iba-1-positive microglia in GluA2+/ECS(C>G) and WT littermate control mice. (A) Iba-1-positive cells in the hippocampus (low magni-fication photos) and CA1 region (high magnification photos) of WT and GluA2+/ECS(C>G) mice at 36 weeks of age. (B) No significant changes to Iba-1-positive microglia occurred between 8 and 36 weeks of age in the CA3 hippocampal region (Two-Way ANOVA; n=3/group). (C) No significant changes to Iba-1-positive microglia occurred between GluA2+/ECS(C>G) mice and WT littermates in the CA1 hippocampal region. However, a significant increase of Iba-1-positive microglia occured between 8 and 36 weeks of age (Two-Way ANOVA; n=3/group). Each value represents the mean ± standard error of the mean (SEM). *p<0.05.

Chapter 4: Hippocampal dysfunction in ECS mutated mice __________________________________________________________________________________
152
Discussion
The reduced editing efficiency of GluA2 RNA at the Q/R site has been strongly
associated with neurological disorders including Huntington’s disease, ischemia and
ALS (Akbarian et al 1995, Kawahara et al 2004a, Peng et al 2006). Furthermore, a
study conducted by Akbarian et al. (1995) showed that GluA2 RNA editing efficiency
is slightly altered in the human AD prefrontal cortex, giving rise to the idea that
unedited GluA2 may cause cell death in AD. In this chapter we characterised mice with
a single point mutation to the ECS, in order to determine if abundant unedited GluA2
can lead to molecular and structural neuronal changes.
AMPA receptors are Ca2+-permeable if they are GluA2-lacking or if they contain the
unedited GluA2 subunit at the Q/R site. While GluA2-lacking receptors appear to have
a role in synaptic plasticity, unedited GluA2 receptors have a fundamentally different
physiological effect. Mice in which GluA2 is ablated (GluA2 KO mice) have Ca2+-
permeable AMPA receptors made up of the GluA1, GluA3, and GluA4 subunits (Sans
et al 2003). These mice are viable, and live to an old age, suggesting that the presence
of Ca2+-permeable AMPA receptors may not be intrinsically excitotoxic (Wiltgen et al
2010). In contrast, in this study, the replacement of a single nucleotide within the ECS
resulted in approximately 26% unedited GluA2 mRNA in the hippocampus. As a result,
GluA2+/ECS(CG) mice exhibited reduced body weight and premature death, with a mean
age of 9 weeks.
Previous studies have indicated that GluA2 expression is downregulated in response to
the knockout of the ECS (Brusa et al 1995, Feldmeyer et al 1999). In contrast, the
protein expression of AMPA receptor subunits was largely unchanged in the
hippocampus of GluA2+/ECS(CG) mice. Firstly we revealed that the expression of GluA2,
and in particular the surface expression of GluA2 was unchanged in the GluA2+/ECS(CG)
mice. In addition, the composition of the AMPA receptors was largely unchanged in
GluA2+/ECS(CG) mice as compared to WT mice. These studies reveal that the expression
of GluA2 is largely normal in GluA2+/ECS(CG) mice. However, we observed large
inward rectifying currents that were blocked by the Ca2+-permeable AMPA receptor
antagonist, Naspm, indicating the presence of synaptic Ca2+-permeable AMPA
Chapter 4: Hippocampal dysfunction in ECS mutated mice __________________________________________________________________________________
153
receptors. Combined with our results that indicated abundant unedited GluA2 mRNA in
the GluA2+/ECS(CG) mice, this data suggests that the majority of the observed Ca2+-
permeable AMPA receptors are indeed unedited GluA2 at the Q/R site, rather than
GluA2-lacking receptors, at the synapse.
As no alteration to surface expression and composition of AMPA receptors were
observed, it is presumed that the cell loss and alteration to dendrites and spines in
GluA2+/ECS(CG) mice is due to an increased expression of unedited GluA2 at the Q/R
site, rather than the expression of GluA2-lacking receptors. Interestingly, we observed a
39% cell loss in the CA1 region of GluA2+/ECS(CG) mice, though no cell loss in the CA3
region of the hippocampus. This is consistent with previous literature, which showed
increase unedited GluA2 and corresponding cell death in the CA1 region, though not
CA3 region, of the hippocampus, following induced ischemia (Peng et al 2006) and
indicates a potential role of GluA2 RNA editing particularly within CA1 neurons. In
addition, our study indicated a significant retraction at the distal end of dendrites and
decreased apical spine density in GluA2+/ECS(CG) mice. These results contrast that of
GluA2-lacking mice, which show no alteration to neuronal numbers (Wiltgen et al
2010). Thus, these results give rise to the idea that GluA2 RNA editing is a key
mechanism required for synaptic strengthening and neuronal cell survival.
We observed an abundant increase to hippocampal astrocyte populations in
GluA2+/ECS(CG) mice at 36 weeks of age. This is potentially due to a simultaneous
inflammatory event, as it is well known that inflammation is increased in response to
dying neurons. Alternatively, the increased astrocyte populations may be due to
increased unedited GluA2 expression, as astrocytes are also known to express Ca2+-
permeable AMPA receptors (Seifert et al 2003). Previous studies have indicated that
astrocytes are able to regulate the expression of GluA2 in neurons and control neuronal
vulnerability to excitotoxicity (Van Damme et al 2007). Furthermore, previous studies
indicated that human malignant gliomas, and in particular astrocytomas, exhibit
downregulation of ADAR2 and express unedited GluA2 (Cenci et al 2008, Maas et al
2001). In this context, GluA2+/ECS(CG) mice may be utilised for future studies to
investigate how RNA editing may lead to tumorigenesis. Further research is required to

Chapter 4: Hippocampal dysfunction in ECS mutated mice __________________________________________________________________________________
154
determine if the increased astrocytic populations in GluA2+/ECS(CG) mice is a response
to neuronal cell death, or a direct consequence of unedited GluA2.
Ca2+-permeable AMPA receptors have been strongly implicated in cell loss in numerous
disorders including ischemia, ALS and epilepsy (Kawahara et al 2003, Pellegrini-
Giampietro et al 1997, Pellegrini-Giampietro et al 1992, Peng et al 2006). However, it is
often debated whether such receptors are GluA2-lacking, or contain the unedited GluA2
receptor. Given the unique role of GluA2-lacking receptors in synaptic plasticity, in
conjunction with the fact that GluA2-KO mice are viable and functional, we presume
that unedited GluA2 at the Q/R site may indeed be a primary cause of excitotoxic cell
death.
The cell loss observed in this study parallels that of the hAPP-J20 mice characterised in
Chapter 3. Both the hAPP-J20 mouse model and the GluA2+/ECS(CG) mice show age-
dependent progressive cell loss in the CA1, though not CA3 region, of the
hippocampus. Thus, we hypothesised that unedited GluA2 may be a potential cause of
cell death in AD. Therefore, in the following chapters, we investigated if the blockade
of unedited GluA2 may rescue neurodegeneration in the hAPP-J20 mouse model.
155
Chapter 5
The expression of forced edited GluA2 at
the Q/R site rescues hippocampal
dysfunction in the hAPP-J20 mouse
model of Alzheimer’s disease

Chapter 5: Forced edited GluA2 alters hippocampal dysfunction in the hAPP-J20 mouse model ___________________________________________________________________________________
156
5.0 Background AD is associated with neurodegeneration that is characterised by synaptic dysfunction,
followed by neuronal cell loss, particularly within the cortex and hippocampus (Braak
& Braak 1991, West et al 1994). Specifically, cell loss is known to occur in the CA1
region of the hippocampus more abundantly than any other region (Scheff et al 2007).
As described in Chapter 3, the hAPP-J20 mouse model of AD shows early
neurodegeneration in the CA1 region of the hippocampus. However, the mechanisms
leading to cell death are largely unknown. Our results in Chapter 4 indicate that reduced
GluA2 RNA editing efficiency at the Q/R site results in modulation to dendritic
morphology and cell death in the CA1 hippocampal region. Thus, in this chapter we
aimed to determine if GluA2 RNA editing is altered in the hippocampus of the hAPP-
J20 mouse model and, further, determine if blockade of unedited GluA2 can rescue
hippocampal degradation.
Unedited GluA2 has been found to play a role in neuronal cell death in disorders such as
amyotrophic lateral sclerosis (ALS) and ischemic injury. Studies have demonstrated the
presence of abundant unedited GluA2 mRNA in human ALS motor neurons (Kawahara
et al 2004a). Further, Peng et al. (2006) revealed a downregulation of GluA2 RNA
editing in CA1 hippocampal neurons following forebrain ischemia, resulting in neuronal
cell death. Additionally, the authors indicated that viral mediated delivery of ADAR2
enzyme to the hippocampus was able to improve GluA2 RNA editing deficiencies and
rescue ischemia-induced neurodegeneration (Peng et al 2006). These elegant
experiments reveal a direct relationship between unedited GluA2 and cell death in
disease. Combined, these experiments provide substantial evidence that GluA2 RNA
editing plays a pivotal role in mediating excitotoxic neuronal death during ALS and
ischemia.
A significant increase in unedited GluA2 has been described in the cerebral cortex of
post-mortem AD patients (Akbarian et al 1995). Given the role of unedited GluA2 in
ischemic cell death, we hypothesised that abundant unedited GluA2 may cause cell
death in AD. Thus, we sought to investigate if blocking unedited GluA2 is
neuroprotective in AD. In order to achieve this, we developed a mouse model that

Chapter 5: Forced edited GluA2 alters hippocampal dysfunction in the hAPP-J20 mouse model ___________________________________________________________________________________
157
expresses only edited GluA2, termed the GluA2R/R mice. To induce the expression of
only edited GluA2, mice were genetically modified so that the DNA encodes an
arginine in place of the glutamate codon (codon 607) within the Gria2 gene and thus,
only encode what is normally present after RNA editing has occurred. This ‘forced
editing’ alleviates the need for endogenous RNA editing and guarantees that all GluA2
containing AMPA receptors are Ca2+-impermeable.
In order to determine the neuroprotective effects of blocking GluA2 in AD, we crossed
the GluA2R/R mouse line with the hAPP-J20 mouse model of AD. From this cross, four
genotypes were analysed: WT/WT, GluA2R/R/WT, WT/hAPP-J20 and GluA2R/R/hAPP-
J20. By inducing forced GluA2 RNA editing in the hAPP-J20 mouse model of AD, we
theorised that the resulting Ca2+-impermeability will protect against hippocampal
dysfunction in AD. Therefore, we tested if forced edited GluA2 at the Q/R site altered
AD associated pathology in the hAPP-J20 mouse model.
Aims:
• To investigate if hAPP-J20 mice exhibit increases to unedited GluA2 at the Q/R
site
• To verify the single point mutation to Gria2 Q/R site of GluA2R/R/WT mice
• To quantify the expression of AMPA receptor subunits in mice with forced
edited GluA2 and the hAPP-J20 mouse model of AD
• To determine if forced edited GluA2 alters the AMPA receptors subunit
formation, the total expression of AMPA receptors, and the surface vs.
intracellular expression of GluA1 and GluA2 in the healthy brain and in the
hAPP-J20 mouse model of AD
• To determine the physiological effects of forced GluA2 RNA editing in the
hAPP-J20 mouse model of AD
• To investigate if forced GluA2 RNA editing alters total Aβ, Aβ40 and Aβ42, and
Aβ plaque deposition in the hAPP-J20 mouse model of AD
• To investigate if forced edited GluA2 protects against hippocampal cell death in
the normal brain and in the hAPP-J20 mouse model of AD

Chapter 5: Forced edited GluA2 alters hippocampal dysfunction in the hAPP-J20 mouse model ___________________________________________________________________________________
158
• To determine if forced edited GluA2 alters dendritic length and spine density in
the normal brain and in the hAPP-J20 mouse model of AD
• To investigate if forced edited GluA2 alters neuroinflammation, including
astrocyte and microglia populations, and cytokine levels in the normal brain and
in the hAPP-J20 mouse model of AD
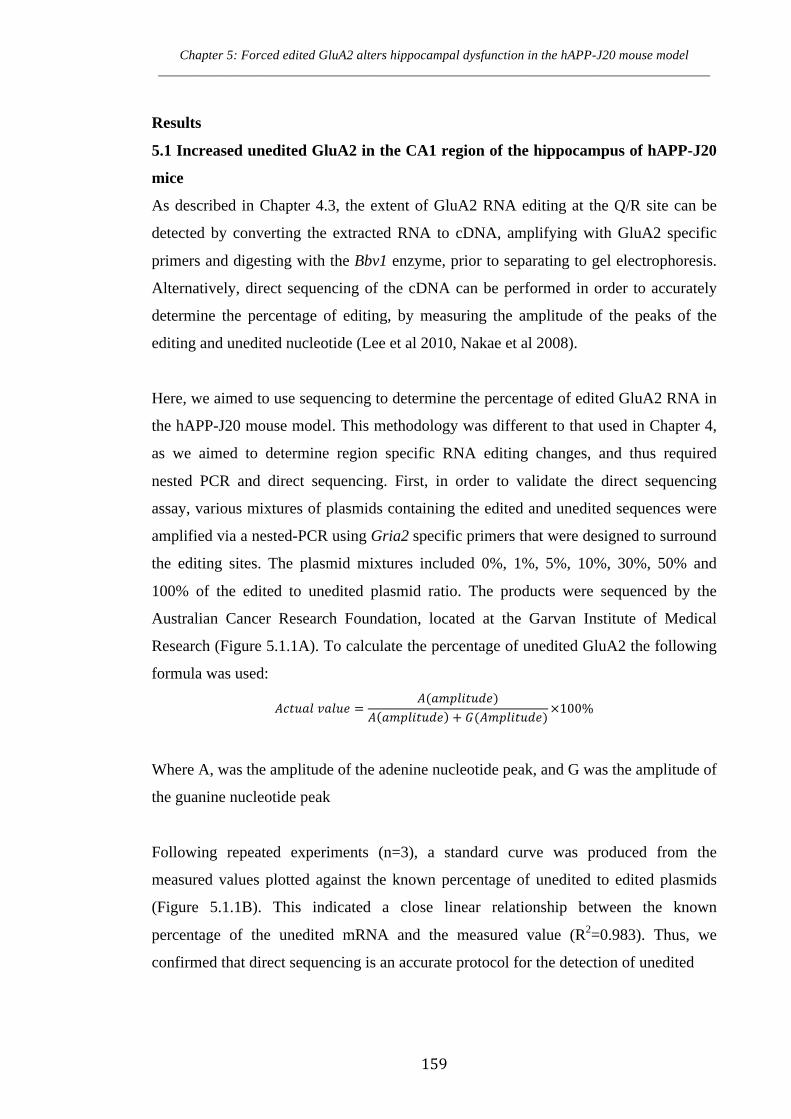
Chapter 5: Forced edited GluA2 alters hippocampal dysfunction in the hAPP-J20 mouse model ___________________________________________________________________________________
159
Results
5.1 Increased unedited GluA2 in the CA1 region of the hippocampus of hAPP-J20
mice
As described in Chapter 4.3, the extent of GluA2 RNA editing at the Q/R site can be
detected by converting the extracted RNA to cDNA, amplifying with GluA2 specific
primers and digesting with the Bbv1 enzyme, prior to separating to gel electrophoresis.
Alternatively, direct sequencing of the cDNA can be performed in order to accurately
determine the percentage of editing, by measuring the amplitude of the peaks of the
editing and unedited nucleotide (Lee et al 2010, Nakae et al 2008).
Here, we aimed to use sequencing to determine the percentage of edited GluA2 RNA in
the hAPP-J20 mouse model. This methodology was different to that used in Chapter 4,
as we aimed to determine region specific RNA editing changes, and thus required
nested PCR and direct sequencing. First, in order to validate the direct sequencing
assay, various mixtures of plasmids containing the edited and unedited sequences were
amplified via a nested-PCR using Gria2 specific primers that were designed to surround
the editing sites. The plasmid mixtures included 0%, 1%, 5%, 10%, 30%, 50% and
100% of the edited to unedited plasmid ratio. The products were sequenced by the
Australian Cancer Research Foundation, located at the Garvan Institute of Medical
Research (Figure 5.1.1A). To calculate the percentage of unedited GluA2 the following
formula was used:
𝐴𝑐𝑡𝑢𝑎𝑙 𝑣𝑎𝑙𝑢𝑒 =𝐴(𝑎𝑚𝑝𝑙𝑖𝑡𝑢𝑑𝑒)
𝐴 𝑎𝑚𝑝𝑙𝑖𝑡𝑢𝑑𝑒 + 𝐺(𝐴𝑚𝑝𝑙𝑖𝑡𝑢𝑑𝑒)×100%
Where A, was the amplitude of the adenine nucleotide peak, and G was the amplitude of
the guanine nucleotide peak
Following repeated experiments (n=3), a standard curve was produced from the
measured values plotted against the known percentage of unedited to edited plasmids
(Figure 5.1.1B). This indicated a close linear relationship between the known
percentage of the unedited mRNA and the measured value (R2=0.983). Thus, we
confirmed that direct sequencing is an accurate protocol for the detection of unedited

Chapter 5: Forced edited GluA2 alters hippocampal dysfunction in the hAPP-J20 mouse model ___________________________________________________________________________________
160
Percentage of unedited plasmid (%)0 1 5 3010 50 100
y = 0.9882x + 3.1819 R = 0.98384
0
10
20
30
40
50
60
70
80
90
100
0 10 20 30 40 50 60 70 80 90 100
Mea
sure
d va
lue
(%)
Edited/undited ratio (%)
Figure 5.1.1. Chromatogram of direct sequencing and quantification of edited and unedited mixed GluA2 plasmids (A) Amplification of plasmids mixtures containing edited and unedited GluA2, utilising PCR with GluA2 gene specific primers and direct sequencing. (B) Quantification of the edited to unedited ratio resulted in a close linear relationship between the values measured on the chromatagram and the known percent plasmid mixed. Each value represents the mean ± standard error of the mean (SEM).
A
B
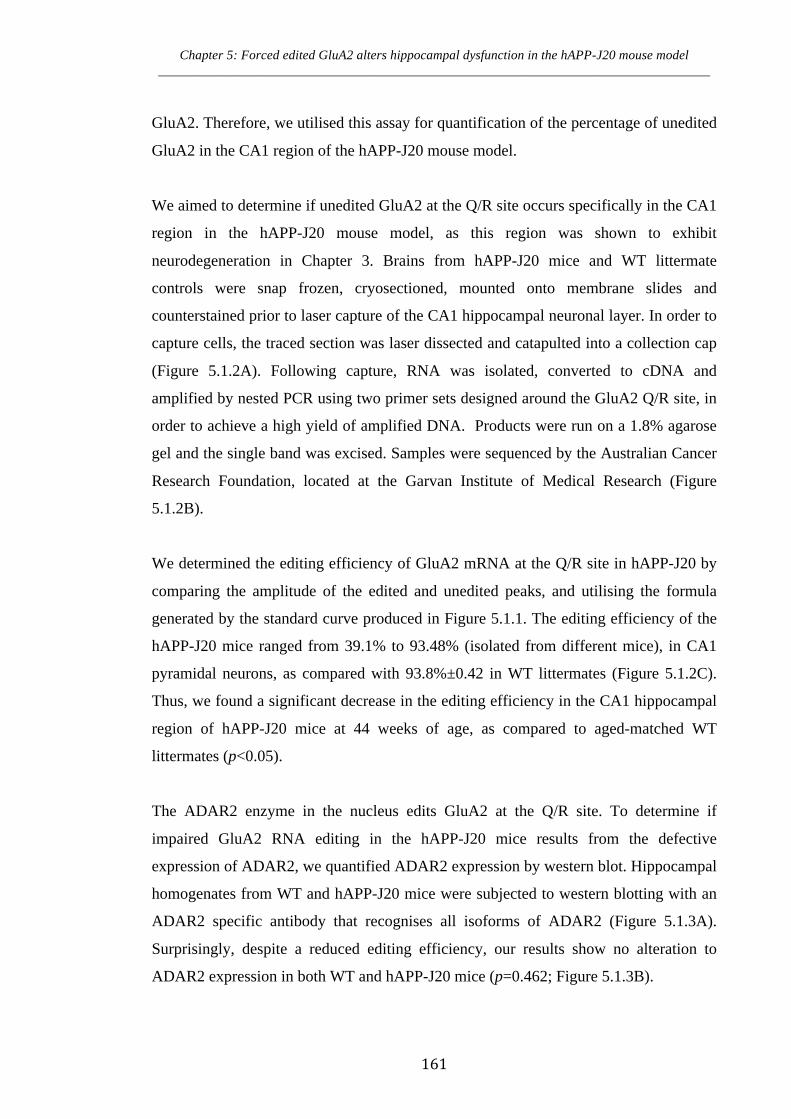
Chapter 5: Forced edited GluA2 alters hippocampal dysfunction in the hAPP-J20 mouse model ___________________________________________________________________________________
161
GluA2. Therefore, we utilised this assay for quantification of the percentage of unedited
GluA2 in the CA1 region of the hAPP-J20 mouse model.
We aimed to determine if unedited GluA2 at the Q/R site occurs specifically in the CA1
region in the hAPP-J20 mouse model, as this region was shown to exhibit
neurodegeneration in Chapter 3. Brains from hAPP-J20 mice and WT littermate
controls were snap frozen, cryosectioned, mounted onto membrane slides and
counterstained prior to laser capture of the CA1 hippocampal neuronal layer. In order to
capture cells, the traced section was laser dissected and catapulted into a collection cap
(Figure 5.1.2A). Following capture, RNA was isolated, converted to cDNA and
amplified by nested PCR using two primer sets designed around the GluA2 Q/R site, in
order to achieve a high yield of amplified DNA. Products were run on a 1.8% agarose
gel and the single band was excised. Samples were sequenced by the Australian Cancer
Research Foundation, located at the Garvan Institute of Medical Research (Figure
5.1.2B).
We determined the editing efficiency of GluA2 mRNA at the Q/R site in hAPP-J20 by
comparing the amplitude of the edited and unedited peaks, and utilising the formula
generated by the standard curve produced in Figure 5.1.1. The editing efficiency of the
hAPP-J20 mice ranged from 39.1% to 93.48% (isolated from different mice), in CA1
pyramidal neurons, as compared with 93.8%±0.42 in WT littermates (Figure 5.1.2C).
Thus, we found a significant decrease in the editing efficiency in the CA1 hippocampal
region of hAPP-J20 mice at 44 weeks of age, as compared to aged-matched WT
littermates (p<0.05).
The ADAR2 enzyme in the nucleus edits GluA2 at the Q/R site. To determine if
impaired GluA2 RNA editing in the hAPP-J20 mice results from the defective
expression of ADAR2, we quantified ADAR2 expression by western blot. Hippocampal
homogenates from WT and hAPP-J20 mice were subjected to western blotting with an
ADAR2 specific antibody that recognises all isoforms of ADAR2 (Figure 5.1.3A).
Surprisingly, despite a reduced editing efficiency, our results show no alteration to
ADAR2 expression in both WT and hAPP-J20 mice (p=0.462; Figure 5.1.3B).
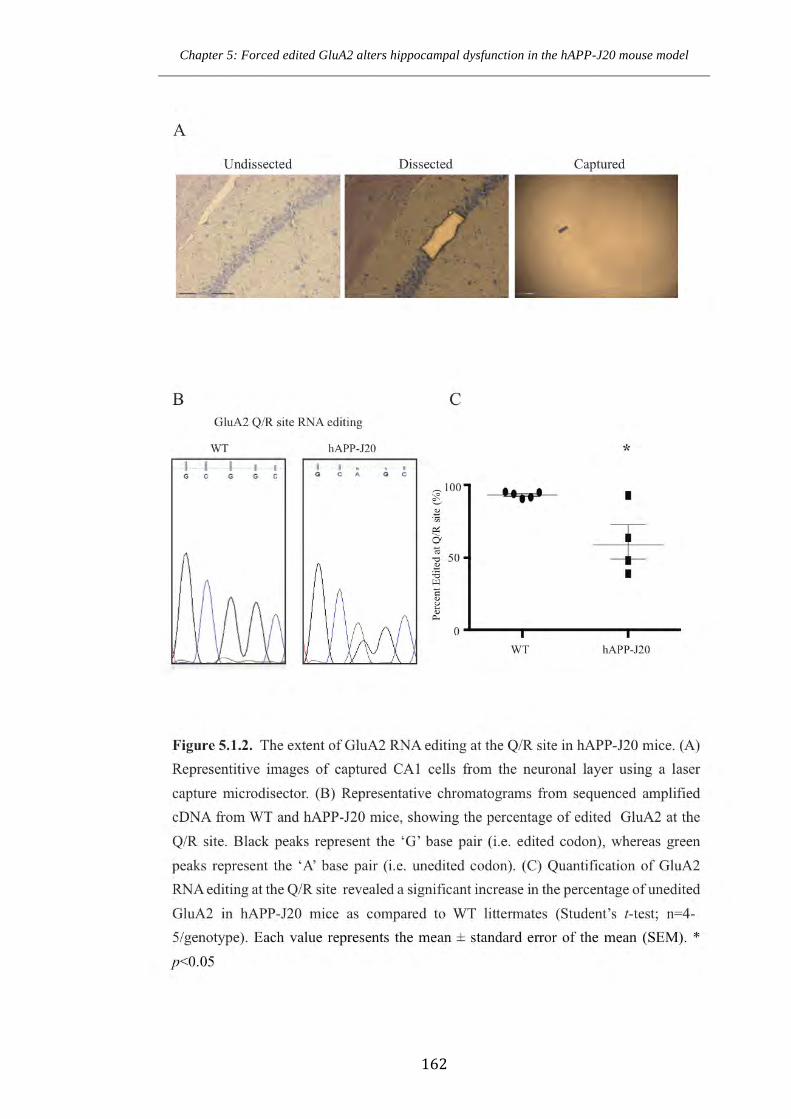
Chapter 5: Forced edited GluA2 alters hippocampal dysfunction in the hAPP-J20 mouse model ___________________________________________________________________________________
162
Chapter 5: Forced edited GluA2 alters hippocampal dysfunction in the hAPP-J20 mouse model ___________________________________________________________________________________
163
WT hAPP-J20
ADAR2
`-tubulin
A
0
0.1
0.2
0.3
0.4
0.5
0.6
0.7
0.8
0.9
1
WT hAPP-J20
Rel
ativ
e ex
pres
sion
nor
mal
ised
to `
-tubu
lin
Figure 5.1.3. ADAR2 expression of WT and hAPP-J20 mice. (A) Expression of ADAR2 and ̀ -tubulin (loading control) in hippocampal homogenates of WT and hAPP-J20 mice. (B) Quantification revealed no differences in ADAR2 expression in hAPP-J20 mice as compared to WT littermates (Student’s t-test; n=6/genotype). Each value represents the mean ± standard error of the mean (SEM).
Chapter 5: Forced edited GluA2 alters hippocampal dysfunction in the hAPP-J20 mouse model ___________________________________________________________________________________
164
5.2 Generation and confirmation of the mutation at the Q/R site in GluA2R/R mice
Next, we sought to determine if blocking unedited GluA2 in the hAPP-J20 mouse
model could improve hippocampal function, by crossing this line with a line that
express only edited GluA2.
To generate mice that only express edited GluA2, Dr. Bryce Vissel and colleagues
developed the mice by replacing the adenosine with a guanine within exon 11 of Gria2
at the Q/R editing site (Figure 5.2Ai). This single base pair mutation resulted in an
alteration from a glutamine codon (CAG) to an arginine codon (CGG). These mice are
termed the GluA2R/R mice. The construct further contained a neomycin gene flanked by
loxP sites downstream of the ECS (Figure 5.2A(ii)). This construct was injected into
embryonic stem cells. Neomycin resistant embryonic stem cells were electroporated
with the Cre-recombinase plasmid to excise the neomycin gene. A single loxP site
remained downstream of the ECS in intron 11 of Gria2 (Figure 5.2A(iii)). Correctly
engineered embryonic stem cells were injected into blastocysts to create the GluA2R/R
mice.
In order to confirm the single point mutation, genomic DNA from homozygous
GluA2R/R mice and WT littermates was sequenced. DNA was extracted from tail
biopsies and subjected to PCR with primers surrounding the Q/R editing site in exon 11
of Gria2. Sequencing confirmed a guanine residual at the Q/R site of GluA2R/R mice,
where an adenine occurs in WT littermates (Figure 5.2B).
To discriminate between homozygous, heterozygous and WT mice, DNA was extracted
from tail biopsies. PCR amplification was performed with specific primers recognising
the GluA2 sequence as well as primers around the residual intronic LoxP sequence.
Following PCR amplification, the products were separated by gel electrophoresis. This
resulted in one band at 200bp for the WT genotype, two bands at 200bp and 250bp for
the heterozygous genotype and one band at 250bp for the homozygous genotype (Figure
5.2C).
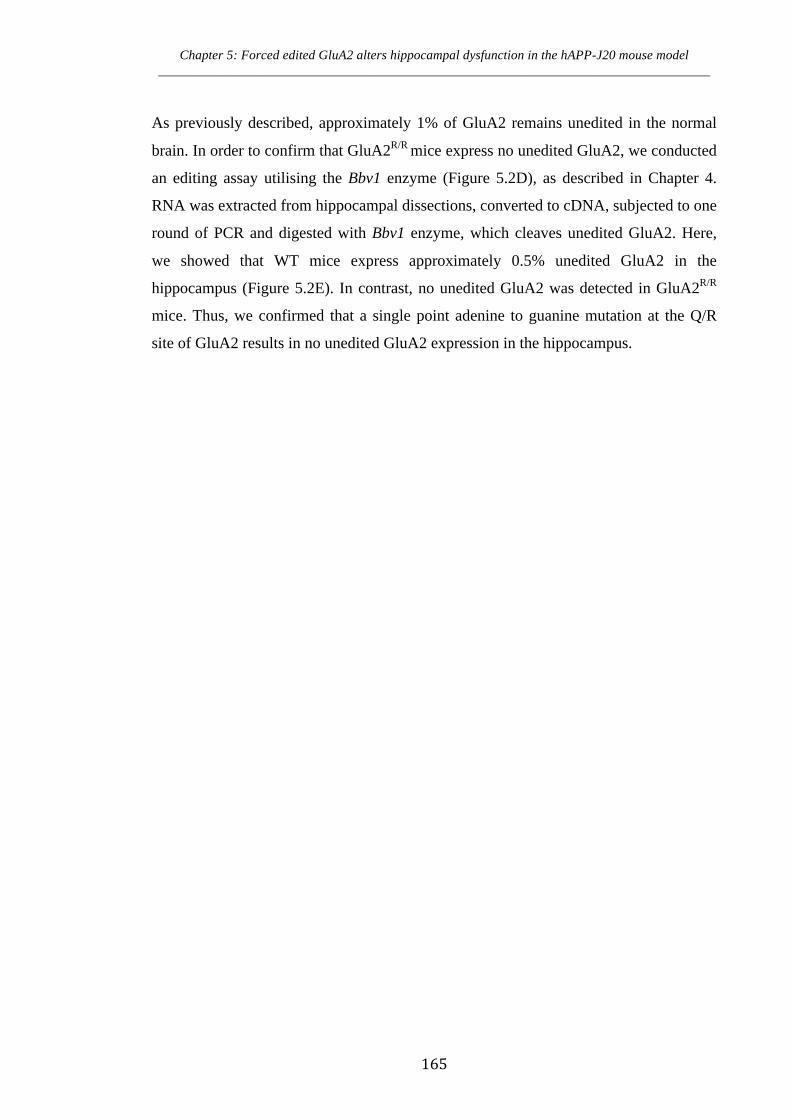
Chapter 5: Forced edited GluA2 alters hippocampal dysfunction in the hAPP-J20 mouse model ___________________________________________________________________________________
165
As previously described, approximately 1% of GluA2 remains unedited in the normal
brain. In order to confirm that GluA2R/R mice express no unedited GluA2, we conducted
an editing assay utilising the Bbv1 enzyme (Figure 5.2D), as described in Chapter 4.
RNA was extracted from hippocampal dissections, converted to cDNA, subjected to one
round of PCR and digested with Bbv1 enzyme, which cleaves unedited GluA2. Here,
we showed that WT mice express approximately 0.5% unedited GluA2 in the
hippocampus (Figure 5.2E). In contrast, no unedited GluA2 was detected in GluA2R/R
mice. Thus, we confirmed that a single point adenine to guanine mutation at the Q/R
site of GluA2 results in no unedited GluA2 expression in the hippocampus.
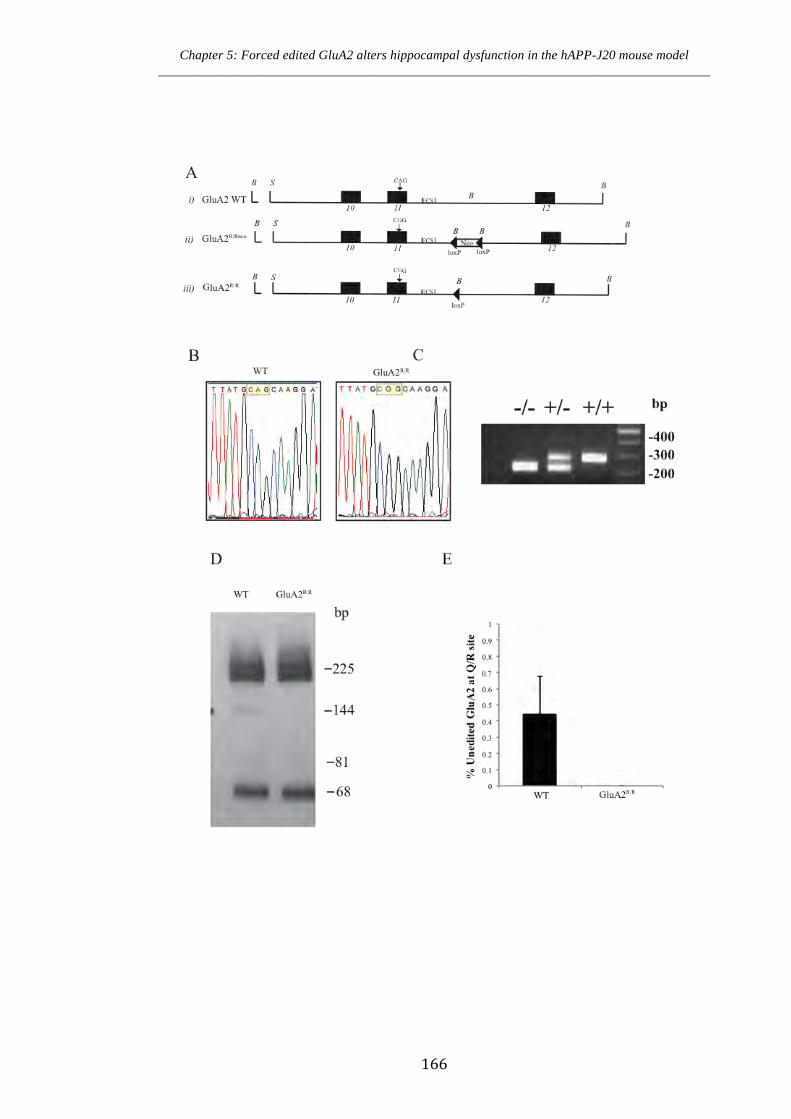
Chapter 5: Forced edited GluA2 alters hippocampal dysfunction in the hAPP-J20 mouse model ___________________________________________________________________________________
166

Chapter 5: Forced edited GluA2 alters hippocampal dysfunction in the hAPP-J20 mouse model ___________________________________________________________________________________
167
Figure 5.2. Generation of the GluA2R/R
mice. (A) Schematic representation of the i) GluA2 WT allele, ii) targeted GluA2
R/Rneo allele and iii) the targeted GluA2
R/R allele, after
the removal of the floxed neo cassette by Cre-mediated recombination. Exons 10, 11 and
12 are shown (black boxes). LoxP sites are indicated by black arrows; these contain
BamHI restriction site. The position of the arginine to guanine mutation within intron 11
is indicated. (B) Sequencing of genomic DNA confirmed a codon for arginine (CGG) at
the Q/R site in GluA2R/R
mice, where WT mice express a glutamine (CAG) codon. (C)
Genotype analysis by PCR amplification detects WT, heterozygous and homozygous
mice for the GluA2 edited allele. (D) PCR product digestions with the Bbv1 enzyme in
WT and GluA2R/R
mice. (E) Analysis of Bbv1 digestion of WT mice revealed approxi-
mately 0.5% unedited GluA2 at the Q/R site, though no unedited GluA2 in GluA2R/R
mice
(n=3/genotype).
Chapter 5: Forced Edited GluA2 alters hippocampal dysfunction in the hAPP-J20 mouse model___________________________________________________________________________________
Chapter 5: Forced edited GluA2 alters hippocampal dysfunction in the hAPP-J20 mouse model ___________________________________________________________________________________
168
5.3 AMPA receptor subunits expression is unaltered in hAPP-J20 mice and mice
expressing force edited GluA2.
Previous studies have indicated a down regulation of AMPA receptor expression in AD
mouse models and patients (Ikonomovic et al 1997, Ikonomovic et al 1995). As AMPA
receptors are important for synaptic plasticity, we aimed to determine if the modulation
of GluA2 RNA editing could alter the expression of AMPA receptor subunits within the
hippocampus. In order to examine AMPA receptor subunit expression, hippocampi
from WT/WT, GluA2R/R/WT, WT/hAPP-J20 and GluA2R/R/hAPP-J20 at 44 weeks of
age were isolated. Tissue was homogenised and immunoblotted with antibodies specific
for GluA1, GluA2 and GluA3 (Figure 5.3A). A one-way ANOVA revealed no
significant differences of GluA1 (F(3,19)=0.282 p=0.8376), GluA2 (F(3,19)=0.7435
p=0.541) and GluA3 (F(3,19)=0.5792 p=0.635) between each genotype (Figure 5.3B).
Thus, total AMPA receptor subunit expression is not altered in the hAPP-J20 mouse
model. Further, the forced expression of edited GluA2 at the Q/R site does not modify
AMPA receptor subunit expression.

Chapter 5: Forced edited GluA2 alters hippocampal dysfunction in the hAPP-J20 mouse model ___________________________________________________________________________________
169
GluA2
GluA1
GluA3
`-tubulin
Figure 5.3. AMPA receptor subunit expression in forced GluA2 edited hAPP-J20 mice.
(A) Expression of GluA1, GluA2, GluA3 and ̀ -tubulin (loading control) in hippocampal
homogenates of WT/WT, GluA2R/R/WT, WT/hAPP-J20 and GluA2R/R/hAPP-J20 mice.
(B) Quantification revealed no differences in GluA1, GluA2 and GluA3 expression
between each genotype (One-Way ANOVA; n=6/genotype). Each value represents the
mean ± standard error of the mean (SEM).
A
B
WT/WT GluA2R/R/WT GluA2R/R/hAPP-J20 WT/hAPP-J20
0
0.2
0.4
0.6
0.8
1
1.2
GluR1 GluR2 GluR3
Rel
ativ
e ex
pres
sion
nor
mal
ised
to `
-tubu
lin
WT/WT
GluA2R/R/WT
WT/hAPP-J20
GluA2R/R/hAPP-J20
Chapter 5: Forced edited GluA2 alters hippocampal dysfunction in the hAPP-J20 mouse model ___________________________________________________________________________________
170
5.4 AMPA receptor complexes are unaltered in hAPP-J20 mice and mice
expressing force edited GluA2.
The relative amounts of heteromeric and homomeric AMPA receptors available for
addition into the synapse have direct effects on functional synaptic plasticity (Sans et al
2003, Wenthold et al 1996). Here we aimed to investigate firstly, if AMPA receptor
subunit expression is altered as a result of forced edited GluA2. Secondly, we aimed to
determine if AMPA receptor complexes were modulated in the hAPP-J20 mouse and/or
altered by the expression of forced edited GluA2.
Previously, studies have shown that GluA2/3 immunoreactivity is down regulated in
post-mortem AD patients (Ikonomovic et al 1997, Ikonomovic et al 1995), however, the
formation of AMPA receptor complexes has not been extensively studied in AD.
Furthermore, it is unknown if the expression of forced edited the GluA2 at the Q/R site
alters AMPA receptor formations. Thus, to investigate alteration to AMPA receptor
subunits, we employed the co-immunoprecipitation assay described by others (Conrad
et al 2008, Reimers et al 2011, Sans et al 2003) and established in section 4.8.
Hippocampal dissections from 44-week-old WT/WT, GluA2R/R/WT, WT/hAPP-J20 and
GluA2R/R/hAPP-J20 mice were solubilised with Triton X-100 and subjected to co-
immunoprecipitations with GluA1, GluA2, GluA2/3, GluA4, GluA1+2/3 and
GluA2/3+4 antibodies and IgG control antibodies (Figure 5.4). A standard curve was
formulated with the IgG control co-immunoprecipitation, by diluting this sample to 5%,
25%, 75% and 100% of the total sample, with the homogenising buffer. The unbound
fraction was analysed for the percentage remaining after the co-immunoprecipitation,
when blotted with antibodies against GluA1, GluA2, GluA2/3 and GluA3.
Our results indicated no alteration to AMPA composition in mice expressing forced
edited GluA2. Most importantly, the GluA2 presence within the receptor was not
altered in GluA2R/R/WT, as compared to WT/WT littermate controls (Figure 5.4). This
was determined as; firstly, immunoprecipitation of GluA1 resulted in 55±7% and
47±7% GluA2 remaining in the WT/WT and GluA2R/R/WT mice, respectively.
Secondly, immunoprecipitation of GluA1 resulted in 61±5% and 53±7% remaining,
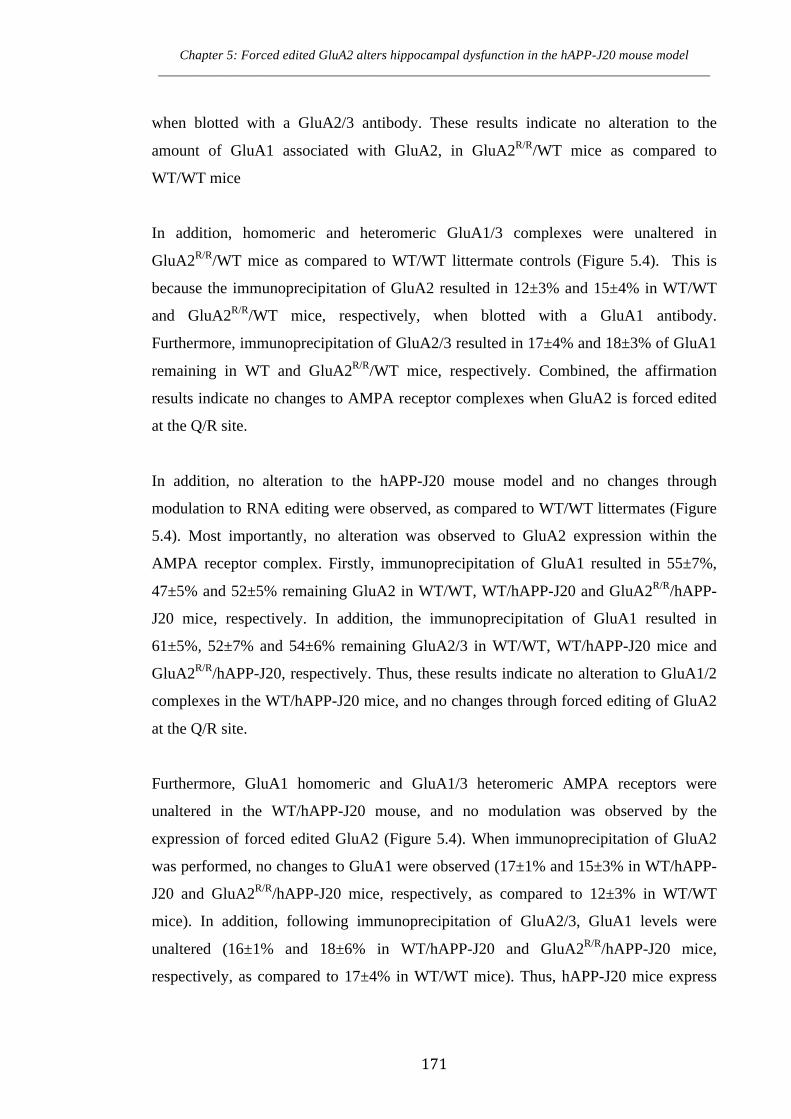
Chapter 5: Forced edited GluA2 alters hippocampal dysfunction in the hAPP-J20 mouse model ___________________________________________________________________________________
171
when blotted with a GluA2/3 antibody. These results indicate no alteration to the
amount of GluA1 associated with GluA2, in GluA2R/R/WT mice as compared to
WT/WT mice
In addition, homomeric and heteromeric GluA1/3 complexes were unaltered in
GluA2R/R/WT mice as compared to WT/WT littermate controls (Figure 5.4). This is
because the immunoprecipitation of GluA2 resulted in 12±3% and 15±4% in WT/WT
and GluA2R/R/WT mice, respectively, when blotted with a GluA1 antibody.
Furthermore, immunoprecipitation of GluA2/3 resulted in 17±4% and 18±3% of GluA1
remaining in WT and GluA2R/R/WT mice, respectively. Combined, the affirmation
results indicate no changes to AMPA receptor complexes when GluA2 is forced edited
at the Q/R site.
In addition, no alteration to the hAPP-J20 mouse model and no changes through
modulation to RNA editing were observed, as compared to WT/WT littermates (Figure
5.4). Most importantly, no alteration was observed to GluA2 expression within the
AMPA receptor complex. Firstly, immunoprecipitation of GluA1 resulted in 55±7%,
47±5% and 52±5% remaining GluA2 in WT/WT, WT/hAPP-J20 and GluA2R/R/hAPP-
J20 mice, respectively. In addition, the immunoprecipitation of GluA1 resulted in
61±5%, 52±7% and 54±6% remaining GluA2/3 in WT/WT, WT/hAPP-J20 mice and
GluA2R/R/hAPP-J20, respectively. Thus, these results indicate no alteration to GluA1/2
complexes in the WT/hAPP-J20 mice, and no changes through forced editing of GluA2
at the Q/R site.
Furthermore, GluA1 homomeric and GluA1/3 heteromeric AMPA receptors were
unaltered in the WT/hAPP-J20 mouse, and no modulation was observed by the
expression of forced edited GluA2 (Figure 5.4). When immunoprecipitation of GluA2
was performed, no changes to GluA1 were observed (17±1% and 15±3% in WT/hAPP-
J20 and GluA2R/R/hAPP-J20 mice, respectively, as compared to 12±3% in WT/WT
mice). In addition, following immunoprecipitation of GluA2/3, GluA1 levels were
unaltered (16±1% and 18±6% in WT/hAPP-J20 and GluA2R/R/hAPP-J20 mice,
respectively, as compared to 17±4% in WT/WT mice). Thus, hAPP-J20 mice express

Chapter 5: Forced edited GluA2 alters hippocampal dysfunction in the hAPP-J20 mouse model ___________________________________________________________________________________
172
normal AMPA receptor composition at 44 weeks of age, and this is unaffected by
forced edited GluA2 expression.
Combined these results indicate that AMPA receptor complexes are unaltered through
the expression of forced edited GluA2 with normal expression of GluA2 containing
receptors. In addition, AMPA receptor complexes remain unchanged in the hAPP-J20
mouse model of AD.
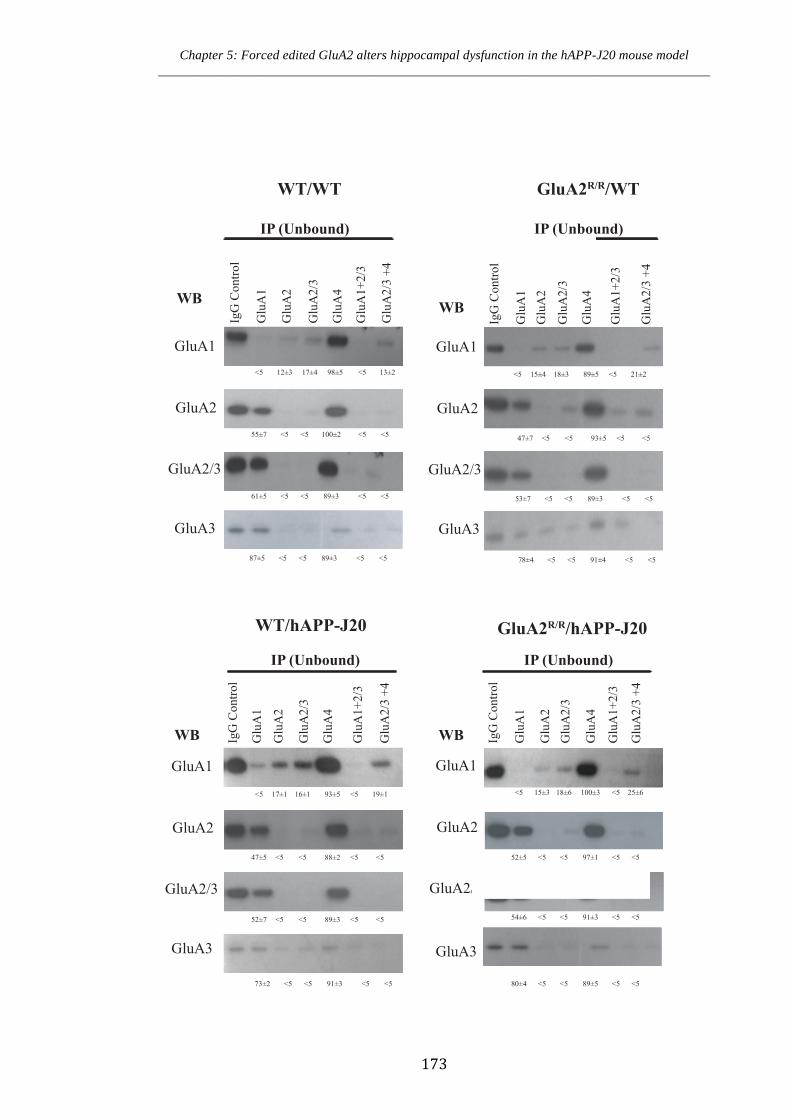
Chapter 5: Forced edited GluA2 alters hippocampal dysfunction in the hAPP-J20 mouse model ___________________________________________________________________________________
173
GluA1
GluA2
GluA2/3
GluA3
Glu
A1
Glu
A2
Glu
A2/
3
Glu
A4
IgG
Con
trol
Glu
A1+
2/3
Glu
A2/
3 +4
GluA1
GluA2
GluA2/3
GluA3G
luA
1G
luA
2
Glu
A2/
3
Glu
A4
IgG
Con
trol
Glu
A1+
2/3
Glu
A2/
3 +4
Glu
A1
Glu
A2
Glu
A2/
3
Glu
A4
IgG
Con
trol
Glu
A1+
2/3
Glu
A2/
3 +4
Glu
A1
Glu
A2
Glu
A2/
3
Glu
A4
IgG
Con
trol
Glu
A1+
2/3
Glu
A2/
3 +4
GluA1
GluA2
GluA2/3
GluA3
GluA1
GluA2
GluA2/3
GluA3
WB
IP (Unbound)
WB
WB WB
WT/WT GluA2R/R/WT
WT/hAPP-J20 GluA2R/R/hAPP-J20
12±3 17±4 98±5 13±2
55±7 100±2
61±5 89±3
17±1 16±1 93±5 19±1
47±5 88±2
89±3 52±7
<5 <5
<5 <5 <5 <5
<5 <5 <5 <5
<5 <5
<5 <5 <5 <5
<5 <5 <5 <5
<5 <5 15±3 18±6 100±3 25±6
52±5 97±1 <5 <5 <5 <5
54±6 91±3 <5 <5 <5 <5
15±4 18±3 89±5 21±2 <5 <5
47±7 93±5 <5 <5 <5 <5
53±7 89±3 <5 <5 <5 <5
87±5 89±3 <5 <5 <5 <5 78±4 91±4 <5 <5 <5 <5
73±2 91±3 <5 <5 <5 <5 80±4 89±5 <5 <5 <5 <5
IP (Unbound)
IP (Unbound) IP (Unbound)
Chapter 5: Forced edited GluA2 alters hippocampal dysfunction in the hAPP-J20 mouse model ___________________________________________________________________________________
174
Figure 5.4. Co-immunoprecipitation of AMPA receptor subunits in WT/WT, GluA2R/R/WT, WT/hAPP-J20 and GluA2R/R/hAPP-J20 mice. The AMPA receptor subunit antibodies used for immunoprecipitation are shown in the top pannels, and the antibodies used for immunoblotting are shown in the side panels. The first lane represents 100% of the IgG control. These results indicate no alteration to AMPA receptor complexes between WT/WT, GluA2R/R/WT, WT/hAPP-J20 and GluA2R/R/hAPP-J20 mice (n=3/genotype).
Chapter 5: Forced edited GluA2 alters hippocampal dysfunction in the hAPP-J20 mouse model ___________________________________________________________________________________
175
5.5 AMPA receptor surface and intracellular expression is unchanged in hAPP-
J20 mice and mice expressing force edited GluA2.
The surface expression of AMPA receptors are largely uncharacterised in AD mouse
models. Further, it is unknown how the expression of forced edited GluA2 at the Q/R
site effects surface expression of AMPA receptors. In order to determine if synaptic
GluA1 and GluA2 expression is altered in the hAPP-J20 mouse model of AD, and if
this is changed by the forced expression of GluA2 at the Q/R site, we performed a BS3
crosslinking assay, as described in Chapter 4.5. Brains from 44-week-old WT/WT,
GluA2R/R/WT, WT/hAPP-J20 and GluA2R/R/hAPP-J20 mice were subjected to the BS3
crosslinking assay and probed for GluA1 (Figure 5.5.1A). A one-way ANOVA revealed
no alteration of GluA1 surface to intracellular ratio (F(3,12)=0.044 p=0.987).
Furthermore, the total surface (F(3,12)=0.582 p=0.638), total intracellular (F(3,12)=1.771
p=0.206) and total expression (F(3,12)=0.998 p=0.427) of GluA1 was unaltered between
genotypes (Figure 5.5.1B). This indicates that GluA1 expression at the synapse is not
changed in the hAPP-J20 mouse model, and further, forced edited GluA2 does not
modulate this phenomena.
The expression of GluA2 at the surface is required to maintain Ca2+-impermeable
AMPA receptors. We aimed to determine if GluA2 expression at the surface is altered
in the hAPP-J20 mouse model expressing forced edited GluA2 (Figure 5.5.2A;
F(3,12)=0.134 p=0.937). A one-way ANOVA revealed no alteration to GluA2 surface to
intracellular ratio between all genotypes (Figure 5.5.2B). In addition, the total surface
(F(3,12)=3.276 p=0.059), total intracellular (F(3,12)=0.201 p=0.894), and total expression
of GluA2 (F(3,12)=0.762 p=0.5386) was not significantly altered between WT/WT,
GluA2R/R/WT, WT/hAPP-J20 and GluA2R/R/hAPP-J20 mice. Thus, GluA2 expression
at the surface is not altered in the hAPP-J20 mouse model and is not modulated by
forced expression of GluA2 at the Q/R site.

Chapter 5: Forced edited GluA2 alters hippocampal dysfunction in the hAPP-J20 mouse model ___________________________________________________________________________________
176
Synaptic
Intracellular
GluA1
B
`-tubulin
WT/WT GluA2R/R/WT GluA2R/R/hAPP-J20 WT/hAPP-J20
Figure 5.5.1. Surface, intracellular and total GluA1 expression in forced edited hAPP-
J20 mice. (A) Crosslinking assays were performed on hippocampal dissections from
WT/WT, GluA2R/R/WT, WT/hAP-J20 and GluA2R/R/hAPP-J20 mice and probed with a
GluA1 specific antibody. Membranes were stripped and reprobed for `-tubulin (loading
control). (B) Quantification of GluA1 revealed no significant changes in expression
patterns between all genotypes in surface to intracellular ratio, total surface, total intra-
cellular and total GluA1 protein (One-Way ANOVA; n=6/genotype). Values are
expressed as a percentage of WT ratios. Each value represents the mean ± standard error
of the mean (SEM).
0
0.5
1
1.5
2
2.5
Surf
ace/
Tota
l exp
ress
ion
as %
of W
T
0
0.2
0.4
0.6
0.8
1
1.2
1.4
1.6
1.8
2
Tota
l Int
race
llula
r ex
pres
sion
as %
of W
T
0
0.2
0.4
0.6
0.8
1
1.2
1.4
Tota
l Glu
A1
expr
essi
on a
s % o
f WT
0
0.2
0.4
0.6
0.8
1
1.2
1.4
1.6
surf
ace/
intr
acel
lula
r ex
pres
sion
as %
of W
T
WT/WT GluA2R/R/WT WT./hAPP-J20 GluA2R/R/hA-PP-J20 WT/WT GluA2R/R/WT WT./hAPP-J20 GluA2R/R/hA-PP-J20
WT/WT GluA2R/R/WT WT./hAPP-J20 GluA2R/R/hA-PP-J20 WT/WT GluA2R/R/WT WT./hAPP-J20 GluA2R/R/hA-PP-J20

Chapter 5: Forced edited GluA2 alters hippocampal dysfunction in the hAPP-J20 mouse model ___________________________________________________________________________________
177
Synaptic
Intracellular
GluA2
B
`-tubulin
0
0.2
0.4
0.6
0.8
1
1.2
1.4
WT/WT GluA2R/R/WT WT./hAPP-J20 GluA2R/R/hA-PP-J20 Surf
ace/
Tota
l exp
ress
ion
as %
of W
T
0
0.2
0.4
0.6
0.8
1
1.2
Tota
l Sur
face
expr
essio
n as
% o
f WT
0
0.2
0.4
0.6
0.8
1
1.2
Tota
l Int
race
llula
r exp
ress
ion
as %
of W
T
0
0.2
0.4
0.6
0.8
1
1.2
1.4
Tota
l Glu
A1 ex
pres
sion
as %
of W
T
WT/WT GluA2R/R/WT WT./hAPP-J20 GluA2R/R/hA-PP-J20
WT/WT GluA2R/R/WT WT./hAPP-J20 GluA2R/R/hA-PP-J20 WT/WT GluA2R/R/WT WT./hAPP-J20 GluA2R/R/hA-PP-J20
WT/WT GluA2R/R/WT GluA2R/R/hAPP-J20 WT/hAPP-J20
Figure 5.5.2. Surface, intracellular and total expression GluA2 in forced edited hAPP-
J20 mice. (A) Crosslinking assays were performed on hippocampal dissections from
WT/WT, GluA2R/R/WT, WT/hAP-J20 and GluA2R/R/hAPP-J20 mice and probed with a
GluA2 specific antibody. Membranes were stripped and reprobed for `-tubulin (loading
control). (B) Quantification of GluA2 revealed no significant changes in expression
patterns between all genotypes in surface to intracellular ratio, total surface, total intra-
cellular and total GluA2 protein (One-Way ANOVA; n=6/genotype). Values are
expressed as a percentage of WT ratios. Each value represents the mean ± standard error
of the mean (SEM).

Chapter 5: Forced edited GluA2 alters hippocampal dysfunction in the hAPP-J20 mouse model ___________________________________________________________________________________
178
5.6 Phenotypic characterisation of GluA2R/R and GluA2R/R/hAPP-J20 mice
As described in Chapter 3, hAPP-J20 mice exhibit lower body weights than WT
littermates at 24 weeks of age. In order to assess if forced edited GluA2 alters body
weight, WT/WT, GluA2R/R/WT, WT/hAPP-J20 and GluA2R/R/hAPP-J20 mice were
assessed at 24 weeks of age (Figure 5.6). A one-way ANOVA revealed significant
differences between genotypes (F(3,117)=7.178, p<0.001). Post hoc analysis with
Bonferroni corrections revealed no significant differences between WT/WT and
GluA2R/R/WT mice, indicating no physiological effect through modulation to the RNA
editing. In contrast, a significant difference occurred between WT/hAPP-J20 and
WT/WT (p<0.01) and GluA2R/R /WT (p<0.01) mice. In addition GluA2R/R/hAPP-J20
mice exhibited significantly less body weight as compared to WT/WT (p<0.01) and
GluA2R/R/WT (p<0.05) mice. No significant difference was detected between
WT/hAPP-J20 and GluA2R/R/hAPP-J20 mice. Thus, the expression of forced edited
GluA2 does not regain normal body weight in the hAPP-J20 mouse model of AD.

Chapter 5: Forced edited GluA2 alters hippocampal dysfunction in the hAPP-J20 mouse model ___________________________________________________________________________________
179
25.00
26.00
27.00
28.00
29.00
30.00
31.00
Bod
y W
eigh
t (gr
ams)
WT/WT GluA2R/R/WT WT/hAPP-J20 GluA2R/R/hAPP-J20
**
**
**
*
Figure 5.6. Body weight analysis of forced edited hAPP-J20 mice. WT/hAPP-J20 and
GluA2R/R/hAPP-J20 mice exhibited decreased body weight, as compated to WT/WT and
GluA2R/R/WT mice (One-Way ANOVA; n=26-34/genotype). Each value represents the
mean ± standard error of the mean (SEM). *p<0.05, **p<0.01
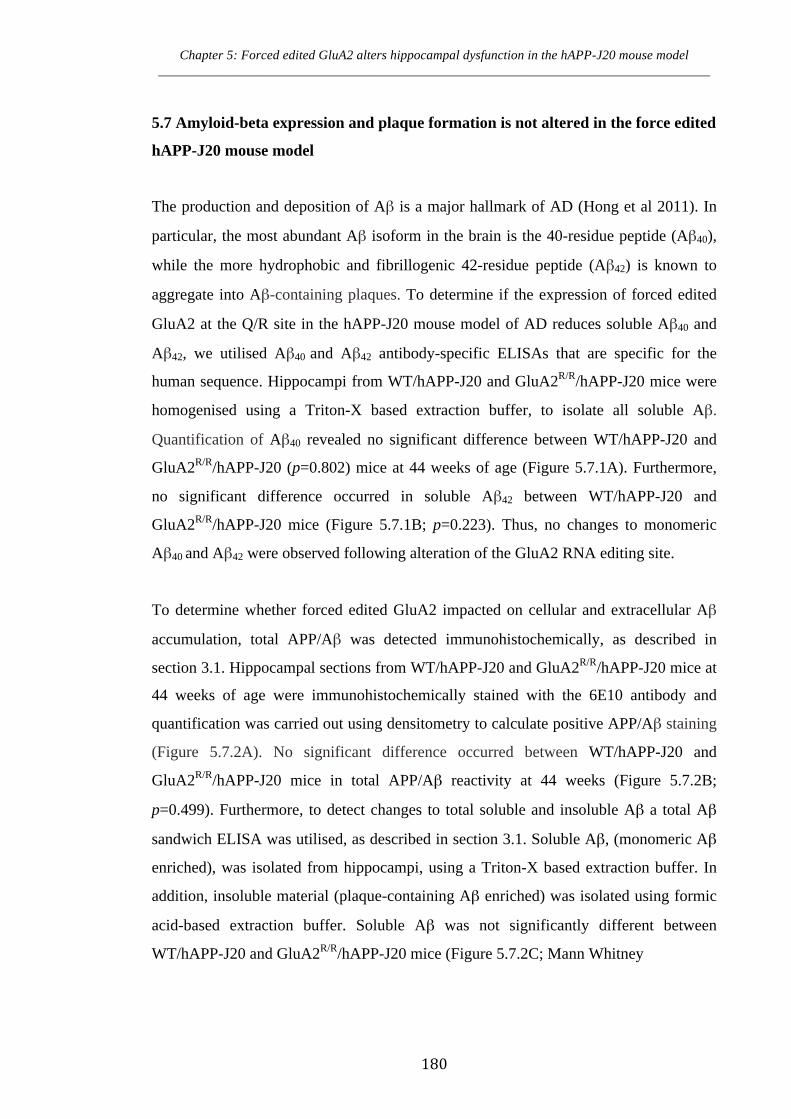
Chapter 5: Forced edited GluA2 alters hippocampal dysfunction in the hAPP-J20 mouse model ___________________________________________________________________________________
180
5.7 Amyloid-beta expression and plaque formation is not altered in the force edited
hAPP-J20 mouse model
The production and deposition of Aβ is a major hallmark of AD (Hong et al 2011). In
particular, the most abundant Aβ isoform in the brain is the 40-residue peptide (Aβ40),
while the more hydrophobic and fibrillogenic 42-residue peptide (Aβ42) is known to
aggregate into Aβ-containing plaques. To determine if the expression of forced edited
GluA2 at the Q/R site in the hAPP-J20 mouse model of AD reduces soluble Aβ40 and
Aβ42, we utilised Aβ40 and Aβ42 antibody-specific ELISAs that are specific for the
human sequence. Hippocampi from WT/hAPP-J20 and GluA2R/R/hAPP-J20 mice were
homogenised using a Triton-X based extraction buffer, to isolate all soluble Aβ.
Quantification of Aβ40 revealed no significant difference between WT/hAPP-J20 and
GluA2R/R/hAPP-J20 (p=0.802) mice at 44 weeks of age (Figure 5.7.1A). Furthermore,
no significant difference occurred in soluble Aβ42 between WT/hAPP-J20 and
GluA2R/R/hAPP-J20 mice (Figure 5.7.1B; p=0.223). Thus, no changes to monomeric
Aβ40 and Aβ42 were observed following alteration of the GluA2 RNA editing site.
To determine whether forced edited GluA2 impacted on cellular and extracellular Aβ
accumulation, total APP/Aβ was detected immunohistochemically, as described in
section 3.1. Hippocampal sections from WT/hAPP-J20 and GluA2R/R/hAPP-J20 mice at
44 weeks of age were immunohistochemically stained with the 6E10 antibody and
quantification was carried out using densitometry to calculate positive APP/Aβ staining
(Figure 5.7.2A). No significant difference occurred between WT/hAPP-J20 and
GluA2R/R/hAPP-J20 mice in total APP/Aβ reactivity at 44 weeks (Figure 5.7.2B;
p=0.499). Furthermore, to detect changes to total soluble and insoluble Aβ a total Aβ
sandwich ELISA was utilised, as described in section 3.1. Soluble Aβ, (monomeric Aβ
enriched), was isolated from hippocampi, using a Triton-X based extraction buffer. In
addition, insoluble material (plaque-containing Aβ enriched) was isolated using formic
acid-based extraction buffer. Soluble Aβ was not significantly different between
WT/hAPP-J20 and GluA2R/R/hAPP-J20 mice (Figure 5.7.2C; Mann Whitney
Chapter 5: Forced edited GluA2 alters hippocampal dysfunction in the hAPP-J20 mouse model ___________________________________________________________________________________
181
0
50
100
150
200
250
Am
yloi
d-`
42 (n
g/m
g pr
otei
n)
0
10
20
30
40
50
60
Am
yloi
d-`
40 (n
g/m
g pr
otei
n)
GluA2R/R/hAPP-J20 WT/hAPP-J20
GluA2R/R/hAPP-J20 WT/hAPP-J20
A
B
Figure 5.7.1 No alteration to A`�40 and 42 expression in hAP-J20 mice expressing forced edited GluA2. (A) Quantification revealed no significant alteration to A`�40 between WT/hAPP-J20 and GluA2R/R/hAPP-J20 mice (Student’s t-test; n=13/genotype). (C) Quantification revealed no significant alteration to A`�42 between WT/hAPP-J20 and GluA2R/R/hAPP-J20 mice (Student’s t-test; n=13/genotype). Each value represents the mean ± standard error of the mean (SEM).
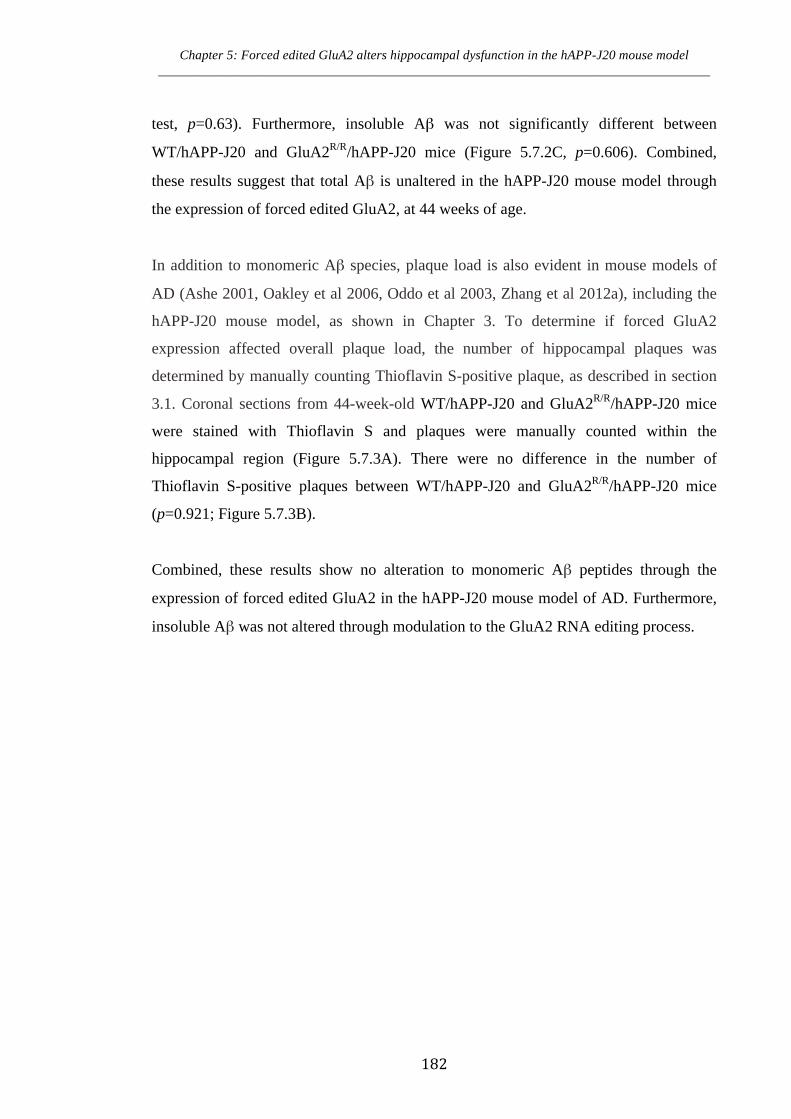
Chapter 5: Forced edited GluA2 alters hippocampal dysfunction in the hAPP-J20 mouse model ___________________________________________________________________________________
182
test, p=0.63). Furthermore, insoluble Aβ was not significantly different between
WT/hAPP-J20 and GluA2R/R/hAPP-J20 mice (Figure 5.7.2C, p=0.606). Combined,
these results suggest that total Aβ is unaltered in the hAPP-J20 mouse model through
the expression of forced edited GluA2, at 44 weeks of age.
In addition to monomeric Aβ species, plaque load is also evident in mouse models of
AD (Ashe 2001, Oakley et al 2006, Oddo et al 2003, Zhang et al 2012a), including the
hAPP-J20 mouse model, as shown in Chapter 3. To determine if forced GluA2
expression affected overall plaque load, the number of hippocampal plaques was
determined by manually counting Thioflavin S-positive plaque, as described in section
3.1. Coronal sections from 44-week-old WT/hAPP-J20 and GluA2R/R/hAPP-J20 mice
were stained with Thioflavin S and plaques were manually counted within the
hippocampal region (Figure 5.7.3A). There were no difference in the number of
Thioflavin S-positive plaques between WT/hAPP-J20 and GluA2R/R/hAPP-J20 mice
(p=0.921; Figure 5.7.3B).
Combined, these results show no alteration to monomeric Aβ peptides through the
expression of forced edited GluA2 in the hAPP-J20 mouse model of AD. Furthermore,
insoluble Aβ was not altered through modulation to the GluA2 RNA editing process.
Chapter 5: Forced edited GluA2 alters hippocampal dysfunction in the hAPP-J20 mouse model ___________________________________________________________________________________
183
0
2
4
6
8
10
12
14
16
18
Tota
l A`
posi
tive
(% o
f Are
a)
0
50
100
150
200
250
Soluble Insoluble
Tota
l A`
(pg/
mg
prot
ein)
WT/hAPP-J20 GluA2R/R/hAPP-J20
GluA2R/R/hAPP-J20 WT/hAPP-J20
WT/hAPP-J20 GluA2R/R/hAPP-J20
Figure 5.7.2 No alteration to total A`�expression in hAPP-J20 mice expressing forced edited GluA2. (A) Representitive images of 6E10-positive staining in WT/hAPP-J20 and GluA2R/R/hAPP-J20 mice. (B) Quantification of 6E10-positive staining revealed no significant alteration to total A`�between WT/hAPP-J20 and GluA2R/R/hAPP-J20 mice (Student’s t-test; n=5/genotype). (C) Soluble and Insolube A` was determined by a total A` ELISA assay. Quantification by ELISA revealed no significant alteration to soluble and insoluble A`�between WT/hAPP-J20 and GluA2R/R/hAPP-J20 mice (Student’s t-test; n=4-5/genotype). Each value represents the mean ± standard error of the mean (SEM).
A
B C
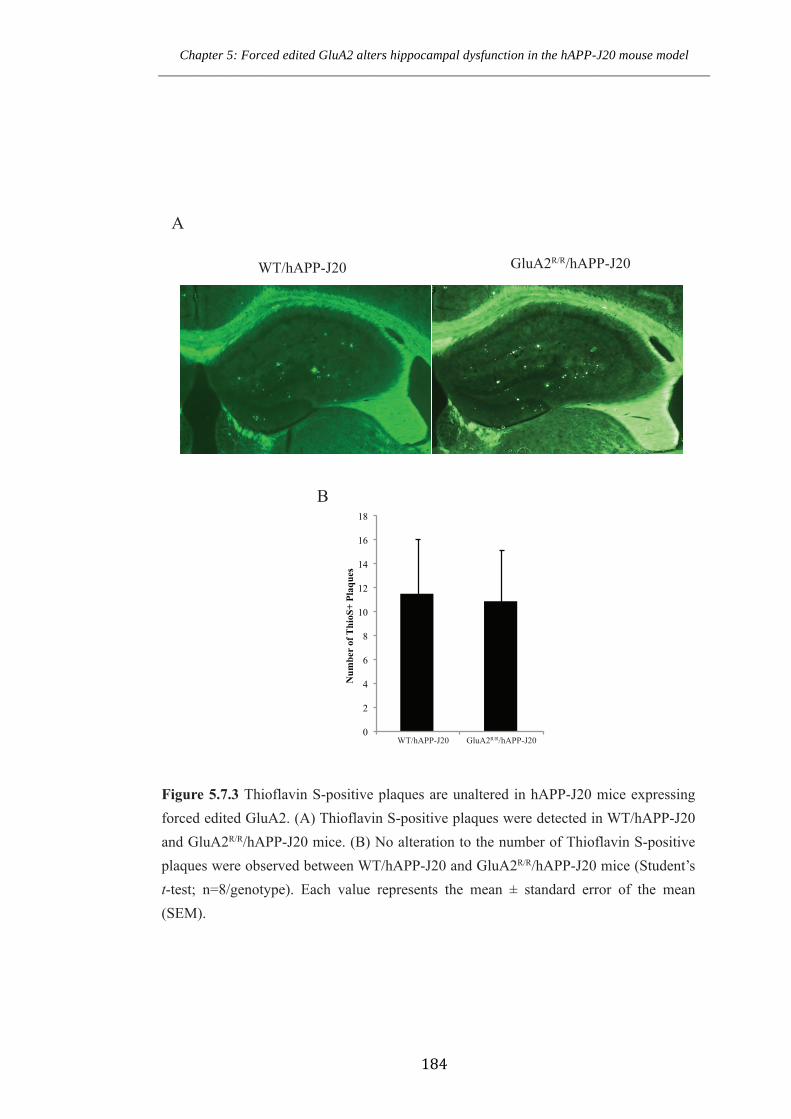
Chapter 5: Forced edited GluA2 alters hippocampal dysfunction in the hAPP-J20 mouse model ___________________________________________________________________________________
184
0
2
4
6
8
10
12
14
16
18
Num
ber
of T
hioS
+ Pl
aque
s
Figure 5.7.3 Thioflavin S-positive plaques are unaltered in hAPP-J20 mice expressing forced edited GluA2. (A) Thioflavin S-positive plaques were detected in WT/hAPP-J20 and GluA2R/R/hAPP-J20 mice. (B) No alteration to the number of Thioflavin S-positive plaques were observed between WT/hAPP-J20 and GluA2R/R/hAPP-J20 mice (Student’s t-test; n=8/genotype). Each value represents the mean ± standard error of the mean (SEM).
WT/hAPP-J20 GluA2R/R/hAPP-J20
WT/hAPP-J20 GluA2R/R/hAPP-J20
A
B

Chapter 5: Forced edited GluA2 alters hippocampal dysfunction in the hAPP-J20 mouse model ___________________________________________________________________________________
185
5.8 The expression of forced GluA2 RNA editing at the Q/R site rescues neuronal
deficits in the hAPP-J20 mouse model.
Neurodegeneration, particularly in the hippocampus, is a major constituent of AD. As
described in Chapter 3, the hAPP-J20 mouse model of AD shows age-dependent
neurodegeneration in the CA1 region of the hippocampus. Here, we aimed to determine
if forced expression of edited GluA2 at the Q/R site could protect against
neurodegeneration in the hAPP-J20 model. We performed stereological quantification
on hippocampal CA3 and CA1 NeuN positive cells in WT/WT, GluA2R/R/WT,
WT/hAPP-J20 and GluA2R/R/hAPP-J20 mice at 44 weeks of age (Figure 5.8A), as
described in section 3.2 and section 4.8.
As expected, no cell loss was apparent in the CA3 region of the hippocampus (Figure
5.8B; F(3,16)=0.457 p=0.716) between all genotypes. In contrast, and most excitingly, a
one-way ANOVA revealed a significant difference between genotypes in the CA1
region at 44 weeks of age (Figure 5.8C; F(3,16)=11.89 p<0.001). Post hoc analysis with
Bonferroni corrections revealed a significant difference between WT/hAPP-J20 mice
and WT/WT (p<0.001), GluA2R/R/WT (p<0.001) and GluA2R/R/hAPP-J20 (p<0.01),
indicating neuronal rescue by the expression of forced edited GluA2 in the hAPP-J20
mouse. No significant differences occurred between WT/WT and GluA2R/R/WT,
indicating that the expression of forced edited GluA2 does not alter neuronal numbers in
the healthy brain. Most importantly, no significant differences occurred between
GluA2R/R/hAPP-J20 and WT/WT and GluA2R/R/WT. Thus, in this study we revealed
that the expression of forced edited GluA2 leads to complete neuroprotection in the
CA1 region of hAPP-J20 mice.
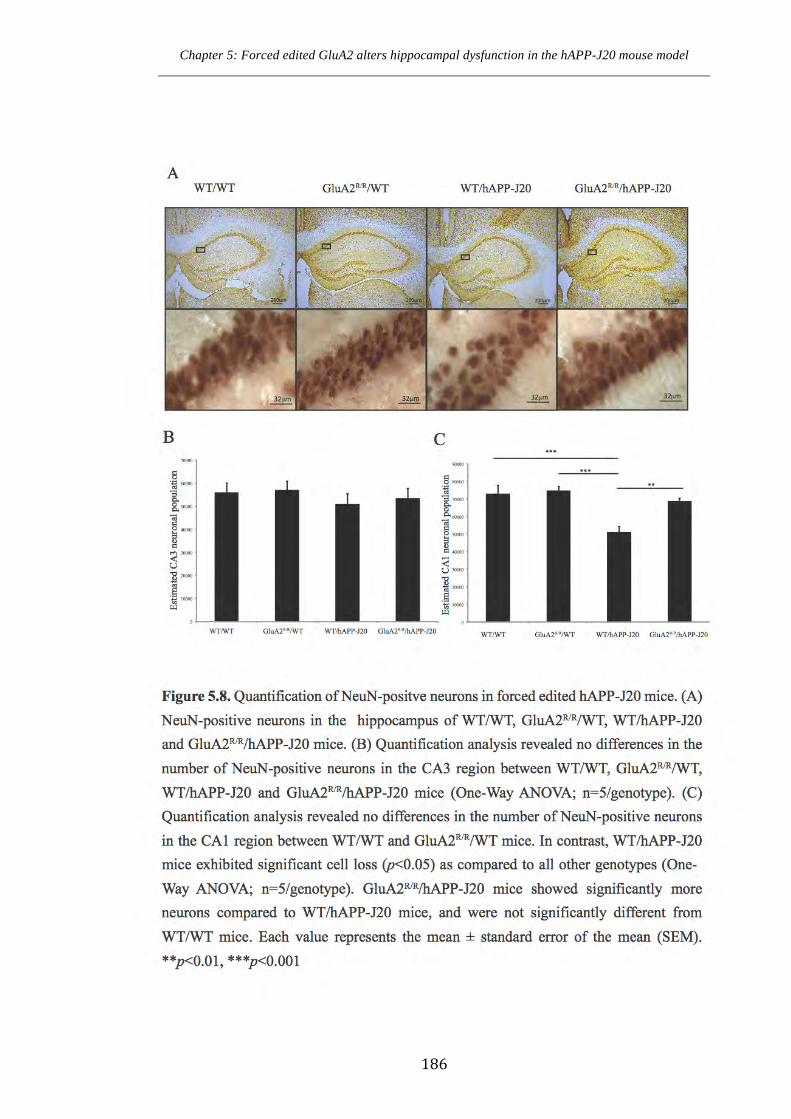
Chapter 5: Forced edited GluA2 alters hippocampal dysfunction in the hAPP-J20 mouse model ___________________________________________________________________________________
186

Chapter 5: Forced edited GluA2 alters hippocampal dysfunction in the hAPP-J20 mouse model ___________________________________________________________________________________
187
5.9 Alteration to dendritic morphology and spine density through the expression of
forced edited GluA2 in the hAPP-J20 mouse model of AD
Reductions to dendritic arborisation and the subsequent decline of postsynaptic surfaces
are early processes in AD hippocampal degeneration (DeKosky & Scheff 1990, Selkoe
2002). Mouse models of AD, such as the Tg2576 mouse model, show decreases to total
dendritic length during disease progression (D'Amelio et al 2011). In this study, we
examined dendritic architecture in the CA1 region of the hippocampus of WT/WT,
GluA2R/R/WT, WT/hAPP-J20 and GluA2R/R/hAPP-J20 mice at 44 weeks of age. We
used Sholl analysis to measure the extent of dendritic branching incrementally from the
cell body. Neurons from Golgi impregnated tissue (Figure 5.9.1A) were manually
traced and analysed at 10 µm increments from the soma. Representative tracings from
WT/WT, GluA2R/R/WT, WT/hAPP-J20 and GluA2R/R/hAPP-J20 mice at 44 weeks of
age are presented in Figure 5.9.1B. Our data indicates a significant decrease in the
number of dendritic intersections in CA1 pyramidal neurons between WT/hAPP-J20
mice as compared to WT/WT and GluA2R/R/WT littermates, at distances of 60-140µm
from the cell body (Figure 5.9.1C). GluA2R/R/hAPP-J20 showed a significant decrease
to the number of intersections at distances of 100-140µm from the cell body, as
compared to WT/WT and GluA2R/R/WT littermates. Importantly, GluA2R/R/hAPP-J20
showed significant increase to the number of intersections from 40-80 µm, as compared
to WT/hAPP-J20 (Figure 5.9.1C), indicating partial rescue of dendritic architecture
through the expression of forced edited GluA2.
Dendritic spines are highly motile structures in which the majority of synapses occur.
An increase to the synaptic strength of neurons is thought to be fundamental to memory
and learning. Synapse loss has been observed in both human patients and mouse models
of AD, and is a major correlate of cognitive function (Selkoe 2002). In this study, we
analysed dendritic spine density in the CA1 hippocampal region in order to determine if
forced edited GluA2 alters postsynaptic elements in the healthy and AD brain. Spines
were manually traced from second order dendritic branches of apical dendrites within
the stratum radiatum of WT/WT, GluA2R/R/WT, WT/hAPP-J20 and GluA2R/R/hAPP-
J20 mice at 44 weeks of age (Figure 5.9.2A). Three dendritic branches per neuron, and
Chapter 5: Forced edited GluA2 alters hippocampal dysfunction in the hAPP-J20 mouse model ___________________________________________________________________________________
188
three neurons per brain were assessed. Spine density was presented as number of spines
per 10µm length. A one-way ANOVA of spine density revealed a significant difference
between genotypes (Figure 5.9.2B; F(3,174)=31.64 p<0.001). Post hoc analysis with
Bonferroni corrections revealed a significant increase of spine density in GluA2R/R/WT
(p<0.01) and GluA2R/R/hAPP-J20 (p<0.01) as compared to WT/WT littermates,
indicating alteration to postsynaptic elements through the expression of forced edited
GluA2 in the healthy brain. Furthermore, WT/hAPP-J20 mice showed a reduction to
spine density as compared to WT/WT (p<0.01), GluA2R/R/WT (p<0.001) and
GluA2R/R/hAPP-J20 (p<0.001), indicating restoration of AD impaired dendritic spines
through modulation to GluA2 RNA editing.
Taken together, these results show that the expression of forced edited GluA2 at the
Q/R site can marginally improve dendritic branching deficiencies in the hAPP-J20
mouse model of AD, and greatly improve reduced spine density in the healthy and
hAPP-J20 brain.
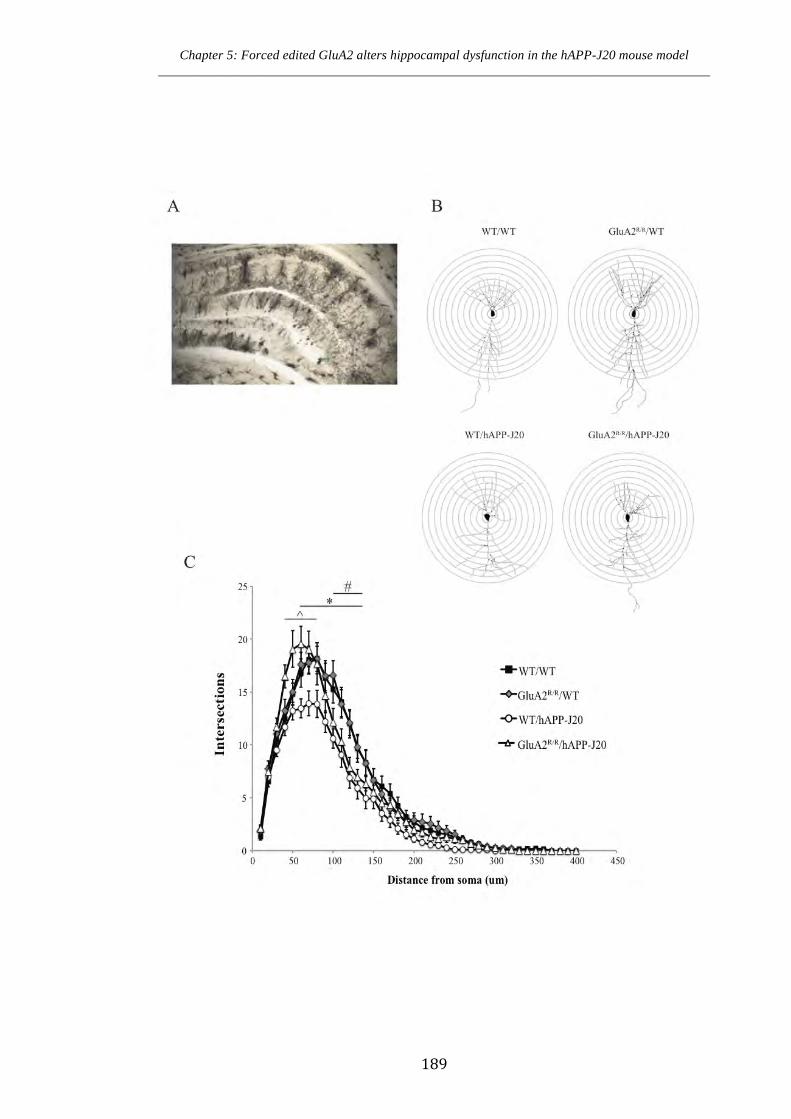
Chapter 5: Forced edited GluA2 alters hippocampal dysfunction in the hAPP-J20 mouse model ___________________________________________________________________________________
189
Chapter 5: Forced edited GluA2 alters hippocampal dysfunction in the hAPP-J20 mouse model ___________________________________________________________________________________
190
Figure 5.9.1 Golgi staining and Sholl analysis of hippocampal CA1 neurons in WT/WT,
GluA2R/R/WT, WT/hAPP-J20 and GluA2R/R/hAPP-J20 mice. (A) Representative image
of Golgi impregnated hippocampal section. (B) Representative traces of CA1 hippocam-
pal neurons from WT/WT, GluA2R/R/WT, WT/hAPP-J20 and GluA2R/R/hAPP-J20 mice.
(B) Number of dendritic intersections in neurons of WT/WT, GluA2R/R/WT, WT/hAPP-
J20 and GluA2R/R/hAPP-J20 mice in relation to distance from the soma revealed
decreases in dendritic intersections in WT/hAPP-J20 mice from 60-140+m, as compared
to WT/WT and GluA2R/R/WT mice. In addition, GluA2R/R/hAPP-J20 mice exhibited
decreased dendritic intersections from 100-140 +m as compared to WT/WT and
GluA2R/R/WT mice. Furthermore, GluA2R/R/hAPP-J20 mice exhibited increased
dendritic intersections from 40-80+m as compared to WT/hAPP-J20 mice (Two-Way
Repeated Measures ANOVA; n=3 neurons/mouse, 5 mice/genotype (15
neurons/genotype)). Each value represents the mean ± standard error of the mean
(SEM). *p<0.05 for WT/hAPP-J20 compared to WT/WT and GluA2R/R/WT mice.
#p<0.05 for GluA2R/R/hAPP-J20 compared to WT/WT and GluA2R/R/WT mice. ^p<0.05
for GluA2R/R/hAPP-J20 compared to hAPP-J20 mice
Chapter 5: Forced Edited GluA2 alters hippocampal dysfunction in the hAPP-J20 mouse model___________________________________________________________________________________
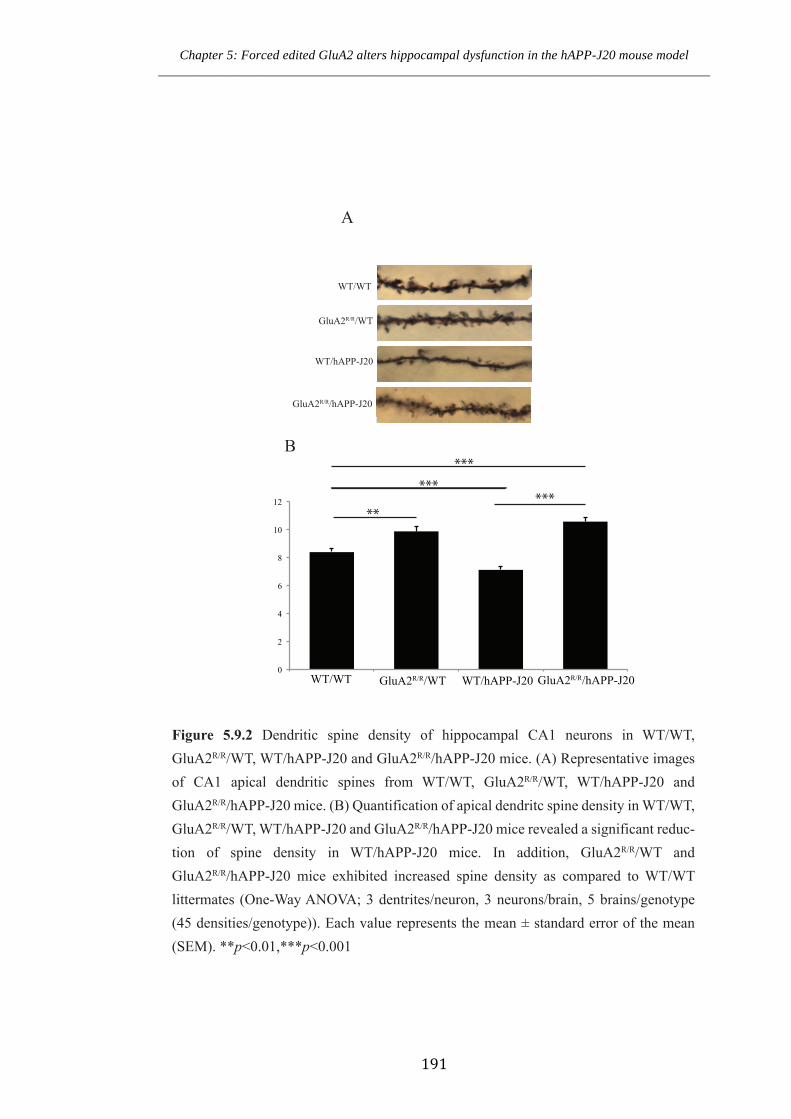
Chapter 5: Forced edited GluA2 alters hippocampal dysfunction in the hAPP-J20 mouse model ___________________________________________________________________________________
191
WT/WT
WT/hAPP-J20
GluA2R/R/WT
0
2
4
6
8
10
12
WT/WT GluA2R/R/WT WT/hAPP-J20 GluA2R/R/hAPP-J20
GluA2R/R/hAPP-J20
******
*****
A
B
Figure 5.9.2 Dendritic spine density of hippocampal CA1 neurons in WT/WT,
GluA2R/R/WT, WT/hAPP-J20 and GluA2R/R/hAPP-J20 mice. (A) Representative images
of CA1 apical dendritic spines from WT/WT, GluA2R/R/WT, WT/hAPP-J20 and
GluA2R/R/hAPP-J20 mice. (B) Quantification of apical dendritc spine density in WT/WT,
GluA2R/R/WT, WT/hAPP-J20 and GluA2R/R/hAPP-J20 mice revealed a significant reduc-
tion of spine density in WT/hAPP-J20 mice. In addition, GluA2R/R/WT and
GluA2R/R/hAPP-J20 mice exhibited increased spine density as compared to WT/WT
littermates (One-Way ANOVA; 3 dentrites/neuron, 3 neurons/brain, 5 brains/genotype
(45 densities/genotype)). Each value represents the mean ± standard error of the mean
(SEM). **p<0.01,***p<0.001
Chapter 5: Forced edited GluA2 alters hippocampal dysfunction in the hAPP-J20 mouse model ___________________________________________________________________________________
192
5.10 The expression of forced edited GluA2 does not alter hippocampal
inflammation in the hAPP-J20 mouse model of AD
Neuroinflammatory processes, consisting of reactive astrocytes and activated microglia
leading to pro-inflammatory cytokine release, are thought to contribute to AD disease
progression. In order to assess if the expression of forced edited GluA2 alters
inflammation in the hAPP-J20 mouse model of AD we performed stereological
quantification of astrocyte and microglial populations in the hippocampus of WT/WT,
GluA2R/R/WT, WT/hAPP-J20 and GluA2R/R/hAPP-J20 mice. Furthermore, the
expression of TNF-α and IL-6 was assessed as markers of pro-inflammatory cytokines,
as these have been implicated in AD disease progression (Clark et al 2010, Hanisch
2002).
To evaluate astrocytic populations, coronal sections from 44-week-old WT/WT,
GluA2R/R/WT, WT/hAPP-J20 and GluA2R/R/hAPP-J20 were immunohistochemically
stained for the astrocyte specific marker glial fibrillary acidic protein (GFAP), and
stereologically assessed (Figure 5.10.1A), as described in Chapter 3 and Chapter 4. As
described in Chapter 3, the hAPP-J20 mice have a biphasic-increased expression of
GFAP, with increased expression at 24 weeks of age, though not at 36 weeks of age.
Here, no significant differences in astrocytic populations occurred between WT/WT,
GluA2R/R/WT, WT/hAPP-J20 and GluA2R/R/hAPP-J20 in the CA3 (Figure 5.10.1B;
F(3,16)=2.279 p=0.119) and CA1 (Figure 5.10.1C; F(3,16)=0.391 p=0.760) regions of the
hippocampus. Thus, the hAPP-J20 mouse model did not show persistent increases to
GFAP positive astrocytes at 44 weeks of age. Furthermore, the expression of forced
edited GluA2 did not alter astrocyte populations in the CA1 and CA3 region of the
hippocampus at 44 weeks of age.
Activated microglia express the typical marker CD68. Thus, we performed stereological
quantification of CD68-positive microglia in WT/WT, GluA2R/R/WT, WT/hAPP-J20
and GluA2R/R/hAPP-J20 in the area of the hippocampus bordered by the CA1, CA3 and
DG regions of the hippocampus, in the stratum radiatum and stratum lacunosum
moleculare (Figure 5.10.2A). This area was selected, as it is the major region in which
Chapter 5: Forced edited GluA2 alters hippocampal dysfunction in the hAPP-J20 mouse model ___________________________________________________________________________________
193
Aβ plaque formation occurs within the hAPP-J20 mouse model, and significant
increases to CD68-positive microglia was observed in this area (Chapter 3). A one-way
ANOVA revealed significant difference of CD68 microglia between genotypes (Figure
5.10.2B; F(3,25)=24.71 p<0.001). Post hoc analysis with Bonferroni corrections revealed
no significant difference between WT/WT and GluA2R/R/WT, indicating no alteration to
microglial populations in the healthy brain, with the forced expression of GluA2. In
contrast, WT/hAPP-J20 mice showed a significant difference from WT/WT (p<0.001)
and GluA2R/R/WT mice (p<0.001). Furthermore, GluA2R/R/hAPP-J20 mice were also
significantly different from WT/WT (p<0.001) and GluA2R/R/WT mice (p<0.001).
Thus, the forced expression of GluA2 did not rescue microglial inflammation in the
hAPP-J20 mouse model of AD.
In Chapter 3, we showed that the hAPP-J20 mouse model of AD exhibits age-dependent
increases to TNF-α and IL-6, though not Il-β, pro-inflammatory cytokines. In order to
determine if the expression of forced edited GluA2 could modulate cytokine release in
the hAPP-J20 mouse model, we quantified IL-6 and TNF-α expression in WT/WT,
GluA2R/R/WT, WT/hAPP-J20 and GluA2R/R/hAPP-J20 at 44 weeks of age. IL-6 is
consistently elevated in the brains of AD patients, thus we measured IL-6 expression in
hippocampal homogenates utilising an IL-6 antibody-specific ELISA kit (Figure
5.10.3A). A one-way ANOVA revealed that, in this particular cohort of mice, no
changes to IL-6 expression was observed between each of the genotypes.
TNF-α is assumed to play a pivotal role in amyloidogenesis and the antagonisation of
TNF-α is known to produce clinical improvements in pilot studies conducted on AD
patients. Hippocampal homogenates of WT/WT, GluA2R/R/WT, WT/hAPP-J20 and
GluA2R/R/hAPP-J20 mice at 44 weeks of age were analysed using a TNF-α antibody-
specific ELISA assay. A one-way ANOVA of TNF-α expression revealed a significant
difference between genotypes (Figure 5.10.3B; F(3,28)=8.651 p<0.001). Post hoc analysis
with Bonferroni corrections revealed no significant difference between WT/WT and
GluA2R/R/WT mice. In contrast, a significant difference occurred between WT/hAPP-
J20 mice and WT/WT (p<0.001) and GluA2R/R/WT (p<0.01). In addition, a significant

Chapter 5: Forced edited GluA2 alters hippocampal dysfunction in the hAPP-J20 mouse model ___________________________________________________________________________________
194
difference occurred between GluA2R/R/hAPP-J20 and WT/WT mice (p<0.05), though
surprisingly not with GluA2R/R/WT.
Combined, these studies revealed that astrocytic populations and IL-6 expression is not
altered at 44 weeks of age in the hAPP-J20 mouse model of AD. Furthermore, the
observed increased microglial populations and TNF-α expression in the hAPP-J20
mouse model is not rescued by the expression of forced edited GluA2.
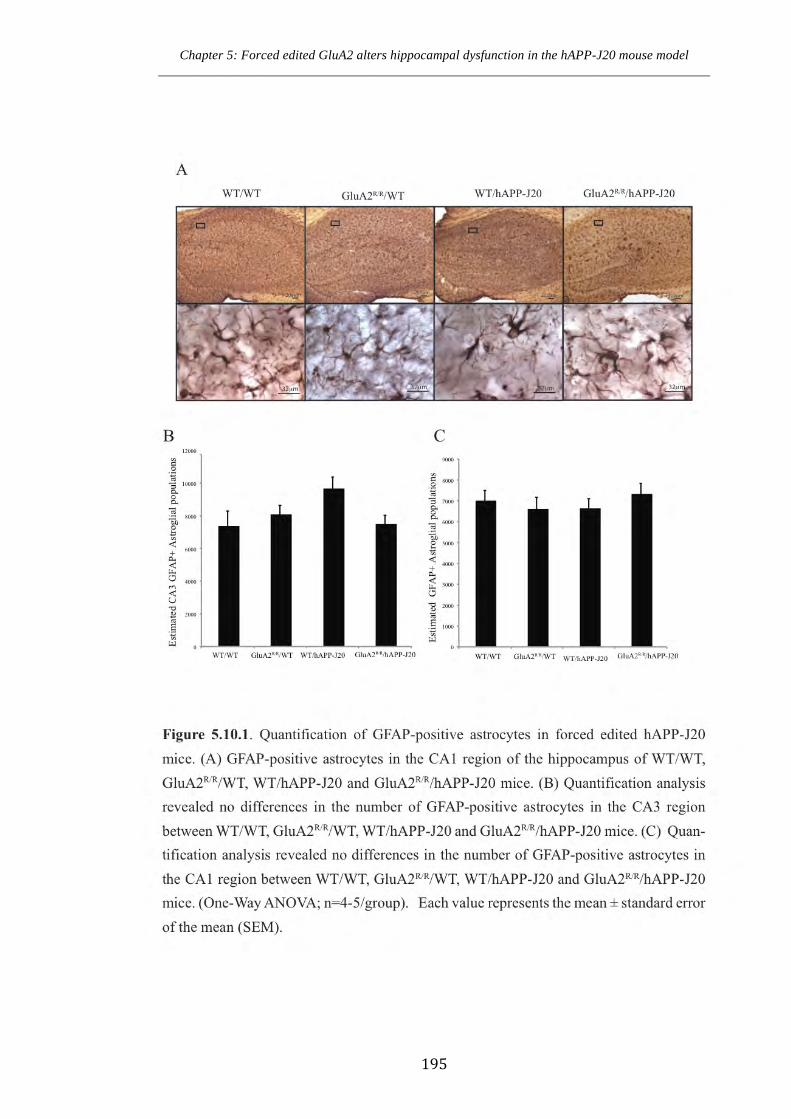
Chapter 5: Forced edited GluA2 alters hippocampal dysfunction in the hAPP-J20 mouse model ___________________________________________________________________________________
195
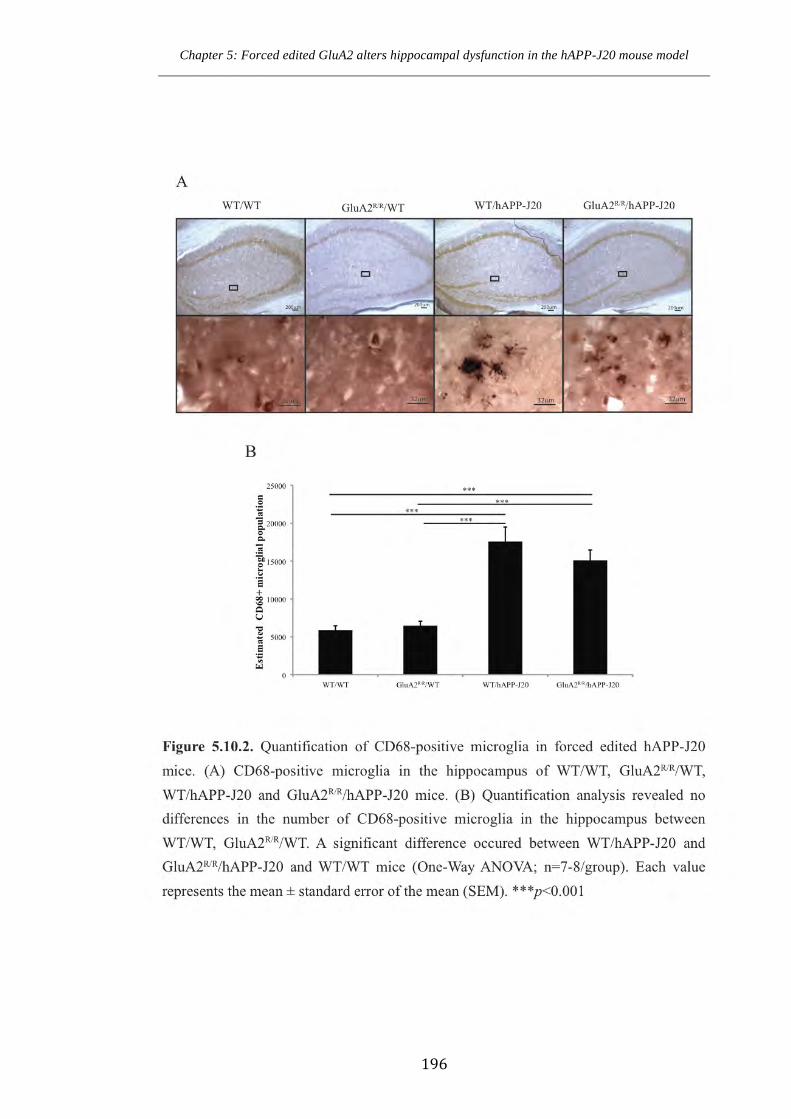
Chapter 5: Forced edited GluA2 alters hippocampal dysfunction in the hAPP-J20 mouse model ___________________________________________________________________________________
196
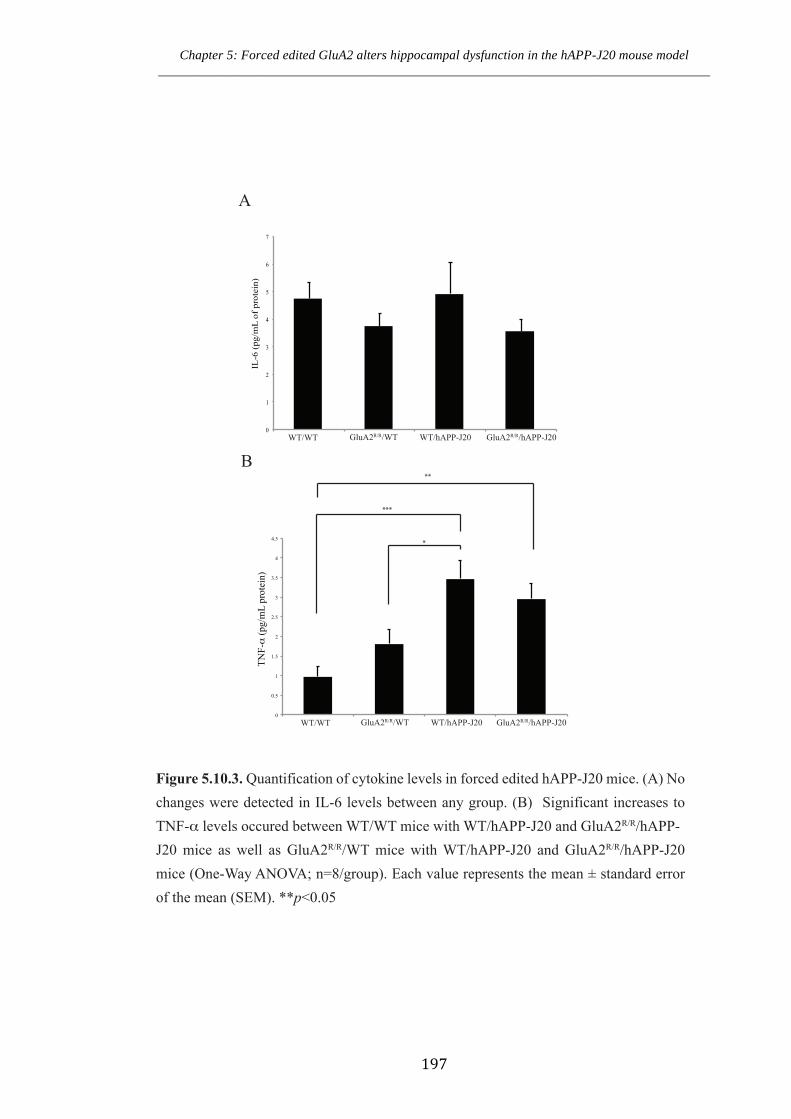
Chapter 5: Forced edited GluA2 alters hippocampal dysfunction in the hAPP-J20 mouse model ___________________________________________________________________________________
197
0
0.5
1
1.5
2
2.5
3
3.5
4
4.5
TN
F-_
(pg/m
L p
rote
in)
**
***
*
0
1
2
3
4
5
6
7
IL
-6
(p
g/m
L o
f p
rote
in)
WT/WT WT/hAPP-J20 GluA2R/R/hAPP-J20GluA2R/R/WT
WT/WT WT/hAPP-J20 GluA2R/R/hAPP-J20GluA2R/R/WT
Figure 5.10.3. Quantification of cytokine levels in forced edited hAPP-J20 mice. (A) No
changes were detected in IL-�� levels between any group. (B) Significant increases to
TNF-_ levels occured between WT/WT mice with WT/hAPP-J20 and GluA2R/R/hAPP-
J20 mice as well as GluA2R/R/WT mice with WT/hAPP-J20 and GluA2R/R/hAPP-J20
mice (One-Way ANOVA; n=8/group). Each value represents the mean ± standard error
of the mean (SEM). **p<0.05
A
B

Chapter 5: Forced edited GluA2 alters hippocampal dysfunction in the hAPP-J20 mouse model ___________________________________________________________________________________
198
Discussion
Unedited GluA2 is strongly associated with excitotoxic neuronal cell death in
ischemia and ALS (Kawahara et al 2004a, Peng et al 2006). In this chapter, we
have found that the hAPP-J20 mouse model exhibits a significant reduction in
GluA2 RNA editing efficiency at the Q/R site in the CA1 hippocampal region.
Further, by crossing the hAPP-J20 mouse model with a model that only expresses
edited GluA2, neural and spine degeneration was protected against in this region.
Combined, these results indicate that GluA2 RNA editing may play a pivotal role
in regulating CA1 neuronal cell fate.
Forced edited GluA2 at the Q/R site modulates hippocampal function
In order to ascertain the role of forced GluA2 RNA editing at the Q/R site, we
substituted the exonic Q (CAG) codon to the R (CGG) codon, to create the
GluA2R/R mice. Previously, Kask et al. (1998) has characterised a similar mouse
line that only expressed edited GluA2 at the Q/R site. The authors revealed that
the forced edited exhibited no obvious deficiencies and did not differ in overall
brain architecture. Our results largely reveal a similar finding, indicating that
GluA2R/R mice exhibit normal neuronal, astrocyte and microglia populations.
However, surprisingly we have revealed that GluA2R/R mice exhibit increased
spine density in the hippocampus.
Firstly, we analysed if the forced expression of GluA2 at the Q/R site modifies
intracellular, synaptic and the composition of AMPA receptors. Previous studies
have indicated that GluA2, in the unedited form, is rapidly exported from the
endoplasmic reticulum and is expressed at the synapse (Greger et al 2002).
However, the authors revealed that when GluA2 was restricted to the edited form,
GluA2 expression localised with the endoplasmic reticulum marker BiP. Thus, in
this study we determined if the expression of only edited GluA2 altered the
synaptic expression of GluA2. Interestingly, our results indicated that GluA2R/R
mice exhibited normal AMPA receptor complex expression and expression at the
synapse.

Chapter 5: Forced edited GluA2 alters hippocampal dysfunction in the hAPP-J20 mouse model ___________________________________________________________________________________
199
AMPA receptors are required for the maintenance of spines (McKinney et al
1999). In our study, we surprisingly revealed a significant increase to spine
density in GluA2R/R/WT mice, however, the mechanisms driving this
phenomenon are unclear. Previous studies have indicated that the synaptic
blockade of AMPA receptors and NMDA receptors render cells impermeable to
Ca2+, and results in increased spine density in vitro (Kirov & Harris 1999). Most
interestingly, this reduction in Ca2+ permeability is able to enhance actin
polymerization, and thus support outgrowth of spine like protrusion (Fischer et al
1998). Therefore, the blockade of unedited GluA2 in vivo may reduce Ca2+
permeability, thus supporting actin-mediated growth of spines. Conversely,
unedited GluA2 may play a role in synaptic elimination. This is a plausible
theory, as it is well known that synaptic pruning occurs at length in the early
stages of development (Yuste & Bonhoeffer 2001). Concurrently, abundant
unedited GluA2 also occurs primarily during development (Melcher et al 1997).
These correlative processes may indicate a role of unedited GluA2 and thus, by
blocking unedited GluA2 in GluA2R/R/WT mice, synaptic elimination may be
hindered. However, further investigation will be required to determine if AMPA
receptor-mediated Ca2+ flow is altered in hippocampal neurons of GluA2R/R mice.
This will enable us to determine how spines are regulated in response to GluA2
RNA editing.
The expression of forced edited GluA2 at the Q/R site improves hippocampal
integrity in the hAPP-J20 mouse model
Akbarian et al. (1995) described an increase to unedited GluA2 RNA editing in
the cerebral cortex of post-mortem AD brains. Here, we revealed that the hAPP-
J20 mouse model of AD exhibited reduced GluA2 RNA editing efficiency at the
Q/R site in hippocampal neurons. Previous studies have implicated a role of Ca2+-
permeable AMPA receptors in neurodegeneration in AD. In vitro studies have
indicated that neuronal populations are sensitive to AMPA receptor mediated
excitotoxicity, potentially due to the possession of Ca2+-permeable AMPA
receptors (Liu et al 2010). In addition, GluA2 expression in the entorhinal cortex
and hippocampus of AD brains decreases prior to neurofibrillary tangle formation,
Chapter 5: Forced edited GluA2 alters hippocampal dysfunction in the hAPP-J20 mouse model ___________________________________________________________________________________
200
indicating that Ca2+-permeable AMPA receptors may predispose neurons to
degeneration (Ikonomovic et al 1997). However, studies have not indicated if the
expression of Ca2+-permeable AMPA receptors at the synapse in AD are GluA2-
lacking or if they contain unedited GluA2. Here, we observed that GluA2
intracellular and synaptic expression, as well as AMPA receptor complex
formation, were normal in the hAPP-J20 mouse. However, when unedited GluA2
was blocked, by crossing the hAPP-J20 mouse line with a line that only expresses
edited GluA2, neuronal and synaptic rescue was observed. Thus, we postulate that
unedited GluA2 is being expressed at the synapse in AD and this is contributing to
the cell death.
Synaptic loss is one of the major triggers for cognitive dysfunction in AD. Indeed,
defects in synaptic transmission occur in AD, well before the formation of Aβ-
containing plaques (Braak & Braak 1991, Thal et al 2002). Most excitingly, in our
study we revealed that the forced expression of GluA2 at the Q/R site protects
against spine loss and neurodegeneration in the hAPP-J20 mouse model, without
altering Aβ plaque formation. Indeed, we revealed no alteration to monomeric Aβ
species and Aβ-containing plaque deposition in hAPP-J20 mice that express
forced edited GluA2. Thus, our results indicate that excitotoxicity can be
prevented without modulation or decreases to Aβ-containing plaques.
In addition to no alteration to Aβ, astrocytes and microglia populations were
unchanged between WT/hAPP-J20 mice and GluA2R/R/hAPP-J20 mice. This is
interesting as it is well established that a significant increase to microglia
populations can lead to a neurotoxic cascade (Akiyama et al 2000). In addition, no
alteration to the pro-inflammatory cytokine TNF-α was observed between
WT/hAPP-J20 mice and GluA2R/R/hAPP-J20 mice. TNF-α is known to lead to
rapid exocytosis of Ca2+-permeable AMPA receptors following spinal cord injury
and is therefore predicted to contribute to neurodegeneration (Ferguson et al
2008). Thus, it is plausible that by blocking unedited GluA2, we have prevented
against TNF-α-mediated Ca2+-permeable AMPA receptor regulated death.
Chapter 5: Forced edited GluA2 alters hippocampal dysfunction in the hAPP-J20 mouse model ___________________________________________________________________________________
201
Therefore, we have shown that it is possible to achieve neuroprotection without
altering the inflammatory response.
In summary, we observed that the forced expression of GluA2 leads to increased
spine density in the stratum radiatum of the hippocampus. Furthermore, we
observed improvements to neuronal and spine populations in hAPP-J20 mice that
express only the edited GluA2. These modifications were made independently of
alteration to other AD hallmarks including Aβ-containing plaque deposition and
neuroinflammation. Therefore, in the following chapter we aimed to determine if
these neuroanatomical changes result in modifications to cognitive function.
202
Chapter 6
Forced edited GluA2 at the Q/R site
rescues behavioural, memory and
learning deficits in the hAPP-J20 mouse
model of Alzheimer’s Disease
Chapter 6: Forced Edited GluA2 Rescues behavioural deficits in the hAPP-J20 mouse model ___________________________________________________________________________________
203
6.0 Background
The hippocampus is responsible for memory and learning and is among the first regions
to degrade in AD. In Chapter 5, we revealed a significant rescue of dendritic spines and
neurons within the CA1 region of the hippocampus through the expression of forced
edited GluA2 at the Q/R site. As the CA1 is primarily responsible for memory retrieval,
in this chapter we therefore aimed to assess if this neuronal rescue corresponded to a
functional rescue of behavioural memory and learning. The role of GluA2-lacking
receptors in memory formation is now emerging, however the importance of unedited
GluA2 at the Q/R site Ca2+-permeable AMPA receptors in memory and learning is
unknown. Furthermore, given the mounting evidence implicating excitotoxicity in
neurodegeneration, the effects that an increase in unedited GluA2 at the Q/R site has on
AD is yet to be elucidated.
Within the hippocampus, AMPA receptors are known to play a critical part in memory
formation, as Na+ influx through AMPA causes depolarisation of the cell and
strengthening of synapses (Henley & Wilkinson 2013). Numerous studies have reported
that knockout or antagonisation of AMPA receptor subunits can lead to impaired
memory and learning in a variety of behavioural tests. For example, ablation of the
AMPA receptor GluA1 subunit via gene knockout is known to lead to hippocampal
dependent spatial working memory deficits in the T-maze (Sanderson et al 2010).
Furthermore, in a groundbreaking study Winters and Bussey (2005) showed that the
CNQX-mediated blockade of AMPA receptors, prior to training in an object recognition
paradigm, impaired memory retrieval (Winters & Bussey 2005). These studies strongly
demonstrate that AMPA receptors are essential for both the formation and retrieval of
memory.
AMPA receptors can be Ca2+-permeable if they are GluA2-lacking, or they contain
unedited GluA2. Ca2+-permeable AMPA receptors (primarily assumed to be GluA2-
lacking receptors) are also trafficked to the cell membrane, following the induction of
LTP (Morita et al 2014). This supports the idea that such receptors also play an
important role in memory and learning. A recent study by Clem and Huganir (2010)
Chapter 6: Forced Edited GluA2 Rescues behavioural deficits in the hAPP-J20 mouse model ___________________________________________________________________________________
204
showed a transient role of Ca2+-permeable AMPA receptors in fear memory and
learning, by observing a larger AMPA-dependent miniature excitatory postsynaptic
current (mEPSC) following auditory fear conditioning. This was further verified by the
addition of the Ca2+-permeable AMPA receptor antagonist 1- Naphthylacetyl spermine
(Naspm), which removed the inward rectification further indicating the requirement for
Ca2+-permeable AMPA receptors in memory formation (Clem & Huganir 2010).
Additionally, our lab has shown that the conditional knockout of GluA2 in the CA1
region of the hippocampus, can lead to changes in synaptic strength after plasticity has
been established (Wiltgen et al 2010). These mice showed a unique form of LTP and
NMDA- independent learning in contextual and auditory fear conditioning. This study
was the first to show unequivocally that GluA2-lacking receptors modulate memory and
learning and offers novel insight into the importance of Ca2+-permeable AMPA
receptors in normal brain function. However, as previously described, AMPA receptors
can be Ca2+-permeable if the lack the GluA2 subunit, or if GluA2 is present in the
unedited form. Despite knowledge of GluA2-lacking receptors in memory and learning,
the role of unedited GluA2 is yet to be elucidated.
Therefore, the aim of this chapter is two-fold. First, given that the hippocampus
normally contains approximately 1% unedited GluA2, we aimed to identify if this plays
a role in memory and learning by testing mice with forced edited GluA2 in a variety of
memory and learning tests. Secondly, since our results showed that forcing GluA2 RNA
editing rescues neuronal loss in the hAPP-J20 mouse model, we aimed to determine if
this correlated with a functional rescue of memory and learning. In order to achieve
these aims, we utilise a series of known hippocampal -dependent and –independent
memory and learning tasks. Furthermore, we aim to determine if gross motor function
and anxiety are modulated by utilising a variety of coordination and movement tasks.
Combined, these investigations will give further insight into the mechanisms of memory
formation in health and aid in the design of novel therapeutic targets for AD.

Chapter 6: Forced Edited GluA2 Rescues behavioural deficits in the hAPP-J20 mouse model ___________________________________________________________________________________
205
Aims:
• To investigate if forced GluA2 RNA editing modulates motor function in the
normal and the hAPP-J20 mouse model of AD by utilising the OFT and rotorod
• To investigate if forced GluA2 RNA editing modulates anxiety-like behaviour in
the normal and the hAPP-J20 mouse model of AD by utilising the OFT and
EPM
• To investigate if forced GluA2 RNA editing modulates non-spatial contextual
memory in the normal and the hAPP-J20 mouse model of AD by utilising the
novel object recognition test
• To investigate if forced GluA2 RNA editing modulates short term working
memory in the normal and the hAPP-J20 mouse model of AD by utilising the Y-
maze and Win-Stay version of the radial arm maze
• To investigate if forced GluA2 RNA editing modulates long term working
memory in the normal and the hAPP-J20 mouse model of AD by utilising the
Win-Shift version of the radial arm maze
Behavioural assessment
In order to elucidate the role of forced GluA2 RNA editing on memory and learning in
the hAPP-J20 mouse model, we utilised a variety of behavioural paradigms. We aimed
to determine if forced GluA2 RNA editing could rescue the behavioural deficits
observed in the hAPP-J20 mouse model that were characterised in Chapter 3. In
addition, we extended upon these tests to include other behavioural paradigms in order
to gather robust information on the role of GluA2 RNA editing in health and disease.
Therefore, we tested 24-week-old WT/WT, GluA2R/R/WT, WT/hAPP-J20 and
GluA2R/R/hAPP-J20 mice in a battery of behavioural memory and learning tests. These
paradigms include: the OFT and rotorod testing for gross motor function, the OFT and
EPM to measure anxiety, the object recognition test to determine non-spatial contextual
memory, the Y-maze and the Win-Stay radial arm maze (RAM) paradigm to determine
spatial working memory deficits and finally the Win-Shift RAM to determine long term
spatial reference memory deficits. These tests were carried out on 3 cohorts (3 trials/
cohort) as describe in Figure 6.0.
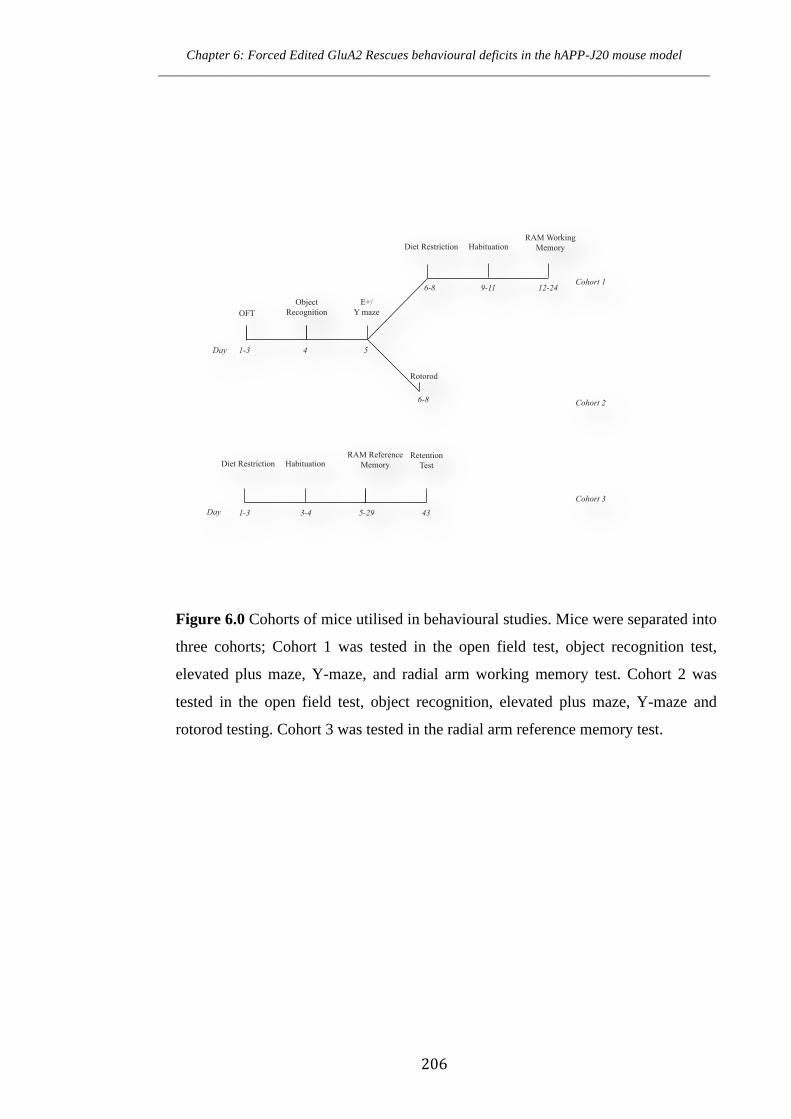
Chapter 6: Forced Edited GluA2 Rescues behavioural deficits in the hAPP-J20 mouse model ___________________________________________________________________________________
206
Figure 6.0 Cohorts of mice utilised in behavioural studies. Mice were separated into
three cohorts; Cohort 1 was tested in the open field test, object recognition test,
elevated plus maze, Y-maze, and radial arm working memory test. Cohort 2 was
tested in the open field test, object recognition, elevated plus maze, Y-maze and
rotorod testing. Cohort 3 was tested in the radial arm reference memory test.
1-3 4 5
6-8
E+/Y maze
Diet Restriction
9-11
HabituationRAM Working
Memory
OFTObject
Recognition
12-24
Rotorod
6-8
Diet Restriction HabituationRAM Reference
Memory
Cohort 1
Cohort 2
Cohort 3
1-3 3-4 5-29 43
RetentionTest
Day
Day
Chapter 6: Forced Edited GluA2 Rescues behavioural deficits in the hAPP-J20 mouse model ___________________________________________________________________________________
207
Results
6.1 Alteration to hyperactivity in the OFT and rotorod performance in hAPP-J20
mice and its modulation by forced edited GluA2
The open field test (OFT) is used to examine general locomotion, motor function and
spontaneous activity in rodent models (Bryan et al 2009). A hyperactive phenotype is
often observed in AD mouse models, as indicated by an increase in locomotion in the
OFT (Arendash et al 2001). In order to determine if forced GluA2 RNA editing could
modulate the observed hyperactivity that occurs in hAPP-J20 mice, WT/WT,
GluA2R/R/WT, WT/hAPP-J20 and GluA2R/R/hAPP-J20 were placed in an OFT and
allowed to explore the environment for ten minutes, as previously described in Chapter
3. The total distance travelled was measured as a guide for locomotion behaviour. A
One-Way ANOVA revealed a significant group effect of locomotion (Figure 6.1.1A and
6.1.1B; F(3,89)=21.69 p<0.001) indicating differences in travel distances between
genotypes. A Bonferroni Post-hoc analysis confirmed a significant increase in
locomotion between WT/WT and WT/hAPP-J20 mice (p<0.05). There was no
significant difference between WT/WT and GluA2R/R/WT mice, suggesting that forced
edited GluA2 does not alter locomotion in the healthy brain. In addition,
GluA2R/R/hAPP-J20 mice performed significantly lower in the total distance travelled in
the OFT compared with WT/hAPP-J20 (p<0.05) mice indicating the expression of
forced edited GluA2 leads to partial recovery of the hyperdynamic behavioural
phenotype in the hAPP-J20 mouse model.
Studies utilising AD mouse models frequently indicate that AD mice are often unable to
acclimatise to a novel environment (Heneka et al 2012). This can be tested by
measuring total distant traveled over the course of a three-day OFT. If habitation
abilities are intact, mice should show reduced total distance travelled over the course of
the three-day test. To determine if forced edited GluA2 was able to modulate
environmental acclimatisation, we performed a three-day habituation protocol whereby
mice were placed in the OFT for 10 minutes per day for three consecutive days. The
total distance travelled each day was analysed as a measure of the ability to habituate to
Chapter 6: Forced Edited GluA2 Rescues behavioural deficits in the hAPP-J20 mouse model ___________________________________________________________________________________
208
a novel environment, as healthy mice will explore the same environment less over time.
A 2-way ANOVA revealed a significant interaction effect of group and day on open
field locomotion (Figure 6.1.1.C; F(6,176)=4.983 p<0.01), suggesting differences in
habituation between groups. Therefore, the effect of group and day were analysed
separately using a one-way ANOVA. A one-way ANOVA of group revealed
indistinguishable habitation between WT/WT and GluA2R/R/WT mice, suggesting
forced edited GluA2 in the healthy brain does not alter habituation in the OFT. In
contrast, WT/hAPP-J20 showed increased locomotion and slowed habitation (p<0.05).
Furthermore, over a three day habituation protocol, their was no significant differences
between GluA2R/R/hAPP-J20 mice and WT/hAPP-J20 mice indicating that forced
GluA2 RNA editing does not rescue the neurobehavioural disturbances such as AD-like
psychomotor disinhibition.
In addition to memory deficits, posture and gait disturbances have been demonstrated
even in early-stage AD (Nakamura et al 1997). In mice, balance disruptions can be
measured by the accelerating rotorod. An increased time spent on the accelerating
rotorod is an indication of normal gait. In the present study, a three trial per day for
three-day design was employed on an accelerating rotorod to test motor coordination in
the hAPP-J20 mice and forced edited GluA2 mice. Each day, mice were placed on the
accelerating rotorod until they fell to the catch tray below, or until five minutes had
elapsed (Figure 6.1.2). The three trials from each day were pooled for final analysis. A
2-way repeated measures ANOVA with group and time as factors, revealed no
interaction and thus main effects were analysed. A significant group main effect
(F(2,116)=4.991, p<0.05) was revealed. Post-hoc analysis with Bonferroni corrections
revealed unexpected significant differences on day one between WT/hAPP-J20 and
WT/WT mice (p<0.05), with WT/hAPP-J20 mice having a longer latency to fall.
Furthermore, GluA2R/R/hAPP-J20 and WT/hAPP-J20 mice had improved latency
compared to GluA2R/R/WT mice (p<0.05). Their were no significant differences on days
two and three, indicating that despite having a lower latency to fall on the first day,
GluA2R/R/WT mice were able to reach normal levels.
Chapter 6: Forced Edited GluA2 Rescues behavioural deficits in the hAPP-J20 mouse model ___________________________________________________________________________________
209
In order to assess if alteration to balance is improved overtime, mice were placed on the
rotorod for three consecutive days. Further analysis revealed a significant difference
over time (F(2,232)=43.85, p<0.001) indicating mice were capable of motor learning
(Figure 6.1.2). Post-hoc analysis with Bonferroni corrections of day revealed a
significant difference between day one and two for each group (p<0.05), indicating all
mice are able to learn the paradigm. No significant differences occurred for any group
between days two and three, as most mice were able to perform the test for the
maximum 300 seconds by day two. In summary, WT/hAPP-J20 and GluA2R/R/hAPP-
J20 mice have an increased latency to fall on the first day, though all mice are able to
learn the accelerating rotorod paradigm over the course of three days.
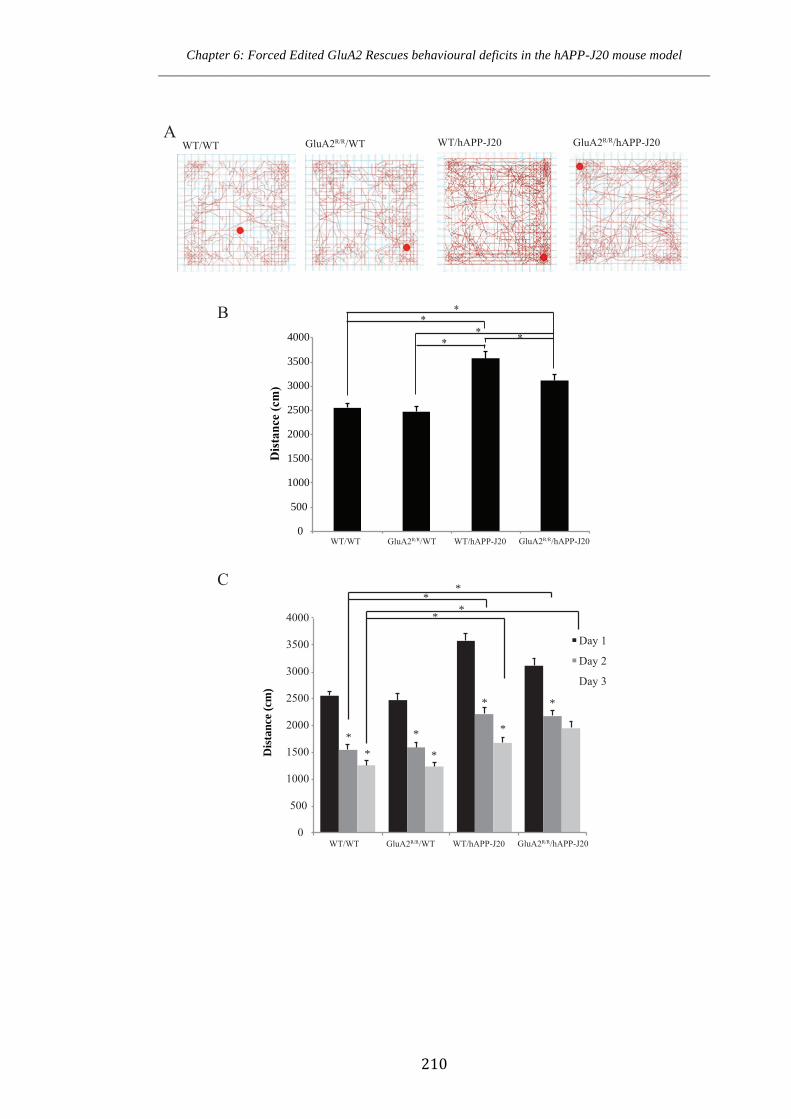
Chapter 6: Forced Edited GluA2 Rescues behavioural deficits in the hAPP-J20 mouse model ___________________________________________________________________________________
210
WT/WT GluA2R/R/WT WT/hAPP-J20 GluA2R/R/hAPP-J20
0
500
1000
1500
2000
2500
3000
3500
4000
WT/WT GluA2R/R/WT WT/hAPP-J20
Dist
ance
(cm
)
*
0
500
1000
1500
2000
2500
3000
3500
4000
Dist
ance
(cm
)
Day 1
Day 2
Day 3
**
*
*
*
*
*
**
*
*
* **
*
A
B
C
GluA2R/R/hAPP-J20
WT/WT GluA2R/R/WT WT/hAPP-J20 GluA2R/R/hAPP-J20
Chapter 6: Forced Edited GluA2 Rescues behavioural deficits in the hAPP-J20 mouse model ___________________________________________________________________________________
211
Figure 6.1.1 Open field test in hAPP-J20 mice expressing forced edited GluA2. (A) Rep-
resentative open field test output data for WT/WT, GluA2R/R/WT, WT/hAPP-J20 and
GluA2R/R/hAPP-J20 mice. (B) Total distance travelled over a 10 minute open field test
revealed increased locomotion in the WT/hAPP-J20 mice, with significant reductions in
the GluA2R/R/hAPP-J20 mice (One-Way ANOVA; n=15-22/group). (C) A three day
habituation test showed slower acclimitisation in the WT/hAPP-J20 and
GluA2R/R/hAPP-J20 mice as compared to WT/WT and GluA2R/R/WT mice (Two-Way
ANOVA; n=15-22/group). Each value represents the mean ± standard error of the mean
(SEM). *p<0.05
Chapter 6: Forced Edited GluA2 Rescues behavioural deficits in the hAPP-J20 mouse model
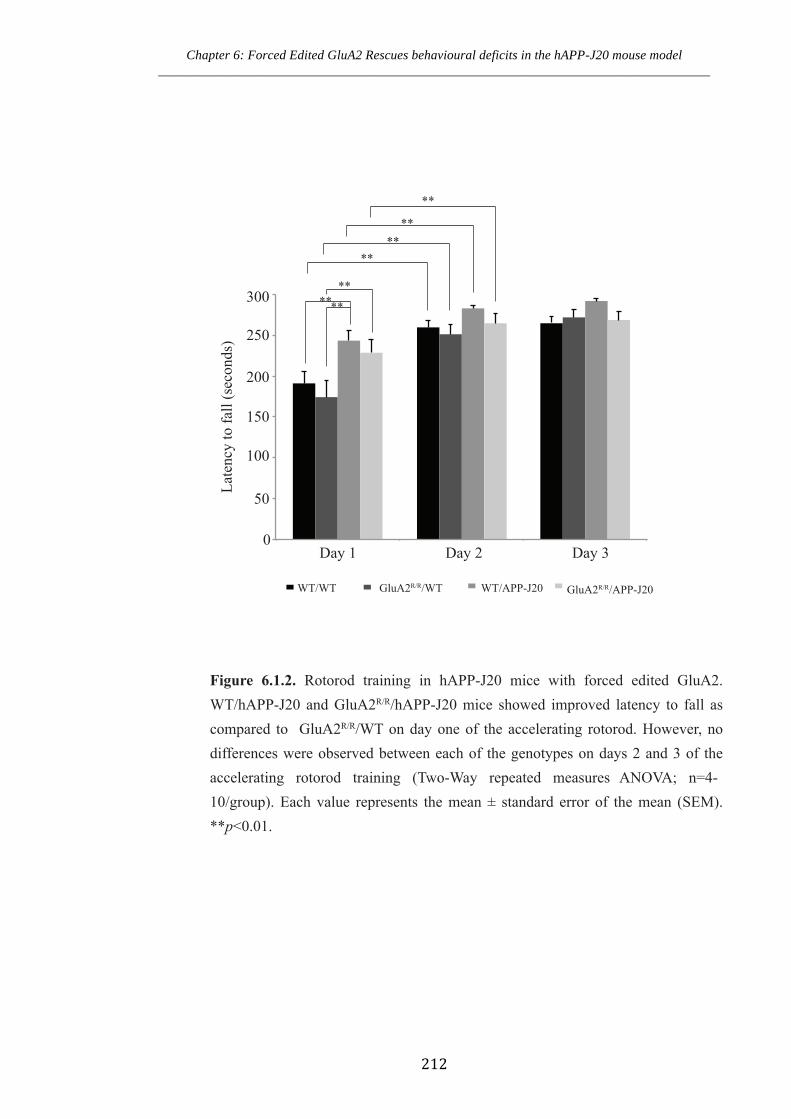
Chapter 6: Forced Edited GluA2 Rescues behavioural deficits in the hAPP-J20 mouse model ___________________________________________________________________________________
212
Day 1 Day 2 Day 3
Late
ncy
to fa
ll (s
econ
ds)
******
Figure 6.1.2. Rotorod training in hAPP-J20 mice with forced edited GluA2. WT/hAPP-J20 and GluA2R/R/hAPP-J20 mice showed improved latency to fall as compared to GluA2R/R/WT on day one of the accelerating rotorod. However, no differences were observed between each of the genotypes on days 2 and 3 of the accelerating rotorod training (Two-Way repeated measures ANOVA; n=4-10/group). Each value represents the mean ± standard error of the mean (SEM). **p<0.01.
******
**
WT/WT GluA2R/R/WT WT/APP-J20 GluA2R/R/APP-J20
300
250
200
150
100
50
0
Chapter 6: Forced Edited GluA2 Rescues behavioural deficits in the hAPP-J20 mouse model ___________________________________________________________________________________
213
6.2 Mice expressing hAPP have reduced anxiety-like behaviour, which is altered
through the expression of forced edited GluA2
The elevated plus maze (EPM) is a classic tool used to measure anxiety and exploratory
behaviours in rodents. The time spent in the open arm of the EPM indicates a lower
level of anxiety. AD mice models often show increased time spent in the open arm of
the EPM (Bryan et al 2009, Cheng et al 2014, Chiba et al 2008). We utilised the
paradigm described in Chapter 3 to test if forced edited GluA2 alters anxiety-like
behaviour in mice and, furthermore, determine if its alteration changes the reduced
anxiety phenotype of the hAPP-J20 mice. Briefly, in this paradigm mice were placed in
the centre of the maze that contained two open and two closed arms (Figure 6.2.1A) and
were allowed to explore for five minutes. The time spent in the open arm, the ratio of
open arm to total arm entries as well as the percentage of zone entries was determined
as measures of anxiety-like behaviour of the mice. In our study, with these particular
cohorts of mice, their were no significant differences between time spent in the open
arm between the groups (Figure 6.2.1B; Kruskall-Wallis statistic 4.263, p= 0.23) when
tested at 24-weeks of age.
To account for increased locomotion in the WT/hAPP-J20 mice observed in the OFT
test, the ratio of open arm entries over the total arm entries was also analysed. A One-
way ANOVA revealed a significant difference (Figure 6.2.1C) in the ratio of open arm
entries to total entries between groups (F(3,54)=4.15, p<0.05). Bonferroni post-hoc
analysis revealed a significant increase in open arm ratio in WT/hAPP-J20 mice
compared to WT/WT (p<0.05), GluA2R/R/WT (p<0.05), and GluA2R/R/hAPP-J20
(p<0.05) mice. Thus, the expression of forced edited GluA2 may install normal anxiety
levels in the hAPP-J20 mouse model.
To determine if there were changes in zone entries between groups, each zone (closed
arms, centre and open arms) were analysed separately. A One-Way ANOVA revealed
no significant differences between closed arm and centre zone entries between any of
the groups (Figure 6.2.1D). However, a significant difference occurred with the
percentage of open arm entries (F(3,54)=3.245, p<0.05). Bonferonni post-hoc analysis
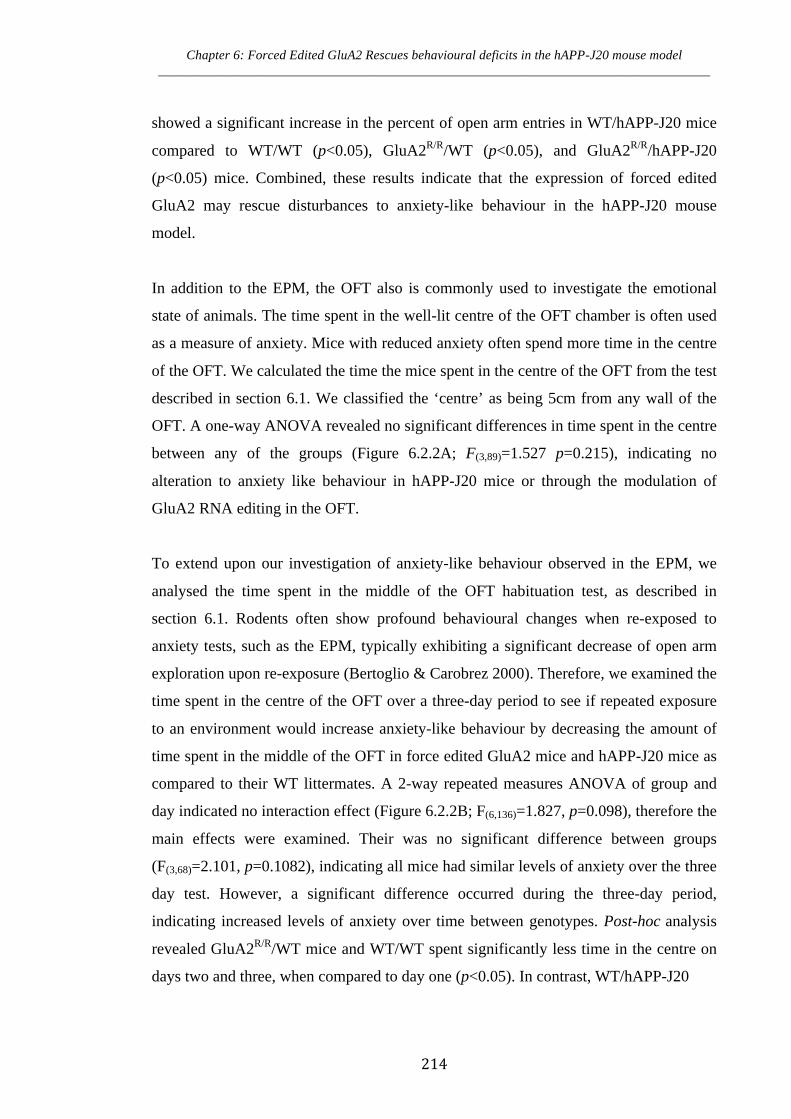
Chapter 6: Forced Edited GluA2 Rescues behavioural deficits in the hAPP-J20 mouse model ___________________________________________________________________________________
214
showed a significant increase in the percent of open arm entries in WT/hAPP-J20 mice
compared to WT/WT (p<0.05), GluA2R/R/WT (p<0.05), and GluA2R/R/hAPP-J20
(p<0.05) mice. Combined, these results indicate that the expression of forced edited
GluA2 may rescue disturbances to anxiety-like behaviour in the hAPP-J20 mouse
model.
In addition to the EPM, the OFT also is commonly used to investigate the emotional
state of animals. The time spent in the well-lit centre of the OFT chamber is often used
as a measure of anxiety. Mice with reduced anxiety often spend more time in the centre
of the OFT. We calculated the time the mice spent in the centre of the OFT from the test
described in section 6.1. We classified the ‘centre’ as being 5cm from any wall of the
OFT. A one-way ANOVA revealed no significant differences in time spent in the centre
between any of the groups (Figure 6.2.2A; F(3,89)=1.527 p=0.215), indicating no
alteration to anxiety like behaviour in hAPP-J20 mice or through the modulation of
GluA2 RNA editing in the OFT.
To extend upon our investigation of anxiety-like behaviour observed in the EPM, we
analysed the time spent in the middle of the OFT habituation test, as described in
section 6.1. Rodents often show profound behavioural changes when re-exposed to
anxiety tests, such as the EPM, typically exhibiting a significant decrease of open arm
exploration upon re-exposure (Bertoglio & Carobrez 2000). Therefore, we examined the
time spent in the centre of the OFT over a three-day period to see if repeated exposure
to an environment would increase anxiety-like behaviour by decreasing the amount of
time spent in the middle of the OFT in force edited GluA2 mice and hAPP-J20 mice as
compared to their WT littermates. A 2-way repeated measures ANOVA of group and
day indicated no interaction effect (Figure 6.2.2B; F(6,136)=1.827, p=0.098), therefore the
main effects were examined. Their was no significant difference between groups
(F(3,68)=2.101, p=0.1082), indicating all mice had similar levels of anxiety over the three
day test. However, a significant difference occurred during the three-day period,
indicating increased levels of anxiety over time between genotypes. Post-hoc analysis
revealed GluA2R/R/WT mice and WT/WT spent significantly less time in the centre on
days two and three, when compared to day one (p<0.05). In contrast, WT/hAPP-J20
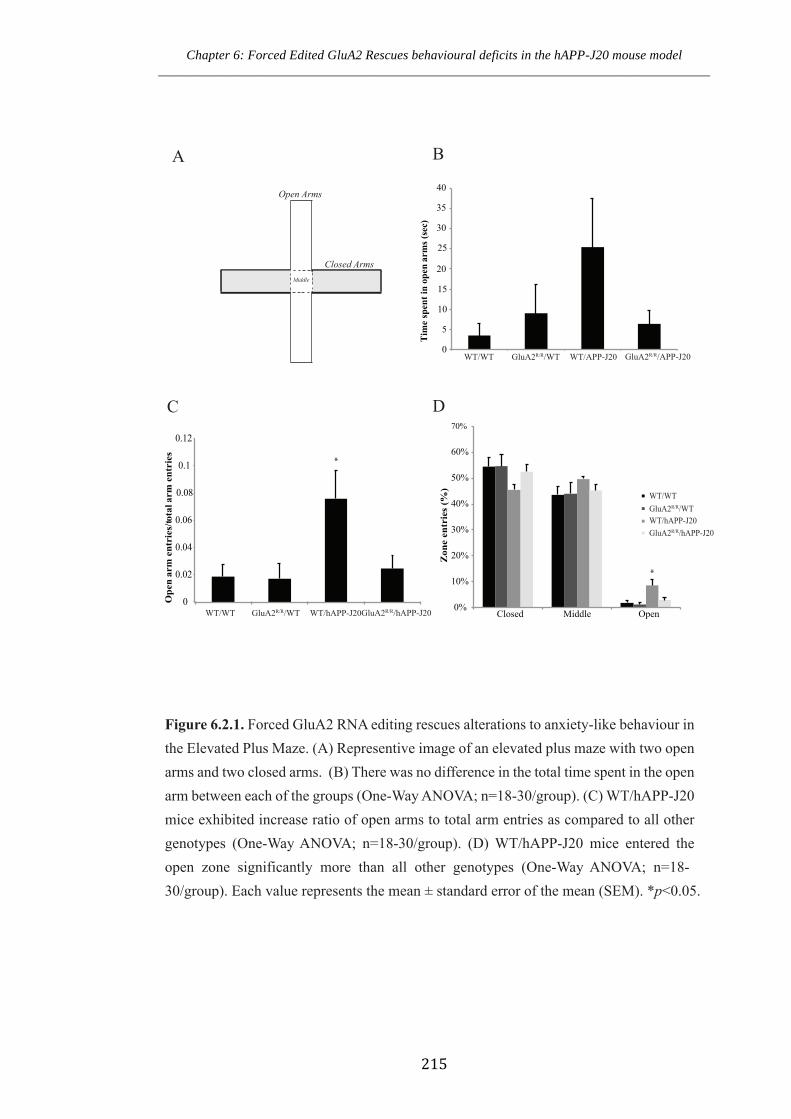
Chapter 6: Forced Edited GluA2 Rescues behavioural deficits in the hAPP-J20 mouse model ___________________________________________________________________________________
215
0
0.02
0.04
0.06
0.08
0.1
0.12
Op
en
arm
en
trie
s/t
otal arm
en
trie
s
0
5
10
15
20
25
30
35
40
Tim
e s
pen
t in
op
en
arm
s (
sec)
*
Closed Arms
Open Arms
Middle
0%
10%
20%
30%
40%
50%
60%
70%
Closed Middle Open
WT/WT
GluA2R/R/WT
WT/hAPP-J20
GluA2R/R/hAPP-J20
Zon
e e
ntrie
s (
%)
*
Figure 6.2.1. Forced GluA2 RNA editing rescues alterations to anxiety-like behaviour in
the Elevated Plus Maze. (A) Representive image of an elevated plus maze with two open
arms and two closed arms. (B) There was no difference in the total time spent in the open
arm between each of the groups (One-Way ANOVA; n=18-30/group). (C) WT/hAPP-J20
mice exhibited increase ratio of open arms to total arm entries as compared to all other
genotypes (One-Way ANOVA; n=18-30/group). (D) WT/hAPP-J20 mice entered the
open zone significantly more than all other genotypes (One-Way ANOVA; n=18-
30/group). Each value represents the mean ± standard error of the mean (SEM). *p<0.05.
A B
C D
WT/WT GluA2R/R/WT WT/hAPP-J20GluA2R/R/hAPP-J20
WT/WT GluA2R/R/WT WT/APP-J20 GluA2R/R/APP-J20

Chapter 6: Forced Edited GluA2 Rescues behavioural deficits in the hAPP-J20 mouse model ___________________________________________________________________________________
216
and GluA2R/R/hAPP-J20 mice (p<0.05) spent significantly less time in the centre on day
three, though not on day two, when compared to day one. This shows hAPP expressing
mice (i.e. WT/hAPP-J20 and GluA2R/R/hAPP-J20) exhibit a delayed anxious phenotype
compared to non-hAPP expressing mice (i.e. WT/WT and GluA2R/R/WT) in the EPM.
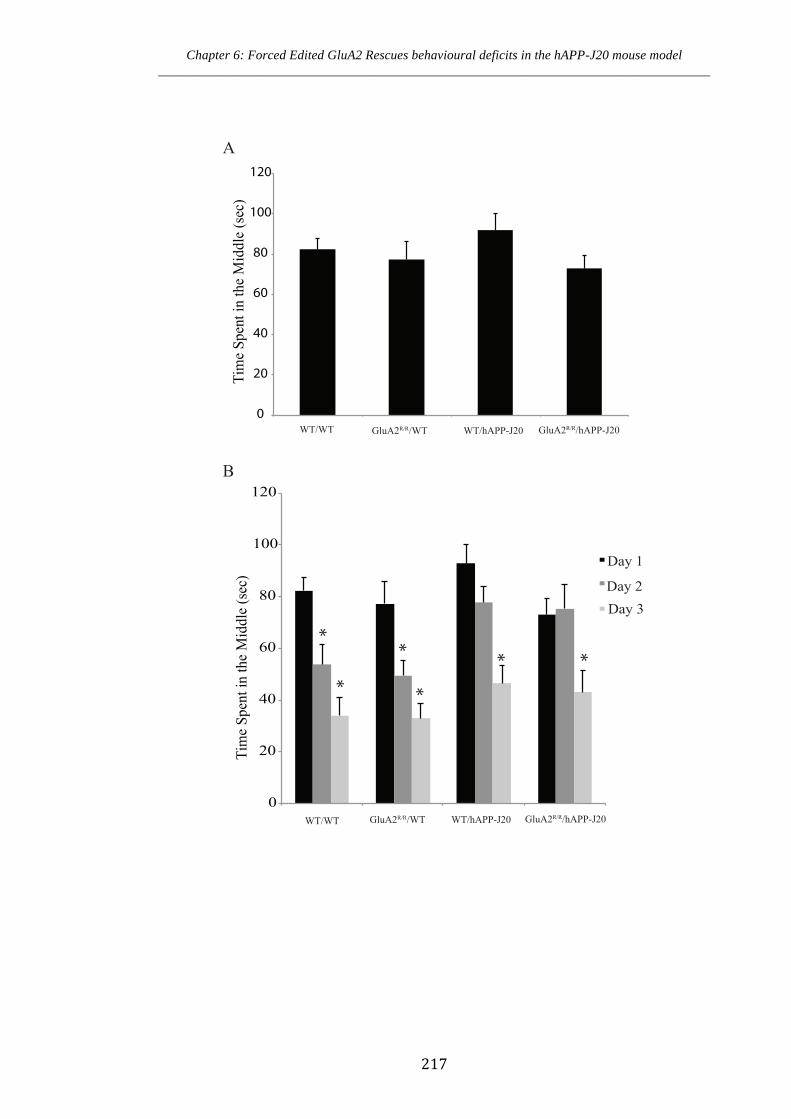
Chapter 6: Forced Edited GluA2 Rescues behavioural deficits in the hAPP-J20 mouse model ___________________________________________________________________________________
217
Time in Middle
0
20
40
60
80
100
120
Tim
e Sp
ent i
n th
e M
iddl
e (s
ec)
0
20
40
60
80
100
120
Tim
e Sp
ent i
n th
e M
iddl
e (s
ec)
Day 1
Day 2 Day 3
*
*
*
*
**
A
B
WT/WT GluA2R/R/WT WT/hAPP-J20 GluA2R/R/hAPP-J20
WT/WT GluA2R/R/WT WT/hAPP-J20 GluA2R/R/hAPP-J20

Chapter 6: Forced Edited GluA2 Rescues behavioural deficits in the hAPP-J20 mouse model ___________________________________________________________________________________
218
Chapter 6: Forced Edited GluA2 Rescues behavioural deficits in the hAPP-J20 mouse model
Figure 6.2.2 No alteration to time spent in the middle of the open field test in forced
edited GLuA2 and hAPP-J20 mice. (A) Analsysis of the open field test in WT/WT,
GluA2R/R/WT, WT/hAPP-J20 and GluA2R/R/hAPP-J20 mice revealed no differences in
the time spent in the middle (One-Way ANOVA; n= 15-21/group). (B) Analysis of the
three day habituation paradigm revealed less time spent in the middle in WT/WT and
GluA2R/R/WT between each day. WT/hAPP-J20 and GluA2R/R/hAPP-J20 exhbited a
delayed anxiety-like disposition, with significant differences between days 3 and days 1
and 2 (Two-Way Repeated Measures ANOVA; n= 15-21/group). Each value represents
the mean ± standard error of the mean (SEM). *p<0.05
Chapter 6: Forced Edited GluA2 Rescues behavioural deficits in the hAPP-J20 mouse model ___________________________________________________________________________________
219
6.3 Novel object discrimination is not altered in hAPP-J20 expressing mice or in
mice with forced edited GluA2
The object recognition test is a non-spatial memory and learning paradigm used to
monitor short- or long- term memory. In order to perform the object recognition test,
mice were placed in a box with two identical objects and allowed to explore for 10
minutes. Four hours after the initial test, mice were placed back into the box, whereby
one of the objects was replaced with a novel object (Figure 6.3A). The time spent
exploring each of the objects (i.e. the old and the novel objects) was manually timed and
analysed. Mice with intact non-spatial memory will tend to assess the new object more
so than the old object. Our results show that the total time spent observing the objects
did not differ between each of the groups (Figure 6.3B; F(3,94)=0.4323, p=0.73),
indicating all mice had equal exploratory behaviour. In order to determine if the mice
had a preference to explore the novel object, the discrimination ratio was calculated by
the time spent exploring the novel object divided by the total time of exploring both
objects. In this study, their was no significant differences for object discrimination
between each of the groups, (Figure 6.3C F(3,94)=1.476, p=0.22) and each group showed
a preference to explore the novel object. Therefore, despite other models, such as the
APP/PS1 model, showing deficits in the object recognition test (Heneka et al 2012), the
hAPP-J20 model did not show deficits in this paradigm following a four-hour retention
period. Furthermore, the alteration of GluA2 RNA editing did not modify the
discrimination ratio of a unique object in the novel object recognition test.

Chapter 6: Forced Edited GluA2 Rescues behavioural deficits in the hAPP-J20 mouse model ___________________________________________________________________________________
220
0
0.1
0.2
0.3
0.4
0.5
0.6
0.7
0.8
Ob
ject
Descrim
inta
tio
n r
ati
o
0
5
10
15
20
25
30
Ob
ject
ex
plo
ra
tio
n (
seco
nd
s)
4 hrs
Figure 6.3. Object recognition testing in hAPP mice with forced edited GluA2. (A) Rep-
resentive image of the testing procedure. (B) No differences occured between the total
time spent exploring objects (One-Way ANOVA; n=13-15/group). (C) No differences
occured between any of the genotypes for the descrimination between objects. Each
value represents the mean ± standard error of the mean (SEM). .
A
B C
WT/WT GluA2R/R/WT WT/hAPP-J20 GluA2R/R/hAPP-J20 WT/WT GluA2R/R/WT WT/hAPP-J20 GluA2R/R/hAPP-J20

Chapter 6: Forced Edited GluA2 Rescues behavioural deficits in the hAPP-J20 mouse model ___________________________________________________________________________________
221
6.4 Working memory is impaired in the hAPP-J20 mouse model and is, in part,
rescued through the expression of forced edited GluA2
The Y-maze is used to determine deficits in short-term memory by measuring forced
alternation within the maze. In this study, mice were placed in the centre of the Y-maze
and allowed to explore for five minutes (Figure 6.4.1A). The number of spontaneous
alternations (e.g movements ABC and BCA but not ABA) was calculated as a
percentage of total arm entries. If short-term working memory is intact, mice will
perform more spontaneous alternations. A One-Way ANOVA revealed significant
differences in spontaneous alternation between groups (Figure 6.4.1B; F(3,86)=5.355,
p<0.05). A post-hoc analysis with Bonferroni corrections discovered reduced
spontaneous alternation behaviour of WT/hAPP-J20 mice as compared to GluA2R/R/WT
mice (p<0.05) and GluA2R/R/hAPP-J20 mice (p<0.05). To account for the potential
impact of increased locomotion, the total number of arm entries over the five-minute
period was analysed (Figure 6.4.1C). A One-Way ANOVA revealed no difference in
the number of arm entries between groups (F(3,86)=2.173, p=0.096), suggesting that all
mice have the same levels of motivation, curiosity and motor function in the Y-maze.
Combined, these results indicate that forced edited GluA2 can improve short term
working memory deficits that occur in WT/hAPP-J20 mice at 24-weeks of age.
In addition the Y-maze, the radial arm maze (RAM) is a strongly hippocampal-
dependent memory and learning test that can accurately determine working memory
function. This test is more complex than the Y-maze as it involves 8 arms, and utilises a
food reward, thus increasing motivation. In order to assess working memory, the Win-
Stay version of the RAM was employed. In this version of the RAM, all 8 arms of the
RAM are baited with sweetened condensed milk (Figure 6.4.2A). Mice must retrieve all
eight arms of the maze and remember not to re-enter an already collected arm. When
working memory is compromised, there is often an increase in the number of re-entries
into previously collected arms (Wenk 2001). In this paradigm, the mice were habituated
to the RAM for three days prior to the beginning of the test by allowing the mouse to
explore one arm of the maze and collect the milk. On day one of the test, mice were
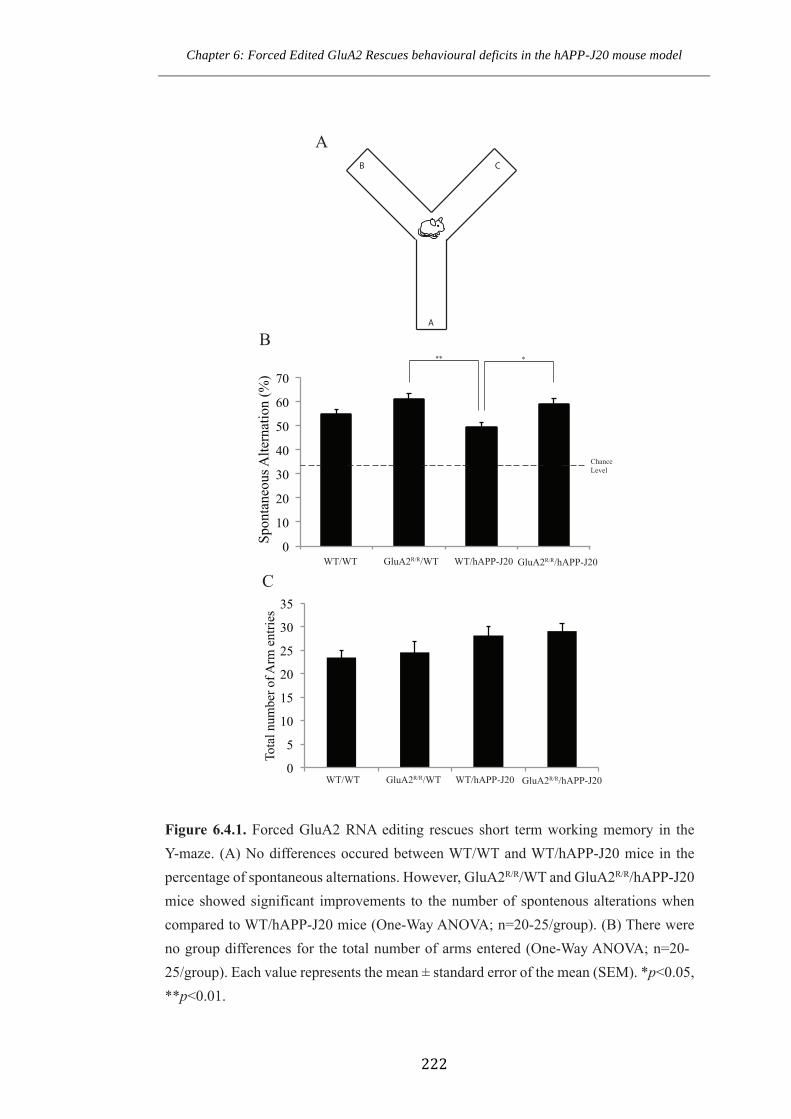
Chapter 6: Forced Edited GluA2 Rescues behavioural deficits in the hAPP-J20 mouse model ___________________________________________________________________________________
222
0
10
20
30
40
50
60
70
Spon
tane
ous A
ltern
atio
n (%
)
0
5
10
15
20
25
30
35
Tota
l num
ber o
f Arm
ent
ries
Chance Level
** *
B C
A
Figure 6.4.1. Forced GluA2 RNA editing rescues short term working memory in the Y-maze. (A) No differences occured between WT/WT and WT/hAPP-J20 mice in the percentage of spontaneous alternations. However, GluA2R/R/WT and GluA2R/R/hAPP-J20 mice showed significant improvements to the number of spontenous alterations when compared to WT/hAPP-J20 mice (One-Way ANOVA; n=20-25/group). (B) There were no group differences for the total number of arms entered (One-Way ANOVA; n=20-25/group). Each value represents the mean ± standard error of the mean (SEM). *p<0.05, **p<0.01.
Chapter 6: Forced Edited GluA2 Rescues behavioural deficits in the hAPP-J20 mouse model
A
B
C
WT/WT GluA2R/R/WT WT/hAPP-J20 GluA2R/R/hAPP-J20
WT/WT GluA2R/R/WT WT/hAPP-J20 GluA2R/R/hAPP-J20
Chapter 6: Forced Edited GluA2 Rescues behavioural deficits in the hAPP-J20 mouse model ___________________________________________________________________________________
223
placed in the centre of the RAM and allowed to explore the maze until baits arms were
collected from each arm, or until 10 minutes had elapsed. The test continued for 12
consecutive days. Two days were combined to form one time point known as ‘Session’.
An error was marked when a mouse made a repeated entry into an already retrieved
baited arm.
The number of repeated entries over the sessions was analysed as an indication of
working memory (Figure 6.4.2C). A 2-way repeated measures ANOVA, with day and
group as factors revealed no interaction effect (F(33,462) =1.261, p=0.1557), therefore the
main effects were analysed. A significant difference occurred over days (F(11,462) = 8.99,
p<0.01) indicating that the mice were able to learn the protocol over time. A significant
group effect was also determined (F(3,42)=18.97, p<0.01) demonstrating differences in
learning between groups. Post-hoc analysis with Bonferroni corrections of group
revealed no difference between GluA2R/R/WT mice and WT/WT mice, showing that
forced expression of edited GluA2 does not modulate short-term working memory
formation in the normal brain. In contrast, a significant difference occurred between
WT/hAPP-J20 mice and all other groups (p<0.05), indicating short term working
memory deficits in these mice. Most excitingly, GluA2R/R/hAPP-J20 mice showed
significant improvements compared to WT/hAPP-J20 mice (p<0.05), indicating that
forced GluA2 RNA editing at the Q/R site can improve memory and learning our AD
mouse model. However, GluA2R/R/hAPP-J20 mice were significantly different from
WT/WT mice (p<0.05; though not GluA2 R/R/WT mice) demonstrating partial
improvement to short term working memory. Importantly, their were no differences in
the time taken to complete the task between genotypes indicating that time was not a
limiting factor in this test (Figure 6.4.2C).

Chapter 6: Forced Edited GluA2 Rescues behavioural deficits in the hAPP-J20 mouse model ___________________________________________________________________________________
224
0
2
4
6
8
10
12
1 2 3 4 5 6
Wor
king
Mem
ory E
rror
s
Session
0
50
100
150
200
250
300
350
400
450
500
1 2 3 4 5 6
TIme
Spen
t in M
aze (
sec)
Session
***
*
A
B
C
WT/WT GluA2R/R/WT WT/hAPP-J20 GluA2R/R/hAPP-J20
WT/WT GluA2R/R/WT WT/hAPP-J20 GluA2R/R/hAPP-J20
Chapter 6: Forced Edited GluA2 Rescues behavioural deficits in the hAPP-J20 mouse model ___________________________________________________________________________________
225
Chapter 6: Forced Edited GluA2 Rescues behavioural deficits in the hAPP-J20 mouse model
Figure 6.4.2 Win-Shift radial arm maze (RAM) working memory test in hAPP-J20 mice
expressing forced edited GluA2. (A) Schematic representation of the Win-Shift version
of the RAM, whereby all arms of the maze are baited. An error was marked if a mouse
entered a previously collected arm. (B) Analysis of the number of repeated entries
revealed WT/hAPP-J20 mice exhibited increased number of errors as compared to
WT/WT, GluA2R/R/WT and GluA2R/R/hAPP-J20 mice. GluA2R/R/hAPP-J20 mice were
significantly different from WT/WT mice, though not from GluA2R/R/WT, indicating
partial recovery of working memory deficits in the hAPP-J20 mouse model of AD
through the expression of forced edited GluA2 (Two-Way Repeated Measures ANOVA;
n=9-13/group). (C) No differences between the time taken to complete the maze between
WT/WT, GluA2R/R/WT, WT/hAPP-J20 and GluA2R/R/hAPP-J20 mice, indicating time
did not play a factor in the working memory test (Two-Way Repeated Measures
ANOVA; n=9-13/group). Each value represents the mean ± standard error of the mean
(SEM). *p<0.05, ***p<0.001
Chapter 6: Forced Edited GluA2 Rescues behavioural deficits in the hAPP-J20 mouse model ___________________________________________________________________________________
226
6.5 Spatial reference memory is impaired in hAPP-J20 mice and is rescued
through the expression of forced edited GluA2 RNA
A modified version of the RAM, the Win-Shift version, is capable of determining long-
term spatial memory and learning deficits in rodents. As previously explained, the
hAPP-J20 mouse model of AD endures deficits in spatial memory and learning during
disease progression. As described in Chapter 3, in the Win-Shift version of the RAM
three of the eight arms were baited with sweetened condensed milk (Figure 6.5A). Over
the testing duration, mice must remember to only enter the baited arms. Long-term
spatial memory deficits often result in entries into non-baited arms and re-entries into
already retrieved arms.
In this paradigm, 24-week old WT/WT, GluA2R/R/WT, WT/hAPP-J20 and
GluA2R/R/hAPP-J20 mice were placed in the maze until all three baits were retrieved, or
until 5 minutes has elapsed. The test was performed two times a day for twenty-four
days. Over the 24-day period, the mice must remember which of the eight arms are
baited and should only enter these arms, utilising spatial cues placed around the room.
An error was scored if the mouse entered a non-baited arm, or an arm in which the bait
had previously been retrieved. Two days (i.e. four trials) were combined to form a
‘Session.’
The percentage of correct entries was analysed as a measure of spatial reference
memory in forced edited GluA2 and hAPP-J20 mice (Figure 6.5B). A 2-way repeated
measures ANOVA revealed a significant difference between sessions (F(11,2068) = 41.04,
p<0.001) indicating that the mice were able to learn the protocol over time. A
significant group effect was also determined (F(3,188)=9.208, p<0.001) demonstrating
differences in learning between groups. Post-hoc analysis of group with Bonferroni
corrections revealed no difference between GluA2R/R/WT mice and WT/WT mice,
demonstrating that forced expression of edited GluA2 does not modulate long-term
spatial memory formation. In contrast, a significant difference occurred between
WT/hAPP-J20 mice and all other groups (p<0.05), indicating long-term spatial memory
deficits in these mice. Most excitingly, GluA2R/R/hAPP-J20 mice showed significant

Chapter 6: Forced Edited GluA2 Rescues behavioural deficits in the hAPP-J20 mouse model ___________________________________________________________________________________
227
improvements compared to WT/hAPP-J20 mice (p<0.05), indicating that the forcing of
GluA2 RNA editing at the Q/R site can improve long-term memory and learning in AD.
In summary, hAPP-J20 mice exhibit memory and learning deficits in a 24 day Win-Stay
protocol of the RAM, which is improved through the forced expression of edited
GluA2.
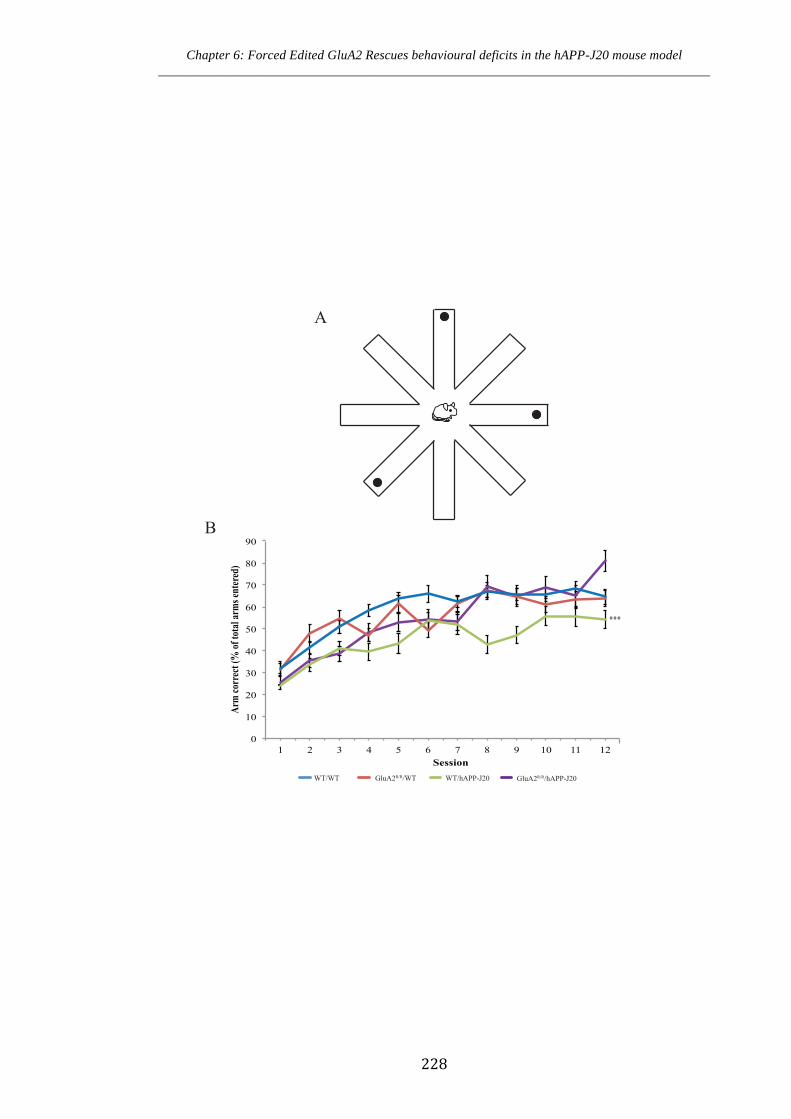
Chapter 6: Forced Edited GluA2 Rescues behavioural deficits in the hAPP-J20 mouse model ___________________________________________________________________________________
228
0
10
20
30
40
50
60
70
80
90
1 2 3 4 5 6 7 8 9 10 11 12 Session
Arm
corr
ect (
% of
tota
l arm
s ent
ered
)
***
A
B
WT/WT GluA2R/R/WT WT/hAPP-J20 GluA2R/R/hAPP-J20

Chapter 6: Forced Edited GluA2 Rescues behavioural deficits in the hAPP-J20 mouse model ___________________________________________________________________________________
229
Chapter 6: Forced Edited GluA2 Rescues behavioural deficits in the hAPP-J20 mouse model
Figure 6.5. Win-Stay radial arm maze (RAM) reference memory test reveals recovery of
spatial reference memory in hAPP-J20 mice expressing forced edited GluA2. (A) Sche-
matic representation of the Win-Stay version of the RAM, whereby three of the eight
arms of the maze are baited. An error is marked if a mouse enters a non-baited or a previ-
ously collected arm. (B) Analysis of the number of non-baited arm entries revealed
WT/hAPP-J20 mice exhibit increased number of errors as compared to WT/WT,
GluA2R/R/WT and GluA2R/R/hAPP-J20 mice. GluA2R/R/hAPP-J20 mice were not signifi-
cantly different from WT/WT mice and GluA2R/R/WT, indicating complete recovery of
spatial reference memory deficits in the hAPP-J20 mouse model of AD through the
expression of forced edited GluA2 (Two-Way Repeated Measures ANOVA; n=8-
17/group). Each value represents the mean ± standard error of the mean
(SEM).***p<0.001

Chapter 6: Forced Edited GluA2 Rescues behavioural deficits in the hAPP-J20 mouse model ___________________________________________________________________________________
230
Discussion
The creation of the GluA2R/R mouse model has allowed us to examine the influence that
RNA editing of the GluA2 subunit at the Q/R site has on memory, learning and motor
function. Furthermore, by crossing the GluA2R/R mouse line with the hAPP-J20 AD
mouse model we have determined the effects of forced edited GluA2 on motor function,
anxiety-like behaviour and spatial and non-spatial memory and learning in AD. Our
results have indicated recovery of memory and learning in hAPP-J20 mice that express
force edited GluA2.
Forced edited GluA2 at the Q/R site does not alter locomotion, anxiety and memory
and learning in the healthy brain
Previous literature has characterised a similar GluA2R/R mouse model at an anatomical
and immunohistochemical level (Kask et al 1998), though the behavioural function of
this genetic mutation has never been examined. Here, we tested GluA2R/R mice in a
battery of behavioural paradigms including the OFT, rotorod, EPM, object recognition
test, Y-maze as well as reference and working memory versions of the RAM. Our data
indicated no differences in each of these tests between GluA2R/R/WT mice and WT/WT
mice, thus leaving the role of GluA2 RNA editing in memory largely unknown. Our
results in Chapter 5 indicated a significant increase in the number of spines in GluA2R/R
mice, however, this did not correlate to alterations in memory and learning in each of
the behavioural paradigms tested. Thus, despite unedited GluA2 at the Q/R site being
expressed in approximately 1% of cases, it does not appear to be essential for
behavioural memory and learning. Therefore, the behavioural improvements observed
in the hAPP-J20 mice through forced edited GluA2 (described below) may be directly
due to the rescue of spines and neuronal numbers.
Forced edited GluA2 at the Q/R site rescues certain behavioural changes, memory
and learning in the hAPP-J20 mouse model of AD.
The consequence of GluA2R/R expression and the resulting neuronal protection in the
hAPP-J20 model was further investigated by determining the behavioural performance
of the GluA2R/R/hAPP-J20 mice. As described in Chapter 3, hAPP-J20 mice exhibited
Chapter 6: Forced Edited GluA2 Rescues behavioural deficits in the hAPP-J20 mouse model ___________________________________________________________________________________
231
deficits in the hippocampal-dependent RAM as well as increased locomotion in the
OFT. In this chapter, we extended upon these findings to test locomotion, motor
function, anxiety-like behaviour as well as both spatial and non-spatial memory and
learning.
Several AD mouse models, such as the APP/PS1 mouse model, are often found to be
more active in the OFT as compared to their age-matched WT controls (Heneka et al
2012). As described in Chapter 3, we and others (Harris et al 2010) have found that
hAPP-J20 mice are hyperactive in the OFT. Here, we determined if the expression of
GluA2R/R in the hAPP-J20 model could potentially rescue this observed hyperactivity.
We have found that WT/hAPP-J20 mice travelled further than GluA2R/R/hAPP-J20
mice over a ten minute OFT, indicating partial rescue of hyperactivity through
modulation to GluA2 RNA editing. In addition, the ability to habituate to an
environment is often impaired in AD mice (Bales et al 2006). This can be determined
by placing the mouse back into the OFT for consecutive days, in which adequate
habituation should cause a decrease in locomotion as the environment becomes more
familiar. Other AD mice models, such as the APP/PS1 model show an inability to
habituate to an open field over a three-day re-exposure test (Heneka et al 2012). In
contrast, WT/hAPP-J20 mice did not show acclimatisation discrepancies and exhibited
no differences in distance travelled over a three day, 10 minute per day habituation test.
Combined, these studies indicate that modification to GluA2 RNA editing in AD can
potentially rescue spontaneous locomotion in the hAPP-J20 mouse model.
The accelerating rotorod test is commonly used to assess motor coordination and motor
learning in many rodent models of disease. In particular, mouse models of AD have
often shown alteration in rotorod performance, with both improved and inferior
performances recorded (Lalonde et al 2002, Morgan et al 2008a). Our study has
indicated that hAPP expressing mice have improved latency to fall on day one of the
rotorod. The differences on the beginning day between hAPP expressing mice (i.e.
WT/hAPP-J20 and GluA2R/R/hAPP-J20) and non-hAPP expressing mice (i.e. WT/WT
and GluA2R/R/WT) may be potentially due to the observed changes in body weight, as it
has previously been shown that lighter mice perform better on the rotorod (McFadyen et
Chapter 6: Forced Edited GluA2 Rescues behavioural deficits in the hAPP-J20 mouse model ___________________________________________________________________________________
232
al 2003). However, other AD mouse models that are not susceptible to alteration in
weight have also shown improvements, thus the current phenomena observed in this
study may be due to a physiological motor benefit of hAPP expression (Morgan et al
2008b).
Anxiety, alteration to fear, and irritability are notable psychological complications that
occur in AD. The EPM is a non-training animal test of anxiety-like behaviour that
depends on the manipulation of natural fear and exploratory motivation upon exposure
to a novel stimulus. Previous studies have indicated that the 3x Tg-AD mouse model
exhibit lower levels of anxiety, and spend more time in the open arms of the EPM arena
compared to WT controls at five months of age (Pietropaolo et al 2014). Furthermore,
the hAPP-J20 mouse model has been shown to spend more time in the open arms of the
EPM compared to WT littermate controls (Harris et al 2010), suggesting lower levels of
anxiety or disinhibition. In Chapter 3, we indicated towards significance for hAPP-J20
mice to spend more time in the open arm of the EPM at 24 weeks of age. In this
particular cohort of mice we have shown that WT/hAPP-J20 mice have an increased
ratio of open arm to total arm entries over a five minute EPM test. Furthermore,
GluA2R/R/hAPP-J20 mice have a decreased ratio of open to total arm entries indicating
improvements to disinhibition of anxiety-like behaviour through the expression of
forced edited GluA2 in an AD mouse model.
Disruptions to the recognition of objects are often among the earliest symptoms of AD.
This form of memory is dependent upon the relay of sensory information between the
neocortex, entorhinal cortex and the hippocampus. The object recognition test is based
on the spontaneous tendency of mice to preferentially explore new objects. This test is
very useful to study short-term memory, intermediate-term memory or long-term
memory through alterations to the retention interval (Antunes & Biala 2012). The object
recognition task does not require external motivation, reward or punishment and little
training is necessary. Lesions to the hippocampus have been shown to produce
profound anterograde memory impairments, resulting in deficits in the object
recognition test. However, other brain regions including the entorhinal, perirhinal and
parahippocampal cortices are known to be involved in object recognition and

Chapter 6: Forced Edited GluA2 Rescues behavioural deficits in the hAPP-J20 mouse model ___________________________________________________________________________________
233
discrimination (Antunes & Biala 2012). Previous studies have indicated that the
APP/PS1 mouse model of AD has impairments in the novel object recognition test
when one of two objects is replaced with another four hours after the initial trial
(Heneka et al 2012). Therefore, we adopted this protocol to determine if forced edited
GluA2 can modulate non-spatial object recognition memory in the hAPP-J20 model. In
our study, WT/hAPP-J20 mice did not show deficits in the object recognition test and
forced edited GluA2 did not alter the preference for mice to explore the novel object.
Potentially, a longer interval between training and testing period may be able to detect
differences in object discrimination in the hAPP-J20 mouse model of AD.
Mouse models of AD often present with alteration to spatial memory and learning due
to alteration of hippocampal synaptic plasticity (Lovasic et al 2005). In order to
determine if modulation to GluA2 RNA editing at the Q/R site can improve working
and reference memory in the hAPP-J20 mouse model of AD, we utilised the Y-maze
and the Win-Shift version of the RAM for short-term working memory as well as the
Win-Stay version of the RAM for long-term reference memory. The Y-maze is based
on the innate preference of mice to alternate arms when exploring a new environment,
and a variety of AD mouse models have shown significant impairment in the Y maze
test (King & Arendash 2002, Ma et al 2013, Oakley et al 2006). Furthermore, the Win-
Shift version of the RAM is a more complex test and several studies have indicated that
for mice to solve the RAM, a memory of previously visited arms is required, as rodents
utilise external spatial cues to navigate through the maze. Through neurosurgical,
pharmacological and molecular manipulations, it is now well known that the RAM is
entirely hippocampal-dependent. In addition, as previously described, the RAM offers
advantages over the more commonly used MWM as it is based on instinctive food
retrieval and is less invasive to the mouse. Thus, we used the Y-maze, Win-Shift and
Win-Stay versions of the RAM to test the effects of forced edited GluA2 in hAPP-J20
mice on hippocampal-dependent memory function. We showed that GluA2R/R/hAPP-
J20 mice have improved working and reference memory in all hippocampal-dependent
tests as compared to WT/hAPP-J20 mice. Therefore, the expression of forced edited
GluA2 is capable of improving hippocampal-dependent spatial navigation in the hAPP-
J20 mouse model of AD.
Chapter 6: Forced Edited GluA2 Rescues behavioural deficits in the hAPP-J20 mouse model ___________________________________________________________________________________
234
Summary
The aetiology of AD encompasses a global deterioration of cognitive functioning across
a variety of domains including attention, memory, visual-spatial skills and problem
solving. Therefore, cognitively characterising mouse models of AD and potential
neuroprotective pathways are a necessary focus for determining treatments for this
disorder. The tests described in this chapter have allowed for the investigation of
behaviour and the processes that guide spatial learning and memory. Combined, our
results have indicated that the expression of forced edited GluA2 in the normal mouse
has no impact on behaviour, memory and learning. However, we cannot exclude that
forced edited GluA2 may alter other behavioural tests that have not been assessed in
this chapter.
One of the most profound findings of this chapter is that the expression of forced edited
GluA2 in the hAPP-J20 mouse model is able to in part rescue behaviours such as
hyperactivity and anxiety and modulate memory and learning in hippocampal-
dependent spatial navigation tasks. Thus, the rescue of spines and neurons by forced
edited GluA2 may be important for triggering functional hippocampal synaptic
alterations that correlate with the rescue of memory deficits in the hAPP-J20 mouse
model of AD. The functional rescue of the hAPP-J20 mouse model of AD through
modulation to the GluA2 RNA editing process gives strong indication that targeting
pathways involved in upregulating GluA2 RNA editing at the Q/R site may be a novel
therapeutic target for treating cell death and memory loss in AD.

235
Chapter 7
Discussion
Chapter 7: Discussion ____________________________________________________________________________________
236
Discussion 7.1 Summary of findings AD is an amnestic disorder that is characterised by the build up of Aβ-containing
plaques, the abnormal hyperphosphorylation of tau, abundant neuroinflammation,
synaptic dysfunction and neuronal loss (Akiyama et al 2000, Benilova et al 2012,
Esposito et al 2013). In particular, AD is associated with neurodegeneration within the
hippocampus and entorhinal cortex (Gómez-Isla et al 1997, West et al 1994, West et al
2000). However, the mechanisms that lead to cell death in AD are largely unknown.
In this study, we described an as-yet unidentified mechanism that may potentially cause
neuronal cell loss in AD. Firstly, in Chapter 3, we revealed that the hAPP-J20 mouse
model of AD shows progressive age-dependent neuronal cell loss that occurs in parallel
with the onset of neuroinflammation and behavioural decline. Utilising stereological
quantification, we gained a robust analysis of neurodegeneration and indicated that CA1
neuronal cell loss occurred well before the onset of Aβ-containing plaques. This gives
rise to the idea that Aβ-containing plaques may not be an early hallmark of AD. In
context of the current debate regarding therapeutically targeting Aβ, our study indicates
that other pathological hallmarks, including prevention of neuronal loss, may be a more
viable approach to halting AD in the early stages.
We next, in Chapter 4, described that alteration to GluA2 RNA editing at the Q/R site,
through modulation of the editing complementary sequence (ECS; termed
GluA2+/ECS(CG) mice), can result in a loss of synapses and neuronal degeneration. We
revealed that the expression of GluA2 at the surface was normal, however Ca2+-
permeable AMPA receptors were still apparent. These results indicated that unedited
GluA2 is incorporated into the AMPA receptor and expressed as the synapse in
GluA2+/ECS(CG) mice. Thus, this study revealed that unedited GluA2 RNA editing may
be a regulator of hippocampal CA1 region neuronal cell fate.
After establishing a parallel cell loss in the CA1 hippocampal region between hAPP-J20
and GluA2+/ECS(CG) mice, we next aimed to determine if unedited GluA2 plays a role in
Chapter 7: Discussion ____________________________________________________________________________________
237
neuronal cell death in AD. In Chapter 5 we revealed that hAPP-J20 mice exhibit
reduced GluA2 RNA editing efficiency at the Q/R site and thus aimed to prevent
against unedited GluA2. This was achieved by crossing the hAPP-J20 mouse model
with a model that only expresses edited GluA2 (GluA2R/R mice). Our results revealed
that the expression of forced edited GluA2 in the hAPP-J20 mouse model was able to
rescue neurodegeneration and restore spine density. GluA2 expression in the hAPP-J20
mice and GluA2R/R mice was fundamentally normal and AMPA receptor complex
formation and surface expression was unaltered. We revealed that Aβ deposition was
unchanged in hAPP-J20 mice expressing forced edited GluA2. However through robust
stereological quantification and spine analysis, we revealed that neuronal protection was
achieved through the forced expression of edited GluA2 in the hAPP-J20 mouse model
of AD.
Finally, in Chapter 6 we aimed to determine if the observed neuronal protection
correlated with a functional recovery of both hippocampal -dependent and –independent
memory and learning tasks, as well as gross motor function and anxiety. We revealed
that hAPP-J20 mice expressing forced edited GluA2 showed improved working and
reference spatial memory in a variety of paradigms tested. Combined, these findings
indicate that GluA2 RNA editing may be a key mediator of synaptic plasticity, and
suggest that blockade of this process is beneficial for neuroprotection in AD.
7.2 hAPP J20 mouse model exhibits cell loss prior to plaque load The hAPP-J20 mouse model of AD, developed by Mucke et al. (2000), over-expresses a
mutated form of the human APP, resulting in a significant increase in Aβ production in
the brain. Previous studies have indicated the hAPP-J20 mouse model exhibit Aβ-
containing plaques by 9 months of age (Cheng et al 2004, Mucke et al 2000, Shankar et
al 2009). However, other pathological hallmarks in this model have been largely
uncharacterised. Here, we revealed that hAPP-J20 mice exhibit age-dependent neuronal
cell loss, an abundant increase to microglia and astrocytes, and memory and behavioural
decline during disease progression.
Chapter 7: Discussion ____________________________________________________________________________________
238
Our findings indicate that neurodegeneration occurs well in advance of plaque load in
the hAPP-J20 mouse model. Plaque load has long been considered to be the major
hallmark and therapeutic target for AD, and as such it is now extensively investigated as
an early prognostic marker of AD. Consequently, the first FDA-approved Aβ imaging
ligand (Amyvid™), which detects neuritic plaques, has recently been released (Yang et
al 2012). However, there is still debate as to the clinical relevance of neuritic plaques, as
the correlation between plaque deposition and cognitive status is not clear (Johnson et al
2013, Knopman et al 2003). Indeed, many Aβ-based drugs have been largely
unsuccessful (Moreth et al 2013). For example, active immunisation has been utilised to
remove Aβ plaques. However, despite diminishing plaque accumulation, patients
continued to show clinical worsening and neuronal loss, suggesting that plaque load
may not be indicative of cognitive status (Holmes et al 2008). Thus, as neuronal cell
loss occurs prior to plaque onset in the hAPP-J20 mouse model, it is possible that
neurodegeneration could be occurring independent of the Aβ processing and the
therapeutics targeted at Aβ may be unviable due to aggressive neurodegeneration many
years in advance of plaque detection.
Many AD patients are susceptible to epileptic seizures (Imfeld et al 2013). This
phenomenon is mimicked in the hAPP-J20 mouse model, and correlates with
synaptotoxicity within the hippocampus (Palop et al 2007). This indicates that hyper-
excited neuronal activity may be a key mediator of synaptic and neuronal degeneration.
More recently, antiepileptic drugs have shown positive effects in patients with MCI and
in AD mouse models (Hommet et al 2008). As it is now well established that synaptic
and neuronal loss in the hippocampus are early events in AD, further investigation into
mechanisms that cause neuronal hyper-excitability and neuronal cell death are key for
understanding how AD progresses. Previous studies, including the present study, have
shown modulation to GluA2 RNA editing at the Q/R site can cause epileptic seizure
activity and cell death in certain neurological disorders (Brusa et al 1995, Feldmeyer et
al 1999, Kawahara et al 2004a, Peng et al 2006). Thus we hypothesised unedited GluA2
to be a cell death mechanism occurring within AD.
Chapter 7: Discussion ____________________________________________________________________________________
239
7.3 Unedited GluA2 RNA editing plays a role in neuronal cell death
The AMPA receptor GluA2 subunit is solely responsible for the Ca2+ permeability of
AMPA receptors. In particular, RNA editing at the Q/R site is essential to render the
AMPA receptor Ca2+-impermeable. Thus, AMPA receptors can be Ca2+-permeable
because they are either GluA2-lacking or because they contain the unedited GluA2(Q)
subunit. Here, we have shown that abundant unedited GluA2 is a driving force of
neuronal cell death.
Previous literature has often indicated that GluA2-lacking receptors are the most
abundant form of Ca2+-permeable AMPA receptors and that these types of receptors are
the primary cause of cell death in disease (Pellegrini-Giampietro et al 1997). However,
where Ca2+-permeable AMPA receptors have been observed, it is often assumed that
they are GluA2-lacking receptors, rather than the unedited form. This is because AMPA
receptors have the same characteristics whether they are GluA2-lacking or whether they
contain the unedited GluA2(Q) subunit; first, they are Ca2+-permeable. Second, the
AMPA receptors exhibit inward rectification when the polyamine, spermine, is diffused
into the cell from the recording electrode: this is measured as an altered rectification
index. Third, Ca2+-permeable AMPA receptors become selectively sensitive to block by
Joro spider toxin (JSTX) and to related drugs such as 1-naphthylacetyl spermine
(Naspm) and IEM-1460. Thus, unless unedited GluA2 is specifically examined, it is
often presumed that the Ca2+-permeable receptors are GluA2-lacking.
There is now strong evidence to indicate that unedited GluA2 receptors are more toxic
than GluA2-lacking receptors. For instance, GluA2 KO mice are functionally viable
(Wiltgen et al 2010), however mice which are produced to have high levels of unedited
GluA2 are susceptible to seizures and premature death (Feldmeyer et al 1999). In
addition, the KO out of ADAR2 is lethal and this is strictly due to its role in GluA2
RNA editing (Higuchi et al 2000). Combined, these results show that GluA2-lacking
receptors do not alter function, however a lack of RNA editing is toxic. Indeed, in this
study we have shown that increased unedited GluA2, through modulation to the ECS
(known as GluA2+/ECS(CG) mice) can cause CA1 hippocampal neuronal cell death. This,
combined with our previous studies that have indicated no cell loss in GluA2 KO mice
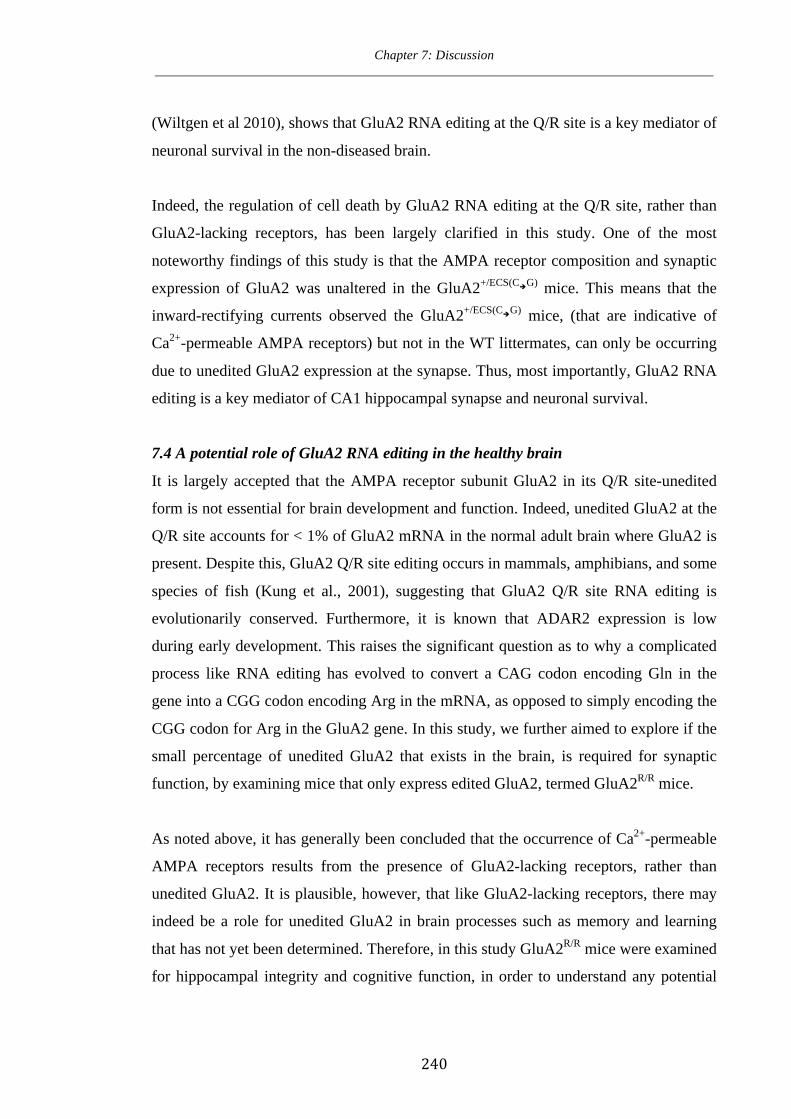
Chapter 7: Discussion ____________________________________________________________________________________
240
(Wiltgen et al 2010), shows that GluA2 RNA editing at the Q/R site is a key mediator of
neuronal survival in the non-diseased brain.
Indeed, the regulation of cell death by GluA2 RNA editing at the Q/R site, rather than
GluA2-lacking receptors, has been largely clarified in this study. One of the most
noteworthy findings of this study is that the AMPA receptor composition and synaptic
expression of GluA2 was unaltered in the GluA2+/ECS(CG) mice. This means that the
inward-rectifying currents observed the GluA2+/ECS(CG) mice, (that are indicative of
Ca2+-permeable AMPA receptors) but not in the WT littermates, can only be occurring
due to unedited GluA2 expression at the synapse. Thus, most importantly, GluA2 RNA
editing is a key mediator of CA1 hippocampal synapse and neuronal survival.
7.4 A potential role of GluA2 RNA editing in the healthy brain
It is largely accepted that the AMPA receptor subunit GluA2 in its Q/R site-unedited
form is not essential for brain development and function. Indeed, unedited GluA2 at the
Q/R site accounts for < 1% of GluA2 mRNA in the normal adult brain where GluA2 is
present. Despite this, GluA2 Q/R site editing occurs in mammals, amphibians, and some
species of fish (Kung et al., 2001), suggesting that GluA2 Q/R site RNA editing is
evolutionarily conserved. Furthermore, it is known that ADAR2 expression is low
during early development. This raises the significant question as to why a complicated
process like RNA editing has evolved to convert a CAG codon encoding Gln in the
gene into a CGG codon encoding Arg in the mRNA, as opposed to simply encoding the
CGG codon for Arg in the GluA2 gene. In this study, we further aimed to explore if the
small percentage of unedited GluA2 that exists in the brain, is required for synaptic
function, by examining mice that only express edited GluA2, termed GluA2R/R mice.
As noted above, it has generally been concluded that the occurrence of Ca2+-permeable
AMPA receptors results from the presence of GluA2-lacking receptors, rather than
unedited GluA2. It is plausible, however, that like GluA2-lacking receptors, there may
indeed be a role for unedited GluA2 in brain processes such as memory and learning
that has not yet been determined. Therefore, in this study GluA2R/R mice were examined
for hippocampal integrity and cognitive function, in order to understand any potential

Chapter 7: Discussion ____________________________________________________________________________________
241
role of unedited GluA2 in the brain. Incredibly, the GluA2R/R mice did not show
alteration to neuronal numbers or dendritic morphology, however, did show a
significant increase to spine density within the stratum radiatum of the hippocampus.
However, no alteration to behaviour, learning and memory was observed. Although, we
cannot rule out that other behavioural functions are potentially altered, such as
contextual fear conditioning, similar to the alterations observed in GluA2 KO mice
(Wiltgen et al 2010). Thus, further investigation into cued and tone conditioning in
GluA2R/R mice may highlight a role for GluA2 RNA editing in memory and learning.
Due to a significant increase of spine density in the brains of GluA2R/R mice, it is
plausible that unedited GluA2 plays a role in synaptic pruning. It is believed that
pruning of unused synapses enhances overall brain signalling and efficiency and occurs
primarily during early development (Yuste & Bonhoeffer 2001). Interestingly, unedited
GluA2 Ca2+-permeable AMPA receptors are also in abundance during early
development (Melcher et al 1997), and thus may be required for the synaptic
elimination. However, further research would be required to determine how synaptic
pruning is regulated in response to unedited GluA2 and what functional effects this may
have, if any.
Combined, we have characterised mice with abundant increases to unedited GluA2 as
well as mice that express no unedited GluA2. These studies have indicated that GluA2
in its unedited form contributes to cell death, though in its edited form no modulation to
neuronal numbers is observed. This profound cell death in the CA1, though not the CA3
region, of GluA2+/ECS(CG) mice interestingly parallels that of the age dependent
neurodegeneration observed in the hAPP-J20 mouse model. Thus, we predicted
unedited GluA2 might be playing a role in AD-mediated cell death.
7.5 Forced edited GluA2 at the Q/R site rescues neurodegeneration in the hAPP-J20
mouse model.
Akbarian et al. (1995) first described an increase to unedited GluA2 at the Q/R site in
the cerebral cortex of post-mortem AD patients. Furthermore, very recent evidence has
indicated that AD patients exhibit increased unedited GluA2 within the hippocampus

Chapter 7: Discussion ____________________________________________________________________________________
242
(Gaisler-Salomon et al 2014). Our study revealed a significant increase to unedited
GluA2 within CA1 pyramidal neurons in the hAPP-J20 mouse model of AD. However,
despite this observation, no changes to the ADAR2 enzyme, the key regulator of GluA2
RNA editing, were observed. It is plausible that like GluA2 RNA editing efficiency,
ADAR2 expression will be changed between hippocampal regions and even within
particular cells. Furthermore, the autoregulation of ADAR2 may be deregulated as it is
known that ADAR2 is controlled by self-editing (Feng et al 2006). Therefore, further
studies will be required to determine ADAR2 cellular localisation and regulation in AD.
Our results have indicated that the expression of forced edited GluA2 can lead to
neuroprotection and spine density protection and that these characteristics are associated
with cognitive recovery in hippocampal-dependent tasks. In particular, our results
indicated a full restoration of neuronal numbers and partial recovery of working and
reference memory within the radial arm maze. Most importantly, the AMPA receptor
composition and the expression of subunits at the synapse was unaltered in the hAPP-
J20 mouse and unchanged through the expression of forced edited GluA2. Thus, we
assume that unedited GluA2 is being incorporated into the AMPA receptor and is
expressed at the synapse. This expression is presumed to cause neuronal excitotoxicity,
as observed in other disease models (Kwak & Kawahara 2005, Peng et al 2006).
However, further research is required to clarify the expression of Ca2+-permeable
AMPA receptors in the AD mouse to ensure the expression of unedited receptors at the
synapse.
Interestingly, the beneficial effects of forcing GluA2 RNA editing in the AD mouse
were observed without detectable changes to Aβ-plaque burden, suggesting that
neuronal rescue can be achieved without targeting APP pathways and processing. As
described, drugs that target Aβ have disappointingly had little success in clinical trials
and there is often little correlation between plaque deposition and cognitive status
(Johnson et al 2013, Knopman et al 2003). This has led to an intense debate amongst the
scientific community as to the clinical relevance of Aβ as both a cause and a hallmark
of AD. There is now evidence to suggest that cell loss, presumably due to excitotoxic
mechanisms, occurs in advance of plaque load and is a critical step in the disease

Chapter 7: Discussion ____________________________________________________________________________________
243
cascade (Bobinski et al 1997). Our study has shown that neuroprotection is achieved
independently of alteration to Aβ plaque deposition. However, it must be taken into
consideration that the work in this study was conducted in a hAPP overexpressing
mouse model, and thus, the abnormal processing of APP is the upstream driver of
abundant unedited GluA2 in this model. However, previous studies have shown
unedited GluA2 in AD brains, regardless of Aβ status (Akbarian et al 1995, Gaisler-
Salomon et al 2014). Nevertheless, this study has indicates that neuroprotection and
cognitive recovery can be regulated through modulation to GluA2 RNA editing at the
Q/R site.
7.6 Future directions
With the predicted exponential growth rate of AD worldwide, there is now an eager
need for a deeper understanding of AD pathology. Investigations into cell death
mechanisms are essential for determining the causes of AD and for developing more
targeted therapies that prevent this neuronal degradation. A deeper understanding of the
initial phases of cell death in AD is crucial for improving cognitive function.
Our study has indicated that GluA2 RNA editing at the Q/R site is required for
protection against AMPA-receptor-mediated excitotoxic neurodegeneration. However,
further evidence is required to show that Ca2+-permeable AMPA receptors exist at the
synapse of AD mice. Here, we have shown that the GluA2 subunit is expressed
normally at the synapse, though we have yet to detect synaptic Ca2+-permeable AMPA
receptors. For this, electrophysiological studies are required to determine the current-
voltage relationship, as it is known that Ca2+-permeable AMPA receptors display
inward rectification. Furthermore, these results will need to be clarified by the addition
of Ca2+-permeable AMPA receptor antagonists, such as Naspm, to show a direct
presence of Ca2+-permeable AMPA receptors. In addition, as it is now well established
that neuronal hyperexcitability leading to seizures, occurs in the hAPP-J20 mouse
model of AD, it would be interesting to test if the expression of forced edited GluA2
could rescue this hyperexcitation by testing mice for seizure activity. Combined, such
future studies will allow us to convincingly conclude that unedited GluA2 is expressed
at the synapse in AD mice, and the prevention of this mechanism is neuroprotective.
Chapter 7: Discussion ____________________________________________________________________________________
244
Further investigation is also required to determine the editing efficiency of other brain
regions. Here, we have shown neuronal loss in the CA1 region of the hippocampus and
revealed that GluA2 RNA editing efficiency is deregulated within this region. In order
to fully elucidate the role of GluA2 RNA editing in AD, the editing efficiency at other
regions of the brain, including the CA3 and cerebral cortex, will need to be examined.
An interesting question that arises is why is there selective vulnerability of CA1
neurons, when these receptor subunits are found in many areas of the brain? Future
studies will be essential to determine if therapies that target GluA2 RNA editing will be
viable to protect against early stage cell death in AD.
As described above, one of the most interesting queries arising from our study is what is
the role of GluA2 RNA editing in the normal brain? GluA2-lacking Ca2+-permeable
AMPA receptors have recently been shown to play a unique role in synaptic function
and experience-dependent plasticity (Clem & Huganir 2010, Isaac et al 2007, Shepherd
2012, Wiltgen et al 2010). However, very little is known about how unedited GluA2
affects neuronal properties. One of the most remarkable results from our study was that
a significant increase to spine density occurs in the GluA2R/R mice. In humans, synaptic
pruning occurs tremendously during childhood and more than half of the synapses are
removed by puberty. Thus, the small percentage (~1%) of unedited GluA2R/R may be
essential for synapse elimination. However, when GluA2 RNA editing becomes
deregulated, such as we observed in the AD mice, then synapse elimination may indeed
become detrimental. Further investigation will be required to characterise the synapses
and synaptic elimination in the early stages of development in GluA2R/R mice.
7.8 Conclusion and significance
In summary, the aim of this thesis was to perform and age-dependent characterisation of
the hAPP-J20 mouse model and identify a mechanism to prevent against
neurodegeneration in AD. Unedited GluA2 at the Q/R site has shown to play a role in
neurodegeneration in ischemia and ALS and has been identified in the hippocampus and
cortex of AD patients. Thus, we hypothesised that unedited GluA2 may be a central
mediator of hippocampal cell loss in the hAPP-J20 mouse model of AD. We have

Chapter 7: Discussion ____________________________________________________________________________________
245
shown that forcing GluA2 RNA editing in AD can lead to neuroprotection, however the
mechanism of the toxicity is still unclear and needs to be elucidated.
Here, by characterising a mouse model with alteration to the ECS, we have revealed
that GluA2 RNA editing is key for CA1 hippocampal region neuronal survival.
Furthermore, we revealed that blocking unedited GluA2 in the hAPP-J20 mouse model
of AD could result in full recovery of neuronal populations within the CA1 region of
the hippocampus and restore deficits to spine density. No changes to Aβ and
neuroinflammation were observed, indicating that neuroprotection can be achieved
without alteration to other pathological hallmarks of AD. This profound neuroprotection
observed by blocking unedited GluA2 further lead to a functional recovery of
hippocampal-dependent memory and learning in numerous tasks. Combined, these
studies indicate that GluA2 RNA editing plays a key role in hippocampal neuronal fate,
both intrinsically and especially within an AD mouse model.
Our findings raise the possibility that therapies targeted at increasing the GluA2 RNA
editing efficiency could protect against AD and other neurological conditions associated
with excitotoxicity. Treatment of GluA2 RNA editing deficiencies is a novel way of
treating excitotoxic neuronal death that should not affect the physiological role of
glutamate receptors in the non-injured neuron. Given the recent literature on the
importance of AMPA receptors in excitotoxic neuronal death (Buckingham et al 2008,
Hideyama et al 2010, Kawahara et al 2004a, Pellegrini-Giampietro et al 1997, Peng et al
2006), and the mechanistic limitations of NMDA receptor antagonists (Herrmann et al
2011, Stone et al 2010, Wilkinson et al 2014), modulation of GluA2 RNA editing may
be a viable therapeutic approach for neuronal protection in a diverse range of CNS
disorders, including AD.

Appendix ____________________________________________________________________________________
246
Appendix 1. Mice utilised in Chapter 3.
Mou
se L
ine
Mou
se ID
Gen
otyp
e
Ana
tom
y
Olig
omer
ic D
ot b
lot
Beh
avio
ur
GT
T
A-b
eta
EL
ISA
Cyt
okin
e E
LSI
A
J20 85 WT X J20 93 WT X J20 94 hAPP-J20 X J20 95 WT X J20 101 WT X X J20 104 hAPP-J20 X X J20 105 hAPP-J20 X J20 112 WT X J20 113 WT X J20 114 hAPP-J20 X X J20 188 WT X J20 189 hAPP-J20 X
X
J20 190 WT X J20 191 WT X J20 192 hAPP-J20 X J20 194 WT X J20 195 WT X X J20 196 WT X J20 197 WT X X J20 222 hAPP-J20 X J20 223 hAPP-J20 X J20 225 hAPP-J20 X J20 226 hAPP-J20 X J20 227 hAPP-J20 X J20 228 WT X J20 230 hAPP-J20 X J20 243 hAPP-J20 X J20 245 hAPP-J20 X J20 250 WT X J20 302 WT X J20 307 hAPP-J20 X J20 313 hAPP-J20 X J20 318 WT X J20 330 hAPP-J20 X J20 333 hAPP-J20 X J20 367 WT X
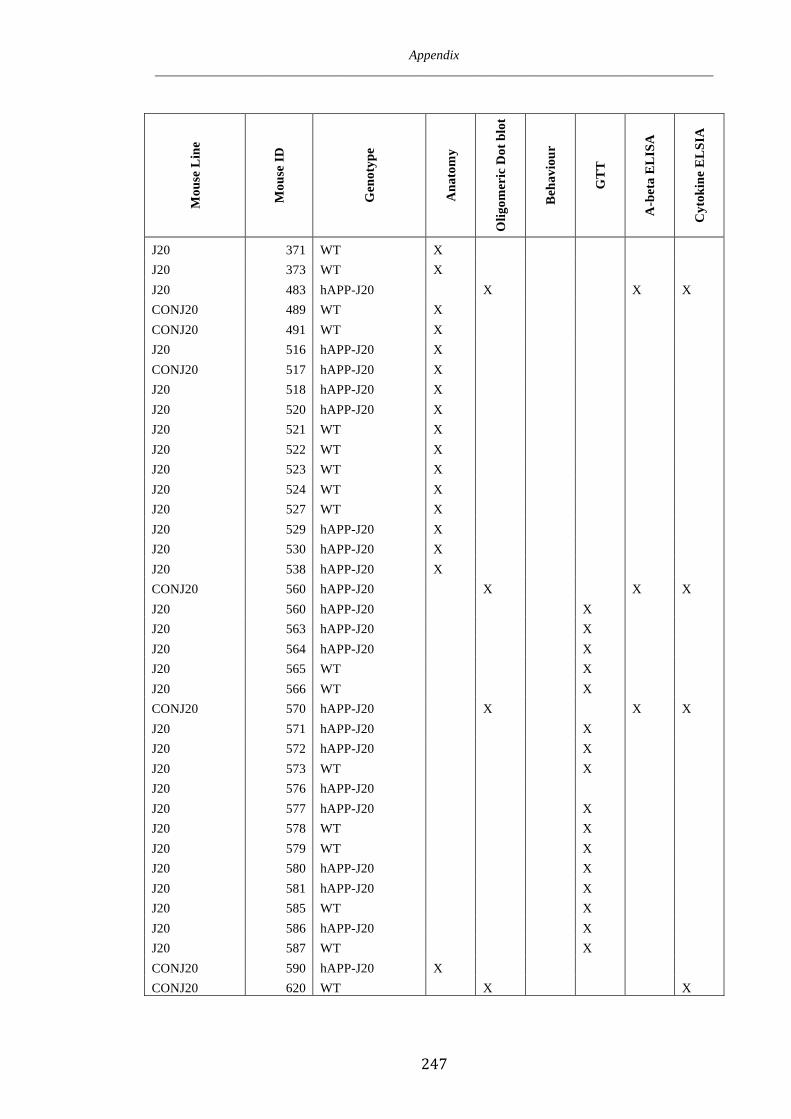
Appendix ____________________________________________________________________________________
247
Mou
se L
ine
Mou
se ID
Gen
otyp
e
Ana
tom
y
Olig
omer
ic D
ot b
lot
Beh
avio
ur
GT
T
A-b
eta
EL
ISA
Cyt
okin
e E
LSI
A
J20 371 WT X J20 373 WT X J20 483 hAPP-J20 X X X CONJ20 489 WT X CONJ20 491 WT X J20 516 hAPP-J20 X CONJ20 517 hAPP-J20 X J20 518 hAPP-J20 X J20 520 hAPP-J20 X J20 521 WT X J20 522 WT X J20 523 WT X J20 524 WT X J20 527 WT X J20 529 hAPP-J20 X J20 530 hAPP-J20 X J20 538 hAPP-J20 X CONJ20 560 hAPP-J20 X X X J20 560 hAPP-J20 X J20 563 hAPP-J20 X J20 564 hAPP-J20 X J20 565 WT X J20 566 WT X CONJ20 570 hAPP-J20 X X X J20 571 hAPP-J20 X J20 572 hAPP-J20 X J20 573 WT X J20 576 hAPP-J20 J20 577 hAPP-J20 X J20 578 WT X J20 579 WT X J20 580 hAPP-J20 X J20 581 hAPP-J20 X J20 585 WT X J20 586 hAPP-J20 X J20 587 WT X CONJ20 590 hAPP-J20 X CONJ20 620 WT X
X

Appendix ____________________________________________________________________________________
248
Mou
se L
ine
Mou
se ID
Gen
otyp
e
Ana
tom
y
Olig
omer
ic D
ot b
lot
Beh
avio
ur
GT
T
A-b
eta
EL
ISA
Cyt
okin
e E
LSI
A
CONJ20 622 hAPP-J20 X X X CONJ20 624 hAPP-J20 X X X CONJ20 626 WT X
X
CONJ20 627 hAPP-J20 X X X CONJ20 647 WT X
X
CONJ20 668 hAPP-J20 X X X CONJ20 670 hAPP-J20 X X X CONJ20 686 WT X
X
CONJ20 692 WT X
X CONJ20 695 hAPP-J20 X X X CONJ20 698 WT X
X
CONJ20 701 hAPP-J20 X X X CONJ20 716 WT X
X
CONJ20 717 WT X
X J20 723 WT X J20 724 hAPP-J20 X J20 725 WT X J20 726 WT X J20 727 WT X J20 728 WT X J20 729 hAPP-J20 X J20 731 hAPP-J20 X J20 733 hAPP-J20 X J20 736 hAPP-J20 X J20 737 hAPP-J20 X J20 738 WT X J20 739 WT X J20 740 WT X J20 741 hAPP-J20 X J20 742 WT X J20 743 hAPP-J20 X J20 744 hAPP-J20 X J20 745 hAPP-J20 X
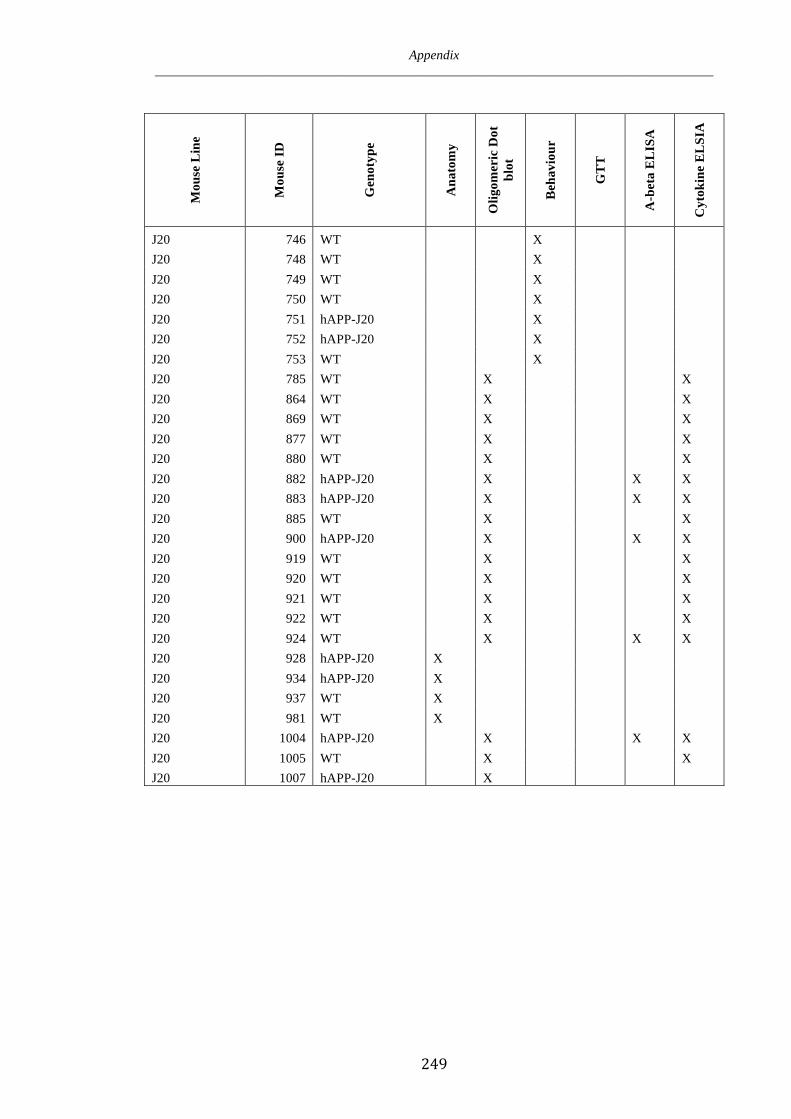
Appendix ____________________________________________________________________________________
249
Mou
se L
ine
Mou
se ID
Gen
otyp
e
Ana
tom
y
Olig
omer
ic D
ot
blot
Beh
avio
ur
GT
T
A-b
eta
EL
ISA
Cyt
okin
e E
LSI
A
J20 746 WT X J20 748 WT X J20 749 WT X J20 750 WT X J20 751 hAPP-J20 X J20 752 hAPP-J20 X J20 753 WT X J20 785 WT X
X
J20 864 WT X
X J20 869 WT X
X
J20 877 WT X
X J20 880 WT X
X
J20 882 hAPP-J20 X X X J20 883 hAPP-J20 X X X J20 885 WT X
X
J20 900 hAPP-J20 X X X J20 919 WT X
X
J20 920 WT X
X J20 921 WT X
X
J20 922 WT X
X J20 924 WT X X X J20 928 hAPP-J20 X J20 934 hAPP-J20 X J20 937 WT X J20 981 WT X J20 1004 hAPP-J20 X X X J20 1005 WT X
X
J20 1007 hAPP-J20 X
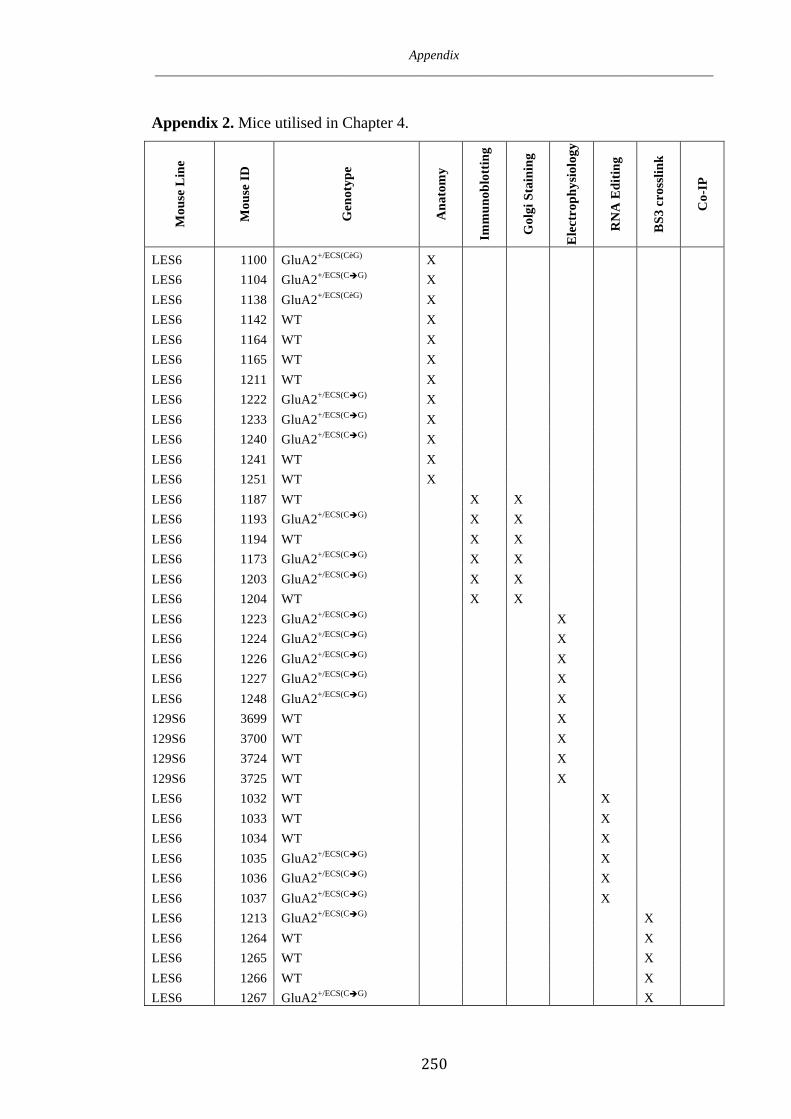
Appendix ____________________________________________________________________________________
250
Appendix 2. Mice utilised in Chapter 4.
Mou
se L
ine
Mou
se ID
Gen
otyp
e
Ana
tom
y
Imm
unob
lott
ing
Gol
gi S
tain
ing
Ele
ctro
phys
iolo
gy
RN
A E
ditin
g
BS3
cro
sslin
k
Co-
IP
LES6 1100 GluA2+/ECS(CèG) X LES6 1104 GluA2+/ECS(CG) X LES6 1138 GluA2+/ECS(CèG) X LES6 1142 WT X LES6 1164 WT X LES6 1165 WT X LES6 1211 WT X LES6 1222 GluA2+/ECS(CG) X LES6 1233 GluA2+/ECS(CG) X LES6 1240 GluA2+/ECS(CG) X LES6 1241 WT X LES6 1251 WT X LES6 1187 WT X X LES6 1193 GluA2+/ECS(CG) X X LES6 1194 WT X X LES6 1173 GluA2+/ECS(CG) X X LES6 1203 GluA2+/ECS(CG) X X LES6 1204 WT X X LES6 1223 GluA2+/ECS(CG) X LES6 1224 GluA2+/ECS(CG) X LES6 1226 GluA2+/ECS(CG) X LES6 1227 GluA2+/ECS(CG) X LES6 1248 GluA2+/ECS(CG) X 129S6 3699 WT X 129S6 3700 WT X 129S6 3724 WT X 129S6 3725 WT X LES6 1032 WT X LES6 1033 WT X LES6 1034 WT X LES6 1035 GluA2+/ECS(CG) X LES6 1036 GluA2+/ECS(CG) X LES6 1037 GluA2+/ECS(CG) X LES6 1213 GluA2+/ECS(CG) X LES6 1264 WT X LES6 1265 WT X LES6 1266 WT X LES6 1267 GluA2+/ECS(CG) X
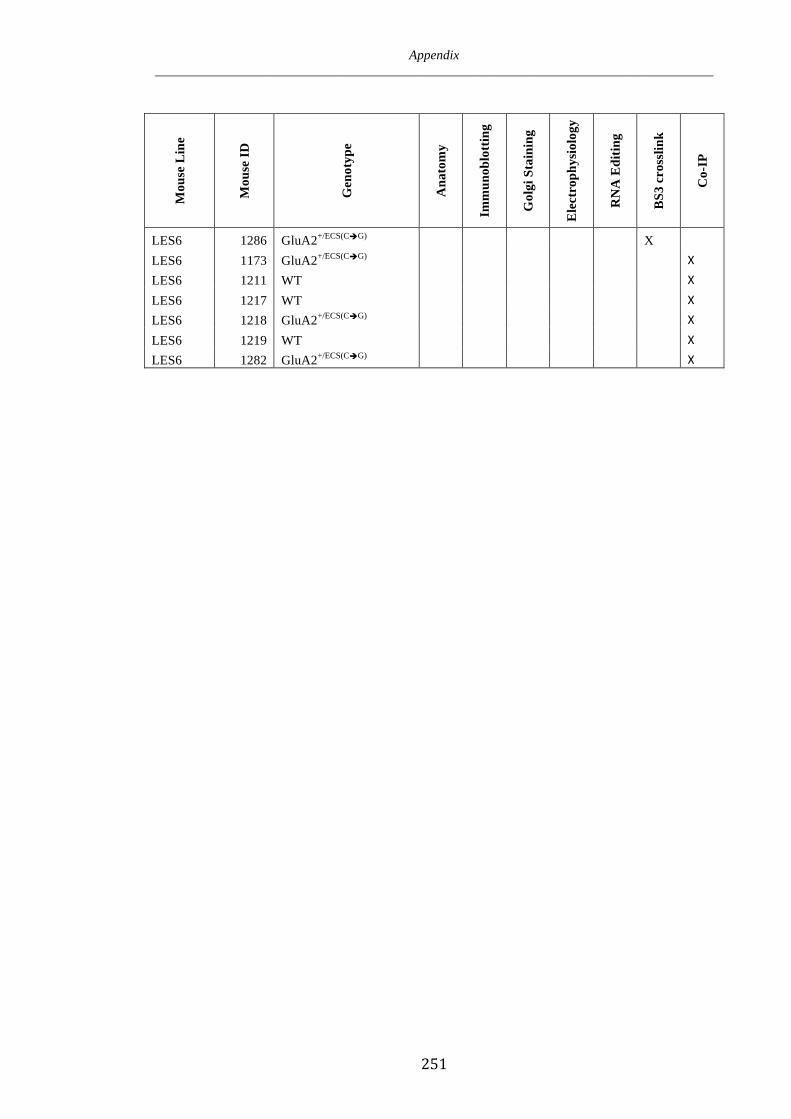
Appendix ____________________________________________________________________________________
251
Mou
se L
ine
Mou
se ID
Gen
otyp
e
Ana
tom
y
Imm
unob
lott
ing
Gol
gi S
tain
ing
Ele
ctro
phys
iolo
gy
RN
A E
ditin
g
BS3
cro
sslin
k
Co-
IP
LES6 1286 GluA2+/ECS(CG) X
LES6 1173 GluA2+/ECS(CG) X LES6 1211 WT X
LES6 1217 WT X LES6 1218 GluA2+/ECS(CG) X
LES6 1219 WT X LES6 1282 GluA2+/ECS(CG) X

Appendix ____________________________________________________________________________________
252
Appendix 3. Mice utilised in Chapters 5 and 6. Behaviour C1, C2, C3 represents
various cohorts described in Chapter 6.
Mou
se L
ine
Mou
se ID
Gen
otyp
e
Beh
avio
ur C
1
Beh
avio
ur C
2
Beh
avio
ur C
3
Ana
tom
y
Gol
gi S
tain
ing
BS3
cro
sslin
k
Co-
IP
A-b
eta
EL
ISA
Cyt
okin
e E
LIS
A
Imm
unob
lott
ing
CONJ20 73 WT/WT X CONJ20 74 WT/hAPP-J20 X CONJ20 75 WT/WT X CONJ20 76 WT/hAPP-J20 X CONJ20 77 WT/hAPP-J20 X CONJ20 78 GluA2R/R/WT X CONJ20 79 WT/hAPP-J20 X CONJ20 80 GluA2R/R/WT X CONJ20 81 WT/WT X CONJ20 87 GluA2R/R/hAPP-J20 X CONJ20 92 GluA2R/R/WT X CONJ20 102 WT/WT X CONJ20 104 WT/WT X CONJ20 109 WT/hAPP-J20 X CONJ20 110 WT/hAPP-J20 X CONJ20 112 WT/hAPP-J20 X CONJ20 118 WT/hAPP-J20 X CONJ20 121 WT/WT X CONJ20 123 WT/WT X CONJ20 125 GluA2R/R/hAPP-J20 X CONJ20 130 WT/WT X CONJ20 136 GluA2R/R/hAPP-J20 X X CONJ20 138 WT/WT X X CONJ20 143 WT/hAPP-J20 X X CONJ20 145 GluA2R/R/hAPP-J20 X X CONJ20 146 WT/WT X X CONJ20 150 GluA2R/R/WT X CONJ20 152 GluA2R/R/WT X CONJ20 155 GluA2R/R/WT X X CONJ20 158 WT/hAPP-J20 X X CONJ20 161 GluA2R/R/hAPP-J20 X X CONJ20 162 GluA2R/R/WT X X CONJ20 165 GluA2R/R/hAPP-J20 X X CONJ20 166 GluA2R/R/WT X X CONJ20 169 WT/WT X
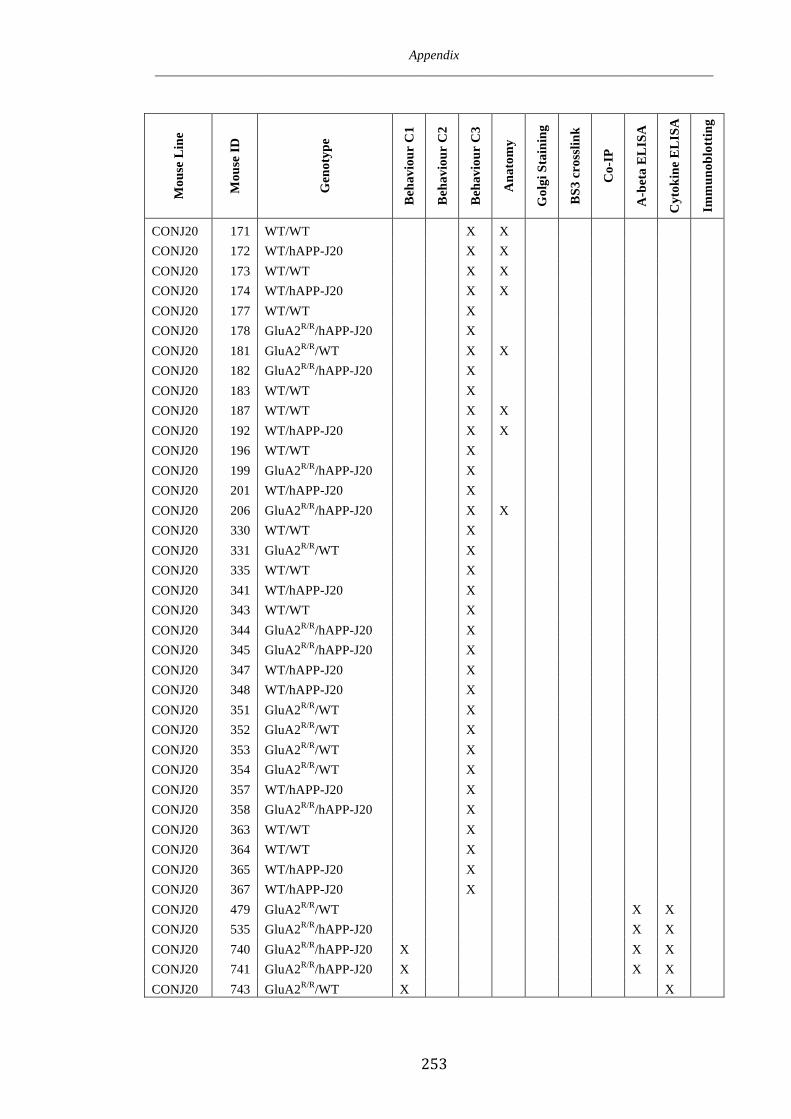
Appendix ____________________________________________________________________________________
253
Mou
se L
ine
Mou
se ID
Gen
otyp
e
Beh
avio
ur C
1
Beh
avio
ur C
2
Beh
avio
ur C
3
Ana
tom
y
Gol
gi S
tain
ing
BS3
cro
sslin
k
Co-
IP
A-b
eta
EL
ISA
Cyt
okin
e E
LIS
A
Imm
unob
lott
ing
CONJ20 171 WT/WT X X CONJ20 172 WT/hAPP-J20 X X CONJ20 173 WT/WT X X CONJ20 174 WT/hAPP-J20 X X CONJ20 177 WT/WT X CONJ20 178 GluA2R/R/hAPP-J20 X CONJ20 181 GluA2R/R/WT X X CONJ20 182 GluA2R/R/hAPP-J20 X CONJ20 183 WT/WT X CONJ20 187 WT/WT X X CONJ20 192 WT/hAPP-J20 X X CONJ20 196 WT/WT X CONJ20 199 GluA2R/R/hAPP-J20 X CONJ20 201 WT/hAPP-J20 X CONJ20 206 GluA2R/R/hAPP-J20 X X CONJ20 330 WT/WT X CONJ20 331 GluA2R/R/WT X CONJ20 335 WT/WT X CONJ20 341 WT/hAPP-J20 X CONJ20 343 WT/WT X CONJ20 344 GluA2R/R/hAPP-J20 X CONJ20 345 GluA2R/R/hAPP-J20 X CONJ20 347 WT/hAPP-J20 X CONJ20 348 WT/hAPP-J20 X CONJ20 351 GluA2R/R/WT X CONJ20 352 GluA2R/R/WT X CONJ20 353 GluA2R/R/WT X CONJ20 354 GluA2R/R/WT X CONJ20 357 WT/hAPP-J20 X CONJ20 358 GluA2R/R/hAPP-J20 X CONJ20 363 WT/WT X CONJ20 364 WT/WT X CONJ20 365 WT/hAPP-J20 X CONJ20 367 WT/hAPP-J20 X CONJ20 479 GluA2R/R/WT X X CONJ20 535 GluA2R/R/hAPP-J20 X X CONJ20 740 GluA2R/R/hAPP-J20 X X X CONJ20 741 GluA2R/R/hAPP-J20 X X X CONJ20 743 GluA2R/R/WT X
X

Appendix ____________________________________________________________________________________
254
Mou
se L
ine
Mou
se ID
Gen
otyp
e
Beh
avio
ur C
1
Beh
avio
ur C
2
Beh
avio
ur C
3
Ana
tom
y
Gol
gi S
tain
ing
BS3
cro
sslin
k
Co-
IP
A-b
eta
EL
ISA
Cyt
okin
e E
LIS
A
Imm
unob
lott
ing
CONJ20 745 WT/hAPP-J20 X CONJ20 746 GluA2R/R/WT X X X CONJ20 754 WT/hAPP-J20 X CONJ20 755 WT/WT X CONJ20 756 WT/WT X CONJ20 761 GluA2R/R/hAPP-J20 X X X CONJ20 764 WT/WT X CONJ20 768 GluA2R/R/hAPP-J20 X X X CONJ20 772 GluA2R/R/WT X CONJ20 774 WT/WT X CONJ20 775 GluA2R/R/WT X
X
CONJ20 799 GluA2R/R/WT
X CONJ20 780 GluA2R/R/WT X
X
CONJ20 784 WT/WT X CONJ20 792 WT/WT X CONJ20 799 GluA2R/R/WT X CONJ20 802 GluA2R/R/hAPP-J20 X CONJ20 807 GluA2R/R/hAPP-J20 X X CONJ20 808 WT/hAPP-J20 X CONJ20 809 GluA2R/R/hAPP-J20 X X CONJ20 810 WT/WT X
X
CONJ20 813 GluA2R/R/hAPP-J20 X CONJ20 814 GluA2R/R/hAPP-J20 X X CONJ20 815 WT/WT X
X
CONJ20 822 WT/WT X CONJ20 826 GluA2R/R/hAPP-J20 X X CONJ20 827 WT/WT
X
CONJ20 828 GluA2R/R/hAPP-J20 X CONJ20 838 GluA2R/R/hAPP-J20 X CONJ20 850 GluA2R/R/WT X CONJ20 852 WT/hAPP-J20 X CONJ20 883 WT/WT
X
CONJ20 888 WT/hAPP-J20 X X CONJ20 890 GluA2R/R/hAPP-J20 X X CONJ20 894 WT/WT
X
CONJ20 895 WT/hAPP-J20 X X CONJ20 900 WT/WT
X
CONJ20 902 GluA2R/R/WT X X
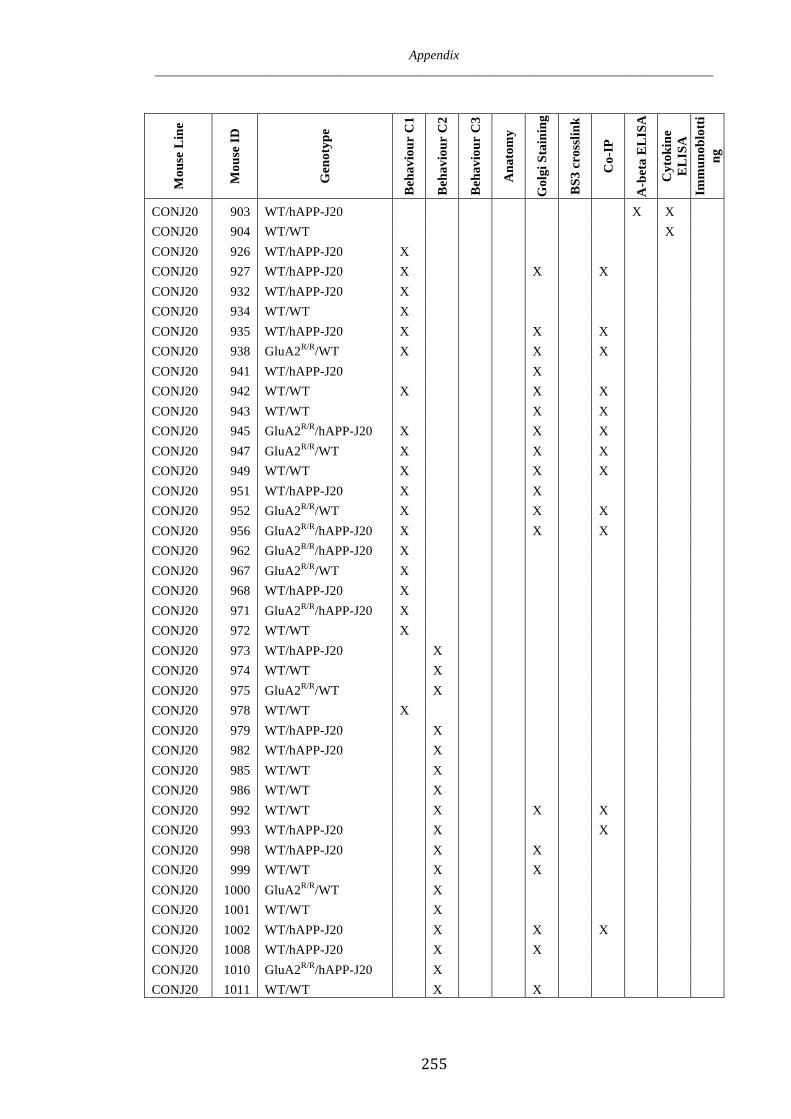
Appendix ____________________________________________________________________________________
255
Mou
se L
ine
Mou
se ID
Gen
otyp
e
Beh
avio
ur C
1
Beh
avio
ur C
2
Beh
avio
ur C
3
Ana
tom
y
Gol
gi S
tain
ing
BS3
cro
sslin
k
Co-
IP
A-b
eta
EL
ISA
Cyt
okin
e E
LIS
A
Imm
unob
lott
ing
CONJ20 903 WT/hAPP-J20 X X CONJ20 904 WT/WT
X
CONJ20 926 WT/hAPP-J20 X CONJ20 927 WT/hAPP-J20 X X X CONJ20 932 WT/hAPP-J20 X CONJ20 934 WT/WT X CONJ20 935 WT/hAPP-J20 X X X CONJ20 938 GluA2R/R/WT X X X CONJ20 941 WT/hAPP-J20 X CONJ20 942 WT/WT X X X CONJ20 943 WT/WT X X CONJ20 945 GluA2R/R/hAPP-J20 X X X CONJ20 947 GluA2R/R/WT X X X CONJ20 949 WT/WT X X X CONJ20 951 WT/hAPP-J20 X X CONJ20 952 GluA2R/R/WT X X X CONJ20 956 GluA2R/R/hAPP-J20 X X X CONJ20 962 GluA2R/R/hAPP-J20 X CONJ20 967 GluA2R/R/WT X CONJ20 968 WT/hAPP-J20 X CONJ20 971 GluA2R/R/hAPP-J20 X CONJ20 972 WT/WT X CONJ20 973 WT/hAPP-J20 X CONJ20 974 WT/WT X CONJ20 975 GluA2R/R/WT X CONJ20 978 WT/WT X CONJ20 979 WT/hAPP-J20 X CONJ20 982 WT/hAPP-J20 X CONJ20 985 WT/WT X CONJ20 986 WT/WT X CONJ20 992 WT/WT X X X CONJ20 993 WT/hAPP-J20 X X CONJ20 998 WT/hAPP-J20 X X CONJ20 999 WT/WT X X CONJ20 1000 GluA2R/R/WT X CONJ20 1001 WT/WT X CONJ20 1002 WT/hAPP-J20 X X X CONJ20 1008 WT/hAPP-J20 X X CONJ20 1010 GluA2R/R/hAPP-J20 X CONJ20 1011 WT/WT X X

Appendix ____________________________________________________________________________________
256
Mou
se L
ine
Mou
se ID
Gen
otyp
e
Beh
avio
ur C
1
Beh
avio
ur C
2
Beh
avio
ur C
3
Ana
tom
y
Gol
gi S
tain
ing
BS3
cro
sslin
k
Co-
IP
A-b
eta
EL
ISA
Cyt
okin
e E
LIS
A
Imm
unob
lott
ing
CONJ20 1015 WT/WT X CONJ20 1016 GluA2R/R/WT X X CONJ20 1023 WT/hAPP-J20 X X CONJ20 1024 WT/WT X X CONJ20 1025 GluA2R/R/hAPP-J20 X CONJ20 1027 GluA2R/R/WT X X CONJ20 1028 GluA2R/R/hAPP-J20 X CONJ20 1036 WT/WT X X CONJ20 1039 WT/hAPP-J20 X X J20 1042 WT/hAPP-J20 X X CONJ20 1045 GluA2R/R/hAPP-J20 X X X CONJ20 1046 GluA2R/R/hAPP-J20 X X X CONJ20 1048 GluA2R/R/hAPP-J20 X CONJ20 1049 WT/hAPP-J20 X X CONJ20 1051 WT/hAPP-J20 X CONJ20 1052 GluA2R/R/WT X X CONJ20 1056 GluA2R/R/WT X CONJ20 1057 GluA2R/R/WT X X CONJ20 1058 GluA2R/R/hAPP-J20 X J20 1063 WT/hAPP-J20 X X J20 1065 WT/hAPP-J20 X X CONJ20 1067 WT/hAPP-J20 X CONJ20 1068 WT/WT X CONJ20 1069 GluA2R/R/hAPP-J20 X X CONJ20 1070 WT/WT X CONJ20 1073 GluA2R/R/WT X CONJ20 1079 GluA2R/R/hAPP-J20 X CONJ20 1080 GluA2R/R/hAPP-J20 X J20 1086 WT/hAPP-J20 X X CONJ20 1090 GluA2R/R/WT X CONJ20 1091 WT/hAPP-J20 X J20 1168 WT/hAPP-J20 X J20 1169 WT/hAPP-J20 X CONJ20 1171 WT/WT X CONJ20 1173 WT/WT X CONJ20 1191 GluA2R/R/hAPP-J20 X CONJ20 1192 WT/WT X CONJ20 1194 GluA2R/R/WT X CONJ20 1198 GluA2R/R/WT X

Appendix ____________________________________________________________________________________
257
Mou
se L
ine
Mou
se ID
Gen
otyp
e
Beh
avio
ur C
1
Beh
avio
ur C
2
Beh
avio
ur C
3
Ana
tom
y
Gol
gi S
tain
ing
BS3
cro
sslin
k
Co-
IP
A-b
eta
EL
ISA
Cyt
okin
e E
LIS
A
Imm
unob
lott
ing
CONJ20 1199 GluA2R/R/hAPP-J20 X CONJ20 1200 WT/hAPP-J20 X CONJ20 1213 GluA2R/R/WT X CONJ20 1214 GluA2R/R/hAPP-J20 X CONJ20 1216 WT/WT X CONJ20 1219 WT/hAPP-J20 X CONJ20 1222 GluA2R/R/WT X CONJ20 1224 GluA2R/R/hAPP-J20 X
References ____________________________________________________________________________________
258
References: Abdipranoto A, Wu S, Stayte S, Vissel B. 2008. The role of neurogenesis in
neurodegernerative diseases and its implications for therapeutic development. CNS Neurol Disord Drug Targets 7: 187-210
Abdipranoto-Cowley A, Park JS, Croucher D, Daniel J, Henshall S, et al. 2009. Activin A Is Essential for Neurogenesis Following Neurodegeneration. Stem Cells 27: 1330-46
Aizawa H, Sawada J, Hideyama T, Yamashita T, Katayama T, et al. 2010. TDP-43 pathology in sporadic ALS occurs in motor neurons lacking the RNA editing enzyme ADAR2. Acta Neuropathol 120: 75-84
Akbarian S, Smith MA, Jones EG. 1995. Editing for an AMPA receptor subunit RNA in prefrontol cortex and striatum in Alzheimer's disease, Huntington's disease and schizophrenia. Brain Res 699: 297-304
Akiyama H, Barger S, Barnum S, Bradt B, Bauer J, et al. 2000. Inflammation and Alzheimer's disease. Neurobiol Aging 21: 383-421
Alberdi E, Sanchez-Gomez M, Cavaliere F, Perez-Samartin A, Zugaza J, et al. 2010. Amyloid beta oligomers induce Ca2+ dysregulation and neuronal death through activation of ionotropic glutamate receptors. Cell Calcium 47: 264-72
Almeida CG, Tampellini D, Takahashi RH, Greengard P, Lin MT, et al. 2005. Beta-amyloid accumulation in APP mutant neurons reduces PSD-95 and GluR1 in synapses. Neurobiology of Disease 20: 187-98
Alzheimer A. 1907. On a peculiar disease of the cerebral cortex. Allg Zeit Psychiat Psychgericht Med 64: 146-8
Antunes M, Biala G. 2012. The novel object recognition memory: neurobiology, test procedure, and its modifications. Cogn Process 13: 93-110
Apelt J, Schliebs R. 2001. beta-Amyloid-induced glial expression of both pro- and anti-inflammatory cytokines in cerebral cortex of aged transgenic Tg2576 mice with Alzheimer plaque pathology. Brain Res 894: 21-30
Arendash GW, King DL, Gordon MN, Morgan D, Hatcher JM, et al. 2001. Progressive, age-related behavioral impairments in transgenic mice carrying both mutant amyloid precursor protein and presenilin-1 transgenes. Brain Research 891: 42-53
Ashe KH. 2001. Learning and memory in transgenic mice modeling Alzheimer's Disease. Learn Mem 8: 301-08
Backman L, Small BJ, Fratiglioni L. 2001. Stability of the preclinical episodic memory deficit in Alzheimer's disease. Brain 124: 96-102
Bales KR, Tzavara ET, Wu S, Wade MR, Bymaster FP, et al. 2006. Cholinergic dysfunction in a mouse model of Alzheimer disease is reversed by an anti-Abeta antibody. The Journal of Clinical Investigation 116: 825-32
Ballard C, Walker M. 1999. Neuropsychiatric aspects of Alzheimer’s disease. Curr Psychatry Rep 1: 49-60
Bass BL. 2002. RNA editing by adenosine deaminases that act on RNA. Annu Rev Biochem 71: 817-46
Bassani S, Valnegri P, Beretta F, Passafaro M. 2009. The GluR2 subunit of AMPA receptors: synaptic role. Neuroscience 158: 55-61

References ____________________________________________________________________________________
259
Bedrosian TA, Herring KL, Weil ZM, Nelson RJ. 2011. Altered temporal patterns of anxiety in aged and amyloid precursor protein (APP) transgenic mice. Proceedings of the National Academy of Sciences 108: 11686-91
Belyaev ND, Kellett KAB, Beckett C, Makova NZ, Revett TJ, et al. 2010. The Transcriptionally Active Amyloid Precursor Protein (APP) Intracellular Domain Is Preferentially Produced from the 695 Isoform of APP in a {beta}-Secretase-dependent Pathway. Journal of Biological Chemistry 285: 41443-54
Ben Menachem-Zidon O, Menahem YB, Hur TB, Yirmiya R. 2014. Intra-Hippocampal Transplantation of Neural Precursor Cells with Transgenic Over-Expression of IL-1 Receptor Antagonist Rescues Memory and Neurogenesis Impairments in an Alzheimer/'s Disease Model. Neuropsychopharmacology 39: 401-14
Benilova I, Karran E, De Strooper B. 2012. The toxic A(beta) oligomer and Alzheimer's disease: an emperor in need of new clothes. Nature Neuroscience 15
Bennett D, Schneider J, Arvanitakis Z, Kelly J, Aggarwal N, et al. 2006. Neuropathology of older persons without cognitive impairment from two community-based studies. Neurology 66: 1837-44
Bertoglio LJ, Carobrez AP. 2000. Previous maze experience required to increase open arms avoidance in rats submitted to the elevated plus-maze model of anxiety. Behav Brain Res 108: 197-203
Bilkei-Gorzo A. 2014. Genetic mouse models of brain ageing and Alzheimer's disease. Pharmacology & Therapeutics 142: 244-57
Billings LM, Oddo S, Green KN, McGaugh JL, LaFerla FM. 2005. Intraneuronal Abeta Causes the Onset of Early Alzheimer's Disease-Related Cognitive Deficits in Transgenic Mice. Neuron 45: 675-88
Biou V, Bhattacharyya S, Malenka RC. 2008. Endocytosis and recycling of AMPA receptors lacking GluR2/3. Proc Natl Acad Sci U S A 150: 1038-43
Birch A, Katsouri L, Sastre M. 2014. Modulation of inflammation in transgenic models of Alzheimer's disease. Journal of Neuroinflammation 11: 25
Bird CM, Burgess N. 2008. The hippocampus and memory: insights from spatial processing. Nat Rev Neurosci 9: 182-94
Blanchard BJ, Chen A, Rozeboom LM, Stafford KA, Weigele P, Ingram VM. 2004. Efficient reversal of Alzheimer's disease fibril formation and elimination of neurotoxicity by a small molecule. Proceedings of the National Academy of Sciences of the United States of America 101: 14326-32
Blanchard V, Moussaoui S, Czech C, Touchet N, Bonici B, et al. 2003. Time sequence of maturation of dystrophic neurites associated with Abeta deposits in APP/PS1 transgenic mice. Exp Neurol 184: 247-63
Bobinski M, Weigiel J, Tarnawski M, Bobinski M, Reisberg B, et al. 1997. Relationships between regional neuronal loss and neurofibrillary changes in the hippocampal formation and duration and severity of Alzheimer disease J Neuropathol Exp Neurol 56: 414-20
Boncristiano S, Calhoun ME, Howard V, Bondolfi L, Kaeser SA, et al. 2005. Neocortical synaptic bouton number is maintained despite robust amyloid deposition in APP23 transgenic mice. Neurobiology of Aging 26: 607-13
Boudreau AC, Milovanovic M, Conrad KL, Nelson C, Ferrario CR, Wolf ME. 2012. A Protein Cross-Linking Assay for Measuring Cell Surface Expression of Glutamate Receptor Subunits in the Rodent Brain After In Vivo Treatments In Current Protocols in Neuroscience

References ____________________________________________________________________________________
260
Braak H, Braak E. 1991. Neuropathological staging of Alzheimer-related changes. Acta Neuropathologica 82: 239-59
Braak H, Braak E. 1995. Staging of alzheimer's disease-related neurofibrillary changes. Neurobiol Aging 16: 271-78
Brown JM, Wiggins J, Dong H, Harvey R, Richardson F, et al. 2014. The hard Test Your Memory. Evaluation of a short cognitive test to detect mild Alzheimer's disease and amnestic mild cognitive impairment. International Journal of Geriatric Psychiatry 29: 272-80
Brun A, Englund E. 1981. Regional pattern of degeneration in Alzheimer’s disease: neuronal loss and histopathological grading. Histopathology 5: 549-64
Brusa R, Zimmermann F, Koh DS, Feldmeyer D, Gass P, et al. 1995. Early-onset epilepsy and postnatal lethality associated with an editing-deficient GluR-B allele in mice. Science 270: 1677-80
Bryan KJ, Lee H, Perry G, Smith MA, Casadesus G. 2009. Transgenic Mouse Models of Alzheimer's Disease: Behavioral Testing and Considerations In Methods of Behavior Analysis in Neuroscience, ed. JJ Buccafusco. Boca Raton (FL)
Buckingham SD, Kwak S, Jones AK, Blackshaw SE, Sattelle DB. 2008. Edited GluR2, a gatekeeper for motor neurone survival? Bioessays 30: 1185-92
Busche MA, Eichhoff G, Adelsberger H, Abramowski D, Wiederhold K-H, et al. 2008. Clusters of Hyperactive Neurons Near Amyloid Plaques in a Mouse Model of Alzheimer's Disease. Science 321: 1686-89
Camandola S, Mattson MP. 2011. Aberrant subcellular neuronal calcium regulation in aging and Alzheimer's disease. Biochimica et Biophysica Acta (BBA) - Molecular Cell Research 1813: 965-73
Cameron J, Worrall-Carter L, Page K, Stewart S, Ski CF. 2013. Screening for mild cognitive impairment in patients with heart failure: Montreal Cognitive Assessment versus Mini Mental State Exam. European Journal of Cardiovascular Nursing 12: 252-60
Cenci C, Barzotti R, Galeano F, Corbelli S, Rota R, et al. 2008. Down-regulation of RNA Editing in Pediatric Astrocytomas: ADAR2 EDITING ACTIVITY INHIBITS CELL MIGRATION AND PROLIFERATION. Journal of Biological Chemistry 283: 7251-60
Cha J-HJ, Farrell LA, Ahmed SF, Frey A, Hsiao-Ashe KK, et al. 2001. Glutamate Receptor Dysregulation in the Hippocampus of Transgenic Mice Carrying Mutated Human Amyloid Precursor Protein. Neurobiology of Disease 8: 90-102
Chang EH, Savage MJ, Flood DG, Thomas JM, Levy RB, et al. 2006. AMPA receptor downscaling at the onset of Alzheimer's disease pathology in double knockin mice. Proceedings of the National Academy of Sciences of the United States of America 103: 3410-15
Chen C, Cho D, Wang Q, Lai F, Carter K, Nishikura K. 2000a. A third member of the RNA-specific adenosine deaminase gene family, ADAR3, contains both single- and double-stranded RNA binding domains. RNA 6: 755-67
Chen G, Chen KS, Knox J, Inglis J, Bernard A, et al. 2000b. A learning deficit related to age and [beta]-amyloid plaques in a mouse model of Alzheimer's disease. Nature 408: 975-79
Cheng D, Low JK, Logge W, Garner B, Karl T. 2014. Novel behavioural characteristics of female APPSwe/PS1ΔE9 double transgenic mice. Behavioural Brain Research 260: 111-18

References ____________________________________________________________________________________
261
Cheng IH, Palop JJ, Esposito LA, Bien-Ly N, Yan F, Mucke L. 2004. Aggressive amyloidosis in mice expressing human amyloid peptides with the Arctic mutation. Nat Med 10: 1190-92
Cheng IH, Scearce-Levie K, Legleiter J, Palop JJ, Gerstein H, et al. 2007. Accelerating amyloid-beta fibrillization reduces oligomer levels and functional deficits in Alzheimer disease mouse models. J Biol Chem 282: 23818-28
Chiba T, Yamada M, Sasabe J, Terashita K, Shimoda M, et al. 2008. Amyloid-[beta] causes memory impairment by disturbing the JAK2/STAT3 axis in hippocampal neurons. Mol Psychiatry 14: 206-22
Chin J, Palop JJ, Puolivali J, Massaro C, Bien-Ly N, et al. 2005. Fyn kinase induces synaptic and cognitive impairments in a transgenic mouse model of Alzheimer's disease. The Journal of Neuroscience 25: 9694-703
Chong Y. 1997. Effect of a carboxy-terminal fragment of the alzheimer's amyloid precursor protein on expression of proinflammatory cytokines in rat glial cells. Life Sciences 61: 2323-33
Clark IA, Alleva LM, Vissel B. 2010. The roles of TNF in brain dysfunction and disease. Pharmacol. Ther. 128: 519-48
Clem RL, Huganir RL. 2010. Calcium-permeable AMPA receptor dynamics mediate fear memory erasure. Science 330: 1108-12
Combs CK, Karlo JC, Kao S-C, Landreth GE. 2001. beta-Amyloid stimulation of microglia and monocytes results in TNFalpha- dependent expression of inducible nitric oxide synthase and neuronal apoptosis. J Neurosci 21: 1179-88
Conrad KL, Tseng KY, Uejima JL, Reimers JM, Jun-Heng LJ, et al. 2008. Formation of accumbens GluR2-lacking AMPA receptors mediates incubation of cacaine craving. Nature 454: 118-21
Corcoran KA, Lu Y, Scott Turner R, Maren S. 2002. Overexpression of hAPPswe impairs rewarded alternation and contextual fear conditioning in a transgenic mouse model of Alzheimer's disease. Learning and Memory 9: 243-52
Coultrap SJ, Nixon KM, Alvestad RM, Fernando Valenzuela C, Browning MD. 2005. Differential expression of NMDA receptor subunits and splice variants among the CA1, CA3 and dentate gyrus of the adult rat. Brain Res Mol Brain Res 135: 104-11
Craft J, Watterson DM, Hirsch E, Van Eldik L. 2005. Interleukin 1 receptor antagonist knockout mice show enhanced microglial activation and neuronal damage induced by intracerebroventricular infusion of human beta-amyloid. Journal of Neuroinflammation 2: 15
Cull-Candy S, Kelly L, Farrant M. 2006. Regulation of Ca2+-permeable AMPA receptors: synaptic plasticity and beyond. Curr Opin Neurobiol 16: 288-97
D'Amelio M, Cavallucci V, Middei S, Marchetti C, Pacioni S, et al. 2011. Caspase-3 triggers early synaptic dysfunction in a mouse model of Alzheimer's disease. Nat Neurosci 14: 69-76
Dabiri GA, Lai F, Drakes RA, Nishikura K. 1996. Editing of the GluR-B ion channel RNA in vitro by recombinant double-stranded RNA adenosine deaminase. EMBO J 15: 34-45
DeIpolyi AR, Fang S, Palop JJ, Yu G-Q, Wang X, Mucke L. 2008. Altered navigational strategy use and visuospatial deficits in hAPP transgenic mice. Neurobiol Aging 29: 253-66

References ____________________________________________________________________________________
262
DeKosky ST, Scheff SW. 1990. Synapse loss in frontal cortex biopsies in Alzheimer's disease: Correlation with cognitive severity. Annals of Neurology 27: 457-64
Dingledine R, Borges K, Bowie D, Traynelis SF. 1999. The glutamate receptor ion channels. Pharmacol Rev 51: 7-61
Dodart J, Meziane H, Mathis CA, Bales K, Paul S, Ungerer A. 1999. Behavioural disturbances in transgenic mice overexpressing the V717F beta-amyloid precursor protein. Behav Neurosci 113: 982-90
Dudal S, Krzywkowski P, Paquette J, Morissette C, Lacombe D, et al. 2004. Inflammation occurs early during the Abeta deposition process in TgCRND8 mice. Neurobiol Aging 25: 861-71
Eimer W, Vassar R. 2013. Neuron loss in the 5XFAD mouse model of Alzheimer's disease correlates with intraneuronal Abeta42 accumulation and Caspase-3 activation. Molecular Neurodegeneration 8: 2
Esposito Z, Belli L, Toniolo S, Sancesario G, Bianconi C, Martorana A. 2013. Amyloid β, Glutamate, Excitotoxicity in Alzheimer's Disease: Are We on the Right Track? CNS Neuroscience & Therapeutics 19: 549-55
Feldmeyer D, Kask K, R B, Kornau HC, Kolhekar R, et al. 1999. Neurological dysfunctions in mice expressing different levels of the Q/R site-unedited AMPAR subunit GluR-B. Nature Neuroci 2: 57-64
Feng Y, Sansam CL, Singh M, Emeson RB. 2006. Altered RNA Editing in Mice Lacking ADAR2 Autoregulation. Molecular and Cellular Biology 26: 480-88
Ferguson AR, Christensen RN, Gensel JC, Miller BA, Sun F, et al. 2008. Cell death after spinal cord injury is exacerbated by rapid TNF alpha-induced trafficking of GluR2-lacking AMPARs to the plasma membrane. J Neurosci 28: 11391-400
Fernandez M, Gobartt A, Balana M, Group tCS. 2010. Behavioural symptoms in patients with Alzheimer's disease and their association with cognitive impairment. BMC Neurology 10: 87
Ferreira A. 2012. Calpain Dysregulation in Alzheimer's Disease. ISRN Biochemistry 2012: 12
Ferretti MT, Bruno MA, Ducatenzeiler A, Klein WL, Cuello AC. 2012. Intracellular Aβ-oligomers and early inflammation in a model of Alzheimer's disease. Neurobiol Aging 33: 1329-42
Fischer M, Kaech S, Knutti D, Matus A. 1998. Rapid Actin-Based Plasticity in Dendritic Spines. Neuron 20: 847-54
Fraser PE, Nguyen JT, Inouye H, Surewicz WK, Selkoe DJ, et al. 1992. Fibril formation by primate, rodent, and Dutch-hemorrhagic analogs of Alzheimer amyloid .beta.-protein. Biochemistry 31: 10716-23
Frisoni GB, Fox NC, Jack CR, Scheltens P, Thompson PM. 2010. The clinical use of structural MRI in Alzheimer disease. Nat Rev Neurol 6: 67-77
Gaisler-Salomon I, Kravitz E, Feiler Y, Safran M, Biegon A, et al. 2014. Hippocampus-specific deficiency in RNA editing of GluA2 in Alzheimer's disease. Neurobiology of Aging
Galton CJ, Patterson K, Xuereb JH, Hodges JR. 2000. Atypical and typical presentations of Alzheimer's disease: a clinical, neuropsychological, neuroimaging and pathological study of 13 cases. Brain 123: 484-98
Galvan V, Gorostiza OF, Banwait S, Ataie M, Logvinova AV, et al. 2006. Reversal of Alzheimer's-like pathology and behavior in human APP transgenic mice by mutation of Asp664. Proc Natl Acad Sci U S A 103: 7130-35

References ____________________________________________________________________________________
263
Galvan V, Zhang J, Gorostiza OF, Banwait S, Huang W, et al. 2008. Long-term prevention of Alzheimer's disease-like behavioral deficits in PDAPP mice carrying a mutation in Asp664. Behav Brain Res 191: 246-55
Games D, Adams D, Alessandrini R, Barbour R, Borthelette P, et al. 1995. Alzheimer-type neuropathology in transgenic mice overexpressing V717F [beta]-amyloid precursor protein. Nature 373: 523-27
Gemmell E, Bosomworth H, Allan L, Hall R, Khundakar A, et al. 2012. Hippocampal Neuronal Atrophy and Cognitive Function in Delayed Poststroke and Aging-Related Dementias. Stroke 43: 808-14
Giuffrida ML, Caraci F, Pignataro B, Cataldo S, De Bona P, et al. 2009. beta-Amyloid Monomers Are Neuroprotective. The Journal of Neuroscience 29: 10582-87
Goate A, Chartier-Harlin M-C, Mullan M, Brown J, Crawford F, et al. 1991. Segregation of a missense mutation in the amyloid precursor protein gene with familial Alzheimer's disease. Nature 349: 704-06
Goedert M, Spillantini MG, Jakes R, Rutherford D, Crowther RA. 1989. Multiple isoforms of human microtubule-associated protein tau: sequences and localization in neurofibrillary tangles of Alzheimer's disease. Neuron 3: 519-26
Gómez-Isla T, Hollister R, West H, Mui S, Growdon JH, et al. 1997. Neuronal loss correlates with but exceeds neurofibrillary tangles in Alzheimer's disease. Annals of Neurology 41: 17-24
Gómez-Isla T, Price JL, McKeel Jr. DW, Morris JC, Growdon JH, Hyman BT. 1996. Profound Loss of Layer II Entorhinal Cortex Neurons Occurs in Very Mild Alzheimer's Disease. The Journal of Neuroscience 16: 4491-500
Gorter JA, Petrozzino JJ, Aronica EM, Rosenbaum DM, Opitz T, et al. 1997. Global Ischemia Induces Downregulation of GluR2 mRNA and Increases AMPA Receptor-Mediated Ca2+ Influx in Hippocampal CA1 Neurons of Gerbil. The Journal of Neuroscience 17: 6179-88
Götz J, Chen F, van Dorpe J, Nitsch RM. 2001. Formation of Neurofibrillary Tangles in P301L Tau Transgenic Mice Induced by Abeta 42 Fibrils. Science 293: 1491-95
Gotz J, Probst A, Spillantini MG, Schafer T, Jakes R, et al. 1995. Somatodendritic localization and hyperphosphorylation of tau protein in transgenic mice expressing the longest human brain tau isoform. EMBO J 14: 1304-13
Gotz J, Schild A, Hoerndli F, Pennanen L. 2004a. Amyloid-induced neurofibrillary tangle formation in Alzheimer's disease: insight from transgenic mouse and tissue-culture models. International Journal of Developmental Neuroscience 22: 453-65
Gotz J, Streffer JR, David D, Schild A, Hoerndli F, et al. 2004b. Transgenic animal models of Alzheimer's disease and related disorders: histopathology, behavior and therapy. Mol Psychiatry 9: 664-83
Greger IH, Khatri L, Ziff EB. 2002. RNA editing at arg607 controls AMPA receptor exit from from the endoplasmic reticulum. Neuron 34: 759-72
Haass C, Lemere CA, Capell A, Citron M, Seubert P, et al. 1995. The Swedish mutation causes early-onset Alzheimer's disease by [beta]-secretase cleavage within the secretory pathway. Nat Med 1: 1291-96
Hall AM, Roberson ED. 2012. Mouse models of Alzheimer's disease. Brain Research Bulletin 88: 3-12
Hanisch U-K. 2002. Microglia as a source and target of cytokines. Glia 40: 140-55
References ____________________________________________________________________________________
264
Harris JA, Devidze N, Halabisky B, Lo I, Thwin MT, et al. 2010. Many Neuronal and Behavioral Impairments in Transgenic Mouse Models of Alzheimer's Disease Are Independent of Caspase Cleavage of the Amyloid Precursor Protein. The Journal of Neuroscience 30: 372-81
He P, Cheng X, Staufenbiel M, Li R, Shen Y. 2013. Long-Term Treatment of Thalidomide Ameliorates Amyloid-Like Pathology through Inhibition of β-Secretase in a Mouse Model of Alzheimer’s Disease. PloS ONE 8: e55091
He P, Zhong Z, Lindholm K, Berning L, Lee W, et al. 2007. Deletion of tumor necrosis factor death receptor inhibits amyloid beta generation and prevents learning and memory deficits in Alzheimer's mice. The Journal of Cell Biology 178: 829-41
Heneka MT, Kummer MP, Stutz A, Delekate A, Schwartz S, et al. 2012. NLRP3 is activated in Alzheimer/'s disease and contributes to pathology in APP/PS1 mice. Nature advance online publication
Henley JM, Wilkinson KA. 2013. AMPA receptor trafficking and the mechanisms underlying synaptic plasticity and cognitive aging. Dialogues in clinical neuroscience 15: 11-27
Herrmann N, Li A, Lanctôt K. 2011. Memantine in dementia: a review of the current evidence. Expert Opinion on Pharmacotherapy 12: 787-800
Hickman SE, Allison EK, El Khoury J. 2008. Microglial Dysfunction and Defective beta-Amyloid Clearance Pathways in Aging Alzheimer's Disease Mice. The Journal of Neuroscience 28: 8354-60
Hideyama T, Yamashita T, Suzuki T, Tsuji S, Higuchi M, et al. 2010. Induced Loss of ADAR2 engenders slow death of motor neurons from Q/R site-unedited GluR2. J Neurosci 30: 11917-25
Higuchi M, Maas S, Single FN, Hartner J, Rozov A, et al. 2000. Point mutation in the AMPA receptor gene rescues lethality in mice deficient in the RNA-editing enzyme ADAR2. Nature 406: 78-81
Higuchi M, Single FN, Kohler M, Sommer B, Sprengel R, Seeburg PH. 1993. RNA editing of AMPA receptor subunit GluR-B: A base paired intron-exon structure determines position and efficiency. Cell 75: 1361-70
Hollmann M, Hartley M, Heinemann S. 1991. Ca2+ permeability of KA-AMPA--gated glutamate receptor channels depends on subunit composition. Science 252: 851-53
Hollmann M, Heinemann S. 1994. Cloned glutamate receptors. Annu Rev Neurosci 17: 31-108
Holmes C, Boche D, Wilkinson D, Yadegarfar G, Hopkins V, et al. 2008. Long-term effects of β42 immunisation in Alzheimer's disease: follow-up of a randomised, placebo-controlled phase I trial. The Lancet 372: 216-23
Holtzman DM, Morris JC, Goate AM. 2011. Alzheimer's Disease: The Challenge of the Second Century. Science Translational Medicine 3: 77sr1
Hommet C, Mondon K, Camus V, De Toffol B, Constans T. 2008. Epilepsy and Dementia in the Elderly. Dement Geriatr Cogn Disord 25: 293-300
Hong S, Quintero-Monzon O, Ostaszewski BL, Podlisny DR, Cavanaugh WT, et al. 2011. Dynamic Analysis of Amyloid β-Protein in Behaving Mice Reveals Opposing Changes in ISF versus Parenchymal Aβ during Age-Related Plaque Formation. The Journal of Neuroscience 31: 15861-69
References ____________________________________________________________________________________
265
Hoogendijk WJG, Pool CW, Troost D, van Zwieten E, Swaab DF. 1995. Image analyser-assisted morphometry of the locus coeruleus in Alzheimer's disease, Parkinson's disease and amyotrophic lateral sclerosis. Brain 118: 131-43
Horsch M, Seeburg PH, Adler T, Aguilar-Pimentel JA, Becker L, et al. 2011. Requirment of the RNA-editing enzyme ADAR2 for normal physiology in mice. J Biol Chem 286: 18614-22
Hsiao K, Chapman P, Nilsen S, Eckman C, Harigaya Y, et al. 1996. Correlative memory deficits, Aβ elevation, and amyloid plaques in transgenic mice. Science 274: 99-102
Hsieh H, Boehm J, Sato C, Iwatsubo T, Tomita T, et al. 2006. AMPAR Removal Underlies Aβ-Induced Synaptic Depression and Dendritic Spine Loss. Neuron 52: 831-43
Hu N-W, Ondrejcak T, Rowan MJ. 2012. Glutamate receptors in preclinical research on Alzheimer's disease: Update on recent advances. Pharmacology Biochemistry and Behavior 100: 855-62
Hume RI, Dingledine R, Heinemann SF. 1991. Identification of a site in glutamate receptor subunits that controls calcium permeability. Science 253: 1028-31
Hynd MR, Scott HL, Dodd PR. 2004. Glutamate-mediated excitotoxicity and neurodegeneration in Alzheimer's disease. Neurochemistry International 45: 583-95
Ikonomovic MD, Mizukami K, Davies P, Hamilton R, Sheffield R, Armstrong DM. 1997. The Loss of GluR2(3) Immunoreactivity Precedes Neurofibrillary Tangle Formation in the Entorhinal Cortex and Hippocampus of Alzheimer Brains. Journal of Neuropathology & Experimental Neurology 56: 1018-27
Ikonomovic MD, Sheffield R, Armstrong DM. 1995. AMPA-selective glutamate receptor subtype immunoreactivity in the hippocampal formation of patients with Alzheimer's disease. Hippocampus 5: 469-86
Imbimbo BP, Solfrizzi V, Panza F. 2010. Are NSAIDs useful to treat Alzheimer's disease or mild cognitive impairment? Frontiers in Aging Neuroscience 2
Imfeld P, Bodmer M, Schuerch M, Jick SS, Meier CR. 2013. Seizures in patients with Alzheimer’s disease or vascular dementia: A population-based nested case–control analysis. Epilepsia 54: 700-07
Irizarry M, McNamara M, Fedorchak K, Hsiao K, Hyman B. 1997. APPSW Transgenic Mice Develop Age-related A[beta] Deposits and Neuropil Abnormalities, but no Neuronal Loss in CA1. Journal of Neuropathology & Experimental Neurology 56: 965-73
Isaac JT, Ashby MC, McBain CJ. 2007. The role of the GluR2 subunit in AMPA receptor function and synaptic plasticity. Neuron 54: 859-71
Ittner LM, Gotz Jr. 2011. Amyloid-β and tau--a toxic pas de deux in Alzheimer's disease. Nat Rev Neurosci 12: 67-72
Jack Jr CR, Holtzman DM. 2013. Biomarker Modeling of Alzheimer's Disease. Neuron 80: 1347-58
Jackson AC, Nicoll RA. 2011. The expanding social network of iontropic glutamate receptors: TARPs and other transmembrane auxiliary subunits. Neuron 70: 178-99
Jawhar S, Trawicka A, Jenneckens C, Bayer TA, Wirths O. 2012. Motor deficits, neuron loss, and reduced anxiety coinciding with axonal degeneration and
References ____________________________________________________________________________________
266
intraneuronal Abeta aggregation in the 5XFAD mouse model of Alzheimer's disease. Neurobiology of Aging 33: 196.e29-96.e40
Jaworski T, Lechat B, Demedts D, Gielis L, Devijver H, et al. 2011. Dendritic Degeneration, Neurovascular Defects, and Inflammation Precede Neuronal Loss in a Mouse Model for Tau-Mediated Neurodegeneration. The American Journal of Pathology 179: 2001-15
Jin K, Galvan V, Xie L, Mao X, Gorostiza O, et al. 2004. Enhanced neurogenesis in Alzheimer disease transgenic (PDGF-APPSw Ind) mice. PNAS 736: 13363-67
Johnson K, Minoshima S, Bohnen N, Donohoe K, Foster N, et al. 2013. Appropriate use criteria for amyloid PET: A report of the Amyloid Imaging Task Force, the Society of Nuclear Medicine and Molecular Imaging, and the Alzheimer’s Association. Journal of Nuclear Medicine 54: 1-16
Karl T, Bhatia S, Cheng D, Kim WS, Garner B. 2012. Cognitive phenotyping of amyloid precursor protein transgenic J20 mice. Behavioural Brain Research 228: 392-97
Kask K, Zamanillo D, Rozov A, Burnashev N, Sprengel R, Seeburg PH. 1998. The AMPA receptor subunit GluR-B in its Q/R site-unedited form is not essential for brain development and function. Proc Natl Acad Sci U S A 95: 13777-82
Kawahara Y, Ito K, Sun H, Aizawa H, Kanazawa I, Kwak S. 2004a. Glutamate receptors: RNA editing and death of motor neurons. Nature 427: 801
Kawahara Y, Ito K, Sun H, Ito M, Kanazawa I, Kwak S. 2004b. Regulation of glutamate receptor RNA editing and ADAR mRNA expression in developing human normal and Down's syndrome brains. Brain Res Dev Brain Res 148: 151-55
Kawahara Y, Ito K, Sun H, Kanazawa I, Kwak S. 2003. Low editing efficiency of GluR2 mRNA is associated with a low relative abundance of ADAR2 mRNA in white matter of normal human brain. Eur J Neurosci 18: 23-33
Kawahara Y, Kwak S. 2005. Excitotoxicity and ALS: what is unique about the AMPA receptors expressed on spinal motor neurons? Amyotroph Lateral Scler Other Motor Neuron Disord 6: 131-44
Kawahara Y, Sun H, Ito K, Hideyama T, Aoki M, et al. 2006. Underediting of GluR2 mRNA, a neuronal death inducing molecular change in sporadic ALS, does not occur in motor neurons in ALS1 or SBMA. Neurosci Res 54: 11-14
Kayed R, Glabe C. 2006. Conformation-dependent anti-amyloid oligomer antibodies. Methods Enzymol 413: 326 - 44
Kayed R, Head E, Sarsoza F, Saing T, Cotman C, et al. 2007. Fibril specific, conformation dependent antibodies recognize a generic epitope common to amyloid fibrils and fibrillar oligomers that is absent in prefibrillar oligomers. Molecular Neurodegeneration 2: 18
Keifer J, Zheng Z. 2010. AMPA receptor trafficking and learning. Eur J Neurosci 32: 269-77
Kenney J, Gould T. 2008. Modulation of Hippocampus-Dependent Learning and Synaptic Plasticity by Nicotine. Molecular Neurobiology 38: 101-21
Kessels H, Malinow R. 2009. Synaptic AMPA receptor plasticity and behaviour. Neuron 61: 340-50
King DL, Arendash GW. 2002. Behavioral characterization of the Tg2576 transgenic model of Alzheimer's disease through 19 months. Physiol Behav 75: 627-42
References ____________________________________________________________________________________
267
Kirov SA, Harris KM. 1999. Dendrites are more spiny on mature hippocampal neurons when synapses are inactivated. Nat Neurosci 2: 878-83
Klyubin I, Cullen W, Hu N-W, Rowan M. 2012. Alzheimer's disease Abeta assemblies mediating rapid disruption of synaptic plasticity and memory. Molecular Brain 5: 25
Klyubin I, Wang Q, Reed MN, Irving EA, Upton N, et al. 2011. Protection against Aβ-mediated rapid disruption of synaptic plasticity and memory by memantine. Neurobiology of Aging 32: 614-23
Knopman DS, Parisi J, Salvati A, Floriach-robert M, Boeve B, et al. 2003. Neuropathology of Cognitively Normal Elderly. Journal of Neuropathology & Experimental Neurology 62: 1087-95
Kobayashi D, Chen K. 2005. Behavioral phenotypes of amyloid-based genetically modified mouse model of Alzheimer's disease. Genes Brain Behav 4: 173-96
Kortenbruck G, Berger E, Speckmann EJ, Musshoff U. 2001. RNA editing at the Q/R site for the glutamate receptor subunits GLUR2, GLUR5, and GLUR6 in hippocampus and temporal cortex from epileptic patients. Neurobiol Dis 8: 459-68
Kuma S, Walter J. 2011. Phosphorylation of amyloid beta (Aβ) peptides – A trigger for formation of toxic aggregates in Alzheimer's disease. Aging 3: 1-10
Kuner R, Groom AJ, Bresink I, Kornau H, Stefovska V, et al. 2005. Late-onset motoneuron disease caused by a functionally modified AMPA receptor subunit. Proc Natl Acad Sci U S A 102: 5826-31
Kwak S, Kawahara Y. 2005. Deficient RNA editing of GluR2 and neuronal death in amyotropic lateral sclerosis. J Mol Med 83: 110-20
Kwak S, Weiss JH. 2006. Calcium-permeable AMPA channels in neurodegenerative disease and ischemia. Curr Opin Neurobiol 16: 281-87
Lacor PN, Buniel MC, Furlow PW, Sanz Clemente A, Velasco PT, et al. 2007. Abeta Oligomer-Induced Aberrations in Synapse Composition, Shape, and Density Provide a Molecular Basis for Loss of Connectivity in Alzheimer's Disease. The Journal of Neuroscience 27: 796-807
LaFerla FM, Green KN, Oddo S. 2007. Intracellular amyloid-[beta] in Alzheimer's disease. Nat Rev Neurosci 8: 499-509
Lalonde R, Dumont M, Staufenbiel M, Sturchler-Pierrat C, Strazielle C. 2002. Spatial learning, exploration, anxiety, and motor coordination in female APP23 transgenic mice with the Swedish mutation. Brain Research 956: 36-44
Lee J-E, Han P-L. 2013. An Update of Animal Models of Alzheimer Disease with a Reevaluation of Plaque Depositions. Exp Neurobiol 22: 84-95
Lee S, Yang G, Yong Y, Liu Y, Zhao L, et al. 2010. ADAR2-dependent RNA editing of GluR2 is involved in thiamine deficiency-induced alteration of calcium dynamics. Molecular Neurodegeneration 5: 54
Lesne SE, Sherman MA, Grant M, Kuskowski M, Schneider JA, et al. 2013. Brain amyloid-β oligomers in ageing and Alzheimer's disease. Brain
Lewis J, Dickson DW, Lin W-L, Chisholm L, Corral A, et al. 2001. Enhanced Neurofibrillary Degeneration in Transgenic Mice Expressing Mutant Tau and APP. Science 293: 1487-91
Lewis J, McGowan E, Rockwood J, Melrose H, Nacharaju P, et al. 2000. Neurofibrillary tangles, amyotrophy and progressive motor disturbance in mice expressing mutant (P301L) tau protein. Nat Genet 25: 402-05

References ____________________________________________________________________________________
268
Lim GP, Yang F, Chu T, Chen P, Beech W, et al. 2000. Ibuprofen Suppresses Plaque Pathology and Inflammation in a Mouse Model for Alzheimer's Disease. J Neurosci 20: 5709-14
Liu S-J, Gasperini R, Foa L, Small DH. 2010. Amyloid-β Decreases Cell-Surface AMPA Receptors by Increasing Intracellular Calcium and Phosphorylation of GluR2. Journal of Alzheimer's Disease 21: 655-66
Lobello K, Ryan J, Liu E, Ribbon G, Black R. 2012. Targeting Beta Amyloid: A Clinical Review of Immunotherapeutic Approaches in Alzheimer's Disease. International Journal of Alzheimer's Disease 2012
Lopez-Toledano M, Shelanski M. 2007. Increased neurogenesis in young transgenic mice overexpressing human APP(Sw, Ind). Journal of Alzheimer's Disease 12: 229-40
Louzada Jr PR, Paula Lima AaC, de Mello FG, Ferreira SrT. 2001. Dual role of glutamatergic neurotransmission on amyloid beta (1-42) aggregation and neurotoxicity in embryonic avian retina. Neuroscience Letters 301: 59-63
Lovasic L, Bauschke H, Janus C. 2005. Working memory impairment in a transgenic amyloid precursor protein TgCRND8 mouse model of Alzheimer's disease. Genes, Brain and Behavior 4: 197-208
Ly PTT, Cai F, Song W. 2011. Detection of Neuritic Plaques in Alzheimer's Disease Mouse Model. e2831
Lyness SA, Lee AY, Zarow C, Teng EL, Chui HC. 2014. 10-Minute Delayed Recall from the Modified Mini-Mental State Test Predicts Alzheimer's Disease Pathology. Journal of Alzheimer's Disease 39: 575-82
Lyness SA, Zarow C, Chui HC. 2003. Neuron loss in key cholinergic and aminergic nuclei in Alzheimer disease: a meta-analysis. Neurobiology of Aging 24: 1-23
Ma T, Trinh MA, Wexler AJ, Bourbon C, Gatti E, et al. 2013. Suppression of eIF2[alpha] kinases alleviates Alzheimer's disease-related plasticity and memory deficits. Nat Neurosci 16: 1299-305
Maas S, Patt S, Schrey M, Rich A. 2001. Underediting of glutamate receptor GluR-B mRNA in malignant gliomas. Proc Natl Acad Sci U S A 98: 14687-92
Mahajan SS, Thai KH, Chen K, Ziff EB. 2011. Exposure of neurons to excitotoxic levels of glutamate induces cleavage of the RNA editing enzyme, adenosine deaminase acting on RNA 2, and loss of GLUR2 editing. Neuroscience 189: 305-15
Malinow R. 2003. AMPA receptor trafficking and long-term potentiation. Philosophical transactions of the Royal Society of London. Series B, Biological sciences 358: 707-14
Malinow R, Malenka RC. 2002. AMPA receptor trafficking and synaptic plasticity. Annu Rev Neurosci 25: 103-26
Man HY. 2011. GluA2-lacking, calcium-permeable AMPA receptors — inducers of plasticity? Curr Opin Neurobiol 21: 291-98
Marcucci R, Brindle J, Paro S, Casadio A, Hempel S, et al. 2011. Pin1 and WWP2 regulate GluR2 Q/R site RNA editing by ADAR2 with opposing effects. EMBO J 30: 4211-22
Matsuoka T, Narumoto J, Shibata K, Okamura A, Nakamura K, et al. 2011. Neural correlates of performance on the different scoring systems of the clock drawing test. Neuroscience Letters 487: 421-25
References ____________________________________________________________________________________
269
Mattson MP. 1990. Antigenic changes similar to those seen in neurofibrillary tangles are elicited by glutamate and Ca2+ influx in cultured hippocampal neurons. Neuron 4: 105-17
McAlpine FE, Lee J-K, Harms AS, Ruhn KA, Blurton-Jones M, et al. 2009. Inhibition of soluble TNF signaling in a mouse model of Alzheimer's disease prevents pre-plaque amyloid-associated neuropathology. Neurobiology of Disease 34: 163-77
McFadyen MP, Kusek G, Bolivar VJ, Flaherty L. 2003. Differences among eight inbred strains of mice in motor ability and motor learning on a rotorod. Genes Brain Behav 2: 214-19
McGeer P, Itagaki S, Tago H, McGeer E. 1987. Reactive microglia in patients with senile dementia of the Alzheimer type are positive for the histocompatibility glycoprotein HLA-DR. Neurosci Lett 79: 195 - 200
McGeer P, McGeer E. 2007. NSAIDs and Alzheimer disease: Epidemiological animal model and clinical studies. Neurobiology of Aging: 639-47
McGeer P, McGeer E, Rogers J, Sibley J. 1990. Anti-inflammatory drugs and Alzheimer disease. The Lancet 335: 1037
McKinney RA, Capogna M, Durr R, Gahwiler BH, Thompson, Scott M. 1999. Miniature synaptic events maintain dendritic spines via AMPA receptor activation. Nat Neurosci 2: 44-49
Meda L, Cassatella M, Szendrei G, Otvos L, Baron P, et al. 1994. Activation of microglial cells by beta-amyloid protein and interferon-gamma. Letters to nature 374: 347-650
Meilandt WJ, Cisse M, Ho K, Wu T, Esposito LA, et al. 2009. Neprilysin Overexpression Inhibits Plaque Formation But Fails to Reduce Pathogenic Aβ Oligomers and Associated Cognitive Deficits in Human Amyloid Precursor Protein Transgenic Mice. The Journal of Neuroscience 29: 1977-86
Melcher T, König N, Berger T, Bardoul M, Jonas P, et al. 1997. Soc. Neurosci. Abstr. 478.26.
Melcher T, Maas S, Herb A, Sprengel R, Seeburg PH, Higuchi M. 1996. A mammalian RNA editing enzyme. Nature 379: 460-64
Metcalfe MJ, Figueiredo-Pereira ME. 2010. Relationship Between Tau Pathology and Neuroinflammation in Alzheimer's Disease. Mount Sinai Journal of Medicine: A Journal of Translational and Personalized Medicine 77: 50-58
Minano-Molina AJ, Espana J, Martin E, Barneda-Zahonero B, Fado R, et al. 2011. Soluble oligomers of amyloid-β peptide disrupt membrane trafficking of α-amino-3-hydroxy-5-methylisoxazole-4-propionic acid receptor contributing to early synapse dysfunction. Journal of Biological Chemistry 286: 27311-21
Miners JS, Barua N, Kehoe PG, Gill S, Love S. 2011. Aβ-Degrading Enzymes: Potential for Treatment of Alzheimer Disease. Journal of Neuropathology & Experimental Neurology 70: 944-59
Mohamed N-E, Zhao Y, Lee JH, Tan MG, Esiri MM, et al. 2011. Upregulation of AMPA receptor GluR2 (GluA2) subunits in subcortical ischemic vascular dementia is repressed in the presence of Alzheimer's disease. Neurochemistry International 58: 820-25
Moolman D, Vitolo O, Vonsattel J-P, Shelanski M. 2004. Dendrite and dendritic spine alterations in alzheimer models. Journal of Neurocytology 33: 377-87

References ____________________________________________________________________________________
270
Moreth J, Mavoungou C, Schindowski K. 2013. Passive anti-amyloid immunotherapy in Alzheimer's disease: What are the most promising targets? Immunity & Ageing 10: 18
Morgan D, Munireddy S, Alamed J, DeLeon J, Diamond DM, et al. 2008a. Apparent Behavioral Benefits of Tau Overexpression in P301L Tau Transgenic Mice. Journal of Alzheimer's Disease 15: 605-14
Morgan D, Munireddy S, Alamed J, DeLeon J, Diamond DM, et al. 2008b. Apparent Behavioral Benefits of Tau Overexpression in P301L Tau Transgenic Mice. J Alzheimers Dis 15: 605-14
Morita D, Rah JC, Isaac JTR. 2014. Incorporation of inwardly rectifying AMPA receptors at silent synapses during hippocampal long-term potentiation. Philosophical Transactions of the Royal Society B: Biological Sciences 369
Morris GP, Clark IA, Zinn R, Vissel B. 2013. Microglia: A new frontier for synaptic plasticity, learning and memory, and neurodegenerative disease research. Neurobiology of Learning and Memory 105: 40-53
Morris R. 1981. Spatial localization does not require the presence of local cues*1. Learning and Motivation 12: 239-60
Mosbacher J, Schoepfer R, Monyer H, Burnashev N, Seeburg PH, Ruppersber JP. 1994. A molecular determinant for submillisecond desensitization in glutamate receptors. Science 266: 1059-62
Mucke L, Masliah E, Yu G, Mallory M, Rockenstein E, et al. 2000. High-level neuronal expression of Aβ1-42 in wild-type human amyloid protein precursor transgenic mice: synaptotoxicity without plaque formation. J Neurosci 20: 4050-58
Mulholland PJ, Prendergast MA. 2003. Transection of intrinsic polysynaptic pathways reduces N-methyl-d-aspartate neurotoxicity in hippocampal slice cultures. Neuroscience Research 46: 369-76
Murphy MP, LeVine IIIH. 2010. Alzheimer's Disease and the Amyloid-β Peptide. Journal of Alzheimer's Disease 19: 311-23
Nakae A, Tanaka T, Miyake K, Hase M, Mashimo T. 2008. Comparing methods of detection and quantitation of RNA editing of rat glycine receptor alpha3P185L. Int J Biol Sci 4: 397-405
Nakamura T, Meguro K, Yamazaki H, Okuzumi H, Tanaka A, et al. 1997. Postural and gait disturbance correlated with decreased frontal cerebral blood flow in Alzheimer disease. Alzheimer disease and associated disorders 11: 132-9
Neumann H, Kotter MR, Franklin RJM. 2009. Debris clearance by microglia: an essential link between degeneration and regeneration. Brain 132: 288-95
Nichol K, Poon W, Parachikova A, Cribbs D, Glabe C, Cotman C. 2008. Exercise alters the immune profile in Tg2576 Alzheimer mice toward a response coincident with improved cognitive performance and decreased amyloid. Journal of Neuroinflammation 5: 13
Nicoll JAR, Mrak RE, Graham DI, Stewart J, Wilcock G, et al. 2000. Association of interleukin-1 gene polymorphisms with Alzheimer's disease. Annals of Neurology 47: 365-68
Nilsberth C, Westlind-Danielsson A, Eckman CB, Condron MM, Axelman K, et al. 2001. The 'Arctic' APP mutation (E693G) causes Alzheimer's disease by enhanced A[beta] protofibril formation. Nat Neurosci 4: 887-93
Nutt SL, Kamboj RK. 1994. Differential RNA editing efficiency of AMPA receptor GluR-2 in human brain. Neuroreport 5: 1679-83
References ____________________________________________________________________________________
271
Oakley H, Cole SL, Logan S, Maus E, Shao P, et al. 2006. β-Amyloid Aggregates, Neurodegeneration, and Neuron Loss in Transgenic Mice with Five Familial Alzheimer's Disease Mutations: Potential Factors in Amyloid Plaque Formation. The Journal of Neuroscience 26: 10129-40
Oddo S, Caccamo A, Shepherd JD, Murphy MP, Golde TE, et al. 2003. Triple-Transgenic Model of Alzheimer's Disease with Plaques and Tangles: Intracellular Abeta and Synaptic Dysfunction. Neuron 39: 409-21
Ofra Ben M-Z, Yair Ben M, Tamir Ben H, Raz Y. 2014. Intra-Hippocampal Transplantation of Neural Precursor Cells with Transgenic Over-Expression of IL-1 Receptor Antagonist Rescues Memory and Neurogenesis Impairments in an Alzheimer's Disease Model. Neuropsychopharmacology 39: 401-14
Olton DS, Samuelson RJ. 1976. Remembrance of places passed: Spatial memory in rats. Journal of Experimental Psychology: Animal Behavior Processes 2: 97-116
Ong W-Y, Tanaka K, Dawe GS, Ittner LM, Farooqui AA. 2013. Slow Excitotoxicity in Alzheimer's Disease. Journal of Alzheimer's Disease 35: 643-68
Palop J, Chin J, Roberson E, Wang J, Thwin M, et al. 2007. Aberrant excitatory neuronal activity and compensatory remodeling of inhibitory hippocampal circuits in mouse models of Alzheimer's Disease. Neuron 55: 697-711
Palop J, Jones B, Kekonius L, Chin J, Yu G, et al. 2003. Neuronal depletion of calcium-dependent proteins in the dentate gyrus is tightly linked to Alzheimer's disease-related cognitive deficits. PNAS 100: 9572-77
Palop JJ, Mucke L. 2010. Amyloid-[beta]-induced neuronal dysfunction in Alzheimer's disease: from synapses toward neural networks. Nat Neurosci 13: 812-18
Panicker S, Brown K, Nicoll RA. 2008. Synaptic AMPA receptor subunit trafficking is independent of the C terminus in the GluR2-lacking mouse. Proc Natl Acad Sci U S A 105: 1032-37
Paschen W, Schmitt J, Uto A. 1996. RNA Editing of Glutamate Receptor Subunits GluR2, GluR5, and GluR6 in Transient Cerebral Ischemia in the Rat. J Cereb Blood Flow Metab 16: 548-56
Pellegrini-Giampietro DE, Gorter JA, Bennet MV, Zukin RS. 1997. The GluR2 (GluR-B) hypothesis: Ca2+-permeable AMPA receptors in neurological disorders. Trends Neurosci 20: 464-70
Pellegrini-Giampietro DE, Zukin RS, Bennet MV, Cho S, Pulsinelli WA. 1992. Switch in glutamate receptor subunit gene expression in CA1 subfield of hippocampus following global ischemia in rats. Proc Natl Acad Sci U S A 89: 10499-503
Peng PL, Zhong X, Tu W, Soundarapandian MM, Molner P, et al. 2006. ADAR2-Dependent RNA Editing of AMPA Receptor Subunit GluR2 Determines Vulnerability of Neurons in Forebrain Ischemia. Neuron 49: 719-33
Perego C, Fumagalli S, De Simoni M-G. 2011. Temporal pattern of expression and colocalization of microglia/macrophage phenotype markers following brain ischemic injury in mice. Journal of Neuroinflammation 8: 174
Perrin RJ, Fagan AM, Holtzman DM. 2009. Multimodal techniques for diagnosis and prognosis of Alzheimer's disease. Nature 461: 916-22
Pietropaolo S, Feldon J, Yee B. 2014. Environmental enrichment eliminates the anxiety phenotypes in a triple transgenic mouse model of Alzheimer’s disease. Cognitive, Affective, & Behavioral Neuroscience: 1-13

References ____________________________________________________________________________________
272
Poirier R, Wolfer DP, Welzl H, Tracy J, Galsworthy MJ, et al. 2006. Neuronal neprilysin overexpression is associated with attenuation of Aβ-related spatial memory deficit. Neurobiology of Disease 24: 475-83
Pollard H, Heron A, Moreau J, Ben-Ari Y, Khrestchatisky M. 1993. Alterations of the GluR-B AMPA receptor subunit flip/flop expression in kainate-induced epilepsy and ischemia. Neuroscience 57: 554-54
Pozueta J, Lefort R, Ribe EM, Troy CM, Arancio O, Shelanski M. 2013. Caspase-2 is required for dendritic spine and behavioural alterations in J20 APP transgenic mice. Nat Commun 4
Quigley H, Colloby SJ, O'Brien JT. 2011. PET imaging of brain amyloid in dementia: a review. International Journal of Geriatric Psychiatry 26: 991-99
Reimers JM, Milovanovic M, Wolf ME. 2011. Quantitative analysis of AMPA receptor subunit composition in addiction-related brain regions. Brain Research 1367: 223-33
Robakis N. 2014. Cell Signaling Abnormalities May Drive Neurodegeneration in Familial Alzheimer Disease. Neurochemical Research 39: 570-75
Roberson ED, Scearce-Levie K, Palop JJ, Yan F, Cheng IH, et al. 2007. Reducing Endogenous Tau Ameliorates Amyloid β-Induced Deficits in an Alzheimer's Disease Mouse Model. Science 316: 750-54
Rodriguez J, Olabarria M, Chvatal A, Verkhratsky A. 2009. Astroglia in dementia and Alzheimer's disease. Cell Death Differ 16: 378-85
Rump A, Sommer C, Gass P, Bele P, Meissner D, Kiessling M. 1996. Editing of GluR2 RNA in the gerbil hippocampus after global cerebral ischemia. J Cereb Blood Flow Metab 16: 1362-65
Sabuncu MR, Desikan RS, Sepulcre J, et al. 2011. The dynamics of cortical and hippocampal atrophy in alzheimer disease. Archives of Neurology 68: 1040-48
Sanchez-Mejia R, Newman J, Toh S, Yu G, Zhou Y, et al. 2008. Phospholipase A2 reduction ameliorates cognitive deficits in a mouse model of Alzheimer's disease. Nature Neuroscience 11: 1311-18
Sanderson DJ, McHugh SB, Good MA, Sprengel R, Seeburg PH, et al. 2010. Spatial working memory deficits in GluA1 AMPA receptor subunit knockout mice reflect impaired short-term habituation: Evidence for Wagner's dual-process memory model. Neuropsychologia 48: 2303-15
Sans N, Vissel B, Petralia RS, Wang YX, Chang K, et al. 2003. Aberrant formation of glutamate receptor complexes in hippocampal neurons of mice lacking the GluR2 AMPA receptor subunit. J Neurosci 23: 9367-73
Santos AN, Ewers M, Minthon L, Simm A, Silber R-E, et al. 2012. Amyloid-β Oligomers in Cerebrospinal Fluid are Associated with Cognitive Decline in Patients with Alzheimer's Disease. Journal of Alzheimer's Disease 29: 171-76
Scheff SW, Price D, Schmitt F, DeKosky S, Mufson E. 2007. Synaptic alterations in CA1 in mild Alzheimer disease and mild cognitive impairment. Neurology 68: 1501-08
Seifert G, Weber M, Schramm J, Steinhouser C. 2003. Changes in splice variant expression and subunit assembly of AMPA receptors during maturation of hippocampal astrocytes. Molecular and Cellular Neuroscience 22: 248-58
Selkoe DJ. 2002. Alzheimer's Disease Is a Synaptic Failure. Science 298: 789-91

References ____________________________________________________________________________________
273
Serrano-Pozo A, Mielke ML, Gomez-Isla T, Betensky RA, Growdon JH, et al. 2011. Reactive Glia not only Associates with Plaques but also Parallels Tangles in Alzheimer's Disease. The American Journal of Pathology 179: 1373-84
Shaftel SS, Kyrkanides S, Olschowka JA, Miller J-nH, Johnson RE, O'Banion MK. 2007. Sustained hippocampal IL-1beta overexpression mediates chronic neuroinflammation and ameliorates Alzheimer plaque pathology. The Journal of Clinical Investigation 117: 1595-604
Shankar G, Leissring M, Adame A, Sun X. 2009. Biochemical and immunohistochemical analysis of an Alzheimer's disease mouse model reveals the presence of multiple cerebral A [beta] assembly forms throughout life. Neurobiolol Dis
Shepherd JD. 2012. Memory, plasticity and sleep - A role for calcium permeable AMPA receptors? Frontiers in molecular neuroscience 5: 49
Shi J-Q, Shen W, Chen J, Wang B-R, Zhong L-L, et al. 2011. Anti-TNF-α reduces amyloid plaques and tau phosphorylation and induces CD11c-positive dendritic-like cell in the APP/PS1 transgenic mouse brains. Brain Research 1368: 239-47
Shirvan A, Reshef A, Yogev-Falach M, Ziv I. 2009. Molecular imaging of neurodegeneration by a novel cross-disease biomarker. Experimental Neurology 219: 274-83
Sisodia SS, St George-Hyslop PH. 2002. [gamma]-Secretase, notch, A[beta] and alzheimer's disease: Where do the presenilins fit in? Nat Rev Neurosci 3: 281-90
Small GW, Kepe V, Ercoli LM, Siddarth P, Bookheimer SY, et al. 2006. PET of Brain Amyloid and Tau in Mild Cognitive Impairment. New England Journal of Medicine 355: 2652-63
Sobolevsky A, Rosconi M, Gouaux E. 2009. X-ray structure, symmetry and mechanism of an AMPA-subtype glutamate receptor. Nature 462: 745-56
Solito E, Sastre M. 2012. Microglia function in Alzheimer's disease. Frontiers in Pharmacology 3
Sommer B, Kˆhler M, Sprengel R, Seeburg PH. 1991. RNA editing in brain controls a determinant of ion flow in glutamate-gated channels. Cell 67: 11-19
Sommer B, Keinanen K, Verdoorn TA, Wisden W, Burnashev N, et al. 1990. Flip and Flop: A cell-specific functional switch in glutamate-operated channels of the CNS. Science 249: 1580-85
Stepanichev MY, Zdobnova IM, Zarubenko II, Moiseeva YV, Lazareva NA, et al. 2004. Amyloid-β (25-35)-induced memory impairments correlate with cell loss in rat hippocampus. Physiology and Behavior 80: 647-55
Stone JG, Casadesus G, Gustaw-Rothenberg K, Siedlak SL, Wang X, et al. 2010. Frontiers in Alzheimer's disease therapeutics. Therapeutic Advances in Chronic Disease
Szegedi V, Juhasz Gb, Budai Dn, Penke B. 2005. Divergent effects of Abeta1-42 on ionotropic glutamate receptor-mediated responses in CA1 neurons in vivo. Brain Research 1062: 120-26
Takeuchi H, Iba M, Inoue H, Higuchi M, Takao K, et al. 2011. P301S Mutant Human Tau Transgenic Mice Manifest Early Symptoms of Human Tauopathies with Dementia and Altered Sensorimotor Gating. PLoS One 6: e21050
Takuma H, Kwak S, Yoshizawa T, Kanazawa I. 1999. Reduction of GluR2 RNA editing, a molecular change that increases calcium influx through AMPA
References ____________________________________________________________________________________
274
receptors, selective in the spinal ventral gray of patients with amyotrophic lateral sclerosis. Ann Neurol 46: 806-15
Tanaka H, Grooms SY, Bennet MV, Zukin RS. 2000. The AMPAR subunit GluR2: still front and center-stage. Brain Res 886: 190-207
Tarkowski E, Liljeroth A-M, Minthon L, Tarkowski A, Wallin A, Blennow K. 2003. Cerebral pattern of pro- and anti-inflammatory cytokines in dementias. Brain Res Bull 61: 255-60
Thal D, Rub U, Orantes M, Braak H. 2002. Phases of A beta-deposition in the human brain and its relevance for the development of AD. Neurology 58: 1791-800
Tobinick E, Gross H. 2008. Rapid cognitive improvement in Alzheimer's disease following perispinal etanercept administration. Journal of Neuroinflammation 5: 2
Tobinick E, Gross H, Weinberger A, Hart C. 2006. TNF-alpha modulation for treatment of Alzheimer's disease: a 6-month pilot study. MedGenMed 8: 25
Trepanier CH, Milgram NW. 2010. Neuroinflammation in Alzheimer's Disease: Are NSAIDs and Selective COX-2 Inhibitors the Next Line of Therapy? Journal of Alzheimer's Disease 21: 1089-99
Tweedie D, Ferguson R, Fishman K, Frankola K, Van Praag H, et al. 2012. Tumor necrosis factor-alpha synthesis inhibitor 3,6'-dithiothalidomide attenuates markers of inflammation, Alzheimer pathology and behavioral deficits in animal models of neuroinflammation and Alzheimer's disease. Journal of Neuroinflammation 9: 106
Van Damme P, Bogaert E, Dewil M, Hersmus N, Kiraly D, et al. 2007. Astrocytes regulate GluR2 expression in motor neurons and their vulnerability to excitotoxicity. PNAS 104: 14825-30
Walsh DM, Teplow DB. 2012. Chapter 4 - Alzheimer's Disease and the Amyloid beta-Protein In Progress in Molecular Biology and Translational Science, ed. BT David, pp. 101-24: Academic Press
Wang D, Govindaiah G, Liu R, De Arcangelis V, Cox CL, Xiang YK. 2010. Binding of amyloid beta peptide to beta2 adrenergic receptor induces PKA-dependent AMPA receptor hyperactivity. The FASEB Journal 24: 3511-21
Wang J-Z, Xia Y-Y, Grundke-Iqbal I, Iqbal K. 2013. Abnormal Hyperphosphorylation of Tau: Sites, Regulation, and Molecular Mechanism of Neurofibrillary Degeneration. Journal of Alzheimer's Disease 33: S123-S39
Wenk GL. 2001. Assessment of Spatial Memory Using the Radial Arm Maze and Morris Water Maze In Current Protocols in Neuroscience: John Wiley & Sons, Inc.
Wenthold RJ, Petralia RS, Blahos JI, Niedzielski AS. 1996. Evidence for multiple AMPA receptor complexes in hippocampal CA1/CA2 neurons. J Neurosci 16: 1982-89
West MJ, Coleman PD, Flood DG, Troncoso JC. 1994. Differences in the pattern of hippocampal neuronal loss in normal ageing and Alzheimer's disease. The Lancet 344: 769-72
West MJ, Kawas CH, Martin LJ, Troncoso JC. 2000. The CA1 Region of the Human Hippocampus Is a Hot Spot in Alzheimer's Disease. Annals of the New York Academy of Sciences 908: 255-59

References ____________________________________________________________________________________
275
Wilkinson D, Wirth Y, Goebel C. 2014. Memantine in Patients with Moderate to Severe Alzheimer's Disease: Meta-Analyses Using Realistic Definitions of Response. Dementia and Geriatric Cognitive Disorders 37: 71-85
Wilson RS, Gilley DW, Bennett DA, Beckett LA, Evans DA. 2000. Hallucinations, delusions, and cognitive decline in Alzheimer's disease. Journal of Neurology, Neurosurgery & Psychiatry 69: 172-77
Wiltgen BJ, Royle GA, Gray EE, Abdipranoto A, Thangthaeng N, et al. 2010. A role for calcium-permeable AMPA receptors in synaptic plasticity and learning. PLoS ONE 5: e12818
Winters BD, Bussey TJ. 2005. Glutamate receptors in perirhinal cortex mediate encoding, retrieval, and consolidation of object recognition memory. J Neurosci 25: 4243-51
Wirths O, Bayer TA. 2010. Neuron Loss in Transgenic Mouse Models of Alzheimer's Disease. International Journal of Alzheimer's Disease 2010
Wirths O, Breyhan H, Marcello A, Cotel M-C, Bruck W, Bayer TA. 2010. Inflammatory changes are tightly associated with neurodegeneration in the brain and spinal cord of the APP/PS1KI mouse model of Alzheimer's disease. Neurobiology of Aging 31: 747-57
Wyss-Coray T. 2006. Inflammation in Alzheimer disease: driving force, bystander or beneficial response? Nat Med 12: 1005-15
Wyss-Coray T, Mucke L. 2002. Inflammation in Neurodegenerative Disease‚ A Double-Edged Sword. Neuron 35: 419-32
Yang L, Rieves D, Ganley C. 2012. Brain Amyloid Imaging — FDA Approval of Florbetapir F18 Injection. New Engl J Med 367: 885-87
Yuste R, Bonhoeffer T. 2001. Morphological changes in dendritic spines associated with long-term synaptic plasticity. Annu Rev Neurosci 24: 1071-89
Zarow C, Lyness SA, Mortimer JA, Chui HC. 2003. Neuronal loss is greater in the locus coeruleus than nucleus basalis and substantia nigra in alzheimer and parkinson diseases. Archives of Neurology 60: 337-41
Zhang W, Bai M, Xi Y, Hao J, Liu L, et al. 2012a. Early memory deficits precede plaque formation in APPswe/PS1dE9 mice: Involvement of oxidative stress and cholinergic dysfunction. Free Radic Biol Med In Press
Zhang W, Bai M, Xi Y, Hao J, Zhang Z, et al. 2012b. Multiple inflammatory pathways are involved in the development and progression of cognitive deficits in APPswe/PS1dE9 mice. Neurobiology of Aging In Press
Zhao W-Q, Santini F, Breese R, Ross D, Zhang XD, et al. 2010. Inhibition of Calcineurin-mediated Endocytosis and α-Amino-3-hydroxy-5-methyl-4-isoxazolepropionic Acid (AMPA) Receptors Prevents Amyloid β Oligomer-induced Synaptic Disruption. Journal of Biological Chemistry 285: 7619-32
Ziff EB. 2007. TARPs and the AMPA receptor trafficking paradox. Neuron 53: 627-33