Enhancement of Post-Editing Performance
320
ADVERTIMENT. Lʼaccés als continguts dʼaquesta tesi queda condicionat a lʼacceptació de les condicions dʼús establertes per la següent llicència Creative Commons: http://cat.creativecommons.org/?page_id=184 ADVERTENCIA. El acceso a los contenidos de esta tesis queda condicionado a la aceptación de las condiciones de uso establecidas por la siguiente licencia Creative Commons: http://es.creativecommons.org/blog/licencias/ WARNING. The access to the contents of this doctoral thesis it is limited to the acceptance of the use conditions set by the following Creative Commons license: https://creativecommons.org/licenses/?lang=en
-
Upload
khangminh22 -
Category
Documents
-
view
0 -
download
0
Transcript of Enhancement of Post-Editing Performance

ADVERTIMENT. Lʼaccés als continguts dʼaquesta tesi queda condicionat a lʼacceptació de les condicions dʼúsestablertes per la següent llicència Creative Commons: http://cat.creativecommons.org/?page_id=184
ADVERTENCIA. El acceso a los contenidos de esta tesis queda condicionado a la aceptación de las condiciones de usoestablecidas por la siguiente licencia Creative Commons: http://es.creativecommons.org/blog/licencias/
WARNING. The access to the contents of this doctoral thesis it is limited to the acceptance of the use conditions setby the following Creative Commons license: https://creativecommons.org/licenses/?lang=en

Doctorat en Traducció i Estudis Interculturals
Departament de Traducció i d’Interpretació i d’Estudis de l’Àsia Oriental
Olena Blagodarna
Enhancement of Post-Editing Performance:
Introducing Machine Translation Post-Editing
in Translator Training
Tesi doctoral dirigida per:
Dra. Pilar Sánchez Gijón
Bellaterra, juliol 2018


Acknowledgements
Many people contributed to this PhD research, and hereafter I would like to
acknowledge their great assistance and support.
First of all, I am very grateful to my academic supervisor Dr. Pilar Sánches Gijón for
guiding and enlightening me on how to perform research of academic value, her
encouragement and insightful comments were very stimulating. Also, I would like to say
thank you to all members of Tradumàtica Research Group (UAB) for sharing their
friendship and experience during our meetings. You have been a great example and
inspiration to me!
A special mention goes to all anonymous post-editors who took part in the survey
and whose answers were an essential element of my research, and I express my sincere
gratitude to Jeannette Ørsted and the International Federation of Translators for their
invaluable help.
A heartfelt thanks to National Aerospace University "Kharkiv Aviation Institute" and
Dr. Viktoria Ryzhkova for accepting to have me as a research visitor and providing me
with all the support for conducting the experimental study, it was an honor to be there. I
should also acknowledge the assistance of Dr. Olga Torres Hostench (UAB) and Dr.
Marharyta Ilchenko (KhAI) in arranging experimental training and testing sessions, and I
am very grateful to all those undergraduate students who volunteered to participate and
provide their data for further analysis and interpretation.
A general thanks to all the great scholars I have had the honor to learn from during
research seminars, conferences, lectures and tutorials, especially to Dr. Caroline Rossi for
her assistance during the final phase of my PhD journey, Dr. Christian Olalla Soler for
helping to choose and apply the most appropriate models of statistical analysis, Dr. Sheila
Castilho for practical suggestions on training materials, and Dr. Joss Moorkens for his
willingness to help me organize my ideas.
To my wonderful family that I am blessed with, and to Ruben – you were always
there for me; the accomplishment of this thesis can be attributed to your support and care.
THANK YOU ALL for contributing directly or indirectly, this dissertation would
have definitely not been possible without each and every one of you!


i
Table of contents
List of tables and figures ................................................................................................................ v
List of abbreviations ....................................................................................................................... x
Abstract .......................................................................................................................................... 1
Resumen ......................................................................................................................................... 2
Introduction ................................................................................................................................... 3
Part I. Theoretical framework ................................................................................................... 11
Chapter 1. Overview of EHEA ..................................................................................... 13
1.1. Recent evolution of training paradigms ................................................................ 14
1.2. Notion of competency ........................................................................................... 17
1.3. CBT model and programmed learning .................................................................. 20
Concluding remarks ......................................................................................................... 26
Chapter 2. Scope of translator training ....................................................................... 27
2.1. Training objectives ................................................................................................ 29
2.2. Translation modalities ........................................................................................... 32
2.3. MTPE assignment ................................................................................................. 36
2.3.1. Project workflow ............................................................................................ 39
2.3.2. MT error typologies ....................................................................................... 41
2.3.3. Tools and systems .......................................................................................... 45
2.3.4. References for decision-making ..................................................................... 47
2.4. Post-editor’s profile ............................................................................................... 52
2.5. Specialized training in MTPE ............................................................................... 56
Concluding remarks ......................................................................................................... 59
Chapter 3. Expertise in PE ............................................................................................ 60
3.1. Sharing Post-Editing Practices: survey setup ........................................................ 60
3.1.1. Data collection ............................................................................................... 62
3.1.2. Questionnaire structure .................................................................................. 64
3.1.3. Sample and dissemination .............................................................................. 66

ii
3.1.4. Piloting ........................................................................................................... 69
3.2. Sharing Post-Editing Practices: survey outcomes ................................................. 70
3.2.1. Block 1: Respondents’ profiles and experience ............................................. 71
3.2.2. Block 2: MTPE workflow .............................................................................. 86
3.2.3. Block 3: Expertise and decision-making in PE .............................................. 90
3.2.4. Block 4: Post-editors’ vs. translators’ performance ....................................... 93
Concluding remarks ......................................................................................................... 96
Part II. Experimental Study ....................................................................................................... 99
Chapter 4. Study methodology and design ................................................................ 100
4.1. Research construct operationalization................................................................. 100
4.2. Methodological framework ................................................................................. 101
4.3. Experimental study design .................................................................................. 103
4.3.1. Training goals............................................................................................... 104
4.3.2. Training principles and content .................................................................... 105
4.4. Study piloting ...................................................................................................... 109
4.4.1. Participants ................................................................................................... 109
4.4.2. Study corpus ................................................................................................. 112
4.4.3. Instruments and tools ................................................................................... 114
4.4.4. Protocol ........................................................................................................ 116
4.4.5. Preliminary evaluation of training outcomes ............................................... 118
Concluding remarks ................................................................................................... 122
Chapter 5. Experimental study conduct .................................................................... 124
5.1. Participants .......................................................................................................... 124
5.2. Study corpus ........................................................................................................ 126
5.3. Instruments .......................................................................................................... 129
5.4. Protocol ............................................................................................................... 134
Concluding remarks ................................................................................................... 140
Part III. Study outcomes: analysis and reflections ................................................................. 143
Chapter 6. Analysis of experimental study outcomes ............................................... 144
6.1. PE performance ................................................................................................... 144
6.1.1. Descriptive and inferential analysis of PE throughput ................................. 147

iii
6.1.2. Descriptive and inferential analysis of PE output: under-edited segments .. 155
6.1.3. Descriptive and inferential analysis of PE output: fit-for-purpose
segments ................................................................................................................. 163
6.1.4. Descriptive and inferential analysis of PE output: over-edited segments .... 170
6.1.5. Associative correlation of PE throughput vs. PE output values................... 178
6.2. Questionnaire responses ...................................................................................... 181
6.2.1. Descriptive analysis of MTPE-related attitudes ........................................... 182
6.2.2. Descriptive analysis of MTPE performance convictions ............................. 187
6.2.3. Interpretative analysis of students’ opinions ................................................ 191
6.2.4. Associative correlation of questionnaire responses ..................................... 193
6.3. Correlation between PE performance and attitude towards MT ......................... 195
6.3.1. Cluster A ...................................................................................................... 196
6.3.2. Cluster A vs. Cluster B................................................................................. 198
6.3.3. Cluster A vs. Cluster C................................................................................. 200
6.3.4. Cluster A vs. Cluster D ................................................................................ 202
Concluding remarks ................................................................................................... 204
Chapter 7. Experimental study: NMT perspective ................................................... 208
7.1. NMT paradigm and the training corpus .............................................................. 208
7.2. (N/S)MT output: comparison and contrast ......................................................... 211
7.3. Adjusting the training proposal focus ................................................................. 218
Concluding remarks ................................................................................................... 220
Conclusions ................................................................................................................................ 222
Bibliography ............................................................................................................................... 232
Appendices ................................................................................................................................. 253
Appendix I. Sharing Post-Editing Practices (the questionnaire) ................................... 253
Appendix II. Pilot study results ...................................................................................... 253
Appendix III. Experimental study corpus, instruments and tools .................................. 254
Appendix IV. PE Performance results ........................................................................... 262
Appendix V. Statistical inferences of WPH rates ........................................................... 265
Appendix VI. Statistical inferences of under-edited segments ....................................... 267

iv
Appendix VII. Statistical inferences of fit-for-purpose segments ................................... 269
Appendix VIII. Statistical inferences of over-edited segments ....................................... 271
Appendix IX. Statistical correlations (TS 1) .................................................................. 273
Appendix X. Statistical correlations (TS 2) .................................................................... 275
Appendix XI. Questionnaire results ............................................................................... 277
Appendix XII. Associative correlations (TS 1) ............................................................... 281
Appendix XIII. Associative correlations (TS 2).............................................................. 285
Appendix XIV. Clusters: attitude towards MT vs. PE performance .............................. 289
Appendix XV. (N/S)MT engines output .......................................................................... 291

v
List of tables and figures
List of tables
Table 1. Informed consent ............................................................................................................. 71
Table 2. Sharing the feedback on survey results ........................................................................... 71
Table 3. Respondents’ ages ........................................................................................................... 72
Table 4. Respondents’ memberships to translators’ associations/federations ............................. 73
Table 5. Correlation of SL(s) and TL(s) ........................................................................................ 74
Table 6. Respondents’ academic backgrounds.............................................................................. 79
Table 7. Respondents’ experience in translation/post-editing ...................................................... 80
Table 8. Regularity of translation/PE-related tasks in respondents’ workflow ............................ 82
Table 9. Respondents’ average productivity for PE projects ........................................................ 83
Table 10. PE rates metrics ............................................................................................................ 84
Table 11. Correlation between manual PE jobs and semi-automatic PE jobs ............................. 84
Table 12. Correlation between full and light PE jobs ................................................................... 85
Table 13. Correlation between regularity of PE tasks in different subject fields ......................... 86
Table 14. Correlation between high-visibility and low-visibility content for PE .......................... 86
Table 15. Starting point(s) of PE projects ..................................................................................... 87
Table 16. Frequency of PE tasks starting points ........................................................................... 88
Table 17. Frequency of usage of PE tools and systems ................................................................ 89
Table 18. Frequency of usage of references for PE ...................................................................... 90
Table 19. Decision-making in PE .................................................................................................. 92
Table 20. Relevance of PE competencies ...................................................................................... 93
Table 21. Comparison of competencies (post-editing vs. translation) .......................................... 94
Table 22. Post-editors’ satisfaction levels ..................................................................................... 95
Table 23.1. TS 1: objectives and activities .................................................................................. 107
Table 23.2. Training proposal: objectives and activities ............................................................ 108
Table 23.3. TS 2: objectives and activities .................................................................................. 109
Table 24. Study corpus for the piloting ....................................................................................... 113
Table 25. Format and content of assignment for the pilot study ................................................. 113
Table 26. Overview of training proposal instruments and tools ................................................. 114
Table 27.1. Experimental study instruments – TS 1 .................................................................... 115
Table 27.2. Experimental study instruments – Training ............................................................. 115

vi
Table 27.3. Experimental study instruments – TS 2 .................................................................... 116
Table 28. PE output minimum, maximum and mean values (TS 1 vs. TS 2) ............................... 118
Table 29. Total nr. of the full-scale study participants ............................................................... 125
Table 30. Study corpus ................................................................................................................ 126
Table 31. Questionnaire (identical for both TSs) ........................................................................ 132
Table 32. In-class training presentation ..................................................................................... 134
Table 33.1.1. Core values and SD (WPH rate, Group 1) ........................................................... 147
Table 33.1.2. Test of normality (WPH rate, Group 1)................................................................. 149
Table 33.1.3. Contrast of hypotheses (WPH rate, Group 1) ....................................................... 150
Table 33.2.1. Throughput core values and SD (WPH rate, Group 2) ......................................... 150
Table 33.2.2. Test of normality (WPH rate, Group 2)................................................................. 152
Table 33.2.3. Contrast of hypotheses (WPH rate, Group 2) ....................................................... 152
Table 33.3.1. Core values and SD (WPH rate, Groups 1 and 2) ............................................... 153
Table 33.3.2. Test of normality (WPH rate, Groups 1 and 2) ..................................................... 154
Table 33.3.3. Contrast of hypothesis (WPH rate, Groups 1 and 2) ............................................ 154
Table 34.1.1 Output quality (under-edited segments, Group 1) .................................................. 155
Table 34.1.2. Test of normality (under-edited segments, Group 1) ............................................ 157
Table 34.1.3. Contrast of hypothesis (under-edited segments, Group 1) .................................... 157
Table 34.2.1. Output quality (under-edited segments, Group 2) ................................................. 158
Table 34.2.2. Test of normality (under-edited segments, Group 2) ............................................ 159
Table 34.2.3. Contrast of hypothesis (under-edited segments, Group 2) .................................... 160
Table 34.3.1. Output quality (under-edited segments, Groups 1 and 2) ..................................... 160
Table 34.3.2. Test of normality (under-edited segments, Groups 1 and 2) ................................. 162
Table 34.3.3. Contrast of hypothesis (under-edited segments, Groups 1 and 2) ........................ 162
Table 35.1.1. Output quality (fit-for-purpose segments, Group 1) ............................................. 163
Table 35.1.2. Test of normality (fit-for-purpose segments, Group 1) ......................................... 165
Table 35.1.3. Contrast of hypotheses (fit-for-purpose segments, Group 1) ................................ 165
Table 35.2.1. Output quality (fit-for-purpose segments, Group 2) ............................................. 166
Table 35.2.2. Test of normality (fit-for-purpose segments, Group 2) ......................................... 167
Table 35.2.3. Contrast of hypotheses (fit-for-purpose segments, Group 2) ................................ 168
Table 35.3.1 Output quality (fit-for-purpose segments, Groups 1 and 2) ................................... 168
Table 35.3.2. Test of normality (fit-for-purpose segments, Groups 1 and 2) .............................. 170
Table 35.3.3. Contrast of hypothesis (fit-for-purpose segments, Groups 1 and 2) ..................... 170

vii
Table 36.1.1 Output quality (over-edited segments, Group 1) .................................................... 171
Table 36.1.2. Test of normality (over-edited segments, Group 1) ............................................... 172
Table 36.1.3. Contrast of hypotheses (over-edited segments, Group 1) ..................................... 173
Table 36.2.1. Output quality (over-edited segments, Group 2) ................................................... 173
Table 36.2.2. Test of normality (over-edited segments, Group 2) ............................................... 175
Table 36.2.3. Contrast of hypotheses (over-edited segments, Group 2) ..................................... 175
Table 36.3.1. Output quality (over-edited segments, Groups 1 and 2) ....................................... 176
Table 36.3.2. Test of normality (over-edited segments, Groups 1 and 2) ................................... 177
Table 36.3.3. Contrast of hypothesis (over-edited segments, Groups 1 and 2) .......................... 177
Table 37.1. Associations of quantitative values (WPH vs. segments) in TS 1 ............................. 178
Table 37.2. Associations of quantitative values ( segments) in TS 1 .......................................... 179
Table 37.3. Associations of quantitative values (WHP vs. segments) in TS 2 ............................. 179
Table 37.4. Associations of quantitative values (segments) in TS 2 ............................................ 180
Table 38. What is your attitude towards the use of Machine Translation in the translation
industry? ...................................................................................................................................... 182
Table 39. Do you agree that MTPE output of “less-than-maximum quality” is good enough
to be delivered to the client as a complete job? .......................................................................... 184
Table 40. Would you be interested in taking up PE as a profession? ......................................... 185
Table 41. Are you satisfied with your performance in this TS? .................................................. 186
Table 42. If asked to perform similar tasks in future, how would you evaluate your level of
PE competency? .......................................................................................................................... 187
Table 43.1. Perceived effect of the training on students’ PE competency (PE skills
perspective) .................................................................................................................................. 189
Table 43.2. Perceived effect of the training on students’ PE competency (MT performance
perspective) .................................................................................................................................. 191
Table 43.3. Perceived effect of the training on students’ PE competency (PE as a career
perspective) .................................................................................................................................. 192
Table 44.1. Associative correlations of TS 1 qualitative values .................................................. 192
Table 44.2. Associative correlations of TS 2 qualitative values .................................................. 193
Table 45. Alternative (N/S)MT systems ....................................................................................... 210
Table 46. Autodesk MT output quality vs. other (N/S)MT systems output quality ..................... 210
Table 47. Autodesk vs. DeepL – comparison and contrast (EN-ES) ........................................... 213
Table 48. Autodesk vs. Yandex – comparison and contrast (EN-ES) .......................................... 214
Table 49. Autodesk vs. Google Translate – comparison and contrast (EN-RU) ........................ 216
Table 50. Autodesk vs. Yandex – comparison and contrast (EN-RU) ......................................... 217

viii
List of figures
Figure 1. Respondents’ current countries of residence ................................................................. 73
Figure. 2. Respondents’ source languages for PE projects .......................................................... 75
Figure 3. Respondents’ target languages for PE projects ............................................................ 75
Figure 4: Correlation of years of experience in translation and post-editing .............................. 81
Figure 5. Correlation of PE output quality mean values before and after the training .............. 119
Figure 6. What is your attitude towards the use of MT in the translation/localization
industry? ...................................................................................................................................... 120
Figure 7. Do you agree with this statement "Machine translated and post-edited output of
less-than-maximum quality is good enough to be delivered to the client as a complete job?" ... 120
Figure 8. As a novice translator, would you be interested in performing PE jobs on a
regular basis? ............................................................................................................................ 121
Figure 9.1.1. Throughput boxplot diagram (Group 1) ................................................................ 148
Figure 9.1.2. Distribution of Group 1 values in TS 1 and TS 2 .................................................. 149
Figure 9.2.1. Throughput boxplot diagram (Group 2) ................................................................ 151
Figure 9.2.2. Distribution of Group 2 values in TS 1 and TS 2 .................................................. 151
Figure 9.3. Throughput boxplot diagram (Groups 1 and 2) ....................................................... 153
Figure 10.1.1. Output quality boxplot diagram (Group 1) ......................................................... 156
Figure 10.1.2. Distribution of Group 1 values in TS 1 and TS 2 ............................................... 157
Figure 10.2.1 Output quality boxplot diagram (Group 2) .......................................................... 158
Figure 10.2.2. Distribution of Group 2 values in TS 1 and TS 2 ................................................ 159
Figure 10.3. Output quality boxplot diagram (Groups 1 and 2) ................................................. 161
Figure 11.1.1. Output quality boxplot diagram (Group 1) ......................................................... 164
Figure 11.1.2. Distribution of Group 1 values in TS 1 and TS 2 ................................................ 164
Figure 11.2.1. Output quality boxplot diagram (Group 2) ......................................................... 166
Figure 11.2.2. Distribution of Group 2 values in TS 1 and TS 2 ................................................ 167
Figure 11.3. Output quality boxplot diagram (Groups 1 and 2) ................................................. 169
Figure 12.1.1.Output quality boxplot diagram (Group 1) .......................................................... 171
Figure 12.1.2. Distribution of Group 1 values in TS 1 and TS 2 ................................................ 172
Figure 12.2.1. Output quality boxplot diagram (Group 2) ......................................................... 174
Figure 12.2.2. Distribution of Group 2 values in TS 1 and TS 2 ................................................ 174
Figure 12.3. Output quality boxplot diagram (Groups 1 and 2) ................................................. 176
Figure 13.1. What is your attitude towards the use of Machine Translation in the translation
industry? (dynamics of individual responses, Group 1) .............................................................. 183

ix
Figure 13.2. What is your attitude towards the use of Machine Translation in the translation
industry? (dynamics of individual responses, Group 2) .............................................................. 183
Figure 14.1. Do you agree that MTPE output of “less-than-maximum quality” is good
enough to be delivered to the client as a complete job? (dynamics of individual responses,
Group 1) ...................................................................................................................................... 184
Figure 14.2. Do you agree that MTPE output of “less-than-maximum quality” is good
enough to be delivered to the client as a complete job? (dynamics of individual responses,
Group 2) ...................................................................................................................................... 185
Figure 15.1. Would you be interested in taking up PE as a profession? (Group 1) ................... 186
Figure 15.2. Would you be interested in taking up PE as a profession? (Group 2) ................... 186
Figure 16.1 Are you satisfied with your performance in this TS? (Group 1).............................. 188
Figure 16.2. Are you satisfied with your performance in this TS? (Group 2)............................. 188
Figure 17.1. If asked to perform similar tasks in future, how would you evaluate your level
of PE competency? (dynamics of individual responses, Group 1) .............................................. 189
Figure 17.2. If asked to perform similar tasks in future, how would you evaluate your level
of PE competency? (dynamics of individual responses, Group 2) .............................................. 190
Figure 18.1. Cluster A: under-/over-edited segments in TS 1 and TS 2 ..................................... 196
Figure 18.2. Cluster A: fit-for-purpose segments in TS 1 and TS 2 ............................................ 197
Figure 18.3. Cluster A: WPH rate in TS 1 and TS 2 ................................................................... 197
Figure 19.1. Distribution of Clusters A and B values: under-/over-edited segments ................. 198
Figure 19.2. Distribution of Clusters A and B values: fit-for-purpose segments ........................ 199
Figure 19.3. Distribution of Clusters A and B values: WPH rate ............................................... 199
Figure 20.1. Distribution of Clusters A and C values: under-/over-edited segments ................. 200
Figure 20.2. Distribution of Clusters A and C values: fit-for-purpose segments ....................... 201
Figure 20.3. Distribution of Clusters A and C values: WPH rate............................................... 201
Figure 21.1. Distribution of Clusters A and D values: under-/over-edited segments ................. 202
Figure 21.2. Distribution of Clusters A and D values: fit-for-purpose segments ....................... 203
Figure 21.3. Distribution of cluster A and D values: WPH rate ................................................. 203
Figure 22: Levenshtein distance between Autodesk/DeepL segments with errors and the
“golden standard” ....................................................................................................................... 213
Figure 23: Levenshtein distance between Autodesk/Yandex segments with errors and the
“golden standard” ....................................................................................................................... 215
Figure 24: Levenshtein distance between Autodesk/Google Translate segments with errors
and the “golden standard” .......................................................................................................... 216
Figure 25: Levenshtein distance between Autodesk/Yandex segments with errors and the
“golden standard” ....................................................................................................................... 218

x
List of abbreviations
ANECA – Agencia Nacional de la Evaluación de la Calidad y Acreditación
CASRO – Council of American Survey Research Organizations
CAT – Computer-Aided Translation
CBT – Competency-Based Training
DQF – Dynamic Quality Framework
EHEA – European Higher Education Area
EMT – European Master in Translation
GILT – Globalization, Internationalization, Localization, Translation
ISO – International Standard Association
LD – Levenshtein Distance
LSP – Language Service Provider
MQM – Multidimensional Quality Metrics
MT – Machine Translation
MTPE – Machine Translation Post-Editing
NMT – Neural Machine Translation
OECD – Organization for Economic Cooperation and Development
PE – Post-Editing
PL – Programmed Learning
QA – Quality Assurance
SL – Source Language
SMT – Statistical Machine Translation
TAP –Think Aloud Protocol
TAUS – Translation Automation Users Society
TL – Target Language
TM – Translation Memory
TS – Translation Studies
WPH – Words Per Hour

1
Abstract
The key objectives of this thesis were to explore the profile of translators involved in
post-editing, to outline the scope of required competencies and skills and to suggest a valid
training proposal that would enhance post-editing performance of novice post-editors in
conformity with the European Higher Education Area requirements.
The thesis integrated two sequential studies: a survey-based research that yielded
authentic information concerning post-editors’ profiles and practices and an empirical-
experimental research that put the suggested training model to the test and involved a total
of 46 translation students in the final year of their Bachelor’s program. To collect
conclusive evidence about the applicability of the proposal across different linguistic
backgrounds, the study focused on 22 participants who were students at Kharkiv National
Aerospace University (Ukraine) and specialized in English-Russian translation, and 24
participants who were students at Universitat Autònoma de Barcelona (Spain) and
specialized in English-Spanish translation. The suggested training model pursued
acquisition of conceptual and operational knowledge by the trainees and was incorporated
in a pretest-posttest experimental study. The impact of such model was examined by the
evaluation of the quality of post-edited segments and throughput rates demonstrated by the
participants as well as the students’ attitudes to MTPE-related issues and self-evaluation of
their post-editing performance before and after the training. The thesis ends with
reflections upon the changes that might be brought to the proposal if neural machine
translation systems were used to generate the training corpus.
The dissertation contributes to the definition of the scope of post-editors’
professional expertise, offers a scalable training model and describes to what extent such
model may enhance post-editing performance in undergraduate translation students.
Keywords: machine translation post-editing, post-editing competency, enhancement
of post-editing performance, translator training, training model, survey, experimental
study.

2
Resumen
Los objetivos clave de esta tesis fueron explorar el perfil de los traductores
involucrados en posedición, establecer el alcance de las competencias y habilidades
requeridas, y sugerir una propuesta de formación válida que mejore el rendimiento de los
post-editores noveles de acuerdo con los requisitos del Espacio Europeo de Educación
Superior.
La tesis integró dos estudios secuenciales: una investigación basada en una encuesta
que proporcionó información real sobre los perfiles y prácticas de los post-editores, y una
investigación empírico-experimental que puso a prueba el modelo de formación sugerido e
involucró a un total de 46 estudiantes de traducción en el último año de su licenciatura.
Para recoger pruebas concluyentes sobre la aplicabilidad de la propuesta en diferentes
contextos lingüísticos, el estudio se centró en 22 participantes que eran estudiantes de la
Universidad Aerospacial Nacional de Kharkiv (Ucrania) especializados en traducción
inglés-ruso, y 24 participantes que eran estudiantes de la Universidad Autónoma de
Barcelona (España) especializados en traducción inglés-español. El modelo de formación
sugerido perseguía la adquisición de conocimientos conceptuales y operativos por parte de
los participantes y se incorporó en un estudio experimental antes y después de la prueba. El
impacto de dicho modelo se examinó mediante la evaluación de la calidad de los
segmentos post-editados y las tasas de rendimiento demostradas por los participantes, así
como las actitudes de los estudiantes hacia los temas relacionados con el traducción
automática y posedición y la autoevaluación de su rendimiento antes y después de dicha
formación. La tesis termina con una reflexión sobre los cambios que podrían introducirse
en la formación si se utilizaran sistemas neurales de traducción automática para generar el
corpus de formación.
La tesis contribuye a la definición del alcance de la experiencia profesional de los
post-editores, ofrece un modelo de formación escalable y describe hasta qué punto dicho
modelo puede mejorar la posedición de los estudiantes universitarios de traducción.
Palabras clave: posedición de traducción automática, competencia en posedición,
mejora del rendimiento de posedición, formación de traductores, modelo de formación,
encuesta, estudio experimental.

Introduction
3
Introduction
The phases and steps of translation jobs in the GILT (Globalization,
Internationalization, Localization, Translation) industry are undergoing dramatic changes
provoked by massive incorporation of machine translation (MT) systems. In 2010 the view
was put forward that 42% of language services providers (LSPs) offered their clients MT
solutions (DePalma et al., 2010), five years later the results of the pan-Spanish survey
conducted by ProjecTA research group (UAB, 2015) showed that nearly 48% of LSPs used
MT in their professional workflow. The recent TAUS Machine Translation Market Report
(2017) estimates the revenues from the MT market as nearly 130 million US dollars, while
this figure is likely to skyrocket by 2022 and make nearly 983 million US dollars as
estimated by MT Industry Report by Grand View Research (2015). Every day that the
number of companies investing in translation engines grows, the demand for post-editing
(PE) services rises favorably. This means that the machine translation post-editing (MTPE)
model will keep increasing its importance in the years to come and will finally be used by
a significant sector of the translation industry. In parallel with the MTPE industry, research
is being conducted on numerous MTPE-related issues, including integration of MT with
commercial CAT-tools (Beaton and Contreras, 2010), measuring the relation of PE effort
to MT output quality (Guerberof, 2009; Thicke, 2011; Plitt and Masselot, 2010; Specia and
Farzindar, 2010; Specia, 2011), estimating post-editors’ productivity (Guerberof, 2008;
O’Brien, 2011) and defining the correlation of professional experience in translation with
post-editing performance rates (O'Brien and de Almeida, 2010). Besides improving return-
on-investment, project throughput and output quality parameters, gradual introduction of
PE practices into the industry also helps translators to no longer feel threatened by the
machine and learn “to reap as much benefit as possible from what the computer gives”
(Senez, 1998: 293).
Keeping these tendencies in mind, Anthony Pym (2012) propounds the view that
machine translation is likely to bring dramatic changes and turn most translators into post-
editors, and calls for reevaluation of existing training programs. Although such predictions
might be far-fetched, training in post-editing is crucial for making MTPE viable for the
needs of the translation industry (Krings and Koby, 2001: 12). To this end, more and more
attention starts being paid to the PE process with a particular focus on how training in post-
editing may improve current practices within the translation industry (O’Brien, 2006,
2011; García, 2010). Researchers have come up with ideas on skills and abilities that a

Introduction
4
professional post-editor should possess for efficient post-editing (O’Brien, 2011; Rico
Pérez, 2012; Sánchez-Gijón, 2016). In conformity with the obtained data the courses and
workshops arranged by industry stakeholders (e.g., SDL Trados, Systran or TAUS) are
already offering PE training to all those interested. The training is mostly focused on MT
systems types, basic notions of MT systems development, evaluation of MT systems,
controlled language, pre-editing and post-editing practices, setting up an MT project,
differentiation among quality levels, performing practical activities for typical errors of
particular language pairs and others.
There can be no doubt that the changes listed above are bound to influence the way
translators perform their professional duties, which means that academic institutions are
expected to foresee possible professional changes in the field and introduce new training
modules into their curricula. Meanwhile, it is worth mentioning the concern regarding the
fact that the presence of machine translation contrasts with the nearly complete absence of
curricula related to this issue (Piqué Huerta and Colominas, 2013).
As of today, the translation industry has not defined clear boundaries for eligibility
criteria involved in job descriptions of different roles (Marinelli, 2017). It is reported that
recruiters often look for profiles of linguists with coordination skills, project managers
with sales skills, salespeople with project management skills, etc. In other words, there is a
high demand for multi-skilled, technical savvy candidates trained in the ability to switch
roles, e.g., from translator and/or project manager to business development manager and/or
solution architect. In this circumstance adaptability, flexibility and curiosity are crucial in
order to adjust rapidly to new market conditions and disruptive technological changes. For
this reason, the European Higher Education Area (EHEA) makes it clear that to succeed in
their careers, university graduates are expected to employ a range of abilities, skills, and
attitudes, as well as demonstrate expertise in their respective subject-fields. Thus, the
ultimate aim of academic translation training programs is adaptation of curricula to
competency-based requirements and preparation of flexible and adaptable experts who are
able to acquire new skills and competencies through guided and/or autonomous learning,
quickly adapt to varied professional situations and thus become proactive and efficient
players of the globalized world.
PE competency is a relatively new area of research and the ways in which post-
editors can acquire it have been given insufficient academic attention to date. Currently,

Introduction
5
there are no widely accepted training proposals for acquisition and enhancement of such
competency. However, many renowned scholars (O'Brien 2002; Rico Pérez and Torrejón,
2012; Guzman, 2007; Guerberof Arenas et al., 2012) show their interest towards research
on PE skills, strategies and techniques, resources and technical means available for PE, etc.
Academic environments put forth specific proposals on the introduction of MTPE modules
in the classroom (Austermuehl, 2013; Doherty and Moorkens 2013; Doherty and Kenny,
2014; Martin-Mor and Piqué i Huerta, 2017), accompanied by a description of PE-related
tasks and processes, central and peripheral PE skills (Rico Pérez and Torrejón, 2012).
All the above-mentioned facts triggered our interest in MTPE as a recently emerged
phenomenon and the underlying concept of PE competency acquisition and enhancement.
For this reason, an in-depth investigation into professional profiles of post-editors and
incorporation of the obtained results into a specialized training model is undertaken. This
research is a conscious effort to contribute to the adaptation of academic syllabi to address
the new challenges of the translation landscape with respect to EHEA requirements.
Research objectives
Improvements in PE training are bound to bring benefits for all parties involved in
MTPE, including translators, LSPs and, ultimately, translation customers. Therefore, the
primary objective of this research is to create a training proposal that would result in the
enhancement of undergraduate translation students’ PE performance and hence contribute
to PE competency acquisition. More specifically, the research focuses on the following
threefold construct: to begin, first-hand information about the background, skills and
working routines of language experts engaged in MTPE is collected in order to highlight
the profile of a post-editor and the scope of PE expertise; next, a training proposal is
drafted and implemented so as to raise subjects’ awareness of PE as an operation that is a
linguistic task in its own right; finally, the results of such training proposal are collected
and analyzed in order to evaluate how and to what extent it contributed to subjects’ PE
competency development.
Besides studying the scope of PE expertise and ways to boost PE competency among
novice translators, attention is also paid to providing the subjects with an understanding of
what changes MT brings to the translation profession, thus helping them to accept MTPE

Introduction
6
advantages and disadvantages and to further enhance PE competency acquisition. The
researcher proposes that MT will not replace translators, but it will complement them,
adding human value to MTPE processes. The practical use of this work is in establishing a
reference point that could serve as a clear guideline for improving PE efficiency of anyone
utilizing it for academic or in-house training.
The research outcomes are expected to make contributions on the conceptual,
methodological and analytical levels. On the conceptual level, we target the problem of
limited first-hand data on post-editors’ profiles and the scope of professional expertise as
well as publicly available training proposals for PE competency enhancement. On the
methodological level, a training baseline for teaching in MTPE that takes into account
EHEA requirements is provided. As for the analytical level, the experimental study results
are thoroughly analyzed and the evidence of the impact of the suggested training on the
participants is collected.
The thesis is a conscious effort to enhance coherence between translation students’
academic and professional profiles by offering them a competency-based training proposal
on PE. In this way, the far-reaching goal is to make a contribution to the debates on the
design of such proposals and to share our vision of this issue with the broader public.
Research design framework
There is growing support for the claim that PE training must give trainees a
comprehensive vision of professional processes and tasks, PE objectives, resources, and
tools, as well as help students acquire self-learning techniques (Martín-Mòr et al., 2016:
10). To pursue that aim, a descriptive study is conducted to investigate multiple facets of
the translation industry and professional PE performance. The data yielded by such inquiry
are used for drafting a training proposal aimed at the enhancement of the participants’
competency in PE. An empirical experimental study that follows examines how and to
what extent PE competency may be boosted among translation students who were not
previously exposed to a PE environment. The primary objective of our training model is
that the subjects adopt a functional approach to PE and improve their PE performance at
the end of the training.

Introduction
7
To collect and systematize the research data a mixed-method approach is used, which
combines quantitative and qualitative methods of analysis applied at different phases and
for different purposes. Such combination of approaches for collecting and interpretation of
data helps to benefit from both methods and minimize the limitations of each one, as well
as provides grounds for “a research design with philosophical assumptions” (Creswell and
Plano Clark, 2011).
The investigation integrates two sequential studies in order to collect the relevant
data on the scope of the profile and skills of post-editors, apply these findings into a
training proposal and measure the efficiency of the latter. During the first phase, authentic
information on post-editors profiles is gathered through a specially designed questionnaire
distributed among language experts currently engaged in PE. In this way, the data on the
respondents’ backgrounds, PE environments and scope of instrumental and technical skills,
and the factors that influence decision making in PE is obtained. The respondents who are
professional translators and/or post-editors also compare the level of professional expertise
and job perception in translation vs. post-editing, as well as provide the ranking of PE-
related skills and competencies.
In continuation, the input yielded by the survey-based study is used to draft a training
proposal that is aimed at enhancing PE competency in undergraduate translation students.
The investigation is based on experimental research with the total of 46 students in the
final year of their Bachelor’s program with two different working language pairs (EN-RU
and EN-ES), and who were not previously exposed to any PE-related experience. The
choice of the subjects rests on the premises that translation competence of undergraduate
students in their fourth year of university training is characterized by the sufficient level of
acquired knowledge, skills, and attitudes that can be expected from novice translators who
are engaged into post-editing jobs at the beginning of their professional careers. The
proposal might have involved the methods used in teaching translation and/or revision due
to the author’s belief that some of the tasks aimed at PE competence development are very
much like those used to train translators/editors, albeit not identical. The suggested training
focuses on boosting subjects’ PE performance, measured by PE output and throughput
rates.
It is believed that the suggested proposal would make a significant contribution to PE
training and give rise to further research prospects.

Introduction
8
Thesis structure
The thesis starts with an Introduction and finishes with Conclusions, List of
references, List of Tables and Figures, and Appendices. Its three parts cover the following
issues: Part I deals on the theoretical premises of the research and describes the outcomes
of the survey carried out among acting post-editors, Part II describes the preparation and
conduct of the experimental study, while Part III is dedicated to the analysis of the training
results and follow-up considerations on the scope of the training from the viewpoint of
neural and/or statistical MT engines used to generate the training corpus.
Part I covers fundamental concepts that underpin our research: the expansion of
MTPE model across the translation industry and the need of specialized training of
language experts, the evolution of training paradigms and EHEA requirement for training
programs, and the scope of professional competencies of translators engaged in post-
editing on a regular basis. Chapter 1 starts with an overview of the training paradigms of
the 20th-21st centuries with a particular focus on social constructivism as the leading
approach to knowledge construction and the applied training methodologies. Such
methodologies are analyzed from the perspective of a competency-based training model
widely adopted for academic purposes, which incorporates generic and specific
competencies. In Chapter 2 the focus of our attention moves to translator training. An
overview of training objectives prescribed by the Qualifications Framework of the EHEA
is outlined. Next, we examine the recent changes in the translation industry provoked by
the incorporation of MTPE models, and reflect on the scope of a post-editing assignment,
PE skill set and specialized training. Chapter 3 reports on the preparation and outcomes of
a survey Sharing Post-Editing Practices, which was designed with a focus on post-editors’
profiles and scope of expertise. The survey sought answers to who the post-editors are,
what their working conditions are like, how they exercise their professional activities and
what their opinions regarding similarities and differences between translation and post-
editing are.
Part II delves into the methodology, design, and conduct of the experimental study
on the enhancement of PE performance among undergraduate students. In Chapter 4 the
research construct is operationalized by singling out the two key indicators of PE
competency, namely adoption and application of the range of adequacy and fluency criteria
to PE output, on the one hand, and throughput rates, on the other. In continuation, MTPE-

Introduction
9
related attitudes and self-evaluation are considered as complementary indicators of PE
competency. The use of the mixed-method approach for the study needs is justified by its
capability to facilitate collection of quantitative and qualitative data for holistic analysis of
the impact of the suggested training. Before proposing a student-centered training agenda,
the training objectives are set forth focusing on the pursuit of conceptual and operational
knowledge. The experimental study involves undergraduate translation students in their
final year of training with English-Spanish and English-Russian as their working
languages. This measure is expected to provide us with conclusive evidence and to
demonstrate that the suggested training could be applied across different language pairs.
The chapter also describes the process of the students’ recruitment, selection of the study
corpus, the instruments and tools needed for the training, and the training protocol. A pilot
study is conducted to ensure the validity and reliability of the proposed training model.
Such steps provide us with an opportunity to test the training methodology, selected tools
and instruments, suitability of corpus and training content. The pilot test sheds light on the
participants’ responses and potential problems that arise in the course of the experiment
both from participants’ and researchers’ perspectives. Upon completion of this phase, the
relevant changes are introduced to the study design. Chapter 5 elaborates on how the full-
scale experiment was conducted.
In Part III the study outcomes are analyzed and reflected upon, and in continuation, a
neural MT perspective of the study is considered. To this end, Chapter 6 summarizes the
outcomes of the training proposal, examines the quantitative data on PE performance by
means of descriptive and inferential analysis, and tests the associative correlation between
PE throughput and PE output values. Quantitative data assessment is followed by a
description and interpretation of qualitative data collected by means of questionnaires.
Finally, the correlations between PE performance and attitude towards MT are scrutinized
to figure out how acceptance/rejection of MT may impact PE performance. Chapter 7
focuses on follow-up assumptions on how and to what extent the training corpus generated
by neural and/or statistical MT systems would influence the proposal structure and its
outcomes. To this end, the corpus used for the testing purposes is machine translated by
alternative neural/statistical MT engines and the obtained segments are compared and
contrasted against the ones used for the experimental study needs.

Introduction
10
The Conclusions section highlights the central hypothesis, aims and objectives of the
thesis, and provides an overview of the findings. Application of the thesis outcomes is
discussed, as are the limitations of the present research and future lines of investigation.

Part I. Theoretical framework
11
Part I. Theoretical framework
Globalization, competition and dramatic increase of content for publishing created a
massive demand for translation services. Meanwhile, new software solutions, availability
of data to train machine translation (MT) systems, and open-code MT systems that offer
opportunities for project-specific tuning contributed to the improvement of machine
translation in the recent years. In this respect, automated translation is seen as “a way to
maximize the amount of information available to customers and constituencies who speak
other languages” (DePalma, et al., 2006). The service offered by the machine translation
and post-editing (MTPE) model consists in translating content from the source language to
the target language(s) by means of machine translation with the following post-editing of
the obtained output. As such, machine translation is believed to help translators work
efficiently by facilitating tedious and repetitive tasks. Available data suggest that the
cutting-edge technology of today makes the MTPE model a viable solution for the growing
needs of the translation industry (Federico, et al., 2012; Zampieri and Vela, 2014; Zhechev,
2014; Gaspari, et al., 2015).
The synergy created by MT advances and the increase of demand for post-editing has
radically altered the translation industry landscape. There is growing research on the
MTPE model dedicated to its different aspects, e.g., evaluation of MT output quality,
comparison of MT errors produced by different engine types, measuring and evaluation of
PE effort, tools and resources, or the scope of MTPE-related competencies and skills
(Specia et al., 2010; Pym, 2013; Melby et al., 2014; Teixeira, 2014; Moorkens et al., 2015).
From the academic viewpoint, it is expected that the presence of MTPE-related training
content in teaching plans will also increase in the nearest future, although the available
evidence proves that so far the academia has not kept the pace with such changes (Piqué
Huerta and Colominas, 2013). In this concern, the claim is put forward that investigation in
the field of MT contrasts with the nearly complete absence of curricula for editing MT
output, otherwise called post-editing (PE).
With the aim to contribute into research on the place of the emerging MTPE
phenomenon inside the academic environment and on the translation industry landscape,
Part I explores the requirements of the European Higher Education Area (EHEA) and its
focus on preparing future professionals for the challenges of the labor market. To this end,
in Chapter 1 theoretical and practical premises behind the EHEA are described with special

Part I. Theoretical framework
12
attention being paid to the competency-based approach to teaching and learning, on the one
hand, and classification, evaluation, and assessment of competencies, on the other. Chapter
2 offers an overview of the present-day scope of translators training adopted by academia.
Recent shifts in translation paradigm caused by massive digitalization are analyzed, and
the spectrum of new translation modalities is examined. Next, a PE assignment is specified
as a particular linguistic task, which is similar to translation, but not identical, with its
proper scope of available technical means, standard routines, reference materials and
accompanying resources. In continuation the skill set that enabling novice translators to
post-edit is explored, and how these skills may be integrated into the training curriculum.
Chapter 3 is dedicated to the preparation and conduct of a survey-based study on the scope
of acting post-editors’ expertise. To this end first a questionnaire is designed and tested,
then the questionnaire form is distributed among practicing post-editors, with subsequent
analysis of the obtained results that contribute to PE competency model definition.

Part I. Theoretical framework
13
Chapter 1. Overview of EHEA
The current agenda of the European educational policies is predetermined by the
OECD’s Definition and Selection of Key Competencies (2005), the European
Commission’s Key Competencies for Lifelong Learning (COM 2005, 2007), and the effect
of competences on the European Credit Transfer System. Some of the prominent features
of these documents are dynamism and evolution of competencies (Rué 2008), ability to
update, expand, or restrict them through application to new professional situations (Pérez
Gómez et al., 2009a, 2009b), transferability and demonstrability (Ledford 1995).
The modern society is in constant need of highly qualified experts who possess the
capacity to communicate effectively and to continually renew their competences in order to
assure the constant development of the former. To enter into a competitive and fast-
changing labor market university graduates are expected to demonstrate relevant
knowledge, skills, and attitudes. The challenge faced by educational institutions is to
balance the academic curricula in a way so that the competencies acquired by students go
in line with the professional demands made on them after graduation. To respond to these
challenges the European Higher Education Area (EHEA) was created as a guarantee of the
three-cycle educational system, quality assurance and recognition of qualifications.
The EHEA broadly welcomes numerous declarations and communiqués that stress
the need to adopt a shift in training, reschedule curricula and solidify the bond between the
academy and the industry. There seems to be a universal consensus that students’
competencies need to be developed to link knowledge and skills acquired at university
with what society requires of them (Salamanca Convention 2001; Wellmon, 2008). The
cornerstone of this transformation is the application of competency-based training to
academic context (Perez Cañado, 2013; Poblete Ruiz, 2006) as a response to the increasing
demand of the industry for versatile and pro-active players. Vast adoption of competency-
based training as the dominant trend at all educational levels is bound to bring new
challenges for learners and educators. This situation implies drafting programs and
establishing learning goals on the basis of practical needs, which are relevant to the
requirements of the industry. To this end, the EHEA is currently focusing its efforts on the
competency-based approach to teaching and highlights advantages of lifelong learning.
Under such circumstances, a training proposal should fit within a framework of three
particular categories (Hurtado Albir, 2007). It should be adapted so that, first, it could be

Part I. Theoretical framework
14
compared and recognized at the international level, second, would meet both the demands
of society and the job market, and third, would correspond to new pedagogical models. To
meet the last criteria, the EHEA suggests that the curricular design should be based on
competency-based training principles. This strategy goes in line with the requirements on
the involvement of students in the learning process in order to provide them with the tools
for self-review both during their university courses and in their professional careers.
A large number of traditional academic programs are often aimed merely at
knowledge acquisition (Zabalza, 2009) due to the lack of normative planning and
integrated curriculum approach. In this respect, the competency-based model is expected to
instigate training programs to adapt their curricula. As a consequence, the academia starts
shifting its focus from what is taught to what is learned and introduces general formative
assessment and continuous feedback intrinsic to the EHEA paradigm (Barblan, 2001). To
get a deeper insight into the actual requirements for training programs, hereafter we are
going to examine the latest changes in training paradigms, key features of competency-
based teaching and evaluation requirements.
1.1. Recent evolution of training paradigms
As previously mentioned, learner’s autonomy, competency-based training, and
continuous professional development occupy leading roles in the EHEA. Yet,
interpretation of approaches to learning and training by some dominant teaching paradigms
of the 20th-21st centuries, i.e., behaviorism, cognitivism and social constructivism have
undergone changes.
The behavioral theory was centered on observable behavior and aimed at achieving
predetermined patterns of conduct. Thus, the studies were mostly focused on observable
and measurable features (e.g., Thorndike, 1920; Skinner, 1953). The objective of teaching
programs was to modify students’ behavior by providing material in small chunks, eliciting
a response and giving stimuli after each answer. For the sake of discussion we may argue
that although behaviorist perspective measures mental activity through its observable
features, it would rather be used in formalized disciplines where problems are
characterized by a high degree of certainty. This approach was criticized for not taking into
account students’ longing for creation and discovery, as well as simplifying the virtue of

Part I. Theoretical framework
15
human mind and reducing it only to giving correct answers (Ramón Martínez et al., 2010:
41-43).
As reported by Pedraja (2001) behaviorism downsides gave rise to the cognitive
social theory with cognitive conductivism being its principal exponent (e.g., Bruner 1966,
Piaget 1969a, 1969b, 1970). The cognitive perspective was aimed at overcoming
limitations of behaviorism since cognitivist school provided key tools and concepts for
efficient teaching, namely spiral learning, situated learning, the importance of making
“hooks” to which students gradually add new knowledge and experience (Morin, 2001).
Covering a vast spectrum of cognition-related theories, conductivism stated that expertise
exists in mind in the form of internal representation of external reality (Duffy and
Jonassen, 2013), while learning was seen as the individual process of internal construction
of the aforementioned knowledge. This being said, students were expected to transform the
knowledge actively and construct alternative conceptual schemes. In other words, learners
built knowledge themselves, while the teacher’s role was to provide the necessary
experience and create situations that would facilitate and enhance such a construction
process.
Despite its learner-centered methodology, cognitive science approach seems to a
certain extent incompatible with the social process perspective, currently adopted by
educational psychology (Kiraly, 2000: 2). The key assumption behind the most recent
educational trends is that knowledge is generated not by the individual mind
independently, but rather through dynamic interpersonal and inter-subjective processes.
And while the cognitive paradigm of knowledge construction focuses mostly on what is
allegedly going inside the person’s mind, in social constructivism paradigm knowledge is
interpreted through collaboration and interpersonal activity. This recently adopted
educational approach also endorses students with responsibility and authority to acquire
professional competence, strive for lifelong learning and achieve autonomy that involves
attitudinal dispositions (e.g. positive attitude to the learning process, willingness to commit
and take on responsibility). The objective of fostering learners’ autonomy is expected to
inspire students to become independent learners and to process information meaningfully
to support their learning process. All that is a consequence of knowledge and abilities (e.g.
strategic power) that are linked to critical awareness and self-determination (Jiménez Raya,
2013).

Part I. Theoretical framework
16
The central theoretical premise behind the social constructivism paradigm is that the
development of cognitive skills is based on experiential learning perspective which is
characterized by a reduced number of verbal messages from teacher’s part and an
increased volume of learners’ performance, who are taking an active role in knowledge
construction. The search of solutions and responses happens as the result of personal
discovery and is guided by students’ motivation, while mental reasoning, information
management, and decision-making help develop cognitive skills and emotional intelligence
that allow optimization of problem-solving by means of creativity and flexibility. The most
important point of this approach is that students “learn to learn” – which means they learn
to reflect on learning processes and actively construct knowledge, becoming professionals
who overshoot the surrounding limitations using constructive thought (Diaz-Barriga and
Hernandez, 2004).
Current research on social constructivism validates the view that knowledge is
created through the interaction of people and merge of content – the phenomenon that was
defined by Rorty as the “conversation of mankind” (Rorty, 1979). Autonomous learning,
interaction, and communication with peers along with teachers’ guidance and support are
particularly helpful to enhance acquisition of professional competence. For this reason, the
experimental part of the research is based on the premises of social constructivism. The
implications of such an approach for training proposals mean reshaping teachers’ and
students’ roles, teaching and learning strategies and techniques as well as evaluation and
assessment routines.
To contribute to the development of contemporary teaching, it is essential to rethink
the way of exercising authority and reshape social interaction between educators and
learners from vertical dimension to horizontal, adding constructivist approach to the
curriculum (Kantun, 2005; Rojas Valenciano, 2006). The new educational strategy makes
it clear that teachers should perform their role through enhancing of rather than exposition
to knowledge, while students should change their attitudes from those of passive onlookers
to those of active participants of the learning process who engage and comment on the
processes of knowledge acquisition.

Part I. Theoretical framework
17
1.2. Notion of competency
The labor market requirements, learning theories and social constructivism paradigm
have influenced teaching-learning scenario in a way that competences acquisition has
become the foundation of the European Credit Transfer System and the European Higher
Education Area (Marquez, 2005; Gregorio Guirles and Ramón, 2002; Smith, 2005,
Palomino et al., 1996). Within the EHEA framework, the competencies are split into
generic, which are similar for different programs, and specific, which have to do with a
particular subject field.
The term competence (or competency) is defined in a number of ways, including the
ones like: “necessary knowledge, skills, and capacity to perform in a profession, solve
occupational problems in an autonomous and flexible manner…” (Bunk, 1994); “the
ability to successfully meet complex demands in a particular context; competent
performance or effective action implies the mobilization of knowledge, cognitive and
practical skills, as well as social and behavioral components such as attitudes, emotions,
and values and motivations…” (OECD 2005); “a dynamic combination of knowledge,
understanding, skills, and abilities” (Tuning General Brochure, 2007) (for a fuller list of
definition see Cano García, 2008). To harmonize the issue, the European Commission
suggested defining a competence as “a combination of knowledge, skills and attitudes
appropriate to a particular situation” (European Commission 2004; COM 2005: 3). Its
guidelines were also delivered in the form of the European Credit Transfer System and
advocated an integral definition of competencies defined as a “dynamic combination of
cognitive and meta-cognitive skills, knowledge and understanding, interpersonal,
intellectual and practical skills, ethical values and attitudes appropriate to a particular
situation”.
There is no academic consensus on the form and meaning of the terms
“competence/competences” on the one hand and “competency/competencies” on the other
(Pérez Cañado, 2013). Some sources (Moore et al., 2002) define competence as a term
related to work, while competencies are interpreted as attributes that underpin such work.
In line with this statement, it is believed that the former involves full capacity or capability
while the latter narrows the focus and applies to the description of particular abilities
(Fleming, 2009). Nonetheless, Pennock-Speck (2009) defends the viewpoint that the term
‘competencies’ comprises the meaning of competence that refers to the ability to carry out

Part I. Theoretical framework
18
tasks, strategies, and attitudes engaged in its successful completion. Additionally, the
Report of the Bologna Working Group on Qualifications Framework (2012) adopts a
neutral position and employs both terms interchangeably, while Rychen and Salganik
(2003) precise that: “examining the usage of ‘competence’ and ‘competency’ in the
literature does not reveal any hard-and-fast rules, and English dictionaries don’t further
elucidate how these words are distinctive […].” To avoid ambiguity in this investigation,
we adopt the last viewpoint and apply the term competency when talking about training
objectives manifestation, while preserving the original spelling for the cases of direct and
indirect referencing.
Competencies are not a mere sum of knowledge, or practice, or know-how, or
particular cases of theory and practice, but a complex construct that every student creates
as the result of learning activities focused on a vast range of specialized knowledge (Le
Boterf, 2000). Interpretation of the term ‘competencies’ goes beyond the combination of
conceptual, procedural and attitudinal knowledge, and permits to select the right set of
skills and attitudes that are indispensable to perform a particular task. Consequently,
competencies require constant development and are not limited to repetitive patterns.
Boshuizen develops the claim that specific competencies are seen as knowledge bank that
is relevant to the special type of work the training program is aimed at (Boshuizen, 2004).
The objective of an educator, in this case, is to provide favorable conditions so that such a
construct could be created. Under the given circumstances competency-based programs
focus on enhancing appropriate choices of resources (knowledge, procedures, attitudes,
informational databases, etc.) and their application to particular objectives (Perrenoud,
2004a, 2004b).
As of today, being a mere content-specialist in the relevant field of study no longer
leads to success as a workforce. Young graduates are required to continually renew their
knowledge, to communicate efficiently, to work independently and in a team, etc. (Miguel
Díaz, 2006). As emphasized, among the generic competencies most highly valued by
potential employers are leadership, project design and management, initiative and
enterprising spirit. The results yielded by the Tuning Project show that the three skills that
are valued the most by workers, as well as employers, are the ability to learn, ability to
analyze and synthesize, and ability to apply the knowledge in practice (Gonzáles and
Wagenaar, 2003). Recent data from the professional sector suggest that applicants’ most

Part I. Theoretical framework
19
sought for qualities are the ability to communicate efficiently, to perform teamwork and
exercise interpersonal skills when solving problems with a feasible approach (ANECA
2007, CHEERS 2003). In this respect overtly incorporation of generic competencies into
academic curriculum is expected to boost graduates’ position in the industry and help them
overcome the precarious nature of the modern working life.
Current academic training programs aim at competencies development, although
there is no mainstream view on competencies classification. In 1993 a dual model of
competences was suggested, splitting the latter between generic and specific categories
(Becker, 1993). The so-called generic competencies are the ones connected with
developmental behavior and are common for different occupations and professional fields.
Specific competencies are further split into three categories: instrumental (means or tools
to reach the objective), interpersonal (getting on with others) and systemic (related with an
understanding of the total of the issue) (Villa and Poblete, 2007). Nordhaug promotes the
idea of firm-specific, task-specific and industry-specific competencies (Nordhaug, 1993),
while another categorization is suggested by a group of authors (Delgado García et al.,
2005) who differentiates between academic (acquisition of knowledge), disciplinary
(practical use of knowledge for a particular field) and professional (communication and
know-how of a specific job) competencies. There seems to be no compelling reason to
argue about which of these classifications has a broader scope since all of them partially
support and complement one another.
Competencies taxonomy widely adopted in higher education nowadays is the one
developed by the Tuning Project experts (Tuning Educational Structures in Europe, 2007)
which proposes two types of competences: cross-curricular generic and subject-specific
ones (Pérez Cañado, 2013). According to the classification the generic competencies are
divided into three sub-categories:
• systemic competencies (a combination of understanding, sensibility, and
knowledge that is crucial for learning capacity, problem-solving, decision-
making, among others);
• instrumental competencies (cognitive, methodological, technological and
linguistic skills which guarantee basic abilities to analyze and synthesize,
computer intelligence, etc.);

Part I. Theoretical framework
20
• interpersonal competencies (related to social and individual skills, e.g., leadership,
teamwork skills and ability to work autonomously).
What is more, the list of transferable generic skills that provide for these
competencies embraces as many as 16 sub-categories, among which are “awareness of
ethical values”, “planning and time management”, “critical thinking”, “decision-making”,
“innovation and creativity” and others; all entries in the list are based on a comprehensive
research of resources from academia and public educational institutions (e.g., OECD,
Ministry of Science and Education of Spain, etc.) (Terrón Lopez et al., 2013).
On the other hand, subject-specific competencies as defined by the Tuning Project
comprise:
• disciplinary knowledge (or theoretical knowledge applied to a specific thematic
field);
• academic abilities (abilities that need to be applied to such thematic field, e.g.,
capacity to receive, understand and transmit scientific production);
• professional competencies (know-how in the specific professional area).
Ongoing research seems to validate the view that in order to help young graduates
meet societal needs it is indispensable to link students’ acquired background with
knowledge and skills required by the labor market (Salamanca convention 2001; Wellmon,
2008). The present research adopts the notion of competency as a flexible and complex
construct made of knowledge, skills, attitudes, and values that all together enable an
individual to efficiently perform (a) task(s) presumably related to one’s professional field.
As aforementioned, the EHEA favors the holistic type of learning with coherence between
students’ academic and professional profiles being its primary goal. Therefore, adoption
and implementation of generic and specific competencies in academic curriculum is bound
to help students deploy a set of abilities, skills, and attitudes necessary to become
competent professionals.
1.3. CBT model and programmed learning
To train competitive specialists, it is necessary to expose students to multiple
opportunities to perform guided and autonomous learning that will enable them to put to
practice a broad range of skills and abilities while resolving practical issues. In this regard
training programs are expected to provide context so that students understand, analyze,

Part I. Theoretical framework
21
synthesize and evaluate the evidence and come to viable conclusions. In other words, the
educational strategy should be aimed at enhancing students’ aspirations to learn what is
necessary for professional development (Zabalza, 2003).
Development of fundamental competencies that are necessary “for individuals to
function proficiently in the society they live in” (Grognet and Crandall, 1982: 3) becomes
of paramount importance in the context of the sustainable growth of society and
economics. The link between higher education and societal needs tends to adjust students
qualifications to the requirements of employers to facilitate graduates’ access to the
marketplace. The EHEA emphasizes the need to train employees who are able to excel in
the global marketplace and provides guidance on the issues related to the introduction of
key competencies required for effective career building. In line with this point, Humphreys
(2005: 31) underscores the importance of “teaching students to apply academic concepts to
real-world contexts,” which results in students’ ability to adapt the learned skills to
different situations: classroom, workplace, community, etc. (AACU report, 2005). In this
respect, the focus on competency-based teaching is considered one of the EHEA’s
priorities (Poblete Ruiz, 2006) because development of a cluster of competencies is
expected to better prepare graduates for professional performance.
On the basis of the evidence currently available, it seems fair to comment that at no
point competency-based training (CBT) model supports a shift from training in knowledge
acquisition to training that is based only on technical and practical competencies
acquisition. On the contrary, students are expected to be trained to apply and synthesize
capacities and skills, as well as to act single-handedly with competence and
professionalism. To that objective, the training provides multiple opportunities to perform
guided and autonomous learning that enables students to put into practice their reasoning
capacity while resolving practical issues. In other words, the CBT syllabus is focused on
preparing graduates to become successful professionals who can meet societal needs.
Learner-centered and motivation-based approach to teaching and learning has
become the pivotal point for European academia. Correspondingly, the CBT model is
meant to bridge the gap between theory and practice in tertiary education and train flexible
and adaptable professionals who can apply their competences to various unforeseeable and
complex situations (Cano García, 2008; Pérez Gómez et al., 2009). For this reason, the
EHEA adopts the contemporary educational paradigm where students are expected to learn

Part I. Theoretical framework
22
how to learn, and academic staff – to teach them how to learn, thus facilitating continuous
lifelong learning.
Competency-based training originated in the USA in the second half of the 20th
century (Richards and Rogers, 2001); it was expected that students to demonstrate their
progress using observable and measurable outcomes after completion of learning. Similar
standards of training in higher education were foreseen in Bologna Process (1999),
although causing certain confusion (Zabalza 2004) and calling for further research.
Likewise, the Graz and Glasgow Declarations (2003; 2005) and the Bergen Communiqué
(2005) press the case for adoption of learning outcomes and competencies as a basis for
each of the three cycles of higher education. The primary goals of the CBT model may be
defined as follows (Cano Garcia, 2008; Miguel Diaz, 2006; Rodriguez Esteban, 2008):
• holistic learning coherence of theory and practice that leads to concordance
between students’ professional and academic profiles;
• training of flexible and adaptable professionals who can apply their
competencies to complex situations in a variety of real-world contexts;
• success in students’ chosen career path provided by their ability to apply a
complex set of skills and attitudes to resolve issues inside and outside their
subject field.
The theoretical premises behind the competency-based approach to education rest on
three dominant assumptions (Cano García, 2008). First, the prevailing model of knowledge
society (as opposed to the information society) is underpinned with abilities to search for
and select from the relevant information that is needed at each particular moment to use it
for the solution of arising problems. Development of multiple competencies and skills
boosts flexibility and enhance lifelong learning in the continually changing social and
professional context. Second, in line with post-modernist logics, the knowledge is
continually getting more complex and complicated. Consequently, the classical separation
of subject and/or knowledge domains appears to become obsolete, while fragmentation is
getting replaced with integrated knowledge (Morin, 2001). The suggested approach to
education goes in line with such a viewpoint and offers multiple competencies
development as a response to diverse contexts. Finally, the aforementioned training model
is a response to an urgent need for integral education, which promotes a combination of
knowledge, abilities, and attitudes along with talents and inclinations that were not in the

Part I. Theoretical framework
23
picture. This model makes it possible to boost multiple intelligences (Gardner, 1987) that
embrace not only cognitive capacities but also emotional intelligence and helps to adapt
and/or perform efficient decision-making.
The present-day capacities and competencies are associated with initiative and
personal creativity, which, in their turn, are linked to the concepts of autonomy, self-
awareness, critical thinking, advanced cognitive and self-regulatory competencies,
tolerance of ambiguity, cooperation and dialogic communication (Jiménez Raya, 2008).
The urge for the development of competency-based approach implies changes not only in
learning outcomes but also in methodology. To achieve results, it becomes essential to
appeal to methodological plurality that favors learners’ commitment and self-
determination, promotes student-centered approach with emphasis on successful learning
rather than on the provided teaching (McLaren et al., 2005: 27), prescribes more
personalized, diversified and transparent evaluation (Miedes Ugarte and Galan García,
2006: 4), attaches importance to the amount of individual work put in by the learner.
The initiated changes call upon academic institutions to re-assess their current
educational policies and move to pragmatically driven approach, which also means using
new teaching and learning practices. Competency training requires a considerably more
significant input than just transmitting contents. The teacher becomes a guide who is
expected to share professional knowledge available to him/her, but not to impose it.
Teacher’s role is transformed into that of a facilitator who encourages learners and
provides grounds for efficient development of professional competences. In this way the
EHEA offers guidance to its graduates on how to become more efficient, to process
content and develop competencies outside the academic environment. As a consequence,
the ultimate objective of the university curriculum is to motivate and empower learners as
well as help them embrace lifelong learning skills.
By introducing the CBT, the European academia has made a shift from the classical
ex-cathedra lecturing (Tudor, 2006) towards a student-centered educational model based
on real-world context, critical thinking and problem resolution (Pérez Gómez et al., 2009;
Perrenoud, 2008). Consequently, an effort is made to overcome the traditional
understanding of knowledge as contemplation in favor of knowledge as operation (Tudor,
2006; Barnett; 2001) with the aim to come up with a nuanced but unambiguous definition
of what the university graduates are expected to know and perform after completion of

Part I. Theoretical framework
24
their degrees. Nevertheless, as student-centered learning and competencies development
become the key goal of the academic syllabus, the traditional lecture does not disappear.
The point is that students are not expected to reproduce the information taught, but rather
to apply their thinking skills, abilities to synthesize and analyze in order to process the
information taught; it is considered a feasible way to foster students’ independence,
involvement, and autonomous learning. On the other hand, traditional lockstep lectures
keep being used alongside other student-centered methods (Miguel Díaz, 2006). Following
the recent methodological shifts, academic trainers assume the role of learning facilitators
by active engagement of training methods that involve problem-based learning, project-
oriented learning, case studies or cooperative learning, simulations, role-play, etc.
When it comes to evaluation and assessment of competencies, the constructivist
standpoint focuses its attention on the processes related to learning, hypothesis-making,
argumentations, reflections, and interpretations rather than the product itself (Madrid
Fernández and Hughes, 2013). It is agreed among scholars (Miguel Díaz, 2006; Poblete
Ruiz, 2006; Pérez Gómez, 2009) that assessment of training is process-oriented, formative
and constant. Also, it should be authentic and involve the application of knowledge to real-
world contexts. The teacher’s role is to provide continuous feedback to the student so that
the necessary re-adjustments and revisions can be made and to constantly incorporate a
variety of strategies and procedures into the training process.
As emphasized before, employers seek specialists who are able to demonstrate the
whole spectrum of competences. Consequently, higher education becomes more linked to
the industry, which is meant to increase the efficiency of training programs as well as
achieve a more transparent and accessible tertiary education system (Yániz, 2008). This
shift tends to adjust students’ qualifications to the requirements of employers and facilitate
the access of the former to the labor market (Mackiewicz, 2002). Identification,
visualization, and circulation of good practices, consolidation of curricula and dynamism
of educational models become the critical challenges for the EHEA. While the student
takes an active role in the learning process, the academic world is expected to make sure
that learning experiences enhance competence(s) acquisition.
The psychology of learning focuses on the importance of two elements of the
learning process: the teacher and the student, who work together on a program that is
designed to modify the student’s behavior and to a certain extent their experience (De

Part I. Theoretical framework
25
Cecco and Grawford, 1974; Duchesne and McMaught, 2015). The theoretical framework
of the psychology of learning gave rise to the concept of programmed learning (PL) that is
broadly incorporated in academic syllabi by the majority of educational institutions
(Howatt, 1969; Talyzina, 1981). The research on PL conducted by field experts shows that
its teaching tactics feature such characteristics as clear statement of the program objectives,
reflection over these objectives and production of observable and measurable answers,
logical layout of the curriculum, active engagement of the student, immediate feedback on
the responses received from students and adaptability of learning to an individual rhythm
of each trainee.
Further investigation in this area proves that PL builds on fundamental principles
borrowed from the domains of experimental behavioral analysis of learning, cognitive
theory, and personality theory. The conduct is better learned when first emitted and then
reinforced, since in this way each student is continuously engaged in the process of
learning. The underlying arguments of experimental behavior analysis suggest that
immediate reinforcement of correct answers not only provides the student with an
opportunity to repeat the answer but also boosts their activity, accelerates learning pace
and motivates them (Knapper and Cropley, 2000). Students learn better if they can advance
at their own pace, as learning through understanding is more transferable and remains
longer than learning through memorization or formulae.
Regarding cognitive theory and personality theory the educational content should be
presented in such a way that the student has a clear vision of its key lines since perceptive
characteristics of the problem is a critical condition for learning. Development of cognitive
skills is among key factors determining the success of any training proposal. Mental
reasoning, information management, and decision-making all help develop cognitive skills
and emotional intelligence and lead to optimization of problem-solving, creativity and
flexibility. This result may be achieved with the help of experiential learning, characterized
by a reduced number of verbal messages from teacher’s part and an increased volume of
learners’ performance. Guided by motivation, a student takes an active part in knowledge
construction, when a search of solutions and responses happens as the result of personal
discovery. The most crucial point of experiential learning is that students “learn to learn” –
which means they learn to reflect on learning processes, actively construct knowledge and

Part I. Theoretical framework
26
“overshoots the surrounding limitations using constructive thought” (Hernandez Rojas and
Díaz Barriga, 2004).
The combined application of CBT and PL principles and strategies enhances
implementation of the knowledge as operation training model through methodological
plurality, self-learning, and personalized evaluation. Correspondingly, the disciplinary
fragmentation is expected to be replaced by knowledge integration and joint planning.
Concluding remarks
Educational paradigm has undergone significant transformations in these recent
decades, which resulted in its evolution from a teacher-centered model to a learner-
centered one. The efforts of the teaching staff, in this case, are focused on promoting the
learning model that is linked to graduates’ commitment to their self-education.
Given the fact that the ultimate objective of the present research is to collect first-
hand information that would configure a training proposal on the enhancement of PE
expertise among graduate students, investigation of the European Higher Education Area
principles and their implication for training proposals was conducted. For this purpose
evolution of academic training policies was summarized, the notions of competency,
competency-based training model, programmed learning and competencies evaluation and
assessment were reviewed.
Implementation of specific requirements in training is meant to impact student and
teacher roles, as well as the evaluation processes. The latter culminates the teaching and
learning process and gives grounds to make conclusions regarding the final results. From
the perspective of the social constructivism paradigm to date academia aims at learning
enhancement, while students are held accountable for their learning outcomes. Under the
circumstances, training in competencies becomes of paramount importance, although a lot
of debate is going on about the scope of such competencies.

Part I. Theoretical framework
27
Chapter 2. Scope of translator training
The joint initiative of translation industry and academia is focused on the
examination of the curriculum offered by translation programs and integration of updated
forms of training. As such, the critical issues get distributed along two major lines of
research – the training content and its delivery. The most significant repercussion of the
Bologna Process (2012) is that higher education institutions are expected to train graduates
in skills and qualifications in accordance with the demands of the industry. On the other
hand, it seems appropriate to consider Pym’s assertion (2002: 25) that in the university
context a school (as a training environment within the tertiary education sector) “cannot be
reduced to a training ground for a labor market… rather than serving no more than that, we
would mostly do better to adopt the perspectives on human resource development”. In this
concern research into the role of translator training supports the view that rather than
preparing high-performing, market-ready, off-the-shelf professionals, academia should
focus more on training critical, independent thinkers who are able to adapt to rapid changes
in translation industry (Locke, 2017).
The assumption that conventional teacher-centered approach is no longer viable for
efficient translators’ training is tightly linked with a rising need of incorporating relevant
skills and abilities overtly into teaching programs and addressing them explicitly at
different stages of the training (Pérez Cañado 2013). Consequently, rather than delivery of
coordinated teaching, the academic objectives of today strive to redirect the concept of
education towards self-learning which results in the further development of autonomy in
students’ learning processes. On these grounds, translation trainers are faced with the task
of not only enabling their trainees to acquire specific competencies and skills required for
professional careers but also providing graduates with the tools to ensure that they are
capable of maintaining and upgrading their competencies throughout their working lives.
With the particular reference to the field of translation, the European Standard for
Translation EN 15038:2006 places emphasis on the continuous professional development
of translators working for LSPs. As Olohan (2007) points out, the Standard explains that
LSPs “ensure that the professional competencies required by 3.2.2 (the earlier paragraph in
the Standard which specifies what is meant by “translator competence”) are maintained
and updated”, suggesting that the responsibility for doing so falls entirely on the translator.
For this reason, the focus on competencies enhancement by means of guided and

Part I. Theoretical framework
28
autonomous learning provides an essential trajectory for translators training research since
the primary objective of such training is to prepare the graduate to enter the professional
market (Kelly, 2005: 20-41). Although some traditional academic programs still focus
mostly on knowledge transfer (Zabalza 2009), when those who pursue a translation degree
are given the role of passive recipients of knowledge, numerous studies report about the
necessity not only to expose students to knowledge but also to train them in other forms of
skills and competencies (Fallows and Steven 2000; Rico, 2017).
After graduation novice translators are expected to have the necessary expertise and
function as fully-fledged professionals. Meanwhile, the distance between competencies
that are stipulated in training plans to be acquired in the course of training, on the one
hand, and requirements associated with the job itself, on the other, remains one more major
challenge of translators training. For example, succeeding in today’s job market requires an
entrepreneurial turn of mind. Even though, current studies seem to validate the view that
very often translation students have the profile of “language geeks with sketchy social
skills, in which case those who are prone to be congenitally self-effacing shrink from
taking risks” (Locke, 2012). These requirements and real-life scenarios may serve as an
illustration of those cases when training falls short of preparing students for the realities of
the translation industry. Another factor that influences market requirements is innovation
in language technology and the changes it brings to enhancing translators’ subject-specific
competence. To this end, universities constantly adjust their syllabi so that software
solutions are integrated across-the-board by highly-competent teaching staff. Nevertheless,
Locke describes some cases when trainers’ expertise turns out to be insufficient due to the
unfamiliarity of the teaching staff with new instruments and labor market requirements,
their skepticism regarding technology or insufficient facilities that complicate integration
of skills and tools proficiency into their courses. In some other cases, academic institutions
feel “cash-strapped” when it comes to the cost of technical supplies which makes setting
up and maintaining a state-of-the-art tools lab very difficult (ibid.).
Within the framework of lifelong learning and continuous professional development,
the competency-based training model enters the European educational standards with the
aim of harmonizing services throughout Europe. Current reforms in higher education
broadly welcome the concept of training in competencies that are of great importance for
students from the perspective of successful completion of academic curriculum and career

Part I. Theoretical framework
29
development. The research into the scope of competencies used by translators is getting
momentum, although there are very few studies which address the issue of whether the
training has prepared them adequately for the professional job market (Monzó, 2002;
Vigier Moreno, 2007). As the latter is in constant and rapid flux, educational programs are
expected to monitor arising requirements regularly to provide relevant training courses that
facilitate graduates’ transition from academy to a workplace.
2.1. Training objectives
To be eligible to carry out assignments in conformity with quality requirements and
project scope, university graduates in translation are expected to have successfully
completed relevant training programs. To prescribe expectations concerning achievements
and abilities associated with academic qualifications of different levels the Qualifications
Framework of the Joint Quality Initiative of the EHEA adopted Dublin Descriptors (2004).
This reference document claims that graduates of Bachelor’s degree should be able to
demonstrate profound understanding of their professional field, to apply this knowledge to
their work and manage existent problems and challenges, to summarize and interpret
relevant data necessary to produce professional judgments, to transmit ideas, problems and
solutions publicly, to develop the skills necessary to undertake further studies with a higher
level of autonomy. Along similar lines the requirements for the graduates of the Master’s
degree involve higher level of proficiency in all aforementioned skills and competencies,
which results in generation and bringing to life new original solutions, application of
decision-making and problem solving to broader and/or multidisciplinary contexts related
to the field of study, making complex judgments while bearing in mind social and ethical
responsibilities, ability to communicate with different types of audiences and to pursue
one’s learning relentlessly. Dublin Descriptors prescribe baseline training outcomes, while
the establishment of the specific skills and competencies required to achieve these goals is
left up to each discipline (González and Wagenaar, 2007). Accordingly, academic training
intends to enhance acquisition of a range of competencies to be deployed in the
professional workflow(s).
As rightly observed by Kiraly (2000: 16), the scope of abilities employed in
translation goes beyond mere source-to-target meaning transfer, since “becoming a
professional translator clearly entails more than learning specific skills that allow one to

Part I. Theoretical framework
30
produce an acceptable target text in one language on the basis of a text written in another
language.” The author draws a line between “translation competence” and “translator
competence” stressing that the latter embraces expertise in specialized fields, proficiency
with technical tools and new technologies, as well as ability to transfer meaning between
linguistically and culturally different expert communities. Other definitions describe the
scope of competencies required for translation as a sum of linguistic competences, or a
super-competence, or a construct of different types of knowledge, skills, and attitudes, or
as an ability to generate more than one target text and select the most viable option (Pym,
2003). There may be no consensus on this term within the discipline, while diverse models
proposed by scholars are becoming increasingly sophisticated. In this regard, Pym (2003:
489) offers a minimalist approach and describes translation competence as “the ability to
select only one viable target text from this series (of more than one viable text) quickly and
with justified confidence.” Moreover, the scholar rightly mentions that the term
‘competence’ has not yet acquired a universal definition in academic circles; researchers
keep using such terms as expertise, proficiency, skill, performance, performance ability
and others (ibid.) to talk about the set of factors that enable translators to perform their
work efficiently. Along similar lines, Kelly (2005: 28-41) mentions that there is no
unanimity in interpreting translation competency since it involves the cognitive process of
translation as an activity, as well as an empirical mode of competency as stipulated by the
market demand and/or educational objective for curriculum design.
Meanwhile, translation studies experts, e.g., Gile (1995), Kiraly (1995, 2000), Presas
(2002), Neubert (2000), Orozco Jutorán (2000), offer multiple models of translation
competencies. Along with the already developed ones, the ongoing analysis continually
adds new features to this research subject to meet the needs of academic and professional
environments. The overall tendency towards competency in translation as a complex
structure that comprises different inter-related sub-competencies and is dominated by a
strategic component has gained support.
The PACTE research group puts forward the holistic view that defines the term
translation competence as the underlying system of declarative and procedural knowledge,
skills, and attitudes required to translate (2014). This model comprises five sub-
competences and a psycho-physiological component, accompanied with attitudinal aspects
and abilities. The sub-competences embrace bilingual sub-competence (pragmatic,

Part I. Theoretical framework
31
sociolinguistic, textual, grammar and lexical knowledge), extra-linguistic competence
(knowledge about world in general and field-specific knowledge), knowledge about
translation (distinctive features of the profession, translation practice, translation
functions), instrumental sub-competence (related to the use of documentation resources,
information and communication, translation technologies), and strategic sub-competence
(efficiency of translation process, problem-solving, control of operations). It is also argued
that strategic competence, instrumental competence, and knowledge of translation are the
sub-competencies which are more specific for translators, as opposed to bilinguals, who as
well possess knowledge of two languages and, most probably, extra-linguistic knowledge.
The model of Kelly (2005) has proved to be a valuable tool for translators training
within the context of the undergraduate programs. The objective of training is described
from the viewpoint of the macro-competence that embraces a set of skills, knowledge, and
attitudes which professional translators use in their daily translation tasks. This macro-
competence is divided into sub-competences, including communicative and textual
competence, cultural competence, subject area competence, instrumental and professional
competence, psycho-physiological or attitudinal competence, interpersonal competence,
strategic competence. The author stresses that the sub-competencies are interrelated and
each is necessary for the overall macro-competence to function correctly. Nevertheless, it
is the strategic competence that coordinates how the other abilities work when performing
the given task.
When defining the scope of competencies which are essential for professional
translators and experts in multilingual and multimedia communication, the expert group of
European Master in Translation (2017) sets out one more noteworthy example of
competence in translation: a reference framework applied to linguistic tasks of wide
semantic and/or professional range. In this case, the term competence is used to describe a
combination of aptitudes, knowledge, behavior and know-how necessary to carry out a
particular task under given conditions.
The EMT model rests on six interdependent areas of competences that overlap
horizontally, in which case one and the same aptitude or skill may be equally relevant to
others. The translation service provision competence has interpersonal and production
dimensions. The former focuses on awareness of the social role of the translator, market
requirements, principles of conducting negotiations, basics of marketing and management,

Part I. Theoretical framework
32
compliance with specifications and professional ethics. The latter, as the name implies, is
about creation and delivering of the output, application of appropriate solutions and
strategies, quality control, justification of translation choices. Language competence
manifests itself in the understanding of lexical and/or grammatical forms, as well as
graphic conventions of SL(s) and TL(s). The intercultural competence is described from
sociolinguistic and textual perspectives. In this case, recognition of function and meaning
in language variations and identification of interaction rules applicable to a specific
community are complemented with knowledge on documents macrostructure and
coherence, peculiarities of rendering intertextuality, allusions or stereotypes, genre and
rhetorical standards of composition. Ability to summarize, to recognize cultural references,
to rephrase, condense and (post-)edit are also among features characteristic of the
intercultural competence. To perform documentary and terminological research, to extract
and process information relevant to the project, to develop evaluation criteria and wisely
use tools, environments, and search engines, students are expected to master the
information mining competence. Enhancement of the thematic competence results in
knowledge regarding how to search for relevant thematic information and to encourage
curiosity. Finally, the realm of technological competence covers the ability to use and
integrate available software while continually learning about new updates, to create and
manage databases and formats, to familiarize oneself with possibilities and limits of MT.
Using the above-mentioned models, academic trainers and scholars outline
prioritized training objectives and legitimize particular combinations of skills, attitudes,
and competencies required from the program graduates. Specialized training in translation
is expected to lead to the qualification of experts in multilingual and multimedia
communication, although the scope of such competencies is not definitive and may be
complemented in each particular case.
2.2. Translation modalities
The origins of Translation Studies (TS) may be traced as far as the Ancient Rome,
but there is no doubt that TS as a scientific subject emerged in the middle of the 20th
century (Hurtado Albir, 2001). As argued by Orozco Jutorán (2000), descriptive and
systematic analysis of translation as a phenomenon started its development together with
first scientific journals, e.g. Traduire (1954) or Babel (1955), which triggered debates on

Part I. Theoretical framework
33
interconnections between linguistics and translation and gave impetus to the
systematization of TS (Fedorov, 1968). In 1972 Holmes published the first meta-
theoretical reflection on TS, giving definition to the subject and suggesting classification
along three primary fields: theoretical, descriptive and applied (Holmes, 1972). Until 1980s
research in translation focused mostly on its philosophical, abstract and inductive aspects;
the theories were constructed mainly on the premises of experience, induction, and
observation. This trend was described as “interpretive traductology” and “hermeneutical
approximation” (Neunzig, 1999: 4), or “theoretical research which focuses on the
intellectual processing of ideas” (Gile, 1998: 70). Then, the 1980s witnessed growing
interest towards empirical research with emphasis on cognitive paradigms, applied to
facilitate translation research methods and concepts (Danks et al., 1997). While the end of
the 1980s only focused on descriptive research tendencies (Toury, 1995; Hermans 1985),
in the 1990s the trend got solidified with massive arrival of corpus studies (Baker, 1995;
Kenny, 1998).
The last decades of the 20th century were marked by a real rise in TS research – from
purely theoretical and mostly applicable to academia to fully practical and relevant for the
needs of the translation industry. The investigation into translation was conducted at
universities and colleges, within (inter)national conferences and symposiums, by language
service providers, freelance translators, NGOs, and industries. The reason why TS research
gained such importance stems from the acceptance of interdisciplinarity as its prominent
feature (Snell-Hornby, 1991; Snell-Hornby et al., 1994) and the growing interest towards
empirical studies focused on translation phenomenon description. With regards to and
respect for innovation in TS research design(s), interdisciplinarity complicated empirical
studies and became one of the reasons why there is no clear cut between empirical and
conceptual domains. For example, in 1982 the first doctoral thesis that used thinking-aloud
protocol (TAP) as data collection technique was published (Sandrock, 1982). That paper
marked a new twist in the TS paradigm when empirical studies started application of
alternatives for data collection, such as computer-assisted methods (Neunzig, 1997) or a
posteriori interviews or translation diaries (Fox, 2000). Traditionally sociological tools
such as tests and questionnaires (Saldanha and O’Brien, 2014: 150) start being extensively
used in applied research to analyze translators’ performance or skills without resorting to
social theories. For the sake of discussion, it should be mentioned that there is a vast

Part I. Theoretical framework
34
number of research and theses that voice criticism and reflection on these techniques (Gile,
1990; PACTE 2000).
The rise of the new millennium brought technology and digitalization to translation
industry landscape, where the traditional translation was no longer able to keep the pace
with the dramatic increase of publishable content (Casacuberta et al., 2009). Although the
principal objective of translation was still defined as transferring message from the source
language to target language(s), yet the components of such translation process, e.g.,
content, translation tools, reference materials, working environments, etc. had undergone
drastic changes. Obtaining the first target language suggestions by means of machine
translation in addition to other technological advances became the new reality. This
phenomenon is likely to start changing the nature of translation per se (Austermühl, 2013:
328), especially given the constant improvement of translation engines performance.
Meanwhile, the traditional understanding of translation as a text-centric activity is still
prevalent today. For this reason, the industry is rife with those who promote the
conventional idea that translation is just “converting text from one language into another”
or replacing “natural-language strings” (Pym, 2004: 51-52).
While researchers and practitioners seem to agree on the origins of the term
translation, there is a growing debate on whether and to what extent the new tasks such as
localization, trans-creation, post-editing or other inter-disciplinary phenomena are related
to translation. An example of such debate is the term localization which is applied to the
process of adapting software-related content for a locale. The objective of this method is to
put together the text and optional non-textual items that must be altered for software to
work efficiently in various locales (Melby et al., 2014). This linguistic task embraces a
variation of a particular language combined with cultural conventions peculiar for a
selected region, its output being a text and culture- or region-specific content (graphics,
music, currencies, or other functional elements). The available evidence seems to suggest
that since the objective of such process lies in the combination of text and optional non-
textual items that must be altered for software to work efficiently in various locales (ibid.),
such task expands the limits of the traditional notion of translation. The language industry
is also questioning if these new processes require special skills different from those
necessary to conduct translation tasks.

Part I. Theoretical framework
35
Given the circumstances, the European Master in Translation expert group (2009)
provides confirmatory evidence on the ambiguity of the term translation: it may be used to
describe word-for-word transfers (e.g. 'pocket translations' which are only lexical
correspondence dictionaries, devoid of context), cases of localization (of software,
websites, video games), versioning (of audiovisual documents), trans-editing (of
information from press agencies, newspapers, television reports), multilingual and
technical writing, adaptation (of advertising), revision, summary translation, among others.
According to the group’s report, the ambiguity hampers the possibility to collect reliable
statistical data on the volume of translation, the number of translators and their routines.
Different parties will have different answers to the arising questions on similarities and
differences between translation and new linguistic tasks. As a result, the role of many
translation-related processes and terms used for their description is likely to remain
controversial. To address the aforementioned issue, the functionalist approach is applied
(Nord, 2013). The key theoretical premise behind functionalism methodology defines
translation as a multimodal activity and distinguishes it from traditional text-only
translation. As such, the concept of translation and its quality becomes related to the type
of content, the targeted audience, availability of tools, specifications, and guidelines, and
the expected effect.
Advances and innovation in the translation industry have shaped newly emerged
(extra-) linguistic operations as a separate task, similar to traditional translation, yet not the
same. The scope of the jobs depends on the quality of the output, text type, purpose of the
target content with regards to recipients. The evolution of translational landscape provoked
by the digitalization of its paradigm gave rise to new research lines in translation, ranging
from purely technological, such as tools and environments for computer-assisted
translation or post-editing, evaluation of MT and its quality estimation, (Specia, et al.,
2010; Martín-Mòr et al., 2016) to the ones deeply ingrained in psychological processes that
underlie translators’ performance, such as analysis of real vs. perceived cognitive effort or
self-efficacy (Koponen, 2012; Teixeira, 2014; Moorkens et al., 2015; Rossi, 2017).
A group of authors (Melby et al., 2014) made a novel contribution to the translation
paradigm of today by suggesting that various definitions of translation can be conceptually
placed on a landscape defined by two axes: scope (narrow-to-broad) and specifications
(absolute-to-relative). In this concern it becomes of paramount importance that theorists

Part I. Theoretical framework
36
and practitioners indicate the definition of translation applied in their research, specifying
whether they are using a narrow notion of purely textual translation or a broader concept of
multimodal translation since the latter includes elements beyond text and could be defined
as: “… the creation of target content that corresponds to source content according to
agreed-upon specifications” (O’Sullivan, 2007).
As we can see, more recent theories of translation have moved away from the notion
of meaning being encoded in the text. Alternatively, they focus on transferring intended or
understood meanings associated with a text by a reader or a writer. In the present research,
we adopt the aforementioned “broad” approach and interpret translation as a multi-modal
phenomenon that integrates a performer into the process of output production under
specified conditions.
2.3. MTPE assignment
The scenario where MT output is post-edited before being delivered as a complete
job (the MTPE model) is expected to lower production costs and help publish more content
faster and into more languages. Under such circumstances, the post-editor is expected to
check the raw MT output, spot possible errors, analyze the original content to clarify any
doubts and correct the errors with regards to quality expectations expressed by the
customer, making as few edits as possible.
Researchers provide various definitions for an assignment aimed at editing raw MT
output to a quality that is close to or indiscernible from a standard translation-editing-
proofreading process (Vashee, 2013). At the end of the 20th century the task of PE was
described as “a process of modification rather than revision” (Loffler-Laurian, 1985),
“adjusting the machine output so that it reflects as accurately as possible the meaning of
the original text, with an emphasis on adjusting relatively predictable difficulties”
(Vasconcellos, 1987: 411), “a term used for the correction of machine translation output by
human linguists/editors” (Veale and Way, 1997). In the 21st century its definition goes as:
“the task [of the post-editor is] to edit, modify and/or correct pre-translated text that has
been processed by a machine translation system from a source language into (a) target
language(s)” (Allen, 2003), “checking, proofreading and revising translations carried out
by any kind of translating automaton” (Gouadec, 2007). Due to the fact that the whole
process of post-editing may be arranged in different ways with regard to the project

Part I. Theoretical framework
37
objectives, workflow and technological solutions available, the ISO 17100 definition of PE
takes a middle-ground position and describes classical PE as a task “to edit and correct raw
MT output” (Martín-Mòr et al., 2016: 65). It is also specified that by raw MT output the
“result of machine translation” is meant, as opposed to results of translation memories
suggested in CAT-tools. This definition proves that post-editing is a linguistic task in its
own right, since performing a PE assignment is not identical to either translation or
proofreading.
Over the last decades, the research in translation studies has involved investigation
on how PE influences translation industry practices (Krings, 2001; Garcia 2010; Ramos,
2010; Tatsumi, 2010), with particular attention to cognitive processes involved (Krings and
Koby, 2001: 360). As previously mentioned, there has been an inconclusive debate about
whether post-editing is a form of translation, or rather a task in itself. To strike a balance, it
may be helpful to analyze the cognitive operations that undermine translation and post-
editing tasks. While human translation output choices are hugely grounded on (extra-)
linguistic data and source language content, raw MT output, on the contrary, is the fruit of
sophisticated algorithms and has to be compared with the SL content and (extra-)linguistic
data for the issues of accuracy and fluency. To put it differently, the process of translation
from scratch (or using a TM) presupposes that target language output is generated as the
result of processing extra-linguistic and linguistic data by the translator. On the other hand,
the post-editor has to work with raw MT output in the target language (TL) computed by a
system without extensive contextual references. In the course of post-editing, it is checked
whether the intended meaning of the source language content is rendered correctly
regarding form and meaning the target language output by gradually comparing
correspondence of TL output with SL linguistic data and TL/SL extra-linguistic data.
Another critical factor to take into consideration when comparing [human] translation and
post-editing is the expected final quality of the output, which in any case might vary
depending on the type of content, target audience, context, and purpose.
Due to the recent changes in the translation industry landscape, a lot of translators
start to dedicate themselves to post-editing assignments. Both activities have a lot in
common, though are not identical. A translator who performs a post-editing task deals with
three different texts: s/he receives the original content (source text), the raw MT output
(raw MT text) and is expected to perform editions to produce the final PE output (target

Part I. Theoretical framework
38
text). Indeed, the three-step process of PE contains the tasks related to source text
processing (reading the source text entirely or in segments in search for patterns to be
further reformulated in the output), raw MT output processing (detecting elements in the
target text that raise doubts and, consequently, require particular attention), and target text
production (Krings and Koby, 2001: 321-522). On top of that, recently more and more
researchers focus their interest on ways to automatize the post-editing process (Simard et
al., 2007; Vié et al., 2011).
Adequacy and fluency requirements for post-editing of high visibility content usually
equal the same parameters expected of human translation, for which reason it is the
translator who is supposed to be charged with a PE assignment. The aforementioned
quality level is known as “publishable” and is also referred to as full PE or high-quality
PE, which implies full or nearly full correspondence of the PE output to human quality.
Full PE is characterized as comprehensible, accurate and stylistically fine with correct
grammar, punctuation, and syntax (Massardo et al., 2016). This category suggests
changing a particular word order or sentence structure to something more appropriate to
make the text flow more smoothly or to increase comprehension.
To meet these quality requirements software for integrated PE that combines MT and
TM features is usually used. MT-only software is more likely to be employed in cases
when the content has limited visibility, and the client agrees to light PE of good-enough
quality (Martín-Mòr et al., 2016). In such scenarios, the final quality criteria might be
inferior regarding fluency, although the adequacy is expected to be sufficient to make the
content comprehensible. For these cases stylistic and/or grammar errors are acceptable as
long as the original message is transferred properly and there is no ambiguity about its
content. When performing light PE otherwise qualified as “fuzzy and wide-ranging”
(Allen, 2003), it is advised not to spend a long time deciding on the very best word or
phrase and not to make the translation sound like a piece of original writing. As the term
makes it clear, in this case, there is a reference to a “minimum” number of changes that are
applied in order to produce acceptable quality. However, precise definition of the
minimum number and the acceptable quality keeps being a matter of debate, and a vital
issue in production as well as in teaching context.
To sum up, a post-editing assignment is a linguistic task in itself performed by
translators who check the raw MT output for errors and correct them in accordance with

Part I. Theoretical framework
39
specific output expectations. When light PE is commissioned, translators would aim at an
accurate transfer of the message and correction of only those grammar issues that interfere
with accuracy, while stylistic problems and terminology are not prioritized due to high
throughput expectations and low-quality expectations. On the other hand, when
publishable quality is expected, as happens in the case of full PE, exact meaning and
accurate grammar along with more thorough terminology choices are expected.
To get a fuller picture of the scope of a PE assignment, further investigation is
required on the proportion of full vs. light PE in a regular workload, as well as the range of
subject fields for MTPE projects and destination of the PE output. Given the novelty of the
PE phenomenon, it seems essential to inquire about the academic background, professional
experience and other characteristics of those currently engaged in the production of PE
output. To provide more detailed insights into a post-editor’s profile and expertise, a
survey is launched and its outcomes are analyzed (Chapter 3).
2.3.1. Project workflow
On a larger scale, the course of an MTPE project, as well as any translation-related
process, includes pre-PE and post-PE phases (Martín-Mòr et al., 2016). The initial stage
presupposes content analysis and formatting, if necessary, drafting of quotes and purchase
orders, evaluation and estimation of available and required resources; all of this is usually
performed by (a) project manager(s). More linguistically focused tasks at this point involve
terminology management, preparation of reference materials, including TMs and
databases, pre-editing of the source text and preparation and/or tuning of MT engines that
may involve project managers and/or translators. After completion of the assignment, it is
expected to be checked for possible linguistic and/or orthographic errors by the translator
him/herself, although other linguists may also be engaged in the post-PE process. Besides
conducting the final proofreading and/or revision, other tasks e.g., manipulations related to
desktop publishing, graphic and/or multimedia design before the ultimate quality control
can be exercised.
On a smaller scale, an MTPE project boils down to a post-editing job, which starts
with obtaining the first draft translation (otherwise called raw MT output) produced by an
MT engine. In some cases, the first draft translation may also be retrieved from translation
memories, if the relevant content was previously translated or post-edited. MT texts are

Part I. Theoretical framework
40
linguistically different from texts translated by human translators, so a post-editor requires
skills to recognize typical “machine” errors that arise due to various reasons, e.g. wrongly
analyzed syntactic structures or defects in the input text (see section 2.3.2 for analysis of
MT output issues). These errors are often typological and recurring, although many of
them appear “comprehensible” at first glance; their swift identification and thorough check
of the MT text against the source text greatly facilitates the PE process. The essential
defects, e.g., incompleteness or untranslated words, are also likely to be identified in the
course of general output check. As a result, a list of unknown words can be compiled to
ensure regular dictionary and system maintenance. Sometimes post-editors are also
required to collect recurring MT errors and report to project coordinator and/or MT system
developers (Zaretskaya, 2017).
When post-editing, the source and target texts usually appear segment by segment
either in translation tools (e.g. computer-assisted translation software suites like MemoQ1
or SDL Trados Studio2), or conventional text processing environments (e.g. Microsoft
Word processor or Excel spreadsheet). At this stage, post-editors’ performance is highly
predetermined by a range of reference materials, such as style guides, PE guidelines,
specific and generic project specifications that give explanations on how to tackle typical
problems provoked by engagement of an MT engine and help translators decide on the
scope of manual PE. Traditionally, a post-editor is also expected to solve any (extra-)
linguistic issues that arise in the course of the process. Both PE tools and reference
materials are discussed in more detail further (sections 2.3.3 and 2.3.4 correspondingly). A
PE assignment is completed with proofreading to assure there are no errors left and that the
output is idiomatic and stylistically adequate. The final check aims to make sure that the
target text corresponds to the relevant quality requirements, e.g., renders the content of the
source text, preserves coherence, or/and is idiomatic.
Alternatively, production of PE output may not always follow the MTPE workflow
when the source content is first processed by an MT engine, then post-edited in conformity
with the required quality criteria, proofread and finally delivered to the client. There is
growing support to the claim that there are cases when the target output is published
without previous post-editing, the phenomenon otherwise known as “unattended
translation” albeit such assignment might be scheduled later (Sánchez-Gijón, 2016). In that
1 http://www.memoq.com/en/ (Last consulted on 14.12.2016) 2 http://www.sdltrados.com/products/trados-studio/ (Last consulted on 14.12.2016)

Part I. Theoretical framework
41
case, the target language content is post-edited only if, for example, it turns out to be in
high demand, or the recipients complain about the incomprehensibility of the content. The
simplicity of the translated content, the proximity between the source and target languages,
or just the fact that it is more important to swiftly provide translation of specific content
into the target language despite its poor quality are the most typical reasons for immediate
post-editing not to be performed.
The conclusion can be made that the scope of MTPE project may vary among a
broad range of tasks and operations, while post-editing of MT output is core to any of
them. Reference materials are used to specify those MT issues that should be attended to.
Production of PE output of specified quality is performed by a post-editor, who resorts to
technical means. To better contextualize the post-editing process, we see it essential to
focus on MT output issues, PE-related tools, systems and reference materials. To that end,
Chapter 3 contains first-hand information provided by acting post-editors, which gives
further insights into phases and tasks incorporated in MTPE workflow.
2.3.2. MT error typologies
To provide consistency and help overcome uncertainty when processing MT results,
industry players created numerous classifications and typologies of MT-related issues,
embracing terminology and lexis, grammar and syntax, orthography and regional
variations. To describe MT output errors, some scholars suggest splitting them into minor,
major, and “grey” categories (Green, 1982) or single word errors, errors of relation,
structural or informational errors (Loffler-Laurian, 1983). Others differentiate among
incorrect verb forms, mistranslation of prepositions, literal rendition of common idioms,
translation of a word in one manner when the context demands another (Lavorel, 1982). It
is also common to propose multiple categories including vocabulary and terminology,
abbreviations and proper nouns, prepositions, determiners, verb modifiers, verb forms,
tense, among others. Also, there appear recommendations that in the course of post-editing,
the linguistic corrections should be limited to ‘fixing’ certain kinds of errors, i.e.,
grammatical and syntax errors (e.g., wrong concordance in number and/or gender, word
order causing grammatical problems); misspellings and punctuation errors (e.g. missing
accents, wrong capitalization) and mistranslation (e.g. wrong use of key terminology;
correct sentences with a different meaning from the source) (Guzman, 2007).

Part I. Theoretical framework
42
The turn of the century brought upgrading and proliferation of MT engines which
caused a more widespread use of MTPE models in the translation industry. Similarly,
researchers and research groups got more data for analysis and description of typical MT-
related problems tackled by post-editors on a daily basis. An MT error typology that was
reported by Schäffer (2001) contained four categories and was tested by SAP group in its
PE guidelines. Our interest to SAP experience is explained by the fact that this industrial
group has been continuously investing in different MT systems for translation of their
content, among which are LOGOS (used for English-Spanish and English-French) and
PROMT (used for English-Russian and English-Portuguese). The post-editing guide
designed to train and support translators working on SAP MT output classifies the errors
into four groups: lexical errors (vocabulary, function words, terminology, polysemic words
and idioms); syntactic errors (sentence and clause analysis, syntagmatic structures, word
order); grammatical mistakes (tense, number, voice) and errors due to defective input text.
The author rightly believes that such error typology makes post-editors aware of main
types of errors and also serves as a methodological framework for further research on PE
and MT. It may be true on the part of comments focusing on improving the MT systems
through translation rules and better dictionary coding. To make justice to the typologies
mentioned above it should be stressed that their drafting was made possible by the
observations of errors detected in raw MT output samples that often bear great
resemblance to each other, even between language pairs as different as English-Portuguese
and English-Japanese, and thus are mostly language- and system-independent.
Another extended research typology based on the LISA QA Model (The Localization
Industry Standards Association, 2009) and the GALE Post-editing guidelines (Post Editing
Guidelines for GALE Machine Translation Evaluation, 2007) comprises eight categories
(De Almeida, 2013: 95). Among the advantages of LISA QA model were mentioned its
applicability for output in different languages, flexibility to be customized with additional
subcategories and the fact that its categories do not overlap. The typology consists of eight
main categories, some of which are further split into correspondent subcategories: accuracy
or completeness (extra information in MT output, information missing from MT output,
untranslated text); consistency; country (decimal points, quotation marks, currency symbol,
date/time format); format; language (adjectives, adverbs, capitalization, conjunctions,
determiners, gender, nouns, number, phrasal ordering, prepositions, pronouns, punctuation,
spelling, verb tense); mistranslation; style; lexical choice. The researcher also makes a

Part I. Theoretical framework
43
stress on minor and major severity levels assigned to the categories of LISA QA Model.
The application of severity levels is described as relevant for evaluating the quality of the
output and contributes to the overall assessment of the work done (ibid.: 88).
One of the most popular MT error typologies that are used as a baseline for a lot of
MTPE-related research is the Translation Automation User Society (TAUS) Error typology
(2013), which has been reviewed and endorsed by a large number of translation services
providers, including the ones mentioned above. As reported by TAUS, the most commonly
used error categories of MTPE industry are: language (grammatical, syntactic or
punctuation errors), terminology (failure to adhere to a glossary or other standard
terminology source), accuracy (incorrect meaning transfer, unacceptable omission or
addition in the translated text) and style. The subjectivity of the last category was reduced
by defining it as ‘contravention of the style guide.’ The typology creators argue that where
an error of this type occurs, reference should be made to a specific recommendation within
the target-language-specific style guide.
The EDI-TA research group (Rico Perez, 2012) devised its MT-error typology in the
shape of a flexible decision tool with all types of errors falling into one of the following
categories: terminology, syntax, morphology, spelling, punctuation, semantics; the last one
embracing the cases of omissions, offensive, and inappropriate language. The experts also
advise that translators make explicit any necessary information and fix stylistic problems
as well as keep track of cohesion and coherence. The importance of the last
recommendations is corroborated by the ProjecTA group members, who stress the need to
single out important issues that influence the final quality of the PE output, namely lexical
and terminological coherence (Martín-Mòr et al., 2016: 73). Reference materials that
contain description of these categories are expected to provide explanations of what is
considered an error that requires post-editing. It is suggested that the cases that most often
need additional attention cover improper use of terminology (terms that do not belong
either to the client's’ term-base or to that of the project or domain); translation of proper
names and commercial brands (depending on the document visibility and the client’s
policy such units may be left untranslated in the TL); abbreviations and acronyms (when
the client is expected to opt for a solution for each particular case in conformity with
particular industry standards); list of recommended equivalents to be systematically

Part I. Theoretical framework
44
applied in course of PE (e.g. software action verb forms, connectors, ambiguous or
polysemic lexical units).
An MT error typology elaborated in the framework of the QTLaunch-Pad project is
based on the MQM annotation guidelines and the MQM annotation decision tree (version
1.4, 2014). There is a growing belief that this model addresses the problem of “one-size-
fits-all metrics” by providing a baseline to declare multiple metrics rather than one
(Lommel et al., 2014). The MQM typology splits all types of MT issues into accuracy, e.g.,
cases of omission, untranslated content, addition, terminology or mistranslation, and
fluency, such as issues with typography, spelling, unintelligible content and grammar. The
latter sub-category is further subdivided into syntactic and morphological issues (e.g., word
order, parts of speech, agreement in person, number or gender, verbal forms) and
extraneous, missing or incorrect function words. A distinctive feature of the model is the
category of verity that refers to extra-linguistic truth correspondence of the original and the
translation. It is important to mention that although the MQM annotation decision tree
provides insight into the nature of its categories, it also contains a free text slot so that the
user could describe any general issues of fluency and accuracy which cannot be
categorized otherwise. The fact that the model is considered language-neutral and as such
may apply to any language pair is regarded as another advantageous feature of MQM,
which allows analyzing the PE outcome in different languages.
Despite the perceived differences, MT error typologies are aimed at identification
and categorization of errors produced by an MT engine. As a rule, the categories are
adapted for different needs, be it evaluation of the MT output quality, improvement of MT
engine performance, evaluation of PE productivity or detection of strategies and techniques
applied by linguists in the course of PE.

Part I. Theoretical framework
45
2.3.3. Tools and systems
In the past decades, technology has become an integral part of translation processes:
connectivity and constant improvement of software have enhanced MT development and
multiplication of resources engaged in production and editing of MT output (Martín-Mòr et
al., 2016). As of today the basic categories of MT systems used in the industry and
academia are rule-based, statistical or hybrid ones, spurred by the emerging neural MT
paradigm in which application of deep neural networks has already yielded notable results
for automatic evaluation (Sutskever et al., 2014, Cho et al., 2014, Bahdanau et al., 2015;
Bojar et al., 2016).
The specially designed software may integrate one or more MT engines with the aim
to provide a better version of raw output for post-editors. In these cases, the source content
is translated sentence by sentence, although the system is also able to focus on segments
that underlie sentence level. The obtained combination of segments is not a fully-fledged
translation yet due to the high probability of MT-related errors and lack of coherence, but it
makes the starting point for a PE assignment (Martín-Mòr et al., 2016). The option of
translation memory searches is believed to improve translators’ performance critically, so
it is also possible that MT systems combine translations memory and machine translation,
or MT systems are integrated directly into translation tools and/or post-editing
environments. Yet, there exists an opinion that a closer look at the combination of MT
systems with translation memories indicates that the differences in their nature make such
integration superficial to an extent (Koehn and Senellart, 2010).
Translation software is familiar to many translators and provides a rich spectrum of
additional functions (O’Brien, 2010). As argued by a group of authors, classical PE is
performed by employing any text-editing environments, be it specially designed software
like MemoQ3 or SmartCAT4, or generic tools like Word or Excel. On the other hand, for
integrated PE it is crucial to use translation editing and management systems which are
able to complement translation memory suggestions with segments obtained employing
MT (Martín-Mòr et al., 2016). The function of working with several files simultaneously
attends to the problem of repetitive MT errors (Zetzsche, 2012), so does the function that
permits to conduct concordance searches and/or search-and-replace operations (Nunes
3 https://www.memoq.com/en/ (Last consulted on 10.02.2017) 4 www.smartcat.ai/ (Last consulted on 14.02.2017)

Part I. Theoretical framework
46
Vieira and Specia, 2011; Vié et al., 2011). In many cases translation environments can be
integrated with Google Translate5 services, Moses6 , Systran7 , Apertium8 or other MT
systems, can process batch tasks and perform a global search and replace operations,
provide access to internal lexical resources, and suggest dynamic re-training based on
previous edits. Simultaneous visualization of the original and the output, possibilities to
use shortcuts and hotkeys and save the original format (ibid.), glossary checks, quality
control, spell checkers, grammar and style checkers (Nunes Vieira and Specia, 2011; Vié et
al., 2011; Zetzsche, 2012) could be mentioned among other available options of software
used for PE projects.
Apart from generic tools and translation environments used to perform post-editing
assignments, it is also worth mentioning complementary tools used for PE (e.g. a cross-
platform application CheckMate9, a terminology tool Xbench10 or a stand-alone tool QA
Distiller11 used to find mistakes in bilingual files). The software of this category allows a
wide range of simple and complex quality assurance features for many languages that help
in spotting the cases of repeated words, corrupted characters, inline codes differences,
wrong spaces, consistency controversies, numeric values and others. An interactive list of
warnings, complete reports on the found issues, support of a broad range of input formats,
clear and structured view of the terminology are among the additional features of such
tools.
The scope of technical means used for post-editing is vast and continually changing.
However, it is possible to group the most popular tools and systems into categories
depending on the origin of TL segments, possibility to be connected directly to an MT
engine and the nature of tasks performed with their help. On the other hand, the frequency
with which these instruments are used in PE workflow and, hence, their importance for a
post-editor is not sufficiently examined and requires further investigation.
5 https://translate.google.com/ (Last consulted on 18.03.2017) 6 www.statmt.org/moses/ (Last consulted on 14.05.2017) 7 www.systransoft.com/lp/machine-translation/ (Last consulted on 10.03.2017) 8 https://www.apertium.org/index.eng.html (Last consulted on 01.04.2017) 9 https://okapiframework.org/wiki/index.php?title=CheckMate (Last consulted on 22.06.2017) 10 https://www.xbench.net (Last consulted on 03.06.2017) 11 http://www.qa-distiller.com/en (Last consulted on 14.05.2017)

Part I. Theoretical framework
47
2.3.4. References for decision-making
The generalized objective of MTPE reference materials is to meet quality
requirements, which are often customer focused (Doherty, 2017). For this reason, Ray et
al. (2013) report that the industry’s research “has long shown that buyers and suppliers
often disagree on what translation quality means,” when the lack of agreement on
definition and measurement criteria results in mismatched expectations. The authors also
identify a trend for ‘no accepted standards’. Given such circumstances, the primary goal of
reference materials is to help translators grasp a specified level of quality for PE project
output, which is expected to be error-free, or rather not to contain issues considered to be
errors for a particular MTPE project. Notions of quality are often described as “boiling
down to the opinion of one person over that of another” with “too much time in arbitration
mode,” in which case they are characterized by subjectivity (Kelly and DePalma, 2009: 1).
Meanwhile, the definition of what could be classified as “good” performance versus
“mediocre” or even “poor” performance keeps being of paramount importance for
measuring the activity of any kind (De Almeida and O’Brien, 2010). For this reason
availability of reference materials helps make decisions when working on a particular PE
project.
The functionalist theory (Reiß and Vermeer, 1984; Nord, 2013) develops the claim
that before performing an assignment, the translator decides on the appropriate translation
strategy. The latter depends on the (extra-)linguistic features of the translation project and
enables delivery of the original message to the recipient in full. Evolution and
digitalization of translation paradigm have significantly influenced this process since the
nature of the original materials, and translation projects have undergone significant
changes. It became standard that the SL content contains elements of different genres
and/or suffers constant changes even after the translation project has been launched. The
translation project might be distributed among a team of translators for throughput reasons,
yet the output is expected to be coherent and correctly transfer the original meaning
(Martín-Mòr et al., 2016: 28).
Given the importance of throughput for timely delivery and output quality for the
successful functioning of the translated content in the market (or any other environment it
is produced for), there is an urgent need for effective strategies that would assure
homogeneity, uniformity, and coherence of MTPE projects. As previously mentioned, to

Part I. Theoretical framework
48
this end the translation industry provides specialized software tools that not only facilitate
the source-to-target meaning transfer and quality assurance but also enable management of
similar projects. What is more, the relevant reference materials (guidelines, specifications
or style guides, for instance) elaborated single-handedly by TLPs, by customers or through
the collaboration of all parties contain advice on how to solve particular issues while
performing a PE assignment. These decision-making tools may to a certain extent facilitate
or even replace the stage of previous analysis of the original content as previewed by
Functionalism (ibid.: 30). The principal objective of regulatory documents available for a
PE project is to make post-editors aware of quality expectations, workflow scenario and
types of issues commonly found in a particular raw MT output, to provide a systematic
framework for carrying out a PE assignment, define the range of corrections and edits to be
made and assure the quality of an MTPE project.
The expected output quality criteria are often communicated to translators using
reference materials available for the project, such as PE guidelines and rules that reflect
quality requirements applicable. The aim of these materials is not only to guide and
support translators in their professional workflow but also to make the PE task more
accessible to them, encouraging open-minded attitude towards translation technology
(Schäfer, 2003). For instance, the post-editing rules written by Belam (2003) on the basis
of an English MT translation of a German text on Christmas shopping in New York focus
on a number of dos and don’ts for rapid PE. The researcher advises correcting any word
that has not been translated and does not resemble its TL equivalent, to retranslate any
word which has been translated so wrongly as to make the sentence meaningless, to delete
anything which is confusing and which does not add or detract significantly to the
meaning. It is recommended not to tidy up the style, not to change a word which has been
translated inaccurately, but which still has a related meaning, not to change the word order
if the meaning is not affected. Language- and content-independent rules of PE have not
undergone any significant changes from early days of MTPE, when translators were
recommended to retain the most of raw output, think fast and abstain from time-consuming
researches, make only necessary changes of ambiguities and not to worry about repetitive
style (Wagner, 1985).
As suggested by Guzmán (2007), creation of clear guidelines with detailed examples
of the scope and boundaries of post-editing as well as anticipation of potential issues and

Part I. Theoretical framework
49
drafting of relevant solutions with explanations on how to treat stylistic and terminological
inconsistencies are particularly crucial for decision-making in PE. Guidelines contain
information regarding post-editing in a particular language pair and illustrate relevant
solutions through examples. To overcome uncertainty and subjectivity when applying
these documents, it is important for translators to possess “a certain degree of tolerance and
ability to draw clear boundaries between purely stylistic improvements and required
linguistic corrections” (Krings and Koby, 2001: 6). Concise PE guidelines usually mention
only specific regulations applicable to the project and provide correspondent samples from
the raw MT output. On the other hand, extended PE guidelines may add information that
helps post-editors better understand the process and particular issues that require editing
(Martín-Mòr et al., 2016: 71).
To facilitate understanding of the PE process, the reference materials specify the
category of MT system(s) used to obtain the output, since this information may improve
understanding of the nature of possible errors. References may also give detailed
information on how to approach PE projects and perform decision-making on whether to
post-edit or start from scratch and contain advice on the terminology applied by the client
in the SL and how it should be rendered in the TL(s). Guidelines for light PE advise
translators to aim for semantically correct translation to use as much of the raw MT as
possible since there is no need to implement purely stylistic changes or to restructure
sentence for the sake of fluency. To achieve similar or equal to human quality translators
are expected to aim for grammatically, syntactically and semantically correct translation
without addition or omission of information, to edit inappropriate or unacceptable content,
make sure terminology and spelling are correct (Massardo et al., 2016).
Keeping in mind the importance of guidelines for coherent and homogenous PE
output, description of their effect on post-editors’ performance is among major research
lines (Guerberof, 2008, 2009, 2012; Plitt and Masselot, 2010; De Almeida and O’Brien,
2010; Temizoz, 2013). The analysis is focused on transparency, consistency and
applicability of PE instructions. For instance, the study conducted by Flanagan and
Christensen (2014) explored the usability of the TAUS guidelines drafted in partnership
with the Centre for Global Intelligent Content. The researchers focused on how translation
students of MA degree interpret these guidelines to produce good-enough and publishable
quality output. The experiment reported difficulties in guidelines understanding, the

Part I. Theoretical framework
50
primary reasons for which was the trainees’ competency gap and the wording of the
guidelines. The study conducted by Depraetere (2010) involved giving participants (MA
students) minimal instructions, like “ensure that source and the target contain the same
information and that the target content is grammatically correct,” along with a few
examples of (non-)essential edits, based on Guzmán (2007). The study objective was to
find out the scope of intuitive post-editing performed by students to be able to focus more
on the issues causing problems. After analysis of the results, the following conclusions
were drawn: correctly transferred sentences were not edited for the sake of fluency,
terminology was left unchanged despite the availability of more appropriate terms, cases of
under-editing or omission of information in the PE output were numerous.
Style guides that contain information on a particular project make another category
of reference materials. The issues in question may include specific cases, e.g., the
equivalence of SL and TL punctuation, units of measurements, decimals points,
capitalization of titles, etc. The information provided may have a more generic scope, e.g.,
opting for a particular verb tenses or/and active or passive voice, specific word order or
narrative style that is expected to facilitate comprehension. Another category of resources
– project specifications – may embrace definition and description of contracted services
(for instance, machine translation with following post-editing or translation-editing-
proofreading scenarios), expected delivery dates, requirements to the technical means
involved, language-related requirements, e.g., compliance with the provided term-bases,
glossaries and/or style-guides, the origins and special features of the source content, among
others. Confidentiality clauses and/or agreements belong to one more category of
regulatory documents that contribute to decision-making and quality assurance when
carrying out a PE project. Such materials may contain information on non-disclosure, the
liability of the parties, procedures applied to deal with potential litigations, protocols on
conflict settlements, governing law principles for those cases when, for instance, the client,
the LSP or/and the translator are subject to the legislation of different countries.
Agreements may also contain restrictions on by-products application, such as term bases,
glossaries, parallel texts and/or translation memories, among others.
Client expectations, the volume of the project, turnaround time, document life
expectancy and the use of the final text all contribute to the preparation of reference
materials for a particular project (Allen, 2003; O’Brien, 2011a: 4). Guerberof (2010: 35)

Part I. Theoretical framework
51
propounds the view that specific linguistic and technical directions for a PE project should
involve the following: type of MT engine, description of the ST, reference to output quality
and client’s expectations, scenarios indicating when to discard a segment, typical errors,
changes to be avoided and guidelines on how to deal with terminological issues.
In an attempt to gather all criteria that help post-editors make informed decisions and
facilitate the process of post-editing a group of authors suggest a PE decision tool (Rico
Pérez, 2012), which is expected to be easy to share and replicate across projects. Its
elements are grouped around PE project information and text profile; these data are
complemented with two rule activation sets (text-related guidelines and language specific
rules) and an example card to demonstrate typical MT issues. PE project information
focuses on the essential features of the job and contains a description of the client and the
content peculiarities, availability of reference materials, e.g., glossaries, particular
characteristics of the MT system used, project domain and the obtained MT output quality.
Text profile embraces three major categories: communication channel (e.g., business to
business), the profile of the content such as marketing materials, online help, social media
content, etc., and an indication of ratings for utility, time and sentiment of the output.
Typical errors of the raw MT output and the rules to edit them are listed in text-related
guidelines. In the framework of such tool, the decision to activate particular rules depends
on the information collected in previous datasets. The cases which are not covered in text-
related guidelines, e.g., the use of a specific language locale, collocation or linguistic
operations with the product name belong to language-specific guidelines. The example
card, as the name implies, provides real samples of raw MT output for (a) particular
language pair(s) of the project in question with the required PE edits introduced. From the
researchers’ point of view, the responsibility to fill in the data sets, activate the rules and
provide adequate examples falls on the project coordinator.
To summarize, an MTPE project may incorporate project specifications, project
brief, guidelines and style-guides, term-bases and TMs, among others. However, the
frequency with which these resources are available is not sufficiently examined and
requires further investigation.

Part I. Theoretical framework
52
2.4. Post-editor’s profile
The ISO 17100 (2015) defines post-editing as a professional activity within the
framework of translation services, which consists in editing the raw output produced using
MT. Post-editing implies a positive and open-minded attitude on the part of translator
towards MT technology; at the same time, it is a linguistic process that requires translation
skills.
The conditions for completion of a PE project are similar to the conditions of a
translation project, where the result is obtained through processing the original input
content concerning requirements for output fluency and adequacy. For this reason, the
professionals who engage themselves in PE-related projects are most commonly
translators. The study conducted by Mesa-Lao (2013) suggests that most translation
agencies use their regular pool of freelance translators to post-edit MT outputs.
Prerequisites for recruiting freelance translators include the target language proficiency
level (native speakers), academic background (degree in translation or related subjects),
experience as translators, experience in the subject matter, familiarity with tools and
technology-related requirements. Short-listed candidates usually pass a series of tests and
fill in questionnaires on their experience before being given the job. The author expresses
uncertainty whether such skills are crucial for efficient PE and makes a remark that not all
freelance translators make efficient post-editors (ibid.). In line with this concern Allen
(2003) quite rightly points out that: “experienced translators find it more difficult to accept
translations with a level of quality that is lower than what they have done for years,” and
many of them voice negative feelings about automation of the industry in general and MT
in particular (LeBlanc 2013, 2017; Ruokonen and Koskinen, 2017). As argued by
Zaretskaya (2017), negative attitude of linguists roots in insufficient knowledge about MT
and erroneous beliefs regarding MT output low quality, poor rates offered for PE jobs and
monotony of assignments which require focusing on errors correction instead of
translation.
Expertise in post-editing prescribes a favorable perception of MT, proficiency in the
subject area, and perfect command of the target language (Johnson and Whitelock, 2003).
Another classification of recommended competencies necessary to become efficient post-
editor prescribes the candidates to have a degree in Translation and Interpreting or related
subjects, to be familiar with localization and/or technical translation, to possess advanced

Part I. Theoretical framework
53
word processing skills, to have positive, tolerant and open-minded predisposition towards
MT, to demonstrate confidence in technical expertise and be able to recognize typical or
repetitive MT errors (O’Brien, 2002). A set of skills for efficient PE might also embrace
word-processing and editing skills, knowledge of MT and its shortcomings, awareness of
the target audience and strong command of SL and TL, advanced decision-making
strategies, ability to find a balance between PE speed and inverted effort (Kenny and
Doherty, 2014). To a large extent, an MT system translates the original content sentence by
sentence regardless of any information that exceeds the sentence level. Under such
circumstances, when performing post-editing the provided raw output should be used as a
draft to produce the final translation. Correspondingly, abstinence from over-editing
contributes to an increase in productivity rates and could be mentioned as one of the
specific PE-related skills. Among other recommendations required to ensure good PE
performance are assessment of the general quality of MT and identification of issues in the
output that need to be addressed; performance of post-editing tasks with reasonable speed,
so as to meet the expectations of daily productivity for this type of activity; maximal
automation of processes with the help of shortcuts and/or find-replace operations; respect
of guidelines, so as to minimize the number of preferential changes, which are normally
outside the scope of PE. There is growing support to the claim that the leading skill that
characterizes the process of post-editing is the ability to decide quickly whether a machine-
translated segment can be used or whether it should be ignored (De Almeida and O’Brien,
2010; Zaretskaya, 2017).
In what concerns post-editors’ SL and TL proficiency, interesting research was
conducted to find out how the degree of TL proficiency affects the output quality of PE
assignments (Sánchez Gijón and Torres Hostench, 2014). The experiment on post-editing
from Spanish into English involved translation trainees who were native speakers of
Spanish and were proficient in English as a foreign language, and native speakers of US
English who were proficient in Spanish. In line with TAUS baseline guidelines, accuracy
and language were the two major categories applied in PE guidelines for this project,
which were respectively sub-divided into mistranslations/omissions and grammar/syntax.
Other (sub-)categories of errors were not included since the experimental corpus of raw
MT output did not contain any of such cases. The data gathered in the study suggests that
non-native English participants performed better in correcting mistranslations (i.e.,
accuracy) rather than language errors. As for the throughput, it was mentioned that the best

Part I. Theoretical framework
54
performer of the group spent more time than the rest while the worst performer was the
fastest in the group. Alternatively, English native-speaking participants were reported to
have corrected almost all syntax errors, the majority of mistranslations, followed by
omissions and grammar. The ratio of spotted accuracy and language errors indicated a
more equal level of skills than that of non-native trainees. Therefore, the experiment
outcome suggests that assigning PE jobs to non-natives of the TL is not advisable unless
the post-editors demonstrate more than 70% success rate in their average performance.
Yet, the researchers expressed their awareness that the results lack solidity due to the
insufficient number of the participants; nevertheless, the study serves as a premise for
further investigation.
Apart from being a demanding linguistic job, an MTPE-related project is likely to
include a set of technical tasks regardless of language pair and/or specific subject-matter,
so LSPs and translators should potentially be able to understand, manage and even run any
of such jobs. And while there is no doubt that (re-)working and revising the text in the
target language are the essential tasks of the PE process, a professional translator/post-
editor shall not limit their ability to accomplish only those tasks, since the MTPE sector is
vast and varied.
A noteworthy model of skills and competencies deployed by post-editors was set
forth by EDI-TA research group (Rico Pérez and Torrejon, 2012; Rico Pérez and Días
Orzas, 2013). The building blocks of the model of competences deployed by post-editors
are instrumental skills, linguistic skills, and core competencies, defined by the authors in
terms of attitudinal and strategic competencies. Acquisition of instrumental competence
implies understanding of the process of MT output production and development of
tolerance toward such product. References are made to the knowledge of key features and
capabilities of rule-based, examples-based, statistical engines or hybrid MT systems,
terminology management, maintenance of dictionaries and translation memories,
assessment of input quality, basic programming skills. Linguistic skills embrace ST and TL
knowledge, familiarity with PE-related reference materials and guidelines, textual and
communicative competence in at least two languages, subject-field competence and
(inter)cultural competence. The attitudinal or psycho-physiological competence allows to
overcome subjectivity and uncertainty when using PE project specifications and to respond
adequately to clients’ expectations. Strategic competence is believed to help translators

Part I. Theoretical framework
55
reach the informed decision on PE choices, “stick stoically” (Guzmán, 2007) to the
specified scope of post-editing, follow the guidelines and abstain from editing stylistic
issues.
The model suggests that the translator's role does not consist only in editing the raw
MT output, but also in performing different MTPE-related tasks. A closer look at the scope
of instrumental competence fosters debate about whether and to what extent a translator's
role in an MTPE-related project might go beyond mere segment validation (Pym 2012,
Austermühl 2013) and aim at control over and management of a broader range of tasks
involved into MT output production. Command of instrumental skills leads to better
interaction with MT systems and PE environments and contributes to efficient decision-
making on how to optimize time and resources with the aim to achieve the required quality
standards. Enhancement of instrumental competence also makes it possible for translators
to create, train and optimize statistical MT engines as well as to tune and improve rule-
based MT engines.
Advanced instrumental skills combined with proficiency in linguistic skills make it
possible for translators to prepare lexical and terminological data that properly correspond
to the project requirements, as well as look for and/or draft other resources outside the
reach of an MT project that might help them guarantee the expected quality of the PE
output through post-editing, proofreading and quality control stages (Sánchez-Gijón,
2016). Indeed, an MT system is bound to yield better results if it is fed with the content of
high quality that is provided in the form of mono- and bilingual corpus, glossaries and
term-bases and is characterized by appropriate style and subject-field. Meanwhile,
installation, tuning, and management of MT systems require excellent technical
competence, which probably overpasses the scope of post-editor’ and/or MTPE project
manager's competence (ibid.).
To summarize, the core competencies required for editing raw MT content include
efficient speed and adherence to the guidelines, which regulates the scope of required
changes. However, a broader range of post-editing skillset grants translators with a
capacity to not only perform PE assignments but also to provide a fuller spectrum of tasks
and actions involved in MTPE projects. In this case a linguist is fully capable of preparing
project materials, improving the resources engaged into the project, preparing and/or
modifying MT systems and, in some cases, installing and/or configuring settings of an MT

Part I. Theoretical framework
56
engine, although the fact that the latter might be seen as a component of PE competence
raises certain doubts.
2.5. Specialized training in MTPE
A qualitative shift from teaching merely contents to teaching competencies requires a
considerable effort from all agents involved in this process of transformation. The global
MTPE market is in constant search of translators who possess SL and TL knowledge and
have a grasp of MT technology and PE practice. Increase in MT use is resulting in
expanding demand for post-editing experts and entails creation and implementation of
MTPE training programs for the industry and academia (O’Brien and Schäler, 2010).
To meet the growing need for large volumes of translated content and enhance PE
competence in those parts where it differs from translation competency, specialized
training on PE is recommended. The training is expected to introduce trainees to PE
strategies and tools as well as improve one’s perception of MT and its capabilities
(O’Brien, 2002: 100). For PE expertise to be enhanced the emphasis is likely to focus on
decision-making, problem-spotting and problem-solving with appropriate application of a
wide range of translation strategies and procedures. Field experts believe that command of
the source and target languages, ability to identify errors, knowledge about the cross-
language meaning transfer, technical resources all contribute to the successful training in
PE (McElhaney and Vasconcellos, 1988). Besides, along with improvement of PE
throughput rates and output quality, there is a suggestion that students’ training in PE has
positive effect on their new TL vocabulary, grammatical points, and style, translation
skills, test analysis skills, the grasp of register for different communicative situations,
theoretical and practical aspects of using language (Belam, 2003).
As evidence shows, training in post-editing differs from training in translation
(Krings and Koby, 2001:12). In this concern graduates of translation programs should be
exposed to a specific range of skills inherent for MTPE, as some of the skills required of
post-editors are contrary to the objectives of a translation assignment. According to the
research conducted by Groves (2008), there emerges a need to educate translators in
limiting their performance to error editing “rather than give into their subjective opinions
or preferred translation style”. On the other hand, Offersgaard et al. (2008) propose that
many of the characteristics attributed to translators could also apply to post-editors. Even

Part I. Theoretical framework
57
so, the authors take into account the fact that while translation training usually focuses on
the creation of a target content of publishable quality with accuracy and equivalence being
the main criteria, quality requirements in PE may vary from minimal to full PE. It is for
this reason that Senez (1998) rightly commented that “a translator will always strive to
disguise the fact that the text has been translated. In the case of post-editing, it is enough
for the text to conform to the basic rules of the target language, even if it closely follows
the source text.”
Introduction of MTPE modules to translator training syllabi may not be a common
practice yet (Niño, 2009: 252), although many language and translation trainers are aware
of the subject. It is believed that the essential features of a training module that aims at
fostering the core PE competencies should develop students’ capacity to identify issues in
the raw MT output that need to be addressed and to fix them appropriately. Such training is
expected to boost students’ ability to carry out the post-editing task with reasonable speed,
to adhere to the guidelines to minimize the number of preferential changes, which are
typically outside the scope of PE (De Almeida and O’Brien, 2010). Ability to identify the
issues in the SL content and apply norms and special requirements to one’s output in the
TL lie in the heart of PE jobs (Toury, 1995; Chesterman, 1993), although criteria and
requirements differ for each project and evolve due to many circumstances. In this
instance, it seems hardly possible to identify and teach one-size-fits-all rules for
enhancement of post-editing. For the sake of discussion, it should be said that on the whole
the information about how proficiency in PE acquired is insufficient and research on how it
can best be taught is scarce. On these grounds investigation of compelling arguments to
corroborate improvements in students’ PE performance that result in detectable and lasting
effects keep staying in the focus of research on PE.
In an attempt to address the issue of specialized training in MTPE, the contribution
of Dublin City University experts into the development and sharing of good practice in
MTPE training paved the way for other researchers in the field (Rossi, 2017). In line with
the claim that efficient teaching of MTPE requires a combination of theory and practice
(O’Brien, 2002: 104-105), the theoretical part of a specialized course proposed by Sharon
O’Brien (ibid.) features topics on the introduction of PE, MT technology, and controlled
language authoring. Then, it is complemented with advanced terminology management and
test linguistics as well as basic programming skills. The syllabus is expected to explain to

Part I. Theoretical framework
58
students how to write macros to automatically clean up texts and familiarize them with
language specific text type norms. The practical part covers a broad range of activities
involved in MTPE projects, such as practicing different levels of PE; making changes to
setting and comparing results of at least two different MT systems; practice with
terminology management tools, dictionary coding utilities, and terminology exchange
formats. To amplify the effect of the practical part of the course, it is advised to include
compilation, analysis, and tagging of parallel corpora as well as opportunities to employ
the acquired programming skills. Enhancement of programming skills contributes to PE
experience and introduces students to how common errors of the content can be
automatically fixed. The researcher also stresses that students should be encouraged to
practice post-editing both within and outside course hours. The last statement shares
premise with the observation that the level of comfort with post-editing is greatly increased
after post-editing 100.000 words, which is usually taken to reflect the number of hours of
training needed to turn someone into a proficient post-editor (Vasconcellos, 1986). Yet, the
DCU proposal represents an ideal case that may not be easy to apply universally given the
number of contact hours and the range of topics to be covered in translation training
curriculum.
As the result of training in the aforementioned fields of knowledge and skills, BA
and MA graduates are expected to know how to create the output of required quality while
making use of available tools, following reference materials provided, and recovering
different kinds of missing information. The knowledge of terminology exchanges formats
and management tools may become useful in case when MT dictionary coding and term-
base management is required. Familiarity with controlled languages and tools combined
with proficiency in source and target language(s) enables post-editors to apply such rules
to the content right before it is processed by an engine to obtain the raw output of better
quality.
The major problem with research on enhancing PE competence is similar to the one
experienced in many other language-related disciplines when teaching effects are uncertain
and hard to assess (Kiraly, 2000). As a consequence, lots of trainers might keep wondering
whether the changes in students’ performance over a period of time happened as a
consequence of the applied teaching methods, inborn and/or previously acquired dexterity
or whether such changes would have occurred anyway. The data gathered by means of

Part I. Theoretical framework
59
classroom experience and empirical research on PE quality and productivity (ProjecTA
report 2015; Guerberof, 2012, 2014) suggests that some students and translators seem to
“instinctively” perform the task faster and better than others, while particular triggers of
such behavior have not been explored in full so far (Sánchez Gijón and Torres-Hostench,
2014). In this respect, the scholars report about the absence of empirical studies that test
the so-called intrinsic skills that might be beneficial when performing PE and call for
further research in this field.
Training in MTPE entails extra advantages for translation degree graduates looking
for employment opportunities mainly, but not solely, with those LSPs that implements
MTPE model in their workflow. Even so, the fast pace of today’s life, technological and
scientific changes and labor market modifications make it impossible to predict what
knowledge, professional skills and competencies will be required in ten or fifteen years.
Correspondingly, after graduation novice translators will have to keep on studying as
active members of emerging lifelong-learning society.
Concluding remarks
The chapter explores the issues related to translators training in the academic
environment with a special focus on translators’ and post-editors’ profiles.
First, an overview of approaches to the definition of translation competency was
conducted, that culminated in the description of training objectives pursued by academia.
Then the focus of our attention moved to translation modalities, the task of post-editing,
and various interpretations of this recently emerged type of professional activity. To shed
light on key issues related to PE output production MTPE-related workflow, commonly
used MT error typologies, software tools and systems used to enhance MTPE performance
and regulatory documents applied to achieve the required quality standards were reviewed.
The broad range of tasks involved in the production of the target output served as a
background for description of professional skills and competencies deployed by translators
working on PE projects. In the end, a sketch of the training content used for MTPE-related
modules was made.

Part I. Theoretical framework
60
Chapter 3. Expertise in PE
This chapter is premised on the assumption that examination of the scope of PE
expertise is highly beneficial for industry and academia with a view to facilitating MTPE
processes and training in PE skills, and could produce a synergistic effect that would give
an impetus to further research and experiment. Therefore, investigation of post-editors’
subjective opinions and viewpoints becomes helpful for those experts who focus on the
development of theories and tools relevant to the current needs of the industry.
In line with the objectives of this research, an empirical survey-based study Sharing
Post-Editing Practices which aimed at investigation of multiple facets of PE expertise was
conducted. Details on survey setup are provided in Section 3.1, namely, general
observations that preceded survey preparation, such as data collection issues, the structure
of the questionnaire, considerations on the sample and generalizability, and questionnaire
piloting. Exploration of the scope of PE expertise is conducted in correspondence to four
aspects of the research construct, namely respondents’ profiles and experience, MTPE
workflow, decision-making and contrast of translators’ vs. post-editors’ profiles, while
Section 3.2 describes and analyzes the collected responses. The combined results
contribute to updating the model of PE expertise and provide grounds for the experimental
study on enhancing PE competency among novice translators (Part II).
3.1. Sharing Post-Editing Practices: survey setup
The broad variety of MT output quality levels, the wide diversity of clients’
expectations and the lack of shared best practices are some of the current problems the
MTPE industry is facing at the moment. With the objective to overcome these stumbling
blocks, translators, translation trainers and the industry have to provide solutions that are
based on the relevant and updated information. To pursue this aim we think it important to
elicit responses to the most common yet insufficiently studied parameters of translators’
performance in post-editing.
Operationalization of the research construct was the essential prerequisite for
drafting the questionnaire. A lot of research has been conducted to study the concerns
expressed by the different groups of experts engaged in MTPE (e.g., linguists, LSPs,
scholars, and students). Among the major issues are the quality of the output produced by

Part I. Theoretical framework
61
MT engine(s) (Gaspari et al., 2015; Guerberof, 2017) and the throughput that may (not)
increase as a consequence of the raw MT output (Gaspari et al., 2015; Ruokonen and
Koskinen, 2017; Cadwell et al., 2017). Measuring and evaluation of post-editing (PE)
effort makes another important line of investigation (Gaspari et al., 2014; Koponen, 2012;
Moorkens et al., 2015; Teixeira, 2014), as well as bias and negative predisposition towards
MT (Cadwell et al., 2017). In contrast, the field studies on who post-editors are, what their
professional workflow is like, and what skills and competencies they employ in day-to-day
activities are few.
In particular, further investigation is required for starting and closing phases of PE
assignments, their scope, productivity, and metrics, not to forget about the profiles of those
who perform PE. Another ongoing debate focuses on whether PE projects should be
carried out by field experts who have a strong command of linguistic skills, or rather
professional translators with specialized training in the subject. Although (re-)working and
revising the text in the target language are without doubt the essential tasks of PE process,
the data also appears to suggest that MTPE experts do not limit their ability to
accomplishing those tasks only, since the professional PE sector is vast and varied. In
parallel with this statement, the assumption is put forward that an MTPE project is likely to
include a set of language-independent tasks, so post-editors, as well as providers of MTPE
services, should potentially be able to understand, manage and even run them. In light of
digitalization of translation paradigm, one more interesting avenue of exploration deals
with the issue of similarities and differences between translation and post-editing.
In conformity with the objectives of the research and the theoretical overview
conducted in Chapters 1 and 2, operationalization of the questionnaire is grounded on four
principal aspects that underpin the concept of PE expertise, namely: (1) respondents’
profiles and experience, (2) PE workflow, (3) expertise and decision making in PE, (4)
post-editing vs. translation. We are conscious of the fact that a thorough study of any of
these aspects could be a research topic in itself. In this concern, our survey does not claim
to give exhaustive feedback on them all, but rather to analyze the first-hand experience of
those who are directly involved in PE practice.
In her doctoral thesis Ana Muñoz (2014) summarized the types of surveys as seen by
many leading scholars (Visauta, 1989; Rea and Parker, 2005; Hernández et al, 2010), who
had set forth the following classification criteria:

Part I. Theoretical framework
62
• the principal research objective: exploratory, descriptive, explicative,
predictive or evaluative;
• the content: focusing on facts, on opinions, or on attitudes, motivation or
feelings;
• the administration processes: conducted personally, by phone, by mail or self-
administered;
• the temporal dimension: transversal or synchronic surveys, on the one side, and
longitudinal or diachronic surveys, on the other;
• the subject: political, social, commercial, etc.
In line with these considerations, we see our survey as a descriptive study that aims
at getting more detailed information on the profiles and the scope of competence of the
respondents for its further use for training purposes. The elicited responses refer to facts
(years of experience, academic background, subject fields, etc.), opinions (perceived
throughput rate, frequency of using specialized tools, importance of specific skills etc.) and
feelings (e.g., comparison of the profiles of translator and post-editor). The survey is self-
administered by means of a questionnaire, as the respondents follow the link and mark
their answers without supervision. The temporal dimension of the survey is transversal,
which means it collects the real-time feedbacks from post-editors, and its objective is to
collect first-hand data on MTPE-related processes and profiles.
Description of the survey setup starts with justification of data collection issues.
Sections 3.1.1 and 3.1.2 report on how the information was gathered and outline the survey
structure. Next, the issues of sample, universe and generalizability are considered (section
3.1.3). To conclude, the questionnaire piloting is explained (section 3.1.4).
3.1.1. Data collection
A questionnaire as a research instrument yields structured and standardized outcome
on “a (usually) large number of cases” (Matthews and Ross, 2010: 201), and lies at the
heart of survey-based study designs (Langdridge and Hagger-Johnson, 2009: 88). It is a
common practice to use the term ‘survey’ to describe the study design on the whole, while
the ‘questionnaire’ is seen as an instrument used for this type of a study (Saldanha and
O’Brien, 2014). Calls for attention to human agents of translation process were triggered
by Robinson’s The Translator’s Turn (1991), followed by a suggestion to add a branch

Part I. Theoretical framework
63
‘Translator Studies’ (Chesterman, 2009). Since then sociological approach starts being
adapted to the study of the interaction between human agents, translated output and
production processes (Inghilleri, 2005; Chesterman, 2006; Wolf and Fukari, 2007; Wolf,
2011). The consensus view seems to be that the method of questionnaire is a staple of
sociological investigation; nevertheless, it has also been extensively used in applied
research without resorting to social theories.
The main reason behind choosing a questionnaire as our investigation tool is its
capacity to obtain quantitative information on a large scale with respect to the anonymity
of its participants (Rojo, 2013). Other benefits of using a questionnaire involve possibility
to quantify and generalize the collected data, respondents’ autonomy which might result in
a higher response rate. The use of questionnaires for research purposes in translation,
namely when studying translation technologies or training efficiency, was reported by a
vast group of investigators (e.g., Chan, 2010; Van Dam and Zethen, 2008, 2010;
Lagoudaki, 2008; Sela-Sheffy, 2005). Some of such studies are conceptual, while others
have a strong empirical perspective and provide relevant details for participant-oriented
research (Saldanha and O’Brien, 2014: 150), and numerous opportunities for data
systematization and analysis (Kumar and Phrommathed, 2005: 130).
The questionnaire contained open and closed fact-finding questions that were used to
collect structured data for further quantitative analysis. Taking into consideration the
variety of issues covered by the questionnaire, we thought it appropriate to use different
formats of questions to elicit a diverse spectrum of answers. To contribute to the already
existing picture of the MTPE industry and create another source of publicly available
information that could be of use for a broad range of industry and academic stakeholders,
the questionnaire combined dichotomous questions (to ask for permission to use the
respondents’ data for research purpose), open-end questions (to inquire about respondents’
age, country of residence or working language pairs, etc.), multiple choice questions (e.g.,
to define common PE throughput rates). However, the vast majority of questions provided
a matrix of answer options; the relevance of each of such options was further specified
either with the help of numeric rating scales (e.g., the volume of a certain types of
projects), or Likert-type scales measuring e.g., the frequency of particular tasks, the
importance of skills and competencies in question, or satisfaction levels of acting post-
editors with their occupation. Although commonly offered rating scales consist of an odd

Part I. Theoretical framework
64
number of points available to grade one’s answer (as a rule, five or seven), when
measuring frequency and importance it was decided to opt for an even number of values so
that the respondents did not feel tempted to pick the mean value and by doing so to
jeopardize reliability of survey results. For this very reason, an even-numbered scale is
favored by some researchers as it prevents respondents from conveniently selecting the
problematic mid-point on the scale and thus limits the reliability of the answers (Saldanha
and O’Brien, 2014: 158). Besides, the large number of questions contained free text slots
aimed at collecting personalized opinions on particular topics.
For the cases when the researcher was not sure if predefined answer categories
incorporated all possible variants of answers, a free-text box was provided for informants
to comment and share their ideas on particular issues. By ‘informant’ we mean any
respondent of the survey who demonstrated more active involvement in constructing the
outcome of the research and contributed not only by answering the questions, but also
providing comments if necessary.
3.1.2. Questionnaire structure
Before drafting this questionnaire the CASRO (Council of American Survey
Research Organizations) codes and standards for internet-based surveys were analyzed,
where among other highlighted criteria the stress was placed on informed consent and
research brief. Therefore, a brief with a description of the research, its title and objectives,
and an invitation for those interested to request general survey results after its completion
were provided at the top of the questionnaire form. The brief was followed by a line
thanking the translators for participating in the questionnaire and informing them about the
number of questions and the approximate completion time, which was defined after
piloting the questionnaire (section 3.1.4), and was considered affordable for any
professionally active individual. It is a common knowledge that the shorter is the
questionnaire, the higher are the chances to avoid non-completion. As stated by Saldanha
and O’Brien (2014: 154) “there is no ideal number of questions for a questionnaire”; for
this reason questions number of questions was kept to the minimum for the sake of the
response rate which could decrease should the questionnaire be too lengthy.
Another important prerequisite for conducting our survey was to assure that the
respondents are fully informed stakeholders whose authorization for further processing of

Part I. Theoretical framework
65
their questionnaires is free and revocable (ibid.: 150). To this end all subjects were invited
to read the informed consent statement at the beginning of the questionnaire form and
express their agreement to participate in the survey and provide data for further processing
for research purposes only; in continuation, they were offered an incentive of sharing the
survey results after their processing and publication.
To avoid misunderstandings and confusions, the questionnaire form also contained a
Glossary with interpretations of special lexical units used in the questionnaire, e.g., semi-
automatic PE, linguistic guidelines, segments of specified origin, fluency issues, etc.
Besides, all questions that involved such lexical units contained an online link to the
Glossary and the participants could easily access it at any moment when filling in the
questionnaire.
The first block – Background information – was dedicated to respondents’
background and experience. The subjects shared information about their predominant
language pairs for PE projects, graduate and postgraduate background, years of experience
in translation and post-editing, age, country of residence and membership in professional
associations. They were asked about how often they perform translation, PE, revision,
project management etc. as part of their professional activity, their average PE productivity
and metrics for defining PE rates. The next sub-set of questions was focused on the total of
performed PE projects and aimed at picking up the data on the percentage of manual vs.
semi-automatic, and full vs. light PE jobs, as well as the prevailing domains and content
types for PE projects. Although not all the obtained data were in the primary focus of our
survey, the collected information contributes to the comprehensibility of the results due to
the diversity of respondents’ backgrounds and experiences.
The second block was focused on MTPE workflow, its questions covered various
aspects of MTPE-related processes and routines. First, information on the ways of starting
a PE project was collected (e.g. pre-editing, raw output evaluation, use of terminology
extraction tools etc.), followed by the starting point of a PE task (e.g. availability of raw
MT output, access to MT engines and TMs from previous projects). Then frequency of use
of the most popular PE tools and systems was questioned (for instance, TM systems, PE
environments, complementary tools) as well as the availability of reference materials, such
as project specifications, linguistic guidelines, client style guides, etc.

Part I. Theoretical framework
66
The third block was called Post-editing and decision-making. It highlighted
respondents’ expertise and decision making in PE. The respondents were invited to
describe the stimuli that trigger one’s decision to post-edit a particular segment, such as
fluency issues in a low-visibility document, absence of the possibility to fix the issue by
means of (semi-)automatic operations, or availability of feedback from previous jobs,
among others. To find out how the subjects themselves rank skills and abilities
indispensable for successful completion of a PE job (e.g. knowledge of programming or
positive attitude towards MT) they were asked to express their opinion on the importance
of competencies that are frequently mentioned in a vast range of research materials on
post-editors’ efficiency.
Since translators and post-editors are often being contrasted and there is an ongoing
debate about how much these two fields of expertise have in common, our fourth block
called Translation vs. post-editing was aimed at the exploration of similarities and
differences as spotted by language experts themselves. To this end, the informants shared
their opinions regarding the most widely adopted features of translators’ expertise by
comparing translation and post-editing performance in terms of translation skills, textual
competence, information-processing competence, and/or instrumental competence. The
penultimate question invited respondents to express their attitude to the MTPE industry
measuring and comparing output quality, profitability and professional demand, among
others, with the same parameters of ‘human’ translation. The final question consisted of an
open text box for personalized responses with an invitation to add any comments that are
relevant to the research on PE expertise and training of novice post-editors.
The final question inquired about any survey-related observations that the
respondents were willing to comment on. The closing page of the questionnaire contained
a thank-you note.
3.1.3. Sample and dissemination
The most widely spread sampling methods are probability-based (or ‘random
sampling’) and non-probability based (or ‘convenience sampling’). In the first case the
probability with which any member of the concerned population could have been selected
and included in the sample is known; in the second case, participants are selected due to
their accessibility to the researcher. Our survey combines salient features of both

Part I. Theoretical framework
67
methodologies, since it was aimed at all those post-editors who could be reached via
multiple online channels, while the responses were provided only by those who had access
to the Internet, were registered on the relevant platforms or connected in any way with the
partner organizations, and had time and wish to participate. Luckily enough, we believe it
to be highly unlikely that in-house or freelance translators would not have access to the
Internet, however time constraints could be a hurdle.
Convenience sampling and an impossibility to confirm respondents’ identity may be
considered as the limitations of the present study. But despite the non-probabilistic nature
of the survey, the data collected from a large number of cases facilitates statistical
inferences about the research construct and can also be used for developing a hypothesis or
outlining general tendencies for future lines of research. The obtained answers make an
interesting and valid dataset to analyze profiles and routines of a broad cross-section of
translators currently engaged in post-editing. The survey results are based on 124 valid
questionnaires filled in by respondents in 26 different countries which we consider as
sufficient. The sampling may be considered reliable since the analyzed data belong to a
wide set of translators with diversified professional background and vast geographic
coverage.
In the framework of our investigation, the target population (Groves et al., 2004: 44)
consisted of all professionally active translators who are engaged in MTPE-related tasks
exclusively or combine them with other professional activities. Although a lot of
researchers focused their surveys on translators who belong to a specific geographic area
(Li, 2000; Van Dam and Zethsen, 2010; Vigier Moreno, 2010; Sachinis, 2011), in our case
experience in PE was put forward as the only necessary requirement, so that to involve the
maximum number of respondents irrespectively of the country of residence or the working
language pair(s).
According to the new MT Industry Report by Grand View Research (2015), the MT
market is expected to reach 983.3 million US dollars by 2022, while TAUS Machine
Translation Market Report (2017) estimates the revenues from MT market on the level of
around 130 million US dollars. However, despite the rapid development of the MTPE
translation market, there is no way to measure the share of MTPE projects performed
worldwide, and the number of professionals engaged in PE is still to be explored. For our
investigation, such circumstances were the major hurdle for making conclusions about the

Part I. Theoretical framework
68
universe. A similar position was voiced in the doctoral thesis by Ana Muños Miquel (2014:
167), who mentioned the absence of publicly-known official census of medical translators
either in Spain or in the other countries as the reason for impossibility to measure the total
population for her research needs.
To get maximal representation in terms of national and geographic coverage, the
information regarding the survey was shared among the contacts of ProjecTA research
group and directed to publicly available contacts of LSPs located worldwide. The
Translation Automation User Society and the International Federation of Translators also
kindly agreed to spread the information about the survey via their channels. The foregoing
discussion implies that in contrast to other subject fields, translation studies manage to
engage a much smaller number of subjects (Saldanha and O’Brien: 2014). To maximize
the reach of the questionnaire and attract even more traffic from the translation community
the call for participation with the link to the questionnaire form was posted in specialized
groups of leading social media platforms. These measures led to extended geographic
coverage of the participants and boosted response rates. However, it is impossible to
estimate the latter since the questionnaire was circulated using a variety of channels, which
does not provide us with information to make a claim regarding the representative
coverage of the responses.
The questionnaire was Internet-mediated so that the information and links to the
questionnaire could be posted on various platforms. Some researchers believe that on
average web surveys get lower response rates when compared to other ways of
administration, although this data is hard to prove since a combination of methods and
technical channels was used to spread the link to the questionnaire among potential
respondents (Vehovar and Manfreda, 2008: 184). Among the advantages of this particular
channel are the possibility to reach out to ‘hidden populations’ or groups that are hard to
identify, to increase participants’ sense of privacy and ease when filling in the
questionnaire, to lower the risk of ‘researcher effect’ (Saldanha and O’Brien, 2014: 166-
167). The Survey Monkey online survey tool that facilitated data collection and processing
was deployed for questionnaire distribution. The selected web-based survey solution
allowed on-line administration of the questionnaire to multiple participants, collection and
summary of the data in numeric and graphical formats. What is more, the Survey Monkey

Part I. Theoretical framework
69
tool used for the survey purposes made it easy for the researcher to get an update on the
response rate on a daily basis.
As previously mentioned, the results of the survey are fully applicable to our aim –
collection of data for a training proposal that would enhance PE competency in novice
translators, as well as help to unveil the emerging profile of MTPE expert. Reliability and
validity of the questionnaire as well as avoidance of errors associated with the applied
research method were assured by the pilot testing outcomes.
3.1.4. Piloting
As argued by Groves et al. (2014: 259), the objective of the piloting phase is to make
sure that the questionnaire goes in line with content standards (i.e., the questions are asking
what they are supposed to ask), cognitive standards (i.e., the respondents understand the
questions consistently, have enough information to answer them, and are willing and able
to give the answer), and usability standards (the questionnaire is easy to complete).
Following the best practices adopted in the field (Fowler, 1995; Kumar and Phrommathed,
2005: 135-138; Hernández et al., 2010: 225-229), the piloting helped us to make sure that
the wording of the questionnaire was clear, precise and up to the point, the vocabulary as
simple and unambiguous, each question is aimed at investigation of one issue at a time; the
questions are free from bias or prejudice and are not drafted in negative form.
The questionnaire contained 25 questions of different complexity, and a progress
indicator was included to inform the respondents about how much was left. To avoid the
situations when the respondents would not provide answers to all required questions
otherwise called ‘nonresponse error’, the Survey Monkey tool was configured in a way that
the participants could submit their answers only if all required fields were filled in. In this
way we spared ourselves from the dilemma of whether to eliminate or not those
questionnaires where the participants may not have answered all questions, reducing the
response rate. The progress bar of the top of each block of questions showed how much of
the total was filled in.
The piloting of the questionnaire was arranged in April 2015 with the help of five
linguists who had 1-3 years of experience in PE. The testing team members were asked to
assess such questionnaire parameters as the time required to fill it in, clarity and

Part I. Theoretical framework
70
comprehensibility of wording, the usability of results. Rasinger (2013: 70-71) stresses that
a questionnaire should start with more straightforward questions, and the whole structure
should somewhat look like a story with its beginning and end. As confirmed by the testing
team, the questions order was logical and the link between questions was made evident by
providing titles of the blocks. The wording of the questionnaire was clear, accessible and
simple since it was aimed at a broad multinational community of professionals engaged in
PE, for which reason the total number of questions did not undergo any changes for the
full-scale phase.
We fully agree with the statement that “no single research study can provide all of
the necessary evidence that a scale has reached the ‘gold standard’ of construct validity”
(Langdridge and Hagger-Johnson, 2009:104). Nevertheless, pilot testing of the
questionnaire proved the practical benefit of the questionnaire design, since the survey
outcomes measured what they purported to measure – i.e., multiple aspects of PE practices.
In particular, the questionnaire output provided us with a comprehensive overview of key
PE skills and functions, as well as shed light on post-editors’ personal and professional
background.
Participants were not rewarded for investing their time and effort in our study, the
only incentive being the possibility for those interested in the survey results to get general
feedback on its completion. The questionnaire form administered to the participants is
presented in Appendix I (Link I.1).
3.2. Sharing Post-Editing Practices: survey outcomes
The full-scale survey was launched in January 2016 and lasted three months in total.
As aforementioned, apart from the introductory and closing sections, the questionnaire
included two clauses to ensure ethical validity of the collected data, followed by four
blocks with questions that aimed at unveiling respondents’ profiles, discovering the key
features of MTPE workflow, disclosing post-editors’ expertise and decision-making
processes and finally analyzing similarities and differences between post-editing and
translation.

Part I. Theoretical framework
71
To begin, it is important to highlight that all 124 respondents granted the researcher
with their consent to participate in the survey and to provide data for further processing for
research purposes only, as can be seen in Table 1:
Q. 1: I agree to participate in the survey and provide data for further processing for
research purposes only
Answer options Response percent Response count
yes 100% 124
Table 1. Informed consent
Since none of the respondents got any financial remuneration for the time and effort
dedicated to our survey, we suggested an incentive for their participation and inquired
whether they would like to receive generalized feedback on the survey once it is completed
(with an invitation for those interested to leave their contact details). When answering this
question, 106 participants expressed their interest in obtaining the results, while 18
abstained. The percentage of responses is shown in Table 2:
Q.2: I would like to receive an email with the general results of the survey
Answer options Response
Percent
Response count
yes 86% 106
no 14% 18
Table 2. Sharing the feedback on survey results
3.2.1. Block 1: Respondents’ profiles and experience
Q 3. How old are you (full years)?
The starting point of the first block of the questionnaire was a question concerning
respondents’ age: we thought it important to inquire about this demographic parameter in
order to have a more complete picture of how old the experts currently engaged in the
MTPE industry are. This parameter might also indicate to the age group of potential
attendees interested in academic and/or in-house training on PE competence enhancement,
which is the major aim of this research. It turned out that the scope of the participants’ age

Part I. Theoretical framework
72
was between 22 years old and 77 years old. Due to the vast range of data, it was decided to
split all responses into categories with the margin of 10 years (e.g. group 1 for those aged
20-29, group 2 for those aged 30-39, etc.). As the results show (Table 3), a substantial
group of survey participants are translators in their early/late thirties, followed by the age
groups of 40-49 y.o. and 50-59 y.o. This data goes in line with the fact that MTPE market
started its rapid growth only in the last decades, although it has been present on the
landscape of translation industry for much longer.
Approximate Answer options Response Percent (round-off) Response count
20-29 y.o. 17% 21
30-39 y.o. 28% 35
40-49 y.o. 20% 25
50-59 y.o. 21% 26
60-69 y.o. 10% 12
70-79 y.o. 4% 5
Table 3. Respondents’ ages
Q.4: Your current country of residence
Before embarking on research regarding MTPE processes we thought it important to
get a general understanding of where the participants of the survey are from. To find out
this information we collected responses on their current country of residence (Figure 1).
The obtained piece of data shows that our informants were based in a large number of
countries since there was no strong intention to conduct this survey with pure European
focus and the link to the questionnaire was spread worldwide. Yet, quite logically, the
larger local representation was from Spain, where the researcher was located: 17
participants mentioned this country as their current whereabouts. Israel was reported as the
country of current residence by 13 respondents, France and Germany where the home for
12 respondents each, and 10 participants informed to be actually living in Russia. As
already mentioned, in total the survey involved 124 participants from 26 countries located
on 4 continents.

Part I. Theoretical framework
73
Fig 1. Respondents’ current countries of residence
(the vertical axis represents the number of respondents)
Q.5: Are you a member of any translators' association? (if yes - please specify which one)
The point of our next question was to inquire if the respondents have membership in
any translators' associations or federations and to specify their responses (Table 4):
Answer options Response Percent (round-off) Response count
yes 37% 40
no 63% 84
Table 4. Respondents’ memberships to translators’ associations/federations
Among the mentioned professional unions of translators there were: SFT (France),
BDÜ and ADÜ Nord (Germany), ABRATES (Brazil), ATA (USA), CIOL (UK), ITIA
(Ireland), STF and NFF (Norway), SKTL (Finland), APTIC and ANETI (Spain), ITA
(Italy), ITA (Israel), SATI and TINSA (South Africa), as well as internationally
functioning the European Language Industry Association (ELIA) and the International
Association of Professional Translators and Interpreters (IAPTI).
On the whole 37% of respondents answered positively to this question, while 63%
responded negatively or abstained, which we interpreted as a ‘no’ (Table 4). These data
can be explained by post-editors’ broad geography and the fact that the majority of them
are freelancers, while the LSP(s) they work for might be a member of translators
federation/association or like. This conclusion is drawn from the fact that among our key

Part I. Theoretical framework
74
partners in questionnaires distribution there was the International Federation of
Translators, and yet none of the respondents mentioned IFT membership, since, most
probably, they were contacted directly by the LSPs which are IFT members.
Q.6: What is (are) your working language pair(s) for PE projects?
The next question concerning respondents’ professional background sheds light on
their working language pair(s). There were no predetermined responses to this question
due to the global focus of the questionnaire. As it turned out, 48% of respondents opted for
one source language and one target language when describing their assignments; 23%
translate from more than one source language into one target language; 19% translate from
one source language into more than one target language, and 10% translate from more than
one source language to more than one target language (Table 5):
Working languages Response Percent (round-off) Response count
1 SL → 1 TL 48% 54
> 1 SL → 1 TL 23% 29
1 SL → > 1 TL 19% 25
> 1 SL → > 1 TL 10% 16
Table 5. Correlation of SL(s) and TL(s)
As a follow-up, the next two graphs represent the mentioned source and target
languages in the alphabetical order. The survey participants were free to mention any
language pair(s) that corresponded to their professional scope and, logically, many of them
opted for more than one source and/or target language, which resulted in selecting multiple
options by about 52% of the participants. For this reason, we do not provide percentage
value for source/target languages as the number of counts largely exceeds the number of
respondents. Instead, above each column representing a language there is a digit that
corresponds to the relevant number of the participants, translating to/from it on a daily
basis.
The pool of source languages was made of Afrikaans, Catalan, Czech, English,
French, German, Greek, Hebrew, Italian, Japanese, Norwegian, Russian, Serbian, Slovak,

Part I. Theoretical framework
75
Spanish, Swedish and Yiddish (17 languages in total), as summarized in Figure 2. This
piece of data shows that in the framework of our survey the most popular source languages
for PE projects are English (55 responses), followed by German (22 responses) and
Spanish (17 responses).
Figure 2. Respondents’ source languages for PE projects
(the vertical axis represents the number of respondents)
As for the target languages, the participants mentioned the total of 26 (Brazilian
Portuguese, Catalan, Chinese, Czech, Danish, Dutch, English, Finnish, French, German,
Greek, Hebrew, Hungarian, Italian, Latvian, Lithuanian, Persian, Polish, Portuguese,
Russian, Serbian, Slovak, Spanish, Swedish, Ukrainian and Yiddish). The obtained
breakdown on responses relevant for our survey (Figure 3) reveals the popularity of target
languages with 21 responses for English, 17 for French, 16 for Spanish, and 15 for
German.
Figure 3. Respondents’ target languages for PE projects
(the vertical axis represents the number of respondents)

Part I. Theoretical framework
76
Q.7: Please indicate your academic background (graduate and postgraduate studies -
please specify your major, academic institution and graduation year)
It is a common knowledge that those involved in post-editing are mostly linguists
with an academic background, and the prevailing amount of their professional workflow
consists of translation and post-editing jobs. It is also true that those who do not have a
special degree in translation-related programs for a number of reasons including the ones
beyond their control, also opt for careers in translation. Quiet reasonably some sectors of
industry would rather turn to a post-editor who, apart from linguistic competence is an
expert in other fields relevant for each particular project, it is important to get an updated
picture on the profile of professionals engaged in PE. In this concern, we decided to focus
our interest on the respondents’ specializations, graduate and postgraduate studies and to
ask them to specify their major(s) and the year of graduation from the relevant academic
institution. No predefined answer boxes were provided since the researcher fully
understood the probable variety and unpredictability of the participants’ backgrounds due
to a number of reasons. As aforementioned, not all those engaged in translation industry
have a degree in Translation: lots of translators are coming from adjacent (e.g. Modern
languages, Philology, etc.) or rather remote majors (e.g. Science, Legal studies, etc.). What
is more, it is becoming common that the need for lifelong personal and professional
development results in constant updating of skills and competencies by means of
specialized and/or postgraduate courses, which adds to the probability of a good variety of
responses to this question.
As expected, the data on participants’ academic backgrounds turned out to be very
diverse and broad-ranging, as some respondents reported to have done two or more degrees
within the time limit of 5 to 40 years. To be able to order and classify the answers it was
decided to split the obtained results into four basic categories in conformity with the major
specialization that resulted in Bachelor or Master degree (or equivalent) and was
mentioned as the first completed academic course (for this reason we paid attention to the
specified year of graduation). On the one hand, such generalization is due to different
geographical locations of the respondents and, consequently, different educational systems
and qualifications; on the other hand, the age composition of the participants (22-77 y.o.)
implies that younger respondents might consider to start and/or complete additional
specialized and/or post-graduate courses in the upcoming years so that their educational

Part I. Theoretical framework
77
portfolio might grow in future. Answers to this question provided us with the general cut-
off of educational and professional inclinations and interests of those involved in MTPE
industry, although such research technique does not pretend to be extensive.
The ‘graduation year’ criterion was included into the question for informational
purposes, i.e. to illustrate the variety of profiles of our respondents, while the major aim of
the question was to generalize academic tendencies among post-editors. Closer inspection
of obtained data reveals that the respondents indicated a vast area of graduation years,
starting with the mid-1960s and till the present day. To mention but a few, Respondent 22
reported to have graduated from the University of Pennsylvania with the major in English
Literature in 1964, Respondent 71 was awarded the MA in Translation from the French
University of Massachusetts in 1970, and Respondents 17 and 129 both graduated in 1976
with the BSc degree in Agriculture from the University of Salford and the MA degree in
Applied Linguistics by the University of Warsaw respectively. On the other hand, as we
have seen in the previous question, 25% of all survey participants are aged between 22 and
32, which explains relatively recent graduation years of many of them, for instance
Respondents 66 and 67 (MA in Scientific and Technical Translation, Haute Alsace
University) or Respondent 96 (BA in Translation and Interpretation, Comenius University,
Slovakia) who all graduated in 2015-2016.
Table 6 gives an overview of respondents’ initial academic background. In
conformity with the above-mentioned selection criteria, the category “Translation” was
made of those who completed translation-related majors (BA, MA or their equivalents) as
their first university qualification (55%). This category united 68 respondents from
Germany (the University of Hildesheim, Munich Institute of Languages and Translation),
Ireland (Dublin City University), the Netherlands (Zuyd University of Applied Sciences),
Spain (University of Barcelona, University of Salamanca, Autonomous University of
Barcelona, University of Vic), Chile (UCINF University), Uruguay (University of the
Republic of Uruguay), France (Jean-Moulin University, Grenoble Alpes University, Haute
Alsace University), Austria (University of Vienna), Portugal (Catholic University of
Lisbon), Greece (Ionian University, National University of Athens), the USA (University
of Washington, University of Massachusetts), the UK (University of Exeter, Queen Mary
University of London), Japan (University of Osaka), Slovakia (Comenius University),
Israel (Hebrew University of Jerusalem) and Italy (SSML Carlo Bo, University of Genoa)

Part I. Theoretical framework
78
who all reported to have completed degrees in such fields as Translation, Translation
Studies, Specialized Translation, Translation and Interpreting, Translation and New
Technologies, etc.
The category “Philology/Linguistics” was designed for those respondents who did
not mention any translation-related majors, but reported to have been awarded their first
university qualification (BA, MA or their equivalents) in such disciplines as Linguistics,
Modern Languages, Language and Literature, Applied Linguistics, Philology,
Scandinavian Studies etc. (22%). This category included graduates from University of
Turin (Italy), University of Clermont-Ferrand (France), University of Frankfurt (Germany),
University of Warsaw (Poland), University of Alcalá (Spain), University College of
Southeast Norway (Norway), University of Pennsylvania and Harvard University (USA),
Hebrew University of Jerusalem (Israel), Moscow State Pedagogical University (Russia),
Lithuanian University of Educational Sciences (Lithuania), and others.
A group of 12 respondents (10%) reported to have completed their initial academic
training in the domain of Natural and Exact Sciences, so one more sub-category was
designed for these purposes. Among the degrees that our respondents mentioned as their
first qualification, there were Industrial Maintenance, Electronic Engineering, Production
Engineering, Chemistry, Physics, Agriculture etc. The universities that awarded such
degrees were Weizmann Institute of Science and Tel-Aviv University (Israel), the City of
London University and University of Salford (UK), Andrés Bello Catholic University
(Venezuela), Leningrad Polytechnic Institute (Russia), and others.
The last sub-category was destined for those respondents whose initial academic
experience did not fully correspond either to “Philology/Linguistics” or to “Natural and
Exact Sciences”. This category was titled “Social Sciences” and united 13% of respondents
(16 participants) who have completed their academic training in the disciplines that either
belong to the field of Humanities (e.g. Law or History), or involve rigorous Science-related
subjects (e.g. Business Administration or Financial Journalism). Those participants who
reported to have completed this kind of studies were from Israel (Tel-Aviv University),
France (Marc Bloch University), Russia (Moscow State University, Kazan Innovative
University), Saudi Arabia (King Faisal University) and the USA (University of Taxes).

Part I. Theoretical framework
79
Approximate
answer categories
Response percent (round-off) Response
count
Translation/Interpretation 55% 68
Philology/Linguistics 22% 28
Social Sciences 13% 16
Natural and Exact Sciences 10% 12
Table 6. Respondents’ academic backgrounds
To further zoom in on academic tendencies among those post-editors who completed
education in different major fields a more detailed breakdown on multi-vector
combinations of academic degrees was needed. For example, Respondent 51 graduated as
Industrial Engineer from UCAB (Venezuela) in 1975, and complemented that degree with
specialization in French-to-Spanish Legal Translation in 2006; Respondent 90 graduated in
Geography from Tel-Aviv University in 1994 and in 2009 got a diploma in Translation
from Beit Berl College; Respondent 101 reported to have graduated from Moscow State
Technical University with the major in Space Engineering in 1992 and then completed the
Degree in Business Studies at the American Institute of Business and Economics
(Moscow, 1997); Respondent 108 was awarded a Diploma in Engineering (France), got a
Ph.D. in Chemistry (USA) and a Certificate in Specialized Translation (France), although
unfortunately s/he did not mention either the institution or the year of graduation. For the
sake of discussion, it should be mentioned that such cases of ‘a wide range of interests’
were rather scarce and lie beyond the scope of this research.
Q. 8: Years of experience in translation
Q.9: Years of experience in PE
In the next two questions, we inquired about respondents’ experience (in years) in
the field of translation and post-editing. It is a common knowledge that those involved in
post-editing are mostly translators who combine and complement their workflow with
translation and post-editing jobs. Yet, this time the focus of our interest was on the number
of years the respondents have worked in the relevant fields, with the aim to compare the
data and find out the general tendencies in the labor market. For the sake of

Part I. Theoretical framework
80
demonstrativeness and after analysis of the available data we decided to group the
respondents’ experience into the categories with 3-year margin. In this way, five categories
of experience were created: from 1 to 3 years, from 4 to 6 years, from 7 to 9 years, from 10
to 12 years and for all those who have been in translation/post-editing for more than 12
years. The obtained results support our previous findings regarding the relative novelty of
PE-related activities and provide a deeper insight into the correlation of translation vs.
post-editing jobs performed by the respondents, specifying their experience for each
category. As can be seen in Table 7, the category ‘≤ 3 years of experience’ yielded 9% of
responses for translation and 47% for post-editing; the category ‘4-6 years of experience’
got 21% of responses for translation and 28% for post-editing; 26% of respondents
selected the category ‘7-9 years of experience’ to illustrate their experience in translation,
while only 16% did so in concern with PE; the category ‘10-12 years of experience’
yielded 26% of responses for translation and 6% for post-editing; finally, the category ‘≥
12 years of experience’ yielded 18% of responses for translation and 3% for post-editing.
Options Translation Post-editing
Response
percent
(round-off)
Response
count
Response
percent
(round-off)
Response
count
≤ 3 years 9% 11 47% 58
4-6 years 21% 26 28% 35
7-9 years 26% 32 13% 16
10-12 years 26% 32 7% 9
≥ 12 years 18% 23 5% 6
Table 7. Respondents’ experience in translation/post-editing
Using the obtained information we graphically represented the changing tendencies
regarding respondents’ experience in the fields of translation and PE (Figure 4). As can be
seen, experience in translation is prone to grow in line with the age of the informants, yet
the tendency characterizing PE experience is more heterogeneous. To inquire whether the
correlation between the years of translation experience and years of post-editing
experience is statistically significant, the distribution of discrete quantitative values in this

Part I. Theoretical framework
81
dataset was defined as non-parametric, and Spearman’s rank-order correlation coefficient
was tested. The results yielded by the test equaled 0,5467 (i.e., ≥ 0,5), which suggests a
positive correlation between both subsets of data. Even so, it is worth mentioning that
despite the availability of MTPE-related modules in the training programs of the last
decade, younger participants did not demonstrate a tendency to be more involved in PE
than older participants. Another particular feature of the cross-section of the linguists
involved in PE is that their experience in PE was less or on seldom occasions equaled the
number of years dedicated to translation. On the basis of the above, it might be possible to
speculate that as of today linguists do not feel like renouncing on translation assignments
for the sake of MTPE-related projects, the finding that is important to consider when
drafting translation training programs.
Figure 4: Correlation of years of experience in translation and post-editing
(the vertical axis represents the respondents)
Q.10: How often do you perform the following tasks in your professional activity?
Having clarified the profiles of survey participants and the general tendencies
regarding their PE experience we moved on to the next question on regularity of most
typical tasks associated with post-editors’ professional experience. The respondents were
asked to indicate the frequency of such activities as, e.g., translation, post-editing,
revision/proofreading or projects management (the relevant details are provided in Table

Part I. Theoretical framework
82
8). It seems that the most common practice for the majority of routines includes translation,
revision and proofreading on a daily basis. At least 20 participants selected each of the
offered Likert scale values to describe the frequency with which they perform PE jobs,
while revision and proofreading of post-edited materials turned out to be less frequent
activities. Project management of both translation and PE projects was reported as the least
frequent activity by nearly half of all respondents.
Answer options never/very
seldom sometimes often
very often/
always
Response
count
Translation 8 17 31 68 124
Revision / proofreading
of translated jobs 18 39 27 40 124
Translation projects
management 66 26 15 17 124
Full / light PE 22 39 34 29 124
Revision / proofreading
of PE jobs 37 47 20 20 124
PE projects
management 82 21 9 12 124
Table 8. Regularity of translation/PE-related tasks in the respondents’ workflow
The comments to this question suggest that among other activities to complement
their workflow survey participants are also engaged in creation of glossaries and style
guidelines, simultaneous and consecutive interpreting, design of original bilingual corpus,
management of reference material, quality management, language and translation training,
teaching, terminology extraction (Informants 39 and 72).
Q. 11. What is your average PE productivity (words per hour and/or words per day)?
The questionnaire also inquired about the average PE productivity of the respondents
as defined in terms of words per hour and/or words per day. We fully understand that the
issue of average post-editing speed is rather premature since so far this parameter hugely
depends on the combination of different factors, such as the quality of the raw MT output,
the domain, source and target languages, quality expectations, etc. Nevertheless,
investigation of these data can serve as a starting point for discussion on the average PE
speed definition and will be of use for future research. As Table 9 shows, the relative

Part I. Theoretical framework
83
majority of respondents opted for the average PE speed of 500 - 700 WPH / 4 000 - 5 500
WPD (23% of the sample).
Answer options Response Percent
(round-off)
Response count
less than 300 WPH / 2 500 WPD 14% 17
300 - 500 WPH / 2 500 - 4 000 WPD 19% 24
500 - 700 WPH / 4 000 - 5 500 WPD 23% 29
700 - 900 WPH / 5 500 - 7 000 WPD 19% 24
900 - 1000 WPH / 7 000 - 8 500 WPD 18% 22
more than 1000 WPH / 8 500 WPD 7% 8
Table 9. Respondents’ average productivity for PE projects
These results prove that although so far there seems to be no absolute advantage of
PE speed as perceived by the respondents over ‘human translation’ speed (the average of
300 - 500 WPH / 2 500 - 4 000 WPD), yet there is an expanding tendency of PE being
more productive.
Q.12: What are your PE rates based on?
The next question concerned the metrics used to decide on PE rates. The respondents
had to choose from the most typical options, namely: number of TT or ST words, number
of edits, hourly or daily rate. A free text-box was also provided for any relevant comments.
Closer inspection of the data (Table 10) show the metrics ‘number of ST words’ and
‘hourly/daily rate’ got a relatively even distribution among four available categories, while
the metrics ‘number of TT words’ shows a tendency towards being used ‘sometimes’ (as
reported by 29 informants) and ‘never/very seldom’ (as reported by 54 informants). The
distribution of choices for the metric ‘number of edits’ suggests its relevant unpopularity,
since more than the half of respondents (81 out of 124) said they ‘never/very seldom’
apply it.

Part I. Theoretical framework
84
Answer options never/
very seldom
someti
mes often
very often/
always
Response
count
number of TT words 54 29 23 18 124
number of ST words 32 27 37 28 124
hourly/daily rate 28 34 37 25 124
number of edits 81 23 11 9 124
Table 10. PE rates metrics
The survey participants also provided additional comments in the free-text field to
give more explanations on how PE rates are calculated: Informant 83 confessed to be using
the number of characters (including the blanks) as metrics, although did not precise if it
was applicable for the source or target text; Informant 111 did not apply any rates and
worked as an internal employee for a translation agency; Informants 104 and 117 said that
their metrics were often based on Blue/TER scores and peer reviews.
Q.13: Out of all your PE projects, what percentage do manual PE jobs account for
and what percentage do semi-automatic PE jobs account for?
To further examine PE trends we focused our attention on manual PE jobs as
opposed to semi-automatic PE jobs performed by the respondents. Manual PE was
reported by 42 participants as the most frequent option for PE workflow (happening in
>90% of all PE projects); while the opposite scale value (<10% of all PE projects) quite
logically was ticket by 53 respondents to describe the frequency of semi-automatic PE
projects. A more detailed breakdown of values can be seen in Table 11:
Answer options <10% 10%-
30%
30%-
50%
50%-
70%
70%-
90% >90%
Response
count
manual PE jobs 20 11 16 20 15 42 124
semi-automatic
PE jobs 53 18 13 15 13 12 124
Table 11. Correlation between manual PE jobs and semi-automatic PE jobs
Q.14: Out of all your PE projects, what percentage do full PE jobs account for and what
percentage do light PE jobs account for?
Similar tendencies were traced in the next question which focused on the percentage
of full vs. light PE jobs performed by survey participants. The analysis of available data

Part I. Theoretical framework
85
reveals that the relative majority (52 participants) admitted to be performing light PE in
>10% of projects. As shown in Table 12, the prevailing tendency of performing mostly full
PE jobs was reported by 25 participants who said 70%-90% of their projects are full PE,
and 39 participants who believe that >90% of their workflow consists of full PE tasks:
Answer options <10% 10%-
30%
30%-
50%
50%-
70%
70%-
90% >90%
Response
count
Full PE jobs 15 16 17 12 25 39 124
Light PE jobs 52 23 10 15 11 13 124
Table 12. Correlation between full and light PE jobs
Q.15: Which fields do you provide PE for?
The point of the question was to find out information about subject domains that are
common for MTPE projects. For this reason, the respondents were asked to indicate the
frequency with which they perform projects that belong to different fields of specialization.
The count of these responses goes beyond 124 units since each respondent was free to
choose multiple subject-fields, as such no percentage values are provided at this point
(Table 13). Having combined the results for ‘often’ and ‘very often/always’ sub-categories
we see that the major industry sector that employs MTPE turns out to be
IT/Software/Websites/E-commerce (the total of 47 participants), followed by Social
Sciences and Heavy Industry/Engineering (the total of 40 and 42 participants respectively).
The highest values for ‘never/very seldom’ sub-category indicate that MTPE model was
used the least in such sectors as Real Estate/Construction, Economics/Finance and Natural
Sciences (79, 71 and 74 participants respectively).
Answer options never/
very seldom
someti
mes often
very often/
always
Response
count
Real estate/Construction 79 27 11 7 124
Economics/Finance 71 27 17 9 124
Law 58 34 18 14 124
Advertising/Marketing 52 38 20 14 124
Tourism/Entertainment 58 33 19 14 124
IT/Software/Websites/E-
commerce 53 24 18 29 124

Part I. Theoretical framework
86
Health/Medicine 55 36 17 16 124
Heavy Industry/Engineering 67 15 25 17 124
Natural Sciences 74 24 10 16 124
Social Sciences 57 27 19 21 124
Table 13. Correlation between regularity of PE task in different subject fields
The comments box provided examples of other subject fields for PE projects,
among which the respondents mentioned special/higher education materials and online
blogs with articles and advice on life ‘hacks’ (Informants 35, 78 and 81).
Q.16: Out of all your PE projects, what percentages do the following content types account
for?
To find out the proportion between post-editing done for documents with restricted
access (e.g. annual reports, company turnover, etc.), on the one hand, and publicly
available documents (e.g. FAQs, user manuals, on-line help, etc.), on the other, the
respondents were asked about the percentage each of these content types accounts for. The
well-defined tendency demonstrated by 55 answers showed that less than 10% of PE
projects contained low-visibility content. As for high-visibility content, 22 and 43
respondents said they deal with it in 70%-90% and more than 90% of projects respectively,
thus demonstrating a relative prevalence of this content type for commissioning PE (Table
14):
Answer options <10% 10%-30% 30%-50% 50%-
70%
70%-
90% >90%
Resp.
count
Documents with
restricted access (low-
visibility content)
55 26 14 14 12 3 124
Publicly available
documents (high-
visibility content,)
22 10 12 15 22 43 124
Table 14. Correlation between high-visibility and low-visibility content for PE
3.2.2. Block 2: MTPE workflow
This subset of questions aimed at the description of the respondents’ workflow in
terms of tasks, tools, systems, and reference materials employed in the course of PE.

Part I. Theoretical framework
87
Q.17: When starting a PE project, you ...
At first, the respondents indicated the most typical ways to prepare for a PE project
(Table 15 provides the breakdown of the responses):
Answer options
never/
hardly
ever
some-
times often
almost
always/
always
Resp.
count
do (semi)-automatic pre-editing of MT input
(e.g. with controlled language rules or spell-
check)
60 27 18 19 124
do (semi)-automatic post-editing (e.g. search-
replace operations) 24 62 25 13 124
evaluate raw output to determine whether it
should be post-edited or translated from
scratch
24 48 29 23 124
use tools to extract terminology and manage
terminological databases and TM(s) 70 34 13 7 124
report to your IT team about the most
recurrent errors in raw MT output 67 30 15 12 124
report to your IT team about the most
recurrent errors in source content 78 25 15 6 124
Table 15. Starting point(s) of PE projects
Somewhat surprisingly the categories ‘never/hardly ever’ were marked by sub-
groups of at least 60 participants for such answer options as (semi)-automatic pre-editing
of MT input (e.g. with controlled language rules or spell-check), usage of terminology
extraction tools, terminological databases, translation memories management, providing
feedback to IT team(s) on recurrent errors with MT output and/or source content.
However, the scenarios of (semi)-automatic post-editing and raw output evaluation showed
higher values for being used ‘sometimes’ (as selected by 62 and 48 participants
accordingly), the results that were reinforced by 25 and 29 respondents who stated that the
aforementioned preparation procedures ‘often’ happen in their PE workflow. Informant
105 who translates into Lithuanian remarked that since the target language is characterized
by a lot of flexions and multiple grammar cases, automatic PE only made sense if special
algorithms for search-replace operations are created for each particular MT output file.
Informant 111 regularly performed online searches to verify content, such as dates, places,
names mentioned in the output, and Informant 109 made use of DRAE (Diccionario de la

Part I. Theoretical framework
88
Real Academia Española) to clarify specific word usage in relation to structural context
when translating to English, describing this resource as ‘invaluable’.
Q.18: What is the starting point of your PE tasks?
As a follow-up, the participants were asked to share the details regarding the starting
point of a PE job: we were interested in how frequently such resources as source text
file(s), raw MT output file(s), previous TM(s) or access to MT engine appear in the regular
workflow. Table 16 demonstrates that the most common way to start a PE assignment is
when post-editors get source text file(s) and file(s) with raw MT output (54 respondents
marked this option as ‘almost always/always’ and 35 as ‘often’, which makes 89 answers
in total). The scenario when post-editors are provided with a source text file(s) and a TM(s)
fed with a mix of raw MT segments, previously translated segments and/or post-edited
segments (otherwise called ‘segments of specified origin’) was the one which the total of
74 participants defined as happening ‘often’ and ‘almost always/always’ (25 and 49
answers respectively), the fact that indicates high probability of this solution. A
considerable number of the participants gave ‘never/hardly ever’ as their answer to the
options when post-editors get an ST file and access to an MT engine and/or an ST file and
a TM fed with raw MT segments. The least popular scenario was to provide post-editors
with an ST file and a TM with segments of unspecified origin, as confirmed by the group
of 75 participants who chose ‘never/hardly ever’ as their answer.
Answer options never/
hardly ever
some-
times often
almost
always/
always
Resp.
count
You get a ST file and access to an MT
engine 64 25 16 19 124
You get a ST file and raw MT output 9 26 35 54 124
You get a ST file and a TM fed with
raw MT segments 62 31 17 14 124
You get a ST file and a TM with
segments of specified origin 24 26 25 49 124
You get a ST file and a TM with
segments of unspecified origin 75 22 17 10 124
Table 16. Frequency of PE tasks starting points

Part I. Theoretical framework
89
Q.19: What percentage of your PE projects involve the use of following tools/systems?
To continue, tools and systems used in MTPE workflow were investigated (Table
17). Quite surprisingly it turned out that 85 respondents use specialized PE tools (e.g. PET,
DQF, etc.) in less than 10% of projects; the same is true for 64 respondents who reported
to be using complementary tools (e.g. quality control tools, archive managers, etc) in the
same percent of projects. No strong tendencies were observed from the data yielded in the
remaining two categories: TM systems (SDL Trados, MemoQ, etc.) and generic tools
(Word, Excel, plain text, etc). But if we compare the maximal and minimal value of both
answer options, it becomes evident that 40 respondents said they used TM systems in more
than 90% of projects as opposed to almost two times fewer number of the participants who
said to be using TM systems in less than 10% of projects. As for generic tools, the equal
number of the participants reported to be using them in more than 90% and less than 10%
of projects (38 participants in each group), although 23 participants stated to be using such
tools in 70%-90% of projects, which suggests its relative popularity among other PE-
related environments.
Answer options <10% 10%-
30%
30%-
50%
50%-
70%
70%-
90% > 90%
Response
count
PE environment 85 19 4 5 5 6 124
TM systems 21 15 16 13 19 40 124
Generic tools 38 9 5 11 23 38 124
Complementary tools 64 13 17 3 10 17 124
Table 17. Frequency of usage of PE tools and systems
The comments provided by the survey participants in the free-text field give a closer
look at PE scenarios: Informant 103 remarked that both source and raw MT outputs are
usually provided in a bilingual Word document, while Informant 42 said that the PE jobs
start with an ST available as a PDF or Word document, so that s/he could maintain the
original design of the document a PE is complete.
Q.20: What percentage of your PE projects include the following materials?
The last question of this block focused on what reference materials post-editors are
provided with when working on a PE project and how often this is the case (Table 18). In
general, the prevailing majority of respondents admitted they get project specifications
(scope of work, expected quality level, delivery dates, required tools, formatting, etc.) in

Part I. Theoretical framework
90
70%-90% and more than 90% of cases (groups of 25 and 53 individuals accordingly). The
category ‘Information about source content that deals on the subject field, audience,
purpose, etc.’ got no salient values apart from 10%-30% of projects marked by 39
respondents. In all other categories (e.g., Linguistic guidelines with generic requirements
of target content regarding terminology, semantic accuracy, lexical cohesion, spelling, etc.,
LSP and Client style guides, TMs, terminology databases) the tendency was focused
rather on the minimal values of the scale (less than 10%). We see it particularly interesting
that in the framework of our survey 75 respondents reported to be provided with PE
guidelines containing instructions on and examples of editing raw MT output errors in less
than 10% of projects, which confirms the conviction on insufficient work being done in the
field of standardization of PE processes and tasks.
Answer options <10% 10%-
30%
30%-
50%
50%-
70%
70%-
90% >90%
Resp.
count
Project specifications 18 9 11 8 25 53 124
Information about
source content 17 39 15 17 18 18 124
Linguistic guidelines 37 16 13 23 14 21 124
LSP style guide with
specific requirements
of target content
51 20 8 15 13 17 124
Client style guide with
specific requirements
of target content
42 21 17 15 13 16 124
PE guidelines 75 10 13 6 10 10 124
Terminology database
and/or glossary 36 17 16 20 15 20 124
Translation memory 41 22 14 10 11 26 124
Other reference
materials (parallel texts,
websites, etc.)
33 19 21 25 13 13 124
Table 18. Frequency of usage of references for PE
3.2.3. Block 3: Expertise and decision-making in PE
Decision-making and the scope of PE expertise have been in the focus of many
research studies and reports, yet this subject is far from being explored in full. To this end,
we decided to ask our respondents about their views on these issues.

Part I. Theoretical framework
91
Q. 21: You decide to edit a particular segment of a particular PE task ...
At first, the survey participants were suggested to decide on the frequency of a wide
range of decision-making ‘triggers’, for instance, fluency issues in documents with public
or restricted access, time constraints, availability of automatized operations, etc. (Table
19). The obtained results show that the large number of post-editors almost always/always
edit segments in case of fluency issues in high-visibility documents with public access (57
individuals) and if inconsistency with expressed quality expectations is spotted (52
individuals). The frequency category ‘often’ was foremost chosen for fluency issues in
low-visibility documents with restricted access (47 respondents), the so-called ‘two (or
five) seconds rule’ (39 respondents) and contradiction to particular comments/feedback
from previous PE tasks (37 respondents). The option ‘inability to fix the issue through
(semi-)automatic operation(s)’ did not show any conspicuous tendencies, and time
constraints were categorized as the reason that ‘sometimes’ influences decision-making by
the relevant majority of 50 participants. Project quote/rates turned out to be the only option
that showed the tendency to ‘never/hardly ever’ influence PE processes (52 respondents).
Answer options never/
hardly ever
some-
times often
almost
always/
always
Resp.
count
if there is a fluency issue in a low-
visibility document 19 28 57 20 124
if there is a fluency issue in a high-
visibility document 17 16 24 67 124
if you exceed the "three seconds
rule" (if it took you more than
two/five seconds to get the gist of
the segment)
19 26 49 30 124
if you are unable to fix the issue
through (semi-)automatic
operation(s)
29 31 30 34 124
in accordance with the time
available until the project deadline 25 50 24 25 124
in accordance with quality
expectations as expressed in
guidelines/style guides/reference
materials
17 25 24 58 124
in accordance with particular
comments/feedback from your
previous PE tasks
22 19 47 36 124
if the rates/project quote are high
enough 52 26 23 23 124
Table 19. Decision-making in PE

Part I. Theoretical framework
92
When sharing their comments, Informant 63 mentioned to be focusing mostly on
fixing grammar, syntax and meaning issues; Informant 106 provided a curious argument
about decision-making driven by “Desire to provide high-quality a.k.a pride in what I do
and the way I do it”; Informant 117 said that clients and project managers hardly ever
expect inferior quality of a PE project (as compared to human translation) and for
Informant 119 sentence length, register, thesaurus, syntax and accuracy were reported to be
equally important.
Q. 22: Specify the relevance of the following skills/abilities for the successful completion of
a PE task
Zooming in on the issues of cognitive effort in PE we then asked the participants to
provide their vision of correlation between successful completion of a PE task on the one
hand, and relevance of particular PE competences (e.g. knowledge of basic programming
or ability to abstain from over-/under-editing) for such outcome, on the other. The vast
majority of respondents attributed the value of ‘very important’ to the ability to make
decisions quickly on whether MT output is editable (85 participants), ability to produce
‘good-enough/fit-for-purpose’ PE output and ability to abstain from over-/under-editing
(75 participants for each answer option). A smaller group of respondents classified the
knowledge of typical MT errors, ability to focus on those issues that are specified in PE
instructions and positive attitude towards MTPE as ‘very important’ (69, 68 and 63
participants respectively); moreover, these answer options got substantial support and the
value ‘moderately important’ from groups of 35, 38 and 33 participants accordingly.
Knowledge of types of MT engines, their functional principles and shortcomings were
characterized as ‘moderately important’ by 56 participants, which is also a noteworthy
result. Alternatively, such competency as knowledge of (basic) programming was
classified as ‘irrelevant’ by 66 respondents and ‘somewhat important’ by 36 respondents;
the latter value was also picked by 48 respondents when defining the importance of
knowledge of text-processing operations. The calculations of all values for available
answer options can be seen in Table 20. Alternatively, Informant 13 stated that “when it
comes to Full PE, it seems to me that none of these factors is very important; they are only
important for light PE”, while Informant 40 expressed a conviction that ability to adapt
language terms to be appropriate for target audience and geographical location as well as

Part I. Theoretical framework
93
being flexible and conscious about different word usages with variable meanings across
different populations are among the crucial PE competences to be employed on daily basis.
Answer options irrelevant somewhat
important
moderately
important
very
important
Resp.
count
knowledge of types of MT engines,
their functional principles and
shortcomings
7 30 56 31 124
knowledge of typical MT errors 2 18 35 69 124
knowledge of (basic) programming 66 36 12 10 124
knowledge of text-processing
operations 15 48 36 25 124
ability to focus on those issues that
are specified in PE instructions 2 16 38 68 124
ability to make decisions quickly on
whether MT output is editable 4 10 25 85 124
ability to produce “good-
enough”/”fit-for-purpose” PE
output
3 15 31 75 124
ability to abstain from over-/under-
editing 0 9 40 75 124
positive attitude towards MTPE 8 18 33 65 124
Table 20. Relevance of PE competences
3.2.4. Block 4: Post-editors’ vs. translators’ performance
The final block of the questionnaire was dedicated to eliciting respondents’ opinions
on correlations between the tasks of (human) translation as opposed to post-editing with
the objective to clarify the picture of the current state of play.
Q.23: Give your opinion on the level of competence of POST-EDITORS vs.
TRANSLATORS by filling in the gaps with: (1) HIGHER THAN (2) EQUAL TO (3)
LOWER THAN
First, the scope of competences was compared between those who perform
translation and/or post-editing tasks: the participants were required to describe knowledge
and skills employed in post-editing (e.g. source-to-target meaning transfer, knowledge and
use of rules and norms of source/target languages, subject-matter, etc.) as ‘higher than’,
‘equal to’ or ‘lower than’ the knowledge and skills required for translation. Table 21

Part I. Theoretical framework
94
summarizes the strong tendency of evaluating both PE and translation as professional
activities that require an equal level of competences from those involved:
Answer options 1 2 3 Response
count
On average, post-editors' competence in translation
skills (SL-to-TL meaning transfer, justification of
translation choices, etc.) is ... translators' expertise
28 72 24 124
On average, post-editors' linguistic and textual
competence (knowledge and use of rules and norms of a
SL/TL) is ... translators' competence
29 73 22 124
On average, post-editors' research and information-
processing competence is ... translators' competence 22 64 38 124
On average, post-editors' SL/TL cultural competence is
... translators' competence 17 80 27 124
On average, post-editors' subject-matter/domain-related
competence is ... translators' competence 22 73 29 124
On average, post-editors' technical/instrumental
competence is ... translators' competence 21 75 28 124
Table 21. Comparison of competencies (post-editing vs. translation)
The comments made in this respect confirm our data: it seemed to Informant 59 that
currently “only translators take on post-editing tasks” and Informant 96 assumed “the same
people are doing both translation and PE, I don't know anyone who is doing only PE”.
Q.24: Give your opinion on PE vs translation (from scratch/using a TM) by filling in
the gaps with: (1) BETTER THAN (2) THE SAME AS (3) WORSE THAN
The penultimate question aimed to get feedback on respondents’ satisfaction levels
regarding quality, productivity, profitability of and professional demand for post-editors if
compared to translators. As reported in Table 22, the large constituency of the participants
classified PE as ‘worse than translation’ for the general category ‘PE output quality’ (69
participants) and the specific category ‘PE output fluency’ (77 participants). The prevailing
majority of 64 participants ticked ‘equal’ as their answer to the specific question regarding
PE vs. translation output adequacy. Profitability of PE and professional demand for post-
editors were also classified as equal to translation-related counterparts by 68 and 66
participants respectively. The only category that demonstrated the prevalence of ‘better
than’ values was that of productivity in PE, as this option was chosen by 68 respondents.

Part I. Theoretical framework
95
Answer options 1 2 3 Response
count
On average, PE output quality is ... translation output
quality 24 31 69 124
On average, PE output adequacy (accuracy of meaning
transfer) is ... translation output adequacy 18 64 42 124
On average, PE output fluency (naturalness and
comprehensibility) is ... translation output fluency 24 23 77 124
On average, my productivity in words for PE tasks is ...
for translation tasks 68 34 22 124
On average, the profitability of PE is ... the profitability
of Translation 28 68 28 124
Professional demand for post-editors is ... professional
demand for translators 21 66 37 124
Table 22. Post-editors’ satisfaction levels
In the end, the participants were invited to fill in a free text field with any
information they considered relevant to the recently filled-in questionnaire. The data
provided by the informants concerned such aspects of PE practices as life-long learning: “I
try to do a MTPE 1-2 times a year to see the development and not to remain behind the
progress. By now, the MT has no sense for Lithuanian, because a very comprehensive PE
is needed to make a text understandable (not fluent or human-like). The best choice for
Lithuanian is still the human translation, if the text should be made for the reader, not for
statistics” (Informant 105); the scope of PE competence: “My opinion is that all post-
editors should have more competence than translators, but this is not always the case. I
answered the questions accordingly to my experience, but this is not how I think it should
be” (Informant 68) and “I think that a successful post-editor needs to be a specialist in a
certain field of science/economy, etc. in addition to his/her excellence in a given language
pair” (Informant 83); and comments on the answers to the questionnaire: “The accuracy of
the answers are very dependent on the type of text to post-edit: I generally considered my
light PE work” (Informant 88), “Regarding question #22, PE productivity and profitability
are only better than that of translation as long as the PE output is not poor. I only accept PE
tasks where the quality of the output is not poor, but unfortunately, this doesn't happen
very often” (Informant 89). This information provides us with a deeper insight into the
nature of post-editing in terms of their wish to constantly update their skills and
competencies, the complexity of post-editing tasks that requires high level of expertise and

Part I. Theoretical framework
96
inability to make generalized conclusions on MTPE issues due to multiple variations of
raw output quality and, consequently, diversity of the expected final quality of the content.
The last line of the questionnaire expressed appreciation of time and effort the
respondents dedicated to participating in the survey.
Concluding remarks
As MTPE industry is getting omnipresent, it becomes crucial for the academia to
keep in line with increased demand for training experts in this field and, logically, to
investigate how and to what extent PE competence can be enhanced in its graduates. To
this end, our survey collected responses from 124 participants currently living in 26
countries on four continents. As reported by the testing team of post-editors, the survey
contained no inappropriate questions. Its sample is considered sufficient due to multiple
administration channels and a satisfactory period of duration (three months). The Survey
Monkey tool was configured in a way so that it did not collect incomplete data. Besides, to
minimize inconsistent or conflicting data the majority of questions were supplied with free-
text fields for respondents to share their concerns. Such measures were taken in order to
meet the basic requirements for survey results, namely reliability, validity and avoidance of
errors associated with the applied research method.
Analysis of the participants’ educational background revealed that the largest
constituency replied to have completed a degree in translation-related major. About one-
third of the participants reported to be a member of translators’ association or federation,
which is arguably due to their freelance status. While nearly half of the group stated to be
working with just one pair of working languages, the rest showed a good variety of
combinations between multiple source and/or target languages. In the framework of our
survey English, German and Spanish were mentioned among the most popular source
languages, and English, Spanish, French, Hebrew and German were reported among top-
five target languages. This piece of data shows that English occupies the leading position
as the principal source and target language.
When respondents’ years of experience in translation and post-editing were
compared, a clear prevalence of the former was noticed, which means that translation
keeps being the most frequently performed task. It is our strong belief that such tendency is

Part I. Theoretical framework
97
bound to change in response to the rising demand for prompt translation of continually
growing amounts of content and improvements of raw MT output quality. The breakdown
of responses for average PE throughput did not provide clear tendencies, although 500 –
700 WPH / 4.000 – 5.500 WPD resulted to be a slightly more popular option. The majority
of post-edited documents were classified by the survey respondents as high-visibility
content. Full and manual PE jobs were reported to be more widespread than light and semi-
automatic PE jobs, with IT/Software/Websites/E-commerce being the leading domain for
such projects.
As derived from the survey results, PE workflow usually begins with evaluation of
the MT output and (semi)-automatic post-editing before starting a PE project. Then post-
editors proceed to ST file(s) and the raw MT output or a TM fed with segments of
specified origin, (e.g. previously translated segments and/or post-edited segments). For
these purposes most often TM systems and generic tools are used. Quiet surprisingly no
strong tendencies were suggested by the answers to the question regarding the reference
materials included in an average PE project, although a substantial group mentioned
project specifications as a resource available in more than 90% of projects.
Inquiries about decision-making processes revealed that for nearly half of the
respondents quality expectations expressed in guidelines, style guides and/or reference
materials and fluency issues were considered a sufficient reason to edit a particular
segment in high-visibility documents with public access. On top of that, a slightly smaller
but still large sub-group of respondents said they also consider editing a segment in a low-
visibility document with restricted access if there is a fluency issue there. This finding
might account for the fact that over-editing is often reported among post-editing tendencies
demonstrated by novice and experienced translators. Insight into the skills and
competences that result in efficient PE revealed abilities to focus on those issues that are
specified in PE instructions, to make rapid decisions on ‘editability’ of MT output, to
produce ‘good-enough/fit-for-purpose’ PE output and to abstain from over-/under-editing.
Translators’ and post-editors’ performance was defined as equal in terms of key
competencies and skills. A similar tendency was traced when comparing the processes of
translation and post-editing, although this time the output quality and fluency of PE were
described as worse than the same parameters in translation, while productivity was
mentioned as an advantage of using PE.

Part I. Theoretical framework
98
This non-commercial survey feeds on factual data and its output serves as a credible
base for empirical research on MTPE industry and PE competences. The obtained survey
outcomes help to bridge the gap between the training programs and market demands and
could be of interest to all parties engaged in the translation industry of today. The
information on respondents’ profiles and experiences contributes to the awareness of
translators’ changing role in light of the emerging MTPE phenomenon. A thorough
analysis of PE-related workflow provides grounds for the actualization of translators
training syllabi so that the latter keep the pace with current practices. The same is true for
the respondents’ experience of decision-making and top skills indispensable for efficient
PE. Both instructors and students could take advantage of the comparison of translators’
and post-editors’ profiles to improve training and make an informed decision on whether to
proceed with this career. However, the ultimate objective of the survey was to collect facts
and findings that would contribute to developing and implementing a specialized training
proposal to boost PE competencies of novice translators.

Part II. Experimental study
99
Part II. Experimental study
This part describes the preparation, piloting and full-scale implementation of the
training proposal aimed at enhancement of PE performance among undergraduate
translation students who were not previously trained in PE.
Chapter 4 delves into the methodology of the experimental study, focusing on
operationalization of the research construct, methodological framework, study design and
piloting; Chapter 5 describes how the suggested training proposal was put in practice and
specifies academic profiles of the participants, the training corpus and instruments as well
as the protocol.

Part II. Experimental study
100
Chapter 4. Study methodology and design
In conformity with the statement made by Richards and Rodgers (2014), the basic
framework of our training proposal comprises three elements: approach, design and
procedures. The approach deals with theoretical issues and shapes methods and practices
implemented in the proposal. The design links the approach to procedures and describes
the key features of the training process. Procedures are characterized by specific diversity
and variability and include practices, behaviors and classroom techniques that accompany
and reflect the proposal application (Kiraly, 2000). At this point, teachers implement
theory to pedagogical practice.
This chapter is dedicated to the development of the research construct framework,
justification of the selected research methodology and discussion of the design and key
phases of the study. Operationalization of the research construct (Section 4.1) pre-defines
the approach to gathering data and their analysis. In this way, further clues on the
appropriate methodology are obtained (Section 4.2). After justifying a mix-method
approach to our investigation, we proceed to the experimental study design (Section 4.3).
Application of pre-/post-test model and its integral parts are discussed, and special
attention is paid to pre-requisites for drafting a training proposal. Also, the chapter
provides a description of the study piloting (Section 4.4), including recruitment of the
participants, preparation of study corpus, tools and instruments applied at each phase of the
study, the range of materials and techniques used for training and testing purposes, the
protocol, analysis of the outcomes and lessons learned. The chapter ends with concluding
remarks which summarize the core features of the study methodology.
4.1. Research construct operationalization
As suggested by the term itself, empirical experimental research is centered around
manipulations with variables and aims to determine the effect that one factor exerts on
(an)other one(s) on condition that the former is being manipulated (Rojo, 2013: 128). The
present study is focused on putting to the test the hypothesis that PE competency can be
enhanced with the help of the proposed training. In other words, PE competency is treated
as a dependent variable subject to treatment and change.

Part II. Experimental study
101
The complexity of PE competency as the research object places it into the category
of research constructs that are to be measured indirectly due to their ‘unobservable’ nature
(Langdridge and Hagger-Johnson, 2009: 40). Having analyzed the finding of theoretical
and practical research in the field (Chapter 2), and the outcomes of the questionnaire
Sharing Post-Editing Practices (Chapter 3), we concluded that adoption and application of
the range of adequacy and fluency criteria to PE output, on the one hand, and throughput
rates, on the other, may be considered the indicators of PE competency that manifests itself
through PE performance. The fact that these items affect the whole process of post-editing,
and can be observed and measured, explains the reason why namely these criteria are in the
focus of our attention. Students’ attitudes towards MTPE-related issues and self-evaluation
of their performance and professionalism were operationalized too, which enabled us to get
a deeper insight into the research construct.
It is believed that investigation in the field of dependent and independent variables is
prone to use quantitative approaches, although qualitative approaches are fitting as well
(O’Brien, 2014). As such, the present research involves not only quantification of those
values that characterize subjects’ PE performance and MTPE-related attitudes, but also
inquires about subjective interpretation of the impact produced by the training. On the
bases of the collected data, the conclusion concerning the contribution of the suggested
training proposal to the enhancement of PE performance in undergraduate translation
students is made, and further lines of improvement are considered.
4.2. Methodological framework
Humanities and social sciences are open-ended systems conditioned by the
propensity of human beings to undergo physical and mental changes which provoke
constant variations in the structure of such systems (Rojo, 2013: 106). In particular,
translators’ performance is affected by their physical and emotional state, cultural and
linguistic interferences, professional and social contexts, among others. All these issues
add complexity to translation-related investigations, as there seems to be no reliable tools
or techniques to keep track of all work-related issues, external effects and behavior.
For this reason, the applied research design uses concurrent strategies which
involve data collection with quantitative and qualitative approaches deployed
simultaneously. Such an approach facilitates examination of the complex multi-tier

Part II. Experimental study
102
phenomenon of PE competency acquisition. As such, a mixed-method approach looks like
an opportunity to detect general patterns and focus on particular cases and their origins
simultaneously, providing grounds for concurrent research design (Creswell and Plano
Clark 2011; Rojo, 2013). One more important feature is that this approach makes it up to
the researcher to identify the paradigm that approximates the particular aspect of the
research construct (Mertens, 2014: 7).
A mixed-method approach benefits our research since it allows for the collection and
analysis of the data from positivist and interpretive epistemological positions (Saldanha
and O’Brien, 2014: 22). Positivism is based on the rationalist, empiricist philosophy; its
underlying assumptions suggest that the social world can be analyzed in the same way as
the natural (Mertens, 2014). This type of research is characterized by an objective and
dispassionate manner in which the researcher manipulates and processes the data. As for
the interpretive paradigm, the researcher adopts multiple, socially constructed realities,
which predetermines the interactive epistemology of research and explicit interaction
between the researcher and participants. The suggested methodology allows for the
description of contextual factors (Guba and Lincoln, 1994). In this case, investigators
interpret the data from a particular standpoint or situation, where the knowledge and reality
make a part of the “complex world of lived experience from the point of view of those who
live it” (Schwandt, 1994: 118). Despite apparent differences, merging of these paradigms
is considered possible, since the lines between both are partially blurred in practice
(Reichardt and Rallis, 1994). The underlying argument in favor of this approach is that
integration of quantitative and qualitative data combines the best of both paradigms and
overcomes their weaknesses (Saldanha and O’Brien, 2014: 201).
The major aim of the present study is to enhance PE competency of undergraduate
translation students with the help of a training proposal that could be further applied in
MTPE-related modules of the academic curriculum. To achieve the aforementioned goal,
we see it important to draft a training proposal in conformity with EHEA requirements
(Chapter 1), field studies (Chapter 2) and the findings on the scope of PE expertise
(Chapter 3), to test the proposal by using it in academic environment, and to evaluate its
efficiency with the help of pre-/post-test model.
Keeping in mind these objectives, application of a mixed-method approach goes in
line with the research needs, such as to collect, interpret and apply different categories of

Part II. Experimental study
103
data when drafting a specialized training program; to measure the training effect from
quantitative and qualitative perspective; and to get a comprehensive idea of the impact
produced by the training and consider lines of improvement. Using classification of mixed-
method research designs by Creswell and Plano Clark (2011: 70), our experimental study
combined the characteristics of sequential explicative and convergent parallel research
designs. For this reason, the primary focus of the investigation is aimed at the quantitative
phase, while the qualitative phase is seen as secondary and contributes to the explanation
of the other one. Collection of both types of data is conducted simultaneously, and data
convergence (or divergence) is investigated and interpreted afterward.
4.3. Experimental study design
Learner-centered and motivation-based approach to teaching and learning has
become the pivotal point for the European academia. As mentioned in Chapter 1,
the EHEA broadly welcomes training proposals aimed at acquisition and development of
autonomy, self-awareness, critical thinking, advanced cognitive and self-regulatory
competencies of students. In this concern methodological plurality of the CBT model
encourages trainees’ commitment and self-determination while emphasizing successful
learning and the importance of more personalized and diversified syllabus on the one hand,
and transparent evaluation, on the other. One more important detail to keep in mind when
drafting a training proposal is its relevance to the real market needs and industry
requirements. The same principle is true when evaluating the training outcomes, since
which should be authentic and involve the application of knowledge to real-world.
Under such circumstances, the instructor provides feedback continuously to facilitate
self-reflection and experiential learning. Another observation on drafting a training
proposal (Martínez, 2006) is that its preparation is only possible after the definition of
available resources, opportunities, constant evaluation of students’ progress and target
groups of subjects, further discussed in Section 4.4. These measures are expected to help
effectively manage the development of training activities and detect whether the planned
objectives are being reached.
The positivist paradigm that underlies empirical studies holds that the objective of an
investigation is to develop confidence that a particular claim about a phenomenon is viable
(Borg and Gall, 1989). As a result, the experimental study takes the form of an empirical

Part II. Experimental study
104
test used to support (or refute) the claim, on condition of its internal and external validity
and generalizability. This type of design is recommended in the situation when it is not
possible to have the control group due to the circumstances that go beyond the researcher's
authority (Mertens, 2014). To examine if and to what extent PE competency may be
enhanced in translation students, the study makes use of pre-/post-test investigation model,
when the researcher first administers a pretest to the group of the participants, then
provides tutoring, and finally measures participants’ performance again. As such,
considerations on the training efficiency are based on the comparison of research construct
indicators before and after that training and in this way measuring the impact of the latter.
4.3.1. Training goals
Teaching theories and psychology of learning, which share theoretical premises
behind the concept of efficient training, stress the necessity to consider operationalization
of training objectives as the starting point of any educational content. In line with the
theoretical and practical data analyzed in Part I, the objective of the suggested baseline
training proposal was to introduce its trainees to a general overview of the pros and cons of
the MTPE phenomenon, provide students with better understanding of MTPE-related
processes, and help them acquire basic skills required for efficient completion of post-
editing jobs. To this end, the proposal canvasses theoretical and practical aspects of the
MTPE industry and provides actual hands-on training to encourage PE competency
enhancement.
The issue of measurable and observable goal(s) – i.e. when students are expected to
understand and be able to demonstrate the acquired skills, knowledge and attitudes – is the
cornerstone of competency-based training. To keep track of the progress made, it seems
logical to incorporate testing sessions in the proposed agenda. On completion of the
training, the participants are expected to showcase an understanding of the principles of
MTPE by critically evaluating the raw MT output and performing post-editing. In
particular, they should be able to demonstrate the following:
• confidently apply the acquired knowledge and skills to the solution of problems
related to post-editing of (non-)specialized texts;

Part II. Experimental study
105
• demonstrate the ability to optimize time/effort when following post-editing
routines;
• be able to identify the scope of required edits of raw MT output and make
informed decisions on how to implement them.
The benefit from participation in the training is seen as twofold: the students improve
their operational knowledge (raw MT evaluation, spotting MT errors and introducing the
necessary edits) as well as conceptual knowledge (MT engines functioning, pre- and post-
production phases of an MTPE project, the scope of expertise required of translators
engaged in the field). Encouragement for advanced training in MTPE skillset and
facilitation of further acquisition of knowledge and competencies in the field are also
considered among the effects of the proposed training.
However, at this point, we would like to emphasize that the experimental study does
not pretend to equally boost all aspects of knowledge mentioned earlier, but rather to prove
our hypothesis that the PE competency can be improved through training.
4.3.2. Training principles and content
The paradigm of competency-based learning adopted by the EHEA broadly
welcomes the effort of academia to overcome the traditional understanding of knowledge
as contemplation in favor of knowledge as operation. The latter, in its turn, implies
integration of empirical and cognitive experiences of the learner in the course of training.
For this reason, the amount of theoretical material is kept to the minimum, the activities
involved in the training are student-centered and provide a lot of room for autonomous
experiential learning, while the instructor performs the role of an assistant.
As described in Chapter 1, the principles of programmed learning provide theoretical
premises for numerous training methodologies that help students acquire knowledge and
skills. It is not a teacher-free method, but the one in which objectives are clearly defined
and operationalized, the material is arranged in sequence and is easily corrected
autonomously. Hence, students may work on themselves, since the training content is
organized logically and in small portions. Application of such model provides
researchers/teachers with an opportunity to track results and continuously evaluate
students. All the facts mentioned above contributed to the practical application of the PL

Part II. Experimental study
106
paradigm principles in the experimental study on the enhancement of post-editing
competency among undergraduate translation students.
Translators training aims at providing the trainees with opportunities to acquire a
sufficient level of translator competency and helps novice translators become successful
players in the labor market. To bridge the gap between the industry and academia, it is of
paramount importance to take into account the skills and attitudes deployed by professional
translators when drafting training agendas. To this end, in the previous part of our research
(Chapter 3) the results of the survey conducted among acting post-editors were described.
The primary goal of the aforementioned survey consisted in mapping the core PE skills
used by translators so that an informed decision on the key focus of the training proposal
could be made. Apart from that, the survey yielded information on a broad range of other
PE-related issues, which are further used to scaffold the training agenda with professional
PE practices.
There is growing support for the claim that a training proposal must give the trainees
a comprehensive vision of professional processes and functions, resources and tools, as
well as help them acquire self-learning techniques (Martín-Mòr et al., 2014: 10). For this
reason, we thought it essential for the suggested training agenda to incorporate insights
from the survey conducted among acting post-editors. As such, along with theoretical
material on the origins of MT industry or differences between the broad and narrow
definition of quality in translation, the session covers practical aspects of the professional
profile of the respondents, PE workflow, decision-making strategies and the changes
brought to translation profession by the rapid expansion of the MTPE model. Enhancement
of PE competency by means of mental reasoning and decision-making on how to deploy
the basic principles of post-editing when performing a PE assignment are considered
among other efficient ways to promote experiential learning. Creation of multiple
opportunities to perform guided and autonomous learning that enables students to put into
practice a broad range of skills and abilities when resolving practical tasks is essential for
the smooth course of training.
The experimental study starts and finishes with a testing session so as to provide the
instructor with an opportunity to measure and evaluate the PE performance and MTPE-
related attitudes of the students, on the one hand, and to offer students another opportunity
to practice PE and to reflect over their own progress and beliefs, on the other. Keeping in

Part II. Experimental study
107
mind that evaluation activities should not only provide the researcher with the proof on the
training effect but also contribute to the trainee’s competency, test assignments are
considered as an integral part of the training proposal.
The training agenda is drafted following the principles of programmed learning. The
in-class part of the training consists of three sections, while the remote training focuses on
putting the acquired knowledge and skills to practice. The lead-in covers description and
analysis of the profile of the respondents who are currently engaged in PE practices and
covers the routines involved in MTPE. Next, the practical workshop pretends to provide
the trainees with a deeper understanding of MTPE origins, the adopted quality standards
and their practical applications, as well as to pinpoint the skills and competencies put to
practice by PE. As a follow-up, discussion on the similarities and differences between
translator and post-editor profiles is held. Finally, the students are assigned homework to
be done and checked remotely.
Incorporation of the remote training session into the training proposal is influenced
by the principles of autonomous learning, which are a milestone in the modern EHEA.
These principles put forward the claim that students should be given an opportunity to
understand, analyze and evaluate while working on themselves at their own pace. It is for
this very reason that after completion of the theoretical part of the training, the students
were provided an opportunity to drill their PE skills remotely over the two weeks that
followed. During this time all communication between the participants and the researcher
was happening through Skype and e-mail.
Tables 23.1-23.3 summarize testing and training activities and their objectives (“In”
stands for the instructor; “Ss” stands for the students):
Phase Objective Activities
Testing session-1 Expose students to PE
experience; call to
reflection on their attitude
towards MTPE-related
issues and evaluation of
their performance
In : provides Ss with testing session
assignments and instructions
Ss : read the instructions, perform MT
evaluation and PE ; fill in the questionnaire
Table 23.1. TS 1: objectives and activities

Part II. Experimental study
108
Phase Objective Activities
In-class training
Lead-in Raise awareness
regarding the professional
profile of a post-editor
In: gives a PPT presentation, moderates the
discussion
Ss: attend the presentation; discuss post-
editors’ role in the industry, their profiles,
experiences, MTPE working routines
Practical workshop Introduce the basic
concepts of MTPE In: gives a PPT presentation, moderates the
discussion
Ss: attend the presentation, make a
hypothesis on the future of the translation
industry
Discuss PE quality
standards In: provides the broad and narrow definition
of quality in translation and their application
in MTPE, moderates the discussion
Ss: work in groups and decide on the
translation quality definition that best suits
the MTPE, justify their choice; apply quality
standards towards MT output
Decide on the key PE
skills In: introduces MT output evaluation criteria
and PE guidelines
Ss: work in groups and suggest their list of
key PE skills
Focus attention on
decision-making triggers In: collects ideas on the topic, gives a
presentation, moderates the discussion
Ss: attend the presentation; (in groups) range
the issues that influence decision-making in
PE, compare their results to the ones exposed
in the presentation
PE practice In: provides a set of raw MT segments, gives
feedback on the suggested PE output
Ss: work individually, evaluate MT output
quality, introduce changes where necessary,
justify their decision
Follow-up Consolidating the
changing role of translator In: collects ideas on the topic, gives a
presentation
Ss: share ideas on the skillset of post-editors,
compare translation and PE as a professional
activity, compare their perceptions with the
survey results
Remote training
Homework Expose students to PE
experience Ss perform PE assignments and get feedback
Table 23.2. Training proposal: objectives and activities

Part II. Experimental study
109
Phase Objective Activities
Training session-2 Expose students to PE
experience; call to
reflection on their attitude
towards MTPE-related
issues
In: provides Ss with assignments and
instructions
Ss : perform an MT evaluation exercise and
a PE exercise; fill in a questionnaire
Table 23.3. TS 2: objectives and activities
After drafting the training proposal, the next logical step was putting it to practice
and measuring its efficiency. Yet, before moving any further, it is important to stress that
enhancement of students’ PE performance was not seen as the training objective per se, but
rather as a means to further develop the subjects’ competency in the field of MTPE, to
contribute to understanding of the multifaceted nature of PE-related processes and tasks
and in this way to expand the trainee’s translation competency.
4.4. Study piloting
As mentioned in the introductory part, the objective of the research was to
investigate how and to what extent PE competency may be enhanced in undergraduate
translation students who were not previously exposed to post-editing. The pilot project was
conducted with the aim to test the training proposal, experimental design, data collection
methods, and to be able to introduce the necessary changes that would ensure smooth
conduct of the full-scale experimental study (Chapter 5).
In this section description of the participants’ recruitment process is provided,
followed by an overview of the relevant instruments involved. Next, attention is paid to the
training protocol that consists of testing and training phases performed in class or/and
remotely. The review of preliminary results is followed by reflection on the training
process and outcomes and consideration on further lines of improvement.
4.4.1. Participants
The choice of the target audience was made after a thorough examination of Dublin
descriptors adopted by Qualifications Framework of the European Higher Education Area
(2009). This reference document provides statements of conventional expectations of
achievements and abilities associated with academic qualifications of different levels. As

Part II. Experimental study
110
claimed in the Dublin descriptors, graduates of Bachelor’s degree should be able to show
profound understanding of their professional field, to apply this knowledge to their work
and demonstrate competency regarding existent problems and challenges, to summarize
and interpret relevant data necessary to produce expert judgments, to transmit ideas, issues
and solutions publicly, to develop the skills required to undertake further studies with a
higher level of autonomy. Consequently, it gives us grounds to argue that undergraduate
students in their final year possess the competency that is similar to that of novice
professionals in the same domain.
In particular, Translation degree graduates are expected to solve problems related to
evaluation/editing of source-to-target meaning transfer in (non-) specialized target
language texts along with problems associated with the lack of specialized knowledge, to
use technology and documentation resources. Among other skills and competencies
possessed at this level are abilities to work in a team and individually, to apply
methodological principles of comprehension and interpretation of texts in the source
language as well as principles of producing and evaluating texts in the target. As such,
translation students in the final year of their BA training demonstrate confident knowledge
and adequate use of vocabulary and grammar of the target and the source languages, ability
to solve problems related to text processing and elicitation of meaning in (non-)specialized
texts and to make decisions and transmit information/ideas regarding existing problems
with elicitation of meaning in general (non-)specialized texts. The scope of skills and
competencies as mentioned above helps graduates in Translation to meet the prerequisites
of participation in the training.
To select participants with the required academic background, the syllabi of the
departments of Ukrainian universities that train translators were examined (the origin of
the researcher being the reason for the choice of the country). On completion of such
examination, four Ukrainian national universities that offer Bachelor’s degree in
translation were approached. The choice of these universities, in particular, was due to the
fact that all of them have the highest (IVth) level of state accreditation. In other words,
these universities are officially authorized to train undergraduate, graduate and post-
graduate students in a broad spectrum of majors and areas of expertise and enjoy the
optimal educational standards. Another important factor was that such educational
establishments train a large number of translation students with English-Russian working

Part II. Experimental study
111
language pair since the majority of translation programs offer English as one of the most
popular foreign languages, and the students are native speakers of Russian. Logically, the
confident knowledge and adequate use of rules and norms of the target language (Russian)
and the source language (English), professional and instrumental awareness of how to
draft, edit, revise and evaluate texts in the target language, ability to solve problems related
to production and evaluation of (non-)specialized texts in the target language were
considered as the prerequisites for participation in the study. What is more, the subjects
were not previously exposed to post-editing in the workplace environment, which made
them perfect candidates to undertake a baseline train proposal on enhancing PE
competency.
To get the permission to invite volunteers for participation in the pilot and later the
full-scale projects, the researcher contacted the Department of Theory and Practice of
Translation at Karazin Kharkiv National University, the Department of Applied Linguistics
at National Aerospace University “KhAI”, the Department of Foreign Languages and
Translation at National Technical University – Kharkiv Polytechnic Institute, the
Department of Foreign Philology at Kharkiv National Pedagogical University. These
universities were contacted by e-mail that contained a description of the scope of the
experimental project and its objectives.
Out of all universities contacted (the academic year 2016-2017), the one that agreed
to cooperate was Kharkiv National Aerospace University. The fourth-year students were
directly contacted by Head of the Applied Linguistics Department Dr. Ryzhkova, and the
ones who volunteered were provided with brief information about the project and got the
researcher’s contact details (phone number and e-mail) to confirm their eagerness to
participate in the project and to ask any relevant questions. To make sure the subjects meet
the requirements, we examined the academic curriculum of those who expressed their
eagerness to join the study and conducted an interview with the Head of the Department on
all unclear issues.
To sum up, the pilot project involved volunteers with English-Russian working
language pair who were in the fourth year of their undergraduate (Bachelor’s) program at
Applied Linguistics Department (School of Humanities, Kharkiv National Aerospace
University), and had no previous experience in post-editing. The piloting was scheduled in
March 2016, and the total of ten students agreed to take part in the pilot project. All of

Part II. Experimental study
112
them gave their written consent to the processing of their data for research purposes, and
participated in the pre-training testing session. Next, they attended the training and
completed the training assignments remotely. However, only eight subjects showed up for
the post-training testing session. To keep the results validity, we had to discard the data
provided by two students who did not attend the final testing session from the data pool to
assure coherence of the processed values.
4.4.2. Study corpus
The choice of the corpus for the study needs was predetermined by the current
tendencies in the MTPE field. As confirmed by the results of our survey Sharing Post-
Editing Practices (Chapter 3), full post-editing of publicly available content is becoming
increasingly common for many subject fields, although IT/e-commerce/software-related
projects are the most common ones. What is more, the study participants were familiar
with the IT field in the course of their academic programs and due to the personal interest
in the IT domain. For this reason, it was decided to use the segments from the freely
accessible multilingual Autodesk post-editing data corpus for the experimental part of our
research. This resource contains sufficient volume of segments for training and testing
assignments available in the language combinations required for the study. The Autodesk
files in .xls format feature three categories of segments: the original segments, the
corresponding raw MT output, and the post-edited output, presumably provided by
Autodesk language experts. In this way, the segments from the third category could be
used as a ‘golden standard’ when performing analysis of post-editing assignments of the
testing sessions and throughout the training. The essential criterion for the corpus used for
the study purposes was that the segments should not contain Autodesk specific
terminology since this feature of the source test was outside the scope of the study, and
correspondingly the subjects were not provided with any glossary or a term-base.
Before launching the pilot project, a set of segments for training and testing was
prepared (full strings are provided in Appendix III, Tables III.1.1, III.1.2 and Link III.1.3).
The key objective of the selected corpus was to provide grounds for the collection of
substantial data in order to track the (anticipated) progress of the trainees. As demonstrated
in Table 24, the set consisted of 168 segments: each testing session involved 10 segments
for MT output evaluation and 20 segments for MT post-editing, 100 segments were used
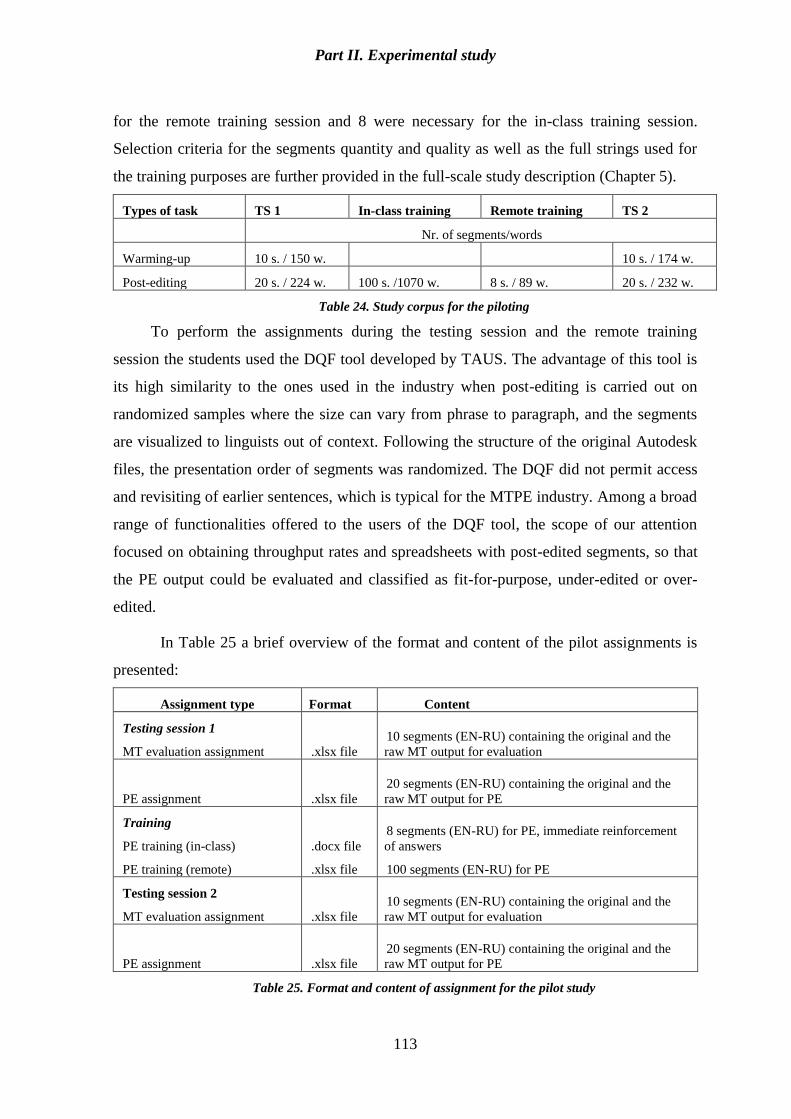
Part II. Experimental study
113
for the remote training session and 8 were necessary for the in-class training session.
Selection criteria for the segments quantity and quality as well as the full strings used for
the training purposes are further provided in the full-scale study description (Chapter 5).
Types of task TS 1 In-class training Remote training TS 2
Nr. of segments/words
Warming-up 10 s. / 150 w. 10 s. / 174 w.
Post-editing 20 s. / 224 w. 100 s. /1070 w. 8 s. / 89 w. 20 s. / 232 w.
Table 24. Study corpus for the piloting
To perform the assignments during the testing session and the remote training
session the students used the DQF tool developed by TAUS. The advantage of this tool is
its high similarity to the ones used in the industry when post-editing is carried out on
randomized samples where the size can vary from phrase to paragraph, and the segments
are visualized to linguists out of context. Following the structure of the original Autodesk
files, the presentation order of segments was randomized. The DQF did not permit access
and revisiting of earlier sentences, which is typical for the MTPE industry. Among a broad
range of functionalities offered to the users of the DQF tool, the scope of our attention
focused on obtaining throughput rates and spreadsheets with post-edited segments, so that
the PE output could be evaluated and classified as fit-for-purpose, under-edited or over-
edited.
In Table 25 a brief overview of the format and content of the pilot assignments is
presented:
Assignment type Format Content
Testing session 1
MT evaluation assignment
.xlsx file
10 segments (EN-RU) containing the original and the
raw MT output for evaluation
PE assignment
.xlsx file
20 segments (EN-RU) containing the original and the
raw MT output for PE
Training
PE training (in-class)
PE training (remote)
.docx file
.xlsx file
8 segments (EN-RU) for PE, immediate reinforcement
of answers
100 segments (EN-RU) for PE
Testing session 2
MT evaluation assignment
.xlsx file
10 segments (EN-RU) containing the original and the
raw MT output for evaluation
PE assignment
.xlsx file
20 segments (EN-RU) containing the original and the
raw MT output for PE
Table 25. Format and content of assignment for the pilot study

Part II. Experimental study
114
4.4.3. Instruments and tools
The corpus used for training and testing purposes made part of a larger array of
instruments and tools used in the course of the piloting and the full-scale study.
Summarized information on their type and purpose is presented in Table 26:
Phase Instrument type Purpose
TS 1 Instructions Introduce the Ss to the testing session agenda,
describe its building blocks and suggest PE
guidelines
MT evaluation assignment Practice evaluation of MT output and warm-up for
the following PE assignment
PE assignment Collection of data on Ss’ entry level of PE
competency
DQF tool Facilitation of MT evaluation and PE assignments
Questionnaire Collection of data on Ss’ attitudes and perceptions
of MTPE-related issues
In-class
training Presentation Visual aids to facilitate assimilation of the training
content and cognitive skills development
PE assignment Reinforcement of decision-making skills
Remote
training PE assignment Drill of PE skills, provide feedback on PE
performance
DQF tool Facilitation of MT evaluation and PE assignments
PE assignment feedback Provide the fit-for-purpose segments approved by
professional post-editors
TS 2 Instructions Introduce the Ss to the testing session agenda,
describe its building blocks and suggest PE
guidelines
MT evaluation assignment Practice evaluation of MT output and warm-up for
the following PE assignment
PE assignment Collection of data on Ss’ achieved level of PE
competency
DQF tool Facilitation of MT evaluation and PE assignments
Questionnaire Collection of data on Ss’ attitudes and perceptions
of MTPE-related issues
Table 26. Overview of training proposal instruments and tools
Section 4.4.2 provided a description of the assignments drafted on the basis of the
selected study corpus. Hereafter, Tables 27.1-27.3 offer a brief overview of the other
study-related instruments, while an in-depth analysis of the latter are examined in Chapter
5 (Section 5.3).

Part II. Experimental study
115
Instrument Format Content
Instructions .docx file o Project specifications
o The sequence of testing activities
o PE guidelines
Questionnaire GoogleForms o Project brief
o Benefits for participants
o Glossary
o Name/department/program
o Previous experience in translation / post-editing
o Attitude towards the usage of MTPE
o Attitude to the statement “Machine translated and
post-edited output of less-than-maximum quality is
good enough to be delivered to the client as a
complete job”
o Attitude to PE as a professional activity
Table 27.1. Experimental study instruments – TS 1
Instrument Format Content
In-class training
Presentation .pptx file o Raising awareness about the professional profile of a
post-editor
o Introduction of the basic concepts of MTPE
o PE quality standards and key PE skills
o Decision-making triggers
o Exposure to PE expertise
Remote training
PE feedback form .xlsx file o 100 segments (EN-RU) with “fit-for-purpose” PE
output to reinforce previous PE performance
Table 27.2. Experimental study instruments – Training
Instrument Format Content
Instructions .docx file o Project specifications
o The sequence of testing activities
o PE guidelines
Questionnaire GoogleForms o Project brief
o Benefits for participants

Part II. Experimental study
116
o Glossary
o Name/department/program
o Previous experience in translation / post-editing
o Attitude towards the usage of MTPE
o Attitude to the statement “Machine translated and
post-edited output of less-than-maximum quality is
good enough to be delivered to the client as a
complete job”
o Attitude to PE as a professional activity
o Comments on the perceived impact of the training
Table 27.3. Experimental study instruments – TS 2
4.4.4. Protocol
The experimental setup of the pilot project was designed with the objective to test the
efficiency and effectiveness of the suggested training proposal. The initial and the closing
testing sessions (further referred to as TS 1 and TS 2) were conducted in the controlled
environment, where all participants performed one warming-up and one testing assignment
on PE and filled in the questionnaires on the same day and in the same location. On
completion of TS 1 (23/03/2016), the students assisted at the in-class training session.
During the next week, they were expected to complete a training assignment autonomously
and get the feedback from the instructor. The training culminated with TS 2 which was
held in the end (04/04/2016).
Pre-training testing session
On March 23, 2016, TS 1 started with an introduction to the research topic. The
students received instructions on how to perform the warming-up exercise and the PE
assignment, and then proceeded to completion of the given tasks. Having finished the two
assignments, the subjects filled in the questionnaire to share their opinions concerning
MTPE-related issues and provided their written consent for participation in the study and
the use of their data in the further investigation.

Part II. Experimental study
117
Training session
o In-class training
The in-class training session was based on the presentation (as described in Section
4.4.3). The lead-in focused on the professional profile of a post-editor and the basic
concepts of MTPE, after which the students were invited to express their opinions on the
emerging phenomenon of MTPE, and what the translation industry can expect in the
nearest future. The practical workshop on PE involved theoretical material and exchange
of opinions on quality standards adopted in translation and how they are applicable to PE,
key PE skills and decision-making triggers. The students also were invited to put PE
strategies to practice by performing an 8-segment long post-editing task in pairs and under
the instructor’s supervision. As a follow-up, the researcher made use of the survey
outcomes and moderated a discussion on the changing role of the translator in the modern
world. The details of the training are further provided in Chapter 5 (Section 5.4).
o Remote training
At the beginning of each of the two following weeks, the students received a 50-
segment long PE assignment to be performed using the DQF tool. As soon as they
completed each assignment, a message containing the same raw MT segments, the PE
output suggested by the student, and the “golden standard” (from the Autodesk database)
was sent back to them as feedback. In this way, the training participants could see for
themselves the cases when post-editing of MT errors was necessary, and the ones where
such edits could be classified as preferential and/or stylistic.
Post-training testing session
On April 4, 2016, TS 2 was conducted. The routine was similar to the one used in TS
1: the subjects received instructions on how to deal with the testing session assignment,
performed the tasks and filled in the questionnaire. As previously mentioned, the closing
testing session was conducted in the controlled environment, on the same day and in the
same location as TS 1.

Part II. Experimental study
118
4.4.5. Preliminary evaluation of training outcomes
The warming-up MT quality evaluation assignment was not in the focus of our
analysis since its only objective was to introduce raw MT output to the subjects. On the
contrary, the PE assignment yielded two types of data regarding PE throughput and output
quality. PE throughput was measured in terms of word-per hour rate (WPH). As for the PE
output, at the end of each testing session all segments post-edited by the study participants
were compared against the “golden standard” and assigned to one of the three MQM
categories: fit-for-purpose, over-edited and under-edited segments. For the sake of brevity
the cases of so-called “pseudo-editing” (when students introduced errors to the segments
rather than edited them) were also considered as the cases of under-editing.
The obtained data indicated that participation in the pilot study resulted in
enhancement of PE quality and throughput rates, although it did not have a noticeable
impact on MTPE-related attitudes. The WPH rates, as well as the minimal and maximal PE
performance values of both TSs, are shown in Table 28 (more detailed information on PE
throughput and output values is provided in Appendix II, Table II.1):
PE performance TS 1 TS 2
WPH rate
Min vs. Max. values
Mean value
514 vs. 974
710,4
868 vs. 2.581
1.482,6
Under-edited segments
Min vs. Max. values
Mean value
3 vs. 8
5,8
1 vs. 8
4,6
Fit-for-purpose segments
Min vs. Max. values
Mean value
4 vs. 14
8,4
11 vs. 18
13,6
Over-edited segments
Min vs. Max. values
Mean value
1 vs. 13
5,9
0 vs. 5
1,8
Table 28. PE output minimum, maximum and mean values (TS 1 vs. TS 2)
As demonstrated in Figure 5, the WPH rate was lower before training and increased
significantly after the training, as the mean value rose almost twice in TS 2. Comparison of
PE output values in both testing sessions demonstrated that the mean value of fit-for-

Part II. Experimental study
119
purpose segments rose, the mean value of over-edited segments decreased significantly,
while the mean value of under-edited segments showed a slight decrease.
Figure 5. Correlation of PE output quality mean values before and after the training
(the vertical axis represents the number of the participants)
Figure 5 represents the tendencies observed in TS 1 and TS 2 regarding the output
quality. This piece of data suggests that one of the benefits of the training proposal for the
given group of subjects results in the overall increase in PE output quality.
As confirmed by the questionnaire responses, all participants were fourth-year
students of Applied Linguistics Department aged between 19 and 20. The question on
whether they had taken any MTPE-related modules previously was answered negatively by
7 out of 8 students (87%), although the one who gave a positive answer did not provide
any further explanation to the question asking to specify the module title and its duration.
When asked about previous experience in translation and post-editing projects, 100% of
participants responded negatively. In both TSs the majority (7 out of 8 students) described
their attitude to the use of MT in the translation and localization industry as ‘rather
positive’.
A detailed breakdown on the students’ responses to the questionnaire is provided in
Appendix II, Table II.2; hereafter the collected data is presented in the form of diagrams
(each combining the answers to one and the same question before and after the training).
When asked about their attitude towards MT, the majority were positive in both testing
sessions. However, there was one student who ticked the option ‘rather negative’ in TS 1;
0
2
4
6
8
10
12
14
16
under-edited segm fit-for-purposesegm.
over-edited segm.
TS_1
TS_2

Part II. Experimental study
120
also, there was one student who described their attitude towards MT as ‘very positive’ in
TS 2 (Figure 6):
Figure 6. What is your attitude regarding the usage of MT in the translation/localization industry?
(the vertical axis represents the percentage distribution of the participants)
When asked to express their opinion on whether machine translated and post-edited
output of ‘less-than-maximum’ quality is good enough to be delivered to the client as a
complete job, the results of both testing sessions coincided (three students chose “I agree”,
three – “I disagree” and two – “I strongly disagree”) (Figure 7):
Figure 7. Do you agree with this statement "Machine translated and post-edited output of less-
than-maximum quality is good enough to be delivered to the client as a complete job?" (the vertical axis
represents the percentage distribution of the participants)
The last question inquired whether the subjects would consider PE as their regular
professional activity. In TS 1 three students reported to have no interest in PE, one student

Part II. Experimental study
121
was positive about PE jobs, and four students said they might consider including PE jobs
into their workflow if needed. Alternatively, in TS 2 one student provided a negative
answer, three students were positive about using PE jobs, and four students said they might
consider including PE into their professional workflow if needed (Figure 8):
Figure 8. As a novice translator, would you be interested in performing PE jobs on a regular basis?
(the vertical axis represents the percentage distribution of the participants)
When answering the TS 2 questionnaire, the subjects also shared the perceived
impact of the training proposal by leaving their comments in the available free-text box. In
this way they got an opportunity to describe the effect (if any) of participation in the
experimental study, such as acquired knowledge, skills and/or attitudes. To summarize, the
majority considered MT to be a useful time- and effort-saving tool for translators that
nevertheless could not be used without human interference. As expected, the students
reported to be aware of the MTPE model even before the beginning of the pilot test.
Nevertheless, they admitted that on the whole such experience contributed to a more
profound understanding of the concept, since the quality of raw MT turned out to be quite
high, the availability of MT output - indeed helpful.
As noted by Doherty (2017), few studies provide detailed information on evaluation
and evaluators, and descriptions of guidelines and operational definitions used in the
assessment of translation quality are scarce. The same is true in the assessment of training
proposals. On the other hand, bias can compromise the validity and reliability of
assessment, and contaminate conclusions of any evaluation-related research. Various types
of biases, such as professional, language, cultural, and universal biases (Dardenne and
Leyens, 1995; MacCoun, 1998; Baron, 2010) were analyzed in many disciplines. To
minimize the threat of bias, the effects discerned in the experimental study are examined

Part II. Experimental study
122
using the previously operationalized variables (Section 4.1). Therefore, when evaluating
the training effect, the focus of attention was aimed at comparison of PE output quality,
throughout and attitude towards MTPE-related issues before and after the training. The
impact of the training as perceived by the participants made another source of information
for further discussion. Finally, analysis of the available data yielded information about how
and to what extent the offered training program contributes to the development of PE
competency in translation students.
The primary criterion for evaluating the effectiveness of our PE training proposal
was the correlation of subjects’ PE performance parameters before and after the training.
Due to the complexity of the research construct, we saw it appropriate to use a mixed-
method approach for measuring the overall feasibility of the suggested proposal. The
conducted pilot study provided an opportunity to test methodology, the relevance of
assignments and questionnaires, the selected tools, suitability of corpus, as well as the
study constraints.
The analysis of quantitative and qualitative data before and after the training yielded
information regarding the acquisition of PE competency by the participants and helped us
to measure the efficiency of the proposal.
Concluding remarks
The pilot project shed light on potential problems that arose in the course of its
implementation, such as the failure of the participants to appear at both testing sessions and
the consequent reduction of the data pool available for the analysis. Unfortunately,
participant drop-out is one of the most common issues happening in experimental studies
and could not be remedied with the means available to the researcher. Nevertheless, the
overall tendency towards an increase of PE throughput and improved PE output quality
suggested the training efficiency and appropriateness of the corpus, tools, and methods
involved in the experimental design. As a result, a preliminary conclusion was made that
the suggested training proposal contributes to enhancing PE competency in undergraduate
translation students, which proves our initial hypothesis, and the overall design and the
instruments are appropriate and do not require significant changes.

Part II. Experimental study
123
To further solidify the applicability of experimental results and their scientific
robustness, some improvements were proposed for the full-scale experimental study:
• to amplify the scope of qualitative values and to investigate if any signs of
progress were noticed by the participants, an inquiry about subjects’ convictions
of their perceived PE performance was added to the questionnaire;
• in the part of quantitative values, it was decided to complement the descriptive
analysis with inferential and associative statistical analysis, and to visualize the
collected values with the help of boxplot diagrams so as to derive further insights
from the obtained quantitative data;
• description of qualitative values provided by the questionnaire in both TSs was
not sufficiently informative either since it did not reflect the changes/permanency
of attitudes as demonstrated by each particular subject. For the sake of a more
fine-grained examination, a different approach should be adopted that permits to
track the changes of attitude (in any) of each student before and after the training;
• the quantitative and qualitative values could be cross-referenced to complement
the comprehensive nature of the experimental research.

Part II. Experimental study
124
Chapter 5. Experimental study conduct
The full-scale research on the enhancement of expertise in PE followed the pretest-
posttest model, which proved its effectiveness during the study piloting. In line with the
latter, the experimental study consisted of three phases: the pre-training testing session (TS
1), the training session which, in its turn, combined in-class and remote training, and the
post-training testing session (TS 2).
The classrooms for testing and training were equipped with a sufficient number of
desktop computers for all participants and an OHP, which made it easier for the researcher
to demonstrate all tasks, links and reference materials on the whiteboard. The
measurements were made before and after exposing the subjects to the training proposal.
To facilitate the conduct of the experimental study, all reference materials and
instructions, as well as screenshots of the DQF tool interface, were collected on a Google
Sites webpage. The link to the page was projected to the whiteboard from the very
beginning of the first testing session so that all participants could copy and open it on their
desktop computers. In conformity with regulations on personal data protection, a
personalized informed consent was obtained from each participant as for the use of their
data for research project purposes only.
5.1. Participants
The language-independent nature of the training proposal suggested the involvement
of students with different working language pairs, and measuring their results not only
within each group but also across the groups. Therefore, the full-scale experimental study
featured two different groups of subjects with EN-RU and EN-ES as their working
language pairs. Members of both groups complied with the prerequisite of being in the
final year of the Bachelor’s degree in Translation, and their academic programs
corresponded to the requirements of Qualifications Framework of the European Higher
Education Area. The choice of the participants was based on the premises that translation
competency of undergraduate students in their fourth year of university training is
characterized by sufficient level of acquired knowledge, skills, and attitudes that can be
expected of novice translators. The process of volunteers’ recruitment was similar to the

Part II. Experimental study
125
one explained in Section 4.4.1. All trainees were volunteers and did not receive any
compensation for their participation.
The training of the EN-RU group was scheduled for autumn semester 2016 and
involved 22 subjects who volunteered to participate and met the requirements. All of them
were fourth-year students of Applied Linguistics Department (Kharkiv National Aerospace
University). Their curriculum 12 featured Theory and Practice of Translation (English-
Russian/Ukrainian and Russian/Ukrainian-English), Translation Technologies, Editing and
Revision (English-Russian/Ukrainian), along with Theory of Algorithms, Computational
Linguistics, Basics of Informatics and Programming and other specialized fields.
In the autumn semester 2017 fourth-year students of Translation and Interpreting
Department (Universitat Autònoma de Barcelona) participated in the experimental study.
This time the total number of students who agreed to undertake the training and met the
requirements was 24 people. The academic curriculum 13 of this group featured such
compulsory and/or optional subjects as Theory and Practice of Translation (English-
Spanish/Catalan and Spanish/Catalan-English), Specialized Translation, Information
Science Applied to Translation and Interpreting, Audiovisual Translation and Localization
and others.
The summarized data of the study participants are presented in Table 29:
University / Department / Year Nr. of subjects Working language pair
Kharkiv National Aerospace University /
Applied Linguistics Department / 2016 22 EN-RU
Autonomous University of Barcelona /
Translation and Interpreting Department /
2017
24 EN-ES
Table 29. Total nr. of the full-scale study participants
12 https://faculty7.khai.edu/ru/site/perechen-distsiplin.html (Last consulted on 20.06.2018) 13 http://www.uab.cat/web/estudiar/ehea-degrees/study-plan/study-plan-structure-
1345467897115.html?param1=1228291018508 (Last consulted on 20.06.2018)

Part II. Experimental study
126
5.2. Study corpus
The language pairs selected for the full-scale study were EN-ES and EN-RU. The
first combination was stipulated by the full-time hosting institution of the researcher –
Universitat Autònoma de Barcelona (UAB, Spain) and, consequently, higher probability of
involving the local students to participate in the experiment. As mentioned in Section
4.4.1, the second combination had to do with the researcher’s country of origin, and the
fact that Kharkiv National Aerospace University (KhAI, Ukraine) was the institution that
agreed to offer internship facilities for the researcher’s external 3-month stay in conformity
with the requirements of the UAB International Doctoral Research Component.
The Autodesk corpus featured the original segments in English for which raw MT
output was available in both target languages (RU and ES). Quite logically, such raw MT
segments were heterogeneous in terms of output quality, and contained different number
and categories of errors. As the pilot study did not suggest crucial changes to the training
agenda and instruments, the segments from the pilot study could be reused for the group
with EN-RU as their working languages (Appendix III, Table III.1.1, III.1.2 and Link
III.1.3). As for the testing and training assignments for the EN-ES group, a new set of
segments was picked from the Autodesk corpus (Appendix III, Table III.2.1, III.2.2 and
Link III.2.3), and it was made sure that the selected EN-ES corpus set contained the similar
number and categories of MT errors as the EN-RU corpus set.
As can be seen in Table 30, the EN-RU set contains the same segments as were used
in the pilot study. Similarly, the segments for EN-ES language pair embraced the total of
168 segments: 60 segments split between two testing sessions (10 segments for warming-
up in each TS and 20 segments for post-editing in each TS), 8 segments for the training
purposes used during the presentation and one set of 100 segments for remote training in
PE:
Types of task TS 1 In-class
training Remote
training TS 2
Nr. of segments/words
EN-RU Warming-up 10 s. / 142 w. 10 s. / 132 w.
Post-editing 20 s. / 224 w. 8 s. / 89 w. 100 s. /1070 w. 20 s. / 232 w.
EN-ES Warming-up 10 s. / 169 w. 10 s. / 163 w.
Post-editing 20 s. / 241 w. 8 s. / 83 w. 100 s. /1103 w. 20 s. / 245 w.
Table 30. Study corpus

Part II. Experimental study
127
During the testing session and the remote training session, the students used the
TAUS DQF tool, which proved its efficiency and applicability in the piloting. The order in
which PE segments were presented to the trainees from both groups was randomized,
revisiting of earlier segments was not possible, which is typical of the MTPE industry.
To decide on the proportion of different categories of MT errors in the segments that
were further used for PE assignments, one hundred random EN-ES and EN-RU strings
from the Autodesk multilingual corpus were analyzed. Each string consisted of the original
segment in the source language, its translation by the MT engine and the “fit-for-purpose”
segment approved by professional linguists. In this way, the general tendencies were
tracked and later employed when selecting the segments for testing and training purposes.
The analysis revealed that about 35% of the selection contained more than two MT
issues, that required intervention on the part of post-editors. These segments were
classified as ‘disfluent’ or ‘incomprehensible’ regarding fluency and as the ones that render
‘little’ or ‘none’ of the meaning regarding adequacy. The other 65% were either not edited
at all or up to two edits were introduced. That meant that they were ‘good’ or ‘flawless’
regarding fluency and rendered ‘everything’ or ‘the most’ of the meaning regarding
adequacy. Such MT output quality better corresponded to our objective to introduce MTPE
to students and to positively influence their attitude to the field. The PE assignments for
testing and training only included the segments from the second category, for which reason
the raw segments selected for the study either contained no issues at all or up to two edits
could be introduced. A closer analysis with the help of MQM revealed that 30% of the
segments were left without changes, the other 30% had issues with accuracy, while the
fluency issues were edited in 40% of segments.
The reason for selecting one hundred segments for testing and training purposes was
stipulated by time constraints, as the subjects were full-time students in the final year of
their Bachelor’s program who were busy with their academic and professional
commitments. That fact implied that participation in the experiment was only possible on
condition that the professor who was supposed to be giving a lecture / practical class to that
group of students agreed to present the course material more compactly at a certain point
of the syllabus. In this way, the researcher could get an opportunity to conduct the testing
sessions and the in-class training session during the time slot previewed for the course
material.

Part II. Experimental study
128
o MT evaluation assignment
Human evaluation of MT output most commonly consists in application of
“adequacy and fluency paradigm” where adequacy (also known as ‘accuracy’) is
understood as the extent to which the machine translation renders the meaning of the input
in the source language, and fluency (also known as ‘intelligibility’) is the extent to which
the MT output is a ‘good’ exemplar of the target language (Doherty, 2017). In such
scenarios, human evaluators are expected to rate MT output segment by segment, i.e.,
without context at the sentence level, with the source text segment presented alongside,
frequently with the help of an ordinal scale (Koehn, 2009). At the same time there is a
rapidly growing literature on limitations such evaluation entails, especially in light of
dichotomies of good versus bad translation (Doherty et al. 2010; Blatz et al., 2003), the use
of interval scales (Koehn and Monz, 2006; Specia and Farzindar, 2010; Bojar et al., 2013;
Graham et al., 2013) or subjectivity of human evaluators has also been highlighted
(Koponen, 2012; Turchi et al., 2014). Even so, it was decided to include this type of task
into both TSs since in our case the issue under scrutiny was not the evaluation of MT
output per se, but rather familiarization of the subjects with MT issues by exposing them to
raw MT output of different quality. Another important argument in favor of including an
MT evaluation assignment into the testing session was that nearly half of the Sharing Post-
Editing Practices questionnaire respondents admitted that it is a common practice to start a
PE project with evaluation of the raw output and determination whether it should be post-
edited or translated from scratch (Chapter 3). For this reason, the MT output evaluation of
ten segments was offered as the first assignment of the pre-training and post-training
testing sessions.
The study corpus made it possible for the researcher to evaluate the required amount
of post-editing by comparing the raw MT category and its PE counterpart. As such, when
drafting the warming-up assignments (ten segments for each TS), five of such segments
them were ‘excellent/good enough’ to be delivered to the client after some editing or
directly without any changes made. The other five warming-up segments would require
more effort and would probably be good candidates to be translated ‘from scratch’ since
post-editing would result counterproductive.

Part II. Experimental study
129
o PE assignment
The original segments and the corresponding MT output came from the online
Autodesk database, and each testing assignment contained twenty segments and the equal
number of MT errors. In terms of quality the PE assignments included a mix of segments
that did not require any editing and segments that contained one/two MT errors. In
particular, each testing session assignment contained six segments that did not require
editing, six segments with adequacy issues and eight segments with fluency issues. In this
way an effort was made to imitate the frequency with which different categories of MT
errors appeared in the Autodesk corpus.
o Remote training
Each training set was comprised of one hundred segments and the equal number of
MT errors. Namely, thirty segments were not to be edited, thirty contained the cases of
adequacy, and the remaining forty were to be post-edited for better fluency. The purpose of
such distribution was to imitate the frequency with which different categories of MT
segments appeared in the selected pool of segments.
5.3. Instruments
This section provides a description of the range of instruments applied in the
experimental study, such as instructions, questionnaires, and in-class training materials
(Appendix III, Table III.3, and Links III.4, III.5.1 and III.5.2).
o Instructions
Apart from drafting the tasks for testing and training sessions, it was essential to
provide participants with clear and concise instructions on how to perform the testing
assignments. It is well known that thorough preparation of reference materials results in
improved validity, reliability, and efficiency of performance, and also increases the value
of the obtained data (Doherty, 2017). The instructions contained explicit information to
minimize cases of assumptions, misunderstanding and arbitrary rankings.
As demonstrated by the pilot training outcomes, the subjects did not experience any
difficulties when interpreting the instructions, for which reason the document that was used
for the pilot study was re-used in the course of the full-scale study. The instructions were

Part II. Experimental study
130
drafted with reference to the industry standards and current practices adopted in the MTPE
sector. We also considered the data from the survey Sharing Post-Editing Practices
(Chapter 3), where among the most popular reference materials the respondents indicated
at the general project specifications regarding the expected output quality level, delivery
dates, required tools etc. In contrast, very few respondents mentioned the use of PE
guidelines with instructions on and example of editing raw MT output errors. This detail
was taken into consideration, and the guidelines were kept to the minimum.
The reference information for the pre-/post-training TSs was presented in three
blocks: the project brief, project objectives, and PE guidelines (Appendix III, Table III.3).
The project brief described the technical details of the assignments, such as the origins and
the total number of segments to be evaluated and post-edited, and the way to access the
DQF tool. The participants were also informed that it was possible to refer to any available
resources in case of issues with meaning, form, and function of source and/or target
segment(s).
The project objectives comprised two types of assignments – the evaluation
assignment for the warming-up and the PE assignments. The expected quality level was
indicated as ‘full post-editing’. The first task focused on the evaluation of adequacy and
fluency. The former was interpreted as “the scope of meaning expressed in the target
translation as compared to the source,” the latter referred to “the extent to which the
translation is error-free and is perceived as natural/intuitive by a native speaker.” In line
with TAUS recommendations, the evaluation scale choices for the category of adequacy
parameter were described as “everything – most – little – none”, while the fluency
category was to be measured in terms of “flawless – good – disfluent – incomprehensible”
values. The second task of each TS was a PE assignment which required
“publishable/human-like” output quality level. Such requirement suggested that the
participants were expected to pay attention and make sure that the MTPE output was
understandable, grammatically correct and conveyed the original meaning.
Finally, the PE guidelines provided concise information on adequacy and fluency
issues. It was explained that the former embraced cases of mistranslation, addition and/or
omission, untranslated segments/words which led to problems with meaning transfer; the
latter focused on possible problems with the target language output, e.g. morphology, verb
forms, syntax, orthography, punctuation and “noise” (e.g., incorrect/missing/extra function

Part II. Experimental study
131
words/symbols, e.g. prepositions or punctuation marks), etc. While moderating the TSs,
the instructor also mentioned those issues with the raw MT that should not be edited (the
so-called “stylistic changes”) such as cases of replacing a correct lexical unit with a
synonym or changing the word order for the sake of fluency or stylistic purpose, etc.
o Questionnaires
To elicit information on the participants’ academic background and attitudes
regarding MTPE-related issues, an online questionnaire was drafted (Appendix III, Links
III.5.1 and III.5.2). The questionnaire was seen as an independent research instrument that
gave access to those aspects of PE performance that could not be observed directly
(Wagner, 2010: 23) and collected information that could not be reached through
quantitative methods.
Unlike most qualitative research approaches that involve direct observation of
behavior, questionnaires rely on individuals’ self-reports of their knowledge, attitude or
behavior; consequently, the validity of the provided data depends on the honesty of
respondents (Mertens, 2014: 105). To meet the needs of our study, the questionnaire
followed simple descriptive approach to gauge the characteristics of the subjects at one
point in time. Given the pre-/post-test nature of the research, its longitudinal application
was considered so that values from the pre-training session could be compared to the post-
training ones.
After analysis of the pilot study results (Section 4.4.5), the updated questionnaire for
TS 1 included the following blocks: introduction, glossary, respondents’ profile, MTPE-
related attitudes, and evaluation of PE performance as perceived by the trainees. At the end
of TS 1 questionnaire form, the students were invited to give written permission to use
their data for further analysis.
In the introductory block, the participants were informed that by filling in the
questionnaire they were contributing to doctoral research on post-editing competency
acquisition that is being conducted within the framework of the ProjecTA research project
(Universitat Autònoma de Barcelona, Spain). Particular attention was paid at the fact that
the experimental results were to be used to evaluate the efficiency of the training proposal
on PE performance enhancement so that such proposal could be incorporated into
academic syllabi of translation/interpreting departments or used for in-house training. The

Part II. Experimental study
132
anonymity of all research participants was guaranteed, identifiable information about
participants’ details was not to be reported or published, and all data were to be processed
confidentially. Also, it was stressed that the benefit of participation in the training
consisted in getting a more profound understanding of Machine Translation and Post-
Editing industry, hands-on PE experience, and practical background for further training in
expert PE skills. The Glossary section comprised a brief description of the key research
concepts – machine translation and post-editing.
To collect information on participants’ profiles, the TS 1 questionnaire inquired
about the subjects’ academic background in MTPE-related modules and translation-related
experience. Next, the students were invited to write down their name,
department/program/academic year and to indicate experience in any MTPE-related
modules and/or translation/PE projects, specifying the details in case the answer was
positive.
The block on MTPE-related attitudes and evaluation of PE performance as perceived
by the trainees consisted of the questions that were identical for both TSs (Table 31):
Question Answer options Objective
1. What is your attitude towards the usage
of MTPE in translation/localization industry?
1-4 scale (1=very
negative, … 4 =
very positive)
To identify possible bias
towards MT
2. Do you agree with this statement:
"Machine translated and post-edited output
of less-than-maximum quality is good
enough to be delivered to the client as a
complete job"?
1-4 scale
(1=strongly
disagree, … 4 =
fully agree)
To investigate how the
subjects see the quality issue in
MTPE
3. As a novice translator, would you be
interested in performing PE jobs on a regular
basis?
1-4 scale (1=no,
… 4 =yes) To get an insight into the
subjects’ attitudes towards
pursuing PE professionally
4. I am ... with my performance during this
testing session
1-4 scale (1 =
very dissatisfied,
… 4 = very
satisfied)
To gauge the participants’ self-
satisfaction level
5. If I am asked to perform similar
evaluation/post-editing jobs, I consider my
PE competency as ...
1-4 scale (1 =
deficient, … 4 =
excellent)...
To investigate the perceived
training effect of the proposal
Table 31. Questionnaire (identical for both TSs)

Part II. Experimental study
133
Along similar lines, the TS 2 questionnaire was drafted. This time there was no need
for background information on the participants (since the researcher had already collected
these data before), for which reason the questionnaire started with a glossary. Then, one
more time the students were invited to express their attitude towards MTPE, less-than-
maximum quality of PE output, eagerness to take up post-editing professionally, self-
satisfaction with PE performance and PE skills. To complement the collected data and get
a deeper insight into the possible impact produced by the training, the students were
encouraged to share their ideas in the free-text slot at the end of the questionnaire form.
The questionnaire ended with a thank-you note and a comment about the anonymity of the
collected data.
o In-class presentation
The PPT presentation combined theoretical and practical topics related to the MTPE
field and translation industry, on the one hand, and shared the results of the survey Sharing
Post-Editing Practices (Chapter 3), on the other. As was already mentioned, the survey
involved acting translators and post-editors and yielded first-hand data on MTPE-related
processes and tasks. The survey results were included s training materials so as to meet the
researcher’s aspiration to provide students with an overview of PE expertise as reported by
post-editors. Our sincere belief is that the real-life examples facilitate the introduction of
the training participants into the field and help them improve their understanding of the
MTPE industry as well as get an overall idea about the emerging profile of a post-editor.
The presentations consisted of seven thematic sections in correspondence with the
aims of the in-class training. Table 32 provides an overview of such objectives, the topics
covered and the relevant slides (Appendix III, Link III.4):
Objectives Content Slide nr.
Raise awareness
regarding the profile of
a post-editor
o respondents’ countries of residence, age, working
language pairs, academic background, professional
background
o the frequency of translation/PE-related tasks in the
regular workflow, perceived average productivity of
PE projects, regularity of PE task in different subject
fields
o PE project preparation, the starting point of a PE job,
1-12

Part II. Experimental study
134
PE tools and systems
Introduce the basic
concepts of MTPE
o origins of the MT industry
o the MTPE market share
o shortcomings of MT
13-18
Discuss PE quality
standards
o broad/narrow definition of translation quality
o light PE vs. full PE 19-20
Decide on the key PE
skills
o pre-conditions for successful PE
o general rules of PE
o 4 levels of MT output quality
o top skills of a post-editor (based on the survey
results)
21-24
Focus attention on
decision-making
triggers
o PE triggers (based on the survey) 25
PE practice o segments with MT issues (EN-RU)
26-27
Expose students to PE
expertise
o comparison of translation vs. PE as professional
activities (based on the survey)
o comparison of the competencys levels: translator vs.
post-editor (based on the survey)
28-29
End of the presentation 30
Table 32. In-class training presentation
5.4. Protocol
o Pre-training testing session
The suggested training proposal aimed at enhancing PE performance of
undergraduate students. At the beginning of the pre-training testing session (TS 1), the
participants were informed that by taking part in the experimental study they contribute to
doctoral research on PE competency acquisition. It was stressed that anonymity of the
participants would be protected, no reports or publications containing identifiable
information regarding their names and contact data would be published.
The testing session started when the participants went to the indicated web-page in
Google Sites and opened the link with instructions on how to perform the testing session
assignments. As explained earlier, this document dealt with the tasks the students were

Part II. Experimental study
135
supposed to perform, described the required tool and how to access it, and contained the
instructions on the performance of the assignments with detailed information on how the
evaluation and post-editing tasks were supposed to be completed. Our objective at this
point was twofold: first, to give students a comprehensive idea of criteria applied to quality
evaluation in PE; and second, to screen subjects’ initial level of PE competency and to
check how/if it changes as a result of the training.
During the warming-up task, the students were asked to evaluate 10 raw MT
segments in the DQF tool. To facilitate evaluation of raw MT output, the instructions
contained the explanation of the adequacy criteria (ranging from everything to none) and
fluency criteria (ranging from flawless to incomprehensible). On top of that, the DQF tool
also featured a built-in option of demonstration of the evaluation criteria on demand. In
the case of the post-editing task, the subjects were informed that “publishable quality” of
the assignments was required. Such a criterion implied full accuracy and compliance with
the target language grammar and spelling rules so that the output was understandable,
grammatically correct and conveyed the original meaning. As well as in the previous case,
all raw MT segments were selected from the Autodesk online multilingual corpus. The
instructions ended with customized PE guidelines, devised to familiarize the subjects with
the types of raw MT issues to be edited (accuracy and/or fluency errors) and not to be
edited (stylistic changes). Having read through the instructions, the participants moved to
the next section of the web-page to check the layout of the warming-up and the post-
editing tasks in the DQF tool. At this point, links to TS 1 assignments were sent to all
participants so that they could start working.
After completion of the evaluation/post-editing part of TS 1, the students proceeded
to the next link, which led them to the questionnaire form. The questionnaire started with a
brief description of the project and benefits of participation, and contained a glossary. First,
the students answered to open- and closed-end questions about their academic background,
professional experience in translation and/or postediting. In the next block of questions,
they shared ideas concerning attitudes towards the usage of MT in translation/localization
industry, their perception of quality standards adopted in MTPE and attitudes towards PE
as a professional occupation. Also, the study participants were asked to evaluate their PE
performance and express the degree of their disposition to perform PE in the future. The
last paragraph read that by writing down their first and last name the students granted their

Part II. Experimental study
136
consent and voluntarily agreed to participate in a series of research assignments as well as
to provide their data for further processing. Such processing included but was not limited
to data evaluation, classification, and publishing of the study results in the present doctoral
research and future publications. All students provided their informed consent to
participate in the study.
The key objective of this phase of the study was to collect data on the subjects’ PE
performance, attitudes towards MTPE-related issues and PE performance convictions
before the training. This information was further used to measure the influence of the
proposal on novice translators and to contribute to the ongoing research in the field of
training in PE.
o Training sessions
The core component of programmed learning is the program itself – an ordered
sequence of chunks with the rising level of difficulty, presenting some information and
ending in a question so that the student provides final answers. The program is expected to
have a logical layout, to engage students in participation, to provide them with feedback
and contain a clear statement of measurable objectives. Another important requirement is
adaptability of the program to individual learning rhythm of the students. For this reason,
the training activities of our proposal consist of a combination of theoretical and practical
elements involving an in-class seminar and remote self-study.
In-class training
The lead-in part of the presentation was focused on the scope of post-editing
expertise, as revealed by the results of the survey (Chapter 3). At first, the students got an
overview of the survey participants’ age, countries of residence and working language
pairs. Then, the information on respondents’ membership in professional translators’
associations, their academic background(s) and experience in translation and/or post-
editing was provided. The next block of slides focused on what PE is about and how it is
performed. Special attention was paid to the frequency of translation/PE-related tasks in
respondents’ workflow, average productivity rates and metrics for their calculation. The
training session participants were informed about the frequency of applying (semi-)
automatic PE operations, correlation of full/light PE and high-/low-visibility content and

Part II. Experimental study
137
the most common subject fields for PE projects. When talking about how the PE workflow
of translators engaged in PE is arranged, MTPE project management and the starting point
of PE assignments were analyzed. Next, the frequency of using relevant tools, systems, and
reference materials in MTPE-related projects was discussed.
The training session continued with a description of the origins of the MT industry in
the middle of the 20th century and a brief overview of MT models developed since then.
Before introducing shortcomings of MT, the participants were invited to come up with
their ideas on what such shortcomings might be like. Having covered this issue, the data
regarding the MTPE market share were discussed, as were the pros and cons of using MT
in the workflow. The latter issue predetermined the theme of the following group of slides,
which dealt on the broad vs. narrow definition of translation quality, followed by the
comparing and contrasting similarities and differences of light vs. full post-editing.
Next, the students were invited to work in groups and decide on the pre-conditions
for a successful MTPE project. The answers were written down and compared to the
training materials. To facilitate acquisition of PE competency, the MT output evaluation
levels were analyzed as interpreted by the flagship of the MTPE industry – TAUS. It was
made clear that no post-editing was required if the MT output could be classified as
“excellent“ and understanding of a particular segment was not improved by reading the
source; minor post-editing was recommended for the cases of “good” segments, i.e., when
the MT output contains minor errors affecting grammar, syntax, punctuation, word
formation or unacceptable style. On the other hand, the training participants were advised
to consider serious post-editing for the MT output samples of “medium” quality, when
understanding was improved by the reading of the ST, and manual retranslation from
scratch in the case of segments of “poor” quality when one’s understanding only derived
from the reading of the source segment.
In continuation, the students learned about the basic principles of PE, such as
maximum use of raw MT output, making sure the target text corresponds to the source text
and contains no additional information, ignoring stylistic errors with the exception of
culturally offensive, inappropriate and unacceptable terms, applying the basic rules of
spelling, grammar, punctuation, and formatting. To approach the topic of PE strategies
from a different angle, the instructor recurred to the survey results in the part of PE-related
skills ranking. It was demonstrated that the total of responses could be boiled down to top

Part II. Experimental study
138
3 PE skills: the ability to make decisions quickly on whether MT output is editable, ability
to produce “fit-for-purpose” output and ability to abstain from over-/under-editing. Then,
the students were invited to think of 3 key reasons that would cause post-editing of a
particular MT issue. The next slide featured another screenshot from the survey – this time
the trainees zoomed into decision-making triggers that cause post-editing or translation
from scratch.
As mentioned in Chapter 1, for training and testing purposes the MT error typology
elaborated in the framework of the QTLaunch-Pad project based on MQM annotation
guidelines and the MQM annotation decision tree (version 1.4, 2014) was used. The
versatile nature of the so-called “one-size-fits-all” metrics provided a solid baseline to
analyze the PE output produced by participants with different target languages and
minimal/no experience in PE. Since the MQM model is characterized as language-neutral,
it could be demonstrated and applied during the training sessions with both groups of the
participants.
On the whole, the MQM model was considered flexible and applicable to the output
available in Spanish and Russian languages, being sufficiently broad to include the main
categories of edits in both languages. Given the time constraints of the project, the brevity
and conciseness of the selected typology were among its other advantages, as were ease of
use and clear boundaries, which facilitated its prompt memorizing by the trainees. To put
to practice the acquired knowledge and skills, the participants were invited to post-edit 8
segments of the corresponding language pair and discuss their outcomes in groups. After
that the instructor demonstrated the “golden standard” to provide feedback on the recently
emitted PE performance.
Since all participants were translation students, at the end of the presentation we
thought it particularly useful to pay attention to the comparison of post-editors’ vs.
translators’ profiles as described by the survey respondents themselves. For this reason,
both activities were compared through the prism of the perceived scope of required
competencies and levels of satisfaction with the roles of a translator and/or post-editor.

Part II. Experimental study
139
Remote training
At the beginning of each of the two following weeks, the students received a 50-
segment long PE assignment to be performed using the DQF tool (the same tool that was
used during the testing session). However, the compilation of segments for this part of the
training was different from the one used in TS 1: the tool was customized in such a way
that first the students received a raw MT segment to be post-edited, and then the system
demonstrated the post-edited equivalent of the aforementioned segment. As a result, the
students could see how close/far from the “golden standard” their output was. In this
manner, the trainees were provided with immediate feedback right after emitting their
response, which reinforced their experiential learning.
Remote training was based on self-learning principles: as soon as the students
submitted their opinion on evaluation, they could see how/if the segment was post-edited
by Autodesk experts (or was left without changes). The raw MT segments were explicitly
marked with the abbreviation MT to demonstrate that intervention might be required, while
the segments that started with the abbreviation PE were the “golden standard” considered
as segments of publishable quality. In this way, the training participants could see for
themselves those cases when post-editing of MT errors was necessary, and the ones where
such edits could be classified as preferential and/or stylistic. To avoid any possible
misunderstandings, before the end of the in-class training session the instructor
demonstrated the sequence of raw and “fit-for-purpose” segments on the whiteboard.
In this way, the students got prompt feedback on how close their evaluation of MT
output quality was to the evaluation performed by professional post-editors. Immediate
error correction made the remote training session a self-consistent model, as the content
was split into small didactic units, which in our case equaled segments. Enhancement of
PE performance happened through exercise and control, which led to PE strategy
assimilation.
o Post-training testing session
At the closing stage of the experimental study, the post-training testing session (TS
2) was conducted. The participants were provided with instructions on how to accomplish
assignments. This time, TS 2 aimed to obtain the information that would facilitate

Part II. Experimental study
140
evaluation of the subjects’ PE performance before and after the suggested training, as well
as measure the subjects’ tendencies in their attitudes.
Using the same data collection instruments, TS 2 started with a warming-up
evaluation assignment. Next, the students performed post-editing of raw MT output. After
the accomplishment of both assignments, they proceeded to filling in the questionnaire. As
explained earlier, the questionnaire was aimed at gauging post-training MTPE-related
attitudes and PE performance convictions. In line with the pilot study, the TS 2
questionnaire was complemented with an open-ended question to collect the students’
impressions about the impact of the training (if any).
In this way, an extensive dataset of quantitative and qualitative values was collected
for further analysis and interpretation (Part III).
Concluding remarks
To enhance PE competency among undergraduate translation students a training
proposal was elaborated in accordance with the EHEA recommendations and competency-
based training principles. The efficiency of such proposal was measured by comparing the
PE performance of the subjects before and after the training. Bearing in mind that the
fewer the number of the participants, the more important it is to include multiple data
sources to achieve a balance in the study (Hatch, 2002: 50), PE competency acquisition
was measured with the help of qualitative and quantitative data collected via questionnaires
and simulations of PE jobs.
Among the major weaknesses of experimental studies are threats to validity, for
which reason a thorough planning was involved to minimize their effect. In order that no
events that happen during the course of the study may influence the result (so-called
“history threat”), it was made sure that the participants did not attend any training aimed at
enhancement of PE competency either before or during the experiment. Both testing
sessions were held at the same time on one and the same day of the week with a two-week
break in between, which helped us exclude maturation threat, since no significant physical
and/or psychological changes that would account for discerned study effect could have
occurred with the participants. The threat of testing (improvement of the post-training test
results only because it is the second time the students take the test) and instrumentation

Part II. Experimental study
141
(difference of measuring instruments used in pre-test and post-test) were minimized by
drafting the test assignments in a way so that they contained an equal number of segments
selected in accordance with the MT error typology applied in the study, and using the same
tools and evaluation scales. Since all participants were volunteers, the only type of threat
that could not be fully controlled by the researcher was mortality. As a consequence,
during the piloting there were students who participated in TS 1, although dropped out
later. Fortunately, no similar cases were reported during the full-scale study.
The conducted study is an example of applied research since it is focused on the
solution of practical problems that exist in the MTPE industry and academic sector. Its
primary objective was to develop a sharable approach to PE competency enhancement, to
describe the implications brought by the study design, and to share suggestions regarding
the procedures and techniques aimed at PE competency acquisition. Efficiency and
effectiveness of the proposed training were first tested in the course of the pilot study,
which was followed by a full-scale experimental study. Collection of qualitative and
quantitative values from the study participants minimized the possible bias and provided a
solid ground for triangulation of the study results.
The aim of the present research was to draft and put into practice a baseline training
proposal that would result in PE competency acquisition by undergraduate translation
students who were not previously exposed to post-editing workflow. The training
objectives included an introduction of the subjects to the concept of MTPE and the changes
it brings to the translation industry; enhancement of the subjects’ PE performance;
improvement/keeping positive the subjects’ attitudes towards MTPE-related issues and
their role in the MTPE process.
Current research into the psychology of learning seems to validate the view that
endorsing responsibility to students makes them responsible for their success and gives
more chances to become professionals after graduation. For this reason, a significant part
of the training was performed by the participants autonomously. The pool of the
participants was made of 46 volunteers in the final year of their undergraduate (Bachelor’s)
program at the Autonomous University of Barcelona (Spain) with EN-ES as their working
language pair and Kharkiv National Aerospace University (Ukraine) with EN-RU as their
working language pair.

Part II. Experimental study
142
To prove the research hypothesis about the beneficial influence of the training on the
subjects’ PE competency, sufficient evidence was to be collected. The pre-/post-test
methodology adopted for the experimental study provided two sets of data: the first one
was collected after TS 1 , and the second one – after TS 2. The use of the TAUS DQF tool
as data collection instrument assured for two types of quantitative values: throughput rates
(measured by the time required to complete a PE assignment, otherwise called the word-
per-hour rate), and output quality (measured by the number of under-edited, over-edited
and fit-for-purpose PE segments produced by the participants). Qualitative values were
obtained in the form of answers to the 6-item questionnaire that gauged students’ attitudes
towards MT phenomenon and quality criteria adopted in the MTPE sector, students’
eagerness to take up PE jobs on a regular basis, and self-assessment of their participation in
the proposed training (in terms of acquired PE competency and satisfaction with PE
performance). Also, at the end of the second testing session, the participants shared their
opinions on the perceived impact of the training.
The case study was aimed at enhancing PE competency in conformity with the
constructivist framework and the principles of programmed learning. The suggested
training program might have involved teaching methods used in teaching translation and/or
revision due to the author’s belief that some of the tasks aimed at PE skills development
are very much like those used to train translators/editors, though not identical. The
proposal may be alternated and adapted to the specific needs of each particular project and
is expected to be of use for teaching staff and those in charge of in-house training.

Part III. Study outcomes: analysis and reflections
143
Part III. Study outcomes: analysis and reflections
After focusing on the design and methodology applied to the experimental study,
conducted at two universities: Universitat Autònoma de Barcelona (Spain), and Kharkiv
National Aerospace University (Ukraine) during 2016-2017 (Part II), in Part III we provide
descriptive, inferential and interpretative analysis of the study outcomes and share our
reflections on the potential of the suggested training proposal in light of the changes
brought to the MTPE landscape by the rise of neural MT paradigm. Therefore, Chapter 6
examines the collected qualitative and quantitative data and focuses on the interrelation of
PE performance values and students’ attitude towards MT. Next, Chapter 7 offers a brief
description of the Neural Machine Translation (NMT) model and speculates over how and
to what extent application of (N/S)MT systems could potentially influence the training.
Finally, a conclusion is drawn about the impact the recent changes in MT principles are
likely to have on the suggested training proposal.

Part III. Study outcomes: analysis and reflections
144
Chapter 6. Analysis of experimental study outcomes
This chapter consists of three sections and conclusive remarks, and offers analysis
and interpretation of the obtained data. Section 6.1 starts with a description of quantitative
datasets, coming from pre- and post-training testing sessions that reflect PE performance of
the participants. For greater clarity, the results of each group are treated as data subsets
inside the total pre-/post-training dataset made of the combined results of both groups. The
analysis includes calculation of core measurements and visual representation of the
obtained values, as well as the comparison of segmented and combined data for each
testing session. To see if and to what extent the tendencies demonstrated by the
experimental groups can be extrapolated more widely, inferential analysis is conducted for
each subset of data. After that, the associative correlations between the quantitative values
are examined.
In continuation, Section 6.2 describes the trends observed in participants’ MTPE-
related attitudes and self-evaluation, as well as students’ opinions regarding the effect of
the suggested training. Associative analysis is performed to measure the statistical
significance between different categories of values within each data set.
Finally, Section 6.3 pretends to correlate quantitative and qualitative values by means
of comparative analysis and in this way to explore the trends of PE performance data
distribution when contrasted against MT-related attitude.
6.1. PE performance
Descriptive analysis of PE performance presupposes examination and contrasting of
the values obtained before and after the training (i.e., testing sessions 1 and 2, further
referred to as TS 1 and TS 2). For better informativeness, the results are presented in tables
and in the form of boxplot diagrams (also known as box-and-whisker diagrams). The
analyzed values are discrete and report on participants’ throughput (i.e., word-per-hour
rate, further referred to as WPH rate), and the quality of PE segments, such as under-edited
segments vs. fit-for-purpose segments vs. over-edited segments. To keep the analysis
succinct and to the point, calculations of the core values are presented in the form of tables,
while the exhaustive numeric breakdown of all PE performance data is displayed in
Appendix IV. To describe the core values of the available datasets, the minimum and

Part III. Study outcomes: analysis and reflections
145
maximum values are defined, the arithmetic mean and median are calculated; to
complement central measures and describe the core values dispersion the standard
deviation is introduced.
Personal information about each participant was coded and stored separately. To
describe and examine inferences and correlations between the collected batches of
quantitative values a separate Excel file was created for each subset of data. This measure
provided us with a possibility to get a clearer picture of the tendencies demonstrated by
each group separately before combining the data. After that, the relevant statistical
methods were applied, and the obtained results were analyzed.
Apart from the core measurements, the distribution of values is visually represented
by boxplot diagrams. To this end, the R Commander was used – a platform-independent
basic-statistics user interface for R, based on the tcltk package. When drawing diagrams,
the R Commander sorted the collected quantitative values into four equal-sized groups
with 25% of the values placed in each group. The median that marks the midpoint of a
dataset was represented by a black line and was consistent with the results, indicated in the
relevant table. The upper whisker presented the values from the upper quartile to the
maximum value and the lower whisker – the values from the lower quartile to the
minimum value. As such, seventy-five percent of experimental data fell below the upper
quartile, and twenty-five percent were placed below the lower quartile. The circles
presented the outliers – i.e., the extreme values that deviate from the rest of the samples.
Descriptive analysis of the results is followed by inferential analysis. Its objective is
to evaluate the possibility to extrapolate the trends demonstrated by the experimental
sample (two groups of undergraduate students) on a larger scale, and as a consequence to
come up with a reasonable prediction of the effect of the suggested training proposal. To
this end, our aim was to infer key tendencies from the sample data so as to make a
judgement on whether the results observed in this study were dependable ones, which
corroborates the beneficial effect of the training on the participants’ PE competency, or
whether such results had happened by chance.
Two methods applied are parameter estimation and hypothesis contrast. Parameter
estimation analyzes the distribution of data, provided by the participants before and after
the training. Data distribution complements the average mean, median, and standard
deviation values, since this time the results are ordered and presented in ascending or

Part III. Study outcomes: analysis and reflections
146
descending way, which opens more possibilities for data interpretation. The method used
to contrast hypothesis depends on data distribution and consists in comparing the
formulated statement against the empirical data to decide whether or not the hypothesis is
compatible with these data.
In concordance with the research hypothesis about the beneficial influence of the
proposed training, we assume that the data should be contrasted unilaterally with the
direction of the contrast toward an increase of throughput and fit-for-purpose PE segments,
on the one hand, and a decrease of over-edited and under-edited segments, on the other. To
provide confirmatory evidence for these hypotheses to be discarded or accepted, bar
diagrams were drawn to define the type of distribution of values, and the normality test
(otherwise called “goodness-of-fit” test) is applied. In conformity with the nature of the
data analyzed in this section, which are discrete quantitative values, a chi-square test is
deployed for these purposes. The level of statistical significance applied in the normality
test was 0,05 which defines data distribution as probabilistic (p>0,05) or non-probabilistic
(p<0,05), thus indicating whether parametric or non-parametric statistical analysis should
be used when contrasting the study hypotheses. Hence, in conformity with the results of
the normality test and bar diagrams, discrete values with probabilistic distribution are
analyzed using Student’s paired-samples t-test, while for values with non-probabilistic
distribution Wilcoxon signed-rank test was applied. Both tests aim at contrasting the
hypotheses and help decide whether the hypothetical judgement should be maintained or
rejected. It is important to mention that for this kind of tests statistical significance level is
0,05. For this reason, when the difference between the groups was checked, the null
hypothesis was accepted in case if p-value>0,05 and was rejected if p-value<0,05. The
calculations are conducted with the help of R Commander.
Finally, associative correlations are analyzed with the aim to measure the relation of
variables within a sample. The available quantitative values are examined using the
relevant associative statistics methods. Given the significant number of the analyzed
values, these datasets are treated like correlations of continuous data. In this case, Pearson
product-moment correlation or Spearman rank-order correlation is applied for parametric
and non-parametric distribution correspondingly. These tests compare the proportion of
cases of each combination of categorized values with the aim to verify whether the
variables are independent (Hypothesis 0) or dependent (Hypothesis 1).

Part III. Study outcomes: analysis and reflections
147
6.1.1. Descriptive and inferential analysis of PE throughput
In this sub-section PE throughput values of Group 1 (EN-RU) and Group 2 (EN-ES)
are studied separately; then the same operations are applied to the combined results. First,
the data are arranged in tables where columns TS 1 and TS 2 show the relevant WPH rate
for each of the TSs, the column Difference demonstrates the increase/decrease of the
throughput values in TS 2 as opposed to TS 1, followed by percentage correlation of the
analyzed results (column “%”). A detailed numeric breakdown of the participants’
throughput is presented in Appendix IV, Table IV.1. Next, to get an even better overview
of data distribution and examine the traceable patterns, the sample results for each group
separately and both groups combined are illustrated by box-and-whisker diagrams.
Group 1. As demonstrated in Table 33.1.1, in Group 1 the core values of TS 2
exceed those of TS 1 in all categories, the fact that is proved by positive increase reported
in the Difference column. The increase in the part of minimum values is reported as 279
WPH (364 WPH in TS 1 vs. 643 WPH in TS 2), while the maximum values demonstrate
improvement of throughput by 775 WPH (2210 WPH in TS 1 and 2985 WPH in TS 2). On
a more fine-grained scale, the increase of the minimum value is nearly twice more
significant than the increase of the maximum value (76 % vs. 35%):
TS 1 TS 2 Diff. %
Min. 364 643 279 76%
Max. 2210 2985 775 35%
Arithmetic Mean 1032,3 1636 603,7 58%
Median 1002,5 1494 491,5 49%
Standard deviation 415,33 582,2 166,87 40%
Table 33.1.1. Core values and SD (WPH rate, Group 1)
The collected data suggest that participation of Group 1 students in the training was
beneficial and contributed to the rise in PE throughput since the arithmetic mean and
median have increased in TS 2 almost twice.
When visualizing Group 1 performance in both TSs, the G 1_TS 1 boxplot turned out
to be comparatively shorter than the G 1_TS 2, suggesting that TS 1 was characterized by a

Part III. Study outcomes: analysis and reflections
148
higher level of internal agreement of values obtained from the subjects. In contrast to TS 1,
students demonstrated quite a different throughput rate in TS 2, which is reflected in a
taller boxplot in general and its third quartile in particular. While in TS 1 the 2nd and 3rd
quartile groups showed a similar distribution regarding the median, in TS 2 the observed
WPH rate for the 3rd quartile group suggests quite varied results (Figure 9.1.1):
Figure 9.1.1. Throughput boxplot diagram (Group 1)
As can be seen from the Figure, the throughput demonstrated by the participants in
TS 2 increased on all levels, be it the extreme values or the median, and showed more
heterogeneity if contrasted against the results of TS 1.
Our hypothesis for this subsection was defined as follows: the WPH rate
demonstrated by Group 1 in TS 1 is lower than the WPH rate in TS 2, which entails
application of unilateral contrast and selecting the option “Difference < 0” in the relevant
statistical test. To reject or accept the aforementioned hypothesis, we proceed to inferential
analysis of Group 1 results. Figure 9.1.2 summarizes the distribution of values in both TSs.

Part III. Study outcomes: analysis and reflections
149
Figure 9.1.2. Distribution of Group 1 values in TS 1 and TS 2 (the horizontal axis represents the
participants, the vertical axis contains the WPH rate)
To get a more in-depth perspective of the data provided by the diagram, and to
decide what type of statistical method to apply, the normality test was conducted. Its
results are shown in Table 33.1.2, while the screenshot of R Commander is demonstrated
in Appendix V, Image V.1.
Test of normality
(statistical significance level p>0,05)
Data distribution
TS 1 p = 0,7024 probabilistic
TS 2 p = 0,1222 probabilistic
Table 33.1.2. Test of normality (WPH rate, Group 1)
As we can see, the distribution of results in both TSs demonstrated probabilistic
tendencies, which gives us grounds to apply the t-Student paired-sample test to confirm or
reject the hypothesis. The results of these operations are shown in Table 33.1.3 (the
screenshot of R Commander calculations are presented in Appendix V, Image V.2).

Part III. Study outcomes: analysis and reflections
150
t-Student test
(statistical significance level p<0,05)
Result
Hypothesis 0: TS 1 ? TS 2
p = 0,0000098
H0 is rejected
Hypothesis 1: TS 1 < TS 2 H1 is accepted
Table 33.1.3. Contrast of hypotheses (WPH rate, Group 1)
As we can see, the reported p-value is 0,000009843 (round off p=0,0000098). It is
smaller than 0,05, which confirms out hypothesis for Group 1 throughput results (TS 1 <
TS 2).
Group 2. As well as in the previous case, the core values of Group 2 in TS 2 exceed
the values of TS 1, as demonstrated by a positive increase in the Difference column (Table
33.2.1). However, in this case, the increase of WPH rate for the minimum and the
maximum value is more similar in terms of absolute values (455 WPH for the minimum
values vs. 530 WPH for the maximum value). On the other hand, when comparing the
increase percentage-wise, the difference between the minimum values is nearly twice
bigger than between the maximum values (66% vs. 21%), which corroborates the tendency
observed in Group 1.
TS 1 TS 2 Diff. %
Min. 689 1144 455 66%
Max. 2432 2962 530 21%
Arithmetic Mean 1244,8 1842 597,2 48%
Median 1154,0 1642 488 42%
Standard deviation 443,85 488,9 45,05 10%
Table 33.2.1. Throughput core values and SD (WPH rate, Group 2)
The collected data suggest that participation of Group 2 students in the training was
beneficial and contributed to the rise in PE throughput since after the training the
arithmetic mean and median have increased.
Distribution of Group 2 throughput results (Figure 9.2.1) indicates similarities in TS
1 and TS 2 inter-quartile range, although with a significant increase of the median value in
TS 2. TS 1 results included an outlier that fell outside the upper whisker. Another

Part III. Study outcomes: analysis and reflections
151
noteworthy observation deals with the data produced by the 2nd quartile group: while in TS
1 the 1st and 2nd quartile groups show a similar range of variability, TS 2 is characterized
by a very uneven distribution of data, especially the 2nd quartile group. This fact suggests
that twenty-five percent of the sample demonstrated very similar PE throughput after the
training:
Figure 9.2.1. Throughput boxplot diagram (Group 2)
The WPH rate reported by Group 2 students in TS 1 and TS 2 respectively was
analyzed for inferences. To estimate the preliminary distribution of values the bar diagram
was drawn based on the data provided in each of the TSs (Figure 9.2.2).
Figure 9.2.2. Distribution of Group 2 values in TS 1 and TS 2 (the horizontal axis represents the
participants, the vertical axis contains the WPH rate)

Part III. Study outcomes: analysis and reflections
152
To zoom into the tendencies of Group 2 data distribution, the normality test was
conducted. Its results are indicated in Table 33.2.2, while the screenshot of R Commander
calculations is shown in Appendix V, Image V.3.
Test of normality
(statistical significance level p>0,05)
Data distribution
TS 1 p = 0,2466 probabilistic
TS 2 p = 0,0029 non-probabilistic
Table 33.2.2. Test of normality (WPH rate, Group 2)
In this case, the TS 1 data set demonstrated probabilistic distribution, while TS 2 data
set was distributed non-probabilistically. For this reason, we apply the non-parametric
Wilcoxon test to corroborate our hypothesis. The results are presented in Table 33.2.3; the
screenshot of R Commander calculations is provided in Appendix V, Image V.4.
Wilcoxon test
(statistical significance level p<0,05)
Result
Hypothesis 0: TS 1 ? TS 2
p = 0,0000097
H0 is rejected
Hypothesis 1: TS 1 < TS 2 H1 is accepted
Table 33.2.3. Contrast of hypotheses (WPH rate, Group 2)
The Wilcoxon test revealed the p-value that equals 0,000009702 (round off p =
0,0000097). This result is smaller than 0,05, which proves statistical inference between TS
1 and TS 2 values and confirms our hypothesis on the increase of the WPH rate after the
training.
Groups 1 and 2. Finally, in Table 33.3.1 the core values of both groups are collected
to see the average rates for core values in each of the TSs. As it turned out, the average
minimum WPH rate corresponded to the data provided by Group 1, while the average
maximum WPH rate was closer to the data provided by Group 2, exceeding the latter only
by 1%. The average values of other core measurements and SD were in between the values
reported by each of the groups.
TS 1 TS 2 Diff. %
Min. 364 643 279 76%
Max. 2432 2985 553 22%
Arithmetic Mean 1143,2 1743 599,8 52%

Part III. Study outcomes: analysis and reflections
153
Median 1052,5 1630 577,5 55%
Standard deviation 439 539,53 100,53 23%
Table 33.3.1. Core values and SD (WPH rate, Groups 1 and 2)
On the whole, the boxplot diagram (Figure 9.3) corroborates the findings that
characterize both groups and indicates the increase of throughput after the training:
Figure 9.3. Throughput boxplot diagram (Groups 1 and 2)
In particular, when analyzing the combined results of both groups, the 2nd quartile in
both TSs demonstrated less varied results than the other quartiles. TS 1 boxplot was
slightly shorter than TS 2 one, indicating an increase of the interquartile range after the
training. Also, in TS 1 some values were recorded outside the upper whisker zone, while
TS 2 did not demonstrate any outliers. The analysis of throughput values reported an
increase of the minimum and maximum values as well as the mean, and rather even
dispersion of data. However, in TS 2 a more significant difference between the extreme
values was observed. In addition, the upper quartile in both TSs was nearly one and a half
times more distant from the median value than the lower quartile, suggesting broader
dispersion of values in the 3rd quartile groups as opposed to the 2nd quartile groups.

Part III. Study outcomes: analysis and reflections
154
Statistical correlations observed in Groups 1 and Group 2 results demonstrated
consistency since in both cases the increase of WPH was reported in TS 2. However, to
corroborate the available evidence the combined results of both groups were required.
Previously Figures 2.1 and 2.2 demonstrated the distribution of values in each of the
groups, while Table 33.3.2 summarizes the results of normality test conducted on the
combined set of values (the screenshot of R Commander results is shown in Appendix V,
Image V.5).
Test of normality
(statistical significance level p>0,05)
Data distribution
TS 1 p = 0,3808 probabilistic
TS 2 p = 0,0005 non-probabilistic
Table 33.3.2. Test of normality (WPH rate, Groups 1 and 2)
As Table 33.3.2 shows, distribution of TS 1 data is probabilistic, while the contrary
is true for TS 2. In this case, the non-parametric test (namely, Wilcoxon signed-rank test)
is applied to examine possible statistical correlations. Its results are provided in Table
33.3.3 (the screenshot of R Commander calculations is presented in Appendix V, Image
V.6).
Wilcoxon test
(statistical significance level p<0,05)
Result
Hypothesis 0: TS 1 ? TS 2
p = 0,0000000024
H0 is rejected
Hypothesis 1: TS 1 < TS 2 H1 is accepted
Table 33.3.3. Contrast of hypothesis (WPH rate, Groups 1 and 2)
The statistical significance level for this type of test was defined as p<0,05, and the
test produced the outcome of p=0,000000002369 (rounded off p=0,0000000023). The test
results confirmed the hypothesis about the increase of the WPH rate increased after the
training.
To summarize, the results of Group 1, Group 2 and the combined results corroborate
our hypothesis about the beneficial influence of the training on the trainees’ throughput
rate. However, if boxplot diagrams that illustrate Group 1 and combined results
distribution do not demonstrate any particular trends, the Group 2 boxplot is skewed
towards the bottom which indicates a tendency to provide more homogenous output by
“slower” performers.

Part III. Study outcomes: analysis and reflections
155
6.1.2. Descriptive and inferential analysis of PE output: under-edited segments
This section describes the distribution of under-edited segments in both TSs. The
columns TS 1 and TS 2 show the core values in each of the TSs, the column Difference
demonstrates the increase/decrease of the number of PE segments in TS 2 as opposed to
TS 1, followed by percentage correlation of the results (column %). To be more succinct,
the Tables 34.1.1, 34.2.1 and 34.3.1 contain only the maximum and minimum values,
arithmetic mean, median and standard deviation. A detailed numeric breakdown of the
participants’ PE output is presented in Appendix IV, Tab. IV.2 (Group 1) and IV.3 (Group
2). Distribution of values is visualized through a box-and-whisker diagram for each group
separately and the combined results.
Group 1. The analysis starts with the examination of under-edited segments, which
were produced by Group 1 in both TSs. Table 34.1.1 contains the core values and standard
deviation. As suggested by the Difference column, the observed values increase in the part
of minimum and maximum values, and decrease in the part of the arithmetic mean and
median, indicating a reduction of data variation after the training. The SD is insignificant
as it is close to 0:
TS1_un TS2_un Diff. %
Min. 1 2 1 100%
Max. 9 10 1 11%
Arithmetic Mean 6 5 -1 -17%
Median 6 4,82 -1,18 -20%
Standard deviation 1,95 1,87 -0,08 -4%
Table 34.1.1 Output quality (Under-edited segments, Group 1)
On the whole, the results indicate a slight decrease in the total number of under-edited
segments after the training.
Visualization of Group 1 under-edited segments (Figure 10.1.1) demonstrates even
distribution of values that belong to the interquartile range as the upper and lower quartile
appear at an equal distance from the median in TS 1. In TS 2 the tendency changes and the
lower quartile is more distant from the median than the upper quartile, which means a

Part III. Study outcomes: analysis and reflections
156
wider variety of results in the 2nd quartile group. Figure 10.1.1 corroborates the
aforementioned finding about a slight decrease in the number of under-edited segments
towards TS 2. At the same time, it is important to mention that TS 2 shows more
heterogeneity of the 2nd quartile group, which may also be interpreted as the effect of the
training.
Figure 10.1.1. Output quality boxplot diagram (under-edited segments, Group 1)
The hypothesis for this subsection is defined as follows: the number of under-edited
segments produced by Group 1 in TS 1 is higher than in TS 2, which entails application of
unilateral contrast and selecting the option “Difference > 0” in the relevant statistical test.
According to the pre-defined order, the descriptive analysis of Group 1 under-edited
segments is followed by the inferential analysis. The bar diagram is drawn to inspect the
distribution of values for this data set in each of the TSs (Figure 10.1.2).

Part III. Study outcomes: analysis and reflections
157
Figure 10.1.2. Distribution of Group 1 values in TS 1 and TS 2 (the horizontal axis represents the
participants, the vertical axis contains the number of under-edited segments)
While the distribution of TS 1 values is seemingly exponential, the diagram does not
yield a clear indication of the values order. To decide on whether parametric or non-
parametric statistics should be applied, it is necessary to conduct the normality test. The
test results are indicated in Table 34.1.2, while the screenshot of R Commander results is
shown in Appendix VI, Image VI.1.
Test of normality
(statistical significance level p>0,05)
Data distribution
TS 1 p = 0,09497 probabilistic
TS 2 p = 0,07352 probabilistic
Table 34.1.2. Test of normality (under-edited segments, Group 1)
Next, given that the under-edited segments were reported to be distributed
probabilistically, the t-Student paired-sample test was applied to evaluate the inference of
the data before and after the training. The results of the test are demonstrated in Table
34.1.3, while the screenshot of R Commander results is shown in Appendix VI, Image
VI.2.
t-Student test
(statistical significance level p<0,05)
Result
Hypothesis 0: TS 1 ? TS 2
p = 0,03582
H0 is rejected
Hypothesis 1: TS 1 > TS 2 H1 is accepted
Table 34.1.3. Contrast of hypothesis (under-edited segments, Group 1)

Part III. Study outcomes: analysis and reflections
158
The test results yielded p-value that is smaller than 0,05, which supports our
hypothesis about the statistically significant decrease of the number of under-edited
segments in PE assignments done by Group 1 students in the post-training test.
Group 2. The core values and standard deviation of under-edited segments of Group
2 are presented in Table 34.2.1. Unlike Group 1 results, the observed differences
demonstrate an increase of the maximum value, and a decrease of the minimum value. The
arithmetic mean, median and SD do not show significant changes and are close to 0.
TS 1_un TS 2_un Diff. %
Min. 1 0 -1 -100%
Max. 11 12 1 9%
Arithmetic Mean 6,1 5,96 -0,14 -3%
Median 5,5 6 0,5 9%
Standard deviation 2,32 2,99 0,67 28%
Table 34.2.1. Output quality (under-edited segments, Group 2)
Analysis of boxplot diagrams representing Group 2 results (Figure 10.2.1)
demonstrates a higher diversity of tendencies than Group 1. The range of values in TS 1
2nd quartile group is rather insignificant and implies their homogeneity in comparison to
other quartiles. In TS 2 both the upper and lower quartile are placed at a nearly equal
distance from the median, suggesting more even distribution of values in the 2nd and 3rd
quartile groups. Another observation concerns the minimum/maximum values, which
demonstrate the tendency to decrease/increase in TS 2.
Figure 10.2.1 Output quality boxplot diagram (under-edited segments, Group 2)

Part III. Study outcomes: analysis and reflections
159
In other words, Groups 2 reported a slight increase of the number of under-editings
after the training, although the minimum value reported a decrease, which means that some
group members managed to commit fewer under-editing in TS 2.
Next, we conducted inferential analysis on the number of under-edited segments
produced by Group 2 students in TS 1 and TS 2 respectively. To estimate the preliminary
distribution of values the bar diagram was drawn using the data collected in each of the
TSs (Figure 10.2.2):
Figure 10.2.2. Distribution of Group 2 values in TS 1 and TS 2 (the horizontal axis represents the
participants, the vertical axis contains the number of under-edited segments)
While the distribution of TS 1 results is seemingly exponential, the diagram contains
no direct indication of how the values are grouped. The normality test was conducted to
decide on the further statistical methods to be employed. Its results are indicated in Table
34.2.2, while the screenshot of R Commander output is shown in Appendix VI, Image
VI.3.
Test of normality
(statistical significance level p>0,05)
Data distribution
TS 1 p = 0,07524 probabilistic
TS 2 p = 0,3766 probabilistic
Table 34.2.2. Test of normality (under-edited segments, Group 2)
The results yielded by the R Commander report show that the data were distributed
probabilistically, so the t-Student paired-sample test was applied to evaluate inference of
the data before and after the training. Table 34.2.3 shows the results of the test; the
screenshot of R Commander calculations is presented in Appendix VI, Image VI.4.

Part III. Study outcomes: analysis and reflections
160
t-Student test
(statistical significance level p<0,05)
Result
Hypothesis 0: TS 1 ? TS 2
p = 0,4385
H0 is accepted
Hypothesis 1: TS 1 > TS 2 H1 is rejected
Table 34.2.3. Contrast of hypothesis (under-edited segments, Group 2)
The test yielded p-value that is larger than 0,05 (p = 0,4385), which rejects our
hypothesis about the decrease of the under-edited segments in PE assignments done by
Group 2 students in the post-training test. Consequently, no statistical correlation was
found between the under-edited results in TS 1 as compared to TS 2.
Groups 1 and 2. Analysis of the combined number of under-edited segments
produced by both groups demonstrates that on the whole, the maximum value grew by 1
segment, while the minimum value decreased by 1 segment:
TS 1_un TS 2_un Diff. %
Min. 1 0 1 -100%
Max. 11 12 -1 9%
Arithmetic Mean 6 5,41 0,59 -10%
Median 6 5 1 -17%
Standard deviation 2,12 2,56 -0,44 -21%
Table 34.3.1. Output quality (under-edited segments, Groups 1 and 2)
As can be seen, the minimum and maximum throughput values in TS 1 and TS 2
show opposite tendencies of decrease vs. increase, although by 1 segment in each case.
The arithmetic mean shows a tendency to decrease (-10%), its value lies in between the
results observed in G 1 (-17%) and G 2 (-3%). The median value also demonstrates a
tendency to decrease by 1 segment; the SD value is close to 0, which corroborates the trend
shown by each of the experimental groups.
According to the predefined order, the data are arranged into boxplot diagrams
(Figure 10.3):

Part III. Study outcomes: analysis and reflections
161
Figure 10.3. Output quality boxplot diagram (under-edited segments, Groups 1 and 2)
The tendencies demonstrated by the combined results of TS 1 and TS 2 go in line
with the ones shown by each group separately in terms of the increase of inter-quartile
range in TS 2. On the other hand, the decrease of the median is reported, which may be
interpreted as a beneficial effect of the training. As such, we may conclude that the
combined results of both groups show that after the training the students are likely to
correct more under-editings than before it, the finding that is supported by the reduced
median value and the lower extreme value.
Having analyzed all sets of data, we may now focus on the principal tendencies.
Although Table 34.3.1 (the combined results) showed weak negative dynamics of
minimum values, scrutinizing Group 1 results reported weak positive dynamics. As for the
maximum values, the combined results showed an increase of values; such tendency goes
in line with the results of each group when analyzed separately. The arithmetic mean
reported a slight decrease in TS 2 for each of the analyzed subsets of data. The median
value decreased in Group 1 and the combined dataset, although the countertendency could
be traced in Group 2. The SD values showed a slight increase for Group 2 and the
combined dataset, while Group 1 reported their decrease. In other words, the results of
each group partially coincide with general observations of the combined results. On a fine-
grained scale, Group 1 shares tendencies on three core measures (maximum value,
arithmetic mean and median); while Group 2 does the same for four core measures

Part III. Study outcomes: analysis and reflections
162
(minimum value, maximum value, arithmetic mean and standard deviation). The standard
deviation of the results of both TSs was rather insignificant for Group 1 and moderately
significant for Group 2.
Comparison of statistical correlations demonstrated by Group 1 and Group 2
produced contradictory results. While the observed decrease of under-edited segments after
undertaking the training was reported as statistically significant in Group 1, quite contrary
data were obtained in Group 2. To find out the prevailing tendency, the combined results
of both groups were analyzed. No preliminary estimation of values distribution using a bar
diagram was made since both sets of data were described in Figure 4.1 and Figure 4.2.
Instead, a chi-square test was applied directly. Its results are indicated in Table 34.3.2 (the
screenshot of R Commander results is shown in Appendix VI, Image VI.5):
Test of normality
(statistical significance level p>0,05)
Data distribution
TS 1 p = 0,000002 non-probabilistic
TS 2 p = 0,0201 non-probabilistic
Table 34.3.2. Test of normality (under-edited segments, Groups 1 and 2)
The test demonstrates the non-probabilistic distribution of values in both TSs of the
combined sample, which requires non-parametric statistical study, such as Wilcoxon
signed-rank test, to evaluate inference of the data before and after the training. Table 34.3.3
shows the results of the test (the screenshot of R Commander calculations are presented in
Appendix VI, Image VI.6):
Wilcoxon test
(statistical significance level p<0,05)
Result
Hypothesis 0: TS 1 ? TS 2
p = 0,06222
H0 is accepted
Hypothesis 1: TS 1 > TS 2 H1 is rejected
Table 34.3.3. Contrast of hypothesis (under-edited segments, Groups 1 and 2)
Although the combined results of the test reject our hypothesis on the decrease of the
total number of under-edited segments after the training, yet the obtained p-value
(0,06222) only slightly exceeds the suggested significance level of p<0,05. It is possible to
speculate that to validate the proposed hypothesis further studies with a higher number of
the participants would be necessary.
Therefore, the hypothesis about the decrease of under-edited segments after the
training proved to be statistically significant for Group 1 only, while Group 2 results

Part III. Study outcomes: analysis and reflections
163
demonstrated the opposite tendency, and the combined results occupied the middle-ground
position with a slight tendency towards the null hypothesis.
6.1.3. Descriptive and inferential analysis of PE output: fit-for-purpose segments
This section starts with the description of core values for fit-for-purpose segments.
Then, the inferences between TS 1 and TS 2 are examined. To this end the hypothesis of
this subsection was defined as follows: the number of fit-for-purpose segments in TS 1 is
lower than in TS 2, which entails application of unilateral contrast of hypotheses and
selecting the option “Difference < 0” in the relevant statistical test.
Group 1. As shown in Table 35.1.1, the core values representing fit-for-purpose
segments of Group 1 increased positively in TS 2. However, the maximum value remained
the same (15 segments in either of the TSs), and the negative difference between SD values
in TS 1 and TS 2 indicates a decrease in results deviation after the training:
TS 1_ffp TS 2_ffp Diff. %
Min. 8 10 2 25%
Max. 15 15 0 0%
Arithmetic Mean 11,55 13 1,45 12%
Median 11,5 13,5 2 17%
Standard deviation 1,99 1,85 -0,14 -7%
Table 35.1.1. Output quality (fit-for-purpose segments, Group 1)
Next, Figure 11.1.1 helps visualize the distribution of values for this data set in each
of the TSs. Examination of the values representing the number of fit-for-purpose segments
demonstrates that while the lower quartile of each boxplot is alike with respect to the
median, the upper quartile is higher in TS 1. The minimum value in TS 1 is 2 segments
lower than in TS 2 (8 segments vs. 10 segments), while the maximum value is equal in
both TSs and makes 15 segments. On the whole, a conclusion may be drawn about the positive
effect of the training as corroborated by the increase of the minimum value.

Part III. Study outcomes: analysis and reflections
164
Figure 11.1.1. Output quality boxplot diagram (fit-for-purpose segments, Group 1)
The increase of the share of fit-for-purpose segments is supported by the rise of the
median and the lower extreme. At the same time, the shortening of the 4th quartile group
indicates to the homogeneity of the values which surpass the median. But while the
distribution of TS 1 results is seemingly exponential, the diagram contains no direct
indication of how the values are distributed (Figure 11.1.2):
Figure 11.1.2. Distribution of Group 1values in TS 1 and TS 2 (the horizontal axis represents the
participants, the vertical axis contains the number of fit-for-purpose segments)

Part III. Study outcomes: analysis and reflections
165
To get a deeper insight in the data and to decide what type of statistical method to
apply, the normality test was conducted. Its results are shown in Table 35.1.2 (the
screenshot of R Commander results is shown in Appendix VII, Image VII.1):
Test of normality
(statistical significance level p>0,05)
Data distribution
TS 1 p = 0,3938 probabilistic
TS 2 p = 0,0255 non-probabilistic
Table 35.1.2. Test of normality (fit-for-purpose segments, Group 1)
Since the TS 1 data set is distributed probabilistically, and TS 2 data set is distributed
non-probabilistically, the Wilcoxon test is used to corroborate our hypothesis that “the
number of fit-for-purpose segments in TS 2 is bigger than the number of such segments in
TS 1”. The results are presented in Table 35.1.3 (the screenshot of R Commander
calculations are displayed in Appendix VII, Image VII.2):
Wilcoxon test
(statistical significance level p<0,05)
Result
Hypothesis 0: TS 1 ? TS 2
p = 0,005
H0 is rejected
Hypothesis 1: TS 1 < TS 2 H1 is accepted
Table 35.1.3. Contrast of hypotheses (fit-for-purpose segments, Group 1)
As we can see, the p-value is smaller than 0,05 (p=0,005), which proves there is a
statistical correlation between the number of fit-for-purpose segments produced by Group
1 before and after the training. These findings corroborate our hypothesis about the
positive influence of the training on the increase of fit-for-purse segments in the students’
output.
Group 2. The tendencies demonstrated by Group 2 are very similar to the ones
reported by Group 1. As shown in Table 35.2.1, all core values representing fit-for-purpose
segments increased positively, excluding the SD rate, which was close to 0.
TS 1_ffp TS 2_ffp Diff. %
Min. 4 6 2 50%
Max. 14 18 4 28%
Arithmetic Mean 9 11,54 2,54 28%

Part III. Study outcomes: analysis and reflections
166
Median 9 11,5 2,5 28%
Standard deviation 3,15 3,13 -0,02 -0,6%
Table 35.2.1. Output quality (fit-for-purpose segments, Group 2)
When comparing TS 1 and TS 2 results, the rise of the median value is evident,
although the interquartile range of both subsets of values is similar in size. The results also
suggest the increase of extreme values in TS 2 as opposed to TS 1. In terms of values
distribution, Group 2 shows even distribution in both TSs, while all core values rose
(Figure 11.2.1):
Figure 11.2.1. Output quality boxplot diagram (fit-for-purpose segments, Group 2)
To conduct the preliminary evaluation of values distribution the bar diagram was
drawn, representing the data provided in each of the TSs (Figure 11.2.2):

Part III. Study outcomes: analysis and reflections
167
Figure 11.2.2. Distribution of Group 2 values in TS 1 and TS 2 (the horizontal axis represents the
participants, the vertical axis contains the number of fit-for-purpose segments)
Next, to reveal the tendencies of data distribution, the normality test was conducted.
Its results are indicated in Table 35.2.2 (the screenshot of R Commander results is shown
in Appendix VII, Image VII.3):
Test of normality
(statistical significance level p>0,05)
Data distribution
TS 1 p = 0,07524 probabilistic
TS 2 p = 0,7512 probabilistic
Table 35.2.2. Test of normality (fit-for-purpose segments, Group 2)
In this case, in both TSs the dataset was distributed probabilistically. For this reason,
we apply the t-Student paired-sample test to corroborate our hypothesis. The obtained
results are presented in Table 35.2.3; the screenshot of R Commander calculations are
indicated in Appendix VII, Image VII.4.

Part III. Study outcomes: analysis and reflections
168
t-Student test
(statistical significance level
p<0,05)
Result
Hypothesis 0: TS 1 ? TS 2
p = 0,01
H0 is rejected
Hypothesis 1: TS 1 < TS 2 H1 is accepted
Table 35.2.3. Contrast of hypotheses (fit-for-purpose segments, Group 2)
The test results reveal that the p-value that is smaller than 0,05, which proves a
statistically significant correlation between TS 1 and TS 2 results and confirms our
hypothesis on the increase of the number of fit-for-purpose segments after the training.
Groups 1 and 2. As shown in Table 35.3.1, the minimum values of the combined
results in TS1 and TS 2 were 4 and 6 segments, while the maximum values in the
corresponding TSs were 15 and 18. The arithmetic mean demonstrated a tendency to
increase by 19 %, supported by similar patterns observed in G 1 and G 2 separately. The
same is true for the median, with the total increase of 13%. Although the SD results did not
show unanimity when comparing G 1 and G 2, the average tendency was reported as
slightly negative (-7%).
TS 1_fit TS 2_fit Diff. %
Min. 4 6 2 50%
Max. 15 18 3 20%
Arithmetic Mean 10,26 12,24 1,98 19%
Median 11 12,5 1,5 13%
Standard deviation 2,9 2,7 -0,2 -7%
Table 35.3.1 Output quality (fit-for-purpose segments, Groups 1 and 2)
The boxplot diagram (Figure 11.3) indicates to a rise in the average number of fit-
for-purpose segments after the training, although in both TSs the lower 50% of the
participants demonstrate more heterogeneous performance than the top 50% of the
participants:

Part III. Study outcomes: analysis and reflections
169
Figure 11.3. Output quality boxplot diagram (fit-for-purpose segments, Groups 1 and 2)
The tendencies tracked in fit-for-purpose results demonstrate unanimity with the
results provided by analysis of each group separately. As such, the key trends are the
increase of the median value, on the one hand, and the increase of minimum and maximum
values, on the other. Yet, the diagram also suggests that in TS 2 the 3rd quartile group
shows less diversity of data as compared to the relevant boxplots of each group.
In total, both groups have reported a positive increase of the number of fit-for-
purpose segments in TS 2. While the minimum values for either session in both groups
showed an increase, the maximum values demonstrated no changes in Group 1 and an
increase in Group 2, which resulted in the average increase by 3 segments when comparing
both groups. On a closer look, the minimum and maximum values differed more
dramatically in Group 2 (TS 1: 4 and 14; TS 2: 6 and 18) than in Group 1 (TS 1: 8 and 15;
TS 2: 10 and 15). The arithmetic mean demonstrated a tendency to increase both in G 1
(12%) and G 2 (28%). The median value for TS 1, as opposed to TS 2, was slightly higher
in Group 1; yet, the combined data reported the average increase of TS 2 results by 1,5
segments. The calculation of the average SD value yielded very close results (2,9 in TS 1
vs. 2,83 in TS 2).
Statistical correlations observed in Groups 1 and 2 demonstrate consistency since in
both cases the number of fit-for-purpose segments increased in TS 2. Even so, in order to
be able to prove that such a tendency could be observed in a sample with a higher number
of the participants, we analyze the combined results of both groups. Figures 11.1.1 and

Part III. Study outcomes: analysis and reflections
170
11.2.1 visualized distribution of values in each of the groups, while Table 35.3.2 shows the
results of normality test conducted on the combined set of values (the screenshot of R
Commander results is shown in Appendix VII, Image VII.5):
Test of normality
(statistical significance level p>0,05)
Data distribution
TS 1 p = 0,1064 probabilistic
TS 2 p = 0,0032 non-probabilistic
Table 35.3.2. Test of normality (fit-for-purpose segments, Groups 1 and 2)
As demonstrated in Table 35.3.2, while the distribution of TS 1 data is probabilistic,
the contrary is true for TS 2. In this case, the non-parametric test (namely, Wilcoxon
signed-rank test) is applied to examine possible statistical correlations. The results of the
test are provided in Table 35.3.3 (the screenshot of R Commander calculations are
presented in Appendix VII, Image VII.6):
Wilcoxon test (statistical
significance level p<0,05)
Result
Hypothesis 0: TS 1 ? TS 2
p = 0,0008
H0 is rejected
Hypothesis 1: TS 1 < TS 2 H1 is accepted
Table 35.3.3. Contrast of hypothesis (fit-for-purpose segments, Groups 1 and 2)
The statistical significance level for this type of test was defined as p<0,05, and the
test result produced the outcome of p=0,0007905 (rounded off p=0,0008). As demonstrated
by the test results, the hypothesis that the number of fit-for-purpose segments will increase
after the training is confirmed.
The analysis of Group 1, Group 2 and the combined data sets all corroborate the
hypothesis about the positive influence of the training on the students’ PE performance in
the part of fit-for-purpose segments.
6.1.4. Descriptive and inferential analysis of PE output: over-edited segments
Finally, the values corresponding to the numbers of over-edited segments in both TSs
are examined. The hypothesis for this subsection was defined as follows: the number of
over-edited segments in TS 1 is higher than in TS 2, which entails application of unilateral
contrast of hypotheses and selecting the option “Difference > 0” in the relevant statistical
test.

Part III. Study outcomes: analysis and reflections
171
Group 1. In Table 36.1.1 Group 1 core values and standard deviation of over-edited
segments number are collected. As can be seen, the minimum value equaled 0, while the
maximum value demonstrated negative decrease comparing TS 1 and TS 2. Although the
difference of arithmetic mean results negative, SD values were somewhat positive, and
their absolute value was close to 0, which similar tendency demonstrated by the median:
TS 1_ov TS 2_ov Diff. %
Min. 0 0 0 0
Max. 6 5 -1 -17%
Arithmetic Mean 2,45 2 -0,45 -18%
Median 2 2 0 0
Standard deviation 1,60 1,64 0,04 2%
Table 36.1.1 Output quality (over-edited segments, Group 1)
In each of the TSs the values representing the number of over-edited segments
rendered very similar results regarding the inter-quartile range and the median value
(Figure 12.1.1). Тhe only moderately significant difference was detected in the part of the
maximum value, which made 6 in TS 1 and 5 in TS 2 respectively, while the minimum
value in both TSs was equal to 0.
Figure 12.1.1.Output quality boxplot diagram (over-edited segments, Group 1)

Part III. Study outcomes: analysis and reflections
172
In other words, the median representing the number of over-edited segments was
reported as equal, and 75% of the results remained the same, while the 4th quartile group of
values got smaller.
Inferences for over-edited segments were calculated starting with the analysis of
Group 1 results in TS 1 and TS 2. Initial evaluation of the distribution of values was done
using the bar diagram, which contained the Group 1 data provided in each of the TSs
(Figure 12.1.2).
Figure 12.1.2. Distribution of Group 1 values in TS 1 and TS 2 (the horizontal axis represents the
participants, the vertical axis contains the number of over-edited segments)
To further explore the tendencies indicated in Figure 12.1.2, the normality test was
conducted. Its results are indicated in Table 36.1.2 (the screenshot of R Commander results
is shown in Appendix VIII, Image VIII.1):
Test of normality
(statistical significance level p>0,05)
Data distribution
TS 1 p = 0,0334 non-probabilistic
TS 2 p = 0,1564 probabilistic
Table 36.1.2. Test of normality (over-edited segments, Group 1)
As demonstrated in the table above, TS 1 data set is distributed non-probabilistically,
while the opposite is true for TS 2. To further process these results and corroborate our
hypothesis that “the number of over-edited segments in TS 1 is bigger than the number of

Part III. Study outcomes: analysis and reflections
173
such segments in TS 2”, the non-parametric Wilcoxon test was applied. Its results are
presented in Table 36.1.3 (the screenshot of R Commander calculations is displayed in
Appendix VIII, Image VIII.2):
Wilcoxon test
(statistical significance level p<0,05)
Result
Hypothesis 0: TS 1 ? TS 2
p = 0,4148
H0 is accepted
Hypothesis 1: TS 1 > TS 2 H1 is rejected
Table 36.1.3. Contrast of hypotheses (over-edited segments, Group 1)
The Wilcoxon test results reveal the p-value which is larger than the established
significance level (p<0,05), which makes us reject the hypothesis about the decrease of
over-editing after the training.
Group 2. Next, analysis of Group 2 over-edited number of segments is done (Table
36.2.1). As well as in G 1, the minimum value in both TSs equals 0. All other
measurements demonstrated a decrease in TS 2, the trend that is confirmed by negative
values of “difference” and “%” columns.
TS 1_ov TS 2_ov Diff. %
Min. 0 0 0 0
Max. 13 9 -4 -31%
Arithmetic
Mean
4,83 2,5 -2,33 -48%
Median 4,5 2 -2,5 -55%
Standard
deviation
3,63 2,25 -1,38 -38%
Table 36.2.1. Output quality (over-edited segments, Group 2)
A different tendency is observed in the boxplots representing the values that
correspond to the number of over-edited segments, as in both TSs the maximum values
decreased, and the minimum values were equal to 0. The upper and lower quartiles are
located symmetrically in respect of the median value; the latter demonstrated significant
decrease, and the TS 1 inter-quartile range is almost two times larger than the TS 2 one,
suggesting less variation of data after the training:

Part III. Study outcomes: analysis and reflections
174
Figure 12.2.1. Output quality boxplot diagram (over-edited segments, Group 2)
Unlike in the previous case, Group 2 demonstrated a substantial decrease of all core
values and more homogeneity in what concerns over-editings after the training. Next, the
inferences of the number of over-edited segments before and after the training are
calculated for Group 2. Once again the bar diagram was used to get an overview of values
distribution in each of the TSs (Figure 12.2.2):
Figure 12.2.2. Distribution of Group 2 values in TS 1 and TS 2 (the horizontal axis represents the
participants, the vertical axis contains the number of over-edited segments)

Part III. Study outcomes: analysis and reflections
175
To further explore the tendencies, the normality test was conducted. Its results are
indicated in Table 36.2.2 (the screenshot of R Commander results is shown in Appendix
VIII, Image VIII.3):
Test of normality
(statistical significance level p>0,05)
Data distribution
TS 1 p = 0,4579 probabilistic
TS 2 p = 0,0204 non-probabilistic
Table 36.2.2. Test of normality (over-edited segments, Group 2)
As we can see, the data from TS 1 demonstrated a probabilistic distribution, while
the opposite tendency was true for TS 2. To further process these results and corroborate
our hypothesis, the non-parametric Wilcoxon test with the “Difference > 0” option was
used. The results are shown in Table 36.2.3; (the screenshot of R Commander calculations
are presented in Appendix VIII, Image VIII.4):
Wilcoxon test
(statistical significance level p<0,05)
Result
Hypothesis 0: TS 1 ? TS 2
p = 0,0133
H0 is rejected
Hypothesis 1: TS 1 > TS 2 H1 is accepted
Table 36.2.3. Contrast of hypotheses (over-edited segments, Group 2)
The p-value, obtained using the Wilcoxon test is smaller than the established
significance level (p<0,05), which gives us grounds to accept the hypothesis about the
positive effect of the training that results in the decrease of over-edited segments in TS 2.
On the whole, when analyzing G 1 and G 2 results, a number of similarities and
differences could be detected. The minimum values in both subgroups equaled 0, while the
maximum values were lower in Group 1 (TS 1: 6 vs. TS 2: 5) as compared to Group 2 (TS
1: 13 vs. TS 2: 9). All other core values demonstrated moderately negative tendencies
towards TS 2.
Groups 1 and 2. The trends observed in the combined data set reveal that the
minimum values in both TSs are equal to 0, while all other average values and SD were
prone to decrease (Table 36.3.1):
TS 1_ov TS 2_ov Diff. %
Min. 0 0 0 0
Max. 13 9 -4 -30%

Part III. Study outcomes: analysis and reflections
176
Arithmetic Mean 3,69 2,39 -1,3 -35%
Median 3 2 -1 -33%
Standard
deviation
3,06 1,96 -1,1 -35%
Table 36.3.1. Output quality (over-edited segments, Groups 1 and 2)
As can be seen from the Table, the combined TS 1 results reported 13 segments
while TS 2 reported 9. These calculations are consistent with the negative dynamics of
values observed for each group separately, although when zooming in the difference
between TS 1 and TS 2, the obtained results were - 1 segment (Group 1) and - 4 (Group 2).
The arithmetic mean of the combined data made 3,69 for TS 1 and 2,39 for TS 2, which
resulted in the total difference of 1,3 segments. The difference of the median value in
Group 1 showed very insignificant positive dynamics, while in Group 2 the dynamic
between both sessions was moderately negative (-2,5). The standard deviation of the
results of both TSs was rather insignificant for Group 1 (TS 1:1,60 vs TS 2: 1,64) and
moderately significant for Group 2 (TS 1: 3,63 and TS 2: 2,25). The data distribution
contributed to the average SD of 3,06 (TS 1) and 1,96 (TS 2).
Another particular feature of the combined data, as can be seen in the boxplot (Figure
12.3), is a decrease of the median value. Although in each of the TSs there were outliers,
we see it possible to make a conclusion that TS 2 is characterized by a reduced number of
over-editings and their higher homogeneity:
Figure 12.3. Output quality boxplot diagram (nr. of over-edited segments, Groups 1 and 2)

Part III. Study outcomes: analysis and reflections
177
Statistical correlations reported by Groups 1 and 2 demonstrate little consistency,
since Group 1 results show some propensity to reject the hypothesis, while Group 2 results
tend to accept it. To generalize the data, the combined results of both groups are analyzed.
Distribution of values in each of the groups was presented in Figures 12.1.2 and 12.2.2,
while Table 36.3.2 shows the results of normality test conducted on the combined set of
values (the screenshot of R Commander results is shown in Appendix VIII, Image VIII.5):
Test of normality
(statistical significance level p>0,05)
Data distribution
TS 1 p = 0,000273 non-probabilistic
TS 2 p = 0,000005 non-probabilistic
Table 36.3.2. Test of normality (over-edited segments, Groups 1 and 2)
As demonstrated in the Table, distribution of the combined values in both TSs is
non-probabilistic. Consequently, the nonparametric Wilcoxon signed-rank test is applied to
examine possible statistical correlations between the results corresponding to the number
of over-edited segments in TS 1 and TS 2. Table 36.3.3 contains the results of the test, (the
screenshot of R Commander calculations are displayed in Appendix VIII, Image VIII.6):
Wilcoxon test
(statistical significance level p<0,05)
Result
Hypothesis 0: TS 1 ? TS 2
p = 0,0176
H0 is rejected
Hypothesis 1: TS 1 > TS 2 H1 is accepted
Table 36.3.3. Contrast of hypothesis (over-edited segments, Groups 1 and 2)
The statistical significance level for this type of test was defined as p<0,05, and the
test result produced the outcome of p=0, 01765 (rounded off p=0,0176). As demonstrated
by the test results, the hypothesis that the number of over-edited segments decreased after
the training is confirmed.
To sum up, both Group 2 and the combined dataset indicate to the statistically
significant drop in the number of over-edited segments after the training; however, in the
case of Group 1 the hypothesis is resected, as the share of over-edited segments was nearly
the same in both testing sessions, which call for further examination of the issue with a
larger number of the participants.

Part III. Study outcomes: analysis and reflections
178
6.1.5. Associative correlation of PE throughput vs. PE output values
In this section, two instruments are used for data analysis: Pearson’s product-moment
correlations (for those cases when the variables were distributed probabilistically) and
Spearman’s rank-order correlations (a non-parametric version of Pearson’s correlations).
To decide which tool to choose, the information on the distribution of variables in each
particular data set is required. To this end, we use the data of sections 6.1.1-6.1.4, where
the distribution of variables representing the WPH rate and the number of under-edited/fit-
for-purpose/over-edited segments in TS 1 and TS 2 was examined. Having analyzed the
available data, a decision was made regarding the relevant operations for each pair of
compared data.
TS 1 reported the non-probabilistic distribution of under-edited and over-edited
segments, while the WPH rates and the number of fit-for-purpose segments were
distributed probabilistically. Table 37.1 summarizes the results of correlation tests for the
aforementioned combinations (screenshots of calculations made with R Commander are
presented in Appendix IX, Images IX.1-IX.3):
TS 1 Type of correlation Strength / direction of
correlation
WPH rate vs. nr. of under-edited
segments
(Spearman)
TS1_un 1.0000 0.2264
WPH1 0.2264 1.0000
Weak/positive
WPH rate vs. nr. of fit-for-purpose
segments
(Pearson)
TS1_ffp 1.0000 0.1045
WPH1 0.1045 1.0000
Weak/positive
WPH rate vs. nr. of over-edited
segments
(Spearman)
TS1_ov 1.0000 -0.1654
WPH1 -0.1654 1.0000
Weak/negative
Table 37.1. Associations of quantitative values (WPH vs. segments) in TS 1
As the table demonstrates, the weak positive correlation is observed in the first and
second clusters (WPH rate vs. under-edited segments and WPH rate vs. fit-for-purpose
segments). However, there is a weak negative correlation detected between the WPH rate
and the number of over-edited segments. On the whole, the examined correlations are not
strong enough to be considered statistically significant.
To corroborate the data gleaned from Table 37.1, a more detailed analysis of
correlations between the available categories of segments was conducted. Since all

Part III. Study outcomes: analysis and reflections
179
combinations contained at least one data subset that was distributed non-probabilistically,
only Spearman correlations test was applied. Its results are presented in Table 37.2
(screenshots of calculations made with R Commander are presented in Appendix IX,
Images IX.4-IX.6):
TS 1 Spearman correlation
Strength / direction of
correlation
Fit-for-purpose vs. under-edited
segments
TS1_ffp 1.0000 -0.3473
TS1_un -0. 3473 1.0000
Weak/negative
Over-edited vs. under-edited segments TS1_ov 1.0000 -0.3674
TS1_un -0. 3674 1.0000
Weak/ negative
Fit-for-purpose vs. nr. of over-edited
segments
TS1_ffp 1.0000 -0.6774
TS1_ov -0.6774 1.0000
Strong/negative
Table 37.2. Associations of quantitative values (segments) in TS 1
As can be seen, the analysis of associations of all PE segments in TS 1 demonstrates
negative correlations in all combinations of data. On a fine-grained scale, the clusters of
“fit-for-purpose vs. under-edited segments” and “over-edited vs. under-edited segments”
demonstrate weak negative correlations and the p-values of -0,3473 (<-0,5) and -0,3674
(<-0,5) respectively. On the other hand, the cluster “fit-for-purpose vs. over-edited
segments” reports strong negative correlation, supported by the calculated p-value of -
0,6774 (>-0,5). The last result implies that in TS 1 the “more accurate” post-editors did not
show a tendency to over-edit.
In TS 2 the distribution of all analyzed data (WPH rate, under-edited, fit-for-
purpose, over-edited segments) was non-probabilistic, for which reason non-parametric
Spearman correlation was applied. Table 37.3 summarizes the results of correlation tests
for the aforementioned combinations (screenshots of the calculations made with R
Commander are presented in Appendix X, Images X.1-X.3):
TS 2 Spearman correlations Strength / direction of
correlation
WPH rate vs. nr. of under-
edited segments
TS2_un 1.0000 -0.0502
WPH2 -0.0502 1.0000
Weak/negative
WPH rate vs. nr. of fit-for-
purpose segments
TS2_ffp 1.0000 -0.1853
WPH2 -0.1853 1.0000
Weak/negative
WPH rate vs. nr. of over-
edited segments
TS2_ov 1.0000 0.3214
WPH2 0.3214 1.0000
Weak/positive
Table 37.3. Associations of quantitative values (WHP vs. segments) in TS 2

Part III. Study outcomes: analysis and reflections
180
The results of the analysis confirm and complement previously detected trends. First,
the correlation of WPH rate and the number of under-edited segments is described as
“weak negative” since the number of under-edited segments demonstrated a propensity to
increase in the output of students with lower throughput rates. However, the correlation is
considered weak since the p-value (-0.0502) is smaller than -0,5 and does not correspond
to the criteria of the statistically significant result. Next, opposing WPH rate and the
number of fit-for-purpose demonstrates a negative correlation, indicating that the rate of
such segments was slightly increased among students with lower throughput. The
correlation is classified as weak, as the p-value (-0.1853) is smaller than -0,5 and does not
correspond to the criteria of the statistically significant result. Finally, contrasting WPH
rate and over-edited segments results in weak positive correlation, which gives us grounds
to suggest that in the output of “faster” students the share of over-edited segments is likely
to increase too.
To corroborate the data gleaned from Table 37.3, once again a more detailed analysis
of correlations in between the available categories of segments was conducted. As well as
in the previous case, all data subsets were reported to be distributed non-probabilistically,
for which reason Spearman correlations test was conducted. The test results are presented
in Table 37.4 (screenshots of calculations made with R Commander are presented in
Appendix X, Images X.4-X.6):
TS 2 Spearman correlations Strength / direction of
correlation
Fit-for-purpose vs. under-
edited segments
TS2_ffp 1.0000 -0.6521
TS2_un -0. 6521 1.0000
Strong/negative
Over-edited vs. under-edited
segments
TS2_ov 1.0000 -0.2354
TS2_un -0.2354 1.0000
Weak/negative
Fit-for-purpose vs. nr. of
over-edited segments
TS2_ffp 1.0000 -0.4105
TS2_ov -0.4105 1.0000
Moderate/negative
Table 37.4. Associations of quantitative values (segments) in TS 2
The analysis of associations of the total of categorized PE segments in TS 2
demonstrates negative correlations in all combinations of data. However, the strength of
these correlations is different for each particular combination. The cluster of “fit-for-
purpose vs. under-edited segments” shows strong negative correlation, validated by its p-
value of -0.6521. The cluster “over-edited vs. under-edited segments” reports weak
negative correlation, in this case, the p-value equals -0.2354 and does not meet the criteria

Part III. Study outcomes: analysis and reflections
181
for statistical significance. The cluster “fit-for-purpose vs. over-edited segments” reports
moderately negative correlation with the p-value of -0.4105.
Thus, the conclusion may be drawn that in TS 2 more “accurate” post-editors showed
a strong tendency towards producing fewer under-edited segments, and a moderate
tendency towards producing fewer over-edited segments while post-editing.
6.2. Questionnaire responses
At the end of each testing session, a questionnaire was administered to the students
so that they could share their opinions on a number of questions, including MTPE-related
issues and auto-evaluate their participation. In particular, the questionnaire aimed at
collecting information on students’ attitude towards the expansion of MT into
translation/localization industry, PE assignment quality threshold, predisposition to
perform PE on a regular basis, self-satisfaction with PE performance, self-evaluation of
acquired PE competency. To measure the participants’ responses to these questions a 4-
value scale was used, with 1 corresponding to the minimum value and 4 to the maximum
one. The last question of TS 2 inquired about the overall effect of the training had no
predefined answer scale so that the participants could freely express their opinions on the
training outcomes. Hereafter we analyze the answers to each group of questions. Diagrams
are used to visually represent the observed tendencies.
Subsections 6.2.1 and 6.2.2 start with a general overview of the participants’ answers
to a particular question. Then, each participant is assigned to one of the categories in
conformity with the tendencies traced in his/her attitudes and convictions as expressed in
TS 1 and TS 2. The categories are the following: “negative” (if the scores assigned by a
particular participant in both TSs were “1” or “2” or changed between these two values),
“improved” (if the assigned score changed from “1” or “2” to “3” or ”4”), “worsened” (if
the assigned score changed from”3” or “4” to “1” or “2”) and “remained positive (if the
scores assigned in both TSs were ”3” or “4” or changed between these two values). In
Subsection 6.2.3 interpretative analysis of the students’ opinions about the influence of the
suggested training on their PE competency is conducted.
As already mentioned in Section 6.1, associative statistics is aimed at measuring the
relation of variables within a sample using, so chi-square test is applied in Subsection 6.2.4

Part III. Study outcomes: analysis and reflections
182
to structure the collected qualitative values. Similarly to Pearson/Spearman correlations, a
chi-square test compares the proportion of cases for each combination of categories
containing the examined variables and helps to decide whether two sets of data are
independent (Hypothesis 0) or dependent (Hypothesis 1).
6.2.1. Descriptive analysis of MTPE-related attitudes
In the first question of the questionnaire, the participants expressed their attitude
towards the usage of MT in the translation industry by picking one of 4 possible answers
(“1” – very negative, “2” – negative, “3” – positive, “4” – very positive). The students’
opinions are summarized in Table 38, (the detailed numeric breakdown on their attitudes
towards MT is presented in Appendix XI, Table XI.1):
Group 1 Group 2
Attitude TS 1 TS 2 TS 1 TS 2
very negative 0 0 0 0
negative 3 6 2 1
positive 18 15 22 15
very positive 1 1 0 8
Total nr. of answers 22 22 24 24
Table 38. What is your attitude towards the use of Machine Translation in the translation industry?
As Table 38 shows, the “positive” opinion regarding the use of MT in the translation
industry turned out to be rather common in both TSs and both groups. However, a slight
decrease of this value towards TS 2 is observed (G 1: 18 vs. 15; G 2: 22 vs. 15). On the
other hand, the number of “negative” opinions also increased from 3 to 6 answers in Group
1, while Group 2 demonstrated a slight tendency of decrease (from 2 to 1).
Figures 13.1 and 13.2 reflect the dynamics of individual responses in each of the
groups.

Part III. Study outcomes: analysis and reflections
183
Figure 13.1. What is your attitude towards the use of Machine Translation in the translation
industry? (dynamics of individual responses, Group 1)
In Figure 13.1 comparison of the participants’ opinions expressed in TS 1 and TS 2
is conducted. As we can see, 68% of the participants (15 students) expressed a positive
attitude towards the use of MT in the translation industry in both sessions. The attitude of 1
student (5%) has improved, the attitude of 18% (4 students) worsened, and 9% (2 students)
kept being negative throughout both TSs.
Figure 13.2. What is your attitude towards the use of Machine Translation in the translation
industry? (dynamics of individual responses, Group 2)
As for Group 2 (Figure 13.2.), the major tendency may be described as stability of
attitude, since 21 students (88%) reported (very) positive attitude in both TSs and 2
students (8%) demonstrated improvement of his/her attitude towards TS 2. A minority (1
student) demonstrated some worsening of their attitude, and there were no participants
whose attitude would have remained negative.
Next was the question of whether the participants agreed with the statement that
machine translated and post-edited output of less-than-maximum quality is good enough to
9%
18%
5%
68%
Remained negative
Worsened
Improved
Remained positive
4% 8%
88%
Remained negative
Worsened
Improved
Remained positive

Part III. Study outcomes: analysis and reflections
184
be delivered to the client as a complete job. The answer scale contained 4 values: “1” – I
strongly disagree, “2” – I disagree, “3” – I agree, “4” – I fully agree. Distribution of
students’ answers among the suggested categories of values is summarized in Table 39,
while the detailed numeric breakdown on participants’ attitudes towards MTPE is
presented in Appendix XI, Table XI.2:
Group 1 Group 2
Opinion on quality standards TS 1 TS 2 TS 1 TS 2
I strongly disagree 6 5 1 1
I disagree 11 6 11 10
I agree 4 10 11 13
I fully agree 1 1 1 0
Total nr. of answers 22 22 24 24
Table 39. Do you agree that MTPE output of “less-than-maximum quality” is good enough to be
delivered to the client as a complete job?
Table 39 shows that in TS 1 the prevailing tendency for Group 1 members was a
propensity to “disagree”, marked by a half of the participants (11 students); a smaller
number of the participants selected other options. However, after TS 2 the more commonly
selected value for this group was “I agree” (10 students). As for Group 2, before
undertaking the training nearly half of the participants “disagreed” (11 students), while the
other relative half (11 students) “agreed”. After the training, the major trend was to “agree”
with the statement, as mentioned by 13 students, while a smaller number of the participants
selected other options.
Figures 14.1 and 14.2 reflect the dynamics of individual responses of each group.
Figure 14.1. Do you agree that MTPE output of “less-than-maximum quality” is good enough to
be delivered to the client as a complete job? (dynamics of individual responses, Group 1)
50%
27%
23%
Remained negative
Worsened
Improved
Remained positive

Part III. Study outcomes: analysis and reflections
185
Figure 14.1 reveals the tendencies of Group 1, in which 16 participants did not
demonstrate significant changes of their attitude: 11 of them (strongly) disagreed and 5 -
(fully) agreed with the question in both TSs (50% and 23% correspondingly). On the other
hand, 6 participants (27%) who disagreed with the statement in TS 1 demonstrated
improvement of their attitude towards PE quality standards in TS 2.
Figure 14.2. Do you agree that MTPE output of “less-than-maximum quality” is good enough to be
delivered to the client as a complete job? (dynamics of individual responses, Group 2)
As for Group 2 (Figure 14.2), the training did not affect the attitude of 9 students, 4
of whom demonstrated disagreement in both TSs (17%), and 5 - agreement (21%). As for
the others, 8 have students improved their attitude and agreed with the statement in TS 2
(33%), while 7 students who agreed with the statement in TS 1 opted to disagree with it in
TS 2 (29%).
In the next question, the participants shared their opinions on whether they would be
interested in performing PE jobs on a regular basis. The response scale contained 4 values:
“1” – no I won’t, “2” – maybe, but I won’t be looking forward to it, “3” – yes I will, “4” –
yes, and I will be looking forward to it. Students’ attitudes towards taking post-editing as a
professional career are summarized in Table 40 (the detailed numeric breakdown on
participants’ attitudes toward MTPE is presented in Appendix XI, Table XI.3):
Group 1 Group 2
Interest in PE as a profession TS 1 TS 2 TS 1 TS 2
no 2 2 1 1
maybe, but rather not 14 14 14 10
yes 5 5 8 11
yes, absolutely 1 1 1 2
Total nr. of answers 22 22 24 24
Table 40. Would you be interested in taking up PE as a profession?
17%
29%33%
21%
Remained negative
Worsened
Improved
Remained positive

Part III. Study outcomes: analysis and reflections
186
Group 1 reported quite balanced willingness to engage into PE with 14 students
demonstrating a weak interest in PE as a profession after TS 1, and the same number of
students ticking this category after TS 2. The results of Group 2 are more varied with a
tendency to improvement of PE job perception. While in TS 1 the relevant majority (14
students) expressed their weak interest in PE as a profession with the answer “maybe, but
rather not”, in TS 2 as many as 11 participants believed they would be quite interested in
taking up PE professionally.
Figures 15.1 and 15.2 show the dynamics of individual responses of each group.
Figure 15.1. Would you be interested in taking up PE as a profession?
(dynamics of individual responses, Group 1)
As demonstrated in Figure 15.1, the majority of the participants (64% which equals
14 students) expressed (relatively) negative attitude towards the perspective of taking up
PE professionally in both TSs. What is more, the interest of 2 students (9%) became
weaker, although 2 other students (9%) demonstrated more interest to PE job in TS 2. Only
4 students (18%) reported a positive attitude to this perspective in both sessions.
Figure 15.2. Would you be interested in taking up PE as a profession?
(dynamics of individual responses, Group 2)
64%9%
9%
18% Remained negative
Worsened
Improved
Remained positive
29%
17%33%
21%
Remained negative
Worsened
Improved
Remained positive

Part III. Study outcomes: analysis and reflections
187
As we can observe in Figure 15.2, the relative majority (8 students, which equals
33%) improved their attitude toward PE as a job towards TS 2. Next goes the category of
those who either did not want to do PE professionally or were not willing to engage in this
activity at all (7 students – 29%). A group of 5 students (21%) reported a positive
perception of PE profession in both sessions, and 4 participants (17%) decided that after
the training their attitude regarding this issue got worse.
Descriptive analysis of the MTPE-related attitudes of the participants demonstrates a
broad variety of obtained answers and few similarities between the groups. On the one
hand, the attitude towards MT expansion was evaluated positively by relative majorities of
both groups in each of the TSs. On the other hand, 50% of Group 1 demonstrated stability
in their negative perception of “less-than-perfect” quality concept, although 27% said their
opinions improved towards TS 2; and 64% were constantly negative about PE as a career.
As for Group 2, no prevailing tendencies were detected when comparing different opinions
on the second and third questions and their dynamics: 33% improved their attitude towards
“less-than-perfect” quality concept, while nearly the same number of students (29%)
demonstrated its worsening. However, in this case, the total of 58% expressed eagerness to
take up PE professionally.
6.2.2. Descriptive analysis of MTPE performance convictions
To inquire about participants’ satisfaction with their PE performance during each of
the testing sessions, the following 4-value scale was proposed: “1” – I am very dissatisfied,
“2” – I am rather dissatisfied, “3” – I’m rather satisfied, “4” – I’m very satisfied.
Students’ answers are collected in Table 41, while the detailed numeric breakdown on their
attitudes towards MTPE is presented in Appendix XI, Table XI.4:
Group 1 Group 2
Satisfaction level TS 1 TS 2 TS 1 TS 2
very dissatisfied 1 0 0 2
rather dissatisfied 9 10 11 12
rather satisfied 11 11 11 10
very satisfied 1 1 2 0
Total nr. of answers 22 22 24 24
Table 41. Are you satisfied with your performance in this TS?

Part III. Study outcomes: analysis and reflections
188
As indicated, in Group 1 the most frequently ticked values for TS 1 and TS 2 were
“rather dissatisfied” (9 vs. 10 participants) and “rather satisfied” (11 vs. 11 participants).
As for Group 2, the frequency of most common values for TS 1 as opposed to TS 2 was
nearly the same: 11 vs. 12 participants were “rather dissatisfied” with their performance,
while 11 vs. 10 participants reported being “rather satisfied” in the corresponding testing
sessions.
Figures 16.1 and 16.2 reflect the dynamics of individual responses for both groups in
each of the TSs.
Figure 16.1. Are you satisfied with your performance in this TS?
(dynamics of individual responses, Group 1)
Group 1 results reported 4 cases of significant improvement in self-satisfaction
(18%) and 4 cases in which self-satisfaction got worse (18%). In 14 cases the perception of
one’s PE performance did not significantly change between the TSs: 6 students were rather
negative about it (27%), while 8 students kept being positive (37%).
Figure 16.2. Are you satisfied with your performance in this TS?
(dynamics of individual responses, Group 2)
The majority of students from Group 2 (19 participants) did not demonstrate
significant changes in satisfaction levels in TS 2: 10 of them (41%) were somewhat
negative when evaluating their satisfaction with PE performance before and after the
27%
18%
18%
37%
Remained negative
Worsened
Improved
Remained positive
41%
17%
4%
38%
Remained negative
Worsened
Improved
Remained positive

Part III. Study outcomes: analysis and reflections
189
training, while the other 9 (38%) demonstrated the opposite tendency. However, 5 students
displayed a propensity to change the attitude towards their PE performance significantly: 4
of them were much less satisfied with their performance in TS 2 (17%), while 1 believed it
got notably better (4%).
One more question concerned students’ satisfaction with their level of competency in
PE if asked to perform similar assignments in the future. Students evaluated the perceived
level of their PE competency on a 4-value scale (“1” – deficient, “2” – average, “3” –
sufficient, “4” – excellent). The students’ answers are summarized in Table 42, (the
detailed numeric breakdown on responses is presented in Appendix XI, Table XI.5):
Group 1 Group 2
Satisfaction level TS 1 TS 2 TS 1 TS 2
deficient 2 0 0 0
average 12 11 15 12
sufficient 8 11 9 12
excellent 0 0 0 0
Total nr. of answers 22 22 24 24
Table 42. If asked to perform similar tasks in future, how would you evaluate your level of PE
competency?
As the results show, the prevailing trends for both Groups were to evaluate one’s PE
competency as “average” or “sufficient” before and after the suggested training.
Figures 17.1 and 17.2 reflect the dynamics of individual responses for TS 1 and TS 2
correspondingly.
Figure 17.1. If asked to perform similar tasks in future, how would you evaluate your level of PE
competency? (dynamics of individual responses, Group 1)
50%
14%
36%
Remained negative
Worsened
Improved
Remained positive

Part III. Study outcomes: analysis and reflections
190
The total of 19 students from Group 1 did not change their perception of PE
competency: 11 of them remained (somewhat) negative about it (50%), while 8 revealed
the opposite tendency (36%). No one has reported PE competency deterioration while the
remaining 3 students believed it got notably better in TS 2 (14%).
Figure 17.2. If asked to perform similar tasks in future, how would you evaluate your level of PE
competency? (dynamics of individual responses, Group 2)
Similar tendencies were tracked in Group 2, where the total number of those whose
opinions did not change much equals 11: 7 students remained negative about their PE
competence (29%), and 4 students kept being positive in their beliefs (17%). What is more,
5 students reported deterioration of their PE competency (21%), while 8 participants
believed in its improvement (33%).
Similarly to the description of MTPE-related attitudes, descriptive analysis of the
participants’ self-evaluation before and after the training demonstrates a broad variety of
opinions and little resemblance between the groups. Yet, in terms of students’ satisfaction
with their performance in the TSs, relatively large constituencies in both groups showed a
tendency towards the stability of their positive/negative opinion, while smaller
constituencies demonstrated improvement/worsening of theirs. As for the self-evaluation
of PE competency from the perspective of future PE assignments, Group 2 members
differed more in their opinions, although on a larger scale in both groups 50% in total
expressed positive/improved opinions regarding their PE skills, while the opinions of the
other 50% remained negative/worsened.
29%
21%33%
17%
Remained negative
Worsened
Improved
Remained positive

Part III. Study outcomes: analysis and reflections
191
6.2.3. Interpretative analysis of students’ opinions
At the end of TS 2 the participants were asked to provide their ideas concerning the
effect the training (if any). Out of the total of 46 participants, two abstained from
comments, thus reducing the pool to 44 opinions. The thematic analysis was used to
identify and interpret “key ideas or themes” (Matthews and Ross, 2010: 373). In this way,
the highlighted themes were labeled as “PE skills” (27 responses), “MT performance” (20
responses) and “PE as a profession” (9 responses). Those comments and concerns which
could not be assigned to any of the outlined sub-categories were analyzed separately. The
total number of opinions exceeds 44, as some participants commented on more than one
issue.
In Table 43.1 we summarized the comments concerning PE skills as perceived by
participants. Here the student mentioned (no) enhancement of such skills as the major
effect of participation in the training:
Participation in the training… Nr. of answers
… did not influence my PE skills 3
… introduced me to a new set of skills 14
… enhanced my PE skills 10
Table 43.1. Perceived effect of the training on students’ PE competency
(PE skills perspective)
As we can see, the relative majority of respondents (14 students) mentioned getting
to know PE as a professional field among the positive effects of their participation in the
experimental study. These results correspond to the initial aim of the training since the
latter was focused not only on the enhancement of PE performance as expressed in PE
productivity and PE output quality but also familiarization of the participants with the new
subject field and sharing the best PE practices as explained in Chapter 2. A smaller part of
the sample (10 students) mentioned skills enhancement among the key benefits of
participation in the training. While some students (G1_16, G1_18, G2_08, G2_09), did not
give any details on what skills they considered enhanced, others (G1_04, G2_16)
mentioned improvement of understanding of PE quality evaluation criteria and an increase
in their PE throughput.
The analysis of the batch of comments focused on how participation in the training
has influenced students’ perception of MT performance revealed several sub-themes, as
summarized in Table 43.2:

Part III. Study outcomes: analysis and reflections
192
MT performance … Nr. of answers
…improved my opinion about MT industry 7
...provides MT output of acceptable quality 6
…makes it possible to use MT as a professional tool 7
Table 43.2. Perceived effect of the training on students’ PE competency
(MT performance perspective)
Investigation of the reasons behind such opinions provides us with grounds for
speculations that those students who noticed changes of their attitude towards MT
performance (G1_01, G1_14, G1_18, G2_01, G2_06, G2_15, G2_18) did so because of
the satisfactory quality of the observed MT output and its practicality for translation
assignments. Six students (G1_15, G2_01, G2_03, G2_05, G2_12, G2_21) mentioned the
improvement of MT quality and, as a consequence, future prospects for this resource. What
concerns MT as a productivity tool, this point of view builds on several reasons: MT helps
to cope with repetitive tasks faster (G2_20), it seems to have a positive influence on the
profitability of translator’s job (G2_02, G2_16, G2_19, G2_20), and to increase
productivity when combined with PE (G1_15, G2_03, G2_07, G2_19, G2_20).
The third theme dealt with participants’ attitude toward PE as a type of professional
activity. The summarized opinions are presented in Table 43.3:
When thinking of PE as a job… Nr. of answers
… the training helped me to make up my mind 5
… my attitude is negative 2
… my attitude is positive 2
Table 43.3. Perceived effect of the training on students’ PE competency
(PE as a career perspective)
As can be seen from this batch, five students (G1_07, G1_10, G1_17, G1_19,
G2_24) said that participation in the experimental study helped them decide whether or not
to take up PE professionally in future. However, they did not reveal more concrete ideas in
this respect. Two students (G1_19, G2_07) expressed their negative attitude to PE as a
professional activity by saying they “don’t enjoy” or “are not interested”. Other two
students (G1_10, G2_02) believed PE looks interesting from the professional viewpoint.
Apart from positive opinions regarding participation in the training program, many
students expressed a wish to proceed with training to be able to improve their PE
performance. This concern goes in line with the concept of lifelong learning and opens an

Part III. Study outcomes: analysis and reflections
193
interesting avenue of exploration for further studies. Another important comment made by
many students concerned MT and MTPE as an unfamiliar subject field. The students
explained that they lack knowledge on the production of MT output and its further use,
drafting and application of PE guidelines. Also, these comments may indicate possible
areas of improvement translation training syllabi.
6.2.4. Associative correlation of questionnaire responses
Positive attitude towards MT and predisposition to get engaged in MTPE projects are
considered to be among the key factors which positively influence PE performance. In this
concern, we were interested in revealing correlations in the MTPE-related attitudes as well
as self-evaluation of PE performance provided by participants of our experimental study.
To investigate associations between the available qualitative data, Chi-square test
was applied to examine each of the following combinations of previously described
categories: (1) attitude towards MTPE vs. attitude toward PE quality threshold; (2) attitude
to PE quality threshold vs. attitude to PE as a job; (3) attitude towards MTPE vs. attitude to
PE as a job; (4) self-satisfaction from PE performance vs. self-evaluation from proficiency
in PE. If p-value > 0.05, the compared variables are considered independent and null
hypothesis was confirmed.
The p-values for TS 1 are summarized in Table 44.1, while the relevant screenshots
of R Commander are represented in Appendix XII, Images XII.1-XII.4 (Group 1), Images
XII.5-XII.8 (Group 2) and Images XII.9-XII.12 (Groups 1 and 2 combined):
TS 1 Group 1
(chi2 p-value)
Group 2
(chi2 p-value)
Groups 1 and 2
(chi2 p-value)
TS 1_Attitude towards MT vs. PE quality standards 0,4686 0,4613 0,2342
TS 1_PE quality standards vs. PE as a job 0,3092 0,2133 0,8121
TS 1_ PE as a job vs. attitude towards MT 0,0386 0,9088 0,7635
TS 1_Self-satisfaction vs. estimation of PE
proficiency
0,0386 0,0026 0,000001
Table 44.1. Associative correlations of TS 1 qualitative values
On the whole, the obtained results do not show statistically significant correlations
among attitudes towards MT, quality standards adopted in MTPE and eagerness to take up
post-editing as a professional career (since the p-values reported by each group in

Part III. Study outcomes: analysis and reflections
194
particular and the combined data exceeded 0.05). However, the opposite is true for Group
1 results on the correlation of students’ attitude to PE as a job vs. MT, yet the small size of
the sample (22 responses) calls for further investigations. On the other hand, the
association between self-satisfaction vs. auto-estimation of PE competency demonstrated
significant results for each group separately and both groups together.
The p-values for TS 2 are summarized in Table 44.2. The relevant screenshots of R
Commander are represented in Appendix XIII, Images XIII.1-XIII.4 (Group 1), Images
XIII.5-XIII.8 (Group 2) and Images XIII.9-XIII.12 (Groups 1 and 2 combined):
TS 2 Group 1
(chi2 p-value)
Group 2
(chi2 p-value)
Groups 1 and 2
(chi2 p-value)
TS 2_Attitude towards MT vs. PE quality
standards
0,8637 0,3326 0,8574
TS 2_PE quality standards vs. PE as a job 0,8239 0,177 0,9077
TS 2_ PE as a job vs. attitude towards MT 0,0001 0,1159 0,0005
TS 2_Self-satisfaction vs. estimation of
PE proficiency
0,0026 0,0009 0,000002
Table 44.2. Associative correlations of TS 2 qualitative values
The results reveal no associative correlation of the combinations “attitude towards
MT vs. PE quality standards” and “PE quality standards vs. PE as a job” for either
separated or combined data sets. On the contrary, statistically significant bonds were
reported for the correlation of “PE as a job vs. attitude towards MT” (Group 1 and
combined results) as well as students’ auto-evaluation.
On the bases of the available evidence, it seems fair to suggest that MTPE-related
attitudes of the participants in both TSs demonstrated no clear associative links except for
the combination “PE as a job vs. attitude towards MT”. Also, similar links were detected in
the part of auto-evaluation, where students expressed their opinions on self-satisfaction
with their PE performance and auto-estimation of PE proficiency. The tendencies are
considered statistically significant as the calculated p-value is below the chi-square test
threshold of 0,05, although a more in-depth study is required to confirm the discerned
trends.

Part III. Study outcomes: analysis and reflections
195
6.3. Correlation between PE performance and attitude towards MT
The previous sections were dedicated to descriptive, inferential and associative
analysis of PE performance, as well as MTPE-related attitudes and convictions. However,
qualitative and quantitative values were examined separately, and no inquiries concerning
possible correlations between both types of data were investigated. To derive further
insights from the available sets of data, Section 6.3 focuses on the interrelation of students’
PE performance vs. their attitude towards MT.
There is a growing support to the claim that positive attitude towards MT improves
PE performance. This viewpoint was also confirmed by the responses yielded by the
survey participants (Chapter 1). To obtain further clues on the possible links between the
available sets of qualitative and quantitative values, we were interested in looking at the
following research question: is there any correlation between positive/negative attitude
towards MT and PE performance?
Given the pre-test/post-test study design, we saw it possible to investigate this
inquiry by splitting the subjects into sub-groups according to their attitude towards MT so
as to compare PE performance of each group and keep track of (possible) changes. As
suggested by the answers to the questionnaire, all participants belong to one of the
following clusters: those with a positive attitude towards MT in both TSs, those with a
negative attitude towards MT in both TSs, those whose attitude towards MT improved and
those whose attitude worsened after undertaking the aforementioned training.
Before clustering, it was necessary to decide on the solid criteria for such
fragmentation. As mentioned before, when filling in the questionnaire the students
measured their attitude towards MT on the scale from 1 to 4, where 1 corresponded to
“very negative”, and 4 – “very positive”. As such, the students who picked “3” and/or“4” in
both TSs were assigned to Cluster A (36 students); those whose attitude towards MT
worsened (i.e., changed from “3”/”4” to “2”/”1”) in TS2 made Cluster B (5 students);
cluster C was made of 3 students whose attitude towards MT improved after the training;
and cluster D was made of those 2 students whose attitude towards MT remained negative
throughout the study. The nature and volume of Cluster A make its results suitable for
drafting baseline box plot diagrams, so as to contrast and compare the values of the other
clusters in continuation.

Part III. Study outcomes: analysis and reflections
196
As already mentioned, the majority of the participants had a positive attitude towards
MT from the very beginning of the experimental research, which resulted in a rather
limited number of those students who expressed negative attitude at any point of the study.
Due to the circumstances, no division between Group 1 (EN-RU) and Group 2 (EN-ES)
was made and all values were examined as one dataset. To be more succinct and keep to
the point, the results are presented in Figures, whereas the detailed numeric data of all
calculations are provided in Appendix XIV, Tables XIV.1-XIV.4.
6.3.1. Cluster A
Interrelation of qualitative and quantitative values started with arranging the data
from cluster A into box plot diagrams. In Figure 18.1 distribution of values that correspond
to the number of under-/over-edited segments is visualized:
Figure 18.1. Cluster A: under-/over-edited segments in TS 1 and TS 2
(the vertical axis represents the number of segments)
In the part of under-edited segments, a slight decrease of the median and a more
substantial decrease of the lower extreme are observed, although the upper extreme value
increased, and an outlier was reported. In TS 2 the interquartile range got bigger which
indicates at a broader variety of values. As for the boxplot representing the number of

Part III. Study outcomes: analysis and reflections
197
over-edited segments, in TS 1 it is skewed towards the lower extreme and demonstrates the
asymmetrical distribution of values inside the interquartile range. In TS 2 the upper
extreme value decreases significantly, and the same tendency is true to the median, while
the lower extreme was constantly reported as 0.
In Figure 18.2 the distribution of values that represent the number of fit-for-purpose
segments in both TSs is portrayed:
Figure 18.2. Cluster A: fit-for-purpose segments in TS 1 and TS 2
(the vertical axis represents the number of segments)
As can be seen, in line with the results previously discussed in Section 6.1, the
median value increased, and so did both extremes.
Figure 18.3 visualizes throughput values distribution in TS 1 and TS 2:
Figure 18.3. Cluster A: WPH rate in TS 1 and TS 2
(the vertical axis represents WPH values)

Part III. Study outcomes: analysis and reflections
198
On logical grounds, Cluster A demonstrated the previously detected tendencies,
namely the increase of all throughput parameters after the training.
6.3.2. Cluster A vs. Cluster B
Having arranged Cluster A values in box plot diagrams, we proceed to contrast them
against the values of the other three clusters. The analysis of correlations between attitude
towards MT and PE performance in the part of under-/over-edited segments starts with
cluster B (Figure 19.1), where the output data of each student is marked by the same color:
Figure 19.1. Distribution of Clusters A and B values: under-/over-edited segments
(the vertical axis represents the number of segments)
In TS 1 the number of under-edited segments produced by 4 out of 5 students
coincided with the interquartile range of the boxplot diagram, whilst one value was
categorized as an outlier. In TS 2 the results of 3 out of 5 students coincided with the
interquartile range of the boxplot diagram, while two values were below the first quartile.
In the part of over-edited segments, the distribution of values in TS 1 demonstrated
slight asymmetry towards the lower extreme. In TS 2 the results of 2 students increased,
while the rest demonstrated decrease or stability of PE performance.
Next, the focus of our attention moved to the correlation between students’ attitude
towards MT and PE performance in the part of fit-for-purpose segments (Figure 19.2):

Part III. Study outcomes: analysis and reflections
199
Figure 19.2. Distribution of Clusters A and B values: fit-for-purpose segments
(the vertical axis represents the number of segments)
The distribution of values in both TSs may be described as balanced. In TS 1 the
majority of values fell into the interquartile range. In TS 2 three of the values demonstrated
the same tendency, while two more values were above the 3rd quartile. On a more fine-
grained scale, one subject worsened their results, while the others demonstrated
improvement.
Finally, the distribution of Cluster A vs. Cluster B throughout rates is visually
represented in Figure 19.3:
Figure 19.3. Distribution of Clusters A and B values: WPH rate
(the vertical axis represents WPH values)

Part III. Study outcomes: analysis and reflections
200
In TS 1 the majority of values were below the median or in its vicinity. TS 2 shows
more balanced results, when nearly all students demonstrated an increase in WPH rate with
the exception of one subject whose WPH rate decreased.
6.3.3. Cluster A vs. Cluster C
In this section PE performance of those with positive attitudes towards MT were
compared with PE performance of those whose attitudes after the training changed from
negative to positive. To begin, we examined the distribution of Cluster C values (under-
/over-edited segments) across the baseline box plot diagram (Figure 20.1), and marked the
output data of each student by the same color:
Figure 20.1. Distribution of Clusters A and C values: under-/over-edited segments
(the vertical axis represents the number of segments)
In the part of under-editing segments, the Cluster C subjects revealed all types of
tendencies: when comparing TS 1 and TS 2, the first subject demonstrated more cases of
under-editings in TS 1 than in TS 2, the second subject, on the contrary, made more under-
editings in TS 2 than in TS 1, and the results of the third student did not change. In the part
of over-edited segments, two students improved their performance and over-edited a
smaller number of segments after the training, while for the third student this value grew
from 0 to 8.

Part III. Study outcomes: analysis and reflections
201
To continue, the correlation between attitude towards MT and PE performance in the
part of fit-for-purpose segments was scrutinized (Figure 20.2):
Figure 20.2. Distribution of Clusters A and C values: fit-for-purpose segments
(the vertical axis represents the number of segments)
The distribution of values in TS 1 was rather dispersed across the boxplot, while in
TS 2 all three values appeared to be located between the 1st quartile and the median. Two
students demonstrated an increase in fit-for-purpose segments, while the results of the third
student decreased.
Finally, in Figure 20.3 the distribution of Cluster A vs. Cluster C throughout rates is
demonstrated:
Figure 20.3. Distribution of Clusters A and C values: WPH rate
(the vertical axis represents WPH values)

Part III. Study outcomes: analysis and reflections
202
As can be seen from the Figure, all values of Cluster C demonstrated an increase
towards TS 2. What it more, while two subjects produced the outcome that was within the
interquartile range, the results of the third subject could be classified as an outlier in both
TSs.
6.3.4. Cluster A vs. Cluster D
Cluster D was made of two subjects whose attitude towards MT remained negative in
both testing sessions. One more time the correlation of both clusters started with analysis
of the number of under-/over-edited segments produced in each TS (Figure 21.1), and the
output data of each student was marked by the same color:
Figure 21.1. Distribution of Clusters A and D values: under-/over-edited segments
(the vertical axis represents the number of segments)
As demonstrated by the Figure, in the part of under-editing segments Cluster D
values were above the 3rd quartile in TS 1, but decreased significantly in TS 2. The
opposite tendency could be traced in the part of over-edited segments, as in TS 1 both
values were below the 1st quartile and increased in TS 2.
Next, we analyzed the correlation between attitude towards MT and PE performance
in the part of fit-for-purpose segments (Figure 21.2):

Part III. Study outcomes: analysis and reflections
203
Figure 21.2. Distribution of Clusters A and D values: fit-for-purpose segments
(the vertical axis represents the number of segments)
The distribution of values in TS 1 was within the interquartile range, although the
second subject had it below the median. In TS 2 both subjects improved their PE
performance and their results equaled the increased median value or the upper quartile
value.
The last Figure to examine was the one with WPH rates of both clusters (Figure
21.3):
Figure 21.3. Distribution of Clusters A and D values: WPH rate
(the vertical axis represents WPH values)

Part III. Study outcomes: analysis and reflections
204
In line with the overall results of the experimental study, Cluster D values increased
in TS 2. However, despite the increase of all values, it is important to pay attention that in
both TSs the WPH rates were below the lower quartile.
Concluding remarks
To describe the trends that emerge from the analysis of PE performance,
investigation of extreme and core values was complemented by the analysis of boxplot
graphs (Section 6.1). The objective of such analysis was to draw inferences from the paired
samples (i.e., results obtained before and after participation in the training) to confirm or
discard the hypothesis that the obtained results were interdependent and did not happen by
chance.
The proposed hypothesis (1) was as follows: the WPH rate in TS 1 is lower than in
TS 2. The analyzed data proved that the inference of this kind was true for Group 1, Group
2 and the combined results. Regarding WPH rates, the minimum values of both TSs were
nearly two times larger in Group 2, while the maximum values of both groups reported
more similarity. Percentage-wise the maximum values in both groups increased less than
minimum values, although both groups demonstrated the increase of WPH rate after the
training.
Corroboration of the hypothesis (2): the number of under-edited segments in TS 1 is
higher than in TS 2 – demonstrated statistical significance for Group 1. This group also
demonstrated reduction of core values variation after the training. However, for Group 2
the core values variations were close to 0. The observed range of values was broader in TS
2 for both groups of data. Analysis of the combined results reported a decrease in the
arithmetic mean and the median indicating less under-editing in TS 2.
In the part of fit-for-purpose segments, the hypothesis (3): the number of fit-for-
purpose segments in TS 1 is lower than in TS 2 was examined. In this case, the p-value in
each of the analyzed samples confirmed the statistical significance of the hypothesis. Both
groups reported an increase of minimum values in TS 2; the same tendency was true for
Group 2 maximum value, while Group 1 maximum value remained unchanged. The
arithmetic mean and median of both groups increased positively, the SD was close to 0.
The combined results reported an increase of all calculated measures except for the SD,

Part III. Study outcomes: analysis and reflections
205
which demonstrated a somewhat negative tendency and suggested a slight decrease of
variety among values after the training.
To complete inferential analysis of PE segments correlations, we focused on the
tendencies of over-edited segments distribution and the hypothesis (4): the number of over-
edited segments in TS 1 is higher than in TS 2. In this case Group 2 demonstrated a
reduction of core data variation after the training. However, for Group 1 the core values
were mostly close to 0. The range of values was smaller in TS 2 for all groups of data. The
analysis of the combined data sets shows a decrease in the arithmetic mean and the median,
indicating to less over-editing in TS 2. The available values suggest no statistically
significant correlation of Group 1 results. Conversely, both Group 2 and the combined data
rendered statistically significant p-value, thus providing us with sufficient grounds to
accept the suggested hypothesis.
On the whole, when comparing the total of TS 1 vs. TS 2 results, the collected values
indicate an increase of word-per-hour rate and the number of fit-for-purpose segments as
opposed to a decrease of the average number of segments categorized as over-edited and
under-edited. Analysis of the obtained results prompts specific conclusions that can be
drawn regarding statistical correlations between the analyzed paired samples. First, the
WPH rate reported an increase in TS 2 for both groups separately and combined, in this
way confirming our hypothesis on the positive influence of the training program. Second,
it is possible to speculate that the number of under-editing is likely to decrease after the
training, although the obtained p-value was slightly above the statistically significant level.
Further studies with a higher number of the participants would be necessary to validate this
hypothesis. Third, participation in the training reports positive influence on the number of
fit-for-purpose segments which results in the increase of PE segments in this category.
Finally, a statistically significant correlation was reported between the segments from the
over-edited category in both TSs. Yet, when analyzed separately, only Group 2 confirmed
this tendency, while Group 1 results were not statistically significant.
The data gleaned from the associative analysis of PE performance lead to two main
conclusions. First, TS 1 and TS 2 trends were reported as opposite when comparing PE
performance and WPH rate. While in TS 1 positive correlation was observed for “WPH
rate vs. fit-for-purpose segments” and “WPH rate vs. under-edited segments”, these two
categories demonstrated negative correlations in TS 2. Conversely, the correlation between

Part III. Study outcomes: analysis and reflections
206
the categories “WPH rate vs. over-edited segments” was reported as negative in TS 1, and
positive in TS 2. For the sake of discussion, it should be mentioned that the nature of all
observed correlations in TS 1 is weak. The similar tendency is observed in TS 2, although
the correlation of “WPH rate vs. over-edited segments” demonstrated moderately
significant dependence. Second, the association among the observed categories of PE
segments yielded negative correlations for nearly all possible combinations in each of the
TSs. However, in two cases a strong negative dependence was reported, namely the
combination “fit-for-purpose segments vs. over-edited segments” in TS 1 and “fit-for-
purpose segments vs. under-edited segments” in TS 2.
As for the qualitative results (Section 6.2), the available evidence indicates that
MTPE-related attitudes and convictions shared by the vast number of the participants did
not undergo significant changes after the training. In both TSs the overall attitude to the
expansion of MTPE in the translation industry landscape was evaluated quite positively.
However, while Group 1 demonstrated improvement towards “less-than-perfect” quality
standards in TS 2, Groups 2 members mostly disapproved of this criterion. On the other
hand, Group 1 members were rather negative about taking up PE as a regular job, while
Group 2 showed a slight improvement of the participants’ attitude towards such prospect.
MTPE-related convictions of the participants demonstrated no drastic changes. The central
values “rather dissatisfied” and “rather satisfied” were the most popular answer options
for evaluation of one’s PE performance in both testing session. Similar tendencies were
noticed when inquiring about students’ perceived PE proficiency, evaluated as “average”
and “sufficient” by the majority of subjects, although this time there were traces of
moderate improvement.
Section 6.2 also examined the students’ opinions about the impact of the training
they participated in. The collected responses were split into two batches. The first batch
concerned the training effects and the comments related to the training evaluation. The
opinions dealt with three main themes: PE skills of the participants, application of MT in
the translation industry and attitude towards PE as a type of professional activity. The
second batch comprised the participants’ worries and concerns regarding the training,
where two key topics could be detected: scarce familiarity with MT and PE, on the one
hand, and the need of more training, on the other.

Part III. Study outcomes: analysis and reflections
207
In the part of the qualitative values association, the majority of combinations within
MTPE-related attitudes reported no statistically significant results. The only combination
where the p-value could be considered as statistically significant was “PE as a job vs.
attitude towards MT“ in TS 2. Consequently, it is reasonable to speculate that one of the
possible reasons for this is students’ participation in the experimental study. As for the
categories of self-evaluation, the voiced opinions reported statistical relationship of values
before and after the training.
The objective of Section 6.3 was to detect and elaborate interrelations that might
exist among the actual PE performance rates demonstrated by the students in terms of
throughput and output quality, and their attitude towards MT. Having compared four
clusters of the participants, who were arranged in conformity with the expressed
positive/negative attitudes towards MT in TS 1 and TS 2, no major tendencies in PE
performance were detected. The WPH rate increased irrespectively of
improvement/stability/worsening of the participants’ attitude between TS 1 and TS 2.
However, it is important to stress that the throughput of Cluster D (students with a negative
attitude towards MT in both TSs) was low before and after the training. As for the PE
output quality parameters, a tendency towards a decrease of “under-edited” segments could
be traced in Cluster B and Cluster D, an increase of over-edited segments was more
common for Cluster D, while Clusters B and C demonstrated a weak opposite tendency.
An increase of fit-for-purpose segments could be traced in all clusters, although to a
different degree.

Part III. Study outcomes: analysis and reflections
208
Chapter 7. Experimental study: NMT perspective
The chapter offers a brief overview of the NMT paradigm and pursues the objective
to shed light on the extent to which this paradigm could impact the training content. To this
end the source segments from the testing assignments are translated by a neural MT system
(a different one for each language pair) and one statistical MT system, since involvement
of a statistical MT engine provides us with an opportunity to contrast the NMT output
against the SMT output that is different from the one used for the experimental study
purposes. In particular, our attention focuses on the degree of similarity between the raw
MT output used for the study needs and the (N/S)MT output of other systems; comparison
of the “golden standard” used for the study needs and the (N/S)MT output of other system;
assessment of the quality of the raw output produced by alternative (N/S)MT engines and
extrapolating the collected pieces of data.
Based on the aforementioned analysis, suggestions are made about the changes in the
design of the training proposal in case an NMT engine is selected to generate the strings
further used for the training needs.
7.1. NMT paradigm and the training corpus
A cutting-edge panorama of MTPE scenario is rapidly changing in response to the
rise of neural machine translation (NMT) models. Their parameters derive from parallel
corpora and are supported by powerful machine learning algorithms and artificial neural
networks (Casacuberta Nolla and Peris Abril, 2017). A lot of research has been done in this
field: end-to-end encoder-decoder models were built (Kalchbrenner and Blunsom, 2013;
Sutskever et al., 2014; Cho et al., 2014), attention mechanisms to the NMT encoder-
decoder framework were introduced (Bahdanau et al., 2015), further improvements were
made with respect to the relevant linguistics information and language pairs (Luong et al.,
2015; Sennrich and Haddow, 2016). Under the circumstances, many translation industry
flagships (e.g., Systran, Google, Wipo) are focusing their efforts on the creation of their
own neural translation systems (Crego et al., 2016; Wu et al., 2016).
From the viewpoint of automatic evaluation, NMT engines are believed to
outperform phrase-based statistical systems (Casacuberta Nolla and Peris Abril, 2017;
Bahdanau et al., 2015; Sennrich et al., 2016; Bojar et al., 2016). The research conducted by

Part III. Study outcomes: analysis and reflections
209
a group of scholars from ADAPT Centre and Iconic Translation Machines (Castilho et al.,
2017) made a step further and examined NMT output scores from the human evaluation
perspective. It was stressed that when comparing neural vs. statistical MT using automatic
metrics, the advantage of the former was reported. Things stopped being so clear-cut once
human evaluation got involved. Despite gains in fluency, NMT demonstrated inconsistent
results in adequacy evaluation and post-editing effort. The research group (ibid.)
propounds the view that the apparent irregularity might be provoked by a relatively short
time invested into NMT development, as opposed to the long-standing phase-based
statistical MT engines. After investigation of three cases where NMT output was compared
against SMT systems and human evaluation, the researchers came to a conclusion that
despite a substantial improvement in the output quality for some language pairs and subject
fields, the results are not yet so precise and there is a way to go before linguists could rank
NMT systems higher than statistical ones.
At this point, it is important to stress that Autodesk post-editing data corpus used in
our experimental study was released in 2015, while its content was translated during 2012-
2014. As such, the MT system used at that time could not benefit from the advances in the
field available nowadays. To see how and to what extent application of other (than
Autodesk) engines would have influenced the output used in the course of the training
(previously described in Part II), 80 original segments from the testing sessions of both
groups (40 for each language pair) were fed to the total of two NMT systems and one
statistical MT system. Combination of an NMT and an SMT engine for each language pair
provided us with the data to roughly evaluate the performance of these types of engines
and to predict possible tweaks to the training proposal.
In particular, the EN-ES training set was translated by DeepL NMT system,
translations of the EN-RU training set were obtained from Google NMT system (as for
June 2018 DeepL did not offer translations from/into Russian). Also, both language pairs
were complemented by the raw output produced by Yandex (an SMT system). The key
features of the engines are collected in Table 45:
DeepL a neural network system capable of translating any type of text; the system
builds on machine learning for natural language processing, and is trained on
billions of high-quality translations
Google a multilingual NMT service by Google, offering a set of robust functionalities
that enable end-users to translate many different types of content

Part III. Study outcomes: analysis and reflections
210
Yandex a statistical machine translation system working with major east- and west-
European languages
Table 45. Alternative (N/S)MT systems
To get an approximate estimate of the raw (N/S)MT output quality, the total of MT
errors produced by the alternative (N/S)MT engines were analyzed with the MQM tool –
the same tool that was used in the full-scale study. Next, the frequency of segments
with/without MT errors was calculated and compared to the frequency of such segments in
the referent output used for the study needs. Table 46 gives a snapshot of the types and
ratio of MT errors produced by all engines, although a detailed analysis of MT errors was
beyond the scope of our investigation. The raw MT segments for the EN-ES and EN-RU
language pairs were split into fit-for-purpose segments (Ffp.) and segments with one or
more errors (Not_ffp.); for the sake of accuracy the latter category was further subdivided
into segments with one or more adequacy error(s) (Ade.), segments with one or more
fluency error(s) (Flu.), or segments with both types of errors (Mix.):
System Ffp. % Not_ffp. % Ade. Flu. Mix.
EN-ES
Autodesk 12 30% 28 70% 11 17 0
DeepL 33 82,2% 7 17,8% 2 4 1
Yandex 17 44,5% 23 54,5% 4 9 10
EN-RU
Autodesk 11 27,5% 29 72,5% 12 17 0
Google Translate 26 65% 14 35% 10 3 1
Yandex 29 72,5% 11 27,5% 5 2 4
Table 46. Autodesk MT output quality vs. other (N/S)MT systems output quality
The results of the EN-ES language pair show a significant (DeepL) and a moderate
(Yandex) increase in the part of fit-for-purpose segments as compared to Autodesk and,
correspondingly, a significant (DeepL) and a moderate (Yandex) decrease in the part of
segments with MT issues. The share of segments with one or more adequacy/fluency
error(s) and mixed errors is higher for Yandex, while DeepL demonstrated a substantial
drop in the frequency of all types of errors.
Relatively similar tendencies were observed in the EN-RU set of segments. It is
worth mentioning that for this language pair performance of NMT (Google Translate) and
SMT (Yandex) systems yielded very similar results in terms of output quality. In

Part III. Study outcomes: analysis and reflections
211
particular, both alternative engines suggest an increased share of fit-for-purpose segments
and, correspondingly, a decreased share of segments with one or more MT issue(s) in
comparison with the output produced by Autodesk.
The performed analysis reveals that as of today both SMT and NMT systems show a
propensity toward the production of good-enough raw output. Also, it is worth mentioning
that the results of both alternative engines are more homogenous for the EN-RU set of
segments, while the NMT model outperforms the SMT model when applied to the EN-ES
set of segments.
7.2. (N/S)MT output: comparison and contrast
To get further insight into the raw MT content generated by the alternative (N/S)MT
engines, the segments from Section 7.1 were involved into calculating the similarity
index 14 between the referent and alternative raw MT outputs, and establishing the
Levenshtein distance15 between the alternative raw output and the “golden standard”.
Given that the referent raw MT output used for the training and testing assignments
is considered to be of good quality, the similarity between this type of the output and the
output produced by alternative (N/S)MT systems could be interpreted as a sign of accurate
performance of the latter. However, this would only be true for the cases when both
outputs are considered as fit-for-purpose and do not require further post-editing. To
neutralize decrease in the similarity index in those cases where the referent segment
contains an error, while the segment produced by an alternative (N/S)MT engine is fit-for-
purpose, the average Levenshtein distance (LD) between the alternative raw (N/S)MT
output and the “golden standard” used in the course of this research was analyzed.
Calculation of the LD also allowed for comparison of the number of edits required for
14 Similarity was estimated as a fuzzy match between sentences. The original formula was published in Stack
Overflow developer community on February 15, 2017. For more details please visit
<https://stackoverflow.com/questions/42257760/define-acronyms-when-running-vb-code-calculating-
similarity> (Last consulted on 24.06.2018)
15The original formula was borrowed from Wikipedia <https://en.wikipedia.org/wiki/Levenshtein_distance>
and published in Stack Overflow developer community on November 22, 2010. For more details please
visit <https://stackoverflow.com/questions/4243036/levenshtein-distance-in-vba> (Last consulted on
24.06.2018)

Part III. Study outcomes: analysis and reflections
212
post-editing of the referent output and the alternative output in those cases when such
segments contained (an) MT error(s).
The screenshots of the Visual Basic code used for calculating the similarity index
and LD are presented in Appendix XV, Images XV.1 and XV.2. For the sake of brevity,
the full strings produced by DeepL, Google and Yandex as well as calculations of
similarity index and the LD are provided in Appendix XV, Tables XV.3-XV.6, while this
section contains only concise information on the relevant calculations.
To take a closer look at what the EN-ES testing assignments might have been if
produced by alternative (N/S)MT engines, Tables 47-50 offer a concise summary on the
average performance of such engines as compared to the Autodesk. The results are split
into three batches: Autodesk fit-for-purpose segments vs. the corresponding (N/S)MT
segments (1), Autodesk segments with adequacy issue(s) vs. the corresponding (N/S)MT
segments (2), and Autodesk segments with fluency issues vs. the corresponding (N/S)MT
segments (3). After calculating the similarity index between two sets of raw MT segments,
the LD_1 between Autodesk raw MT and “the golden standard” (i.e., the post-edited
output produced by Autodesk linguists) was examined, as was the LD_2 between the raw
MT output produced by an (N/S)MT engine and the “golden standard”.
Quite logically, in Batch 1 (fit-for-purpose segments produced by Autodesk vs. the
corresponding segments produced by (N/S)MT engines) the average LD_1 value is equal
to 0, since the raw MT segments produced by Autodesk did not undergo any post-editing.
When comparing fit-for-purpose (N/S)MT output with the corresponding Autodesk
segments, it is plausible that the output of the former contains lexical forms and syntactic
structures that differ from the ones produced by Autodesk, which results in longer average
LD_2 as opposed to average LD_1.
Table 47 reports on the calculations performed for Autodesk raw/post-edited output
vs. DeepL raw output:
Autodesk DeepL Similarity LD_1(av.) LD_2 (av.)
Nr. of segm
(Autodesk)
Nr. of segm
(DeepL)
Types of segments
1. Ffp.
Ffp. 0,84 0 15,4
12
9
Ade. 0,85 0 20 1
Flu. 0,93 0 10 1
Mix. 0,67 0 60 1

Part III. Study outcomes: analysis and reflections
213
2. Ade
Ffp. 0,76 14,8 22,4
12
10
Ade. 0,74 20 17 1
Flu. 0,85 11 4 1
Mix. - - - -
3. Flu.
Ffp. 0,84 9,2 16,0
16
14
Ade. - - - -
Flu. 0,92 6 10,5 2
Mix. - - - -
Table 47. Autodesk vs. DeepL – comparison and contrast (EN-ES)
On the whole, Batch 1 demonstrates high index of similarity between the raw MT
outputs produced by Autodesk and DeepL. However, the similarity index gets somewhat
lower when the DeepL segment contains a mix of fluency and adequacy errors, which is
also reflected in the increased the average LD_2 value. Focusing on the segments with one
or more MT errors produced by Autodesk vs. the corresponding segments of DeepL
(Batches 2 and 3), we can see that Batch 2 segments by DeepL are more similar to the
“golden standard” (as proved by shorter average LD_2), while Batch 3 demonstrates the
opposite tendency and as the average LD_2 is longer than the average LD_1.
To better visualize the amount of editing required in those cases when the original
segment was (machine) translated by Autodesk/DeepL, and an error (or more) occurred in
both cases (Batches 2 and 3), in Figure 22 we collected the LD values for all segments
from Batches 2 and 3, excluding the cases where DeepL output was fit-for-purpose:
Figure 22. Levenshtein distance between Autodesk/DeepL segments with errors and the “golden
standard” (the horizontal axis shows the number of segments)

Part III. Study outcomes: analysis and reflections
214
Judging from the Figure 22 data, it is possible to assume that when the referent raw
segment contains an adequacy error, and the corresponding DeepL segment also contains
adequacy/fluency/mixed error(s) (segments 1 and 2), the output produced by DeepL would
require less editing, as demonstrated by LD_2 values which are smaller than LD_1 values.
However the same is not true for the case when both the raw referent segment and the
DeepL segment contain fluency errors (segments 3 and 4), as despite a very high similarity
between the raw output of both engines, more editing would be needed if the original were
translated by DeepL (segment 3) and the amount of editing would be the same for both
types of output (segment 4).
Along similar lines the segments used for the experimental study were compared and
contrasted against the output produced by the SMT system Yandex (Table 48):
Autodesk Yandex Similarity
LD_1
(av.)
LD_2
(av.)
Nr. of segm
(Autodesk)
Nr. of segm
(Yandex)
Types of segments
1. Ffp.
Ffp. 0,87 0 15,1
12
7
Ade. 0,66 0 50 1
Flu. 0,80 0 23,5 2
Mix. 0,52 0 57,5 2
2. Ade
Ffp. 0,77 14,75 19,8
12
4
Ade. 0,85 14,5 46 2
Flu. - - - -
Mix. 0,65 15,16 35,66 6
3. Flu
Ffp. 0,79 5,33 34,33
16
6
Ade. 0,55 2 32 1
Flu. 0,78 11,42 33,28 7
Mix. 0,70 13,5 49,5 2
Table 48. Autodesk vs. Yandex – comparison and contrast (EN-ES)
For this type of engine, the similarity index of Batch 1 is characterized by higher
heterogeneity than in the previous case (Table 47), this observation is supported by a rather
long LD between the “golden standard” and the raw Yandex output. The similar tendency
is preserved in Batches 2 and 3, where the alternative raw output bears less resemblance to
the referent raw output and also is likely to require more effort on the part of post-editors,
as implied by the longer LD between the Yandex output and the “golden standard”
(LD_2). On the other hand, Yandex produced a slightly higher number of good-enough
segments than Autodesk.

Part III. Study outcomes: analysis and reflections
215
Along similar lines, to better visualize the amount of editing required in those cases
when the original segment was (machine) translated by Autodesk/Yandex and an error (or
more) occurred in both cases (Batches 2 and 3), in Figure 23 we collected the LD values
for all segments from Batches 2 and 3, excluding the cases when Yandex output was fit-
for-purpose:
Figure 23. Levenshtein distance between Autodesk/Yandex segments with errors and the “golden
standard” (the horizontal axis shows the cardinal number of segments)
On the bases of the above mentioned data it is possible to speculate that on the whole
Yandex generated a bigger share of good-enough raw MT segment as opposed to the
output produced by Autodesk. However, if the Yandex engine is applied in the course of
the training, its MT errors would require the same/bigger amount of post-editing than
Autodesk MT errors of the original training content, as proved by equal / slightly higher /
significantly higher LD values.
Next, the focus of our attention moved to the EN-RU set of segments. First, the
segments used for the experimental study were compared and contrasted against the output
produced by the NMT system Google Translate (Table 49):
Autodesk
Translate Similarity
LD_1
(av.)
LD_2
(av.)
Nr. of segm
(Autodesk)
Nr. of segm
(Google Translate)
Types of segments
1. Ffp.
Ffp. 0,80 0 22,6
11
7
Ade. 0,76 0 22,6 3
Flu. 0,48 0 34 1
Mix. - - - -

Part III. Study outcomes: analysis and reflections
216
2. Ade.
Ffp. 0,73 11,12 27,9
12
8
Ade. 0,78 11 23 2
Flu. 0,85 7 2 1
Mix. 0,60 9 48 1
3. Flu.
Ffp. 0,75 3,55 24,82
17
11
Ade. 0,60 18,80 35,60 5
Flu. 0,60 1 43 1
Mix. - - -
Table 49. Autodesk vs. Google Translate – comparison and contrast (EN-RU)
The similarity index of Batch 1 may be described as somewhat heterogeneous, and
the LD between the raw output and the “golden standard” is rather long (LD_2). Similar
tendencies in terms of similarity index and the LD_2 are demonstrated in the Batches 2 and
3. The only exception is the case is when an adequacy issue in the raw Autodesk output
was juxtaposed to a fluency issue in raw Google Translate, where the LD_2 value is
smaller than LD_1 value, and similarity between two raw segments is somewhat high.
Even so, Google Translate produced a larger number of fit-for-purpose segments than
Autodesk.
In Figure 24 we collected the LD values for all segments from Batches 2 and 3,
excluding the cases when Google Translate output was fit-for-purpose for better
visualization of the amount of editing required in those cases when the original segment
was (machine) translated by Autodesk/Google Translate and an error (or more) occurred in
both cases:
Figure 24. Levenshtein distance between Autodesk/Google Translate segments with errors and the
“golden standard” (the horizontal axis shows the cardinal number of segments)

Part III. Study outcomes: analysis and reflections
217
Although the share of fit-for-purpose segments would be higher if compared with the
original content used for the training, the visualized data suggest that involvement of the
output produced by an NMT system (e.g., Google Translate) into the training is likely to
require more edits on the side of post-editors, as indicated by a longer distance from the
“golden standard” in nearly all cases.
Finally, the segments used for the experimental study were compared and contrasted
against the output produced by the SMT system Yandex (Table 50):
Autodesk Yandex Similarity LD_1 (av.) LD_2 (av.)
Nr. of segm
(Autodesk)
Nr. of segm
(Yandex)
Types of segments
1. Ffp.
Ffp. 0,78 0 19,4
11
9
Ade. - - - -
Flu. 0,79 0 17 1
Mix. 0,54 0 60 1
2. Ade
Ffp. 0,67 12,87 24,5
12
8
Ade. 0,82 15 22 2
Flu. - - - -
Mix. 0,80 8 50 2
3. Flu.
Ffp. 0,78 3,17 21,92
17
12
Ade. 0,86 2,6 20 3
Flu. 0,68 1 30 1
Mix. 0,64 2 27 1
Table 50: Autodesk vs. Yandex – comparison and contrast (EN-RU)
As well as in the previous case (Table 49), the similarity index of Batch 1 may be
described as heterogeneous, and the LD between the raw output and the “golden standard”
is rather long. This tendency keeps being reported in the Batches 2 and 3.
In order to better visualize the amount of editing required in those cases when the
original segment was (machine) translated by Autodesk/Yandex and an error (or more)
occurred in both cases, in Figure 25 we collected the LD values for all segments from
Batches 2 and 3, excluding the cases when Google Translate output was fit-for-purpose:

Part III. Study outcomes: analysis and reflections
218
Figure 25. Levenshtein distance between Autodesk/Yandex segments with errors and the “golden
standard” (the horizontal axis shows the number of segments)
As such, one more time it is possible to suggest that involvement of the output
produced by an SMT system (e.g., Yandex) into the training is likely to imply more post-
editing, although the share of the fit-for-purpose segment would be higher if compared
with the original materials used for the training.
To conclude, out of all tested (N/S)MT engines, the performance of DeepL may be
considered more accurate for the EN-ES language pair than the performance of Yandex, as
the former is confirmed by a shorter LD from the “golden standard” and a higher amount
of fit-for-purpose segments. In the case of the EN-RU language combination, Google
Translate and Yandex systems demonstrate similar results, and application of either of
them for the training purposes is likely to imply more post-editing than in the course of the
present experimental study, since the LD between the newly generated (N/S)MT output
and the “golden standard” is rather long. On the other hand, both alternative engines
demonstrate a higher ratio of good-enough raw segments in comparison to the raw MT
produced by Autodesk.
7.3. Adjusting the training proposal focus
Analysis of (N/S)MT systems performance provided us with an approximate
estimate of what raw (N/S)MT output quality would be like, to what extent it would
resemble the MT output generated by Autodesk MT engines, on the one hand, and the
segments post-edited by Autodesk linguists (i.e., “golden standard”), on the other. In
continuation, this section reflects on the training proposal design and suggests

Part III. Study outcomes: analysis and reflections
219
considerations regarding the scope of this proposal in light of (N/S)MT systems
performance.
Evaluation of the obtained (N/S)MT output partially confirms the viewpoints voiced
by the field experts in Section 7.1: the arrival of neural MT paradigm results in the increase
of fit-for-purpose segments, and the decrease of segments with MT errors, especially in
what concerns fluency issues. Judging from the data obtained in the previous section, in the
EN-ES dataset the ratio of adequacy issues also shows a tendency to decline, although the
same cannot be said about the EN-RU sample, where the ratio of such segments does not
differ much from the reference. Further analysis revealed that DeepL performed better than
Yandex in terms of similarity to the referent raw output and the “golden standard” for the
EN-ES combination, while Google Translation and Yandex showed similar results in terms
of resemblance to the referent raw output and the “golden standard” for the EN-RU
combination.
This information may provide an interesting foundation for future research on or
application of the suggested training proposal. According to the training outcomes
described in Chapter 6, after the training the students with EN-ES language combination
demonstrated an increase of fit-for-purpose segments and a decrease of over-edited
segments in their PE output, while the share of under-edited segment did not report a
statistically significant decrease. In other words, despite participation in the training, the
trainees still demonstrated a tendency to leave out fluency/accuracy issues. In this case, if
the training content comes from an NMT engine, it would seem logical to focus the
training in PE mostly on detecting various types of adequacy errors, since fluency issues
were reported as less frequent.
What concerns the EN-RU set of segments, after the training the students of this
group showed a strong tendency towards an increase of fit-for-purpose segments and a
decrease of under-edited segments in their PE output, while the share of over-edited
segments did not change significantly. Under the circumstances, it seems possible to
speculate that application of an NMT system which is likely to produce a larger number of
fit-for-purpose segments would imply a higher probability of over-editings, since the
trainees would feel tempted to improve the output that could be classified as “good-
enough”. To that end, the training activities should be specifically designed so as to
provide the trainees with multiple opportunities to take an informed decision on the

Part III. Study outcomes: analysis and reflections
220
amount of post-editing and abstain from over-editing. On the other hand, the MT errors
produced by an NMT engine are likely to require less editing than the errors produced by
an SMT engine.
Concluding remarks
This chapter shared some general observations about the recent advances in the field
of machine translation brought by neural machine translation systems, and the implications
such changes might have on the suggested training proposal.
To forecast the possible consequences of alternative (N/S)MT systems for the
training content, Autodesk raw MT output and post-edited segments used for the needs of
the experimental study were contrasted against the output generated by DeepL (NMT) and
Yandex (SMT) (for the EN-ES language pair), and by Google Translate (NMT) and
Yandex (SMT) (for the EN-RU language pair). For the EN-ES dataset, the results of
DeepL were very similar to the Autodesk raw MT reference, the Levenshtein distance
between the raw segments generated by DeepL and the “golden standard” was shorter. In
terms of output quality, the NMT system showed a strong tendency towards an increase of
fit-for-purpose segments and decrease of segments with fluency/adequacy issues. As for
the EN-RU combination, all aforementioned featured could be applied to the output
produced by Google Translate and also by Yandex, despite the fact that the former applies
neural principles of functioning, and the latter – statistical. Analysis of the possible impact
of NMT on the proposal outcomes suggests that in order to raise the trainees’ awareness of
differences in MT error typologies associated with a particular type of (N/S)MT engine, it
may be beneficial to create training content based on the raw output generated by different
types of (N/S)MT systems.
Although the findings about the more accurate performance of neural MT systems
(as opposed to statistical MT systems) are consistent with current research in the field, we
are fully aware of the fact that more data and investigation would be necessary to come up
with clear guidelines on how to use NMT output for training needs. The analysis of
(N/S)MT potential and limitations conducted in this chapter does not pretend to be
exhaustive; its results rather contribute to the ongoing discussion about similarities and

Part III. Study outcomes: analysis and reflections
221
differences between SMT and NMT systems, and how both of them may be involved in the
MTPE-related training course(s).

Conclusions
222
Conclusions
Hereafter we highlight the key findings and conclusions drawn after completion of
all research phases. Special attention is paid to the research hypothesis and the objectives
and aims that have been achieved. Additionally, application of the thesis outcomes is
considered, the limitations and weaknesses of the conducted study are discussed, and
predictions concerning the future lines of investigation are made.
Research outcomes
This doctoral thesis is an attempt to outline the scope of professional competencies of
language experts engaged in the MTPE sector, and to use the collected first-hand data for
drafting a training proposal aimed at the enhancement of PE competency of novice
translators.
The thesis highlighted the fundamental mainstays of the state-of-play, namely the
expansion of the MTPE model across the translation industry and the need for specialized
training of university graduates in response to constantly emerging new challenges. The
review of the EHEA principles, the scope of translators training and the recent changes in
the translation studies paradigm served as the foundation for a survey-based investigation
conducted among acting post-editors, and the subsequent experimental study that involved
undergraduate translation students in the final years of their academic training. The survey
sought answers to questions about the professional profiles of post-editors, their working
conditions and routines, the ways to exercise their professional activity and opinions
regarding similarities and differences between translation and post-editing. On the one
hand, its outcomes facilitated familiarization of the trainees with the emerging profile of
post-editor and the scope of professional expertise required for post-editing, and on the
other – they indicated the key lines for drafting a corresponding training proposal that was
further applied in the course of the experimental study. The study followed a pre-/post-test
model and involved participants with different working language pairs. Such a measure
provided us with sufficient evidence to consider the training proposal as language
independent. A full-scale experimental study enabled us to test the hypothesis and examine
the extent to which the research objectives and aims were achieved.

Conclusions
223
The results of the empirical experimental study validated our hypothesis that
specialized basic training offered by the suggested proposal is bound to enhance the PE
performance of novice translators who were not previously exposed to a post-editing
workflow. It was expected that after the training the students would adopt the functional
approach to PE and improve their PE performance indicators. As exposed in the study
outcomes, the training resulted in the increase of PE proficiency in the part of PE output
quality and throughput rates, while the attitude to MTPE-related issues was somewhat
positive from the very beginning and did not undergo dramatic changes.
In continuation we offer an overview of the investigation and findings that provided
the solid background for an informed decision concerning the research hypothesis and
study objectives:
o Post-editors’ profiles and the scope of PE expertise
In-depth analysis of MTPE actors and processes is highly beneficial for the industry
and academia. Investigation of this kind is bound to produce a synergistic effect and
propagate further research in the field. As such, first-hand information about the
background, skills and working routines of language experts engaged in MTPE were
considered as a valuable source of data for further study programmed in the framework of
this thesis. To collect the relevant data on MTPE-related processes and profiles, our
survey-based empirical investigation focused on four research themes: respondents’
profiles and experience (e.g., the working language pair, throughput rates, academic
background, years of experience), MTPE workflow (e.g., tools, reference materials and
routines), decision-making and contrast of translators’ vs. post-editors’ profiles. The
survey was administered using a questionnaire; the responses elicited facts, opinions and
feelings.
The study results not only provided us with the necessary information for drafting a
training proposal, but also allowed us to obtain a comprehensive picture of the MTPE field,
and its implications for the industry and academia. In particular, the survey outcomes
contributed to the awareness of translators’ changing role in light of the recent
developments in the MTPE sector and helped to customize training programs and market
demands. The information concerning profiles and daily routines of professionals may be
used by LSPs to adapt their expectations and improve their workflow. What is more, the

Conclusions
224
results provided the empirical bases for outlining the scope of competencies currently
deployed by post-editors, which may serve as a reference point for specifying translator
training objectives by the academic sector.
o Design and implementation of the training proposal
A holistic approach to translator training is directly linked to the right balance
between drafting a curriculum in conformity with the expectations of the translation
industry, and enhancement of MTPE expertise that would enable translators to go beyond
such expectations. Under such circumstances, the authentic feedbacks collected from the
professional post-editors by means of a survey-based study, thorough consideration of the
EHEA recommendations and competency-based training principles procured us with
substantial content to draft a training proposal. The ultimate goal of such training was to
provide its participants with a better understanding of the MTPE industry and to gain the
proficiency required for efficient completion of post-editing jobs. It is for this reason that
the trainees were provided with multiple opportunities to enhance their PE performance
and get a deeper insight into social and professional characteristics of those translators who
are currently engaged in MTPE projects.
The subjects of our experimental study were undergraduate translation students in
their final year of academic training. This choice was based on the premises that translation
competency of this category of students is characterized by sufficient level of acquired
knowledge, skills, and attitudes that can be expected of novice translators.
The training objectives included introduction of the trainees to the concept of MTPE
and the changes it brought to the translation industry; followed by enhancement of PE
expertise that manifested itself in improved PE performance and positive attitudes towards
MTPE-related issues. The study followed a pre-/post-test methodology, for which reason
its efficiency was measured by evaluating the data produced by the trainees in the pre-
training and post-training testing sessions. The training model was comprised of two
training sessions: first, the trainees assisted an in-class session, which was followed by a
remote training session performed individually by each student. The training agenda
followed a logical layout and consisted of the ordered sequence of chunks. In conformity
with the current research into the psychology of learning, a significant part of the training

Conclusions
225
was performed by the participants autonomously. This measure contributed to holding the
students accountable for their own academic success and professional development.
o Training outcomes
PE throughput/output results were first examined by means of descriptive analysis of
values that characterized the subjects’ PE performance in each of the testing sessions.
Next, in the course of the inferential analysis the obtained values were scrutinized to
confirm or discard the hypothesis that study results were inter-dependent and did not
happen by chance. The collected evidence indicated to a statistically significant increase of
PE throughput rate and the number of fit-for-purpose segments in the output of all
participants after undertaking the proposed training. It is also worth mentioning that when
analyzing associative correlations among different types of PE performance data, in TS 1 a
strong negative correlation was reported by fit-for-purpose vs. over-edited segments,
implying that more “accurate” post-editors did not show a tendency to over-edit. Even so,
in TS 2 a strong negative correlation was reported by fit-for-purpose segments vs. under-
edited segments, since more “accurate” post-editors showed a tendency towards production
of fewer under-edited segments, suggesting another effect of the training. In what concerns
qualitative values yielded by the participants before and after the training, a conclusion
may be drawn that the majority of the participants broadly welcomed the advances made
by MT to the translational landscape.
At the end of the experimental study, the students’ feedback on the perceived effect
of the training was collected. The obtained answers were assigned to one of two batches:
(1) evaluation of the training, when the trainees shared their ideas on the acquired PE
skills, the impact of MT on the industry, and their feelings about PE as a professional
activity; (2) worries and concerns regarding the training, focused mostly on limited
familiarity with MTPE processes and tasks and criticality of more in-depth training. After
the examination of correlations between the students’ PE performance and attitude towards
MT, an observation was made that although the throughput rate of the participants seemed
to increase irrespectively of their attitude to MT, those students who remained negative in
their attitude towards MT demonstrated throughput rates below average in both testing
sessions.

Conclusions
226
o NMT perspective of the training
The empirical experimental study was based on an SMT engine output; however,
given the rise of NMT systems in the last few years, we tried to reflect on how and to what
extent the training proposal design and outcomes would change should the training corpus
be generated by an NMT engine.
To this end, similarity index between the referent raw MT output strings and the ones
produced by an NMT engine was examined, and the Levenshtein distance between the
“golden standard” and the raw NMT output was calculated. In this way, we simulated the
used of an alternative engine for the training needs, and the corresponding adjustments of
the training proposal were suggested. Application of NMT systems for generating
translation in each of the target languages resulted in the increase of fit-for-purpose MT
segments, and the decrease of segments with MT errors, especially with fluency issues.
Additionally, in the EN-ES dataset the proportion of adequacy issues also tended to
decline. However, the proportion of such issues in the EN-RU dataset does not differ much
from the referent raw MT output. Consequently, it seems logical to suggest that if the
training proposal made use of segments generated by an NMT system, then those students
whose profiles were similar to the ones of Group 1 (EN-RU) should focus more on
abstinence from over-editing such increased amount of good-enough segments (as this
group did not report a statistically significant decrease in the number of over-edited
segments after the training). On the other hand, those students whose profiles are similar to
the ones of Group 2 (EN-ES) should be trained to detect various types of mostly adequacy
errors (given the fact that the participants of this group did not report a statistically
significant decrease in the number of under-edited segments after the training).
To summarize, enhancement of PE performance happened in conformity with the
constructivist framework and the principles of programmed learning. The key
characteristics of the proposal are its ability to be adapted to the individual learning rhythm
of each student and give immediate feedback, which provides the trainees with a sufficient
amount of experiential learning and, therefore, contributes to PE competency
enhancement. It is also important to stress that the suggested proposal may be alternated
and adapted to the specific needs of each particular project and is expected to be of use for
teaching staff and those in charge of in-house training.

Conclusions
227
The outcomes of the empirical study conducted in the framework of this research
made impacts on conceptual, methodological and analytical levels. Shedding light on post-
editors’ profiles and the scope of professional expertise contributed to the conceptual
dimension of MTPE-related research, as did drafting a proposal for PE competency
enhancement. On the methodological level, baseline training that goes in conformity with
EHEA requirements is bound to expand trainees’ proficiency and boost competitiveness of
novice translators in the labor market. Finally, detailed examination of quantitative and
qualitative data yielded by the experimental study, as well as the correlation between the
two provides us with empirical evidence on the impact of the suggested training on the
participants, and showcases analytical practices applied by industry and academia.
The survey results demonstrate that the scope of post-editors’ expertise fits within
translation competencies models, for which reason translation students in the last year of
their Bachelor’s program(s) have a predisposition towards PE competency development.
Such predisposition manifests itself in a positive attitude towards MT, the capability to
grasp the basic principles of post-editing and improve their performance after undertaking
baseline training, as demonstrated by the experimental study results.
The proposed training model contains theoretical and practical modules and was
aimed at PE competency acquisition. In case the model is used for more in-depth training,
its flexibility allows for incorporation of modules that focus on professional aspects of
post-editing and trainees’ instrumental competencies. The suggested training proposal may
be customized in conformity with the trainees’ academic backgrounds, language pairs, or
the type of MT engine used to generate the training corpus.
Research limitations
The empirical studies conducted in conformity with the research objectives of the
present thesis are not free of certain limitations which prevent us from generalizing the
achieved results.
In what concerns preparation and conduct of the survey, the main limitation had to
do with an inability to make assumptions concerning the total population rate, since
measuring the share of MTPE projects performed worldwide may seem too ambitious.
However, to compensate for this shortcoming, the researcher made an effort and used all

Conclusions
228
available communication channels to reach potential survey participants by means of an
Internet-mediated questionnaire. The call for participation was distributed through
databases of LSPs collected by academic institutions, professional associations and/or
federations of translators. In addition, the relevant links to the questionnaire were
published on a number of social media platforms. On the other hand, the variety of
communication channels resulted in the impossibility to gauge the exact response rate and
to make a claim on the representative coverage.
Convenience sampling and an impossibility to confirm respondents’ identity may be
considered two other limitations of the present study. Even so, we believe that the total
number of the filled-in questionnaires is sufficient for fairly complete and reliable analysis
of professional profiles and routines performed by the covered cross-section of translators
currently engaged in the MTPE sector.
As for the full-scale empirical study which involved undergraduate translation
students from Universitat Autònoma de Barcelona and Kharkiv National Aerospace
University with EN-ES and EN-RU as their working language pairs, the variations in the
academic programs and differences in training methodologies may be considered other
limitations to the study. Despite the similar range of disciplines and courses covered by the
students, there may have been divergences between what was stated in the plans and what
was actually put to practice in the classroom, as well as certain modifications and
customization of the training content by academic instructors so as to better meet the needs
of each group.
However, even though heterogeneity of the academic programs might be a
constraint, the study outcomes prove the efficiency of the suggested training proposal and
its positive influence not only on PE performance indicators but also on the trainees’
MTPE-related attitudes and satisfaction levels.
Applicability of study results
The present thesis is an authentic example of applied research focused on the
solution of practical problems that exist in the translation industry and the academic sector.
Its primary goals were to provide a snapshot of the professional profiles of those language
experts who are engaged in the MTPE sector, to outline the scope of PE expertise, to

Conclusions
229
develop a sharable approach to its enhancement, to describe the implementation of the
study design, and to share suggestions regarding the procedures and techniques aimed at
stimulation of PE competency acquisition, as well as its outcomes.
Thinking about the applicability of the research results, the academic and pedagogic
fields seem to be the main beneficiaries who may take advantage of the survey results and
use them as a starting point to draw up their own proposals for undergraduate and
postgraduate training in PE. However, bearing in mind constant changes happening in the
professional market, it is not enough to use the study results as the only reference. A
training program would only bring fruit as long as there is a right balance between the
training content, and the translation industry requirements.
Furthermore, the research findings may also be beneficial for a broad range of MTPE
market players, and in particular to novice translators who want to familiarize themselves
with post-editing and become more competitive in the labor market, and to LSPs who may
gain a better insight into the common routines, PE-related skills and competencies,
opinions and concerns of their vendors and adapt, if possible, their workflow
correspondingly.
On the whole, the applicability of the study outcomes consists of the following:
● the findings contribute to the awareness of translators’ changing role in light of the
emerging developments in the MTPE sector and the on-going research on post-editors’
profiles;
● both the survey and the training proposal can be used for the actualization and
adjusting the translators training syllabi so that the latter keep the pace with current
practices;
● the experimental study outcomes establish a common reference-point to serve as a
clear guideline that enhances more efficient performance from anyone utilizing this
model in academic context; however, we wholeheartedly agree with the belief that for
optimal results the training program should be tailored for a particular PE project; on
top of that the suggested proposal may serve as a baseline model for a broad range of
PE-related projects and training modules, as it permits to emphasize various
characteristics of the latter;

Conclusions
230
● although the training participants demonstrated advances in terms of PE performance
after the training, it seems fair to pinpoint that when post-editing, students from Group
1 (EN-RU) were inclined to commit errors of a different nature than students from
Group 2 (EN-ES), hence the results call for further adaptation of the training proposal
for specific needs of each language pair;
● comparison of the output of the statistical MT engine used for the study purposes with
the output of alternative neural and statistical MT engines helped all those interested to
make an informed decision about how the use of NMT systems, which could have
influenced the training proposal focus;
● MTPE experts and researchers could take advantage of the collected data to compare
them to their own findings and embark on an in-depth exploration of different facets of
this phenomenon, such as correlation of years of experience in PE vs. typical
workflow routines, throughput rates and/or satisfaction levels, prioritization of PE-
related skills, or further exploration of decision-making triggers.
It seems essential to positively influence the natural skepticism towards MT and PE
training, and to that point to suggest first-hand data of post-editors’ profiles and a training
baseline that can be applied for any language pair on condition of the available corpus. We
believe that this investigation bridges the gap between the academic and professional fields
and helps to train novice post-editors and all those who aspire for additional MTPE-related
training in conformity with the demands and requirements of the translation industry.
Future lines of investigation
The outcomes exposed in this work contribute to the investigation of changes
brought to the translation landscape by machine translation and offer a solid foundation
that could be used as a starting point for further research in the field of MTPE-related
competencies and skills enhancement. In particular, the thesis outcomes give rise to a set of
exploration opportunities, such as:
• to invite students with other language combinations and/or academic backgrounds
(e.g., Arts vs. Sciences) to undertake the suggested training proposal and deduce
special needs of such trainees, as well as possible lines of improvement of the training;

Conclusions
231
• to arrange one-to-one interviews with acting post-editors and collect a more reliable
set of data regarding the issues raised in the survey, as well as inquire about their
unmet needs and difficulties they come across when performing PE, and primary
concerns; such investigation could be followed by dissemination of this information
for the sake of further advances in the MTPE sector;
• to initiate an investigation aimed at researching the broad range of factors that can
influence the effect of the proposal, such as target languages, the type of engine used
for MT purposes, students’ academic backgrounds, available resources and evaluation
criteria that could facilitate selection of teaching content, etc.;
• to interview professional post-editors as well as undergraduate/postgraduate students
with experience in PE about their preferences and recommendations on how the
training content could be collected, structured and put into practice.
The abovementioned avenues of exploration imply that MTPE-focused theory and
practice have a long way to go. But as once said by Seneca: every new beginning comes
from some other beginning’s end, so for the time being this research is considered a full-
fledged dissertation which meets all the necessary requirements, although the avenues of
further investigation are many. As such, the author wholeheartedly hopes to continue the
in-depth analysis of the intricate combinations between translation studies and technology,
both of which have paved the way for the rise of MTPE in the future.

Bibliography
232
Bibliography
Allen, J., 2003. Post-editing. In Benjamins Translation Library, 35, pp.297-318.
ANECA. 2007. June 28. REFLEX. Informe ejecutivo: El profesional flexible en la
Sociedad del Conocimiento. Agencia Nacional de la Evaluación de la Calidad y
Acreditación (ANECA): Unidad de Estudios. Available at:
http://www.aneca.es/var/media/151847/informeejecutivoaneca_jornadasreflexv20.pd
f (Last consulted on 16.05.2016).
Aranberri-Monasterio, N. and O’Brien, S., 2010. Evaluating RBMT output for-ing forms:
A study of four tar-get languages. In Evaluation of Translation Technology, 8, p.105.
Arenas, A.G., 2012. Productivity and quality in the post-editing of outputs from translation
memories and machine translation (Doctoral dissertation, Universitat Rovira i
Virgili).
Association of American Colleges and Universities (AACU), Washington, Dc, 2002.
Greater Expectations: A New Vision for Learning as a Nation Goes to College.
National Panel Report. Association of American Colleges and Universities.
Austermuehl, F., 2013. Future (and not-so-future) trends in the teaching of translation
technology. In Revista Tradumàtica (11), pp.326-337.
Bahdanau, D., Cho, K. and Bengio, Y., 2014. Neural machine translation by jointly
learning to align and translate. In International Conference on Learning
Representations, ICLR 2015, San Diego, California, 2015.
Baker, M., 1995. Corpora in translation studies: An overview and some suggestions for
future research. In Target. International Journal of Translation Studies, 7 (2),
pp.223-243.
Barblan, A. and Fayant, C., ed., 2001. Salamanca Convention 2001: the Bologna process
and the European higher education area, EUA Genève.
Barnett, C., 2001. Culture, policy, and subsidiarity in the European Union: from symbolic
identity to the governmentalisation of culture. In Political geography, 20(4), pp.405-
426.
Baron, J., 2010. Cognitive biases in moral judgments that affect political behavior. In
Synthese, 172(1), p.7.
Beaton, A. and Contreras, G., 2010, October. Sharing the Continental Airlines and SDL
post-editing experience. In Proceedings, Ninth Conference of AMTA, Denver,
Colorado.
Becker, G.S. 1993. Human Capital: A Theoretical and Empirical Analysis with Special
Reference to Education (3rd ed.), Chicago: The University of Chicago Press.
Belam, J., 2003, September. Buying up to falling down: A deductive approach to teaching
post-editing. In Proceedings of MT Summit IX, pp. 1-10.

Bibliography
233
Beneitone, P., Esquetini, C., González, J., Maleta, M.M., Siufi, G. and Wagenaar, R. eds.,
2007. Reflections on and outlook for higher education in Latin America: Final report
tuning Latin America project 2004-2007. Universidad de Deusto.
Bergen Communiqué, 2005. The European higher education area–achieving the goals. In
Communiqué of the conference of European ministers responsible for higher
education, pp. 19-20.
Blatz, J., Fitzgerald, E., Foster, G., Gandrabur, S., Goutte, C., Kulesza, A., Sanchis, A. and
Ueffing, N., 2003. Confidence estimation for statistical machine translation. In Johns
Hopkins Summer Workshop Final Report.
Bojar, O., Buck, C., Callison-Burch, C., Federmann, C., Haddow, B., Koehn, P., Monz, C.,
Post, M., Soricut, R., and Specia, L. 2013. Findings of the 2013 workshop on
statistical machine translation. In Proceedings of the 2013 workshop on statistical
machine translation, Sofia, Bulgaria, 8-9 June, pp. 1-44.
Bojar, O., Buck, C., Federmann, C., Haddow, B., Koehn, P., Leveling, J., Monz, C.,
Pecina, P., Post, M., Saint-Amand, H. and Soricut, R., 2014. Findings of the 2014
workshop on statistical machine translation. In Proceedings of the ninth workshop on
statistical machine translation, Baltimore, Maryland, USA, 26-27 June, pp. 12-58.
Bojar, O., Chatterjee, R., Federmann, C., Graham, Y., Haddow, B., Huck, M., Yepes, A.J.,
Koehn, P., Logacheva, V., Monz, C. and Negri, M., 2016. Findings of the 2016
Conference on Machine Translation. In ACL 2016 FIRST CONFERENCE ON
MACHINE TRANSLATION (WMT16). The Association for Computational
Linguistics, pp. 131-198.
Bologna Working Group on Qualifications Frameworks. 2012. Report by the EHEA
Working Group on Qualifications Framework. In: EHEA Ministeria Conference.
Bucharest, Hungary.
Borg, W. R., and Gall, M. D. 1989. Educational research. An introduction (5th ed.). White
Plains, NY: Longman.
Boshuizen, H.P., 2004. Does practice make perfect? In Professional learning: Gaps and
transitions on the way from novice to expert, Springer, Dordrecht, pp. 73-95.
Bruner, J.S., 1966. Toward a theory of instruction (Vol. 59). Harvard University Press.
Bunk, G., 1994. La transmisión de las competencias en la formación y perfeccionamiento
profesionales de la RFA. In Revista europea de formación profesional, (1), pp.8-14.
Burchardt, A. and Lommel, A., 2014. Practical guidelines for the use of MQM in scientific
research on translation quality. Available at: http://www.qt21.eu/downloads/MQM-
usage-guidelines.pdf (Last consulted on 15.07.2017)
Cadwell, P., Castilho, S., O’Brien, S. and Mitchell L. 2016. Human factors in machine
translation and post-editing among institutional translators. In Translation Spaces, 5,
pp. 222-243.

Bibliography
234
Callender, P., 1969. Programmed learning: its development and structure. Longman.
Cano García, M.E., 2008. La evaluación por competencias en la educación superior. In
Profesorado. Revista de curriculum y formación de profesorado, 12 (3), pp.1-16.
Casacuberta Nolla, F. and Peris Abril, Á., 2017. Traducció automàtica neuronal. In Revista
Tradumàtica (15), pp.66-74.
Casacuberta, F., Civera, J., Cubel, E., Lagarda, A.L., Lapalme, G., Macklovitch, E. and
Vidal, E., 2009. Human interaction for high-quality machine translation. In
Communications of the ACM, 52 (10), pp.135-138.
Castilho, S., Moorkens, J., Gaspari, F., Calixto, I., Tinsley, J. and Way, A., 2017. Is neural
machine translation the new state of the art? In The Prague Bulletin of Mathematical
Linguistics, 108 (1), pp.109-120.
Chan, A., 2010. Perceived benefits of translator certification to stakeholders in the
translation profession: A survey of vendor managers. In Across Languages and
Cultures, 11 (1), pp.93-113.
CHEERS. 2003. Careers after higher education: A European research study. Higher
Education and Graduate Employment in Europe – European Graduate Survey.
Available at: http://www.uni-kassel.de/einrichtungen/de/incher/ (Last consulted on
16.05.2016).
Chesterman, A., 1993. From 'is' to 'ought': Laws, norms and strategies in translation
studies. In Target. International Journal of Translation Studies, 5 (1), pp.1-20.
Chesterman, A., 2006. Questions in the sociology of translation. In Benjamins Translation
Library, 68, p.9.
Chesterman, A., 2009. The name and nature of translator studies. HERMES-Journal of
Language and Communication in Business, 22 (42), pp.13-22.
Cho, K., Van Merriënboer, B., Bahdanau, D. and Bengio, Y., 2014. On the properties of
neural machine translation: Encoder-decoder approaches. Available at:
https://arxiv.org/abs/1409.1259 (Last consulted on 10.04.2018).
Cho, K., Van Merriënboer, B., Gulcehre, C., Bahdanau, D., Bougares, F., Schwenk, H. and
Bengio, Y., 2014. Learning phrase representations using RNN encoder-decoder for
statistical machine translation. Available at: https://www.aclweb.org/anthology/D14-
1179 (Last consulted on 20.04.2018).
COM. 2005. Key competences for lifelong learning: European reference framework.
Available at: http://ec.europa.eu/dgs/education_culture/publ/pdf/ll-learning/key
comp_en.pdf (Last consulted on 26.05.2010).
Crego, J., Kim, J., Klein, G., Rebollo, A., Yang, K., Senellart, J., Akhanov, E., Brunelle,
P., Coquard, A., Deng, Y. and Enoue, S., 2016. SYSTRAN's Pure Neural Machine
Translation Systems. Available at: https://arxiv.org/abs/1610.05540 (Page consulter
on 11.06.2018).

Bibliography
235
Creswell, J.W. and Plano Clark, V.L., 2011. Choosing a mixed methods design. In
Designing and conducting mixed methods research, pp.53-106.
Creswell, J.W., Plano Clark, V.L., Gutmann, M.L. and Hanson, W.E., 2003. Advanced
mixed methods research designs. In Handbook of mixed methods in social and
behavioral research, 209, p.240.
Curaj, A., Scott, P., Vlasceanu, L. and Wilson, L. eds., 2012. European higher education
at the crossroads: between the Bologna process and national reforms. Springer
Science & Business Media.
Danks, J.H., Shreve, G., Fountain, S., McBeath, M. (eds.). 1997. Cognitive processes in
translation and interpreting . Applied Psychology (Vol. 3). Thousand Oaks: Sage
Publications, Inc.
Dardenne, B. and Leyens, J.P., 1995. Confirmation bias as a social skill. In Personality and
Social Psychology Bulletin, 21 (11), pp.1229-1239.
De Almeida, G. and O’Brien, S., 2010. Analyzing post-editing performance: correlations
with years of translation experience. In Proceedings of the 14th annual conference of
the European association for machine translation, pp. 26-28.
De Almeida, G., 2013. Translating the post-editor: an investigation of post-editing
changes and correlations with professional experience across two Romance
languages. (Doctoral dissertation, Dublin City University).
De Cecco, J.P. and Crawford, W.R., 1974. The psychology of learning and instruction
educational psychology. Prentice-Hall.
De Miguel Díaz, M., 2005. Modalidades de enseñanza centradas en el desarrollo de
competencias: orientaciones para promover el cambio metodológico en el espacio
europeo de educación superior. Servicio de Publicaciones: Universidad de Oviedo.
De Miguel Díaz, M., Alfaro Rocher, I., Apodaca Urquijo, P., Arias Blanco, J., García
Jiménez, E. and Lobato Fraile, C., 2006. Metodologías de enseñanza y aprendizaje
para el desarrollo de competencias: orientaciones para el profesorado universitario
ante el Espacio Europeo de Educación Superior. Madrid: Alianza editorial.
Delgado García, A.M. (coord), Borges Bravo, R., García Alberto, J., Oliver Cuello, R.,
Salomón Sancho, L., 2005. Competencias y diseño de la evaluación continua y final
en el Espacio Europeo de Educación Superior. Programa de estudios y análisis.
Madrid: Dirección General de Universidades, MEC.
DePalma, D. and Kelly, N., 2009. Project management for crowdsourced translation: how
user-translated content projects work in real life. In Translation and localization
project management: The art of the possible, pp. 379-408.
DePalma, D.A., Sargent, B.B. and Beninatto, R.S., 2006. Can’t read, won’t buy: Why
language matters on global websites. An International Survey of Global Consumer
Buying Preferences. Available at:

Bibliography
236
https://www.commonsenseadvisory.com/portals/_default/knowledgebase/articleimag
es/060926_r_global_consumer_preview.pdf (Last consulted on 20.12.2015)
DePalma, D.A., Hegde, V., Pielmeier, H., Stewart, R.G. and Hedge, V., 2013. The
language services market: 2013. Lowell, MA: Common Sense Advisory.
Depraetere, I., 2010. What counts as useful advice in a university post-editing training
context? Report on a case study. In EAMT 2010: proceedings of the 14th annual
conference of the European association for machine translation, Saint-Raphaël,
France.
Días-Barriga, A.Y.H. and Hernández, R., 2004. Estrategias docentes para un aprendizaje
significativo: una interpretación constructivista. Ed. McGraw-Hill: México.
Doherty, S. and Kenny, D., 2014. The design and evaluation of a statistical machine
translation syllabus for translation students. In The Interpreter and Translator
Trainer, 8 (2), pp.295-315.
Doherty, S. and Moorkens, J., 2013. Investigating the experience of translation technology
labs: pedagogical implications. In Journal of Specialised Translation, 19, pp.122-
136.
Doherty, S., 2017. Issues in human and automatic translation quality assessment. In
Human Issues in Translation Technology: The IATIS Yearbook, p.131.
Doherty, S., O’Brien, S. and Carl, M., 2010. Eye tracking as an MT evaluation technique.
In Machine translation, 24 (1), pp.1-13.
Duchesne, S. and McMaugh, A., 2015. Educational psychology for learning and teaching.
Cengage AU.
Duffy, T.M., and Jonassen, D.H., eds., 2013. Constructivism and the technology of
instruction: A conversation. Routledge.
European Commission. 2004. Competencias Clave para un Aprendizaje a lo Largo de la
Vida. Un Marco de Referencia Europeo. Bruselas: Dirección Geberal de Educación y
Cultura.
European Master in Translation competence framework. 2017. Available at:
https://ec.europa.eu/info/sites/info/files/emt_competence_fwk_2017_en_web.pdf
(Last consulted on 20.04.2017).
Fallows, S. and Steven, C., 2000. Building employability skills into the higher education
curriculum: a university-wide initiative. In Education+ training, 42 (2), pp.75-83.
Federico, M., Cattelan, A. and Trombetti, M., 2012. Measuring user productivity in
machine translation enhanced computer assisted translation. In Proceedings of the
Tenth Conference of the Association for Machine Translation in the Americas
(AMTA) (pp. 44-56). Madison, WI: AMTA.

Bibliography
237
Fedorov, A.V., 1968. Introduction à la théorie de la traduction. École Supérieure de
Traducteurs et d’Interprètes, Bruxelles: ESIT.
Fernández, D.M. and Hughes, S., 2013. Competences and foreign language teacher
education in Spain. In Competency-based Language Teaching in Higher Education,
pp. 63-75. Springer, Dordrecht.
Flanagan, M. and Christensen, T.P., 2014. Testing post-editing guidelines: how translation
trainees interpret them and how to tailor them for translator training purposes. In The
Interpreter and Translator Trainer, 8 (2), pp.257-275.
Fleming, M. 2009. Perspectives on the use of competence statements in the teaching of the
English language. In English language teaching in the European Credit Transfer
System: Facing the challenge, ed. M.L. Pérez Cañado, 75-92. Frankfurt am Main:
Peter Lang.
Flórez, S. and Alcina, A., 2011. Free/Open-Source Software for the Translation
Classroom: A Catalogue of Available Tools. In The Interpreter and Translator
Trainer, 5 (2), pp.325-357.
Fowler, F.J., 1995. Improving survey questions: Design and evaluation (Vol. 38). Sage.
Fox, O., 2000. The use of translation diaries in a process-oriented translation teaching
methodology. In Benjamins Translation Library, 38, pp.115-130.
Garcia, I., 2010. Is machine translation ready yet? In Target. International Journal of
Translation Studies, 22 (1), pp.7-21.
Gardner, H., 1987. The mind's new science: A history of the cognitive revolution. Basic
Books.
Gaspari, F., Almaghout, H. and Doherty, S., 2015. A survey of machine translation
competences: Insights for translation technology educators and practitioners. In
Perspectives, 23 (3), pp.333-358.
Gaspari, F., Toral, A., Naskar, S.K., Groves, D. and Way, A., 2014. Perception vs reality:
Measuring machine translation post-editing productivity. In Proc. Third Workshop
on Post-Editing Technology and Practice.
Gile, D., 1990. Scientific research vs. personal theories in the investigation of
interpretation. In Aspects of applied and experimental research on conference
interpretation (28), Udine, Campanotto, p. 41
Gile, D., 1995. Basic concepts and models for translator and interpreter training.
Amsterdam y Filadelfia: John Benjamins Publishing Company.
Gile, D., 1998. Observational studies and experimental studies in the investigation of
conference interpreting. In Target. International Journal of Translation Studies, 10
(1), pp.69-93.

Bibliography
238
Glasgow Declaration, 2005. Strong Universities for a Strong Europe. European University
Association, Brussels.
Gonzales, J. and Wagenaar, R., 2003. Tuning educational structures in Europe: final report.
Phase I. Universidad de Deusto.
Gouadec, D., 2007. Translation as a Profession (Vol. 73). John Benjamins Publishing.
Graham, Y., Baldwin, T., Moffat, A. and Zobel, J., 2013. Continuous measurement scales
in human evaluation of machine translation. In Proceedings of the 7th Linguistic
Annotation Workshop and Interoperability with Discourse, pp. 33-41.
Graham, Y., Baldwin, T., Moffat, A. and Zobel, J., 2013. Crowd-Sourcing of Human
Judgments of Machine Translation Fluency. In Proceedings of the Australasian
Language Technology Association Workshop 2013 (ALTA 2013), pp. 16-24.
Graz Declaration, 2003. Forward from Berlin: The Role of Universities. European
University Association, Brussels Office.
Green, R., 1982. The MT errors which cause most trouble to posteditors. In Lawson (ed.),
Practical experience of mahine translation, pp.101-104.
Gregorio Guirles, J.R. and Ramón, J., 2002. El constructivismo y las matemáticas. Sigma:
Revista de Matemáticas, Vitoria, 2, pp.113-129.
Grognet, A.G. and Crandall, J., 1982. Competency-based curricula in adult ESL.
ERIC/CLL News Bulletin, 6 (1), pp.3-4.
Groves, D., 2008. Bringing humans into the loop: localization with machine translation at
Traslan. In Proceedings of the Conference of the American Machine Translation
Association (AMTA). Waikiki, Hawaii, pp. 11-22.
Groves, R.M., Presser, S. and Dipko, S., 2004. The role of topic interest in survey
participation decisions. Public Opinion Quarterly, 68 (1), pp.2-31.
Guba, E.G. and Lincoln, Y.S., 1994. Competing paradigms in qualitative research.
Handbook of qualitative research, 2 (163-194), p.105.
Guerberof, A., 2008. Productivity and quality in the post-editing of outputs from
translation memories and machine translation: A pilot study. Minor Dissertation.
Tarragona: Universitat Rovira i Virgili.
Guerberof, A., 2009. Productivity and quality in MT post-editing. In MT Summit XII-
Workshop: Beyond Translation Memories: New Tools for Translators MT.
Guerberof Arenas, A., 2010. Project management and machine translation. Multilingual
computing & technology, 21 (3), p.34.
Guerberof, A., 2017. Quality is in the eyes of the reviewer. Translation in Transition:
Between cognition, computing and technology, 133, p.187.

Bibliography
239
Guerberof Arenas, A., Depraetere, H. and O’Brien, S., 2012. What we know and what we
would like to know about post-editing. In Revista Tradumàtica, (10), pp.0211-218.
Guzmán, R., 2007. Manual MT Post-editing. “If it’s not Broken, don’t Fix it”. In
Translation Journal (Vol. 11, No. 4). Available at:
https://translationjournal.net/journal/42mt.htm (Last consulted on 10.10.2015).
Hatch, J.A., 2002. Doing qualitative research in education settings. Suny Press.
Hermans, T., 1985. The manipulation of literature. Studies in literary translation. Croom
Helm, pp. 1-250.
Hernández Rojas, G. and Díaz Barriga, F., 2013. Una mirada psicoeducativa al
aprendizaje: qué sabemos y hacia dónde vamos. Sinéctica, (40), pp.01-19.
Hernández Sampieri, R., Fernández Collado, C. and Baptista Lucio, P., 2006. Metodología
de la investigación.(Vol. 3). México: McGraw-Hill.
Holmes, J.S., 1972. The name and nature of translation studies. In Translated, 2.
Howatt, A.P.R., 1969. Programmed learning and the language teacher: some implications
and suggestions for the use of programmes in the teaching of a foreign language.
Longmans.
Humphreys, D., 2005. Why integrative learning? Why now? Peer Review, 7 (4), p.30-31.
Hurtado Albir, A., 1999. La competencia traductora y su adquisición. Un modelo holístico
y dinámico. In Perspectives: Studies in Translatology, 7 (2), pp.177-188.
Hurtado Albir, A., 2001. Traducción y traductología. Cátedra.
Hurtado Albir, A., 2007. Competence-based curriculum design for training translators. In
The interpreter and translator trainer, 1 (2), pp.163-195.
Hurtado Albir, A. ed., 2017. Researching translation competence by PACTE group (Vol.
127). John Benjamins Publishing Company.
Inghilleri, M., 2005. The sociology of Bourdieu and the construction of the ‘object’ in
translation and interpreting studies. In The Translator, 11 (2), pp.125-145.
ISO (International Organization for Standardization), 2015. ISO 17100: 2015 Translation
services–requirements for translation services.
Ivankova, N.V., Creswell, J.W. and Plano Clark, V.L., 2007. Foundations and approaches
to mixed methods research. In First steps in research. Pretoria: Van Schaik, pp.253-
282.
Jakobsen, A.L., 1999. Logging target text production with Translog. In Copenhagen
studies in language. Samfundslitteratur, pp. 9-20.

Bibliography
240
Jiménez Raya, M., 2008. Technology-mediated professional develpoment for modern
language teachers. In Studies in honour of Neil Mclaren: a man for all seasons,
Universidad de Granada, pp. 47-58.
Jiménez Raya, M., 2013. Pedagogía de la experiencia en la universidad: Una apuesta por el
espacio de lo posible en la formación para la autonomía en la profesión docente
[Pedagogy of experience at the university: A commitment to the space of possibility
in teacher development for autonomy]. In Ensino para Autonomia: Inovando a
Formação Profissional, pp.93-123.
Johnson, R. and Whitelock, P., 2003. Machine translation as an expert task. In Readings in
Machine Translation, p.233.
Joint Quality Initiative, 2004. Dublin descriptors. JQI.-The Joint Quality Initiative Working
document. Shared Dublin descriptors for the Bachelor’s, Master’s and Doctoral
awards.
Jonassen, D.H. and Wang, S., 1992. Acquiring structural knowledge from semantically
structured hypertext. In J. Comput.-Based Instruct., 20 (1), pp. 1-8.
Kalchbrenner, N. and Blunsom, P., 2013. Recurrent continuous translation models. In
Proceedings of the 2013 Conference on Empirical Methods in Natural Language
Processing, pp. 1700-1709.
Kantún, M.A., 2005. El aprendizaje significativo en la formación del profesional de
enfermería. Rev Des Cientif Enferm, 13 (10), pp.314-316.
Kelly, D., 2005. A Handbook for Translator Trainers, Translation Practices Explained
Series. Manchester: St. Jerome.
Kenny, D. and Doherty, S., 2014. Statistical machine translation in the translation
curriculum: overcoming obstacles and empowering translators. In The Interpreter
and translator trainer, 8 (2), pp.276-294.
Kenny, D., 1998. Corpora in translation studies. In Routledge encyclopedia of translation
studies, pp.50-53.
Kiraly, D.C., 1995. Pathways to translation: Pedagogy and process (No. 3). Kent State
University Press.
Kiraly, D., 2000. A social constructivist approach to translator education: Empowerment
from Theory to Practice. St. Jerome Pub.
Knapper, C. and Cropley, A.J., 2000. Lifelong learning in higher education. Psychology
Press.
Koehn, P., 2009. Statistical machine translation. Cambridge University Press.
Koehn, P., 2010. Empirical methods for splitting compound words with application to
machine translation. U.S. Patent No. 7,711,545.

Bibliography
241
Koehn, P. and Monz, C., 2006. Manual and automatic evaluation of machine translation
between European languages. In Proceedings of the Workshop on Statistical
Machine Translation. Association for Computational Linguistics, pp. 102-121.
Koehn, P. and Senellart, J., 2010. Convergence of translation memory and statistical
machine translation. In Proceedings of AMTA Workshop on MT Research and the
Translation Industry, pp. 21-31.
Koponen, M., 2012, June. Comparing human perceptions of post-editing effort with post-
editing operations. In Proceedings of the seventh workshop on statistical machine
translation, Association for Computational Linguistics, pp. 181-190.
Koponen, M., Aziz, W., Ramos, L. and Specia, L., 2012. Post-editing time as a measure of
cognitive effort. In Proceedings of WPTP, pp.11-20.
Krings, H.P. and Koby, G.S., 2001. Repairing texts. In Empirical Investigations of
Machine Translation Post-Editing Processes. Kent, Ohio: Kent State UP.
Kumar, S. and Phrommathed, P., 2005. Research methodology, Springer US, pp. 43-50.
Lagoudaki, E., 2008. The value of machine translation for the professional translator. In
Proceedings of the 8th Conference of the Association for Machine Translation in the
Americas, pp. 262-269.
Langdridge, D. and Hagger-Johnson, G., 2009. Introduction to research methods and data
analysis in psychology. Pearson Education.
Lavorel, B., 1982. Experience in English-French post-editing. In Lawson (ed.), Practical
experience of mahine translation, pp.105-109.
Le Boterf, G., 2000. Construire les compétences individuelles et collectives. Eyrolles :
Livres Outils.
LeBlanc, M., 2013. Translators on translation memory (TM). Results of an ethnographic
study in three translation services and agencies. In Translation & Interpreting, 5 (2),
pp.1-13.
LeBlanc, M., 2017. ‘I can’t get no satisfaction!’ Should we blame translation technologies
or shifting business practices? In Human issues in translation technology, Routledge,
pp. 63-80.
Ledford Jr, G.E., 1995. Paying for the skills, knowledge, and competencies of knowledge
workers. Compensation & Benefits Review, 27 (4), pp.55-62.
Li, D., 2000. Tailoring translation programs to social needs: a survey of professional
translators. Target. International Journal of Translation Studies, 12 (1), pp.127-149.
Locke, N.A., 2012. Navigating the Absurd. The Big Wave of Language Technology, 2.

Bibliography
242
Locke, N.A., 2017. Translators Training: Navigating the Absurd. Published in #Smart
Reads on the Translation Industry (Isabella Massardo) Available at:
https://massardo.com/blog/translator-training/ (Last consulted on 15.08.18)
Loffler-Laurian, A.M., 1983. Pour une typologie des erreurs dans la traduction
automatique. In Multilingua – Journal of Cross-Cultural and Interlanguage
Communication, 2 (2), pp.65-78.
Loffler-Laurian, A.M., 1985. Traduction automatique et style (Machine Translation and
Style). Babel: International Journal of Translation, 31 (2), pp.70-76.
Lommel, A., Uszkoreit, H. and Burchardt, A., 2014. Multidimensional Quality Metrics
(MQM). In Revista Tradumàtica, (12), pp.0455-463.
Luong, M.T., Pham, H. and Manning, C.D., 2015. Effective approaches to attention-based
neural machine translation. Available at: https://arxiv.org/abs/1508.04025 (Last
consulted on 06.06.2018).
MacCoun, R.J., 1998. Biases in the interpretation and use of research results. In Annual
review of psychology, 49 (1), pp.259-287.
Machine Translation (MT) Market Analysis by Application (Automotive, Military &
Defense, Electronics, IT, Healthcare), By Technology (Rule-Based Machine
Translation (RBMT), Statistical Machine Translation (SMT)) and Segment Forecasts
to 2022. Grand View Research, 2015. Available at:
https://www.grandviewresearch.com/press-release/global-machine-translation-
market (Last consulted on 30.04.18).
Mackiewicz, W., 2002. Lifelong foreign language learning. In European Seminar on
Foreign Language Learning Needs in Education Systems, pp. 5-7.
Manjón, J.V.G. and López, M.D.C.P., 2008. Espacio Europeo de Educación Superior:
competencias profesionales y empleabilidad. In Revista Iberoamericana de
Educación, 46 (9), p.4.
Marinelli C., Translators Training: a Recruiter’s Point of View, 2017. Published in #Smart
Reads on the Translation Industry (Isabella Massardo) Available at:
https://massardo.com/blog/translatorstraining-recruiters-point-view/ (Last consulted
on 15.08.18)
Márquez, M.E., 2005. Reflexiones sobre el proceso de enseñanza-aprendizaje en la
medicina desde las teorías socio históricas. In Rev. Facultad de Medicina; 5 (1).
Márquez, M.E., 2007. Reflexiones sobre el proceso de enseñanza-aprendizaje de la
medicina desde las teorías socio históricas. In Rev. Fac. Med, 5 (1).
Martin-Mor, A., and Piqué i Huerta, R. 2017. MTradumàtica i la formació de traductors en
Traducció Automàtica Estadistica. In Revista Tradumàtica (15), pp.97-115.
Martínez J.R., Cibanal, L. and Jesús Pérez, M., 2010. Metodología y aprendizaje en el
espacio europeo de educación superior. Universidad de Alicante.

Bibliography
243
Martínez Martín, M., 2006. Formación para la ciudadanía y educación superior. In Revista
Iberoamericana de Educación (OEI), 2006, num. 42, p. 85-102.
Martínez, R.A., 2010. "Spanglish" as Literacy Tool: Toward an Understanding of the
Potential Role of Spanish-English Code-Switching in the Development of Academic
Literacy. In Research in the Teaching of English, pp.124-149.
Martín-Mòr, A., Piqué, R., Sánchez-Gijón, P., 2016. Tradumàtica. Tecnologies de la
traucció. Biblioteca de traducció i interpretació, Romanyà Valls.
Massardo, I., van der Meer, J., O’Brien, S., Hollowiid, F., Aranberri, N. and Drescher, K.,
2016. MT post-editing guidelines. TAUS Signature Editions, Amsterdam.
Matthews, B. and Ross, L., 2010. Research methods. Longman/Pearson Education.
McElhaney, T. and Vasconcellos, M., 1988. The translator and the postediting experience.
In Technology as Translation Strategy, Binghamton, NY: State University of New
York at Binghamton (SUNY), pp.140-148.
McLaren, B.M., Bollen, L., Walker, E., Harrer, A. and Sewall, J., 2005, May. Cognitive
tutoring of collaboration: Developmental and empirical steps towards realization. In
Proceedings of the 2005 conference on Computer support for collaborative learning:
learning 2005: the next 10 years! International Society of the Learning Sciences, pp.
418-422.
Melby, A., Fields, P., Hague, D.R., Koby, G.S. and Lommel, A., 2014. Defining the
landscape of translation. In Revista Tradumàtica, (12), pp.0392-403.
Mertens, D.M., 2014. Research and evaluation in education and psychology: Integrating
diversity with quantitative, qualitative, and mixed methods. Sage publications.
Mesa-Lao, B., 2013. Introduction to post-editing. The CasMaCat GUI. SEECAT project.
Center for Research and Innovation in Translation and Translation Technology,
Copenhagen Business School, Denmark.
Miedes Ugarte, B. and Galan García, A., 2006. La aplicación del ECTS en Relaciones
Laborales: un atisbo de los cambios necesarios para alcanzar la convergencia.
Actas de las Jornadas de Trabajo sobre Experiencias Piloto de Implantación del
Crédito Europeo en las Universidades Andaluzas.
Miguel Díaz, M.D., 2006. Metodologías de enseñanza y aprendizaje para el desarrollo de
competencias. Orientaciones para el profesorado universitario ante el Espacio
Europeo de Educación Superior. Madrid: Alianza.
Moore, D.R., Cheng, M.I. and Dainty, A.R., 2002. Competence, competency and
competencies: performance assessment in organizations. In Work study, 51 (6),
pp.314-319.
Moorkens, J., O’Brien, S., da Silva, I.A., de Lima Fonseca, N.B. and Alves, F., 2015.
Correlations of perceived post-editing effort with measurements of actual effort. In
Machine Translation, 29 (3-4), pp.267-284.

Bibliography
244
Morin, E., 2001. Los siete saberes necesarios para la educación del futuro. Barcelona:
UNESCO. Paidós.
Morin, A., 2002. Right hemispheric self-awareness: A critical assessment. In
Consciousness and Cognition, 11 (3), pp.396-401.
Muños Miquel, A., 2014. El perfil del traductor médico: análisis y descripción de
competencias específicas para su formación (Doctoral dissertation, Universitat
Jaume I).
Neubert, A., 2000. Competence in language, in languages, and in translation. Benjamins
Translation Library, 38, pp.3-18.
Neunzig, W., 1997. Der Computer als Hilfsmittel beim Erwerb kognitiver
Übersetzungsstrategien. Fleischmann, E.(ed.), 1997, pp.377-384.
Neunzig, W., 1999. Sobre la investigación empírica en traductología: Cuestiones
epistémicas y metodológicas.
Niño, A., 2009. Machine translation in foreign language learning: Language learners’ and
tutors’ perceptions of its advantages and disadvantages. ReCALL, 21(2), pp.241-258.
Nord, C., 1991. Scopos, loyalty, and translational conventions. Target. International
Journal of Translation Studies, 3 (1), pp.91-109.
Nord, C., 2013. Functionalism in translation studies. In The Routledge Handbook of
Translation Studies, Routledge, pp. 219-230.
Nordhaug, O., 1993. Human capital in organizations: Competence, training, and learning.
Oslo: Scandinavian university press.
Nunez Vieira, L. and Specia, L., 2011. A review of translation tools from a post-editing
perspective. In 3rd joint EM+/CNGL Workshop bringing MT to the user: Research
meets translators (JEC), pp.33-42.
O’Brien, S., 2002. Teaching post-editing: a proposal for course content. In 6th EAMT
Workshop Teaching Machine Translation, pp. 99-106.
O'Brien, S., 2006. Machine-translatability and post-editing effort: An empirical study
using Translog and Choice Network Analysis (Doctoral dissertation, Dublin City
University).
O'Brien, S., 2009. Eye tracking in translation process research: methodological challenges
and solutions. In Methodology, Technology and Innovation in Translation Process
Research, 38, pp.251-266.
O’Brien, S., 2011. Towards predicting post-editing productivity. In Machine translation,
25 (3), p.197.
O'Brien, S. and Saldanha, G., 2014. Research methodologies in translation studies.
Routledge.

Bibliography
245
O'Brien, S. and Schäler, R., 2010. Next generation translation and localization: Users are
taking charge. In: Translating and the Computer 32, 18-19, London.
O’Sullivan, C., 2007. Multilingualism at the multiplex: a new audience for screen
translation? In Linguistica Antverpiensia, New Series–Themes in Translation Studies,
(6).
OECD. 2005. The definition and selection of key competencies. Available at:
https://www.oecd.org/pisa/35070367.pdf (Last consulted on 11.05.16).
Offersgaard, L., Povlsen, C., Almsten, L. and Maegaard, B., 2008. Domain specific MT in
use. In Proceedings of the 12th EAMT conference, pp.22-23.
Olohan, M., 2007. Economic Trends and Developments in the Translation Industry: What
Relevance for Translator Training?. The Interpreter and Translator Trainer, 1 (1),
pp.37-63.
Organisation for Economic Co-operation and Development (OECD), 2005. The definition
and selection of key competencies: Executive summary.
Orozco Jutorán, M., 2000. Instrumentos de medida de la adquisición de la competencia
traductora: Construcción y validación (Tesis doctoral, Universitat Autònoma de
Barcelona).
PACTE Research Group, 2000. Acquiring translation competence: hypotheses and
methodological problems of a research project. In Investigating Translation.
Amsterdam: John Benjamins, pp.99-106.
PACTE Research Group, 2014. First results of PACTE group’s experimental research on
translation competence acquisition: the acquisition of declarative knowledge of
translation. In MonTI. Monografías de Traducción e Interpretación, pp.85-115.
Palomino, W., Delgado, Z. and Valcarcel, L., 1996. Enseñanza termodinámica: un enfoque
constructivista. In II encuentro de físicos en la región Inka UNSAAC, Perú.
Pedraja, M.J., 2001. El conductismo de Edward C. Tolman: Un cordero con piel de lobo.
In Revista de Historia de la Psicología, 22 (2), pp.135-170.
Pennock-Speck, B., 2009. European convergence and the role of ICT in English Studies at
the Universitat de València: Lessons learned and prospects for the future. In English
language teaching in the European credit transfer system: Facing the challenge,
pp.169-185.
Perez Cañado, M.L. 2013. Adapting to a Competency-Based Model in Tertiary Education:
Lessons Learned from the European Project ADELEEES. In Competency-based
Language Teaching in Higher Education, ed. Perez Cañado, M.L. Jaen: University
of Jaen.
Pérez Gómez, Á., 2009. Aprender en la universidad (Vol. 1). Ediciones Akal.

Bibliography
246
Pérez Gómez, Á., 2010. Aprender a educar. Nuevos desafíos para la formación de
docentes. In Revista interuniversitaria de formación del profesorado 24, no. 2.
Pérez Gómez, A., Gómez, E.S., Fernández, M.S. and Núñez, M.S., 2009. Los títulos
universitarios y las competencias fundamentales: los tres ciclos. Ediciones Akal
Perrenoud, P., 2004a. Adosser la pratique réflexive aux sciences sociales, condition de la
professionnalisation. In Éducation permanente, 160 (3), pp.35-60.
Perrenoud, P., 2004b. Diez nuevas competencias para enseñar: invitación al viaje (Vol.
196). Graó.
Perrenoud, P., 2008. Préface. In Compétences et contenus (pp. 7-14). De Boeck Supérieur.
Piaget, J., 1969a. Psicología y pedagogía. Barcelona: Ed. Ariel.
Piaget, J., 1969b. The mechanisms of perception. Routledge & Kegan Paul, London.
Piaget, J., 1970. Science of education and the psychology of the child. The Essential Piaget.
Northvale, NJ: JasonAronson.
Piqué Huerta, R. and Colominas, C., 2013. Les tecnologies de la traducció en la formació
de grau de traductors i intèrprets. In Revista Tradumàtica, (11), pp.297-312.
Plitt, M. and Masselot, F., 2010. A productivity test of statistical machine translation post-
editing in a typical localisation context. In The Prague bulletin of mathematical
linguistics, 93, pp.7-16.
Poblete Ruiz, M., 2006. Las competencias, instrumento para un cambio de paradigma. In
Investigación en educación matemática: actas del X Simposio de la Sociedad
Española de Investigación en Educación Matemática, Huesca, 6-9 de septiembre de
2006. Instituto de Estudios Altoaragoneses, pp. 83-106.
Popovic, M., Lommel, A., Burchardt, A., Avramidis E. and Uszkoreit, H., 2014. Relations
between different types of post-editing operations, cognitive effort and temporal
effort. In Proceedings of the 17th Annual Conference of the European Association
for Machine Translation (EAMT 14), pp.191-198.
Presas, M., 2000. Bilingual competence and translation competence. Benjamins
Translation Library, 38, pp.19-32.
ProjecTA, 2015. Los proyectos de traducción con traducción estadística y posedición:
ProjecTA. Póster presentado en el congreso AIETI7 Nuevos horizontes en los
Estudios de Traducción e Interpretación, Málaga.
Pym, A., 2002. Training language service providers: local knowledge in institutional
contexts. Training the Language Services Provider for the New Millennium, Porto:
Universidad do Porto, pp.21-30.

Bibliography
247
Pym, A., 2003. Redefining translation competence in an electronic age. In defense of a
minimalist approach. Meta: journal des traducteurs/Meta: Translators' Journal, 48
(4), pp.481-497.
Pym, A., 2004. The moving text: Localization, translation, and distribution (Vol. 49). John
Benjamins Publishing.
Pym, A., 2012. Democratizing translation technologies: The role of humanistic research. In
Language and Translation Automation Conference, (1), pp.14-29.
Pym, A., 2013. Translation skill-sets in a machine-translation age. Available at:
http://usuaris.tinet.cat/apym/on-line/training/2012_competence_pym.pdf (Last
consulted on 15.07.18)
Qualifications Framework in the EHEA, 2009. Available at:
http://www.ehea.info/cid102842/qualifications-frameworks-in-the-ehea-2009.html
(Last consulted on 15.07.18)
Ramos, L.C., 2010. Post-editing free machine translation: from a language vendor’s
perspective. In Proceedings of the Conference of the American Machine Translation
Association (AMTA). Denver, CO: AMTA.
Rasinger, S.M., 2013. Quantitative research in linguistics: An introduction. A&C Black.
Ray, R., DePalma, D.A. and Pielmeier, H., 2013. Common Sense Advisory: The Link
between Price and Translation Quality. Available at:
http://www.commonsenseadvisory.com/Portals/_default/Knowledgebase/ArticleIma
ges/130219_R_Price_Quality_Preview.pdf (Last consulted on 17.07.2016)
Rea, L. and Parker, R., 2005. Selecting a representative sample. In Designing and
conducting survey research: A comprehensive guide, pp.157-176.
Reichardt, C.S. and Rallis, S.F., 1994. The relationship between the qualitative and
quantitative research traditions. New Directions for Evaluation (61), pp.5-11.
Reiß, K. and Vermeer, H.J., 1984. Grundlegung einer allgemeinen Translationstheorie
(Vol. 147). Walter de Gruyter.
Richards, J.C. and Rodgers, T.S., 2014. Approaches and methods in language teaching.
Cambridge university press.
Rico Pérez, C. and Díez Orzas, P.L., 2013. EDI-TA: Training methodology for Machine
Translation Post-editing. Multilingualweb-LT Deliverable 4.1. 4. Annex II.
Rico Pérez, C. and Torrejón, E., 2012. Skills and Profile of the New Role of the Translator
as MT Post-editor. In Revista Tradumàtica (10), pp.166-178.
Rico Pérez, C., 2012. A Flexible Decision Tool for Implementing Post-editing Guidelines.
In The International Journal of Localisation. Localisation Focus. Vol.11, Issue 1.
pp.54-66.

Bibliography
248
Rico, C., 2017. The ePortfolio: constructing learning in translation technology. In The
Interpreter and Translator Trainer, 11 (1), pp.79-95.
Robinson, D., 1991. The translator's turn. JHU Press.
Rodríguez Esteban, A., 2008. Las competencias en el Espacio Europeo de Educación
Superior: tipologías. In Humanismo y Trabajo Social. Volumen 006. Universidad de
León, pp.139-153.
Rojas Valenciano, L., 2006. El enfoque constructivista en el curriculum de enfermería:
motivación, dificultades y demandas que enfrenta el o la docente. Enfermería Actual
en Costa Rica, 5 (9).
Rojo, A. 2013. Diseños y métodos en la investigación en traducción. Editorial SINTESIS.
Rorty, R., 1979. Philosophy and the Mirror of Nature. Princeton University Press.
Rossi, C., 2017. Introducing statistical machine translation in translator training: from uses
and perceptions to course design, and back again. In Revista Tradumàtica (15),
pp.0048-62.
Rué, D. and Martínez, M., 2005. Las titulaciones UAB en el Espacio Europeo de
Educación Superior. Sistema Europeo de Transferencia de Créditos, Colección
Eines, 1.
Ruokonen, M. and Koskinen, K., 2017. Love letters or hate mail? Translators’ technology
acceptance in the light of their emotional narratives. In Human issues in translation
technology, Routledge, pp. 26-42.
Rychen, D.S. and Salganik, L.H. eds., 2003. Key competencies for a successful life and
well-functioning society. Hogrefe Publishing.
Sachinis, M., 2011. Curriculum Renewal in Greek Taught Postgraduate Translation
Courses: Aligning Student Needs and Translation Market Requirements. (Doctoral
thesis, Imperial College London).
Salamanca Convention 2001. European University Association, 2001. The Bologna
process and the European Higher Education Area. Geneva: European University
Association.
Saldanha, G., and O'Brien, S. 2014. Research methodologies in translation studies.
Routledge.
Sánchez-Gijón, P. and Torres Hostench, O., 2014. MT Post-editing into the mother tongue
or into a foreign language?. In Workshop on Post-Editing Technology and Practice-
AMTA.
Sánchez-Gijón, P., 2016. La posedición: hacia una definición competencial del perfil y una
descripción multidimensional del fenómeno. Sendebar, 27, pp.151-162.

Bibliography
249
Sandrock, U., 1982. Thinking Aloud Protocols (TAPs) – Ein instrument zur decomposition
des komplexen Prozesses “Übersetzen”. (Tesis Doctoral inédita. Universität Kassel,
Alemania).
Schäfer, F., 2003. MT post-editing: How to shed light on the" unknown task" Experiences
made at SAP. In 8th international workshop of the European Association for Machine
Translation (EAMT 03). Dublin City University, Dublin, Ireland, May 15-17.
Schwandt, T.A., 1994. Constructivist, interpretivist approaches to human inquiry. In
Handbook of qualitative research, 1, pp.118-137.
Sela-Sheffy, R., 2005. How to be a (recognized) translator: Rethinking habitus, norms, and
the field of translation. In Target. International Journal of Translation Studies, 17
(1), pp.1-26.
Senez, D., 1998. Post-editing service for machine translation users at the European
Commission. In Translating and the Computer, 20.
Sennrich, R. and Haddow, B., 2016. Linguistic input features improve neural machine
translation. In Proceedings of the First Conference on Machine Translation, Berlin,
Germany, pp.83-91.
Sennrich, R., Haddow, B. and Birch, A., 2016. Edinburgh neural machine translation
systems for wmt 16. In Proceedings of the First Conference on Machine Translation
(WMT16), Berlin, Germany.
Simard, M., Ueffing, N., Isabelle, P. and Kuhn, R., 2007. Rule-based translation with
statistical phrase-based post-editing. In Proceedings of the Second Workshop on
Statistical Machine Translation. Association for Computational Linguistics, pp. 203-
206.
Smith, V.L., 2005. Racionalidad constructivista y ecológica en economía: discurso
pronunciado en el acto de entrega del premio Nobel de Economía 2002. RAE:
Revista Asturiana de Economía (32), pp.197-273.
Snell-Hornby, M., 1991. Translation studies: art, science or utopia?. K. van Leuven-Zwart
and T. Naaijkens (eds), pp.13-23.
Snell-Hornby, M., Pöchhacker, F. and Kaindl, K. eds., 1994. Translation Studies: An
Interdiscipline: Selected papers from the Translation Studies Congress, Vienna,
1992 (Vol. 2). John Benjamins Publishing.
Specia, L., 2011, May. Exploiting objective annotations for measuring translation post-
editing effort. In Proceedings of the 15th Conference of the European Association for
Machine Translation, pp. 73-80.
Specia, L. and Farzindar, A., 2010. Estimating machine translation post-editing effort with
HTER. In Proceedings of the Second Joint EM+/CNGL Workshop Bringing MT to
the User: Research on Integrating MT in the Translation Industry (JEC 10), pp. 33-
41.

Bibliography
250
Specia, L., Raj, D. and Turchi, M., 2010. Machine translation evaluation versus quality
estimation. Machine translation, 24 (1), pp.39-50.
Sutskever, I., Vinyals, O. and Le, Q.V., 2014. Sequence to sequence learning with neural
networks. In Advances in neural information processing systems, pp. 3104-3112.
Talyzina, N.F., 1981. The psychology of learning: Theories of learning and programmed
instruction. Progress Publishers.
Tatsumi, M., 2010. Post-editing machine translated text in a commercial setting:
Observation and statistical analysis (Doctoral dissertation, Dublin City University).
TAUS Error Typology Guidelines, 2013. Available at: https://www.taus.net/academy/best-
practices/evaluate-best-practices/error-typology-guidelines (Last consulted on
15.07.2018).
TAUS Machine Translation Market Report, 2017. Available at: https://www.taus.net/think-
tank/reports/translate-reports/taus-machine-translation-market-report-2017 (Last
consulted on: 30.04.2018).
Teixeira, C.S., 2014a. Perceived vs. measured performance in the post-editing of
suggestions from machine translation and translation memories. In Third Workshop
on Post-Editing Technology and Practice, p.45.
Temizöz, Ö., 2013. Postediting machine translation output and its revision: Subject-Matter
Experts versus Professional Translators (Doctoral dissertation, Universitat Rovira i
Virgili).
Terrón-López, M.J. and García-García, M.J., 2013. Assessing transferable generic skills in
language degrees. In Competency-based language teaching in higher education
Springer, Dordrecht, pp.151-167.
Thicke, L., 2011. Improving MT results: a study. MultiLingual, 22 (1), p.37.
Thorndike, E.L., 1920. Intelligence and its uses. In Harper's magazine.
Toury, G., 1995. Descriptive Translation Studies and beyond: revised edition (Vol. 100).
John Benjamins Publishing.
Tudor, I., 2006. Trends in higher education language policy in Europe: The case of
English as a language of instruction. Communication à un colloque: Challenges of
Multilingual Societies’, 9-10 juin: ECORE, Université Libre de Bruxelles.
Tuning General Brochure. Final Version. 2007. Available at:
http://www.unideusto.org/tuningeu/images/stories/documents/General_Brochure_fin
al_version.pdf (Last consulted on 11.05.16).
Turchi, M., Negri, M. and Federico, M., 2014. Data-driven annotation of binary MT
quality estimation corpora based on human post-editions. IN Machine translation, 28
(3-4), pp.281-308.

Bibliography
251
Turchi, M., Negri, M. and Federico, M., 2015. MT Quality Estimation for Computer-
assisted Translation: Does it Really Help? In Proceedings of the 53rd Annual
Meeting of the Association for Computational Linguistics and the 7th International
Joint Conference on Natural Language Processing (Volume 2: Short Papers) (Vol.
2), pp.530-535.
Van Dam, H. and Zethsen, K.K., 2010. Translator status: Helpers and opponents in the
ongoing battle of an emerging profession. In Target. International Journal of
Translation Studies, 22 (2), pp.194-211.
Vasconcellos, M., 1986. Functional considerations in the postediting of machine-translated
output. In Computers and translation, 1 (1), pp.21-38.
Vasconcellos, M., 1987. A comparison of MT post-editing and traditional revision. In
Proceedings of the 28th Annual Conference of the American Translators Association,
Medford, NJ: Learned Information, pp.409-415.
Vashee, K., 2013. Understanding the economics of machine translation. In Translation
Spaces, 2 (1), pp.125-149.
Veale, T. and Way, A., 1997. Gaijin: A bootstrapping, template-driven approach to
example-based MT. In Proc. of the NeMNLP97.
Vehovar, V. and Manfreda, K.L., 2008. Overview: online surveys. In The SAGE handbook
of online research methods, pp.177-194.
Vié, A., Villarejo Muñoz, L., O'Regan, J. and Farrús Cabecerán, M., 2011. Apertium
Advanced Web Interface: A first step towards interactivity and language tools
convergence. International Workshop on Free/Open-Source Rule-Based Machine
Translation, Barcelona.
Vié, B., Nuissier, O. and Ducrocq, V., 2011. Cloud-resolving ensemble simulations of
Mediterranean heavy precipitating events: uncertainty on initial conditions and
lateral boundary conditions. In Monthly Weather Review, 139 (2), pp.403-423.
Vigier Moreno, F.J., 2007. El nombramiento de Intérprete Jurado de Inglés mediante
acreditación académica: estudio de la formación específica en España. Trabajo de
investigación tutelar: Universidad de Granada.
Vigier Moreno, F.J., 2010. El nombramiento de traductores-intérpretes jurados de inglés
mediante acreditación académica: descripción de la formación específica y del
grado de satisfacción de los egresados. Universidad de Granada.
Villa, A., and Poblete, M., 2007. Aprendizaje basado en competencias. Una propuesta
para la evaluación de las competencias genéricas. Bilbao: Ediciones Mensajero.
Villa, V., 2011. Constructivismo y teorías del derecho. Universidad Nacional Autónoma de
México.
Visauta, B., 1989. La entrevista. In Técnicas de investigación social, 1, pp.235-257.

Bibliography
252
Wagner, E., 1985. Rapid post-editing of Systran. In Tools for the Trade, Translating and
the Computer, 5, pp.199-213.
Wagner, E., 2010. Survey research. In Continuum companion to research in applied
linguistics, edited by B. Paltridge, and A. Phakiti, pp. 22–38.
Wellmon, C., 2008. Languages, cultural studies, and the futures of foreign language
education. In The Modern Language Journal, 92 (2), pp.292-295.
Wolf, M., 2011. Mapping the field: Sociological perspectives on translation, Available at:
https://www.degruyter.com/view/j/ijsl.2011.2011.issue-
207/ijsl.2011.001/ijsl.2011.001.xml (Last consulted on 28.09.2016).
Wolf, M. and Fukari, A. eds., 2007. Constructing a sociology of translation (Vol. 74). John
Benjamins Publishing.
Wu, Y., Schuster, M., Chen, Z., Le, Q.V., Norouzi, M., Macherey, W., Krikun, M., Cao,
Y., Gao, Q., Macherey, K. and Klingner, J., 2016. Google's neural machine
translation system: Bridging the gap between human and machine translation.
Available at: https://arxiv.org/abs/1609.08144 (Last consulted on 08.07.2018).
Yániz, C., 2008. Las competencias en currículo universitario: implicaciones para diseñar
el aprendizaje y para la formación del profesorado. Revista de docencia
universitaria.
Zabalza, M.A., 2003. Trabajar por competencias: implicaciones para la práctica docente.
ICE. Programa de Formación de profesores noveles. Universidad de Santiago de
Compostela. Santiago de Compostela.
Zabalza, M.A., 2004. Guía para la planificación didáctica de la docencia universitaria en
el marco del EEES. Documento de trabajo.
Zabalza, M.A., 2009. O ensino universitário. Artmed Editora.
Zabalza, M.Á., 2016. Ser profesor universitario hoy. In La cuestión universitaria (5),
pp.68-80.
Zampieri, M. and Vela, M., 2014. Quantifying the Influence of MT Output in the
Translators' Performance: A Case Study in Technical Translation. In Proceedings of
the EACL 2014 Workshop on Humans and Computer-assisted Translation, pp. 93-
98.
Zaretskaya A., 2017. Machine Translation PostEditing at TransPerfect – the ‘Human’ Side
of the Process. In Revista Tradumatica (15), pp.116-123.
Zetzsche, J., 2012. MT Post-Editing Made Easy. The Tool Box. Premium Edition.
Zhechev, V., 2014. Analysing the post-editing of machine translation at Autodesk. In Post-
Editing of Machine Translation: Processes and Applications. Newcastle upon Tyne:
Cambridge Scholars Publishing, pp.2-23.

Appendices
253
Appendices
Appendix I. Sharing Post-Editing Practices (the questionnaire)
Link I.1.
https://www.surveymonkey.com/r/Preview/?sm=A6RIjglOBuoncTZNdlA_2B1JnugsK6Tu
hX2xn2gv8U5JxMiHiQr3GpfyEvaeWHJmQ1

Appendices
254
Appendix II. Pilot study results
Table II.1. Pilot study (PE performance)
TS 1 TS 2
Ffp.
segm.
Over.ed.
segm.
Under.ed.
segm.
WPH
rate
Ffp.
segm.
Over.ed.
segm.
Under.ed.
segm.
WPH
rate
Subject 1 14 1 5 514 12 0 8 1489
Subject 2 9 6 5 722 12 1 7 2010
Subject 3 11 4 5 738 14 5 1 868
Subject 4 12 3 5 628 14 2 4 920
Subject 5 5 8 7 638 16 1 3 1164
Subject 6 4 13 3 974 18 0 2 2581
Subject 7 5 7 8 689 12 0 8 1247
Subject 8 7 5 8 780 11 5 4 1582
Mean 8,4 5,9 5,8 710,4 13,6 1,8 4,6 1482,6
Table II.2. Pilot study (the questionnaire)
Q.1: What is your attitude regarding the usage of MT in translation/localization industry? (1 –
very negative, 2 – negative, 3 – positive, 4 – very positive)
Q.2: Do you agree with this statement: "Machine translated and post-edited output of less-than-
maximum quality is good enough to be delivered to the client as a complete job"? (1 – a strongly
disagree, 2 – a disagree, 3 – I agree , 4 – I fully agree)
Q.3: As a novice translator, would you be interested in performing PE jobs on a regular basis? (1
– no, 2 – rather not, 3 – maybe yes, 4 – yes)
Q.1 Q.2 Q.3
TS 1 TS 2 TS 1 TS 2 TS 1 TS 2
Subject 1 3 3 1 2 1 1
Subject 2 4 3 2 3 2 2
Subject 3 3 3 2 1 2 1
Subject 4 3 3 1 1 3 3
Subject 5 3 2 3 3 2 2
Subject 6 3 3 2 2 2 1
Subject 7 3 3 3 2 3 2
Subject 8 3 3 3 3 3 2

Appendices
255
Appendix III. Experimental study corpus, instruments and tools
Table III.1.1. Evaluation assignments (EN-RU, TS 1 and TS 2)
Segm.
nr.
Source segment Target segment (Raw MT for evaluation)
TS 1
1 While certified hardware does not
guarantee a particular system will meet
your particular needs, it does reflect that
the hardware supports the advanced
features in the latest release.
При сертифицированного аппаратного
обеспечения конкретной системы не будет
соответствовать конкретному случаю, это
означает, что аппаратное обеспечение,
поддерживающий расширенный элемент в
последней версии.
2 Changing the locations of the features
with the Properties window
Изменение местоположений элементов с
помощью окна свойств
3 The document file size may be large. Документ размер файла может быть
большими.
4 Unlike at attach time, the system does
not warn you of a coordinate system
mismatch when you do this change.
В отличие от во время вставки, система не
отображать предупреждение, системы
координат несоответствие при этом
изменяется.
5 A similar situation occurs if you change
the GIS coordinate system of the host
drawing or referenced drawing.
Подобная ситуация возникает при
изменении ГИС систему координат Файл-
владелец чертежа или чертеж внешней
ссылки.
6 You may need to restart AutoCAD to
activate the plug-in.
Возможно, для активации модуля нужно
будет перезапустить AutoCAD.
7 This paragraph must replace the
preceding paragraph if the ECO for the
warning is approved.
Это Абзац необходимо заменить перед
абзацем, если для предупреждение
утверждения запроса на изменение.
8 Because of the coordinate system
mismatch, the points in the referenced
drawing file do not transform to the
coordinate system of the host drawing.
Так как несоответствие системы координат
точки в связанный файл чертежа не
преобразование системы координат Файл-
владелец чертежа.
9 Case 1: No geographic location is
assigned to the drawing file.
Случай 1. Файлу чертежа не назначено
географическое местоположение.
10 Assign the geographic location again,
using the current version of AutoCAD.
Необходимо повторно назначить
географическое местоположение с
использованием текущей версии AutoCAD. TS 2
1 Case 2: The geographic location was
assigned to the drawing file using an
earlier version of AutoCAD.
Случай 2. Географическое местоположение
назначено файлу чертежа с использованием
более ранней версии AutoCAD.
2 It is not possible to test all combinations
of hardware that can go into a computer,
if your hardware is not listed, it does not
mean it cannot run the latest release of
an AutoCAD-based product.
Невозможно проверить все комбинации
оборудование, можно перейти на
компьютере, если оборудование не указан в
списке, он не означает, что невозможно
выполнить последней версии продукта,

Appendices
256
основанного на AutoCAD.
3 A default color scheme based on LAS
classification values is provided.
Предоставляется цветовая схема по
умолчанию с учетом заданных значений
классификации LAS.
4 The Design Feed panel opens and the
view changes to the way it was when the
comment was posted.
Откроется панель для проектирования и
изменения вида на версию, которая была в
хранилище при комментарий был
размещен.
5 When the Featured Apps tab plug-in has
been installed, a new tab is available on
the ribbon.
При установке подключаемого модуля
вкладки "Активные приложения" на ленте
появляется новая вкладка.
6 You may need to restart AutoCAD to
activate the plug-in.
Возможно, для активации модуля нужно
будет перезапустить AutoCAD.
7 Login to Autodesk 360, or create an
account, if necessary.
Выполните вход в Autodesk 360 или, если
нужно, создайте учетную запись.
8 Depending on the document file type,
not all comment types may be available.
В зависимости от типа файла документа не
все типы "Комментарий".
9 In the Design Feed panel, each comment
is numbered in the order posted and
shows the type of comment:
В проекте " подачи каждого комментария
не нумеруются в порядке, размещенные и
отображает тип комментарий:
10 You may need to restart AutoCAD to
activate the plug-in.
Возможно, для активации модуля нужно
будет перезапустить AutoCAD.
Table III.1.2. Post-editing assignments (EN-RU, TS 1 and TS 2)
Segm.
nr.
Source segment Target segment (Raw MT for post-editing)
TS 1
1 To Work With Pressing or Pulling
Bounded Areas
Работа со сжатием или вытягиванием
ограниченных областей
2 Create a Solid Object by Pressing or
Pulling a Bounded Area
Создание твердотельного объекта путем
сжатие или вытягивание ограниченной
области
3 Rendered images take longer to process,
but the image quality is better.
Визуализированные изображения
обрабатываются дольше, но качество
изобрoжения лучше.
4 For custom routines, the CTAB system
variable can also be useful.
Для выполнения рутинных
пользовательских операций системная
переменная CTAB можно использовать,
также.
5 Displays the file tabs in the application. Отображение вкладок в окне приложения.
6 In the Geographic Location dialog box,
in the Search box, type the name of a
landmark near your location and click
Search.
В диалоговом окне "Географическое
положение", в поле поиска введите
название ориентира вблизи нужного
местоположения и щелкните "Поиск".
7 The 3D Warehouse browser may have
problems connecting to the internet, if
your network uses a proxy server that
При подключении обозревателя 3D-
хранилища к Интернету могут возникнуть
проблемы, если в сети используется

Appendices
257
requires authentication. прокси-сервер требует проверки
подлинности.
8 Click Open to import the file as a block. Щелкните "Открыть", чтобы
импортировать файл в виде блока.
9 Closes the Point Cloud Manager palette. Закрытие палитры Диспетчера облака
точек.
10 Specifies geographic location
information for a drawing file.
Задание информации о географическом
положении для файла чертежа.
11 {1}Image tab {2}Clipping panel
{3}Create Clipping Boundary{4}. {5}
{1}Вкладка "Изображение" {2}панель
"Осечение" {3}Создать контур
подрезки{4}.{5}
12 Multi-functional grip options are not
available.
Параметры многофункциональных ручек
недоступен.
13 On the Command line, you can search
for named objects such as blocks,
hatches, layers, or styles, and then
initiate an appropriate action by selecting
them.
В командной строке можно выполнить
поиск именованные объекты, такие как
блоки, штриховки, слои или стили, а затем
запустить соответствующую операцию,
выбрав нужный объект.
14 Click {1}Insert tab {2}Reference panel
{3}> External References{4}.
Выберите {1}вкладка "Вставка" {2}панель
"Ссылка" {3} "Внешние ссылки"{4}.
15 To Work with the Coordinate Display on
the Status Bar
Работа с отображения координат в строке
состояния
16 The current drawing is associated with
one or more standards (DWS) files.
Текущий чертеж связан с одним или
несколькими файлами стандартов (DWS).
17 Inserts a position marker at the position
corresponding to your current location.
Вставляет маркер в положение,
соответствующее текущее
местоположение.
18 As much as possible, layer names are
kept the same.
По возможности сохраняются имена слоев.
19 Follow these steps to access more
linetypes:
Выполните следующие действия, чтобы
получить доступ к несколько типов линий:
20 After the drawing is uploaded to
Autodesk 360, a URL is generated for
the drawing.
После того, как чертеж загружен в
Autodesk 360, будет сгенерирован URL-
адрес . TS 2
1 While the command is active, right-click
to display additional options from a
context menu.
При активной команде щелкните правой
кнопкой мыши для отображения
контекстного меню с дополнительными
параметрами.
2 Right-click the layout, and click Page
Setup Manager.
Щелкните лист правой кнопкой мыши и
выбрать "Диспетчер параметров листов".
3 Switching between color schemes is not
available in some AutoCAD-based
products.
Переключение между Цветовыми схемами
доступно в некоторых продуктах на основе
AutoCAD.
4 Displays the map as a series of satellite
images.
Отображение карты в виде
последовательности спутниковые
изображения.
5 The exact size of the text box is not
critically important.
Точный размер текста critically важно.
6 For quick access to the most common
properties, use the Properties panel on
the Home tab.
Для быстрого доступа к наиболее обычным
свойствам, используйте панель "Свойства"
на вкладке "Главная".

Appendices
258
7 On the Featured Apps tab, click an App
button on the ribbon tab.
На вкладке "Активные приложения",
нажмите кнопку "Приложение" на вкладку
ленты.
8 Enter the time in seconds or fractions of
a second.
Введите время в секундах или дробей в
секунду.
9 In the Geographic Location dialog box,
enter the values in the Latitude and
Longitude boxes.
В диалоговом окне "Географическое
положение" введите значения в поле
"Широта" и "Долгота".
10 Stylizes each point based on the intensity
value of the point.
Стилизация каждой точки с учетом
значения интенсивности для данной точки.
11 {1}Annotate tab{2}Dimensions panel
{3}Update{4}. {5}
{1}Вкладка "Аннотации"{2}панель
"Размеры"{3}Обновить{4}. {5}
12 The Featured Apps tab displays an RSS
feed of featured or suggested apps.
На вкладке "Активные приложения"
отображаются RSS-канала активных или
рекомендуемых приложений.
13 Controls the shadows displayed in the
scene.
Управление тени отображается в сцене.
14 {1}Windows XP:{2} Click Start menu
{3} Programs {4} Autodesk
{5}<Product Name>{6} Reset Settings
to Default.
{1}Windows XP: {2} выберите меню
"Пуск" {3} "Программы" {4} Autodesk
{5}<имя продукту> {6} "Восстановить
параметры по умолчанию".
15 You can change any of these properties
by clicking and changing its setting.
Можно изменить любое из этих свойств,
щелкнув изменения его настройку.
16 In the Sheet Set Manager, Sheet List tab,
click the sheets and subsets to include in
the sheet selection.
В Диспетчере подшивок на вкладке
"Список листов" выберите листы и группы
листов, которые требуется включить в
набор листов.
17 The current text style is displayed at the
top of the drop-down list.
Текущий стиль текста шаблона
отображается в верхней части списка.
18 If necessary, login to Facebook. При необходимости выполните вход в
Facebook.
19 Do one of the following to complete the
offset:
Выполните одно из следующих действий
для выполнения смещения:
20 In the Sheet Set Manager, Sheet List tab,
open the sheet that you want to
reassociate.
На вкладке "Список листов" Диспетчера
подшивок откройте лист, который
требуется прикрепить.
Link III.1.3. Remote training (EN-RU)
https://docs.google.com/spreadsheets/d/1u3w9EG5WCsmukmvHW6JJbolk8G-HDk85-
rjTyer2N-M/edit?usp=sharing
Table III.2.1. Evaluation assignments (EN-ES, TS 1 and TS 2)
Segm.
nr.
Source segment Target segments (Raw MT for evaluation)
TS 1
1 Click inside the closed shape or object
and drag the cursor through the interior
Haga clic dentro de la forma cerrada o el
objeto y arrastre el cursor en el interior del

Appendices
259
of the 3D solid object to create the hole. objeto sólido 3D para crear el agujero.
2 If no colors are captured with the scan,
grayscale colors are inferred based on
the exiting algorithm.
Si no hay colores se capturan con la
exploración, escala de grises, los colores se
deducen según el algoritmo de salida.
3 AutoCAD 2007 and earlier releases did
not support annotative objects.
AutoCAD 2007 y más pronto liberación no
apoya objetos anotativos.
4 You can change the orientation of the
geographic marker (geo marker) without
changing its coordinates.
Puede modificar la orientación del marcador
geográfico (GEO marcador) sin cambiar sus
coordenadas.
5 In the Select SKP File dialog, navigate
to and select a SketchUp file in a local
or shared folder.
En el cuadro de diálogo Seleccionar archivo
SKP, busque y seleccione un archivo de
SketchUp en una unidad local o una carpeta
compartida.
6 In the Design Feed panel, each comment
is numbered in the order posted.
En el diseño del armario de alimentación, cada
comentario se numeran en el orden.
7 If you are connected to the Internet, you
can use an online mapping service to
pick a geographical location from a map.
Si está conectado a Internet, puede utilizar una
línea de servicio de cartografía para designar
una ubicación geográfica en un mapa.
8 You can track the current location only
if you have assigned a geographical
location to the drawing file.
Puede realizar un seguimiento de la ubicación
actual sólo si ha asignado una ubicación
geográfica del archivo de dibujo.
9 Uses named plot style tables (STB) in
the current drawing
Utiliza tablas de estilos de trazado guardados
(STB) en el dibujo actual
10 If you move, the my current location
indicator also moves.
Si mueve el indicador de Mi ubicación actual
también se mueve. TS 2
1 Provides highlighted edges by darkening
groups of points that are inferred to lie
on the same plane.
Proporciona bordes resaltados de
oscurecimiento de grupos de puntos que se
deduce que se encuentren en el mismo plano.
2 The Feature Apps tab uses a filter to
hide featured apps that you may already
have installed.
La Cuenta de anexos de propiedades utiliza un
filtro para ocultar los usos presentados, que ya
puede haber definido.
3 The following photometric properties
can be set with the Properties Inspector
palette:
La propiedad fotométrica de mantener se
puede establecer con la paleta del inspector de
propiedades:
4 The following table lists the disciplines
available for Revit in the Autodesk
Building Design Suite.
La siguiente tabla enumera la lista de
esquemas de pedidos disponibles para los
diseños revit disponibles en la construcción de
autodesk.
5 The system inserts a position marker on
the current layer, at the coordinates
corresponding to the imported location.
El sistema coloca la posición en el marcador en
la capa actual, las coordenadas y las
importaciones.
6 Controls whether the render is targeted
at a render level or a certain amount of
time.
Gestionado, si la cuota se paga en una cierta
cantidad de pago o una cantidad de tiempo
especificada.
7 Create realistic natural detail and
painterly effects.
Crear detalles naturales realistas y efectos
pictóricos.
8 Furthermore, this command works only
if you have assigned a geographic
location to your drawing.
Además, este comando sólo funciona si ha
asignado una ubicación geográfica en un
dibujo.
9 The map is available only when you are
connected to the Internet.
El mapa sólo está disponible cuando se está
conectado a Internet.

Appendices
260
10 Create and edit UVs, normals, and
color-per-vertex data.
Creación y edición de UV, normales y color
por vértice.
Table III.2.2. EN-ES - post-editing assignments (TS 1 and TS 2)
Segm.
nr.
Source segment Raw MT (for post-editing)
TS 1
1 Create a solid object by pressing or
pulling a bounded area
Crear un objeto sólido pulsando en un área
delimitada
2 Rendered images take longer to process,
but the image quality is better.
Las imágenes modelizadas tardan más en
procesarse, pero la calidad es superior.
3 For custom routines, the CTAB system
variable can also be useful.
Para rutinas personalizadas, la variable de
sistema CTAB también pueden ser útiles.
4 Displays the file tabs in the application. Muestra las fichas en la aplicación.
5 In the Geographic Location dialog box, in
the Search box, type the name of a
landmark near your location and click
Search.
En el cuadro de diálogo Ubicación
geográfica, en el cuadro de búsqueda,
escriba el nombre de una landmark cercana
a su ubicación y haga clic en Buscar.
6 Inserts a position marker in model space,
at the position corresponding to your
current location.
Inserta un marcador de posición en el
espacio modelo, en la posición
correspondiente a su ubicación actual.
7 Specifies geographic location information
for a drawing file.
Especifica la información de ubicación
geográfica de un archivo de dibujo.
8 {1}Image tab {2}Clipping panel
{3}Create Clipping Boundary{4}. {5}
{1}Ficha {2}grupo Delimitación {3}Crear
contorno delimitador{4}. {5}
9 Click to specify slot width, or enter
diameter or radius of the slot arcs.
Haga clic para especificar anchura de ranura
o escriba el diámetro o el radio de los arcos
de la ranura.
10 Click {1}Insert tab {2}Reference panel
{3}> External References{4}.
Haga clic en la {1}ficha Insertar {2}grupo
Referencia {3}> referencias externas{4}.
11 To work with the coordinate display on
the status bar
Para modificar la visualización de las
coordenadas en la barra de estado
12 The current drawing is associated with
one or more standards (DWS) files.
El dibujo actual está asociado con uno o más
archivos de normas (DWS).
13 Inserts a position marker at the position
corresponding to your current location.
Inserta un marcador de posición en la
posición correspondiente a su ubicación
actual.
14 About Searching for Content by Name Acerca de la búsqueda de contenido por
nombre
15 Follow these steps to access more
linetypes:
Siga estos pasos para acceder a varios tipos
de línea:
16 After the drawing is uploaded to
Autodesk 360, a URL is generated for the
drawing.
Una vez que se haya cargando el dibujo en
Autodesk 360, se generará una dirección
URL para el mismo.
17 The 3D-Warehouse browser may have
problems connecting to the internet.
El navegador 3D-Warehouse puede tener
problemas para conectarse a Internet.
18 Tap the Ctrl key to switch to face
extrusion, which presses or pulls the face
Pulse la tecla Ctrl para cambiar a la cara de
extrusión, que presiona o tira sin que esto

Appendices
261
without affecting adjacent geometry. afecte a las caras adyacentes de la
geometría.
19 This paragraph must replace the
preceding paragraph if the ECO for the
warning is approved.
Este párrafo debe sustituir al párrafo anterior
si la aprobación de ECO por la advertencia.
20 Click a closed object such as a circle and
move the cursor to establish an extrusion
direction.
Haga clic en un objeto cerrado, como un
círculo y mueva el cursor para establecer
una dirección de extrusión. TS 2
1 While the command is active, right-click
to display additional options from a
context menu.
Cuando el comando esté activo, haga clic
con el botón derecho para mostrar más
opciones en un menú contextual.
2 Right-click the layout, and click Page
Setup Manager.
Haga clic con el botón derecho en la
presentación y seleccione Administrador de
configuraciones de página.
3 Switching between color schemes is not
available in some AutoCAD-based
products.
Cambiar entre los esquemas de color está
disponible en determinados productos
basados en AutoCAD.
4 Displays the map as a series of satellite
images.
Muestra el mapa como una serie de
imágenes de satélite.
5 The exact size of the text box is not
critically important.
El tamaño exacto del cuadro de texto no es
critically importante.
6 For quick access to the most common
properties, use the Properties panel on the
Home tab.
Para acceder rápidamente a la mayoría de
las propiedades comunes, utilicen el panel
Propiedades de la ficha Inicio.
7 On the Featured Apps tab, click an App
button on the ribbon tab.
En la ficha Apps, haga clic en el botón App
de la ficha cinta.
8 {1}Stylizes each point based on the
intensity value of the point.
{1}Stylizes cada punto basado en el valor de
intensidad del punto.
9 {1}Annotate tab{2}Dimensions panel
{3}Update{4}. {5}
{1}ficha Anotar{2}grupo Cotas
{3}Actualizar{4}. {5}
10 The Featured Apps tab displays an RSS
feed of featured or suggested apps.
La pestaña apps Featured muestra un feed
RSS de las aplicaciones ofrecidas o
sugeridas.
11 Controls the shadows displayed in the
scene.
Controla las sombras mostradas en la
escena.
12 {1}Windows XP:{2} Click Start menu
{3} Programs {4} Autodesk {5}<Product
Name>{6} Reset Settings to Default.
{1}Windows XP:{2} haga clic en el menú
Inicio {3} Programas {4} Autodesk {5}<
nombre de producto >{6} Restablecer
parámetros por defecto.
13 You can change any of these properties
by clicking and changing its setting.
Se puede cambiar cualquiera de estas
propiedades haciendo clic y cambiar su
configuración.
14 Use this method to attach a point cloud
file without using a dialog box interface.
Utilice este procedimiento para enlazar un
archivo de nube de puntos sin mediante una
interfaz de cuadro de diálogo.
15 In the Geographic Location dialog box,
enter the values in the Latitude and
Longitude boxes.
En el cuadro de diálogo Ubicación
geográfica, escriba los valores en los
cuadros latitud y longitud.
16 In the Sheet Set Manager, Sheet List tab,
open the sheet that you want to
reassociate.
En el Administrador de conjuntos de planos,
ficha Lista de planos, abra el plano que
desee reasociar.

Appendices
262
17 A similar situation occurs if you change
the GIS coordinate system of the host
drawing or referenced drawing.
Una situación similar se produce si cambia
el sistema de coordenadas SIG del host o de
dibujo del dibujo de referencia.
18 The TILEMODE system variable can
have the same results as the MODEL and
LAYOUT commands.
La variable de sistema TILEMODE puede
tener los mismos resultados que el modelo y
comandos de composición.
19 This permits text editing, program
debugging, and interaction with
AutoCAD and other applications.
Esto permite la edición de texto, el programa
la depuración, y la interacción con
AutoCAD y otras aplicaciones.
20 Uses color-dependent plot style tables
(CTB) in the current drawing
Utiliza tablas de estilos de trazado
dependientes de color (CTB) en el dibujo
actual.
Link III.2.3. Remote training (EN-ES):
https://docs.google.com/spreadsheets/d/1Jwg4bGdYGwYwp_tzZ7NVKyBADiUv97M8d8
yOfjZXeEI/edit?usp=sharing
Table III.3. Testing session instructions
Project brief
At this stage of the study you are asked to complete two tasks using a DQF
tool:
1. an evaluation task (20 segments, 205 words);
2. a post-editing task (20 segments, 227 words).
In your e-mail box, you will find two links to TAUS DQF tool, one for the
evaluation task and the other one for the post-editing task. All segments are
taken from Post-Editing Data corpus of Autodesk (multinational software
corporation).
While performing the assignments you may refer to any sources you
consider useful for clarifying doubts about any issues with meaning, form
and function of source and/or target TUs that might arise.
Project objectives
Task 1 – evaluation of PE
The main objective of this assignment is to evaluate Adequacy and Fluency.
Adequacy means the (scope of) meaning expressed in the target translation
as compared to the source. The scale for Adequacy evaluation includes four
choices: Everything – Most – Little – None.
Fluency means the extent to which the translation is error-free and is
perceived as natural/intuitive by a native speaker. The scale for Frequency
evaluation includes four choices: Flawless – Good – Disfluent –
Incomprehensible.

Appendices
263
Task 2 – performing PE
The required level of output quality for this task is “publishable/human-like”
quality. This means that your objective is to make sure the MTPE output is
understandable, grammatically correct and conveys the original meaning.
PE guidelines
1. Accuracy (problems with source-to-target meaning transfer): cases of
mistranslation, addition and/or omission, untranslated segments/words.
2. Language (problems with the target language): morphology (agreement in
number/gender, POS, cases), verb forms (tense/mood/aspect, etc.), syntax
(wrong word order of a sentence/phase), orthography (capitalization,
spelling, hyphenation etc.), punctuation and “noise” (incorrect/missing/extra
function words/symbols, e.g. prepositions or punctuation marks), etc.
Link III.4. Presentation: The Art of Post-Editing :
https://docs.google.com/presentation/d/1E1r_gaQGXCenuCS67qH9QibuauwIWWo__C9_
sBwcrEk/edit#slide=id.p1
Link III.5.1. Testing session 1 - Questionnaire:
https://docs.google.com/forms/d/e/1FAIpQLScABgK_tqWsoJwd6uReyM2WyC7zKVNyc
8VyXfX_tqoYQMqO7g/viewform
Link III.5.2. Testing session 2 - Questionnaire:
https://docs.google.com/forms/d/e/1FAIpQLSdbrD2cQ6rItVE2jgN8lA89kGTAHm2Tog9
mDpTQXelm4naxyA/viewform
https://docs.google.com/presentation/d/1E1r_gaQGXCenuCS67qH9QibuauwIWWo__C9_sBwcrEk/edit#slide=id.p1

Appendices
264
Appendix IV. PE Performance results
Table IV.1. Throughput values
Participant TS 1 TS 2 TS 1 TS 2
Group 1 Group 2
G1_01 1439 1436 950 1594
G1_02 960 1206 1822 2422
G1_03 488 643 862 1629
G1_04 1173 1613 2177 2685
G1_05 1159 1755 689 1325
G1_06 812 2351 972 1619
G1_07 663 1334 1012 1359
G1_08 1311 2468 999 1638
G1_09 1522 2324 1456 1929
G1_10 896 1458 1276 1678
G1_11 1060 1672 779 1235
G1_12 364 2547 905 1623
G1_13 481 1203 1622 1890
G1_14 897 941 1232 1647
G1_15 869 1363 732 1144
G1_16 736 1365 2432 2962
G1_17 1045 976 1533 2673
G1_18 2210 2985 1282 1637
G1_19 1550 1632 897 1427
G1_20 1129 1531 1331 2411
G1_21 1120 1894 1324 2017
G1_22 826 1304 1076 2291
G1_23 1538 1741
G1_24 978 1623

Appendices
265
Table IV.2. Output quality (Group 1)
Participant TS1_un TS2_un TS1_fit TS2_fit TS1_ov TS2_ov
G1_01 7 6 11 14 2 0
G1_02 7 4 10 14 3 2
G1_03 3 3 11 15 6 2
G1_04 5 4 13 15 2 1
G1_05 5 5 14 13 1 2
G1_06 5 5 13 11 2 4
G1_07 5 7 9 10 6 3
G1_08 7 6 12 12 1 2
G1_09 9 5 9 10 2 5
G1_10 7 3 9 12 4 5
G1_11 6 4 13 12 1 4
G1_12 5 3 12 14 3 3
G1_13 7 3 12 14 1 3
G1_14 6 5 14 15 0 0
G1_15 8 5 11 13 1 2
G1_16 9 3 10 12 1 5
G1_17 6 5 11 15 3 0
G1_18 3 2 15 15 2 3
G1_19 6 6 12 13 2 1
G1_20 8 8 8 10 4 2
G1_21 7 4 10 15 3 1
G1_22 1 10 15 10 4 0
Table IV.3. Output quality (Group 2)
Participant TS1_un TS2_un TS1_fit TS2_fit TS1_ov TS2_ov
G2_01 5 7 9 12 6 1
G2_02 5 1 11 14 4 5
G2_03 5 5 8 14 7 1
G2_04 7 6 13 10 0 4
G2_05 3 2 4 18 13 0
G2_06 1 8 7 10 12 2
G2_07 5 4 13 14 2 2

Appendices
266
G2_08 8 5 4 14 8 1
G2_09 9 11 10 6 1 3
G2_10 9 7 9 10 2 3
G2_11 5 4 12 14 3 2
G2_12 5 9 13 8 2 3
G2_13 7 3 5 16 8 1
G2_14 6 7 4 7 10 6
G2_15 4 12 11 7 5 1
G2_16 7 0 13 11 0 9
G2_17 4 6 9 11 7 3
G2_18 5 8 14 12 1 0
G2_19 10 6 7 8 3 6
G2_20 6 10 9 9 5 1
G2_21 4 6 11 13 5 1
G2_22 11 3 8 16 1 1
G2_23 8 8 5 12 7 0
G2_24 7 5 9 11 4 4

Appendices
267
Appendix V. Statistical inferences of WPH rates
Image V.I. Test of normality (WPH rate, Group 1)
Image V.2. Contrast of hypotheses (WPH rate, Group 1)
Image V.3. Test of normality (WPH rate, Group 2)

Appendices
268
Image V.4. Contrast of hypotheses (WPH rate, Group 2)
Image V.5. Test of normality (WPH rate, Groups 1 and 2)
Image V.6. Contrast of hypothesis (WPH rate, Groups 1 and 2)

Appendices
269
Appendix VI. Statistical inferences of under-edited segments
Image VI.1. Test of normality (under-edited segments, Group 1)
Image VI.2. Contrast of hypothesis (under-edited segments, Group 1)
Image VI.3. Test of normality (under-edited segments, Group 2)

Appendices
270
Image VI.4. Contrast of hypothesis (under-edited segments, Group 2)
Image VI.5. Test of normality (under-edited segments, Groups 1 and 2)
Image VI.6. Contrast of hypothesis (under-edited segments, Groups 1 and 2)

Appendices
271
Appendix VII. Statistical inferences of fit-for-purpose segments
Image VII.1. Test of normality (fit-for-purpose segments, Group 1)
Image VII.2. Contrast of hypotheses (fit-for-purpose segments, Group 1)
Image VII.3. Test of normality (fit-for-purpose segments, Group 2)

Appendices
272
Image VII.4. Contrast of hypotheses (fit-for-purpose segments, Group 2)
Image VII.5. Test of normality (fit-for-purpose segments, Groups 1 and 2)
Image VII.6. Contrast of hypothesis (fit-for-purpose segments, Groups 1 and 2)

Appendices
273
Appendix VIII. Statistical inferences of over-edited segments
Image VIII.1. Test of normality (over-edited segments, Group 1)
Image VIII.2. Contrast of hypotheses (over-edited segments, Group 1)
Image VIII.3. Test of normality (over-edited segments, Group 2)

Appendices
274
Image VIII.4. Contrast of hypotheses (over-edited segments, Group 2)
Image VIII.5. Test of normality (over-edited segments, Groups 1 and 2)
Image VIII.6. Contrast of hypothesis (over-edited segments, Groups 1 and 2)

Appendices
275
Appendix IX. Statistical correlations (TS 1)
Image IX.1. Spearman correlations of WPH rate vs. nr. of under-edited segments (TS 1)
Image IX.2. Spearman correlations of WPH rate vs. nr. of fit-for-purpose segments (TS 1)
Image IX.3. Spearman correlations of WPH rate vs. nr. of over-edited segments (TS 1)

Appendices
276
Image IX.4. Spearman correlations of fit-for-purpose vs. under-edited segments (TS 1)
Image IX.5. Spearman correlations of over-edited vs. under-edited segments (TS 1)
Image IX.6. Spearman correlations of fit-for-purpose vs. over-edited segments (TS 1)

Appendices
277
Appendix X. Statistical correlations (TS 2)
Image X.1. Spearman correlations of WPH rate vs. nr. of under-edited segments (TS 2)
Image X.2. Spearman correlations of WPH rate vs. nr. of fit-for-purpose segments (TS 2)
Image X.3. Spearman correlations of WPH rate vs. nr. of over-edited segments (TS 2)

Appendices
278
Image X.4. Spearman correlations of fit-for-purpose vs. under-edited segments (TS 2)
Image X.5. Spearman correlations of over-edited vs. under-edited segments (TS 2)
Image X.6. Spearman correlations of fit-for-purpose vs. over-edited segments (TS 2)

Appendices
279
Appendix XI. Questionnaire results
Table XI.1. Attitude to MTPE (Groups 1 and 2)
“1” – very negative, “2” – negative, “3” – positive, “4” – very positive
Participant TS1 TS2 TS1 TS2
Group 1 Group 2
G1_01 3 3 2 4
G1_02 3 3 3 3
G1_03 3 3 3 4
G1_04 3 3 3 3
G1_05 3 3 3 3
G1_06 4 2 3 4
G1_07 3 3 3 3
G1_08 3 3 3 3
G1_09 3 3 3 3
G1_10 3 2 3 3
G1_11 3 3 3 4
G1_12 3 3 3 3
G1_13 3 3 3 4
G1_14 3 3 3 3
G1_15 2 2 3 3
G1_16 2 2 2 3
G1_17 3 2 3 3
G1_18 3 4 3 3
G1_19 3 2 3 4
G1_20 2 3 3 4
G1_21 3 3 3 3
G1_22 3 3 3 2
G1_23 3 4
G1_24 3 3

Appendices
280
Table XI.2. Attitude to quality standards in PE (Groups 1 and 2)
“1” – I strongly disagree, “2” – I disagree, “3” – I agree, “4” – I fully agree
Participant TS1 TS2 TS1 TS2
Group 1 Group 2
G1_01 2 2 2 1
G1_02 1 2 2 3
G1_03 1 1 3 2
G1_04 2 2 3 3
G1_05 1 1 2 3
G1_06 1 1 3 2
G1_07 2 3 3 2
G1_08 4 3 3 2
G1_09 2 2 3 3
G1_10 2 3 3 3
G1_11 1 4 2 2
G1_12 3 3 1 2
G1_13 3 3 2 2
G1_14 2 1 2 3
G1_15 3 3 2 2
G1_16 2 2 2 2
G1_17 2 3 3 3
G1_18 3 3 2 3
G1_19 1 1 4 3
G1_20 2 3 3 3
G1_21 2 2 2 3
G1_22 2 3 3 2
G1_23 2 3
G1_24 3 3

Appendices
281
Table XI.3. Attitude towards PE as a profession (Groups 1 and 2)
“1” – no I won’t, “2” – maybe, but I won’t be looking forward to it, “3” – yes I will,
“4” – yes, and I will be looking forward to it
Participant TS1 TS2 TS1 TS2
Group 1 Group 2
G1_01 1 2 2 3
G1_02 2 2 2
G1_03 2 2 2 3
G1_04 2 2 2 2
G1_05 2 3 2 2
G1_06 3 2 3 3
G1_07 2 2 2 1
G1_08 2 2 2 3
G1_09 2 2 3 2
G1_10 2 3 1 3
G1_11 3 2 3 4
G1_12 3 3 2 2
G1_13 3 3 3 4
G1_14 2 2 2 3
G1_15 2 2 3 2
G1_16 2 1 2 2
G1_17 2 1 3 3
G1_18 4 4 3 2
G1_19 2 2 3 2
G1_20 1 2 2 3
G1_21 2 2 2 2
G1_22 3 3 4 3
G1_23 2 2
G1_24 2 3

Appendices
282
Table XI.4. Satisfaction with performance of a PE task (Groups 1 and 2)
“1” – I am very dissatisfied, “2” – I am rather dissatisfied, “3” – I’m rather satisfied,
“4” – I’m very satisfied
Participant TS1 TS2 TS1 TS2
Group 1 Group 2
G1_01 1 2 2 1
G1_02 2 3 3 3
G1_03 2 3 2 2
G1_04 3 3 3 2
G1_05 2 2 3 2
G1_06 3 2 2 3
G1_07 3 3 2 1
G1_08 3 2 3 3
G1_09 3 2 2 2
G1_10 3 3 3 3
G1_11 2 3 3 3
G1_12 2 2 2 2
G1_13 2 2 4 3
G1_14 3 3 2 2
G1_15 4 3 3 2
G1_16 2 2 3 3
G1_17 3 2 2 2
G1_18 3 4 3 3
G1_19 2 2 2 2
G1_20 3 3 2 2
G1_21 2 3 4 3
G1_22 3 3 2 2
G1_23 3 2
G1_24 3 3

Appendices
283
Table XI.5. Self-evaluation of PE competence (Groups 1 and 2)
“1” – deficient, “2” – average, “3” – sufficient, “4” – excellent
Participant TS1 TS2 TS1 TS2
Group 1 Group 2
G1_01 1 2 2 2
G1_02 2 3 3 3
G1_03 2 3 2 2
G1_04 3 3 2 3
G1_05 2 2 3 3
G1_06 1 2 3 2
G1_07 3 3 2 2
G1_08 2 2 3 3
G1_09 3 3 2 2
G1_10 3 3 2 3
G1_11 3 3 3 3
G1_12 2 2 2 2
G1_13 2 2 3 3
G1_14 3 3 2 2
G1_15 3 3 2 2
G1_16 2 2 2 3
G1_17 2 2 2 2
G1_18 3 3 3 3
G1_19 2 2 2 3
G1_20 2 2 2 2
G1_21 2 2 3 3
G1_22 2 3 2 2
G1_23 2 2
G1_24 3 3

Appendices
284
Appendix XII. Associative correlations (TS 1)
Image XII.1. Associative correlation of attitude to MT vs. PE quality standards
(Group 1, TS 1)
Image XII.2. Associative correlation of PE quality standards vs. PE as a job
(Group 1, TS 1)
Image XII.3. Associative correlation of PE as a job vs. attitude to MT (Group 1, TS 1)

Appendices
285
Image XII.4. Associative correlation of self-satisfaction vs. estimation of PE competence
(Group 1, TS 1)
Image XII.5. Associative correlation of Attitude to MT vs. PE quality standards
(Group 2, TS 1)
Image XII.6. Associative correlation of PE quality standards vs. PE as a job
(Group 2, TS 1)

Appendices
286
Image XII.7. Associative correlation of PE as a job vs. attitude to MT (Group 2, TS 1)
Image XII.8. Associative correlation of self-satisfaction vs. estimation of PE competence
(Group 2, TS 1)
Image XII.9. Associative correlation of attitude to MT vs. PE quality standards
(Groups 1 and 2, TS 1)

Appendices
287
Image XII.10. Associative correlation of PE quality standards vs. PE as a job
(Groups 1 and 2, TS 1)
Image XII.11. Associative correlation of PE as a job vs. attitude to MT
(Groups 1 and 2, TS 1)
Image XII.12. Associative correlation of self-satisfaction vs. estimation of PE competence
(Groups I and II, TS 1)

Appendices
288
Appendix XIII. Associative correlations (TS 2)
Image XIII.1. Associative correlation of attitude to MT vs. PE quality standards
(Group 1, TS 2)
Image XIII.2. Associative correlation of PE quality standards vs. PE as a job
(Group 1, TS 2)
Image XIII.3. Associative correlation of PE as a job vs. attitude to MT
(Group 1, TS 2)

Appendices
289
Image XIII.4. Associative correlation of self-satisfaction vs. estimation of PE competence
(Group 1, TS 2)
Image XIII.5. Associative correlation of attitude to MT vs. PE quality standards
(Group 2, TS 2)
Image XIII.6. Associative correlation of attitude PE quality standards vs. PE as a job
(Group 2, TS 2)

Appendices
290
Image XIII.7. Associative correlation of PE as a job vs. attitude to MT
(Group 2, TS 2)
Image XIII.8. Associative correlation of self-satisfaction vs. estimation of PE competence
(Group 2, TS 2)
Image XIII.9. Associative correlation of attitude to MT vs. PE quality standards
(Groups 1 and 2, TS 2)

Appendices
291
Image XII.10. Associative correlation of PE quality standards vs. PE as a job
(Groups 1 and 2, TS 2)
Image XIII.11. Associative correlation of PE as a job vs. attitude to MT
(Groups 1 and 2, TS 2)
Image XII.12. Associative correlation of self-satisfaction vs. estimation of PE
competence (Groups 1 and 2, TS 2)

Appendices
292
Appendix XIV. Clusters: attitude towards MT vs. PE performance
Table XIV.1. Cluster A (unchanged positive attitude to MTPE) performance values
Subject TS1_un TS1_ok TS1_ov TS2_un TS2_ok TS2_ov WPH1 WPH2
G1_01 7 11 2 6 14 0 1439 1436
G1_02 7 10 3 4 14 2 960 1206
G1_03 3 11 6 3 15 2 488 643
G1_04 5 13 2 4 15 1 1173 1613
G1_05 5 14 1 5 13 2 1159 1755
G1_07 5 9 6 7 10 3 663 1334
G1_08 7 12 1 6 12 2 1311 2468
G1_09 9 9 2 5 10 5 1522 2324
G1_11 6 13 1 4 12 4 1060 1672
G1_12 5 12 3 3 14 3 364 2547
G1_13 7 12 1 3 14 3 481 1203
G1_14 6 14 0 5 15 0 897 941
G1_21 7 10 3 4 15 1 1120 1894
G1_22 1 15 4 10 10 0 826 1304
G2_02 5 11 4 1 14 5 1822 2422
G2_04 7 13 0 6 10 4 2177 2685
G2_05 3 4 13 2 18 0 689 1325
G2_07 5 13 2 4 14 2 1012 1359
G2_08 8 4 8 5 14 1 999 1638
G2_09 9 10 1 11 6 3 1456 1929
G2_10 9 9 2 7 10 3 1276 1678
G2_12 5 13 2 9 8 3 905 1623
G2_14 6 4 10 7 7 6 1232 1647
G2_15 4 11 5 12 7 1 732 1144
G2_17 4 9 7 6 11 3 1533 2673
G2_18 5 14 1 8 12 0 1282 1637
G2_21 4 11 5 6 13 1 1324 2017
G2_24 7 9 4 5 11 4 978 1623
G1_18 3 15 2 2 15 3 2210 2985
G2_03 5 8 7 5 14 1 862 1629

Appendices
293
G2_06 1 7 12 8 19 2 972 1619
G2_11 5 12 3 4 14 2 779 1235
G2_13 7 5 8 3 16 1 1622 1890
G2_19 10 7 3 6 8 6 897 1427
G2_20 6 9 5 10 9 1 1331 2411
G2_23 8 5 7 8 12 0 1538 1741
Table XIV.2. Cluster B (worsened attitude to MTPE) performance values
Subject TS1_un TS1_ok TS1_ov TS2_un TS2_ok TS2_ov WPH1 WPH2
G1_06 5 13 2 5 11 4 812 2351
G1_10 7 9 4 3 12 5 896 1458
G1_17 6 11 3 5 15 0 1045 976
G1_19 6 12 2 6 13 1 1550 1632
G2_22 11 8 1 3 16 1 1076 2291
Table XIV.3. Cluster C (improved attitude to MTPE) performance values
Subject TS1_un TS1_ok TS1_ov TS2_un TS2_ok TS2_ov WPH1 WPH2
G1_20 8 8 4 8 10 2 1129 1531
G2_16 7 13 0 0 11 9 2432 2962
G2_01 5 9 6 7 12 1 950 1594
Table XIV.4. Cluster D (unchanged negative attitude to MTPE) performance values
Subject TS1_un TS1_ok TS1_ov TS2_un TS2_ok TS2_ov WPH1 WPH2
G1_15 8 11 1 5 13 2 869 1363
G1_16 9 10 1 3 14 5 736 1365

Appendices
294
Appendix XV. (N/S)MT engines output
Image XV.1. Similarity index

Appendices
295
Image XV.2. Levenshtein distance
Table XV.3 ((N/S)MT strings) EN-ES
Input Raw MT output (DeepL) Raw MT output (Yandex)
TS 1
1
Create a solid object by
pressing or pulling a
bounded area
Crear un objeto sólido
presionando o tirando de un
área delimitada
Para crear un objeto sólido
presionando o tirando de un
área limitada
2
Rendered images take
longer to process, but the
image quality is better.
Las imágenes renderizadas
tardan más en procesarse,
pero la calidad de la imagen
es mejor.
Las imágenes renderizadas
tomar más tiempo para
procesar, pero la calidad de
imagen es mejor.

Appendices
296
3
For custom routines, the
CTAB system variable can
also be useful.
Para rutinas personalizadas,
la variable de sistema CTAB
también puede ser útil.
Para rutinas personalizadas, el
CTAB variable de sistema
también puede ser útil.
4 Displays the file tabs in the
application.
Muestra las fichas de archivo
de la aplicación.
Muestra el archivo de fichas en
la aplicación.
5
In the Geographic Location
dialog box, in the Search
box, type the name of a
landmark near your
location and click Search.
En el cuadro de diálogo
Ubicación geográfica, en el
cuadro Buscar, escriba el
nombre de un punto de
referencia cercano a su
ubicación y haga clic en
Buscar.
En la Ubicación Geográfica
cuadro de diálogo, en el
cuadro de Búsqueda, escriba el
nombre de un punto de
referencia cerca de su
ubicación y haga clic en
Buscar.
6
Inserts a position marker in
model space, at the position
corresponding to your
current location.
Inserta un marcador de
posición en el espacio del
modelo, en la posición
correspondiente a su posición
actual.
Inserta un marcador de
posición en el espacio del
modelo, en la posición
correspondiente a su ubicación
actual.
7
Specifies geographic
location information for a
drawing file.
Especifica la información de
la ubicación geográfica de un
archivo de dibujo.
Especifica la ubicación
geográfica de la información
de un archivo de dibujo.
8
{1}Image tab {2}Clipping
panel {3}Create Clipping
Boundary{4}. {5}
1}Ficha Imagen {2}Panel de
recorte {3}Crear límite de
recorte{4}. {5}
{1}la Imagen de ficha
{2}Recorte del panel {3}Crear
Recorte Límite de{4}. {5}
9
Click to specify slot width,
or enter diameter or radius
of the slot arcs.
Haga clic para especificar el
ancho de la ranura o
introduzca el diámetro o el
radio de los arcos de la
ranura.
Haga clic para especificar la
ranura de ancho, o introduzca
el diámetro o el radio de la
ranura de arcos.
10
Click {1}Insert tab
{2}Reference panel {3}>
External References{4}.
Haga clic en {1}Pestaña
Insertar {2}Panel de
referencia {3}> Referencias
externas{4}.
Haga clic en {1}ficha Insertar
{2}panel de Referencia {3}>
Referencias Externas{4}.
11
To work with the
coordinate display on the
status bar
Para trabajar con la
visualización de coordenadas
en la barra de estado
Para trabajar con la pantalla de
coordenadas en la barra de
estado
12
The current drawing is
associated with one or more
standards (DWS) files.
El dibujo actual está asociado
a uno o más archivos de
estándares (DWS).
El dibujo actual se asocia con
uno o más estándares (DWS)
archivos.
13
Inserts a position marker at
the position corresponding
to your current location.
Inserta un marcador de
posición en la posición
correspondiente a su posición
actual.
Inserta un marcador de
posición en la posición
correspondiente a su ubicación
actual.
14 About Searching for
Content by Name
Acerca de la búsqueda de
contenido por nombre
Acerca de la Búsqueda de
Contenido por Nombre
15 Follow these steps to access
more linetypes:
Siga estos pasos para acceder
a más tipos de línea:
Siga estos pasos para acceder a
más tipos de línea:
16
After the drawing is
uploaded to Autodesk 360,
a URL is generated for the
drawing.
Después de cargar el dibujo
en Autodesk 360, se genera
una URL para el dibujo.
Después de que el dibujo es
subido a Autodesk 360, una
URL que se genera para el
dibujo.
17
The 3D-Warehouse
browser may have
problems connecting to the
El navegador 3D-Warehouse
puede tener problemas para
conectarse a Internet.
El 3D-Almacén navegador
puede tener problemas para
conectarse a internet.

Appendices
297
internet.
18
Tap the Ctrl key to switch
to face extrusion, which
presses or pulls the face
without affecting adjacent
geometry.
Toque la tecla Ctrl para
cambiar a la extrusión de
cara, que presiona o tira de la
cara sin afectar a la
geometría adyacente.
Presiona la tecla Ctrl para
cambiar a la cara de extrusión,
que empuja o tira de la cara sin
afectar adyacentes de la
geometría.
19
This paragraph must
replace the preceding
paragraph if the ECO for
the warning is approved.
Este párrafo debe sustituir al
párrafo anterior si se aprueba
el OCE para la advertencia.
Este párrafo debe reemplazar
el párrafo anterior, si el ECO
de la advertencia es aprobado.
20
Click a closed object such
as a circle and move the
cursor to establish an
extrusion direction.
Haga clic en un objeto
cerrado, como un círculo, y
mueva el cursor para
establecer una dirección de
extrusión.
Haga clic en un objeto cerrado
como un círculo y mueva el
cursor para establecer una
dirección de extrusión.
TS 2
1
While the command is
active, right-click to
display additional options
from a context menu.
Mientras el comando está
activo, haga clic con el botón
secundario para mostrar
opciones adicionales desde un
menú contextual.
Mientras que el comando está
activo, haga clic en mostrar
opciones adicionales en el
menú contextual.
2
Right-click the layout,
and click Page Setup
Manager.
Haga clic con el botón
secundario en la presentación
y haga clic en Administrador
de configuración de página.
Haga clic en el diseño y haga
clic en la Página de
Configuración de
Administrador.
3
Switching between color
schemes is not available
in some AutoCAD-based
products.
Algunos productos basados en
AutoCAD no permiten
cambiar entre combinaciones
de colores.
La conmutación entre los
esquemas de color no está
disponible en algunos de
AutoCAD basada en los
productos.
4 Displays the map as a
series of satellite images.
Muestra el mapa como una
serie de imágenes de satélite.
Muestra el mapa como una
serie de imágenes de satélite.
5
The exact size of the text
box is not critically
important.
El tamaño exacto del cuadro
de texto no es de importancia
crítica.
El tamaño exacto de la caja de
texto no es muy importante.
6
For quick access to the
most common properties,
use the Properties panel
on the Home tab.
Para acceder rápidamente a las
propiedades más comunes,
utilice el panel Propiedades en
la ficha Inicio.
Para el acceso rápido a las
propiedades más comunes,
utilice el panel Propiedades, en
la pestaña Inicio.
7
On the Featured Apps tab,
click an App button on
the ribbon tab.
En la ficha Apps destacadas,
haga clic en un botón App de
la ficha de la cinta.
En las Aplicaciones
Destacadas de la ficha, haga
clic un botón de la Aplicación
en la ficha de la cinta.
8
{1}Stylizes each point
based on the intensity
value of the point.
Estila cada punto basado en el
valor de intensidad del punto.
{1}Stylizes cada punto de base
en el valor de la intensidad del
punto.
9
{1}Annotate
tab{2}Dimensions panel
{3}Update{4}. {5}
1}Pestaña Anotar{2}Panel de
dimensiones
{3}Actualizar{4}. {5}
{1}ficha
anotación{2}Dimensiones del
panel {3}Update{4}. {5}
10
The Featured Apps tab
displays an RSS feed of
featured or suggested
apps.
La pestaña Aplicaciones
destacadas muestra un canal
RSS de aplicaciones
destacadas o sugeridas.
Las Aplicaciones Destacadas
de la ficha muestra un feed
RSS de destacados o sugerido
aplicaciones.

Appendices
298
11 Controls the shadows
displayed in the scene.
Controla las sombras que se
muestran en la escena.
Los controles de las sombras
aparece en la escena.
12
{1}Windows XP:{2}
Click Start menu {3}
Programs {4} Autodesk
{5}<Product Name>{6}
Reset Settings to Default.
{1}Windows XP:{2} Haga
clic en el menú Inicio {3}.
Programas {4} Autodesk
{5}<Nombre del
producto>{6}. Restablecer los
ajustes a los valores
predeterminados.
{1}Windows XP:{2} haga
Clic en menú Inicio {3}
Programas {4} Autodesk
{5}<Nombre de Producto>{6}
Restablecer la Configuración a
los valores Predeterminados.
13
You can change any of
these properties by
clicking and changing its
setting.
Puede cambiar cualquiera de
estas propiedades haciendo
clic y cambiando su
configuración.
Usted puede cambiar
cualquiera de estas
propiedades, haga clic y
cambiar su configuración.
14
Use this method to attach
a point cloud file without
using a dialog box
interface.
Utilice este método para
adjuntar un archivo de nube de
puntos sin utilizar una interfaz
de cuadro de diálogo.
Utilice este método para fijar
un punto de archivos en la
nube sin necesidad de utilizar
un cuadro de diálogo de la
interfaz.
15
In the Geographic
Location dialog box, enter
the values in the Latitude
and Longitude boxes.
En el cuadro de diálogo
Ubicación geográfica,
introduzca los valores en los
cuadros Latitud y Longitud.
En la Ubicación Geográfica
cuadro de diálogo, introduzca
los valores de la Latitud y la
Longitud de las cajas.
16
In the Sheet Set Manager,
Sheet List tab, open the
sheet that you want to
reassociate.
En la ficha Lista de hojas del
Administrador de conjuntos de
hojas, abra la hoja que desea
reasociar.
En la ficha Administrador de
Conjunto, la Hoja de la ficha
Lista, abra la hoja de trabajo
que desea volver a asociar.
17
A similar situation occurs
if you change the GIS
coordinate system of the
host drawing or
referenced drawing.
Una situación similar ocurre si
cambia el sistema de
coordenadas GIS del dibujo
del host o del dibujo
referenciado.
Una situación similar se
produce si cambia el sistema
de información geográfica
sistema de coordenadas de la
acogida de dibujo o dibujo que
se hace referencia.
18
The TILEMODE system
variable can have the
same results as the
MODEL and LAYOUT
commands.
La variable de sistema
TILEMODE puede tener los
mismos resultados que los
comandos MODELO y
LAYOUT.
El TILEMODE variable de
sistema puede tener los
mismos resultados que el
MODELO y el DISEÑO de los
comandos.
19
This permits text editing,
program debugging, and
interaction with
AutoCAD and other
applications.
Esto permite la edición de
texto, la depuración de
programas y la interacción con
AutoCAD y otras aplicaciones.
Esto permite la edición de
texto, programa de depuración,
y la interacción con AutoCAD
y otras aplicaciones.
20
Uses color-dependent plot
style tables (CTB) in the
current drawing
Utiliza tablas de estilo de
trazado en función del color
(CTB) en el dibujo actual
Utiliza el color dependiente de
tablas de estilo de trazado
(CTB) en el dibujo actual

Appendices
299
Table XV.4. (N/S)MT strings vs. referent strings
Similarity (between Autodesk raw output and DeepL/Yandex raw output)
LD_1: Levenshtein distance between the PE output and the raw MT output by Autodesk
LD_2: Levenshtein distance between the PE output and the raw MT output by Deepl/Yandex
Deepl Yandex
Similarity LD_1 LD_2 Similarity LD_1 LD_2
TS 1
1 0,76 10 7 0,70 10 15
2 0,79 4 16 0,70 4 29
3 0,96 9 6 0,90 9 17
4 0,74 20 17 0,76 20 22
5 0,86 21 20 0,76 21 47
6 0,93 0 10 0,96 0 5
7 0,96 0 3 0,77 0 27
8 0,61 7 34 0,62 7 43
9 0,86 12 15 0,73 12 33
10 0,85 5 22 0,92 5 16
11 0,85 11 4 0,71 11 14
12 0,89 3 8 0,70 3 30
13 0,95 0 5 1,00 0 0
14 1,00 0 0 1,00 0 3
15 0,93 5 0 0,93 5 0
16 0,68 1 33 0,55 1 56
17 1,00 0 0 0,83 0 20
18 0,67 0 60 0,79 0 36
19 0,86 13 6 0,70 13 34
20 0,99 1 0 0,99 1 2
TS 2
1 0,75 0 32 0,67 0 47
2 0,85 0 20 0,53 0 61
3 0,35 33 73 0,64 33 59
4 1,00 0 0 1,00 0 0
5 0,81 10 13 0,80 10 6

Appendices
300
6 0,86 2 20 0,75 2 39
7 0,76 23 17 0,23 23 53
8 0,88 26 26 0,89 26 27
9 0,62 2 25 0,55 2 32
10 0,46 0 32 0,52 0 54
11 0,80 0 12 0,70 0 18
12 0,78 9 39 0,79 9 47
13 0,96 10 10 0,92 10 20
14 0,83 9 18 0,94 9 70
15 0,92 2 8 0,61 2 68
16 0,67 0 55 0,66 0 50
17 0,82 15 24 0,66 15 66
18 0,78 36 17 0,74 36 56
19 0,88 19 1 0,95 19 19
20 0,88 2 11 0,72 2 35
Table XV.5. (N/S)MT strings (EN-RU)
Source
Raw MT output
(Google Translate)
Raw MT output
(Yandex)
TS 1
1
To Work With Pressing or
Pulling Bounded Areas
Работать с нажатием или
вытягиванием ограниченных
областей
Работать с отжимать или
вытягивать ограниченные
области
2
Create a Solid Object by
Pressing or Pulling a
Bounded Area
Создание твердого объекта
путем нажатия или
выталкивания ограниченной
области
Создание твердого объекта
путем нажатия или
вытягивания ограниченной
области
3
Rendered images take
longer to process, but the
image quality is better.
Полученные изображения
занимают больше времени
для обработки, но качество
изображения лучше.
Обработанные изображения
занимает больше времени,
но качество изображения
лучше.
4
For custom routines, the
CTAB system variable
can also be useful.
Для пользовательских
подпрограмм также может
быть полезна системная
переменная CTAB.
Для пользовательских
подпрограмм также может
быть полезна системная
переменная CTAB.
5 Displays the file tabs in
the application.
Отображает вкладки файлов
в приложении.
Отображает вкладки файлов
в приложении.
6
In the Geographic
Location dialog box, in
the Search box, type the
name of a landmark near
your location and click
Search.
В диалоговом окне
«Географическое
местоположение» в поле
«Поиск» введите имя
ориентира рядом с вашим
местоположением и нажмите
В диалоговом окне
Географическое
Местоположение В поле
поиска введите имя
ориентира рядом с вашим
местоположением и нажмите

Appendices
301
«Поиск». кнопку Поиск.
7
The 3D Warehouse
browser may have
problems connecting to
the internet, if your
network uses a proxy
server that requires
authentication.
У браузера 3D Warehouse
могут возникнуть проблемы
с подключением к
Интернету, если ваша сеть
использует прокси-сервер,
для которого требуется
аутентификация.
Браузер 3D Warehouse может
иметь проблемы с
подключением к интернету,
если в сети используется
прокси-сервер, требующий
проверки подлинности.
8
Click Open to import the
file as a block.
Щелкните "Открыть", чтобы
импортировать файл в виде
блока.
Щелкните "Открыть", чтобы
импортировать файл в виде
блока.
9 Closes the Point Cloud
Manager palette.
Закрывает палитру
диспетчера точек.
Закрывает палитру
Диспетчер облаков точек.
10
Specifies geographic
location information for a
drawing file.
Задает информацию о
географическом
местоположении для файла
чертежа.
Указывает сведения о
географическом
местоположении для файла
чертежа.
11
{1}Image tab
{2}Clipping panel
{3}Create Clipping
Boundary{4}. {5}
{1} Вкладка «Изображение»
{2} Панель обрезки {3}
Создать граничную границу
{4}. {5}
{1}вкладка "образ"
{2}отсечения группы
{3}создать Обтравочную
границу{4}. {5}
12
Multi-functional grip
options are not available.
Многофункциональные
функции захвата
недоступны.
Многофункциональные
варианты сжатия не
доступны.
13
On the Command line,
you can search for named
objects such as blocks,
hatches, layers, or styles,
and then initiate an
appropriate action by
selecting them.
В командной строке вы
можете искать именованные
объекты, такие как блоки,
штриховки, слои или стили,
а затем инициировать
соответствующее действие,
выбирая их.
В командной строке можно
выполнить поиск
именованных объектов,
таких как блоки, штриховки,
слои или стили, а затем
запустить соответствующее
действие, выбрав их.
14
Click {1}Insert tab
{2}Reference panel {3}>
External References{4}.
Нажмите {1} Вставить
вкладку {2} Панель ссылок
{3}> Внешние ссылки {4}.
Нажмите {1}вкладку
"Вставка" {2}панель
"ссылка" {3}> внешние
ссылки{4}.
15
To Work with the
Coordinate Display on the
Status Bar
Работа с дисплеем
координат на панели
состояния
Для работы с отображением
координат в строке
состояния
16
The current drawing is
associated with one or
more standards (DWS)
files.
Текущий рисунок связан с
одним или несколькими
стандартными (DWS)
файлами.
Текущий чертеж связан с
одним или несколькими
файлами стандартов (DWS).
17
Inserts a position marker
at the position
corresponding to your
current location.
Вставляет маркер положения
в положение,
соответствующее вашему
текущему местоположению.
Вставляет маркер позиции в
позицию, соответствующую
текущему местоположению.
18
As much as possible,
layer names are kept the
same.
Как можно больше, имена
слоев сохраняются
одинаковыми.
Насколько это возможно,
имена слоев остаются
неизменными.
19
Follow these steps to
access more linetypes:
Выполните следующие
действия для доступа к
другим типам линий:
Чтобы получить доступ к
другим типам линий,
выполните следующие
действия:

Appendices
302
20
After the drawing is
uploaded to Autodesk
360, a URL is generated
for the drawing.
После того, как чертеж
загружен в Autodesk 360, для
чертежа создается URL-
адрес.
После загрузки чертежа в
Autodesk 360 создается URL-
Адрес для чертежа.
TS 2
1
While the command is
active, right-click to
display additional options
from a context menu.
Пока команда активна,
щелкните правой кнопкой
мыши, чтобы отобразить
дополнительные параметры
из контекстного меню.
Пока команда активна,
щелкните правой кнопкой
мыши, чтобы отобразить
дополнительные параметры
из контекстного меню.
2
Right-click the layout,
and click Page Setup
Manager.
Щелкните правой кнопкой
мыши макет и выберите
«Диспетчер настройки
страницы».
Щелкните правой кнопкой
мыши макет и выберите
пункт Диспетчер установки
Страниц.
3
Switching between color
schemes is not available
in some AutoCAD-based
products.
Переключение между
цветовыми схемами
недоступно в некоторых
продуктах на базе AutoCAD.
Переключение между
цветовыми схемами
недоступно в некоторых
продуктах на основе
AutoCAD.
4
Displays the map as a
series of satellite images.
Отображает карту как серию
спутниковых изображений.
Отображает карту в виде
серии спутниковых
изображений.
5
The exact size of the text
box is not critically
important.
Точный размер текстового
поля не является
критическим.
Точный размер текстового
поля не является критически
важным.
6
For quick access to the
most common properties,
use the Properties panel
on the Home tab.
Для быстрого доступа к
наиболее распространенным
свойствам используйте
панель «Свойства» на
вкладке «Главная».
Для быстрого доступа к
наиболее распространенным
свойствам используйте
панель "свойства" на вкладке
"Главная".
7
On the Featured Apps tab,
click an App button on
the ribbon tab.
На вкладке «Рекомендуемые
приложения» нажмите
кнопку «Приложение» на
вкладке «Лента».
На вкладке Избранные
приложения нажмите кнопку
приложения на вкладке
ленты.
8 Enter the time in seconds
or fractions of a second.
Введите время в секундах
или доли секунды.
Введите время в секундах
или долях секунды.
9
In the Geographic
Location dialog box, enter
the values in the Latitude
and Longitude boxes.
В диалоговом окне
«Географическое
местоположение» введите
значения в полях «Широта и
долгота».
В диалоговом окне
Географическое положение
введите значения в полях
широта и Долгота.
10
Stylizes each point based
on the intensity value of
the point.
Стилизирует каждую точку в
зависимости от значения
интенсивности точки.
Стилизует каждую точку на
основе значения
интенсивности точки.
11
{1}Annotate
tab{2}Dimensions panel
{3}Update{4}. {5}
{1} Вкладка
«Аннотировать» {2} Панель
«Параметры» {3} Обновить
{4}. {5}
{1}вкладка "Примечания"
{2}панель "измерения"
{3}обновление{4}. {5}
12
The Featured Apps tab
displays an RSS feed of
featured or suggested
apps.
На вкладке «Рекомендуемые
приложения» отображается
RSS-канал избранных или
предлагаемых приложений.
На вкладке Рекомендуемые
приложения отображается
RSS-канал рекомендуемых
или рекомендуемых
приложений.

Appendices
303
13 Controls the shadows
displayed in the scene.
Управляет тенями,
отображаемыми в сцене.
Управляет тенями,
отображаемыми в сцене.
14
{1}Windows XP:{2}
Click Start menu {3}
Programs {4} Autodesk
{5}<Product Name>{6}
Reset Settings to Default.
{1} Windows XP: {2}
Нажмите «Пуск» {3}
Программы {4} Autodesk {5}
<Название продукта> {6}
Сброс настроек по
умолчанию.
{1}Windows XP: {2}
Выберите меню Пуск {3}
программы {4} Autodesk
{5}<имя продукта>{6}
сбросить настройки по
умолчанию.
15
You can change any of
these properties by
clicking and changing its
setting.
Вы можете изменить любое
из этих свойств, щелкнув и
изменив его настройку.
Вы можете изменить любое
из этих свойств, щелкнув и
изменив его настройки.
16
In the Sheet Set Manager,
Sheet List tab, click the
sheets and subsets to
include in the sheet
selection.
На вкладке «Список листов»
на вкладке «Список листов»
щелкните листы и
подмножества, которые
нужно включить в выбор
листа.
На вкладке Диспетчер
Подшивок, список листов
выберите листы и
подмножества для
включения в выбор листа.
17
The current text style is
displayed at the top of the
drop-down list.
Текущий стиль текста
отображается в верхней
части раскрывающегося
списка.
Текущий стиль текста
отображается в верхней
части раскрывающегося
списка.
18 If necessary, login to
Facebook.
При необходимости войдите
в Facebook.
При необходимости войдите
в Facebook.
19
Do one of the following
to complete the offset:
Для завершения смещения
выполните одно из
следующих действий:
Для завершения смещения
выполните одно из
следующих действий:
20
In the Sheet Set Manager,
Sheet List tab, open the
sheet that you want to
reassociate.
На вкладке «Список листов»
на вкладке «Список листов»
откройте лист, который вы
хотите повторно связать.
В диспетчере подшивок на
вкладке "список листов",
откройте лист, который
требуется связать.
Table XV.6. (N/S)MT strings vs. referent strings
Similarity (between Autodesk raw output and Google Translate/Yandex raw output)
LD_1: Levenshtein distance between the PE output and the raw MT output by Autodesk
LD_2: Levenshtein distance between the PE output and the raw MT output by Google
Translate/Yandex
Google Translate Yandex
Similarity LD_1 LD_2 Similarity LD_1 LD_2
TS 1
1 0,93 0 5 0,79 58 55
2 0,86 2 11 0,96 77 76
3 0,60 1 43 0,78 92 80

Appendices
304
4 0,51 52 56 1,00 84 84
5 0,72 8 6 1,00 39 39
6 0,78 1 40 0,94 135 137
7 0,54 9 101 0,72 157 141
8 1,00 0 0 1,00 58 58
9 0,76 0 12 0,83 35 42
10 0,90 0 9 0,83 68 69
11 0,73 0 27 0,66 83 77
12 0,64 2 26 0,75 47 48
13 0,75 4 55 0,85 159 161
14 0,73 0 30 0,82 71 71
15 0,67 2 17 0,63 47 54
16 0,76 0 27 0,76 74 71
17 0,77 15 30 0,77 87 76
18 0,48 0 34 0,61 54 57
19 0,67 12 16 0,40 62 73
20 0,79 12 17 0,65 80 70
TS 2
1 0,58 0 66 1,00 115 115
2 0,71 3 29 0,86 77 81
3 0,94 3 5 0,94 86 88
4 0,57 2 27 0,87 51 54
5 0,43 31 35 0,89 54 61
6 0,84 0 19 0,95 110 111
7 0,80 2 17 0,80 85 75
8 0,85 7 2 0,95 42 43
9 0,88 0 14 0,90 94 85
10 0,68 0 33 0,80 71 63
11 0,73 1 20 0,65 71 67
12 0,77 1 27 0,85 99 102
13 0,77 11 0 1,00 40 40
14 0,73 0 44 0,86 118 118
15 0,88 5 17 0,97 74 75
16 0,61 0 51 0,61 122 103
17 0,78 24 1 0,00 73 73

Appendices
305
18 0,80 0 9 1,00 37 37
19 0,61 6 47 1,00 61 61
20 0,60 9 48 0,57 104 91