Journal of Liquid Chromatography & Related Technologies ...
174
OURNAL OF LIQUID HROMATOGRAPKY RELATED TECH NO LO G IES H PLC TLC C apillary E lectrophoresis Supercritical F luid T echniques M em brane T echnology F ield-F low F ractionation P reparative & A nalytical Separations ¿•m iiM iviii
-
Upload
khangminh22 -
Category
Documents
-
view
3 -
download
0
Transcript of Journal of Liquid Chromatography & Related Technologies ...

OURNAL OF LIQUID HROMATOGRAPKYR E L A T E D T E C H N O L O G I E S
H P L C
T L C
C a p i l l a r y E l e c t r o p h o r e s i s
S u p e r c r i t i c a l F l u i d T e c h n i q u e s
M e m b r a n e T e c h n o l o g y
F i e l d - F l o w F r a c t i o n a t i o n
P r e p a r a t i v e & A n a l y t i c a l S e p a r a t i o n s
¿ • m i i M i v i i i

JOURNAL OF LIQUID CHROMATOGRAPHY & RELATED TECHNOLOGIES
January 1997
Aims and Scope. The journal publishes an outstanding selection of critical, peer- reviewed papers dealing with analytical, preparative and process-scale liquid chromatography of all types and related technologies such as TLC; capillary electrophoresis; supercritical fluid extraction and chromatography; membrane separation technology; field-flow techniques; and others. As new separation technologies are introduced, they will also be included in the journal. On a regular basis, special topical issues are devoted to specific technologies and applications. Book reviews, software reviews and a calendar of meetings, symposia and expositions are also included.
Identification Statement. J o u rn a l o f L iq u id C h ro m a to g ra p h y & R e la te d
T e c h n o lo g ie s (ISSN: 1082-6076) is published semimonthly except monthly inMay, August, October, and December for the institutional rate of $1,750.00 and the individual rate of $875.00 by Marcel Dekker, Inc., P.O. Box 5005, Monticello, NY 12701-5185. Periodicals postage paid at Monticello, NY. POSTMASTER: Send address changes to J o u rn a l o f L iq u id C h ro m a to g ra p h y &
R e la te d T e c h n o lo g ie s , P.O. Box 5005, Monticello, NY 12701-5185.
Individual Foreign Postage
Volume IssuesInstitutional
Rate
Professionals’ and Student
RateAirmail
Surface to EuropeAirmail to Asia
20 20 $1,750.00 $875.00 $75.00 $110.00 $130.00
Individual professionals’ and student orders must be prepaid by personal check or may be charged to MasterCard, VISA, or American Express. Please mail payment with your order to: Marcel Dekker Journals, P.O. Box 5017,Monticello, New York 12701-5176.
CODEN: JLCTFC 20(1) i-vi, 1-166 (1997)ISSN: 1082-6076Printed in the U.S.A.

S u b s c r i b e T o d a y !
Use the cards below to subscribe to the Jo u rn a l o f L iq u id C hrom atography & R e la ted Techno log ies or to recommend the journal to your library for acquisition.
Order Form Journal of Liquid Chromatography& Related Technologies
Please enter my subscription to Vol. 20, 20 Numbers, 1997 at the □ institutional rate of $1750.00; □ individual rate of $875.00 I n d iv id u a l su b s c r ip t io n s m u s t b e p r e p a i d in A m e r ic a n c u r r e n c y b y p e r s o n a l c h e c k o r c r e d i t c a rd . P le a s e a d d $ 3 .7 5 p e r is su e (n u m b er) f o r s h ip p in g o u ts id e th e U .S . F o r a ir m a i l to E u ro p e , a d d $ 5 .5 0 p e r is su e ; to A s ia , a d d $ 6 .5 0 p e r is su e . C a n a d ia n c u s to m e rs p l e a s e a d d 7 % G S T .
___Please send me a pro forma invoice.___Check enclosed made payable to Marcel Dekker, Inc.___Charge my: □ MasterCard □ Visa □ American Express___Please bill my company: P.O. No._________________
Card No.__________________________________ Exp. Date
Signature__________________________________________
Name____________________________________________
Address__________________________________________
City/State/Zip_______________________________________
Does your library subscribe to the J o u r n a l o f L iq u id C h r o m a to g r a p h y & R e la te d T e c h n o lo g ie s? Just complete this card and submit it to your librarian or department head.
Attention: Librarian/Department Head: I have examined theJ o u r n a l o f L iq u id C h r o m a to g r a p h y & R e la te d T e c h n o lo g ie s and would like to recommend the journal for acquisition.
Signature___________________________________ Date___________
Name___________________________ Department________________
Journal of Liquid Chromatography & Related Technologies Volume 20, 20 Numbers, 1997: $1750.00IS S N : 1 0 8 2 - 6 0 7 6 C O D E N : J L C T F C
Sample copy and pro forma invoice available upon request.
Please contact the Promotion Department at: Marcel Dekker, Inc.270 Madison Avenue New York, NY 10016 (212) 696-9000 phone (212) 685-4540 fax

S u b s c r i b e T o d a y !
Use the cards below to subscribe to the Jo u rn a l o f L iq u id ; C hrom atography & R e la ted Techno log ies or to recommend the journal ; to your library for acquisition.
iI
IpIIIIÌ
Ii
POSTAGE WILL BE PAID BY ADDRESSEE
BUSINESS REPLY MAILFIRST-CLASS MAIL PERMIT NO. 2863 NEW YORK NY
NO POSTAGE NECESSARY
IF MAILED IN THE
UNITED STATES
PROMOTION DEPT MARCEL DEKKER INC 270 MADISON AVE NEW YORK NY 10157-1928
Journal of Liquid !Chromatography & Related ;Technologies !
III
Editor: JACK CAZESC o c o n u t C re e k , F lo r id a
The J o u rn a l o f L iq u id C h ro m a to g ra p h y & R e la te d T e c h n o lo g ie s now publishes an outstanding selection of critical, peer-reviewed papers dealing with analytical, preparative, and process-scale liquid chromatography of all types and related technologies such as TLC; capillary electrophoresis; supercritical fluid extraction and chromatography; membrane separation technology; field-flow techniques; and others. As new separation technologies are introduced, they will also be included in the journal.
On a regular basis, special topical issues will be devoted to specific technologies and I applications. Book reviews, software reviews, and schedules of meetings, sympo- : siums, and expositions are also included. j

JOURNAL OF LIQUID CHROMATOGRAPHY& RELATED TECHNOLOGIES
Editor: DR. JACK CAZES
Editorial Manager: ELEANOR CAZES
T L C & R T
P .O . B o x 9 7 0 2 1 0
C o c o n u t C re e k , F lo r id a 3 3 0 9 7
Associate Editor:
DR. HALEEM J. ISSAQN C l-F r e d e r ic k C a n c e r R e se a rc h
& D e v e lo p m e n t C e n te r
F re d e r ic k , M a r y la n d
Editorial Board
H.Y. ABOUL-ENEIN, K in g F a is a l S p e c ia l is t H o s p ita l & R e se a rc h C e n tre ,
R iy a d h , S a u d i A r a b ia
V.K. AGARWAL, B a y e r C o rp o ra tio n , W e s t H a v e n , C o n n e c tic u t
J.G. ALVAREZ, H a r v a r d U n iv e rs ity , B o s to n , M a s sa c h u se tts
D.W. ARMSTRONG, U n iv e r s ity o f M is so u r i, R o lla , M is so u r i
A. BERTHOD, U n iv e r s ité C la u d e B e m a r d - L y o n 1, V ille u rb a n n e , F ra n c e
U.A.TH. BRINKMAN, T h e F r e e U n iv e r s ity , A m s te r d a m , T n e N e th e r la n d s P.R. BROWN, U n iv e r s ity o f R h o d e Is la n d , K in g s to n , R h o d e I s la n d
D. CORRADINI, I s t i tu to d i C r o m a to g ra f ia d e l C N R , R o m e , I ta ly
R. DEMURO, S h im a d zu S c ie n tif ic In s tru m e n ts , I n c ., C o lu m b ia , M a r y la n d
J.G. DORSEY, F lo r id a S ta te U n iv e rs ity , T a lla h a sse e , F lo r id a
Z. EL RASSI, O k la h o m a S ta te U n iv e rs ity , S ti llw a te r , O k la h o m a
J.C. GIDDINGS, U n iv e r s ity o f U tah , S a lt L a k e C ity , U ta h
E. GRUSHKA, T h e H e b r e w U n iv e rs ity , J e ru s a le m , I s r a e l
G. GUIOCHON, U n iv e r s ity o f T e n n e sse e , K n o x v il le , T e n n e sse e
N.A. GUZMAN, R .W . J o h n so n P h a rm . R e s . In s t. , R a r ita n , N e w J e r s e y
S. HARA, T o k y o C o lle g e o f P h a rm a c y , T o k yo , J a p a n
(co n tin u ed )
JOURNAL OF LIQUID CHROMATOGRAPHY & RELATED TECHNOLOGIES
Editorial Board (co n tin u ed )
W.L. HINZE, W a k e F o r e s t U n iv e rs ity , W in s to n -S a le m , N o r th C a ro lin a
C. HORVATH, Y a le U n iv e rs ity , N e w H a v e n , C o n n e c tic u t
W.J. HURST, H e r s h e y F o o d s T e c h n ic a l C e n te r , H e r sh e y , P e n n sy lv a n ia
J. JANCA, U n iv e r s ité d e la R o c h e lle , L a R o c h e lle , F ra n c e
G. M. JANINI, N C I -F r e d e r ic k C a n c e r R & D C e n te r , F re d e r ic k , M a r y la n d
M. JARONEEC, K e n t S ta te U n iv e r s ity , K e n t, O h io
K. JINNO, T o y o h a sh i U n iv e r s ity o f T e c h n o lo g y , T o y o h a sh i, J a p a n
P.T. KISSINGER, P u rd u e U n iv e rs ity , W e s t L a fa y e t te , In d ia n a
J. LESEC, E c o le S u p é r ie u re d e P h y s iq u e e t d e C h e m ie , P a r is , F ra n c e
F. LYABAYA, S h im a d zu S c ie n tif ic In s tru m e n ts , In c ., C o lu m b ia , M a r y la n d
H. M. MC NAIR, V irg in ia P o ly te c h n ic In s titu te , B la c k sb u r g , V irg in ia
R. B. MILLER, F u jisa w a U S A , I n c ., M e lr o s e P a rk , I llin o is
S. MORI, M ie U n iv e r s ity , T su , M ie , J a p a n
I. N. PAPADOYANNIS, A r is to te l ia n U n iv e r s ity o f T h e ssa lo n ik i, T h e ssa lo n ik i,
G r e e c e
W.H. PIRKLE, U n iv e r s ity o f I llin o is , U rb a n a , I llin o is
F.M. RABEL, E -M S e p a ra tio n s , I n c ., G ib b s to w n , N e w J e r s e y
D. A. ROSTON, S e a r le R e s e a r c h & D e v e lo p m e n t, S k o k ie , I llin o is
R.P.W. SCOTT, C o n su lta n t, A v o n , C o n n e c tic u t
Z.K. SHIHABI, B o w m a n G ra y S c h o o l o f M e d ic in e , W in sto n , S a le m , N o r th
C a ro lin a
J. H.M. van den BERG, B u d e lc o , B . V ., B u d e l, T h e N e th e r la n d s
R. WEINBERGER, C E T e c h n o lo g ie s , C h a p p a q u a , N e w Y ork

JOURNAL OF LIQUID CHROMATOGRAPHY & RELATED TECHNOLOGIES
Indexing and Abstracting Services. Articles published in J o u rn a l o f L iq u id
C h ro m a to g ra p h y & R e la te d T e c h n o lo g ie s are selectively indexed or abstracted in:
■ Abstracts Journal of the Institute of Scientific and Technical Information of the Russian Academy of Sciences ■ Alerts ■ Aluminium Industry Abstracts ■ Analytical Abstracts ■ ASCA ■ Berichte Pathologie ■ CAB Abstracts ■ Cambridge Scientific Abstracts ■ Chemical Abstracts ■ Chemical Reactions Documentation Service ■ Current Awareness in Biological Sciences ■ Current Contents/Life Sciences ■ Current Contents/Physical and Chemical Sciences ■ Current Opinion ■ Engineered Materials Abstracts ■ Engineering Index ■ Excerpta Medica ■ Metals Abstracts ■ Reference Update ■ Saltykov-Shchedrin State Public Library ■ Science Citation Index ■ Tobacco Abstracts
Manuscript Preparation and Submission. See end of issue.
Copyright © 1997 by Marcel Dekker, Inc. All rights reserved. Neither this work nor any part may be reproduced or transmitted in any form or by any means, electronic or mechanical, microfilming and recording, or by any information storage and retrieval systems without permission in writing from the publisher.
TMThis journal is also available on CD-ROM through ADONIS beginning with the 1991 volume year. For information contact: ADONIS, Marketing Services, P.O. Box 17005, 1001 JA Amsterdam, The Netherlands, Tel: +31-20-626-2629, Fax: +31-20-626-1437.
The journals of Marcel Dekker, Inc. are available in microform from: University Microfilms, Inc., 300 North Zeeb Road, Ann Arbor, Michigan 48106-1346, Telephone: 800-521-0600; Fax: (313) 761-1203.
Authorization to photocopy items for internal or personal use, or the internal or personal use of specific clients, is granted by Marcel Dekker, Inc., for users registered with the Copyright Clearance Center (CCC) Transactional Reporting Service, provided that the fee of $10.00 per article is paid directly to CCC, 222 Rosewood Drive, Danvers, MA 01923. For those organizations that have been granted a photocopy license by CCC, a separate system of payment has been arranged.
Contributions to this journal are published free of charge.
Effective with Volume 6, Number 11, this journal is printed on acid-free paper.

J. LIQ. CHROM. & REL. TECHNOL.. 20(1). 1-20 (1997)
CAPILLARY ZONE ELECTROPHORESIS VERSUS MICELLAR ELECTROKINETIC
CHROMATOGRAPHY IN THE SEPARATION OF PHENOLS OF ENVIRONMENTAL INTEREST
A. L. Crego. M. L. Marina
Departamento de Química Analítica Facultad de Ciencias
Universidad de Alcalá de Flenares 28871 Alcalá de Henares. Madrid. Spain
ABSTRACT
The application of capillary electrophoresis techniques to the analysis of phenols is reviewed. Capillary Zone Electrophoresis and Micellar Electrokinetic Chromatography have been primarily- employed. The experimental conditions used for determining phenols in environmental samples by these techniques are presented.
INTRODUCTION
Phenolic compounds are important environmental pollutants, due to their high toxicity even at low concentrations (ug . L'1 range) and common use. Therefore, their concentration in the environment requires constant monitoring. Many important phenolic compounds haw nitro groups (NO;) and halogen atoms (Cl) bonded to the aromatic rings. These substituents may strongly affect chemical and toxicological behavior.1" These compounds originate from such diverse sources as pesticide application, industrial wastes, water supplies, and automobile exhausts. Chlorophenols as pollutants in drinking water, released
1
Copyright C 199 7 by M arcel D ekker. Inc.

2 CREGO AND MARINA
through waste water, have urged the need for methods to monitor these compounds in industrial effluents and natural waters. In addition, the US Environmental Protection Agency (EPA)3 has listed eleven phenols as organic priority pollutants: phenol; 2-nitrophenol; 4-nitrophenol; 2.4-dinitrophenol; 2- chlorophenol: 2.4-dichlorophenoh 2.4-dimethylphenoh 4-chloro-3-methyl- phenol; 2-methyl-4.6-dinitrophcnol; 2,4.6-trichlorophenol and pentachloro- phenol.
The analysis of phenols has been widely studied using Gas Chromatography (GC)4'6 and High Performance Liquid Chromatography (HPLC). 11 The polarity' of phenols and their low vapor pressure are factors that complicate GC analysis. In order to enhance the volatility' and detectability of phenols, sample derivatization is typically necessary prior to GC analysis. This is why GC methods present some disadvantages, such as long sample preparation time and incomplete recoveries for many phenolic derivatives. On the other hand, the factors that complicate GC analysis do not have adverse effects on HPLC analysis. The mode utilized in HPLC is the reversed-phase mode with isocratic or gradient elution. However, owing to the inherent limited resolving power of conventional HPLC techniques, optimization of phenols separation often involves complex procedures or numerous experiments, especially gradient elution.
Presently, Capillary' Electrophoresis (CE) is a major trend in analytical chemistry, and the number of publications has increased exponentially in recent years.1“'1 Initially. CE was primarily applied to the field of biochemical analy sis, but it has also proved useful in the separation of pollutants. The need for optimized separations for a w idc variety of compounds has promoted several working modes that can be used in CE. Capillary' Zone Electrophoresis (CZE) and Micellar Elcctrokinetic Chromatography (MEKC) have become the most popular modes of CE in environmental applications. These techniques are a good alternative for pollutants unsuitable for GC, and affected by the poor efficiency of HPLC. For this reason, the review of CZE and MEKC capabilities for the analy sis of phenolic compounds is the aim of this work. Articles which appeared on the subject from 1984 through February 1996 are included.
ANALYSIS OF PHENOLS BY MICELLAR ELECTROKINETIC CHROMATOGRAPHY
M i c e l l a r E lc c t r o k in e t ic C h r o m a to g r a p h y (MEKC) w'as developed by Terabe et al.ls'“" In this technique, an ionic surfactant is added to the CZE buffer at concentrations exceeding the critical micelle concentration (cmc) to form micelles, therefore expanding CE's enormous power to the separation of

CZE VS. MEKC SEPARATION OF PHENOLS 3
10
Figure 1 E lc e tro p h e r o g r a m o f a m ix tu r e o f a l l th e i s o m e r ic c h lo r in a te d p h e n o ls ,
in c lu d in g p h e n o l b y M E K C . P e a k s : ( 1 ) p h e n o l; ( 2 ) 2 -c h lo ro ; ( 3 ) 3 -c h lo ro ; ( 4 ) 4 -e h lo ro ; ( 5 ) 2 ,3 - d ic h lo ro ; ( 6 ) 2 ,4 - d ic h lo ro ; ( 7 ) 2 ,5 - d ic h lo ro ; ( 8 ) 2 ,6 - d ic h lo ro , ( 9 ) 3 ,4 -d ic h lo ro ; ( 1 0 ) 3 ,5 -d ic h lo ro ; ( 1 1 ) 2 ,3 ,4 - t r ic h lo r o ; ( 1 2 ) 2 ,3 ,5 - t r ic h lo r o ; ( 1 3 ) 2 ,3 ,6 - t r ic h lo r o ; ( 1 4 )
2 ,4 ,5 - t r ic h lo r o ; ( 1 5 ) 2 ,4 ,6 - t r ic h lo r o ; ( 1 6 ) 3 ,4 ,5 - t r ic h lo r o ; ( 1 7 ) 2 ,3 ,4 ,5 - te t r a c h lo r o ; ( 1 8 )
2 ,3 ,4 ,6 - te t r a c h lo r o ; ( 1 9 ) 2 ,3 ,5 ,6 - te t r a c h lo r o ; ( 2 0 ) p e n ta c h lo ro . C o n d it io n s : m ic e l la r
s o lu t io n , 0 .0 7 M S D S , in p h o s p h a te - b o r a te b u f fe r , p H 7 .0 ; s e p a ra t io n tu b e , 6 5 0 x 0 .0 5
m m i d .; le n g th o f th e tu b e u s e d fo r s e p a ra t io n , 5 0 0 m m ; to ta l a p p l ie d v o l ta g e , 15 k V ;
c u r r e n t 2 8 p A ; d e te c t io n w a v e le n g th , 2 2 0 n m ; t e m p e r a tu r e , 3 5 °C . R e p ro d u c e d f ro m ( 2 3 )
w ith p e r m is s io n o f E ls e v ie r S c ie n c e P u b l is h e r s .
both charged and uncharged solutes.“1'22 Although anionic surfactants are the most commonly used, especially sodium dodecyl sulphate (SDS), others such as cationic, non-ionic, and zwitterionic have been used too. The micelles are spherical aggregates the hydrophobic groups of which are oriented toward the center of the micelle, and polar or charged groups are along the sphere's surface. Anionic micelles are retarded in the electric field and move at slower velocity than the electroosmotic flow. In this instance, analytes are separated based on their differential partitioning between the buffer phase (which migrates with the velocity of the electroosmotic flow') and the hydrophobic interior of the micelles (micellar phase, which acts as a pseudo-stationary phase). Due to the fact that the micellar phase is moving toward the detector.
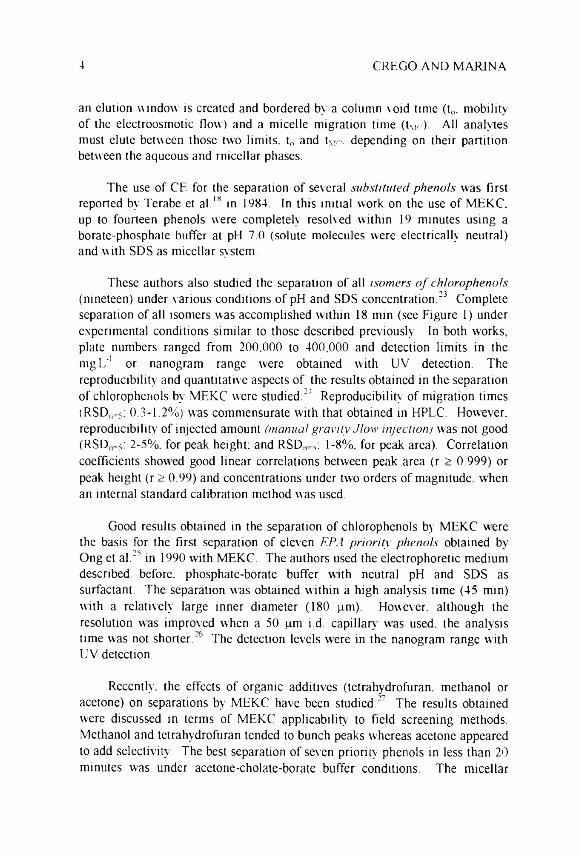
4 CREGO AND MARINA
an elution window is created and bordered by a column void time (t0. mobility of the electroosmotic flow) and a micelle migration time (t\ic). All analytes must elute between those two limits. t0 and tMC. depending on their partition between the aqueous and micellar phases.
The use of CE for the separation of several s u b s t i tu te d p h e n o ls was first reported by Terabe et al.18 in 1984. In this initial work on the use of MEKC. up to fourteen phenols were completely resolved within 19 minutes using a borate-phosphate buffer at pH 7.0 (solute molecules were electrically neutral) and with SDS as micellar system.
These authors also studied the separation of all i s o m e r s o f c h lo r o p h e n o ls
(nineteen) under various conditions of pH and SDS concentration.23 Complete separation of all isomers was accomplished within 18 min (see Figure 1) under experimental conditions similar to those described previously. In both works, plate numbers ranged from 200,000 to 400,000 and detection limits in the mg'L'1 or nanogram range were obtained with UV detection. The reproducibility and quantitative aspects of the results obtained in the separation of chlorophenols by MEKC were studied.23 Reproducibility of migration times (RSDlr 5: 0.3-12%) was commensurate with that obtained in HPLC. However, reproducibility of injected amount (m a n u a l g r a v i t y J lo w in je c t io n ) was not good (RSDn 5: 2-5%, for peak height; and RSDn 5: 1-8%. for peak area). Correlation coefficients showed good linear correlations between peak area (r > 0.999) or peak height (r > 0.99) and concentrations under two orders of magnitude, when an internal standard calibration method was used.
Good results obtained in the separation of chlorophenols by MEKC were the basis for the first separation of eleven E P A p r io r i t y > p h e n o ls obtained by Ong et al.23 in 1990 with MEKC. The authors used the electrophoretic medium described before, phosphate-borate buffer with neutral pH and SDS as surfactant. The separation was obtained within a high analysis time (45 min) with a relatively large inner diameter (180 pm). However, although the resolution was improved when a 50 pm i.d. capillary was used, the analysis time was not shorter.“6 The detection levels were in the nanogram range with UV detection.
Recently, the effects of organic additives (tetrahydrofuran. methanol or acetone) on separations by MEKC have been studied.2 The results obtained were discussed in terms of MEKC applicability to field screening methods. Methanol and tetrahydrofuran tended to bunch peaks whereas acetone appeared to add selectivity. The best separation of seven priority phenols in less than 20 minutes was under acetone-cholate-borate buffer conditions. The micellar

CZE VS. MEKC SEPARATION OF PHENOLS 5
agent chosen was sodium cholate because bile salts micelles arc more stable than conventional SDS micelles in the presence of organic modifiers. Acetone allowed a better resolution by reducing the electroosmotic flow.
Table 1 groups the experimental conditions in which the separation of phenols by MEKC was achieved. It is observed that the electrophoretic medium used is similar in almost all applications. 50-100 niM SDS and borate-phosphate buffer (pH 7). However, sodium cholate with acetone and basic pH can be used for rapid separations. On the other hand, the instrumentation is the same: capillaries of 50 pm i d. and an effective length of ~ 50 cm. at 10-15 kV. with hydrodynamic injection and on-column UV detector. Finally, it is important to note that all applications include demonstrations of standard separations but not real samples. The reason is the limited sensitivity ofUV detectors ( > mgL'1).
PHENOLS ANALYSIS BY CZE
C a p i l la r y Z o n e E le c t r o p h o r e s i s (CZE) is the most common and simple working mode in CE. The separation by CZE is carried out in a capillary filled with a continuous background electrolyte (buffer).28'3'1 The direction and the migration velocity of the analytes are determined by both electrophoresis and electroosmosis phenomena. Analytes are separated based on the difference in their electrophoretic mobilities, which are related to their charge densities, mainly based on differences in solute size and charge at a given pH. Generally, the electroosmotic flow will be higher than the electrophoretic migration v elocity of most anionic analyses. Consequently, both cations and anions will migrate in the same direction and can be separated in the same run.
With regard to CZE applicability in the analysis of phenols, it is very interesting to note that, if the suitability of CZE for the separation of the chlorophenols is compared with the results obtained by MEKC.'3 even though the separation by CZE was optimized in terms of pH. buffer concentration, and applied voltage to obtain maximum peak separation, all the isomers of chlorinated phenols could not be resolved by CZE.31 Therefore. MEKC has greater selectivity than CZE. allowing the analysis of af. chlorophenol isomers, as stated previously.
On the other hand, the electrophoretic behav ior of the eleven E P. I p r i o r i t y
p h e n o ls was studied recently by Li and Locke3- and a simple analytical method using CZE was established. The effects of pH. buffer concentration, and applied voltage on the separation were investigated, anc the main conclusion

Exp
erim
enta
l Con
ditio
ns fo
r Se
para
tion
of P
heno
ls b
y M
EK
C
CREGO AND MARINA
«X4* 00 ro m •OX — 1 OH os os
„ >x
Cfl4«1. . t/>O 300 3
T34»N C "O
00u
Qua
ntit
atio
r re
prod
ucib
ilit
of s
td
t/3ÜCO O
Oz
a 0 a . 1/3 a> "a
00 ~
£
1
0 . « S 0
a000
a0Crt
C > OJ «a oj 0C x
TDCJ3G
c 5 -J i J § X § -3.o a o ob 'ob Tiba Ê E 0 pos C 0 pOH C ^ p >o C4* <7 0 <7 0 <7 O <7 0aa > *7 > *7 > T C> *7
CD D ~ D - D -
t/>O CJ
Inje
ctio
nS
yst/
Lim
it
ydro
dvna
n (g
ravi
ty)
4 cm
x 5
s
vdro
dyna
n (g
ravi
ty)
f.5 c
m x
5:
X X
*8 2 I•ri
s ^
f t2 &
Q. V5C3Ü
, aoEa
E &X aS °«0 x
o C «o —,
o ~ o X
><
c> > > >¿C L*î
•ox •O «O O
oc,-~T Q
0C C da. OC O df t . cc q
aC«
CQ £ Ûoc CQ x 0
0(A CQ x o "
osC/2
q
2 Zce
z srt
ZP3
Z K Sce ce
Z Z r -z '. Z
E 2 2 CL E 2 Sx
CLE S S
XCL E s
0VO E E 0r - E E 00 e E 0»O E•o 0 »0 0 •o 0 0OH «0 0H «0 0H «0
oc<n Cj
! ? . i cd a , q■a <n
XI2
~ >o
O > X^5 */.' prTa
Cjto „
¿.T aO *r rn os
• X
CJTift.'
o ^ s aT4* r? X o
£ ? . o &- 2 ü
&T ¿ ;O OQ G
. . o . e , - O O
h- *7►71 *0 »O*7 '‘7 ^ ^ oh o s
ft.Uft, 4J
O H H no,>0 «o'
m <N £O h ? ho yQ G
CL 0-, ft,0 u o a h fr 4 T vo.m "> "1
(N (N
O h Oh 'SO O 5 *7 h
a
z 4-, r .js T. a.*0 ft. O£ 21 c.
> > - 5
1 “C -N ft*
2.4-
DM
P;
4-C
-3-M
P;
50 m
M N
aHjP
Oj
5 cm
x 5
s sl
d so
lute
s2-
M-4
.6-D
NP
, 2.
4,6-
TC
P
(pH
6.6
)an
d P
CP

Exp
erim
enta
l Con
ditio
ns fo
r Se
para
tion
of P
heno
ls by
ME
KC
CZE VS. MEKC SEPARATION OF PHENOLS 7
OZ
c <- 5 u~c O U- ■£ °c1» s |X 1/5CL CCO ' ¡v CU» (UC/5<u
a: ■ 21
CJ x
g su§ ZX r\ Cu TI sx —'
- J'où£
CU XU w
M oO s S O -S. =u 2 S
J.«>
£ - « « >, m•§ M P! 6b 0s—'X
£ o H c• ■ <u eu X U 3
-5C/3 Oo £ g Q
-ë Q*
* m
C S 1 I I I3-gÜ § -> *5
i f . £ , ® O -,c ^
—\ cu -u o
CU ^ O y r - x M Xcs SO *3 •£
U c ÛX « CL FT O Zö Q
c3a
O c»! JO.2 a '• — M a i '“ S z z -°S i sO C £, —
xo.S c ocs S a
O Ä euO E wo
U xeuX- O
JU U ■
i eZ * o-< *
oü
e euO Xtao o*c £
£ M SUCL 5^
5* c'Eeu
fN
CU
\0 4 4 ü « ! 4 eu i
& §n i « (N <N
euz
eu
a ys r
.r r>a.Z
o, ^ a
U « U U a ar' Z T3a Q e^ i aQ. a-f sr i .<£
(N
X U4 sI uÛ -3a §«■§.. . o
dini
trop
heno
l.**
Sod
ium
dod
ecyl
sul
fate
.**
*x(y
). x
: to
tal
leng
th,
y: e
ffec
tive
len
gth
****
. App
licat
ion
incl
udi
ng th
e se
para
tion
of s
olut
es i
n ne
grile
.
8 CREGO AND MARINA
d\
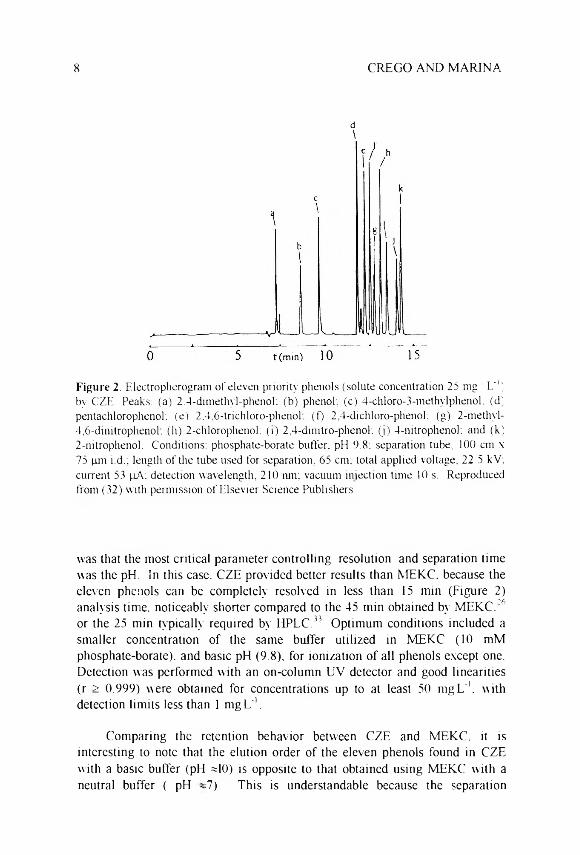
Figure 2. F .le c tro p h e ro g ra m o f e le v e n p r io r i ty p h e n o ls ( s o lu te c o n c e n t r a t io n 2 5 m g L ’1) b y C Z E . P e a k s : ( a ) 2 .4 -d im e th y l-p h e n o l ', ( b ) p h e n o l; ( c ) 4 -c h lo ro - 3 - m e th y lp h e n o l ; (d )
p e n ta c h lo r o p h e n o h ( e ) 2 .4 ,6 - t r ic h lo r o -p h e n o l . ( f ) 2 ,4 - d ic h lo ro - p h e n o l ; (g ) 2 -m e th y l-
4 ,6 - d in i t r o p h e n o l . ( h ) 2 -c h lo ro p h e n o h ( l ) 2 ,4 - d in i t r o - p h e n o l ; ( j ) 4 - n i tr o p h e n o l : a n d (k ) 2 -n i tr o p h e n o l . C o n d it io n s : p h o s p h a te -b o r a te b u f fe r . p H 9 .8 ; s e p a ra t io n tu b e , 10 0 c m x
7 5 p m i .d .; le n g th o f th e tu b e u s e d fo r s e p a ra t io n , 6 5 c m ; to ta l a p p l ie d v o l ta g e , 2 2 .5 k V ;
c u r r e n t 53 p A ; d e te c t io n w a v e le n g th , 2 1 0 n m ; v a c u u m in je c t io n t im e 10 s. R e p ro d u c e d
f ro m ( 3 2 ) w i th p e r m is s io n o f E ls e v ie r S c ie n c e P u b l is h e r s .
was that the most critical parameter controlling resolution and separation time was the pH. In this case. CZE provided better results than MEKC. because the eleven phenols can be completely resolved in less than 15 min (Figure 2) analysis time, noticeably shorter compared to the 45 min obtained by MEKC.36 or the 25 min ty pically required by HPLC.33 Optimum conditions included a smaller concentration of the same buffer utilized in MEKC (10 mM phosphate-borate), and basic pH (9.8), for ionization of all phenols except one. Detection was performed with an on-column UV detector and good linearities (r > 0.999) were obtained for concentrations up to at least 50 mgL'1. with detection limits less than 1 mg L*’ .
Comparing the retention behavior between CZE and MEKC, it is interesting to note that the elution order of the eleven phenols found in CZE with a basic buffer (pH M0) is opposite to that obtained using MEKC with a neutral buffer ( pH -7). This is understandable because the separation

CZE VS. MEKC SEPARATION OF PHENOLS 9
mechanisms in CZE and MEKC are basically different. CZE separation is only based on the phenols difference in size and charge at a given pH. whereas in MEKC. it is based on a combination of effects, such as charge/mass ratios, hydrophobicity and charge interactions at the surface of the micelles In both techniques, the most critical parameter in the separation is the pH. because phenols are weakly basic solutes and the extent of their dissociation, which determines the overall electrical charge of the solute, is governed by the buffer pH.
A new method for the rapid analysis of phenols by CZE was developed in 1995 by Massclter and Zemann.34,35 In this method, the direction of the electroosmotic flow in a fused silica capillary is reversed by dynamically coating the negatively charged inner surface of the capillary with a layer of either positively charged hemimicelles or polycations, which is formed by adding either a cationic surfactant (cetyltrimethylammonium bromide. CTAB) or a poly cation (1.5-dimethyl-1.5-diazaundecamcthylene polymethobromide, HDB) to the buffer. A reversal of the clcctroosmotic flow reduces the analysis time by migration of the anionic analytes in the same direction as the electroosmotic flow ( C o e le c t r o o s m o t i c C a p i l la r y E le c t r o p h o r e s i s ) . The best separation of several i s o m e r s o f a lk v l - p h e n o ls , in less than 6 min, is performed using a buffer of low concentration and at high pH value (pH 11. above the pKA value of the solutes) to achieve the complete dissociation of phenols,34 with2-propanol as organic modifier to improve, significantly, peak shape and separation.35 Other organic solvents (methanol, ethanol, 1-propanol and acetonitrile) have also been studied. 35 The only advantage of this method is the ability to achieve rapid separations of anions at the expense of selectivity and resolution and. although it has been applied only to the separation of several isomers of alkyl-phenols, none of which are priority pollutants, its possibilities could be employed for the rapid analysis of phenols to field-screening methods in simple samples.
The detection system used in all the above-mentioned works has been on-column UV detection, generally employed in CE.36 This detector is commonly employed in the analysis of phenols because these compounds possess strong absorption in the UV region (210-280 nm). However, despite this detector's acceptable absolute detection limits (in the range of ng solute), the concentration in the peak is relatively high (more than 1 mg L"1 for a common solute), because the injection volume in CE is often several nanoliters. This concentration detection ability is not sensitive enough to determine phenols in environmental samples, in which pollutants exist at jig L'1 level or lower. Therefore, the use of CE for the analysis of phenols in real samples will not be possible unless enrichment procedures or improved detection systems are employed.
10 CREGO AND MARINA
5 0 pA
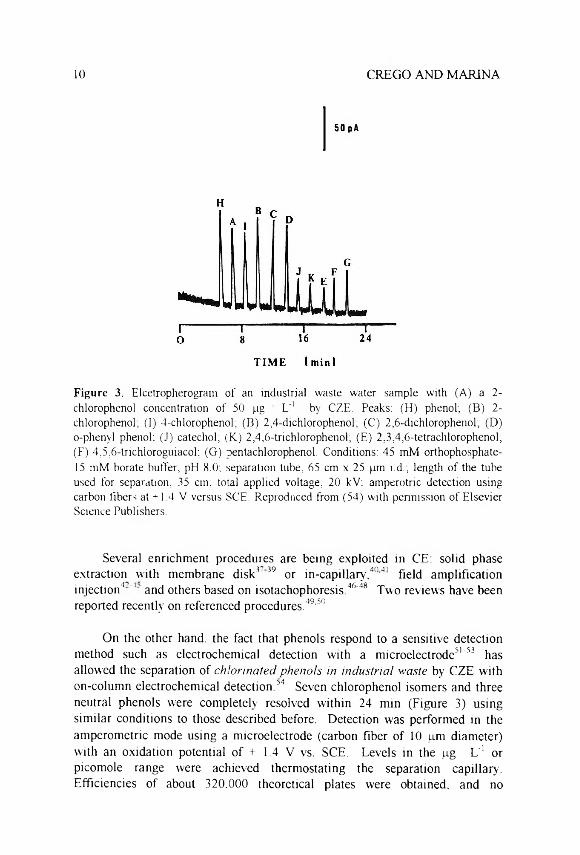
Figure 3. E lc e t ro p h e r o g r a m o f a n in d u s t r i a l w a s te w a te r s a m p le w i th (A ) a 2 -
c h lo ro p h e n o l c o n c e n t r a t io n o f 5 0 p g L '1 b y C Z E . P e a k s : ( H ) p h e n o l; ( B ) 2 -
c h lo ro p h e n o l; ( I ) 4 - c h lo ro p h e n o l ; ( B ) 2 ,4 - d ic h lo ro p h e n o l ; ( C ) 2 ,6 - d ic h lo ro p h e n o l ; (D ) o -p h e n y l p h e n o l: ( J ) c a te c h o l ; ( K ) 2 ,4 ,6 - t r ic h lo r o p h e n o l ; ( £ ) 2 ,3 ,4 ,6 - te t r a c h lo r o p h e n o l ;
( F ) 4 ,5 ,6 - t r ic h lo r o g u ia c o l ; ( G ) p e n ta c h lo r o p h e n o l . C o n d it io n s : 4 5 m M o r th o p h o s p h a te -
15 m M b o r a te b u f fe r , p H 8 .0 ; s e p a r a t io n tu b e , 6 5 c m x 2 5 p m i .d .; le n g th o f th e tu b e
u s e d fo r s e p a ra t io n , 35 cm ; to ta l a p p l ie d v o l ta g e , 2 0 k V : a m p e r o t r ic d e te c t io n u s in g
c a rb o n f ib e rs a t + 1 .4 V v e r s u s S C E . R e p ro d u c e d f ro m ( 5 4 ) w i th p e r m is s io n o f E ls e v ie r S c ie n c e P u b l is h e r s .
Several enrichment procedures are being exploited in CE: solid phase extraction with membrane disk3 39 or in-capillary,4041 field amplification injection4"'4"’ and others based on isotachophoresis.46'48 Two reviews have been reported recently on referenced procedures.49,50
On the other hand, the fact that phenols respond to a sensitive detection method such as electrochemical detection with a microelectrode51'53 has allowed the separation of c h lo r in a te d p h e n o ls in in d u s tr ia l w a s te by CZE with on-coluntn electrochemical detection.34 Seven chlorophenol isomers and three neutral phenols were completely resolved within 24 min (Figure 3) using similar conditions to those described before. Detection was performed in the amperometric mode using a microelectrode (carbon fiber of 10 pm diameter) with an oxidation potential of + 1.4 V vs. SCE. Levels in the pg L'1 or picomole range were achieved thermostating the separation capillary. Efficiencies of about 320,000 theoretical plates were obtained, and no
CZE VS. MEKC SEPARATION OF PHENOLS 11
interferences from the impurities present in industrial waste water samples were observed, using only a simple liquid-liquid extraction with chloroforrn-diethyl ether. Therefore, the use of an on-line electrochemical detector provides excellent sensitivity and selectivity without derivatization.
Chen and Whang’ also obtained the separation of eleven EPA priority phenols by CZE with on-column amperometric detection. This method has been successfully applied to the analysis of p r io r i t y ’ p h e n o ls in in d u s tr ia l w a s te
w a te r . Initially, sodium borate was used as the background buffer (according to previous results). However, large electrophoretic currents (10-100 p.A) generated large detector noise, which seriously interfered with amperometric detection (phenomenon reported by other workers56,57). In order to minimize this effect. Cyclohexylaminoethanesulfonic acid (CHES) was used as the operating buffer. Due to its zwitterionic nature, electrophoretic currents were only about 1-4 pA. On the other hand, the work electrode potential must be +1.50 V vs. SCE to detect the eleven phenols, although :he background stability was poorer than that obtained at +1.10 V. and the carbon fiber electrode durability decreased significantly. But only nine phenols were detected with +1.10 V. The separation of all phenols, obtained within 17 min. presented a number of theoretical plates in the range from 87.000-114.000. Reproducibility results showed satisfactory values in migration times (RSDn=5 < 2 % ), but not good reproducibilities in the injected amount (m a n u a l g r a v i t y f lo w in je c t io n )
with values of RSDn=5: 2-9 % for the peak height. However, the results showed good linear correlation (r >0.99) between peak height and concentration (over two orders of magnitude), and with concentration detection limits in the pg L'1 level ( 10'5 - 10'7 M). These values were better than those obtained with UV detection but poorer than those of HPLC-amperometric detection.58
Finally, laser-induced fluorescence based detection systems have become popular mainly because of their capability to provide extremely high sensitivity ( 10'12 M ). However, phenols, as many other compounds, cannot give response because only a few compounds show native fluorescence. In these cases, there are two alternatives: to derivatize non-flucrescent substances 9 or use indirect detection techniques.60 Briefly, indirect detection consists in the addition of a non-interacting and fluorescing ion to the running buffer to create a constant fluorescence background. When a charged analyte is present, it displaces the fluorescing ion of the same charge due to local charge neutrality, resulting in a decreased background signal even though the analyte does not absorb or fluoresce. This technique was applied by Chao and Whang61 to the analysis of eleven priority phenols by CZE in NIST standard reference materials and industrial waste waters. In this method, a compromise between optimum peak resolution and satisfactory detection sensitivity must be considered.
12 CREGO AND MARINA
t i m e I m i n 1
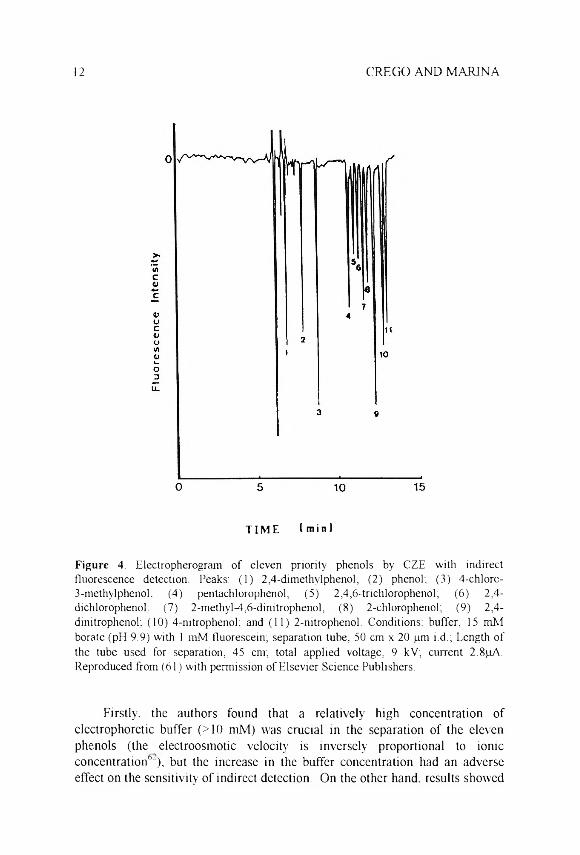
F ig u re 4. Electropherogram of eleven priority phenols by CZE with indirect fluorescence detection. Peaks: (1) 2,4-dimethyl phenol; (2) phenol; (3) 4-chlorc-3-methylphenok (4) pentachlorophenol; (5) 2,4,6-trichlorophenol; (6) 2,4-dichlorophenol: (7) 2-methyl-4,6-dinitrophenol; (8) 2-chlorophenol; (9) 2,4-dinitrophenol; (10) 4-nitrophenol; and (11) 2-nitrophenol. Conditions: buffer, 15 mM borate (pH 9.9) with 1 mM fluorescein; separation tube, 50 cm x 20 pm i.d.; Length of the tube used for separation, 45 cnv, total applied voltage, 9 kV; current 2.8pA. Reproduced from (61) with permission of Elsevier Science Publishers.
Firstly, the authors found that a relatively high concentration of electrophoretic buffer (>10 mM) was crucial in the separation of the eleven phenols (the electroosmotic velocity' is inversely proportional to ionic concentration6“), but the increase in the buffer concentration had an adverse effect on the sensitivity of indirect detection. On the other hand, results showed

CZE VS. MEKC SEPARATION OF PHENOLS 13
that the direction of some peaks (positive or negative) was affected by both electric field and background fluorophore concentration. Once the optimal concentrations for the buffer and the fluorophore were chosen (see Table 2), complete separation of the eleven compounds could be achieved in less than 14 min ( Figure 4) using a sodium borate buffer at basic pH. as in previous works. The results obtained showed lower analysis time, with better resolution and a higher number of theoretical plates (in the range 99.000-187.000) than those obtained by amperometric detection.20 The results on reproducibility and quantitative aspects are similar or slightly better, values of RSDI1=i 5 < 1 % in migration times. RSDn=- 2.7-6 3 % for peak height, and linear correlations (r >0.99) between peak height and concentration over two orders of magnitude were obtained, with detection limits in the pg L'1 range (106-l(f M).
Table 2 groups the experimental conditions in which the analysis of phenols by CZE was performed. It is observed that the pH chosen for the electrophoretic medium depends on the type of compounds. The analysis of chlorophenols need a pH between 7 and 8 but, for priority phenols, is more basic (pH ~ 10). Another possibility is a pH 11 when a new method of CZE is used (Coelectroosmotfc Capillary Electrophoresis). On the other hand, although in general terms, the buffer used is borate/phosphate. CHES can be utilized. As for the instrumentation, there are several options: capillaries with inner diameter between 20-75 pm, at 9-30 kV. with different injection (hydrodynamic or electrokinetic) and detection systems (UV, amperometric or indirect fluorimetry). It is important to note that detection systems other than UV detectors help to obtain adequate detection limits (in the pg L'1 range) to analyze phenols in real samples (industrial waste water), being the most adequate the amperometric to chlorophenols and indirect fluorimetry detection to priority phenols. Finally, the sensitivity obtained by CZE with UV detection is better than that obtained by MEKC (see Table 1). but it is still inadequate for trace analysis of real samples.
CONCLUSION
MEKC techniques w ere w idely used in the analysis of phenols in the past. However, in the last fiv e years. CZE has received more attention. In fact, the theoretical plate number obtained with CZE is higher than with MEKC due to the mass transfer resistance caused by solute partitioning between the bulk buffer and the micelles. Consequently, the sensitivity in MEKC is lower than in CZE.63 On the other hand, micellar systems are less stable than CZE systems because of the temperature effect on the equilibrium involved. In addition. MEKC optimization is more complicated than in CZE. Two important experimental parameters. pH and micelle concentration, have a great

Exp
erim
enta
l C
ondi
tion
s fo
r Se
para
tion
of P
heno
ls b
y C
ZE
14 CREGO AND MARINA
c tT v~> rs« pO m <i •O ri
L-.n wL_ «J O *n to U L U JS 1 "O toU <M Oc/50; C/5 © N O 3 c * .a 0 3©
2,c 0CL U T3^ To
S -c ö• — p, toCL « -OO «
£ ■«3 ¿3C/2cd *Q <D rZ wa
ter E -c Ö• — p co5 - 8 ?
X -S
"Oo
coo
c©CS
'où
>D
o W'S <-> £ ^ o
CS
ù£
sooroÖ
C •“
y -3 •8 s e■Ö &o — T3 fi’O5JUW
i iE r-'J c E0 1
= ï .4" 4 Ci X
0in «nr-'c. x rs x X« rp •n
5 E^ n.•n u-i *2, 01 v~> X VO
p5.
.xo
s332
! 2 £ “ <2 9, ~ '5 — °r« ~ ^ rs7 cd , •> ^2 2 = - 1j, e : ^ p
oCL£«
sE
C o. r, sc'S ^z ô
d 2“ x o5 5 “1 2 E E
Xa.
ÒCC 1 rr-| 2 S¡ z |o
3©P.£
I I ¡7.^ T m !
■s.Ô ' • v I4* 2-1 CS • r—£ -? a; " s=■a 9 S 2o il, Q ^ fNa ^ "j 43 M (N ■V) r+-,-O3X
Ä Sn
J£ O© Q5 4■§.-;© à, L n je V2 «N
4 ^ v4<4 *2 ^<N rSCS¿T E" fio p yp, • w •A ^4 ^ ^CS rs
»? fi u o ^ Û- 4 0 •o : uc — Hcd o Vo' o ~4p U iny £ 4
H U L s© o i/T c ©■< rs<4 t
■© ^c rs
*C Ol ©•c
Cm
CL 3-^ CL' P9 2 ^4 • ^<N ^ ^ CLd V ^ .ocj à. 0 . (N L S "5 ó-l S Qg Q VO d 4 f 4 L S<4 rs
cd

Exp
erim
enta
l C
ondi
tions
for
Sep
arat
ion
of P
heno
ls b
y C
ZE
CZE VS. MEKC SEPARATION OF PHENOLS 15
Oz
•S _ b -S&“ to E 3 03 T3 M5 C
o W ,c o sJy M ME £ 2 * ^ g > fôJa ^ÎO
- Ö
Cl r- «2 £ 3 > fl T3 5M C « o3 Ci ^£ ° t
Jë’ï
1QCl,
.. Z a . QSO J2JS §§ 1u S*•ç 2
¿3
x: eu O Z eu _ru 2
«S .3o CJOJ Vi
•a ! c C4 _cX 42a § o > o5 i£. V OS o-uCft UJ Uj
fc3CQ
H
CoÜ
00 ^ w —X o U —
X
c ZP c
- ZO "T Ç (N
Ou gC‘ C *E eu o *E eu
>
£ 1 E o i 1 E^ =L-ta* */n o £ o'r' v> in S <NCft • X O x(NvO «ni
>• >U*ON ON
OCQcdZs£
^ 3 on euX ^Ä E
4 -? A<s T ■». o,d.' V '"t oO 'f à °- r^aS-S¿•S O S 7 Q vO Ci 4 "f 4
H UÖ °"
. g§ e-o> o•g. 2— CJ>. «J§ 5
c ^X U X DCu Ç.
O ¿2. C O« c-C D CL J3f g*« OC -3•c / ’ H ,CH& C S uH H*3 Z
« usE -S
.H j=
.5 f3 —
. g >•— .¿s ? e a q . c o t:*—J — O O 0)S3 eu ^ O iû G
2 ^ 5 *, tû
K
C G .S £ « ö • « . 5 -C _C C T3 CL CL cd*>, *5L •£ *•s '1 5u 1 ) 2
2s l é r S s
- 3& sO .
u *v * s
App
licat
ion
incl
udin
g th
e se
para
tion
of so
lute
s in
neg
rite
and
thos
e in
clud
ed in
par
enth
eses
.
16 CREGO AND MARINA
influence on the migration behavior and selectivity in MEKC;6' but only one important experimental parameter. pH. has a great influence in CZE.65,66 Despite these drawbacks. MEK.C. as opposed to CZE. allows the separation of ions with very similar electrophoretic mobilities, as chlorophenol isomers, because the partition between the aqueous and micellar phases increases the selectivity.
In summary. CZE in conjunction with laser-induced indirect fluorimetry can provide rapid separation and sensitive detection of the eleven priority phenols in real samples. On the other hand, a sensitive detection of chlorophenols can be obtained with amperometric detection, but the separation of all chlorophenols isomers that is possible by MEKC. cannot be achieved by CZE. Finally, it is interesting to note that the separations can be compared to GC separations in terms of resolving power, efficiency, and run time. Moreover. CE techniques do not show peak tailing with the polar nitrophenols and pentachlorophenol. but this appears to be a recurring problem with GC when real sample extracts are injected.
ACKNOWLEDGMENTS
The authors thank the Comunidad Autonoma de Madrid (Spain) for project COROO10/94.
REFERENCES
1. S. E. Manahan. Toxicological Chemistry, 2th ed., Lewis Publishers. Inc.,Chelsea. Michigan. 1992. Chapters 15 and 16.
2. R. E. Gosselin. R. P. Smith. H. C. Hodge. Clinical Toxicology ofCommercial Products, 5th ea.. Williams and Wilkins. Baltimore/ London. 1984. pp. III-344 - III-348.
3. Toxic Substance Control Act. U.S. Environmental Protection Agency.Washington. DC. 1979
4. L. Renberg. K. Lindstrom. J. Chromatogr., 214, 327 (1981).
5. J. I. Hedges, J. R. Ertel. Anal. Chem., 54, 174 (1982).
6. K. Abrahamsson. T. M. Xie. J. Chromatogr.. 279. 199 (1983).
CZE VS. M.EKC SEPARATION OF PHENOLS 17
7. C. P. Ong, H. K. Lee, S. F. Y. Li, J. Chromatogr., 464, 405 (1989).
8. B. Gawdzik. J. Gawdzik. U. Czerwinska-Bil, J. Chromatogr., 509, 135(1990).
9. M. D. Andres. B. Canas. R. Izquierdo, L. Polo, J. Chromatogr., 507, 399(1990).
10. O. Busto. J. Olucha. F. Borrull, Chromatographia, 32, 566 (1991).
11. G. Lamprecht. J. Huber. J. Chromatogr., A. 667, 47 (1994).
12. A. G. Ewing. R. A. Wallingford. T M. Olefirowcz, Anal. Chem.. 61. 292R(1989).
13. W. G. Kuhr. Anal. Chem.. 62. 403R(1990).
14. W. G. Kuhr. C. A. Monning, Anal. Chem.. 64, 389R (1992).
15. Y. Xu. Anal. Chem.. 65. 425R (1993).
16. C. A. Monning. R. T. Kennedy. Anal. Chem.. 66, 280R (1994).
17. D. R. Baker. Capillary Electrophoresis, J. Wiley & Sons. Inc., New York,1995.
18. S. Terabe. K. Otsuka. K. Ichikawa. A. Tsuchiya. T. Ando, Anal. Chem..56. I l l (1984).
19. K. Otsuka, S. Terabe, T. Ando. J. Chromatogr., 332, 219 (1985).
20. S. Terabe. K. Otsuka. T. Ando. Anal. Chem.. 57, 834 (1985).
21. S. Terabe. K. Otsuka. T. Ando. Anal. Chem., 61, 251 (1989).
22. K. Otsuka. S. Terabe. J. Microcol. Sepn.. 1, 150 (1989).
23. K. Otsuka. S. Terabe. T. Ando. J. Chromatogr.. 348. 39 (1985).
24. K. Otsuka. S. Terabe. T. Ando. J. Chromatogr.. 396. 350 (1987).
18 CREGO AND MARINA
25. C. P. Ong. C. L. Ng. N. C. Chong, H. K. Lee, S. F. Y. Li, J. Chromatogr.,516, 263 (1990).
26. C. P. Ong, C. L. Ng, N. C. Chong, H. K. Lee, S. F. Y. Li, Environ. Monit.Assess, 19. 93 (1991).
27. W. C. Brumley. W. J. Jones, J. Chromatogr., A, 680, 163 (1994).
28. J. W. Jorgenson, Trends Anal. Chem., 3, 51 (1984).
29. K. Altria. C. Simpson. Anal. Proc., 23, 453 (1986).
30. T. Tsuda. J. H. R. C. & C. C., 10. 622 (1987).
31. M. F. Gonnord. J. Collet. J. Chromatogr., 645, 327 (1993).
32. G. Li, C. Locke, J. Chromatogr., 669, 93 (1995).
33. H. K. Lee. S. F. Y. Li, Y. H. Tay, J. Chromatogr., 438, 429 (1988).
34. Masselter. Zemann. J. Chromatogr.. A. 693. 359 (1995).
35. Masselter. Zemann. Anal. Chem., 67. 1047 (1995).
36. S. Terabe. Trends Anal. Chem.. 8. 129 (1989).
37. D. F. Hagen. C. G. Markell. G. A. Schmitt. Anal. Chim. Acta, 236, 157(1990).
38. A. Kraut-Vass, J. Thoma, J. Chromatogr., 538. 233 (1991).
39. D. Barcelo. G. Durand. V. Boucot. M. Nielen. Environ. Sci. Technol., 27.271 (1993).
40. J. Cai. Z. El Rassi. J. Liq. Chromatogr.. 15, 1179 (1992).
4L M. E. Swartz. M. Merion. J. Chromatogr.. 632, 209 (1993).
42. D. S. Burgi. R. L. Chien. Anal. Chem., 63. 2042 (1991).
43. R. L. Chien. D. S. Burgi. Anal.Chem.. 64, 489A (1992).

CZE VS. MEKC SEPARATION OF PHENOLS 19
44. R. L. Chien. D. S. Burgi. Anal.Chem., 64, 1096 (1992).
45. Z. Liu, P. Sam, S. R. Sirimanne, P. C. McClure, J. Grainger, D. G.Patterson. Jr., J. Chromatogr.. A, 673, 125 (1994).
46. F. Foret, V. Sustacek. P. Bocek. J. Microcol Sepn. 2, 229 (1990).
47. D. Kaniansky, J. Marak. J. Chromatogr, 498,191 (1990).
48. D. . Stegehuis, U. . Tjaden. J. van der Greef, J. Chromatogr., 591.341(1992).
49. M. W. F. Nielen. Trends Anal. Chem.. 12, 345 (1993).
50. M. Albin. P. D. Grossman. S. E. Moring, Anal. Chem.. 65. 489A (1993).
51. T. J. O'Shea, S. M. Lunte. Anal. Chem., 65, 247 (1993).
52. I. A Colon, R. Dadoo. R.N. Zare, Anal. Chem.. 65, 476 (1993).
53.1. C. Chen. C. W. Whang. J. Chromatogr.. 644. 208 (1993).
54. C. D. Gaitonde. P. Pathak. J. Chromatogr.. 514, 389 (1990).
55. I. C. Chen, C. W. Whang, J. Chin. Chem. Soc., 41, 419 (1994).
56. R. A. Wallingford. A. G. Ewing, Anal. Chem., 59. 1762 (1987).
57. T. J. O Shea, R. D. Greenhagen, S. M. Lunte. C. E. Lunte, M. R. Smyth,D. M. Radzik, N. Watanabe, J. Chromatogr., 593. 305 (1992).
58. C. W. Whang. J. Chin. Chem. Soc., 34, 81 (1987).
59. D. R. J. Rose, J. W. Jorgenson, J. Chromatogr., 447. 117 (1988).
60. E. S.Yeung. W. G.Kuhr, Anal. Chem., 63, 275A (1991).
61. Y. C. Chao. C. W. Whang. J. Chromatogr.. 663. 229 (1994).
62. T. Tsuda. K. Nomura, G. Nakagawa, J. Chromatogr., 248, 241 (1982).
63. G. M. Janini, H. J. Issaq, J. Liq. Chromatogr., 15, 927 (1992).

20 CREGO AND MARINA
64. M. G. Khaledi. S. C. Smith. J. K. Strasters. Anal. Chem.. 63, 1820 (1991).
65. S. C. Smith. M. G. Khaledi, Anal. Chem.. 65. 193 (1993).
66. C. E. Lin. W. C. Lin. W. C. Chiou. J. Chromatogr. A. 705. 325 (1995).
Received April 3. 1996 Accepted April 23. 1996 Manuscript 4135

J. LIQ. CHROM & REL. TECHNOL., 20(1). 21-29 (1997)
STUDIES OF THE INFLUENCE OF HYDROGEN CHLORIDE ON THE LIQUID
CHROMATOGRAPHIC PROPERTIES OF SILICA- IMMOBILIZED BOVINE SERUM ALBUMIN
UNDER NORMAL-PHASE CONDITIONS
H. Gao,17 R. K. Gilpin*
Department of Chemistry Kent State University
Kent. OH 44242 ’
ABSTRACT
The influence of hydrogen chloride on the retention properties of silica-immobilized bovine serum albumin has been studied using a series of simple aromatic phenols and acids. The result of treating the protein with HC1 is to mediate hydrogen bonding interactions between the solutes and basic sites in the protein or unreacted amino groups on the surface. The current observations are consistent with previously reported work which examined the influence of HC1 on aminopropvl surfaces.
INTRODUCTION
Bovine serum albumin (BSA) is a large flexible "cigar-shaped" protein with a molecular weight of 66.267. The protein has the natural ability to selectively bind a number of ligands including enantiomers such as L- tryptophan and related L-analogs, whereas the corresponding D-isomers do not.1 A number of investigators have used the silica-immobilized BSA as a
21
Copyright © 1997 by Marcel Dekker. Inc.
22 GAO AND GILPIN
chiral selective stationary phase in liquid chromatography to resolve racemic compounds.2'12 The separations are carried out in combination with aqueous buffered eluents to insure that the protein retains much of its native conformation and indigenous binding properties. However, to date, little has been done to investigate silica-immobilized BSA as a normal-phase liquid chromatographic packing.1314
Because proteins are extremely complex biomolecules with tertiary structures stabilized by disulfide bridges, as well as numerous intra- and inter- molecular hydrogen bonding, the number of possible sites where a polar solute molecule may interact, as well as the heterogeneity of these interactions, is great. In the case of BSA, the protein is made up of 582 amino acids with varying a-substituents folded into three domains. To complicate the situation further, the interactions of BSA with numerous organic and inorganic ligands is well known.13 The protein will bind both anions (chloride, fluoride, bromide and iodide, etc.) and cations (Cu‘\ Zn^, Ca^, Mg^, etc.).2
Since the possibility of hydrogen bonding between ligands and native BSA is known to be an important factor which influence binding, similar strong interactions should potenitally be useful for controling solute retention under normal-phase eleuent conditions. This approach recently has been used to separate phenolic solutes with a ternary mixture of hydrogen chloride-diethyl ether-hexane eluent.
Recently, Ehtesham and Gilpin,16 have studied the influence of hydrogen chloride on the retention properties of aminopropyl bonded phases under normal-phase eluent conditions by measuring differences in solute retention before and after converting the surface to its corresponding hydrochloride salt. The result of treating the amino groups with HC1 was to dramatically decrease the interactions of hydroxy lated solutes. In a similar fashion, the influence of hydrogen chloride on the chromatographic properties of silica-immobilized BSA under normal-phase conditions have been examined. The capacity’ factors for a series of simple hydroxylated and acid containing aromatic compounds have been studied before and after the protein surface was modified by passing a dry HCl-saturated solution of diethyl ether through the column.
The result of this treatment was to mediate the polar interactions which exist between the bonded BSA surface and polar solutes. Thus, solutes which were strongly retained by the unmodified protein could be eluted in a significantly shorter time.

SILICA-IMMOBILIZED BOVINE SERUM ALBUMIN 23
EXPERIMENTAL
Chemicals
All compounds used as solutes as well as the 25% solution of glutaric dialdehyde, the ethanol (anhydrous and denatured with 5% 2-propanol) and the hydrogen chloride (220 g lecture cylinder) were purchased from the Aldrich Chemical Company (Milwaukee. WI, USA). The anhydrous diethyl ether and the HPLC grade 2-propanol, methanol and hexane were from the Fisher Scientific Company (Pittsburgh, PA, USA), the bovine serum albumin (fatty acid free), sodium phosphate (reagent grade) and sodium cyanoborohydride were from Sigma (St. Louis. MO, USA), and the 3-aminopropyltriethoxysilane was from Huls (Bristol. PA. USA). The deionized water was produced in- house using a Millipore (El Paso. TX. USA) model Milli-Q purification system.
Instrumentation
The chromatographic system consisted of a Spectra-Physics (San Jose, CA, USA) model SP8810 precision isocratic pump, model SpectroMonitor III variable wavelength UV detector, and model 4400 Datajet integrator. The samples were introduced using a Rheodyne (Berkeley. CA. USA) model 7125 injection valve with a 20pL loop. In order to insure controlled eluent conditions, the flow rate of the mobile phase was monitored with a Phase Separation LTD (Queensberry, Clwyd. UK) model FLOSOA1 flow1 meter and the column temperature was controlled in a water bath equipped with a Fisher Scientific model 730 isotemp immersion circulator and a Neslab Instrument (Portsmouth. NH. USA) model EN-350 flow-through cooler.
Column Preparation
The silica-immobilized BSA was prepared as follows. Approximately 2.3 g of Licrospher Si-300 silica (EM Separations. Gibbstown. NJ. USA) were washed with 25 mL of deionized water and the water was decanted off after centrifugation. The silica was dried at 85°C for 4 hours and transferred to a glass reaction vessel. Subsequently. 10 mL of a 10% (v/v) aqueous solution of3-aminopropyltriethoxysilane were added and the pH of the mixture was adjusted to 3.4 via addition of phosphoric acid. After allowing the reaction to proceed for 3 hours at 75°C. the arninopropyl-silice was washed using six portions of 25 mL deionized water (i.e.. the material was centrifuged and the water decanted off between each wash). The product was dried at 100°C
24 GAO AND GILPIN
overnight and a small portion of the material was removed for elemental analysis. The remainder (2.4 g) of the modified silica was placed in a flask and 100 mL of a 2.5% aqueous glutaric dialdehyde (10 mL of 25% glutaric dialdehyde and 90 mL 0.05M pH 7 phosphate buffer) and 0.13 g of sodium cyanoborohydride were added. The mixture was allowed to stand for 3 hours after which time the aldehyde activated silica was washed with five 30 mL portions of deionized water and the material freeze dried.
The final protein coupling step was carried out by the drop wise addition of bovine serum albumin (30 mL of 1% BSA diluted with 55 mL of 0.05M pH 7 phosphate buffer) to a flask which contained 2.0 g of the aldehyde-activated silica, 85 mL of 0.05M pH 7 phosphate buffer and 0.1 g sodium cyanoborohydride. The reaction was allowed to proceed 0.5 hour, another 0.1 g of sodium cyanoborohydride was added, and the reaction continued for 12 hours. The resulting silica-immobilized BSA was then washed with 150 mL of deionized water and freeze dried.
A sample of this material was analyzed by Huffman Laboratories (Golden, CO. USA) for carbon, nitrogen and sulfur. The resulting data indicated a coverage of 67 mg of immobilized protein/g of silica.
Approximately 0.5 g of the dried silica-immobilized BSA was added gradually to 30 mL of denatured anhydrous ethanol which was contained in a dynamic packing apparatus. The apparatus was sealed and pressurized to 6000 psi using a Haskel (Burbank, CA. USA) model DST-52 air driven fluid pump with ethanol as the carrier solvent. During this process the 2.1 mm i.d. X 150 mm stainless column were backed in upward fashion.
Chromatographic Studies
The compounds used as test solutes were dissolved in a 17% solution of 2- propanol in hexane at a concentration of ~ 1 mg/mL. Retention data were collected using mobile phases of 100% hexane. 5:95 2-propanol-hexane (v/v) and 10:90 2-propanol-hexane (v/v).
These experiments were carried out on the silica-immobilized BSA before and after it had been treated with a hydrogen chloride-saturated diethyl ether solution. In order to determine the completion of this latter treatment, aliquots were collected at 5 mL intervals, each of these mixed with 25 mL of distilled water and the pH of the water layer measured.
SILICA-IMMOBILIZED BOVINE SERUM ALBUMIN 25
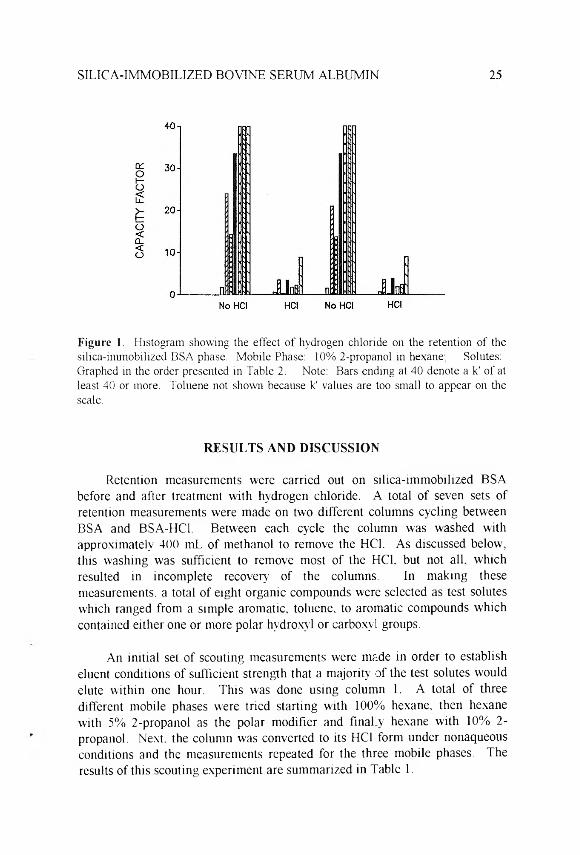
F i g u r e 1. Histogram showing the effect of hydrogen chloride on the retention of the silica-immobilized BSA phase. Mobile Phase: 10% 2-propanol in hexane; Solutes: Graphed in the order presented in Table 2. Note: Bars ending at 40 denote a k' of at least 40 or more. Toluene not shown because k' values are too small to appear on the scale.
RESULTS AND DISCUSSION
Retention measurements were carried out on silica-immobilized BSA before and after treatment with hydrogen chloride. A total of seven sets of retention measurements were made on two different columns cycling between BSA and BSA-HC1. Between each cycle the column was washed with approximately 400 mL of methanol to remove the HC1. As discussed below, this washing was sufficient to remove most of the HC1. but not all, which resulted in incomplete recovery of the columns. In making thesemeasurements, a total of eight organic compounds were selected as test solutes which ranged from a simple aromatic, toluene, to aromatic compounds which contained either one or more polar hydroxyl or carboxyl groups.
An initial set of scouting measurements were made in order to establish eluent conditions of sufficient strength that a majority of the test solutes would elute within one hour. This was done using column 1. A total of three different mobile phases were tried starting with 100% hexane, then hexane with 5% 2-propanol as the polar modifier and finally hexane with 10% 2- propanol. Next, the column was converted to its HC1 form under nonaqueous conditions and the measurements repeated for the three mobile phases. The results of this scouting experiment are summarized in Table 1.

26 GAO AND GILPIN
Table 1
Retention Data for Silica-Immobilized BSA Before and After Treatmentwith HC1
Without HC1 With HC1
Mobile Phase: 10% 2-Propanol in Hexane
Toluene 0.05 0.03Phenol 1.57 0.62Resorcinol 20.9 3.58Benzoic Acid 13.7 0.20Methyl 3,5-dihydroxybenzoate 33.4 3.763- Hydroxybenozic Acid Ret. 1.894- Hydroxybenzoic Acid — 2.363.5- Dihydroxybenzoic Acid — 8.86
Mobile Phase: 5% 2-Propanol in Hexane
Toluene 0.04 0.03Phenol 3.54 0.70Resorcinol 99.1 6.96Benzoic Acid 23.3 0.32Methyl 3.5-dihvdroxybenzoate Ret. 7.073- Hydroxybenzoic Acid — 3.274- Hvdroxybenzoic Acid — 5.103.5- Dihydroxybenzoic Acid — 28.1
Mobile Phase: 100% Hexane
Toluene 0.08 0.07Phenol Ret. 25.4Resorcinol -— Ret.Benzoic Acid -— Ret
Subsequently, additional experiments were carried out on the same column as well as on a second duplicate column cycling between the BSA and BSA-HC1 forms of the surface using hexane with 10% 2-propanol as the eluent. The results from this latter study are given in Table 2.

SILICA-IMMOBILIZED BOVINE SERUM ALBUMIN 27
Table 2
Retention Data Illustrating the Reproducibility of HC1 Cycling
Without HC1 With HC1
Toluene cycle 1 0.04 ±0.01 0.03 ±0.01cycle 2 0.0510.00 0.03 ±0.00
Phenol cycle 1 1.5710.15 0.5910.04cycle 2 1.4210.18 0.62 ±0.01
Resorcinol cycle 1 21.213.1 3.4910.04cycle 2 18.812.5 3.5810.06
Benzoic Acid cycle 1 12.3 ±3.5 0.2710.04cycle 2 11.1 ±3.1 0.2010.07
Methyl 3,5-dihydroxybenzoate cycle 1 34.8= 1.4 3.54 ±0.00cycle 2 28.8 = 5.3 3.7610.01
3-Hydroxybenzoic Acid cycle 1 Ret* 2.83 ±0.01cycle 2 Ret. 1.8910.00
4-Hydroxybenzoic Acid cycle 1 Ret. 2.2610.03cycle 2 Ret. 2.3610.01
3,5-Dihydroxybenzoic Acid cycle 1 Ret. 10.712.1cycle 2 Ret. 8.86 ±0.06
* Retained with a capacity factor greater than 40.
The variation in capacity factor values obtained between the duplicate columns were within 3-5% for the unmodified BSA and better than 2% for the HC1 treated protein. However, comparing the results between the untreated and HC1 treated columns, there was a large reduction in retention for the solutes which interact with basic sites. This effect was enhanced as multiple substituents were added to the solute. To further illustrate this dramatic effect the average of the two columns through two complete cycles are presented as a histogram in Figure 1.
28 GAO AND GILPIN
The current results are consistent with previously observed reductions in retention for similar hydroxylated solute on aminopropyl bonded phases following conversion of the surface to its hydrochloride salt.16 The effect of the HC1 treatment is to mediate the strong interactions which can occur between the solutes and the basic sites in the protein, as well as possible unreacted basic sites on the surface, since the protein is coupled to the surface via aminopropyl groups. A second feature of the current work, was to illustrate that the protein can be reversibly altered by treatment with HC1 as long as eluent conditions are dry. Although there appears to be a small reduction in retention comparing the date from cycle 1 and cycle 2 for both columns (i.e., the retention was always slightly longer in cycle 1 than cycle 2), statistically the results are equivalent within 1 standard deviation unit. The slight reduction, if real, is probably due to trace amounts of HC1 retained on the column, even after washing with 400 mL of methanol.
CONCLUSIONS
The strong interactions between silica-immobilized BSA and solutes that contain polar functionality such as hydroxyl and carboxyl groups can be decreased by converting the protein to its HC1 form. Such an approach (i.e., the use of protein modifiers) may be useful to create a variety of novel chromatographic supports. It appears that the modification of BSA is reversible assuming that completely anhydrous conditions are maintained. Further experiments are in progress to characterize the normal-phase behavior of silica-immobilized BSA and BSA-HC1, as well as other protein modifiers.
ACKNOWLEDGEMENTS
This work was supported by U.S. Army Research Office Grant DAAL03- 90-G-0061.
REFERENCES
1. R. H. McMenamy, J. L. Oncley, J. Biol. Chem., 233, 1436 (1958).
2. R. H. McMenamy, in V. M. Rosenoer, M. Oratz, M. A. Rothchild (Editors),Albumin Structure, Function and Uses, New York. 1976, p. 143.
3. S. Allenmark, J. Liq. Chromatogr., 9(2&3), 425 (1986).
SILICA-IMMOBILIZED BOVINE SERUM ALBUMIN 29
4. S. Allenmark. S. Andersson. J. Chromatogr., 351, 231 (1986).
5. S. Allenmark. S. Andersson. J. Chromatogr.. 436. 479 (1988).
6. S. Andersson. S. Allenmark. P. Erlandsson. S. Nilsson. J. Chromatogr..498. 81 (1990).
7. S. Andersson. S. Allenmark. J. Chromatogr.. 12(3). 345 (1989).
8. M. Aubel. L. B. Rogers. J. Chromatogr.. 392. 415 (1987).
9. M. Aubel. L. B. Rogers, J. Chromatogr.. 408. 99 (1987).
10. R. K. Gilpin. S. B. Ehtesham. R. B. Gregory, Anal. Chem.. 63, 2825(1991).
11. V. Tittelbach. R. K. Gilpin. Anal. Chem.. 67. 44 (1995).
12. R. K. Gilpin. S. B. Ehtesham . C. S. Gilpin. S. T. Liao. J. Liq. Chromatogr.In Press.
13. R. A. Thompson. S. Andersson. S. Allenmark. J. Chromatogr.. 465. 263(1989).
14. R. K. Gilpin. H. Gao. M. Jaroniec. J. Liq. Chromatogr.. 15. 2503 (1992).
15. T. Peters. Jr. in C. B. Anfinsen. J. T. Edsall. F. M. Richards (Eds.).Advances in Protein Chemistry. New York. Vol. 37. 1985. p. 161.
16. S. B. Ehtesham. R. K. Gilpin. Chromatographia. 32(1/2). 79 (1991).
17. Current address: Master Builders. Inc.. Cleveland. Ohio.
Received May 1. 1996 Accepted May 14. 1996 Manuscript 4177

J. LIQ. CHROM. & REL. TECHNOL., 20(1), 31^46 (1997)
A FIRST-LEVEL ANALYSIS OF THE ADSORPTION MECHANISM OF ESTERS OF
RACEMIC AND MESO-2,3-DIBROMOBUTANE- 1,4-DIOIC ACIDS ON SILICA
M. Palamareva.* I. Kozekov
Department of Chemistry University of Sofia
1 James Bourchier Avenue Sofia 1126. Bulgaria
ABSTRACT
The thin-layer chromatographic (TLC) retention of eighteen diastereoisomers of type RO;C-C'H(Br)-CH(Br)-C02R on silica was studied with 20 computer-selected on the basis of Snyder theory mobile phases having strength, e, in the range 0.215- 0.305 and significantly greater variation in localization, m, and polarity . P'.
A theoretical analysis, using Soczewinski method, the e values of the mobile phases used and the stereochemical particularities of the compounds, showed that the two ester groups are the main adsorbing groups, shielded by the bromine atoms, which accounts for the relative retention: racemate > meso found in all cases studied. Two mobile phases of intermediate m values lead to best separation of all diastereoisomeric pairs studied.
31
Copyright © 1997 by Marcel Dekker, Inc.

PALAMAREVA AND KOZEKOV32
\ / "c = c / \
r o 2c c o 2r
'V /C — c
/ \ROjC
C 0 2 R
II
/. Iit y p e a
COjR
Br-
H-- H-Br
c o 2r
racemale (RR|SS)t y p e b
COtR
II-H-
-B r
Br
CC,R
meso (RS)
Cllj ,C2Hs . n - C , l l 7. i sq -C , l l7. R = n - C 4H9.sec.-C4H9 j s o - C 4U9,
n - C5H ,, ,iso - C5H ,| .cyclohexylR
CIlj, C 2H5, n - C 3H7, i s o -C 3II7, n - C 4M9. sec.-C4H9, i so -C 4H9, n - C 5l l M, iso -C 5H n
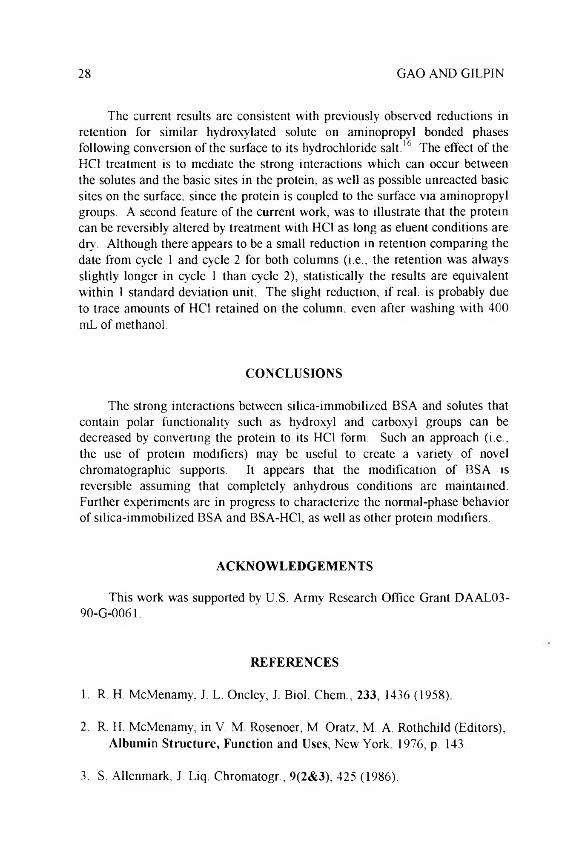
F i g u r e 1 . Types of the diastereoisomers studied recently8 and in this paper. One of the enantiomers is represented for the racemate.
INTRODUCTION
In a series of papers,1 we have reported the TLC adsorptivity of a vast number of conformationally flexible threo-erythro and cis-trans diastereoisomers and rigid Z-E diastereoisomers on, mainly, silica or alumina, with numerous mobile phases. The retention, relative retention and separation of the diastereoisomers have been treated in terms of Snyder theory."'4 the Soczewinski method8 and the Hammett equation.6’' Recently, we have studied8 TLC on silica, of diastereoisomers of type a with an increasing size of group R as a simple case of conformationally rigid diastereoisomers possessing only two equal substituents (see Figure 1).
This paper reports the TLC adsorptivity of the related, but conformationally flexible, diastereoisomers of type b . containing two bromine atoms instead of the double bond, enabling us to further compare the role of conformational effects. The mobile phases used were selected on the basis of Sny der theory by a computer program9 whose general validity in this respect has been recently summarised.111 The discussion of the data obtained includes the application of the Soczewinski method and a first-level analysis of the adsorption mechanism by a newly proposed procedure."
THEORY
The conversion of the experimental RF to the TLC retention, RXi. and separation, a. was done by the following equations:
ADSORPTION MECHANISM OF ESTERS ON SILICA 33
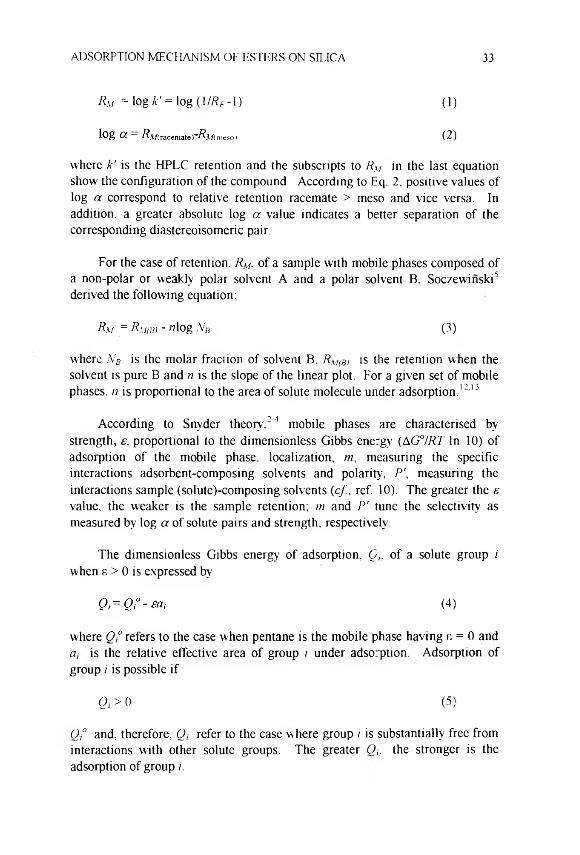
Rm = log k' = log (l/RF-l) (1)
m eso ) (2)
where k' is the HPLC retention and the subscripts to RM in the last equation show the configuration of the compound. According to Eq. 2, positive values of log a correspond to relative retention racemate > meso and vice versa. In addition, a greater absolute log a value indicates a better separation of the corresponding diastereoisomeric pair.
For the case of retention. RM, of a sample with mobile phases composed of a non-polar or weakly polar solvent A and a polar solvent B. Soczewinski5 derived the following equation:
Rm = Rm,w - «log -VB (3)
where NB is the molar fraction of solvent B. RM(B, is the retention when the solvent is pure B and n is the slope of the linear plot. For a given set of mobile phases, n is proportional to the area of solute molecule under adsorption.12,13
According to Snyder theory.2"4 mobile phases are characterised by strength, s, proportional to the dimensionless Gibbs energy (AG°IRT In 10) of adsorption of the mobile phase, localization, m, measuring the specific interactions adsorbent-composing solvents and polarity, P\ measuring the interactions sample (solute)-composing solvents (cf.. ref. 10). The greater the s value, the weaker is the sample retention; m and P' tune the selectivity as measured by log a of solute pairs and strength, respectively.
The dimensionless Gibbs energy of adsorption, Q,. of a solute group i when s > 0 is expressed by
where 0 ° refers to the case when pentane is the mobile phase having e = 0 and a, is the relative effective area of group i under adsorption. Adsorption of group /' is possible if
0 ° and, therefore, 0, refer to the case where group i is substantially free from interactions w'ith other solute groups. The greater 0,. the stronger is the adsorption of group i.
(4)
Q, > o (5)
34 PALAMAREVA AND KOZEKOV
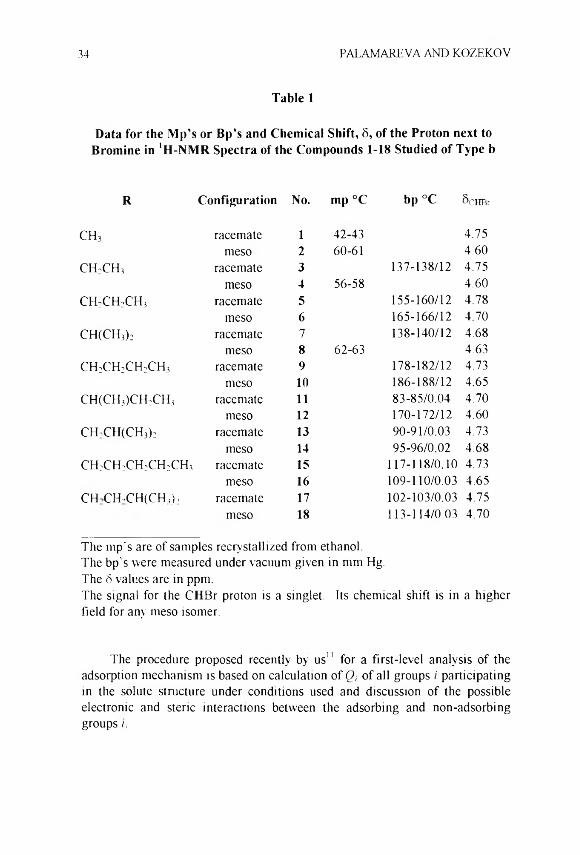
Table 1
Data for the Mp’s or Bp’s and Chemical Shift, S, of the Proton next to Bromine in 'H-NMR Spectra of the Compounds 1-18 Studied of Type b
R Configuration No. mp °C bp °C ScHBr
c h 3 racemate 1 42-43 4.75meso 2 60-61 4.60
c h ;c h 3 racemate 3 137-138/12 4.75meso 4 56-58 4.60
c h 2c h 2c h 3 racemate 5 155-160/12 4.78meso 6 165-166/12 4.70
CH(CH3)2 racemate 7 138-140/12 4.68meso 8 62-63 4.63
c h 2c h 2c h 2c h 3 racemate 9 178-182/12 4.73meso 10 186-188/12 4.65
CH(CH3)CH:CH3 racemate 11 83-85/0.04 4.70meso 12 170-172/12 4.60
CH;CH(CH3)2 racemate 13 90-91/0.03 4.73meso 14 95-96/0.02 4.68
CH2CH2CH2CH2CH3 racemate 15 117-118/0.10 4.73meso 16 109-110/0.03 4.65
CHCH.CH(CH(); racemate 17 102-103/0.03 4.75meso 18 113-114/0.03 4.70
The mp‘s are of samples recrystallized from ethanol.The bp’s were measured under vacuum given in mm Hg.The 8 values are in ppm.The signal for the CHBr proton is a singlet. Its chemical shift is in a higher field for any meso isomer.
The procedure proposed recently by us" for a first-level analysis of the adsorption mechanism is based on calculation of Q, of all groups i participating in the solute structure under conditions used and discussion of the possible electronic and steric interactions between the adsorbing and non-adsorbing groups /.

ADSORPTION MECHANISM OF ESTERS ON SILICA 35
EXPERIMENTAL
Compounds 1-18 of type b were prepared in good to high yields by the following stereospecific reactions: (a) addition of bromine to maleic anhydride and following esterification gave the racemic compounds and (b) addition of bromine to the corresponding ester of fumaric acid resulted in the meso compounds.
The ’H-NMR spectra of compounds 1-18 were measured on a TESLA 80 MHz spectrometer in acetone solutions with TMS as internal standard. Compounds 1-5, 8, 9 and 18 are known.14"19
TLC was performed on silica 60 DG (Readel de Haen, Germany) using the procedure given in ref. 20. The solvents were of analytical-reagent grade. The Rf values were arithmetic means of four to six measurements, showing a reproducibility of ±0.025. The computer program9 used was LSChrom Ver. 2 for Windows.
RESULTS AND DISCUSSION
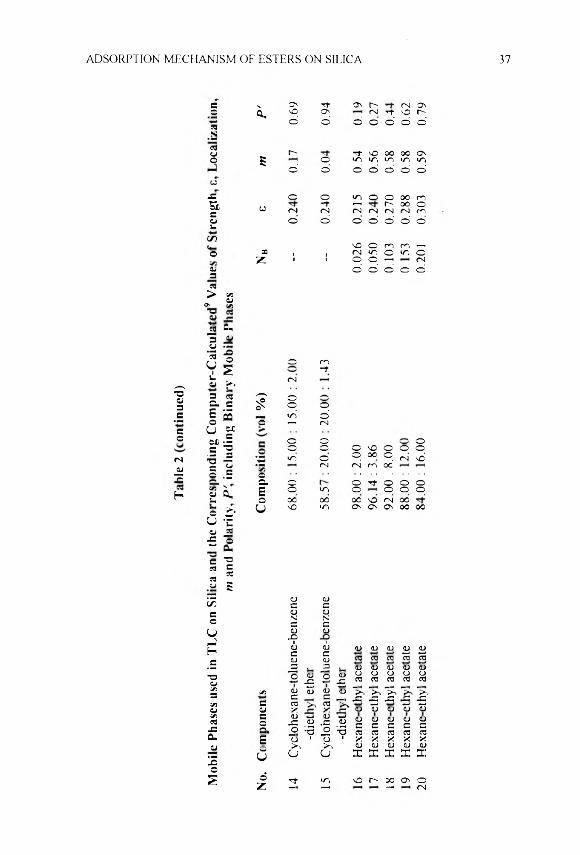
The mp’s or bp's and data from 'H-NMR spectra of compounds 1-18 are given in Table 1. Table 2 summarizes the mobile phases 1-20 used with their computer - calculated9 values of e. m and P\ including NB for the binary mobile phases. The computer choice of mobile phases 1-18 was similar to that described in ref. 10. The mobile phases are composed of two to four solvents comprising eight non-localizing or weakly-localizing solvents and the localizing diethyl ether, ethyl acetate, methyl tert-butyl ether, acetonitrile and tetrahydrofurane.4 Mobile phases 1-10 and mobile phases 11-15 have equal fo f0.253 and 0.240. respectively. Mobile phases 5 and 16-20 are composed of hexane (solvent A) and ethyl acetate (solvent B) in different ratios, showing molar fraction. \ 'B. from 0.026 to 0.201 and s in the range 0.215-0.303. Thus, all mobile phases used have minimum and maximum s of 0.215 and 0.303, respectively. They show greater variations in m and P\ namely -0.15 < m <0.95 and 0.19 < P’< 2.75.
Table 3 includes the data for the experimental RF values obtained in TLC on silica of compounds 1-18 w ith mobile phases 1-20. The values of log a derived by Eqns. 1 and 2 and their average values are also included. The tuning effect of P' on t: is seen. For instance, mobile phases 9 and 10 with the greatest P' when s = 0.253. lead to reduction in retention and higher RF. The small difference in s of mobile phases 1-10 and 11-15 (0.013) results in

Mob
ile P
hase
s us
ed in
TLC
on
Silic
a an
d th
e C
orre
spon
ding
Com
pute
r-C
alcu
late
d9 V
alue
s of
Str
engt
h, s
, Loc
aliz
atio
n,
36 PALAMAREVA AND KOZEKOV
a.
5
03
r- vi 00 <N co (N Os Vd ,—i otp 04 p { 04 CO r~- *—1r—< 04© —<’ d O © O 04 04 o' ©
Tj- o vd r- CO 04 '/I ,— , Vd SOSO *—<'—100 vd r- 00 Os O ' ! vdo © o © o o' o' o ’ o ’ oi o ’ o ’
CO CO CO CO CO CO co CO CO CO o ot/d 1/1 '/l •/d ‘/d Vd »/d ‘O >/d vd04 04 04 04 04 04 04 04 04 04 04 04o' o' O © © o ’ © d o ’ o o' o ’
04 SO ,—1r-H o Vd OS CO o o04 r-H 04 'd* C" "d- t-H OS I-H<-h Vd o © o p '—1p 00o' o ’ o' o ’ o ’ o ’ d d o ’ o'
xo
Cd
aaeuc•3s
oeuT 3C«d5
£ 00cn
o sjOc;©*5«O£oU
oo oSO Os00 so t/d to, CO Os SO o Ood Os' in CO CO p o CO 04 04 dr—. CO VI 04 to, "Cf 04 K r~ t-Ho "d* vd to, O' OS 04o f-H SO so 00 Os so 04 Os Oo o' d O' d Vd O' 04 0 - r- COOs so Os Os Os Os Os 00 04 00
»o<N
Op1/1•oo
Vdr-«ri00
00 2c scd *3i—i
COX
*-ccd cd
aaoG
00Gcd
xCO
CO
d * c
COso
CO£oEh
aoNGCO
t—i00
X3
3ot—o
2
3-aCOEo CO
COcdCO(J
aX -1k! CO
c
cdt-,
ao
TD
o
CO3
00Gcd
aCO
22COaEh Eh
aCOGCO
2
i/3X ,
-5
co* 3i
t-,
x5CO
cd
d *CdCOGCO
o£
21CO
COX3
3V •;CO
3 04 CO CO x * CO CO Vh N Eh G , G „co '-3 •3 < CO s
COcd 00 G
CO •9cdX X
cdX
c© co
gCOc
COg
CLOG
COG
COa
COC
CO©
Xo
COc
COx ; 3 2 ^
MW cd cd cd 03 03 03 cd cd oCOi-H o 3 O r
E X X x X X X X X r-t 3 i 30) (L) CO CO CO 00 CO CO 2 3 >■.
u f f i E 2 X 2 X X X U H U c
6 , rs i•—1 O i CO •r, so r - 00 Os <—i r-H r-H
Cycl
ohex
ane-
tolu
ene-
benz
ene
77.2
0: 1
0.00
: 10
.00
: 2.8
0 —
0.24
0 0.
34
0.43
-die
thyl
eth
er(c
ontin
ued)
ADSORPTION MECHANISM OF ESTERS ON SILICA 37
c V ON rf O n r- CN O n#c a, nO O <n ,ft' vO r"3N
o Ö Ö © Ö Ö O
3© r-* •3* NO 00 00 ONO s o un vn un un un
Ö © Ö Ö Ö Ö Ö
-c o o un o o 00 mac CO nf *—i r- 00 OCN CN CN CN CN cn cn©1m © Ö © Ö Ö Ö O
GONO o rn cn i—<
o 3 i i CN un o un oz i i O o —! CN
©3 Ö Ö Ö Ö Ö
3> 5Ä©C7v C«
«S au3 «y
■3 -g
y 103 m
~+k. CNz*»S «y f ‘
"O©3
3 3c. C E 2O w
?OO O
C un Ö© i— < CN
c9
U ox M .S o O oC "3 o O o N0 O O o
CN i J un o p 00 ° . CN NO© e g CN CN en oc’
s © .E OS. 0 O Tf o O o
HV> Xg ° -
E o un O o O o© 00 oo 00 N0 CN 00
o £ U NO un ON ON ON 00 00
U -Cçj 3■E ©c -o3 c
33© S3 © ©C/) C cC ©
N©NI© C ©
uj
©-9
©i
H © © © © © © ©c © •8-J •8—»© © 3 3 3 3 3
.s 3 J3 © © © © ©-oo
O ©’S
2 ©-©
©3 ©3 ©3 ©3 ©35/3 î/3 © © © © In In In Tn In3 C © ! Æ •S Æ •£uo C 3 in 3 in -*—•© © X X © © © © ©V33-C
co*“*©ÄO
■«—>©•3
©•C2
«—>©’S
©C3
©©3
©C3
©©3
©c3eu g" T> 1 *© 1 X X X X X
© ?n in © © © © ©
S©U O O X SC X X 33
© #s © Tt un nO r- OOON o
Z — •—i —H CN

Tab
le 3
38 PALAMAREVA AND KOZF.KOV
ox O o X NO we _ NT — © we CN r- CN r-> we © VO> CN NT re NT NT •/e NT we we we we we we we we VO we NO< O © d d d d d © d © d © © © © © © ©
We r- NO r~ NT X re NT X r** ON © On Onwe NO VO r- f" X r- X X X X X X On X ON X ONJO O © d d d d d © © © © © © © d © © ©
VO X X r-» NO re X NT re On X CN ON NT X NT © r^C. T •CNwe NO NO r-~ NO r- r- r- r- X r- X r-* X X X
o' © d d © d d d © © d © d © © © d ©X *—CN o ON r- re X we CN X NO we © we NO __re *T NT T NT we T we we we we VO we VO we vD we VO
© © d O d O d © © © d © d © © © © © doc CN X we re CN r~ _ re o we © CN ON NT © we•— CN r-t re CN re re re re NT re NT r '. re re NT re NT1 d © O d d d d © d d d © © d o’ © © d* * VO — X nO _ X NT o Wi — VC re X © o CN r- CN X— '—■■—■CN •—• CN CN CN CN r1 CN CN CN CN CN CN CN ri■© d d d d d d © © d d d d d © © © © ©w3 IT; ON On NO r- we © — we O' we ON © NT © NTo CN r, re T NT we NT we we we we we we we VO vO VO VO
© d o o d © d © d © © © © © © © © OE* NO r~ re T re On CN On X re r- CN On NT NT r- we t"CN rC re T NT T re nT NT w-i NT we NT we we we we we©( J d © d d d © d © © © © © d © © © © d
fO X On vO NO we CN o On NT c- NT X r- CN On reCJ CN re re T T we NT we NT we we we we we we vo we vo’u d d d © d © © © © © © © © © d © d ©GJ fS o NO X CN re re CN X r- r- we r- NT X re XE CN re CN re re T re NT re NT NT we NT we NT we we weo © d d d © d d © © © © © © © © © © ©
NO r- X X X NT NT re © X re © re © we re X NTo CN re re T NT we NT we we we we NO we VO we VO we vO
© d d d d d © © d d d © © d © © © ©S3 vO CN r"> ON CN VO we X CN NT Wi r> © © Ono we NO vo NO NO r- vo r- t- r- C' r* r- r- X X X
5 d © d d © © d © © © © © d © © © d ©CJ o — r-~ NT we o © VO NT W-| X © © we X ON NT X
J= ON NT W. T we we vO we we \C NO we NO NO VO VO vO NO NO© O d d d © d © © © © d © d © o’ d d
*■ T we so re NT Onwe © © re X NO © we CN X£ X rC *T NT we we we we NO VO NO we NO we NO NO VO NO NOd
d d d d d d d © © © d d © d © © d dX re — VO CN X re X X __ we X re X NT re we NTox r- © —' •—* •—1 11•—1 CN CN CN CN CN CN re CN re
o d d d d © © © © © d © © d © © d © ©— ON vo re _ r* _ r- we X CN VO CN we NT re© nO CN CN CN re re re re re re re NT NT NT NT NT we NT we
-•fi d d d d d © d © © © © © d © © © d ©© T We NT CN © X CN X we X CN X re r- we r~ we3 IT. CN re re T NT NT NT NT NT we NT we NT we NT we NT we53 d d d d d d d © © d d © © © d d © d
> X C- vC re _ X X C- © NT X we ON \o X vO"í '—• CN CN re re re re re re NT NT NT re NT re NT re NTT3© d d d d d d © d d © o © © © d © © ©>• CN — Q we we ON NT On CN CN X X X © On ©re T e WN Vi we we we we vo vO we we we vo we vC vD NO© d d d d d d © d © d © © © © © © © d
Q vO — CN X o vo o VO © _ re NT re •e r- ON CNN cx NT NT NT we we W", we NO o NO NO VO NO VO NO NOT3 o d d d © © © © © © © © © © © © © ©©53 r- — NO o we NO NO o — NO re re re NT vO vOCN NT re Vi T we T we •re NO we NO w. vo we vO we NO
(AZJ d d © d d © © © d d d © © d © © © d
J3 i.«3 3
> "o O* 2: CN re -T \r. NO r- X On 10 G CN re NT 15 NO r~ 81
"33n-c© ■u it a Hi a iJ it u§
‘uCJ
OilCp
TOOo M
eso TO
itit Mes
o TO£'JoTO M
eso £-jCJSB M
eso 2
OCB Mes
o <B£itoCB M
eso £<uucB M
eso TO
£<uCJTO Mes
o TO£uCJTO M
eso
oc cc oz CC Oi ca oc
W
as < o G C
(con
tinue
d)

Tab
le 3
(co
ntin
ued)
ADSORPTION MECHANISM OF ESTERS ON SILICA 39
ox fN SO m r e Os 00 © ©> fN ’—1 «—j r—• O © a—( a—a< o d d o d © © © d ¡u
fN Os o ^ r Vl 00 fO © © Tf S3o <N •—i fN <—< >—I © © *T* cnj a d d o d d © © © © ©
►JnCJ
4J3
© OS fNr~~ •^r r e - fN
fN•O £ 1Q . d d d d d © © © © d CJ a
H 00 so o fN a—1 Ov Os aH Os fN TC oofN ■—' »—1 ■—1 © © a—' © —i CJ £o d d d d d © © © © © X <u
00 cn r~~ vo fN r e Os r e or s ■—> *—< >—> <—» © —« •—> ■—«
1 d d d d d © © © © © Xu fN
■o v s SO fN fN vs fN •fT -r> T3Vi fN X C
"O d d d d o © © © © ©c3 IT. Ov o o VO r - •^r r - r - r^ "Noc . d
cnd d d
od ©
©©
©©
©© © X
r j
c ru )
p fN o 00 Os OS Os fNv»/
a 'T fN fN ■—1 •—1 o © © © © X u.wr j d d d d d © o ’ © © © CJ X
<N 00 o ■'T Os r - Os r - <N X S© fN —* o © © © CJ |*c d d d o d © © © © ©
d<4»<
© •'T o r-* so ^ r fN VO Os r - ■o<0s N c s <N fN — — © . a. i s©
£dCNfN
d00
do
dvO
dT
©fN
©fN
© © ©*=*
XCJ
3_o© d d d d d © © © © © X o
DVias _ ,_, so o r~- ^r v» © r -
i—> <UQ
Od d
od o
oo
©©
©©
©©
©©
o© X
CJ><U
© CS fN Os o fN Os fN 00 oo XJC Os •— «—<o —- O © © © © ©d d d d d © © © © © o >
u o fN Os os vO v t Os © © 3£ 00 cn •—1O o O © © © 00od
d d d d o © © © © ©Xr i■*r Os _ t*- OC r - IM Cs © SO
<oaC
0£ r - r s —1 fN c © —* r* H© d d o d o © © © © © Xana r )
^ n Os VS <N fN VO r - Os © so fN w0J
© s0 •—• 1—1 r~‘1 © © © •—1 XVi d d d o © © © © © © CJ 2«j© r , V) _ © Ov ■ r ^ r X H3 IT; fN <—i •—i <—1 © © >—■—i r s <u
"e3 d d d o © © © © © © S_/ o>£«> vs re re vO Vl re fN ^r m Eij tyT
©T CN
d d d©©
©© © © © © 1-C
> © os r - os © © Tj- (N VO X Cl*u©
f*> do
od
odo
pdo
©©fN
©©fN
©©
©©vO
©©©
©©OO
CJXo
jh2o
fN f'". ■—' •— © © © © © p E“©cas
dr-
dv t Os
dso
©Os
©Ov
©00
©©
©00
©OS
ci 5mocfN <N ■—• >— © •—1 fN —< 'aa o
5/5 o d d d © © © © © © X©3cS
>
5JJ3O 3 rs •t SO 00 © fN SO 00 a
OX
CJ
G
COasOQ
^ Z a—< E ON IT- o XU. nN (J oUad
■WC *T"© ox G X
#E © X u'u o CJ X©c . w ¿i CJ* X
XCJ
CJXu
<x
aver
age
valu
es o
flo
g a
for
all
dias
tere
omer
ic p
airs
obt
aine
d w
ith
a gi
ven
mob
ile
phas
e.

40 PALAMAREVA AND KOZEKOV
practically equal average RF of 0.49 and 0.48. respectively. Similarly to a previous study.111 a linear relationship was found between the average RF values of the individual compounds of a given configuration with mobile phases 1-10 and 11-15 of equal ¿-and the corresponding standard deviations. S.D.. within Rf .. The plots shorv S.D. in the range 0.003-0.012. The relative retention racemate > meso w as established in all cases studied as seen from the positive log o independentlv of the size of group R and the variation in e, m, P' and Nb.
Using linear regression analysis, the retention, RM. of compounds 1-18 with mobile phases 5 and 16-20 and the corresponding NB showed a good agreement with Eq. 3. The resulting data for the slope, n. intercept. R\tfm- correlation coefficient, r. and S.D. are summarised in Table 4.
Table 5 includes literature data2 for 0°, a, and calculated by eqn. 4 O, values for the groups i participating in the structure of compounds 1-18 under the conditions used specified by the mobile phases 16 and 20 of minimum and maximum s, respectively.
Application of the Soczewinski Method
The data of Table 4 show that the Soczewinski method is applicable to the cases studied showing average r of 0.957 and S.D. of 0.11. The very close n values for any diastereoisomeric pair support practically equal, w'ithin the experimental error, solute areas under adsorption and. therefore, same adsorbing groups for the individual diastereoisomers. For all compounds studied, the absolute n values increase from 1.11 to 1.63 with the increase in the size of group R supporting that the two ester groups are adsorbing in any case. The increase in the area of the ester groups is expected on the basis of their increasing a, values given in Table 5. The values of the slope, n, and intercept, Rm(b„ found determine practically parallel plots for any diastereoisomeric pair showing always a stronger retention for the racemic isomer (see Figure 2), which means that the relative retention racemate > meso cannot change with any variation of NB.
The Relative Retention of Diastereoisomers 1-18 in Terms of a First-level Analysis of the Adsorption Mechanism
As seen from Table 5. the O, values of bromine and the ester groups are positive under conditions used. Considerable changes in O, are not expected because both bromine and the ester groups have negative inductive effects and
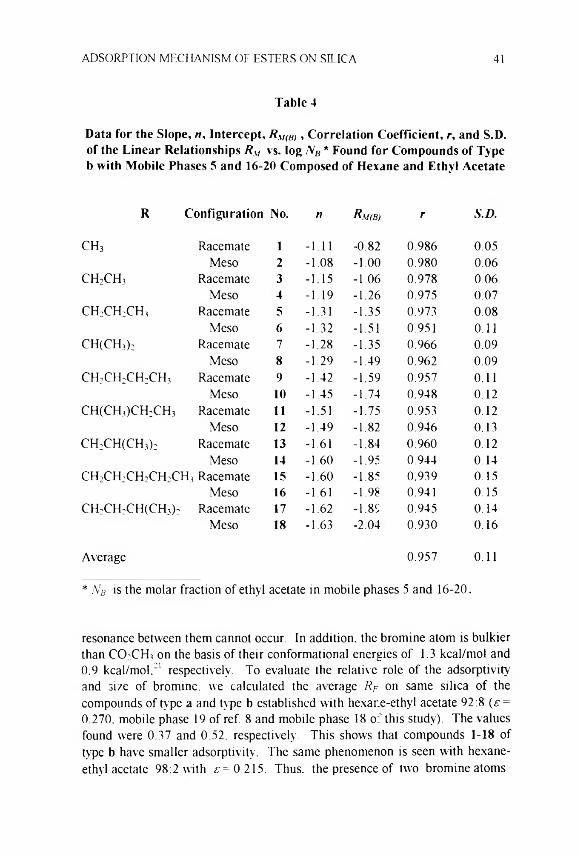
ADSORPTION MECHANISM OF ESTERS ON SILICA 41
Table 4
Data for the Slope, «, Intercept, RM(B), Correlation Coefficient, r, and S.D. of the Linear Relationships RSf vs. log NB * Found for Compounds of Type b with Mobile Phases 5 and 16-20 Composed of Hexane and Ethyl Acetate
R Configuration No. n Rm(B) r S.D.
CH3 Racemate 1 -1.11 -0.82 0.986 0.05Meso 2 -1.08 -1.00 0.980 0.06
c h2c h 3 Racemate 3 -1.15 -1.06 0.978 0.06Meso 4 -1.19 -1.26 0.975 0.07
CH2CH2CH3 Racemate 5 -1.31 -1.35 0.973 0.08Meso 6 -1.32 -1.51 0.951 0.11
CH(CH3): Racemate 7 -1.28 -1.35 0.966 0.09Meso 8 -1.29 -1.49 0.962 0.09
c h 2c h 2c h ;c h 3 Racemate 9 -1.42 -1.59 0.957 0.11Meso 10 -1.45 -1.74 0.948 0.12
CH(CH3)CH2CH3 Racemate 11 -1.51 -1.75 0.953 0.12Meso 12 -1.49 -1.82 0.946 0.13
CH2CH(CH3): Racemate 13 -1.61 -1.84 0.960 0.12Meso 14 -1.60 -1.95 0.944 0.14
CH2CH2CH2CH2CH3 Racemate 15 -1.60 -1.85 0.939 0.15Meso 16 -1.61 -1.98 0.941 0.15
CH2CH;CH(CH3)2 Racemate 17 -1.62 -1.89 0.945 0.14Meso 18 -1.63 -2.04 0.930 0.16
Average 0.957 0.11
* Nb is the molar fraction of ethyl acetate in mobile phases 5 and 16-20.
resonance between them cannot occur. In addition, the bromine atom is bulkier than CO;CH? on the basis of their conformational energies of 1.3 kcal/mol and0.9 kcal/mol.:i respectively. To evaluate the relative role of the adsorptivity and size of bromine, we calculated the average RF on same silica of the compounds of type a and type b established with hexar.e-ethyl acetate 92:8 (s =0.270. mobile phase 19 of ref. 8 and mobile phase 18 of this study). The values found were 0.37 and 0.52. respectively. This shows that compounds 1-18 of type b have smaller adsorptivity. The same phenomenon is seen with hexane- ethyl acetate 98:2 with s= 0.215. Thus, the presence of two bromine atoms

42 PALAMAREVA AND KOZEKOV
Table 5
Data According to Snyder2 for the Adsorption Properties on Silica of Groups i Participating in the Compounds Studied
Q i = O f - sa,Group i Qi «, £=0.215 s=0.303
Br 1.94 1.80 1.55 1.39CHj 0.07 1.60 -0.27 -0.41CH: -0.05 0.90 -0.24 -0.32CCfCHj 5.27 10.50 3.01 2.09CCFCTT 5.22 11.40 2.77 1.77CO-C,H~n 5.17 12.30 2.53 1.44CO:CTT-iso 5.29 13.00 2.50 1.35CO;C4H9-n 5.12 13.20 2.28 1.12CO:C4H5-sec 5.24 13.90 2.25 1.03C02C4H9-iso 5.24 13.90 2.25 1.03CCFCjHn-n 5.07 14.10 2.04 0.80CO;C5Hn-iso 5.19 14.80 2.01 0.71
The data for Q,° and a, are taken from ref. 2. p. 200 and p. 264 orcalculated by summation of the contribution of the composing fragments. The calculated by Eq. 4 0, values refer to the mobile phases of minimum and maximum f value used.
with Oi> 0 does not increase the retention of the compounds of type b and. therefore, these atoms are expected to have mainly a shielding role. Consequently, adsorption of any two equal ester groups, hindered by the bromine atoms, is the expected simplified adsorption mechanism. The ester groups and. more precisely, their carbonyls having an increased electron density can form hydrogen bonds with the silanol groups. The two-point adsorption occurs via site chelation (see ref. 2, p. 315), i.e., interaction of two adjacent adsorbing groups with a given adsorption site. Conformations suitable for site chelation of the two ester groups are M for the racemates and N for the meso isomers hav ing these two groups in gauche position (see Figure 3). For the racemate, another conformation M' with gauche esters hindered by each of the bromine atoms is not taken into account because the conformational equilibrium is expected to shift to the conformation which will give best adsorption.
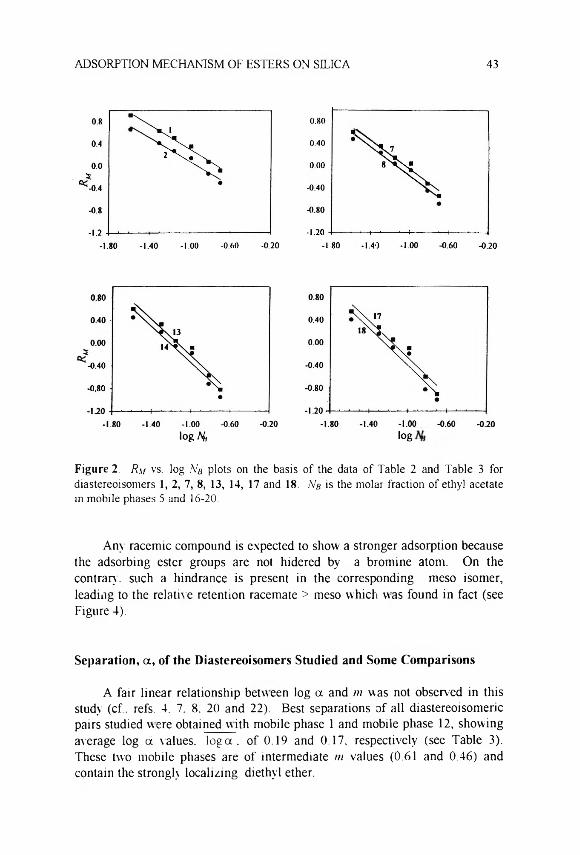
ADSORPTION MECHANISM OF ESTERS ON SILICA 43
log H, log
Figure 2. R\t vs. log Nb plots on the basis of the data of Table 2 and Table 3 for diastereoisomers 1, 2, 7, 8, 13, 14, 17 and 18. Nb is the molar fraction of ethyl acetate in mobile phases 5 and 16-20.
Any racemic compound is expected to show a stronger adsorption because the adsorbing ester groups are not hidered by a bromine atom. On the contrary, such a hindrance is present in the corresponding meso isomer, leading to the relative retention racemate > meso which was found in fact (see Figure 4).
Separation, a , of the Diastereoisomers Studied and Some Comparisons
A fair linear relationship between log a and m was not observed in this study (cf.. refs. 4. 7. 8. 20 and 22). Best separations of all diastereoisomeric pairs studied were obtained with mobile phase 1 and mobile phase 12, showing average log a values, log a . of 0.19 and 0.17, respectively (see Table 3). These two mobile phases are of intermediate m values (0.61 and 0.46) and contain the strongly localizing diethyl ether.
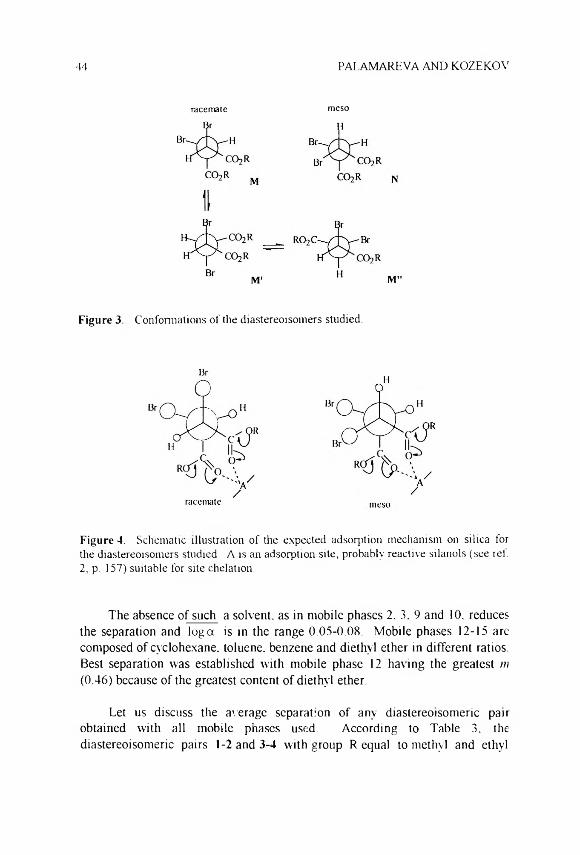
44 PALAMAREVA AND KOZEKOV
racemate meso
Figure 3 Confomiations of the diastereoisomers studied.
Figure 4. Schematic illustration of the expected adsorption mechanism on silica for the diastereoisomers studied. A is an adsorption site, probably reactive silanols (see ref. 2, p. 157) suitable for site chelation.
The absence of such a solvent, as in mobile phases 2. 3. 9 and 10. reduces the separation and log a is in the range 0.05-0.08. Mobile phases 12-15 are composed of cyclohexane, toluene, benzene and diethyl ether in different ratios. Best separation was established with mobile phase 12 hat ing the greatest m (0.46) because of the greatest content of diethyl ether.
Let us discuss the average separation of any diastereoisomeric pair obtained with all mobile phases used. According to Table 3. the diastereoisomeric pairs 1-2 and 3-4 with group R equal to methyl and ethyl
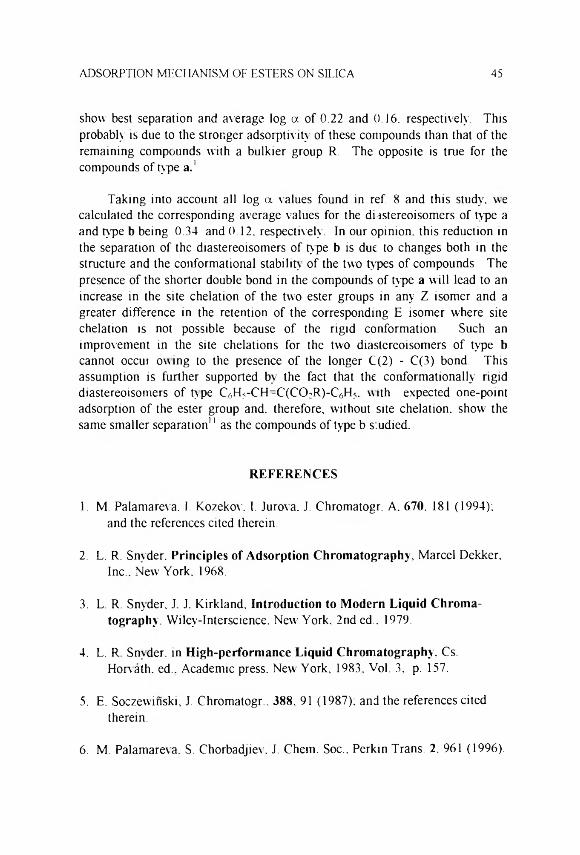
ADSORPTION MECHANISM OF ESTERS ON SILICA 45
show best separation and average log a of 0.22 and 0.16. respectively. This probably is due to the stronger adsorptivity of these compounds than that of the remaining compounds with a bulkier group R. The opposite is true for the compounds of type a.1
Taking into account all log a values found in ref. 8 and this study, we calculated the corresponding average values for the diastereoisomers of type a and type b being 0.34 and 0.12. respectively. In our opinion, this reduction in the separation of the diastereoisomers of type b is due to changes both in the structure and the conformational stability of the two types of compounds. The presence of the shorter double bond in the compounds of type a will lead to an increase in the site chelation of the two ester groups in any Z isomer and a greater difference in the retention of the corresponding E isomer where site chelation is not possible because of the rigid conformation. Such an improvement in the site chelations for the two diastereoisomers of type b cannot occur owing to the presence of the longer C(2) - C(3) bond. This assumption is further supported by the fact that the conformationally rigid diastereoisomers of type C6H5-CH=C(CO;R)-C6H5. with expected one-point adsorption of the ester group and. therefore, without site chelation, show the same smaller separation11 as the compounds of type b studied.
REFERENCES
1. M. Palamareva. I. Kozekov. I. Jurova. J. Chromatogr. A. 670. 181 (1994):and the references cited therein.
2. L. R. Sny der. Principles of Adsorption Chromatography, Marcel Dekker.Inc.. New York. 1968.
3. L. R. Snyder. J J Kirkland. Introduction to Modern Liquid Chromatography. Wiley-Interscience. New' York, 2nd ed.. 1979.
4. L. R Snyder, in High-performance Liquid Chromatography, Cs.Horvath, ed.. Academic press. New York, 1983. Vol. 3. p. 157.
5. E. Soczewinski, J. Chromatogr., 388, 91 (1987); and the references citedtherein.
6 . M. Palamareva. S. Chorbadjiev. J. Chem. Soc.. Perkin Trans. 2. 961 (1996).
46 PALAMAREVA AND KOZEKOV
7. M. D. Palamareva, B. J. Kurtev, I. Kavrakova. J. Chromatogr.. 545, 161(1991).
8 . M. Palamareva. I. Kozekov. J. Chromatogr., 606, 113 (1992).
9. M. D. Palamareva. H. E. Palamarev, J. Chromatogr., 477, 235 (1989).
10. M. Palamareva. I. Kozekov. J. Liq. Chromatogr., 19, 1483, 1996.
11. M. Palamareva. I. Kozekov. J. Chromatogr.. (in press).
12. E. Soczewinski. W. Golkiewicz, H. Szumilo. J. Chromatogr.. 45. 1 (1969).
13. T. Wavvrzynowicz. Chem. Anal. (Warsaw). 22. 17 (1977).
14. A. Kekule. Ann. Chem. Pharm., Suppl. 1. 1861. 358.
15. R. Auschutz. Chem. Ber.. 13. 2281 (1879).
16. H. R. Ing. W. H. Perkin. J. Chem. Soc.. 125. 1822 (1925).
17. V. D. Yasnopolskii. Zh. Pnkl. Khim.. 36. 2779 (1963).
18. L. E. Erickson, J. Am. Chem. Soc., 87. 1867 (1965).
19. E. Larsson. Org. Magn. Resonance. 6 . 103 (1974).
20. L. R. Snyder. M. D. Palamareva. B. J. Kurtev. L. Z. Viteva. J. N.Stefanovsky. J. Chromatogr.. 354, 107 (1986). 21 22
21. G. Whitesides. J Sevenair. R. Goetz. J. Amer. Chem. Soc.. 89. 1135(1967).
22. L. R. Snyder. J. Chromatogr.. 245. 165 (1982).
Received April 1. 1996 Accepted April 24. 1996 Manuscript 4138
J. LIQ. CHROM. & REL. TECHNOL., 20(1), 47-55 (1997)
SIMULTANEOUS DETERMINATION OF CAFFEINE AND ERGOTAMINE IN
PHARMACEUTICAL DOSAGE FORMULATION BY CAPILLARY ELECTROPHORESIS
Hassan Y. Aboul-Enein. Soliman A. Bakr
Bioanalvtical and Drag Development Laboratory Biological and Medical Research (MBC-03)
King Faisal Specialist Hospital and Research CentreP.O. Box 3354
Riyadh 11211, Saudi Arabia
ABSTRACT
A method has been developed for the simultaneous assay of caffeine and ergotamine in the pharmaceutical dosage tablet formulations (Cafcrgot ” ) by capillary electrophoresis (CE). The analysis was accomplished by using 25 mM sodium phosphate buffer at pH 6.0 with UV detection at 214 nm. The mean recoveries were 98.9% ± 1.9% and 101% ± 1.03% for the analysis of caffeine and ergotamine respectively. Run time was less than six minutes for the analysis of the two active constituents in the tablets. There were no excipients interferences.
47
Copyright © 1997 by Marcel Dekker. Inc.

48 ABOUL-ENEIN AND BAKR
Minutes
Minutes
Figure 1. (above & right) Electropherogram of (A) caffeine (B) Fresh solution of ergotamine tartarate (C) Ergotamine tartarate solution after 24 hours.

DETERMINATION OF CAFFEINE AND ERGOTAMINE 49
INTRODUCTION
Capillar)' electrophoresis (CE) has recently emerged as a powerful separation tool for the analysis of a wide variety of complex mixtures . 1 The characteristics of CE modality are reflected in its high separation efficiency, rapid analysis, small sample consumption. Direct detection of analytes and selectivity are remarkable and impressive, which make it very attractive for pharmaceutical analysis.
Ergotamine is considered to be one of the most effective drugs in the treatment of migraine and cluster headaches. " ' 3 A combination of ergotamine and caffeine is clinically used for the treatment of acute attacks of migraine. Saxena and De Deyn reviewed the use of this combination drug in treatment of migraine and its complications. 4
Determination of ergotamine has been reported using high performance liquid chromatography'. Also its analysis in plasma by fluorescence detection6
and by ion-pair chromatography w'ere published .7 The analytical profile of


DETERMINATION OF CAFFEINE AND ERGOTAMINE 51
caffeine was reviewed by Zubair et al8 which include a compilation of the analytical methods reported in the literature for caffeine analysis. Furthermore, the analysis of caffeine content in various pharmaceutical formulations were also cited9.
The purpose of this paper is to report, for the first time, a rapid and accurate capillary electrophoresis (CE) method for the simultaneous analysis of ergotamine and caffeine in the pharmaceutical tablet formulation.
EXPERIMENTAL
Chemicals
A standard of ergotamine tartarate was obtained from (GNF, GmbH, Berlin. Germany), caffeine and sodium phosphate were obtained from Sigma (St. Louis. MO. USA). High purity' w'ater was obtained from a Milli-Q Water System (Millipore. Bedford. MA). The pharmaceutical dosage forms of Carfergot3 tablets (Sandoz Pharmaceuticals, Cambelev Surrey, UK) were purchased from local markets.
Apparatus
A Waters Quanta 4000E capillary electrophoresis system with positive power supply was used (Waters. Milford. MA. USA). The electrophoretic system was controlled by the Millennium 2010 Chromatography Manager (Waters) which was also used for data collection (5 points/sec.) and processing.
All analyses were performed on Accusep polyamide fused-silica capillaries (60 cm x 75 p.m ID) obtained from Waters (Milford, MA, USA). The detector time constant was set at 0.3 seconds, all analyses were for 10 second injections, with hydrostatic mode and applied voltage of +20 KV at 30°C with detection at 214 nm.
Figure 2. (left) Electropherogram of caffeine and ergotamine tartarate after extractionfrom CafergoC tablets. (A) Fresh solution (B) Solution after 24 hours.

52 ABOUL-ENEIN AND BAKR
Buffer and Solutions
A standard solution (500 pg/mL) of ergotamine tartarate and (100 pg/mL) of caffeine were prepared by dissolving in high purity water. For establishment of calibration curves of each, five concentrations of ergotamine tartarate in the range of 10-250 pg/mL and of caffeine in the range of 2.5-50 pg/mL were made in running buffer. The buffer used for CE analysis was 25 rnM sodium phosphate at pH 6.0. Duplicate runs were made of all concentrations.
Sample Preparations
Two tablets of CafergoT containing 2 mg of ergotamine tartarate and 200 mg of caffeine were accurately weighed and powdered. An aliquot portion of the pow der containing an equivalent of 0.5 mg of ergotamine tartarate. and 50 mg of caffeine was diluted in 10 mL of sodium phosphate buffer and was shaken vigorously for 15 min. followed by centrifugation. An aliquot of the supernatant was then used for the determination of ergotamine tartarate. Further dilutions were made for caffeine determination in order to bring the peak area within scale.
RESULTS AND DISCUSSION
A rapid and simple capillary electrophoresis method has been achieved for the analysis of both ergotamine and caffeine as bulk drug and simultaneously in the pharmaceutical tablet form known as Cafergot® . Detection and separation of these tw o drugs was accomplished in less than 6 minutes. Retention time fcr caffeine and ergotamine tartarate as bulk drugs were 4.8 and 4.2 minutes, respectively (Figure 1 A & B).
An unknown peak was observed in the electropheragram of ergotamine tartarate which has a retention time of 4.1 minutes. This peak is believed to be a decomposition or degradation product as its size increases to reach about 50% of the ergotamine peak size within 24 hours (Figure 1 C). This requires the carrying out of the analysis of ergotamine in bulk form or in pharmaceutical tablets, as soon as possible, to avoid the formation of this decomposition product. Shown in Figure 2 A and B are the differences in the electropheragrams after 24 hours.
A regression analysis indicated a linear relationship between the peak area Y and the concentration X. over the range 10-250 pg/mL with correlation coefficient (r) of 0.997 and mean recovery of 101.9% ± 1.05% for ergotamine

Respo
nse Pe
ak Are
a hj*
Re
sponse
Peak
Area
DETERMINATION OF CAFFEINE AND ERGOTAMINE 53
Amount jig/ml
igure 3. Calibration curve for ergotamine tartarate over the range of 10-250 (ig/mL.
Figure 4. Calibration curve for caffeine over the range of 2.5-50 |ig/mL.
54 ABOUL-ENEIN AND BAKR
tartarate as shown in Figure 3. The calibration curve for caffeine (Figure 4) was linear in the range of 2.5 - 50 pg/mL with correlation coefficient (r) of 0.993 and mean recovery of 98.9% ± 1.9% for caffeine.
The precision and accuracy of the method were verified by analysis of the samples after adding known concentrations of ergotamine tartarate and caffeine to the dosage forms. Tablet excipients did not interfere with the assay of the two drugs.
In summary, the method described permits a simultaneous determination of ergotamine tartarate and caffeine in bulk drug and pharmaceutical tablet forms by CE. This method is simple, rapid, specific and stability-indicating. The proposed method can be used for routine analysis of these drugs and can be used as an alternative tool for the drug quality control laboratories.
ACKNOWLEDGEMENT
The authors would like to thank the Administration of King Faisal Specialist Hospital and Research Centre for its support to the Bioanalytical and Drug Development research program.
REFERENCES
1 F Foret. L Krivankova. P Bocek, Capillary Zone Electrophoresis, VCHVerlagsgesellschaft, Weinheim, Germany. Chapter 10, 1993, pp. 211-333.
2. V. L. Perrin. Clinical Pharmacokinetics. 10, 334-352 (1985) and referenceswere cited therein.
3. M. D. Ferrari. J. Haan. Current Opinion in Neurology. 8 , 237-242 (1995).
4. V. K. Saxena. P.P. De Deyn, Acta Neurologica 14, 140-146 (1992).
5. H. Bethke, B. Delz. K. Stich. J. Chromatogr., 123, 193-203 (1976).
6 . P. O. Edlund. J. Chromatogr . 226. 107-115 (1981).
7. W. Santi. J. M. Huen. R. W. Frei, J. Chromatogr., 115. 423-436 (1975).

DETERMINATION OF CAFFEINE AND ERGOTAMINE 55
8 . M. U. Zubair. M. M. A. Hassan. I. A. Al-Meshal “Caffeine” in AnalyticalProfiles of Drug Substances, Volume 15, K. Florey (editor). Academic Press Inc.. New York, USA, 1986, pp. 71-150.
9. Official Methods of Analysis of AOAC International, edited by P.Cunniff. Chapter 19, Drugs: Part II, 16th edition, AOAC International, Arlington. VA, USA, 1995, pp 9-11.
Received May 15, 1996 Accepted May 30. 1996 Manuscript 4189

J. LIQ. CHROM. & REL. TECHNOL., 20(1). 57-61 (1997)
SEPARATION OF TAXOL AND CEPHALOMANNINE BY COUNTERCURRENT
CHROMATOGRAPHY
Fu-Ying Chiou. Pei Kan. I-Ming Chu.* Chau-Jen Lee
Department of Chemical Engineering National Tsing Hua University
Hsinchu, 300. Taiwan
ABSTRACT
Countercurrent chromatography was used to separate taxol from cephalomannine, on a preparative scale for the final purification of taxol. A solvent system consisting of hexane:ethyl acetate:methanol: ethanohwater in 5:7:5:1:6.5 was found to be suitable in achieving near base-line resolution of the two components. It was found that the amount of methanol in the solvent system was very' critical to a successful separation operation.
INTRODUCTION
Taxol1: has been found to be active toward various kinds of cancers and is a major focus of research in chemotherapeutic agents during recent years. Typically, barks, needles or twigs from trees of T a x u s genus were ground and extracted by a series of polar or non-polar solvents, such as methylene chloride, methanol and. in some cases, supercritical carbon dioxide, to get rid of most
57
Copyright © 1997 by Marcel Dektcer. Inc.

58 CHIOU ET AL.
contaminants and recover taxol. 3,4,5 However, to separate cephalomanine, a contaminant that is most difficult to separate taxol from, which is present in most plant sources in about half as much as taxol, higher resolution methods are required. Column chromatography using silica gel with normal phase elution is widely used .6
In preparation of pure taxol in gram quantities for laboratory uses, countercurrent chromatocraphy (CCC) provides a convenient alterative .7 This technique uses no solid particles and can adjust to the variable conditions of crude extract by adjusting solvent composition to achieve good results. Search for suitable solvent systems is the first step of CCC separation. A successful sy stem was found and reported below.
MATERIALS AND METHODS
Taxol was purchased from suppliers of Yunnan, China in partially purified form. The off-white powder contains about 75 wt % of taxol and 25 wt % cephalomannine. Hexane, ethyl acetate, anhydrous ethanol and methanol were of HPLC grade. The countercurrent chromatography device used was Model CCC-1000 from PharmaTech, Baltimore, USA. Three consecutive coaxial multilayer coil columns were used with a total volume of 320 mL.
An appropriate amount of solvents were mixed and two phases were equilibrated. The top phase was chosen to be the stationary phase and filled the columns first and then the columns were rotated at 1000 rpm. Mobile phase was then pumped in via an HPLC pump at a rate of 1.5 mL/min. After the mobile phase fluid emerged at the exit of the columns, 1.0 mL of sample was injected. The sample contained 6.1 mg of the partially purified taxol. dissolved in 50:50 stationary and mobile phase. Fractions were collected in a size of 6.0 mL, and analyzed by HPLC. A C , 8 reverse phase column (LiChroCART 100, 5 pm, Merck ) was used, and taxol was detected at 229 mn. The mobile phase used for HPLC analysis was composed of water/methanol (60: 40) at a flow rate of 0.5 mL/min.
Partition coefficients measurement was made for taxol and cephalomannine in liquid-liquid two-phase systems. Partially purified taxol was dissolved in equilibrated two-phase solution. Samples were drawn from two phases and analyzed for taxol and cephalomannine. Samples from the top phase were first vacuumed to dryness and redissolved in the methanol before the HPLC analysis.

SEPARATION OF TAXOL AND CEPHALOMANNINE 59
Table 1
Partition Coefficients of Taxol and Cephalomannine in the SolventSystems* *
Systems Hexane E.A. MEOH EtOH Water Pt Pc
1 5 7 4 1 6.5 5.67 4.312 5 7 5 1 6.5 1.80 1.423 5 7 6 1 6.5 1.09 1.094 5 7 7 1 6.5 0 . 2 0 0.195 5 7 8 1 6.5 0.29 0.27
E.A.: ethyl acetatePt: partition coefficient of taxolPc: partition coefficient of cephalomannine* expressed in volume ratio of their constituents
RESULTS
A basic formulation of the solvent system was first chosen, considering past experiences in CCC separation and taxol's general properties, such as its hydrophobicity. The hexane-ethvl acetate-methanol (or ethanol)-water system was commonly used in CCC for the separation of slightly hydrophobic components. The top phase was rich in hexane and the bottom phase was rich in water. Preliminary tests revealed that, in the hexane-ethyl acetate-ethanol-water system (5: 7: 4: 6.5). the elution times for both taxol and cephalomannine were very long compared to the mobile phase elution time. Thus a typical run would require up to 12 h for taxol or cephalomannine to exit the columns. This is caused by the high partition coefficients in this system,i.e. high affinity for the upper phase (stationary phase) by taxol and cephalomannine. Thus, this was not a practical system for the separation. The system using methanol instead of ethanol, e.g. hexane-ethyl acetate-m ethanol- water (6 : 4: 6.5: 3.5) suffered from the opposite problem, i.e., very low affinity for the upper phase by the two components; thus, insufficient resolution. The two components were not separated at the exit, and emerged in one peak.
It seemed reasonable to try using both ethanol and methanol in the solvent system, as their opposite effects on affinity to the upper phase by these two solvents may cancel out. Partition coefficients of taxol and cephalomannine in a series of solvent systems were measured. The results are shown in Table 1.

60 CHIOU ET AL.
ELUTION TIME(MINS)
Figure 1. Elution profiles for taxol and cephalomannine. • : taxol. ■: cephalomannine.
It was somewhat surprising to find that the amount of methanol in this solvent system had a major impact on the partition behavior of taxol and cephalomannine. The reason for this particular phenomenon was not determined.
The solvent system chosen for the CCC separation system was hexane-ethyl acetate-methanol-ethanol-water in 5: 7: 5: 1: 6.5 (system 2 in Table 1), since this was the only one that would result in suitable elution time and separation factor. Rotational speed of the CCC was set at 1000 rpm, the normal operating speed for this model. Mobile phase flow rate was 1.5 mL/min. The stationary phase retention was 264 mL in 320 mL total volume. Thus the mobile phase volume was 56 mL. the elution time for the mobile phase was thus 38 min. As shown in Fig. 1. cephalomannine was ahead of taxof and near base-line resolution was achieved. The number of theoretical
SEPARATION OF TAXOL AND CEPHALOMANNINE 61
plates was calculated to be 560 and the resolution was 0.98. The results were consistent with the partition coefficients (taxol: 1.80, cephalomannine: 1.42). Recovery of taxol w as 90% w ith purity above 98%. w hen the collected fractions were dried under vacuum. These results can be helpful in scaling up the process in larger countercurrent chromatography units, in order to process gram levels of taxol in v arious kinds of extracts.
ACKNOWLEDGMENT
This research is supported by grant DOH84-HR-408 from the Department of Health of the Republic of China.
REFERENCES
1. M. C. Warn. H. L. Taylor. M. E. Wall. P. Coggon, A. T. McPhail, J. Am.Chem. Soc, 93. 2325-2327 (1971).
2. E. K. Rovvinsky. R. C. Donehower, Drug Therapy. 332. 1004-1014 (1995).
3. K. M. Witherup. M. W. Stasko. T. G. McCloud. S. A. Look. G. M.Muschik. H. J. Issaq. J. Liq. Chromatogr.. 12. 2117-2132 (1989).
4. J. C. Vergniol. R. Bruno. G. Montay. A. Frydman. J. Chromatogr.. 582.273-278 (1992).
5. D. W. Jennings, H. M. Deutsch. L. H. Zalkovv. A. S. Ceja. J. SuprecriticalFluids. 5. 1-6 (1992).
6 . S. L. Richheimer. D. M. Tinnermeier. D. W. Timmor.s. Anal. Chem.. 64.2323-2326 (1992).
7. R. Vanhaelenfastre. B. Diallo. M. Jaziri. M. L. Faes. J . Homes. M.Vanhaelen. J. Liq. Chromatogr.. 15. 697-706 (1992).
Received April 24. 1996 Accepted May 13, 1996 Manuscript 4174

J. LIQ. CHROM. & REL. TECHNOL.. 20(1). 63-78 (1997)
DETERMINATION OF THE ALKALOIDS IN COPTIS-EVODIA HERB COUPLE BY
CAPILLARY ELECTROPHORESIS
Ming-Chung Lee. Shuenn-Jyi Sheu
Department of Chemistry National Taiwan Normal University
8 8 . Sec. 4. Tingchow Road Taipei. Taiwan. Republic of China
ABSTRACT
A method combining the techniques of micellar electrokinetic capillary chromatography (MECC) and capillary zone electrophoresis (CZE) has been developed to assay seventeen alkaloids in coptis-evodia herb couple. The MECC method, based on SDS. was applied to analyze three indolequinazoline alkaloids and six quinolone alkaloids in evodia within 30 minutes, and a CZE technique was used to determine eight quaternary alkaloids (dehydroevodiamine in evodia. and seven protoberberine alkaloids in coptis) within 25 minutes. The recovery efficiencies were 96.68-103.19% in MECC and 99.65- 103.28% in CZE. with a relative standard deviation of 1.67-4.00% for MECC and 2.33-4.38% for CZE. The calibration curves exhibited good linearity' over one order of magnitude of concentration, and their minimum detectable concentrations were approximately 15.78 to 47.33 pg/mL using a C.75 pm inner diameter column. Contents of the seventeen alkaloids in a methanol-water crude extract of coptis-evodia herb couple could easily be determined by this method.
63
Copyright £ 1997 by Marcel Dekker. Inc.

64 LEE AND SHEU
INTRODUCTION
Herbs simultaneously used together and in couples are the basic composition units of Chinese herbal formulas and have special clinical significance in Chinese medicine. They are much simpler than complicated formulas in composition, but retain the basic therapeutic features. 1 Coptis (Coptidis Rhizoma) possesses the effects of dispelling heat, drying dampness, purging fire and removing toxin, and evodia (Evodiae Fructus) has the actions of warming middle, dispelling cold, causing vitality to descend and controlling pain .2 The combined use of these two herbs will enable the healing of hypochondric and costar pain, stomach ache, acid regurgitation, nausea and gastric upset. 1
The pharmacologically active constituents of coptis are a number of protoberberine alkaloids such as coptisine (1). berberine (3), berberastine (4), epiberberine (5). columbamine (6 ). jatrorrhizine (7), palmatine (8 ).3' and those of ev odia are indolequinazoline alkaloids, deity droevodiamine (2 ), evodiamine (9). rutaecarpine (10). carbowevodiamine (17). and quinolone alkaloids,1- methyl-2-nonyl-quinolone (11). l-methyl-2-[(Z)-6-undecenyl]-4(lH)-quino- lone (12). l-methyl-2-undecyl-4(lH)quinolone (13), evocarpine (14). 1-methyl-2- [(6Z.9Z)-6.9-pentadecadienyl]-4(lH)quinolone (15) and dihydroevocarpine (16).8'12 as shown in Figure 1. The former can be analyzed by a standard capillary zone electrophoretic (CZE) method . 13 and the latter have to be separated by both CZE and micellar electrokinetic capillary chromatographic (MECC) methods. 14 The two systems are distinctly different. In order to determine, simultaneously , the chemical constituents of the two herbs, this paper reports a facile and rapid CE analytical method that can be used to help assess not only the herb couple itself but also the quality of Chinese herbal preparations containing the herb couple mentioned herein.
EXPERIMENTAL
Apparatus and Conditions
The analysis was carried out on a Waters (Milford. MA) Quanta 4000 capillary electrophoresis system, equipped with a UV detector set at 254 nm and a 90 cm x 75pm I D. fused silica capillary tube (Polymicro Technologies. Phoenix. AZ) with the detection window placed 82.5 cm from the injection. The conditions were as follows: sampling time. 2 s, hydrostatic (injection volume. 3.4 nL): applied voltage. 25 kV (constant voltage, positive to negative polarity); and temperature. 24.5-25.0 °C. In CZE. the electrolyte was a buffer

ALKALOIDS IN COPTIS-EVODIA HERB COUPLE 65
OH
NlCH3
11. R :(C H 2)sC H 3
12. R :(C H 2 )sC H = C H (C H 2 )3C H 3
13. R :(C H 2 ) ioC H 3
14. R :(C H 2)7C H =C H (C H 2)3C H 2
15. R :(C H 2)sC H = C H C H 2 C H = C H (C H 2 )4 C H 3
16. R :(C H 2)i2C H 3
Figure 1. Structures of the seventeen alkaloids. 1, coptisine; 2, dehydroevodiamine; 3, berberine; 4, berberastine; 5, epiberberine; 6, columbamine; 7, jatrorrhizine; 8, palmatine; 9, evodiamine; 10, rutaecarpine; 11, l-methyl-2-nonyl-quinolone; 12, 1- methyl-2-[(Z)-6-undecenyl]-4( 1 H)-quinolone; 13, 1-methyl-2-undecyl-4( 1 H)-quinolone; 14, evocarpine; 15, l-methyl-2-[(6Z,9Z)-6,9-pentadecadienvl]-4(lH)- quinolone; 16. dihydroevocarpine: 17, carboxyevodiamine.
66 LEE AND SHEU
solution of 50 mM maleic acid and 40 mM NaH2P 0 4 and acetonitrile (9:1); run time. 25 min. In MECC. the electrolyte was a buffer solution of 40 mM SDS. 20 mM NaLLPO, and 9 mM Na2B40 7 and acetonitrile (3:2); run time, 30 min. Before each run. the capillaiy was washed with 0.1 N NaOH for 5 min. with water for 5 min and then with buffer for 5 min.
Reagents and Materials
The alkaloids were isolated from Coptidis Rhizoma3" and Evodiae Fructus8'1- and their structures w;ere elucidated on the basis of spectra such as IR. PMR. CMR and MS. The purities of these compounds were checked by HPLC. Maleic acid was purchased from Wako (Osaka. Japan), sodium dodecyl sulphate (SDS) and I8 p-glycyrrhetinic acid from Sigma (St. Louis. MO), benzyltriéthylammonium chloride from Merck (Darmstadt. Germany), sodium dihydrogenphosphate from Yoneyama (Osaka. Japan) and sodium borate from Kanto (Kyoto. Japan).
Acetonitrile and methanol were of LC grade (Fisons. Loughborough. England). Deionized water from a Milli-Q system (Millipore. Bedford. MA) was used to prepare all buffer and sample solutions. Coptidis Rhizoma and Evodiae Fructus were purchased from the Chinese herbal market in Taipei (Taiwan).
Preparation of Herb Couple and Chinese Herbal Preparation Extracts
A 1.0 g sample of the pulverized herb couple (containing 0.5 g Coptidis Rhizoma and 0.5 g Evodiae Fructus) was extracted with 70% methanol ( 6 mL) by stirring at room temperature for 30 min,, then centrifuging at 1500 g (Universal. Hettich Zentrifugen) for 5 min. Extraction was repeated three times. The extracts were combined and filtered through a No.l filter paper. After adding a 5 mL aliquot of internal standard solution. ISi. (20 mg of benzyltriéthylammonium chloride in 1 mL of 70% methanol) for CZE. 2 mL aliquot of internal standard solution, IS2, (2 mg of 18P-glycyrrhetinic acid in 1 mL of 70% methanol) for MECC. the extract was diluted to 25 mL with 70% methanol. This solution was passed through a 0.45 pm filter and the filtrate was then injected into the capillaiy electrophoresis system.
2.0 g of the constituent crude drugs of P ie n - tu n g -w a n (including 1.0 g Coptidis Rhizoma and LO g Evodiae Fructus) was added with a twenty-fold mass of water (40 mL) and boiled mildly for 30 min until the volume becomes halved. After filtration while hot, to the filtrate was added suitable amounts of

ALKALOIDS IN COPTIS-EVODIA HERB COUPLE 67
0 10 20 30 40 50 60 70 80M a le ic a c id c o n c e n tr a t io n (m M )
Figure 2. Effect of maleic acid concentration on migration time. All these experiments were conducted at a voltage of 25 kV across the 90 cm x 75 pm I D. separating tube filled with phosphate buffers of different maleic acid concentrations containing 10% acetonitrile; temperature 24.5-25.0°C; detection wavelength, 254 nm. Symbols are the same as those in Fig. 1.
ISi and IS;, and the resultant solution was diluted with methanol to give a 70% methanol solution. This solution was passed through a 0.45 pm filter and the filtrate was then injected into the capillary electrophoresis system. Similarly, a standard decoction of K a n - lu -s a n (including 2.0 g Coptidis Rhizoma and 1.0 g Evodiae Fructus) was also prepared :n the same procedure.

68 LEE AND SHEU
RESULTS AND DISCUSSION
Analytical Conditions
The quaternary alkaloids in Coptidis Rliizoma have been well separated by a CZE technique with the use of acetate as counter ion . 13 However, a similar process was found to fail in the analysis of coptis-evodia herb couple. Under this condition (0.1 M CH3COONa and methanol in the ratio of 85:15). the peak of dehydroevodiamine not only overlapped with berberine, but also exhibited serious tailing. The alkaloids in Evodiae Fructus were analyzed by two modes, CZE and MECC . 14 Following the evodia CZE condition (40 mM Nal I2P 0 4
and acetonitrile in the ratio of 9:1). all evodia alkaloids were eluted along with EOF except for dehydroevodiamine (2) which was overlapped with coptis alkaloids: however, using the MECC condition (40 mM SDS. 20 mM NaH-PO,. 9 mM Na;B40 - and 40% CH3CN). the evodia alkaloids (except 2) in the herb couple were separated as well as those obtained with evodia crude drag itself, without interference. The migration times of those compounds were: 9. 17.15 min; 10. 17.47 min; 11. 18.19 min; 12. 18.35 min; 13. 19.10 min; 14, 19.39 min: 15. 19.64 min; 16. 20.30 min; 17. 20.65 min.
In order to separate the quaternary' alkaloids (1-8) in coptis-evodia herb couple, a new CZE method was developed with the addition of a dicarboxylic acid to the phosphate buffer in evodia's CZE system. Acetic acid and four dicarboxy lic acids, tartaric acid, oxalic acid, succinic acid and maleic acid, had ever been used in this series of trials. From the experiments, maleic acid was found to be the best. Acetonitrile was added to the carrier as organic modifier to achieve a better resolved electropherogram. Other organic solvents such as methanol, ethanol and isopropanol had also been tried as substitutes for acetonitrile, but a much broader peak was obtained.
Effect of Maleic Acid Concentration
Nine electrolyte systems containing 40 mM NaH;PO, and 10% CH3CN at different maleic acid concentrations, ranging from 0 to 80 mM were used to study the effect of maleic acid concentration on the separability . The results obtained are shown in Figure 2. where the migration times are plotted against maleic acid concentrations. In Figure 2, the migration times of all quaternary alkaloids increased rapidly from 0 to 10 mM maleic acid, showing that there should be a strong interaction between a carboxylic group and a positive nitrogen atom. After that, the migration times were found to increase gradually w ith the increasing maleic acid concentrations. Usually, the migration times of

ALKALOIDS IN COPTIS-EVODIA HERB COUPLE 69
0 5 10 15C I l iC N c o n c e n tr a tio n (% )
Figure 3. Effect of acetonitrile concentration on migration time. The carriers were 50 mM maleic acid-40 mM NaH:PO.j solutions containing 0-15% acetonitrile. Other conditions are the same as those in Fig. 2.
quaternary alkaloids in Coptidis Rhizoma were influenced much more by maleic acid concentration than in Evodiae Fructus. From the results, concentrations at 50 and 60 mM were found to be the best conditions for the separation of these eight alkaloids. However. 60 mM maleic acid gave more baseline noise and. therefore. 50 mM was chosen.
Effect of Acetonitrile Concentration
Four electrolyte systems, containing 50 mM maleic acid and 40 ntM NaHiPOi at different acetonitrile concentrations ranging from 0 to 15%. were

70 LEE AND SHEU
used to study the effect of the acetonitrile concentration on the resolution. The results obtained are given in Figure 3. As the acetonitrile concentration increased, the migration times of all quaternary alkaloids became longer, but the resolution of these compounds did vary. When acetonitrile was absent, the resolution value (Rs) between 7 and 8 was 1.19; however, that of 1 and 2 was only 0.50. At 5%, 10% and 15% acetonitrile, the Rs values between 1 and 2 were 1.24, 1.38 and 2.82, respectively, but were 1.35, 0.83 and 0.64 between 7 and 8 . From the calculated results, the best resolution for all the compounds was at 10% acetonitrile. Meanwhile, the addition of acetonitrile to the buffer could also result in a sharper peak and smoother baseline, which came from the reduction of interaction between the silanol group on the capillary wall and the quaternary alkaloids.
Effect of Phosphate Concentration
Six electrolyte systems, at different phosphate concentrations (10-60 mM sodium dihydrogenphosphate), were used to study the effect of phosphate concentration on the resolution. The number of theoretical plates and the resolution values between 1 and 2 and between 7 and 8 , obtained at different phosphate concentrations are listed in Table 1.
Data in Table 1 show that the numbers of theoretical plates for these eight alkaloids, especially those of 1 , 2 and 6 . varied markedly with the change of phosphate concentration of the buffer, and ideal plate numbers could be successfully achieved when the concentrations were higher than 30 mM. However, influence on resolution by changing the phosphate concentration was found to be reverse between 1-2 and 7-8.
As the phosphate concentration was increased, the Rs values on 1 - 2 were increased, but that on 7-8 were decreased. In order to assay all the quaternary alkaloids simultaneously, a concentration of 40 mM was therefore selected.
From the above results, a buffer solution consisting of 50 mM maleic acid and 40 mM NaJLPO.] and acetonitrile (9:1) were chosen. Figure 4 is an electropherogram showing the separation of a mixture of the quaternary alkaloids with the following migration times: 1, 19.39 min; 2, 19.70 min; 3, 20.69 min; 4, 21.55 min; 5, 21.70 min; 6 , 22.33 min; 7, 22.71 min; 8 . 22.95 min.
Cyclodextrins (CD’s) had also been added to the electrolyte in an attempt to get more improvement on resolution, but this approach failed. However, some information about the relationship betw een the structures of alkaloids and

ALKALOIDS IN COPTIS-EVODIA HERB COUPLE 71
—I----1-------1------- 1-------- 1-------T"14 1 6 1 8 2 0 2 2 24
Migration time (min)
Figure 4. Capillary electropherogram of a mixture of eight quaternary alkaloids in CZE. ISi = benzyltriéthylammonium chloride; other symbols are the same as those in Fig. 1.
Table 1
Theoretical Plates and Resolutions of the Alkaloids at Different Phosphate Concentrations
No. of Theoretical Plates (XI 0 s) Resol’n (Rs)Conc’n (mM) 1 2 3 4 5 6 7 8 1-2 7-8
1 0 1.30 0.83 0.27 0.93 0.75 0.16 0.91 0.63 0.80 1 . 0 2
2 0 1.17 1 . 2 0 0.44 1.51 1 . 1 2 1.06 1.56 0.70 0.92 1.0930 0 . 6 8 0.75 0.38 1.45 1.08 1 . 0 2 1.52 0.91 0.96 0.9940 1 . 0 0 1.39 0.44 1.48 1.14 0.83 1 . 1 0 0.82 1.38 0.8350 1.17 1.25 0.41 1 . 6 6 1 . 1 2 0.82 1.63 0.95 1.61 0.7560 1.45 1.39 0.49 1.58 1.41 0.95 1.54 1 . 0 0 1.93 0.70
the size of cyclodextrins was obtained. There was almost no influence on all compounds when a-CD was added, but a marked change on the migration times of 1, 3, 4, 6 and 7 was observed when p- and y-CD were used.

72 LEE AND SHEU
Table 2
Detection Limits and Reproducibility of Migration Time (Mt) and Peak Area Ratio (Ar, Peak Area/IS Area) (n=6)
of the Alkaloids
Compound Detection Limit Intra-Day Inter-Dayng (pg/mL) RSD, % RSD, %
Mt Ar Mt Ar
1 0.06(17.43) 0.73 2.33 1.96 3.592 0.11 (31.40) 0.77 3.10 1.34 3.173 0.06 (16.77) 0.67 3.24 1 . 6 8 .3.764 0.05 (15-97) 0 . 8 6 2.89 1.46 4.385 0.06 (16.77) 0.87 3.71 1.52 3.716 0.06 (16.46) 0.91 2.33 1.53 3.317 0.06 (16.46) 0.95 2.77 1.55 3.288 0.05 (15.78) 0.95 2.75 1.62 3.079 0.13 (39.50) 0.69 2.07 1.52 2.4810 0.16 (47.33) 0.69 1.67 1.53 2 . 0 0
11 0.12 (35.85) 0.75 2.60 1.51 3.4612 0.12 (35.88) 0.79 2.92 1.51 3.6813 0.12 (35.65) 0.83 3.33 1.46 4.0014 0.12 (35.25) 0.89 2.39 1.46 2 . 6 8
15 0.12 (35.91) 0.91 3.53 1.47 3.8816 0.12 (35.85) 0.92 2.69 1.41 2.9317 0.06 (16.50) 0 . 6 6 3.57 1.36 3.78
Compound 1-8 were measured by CZE and 9-17 were determined by MECC.
Obviously, the alkaloids with a highly hydrophilic group on their2.3-positions, and a dialkoxy group on their 9.10-positions, and the CD with a large-size cavity are the paramount factors for forming a reasonable complex.
METHOD VALIDATION
Precision
The reproducibility (relativ e standard dev iation) of the proposed method, on the basis of peak-area ratios for six replicate injections, was 1.67-4.00% in

ALKALOIDS IN COPTIS-EVODIA HERB COUPLE 73
Table 3
Data of Linear Ranges and Correlation Coefficients (r) of the Alkaloids
Compound Linear Range (mg/mL) Slope Intercept r
1 0.016-0.492 14.024 0.434 0.99542 0.076-1.216 3.750 0.086 0.99933 0.067-2.138 13.495 0.417 0.99504 0.015-0.116 13.221 0.147 0.99625 0.022-0.350 13.763 0.149 0.99636 0.012-0.198 15.790 0.171 0.99627 0.012-0.197 13.508 0.147 0.99638 0.023-0.720 12.948 0.140 0.99609 0.089-0.890 2.611 0.353 0.999910 0.085-0.850 2.180 0 . 1 0 2 0.999911 0.013-0.130 3.803 0.006 0.999012 0 .0 1 1 -0 . 1 1 0 3.485 0.005 0.998513 0.017-0.170 3.463 0.005 0.998214 0.071-0.710 3.197 0.005 0.998715 0.016-0.160 2.969 0.004 0.999116 0 .0 2 1 - 0 2 1 0 3.178 0.005 0.998917 0.041-0.410 3.567 0.064 0.9997
Compound 1-8 were measured by CZE and 9-17 were determined by MECC.
MECC and 2.33-4.38% in CZE. and the variation of the migration time of each peak was less than 2% (n=6 ). The detection limits (S/N=3) for the quaternary alkaloids were 0.05-0.16 ng (15.78-47.33 pg/mL. column inner diameter 75 pm). Detailed data for R. S. D. and detection limits are shown in Table 2.
Linearity
Calibration graphs for the seventeen alkaloids were obtained over a range of one order of magnitude of concentration. Results of the regression analyses and the correlation coefficients (r) are shown in Table 3. The results showed good linear relationships between peak-area ratios (y) and concentration (x,mg/mL).

74 LEE AND SHEU
mAu 50 r
45-
40-
35 -
3 0 -
25 -
20
15 -
10 -
5 ■
Migration time (min)
O H K8 10
i-------— i-------1--------- 1------------ 1------- 1------- — r-12 14 15 18 20 22 24
Migration time (min)
—I--- 1-------125 28 30
Figure 5. Capillary electropherograms of the coptis-evodia herb couple in (A) CZE and (B) MECC. IS2 = 18(3-glycyrrhetinic acid and other peaks as in Fig. 4.

ALKALOIDS IN COPTIS-EVODIA HERB COUPLE 75
Accuracy
Suitable amounts (0.01-10.45 mg) of the seventeen alkaloids were added to a sample of coptis-evodia herb couple of known alkaloid content and the mixture was analysed using the proposed procedure.
The recoveries of the alkaloids were 96.68-103.19% in MECC. and 99.65-103.28% in CZE.
Separation of 1, 4, 6, 7 and 8 with MECC; an Alternative Route
Although compounds 1-8 had better to be analyzed by CZE method. Figure 5-B shows clearly that 1, 4. 6. 7 and 8 could also be determined by MECC technique. After comparing the electropherograms in Figure 5-A and5-B. it was found that MECC provided not only sharper peaks but also shorter migration times than that of CZE. In order to investigate the differences obtained from CZE and MECC systems, the following data were calculated. The Rs values of 1-2, 6-8 and 4-8 were 2.10. 2.09 and 2.00. and the numbers of theoretical plate of 1, 4. 6. 7 and 8 were 541945. 166641. 627312, 317957 and 285733. respectively. The detection limits w-ere 0.10 ng (30.36 pg/mL) for 1,0.08 ng (23.96 pg/mL) for 4. 0.08 ng (23.01 pg/mL) for 6, 0.08 ng (23.25 pg/mL) for 7. 0.08 ng (24.18 pg/mL) for 8. Regression equations and correlation coefficients were calculated as follow's: 1, y=15.695x-0.175 (r=0.9995); 4. y=14.060x-0.035 (r=0.9996); 6. y=l 4.773x-0.038 (r=0.9993); 7. y=14.491x-0.035 (r=0.9995); 8 . y=13.894x-0.034 (r=0.9995).
The recoveries w'ere 98.52-103.58%. These data indicate that MECC method could give higher theoretical plate numbers and Rs values, but has lower detection limits than that of CZE. As a result. CZE was able to analyze all the quaternary alkaloids 1-8 simultaneously, and MECC was suitable for the determination of 1. 4. 6 . 7. 8 and 9-17 in a single run.
Determination of the Alkaloids in Herb Couple and Chinese Herbal Preparations
When the test solution of the herb couple was analysed by CE under the selected conditions, the electropherograms shown in Figure 5-A and B were obtained. The peaks were identified by comparison of the migration times and by spiking the mixture with a single alkaloid in a subsequent mn. By substituting the peak-area ratios of the individual peaks for y in the above

76 LEE AND SHEL
Table 4
Contents (mg/g Crude Drug) of the Alkaloids in the Herb Couple and the Chinese Herbal Preparations (Mean±SD; n=3)
Compound H erb Couple P ie n - tu n g - w a n K a n - lu - s a n
1 7.4310.14 4.6910.27 5.3210.362 17.34±1.00 7.59±0.23 6.3510.123 32.47±0.80 12.17±0.35 17.1110.394 1.2410.11 1.3210.02 1.0710.025 4.8910.27 2.5810.22 3.1110.176 2.7710.18 1.8610.19 1.8910.227 2.7610.17 2 .0 0 1 0 . 2 2 1.8910.068 10.0710.52 4.2110.26 5.9310.209 6.5610.05 - -1 0 10.1510.21 - -11 0.4.3 10.03 - -
12 0.7710.07 - -
13 1.3.7 10.0.7 - -
14 4.9610.24 - -
15 1.29K). 14 - -
16 1.1910.08 - -
17 2.3810.08 - -
The content was below detection limit. Compound 1 - 8 were measured by CZE and 9-17 were determined by MECC.
equations, the contents of the individual alkaloids in the coptis-evodia herb couple were calculated. Alkaloid contents in the herb couple containing Chinese herbal preparations such as P ie n - tu n g -w a n and K a n - lu -s a n could also be determined by the same procedure.
The results arc given in Table 4. Data in Table 4 show that there are only the water-soluble components, quaternary alkaloids, present in the preparation decoction. Those alkaloids (9-17) that were water insoluble or practically insoluble were absent or existed in the amount below detection limits.
This work has successfully demonstrated that, by optimizing parameters such as maleic acid, phosphate and acetonitrile concentration of the electrophoretic media, high resolution separation of a complicated mixture can

ALKALOIDS IN COPTIS-EVODIA HERB COUPLE 77
easily be achieved. Furthermore, the results obtained indicate that the CZE method proposed for the separation and determination of quaternary' alkaloids may be conveniently used for quality' assurance of commercially available samples of some Chinese herbal preparations that contain coptis and evodia and also for quality' control in pharmaceutical factories.
ACKNOWLEDGEMENT
Financial support from the National Science Council. Republic of China, is gratefully acknowledged (NSC 85-2113-M-003-008).
REFERENCES
1. C. L. Lin. H. Y. Hsu. Herb Couples, Oriental Healing Arts Institute. LosAngeles. CA. 1992. pp. 1-13. p. 25.
2. H. Y. Hsu. Y. P. Chen. S. J. Sheu. C. H. Hsu. C. C. Chen. H. C. Chang.Chinese Material Medica—A Concise Guide, Modern Drug Press. Taipei. 1985. pp. 112-113. 288-289.
3. Y. Murayama, K. Shinozaki, J. Pharm. Soc. Jpn.. 46. 299-302 (1926).
4. M. Tomita. S. Kura. J. Pharm. Soc. Jpn.. 76. 1425-1426 (1956).
5. C. Tani. N. Takao. Yakugaku Zasshi. 77. 805-806 (1957).
6 . G. Kurono, K. Ogura. Y. Sasaki. Yakugaku Zasshi. 85. 262-266 (1965).
7. M. P. Cava. T. A. Reed. J. L. Beal. Lloydia. 28. 73-83 (1965); Chem.Abstr.. 63. 3226f (1965).
8 . Y. Asahina. J. Pharrn. Soc. Japan.. 503. 1-7 (1924).
9. T. Nakasato. S. Asada. K. Marui. Yakugaku Zasshi. 82. 619-626 (1962).
10. B. Danieli. G. Lesma. G. Palmisano. Experientia. 35. 156 (1979); Chem.Abstr.. 90. 135100 (1979).
11. T. Sugimoto. T. Miyase. M. Kurovanagi. A. Uene. Chem. Pharm. Bull.. 36,4453-4461 (1988).

78 LEE AND SHEU
12. T. Kamikado. C. F. Chang. S. Murakoshi, A. Sakurui. S. Tamura, Agric.Biol. Chem.. 40. 605-609 (1976); Chem. Abstr.. 84. 80446 (1976).
13. Y. M. Liu. S. J. Sheu. J.Chromatogr.. 623, 196-199 (1992).
14. M. C. Lee, W. C. Chuang. S. J. Sheu, J. Chromatogr. A, submitted forpublication.
Received April 14. 1996 Accepted May 28. 1996 Manuscript 4141

J. LIQ. CHROM. & REL. TECHNOL., 20(1), 79-100 (1997)
PRECONCENTRATION OF ALIPHATIC AMINES FROM WATER DETERMINED BY CAPILLARY
ELECTROPHORESIS WITH INDIRECT UV DETECTION
W. H. M atchetC W. C. Brumley*
U.S. Environmental Protection Agency National Exposure Research Laboratory
Characterization Research DivisionP.O. Box 93478
Las Vegas, NV 89193-3478
ABSTRACT
Preconcentration methodology based on adsorption chromatographies for enriching aliphatic amines (Cl to C4 substituted primary, secondary, and tertiary) and alkanolamines in water was studied by free zone capillary electrophoresis (CZE) with indirect UV detection. The solid-phase extraction of amines from water (pH 5) as a preconcentration step was studied for ion exchange solid-phase extraction (SCX) cartridges, cation ion exchange extraction disks, and ion-pairing with Clg extraction disks. In the course of the investigations, the electrophoretic properties of the amines was studied in some detail in order to optimize separations and detection limits. The indirect mode is particularly powerful in being able to detect primary through quarternary amines without derivatization. Mobilities of amines were correlated with their Stokes' radii. Increased selectivity for resolving closely related amines under CZE was explored using nonionic surfactants, pH adjustment, and optimized background
79
Copyright €> 1997 by Marcel Dekker, Inc.

80 MATCHETT AND BRUMLEY
electrolyte. Techniques were developed for obtaining stable baselines in the indirect detection mode. Linearity, sensitivity, and efficiency were explored for this mode of detection for a large set of amines.
INTRODUCTION
Aliphatic amines are toxic substances and irritants to mucous membranes1
that are among the common chemicals of commerce. They are used as corrosion inhibitors in steam boilers and as starting materials in the manufacture of pharmaceuticals, insecticides, herbicides, fungicides, polymers, surfactants, and rubber accelerators. The related alkanolamines function as solvents and starting materials for surfactants, but they appear to be less toxic than the aliphatic amines.
The many commercial uses and natural occurrences of aliphatic amines (here we refer primarily to C, to C.i alky l-substituted primary , secondary , and tertiary amines) suggest that ultimately they w ill appear in the environment as pollutants. Thus, they are target analytes of U S. EPA Method 8260“ (also Method 6243) w here they are classified as volatiles.
The U S. EPA. EMSL-LV. maintains a continuing interest in analytical methods for amines because of their wide occurrence and toxicity' and because there is need for determinative methods for amines as a result of the listing activities for various hazardous wastes under RCRA1 when amines are suspected to be present.
Aliphatic amines are basic compounds with pKb values5 of approximately 5 X 10“'. The replacement of an aliphatic group, or hydrogen, of an amine with an aromatic ring causes a profound change in the basicity, typically reducing the pKb by six orders of magnitude. Aliphatic amines and their derivatives arc essential to life, functioning as neurotransmitters and hormones6
and occurring in biological tissues and fluids.
Aliphatic amines can present chromatographic problems due to their reactivity and extreme basicity . Derivatization has. therefore, been frequently employed. However, derivatization (e g.. Method 8042)' has not achieved as wide adoption in environmental analysis as it has in biological and pharmaceutical analy sis. Part of the reason may lie in the large number and complex nature of environmental matrices and the possibility of artifact formation from co-extractives.

ALIPHATIC AMINES BY CE 81
Gas chromatography (GC) is frequently used to separate amines using a variety of GC detectors. Amines can be chromatographed underivatized on porous polymers such as HaveSep B, even in the presence of w ater." Chromosorb 102 treated with KOH1“ and liquid-coated supports using ammonia as carrier gas1’ have been reported. Alternatively, a variety of derivatizing agents have been used for the GC of amines . 14 ,8
Liquid chromatography has often been the separation technique of choice for amines due to the variety of derivatizing agents available to introduce chromophores for UV detection or fluorophores for fluorescence detection.1419'3' Other techniques used to separate amines include supercritical fluid chromatography . 36 thermospray LC/MS . 37 and ion chromatography . 38
Applications of capillary electrophoresis to environmental analysis have increased dramatically . 39' 46 Usually, these applications have depended on UV detection with separations using free zone electrophoresis or micellar electrokinetic chromatography (MEKC). Applications of CE to inorganic cations and anions have been based on indirect UV detection .47 Beck and Englehardt developed applications of imidazole and other chromophoric amines as background ions for indirect detection of aliphatic amines and alkali ions in water samples .48 As pointed out by Kuhr and Yeung . 49 indirect detection methods in CE have their origin in ion chromatography applications.'“ Kuhr and Yeung have discussed the conditions for optimization of indirect UV and fluorescence detection . 31 Kuhr has introduced indirect fluorescence detection under MEKC conditions ' 3 and further discussed indirect fluorescence detection."
In this work, we evaluate various solid-phase extraction (SPE) adsorbents and systems for the preconcentration of aliphatic amines and some alkanolamines in water. The recoveries from these adsorbent systems are determined using capillary zone electrophoresis (CZE) with indirect UV detection. Three adsorbent systems were examined fcr the concentration of amines from water: ( 1 ) cation exchange ' 4 solid-phase extraction cartridges. (2 ) ion-pairing with extraction disks, and (3) cation exchange extraction disks. In the course of the recovery studies, procedures were developed to optimize separations and characterize the electrophoretic properties of amines. Correlations of electrophoretic mobilities with structure were m ade." ' 6 and practical techniques were developed for minimizing baseline fluctuations. Resolution of amines w ith similar mobilities was effected by' adding nonionic surfactants' or through pH selection and optimized matching of mobility of amines w ith that of the background electrolyte. 1
82 MATCHETT AND BRUMLEY
EXPERIMENTAL
Chemicals
All organic compounds were obtained from Aldrich Chemical Company, Inc. (Milwaukee. WI. USA) unless otherwise specified. Other chemicals were from standard sources of supply, and all were used as received. Deionized water (ASTM Type II) was used for all aqueous solutions. Solutions were freshly prepared for each experiment. Liquid amines were measured gravimetrically for preparation of standard solutions.
Capillary Electrophoresis
A P/ACE Model 2050 Capillary Electrophoresis System (Beckman Instruments, Fullerton, CA, USA) was used for all capillary electrophoretic experiments. The instrument was fitted with a capillary 57 cm X 75-p.m ID .. 50 cm to the detector, with UV detection at 214 nm. The temperature of the capillary7 was 25°C. and electrophoretic runs were 10 minutes at 30 kV. The capillary was equilibrated with running buffer at the start of each experiment, and washed extensively with acid, alkali, water, and running buffer between runs. Migration times, peak widths, and dynamic reserves were estimated directly from the monitor of the data sy stem (software System Gold. Ver. 6.1). Corrected peak areas, as computed by the data system (peak area multiplied by the velocity of the ion [length to the detector divided by time]), were normalized to the corrected peak area of the internal standard (tetrabutylammonium ion) as a control for the small variations in the nominal volumes of the pressure injections (ca. 5 nL from 1-s injections).
Solid Phase Extraction Studies
Solid phase extraction disks (Bakerbond Octadecyl C18; J.T. Baker, Inc., Phillipsburg. NJ. USA) and SCX cartridges containing 500 mg benzenesulfonic acid and used for cation exchange (Varian Associates Inc.. Sunnyvale. CA. USA) were prepared according to the manufacturers’ instructions. An experimental product cation exchange disk was a gift of 3M Industrial and Consumer Sector, New Products Department, St. Paul, MN, USA. Aqueous solutions of analytes were applied at flow rates of about 1 L/h. Increasing flow rates to 1 1/15 min for disk extractions did not adversely affect recovery.
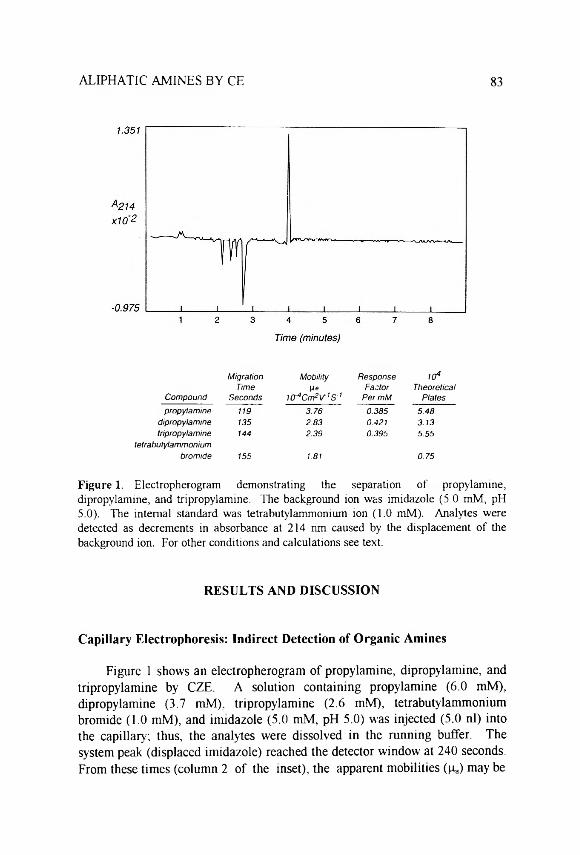
ALIPHATIC AMINES BY CE 83
C om pound
M igrationTime
Seconds
M obility[ie
t d ^ C n ^ V 1 S '1
Response Factor
P er mM
104Theoretical
Plates
propylam ine 119 3.76 0.385 5.48dipropylam ine 135 2.83 0.421 3.13tripropylam ine
tetrabutylammonium144 2.39 0.395 5.55
brom ide 155 1.81 0.75
Figure 1. Electropherogram demonstrating the separation of propylamine,dipropylamine, and tripropylamine. The background ion was imidazole (5.0 mM, pH 5.0). The internal standard was tetrabutylammonium ion (1.0 mM). Analytes were detected as decrements in absorbance at 214 nm caused by the displacement of the background ion. For other conditions and calculations see text.
RESULTS AND DISCUSSION
Capillary Electrophoresis: Indirect Detection of Organic Amines
Figure 1 shows an electropherogram of propylamine, dipropylamine, and tripropylamine by CZE. A solution containing propylamine (6.0 mM), dipropylamine (3.7 mM), tripropylamine (2.6 mM), tetrabutylammonium bromide (1.0 mM), and imidazole (5.0 mM, pH 5.0) was injected (5.0 nl) into the capillary'; thus, the analytes were dissolved in the running buffer. The system peak (displaced imidazole) reached the detector window at 240 seconds. From these times (column 2 of the inset), the apparent mobilities (ga) may be
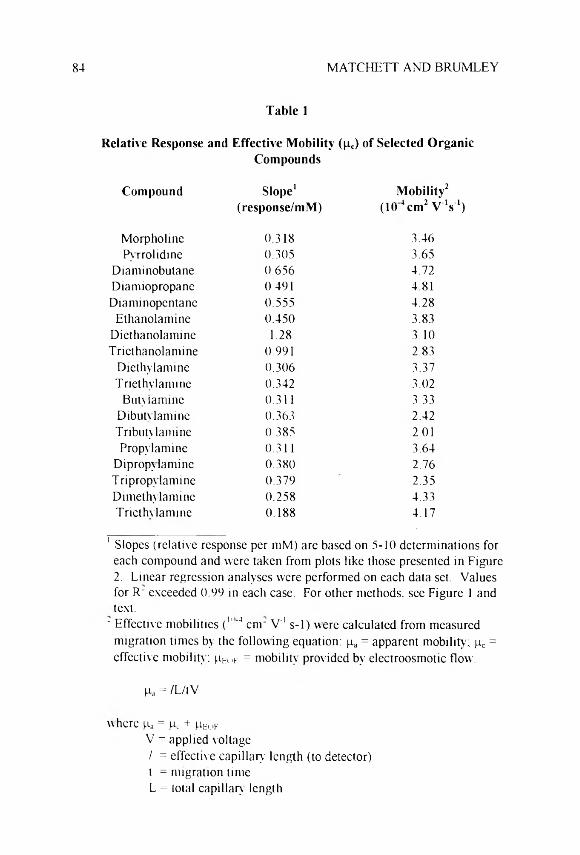
84 MATCHETT AND BRUMLEY
Table 1
Relative Response and Effective Mobility (pc) of Selected OrganicCompounds
Compound Slope1(response/mM)
Mobility2 *(104 cm2 V V )
Morpholine 0.318 3.46Pyrrolidine 0.305 3.65
Diaminobutane 0.656 4.72Diamiopropane 0.491 4.81Diaminopentane 0.555 4.28
Ethanolanune 0.450 3.83Diethanolamine 1.28 3.10Triethanolamine 0.991 2.83
Diethylamine 0.306 3.37Triethylamine 0.342 3.02
Butyiamine 0.311 3.33Dibutylaminc 0.363 2.42Tributy lan tine 0.385 2 .0 1
Propylamine 0.311 3.64Dipropylamine 0.380 2.76Tripropylamine 0.379 2.35Dimethylamine 0.258 4.33Triclhvlamine 0.188 4.17
' Slopes (relative response per mM) are based on 5-10 determinations for each compound and were taken from plots like those presented in Figure2. Linear regression analyses were performed on each data set. Values for R~ exceeded 0.99 in each case. For other methods, see Figure 1 and text.
" Effective mobilities (" ' 4 c n r V ' 1 s-1) were calculated from measured migration times by the following equation: pa = apparent mobility; pc = effective mobility; pE0F = mobility provided by electroosmotic flow.
Pa = /L/tV
where pa = pc + pE0FV = applied voltage/ = effective capillary’ length (to detector) l = migration time L = total capillary length
ALIPHATIC AMINES BY CE 85
calculated. The effective mobilities (p.e; column 3 of inset) are then obtained from familiar equations of CE (see also Table l ) . 58 The relationship between the mobility of the amines and the background electrolyte is of interest, and we shall correlate the mobility with an empirical relationship for a large class of amines. The relationship between the response factor (corrected area of analyte ion/corrected area of internal standard ion) of each peak and the concentration of that particular analyte in the test solution injected into the capillary is shown in column 4 (inset). The proportionality between concentration of analyte and the response factor of its peak was constant over a 150-fold concentration range.
Theoretical plate number, or the height equivalent to a theoretical plate (HETP) is a measure of zone broadening and of efficiency of separation and will be discussed in a later section of this paper (cf. Figure 4). The analyte peaks shown in Figure 1 exhibited plate numbers (column 5) from about10.000 to more than 50.000.
The area of the positive peak which migrates at the EOF, as verified by measuring the migration time of benzyl alcohol, and represents the displaced chromophoric background ion. imidazole, was very nearly equal to the sum of the areas of the negative peaks representing the positively charged cationic analytes and the internal standard. In a series of 15 electropherograms (not presented here), the ratios of the sums of the negative peaks to the sums of the positive peaks were calculated. The average of these ratios was 1.072, and the standard deviation was 0.031.
These results suggest that the analyte ions effect a nearly 1:1 displacement of background electrolyte ions because the analyte ions are dissolved in the running buffer (background electrolyte).5'
Detector Response is a Linear Function of Analyte Concentration
The usefulness of any determination depends on its ability to measure a target analyte over a useful range of concentrations with a response that is directly proportional to concentration over the entire range. Several experiments demonstrated that the method permitted detection of the analytes of interest over a 150-fold range of concentrations, from 0.02 mM to 3.0 mM, with as little as 5-nL injections (Fig. 2). The mass limit of detection was about0 . 1 pmol of analyte injected on-column.

86 MATCHETT AND BRUMLEY
RelativeResponse
ArbitraryUnits
F i g u r e 2 . Relative response is a linear function of analyte concentration. Relative responses (corrected area of analyte peak divided by corrected area of internal standard peak) are plotted as a function of the analyte concentrations injected into the capillary. Upper inset gives results for the indicated compounds in similar experiments. Inset at lower right shows enlargement of the plot near the origin surrounded by the dotted line.
The inset in the lower right comer of Figure 2 shows an enlarged plot of that portion of the main figure (dotted outline) representing concentrations of analytes from 0.02 mM to 0.1 mM. Linear regression analyses on data sets like that of Figure 2 gave correlation coefficients (R:) in excess of 0.99. In the upper inset of the figure are results for six of the organic compounds studied here. Similar analyses were conducted for all of the compounds listed in Table1. where the slopes of the regressions are given. The detection limit was about1.5 ppm without preconcentration.
ALIPHATIC AMINES BY CE 87
Migration Time and Electrophoretic Mobility Correlations
The electrophoretic mobilities of the organic compounds were calculated from the observed migration times taken directly from data like those presented in Figure 1 and are listed in Table 1. The intrinsic mobility of the internal standard, tetrabutylammonium ion, in these experiments was 1.81xl0'4 c n r V 'V and varied less than 1% between experiments. In contrast, the value of peo in these experiments was quite variable. In a typical experiment, the data permitted 15 determinations of the mobility imparted by the EOF. The average of these was 3.50 with a standard deviation of 0.45.
The mobilities calculated for the organic amines were in accord with expectations, which follow from the basic equation describing electrophoretic mobility:
p e = q/(67 ir|r)
where pe = electrophoretic mobilityq = ion chargeT = solution viscositj’r = ion radius.
The relationship predicts that small, highly charged species would exhibit high mobilities and that large, minimally charged species would exhibit low mobilities. 59 In some cases, the radius must include the solvation sphere of the ion. Figure 3 presents a plot of the reciprocal of the Stokes' radius, based on the empirical formula l/(m /z ) ° 7 , 68 of the organic compounds listed in Table 1 as a function of their calculated electrophoretic mobilities. This plot suggests a qualitative inference may be possible in predicting the m/z value of an unknown amine whose mobility falls on the curve between known compounds. The data point representing the ammonium ion (pe = 5.8) fell well off the curve, suggesting that the computation used for the organic amines underestimated the effective radius of this ion. These data represent an extension of previous studies to a larger data set o f aliphatic amines of environmental interest.
The ionic radii for several inorganic cations (potential interferences to indirect detection of aliphatic amines) can be plotted as a function of their calculated electrophoretic mobilities (not shown). For these ions, the mobility increased with increasing ionic radius.

88 MATCHETT AND BRUMLEY
Figure 3. Electrophoretic mobility of several organic amines as a linear function of the reciprocal of their Stokes' radii [l/(m/z)°7]. The mobilities listed in Table 1 are plotted as a function of this parameter for each of the listed compounds. The point lying well off the curve (mobility=5.8) represents the ammonium ion.
One explanation for this, offered by Hamed and Owen61’ is that relatively small ions of high charge density would be expected to exhibit relatively large hydration spheres. With increasing radius of given ions, both the hydration number and the radius of the hydration sphere decrease .61
Theoretical Plate Number and Efficiency of Separation
The efficiency of separations attainable with electrophoretic methods is determined by a combination of at least two factors. The first is the effective mobility (pe). w hich is determined by charge, size, and resistance to flow' of an analyte. The second is dispersion of the analyte ion, which determines the zone length . 79 Dispersion in CE is often dominated by longitudinal diffusion and depends on the molecular diffusion coefficient (D). which can be determined under CZE conditions.62 Dispersion, or zone length, is also dramatically
ALIPHATIC AMINES BY CE 89
influenced by the length of the injection plug and, in the indirect detection method described here, by the difference between the electrophoretic mobility of the analyte and the electrophoretic mobility of the background ion itself, according to the Kohlrausch regulating function .4 ,f9 Dispersion will be minimal when the mobilities of both the analyte and the background ion are equal or nearly so . 4 7,63 With indirect detection, peak broadening will increase as the concentration of the analyte approaches that of the background ion .64
Zone length or broadening of the peak in an electropherogram may be quantified by calculating the plate number according to:
N = 5.545 (t/w'1/2 ) 2
where t = migration time in seconds
W) ,2 = peak width, in seconds, at half height
Plate counts of the order of 300.000 are quite satisfactory .63,65 Zone broadening relative to the concentration of analyte is negligible when the analyte concentration is two orders of magnitude below that of the background ion.
In the work reported here, we have noted the previously observed inverse relationship between theoretical plate number and analyte concentration at constant injection volume. These observations are presented in Figure 4, where the reciprocals of the calculated theoretical plate numbers are plotted as a function of the concentrations of injected tripropylamine solutions. The linear relationship thus obtained permitted extrapolation to infinite dilution of the analyte. From the intercept on the ordinate, we inferred the theoretical plate number at zero analyte concentration. Data for tripropy lamine are presented in the figure, and from the ordinal intercept a maximal plate number of 2 . 2 2 x 1 o 6 was obtained.
Similar plots were prepared for each of the compounds listed in the inset (Fig. 4). As shown, these plate numbers were of the order of 2 to 4 x 10\ and were comparable to those reported by Gross and Yeung64 and indicate satisfactory efficiencies.
Maximal theoretical plate numbers were calculated for these compounds based on an assumed value for diffusion coefficients of the order of 1x 1 0 o c m V . These values were found to vary between 1.8 and 2.9 x 10⁶ plates. The plate numbers measured and reported here (1.8 to 3.5 x 10⁵) represented 10%
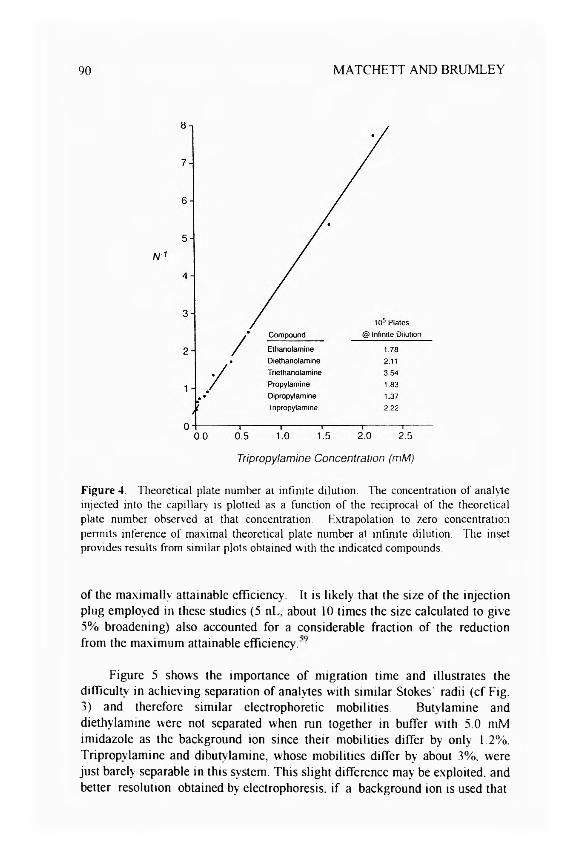
90 MATCHETT AND BRUMLEY
Tripropylamine Concentration (mM)
F ig u re 4. Theoretical plate number at infinite dilution. The concentration of analyte injected into the capillary is plotted as a function of the reciprocal of the theoretical plate number observed at that concentration. Extrapolation to zero concentration permits inference of maximal theoretical plate number at infinite dilution. The inset provides results from similar plots obtained with the indicated compounds.
of the maximally attainable efficiency. It is likely that the size of the injection plug employed in these studies (5 nL. about 10 times the size calculated to give 5% broadening) also accounted for a considerable fraction of the reduction from the maximum attainable efficiency . '’9
Figure 5 shows the importance of migration time and illustrates the difficulty in achieving separation of analytes with similar Stokes" radii (cf Fig. 3) and therefore similar electrophoretic mobilities. Butylamine and diethylamine were not separated when run together in buffer with 5.0 mM imidazole as the background ion since their mobilities differ by only 1 .2 %. Tripropvlamine and dibutylamine, whose mobilities differ by about 3%. were just barely separable in this system. This slight difference may be exploited, and better resolution obtained by electrophoresis, if a background ion is used that

ALIPHATIC AMINES BY CE 91
A B
Compound Mobilitybutylamine 3.33diethylamine 3.37tetrabutylammonium bromide 1.81
Compound Mobility
tripropylamine 2.35dibutylamine 2.42tetrabutylammonium bromide 1-81
cCompound Mobilitytripropylamine 2.25dibutylamine 2.31tetrabutylammonium bromide 1.81
D
Compound Mobility
dibutylamine 2.42tetrabutylammonium bromide 1.81
F ig u re 5. Efficiency of separation depends upon mobility and plate number. Panels A and B show that butylamine and diethylamine are poorly separated and that tripropylamine and dibutylamine are poorly separated in a running buffer consisting of 5.0 mM imidazole at pH 5.0. As shown in panel C, tripropylamine may be separated from dibutylamine by running in buffer consisting of 5.5 mM N-ethylbenzylamine at pH 5.5 and with the detergent POE 20 (2%). Panel D demonstrates that dibutylamine and tetrabutylammonium ion are well separated in either running buffer.
has a mobility more nearly equal to the mobilities of the barely separable pair of analytes. For example, as shown in Figure 5C, when tripropylamine and dibutylamine were run together with N-ethylbenzylamine (pH 5.1. 5.7 mM) as the background ion and in the presence of the nonionic surfactant57 Tween 20, a considerable improvement in separation was achieved even though no changes in the values of were observed. The mobilities of dibutylamine and tetrabutylammonium ion differ by 34% and were easily separated in either solvent.

92 MATCHETT AND BRUMLEY
Table 2
Separation of Similarly Migrating Compounds1
Effective Mobility (104 cm2 V ’s 1)
Compound N-ethylbenzylBenzyltriéthyl
ammoniumImidazole amine chloride
(5.0 mM, pH 5.0) (5.5mM, pH 5.1) (5.0 mM, pH 10.1)
Tetrabutyl- 1.81 1.81 1.75ammonium ion
Triethanolamine 2.83 N/D 1.75Dipropylamine 2.76 N/D 2.53Tipropvlamine 2.35 2.35 2.28Dibutylamine 2.42 2.42 2.29Butylamine 3.33 N/D 2.23
Diethylamine 3.37 N/D 2.61
1 See legends of Figure 1 and Table 1. N/D = not determined.
In Table 2 the results obtained with three buffer systems are compared. Note that triethanolamine and dipropylamine were well separated in benzyltriéthylammonium chloride at pH 10.1 but not in imidazole at pH 5.0. Similarly, butyl a mine and diethylamine were not separated in imidazole but were easily separated in benzyltriéthylammonium chloride. These data demonstrate that compounds that are difficult to separate in one electrolyte system may indeed be well separated in another system by taking advantage of slight differences in pKb values of the target analytes and by optimizing the mobility of the background electrolyte.
This situation is analogous to the recommendation of Terabe et. al. for the separation of weak acids at their respective values of pKa 66 To our knowledge, this principle has not been previously applied to the separation of aliphatic amines as shown here.
Addition to the running buffer of nonionic surfactants such as Tween 20 may also enhance resolution of closely migrating analytes. Ionic additives are not recommended in the indirect mode because they may well compete for displacement with the background electrolyte and thereby reduce the response.
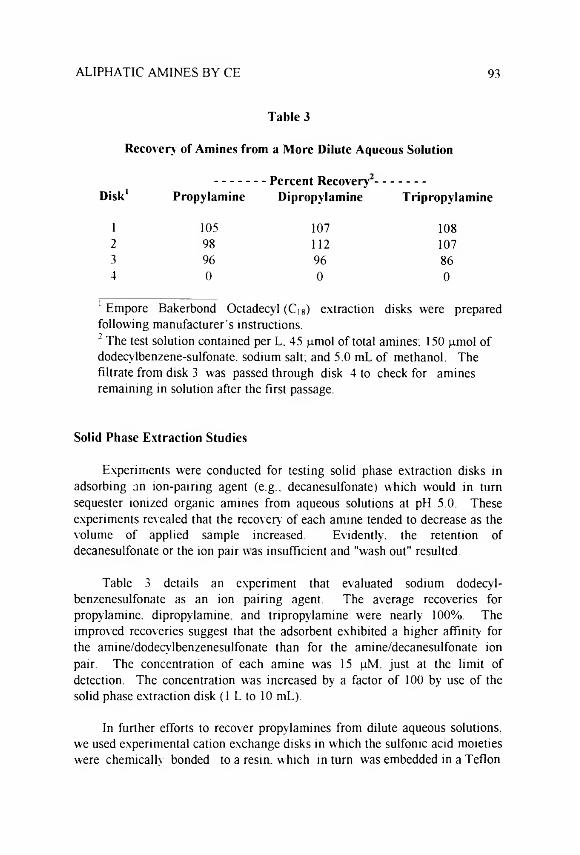
ALIPHATIC AMINES BY CE 93
Table 3
Recovery of Amines from a More Dilute Aqueous Solution
Disk1 2 Propylamine- Percent Recovery - -
Dipropylamine Tripropylamine
1 105 107 1082 98 112 1073 96 96 864 0 0 0
1 Empore Bakerbond Octadecyl (Ci8) extraction disks were prepared following manufacturer’s instructions.2 The test solution contained per L, 45 pmol of total amines; 150 pmol of dodecylbenzene-sulfonate. sodium salt; and 5.0 mL of methanol. The filtrate from disk 3 was passed through disk 4 to check for amines remaining in solution after the first passage.
Solid Phase Extraction Studies
Experiments were conducted for testing solid phase extraction disks in adsorbing an ion-pairing agent (e.g.. decanesulfonate) which would in turn sequester ionized organic amines from aqueous solutions at pH 5.0. These experiments revealed that the recovery of each amine tended to decrease as the volume of applied sample increased. Evidently, the retention of decanesulfonate or the ion pair was insufficient and "wash out" resulted.
Table 3 details an experiment that evaluated sodium dodecyl- benzenesulfonate as an ion pairing agent. The average recoveries for propylamine, dipropylamine, and tripropylamine were nearly 100%. The improved recoveries suggest that the adsorbent exhibited a higher affinity for the amine/dodecylbenzenesulfonate than for the amine/decanesulfonate ion pair. The concentration of each amine w'as 15 pM. just at the limit of detection. The concentration was increased by a factor of 100 by use of the solid phase extraction disk (1 L to 10 mL).
In further efforts to recover propylamines from dilute aqueous solutions, we used experimental cation exchange disks in which the sulfonic acid moieties were chemically bonded to a resin, which in turn was embedded in a Teflon

94 MATCHETT AND BRUMLEY
Table 4
Solid Phase Extraction of Organic Amines from Aqueous Solution: Sulfonic Acid Bonded to Poly(styrenedivinylbenzene) as
Cationic Exchange Resin1
------------Percent Recovery-------------Compound2 Sample 1 Sample 2 Sample 3 Average
Butylamine 49 67 60 59Dibutylamine 50 66 76 64Tributylamine 42 58 46 49Dimethylamine 1 2 15 23 17Diethylamine 10 14 18 14Triethylamine 1 2 16 20 16Propylamine 79 85 83 82
Dipropylamine 72 84 78 78Tripropylamine 74 75 68 72
1 Cation exchange disks (47-mm. sulfonic acid bonded to poly(styrene- divnylbenzene) copolymer, hydrogen form) were a gift of 3M. New Products Department, St. Paul, MN 55144. Disks were prepared by first washing with acetone, methanol, water, then very dilute H2S 0 4 (2 drops/ 100 mL), and finally with H20 until the pH reached5.5. Disks were then eluted with four 5.0-mL protions of 4% NH4OH in methanol (v/v); and following elution, the disks were regenerated as indicated in the washing procedure.2 Samples consisting of 1L. were passed through the disk at a flow rate of approximately 2 0 0 mL/min.
matrix. Several analytes were examined (Table 4). The recoveries for propyl-, dipropyl-, and tripropylamine compared well with the best ion-pairing results. Recoveries for some analytes, however, were disappointing. In particular, methylamine and ethylamine were not quantitatively recovered from the disks. Butyl-, dibutyl-, and tributyfamine approached quantitative recovery levels, and improvements may result from alternative elution conditions. All analytes were quantitatively sequestered. Recoveries were limited by our inability to elute analytes quantitatively from the disks using the 4% ammonium hydroxide in methanol54 (i.e., the system best suited for indirect detection). To our knowledge, these data represent the first report for the application of these disks for recover}' of aliphatic amines .67

ALIPHATIC AMINES BY CE 95
CONCLUSIONS
These results have demonstrated the utility of capillary electrophoresis coupled with indirect UV detection to measure the recovery of organic amines in aqueous solutions using various SPE techniques. The limit of detection was in the range of 0.02 mM. The results obtained showed a linear response over a 150-fold range in concentration for the several amines examined, and also that solid phase extraction could routinely achieve concentration factors on the order of 100-fold or more for selected analytes. The indirect detection mode is, however, the least selective and therefore the most subject to interferences. The indirect mode also imposes severe limitations on the choice of electrolytes, their concentrations, additives, and elution systems for solid phase extraction isolation. These restrictions impose practical limitations on the determination of amines in various matrices and to the levels obtainable. The indirect detection mode does offer broad applicability' since primary' through quarternary amines can be detected under one set of CE conditions. Future work will need to address cleanup techniques for eliminating interferences from inorganic ions such as the alkali metals and alkaline earths using organic solvents and pH. Additional work will examine selective derivatization for laser-induced fluorescence detection .6
NOTICE
The U.S. Environmental Protection Agency (EPA). through its Office of Research and Development, funded and performed the research described here. This work has been subjected to the Agency's peer review and has been approved as an EPA publication. The U.S. Government has the right to retain a non-exclusive, royalty-free license in and to any copyright covering this article. Mention of trade names or commercial products does not constitute endorsement or recommendation for use.
REFERENCES
1. Kirk-Othmer Encyclopedia of Chemical Technology . J. I. Korschwitz,M. Howe-Grant. Vol. 2. Fourth Ed.. J. Wiley & Sons, New York, 1991.
2. Test Methods for Evaluating Solid Waste (SW-846), Vol IB, U.S.Environmental Protection Agency, Washington, D C.. USA, 3rd ed.. November 1986.
96 MATCHETT AND BRUMLEY
3. Code of Federal Regulations, 40 CFR Pt. 136, App. A. Method 624, July 1,1988.
4. Resource Conservation and Recovery Act (RCRA), Part 261; Fed. Reg..45. No. 98 May 19. 1980.
5. J. D. Roberts. M. C. Caserio, Basic Principles of Organic Chemistry. W.A. Benjamin. New York. USA, 1965.
6 . D. Voet. J. G. Voet. Biochemistry, J. Wiley & Sons. New York. USA. 1990.
7. A. White. P. Handler. E. L. Smith. Principles of Biochemistry', McGraw-Hill. New York. USA. 1964.
8 . M. Kurosawa. Y. Shimizu. H. Tsukagoshi, M. Ueki. Allergy (CPH). 47,638-643 (1992).
9. A. Q. Zhang. S. C. Mitchell, R. Ayesh. R. L. Smith, J. Chromatogr.. 584.141-145 (1992).
10. S. H. Zeisel. K. -A. Dacosta, G. Fox, Biochem. J„ 232, 403-408 (1985).
11. Alltech Chromatography Catalog 300. Alltech Associates, Inc., Deerfield.IL. 1993.
12. K. Kuwata. Y. Yamazaki, M. Uebori. Anal. Chem.. 52. 1980-1982 (1980).
13. M. Abdel-Rehim. M. Hassan. H. Ehrsson, J. High Resolut. Chromatogr.,13. 252-256 (1990).
14. D. R. Knapp. Handbook of Analytical Derivatization Reactions. Wiley-Interscience. New York. USA. 1979.
15. H. Kataoka. S. Ohrui. Y. Miyamoto. M. Makita. Biomed. Chromatogr.. 6 .251-254 (1992).
16. M. J. Avery. G. A. Junk. Anal. Chem.. 57. 790-792 (1985).
17. T. Lundi). B. Aakesson. J. Chromatogr., 617, 191-196 (1993).
18. T. Tsukioka. H. Ozawa. T. Murakami, J. Chromatogr., 64, 395-400 (1993).

ALIPHATIC AMINES BY CE 97
19. Z. Wang. H. Xu, C. Fu, Sepu. 8 , 325-327 (1990) (Chinese).
20. M. -L. Henriks-Eckerman, T. Laijoki, J. Chromatogr., 333, 220-224 (1985).
21. M. C. Gennaro, E. Mentasti, C. Sarzanini, V. Porta, Chromatographia, 25,117-124 (1988).
22. J. -K. Lin. S. -S. Wu, J. Chin. Biochem. Soc., 14, 10-19 (1985).
23. K. D. Duong. H. Kolodziejczyk. D. D. Blanco-Gomis, R. Rosset, Analusis,19. 103-106 (1991).
24. K. D. Duong. H. Kolodziejczyk, R. Rosset, Analusis, 19. 154-157 (1991)(French).
25. P. Simon. C. Lemacon, Anal. Chem., 59, 480-484 (1987).
26. K. Hunter, D. Lindsay, Pestic. Sei., 12, 319-324 (1981).
27. J. Lehotay, V. Rattay. E. Brandsteterova, D. Oktavec, J Liq. Chromatogr.,15.307-318 (1992).
28. E. Mentasti. C. Sarzanini. O. Abollino, V. Porta, Chromatographia, 31, 41-49 (1991).
29. A. J. Bourque, I. S. Krull. J. Chromatogr., 537, 123-152 (1991).
30. R. Siegler. L. A. Sternson. J. Pharm. Biomed. Anal.. 6 , 485-492 (1988).
31. Y. Nishikawa. J. Chromatogr.. 392. 349-360 (1987).
32. C. J. Elskamp. G. R. Schultz. Am. Ind. Hyg. Assoc. J.. 47. 41-49 (1986).
33. G. M. Murray. M. J. Sepaniak, J. Liq. Chromatogr.. 6 , 931-938 (1983).
34. S. Baba. Y. Watanabe. F. Gejvo. M. Arakawa. Clin. Chim. Acta, 136. 49-56 (1984).
35. O.R. Idowu. G. O. Adequyi, J. Liq. Chromatogr., 16, 2501-2518 (1993).

98 MATCHETT AND BRUMLEY
36. F. David, P. Sandra, J. High Resolution Chromatogr., Chromatogr.Commun., 11, 897-898 (1988).
37. S. Imajo. T. Hiroi. S. Murai, Kcnkyu Hokoku - Kanagawa-ken KogyoShikensho, 63, 104-107 (1992) (Japanese).
38. B. Kersten, Chromatographia, 34, 11-12 (1992).
39. W. G. Kuhr. C. A. Monnig, Anal. Chem.. 64, 389R-407R (1992).
40. W. C. Brumley. J. Chromatogr., 603, 267-272 (1992).
41. W. C. Brumley, C. M. Brownrigg, J. Chromatogr., 646. 377-389 (1993).
42. C. P. Ong; H. K. Lee, S. F. Y. Li, J. Chromatogr., 542. 473-481 (1991).
43. S. Terabe, Y. Miyashita, O. Shibata, E. R. Barnhart, L. R. Alexander, D J.Patterson, B. L. Karger, K. Hosoya, N. Tanaka, J. Chromatogr., 516, 23- 31 (1990).
44. F. Foret, V. Sustacek. P. Bocek, Electrophoresis, 11. 95-97 (1990).
45. W. C. Brumley, C. M. Brownrigg. J. Chromatogr. Sci.. 32, 69-75 (1994).
46. D. Kaniansky, F. Ivânyi, F. I. Onuska, Anal. Chem., 6 6 , 1817-1824 (1994).
47. P. Jandik, W. R. Jones, A. Weston. P. R. Brown, LC-GC, 9. 634-645(1991) .
48. W. Beck, H. Engelhardt. Chromatographia, 33, 313-316 (1992).
49. W. G. Kuhr, E. S. Yeung, Anal. Chem., 60, 1832-1834 (1988).
50. S. -I. Mho, E. S. Yeung, Anal. Chem., 57, 2253-2256 (1985).
51. W. G. Kuhr, E. S. Yeung, Anal. Chem., 60, 2642-2646 (1988).
52. L. N. Amankwa, W. G. Kuhr, Anal. Chem., 63. 1733-1737 (1991).
53. L. N. Amankwa, M. Albin, W. G. Kuhr. Trends Anal. Chem.. 11, 114-120(1992) .

ALIPHATIC AMINES BY CE 99
54. J. R. Kaczvinsky, Jr.. K. Saitoh, J. S. Fritz, Anal. Chem., 55, 1210-1215(1983).
55. M. J. Wronski. J. Chromatogr. A, 657, 165-173 (1993).
56. C. Quang. M. G. Khaledi. J. Chromatogr. A, 659, 459-466 (1994).
57. S. A. Swedberg. J. Chromatogr., 503, 449-452 (1990).
58. E. S. Yeung, W. G. Kuhr. Anal. Chem., 63, 275A-282A (1991).
59. D. N. Heiger, High Performance Capillary Electrophoresis, Hewlett-Packard, Waldbronn 2, Germany (Publication # 12-5091-6199E).
60. H. S. Harned. B. B. Owen, The Physical Chemistry of ElectrolyticSolutions, 3rd ed.. Reinhold, New York, 1958.
61. F. A. Cotton. G. Wilkinson, Advanced Inorganic Chemistry. 5th ed.,Wiley-Interscience, New York, 1988.
62. M. S. Bello. R. Rezzonico, P. G. Righetti. Science, 266. 773-776 (1994).
63. F. Foret, S. Fanali, L. Ossicini, P. Bocek, J. Chromatogr., 470, 299-308(1989).
64. L. Gross. E. Yeung. J. Chromatogr.. 480. 169-178 (1989).
65. C. F. Poole, S. A. Schuette, Contemporary Practice of Chromatography,Elsevier. Amsterdam, 1984.
66. S. Terabe. T. Yashima. N. Tanaka. M. Araki. Anal. Chem., 60, 1673-1677(1988).
67. W. C. Brumley, W. H. Matchett, “Separation and Determination ofAliphatic Amines in Environmental Matrices by CE Using Indirect UV and Laser-Induced Fluorescence Detection.” Paper presented at the 17th International Symposium on Capillary Chromatography and Electrophoresis, Wintergreen, VA, May 7-11,1995.
68. J. Bennett, G. Gillen, J. Am. Soc. Mass Spectrom., 4, 930-937 (1993).

100 MATCHETT AND BRUMLEY
Enrôlée in the Senior Environmental Employee Program, assisting the U.S. Environmental Protection Agency under a cooperative agreement with the National Association for Hispanic Elderly,
Received April 12, 1996 Accepted April 30. 1996 Manuscript 4150

J. LIQ. CHROM. & REL. TECHNOL., 20(1), 101-110 (1996)
DETERMINATION OF NATURAL AND SYNTHETIC COLORS IN ALCOHOLIC AND
NON-ALCOHOLIC BEVERAGES BY QUANTITATIVE HPTLC
Susan M. Anderton. Christopher D. Incarvito,Joseph Sherma
Department of Chemistry Lafayette College
Easton. Pennsy lvania 18042
A B S T R A C T
Methods based on high performance thin layer chromatography with scanning densitometry and solid phase extraction were developed for quantification of lycopene and permitted synthetic food dyes in alcoholic and nonalcoholic beverages. Results of analyses of real samples are reported, and the methods were validated by determining the precision of replicate analyses and accuracy (recovery-) by analyzing spiked samples.
IN T R O D U C T IO N
Thin layer chromatography (TLC) has been used to separate and detect natural colorants added to food products to fraudulently intensify colors, such as ly copene, bixin. canthaxanthin. and beta-apo-8'-carotenal added to products deriv ed from red pepper. The pigments were quantified by scraping the zone
101
C o p y rig h t £ 1 9 9 7 b y M arce l D ek k er. Inc.

102 ANDERTON ET AL.
off the layer and elution front the silica gel with petroleum ether followed by spectrophotometry or by gradient elution high performance liquid chromatography (HPLC) after saponification.1 TLC combined with solid phase extraction (SPE) has been used for the identification of synthetic color additives (permitted FD&C food dyes) in nonalcoholic2'3 and alcoholic beverages.4 but quantification, which is usually performed by column liquid chromatography (HPLC)3,6 was not carried out.
The purpose of the present study was to develop quantitative high performance TLC (HPTLC) methods for natural and synthetic food colors, to demonstrate the application of the methods to actual samples, and to evaluate their sensitivity, selectivity, accuracy, and precision. A direct-spotting method is described for the determination of lycopene, the natural red pigment in tomatoes, in tomato juice and paste, which would be applicable for quantitative analysis of other sample types' to which this pigment had been added.
Methods are also described for the quantification of synthetic food colors in nonalcoholic beverages such as fruit drinks and soda and alcoholic wine coolers by SPE combined with HPTLC. SPE is required for these samples in order to concentrate the colors and remove interferences that cause analyte zones in sample chromatograms that are streaked or do not line up with standards.
EXPERIMENTAL
Standards and Standard Solutions
Lycopene (92.5% purity) and carotene standards were obtained from Sigma Chemical Co. (St. Louis. MO). TLC standard solutions (92.5 ng/pL were prepared in methylene chloride. Standards of the synthetic certified food colors listed in Table 1 were obtained from Warner Jenkinson Co. (St. Louis, MO, USA) with certificates of analyzed purity.
TLC standard solutions were prepared at concentrations of 180 ng/pL in ethanol-water (1:1) for C18 solid phase extraction (SPE) of nonalcoholic beverages and for amino-column SPE of alcoholic beverages, and in ethanol-0.2 M sulfuric acid (1:1) for amino-column SPE of nonalcoholic beverages. The Blue No. 1 solutions were diluted 1:10 (18.0 pg/pL) to prepare the TLC standard.

NATURAL AND SYNTHETIC COLORS 103
Thin Layer Chromatography
TLC was carried out on 10 x 20 cm Whatman (Clifton. NJ) LHPKDF laned, high performance preadsorbent silica gel plates prewashed by development with methylene chloride-methanol (1:1). Standards and samples were applied to the preadsorbent using a 10 pL Drummond (Broomall. PA) digital microdispenser, and plates were developed in a paper-lined, vapor saturated Camag (Wilmington, NC) HPTLC twin-trough chamber. After drying with warm air from a hair drier or in an oven for ca. 5 min., the areas of the colored zones were scanned with a Shimadzu (Columbia, MD) CS-930 densitometer in the single beam, reflectance mode at the wavelength of maximum absorption for each compound, as determined from the in situ spectra recorded between 370 and 700 nm with the spectral mode of the densitometer. A calibration curve was constructed by linear regression of standard area and weight data, and the weights of analyte in the spotted sample aliquots were interpolated from the curve. Accuracy was determined by adding a known amount of dye to a blank sample not containing that dye or spiking a preanalyzed sample with an additional amount of dye naturally contained. Recovery from these spiked samples was calculated by comparing the experimental concentrations of the dye with the theoretical concentration based on the level of fortification.
Analysis of Samples
Determination of lycopene in tomato juice and paste
Tomato juice was spotted directly with no sample preparation and tomato paste (6.32 g) was dissolved in 30.0 mL of deionized water prior to spotting. The lycopene TLC standard was spotted in 4.00, 6.00, and 8.00 pL aliquots (370, 555, and 770 ng, respectively) to prepare the calibration curve, along with duplicate 5.00 pL aliquots of the tomato juice and paste samples. Development of the plate with petroleum ether-methylene chloride (85:15) for a distance of 7 cm beyond the preadsorbent-silica gel interface required ca. 20 min., and the zones were scanned at 385 nm. The concentration of lycopene in tomato juice (mg/mL) was calculated by dividing the weight interpolated from the calibration curve by the volume of sample spotted.
For tomato paste (mg/g), the interpolated weight was divided by the sample volume spotted and multiplied by the volume of water in which the paste was dissolved; this weight was divided by the weight of paste used.
104 ANDERTON ET AL.
Determination of Synthetic Food Colors in Non-Alcoholic Beverages by Ci8 SPE
The applicability of the quantitative TLC method was demonstrated by determining Red No. 40 and Blue No. 1 food colors in fruit drinks, and the method was vaildated by analyzing a colorless citrus soda spiked with Red No. 40.
Samples were analyzed by use of a J. T. Baker (Phillipsburg. NJ) glass manifold (no. 7018-00) operated with sufficient vacuum (ca. 15-20 mm of mercury) to produce a flow rate of ca. 3 mL/min. Bakerbond 3 mL light-loaded Cis columns (no. 7189-03) were prewashed with 3 mL of isopropanol and 12 mL of deionized water. Columns were inserted into the manifold through stopcock-adaptors, which were adjusted to prevent the column from becoming dry during or after the conditioning stages. Following addition of 5.00 mL of sample with a pipet. the column was washed with 5 mL of 5% aqueous acetic acid to elute polar impurities, dried by drawing vacuum for 10 minutes, and removed from the manifold. Dyes were eluted into a 5 mL graduated vial with a tapered bottom by forcing an appropriate volume of the eluent through the column with gentle pressure from a rubber bulb. The eluent was adjusted to a definite volume prior to spotting for TLC analysis by dilution to a knowm volume w ith isopropanol or concentration by evaporation with nitrogen gas flow.
For the determination of Red No. 40 in a fruit punch, the dye was eluted from the SPE column with 2-2.5 mL of isopropanol-water (17:83), and the eluate volume was adjusted to 2.00 mL to prepare the TLC sample. Standard aliquots of 1.00. 2.00, 4.00. and 6.00 p.L (18.0-108 ng) and duplicate 2.00 pL aliquots of sample were applied to a silica gel layer, which was developed with butanol-acetic acid-water (4:1:5). Zones were scanned at 500 nm, and the concentration of dye (mg/mL) was calculated by' dividing the interpolated weight by the volume of TLC sample spotted, multiply ing by the total volume of sample, and dividing again by the volume of beverage placed on the column.
The determination of Blue No. 1 in a raspberry drink was carried out as above except that the dye was eluted from the column with 2.5-3 mL of isopropanol-water (23:77). the eluate was adjusted to 3.00 mL. the 1.00-6.00 pL standard aliquots contained 180 ng-1.08 ug of dye. duplicate 4.00 pL aliquots of sample solution were spotted (delete if same as above), and zones were scanned at 630 nm. For the determination of Red No. 40 and Blue No. 1 in a grape drink, both dyes were eluted from the SPE column with 2.5-3 mL of isopropanol-water (2:8) and the eluate adjusted to 3.00 mL to prepare the TLC standard. After TLC. as described above for the samples containing the

NATURAL AND SYNTHETIC COLORS 105
individual dyes, the separated dye zones in the sample chromatograms were scanned at their respective wavelengths of maximum absorption and quantified against calibration curves prepared from standards of each dye chromatographed on the same plate.
To determine the accuracy of the TLC method, a 0.0500 mg/mL spiked sample was prepared by diluting 50.0 pL of a 10.0 pg/pL standard solution of Red No. 40 to 10.0 mL with decarbonated, colorless citrus soda, and a TLC standard was prepared containing 200 ng/pL of the dye in ethanol-water (1:1). Five pL of the spiked sample was analyzed by eluting the SPE column with 5 mL of isopropanol-water (17:83). adjusting the eluate volume to 5.00 mL. and chromatographing duplicate 6.00 pL aliquots of sample together with 1.00. 1.50, and 2.00 pL aliquots of the TLC standard. The theoretical weight in the sample aliquots was 300 ng for 100% recovery, which would match the 1.50 pL standard.
Determination of Synthetic Food Colors in Non-Alcoholic Beverages by Amino Column SPE
The applicability of the method was demonstrated by determining Yellow No. 5 and Blue No. 1 food colors in a lemon-lime drink, and the method was vaildated by analyzing a colorless citrus soda spiked with Blue No. 1.
SPE and TLC were performed in general as described in the last section with the following changes. SPE was performed on Fisher (Pittsburgh. PA) PrepSep NH: columns (no. P456). which were prewashed with 5 mL of ethanol-water (1:1) and 10 mL of deionized water. Follow ing addition of 10.0 mL of sample with a pipet. the column was washed with 10 mL of ethanol and 40 mL of w ater to elute interferences, and the column w as not dried by draw ing vacuum. The colors were eluted with 3.5-4.0 mL ethanol-0.20 M sulfuric acid (1:1) into a 10 mL vial, and the eluate was blown down just to dryness under a nitrogen stream and reconstituted in 1.00 mL of ethanol-0.2 M sulfuric acid (1:1). The mobile phase was butanol-ethanol-water-ammonia (50:25:25:10), and 1.00. 2.00. 4.00, and 8.00 pL of the TLC standards (18.0-108 ng for Blue No. 1 and 0.180-108 pg for Yellow No. 5) were spotted with duplicate 7.00 pL sample aliquots. Blue and yellow dye zones were scanned at 630 and 420 nm. respectively.
To determine the accuracy of the TLC/amino SPE method, a 0.0500 mg/mL spiked sample of Blue No. 1 in decarbonated colorless citrus soda and corresponding TLC standard were prepared as described above for the Red No.

106 ANDERTON ET AL.
40 spike. Recovery analyses were performed as for described for the unknown lemon-lime drink except that 5.00 mL of sample was applied to the column; the dye was eluted with 5.0 mL of ethanol-0.2 M sulfuric acid (1:1) and the eluate volume was adjusted to exactly 5.00 mL; and 2,00, 4.00, and 6.00 uL (40.0- 120 ng) and duplicate 2.00 pL of sample were applied for TLC.
Determination of Synthetic Food Colors in Alcoholic Beverages by Amino Column SPE
Red No. 40 and Yellow No. 5 were determined in strawberry- and lemon- flavored wine coolers, respectively, using the SPE technique described above for nonalcoholic beverages except that 30.0 mL of sample was applied to the amino column, the column was washed with 10 mL of water instead of 40 mL to elute interferences, the colors were eluted with 4.0 mL of ethanol-0.5 M sulfuric acid (1:1). and the evaporated eluate was reconstituted in 1.00 mL of ethanol-water (1:1). TLC was carried out using 0.50-8.00 uL of standards and duplicate 9.00 pL (yellow) and 2.00 pL (red) aliquots of samples. Mobile phases were butanol-ethanol-water ammonia (50:25:25:10) (yellow) and butanol-acetic acid-water (4:1:5) (red), and zones were scanned at 420 and 500 nm. respectively. Accuracy was determined by analyzing a wine cooler containing Yellow No. 5 and then spiking the sample with a sufficient volume of a 1.83 mg/mL stock solution to double the dye concentration. The analysis was repeated and duplicate 4.5 pL aliquots of the spiked sample were spotted with duplicate 9.0 pL aliquots of the original sample on the same plate. The average scan areas of the two samples would be equal for 100% recovery.
RESULTS AND DISCUSSION
Determination of Lycopene
Lycopene standard formed a red-orange flat, oval-shaped zone with an Rf value of 0.32 when developed with petroleum ether-methylene chloride (85:15) on preadsorbent HPTLC silica gel plates. Development with petroleum ether- acetonitrile-methanol (2:2:4) on a Whatman LKC-18F reversed phase bonded silica gel layer produced a compact lycopene standard zone with an Rt- value of0.24. but directly-spotted samples did not chromatograph as well on the C]8 plate as on silica gel. which was used in all analyses. No sample preparation was required for analysis of tomato juice or dissolved tomato paste because directly spotted samples produced zones that matched standards in migration distance and shape. The in situ visible spectrum of a standard zone exhibited a

NATURAL AND SYNTHETIC COLORS 107
major absorption peak at 385 nm and a smaller peak at 440 nm. This spectrum differed markedly from the spectrum recorded in petroleum ether, which had three roughly equal peaks at 446, 475, and 505 nm. Carotene, which is also present in tomatoes, was separated from lycopene as a yellow v-shaped zone with an Rf value of 0.57. The red zones from the samples and the lycopene standard had identical Rf values and in situ spectra, which confirmed the identity of lycopene in the sample.
For quantification, samples and standards were scanned at 385 nm immediately after TLC because zones faded with increased time of standing due to photochemical air oxidation, resulting in decreased scan areas. The calibration curve prepared from the area of the three standard aliquots had a linear regression correlation coefficient (r value) of 0.99. A sample of tomato juice was analyzed four times and the average concentration of lycopene found w'as 0.123 mg/mL w'ith a coefficient of variation (CV) of 3.7%, while dissolved tomato paste assayed at 0.483 mg/g with a CV of 0.72%. As another indication of the excellent precision of the quantitative TLC method, the differences between the scan areas of the duplicate 5.00 pL sample aliquots w'ere 1.2% and 1.8%. respectively.
Although the applicability of the new direct TLC method was demonstrated for the analysis of two tomato products, it is equally appropriate for the quantification of lycopene in red pepper products to which it has been added as a coloring agent. The same extraction and solvent partition cleanup methods already described for indirect quantification by spectrometry after scraping and elution of TLC zones and proven to provide quantitative recoveries1 would be used prior to the much simpler described densitometric TLC method. The method can also be combined with the alumina column chromatographic isolation of lycopene in tomato paste described in university laboratory manuals7 to form the basis of an excellent organic/analytical student experiment.
Determination of Synthetic Food Colors
The Rf values of 11 synthetic colors encountered in beverages are shown in Table 1 for the two mobile phases used in this study. Red No. 40, Blue No. 1, and Yellow No. 5, which are among the most widely used colors, were chosen to test the quantitative methods for nonalcoholic beverages. With both mobile phases, the dyes formed compact, flat, v-shaped zones that produced narrow, symmetrical scan peaks. Calibration curves typically had r values of0.96-0.99.
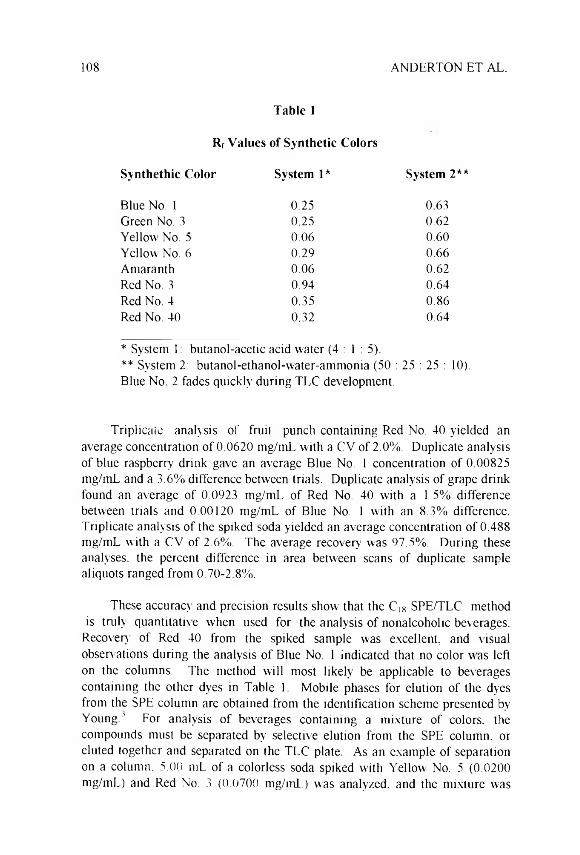
108 ANDERTON ET AL.
Table 1
Rf Values of Synthetic Colors
Synthethic Color System 1* System 2**
Blue No. 1 0.25 0.63Green No. 3 0.25 0.62Yellow No. 5 0.06 0.60Yellow No. 6 0.29 0.66Amaranth 0.06 0.62Red No. 3 0.94 0.64Red No. 4 0.35 0.86Red No. 40 0.32 0.64
* System 1 : butanol-acetic acid water (4 : 1 : 5).** System 2: butanol-ethanol-water-ammonia (50 : Blue No. 2 fades quickly during TLC development.
25 : 25 : 10).
Triplicate analysis of fruit punch containing Red No. 40 yielded an average concentration of 0.0620 mg/mL with a CV of 2.0%. Duplicate analysis of blue raspberry drink gave an average Blue No. 1 concentration of 0.00825 mg/mL and a 3.6% difference between trials. Duplicate analysis of grape drink found an average of 0.0923 mg/mL of Red No. 40 with a 1.5% difference between trials and 0.00120 mg/mL of Blue No. 1 with an 8.3% difference. Triplicate analysis of the spiked soda yielded an average concentration of 0.488 mg/mL with a CV of 2.6%. The average recovery was 97.5%. During these analyses, the percent difference in area between scans of duplicate sample aliquots ranged from 0.70-2.8%.
These accuracy and precision results show that the C]8 SPE/TLC method is truly quantitativ e when used for the analysis of nonalcoholic beverages.
Recovers’ of Red 40 from the spiked sample was excellent, and visual observations during the analysis of Blue No. 1 indicated that no color was left on the columns. The method will most likely be applicable to beverages containing the other dyes in Table 1. Mobile phases for elution of the dyes from the SPE column are obtained from the identification scheme presented by Young.3 For analysis of beverages containing a mixture of colors, the compounds must be separated by selective elution from the SPE column, or eluted together and separated on the TLC plate. As an example of separation on a column. 5.00 mL of a colorless soda spiked with Yellow No. 5 (0.0200 mg/mL) and Red No. 3 (0.0700 mg/mL) was analyzed, and the mixture was
NATURAL AND SYNTHETIC COLORS 109
completely separated by elution of the yellow dye with 3.0 mL of isopropanol- water (2.5:97.5) and the red dve with the same volume of isopropanol-water (1:1). If a dye mixture is not separated either on the column or the TLC plate, it is still be possible to analyze the compounds individually by scanning at specific wavelengths where one absorbs and the other does not.
For analyses of nonalcoholic beverages using amino-column SPE. standards were prepared in the same ethanol-sulfuric acid solution as used to elute the column and the basic mobile phase (solvent 2. Table 1) so that the sample and standard zones lined up and sample zone streaking was minimized. The dyes are retained on the SPE column because of ionic interactions with the amino groups.^ rather than hydrophobic interactions as in C]S SPE, and the dyes are all eluted together so that selectivity must be achieved by TLC separation or scanning at specific wavelengths.
Duplicate analysis of the lemon-lime drink resulted in identical concentration values of 0.118 mg/mL for Yellow No. 5, and a mean of 0.000747 mg/mL with a difference of 1.2% for Blue No. 1. For these analyses. Epical differences between the scan areas of the duplicate sample aliquots was 4.5%. Duplicate analysis of the spiked sample gave an average of 0.0485 mg/mL with a difference of 2.1%. which corresponded to a recovery of 97.0%.
For analysis of wine coolers using amino column SPE, preparation of standards and reconstitution of evaporated SPE column eluates in ethanol-water (1:1) resulted in the best line-up of sample and standard zones and sample least zone streaking. Triplicate analyses of a wine cooler containing Red No. 40 gave an average value of 0.00282 mg/mL w ith a CV of 8 1%. Analysis of a cooler containing Yellow No. 5 gave a similar dye content value. 0.00192 mg/mL. The spiking experiment on this sample yielded a percent difference of 2.8% between areas of the original and fortified samples, proving the accuracy of the analysis.
The purpose of these studies was to demonstrate the quantitative determination of natural and synthetic food colors using HPTLC and SPE. The optimal approach to analyzing unknown samples involves spotting a series of dye standards prov iding linear response along with a range of sample volumes, in order to find at least one sample whose scan area is bracketed by standards. Quantification can then be done more reliably by spotting duplicate aliquots of a single sample v olume and a smaller range of standard volumes within the linear response region that more closely bracket the sample. Because of this method of in-system calibration, the quantitative results obtained will be at

110 ANDERTON ET AL.
least as accurate and precise as those achieved by spectrophotometry or HPLC, and the ability to spot multiple samples on the same plate and the small solvent volume used for plate development provide very favorable sample throughput and cost-effectiveness.
A C K N O W L E D G E M E N T
SMA was supported by a grant from the Dow Chemical Company Foundation.
R E F E R E N C E S
1. M. Isabel Minguez-Mosquera. D. Hornero-Mendez. J. Garrido-Fernandez.J. AOAC Int., 78, 491 (1995).
2. M. L. Young, J. Assoc. Off. Anal. Chem., 67, 1022 (1984).
3. M. L.Young, J. Assoc. Off. Anal. Chem., 71, 458 (1988).
4. S. M. Dugar, J. N. Leibowitz, R. H. Dyer, J. AOAC Int.. 77, 1335 (1994).
5. V. Rizova. T. StaFilov, Anal. Lett., 28, 1305 (1995).
6. H. T. McKone, K. Ivie, J. Chem. Educ.. 57, 321 (1980).
7 . D. C. Eaton. L a b o r a t o r y I n v e s t ig a t io n s in O r g a n ic C h e m is t r y , McGraw-Hill Book Co., NY, 1989, pp. 168-174.
Received May 1, 1996 Accepted May 15, 1996 Manuscript 4168

J. LIQ. CHROM. &REL. TECHNOL.. 20(1). 111-121 (1997)
ANALYTICAL AND PREPARATIVE ENANTIOMERIC SEPARATION OF A SERIES OF C5-C Y CLOALKYL AMINE-1,4-BENZODI AZEPIN-
2-ONE CCKB RECEPTOR ANTAGONISTS BY CHIRAL HPLC
Alan P. Watt, Hugh M. Verrier, Denise Rathbone
Department of Medicinal Chemistry Merck Sharp and Dohme Research Laboratories
Neuroscience Research Centre Terlings Park, Eastwick Road
Harlow, Essex, CM20 2QR
ABSTRACT
A series of C5 cycloalkyl benzodiazepin-2-one CCKB receptor antagonists are reported in which substitution by tolyl-urea at C3 has generated a chiral centre. As only one of these enantiomers is selective for the CCKB receptor an analytical separation of the enantiomers was developed to monitor the resolution of compounds by chemical means. It was shown that such compounds may be resolved using a Pirkle-type 3,5- (dinitrobenzoyl)-leucine (DNBL) chiral stationary phase (CSP) to give high a and Rs values. Such high enantioselectivities allowed the separation to be scaled-up sufficiently such that gram quantities of each enantiomer could be isolated by preparative chiral HPLC. An investigation is described in which the effect of substituent, mobile phase composition, temperature and the alternate CSP 3,5-(dinitrobenzoyl)-phenylglycine (DNPBG) is discussed for such compounds.
I l l
Copyright © 199 7 by Marcel Dekker, Inc.
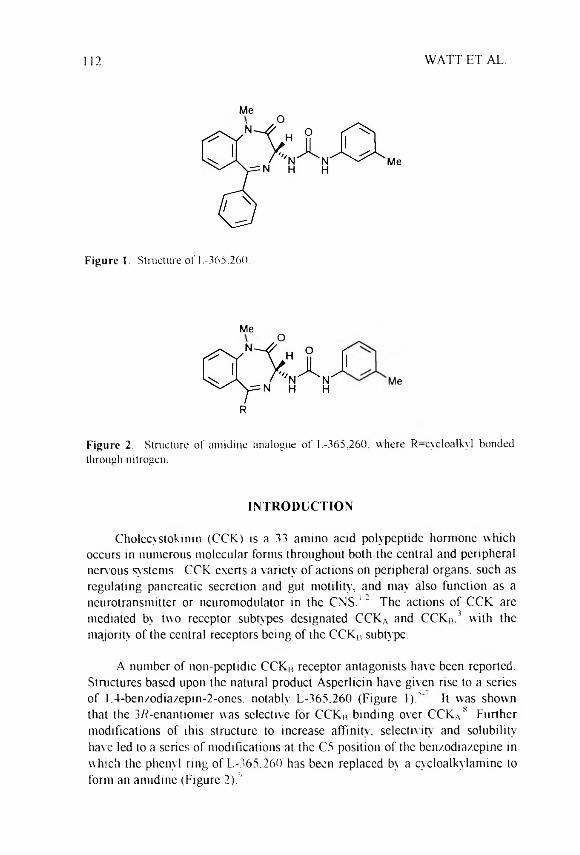
112 WATT ET AL.
MeO
Me
F ig u re 1. Structure of 1,-365,260.
MeO
Me
R
F ig u re 2. Structure of amidine analogue ol' L-365,260, where R-cycloalkyl bonded through nitrogen.
Cholecystokinin (CCK) is a 33 amino acid polypeptide hormone which occurs in numerous molecular forms throughout both the central and peripheral nervous systems. CCK exerts a variety of actions on peripheral organs, such as regulating pancreatic secretion and gut motility', and may also function as a neurotransmitter or neuromodulator in the CNS.1 " The actions of CCK are mediated by two receptor subtypes designated CCKA and CCKB.3 with the majority of the central receptors being of the CCKB subtype.
A number of non-peptidic CCKB receptor antagonists har e been reported. Stmctures based upon the natural product Asperlicin har e given rise to a series of 1.4-ben/odia/.epin-2-ones. notably L-365.260 (Figure l).5" It was shown that the 3R-enantiomer was selective for CCKB binding over CCKA8 Further modifications of ihis slructurc to increase affinity, selectivity and solubility har e led to a series of modifications at the C5 position of the benzodiazepine in which the phenyl ring of L-365.260 has been replaced by a cycloalkylamine to form an amidine (Figure 2).9
I N T R O D U C T I O N

CCKb r e c e p t o r a n t a g o n is t s 113
The enantiomeric separation of substituted 1.4-benzodiazepine-2-ones using Pirkle type DNBPG or DNBL chiral stationary phases has already been demonstrated where the C5 substituent was phenyl.10 However, loss of enantiomeric discrimination was observed in changing to cyclohexyl.
As stereochemistry at C3 is an important factor in determining CCKB / CCKa binding selectivity, it is essential to separate the enantiomers of these molecules cither to provide enantiomeric purities of resolved material or to preparativelv separate racemates. In the present study, the resolution of 1.4- benzodiazepine-2-ones bearing C5-amidine substituents is investigated using both Pirkle DNBPG and DNBL columns. The effect of C5 substituent, temperature and mobile phase composition is considered along with efforts to scale the separation up to prov ide a preparative method for obtaining individual enantiomers from racemic mixtures.
E X P E R I M E N T A L
M a t e r ia l s
All compounds described were synthesised in-house with identity and purity confirmed by NMR. MS. HPLC and elemental analysis. HPLC grade methanol, hexane and 1-chlorobutane were obtained from Fisons (Loughborough. UK). Ethanol was obtained from Havman Limited (Witham, UK).
I n s t r u m e n t a t io n
An HP1090L series high performance liquid chromatograph was used for the analytical separations (Hewlett Packard. Avondale. USA). The system comprises an autoinjector, consisting of a Rheodyne 7010 injection valve fitted with a 250 ul loop, an autosampler and a binary DR-5 solvent delivery sy stem. Detection was by UV using a built-in filter photometric detector (FPD) and data was processed using an HP DOS ChemStation. Column temperature was regulated using a Violet T-55S column cooler (Flowgen. UK).
Preparative separations were performed using a Shimadzu preparative HPLC supplied by Dyson Instruments (Houghton-le-Spring. UK) consisting of a C-R4A Chromatopac. a SCL-8A system controller, a SIL-8A autoinjector, two LC-8A pumps, a SPD-6.A UV detector and a FCV-100B fraction collector.
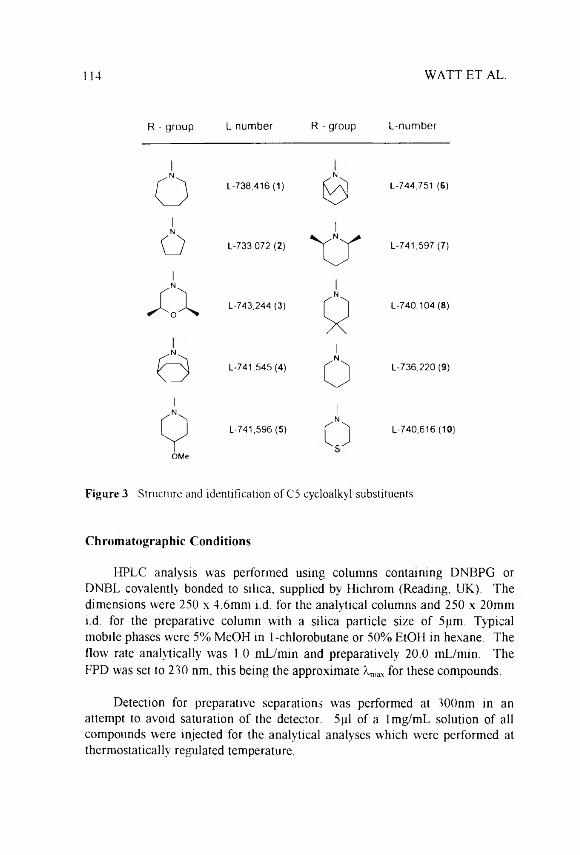
114 WATT ET AL.
R - group L-number R - group L-number
01
L-738,416 (1) e L-744,751 (6)
1No L-733,072 (2) A L-741,597 (7)
A L-743,244 (3) Q L-740,104 (8)
ei
L-741,545 (4)
6L-736,220 (9)
Q L-741,596 (5)
6L-740,616 (10)
OMe
F ig u re 3. Structure and identification of C5 cycloalkyl substituents.
C h r o m a t o g r a p h ic C o n d it io n s
HPLC analysis was performed using columns containing DNBPG or DNBL covalently bonded to silica, supplied by Hichrom (Reading, UK.). The dimensions were 250 x 4.6mm i d. for the analytical columns and 250 x 20mmi.d. for the preparative column with a silica particle size of 5pm. Typical mobile phases were 5% MeOH in 1-chlorobutane or 50% EtOH in hexane. The flow rate analytically was 1.0 mL/min and preparatively 20.0 mL/min. The FPD was set to 230 nm, this being the approximate l m!iX for these compounds.
Detection for preparative separations was performed at 300nm in an attempt to avoid saturation of the detector. 5 pi of a lmg/mL solution of all compounds were injected for the analytical analyses which were performed at thermostatically regulated temperature.
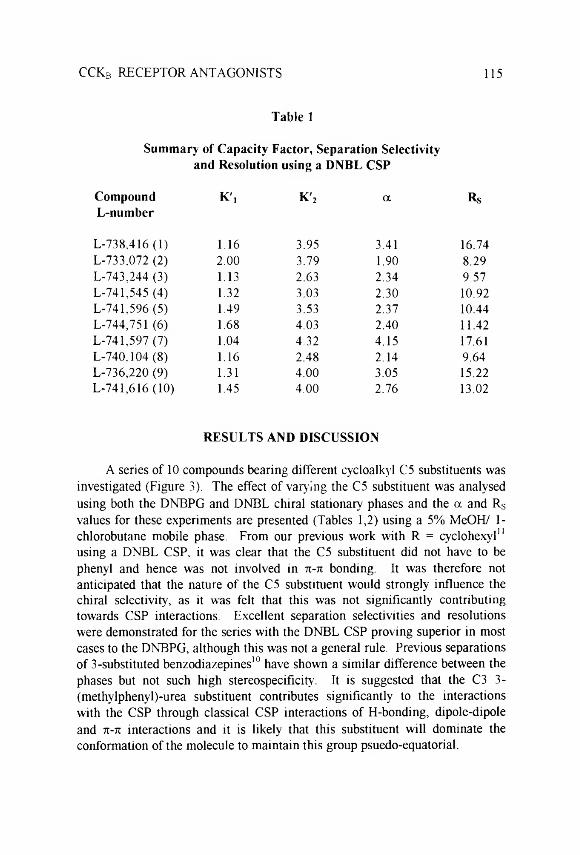
CCKb r e c e p t o r a n t a g o n i s t s 115
T a b le 1
S u m m a r y o f C a p a c i t y F a c t o r , S e p a r a t io n S e le c t iv i t y a n d R e s o lu t io n u s in g a D N B L C S P
C o m p o u n dL - n u m b e r
K ', K '2 a R s
L-738,416 (1) 1.16 3.95 3.41 16.74L-733,072 (2) 2.00 3.79 1.90 8.29L-743,244 (3) 1.13 2.63 2.34 9.57L-741,545 (4) 1.32 3.03 2.30 10.92L-741,596 (5) 1.49 3.53 2.37 10.44L-744,751 (6) 1.68 4.03 2.40 11.42L-741,597 (7) 1.04 4.32 4.15 17.61L-740,104 (8) 1.16 2.48 2.14 9.64L-736,220 (9) 1.31 4.00 3.05 15.22L-741,616 (10) 1.45 4.00 2.76 13.02
R E S U L T S A N D D I S C U S S I O N
A series of 10 compounds bearing different cycloalkyl C5 substituents was investigated (Figure 3). The effect of varying the C5 substituent was analysed using both the DNBPG and DNBL chiral stationary phases and the a and Rs values for these experiments are presented (Tables 1,2) using a 5% MeOH/ 1- chlorobutane mobile phase. From our previous work with R = cyclohexyl11 using a DNBL CSP, it was clear that the C5 substituent did not have to be phenyl and hence was not involved in n-n bonding. It was therefore not anticipated that the nature of the C5 substituent would strongly influence the chiral selectivity, as it was felt that this was not significantly contributing towards CSP interactions. Excellent separation selectivities and resolutions were demonstrated for the series with the DNBL CSP proving superior in most cases to the DNBPG, although this was not a general rule. Previous separations of 3-substituted benzodiazepines10 have shown a similar difference between the phases but not such high stereospecificity. It is suggested that the C3 3- (methylphenyl)-urea substituent contributes significantly to the interactions with the CSP through classical CSP interactions of H-bonding, dipole-dipole and n-n interactions and it is likely that this substituent will dominate the conformation of the molecule to maintain this group psuedo-equatorial.

116 WATT ET AL.
T a b le 2
S u m m a r y o f C a p a c i t y F a c t o r , S e p a r a t io n S e le c t iv i t y , a n d R e s o lu t io n
u s in g a D N B P G C S P
C o m p o u n dL -n u m b e r
K 'i K '2 a R s
L-738,416 (1) 1.36 1.65 1.21 2.65L-733.072 (2) 3.31 4.34 1.27 4.54L-743.244 (3) 1.25 1.40 1.12 1.55L-741.545 (4) 1.49 1.76 1.18 2.27L-741.596 (5) 1.65 1.93 1.17 2.88L-744.751 (6) 2.73 3.80 1.39 5.49L-741.597 (7) 0.99 1.40 1.42 5.29L-740.104 (8) 1.32 1.38 1.05 0.66L-736,220 (9) 1.75 1.86 1.06 0.91L-741.616 (10) 1.34 1.75 1.31 4.20
In the absence of 'classical1 interactions between the CSP and thesubstituent at C5. one explanation for the differences observed in separation selectivity and resolution upon substituent variation is that the directionality of the classical H-bonds or dipole interactions are altered. If one considers analogue 7. which possesses a cycloalkylamine with 2,6-dimethyl substitution, an a value of 4.15 and an Rs value of 17.61 indicates a significant energy difference between the CSP-interactions of the two enantiomers. Although the amidine group will preferentially try to adopt a planar arrangement, the effect of 2.6-dimethylation will be to partially disrupt the conjugation, hence the substituent will sit slightly out of plane. Assuming that the 7i-acid/7i-base interaction between the benzodiazepine nucleus and the 3.5-(dinitrobenzovl) group predominates for such CSP's. then this interaction is likely to be restricted by the C5 substituent. Consequently, if one overlays the benzodiazepine portion of each enantiomer, it is found that the directionality of, for example, the C2 carbonyl group of the benzodiazepine is markedly different between these enantiomers, with one projecting above and the other below the plane of the molecule.
This suggests that the carbonyl from only one enantiomer can interact optimally with the CSP. leading to a large difference in interaction energy betw een enantiomers. This may also be true of other dipoles. H-bond acceptor or H-bond donor group in the molecule. The effect of C5 substitution on

CCKb r e c e p t o r a n t a g o n is t s 117
mAU
time
F ig u re 4. Chromatogram of enantiomeric separation of L-741,597. (Conditions: Hichrom DNBL column (250 x 4.6mm i.d.); mobile phase 5% MeOH in 1- Chlorobutane; Flow lml/min; Detect 230mn).
enantiomeric selectivity may therefore be to sterically restrict access to an optimal Ti-TT interaction. The effect of this could therefore be to change the directionality of other substituents on the molecule towards the CSP thereby optimising the energy of interaction for one enantiomer.
It was found that prediction of separation selectivities between the DNBL and DNBPG CSP's was not straightforward. For example, the highest separation selectivity was achieved for 7 on the DNBL phase and this compound also proved to have one of the highest separation selectivities using the DNBPG phase, suggesting that there is some commonality of interactions between the two phases for this compound. However, a major difference between the phases is demonstrated with the C5 pyrrolidine derivative 2. This showed the lowest separation selectivity on the DNBL but one of the highest using DNBPG.
The effect of mobile phase was investigated, as it had been shown that ethanol/hexane mixtures were capable of achieving high separation selectivities. but it was felt that for preparative purposes this would be inadequate due to solubility criteria since these molecules were poorly soluble in such mixtures. Also, since high percentages of ethanol were required for adequate elution times the viscosity of the mobile phase was higher than desired leading to poor mass transport between the phases and consequent
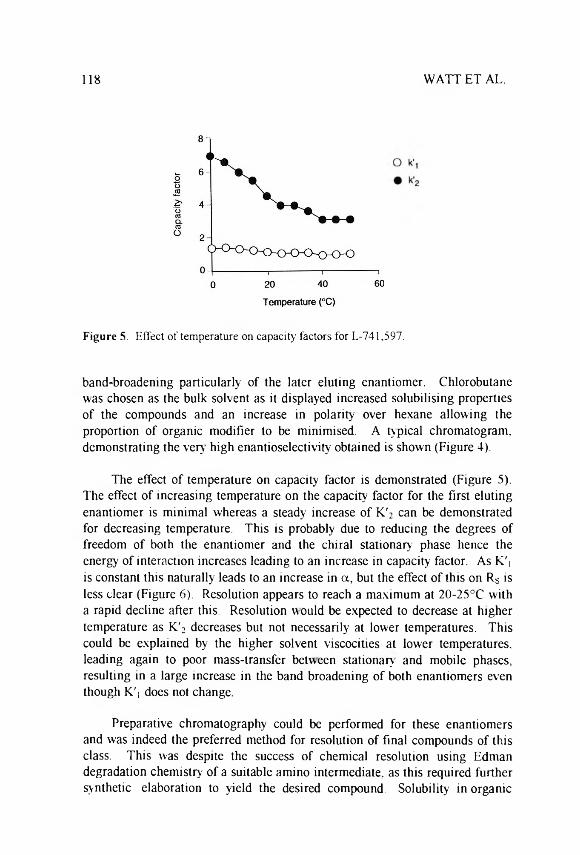
118 WATT ET AL.
Figure 5. Effect of temperature on capacity factors for L -741,597.
band-broadening particularly of the later eluting enantiomer. Chlorobutane was chosen as the bulk solvent as it displayed increased solubilising properties of the compounds and an increase in polarity over hexane allowing the proportion of organic modifier to be minimised. A typical chromatogram, demonstrating the very high enantioselectivity obtained is shown (Figure 4).
The effect of temperature on capacity factor is demonstrated (Figure 5). The effect of increasing temperature on the capacity factor for the first eluting enantiomer is minimal whereas a steady increase of K'2 can be demonstrated for decreasing temperature. This is probably due to reducing the degrees of freedom of both the enantiomer and the chiral stationary phase hence the energy of interaction increases leading to an increase in capacity factor. As K'i is constant this naturally leads to an increase in a , but the effect of this on Rs is less clear (Figure 6). Resolution appears to reach a maximum at 20-25°C with a rapid decline after this. Resolution would be expected to decrease at higher temperature as K'2 decreases but not necessarily at lower temperatures. This could be explained by the higher solvent viscocities at lower temperatures, leading again to poor mass-transfer between stationary and mobile phases, resulting in a large increase in the band broadening of both enantiomers even though K'i does not change.
Preparative chromatography could be performed for these enantiomers and was indeed the preferred method for resolution of final compounds of this class. This was despite the success of chemical resolution using Edman degradation chemistry' of a suitable amino intermediate, as this required further sy nthetic elaboration to yield the desired compound. Solubility in organic
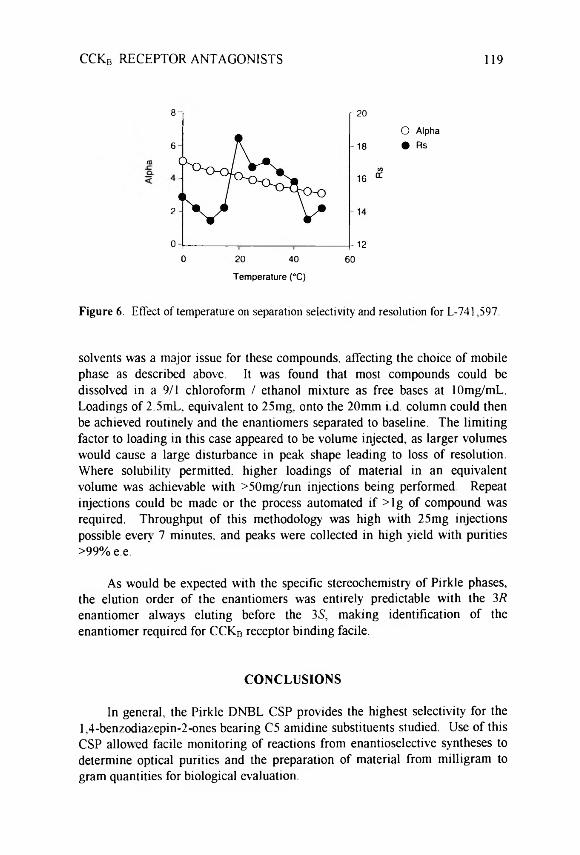
CCKb r e c e p t o r a n t a g o n is t s 119
8 f 20
6O Alpha • Rs
ro
2
0 -- 12 600 20 40
Temperature (°C)
Figure 6. Effect of temperature on separation selectivity and resolution for L-741,597.
solvents was a major issue for these compounds, affecting the choice of mobile phase as described above. It was found that most compounds could be dissolved in a 9/1 chloroform / ethanol mixture as free bases at lOmg/mL. Loadings of 2.5mL. equivalent to 25mg. onto the 20mm i d. column could then be achieved routinely and the enantiomers separated to baseline. The limiting factor to loading in this case appeared to be volume injected, as larger volumes would cause a large disturbance in peak shape leading to loss of resolution. Where solubility permitted, higher loadings of material in an equivalent volume was achievable with >50mg/run injections being performed Repeat injections could be made or the process automated if > lg of compound was required. Throughput of this methodology7 was high with 25mg injections possible every 7 minutes, and peaks were collected in high yield with purities >99% e.e.
As would be expected with the specific stereochemistry of Pirkle phases, the elution order of the enantiomers was entirely predictable with the 3R enantiomer always eluting before the 3S, making identification of the enantiomer required for CCKB receptor binding facile.
In general, the Pirkle DNBL CSP provides the highest selectivity for thel,4-benzodiazepin-2-ones bearing C5 amidine substituents studied. Use of this CSP allowed facile monitoring of reactions from enantioselective syntheses to determine optical purities and the preparation of material from milligram to gram quantities for biological evaluation.
CONCLUSIONS

120 WATT ET AL.
Although insufficient compounds were available to perform quantitative structural analysis, the compounds that separated well appear to have large bulky groups at C5 that cause this substituent to lie out of the plane of the benzodiazepine portion of the molecule. Additionally it is suggested that the steric effect of the C5 substituents affect the attainment of the dominant n- n interaction and in so doing alter the directionality of interactions of other substituents thereby accentuating the energy differences between the 3S and 3R enantiomers.
Preparatively. high separation loadings were possible due to the high separation selectivities and good resolutions observed although solubility in suitable organic solvents w as a limiting factor. Gram quantities of enantiomers could be prepared using this methodology and this helped to establish chiral HPLC as the method of choice over more classical resolution methods for these molecules.
A C K N O W L E D G E M E N T S
The authors wish to thank Victor Matassa and Ray Baker for their contributions and support. Rajinder Bahra. Desmond O'Connor. Steve Matheson and Steve Feeley for their technical assistance and Mark Chambers. Sarah Hobbs and Graham Showed for the provision of racemic L-number compounds.
R E F E R E N C E S
1. R. Y Wang. Ann. N Y. Acad. Sci.. 537. 362-379. (1988).
2. M. Albus. Prog. Ncuro-Psychopharmacol. Biol. Psychiatry .. 12. S5-S21(1988) .
3. T. Moran. R. Robinson. M. S. Goldrich. P. McHigh. Brain Res.. 365. 175-179 (1986).
4. R. S. Chang. V. I Lotti. R. L. Monaghan. J. Birnbaum. E. O. Stapely. M. A.Goetz . G Albers-Schonberg. A. A. Patchett. J. M. Liesch. O. D. Hensens. J. P. Springer, Science. 230. 177-179 (1985).
5. M. G. Bock. R. M. DiPardo. B. E. Evans. K. E.Rittle. W. L. Whitter. D. F.Veber. P. S. Anderson. R. M. Friedinger. J. Med. Chem.. 32. 16-23.(1989) .

CCKb r e c e p t o r a n t a g o n is t s 121
6. R. S. Chang , T. B. Chen, M. G. Bock, R. M. Freidinger, R. Chen, A.Rosegay. V. J. Lotti. Mol. Pharmacol, 35, 803-808 (1989).
7. V. J. Lotti, R. S. Chang. Eur. J. Pharmacol., 162, 273-280 (1989).
8. M. G. Bock, Drugs Fut, 16. 631, (1991).
9. G. A. Showell, S. Bourrain. J. G. Neduvelil, S. REletcher, R. Baker, A. P.Watt, A. E. Fletcher, S. B. Freedman, J. A. Kemp, G. R. Marshall, S. Patel, A. J. Smith, V. G. Matassa J. Med Chem., 37, 719-721 (1994).
10. W. H. Pirkle, A. Tsipouras. J. Chromatogr., 291, 291-298, (1984).
11. M. S. Chambers. S. C. Hobbs, S. R. Fletcher, V. G. Matassa. P. J. Mitchell,A. P. Watt. R. Baker, S. B. Freedman, S. Patel, A. J. Smith, Bioorg. Med. Chem. Lett.. 3 (10). 1919-1924 (1993).
Received May 22. 1996 Accepted June 8. 1996 Manuscript 4185

J. LIQ. CHROM. & REL. TECHNOL., 20(1), 123-142 (1997)
IMMOBILIZED IRON(III) METAL AFFINITY CHROMATOGRAPHY FOR THE SEPARATION OF PHOSPHORYLATED MACROMOLECULES:
LIGANDS AND APPLICATIONS
Leonard D. Holmes Department of Physical Science
University of North Carolina at Pembroke Pembroke. North Carolina 28372
Martin R. Schiller Department of Neuroscience
Johns Hopkins University School of Medicine Baltimore, Maryland 21205
A B S T R A C T
This review highlights the advances in Fe(III)-Immobilized Metal Affinity Chromatography [Fe(III)-IMAC] for the separation and characterization of phosphorylated biomolecules. Fe(III)-IMAC has demonstrated a selective interaction with phosphate groups and other hard Lewis bases such as carboxylate and phenol functional groups. These properties make this technique useful for separating and studying macromolecules. Since phosphorylation is a central means of regulation in eukaryotes and prokaryotes, the development of Fe(III)-IMAC is important. Various iron chelating ligands and their properties are discussed. General features of Fe(III)-IMAC are examined and examples of useful separations are considered.
123
C opyright © 1 9 9 7 by M arcel D ekker, Inc.

124 HOLMES AND SCHILLER
INTRODUCTION
Immobilized metal affinity chromatography (IMAC) is useful for the separation of biomolecules. The choice of chromatographic support, support activation method, the ligand attached, and immobilized metal ion depends on the properties of the biomolecules to be separated. General IMAC methods and applications have been extensively reviewed.11 Many studies have used divalent metal ions such as Cu(II). Ni(II) and Zn(II) and exploited the affinities for bases such as histidine via metal ion coordination.
Several volumes on general chromatography contain special practical sections describing IMAC protocols.5'6 Recently, Fe(III)-IMAC has found specific application in the separation of phosphorvlated macromolecules and other biological substances.
This review covers the general principles of Fe(III)-IMAC, useful Fe(III) chelating ligands, and the application of Fe(III)-IMAC in adsorption affinity techniques for the separation and study of a variety of phosphorylated biological molecules. The physico-chemical properties of immobilized Fe(III) and its interaction with hard Lewis bases such as phosphate or carboxylate oxygens render this metal ion unique and useful for Immobilized Metal-Affinity Chromatography.
F e ( I I I ) - I M A C : G E N E R A L P R I N C I P L E S
F ir s t C o n s id e r a t io n s
Porath and Olin suggested metal-ion "hardness and softness" may be helpful for understanding the mechanisms of Fe(III)-IMAC. At pH's above 7, nickel prefers ligands containing "soft" uncharged sulfur and nitrogen atoms as in cysteine and histidine, while Fe(III) has strong affinity for phosphate, sulfate, carboxylic, and phenolic oxygens. Fe(III) is considered a "hard" Lewis acid, thus it will associate more strongly with "hard" bases such as oxygen.8 Molecules that have hard bases such as phosphates, carboxylates and phenolic groups have high binding constants. Ligands containing soft bases such as amino and sulfhydryl groups have lower constants. Softer Lewis acids such as divalent metal-ions prefer softer atoms such as nitrogen and sulfur. Although sulfur and nitrogen can be electron donors to Fe(III). these generally form weaker complexes.

IMMOBILIZED IRON (III) METAL AFFINITY 125
0II
Support Matrix
Figure 1. Octahedral Fe(m)-IDA-water complex.
The strength of the coordinate bond between a Fe(III) ion and an immobilized ligand is controlled mainly by three factors:
1. Pure electrostatic interaction controlled by the charge and the ionic radius.2. The overall affinity of the central metal ion to accept electrons from the 1
ligand.93. Metal ion electronic configuration which is capable of stabilization due to
distortion of octahedral symmetry (Jahn-Teller effect).910
M e t a l C o o r d in a t io n o r Io n E x c h a n g e ?
The flexibility of Fe(III)-IMAC stems from the fact that either ion- exchange or ligand coordination properties can be exploited to "tune" specificity. Factors to consider when designing an Fe(III)-IMAC separation are: the net charge of the metal-ligand complex, the ionic strength of the buffer, the presence of surface accessible protein phosphate groups and the isoelectric point of the protein.
Consider the use of immobilized iminodiacetic acid (IDA) as a chelating ligand. Without coordinated metal ion, negatively charged IDA-bonded stationary phases behave as relatively strong cation exchangers.11 Sulkowski12 and others13 showed that a protein mixture could be separated by chromatography over naked bound IDA and that retention increased in order of increasing isoelectric point. When IDA is chelated to Fe(III), the metal ligand complex has a net positive charge (Fig. 1).

126 HOLMES AND SCHILLER
Figure 2 Interaction of Fe(HI) and phosphate to form a four-membcred ring. (Adapted from reference 19).
This situation is different from that of divalent metal ion-IDA complexes such as Cu(II)-IDA which have no formal charge. For Fe(III) complexes, electrostatic interactions are significant In this situation, as ionic strength of the buffer is increased, retention of proteins at a pH above their pi (negatively charged) would be expected to decrease due to to shielding of the ligand-metal complex. Proteins of pi 4 to 11 bind to Fe(III)-IDA at pH 6 and low ionic strength.12
It has been shown that ion-exchange is the primary binding mechanism for the purification of lactate dehydrogenase by Fe(III)-IMAC.14-15 It is not displaced from the Fe(III) column by phosphate unless the ionic strength is increased. Ligand-Fe(III) complexes which have no net formal charge bind serum proteins more efficiently than Fe(III)-IDA at low pH, suggesting that nonionic interactions may also play a role in protein-metal complex binding.' It may also be useful to consider that steric factors control adsorption or that charge controlled mechanisms occur locally reducing the importance of the net protein charge.
I r o n - P h o s p h a t e I n t e r a c t io n s
The adsorption of phosphate groups to immobilized Fe(lII) is not simply the result of electrostatic interactions as negatively charged nucleosides, cyclic mononucleotides and dinucleotides do not bind to IDA-Fe(III).16 and strength of binding of nucleotides is not affected by the number of phosphates.1 Thehigh affinity which phosphate has toward Fe(IlI) is partially explained by the fact that it probably forms two coordinate bonds with the metal ion. whereas, carboxyl groups will form only a single bond (Fig. 2).

IMMOBILIZED IRON(III) METAL AFFINITY 127
The interaction of ferric ion with phosphate has been examined in PEG/dextran two-phase partitioning systems.18 Affinity for phosphate decreases as alkaline pH is approached. The steep increase in phosphate affinity' between pH 3 and 5 is attributed to the ionization of the second acidic oxygen of phosphate. The affinity' decreases above pH 5 due to the competitive binding of hydroxyl ions to Fe(III).
A d s o r p t io n a n d E lu t io n
In IMAC. the adsorption of the sample to the resin involves new interactions of the sample with the metal while displacing one or more weakly bound ligands such as water.3"46 When the metal ion binds multiple donor atoms, there is a favorable entropic contribution to the binding energy resulting from displacement of multiple w eakly bound ligands (chelate effect).119
Several methods have been most commonly used for dissociation of phosphorylated molecules from Fe(III)-IMAC columns. They include: pHO Ijl 'SI ssgradient; ‘ competitive elution with a Fe(III)-binding molecule" and elution with Magnesium ion19 or phosphate ion.14'23"25
Mg(II) binds to phosphate groups of the sample, causing desorption. Gradients of NaCl have also been used in Fe(III)-IMAC.12
Ov albumin which contains up to two phosphate groups per molecule, was shown to elute from a Fe(III)-IDA column with a linear gradient of NaCl.13 This suggested an ionic interaction. However, these experiments were carried out in 25 mM phosphate buffer, explaining the lack of ovalbumin retention. For Fe(III)-IMAC. up to 1 M sodium chloride is often included in the buffer to minimize ion-exchange effects.
NaCl concentrations higher than 1 M do not significantly affect Fe(III)- phosphate interactions.19 Elution from Fe(III)-IMAC may also be completed by a decreasing salt gradient, because at high salt concentration some proteins may be bound to the stationary phase via hydrophobic interactions.13
Samples are easily eluted from iron(III) columns using increasing pH 13,1x26 or gddjtjQH 0f phosphate to the elution buffer to compete off the phosphorylated sample.2 28 Phosphoserine is also useful as elution agents.'" Phosphoserine binds to the immobilized Fe(III) displacing the bound sample.

128 HOLMES AND SCHILLER
T a b le 1
C o m m e r c ia l ly A v a i la b le M e t a l - C h e la t in g S u p p o r t s
P r o d u c t S u p p l ie r S u p p o r t L ig a n d R e f .
Chelating Sepharose Fast Flow
Pharmacia Cross-linkedagarose
IDA 14.19.26
Chelating Sepharose 6B
Sigma Sepharose 6B IDA 23
ChelatingAmberlite
Sigma Polystyrenebeads
IDA 23
SigmaChrome Sigma Poly(hvdroxy)-methacrylate
IDA 66
Chelating Superose (a)
Pharmacia Superose(cross-) linked agarose
IDA 19
Hi-Trap Chelating (a)
Pharmacia Sepharose, High performance
IDA 19
NTA-Resin Qiagen Sepharose-CL-6 NT A 39
(a) Prepacked LC and HPLC columns available.
I R O N C H E L A T I N G L I G A N D S
Almost without exception, commercially available IMAC supports utilize iminodiacetic acid (IDA) as the metal-chelating group. Several available metal chelating supports are listed in Table 1.
Chelating Sepharose 6B® was the first commercially available support to be used for the specific isolation of phosphoproteins by Fe(III)-IMAC.12,20,29-30 Pre-packed metal affinity columns31 for fast protein liquid chromatography (FPLC) are also available. These have been used for Fe(III) affinity isolation of phosphopeptides2 and for model studies of the interactions of Fe(III) ions with phosphoiy lated amino acids and phosphoproteins.19

IMMOBILIZED IRON(III) METAL AFFINITY 129
T a b le 2
I r o n ( I I I ) B in d in g L ig a n d s
L ig a n d C o o r d in a t io n S t a b i l i t y ( lo g K ) R e f .
IDA .3 1 0 .7 7 .1 2 .1 9 .3 78 -H Q 2 13 3 7 .4 3 .5 5Glvcylhydroxamate 3 11 3 7 .4 5 ,4 7 - 4 8o p s ' ->
.1 13 3 7 ,5 0 ,5 4Catechol 2 2 0 3 7 ,6 7TED 5 2 0 7 ,3 7NT A 4 15 3 7EDTA 6 2 5 3 7HPO,'2 2 8 .3 3 7
Numerous volumes are available describing the chemistries and detailed protocols to attach Fe(III)-binding ligands to a natural, synthetic or inorganic chromatographic support.6 3- 34 Fe(III) chelators have been reviewed,35'36 and only the most common will be discussed. Table 2 shows that Fe(III) prefers binding oxygen and that higher saturation of the six coordination sites forms the most stable complexes. Useful molecules known to chelate iron, the coordination number and their binding constants are tabulated.
I m in o d ia c e t ic A c id a n d i t s D e r iv a t iv e s
Iminodiacetic acid (IDA) is a "tridentate" iron chelator, with metal coordination through the nitrogen and the two carboxylale oxygen unpaired electrons. Importantly, the metal-ligand complex has 3 coordination sites occupied by weakly bound water which can be displaced by electron rich sites on the molecules to be separated. The iron-lDA complex has a binding constant of log K. =10.7 in solution.3 The iron complex with IDA and water is shown in Fig. 1.
T r is ( c a r b o x y m e t h y l ) e t h y le n d ia m in e ( T E D )
Similar to IDA. TED forms a very stable five-membered ring system with Fe(III) (Fig. 3a). The stoichiometry of the metal-chelate complex is not completely defined.38
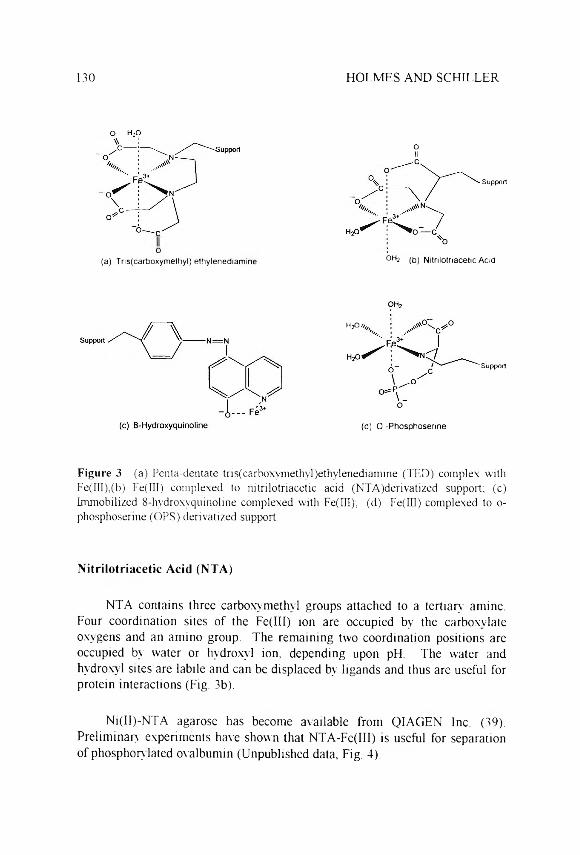
130 HOLMES AND SCHILLER
o(a) Tris(carboxymethyi) ethylenediamine
oII
Support
o h 2 (b) Nitrilotriacetic Acid
HzO///,
Support
(d) O -Phosphoserine
Figure 3. (a) Penta-dentate tris(carboxymethyl)ethylenediamine (TED) complex with Fe(IH);(b) Fe(III) complexed to nitrilotriacetic acid (NTA)derivatized support; (c) Immobilized 8 -hydroxyqumoline complexed with Fe(ffl); (d) Fe(lH) complexed to o- phosphoserme (OPS) derivatized support.
N it r i lo t r ia c e t i c A c id (N T A )
NTA contains three carboxvmethyl groups attached to a tertiary amine. Four coordination sites of the Fe(III) ion are occupied by the carboxvlate oxygens and an amino group. The remaining two coordination positions are occupied by water or hydroxyl ion, depending upon pH. The water and hydroxy l sites are labile and can be displaced by ligands and thus are useful for protein interactions (Fig. 3b).
Ni(II)-NTA agarose has become available from QIAGEN Inc. (39). Preliminary experiments have shown that NTA-Fe(IlI) is useful for separation of phosphor) lated ovalbumin (Unpublished data. Fig. 4).
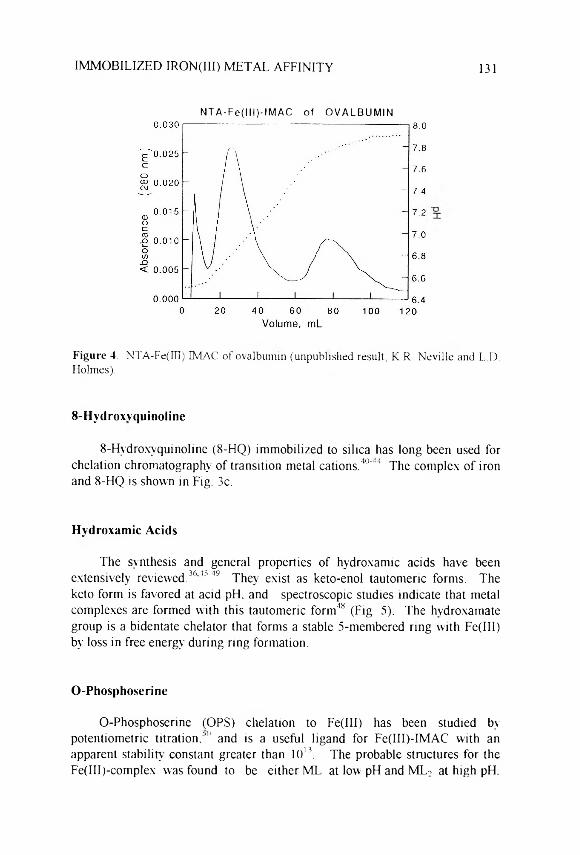
IMMOBILIZED IRON(III) METAL AFFINITY 131
NT A-Fe( l l l) - IMAC of O VALBUMIN
F i g u r e 4 . NTA-Fe(HI) EMAC of ovalbumin (unpublished result, K.R. Neville and L,D. Holmes).
8 - H y d r o x v q u in o l in e
8-Hydroxyquinoline (8-HQ) immobilized to silica has long been used for chelation chromatography of transition metal cations.40'“4 The complex of iron and 8-HQ is shown in Fig. 3c.
H y d r o x a m ic A c id s
The synthesis and general properties of hydroxamic acids have been extensively reviewed.3645'49 They exist as keto-enol tautomeric forms. The keto form is favored at acid pH, and spectroscopic studies indicate that metal complexes are formed with this tautomeric form48 (Fig. 5). The hvdroxamate group is a bidentate chelator that forms a stable 5-membered ring with Fe(III) by loss in free energy during ring formation.
O - P h o s p h o s e r in e
O-Phosphoserine (OPS) chelation to Fe(III) has been studied by potentiometric titration,"’" and is a useful ligand for Fe(III)-IMAC with an apparent stability constant greater than 1013. The probable structures for the Fe(III)-complex was found to be either ML at low pH and ML: at high pH.

132 HOLMES AND SCHILLER
-ow o
Basic pH _ R—1
NOH
Acid pH H—(
OH
OH
F i g u r e 5 . Keto-enol tautomers of a hydroxamic acid.
The chemistries of metal-phosphoserine interactions relating to the role of phosphate esters (e.g. phospholipids) in biochemical processes have been reported.51'53 The use of OPS-Fe(III) IMAC was recently reported by Zachariou.54 OPS metal binding is pH-dependent and involves the oxygens in the carboxyl and phosphate groups and the amino nitrogen (Fig. 3d).
E X A M P L E S O F F e ( I I I ) - I M A C A P P L I C A T I O N S
The usefulness of Fe(III)-IMAC for separation and study of several classes of biomolecules is summarized below.
A m in o A c id s
Amino acids are zwitter ions and will ionize according to pH. It is interesting to note the contribution nonphosphorylated amino acid residues may make toward the total protein retention in an Fe(III)-IMAC experiment. Cysteine is retained markedly longer on Fe(III)-hydroxymate than any other amino acid.46 This behavior may be explained by the Lewis base behavior of the sulfhydral group which is chemically similar to hydroxyl and would thus be expected to have appreciable Fe(III) affinity. Cysteine was reported to "destroy" the support in Fe(III)-IDA IMAC due to irreversible binding at low pH.29 One would anticipate aspartic and glutamic acid residues to show significant Fe(III) interaction through coulombic interactions. Hydrophobic or aromatic amino acids exhibit no special affinity for Fe(III), but phosphoamino acids are strongly retained.29-46
Cu(II)-IDA retains amino acids significantly at pH 5 to 6.13 This is especially interesting for the case of histidine, which strongly interacts with Cu(II).1-4 Copolymers of glutamate and tyrosine have an affinity for Fe(III)- IDA through carboxylate and phenolic functional groups, although this interaction is weak when compared to phosphate.16-19 Binding is probably a combination of metal coordination and ion-exchange interactions.

IMMOBILIZED IRON(III) METAL AFFINITY 133
The binding of phosphoamino acids to Fe(III)-IDA Sepharose is very strong compared to that of all amino acids including cysteine, L-aspartic and L-glutamic acids (sulfhydryl and carboxylic group-containing residues). In the absence or presence of high salt, phosphorylated serine, tyrosine and threonine are strongly retained on the IDA-Fe(III) gel at acid pH but not retained at neutral or weakly basic pH.29 Binding studies using Fe(III)-hydroxamate IMAC demonstrated affinity for surface accessible cysteine, aspartyl and glutamyl residues of proteins.45'4 Furthermore, binding of proteins to a Fe(III)- 8-HQ IMAC resin was demonstrated to be independent of surface accessible histidine, tryptophan or cysteine residues.55
P h o s p h o p e p t id e S t u d ie s
The chromatographic behavior of peptides and phosphory lated peptides on Fe(III)-Separose has been analyzed. Basic peptides pass freely through an IMAC column, and acidic peptides are retarded and elute as a broad peak in the pH range 5.5-6 2. Phosphopeptides eluted in the pH range 6.9-7.5.19
Certain biological functions of phosphorylation, protein turnover and sequence specificity of protein kinases have been studied by Fe(III)-IMAC of phosphoprotein fragments. Tryptic digests of Photosystem II purified from spinach '-P-labclled chloroplasts were shown to contain phosphothreonine by their retention on Fe(III) chelating Sepharose columns.20
Phosphopeptide-mediated intestinal absorption of calcium has been examined Fe(lII)-lMAC. Several low abundance caseinophosphopeptides of the pig small intestine have been separated using iron IMAC.3" Phosphorylated casein proteins are suspected to function as iron transporters and/or storage proteins by forming soluble complexes.56'59 The physiology of gastric emptying has been studied using Fe(III)-lMAC. Scanff et al.27 separated low abundance phosphopeptides from a tryptic digest of casein and gastric effluents using an FPLC Fe(lII)-Superose HR 10/2 column. Elution was carried out with phosphate buffer.
Secondary, electrostatic interactions were significant, as other non- phosphorylated. strongly basic peptides were also adsorbed to the affinity' column. Phosphory lated peptides have been adsorbed with high specificity to Fe(III) immobilized to Whatman paper designed as a counter-part to derivatized Sepharose.1

134 HOLMES AND SCHILLER
F i g u r e 6 . Fe('III)-IMAC of ovalbumin by elution with a pH gradient. (A) Native ovalbumin; (B) partiallv dephosphorslated ovalbumin. (Used with permission from Ref.29.)
P h o s p h o p r o t e in
The first indication that specific phosphate-Fe(III) interactions may be useful for protein separations grew fioin the work by Porath and Olin comparing the affinities of serum proteins on Fe(III) and Ni(II) columns. The next step was to analyze the Fe(III) binding charateristics of native and dephosphorylated ovalbumin.-9
At low pH (3.1 and 5.0) the components of native ovalbumin were fractionated according to the number of phosphon lated ammo acid residues. Elution of retained proteins was accomplished by pH gradient (Fig. 6).
Similar separation characteristics were found in experiments designed to reduce nonspecific ionic interactions by the use of 1 M NaCl. Enzymatically phosphon lated histone protein showed strong affinity to Fe(III)-IDA.:: 1 M sodium chloride was used to reduce nonspecific electrostatic interactions. Elution was w ith a pH gradient, phosphoserine or Mg(II). a phosphate binding ion"''9'6-(Fig. 7) .

IMMOBILIZED IRON(III) METAL AFFINITY 135
Figure 7. Difference in the pH-dependent elution profiles between phosphorylated (o) and nonphosphorvlated histone protein ( • ) from Fe(III)-IDA gel. (Used with permission from Ref. 22).
Sulkowski12 studied the affinity of ovalbumin to IDA-Fe(III) and concluded that phosphoproteins display a particularly high affinity for IDA-Fe(III). Secondary interactions involving "nonionic" interactions as well as coulombic interactions were also detected. Ovalbumin has also been purified using metal-affinity partitioning in aqueous two-phase systems.18 Interestingly, neither TED-Fe(III) or hydroxamate-Fe(III) display any affinity- for ovalbumin/9'46
Singly phosphorylated pepsin (pl=2.9) was also retained and subsequently eluted with 20 mM phosphate. Furthermore, Kuceroia ’9 separatee human gastric pepsins and pepsinogens by this technique, suggesting that the degree of phosphorylation may be correlated with gastric disease. Michel and Bennett20 in their studies of the photosynthetic electron transport system, found that phosphoprotein from Photosystem II of spinach was retained on IDA-Fe(III) gel at pH 5.0 and eluted upon increasing the pH to 8.0. Phosphorylation is implicated in photosystem control.62 Fe(III) immobilized to an agarose-carboxymethyl-picolyamine matrix has been used to isolate insect phosphol ipoproteins. 8
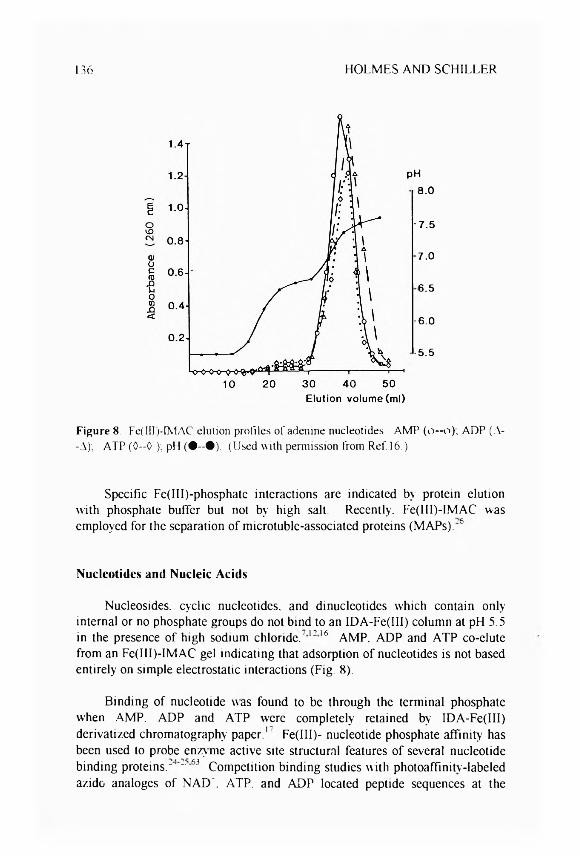
136 HOLMES AND SCHILLER
p H
8.0
■7.5
7.0
6.5
-6.0
-5.5
Figure 8. Fe(IiI)-IMAC elution profiles of adenine nucleotides. AMP (o—o); ADP (A- -A); ATP (0-0 ); pi 1 ( • —• ) . (Used with permission from Ref. 16.)
Specific Fe(III)-phosphate interactions are indicated by protein elution with phosphate buffer but not by high salt. Recently. Fe(III)-IMAC was employed for the separation of microtuble-associated proteins (MAPs)."6
N u c le o t id e s a n d N u c le ic A c id s
Nucleosides, cyclic nucleotides, and dinucleotides which contain only internal or no phosphate groups do not bind to an IDA-Fe(III) column at pH 5.5 in the presence of high sodium chloride. 1216 AMP. ADP and ATP co-elute from an Fe(III)-IMAC gel indicating that adsorption of nucleotides is not based entirely on simple electrostatic interactions (Fig. 8).
Binding of nucleotide was found to be through the terminal phosphate when AMP. ADP and ATP were completely retained by IDA-Fe(III) derivatized chromatography paper.' Fe(III)- nucleotide phosphate affinity has been used to probe enzyme active site structural features of several nucleotide binding proteins."1 ~ 63 Competition binding studies with photoaffinitv-labeled azide analoges of NADU ATP. and ADP located peptide sequences at the

IMMOBILIZED IRON(III) METAL AFFINITY 137
adenine binding domains. Also the guanine binding site for glutamate dehydrogenase was identified using this method.23 Iron(III) IMAC provides a one-step approach for separation of photoaffinity-Iabeled peptides from non- labeled peptides.
C O N C L U S I O N S
Fe(lII)-IMAC has become a useful technique for the purification and characterization of phosphory lated biomolecules. Phosphorylation modulates enzyme activities in the cell nucleus, mitochondrian. ribosomes and cell membranes. Protein phosphorylation also mediates secretion, molecular transport and membrane permeability.6''63 The abundance and diversity of phosphory lated molecules and the nature of protein-bound phosphate will drive the development of immobilized iron separation techniques.
Although experiments have reported significant success in achieving phosphate-specific separations, a detailed analysis of the mechanism of adsorption of phosphorylated biomolecules remains to be completed. A wide range of parameters affect chromatographic behavior. Factors such as chelating ligand, support matrix, buffer conditions and temperature require further study in order to optimize analyses. Undoubtedly, a portion of the adsorption behavior is due to general ionic or electrostatic interaction of the metal ion with phosphate or other negatively charged groups. Hydrophobic interactions also must not be ignored. However. Fe(III)-IMAC systems do not interact with phosphoproteins in the same way as ordinary ion exchange resins. Fe(lll)-IMAC can be employed to resolve proteins with a wide range of isoelectric points, a task not generally possible in ion exchange chromatography. Fe(III)-IMAC is also effective in probing the accessible surfaces of proteins for the presence of certain amino acids such as aspartate, glutamate and cy steine. This is a useful addition to Cu(II)-IMAC which binds surface histidines.
A C K N O W L E D G E M E N T S
LDH is grateful to Professor Frances H. Arnold at the California Institute of Technology (USA) and Professor M.A. Vijayalakshmi at the Université De Technologie De Compiegne (France) for both financial support and inspiration. Gratitude is expressed to their wonderful research groups for the many hours of instruction and discussion on all aspects of metal affinity chemistry. This work has also been made possible through the generosity of the North Carolina Biotechnology Center.

138 HOLMES AND SCHILLER
R E F E R E N C E S
1. F. H. Arnold. Bio/Technology, 9, 151-156 (1991).
2. J. W. Wong. R. L. Albright. N. L. Wang, Sepn., Purif. Meth., 20, 49-106(1991).
3. R. R. Beitle. M. M. Ataai, “'Immobilized Metal Affinity Chromatographyand Related Techniques,” in N e w D e v e lo p m e n t s in B io s e p a r a t io n s 8 8 ,M. M. Ataai, S. K. Sikdar, eds., Amer. Instit. Chem. Eng.. New York, 1992, pp. 34-44.
4. J. J. Winzerling. P. Bema. J. Poralh. Methods: A Companion to Methods inEnzymology. 4 . 4-13 (1992)
5. R. K. Scopes. P r o t e in P u r i f i c a t io n , P r in c ip l e s a n d P r a c t ic e , Springer-Verlag. New York. 1994.
6. T. T. Yip. T. W. Hutchens. "Immobilized Metal Affinity Chromatography,”in M e t h o d s in M o le c u la r B io lo g y .V o l . 1 1 , P r a c t ic a l P r o t e in
C h r o m a t o g r a p h y , A. Kenney. S. Fowell, eds., Humana Press. Totowa. NJ. 1992. pp. 17-31.
7. J. Porath. B. Olin. Biochemistry, 22. 1621-1630 (1983).
8. R. G. Pearson. J. Amer. Chem. Soc.. 85. 3533-3539 (1963).
9. L. E Orgel. A n I n t r o d u c t io n to T r a n s i t io n M e t a l C h e m is t r y : L ig a n d
F ie ld T h e o r y . Methuen Pub.. London. 1966.
10. L. Pauling. J. Chem. Soc. (London). 1461-1467 (1948).
11. Cs. Horvath. G Y. Nagydiosi, J. Inorg. Nucl. Chem., 37, 767-769 (1975).
12. E. Sulkowski. Makromol. Chem. Macromol. Symp.. 17. 335-348 (1988).
13. Z. El Rassi. Cs. Horvath. J. Chromatogr.. 359.241-253 (1986).
14. G. Chaga. L. Andersson. J. Porath. J. Chromatogr.. 627. 163-172 (1992).
15. G. Chaga. L. Andersson. B. Ersson. J. Porath. Biotech. Appl. Biochem., 11,424-431 (1989).
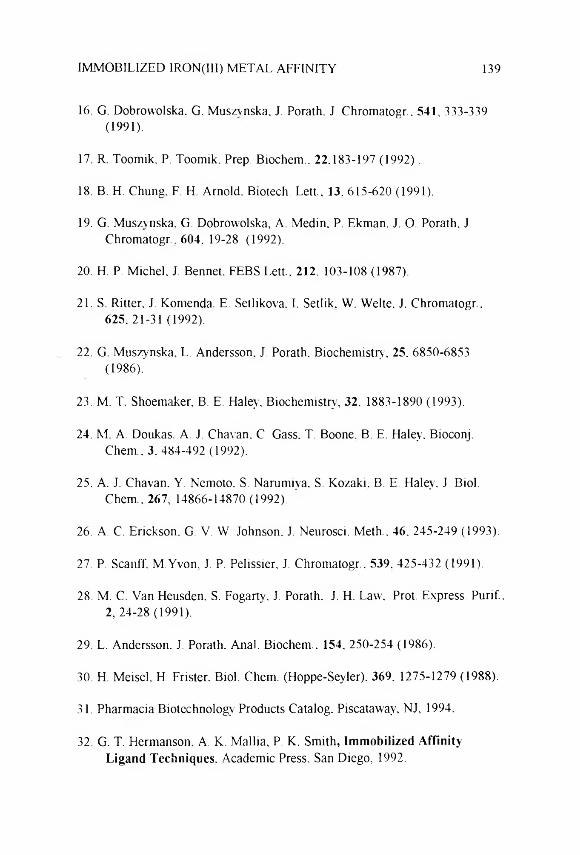
IMMOBILIZED IRON(III) METAL AFFINITY 139
16. G. Dobrowolska. G. Muszvnska, J. Porath. J. Chromatogr.. 541, 333-339(1991).
17. R. Toomik, P. Toomik. Prep. Biochem.. 22.183-197 (1992).
18. B. H. Chung. F. H. Arnold. Biotech. Lett., 13. 615-620 (1991).
19. G. Muszvnska. G. Dobrowolska, A. Medin. P. Ekman. J. O. Porath, J.Chromatogr.. 604. 19-28 (1992).
20. H. P. Michel, J. Bennet. FEBS Lett.. 212. 103-108 (1987).
21. S. Ritter, J. Komenda. E. Setlikova. I. Setlik. W. Welte. J. Chromatogr..625. 21-31 (1992).
22. G. Muszynska, L. Andersson, J. Porath. Biochemistry. 25. 6850-6853(1986).'
23. M. T. Shoemaker, B. E. Haley. Biochemistry, 32. 1883-1890 (1993).
24. M. A. Doukas. A. J. Chavan. C Gass. T. Boone. B. E. Haley. Bioconj.Chem. 3.484-492 (1992).
25. A. J. Chavan. Y. Nemoto. S. Narumiya. S. Kozaki. B. E. Haley. I. Biol.Chem.. 267, 14866-14870 (1992).
26. A. C. Erickson. G. V. W. Johnson. J. Neurosci. Meth.. 46. 245-249 (1993).
27. P. Scanff. M.Yvon, J. P. Pelissier, J. Chromatogr.. 539. 425-432 (1991).
28. M. C. Van Heusden, S. Fogarty. J. Porath. J. H. Law', Prot. Express. Purif.,2, 24-28 (1991).
29. L. Andersson. J. Porath. Anal. Biochem.. 154, 250-254 (1986).
30. H. Meisel. H. Frister. Biol. Chem. (Hoppe-Seyler), 369. 1275-1279 (1988).
31. Pharmacia Biotechnology Products Catalog. Piscataway, NJ, 1994.
32. G. T. Hermanson. A. K. Mallia, P. K. Smith, I m m o b i l i z e d A f f in i t y
L ig a n d T e c h n iq u e s . Academic Press, San Diego, 1992.

140 HOLMES AND SCHILLER
33. P. D G. Dean. W. S. Johnson. F. A. Middle. A f f in i t y C h r o m a t o g r a p h y , aP r a c t ic a l A p p r o a c h . IRL Press. 1985.
34. W. Schossler. "Affinity Electrophoresis’" in A f f in i t y C h r o m a t o g r a p h y ,
P r a c t ic a l a n d T h e o r e t i c a l A s p e c t s . P. Mohr, K. Pommerening. eds.. Marcel Dekker. New York. 1985. pp. 259-275.
35. V. A. Davankov. A. V. Semcechkin. J. Chromatogr.. 141. 313-353 (1977).
36. S. K. Sahni. J. Reedijk. Coord. Chem. Rev.. 59. 1-139 (1984).
37. A. E. Martell. R. M. Smith, in C r i t ic a l S t a b i l i t y C o n s t a n t s . Plenum Press.New York. Vol. 1. 1974. pp. 29. 116. 139: Vol. 2. 1975. pp. 223. 347:Vol. 4. 1976. p. 56: Vol.5. 1982. pp. 74. 76. 340.
38. M. F. McCurley. W. R. Seitz. Talanta. 36. 341-346 (1989).
39. T h e Q I A e x p r e s s io n is t . Second Edition. QIAGEN Inc., Chatsworth. CA.(1992).
40. J. M. Hill. J. Chromatogr.. 76. 455-458 (1973).
4L K. F. Sugawara, H. H. Weetall, G. D. Schucker, Anal. Chem., 46. 489-492 (1974).
42. J. R. Jezorek. H. Freiser. Anal. Chem.. 51. 366-373 (1979).
43. G. J. Shahwan. J. R. Jezorek. J. Chromatogr., 256, 39-48 (1983).
44. J. R. Jezorek. C. Fulcher. M. A. Crowell. R. Bayliss, B. Greenwood. J.Lyon. Anal. Chim. Acta. 131. 223-231 (1981).
45. N. Ramadan. J. Porath. J. Chromatogr.. 321, 81-91 (1985).
46. N. Ramadan, J. Porath. J. Chromatogr.. 321, 93-104 (1985).
47. N. Ramadan. J. Porath. J. Chromatogr.. 321. 105-113 (1985).
48. B. Chatterjee. Coord. Chem. Rev., 26, 281-303 (1978).
49. M. E. Keeney. K. Osseo-Asare. K. Woode. Coord. Chem. Rev., 59, 141-201(1984).

IMMOBILIZED IRON(III) METAL AFFINITY 141
50. R. Oslerberg. Nature (London). 179. 476-477 (1957).
51. H. S. Hendrickson. J. G. Fullington. Biochemistry, 4. 1599-1605 (1965).
52. C. W. Childs. Can. J. Chem.. 49. 2359-2364 (1971).
53. M. S. Mohan. E. H. Abbott. Inorg. Chem.. 17. 2203-2207 (1978).
54. M. Zachariou. I. Traverso. M. T. W. Hearn, J. Chromatogr., 646, 107-120(1993).
55. M. Zachariou. M. T. W. Hearn. J. Chromatogr.. 599. 171-177 (1992).
56. O. Mellander. B. Vahlqvist. Amer. J. Clin. Nutrition. 5. 493-499 (1957).
57. W. Manson. J. Cannon. J. Daily Res.. 45. 59-67 (1978).
58. R. Sato. T. Noguchi. H. Naito. J. Nutr. Sei. Vitaminol.. 32. 67-76 (1986).
59. Z. Kucerova. J. Chromatogr.. 489. 390-393 (1989).
60. G. Perlmann. Adv. Prot. Chem.. 10. 1-30 (1955).
61. A. Lehninger. D. L. Nelson. M. M. Cox. P r in c ip le s o f B io c h e m is t r y .Worth Publ.. New York. 1993.
62. L. A. Staehelin. C. J. Arntzen. J. Cell Biol.. 97, 1327- 1337 (1983).
63. M. E. Salvucci. A. J. Chavan. B. E. Haley. Biochemistry. 31, 4479-4487(1992).
64. M. Weller. P r o t e in P h o s p h o r y la t io n . Pion Ltd.. London. 1979.
65. P. Cohen. Trends Biol. Sei.. 17. 408-413 (1992).
66. Sigma Chemical Company Catalog. St. Louis. MO. 1995.

142 HOLMES AND SCHILLER
67. S. A. Koch. M. Millar. J. Amer. Chem. Soc.. 104, 5255-5257 (1982).
Received April 27. 1996 Accepted May 14. 1996 Manuscript 4182

J. LIQ. CHROM. & REL. TECHNOL.. 20(1). 143-153 (1997)
NON-IDEAL SIZE EXCLUSION CHROMATOGRAPHY OF EUKARYOTIC
PROTEIN SYNTHESIS IN ITIATION FACTOR 2
M. F. Mouat.*: K. L. Manchester'
1 Department of Biochemistry University of the Witwatersrand
Johannesburg. South Africa
“Department of Human Ecology The University of Texas at Austin
Austin. Texas 78712-1097
A B S T R A C T
Eukaryotic protein synthesis initiation factor 2 (eIF-2). a heterotrimer. was chromatographed on high performance (Superóse 6) and standard (Uitrogel AcA 34 and Sephacryl S- 300) size exclusion chromatography (SEC) media. The retention volume of eIF-2 on the Superóse 6 column was higher than expected from its Mr and elution of a py eIF-2 dimer was seen. Conversely , on AcA 34 and Sephacry l S-300 most of the eIF-2 was eluted at its expected position, considering its ellipsoidal structure, as the heterotrimer. Elution of the Py heterodimcric eIF-2 may therefore be promoted by Superóse 6 high performance SEC which therefore provides a means for its rapid preparation for studies in protein sy nthesis initiation.
143
Copyright © 1997 by M a rc e l D e k k e r . In c .

144 MOUAT AND MANCHESTER
I N T R O D U C T I O N
Size-exclusion chromatography (SEC), also known as gel filtration and gel permeation chromatography, is an established technique for the separation and characterization of biopolymers. In general, mild conditions for the mobile liquid phase are employed so as to preserve the structural and functional integrity of the molecules. In ideal, or "pure". SEC. solute molecules are separated solely on the basis of size by equilibrium partitioning via diffusion between the mobile phase and gel pores.1 The non-ideal behaviour of biopolymers and other substances in size-exclusion chromatography (non-ideal SEC or nSEC) has been characterized for many situations2'7 and has been effectively utilized to improve the separation of biomolecules.8 It therefore has considerable potential for exploitation in the chromatographic purification and analysis of biopolymers.
In this study the behaviour of eukaryotic protein s\ nthesis initiation factor eIF-2. a heterotrimer (cxpy) of Mr 122,000, on different size-exclusion chromatographic media was examined it is shown that the chromatographic behaviour on the high performance medium Superóse 6 differs markedly from that on standard media (Ultrogel AcA 34 and Sephacryl S-300). the latter, but not the former behaviour, being in accord with that expected for eIF-2 on SEC. On Superóse 6 the interactions between solute and gel matrix responsible for this may have facilitated, together with the high separation efficiencies obtainable with this gel. the elution of a py dimer form of eIF-2. Superóse 6 high performance SEC thus affords a means for the rapid and efficient preparation of eIF-2 deficient in the a subunit, i.e. the py dimer.
M A T E R I A L S A N D M E T H O D S
The pre-packed Superose 6 column (1.0 x 30 cm) for high performance SEC and Sephacryl S-300 (pre-swollen) were from Pharmacia Fine Chemicals AB, Uppsala. Sweden. The AcA 34 Ultrogel (pre-swollen) was obtained from LKB (Bromma. Sweden). Protein molecular mass markers were from Sigma Chemical Company. Lactate dehydrogenase (pig heart), pyruvate kinase (rabbit muscle), glucose oxidase (A s p e r g i l lu s n ig e r ) and hexokinase (yeast) were all acquired from Boehringer Mannheim. The initiation factor, elF-2, was obtained from rabbit reticulocyte lysate by purification through the phosphocellulose step of a conventional purification procedure.9 but with the substitution of DEAE-Sephacel for the DEAE-cellulose step since this improved the resolution of eIF-2.

EUKARYOTIC PROTEIN SYNTHESIS INITIATION FACTOR 2 145
0 10 20 30
VOLUME (ml)
F ig u re 1. S u p e ró s e 6 c h ro m a to g ra p h y o f e I F - 2 . T h e e IF -2 ( 1 0 0 ug in a lo a d e d v o lu m e o f
0 .2 in L ) , p u r i f i e d th ro u g h th e p h o s p h o c e l lu lo s e s te p o f th e c o n v e n t io n a l p u r i f ic a t io n (9 ) , w a s a p p l ie d to th e S u p e ró s e 6 c o lu m n . T h e c o lu m n w a s e q u i l ib r a te d a n d d e v e lo p e d , a t a
f lo w r a te o f 0 .3 m L /m in , w ith th e fo llo w in g b u ffe r : 0 .1 M K C 1; 10 m M p o ta s s iu m
p h o s p h a te , p H 6 .8 ; 7 m M 2 - m e rc a p to e th a n o l ; 1 0 % g ly c e ro l. T h e tw o m a jo r p e a k s (A
a n d B ) e lu te d fro m th e c o lu m n w e re a n a ly z e d b y S D S -P A G E (F ig . 3 ). T h e
c h ro m a to g ra p h y w a s p e r fo r m e d a n o th e r t h r e e t im e s a n d a v i r tu a l ly id e n t ic a l e lu t io n p a t te r n w a s o b ta in e d o n e a c h o c c a s io n . T h e a p p a r e n t M r o f p e a k A w a s 6 0 ,0 0 0 a n d th a t o f p e a k B 5 .0 0 0 - 1 3 .0 0 0 T h e s e v a lu e s w e r e o b ta in e d b y r e fe re n c e to th e M r c a l ib r a t io n
c u rv e ( in s e t ) o b ta in e d fro m c h ro m a to g ra p h y o f th e fo llo w in g p r o te in M , m a r k e r s ( M r v a lu e s in b r a c k e t s ) o n th e S u p e ró s e 6 c o lu m n : ( 1 ) c y to c h ro m e c ( 1 2 ,6 0 0 ) , 0 .3 m g ; (2 )
m y o g lo b in ( 1 7 ,5 0 0 ) , 0 .3 m g ; (3 ) c a r b o n ic a n h y d r a s e ( 2 9 ,0 0 0 ) , 0 .4 m g ; ( 4 ) b o v in e s e r u m
a lb u m in ( 6 8 ,0 0 0 ) , 0 .8 m g ; ( 5 ) a lc o h o l d e h y d ro g e n a s e ( 1 5 0 ,0 0 0 ) , 0 .4 m g ; ( 6 ) [3 -an ty lase ( 2 0 0 ,0 0 0 ) , 0 .3 m g ; ( 7 ) a p o f e r r i t in ( 4 4 3 ,0 0 0 ) , 0 .4 m g ; ( 8 ) th y ro g lo b u l in ( 6 6 9 ,0 0 0 ) , 0 .6 m g . A very s im i la r p lo t w a s o b ta in e d w h e n th e c a l ib r a t io n w a s r e p e a te d .
For standard SEC. AcA 34 (1.6 x 28 cm) and Sephacryl S-300 (1 x 13 cm) columns were used. To maintain a smooth, even and reproducible flow of eluent through the columns the LKB 2150 HPLC pump was employed. The effluent was also monitored continuously with the LKB 2158 Uvicord detector set to measure absorbance at 280 nm.
For all the columns equilibration and development was with the following buffer: 0.1 M KC1. 10 mM potassium phosphate. pH 6.8, 7 mM 2- mercaptoethanol. 10% glycerol. The flow rate was 0.30 mL/min for the

146 MOUAT AND MANCHESTER
Superose 6 column. For the AcA column the flow rate was 0.17 mL/min and for the Sephacryl S-300 column it was 0.10 mL/min. The chromatography was conducted at 4 °C. The void volumes, VD, of the columns were determined using blue dextran. The total permeation volumes, V, . were determined with acetone.
For analysis of column effluent, sodium dodecyl sulphate-polyacrylamide gel electrophoresis was performed according to a modified Laemmli method."’
R E S U L T S
H ig h P e r f o r m a n c e S E C o f e I F -2
On the application of eIF-2 to the Superose 6 column, two A2go peaks were eluted (Fig. 1). The apparent Mr of each of the peaks was determined from the Mr calibration curve for Superose 6 as indicated. The apparent Mr of5,000-13.000 (elution close to cytochrome c, but before Vt) for the larger peak and that of 60.000 for the other prominent peak were less than those expected for eIF-2. The recovery in terms of A 2S0 units was 60%. Since the actual Mr of eIF-2 is 122,00o11,12 and it elutes from gel filtration columns with a higher apparent Mr than this owing to its ellipsoidal structure,12'14 the peaks of low apparent M, obtained for it on Superose 6 chromatography suggest retardation on the column and/or subunit dissociation.
H ig h P e r fo r m a n c e S E C o f o th e r P r o te in s
Several different oligomeric proteins were chromatographed on the Superose 6 column to determine if any of them underwent clearly detectable subunit dissociation. Individually applied to the column were hexokinase, lactate dehydrogenase, glucose oxidase and pyruvate kinase. On elution a single symmetrical peak was obtained for each protein.
Hexokinase and glucose oxidase eluted in accord with their reported Mr values (Table 1). but the apparent Mr of 85,000 of lactate dehydrogenase was less than its reported Mr of 109,000. For pyruvate kinase the apparent Mr of114,000 was about half its reported Mr15 of 237.000. It should be noted that these proteins were loaded at 5 times the concentration of eIF-2.

EUKARYOTIC PROTEIN SYNTHESIS INITIATION FACTOR 2 147
Table I
A p p a r e n t M r o f O lig o m e r ic P r o te in s o n S u p e r o s e 6 S E C *
A p p a r e n t M rP r o te in M r
( x lO 3)o n S u p e r o s e 6
(xlO"3)
Hexokinase 104 101Lactate dehydrogenase 109 85
Glucose oxidase 186 166Pyruvate kinase 237 114
* The proteins (0.5 mg of each in a loaded volume of 0.2 mL) were chromatographed on Superose 6 and their apparent Mr values determined by reference to the Mr calibration curve for Superose 6 (inset to Fig. 1).
S ta n d a r d S E C o f e IF -2
On AcA 34. eIF-2 eluted as two A;8U peaks. The larger (peak A) was eluted with an apparent Mr of 200.000 and the smaller (peak B) of 68.000 (Fig.2). The ellipsoidal structure12"14 of the eIF-2 explains its elution at an apparent Mr value greater than the true M, of 122,000. SDS-PAGE analysis of the eluted fractions confirmed the elution of the eIF-2 heterotrimer in peak A (not shown). The tailing of the first peak (A) was due, from the SDS-PAGE analysis, to some proteolysis of the p subunit which is a well-documented phenomenon.16 The occurrence of the second peak (B) was due to a 67 kDa polypeptide present in the eIF-2 preparation (see below). Similar results were obtained on Sephacryl S-300. Care was taken in comparing the behaviour of eIF-2 on the three different SEC media used to ensure that the results on Superose 6 were not due to a lower ratio of amount loaded to column volume compared with the ratios for the AcA 34 and Sephacryl S-300 columns.
S D S - P A G E A n a ly s i s o f e I F -2 F r a c t io n s E lu t e d o n S u p e r o s e 6 S E C
The two peaks, A and B of the experiment of Fig. 1, were each collected and concentrated by Millipore ultrafiltration. After lyophilization, the peaks were subjected to SDS-PAGE (Fig. 3). Electrophoresis was stopped before the bromophenol blue had run off the gel in order to search for the presence of any low Mr peptides. On staining the gel with Coomassie Blue only very faint bands could be detected for each of the peaks so the portion of the gel on which

148 MOUAT AND MANCHESTER
F ig u re 2. A c A 34 c h ro m a to g ra p h y o f e IF -2 . T h e e IF -2 ( 1 0 0 |ig in a lo a d e d v o lu m e o f 0 .5 rn L ), p u r i f ie d th ro u g h th e p h o s p h o c e l lu lo s e s te p , w a s c h ro m a to g ra p h e d o n A c A 34
( 1 .6 x 2 8 c m ) a t a f lo w r a te o f 0 .1 7 m L /m in . T h e c o lu m n b u f f e r w a s a s fo r S u p e ro s e 6
( le g e n d to F ig . 1 ). T h e c h ro m a to g ra p h y w a s r e p e a t e d tw ic e a n d s im i la r r e s u l t s w e re o b ta in e d in e a c h c a s e . T h e a p p a r e n t Mr o f p e a k A w a s 2 0 0 ,0 0 0 a n d th a t o f p e a k B 6 8 ,0 0 0 b y r e fe re n c e to th e Mr c a l ib r a t io n c u rv e fo r A c A 3 4 ( in s e t ) c o n s t r u c te d u s in g th e
fo l lo w in g p r o te in Mr m a r k e r s (Mr v a lu e s in b ra c k e t s ) : (1) c a r b o n ic a n h y d r a s e ( 2 9 ,0 0 0 ) ,
3 m g ; ( 2 ) b o v in e s e r u m a lb u m in ( 6 8 ,0 0 0 ) , 6 m g ; ( 3 ) a lc o h o l d e h y d ro g e n a s e ( 1 5 0 ,0 0 0 ) , 4
m g ; (4 ) P -a m y Ia s e ( 2 0 0 ,0 0 0 ) , 4 m g . A s im i la r p lo t w a s o b ta in e d w h e n th e c a l ib r a t io n w a s r e p e a te d . O n c h ro m a to g ra p h y o f th e e lF -2 , 2 m L f r a c t io n s w e re c o l le c te d , c o n c e n t r a te d , ly o p h il iz e d a n d a n a ly z e d b y S D S - P A G E (n o t s h o w n ) . P e a k A c o n s is te d o f th e e IF -2 h e te r o t r im e r a n d p e a k B a 6 7 k D a p o ly p e p t id e . T h is a n a ly s is w a s a ls o u n d e r ta k e n o n th e f r a c t io n s e lu te d fo r e a c h o f th e tw o r e p e a t c h ro m a to g ra p h ic ru n s a n d th e r e s u l t s w e r e v e ry s im ila r .
the peaks were run was separated from the portion containing eIF-2 as a marker and the former silver stained. Comparing the bands obtained for each of the peaks with the subunit bands of the marker eIF-2 (Fig. 3), for peak A the p and y subunits of eIF-2 were clearly evident, but not the a subunit. That loss was of the a subunit was confirmed by measurement of the migration distances of the polypeptide bands relative to that of bromophenol blue, i.e. the Rf values (legend to Fig. 3).

EUKARYOTIC PROTEIN SYNTHESIS INITIATION FACTOR 2 149
a
Y -
X -
P-Y-
Peak
A BelF-2
F ig u re 3. A n a ly s is o f p e a k s e lu te d o n S u p e ro s e 6 c h ro m a to g ra p h y o f e IF -2 . T h e p e a k s
A a n d 13 e lu te d o n S u p e ro s e 6 c h ro m a to g ra p h y o f e IF -2 (F ig . 1 ) w e re c o n c e n tr a te d ,
ly o p h il iz e d a n d th e n s u b je c te d to S D S -P A G E . T h i r ty p L S D S -P A G E s a m p le b u f f e r w a s
a d d e d to e a c h ly o p h i l iz e d p e a k . T h e p o r t io n o f th e g e l c o n ta in in g th e p e a k s w a s s i lv e r s ta in e d ( a ) , a n d th e p o r t io n c o n ta in in g m a r k e r e IF -2 s ta in e d w ith C o o m a s s ie B lu e (b ) . B e c a u s e o f th e d i f f e r e n t s ta in in g c o n d i t io n s , th e l a t t e r w a s m o r e s w o l le n th a n th e
fo rm e r . R r v a lu e s fo r th e b a n d s w e re a s fo llo w s : ( a ) Y = 0 .3 0 , X = 0 .3 7 , (3 = 0 .4 4 , y = 0 .5 0 .
( b ) Y = 0 .2 3 , X = 0 .3 1 , (3 = 0 .4 0 , y = 0 .4 5 , a = 0 .5 8 . S im i la r r e s u l t s w e re o b ta in e d o n a n a ly s is o f th e p e a k s e lu te d o n a r e p e a t S u p e ro s e 6 S E C o f e IF -2 .
Two contaminating peptides. X and Y. of apparently higher Mr on the gel than eIF-2|3 were in the eIF-2 preparation. X could have been the 67 kDa noted previously1 ls with a presumed function in protein synthesis initiation.19 Very little could be detected in peak B (Fig. 3) except for the two relatively high M, contaminating polypeptides. X and Y. Their positions on the gel implied that each had an M, >60.000. wheieas the apparent Mr of peak B from its elution position was 5.000-13,000. Retardation on the column must therefore have occurred. Retardation of eIF-2 was implied also by the apparent M, of peak A being 60.000 (Fig. 1) whereas if the p and y subunits eluted in this peak (Fig. 3) were still bonded together a higher apparent Mr (>90.000) would have been obtained. Retardation may have also been implicated in the loss of a subunit from the peak A eIF-2 (Fig. 3).

150 MOUAT AND MANCHESTER
Peptides, as degradation products, eluted from the Superose 6 column would be expected to be largely lost during concentration by Millipore ultrafiltration since the nominal Mr of the filter unit was 30,000. Free a subunit may have also been lost on concentration because of its Mr. 32,000, being close to the nominal Mr of the filter unit.
D I S C U S S I O N
The deviation of nSEC from "pure" SEC is generally due to one or more of the following effects: (i) electrostatic interactions between the solute molecule and charged groups of the gel matrix; (ii) hydrophobic interactions between solute and stationary phase; (iii) hydrogen bonding between solute and resin; and (iv) steric effects which are dependent on the shape of the solute molecules, i.e. whether spherical, ellipsoidal or rod-shaped, for example.
Assessment of the different chromatographic behaviours of eIF-2 requires consideration of the compositions of the gel matrices. Superóse 6 is agarose- based with a 6% agarose composition.20 AcA 34 is a mixed polyacry lamide and agarose gel. Sephacryl S-300 is a cross-linked copolymer of allyldcxtran andN. N'-methylenebisacrylamide.
For explanation of the behaviour of elF-2 on Superóse 6, this gel is known to contain small amounts of negatively charged carboxyl and sulphate groups.“" Superóse media in most situations would therefore behave as weak cation- exchange resins.6 Hydrophobic2 and aromatic4 interactions also cannot be ruled out. While the gel hydrophobicitv parameter value, which is able to define the relative hydrophobicitv of a gel.“1 of 0.084 for Superóse 6 may seem relatively low. it is much higher than those of 0.015 and <0.01 for the polyacrylamide- based Biogel A-50M and Sephadex G-100 dextran. repectively.21 Coulombic and hydrophobic attractions between solute molecules and Superóse media are difficult to suppress.2 2“ Retarding aromatic interactions have been claimed to induce the unexpectedly late elution of different hybridoma antibodies when chromatographed on a Superóse column.4 Aromatic amino acids and hydrophobic peptides have been found to undergo retarding interactions w'ith the matrix of a Superóse 12 column during SEC of milk protein hydrolysates.7 The potential for agarose gels to bind biopolymers has been demonstrated by the adsorption of ribosomal RNA.24 specifically 28 S RNA.24,22 to Sepharose 4B. Rat liver 60 S ribosomal subunits adsorb to the agarose gels, Sepharose 4B and Biogel A-15M. which could be as a result of interaction between the gel and the 28 S RNA of the subunits.26 That the binding, in each case, was promoted by conditions of high salt and lower temperatures suggests that the interaction in each instance is hydrophobic.

EUKARYOTIC PROTEIN SYNTHESIS INITIATION FACTOR 2 151
Notwithstanding the influence of nSEC effects for specific biopolymers, the maximum selectivity and high efficiency of Superóse is reported to make it very effective in the resolution of solutes differing in molecular mass by as little as 20%.20,27 HPLC gel filtration has also been used to study the concentration- dependent association-dissociation of bovine and rat liver glutamate dehydrogenase.28 It seems likely that in trimeric eIF-2 there is a dynamic equilibrium between the three subunits such that loss of a temporarily dissociated a subunit into a gel pore will lead to further a subunit dissociation to restore equilibrium of the reaction aPy » a + Py in the interstitial volume. Repetition of sequestration of the a subunit by the gel will lead to progressive formation of the py dimer. The much lower surface contact between gel and solution in the AcA and Sephacryl gels results in a much less effective sequestration of the a subunit. Superóse 6 nSEC interactions may have enhanced sequestration of the a subunit w ith this matrix.
Elution of the py dimer on Superóse 6 chromatography of eIF-2 suggests that in addition to enabling rapid isolation of this dimer, the technique may be a very useful tool for study of the association-dissociation equilibrium between a subunit and the Py dimer in the same way that high performance gel filtration has been used to study the association-dissociation behaviour of bovine and rat liver glutamic dehydrogenase.28
A C K N O W L E D G E M E N T S
Financial support was provided by the Foundation for Research Development.
R E F E R E N C E S
1. M. E. Himmel, P. G. Squire, "Size Exclusion Parameters" in A q u e o u s S i z e -
E x c lu s io n C h r o m a t o g r a p h y . P. L. Dubin, ed., Elsevier. Amsterdam, 1988, Chapt. 1, pp. 3-22.
2. B. L. Johansson, J. Gustavsson, J. Chromatogr., 457, 205-213 (1988).
3. K. Inouye. Agric. Biol. Chem., 55, 2129-2139 (1991).
4. T. E. Michaelsen, M. F. Lofsgaard, A. Aase, B. Heyman, J. Immunol.Methods, 146, 9-16 (1992).

152 MOU AT AND MANCHESTER
5. N. P. Golovchenko. I. A. Kataeva, V. K. Akimenko, J. Chromatogr., 591.121-128 (1992).
6. S. L. Edwards, P.L. Dubin. J. Chromatogr.. 648, 3-7 (1993).
7. D. M. O'Callaghan. W. J. Donnelly. H. M. Slattery, D. M. Mulvihill. J. Liq.Chromatogr.. 18. 1543-1562 (1995).
8. H. Schlüter. W. Zidek. J. Chromatogr., 639, 17-22 (1993).
9. R. Benne. C. Wong. M. Luedi. J. W. B. Hershey, J. Biol. Chem., 251, 7675-7681 (1976).
10. M. H. Schreier. B. Erni. T. Staehelm, J. Mol. Biol.. 116. 727-753 (1977).
11. M. A. Lloyd. J. C. Osborne (Jr ). B. Safer. G. M. Powell. W. C. Merrick. J.Biol. Chem. 255, 1189-119.3 (1980).
12. U. -A. Bommer. G. Lutsch. J. Behlke, J. Stahl. N. Nesytova. A. Henske, H.Bielka. Eur. J. Biochem., 172. 653-662 (1988).
13. B. Safer. W. F. Anderson. W. C. Merrick. J. Biol. Chem.. 250. 9067-9075(1975).
14. S. R. Kimball. W. V. Everson, L. M. Myers, L. S. Jefferson, J. Biol. Chem.,262,2220-2227 (1987).
15. R. C. Warner. Arch. Biochem. Biophys., 78, 494-496 (1958).
16. N. T. Price, S. F. Nakielny. S. J. Clark. C. G. Proud, Biochim. Biophys.Acta, 1008. 177-182 (1989).
17. S. J. Morley, W.-J. Buhl, R. J. Jackson, Biochim. Biophys. Acta. 825, 57-69(1985).
18. B. Datta. D. Chakrabarti. A. L. Roy. N. K. Gupta. Proc. Natl. Acad. Sci.USA. 85. 3324-3328 (1988).
19. B. Datta, M. K. Ray, D. Chakrabarti, D. E. Wylie, N. K. Gupta, J. Biol.Chem., 264, 20620-20624 (1989).
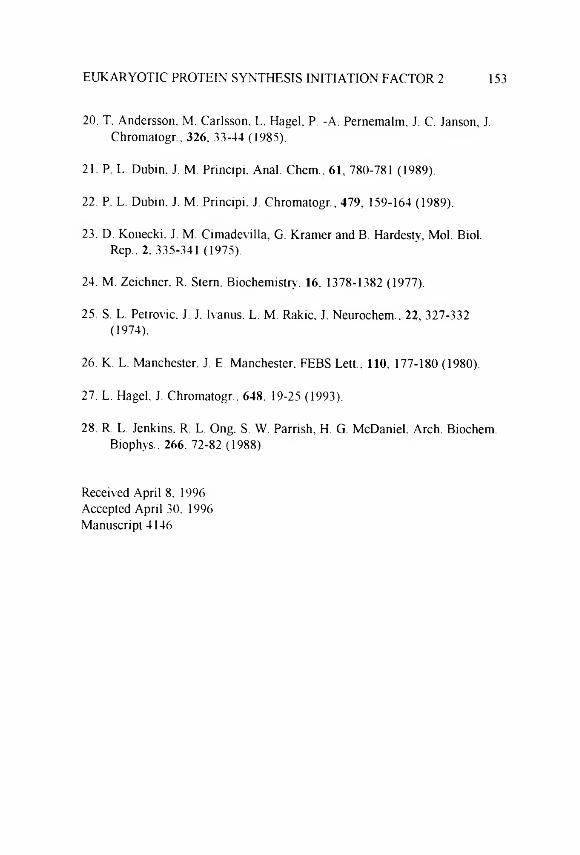
EUKARYOTIC PROTEIN SYNTHESIS INITIATION FACTOR 2 153
20. T. Andersson, M. Carlsson, L. Hagel. P. -A. Pernemalm, J. C. Janson, J.Chromatogr.. 326. 33-44 (1985).
21. P. L. Dubin. J. M. Principi. Anal. Chem., 61. 780-781 (1989).
22. P. L. Dubin. J. M. Principi. J. Chromatogr., 479, 159-164 (1989).
23. D. Konecki. J. M. Cimadevilla, G. Kramer and B. Hardesty, Mol. Biol.Rep.. 2. 335-341 (1975).
24. M. Zeichner. R. Stern. Biochemistry. 16. 1378-1382 (1977).
25. S. L. Petrovic. J. J. Ivanus. L. M. Rakic, J. Neurochem., 22, 327-332(1974).
26. K. L. Manchester. J. E. Manchester. FEBS Lett.. 110. 177-180 (1980).
27. L. Hagel. J. Chromatogr.. 648, 19-25 (1993).
28. R. L. Jenkins. R. L. Ong. S. W. Parrish, H. G. McDaniel. Arch. Biochem.Biophys.. 266. 72-82 (1988).
Received April 8, 1996 Accepted April 30. 1996 Manuscript 4146
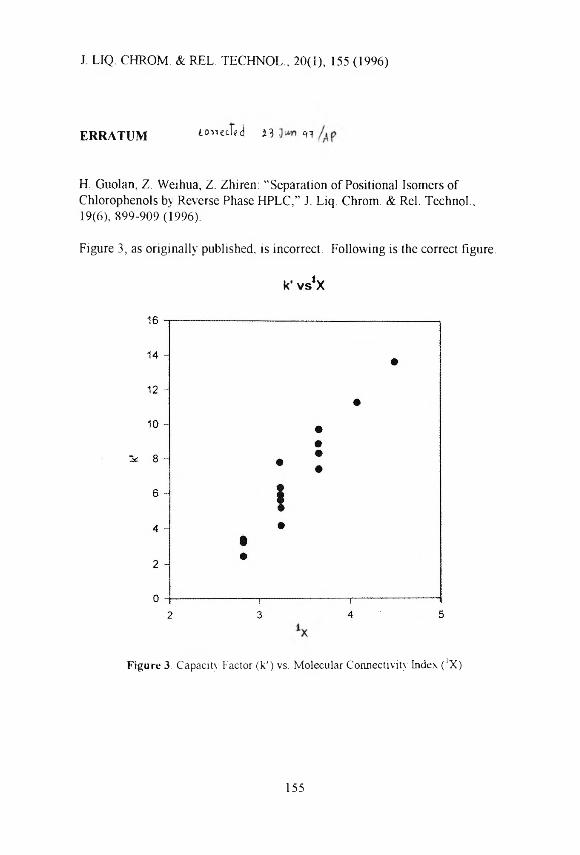
J. LIQ. CHROM. & REL. TECHNOL., 20(1), 155 (1996)
E R R A T U M i t w e c f H ¿3 ^
H. Guolan, Z. Weihua, Z. Zhiren: “Separation of Positional Isomers of Chlorophenols by Reverse Phase HPLC,” J. Liq. Chrom. & Rel. Technol.. 19(6), 899-909 (1996).
Figure 3, as originally published, is incorrect. Following is the correct figure.
k ' v s * X
Figure 3 . C a p a c i ty F a c to r ( k ' ) v s . M o le c u la r C o n n e c t iv i ty In d e x ( ’X )
155
J. LIQ. CHROM. & REL. TECHNOL., 20(1). 157-158 (1997)
T H E B O O K C O R N E R
B I O F L U I D A S S A Y F O R P E P T I D E - R E L A T E D A N D O T H E R D R U G S , EReid, H. M. Hill. I. D. Wilson, eds.. Volume 24 in the Methodological Surveys in Bioanalysis of Drugs series. The Royal Society of Chemistry, Cambridge.U.K., 1996. 350 pp„ £89.50.
This volume is based on the proceedings of the 11th International Bioanalytical Forum, conducted by the Forum Syndicate of the Chromatographic Society . The symposium was held August 29 to September 1, 1995 in Guildford, U K.
The apparent purpose of this volume is, simply, to record and disseminate the proceedings. Although some of the contributions are excellently reported, some of the proceedings included in this volume are somewhat abbreviated, sometimes comprising no more than a brief outline of the work that is reported. Expanded, complete papers would, no doubt, have made this a useful reference manual.
An analyte index is included at the end of the book. This would be, perhaps, the most valuable contribution. But, its organization is confusing, requiring more than a quick reference to locate a specific analyte.
The contributions are grouped under the following topics:
Peptide-Type Agents
Agents with Peptide-Type Targets
Various Drug Analytes: Problems and Strategies
Sample Treatment including Protein Removal and SPE
Approaches for Analytical Separation and Detection
Data Acquisition and Validity' in Relation to Drug Appraisal
157

158 THE BOOK CORNER
This volume, according to the publisher, is aimed at the staffs of research and professional organizations involved in drug development and bioanalytical research. Although this is the audience to whom the covered subjects would would appeal, one must be cautioned not to expect more than sketchy overviews with minimal references to the published literature. As such, the volume’s utility is limited.
Reviewed byDr. Jack CazesThe Cazes Group. Inc.P. O. Box 970210 Coconut Creek. FL 33097
J. LIQ. CHROM. & REL. TECHNOL., 20(1). 159 (1997)
E D U C A T I O N A N N O U N C E M E N T
BASIC PRINCIPLES OF HPLC AND HPLC SYSTEM TROUBLESHOOTING
A Two-DayIn-House Training Course
The course, which is offered for presentation at corporate laboratories, is aimed at chemists, engineers and technicians who use, or plan to use, high performance liquid chromatography in their work. The training covers HPLC fundamentals and method development, as well as systematic diagnosis and solution of HPLC hardware module and system problems.
The following topics are covered in depth:• Introduction to HPLC Theory
• Modes of HPLC Separation• Developing and Controlling Resolution
• Mobile Phase Selection and Optimization • Ion-Pairing Principles
• Gradient Elution Techniques • Calibration and Quantitation
• Logical HPLC System Troubleshooting
The instructor, Dr. Jack Cazes, is founder and Editor-in-Chief of the Journal of Liquid Chromatography & Related Technologies, Editor of Instrumentation Science & Technology', and Series Editor of the Chromatographic Science Book Series. He has been intimately involved with liquid chromatography for more than 35 years; he pioneered the development of modern HPLC technology. Dr. Cazes was Professor-in-Charge of the ACS Short Course and the ACS Audio Course on Gel Permeation Chromatography for many years.
Details may be obtained from Dr. Jack Cazes, P. O. Box 970210, Coconut Creek, FL 33097, USA. (954) 973-8516; E-Mail: [email protected].
159

J. LIQ. CHROM. & REL. TECHNOL.. 20(1). 161-166 (1997)
LIQUID CHROMATOGRAPHY CALENDAR
1 9 9 7
M A R C H 16 - 2 1 : P it t C o n ‘97, A t la n t a , G e o r g ia . Contact: PittCon ‘97. Suite 332, 300 Penn Center Blvd.. Pittsburgh. PA 15235-5503, USA. Tel: (800) 825- 3221; FAX: (412) 825-3224.
A P R I L 1 3 - 1 7 : 2 1 3 t h A C S N a t io n a l M e e t in g , S a n F r a n c is c o , C a l i f o r n ia .Contact: ACS Meetings. ACS. 1155 16th Street, NW, Washington, DC 20036- 4899. USA. Tel: (202) 872-6059; FAX: (202) 872-6128.
A P R I L 1 4 - 1 9 : G e n e s a n d G e n e F a m il ie s in M e d ic a l , A g r ic u l t u r a l a n d
B io lo g ic a l R e s e a r c h : 9 th I n t e r n a t io n a l C o n g r e s s o n I s o z y m e s , sponsored by the Southwest Foundation for Biomedical Research, Hilton Palacio del Rio, San Antonio. Texas. Contact: Mrs. Janet Cunningham, Barr Enterprises, P. O. Box 279. Walkersville. MD 21793. USA.
M A Y 5 - 9 : 1 5 1 s t A C S R u b b e r D iv S p r in g T e c h n ic a l M e e t in g , A n a h e im ,
C a l i f o r n ia . Contact: L. Blazeff. P. O. Box 499, Akron. OH 44309-0499. USA.
M A Y 2 3 - 2 4 : A C S B io lo g ic a l C h e m is t r y D iv M e e t in g , S a n F r a n c is c o , C a l i f o r n ia . Contact: K. S. Johnson. Dept of Biochem & Molec Biol. Penn State Unit . 106 Allhouse Lab. University Park. PA 16802. USA.
M A Y 2 7 - 2 8 : I ln d M in ia t u r i s a t io n in L iq u id C h r o m a t o g r a p h y v e r s u s
C a p i l la r y E le c t r o p h o r e s is C o n f e r e n c e , U n iv e r s i t y o f G h e n t , G h e n t , B e lg iu m . Contact: Prof. Dr. W. Baeyens. Faculty of Pharmaceutical Analysis, University of Ghent. Harelbekestraat 72. B-9000 Ghent. Belgium.
161

162 LIQUID CHROMATOGRAPHY CALENDAR
M A Y 2 7 - 3 0 : A C S 2 9 th C e n t r a l R e g io n a l M e e t in g , M id la n d , M ic h ig a n .Contact: S. A. Snow. Dow Corning Corp.. C042A1, Midland, MI 48686-0994.
M A Y 2 8 - 3 0 : 3 1 s t A C S M id d le A t la n t i c R e g io n a l M e e t in g , P a c e U n iv , P le a s a n t v i l l e , N Y . Contact: D. Rhani, Chem Dept, Pace University, 861 Bedford Rd, Pleasantville. NY 10570-2799, USA. Tel: (914) 773-3655.
M A Y 2 8 - J U N E 1: 3 0 t h G r e a t L a k e s R e g io n a l A C S M e e t in g , L o y o la
U n iv e r s i t y , C h ic a g o I l l in o is . Contact: M. Kouba, 400G Randolph St, #3025, Chicago. IL 60601. USA. Email: [email protected].
J U N E 2 2 - 2 5 : 2 7 th A C S N o r t h e a s t R e g io n a l M e e t in g , S a r a t o g a S p r in g s ,
N e w Y o r k . Contact: T. Noce. Rust Envir & Infrastructure. 12 Metro Park Rd. Albany. NY 12205. USA. Tel: (518) 458-1313; FAX: (518) 458-2472.
J U N E 2 2 - 2 6 : 3 5 th N a t io n a l O r g a n ic C h e m is t r y S y m p o s iu m , T r in i t y
U n iv . , S a n A n t o n io , T e x a s . Contact: 3. H. Rigby, Chem Dept. Wayne State Unix.. Detroit. MI 48202-3489. USA. Tel: (313) 577-3472.
S E P T E M B E R 7 - 1 1 : 2 1 4 th A C S N a t io n a l M e e t in g , L a s V e g a s , N e v a d a .
Contact: ACS Meetings. 1155 16th Street. NW. Washington. DC 20036-4899.
S E P T E M B E R 21 - 2 6 : F e d e r a t io n o f A n a ly t i c a l C h e m is t r y &S p e c t r o s c o p y S o c ie t ie s ( F A C S S ) , C le v e la n d , O h io . Contact: J. A Broxvn, FACSS. 198 Thomas Johnson Dr. Suite S-2. Frederick. MD 21702. USA. Tel: (301) 846-4797: FAX: (301 ) 694-6860.
O C T O B E R 1 9 - 2 2 : 4 9 t h A C S S o u t h e a s t R e g io n a l M e e t in g , R o a n o k e ,
V ir g in ia . Contact: J. Graybeal. Chem Dept. Virginia Tech. Blacksburg, VA 24061. USA. Tel: (703) 231-8222: Email: [email protected].
O C T O B E R 2 1 - 2 5 : 3 3 r d A C S W e s t e r n R e g io n a l M e e t in g , I r v in e ,
C a l i f o r n ia . Contact: L. Stemler. 8340 Luxor St, Downey. CA 90241. USA. Tel: (310) 869-9838: Email: [email protected].
O C T O B E R 2 6 - 2 9 : 8 th S y m p o s iu m o n H a n d l in g o f E n v ir o n m e n t a l &
B io lo g ic a l S a m p le s in C h r o m a t o g r a p h y a n d t h e 2 6 th S c i e n t i f i c M e e t in g o f
t h e G r o u p o f C h r o m a t o g r a p h y a n d R e la t e d T e c h n iq u e s o f t h e S p a n is h
R o y a l S o c ie t y o f C h e m is t r y , A lm e r ia , S p a in . Contact: M. Frei-Hausler, IAEAC Secretariat. Postfach 46. CH-4123 Allschwill 2. Switzerland. FAX: 41-61-4820805.

LIQUID CHROMATOGRAPHY CALENDAR 163
O C T O B E R 2 9 - N O V E M B E R 1: 3 2 n d A C S M id w e s t R e g io n a l M e e t in g ,
L a k e o f t h e O z a r k s , O s a g e B e a c h , M is s o u r i . Contact: C. Heitsch, Chem Dept, Univ of Missouri-Rolla, Rolla, MO 65401, USA. Tel: (314) 341-4536; FAX: (314) 341-6033; Email: [email protected].
N O V E M B E R 1 1 - 1 5 : 5 t h C h e m ic a l C o n g r e s s o f N o r th A m e r ic a , C a n c ú n ,
M e x ic o . Contact: ACS Meetings. 1155 16th St, NW, Washington, DC 20036- 4899, USA. Tel: (202) 872-6286; FAX: (202) 872-6128.
N O V E M B E R 1 6 - 2 1 : E a s t e r n A n a ly t i c a l S y m p o s iu m , G a r d e n S t a t e
C o n v e n t io n C e n t e r , S o m e r s e t , N e w J e r s e y . Contact: S. Good, EAS. P . O . Box 633, Montchanin, DE 19710-0635, USA. Tel: (302) 738-6218.
1 9 9 8
M A R C H 1 - 6 : P it t C o n ‘9 8 , N e w O r le a n s , L o u is ia n a . Contact: PittCon ‘98, Suite 332, 300 Penn Center Blvd., Pittsburgh, PA 15235-5503, USA. Tel: (800) 825-3221; FAX: (412) 825-3224.
M A R C H 2 9 - A P R I L 2: 2 1 5 t h A C S N a t io n a l M e e t in g , D a l la s , T e x a s .
Contact: ACS Meetings, 1155 16th Street, NW, Washington, DC 20036-4899, USA. Tel: (202) 872-4396; FAX: (202) 872-6128; Email: [email protected].
J U N E 1 0 - 1 2 : 5 3 r d A C S N o r t h w e s t R e g io n a l M e e t in g , C o lu m b ia B a s in
C o l le g e , P a s c o , W a s h in g t o n . Contact: K. Grant, Math/Science Div,Columbia Basin College, 2600 N 20th Ave, Pasco, WA 99301, USA. Email: [email protected].
J U N E 1 3 - 1 9 : 2 6 th A C S N a t io n a l M e d ic a l C h e m is t r y S y m p o s iu m , V i r g in ia
C o m m o n w e a lt h U n iv /O m n i R ic h m o n d H o t e l , R ic h m o n d , V ir g in ia . Contact:D. J. Abraham, Virginia Commonwealth Univ, Dept of Med Chem, P. O. Box 581, Richmond, VA 23298, USA. Tel: (804) 828-8483; FAX: (804) 828- 7436.
A U G U S T 2 3 - 2 8 : 2 1 6 t h A C S N a t io n a l M e e t in g , B o s t o n , M a s s a c h u s e t t s .Contact: ACS Meetings, 1155 16th Street, NW, Washington, DC 20036-4899, USA. Tel: (202) 872-4396; FAX: (202) 872-6218; Email: [email protected].
S E P T E M B E R 7 - 1 1 : 1 5 th I n t e r n a t io n a l S y m p o s iu m o n M e d ic in a l
C h e m is t r y , E d in b u r g h , S c o t la n d . Contact: M. Campbell, Bath University School of Chemistry, Claverton Down, Bath, BA2 7AY, UK. Tel: (44) 1225 826565; FAX: (44) 1225 826231; Email: [email protected].

164 LIQUID CHROMATOGRAPHY CALENDAR
S E P T E M B E R 2 4 - 2 6 : X I V t h C o n f e r e n c e o n A n a ly t i c a l C h e m is t r y ,s p o n s o r e d by t h e R o m a n ia n S o c ie ty o f A n a ly t i c a l C h e m is t r y ( S .C .A .R .) , P ia t r a N c a m t , R o m a n ia . Contact: Dr. G. L. Radu. S.C.A.R.. Faculty of Chemistry . University of Bucharest. 13 Blvd. Reepublicii. 70.346 Bucharest -III. Romania.
N O V E M B E R 4 - 7: 5 0 th A C S S o u t h w e s t R e g io n a l M e e t in g , R e sw
T r ia n g le P k , N o r th C a r o l in a . Contact: B. Switzer. Chem Dept. N Carolina State University. Box 8204. Raleigh. NC 27695-8204. USA. Tel: (919) 775- 0800. ext 944: Email: [email protected].
1 9 9 9
M A R C H 7 - 12: P it t C o n ‘9 9 , O r la n d o , F lo r id a . Contact: PittCon '99. Suite 332. 300 Penn Center Blvd.. Pittsburgh. PA 15235-5503. USA. Tel: (800) 825- 3221; FAX: (412) 825-3224.
M A R C H 21 - 2 5 : 2 1 7 th A C S N a t io n a l M e e t in g , A n a h e im , C a li f . Contact: ACS Meetings. 1155 16th Street. NW. Washington. DC 200.36-4899. USA. Tel: (202) 872-4396; F.AX: (202) 872-6128; Email: natlmtgsr/acs.org.
A U G U S T 2 2 - 2 6 : 2 1 8 th A C S N a t io n a l M e e t in g , N e w O r le a n s , L o u is ia n a .Contact: ACS Meetings. 1155 16th Street. NW. Washington. DC 20036-4899. USA. Tel: (202) 872-4.396; FAX: (202) 872-6128; Email: [email protected].
O C T O B E R 8 - 13: 5 1 s t A C S S o u t h e a s t R e g io n a l M e e t in g , K n o x v i l l e ,T e n n e s s e e . Contact: C. Feigerle, Chem Dept. University of Tennessee. Knoxville. TN 37996. USA. Tel: (615) 974-2129; Email: [email protected].
2000
M A R C H 5 - 1 0 : P it tC o n 2 0 0 0 , C h ic a g o , I l l in o is . Contact: PittCon 2000. Suite 332. 300 Penn Center Blvd.. Pittsburgh. PA 15235-5503. USA.
M A R C H 2 6 - 3 0 : 2 1 9 th A C S N a t io n a l M e e t in g , L a s V e g a s , N e v a d a .Contact: ACS Meetings. 1155 16th Street. NW. Washington. DC 20036-4899, USA. Tel: (202) 872-4.396; FAX: (202) 872-6128; Email: [email protected].
A U G U S T 2 0 - 2 4 : 2 2 0 t h A C S N a t io n a l M e e t in g , W a s h in g t o n , D C . Contact: ACS Meetings. 1155 16th Street. NW. Washington. DC 20036-4899. USA.
LIQUID CHROMATOGRAPHY CALENDAR 165
2001
A P R I L 1 - 5 : 2 2 1 s t A C S N a t io n a l M e e t in g , S a n F r a n c is c o , C a l i f . Contact: ACS Meetings, 1155 16th Street, NW, Washington. DC 20036-4899. USA. Tel: (202) 872-4396; FAX: (202) 872-6128; Email: [email protected].
A U G U S T 1 9 - 2 3 : 2 2 2 n d A C S N a t io n a l M e e t in g , C h ic a g o , I l l in o is . Contact: ACS Meetings. 1155 16th Street. NW, Washington, DC 20036-4899, USA. Tel: (202) 872-4396; FAX: (202) 872-6128; Email: [email protected].
2002
A P R I L 7 - 1 1 : 2 2 3 r d A C S N a t io n a l M e e t in g , O r la n d o , F lo r id a . Contact ACS Meetings, 1155 16th Street. NW. Washington, DC 20036-4899, USA.
S E P T E M B E R 8 - 1 2 : 2 2 4 th A C S N a t io n a l M e e t in g , B o s t o n , M a s s .Contact: ACS Meetings, 1155 16th Street, NW. Washington. DC 20036-4899.
2 0 0 3
M A R C H 2 3 - 2 7 : 2 2 5 t h A C S N a t io n a l M e e t in g , N e w O r le a n s , L o u is ia n a .Contact: ACS Meetings, 1155 16th Street, NW, Washington, DC 20036-4899, USA. Tel: (202) 872-4396; FAX: (202) 872-6128; Email: [email protected].
S E P T E M B E R 7 - 1 1 : 2 2 6 t h A C S N a t io n a l M e e t in g , N e w Y o r k C it y .Contact: ACS Meetings, 1155 16th Street, NW, Washington, DC 20036-4899, USA. Tel: (202) 872-4396; FAX: (202) 872-6128; Email: [email protected].
2 0 0 4
M A R C H 2 8 - A P R I L 1: 2 2 7 t h A C S N a t io n a l M e e t in g , A n a h e im ,
C a l i f o r n ia . Contact: ACS Meetings. 1155 16th Street, NW, Washington, DC 20036-4899. USA. Tel: (202) 872-4396; FAX: (202) 872-6128; Email: [email protected].
A U G U S T 2 2 - 2 6 : 2 2 8 t h A C S N a t io n a l M e e t in g , P h i la d e lp h ia ,
P e n n s y lv a n ia . Contact: ACS Meetings. 1155 16th Street. NW. Washington, DC 20036-4899. USA. Tel: (202) 872-4396: FAX: (202) 872-6128.

166 LIQUID CHROMATOGRAPHY CALENDAR
2 0 0 5
M A R C H 1 3 - 1 7 : 2 2 9 t h A C S N a t io n a l M e e t in g , S a n D ie g o , C a l i f o r n ia .Contact: ACS Meetings. 1155 16th Street, NW. Washington. DC 20036-4899, USA. Tel: (202) 872-4396. FAX: (202) 872-6128; Email: [email protected].
A U G U S T 2 8 - S E P T E M B E R 1: 2 3 0 t h A C S N a t io n a l M e e t in g ,W a s h in g t o n , D C . Contact: ACS Meetings, 1155 16th Street, NW, Washington. DC 20036-4899, USA. Tel: (202) 872-4396; FAX: (202) 872- 6128; Email: [email protected].
The J o u r n a l o f L iq u id C h r o m a t o g r a p h y & R e la t e d T e c h n o lo g ie swill publish, at no charge, announcements of interest to scientists in every issue of the journal. To be listed in the Liquid Chromatography Calendar, we will need to know:
a) Name of the meeting or symposium,b) Sponsoring organization,c) When and where it will be held, andd) Whom to contact for additional details.
Incomplete information will not be published. You are invited to send announcements to D r . J a c k C a z e s , E d i t o r , J o u r n a l o f L iq u id
C h r o m a t o g r a p h y & R e la t e d T e c h n o lo g ie s , P . O . B o x 9 7 0 2 1 0 , C o c o n u t
C r e e k , F L 3 3 0 9 7 , U S A .

I N S T R U C T I O N S T O A U T H O R S
The J o u r n a l o f L i q u i d C h r o m a to g r a p h y & R e l a t e d T e c h n o lo g ie s is published in the English language for the rapid communication of research results in liquid chromatography and its related sciences and technologies.
D ir e c t io n s f o r S u b m is s io n
One complete original manuscript and two (2) clear copies, with figures, must be submitted for peer review. After all required revisions have been completed, and the final manuscript has been accepted, the author will be asked to provide, if possible, a 3 / T or 5 '/T PC-Compatible computer diskette containing the complete manuscript. Microsoft Word. Word for Windows, WordPerfect, WordPerfect for Windows and ASCII are preferred formats. Text, including tables, and figures, if in electronic format, should be saved in separate files on the diskette. Label the diskette with the corresponding author’s last name, the title of the manuscript and the file number assigned to the manuscript.
Submission of a manuscript on diskette, in a suitable format, will significantly _________________ expedite its publication._________________
Manuscripts and computer diskettes should be mailed to the Editor:
D r . J a c k C a z e s
J o u r n a l o f L iq u id C h r o m a t o g r a p h y & R e la t e d T e c h n o lo g ie s
P . O . B o x 9 7 0 2 1 0
C o c o n u t C r e e k , F L 3 3 0 9 7
R e p r in t sDue to the short production time for papers in this journal, it is essential to order reprints immediately upon receiving notification of acceptance of the manuscript. A reprint order form will be sent to the author with the letter of acceptance for the manuscript. Reprints are available in quantities of 100 and multiples thereof. Twenty (20) free reprints will be included with orders of 100 or more reprints.
F o r m a t o f t h e M a n u s c r ip tNOTE: Failure to adhere to the following guidelines will delay publication of a manuscript.
1. The preferred dimensions of the printed area of a page are 6” (15.2 cm) width by 8.5” (21.6 cm) height.Use Times Roman 12 point font, if possible.

The general organization of the manuscript should be:
TitleAuthor(s)' names and full addressesAbstractText DiscussionReferences
2. T i t le & A u th o r s : The entire title should be in bold-face capital letters and centered within the width of the printed area, located 2 inches (5.1 cm) from the top of the page. This should be followed by 2 lines of space, then by the names and addresses of the authors, also centered, in the following manner:
A S E M I - A U T O M A T I C T E C H N I Q U E F O R T H E S E P A R A T I O N A N D D E T E R M I N A T I O N O F
B A R I U M A N D S T R O N T I U M I N W A T E R
B Y I O N E X C H A N G E C H R O M A T O G R A P H Y A N D
A T O M I C E M I S S I O N S P E C T R O M E T R Y
F. D. Pierce. H. R. Brown Utah Biomedical Test Laboratory
520 Wakara Way Salt Lake City, Utah 84108
3. A b s t r a c t : The heading A B S T R A C T should be typed boldface, capitalized and centered, 2 lines below the addresses. This should be followed by a single- spaced, concise abstract. Allow 2 lines of space below the abstract before beginning the text of the manuscript.
4 . T e x t D is c u s s io n : Whenever possible, the text discussion should be divided into major sections such as
INTRODUCTIONMATERIALSMETHODSRESULTSDISCUSSIONACKNOWLEDGMENTS
These m ajor headings should be separated from the text by two lines of spaceabove and one line of space below. Each major heading should be typedboldface, in capital letters, centered.

S e c o n d a r y h e a d in g s , if any, should be placed flush with the left margin, and have the first letter of main words capitalized. Leave two lines of space above and one line of space below secondary headings.
5. The f i r s t l in e o f e a c h p a r a g r a p h within the body of the text should be indented a half inch.
6. A c k n o w le d g m e n t s , sources of research funds and address changes for authors should be listed in a separate section at the end of the manuscript, immediately preceding the references.
7. R e f e r e n c e s should be numbered consecutively and placed in a separate section at the end of the manuscript. They should be typed single-spaced, with one line space between each reference.
Each reference should contain names of all authors (with initials of their first and middle names); do not use et al. for a list of authors. Abbreviations of journal titles will follow the American Chemical Society's Chemical Abstracts List of Periodicals. The word R E F E R E N C E S , in boldface type, should be capitalized and centered above the reference list.
Following are acceptable reference formats:
J o u r n a l:
1. D. K. Morgan, N. D. Danielson, J. E. Eaton, Anal. Lett.. 18. 1979-1998 (1985).
B o o k :
1. L. R. Snyder. J. J. Kirkland, I n t r o d u c t io n t o M o d e r n L iq u id C h r o m a t o
g r a p h y , John Wiley & Sons. Inc.. New York, 1979.
C h a p t e r in a B o o k :
1. C. T. Mant, R. S. Hodges, "HPLC of Peptides," in H P L C o f B io lo g ic a l
M a c r o m o le c u le s . K. M. Gooding. F. E. Regnier, eds.. Marcel Dekker, Inc., New York, 1990. pp. 301-332.
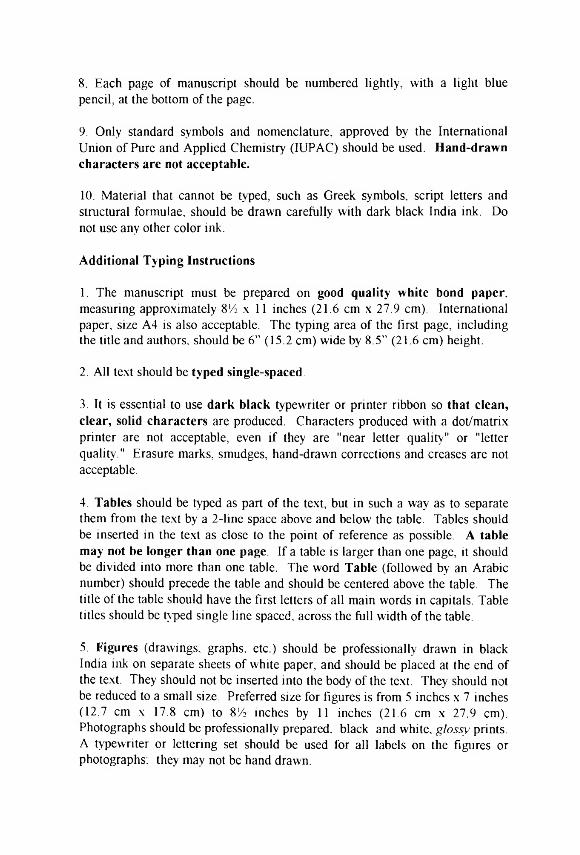
8. Each page of manuscript should be numbered lightly, with a light blue pencil, at the bottom of the page.
9. Only standard symbols and nomenclature, approved by the International Union of Pure and Applied Chemistry (IUPAC) should be used. H a n d -d r a w n
c h a r a c t e r s a r e n o t a c c e p t a b le .
10. Material that cannot be typed, such as Greek symbols, script letters and structural formulae, should be drawn carefully with dark black India ink. Do not use any other color ink.
A d d it io n a l T y p in g I n s t r u c t io n s
1. The manuscript must be prepared on g o o d q u a l i t y w h it e b o n d p a p e r ,
measuring approximately 8‘/ 2 x 11 inches (21.6 cm x 27.9 cm). International paper, size A4 is also acceptable. The typing area of the first page, including the title and authors, should be 6” (15.2 cm) wide by 8.5” (21.6 cm) height.
2. All text should be t y p e d s in g le - s p a c e d .
3. It is essential to use d a r k b la c k typewriter or printer ribbon so t h a t c le a n ,
c le a r , s o l id c h a r a c t e r s are produced. Characters produced with a dot/matrix printer are not acceptable, even if they are "near letter quality" or "letter quality." Erasure marks, smudges, hand-drawn corrections and creases are not acceptable.
4 . T a b le s should be typed as part of the text, but in such a way as to separate them from the text by a 2-line space above and below the table. Tables should be inserted in the text as close to the point of reference as possible. A t a b l e
m a y n o t b e lo n g e r t h a n o n e p a g e . If a table is larger than one page, it should be divided into more than one table. The word T a b le (followed by an Arabic number) should precede the table and should be centered above the table. The title of the table should have the first letters of all main words in capitals. Table titles should be typed single line spaced, across the full width of the table.
5. F ig u r e s (drawings, graphs, etc.) should be professionally drawn in black India ink on separate sheets of white paper, and should be placed at the end of the text. They should not be inserted into the body of the text. They should not be reduced to a small size. Preferred size for figures is from 5 inches x 7 inches (12.7 cm x 17.8 cm) to 8Vi inches by 11 inches (21.6 cm x 27.9 cm). Photographs should be professionally prepared, black and white, glossy prints. A typewriter or lettering set should be used for all labels on the figures or photographs; they may not be hand drawn.
C a p t io n s f o r f i g u r e s should be typed single-spaced on a separate sheet of white paper, along the full width of the type page, and should be preceded with the word F ig u r e and an Arabic numeral. All figures and lettering must be of a size that will remain legible after a 20% reduction from the original size. Figure numbers, name of senior author and an arrow indicating "top" should be written in light blue pencil on the back of the figure. Indicate the approximate placement for each figure in the text with a note written with a light blue pencil in the margin of the manuscript page.
6. The reference list should be typed single-spaced. A single line space should be inserted after each reference. The format for references should be as given above.
Manuscripts which require correction of English usage will be returned to theauthor for major revision.____________________
A n a ly z e b u l k a n d f o r m u la t e d d r u g p r o d u c t s w i th t h e n e w e d i t i o n o f . . .
Diromatographic Analysis of Pharmaceuticals
SECOND EDITION(C h ro m a to g ra p h ic S c ie n c e S e r ie s /7 4 )
e d i t e d b y JOHN A . A DAM O VICSCytogcn Corporation, Princeton, Hew Jersey
October, 1996 / 544 pages, illustrated / $ 165.00
P r a i s e f o r t h e f i r s t e d i t i o n ...“ There is no doubt that this book should have wide appeal to all those involved in pharmaceutical analysis. Over 1300 drugs and related substances are considered...a veritable mine of information.“ — A n a ly s t
“ ...an excellent reference for those who are involved in the chromatographic analysis of pharmaceutical compounds and their formulation.“
— J o u r n a l o f P h a rm a c e u tic a l S c ie n c e s
“ ...recommended as a primary source of information for drug analysis in different drug forms.“
— J o u r n a l o f C h ro m a to g ra p h y
“ ...a valuable reference source for practicing chro- matographers in the pharmaceutical industry.“
— M ic ro c h e m ic a l J o u r n a l
“ ...provides a comprehensive overview of the chromatographic methods of analysis for pharmaceuticals.“ — A n a ly t ic a l C h e m is try
“ ...has a place as a quick reference tool and as a general introduction to chromatography in pharmaceutics.“ — LC -G C
“ ...contains a wealth of information on the main chromatographic techniques and numerous examples on the application of these methods in the drug industry.“
— J o u r n a l o f L a b e lle d C o m p o u n d s a n d R a d io p h a rm a c e u tic a ls
Updated and revised throughout, the S e c o n d E d i t io n of C h r o m a t o g r a p h ic A n a ly s i s o f P h a r m a c e u t ic a lsexplores the chromatographic methods used for the measurement of drugs, impurities, and excipients in pharmaceutical preparations— such as tablets, ointments, and injectables.
M arcel D ekker, Inc.
C o n ta in s a 1 4 8 - p a g e ta b l e l i s t in g th e c h r o m a to g r a p h ic d a ta o f o v e r 1 3 0 0 d r u g s a n d r e la te d s u b s t a n c e s — in c lu d in g s a m p le m a tr ix a n a ly z e d , s a m p l e h a n d l in g p r o c e d u r e s , c o lu m n p a c k in g s , m o b i l e p h a s e , m o d e o f d e te c t io n , a n d m o r e !
Maintaining the features that made the first edition so popular, C h r o m a t o g r a p h ic A n a ly s i s o f P h a r m a c e u t ic a l s , S e c o n d E d i t i o n now offers
■ n e w c h a p te rs on capillary electrophoresis and supercritical fluid chromatography
■ u f> - to - th e -m in u te information on proteinaceous pharmaceuticals
■ n e w c o v e ra g e of chromatographic methods from the Chinese Pharmacopoeia
■ u p d a te d d a ta from US P h a rm a c o p e ia 2 3 and from the British and European Pharmacopoeias
■ the la te s t m e th o d s developed by instrument and column manufacturers
■ over 2100 key literature citations, including re c e n t re fe re n c e s from the chromatographic literature up to 1996
Written in a clear, easy-to-read style. C h r o m a t o g r a p h ic A n a ly s is o f P h a r m a c e u t ic a ls , S e c o n d E d i t io n serves as a timesaving resource for analytical, bioanalytical, pharmaceutical, organic, clinical, physical, quality control, and process chemists and biochemists; chromato- graphers; pharmaceutical scientists; and professional seminars and graduate-level courses in these disciplines.
Regulatory Considerations for the Chroma- tographer. J o h n A . A d a m o v ic s
Sample Treatment, J o h n A . A d a m o v ic s Planar Chromatography,
J o h n A . A d a m o v ic s a n d J a m e s C. E s c h b a c h Gas Chromatography,
J o h n A . A d a m o v ic s a n d J a m e s C. E s c h b a c h High-Performance Liquid Chromatography,
J o h n A. A d a m o v ic s a n d D a v id F a rb Capillary Electrophoresis,
S h e lle y R. R a b e l a n d J o h n F. S to b a u g h
Supercritical Fluid Chromatography o f Bulk and Formulated Pharmaceuticals,J a m e s T. S te w a r t a n d H ird o s h K. J a g o ta
Applications. J o h n A . A d a m o v ic s
I S B N : 0 — 8 2 4 7 — 9 7 7 6 — 0
This hook is printed on at id-free pa/ter.270 M a d iso n A v en u e , New York. NY 10016 • (212) 696 9000H u tg a s s e 4, P o s t fa c h 812. CH-4001 B ase l. S w itz e r la n d • Tel. 061-261-8482
J. LIQ. CHROM. & REL. TECHNOL., 20(1), (1997)
C ontents C ontinued
D e t e r m in a t io n o f N a t u r a l a n d S y n th e t ic C o lo r s in A lc o h o lic
a n d N o n A lc o h o l ic B e v e r a g e s b y Q u a n t i ta t iv e H P T L C ......................................... 101
S. M . A n derton , C. D . In carv ito , a n d J. Sherm a
A n a ly t ic a l a n d P r e p a r a t iv e E n a n t io m e r ic S e p a r a t io n o f a
S e r ie s o f C 5 - C y c l o a l k y l a m in e - l ,4 - b e n z o d ia z e p i n - 2 - o n e C C K B
R e c e p t o r A n t a g o n is t s b y C h ir a l H P L C ........................................................................... I l l
A . P . W att, H . M . V errier, a n d D . R a th bon e
I m m o b i l i z e d I r o n ( I I I ) M e t a l A f f in i t y C h r o m a t o g r a p h y fo r
t h e S e p a r a t io n o f P h o s p h o r y la t e d M a c r o m o le c u le s : L ig a n d s
a n d A p p l i c a t i o n s ............................................................................................................................... 1 2 3
L. D . H olm es a n d M . R. S ch iller
N o n I d e a l S iz e E x c lu s io n C h r o m a t o g r a p h y o f E u k a r y o t icP r o t e in S y n t h e s i s I n i t ia t io n F a c t o r 2 ................................................................................. 1 4 3
M . F. M o u a t a n d K . L . M a n ch este r
E r r a t u m ..................................................................................................................................................... 1 5 5
T h e B o o k C o r n e r ............................................................................................................................... 1 5 7
A n n o u n c e m e n t ..................................................................................................................................... 1 5 9
L iq u id C h r o m a t o g r a p h y C a l e n d a r .................................................................................... 161
JO U R N A L O F L IQ U ID C H R O M A T O G R A P H Y & R E L A T E D T E C H N O L O G IE S
V o lu m e 2 0 , N u m b e r I , 1 9 9 7
C O N TE N TS
C a p i l la r y Z o n e E le c t r o p h o r e s is V e r s u s M ic e l la r E le c t r o -
k in e t ic C h r o m a t o g r a p h y in t h e S e p a r a t io n o f P h e n o ls o f
E n v ir o n m e n t a l I n t e r e s t ................................................................................................................ 1
A . L. C reg o a n d M . L . M arin a
S t u d ie s o f t h e I n f lu e n c e o f H y d r o g e n C h lo r id e o n t h e
L iq u id C h r o m a t o g r a p h ic P r o p e r t ie s o f S i l ic a - I m m o b i l i z e d
B o v in e S e r u m A lb u m in U n d e r N o r m a l - P h a s e C o n d i t i o n s ........................... 2 1
H. G ao a n d R . K . G ilp in
A F ir s t - L e v e l A n a ly s is o f t h e A d s o r p t io n M e c h a n is m o f
E s t e r s o f R a c e m ic a n d M e s o - 2 ,3 - d i b r o m o b u t a n e - l , 4 - d i o i c
A c id s o n S i l i c a ..................................................................................................................................... 3 1
M . P a la m a re v a a n d I. K o zek o v
S im u lt a n e o u s D e t e r m in a t io n o f C a f f e in e a n d E r g o t a m in e
in P h a r m a c e u t ic a l D o s a g e F o r m u la t io n b y C a p i l la r y E le c t r o
p h o r e s i s ..................................................................................................................................................... 4 7
H. Y. A bou l-E n ein a n d S. A . B akr
S e p a r a t io n o f T a x o l a n d C e p h a lo m a n n in e b y C o u n t e r c u r r e n t C h r o m a t o g r a p h y ............................................................................................................................... 5 7
F .-Y . Chiou, P. K an , I.-M . Chu, a n d C .-J . L e e
D e t e r m in a t io n o f t h e A lk a lo id s in C o p t is - E v o d ia H e r b C o u p le
b y C a p i l la r y E l e c t r o p h o r e s i s ................................................................................................... 6 3
M .-C . L e e a n d S .-J . Sheu
P r e c o n c e n t r a t io n o f A l ip h a t ic A m in e s f r o m W a t e r D e t e r m in e d
b y C a p i l la r y E le c t r o p h o r e s is w i t h I n d ir e c t U V D e t e c t i o n ............................... 7 9
W. H. M a tch e tt a n d W. C. B rum ley
(continued on inside b ack cover)
M a r c e l D e k k e r , I n c . N ew Yo r k • Ba se l • H o n g K o n g
Contributions to this journal are published free of charge
DEKKER