Evaluation of an International Pharmacopoeia method for the analysis of ritonavir by liquid...
10
Journal of Pharmaceutical and Biomedical Analysis 42 (2006) 71–80 Evaluation of an International Pharmacopoeia method for the analysis of indinavir sulfate by liquid chromatography R. Yekkala, H. Lei, J. Hoogmartens, E. Adams ∗ Laboratorium voor Farmaceutische Chemie en Analyse van Geneesmiddelen, Faculteit Farmaceutische Wetenschappen, Katholieke Universiteit Leuven, O & N 2, Postbus 923, Herestraat 49, B-3000 Leuven, Belgium Received 24 October 2005; accepted 15 January 2006 Available online 28 February 2006 Abstract A gradient LC method for the determination of indinavir sulfate (IDV) and its impurities has been recently published in a consultation document of the International Pharmacopoeia, WHO Drug Information. The method uses a base-deactivated reversed-phase C18 column (25 cm × 4.6 mm i.d.), 5 m kept at a temperature of 40 ◦ C. The mobile phases consist of acetonitrile, phosphate buffer pH 7.5 and water. The flow rate is 1.0 ml/min. UV detection is performed at 220 nm. A system suitability test (SST) is described to govern the quality of the separation. The separation towards IDV components was investigated on 16 C18 columns and correlation was made with the column classification system developed in our laboratory. The method was evaluated using a Hypersil BDS C18 column (25 cm × 4.6 mm i.d.), 5 m. A central composite design was applied to examine the robustness of the method. The method shows good precision, linearity, sensitivity and robustness. Six commercial samples were examined using this method. © 2006 Elsevier B.V. All rights reserved. Keywords: Liquid chromatography; Purity testing; Indinavir sulfate; Validation; Column ranking system 1. Introduction Indinavir sulfate (IDV) is a potent protease inhibitor of the human immunodeficiency virus (HIV) widely used in the treat- ment against the acquired immune deficiency syndrome (AIDS) and prescribed in combination with other protease inhibitors, nucleoside analogues or reverse transcriptase inhibitors. IDV is synthesized via the penultimate intermediate by convergent cou- pling of an optically active mono-substituted epoxide (EPO) and an optically active piperazine-2-carboxamide (CAR), which is further alkylated with picolyl chloride in presence of sulfuric acid to give IDV [1,2] (Fig. 1). Therefore, EPO and CAR can be present as impurities in IDV samples. Indinavir lactone and cis- amino-2-indanol can be formed due to amide hydrolysis [2–5]. Several methods have been described for the analysis of IDV, such as potentiometry [2,6,7], thin layer chromatography [2,6], capillary electrophoresis (CE) [3,8–11], liquid chromatography (LC) with electrochemical detection [12], LC with UV detection ∗ Corresponding author. Tel.: +3216323443; fax: +3216323448. E-mail address: [email protected] (E. Adams). [2,4,5,13–32] and with mass spectrometric detection [33–49]. Most of these methods were used to monitor IDV in blood. The method described by Aurora Prado et al. [3] allows the separa- tion of IDV from its degradation impurities in capsules, using CE. A few LC methods were published for the assay and purity control of IDV formulations [2,4,5]. LC methods for the purity control of the IDV bulk drug have been published in the Indian Pharmacopoeia (IP) [50], the United States Pharmacopeia (USP) [51], Pharmeuropa [52] and a consultation document of the Inter- national Pharmacopoeia (Int. Ph.) [6]. An LC method for IDV capsules has also been published in the United States Pharma- copeial Forum (USPF) [53]. The LC method described by Silva et al. [4] was the basis of the assay methods of the USP and the USPF. The purpose of this study was to evaluate the LC method described for purity control of IDV in the Int. Ph. monograph, not only for purity control but also for assay. This is useful in case the LC method has to be used to assay dosage forms. Selectivity, limit of detection, limit of quantitation, linearity, repeatability and intermediate precision were examined. Since no brand names are mentioned in the monograph, the suitability on a set of 16 similar columns towards the separation of IDV and 0731-7085/$ – see front matter © 2006 Elsevier B.V. All rights reserved. doi:10.1016/j.jpba.2006.01.045
-
Upload
independent -
Category
Documents
-
view
3 -
download
0
Transcript of Evaluation of an International Pharmacopoeia method for the analysis of ritonavir by liquid...
A
oiUITrt©
K
1
hmanspafapaSsc(
0d
Journal of Pharmaceutical and Biomedical Analysis 42 (2006) 71–80
Evaluation of an International Pharmacopoeia method for the analysis ofindinavir sulfate by liquid chromatography
R. Yekkala, H. Lei, J. Hoogmartens, E. Adams ∗Laboratorium voor Farmaceutische Chemie en Analyse van Geneesmiddelen, Faculteit Farmaceutische Wetenschappen,
Katholieke Universiteit Leuven, O & N 2, Postbus 923, Herestraat 49, B-3000 Leuven, Belgium
Received 24 October 2005; accepted 15 January 2006Available online 28 February 2006
bstract
A gradient LC method for the determination of indinavir sulfate (IDV) and its impurities has been recently published in a consultation documentf the International Pharmacopoeia, WHO Drug Information. The method uses a base-deactivated reversed-phase C18 column (25 cm × 4.6 mm.d.), 5 �m kept at a temperature of 40 ◦C. The mobile phases consist of acetonitrile, phosphate buffer pH 7.5 and water. The flow rate is 1.0 ml/min.V detection is performed at 220 nm. A system suitability test (SST) is described to govern the quality of the separation. The separation towards
DV components was investigated on 16 C18 columns and correlation was made with the column classification system developed in our laboratory.
he method was evaluated using a Hypersil BDS C18 column (25 cm × 4.6 mm i.d.), 5 �m. A central composite design was applied to examine theobustness of the method. The method shows good precision, linearity, sensitivity and robustness. Six commercial samples were examined usinghis method.
2006 Elsevier B.V. All rights reserved.
; Colu
[MmtCccP[ncceU
eywords: Liquid chromatography; Purity testing; Indinavir sulfate; Validation
. Introduction
Indinavir sulfate (IDV) is a potent protease inhibitor of theuman immunodeficiency virus (HIV) widely used in the treat-ent against the acquired immune deficiency syndrome (AIDS)
nd prescribed in combination with other protease inhibitors,ucleoside analogues or reverse transcriptase inhibitors. IDV isynthesized via the penultimate intermediate by convergent cou-ling of an optically active mono-substituted epoxide (EPO) andn optically active piperazine-2-carboxamide (CAR), which isurther alkylated with picolyl chloride in presence of sulfuriccid to give IDV [1,2] (Fig. 1). Therefore, EPO and CAR can beresent as impurities in IDV samples. Indinavir lactone and cis-mino-2-indanol can be formed due to amide hydrolysis [2–5].everal methods have been described for the analysis of IDV,
uch as potentiometry [2,6,7], thin layer chromatography [2,6],apillary electrophoresis (CE) [3,8–11], liquid chromatographyLC) with electrochemical detection [12], LC with UV detection∗ Corresponding author. Tel.: +3216323443; fax: +3216323448.E-mail address: [email protected] (E. Adams).
dniSrno
731-7085/$ – see front matter © 2006 Elsevier B.V. All rights reserved.oi:10.1016/j.jpba.2006.01.045
mn ranking system
2,4,5,13–32] and with mass spectrometric detection [33–49].ost of these methods were used to monitor IDV in blood. Theethod described by Aurora Prado et al. [3] allows the separa-
ion of IDV from its degradation impurities in capsules, usingE. A few LC methods were published for the assay and purityontrol of IDV formulations [2,4,5]. LC methods for the purityontrol of the IDV bulk drug have been published in the Indianharmacopoeia (IP) [50], the United States Pharmacopeia (USP)51], Pharmeuropa [52] and a consultation document of the Inter-ational Pharmacopoeia (Int. Ph.) [6]. An LC method for IDVapsules has also been published in the United States Pharma-opeial Forum (USPF) [53]. The LC method described by Silvat al. [4] was the basis of the assay methods of the USP and theSPF.The purpose of this study was to evaluate the LC method
escribed for purity control of IDV in the Int. Ph. monograph,ot only for purity control but also for assay. This is usefuln case the LC method has to be used to assay dosage forms.
electivity, limit of detection, limit of quantitation, linearity,epeatability and intermediate precision were examined. Sinceo brand names are mentioned in the monograph, the suitabilityn a set of 16 similar columns towards the separation of IDV and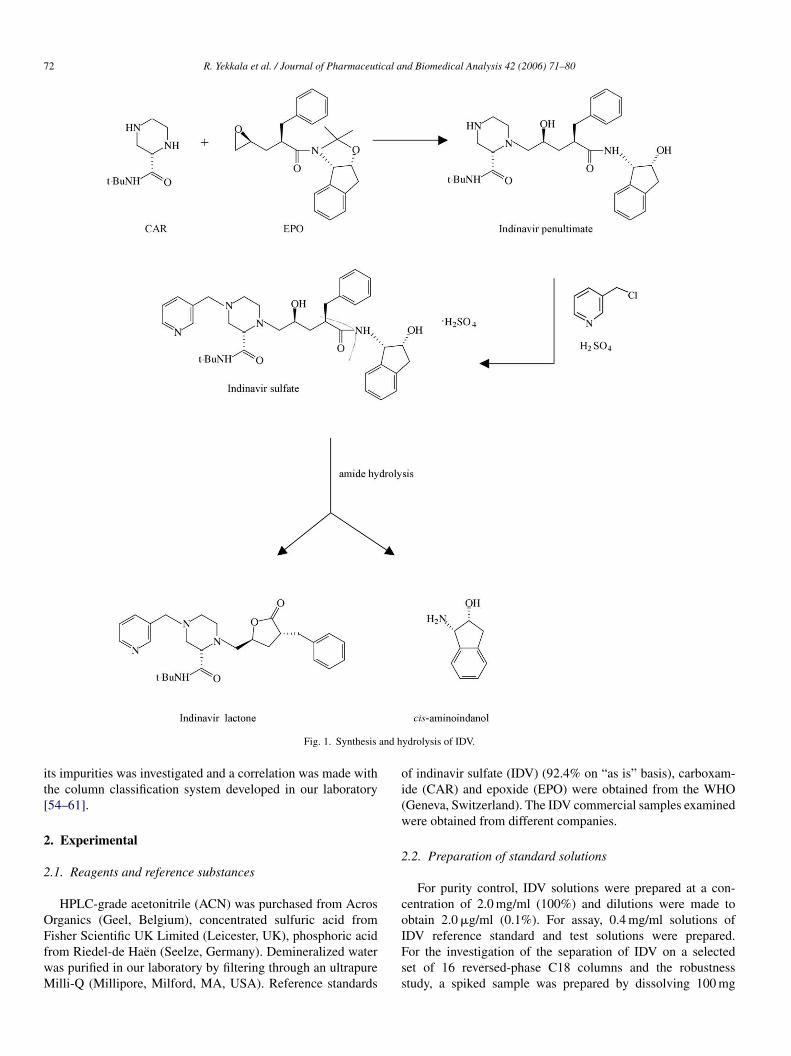
72 R. Yekkala et al. / Journal of Pharmaceutical and Biomedical Analysis 42 (2006) 71–80
and h
it[
2
2
OFfwM
oi(w
2
co
Fig. 1. Synthesis
ts impurities was investigated and a correlation was made withhe column classification system developed in our laboratory54–61].
. Experimental
.1. Reagents and reference substances
HPLC-grade acetonitrile (ACN) was purchased from Acrosrganics (Geel, Belgium), concentrated sulfuric acid from
isher Scientific UK Limited (Leicester, UK), phosphoric acidrom Riedel-de Haen (Seelze, Germany). Demineralized wateras purified in our laboratory by filtering through an ultrapureilli-Q (Millipore, Milford, MA, USA). Reference standardsIFss
ydrolysis of IDV.
f indinavir sulfate (IDV) (92.4% on “as is” basis), carboxam-de (CAR) and epoxide (EPO) were obtained from the WHOGeneva, Switzerland). The IDV commercial samples examinedere obtained from different companies.
.2. Preparation of standard solutions
For purity control, IDV solutions were prepared at a con-entration of 2.0 mg/ml (100%) and dilutions were made tobtain 2.0 �g/ml (0.1%). For assay, 0.4 mg/ml solutions of
DV reference standard and test solutions were prepared.or the investigation of the separation of IDV on a selectedet of 16 reversed-phase C18 columns and the robustnesstudy, a spiked sample was prepared by dissolving 100 mg
R. Yekkala et al. / Journal of Pharmaceutical and Biomedical Analysis 42 (2006) 71–80 73
Table 1Gradient program used for assay and purity control of IDV
Time (min) Mobile phase A (% v/v) Mobile phase B (% v/v)
0–5 93 7 Isocratic5–25 93–20 7–80 Linear gradient25–30 20 80 Isocratic3 83 7
ooawute
2c
G7oHkusH1
oiMad
2
bOcsawabg
2
rusamwa
TT
N
1111111
0–35 20–935–45 93
f an IDV commercial sample, 0.5 mg of CAR and 0.2 mgf EPO in 50 ml of mobile phase A. Both commercial IDVnd spiked IDV solutions slightly degraded within three dayshen they were kept at room temperature, but they could besed for several days when they were stored in the refrigera-or. However, fresh solutions were prepared for quantificationxperiments.
.3. Instrumentation and liquid chromatographiconditions
The LC apparatus (LaChrom, Merck Hitachi, Darmstadt,ermany) (equipment I) consisted of an L-7100 pump, an L-200 autosampler, an L-7400 UV detector set at a wavelengthf 220 nm and a D-7000 interface. EZChrome Elite 4.0 (Merckitachi) software was used for data acquisition. The column wasept in a water bath at 40 ◦C and the temperature was controlledsing an EC Julabo thermostat (Seelbach, Germany). A Hyper-il BDS C18 column (25 cm × 4.6 mm i.d.), 5 �m (Thermoypersil-Keystone, Cheshire, UK) was used. The flow rate was.0 ml/min. The injection volume was 20 �l.
For the intermediate precision study, analyses were carriedut using a new Hypersil BDS C18 column (25 cm × 4.6 mm
.d.), 5 �m and using a different LC apparatus (LaChrom Elite,erck Hitachi) (equipment II) consisting of an L-2130 pump,n L-2200 autosampler and an L-2400 UV detector. Other con-itions were identical.
dtuw
able 2he list of C18 columns (25 cm × 4.6 mm i.d.), 5 �m examined and their characterist
umber F-value Name of the column End-capped Ba
1 0.000 Hypersil BDS C18 + +2 0.436 ACE C18 + +3 0.480 Discovery C18 + −4 0.667 Supelcosil LC-18 DB − +5 2.135 Nucleosil HD + −6 2.303 Validated C18 + −7 2.813 Platinum C18 + +8 3.030 Symmetry + −9 3.940 Purospher + −0 4.698 Kromasil EKA + −1 4.888 Purospher Star + +2 5.456 Alltima C18 + +3 7.162 Platinum EPS C18 − +4 9.146 LiChrospher − +5 10.477 Apex Basic + +6 26.256 Apex ODS II + −
0–7 Return to the initial conditionsIsocratic
.4. Mobile phase
The mobile phase consisted of ACN—sodium phosphateuffer pH 7.5—water (A; 30:5:65 v/v/v) and (B; 60:5:35 v/v/v).n standing and depending on the room temperature, buffer pre-
ipitation was observed in mobile phase B. Therefore, the bufferolution was prepared by dissolving 1.0 g (instead of 1.4 g) ofnhydrous disodium hydrogen phosphate in 80 ml of purifiedater, adjusting the pH to 7.5 by adding phosphoric acid (105 g/l)
nd dilution to 100.0 ml with purified water. This change in theuffer content did not effect the quality of the separation. Theradient applied is shown in Table 1.
.5. Selection of a set of 16 C18 columns
The monograph of IDV prescribes in the LC method forelated substances a base deactivated reversed-phase C18 col-mn (25 cm × 4.6 mm i.d.), 5 �m. This information is not alwaysufficient to select a column giving the required quality of sep-ration although the chromatographic conditions given in theonographs may be adjusted to reach the SST. Therefore, itas decided to examine the separation on a set of 16 columns,
vailable in our laboratory and which are at least either base-
eactivated or end-capped (the latter were included to checkheir performance). The columns were chosen based on a col-mn ranking system published in the literature [54–60] andhich is also freely accessible on the website of our laboratoryics provided by the manufacturers
se-deactivated Pore-size (A) Manufacturer/supplier
130 ThermoQuest100 Advanced Chrom. Tech./Achrom180 Supelco120 Supelco100 Macherey-Nagel/Filter Service100 Perkin-Elmer100 Alltech100 Waters
80 Merck100 Akzo Noble/SerCoLab80 Merck
120 Alltech100 Alltech100 Merck100 Jones Chromatography/Sopachem100 Jones Chromatography/Sopachem
7 ical and Biomedical Analysis 42 (2006) 71–80
[frecvcvi
stt
3
3
btoabsaImWdc
3
Stttb
Fb
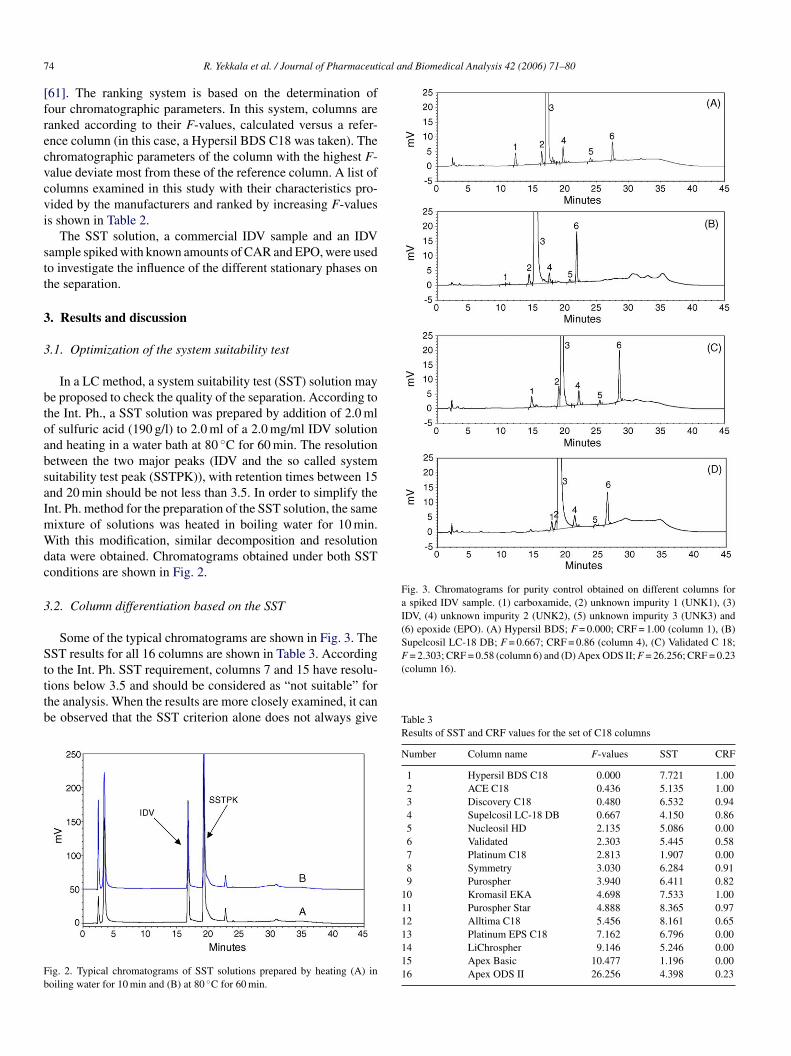
Fig. 3. Chromatograms for purity control obtained on different columns fora spiked IDV sample. (1) carboxamide, (2) unknown impurity 1 (UNK1), (3)IDV, (4) unknown impurity 2 (UNK2), (5) unknown impurity 3 (UNK3) and(6) epoxide (EPO). (A) Hypersil BDS; F = 0.000; CRF = 1.00 (column 1), (B)Supelcosil LC-18 DB; F = 0.667; CRF = 0.86 (column 4), (C) Validated C 18;F = 2.303; CRF = 0.58 (column 6) and (D) Apex ODS II; F = 26.256; CRF = 0.23
4 R. Yekkala et al. / Journal of Pharmaceut
61]. The ranking system is based on the determination ofour chromatographic parameters. In this system, columns areanked according to their F-values, calculated versus a refer-nce column (in this case, a Hypersil BDS C18 was taken). Thehromatographic parameters of the column with the highest F-alue deviate most from these of the reference column. A list ofolumns examined in this study with their characteristics pro-ided by the manufacturers and ranked by increasing F-valuess shown in Table 2.
The SST solution, a commercial IDV sample and an IDVample spiked with known amounts of CAR and EPO, were usedo investigate the influence of the different stationary phases onhe separation.
. Results and discussion
.1. Optimization of the system suitability test
In a LC method, a system suitability test (SST) solution maye proposed to check the quality of the separation. According tohe Int. Ph., a SST solution was prepared by addition of 2.0 mlf sulfuric acid (190 g/l) to 2.0 ml of a 2.0 mg/ml IDV solutionnd heating in a water bath at 80 ◦C for 60 min. The resolutionetween the two major peaks (IDV and the so called systemuitability test peak (SSTPK)), with retention times between 15nd 20 min should be not less than 3.5. In order to simplify thent. Ph. method for the preparation of the SST solution, the sameixture of solutions was heated in boiling water for 10 min.ith this modification, similar decomposition and resolution
ata were obtained. Chromatograms obtained under both SSTonditions are shown in Fig. 2.
.2. Column differentiation based on the SST
Some of the typical chromatograms are shown in Fig. 3. TheST results for all 16 columns are shown in Table 3. According
o the Int. Ph. SST requirement, columns 7 and 15 have resolu-ions below 3.5 and should be considered as “not suitable” forhe analysis. When the results are more closely examined, it cane observed that the SST criterion alone does not always give
ig. 2. Typical chromatograms of SST solutions prepared by heating (A) inoiling water for 10 min and (B) at 80 ◦C for 60 min.
(column 16).
Table 3Results of SST and CRF values for the set of C18 columns
Number Column name F-values SST CRF
1 Hypersil BDS C18 0.000 7.721 1.002 ACE C18 0.436 5.135 1.003 Discovery C18 0.480 6.532 0.944 Supelcosil LC-18 DB 0.667 4.150 0.865 Nucleosil HD 2.135 5.086 0.006 Validated 2.303 5.445 0.587 Platinum C18 2.813 1.907 0.008 Symmetry 3.030 6.284 0.919 Purospher 3.940 6.411 0.82
10 Kromasil EKA 4.698 7.533 1.0011 Purospher Star 4.888 8.365 0.9712 Alltima C18 5.456 8.161 0.6513 Platinum EPS C18 7.162 6.796 0.0014 LiChrospher 9.146 5.246 0.0015 Apex Basic 10.477 1.196 0.0016 Apex ODS II 26.256 4.398 0.23

R. Yekkala et al. / Journal of Pharmaceutical a
t5cpasfstc
3
e(tsm
C
whavc
mBaF
asptt0ldd
eoSst
cce
3s
bBTIw
gr(dtbaat
2fTf
3
3
eCAA
Fig. 4. Illustration of g and f for the calculation of CRF.
he correct/required information, as may be expected. Columnsand 14 show co-elution of the UNK1-IDV peak pair, whereas
olumn 13 shows a change in elution order and some of theeaks are co-eluted. Columns 3, 4, 6, 8, 9, 11, 12 and 16, whichre suitable according to the SST, do not give overall baselineeparation. Although small adjustment of the mobile phase mayurther improve the separation, it was not adjusted during thistudy because the aim of the study was to compare the separa-ion of IDV and its impurities on different columns in identicalonditions.
.3. Further column differentiation based on the CRF
The suitability of a column for a separation can also bexamined by calculating the chromatographic response functionCRF), a measure of overall selectivity. Of course, this requireshe presence of measurable impurity peaks, which is not pos-ible in daily routine analysis, unless reference substances areade available. The CRF is defined as:
RF =n−1∏
i=1
fi
gi
here n is the total number of peaks, g the interpolated peakeight between two peaks (i.e., the distance between the baselinend a line connecting the two peak apexes, at the location of thealley) and f is the depth of the valley, measured from the lineonnecting two peak apexes [58–60]. See Fig. 4a.
In this IDV analysis, the baseline separation problems are
ainly related to the peak pairs of UNK1-IDV or IDV-UNK2.oth UNK1 and UNK2 are relatively small compared with IDVnd it is difficult to draw a line connecting the peak apexes.or these peak pairs, the calculation of f and g was slightlyoIea
nd Biomedical Analysis 42 (2006) 71–80 75
dapted as follows: g is the height above the baseline of themallest peak of the pair and f is the distance between the linearallel to the baseline constructed through the highest point ofhe small peak and the lowest point of the valley between thewo peaks (Fig. 4b). CRF values are always situated between
(two or more peaks are co-eluted) and 1 (all peaks are base-ine separated). The CRF is a measure of the selectivity andoes not take into account the peak shape (while resolutionoes).
Columns 7 and 15 did not reach the SST requirements. Co-lution of two or more peaks was observed, leading to a CRFf 0. Although columns 5, 13 and 14 were suitable according toST, they do not separate all peaks. It was observed that baselineeparation for all peaks (CRF = 1.00) could only be obtained onhree columns (1, 2 and 10).
Columns 4 and 14 show peak broadening for CAR. Thisan be due to the stationary phase (only base-deactivated), butolumn 13 (also only base-deactivated) did not show peak broad-ning.
.4. Correlation between the column classification and theeparation of IDV
In the next step, it was examined whether a correlation coulde found between the column classification (taking the HypersilDS C18 column as reference) and the separation data for IDV.he quality of the separations was evaluated by the CRF-values.
n previous correlation experiments, three ranges of CRF valuesere examined: F < 2, 2 < F < 6, F > 6 [59,60].It was observed that two out of four columns with F < 2
ive baseline separation for the analysis of IDV and its impu-ities (CRF = 1.00). Column 3 (CRF = 0.94) and column 4CRF = 0.86) still yield an acceptable separation as can beeduced from Fig. 3. For columns with F > 2 the probabilityo separate IDV from its impurities clearly decreases. When F isetween 2 and 6, only one out of eight columns gave CRF = 1.00nd 2 columns were not suitable at all (CRF = 0). For F-valuesbove 6, none out of four columns showed an appropriate selec-ivity (Table 3).
As it is clearly seen, with the increase of the F-values from 0 to6, the probability of finding a column with a suitable separationor the analysis of IDV and its impurities has clearly decreased.he column classification system indicates to be a helpful tool
or choosing a suitable stationary phase.
.5. Method validation
.5.1. Robustness studyIn this part, the influence of four (k) chromatographic param-
ters on the separation was investigated using the Hypersil BDS18 column. The parameters examined were the amount ofCN, the amount and the pH of the buffer in mobile phaseand the column temperature. Their effects on the resolution
f the different pairs of compounds (CAR-UNK1, UNK1-IDV,DV-UNK2, UNK2-UNK3, UNK3-EPO and IDV-SSTPK) werevaluated by means of an experimental design and multivariatenalysis using Modde 5.0 statistical graphic software (Umetrics,
76 R. Yekkala et al. / Journal of Pharmaceutical and Biomedical Analysis 42 (2006) 71–80
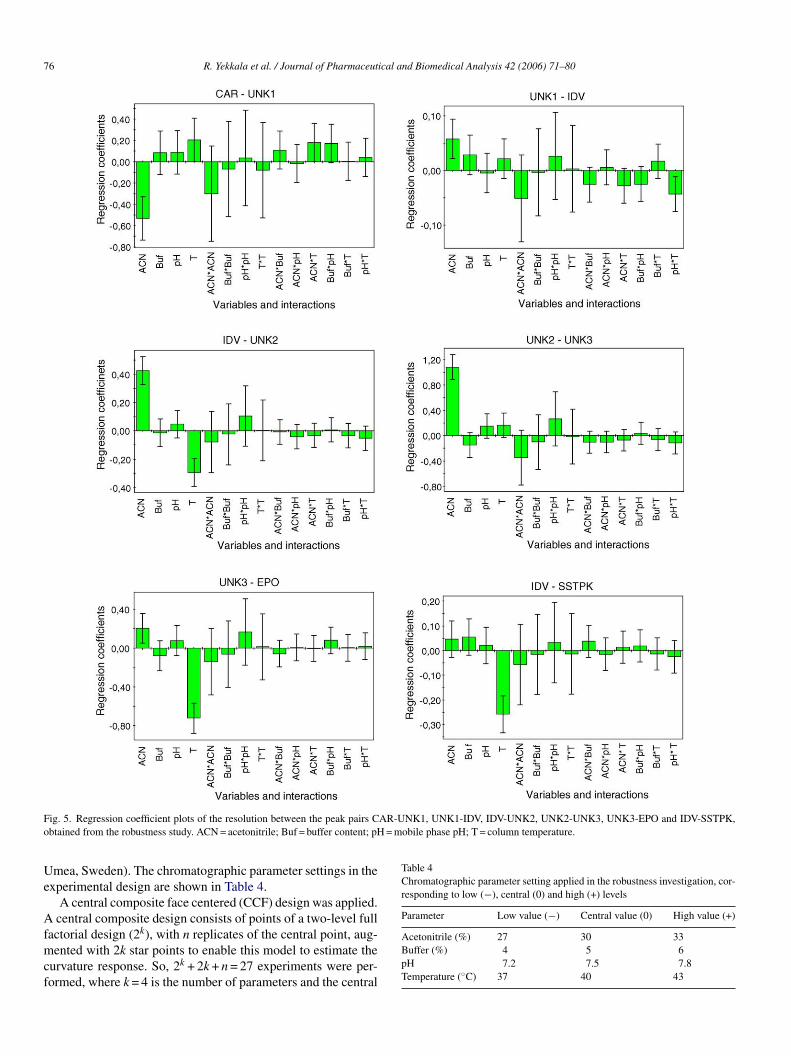
F AR-UNK1, UNK1-IDV, IDV-UNK2, UNK2-UNK3, UNK3-EPO and IDV-SSTPK,o = mobile phase pH; T = column temperature.
Ue
Afmcf
Table 4Chromatographic parameter setting applied in the robustness investigation, cor-responding to low (−), central (0) and high (+) levels
Parameter Low value (−) Central value (0) High value (+)
ig. 5. Regression coefficient plots of the resolution between the peak pairs Cbtained from the robustness study. ACN = acetonitrile; Buf = buffer content; pH
mea, Sweden). The chromatographic parameter settings in thexperimental design are shown in Table 4.
A central composite face centered (CCF) design was applied.central composite design consists of points of a two-level full
actorial design (2k), with n replicates of the central point, aug-ented with 2k star points to enable this model to estimate the
urvature response. So, 2k + 2k + n = 27 experiments were per-ormed, where k = 4 is the number of parameters and the central
Acetonitrile (%) 27 30 33Buffer (%) 4 5 6pH 7.2 7.5 7.8Temperature (◦C) 37 40 43
R. Yekkala et al. / Journal of Pharmaceutical and Biomedical Analysis 42 (2006) 71–80 77
F K1-IDa
pdabi
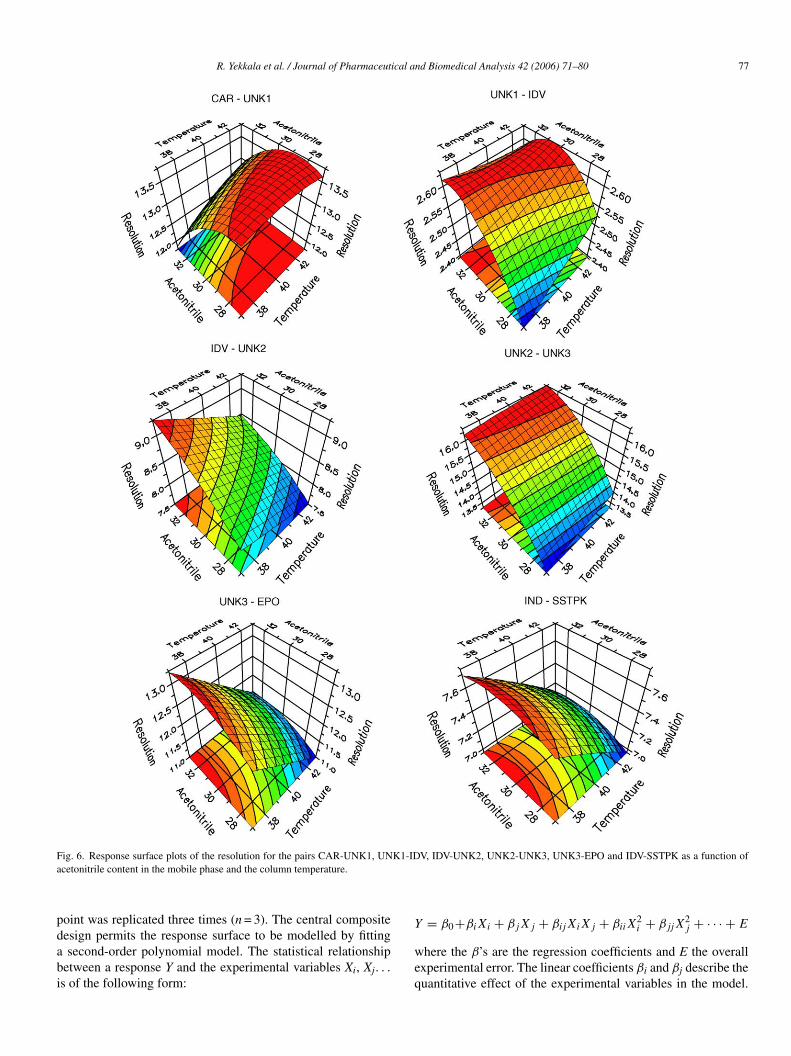
ig. 6. Response surface plots of the resolution for the pairs CAR-UNK1, UNcetonitrile content in the mobile phase and the column temperature.
oint was replicated three times (n = 3). The central composite
esign permits the response surface to be modelled by fittingsecond-order polynomial model. The statistical relationshipetween a response Y and the experimental variables Xi, Xj. . .
s of the following form:
Y
weq
V, IDV-UNK2, UNK2-UNK3, UNK3-EPO and IDV-SSTPK as a function of
= β +β X + β X + β X X + β X2 + β X2 + · · · + E
0 i i j j ij i j ii i jj jhere the β’s are the regression coefficients and E the overallxperimental error. The linear coefficients βi and βj describe theuantitative effect of the experimental variables in the model.
7 ical and Biomedical Analysis 42 (2006) 71–80
Tbd
lUTp(ribtdtetctiosRpSo
iUpppEiEiooatA
dt
TLv
L
L
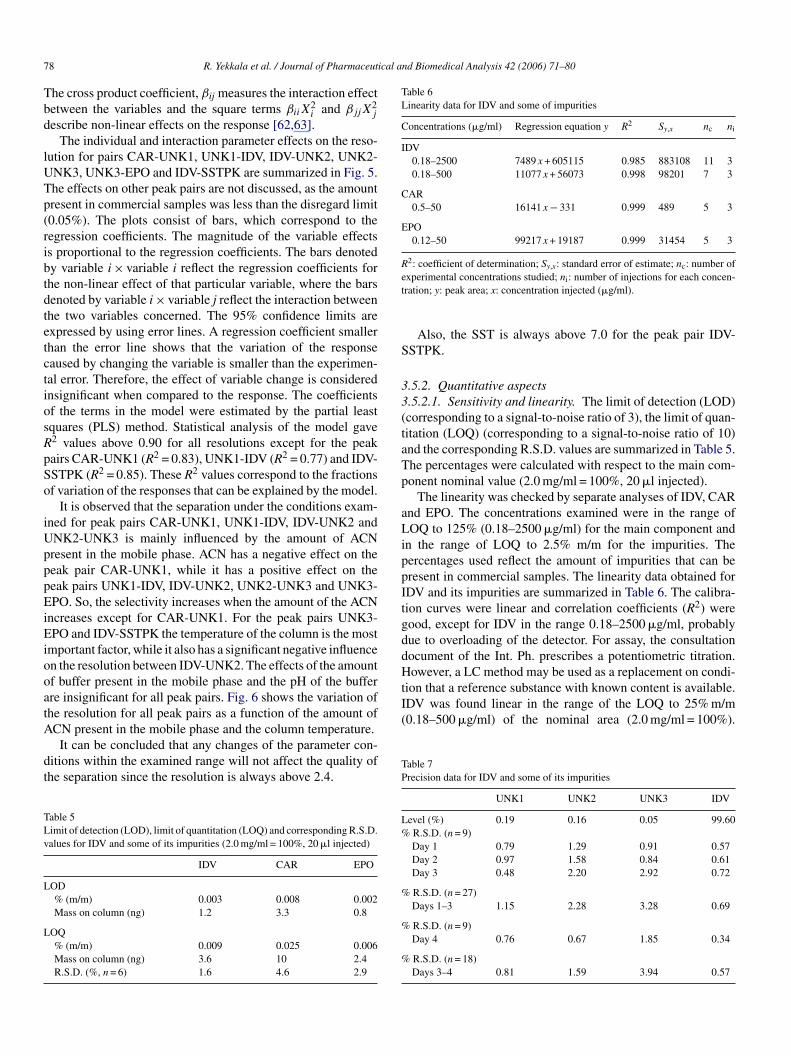
Table 6Linearity data for IDV and some of impurities
Concentrations (�g/ml) Regression equation y R2 Sy,x nc ni
IDV0.18–2500 7489 x + 605115 0.985 883108 11 30.18–500 11077 x + 56073 0.998 98201 7 3
CAR0.5–50 16141 x − 331 0.999 489 5 3
EPO0.12–50 99217 x + 19187 0.999 31454 5 3
R2: coefficient of determination; Sy,x: standard error of estimate; nc: number ofet
S
33(taTp
aLippItgddHowever, a LC method may be used as a replacement on condi-tion that a reference substance with known content is available.IDV was found linear in the range of the LOQ to 25% m/m(0.18–500 �g/ml) of the nominal area (2.0 mg/ml = 100%).
8 R. Yekkala et al. / Journal of Pharmaceut
he cross product coefficient, βij measures the interaction effectetween the variables and the square terms βiiX
2i and βjjX
2j
escribe non-linear effects on the response [62,63].The individual and interaction parameter effects on the reso-
ution for pairs CAR-UNK1, UNK1-IDV, IDV-UNK2, UNK2-NK3, UNK3-EPO and IDV-SSTPK are summarized in Fig. 5.he effects on other peak pairs are not discussed, as the amountresent in commercial samples was less than the disregard limit0.05%). The plots consist of bars, which correspond to theegression coefficients. The magnitude of the variable effectss proportional to the regression coefficients. The bars denotedy variable i × variable i reflect the regression coefficients forhe non-linear effect of that particular variable, where the barsenoted by variable i × variable j reflect the interaction betweenhe two variables concerned. The 95% confidence limits arexpressed by using error lines. A regression coefficient smallerhan the error line shows that the variation of the responseaused by changing the variable is smaller than the experimen-al error. Therefore, the effect of variable change is considerednsignificant when compared to the response. The coefficientsf the terms in the model were estimated by the partial leastquares (PLS) method. Statistical analysis of the model gave2 values above 0.90 for all resolutions except for the peakairs CAR-UNK1 (R2 = 0.83), UNK1-IDV (R2 = 0.77) and IDV-STPK (R2 = 0.85). These R2 values correspond to the fractionsf variation of the responses that can be explained by the model.
It is observed that the separation under the conditions exam-ned for peak pairs CAR-UNK1, UNK1-IDV, IDV-UNK2 andNK2-UNK3 is mainly influenced by the amount of ACNresent in the mobile phase. ACN has a negative effect on theeak pair CAR-UNK1, while it has a positive effect on theeak pairs UNK1-IDV, IDV-UNK2, UNK2-UNK3 and UNK3-PO. So, the selectivity increases when the amount of the ACN
ncreases except for CAR-UNK1. For the peak pairs UNK3-PO and IDV-SSTPK the temperature of the column is the most
mportant factor, while it also has a significant negative influencen the resolution between IDV-UNK2. The effects of the amountf buffer present in the mobile phase and the pH of the bufferre insignificant for all peak pairs. Fig. 6 shows the variation ofhe resolution for all peak pairs as a function of the amount of
CN present in the mobile phase and the column temperature.It can be concluded that any changes of the parameter con-itions within the examined range will not affect the quality ofhe separation since the resolution is always above 2.4.
able 5imit of detection (LOD), limit of quantitation (LOQ) and corresponding R.S.D.alues for IDV and some of its impurities (2.0 mg/ml = 100%, 20 �l injected)
IDV CAR EPO
OD% (m/m) 0.003 0.008 0.002Mass on column (ng) 1.2 3.3 0.8
OQ% (m/m) 0.009 0.025 0.006Mass on column (ng) 3.6 10 2.4R.S.D. (%, n = 6) 1.6 4.6 2.9
TP
L%
%
%
%
xperimental concentrations studied; ni: number of injections for each concen-ration; y: peak area; x: concentration injected (�g/ml).
Also, the SST is always above 7.0 for the peak pair IDV-STPK.
.5.2. Quantitative aspects
.5.2.1. Sensitivity and linearity. The limit of detection (LOD)corresponding to a signal-to-noise ratio of 3), the limit of quan-itation (LOQ) (corresponding to a signal-to-noise ratio of 10)nd the corresponding R.S.D. values are summarized in Table 5.he percentages were calculated with respect to the main com-onent nominal value (2.0 mg/ml = 100%, 20 �l injected).
The linearity was checked by separate analyses of IDV, CARnd EPO. The concentrations examined were in the range ofOQ to 125% (0.18–2500 �g/ml) for the main component and
n the range of LOQ to 2.5% m/m for the impurities. Theercentages used reflect the amount of impurities that can beresent in commercial samples. The linearity data obtained forDV and its impurities are summarized in Table 6. The calibra-ion curves were linear and correlation coefficients (R2) wereood, except for IDV in the range 0.18–2500 �g/ml, probablyue to overloading of the detector. For assay, the consultationocument of the Int. Ph. prescribes a potentiometric titration.
able 7recision data for IDV and some of its impurities
UNK1 UNK2 UNK3 IDV
evel (%) 0.19 0.16 0.05 99.60R.S.D. (n = 9)Day 1 0.79 1.29 0.91 0.57Day 2 0.97 1.58 0.84 0.61Day 3 0.48 2.20 2.92 0.72
R.S.D. (n = 27)Days 1–3 1.15 2.28 3.28 0.69
R.S.D. (n = 9)Day 4 0.76 0.67 1.85 0.34
R.S.D. (n = 18)Days 3–4 0.81 1.59 3.94 0.57

R. Yekkala et al. / Journal of Pharmaceutical and Biomedical Analysis 42 (2006) 71–80 79
Table 8Purity control of IDV samples, expressed as IDV (%)
Impurities Sample number 1 Sample number 2 Sample number 3 Sample number 4 Sample number 5 Sample number 6
Sum of impurities (%) 0.25 0.26 0.40 0.06 0.05 0.40Total numbers of impurities above 3 3 3 1 1 3
N 2
Ta
3ptagffLpvl(4i
3ltsrrfcIa
4
tiac
siao
A
fH
d(
R
[
[
[
[
[
[
[
[
[
[
[
disregard limit (0.05%)umber of impurities above 0.1% 0 1
herefore, a 0.4 mg/ml IDV solution should be used forssay.
.5.2.2. Precision. The method was assessed using multiplereparations of a single sample. Three different solutions ofhe commercial IDV sample each 2.0 mg/ml for purity controlnd 0.4 mg/ml for assay were analysed in triplicate on a sin-le day. New preparations were made and analyzed on each ofour successive days. An intermediate precision study was per-ormed using a new Hypersil BDS C18 column and differentC equipment. Three solutions of the same commercial sam-le were analysed in triplicate on a single day (day 4). R.S.D.alues calculated for IDV, UNK1, UNK2 and UNK3 on trip-icate injections in a single day (n = 9), three successive daysdays 1–3) (n = 27) and combining day 3 (equipment I) and day(equipment II) for the intermediate precision are summarized
n Table 7.
.5.2.3. Analysis of commercial samples. The Int. Ph. sets theimit for any individual impurity to be not more than 0.1% andhe sum of the impurities to be not more than 0.5% in bulkamples. Six commercial samples of IDV were analyzed forelated substances of IDV using the monograph method andesults obtained are summarized in Table 8. All samples complyor the sum of impurities whereas samples No. 2, 3 and 6 do notomply for individual impurities. All impurities are expressed asDV, using a 0.1% dilution (2.0 �g/ml) of the examined samples the reference.
. Conclusion
The column classification system indicated to be a helpfulool for choosing a suitable column. It was found that, with thencrease of the F-values, the probability of finding a column withsuitable separation for the analysis of IDV and its impurities
learly decreased.The gradient LC method proposed in the Int. Ph. Monograph
hows a good separation of IDV from its impurities. This methods robust, precise and linear. However, if it is to be used forssay, more dilute solutions have to be used (0.4 mg/ml insteadf 2.0 mg/ml).
cknowledgements
The authors thank the manufacturers and the suppliersor the gift of columns. The author also thanks the Worldealth Organization (WHO) for support. E. Adams is a post-
[
[
0 0 2
octoral fellow of the Fund for Scientific Research-FlandersBelgium).
eferences
[1] B.C. Buckland, S.W. Drew, N.C. Connors, M.M. Chartrain, C. Lee, P.M.Salmon, K. Gbewonyo, W. Zhou, P. Gailliot, R. Singhvi, R.C. OlewinskiJr., W.J. Sun, J. Reddy, J. Zhang, B.A. Jackey, C. Taylor, K.E. Goklen,B. Junker, R.L. Greasham, Metab. Eng. 1 (1999) 63–74.
[2] B.D. Johnson, A. Howard, R. Varasolona, J. McCauley, D.K. Ellison, in:G. Brittain (Ed.), Analytical Profiles of Drug Substances and Excipients,vol. 26, Academic Press, San Diego, California, 1996, pp. 319–358.
[3] M.S. Aurora Prado, E.R.M. Kedor-Hackmann, M.I.R.M. Santoro, T.J.A.Pinto, M.F.M. Tavares, J. Pharm. Biomed. Anal. 34 (2004) 441–450.
[4] B.C.E. Silva, L.M.M. de Campos, E.A. Nunan, C.D.V. Soares, G.R.Silva, J.A.A. Ribeiro, G.A. Pianetti, Quim. Nova 28 (2005) 50–53.
[5] B. Jancic, M. Medenica, D. Ivanovic, A. Malenovic, Chromatographia62 (2005) 233–238.
[6] Consultation document of International Pharmacopoeia, WHO DrugInformation, 19th vol. Geneva, Switzerland, 2005. pp. 51-55.
[7] B.C.E. Silva, L.M.M. de Campos, G.A. Pianetti, Quim. Nova 28 (2005)54–56.
[8] W. Gutleben, N.D. Tuan, H. Stoiber, M.P. Dierich, M. Sarcletti, A.Zemann, J. Chromatogr. A 922 (2001) 313–320.
[9] N. Chelyapov, S.A. Jacobs, T.J. Magee, J. Chromatogr. A 853 (1999)431–437.
10] W. Gutleben, K. Scherer, N.D. Tuan, H. Stoiber, M.P. Dierich, A.Zemann, J. Chromatogr. A 982 (2002) 153–161.
11] N.D. Tuan, W. Gutleben, K. Scherer, H. Stoiber, B. Falkensammer, M.P.Dierich, A. Zemann, Electrophoresis 24 (2003) 662–670.
12] M.R. Fizzano, L. Valvo, M.L. Dupuis, V. Mennella, M. Cianfriglia, J.Pharm. Biomed. Anal. 22 (2000) 307–314.
13] J.P. Vacca, B.D. Dorsey, W.A. Schleif, R.B. Levin, S.L. Mc Daniel, P.L.Darke, J. Zugay, J.C. Quintero, O.M. Blahy, E. Roth, V.V. Sardana, A.J.Schlabach, P.I. Graham, J.H. Condra, L. Gotlib, M.K. Holloway, J. Lin,I.W. Chen, K. Vastag, D. Ostovic, P.S. Anderson, E.A. Emini, J.R. Huff,Proc. Natl. Acad. Sci. U.S.A. 91 (1994) 4096–4100.
14] K.C. Yeh, P.J. Deutsch, H. Haddix, M. Hesney, V. Hoagland, W.D. Ju,S.J. Justice, B. Osborne, A.T. Sterrett, J.A. Stone, E. Woolf, S. Waldman,Antimicrob. Agents Chemother. 42 (1998) 332–338.
15] D.M. Burger, M. de Graaff, E.W. Wuis, P.P. Koopmans, Y.A. Hekster,J. Chromatogr. B 703 (1997) 235–241.
16] G. Aymard, M. Legrand, N. Trichereau, B. Diquet, J. Chromatogr. B744 (2000) 227–240.
17] S. Laussine, A. Roux, B. Delhotal-Landes, B. Flouvat, Ann. Biol. Clin.59 (2001) 169–175.
18] K. Keil, V.A. Frerichs, R. DiFrancesco, G. Morse, Ther. Drug Monit.25 (2003) 340–346.
19] J. Donnerer, M. Kronawetter, A. Kapper, I. Haas, H.H. Kessler, Phar-macology 69 (2003) 197–204.
20] D.M. Kreuz, A.L. Howard, D. Ip, J. Pharm. Biomed. Anal. 19 (1999)
725–735.21] M. Takahashi, M. Yoshida, T. Oki, N. Okumura, T. Suzuki, T. Kaneda,Biol. Pharm. Bull. 28 (2005) 1286–1290.
22] S.M. Hsieh, H.Y. Yu, S.C. Chang, J. Formos. Med. Assoc. 103 (2004)191–195.

8 ical a
[
[
[
[
[
[
[
[
[[
[
[
[
[
[
[
[
[
[[
[
[
[
[
[
[
[
[
[
[
[
[
[
[
[
[
[
[
[
0 R. Yekkala et al. / Journal of Pharmaceut
23] N.L. Rezk, R.R. Tidwell, A.D.M. Kashuba, J. Chromatogr. B 805 (2004)241–247.
24] P.D. Walson, S. Cox, I. Utkin, N. Gerber, L. Crim, M. Brady, K. Koranyi,Ther. Drug Monit. 25 (2003) 649–656.
25] J. Faux, N. Venisse, G. Le Moal, A. Dupuis, S. Bouquet, Chro-matographia 58 (2003) 421–426.
26] M.L. Turner, K. Reed-Walker, J.R. King, E.P. Acosta, J. Chromatogr. B784 (2003) 331–341.
27] E. Marchei, R. Pacifici, G. Tossini, R. Di Fava, L. Valvo, P. Zuccaro, J.Liq. Chromatogr. Relat. Technol. 24 (2001) 2325–2336.
28] M. Sarasa-Nacenta, Y. Lopez-Pua, J. Mallolas, J.L. Blanco, J.M. Gatell,X. Carne, J. Chromatogr. B 757 (2001) 325–332.
29] C. Marzolini, A. Telenti, T. Buclin, J. Biollaz, L.A. Decosterd, J. Chro-matogr. B 740 (2000) 43–58.
30] P. Remmel, S.P. Kawle, D. Weller, C.V. Fletcher, Clin. Chem. 46 (2000)73–81.
31] M.L. Foisy, J.P. Sommadossi, J. Chromatogr. B 721 (1999) 239–247.32] A.L. Jayewardene, F. Zhu, F.T. Aweeka, J.G. Gambertoglio, J. Chro-
matogr. B 707 (1998) 203–211.33] C. Armbruster, H. Vorbach, F. Steindl, I. El Menyawi, J. Antimicrob.
Chemother. 47 (2001) 487–490.34] E. Dailly, L. Thomas, M.F. Kergueris, P. Jolliet, M. Bourin, J. Chro-
matogr. B 758 (2001) 129–135.35] A. Volosov, C. Alexander, L. Ting, S.J. Soldin, Clin. Biochem. 35 (2002)
99–103.36] V.A. Frerichs, R. DiFrancesco, G.D. Morse, J. Chromatogr. B 787 (2003)
393–403.37] H. Pelerin, S. Compain, X. Duval, F. Gimenez, H. Benech, A.
Mabondzo, J. Chromatogr. B 819 (2005) 47–57.38] S. Colombo, A. Beguin, A. Telenti, J. Biollaz, T. Buclin, B. Rochat,
L.A. Decosterd, J. Chromatogr. B 819 (2005) 259–276.39] J.M. Poirier, P. Robidou, P. Jaillon, Ther. Drug Monit. 27 (2005)
186–192.40] W. Egge-Jacobsen, M. Unger, C.U. Niemann, M. Baluom, S. Hirai,
L.Z. Benet, U. Christians, Ther. Drug Monit. 26 (2004) 546–562.
41] K.M. Rentsch, J. Chromatogr. B 788 (2003) 339–350.42] K.M.L. Crommentuyn, H. Rosing, L.G.A.H. Nan-Offeringa, M.J.X.
Hillebrand, A.D.R. Huitema, J.H. Beijnen, J. Mass Spectrom. 38 (2003)
157–166.43] U.S. Justesen, C. Pedersen, N.A. Klitgaard, J. Chromatogr. B 783 (2003)491–500.
44] E. Gangl, I. Utkin, N. Gerber, P. Vouros, J. Chromatogr. A 974 (2002)91–101.
[
[
nd Biomedical Analysis 42 (2006) 71–80
45] J. Chi, A.L. Jayewardene, J.A. Stone, T. Motoya, F.T. Aweeka, J. Pharm.Biomed. Anal. 30 (200) 675–684.
46] P. Villani, M. Feroggio, L. Gianelli, A. Bartoli, M. Montagna, R.Maserati, M.B. Regazzi, Ther. Drug Monit. 23 (2001) 380–388.
47] A.L. Jayewardene, B. Kearney, J.A. Stone, J.G. Gambertoglio, F.T.Aweeka, J. Pharm. Biomed. Anal. 25 (2001) 309–317.
48] L.L. Lopez, X. Yu, D.H. Cui, M.R. Davis, Rapid Commun. Mass Spec-trom. 12 (1998) 1756–1760.
49] S.K. Balani, E.J. Woolf, V.L. Hoagland, M.G. Sturgill, P.J. Deutsch,K.C. Yeh, J.H. Lin, Drug Metab. Dispos. 24 (1996) 1389–1394.
50] Indian Pharmacopoeia, Addendum 2002. The controller of Publications,Delhi, India, pp. 910–912.
51] United States Pharmacopeia, 28th ed., U.S. Pharmacopeial Convention,Rockville, MD, USA, 2005, pp. 3247–3248.
52] Pharmeuropa, 17th vol., European Directorate for the Quality ofMedicines, Strasbourg, France, 2005, pp. 483–485.
53] United States Pharmacopeial Pharmacopeial Forum, 26th vol., US Phar-macopeial Convention, Rockville, MD, USA, 2000, pp. 1641–1643.
54] D. Visky, Y. Vander Heyden, T. Ivanyi, P. Baten, J. De Beer, B.Noszal, E. Roets, D.L. Massart, J. Hoogmartens, Pharmaeuropa 14(2002) 288–297.
55] D. Visky, Y. Vander Heyden, T. Ivanyi, P. Baten, J. De Beer, Zs. Kovacs,B. Noszal, E. Roets, D.L. Massart, J. Hoogmartens, J. Chromatogr. A977 (2002) 39–58.
56] T. Ivanyi, Y. Vander Heyden, D. Visky, P. Baten, J. De Beer, I. Lazar,D.L. Massart, E. Roets, J. Hoogmartens, J. Chromatogr. A 954 (2002)99–114.
57] D. Visky, Y. Vander Heyden, T. Ivanyi, P. Baten, J. De Beer, Zs. Kovacs,B. Noszal, P. Dehouck, E. Roets, D.L. Massart, J. Hoogmartens, J.Chromatogr. A 1012 (2003) 11–29.
58] P. Dehouck, D. Visky, Y. Vander Heyden, E. Adams, Zs. Kovacs, B.Noszal, D.L. Massart, J. Hoogmartens, J. Chromatogr. A 1025 (2004)189–200.
59] P. Dehouck, D. Visky, G. Van den Bergh, E. Haghedooren, E. Adams,A. Kerner, Y. Vander Heyden, D.L. Massart, Z. Kovacs, B. Noszal, J.Hoogmartens, LC-GC Europe 17 (2004) 592–601.
60] D. Visky, E. Haghedooren, P. Dehouck, Zs. Kovacs, K. Koczian, B.Noszal, J. Hoogmartens, E. Adams, J. Chromatogr. A, in press.
61] Column classification, Katholieke Universiteit Leuven, http://pharm.
kuleuven.be/pharmchem/columnclassification, 2005.62] D.L. Massart, R.G. Brereton, R.E. Dessy, P.K. Hopke, C.H. Spiegelman,W. Wegscheilder, Chemometrics Tutorials, Elsevier, Amsterdam, 1990.
63] R. Carlson, Design and Optimization in Organic Synthesis, Elsevier,Amsterdam, 1992.