Urine analysis for it's Normal & Abnormal Constituents - Gyan Sanchay
Upload
independentCategory
view
1download
0
ELSEVIER
Determination of immunoaffinity
Journal of Chromatography B, 660 (1994) 303-313
JOURNAL OF CHROMATOGRAPHY B: BIOMEDICAL APPLICATIONS
beta-sympathomimetics in liver and urine by chromatography and gas chromatography-
mass-selective detection
H. Hooijerink*, R. Schilt, E.O. van Bennekom, F.A. Huf
State Institute for Quality Control of Agricultural Products (RIKILT-DLO), Bornsesteeg 45, P.O. Box 230, 67W AE Wageningen, Netherlands
First received 7 February 1994; revised manuscript received 22 June 1994
Abstract
A specific and sensitive method for the determination of several P-agonistic drugs in liver and urine is described. Following clean-up by immunoaffinity chromatography and two different derivatizations, gas chromatography- mass spectrometry with electron-impact ionization is performed. The immunoaffinity chromatography columns were packed with Sepharose-immobilized polyclonal antibodies raised against the P-agonist clenbuterol. Owing to the high clean-up efficiency of the immunoaffinity column large sample volumes can be used (up to 100 ml urine or 25 gram liver). The immunoaffinity sample pretreatment is highly specific and no further sample pretreatment was necessary. Due to the combination of two different derivatizations only GC-MS with electron-impact ionization is necessary to fulfil legal requirements. The first confirmation step consists of a derivatization reaction between the hydroxyl group of the parent compound and trimethylsilane. The second confirmation method is a derivatization to a cyclic derivative with the hydroxyl group and the aliphatic nitrogen group. Limits of determination in liver as well in urine are at the 10 ng/kg or rig/l (ppt) level with acceptable signal-to-noise ratio. The method is suitable for identification and quantification of trace amounts of several similar P-agonistic drugs either used separately or in combination and can be used also for quantification of clenbuterol in liver with regard to levels exceeding the maximum residue limit (MRL) of 1 pg/kg (ppb).
1. Introduction
Beta-sympathomimetics or j3-agonistic drugs are used for the treatment of obstructions of the bronchial tubes of domestic animals. These p- agonistic drugs decrease muscle activity and as bronchodilators they increase the airway size and decrease airway resistance [1,2]. In the Nether- lands and several other countries in the Euro-
pean Union (EU) clenbuterol is registered as bronchodilator. “Side effects” of these com- pounds (like live-weight gain, improvement of feed conversion, and increase of the ratio of muscle and fat tissue) are of economical impor- tance because of their growth-promoting effects
PI. In the EU the use of growth promoters is
banned. Copsumers in the EU generally reject the use of growth promoting substances. In the
* Corresponding author. Netherlands the first illegally used P-agonist was
0378-4347/94/$07.oiI 0 1994 Elsevier Science B.V. All rights reserved SSDZ 037%4347(94)00315-7

304 H. Hooijerink et al. I J. Chromatogr. B 660 (1994) 303-313
clenbuterol. Later on salbutamol, mabuterol and mapenterol were found. Although the use is illegal different growth promoters are sometimes used. Consequently, consumers might be at risk when consuming meat or liver. The P-agonist clenbuterol exerts its toxic effects at a relative high level (200-300 ppb) in liver [3,4]. The maximum residue limit (MRL) for clenbuterol in the Netherlands is 1 ppb.
In a previous report [5] several analytical methods for the determination of clenbuterol were extensively described. Recently the deter- mination of several P-agonists in urine, tissue and liver were reported [6-91. The sample pre- treatment used in most of these determinations described is based on physical-chemical proce- dures, like liquid-liquid extraction, solid-phase extraction and analytical detection. Biochemical methods (enzyme-linked immunoassay, ELISA) were reported by Yamamoto and Iwata [lo], and Meyer et al. [ll]. In our institute an ELISA for clenbuterol and salbutamol was developed by Haasnoot et al. [12]. Although the ELISA meth- ods are very sensitive and fast they lack specifici- ty for the determination of multi-components. Van Ginkel et al. [13] described a method for several p-agonists applying immunoaffinity chro- matography and gas chromatography-mass spec- trometry with electron-impact ionization.
The principle of affinity chromatography is based on the specificity of a protein-ligand interaction. Immunoaffinity chromatography is a technique which is based on antibody-antigen interaction and has become a valuable tool in residue analysis [14]. The affinity of an analyte for antibodies immobilized on an insoluble sup- port material functions as selection criterium. With regard to the structure of the several /3- agonists and the way antibodies were raised it is plausible that many similar compounds will cross-react with the antibodies.
In literature [15] the effectiveness of reparti- tioning agents has been described.
Mabuterol, mapenterol, cimbuterol, and clen- penterol have high potencies compared to clen- buterol. For that reason these compounds ob- tained high priority in the present study and
were used to develop this immuno-analytical method. From the above mentioned compounds only some are commercially available. Some were synthesized and some were obtained from the black market. For quantification we used specially prepared deuterated clenbuterol.
To fulfil the gas-chromatographic-mass spec- trometric (GC-MS) confirmation criteria of the EU [16] it is necessary to measure four indepen- dent mass fragments in the mass spectrum. A straightforward ionization method like electron- impact (EI) ionization does not yield four peaks of sufficient intensity for most of the p-agonists and thus a second derivatization is needed for a second mass spectrum in order to obtain suffi- cient conclusive prove in accordance with the EU-criteria. Derivatization and cyclization of the aliphatic part of the molecule is a generally applicable and specific method for a great variety of p-agonists since aminoethanol moiety is a characteristic part of these substances.
This study aimed to combine a biochemical tool (immunoaffinity chromatography) with an analytical instrument (GC-MS), which both are very specific, for the determination of various P-agonists at the sub-ppb level.
2. Experimental
2.1. Chemicals and reagents
Clenbuterol - HCl was obtained from Sigma (St. Louis, MO, USA), d,-clenbuterol was syn- thesized by the Laboratory of Organic Chemis-
try, Agricultural University, Wageningen, Netherlands. Mabuterol and mapenterol were prepared by Rephartox (Maarssen, Nether- lands), cimbuterol was a gift from F. Andre (Ecole Veterinaire Nantes, Nantes, France). Clenpenterol was isolated from material ob- tained from the black market. (For structures of the compounds see Fig. 1). All other chemicals were of analytical grade and were obtained from Sigma, Merck (Darmstadt, Germany) or Pierce (Oud-Beijerland, Netherlands).

H. Hooijerink et al. I .I. Chromatogr. B 660 (1994) 303-313 305
Compound 6 4 R, R, R5 _________________________-_______-____-_~~~-~~~~~~~~~~
Mabuterol CF, NH, Cl H CH,
Mapenterol CF, NH, Cl H CH,CH,
Clenbuterol Cl NH, Cl H CH,
Cimbuterol CN NH, Cl H CH,
Clenpenterol Cl NH, Cl H CH,CH,
Salbutamol CH,OH OH H H CH,
Fig. 1. Structures of /3-agonistic drugs.
2.2. Sample materials
Urine samples were obtained from two animal experiments and from several slaughterhouses in the Netherlands.
In experiment I, urine samples were obtained from a six-month old male veal calf that was treated with clenbuterol * HCl (Ventipulmin, Boehringer Ingelheim, Germany) at the Institute for Animal Nutrition Research (ILOB/TNO, Wageningen, Netherlands). The animal received a relatively high oral dose (five times the thera- peutic dose) of 4 pg clenbuterol- HCl per kg body weight, twice a day (8:OO a.m. and 8:00 p.m.), for a period of five days. On the sixth day the animal was slaughtered.
In experiment II, two bulls (approximately 14 months old) were treated orally with the rec- ommended therapeutic dose of clenbuterol * HCl (0.8 pg per kg body weight) and two bulls (approximately 14 months old) were treated orally with lo-fold the therapeutic dose of clenbuterol- HCl (8 pg per kg body weight)
twice a day over a period of four weeks at the DLO-Institute for Livestock Feeding and Nutri- tion Research (IVVO-DLO). After the last day of application the animals were slaughtered.
Other urine samples were taken by inspectors of the National Inspection Service for Meat, Livestock and Animal Products at slaughter- houses and farmhouses in the Netherlands. All urine and liver samples were stored at -20°C.
2.3. Sample preparation
Liver A 25-g amount of grounded calve liver was
weighed into a 150-ml centrifuge tube. Twenty- five ml 0.1 M phosphoric acid was added, the sample was homogenated with a Sorvall Omni- Mixer (Model 17106, DuPont, Newtown, USA) and subsequently treated in an ultrasonic bath during 15 min. The homogenate was heated at 120°C for 30 min, followed by centrifugation for 30 min at 19 000 g. The supematant was trans- ferred into another centrifuge tube, and the pH adjusted to 7.2 with 1 M sodium hydroxide. Subsequently an equal volume of double concen- trated phosphate buffered saline (PBS) was added and the buffered homogenate was cen- trifuged again under the same conditions. Finally the resulting supematant was filtered over a 5- pm filter.
Urine A 50-ml volume of urine was adjusted to pH
7.2, and an equal amount of double concentrated phosphate buffered saline (PBS) was added. This buffered homogenate was filtered over a 5- pm filter.
2.4. Sample clean-up (immunoafinity chromatography)
Preparation of antibodies Polyclonal antibodies were raised against a
clenbuterol-BSA (bovine serum albumin) conju-

306 H. Hooijerink et al. I J. Chromatogr. B 660 (1994) 303-313
gate. This conjugate was prepared by diazotation of clenbuterol and subsequent coupling of diazo- clenbuterol to BSA according to Yamamoto and Iwata [lo]. From blood serum the IgG fraction was isolated by ammoniumsulphate precipita- tion. A detailed description is given by Haasnoot et al. [12].
Preparation of the immunoaflnity column The immunoaffinity column was prepared as
follows. IgG antibodies were coupled to CNBr activated Sepharose (Pharmacia, Sweden) ac- cording to the procedure described by the manu- facturer. This antibody-gel was poured into chro- matography column (I.D. 10 mm) (BioRad, Richmond, USA) to a height of the sedimented gel of 60 + 5 mm. The column was washed with 25 ml phosphate buffered saline (PBS) and 25 ml of 0.02% sodium azide as preservative. Under these conditions the column could be stored at 4°C in a refrigerator.
ml of water. P-Agonistic drugs were eluted with 10 ml of methanol-O.1 M acetic acid (70:30, v/v). After evaporation of the methanol fraction under a stream of nitrogen, the remaining solu- tion was adjusted to pH 6.0 with 0.1 M sodium hydroxide and transferred to a Clean Screen Dau column (500 mg) as described by Montrade et al. [17]. This column was washed successively with 2 ml of 0.1 M KH,PO,, 1 ml of acetic acid and 6 ml of methanol. Subsequently the P-agonistic drugs were eluted with 3 x 2.5 ml of ethylace- tate-ammonia (97:3, v/v). This eluate was evaporated and transferred with 2 x 250 ~1 of methanol to a 1. l-ml tapered screw-top vial (Chromacol, London, UK). The methanol phase was evaporated before derivatization.
2.5. Derivatization
Determination of the maximum capacity of the immunoafinity column
The maximal capacity of the immunoaffinity column (IAC) was determined by adding differ- ent amounts of clenbuterol (O-10 000 nanogram in PBS-buffer) to the column. The column was subsequently washed with 10 ml water. Clen- buterol was eluted with 10 ml methanol-O.1 M acetic acid (70:30, v/v). After elution the column was washed with 5 ml of methanol-O.1 M acetic acid mixture, 10 ml of water and 5 ml of 0.02% sodium azide. The eluates were evaporated under a stream of nitrogen at 50°C. The residues were dissolved in 250 ~1 HPLC eluent prior to HPLC analysis [5].
Trimethylsilylethers were prepared by adding 100 ~1 of a derivatization solution containing N-methyl-N-trimethylsilyltrifluoracetamide (MS- TPA) with 1% trimethylchlorosilane (TMCS) to the dried sample extracts or standards, followed by mixing and heating for 30 min at 60°C. After cooling the derivatization reagent was evapo- rated till dryness, and the residue was dissolved in 12.5 ~1 of dried toluene.
From the HPLC data a capacity curve was constructed with the amounts of clenbuterol added on the x-axis and the amount determined by HPLC on the y-axis. The capacity is defined as the intersection of the two tangents drawn.
The cyclic DMS (dimethylsilylmethylene) de- rivatives were prepared according to Dumasia and Houghton [18]. The reagent was prepared by mixing 2 ml of n-hexane, 100 ~1 of N-diethyl- amine and 160 ~1 of chloromethyldimethylchlo- rosilane. This reagent was mixed and centrifuged for 15 min at 2000 g. To each vial 25 ~1 of the reagent mixture was added, the vial was capped and heated for 60 min at 60°C. After cooling the reagent was evaporated to dryness, and the residue was dissolved in 12.5 ~1 of dried toluene. Thereafter the tube was centrifuged.
2.6. Apparatus Immunoafinity chromatography
Before sample clean-up the immunoaffinity The GC-MS system (Hewlett-Packard, Rock- (IA) column was washed with 25 ml of phos- ville, USA) consisted of a gas chromatograph phate buffered saline. The filtered sample was Model 5890 Series II, a mass-selective detector transferred to the IA column and washed with 10 Model 5970 (electron-impact mode), and an

H. Hooijerink et al. I J. Chromatogr. B 460 (1994) 303-313 3ol
autoinjector Model 7673-A with Pascal Chem- station. The column used was a DB-1 capillary column (30 m x 0.25 mm I.D., J and W Sci- entific) with a film thickness of 0.25 pm; helium was used as carrier gas. The inlet pressure was 75 kPa at 70°C. A volume of 2 ~1 was injected (splitless mode) for both derivatives. For tri- methylsilylethers the oven was programmed as follows: injector temperature 260°C the oven temperature programmed from 70°C (2 min) to 210°C at 12.5”C/min and subsequently from 210°C to 300°C at 15”CYmin. The transfer line was kept at 300°C. For cyclic dimethyl- chlorosilane derivatives the oven temperature was programmed as follows: from 70°C (2 min) to 200°C at 20”C/min and from 210°C to 300°C at 40”C/min.
3. Results and discussion
Regulatory control of growth-promoting p- agonistic drugs demands a highly specific and reliable analytical-chemical control, which in addition must have a large sample throughput. The use of a two-stage approach, i.e. ELISA for screening and GC-MS for confirmation, has proven to be successful [12,19]. Using polyclonal antibodies raised against the tertiary butyl amino group of clenbuterol we were able to detect several compounds that have the same tertiary butyl amino group or pentyl amino group (see Fig. 1) simultaneously. For the determination of traces of chemicals in biological materials the major aspect is the limit of determination. Gas chromatography-mass spectrometry (GC-MS) has proven to fulfil this requirement. However another important aspect in lowering the limits of determination is the starting amount of bio- logical material. The limit of determination will always depend on the compound to matrix ratio. If sample pretreatments like liquid-liquid ex- traction and solid-phase extraction are used, which are generally not specific, there is an optimum in the compound to matrix ratio, Gen- erally, such methods are not specific enough for residue analysis in biological materials.
Using polyclonal antibodies against clen-
buterol the specificity of antibodies, which will only interact with clenbuterol and similar com- pounds under the right conditions, makes it possible to start with relatively large quantities of biological material for sample preparation. Ex- periments with clenbuterol in urine [5] showed that clenbuterol was not excreted as a conjugate. So in this study of non-phenolic P-agonists enzymatic deconjugation was not performed.
3.1. Immunoafinity chromatography
The maximum capacity of the IA column was determined as approximately 400 ng of clen- buterol. For desorption of cross-reacting analytes different desorption mechanisms can be used, i.e. desorption with a competing compound, a buffer solution or a mixture of a buffer solution with an organic modifier. Several different de- sorption solutions were evaluated like acetic acid, acetone-water (95:5, v/v) and mixtures of acetic acid and methanol. A mixture of 0.1 it4 acetic acid and methanol (30:70, v/v) gave the highest recoveries and the lowest number of co-extracted compounds in GC-MS. For appli- cation of the large amount of sample material on the IA column a multichannel pump was used. An advantage of the use of a multichannel pump is its constant flow-rate (0.15 ml/min).
Analytes with a lower affinity towards the antibodies than clenbuterol can be reproducibly bound under these conditions. The relatively expensive IA columns are destined for multiple use. Therefore they have to be cleaned thor- oughly to avoid cross-contamination. In general the capacity of the IA columns decreases. After preparation the IA columns had a capacity of approx. 200 ng of clenbuterol and after analysis of twenty samples the capacity had decreased to approx. 400 ng of clenbuterol. After the im- munoaffinity chromatography step the methanol in the eluate was evaporated and the analytes were subsequently extracted from the aqueous phase with a solid-phase extraction column (Clean Screen DAU). This type of column enabled the extraction of a range of analytes including amphoteric p-agonists such as sal- butamol.
308 H. Hooijerink et al. I J. Chromatogr. B 660 (1994) 303-313
3.2. Gas chromatography-mass spectrometry
With GC-MS in the single-ion monitoring mode we used two different derivatizations: derivatization with the trimethylsilyl ether (TMS) as the first step, and the cyclic deri- vatization with the dimethylsilyl ether (DMS) as the second confirmation step. Mass spectromet- ric data obtained in the electron-impact ioniza- tion mode show that the fragmentation processes are very intense: The p-agonist-trimethylsilyl ethers are very susceptible to fragmentation. The base-peak ions m/z 86 and m/z 100 are observed in all p-agonists investigated. The part of the molecule responsible for that base-peak is [CH, = N+H-C,H,-RI+, in which R = CH, (for mabuterol, clenbuterol and cimbuterol) or C,H,
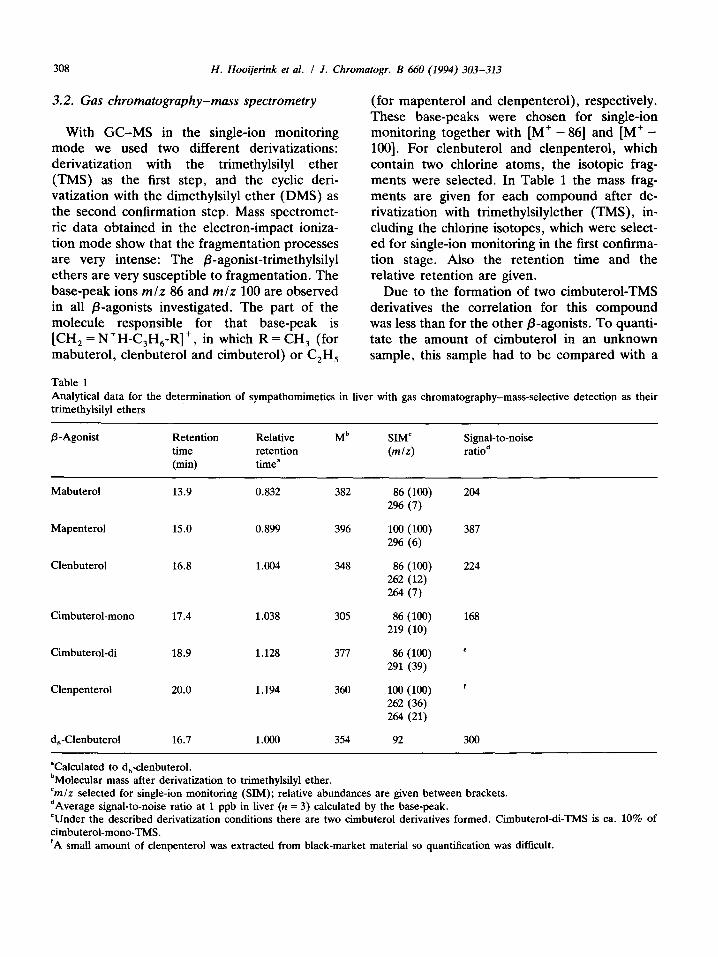
(for mapenterol and clenpenterol), respectively. These base-peaks were chosen for single-ion monitoring together with [M+ - 861 and [M+ - 1001. For clenbuterol and clenpenterol, which contain two chlorine atoms, the isotopic frag- ments were selected. In Table 1 the mass frag- ments are given for each compound after de- rivatization with trimethylsilylether (TMS), in- cluding the chlorine isotopes, which were select- ed for single-ion monitoring in the first confirma- tion stage. Also the retention time and the relative retention are given.
Due to the formation of two cimbuterol-TMS derivatives the correlation for this compound was less than for the other p-agonists. To quanti- tate the amount of cimbuterol in an unknown sample, this sample had to be compared with a
Table 1 Analytical data for the determination of sympathomimetics in liver with gas chromatography-mass-selective detection as their trimethylsilyl ethers
P-Agonist Retention time (min)
Relative retention time”
Mb SIM’
(m/r)
Signal-to-noise ratio*
Mabuterol 13.9 0.832 382 86 (100) 204 296 (7)
Mapenterol 15.0 0.899 396 100 (100) 387 296 (6)
Clenbuterol 16.8 1.004 348 86 (100) 224 262 (12) 264 (7)
Cimbuterol-mono 17.4 1.038 305 86 (100) 168 219 (10)
Cimbuterol-di 18.9 1.128 377 86 (100) e 291 (39)
Clenpenterol 20.0 1.194 360 loo (100) f 262 (36) 264 (21)
d,-Clenbuterol 16.7 1.000 3.54 92 300
“Calculated to d,-clenbuterol. bMolecular mass after derivatization to trimethylsilyl ether. ‘m/z selected for single-ion monitoring (SIM); relative abundances are given between brackets. dAverage signal-to-noise ratio at 1 ppb in liver (n = 3) calculated by the base-peak. ‘Under the described derivatization conditions there are two cimbuterol derivatives formed. Cimbuterol-di-TMS is ca. 10% of cimbuterol-mono-TMS. ‘A small amount of clenpenterol was extracted from black-market material so quantification was difficult.
H. Hooijerink et al. 1 J. Chromatogr. B 460 (1994) 303-313 309
spiked control sample. Calibration curves, pre- pared form five standard solutions in the range 0.25-2.5 ng/pl with a fixed amount of internal standard (1.0 ng/pl) gave linear correlations (r > 0.999). A calibration curve for mabuterol, mapenterol and clenbuterol, in the range O-3 rig/g liver, was obtained by adding standard solution to 25 g of liver. In this linearity study, the correlation coefficients were respectively 0.998, 0.987 and 0.985. The deuterated clen- buterol standard is very well suited for mabuterol, mapenterol, clenbuterol and clenpen- terol quantitation. In Table 2 the inter-assay precision for two fortified liver samples of 1 and 2 ppb is given. The coefficients of variation were respectively 15.7 and 12.0 (n = 6).
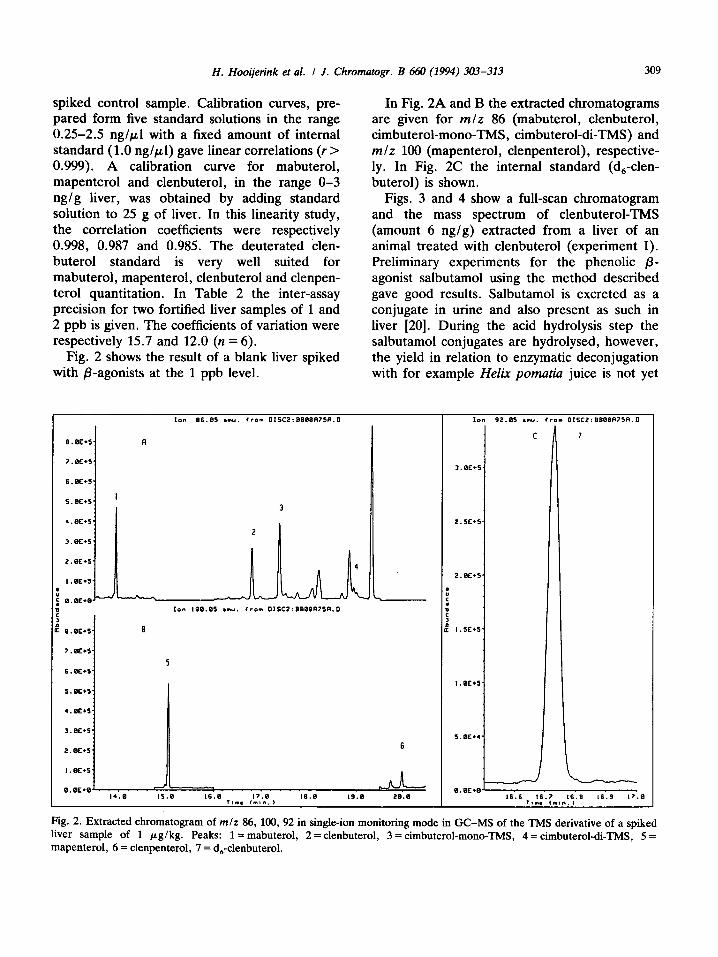
Fig. 2 shows the result of a blank liver spiked with P-agonists at the 1 ppb level.
In Fig. 2A and B the extracted chromatograms are given for m/z 86 (mabuterol, clenbuterol, cimbuterol-mono-TMS, cimbuterol-di-TMS) and m/z 100 (mapenterol, clenpenterol), respective- ly. In Fig. 2C the internal standard (d,-clen- buterol) is shown.
Figs. 3 and 4 show a full-scan chromatogram and the mass spectrum of clenbuterol-TMS (amount 6 rig/g)) extracted from a liver of an animal treated with clenbuterol (experiment I). Preliminary experiments for the phenolic /3- agonist salbutamol using the method described gave good results. Salbutamol is excreted as a conjugate in urine and also present as such in liver [20]. During the acid hydrolysis step the salbutamol conjugates are hydrolysed, however, the yield in relation to enzymatic deconjugation with for example Helix pomatia juice is not yet
..Bc.s
B.BE.0 J- _--I’ B.aE+B 14.8 15.8 16.0 17.8 18.8 19.8 ZB.B 15.6 16.7 16.8 16.9 IT.0
T,l. Cm.,“. , Iln* tn,n.,
Fig. 2. Extracted chromatogram of m/z 86, 100, 92 in single-ion monitoring mode in GC-MS of the TMS derivative of a spiked liver sample of 1 pglkg. Peaks: 1= mabuterol, 2 = clenbuterol, 3 = cimbuterol-mono-TM& 4 = cimbuterol-di-TMS, 5 = mapenterol, 6 = clenpenterol, 7 = d,-clenbuterol.

310 H. Hooijerink et al. I J. Chl romatogr. B 660 (1994) 303-313
Table 2 Analytical data for the between-day analysis of two fortified liver samples of 1 and 2 rig/g in six days
Day of analysis
Clenbuterol . HCl (ng/g)
1 2
Mean 1.3 2.4 C.V. 15.7 12.0
1.3 2.5 1.0 3.0 1.6 2.4 1.5 2.4 1.3 2.3 1.3 2.1
The samples were measured with GC-MSD as their tri- methylsilyl derivatives.
thoroughly tested. In GC-MS the fragmentation of salbutamol as TMS-derivative is less extensive than that of the other compounds investigated, so to fulfil the EU requirements of measurement of at least four diagnostic ions was possible at the level of interest.
A schematic representation of the reaction of the cyclic derivatization of the p-agonists is shown in Fig. 5. A ring is formed between nitrogen and oxygen. In Fig. 5 the fragmentation
of the cyclic DMS derivative of a P-agonist is shown. The cyclic DMS derivative shows a completely different mass fragmentation com- pared to that of the TMS derivative, as can be seen in Fig. 6 where the mass spectrum of the cyclic DMS derivative of clenbuterol is shown. The abundance of the molecular ion for TMS derivatives is only 1% or less of the base-peak. In cyclic DMS the abundance of the molecular ion for the investigated compounds is ca. 25% of the base-peak. The other investigated com- pounds have almost the same fragmentation pattern. In Table 3 the selected mass fragments are given for single-ion monitoring. Although the mass fragments c and d (m/z 100 and m/z 128) (see Fig. 5) are very specific for the cyclic aminoethanol/silyl part of the P-agonist mole- cule they were not chosen in single-ion moni- toring because the variation in the relative abun- dance of the standards was larger then for the other mass fragments mentioned in Table 3. In Fig. 6 a full-scan spectrum of cyclic clenbuterol is given for a liver sample from an animal experi- ment. In this liver sample clenbuterol was de- termined as TMS derivative and as cyclic deriva- tive both in the single-ion monitoring mode and full-scan analyses. The GC-MS measurements in the single-ion monitoring mode fulfilled the EU
Fig. 3. Total-ion chromatogram of a TMS derivative of a liver sample from an animal treated with clenbuterol in GC-MS in the full-scan mode. The mass range was 80-350 amu.

H. Hooijerink et al. I J. Chromatogr. B 660 (1994) 303-313 311
E.BE.5.
Fig. 4. Full-scan spectrum of clenbuterol-TMS on the top of the peak at 16.808 min of the chromatogram in Fig. 3.
Table 3 Analytical data for the gas chromatographic-mass-selective detection of P-agonist measurements in the electron-impact ionization mode as their cyclic derivatives
P-Agonist Retention time (min)
Diagnostic ions” (m/z)
M’ M++2 M’ - CH, M’ - C(CH,),
Mabuterol 14.3 380 (15) 365/367 (100/39) 323 (31) Mapenterol 15.3 394 (4) 3791381 (12/4) 365 (100) Clenbuterol 16.2 346 (23) 348 (14) 331/333 (100166) 289 (48) Cimbuterol 16.3 303 (22) 288 (100) 246 (38) Clenpenterol 16.8 360 (25) 362 (17) 3451367 (16/11) 303 (100)
“m/z selected for single-ion monitoring; relative abundances are given between brackets.
Table 4 Results of the analysis of clenbuterol in liver from animal experiment II
Animal Amount Amount clenbuterol . HCl
criteria [16]. In Table 4 the results are given for the analyses of clenbuterol in animal experiment II using-the method described. -
1
applied
@g/kg bodyweight)
0.8 LL.CL~
(ng/g) (n = 2)
4. Conclusion 5.5
2 0.8 jog 11 3 8.0 cLg 74 4 8.0 us 72
The present study clearly indicates the feasibility of a two-stage confirmation method for gas chromatography-mass spectrometry with electron-impact ionization for a number of /?- For detailed information see sample materials.

312 H. Hooijerink et al. / .I. Chromatogr. B 640 (1994) 303-313
I______-_____-__ ___, Fig. 5. Reaction of a P-agonist to a cyclic DMS derivative. The main mass fragments a, b, c and d (including c) are m/z 15, mlz 57, mlz 100 and m/z 128, respectively
agonistic drugs in liver and urine at the levels of the maximum residue limits. This two-step con- firmation method fulfils the quality requirements of the EU [16] in which is stated that the identification of the analyte should be based on the result of at least two independent GC-low resolution MS methods with different derivatives and/or different ionization techniques. Although the fragmentation of the cyclic DMS derivative is not as hard as that of the TMS derivative, four
diagnostic ions can easily be chosen. We prefer to analyze liver and urine samples in duplicate with two different derivatization reagents to prevent false positives and to exclude cross-con- tamination. The first step confirmation, derivati- zation to a TMS derivative, can be automated, but for practical reasons the second confirmation step requires injection by hand. The method allows the analysis of large amounts of biological material. In view of the fact that generally the level of P-agonists in meat is very low, a factor of 10 lower than in liver, it is expected that the reported method may also be used for sample pretreatment and analysis of meat.
Acknowledgements
The authors thank G. Cazemier, L. Brouwer and P. Stouten for the technical assistance, N.J.G. Broex and P.L.M. Berende for perform- ing the animal experiments and W. Haasnoot for supplying the antibodies and stimulating discus- sions and A.J. Baars for critically reading the manuscript.
1
I-
/-
I-
1
Fig. 6. Mass spectrum of clenbuterol from a liver extract of animal experiment I as cyclic DMS derivative.
H. Hooijerink et al. I 1. Chromatogr. B 660 (1994) 303-313 313
References
PI
PI
[31 [41
PI
161
171
PI
191
WI
P.L.M. Berende and E.J. Ruitenberg, in L. Peel and D.E. Tribe (Editors), World Animal Science I: Domestic Conversation and Animal Resources, Elsevier, Amster- dam, 1983, pp. 191-233. J.P. Hanrahan (Ed.), Proceedings of the seminar in the CEC Programme of Coordination of Research in Ani- mal Husbandry, Brussels, 19-20 May, 1987, Elsevier, London, 1987, p. 193. J.F. Martinez-Navarro, Lancet, 336 (1990) 1311. C. Pulce, D. Lamaison, G. Keck, C. Bostvironnois, J. Nicolais, J. Descottes, M. Mora and A. Colmant, Bull. Epidemiol. Hebd., 5 (1991) 17. H. Hooijerink, R. Schilt, W. Haasnoot and D. Cour- theyn, J. Pharm. Biomed. Anal., 9 (1991) 485. J.M. Degroodt, B. Wyhowski de Bukanski, J. de Groof and H. Beernaert, Z. Lebensm. Unters. Forsch., 192 (1991) 430. J.M. Degroodt, B. Wyhowski de Bukanski, H. Beer- naert and D. Courtheyn, Z. Lebensm. Unters. Forsch., 189 (1989) 128. L. Leyssens, C. Driessen, A. Jacobs, J. Czech and J. Raus, J. Chromatogr., 564 (1991) 515. D. Courtheyn, C. Desaever and R. Verhe, J. Chroma- togr., 564 (1991) 537. I. Yamamoto and K. Itawa, J. Immunoassay, 3 (1982) 155.
[ll] H.H.D. Meyer, L. Rinke and I. Diirsch, J. Chroma- togr., 564 (1991) 551.
[12] W. Haasnoot, M.E. Ploum, R.J.A. Paulussen, R. &hilt, and F.A. Huf, J. Chromatogr., 519 (1990) 323.
[13] L.A. van Ginkel, R.W. Stephany and H.J. van Rossum, J. Assoc. Off. Anal. Chem., 75 (1992) 554.
[14] A. Farjam, PhD Thesis, Free University Amsterdam, Netherlands, 1991.
[15] G. Asato, P.K. Baker, R.T. Bass, T.J. Bentley, S. Chari, R.H. Dalrymple, D.J. France, P.E. Gingher, B.L. Lences, J.J. Pascavage, J.M. Pensack and C.A. Ricks, Agric. Biol. Chem., 48 (1984) 2883.
[16] EC Council Directive 93/256/EEC, 14/05/1993. [17] M.P. Montrade, B. Le Bizec, F. Monteau, B. Silart and
F. Andre, Anal. Chim. Acta, 275 (1993) 253. [18] M.C. Dumasia and E. Houghton, J. Chromatogr., 564
(1991) 503. [19] W. Haasnoot, R. Schilt, A.R.M. Hamers, F.A. Huf, A.
Farjam, R.W. Frei and U.A.Th. Brinkman, J. Chroma- togr., 489 (1989) 157.
[20] M.P. Montrade, S. Riverain, B. Le Bizec and F. Andre, in H.A. Kuiper and L.A.P. Hoogenboom, Proceedings of the EC FLAIR Concerted Action No. 8 In Vitro Toxicological Studies and Real Time Analysts of Res- idues in Food workshops, Ghent (Belgium) and Thes- saloniki (Greece), 1992, State Institute of Quality Con- trol of Agricultural Products, Wageningen, Netherlands, pp. 143-148.
Copyright © 2022 FDOKUMEN