Urine Bikunin as a Marker of Renal Impairment in Fabry's Disease
Upload
khangminh22Category
view
3download
0
The Journal of Clinical Endocrinology & Metabolism, 2021, Vol. 106, No. 5, 1269–1283doi:10.1210/clinem/dgab086
Clinical Research Article
ISSN Print 0021-972X ISSN Online 1945-7197Printed in USA
https://academic.oup.com/jcem 1269© The Author(s) 2021. Published by Oxford University Press on behalf of the Endocrine Society.This is an Open Access article distributed under the terms of the Creative Commons Attribution License (http://creativecommons.org/licenses/by/4.0/), which permits unrestricted reuse, distribution, and reproduction in any medium, provided the original work is properly cited.
Clinical Research Article
Effect of Dapagliflozin on Urine Metabolome in Patients with Type 2 DiabetesEvdoxia Bletsa,1,* Sebastien Filippas-Dekouan,2,* Christina Kostara,3 Panagiotis Dafopoulos,3 Aikaterini Dimou,3 Eleni Pappa,2 Styliani Chasapi,4 Georgios Spyroulias,4 Anastasios Koutsovasilis,1 Eleni Bairaktari,3 Ele Ferrannini,5 and Vasilis Tsimihodimos2
1Third Internal Medicine Department, General Hospital of Nikaia, Athens, Greece; 2Department of Internal Medicine, University of Ioannina, Ioannina, Greece; 3Laboratory of Clinical Chemistry, University of Ioannina, Ioannina, Greece; 4Department of Pharmacy, University of Patras, Rio, Greece; and 5CNR Institute of Clinical Physiology, Pisa, Italy
ORCiD number: 0000-0002-1384-1584 (E. Ferrannini); 0000-0003-1708-3415 (V. Tsimihodimos).
*Equal contribution.
Abbreviations: BCAAs, branched-chain amino acids; BCAT, branched-chain aminotransferase; BCKDH, branched-chain keto acid dehydrogenase; FE, fractional excretion; NHE3-transporters, Na(+)/H(+) exchanger; 1H-NMR, proton-nuclear magnetic resonance; OPLS-DA, orthogonal projections to latent structures discriminant analysis; PCA, principal component analysis; SGLT-2, sodium glucose co-transporters-2; TSP, sodium 3-trimethylsilyl (2,2,3,3,-2h4) propionate.
Received: 12 November 2020; Editorial Decision: 5 February 2021; First Published Online: 16 February 2021; Corrected and Typeset: 19 March 2021.
Abstract
Context: Inhibitors of sodium-glucose cotransporters-2 have cardio- and renoprotective properties. However, the underlying mechanisms remain indeterminate.Objective: To evaluate the effect of dapagliflozin on renal metabolism assessed by urine metabolome analysis in patients with type 2 diabetes.Design: Prospective cohort study.Setting: Outpatient diabetes clinic of a tertiary academic center.Patients: Eighty patients with hemoglobin A1c > 7% on metformin monotherapy were prospectively enrolled.Intervention: Fifty patients were treated with dapagliflozin for 3 months. To exclude that the changes observed in urine metabolome were merely the result of the improvement in glycemia, 30 patients treated with insulin degludec were used for comparison.Main Outcome Measure: Changes in urine metabolic profile before and after the administration of dapagliflozin and insulin degludec were assessed by proton-nuclear magnetic resonance spectroscopy.
Dow
nloaded from https://academ
ic.oup.com/jcem
/article/106/5/1269/6139141 by guest on 13 April 2022

1270 The Journal of Clinical Endocrinology & Metabolism, 2021, Vol. 106, No. 5
Results: In multivariate analysis urine metabolome was significantly altered by dapagliflozin (R2X = 0.819, R2Y = 0.627, Q2Y = 0.362, and coefficient of variation analysis of variance, P < 0.001) but not insulin. After dapagliflozin, the urine concentrations of ketone bodies, lactate, branched chain amino acids (P < 0.001), betaine, myo-inositol (P < 0001), and N-methylhydantoin (P < 0.005) were significantly increased. Additionally, the urine levels of alanine, creatine, sarcosine, and citrate were also increased (P < 0001, P <0.0001, and P <0.0005, respectively) whereas anserine decreased (P < 0005).Conclusions: Dapagliflozin significantly affects urine metabolome in patients with type 2 diabetes in a glucose lowering-independent way. Most of the observed changes can be considered beneficial and may contribute to the renoprotective properties of dapagliflozin.
Key Words: branched chain amino acids, dapagliflozin, kidney, metabolomics, osmolytes
Inhibitors of sodium glucose co-transporters-2 (SGLT-2) are a relatively new class of antidiabetic agents that exert their glucose-lowering action by promoting glucosuria even at physiological plasma glucose concentrations. In addition to their antihyperglycemic effect, these com-pounds decrease body weight and blood pressure and have a beneficial impact on uric acid homeostasis and arterial stiffness. Large clinical trials have shown that these drugs significantly reduce the incidence of diabetic nephropathy and the rate of hospitalizations for heart failure (1-4) and, in selected populations, decrease total and cardiovascular mortality. As a consequence, SGLT-2 inhibitors are now considered as the drugs of choice for patients with very high or high cardiovascular risk and/or diabetic nephrop-athy (5). However, what remains largely unknown is the mechanisms that underlie these beneficial effects. Although the change in the conventional cardiovascular or renal risk factors as just described can be an answer, the very early emergence of the cardiovascular benefit makes this possi-bility unlikely. Novel mechanisms that have been proposed during the previous years point at the effect of these drugs on energy metabolism either locally (myocardial or renal metabolism) or systemically (6,7).
Among the new approaches that have been recently developed to improve understanding within molecular biology, metabolomics—the qualitative and quantitative assessment of metabolites in biological matrices (body fluids, tissues, cells, etc)—is now a widely utilized method-ology. Simultaneous profiling of multiple metabolites in a biological system, called metabolic phenotyping, combined with multivariate statistical analysis, has been successfully used for biomarker discovery, understanding disease pro-cesses, and exploring the involvement of nongenetic in-fluences, such as gut microflora. Metabolomics has been extensively applied for the understanding of the meta-bolic footprint of diabetes, to reveal novel insights into the biochemical consequences of the disease, and to identify
biomarker panels or specific molecules, such as branched chain amino acids (BCAAs) (8), alpha-hydroxybutyrate (9), and 2-aminoadipic acid (10), related to altered metabolic processes of major fuel classes (11).
Previous metabolomic studies in patients receiving SGLT-2 inhibitors have shown a shift in energy metabolism toward the use of substrates other than glucose (such as ketone bodies or amino acids) (12) as well as an improve-ment in mitochondrial function (13) following the admin-istration of empagliflozin or dapagliflozin, respectively. These studies either used plasma metabolomics only (12) or performed urine metabolomics in patients with estab-lished diabetic nephropathy (13). In the present study we explored the effect of dapagliflozin on proton-nuclear mag-netic resonance (1H-NMR)-based urine metabolomic sig-nature in patients with type 2 diabetes of early onset who had normal renal function at baseline. For this reason, we assessed the urine metabolic profile of patients with type 2 diabetes before and after the administration of dapagliflozin and insulin degludec using 1H-NMR spectroscopy.
Materials and Methods
Patients
Fifty patients with type 2 diabetes on metformin mono-therapy (at least 2000 mg daily or maximum tolerated dose) with hemoglobin A1c (HbA1c) > 7% were included between June 2016 and March 2018 (dapagliflozin group). All patients were given dapagliflozin 10 mg daily for 3 months. Patient with preexisting kidney disease [estimated glomerular filtration rate (eGFR) < 60 mL.min−1.1.73m−2), history of treated hypertension, established cardiovascular disease or heart failure were excluded. Patient were asked to keep their dietary habits as constant as possible during the study. In addition, during this period the dose of concomitant medications (lipid-lowering drugs, antiplatelet agents,
Dow
nloaded from https://academ
ic.oup.com/jcem
/article/106/5/1269/6139141 by guest on 13 April 2022

The Journal of Clinical Endocrinology & Metabolism, 2021, Vol. 106, No. 5 1271
etc) was kept stable. Study participants were followed up at monthly intervals for safety reasons. Since there are limited data on the reference values for the various urine low molecular weight metabolites, we included 53 healthy age- and sex-matched individuals to serve as controls. In addition, to exclude that the effects of dapagliflozin on urine metabolome represent nonspecific consequences of the correction of hyperglycemia, we compared them with those observed in a group of 30 patients with type 2 diabetes and HbA1c > 7% on metformin monotherapy that were treated with insulin degludec for 3 months (insulin group). Degludec was administered in 1 daily dose every evening, and it was titrated every 3 days to a target of fasting glucose 100 to 120 mg/dL. All study subjects provided written informed consent prior to any trial procedure. The trial protocol was approved by the Greek Food and Drug Administration and the Scientific Committee of the University Hospital of Ioannina. The study was registered with ClinicalTrials.gov (identifier: NCT02798757).
Analytical methods
Blood and urine samples were collected in the morning, after an overnight fast, at baseline and at the end of the active treatment period. Serum was separated by centrifu-gation at 1500 g for 15 min and an aliquot was stored at −80°C until nuclear magnetic resonance (NMR) analysis. Hematological and biochemical parameters were measured by standard laboratory methods. HbA1c were determined by a HPLC Variant II analyzer (Bio-Rad Laboratories, Munich, Germany). Urine samples were centrifuged at 1000 g for 10min and stored at −80°C until NMR ana-lysis. Biochemical parameters were measured directly by standard laboratory methods. Urinary α1-microglobulin and immunoglobulin G levels were measured by immunonephelometry on a BN ProSpec System (Siemens, Marburg, Germany).
1H NMR spectroscopy
Urine samples were thawed and 400 µL were mixed with 200 µL of phosphate buffer and centrifuged at 8000 rpm. Five-hundred µL of the supernatant was mixed with 50 µL of sodium-3-trimethylsilyl-(2,2,3,3,-2H4)-propionate (TSP) in D2O to a final concentration 0.456 mmol/L and transferred to 5 mm tubes for the NMR measure-ments. Serum samples were deproteinized before the pre-viously mentioned procedure using the centrifugal filter devices Amicon Ultra-2mL, 3-kDa cutoff (Merck KGaA, Darmstadt, Germany).
NMR spectra acquisition and data processing1H-NMR spectra were recorded at 300K on an Avance III 700 MHz spectrometer equipped with a cryogenically cooled gradient probe (Bruker BioSpin GmbH). A standard nuclear overhauser enhancement spectroscopy pulse se-quence with a relaxation delay of 4 s and a mixing time of 0.01 s for serum, and 0.015 s for urine was used to suppress the water signal. For each spectrum, a total of 128 scans for serum and 64 for urine were collected into 64K data points over a spectral width of 14.9995 Hz with an acquisi-tion time of 3.5 and 3.12 s, respectively. Free-induction de-cays were multiplied with an exponential line broadening function of 0.3 Hz prior to Fourier transformation. NMR spectra were manually corrected for phase and baseline distortions (Topspin 4.0.6, Bruker Biospin, Rheinstetten, Germany) and referenced to TSP (δ1H 0.0).
Spectral intensities were scaled to the total intensity and reduced to equidistant integrated regions of 0.04 ppm. Spectral region related to residual water and urea (4.38 and 6.30 ppm, respectively) was excluded. Before the multi-variate analysis, the data set was preprocessed using the interval correlation optimized shifting (Icoshift) algorithm (14) (Matlab, version 8.5, MathWorks, Natick, MA, USA) to minimize spectral peak shift due to residual pH differ-ences within samples and exported to the SIMCA-P+ 15 software package (Umetrics, Umea, Sweden), centered and Pareto scaled for multivariate statistical analysis.
Targeted metabolite profiling
Metabolite identification was performed according to Chenomx NMR Suite 8.4 profiler (Chenomx Edmonton, Canada), the available databases such as the Human Metabolome Database (http://www.hmdb.ca), Biological Magnetic Resonance Data Bank (http://www.bmrb.wisc.edu), J-res 2D experiments, and the existing NMR-based metabolomics literature. Τhe 700 MHz library of the Chenomx NMR Suite software was used for the metab-olites quantification, urinary creatinine was used as an in-ternal reference, and values were expressed as µmoles of metabolite per mmol (μΜ/mM) of creatinine. For serum samples, an internal standard of known concentration (TSP) was used for the obtained quantitative values of metabol-ites concentration, which were presented in micromoles per liter (μM).
Calculations
Body mass index was calculated as weight (kg) divided by height squared (m2). Glomerular filtration rate was
Dow
nloaded from https://academ
ic.oup.com/jcem
/article/106/5/1269/6139141 by guest on 13 April 2022
1272 The Journal of Clinical Endocrinology & Metabolism, 2021, Vol. 106, No. 5
estimated from serum creatinine, using the modification of diet in renal disease study equation. Fractional excretion of uric acid and electrolytes was calculated from the standard formula:
%FEχ = (Uχ× Scr/Sχ× Ucr)× 100%
where Sχ and Uχ represent the serum and urine concen-trations of electrolyte χ, and Scr and Ucr serum and urine concentrations of creatinine, respectively.
Statistical analysis
Statistical analysis was performed using the SPSS v20.0 statistical package. Check for normality was done using the Kolmogorov-Smirnov test. The mean concentration of the various metabolic parameters before and after the ad-ministration of dapagliflozin was compared using Student’s paired t-test for normally distributed values and Wilcoxon matched pairs test for values deviating from normal distri-bution. The Bonferroni correction was applied to account for multiple comparisons. Two-way repeated measures analysis of variance was used for the comparison of the effects of dapagliflozin and insulin degludec on the con-centrations of the various metabolites. The correlations be-tween these changes were assessed using linear regression analysis after log-transformation of the values that did not follow normal distribution. Independent t-test was used for the comparison of the percentage changes in the concen-trations of urine metabolites in dapagliflozin and insulin groups.
Multivariate statistical analysis
Principal component analysis (PCA) and orthogonal projec-tions to latent structures discriminant analysis (OPLS-DA) were used to construct pattern recognition models. PCA was used to obtain a general overview on samples and highlight possible clusters, trends, or outliers followed by OPLS-DA analysis to eliminate the uncorrelated systematic variation and describe the maximum separation based on class membership. The results of OPLS-DA analysis dis-played by scores (detection observations lying outside the 0.95 Hotteling’s T2 ellipse, grouping trend, or separation) and loading coefficient plots (contribution of NMR spec-tral regions or variables, corresponding to metabolites. to the grouping trend or separation seen in the scores plot). OPLS-DA models were assessed by goodness-of-fit param-eters R2 (R2X and R2Y) and Q2, related, respectively, to the explained and predicted variance. Cross-validated coef-ficient of variation analysis of variance (CV-ANOVA) and permutation tests were used to assess the significance and
validity of the resulting OPLS-DA models, respectively (15). Finally, model validation was performed by constructing new OPLS-DA models with 80% of randomly selected samples considered as a training set, whereas the remaining 20% of samples, named as a test set, was used to predict their class membership.
Results
The aim of the present study was to assess the urine metabolic profile before and after the administration of dapagliflozin in 50 patients with type 2 diabetes on metformin monotherapy using 1H-NMR spectroscopy (dapagliflozin group). For comparison, we also determined the urine metabolic profile of 53 healthy age- and sex-matched individuals (controls) and in 30 patients before and after the administration of insulin degludec (insulin group). Of the 50 patients treated with dapagliflozin, 2 stopped the investigational product prematurely. The dis-continuation was not due to an adverse event and both pa-tients did not withdraw their consent. As a consequence, they were included in the intention to treat analysis. With the exception of these 2 patients, treatment compliance, as assessed by tablet counting, was 100%.
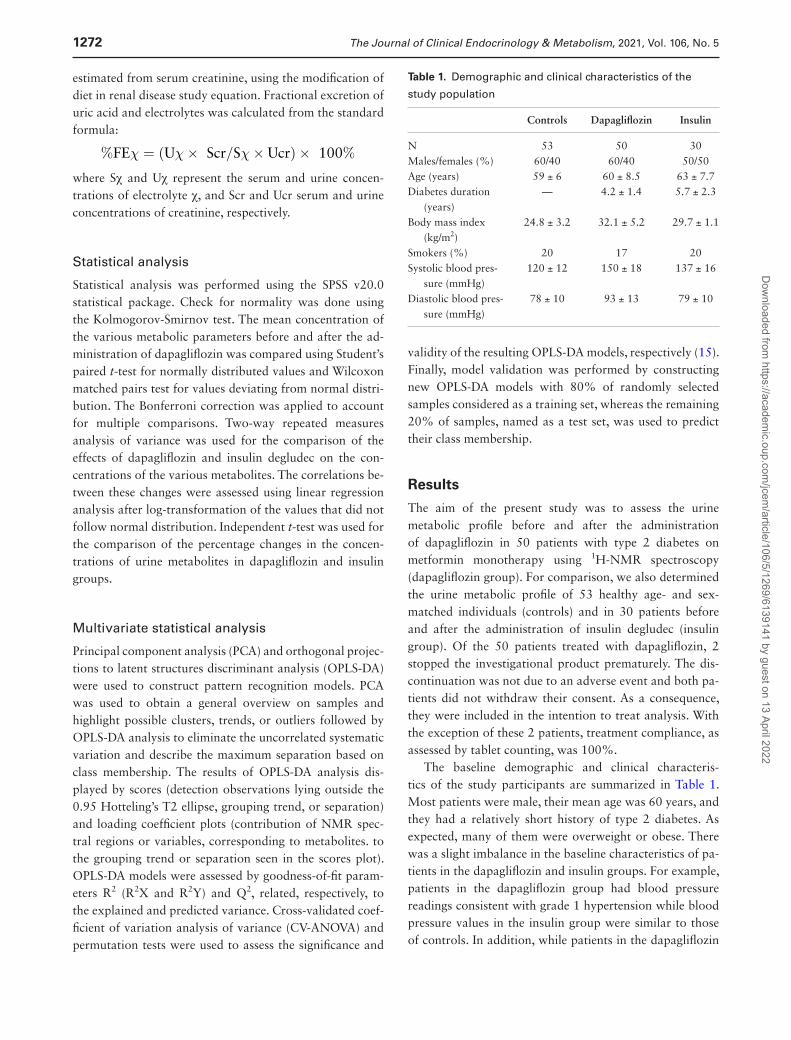
The baseline demographic and clinical characteris-tics of the study participants are summarized in Table 1. Most patients were male, their mean age was 60 years, and they had a relatively short history of type 2 diabetes. As expected, many of them were overweight or obese. There was a slight imbalance in the baseline characteristics of pa-tients in the dapagliflozin and insulin groups. For example, patients in the dapagliflozin group had blood pressure readings consistent with grade 1 hypertension while blood pressure values in the insulin group were similar to those of controls. In addition, while patients in the dapagliflozin
Table 1. Demographic and clinical characteristics of the
study population
Controls Dapagliflozin Insulin
N 53 50 30Males/females (%) 60/40 60/40 50/50Age (years) 59 ± 6 60 ± 8.5 63 ± 7.7Diabetes duration
(years)— 4.2 ± 1.4 5.7 ± 2.3
Body mass index (kg/m2)
24.8 ± 3.2 32.1 ± 5.2 29.7 ± 1.1
Smokers (%) 20 17 20Systolic blood pres-
sure (mmHg)120 ± 12 150 ± 18 137 ± 16
Diastolic blood pres-sure (mmHg)
78 ± 10 93 ± 13 79 ± 10
Dow
nloaded from https://academ
ic.oup.com/jcem
/article/106/5/1269/6139141 by guest on 13 April 2022

The Journal of Clinical Endocrinology & Metabolism, 2021, Vol. 106, No. 5 1273
group had higher eGFR values compared to control group, mean eGFR in the insulin group was lower than that in the control and dapagliflozin groups. (Table 2).
Dapagliflozin significantly reduced body mass index, blood pressure values, and glycemic indices without signifi-cantly affecting the serum levels of insulin (Table 2). Serum creatinine showed a small but significant increase after dapagliflozin administration (by 2.5 μmol/L, P = 0.005). The drug had no consistent effect on serum lipids. On the other hand, dapagliflozin induced a significant decrease in the serum concentrations of uric acid (from 0.32 ± 0.09 to
0.28 ± 0.07 mmol/L, P = 0.001) and a small but significant elevation in the levels of serum phosphate (from 1.13 ± 0.19 to 1.23 ± 0.16 mmol/L, P = 0.005). These latter changes where accompanied by reciprocal changes in the renal fractional excretion values of these compounds (Table 2). Finally, although the patients had only marginal degree of albuminuria at baseline, dapagliflozin significantly re-duced urine albumin at 3 months (from 17.7 ± 16.6 to 14.4 ± 11.6 mg/g creatinine, P = 0.005). On the other hand, most of the patients had urine α-1-microglobulin and im-munoglobulin G concentrations below the detection limit
Table 2. Clinical characteristics and serum and urine biochemical parameters before and 3 months after dapagliflozin and
insulin degludec
Controls Dapagliflozin Insulin
Before After P-value Before After P-value
Clinical parameters Weight (kg) 72.2 ± 9.1 92.8 ± 14.8** 91.1 ± 12.2** 0.001 87.8 ± 9.2** § 88.1 ± 8.9** § NS Body mass index (kg/m2) 24.8 ± 3.2 32.1 ± 5.2** 31.8 ± 5.6** 0.001 29.7 ± 1.1** § 29.9 ± 1.3** § NS Systolic blood pressure (mmHg) 120 ± 12 150 ± 18** 138 ± 15* 0.001 137 ± 16§ 136 ± 13 NS Diastolic blood pressure (mmHg) 78 ± 10 93 ± 13* 87 ± 15* 0.001 79 ± 10§ 80 ± 8.3§ NS Heart rate (bpm) 76 ± 12 80 ± 15 79 ± 12 NS 80 ± 8 78 ± 4 NSSerum biochemical parameters Blood glucose (mmol/L) 4.94 ± 0.78 9.32 ± 3.05** 7.88 ± 2.00** 0.001 8.82 ± 1.39** 7.55 ± 1.44** 0.001 HbA1c (mmol/mol) 32.2 ± 7.9 65 ± 9.2** 57.4 ± 10.2** 0.001 66.1 ± 9.7** 54.1 ± 8.7** 0.001 HbA1c (%) 5.1 ± 0.7 8.1 ± 0.9** 7.4 ± 0.9** 0.001 8.2 ± 0.9** 7.1 ± 0.8** 0.001 Insulin (pmol/L) — 15.9 ± 8.8 13.2 ± 11.8 NS Urea (mmol/L) 12.89 ± 2.61 12.89 ± 3.46 13.42 ± 4.25 NS 16.78 ± 6.43 16.06 ± 5.35 NS Creatinine (μmol/L) 86.63 ± 14.14 74.26 ± 15.03* 76.91 ± 15.03* 0.005 97.24 ± 26.52§ 97.24 ± 26.52§ NS eGFR (mL.min−1.1.73m−2) 80.2 ± 12.4 89.3 ± 14.9* 85.7 ± 16.1* 0.005 72.4 ± 8.1§ 71.8 ± 7.4§ NS Total cholesterol (mmol/L) 5.8 ± 1.04 4.87 ± 1.29 4.71 ± 0.96 NS 4.84 ± 1.06 4.66 ± 0.93 NS Triglycerides (mmol/L) 1.33 ± 0.66 1.84 ± 0.96 1.73 ± 0.67 NS 1.91 ± 1.20 1.71 ± 1.27 NS HDL-cholesterol (mmol/L) 1.5 ± 0.34 1.14 ± 0.23 1.17 ± 0.26 NS 1.22 ± 0.26 1.22 ± 0.34 NS LDL-cholesterol (mmol/L) 3.7 ± 0.93 2.85 ± 1.06 2.72 ± 0.88 NS 2.75 ± 0.88 2.69 ± 0.7 NS Uric acid (mmol/L) 0.32 ± 0.07 0.32 ± 0.09 0.28 ± 0.07 0.001 0.32 ± 0.12 0.3 ± 0.07 NS Sodium (mmol/L) 140 ± 2 138 ± 2 139 ± 2 NS 137.5 ± 2.4 138.7 ± 1.9 NS Potassium (mmol/L) 4.5 ± 0.3 4.5 ± 0.4 4.5 ± 0.4 NS 4.5 ± 0.5 4.6 ± 0.4 NS Calcium (mmol/L) 2.38 ± 0.35 2.38 ± 0.1 2.4 ± 0.1 NS 2.4 ± 0.07 2.38 ± 0.1 NS Magnesium (mmol/L) 1.8 ± 0.1 1.7 ± 0.2 1.8 ± 0.3 NS 1.5 ± 0.2 1.5 ± 0.2 NS Phosphorus (mmol/L) 1.29 ± 0.19 1.13 ± 0.19 1.23 ± 0.16 0.005 1 ± 0.16 1.03 ± 0.23 NS Chloride (mmol/L) 100.9 ± 2.3 101.9 ± 1.9 101.9 ± 2.5 NS 101. 6 ± 3.2 102.1 ± 3.7 NS Intact parathyroid hormone (ng/L) — 37.7 ± 14.8 39.3 ± 15.2 NS 42.5 ± 11.3 45.3 ± 12.4 NSUrine biochemical parameters Microalbumin (mg/g creatinine) — 17.7 ± 16.6 14.4 ± 11.6 0.005 22 ± 18 25 ± 20 NS FE uric acid (%) — 7.2 ± 2.4 7.8 ± 3.4 0.005 8.8 ± 6.6 7.2 ± 3.9 NS FE sodium (%) — 0.62 ± 0.43 0.56 ± 0.31 NS 0.7 ± 0.4 0.9 ± 0.7 NS FE potassium (%) — 9.3 ± 4.2 12.5 ± 8.5 NS 10.5 ± 4.7 12.5 ± 8.6 NS FE calcium (%) — 0.9 ± 0.7 1.1 ± 0.9 NS 0.8 ± 0.6 1.1 ± 0.8 NS FE magnesium (%) — 2.2 ± 1.2 2.3 ± 1.2 NS 3.2 ± 1.6 4.4 ± 3.1 NS FE phosphate (%) — 11.7 ± 4.4 10.9 ± 5.3 0.005 13.3 ± 4.5 14.2 ± 6.2 NS FE chloride (%) 1.1 ± 0.6 1.1 ± 0.5 NS 1.1 ± 0.6 1.3 ± 0.5 NS
**P < 0.001 and *P < 0.01 compared to control group; §§P < 0.001 and §P < 0.01 compared to dapagliflozin group at the same time-point (baseline or post-treatment)Abbreviations: FE, fractional excretion; HDL, high-density lipoprotein; LDL, low-density lipoprotein.
Dow
nloaded from https://academ
ic.oup.com/jcem
/article/106/5/1269/6139141 by guest on 13 April 2022

1274 The Journal of Clinical Endocrinology & Metabolism, 2021, Vol. 106, No. 5
of the method, and this did not change with dapagliflozin administration (data not shown). Insulin degludec, apart from its effect on HbA1c and fasting glucose levels, had no meaningful effect on plasma and urine conventional meta-bolic parameters (Table 2).
Supplementary Figure 1 (16) shows a representative 1H-NMR spectrum of urine from a patient with T2D at baseline. The main constituents of the urine spectrum were creatinine, hippurate, citrate, glycine, trimethylamine-N-oxide, dimethylamine, lactate, 3-hydroxybutyrate, and amino acids such as alanine, phenylalanine, tyrosine, and the BCAAs valine, leucine, and isoleucine (Supplementary Table 1 (16)). For the accurate assessment of the effect of dapagliflozin on urine metabolome, the metabolic profile of urine as recorded by 1H-NMR spectroscopy was then analyzed by multivariate data analysis (untargeted ana-lysis) as well as by quantification of selected metabolite signals (targeted analysis).
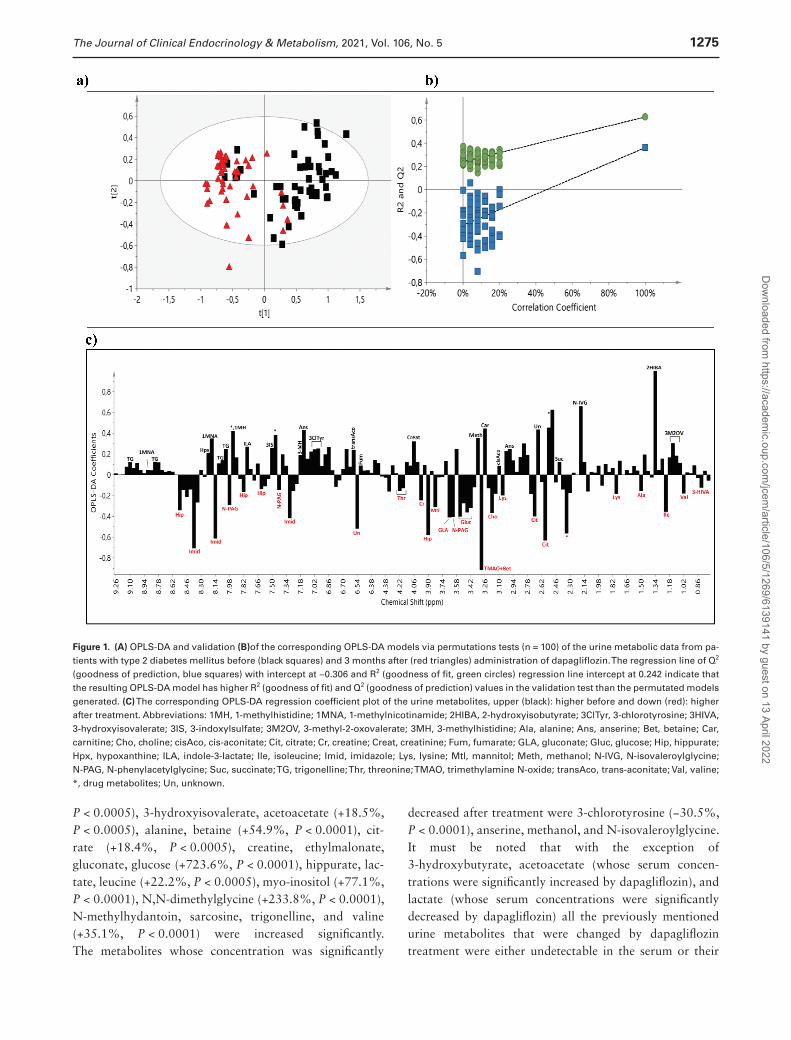
For the untargeted analysis the data set consisted of the 1-dimensional 1H-NMR spectra of the urine derived from all patients before and after the administration of dapagliflozin and insulin degludec. PCA was initially applied to obtain a general overview (Supplementary Figure 2 (16)). No remarkable outliers were observed in the scores plot whereas a separation trend was appeared between diabetic patients before and after treatment with dapagliflozin. In the OPLS-DA scores plot of the untargeted metabolic profile (Fig. 1A), the groups before and after the administration of dapagliflozin were well separated with a small degree of overlap, with the sam-ples of diabetic patients before treatment placed on the right half of the plot, and those after treatment, on the left half. The separation between the 2 groups assessed by the following quality parameters of the resulting OPLS-DA model: R2X = 0.819, R2Y = 0.627, and Q2Y = 0.362, and the CV-ANOVA P-value was <0.001. As shown in Figure 1B, the OPLS-DA model had a R2Y intercept of 0.242 and a Q2Y intercept value of −0.306, indicating that the re-sulting statistical model is valid.
The OPLS-DA loading coefficient plot, which depicts the main spectral regions contributing to group discrimination, yielded a rather large number of metabolites (Fig. 1C). In addition to marked glycosuria, posttreatment samples pre-sented higher levels of hippurate, citrate, trimethylamine N-oxide (TMAO) and betaine, isoleucine, choline, gluconate, and N-phenylacetylglycine, as well as lower levels of 2-hydroxyisobutyrate, carnitine, N-isovaleroylglycine, trigonelline, methanol, and anserine as compared to those before treatment. Higher excretion of mannitol, creatine, and valine and lower excretion of 3-methyl-2-oxovalerate, 3-methylhistidine, trans-aconitate, and hypoxanthine made a smaller contribution to the group separation.
To test the reliability of the OPLS-DA model between dia-betic patients before and after treatment with dapagliflozin, validation was carried out. The corresponding training (40 patients before/40 patients after treatment) and test (10 patients before/10 patients after treatment) sets were ran-domly selected, and the validation was repeated 3 times with a new random selection of equally numbered sets each time. The average classification rate was 86.67% for pa-tients before treatment (first repeat: 9 out of 10; second repeat: 9 out of 10; and third repeat: 8 out of 10) and 90% for those after treatment (first repeat: 8 out of 10; second repeat: 9 out of 10; and third repeat: 10 out of 10) (Supplemenatry Figure 3 (16)).
PCA was applied and no distinct grouping was identi-fied between the patients before and after the administra-tion of insulin degludec in the scores plot (Supplementary Figure 4A) (16). OPLS-DA scores also did not show sig-nificant separation between the 2 groups (Supplementary Figure 4B) (16) with low goodness-of-fit parameters (R2X = 0.937, R2Y = 0.414, and Q2Y = -0.109, and the CV-ANOVA P-value was >0.05).
For the targeted analysis, 70 urine metabolites were quantified in the urine of the patients before and after dapagliflozin and insulin degludec treatment as well as of the control group using the Chenomx NMR Suite 8.4 software. At baseline, patients with type 2 diabetes in both dapagliflozin and insulin groups had higher concentra-tions of 1-methylhistidine, 2-aminobutyrate, 2-hydroxy-3-methylvalerate, 3-chlorotyrosine, 3-hydroxybutyrate, 3-indoxylsulfate, 3-methyl-2-oxovalerate, 3-methyladipate, 3-methylhistidine, 4-hydroxybenzoate, acetoacetate, ala-nine, betaine, creatine, creatine phosphate, glucose, isoleucine, lactate, leucine, lysine, myoinositol, N-isovaleroylglycine, N-methylhydantoin, N-phenylacetylglycine, phenylalanine, tyrosine, and valerate compared to controls. The levels of butyrate, ethylmalonate, methanol, and sarcosine were sig-nificantly lower in these groups compared to those in the control group. We also observed differences in the urine con-centrations of some metabolites between the dapagliflozin and insulin groups at baseline. So, the concentrations of 1-methylnicotinamide, 2-hydroxy-3-methylvalerate, 2-hydroxyisobutyrate, 2-hydroxyisovalerate, 2-hydroxyvalerate, 3-hydroxybutyrate, 3-indoxylsulfate, 3-methyl-2-oxovalerate, phenylalanine, and valine were lower in the insulin group compared to the corres-ponding values in the dapagliflozin group, while that of 2-hydroxybutyrate was higher.
Our results (Table 3) show that 27 of the 70 quantified metabolites were significantly al-tered by dapagliflozin treatment: 2-aminobutyrate, 2-hydroxy-3-methylvalerate, 2-hydroxybutyrate, 2-hydroxyisovalerate, 3-hydroxybutyrate (+21.2%,
Dow
nloaded from https://academ
ic.oup.com/jcem
/article/106/5/1269/6139141 by guest on 13 April 2022
The Journal of Clinical Endocrinology & Metabolism, 2021, Vol. 106, No. 5 1275
P < 0.0005), 3-hydroxyisovalerate, acetoacetate (+18.5%, P < 0.0005), alanine, betaine (+54.9%, P < 0.0001), cit-rate (+18.4%, P < 0.0005), creatine, ethylmalonate, gluconate, glucose (+723.6%, P < 0.0001), hippurate, lac-tate, leucine (+22.2%, P < 0.0005), myo-inositol (+77.1%, P < 0.0001), N,N-dimethylglycine (+233.8%, P < 0.0001), N-methylhydantoin, sarcosine, trigonelline, and valine (+35.1%, P < 0.0001) were increased significantly. The metabolites whose concentration was significantly
decreased after treatment were 3-chlorotyrosine (−30.5%, P < 0.0001), anserine, methanol, and N-isovaleroylglycine. It must be noted that with the exception of 3-hydroxybutyrate, acetoacetate (whose serum concen-trations were significantly increased by dapagliflozin), and lactate (whose serum concentrations were significantly decreased by dapagliflozin) all the previously mentioned urine metabolites that were changed by dapagliflozin treatment were either undetectable in the serum or their
Figure 1. (A) OPLS-DA and validation (B)of the corresponding OPLS-DA models via permutations tests (n = 100) of the urine metabolic data from pa-tients with type 2 diabetes mellitus before (black squares) and 3 months after (red triangles) administration of dapagliflozin. The regression line of Q2 (goodness of prediction, blue squares) with intercept at −0.306 and R2 (goodness of fit, green circles) regression line intercept at 0.242 indicate that the resulting OPLS-DA model has higher R2 (goodness of fit) and Q2 (goodness of prediction) values in the validation test than the permutated models generated. (C) The corresponding OPLS-DA regression coefficient plot of the urine metabolites, upper (black): higher before and down (red): higher after treatment. Abbreviations: 1MH, 1-methylhistidine; 1MNA, 1-methylnicotinamide; 2HIBA, 2-hydroxyisobutyrate; 3ClTyr, 3-chlorotyrosine; 3HIVA, 3-hydroxyisovalerate; 3IS, 3-indoxylsulfate; 3M2OV, 3-methyl-2-oxovalerate; 3MH, 3-methylhistidine; Ala, alanine; Ans, anserine; Bet, betaine; Car, carnitine; Cho, choline; cisAco, cis-aconitate; Cit, citrate; Cr, creatine; Creat, creatinine; Fum, fumarate; GLA, gluconate; Gluc, glucose; Hip, hippurate; Hpx, hypoxanthine; ILA, indole-3-lactate; Ile, isoleucine; Imid, imidazole; Lys, lysine; Mtl, mannitol; Meth, methanol; N-IVG, N-isovaleroylglycine; N-PAG, N-phenylacetylglycine; Suc, succinate; TG, trigonelline; Thr, threonine; TMAO, trimethylamine N-oxide; transAco, trans-aconitate; Val, valine; *, drug metabolites; Un, unknown.
Dow
nloaded from https://academ
ic.oup.com/jcem
/article/106/5/1269/6139141 by guest on 13 April 2022

1276 The Journal of Clinical Endocrinology & Metabolism, 2021, Vol. 106, No. 5
serum concentration was not modified by the drug (un-published data). On the other hand, the serum levels of threonine (a metabolite whose urine concentration was not affected by dapagliflozin) was significantly reduced fol-lowing dapagliflozin administration (from 185.6 ± 52.5 to 167.7 ± 40.6µM, P < 0.01).
The results in the targeted analysis are nearly totally consistent with those found in the untargeted multivariate analysis. With both methods, all metabolites are altered to the same direction and most of them with similar sig-nificance. We observed discrepancy only in 2 metabolites, TMAO and N,N-dimethylglycine, due to the high values of SD.
The increases in the urinary excretion of the BCAAs were significantly correlated with the corresponding increase in the degree of glycosuria after dapagliflozin administration (Pearson correlation coefficients 0.346, 0.339, and 0.467 for leucine, isoleucine, and valine, respectively; P < 0.05 for all correlations). In addition, the baseline values of betaine and myo-inositol were highly correlated with urine concentration of glucose (Pearson correlation coefficients 0.511 and 0.658 for betaine and myo-inositol, respect-ively; P < 0.001 for all correlations) whereas the increase in the urine concentrations of these compounds following dapagliflozin administration was also significantly correl-ated with the drug-induced increase in glycosuria (Pearson correlation coefficients 0.341 and 0.397 for betaine and myo-inositol, respectively; P < 0.001 for all correlations).
Although insulin degludec improved glycemia to a de-gree similar to that observed with dapagliflozin, it had no effect on the levels of the majority of urine metabolites. In addition to a reduction in glycosuria, insulin degludec reduced the urine concentrations of 3-hydroxybutyrate, acetoacetate, betaine, lactate, and myo-inositol (Table 3). Two-way analysis for time points revealed that all the stat-istically significant dapagliflozin-induced changes in urine metabolites were also different from the effect of insulin on the levels of these metabolites (Table 3). In addition, although the changes in the concentrations of 3-methyl-2-oxovalerate (−18.4%), hypoxanthine (−18.9%), and N-phenylacetylglycine (+13.1%) after dapagliflozin treat-ment did not reach statistical significance, these alterations were found to be significantly different from those observed after insulin administration by 2-way analysis.
Discussion
In the current study, we show that patients with type 2 diabetes exhibit an altered urine metabolic profile charac-terized by changes in the concentrations of ketone bodies, osmolytes, amino acids, and various other metabolites. There were differences in the values of some metabolites
between the patients with type 2 diabetes included in the dapagliflozin and insulin groups at baseline; however, these can be attributed to the lack of randomization. Although most of the clinical and conventional laboratory charac-teristics of the 2 groups were similar, residual confounding due to unmeasured factors cannot be excluded.
Along with the expected increase in glycosuria, treat-ment with dapagliflozin resulted in significant changes in the renal excretion of amino acids and their derivatives, tri-carboxylic acid cycle intermediates, amines, organic acids, and products of gut microbial origin.
In agreement with previous studies, we found a signifi-cant increase in the urine concentrations of ketone bodies (3-hydroxybutyrate and acetoacetate) as well as lactate following dapagliflozin administration (17). However, whether these changes represent drug-induced modifica-tions in the tubular handling of these compounds, reflect shifts in the energy metabolism of renal cells, or result from the increased systemic production of these compounds remains indeterminate. On the other hand, insulin sig-nificantly reduced the urine concentrations of these metab-olites, a finding that can be attributed to parallel changes in the serum concentrations of these compounds and/or to changes in their renal metabolism and tubular handling.
The essential BCAAs leucine, isoleucine, and valine are important for tissue expansion and regeneration and are involved in various metabolic functions. BCAAs are found in abundance in dietary proteins, and it has been shown that a BCAA-rich diet correlates positively with meta-bolic health, including regulation of body weight, muscle protein synthesis, and glucose homeostasis. However, cross-sectional and prospective human studies have high-lighted that increased fasting concentrations of circulating BCAAs and BCAA supplementation are associated with an increased risk for insulin resistance and type 2 diabetes (18). So, the effects of BCAA on human metabolism can be considered as pleiotropic, depending on host meta-bolic state. BCAA catabolism involves 2 steps: a revers-ible one—catalyzed by a branched-chain aminotransferase (BCAT), either cytosolic or mitochondrial, requiring pyri-doxal to function as an amino group carrier by which the BCAA and 2-ketoglutarate produce a branched-chain keto acid and glutamate, and the irreversible mitochondrial process catalyzed by branched-chain keto acid dehydro-genase (BCKDH) leading to the formation of acetyl-CoA, propionyl-CoA, and 2-methyl-3-hydroxybutyryl-CoA (from leucine, valine, and isoleucine, respectively), which enter the tricarboxylic acid cycle leading to adenosine 5′-triphosphate formation (19). Impaired function of the BCAT and BCKDH enzymes has been observed in genetic disorders such as maple syrup urine disease or as a result of elevated concentrations of fatty acids, proinflammatory
Dow
nloaded from https://academ
ic.oup.com/jcem
/article/106/5/1269/6139141 by guest on 13 April 2022

The Journal of Clinical Endocrinology & Metabolism, 2021, Vol. 106, No. 5 1277
Tab
le 3
. C
on
cen
trat
ion
s o
f U
rin
e m
etab
olit
es in
pat
ien
ts w
ith
typ
e 2
dia
bet
es m
ellit
us
bef
ore
an
d 3
mo
nth
s af
ter
adm
inis
trat
ion
of
dap
aglifl
ozi
n a
nd
insu
lin d
eglu
dec
Met
abol
ite
conc
entr
atio
n
(μm
ol/m
mol
cre
atin
ine)
Bas
elin
ePo
sttr
eatm
ent
2-w
ay a
naly
sisa
D
apag
lifloz
inIn
sulin
C
ontr
ols
Dap
aglifl
ozin
Insu
lin%
cha
nge
P%
cha
nge
PF
P
1-m
ethy
lnic
otin
amid
e1.
97 ±
0.7
02.
72 ±
1.7
0*1.
60 ±
0.4
9+−6
.6N
S+1
5N
S0.
91N
S1-
met
hylh
isti
dine
9.44
± 8
.24
26.5
4 ±
14.1
4**13
.18
± 10
.11*
+2.4
NS
+17.
7N
S0.
14N
S2-
amin
obut
yrat
e4.
08 ±
2.0
26.
46 ±
2.8
3**5.
85 ±
4.3
4**+1
4.4
<0.0
005
+6.6
NS
8.92
<0.0
52-
hydr
oxy-
3-m
ethy
lval
erat
e3.
87 ±
1.6
711
.46
± 6.
34**
5.56
± 2
.91*+
+17.
3<0
.000
5+1
0.2
NS
4.12
<0.0
52-
hydr
oxyb
utyr
ate
1.91
± 1
.12
1.20
± 1
.00
3.61
± 1
.64*+
+30
<0.0
005
+22.
2N
S3.
71<0
.05
2-hy
drox
yiso
buty
rate
5.66
± 1
.50
8.80
± 3
.08**
4.31
± 2
.56+
−7.6
NS
+5.8
NS
1.61
NS
2-hy
drox
yiso
vale
rate
1.43
± 0
.59
4.72
± 1
.62**
1.79
± 1
.22++
+14.
5<0
.000
5−1
.1N
S4.
37<0
.05
2-hy
drox
yval
erat
e2.
36 ±
1.3
37.
54 ±
6.2
9**3.
33 ±
2.2
8++2
.9N
S+1
6.7
NS
0.06
NS
2-ox
ocap
roat
e3.
58 ±
1.6
62.
7 ±
2.03
4.45
± 3
.72
+0.2
NS
−13.
1N
S0.
71N
S3-
chlo
roty
rosi
ne9.
10 ±
12.
4024
.17
± 17
.02**
20.2
5 ±
19.2
7**−3
0.5
<0.0
001
+4.9
NS
3.90
<0.0
53-
hydr
oxyb
utyr
ate
12.9
3 ±
13.1
046
.00
± 41
.78**
30.4
6 ±
20.0
2**+
+21.
2<0
.000
5−4
3.1
<0.0
005
7.25
<0.0
53-
hydr
oxyi
sobu
tyra
te11
.12
± 10
.21
12.3
4 ±
10.9
613
.50
± 12
.91
+15.
2N
S−1
1.1
NS
2.28
NS
3-hy
drox
yiso
vale
rate
5.16
± 1
.73
4.78
± 2
.83
3.40
± 2
.53*
+18
<0.0
005
+5.3
NS
3.44
<0.0
53-
indo
xyls
ulfa
te13
.85
± 8.
4130
.6 ±
17.
61**
21.1
7 ±
10.3
5**+
−4.4
NS
+11.
3N
S0.
69N
S3-
met
hyl-
2-ox
oval
erat
e3.
98 ±
2.0
512
.23
± 7.
54**
9.33
± 4
.88**
+−1
8.4
NS
−10.
6N
S4.
32<0
.05
3-m
ethy
ladi
pate
2.96
± 1
.85
7.32
± 6
.45**
6.65
± 4
.34**
+19.
1N
S+8
.5N
S0.
92N
S3-
met
hylh
isti
dine
15.7
0 ±
8.37
27.1
6 ±
17.8
5**22
.15
± 19
.22**
−1.8
NS
+5.7
NS
0.54
NS
4-hy
drox
yben
zoat
e3.
14 ±
2.5
15.
90 ±
5.7
6*5.
50 ±
3.9
7*+7
.9N
S+4
0.1
NS
2.64
NS
Ace
tate
15.2
0 ±
11.2
2 28
.07
± 9.
25*
20.8
6 ±
11.6
8−1
.3N
S+2
3.5
NS
1.06
NS
Ace
toac
etat
e14
.08
± 13
.53
43.6
8 ±
16.6
8**36
.05
± 18
.06**
+18.
5<0
.000
5−4
5.2
<0.0
005
36.6
8<0
.01
Ace
tone
4.21
± 2
.07
3.35
± 2
.10
5.49
± 4
.72
+14
NS
−10.
7N
S1.
05N
SA
lani
ne21
.25
± 9.
3644
.63
± 30
.47**
40.4
5 ±
24.9
3**+2
6.5
<0.0
001
+13.
1N
S3.
42<0
.05
Alla
ntoi
n10
.38
± 6.
838.
55 ±
5.1
86.
64 ±
5.5
8+7
.2N
S+7
.3N
S0.
25N
SA
nser
ine
6.57
± 3
.79
9.76
± 4
.51*
8.64
± 6
.32
−19.
4<0
.000
5−8
.3N
S4.
58<0
.05
Bet
aine
12.9
6 ±
7.74
72.8
7 ±
48.0
4**76
.92
± 42
.12**
+54.
9<0
.000
1−5
8.3
<0.0
005
9.22
<0.0
1B
utyr
ate
3.35
± 1
.71
1.69
± 0
.98*
1.05
± 0
.84*
+15.
4N
S+2
.6N
S1.
20N
SC
arni
tine
8.12
± 6
.57
6.75
± 5
.85
6.73
± 7
.33
−15.
9N
S−1
0.4
NS
0.02
NS
Cho
line
5.68
± 4
.18
6.69
± 4
.78
5.35
± 4
.08
+13.
5N
S+1
1.2
NS
0.07
NS
cis-
Aco
nita
te22
.11
± 14
.96
16.5
6 ±
8.73
15.2
7 ±
7.84
−10.
9N
S+9
.2N
S3.
02N
SC
itra
te34
7.10
± 1
81.6
835
7.30
± 2
33.2
737
3.18
± 2
73.6
3+1
8.4
<0.0
005
−10.
5N
S3.
85<0
.05
Cre
atin
e12
.62
± 12
.69
49.6
5 ±
31.6
4**50
.69
± 37
.23**
+40.
3<0
.000
1+2
.3N
S4.
22<0
.05
Cre
atin
e ph
osph
ate
26.6
1 ±
18.7
015
5.92
± 1
88.6
1**14
3 ±
127.
89**
+1.6
NS
−6.1
NS
0.04
NS
Cyt
osin
e5.
16 ±
3.6
43.
35 ±
2.5
96.
34 ±
5.5
8+1
.2N
S−9
.6N
S0.
95N
SD
imet
hyla
min
e35
.05
± 12
.24
24.6
7 ±
10.9
2*27
.23
± 14
.85
+0.1
NS
+18.
5N
S0.
68N
SE
thyl
mal
onat
e4.
02 ±
1.8
91.
64 ±
0.9
7**1.
92 ±
1.3
4**+3
3.5
<0.0
001
+4.6
NS
6.52
<0.0
1Fo
rmat
e27
.89
± 16
.14
22.9
2 ±
11.7
221
.45
± 21
.31
−4.8
NS
+24.
2N
S0.
56N
SFu
mar
ate
0.80
± 0
.56
1.00
± 0
.72
1.23
± 1
.12
−2.0
NS
−14.
6N
S0.
66N
S
Dow
nloaded from https://academ
ic.oup.com/jcem
/article/106/5/1269/6139141 by guest on 13 April 2022

1278 The Journal of Clinical Endocrinology & Metabolism, 2021, Vol. 106, No. 5
Met
abol
ite
conc
entr
atio
n
(μm
ol/m
mol
cre
atin
ine)
Bas
elin
ePo
sttr
eatm
ent
2-w
ay a
naly
sisa
D
apag
lifloz
inIn
sulin
C
ontr
ols
Dap
aglifl
ozin
Insu
lin%
cha
nge
P%
cha
nge
PF
P
Glu
cona
te44
.28
± 18
.37
45.5
5 ±
25.2
337
.58
± 26
.88
+33.
26<0
.000
5+7
.2N
S5.
42<0
.05
Glu
cose
39.5
5 ±
14.1
322
73 ±
555
1**11
75 ±
217
4*+7
23.6
<0.0
001
−68.
1<0
.000
531
.18
<0.0
1G
lyci
ne12
4.18
± 7
8.18
121.
35 ±
78.
7486
.65
± 76
.54
−7.7
NS
+5.8
NS
0.05
NS
Hip
pura
te32
5.72
± 2
55.7
932
7.06
± 2
59.0
230
0.01
± 3
49.2
5+3
3.3
<0.0
005
+7.7
NS
6.33
<0.0
5H
ypox
anth
ine
7.59
± 8
.02
5.55
± 5
.05
4.41
± 4
.76
−18.
9N
S+1
9.5
NS
5.88
<0.0
5In
dole
-3-a
ceta
te6.
32 ±
5.0
36.
01 ±
4.1
19.
35 ±
7.1
8−3
.3N
S+8
.2N
S0.
65N
SIn
dole
-3-l
acta
te7.
76 ±
8.1
113
.03
± 6.
27*
9.35
± 8
.42
−8.5
NS
+5.6
NS
0.58
NS
Isol
euci
ne2.
25 ±
1.0
16.
46 ±
3.6
2*9.
88 ±
6.4
3**+1
3.3
NS
−9.2
NS
2.85
NS
Kyn
uren
ate
2.29
± 1
.66
2.86
± 2
.13
4.17
± 2
.84*
+32.
1N
S+2
8.2
NS
0.74
NS
Lac
tate
7.94
± 4
.74
12.9
3 ±
8.43
**11
.16
± 7.
02**
+116
<0.0
001
−25.
2<0
.000
59.
82<0
.01
Leu
cine
2.50
± 1
.28
11.2
7 ±
4.31
**9.
04 ±
9.0
3**+2
2.2
<0.0
005
−8.5
NS
4.88
<0.0
5Ly
sine
19.8
2 ±
15.3
757
.45
± 17
.51**
46.8
3 ±
47.2
7**+7
.2N
S−7
.3N
S1.
30N
SM
anni
tol
49.6
8 ±
20.9
372
.21
± 41
.17
83.2
2 ±
117.
08+7
.7N
S−1
1.3
NS
0.23
NS
Met
hano
l47
.61
± 30
.70
23.3
1 ±
12.4
5**16
.09
± 13
.63**
−22.
7<0
.000
5+1
8N
S6.
10<0
.05
Met
hyla
min
e4.
79 ±
5.0
25.
52 ±
3.8
64.
92 ±
4.4
2−4
.3N
S−7
.11
NS
0.10
NS
Myo
-ino
sito
l42
.23
± 26
.31
87.6
1 ±
71.3
1**82
.88
± 68
.71**
+77.
1<0
.000
1−3
2.5
<0.0
005
14.4
9<0
.01
N,N
-dim
ethy
lgly
cine
2.73
± 1
.38
4.47
± 3
.60
3.54
± 3
.11
+233
.8<0
.000
1+1
.4N
S13
.92
<0.0
1N
-iso
vale
royl
glyc
ine
1.37
± 0
.66
3.39
± 1
.91**
2.13
± 1
.54*
−17.
7<0
.000
5+1
3.6
NS
4.89
<0.0
5N
-met
hylh
ydan
toin
10.3
3 ±
5.45
20.8
3 ±
9.15
**22
.44
± 21
.34**
+16
<0.0
005
+2.9
NS
4.32
<0.0
5N
-phe
nyla
cety
lgly
cine
34.9
9 ±
13.7
049
.64
± 30
.41*
58.9
0 ±
43.3
6**+1
3.1
NS
−12.
1N
S4.
81<0
.05
Phen
ylal
anin
e11
.40
± 12
.43
46.7
2 ±
39.1
0**30
.19
± 28
.36**
+−5
.2N
S+3
8.1
NS
2.25
NS
Pyru
vate
4.40
± 2
.52
5.56
± 3
.17
5.05
± 3
.20
−3.9
NS
−3.9
NS
0.06
NS
Sarc
osin
e6.
07 ±
7.4
61.
66 ±
0.8
8**1.
98 ±
1.5
3**+1
09<0
.000
5−1
4.1
NS
56.3
1<0
.01
Succ
inat
e5.
29 ±
3.3
912
.49
± 5.
8913
.99
± 12
.4*
+5.8
NS
−2.3
NS
0.03
NS
Thr
eoni
ne21
.59
± 10
.92
36.6
1 ±
21.6
3*29
.20
± 22
.91
+10.
4N
S+1
0.5
NS
0.01
NS
tran
s-A
coni
tate
5.26
± 4
.18
4.24
± 3
,81
2.94
± 1
.91
−24.
5N
S+0
.7N
S2.
41N
ST
rigo
nelli
ne33
.46
± 35
.39
35.6
9 ±
28.7
743
.02
± 19
.15
+96.
1<0
.000
1+7
.6N
S22
.37
<0.0
1T
rim
ethy
lam
ine
2.08
± 0
.96
3.79
± 1
.91
4.34
± 4
.13
−2.6
NS
+3.7
NS
0.22
NS
Tri
met
hyla
min
e N
-oxi
de50
.40
± 41
.32
36.3
8 ±
37.8
036
.63
± 28
.06
−16.
8N
S+2
.9N
S0.
47N
STy
rosi
ne6.
78 ±
3.8
219
.11
± 7.
38**
15.8
1 ±
14.6
9**+9
.4N
S−2
.1N
S0.
29N
SV
aler
ate
4.69
± 3
.20
20.9
6 ±
11.7
3**15
.95
± 13
.00**
−28.
72N
S+1
.2N
S1.
99N
SV
alin
e3.
63 ±
1.2
88.
56 ±
4.1
0**3.
11 ±
1.9
1+++3
5.1
<0.0
001
+19.
2N
S4.
45<0
.05
Xan
thur
enat
e9.
81 ±
10.
2618
.17
± 12
.75*
12.1
5 ±
28.2
4+1
1.8
NS
+28.
2N
S1.
23N
S
a F- a
nd P
-val
ues
for
the
trea
tmen
t*ti
me
poin
t in
tera
ctio
n.* P
< 0
.000
5 an
d **
P <
0.0
001
com
pare
d to
con
trol
gro
up b
asel
ine
valu
es.
+ P <
0.0
005
and
++P
< 0
.000
1 co
mpa
red
to d
apag
lifloz
in g
roup
bas
elin
e va
lues
.
Tab
le 3
. C
on
tin
ued
Dow
nloaded from https://academ
ic.oup.com/jcem
/article/106/5/1269/6139141 by guest on 13 April 2022

The Journal of Clinical Endocrinology & Metabolism, 2021, Vol. 106, No. 5 1279
cytokines, or insulin. The resulting accumulation of branched-chain keto acids and other metabolites poten-tially contributes to the development of insulin resistance and decreases further the expression of BCAT and BCKDH in skeletal muscles, thus leading to the establishment of a vicious cycle that predisposes to the development of type 2 diabetes (19). Our results suggest that dapagliflozin in-creases the urine concentration of BCAAs. These effects pre-sumably result from the decreased proximal reabsorption of these metabolites since dapagliflozin increased neither their serum levels nor eGFR. The mechanism and the clin-ical significance of this phenomenon remain indeterminate. However, previous studies have shown that proximal tubular cells in culture incorporate leucine more readily when they are incubated in media with high concentrations of glucose or sodium (20). This process possibly involves internalization of glucose and sodium through SGLT-2 and Na(+)/H(+) exchanger (NHE3) transporters (21-23). As a consequence, we propose that the inhibition of SGLT-2 and possibly NHE3 transporters by dapagliflozin is responsible for the increased renal excretion of BCAAs. Indeed, the percentage changes in the excretion rates of all 3 BCAAs showed a significant correlation with the changes in glu-cose excretion. Since the incorporation of amino acids is an essential step for proximal tubular cell hypertrophy (an early manifestation of diabetic nephropathy), it can be as-sumed that the dapagliflozin-induced decrease in the re-absorption of BCAAs may contribute to the regression of proximal tubular hypertrophy (24).
In the present study, we identified 6 BCAA catabolism intermediates in the urine of patients with type 2 dia-betes (Supplementary Figure 5A (16)). More specifically, 2-hydroxy-3-methylvalerate, 2-hydroxyisovalerate, and 3-hydroxyisovalerate were significantly increased after dapagliflozin administration whereas 3-hydroxyisobutyrate fell short of statistical significance probably due to a large SD value. In addition, 2 toxic metabolites—namely, 3-methyl-2-oxovalerate and N-isovaleroylglycine (arising from the incomplete breakdown of isoleucine and leucine, respectively) that were found to be increased in patients with type 2 diabetes compared to controls—were signifi-cantly decreased. These changes possibly reflect an im-provement in BCAA metabolism and are in line with those observed after empagliflozin administration (12).
Another novel finding of our study is the almost 2-fold increase in the urine concentrations of betaine and myo-inositol after dapagliflozin administration. These “compat-ible organic osmolytes” are present in high concentrations in renal medulla where they protect renal cells from hyper-tonicity (25). The increased urine levels of these mol-ecules following dapagliflozin treatment may result from a decrease in their tubular reabsorption or may represent
an adaptive response to the increased medullary tonicity that results from massive glycosuria and natriuresis. Both betaine and myo-inositol urine concentrations showed a significant correlation with glucose and sodium excretion at baseline. In addition, the increase in their urine con-centrations following dapagliflozin administration signifi-cantly correlated with the changes in the concentration of glucose. The reduction in the urine concentrations of betaine and myo-inositol with insulin degludec, which re-duced significantly the degree of glycosuria, is in line with this assumption.
In addition to their role as osmolytes, betaine and myo-inositol may also exert additional beneficial effects that possibly contribute to the renoprotective properties of dapagliflozin. Indeed, previous studies have shown that myo-inositol protects renal cells during their exposure to high glucose concentrations and reduces the fibrotic changes that characterize the development of diabetic nephropathy (26). Further, myo-inositol depletion has been shown to exert deleterious effects on tubular cells (27). This depletion may result from glucose toxicity since high glu-cose concentrations upregulate the myo-inositol-degrading enzyme myo-inositol oxygenase (28). In this perspective, the dapagliflozin-induced increase in urine myo-inositol may reflect the reduction in the exposure of tubular cells to high glucose concentrations and the restoration of cell metabolism. Similarly, previous studies suggest that betaine has important anti-inflammatory actions (29), re-duces liver steatosis (30) and improves mitochondrial con-tent and function in liver cells (31). Interestingly, a recent metabolomic study in patients with type 2 diabetes treated with dapagliflozin identified changes in urine metabolites consistent with an improvement in mitochondrial function (13). Whether increased renal concentrations of betaine contribute to this effect remains to be established.
N-methylhydantoin is an oxidative metabolite of creatinine. Previous studies in cell lines and animal models of kidney injury revealed that this compound exerts important antioxidant properties and can pro-tect tubular cells during their exposure to various toxic insults (32,33). We found that dapagliflozin induced a significant increase in the urine concentration of N-methylhydantoin. Since N-methylhydantoin is pro-duced by the metabolism of creatinine by gut microbes it appears tempting to hypothesize that the previously described effect of the drug on gut microbiota (34) may contribute to the observed increase in the renal excretion of this compound. On the other hand, alterations in the renal handling of N-methylhydantoin may also play a role in these changes. The microbial decomposition of creatinine can also proceed via creatine as the first deg-radation product. Both N-methylhydantoin and creatine
Dow
nloaded from https://academ
ic.oup.com/jcem
/article/106/5/1269/6139141 by guest on 13 April 2022

1280 The Journal of Clinical Endocrinology & Metabolism, 2021, Vol. 106, No. 5
are further metabolized to sarcosine (Supplementary Figure 5B (16)). Sarcosine can also be produced by cho-line that escapes microbial degradation and is oxidized to betaine, which is converted to N,N-dimethylglycine and then to sarcosine. This pathway is important for osmo-regulation and as a source of methyl groups (35). In our study, the excretion of the previously mentioned metabol-ites N-methylhydantoin, creatine, betaine, sarcosine, and N,N-dimethylglycine was increased after dapagliflozin treatment, a finding suggesting that the drug may have a beneficial effect on gut microbiota metabolism as previ-ously reported (36).
Methylglyoxal, a highly reactive dicarbonyl aldehyde, is a major precursor of nonenzymatic glycation of proteins and DNA, leading to the formation of advanced glycation endproducts that can affect the function and structure of or-gans and tissues and has subsequently been implicated in the pathogenesis of type 2 diabetes and its complications (37). Methylglyoxal is a by-product of glycolysis but can also be produced by the catabolism of threonine (Supplementary Figure 5C) (16,37). The principal threonine catabolic pathway in humans involves a glycine-independent serine/threonine dehydratase yielding 2-ketobutyrate, which is further catabolized to propionyl coenzyme A (CoA) and then to succinyl CoA or to 2-aminobutyrate and 2-hydroxybutyrate. Threonine can also be converted to 2-amino-3-ketobutyrate and then to glycine and acetyl-CoA. Alternatively, 2-amino-3-ketobutyrate can be decarb-oxylated nonenzymatically to aminoacetone and then to pyruvate or to methylglyoxal (38). In our study, succinate and pyruvate were not increased but 2-aminobutyrate and 2-hydroxybutyrate were significantly increased. These find-ings along with the decrease in the serum levels of threo-nine in our study following dapagliflozin treatment indicate an altered catabolism of threonine that does not favor the formation of methylglyoxal. In addition, the dapagliflozin-induced decrease in glucose utilization for energy produc-tion may further results in a decrease in the concentrations of methylglyoxal, which, in turn, may translate into a reduction in the complications of diabetes. However, how dapagliflozin affects threonine metabolism remains indeterminate.
The renal excretion of the compounds related to muscle metabolism, alanine and anserine, were also signifi-cantly altered by dapagliflozin administration. Alanine, a nonessential amino acid, is highly concentrated in muscles, functioning as key in glucose-alanine cycle between tis-sues and liver. Its biosynthesis occurs either from the con-version of pyruvate or the breakdown of DNA and the dipeptides carnosine and anserine. In our study, urine alanine concentration was significantly higher following dapagliflozin therapy. This change can be attributed either
to the increased concentrations of this metabolite sys-temically or locally or to its decreased tubular reabsorp-tion (39). In tubular cells alanine can be used either for ammoniagenesis, gluconeogenesis, or energy production (40,41). Dapagliflozin, by inhibiting NHE3 exchangers in proximal tubular cells may decrease net acid excretion and thus the use of alanine as ammonia precursor. This, in turn, may result in increased concentration of this amino acid in tubular cells and increased urine leakage. On the other hand, the use of alanine as a substrate for gluconeogenesis in renal cells following dapagliflozin treatment has not been determined. Previous studies provided conflicting data on the effect of SGLT-2 inhibitors on endogenous glu-cose production (42-44), whereas the role of the kidney in this process remains elusive. Although the clinical signifi-cance of the increased urine concentrations of alanine after dapagliflozin administrations is unknown, experimental studies suggest that alanine may protect tubular cells form hypoxic injury (45).
Trigonelline, N-methyl nicotinic acid or betaine nico-tinate, is a product of niacin (vitamin B3) metabolism that is excreted in the urine. Experimental studies have shown that trigonelline ameliorates diabetic hypertensive nephropathy by suppression of oxidative stress in kidney and reduction in renal cell apoptosis and fibrosis (46). Trigonelline is also reported as a constituent found in tis-sues that correlates positively with lean mass quantity of which the physiological properties remain unexplored and also as a metabolite that could reflect part of the metab-olism of choline through betaine and glycine metabolic pathways (47). The statistically significant increased levels in our study after dapagliflozin treatment may indicate an improved metabolic status of our patients.
Proximal tubules have a very high content of mitochon-dria and are highly dependent on oxidative phosphoryl-ation. Previous studies in diabetic and nondiabetic models of chronic kidney disease revealed significant disruption of mitochondrial function that parallels the evolution of the disease and is translated into abnormal renal excretion of citric acid cycle (tricarboxylic acid) intermediates (48,49). In our patients, we observed a significant increase in the renal excretion of citrate following dapagliflozin treatment, a finding that may indicate a restoration of mitochondrial function and an improvement in energy metabolism in tubular cells. Other conditions that may increase citrate ex-cretion like potassium depletion, acid-base abnormalities, hyperparathyroidism, or protein-rich diet are unlikely in our population. Hippurate is a metabolite normally found in human urine. It is synthesized in the kidney and liver from glycine and benzoic acid, secreted by the renal tubular cells, and excreted in the urine. Dapagliflozin altered hip-purate excretion in the same direction as did for citrate.
Dow
nloaded from https://academ
ic.oup.com/jcem
/article/106/5/1269/6139141 by guest on 13 April 2022

The Journal of Clinical Endocrinology & Metabolism, 2021, Vol. 106, No. 5 1281
This covariation that has been also noted in certain renal disorders can be explained by the link between hippurate synthesis and mitochondrial function. The first step in the formation of hippurate from benzoate in the mitochondrial matrix requires adenosine 5′-triphosphate. Thus, it is pos-sible that impaired mitochondrial functioning may have contributed to the lower levels of hippurate excretion be-fore treatment (50).
We also observed altered levels of a number of less studied metabolites such as ethylmalonate, nutrition-related gluconate, and 3-Chlorotyrosine. Ethylmalonate, also known as alpha-carboxybutyric acid, is a breakdown product of butyrate and member of the class of compounds known as branched fatty acids. Ethylmalonate may reflect metabolic processes involved in long-chain fatty acid me-tabolism (such as carnitine-dependent pathways) and re-lated mitochondrial function, and it is mainly studied in cases of inherited metabolic disorders (51).
3-chlorotyrosine, a specific marker of myeloperoxidase-catalyzed oxidation, was decreased after treatment in our study. It has been reported that increased levels of 3-chlorotyrosine predict chronic kidney disease severity and associated coronary artery disease (52).
Our study has limitations. The most important of them is probably the lack of a placebo arm. Although the inclu-sion of a control group of age- and sex-matched healthy individuals allows the interpretation of the direction of the changes in the urine concentrations of the various metab-olites, the precise estimation of their magnitude remains problematic. On the other hand, the inclusion of an insulin arm excludes the possibility that the dapagliflozin-induced changes in urine metabolome are the consequence of the improvement in glycemia, a conclusion that could not have been drawn had a placebo group been utilized. We under-stand that the mechanisms we propose for the observed dapagliflozin-induced changes in urine metabolome are speculative. However, since metabolomic studies usually detect changes in the concentrations of several metabolites, the complete characterization of the underlying mechan-isms and the potential clinical consequences is extremely difficult. We tried to base our speculations on solid scien-tific evidence, but we believe that further studies are re-quired to confirm and extend our observations.
In conclusion, our results suggest that dapagliflozin treatment is associated with a significant change in urine metabolome. On a pathophysiological basis, most of the observed changes in the urine concentrations of the indi-vidual metabolites can be considered beneficial and may contribute to the renoprotective properties of dapagliflozin. Further studies are needed to confirm our results and to ex-plore the mechanisms that underlie them.
AcknowledgmentsFinancial Support: Funding for this study was provided by
Astra Zeneca.Clinical Trial Information: The primary study was registered on
ClinicalTrials.gov (NCT02798757)Author Contributions: V.T. conceived the original study design
and analyses plan, interpreted the results, wrote the manuscript, and is the guarantor of this work; El.B. and C.K. designed the experi-ments plan and supervised the analyses; Ev.B., SF.D., and E.P. col-lected physical data from patients, collected samples, and analyzed data; S.C. and G.S. conducted data acquisition; P.N. and A.D. car-ried out data analyses; and E.F. and A.K. reviewed and critically edited the manuscript. All the authors have accepted responsibility for the entire content of this submitted manuscript and approved the final version of the manuscript for submission.
Additional InformationCorrespondence: Vasilis Tsimihodimos, MD, PhD, Associate
Professor of Internal Medicine, Department of Internal Medicine, School of Medicine, University of Ioannina, Niarchou Avenue, 45500 Ioannina, Greece. Email: [email protected].
Disclosures: Authors have nothing to declareData Availability: Data sets generated during and/or analyzed
during the current study are not publicly available but are available from the corresponding author on reasonable request.
References 1. Zinman B, Wanner C, Lachin JM, et al; EMPA-REG OUTCOME
Investigators. Empagliflozin, cardiovascular outcomes, and mor-tality in type 2 diabetes. N Engl J Med. 2015;373(22):2117-2128.
2. Neal B, Perkovic V, Mahaffey KW, et al; CANVAS Program Collaborative Group. Canagliflozin and cardiovascular and renal events in type 2 diabetes. N Engl J Med. 2017;377(7):644-657.
3. Wiviott SD, Raz I, Bonaca MP, et al; DECLARE–TIMI 58 Investigators. Dapagliflozin and cardiovascular outcomes in type 2 diabetes. N Engl J Med. 2019;380(4):347-357.
4. Heerspink HJL, Stefánsson BV, Correa-Rotter R, et al; DAPA-CKD Trial Committees and Investigators. Dapagliflozin in patients with chronic kidney disease. N Engl J Med. 2020;383(15):1436-1446.
5. Cosentino F, Grant PJ, Aboyans V, et al; ESC Scientific Document Group. 2019 ESC guidelines on diabetes, pre-diabetes, and car-diovascular diseases developed in collaboration with the EASD. Eur Heart J. 2020;41(2):255-323.
6. Ferrannini E, Mark M, Mayoux E. CV protection in the EMPA-REG OUTCOME trial: a “thrifty substrate” hypothesis. Diabetes Care. 2016;39(7):1108-1114.
7. Perrone-Filardi P, Avogaro A, Bonora E, et al. Mechanisms linking empagliflozin to cardiovascular and renal protection. Int J Cardiol. 2017;241:450-456.
8. Newgard CB. Metabolomics and metabolic diseases: where do we stand? Cell Metab. 2017;25(1):43-56.
9. Gall WE, Beebe K, Lawton KA, et al; RISC Study Group. alpha-hydroxybutyrate is an early biomarker of insulin resistance and glucose intolerance in a nondiabetic population. PLoS One. 2010;5(5):e10883.
Dow
nloaded from https://academ
ic.oup.com/jcem
/article/106/5/1269/6139141 by guest on 13 April 2022

1282 The Journal of Clinical Endocrinology & Metabolism, 2021, Vol. 106, No. 5
10. Wang TJ, Ngo D, Psychogios N, et al. 2-Aminoadipic acid is a bio-marker for diabetes risk. J Clin Invest. 2013;123(10):4309-4317.
11. Liggi S, Griffin JL. Metabolomics applied to diabetes-lessons from human population studies. Int J Biochem Cell Biol. 2017;93:136-147.
12. Kappel BA, Lehrke M, Schütt K, et al. Effect of empagliflozin on the metabolic signature of patients with type 2 diabetes mellitus and cardiovascular disease. Circulation. 2017;136(10):969-972.
13. Mulder S, Heerspink HJL, Darshi M, et al. Effects of dapagliflozin on urinary metabolites in people with type 2 diabetes. Diabetes Obes Metab. 2019;21(11):2422-2428.
14. Savorani F, Tomasi G, Engelsen SB. icoshift: A versatile tool for the rapid alignment of 1D NMR spectra. J Magn Reson. 2010;202(2):190-202.
15. Eriksson L, Trygg J, Wold S. CV-ANOVA for significance testing of PLS and OPLS (R) models. J Chemom. 2008(22):594-600.
16. Bletsa Ε, Filippas-Dekouan S, Kostara C, et al. Effect of dapagliflozin on urine metabolome in patients with type 2 diabetes. Dryad data set, ProMED-mail website. https://doi.org/10.5061/dryad.3n5tb2rg9. Accessed March 9, 2021.
17. Ferrannini E, Baldi S, Frascerra S, et al. Renal handling of ketones in response to sodium-glucose cotransporter 2 inhibition in pa-tients with type 2 diabetes. Diabetes Care. 2017;40(6):771-776.
18. White PJ, Newgard CB. Branched-chain amino acids in disease. Science. 2019;363(6427):582-583.
19. Bloomgarden Z. Diabetes and branched-chain amino acids: what is the link? J Diabetes. 2018;10(5):350-352.
20. Park SH, Choi HJ, Lee JH, Woo CH, Kim JH, Han HJ. High glucose inhibits renal proximal tubule cell proliferation and involves PKC, oxidative stress, and TGF-beta 1. Kidney Int. 2001;59(5):1695-1705.
21. Peñaranda C, García-Ocaña A, Sarasa JL, Esbrit P. Hypertrophy of rabbit proximal tubule cells is associated with overexpression of TGF beta. Life Sci. 1996;59(21):1773-1782.
22. Johnson DW, Saunders HJ, Poronnik P, Cook DI, Field MJ, Pollock CA. Physiological changes in extracellular sodium dir-ectly control human proximal tubule growth and transport. Pflugers Arch. 1998;435(2):211-218.
23. Onishi A, Fu Y, Darshi M, et al. Effect of renal tubule-specific knockdown of the Na+/H+ exchanger NHE3 in Akita diabetic mice. Am J Physiol Renal Physiol. 2019;317(2):F419-F434.
24. Vallon V, Gerasimova M, Rose MA, et al. SGLT2 inhibitor empagliflozin reduces renal growth and albuminuria in propor-tion to hyperglycemia and prevents glomerular hyperfiltration in diabetic Akita mice. Am J Physiol Renal Physiol. 2014;306(2):F194-F204.
25. Garcia-Perez A, Burg MB. Renal medullary organic osmolytes. Physiol Rev. 1991;71(4):1081-1115.
26. Ziyadeh FN, Simmons DA, Snipes ER, Goldfarb S. Effect of myo-inositol on cell proliferation and collagen transcription and secretion in proximal tubule cells cultured in elevated glucose. J Am Soc Nephrol. 1991;1(11):1220-1229.
27. Chang HH, Chao HN, Walker CS, Choong SY, Phillips A, Loomes KM. Renal depletion of myo-inositol is associated with its increased degradation in animal models of metabolic disease. Am J Physiol Renal Physiol. 2015;309(9):F755-F763.
28. Nayak B, Kondeti VK, Xie P, et al. Transcriptional and post-translational modulation of myo-inositol oxygenase by high
glucose and related pathobiological stresses. J Biol Chem. 2011;286(31):27594-27611.
29. Zhao G, He F, Wu C, et al. Betaine in inflammation: mechanistic aspects and applications. Front Immunol. 2018;9:1070.
30. Ejaz A, Martinez-Guino L, Goldfine AB, et al. Dietary betaine supplementation increases Fgf21 levels to improve glucose homeostasis and reduce hepatic lipid accumulation in mice. Diabetes. 2016;65(4):902-912.
31. Zhang L, Qi Y, ALuo Z, Liu S, Zhang Z, Zhou L. Betaine in-creases mitochondrial content and improves hepatic lipid me-tabolism. Food Funct. 2019;10(1):216-223.
32. Hasegawa G, Nakano K, Ienaga K. Serum accumulation of a creatinine oxidative metabolite (NZ-419: 5-hydroxy-1- methylhydatoin) as an intrinsic antioxidant in diabetic pa-tients with or without chronic kidney disease. Clin Nephrol. 2011;76(4):284-289.
33. Ienaga K, Park CH, Yokozawa T. Protective effect of an intrinsic antioxidant, HMH (5-hydroxy-1-methylhydantoin; NZ-419), against cellular damage of kidney tubules. Exp Toxicol Pathol. 2013;65(5):559-566.
34. Lee DM, Battson ML, Jarrell DK, et al. SGLT2 inhibition via dapagliflozin improves generalized vascular dysfunction and alters the gut microbiota in type 2 diabetic mice. Cardiovasc Diabetol. 2018;17(1):62.
35. Lever M, McEntyre CJ, George PM, Chambers ST. Is N,N-dimethylglycine N-oxide a choline and betaine metabolite? Biol Chem. 2017;398(7):775-784.
36. Huo T, Xiong Z, Lu X, Cai S. Metabonomic study of biochem-ical changes in urinary of type 2 diabetes mellitus patients after the treatment of sulfonylurea antidiabetic drugs based on ultra-performance liquid chromatography/mass spectrometry. Biomed Chromatogr. 2015;29(1):115-122.
37. Schalkwijk CG, Stehouwer CDA. Methylglyoxal, a highly re-active dicarbonyl compound, in diabetes, its vascular com-plications, and other age-related diseases. Physiol Rev. 2020;100(1):407-461.
38. Ravichandran M, Priebe S, Grigolon G, et al. Impairing L-threonine catabolism promotes healthspan through methylglyoxal-mediated proteohormesis. Cell Metab. 2018;27(4):914-925.e5.
39. Jessen H. Taurine and beta-alanine transport in an established human kidney cell line derived from the proximal tubule. Biochim Biophys Acta. 1994;1194(1):44-52.
40. van de Poll MC, Soeters PB, Deutz NE, Fearon KC, Dejong CH. Renal metabolism of amino acids: its role in interorgan amino acid exchange. Am J Clin Nutr. 2004;79(2):185-197.
41. Tizianello A, De Ferrari G, Garibotto G, Gurreri G, Robaudo C. Renal metabolism of amino acids and ammonia in subjects with normal renal function and in patients with chronic renal insuffi-ciency. J Clin Invest. 1980;65(5):1162-1173.
42. Latva-Rasku A, Honka MJ, Kullberg J, et al. The SGLT2 in-hibitor dapagliflozin reduces liver fat but does not affect tissue insulin sensitivity: a randomized, double-blind, placebo-controlled study with 8-week treatment in type 2 diabetes pa-tients. Diabetes Care. 2019;42(5):931-937.
43. Martinez R, Al-Jobori H, Ali AM, et al. Endogenous glu-cose production and hormonal changes in response to canagliflozin and liraglutide combination therapy. Diabetes. 2018;67(6):1182-1189.
Dow
nloaded from https://academ
ic.oup.com/jcem
/article/106/5/1269/6139141 by guest on 13 April 2022
The Journal of Clinical Endocrinology & Metabolism, 2021, Vol. 106, No. 5 1283
44. Ferrannini E, Baldi S, Frascerra S, et al. Shift to fatty substrate utilization in response to sodium-glucose cotransporter 2 inhib-ition in subjects without diabetes and patients with type 2 dia-betes. Diabetes. 2016;65(5):1190-1195.
45. Paller MS, Patten M. Protective effects of glutathione, glycine, or alanine in an in vitro model of renal anoxia. J Am Soc Nephrol. 1992;2(8):1338-1344.
46. Ghule AE, Jadhav SS, Bodhankar SL. Trigonelline ameliorates diabetic hypertensive nephropathy by suppression of oxidative stress in kidney and reduction in renal cell apoptosis and fibrosis in streptozotocin induced neonatal diabetic (nSTZ) rats. Int Immunopharmacol. 2012;14(4):740-748.
47. Huang CF, Cheng ML, Fan CM, Hong CY, Shiao MS. Nicotinuric acid: a potential marker of metabolic syndrome through a metabolomics-based approach. Diabetes Care. 2013;36(6):1729-1731.
48. Liu JJ, Liu S, Gurung RL, et al. Urine tricarboxylic acid cycle metabolites predict progressive chronic kidney disease in Type 2 diabetes. J Clin Endocrinol Metab. 2018;103(12):4357-4364.
49. Forbes JM, Thorburn DR. Mitochondrial dysfunction in dia-betic kidney disease. Nat Rev Nephrol. 2018;14(5):291-312.
50. Lees HJ, Swann JR, Wilson ID, Nicholson JK, Holmes E. Hippurate: the natural history of a mammalian-microbial cometabolite. J Proteome Res. 2013;12(4):1527-1546.
51. Nochi Z, Olsen RKJ, Gregersen N. Short-chain acyl-CoA de-hydrogenase deficiency: from gene to cell pathology and possible disease mechanisms. J Inherit Metab Dis. 2017;40(5):641-655.
52. Afshinnia F, Zeng L, Byun J, et al; Michigan Kidney Translational Core CPROBE Investigator Group. Myeloperoxidase levels and its product 3-chlorotyrosine predict chronic kidney disease se-verity and associated coronary artery disease. Am J Nephrol. 2017;46(1):73-81.
Dow
nloaded from https://academ
ic.oup.com/jcem
/article/106/5/1269/6139141 by guest on 13 April 2022
Copyright © 2022 FDOKUMEN