The Bacteriome and Metabolome of Human Breast Milk and ...
179
The Bacteriome and Metabolome of Human Breast Milk and their association with infant growth Anna Olutoyin Ojo Thesis Presented for the Degree of DOCTOR OF PHILOSOPHY in the Division of Medical Microbiology Faculty of Health Sciences UNIVERSITY OF CAPE TOWN July 2019 University of Cape Town
-
Upload
khangminh22 -
Category
Documents
-
view
3 -
download
0
Transcript of The Bacteriome and Metabolome of Human Breast Milk and ...

The Bacteriome and Metabolome of Human Breast Milk
and their association with infant growth
Anna Olutoyin Ojo
Thesis Presented for the Degree of
DOCTOR OF PHILOSOPHY
in the Division of Medical Microbiology
Faculty of Health Sciences
UNIVERSITY OF CAPE TOWN
July 2019
Univers
ity of
Cap
e Tow
n

The copyright of this thesis vests in the author. No quotation from it or information derived from it is to be published without full acknowledgement of the source. The thesis is to be used for private study or non-commercial research purposes only.
Published by the University of Cape Town (UCT) in terms of the non-exclusive license granted to UCT by the author.
Univers
ity of
Cap
e Tow
n

ii
DECLARATION
I hereby declare that the work on which this dissertation is based is my original work (except where
acknowledgements indicate otherwise) and that neither the whole work or any part thereof is being,
has been, or is to be submitted for another degree in this or any other university. The research
described here was carried out in the Division of Medical Microbiology, Faculty of Health Sciences,
University of Cape Town under the supervision of Dr Elloise du Toit and Professor Mark Nicol.
----------------------
Anna Olutoyin Ojo
09 July 2019

iii
DECLARATION: INCLUSION OF PUBLICATIONS
I confirm that I have been granted permission by the University of Cape Town’s Doctoral Degrees
Board to include the following publications in my PhD thesis, and where co-authorships are involved,
my co-authors have agreed that I may include the publications:
i. Ojo-Okunola A, Nicol M, Du Toit E. Human Breast Milk Bacteriome in Health and
Disease. Nutrients. 2018; 10(11):1643.
ii. The Influence of DNA Extraction and Milk Skimming on Human Breast Milk Bacterial
Profiles (Revised version submitted to PlosOne, under review).
iii. Ojo-Okunola A, Claassen-Weitz S, Mwaikono KS, Gardner-Lubbe S, Stein DJ, Zar HJ, Nicol
MP, du Toit E. Influence of Socio-Economic and Psychosocial Profiles on the Human Breast
Milk Bacteriome of South African Women. Nutrients. 2019; 11(6):1390.
SIGNATURE: DATE: 09 July 2019
STUDENT
NAME:
Anna Olutoyin Ojo STUDENT NUMBER: OJXANN001

iv
ABSTRACT
Human breast milk is a complex species-specific biological fluid universally known as the optimal
post-natal source of nutrition for infants and therefore, recommended by the World Health
Organization as the exclusive food for infants in the first six months of life. Despite the importance of
human breast milk in infant health, study of its composition, especially the bacteriome (bacterial
communities) and metabolome (complete set of metabolites), and their relationship to infant health
and growth have not yet been comprehensively characterized. This is particularly true in low- and
middle-income countries. We therefore conducted a cross-sectional study, nested within an existing
birth cohort, the Drakenstein Child Health Study, to describe the bacteriome and metabolome of
human breast milk samples collected between 6-10 weeks postpartum from lactating women living in
South Africa. The determinants of these components of human breast milk and their role in infant
growth were also investigated.
Four commercial DNA extraction kits were compared for DNA extraction from human breast milk
samples. The kit showing the best results, including quality and quantity of DNA, as well as best
reproducibility, was chosen for further extractions. Using 16S rRNA gene amplicon next generation
sequencing, a reproducible bioinformatics sequencing pipeline, and robust multivariate statistical
analysis, we confirmed the presence of a diverse bacterial community in human breast milk and
identified a core bacteriome, present in 80% of the samples. The bacteriome was shown to cluster into
three different profile groups (biotypes) according to the predominant bacterial genus present.
Bacterial interactions were suggested by the finding of positive correlations between the relative
abundances of bacteria usually found in the oral or skin microbiota. Apart from study site (a proxy for
ethnicity in this study), infant birth length and maternal age, no other associations were found between
potential socio-demographic and psychosocial determinants and the composition of the human breast
milk bacteriome.
Using Nuclear Magnetic Resonance spectroscopy, we quantified forty-nine metabolites in all human
breast milk samples. A subset of women with low levels of lactose concentrations were identified.
Low lactose was associated with an increase in metabolites associated with mixed acid fermentation
and microbial dysbiosis (staphylococcal-predominant biotype). Low-lactose (vs normal lactose)
human breast milk correlated with a reduced median duration of exclusive breastfeeding and reduced
infant growth (reduced weight and length z-scores) during the period of exclusive breastfeeding.
These results suggest that bacterial fermentation of lactose results in low-lactose breast milk, which in
turn impacts on breastfeeding outcome.
Taken together, the results presented in this thesis provide a better understanding of human breast
milk composition among lactating mothers living in South Africa, their potential determinants and
their role in infant growth. Knowledge about the composition of human breast milk may provide

v
opportunity for diagnostic and therapeutic interventions and help promote (exclusive) breastfeeding
for the recommended period to improve infant health.

vi
ACKNOWLEDGEMENT
I wish to acknowledge the unwavering support of my supervisors, Dr Elloise du Toit and Prof. Mark
Nicol who have guided and tutored me throughout my years as their student. Thank you for providing
me with this PhD position and for going beyond your point of duty to make me feel comfortable. To
Mark, I am always intrigued with your knowledge not only in Microbiology but other medical fields, I
always learn something new when being around you.
I would like to acknowledge the financial support received from Bill and Melinda Gates Foundation,
National Institutes of Health of the USA awarded to Prof. Mark Nicol, H3Africa, National Research
Foundation, Drakenstein Child Health Study (DCHS) and the University of Cape Town.
I would like to thank the following individuals for their technical support and expertise: Dr. Kilaza. S.
Mwaikono for being a wonderful and approachable bioinformatician, Prof. Sugnet Lubbe for the
statistical analysis and writing the microbiome analysis script, Dr. Stefano Cacciatore for the Nuclear
Magnetic Resonance spectroscopy profiling and analysis, and Shantelle Claassen-Weitz for her
expertise in 16S rRNA gene amplicon library preparation and sequencing.
I also wish to thank the mothers and their families who participated in the DCHS without whom this
research would not have been possible. I further wish to thank the clinical research staff of the DCHS
and Prof. Heather Zar for providing me with the opportunity to be part of the DCHS research team. I
acknowledge Mr. Polite Nduru, Mr. Raymond Nhapi, Ms. Whitney Barnett, Dr. Aneesa Vanker and
Dr Nastassja Koen for their assistance in the study. I also acknowledge facilities provided by the
University of Cape Town’s ICTS High Performance Computing team: http://hpc.uct.ac.za for
computations being performed.
To staff and students of the Division of Medical Microbiology, who have all contributed to my
pleasant experience at the department: Dr. Mamadou Kaba for his critical comments especially during
the DCHS monthly meetings, Ms. Fadheela Patel (for the listening ear and always helping out without
complaining), laboratory technologists, colleagues to mention a few.
On a personal note, I will like to thank Dr. Mike Oluwatayo Ojo who has constantly supported me
both emotionally and financially. Your encouragement got me through this PhD. You have really
demonstrated your love as a twin brother. To my family, Prof. Matthews & Mrs. Florence Ojo (my
parents), Barrister ‘Diran & Mrs Titilope Okunola who made the sacrifice of not seeing me
physically, nor their grandchild, due to this sojourn. Thank you for your prayers, encouragement and
financial support. Dad: Your academic achievements have encouraged me. To Abisola Okunola, my
life partner who has constantly been there for me through this journey, sacrificing his time as a PhD
student to care for our children and ensuring that my work takes a priority. To Eriifeoluwa, who
knows that mummy has to do her assignment and to my baby boy, Oluwatimileyin, whose arrival

vii
coincides with the proof-reading of the thesis, I hope you and your sister both grow to love knowledge
and develop an inquisitive mind.
To those whose paths have crossed mine while in Cape Town and have contributed to me having a
lovely and peaceful stay in Cape Town: Mowbray Baptist Church members, Dr. Judith Head to
mention but a few, know that your names are imprinted in my heart and I am grateful that we met.
Finally, to God, who has kept me and my dreams alive, and for keeping my hope alive throughout this
challenging and daunting task.

viii
Table of Contents
DECLARATION .................................................................................................................................... ii
DECLARATION: INCLUSION OF PUBLICATIONS ........................................................................ iii
ABSTRACT ........................................................................................................................................... iv
ACKNOWLEDGEMENT ..................................................................................................................... vi
ABBREVIATIONS .............................................................................................................................. xii
List of Figures ...................................................................................................................................... xiv
List of Tables ....................................................................................................................................... xvi
CHAPTER 1 ........................................................................................................................................... 1
General Introduction ........................................................................................................................... 1
1.1 Background and Rationale ...................................................................................................... 2
1.2 Thesis Outline ......................................................................................................................... 4
1.3 References ............................................................................................................................... 6
CHAPTER 2 ........................................................................................................................................... 8
Human Breast Milk Bacteriome in Health and Disease ..................................................................... 8
Abstract .......................................................................................................................................... 9
2.1 Introduction ........................................................................................................................... 10
2.2 Human Breast Milk Bacteriome ........................................................................................... 10
2.3 Bacterial Diversity in Human Breast Milk............................................................................ 10
2.4 The Core Milk Bacteriome? .................................................................................................. 11
2.5 Origin of The Human Breast Milk Bacteriome..................................................................... 12
2.6 Factors Which May Affect the Human Breast Milk Bacteriome .......................................... 14
2.7 Plausible Functions of Human Breast Milk Bacteria ............................................................ 16
2.8 Implications of The Human Breast Milk Bacteriome In Disease ......................................... 19
2.9 Conclusions ........................................................................................................................... 21
2.9.1 Gaps Identified .............................................................................................................. 21
2.10 References ......................................................................................................................... 22
CHAPTER 3 ......................................................................................................................................... 28
The determinants of the human breast milk metabolome and its role in infant health ..................... 28
Abstract ........................................................................................................................................ 29
3.1 Introduction ........................................................................................................................... 30
3.2 Human Breast Milk Metabolome .......................................................................................... 30

ix
3.3 Specific Human Breast Milk (HBM) Metabolites and Their Role in Health ........................ 31
3.4 Determinants of The Human Breast Milk Metabolome ........................................................ 38
3.5 Conclusion ............................................................................................................................ 42
3.6 References ............................................................................................................................. 43
CHAPTER 4 ......................................................................................................................................... 51
The Influence of DNA Extraction and Milk Skimming on Human Breast Milk Bacterial Profiles . 51
Abstract ........................................................................................................................................ 52
4.1 Introduction ........................................................................................................................... 53
4.2 Material and Methods ........................................................................................................... 54
4.2.1 Subjects and sample collection ..................................................................................... 54
4.2.2 Methods of DNA extraction .......................................................................................... 54
4.2.3 DNA quantification ....................................................................................................... 57
4.2.4 Extraction and sequencing controls .............................................................................. 57
4.2.5 16S ribosomal ribonucleic acid (rRNA) amplicon library preparation ......................... 58
4.2.6 16S ribosomal ribonucleic acid (rRNA) gene sequencing ............................................ 59
4.2.7 Bioinformatics workflow .............................................................................................. 59
4.2.8 Data analysis ................................................................................................................. 60
4.3 Results ................................................................................................................................... 61
4.3.1 Influence of DNA extraction kits and milk skimming on yield and quality of DNA
extracted from un-spiked human breast milk samples ................................................................. 61
4.3.2 Influence of DNA extraction kits and milk skimming on bacterial profiles obtained
from mock microbial community standard spiked into human breast milk ................................. 62
4.3.3 Influence of DNA extraction kit and milk type on bacterial diversity in un-spiked HBM
samples 66
4.3.4 Reproducibility of extractions ....................................................................................... 69
4.4 Discussion ............................................................................................................................. 69
4.5 Conclusion ............................................................................................................................ 73
4.6 References ............................................................................................................................. 74
CHAPTER 5 ......................................................................................................................................... 79
Influence of socio-economic and psychosocial profiles on the human breast milk bacteriome of
South African women ....................................................................................................................... 79
Abstract ........................................................................................................................................ 80

x
5.1 Introduction ........................................................................................................................... 81
5.2 Materials and Methods .......................................................................................................... 81
5.2.1 Study settings: Drakenstein Child Health Study ........................................................... 81
5.2.2 Clinical data and sample collection............................................................................... 82
5.2.3 Bacterial nucleic acid extraction and quantification ..................................................... 82
5.2.4 Extraction and sequencing controls .............................................................................. 83
5.2.5 16S ribosomal ribonucleic acid (rRNA) gene amplicon library preparation and
sequencing .................................................................................................................................... 83
5.2.6 Processing of 16S rRNA gene sequences ..................................................................... 84
5.2.7 Statistical analyses ........................................................................................................ 85
5.3 Results ................................................................................................................................... 87
5.3.1 Participant characteristics ............................................................................................. 87
5.3.2 Sequencing results and OTU analysis ........................................................................... 87
5.3.3 Profiling of human breast milk bacteriome ................................................................... 88
5.3.4 Breast milk bacteriome profiles segregate into three major clusters............................. 88
5.3.5 Alpha diversity of bacterial communities within the DCHS cohort study .................... 90
5.3.6 Human breast milk bacterial profiles in relation to demographic, socio-economic and
psychosocial variables .................................................................................................................. 91
5.3.7 Co-occurrence networks in human breast milk bacterial communities ........................ 95
5.3.8 Reproducibility of bacterial profiling............................................................................ 96
5.4 Discussion ............................................................................................................................. 96
5.4.1 Bacterial interactions within the human breast milk bacterial community ................... 98
5.4.2 Impact of maternal and infant factors on human breast milk bacterial profiles ............ 98
5.5 Conclusion .......................................................................................................................... 100
5.6 References ........................................................................................................................... 101
CHAPTER 6 ....................................................................................................................................... 106
Human breast milk bacterial dysbiosis is associated with lactose fermentation and poor breast-
feeding outcomes ............................................................................................................................ 106
Abstract ...................................................................................................................................... 107
6.1 Introduction ......................................................................................................................... 108
6.2 Materials and Methods ........................................................................................................ 108
6.2.1 Subjects and sample collection ................................................................................... 108

xi
6.2.2 Demographic and growth measures ............................................................................ 108
6.2.3 Human breast milk sample preparation ....................................................................... 109
6.2.4 Nuclear magnetic resonance (NMR) profiling ............................................................ 110
6.2.5 Human breast milk bacterial profiling by 16S rRNA amplicon sequencing ............... 111
6.2.6 Processing of 16S rRNA gene sequences ................................................................... 111
6.2.7 Statistical and data analysis ......................................................................................... 112
6.3 Result and discussion .......................................................................................................... 112
6.3.1 Participant characteristics ........................................................................................... 112
6.3.2 Metabolic profiles of human breast milk (HBM) cluster according to lactose level and
HMO phenotype. ........................................................................................................................ 113
6.3.3 Low lactose level associates with reduced duration of exclusive breastfeeding, lower
infant growth and metabolites from mixed acid fermentation. .................................................. 115
6.3.4 Human breast milk (HBM) samples with low lactose level are associated with distinct
bacterial profiles. ........................................................................................................................ 117
6.4 Conclusion .......................................................................................................................... 119
6.5 References ........................................................................................................................... 120
Chapter 7 ............................................................................................................................................. 123
General conclusions ........................................................................................................................ 123
APPENDIX 1: Chapter 4 supplementary tables and figures .............................................................. 127
APPENDIX 2: Chapter 5 supplementary tables and figures .............................................................. 136
APPENDIX 3: Chapter 6 supplementary tables and figures .............................................................. 150

xii
ABBREVIATIONS
ANOVA analysis of variance
BF breastfeeding
bp base pair
DNA deoxyribonucleic acid
dsDNA double-stranded DNA
CI confidence Interval
EBF exclusive breastfeeding
e.g. exempli gratia
Etc. et cetera
GC-MS gas chromatography- mass spectrometry
HBM human breast milk
HMO human milk oligosaccharides
kDa kilodalton
LC-MS liquid chromatography- mass spectrometry
mins minute(s)
mM millimolar
NCBI national center for biotechnology information
NGS next generation sequencing
OTU operational taxonomic unit
PCA principal component analysis
PCR polymerase chain reaction
PERMANOVA permutational multivariate analysis of variance
pM picomolar
RNA ribonucleic acid
rRNA ribosomal RNA
rpm revolutions per minute
RT room temperature
SCFA short chain fatty acids
sec second(s)
SM skim milk
TAE tris-acetate-EDTA
Treg T regulatory
Tris-HCl tris-hydrochloride
UCT university of cape town
μl microliter
xiii
V volts
WHO world health organization
WM whole milk
% percent
oC degree(s) Celsius

xiv
LIST OF FIGURES
Figure 2. 1: The core human breast milk bacteriome. .......................................................................................... 12
Figure 3. 1: Graphical representation of the enzymatic processes that lead to the different HMO phenotypes. .. 33
Figure 4. 1: Human breast milk samples collection per milk type and DNA extraction method. ........................ 55
Figure 4. 2: DNA yield and purity of the four different commercial kits. ............................................................ 62
Figure 4. 3: Relative abundances of bacterial taxa extracted by kits in comparison to the commercial ZMCS
composition. ......................................................................................................................................................... 64
Figure 4. 4: Relative abundances of bacterial taxa extracted by skim milk and whole milk in comparison to the
commercial ZMCS composition. .......................................................................................................................... 65
Figure 4. 5: Complete linkage hierarchical clustering showing the relative abundances of bacterial taxa in the
HBM sample spiked with ZMCS. ........................................................................................................................ 66
Figure 4. 6: Shannon diversity index of the un-spiked HBM samples based on kits and milk type. .................... 67
Figure 4. 7: HBM samples cluster primarily based on the donor. ........................................................................ 68
Figure 5. 1: Complete linkage unsupervised hierarchical clustering of relative abundances of human breast milk
(HBM) bacterial phyla. ......................................................................................................................................... 88
Figure 5. 2: Human breast milk (HBM) bacterial profiles of the three clusters in which samples were grouped at
genus level. ........................................................................................................................................................... 89
Figure 5. 3: Human breast milk (HBM) bacteriome profiles coloured by clusters. .............................................. 90
Figure 5. 4: Alpha diversity indices of human breast milk bacteriome profiles. .................................................. 91
Figure 5. 5: Complete linkage unsupervised hierarchical clustering of human breast milk (HBM) bacterial
profiles. ................................................................................................................................................................. 92
Figure 5. 6: Log ratio biplot of human breast milk bacterial abundances at the genus level. ............................... 93
Figure 5. 7: Bacterial networks within the human breast milk bacteriome community based on correlation
between relative abundances. ............................................................................................................................... 96
Figure 6. 1: 1H-NMR spectrum of a representative HBM sample. ..................................................................... 113
Figure 6. 2: Distinct metabolic profiles of human breast milk (HBM) are observed based on HMO phenotype.
............................................................................................................................................................................ 114
Figure 6. 3: Metabolic profiles of human breast milk (HBM) cluster according to lactose levels and HMO
phenotype. .......................................................................................................................................................... 115
Figure 6. 4: Low lactose level in human breast milk (HBM) associates with reduced duration of exclusive
breastfeeding. ...................................................................................................................................................... 115
Figure 6. 5: Low lactose level in human breast milk (HBM) associates with lower infant growth. ................... 116

xv
Figure 6. 6: Low lactose level in human breast milk (HBM) associates with metabolites from mixed acid
fermentation. ....................................................................................................................................................... 117
Figure 6. 7: Low lactose samples are associated with distinct bacterial profiles. ............................................... 118
Figure 6. 8: Low lactose samples are associated with distinct bacterial signatures. ........................................... 119

xvi
LIST OF TABLES
Table 2. 1: Factors influencing human breast milk bacteriome. ........................................................................... 16
Table 3. 1: Lipid classes in human breast milk. .................................................................................................... 35
Table 3. 2: Long chain-polyunsaturated fatty acids (LC-PUFA) in HBM. ........................................................... 36
Table 3. 3: Factors Which May Influence the Human Breast Milk (HBM) Metabolome .................................... 41
Table 4. 1: DNA extraction kits used in this study ............................................................................................... 56
Table 5. 1: Permutational multivariate analysis of variance (PERMANOVA) analyses of HBM bacteriome and
its association with maternal demographic and psychosocial factors. .................................................................. 94

1
CHAPTER 1
GENERAL INTRODUCTION

2
1.1 Background and Rationale
Infant breast feeding (BF) emerged as an evolutionary strategy subsequent to the divergence of
mammals millions of years ago and natural selection has made milk uniquely suited to nourish
infants of each species (1). Human breast milk (HBM) is uniquely adapted and is universally
regarded as the optimal post-natal source of nutrition for the growing infant. Breast-fed infants have
been shown to have a lower morbidity and mortality during 1st year of life, and reduced risk of
respiratory and gastrointestinal infections (2, 3). The components of HBM including water, protein,
fatty acids, microbes, immunological factors, glyco-conjugates and metabolites all play important
roles in the beneficial properties of BF.
Although analysis of HBM was not included in Human Microbiome Project (HMP), a project
designed to comprehensively characterize the presence and function of microbiome colonizing
different body sites, several studies have shown that HBM harbours its own microbiome (4-7). The
term microbiome was first mentioned in 2001 by Joshua Lederberg as a descendant of the word
‘genome’ and was described as “the ecological community of commensal. symbiotic, and
pathogenic microorganisms that literally share our body space” (8). These micro-organisms include
the bacteria, archaea, fungi, lower and higher eukaryotes, and viruses (9). The microbiome has,
more recently, been defined as “the entire habitat, including the microorganisms, their genomes and
the surrounding environmental conditions” (10), while the collection of all bacteria residing in or on
humans (i.e. the bacterial component of the human microbiome) is referred to as the bacteriome (8,
11).
Recently, next-generation sequencing (NGS) has been adopted for microbial identification by
profiling of 16S rRNA gene amplicons or whole metagenome shotgun sequencing. The bacterial
diversity in HBM has been shown to be larger than originally thought, with more than 600
Operational Taxonomic Units (OTU)s having been identified (4, 7). NGS has also been used to
analyse the temporal stability of the bacterial community in HBM, and various factors that lead to
variability in HBM bacterial profiles between women have been identified (4).
HBM bacteria are one of the main sources of microbes to the neonate postnatally and may play an
important role in ‘shaping’ the intestinal microbiome early in life including priming and maturation

3
of the infant’s gut immune system (7, 12). Breast-fed infants have been reported to have a decreased
faecal species richness with less colonization by bacteria known to be pathogenic, compared with
formula-fed infants (13, 14). Recent reports suggest that early microbial colonization has an
important role in promoting health and may contribute to reducing the risk of diseases (15-17).
In addition to microbes in HBM, there are numerous nutritive and non-nutritive bioactive factors
that elicit protective and promoting effects during the early infant years (13). One of such
components is the metabolome defined as “complete complement of all small-molecule (<1500 Da)
metabolites found in a specific cell, organ or organism” (18). In HBM, human milk oligosaccharides
(HMOs), lactose, lipids, amino acids and biogenic amines are some examples of the metabolites
present. A recent study has shown the influence of the HBM metabolome on promoting growth in
infants, in part through interaction with the bacteriome (19). For example, fermentation of HMOs by
bacteria in the infant’s gut produces short chain fatty acids which promote gut epithelial barrier
function and modulate immune responses (20, 21).
Despite a complex and diverse bacteriome and metabolome in HBM, previous studies have been
limited by sample size with few studies having been performed in sub-Saharan Africa. HBM
composition is influenced by a number of maternal, infant, and environmental factors including
geographical location, maternal weight and body mass index, maternal health, maternal dietary
intake and lactational stage (22-25), though the impact of these variations on the different
components of HBM and its health outcomes on the infant is not fully understood. Moreover, the
relationship between the HBM metabolome and microbiome has not been well-studied and related
to infant health and growth. Thus, a comprehensive analysis of the HBM bacteriome and
metabolome is presented in this thesis, including their influence on the breastfeeding outcomes and
the health and growth of an infant. We addressed the following questions:
i. What is the composition of HBM bacteriome and metabolome in a cohort of South African
mothers enrolled in the Drakenstein Child Health Study?
ii. Do maternal (mode of delivery, maternal BMI, maternal age), infant and environmental
factors (smoking, dwelling type, alcohol use) influence the composition of HBM
bacteriome and metabolome?

4
iii. Is there an association between the composition of the HBM bacteriome and metabolome,
and breastfeeding outcomes and infant growth in the first year of life?
1.2 Thesis Outline
Chapter 2 is an in-depth literature review into the immunomodulatory, metabolic, and anti-
infective role of the HBM bacteriome and its effect on infant health. Key information from the
literature was provided by exploring the possible origin of microbial communities in HBM, the
bacterial diversity in this niche, the concept of a “core” HBM bacteriome, and the determinants
influencing the HBM bacteriome. Lastly, the role of the HBM bacteriome in maternal infectious
disease (human immunodeficiency virus infection and mastitis), and cancer was investigated. Key
gaps in HBM bacterial research are also identified.
Chapter 3 is a review of the literature regarding the metabolomic diversity of HBM, the technical
approaches to studying the HBM metabolome, immune modulatory and anti-infective role of HBM
metabolites and their effects on infant health and development. The literature on potential
determinants of the HBM metabolome, including maternal infectious diseases such as human
immunodeficiency virus infection and mastitis was also reviewed.
Chapter 4 explores the influence of laboratory technical procedures (DNA extraction and milk
skimming) on HBM bacterial profiling. This chapter compares four commercial DNA extraction
kits and milk skimming in relation to HBM bacterial profiles using ten healthy donor breast milk
samples. The kits were evaluated based on their ability to extract high quantities of pure DNA from
HBM, and how well they extracted DNA from bacterial communities present in a commercial mock
microbial community standard spiked into HBM. Finally, the kits were evaluated by assessing their
extraction reproducibility. Bacterial profiles were assessed using Illumina MiSeq sequencing
targeting the V4 region of the 16S rRNA gene.
Chapter 5 describes our findings from 16S rRNA amplicon sequencing information on the bacterial
composition of HBM samples in a large cohort of lactating women living in South Africa. It also
provides information on possible determinants of the HBM bacterial composition including

5
maternal, socio-demographic and psychosocial factors. Finally, bacterial interactions were studied
using co-occurrence networks.
Chapter 6 describes the metabolic profiles of HBM samples from a large cohort of lactating women
living in South Africa, as determined by nuclear magnetic resonance spectroscopy. In particular, the
relationship between the HBM metabolome and microbiome and their effect on breastfeeding
outcomes and infant health is studied.
Chapter 7 concludes the dissertation by summarizing the important findings and main conclusions
of each result chapter, limitation of the technical approaches and study design, and
recommendations for further research and planned future work.

6
1.3 REFERENCES
1. Goldman AS. Evolution of immune functions of the mammary gland and protection of the
infant. Breastfeed Med. 2012;7(3):132-42.
2. Lamberti LM, Fischer Walker CL, Noiman A, Victora C, Black RE. Breastfeeding and the
risk for diarrhea morbidity and mortality. BMC Public Health. 2011;11 Suppl 3:S15.
3. Victora C, Barros A. Effect of breastfeeding on infant and child mortality due to infectious
diseases in less developed countries. The Lancet. 2000;355(9202):451-5.
4. Hunt KM, Foster JA, Forney LJ, Schutte UM, Beck DL, Abdo Z, et al. Characterization of
the diversity and temporal stability of bacterial communities in human milk. PLoS One.
2011;6(6):e21313.
5. Martín R, Heilig HGHJ, Zoetendal EG, Jiménez E, Fernández L, Smidt H, et al.
Cultivation-independent assessment of the bacterial diversity of breast milk among healthy women.
Res Microbiol. 2007;158(1):31-7.
6. Martín V, Maldonado-Barragán A, Moles L, Rodriguez-Baños M, Campo RD, Fernández
L, et al. Sharing of bacterial strains between breast milk and infant feces. J Hum Lact.
2012;28(1):36-44.
7. Jost T, Lacroix C, Braegger C, Chassard C. Assessment of bacterial diversity in breast milk
using culture-dependent and culture-independent approaches. Br J Nutr. 2013;110(7):1253-62.
8. Lederberg J, McCray AT. Ome SweetOmics--A Genealogical Treasury of Words. The
Scientist. 2001;15(7):8-.
9. Grice EA, Segre JA. The human microbiome: our second genome. Annu Rev Genomics
Hum Genet. 2012;13:151-70.
10. Marchesi JR, Ravel J. The vocabulary of microbiome research: a proposal. BioMed Central;
2015.
11. Hoarau G, Mukherjee PK, Gower-Rousseau C, Hager C, Chandra J, Retuerto MA, et al.
Bacteriome and Mycobiome Interactions Underscore Microbial Dysbiosis in Familial Crohn’s
Disease. mBio. 2016;7(5):e01250-16.
12. Pannaraj PS, Li F, Cerini C, et al. Association between breast milk bacterial communities
and establishment and development of the infant gut microbiome. JAMA Pediatrics.
2017;171(7):647-54.
13. Murphy K, Curley D, O'Callaghan TF, O'Shea CA, Dempsey EM, O'Toole PW, et al. The
composition of human milk and infant faecal microbiota over the first three months of life: A pilot
study. Sci Rep. 2017;7.
14. Azad MB, Konya T, Maughan H, Guttman DS, Field CJ, Chari RS, et al. Gut microbiota of
healthy Canadian infants: profiles by mode of delivery and infant diet at 4 months. Can Med Assoc
J. 2013;185(5):385-94.

7
15. Wopereis H, Oozeer R, Knipping K, Belzer C, Knol J. The first thousand days–intestinal
microbiology of early life: establishing a symbiosis. Pediatr Allergy Immunol. 2014;25(5):428-38.
16. Penders J, Thijs C, Vink C, Stelma FF, Snijders B, Kummeling I, et al. Factors influencing
the composition of the intestinal microbiota in early infancy. Pediatrics. 2006;118(2):511-21.
17. van Best N, Hornef MW, Savelkoul PHM, Penders J. On the origin of species: Factors
shaping the establishment of infant's gut microbiota. Birth Defects Research Part C - Embryo
Today: Reviews. 2015;105(4):240-51.
18. Wishart DS. Proteomics and the Human Metabolome Project. Expert Review of
Proteomics. 2007;4(3):333-5.
19. Charbonneau MR, O’Donnell D, Blanton LV, Totten SM, Davis JC, Barratt MJ, et al.
Sialylated milk oligosaccharides promote microbiota-dependent growth in models of infant
undernutrition. Cell. 2016;164(5):859-71.
20. Sun Y, O’Riordan MX. Regulation of bacterial pathogenesis by intestinal short-chain fatty
acids. Adv Appl Microbiol. 85: Elsevier; 2013. p. 93-118.
21. Smilowitz JT, Lebrilla CB, Mills DA, German JB, Freeman SL. Breast milk
oligosaccharides: structure-function relationships in the neonate. Annu Rev Nutr. 2014;34:143-69.
22. Kumar H, du Toit E, Kulkarni A, Aakko J, Linderborg KM, Zhang Y, et al. Distinct
Patterns in Human Milk Microbiota and Fatty Acid Profiles Across Specific Geographic Locations.
Front Microbiol. 2016;7:1619.
23. Xi X, Huang W, Hou Q, Kwok LY, Sun Z, Sun T. Assessment of microbial community
structure in human colostrum and mature milk based on geographical location and delivery mode.
Science Bulletin. 2017;62(11):745-7.
24. Ali MA, Strandvik B, Palme-Kilander C, Yngve A. Lower polyamine levels in breast milk
of obese mothers compared to mothers with normal body weight. J Hum Nutr Diet. 2013;26 Suppl
1:164-70.
25. Urbaniak C, Angelini M, Gloor GB, Reid G. Human milk microbiota profiles in relation to
birthing method, gestation and infant gender. Microbiome. 2016;4:1.

8
CHAPTER 2
HUMAN BREAST MILK BACTERIOME IN HEALTH AND DISEASE
Anna Ojo-Okunola 1,*, Mark Nicol 1,2 and Elloise du Toit 1
1 Division of Medical Microbiology, Department of Pathology, University of Cape Town,
Observatory, Cape Town 7925, South Africa; [email protected] (M.N.);
[email protected] (E.dT.)
2 Division of Medical Microbiology, National Health Laboratory Service, Observatory, Cape
Town 7925, South Africa
* Correspondence: [email protected]; Tel.: +27-83-492-5284
Copyright
© 2018 by the authors. Licensee MDPI, Basel, Switzerland. This is an open access article
distributed under the Creative Commons Attribution License which permits unrestricted use,
distribution, and reproduction in any medium, provided the original work is properly cited (CC BY
4.0). (http://creativecommons.org/licenses/by/4.0/).
Citation
Ojo-Okunola A, Nicol M, du Toit E. Human breast milk bacteriome in health and disease.
Nutrients. 2018 Nov 3;10(11):1643. doi:10.3390/nu10111643
Author Contributions
A.O.-O. wrote all versions of the manuscript; E.dT. and M.N. supervised the project and reviewed
all versions of the manuscript. All authors reviewed and approved the final manuscript.

9
Abstract
It is well-known that, beyond nutritional components, human breast milk (HBM) contains a wide
variety of non-nutritive bio-factors perfectly suited for the growing infant. In the pre-2000 era,
HBM was considered sterile and devoid of micro-organisms. Though HBM was not included as part
of the human microbiome project launched in 2007, great strides have been made in studying the
bacterial diversity of HBM in both a healthy state and diseased state, and in understanding their role
in infant health. HBM provides a vast array of beneficial micro-organisms that play a key role in
colonizing the infant’s mucosal system, including that of the gut. They also have a role in priming
the infant’s immune system and supporting its maturation. In this review, we provide an in-depth
and updated insight into the immunomodulatory, metabolic, and anti-infective role of HBM
bacteriome (bacterial community) and its effect on infant health. We also provide key information
from the literature by exploring the possible origin of microbial communities in HBM, the bacterial
diversity in this niche and the determinants influencing the HBM bacteriome. Lastly, we investigate
the role of the HBM bacteriome in maternal infectious disease (human immunodeficiency virus
(HIV) and mastitis)), and cancer. Key gaps in HBM bacterial research are also identified.
Keywords: bacteriome; human breast milk; bacterial community; mastitis; human
immunodeficiency virus (HIV); cancer

10
2.1 INTRODUCTION
Human breast milk (HBM) is a complex, specific, physiological fluid universally known as the
optimal post-natal source of nutrition for infants (1-3). It consists not only of essential nutrients
(vitamins, minerals, protein), cells, hormones, immunological and immunomodulatory factors
(cytokines, immunoglobulin A, microRNAs), but also of non-nutritive bio-molecules (glyco-
conjugates, oligosaccharides) (4) and a vast array of microbes (the bacteria, archaea, viruses,
protozoa and anaerobic fungi) known as the human milk microbiota (5-7).
2.2 Human Breast Milk Bacteriome
The presence of bacteria in HBM as both an evolutionary strategy subsequent to the divergence
of mammals millions of years ago and an effect of natural selection has made it uniquely suited to
nourish infants (8). For example, an infant consuming an average of 800 mL HBM per day has been
reported to ingest 104–106 commensal bacteria (9). These bacteria are not merely present or
transient but are rather transcriptionally active and functioning participants in the infant’s gut
community (10). These bacteria serve as a physiological and continuous source of commensal and
potential probiotic bacteria to the infant’s gut (2, 11, 12). In addition to the role of HBM bacteria in
infants, these bacteria also help in maintaining the mother’s health, i.e., aiding in the prevention of
mastitis (13).
2.3 Bacterial Diversity in Human Breast Milk
In the pre-2000 era, HBM was considered sterile and devoid of micro-organisms (2). However,
in 2003, Martin et al. described the presence of commensal and probiotic bacteria in HBM. The
study used culture-dependent techniques and found, in all samples, a predominance of the lactic
acid bacteria Lactobacillus gasseri and Lactobacillus fermentum (14). Lactic acid bacteria,
including species of genera Lactobacillus and Bifidobacterium, are of interest in matters of human
health. They are known to limit the growth of potential pathogenic organisms in the gastrointestinal
tract due to their ability to produce acetate and lactate from the metabolism of ingested sugars.
Bifidobacterium was not initially regarded as a typical lactic acid bacteria due to their unrelated
genetic structure, however, their habitat overlaps with that of lactic acid bacteria and they produce
lactic acid as an end-product of fermentation (15). According to FAO/WHO, select lactic acid
bacteria strains with proven probiotic properties are thereby referred to as probiotics (16).
These early descriptions of bacterial diversity in HBM came from utilizing culture-dependent
techniques which allowed for the detection of facultative anaerobic bacteria, their close-relatives
Gram-positive bacteria and lactic acid bacteria in aseptically collected HBM (9, 14). The more
fastidious organisms, such as strict anaerobes which require a more exacting culture media and
stricter growth requirements, were not detected (11). More recently, and only using culture-

11
independent DNA-based techniques including denaturing gradient gel electrophoresis (DGGE),
temperature gradient gel electrophoresis (TGGE) and next generation sequencing (NGS), additional
bacterial genera have been detected. These include the obligate anaerobes, particularly
Bifidobacterium spp., Bacteroides spp., and members of the Clostridia class (5, 17).
In the first NGS study of HBM samples, the diversity of bacterial communities, or bacteriomes,
was characterized using 454 pyrosequencing to target the 16S rRNA gene. The most abundant
genera were found to be Streptococcus, Staphylococcus, Serratia and Corynebacterium (5). In
another study by Jost et al. (2013), NGS revealed gut anaerobes including Clostridia whose
members produce the metabolite butyrate which helps maintain colon health (11). The bacterial
diversity of HBM over the course of lactation (colostrum, transitional and mature milk) was also
characterized using same technique (18). Several micro-organisms including Streptococcus spp.,
Staphylococcus spp. and lactic acid bacteria (Weisella spp. and Leuconostoc spp.) were found
throughout; mature milk samples, however, possessed additional bacterial genera that typically
dwell in the oral cavity (18). Similar bacterial diversity patterns were seen using NGS with Illumina
MiSeq (19), as well as in two studies using metagenomic approaches (6, 13). While 16S amplicon
approaches target bacteria, metagenomic studies allow for the detection of other microorganisms
such as fungi, protozoa, archaea and viruses. Another advantage of metagenomic methods is that
they allow for taxonomic identification at the species level, whereas 16S can only confidently
identify organisms until the genus level. Firmicutes and Proteobacteria were the dominant phyla
observed in both the metagenomic studies and the 16S sequencing studies. At the genus level,
however, the relative abundance of Streptococcus and Staphylococcus was relatively low (6, 13). A
systematic review of the HBM bacteriome using culture-independent techniques has revealed that
these two genera (Staphylococcus and Streptococcus) may be universally predominant regardless of
differences in geographical area or methodological approach (20).
2.4 The Core Milk Bacteriome?
Hunt and co-workers (2011) suggested that there is a “core” HBM bacteriome of nine bacterial
genera including Staphylococcus, Streptococcus, Serratia, Pseudomonas, Corynebacterium,
Ralstonia, Propionibacterium, Sphingomonas, and Bradyrhizobium. The operational taxonomic
units (OTU) were found to represent about half of the observed microbial community, though their
relative abundances varied quite significantly among women (5). Since then, various studies have
confirmed the hypothesis of a core bacteriome (13, 19, 21). This “core” was not observed across
colostrum samples, suggesting that the acquisition of a stable microbial profile is gradual (22).
The core bacteriome may consist of species needed for maintaining efficient ecosystem
homeostasis whose loss (or gain) may negatively impact the structure and function of other
members in the ecosystem (23). Interestingly, however, it is assumed that the core bacteria are less

12
affected by the environmental factors (diet, obesity, stress) which are known to alter the
composition of the other bacteriome (24).
Differences in this “core” bacteriome have been reported across various studies (5, 19, 21).
These differences could be a result of the following factors: sample collection methods (electric
pump vs. manual expression, skin cleaning vs. decontamination), use of different DNA extraction
kits, storage conditions and freeze/thaw cycles of samples, sequencing platforms, possible biases
introduced by the use of primers with the amplification of different 16S rRNA gene hypervariable
regions and use of different pipelines in analyzing sequence reads (6, 21). Despite these factors, the
identified core bacteria genera commonly included Staphylococcus, Streptococcus, Lactobacillus
and Propionibacterium (see Figure 2.1). Formal meta-analysis of studies characterizing the core
HBM bacteriome in different geographical locations, however, is required.
Figure 2. 1: The core human breast milk bacteriome. *QIAamp® DNA Stool Kit (Qiagen), V6 region of
bacterial 16S rRNA gene, Ion Torrent platform. ˠQIAmp DNA Stool Mini Kit (Qiagen), V3–V4 region of
bacterial 16S rRNA gene, Illumina MiSeq platform. ‡QIAamp DNA Mini Kit (Qiagen) with previous
mechanical and enzymatic lysis, V1–V2 region, Pyrosequencing.
2.5 Origin of The Human Breast Milk Bacteriome
There have been several debates about the origin of bacterial communities in HBM. In 2003,
Martin et al. used randomly amplified polymorphic DNA (RAPD) polymerase chain reaction (PCR)
to analyze lactic acid bacteria from HBM, breast skin and areola. It was observed that the lactic acid
bacteria isolated from HBM had DNA profiles that were different from those isolated from either
the breast skin or the mammary areola (14). Obligate anaerobes (Bacteroides spp. and/or

13
Bifidobacterium spp.) which are unlikely to survive the aerobic conditions of the breast skin have
also been isolated from HBM (12, 21).
In addition, an experiment conducted by Hunt et al. (2011) showed that although the
bacteriome in the sebaceous skin and HBM share many of the same phylotypes, differences were
found. Streptococcus, one of the most abundant genera in HBM samples globally, was only a minor
component of the sebaceous skin bacteriome. Propionibacterium, on the other hand, reported as one
of the most abundant in sebaceous skin genera, was not among the most abundant genera found in
HBM samples (5). Bacteriome found in HBM using Illumina MiSeq were distinct from the areolar
skin in both composition and diversity (25).
2.5.1 Retrograde Flow
It is possible that some bacteria found in HBM come from the transfer of oral and skin bacteria
which enter the mammary ducts during suckling in a process called retrograde flow (26). This
hypothesis was investigated by Ramsay and colleagues who used ultrasound imaging to
demonstrate that there is a high degree of retrograde flow of milk from the infants’ mouth back into
the mammary ducts during breastfeeding, providing an ideal route for the exchange of bacteria back
into the mammary ducts (26). Streptococcus, one of the most abundant bacterial genera in the HBM
bacteriome, also dominates the salivary bacteriome (5, 27) lending support to the retrograde flow
mechanism, however, investigation into whether both bacterial communities share identical species
and strains of Streptococcus spp. is warranted.
2.5.2 Gut–Mammary-Axis
Another more recent hypothesis on the origin of the HBM bacteriome is the entero-mammary
pathway where non-pathogenic, intestinally derived bacteria may be transported to other locations
such as mucosal surfaces of the lactating mammary gland through the endogenous cellular pathway
known as the mononuclear cells (2, 3, 28).
The translocation of the gut bacteria to the mammary glands is aided by the physiological and
hormonal changes during late pregnancy and the increased permeability of the intestinal epithelial
lining (27). In support of this hypothesis, animal studies have shown increased bacterial
translocation of both aerobic and anaerobic organisms from the gut to the mesenteric lymph nodes
and mammary glands in pregnant and lactating mice (28).
In addition, Zhou et al. have found similar bacterial signatures in the dendritic cells (DC),
breast milk (BM), intestines and lymph nodes of lactating mice (29) suggesting translocation of
bacteria from the intestines by the DC, into the lymphatic system and carried through to the
mammary gland environment.
14
2.5.3 Mammary Gland Bacteriome
The human breast tissue bacteriome has recently been determined (30, 31) from breast tissue
biopsies collected from different sites within the breast. The viability of the bacteria was confirmed
by culture. As in HBM bacteriome, the principal phylum, Proteobacteria, was the major phylum
detected in human breast tissue bacteriome. Moreover, the two microbial communities share several
bacteria genera (6, 21).
The breast ductal bacteriome has recently been described by analyzing nipple aspirate fluid
(NAF) (32). NAF is regularly secreted by the epithelial cells lining the breast ducts that can be
collected non-invasively from the duct in most women by applying negative pressure with a syringe
attached to a suction cup (33). The duct is in constant communication with the external environment
through the areola. There is likely to be interaction of microbes between these various
compartments in the mammary environment.
Together, we may view the ecological niches in the human bacteriome, not as isolated
environments, but as a network of inter-related communities experiencing constant exchange (5). It
seems likely that the HBM bacteriome may be constantly influenced by exposure to other microbial
populations associated with mother and child.
2.6 Factors Which May Affect the Human Breast Milk Bacteriome
Many factors have been identified to contribute to the variability of the HBM bacterial
community between different women and within the same woman while she is experiencing
different physiological, hormonal and pathological conditions. Both maternal and infant factors
have been shown to contribute to this variation. While factors such as infant gender have been
shown to have no influence (19), studies have shown that maternal health and geographical location
play a major role (see Table 2.1).
1. Mode of delivery: An estimate by qPCR (34, 35) claims that women who delivered via
caesarean section (CS) have been shown to have a lower abundance of Lactobacillus spp.
(L. fermentum and L. salivarius), Bifidobacterium spp. when compared with the higher
bacterial counts of women who delivered vaginally. The HBM of mothers who had
elective CS also showed decreased members of the family Leuconostocaceae and
increased Carnobacteriaceae, when compared with women who delivered vaginally (18).
However, in a study by Urbaniak and colleagues which utilized a more robust statistical
analysis (19), no difference in bacterial profiles was observed between women who
delivered vaginally and those who delivered via emergency CS. It was suggested that this
could be due to the initiation of the labor process, including physiological stress and
hormonal signals which may influence increased permeability of intestinal epithelial lining
for translocation (18, 19).

15
2. Maternal weight: Higher levels of Staphylococcus spp. and lower levels of
Bifidobacterium spp. were observed in HBM from overweight mothers as compared with
normal-weight mothers (36); and a less diverse bacterial community has also been
observed in obese mothers (18). This may be due to the metabolic capacity of the
bacteriome of obese individuals which has an increased capacity to harvest energy from
diet (37).
3. Antibiotics and Chemotherapy: A lower abundance of lactobacilli and bifidobacteria was
detected in HBM of mothers who were exposed to antibiotics during the perinatal stage
(35). Exposure to anti-cancer chemotherapy also resulted in a reduction of the genera
Bifidobacterium, Eubacterium, Staphylococcus and Cloacibacterium (38).
4. Maternal health: Gronlund et al. (2007) described that the bacteriome is influenced by
maternal health. In his study using direct PCR analysis, allergic women exhibited a
significantly lower Bifidobacterium spp. in their BM, with their infants also having lower
fecal bifidobacteria counts (39). African women with HIV–RNA in their HBM had an
increased bacterial diversity and higher abundance of Lactobacillus spp. compared to
controls (40). Lower abundance of Bifidobacterium spp. and Bacteroides fragilis group
have been detected in HBM of women with celiac disease (41).
5. Lactation stage: A higher bacterial diversity but lower total bacterial count and less
bifidobacteria species were detected in colostrum when compared with mature HBM (18).
Bifidobacterium spp. and Enterococcus spp. counts, along with total bacteria increased as
the lactation stage progressed (34). In a similar study, however, transition milk samples
were observed to possess higher diversity than colostrum and mature milk (7, 34).
6. Geographical location: The bacterial genera found in HBM of Spanish mothers were
different to those of Americans (5, 7), or Finnish women (18) using sequencing techniques
with a similarly high throughput. In a study by Kumar et al., Chinese women had high
levels of Actinobacteria in comparison to the similarly high levels of Bacteroidetes
detected in Spanish women (42).
7. Gestational age: Bifidobacterium spp. were observed to be higher in HBM of women with
term babies than in preterm gestation.

16
Table 2. 1: Factors influencing human breast milk bacteriome.
Factors Influencing Human
Breast Milk Bacteriome Bacteriome References
Mode of delivery
Caesarean section
↓ Bifidobacterium spp., ↑ Proteobacteria, ↓ Lactobacillus
spp (L. fermentum and L salivarius), ↓
Leuconostocaceae, ↑ Carnobacteriaceae
(18, 34, 35)
Vaginal delivery ↑ Bifidobacterium spp., ↑ Lactobacillus spp. (34, 35)
Maternal weight
Overweight mothers ↑Staphylococcus, ↓ Bifidobacterium (36)
Obese mothers Less diverse bacterial community (18)
Antibiotic and Chemotherapy
Perinatal antibiotics usage ↓ Lactobacillus/Bifidobacterium (35)
Chemotherapy ↓ Bifidobacterium, ↓ Eubacterium, ↓ Staphylococcus and
↓ Cloacibacterium (38)
Maternal health
Allergy ↓ Bifidobacterium (39)
Celiac disease ↓ Bifidobacterium spp., ↓ Bacteroides fragilis group (41)
HIV ↑ Bacterial diversity, ↑ Lactobacillus spp. (40)
Geographical location
Spanish women ↑ Bacteroidetes (42)
Chinese women ↑ Actinobacteria (42)
Lactation stage
Colostrum ↑ Bacterial diversity, ↓ Bifidobacterium spp., ↓ Total
bacterial count (18)
Transition milk ↑ Bifidobacterium, ↑ Enterococcus spp. counts, ↑ Total
bacteria count (7, 34)
HIV: human immunodeficiency virus, ↑ and ↓ corresponds to increase and decrease levels of specific bacteria
genera respectively.
2.7 Plausible Functions of Human Breast Milk Bacteria
The HBM bacterial communities play a role in reduction of the incidence and severity of
infections in the breastfed infant via mechanisms such as competitive exclusion and production of
antimicrobial compounds. HBM bacteriome also improve the intestinal barrier function by
increasing mucin production and reducing intestinal permeability (2, 3).
2.7.1 Vertical Transmission and Seeding of Infant Gut by HBM Bacteria
Evidence for vertical transmission of maternal bacteria, via milk, to the infant’s gut has been
shown in humans (12, 14). Lactobacillus spp. sequences isolated from infant feces showed identical

17
patterns to those found in their respective maternal HBM but differed from the profiles found in the
maternal vagina (14). Identical bacterial strains of bifidobacterium (Bifidobacterium breve and
Bifidobacterium longum subsp. longum), and Lactobacillus plantarum have been confirmed in
HBM and infant feces of mother-infant pairs, suggesting vertical transfer from the mother’s milk to
the infant (21, 43, 44).
Recently, additional supporting evidence for vertical transmission of maternal microbes has
been published. Shotgun metagenomics was used to demonstrate the transfer of specific strains of
Bifidobacterium spp., Ruminococcus bromii, and Coprococcus comes within different mother-infant
pairs (10). Another study compared the fecal bacteriome of breastfed infants, whose gut is
dominated by Bifidobacterium spp. and Lactobacillus spp. transmitted from HBM, to that of
formula-fed infants, whose gut is predominantly colonized by enterococci, enterobacteria and
Clostridium difficile—a pathogen associated with enteric and atopic diseases (45, 46).
2.7.2 Anti-Infective Activities of HBM Bacteria
In vitro studies show that Lactobacillus rhamnosus and Lactobacillus crispatus, isolated from
HBM have anti-infective properties against Staphylococcus aureus (S. aureus). S. aureus has been
implicated in mastitis (9), antibiotic-resistant nosocomial infections, and neonatal infections. HBM-
derived lactobacilli strains, particularly Lactobacillus salivarius (L. salivarius) CECT5713, produce
not only in vitro antibacterial activity, but also a protective effect against Salmonella enterica
serovar Cholerasuis (S. enterica) CECT4155 in animal models. This is mediated through inhibiting
the adhesion of S. enterica to mucins and increasing the likelihood of survival of infected mice (47).
Additionally, HBM lactic acid bacteria protect the physiological environment of the gut
through mechanisms such as the production of organic acids and the lowering of pH to inhibit the
growth of various facultative and anaerobic bacteria (47, 48).
2.7.3 Immuno-Modulatory Activities of HBM Bacteria
HBM bacteria provide a source of bifidobacteria to the infants’ gut. Bifidobacteria in turn
activate T-regulatory cells which can result in improved resistance to pathogenic microorganisms
(2, 45). In addition, the human milk metagenome has been shown to contain immunomodulatory
DNA motifs which may help decrease exaggerated inflammatory responses to colonizing bacteria
(6). HBM derived probiotic strains, Lactobacillus fermentum CECT5716 and Lactobacillus
salivarius CECT5713, have demonstrated in vitro immunomodulatory activity by modulating the
activation of peripheral blood mononuclear cell (PBMC) subsets, CD8+ natural killer cells, Treg
cells, and several cytokines and chemokines. This effect was not seen with probiotic bacteria of
non-milk origin (49).
18
2.7.4 Anti-Allergic Properties of HBM Bacteria
A beneficial association has been proposed between HBM lactic acid bacteria and allergies.
For example, animal studies have shown that probiotic lactobacilli (of HBM origin), Lactobacillus
gasseri together with Lactobacillus coryniformis, decrease the occurrence and severity of allergic
responses to cow milk protein (50). Although a randomized, controlled trial showed that probiotic
supplementation in the first six months of life did not reduce the risk of atopic eczema (51), other
studies found that supplementation with specific Lactobacillus spp. and/or Bifidobacterium spp. in
mothers led to a reduced infant eczema at one year and two years of age (52, 53). The Hygiene
Hypothesis suggests that the anti-allergy properties of probiotics are due to the down-regulation in
the production of Th2 cytokines by inducing a Th1 response (50). Disturbance in the regulation of
the immune system is considered an underlying cause of allergies (54).
It is also interesting to note that the presence of viridans streptococci, one of the dominant
bacterial groups in HBM, seems to be a feature of a healthy infant gut in contrast to that of atopic
infants whose gut is dominated by Klebsiella spp. (55). Animal studies have shown that defective
maturation of the immune system in animals that lack appropriate host–microbe interactions during
early life makes them prone to allergic immune responses. This defective immune maturation
occurs with the introduction of even a single strain of bacteria such as Bifidobacterium spp. during
the neonatal phase (56).
2.7.5 Metabolic Activities of HBM Bacteria
HBM bacteria are essential for the digestion of oligosaccharides (the fourth main component of
HBM). Infants lack the necessary enzymes to digest these and, instead, the HBM microbes ingested
during feedings break them down into short chain fatty acids (SCFA); this end-product also serves
as one of the main energy sources for colonocytes (57). This is helpful for increased nutrient
absorption as the gut of an infant is much shorter than in adults leading to quick transit of food (7).
2.7.6 Anti-Tumour Properties of HBM Bacteria
HBM bacteriome may have an anti-tumor role. In vitro studies have demonstrated that the heat-
killed cells and cytoplasmic fractions of Enterococcus faecalis and Staphylococcus hominis isolated
from HBM possess anti-tumor activity against a breast cancer cell line (58). Another in vitro study
has demonstrated the therapeutic, anti-cancer activity of lactic acid bacteria, Lactococccus lactis
subsp. lactis, against colon cancer (59), This is relevant to both mother and infant health.

19
2.8 Implications of The Human Breast Milk Bacteriome In Disease
2.8.1 Mastitis
Lactational mastitis is an inflammatory condition of the mammary gland that occurs in about
30% of breastfeeding women (60, 61). It is characterized by local symptoms (localized warmness
and soreness on the affected breast, pain, redness, swelling of the breast), in addition to systemic
symptoms (fever). It is also a major reason breastfeeding (BF) is discontinued (62, 63).
Mastitis is a dysbiosis of the HBM bacteriome characterized by rapid growth of opportunistic
pathogenic bacteria including members of Staphylococcus and/or Streptococcus, Corynebacterium
and depletion of commensal bacteria (Lactococcus and Lactobacillus) (60, 64, 65). In acute mastitis,
the bacteria count of Staphylococcus aureus (S. aureus) is said to increase greatly to about 4.0 log10
cfu/mL from 1.5–3.0 log10 cfu/mL in healthy subjects. Another species, Staphylococcus
epidermidis (S. epidermidis), normally appearing on skin and mucosa, is an under-recognized
causative agent of lactational mastitis. This lack of recognition may occur if the clinician believes
its presence stems from contamination of HBM samples with skin flora (60), however, recent
studies have shown it plays an increasing role (13).
Coagulase-negative staphylococci (CNS) and S. epidermidis have been isolated in HBM of
women with chronic mastitis. The chronic nature is because S. epidermidis forms biofilms and is
resistant to many antibiotics (63). Recent studies also show that the HBM metagenome in women
with mastitis is different based on the stage/type of infection. While S. aureus was the most
common etiological agent of acute mastitis, S. epidermidis was found to be the most common
bacteria in subacute mastitis (13).
A reduced bacterial diversity and species richness has been observed in HBM of women with
mastitis (13, 64). Phage related sequences were also observed in HBM of women with acute
mastitis. This is because the virulence factors of S. aureus are encoded inside phages, making it
easier for the bacteria to evade the host’s immune system (13).
Patel et al. (2017) observed members of the genus Staphylococcus to be differentially abundant
in sub-acute mastitis. Genes related to bacterial chemotaxis and invasion of epithelial cells, bacterial
motility proteins and secretion system were enriched in women having sub-acute and acute mastitis
(64).
A randomized clinical trial has shown that HBM derived probiotics, Lactobacillus salivarius
CECT5713 and Lactobacillus gasseri CECT5714, when compared with antibiotics (65), are a
complementary and effective substitute for the treatment and control of mastitis.

20
2.8.2 Human Immunodeficiency Virus (HIV)
HBM of women infected with HIV has been shown to have a different bacterial composition
compared with non-infected women. An increase in both bacterial diversity and Lactobacillus spp.
frequency has been observed. In contrast, Staphylococcus hominis (S. hominis) and S. aureus were
significantly reduced (40) in HIV-infected women. The reduction of these two Staphylococcus
species may be due to the inhibitory features of lactic acid bacteria against S. aureus (40). In
addition, a pathological or disturbed HIV-positive immune system could be a reason for the
observed results. In a similar study, however, there was no difference either in bacterial diversity or
in the bacterial profiles between HIV-positive and HIV-negative women (66). The discrepancies in
these results are unknown but could, however, be due to a difference in geological location,
methodological differences or the small sample sizes used in the later study.
2.8.3 Cancer
Although there has been no direct study on breast milk bacteriome and (breast) cancer, as
women with cancer seldom breastfeed, the microbial ecology of other compartments within the
mammary environment such as the breast tissue bacteriome and breast ductal bacteriome (using
nipple aspirate fluid) have been linked to cancer (32, 67).
Microbial dysbiosis was implicated in breast cancer in a study by Urbaniak and colleagues.
There was a depletion of the lactic acid bacteria, Lactococcus spp. and Streptococcus spp., and an
increased abundance of Bacillus spp., Staphylococcus spp. and the family Comamonadaceae and
Enterobacteria. Escherichia coli isolated from breast cancer patients in the same study induced
DNA double-stranded breaks (67).
Bacteria may have a systemic influence in the host, promoting, regulating and training the
immune system (68). Bacteria maintain the health of breast tissue by stimulating resident immune
cells. In dysbiosis, a condition characterized by the reduction of specific bacterial taxa, there may be
lower immune cell stimulation by such bacteria. This in turn creates an environment which may be
conducive for breast tumor formation. Xuan et al. found that compared with the adjacent normal
tissue, there was a significant reduction of Sphingomonas yanoikuyae in breast cancer patients (69).
In a similar study, a member of the Sphingomonadaceae family was enriched in nipple aspirate fluid
from healthy controls while Alistipes was enriched in breast cancer patients (32).
The mechanisms, e.g., inflammation and DNA damage, through which bacteria play a role in
cancer should be studied further, using animal models, as it’s unsure whether the association of
specific bacteria with tumors could be due to their ability to thrive well in particular milieus or
because they cause cancer (70).

21
2.9 CONCLUSIONS
In conclusion, the HBM bacteriome has been shown to play a role in anti-infection,
immunomodulation and metabolic activity and is known to be influenced by maternal and socio-
economic factors. A better understanding of the factors influencing HBM bacteriome may make it
possible to manipulate bacterial communities to improve the health and development outcomes of
infants. Lastly, the HBM bacteriome may be associated with, or cause, specific disease conditions.
2.9.1 Gaps Identified
1. There are very limited animal studies demonstrating the specific role of breast milk
bacteria in disease conditions.
2. There are few integrative studies exploring the interplay between HBM bacteriome and its
metabolites, and their collective role in diseased condition.
3. There is insufficient data on some of the identified HBM bacterial groups. It isn’t enough
to simply characterize the bacterial diversity of HBM; rather, the role that each of the
bacterium play in maintaining the microbial ecology of the HBM bacteriome and their role
in infant and maternal health must be understood.
4. There are few studies on HBM bacteriome and the factors influencing low socio-economic
regions, such as many African settings. These regions also boast less research of infant
nutrition and this research is necessary to know if there are any underlying genetic
mechanisms involved.

22
2.10 REFERENCES
1. Agostoni C, Braegger C, Decsi T, Kolacek S, Koletzko B, Michaelsen KF, et al. Breast-
feeding: A commentary by the ESPGHAN Committee on Nutrition. J Pediatr Gastroenterol Nutr.
2009;49(1):112-25.
2. Civardi E, Garofoli F, Tzialla C, Paolillo P, Bollani L, Stronati M. Microorganisms in
human milk: lights and shadows. J Matern Fetal Neonatal Med. 2013;26 Suppl 2:30-4.
3. Jeurink PV, van Bergenhenegouwen J, Jimenez E, Knippels LM, Fernandez L, Garssen J, et
al. Human milk: a source of more life than we imagine. Benef Microbes. 2013;4(1):17-30.
4. Aakko J, Kumar H, Rautava S, Wise A, Autran C, Bode L, et al. Human milk
oligosaccharide categories define the microbiota composition in human colostrum. Benef Microbes.
2017;8(4):563-7.
5. Hunt KM, Foster JA, Forney LJ, Schutte UM, Beck DL, Abdo Z, et al. Characterization of
the diversity and temporal stability of bacterial communities in human milk. PLoS One.
2011;6(6):e21313.
6. Ward TL, Hosid S, Ioshikhes I, Altosaar I. Human milk metagenome: A functional capacity
analysis. BMC Microbiol. 2013;13(1).
7. Boix-Amorós A, Collado MC, Mira A. Relationship between milk microbiota, bacterial
load, macronutrients, and human cells during lactation. Front Microbiol. 2016;7(APR).
8. Goldman AS. Evolution of immune functions of the mammary gland and protection of the
infant. Breastfeed Med. 2012;7(3):132-42.
9. Heikkila MP, Saris PE. Inhibition of Staphylococcus aureus by the commensal bacteria of
human milk. J Appl Microbiol. 2003;95(3):471-8.
10. Asnicar F, Manara S, Zolfo M, Truong DT, Scholz M, Armanini F, et al. Studying Vertical
Microbiome Transmission from Mothers to Infants by Strain-Level Metagenomic Profiling.
mSystems. 2017;2(1).
11. Jost T, Lacroix C, Braegger C, Chassard C. Assessment of bacterial diversity in breast milk
using culture-dependent and culture-independent approaches. Br J Nutr. 2013;110(7):1253-62.
12. Jost T, Lacroix C, Braegger CP, Rochat F, Chassard C. Vertical mother-neonate transfer of
maternal gut bacteria via breastfeeding. Environ Microbiol. 2014;16(9):2891-904.
13. Jimenez E, de Andres J, Manrique M, Pareja-Tobes P, Tobes R, Martinez-Blanch JF, et al.
Metagenomic Analysis of Milk of Healthy and Mastitis-Suffering Women. J Hum Lact.
2015;31(3):406-15.
14. Martin R, Langa S, Reviriego C, Jiminez E, Marin ML, Xaus J, et al. Human milk is a
source of lactic acid bacteria for the infant gut. J Pediatr. 2003;143(6):754-8.
15. Kenneth T. Important Groups of Procaryotes. Today’s online textbook of bacteriology.
2012:1.

23
16. Mohania D, Nagpal R, Kumar M, Bhardwaj A, Yadav M, Jain S, et al. Molecular
approaches for identification and characterization of lactic acid bacteria. J Dig Dis. 2008;9(4):190-8.
17. Fouhy Fab, Ross RPac, Fitzgerald Gbc, Stanton Cac, Cotter PDac. Composition of the early
intestinal microbiota:Knowledge, knowledge gaps and the use of high-throughput sequencing to
address these gaps. Gut Microbes. 2012;3(3):1-18.
18. Cabrera-Rubio R, Collado MC, Laitinen K, Salminen S, Isolauri E, Mira A. The human
milk microbiome changes over lactation and is shaped by maternal weight and mode of delivery.
Am J Clin Nutr. 2012;96(3):544-51.
19. Urbaniak C, Angelini M, Gloor GB, Reid G. Human milk microbiota profiles in relation to
birthing method, gestation and infant gender. Microbiome. 2016;4:1.
20. Fitzstevens JL, Smith KC, Hagadorn JI, Caimano MJ, Matson AP, Brownell EA.
Systematic Review of the Human Milk Microbiota. Nutr Clin Pract. 2016.
21. Murphy K, Curley D, O'Callaghan TF, O'Shea CA, Dempsey EM, O'Toole PW, et al. The
composition of human milk and infant faecal microbiota over the first three months of life: A pilot
study. Sci Rep. 2017;7.
22. Jimenez E, Delgado S, Fernandez L, Garcia N, Albujar M, Gomez A, et al. Assessment of
the bacterial diversity of human colostrum and screening of staphylococcal and enterococcal
populations for potential virulence factors. Res Microbiol. 2008;159(9-10):595-601.
23. Shetty SA, Hugenholtz F, Lahti L, Smidt H, de Vos WM. Intestinal microbiome
landscaping: insight in community assemblage and implications for microbial modulation strategies.
FEMS Microbiol Rev. 2017;41(2):182-99.
24. Salonen A, Salojarvi J, Lahti L, de Vos WM. The adult intestinal core microbiota is
determined by analysis depth and health status. Clin Microbiol Infect. 2012;18 Suppl 4:16-20.
25. Pannaraj PS, Li F, Cerini C, et al. Association between breast milk bacterial communities
and establishment and development of the infant gut microbiome. JAMA Pediatrics.
2017;171(7):647-54.
26. Ramsay DT, Kent JC, Owens RA, Hartmann PE. Ultrasound imaging of milk ejection in the
breast of lactating women. Pediatrics. 2004;113(2):361-7.
27. Rodriguez JM. The origin of human milk bacteria: is there a bacterial entero-mammary
pathway during late pregnancy and lactation? Adv Nutr. 2014;5(6):779-84.
28. Perez PF, Dore J, Leclerc M, Levenez F, Benyacoub J, Serrant P, et al. Bacterial imprinting
of the neonatal immune system: lessons from maternal cells? Pediatrics. 2007;119(3):e724-32.
29. Zhou X, Voigt A, Paveglio S, Weinstock G, Matson A, Davidovics Z. SIMILAR
BACTERIAL SIGNATURES IN INTESTINAL TISSUES, MILK, AND DENDRITIC CELLS OF
LACTATING MICE SUGGEST A POSSIBLE ENTERO-MAMMARY PATHWAY. AGA
Abstracts. 2017:S-172.

24
30. Urbaniak C, Cummins J, Brackstone M, Macklaim JM, Gloor GB, Baban CK, et al.
Microbiota of human breast tissue. Appl Environ Microbiol. 2014;80(10):3007-14.
31. Hieken TJ, Chen J, Hoskin TL, Walther-Antonio M, Johnson S, Ramaker S, et al. The
microbiome of aseptically collected human breast tissue in benign and malignant disease. Sci Rep.
2016;6.
32. Chan AA, Bashir M, Rivas MN, Duvall K, Sieling PA, Pieber TR, et al. Characterization of
the microbiome of nipple aspirate fluid of breast cancer survivors. Sci Rep. 2016;6:28061.
33. Petrakis NL. Nipple Aspirate Fluid in Epidemiologic Studies of Breast Disease. Epidemiol
Rev. 1993;15(1):188-95.
34. Khodayar-Pardo P, Mira-Pascual L, Collado MC, Martinez-Costa C. Impact of lactation
stage, gestational age and mode of delivery on breast milk microbiota. J Perinatol. 2014;34(8):599-
605.
35. Soto A, Martin V, Jimenez E, Mader I, Rodriguez JM, Fernandez L. Lactobacilli and
bifidobacteria in human breast milk: influence of antibiotherapy and other host and clinical factors.
J Pediatr Gastroenterol Nutr. 2014;59(1):78-88.
36. Collado MC, Laitinen K, Salminen S, Isolauri E. Maternal weight and excessive weight
gain during pregnancy modify the immunomodulatory potential of breast milk. Pediatr Res.
2012;72(1):77-85.
37. Turnbaugh PJ, Ley RE, Mahowald MA, Magrini V, Mardis ER, Gordon JI. An obesity-
associated gut microbiome with increased capacity for energy harvest. Nature.
2006;444(7122):1027-131.
38. Urbaniak C, McMillan A, Angelini M, Gloor GB, Sumarah M, Burton JP, et al. Effect of
chemotherapy on the microbiota and metabolome of human milk, a case report. Microbiome.
2014;2(1):24.
39. Gronlund MM, Gueimonde M, Laitinen K, Kociubinski G, Gronroos T, Salminen S, et al.
Maternal breast-milk and intestinal bifidobacteria guide the compositional development of the
Bifidobacterium microbiota in infants at risk of allergic disease. Clin Exp Allergy.
2007;37(12):1764-72.
40. Gonzalez R, Maldonado A, Martin V, Mandomando I, Fumado V, Metzner KJ, et al. Breast
milk and gut microbiota in African mothers and infants from an area of high HIV prevalence. PLoS
One. 2013;8(11):e80299.
41. Olivares M, Albrecht S, De Palma G, Ferrer MD, Castillejo G, Schols HA, et al. Human
milk composition differs in healthy mothers and mothers with celiac disease. Eur J Nutr.
2015;54(1):119-28.
42. Kumar H, du Toit E, Kulkarni A, Aakko J, Linderborg KM, Zhang Y, et al. Distinct
Patterns in Human Milk Microbiota and Fatty Acid Profiles Across Specific Geographic Locations.
Front Microbiol. 2016;7:1619.

25
43. Milani C, Mancabelli L, Lugli GA, Duranti S, Turroni F, Ferrario C, et al. Exploring
Vertical Transmission of Bifidobacteria from Mother to Child. Appl Environ Microbiol.
2015;81(20):7078-87.
44. Solís G, de los Reyes-Gavilan CG, Fernández N, Margolles A, Gueimonde M.
Establishment and development of lactic acid bacteria and bifidobacteria microbiota in breast-milk
and the infant gut. Anaerobe. 2010;16(3):307-10.
45. Walker WA, Iyengar RS. Breast milk, microbiota, and intestinal immune homeostasis.
Pediatr Res. 2015;77(1-2):220-8.
46. Azad MB, Konya T, Maughan H, Guttman DS, Field CJ, Chari RS, et al. Gut microbiota of
healthy Canadian infants: profiles by mode of delivery and infant diet at 4 months. Can Med Assoc
J. 2013;185(5):385-94.
47. Olivares M, Díaz‐Ropero MP, Martín R, Rodríguez JM, Xaus J. Antimicrobial potential of
four Lactobacillus strains isolated from breast milk. J Appl Microbiol. 2006;101(1):72-9.
48. Fons AG, Tuomo Karjalainen, Michel. Mechanisms of colonisation and colonisation
resistance of the digestive tract part 2: bacteria/bacteria interactions. Microb Ecol Health Dis.
2000;12(2):240-6.
49. Perez-Cano FJ, Dong H, Yaqoob P. In vitro immunomodulatory activity of Lactobacillus
fermentum CECT5716 and Lactobacillus salivarius CECT5713: two probiotic strains isolated from
human breast milk. Immunobiology. 2010;215(12):996-1004.
50. Lara-Villoslada F, Olivares M, Sierra S, Rodriguez JM, Boza J, Xaus J. Beneficial effects
of probiotic bacteria isolated from breast milk. Br J Nutr. 2007;98 Suppl 1:S96-100.
51. Taylor AL, Dunstan JA, Prescott SL. Probiotic supplementation for the first 6 months of life
fails to reduce the risk of atopic dermatitis and increases the risk of allergen sensitization in high-
risk children: A randomized controlled trial. J Allergy Clin Immunol. 2007;119(1):184-91.
52. Abrahamsson TR, Jakobsson T, Böttcher MF, Fredrikson M, Jenmalm MC, Björkstén B, et
al. Probiotics in prevention of IgE-associated eczema: A double-blind, randomized, placebo-
controlled trial. J Allergy Clin Immunol. 2007;119(5):1174-80.
53. Kim JY, Kwon JH, Ahn SH, Lee SI, Han YS, Choi YO, et al. Effect of probiotic mix
(Bifidobacterium bifidum, Bifidobacterium lactis, Lactobacillus acidophilus) in the primary
prevention of eczema: a double-blind, randomized, placebo-controlled trial. Pediatr Allergy
Immunol. 2010;21(2 Pt 2):e386-93.
54. Prokopakis E, Vardouniotis A, Kawauchi H, Scadding G, Georgalas C, Hellings P, et al.
The pathophysiology of the hygiene hypothesis. Int J Pediatr Otorhinolaryngol. 2013;77(7):1065-
71.
55. Kirjavainen PV, Apostolou E, Arvola T, Salminen SJ, Gibson GR, Isolauri E.
Characterizing the composition of intestinal microflora as a prospective treatment target in infant
allergic disease. FEMS Immunol Med Microbiol. 2001;32(1):1-7.

26
56. Rautava S. Early microbial contact, the breast milk microbiome and child health. J Dev
Orig Health Dis. 2016;7(1):5-14.
57. Maldonado J, Lara-Villoslada F, Sierra S, Sempere L, Gómez M, Rodriguez JM, et al.
Safety and tolerance of the human milk probiotic strain Lactobacillus salivarius CECT5713 in 6-
month-old children. Nutrition. 2010;26(11-12):1082-7.
58. Hassan Z, Mustafa S, Rahim RA, Isa NM. Anti-breast cancer effects of live, heat-killed and
cytoplasmic fractions of Enterococcus faecalis and Staphylococcus hominis isolated from human
breast milk. In vitro cellular & developmental biology Animal. 2016;52(3):337-48.
59. Kim JY, Woo HJ, Kim YS, Kim KH, Lee HJ. Cell cycle dysregulation induced by
cytoplasm of Lactococcus lactis ssp lactis in SNUC2A, a colon cancer cell line. Nutr Cancer.
2003;46(2):197-201.
60. Delgado S, Arroyo R, Martin R, Rodriguez JM. PCR-DGGE assessment of the bacterial
diversity of breast milk in women with lactational infectious mastitis. BMC Infect Dis. 2008;8:51.
61. Foxman B, D'Arcy H, Gillespie B, Bobo JK, Schwartz K. Lactation Mastitis: Occurrence
and Medical Management among 946 Breastfeeding Women in the United States. Am J Epidemiol.
2002;155(2):103-14.
62. Cullinane M, Amir LH. In Response to "Microbial Diversity in Milk of Women With
Mastitis: Potential Role of Coagulase-Negative Staphylococci, Viridans Group Streptococci, and
Corynebacteria". J Hum Lact. 2017;33(4):815-6.
63. Delgado S, Arroyo R, Jimenez E, Marin ML, del Campo R, Fernandez L, et al.
Staphylococcus epidermidis strains isolated from breast milk of women suffering infectious
mastitis: potential virulence traits and resistance to antibiotics. BMC Microbiol. 2009;9:82.
64. Patel SH, Vaidya YH, Patel RJ, Pandit RJ, Joshi CG, Kunjadiya AP. Culture independent
assessment of human milk microbial community in lactational mastitis. Sci Rep. 2017;7(1):7804.
65. Arroyo R, Martín V, Maldonado A, Jiménez E, Fernández L, Rodríguez JM. Treatment of
infectious mastitis during lactation: Antibiotics versus oral administration of lactobacilli isolated
from breast milk. Clin Infect Dis. 2010;50(12):1551-8.
66. Bender JM, Li F, Martelly S, Byrt E, Rouzier V, Leo M, et al. Maternal HIV Infection
Influences the Microbiome of HIV Uninfected Infants. Sci Transl Med. 2016;8(349):349ra100-
349ra100.
67. Urbaniak C, Gloor GB, Brackstone M, Scott L, Tangney M, Reid G. The Microbiota of
Breast Tissue and Its Association with Breast Cancer. Appl Environ Microbiol. 2016;82(16):5039-
48.
68. Belkaid Y, Hand T. Role of the Microbiota in Immunity and inflammation. Cell.
2014;157(1):121-41.
69. Xuan C, Shamonki JM, Chung A, DiNome ML, Chung M, Sieling PA, et al. Microbial
dysbiosis is associated with human breast cancer. PLoS One. 2014;9(1):e83744.

27
70. Sheikh K. The Breast Has Its Own Microbiome. Sci Am. 2016;20(8):947-57.

28
CHAPTER 3
THE DETERMINANTS OF THE HUMAN BREAST MILK
METABOLOME AND ITS ROLE IN INFANT HEALTH

29
Abstract
Human breast milk is needed for optimal growth as it satisfies both the nutritional and biological
needs of an infant. The established relationship between breastfeeding and an infant’s health is
attributable to the nutritional and non-nutritional, functional components of human breast milk
including metabolites such as the lipids, amino acids, biogenic amines and carbohydrates. These
components have diverse roles, including protecting the infant against infections and guiding the
development of the infant’s immature immune system. In this review, we provide an in-depth and
updated insight into the immune modulatory and anti-infective role of human breast milk
metabolites and their effects on infant health and development. We also review the literature on
potential determinants of the human breast milk metabolome, including maternal infectious diseases
such as human immunodeficiency virus and mastitis.
Keywords: metabolome; human breast milk; metabolite profiles; human immunodeficiency virus ,
mastitis.

30
3.1 INTRODUCTION
Human breast milk (HBM) is the optimal nutrition for infants, and the WHO recommends
exclusive breastfeeding (EBF) for the first 6 months of life (1) with continued breastfeeding (BF) up
to two years of age. EBF, especially during the first 6 months of life, has a protective effect against
acute respiratory tract infection (RTI) and mortality due to diarrheal illness in developing countries
(2, 3). In pre-term infants or (very) low birth weight infants, EBF has been linked to a reduction in
infant morbidity and mortality in the first year of life (4, 5).
The benefits of BF an infant are long-lasting, and extend beyond the period of BF (6). For
example, BF has been shown to be beneficial for cardiovascular health and for the prevention of
hypertension and type I and II diabetes during childhood and later adolescent life (7). Also, EBF has
been linked to a lower risk of childhood obesity, which is fast becoming a global epidemic (8). It
has also been estimated that by increasing the rate of BF in low and middle-income countries
(LMIC), 823,000 child deaths per year due to gastrointestinal disorders could be prevented (9).
In full-term infants, HBM is almost always sufficient in providing essential nutrients for infant
growth and development, irrespective of the mother’s own nutritional status (10). The components
of HBM including water, protein, fatty acids, microbes, immunological factors, human milk
oligosaccharides and metabolites all play important roles in the beneficial properties of BF.
3.2 Human Breast Milk Metabolome
HBM metabolites are low molecular weight compounds which include the intermediate and
end products of metabolism, originating from different metabolic processes in the mammary gland.
Some metabolites, such as lactose, are produced in the endoplasmic reticulum of the milk secretory
cells (11). Other metabolites are produced through the metabolic processes of resident microbes in
HBM or originate from other cell types and are filtered through the mammary epithelium from
bloodstream (12, 13). While the abundance of some metabolites, such as fatty acids, is highly
variable, the abundance of other metabolites, e.g., urea, is highly conserved suggesting a specific
functional role in the infant (13). This review describes the nutritional and non-nutritional
biologically active metabolites of HBM, their determinants and their role in infant immune
development, gut microbial colonization, and infant health and developmental outcomes.
The HBM metabolome can be investigated using two main technical approaches: proton
nuclear magnetic resonance spectroscopy (1H NMR) and mass spectrometry (MS). 1H-NMR
spectroscopy has the following advantages: (1) it is a highly reproducible technique that specifically
identifies small molecule in a non-targeted, non-destructive manner from biological fluids; (2) it
does not require extra steps during sample preparation, such as separation or sample derivatization;
(3) it allows for the identification of a wide range of compounds and provides information about
chemical structure; (4) it is the preferred method for the detection of hydrophilic and uncharged

31
compounds, such as sugars, which are often undetectable by liquid chromatography-mass
spectrometry (LC–MS) methods (14-16). MS, on the other hand, is (1) highly sensitive, with a
detection limit in the nanomolar range; (2) requires only a small volume of sample as its starting
material; (3) it is the recommended technique for targeted analysis; (4) when coupled with gas
chromatography, it is preferred in the detection of hydrophobic and volatile compounds, such as
lipids (17). Overall, both techniques can be used in a complementary manner to maximize the
identification of different metabolites within the HBM sample.
The first metabolomic study on HBM was conducted in 2012 by Marincola et al (18) using
both NMR spectroscopy and gas chromatography-mass spectrometry (GC-MS) to study the aqueous
and lipid fractions, respectively, of preterm HBM. Compared to the metabolites in pre-term formula
milk, the aqueous extracts of preterm HBM were shown to have high lactose concentrations. The
pre-term formula milk, on the other hand, had a higher concentration of maltose (18). The HBM
metabolome was further explored by Practico et al (19) with NMR spectroscopy. Twenty HBM
samples were analyzed and a total of 43 metabolites were detected at least once in all HBM samples
including amino acids, short chain fatty acids, oligosaccharides, sugars, phenolic compounds,
tricarboxylic acid (TCA) cycle intermediates and N-trimethyl moieties (choline and acetyl-L-
carnitine) (19).
Using mass spectrometry coupled with both gas chromatography and liquid chromatography,
Qian et al (20) confirmed the unique metabolic profile of HBM and highlighted the significant
differences between HBM and bovine or formula milk, in relation to both the presence and
abundance of most metabolites (20). For example, non-esterified fatty acids such as saturated fatty
acids with aliphatic tails <16 carbons (capric acid, myristic acid, lauric acid), mono-unsaturated
fatty acids (oleic acid, palmitoleic acid, eicosenoic acid) and essential polyunsaturated fatty acids
(PUFAs) such as linoleic acid and α-linolenic acid were highly abundant in HBM compared with
bovine or formula milk (20).
3.3 Specific Human Breast Milk (HBM) Metabolites and Their Role in
Health
3.3.1 Carbohydrates
3.3.1.1 Lactose
Lactose represents the most abundant metabolite and the major carbohydrate in HBM (21). It is
the primary source of calories, providing about 40% of total energy value of HBM to the infant. It is
the major osmotic component regulating HBM volume by drawing water into the intracellular
secretory vesicles (13, 21). Lactose concentration ranges between 6.7-7.8 g/dl in mature HBM, and

32
its concentration is the least variable of the macronutrients as it is tightly regulated by the mammary
gland (22, 23).
Lactose induces innate immunity by upregulating gastrointestinal antimicrobial peptides
(AMPs), as demonstrated in the colonic epithelial cell line T84 and in THP-1 monocytes and
macrophages. This induction may promote intestinal homeostasis and protection of the gut against
pathogenic micro-organisms (24). In addition, a recent study has demonstrated an antagonistic
effect of lactose on growth of specific bacteria. The concentration of lactose in HBM was shown to
be negatively correlated with the HBM bacterial genera Enterobacter spp. and Actinomyces spp.
(25) which contain important opportunistic and multi-resistant bacterial species (26, 27).
Lactose concentration has been shown to be positively correlated with the volume of HBM
intake and the number of HBM feeds per day (28, 29). Unlike lipids, lactose concentration was
shown to be positively associated with infant weight and adiposity gains between 3 and 12 months
of life (28). Also, the influence of HBM lactose on infant growth has been confirmed in a computer
model of a newborn baby (from birth to age 6 months) which simulates the baby’s metabolism of
HBM to understand the mechanisms of infant growth (30).
Lactose also forms part of many carbohydrate-based bioactive compounds in HBM, such as
forming the backbone of oligosaccharides (10). Lactose aids mineral absorption in infants including
calcium, copper, magnesium and manganese (31).
3.3.1.2 Human milk oligosaccharides
HMOs are a group of bioactive compounds representing the third most abundant metabolite in
HBM, after lactose and lipids (32). Compared to other mammalian milk, HBM contains a higher
variety (>200), and more complex structures of soluble oligosaccharides, of which 162 chemical
structures have been characterized (33). Although diverse and structurally complex, each lactating
mother synthesizes a unique compositional subset (34).
HMOs are complex sugars with a lactose core at the reducing end, and are differentiated based
on the linkages with one or more building blocks: D- glucose (Glc), L- fucose (Fuc), D- galactose
(Gal), N-acetylglucosamine (GlcNAc) or N-acetylneuraminic acid (Neu5Ac) residues (32). HMO
composition depends, in part, upon the expression of two specific genes and as such, individual
women synthesize different sets of oligosaccharides (13). For example, fucose residues may be
attached to a lactose core by an α 1, 2-linkage, which is catalyzed by the enzyme, fucosyltransferase
2 (FUT2), encoded by the secretor gene (Se) or by means of α 1, 3/4-linkages catalyzed by the
enzyme, fucosyltransferase 3 (FUT3), which is encoded by the Lewis gene (Le) (Figure 1) (13).
Women can therefore be differentiated into being a secretor or a non-secretor depending on the
expression of active FUT2 enzymes. As such, women can have either of four different phenotypes

33
namely Lewis-positive Secretors (Se+Le+), Lewis-negative Secretors (Se+Le−), Lewis-positive
non-Secretors (Se−Le+) or Lewis-negative non-Secretors (Se−Le−) depending on the expression of
FUT2 and/or FUT3 gene as shown in Figure 3.1 (35). Non-secretors have low or undetectable
concentrations of 2’-fucosyllactose (2’-FL), lactodifucotetraose (LDFT), lacto-N-fucopentaose
(LNFP) I, or lacto-N-difucohexaose (LNDFHI) I in their HBM which are all α-1,2-linked
fucosylated HMOs (13).
Figure 3. 1: Graphical representation of the enzymatic processes that lead to the different HMO
phenotypes. Adapted from Bode 2012 (36). FUT2: Fucosyltransferase 2; FUT3: Fucosyltransferase 3. 2’-FL:
2’-fucosyllactose; 3’-FL: 3’-fucosyllactose
HMOs act as prebiotics which selectively stimulate the function of beneficial bacteria such as
Bifidobacterium spp. while suppressing the growth of pathogens (37). HMOs are resistant to
digestion during their passage through the alimentary canal as human infants lack the glycolytic
enzymes needed to break them down. Instead, they are digested by certain commensal bacteria in
the infant gut to produce short chain fatty acids (SCFAs) which help in establishing a stable
ecosystem in an infant’s gut by modulating the immune system and promoting the gut epithelial
barrier function (38, 39). SCFAs drive the development and function of regulatory T (Treg) cells
thereby limiting intestinal inflammation. They also serve as an energy source for the epithelial cells
of the colon and produce an acidic milieu in the gut, making it inhospitable to potentially pathogenic
microbes (40, 41). SCFAs such as butyrate, regulate gene expression through inhibition of histone
deacetylase. This action may lead to the inhibition of interferon-γ production and suppression of
nuclear factor κB (NF-kB) activation in human colonic epithelial cells (42). NF-κB, for example, is

34
responsible for early immune inflammatory responses and its dysregulation is seen in inflammatory
bowel diseases (IBDs) (43).
HMOs inhibit many enteric pathogens, such as toxin-producing Escherichia coli, which causes
diarrhea in infants (44), Campylobacter spp. (45) and Norovirus spp. (46) by acting as a decoy
receptor for pathogens. HMOs are structurally related to glycans on the intestinal epithelial cell
surfaces, to which pathogenic bacteria bind. Breastfed infants, for example, are protected against
Campylobacter jejuni, which causes diarrhea, as 2’-fucosyllactosamine found on intestinal cells,
which acts as a receptor for C. jejuni, is also present on HMOs (38, 47). HMOs have also been
shown to reduce attachment of the protozoan parasite, Entamoeba histolytica (E. histolytica), and
associated cell toxicity in a human colon adenocarcinoma cell line. The main adhesion-related
virulence factor in E. histolytica is a lectin which binds with galactose and N-acetyl-galactosamine,
and HMOs containing terminal galactose, such as Lacto-N-tetraose (LNT), act as decoy receptors
(48). Cell culture studies have shown that pooled HMOs reduced the invasion and virulence of
Candida albicans in human premature intestinal epithelial cells (pIECs) by delaying the induction
of hyphal morphogenesis after inoculation of C. albicans onto pIECs (49).
Different groups of HMOs often exhibit specific properties. For example, sialylated HMOs
provide sialic acid needed for neural development, function and cognition (36). Also, a significantly
lower concentration of disialyllacto-N-tetraose (DSLNT) has been observed in HBM of mothers
whose infants developed necrotizing enterocolitis compared to healthy infants, suggesting a possible
protective role of DSLNT to the intestinal tissues of preterm infants and very-low-birth-weight
infants (50).
3.3.2 Lipids
Lipids in HBM are complex and diverse and provide 45% - 55% of the total energy needed by
infants to support optimal growth (51). Compared to other macronutrients, the lipid composition of
HBM is highly variable, and can be affected by duration of breastfeeding, time of day, stage of
lactation, maternal nutritional status, and particularly, maternal diet (related to geographic location)
(51-53).
Lipids play a role in membrane structure, signal transmission and cell recognition in signaling
pathways, lipoprotein metabolism and as a source and carrier of lipid-soluble vitamins (54). For
example, palmitic acid, which is a saturated fatty acid, is not only an energy source for the infant but
also acts as a pulmonary surfactant that reduces the surface tension at the alveolar air-liquid
interface and prevents collapse of alveoli (55). Triacylglycerides are the most abundant lipids in
HBM. The remaining lipid classes include diacylglycerides, monoacylglycerides, cholesterol,
phospholipids (phosphatidylinositol, phosphatidylserine, sphingomyelin, phosphatidylcholine,

35
phosphatidylethanolamine), and free fatty acids (Table 3.1) (53). Phospholipids play a vital role in
the infant’s immune and inflammatory responses, while sphingomyelin plays a role in central
nervous system myelination (56). In a randomized control trial, low birth weight infants randomized
to receive sphingomyelin-fortified milk showed improved neurobehavioral development during
infancy compared with the control group which received only milk (57).
Table 3. 1: Lipid classes in human breast milk. Adapted from (53).
Lipid classes Proportion of total lipids in HBM (%)
Triacylglycerides 98.1–98.8
Phospholipids 0.26–0.8
Phosphatidylinositol ND
Phosphatidylserine ND
Sphingomyelin ND
Phosphatidylcholine ND
Phosphatidylethanolamine ND
Cholesterol 0.25–0.34
Non-esterified fatty acids (free fatty acids) 0.08–0.4
Diacylglycerides 0.01–0.7
Monoacylglycerides Traces
ND: Not determined
All these components make up the milk fat lipid globules (MFLG) which are produced by the
alveolar cells of the mammary gland. The MFLG consists of a core of triacylglycerides and a
membrane of phospholipids (58). Triacylglycerides are molecules comprised of mixtures of three
fatty acids esterified to a glycerol backbone. Triglyceride synthesis involves specific positioning of
the fatty acids at the outer sn-1 and sn-3, and center sn-2 positions of the glycerol molecule (59).
Palmitic acid with a 16-carbon backbone (16:0) is the most common saturated fatty acid in
HBM and has a preferential positioning of its fatty acids at the sn-2 position, instead of the sn-1,3
positions that are typical of human tissue lipids, infant formula and vegetable oils common in
human diets (59). Studies have shown that this specific position of triglycerides in palmitic acid
improves the absorption of both palmitic acid and macroelements such as calcium and magnesium.
This improved absorption decreases constipation and enhances the BF infant’s intestinal well-being
(59, 60).
Lipid fractions in HBM include ~34% to 47% saturated fatty acid with mainly ~17%–25% of
palmitic acid, ~31% to 43% monounsaturated fatty acids, ~ 12% to 26% n-6 polyunsaturated fatty
acids (PUFA), and ~ 0.8% - 3.6% of n-3 PUFA. PUFA are fatty acids containing two or more
double bonds along their carbon backbones and include two biologically important subgroups in

36
HBM, the n-3 and n-6 essential fatty acids represented by α-linolenic acid (ALA) and linoleic acid
(LA) respectively. Both ALA and LA are needed for the growth and maturation of various organs in
the infant, especially the brain and eye (61). Although PUFA have been shown to prevent various
allergic diseases in several studies, recent systematic reviews concluded that there is insufficient
evidence that HBM PUFA influence the risk of childhood allergic and respiratory outcomes (62,
63).
ALA can be converted to the long chain-polyunsaturated fatty acids (LC-PUFA),
eicosapentaenoic acid (EPA) and docohexaenoic acid (DHA) while LA is converted to arachidonic
acid (AA) through consecutive steps involving desaturation and elongation. LC-PUFA of the n-3
and n-6 series are indispensable nutrients with anti-inflammatory and inflammatory activities
respectively (62). Table 3.2 below summarizes the major LC-PUFA in HBM, their source and
functions.
Table 3. 2: Long chain-polyunsaturated fatty acids (LC-PUFA) in HBM.
Long chain-polyunsaturated
fatty acids (LC-PUFA)
Source, functions and determinants References
n-3 series
Docohexaenoic acid (DHA) Higher DHA concentration in HBM leads to
improved neurodevelopmental and vision outcomes in
infants.
DHA concentration is greatly influenced by dietary
intake especially of fish or fish oil supplements in lactating
mothers.
A dose dependent relationship exists between
maternal DHA intake and its concentration in HBM, as an
increased DHA concentration in HBM has been observed
in lactating women supplemented with DHA.
A lower AA to DHA ratio is found in HBM of
women from Asian and Scandinavian countries due to
higher feeding of DHA-rich fish.
(51, 53, 61,
64, 65)
Eicosapentaenoic acid (EPA) EPA competes with AA for 5-lipoxygenase and
cyclooxygenase enzymes needed for the metabolism of
AA, thereby antagonizing the pro-inflammatory effects of
AA.
Lower concentrations of EPA and DHA in HBM
have been associated with allergy in children.
(66, 67)
n-6 series
Arachidonic acid (AA) AA is the most abundant of the PUFA with ~0.5% of
total fatty acids in HBM.
AA content of HBM is relatively stable among
women despite variations in diet and lifestyles as it is
derived from pre-existing maternal stores.
AA serves as a progenitor to signaling molecules,
leukotrienes (LTs), thromboxane and the prostaglandins.
These products have inflammatory and atherogenic effects
(53, 66, 67)

37
on cells.
High AA:EPA ratio in HBM has been associated with
the development of allergy symptoms at 18 months.
3.3.3 Biogenic amines
Biogenic amines are low molecular weight nitrogenous organic bases that are secreted in
HBM. They include the polyamines (spermine, spermidine and putrescine), together with the
monoamines (tyramine) and diamines (histamine and cadaverine) (68). The polyamines are the main
biogenic amines found in HBM, with the most abundant being spermine and spermidine.
Polyamines are synthesized from the precursor, ornithine, through the action of the enzyme,
ornithine decarboxylase. HBM is the first source of exogenous polyamines for the growing infant
(69). Polyamines inhibit cytokine synthesis in human mononuclear cells, downregulating the pro-
inflammatory cytokine response (70). Polyamines are involved in cell growth and proliferation (68,
71). Rapidly growing tissues, such as the mucosa of an infant’s gut require high concentrations of
polyamines (69).
A higher polyamine concentration has been observed in HBM of women with preterm babies
compared to those with full term babies in early lactation (69), suggesting a greater requirement of
this metabolite for the undeveloped intestinal tissues of preterm babies.
A qualitative case study and mathematical model which evaluated the correlation between
mean spermine concentration of HBM in the first month of life and allergy appearance estimated
that at least 5.02 nmol/ml of spermine is needed to prevent the appearance of allergy in breastfed
infants (72). Another study showed that putrescine and spermine concentrations were lower in
mature HBM from atopic mothers than non-atopic mothers (73).
3.3.4 Nonprotein Nitrogen Molecules
HBM nonprotein nitrogen comprises many bioactive molecules including the nucleotides, free
amino acids, amino sugars, creatine, urea, carnitine and nucleic acids. These make up approximately
25% of the total nitrogen in HBM (56, 74, 75).
3.3.4.1 Free amino acids
Free amino acids including alanine, glutamate, glutamine, isoleucine, threonine and valine, are
more readily absorbed than protein-derived amino acids and they provide a nitrogen source for
growing infants (76). Free amino acids are also known to give HBM its unique taste as each free
amino acid has its own flavor and can be sensed by receptors in the taste-goblet (20).
Glutamine is the most abundant free amino acid and supplies ketoglutaric acid for the citric
acid cycle. It also serves as a major energy substrate for enterocytes and as a brain neurotransmitter
(10). Glutamate, on the other hand, is a signaling molecule involved in sustaining gut barrier

38
function and neuroendocrine reflexes. Glutamate serves as an important precursor for other
bioactive molecules, including glutathione and proline (77). Taurine helps in structural and
functional development of retina receptors and may also aid in fat absorption (78). Together,
glutamine, glutamate, taurine and alanine make up 50% of the total free amino acids in HBM.
3.3.4.2 Creatine
Creatine is an essential metabolite needed for normal neural development (74). Neurological
symptoms such as speech delay, intellectual disability and epilepsy are displayed in children with
inborn errors of creatine synthesis or transport. Creatine helps to buffer cellular adenosine
triphosphate (ATP) levels when energy demand is transiently greater than ATP synthesis rate (79).
Creatine also serves as an energy vector between the sites of ATP synthesis and use. Creatine is
spontaneously and irreversibly broken down to creatinine which is excreted in urine. Therefore,
there is a continuous need to replace creatine to meet the growing infant's expanding tissue mass
(79).
Infants receive their dietary creatine from mother's HBM. Edison et al (74), however, showed
that a breast-fed infant only receives about 9% of the creatine needed from the diet (74). The
remainder is provided through de novo synthesis in the infant in which creatine is produced from
the amino acids, glycine and arginine.
3.4 Determinants of The Human Breast Milk Metabolome
Several maternal and infant factors have been identified as potential determinants of the HBM
metabolome (Table 3.4). Some of these factors are explored further below.
1. Mastitis: Lactational mastitis is a lobular inflammation of the mammary gland caused by
Staphylococcus spp. and/or Corynebacterium spp. with clinical symptoms including fever,
chills and localized inflammation of the breast tissue (80). It often results in early cessation
of EBF and may affect up to 33% of lactating women (68). Mastitis is associated with
increased concentrations of the biogenic amines: spermine, putrescine, and histamine (68).
Biogenic amines are usually produced due to the metabolic activity of certain
microorganisms including some Staphylococcus epidermidis strains with activity for
decarboxylation of amino acids; high concentration of biogenic amines in a mastitic breast
could be due to increased decarboxylase activity (81). Mastitis is associated with an
increased free fatty acid (FFA) concentration, although no change is observed in the total
lipids and phospholipids, suggesting increased lipolysis within HBM (82). The release of
FFA in an infected body site is one of the hallmarks of Staphylococcus aureus infection;
elevated FFA may be a nonspecific immune response to bacteria-associated lactational
mastitis (82, 83).

39
2. Human Immunodeficiency Virus (HIV): Normal HMO composition in HBM is disrupted
in maternal HIV infection. Several studies show an increased abundance of 3’- sialyllactose
(3′-SL) in HBM of HIV-positive mothers compared to HIV-negative mothers (50, 84, 85).
Also, a higher proportion of 3′-SL amongst total HMOs was observed in HBM of HIV-
negative women with lower CD4 counts (86). On the other hand, LNT and LNnT were
more abundant in HBM of HIV-negative mothers (84).
Among secretors, significantly higher absolute concentrations of 2’-FL, LNT and LNFP I
and higher relative abundance of difucosyllacto-N-tetraose (DFLNT) and fucosyl-
disialyllacto-N-hexaose (FDSLNH) was observed in HBM of HIV-infected women
compared to uninfected secretor women (86). In non-secretors, only the relative abundance
of DFLNH was higher in HBM of HIV-infected women compared with HIV-uninfected
non-secretors (86).
A higher proportion of 3′-SL per total HMOs in HBM has been associated with an increased
risk of HIV transmission to infants and with markers of advanced HIV disease, while higher
total HMO, LNnT and non-3’-SL HMO concentrations in HBM were associated with
reduced vertical HIV transmission from mother to child (85). HMO composition of HBM
has been found to influence the survival of HIV-exposed, uninfected (HEU) children born
to HIV-infected mothers in Zambia up to 2 years of age (86). During the BF period, higher
concentrations of 2′-FL, 3′-FL, and LNFP I, II/III were significantly associated with
reduced mortality among HEU children (86).
3. Maternal weight: Compared to HBM of women with normal weight, HBM of overweight
mothers had a higher abundance of saturated fatty acid, lower abundance of n-3 PUFA and
also, a lower ratio of unsaturated to saturated fatty acids (87). Lower total polyamines have
also been observed in HBM of obese mothers compared to HBM of mothers with normal
body weight (71).
4. Chemotherapy: A case report has shown that DHA and inositol concentrations are reduced
in HBM of a mother who underwent a chemotherapy cocktail for Hodgkin’s lymphoma as
compared with healthy controls (88).
5. Maternal diet: Dietary intake in the United States is skewed towards omega-6 fatty acids
and associated with high content of LA in HBM of American mothers, and a particularly
low DHA concentration (61). Unlike an omnivorous diet, a vegetarian diet provides high
concentration of LA and ALA; hence a high concentration of these essential fatty acids in
HBM of vegans (89).
6. Maternal education: In a study conducted by Nayak et al (2017) among low income
families in an urban area in Bangladesh and India, higher level of maternal education was

40
associated with decreased saturated fatty acids, and increased ratio of polyunsaturated fatty
acids to saturated fatty acids in HBM (90) possibly due to better informed food choices.
7. Geographical location: Significant differences in metabolite profiles have been observed
based on geographical locations (91-94). With respect to HMOs, HBM of Chinese women
had highest concentrations of 3′-FL and LNFP III, Spanish women had the highest
concentration of 2’-FL, while the highest concentration of LNFP I was observed in HBM of
women from Finland (91). Other metabolites including fatty acids, ethanolamine, n-6
PUFA, creatine, lactose and 2-oxoglutarate, pyruvate and lactate, methanol, polyamines,
tyrosine have also been found to differ significantly between different geographical
locations (91, 93, 94).
8. Ethnicity: Compared to Caucasian women, black women had higher HBM concentrations
of 2-oxoglutarate, betaine and glycerophosphocholine and lower HBM valine concentration
(93). HBM of Caucasians, on the other hand, had significantly lower concentrations of
lactate and fucose compared to Asian women (93).
9. Gestational age: The HBM metabolite profile of full term babies shows higher
concentrations of carnitine, caprylate, caprate, pantothenate, β-hydroxybutyrate and urea as
compared with pre-term HBM, which has higher concentrations of lactose, phosphocholine,
choline, glutamate, DHA, total polyamine, 3’-SL, and 6’-sialylactose (6’-SL) (69, 95, 96).
10. Stage of lactation: The composition and concentration of HMOs in HBM varies over the
period of lactation (97, 98) with the mean total HMO concentration decreasing from 20.9
g/l in colostrum to 12.9 g/l in mature HBM at 4 months postpartum (99). The mean lactose
concentration increases with period of lactation, from 56 g/L on day 4 to 68.9 g/L at 4
months postpartum (99).
11. Course of lactation: The last milk of a feed, the hind HBM, has been found to contain up
to two or three times the total lipid concentration of foremilk (at the beginning of a feed)
(23). Preterm low birthweight infants have been shown to exhibit increased weight gain
when EBF hind HBM (100).
12. Mode of delivery: Though the impact of mode of delivery on metabolite profiles was found
to be dependent on geographical location in a recent study (91), overall, women who had a
vaginal delivery had significantly higher HBM concentrations of 3-hydroxybutyrate and
LNFP III, while higher HBM concentrations of butyrate, urea, ethanolamine and proline
were observed among women who underwent caesarean section (CS) delivery (91).
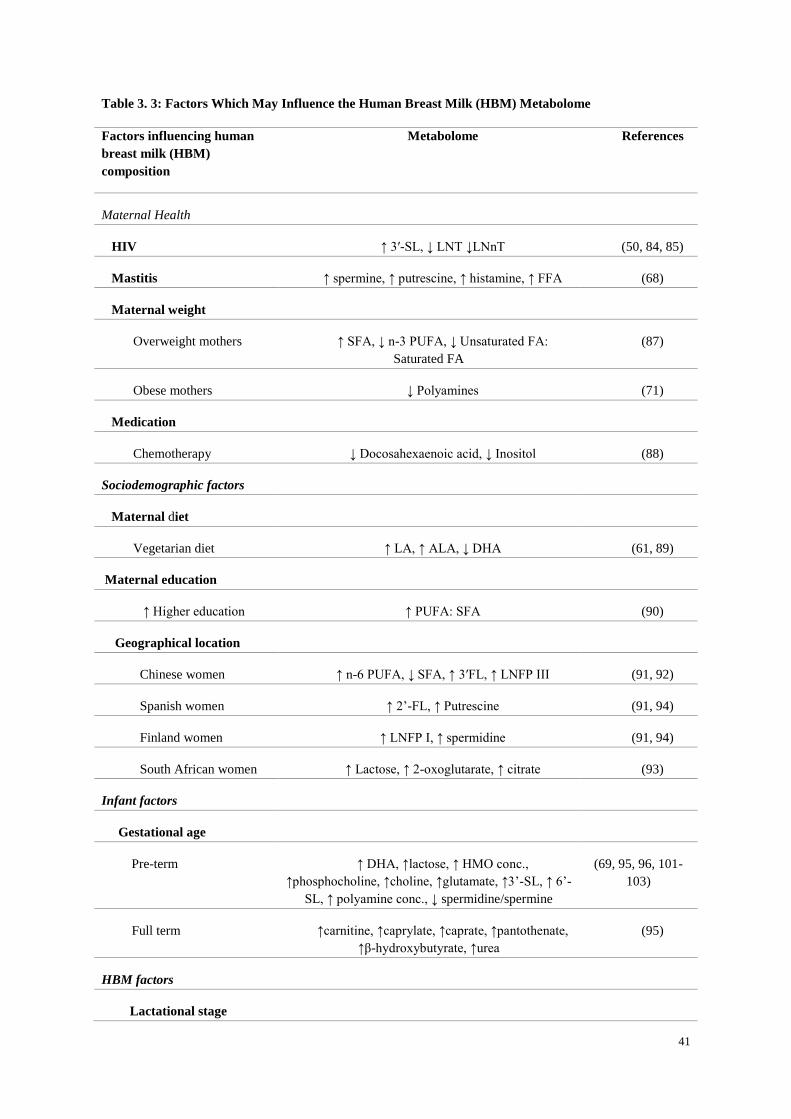
41
Table 3. 3: Factors Which May Influence the Human Breast Milk (HBM) Metabolome
Factors influencing human
breast milk (HBM)
composition
Metabolome References
Maternal Health
HIV ↑ 3′-SL, ↓ LNT ↓LNnT (50, 84, 85)
Mastitis ↑ spermine, ↑ putrescine, ↑ histamine, ↑ FFA (68)
Maternal weight
Overweight mothers ↑ SFA, ↓ n-3 PUFA, ↓ Unsaturated FA:
Saturated FA
(87)
Obese mothers ↓ Polyamines (71)
Medication
Chemotherapy ↓ Docosahexaenoic acid, ↓ Inositol (88)
Sociodemographic factors
Maternal diet
Vegetarian diet ↑ LA, ↑ ALA, ↓ DHA (61, 89)
Maternal education
↑ Higher education ↑ PUFA: SFA (90)
Geographical location
Chinese women ↑ n-6 PUFA, ↓ SFA, ↑ 3′FL, ↑ LNFP III (91, 92)
Spanish women ↑ 2’-FL, ↑ Putrescine (91, 94)
Finland women ↑ LNFP I, ↑ spermidine (91, 94)
South African women ↑ Lactose, ↑ 2-oxoglutarate, ↑ citrate (93)
Infant factors
Gestational age
Pre-term ↑ DHA, ↑lactose, ↑ HMO conc.,
↑phosphocholine, ↑choline, ↑glutamate, ↑3’-SL, ↑ 6’-
SL, ↑ polyamine conc., ↓ spermidine/spermine
(69, 95, 96, 101-
103)
Full term ↑carnitine, ↑caprylate, ↑caprate, ↑pantothenate,
↑β-hydroxybutyrate, ↑urea
(95)
HBM factors
Lactational stage

42
Colostrum ↑ HMOs, ↑ LNnT, ↑ 2’-FL, ↑ 3’-SL, ↓ Lactose,
↑ Leucine, ↑ Betaine, and ↑ Creatinine
(38, 95, 98)
Mature HBM ↓ Total HMOs, ↑ 3’-FL, ω6/ ω3 PUFA, ↑ oleic
acid, ↑ palmitoleic acid, ↑ linoleic acid, ↑ tri-, di-,
mono-glycerides, ↓ cholesterol, ↓ phospholipids, ↓ α-
tocopherol, ↓ fucose, ↓ furanose isomers, ↓ D-
glucosaminic acid, ↑ Alanine, ↑ caprylate, ↑ caprate,
↑ glutamate
(13, 21, 90, 95, 98,
104, 105)
Course of lactation
Foremilk ↑ free amino acids, ↑ phenylalanine, ↑
threonine, ↑ valine, ↑ alanine, ↑ glutamine, ↑ serine
(100)
Delivery mode
Vaginal delivery ↑ 3-hydroxybutyrate and ↑ LNFP III (91)
CS delivery ↑ Butyrate, ↑ urea, ↑ ethanolamine and ↑ proline (91)
↑: Increase concentrations, ↓ Decrease concentrations, SFA: Saturated fatty acids, PUFA: Polyunsaturated
fatty acids; FFA: Free fatty acids; LNFP: Lacto-N-fucopentaose: 2’-FL: 2′-fucosyllactose; 3’-SL: 3’-
sialyllactose; 6’-SL; 6’-sialyllactose; LA: Linoleic acid: ALA: α-Linolenic acid; DHA: Docosahexaenoic acid;
LNT: lacto-N-tetraose LNT; LNnT: lacto-N-neotetraose; HIV: Human Immunodeficiency Virus.
3.5 CONCLUSION
HBM is a rich source of metabolites which contribute to HBM’s beneficial properties, needed
for optimal growth and development of infants. Our current knowledge of the HBM metabolome is
largely restricted to studies from industrialized/westernized countries, with under-representation of
samples from Sub-Saharan Africa. Further studies of geographically and ethnically diverse
populations are needed.
A thorough understanding of HBM metabolites, their role in the developing infant and
potential determinants is important for our understanding of its nutritional and bioactive value.

43
3.6 REFERENCES
1. Zalewski BM, Patro B, Veldhorst M, Kouwenhoven S, Crespo Escobar P, Calvo Lerma J, et
al. Nutrition of infants and young children (one to three years) and its effect on later health: A
systematic review of current recommendations (EarlyNutrition project). Crit Rev Food Sci Nutr.
2017;57(3):489-500.
2. Arifeen S, Black RE, Antelman G, Baqui A, Caulfield L, Becker S. Exclusive breastfeeding
reduces acute respiratory infection and diarrhea deaths among infants in Dhaka slums. Pediatrics.
2001;108(4):E67.
3. Lamberti LM, Fischer Walker CL, Noiman A, Victora C, Black RE. Breastfeeding and the
risk for diarrhea morbidity and mortality. BMC Public Health. 2011;11 Suppl 3:S15.
4. Victora C, Barros A. Effect of breastfeeding on infant and child mortality due to infectious
diseases in less developed countries. The Lancet. 2000;355(9202):451-5.
5. World Health Organization. Guidelines on HIV and Infant Feeding 2010: Principles and
Recommendations for Infant Feeding in the Context of HIV and a Summary of Evidence. WHO
Guidelines Approved by the Guidelines Review Committee. Geneva2010.
6. Garrido D, Dallas DC, Mills DA. Consumption of human milk glycoconjugates by infant-
associated bifidobacteria: Mechanisms and implications. Microbiology (United Kingdom).
2013;159(4):649-64.
7. Expert Panel on Integrated Guidelines for Cardiovascular H, Risk Reduction in C,
Adolescents, National Heart L, Blood I. Expert panel on integrated guidelines for cardiovascular
health and risk reduction in children and adolescents: summary report. Pediatrics. 2011;128 Suppl
5:S213-56.
8. Uwaezuoke SN, Eneh CI, Ndu IK. Relationship Between Exclusive Breastfeeding and
Lower Risk of Childhood Obesity: A Narrative Review of Published Evidence. Clinical Medicine
Insights: Pediatrics. 2017;11:1179556517690196.
9. Victora CG, Bahl R, Barros AJ, Franca GV, Horton S, Krasevec J, et al. Breastfeeding in
the 21st century: epidemiology, mechanisms, and lifelong effect. Lancet. 2016;387(10017):475-90.
10. Martin CR, Ling P-R, Blackburn GL. Review of infant feeding: key features of breast milk
and infant formula. Nutrients. 2016;8(5):279.
11. Kresge N, Simoni RD. Lactose Synthesis in the Mammary Gland: Lactose Synthase and the
Work of Robert L. Hill. J Biol Chem. 2006;281(6):e6-e.
12. Sundekilde UK, Larsen LB, Bertram HC. NMR-Based Milk Metabolomics. Metabolites.
2013;3(2):204-22.
13. Smilowitz JT, O'Sullivan A, Barile D, German JB, Lonnerdal B, Slupsky CM. The human
milk metabolome reveals diverse oligosaccharide profiles. J Nutr. 2013;143(11):1709-18.

44
14. Moutloatse GP, Bunders MJ, van Reenen M, Mason S, Kuijpers TW, Engelke UF, et al.
Metabolic risks at birth of neonates exposed in utero to HIV-antiretroviral therapy relative to
unexposed neonates: an NMR metabolomics study of cord blood. Metabolomics. 2016;12(11):175.
15. Alonso A, Marsal S, Julià A. Analytical methods in untargeted metabolomics: state of the
art in 2015. Frontiers in bioengineering and biotechnology. 2015;3:23.
16. Wishart DS. Quantitative metabolomics using NMR. TrAC Trends in Analytical Chemistry.
2008;27(3):228-37.
17. Emwas A-HM. The Strengths and Weaknesses of NMR Spectroscopy and Mass
Spectrometry with Particular Focus on Metabolomics Research. In: Bjerrum JT, editor.
Metabonomics: Methods and Protocols. New York, NY: Springer New York; 2015. p. 161-93.
18. Marincola FC, Noto A, Caboni P, Reali A, Barberini L, Lussu M, et al. A metabolomic
study of preterm human and formula milk by high resolution NMR and GC/MS analysis:
Preliminary results. Journal of Maternal-Fetal and Neonatal Medicine. 2012;25(SUPPL. 5):62-7.
19. Pratico G, Capuani G, Tomassini A, Baldassarre ME, Delfini M, Miccheli A. Exploring
human breast milk composition by NMR-based metabolomics. Nat Prod Res. 2014;28(2):95-101.
20. Qian L, Zhao A, Zhang Y, Chen T, Zeisel SH, Jia W, et al. Metabolomic Approaches to
Explore Chemical Diversity of Human Breast-Milk, Formula Milk and Bovine Milk. Int J Mol Sci.
2016;17(12).
21. Hennet T, Borsig L. Breastfed at Tiffany's. Trends Biochem Sci. 2016;41(6):508-18.
22. Koletzko B, Agostoni C, Bergmann R, Ritzenthaler K, Shamir R. Physiological aspects of
human milk lipids and implications for infant feeding: a workshop report. Acta Paediatr.
2011;100(11):1405-15.
23. Ballard O, Morrow AL. Human milk composition: nutrients and bioactive factors. Pediatric
Clinics. 2013;60(1):49-74.
24. Cederlund A, Kai-Larsen Y, Printz G, Yoshio H, Alvelius G, Lagercrantz H, et al. Lactose
in Human Breast Milk an Inducer of Innate Immunity with Implications for a Role in Intestinal
Homeostasis. PLoS One. 2013;8(1).
25. Boix-Amoros A, Collado MC, Mira A. Relationship between Milk Microbiota, Bacterial
Load, Macronutrients, and Human Cells during Lactation. Front Microbiol. 2016;7:492.
26. Davin-Regli A, Pagès J-M. Enterobacter aerogenes and Enterobacter cloacae; versatile
bacterial pathogens confronting antibiotic treatment. Front Microbiol. 2015;6(392).
27. Könönen E, Wade WG. Actinomyces and related organisms in human infections. Clin
Microbiol Rev. 2015;28(2):419-42.
28. Prentice P, Ong KK, Schoemaker MH, van Tol EA, Vervoort J, Hughes IA, et al. Breast
milk nutrient content and infancy growth. Acta Paediatr. 2016;105(6):641-7.

45
29. Khan S, Hepworth AR, Prime DK, Lai CT, Trengove NJ, Hartmann PE. Variation in fat,
lactose, and protein composition in breast milk over 24 hours: associations with infant feeding
patterns. J Hum Lact. 2013;29(1):81-9.
30. Nilsson A, Mardinoglu A, Nielsen J. Predicting growth of the healthy infant using a genome
scale metabolic model. NPJ systems biology and applications. 2017;3(1):3.
31. Ziegler EE, Fomon SJ. Lactose enhances mineral absorption in infancy. J Pediatr
Gastroenterol Nutr. 1983;2(2):288-94.
32. Goehring KC, Kennedy AD, Prieto PA, Buck RH. Direct evidence for the presence of
human milk oligosaccharides in the circulation of breastfed infants. PLoS One. 2014;9(7):e101692.
33. Urashima T, Hirabayashi J, Sato S, Kobata A. Human milk oligosaccharides as essential
tools for basic and application studies on galectins. Trends in Glycoscience and Glycotechnology.
2018;30(172):SE51-SE65.
34. Aakko J, Kumar H, Rautava S, Wise A, Autran C, Bode L, et al. Human milk
oligosaccharide categories define the microbiota composition in human colostrum. Benef Microbes.
2017;8(4):563-7.
35. Bode L. The functional biology of human milk oligosaccharides. Early Hum Dev.
2015;91(11):619-22.
36. Bode L. Human milk oligosaccharides: Every baby needs a sugar mama. Glycobiology.
2012;22(9):1147-62.
37. Walker WA, Iyengar RS. Breast milk, microbiota, and intestinal immune homeostasis.
Pediatr Res. 2015;77(1-2):220-8.
38. Smilowitz JT, Lebrilla CB, Mills DA, German JB, Freeman SL. Breast milk
oligosaccharides: structure-function relationships in the neonate. Annu Rev Nutr. 2014;34:143-69.
39. Sun Y, O’Riordan MX. Regulation of bacterial pathogenesis by intestinal short-chain fatty
acids. Adv Appl Microbiol. 85: Elsevier; 2013. p. 93-118.
40. Smith PM, Howitt MR, Panikov N, Michaud M, Gallini CA, Bohlooly YM, et al. The
microbial metabolites, short-chain fatty acids, regulate colonic Treg cell homeostasis. Science.
2013;341(6145):569-73.
41. Fukuda S, Toh H, Hase K, Oshima K, Nakanishi Y, Yoshimura K, et al. Bifidobacteria can
protect from enteropathogenic infection through production of acetate. Nature. 2011;469(7331):543.
42. Berni Canani R, Di Costanzo M, Leone L. The epigenetic effects of butyrate: potential
therapeutic implications for clinical practice. Clin Epigenetics. 2012;4(1):4.
43. Canani RB, Costanzo MD, Leone L, Pedata M, Meli R, Calignano A. Potential beneficial
effects of butyrate in intestinal and extraintestinal diseases. World J Gastroenterol.
2011;17(12):1519-28.

46
44. Newburg DS, Pickering LK, McCluer RH, Cleary TG. Fucosylated oligosaccharides of
human milk protect suckling mice from heat-stabile enterotoxin of Escherichia coli. J Infect Dis.
1990;162(5):1075-80.
45. Ruiz-Palacios GM, Cervantes LE, Ramos P, Chavez-Munguia B, Newburg DS.
Campylobacter jejuni binds intestinal H (O) antigen (Fuca1, 2Galb1, 4GlcNAc), and
fucosyloligosaccharides of human milk ihibit its binding and infection. J Biol Chem. 2003.
46. Jiang X, Huang P, Zhong W, Tan M, Farkas T, Morrow AL, et al. Human milk contains
elements that block binding of noroviruses to human histo—Blood group antigens in saliva. The
Journal of infectious diseases. 2004;190(10):1850-9.
47. Bode L. Recent advances on structure, metabolism, and function of human milk
oligosaccharides. The Journal of Nutrition. 2006;136(8):2127-30.
48. Jantscher-Krenn E, Lauwaet T, Bliss LA, Reed SL, Gillin FD, Bode L. Human milk
oligosaccharides reduce Entamoeba histolytica attachment and cytotoxicity in vitro. Br J Nutr.
2012;108(10):1839-46.
49. Gonia S, Tuepker M, Heisel T, Autran C, Bode L, Gale CA. Human Milk Oligosaccharides
Inhibit Candida albicans Invasion of Human Premature Intestinal Epithelial Cells, 2. The Journal of
nutrition. 2015;145(9):1992-8.
50. Van Niekerk E, Autran CA, Nel DG, Kirsten GF, Blaauw R, Bode L. Human Milk
Oligosaccharides Differ between HIV-Infected and HIV-Uninfected Mothers and Are Related to
Necrotizing Enterocolitis Incidence in Their Preterm Very-Low-Birth-Weight Infants–3. The
Journal of nutrition. 2014;144(8):1227-33.
51. Yuhas R, Pramuk K, Lien EL. Human milk fatty acid composition from nine countries
varies most in DHA. Lipids. 2006;41(9):851-8.
52. Dizdar EA, Sari FN, Degirmencioglu H, Canpolat FE, Oguz SS, Uras N, et al. Effect of
mode of delivery on macronutrient content of breast milk. J Matern Fetal Neonatal Med.
2014;27(11):1099-102.
53. Delplanque B, Gibson R, Koletzko B, Lapillonne A, Strandvik B. Lipid Quality in Infant
Nutrition: Current Knowledge and Future Opportunities. J Pediatr Gastroenterol Nutr. 2015;61(1):8-
17.
54. Jensen RG. Lipids in human milk. Lipids. 1999;34(12):1243-71.
55. Schmidt R, Meier U, Markart P, Grimminger F, Velcovsky H, Morr H, et al. Altered fatty
acid composition of lung surfactant phospholipidsin interstitial lung disease. American Journal of
Physiology-Lung Cellular and Molecular Physiology. 2002.
56. Andreas NJ, Kampmann B, Le-Doare KM. Human breast milk: a review on its composition
and bioactivity. Early Hum Dev. 2015;91(11):629-35.
57. Tanaka K, Hosozawa M, Kudo N, Yoshikawa N, Hisata K, Shoji H, et al. The pilot study:
sphingomyelin-fortified milk has a positive association with the neurobehavioural development of

47
very low birth weight infants during infancy, randomized control trial. Brain Dev. 2013;35(1):45-
52.
58. Zou X, Ali AH, Abed SM, Guo Z. Current knowledge of lipids in human milk and recent
innovations in infant formulas. Current Opinion in Food Science. 2017;16:28-39.
59. Bar-Yoseph F, Lifshitz Y, Cohen T. Review of sn-2 palmitate oil implications for infant
health. Prostaglandins, Leukotrienes and Essential Fatty Acids (PLEFA). 2013;89(4):139-43.
60. Mehrotra V, Sehgal SK, Bangale NR. Fat structure and composition in human milk and
infant formulas: Implications in infant health. Clinical Epidemiology and Global Health. 2018.
61. Koletzko B, Lien E, Agostoni C, Bohles H, Campoy C, Cetin I, et al. The roles of long-
chain polyunsaturated fatty acids in pregnancy, lactation and infancy: review of current knowledge
and consensus recommendations. J Perinat Med. 2008;36(1):5-14.
62. Waidyatillake NT, Dharmage SC, Allen KJ, Lodge CJ, Simpson JA, Bowatte G, et al.
Association of breast milk fatty acids with allergic disease outcomes-A systematic review. Allergy.
2017.
63. Logan CA, Brandt S, Wabitsch M, Brenner H, Wiens F, Stahl B, et al. New approach shows
no association between maternal milk fatty acid composition and childhood wheeze or asthma.
Allergy. 2017;72(9):1374-83.
64. Demmelmair H, Koletzko B. Lipids in human milk. Best Practice & Research Clinical
Endocrinology & Metabolism. 2018;32(1):57-68.
65. Jensen CL, Voigt RG, Prager TC, Zou YL, Fraley JK, Rozelle JC, et al. Effects of maternal
docosahexaenoic acid intake on visual function and neurodevelopment in breastfed term infants–.
The American journal of clinical nutrition. 2005;82(1):125-32.
66. Yu G, Bjorksten B. Serum levels of phospholipid fatty acids in mothers and their babies in
relation to allergic disease. Eur J Pediatr. 1998;157(4):298-303.
67. Duchen K, Casas R, Fageras-Bottcher M, Yu G, Bjorksten B. Human milk polyunsaturated
long-chain fatty acids and secretory immunoglobulin A antibodies and early childhood allergy.
Pediatr Allergy Immunol. 2000;11(1):29-39.
68. Perez M, Ladero V, Redruello B, Del Rio B, Fernandez L, Rodriguez JM, et al. Mastitis
Modifies the Biogenic Amines Profile in Human Milk, with Significant Changes in the Presence of
Histamine, Putrescine and Spermine. PLoS One. 2016;11(9):e0162426.
69. Plaza-Zamora J, Sabater-Molina M, Rodriguez-Palmero M, Rivero M, Bosch V, Nadal JM,
et al. Polyamines in human breast milk for preterm and term infants. Br J Nutr. 2013;110(3):524-8.
70. Zhang M, Caragine T, Wang H, Cohen PS, Botchkina G, Soda K, et al. Spermine inhibits
proinflammatory cytokine synthesis in human mononuclear cells: a counterregulatory mechanism
that restrains the immune response. The Journal of experimental medicine. 1997;185(10):1759-68.

48
71. Ali MA, Strandvik B, Palme-Kilander C, Yngve A. Lower polyamine levels in breast milk
of obese mothers compared to mothers with normal body weight. J Hum Nutr Diet. 2013;26 Suppl
1:164-70.
72. Peulen O, Dewé W, Dandrifosse G, Henrotay I, Romain N. The relationship between
spermine content of human milk during the first postnatal month and allergy in children. Public
Health Nutr. 1998;1(3):181-4.
73. Duchén K, Thorell L. Nucleotide and polyamine levels in colostrum and mature milk in
relation to maternal atopy and atopic development in the children. Acta Paediatr. 1999;88(12):1338-
43.
74. Edison EE, Brosnan ME, Aziz K, Brosnan JT. Creatine and guanidinoacetate content of
human milk and infant formulas: implications for creatine deficiency syndromes and amino acid
metabolism. Br J Nutr. 2013;110(6):1075-8.
75. Xiao G, Xiao H, Zhu Y, You Y. Determination of nucleotides in Chinese human milk by
high-performance liquid chromatography–tandem mass spectrometry. Dairy science & technology.
2014;94(6):591-602.
76. Agostoni C, Carratu B, Boniglia C, Riva E, Sanzini E. Free amino acid content in standard
infant formulas: comparison with human milk. J Am Coll Nutr. 2000;19(4):434-8.
77. Burrin DG, Stoll B. Metabolic fate and function of dietary glutamate in the gut. Am J Clin
Nutr. 2009;90(3):850S-6S.
78. Emmett PM, Rogers IS. Properties of human milk and their relationship with maternal
nutrition. Early Hum Dev. 1997;49:S7-S28.
79. da Silva RP, Nissim I, Brosnan ME, Brosnan JT. Creatine synthesis: hepatic metabolism of
guanidinoacetate and creatine in the rat in vitro and in vivo. American journal of physiology
Endocrinology and metabolism. 2009;296(2):E256-E61.
80. Foxman B, D'Arcy H, Gillespie B, Bobo JK, Schwartz K. Lactation Mastitis: Occurrence
and Medical Management among 946 Breastfeeding Women in the United States. Am J Epidemiol.
2002;155(2):103-14.
81. Bermúdez R, Lorenzo JM, Fonseca S, Franco I, Carballo J. Strains of Staphylococcus and
Bacillus isolated from traditional sausages as producers of biogenic amines. Front Microbiol.
2012;3:151-.
82. Hunt KM, Williams JE, Shafii B, Hunt MK, Behre R, Ting R, et al. Mastitis Is Associated
with Increased Free Fatty Acids, Somatic Cell Count, and Interleukin-8 Concentrations in Human
Milk. Breastfeed Med. 2013;8(1):105-10.
83. Kelsey J, Bayles KW, Shafii B, McGuire M. Fatty acids and monoacylglycerols inhibit
growth ofStaphylococcus aureus. Lipids. 2006;41(10):951-61.

49
84. Bender JM, Li F, Martelly S, Byrt E, Rouzier V, Leo M, et al. Maternal HIV Infection
Influences the Microbiome of HIV Uninfected Infants. Sci Transl Med. 2016;8(349):349ra100-
349ra100.
85. Bode L, Kuhn L, Kim H-Y, Hsiao L, Nissan C, Sinkala M, et al. Human milk
oligosaccharide concentration and risk of postnatal transmission of HIV through breastfeeding. The
American Journal of Clinical Nutrition. 2012;96(4):831-9.
86. Kuhn L, Kim H-Y, Hsiao L, Nissan C, Kankasa C, Mwiya M, et al. Oligosaccharide
Composition of Breast Milk Influences Survival of Uninfected Children Born to HIV-Infected
Mothers in Lusaka, Zambia, 2. The Journal of nutrition. 2014;145(1):66-72.
87. Makela J, Linderborg K, Niinikoski H, Yang B, Lagstrom H. Breast milk fatty acid
composition differs between overweight and normal weight women: the STEPS Study. Eur J Nutr.
2013;52(2):727-35.
88. Urbaniak C, McMillan A, Angelini M, Gloor GB, Sumarah M, Burton JP, et al. Effect of
chemotherapy on the microbiota and metabolome of human milk, a case report. Microbiome.
2014;2(1):24.
89. Sanders TA, Reddy S. The influence of a vegetarian diet on the fatty acid composition of
human milk and the essential fatty acid status of the infant. J Pediatr. 1992;120(4 Pt 2):S71-7.
90. Nayak U, Kanungo S, Zhang D, Ross Colgate E, Carmolli MP, Dey A, et al. Influence of
maternal and socioeconomic factors on breast milk fatty acid composition in urban, low-income
families. Matern Child Nutr. 2017.
91. Gómez-Gallego C, Morales J, Monleón D, du Toit E, Kumar H, Linderborg K, et al. Human
Breast Milk NMR Metabolomic Profile across Specific Geographical Locations and Its Association
with the Milk Microbiota. Nutrients. 2018;10(10):1355.
92. Kumar H, du Toit E, Kulkarni A, Aakko J, Linderborg KM, Zhang Y, et al. Distinct
patterns in human milk microbiota and fatty acid profiles across specific geographic locations. Front
Microbiol. 2016;7:1619.
93. Gay M, Koleva P, Slupsky C, Toit E, Eggesbo M, Johnson C, et al. Worldwide Variation in
Human Milk Metabolome: Indicators of Breast Physiology and Maternal Lifestyle? Nutrients.
2018;10(9):1151.
94. Gómez-Gallego C, Kumar H, García-Mantrana I, du Toit E, Suomela J-P, Linderborg KM,
et al. Breast Milk Polyamines and Microbiota Interactions: Impact of Mode of Delivery and
Geographical Location. Ann Nutr Metab. 2017;70(3):184-90.
95. Sundekilde UK, Downey E, O’Mahony JA, O’Shea CA, Ryan CA, Kelly AL, et al. The
effect of gestational and lactational age on the human milk metabolome. Nutrients. 2016;8(5).
96. Lapillonne A, Groh-Wargo S, Gonzalez CH, Uauy R. Lipid needs of preterm infants:
updated recommendations. J Pediatr. 2013;162(3 Suppl):S37-47.

50
97. Thurl S, Munzert M, Henker J, Boehm G, Muller-Werner B, Jelinek J, et al. Variation of
human milk oligosaccharides in relation to milk groups and lactational periods. Br J Nutr.
2010;104(9):1261-71.
98. Spevacek AR, Smilowitz JT, Chin EL, Underwood MA, German JB, Slupsky CM. Infant
maturity at birth reveals minor differences in the maternal milk metabolome in the first month of
lactation. J Nutr. 2015;145(8):1698-708.
99. Coppa GV, Gabrielli O, Pierani P, Catassi C, Carlucci A, Giorgi PL. Changes in
carbohydrate composition in human milk over 4 months of lactation. Pediatrics. 1993;91(3):637-41.
100. van Sadelhoff J, Mastorakou D, Weenen H, Stahl B, Garssen J, Hartog A. Short
Communication: Differences in Levels of Free Amino Acids and Total Protein in Human Foremilk
and Hindmilk. Nutrients. 2018;10(12):1828.
101. Atiya Ali M, Strandvik B, Sabel KG, Palme Kilander C, Stromberg R, Yngve A. Polyamine
levels in breast milk are associated with mothers' dietary intake and are higher in preterm than full-
term human milk and formulas. J Hum Nutr Diet. 2014;27(5):459-67.
102. Bauer J, Gerss J. Longitudinal analysis of macronutrients and minerals in human milk
produced by mothers of preterm infants. Clin Nutr. 2011;30(2):215-20.
103. Gabrielli O, Zampini L, Galeazzi T, Padella L, Santoro L, Peila C, et al. Preterm milk
oligosaccharides during the first month of lactation. Pediatrics. 2011:peds. 2011-1206.
104. Villasenor A, Garcia-Perez I, Garcia A, Posma JM, Fernandez-Lopez M, Nicholas AJ, et al.
Breast milk metabolome characterization in a single-phase extraction, multiplatform analytical
approach. Anal Chem. 2014;86(16):8245-52.
105. Boersma ER, Offringa PJ, Muskiet FA, Chase WM, Simmons IJ. Vitamin E, lipid fractions,
and fatty acid composition of colostrum, transitional milk, and mature milk: an international
comparative study. Am J Clin Nutr. 1991;53(5):1197-204.

51
CHAPTER 4
THE INFLUENCE OF DNA EXTRACTION AND MILK SKIMMING ON
HUMAN BREAST MILK BACTERIAL PROFILES

52
Abstract
Culture-independent molecular techniques have advanced the characterization of environmental and
human samples including the human breast milk (HBM) bacteriome. However, extraction of high-
quality genomic DNA that is representative of the bacterial population in samples is crucial. Fat
removal from HBM prior to DNA extraction is common practice but this may influence the
bacterial population detected. The objective of this study was to compare four commercial DNA
extraction kits and milk skimming in relation to HBM bacterial profiles. Four commercial DNA
extraction kits, QIAamp® DNA Microbiome Kit, ZR Fungal/Bacterial DNA MiniPrep™,
QIAsymphony DSP DNA Kit and ZymoBIOMICS™ DNA Miniprep Kit, were assessed using ten
healthy donor breast milk samples. The kits were evaluated based on their ability to extract high
quantities of pure DNA from HBM, and how well they extracted DNA from bacterial communities
present in a commercial mock microbial community standard spiked into HBM. Finally, the kits
were evaluated by assessing their extraction reproducibility. Bacterial profiles were assessed using
Illumina MiSeq sequencing targeting the V4 region of the 16S rRNA gene. The ZR
Fungal/Bacterial DNA MiniPrep™ and ZymoBIOMICS™ DNA Miniprep (Zymo Research Corp.,
Irvine, USA) kits extracted the highest DNA yields with the best purity. DNA extracted using ZR
Fungal/Bacterial DNA MiniPrep™ best represented the bacteria in the mock community spiked into
HBM. In un-spiked HBM samples, DNA extracted using the QIAsymphony DSP DNA kit showed
statistically significant differences in taxa prevalence from DNA extracted using ZR
Fungal/Bacterial DNA MiniPrep™ and ZymoBIOMICS™ DNA Miniprep kits. The only difference
between skim and whole milk is observed in bacterial profiles with differing relative abundances of
Enhydrobacter and Acinetobacter. DNA extraction, but not fat removal, substantially influences
bacterial profiles of HBM samples, emphasizing the need for careful selection of a DNA extraction
kit to improve DNA recovery from a range of bacterial taxa.

53
4.1 INTRODUCTION
There is a growing interest in the role that human breast milk (HBM) microbes play in infant and
maternal health. The HBM microbiota has been shown to have a role in the development of the
infant gut bacteriome and in promoting programming of the immune system (1, 2). Randomized
clinical trials have shown that in mothers, these microbes could prevent and serve as an alternative
treatment for lactational infectious mastitis caused by Staphylococcus aureus (3, 4).
Studies characterizing the bacterial diversity in HBM initially used bacterial culture, which has
several limitations including detection of only viable organisms and being labour-intensive (5-7).
Culture-independent molecular techniques, enabled by next-generation sequencing (NGS), can
profile bacteria in complex environments and provide detailed phylogenetic information (8, 9). For
this however, high quality genomic DNA that is representative of the microbial communities is
required.
DNA extraction methods from samples such as faeces (10, 11), insects (12), soil (13), saliva (14)
and colonic tissue (15) have been studied, yet, to our knowledge, no studies have documented
optimization of DNA extraction from HBM samples. This is crucial as methodological variation
such as the use of different DNA extraction kits may impact on microbial community profiling (16).
Moreover, the effect of removing the fat layer of milk prior to DNA extraction is unknown, even
though this approach is commonly used (17-19). Fat-rich tissue can cause difficulties in DNA
extraction due to fat interfering with tissue disruption or by influencing the chemistry of the DNA
isolation buffers (20).
Optimization of DNA extraction from HBM is necessary as HBM is known to have a relatively low
bacterial biomass, and interfering substances (such as proteins) pose a challenge to the extraction of
large amounts of quality DNA (21). In addition, the HBM bacteriome has been reported to contain a
variety of gram-positive and gram-negative bacterial species (17) with differing cell wall
composition which makes some species more difficult to lyse than the other. Improper lysis of these
two groups of bacteria may result in a biased representation of the bacterial community present in
HBM samples. Hence, methods need to be tested for their effectiveness, efficiency to lyse bacterial

54
cells, and the quality of the extracted DNA (12). We also incorporated a mock microbial community
with predetermined DNA ratios from a mixture of bacterial species to assess bias of the DNA
extraction kits.
The aim of this study was to compare and evaluate the extraction of bacterial genomic DNA from
HBM samples using four commercial DNA extraction kits. Selection of kits used in this study was
based on their availability and prior use for HBM bacteriome studies. Also, whole milk (WM) and
skim milk (SM) were compared to determine whether the removal of the fat layer affected the
bacterial population detected in HBM.
4.2 MATERIAL AND METHODS
4.2.1 Subjects and sample collection
HBM samples were collected from ten healthy lactating women residing in Cape Town, South
Africa, after obtaining their consent. The women were asked to wash their hands, their nipples and
surrounding breast area with soap and water. Milk was collected manually by hand expression into a
50 ml sterile collection bottle after discarding the first few drops. After collection, the samples were
transported on ice and stored at −20◦C until further processing. This study received ethical approval
from the University of Cape Town Human Research Ethics Committee, South Africa (HREC REF:
649/2016).
4.2.2 Methods of DNA extraction
Each of the ten HBM samples was processed as un-spiked SM (n=10) and WM (n=10). DNA was
extracted in duplicate from each SM and WM sample, using 4 different kits (total number of
extracts=160, Figure 4.1A). In addition, as an extraction control, one HBM sample was divided into
SM and WM, with each 1ml sample spiked with 75 µl (1x 10⁹ cells) of Zymobiomics Microbial
Community Standard ((ZMCS), (Catalogue no. D6300, Zymo Research Corp., Irvine, USA),
Appendix 1, Table 1). Commercial ZMCS was employed as the mock community because it’s
readily available and affordable, and also manufactured by Zymo Research Corp., Irvine, USA,
same company which manufactured two of the DNA kits assessed in the study. DNA was extracted

55
from replicas (on consecutive days) of the same spiked sample with each of the 4 kits (n=16)
(Figure 4.1B).
Figure 4. 1: Human breast milk samples collection per milk type and DNA extraction method. (A) DNA
extraction from un-spiked skim milk and whole milk samples. (B) DNA extraction from spiked skim milk and
whole milk samples.
HBM samples were homogenized by vortexing and SM was prepared according to a previously
published protocol (22). In brief, the samples were centrifuged at 3500 g for 20 minutes at -10 °C,
and the fat layer discarded. The supernatant was thereafter centrifuged at 7600 g for 10 minutes at
room temperature, and the pellet used for further processing. The pellet from WM was prepared by
centrifugation of the original milk sample at 7600 g for 10 minutes at room temperature. DNA was
extracted from un-spiked HBM samples (n=160) and spiked HBM samples (n=16) using the
recommended starting volume of the four different commercial DNA kits (Table 4.1).
Kit A: 500 μl Buffer AHL (host cell lysis buffer) was added to either 1ml of WM (or SM) for DNA
extraction from WM and SM respectively.
Kit B: The pellet obtained from centrifugation of 1ml of WM (or SM), was resuspended in 250 μl
of the resultant supernatant before proceeding to add 750 μl Lysis Solution (Zymo Research Corp.,
Irvine, USA) to the tube.

56
Kit C: The pellet obtained from centrifugation of 1ml of WM (or SM), was resuspended in 250 μl
of the resultant supernatant before proceeding to add 750 μl Lysis Solution (Zymo Research Corp.,
Irvine, USA). An “off-board” mechanical lysis step followed using ZR BashingBeadTM (Zymo
Research Corp., Irvine, USA). Following mechanical lysis, the lysate was centrifuged at 5800 g for
1 min, and 400 µl of the supernatant was used for DNA extraction on the QIAsymphony® SP
instrument (Qiagen, Hombrechtikon, Switzerland).
Kit D: The pellet obtained from centrifugation of 1ml of WM (or SM), was resuspended in 250 μl
of the resultant supernatant before proceeding to add 750 μl ZymoBIOMICS™ Lysis Solution
(Zymo Research Corp., Irvine, USA) to the tube.
An elution volume of 50 µl was used for all the kits except kit C in which the minimum elution
volume was 60 µl as set by the supplier. For homogeneity and to ensure higher concentrations of
DNA samples (as recommended by the manufacturer), 50 µl elution volume was used for Kit D.
With the exception of Kit D which was eluted in DNase/RNase Free Water, DNA eluted from other
kits were extracted in elution buffers. All bead-beating steps were performed in the TissueLyser LT
(Qiagen) at a frequency of 50Hz for 5 min.
Table 4. 1: DNA extraction kits used in this study
Name of kit Manufacturer’s
details
Extraction
method
Kit name
abbreviation
Recommended
starting volume
(µl)
Elution
volume
used (µl)
QIAamp® DNA
Microbiome Kit
Qiagen, Hilden,
Germany
Manual kit A 1000 50
ZR Fungal/Bacterial
DNA MiniPrep™
Zymo Research
Corp., Irvine,
USA
Manual kit B 250 50
QIAsymphony DSP
DNA Kit
Qiagen, Hilden,
Germany
Automated kit C 400 60
ZymoBIOMICS™
DNA Miniprep Kit
Zymo Research
Corp., Irvine,
USA
Manual kit D 250 50

57
4.2.3 DNA quantification
The concentration and purity of DNA was measured using a NanoDrop™ ND-2000c
Spectrophotometer (Thermo Scientific, Inc.). DNA yield was obtained by multiplying the DNA
concentration by the final elution volume. The DNA yield from all samples was also assessed by
16S qPCR using a protocol previously described (23). Each 30 µl PCR reaction contained 2.5 µl
DNA template, 1µl of probe, 15 µl Sensifast Probe No-rox (BIO-86020), 9.5 µl of MilliQ water and
1 µl each of 0.333 µM forward and reverse primer with conditions as described (Appendix 1, Table
2A). The qPCR was carried out on a 7500 Fast Real-Time PCR System (Applied Biosystems, CA
94404 USA). DNA was stored at -20 °C until further processing.
4.2.4 Extraction and sequencing controls
The respective elution buffer from each of the kits under investigation was processed as a negative
extraction control. The ZMCS was extracted using all four kits and served as a positive extraction
control. As per manufacturer’s specifications, the genomic DNA abundance (%) for each bacteria
species is 12% while the microbial OTU relative abundances are Pseudomonas spp. (4.6%),
Enterobacteriaceae 1 (11.3%), Enterobacteriaceae 2 (10.0%), Listeria spp. (15.9%), Staphylococcus
spp. (13.3%), and Lactobacillus spp. (18.8%) (Appendix 1, Table 1). DNA extraction on all HBM
samples was done in duplicate on two consecutive days using the respective kits to evaluate
extraction reproducibility. In addition, DNA extracts from two samples were randomly selected for
repeat processing (library preparation and sequencing) to evaluate reproducibility of steps following
DNA extraction.
In low biomass samples such as HBM samples, a portion of sequence reads may result from
exogenous DNA contributed by reagent contaminants used during the process of DNA extraction
and 16S rRNA gene library preparation. To allow in silico correction for contamination,
cyanobacteria (Arthrospira spirulina) DNA extract obtained from a pure culture of Cyanobacterium
(Arthrospira spirulina) , was spiked into DNA extracts from each of the respective negative controls
(elution buffers) at a 16S rRNA gene concentration similar to that of HBM samples as assessed by
qPCR. Since negative controls have little or no “competing” naturally present bacterial DNA,
amplification of this small amount of background DNA may lead to over-estimation of the

58
contribution of contaminants to bacterial profiles. We compensated for this effect by spiking an
amount of known bacterial DNA into control samples at an equivalent concentration to that found in
HBM samples. These “cyanobacteria-spiked-elution buffers” were included in the library
preparation and sequencing steps alongside the samples.
4.2.5 16S ribosomal ribonucleic acid (rRNA) amplicon library preparation
A two-step amplification approach described by Wu and colleagues (24) was employed to avoid
PCR amplification biases associated with the use of adapter and index sequences. In the first PCR
reaction, the hypervariable V4 region of the 16S rRNA gene was amplified using primers and PCR
cycling conditions as previously described (25) (Appendix 1, Table 2B). Each 25.25 µl PCR
reaction contained 12.5 µl 2X MyTaq™ HS Mix (BIO-25046), 2 µl of 0.8 µM forward and reverse
primers, 1 µl of MilliQ water, 0.75 µl dimethyl sulphoxide (catalogue no D4540, Sigma-Aldrich®,
MO, USA) and 7 µl bacterial genomic DNA.
In the second PCR reaction, the same reagents were used as above, except that the template was 7 µl
of the amplicon product from the first PCR reaction, and the reverse primers contained Illumina
adapters and various unique index sequences at the 3’ end for each sample (26). The PCR
conditions are the same with the short PCR run as described except for an additional 20 cycles in
the PCR run (25) (Appendix 1, Table 2C).
Amplicon products were cleaned with Agencourt SPRIPlate 96 super Magnet Plate and
QuantiFluor™ dsDNA System was used to quantify cleaned amplicons (25). The integrity of the
cleaned amplicons was checked by UV illumination of the gel. Briefly, 5 µl of each cleaned
amplicon was analyzed on a 2% agarose gel containing 1% ethidium bromide. Amplicons were
normalized by pooling at an equimolar concentration of 100 ng, and purified using Agencourt
AMPure system (Beckman Coulter, UK). Pooled library was extracted on 1.5% agarose gel.
QIAquick Gel Extraction Kit (Qiagen, MA, USA) was used for gel purification with the following
minor modification to manufacturer’s protocol. The elution buffer, Tris-EDTA buffer (pH 8.0), was
heated at 70 °C to improve amplicon recovery (step 13). Qubit® dsDNA BR Assay Kit was used for
final quantification of the pooled 16S library.

59
4.2.6 16S ribosomal ribonucleic acid (rRNA) gene sequencing
The pooled 16S library was paired-end sequenced on the Illumina MiSeq® system using the
MiSeq® Reagent v3 kit (600 cycles). The quality control steps entailed 1) the quantitation of
adapter-ligated dsDNA and 2) analysis of fragment size of the pooled library using the KAPA
Library Quantification Kits (Illumina®) (KAPA Biosystems, MA, USA) and Agilent High-
Sensitivity (HS) DNA Kit (Agilent Technologies, CA, USA) respectively. The library pool was
thereafter diluted to 4nM and denatured using Buffer EB (Qiagen) and 0.2 N NaOH respectively.
The mixture was neutralized and further diluted with HT1 Buffer (Illumina®) to 5.5 pM which was
loaded to the sequencer according to the manufacturer’s instructions (27), alongside the sequencing
control (PhiX library) spiked into the 16S library at 15% (v/v).
4.2.7 Bioinformatics workflow
The sequencing quality of FASTQ files was assessed using FASTQC (v0.10.1) package (28).
Forward and reverse sequences were then merged using UPARSE (v7.0.1090) allowing 3
mismatches in overlaps (fastq_maxdiff set to 3), followed by quality filtering using USEARCH9
fastq_filter (sequences truncated to 250bp). Reads with a maximum expected number of error >0.1
were discarded (fastq_maxee set to 0.1) (29). De-replication and selection of sequences occurring
more than once was performed by sortbysize command in USEARCH9. Clustering of sequences
into operational taxonomic units (OTUs) (with a clustering radius of 3) was done using
USEARCH9 cluster_otus command. The USEARCH9_uchime2_ref tool was used to detect and
remove chimeras and OTU counts were obtained using USEARCH9 usearch-global (30).
Decontamination of biological samples was done by first removing cyanobacteria sequences from
the four “cyanobacteria-spiked-NTC” controls. Sequences remaining after the removal of
cyanobacteria sequences were identified as “contaminant sequences”. The latter were screened
against biological samples by aligning biological sample sequences to spiked control sequences at
100% similarity using align_seq.py, based on PyNAST (31). An average number of reads was
calculated for each of the “contaminant sequences” matching at 100% similarity to biological
sample sequences. “Contaminant sequences” were removed from biological samples by removing
the average number of reads calculated from the four “cyanobacteria-spiked-NTC” controls.

60
Further processing of data was performed using Quantitative Insights Into Microbial Ecology
(QIIME) 1.9.1 suite of software tools (32). OTU picking was occurred at 97% sequence similarity
and taxonomic assignment was carried out against SILVA database (Version 132.) (33) using RDP
classifier (v2.2) in QIIME (v1.9.1) (32). Rarefaction plot of Shannon diversity against sequencing
depth was also generated in QIIME using alpha_rarefaction.py (32). The raw sequencing reads
were deposited in the NCBI Sequence Read Archive (SRA) database with accession number
PRJNA510564.
4.2.8 Data analysis
Data analysis and graphical illustrations of the data (bar plots, boxplots, dendograms) were
generated in R statistical package (version 3.4.1) and R studio 1.1.456 (34). Agglomerative cluster
dendograms were generated by complete linkage hierarchical clustering (35) using the [hclust]
function (36). This hierarchical clustering method is based on the Bray-Curtis dissimilarity index
(37) of the R vegan package (38). Cluster dendogram was performed for all OTUs with relative
abundance of > 0.5%. Alpha diversity within each sample was measured using the Shannon–
Weaver index with function [diversity] in the R package vegan (39), which measures both the
richness and evenness of organisms within a given sample. Analysis of Variance Table (Type II
tests) (40) was used to test the significance difference in alpha diversity between groups and to
generate a p-value with a significance threshold of p < 0.05, while error estimates were based on
Pearson residuals. Log-ratio biplots using a Bayesian prior technique for adjustments of zero counts
were made as previously described (41) and employed lambda-scaling to ensure evenness in the
“total spread” of the data sets (42). Log-ratio biplots were used to show multivariate clustering
patterns as they are specific for proportions/percentages (43).
Generalized linear models (GLM) were used to test the effect of SM and WM, and the four DNA
extraction kits on HBM bacterial profiles at different taxonomy levels. The negative binomial
distribution (44) in the package stats with the Quasi-Poisson family function (45) was applied to
model over-dispersion. “Breast milk” bacteria profiles were removed from the HBM sample spiked
with ZMCS to investigate the eight bacteria genera expected in the ZMCS. Following this, bacteria
genera in the known “theoretical” ZMCS were compared with similar bacteria profiles in the HBM

61
sample spiked with ZMCS. Benjamini–Hochberg method for multiple correction was used to
correct all p-values, set at a 5% significance level, by the false discovery rate (FDR) (46). Tukey’s
Honest Significant Differences (HSD) method was used to generate a single-step multiple
comparison of means procedure with 95% family-wise confidence intervals (47). Notched box-plots
(48) were made to show distribution analysis of the data, as they display the 95% confidence
interval for the median.
4.3 RESULTS
4.3.1 Influence of DNA extraction kits and milk skimming on yield and quality of DNA
extracted from un-spiked human breast milk samples
The efficiency of four DNA extraction kits were compared based on yield and purity of the
extracted DNA from un-spiked HBM samples (n=160) with NanoDrop™ ND-2000c
Spectrophotometer (Figure 4.2). A significant difference in the yield of DNA extracted was
observed between the kits (p = 8.71e-09) (Figure 4.2A). Kits B and D gave the highest DNA yield;
Tukey’s HSD revealed no significant difference between these two kits (p = 0.96). No significant
difference was observed in DNA yield when comparing SM and WM (Appendix 1, Figure 1A).
However, when comparing bacterial 16S DNA concentration from HBM samples, using qPCR, no
significant difference was observed between kits (p=0.253) (Appendix 1, Figure 2A). Similarly, no
significant difference was observed in 16S DNA concentration when comparing SM and WM
(p=0.524) (Appendix 1, Figure 2B).
DNA purity was assessed using the 260/280 absorbance ratio measure and no significant differences
were observed between the four kits (p = 0.327) (Figure 4.2B) though the purity of DNA varied
between the kits. Kits B and D had DNA purity closest to the recommended range of 1.8-2.0, while
kit C showed a large variation in DNA purity between samples. There was no significant difference
in DNA purity between SM and WM (Appendix 1, Figure 1B).

62
Figure 4. 2: DNA yield and purity of the four different commercial kits. Notched box plots showing (A)
the DNA yield and (B) the DNA purity (260/280 absorbance) obtained by using each of the four kits. The
notched box signifies the 75% (upper) and 25% (lower) quartile showing the distribution of 50% of the
samples. The line inside the box plot represents the median, and the notch the 95% confidence interval for the
median. The whiskers (top and bottom) represent the maximum and minimum values. Outliers, which are
beyond 1.5 times the interquartile range above the maximum value and below the minimum value, are shown
with open circles. *** represents p<0.001.
4.3.2 Influence of DNA extraction kits and milk skimming on bacterial profiles obtained
from mock microbial community standard spiked into human breast milk
To evaluate which DNA extraction kit best extracted the bacterial communities in the known ZMCS
community, composition and abundance were assessed after spiking this community into WM and
SM of sample 1 (extracted by each of the 4 kits in duplicate) (Appendix 1, Figure 3B). When
comparing the bacterial 16S DNA concentration in the spiked vs. un-spiked sample, >99.7% of the
total 16S DNA within the spiked sample originated from the ZMCS (Appendix 1, Table 3B), and
therefore, the contribution of the indigenous bacterial flora of this sample to the profiles generated
from this sample would be negligible.
Hierarchical cluster analysis was used to create a dendogram of the bacterial composition of the
ZMCS spiked into the HBM sample alongside the community profile provided by the manufacturer
(Appendix 1, Figure 3B). Bacterial profiles did not cluster based on whether DNA was extracted
from WM or SM, but rather based on the DNA extraction kit used. Overall, kit A showed a very
different profile compared to ZMCS and the other three kits under investigation. Kit A only

63
extracted DNA from three of the eight bacterial genera/families present in ZMCS. The three other
kits (kits B, C and D) represented all the eight bacterial genera/families albeit in differing
abundance. Kit C showed the widest variation in composition between replicates, with the samples
clustering on different clades of the dendogram. Kit B (and some replicates for kit C) clustered
closest to the ZMCS suggesting the best representation of the microbial community standard.
Beta diversity (Bray-Curtis dissimilarity index) was also computed to show the differences in
bacterial composition between the composition of ZMCS and DNA extracted from each kit for WM
and SM spiked samples. A lower beta diversity value would mean greater similarity between the
composition of ZMCS and the HBM sample spiked with ZMCS. For SM, kit B had the lowest beta
diversity of 0.06, meaning it most closely represented the bacterial profiles of the ZMCS. For WM,
the lowest beta diversity of 0.16 was seen for kits B and C (Appendix 1, Table 4).
We further evaluated the differences in relative abundances of the eight bacterial genera/families
expected from the known “theoretical” bacterial profile of ZMCS and those resulting from the
extraction kits (Figure 4.3). Gram-negative organisms present in ZMCS were substantially under-
represented in samples extracted with Kit A (Figure 4.3 A-C). Kit B best represented the gram-
negative organisms in the known mock community with relative abundances closest to the mock
community (Figure 4.3 A-C). The relative abundances of gram-negative organisms in the ZMCS
was over-represented in DNA extracted using Kit C and Kit D (Figure 4.3 A-C). In relation to the
five gram-positive organisms, no kit showed an ideal representation of all (Figure 4.3 D-H). Kit B
and Kit C resulted in the closest proportional representation of Lactobacillus spp. to the ZMCS. On
the other hand, they showed a lower relative abundance of Listeria spp. and Staphylococcus spp.
compared with ZMCS. There were no differences in relative abundances of taxa in ZMCS extracted
from SM vs. WM (Figure 4.4 A-H).

64
Figure 4. 3: Relative abundances of bacterial taxa extracted by kits in comparison to the commercial
ZMCS composition. The horizontal line in each box indicates the relative abundance of the organism in
question in the commercial ZMCS as given by the manufacturer. P values refer to differences in relative
abundance of each bacterial taxon between different kits (p < 0.05: ∗; p < 0.01: ∗∗). P-values were generated by
Anova test in stats package of R and adjusted using Benjamini–Hochberg’s false discovery rate. ZMCS=
Zymobiomics Microbial Community Standard.

65
Figure 4. 4: Relative abundances of bacterial taxa extracted by skim milk and whole milk in
comparison to the commercial ZMCS composition. The horizontal line in each box indicates the relative
abundance of the organism in question in the commercial ZMCS as given by the manufacturer. P > 0.05
shows a non-statistically significant difference in relative abundance of each bacterial taxon in the HBM
sample spiked with ZMCS as extracted by skim milk and whole milk. P-values were generated by Anova test
in stats package of R and adjusted using Benjamini–Hochberg’s false discovery rate. ZMCS= Zymobiomics
Microbial Community Standard.
Due to the poor performance of kit A in extracting DNA from Pseudomonas spp.,
Enterobacteriaceae, Enterococcus spp. and Bacillus spp. in the HBM sample spiked with ZMCS, the
spiked sample were re-extracted with kit A, however on this occasion, the first steps of the
manufacturer’s guidelines involving the initial host DNA depletion step (benzonase treatment) were
omitted; a decision based on communication with the manufacturer. The benzonase steps are
intended to deplete extracellular bacterial DNA. This modification of the extraction protocol
resulted in substantially improved representation of the bacteria in the ZMCS (Figure 4.5).
However, at this point, kit A was excluded from further analysis of (un-spiked) HBM samples.

66
Figure 4. 5: Complete linkage hierarchical clustering showing the relative abundances of bacterial taxa
in the HBM sample spiked with ZMCS. (A) Kit A DNA extraction protocol as per manufacturer’s
recommendations and (B) Kit A DNA extraction protocol in which the initial steps (steps 1 to 4) involving
degradation and digestion of host DNA were omitted. Samples were processed in duplicate. WM-whole milk,
SM-skim milk. ZMCS: Zymobiomics Microbial Community Standard reference.
4.3.3 Influence of DNA extraction kit and milk type on bacterial diversity in un-spiked
HBM samples
A total of 3,559,506 high-quality filtered raw paired-end reads was obtained from 160 HBM
samples. The number of post-filtered reads after the removal of contaminant sequences was
263,464. The median and mean sequence read count per sample was 1,405 and 1,670 (range 163-
5,681) respectively. Alpha rarefaction curves showed that Shannon diversity plateaued at a
sequence depth of 100 (Appendix 1, Figure 4).
The dominant phyla in HBM samples were Firmicutes and Proteobacteria, followed by a relatively
low abundance of Actinobacteria and Cyanobacteria. At the genus level, the predominant bacteria
were Staphylococcus spp., Streptococcus spp., Lactobacillus spp., Acinetobacter spp., and members
of the family Enterobacteriaceae (Appendix 1, Figure 5).
The influence of DNA extraction kits and extraction from SM vs. WM were compared with respect
to bacterial alpha diversity (Shannon diversity index). Overall; there were no significant differences

67
in alpha diversity between DNA extracted by different kits (p=0.11) (Figure 4.6). Tukey HSD
multiple comparisons of means also showed no significant difference in alpha diversity of samples
between each of the kits. Similarly, there were no statistically significant differences in alpha
diversity of DNA extracted from WM vs. SM (p=0.88) (Figure 4.6). Therefore, extraction kit and
milk type did not influence the alpha diversity of bacterial composition in HBM samples.
Figure 4. 6: Shannon diversity index of the un-spiked HBM samples based on kits and milk type. Each
HBM sample is represented by a rectangle. The horizontal cyan and orange lines represent bacterial alpha
diversity from skim milk and whole milk respectively. The alpha diversity in bacterial DNA extracted by each
kit is indicated by coloured boxes. Kits B, C and D are represented by red, blue and grey lines respectively.
WM=whole milk, SM=skim milk.
Unsupervised hierarchical clustering of samples based on Bray-Curtis dissimilarity index showed
clustering largely based on HBM donor, rather than on the basis of DNA extraction kit used (Figure
4.7).

68
Figure 4. 7: HBM samples cluster primarily based on the donor. Complete linkage unsupervised
hierarchical clustering based on the relative abundances of bacteria genera in un-spiked HBM samples show
that DNA extraction kits and milk type affects bacterial profiles less when compared to the source. W: whole
milk, S: skim milk; 1-10 represents each donor; kit B: ZR Fungal/Bacterial DNA MiniPrep™, kit C:
QIAsymphony DSP DNA Kit, and kit D: ZymoBIOMICS™ DNA Miniprep Kit.
Furthermore, exploration of bacteria with abundances > 0.5% using log ratio biplots did not show
clustering of HBM samples associated with either DNA extraction kit used (B, C or D) or milk type
(SM or WM) either at the phylum level (Appendix 1, Figure 6A-B) or genus level (Appendix 1,
Figure 7A-B), suggesting that neither extraction kit nor use of WM vs. SM were major drivers of
differences between samples. In contrast, clustering was observed among samples from each donor,
irrespective of the kit used for extraction or whether WM or SM was extracted (Appendix 1, Figure
6C; Appendix 1, Figure 7C). Therefore, donor, rather than extraction kit or milk type, was the major
determinant of bacterial profiles identified in HBM samples.
GLM and Turkey HSD were used to compare the different taxa observed in HBM samples in
relation to DNA extraction kit used and between WM and SM. Appendix 1, Table 5 summarizes the
mean relative abundance of statistically significant bacteria at the different taxonomy levels for the
kits, and WM and SM. Comparison of different bacteria taxa between samples processed with the
different DNA extraction kits showed significant differences in relative abundances of six bacterial
genera (Ralstonia spp., Pseudomonas spp., Haemophilus spp., Acinetobacter spp., OTU_52
belonging to the family Rhodobacterales, and Lactobacillus spp.), while WM and SM differed only
for two bacterial genera, Enhydrobacter spp., and Acinetobacter spp., both belonging to the family
Moraxellaceae. No significant differences in relative abundances were observed between Kit B and
Kit D at any taxonomy level.

69
4.3.4 Reproducibility of extractions
DNA extraction was carried out in duplicate, on consecutive days to evaluate the reproducibility of
each DNA extraction kit. The total read count of each OTU in each duplicate set (per kit and per
milk type) was tested using multiple R-squared, representing the proportion of variance reproduced
by replicating the reads.
Reproducibility (R2) ranged from 0.4751 to 0.9483 (Appendix 1, Table 6). For WM, kit D produced
the most reproducible results with R2 of 0.9483, followed by kit C with R2 of 0.7421 while kit B
produced the least reproducible results with R2 of 0.4908. For SM, kit D produced the most
reproducible results with R2 of 0.7976, followed by kit B with R2 of 0.7581 while kit C produced
the least reproducible results with R2 of 0.4751. We observed wide variations in reproducibility of
SM and WM for kit B and kit C, unlike kit D where reproducibility was better, independent of milk
type. The multiple R2 generated for the two sequencing controls included during the 16S library
preparation was 0.9713.
4.4 DISCUSSION
We compared different methods of bacterial nucleic acid extraction from HBM prior to 16S
microbiome profiling, including the effect of removing the fat layer. To our knowledge there are no
published studies exploring this method. We observed a significant difference in DNA yield and
purity, relative abundance of specific taxa, and the ability to represent the bacteria composition in a
known mock microbial community when different DNA extraction kits were employed to extract
DNA from HBM samples. On the other hand, skimming of milk prior to DNA extraction had
limited impact on bacterial profiles, only showing a small influence on the relative abundance of
two specific taxa within the phylum Proteobacteria.
In agreement with previously published literature (2, 17, 49), HBM has a vast population of
bacterial communities in healthy individuals and dominated at the phylum level by Firmicutes and
Proteobacteria, followed by Actinobacteria. At the genus level, we found that Staphylococcus spp.,
Streptococcus spp., Lactobacillus spp., Acinetobacter spp., and members of the family
Enterobacteria were the dominant members.

70
DNA extraction has been validated for several bacteriome studies including feces, oral cavity,
turkey cecum and soil using evaluation criteria such as DNA yield and purity, DNA shearing,
reproducibility, quantitative PCR (5, 15, 50-52), 16S rRNA gene sequence-based taxonomic
signatures (50-52), bacterial community fingerprints (10, 16), and custom designed phylogenetic
microarray profiles (15). However, to our knowledge, no study has previously compared different
DNA extraction methods for HBM.
In this study, DNA extraction methods were evaluated based on DNA yield and purity, bacterial
diversity and reproducibility. HBM has a high fat content which may present challenges in
extraction of DNA for molecular testing (21, 53). Furthermore, given the low microbial biomass
present in HBM, it would be expected that the bacterial DNA yields would be substantially lower
than those of other specimen types, for example faecal specimens, posing a challenge for 16S rRNA
based studies (54). Despite these potential complications, high DNA yields and within-range DNA
purity were achieved by kits B and D, both from Zymo Research Corp., Irvine, USA.
Low biomass specimens are prone to contaminating microbial DNA which is ubiquitous within
DNA extraction kits, PCR reagents and other laboratory reagents. (55, 56). This contaminating
DNA may distort the relative abundances of microbial composition in datasets, thereby leading to
erroneous interpretations (55). We therefore mitigated this effect by in-silico decontamination of our
biological samples. The variation experienced with kit C might be because the DNA yields were
very low, thus a higher risk of cross-contamination.
In addition to the above criteria, we also evaluated the kits based on representation of the bacterial
profile in a commercial mock microbial community standard. A bacterial community with a defined
composition and abundance (5) is unlike environmental or human samples, which can be
complicated by an unknown type and number of indigenous microorganisms. In the study by
Willner and colleagues, a mock community was also used in identifying methodological
contaminants, identifying detection limits and empirical cut-off values for 16S pyrosequencing in
order to filter out spurious OTUs, and also to compare method reproducibility (57).
Using 16S rRNA gene sequencing we compared the ability of four commercial DNA extraction kits
to recover DNA from bacteria from a known commercial mock microbial community containing

71
eight bacterial species, which had been spiked into HBM by comparing the expected bacterial
profiles in the HBM sample spiked with ZMCS to the theoretical bacterial composition of the mock
microbial community standard. Importantly, the proportion of the total 16S bacterial DNA within
the spiked samples was derived almost exclusively (>99.7%) from the mock community, and so one
would not expect these profiles to be affected by the indigenous bacterial community within the
spiked HBM sample. Whilst extraction using three of the kits resulted in reasonable representation
of the mock community composition, as with other studies (5, 51), significant differences in
bacterial profiles were shown when DNA from mock bacterial communities was extracted with
different kits.
Gram-positive organisms are more difficult to lyse; however, kits B, C and D showed an over-
representation of the genus Bacillus despite an under-representation of similar hard-to-lyse bacteria
like Enterococcus. In a study by Yuan et al. (2012) which evaluated six commonly used DNA
extraction procedures from the Human Microbiome study, the observed relative abundance of
Lactobacillus iners in a mock community was higher than its expected relative abundance (5). In a
previous study which evaluated the influence of four DNA extraction methods on oral bacterial
profiles, only one method was able to represent all bacteria in the mock community (51). Overall,
kits B, C and D represented all eight expected bacterial genera/families, though in differing
abundance.
Kit A performed markedly differently from the other kits. This kit had a considerably lower DNA
yield, perhaps because the initial steps incorporate the depletion of human DNA to yield enriched
bacterial DNA. This supports the report of Wen et al. (2016) in which a microbial DNA extraction
method with pre-treatment of depletion of host nucleic acid by benzonase resulted in significantly
lower DNA concentrations of samples (58). Bacterial profiles in HBM spiked with the mock
community and extracted with Kit A revealed a biased composition with over-representation of
gram-positive organisms, with Staphylococcus spp. dominating. This may have been due to lysis of
gram-negative bacteria during the early extraction steps, and subsequent depletion by benzonase
treatment. On repeating this extraction, but omitting the initial benzonase treatment steps, a good
representation of all the eight bacterial genera in the mock standard was shown. It’s therefore

72
imperative that researchers fully understand the importance of each step in any DNA extraction
protocol and its impact on the bacterial community of their samples.
We showed no impact of DNA extraction kit on alpha diversity (reported using the Shannon-
diversity index), as has previously been shown on salivary bacterial communities (14). When
considering beta diversity (reported using Bray-Curtis dissimilarity index), samples clustered
together based on donor, irrespective of the DNA extraction kit used or whether HBM was skimmed
or not prior to DNA extraction. A study evaluating variation in human gut microbiota profiles due to
DNA extraction methods, confirmed this. In this study, the main source of variation in a
dissimilarity matrix was related to donor, followed by the DNA extraction method (16). Another
study by Wesolowska-Andersen et al. (2014) which assessed the effect of bacterial DNA extraction
method from faeces, observed a higher inter-individual variation than that seen for the extraction
method (59).
We observed in our study that DNA extraction kits had an impact, albeit relatively minor, on the
relative abundances of specific bacterial taxa from extracted DNA of samples. Other studies have
also observed significant differences in relative abundances of bacterial taxa based on DNA
extraction methods for faecal specimens (59, 60).
Though a major strength of this study is the use of mock microbial community, this study was faced
with some limitations. One is that the bacterial composition in the commercial mock community is
not a true reflection of microbes usually found in HBM. However, seven bacterial genera that are
commonly isolated in HBM were represented in the mock standard at the genus level. A further
limitation is associated with the use of 16S rRNA gene targeted sequencing which gives low
phylogenetic resolution power of bacteria up to the species level. Also, the mock microbial
community was not extracted independently and processed by itself. Lastly, the “theoretical”
bacterial profiles may differ from our experimental profiles due to factors such as the use of
different 16S gene variable region and sequencing approaches.

73
4.5 CONCLUSION
In summary, we have shown that DNA extraction method, but not fat removal, has an important
influence on characterization of the HBM bacteriome by 16S rRNA sequencing. Detailed
understanding of the impact of individual steps within an extraction procedure is required to prevent
significant bias in determining the composition of the HBM bacteriome.

74
4.6 REFERENCES
1. Asnicar F, Manara S, Zolfo M, Truong DT, Scholz M, Armanini F, et al. Studying Vertical
Microbiome Transmission from Mothers to Infants by Strain-Level Metagenomic Profiling.
mSystems. 2017;2(1).
2. Civardi E, Garofoli F, Tzialla C, Paolillo P, Bollani L, Stronati M. Microorganisms in
human milk: lights and shadows. J Matern Fetal Neonatal Med. 2013;26 Suppl 2:30-4.
3. Jimenez E, Fernandez L, Maldonado A, Martin R, Olivares M, Xaus J, et al. Oral
administration of Lactobacillus strains isolated from breast milk as an alternative for the treatment
of infectious mastitis during lactation. Appl Environ Microbiol. 2008;74(15):4650-5.
4. Fernández L, Cárdenas N, Arroyo R, Manzano S, Jiménez E, Martín V, et al. Prevention of
Infectious Mastitis by Oral Administration of Lactobacillus salivarius PS2 during Late Pregnancy.
Clin Infect Dis. 2016;62(5):568-73.
5. Yuan S, Cohen DB, Ravel J, Abdo Z, Forney LJ. Evaluation of methods for the extraction
and purification of DNA from the human microbiome. PLoS One. 2012;7(3):e33865.
6. Fouhy Fab, Ross RPac, Fitzgerald Gbc, Stanton Cac, Cotter PDac. Composition of the early
intestinal microbiota:Knowledge, knowledge gaps and the use of high-throughput sequencing to
address these gaps. Gut Microbes. 2012;3(3):1-18.
7. Ojo-Okunola A, Nicol M, du Toit E. Human Breast Milk Bacteriome in Health and Disease.
Nutrients. 2018;10(11):1643.
8. Claesson MJ, Wang Q, O'sullivan O, Greene-Diniz R, Cole JR, Ross RP, et al. Comparison
of two next-generation sequencing technologies for resolving highly complex microbiota
composition using tandem variable 16S rRNA gene regions. Nucleic Acids Res. 2010;38(22):e200-
e.
9. Salipante SJ, Sengupta DJ, Rosenthal C, Costa G, Spangler J, Sims EH, et al. Rapid 16S
rRNA Next-Generation Sequencing of Polymicrobial Clinical Samples for Diagnosis of Complex
Bacterial Infections. PLoS One. 2013;8(5):e65226.
10. Ariefdjohan MW, Savaiano DA, Nakatsu CH. Comparison of DNA extraction kits for PCR-
DGGE analysis of human intestinal microbial communities from fecal specimens. Nutr J.
2010;9:23.
11. Claassen S, du Toit E, Kaba M, Moodley C, Zar HJ, Nicol MP. A comparison of the
efficiency of five different commercial DNA extraction kits for extraction of DNA from faecal
samples. J Microbiol Methods. 2013;94(2):103-10.
12. Chen H, Rangasamy M, Tan SY, Wang H, Siegfried BD. Evaluation of five methods for
total DNA extraction from western corn rootworm beetles. PLoS One. 2010;5(8):e11963.
13. Miller DN, Bryant JE, Madsen EL, Ghiorse WC. Evaluation and optimization of DNA
extraction and purification procedures for soil and sediment samples. Appl Environ Microbiol.
1999;65(11):4715-24.

75
14. Lazarevic V, Gaia N, Girard M, Francois P, Schrenzel J. Comparison of DNA extraction
methods in analysis of salivary bacterial communities. PLoS One. 2013;8(7):e67699.
15. Ó Cuív P, Aguirre de Cárcer D, Jones M, Klaassens ES, Worthley DL, Whitehall VLJ, et al.
The Effects from DNA Extraction Methods on the Evaluation of Microbial Diversity Associated
with Human Colonic Tissue. Microb Ecol. 2011;61(2):353-62.
16. Wagner Mackenzie B, Waite DW, Taylor MW. Evaluating variation in human gut
microbiota profiles due to DNA extraction method and inter-subject differences. Front Microbiol.
2015;6:130.
17. Hunt KM, Foster JA, Forney LJ, Schutte UM, Beck DL, Abdo Z, et al. Characterization of
the diversity and temporal stability of bacterial communities in human milk. PLoS One.
2011;6(6):e21313.
18. Urbaniak C, Angelini M, Gloor GB, Reid G. Human milk microbiota profiles in relation to
birthing method, gestation and infant gender. Microbiome. 2016;4:1.
19. Cabrera-Rubio R, Collado MC, Laitinen K, Salminen S, Isolauri E, Mira A. The human
milk microbiome changes over lactation and is shaped by maternal weight and mode of delivery.
Am J Clin Nutr. 2012;96(3):544-51.
20. Macherey-Nagel. Genomic DNA from lipid-rich tissue: User manual [Internet]. 2016 [cited
2019 May 10]. Available from: https://www.mn-
net.com/Portals/8/attachments/Redakteure_Bio/Protocols/Genomic%20DNA/UM_gDNALipidTissu
e.pdf.
21. Usman T, Yu Y, Liu C, Fan Z, Wang Y. Comparison of methods for high quantity and
quality genomic DNA extraction from raw cow milk. Genet Mol Res. 2014;13(2):3319-28.
22. Lucey JA, Tamehana M, Singh H, Munro PA. Effect of interactions between denatured
whey proteins and casein micelles on the formation and rheological properties of acid skim milk
gels. J Dairy Res. 1998;65(4):555-67.
23. Bogaert D, Keijser B, Huse S, Rossen J, Veenhoven R, van Gils E, et al. Variability and
diversity of nasopharyngeal microbiota in children: a metagenomic analysis. PLoS One.
2011;6(2):e17035.
24. Wu L, Wen C, Qin Y, Yin H, Tu Q, Van Nostrand JD, et al. Phasing amplicon sequencing
on Illumina Miseq for robust environmental microbial community analysis. BMC Microbiol.
2015;15(1):125.
25. Claassen-Weitz S, Gardner-Lubbe S, Nicol P, Botha G, Mounaud S, Shankar J, et al. HIV-
exposure, early life feeding practices and delivery mode impacts on faecal bacterial profiles in a
South African birth cohort. Sci Rep. 2018;8(1):5078.
26. Caporaso JG, Lauber CL, Walters WA, Berg-Lyons D, Lozupone CA, Turnbaugh PJ, et al.
Global patterns of 16S rRNA diversity at a depth of millions of sequences per sample. Proceedings
of the national academy of sciences. 2011;108(Supplement 1):4516-22.

76
27. Illumina P. MiSeq® System User Guide. . 2014:1–94.
28. Andrews S. FastQC: a quality control tool for high throughput sequence data. 2010.
29. Edgar RC. UPARSE: highly accurate OTU sequences from microbial amplicon reads.
Nature methods. 2013;10(10):996.
30. Edgar RC. Search and clustering orders of magnitude faster than BLAST. Bioinformatics.
2010;26(19):2460-1.
31. Wang Q, Garrity GM, Tiedje JM, Cole JR. Naive Bayesian classifier for rapid assignment
of rRNA sequences into the new bacterial taxonomy. Applied and environmental microbiology.
2007;73(16):5261-7.
32. Caporaso JG, Kuczynski J, Stombaugh J, Bittinger K, Bushman FD, Costello EK, et al.
QIIME allows analysis of high-throughput community sequencing data. Nature methods.
2010;7(5):335.
33. Quast C, Pruesse E, Yilmaz P, Gerken J, Schweer T, Yarza P, et al. The SILVA ribosomal
RNA gene database project: improved data processing and web-based tools. Nucleic Acids Res.
2013;41(Database issue):D590-6.
34. Team RC. R: A language and environment for statistical computing. R Foundation for
Statistical Computing, Vienna, Austria. 2017.
35. Hartigan JA. Clustering Algorithms, New York: John Willey and Sons. Inc Pages113129.
1975.
36. Murtagh F. Multidimensional clustering algorithms. Compstat Lectures, Vienna: Physika
Verlag, 1985. 1985.
37. Bray JR, Curtis JT. An ordination of the upland forest communities of southern Wisconsin.
Ecol Monogr. 1957;27(4):325-49.
38. Oksanen J, Blanchet F, Kindt R, Legendre P, Minchin P, O'Hara R, et al. vegan:
Community Ecology Package. R package version 2.4-4. 2017.
39. Hill MO. Diversity and Evenness: A Unifying Notation and Its Consequences. Ecology.
1973;54(2):427-32.
40. Chambers JM, Hastie TJ. Statistical models in S: Wadsworth & Brooks/Cole Advanced
Books & Software Pacific Grove, CA; 1992.
41. Greenacre MJ. Biplots in practice: Fundacion BBVA; 2010.
42. Gower JC, Lubbe SG, Le Roux NJ. Understanding biplots: John Wiley & Sons; 2011.
43. Fernandes AD, Reid JN, Macklaim JM, McMurrough TA, Edgell DR, Gloor GB. Unifying
the analysis of high-throughput sequencing datasets: characterizing RNA-seq, 16S rRNA gene
sequencing and selective growth experiments by compositional data analysis. Microbiome.
2014;2:15.
44. Devroye L, editor Sample-based non-uniform random variate generation. Proceedings of
the 18th conference on Winter simulation; 1986: ACM.

77
45. McCullagh P, Nelder JA. Generalized linear models: CRC press; 1989.
46. Benjamini Y, Hochberg Y. Controlling the false discovery rate: a practical and powerful
approach to multiple testing. Journal of the royal statistical society Series B (Methodological).
1995:289-300.
47. Yandell BS. Practical data analysis for designed experiments: Crc Press; 1997.
48. Chambers JM, Cleveland, W. S., Kleiner, B., Tukey, P. A. Graphical Methods for Data
Analysis: Wadsworth & Brooks/Cole Publishing Company. New Jersey; 1983.
49. Jost T, Lacroix C, Braegger C, Chassard C. Assessment of bacterial diversity in breast milk
using culture-dependent and culture-independent approaches. Br J Nutr. 2013;110(7):1253-62.
50. Mathay C, Hamot G, Henry E, Georges L, Bellora C, Lebrun L, et al. Method optimization
for fecal sample collection and fecal DNA extraction. Biopreserv Biobank. 2015;13(2):79-93.
51. Abusleme L, Hong BY, Dupuy AK, Strausbaugh LD, Diaz PI. Influence of DNA extraction
on oral microbial profiles obtained via 16S rRNA gene sequencing. J Oral Microbiol. 2014;6.
52. Terrat S, Christen R, Dequiedt S, Lelievre M, Nowak V, Regnier T, et al. Molecular
biomass and MetaTaxogenomic assessment of soil microbial communities as influenced by soil
DNA extraction procedure. Microb Biotechnol. 2012;5(1):135-41.
53. Cremonesi P, Castiglioni B, Malferrari G, Biunno I, Vimercati C, Moroni P, et al. Technical
note: Improved method for rapid DNA extraction of mastitis pathogens directly from milk. J Dairy
Sci. 2006;89(1):163-9.
54. Jervis-Bardy J, Leong LEX, Marri S, Smith RJ, Choo JM, Smith-Vaughan HC, et al.
Deriving accurate microbiota profiles from human samples with low bacterial content through post-
sequencing processing of Illumina MiSeq data. Microbiome. 2015;3(1):19.
55. Glassing A, Dowd SE, Galandiuk S, Davis B, Chiodini RJ. Inherent bacterial DNA
contamination of extraction and sequencing reagents may affect interpretation of microbiota in low
bacterial biomass samples. Gut Pathog. 2016;8(1):24.
56. Salter SJ, Cox MJ, Turek EM, Calus ST, Cookson WO, Moffatt MF, et al. Reagent and
laboratory contamination can critically impact sequence-based microbiome analyses. BMC Biol.
2014;12(1):87.
57. Willner D, Daly J, Whiley D, Grimwood K, Wainwright CE, Hugenholtz P. Comparison of
DNA extraction methods for microbial community profiling with an application to pediatric
bronchoalveolar lavage samples. PLoS One. 2012;7(4):e34605.
58. Wen Y, Xiao F, Wang C, Wang Z. The impact of different methods of DNA extraction on
microbial community measures of BALF samples based on metagenomic data. American Journal of
Translational Research. 2016;8(3):1412-25.
59. Wesolowska-Andersen A, Bahl MI, Carvalho V, Kristiansen K, Sicheritz-Pontén T, Gupta
R, et al. Choice of bacterial DNA extraction method from fecal material influences community
structure as evaluated by metagenomic analysis. Microbiome. 2014;2(1):19.

78
60. Kennedy NA, Walker AW, Berry SH, Duncan SH, Farquarson FM, Louis P, et al. The
Impact of Different DNA Extraction Kits and Laboratories upon the Assessment of Human Gut
Microbiota Composition by 16S rRNA Gene Sequencing. PLoS One. 2014;9(2):e88982.

79
CHAPTER 5
INFLUENCE OF SOCIO-ECONOMIC AND PSYCHOSOCIAL PROFILES
ON THE HUMAN BREAST MILK BACTERIOME OF SOUTH AFRICAN
WOMEN
Anna Ojo-Okunola 1,* , Shantelle Claassen-Weitz 1, Kilaza S. Mwaikono 2,3, Sugnet Gardner-Lubbe
4 , Dan J. Stein 5, Heather J. Zar 6,7,8, Mark P. Nicol 1,6,9 and Elloise du Toit 1
Copyright
© 2019 by the authors. Licensee MDPI, Basel, Switzerland. This article is an open access
article distributed under the terms and conditions of the Creative Commons Attribution (CC BY
4.0). (http://creativecommons.org/licenses/by/4.0/).
Citation
Ojo-Okunola A, Claassen-Weitz S, Mwaikono KS, Gardner-Lubbe S, Stein DJ, Zar HJ, Nicol MP,
du Toit E. Influence of Socio-Economic and Psychosocial Profiles on the Human Breast Milk
Bacteriome of South African Women. Nutrients. 2019 Jun;11(6):1390.
https://doi.org/10.3390/nu11061390
Author Contributions
Conceptualization, M.P.N., D.J.S., and H.J.Z.; methodology, S.C.-W.; software, K.S.M.; formal
analysis, S.G.-L. and A.O.-O.; investigation, A.O.-O.; resources, M.P.N. and H.J.Z.; writing—
original draft preparation, A.O.-O.; writing—review and editing, S.C.-W., K.S.M., S.G.-L., D.J.S.,
M.P.N., H.J.Z., and E.d.T.; visualization, A.O.-O.; supervision, M.P.N. and E.d.T.; funding
acquisition, M.P.N. and H.J.Z.

80
Abstract
The human breast milk (HBM) bacteriome is an important, continuous source of microbes to the
neonate in early life, playing an important role in shaping the infant’s intestinal bacteriome. Study
of the composition of the HBM bacteriome is an emerging area of research, with little information
available, particularly from low- and middle-income countries. The aim of this study was to
characterize the diversity of bacterial communities in HBM samples collected between 6-10 weeks
postpartum from lactating South African women, and to study potential influencing factors of the
bacteriome. Using 16S rRNA gene sequencing of samples from 554 women, we demonstrated that
the HBM bacteriome was largely dominated by the phyla Firmicutes (mean relative abundance:
71.1%) and Actinobacteria (mean relative abundance: 16.4%). The most abundant genera identified
from the HBM bacteriome were Streptococcus (mean relative abundance: 48.6%), Staphylococcus
(mean relative abundance: 17.8%), Rothia (mean relative abundance: 5.8%) and Corynebacterium
(mean relative abundance: 4.3%). “Core” bacterial genera including Corynebacterium,
Streptococcus, Staphylococcus, Rothia, Veillonella, Gemella, Acinetobacter, Micrococcus and a
genus belonging to the family, Enterobacteriaceae, were present in 80% of samples. HBM samples
were classified, according to their bacteriome, into three major clusters, dominated by the genera
Staphylococcus (cluster 1), a combination of Staphylococcus and Streptococcus (cluster 2) and
Streptococcus (cluster 3). The cluster groups differed significantly for Shannon and chao1 richness
indices. Bacterial interactions were studied using co-occurrence networks with positive associations
observed between the abundances of Staphylococcus and Corynebacteria (members of the skin
microbiota) and between Streptococcus, Rothia, Veillonella and Gemella (members of the oral
microbiota). HBM from older mothers had a higher Shannon diversity index. Study site was
associated with differences in HBM bacteriome composition (PERMANOVA, p < 0.05). No other
tested socio-demographic or psychosocial factors were associated with HBM bacterial composition.
Keywords: Human breast milk; bacteriome; microbiome; 16S rRNA gene sequencing; bacterial
profiles; socio-economic; psychosocial; Africa.

81
5.1 INTRODUCTION
The bacterial community (the bacteriome) present in human breast milk (HBM) is diverse and
plays an important role in the health of both mothers and their infants (1, 2). HBM bacteria are one
of the main sources of continuous microbes to the infant in early life and play a role in shaping the
infant’s intestinal bacteriome (3). Several bacterial genera, including Streptococcus,
Staphylococcus, Corynebacterium, Pseudomonas, and lactic acid bacteria (LAB; Lactobacillus spp.
and Bifidobacterium spp.) have been identified as key components of the HBM bacteriome, with the
phyla Firmicutes and Proteobacteria typically dominating (4-6).
The concept of a core bacteriome has been proposed (7), with Staphylococcus and
Streptococcus uniformly present (1, 8, 9), but with variation in other genera (10). Despite a core
bacteriome, substantial variability in HBM bacterial profiles occurs and has been linked to various
exposures. For example, HBM from women who delivered vaginally showed a different bacterial
profile compared to those who had caesarean section delivery (6). Other factors, such as
geographical location, maternal weight and body mass index, maternal health, maternal dietary
intake and lactational stage have also been shown to influence the HBM bacteriome composition (5,
6, 11-13). However, previous studies have been limited by sample size (n=10 to 133), with few
studies having been performed in sub-Saharan Africa (5, 14) and studies have not yet evaluated
socio-demographic and psychosocial factors in detail.
We therefore conducted a large cross-sectional study, nested within an existing birth cohort, to
describe the bacteriome of HBM from a cohort of South African women and the associated factors.
5.2 MATERIALS AND METHODS
5.2.1 Study settings: Drakenstein Child Health Study
This was a cross-sectional study nested within an existing birth cohort study, the “Drakenstein
Child Health Study” (DCHS) (15). The primary aim of the DCHS is to investigate the early life
determinants of child health in two poor communities in South Africa, a Low and Middle-Income
Country (LMIC). The birth cohort is based in the Drakenstein sub-district, a semi-rural area 60
kilometers outside Cape Town, South Africa and has an estimated population of 200,000. The study
sites include the TC Newman community health clinic (which serves a population with mixed
ancestry), and Mbekweni (which serves a population with predominately black African isiXhosa
ancestry). These two study sites are approximately 5 km apart. Inhabitants live in informal housing
or crowded conditions, with high levels of unemployment, a high prevalence of tobacco smoke
exposure, alcohol misuse, malnutrition and other poverty-related exposures (15).
82
5.2.2 Clinical data and sample collection
Pregnant women, 18 years of age or older (n = 1137), were enrolled between 20- and 28-weeks
of gestation and were followed up until their infants were 5 years old. Written informed consent was
obtained from all participating mothers. On recruitment, detailed demographic and risk factor data
were collected. Mothers underwent physical examination and metrics such as maternal height and
weight were collected (15).
HBM samples were collected from 554 women at 6-10 weeks postpartum. All participating
women were asked to wash their hands, nipples and surrounding breast area with soap and water to
minimize the presence of skin bacteria. HBM was collected manually by hand expression into a
sterile collection container after discarding the first few drops. After collection, the samples were
transported on ice to the research laboratory at the University of Cape Town and stored at −80oC
until further processing.
Ethical approval for the present study and the parent study (DCHS) was obtained from the
University of Cape Town (UCT) Human Research Ethics committee (reference numbers 649/2016
and 401/2009).
5.2.3 Bacterial nucleic acid extraction and quantification
HBM samples were homogenized by vortexing and skim milk preparation was adapted from a
previously published protocol (16). In brief, the samples were centrifuged at 3500 g for 20 mins at -
10 °C, and the fat layer discarded. The supernatant was then centrifuged at 7600 g for 10 mins at
room temperature, and the pellet was used for DNA extraction. Total genomic DNA was extracted
using the commercial manual extraction kit, ZR Fungal/Bacterial DNA MiniPrep™ (Zymo
Research Corp., CA, Irvine, USA), which incorporates a bead-beading step. All bead-beating steps
were performed in a TissueLyser LT (Qiagen) at a frequency of 50Hz for 5 min.
The quantity and purity of DNA was measured using a NanoDrop™ ND-2000c
Spectrophotometer (Thermo Scientific, Inc.). DNA was stored at -20°C until further processing. The
bacterial 16S rRNA gene was quantified using a 16S qPCR protocol previously described (17).
Each 30 µl PCR reaction contained 2.5 µl DNA template, 1 µl of probe (16S-P1 (FAM- ATT AGA
TAC CCT GGT AGT CCA –MGB), 15 µl Sensifast Probe No-rox (BIO-86020), 9.5 µl of MilliQ
water and 1 µl each of 0.333 µM forward and reverse primer (16S-F1: 5′-CGA AAG CGT GGG
GAG CAA A -3′ and 16S-R1: 5′-GTT CGT ACT CCC CAG GCG G-3′, respectively) (17). PCR
cycling conditions were as follows: 50 °C for 2 mins. 95 °C for 10 mins; 45 cycles of 95 °C for 15
s, 60 °C for 60 s, and 72 °C for 1 s (17).

83
5.2.4 Extraction and sequencing controls
Extraction controls were processed alongside HBM specimens and were included for each
batch of extractions (Appendix 2, Figure 1). Positive extraction controls consisted of 1000 µl elution
buffer (provided by the ZR Fungal/Bacterial DNA MiniPrep™ kit) spiked with 75 µl
Zymobiomics™ microbial community standard (Catalogue no. D6300, Zymo Research Corp.,
Irvine, CA, USA). Negative extraction controls (NTC; no template control) consisted of 1000 µl of
un-spiked elution buffer. DNA extracts from negative extraction controls served as negative PCR
and sequencing controls. A subset of DNA extracts from negative extraction controls were spiked
with Mycobacterium smegmatis (M. smegmatis) DNA (Appendix 2, Figure 1B) at a 16S rRNA gene
concentration similar to that obtained from HBM samples assessed by qPCR (herein referred to as
“M. smegmatis-spiked-NTC”. M. smegmatis-spiked-NTC were used to correct for potential
contamination, resulting from bacterial DNA in buffers and reagents, during bioinformatics
processing of sequenced reads. To determine experimental reproducibility, library preparation and
sequencing were carried out in duplicate for 11 HBM DNA extracts. These included seven DNA
extracts randomly selected for repeat processing within a single run (“within-run repeats”); and four
DNA extracts randomly selected for repeat processing between the two sequencing runs performed
(“between-run repeats”). In addition, the ZymoBIOMICS™ Microbial Community DNA Standard
(Catalogue no. D6305, Zymo Research Corp., Irvine, CA, USA) was used to assess library
preparation, sequencing reproducibility and bias.
5.2.5 16S ribosomal ribonucleic acid (rRNA) gene amplicon library preparation and
sequencing
Previously published primers (18) [with slight modifications (19)], PCR conditions and library
preparation steps were followed to generate 16S rRNA gene libraries (19). Libraries were
constructed using a two-step amplification approach described by Wu and colleagues (20). In the
first PCR reaction, the hypervariable V4 region of the 16S rRNA gene was amplified using primers
(515Fshort)-5’GTGCCAGCHGCYGCGGT3’ and (806Rshort)-
5’GGACTACNNGGGTNTCTAAT3’ respectively. Each 25.25 µl PCR reaction contained 12.5 µl
2X MyTaq™ HS Mix (BIO-25046), 2 µl each of 0.8 µM forward and reverse primers, 1 µl of
MilliQ water, 0.75µl dimethyl sulphoxide (Sigma-Aldrich®, MO, USA) and 7 µl bacterial genomic
DNA. PCR was carried out under the following conditions: 95 °C for 3 min; 10 cycles of 95 °C for
30 s, 50 °C for 30 s and 72 °C for 1 s; and finally, 72 °C for 5 min. Amplicon product (7 µl) from
the first PCR reaction was used as template in the second PCR reaction. The second PCR reaction
mixture was the same as the first except for the use of modified reverse primers. Reverse primers
were modified at the 3′ end with Illumina adapter sequences and unique index barcodes for each
sample. The use of index sequences allowed multiplexing of samples in a single sequencing run

84
(18). The PCR conditions for the second PCR were the same as for the first PCR but run for 30
cycles.
Amplicon products were cleaned with the Agencourt AMPure system (Beckman Coulter, UK)
using an Agencourt SPRIPlate 96 super Magnet Plate. The QuantiFluor™ dsDNA System
(Promega, Madison, WI, USA) was used to quantify the cleaned amplicons. The integrity of the
cleaned amplicons was assessed by gel electrophoresis. Amplicons were normalized by pooling the
different samples at 100 ng each. The pooled library was purified using the Agencourt AMPure
system and extracted from a 1.5% agarose gel following gel electrophoresis (30 min at 35 V; 45 min
at 40 V; and finally, 3h30 min at 70 V). Excision of the pooled 16S library was followed by
purification using QIAquick Gel Extraction Kit (Qiagen, Valencia, CA, United States) according to
manufacturer’s protocol. The elution buffer, Tris-EDTA (pH 8.0), was heated at 70 °C to improve
amplicon recovery (step 13). Finally, the Qubit® dsDNA BR Assay Kit was used for quantification
of the pooled library.
Sequencing was carried out at the Centre for Proteomic and Genomic Research, Cape Town,
South Africa. Quality control pre-sequencing steps included quantification of adapter-ligated
dsDNA using the KAPA Library Quantification Kit (Illumina®) (KAPA Biosystems, MA, USA)
and analysis of the fragment size of the pooled library using the Agilent High-Sensitivity (HS) DNA
Kit (Agilent Technologies, CA, USA). The library pool was diluted to 5.5 pM for sequencing and
the internal sequencing control (PhiX control V3, Illumina, CA, USA) was spiked into the diluted
library at 15% (v/v) according to the manufacturer’s instructions (21). The first and second library
pool had 352 and 202 samples multiplexed per Illumina run. The pooled 16S library was paired-end
sequenced on the Illumina MiSeq® system using the MiSeq® Reagent v3 kit (600 cycles)
(Illumina, CA, USA).
5.2.6 Processing of 16S rRNA gene sequences
16S rRNA gene sequences were processed using an in-house pipeline. Briefly, the sequencing
quality of FASTQ files were assessed using FastQC and MultiQC packages (22, 23). Forward and
reverse sequences were then merged using UPARSE (24) allowing 3 mismatches in overlaps
(uparse_merge_fastq, fastq_maxdiff set to 3), followed by quality filtering using uparse_filter_fastq
fastq_filter (sequences truncated to 250bp). Reads with a maximum expected error >0.1 were
discarded (fastq_maxee set to 0.1). USEARCH10 (25) sortbysize command was used to dereplicate
and select sequences occurring more than once. Clustering of sequences into operational taxonomic
units (OTUs) (with a clustering radius of 3) was performed with USEARCH10. The
USEARCH10_uchime2_ref tool was used to detect and remove chimeras, and OTU counts were
obtained using USEARCH10 usearch-global.

85
In-silico correction for contamination of biological HBM samples was carried out using a
procedure to control for “over-compensation” during contaminant removal (Appendix 2, Figure 1).
Firstly, M. smegmatis sequences were removed from the “M. smegmatis-spiked-NTC” controls.
Background sequences present in the M. smegmatis-spiked-NTC controls after the removal of M.
smegmatis sequences were screened against biological sample sequences by aligning biological
sample sequences to background sequences at 100% identity using align_seq.py, based on PyNAST
(26) algorithm and uclust (25) (Appendix 2, Figure 1D). The average number of reads was
calculated for each of the “background sequences” across M. smegmatis-spiked-NTCs, and the
corresponding number of reads was thereafter removed from the biological HBM samples
(Appendix 2, Figure 1E). Further processing of data was performed using Quantitative Insights Into
Microbial Ecology (QIIME) 1.9.0 suite of software tools (27). Taxonomy was assigned to
representative sequences of the OTUs using assign_taxonomy.py (method set to Ribosomal
Database Project (RDP)) Classifier (26) and identity was set to 97% with SILVA 132 release
database (28). Sequence alignment and filtering was performed with align_seqs.py (97% identity)
and filter_alignment.py, while construction of a phylogenetic tree was done using
make_phylogeny.py script.
Chao1 species richness (29) was used to estimate species richness and a rarefaction plot of
Shannon diversity against sequencing depth was generated using alpha_rarefaction.py in QIIME
1.9.0. Samples with <1000 reads were removed from further analysis as the rarefaction curve
plateaued at a sequence depth of 1000 read counts. The core bacteriome, defined as the OTUs that
were present in at least 80% of the samples, was determined with QIIME with the script
“compute_core_microbiome.py”. Nextflow (30) was used to loop the entire processing workflow.
The 16S rRNA gene sequencing datasets used in this study are stored in the National Center for
Biotechnology Information (NCBI) Sequence Read Archive (SRA) repository (BioProject
PRJNA520889).
5.2.7 Statistical analyses
Statistical analysis and graphical illustrations of the data (barplots, boxplots, dendograms) were
generated in R statistical package (version 3.4.4) (31) and R studio 1.1.456, respectively. Alpha
diversity was calculated using the Shannon–Weaver index (32). Analysis of Variance (Type II test)
(33) was used to test the difference in alpha diversity between groups, while error estimates were
based on Pearson residuals.
Agglomerative clustering was performed for all OTUs with relative abundance of >0.5% and
was generated by complete linkage hierarchical clustering (34) using the [hclust] function (35). This
hierarchical clustering method is based on the Bray-Curtis dissimilarity index (36) of the R vegan
package (37). To determine the relative abundances of bacterial profiles, the operational taxonomic
unit (OTU) table (clustered at 97% sequence similarity) was transformed from count data to

86
compositional data (38). The hierarchical clustering tree was cut at a height of 0.8 to cluster samples
into groups based on relative abundance of bacteria in HBM samples at genus level. The optimal
number of clusters was determined by Calinski–Harabasz index (39) and validated by silhouette
width index (40).
Log-ratio biplots using a Bayesian prior technique for adjustments of zero counts were made as
previously described (41) and lambda-scaling was employed to ensure evenness in the “total
spread” of the data sets (42). Box-plots (43) were used for visualization of distribution of the data.
A co-occurrence network was constructed using the R network package with centered log-ratio
data (44). The cut-off was set to 0.28 to generate the network for each of the different clusters and
for all samples, using bacteria with genus-level abundances >0.5%. A bivariate correlation analysis
for the 16 most abundant genera was performed using Pearson correlation.
Permutational Multivariate Analysis of Variance Using Distance Matrices (PERMANOVA)
via “adonis” in the R package vegan (45, 46) with Aitchison’s distance (47, 48) in the R package
robCompositions (49) was used to test the effects of potential influencing factors on the
composition and diversity of HBM bacteriome. ADONIS was performed with 999 x permutations
and method "bray". Benjamini–Hochberg method for multiple correction was used to correct all p-
values, set at a 5% significance level, by the false discovery rate (FDR) (50). All OTUs irrespective
of their abundance at each taxonomy level were tested in the model and a multivariate p-value was
generated for the covariates. Linear discriminant analysis (LDA) effect size (LEfSe) with default
parameters (51) was used to asses taxa that differed between groups, for any covariate significant by
ADONIS.
The Beck Depression Inventory (BDI-II) is a self-report measure of depressive symptoms that
assesses key symptoms of depression between 0 (absence of symptom) and 3 (severe, often with
functional impairment). Individual items are summed and scores of ≥20 is indicative of
moderate/severe depression (52, 53). Self-Regulation Questionnaire (SRQ) is a WHO-endorsed
self-report measure assessing psychological distress, including symptoms of depressive and anxiety
disorders in which individual items are scored according to whether or not the symptom is present.
SRQ scores ≥8 is indicative of “high risk” participants (54, 55). PTSD was measured by the
Modified Posttraumatic Stress Disorder Symptom Scale (MPSS) (56) which is a self-report measure
with scale including items which assess 3 symptom clusters for PTSD: re-experiencing, avoidance/
emotional numbing, and increased arousal. Items assessing the re-experiencing symptom cluster
were scored as “above threshold” if their sum totaled ≥1; avoidance/emotional numbing ≥3; and
increased arousal ≥2. Participants who scored above threshold across all three symptom clusters and
reported symptom duration of at least 1 month (scored ≥1 for item 18) were classified as “suspected
PTSD cases”. An intimate partner violence (IPV) questionnaire was used to assess recent exposure

87
to physical, emotional and sexual IPV as previously described (57). The four psychosocial variables
described above were collected at the 28-32 week antenatal visit.
The Alcohol, Smoking and Substance Involvement Screening test (ASSIST) was used to assess
maternal alcohol consumption based on a scoring system as previously described (57). Scores of 0–
10 for alcohol indicate that a participant is at low risk for substance-related health problems.
Infant length was measured in centimeters to the nearest completed 0.5 cm, and weight was
measured in kilograms to the nearest completed 10 g at the hospital as previously described (58).
A coefficient of multiple determination was generated using linear regression analysis (59) to
determine the reproducibility of the eleven DNA extracts which were processed in duplicate. The
total read count of each OTU in a sample was compared with the total read count of each OTU in its
duplicate set.
5.3 RESULTS
5.3.1 Participant characteristics
HBM samples were collected from 554 mothers at 6-10 weeks (median 7.5 weeks) postpartum.
Maternal characteristics can be found as Appendix 2, Table 1. The median maternal weight and
body mass index (BMI) at time of HBM collection was 63.7kg and 25 kg/m2, respectively. The
majority of the mothers were unemployed, and only 13% of participants had a household income of
>ZAR5000/month (>360 USD/month). HIV prevalence was higher at the Mbekweni study site
(18.4% of mothers) compared to TC Newman (2% of mothers). Smoking status, as measured by
urine cotinine levels at the 28–32-week antenatal visit, classified 13% of women at Mbekweni as
active smokers compared to 52% of mothers at TC Newman. At the 6-10-week postpartum study
visit, only 53% of women were exclusively breastfeeding their babies. Most of the women delivered
their infants vaginally (81%). Maternal post-traumatic stress disorder (PTSD) was documented in
8% of mothers, while 25% and 22% of women were above the Beck Depression Inventory (BDI)
and Self-Regulation Questionnaire (SRQ) threshold, respectively. The median household size was 5
people across both sites. Twenty-three percentage (23%) of infants were delivered pre-term
(Appendix 2, Table 1).
5.3.2 Sequencing results and OTU analysis
A total of 16,835,376 high-quality raw paired-end reads were obtained. The total number of
post-filtered reads was 4,865,561. The median and mean sequence read count per sample was 8007
and 8782.6 (range 48-40,919) respectively. A rarefaction curve of Shannon diversity plateaued at a
sequence depth of 1000 read counts (Appendix 2, Figure 2), therefore 32 samples with sequence
read counts <1000 were removed from further analysis. USEARCH9 mapping of sequences

88
revealed that the sequence reads clustered into 2284 OTUs. The OTUs were classified into 58 phyla,
133 classes, 263 orders, 596 families and 1,300 genera.
5.3.3 Profiling of human breast milk bacteriome
HBM bacterial profiles revealed diverse bacterial communities. Four phyla had mean relative
abundances >0.5%: Firmicutes (mean relative abundance [MRA]: 72%), Actinobacteria (16%),
Proteobacteria (10%) and Cyanobacteria (0.9%) (Figure 5.1). At the genus level, 16 genera had
MRAs >0.5%, of which Streptococcus (49%), Staphylococcus (18%) and Rothia (6%) were most
abundant (Appendix 2, Figure 3). A core bacteriome consisting of 14 OTUs from 9 genera,
Corynebacterium, Streptococcus, Staphylococcus, Rothia, Veillonella, Gemella, Acinetobacter,
Micrococcus and a genus belonging to the family, Enterobacteriaceae, was observed (these genera
were all present in HBM samples from >80% of women) (Appendix 2, Table 2).
Figure 5. 1: Complete linkage unsupervised hierarchical clustering of relative abundances of human
breast milk (HBM) bacterial phyla. Bar-plot of relative abundances of HBM bacteria genera at (A)
Mbekweni and (B) TC Newman study sites. Each bar represents a mother’s HBM bacteriome profile and each
coloured box, a bacterial phylum. Phyla with less than 0.5% abundance in a given sample are grouped
together, herein referred to as “other” (grey boxes).
5.3.4 Breast milk bacteriome profiles segregate into three major clusters
Hierarchical complete linkage unsupervised clustering based on Bray-Curtis dissimilarities at
the genus level resulted in an eleven-cluster best fit model. Clusters 4-11 however, had very few
participants and were therefore excluded from further analysis (Appendix 2, Figure 4).
Streptococcus and/or Staphylococcus were responsible for the formation of the three dominant
clusters in our study population. Cluster 1 showed the highest abundance of Staphylococcus spp.,
Cluster 2 was dominated by relatively equal proportions of both Streptococcus spp. and

89
Staphylococcus spp., while Cluster 3 showed the highest relative abundance of Streptococcus spp.
(Figure 5.2). Similar numbers of HBM samples were found in clusters 1 and 2, with the majority in
cluster 3 (Figure 5.2A).
Bacterial profiles of many of the most abundant taxa also differed between the cluster groups.
At phylum level, Cluster 2 showed the highest abundance of Actinobacteria and Proteobacteria but
lowest abundance of Firmicutes. Cluster 3, on the other hand, showed the highest abundance of
Firmicutes but lowest abundance of Proteobacteria (Appendix 2, Table 3). At genus level, Cluster 1
showed the highest abundance of OTU_24 (belonging to the family Enterobacteriaceae) and
Corynebacterium, with the lowest abundance of Veillonella, and Rothia; Cluster 2 showed the
highest abundance of Acinetobacter and the LAB-Lactobacillus and Bifidobacterium; Cluster 3
showed the highest abundance of Veillonella and Rothia but lowest abundance of Corynebacterium,
OTU_24 and Acinetobacter (Figure 5.2 and Appendix 2, Table 3).
Figure 5. 2: Human breast milk (HBM) bacterial profiles of the three clusters in which samples were
grouped at genus level. (A) Pie charts show the mean relative abundances in each cluster at the genus level
(for genera with abundance >0.05%). (B) Notched box plots show the mean relative abundance of the
predominant bacteria genera in each cluster. The notched box signifies the 75% (upper) and 25% (lower)
quartile showing the distribution of 50% of the samples. The median is represented by the line inside the box
plot, and the notch shows the 95% confidence interval for the median. The whiskers (top and bottom)
represent the maximum and minimum values. Outliers, which are beyond 1.5 times the interquartile range
above the maximum value and below the minimum value, are shown with open circles. (∗∗∗p < 0.001).
Furthermore, exploration of β-diversity using principal coordinate analysis (PCoA) revealed
distinct separation of HBM samples based on the three dominant bacterial profile cluster groups

90
(Figure 5.3A). PERMANOVA “adonis” analysis identified significant dissimilarity in bacterial
composition between the clusters at order, family and genus taxonomy levels (p≤0.001). Cluster 3
was common at both study sites, but more prevalent at Mbekweni, while Cluster 1 was more
prevalent at TC Newman (p=0.018) (Figure 5.3B).
Figure 5. 3: Human breast milk (HBM) bacteriome profiles coloured by clusters. (A) Principal
coordinate analysis (PCoA) of Bray-Curtis distance matrices of bacteria genera from all 522 HBM samples in
the study. (B) Bar plots showing the proportion of different clusters detected from each study site.
5.3.5 Alpha diversity of bacterial communities within the DCHS cohort study
Of the 26 covariates tested in this study (Appendix 2, Table 1), only the phenotypic cluster
groups and infant birth length showed significant differences in both alpha diversity measures
(Shannon diversity and Chao1 index). Figure 5.4 shows the alpha diversity matrices for 5 selected
covariates. For phenotypic cluster groups, cluster 1 had the lowest diversity by both measures, while
Cluster 2 had the highest Shannon diversity and Cluster 3 had the highest Chao1 species richness
(Figure 5.4). To analyse the association of infant birth length with HBM bacterial diversity, samples
were stratified into three groups: mothers with infant birth length of 0-40cm, 40-48cm, and 48-
60cm. HBM from mothers with infant birth length 48-60cm had the lowest bacterial diversity by
both measures (Appendix 2, Table 4). A significant difference in Shannon diversity was observed
based on maternal age in all samples and at the Mbekweni study site, with older mothers (ages ≥35)
having a higher Shannon diversity index (p<0.05) (Figure 5.4 and Appendix 2, Table 4).

91
Figure 5. 4: Alpha diversity indices of human breast milk bacteriome profiles. (A) Shannon diversity
index, and (B) Chao1 index of HBM bacteriome profiles of participants based on cluster group, study site,
maternal age (in years), infant feeding at 6–10 weeks, and smoking during pregnancy. M = Mbekweni, TCN =
TC Newman, EBF = exclusive breastfeeding, MF = mixed feeding, NS = non-smoker, PS = passive smoker,
AS = active smoker.
5.3.6 Human breast milk bacterial profiles in relation to demographic, socio-economic
and psychosocial variables
Beta-diversity clustering at the genus level of all HBM samples based on Bray-Curtis
dissimilarity index showed no clear association between bacterial profiles and the different
covariates studied (Figure 5.5). We also visualized bacterial diversity at the genus level for genera
with abundances >0.5% using log ratio biplots. Clustering was not observed for any covariates
studied (Figure 5.6 and Appendix 2, Figure 5). Figure 5.6 shows results for a selection of 4
covariates (study site, maternal smoking, maternal BMI and mode of delivery). Mothers with
elective caesarean section delivery had bacterial profiles with less clustering towards
Staphylococcus (Figure 6).

92
Figure 5. 5: Complete linkage unsupervised hierarchical clustering of human breast milk (HBM) bacterial profiles. (A) Dendogram of bacterial profiles present in 522
HBM samples at genus level. (B) Horizontal coloured bars below the dendogram summarize covariate data for each sample.

93
Figure 5. 6: Log ratio biplot of human breast milk bacterial abundances at the genus level. Samples are coloured according to (A) study site, (B) maternal smoking, (C)
Body Mass Index (BMI), and (D) delivery mode. Each sample is represented by a circle and is coloured based on group type. Samples (circles) that cluster together are similar in
bacterial composition and abundance.

94
Associations between bacterial profiles and socio-demographic and psychosocial characteristics were also
investigated at different taxonomy levels using PERMANOVA. At the phylum, order, family and genus levels,
only study site (which was also a marker for ethnicity) was associated with significant dissimilarity of the
HBM bacterial communities (ANOVA, p < 0.05). There were no statistically significant differences between
HBM bacterial profiles in relation to the remaining covariates (Table 5.1). LEFSe was performed to further
explore differences in specific bacterial taxa in relation to study site. In line with the prevalence of the
different cluster groups between study sites, HBM samples from Mbekweni had significantly higher relative
abundance of the genus Streptococcus while samples from TC Newman had significantly higher relative
abundances of the genera Staphylococcus, Acinetobacter and Escherichia_Shigella (Appendix 2, Figure 6A).
Table 5. 1: Permutational multivariate analysis of variance (PERMANOVA) analyses of HBM bacteriome and its
association with maternal demographic and psychosocial factors.
Covariates Phylum
(p-value)
Class Order Family
(p-value)
Genus
(p-value) (p-value) (p-value)
Study site (Ethnicity) 0.041* 0.0628 0.0036* 0.004* 0.0028*
Mode of delivery 0.9756 0.9492 0.8276 0.8358 0.793
Gestational age 0.1266 0.126 0.944 0.3424 0.3538
Infant gender 0.7818 0.8142 0.3084 0.9608 0.7898
Infant feeding options 0.1716 0.2244 0.9502 0.2888 0.4662
Maternal education 0.275 0.3486 0.2202 0.189 0.1734
Maternal employment 0.7434 0.7192 0.2346 0.6372 0.7988
Maternal BMI 0.3886 0.3806 0.6206 0.714 0.5788
Infant birth weight 0.836 0.933 0.6886 0.719 0.7824
Infant birth length 0.9876 0.971 0.9006 0.895 0.9414
Maternal age 0.3286 0.3986 0.8976 0.641 0.7316
Dwelling type 0.5846 0.4892 0.6306 0.136 0.1158
Marital status 0.4194 0.4406 0.1362 0.7608 0.7778
Household income 0.6062 0.6988 0.663 0.0922 0.0988
Maternal HIV status 0.7238 0.6582 0.0836 0.9242 0.9252
Antibiotics 0.4178 0.4446 0.951 0.3334 0.2128
Household size 0.559 0.4248 0.3374 0.9198 0.8276
Maternal smoking 0.867 0.8698 0.837 0.7986 0.7448
Alcohol score 0.1216 0.0974 0.8012 0.2018 0.8706
IPV-emotional 0.9198 0.9132 0.806 0.8394 0.3256
IPV-physical 0.2504 0.2432 0.1708 0.6604 0.817
IPV-sexual 0.7438 0.8552 0.8676 0.2556 0.8092
PTSD 0.847 0.6846 0.724 0.3232 0.1342
BDI score 0.127 0.876 0.2598 0.3168 0.3246

95
SRQ 0.7408 0.5376 0.2576 0.8204 0.3012
EBF=Exclusive breastfeeding; BMI=Body Mass Index; IPV=Induced Partner Violence; PTSD=post-traumatic stress
disorder; BDI=Beck Depression Inventory; SRQ=Self-Regulation Questionnaire; smoking status was based on cotinine
levels measured during an antenatal visit. Cotinine levels ≥ 500 (Active smoker); Cotinine levels >10<500 (Passive
smoker); Cotinine levels ≤ 10 (Non-smoker). p-values were generated by multivariable PERMANOVA analyses and
adjusted using Benjamini–Hochberg’s false discovery rate. Significant results (p<0.05) are labelled with asterisks.
5.3.7 Co-occurrence networks in human breast milk bacterial communities
Bacterial correlations within the HBM bacteriome were explored, since bacteria cohabit ecological
niches, and interactions between bacterial species may be present (60). We constructed a network for all
HBM samples, and across the 3 main clusters based on Pearson’s correlations of relative abundance ( -0.28
>|r|<0.28) at genus level (Figure 5.7 and Appendix 2, Table 5). The network of all HBM samples contained
12 nodes (bacterial genera) and 19 edges (interconnecting lines denoting correlations) (Figure 5.7A).
Bacterial correlations within each cluster group were similar except for Streptococcus spp. and
Staphylococcus spp. While a negative correlation was observed between these two genera in a co-
occurrence network involving all samples, a positive interaction was observed in cluster 2 where the
relative abundances of Streptococcus spp. and Staphylococcus spp. were similar.
Within the Firmicutes phylum, the abundance of Staphylococcus spp. was positively correlated with
Corynebacterium spp. (both common commensals of the skin), but was negatively correlated with
Streptococcus spp. and Veillonella spp. Streptococcus spp. abundance, on the other hand, was positively
correlated with other members of the oral flora, Veillonella spp., Gemella spp., and Rothia spp., and
negatively correlated with the Proteobacteria (Acinetobacter spp., and Enhydrobacter spp.), and with skin
commensals such as Micrococcus spp. and Staphylococcus spp. A positive correlation was observed
between Pseudomonas spp., Acinetobacter spp. and Enhydrobacter spp., all members of the order
Pseudomonadales.

96
Figure 5. 7: Bacterial networks within the human breast milk bacteriome community based on correlation
between relative abundances. Figures show correlations between predominant bacteria in (A), all HBM samples, (B),
Cluster 1, (C), Cluster 2, and (D), Cluster 3. Nodes and node sizes represent bacterial genera and their relative
abundances, respectively. Green and red lines represent positive and negative correlations respectively between the
bacteria, with the thickness of the line indicating the degree of correlation.
5.3.8 Reproducibility of bacterial profiling
The bacterial composition of each sample and its repeat was evaluated to test for reproducibility. Multiple
R-square values of >0.97 for both within-run and between-run repeats showed excellent reproducibility
(Appendix 2, Figure 7). Hierarchical clustering also showed that replicate samples clustered together
(Appendix 2, Figure 8).
5.4 DISCUSSION
In this study, the largest of its kind to date, we describe the composition of the HBM bacteriome in
samples from mothers living in South Africa. We identify a core bacteriome consisting of 9 bacterial genera
present in >80% of samples. We also show that there are three major HBM bacteriome profiles, distinguished
by the relative abundance of the genera Streptococcus and Staphylococcus and that bacteria which are
commonly found as part of the skin flora correlate in relative abundance in HBM, as do bacteria which are part
of the oral microbiota. We are able to demonstrate an association between study site (a proxy for ethnicity in
this study), infant birth length and maternal age, a range of potential determinants and the composition of the
HBM bacteriome.

97
Previous studies of the HBM bacteriome have revealed a diverse bacterial population, including gram
positive (Corynebacterium spp., Lactobacillus spp., Bifidobacterium spp., Staphylococcus spp.) and gram
negative (Pseudomonas spp., Veillonella spp.) bacteria (7, 9, 61, 62). The most abundant bacterial phyla in our
study were Firmicutes and Actinobacteria, in contrast to several other studies (8, 9, 63-65) which described a
predominance of Proteobacteria and Firmicutes. Our findings are similar, however, to those of Williams et al
(13) who showed similar relative abundances at the phylum level in HBM from mothers in the U.S.A. Many
factors including geographical region (which influences diet and cultural practices) (66), lactational stage, and
maternal health may influence the HBM bacterial community, with considerable diversity reported between
individuals (5, 63). Methodological differences including sample processing and analytical techniques may
also account for differences between studies.
At the bacterial genus level, Streptococcus spp. and Staphylococcus spp. were most abundant, in line with
previous studies (7-9, 63, 67, 68) and a recent systematic review (69). Other abundant genera included Rothia
spp., Corynebacteria spp. and Acinetobacter spp. Of note, the relative abundance of Acinetobacter spp.
observed in our cohort (2.2%) was low. When comparing our findings to those published previously; we found
that studies with sample collection protocols similar to ours identified Acinetobacter spp. proportions
comparable to those in our study (67). In contrast, proportions of Acinetobacter spp. were higher (32%) when
the sample collection protocol omitted cleaning of breast skin prior to collection and discarding of the first few
drops of milk during the collection procedure (67).
Bifidobacterium spp. and Lactobacillus spp. [lactic acid bacteria (LAB)] were detected at low relative
abundances (mean relative abundances of 1.0% and 0.9%) but detected in 72% and 76% of women in our
study. Previous studies using quantitative polymerase chain reaction (qPCR) have estimated the absolute
abundance of Lactobacillus spp. and Bifidobacterium spp. as 103–104 cells/ml and 102–105 cells/ml
respectively (4, 70, 71), however, we are not able to determine absolute abundance using 16S rRNA gene
amplicon sequencing. LAB have been identified as probiotics which colonize the infant gut even at relatively
small dose, and function to competitively exclude pathogens (72, 73). Studies have suggested that HBM is an
important source of Bifidobacterium for the infant gut. In support of this, it has been shown that
Bifidobacterium dominates the gut of a breastfed full-term infant as early as the first 3-6 days of life and
makes up 60-90% of the total bacteriome of the infant gut (74). Furthermore, identical strains of
Bifidobacterium breve and Lactobacillus plantarum have been isolated from HBM and infant feces in a
mother-infant pair, confirming vertical transmission (9).
Our study confirmed the existence of a shared and conserved “core” bacteriome in HBM which is
consistent with previous studies (7-9, 64, 65, 75). The core bacteriome identified from HBM samples assessed
in our study included eight bacterial genera at 80% prevalence. Bifidobacterium and Lactobacillus were not
part of the core bacteriome in our study, in contrast to a previous study in Ireland (9).

98
Further investigation into HBM bacterial profiles using clustering analysis revealed three major dominant
profiles present in our samples, determined by the relative abundances of Streptococcus spp. and/or
Staphylococcus spp. Similar to our study (76), the cluster dominated by Staphylococcus spp., was associated
with a less diverse bacteriome. Previous studies among lactating women in Italy, and Taiwan and mainland
China similarly described three bacterial profiles with clustering of bacterial profiles based on the dominance
of Streptococcus spp. or Staphylococcus spp., either at the genus and family taxonomy level respectively (63,
76). A Canadian cohort has however described four clusters based on the relative abundances of a different set
of bacterial profiles including Moraxellaceae, Enterobacteriaceae, and Pseudomonadaceae (Cluster 1),
Streptococcaceae, Staphylococcaceae, and Oxalobacteraceae (Cluster 2), Oxalobacteriaceae and
Comamonadaceae (Cluster 3), and Streptococcaceae and Comamonadaceae (Cluster 4) (65).
5.4.1 Bacterial interactions within the human breast milk bacterial community
We explored the correlation between bacterial genera, based on relative abundance. We showed a positive
relationship between the two skin commensals, Staphylococcus spp. and Corynebacterium spp. in line with
previous findings by Ma et al. (2015) (77). Recently, an “evil alliance” was proposed to occur between these
two genera, as both have been implicated as the cause of mastitis in breastfeeding women (77, 78).
Staphylococcus epidermidis and Staphylococcus aureus are major causes of infectious mastitis, a major reason
of premature cessation of breastfeeding among lactating women (1). Corynebacterium spp., has been
implicated as the third most prevalent bacterial group causing infectious mastitis (78).
Veillonella spp., Gemella spp., Rothia spp. and Streptococcus spp. which are commensals of the oral
cavity, demonstrated positive correlations. A similar positive correlation was also observed between
Pseudomonas spp., Acinetobacter spp. and Enhydrobacter spp. which are all members of the order
Pseudomonadales and live in the nasal cavities.
A negative correlation was observed between the abundances of Acinetobacter spp. and Staphylococcus
spp. Unlike a previous study in Taiwan and Mainland China (63), Correlations between Streptococcus spp.
and Staphylococcus spp. varied between cluster groups, being negative for clusters 1 and 3, but positive for
Cluster 2 where both bacterial genera had high relative abundances.
5.4.2 Impact of maternal and infant factors on human breast milk bacterial profiles
We studied a broad range of potential influencing factors of the HBM bacteriome but showed no
association of maternal, socio-economic and psychosocial variables with the HBM bacteriome, apart from
maternal age, infant birth length and study site (which almost completely correlated with ethnicity). Our
findings are similar to those of Urbaniak and colleagues (2016) who found that HBM bacterial profiles did not
differ significantly based on mode of delivery, gestation or infant gender in a Canadian population (8). In
support of our and Urbaniak and colleagues’ findings, a previous study conducted on HBM samples among

99
Chinese women (n=90), and a longitudinal study conducted among American women (n=104) also found that
the mode of delivery had no influence on HBM bacteriome (13, 67).
In contrast to these reports, two recent studies show separation of HBM bacterial profiles on principal
component analysis of beta diversity in relation to mode of delivery (64, 79). Both studies, however, had
relatively small sample sizes (12 and 84 participants). In our study, we observed separation of HBM bacterial
profiles of women who underwent elective caesarean section from HBM profiles of women who underwent
either vaginal or emergency caesarean section delivery in a log ratio biplot with less clustering around
Staphylococcus, however this association did not show statistical significance on PERMANOVA testing.
Kumar et al. (2016) showed that while delivery mode was not associated with HBM bacterial profiles among
South African and Finnish women, Chinese and Spanish women showed different bacterial profiles based on
mode of delivery (5). Li et al (2017) found no difference in the abundance of bacterial families in HBM based
on delivery mode, however, the genus, Lactobacillus, differed between the two groups (63). In another recent
study, mode of delivery was associated with bacterial composition of colostrum. Higher abundances of
Pseudomonas spp., Staphylococcus spp. and Prevotella spp. were observed in the colostrum of mothers with
caesarean section delivery. It is possible that differences in HBM profiles would be most marked in early
HBM samples where the hormones involved in the delivery process still have an impact.
Other factors which have been associated with HBM bacterial profiles include gestational age, maternal
age, and maternal BMI. Interestingly one previous study, using qPCR showed differences in HBM
composition between preterm and term milk, with higher Bifidobacterium spp. and lower Enterococcus spp.
counts among women who delivered term babies (71). A more recent study and ours, using 16S rRNA gene
sequencing, showed no impact of gestational age on the HBM bacteriome (8). With focus on infant gender, a
previous study reported higher mean relative abundances of Streptococcus spp. and lower mean relative
abundances of Staphylococcus spp. from HBM of mothers with male infants (13), although we did not find
any significant association. Contrary to our study, BMI within the normal range was associated with higher
proportions of Alphaproteobacteria and Betaproteobacteria at the class level (80). Maternal age, on the other
hand, influenced the diversity of HBM bacterial profiles in our study and previous reports (63, 80). How
maternal age or infant sex drives the bacteriome is largely unknown till date.
A study in Taiwan showed no influence of BMI on HBM bacteriome (63), as was found in our study,
however, higher Granulicatella spp. relative abundance was observed in another study of HBM from
overweight and obese mothers (13). A more recent study showed that maternal obesity was inversely
associated with Proteobacteria diversity but positively associated with Firmicutes diversity at the phylum level
(65).
There is increasing awareness of the microbiota-gut-brain axis, with several studies describing an
association between the gut microbiota, neuropsychiatric and psychosocial variables in both mouse models

100
and humans (81-83). We however did not observe any association between psychosocial variables and the
HBM bacteriome. To the best of our knowledge, this is the first study to examine the association of
psychosocial variables with HBM bacteriome composition.
In our study, we found an association between study site and the HBM bacteriome. However, since
ethnicity was almost completely correlated with study site, we are unable to determine whether these
differences were due to ethnicity or other unmeasured factors associated with study site. Li et al (63)
demonstrated similar findings in a study characterizing the HBM bacteriome from various regions within
Taiwan and Mainland China (63). Ethnicity has been found to have an influence on the gut microbiome in
several studies (66, 84), and could be driven by a range of factors, such as genetic differences or diet (85).
Strengths of our study include large sample size, consistent methods for sample collection, processing and
sequencing, detailed metadata collection, a reproducible sequencing pipeline and robust multivariate statistical
analysis. The major limitation of our study was the use of a single sampling time point, which precludes us
from studying intra-individual variability or exploring changes in bacterial profiles and associated risk factors
over time.
5.5 CONCLUSION
We used 16S rRNA gene sequencing to characterize the HBM bacteriome of a large cohort of mothers
living in South Africa. We showed that the HBM bacteriome was dominated at the phylum level by Firmicutes
and Actinobacteria, and at the genus level by Staphylococcus, Streptococcus and Rothia. We identified three
major microbiome profile groups, defined by the relative abundances of Staphylococci and Streptococci. We
found little evidence of the association of various socio-economic or psychosocial variables with the HBM
bacteriome, but we showed that maternal age, infant birth length, and study site were associated with
composition of the HBM bacteriome.

101
5.6 REFERENCES
1. Jimenez E, de Andres J, Manrique M, Pareja-Tobes P, Tobes R, Martinez-Blanch JF, et al.
Metagenomic Analysis of Milk of Healthy and Mastitis-Suffering Women. J Hum Lact. 2015;31(3):406-15.
2. Pannaraj PS, Li F, Cerini C, et al. Association between breast milk bacterial communities and
establishment and development of the infant gut microbiome. JAMA Pediatrics. 2017;171(7):647-54.
3. Makino H, Kushiro A, Ishikawa E, Muylaert D, Kubota H, Sakai T, et al. Transmission of intestinal
Bifidobacterium longum subsp. longum strains from mother to infant determined by multilocus sequencing
typing and amplified fragment length polymorphism. Appl Environ Microbiol. 2011:AEM. 05346-11.
4. Martín R, Jiménez E, Heilig H, Fernández L, Marín ML, Zoetendal EG, et al. Isolation of
bifidobacteria from breast milk and assessment of the bifidobacterial population by PCR-denaturing gradient
gel electrophoresis and quantitative real-time PCR. Appl Environ Microbiol. 2009;75(4):965-9.
5. Kumar H, du Toit E, Kulkarni A, Aakko J, Linderborg KM, Zhang Y, et al. Distinct Patterns in
Human Milk Microbiota and Fatty Acid Profiles Across Specific Geographic Locations. Front Microbiol.
2016;7:1619.
6. Cabrera-Rubio R, Mira-Pascual L, Mira A, Collado MC. Impact of mode of delivery on the milk
microbiota composition of healthy women. J Dev Orig Health Dis. 2016;7(1):54-60.
7. Hunt KM, Foster JA, Forney LJ, Schutte UM, Beck DL, Abdo Z, et al. Characterization of the
diversity and temporal stability of bacterial communities in human milk. PLoS One. 2011;6(6):e21313.
8. Urbaniak C, Angelini M, Gloor GB, Reid G. Human milk microbiota profiles in relation to birthing
method, gestation and infant gender. Microbiome. 2016;4:1.
9. Murphy K, Curley D, O'Callaghan TF, O'Shea CA, Dempsey EM, O'Toole PW, et al. The
composition of human milk and infant faecal microbiota over the first three months of life: A pilot study. Sci
Rep. 2017;7.
10. Ojo-Okunola A, Nicol M, du Toit E. Human Breast Milk Bacteriome in Health and Disease. Nutrients.
2018;10(11):1643.
11. Cabrera-Rubio R, Collado MC, Laitinen K, Salminen S, Isolauri E, Mira A. The human milk
microbiome changes over lactation and is shaped by maternal weight and mode of delivery. Am J Clin Nutr.
2012;96(3):544-51.
12. Olivares M, Albrecht S, De Palma G, Ferrer MD, Castillejo G, Schols HA, et al. Human milk
composition differs in healthy mothers and mothers with celiac disease. Eur J Nutr. 2015;54(1):119-28.
13. Williams JE, Carrothers JM, Lackey KA, Beatty NF, York MA, Brooker SL, et al. Human Milk
Microbial Community Structure Is Relatively Stable and Related to Variations in Macronutrient and
Micronutrient Intakes in Healthy Lactating Women. J Nutr. 2017;147(9):1739-48.
14. González R, Mandomando I, Fumadó V, Sacoor C, Macete E, Alonso PL, et al. Breast milk and gut
microbiota in African mothers and infants from an area of high HIV prevalence. PLoS One. 2013;8(11).
15. Zar HJ, Barnett W, Myer L, Stein DJ, Nicol MP. Investigating the early-life determinants of illness in
Africa: the Drakenstein Child Health Study. Thorax. 2015;70(6):592-4.
16. Lucey JA, Tamehana M, Singh H, Munro PA. Effect of interactions between denatured whey proteins
and casein micelles on the formation and rheological properties of acid skim milk gels. J Dairy Res.
1998;65(4):555-67.
17. Bogaert D, Keijser B, Huse S, Rossen J, Veenhoven R, van Gils E, et al. Variability and diversity of
nasopharyngeal microbiota in children: a metagenomic analysis. PLoS One. 2011;6(2):e17035.
18. Caporaso JG, Lauber CL, Walters WA, Berg-Lyons D, Lozupone CA, Turnbaugh PJ, et al. Global
patterns of 16S rRNA diversity at a depth of millions of sequences per sample. Proceedings of the national
academy of sciences. 2011;108(Supplement 1):4516-22.

102
19. Claassen-Weitz S, Gardner-Lubbe S, Nicol P, Botha G, Mounaud S, Shankar J, et al. HIV-exposure,
early life feeding practices and delivery mode impacts on faecal bacterial profiles in a South African birth
cohort. Sci Rep. 2018;8(1):5078.
20. Wu L, Wen C, Qin Y, Yin H, Tu Q, Van Nostrand JD, et al. Phasing amplicon sequencing on Illumina
Miseq for robust environmental microbial community analysis. BMC Microbiol. 2015;15(1):125.
21. Illumina P. MiSeq® System User Guide. . 2014:1–94.
22. Ewels P, Magnusson M, Lundin S, Kaller M. MultiQC: summarize analysis results for multiple tools
and samples in a single report. Bioinformatics. 2016;32(19):3047-8.
23. Andrews S. FastQC: a quality control tool for high throughput sequence data. 2010.
24. Edgar RC. UPARSE: highly accurate OTU sequences from microbial amplicon reads. Nature
methods. 2013;10(10):996.
25. Edgar RC. Search and clustering orders of magnitude faster than BLAST. Bioinformatics.
2010;26(19):2460-1.
26. Wang Q, Garrity GM, Tiedje JM, Cole JR. Naive Bayesian classifier for rapid assignment of rRNA
sequences into the new bacterial taxonomy. Appl Environ Microbiol. 2007;73(16):5261-7.
27. Caporaso JG, Kuczynski J, Stombaugh J, Bittinger K, Bushman FD, Costello EK, et al. QIIME allows
analysis of high-throughput community sequencing data. Nature methods. 2010;7(5):335.
28. Quast C, Pruesse E, Yilmaz P, Gerken J, Schweer T, Yarza P, et al. The SILVA ribosomal RNA gene
database project: improved data processing and web-based tools. Nucleic Acids Res. 2013;41(Database
issue):D590-6.
29. Chao A. Nonparametric estimation of the number of classes in a population. Scandinavian Journal of
statistics. 1984:265-70.
30. Di Tommaso P, Chatzou M, Floden EW, Barja PP, Palumbo E, Notredame C. Nextflow enables
reproducible computational workflows. Nat Biotechnol. 2017;35(4):316-9.
31. Team RC. R: A Language and Environment for Statistical Computing. R Foundation for Statistical
Computing, Vienna, Austria. URL https://www.R-project.org/. 2018.
32. Oksanen J, Blanchet FG, Kindt R, Legendre P, Minchin PR, O’hara R, et al. Package ‘vegan’.
Community ecology package, version. 2013;2(9).
33. Fox J, Weisberg S. An R companion to applied regression: Sage Publications; 2018.
34. Hartigan JA. Clustering Algorithms, New York: John Willey and Sons. Inc Pages113129. 1975.
35. Murtagh F. Multidimensional clustering algorithms. Compstat Lectures, Vienna: Physika Verlag,
1985. 1985.
36. Bray JR, Curtis JT. An ordination of the upland forest communities of southern Wisconsin. Ecol
Monogr. 1957;27(4):325-49.
37. Oksanen J, Blanchet F, Kindt R, Legendre P, Minchin P, O'Hara R, et al. vegan: Community Ecology
Package. R package version 2.4-4. 2017.
38. Anders S, Huber W. Differential expression analysis for sequence count data. Genome Biol.
2010;11(10):R106.
39. Caliński T, Harabasz J. A dendrite method for cluster analysis. Communications in Statistics-theory
and Methods. 1974;3(1):1-27.
40. Rousseeuw PJ. Silhouettes: a graphical aid to the interpretation and validation of cluster analysis.
Journal of computational and applied mathematics. 1987;20:53-65.
41. Greenacre MJ. Biplots in practice: Fundacion BBVA; 2010.
42. Gower JC, Lubbe SG, Le Roux NJ. Understanding biplots: John Wiley & Sons; 2011.
43. Williamson DF, Parker RA, Kendrick JS. The box plot: a simple visual method to interpret data. Ann
Intern Med. 1989;110(11):916-21.

103
44. Butts CT. network: a Package for Managing Relational Data in R. Journal of Statistical Software.
2008;24(2):1-36.
45. Anderson MJ. A new method for non-parametric multivariate analysis of variance. Austral Ecol.
2001;26(1):32-46.
46. Excoffier L, Smouse PE, Quattro JM. Analysis of molecular variance inferred from metric distances
among DNA haplotypes: application to human mitochondrial DNA restriction data. Genetics.
1992;131(2):479-91.
47. Pawlowsky-Glahn V, Egozcue JJ, Tolosana-Delgado R. Modeling and analysis of compositional data:
John Wiley & Sons; 2015.
48. Aitchison J, Barceló-Vidal C, Martín-Fernández J, Pawlowsky-Glahn V. Logratio analysis and
compositional distance. Mathematical Geology. 2000;32(3):271-5.
49. Templ M, Hron K, Filzmoser P. robCompositions: an R-package for robust statistical analysis of
compositional data: na; 2011.
50. Benjamini Y, Hochberg Y. Controlling the false discovery rate: a practical and powerful approach to
multiple testing. Journal of the royal statistical society Series B (Methodological). 1995:289-300.
51. Segata N, Izard J, Waldron L, Gevers D, Miropolsky L, Garrett WS, et al. Metagenomic biomarker
discovery and explanation. Genome Biol. 2011;12(6):R60.
52. Lasa L, Ayuso-Mateos J, Vazquez-Barquero J, Dıez-Manrique F, Dowrick C. The use of the Beck
Depression Inventory to screen for depression in the general population: a preliminary analysis. J Affect
Disord. 2000;57(1-3):261-5.
53. Beck AT, Steer RA, Brown GK. Beck depression inventory-II. San Antonio. 1996;78(2):490-8.
54. Beusenberg M, Orley JH, World Health Organization. A User's guide to the self reporting
questionnaire (SRQ). Geneva: World Health Organization; 1994.
55. Harpham T, Reichenheim M, Oser R, Thomas E, Hamid N, Jaswal S, et al. Measuring mental health
in a cost-effective manner. Health Policy Plan. 2003;18(3):344-9.
56. Foa EB, Riggs DS, Dancu CV, Rothbaum BO. Reliability and validity of a brief instrument for
assessing post‐traumatic stress disorder. J Trauma Stress. 1993;6(4):459-73.
57. Stein DJ, Koen N, Donald K, Adnams CM, Koopowitz S, Lund C, et al. Investigating the
psychosocial determinants of child health in Africa: the Drakenstein Child Health Study. J Neurosci Methods.
2015;252:27-35.
58. Budree S, Stein D, Brittain K, Goddard E, Koen N, Barnett W, et al. Maternal and infant factors had a
significant impact on birthweight and longitudinal growth in a South African birth cohort. Acta Paediatr.
2017;106(11):1793-801.
59. Draper NR, Smith H. Applied regression analysis: John Wiley & Sons; 2014.
60. Faust K, Raes J. Microbial interactions: from networks to models. Nature Reviews Microbiology.
2012;10(8):538.
61. Jiménez E, Delgado S, Fernández L, García N, Albújar M, Gómez A, et al. Assessment of the
bacterial diversity of human colostrum and screening of staphylococcal and enterococcal populations for
potential virulence factors. Res Microbiol. 2008;159(9-10):595-601.
62. Ward TL, Hosid S, Ioshikhes I, Altosaar I. Human milk metagenome: A functional capacity analysis.
BMC Microbiol. 2013;13(1).
63. Li S-W, Watanabe K, Hsu C-C, Chao S-H, Yang Z-H, Lin Y-J, et al. Bacterial composition and
diversity in breast milk samples from mothers living in Taiwan and Mainland China. Front Microbiol.
2017;8:965.
64. Hermansson H, Kumar H, Collado MC, Salminen S, Isolauri E, Rautava S. Breast milk microbiota is
shaped by mode of delivery and intrapartum antibiotic exposure. Frontiers in Nutrition. 2019;6:4.

104
65. Moossavi S, Sepehri S, Robertson B, Bode L, Goruk S, Field CJ, et al. Composition and Variation of
the Human Milk Microbiota Are Influenced by Maternal and Early-Life Factors. Cell host & microbe.
2019;25(2):324-35. e4.
66. Deschasaux M, Bouter KE, Prodan A, Levin E, Groen AK, Herrema H, et al. Depicting the
composition of gut microbiota in a population with varied ethnic origins but shared geography. Nat Med.
2018;24(10):1526-31.
67. Sakwinska O, Moine D, Delley M, Combremont S, Rezzonico E, Descombes P, et al. Microbiota in
breast milk of Chinese lactating mothers. PLoS One. 2016;11(8).
68. Chen PW, Lin YL, Huang MS. Profiles of commensal and opportunistic bacteria in human milk from
healthy donors in Taiwan. Journal of Food and Drug Analysis. 2018.
69. Fitzstevens JL, Smith KC, Hagadorn JI, Caimano MJ, Matson AP, Brownell EA. Systematic Review
of the Human Milk Microbiota. Nutr Clin Pract. 2017;32(3):354-64.
70. Collado MC, Delgado S, Maldonado A, Rodríguez JM. Assessment of the bacterial diversity of breast
milk of healthy women by quantitative real-time PCR. Lett Appl Microbiol. 2009;48(5):523-8.
71. Khodayar-Pardo P, Mira-Pascual L, Collado MC, Martínez-Costa C. Impact of lactation stage,
gestational age and mode of delivery on breast milk microbiota. J Perinatol. 2014;34(8):599-605.
72. Fernández L, Langa S, Martín V, Jiménez E, Martín R, Rodríguez JM. The microbiota of human milk
in healthy women. Cell Mol Biol. 2013;59(1):31-42.
73. Fernandez MF, Boris S, Barbes C. Probiotic properties of human lactobacilli strains to be used in the
gastrointestinal tract. J Appl Microbiol. 2003;94(3):449-55.
74. Fan W, Huo G, Li X, Yang L, Duan C. Impact of diet in shaping gut microbiota revealed by a
comparative study in infants during the first six months of life. J Microbiol Biotechnol. 2014;24(2):133-43.
75. Lackey KA, Williams JE, Meehan CL, Zachek JA, Benda ED, Price WJ, et al. What's Normal?
Microbiomes in Human Milk and Infant Feces Are Related to Each Other but Vary Geographically: The
INSPIRE Study. Frontiers in Nutrition. 2019;6(45).
76. Biagi E, Aceti A, Quercia S, Beghetti I, Rampelli S, Turroni S, et al. Microbial Community Dynamics
in Mother’s Milk and Infant’s Mouth and Gut in Moderately Preterm Infants. Front Microbiol. 2018;9(2512).
77. Ma Z, Guan Q, Ye C, Zhang C, Foster JA, Forney LJ. Network analysis suggests a potentially 'evil'
alliance of opportunistic pathogens inhibited by a cooperative network in human milk bacterial communities.
Sci Rep. 2015;5.
78. Mediano P, Fernández L, Jiménez E, Arroyo R, Espinosa-Martos I, Rodríguez JM, et al. Microbial
Diversity in Milk of Women with Mastitis: Potential Role of Coagulase-Negative Staphylococci, Viridans
Group Streptococci, and Corynebacteria. J Hum Lact. 2017;33(2):309-18.
79. Cacho NT, Harrison NA, Parker LA, Padgett KA, Lemas DJ, Marcial GE, et al. Personalization of the
Microbiota of Donor Human Milk with Mother's Own Milk. Front Microbiol. 2017;8:1470.
80. Li C, Gonzalez E, Solomons N, Scott ME, Koski K. Human Breast Milk Microbiota is Influenced by
Maternal Age and BMI, Stage of Lactation and Infant Feeding Practices. FASEB J. 2017;31(s1).
81. Naseribafrouei A, Hestad K, Avershina E, Sekelja M, Linløkken A, Wilson R, et al. Correlation
between the human fecal microbiota and depression. Neurogastroenterol Motil. 2014;26(8):1155-62.
82. Bendtsen KMB, Krych L, Sørensen DB, Pang W, Nielsen DS, Josefsen K, et al. Gut microbiota
composition is correlated to grid floor induced stress and behavior in the BALB/c mouse. PLoS One.
2012;7(10):e46231.
83. Shen Y, Xu J, Li Z, Huang Y, Yuan Y, Wang J, et al. Analysis of gut microbiota diversity and
auxiliary diagnosis as a biomarker in patients with schizophrenia: a cross-sectional study. Schizophr Res.
2018.

105
84. He Y, Wu W, Zheng H-M, Li P, McDonald D, Sheng H-F, et al. Regional variation limits applications
of healthy gut microbiome reference ranges and disease models. Nat Med. 2018;24(10):1532-5.
85. Gaulke CA, Sharpton TJ. The influence of ethnicity and geography on human gut microbiome
composition. Nat Med. 2018;24(10):1495-6.

106
CHAPTER 6
HUMAN BREAST MILK BACTERIAL DYSBIOSIS IS ASSOCIATED WITH
LACTOSE FERMENTATION AND POOR BREAST-FEEDING OUTCOMES

107
Abstract
Human breast milk (HBM) is universally regarded as the optimal source of nutrition for the growing infant,
however the impact of variation in the different components of HBM on breastfeeding outcomes is not fully
understood. In particular, the relationship between the HBM metabolome and microbiome has not been well-
studied. Here we show that a dysbiotic HBM microbiota is associated with evidence of fermentation of lactose
in HBM, low lactose concentration and poor breastfeeding outcomes. We identified a subset of 45/519 (8.7%)
South African lactating mothers with markedly reduced HBM lactose concentrations. Mothers with low-
lactose (vs normal lactose) HBM had reduced median duration of exclusive breastfeeding (27.6 vs. 55.2 days)
and their infants grew less well during the period of exclusive breastfeeding (reduced weight and length z-
scores). Metabolomic profiling of low-lactose HBM revealed an increase in metabolites associated with mixed
acid fermentation (characteristic of microbial carbohydrate metabolism) and depletion of metabolites in the
tricarboxylic acid cycle. We therefore explored the bacterial composition of HBM using 16S rRNA amplicon
sequencing and showed that the bacterial composition in samples with low lactose was markedly different
from those with normal lactose. Low-lactose HBM had a strikingly higher median relative abundance of
Staphylococcus species (19.0% vs. 5.0%), lower abundance of Streptococcus species (32% vs. 58%) and
increased bacterial load. Since the HBM microbiota is a potentially modifiable risk factor, this may provide
opportunity for diagnostic and therapeutic intervention to avert poor breastfeeding outcomes. These findings
should be explored in other populations to identify women and their infants at risk.

108
6.1 INTRODUCTION
Human breast milk (HBM) is a complex physiological fluid universally regarded as the optimal source of
nutrition for growing infants (1-3). It consists of essential nutrients including fatty acids, carbohydrates and
protein, a host of non-nutritive bio-molecules including glycoconjugates, oligosaccharides, and anti-microbial
peptides, and a resident microbial flora (4, 5). Despite the importance of HBM in infant health (6), the
relationship between the HBM metabolome and bacteriome has not been comprehensively characterized in
large studies, and related to infant health and growth.
6.2 MATERIALS AND METHODS
6.2.1 Subjects and sample collection
This cross-sectional study was nested within a birth cohort study, the “Drakenstein Child Health Study”
(DCHS) which aims to investigate the early life determinants of child health within the Drakenstein sub-
district in South Africa (7). Pregnant women, 18 years of age or older (n = 1137), were recruited antenatally
from clinics within the Drakenstein sub-district, Western Cape, South Africa between 20- and 28-weeks’
gestation and were followed up until their infants were 5 years old. On recruitment, detailed demographic and
risk factor data were collected (7). HBM samples were collected from 554 women at 5-10 weeks postpartum.
To ensure a narrow collection window, HBM samples collected before 5 weeks and after 10 weeks (n=35)
were excluded from further analysis. None of the women described difficulties with breastfeeding at the time
of breast milk collection. Women were asked to wash their hands, nipples and surrounding breast area with
soap and water. Milk was collected manually by hand expression into a sterile collection bottle after
discarding the first few drops. After collection, the samples were immediately refrigerated at 4 oC for a
maximum of 4 hours, then transported on ice to the laboratory and then stored at −80 oC until further
processing. Ethical approval for the present study and DCHS study was obtained from the Human Research
Ethics committee of the University of Cape Town (reference numbers 649/2016 and 401/2009).
6.2.2 Demographic and growth measures
Socio-demographic and health information were obtained from questionnaires administered to mothers during
antenatal and postnatal study visits. Birthweight and length were measured at the hospital. Gestational age at
birth was estimated based on an antenatal ultrasound carried out in the second trimester. Trained study staff
collected serial anthropometric measurements on the infants across 8 different time points (weeks+days: 5+0-8+6,
9+0-11+6, 12+0-19+6, 20+0-34+6, 35+0-45+6, 46+0-70+6, 71+0-95+6, 96+0-120+6). Infant length was measured in
centimetres to the nearest completed 0.5 cm, and weight was measured in kilograms to the nearest completed
10 g. Maternal height was measured to the nearest 0.1 cm at enrolment. BMI was calculated using weight in
kilograms divided by length in centimetres squared. All anthropometric measurements were carried out twice
for each child, with a third measurement if the difference between the first and second measurement differed

109
by more than 0.5 cm for length or more than 0.5 kg for weight. Birth weight, length, and BMI were converted
to z-scores for gender and gestational age using the INTERGROWTH-21st standards (8). Infants were
classified into low birthweight (LBW) if they weighed less than 2500g at birth, preterm if born at less than 37
weeks of gestational age and small for gestational age (SGA) if weighted less than the 10th percentile for
gestational age, based on gender and gestational age. Corrected gestational age was used to calculate the WHO
z-score for preterm infants. The weight and length measurements following birth were converted to z-scores
based on age and gender, using Anthro software (9). Weight-for-age z-scores (WFAZ), height-for-age z-scores
(HFAZ) and BMI for age z scores (BMIZ) were calculated.
Infant feeding practice was categorized based on the World Health Organization’s (WHO) Infant and Young
Child feeding indicators, namely exclusive breastfeeding or mixed feeding, which included infant cow milk-
based formula with or without breastmilk or semisolids (10).
Validated questionnaires were administered to mothers at the 28-32 week antenatal visit to assess psychosocial
factors. Beck’s Depression Inventory is a self-report measure of depressive symptoms that assesses key
symptoms of depression between 0 (absence of symptom) and 3 (severe, often with functional impairment).
Individual items are summed and ≥ 20 is indicative of moderate/severe depression (11, 12). The Self-
Regulation Questionnaire (SRQ) is a WHO-endorsed self-report measure assessing psychological distress in
which individual items are scored according to whether or not the symptom is present; score ≥ 8 is indicative
of “high risk” participants (13, 14). Post-traumatic Stress Disorder (PTSD) was measured by the Modified
PTSD Symptom Scale (MPSS) (15) which is a self-report measure with scale including items which assess 3
symptom clusters for PTSD. An intimate partner violence (IPV) questionnaire was used to assess recent
exposure to physical, emotional and sexual IPV as previously described (16). Exposure was categorized as
above the threshold if a participant reported more than one incident of IPV during the previous year.
Peritraumatic Distress Inventory (PDI) is a self-report measure assessing the level of distress experienced
during and immediately after a traumatic event with each item that assesses symptoms of distress related to the
event scored between 0 (“not at all”) and 4 (“extremely”) (17).
The Alcohol, Smoking and Substance Involvement Screening test (ASSIST) was used to assess maternal
alcohol consumption based on a scoring system as previously described(16). Scores of 0–10 for
alcohol indicate that a participant is at low risk for substance-related health problems. Tobacco smoke
exposure was measured using maternal urinary cotinine levels at antenatal visit. A urinary cotinine level of
≥500 ng/mL was used as the threshold to categorize mothers into active smokers. Maternal diet was assessed
at 6 weeks postpartum with a validated food frequency questionnaire (18).
6.2.3 Human breast milk sample preparation
HBM samples were homogenized by vortexing and skim milk was prepared using an adaptation of a
previously published protocol (19). In brief, 1 ml of each sample was centrifuged at 3500 g, -10 °C for 20

110
mins to remove the fatty layer. The remaining sample was thereafter centrifuged at 7600 g for 10 mins at room
temperature to sediment the pellets. 800 µL of sample supernatant was collected into tubes and stored at -80
°C for NMR processing, whilst pellets were stored at -80 °C for bacterial profiling.
NMR experiments were carried out at the Centre for Human Metabolomics, Potchefstroom, South Africa.
Samples were filtered using a pre-rinsed 2ml Amicon® Ultra 10 kDa centrifugal filter unit (Merck; Ref
UFC201024) by centrifuging at 4500 g for 30 mins to remove residual lipids and protein. The filter was pre-
rinsed twice with distilled water by centrifugation at 4500 g for 15 mins to remove trace amounts of glycerol
and glycerin from membrane filters. A 60 μl volume of NMR buffer solution (pH 7.4) was added to 540 µL
filtrate in a microcentrifuge tube. The NMR buffer solution consisted of 1.5 M potassium phosphate buffer
(pH 7.4) in deuterium oxide and 5.805 mM of trimethylsilyl-2,2,3,3-tetradeuteropropionic acid (TSP; Sigma-
Aldrich, St. Louis, MO, USA). A trace amount of sodium azide was included in the buffer to prevent bacterial
growth in the sample. A 600 µL filtrate-buffer solution was mixed under vortex to ensure complete
homogeneity and transferred to a 5 mm NMR tube (Wilmad Royal Imperial; Wilmad LabGlass, USA). A total
of 6 samples were excluded from the analysis because their sample preparation did not reach the standard of
quality.
6.2.4 Nuclear magnetic resonance (NMR) profiling
Samples were measured at 500 MHz on a Bruker Avance III HD NMR spectrometer (Bruker Analytische
Messtechnik, Karlsruhe, Germany) equipped with a triple-resonance inverse (TXI) 1H probe head and x, y, z
gradient coils. 1H NMR spectra were acquired as 128 transients in 32K data points with a spectral width of
6002 Hz and acquisition time of 2.72 sec (relaxation delay time of 4s; 8μs (90°) pulse; sample temperature
300 K). Receiver gain was set to 64 and water suppression was by single frequency irradiation focused on H2O
resonance. Shimming of the samples was performed automatically on the deuterium signal. The resultant raw
spectral data were Fourier transformed. These transformed spectra were automatically corrected for phase and
baseline using Bruker Topspin (V3.5) (Bruker Biospin, Germany). Spectra were calibrated in automation to
the TSP signal (0.00 pm). Spectral regions belonging to water (4.70–5.00 ppm) and urea (5.68–5.96 ppm)
were removed from subsequent analysis. Spectral analysis was by “fixed-width” binning - dividing the spectra
into set widths of 0.02 ppm.
Identification of signals was undertaken using the SBASE database in Amix (v3.9.11; Bruker BioSpin,
Germany) or available assignments in the literature (20). A commercial spectral library from Bruker, along
with pure compound spectral libraries of oligosaccharides (Elicityl-OligoTech®, France), were used to
identify HMO signals. In addition, two-dimensional analysis (JRES and COSY) of pooled HBM samples was
done to confirm metabolite identification. The peaks of the identified metabolites (Appendix 3, Table 6) were
fitted by a combination of Voigt functions based on the multiplicity of the NMR signal (21) using an in-house
R script. The absolute concentration of each metabolite was calculated according to the equation described by

111
Serkova et al (22). To consider the variability introduced by the preparation of the NMR samples, the area of
the spectra was corrected using the area of TSP (Appendix 3, Figure 1A) with the following formula:
Ni = 1 - (TSPi x 0.1 / TSPmedian)
Where N is the coefficient multiplied to ith spectrum, TSPi is the area of the TSP signal of the ith spectrum, and
TSPmedian is the median value of the TSP signals.
Pooled supernatant from all HBM samples was used as a quality control sample and was included in each
batch for qualitative assessment of repeatability by overlaying the raw spectra. No notable deviations were
detectable (Appendix 3, Figure 1B). We did not detect any deviations in the lactose concentration among the
quality control samples (Appendix 3, Figure 1C).
The HMO phenotype of each sample was assigned according to the presence of 3’FL, 2’FL and LNDFH I
HMOs as described in the Appendix 3, Figure 2.
6.2.5 Human breast milk bacterial profiling by 16S rRNA amplicon sequencing
Total genomic DNA was extracted from pellets using the ZR Fungal/Bacterial DNA MiniPrep™ (Zymo
Research Corp., Irvine, USA), which incorporates a bead-beating step. DNA yield was assessed using a 16S
qPCR protocol previously described (23). PCR amplicon libraries were constructed using a two-step
amplification approach described by Wu and colleagues (24) to avoid PCR amplification biases associated
with the use of adapter and index sequences. The hypervariable V4 region of the 16S rRNA gene was
amplified as previously described (25) with primers containing Illumina adapters and various unique index
sequences at the 3’ end for each sample (26). Amplicons were normalized by pooling at an equimolar
concentration of 100 ng, and purified using the Agencourt AMPure system (Beckman Coulter, UK). Excision
of the pooled 16S library was followed by purification using the QIAquick Gel Extraction Kit (Qiagen,
Valencia, CA, United States). The Qubit® dsDNA BR Assay Kit was used for final quantification of the
pooled library. The quantitation of adapter-ligated dsDNA and analysis of fragment size of the pooled library
was done with the KAPA Library Quantification Kit (Illumina®) (KAPA Biosystems, MA, USA) and Agilent
High-Sensitivity (HS) DNA Kit (Agilent Technologies, CA, USA), respectively. The library pool was diluted
to 5.5 pM for sequencing and the internal sequencing control (PhiX control V3, Illumina, CA, USA) was
spiked into the diluted library at 15% (v/v)(27). The pooled 16S library was paired-end sequenced on the
Illumina MiSeq® system using the MiSeq® Reagent v3 kit (600 cycles) according to the manufacturer’s
instructions (27). Reagents used for DNA extraction and PCR amplification were also sequenced as no
template controls.
6.2.6 Processing of 16S rRNA gene sequences
The quality of FASTQ files was assessed using FastQC and MultiQC packages (28, 29). Forward and reverse
sequences were then merged using UPARSE (30) allowing 3 mismatches in overlaps (uparse_merge_fastq,

112
fastq_maxdiff set to 3), followed by quality filtering using uparse_filter_fastq fastq_filter (sequences
truncated to 250bp). Reads with a maximum expected error >0.1 were discarded (fastq_maxee set to 0.1).
USEARCH10 (31) sortbysize command allowed for dereplication and selection of sequences occurring more
than once. Clustering of sequences into operational taxonomic units (OTUs) (with a clustering radius of 3) was
performed with USEARCH10. The USEARCH10_uchime2_ref tool was used to remove chimeras, and OTU
counts were obtained using USEARCH10 usearch-global. OTU picking was at 97% sequence identity and
taxonomic assignment was carried out using assign_taxonomy.py (method set to Ribosomal Database Project
(RDP)) Classifier (32) and identity was set to 97% with SILVA 132 release database (33) in Quantitative
Insights Into Microbial Ecology (QIIME) 1.9.0 suite of software tools (34). The dataset supporting the bacteria
profiling results of this article is available in the National Center for Biotechnology Information (NCBI)
Sequence Read Archive (SRA) repository (BioProject PRJNA520889).
6.2.7 Statistical and data analysis
Statistical analysis and graphical illustrations of the data were generated in R statistical package (version
3.4.4) (35) and R studio 1.1.456 using scripts developed in-house. The Iglewicz and Hoaglin outlier test (36)
was used to classify the HBM samples into low and normal level of lactose based on the lactose concentration.
P less than 10-3 was considered significant.
Wilcoxon Rank Sum test (37) and Kruskal-Wallis Rank Sum Test (38) were used to compare differences in
numerical covariates (e.g., maternal age). Fisher's exact test (39) was used to assess differences between
categorical variables (e.g., ethnicity). Kaplan–Meier plot (40) was used to visualize the difference of the
percentage of exclusive breastfeeding between low and normal lactose level across time. The Wald test was
used to calculate the statistical significance (P) of the differences between curves. Spearman rank correlation
was used to explore the relationships of lactose across time postpartum. PCA was performed on the processed
spectra to obtain an overview of the structure of the data. The KODAMA algorithm was used to facilitate
identification of patterns representing underlying metabolic phenotypes on all samples in the data set. A fuzzy
version of the known k-means clustering algorithm (41) was used to identify the different bacterial signatures
in the KODAMA plot. Only entries with membership grades higher than 60% were considered in the
classification of the bacteria signatures. Dendrograms were performed using Euclidean distance and Ward
linkage. P<0.05 was considered to be significant. To account for multiple testing, a false discovery rate (FDR)
of <20% was applied (42).
6.3 RESULT AND DISCUSSION
6.3.1 Participant characteristics
Here, we characterized HBM samples from 519 women enrolled in a birth cohort study, the Drakenstein Child
Health Study (7). The socio-demographic features of the study participants are shown in Appendix 3, Table 1.

113
Many participants are poor with 41% of women having a mean household income of less than US$70 per
month. HIV infection among mothers was low (9%). Each woman donated a HBM sample between 5 and 10
weeks postpartum.
6.3.2 Metabolic profiles of human breast milk (HBM) cluster according to lactose level and HMO
phenotype.
We first used Nuclear Magnetic Resonance (NMR) spectroscopy to identify lactose (Figure 6.1) and
characterize the specific pattern of fucosylated human milk oligosaccharides (HMOs) of each sample (Figure
6.2A). The fucosylation pattern of HMOs correlates with the activity of the enzymes, α1,2 fucosyltransferase
(FUT2) and α1,3/4 fucosyltransferase (FUT3), encoded by the Secretor gene (Se) and the Lewis gene (Le)
respectively (43, 44) (Figure 6.2B). We identified HMO phenotypes (i.e., Se+/Le+, Se-/Le+, Se+/Le- and Se-
/Le-) based on the presence of 3′ fucosyllactose (3′FL), lacto-N-fucopentaose I (LNFP I), and lacto-N-
difucohexaose I (LNDFH I) in the NMR spectra of HBM samples (Figure 6.2B). Se+/Le+ was the largest
group, with 310 women, followed by Se-/Le+, Se+/Le- and Se-/Le- phenotypes with 120, 84 and 5 women
respectively (Appendix 3, Table 1).
Figure 6. 1: 1H-NMR spectrum of a representative HBM sample. Representative HBM sample showing NMR signals
of lactose.

114
Figure 6. 2: Distinct metabolic profiles of human breast milk (HBM) are observed based on HMO phenotype. (A)
HMO phenotype detection using the NMR signals of 3’-FL, 2’-FL and LNDFHI. (B) Graphical representation of the
enzymatic processes that lead to the different HMO phenotypes. The figure was adapted from Bode 2012 (45).
FUT2=Fucosyltransferase 2; FUT3=Fucosyltransferase 3; 3’-FL=3'-fucosyllactose; 2’-FL=2'-fucosyllactose; LNDFH
I=Lacto-N-difucohexaose I.
Next, we performed unsupervised analysis of the NMR spectra to explore patterns representing underlying
metabolic phenotypes on all samples. Although separation among the different HMO phenotypes was
observed (Figure 6.3A-B), a subset showed a distinct metabolic signature characterized by a substantially
lower lactose concentration than other samples (Figure 6.3B). We identified 45 (8.7%) samples with atypically
low lactose concentration (Figure 6.3C) below a threshold of 128 mM (4.4 g/dL). We then investigated if the
Se/Le status, could affect the concentration of lactose (Figure 6.3D). We show reduced concentration of
lactose with presence of FUT2 and/or FUT3 however this did not account for the strikingly lower levels of
lactose in the low-lactose subset. We also did not observe any statistically significant correlation between
lactose concentrations and time postpartum, within the 5-10 week window for collection (Figure 6.3E).

115
Figure 6. 3: Metabolic profiles of human breast milk (HBM) cluster according to lactose levels and HMO
phenotype. (A) Principal components analysis (PCA) and, (B) unsupervised Knowledge Discovery by Accuracy
Maximization (KODAMA) of HBM metabolic profiles. Major variance in the dataset, which was driven mainly by the
lactose concentration, was explained by the first component of PCA (PC1). KODAMA shows separation of samples
based on lactose concentration. (C) Distribution of lactose concentration and classification into low (pink) and normal
(green) lactose levels. (D) Lactose concentration within the four different HMO phenotypes. P value is calculated by
Wilcoxon rank sum test on the normal lactose level subset. (E) Lactose concentration over time postpartum. Spearman’s
coefficients (ρ) and P values are calculated on the normal lactose level subset.
6.3.3 Low lactose level associates with reduced duration of exclusive breastfeeding, lower infant
growth and metabolites from mixed acid fermentation.
Since lactose is the major carbohydrate in HBM and plays a key role as a source of energy for the infant (46,
47), we explored the relationship between reduced lactose concentration and breastfeeding and infant
outcomes. Strikingly, the median duration of exclusive breastfeeding was half as long (27.6 vs. 55.2 days,
P=2.61x10⁻⁴) in mothers with low (n=45) vs. normal (n=474) lactose concentrations (Figure 6.4 and Appendix
3, Table 2).
Figure 6. 4: Low lactose level in human breast milk (HBM) associates with reduced duration of exclusive
breastfeeding. Kaplan-Meier plot shows duration of exclusive breastfeeding as assessed at the different clinic visits
(Wald test was used to detect significance). HR: Hazard ratio. Low lactose samples are coloured pink and normal lactose
samples green.

116
The proportion of calories from carbohydrate in HBM has been reported to positively correlate with infant
weight, BMI and adiposity gains (48). Here, we found that infants breastfed by mothers with low HBM lactose
had poorer anthropometric measures of growth, including lower z-scores for body length, body weight, and
BMI; the differences in weight and BMI z-scores disappeared after the end of the exclusive breastfeeding
period (Figure 6.5, Appendix 3, Table 3). The effect of low HBM lactose on infant length lasted longer (until 6
months) than the effect on weight, presumably since weight is a measure of acute nutritional status whilst
length reflects longer-term effects.
We compared socio-demographic and psychosocial features between the groups of women whose HBM had
normal and low levels of lactose (Appendix 3, Table 2). Low lactose level was more common amongst
younger women (P=1.21x10⁻², Wilcoxon rank sum test). Daily consumption of organ meat, such as liver,
heart, kidney, and tripe was less frequent (P=2.01x10⁻², Wilcoxon rank sum test), while daily consumption of
fruit juice (P= 2.46x10⁻², Wilcoxon rank sum test) and cold drink (P= 2.79x10⁻², Wilcoxon rank sum test) were
more frequent amongst women with low HBM lactose. Mothers with low HBM lactose were more likely to
score above the threshold on Beck’s Depression Inventory (P=1.20x10⁻², Fisher’s exact test). Whilst we have
few data on sleep or feeding patterns in the two groups, it would be interesting to explore the relationship
between these patterns, low lactose HBM and maternal depression.
Figure 6. 5: Low lactose level in human breast milk (HBM) associates with lower infant growth. (A) Infant weight
z-scores, (B) Infant height z-scores, and (C) Infant BMI z-scores at different study visits based on the level of lactose in
the HBM. Low lactose samples are coloured pink and normal lactose samples green.
Next, we quantified 50 metabolites in all HBM samples (Appendix 3, Table 6) and we noted that the metabolic
profile of samples with low lactose was very different from samples from the rest of the cohort (Figure 6.6A;
Appendix 3, Table 4). Low lactose HBM samples showed evidence of mixed acid fermentation of lactose,
with accumulation of pyruvate, lactate, acetate and formate, and a substantial reduction in all energetic

117
metabolites in the Krebs cycle (Figure 6.6B). Mixed acid fermentation is characteristic of microbial
metabolism. Lactose is a major substrate for some micro-organisms including lactic acid bacteria which
naturally occur in breast milk (49). There was also an increased concentration of uracil and its glycosylated
form, uridine, in samples with low lactose (Figure 6.6B). Uridine is a precursor of uridine diphosphate (UDP)
that plays a key role in the Leloir pathway to convert galactose (lactose is a disaccharide comprising galactose
and glucose) into glucose.
Figure 6. 6: Low lactose level in human breast milk (HBM) associates with metabolites from mixed acid
fermentation. (A) Heatmap of metabolite concentrations in HBM samples. The samples were ordered based on the
lactose concentration and metabolites using a hierarchical clustering algorithm. LNDFH II=Lacto-N-difucohexaose II;
LNDFH I=Lacto-N-difucohexaose I; LDFT= Lactodifucotetraose; LNFP III= Lacto-N-fucopentaose III. (B) Schematic
representation of metabolic changes in HBM samples with low lactose levels. Low lactose samples are coloured pink and
normal lactose samples green.
6.3.4 Human breast milk (HBM) samples with low lactose level are associated with distinct
bacterial profiles.
To evaluate the hypothesis that the depletion of lactose could be caused by fermentation associated with
bacterial dysbiosis, we performed 16S rRNA gene amplicon sequencing (bacterial community analysis). In
Figure 6.7A, we show bacterial profiles in HBM samples. We noted a strong association between bacterial
profiles and lactose concentration. Strikingly higher abundance of Staphylococcus (order: Bacillales) and a
lower abundance of Streptococcus and Lactobacillus (order: Lactobacillales), traditionally identified as using
lactose as a substrate, was observed among low-lactose HBM samples. In addition, Rothia, Gemella and
Veillonella which are members of the oral flora were also significantly lower among low-lactose HBM
samples (Figure 6.7B, Appendix 3, Table 5). Staphylococcus is able to utilize lactose as energy source, with

118
particular animal-associated strains showing increased efficiency of lactose fermentation (50). We also
observed a significantly higher absolute abundance of bacterial DNA in HBM with low lactose levels, as
measured by quantitative polymerase chain reaction (PCR) targeting the 16S rRNA gene (Figure 6.7C).
Figure 6. 7: Low lactose samples are associated with distinct bacterial profiles. (A) Relative abundances of HBM
bacterial genera ordered based on the lactose concentration. Genera with a low relative abundance in a given sample are
included as “Others”. (B) Boxplot showing differences in relative abundances of the most abundant bacterial genera
between samples with low and normal lactose level, ** P<0.01, *** P<0.001. The line inside the box plot represents the
median, while the box signifies the 75% (upper) and 25% (lower) quartile showing the distribution of 50% of the
samples. P is calculated by Wilcoxon rank sum test. (C) 16S qPCR DNA copies/ul values of samples with low vs. normal
lactose levels. The line inside the box plot represents the median, while the box signifies the 75% (upper) and 25%
(lower) quartile showing the distribution of 50% of the samples. P is calculated by Wilcoxon rank sum test.
Unsupervised analysis of HBM bacterial profiles (Figure 6.8A) revealed three bacterial signatures,
distinguished by the relative abundances of Staphylococcus spp. and/or Streptococcus spp (Figure 6.8B). We
observed a higher percentage of samples with low lactose in signature 2 dominated by Staphylococcus spp.
Mastitis, an infection of the breast tissue in breastfeeding women, is most commonly caused by staphylococcal
infection (51) and has previously been associated with relatively lower levels of lactose in HBM (52, 53). The
women in our cohort did not report symptoms of mastitis, however it is possible that sub-clinical mastitis may
have been present. Whilst the phenomenon of subclinical mastitis has been reported in animals in the dairy
industry (54, 55), it is not widely recognized as a distinct condition in humans.

119
Figure 6. 8: Low lactose samples are associated with distinct bacterial signatures. (A) Unsupervised KODAMA of
the HBM bacterial profile data showing three different bacterial signatures. (B) Boxplots of the relative abundance of
major bacterial genera in the three different signatures and proportion of samples with low lactose. Low lactose samples
are coloured pink and normal lactose samples green throughout.
6.4 CONCLUSION
In summary, we describe here a subset of breastfeeding women whose HBM had very low levels of lactose.
Low lactose was associated with reduced duration of exclusive breastfeeding and poorer infant growth during
the period of exclusive breastfeeding. Low lactose concentration was associated with HBM bacterial dysbiosis
(evidence of mixed acid fermentation of lactose by an HBM bacteriome dominated by staphylococci). Our
study has several limitations.
Despite the large sample size, the population studied comes from a single semi-rural geographical setting. This
was a cross-sectional study with only one sampling time point; we were not able to assess whether this
phenotype is persistent. Further work is required to determine whether this finding is generalizable to other
populations or stages of lactation. If these findings are replicated in other populations, they may have
relevance for the health of mother and child populations, and consideration should be given to diagnostic and
therapeutic studies.

120
6.5 REFERENCES
1. Civardi E, Garofoli F, Tzialla C, Paolillo P, Bollani L, Stronati M. Microorganisms in human milk:
lights and shadows. J Matern Fetal Neonatal Med. 2013;26 Suppl 2:30-4.
2. Fernandez L, Langa S, Martin V, Jimenez E, Martin R, Rodriguez JM. The microbiota of human milk
in healthy women. Cell Mol Biol (Noisy-le-grand). 2013;59(1):31-42.
3. Walker A. Breast Milk as the Gold Standard for Protective Nutrients. J Pediatr. 2010;156(2
SUPPL.):S3-S7.
4. Jeurink PV, van Bergenhenegouwen J, Jimenez E, Knippels LM, Fernandez L, Garssen J, et al.
Human milk: a source of more life than we imagine. Benef Microbes. 2013;4(1):17-30.
5. Marincola FC, Dessi A, Pattumelli MG, Corbu S, Ossicini C, Ciccarelli S, et al. (1)H NMR-based
urine metabolic profile of IUGR, LGA, and AGA newborns in the first week of life. Clin Chim Acta.
2015;451(Pt A):28-34.
6. Cederlund A, Kai-Larsen Y, Printz G, Yoshio H, Alvelius G, Lagercrantz H, et al. Lactose in Human
Breast Milk an Inducer of Innate Immunity with Implications for a Role in Intestinal Homeostasis. PLoS One.
2013;8(1).
7. Zar HJ, Barnett W, Myer L, Stein DJ, Nicol MP. Investigating the early-life determinants of illness in
Africa: the Drakenstein Child Health Study. Thorax. 2015;70(6):592-4.
8. Villar J, Papageorghiou AT, Pang R, Ohuma EO, Ismail LC, Barros FC, et al. The likeness of fetal
growth and newborn size across non-isolated populations in the INTERGROWTH-21st Project: the Fetal
Growth Longitudinal Study and Newborn Cross-Sectional Study. The lancet Diabetes & endocrinology.
2014;2(10):781-92.
9. World Health Organization. WHO child growth standards: length/height-for-age, weight-for-age,
weight-for-length, weight-for-height and body mass index-for-age: methods and development. 2006.
10. World Health Organization. Indicators for assessing infant and young child feeding practices: part 2-
measurement. Geneva, Switzerland: World Health Organization. 2010.
11. Lasa L, Ayuso-Mateos J, Vazquez-Barquero J, Dıez-Manrique F, Dowrick C. The use of the Beck
Depression Inventory to screen for depression in the general population: a preliminary analysis. J Affect
Disord. 2000;57(1-3):261-5.
12. Beck AT, Steer RA, Brown GK. Beck depression inventory-II. San Antonio. 1996;78(2):490-8.
13. Beusenberg M, Orley JH, World Health Organization. A User's guide to the self reporting
questionnaire (SRQ). Geneva: World Health Organization; 1994.
14. Harpham T, Reichenheim M, Oser R, Thomas E, Hamid N, Jaswal S, et al. Measuring mental health
in a cost-effective manner. Health Policy Plan. 2003;18(3):344-9.
15. Foa EB, Riggs DS, Dancu CV, Rothbaum BO. Reliability and validity of a brief instrument for
assessing post‐traumatic stress disorder. J Trauma Stress. 1993;6(4):459-73.
16. Stein DJ, Koen N, Donald K, Adnams CM, Koopowitz S, Lund C, et al. Investigating the
psychosocial determinants of child health in Africa: the Drakenstein Child Health Study. J Neurosci Methods.
2015;252:27-35.
17. Brunet A, Weiss DS, Metzler TJ, Best SR, Neylan TC, Rogers C, et al. The Peritraumatic Distress
Inventory: a proposed measure of PTSD criterion A2. Am J Psychiatry. 2001;158(9):1480-5.
18. Willett WC, Sampson L, Stampfer MJ, Rosner B, Bain C, Witschi J, et al. Reproducibility and validity
of a semiquantitative food frequency questionnaire. Am J Epidemiol. 1985;122(1):51-65.
19. Lucey JA, Tamehana M, Singh H, Munro PA. Effect of interactions between denatured whey proteins
and casein micelles on the formation and rheological properties of acid skim milk gels. J Dairy Res.
1998;65(4):555-67.

121
20. Wishart DS, Jewison T, Guo AC, Wilson M, Knox C, Liu Y, et al. HMDB 3.0—the human
metabolome database in 2013. Nucleic Acids Res. 2012;41(D1):D801-D7.
21. Marshall I, Higinbotham J, Bruce S, Freise A. Use of voigt lineshape for quantification of in vivo 1H
spectra. Magn Reson Med. 1997;37(5):651-7.
22. Serkova N, Fuller TF, Klawitter J, Freise CE, Niemann CU. 1H-NMR–based metabolic signatures of
mild and severe ischemia/reperfusion injury in rat kidney transplants. Kidney Int. 2005;67(3):1142-51.
23. Bogaert D, Keijser B, Huse S, Rossen J, Veenhoven R, van Gils E, et al. Variability and diversity of
nasopharyngeal microbiota in children: a metagenomic analysis. PLoS One. 2011;6(2):e17035.
24. Wu L, Wen C, Qin Y, Yin H, Tu Q, Van Nostrand JD, et al. Phasing amplicon sequencing on Illumina
Miseq for robust environmental microbial community analysis. BMC Microbiol. 2015;15(1):125.
25. Claassen-Weitz S, Gardner-Lubbe S, Nicol P, Botha G, Mounaud S, Shankar J, et al. HIV-exposure,
early life feeding practices and delivery mode impacts on faecal bacterial profiles in a South African birth
cohort. Sci Rep. 2018;8(1):5078.
26. Caporaso JG, Lauber CL, Walters WA, Berg-Lyons D, Lozupone CA, Turnbaugh PJ, et al. Global
patterns of 16S rRNA diversity at a depth of millions of sequences per sample. Proceedings of the national
academy of sciences. 2011;108(Supplement 1):4516-22.
27. Illumina P. MiSeq® System User Guide. . 2014:1–94.
28. FastQC: A quality control tool for high throughput sequence data. Available online at:
http://www.bioinformatics.babraham.ac.uk/projects/fastqc [Internet]. 2010.
29. Ewels P, Magnusson M, Lundin S, Kaller M. MultiQC: summarize analysis results for multiple tools
and samples in a single report. Bioinformatics. 2016;32(19):3047-8.
30. Edgar RC. UPARSE: highly accurate OTU sequences from microbial amplicon reads. Nature
methods. 2013;10(10):996.
31. Edgar RC. Search and clustering orders of magnitude faster than BLAST. Bioinformatics.
2010;26(19):2460-1.
32. Wang Q, Garrity GM, Tiedje JM, Cole JR. Naive Bayesian classifier for rapid assignment of rRNA
sequences into the new bacterial taxonomy. Appl Environ Microbiol. 2007;73(16):5261-7.
33. Quast C, Pruesse E, Yilmaz P, Gerken J, Schweer T, Yarza P, et al. The SILVA ribosomal RNA gene
database project: improved data processing and web-based tools. Nucleic Acids Res. 2013;41(Database
issue):D590-6.
34. Caporaso JG, Kuczynski J, Stombaugh J, Bittinger K, Bushman FD, Costello EK, et al. QIIME allows
analysis of high-throughput community sequencing data. Nature methods. 2010;7(5):335.
35. Team RC. R: A Language and Environment for Statistical Computing. R Foundation for Statistical
Computing, Vienna, Austria. URL https://www.R-project.org/. 2018.
36. Iglewicz B, Hoaglin DC. How to detect and handle outliers: Asq Press; 1993.
37. Bauer DF. Constructing confidence sets using rank statistics. Journal of the American Statistical
Association. 1972;67(339):687-90.
38. Hollander M, Wolfe DA, Chicken E. Nonparametric statistical methods: John Wiley & Sons; 2013.
39. Clarkson DB, Fan Y-A, Joe H. A remark on algorithm 643: FEXACT: An algorithm for performing
Fisher's exact test in rxc contingency tables. ACM Transactions on Mathematical Software (TOMS).
1993;19(4):484-8.
40. Bland JM, Altman DG. Survival probabilities (the Kaplan-Meier method). BMJ.
1998;317(7172):1572-80.
41. Pal NR, Bezdek JC, Hathaway RJ. Sequential competitive learning and the fuzzy c-means clustering
algorithms. Neural Netw. 1996;9(5):787-96.

122
42. Storey JD. A direct approach to false discovery rates. Journal of the Royal Statistical Society: Series B
(Statistical Methodology). 2002;64(3):479-98.
43. Thurl S, Munzert M, Henker J, Boehm G, Muller-Werner B, Jelinek J, et al. Variation of human milk
oligosaccharides in relation to milk groups and lactational periods. Br J Nutr. 2010;104(9):1261-71.
44. Totten SM, Zivkovic AM, Wu S, Ngyuen U, Freeman SL, Ruhaak LR, et al. Comprehensive profiles
of human milk oligosaccharides yield highly sensitive and specific markers for determining secretor status in
lactating mothers. J Proteome Res. 2012;11(12):6124-33.
45. Bode L. Human milk oligosaccharides: Every baby needs a sugar mama. Glycobiology.
2012;22(9):1147-62.
46. Andreas NJ, Hyde MJ, Gomez‐Romero M, Lopez‐Gonzalvez MA, Villaseñor A, Wijeyesekera A, et
al. Multiplatform characterization of dynamic changes in breast milk during lactation. Electrophoresis.
2015;36(18):2269-85.
47. O'sullivan A, He X, McNiven EM, Hinde K, Haggarty NW, Lönnerdal B, et al. Metabolomic
phenotyping validates the infant rhesus monkey as a model of human infant metabolism. J Pediatr
Gastroenterol Nutr. 2013;56(4):355-63.
48. Prentice P, Ong KK, Schoemaker MH, van Tol EA, Vervoort J, Hughes IA, et al. Breast milk nutrient
content and infancy growth. Acta Paediatr. 2016;105(6):641-7.
49. Widyastuti Y, Rohmatussolihat, nbsp, Febrisiantosa A. The Role of Lactic Acid Bacteria in Milk
Fermentation. Food and Nutrition Sciences. 2014;Vol.05No.04:8.
50. Richardson EJ, Bacigalupe R, Harrison EM, Weinert LA, Lycett S, Vrieling M, et al. Gene exchange
drives the ecological success of a multi-host bacterial pathogen. Nature Ecology & Evolution. 2018;2(9):1468-
78.
51. Patel SH, Vaidya YH, Patel RJ, Pandit RJ, Joshi CG, Kunjadiya AP. Culture independent assessment
of human milk microbial community in lactational mastitis. Sci Rep. 2017;7(1):7804.
52. Fetherston CM, Lai C, Hartmann PE. Relationships between symptoms and changes in breast
physiology during lactation mastitis. Breastfeed Med. 2006;1(3):136-45.
53. Prentice A, Prentice A, Lamb W. Mastitis in rural Gambian mothers and the protection of the breast
by milk antimicrobial factors. Trans R Soc Trop Med Hyg. 1985;79(1):90-5.
54. Busato A, Trachsel P, Schällibaum M, Blum J. Udder health and risk factors for subclinical mastitis in
organic dairy farms in Switzerland. Prev Vet Med. 2000;44(3-4):205-20.
55. Kivaria F, Noordhuizen J, Kapaga A. Risk indicators associated with subclinical mastitis in
smallholder dairy cows in Tanzania. Trop Anim Health Prod. 2004;36(6):581-92.

123
CHAPTER 7
GENERAL CONCLUSIONS

124
HBM is a unique physiological fluid adapted for the growth and wellbeing of an infant. Its composition is
complex; this thesis focuses on two components: the bacteriome and metabolome. The HBM bacteriome is
diverse but understudied. We used culture independent techniques, specifically, next generation sequencing to
explore its composition and determinants. The metabolome also has an important role in infant health and is
increasingly studied for its nutritive and bioactive molecules; here we studied the metabolome in the context of
the associated microbiome.
In the first two chapters, we reviewed the scientific literature on the constituents of the HBM bacteriome and
metabolome, the role they play in infant health and well-being, and their determinants including maternal,
infant and environmental factors. We also identified existing gaps in HBM research – and these include
limited studies on HBM bacteriome and metabolome and their influencing factors in low socio-economic
regions, particularly in African populations. Furthermore, there are few integrative studies exploring the
interplay between the HBM bacteriome and the metabolome, and their collective role in infant health and
growth.
The first part of the original research towards this thesis highlighted the importance of optimisation of
laboratory technical procedures in HBM bacteriome research, including DNA extraction as well as milk
skimming on HBM bacterial profiles. Illumina MiSeq sequencing targeting the V4 region of the 16S rRNA
gene was used to assess the bacterial profiles using ten healthy donor breast milk samples. Although
optimization of DNA extraction kits has been conducted on other biological samples, to the best of our
knowledge, this is the first of such studies to be published on HBM samples. We showed that DNA extraction
kits, but not milk skimming, impacted significantly on both DNA yield and purity, the recovery of specific
bacterial genera, and the efficiency of DNA extraction from bacterial communities present in a commercial
mock microbial community standard spiked into HBM. Although the extraction kits all gave similar bacterial
diversity measures, the relative abundances of bacteria obtained with each kit differed. An interesting
observation was the influence of benzonase pre-treatment on DNA recovery, a step included in one of the kits
used in this optimisation step. Benzonase treatment led to low DNA yield, and biased representation of
bacteria in the mock community. Since this kit is routinely recommended for microbiome studies, optimization
of extraction kits and methods is important as this influences the downstream analysis of next generation
sequencing experiments.
The result of this optimisation was that ZR Fungal/Bacterial DNA MiniPrep™ was chosen for further DNA
extraction from HBM samples. This was based on the higher DNA yield obtained, best DNA purity measures,
and its ability to most accurately represent the bacteria in the mock community.
In the next research chapter of this thesis, the bacteriome of HBM in a cohort of lactating women living in
South Africa was comprehensively described. By analysing the V4 region of the 16S rRNA gene of HBM
bacterial communities, we confirmed that a diverse bacteriome exists. We identified a core bacteriome that is

125
shared among 80% of samples. Three bacterial cluster groups (biotypes) were identified based on the relative
abundances of Staphylococcus and/or Streptococcus. Inter-individual variability was observed in the bacterial
profiles of samples. A major strength of this study is the detailed metadata collected. A robust multivariate
statistical analysis showed that study site (a proxy for ethnicity) was an important factor associated with the
composition of the HBM microbiome. While the HBM samples from Mbekweni had significantly higher
relative abundance of the genus Streptococcus (which has been associated with health), HBM samples from
TC Newman had significantly higher relative abundances of the genera Staphylococcus, Acinetobacter, and
Escherichia Maternal age influenced the diversity of HBM bacterial profiles, with older mothers having a
higher Shannon diversity index. Though limited by the cross-sectional design of this study, a longitudinal
study would have afforded us the opportunity to study the determinants of the HBM bacteriome (i.e.
antibiotics use, diet and maternal stress) over time.
Lastly, correlations between bacterial abundances were observed within the HBM bacteriome, notably
between bacteria that are members of the skin microbiota, and, separately, those that are members of the oral
microbiota. Although not within the scope of this research, research has shown that HBM bacteria originates,
among others, from the oral microbiome of the infant due to a retrograde flow of milk during suckling, and
from the surrounding breast skin and areola which is open to the external environment. It is therefore not
surprising to see interactions between bacteria based on the assumed origin. Being limited by the targeted 16S
rRNA sequence analysis approach, we could not assess the functional capacity of the bacterial communities
within the HBM. Future work will involve the use of shotgun metagenomic sequencing to comprehensively
sample all genes of all bacterial organisms present to determine species-level identity and functional capacity
and relate this to infant gut health.
The final stage of this thesis investigated the metabolome of HBM. The nutritive and non-nutritive bio-active
metabolites in HBM are considered extremely important in the first six months of life. We were able to detect
a total of 49 metabolites from HBM samples included in this study, with nuclear magnetic resonance
spectroscopy. More importantly, a subset of lactating women with unusually low lactose concentration in their
HBM sample was detected in the cohort. This subset of women exclusively breastfed for shorter than the rest
of the cohort, and their infants demonstrated lower growth during the period of exclusive breastfeeding. This
subset of women also had a higher prevalence of depression. Metabolites characteristic of mixed acid
fermentation were also observed in the HBM samples of this subset of women, and this was associated with a
dysbiotic, staphylococcal-predominant microbiota. While the cross-sectional study design employed in this
study and the peri-urban settings from which participants are recruited limits the generalizability of these
results, the use of NMR spectroscopy provides new insight to detecting variability in HBM metabolites.
In summary, this thesis presents a detailed description of the bacteriome, and metabolome in HBM samples
using 16S rRNA gene amplicon sequencing and nuclear magnetic resonance spectroscopy respectively. We
identified factors that influence the HBM composition and showed that HBM bacteriome and metabolome
126
modulates the growth of an infant and breastfeeding outcomes. The results presented in this thesis clearly
highlight the need for further HBM research in an African setting.
In addition to future work highlighted in each research chapter, future work will include:
i. Characterizing the HBM lipidome in this cohort of lactating South African mothers enrolled in the
Drakenstein Child Health Study.
ii. Determining maternal, infant and environmental factors that influences the HBM lipidome in this
cohort.
iii. Investigating the association between HBM lipidome and infant growth in the first year of life and
determining the association (if any) between these three components of HBM.

127
APPENDIX 1: Chapter 4 supplementary tables and figures
Appendix 1, Table 1: Zymobiomics™ microbial community standard composition as per manufacturer’s
specifications.
Bacteria species gDNA abundance
(%)
mOTU abundance
(%)
Gram stain
Pseudomonas spp. 12% 4.6 -
Enterobacteriaceae 1 12% 11.3 -
Enterobacteriaceae 2 12% 10.0 -
Listeria spp. 12% 15.9 +
Staphylococcus spp. 12% 13.3 +
Lactobacillus spp. 12% 18.8 +
Enterococcus spp. 12% 10.4 +
Bacillus spp. 12% 15.7 +
Appendix 1, Table 2: Primers, probes and cycling conditions
Forward primer Reverse primer Probe PCR cycling conditions
A qPCR 16S-F1(5′-CGA AAG CGT
GGG GAG CAA A -3′)
16S-R1(5′-GTT CGT ACT CCC
CAG GCG G-3′)
16S-P1 (FAM- ATT AGA TAC
CCT GGT AGT
CCA –MGB
45 cycles
50 oC 95 oC 95 oC 60 °C 72 °C
2min 10min 15s 60s 1s
B Short
PCR
(515Fshort)
GTGCCAGCHGCYGCGGT
(806Rshort)
GGACTACNNGGGTNTCTAAT
- 10 cycles
95 oC 95 oC 50 °C 72 °C 72 °C 4 °C
3min 30s 30s 1s 5min ∞
C Long
PCR
(515Flong)
GTGCCAGCHGCYGCGGT
(806Rlong_barcoded)
GGACTACNNGGGTNTCTAAT - 30 cycles
95 oC 95 oC 50 °C 72 °C 72 °C 4 °C
3min 30s 30s 1s 5min ∞

128
Appendix 1, Figure 1: DNA yield and purity based on skim milk and whole milk. Notched box plots showing (A) the
DNA yield and (B) the DNA purity (260/280 absorbance) obtained from skim and whole milk. The notched box signifies
the 75% (upper) and 25% (lower) quartile showing the distribution of 50% of the samples. The line inside the box plot
represents the median, and the notch the 95% confidence interval for the median. The whiskers (top and bottom)
represent the maximum and minimum values. Outliers, which are beyond 1.5 times the interquartile range above the
maximum value and below the minimum value, are shown with open circles.
Appendix 1, Figure 2: 16SqPCR DNA concentration based on kit and milk type (skim milk and whole milk).
Notched box plots showing the 16SqPCR DNA concentration obtained by using (A) the kits, and (B) skim and whole
milk. The notched box signifies the 75% (upper) and 25% (lower) quartile showing the distribution of 50% of the
samples. The line inside the box plot represents the median, and the notch the 95% confidence interval for the median.
The whiskers (top and bottom) represent the maximum and minimum values. Outliers, which are beyond 1.5 times the
interquartile range above the maximum value and below the minimum value, are shown with open circles. SM=skim
milk, WM=whole milk.

129
Appendix 1, Figure 3: Complete linkage hierarchical clustering of human breast milk spiked with the microbial
mock community standard. (A) Dendogram of bacterial profiles present in the HBM sample spiked with ZMCS
processed as skim and whole milk using four DNA extraction kits. (B) Relative abundances of ZMCS bacterial
composition in the HBM sample spiked with ZMCS. Each column represents milk type (skim or whole) extracted by one
of the four kits. W: whole milk, S: skim milk; S2 and W2: replicates of S and W respectively. ZMCS: Zymobiomics
Microbial Community Standard reference (“theoretical” bacterial profile) specified by the manufacturer.

130
Appendix 1, Table 3: Bacterial 16S DNA concentration in the spiked and un-spiked human breast milk sample.
Sample_ID Spike/Unspiked_Kit
Donor
sample
Template DNA 16SqPCR
concentration (ng/ul)
Median 16S qPCR DNA
concentration
%16S DNA in HBM
sample
BM_AO_KITdnam_extractioncontrolspike_1_kitcomparison_P3_A06 Spiked_Kit A 1 0.251124139 0.195487886 99.975%
BM_AO_KITdnam_extractioncontrolspike_1_kitcomparison_P3_A07 Spiked_Kit A 1 0.175701367
BM_AO_KITdnam_extractioncontrolspike_1_kitcomparison_P3_B06 Spiked_Kit A 1 0.215274404
BM_AO_KITdnam_extractioncontrolspike_1_kitcomparison_P3_B07 Spiked_Kit A 1 0.047838204
BM_AO_KITdnam_skim_1_kitcomparison_P3_C01 Unspiked_Kit A 1 0.000047258 0.000047105 0.024%
BM_AO_KITdnam_skim_1_kitcomparison_P3_C08 Unspiked_Kit A 1 0.000046952
BM_AO_KITdnam_whole_1_kitcomparison_P3_A01 Unspiked_Kit A 1 0.000068726
BM_AO_KITdnam_whole_1_kitcomparison_P3_A08 Unspiked_Kit A 1 0.000045226
BM_AO_KITqias_extractioncontrol_1_kitcomparison_P4_A06 Spiked_Kit C 1 0.332685221 0.151318187 99.983%
BM_AO_KITqias_extractioncontrol_1_kitcomparison_P4_A07 Spiked_Kit C 1 0.293789111
BM_AO_KITqias_extractioncontrol_1_kitcomparison_P4_B06 Spiked_Kit C 1 0.002849745
BM_AO_KITqias_extractioncontrol_1_kitcomparison_P4_B07 Spiked_Kit C 1 0.008847263
BM_AO_KITqias_skim_1_kitcomparison_P4_C01 Unspiked_Kit C 1 0.000060109 0.000025238 0.016%
BM_AO_KITqias_skim_1_kitcomparison_P4_C08 Unspiked_Kit C 1 0.000024687
BM_AO_KITqias_whole_1_kitcomparison_P4_A01 Unspiked_Kit C 1 0.000025790
BM_AO_KITqias_whole_1_kitcomparison_P4_A08 Unspiked_Kit C 1 0.000020727
BM_AO_KITzymob_extractioncontrol_1_kitcomparison_P4_G06 Spiked_Kit D 1 1.214408365 0.843423774 99.989%
BM_AO_KITzymob_extractioncontrol_1_kitcomparison_P4_G07 Spiked_Kit D 1 0.397619204
BM_AO_KITzymob_extractioncontrol_1_kitcomparison_P4_H06 Spiked_Kit D 1 0.792653652
BM_AO_KITzymob_extractioncontrol_1_kitcomparison_P4_H07 Spiked_Kit D 1 0.894193897
BM_AO_KITzymob_skim_1_kitcomparison_P4_G01 Unspiked_Kit D 1 0.000066957 0.000087592 0.01%
BM_AO_KITzymob_skim_1_kitcomparison_P4_G08 Unspiked_Kit D 1 0.000108227
BM_AO_KITzymob_whole_1_kitcomparison_P4_E01 Unspiked_Kit D 1 0.000059373
BM_AO_KITzymob_whole_1_kitcomparison_P4_E08 Unspiked_Kit D 1 0.000198393
BM_AO_KITzymo_extractioncontrol_1_kitcomparison_P3_G06 Spiked_Kit B 1 0.703367972 0.898759654 99.984%
BM_AO_KITzymo_extractioncontrol_1_kitcomparison_P3_G07 Spiked_Kit B 1 1.094151336
BM_AO_KITzymo_extractioncontrol_1_kitcomparison_P3_H06 Spiked_Kit B 1 0.654916126
BM_AO_KITzymo_extractioncontrol_1_kitcomparison_P3_H07 Spiked_Kit B 1 1.123935714
BM_AO_KITzymo_skim_1_kitcomparison_P3_G01 Unspiked_Kit B 1 0.000194474 0.000141692 0.015%

131
BM_AO_KITzymo_skim_1_kitcomparison_P3_G08 Unspiked_Kit B 1 0.000211923
BM_AO_KITzymo_whole_1_kitcomparison_P3_E01 Unspiked_Kit B 1 0.000025031
BM_AO_KITzymo_whole_1_kitcomparison_P3_E08 Unspiked_Kit B 1 0.000088910
ZMCS: Zymobiomics Microbial Community Standard; HBM: Human breast milk

132
Appendix 1, Table 4: Beta diversity (Bray-Curtis dissimilarity index) measuring dissimilarity between
Zymobiomics microbial community standard (ZMCS) and the milk type, for each of the kits.
Milk type
Kits Skim milk Whole milk
Kit A vs. ZMCS 0.29 0.25
Kit B vs. ZMCS 0.06 0.16
Kit C vs. ZMCS 0.16 0.16
Kit D vs. ZMCS 0.11 0.20
Appendix 1, Figure 4: Alpha diversity rarefaction curve. A line graph relating the sequencing depth to
Shannon diversity index of sequenced un-spiked breast milk samples at a sub-sampling depth of 100.

133
Appendix 1, Figure 5: Relative abundances of bacterial composition in un-spiked human breast milk
samples at genus level. Each bar represents a sample and each coloured box, a bacterium. Genera less than
0.5% abundance in a given sample are included in the “other” at the top of the graph (grey boxes).
Appendix 1, Figure 6: Log ratio biplot human of human breast milk bacterial abundances at the
phylum level. Samples are coloured according to (a) extraction kit used, and (b) whole and skim milk (c)
donors. Points (circles) that cluster together are similar in bacterial composition and abundance.

134
Appendix 1, Figure 7: Log ratio biplot human of human breast milk bacterial abundances at the genus
level. Samples are coloured according to (a) extraction kit used, and (b) whole and skim milk (c) donors.
Points (circles) that cluster together are similar in bacterial composition and abundance.
Appendix 1, Table 5: Differential abundances of statistically significant bacteria taxa in relation to extraction
kits and milk type in un-spiked breast milk samples.
Taxonomy level Kit B Kit C Kit D p-value
KITS
Proteobacteria 0.3436 0.4761 0.3772 0.005
Alphaproteobacteria 0.0135 0.0162 0.0093 0.001
Sphingomonadales 0.0058 0.0087 0.0039 <0.001
Rhodobacterales
OTU_52 0.0712 0.0564 0.0561 0.035
Betaproteobacteria 0.0294 0.089 0.0271 <0.001
Burkholderiales 0.0244 0.0856 0.0242 <0.001
Burkholderiaceae 0.007 0.0758 0.0176 <0.001
Ralstonia 0.007 0.075 0.0175 <0.001
Gammaproteobacteria
Pseudomonadales 0.1157 0.2086 0.1607 <0.001
Pseudomonadaceae 0.0167 0.0259 0.024 0.016
Pseudomonas 0.0165 0.0259 0.024 0.016
Pasteurellales 0.1109 0.2205 0.0045 <0.001
Pasteurellaceae 0.011 0.2205 0.0045 <0.001
Haemophilus 0.011 0.022 0.0045 <0.001
Moraxellaceae
Acinetobacter 0.0606 0.1544 0.1026 <0.001
Firmicutes
Bacillus
Lactobacillales

135
Lactobacillaceae 0.1084 0.0632 0.1088 <0.001
Lactobacillus 0.1084 0.0632 0.1088 <0.001
WM/SM
Skim milk Whole milk
Pseudomonadales 0.1948 0.1288 -- 0.009
Moraxellaceae 0.1721 0.1068 -- 0.004
Enhydrobacter 0.0078 0.0039 -- 0.002
Acinetobacter 0.1353 0.0767 -- 0.003
Mean values of relative abundance proportions for statistically significant bacteria at different taxonomy
levels are shown. p-values are Benjamini-Hochberg corrected. p-values are represented as ‘***’ 0.001; ‘**’
0.01; and ‘*’ 0.05. WM and SM represents whole milk and skim milk respectively.
Appendix 1, Table 6: Reproducibility of extractions tested using multiple R-squared.
Multiple R-square
Whole milk Skim milk
Kit B 0.4908 0.7581
Kit C 0.7421 0.4751
Kit D 0.9483 0.7976

136
APPENDIX 2: Chapter 5 supplementary tables and figures
Appendix 2, Figure 1: In-silico de-contamination of biological human breast milk samples.
Appendix 2, Table 1: Demographic and clinical characteristics of mothers and their infants
Mbekweni TC Newman Both study sites
Maternal demographic and psychosocial characteristics
Maternal age at enrolment (years), 25.5 [18.5 39.5] 25.3 [18.7 39.6] 25.3 [18.6 39.6]
median [95%CI]
Maternal weight (kg), median [95%CI] 68.1 [48 110.6] 59.5 [42.7 95.3] 63.7 [43.7 102.3]
Maternal BMI, median [95%CI] 26.7 [19.1 41.1] 23.6 [17.6 37.7] 25 [17.9 40.6]
Lactation stage (weeks), median [range] 7.7 [5.3 19.5] 7.4 [2.4 18.7] 7.5 [2.4 19.5]
Ethnicity, n (%)
Black African 244 (99.2%) 0 (0.0%) 244 (44.0%)
Mixed ancestry 2 (0.8%) 308 (100.0%) 310 (56.0%)
Maternal education, n (%)

137
Primary 152 (61.8%) 191 (62.0%) 343 (61.9%)
Secondary 72 (29.3%) 102 (33.1%) 174 (31.4%)
Tertiary 22 (8.9%) 15 (4.9%) 37 (6.7%)
Mother employed, n(%) 56 (22.8%) 79 (25.6%) 134 (24.4%)
Household income, n (%)
<ZAR1000/m 126 (51.2%) 99 (32.1%) 225 (40.6%)
>ZAR5000/m 17 (6.9%) 58 (18.8%) 75 (13.5%)
ZAR1000-5000/m 103 (41.9%) 151 (49.0%) 254 (45.8%)
HIV infected mothers, n(%) 46 (18.7%) 6 (1.9%) 52 (9.4%)
Maternal smoking status, n (%)
Active smoker 30 (12.9%) 154 (51.9%) 184 (34.8%)
Non-smoker 81 (34.9%) 30 (10.1%) 111 (21.0%)
Passive smoker 121 (52.2%) 112 (38.0%) 234 (44.2%)
Infant feeding at 6-10 weeks, n (%)
Exclusive breastfeeding 131 (54.8%) 155 (51.2%) 286 (52.8%)
Mixed breastfeeding 108 (45.2%) 148 (48.8%) 256 (47.2%)
Exclusive breastfeeding at 4 months, n (%) 66 (27.5%) 82 (27.0%) 148 (27.2%)
Mode of delivery, n (%)
Elective C/S 18 (7.4%) 16 (5.2%) 34 (6.2%)
Emergency C/S 37 (15.2%) 34 (11.0%) 71 (12.9%)
Vaginal 189 (77.5%) 258 (83.8%) 447 (81.0%)
Maternal PTSD, n (%)
No exposure 178 (83.6%) 243 (86.2%) 421 (85.1%)
Suspected PTSD 20 (9.4%) 16 (5.7%) 36 (7.3%)
Trauma exposed 15 (7.0%) 23 (8.2%) 38 (7.7%)
Maternal BDI Threshold, n (%)
Above threshold 49 (22.5%) 77 (27.3%) 126 (25.2%)
Below threshold 169 (77.5%) 205 (72.7%) 374 (74.8%)
Maternal SRQ Threshold, n (%)
Above threshold 41 (18.7%) 71 (25.2%) 112 (22.4%)
Below threshold 178 (81.3%) 211 (74.8%) 389 (77.6%)
Household size, median [95%CI] 4 [1 11] 5 [2 12] 5 [2 12]
Maternal alcohol score, median [95%CI] 0 [0 30.2] 0 [0 25.9] 0 [0 26]
Infant characteristics
Infant weight for age z-score, median [95%CI] -0.36 [-2.5 1.86] -0.74 [-2.92 1.06 -0.6 [-2.81 1.62]
Infant height for age z-score, median [95%CI] 0.1 [-3.44 2.74] -0.27 [-3.44 2.11] 0 [-3.4 2.6]
Infant gestational age, n (%)
Preterm 55 (22.4%) 71 (23.1%) 126 (22.7%)
Term 184 (74.8%) 230 (74.7%) 414 (74.7%)
Very preterm 7 (2.8%) 7 (2.3%) 14 (2.5%)
Infant gender, n (%)
Female 122 (49.6%) 143 (46.6%) 265 (47.8%)
Male 123 (50.0%) 165 (53.6%) 288 (52.0%)
Triplets 1 (0.4%) 0 (0.0%) 1 (0.2%)

138
BMI=Body Mass Index; HIV= Human Immunodeficiency Virus; EBF=Exclusive breastfeeding; PTSD= post-
traumatic stress disorder; BDI= Beck Depression Inventory; SRQ= Self-Regulation Questionnaire; Smoking
status was measured as Active smoker (cotinine levels ≥ 500); Passive smoker (cotinine levels 10 – 500);
Non-smoker (cotinine levels ≤ 10). Term, Preterm and Very-preterm infants are infant with gestational age of
>37 weeks, 32-37 weeks and 28-31.9 weeks respectively. C/S=caesarean section.
Appendix 2, Figure 2: Alpha rarefaction curve relating the sequencing depth to Shannon diversity index of
all sequenced breast milk samples.

139
Appendix 2, Figure 3: Bar-plot of relative abundances of bacteria genera. (A) Complete linkage
unsupervised hierarchical clustering of bacterial abundances within the human breast milk bacteriome at
Mbekweni study site (n =235). (B) Complete linkage unsupervised hierarchical clustering of bacterial
abundances within the human breast milk bacteriome at TC Newman study site (n =287). Each bar represents
a mother’s HBM bacteriome profile and each coloured box, a bacterial genus. Genera with less than 0.5%
abundance in a given sample are grouped together, herein referred to as “other” (grey boxes).

140
Appendix 2, Table 2: Core taxa in human breast milk bacteriome.
Phylum Class Order Family Genus OTU MRA of taxa in the cohort Percentage of women with specific taxa (%)
Firmicutes Bacilli Bacillales Staphylococcaceae Staphylococcus OTU_18 0.177 99.8
Firmicutes Bacilli Lactobacillales Streptococcaceae Streptococcus OTU_20 0.222 99.6
Firmicutes Bacilli Lactobacillales Streptococcaceae Streptococcus OTU_1 0.262 96.4
Firmicutes Clostridia Clostridiales Veillonellaceae Veillonella OTU_33 0.015 84.5
Firmicutes Bacilli Lactobacillales Streptococcaceae Streptococcus OTU_1557 0.002 83.3
Firmicutes Bacilli Bacillales Family_XI_Incertae_Sedis Gemella OTU_42 0.006 83.3
Firmicutes Bacilli Lactobacillales Streptococcaceae Streptococcus OTU_2110 0.001 82
Actinobacteria Actinobacteria Corynebacteriales Corynebacteriaceae Corynebacterium OTU_34 0.012 98.3
Actinobacteria Actinobacteria Micrococcales Micrococcaceae Rothia OTU_38 0.059 94.1
Actinobacteria Actinobacteria Corynebacteriales Corynebacteriaceae Corynebacterium OTU_30 0.015 92.9
Actinobacteria Actinobacteria Micrococcales Micrococcaceae Micrococcus OTU_41 0.013 92.5
Actinobacteria Actinobacteria Corynebacteriales Corynebacteriaceae Corynebacterium OTU_113 0.003 84.9
Proteobacteria Gammaproteobacteria Pseudomonadales Moraxellaceae Acinetobacter OTU_35 0.013 92.1
Proteobacteria Gammaproteobacteria Enterobacteriales Enterobacteriaceae unclassified OTU_24 0.02 86.2
Core taxa in human breast milk bacteriome at different taxonomy levels. Core is defined by the presence of taxa found in HBM from 80% of all mothers enrolled in the study.
MRA=Mean relative abundance.

141
Appendix 2, Figure 4: Dendogram of relative abundances of bacteria in HBM samples at genus level. Hierarchical complete linkage unsupervised clustering on Bray-Curtis
dissimilarities shows 11 clusters at a clustering of height 0.8. Cluster 1 (65 members), cluster 2(68 members), cluster 3 (319 members), cluster 4 (6 members), cluster 5 (31
members), cluster 6 (3 members), cluster 7 (9 members), cluster 8 (5 members), cluster 9 (5 members), cluster 10 (3 members), and cluster 11 (8 members).

142
Appendix 2, Table 3: Mean relative abundance of dominant phyla and genera (>0.5%) across
phenotypic clusters in HBM samples.
Cluster 1 Cluster 2 Cluster 3 p-value
Shannon diversity 1.07 1.65 1.23 < 0.001
Chao1 index 128.84 155.96 174.44 < 0.001
Phylum Firmicutes 79.16 68.04 79.62 < 0.001
Actinobacteria 10.93 18.22 14.1 < 0.001
Proteobacteria 9 10.66 5.14 < 0.001
Cyanobacteria 0.43 2.51 0.43 < 0.001
Genus Staphylococcus 70.8 32.89 5.62 < 0.001
Streptococcus 6 31.16 68.91 < 0.001
Rothia 0.99 7.24 7.72 < 0.001
Corynebacterium 6.16 5.57 2.45 < 0.001
Acinetobacter 2.17 2.58 1.28 0.0144
Chloroplast 0.4 2.5 0.35 < 0.001
Micrococcus 1.01 1.49 0.73 0.057
OTU_24 2.75 1.43 0.6 < 0.001
Enhydrobacter 0.91 1.42 0.23 < 0.001
Escherichia-
Shigella 0.36 1.38 0.3 < 0.001
Lactobacillus 0.1 1.08 0.95 0.101
Bifidobacterium 0.7 0.81 0.71 0.956
Veillonella 0.16 0.71 2.47 < 0.001
Kocuria 0.39 0.52 0.45 < 0.001
Gemella 0.12 0.44 0.74 < 0.001
Pseudomonas 0.47 0.28 0.13 < 0.001
Appendix 2, Table 4: Mean Shannon diversity and mean chao1 index of HBM bacteriome profiles
across different socio-economic and psychosocial factors.
Shannon diversity
All samples Mbekweni clinic TC Newman clinic
Covariates
Mean Shannon
diversity p-value Mean Shannon diversity p-value Mean Shannon diversity p-value
Study site (Ethnicity) 0.535 - -
Mbekweni 1.343 - -
TC Newman 1.3882 - -
Mode of delivery 0.337 0.527 0.602
Vaginal 1.3649 1.3287 1.3925
Elective CS 1.5284 1.5303 1.526
Emergency CS 1.3219 1.3486 1.2945
Gestational age 0.492 0.201 0.5

143
Term 1.3655 1.3713 1.3606
Pre-term 1.3773 1.2808 1.4565
Very pre-term 1.3492 1.0337 1.6121
Infant gender 0.886 0.388 0.386
Male 1.3697 1.3594 1.3777
Female 1.3651 1.3243 1.4004 Infant feeding options 0.575 0.991 0.995
Exclusive BF 1.3799 1.3434 1.4111
Mixed BF 1.3519 1.3409 1.3602
Maternal education 0.236 0.404 0.247
Primary 1.3724 1.3454 1.3946
Secondary 1.3661 1.3326 1.3895
Tertiary 1.3371 1.3587 1.3053 Maternal
employment 0.277 0.459 0.423
Working 1.4339 1.3209 1.4399
Not working 1.3468 1.4247 1.3696
Maternal BMI 0.667 0.443 0.645
0-18.5 1.333 1.563 1.3089
18.5-25 1.3521 1.3006 1.3877
25-30 1.3585 1.4047 1.3138
30-50 1.4453 1.4138 1.4825
Infant birth weight kg 0.346 0.929 0.264
0-2.5 1.3297 1.3525 1.3176
2.5-4.5 1.3738 1.395 1.4042
Infant birth length cm 0.041* 0.934 0.012*
0-40 1.4105 1.13 1.7844
40-48 1.4229 1.4023 1.4343
48-60 1.3502 1.3365 1.3632
Maternal age years 0.036* 0.032* 0.454
17-22 1.3151 1.2956 1.3306
22-35 1.3667 1.3106 1.4128
35-45 1.5333 1.6809 1.3976
Dwelling type 0.249 0.705 0.329
Shack 1.3556 1.3156 1.5876
House 1.3974 1.3653 1.4429
Flat 1.3076 1.5755 1.3026
Backyard 1.3378 1.05 1.3648
Household income
0.807 0.548 0.98
>R5000/m 1.4479 1.5093 1.4315
R1000-5000/m 1.377 1.351 1.3948
<R1000/m 1.33 1.3161 1.3496
Maternal HIV status 0.379 0.247 0.779
Negative 1.3594 1.3151 1.3898
Positive 1.453 1.4737 1.3118
Household size 0.473 0.133 0.814
1-5 1.346 1.2882 1.3988

144
5-10 1.3951 1.436 1.3667
10-17 1.5016 1.6911 1.4069
Maternal smoking 0.644 0.877 0.585
Non-smoker 1.3395 1.3213 1.3937
Passive smoker 1.3241 1.318 1.3306
Active smoker 1.4403 1.4714 1.4341
Alcohol score 0.948 0.707 0.672
0-10.5 1.3635 1.3409 1.3829
10.5-20.5 1.4996 1.0649 1.5589
20.5-35 1.3106 1.4172 1.2395
Maternal PTSD 0.384 0.307 0.961
No exposure 1.3562 1.3404 1.3681
Trauma exposed 1.2782 1.1243 1.3719
Suspected PTSD 1.6087 1.5046 1.7607
Maternal BDI 0.574 0.854 0.902
Above threshold 1.4243 1.3946 1.4438
Below threshold 1.3457 1.3293 1.3663
Maternal SRQ 0.211 0.188 0.428
Above threshold 1.4483 1.4413 1.4525
Below threshold 1.3457 1.3208 1.3663
Appendix 2, Table 4: Mean Shannon diversity mean chao1 index of HBM bacteriome profiles across
different socio-economic and psychosocial factors (cont’d).
Chao1 index
All samples
Mbekweni clinic
TC Newman clinic
Covariates Mean Chao1 index p-value Mean Chao1 index p-value Mean Chao1 index p-value
Study site (Ethnicity) 0.401 - -
Mbekweni 159.25
-
-
TC Newman 169.33
-
-
Mode of delivery 0.971 0.754 0.452
Vaginal 164.22
158.2
168.81
Elective CS 181.72
166.62
198.82
Emergency CS 162.11
164.43
159.71
Gestational age 0.552 0.428 0.415
Term 163.4
157.97
167.85
Pre-term 170.6
166.11
174.29
Very pre-term 149.47
128.42
167.02
Infant gender 0.725 0.036* 0.085
Male 162.34
160.46
163.8
Female 167.46
157.89
175.74
Infant feeding options 0.569 0.681 0.906
Exclusive BF 167.01
159.01
173.74
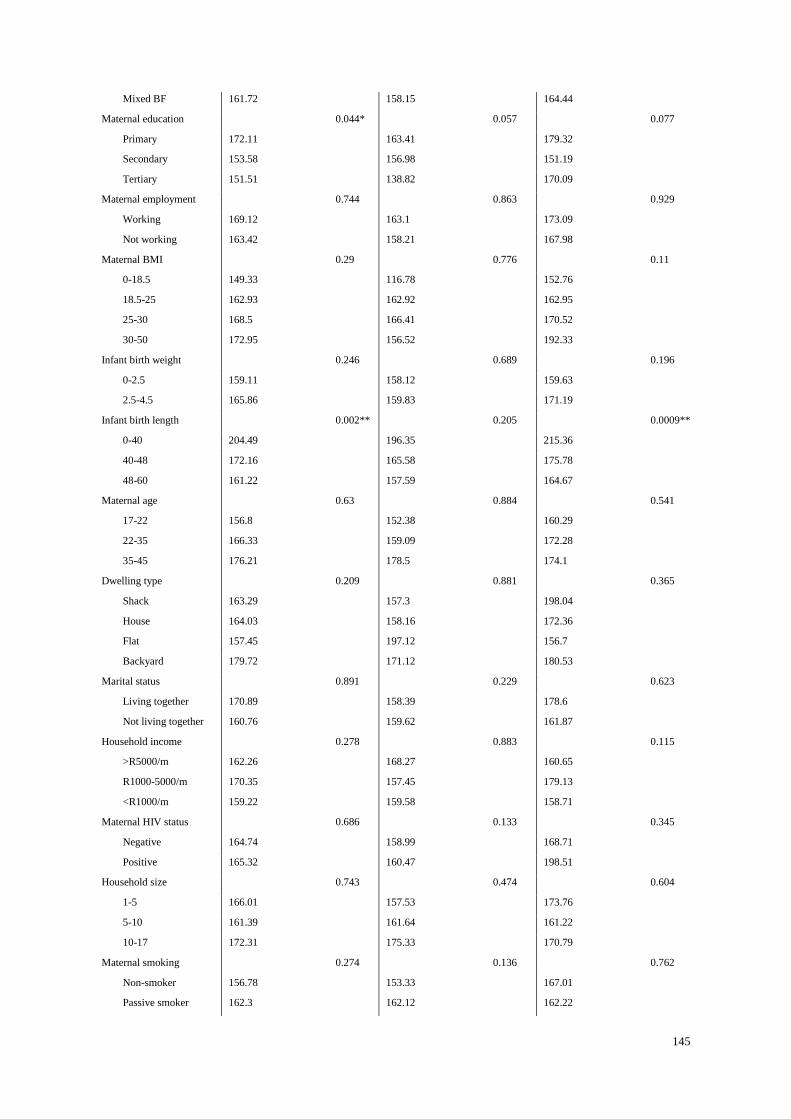
145
Mixed BF 161.72
158.15
164.44
Maternal education 0.044* 0.057 0.077
Primary 172.11
163.41
179.32
Secondary 153.58
156.98
151.19
Tertiary 151.51
138.82
170.09
Maternal employment 0.744 0.863 0.929
Working 169.12
163.1
173.09
Not working 163.42
158.21
167.98
Maternal BMI 0.29 0.776 0.11
0-18.5 149.33
116.78
152.76
18.5-25 162.93
162.92
162.95
25-30 168.5
166.41
170.52
30-50 172.95
156.52
192.33
Infant birth weight 0.246 0.689 0.196
0-2.5 159.11
158.12
159.63
2.5-4.5 165.86
159.83
171.19
Infant birth length 0.002** 0.205 0.0009**
0-40 204.49
196.35
215.36
40-48 172.16
165.58
175.78
48-60 161.22
157.59
164.67
Maternal age 0.63 0.884 0.541
17-22 156.8
152.38
160.29
22-35 166.33
159.09
172.28
35-45 176.21
178.5
174.1
Dwelling type 0.209 0.881 0.365
Shack 163.29
157.3
198.04
House 164.03
158.16
172.36
Flat 157.45
197.12
156.7
Backyard 179.72
171.12
180.53
Marital status 0.891 0.229 0.623
Living together 170.89
158.39
178.6
Not living together 160.76
159.62
161.87
Household income 0.278 0.883 0.115
>R5000/m 162.26
168.27
160.65
R1000-5000/m 170.35
157.45
179.13
<R1000/m 159.22
159.58
158.71
Maternal HIV status 0.686 0.133 0.345
Negative 164.74
158.99
168.71
Positive 165.32
160.47
198.51
Household size 0.743 0.474 0.604
1-5 166.01
157.53
173.76
5-10 161.39
161.64
161.22
10-17 172.31
175.33
170.79
Maternal smoking 0.274 0.136 0.762
Non-smoker 156.78
153.33
167.01
Passive smoker 162.3
162.12
162.22

146
Active smoker 173.44
158.97
170.79
Alcohol score 0.046* 0.177 0.183
0-10.5 166.36
161.11
170.87
10.5-20.5 153.01
105.01
159.55
20.5-35 152.7
136.9
163.24
Maternal PTSD 0.218 0.096 0.634
No exposure 163.13
155.69
168.74
Trauma exposed 158.68
154.95
160.88
Suspected PTSD 189.87
185.66
196.01
Maternal BDI 0.012* 0.607 0.096
Above threshold 181.08
176.08
184.37
Below threshold 159.19
153.89
163.65
Maternal SRQ 0.185 0.839 0.259
Above threshold 165.64
146.57
177.26
Below threshold 164.49
161.7
166.88
BMI=Body Mass Index; HIV= Human Immunodeficiency Virus; EBF=Exclusive breastfeeding; PTSD= post-
traumatic stress disorder; BDI= Beck Depression Inventory; SRQ= Self-Regulation Questionnaire;
CS=Caeserean section. P<0.001, ***; p<0.01, **; p<0.05*.
Appendix 2, Figure 5: Log ratio biplot of human breast milk bacterial abundances at the genus level.
Samples are coloured according to (A) gestational age, (B) maternal smoking, (C) Body Mass Index (BMI),
and (D) delivery mode. Each sample is represented by a circle and is coloured based on group type. Samples
(circles) that cluster together are similar in bacteria composition and abundance.

147
Appendix 2, Figure 6: LEFSe plots showing differences between the HBM bacteriome of participants
based on study site. The histograms show the linear discriminant analysis (LDA) scores of bacteriome at (A)
genus, (B) family, (C) order and (D) phylum level. The higher the LDA score, the more likely it is that the
specific taxon is differentially abundant in one group compared to the other group. HBM samples of mothers
from Mbekweni study site have higher relative abundance of the taxa shown in red, while HBM samples of
mothers from TC Newman study site have higher relative abundance of the taxa shown in green.
LEFSe=Linear Discriminant Analysis Effect Size.

148
Appendix 2, Table 5: Pearson’s correlations between the relative abundances of the predominant bacterial genera in the human breast milk samples.
Co-occurrences between the relative abundances of the sixteen most predominant bacteria genera. Negative and positive values represent negative and positive correlations
respectively between the bacteria. Cut-off value was set to 0.28.
All samples (n=522)
Acinetoba
cter
Bifidobacte
rium
Chlorop
last
Corynebacte
rium
Enhydrob
acter
Escherichia-
Shigella
Geme
lla
Kocu
ria
Lactobaci
llus
Microco
ccus
OTU_
24
Pseudom
onas
Roth
ia
Staphyloco
ccus
Streptoco
ccus
Veillon
ella
Acinetobacter 1
Bifidobacteriu
m
-0.12 1
Chloroplast 0.07 -0.09 1
Corynebacteri
um -0.06 -0.08 0.06 1
Enhydrobacter 0.3 -0.16 0.02 0.01 1
Escherichia-
Shigella 0.07 -0.06 -0.09 -0.15 0.02 1
Gemella -0.3 -0.03 -0.1 -0.1 -0.2 -0.25 1
Kocuria -0.09 -0.12 -0.11 0.04 -0.04 -0.11 -0.13 1
Lactobacillus -0.19 0.01 0 -0.09 -0.19 -0.02 -0.08 -0.07 1
Micrococcus 0.08 0 -0.17 0.11 0.19 -0.12 -0.09 0.13 -0.12 1
OTU_24 0.19 -0.15 -0.07 -0.12 0.03 0.42 -0.25 0.01 -0.14 -0.07 1
Pseudomonas 0.34 -0.19 0.16 -0.09 0.06 0.15 -0.3 -0.12 -0.1 -0.09 0.26 1
Rothia -0.25 -0.09 -0.19 -0.21 -0.22 -0.23 0.17 -0.09 -0.14 -0.16 -0.3 -0.26 1
Staphylococcu
s
-0.12 -0.11 -0.03 0.4 0.05 -0.04 -0.13 0.07 -0.07 -0.02 -0.02 -0.02 -
0.25
1
Streptococcus -0.32 -0.01 -0.14 -0.27 -0.32 -0.25 0.39 -0.16 0.12 -0.3 -0.37 -0.28 0.48 -0.33 1
Veillonella -0.25 0.05 -0.15 -0.21 -0.27 -0.3 0.26 -0.16 -0.05 -0.18 -0.33 -0.24 0.37 -0.34 0.49 1

149
Appendix 2, Figure 7: 16S rRNA gene sequencing reproducibility. Scatter plots represent the relative
abundance of each OTU from (A) seven within-run repeats and (B) four between-run repeats together with
their technical repeats. A multiple R-square which is the proportion of variance reproduced by replicating the
reads is generated.
Appendix 2, Figure 8: Bar-plot of relative abundances of bacteria genera in human breast milk (HBM)
samples and their technical repeats. Complete linkage unsupervised hierarchical clustering of human breast
milk bacterial profiles within a sample and its repeat (paired bar-plots). Each bar represents a sample and each
coloured box, a bacteria genus. Genera with less than 0.5% abundance in a given sample are grouped together,
herein referred to as “other” (grey boxes). W-Within run repeat, B-Between run repeat.

150
APPENDIX 3: Chapter 6 supplementary tables and figures
Appendix 3, Table 1: Sociodemographic, psychosocial and clinical characteristics of mothers and their
infants.
Feature Participants (n=519) (%)
Socio-demographics characteristics
Self-defined ethnicity, n (%)
Black African 229 (44.1%)
Mixed ancestry 290 (55.9%)
Household income, n (%)
<ZAR1000/m 214 (41.2%)
ZAR1000-5000/m 233 (44.9%)
>ZAR5000/m 72 (13.9%)
Household size, median [95%CI] 5 [2 12]
Maternal characteristics
Maternal age at enrolment (years), median [95%CI] 25.37 [18.6 39.57]
Maternal BMI, median [95%CI] 25.1 [18.12 40.51]
HIV infected mothers, n (%) 47 (9.1%)
Infant characteristics
Infant weight at birth (kg), median [95%CI] 3.08 [1.94 3.94]
Infant length at birth (cm), median [95%CI] 50 [41.88 56]
Infant gestational age, n (%)
Term 403 (77.6%)
Preterm 113 (21.8%)
Very preterm 3 (0.6%)
Infant gender, n (%)
Female 248 (47.8%)
Male 271 (52.2%)
Pregnancy characteristics
Exclusive breastfeeding (day), median [95%CI] 55.2 [0 181.75]
Antibiotic during pregnancy, n (%) 7 (1.4%)
Smoking status, n (%)
Non-smoker 101 (20.4%)
Passive smoker 223 (45.0%)
Active smoker 172 (34.7%)
Alcohol intake during pregnancy, n (%) 67 (14.3%)
HBM sample characteristics
Collection time (weeks), median [95%CI] 7.43 [5.86 9.43]
Human milk oligosaccharide (HMO) phenotype, n (%)
Se-/Le- 5 (1.0%)
Se-/Le+ 120 (23.1%)
Se+/Le- 84 (16.2%)
Se+/Le+ 310 (59.7%)
Lactose concentrations (mM), median [95%CI] 168.16 [80.05 188.49]
Pregnancy characteristics

151
IPV Emotional category, n (%)
No IPV 218 (46.5%)
Isolated incident 64 (13.6%)
Low frequency 38 (8.1%)
Mid frequency 100 (21.3%)
High frequency 49 (10.4%)
Maternal PTSD, n (%)
No exposure 395 (84.9%)
Suspected PTSD 34 (7.3%)
Trauma exposed 36 (7.7%)
PDI score, median [95%CI] 1.23 [0 3.29]
BDI score, median [95%CI] 11 [0 39]
Maternal BDI Threshold, n (%)
Above threshold 122 (26.0%)
Below threshold 347 (74.0%)
Maternal SRQ Threshold, n (%)
Above threshold 102 (21.7%)
Below threshold 368 (78.3%)
Diet characteristics
Adult food frequency-fish, n (%)
Never 45 (9.3%)
Monthly 120 (24.8%)
Weekly 256 (53.0%)
Daily 62 (12.8%)
Adult food frequency-starch, n (%)
Never 0 (0.0%)
Monthly 10 (2.1%)
Weekly 87 (18.0%)
Daily 386 (79.9%)
Adult food frequency- Red meat, n (%)
Never 81 (16.8%)
Monthly 157 (32.6%)
Weekly 208 (43.2%)
Daily 36 (7.5%)
Adult food frequency-Organ meat, n (%)
Never 109 (22.7%)
Monthly 173 (36.0%)
Weekly 175 (36.5%)
Daily 23 (4.8%)
Adult food frequency-Poultry, n (%)
Never 28 (5.8%)
Monthly 20 (4.1%)
Weekly 246 (50.9%)
Daily 189 (39.1%)
Adult food frequency-Eggs, n (%)
Never 48 (9.9%)

152
Monthly 58 (12.0%)
Weekly 253 (52.4%)
Daily 124 (25.7%)
Adult food frequency-Processed meat, n (%)
Never 44 (9.1%)
Monthly 76 (15.8%)
Weekly 247 (51.2%)
Daily 115 (23.9%)
Adult food frequency-Legumes, n (%)
Never 60 (12.5%)
Monthly 150 (31.2%)
Weekly 230 (47.8%)
Daily 41 (8.5%)
Adult food frequency-Dairy, n (%)
Never 29 (6.0%)
Monthly 36 (7.5%)
Weekly 172 (35.7%)
Daily 245 (50.8%)
Adult food frequency-Vegetables, n (%)
Never 16 (3.3%)
Monthly 23 (4.8%)
Weekly 206 (42.7%)
Daily 238 (49.3%)
Adult food frequency-Fruit, n (%)
Never 13 (2.7%)
Monthly 26 (5.4%)
Weekly 171 (35.4%)
Daily 273 (56.5%)
Adult food frequency-Crisps, n (%)
Never 34 (7.1%)
Monthly 76 (15.8%)
Weekly 253 (52.5%)
Daily 119 (24.7%)
Adult food frequency-Cold drinks, n (%)
Never 38 (7.9%)
Monthly 53 (11.0%)
Weekly 209 (43.3%)
Daily 183 (37.9%)
Adult food frequency-Fruit juice., n (%)
Never 58 (12.0%)
Monthly 125 (25.9%)
Weekly 184 (38.1%)
Daily 116 (24.0%)
BMI=Body Mass Index; HIV= Human Immunodeficiency Virus; EBF=Exclusive breastfeeding; PTSD= post-
traumatic stress disorder; IPV= Induced Partner Violence; BDI= Beck Depression Inventory; SRQ= Self-
Regulation Questionnaire; Smoking status was measured as Active smoker (cotinine levels ≥ 500); Passive

153
smoker (cotinine levels 10 – 500); Non-smoker (cotinine levels ≤ 10). Term, Preterm and Very-preterm
infants are infant with gestational age of >37 weeks, 32-37 weeks and 28-31.9 weeks respectively.
Appendix 3, Table 2: Comparison of sociodemographic, psychosocial and clinical characteristics
between mothers with low and normal breast milk lactose levels.
Feature Low lactose level (n=45) Normal lactose level (n=474) p-value
Socio-demographics characteristics
Ethnicity, n (%)
9.82E-01
Black African 19 (42.2%) 210 (44.3%)
Mixed ancestry 26 (57.8%) 264 (55.7%)
Household income, n (%)
2.42E-01
<ZAR1000/m 23 (51.1%) 191 (40.3%)
ZAR1000-5000/m 16 (35.6%) 217 (45.8%)
>ZAR5000/m 6 (13.3%) 66 (13.9%)
Household size, median [95%CI] 5 [2 11.9] 5 [2 12] 4.77E-01
Maternal clinical characteristics
Maternal age at enrolment, median [95%CI] 22.98 [18.45 39.02] 25.85 [18.67 39.6] 1.21E-02
Maternal BMI, median [95%CI] 24.8 [17.8 40.88] 25.1 [18.2 39.77] 5.66E-01
HIV infected mothers, n (%) 3 (6.7%) 44 (9.3%) 9.28E-01
Infant clinical characteristics
Infant weight at birth(kg), median [95%CI] 3.04 [2.33 3.83] 3.1 [1.94 4] 3.95E-01
Infant length at birth(cm), median [95%CI] 49 [43 55.9] 50 [41 56] 1.20E-01
Infant gestational age, n (%)
7.43E-01
Term 34 (75.6%) 369 (77.8%)
Preterm 11 (24.4%) 102 (21.5%)
Very preterm 0 (0.0%) 3 (0.6%)
Infant gender, n (%)
7.41E-01
Female 24 (53.3%) 224 (47.3%)
Male 21 (46.7%) 250 (52.7%)
Pregnancy characteristics
Exclusive breastfeeding (months), median [95%CI] 27.6 [0 150] 55.2 [0 182.4] 2.61E-04
Antibiotic use during pregnancy, n (%) 1 (2.2%) 6 (1.3%) 6.16E-01
Smoking status, n (%)
2.36E-01
Non-smoker 7 (17.1%) 94 (20.7%)
Passive Smoker 16 (39.0%) 207 (45.5%)
Active Smoker 18 (43.9%) 154 (33.8%)
Alcohol exposure, n (%) 8 (19.5%) 59 (13.8%) 5.60E-01

154
HBM sample characteristics
Collection time (weeks), median [95%CI] 7.29 [5.6 9.39] 7.43 [5.86 9.43] 1.56E-01
Human milk oligosaccharide (HMO) phenotype, n (%)
5.07E-01
Se-/Le- 1 (2.2%) 4 (0.8%)
Se-/Le+ 10 (22.2%) 110 (23.2%)
Se+/Le- 3 (6.7%) 81 (17.1%)
Se+/Le+ 31 (68.9%) 279 (58.9%)
Lactose concentrations (mM), median [95%CI] 97.65 [32.78 126.54] 169.61 [139.38 188.66] 1.36E-28
Pregnancy characteristics
IPV Emotional category, n (%)
9.03E-01
No IPV 19 (46.3%) 199 (46.5%)
Isolated incident 6 (14.6%) 58 (13.6%)
Low frequency 5 (12.2%) 33 (7.7%)
Mid frequency 6 (14.6%) 94 (22.0%)
High frequency 5 (12.2%) 44 (10.3%)
Maternal PTSD, n (%)
7.90E-01
No exposure 34 (82.9%) 361 (85.1%)
Suspected PTSD 5 (12.2%) 29 (6.8%)
Trauma exposed 2 (4.9%) 34 (8.0%)
BDI score, median [95%CI] 16 [0 39] 11 [0 39] 4.51E-02
Maternal BDI Threshold, n (%)
1.20E-02
Above threshold 19 (46.3%) 103 (24.1%)
Below threshold 22 (53.7%) 325 (75.9%)
Maternal SRQ Threshold, n (%)
2.55E-01
Above threshold 13 (31.7%) 89 (20.7%)
Below threshold 28 (68.3%) 340 (79.3%)
Diet characteristics
Adult food frequency-fish, n (%)
4.65E-01
Never 4 (9.3%) 41 (9.3%)
Monthly 8 (18.6%) 112 (25.5%)
Weekly 25 (58.1%) 231 (52.5%)
Daily 6 (14.0%) 56 (12.7%)
Adult food frequency-starch, n (%)
1.85E-01
Never 0 (0.0%) 0 (0.0%)
Monthly 2 (4.7%) 8 (1.8%)
Weekly 3 (7.0%) 84 (19.1%)
Daily 38 (88.4%) 348 (79.1%)
Adult food frequency-Red meat, n (%)
3.89E-01
Never 4 (9.3%) 77 (17.5%)

155
Monthly 16 (37.2%) 141 (32.1%)
Weekly 19 (44.2%) 189 (43.1%)
Daily 4 (9.3%) 32 (7.3%)
Adult food frequency-Organ meat, n (%)
2.01E-02
Never 16 (37.2%) 93 (21.3%)
Monthly 14 (32.6%) 159 (36.4%)
Weekly 13 (30.2%) 162 (37.1%)
Daily 0 (0.0%) 23 (5.3%)
Adult food frequency-Poultry, n (%)
9.38E-01
Never 3 (7.0%) 25 (5.7%)
Monthly 1 (2.3%) 19 (4.3%)
Weekly 22 (51.2%) 224 (50.9%)
Daily 17 (39.5%) 172 (39.1%)
Adult food frequency-Eggs, n (%)
6.57E-01
Never 5 (11.6%) 43 (9.8%)
Monthly 4 (9.3%) 54 (12.3%)
Weekly 25 (58.1%) 228 (51.8%)
Daily 9 (20.9%) 115 (26.1%)
Adult food frequency-Processed meat, n (%)
7.44E-01
Never 1 (2.3%) 43 (9.8%)
Monthly 10 (23.3%) 66 (15.0%)
Weekly 21 (48.8%) 226 (51.5%)
Daily 11 (25.6%) 104 (23.7%)
Adult food frequency-Legumes, n (%)
3.95E-01
Never 3 (7.0%) 57 (13.0%)
Monthly 13 (30.2%) 137 (31.3%)
Weekly 24 (55.8%) 206 (47.0%)
Daily 3 (7.0%) 38 (8.7%)
Adult food frequency-Cold drinks, n (%)
2.79E-02
Never 2 (4.7%) 36 (8.2%)
Monthly 3 (7.0%) 50 (11.4%)
Weekly 15 (34.9%) 194 (44.1%)
Daily 23 (53.5%) 160 (36.4%)
Adult food frequency-Fruit juice., n (%)
2.46E-02
Never 3 (7.0%) 55 (12.5%)
Monthly 6 (14.0%) 119 (27.0%)
Weekly 20 (46.5%) 164 (37.3%)
Daily 14 (32.6%) 102 (23.2%)

156
BMI=Body Mass Index; HIV= Human Immunodeficiency Virus; EBF=Exclusive breastfeeding; PTSD= post-
traumatic stress disorder; IPV= Induced Partner Violence; BDI= Beck Depression Inventory; SRQ= Self-
Regulation Questionnaire; Smoking status was measured as Active smoker (cotinine levels ≥ 500); Passive
smoker (cotinine levels 10 – 500); Non-smoker (cotinine levels ≤ 10). Term, Preterm and Very-preterm
infants are infant with gestational age of >37 weeks, 32-37 weeks and 28-31.9 weeks respectively.
Appendix 3, Table 3: Comparison of infant anthropometric measures between infants receiving breast
milk with low and normal lactose levels.
Features Low lactose level (n=45) Normal lactose level (n=474) p-value
7 weeks
Z-score for weight, median [95%CI] -0.46 [-3.74 1.11] -0.3 [-3.07 1.45] 1.20E-01
Z-score for length, median [95%CI] -0.74 [-3.35 1.14] -0.41 [-3.5 1.73] 2.14E-01
Body mass index z-score, median [95%CI] -0.54 [-2.66 1.57] -0.13 [-2.45 1.97] 9.64E-02
10 weeks
Z-score for weight, median [95%CI] -0.58 [-3.21 1.05] -0.18 [-2.77 1.87] 1.38E-02
Z-score for length, median [95%CI] -0.7 [-4.34 2.28] -0.34 [-3.84 3] 1.61E-01
Body mass index z-score, median [95%CI] -0.26 [-3.53 1.95] 0.13 [-3.21 2.54] 1.45E-01
14 weeks
Z-score for weight, median [95%CI] -0.64 [-3.81 1.31] -0.13 [-2.34 1.88] 3.68E-03
Z-score for length, median [95%CI] -1.13 [-3.64 2.47] -0.3 [-3.59 3.39] 1.95E-02
Body mass index z-score, median [95%CI] -0.47 [-2.75 2.19] 0.12 [-2.79 2.68] 3.87E-02
6 months
Z-score for weight, median [95%CI] -0.04 [-2.23 2.44] 0.08 [-2.65 2.21] 2.67E-01
Z-score for length, median [95%CI] -0.7 [-3.96 2.62] -0.07 [-3.18 3.39] 4.85E-02
Body mass index z-score, median [95%CI] 0.38 [-1.59 3.13] 0.32 [-2.41 2.86] 6.57E-01
9 months
Z-score for weight, median [95%CI] 0.3 [-2.09 2.38] 0.15 [-2.45 2.47] 9.98E-01
Z-score for length, median [95%CI] -0.35 [-3.36 2.57] -0.12 [-2.9 2.72] 4.76E-01
Body mass index z-score, median [95%CI] 0.98 [-1.96 2.55] 0.38 [-2.18 2.79] 3.82E-01
12 months
Z-score for weight, median [95%CI] 0 [-2.55 2.4] -0.12 [-2.58 2.37] 6.07E-01
Z-score for length, median [95%CI] -0.1 [-3.15 1.87] -0.35 [-2.56 1.98] 8.64E-01
Body mass index z-score, median [95%CI] 0.36 [-2.08 2.34] 0.11 [-2.18 2.53] 2.05E-01
18 months
Z-score for weight, median [95%CI] 0.05 [-2.85 2.16] 0.03 [-2.42 2.42] 7.36E-01

157
Z-score for length, median [95%CI] -0.77 [-2.65 1.85] -0.62 [-3.71 1.93] 8.54E-01
Body mass index z-score, median [95%CI] 0.5 [-2.5 2.54] 0.7 [-2.63 3.74] 4.59E-01
24 months
Z-score for weight, median [95%CI] -0.35 [-2.97 2.25] -0.42 [-2.87 1.95] 9.76E-01
Z-score for length, median [95%CI] -1.31 [-3.49 0.88] -1.05 [-3.58 1.34] 2.68E-01
Body mass index z-score, median [95%CI] 0.82 [-1.48 2.94] 0.45 [-1.82 2.97] 2.41E-01
Appendix 3, Table 4: Differences in metabolite profiles of human breast milk from mothers with low and
normal lactose levels.
Feature Low lactose level (mM) Normal lactose level (mM) p-value FDR
2-Fucosyllactose, median [95%CI] 3.535 [0 11.824] 4.435 [0 13.788] 7.83E-02 8.90E-02
2-oxoglutarate, median [95%CI] 0.118 [0.048 0.225] 0.113 [0.036 0.374] 4.97E-01 5.18E-01
3-Fucosyllactose, median [95%CI] 0.862 [0 5.789] 1.715 [0 6.276] 8.91E-02 9.90E-02
3-Sialyllactose, median [95%CI] 0.154 [0.048 0.289] 0.093 [0.039 0.183] 6.22E-11 1.20E-10
6-Sialyllactose, median [95%CI] 0.078 [0 0.19] 0.091 [0 0.195] 5.14E-02 5.98E-02
Acetate, median [95%CI] 0.097 [0.04 0.261] 0.047 [0.026 0.103] 7.15E-16 1.88E-15
Acetone, median [95%CI] 0.004 [0.001 0.031] 0.002 [0.001 0.009] 5.66E-07 9.13E-07
Acetyl carnitine, median [95%CI] 0.026 [0.001 0.115] 0.007 [0 0.034] 1.25E-12 2.84E-12
Alanine, median [95%CI] 0.302 [0.093 0.64] 0.302 [0.131 0.598] 6.78E-01 6.92E-01
Asparagine, median [95%CI] 0.025 [0 0.081] 0.034 [0 0.082] 6.30E-03 7.88E-03
Aspartate, median [95%CI] 0.097 [0 0.186] 0.07 [0 0.2] 1.58E-02 1.88E-02
Butyrate, median [95%CI] 0 [0 0.39] 0.203 [0 0.481] 1.62E-10 2.89E-10
Caprate, median [95%CI] 0 [0 0.558] 0.352 [0 0.733] 5.59E-14 1.33E-13
Caprylate, median [95%CI] 0.164 [0 0.627] 0.341 [0 0.617] 1.12E-04 1.56E-04
Choline, median [95%CI] 0.353 [0.073 0.759] 0.197 [0.054 0.675] 4.52E-05 6.46E-05
cis-aconitate, median [95%CI] 0.008 [0 0.04] 0.025 [0.012 0.043] 3.94E-18 1.41E-17
Citrate, median [95%CI] 3.099 [0.685 6.199] 6.025 [3.389 9.345] 8.89E-20 4.04E-19
Creatine, median [95%CI] 0.07 [0.018 0.129] 0.073 [0.026 0.142] 8.12E-01 8.12E-01
Creatinine, median [95%CI] 0.071 [0.036 0.099] 0.052 [0.033 0.081] 8.61E-12 1.79E-11
Cytidine triphosphate, median [95%CI] 0.003 [0 0.044] 0.034 [0 0.101] 1.39E-18 5.35E-18
Cytidine, median [95%CI] 0 [0 0.022] 0.027 [0.005 0.058] 2.13E-21 1.33E-20
Difucosyllactose, median [95%CI] 0.978 [0 8.118] 0.226 [0 1.822] 5.34E-06 8.09E-06
Dimethylamine, median [95%CI] 0 [0 0.004] 0.003 [0 0.007] 5.54E-12 1.20E-11
Formate, median [95%CI] 0.015 [0 0.056] 0.011 [0 0.025] 1.54E-02 1.88E-02
Fumarate, median [95%CI] 0.004 [0.002 0.013] 0.007 [0.002 0.021] 3.35E-06 5.23E-06
Galactose, median [95%CI] 0 [0 0.816] 0 [0 0.77] 4.97E-01 5.18E-01
Glucose, median [95%CI] 0.094 [0 0.383] 0.546 [0 1.109] 2.73E-20 1.52E-19

158
Glutamate, median [95%CI] 0.69 [0.163 2.038] 1.437 [0.508 2.333] 2.67E-14 6.67E-14
Glutamine, median [95%CI] 0 [0 0] 0.014 [0 0.086] 1.19E-18 4.96E-18
Glycerophosphocholine, median [95%CI] 0.061 [0.015 0.384] 0.613 [0.22 1.079] 2.58E-27 6.45E-26
Isoleucine, median [95%CI] 0.234 [0.052 0.399] 0.041 [0 0.222] 9.14E-22 6.53E-21
Lactate, median [95%CI] 1.606 [0.495 8.114] 0.352 [0.167 1.288] 1.51E-22 1.26E-21
Lactose, median [95%CI] 97.654 [32.783 126.535] 169.608 [139.379 188.661] 1.36E-28 6.80E-27
Leucine, median [95%CI] 0.195 [0.049 0.383] 0.033 [0.011 0.177] 4.95E-24 4.95E-23
LNDFH I, median [95%CI] 2.698 [0 5.886] 0.807 [0 3.685] 8.63E-06 1.27E-05
LNDFH II, median [95%CI] 0.143 [0 1.476] 0.097 [0 0.898] 1.22E-01 1.33E-01
LNFP I, median [95%CI] 2.283 [0 8.4] 1.049 [0 6.563] 4.05E-03 5.19E-03
Lysine, median [95%CI] 0.119 [0.038 0.402] 0.068 [0.008 0.248] 3.33E-07 5.55E-07
Methylguanidine, median [95%CI] 0 [0 0] 0 [0 0.01] 1.06E-03 1.43E-03
Methylhistidine, median [95%CI] 0.05 [0.008 0.102] 0.035 [0.011 0.076] 2.97E-03 3.91E-03
Phenylalanine, median [95%CI] 0.048 [0 0.09] 0.022 [0.01 0.062] 1.23E-09 2.12E-09
Phosphocholine, median [95%CI] 0 [0 0.381] 0.646 [0.033 1.045] 7.04E-25 1.17E-23
Phosphocreatinine, median [95%CI] 0 [0 0.043] 0.035 [0.006 0.09] 3.42E-20 1.71E-19
Pyruvate, median [95%CI] 0.04 [0.017 0.085] 0.022 [0.006 0.055] 1.21E-11 2.42E-11
Succinate, median [95%CI] 0.021 [0.006 0.058] 0.037 [0.015 0.077] 1.54E-10 2.85E-10
Tryptophan, median [95%CI] 0.015 [0.006 0.042] 0 [0 0.016] 1.60E-24 2.00E-23
Tyrosine, median [95%CI] 0.089 [0.025 0.164] 0.031 [0.011 0.114] 1.59E-16 4.68E-16
Uracil, median [95%CI] 0.004 [0 0.072] 0 [0 0.007] 6.29E-17 1.97E-16
Uridine, median [95%CI] 0.078 [0.023 0.197] 0.031 [0.011 0.101] 2.01E-16 5.58E-16
Valine, median [95%CI] 0.236 [0.056 0.411] 0.079 [0.034 0.263] 5.23E-18 1.74E-17
LNDFH II=Lacto-N-difucohexaose II; LNFP I=Lacto-N-fucopentaose I; LNDFH I=Lacto-N-difucohexaose I;
FDR: False Discovery Rate
Appendix 3, Table 5: Median relative abundances of predominant human breast milk bacterial genera
in mothers with low and normal breast milk lactose levels.
Feature Low lactose level (n=44) Normal lactose level (n=441) p-value FDR
Streptococcus, median [95%CI] 0.32 [0 0.86] 0.58 [0.01 0.87] 1.10E-04 1.32E-03
Staphylococcus, median [95%CI] 0.19 [0 0.98] 0.05 [0 0.84] 4.54E-04 2.00E-03
Rothia, median [95%CI] 0.01 [0 0.18] 0.03 [0 0.35] 1.57E-03 3.77E-03
Corynebacterium, median [95%CI] 0.02 [0 0.38] 0.01 [0 0.27] 5.11E-02 8.76E-02
Veillonella, median [95%CI] 0 [0 0.07] 0.01 [0 0.09] 6.63E-03 1.33E-02
Acinetobacter, median [95%CI] 0 [0 0.12] 0 [0 0.19] 4.57E-01 4.99E-01
Micrococcus, median [95%CI] 0 [0 0.39] 0 [0 0.07] 2.97E-01 3.56E-01
Gemella, median [95%CI] 0 [0 0.01] 0 [0 0.04] 1.56E-03 3.77E-03

159
Kocuria, median [95%CI] 0 [0 0.01] 0 [0 0.09] 1.01E-01 1.52E-01
Enterobacteriaceae OTU_24, median [95%CI] 0 [0 0.07] 0 [0 0.21] 2.15E-01 2.87E-01
Lactobacillus, median [95%CI] 0 [0 0.01] 0 [0 0.08] 4.99E-04 2.00E-03
Others, median [95%CI] 0.07 [0 0.7] 0.07 [0 0.6] 9.96E-01 9.96E-01
Median values refer to the median relative abundance of bacteria genera. FDR: False Discovery Rate
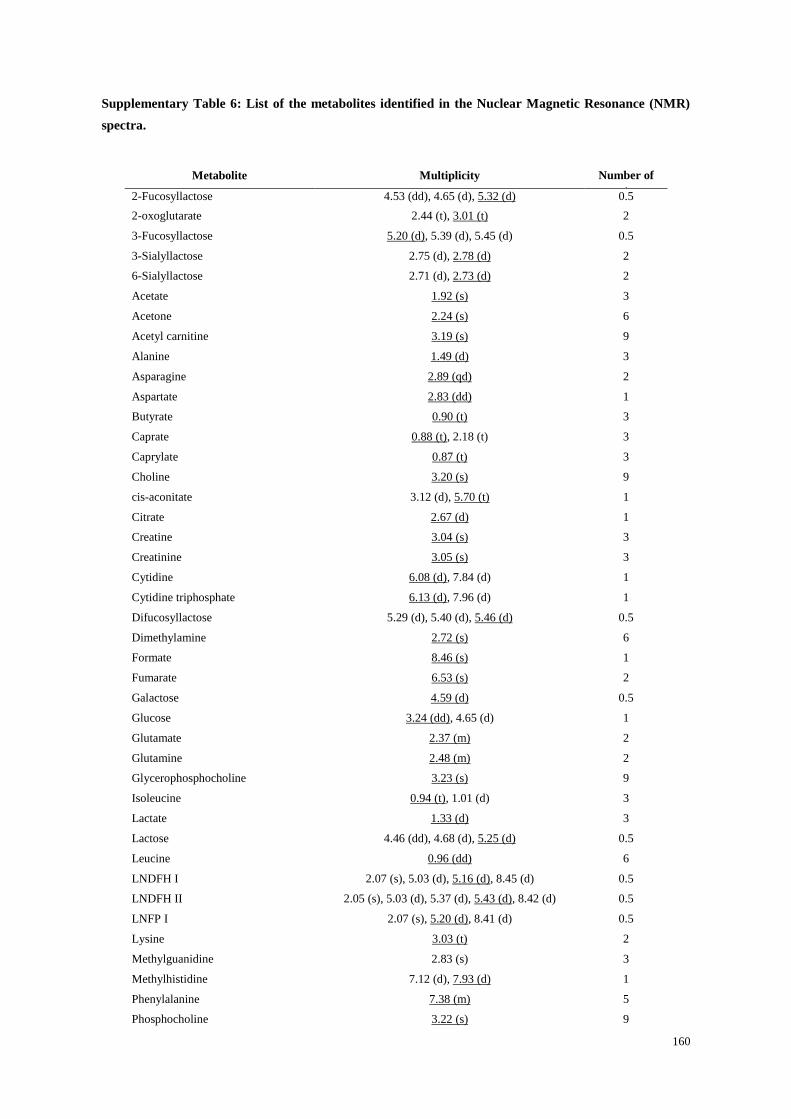
160
Supplementary Table 6: List of the metabolites identified in the Nuclear Magnetic Resonance (NMR)
spectra.
Metabolite Multiplicity Number of
protons 2-Fucosyllactose 4.53 (dd), 4.65 (d), 5.32 (d) 0.5
2-oxoglutarate 2.44 (t), 3.01 (t) 2
3-Fucosyllactose 5.20 (d), 5.39 (d), 5.45 (d) 0.5
3-Sialyllactose 2.75 (d), 2.78 (d) 2
6-Sialyllactose 2.71 (d), 2.73 (d) 2
Acetate 1.92 (s) 3
Acetone 2.24 (s) 6
Acetyl carnitine 3.19 (s) 9
Alanine 1.49 (d) 3
Asparagine 2.89 (qd) 2
Aspartate 2.83 (dd) 1
Butyrate 0.90 (t) 3
Caprate 0.88 (t), 2.18 (t) 3
Caprylate 0.87 (t) 3
Choline 3.20 (s) 9
cis-aconitate 3.12 (d), 5.70 (t) 1
Citrate 2.67 (d) 1
Creatine 3.04 (s) 3
Creatinine 3.05 (s) 3
Cytidine 6.08 (d), 7.84 (d) 1
Cytidine triphosphate 6.13 (d), 7.96 (d) 1
Difucosyllactose 5.29 (d), 5.40 (d), 5.46 (d) 0.5
Dimethylamine 2.72 (s) 6
Formate 8.46 (s) 1
Fumarate 6.53 (s) 2
Galactose 4.59 (d) 0.5
Glucose 3.24 (dd), 4.65 (d) 1
Glutamate 2.37 (m) 2
Glutamine 2.48 (m) 2
Glycerophosphocholine 3.23 (s) 9
Isoleucine 0.94 (t), 1.01 (d) 3
Lactate 1.33 (d) 3
Lactose 4.46 (dd), 4.68 (d), 5.25 (d) 0.5
Leucine 0.96 (dd) 6
LNDFH I 2.07 (s), 5.03 (d), 5.16 (d), 8.45 (d) 0.5
LNDFH II 2.05 (s), 5.03 (d), 5.37 (d), 5.43 (d), 8.42 (d) 0.5
LNFP I 2.07 (s), 5.20 (d), 8.41 (d) 0.5
Lysine 3.03 (t) 2
Methylguanidine 2.83 (s) 3
Methylhistidine 7.12 (d), 7.93 (d) 1
Phenylalanine 7.38 (m) 5
Phosphocholine 3.22 (s) 9

161
Phosphocreatine 3.05 (s) 3
Pyruvate 2.38 (s) 3
Succinate 2.41 (s) 4
Tryptophan 7.74 (d) 1
Tyrosine 7.20 (m) 2
Uracil 5.81 (d) 1
Uridine 7.88 (d) 1
Valine 0.99 (d), 1.04 (d) 3
TSP 0.00 (t) 9
Peak multiplicity: s = singlet, d = doublet, dd = double doublet, t = triplet, h = hextet, m = multiplet. TSP =
Trimethylsilylpropionic acid, (internal standard).
Appendix 3, Figure 1: Quality control analysis of the nuclear magnetic resonance (NMR) experiments.
a, Trimethylsilylpropionic acid (TSP; internal standard) concentration of the samples and quality controls
calculated on the NMR signal at 0.00 ppm. b, Principal components analysis (PCA) of the samples and
quality controls showing the high reproducibility of the quality controls. c, Lactose concentration of the
quality control samples.

162
Appendix 3, Figure 2: Assignment of the Human milk oligosaccharides (HMO) phenotype. The HMO
phenotype was associated to each sample according to the presence of 3’FL, LNFP, and LNDFH I signals.