ANNUAL REPORT 2021 - Synlait Milk
77
ANNUAL REPORT 2021 Doing Milk Differently For A Healthier World
-
Upload
khangminh22 -
Category
Documents
-
view
0 -
download
0
Transcript of ANNUAL REPORT 2021 - Synlait Milk

ANNUAL REPORT 2021
Doing Milk Differently For A Healthier World

ABOUT THIS REPORT
For shareholders interested in Synlait’s environmental and social impact, a standalone sustainability report will be released in November. This report will review Synlait’s strategy and initiatives to deliver on our sustainability objectives and targets. It remains our intention to merge the sustainability and annual reports over time.
Good corporate governance is critical to protect all stakeholder interests. Our Corporate Governance Statement describes Synlait’s current compliance with the NZX Corporate Governance Code recommendations in the year to 31 July 2021. In order to enable us to update this more regularly, this section of the Annual Report has been moved to Synlait’s website: synlait.com/investors/corporate-governance
Welcome to our Annual Report. This Annual Report reviews Synlait Milk Limited’s (Synlait) and subsidiaries’ financial performance and business achievements for the year ended 31 July 2021.
We always look for ways to improve our reporting, please email any feedback to: [email protected]
An online copy of this report and our previous annual, interim and sustainability reports are available at: synlait.com/investors/
SUSTAINABILITY REPORTING
CORPORATE GOVERNANCE
Synlait’s commitment to elevating people and planet to the same level as profit was recognised in June 2020 when it became part of the B Corp™ community.
B Corp™ is a community of leaders driving a global movement of people using business as a force for good. Certified B Corporations™ consider the impact of their decisions on their workers, customers, suppliers, community, and the environment.
B Corp™ resonates strongly with Synlait’s purpose of Doing Milk Differently For A Healthier World.
Learn more about what being a B Corporation™ means for our people, our community, and our customers at: synlait.com/bcorp
ANNUAL REPORT 2021

Our rail siding at Synlait Dunsandel benefits people, planet and profit while further extending our highly integrated manufacturing facility from farm-to-port. The 30-wagon rail siding at Synlait Dunsandel opened in May. Containerised goods are now transported by rail between Synlait Dunsandel and Lyttelton Port significantly reducing Synlait’s environmental footprint, with approximately 16,000 truck movements removed from State Highway One saving an estimated 888 tonnes of CO2-e annually.
Our world class and sustainable value chain is part of what makes Synlait unique. The rail siding significantly simplifies Synlait’s supply chain network providing greater control and traceability of product. It also improves responsiveness to customers.
SYNLAIT DUNSANDEL’S RAIL SIDING
ANNUAL REPORT 2021PAGE 02 & 03

A forklift moves a pallet of Skim Milk Powder in our new Dry Store 4 at Synlait Dunsandel.
CONTENTS About this report 01
Chair review 08
CEO review 16
Meet the team 28
Our board 28
Our executive team 29
Review of financial performance 32
Financial and performance metrics 44
Milk price 45
Financial contents 49
Financial statements 49
Auditors report 122
Statutory information 129
Directory 148
ANNUAL REPORT 2021PAGE 04 & 05

In April, we were proud to launch Made With Better Milk, a value-add premium ingredients offering built upon the sustainability credentials of Synlait’s best practice Lead With Pride™ farming system, our integrated manufacturing and supply chain, and our people and planet focus as a B Corp™ certified business. New Zealand made milk nutrition ingredients are well known for quality and safety, however, we need to keep raising the game to differentiate ourselves. That game is being played out in terms of environmental and social performance and we are excited about having a product that allows us to better meet what our customers are asking for.
Made With Better Milk provides Synlait’s global customers with the opportunity to differentiate the products they market to consumers based on a supply chain that takes better care of people and animals, and generates better outcomes for climate, water, soil, and biodiversity. Synlait farmers have been building up their credentials since Lead With Pride™ was launched 2014. After years of hard work, Synlait’s most innovative and determined farmers are now being rewarded with the recognition they deserve. Our inaugural Made With Better Milk customer is a prominent consumer brand owner in Asia. The Made With Better Milk range initially includes whole milk and skim milk powder.
MADE WITH BETTER MILK
PAGE 06 & 07 ANNUAL REPORT 2021

Challenging trading conditions and a poor financial performance meant our share price underperformed. As our performance improves, we expect our share price will follow. Improving future earnings, and consequently share price performance, continues to have everyone’s full focus.
A strategy that remains fit for purpose While this is an extremely disappointing financial result, we continued to execute our strategy and are planning a strong recovery. Key highlights include:
• Modifications to Synlait Pokeno for our new multinational customer, which remain on track. Building and installation is now well underway and commercial production will commence in late 2022. In our first full year of production in FY24 we expect to increase our nutritional consumer-packaged volumes by 35% to 40%.
• Dairyworks extended its range of products with the launch of protein and muesli yoghurts and finishing butters. It continues to position itself as a provider of innovative dairy products packed in a way that makes them easy to store, open, and use.
A challenging trading environment.
My last year as Synlait’s Chair was an unexpected and challenging one. Our financial result for the 12 months to 31 July 2021 (FY21) unfortunately reaffirmed our over reliance on one product, one customer, and one market. While we have invested significantly in our diversification strategy, we did not anticipate the impact COVID-19 would have on The a2 Milk Company, our key customer, and consequently, our own financial performance.
Heading into FY21 we had experienced a period of strong orders from The a2 Milk Company. Our team worked around the clock to respond to the pantry stocking behaviour experienced after the first wave of the pandemic. However, the revised consumer-packaged infant formula demand forecast received from The a2 Milk Company five months into FY21 was massive and sudden. The delayed impacts of COVID-19 on consumer behaviour, channel dynamics and supply chain disruptions became very real.
The drop in demand resulted in an immediate change to our manufacturing plans as we switched to ingredients production for the
remainder of FY21. This happened as global commodity markets firmed, and global shipping delays intensified, making it harder for our team to find new customers and achieve our usual ingredient premiums.
A result that reflects the environment we found ourselves These trading headwinds were significant and meant our result at an EBITDA level reduced 78% to $37.3 million, further resulting in an NPAT loss of $(28.5) million. This is very disappointing. It is our first loss since listing on the NZX in 2013.
Sales of nutritionals declined 35% to 34,362 MT. The a2 Milk Company sells product via two main channels: directly into China via bricks and mortar Mother and Baby Stores; and via the daigou channel. COVID-19 shut down the daigou channel as border closures meant Chinese operators were unable to travel. While direct export sales to China have grown, and we expect a further recovery over the next year or two, the unknown is still COVID-19. Despite the removal of China’s one-child policy, the number of babies born has also fallen, slowing the industry’s recovery. Synlait must therefore continue to take a conservative approach to its forecasting in this area.
CHAIR REVIEW
Synlait Chair Graeme Milne ONZM
PAGE 08 & 09 ANNUAL REPORT 2021

• The team are in the final stages of preparing to launch our Foodservice UHT whipping cream product internationally, with strong revenues to flow through from FY23.
• Our new Enterprise Resource Planning system has been built and is being tested. It is due to be rolled out by the end of this calendar year. Productivity benefits will include the automation of several manual processes and operational efficiencies such as improved inventory management, and real-time data insights.
• Finally, next month we will launch Synlait Swappa Bottle our first consumer product under Synlait’s own brand. This 1.5 litre reusable, stainless steel bottle of homogenised milk, exclusively sourced from Synlait’s highest performing farms will deliver on our intention to move closer to the consumer and complement our existing business portfolios.
A balance sheet ready for what comes next We have invested heavily in our growth initiatives over the last few years. Due to the uncertainty of COVID-19, we raised $200 million of equity in November 2020. This had strong support from our existing shareholders – thank you. The equity raise was considered prudent at the time and has proven to be the case given the negative change to our trading conditions from December 2020.
New funding arrangements with our banking syndicate were announced in July. ANZ and BNZ have been supportive of the Synlait story and strategy since the early 2000s and 2011 respectively. We are pleased to have completed this refinancing exercise and to provide increased certainty for all our stakeholders.
A changing team Executive changes The pandemic’s impact on Synlait is obvious and unfortunate. During the year CEO Leon Clement, CFO Angela Dixon, and Director Operations Mark Toomey resigned. We thank them all for their contribution and commitment to Synlait.
John Penno, Synlait Co-Founder, Former CEO, and current Director stepped into the Interim CEO role. From John’s 1 May start date, he set about formulating a plan for our return to profitability. John has been ably assisted by Robert Stowell, a long-term senior leader at Synlait, who has been appointed as our CFO, and by Matthew Foster, a retired senior manager who returned as Acting Director Operations.
Earlier this month we announced a consultation process had commenced with staff to update our organisational structure. The changes, which are now finalised and included in the Investor Presentation released alongside this Annual Report, align leadership and resourcing around key business units (Nutritionals, Ingredients, Liquids and Consumer Foods).
As a final step in the process to reset Synlait, today we announced our new CEO. Grant Watson will join the Synlait team in January 2022. Grant is currently CEO of dairy company, Miraka. Prior to Miraka, He spent 10 years at Fonterra where he held several senior roles including Director of Global Foodservice, Acting Director of Sales Fonterra Brands New Zealand, Managing Director of Tip Top and Director of Route and Foodservice Fonterra Brands New Zealand. Prior to Fonterra, Grant built his executive career at McDonalds New Zealand to become Chief Operating Officer. He has also held several governance and directorship roles for private and publicly listed companies.
Grant has a track record of materially transforming and accelerating businesses by setting clear strategies, surrounding himself with diverse and talented people, and relentlessly driving execution to deliver strong sustainable results. Prior to Miraka, Grant led the significant growth of Fonterra’s Global Foodservice business and has overseen the successful commercialisation of numerous value-added dairy products. This is a key part of Synlait’s strategy going forward and we look forward to benefiting from his skills and experience.
Grant will be supported by Nigel Macdonald who was appointed as our new Director Operations last
month. Nigel has had a lengthy tenure in the global dairy industry and has led operations, manufacturing, and supply chain teams in the areas of infant nutrition, fast moving consumer goods, and ingredients in New Zealand, the Middle East, and Latin America. He is currently General Manager, Manufacturing at Baladna Food Industries, Qatar’s leading dairy company.
We look forward to Grant and Nigel joining our team over the coming months.
Governance changes As announced in 2018 when standing for re-election, I intended for this to be my last three-year term as a Director and Chair. Having been Synlait’s inaugural Chair, and on the Board for some 17 years, it is certainly time to hand over to a successor. Our poor financial performance, however, does not make it an ideal time to lose industry knowledge and experience. Therefore, when Grant starts as CEO, I will retire as Chair and be appointed as a Board Advisor for one year.
John Penno will assume the role of Chair. This is a very logical step for Synlait. John has been the chief architect of our recovery plan and is the best position to Chair the Board and guide Grant through his induction and establishment.
As John is a Board Appointed Director the Board will seek ratification from shareholders at the Annual Meeting in
December via a change to Synlait’s constitution. The constitution will be amended to remove the requirement for the Chair to be an Independent Director. This will be a temporary measure as the Board is aware it is best practice to have an Independent Chair.
When I retire in 2022 the Board will appoint Paul McGilvary as an Independent Director. Paul has extensive experience in the dairy sector. He is currently Deputy Chair of AsureQuality, Chair of BVAQ Australia, and a Non-Executive Director of Waikato Milking Systems. Paul previously held several executive roles including, CEO of Tatua Co-operative Dairy Company Limited, CEO of HortResearch, and Managing Director, Fonterra (Europe). Paul’s strong dairy experience gives the Board every confidence that this will make him an asset to the Synlait Board. Paul’s appointment will be ratified by shareholders at the 2022 Annual Meeting.
As a shareholder you will have the opportunity to ask questions and vote on these changes at our Annual Meeting to be held on 1 December in Christchurch. We hope to have your support.
A return to sustainable profitability Our key priority is to return Synlait to profitability in a sustainable manner. We expect our consumer-packaged infant formula business to recover
slowly and our Dairyworks business to trade well. The increased size of our ingredients business also has the right customer base to support our expanded capacity. However, it will be FY23 before our new multinational customer at Synlait Pokeno adds significant value to our performance.
Under these conditions we do see a return to profitability, but not immediately to previous levels. Synlait expects its Net Profit After Tax result to return to robust profitability in FY22 based on tighter management of its Ingredient business, improved infant base powder volumes and cost savings. By the end of FY23, the recovery plan will have seen Synlait return to similar levels of profitability, operating cash flows, and debt ratios as the years leading into FY21. The full guidance statement can be found in the Investor Presentation.
A final thanks The last 12 months has also been challenging for our farmer suppliers as they battle a rapidly changing regulatory environment, labour shortages due to COVID-19, and a significant flooding event in Canterbury. I acknowledge that the impact of COVID-19 and Synlait’s financial performance has been unsettling. The importance of our relationship with you cannot be overstated. I thank you for your loyal support.
PAGE 10 & 11 ANNUAL REPORT 2021

When I joined Synlait in 2004, we set out to develop a billion-dollar company, and we did. It is unfortunate that the timing of my retirement as Chair coincides with one of our poorer financial performances, however, I remain very proud of the company we have built. There have been many ups and downs, but COVID-19 has certainly been a rollercoaster, particularly for our staff whose initial pandemic response started with strong consumer-packaged infant formula orders and ended with the reorientation of our facilities to manufacture ingredients. Doing Milk Differently For A Healthier World once again proved its resilience and value as we navigated the challenges of the last 12 months, and I have no doubt it will continue to do so as we focus on rebuilding the business and returning to profitability.
Thank you to our shareholders, farmer suppliers, customers, and staff for your continued belief in the Synlait story. We could not do this without you.
Graeme Milne, ONZM Chair
Our Liquids business started with a 10-year supply agreement with Foodstuffs South Island for the exclusive manufacture of their private label brands of Pams and Value fresh milk and cream which commenced in April 2019.
ANNUAL REPORT 2021PAGE 12 & 13

We will launch our first consumer foods product under our own brand – Synlait Swappa Bottle – next month.
Synlait Swappa Bottle is a 1.5 litre reusable, stainless steel bottle of homogenised milk exclusively sourced from Synlait’s highest performing farms. The Synlait Swappa Bottle concept is simple – drink, return, repeat.
New Zealanders have been telling us for years that they are deeply concerned about plastic waste, but in milk, there haven’t been many options. Synlait Swappa Bottle is a step in the journey towards eliminating plastic waste. Each time we drink, return, repeat, we contribute to a better future.
Synlait Swappa Bottles are initially being launched in South Island New World stores, with plans to widen distribution over time.
We have signalled our intention to move closer to the consumer for some time. Our acquisition of Dairyworks in 2019 was the start of this and adding Synlait-branded product strengthens and complements our business portfolio and expertise.
The Synlait Swappa Bottle carries the B-Corp stamp representing our 2020 certification and commitment to using business as a force for good.
SYNLAIT SWAPPA BOTTLE
PAGE 14 & 15 ANNUAL REPORT 2021

Dear Shareholders
The past year proved to be very challenging for Synlait Milk.
After nine straight years of solid profitability, we are bitterly disappointed to post our largest ever financial loss. While the reasons for this have been widely canvased and signalled in our half year results, it is important we go over these to ensure you understand the drivers, and more importantly feel confident in our path forward.
During the last quarter of this financial year the Board and management worked together to build a clear and accurate picture of our performance over the last five years. We needed to quickly understand what must be done to rebuild Synlait’s financial strength, because this business has far from reached its potential.
I hope this report demonstrates that we have taken stock, understood, and learnt from what went wrong, and that we have a clear plan to return to profitability.
Our strategy remains fit for purpose As part of this process, we paused and reconsidered Synlait’s strategy
to ensure we remained confident in it. We are. Synlait Milk has always had the enormous advantage of starting fresh some 13 years ago, as a small part of a large, successful, and well-established global industry. Our strategy fundamentally plays to this competitive advantage and is driven by our purpose: Doing Milk Differently For A Healthier World.
As obvious as it seems, we are focused on the things consumers increasingly value. While everyone wants great tasting and performing dairy products at a fair price, there is a growing focus on where products come from and how they are made. Like you and me, consumers are demanding more information about where their food comes from and are increasingly supporting brands and companies that are doing their part to protect and nurture people and planet. In all that we do, from the way we work with our farmers, to how we operate our manufacturing processes, we have invested in developing a leadership position in our industry. We are very proud of the industry-wide changes we have been part of delivering, particularly on-farm sustainability. This is part of what makes Synlait unique.
To support this, our strategy has matured into four parts:
• Ingredients – an efficient and focused business that manufactures high-quality whole and skim milk powder and milk fat products from a differentiated milk supply for leading multinationals and large Chinese customers.
• Nutritionals – offers a whole of supply chain solution for large-scale, world-class, multinational brand owners of infant, children, and adult formulated nutritional powders. This business also manufactures specialised nutritional ingredients such as base powders for others to blend and package, and lactoferrin as a high value ingredient.
• Liquids – a growing business focused on product development and innovation to manufacture high-specification, long-life consumer-packaged beverages, foodservice cream products and ready to feed infant formula.
• Consumer Foods – a manufacturer of consumer fresh milk, cheese, butter, and yogurt products in the New Zealand and Australia domestic markets under our own and/or private label brands.
CEO REVIEW
Synlait Co-Founder, Director and Current CEO Dr John Penno
PAGE 16 & 17 ANNUAL REPORT 2021

Ingredients From day one we worked hard to build a strong dairy ingredients business based on the fundamentals of being a small, but respected manufacturer of high-specification milk powders and cream products. This enabled us to develop meaningful relationships with the world’s leading consumer dairy and infant formula companies, and this created a solid foundation for everything else we do. Synlait built its profitability from operating its Ingredients business to the highest quality standards, facility utilisation, and low-cost structures, as we learnt our way in the global dairy industry.
Nutritionals The second part of our strategy was to add as much value as we could to the products we manufactured. Our aspiration at the beginning was to simply: Make More From Milk. By the time we built our small-scale high specification specialty milk dryer at Synlait Dunsandel in 2009 it was clear that the enormous growth of China’s infant formula market would play a key role in our future.
By 2010 we had raised the necessary capital to build New Zealand’s first global scale infant formula manufacturing facility and since then we have built out a highly integrated infant formula manufacturing organisation that meets the high standards of both multinational customers and the increasingly demanding Chinese regulatory regime, the world’s largest infant nutrition market. We have invested significantly in regulatory management, product
formulation, quality, full laboratory services, procurement, supply chain management, wet mix, spray drying, dry blending and consumer packaging. These services are what makes Synlait truly unique.
In parallel, we developed our own proprietary lactoferrin manufacturing process which has become world leading and delivers high quality lactoferrin. This process was specifically designed by our research and product development team to manufacture lactoferrin product for use in infant formula. A study by the University of California Davis which tested key biological functions of lactoferrin relevant for infant nutrition, found that Synlait lactoferrin was one of the best performing products among ten commercial samples, with researchers highlighting its purity which was similar to human lactoferrin. We have built a successful business using our own formulations and product is sold to our well-established multinational customer base and leading Chinese infant formula customers.
As our Nutritionals business developed, we built a strong partnership with The a2 Milk Company, who Synlait have an exclusive manufacturing and supply arrangement with for a2 Platinum® for the New Zealand, Australia, and China markets. This business grew fast, as other early partners in our portfolio fell away failing to achieve the various regulatory hurdles needed for the China market. Our partnership with The a2 Milk Company remains our most important, and we believe it will
continue to be for some years. While our relationship continued to grow, we also recognised it came with customer and market concentration risk. To address this, we looked to diversify within the broader formulated milk products category and into new markets.
Almost 12 months ago we signed a third-party manufacturing agreement with an established, global category leader in the Asia Pacific region, for spray-dried and consumer packaged nutritional powder products. In our first full year of production in FY24, these high value plant-based products are expected to increase our nutritional consumer-packaged volumes by 35%-40%. We expect to grow volumes and add further markets and products to this agreement over time.
We are investing approximately $85 million in the processing and packaging customisation needed to support this new customer at Synlait Pokeno and Auckland. The sachet filling line being installed will expand our nutritional consumer-packaging capability from cans to sachet and enable bag-box type formats, which are in demand in specific markets. Commercial production remains on track to start in late 2022.
Over recent years China’s infant nutrition market has swung in favour of locally manufactured brands. Initially, this meant our infant formula base powder business to multinationals fell away as demand growth had fallen for their products. However, we are starting to see new
demand emerging from large Chinese manufacturers as their market share growth exceeds their own manufacturing capacity presenting an opportunity for us to rebuild this business with new partnerships.
Over the next two years we expect to see our Nutritionals business mature. It has an excellent foundation with The a2 Milk Company, and our second, large-scale, long-term relationship with the multinational customer at Synlait Pokeno is an enormous opportunity, as are the relationships we are building with new, emerging infant formula players in China. Our strong position in the global lactoferrin market also remains a cornerstone of this business.
Liquids The third part of our strategy is Liquids. It is based on a strongly held view that in time China will move away from powdered products to fresh or long-life milk products packaged at source and shipped to market ready for distribution and sale.
Taking the same approach as we did with our lactoferrin business, we invested in building a facility at Synlait Dunsandel to make these products. We also invested in the establishment of a research and development team at Massey University in Palmerston North. This team has developed high performing processes and products in the formulated creams, ambient drinking yogurt, and ready-to-feed infant formula categories – all fast growing, or high potential opportunities in affluent regions of China.
Our Liquids business began with a 10-year agreement with Foodstuffs South Island signed in December 2017 for the exclusive manufacture of their private label brands of Pams and Value fresh milk and cream commencing in April 2019. To build on this we are about to launch Synlait Swappa Bottle next month, our first product under our own brand. The 1.5 litre reusable, stainless steel bottle of homogenised milk is exclusively sourced from our highest performing farms and will be available in South Island New World stores.
Consumer Foods We have signalled our intention to move closer to the consumer for some time. The Dairyworks acquisition was the start of this and forms the fourth part of our strategy. Our ambition is to become the second largest player in New Zealand’s consumer dairy food category, and in time, use this, and our wider Synlait capability, to develop our own branded consumer dairy foods export business.
After fresh milk, cheese is the second largest part of the consumer dairy food category. Dairyworks’ portfolio of cheese and butter brands has national reach and is growing steadily in Australia. Dairyworks packages approximately 60% of New Zealand domestic consumer cheese sales; made up of around 30% of Dairyworks own branded products, and cheese it packages for other household brands.
While dominant in the cheese category, the strategy is to move from cheese to dairy and build out a portfolio of butter, yoghurt, and fresh
milk products. So far this is going well with Dairyworks’ Protein Yoghurt & Muesli launched in New Zealand during FY21, with sales 106% ahead of forecast. Dairyworks’ Flavoured Butters also launched in Australia, with sales 132% ahead of forecast.
We have also been working with the Dairyworks team to leverage Synlait’s liquids capability and in September started to manufacture Dairyworks fresh milk. Initially this will focus on the Foodservice channel with an ambition to extend into retail and have national distribution.
Dairyworks has been part of the Synlait family for around 18 months. Dairyworks’ EBITDA contribution for FY21 was disappointing and lower than anticipated at $10.3 million. This was mainly due to a profit drag caused by the Talbot Forest Cheese Temuka site because of whey stream losses and the high comparative cost of manufacturing due to its low utilisation, butter margins being squeezed by the high cost of milk and a new entrant in the market, and one-off write-downs of inventory balances. While earnings were disappointing in FY21 we anticipate a strong bounce back in FY22 and FY23 as we rectify these issues and continue to grow the business.
The year that’s been – what we learnt During the final quarter of FY21, the Board and management team completed a comprehensive review of Synlait to ensure we had a robust understanding of our underperformance. What quickly became clear is that while the sudden
PAGE 18 & 19 ANNUAL REPORT 2021
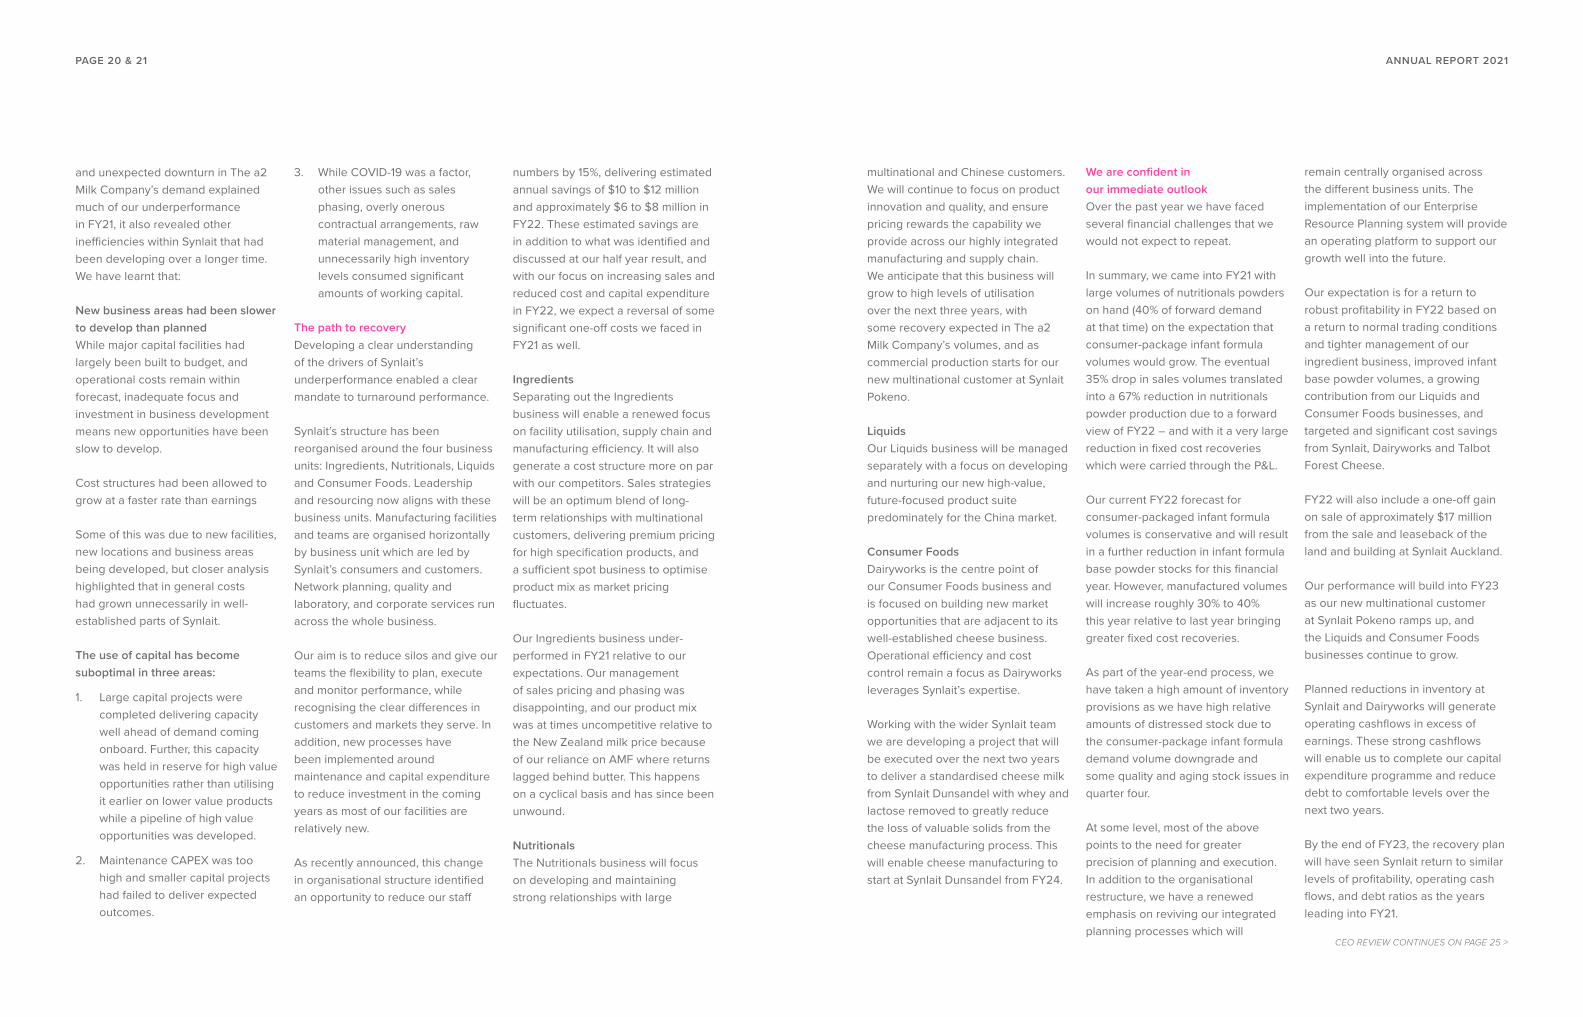
and unexpected downturn in The a2 Milk Company’s demand explained much of our underperformance in FY21, it also revealed other inefficiencies within Synlait that had been developing over a longer time. We have learnt that:
New business areas had been slower to develop than planned While major capital facilities had largely been built to budget, and operational costs remain within forecast, inadequate focus and investment in business development means new opportunities have been slow to develop.
Cost structures had been allowed to grow at a faster rate than earnings
Some of this was due to new facilities, new locations and business areas being developed, but closer analysis highlighted that in general costs had grown unnecessarily in well-established parts of Synlait.
The use of capital has become suboptimal in three areas:
1. Large capital projects were completed delivering capacity well ahead of demand coming onboard. Further, this capacity was held in reserve for high value opportunities rather than utilising it earlier on lower value products while a pipeline of high value opportunities was developed.
2. Maintenance CAPEX was too high and smaller capital projects had failed to deliver expected outcomes.
3. While COVID-19 was a factor, other issues such as sales phasing, overly onerous contractual arrangements, raw material management, and unnecessarily high inventory levels consumed significant amounts of working capital.
The path to recovery Developing a clear understanding of the drivers of Synlait’s underperformance enabled a clear mandate to turnaround performance.
Synlait’s structure has been reorganised around the four business units: Ingredients, Nutritionals, Liquids and Consumer Foods. Leadership and resourcing now aligns with these business units. Manufacturing facilities and teams are organised horizontally by business unit which are led by Synlait’s consumers and customers. Network planning, quality and laboratory, and corporate services run across the whole business.
Our aim is to reduce silos and give our teams the flexibility to plan, execute and monitor performance, while recognising the clear differences in customers and markets they serve. In addition, new processes have been implemented around maintenance and capital expenditure to reduce investment in the coming years as most of our facilities are relatively new.
As recently announced, this change in organisational structure identified an opportunity to reduce our staff
numbers by 15%, delivering estimated annual savings of $10 to $12 million and approximately $6 to $8 million in FY22. These estimated savings are in addition to what was identified and discussed at our half year result, and with our focus on increasing sales and reduced cost and capital expenditure in FY22, we expect a reversal of some significant one-off costs we faced in FY21 as well.
Ingredients Separating out the Ingredients business will enable a renewed focus on facility utilisation, supply chain and manufacturing efficiency. It will also generate a cost structure more on par with our competitors. Sales strategies will be an optimum blend of long-term relationships with multinational customers, delivering premium pricing for high specification products, and a sufficient spot business to optimise product mix as market pricing fluctuates.
Our Ingredients business under-performed in FY21 relative to our expectations. Our management of sales pricing and phasing was disappointing, and our product mix was at times uncompetitive relative to the New Zealand milk price because of our reliance on AMF where returns lagged behind butter. This happens on a cyclical basis and has since been unwound.
Nutritionals The Nutritionals business will focus on developing and maintaining strong relationships with large
multinational and Chinese customers. We will continue to focus on product innovation and quality, and ensure pricing rewards the capability we provide across our highly integrated manufacturing and supply chain. We anticipate that this business will grow to high levels of utilisation over the next three years, with some recovery expected in The a2 Milk Company’s volumes, and as commercial production starts for our new multinational customer at Synlait Pokeno.
Liquids Our Liquids business will be managed separately with a focus on developing and nurturing our new high-value, future-focused product suite predominately for the China market.
Consumer Foods Dairyworks is the centre point of our Consumer Foods business and is focused on building new market opportunities that are adjacent to its well-established cheese business. Operational efficiency and cost control remain a focus as Dairyworks leverages Synlait’s expertise.
Working with the wider Synlait team we are developing a project that will be executed over the next two years to deliver a standardised cheese milk from Synlait Dunsandel with whey and lactose removed to greatly reduce the loss of valuable solids from the cheese manufacturing process. This will enable cheese manufacturing to start at Synlait Dunsandel from FY24.
We are confident in our immediate outlook Over the past year we have faced several financial challenges that we would not expect to repeat.
In summary, we came into FY21 with large volumes of nutritionals powders on hand (40% of forward demand at that time) on the expectation that consumer-package infant formula volumes would grow. The eventual 35% drop in sales volumes translated into a 67% reduction in nutritionals powder production due to a forward view of FY22 – and with it a very large reduction in fixed cost recoveries which were carried through the P&L.
Our current FY22 forecast for consumer-packaged infant formula volumes is conservative and will result in a further reduction in infant formula base powder stocks for this financial year. However, manufactured volumes will increase roughly 30% to 40% this year relative to last year bringing greater fixed cost recoveries.
As part of the year-end process, we have taken a high amount of inventory provisions as we have high relative amounts of distressed stock due to the consumer-package infant formula demand volume downgrade and some quality and aging stock issues in quarter four.
At some level, most of the above points to the need for greater precision of planning and execution. In addition to the organisational restructure, we have a renewed emphasis on reviving our integrated planning processes which will
remain centrally organised across the different business units. The implementation of our Enterprise Resource Planning system will provide an operating platform to support our growth well into the future.
Our expectation is for a return to robust profitability in FY22 based on a return to normal trading conditions and tighter management of our ingredient business, improved infant base powder volumes, a growing contribution from our Liquids and Consumer Foods businesses, and targeted and significant cost savings from Synlait, Dairyworks and Talbot Forest Cheese.
FY22 will also include a one-off gain on sale of approximately $17 million from the sale and leaseback of the land and building at Synlait Auckland.
Our performance will build into FY23 as our new multinational customer at Synlait Pokeno ramps up, and the Liquids and Consumer Foods businesses continue to grow.
Planned reductions in inventory at Synlait and Dairyworks will generate operating cashflows in excess of earnings. These strong cashflows will enable us to complete our capital expenditure programme and reduce debt to comfortable levels over the next two years.
By the end of FY23, the recovery plan will have seen Synlait return to similar levels of profitability, operating cash flows, and debt ratios as the years leading into FY21.
CEO REVIEW CONTINUES ON PAGE 25 >
PAGE 20 & 21 ANNUAL REPORT 2021

TEC
HN
ICA
L SE
RVIC
ES (M
AN
UFA
CTU
RIN
G)
SITE
SER
VIC
ES, E
NER
GY,
MA
INTE
NA
NC
E
Supply
Supply
Optimise
Supply
NUTRITIONAL PRODUCTS
INGREDIENT PRODUCTS
LIQUID PRODUCTS
DAIRYWORKS
Synlait Pokeno and Auckland: D4, wetmix and blending and canning
Talbot Forest Cheese
Synlait Dunsandel: DLP1
Synlait Dunsandel: D3, wetmix, lactoferrin, blending and canning, whey
Synlait Dunsandel: D1, D2, AMF
NET
WO
RK P
LAN
NIN
G
LOG
ISTI
CS
CORPORATE SERVICES
QU
ALI
TY A
ND
LA
BO
RATO
RY
TEC
HN
ICA
L SE
RVIC
ES (P
ROD
UC
T)
PROCUREMENT AND MILK SUPPLY
Order
Order
Order
THE PATH TO RECOVERY: ALIGNING STRUCTURE TO STRATEGY AND RESETTING HOW WE OPERATE
Supply
PAGE 22 & 23 ANNUAL REPORT 2021

Thank you I would like to thank the management team for their work, particularly over the last six months. Facing into and executing this level of change has been great to be part of again. I am very proud of the way you met the challenge head on and delivered. I would particularly like to thank Matthew Foster and Robert Stowell who both stepped into key roles at short notice and have driven the changes required with true professionalism.
Today we announced a new Synlait CEO, Grant Watson, who will join the team in 2022. I look forward to introducing you to Grant next year. Grant will be joined by Robert Stowell who has been appointed CFO after acting in the role for the last five months.
Thanks also to our suppliers, including our farmers, who have continued to partner and support us through a challenging year.
To our shareholders, I thank you for your patience. We have fallen far short of our own, and I am sure, your expectations over the past period. Having read this report, I trust you recognise a business that has taken the opportunity to pause, learn, change, and then double down on delivering the potential that the Board, management, and I firmly believe is there for the taking. You have my commitment that we will work to get the job done.
Dr John Penno Co-Founder, Director and Current CEO
Marketing, Sales and Business Development
Chief Financial OfficerOperations
Marketing and Business Development
Sales and Business Development
Dedicated Finance Manager
Dedicated Finance Manager
Dedicated Finance Manager
Sales and Business Development
Deborah Marris Director, Legal, Risk
and Governance
Boyd Williams Director, People
and Culture
Robert Stowell* Chief Financial
Officer
Nigel Macdonald** Director,
Operations
Suzan Horst Quality, Regulatory and
Laboratory Services
Martijn Jager Director, Sales and
Business Development
Hamish Reid Director Sustainability,
Brand & Liquid Products
Tim Carter Dairyworks Chief Executive Officer
Chris France Director, Strategy and
Business Transformation
Business teams with P&L responsibility
Business teams with P&L responsibility
Business teams with P&L responsibility
LIQUID PRODUCTS
DAIRYWORKS
INGREDIENT PRODUCTS
NUTRITIONAL PRODUCTS
Grant Watson*** Chief Executive Officer
* Robert has been appointed CFO after acting in the role for the last five months.** Nigel will join Synlait in November subject to completing MIQ requirements.*** Grant will join Synlait in January 2022.
THE PATH TO RECOVERY: SYNLAIT’S NEW ORGANISATIONAL STRUCTURE
Quality Management
Quality Management
Quality Management
Synlait Dunsandel: D3, wetmix, lactoferrin, whey and blending and canningSynlait Pokeno Synlait Auckland
Synlait Dunsandel: D1, D2 and AMFTalbot Forest Cheese
Synlait Dunsandel: DLP1
PAGE 24 & 25 ANNUAL REPORT 2021

The annual Synlait Dairy Honours Awards recognise best in class dairy farming. We presented four national awards along with eight regional awards at our 2021 Synlait Winter Farmer events.
The Kotahitanga Award focuses on the all-important people side of dairy farming, and it recognises the team spirit of a farming operation. The winners this year were Glen Ashford and Shelley Lawson of Kaimai Dairy Farm Ltd. (pictured).
The judges for the award remarked “the minute Shelley and Glen’s employees start, they are welcomed into a culture of collaboration, support and clarity. There is an exceptional induction process; and a calendar of events is put together in the first few weeks. The unique job title structure put in place on-farm ensures employees have complete clarity over their roles and a clear pathway of progression. Shelley and Glen have fostered an inclusive and collaborative approach to improvement and problem solving. Staff members are given the opportunity to share feedback and ideas. Shelley and Glen also go the extra mile for their farm team, whether it is takeaway nights, or going fishing or hunting with Glen. These two are true role models of Kotahitanga.”
CELEBRATING OUR FARMERS
ANNUAL REPORT 2021PAGE 26 & 27

OUR BOARD
LEARN MORE
The Board’s full profiles are available on our website: synlait.com/people
Graeme Milne ONZM (Chair)
Sam Knowles
Min Ben
Qikai LuSimon Robertson
Sihang Yang
Dr John Penno
Hon. Ruth Richardson
OUR EXECUTIVE TEAM
LEARN MORE
Our Executive Team’s full profiles are available on our website: synlait.com/people
Dr John PennoChief Executive Officer
Chris FranceDirector, Strategy and Business Transformation
Matthew FosterActing Director, Operations
Deborah MarrisDirector, Legal, Risk and Governance
Martijn JagerDirector, Sales and Business Development
Robert StowellChief Financial Officer
Boyd WilliamsDirector, People, Culture and Performance
Hamish ReidDirector, Sustainability, Brand and Liquid Products
Dr Suzan HorstDirector, Quality, Regulatory and Laboratory Services
PAGE 28 & 29 ANNUAL REPORT 2021

Almost 80,000 plants went into the ground during the 2021 planting season as part of our Whakapuāwai programme. Whakapuāwai connects our people, our farmers, and our community through the planting of native trees. This year we also began on-farm planting in the North Island. Six Waikato farms took part with around forty staff planting 7,500 trees alongside our farmers.
WHAKAPUĀWAI -To cause to blossom, develop, flourish, prosper, thrive
ANNUAL REPORT 2021PAGE 30 & 31

REVIEW OF FINANCIAL PERFORMANCE
Synlait CFO Robert Stowell
Dear Shareholders
FY21 proved to be a very challenging year for Synlait Milk. After nine years of profitability, it is disappointing to post the company’s largest ever loss.
COVID-19 hit Synlait late and hit the company hard. Following the initial COVID-19 upside caused by pantry stocking of consumer-packaged infant formula, the market corrected as channels shut down due to boarder closures. When this business fell away other areas of underperformance were identified within Synlait that contributed to this result.
Today’s result is within the guidance range provided in May of a loss of $20 million to $30 million NPAT. More importantly however, are the actions taken in the last quarter of FY21 to review the strategy, align structures, refinance the business, and turn around financial performance through a combination of initiatives that will set the company up for the future growth.
In this Annual Report, and accompanying Investor Presentation, business performance is presented under our four new and revised key business units: Nutritionals (consumer-packed nutritional products, base infant formula sold to external customers and consumed into consumer-packaged infant formula, and lactoferrin), Ingredients (commodity ingredients – whole milk powder, skim milk powder, anhydrous milk fat, butter milk powder), Liquids, and Consumer Foods (Dairyworks). Downgraded product has been allocated to the business unit to which it relates.
PAGE 32 & 33 ANNUAL REPORT 2021

NutritionalsOur Nutritionals business unit includes consumer-packaged infant formula, base infant formula both sold to external customers and consumed into consumer-packaged infant formula, and lactoferrin. Nutritional volumes fell 35% to 34,362MT. This was driven by the material reduction in consumer-packaged infant formula demand. Nutritionals gross profit per MT decreased significantly to $1,246 due to the high level of under-recovered manufacturing overheads resulting from the significant reduction in base infant formula manufactured. The lactoferrin business continues to perform, despite unfavourable market pricing. Lactoferrin sales increased 10% to 33MT driven by increased production and demand. Gross profit at $25.1 million and gross profit per MT at $758,264, both decreased.
Nutritionals Ingredients Liquids Consumer Foods Total
FY21Sales Volume (MT) 34,362 125,914 31,499 26,983 218,758Gross Profit ($) 42.8 14.5 (4.9) 15.3 67.7Gross Profit/MT 1,246 115 (154) 568 310
FY20Sales Volume (MT) 52,871 97,561 32,803 12,015 195,250Gross Profit ($) 170.0 31.3 (2.2) 2.2 201.3Gross Profit/MT 3,215 321 (66) 186 1,031
% ChangeSales Volume (35%) 29% (4%) 125% 12%Gross Profit (75%) (54%) (125%) 587% (66%)Gross Profit/MT (61%) (64%) (135%) 206% (70%)
1 Gross profit per MT includes downgrade product related to each business unit. Gross profit not attributable to business units is not included
Gross profit by business unit1
IngredientsAs a result of a drop in consumer-packaged infant formula demand, and significant volume of base infant formula carried forward from FY20, Synlait immediately turned to manufacturing ingredient products. Consequently, sales of ingredients increased 29% to 125,914MT. A few factors affected margins in a challenging year for ingredients - the most notable of which was butter prices being very high relative to AMF prices when Synlait is not a butter producer. The sudden nature of the change in the sales product mix, together with a sharp increase in global dairy commodity prices, meant we did not achieve our usual ingredients premiums. Global shipping delays due to the pandemic, and late season volumes, also meant we ended the financial year with ingredients inventory at historically high levels. Ingredients gross profit per MT of $115 is down 64% as a result.
Separating out the Ingredients business in FY22 will enable a renewed focus on pricing performance, manufacturing efficiencies and supply chain management, and generate a cost structure more on par with Synlait’s competitors. Therefore, we expect this business should see a material improvement over the coming year.
LiquidsSales volumes of liquid milk and creams in FY21 were down 4% under our agreement with Foodstuffs South Island due to the positive impact COVID-19 lockdowns had on consumer demand in FY20. The focus in this business is on developing and nurturing new high-value, future focused product suites aimed at both the domestic market and maturing China market. Volumes and profitability will increase overtime as several initiatives are launched over the next 12 months. Overall, the Liquids business delivered a gross loss of ($4.9) million.
Consumer FoodsSynlait benefited from the first full year of Dairyworks’ operations with sales volumes of 26,983 MT (FY20: 12,015MT). The divestment of the Deep South brand and associated ice cream operations to Talley’s in November 2020 enabled Dairyworks to focus back onto core business and continued progression of strategy to move from cheese to dairy. This has been successful with Dairyworks launching a range of products over the past 12 months including Dairyworks Protein Yoghurt & Muesli launched in New Zealand, sales 106% ahead of forecast and Flavoured Butters launched in Australia, sales 132% ahead of forecast. Dairyworks’ full year gross profit contribution is $15.2 million. EBITDA contribution of $10.3 million is lower than expected due to profit drag caused by Talbot Forest Cheese (whey stream losses and low utilisation), butter competition, and one-off inventory write-downs.
Milk price and milk supplyRaw milk remains Synlait’s most significant component of our cost of goods sold.
Our final base milk price for the 2020/21 season is $7.55 per kgMS, compared to our 2019/20 base milk price of $7.05 per kgMS. In addition, we paid out an additional $0.27 per kgMS in incentive and premium payments through a2, Lead With Pride™ and winter milk payments, increasing the average total milk price to $7.82 per kgMS compared with $7.30 per kgMS in 2019/20. Premiums and incentive payments are higher in 2020/21 predominantly through an increase in our winter milk and Lead With Pride™ payments. This resulted in our contracted suppliers receiving a total of $23.5 million in additional value-added premiums in the 2020/21 season, compared to $19.3 million in 2019/20.
FINANCIAL PERFORMANCE
Sales and gross profit performanceTotal revenues of $1,367.3 million are $65.3 million, or 5%, higher than FY20. Total sales volume of 218,758 MT are 12% higher. Revenue growth was largely driven by the first full year contribution from Dairyworks of $229.0 million (FY20 $92.0 million). Dairyworks’ revenue increase was offset by a $72.2 million reduction in Synlait’s revenue contribution driven by the well-canvased impact COVID-19 has had on our key customer, The a2 Milk Company. This resulted in a significant product mix shift from higher value consumer-packaged infant formula to ingredients.
Sales (metric tonnes) FY21 FY20 Growth %
Nutritionals 34,362 52,871 (35%)Ingredients 125,914 97,561 29%Liquids 31,499 32,803 (4%)Consumer Foods 26,983 12,015 125%Total 218,758 195,250 12%
PAGE 34 & 35 ANNUAL REPORT 2021

Net financing costsNet financing costs increased 0.5% to $21.5 million.
$ million FY21 FY20
Profit before tax ($39.2) $100.7Add back: net financing costs $21.5 $21.4EBIT ($17.7) $122.1Add back: depreciation and amortisation $55.0 $47.5EBITDA $37.3 $169.6
FY21 FY20 Var.
Gross term debt interest (16.2) (15.2) (1.0)Less capitalised interest 2.3 2.1 0.2Net term funding interest (13.9) (13.1) (0.8)Working capital funding interest (6.0) (6.2) 0.2Interest received 0.0 0.1 (0.1)Loss on derecognition of financial assets (1.0) (1.7) 0.7Net short-term funding interest (7.0) (7.8) 0.8Interest on lease liabilities (0.6) (0.5) (0.1)Net finance costs (21.5) (21.4) (0.1)
The $0.1 million uplift in net financing costs is due to an increase in average interest-bearing debt due to continued capital expenditure, offset by lower interest rates.
Gross interest on term debt increased by $1 million to $16.2 million with higher average interest-bearing debt year-on-year, with lower interest rates providing some offset. Capitalised interest increased by $0.2 million to $2.3 million.
Working capital funding interest decreased $0.2 million due to lower interest rates, with similar facility utilisation to prior year.
Loss on derecognition of financial assets is the financing cost associated with our receivables financing programme. It decreased $0.7 million to $1 million with lower interest rates and lower utilisation due to the reduction in sales volumes of consumer-packaged infant formula.
Further, Synlait incurred $0.6 million interest on lease liabilities, up $0.1 million.
Foreign exchangeManagement of foreign exchange exposure is one of Synlait’s key risks with many product sales being to overseas markets, creating a primarily United States Dollar (USD) exposure risk. Our foreign exchange policy seeks to achieve the lowest annual average New Zealand Dollar (NZD)/USD exchange rate for the year. In FY21 we achieved a net annual average NZD/USD exchange rate of 0.6659 (FY20: 0.6651).
Earnings per share and return on capital employed Our reported basic and diluted earnings per share (EPS) was (13.77) cents and (13.75) cents respectively, against 41.45 cents and 41.35 cents in FY20. The dilutive shares are basic EPS adjusted for contingently issuable shares in accordance with the Employee Share Scheme. Synlait also generated a pre-tax return on average capital employed of (1.5%) in FY21 compared with 12.6% in FY20.
We received 86.8 million kgMS from our contracted suppliers, 10.3 million kgMS more than FY20, as we increased our farm supplier network across both of our sites. We also sold (net) 4.1 million KgMS over the season, resulting in an overall 17%, or 12.3 million kgMS, increase in milk processed in FY21.
Average reference commodity prices increased sharply through the 2020/21 milk season until March after which they remained relatively steady through to the end of the season. The average reference basket price in the 2020/21 season increased to USD$3,358, a 7% increase vs the 2019/20 season. This increase is the key contributor to the $0.50 increase in the average base milk price paid to our suppliers in 2020/21.
Overhead expenditure Overhead expenses increased $6.7 million to $88.8 million. This was driven by the inclusion of Dairyworks overhead expenditure ($6.8 million), employee costs ($1.3 million), provisions and write-downs ($1.5 million), and IT costs relating to software as a service and cyber security costs ($1.3 million) offset by lower multi-site distribution costs (-$1.1 million) and other controllable costs (-$3.1 million).
Operating cost saving initiatives announced at HY21 on the organisational reset, production efficiencies, and discretionary spend delivered $9.3 million of the $10.8 million savings targeted. Value chain cost saving initiatives delivered $3 million of benefit. Dry Store 4 and the Rail Siding delivered part year benefit of $3 million with the project still being on track to deliver annualised benefits of $8 million.
EBITDAEarnings before interest, tax, depreciation, and amortisation (EBITDA) decreased $132.3 million to $37.3 million.
PAGE 36 & 37 ANNUAL REPORT 2021

Raw material inventories at $74.4 million (13,733 MT) increased slightly on the prior year (FY20: $71.3 million, 13,614 MT). Work in progress, which is primarily Dairyworks’ maturing cheese volumes, in FY21 of $16.6 million has increased from prior year (FY20: $11.5 million) and reflects higher and more valuable volumes of cheese maturing at Dairyworks.
FY21 FY20$ million MT $ million MT
Synlait Milk Limited 216.8 41,099* 216.1 40,787*Dairyworks Limited 54.2 6,954* 53.3 6,564*
* Inventory not measured in metric tonnes is excluded as not material to our volumes.
Finished goods inventory, which includes base infant formula, decreased to $180.0 million (FY20: $186.5 million) despite tonnage of finished goods on hand increasing slightly to 32,144 MT (FY20: 32,109 MT). As noted above, this relates to a lower holding of our core infant formula products and a higher holding of our core ingredients products (whole milk powder, skim milk powder and anhydrous milk fat), offset by a higher season ending milk price.
Inventories were reviewed for impairment, resulting in a stock impairment provision totalling $8.3 million relating to finished goods ($7.6 million) and raw materials ($0.7 million) (FY20: $2.0 million, $1.8 million related to finished goods and $0.2m related to raw materials). The increase primarily relates to consumer-packaged infant formula products on hand that are provisioned to expire because of decreased demand.
In addition, we have an onerous contracts provision of $2.1 million (FY20: $0.3 million); the increase from prior year is due to an increased weighted average cost of products on hand at balance date; the most significant driver being the increase in 2020/21 milk price through the second half of the season.
Property, plant and equipmentProperty, plant, and equipment at $1027.1 million, is up $62.0 million. The year-over-year increase is a consequence of total capital expenditure of $112.0 million, less depreciation of $46.8 million, net impairment of $1.7 million, and net disposals of $1.4 million. The capital expenditure of $112.0 million primarily relates to our growth initiative projects with $88.0 million of total spend in FY21.
In November 2020, we commissioned our new Dry Store 4 facility followed by our new rail siding in May 2021. The construction of the project was budgeted to cost $41.3 million. Total spend on the project in FY21 was $21.6 million (FY20: $18.7 million, FY19: $1.1 million) for total of $41.4 million.
In August 2020 we completed the purchase of farmland adjacent to Synlait Dunsandel for total consideration of $26.1 million. The farmland was purchased to enable greater control over water rights, the development of the rail siding, and opportunities to trial sustainable farming practices. We also progressed modifications at Synlait Pokeno to support our new multinational customer. Total spend on the project in FY21 was $33.5 million (FY20: $1.0 million).
Operational capital expenditure in FY21 decreased to $24.7 million from $35.5 million in FY20 ($27.9 million in FY21 from $37.5 million in FY20 including intangible assets and net disposals).
Synlait is nearing the completion of its ERP implementation project expected to go live in the second quarter of FY22. Total spend in FY21 was $19.2 million (2020: $6.0 million, 2019: $2.7 million).
Trade and other payables Trade and other payables at $264.1 million is up $25.3 million. This is driven by higher milk payments to our farm suppliers due to the increased volume of milk solids collected and the higher milk price, offset by a reduction in trade creditors and accruals.
FINANCIAL POSITION
OverviewDuring FY21 the Group’s investment phase began to wind down. Synlait raised $200 million of share capital to repay debt and support the conclusion of several growth initiative projects.
Our reported net loss after tax of ($28.5) million, plus the net proceeds from the capital raise and the movement in reserves, has increased total equity to $767.1 million at 31 July 2021 from $604.5 million in FY20.
We successfully refinanced maturing syndicated bank facilities in July on new terms. The banking syndicate was very supportive of the Synlait story and our future. The renegotiated facilities give us a sound, secure, and certain platform to build from.
Trade and other receivables At $108.4 million, trade and other receivables have increased by $45.3 million on FY20 ($63.1 million). The increase primarily relates to the change in product mix sold reducing the balance of receivables assigned as at 31 July 2021 (FY21: $112.4 million, FY20: $131.3 million) and changing our customer mix, together with an increase in Dairyworks’ receivables year-on-year.
InventoriesOur inventory holdings have remained relatively unchanged at $270.9 million (FY20: $269.4 million), although there have been material movements between its components. Synlait entered FY21 holding higher than prior years volumes of base infant formula and consumer-packaged infant formula to meet higher anticipated FY21 demand, to ensure higher utilisation of our plant through peak milk, and protect against potential COVID-19 related supply chain disruption. As at 31 July 2021, base infant formula and consumer-packaged infant formula holdings have reduced significantly due to a reduction of production off the back of the sudden demand reduction and outlook for a2 Milk Company nutritional products and to reflect our new conservative working capital approach to inventory holdings in FY22. Holdings of ingredients increased significantly due to the material increase in volumes manufactured in the second half and difficulties faced selling and shipping the product because of the pandemic.
PAGE 38 & 39 ANNUAL REPORT 2021

Total net debt (excluding lease liabilities) decreased with net cash from the issue of shares of $196.1 million and positive cash flow from operating activities of $15.9 million (FY20: $103.8 million), offset by cash spent on investing activities of $136.8 million (FY20: $223.2 million), interest and financing fees paid of $23.1 million (FY20: $26.4 million) and repayment of lease liabilities of $4.5 million. Operating cash flows are discussed further below.
With net debt of $479.4 million, our gearing (net debt/net debt + equity) is 38.7% (FY20: 47.2%) and our leverage (net debt/EBITDA) is 12.85x (FY20: 3.08x).
Derivatives At 31 July 2021 we held USD$498.9 million (net) and AUD$7.5 million in foreign exchange contracts as detailed in note 16 of the annual financial statements. These have been placed across a 24-month future period, in accordance with our Treasury Policy.
Given the appreciation in the NZD/USD exchange rate across the last 24 months, we have mark to market unrealised gains associated with these contracts at year-end of $10.4 million after tax, a movement of ($7.2) million after tax. As our foreign exchange contracts hedge against future USD receipts and payments, this unrealised gain is recognised in other reserves in equity rather than through the income statement. The impact of these foreign exchange contracts will play out in the periods in which they mature, and they will form part of our annual average NZD/USD exchange rate in those periods.
We also have in place a nominal balance of $40 million of interest rate swap agreements at year-end (FY20: $57.3 million) at various weighted average interest rates. The agreements have unrealised mark to market losses of $2.5 million after tax, a positive movement of $2.4m after tax on FY20. The movement is a result of historical agreements unwinding.
Total net debt Total net debt (excluding lease liabilities) at year end, including both current and term debt facilities less cash on hand, was $479.4 million, a decrease of $47.6 million.
$ million FY21 FY20
Current debt $33.3 $102.8Term debt (carry amount) $459.6 $426.8Transaction costs $2.5 $3.2Cash on hand ($16.0) ($5.9)Total Net Debt (excluding lease liabilities) $479.4 $526.9
We continue to use dairy commodity derivatives to support the management of the risk of movement in dairy commodity prices. Dairy commodity derivatives with a nominal balance of NZD $13.9 million were in place at year end (FY20: NZD $12.0). These derivatives have mark to market unrealised gains of $0.2 million after tax (FY20: $nil).
Unrealised gains and losses on derivatives detailed above are deferred to the cash flow hedge reserve. Year-on-year there was a ($4.5) million movement in the reserve from $12.6 million in FY20 to $8.1 million in FY21. The movement is explained by the decrease in foreign exchange derivatives gain offset by the decrease in interest rate swap agreements loss.
Price risk management In addition to derivatives, Synlait also carefully manages price risk. It holds carbon units to cover all forecast obligations three years forward, with an average purchase price well below current market pricing. We also entered into fixed price electricity and fixed price gas contracts in October 2020, with the contracts for five and three years respectively.
Operating cash flows Operating cash flows at $15.9 million, are down $87.9 million. The decrease was due to lower profitability year-on-year largely due to the sales mix shift from consumer-packaged infant formula to ingredients, with EBITDA $132.3 million lower, together with an unfavourable movement in working capital with an increase in receivables and high holdings of ingredients inventory on hand at year end.
Funding facilities and covenantsAs announced in July and noted above, we worked with our banking syndicate, who again showed their commitment to and support of Synlait, and agreed terms to refinance maturing banking facilities. Synlait has four syndicated bank facilities in place with ANZ and BNZ:
1. Working Capital Facility – reviewed annually with a year-end facility limit of NZD $250 million. This facility increases to $330 million in September 2021 and steps down over a period of six months back to $250 million by February 2022. This is a dual currency (NZD & USD) facility.
2. Revolving Credit Facility A – maturing 1 October 2023 with a fixed facility limit of $100 million, amortising $33.3 million on 31 July 2022 and $33.3 million on 31 July 2023.
3. Revolving Credit Facility B (ESG loan) – maturing 1 October 2023 with a fixed facility limit of $50 million.
4. Revolving Credit Facility C (ESG loan) – maturing 1 October 2023 with a fixed facility limit of $50 million.
In addition to banking facilities, Synlait has an NZX-listed $180 million unsecured, subordinated, fixed rate bond maturing 17 December 2024.
PAGE 40 & 41 ANNUAL REPORT 2021

At 31 July 2021, Synlait had five key bank covenants in place within our syndicated bank facility agreement. These were:
1. Interest cover ratio – EBITDA to interest expense no less than 3.0x (FY21: 1.74x). This covenant was waived for FY21.
2. Minimum shareholders’ funds – must exceed $400.0 million (FY21: $625.2 million).
3. Working capital ratio – must exceed 1.50x (FY21: 3.79x).
4. Total debt/EBITDA – no greater than 7.50x (FY21: 13.25x). This covenant was waived for FY21.
5. Senior debt/EBITDA – no greater than 4.75x (FY21: 8.43x). This covenant was waived for FY21.
The interest cover ratio, leverage ratio and senior leverage ratio were waived for FY21 as previously disclosed to the market. Synlait was compliant with the shareholder’s funds and working capital ratio covenant at all times during FY21. Note that the covenants are calculated in accordance with our banking facilities agreement and include adjusting items that are not presented in the financial statements.
Following refinancing, Synlait have five key bank covenants in place within our syndicated bank facility agreement for FY22. These are:
1. Interest cover ratio – EBITDA to interest expense of no less than 3.0x.
2. Minimum shareholders’ funds – must exceed $600.0 million.
3. Working capital ratio – inventory and debtors to working capital facility outstanding of no less than 1.5x
4. Total debt/EBITDA – total debt to EBITDA is no greater than 4.5x.
5. Senior debt/EBITDA – total debt excluding Subordinate Bond to EBITDA is no greater than 3.0x.
Robert Stowell Chief Financial Officer
PAGE 42 & 43 ANNUAL REPORT 2021

MILK PRICEFINANCIAL AND PERFORMANCE METRICS
2016/17 2017/18 2018/19 2019/20 2020/21
kgMS collected 63,249,602 63,616,077 63,438,694 76,550,913 86,812,624Average fat % 4.90 4.86 4.91 4.90 4.90Average protein % 3.92 3.89 3.92 3.98 3.97Average lactose % 5.06 4.99 4.99 4.99 4.98
Volume of components collected (kg)Fat 35,123,275 35,289,377 35,270,506 42,252,084 47,954,515Protein 28,126,327 28,327,076 28,168,188 34,298,829 38,858,109Lactose 36,292,742 36,221,310 35,894,766 42,977,611 48,760,985
Component value1
Fat $4.70 $6.97 $7.36 $8.44 $8.73Protein $6.56 $4.63 $4.18 $4.20 $5.02Lactose $1.87 $2.03 $1.53 $1.67 $1.68
Component value ratioFat 1 1 1 1 1Protein 1.397 0.664 0.567 0.497 0.575Lactose 0.398 0.291 0.208 0.198 0.193
Total $ paid per componentFat $164,998,609 $245,903,402 $259,645,339 $356,688,641 $418,541,147Protein $184,528,391 $131,063,290 $117,657,713 $143,911,349 $194,874,913Lactose $67,823,876 $73,377,129 $54,987,988 $71,818,527 $82,136,925Volume charge ($27,732,308) ($27,289,173) ($26,283,402) ($32,746,784) ($40,117,675)Average base milk price2 $6.16 $6.65 $6.40 $7.05 $7.55
Total incentive payment $8,908,367 $8,127,045 $11,530,895 $19,249,791 $23,518,487Average incentive payment per kgMS3 $0.14 $0.13 $0.18 $0.25 $0.27
Total average Synlait payment per kgMS4 $6.30 $6.78 $6.58 $7.30 7.82
This table shows how Synlait take the milk supplied by our contracted farmer suppliers, value the milk components, and make a pay-out via the average base milk price.
The 2020/21 milk price has not fully been paid out at the time of annual report release, figures represent what has been paid and is accrued to be paid.
It also highlights the incentive payments made to our farmer suppliers in addition to the average base milk price.
This information represents payments made in the milk season which runs 1 June to 31 May as opposed to Synlait’s financial year.
For the recently completed 2020/2021 milk season we paid out an average base milk price of $7.55 with an average additional incentive payment of $0.27 per kgMS.
1 Rounded to two decimal places2 Amount paid for components + volume charge/kgMS collected = base milk price3 Includes incentives and winter incentive payments4 Base milk price + average incentive payment
Key financial metrics1,3
Currency as stated (in millions) FY17 FY18 FY19 FY20 FY21
Income statementRevenue 759.0 879.0 1,024.3 1,302.0 1,367.3Gross profit 112.1 166.5 186.3 203.7 67.3EBITDA2 88.8 138.6 150.8 169.6 37.3EBIT2 67.6 113.0 123.1 122.0 (17.7)NPAT 39.5 74.5 81.2 74.3 (28.5)Revenue (USD per MT) 3,658 4,815 4,384 4,435 4,162Gross profit per MT (NZD) 792 1,294 1,174 1,043 308EBIT per MT sold (NZD) 478 879 776 625 (81)Net cash from/(used in) operating activities 115.2 98.4 136.7 103.8 15.9
Balance sheetCapital employed 459.0 538.9 824.4 1,128.2 1,244.0Net operating assets4 423.5 493.1 632.4 1,040.5 1,152.3Return on net operating assets 15.4% 24.6% 21.9% 14.6% (1.6%)Net return on capital employed (pre-tax) 14.8% 22.6% 18.1% 12.5% (1.5%)Debt/debt + equity (excl. derivatives) 18.7% 20.9% 39.3% 47.2% 38.7%Net debt/EBITDA6 0.9 0.8 2.2 3.1 12.9Earnings per share 22.82 41.55 45.33 41.45 (13.77)Average FX conversion rate (NZD:USD) 0.6814 0.7047 0.6792 0.6651 0.6659 Base milk price 6.16 6.65 6.40 7.05 7.55Total milk price (kgMs)5 6.30 6.78 6.58 7.30 7.82
Key operational metricsSales (MT)7
Ingredients 114,718 86,424 98,499 97,561 125,914Nutritionals 24,576 42,177 51,231 52,871 34,362Liquids - - 8,947 32,803 31,499Consumer foods - - - 12,015 26,983Total sales (MT) 139,295 128,601 158,677 195,250 218,758Production (net production) (MT)7
Ingredients 109,899 88,448 96,158 94,188 138,971Nutritionals 25,508 51,048 50,165 63,857 20,990Liquids - - 9,466 32,894 31,492Consumer foods - - - 11,850 23,597Total production (MT) 135,407 139,496 155,788 202,789 215,050Milk purchases ('000 kg MS)Milk purchased from contracted supply 63,255 63,639 64,189 76,551 86,814Milk purchased from other suppliers 1,700 (2,853) 1,877 (6,079) (4,076)Total milk purchases ('000 kg MS) 64,954 60,785 66,066 70,472 82,7371 The group uses several non-GAAP measures when discussing financial performance. Management believes these measures provide useful insight on the performance of the business, to analyse trends and to assist stakeholders in making informed decisions.2 EBIT is calculated by excluding financing costs and income tax, with EBITDA also excluding depreciation and amortisation accordingly. EBIT and EBITDA include the IFRS16 impact, whereas net debt excludes this impact. A reconciliation of EBIT and EBITDA is provided in the CFO Review on page 36.3 Amounts have been restated for a change in accounting policy. Refer to note 9 of the 2021 financial statements for additional information.4 Net operating assets includes current assets, property, plant, and equipment and intangible assets. It excludes capital work in progress, derivatives, goodwill, trade payables and tax liabilities.5 Total milk price for Synlait Milk suppliers on standard milk supply contract, includes value and seasonal premiums. This is a milk season reflective payment that runs 1 June to 31 May.6 Net debt calculation excludes lease liabilities, for banking covenant purposes lease liabilties are included.7 Prior period volumes have been restated to conform to current year presentation.
PAGE 44 & 45 ANNUAL REPORT 2021

Last summer Dairyworks launched a range of truly differentiated high protein yoghurts in a convenient on the go single format.
The range exceeded performance expectations and clearly signalled an opportunity for Dairyworks to expand further into the yoghurt space. Strategically, the entry into the yoghurt category allows Dairyworks to grow beyond its core cheese business, which is something we will continue to see more of.
The team are excited to be working on the next stage of our yoghurt plans – we’ll see you in supermarkets soon!
DAIRYWORKS: MOVING FROM CHEESE TO DAIRY
Last summer Dairyworks launched a range of truly differentiated high protein yoghurts in a convenient on-the-go single format.
ANNUAL REPORT 2021PAGE 46 & 47

Director’s responsibility statement 50
Financial statements 51
Income statement 51
Statement of comprehensive income 52
Statement of changes in equity 53
Statement of financial position 54
Statement of cash flows 55
Notes to the financial statements 56
Performance 60 01 Revenue recognition 61 02 Segment reporting 62 03 Expenses 65 04 Reconciliation of (loss)/profit after income tax to net cash inflow from operating activities 66
Working Capital 67 05 Trade and other receivables 68 06 Inventories 72 07 Trade and other payables 74
Long Term Assets 75 08 Property, plant and equipment 76 09 Intangible assets 79 10 Leases 85
Debt and Equity 88 11 Finance income and expenses 89 12 Loans and borrowings 90 13 Share capital 92 14 Share based payments 94 15 Reserves and retained earnings 96
Financial Risk Management 97 16 Financial risk management 98 17 Financial instruments 106
Other 111 18 Income tax 112 19 Other investments 116 20 Related party transactions 118 21 Contingencies 120 22 Commitments 120 23 Events occurring after the reporting period 121 24 Other accounting policies 121
Auditors report 122
FINANCIAL CONTENTS
FINANCIAL STATEMENTS
The cafe at Synlait Dunsandel provides a wide range of healthy meals and snacks for staff and contractors.
ANNUAL REPORT 2021PAGE 48 & 49

The Directors are pleased to present the financial statements for Synlait Milk Limited and its subsidiaries, Synlait Milk Finance Limited, The New Zealand Dairy Company Limited, Eighty Nine Richard Pearse Drive Limited, Synlait Business Consulting (Shanghai) Limited, Dairyworks Limited, Dairyworks (Australia) Pty Limited, and Synlait Milk (Dunsandel Farms) Limited (together “the Group”) as set out on pages 51-121 for the year ended 31 July 2021.
The Directors are responsible for ensuring that the financial statements present fairly the financial position of the Group as at 31 July 2021 and the financial performance and cash flows for the year ended on that date.
The Directors consider that the financial statements of the Group have been prepared using appropriate accounting policies, consistently applied and supported by reasonable judgements and estimates and that all relevant financial reporting and accounting standards have been followed.
The Directors believe that proper accounting records have been kept which enable, with reasonable accuracy, the determination of the financial position of the Group and facilitate compliance of the financial statements with the Financial Markets Conduct Act 2013.
For and on behalf of the Board.
Graeme Milne Chairman24 September 2021
Simon Robertson Independent Director24 September 2021
DIRECTORS’ RESPONSIBILITY STATEMENT
2021 2020
Notes $’000 $’000 (restated)
Revenue 1 1,367,349 1,302,025Cost of sales 3 (1,300,042) (1,098,292)Gross profit 67,307 203,733
Other income 1 3,870 404Share of (loss)/profit from associates 19 (33) 33Sales and distribution expenses 3 (36,791) (32,318)Administrative and operating expenses 3 (52,018) (49,809)Earnings before net finance costs and income tax (17,665) 122,043
Finance expenses 11 (20,488) (19,777)Finance income 11 44 134Loss on derecognition of financial assets 11,5 (1,045) (1,747)Net finance costs (21,489) (21,390)
(Loss)/profit before income tax (39,154) 100,653Income tax benefit/(expense) 18 10,703 (26,344)Net (loss)/profit after tax for the year (28,451) 74,309
Earnings per shareBasic earnings per share (cents) 13 (13.77) 41.45Diluted earnings per share (cents) 13 (13.75) 41.35
INCOME STATEMENTFor the year ended 31 July 2021
ANNUAL REPORT 2021
The accompanying notes form part of and are to be read in conjunction with these financial statements. Comparative numbers have been restated due to a change in accounting policy. Refer to note 9 for further detail.
PAGE 50 & 51

2021 2020
Notes $’000 $’000 (restated)
(Loss)/profit for the period (28,451) 74,309Items that may be reclassified subsequently to profit and lossEffective portion of changes in fair value of cash flow hedges 16 (6,330) 53,882Exchange differences on translation of foreign operations 10 (12)Income tax benefit/(expense) on other comprehensive income 18 1,772 (15,087)Total items that may be reclassified subsequently to profit and loss (4,548) 38,783Other comprehensive income for the year, net of tax (4,548) 38,783Total comprehensive income for the year (32,999) 113,092
STATEMENT OF COMPREHENSIVE INCOMEFor the year ended 31 July 2021
Share capital
Employee benefits reserve
Hedging reserves
Foreign currency
translation reserve
Retained earnings
Total equity
Group Notes $’000 $’000 $’000 $’000 $’000 $’000
Equity as at 1 August 2019 268,074 1,658 (26,148) - 248,775 492,359Change in accounting policy 9 - - - - (1,078) (1,078)Restated equity as at 1 August 2019 268,074 1,658 (26,148) - 247,697 491,281Profit or loss for the year (restated) - - - - 74,309 74,309
Other comprehensive incomeEffective portion of changes in fair value of cash flow hedges - - 53,882 - - 53,882Exchange differences on translation of foreign operations - - - (12) - (12)Income tax on other comprehensive income - - (15,087) - - (15,087)Total other comprehensive income - - 38,795 (12) - 38,783
Employee benefits reserve 13, 14 470 (336) - - - 134Total contributions by and distributions to owners 470 (336) - - - 134
Equity as at 31 July 2020 (restated) 268,544 1,322 12,647 (12) 322,006 604,507Equity as at 1 August 2020 268,544 1,322 12,647 (12) 322,006 604,507Profit or loss for the year - - - - (28,451) (28,451)
Other comprehensive incomeEffective portion of changes in fair value of cash flow hedges - - (6,330) - - (6,330)Exchange differences on translation of foreign operations - - - 10 - 10Income tax on other comprehensive income - - 1,772 - - 1,772Total other comprehensive income - - (4,558) 10 - (4,548)
Issue of new shares 13 196,082 - - - - 196,082Employee benefits reserve 13, 14 148 (624) - - - (476)Total contributions by and distributions to owners 196,230 (624) - - - 195,606
Equity as at 31 July 2021 464,774 698 8,089 (2) 293,555 767,114
STATEMENT OF CHANGES IN EQUITYFor the year ended 31 July 2021
PAGE 52 & 53 ANNUAL REPORT 2021
The accompanying notes form part of and are to be read in conjunction with these financial statements. Comparative numbers have been restated due to a change in accounting policy. Refer to note 9 for further detail.
The accompanying notes form part of and are to be read in conjunction with these financial statements. Comparative numbers have been restated due to a change in accounting policy. Refer to note 9 for further detail.

STATEMENT OF FINANCIAL POSITIONAs at 31 July 2021
STATEMENT OF CASH FLOWSFor the year ended 31 July 2021
2021 2020Notes $’000 $’000
(restated)
ASSETSCurrent assetsCash and cash equivalents 16,020 5,887Trade and other receivables 5 108,380 63,057Intangible assets 9 3,712 4,230Goods and services tax refundable 4,461 6,398Income accruals and prepayments 14,297 12,404Inventories 6 270,944 269,384Derivative financial instruments 16, 17 30,943 22,530Current tax asset 1,743 -Other current assets 2,500 2,500Total current assets 453,000 386,390
Non-current assetsProperty, plant and equipment 8 1,027,149 965,104Intangible assets 9 59,631 39,758Goodwill 9 64,189 65,545Other investments 19 110 143Derivative financial instruments 16, 17 53 14,084Right-of-use assets 10 14,018 18,497Total non-current assets 1,165,150 1,103,131Total assets 1,618,150 1,489,521
LIABILITIESCurrent liabilitiesTrade and other payables 7 264,068 238,771Loans and borrowings 12 33,333 102,837Current tax liabilities - 24,561Derivative financial instruments 16, 17 10,770 14,148Lease liabilities 10 3,243 4,422Total current liabilities 311,414 384,739
Non-current liabilitiesLoans and borrowings 12 459,584 426,754Deferred tax liabilities 18 59,433 53,878Derivative financial instruments 16, 17 8,830 4,805Lease liabilities 10 11,775 14,838Total non-current liabilities 539,622 500,275Total liabilities 851,036 885,014
EquityShare capital 13 464,774 268,544Reserves 8,785 13,957Retained earnings 15 293,555 322,006Total equity attributable to equity holders of the Group 767,114 604,507Total liabilities and equity 1,618,150 1,489,521
2021 2020
Notes $’000 $’000 (restated)
Cash flows from operating activitiesCash receipts from customers 1,327,444 1,316,076Cash paid for milk purchased (653,132) (545,792)Cash paid to other creditors and employees (652,402) (637,181)Net movement in goods and services tax 1,937 (2,709)Income tax payments (7,979) (26,633)Net cash inflow from operating activities 4 15,868 103,761
Cash flows from investing activitiesAcquisition of subsidiaries, net of cash acquired - (72,927)Interest received 44 134Acquisition of property, plant and equipment (116,163) (139,212)Proceeds from sale of property, plant and equipment 1,102 242Acquisition of intangible assets (24,205) (11,483)Proceeds from sale of intangible assets 2,450 -Net cash outflow from investing activities (136,772) (223,246)
Cash flows from financing activitiesProceeds from the issuance of subordinated bonds 12 - 180,000Transaction costs paid on issue of subordinated bonds - (3,370)Repayment of borrowings (50,000) (43,224)Net movement in working capital facility 12,586 3,211Interest paid (23,108) (23,048)Repayment of lease liabilities (4,499) (4,185)Receipt of cash from issue of shares 13 196,082 -Net cash inflow from financing activities 131,061 109,384
Net increase/(decrease) in cash and cash equivalents 10,157 (10,101)Cash and cash equivalents at the beginning of the financial year 5,887 16,007Effects of exchange rate changes on cash and cash equivalents (24) (19)Cash and cash equivalents at end of year 16,020 5,887
PAGE 54 & 55 ANNUAL REPORT 2021
The accompanying notes form part of and are to be read in conjunction with these financial statements. Comparative numbers have been restated due to a change in accounting policy. Refer to note 9 for further detail.
The accompanying notes form part of and are to be read in conjunction with these financial statements. Comparative numbers have been restated due to a change in accounting policy. Refer to note 9 for further detail.

The consolidated financial statements (“financial statements”) presented are those of the Group, including Synlait Milk Limited and its subsidiaries Synlait Milk Finance Limited, The New Zealand Dairy Company Limited, Eighty Nine Richard Pearse Drive Limited, Synlait Business Consulting (Shanghai) Limited, Dairyworks Limited, Dairyworks (Australia) Pty Limited, and Synlait Milk (Dunsandel Farms) Limited.
Readers of these financial statements should be mindful of the impact of the acquisition of Dairyworks Limited on 1 April 2020 when making comparisons to the year ended 31 July 2020.
Synlait Milk Limited and its subsidiaries are primarily involved in the manufacture and sale of dairy products.
The parent company, Synlait Milk Limited, is a profit oriented entity, domiciled in New Zealand, registered under the Companies Act 1993 and listed on the New Zealand Stock Exchange and the Australian Securities Exchange. Synlait Milk Limited is an FMC reporting entity under the Financial Market Conducts Act 2013 and its financial statements comply with that Act.
REPORTING ENTITY
The financial statements of the Group have been prepared in accordance with Generally Accepted Accounting Practice. They comply with New Zealand equivalents to International Financial Reporting Standards (‘NZ IFRS’) and other applicable Financial Reporting Standards, as applicable for profit oriented entities. The consolidated financial statements also comply with International Financial Reporting Standards (‘IFRS’).
Certain comparative figures have been reclassified during the year for consistency with the current year presentation and in account of trivial rounding differences. These classifications had no effect on the reported results of operations.
The financial statements were authorised for issue by the directors on 24 September 2021.
Basis of measurementThese financial statements have been prepared on the historical cost basis except for certain items as identified in specific accounting policies.
Functional and presentation currencyItems included in the financial statements of the Group are measured using the currency of the primary economic environment in which the entity operates (‘the functional currency’). The financial statements are presented in New Zealand Dollars ($), which is the Company’s functional currency and are rounded to the nearest thousand ($000).
BASIS OF PREPARATION
These financial statements include the impact of a number of material events which occurred during the year, including the renegotiation of key terms of financing arrangements, the issue of new shares by way of an equity raise and share placement, and multiple financial forecast downgrades. As a result of the COVID-19 pandemic, the Group announced to the market in the period that it forecast a full year loss for the year ended 31 July 2021. This constituted an indicator of impairment under NZ IAS 36 “Impairment of Assets” and triggered the impairment testing of all Group assets in addition to the annual impairment test for goodwill and intangible assets. It was determined that no assets, except for the immaterial write-offs as noted in notes 8 and 9, were impaired.
COVID-19In the prior financial year, the World Health Organisation declared a global pandemic because of the international outbreak and spread of COVID-19. During the year, the COVID-19 pandemic resulted in a shift for Synlait in product mix from high margin nutritional powders to lower margin ingredient powders due to a significant decrease in demand for consumer-packaged infant formula. This was a key factor in the forecast earnings downgrades which were communicated to the market in the year. Current global economic conditions continue to be highly volatile due to the COVID-19 pandemic. Ongoing uncertainty around the magnitude, duration, and severity of the COVID-19 pandemic could affect the significant estimates and judgements used in the preparation of the consolidated financial statements. Management continues to assess the impact of COVID-19 on all aspects of the Group’s supply chain and financial performance and position, in particular the carrying value of receivables and inventory, the impact of key customer demand on revenue, the timing of receivables collection on cashflows, impairment of assets such as goodwill and intangibles, and any impact from currency volatility on the Group portfolio of derivatives.
MATERIAL EVENTS DURING THE YEAR
Transactions and balancesTransactions in foreign currencies are translated to the functional currency at the exchange rates at the dates of the transactions. Monetary assets and liabilities denominated in foreign currencies at the reporting date are retranslated to the functional currency at the exchange rate at that date.
Use of accounting estimates and judgementsThe preparation of these financial statements in conformity with NZ IFRS requires management to make judgements, estimates and assumptions that affect the application of accounting policies and the reported amounts of assets, liabilities, income, and expenses. Actual results may differ from these estimates and assumptions.
Estimates and assumptions are reviewed on an ongoing basis. Revisions to accounting estimates are recognised in the period in which the estimate is revised and in any future periods affected.
Key sources of estimation uncertainty and key judgements relate to derecognition of financial assets, the assessment of impairment of inventory and property plant and equipment, the capitalisation of costs to intangible assets, and the assessment of impairment for goodwill and any other indefinite life intangible assets. The individual notes in the financial statements provide additional information.
NOTES TO THE FINANCIAL STATEMENTS
PAGE 56 & 57 ANNUAL REPORT 2021

SIGNIFICANT ACCOUNTING POLICIES
Standards, amendments and interpretations to existing standards that are not yet effectiveIFRS 9, IAS 39, IFRS 7, IFRS 4, Insurance contracts and IFRS 16 Leases – Interest Rate Benchmark Reform, Phase 2
In August 2020, the IASB issued amendments to IFRS 9, Financial Instruments (IFRS 9), IAS 39, Financial Instruments: Recognition and Measurement (IAS 39), IFRS 7, Financial Instruments: Disclosures (IFRS 7), IFRS 4, Insurance Contracts (IFRS 4) and IFRS 16, Leases (IFRS 16) as a result of Phase 2 of the IASB’s Interest Rate Benchmark Reform project. The amendments address issues arising in connection with reform of benchmark interest rates including the replacement of one benchmark rate with an alternative one. The amendments are effective for the Group from 1 August 2021.
As at 31 July 2021, these amendments did not affect the Group’s financial statements as it has not yet transitioned any agreements that are exposed to Inter-bank Offered Rates (IBOR) to an alternative benchmark interest rate. While there remains some uncertainty around the timing of adoption and the precise nature of an alternative benchmark rate, the replacement of the rate is not expected to result in a significant change in the Group’s interest rate risk management strategy or interest rate risk. The Group continues to monitor developments on alternative benchmark interest rates and expect to transition to alternative rates as widespread market practice is established.
There are no other standards that are not yet effective and expected to have a material impact on the entity in the current or future reporting periods and on foreseeable future transactions.
Implementation of IFRIC agenda decisionDuring the period the Group recognised the impact of a new IFRIC agenda decision on cloud software costs. Refer to note 9 (Intangible assets) for further information.
Accounting policies, accounting estimates and judgements that summarise the measurement basis used and are relevant to the understanding of the financial statements are provided throughout the accompanying notes and are designated by a shaded area.
The accounting policies adopted have been applied consistently throughout the periods presented in these financial statements, except for a change in accounting policy relating to the implementation of the IFRS Interpretation Committee’s (“IFRIC”) April 2021 agenda decision on the capitalisation of cloud software costs.
The Group’s financial statements consolidate the financial statements of Synlait Milk Limited and its subsidiaries, accounted for using the acquisition method, and the results of its associates, accounted for using the equity method. Intercompany transactions and balances between group companies are eliminated upon consolidation.
BASIS OF CONSOLIDATION
Renegotiation of financing arrangementsAs a result of the impact of the forecast earnings downgrades during the period, the Group forecast a potential breach of covenants which were scheduled to be tested as at 31 July 2021. In response, the Group engaged its banking syndicate and successfully refinanced its key banking facilities and obtained waivers for the period ended 31 July 2021. Revised terms for all financing arrangements was concluded in July 2021 with new covenant terms agreed. Refer to note 12 for details of revised loan maturity dates and covenant waivers.
Share issueIn November 2020 the Group completed an issue of ordinary shares and an underwritten share placement for net proceeds of $196.1 million. The proceeds were used to retire existing debt and fund ongoing capital improvements. Refer to note 13 for further detail.
Impairment testingThe forecasted full year loss for the Group and resulting decrease in market capitalisation constituted an indicator of impairment in accordance with NZ IAS 36 “Impairment of Assets.” As a result, all assets, which are allocated to either the Synlait Milk cash generating unit (CGU) or Dairyworks CGU, were impairment tested (refer to note 9 for further detail). It was determined that there was no impairment present at a CGU level. Individual assets totalling $2.2m were determined to be impaired in the year (refer to note 8 and 9 for further detail) and provisioned. In addition, $1.4m of goodwill and $1.0m of brand assets were derecognised in relation to the sale of the Deep South brand and related assets.
GOING CONCERN
In preparing these financial statements, the Directors have assessed the Group’s ability to continue as a going concern. In making this assessment, the Directors have considered the level of debt and facilities the Group had available at 31 July 2021, the Group’s renegotiation of financing arrangements, and the Group’s forecast financial results for the 12 months subsequent to the date of issue of these financial statements. While uncertainties continue to exist as a result of the COVID-19 pandemic, the Directors consider that the Group is a going concern.
MATERIAL EVENTS DURING THE YEAR (CONTINUED)
PAGE 58 & 59 ANNUAL REPORT 2021

This section covers the Group’s financial performance and includes the following notes:
01 Revenue recognition 61
02 Segment reporting 62
03 Expenses 65
04 Reconciliation of (loss)/profit after income tax to net cash inflow from operating activities 66
PERFORMANCE 01. REVENUE RECOGNITION
Sales of goodsThe Group manufactures and sells a range of milk powder, milk powder related products, liquid milk, cheese, and butter to customers. Revenue from contracts with customers is recognised when the control of the goods has been transferred to customers, being at the point when the goods are delivered. Delivery of goods is completed (i.e.. the performance obligation is fulfilled) when the goods have been delivered pursuant to the terms of the specific contract agreed with the customer and the risks associated with ownership have been transferred to the customer.
Revenue is measured according to the contracted price agreed with customers, which represents fair value of the consideration received or receivable, net of returns, discounts, and allowances. Revenue is only recognised to the extent that it is highly probable that a significant reversal will not occur. The payment terms vary depending on the individual contracts. No deemed financing components are present as there are no significant timing differences between the payment terms and revenue recognition.
2021 2020
$’000 $’000
Dairy products 1,367,349 1,302,025Other sundry income 3,870 404Total income 1,371,219 1,302,429
The increase in other sundry income is primarily attributable to short-term rental income earned in the period.
PAGE 60 & 61 ANNUAL REPORT 2021

31 July 2020 31 July 2020 31 July 2020 31 July 2020$000’s
(restated)$000’s $000’s $000’s
(restated)Nutritionals,ingredients,
fresh milk
Cheese,butter,
yoghurt*
Eliminations Total
External revenue 1,209,980 92,045 - 1,302,025Inter-segment revenue from sale of goods 13,296 - (13,296) -Revenue from sale of goods 1,223,276 92,045 (13,296) 1,302,025
Net profit/(loss) after tax for the period 76,435 (2,126) - 74,309
Finance income 125 9 - 134Finance expenses (18,661) (1,116) - (19,777)Depreciation and amortisation (44,831) (2,698) - (47,529)Income tax (expense)/benefit (27,541) 1,197 - (26,344)
Total assets 1,291,997 197,524 - 1,489,521Total liabilities (786,450) (98,564) - (885,014)Net assets 505,547 98,960 - 604,507
02. SEGMENT REPORTING
(a) Segment revenues and resultsThe following is an analysis of the Group’s revenue and results by reportable segment:Reportable segments
NZ IFRS 8 Operating Segments requires disclosure of information about operating segments, products and services, geographical areas of operation, and major customers. Information is based on internal management reports, both in the identification of operating segments and measurement of disclosed segment information.
The Group’s chief operating decision maker is the Synlait Milk Limited Board of Directors (“the Board”). Previously the Board made resource allocation decisions based on expected cash flows and results of the Group’s operations as a whole rather than on a segment basis. In prior years, the Group has therefore reported that it operates in one segment, being the manufacture and sale of fresh milk and milk powder related products.
During the period ended 31 July 2020, the Group acquired selected assets in Talbot Forest Cheese Limited through its newly incorporated subsidiary Synlait Foods (Talbot Forest) Limited and also acquired Dairyworks Limited. On 31 December 2020, Synlait Foods (Talbot Forest) Limited was amalgamated into Dairyworks Limited. Following the acquisition, the Group has determined that the company (and its predecessor companies) operates in the manufacture and sale of cheese and other products segment, and that this segment exceeds the quantitative thresholds for a reportable segment under NZ IFRS 8.
As such, although the Group continues to report internally on a consolidated Group basis, the Group has identified the following segments for external reporting purposes:
• Manufacture and sale of fresh milk and milk powder related products (nutritionals, ingredients, fresh milk).
• Manufacture and sale of cheese and other products (cheese, butter, yoghurt).
The accounting policies of the Group have been consistently applied to the operating segments. Net Profit After Tax (NPAT) is the measure reported to the chief operating decision-maker for the purposes of resource allocation and assessment of performance for the Group. A consistent measure has been used for the purpose of reporting the performance of each operating segment. Inter-segment pricing is determined on an arm’s length basis.
* Results for the 31 July 2020 period for the cheese, butter, yoghurt segment reflect 4 months of results for Dairyworks Limited which was acquired on 1 April 2020.
(28,451) 31 July 2021 31 July 2021 31 July 2021 31 July 2021$000’s $000’s $000’s $000’s
Nutritionals,ingredients,
fresh milk
Cheese,butter,
yoghurt
Eliminations Total
External revenue 1,138,302 229,047 - 1,367,349Inter-segment revenue from sale of goods 12,785 - (12,785) -Revenue from sale of goods 1,151,087 229,047 (12,785) 1,367,349
Net (loss)/profit after tax for the period (28,802) 351 - (28,451)
Finance income 14 30 - 44Finance expense (16,876) (3,612) - (20,488)Depreciation and amortisation (48,855) (6,117) - (54,972)Income tax benefit/(expense) 10,985 (282) - 10,703
Total assets 1,405,478 212,672 - 1,618,150Total liabilities (737,675) (113,361) - (851,036)Net assets 667,803 99,311 - 767,114
PAGE 62 & 63 ANNUAL REPORT 2021

03. EXPENSES
2021 2020
$’000 $’000 restated
The following items of expenditure are included in cost of salesDepreciation and amortisation 45,638 38,852Employee benefit expense 80,926 78,748KiwiSaver contributions 1,941 1,841Export freight 10,846 11,104Rent and storage 4,028 2,471Increase in inventory provision 6,257 1,702Increase/(decrease) in onerous contract provision 1,777 (156)
The following items of expenditure are included in sales and distribution expenseDepreciation and amortisation 5,579 5,936Employee benefit expense 16,177 13,137KiwiSaver contributions 419 307Rent and storage 1,971 1,284
The following items of expenditure are included in administrative and operating expensesDepreciation and amortisation 3,755 2,741Employee benefit expense 25,201 21,467KiwiSaver contributions 604 502Information services 8,218 6,897Directors’ fees 829 802Share based payments (recovery)/expense (610) 523Impairment of intangible assets 530 1,561Consultancy 4,623 3,268Strategic Initiatives 1,181 1,362
Deloitte services included in administrative and operating expensesStatutory audit fee 270 276Half year accounts review 62 57Other assurance services 23 130Taxation compliance 69 53Total 424 516
All Group non-current assets are in New Zealand, other than $0.5m (2020: $0.7m) located in China.
(b) Sales by geographical areaThe Group operates in one principal geographical area being New Zealand. Although the Group sells to many different countries, it is understood that a significant portion of both infant nutritional and ingredients sales are ultimately consumed in China.
The proportion of sales revenue by geographical area is summarised below:
Year ended 31 July 2021
Year ended 31 July 2020
$’000 $’000
China 14% 5%Rest of Asia 24% 19%Middle East and Africa 5% 8%New Zealand 47% 43%Australia 8% 22%Rest of World 2% 3%Total 100% 100%
(c) Major customersRevenues of approximately 42% (2020: 64%) are derived from the top three external customers.
02. SEGMENT REPORTING (CONTINUED)
PAGE 64 & 65 ANNUAL REPORT 2021

04. RECONCILIATION OF (LOSS)/PROFIT AFTER INCOME TAX TO NET CASH INFLOW FROM OPERATING ACTIVITIES
2021 2020
$’000 $’000 (restated)
(Loss)/profit for the year (28,451) 74,309
Non-cash and non-operating itemsDepreciation and amortisation of non-current assets 50,236 42,581Depreciation of right-of-use assets 4,736 4,948Loss on sale of property, plant and equipment 100 355Impairment of property, plant and equipment and intangible assets 2,242 4,761Impairment recovery on property, plant and equipment - (2,958)Share of loss/(gain) from associate 33 (33)Non-cash share based payments (recovery)/expense (476) 523Interest costs classified as financing cash flow 20,488 19,777Interest received classified as investing cash flow (44) (134)Loss on derecognition of financial assets 1,045 1,747Deferred tax 7,329 8,942Gain on derivative financial instruments (64) (23)Unrealised foreign exchange losses 24 6
Movements in working capital(Increase)/decrease in trade and other receivables (45,323) 1,833Increase in prepayments (1,893) (2,850)Increase in inventories (1,561) (104,533)Decrease/(increase) in goods and services tax refundable 1,937 (2,709)Increase in trade and other payables 31,814 34,673Decrease in current tax liabilities (26,304) (4,659)Working capital items acquired - 27,205Net cash inflow from operating activities 15,868 103,761
WORKING CAPITAL The working capital section gives information about the short term assets and liabilities of the Group. This section includes the following notes:
05 Trade and other receivables 68
06 Inventories 72
07 Trade and other payables 74
PAGE 66 & 67 ANNUAL REPORT 2021

05. TRADE AND OTHER RECEIVABLES
Trade receivables are amounts due from customers for merchandise sold or services performed in the ordinary course of business. If collection is expected in one year or less they are classified as current assets. If not, they are classified as non-current assets.
ImpairmentThe Group recognises a loss allowance for expected credit losses (“ECL”) on trade and other receivables.
The Group measures the provision for ECL using the simplified approach to measuring ECL which uses a lifetime expected loss allowance for all trade receivables. The Group’s credit loss model requires the Group to account for expected credit losses and changes in those expected credit losses at each reporting date to reflect changes in credit risk since initial recognition of the financial assets. Therefore, it is no longer necessary for a credit event to have occurred before credit losses are recognised.
The model is based on the Group’s historical credit loss experience, adjusted for factors that are specific to the debtors, general economic conditions, and an assessment of both the current as well as the forecast direction of conditions at the reporting date.
Lifetime ECL represents the expected credit losses that will result from all possible default events over the expected life of a financial instrument. The expected credit loss is estimated as the difference between all contractual cash flows that are due to the Group in accordance with the contract and all the cash flows that the Group expects to receive, discounted at the original effective interest rate.
The Group writes off a financial asset when there is information indicating that the debtor is in severe financial difficulty and there is no reasonable and realistic prospect of recovery.
Furthermore, other impairment losses on an individual basis are determined by an evaluation of the exposures on an instrument-by-instrument basis. All individual instruments that are considered significant are subject to this approach.
Credit Risk ManagementThe Group activities expose it to credit risk which refers to the risk that a counterparty will default on its contractual obligations resulting in financial loss to the Group. Trade and other receivables are potentially subject to credit risk. The Group performs credit evaluations on trade customers. The Group continuously monitors the credit quality of its major receivables and does not anticipate non-performance of those customers, nor has there been historical non-performance of these customers. The Group also maintains strict controls for any credit reviews such as credit increases.
The receivables assignment processes ensure that the Group’s trade receivables are materially managed in an efficient and effective basis.
The carrying amount of financial assets recorded in the financial statements represents the Group’s maximum exposure to credit risk.
Included in trade receivables are debtors which are past due at balance date, as payment was not received within 30 days, and for which no provision has been made as there has not been a significant change in credit quality and the amounts are still considered fully recoverable. No collateral is held over these balances and trade credit insurance cover was not obtained in respect of these receivables. Interest is not charged on overdue debtors.
In the past seven financial years, the Group has not written off any bad debts, although it has recognised provisions for debts when collection was considered doubtful. The historical analysis of bad debts on a customer basis assists in the determination of any increases in credit risk since initial recognition. There are no significant credit risk concentrations as at 31 July 2021. Three customers represent 70% of the overdue receivables. There were no other forward-looking indicators to indicate increases in credit risk. Refer to the “material events during the year” section of the accounts for further detail on the impact of COVID-19 on receivables.
For cash and cash equivalents the Group has determined that all bank balances have low credit risk at each reporting period as they are held by reputable international banking institutions.
The Group has not changed its overall strategy regarding the management of risk from 2020.
2021 2020
$’000 $’000
Trade receivables 101,243 56,484Provision for doubtful and impaired receivables (2,583) (977)Net trade receivables 98,660 55,507
Other receivables 9,720 7,550Total receivables 108,380 63,057
PAGE 68 & 69 ANNUAL REPORT 2021

2021 2020
$’000 $’000
Overdue by0 to 30 days 8,306 5,95030 to 60 days 673 549Over 60 days 4,330 2,725Total overdue trade receivables 13,309 9,224
(a) Impaired receivablesAs at 31 July 2021, trade receivables of $13.3m were overdue (2020: $9.2m). These relate to several independent customers for whom there is no recent history of default. The majority has since been collected except for $4.7m which remains unpaid and is expected to be collected in the 2022 financial year.
The aging analysis of these overdue trade receivables is as follows:
(b) Allowance for bad and doubtful receivables The Group has recognised a loss of $1.5m in relation to unrecoverable trade receivables during the year (2020: $0.4m). This relates to debtors that are overdue by more than 60 days. The Group has also recognised a loss of $0.1m for estimated receivables impairment under NZ IFRS 9 Financial Instruments (2020: $0.1m).
(c) Trade and other receivablesAccounts receivable are amounts incurred in the normal course of business.
Receivables denominated in currencies other than the functional currency comprise NZ$59.4m (2020: $38.5m) of USD and AUD denominated trade receivables.
(d) Derecognised financial assetsThe Group has derecognised trade receivables that have been sold to two banks under the terms of receivables purchase agreements entered into during January 2015 and January 2016. The Group routinely assess the terms of the agreements and has determined that substantially all the risks and rewards have been transferred to the banks. Receivables selected for assignment are with customers with strong credit ratings and good payment histories. This minimises the risk (and therefore consequences) of late payment or default, as well as resulting in little volatility in the present value of future cash flows in relation to assigned receivables under the various scenarios detailed in the terms of the two agreements. An evaluation of external evidence of credit risk has also been performed for each customer. The Group has assigned $112.4m of receivables as at 31 July 2021 (2020: $131.3m).
The Group has assessed its continuing involvement in the assigned receivables and determined that the fair value of continuing involvement is immaterial. The Group reassesses the facility for qualification for derecognition at each reporting date, when the terms of the facility are amended, and assesses each new customer at the initial assignment of a receivable. No new customers were assigned during the period.
If the Group’s customers defaulted on all trade receivables that have been derecognised at balance date, the Group would be required to pay a late payment charge of $4,550 per day (2020: $5,351) for each day that these receivables remain overdue, assuming that market conditions remain unchanged from reporting date. The likelihood that debtors will fall overdue or remain overdue for a long period of time is small, given the strong credit ratings and good payment histories of the customers whose receivables have been selected for assignment.
The loss for the period of $1.0m (2020: $1.7m) arising from derecognition of assigned receivables is the discount paid to the banks for acquiring these receivables.
05. TRADE AND OTHER RECEIVABLES (CONTINUED)
PAGE 70 & 71 ANNUAL REPORT 2021
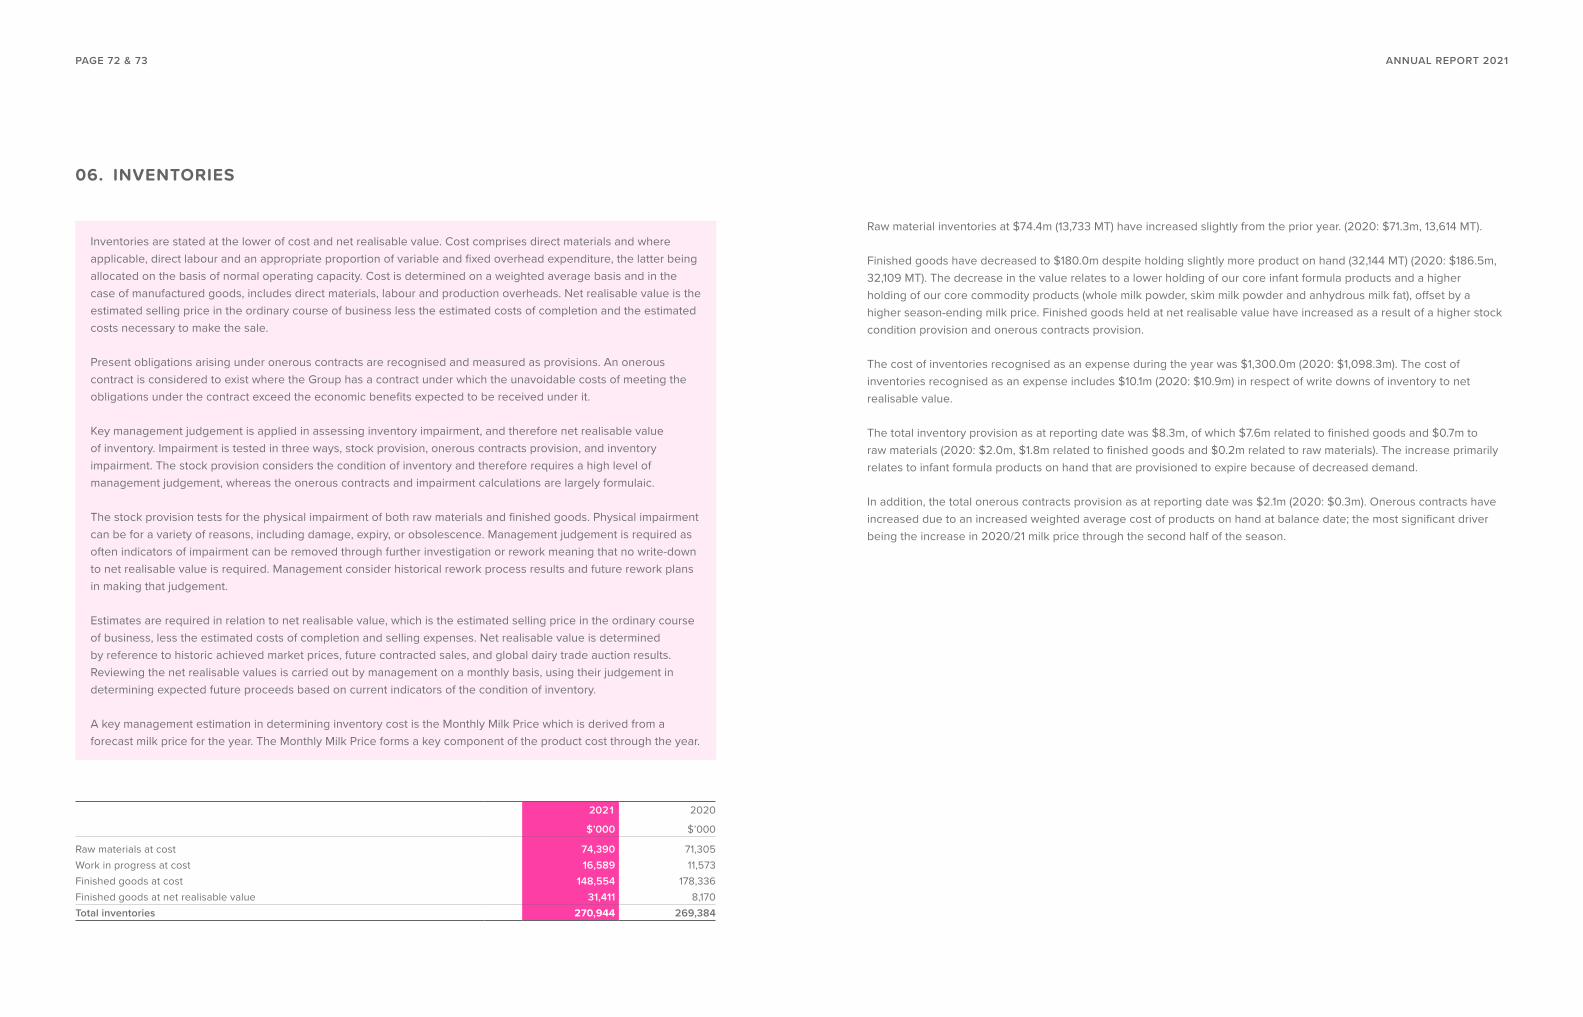
06. INVENTORIES
Inventories are stated at the lower of cost and net realisable value. Cost comprises direct materials and where applicable, direct labour and an appropriate proportion of variable and fixed overhead expenditure, the latter being allocated on the basis of normal operating capacity. Cost is determined on a weighted average basis and in the case of manufactured goods, includes direct materials, labour and production overheads. Net realisable value is the estimated selling price in the ordinary course of business less the estimated costs of completion and the estimated costs necessary to make the sale.
Present obligations arising under onerous contracts are recognised and measured as provisions. An onerous contract is considered to exist where the Group has a contract under which the unavoidable costs of meeting the obligations under the contract exceed the economic benefits expected to be received under it.
Key management judgement is applied in assessing inventory impairment, and therefore net realisable value of inventory. Impairment is tested in three ways, stock provision, onerous contracts provision, and inventory impairment. The stock provision considers the condition of inventory and therefore requires a high level of management judgement, whereas the onerous contracts and impairment calculations are largely formulaic.
The stock provision tests for the physical impairment of both raw materials and finished goods. Physical impairment can be for a variety of reasons, including damage, expiry, or obsolescence. Management judgement is required as often indicators of impairment can be removed through further investigation or rework meaning that no write-down to net realisable value is required. Management consider historical rework process results and future rework plans in making that judgement.
Estimates are required in relation to net realisable value, which is the estimated selling price in the ordinary course of business, less the estimated costs of completion and selling expenses. Net realisable value is determined by reference to historic achieved market prices, future contracted sales, and global dairy trade auction results. Reviewing the net realisable values is carried out by management on a monthly basis, using their judgement in determining expected future proceeds based on current indicators of the condition of inventory.
A key management estimation in determining inventory cost is the Monthly Milk Price which is derived from a forecast milk price for the year. The Monthly Milk Price forms a key component of the product cost through the year.
2021 2020
$’000 $’000
Raw materials at cost 74,390 71,305Work in progress at cost 16,589 11,573Finished goods at cost 148,554 178,336Finished goods at net realisable value 31,411 8,170Total inventories 270,944 269,384
Raw material inventories at $74.4m (13,733 MT) have increased slightly from the prior year. (2020: $71.3m, 13,614 MT).
Finished goods have decreased to $180.0m despite holding slightly more product on hand (32,144 MT) (2020: $186.5m, 32,109 MT). The decrease in the value relates to a lower holding of our core infant formula products and a higher holding of our core commodity products (whole milk powder, skim milk powder and anhydrous milk fat), offset by a higher season-ending milk price. Finished goods held at net realisable value have increased as a result of a higher stock condition provision and onerous contracts provision.
The cost of inventories recognised as an expense during the year was $1,300.0m (2020: $1,098.3m). The cost of inventories recognised as an expense includes $10.1m (2020: $10.9m) in respect of write downs of inventory to net realisable value.
The total inventory provision as at reporting date was $8.3m, of which $7.6m related to finished goods and $0.7m to raw materials (2020: $2.0m, $1.8m related to finished goods and $0.2m related to raw materials). The increase primarily relates to infant formula products on hand that are provisioned to expire because of decreased demand.
In addition, the total onerous contracts provision as at reporting date was $2.1m (2020: $0.3m). Onerous contracts have increased due to an increased weighted average cost of products on hand at balance date; the most significant driver being the increase in 2020/21 milk price through the second half of the season.
PAGE 72 & 73 ANNUAL REPORT 2021

07. TRADE AND OTHER PAYABLES
Trade payables are obligations to pay for goods or services that have been acquired in the ordinary course of business from suppliers. Accounts payable are classified as current liabilities if payment is due within one year or less otherwise, they are presented as non-current liabilities.
Trade and other payables are recognised initially at fair value plus any directly attributable transaction costs and are subsequently measured at amortised cost using the effective interest method. Payables that are settled within a short duration are not discounted.
2021 2020
$’000 $’000
Trade payables 101,121 106,942Accrued expenses 150,378 118,854Employee entitlements 12,569 12,809Other payables - 166Total trade and other payables 264,068 238,771
Payables denominated in currencies other than the functional currency comprise NZ$4.5m (2020: $11.9m) of USD, EUR, GBP, RMB, SGD, and AUD denominated trade payables and accruals.
LONG TERM ASSETS The assets section provides information about the long term investments made by the Group to operate the business and generate returns to shareholders. This section includes the following notes:
08 Property, plant and equipment 76
09 Intangible assets 79
10 Leases 85
PAGE 74 & 75 ANNUAL REPORT 2021

08. PROPERTY, PLANT AND EQUIPMENT
Recognition and measurementProperty, plant and equipment are initially measured at cost less accumulated depreciation.
Cost includes expenditures that are directly attributable to the acquisition of the asset. The cost of self-constructed assets includes the cost of materials and direct labour, any other costs directly attributable to bringing the asset to a working condition for its intended use, and the costs of dismantling and removing the items and restoring the site on which they are located where the Group has an obligation to remove and restore.
When a self-constructed asset meets the definition of a qualifying asset under NZ IAS 23 Borrowing Costs, borrowing costs directly attributable to the construction of the asset are capitalised until such a time as the asset is substantially ready for its intended use or sale.
All other borrowing costs are recognised in profit or loss in the period in which they are incurred.
When major components of an item of property, plant and equipment have different useful lives, they are accounted for as separate items of property, plant and equipment.
Subsequent costsThe cost of replacing part of an item of property, plant and equipment is recognised in the carrying amount of the item if it is probable that the future economic benefits embodied within the part will flow to the Group and its cost can be measured reliably. The costs of the day-to-day servicing of property, plant and equipment are recognised in profit or loss as incurred.
DepreciationDepreciation of property, plant and equipment is recognised in profit or loss on a straight-line basis over the estimated useful lives of each part of an item of property, plant and equipment. Land is not depreciated.
Capital work in progress is not depreciated. The total cost of this work is transferred to the relevant asset category on the completion of the project and then depreciated.
Estimation and judgement is also required in the selection and application of useful lives. It is management’s best estimate that the useful lives adopted adequately reflect the flow of resources and the economic benefits required and derived in the use and servicing of property, plant, and equipment.
The estimated useful lives for the current and comparative periods are as follows:
Buildings 10 - 60 years
Plant and equipment 3 - 35 years
Fixtures and fittings 2 - 25 years
Depreciation methods, useful lives and residual values are reassessed at each reporting date.
ImpairmentEstimation and judgement is required in the impairment of property, plant, and equipment. The Group estimates or exercises judgement in assessing indicators of impairment, forecasting future cash flows, and determining other key assumptions used for assessing fair values (less costs of disposal) or value in use.
Land Buildings Plant and
equipment
Fixtures and
fittings
Capital work in progress
Total
$’000 $’000 $’000 $’000 $’000 $’000
CostBalance as at 1 August 2019 34,957 183,039 513,208 12,774 240,209 984,187
Additions - - - - 129,381 129,381Additions through business combinations 1,350 4,610 26,060 2,021 233 34,274Reclassification/transfer 458 103,202 185,441 11,213 (300,314) -Impairment - - (1,050) - (2,301) (3,351)Disposals - (75) (2,777) (746) - (3,598)Balance as at 31 July 2020 36,765 290,776 720,882 25,262 67,208 1,140,893
Additions - - - - 111,955 111,955Reclassification/transfer 23,890 33,584 59,679 4,338 (121,491) -Impairment - - (969) - (1,244) (2,213)Disposals - (185) (3,471) (982) (11) (4,649)Balance as at 31 July 2021 60,655 324,175 776,121 28,618 56,417 1,245,986
Accumulated depreciationBalance as at 1 August 2019 - 22,550 110,943 5,493 - 138,986
Depreciation (note 3) - 6,909 29,869 3,177 - 39,955Impairment - - (151) - - (151)Disposals - (33) (2,300) (668) - (3,001)Balance as at 31 July 2020 - 29,426 138,361 8,002 - 175,789
Depreciation (note 3) - 7,393 35,068 4,379 - 46,840Impairment - - (500) - - (500)Disposals - (158) (2,188) (946) - (3,292)Balance as at 31 July 2021 - 36,661 170,741 11,435 - 218,837
Carrying amountsAs at 31 July 2020 36,765 261,350 582,521 17,260 67,208 965,104As at 31 July 2021 60,655 287,514 605,380 17,183 56,417 1,027,149
PAGE 76 & 77 ANNUAL REPORT 2021

(a) ImpairmentDuring the period, property, plant, and equipment have been examined for impairment. A $1.7m (2020: $3.2m) impairment charge has been recognised to reflect the write-down of select assets to the higher of their fair value less costs of disposal (FVLCOD) and value-in-use. Of the $1.7m write-down, $1.2m relates to work in progress costs for projects which have been indefinitely deferred, and $0.5m relates to the derecognition of assets which were determined to no longer meet the definition of an asset.
(b) Capital work in progressAssets under construction includes capital expenditure projects until they are commissioned and transferred to property, plant and equipment. Capital work in progress of $56.4m is lower than 2020 ($67.2m) due to the completion of the Dry Store 4 project and a lower level of capital expenditure in 2021. The current work in progress balance is comprised primarily of $34.5m (2020 - $1.0m) of costs relating to the Group’s ongoing Pokeno processing upgrade project and the balance comprises of routine operational capital expenditure.
(c) Capitalised borrowing costsDuring the year, the Group has capitalised borrowing costs amounting to $2.3m (2020: $2.1m) on qualifying assets. Interest has been capitalised at the rate at which borrowing has been specifically drawn to fund the qualifying asset. In the year, borrowing costs were capitalised for the Dry Store 4, Pokeno modifications, and ERP implementation (refer to note 9) projects.
09. INTANGIBLE ASSETS
GoodwillGoodwill arises on the acquisition of subsidiaries and represents the excess of the cost of the acquisition over the net of the fair values of the assets and liabilities of the subsidiaries acquired. Goodwill is tested for impairment annually and is carried at cost as established at the date of acquisition of the subsidiary, less accumulated impairment losses, if any.
For the purposes of impairment testing, goodwill is allocated to cash-generating units (CGU) that are expected to benefit from the business combination in which the goodwill arose. The recoverable amount of CGUs is the higher of fair value less costs to sell and value in use. If this recoverable amount is less than the carrying amount of the CGU an impairment loss is recognised immediately in the profit and loss, and it is not subsequently reversed.
BrandsPurchased brands have been assessed as indefinite life intangible assets, after considering factors such as the expected use of the assets, the period of legal control, the typical product life cycle of these assets, the industry in which the assets are operating, and the level of maintenance expenditure required. Purchased brands are initially recognised at fair value if acquired as part of a business combination, and are tested for impairment annually, or more frequently if there are any indicators of impairment, on the same basis as goodwill.
Patents, trademarks and other rightsSeparately acquired patents, trademarks, and other rights are shown at historical cost. Patents, trademarks, and other rights have a finite useful life and are carried at cost less accumulated amortisation. Amortisation is calculated using the straight-line method to allocate the cost of patents, trademarks, and other rights over their estimated useful lives of 10 to 20 years.
Computer softwareCosts associated with maintaining computer software programmes are recognised as an expense as incurred. Development costs that are directly attributable to the design, testing, and implementation of identifiable and unique software products controlled by the Group are recognised as intangible assets. Amortisation is calculated using the straight-line method to allocate the cost of computer software over an estimated useful life of 4 years.
08. PROPERTY, PLANT AND EQUIPMENT (CONTINUED)
PAGE 78 & 79 ANNUAL REPORT 2021
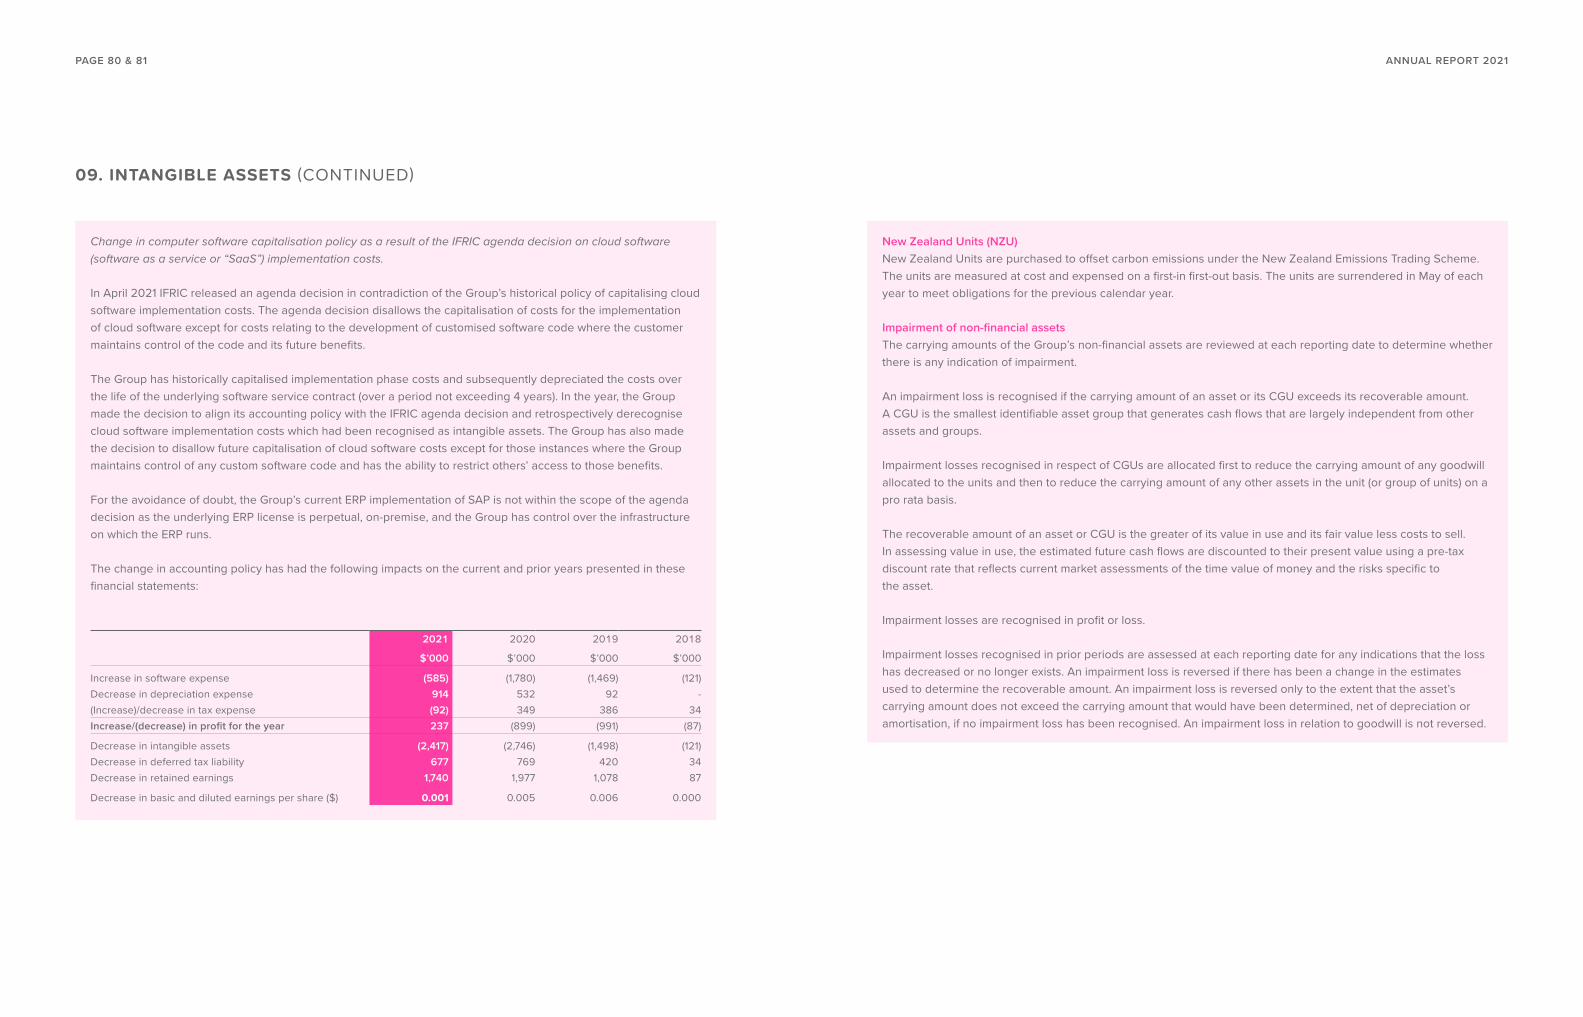
Change in computer software capitalisation policy as a result of the IFRIC agenda decision on cloud software (software as a service or “SaaS”) implementation costs.
In April 2021 IFRIC released an agenda decision in contradiction of the Group’s historical policy of capitalising cloud software implementation costs. The agenda decision disallows the capitalisation of costs for the implementation of cloud software except for costs relating to the development of customised software code where the customer maintains control of the code and its future benefits.
The Group has historically capitalised implementation phase costs and subsequently depreciated the costs over the life of the underlying software service contract (over a period not exceeding 4 years). In the year, the Group made the decision to align its accounting policy with the IFRIC agenda decision and retrospectively derecognise cloud software implementation costs which had been recognised as intangible assets. The Group has also made the decision to disallow future capitalisation of cloud software costs except for those instances where the Group maintains control of any custom software code and has the ability to restrict others’ access to those benefits.
For the avoidance of doubt, the Group’s current ERP implementation of SAP is not within the scope of the agenda decision as the underlying ERP license is perpetual, on-premise, and the Group has control over the infrastructure on which the ERP runs.
The change in accounting policy has had the following impacts on the current and prior years presented in these financial statements:
New Zealand Units (NZU)New Zealand Units are purchased to offset carbon emissions under the New Zealand Emissions Trading Scheme. The units are measured at cost and expensed on a first-in first-out basis. The units are surrendered in May of each year to meet obligations for the previous calendar year.
Impairment of non-financial assetsThe carrying amounts of the Group’s non-financial assets are reviewed at each reporting date to determine whether there is any indication of impairment.
An impairment loss is recognised if the carrying amount of an asset or its CGU exceeds its recoverable amount. A CGU is the smallest identifiable asset group that generates cash flows that are largely independent from other assets and groups.
Impairment losses recognised in respect of CGUs are allocated first to reduce the carrying amount of any goodwill allocated to the units and then to reduce the carrying amount of any other assets in the unit (or group of units) on a pro rata basis.
The recoverable amount of an asset or CGU is the greater of its value in use and its fair value less costs to sell. In assessing value in use, the estimated future cash flows are discounted to their present value using a pre-tax discount rate that reflects current market assessments of the time value of money and the risks specific to the asset.
Impairment losses are recognised in profit or loss.
Impairment losses recognised in prior periods are assessed at each reporting date for any indications that the loss has decreased or no longer exists. An impairment loss is reversed if there has been a change in the estimates used to determine the recoverable amount. An impairment loss is reversed only to the extent that the asset’s carrying amount does not exceed the carrying amount that would have been determined, net of depreciation or amortisation, if no impairment loss has been recognised. An impairment loss in relation to goodwill is not reversed.
2021 2020 2019 2018
$’000 $’000 $’000 $’000
Increase in software expense (585) (1,780) (1,469) (121)Decrease in depreciation expense 914 532 92 -(Increase)/decrease in tax expense (92) 349 386 34Increase/(decrease) in profit for the year 237 (899) (991) (87)
Decrease in intangible assets (2,417) (2,746) (1,498) (121)Decrease in deferred tax liability 677 769 420 34Decrease in retained earnings 1,740 1,977 1,078 87
Decrease in basic and diluted earnings per share ($) 0.001 0.005 0.006 0.000
09. INTANGIBLE ASSETS (CONTINUED)
PAGE 80 & 81 ANNUAL REPORT 2021

Goodwill Brands Patents, trademarks
and other intangibles
Computer software
Intangibles in progress
New Zealand
Units
Total
$’000 $’000 $’000 $’000 $’000 $’000 $’000
Year ended 31 July 2020Opening net book amount (restated) 6,026 - 718 4,395 6,528 6,976 24,643Additions (restated) - - 908 3,455 9,548 4,138 18,049Acquisition through business combination 59,519 17,545 107 263 160 - 77,594Development costs recognised as an asset (restated) - - 25 15 (4,404) - (4,364)Impairment charge - - - - (1,561) - (1,561)Amortisation charge (restated) (note 3) - - (344) (2,281) - - (2,625)Asset disposals/surrendered - - - - - (2,203) (2,203)Closing net book value (restated) 65,545 17,545 1,414 5,847 10,271 8,911 109,533
Year ended 31 July 2020Current - - - - - 4,230 4,230Non-current (restated) 65,545 17,545 1,414 5,847 10,271 4,681 105,303Closing net book value (restated) 65,545 17,545 1,414 5,847 10,271 8,911 109,533
Year ended 31 July 2021Opening net book value 65,545 17,545 1,414 5,847 10,271 8,911 109,533Additions - - - 1,249 23,167 3,672 28,088Development costs recognised as an asset - - - - (1,249) - (1,249)Impairment (note 3) - - - - (530) - (530)Amortisation charge (note 3) - - (414) (2,982) - - (3,396)Asset disposals/surrendered (1,356) (976) (52) (4) - (2,526) (4,914)Closing net book value 64,189 16,569 948 4,110 31,659 10,057 127,532
Year ended 31 July 2021Current - - - - - 3,712 3,712Non-current 64,189 16,569 948 4,110 31,659 6,345 123,820Closing net book value 64,189 16,569 948 4,110 31,659 10,057 127,532
Intangibles in progress of $31.7m at balance date is comprised primarily of project to date spend on the Group’s implementation of an on-premise, perpetually licensed ERP system.
Opening balances, additions, and amortisation for the year ended 31 July 2020 have been restated to reflect a change in policy relating to the IFRIC Agenda decision on cloud software costs as detailed in the accounting policy section of this note.
In the year, $1.4m of goodwill and $1.0m of brands were derecognised when the Group disposed of its Deep South ice cream manufacturing operation.
(a) Impairment tests for indefinite life intangiblesAs at 31 July 2021 management has determined that there is no impairment of any CGU’s containing goodwill.
For the purposes of goodwill impairment testing, goodwill has been allocated to two CGU groups; the Synlait Milk CGU (nutritionals, ingredients, fresh milk) and Dairyworks CGU (cheese, butter, yoghurt). The Group’s CGU’s were aligned with the Group’s operating segments in the year. The impact of this alignment is the reallocation of $6.0m of goodwill and all other assets from the previous Auckland Blending and Canning CGU to the Synlait Milk CGU.
At 31 July 2021, $58.2m (2020: $59.5m) of goodwill and $16.6m (2020: $17.5m) of brand assets were allocated to the Dairyworks CGU. $6.0m (2020: $nil) of goodwill and $nil (2020: $nil) of brand assets were allocated to the Synlait Milk CGU.
The value-in-use calculation uses five-year future cash flows based on Board approved business plans. Based on projected future cash flows, management has determined that the recoverable amount of each CGU exceeds its carrying amount and therefore goodwill is not impaired. The business plans were modelled using the following key assumptions:
2021 2020
Annual revenue growth rates (7.2%) - 15.3% (0.6%) - 7.9%Allowance for increase in expenses (9.7%) - 8.6% 1.9% - 4.0%Pre-tax discount rate 9.5% - 11.7% 10.7% - 15.2%Terminal growth rate 2.0% 0.0% - 2.0%
The range of annual revenue growth rates and allowance for increase in expenses is primarily attributable to a significant drawdown of inventory anticipated over the course of the 2022 financial year, followed by a return to a more balanced level of inventory in the following year.
09. INTANGIBLE ASSETS (CONTINUED)
PAGE 82 & 83 ANNUAL REPORT 2021

Management has carried out a sensitivity analysis and believe that any reasonably possible change in the key assumptions would not cause the book value of any of the CGU’s, or groups of CGU’s, to exceed their recoverable amount.
(b) Forward cover of emissions unitsThe following table summarises the Group’s emissions units forward cover as at 31 July 2021.
10. LEASES
2021 2020
Annual revenue growth rates 1.5% - 6.4% (30.0%) - 7.9%Allowance for increase in expenses 2.0% - 4.0% 1.9% - 4.0%Royalty rate 3.75% - 4.25% 25.0%Post-tax discount rate 11.0% 8.5% - 11.2%Terminal growth rate 2.0% 0.0% - 2.0%
Indefinite life intangibles, which is comprised entirely of brands, have been tested using the relief from royalty method. Brand royalty rates for the year ended 31 July 2021 are based on a percentage of revenue (2020: percentage of earnings before interest and taxes). The impairment testing was modelled using the following key assumptions:
NZUs held Average cost per unit Total
# of units $ $’000
2021 (January to July) 48,543 25.36 1,2312022 99,185 25.01 2,4812023 101,665 24.48 2,4892024 101,665 37.67 3,8292025 651 40.85 27Total 351,709 28.59 10,057
At 31 July 2021 the total fair value of units held by the group was $17.1m based on a quoted price of $48.60 per unit.
Right-of-use assets and lease obligationsRight-of-use assets are initially measured equal to the corresponding present value of the remaining lease liability. Subsequent additions are measured at the initial amount of the lease obligation adjusted for any lease payments made at, or before, the commencement date, plus any initial direct costs incurred, less any lease incentives received.
The ROU asset is subsequently depreciated on a straight-line basis over the shorter of the term of the lease, or the useful life of the asset determined on the same basis as the Group’s property, plant and equipment. The ROU asset is periodically reduced by impairment losses, if any, and adjusted for certain remeasurements of the lease obligation.
Lease obligationsThe lease obligation is initially measured at the present value of lease payments remaining at the lease commencement date, discounted using the Group’s incremental borrowing rate. Lease payments included in the measurement of the lease obligation, when applicable, may comprise fixed payments, variable payments that depend on an index or rate, amounts expected to be payable under a residual value guarantee and the exercise price under a purchase, extension or termination option that the Group is reasonably certain to exercise.
The lease obligation is subsequently measured at amortised cost using the effective interest method. It is remeasured when there is a change in future lease payments arising from a change in an index or rate, if there is a change in the Group’s estimate of the amount expected to be payable under a residual value guarantee, or if the Group exercises a purchase, extension or termination option. When the lease obligation is remeasured, a corresponding adjustment is made to the carrying amount of the ROU asset.
The Group does not recognise ROU assets and lease obligations for short-term leases that have a lease term of twelve months or less or for leases of low-value assets. Payments associated with these leases are recognised as an operating expense on a straight-line basis over the lease term within costs and expenses on the consolidated income statement. The Group has also elected to apply a single discount rate to portfolios of leases with reasonably similar characteristics.
09. INTANGIBLE ASSETS (CONTINUED)
PAGE 84 & 85 ANNUAL REPORT 2021

2021 2020
$’000 $’000
LEASE OBLIGATIONSContractual, undiscounted cash flows associated with the Group’s lease obligations are as follows:Within one year 3,760 5,061Between one and five years 11,325 15,015Beyond five years 1,455 2,443Total undiscounted lease obligations 16,540 22,519
Discounted lease obligations recognised on the Company’s consolidated balance sheet are as follows:Current 3,243 4,422Non-current 11,775 14,838Total discounted lease obligations 15,018 19,260
Interest expense on lease obligations for the year ended 31 July 2021 was $0.6m (2020: $0.5m) and is included in finance expense. Operating lease expense relating to short-term and low-value leases not included in the measurement of lease obligations for the year ended 31 July 2021 is $1.7m (2020: $1.4m). The Group’s weighted average cost of borrowing at 31 July 2021 was 3.53% (2020: 3.49%).
10. LEASES (CONTINUED)
Buildings Plant and equipment
Total
$’000 $’000 $’000
RIGHT-OF-USE ASSETSCostBalance as at 1 August 2019 6,726 466 7,192Additions and acquisitions 6,497 60 6,557Acquisitions through business combinations 8,992 708 9,700Foreign exchange differences (9) - (9)Balance as at 31 July 2020 22,206 1,234 23,440
Balance as at 1 August 2020 22,206 1,234 23,440Additions and acquisitions - 243 243Disposals (3,939) (88) (4,027)Foreign exchange differences 22 - 22Balance as at 31 July 2021 18,289 1,389 19,678
DepreciationBalance as at 1 August 2019 - - -Depreciation 4,702 246 4,948Foreign exchange differences (5) - (5)Balance as at 31 July 2020 4,697 246 4,943
DepreciationBalance as at 1 August 2020 4,697 246 4,943Disposals (3,939) (88) (4,027)Depreciation 4,362 374 4,736Foreign exchange differences 8 - 8Balance as at 31 July 2021 5,128 532 5,660
Carrying amountsBalance as at 31 July 2020 17,509 988 18,497Balance as at 31 July 2021 13,161 857 14,018
PAGE 86 & 87 ANNUAL REPORT 2021

DEBT AND EQUITY The debt and equity section gives information about the Group’s capital structure and financing costs related to this structure. This section includes the following notes:
11 Finance income and expenses 89
12 Loans and borrowings 90
13 Share capital 92
14 Share based payments 94
15 Reserves and retained earnings 96
11. FINANCE INCOME AND EXPENSES
Interest income is recognised using the effective interest method. When a loan or receivable is impaired, the Group reduces the carrying amount to its recoverable amount, being the estimated future cash flow discounted at the original effective interest rate of the instrument and continues unwinding the discount as interest income. Interest income on impaired loans and receivables is recognised using the original effective interest rate.
Interest expense on borrowings, bank and facility fees and transaction costs are recognised in the income statement over the period of the borrowings, using the effective interest rate method, unless such costs relate to funding capital work in progress. Interest expense on lease obligations are also recognised in the income statement in accordance with NZ IFRS 16.
2021 2020
$’000 $’000
Interest income on loans and deposits 44 134Total finance income 44 134
Interest and facility fees (22,223) (21,414)Capitalised borrowing cost 2,325 2,089Interest on leases (590) (452)Total finance costs (20,488) (19,777)Loss on derecognition of financial assets (1,045) (1,747)Net finance costs (21,489) (21,390)
PAGE 88 & 89 ANNUAL REPORT 2021

12. LOANS AND BORROWINGS
Interest bearing liabilities are recognised initially at fair value, net of transaction costs incurred. Interest bearing liabilities are subsequently carried at amortised cost; any difference between the proceeds (net of transaction costs) and the redemption value is recognised in the profit and loss component of the statement of comprehensive income over the period of the borrowings using the effective interest method.
2021 2020Drawn facility
amountTransaction
costsCarrying amount
Drawn facility amount
Transaction costs
Carrying amount
$’000 $’000 $’000 $’000 $’000 $’000
Working capital facility NZD - - - 68,910 - 68,910Working capital facility USD - - - 33,927 - 33,927Revolving credit facility 33,333 - 33,333 - - -Current liabilities 33,333 - 33,333 102,837 - 102,837
Working capital facility NZD 60,495 - 60,495Working capital facility USD 54,928 - 54,928Retail bonds 180,000 (2,353) 177,647 180,000 (2,987) 177,013Revolving credit facility 166,667 (153) 166,514 250,000 (259) 249,741Non-current liabilities 462,090 (2,506) 459,584 430,000 (3,246) 426,754
(a) Terms of loans and borrowingsThe revolving credit facility and working capital facility within the Group are secured under the terms of the General Security Deed dated 26 June 2013, by which all present and future property is secured to the ANZ Bank and Bank of New Zealand.
The Group facilities include:
• A secured revolving credit facility (Facility A) of $100m maturing 1 October 2023, with $33.3m amortising 31 July 2022 and 31 July 2023.
• A secured revolving credit facility (Facility B) of $50m maturing 1 October 2023.
• A secured revolving credit facility (Facility C) of $50m maturing 1 October 2023.
• A secured working capital facility of NZD $250m maturing 1 October 2022 and temporarily increasing by $80m to $330m in September 2021, stepping down over six months back to $250m in February 2022.
The Group is subject to capital requirements imposed by its banking syndicate through covenants agreed as part of the lending facility arrangements. The Group had the interest cover ratio, the total debt to EBITDA ratio and senior debt to EBITDA ratio covenants as at 31 July 2021 waived in the current year. The Group met all other externally imposed capital requirements for the twelve months ended 31 July 2021 and 31 July 2020.
The following summarises banking covenants effective for the year ending 31 July 2022:
1. Total shareholder funds of no less than $600.0m at all times.
2. Working capital ratio of no less than 1.5x at all times.
3. Interest cover ratio of no less than 3.0x on and from 31 July 2022.
4. Leverage ratio of no greater than 4.5x for the 31 July 2022 reporting date, increasing to no greater than 4.0x on and from 31 July 2023.
5. Senior leverage ratio of no greater than 3.0x on and from 31 July 2022.
Retail BondsBorrowings under the retail bond programme are supported by a Master Trust Deed and supplemented by the Series Supplement entered into between the Group and the New Zealand Guardian Trust Company Limited. The retail bonds are unsecured and unsubordinated. At 31 July 2021, the retail bond had a fair value of $175.0m, based on NZDX valuation.
Nominal interest rate %
Financial year of maturity
Carrying amount 2021
Carrying amount 2020
Secured revolving credit facility (Facility A, B & C) - ANZ/BNZ 2.21% 2023 200,000 250,000Secured working capital facility - ANZ/BNZ - USD 1.52% 2023 54,928 33,927Secured working capital facility - ANZ/BNZ - NZD 1.96% 2023 60,495 68,910Subordinated retail bonds 3.83% 2025 180,000 180,000
The nominal interest rate is calculated by adding the BKBM rate for NZD facilities, US LIBOR rate for USD facilities and the applicable margin rate. It excludes line fees and swap costs. Nominal interest rate for the subordinated retail bonds excludes transaction costs.
PAGE 90 & 91 ANNUAL REPORT 2021

13. SHARE CAPITAL
Ordinary shares are classified as equity.
Incremental costs directly attributable to the issue of new ordinary shares or options are shown in equity as a deduction from the proceeds.
During the reporting period, 59,068 new ordinary shares were granted to participants of the Group’s Long Term Incentive scheme as a result of share options that were granted under the scheme vesting and being converted to ordinary shares (2020: 83,880). These shares were issued to the participants at no cost. Refer to Note 14 for further information.
On 18 November 2020 32,785,933 shares were granted to participants of an underwritten placement announced on 10 November 2020 for total proceeds of $167.2m. On 1 December 2020 a further 6,429,752 shares were granted to participants of a share purchase plan for existing shareholders which was also announced on 10 November 2020 for total proceeds of $32.8m. Total transaction costs for shares issued under the underwritten placement and share purchase plan were $3.9m for net proceeds of $196.1m.
2021 Shares 2020 Shares 2021 2020$’000 $’000
(a) Share capitalOrdinary sharesOn issue at beginning of period 179,306,908 179,223,028 268,544 268,074Issue of share capital under employee share plans 59,068 83,880 148 470Issue of share capital under equity raise 32,785,933 - 167,208 -Issue of share capital under underwritten placement 6,429,752 - 32,791 -Transaction costs for issue of share capital - - (3,917) -On issue at end of period 218,581,661 179,306,908 464,774 268,544
(b) Ordinary sharesAll issued shares are fully paid and have no par value. Ordinary shares are entitled to one vote per share at meetings of Synlait Milk Limited. All ordinary shares rank equally with regard to Synlait Milk Limited’s residual assets.
None of the above shares are held by the Group or its subsidiaries.
(d) Earnings per shareThe Group presents basic and diluted earnings per share (EPS) data for its ordinary shares. Basic EPS is calculated by dividing the profit or loss attributable to shareholders by the weighted average number of shares outstanding during the period. Diluted EPS is determined by adjusting the profit or loss attributable to shareholders and the number of shares outstanding to include the effects of all potential dilutive shares.
Basic EPS for the 2021 financial period was (13.77) cents (2020: 41.45). Diluted EPS for the 2021 financial period was (13.75) cents (2020: 41.35).
(c) Capital risk managementThe Group’s capital includes share capital, retained earnings and reserves.
The Group’s policy is to maintain a sound capital base so as to maintain investor and creditor confidence and to sustain future development of the business. The impact of the level of capital on shareholders’ return is also recognised and the Group recognises the need to maintain a balance between the higher returns that might be possible with greater gearing and the advantages and security afforded by a sound capital position.
The Group is subject to various security ratios within the bank facilities agreement.
The Group’s policies in respect of capital management and allocation are reviewed by the Board of Directors.
PAGE 92 & 93 ANNUAL REPORT 2021

14. SHARE BASED PAYMENTS
(a) LTI share schemeUnder the LTI share scheme, participants receive Performance Share Rights (“PSRs”) which can be converted into Ordinary Shares in Synlait Milk Limited in three financial years’ time provided performance hurdles have been met during the assessment period (the date of award of the PSRs plus three financial years). The number of PSRs granted to participants is set at one quarter of their base salary divided by Synlait Milk Limited’s share price on the date of the award of the PSRs.
The PSRs consist of 50% Total Shareholder Return Rights (“TSR Rights”) and 50% Earnings Per Share Rights (“EPS Rights”). The vesting for both TSR Rights and EPS Rights is determined in accordance with progressive vesting scales.
Synlait Milk Limited’s TSR must be greater than or equal to the 50th percentile of the constituents of the TSR Peer Group over the assessment period for 50% of the TSR Rights to vest, scaled so that 100% of the TSR Rights vest if Synlait Milk Limited’s TSR equals or exceeds the 75th percentile of the TSR Peer Group over the assessment period. The TSR Peer Group is determined as at the date of award of the PSRs.
If Synlait Milk Limited’s EPS over the assessment period equals a Board approved EPS target, 50% of the EPS Rights vest, scaled so that 100% of the EPS Rights vest if Synlait Milk Limited’s EPS over the assessment period equals the Board approved EPS target plus 10%.
For either performance hurdle to be met, Synlait Milk Limited’s TSR must be positive over the assessment period. No exercise price is payable upon exercise of a PSR, Synlait Milk Limited’s ordinary shares being delivered to a participant for nil consideration. The LTI share scheme is an annual scheme with PSRs granted to Board approved participants each year, noting however that the annual award is assessed over a three-year period.
The table below sets out the movement in LTI share scheme PSR’s during the year:
2021 2020
Outstanding 1 August 334,880 472,934Granted during the year 197,276 148,005Forfeited during the year (92,986) (202,179)Exercised during the year (59,068) (83,880)Total 380,102 334,880
2021 PSRs 2020 PSRs
Risk free rate 0.21% 0.83%Volatility 40.27% 37.70%Share price at entitlement date 6.97 9.79Share price at grant date 5.52 9.18Total value of options granted at grant date ($000’s) 468 783
2021 2020
$’000 $’000
(Recoveries)/expenses for equity settled share based payment transactions (610) 523
The fair value of the PSRs awarded at grant date has been determined by an independent third party valuer, using a Monte Carlo simulation to model the total share return for Synlait and the TSR peer group. The fair value of the PSRs awarded, along with key assumptions, are listed below:
The estimated value of the PSRs is amortised over the vesting period from grant date.
(b) Expenses arising from share based payment transactionsTotal expenses arising from share based payment transactions recognised during the period as part of employee benefit expense were as follows:
During the period, 59,068 new ordinary shares were granted to participants of the LTI scheme. See Note 13 for further detail.
PAGE 94 & 95 ANNUAL REPORT 2021

15. RESERVES AND RETAINED EARNINGS
(a) Retained earningsMovements in retained earnings were as follows:
Group
2021 2020
$’000 $’000 (restated)
Balance 1 August 322,006 247,697Net (loss)/profit for the year (28,451) 74,309Balance 31 July 293,555 322,006
(b) Nature and purpose of reserves(i) Cash flow hedge reserve The cash flow hedge reserve comprises the effective portion of the cumulative net change in the fair value of cash flow hedging instruments and the cost of cash flow hedging instruments. Cash flow hedging instruments relate to hedged transactions that have not yet occurred.
(ii) Employee benefits reserveThe current year movement in the employee benefits reserve of ($0.6m) (2020: ($0.3m)) is comprised of the cumulative share based payment expense for share options not yet vested of $0.2m (2020: $0.5m), vesting of rights during the period of ($0.8m) (2020: $0.5m) and the related movement in deferred tax asset of $nil (2020: ($0.3m)).
(c) DividendsNo dividends were declared by the Group during the year.
FINANCIAL RISK MANAGEMENT
The financial risk management section presents information about the Group’s financial risk exposures and the financial instruments used to mitigate this. This section includes the following notes:
16 Financial risk management 98
17 Financial instruments 106
PAGE 96 & 97 ANNUAL REPORT 2021

16. FINANCIAL RISK MANAGEMENT
The Group enters into a variety of derivative financial instruments to manage its exposure to interest rate risk, foreign exchange rate risk, and commodity price risk including forward exchange contracts, interest rate swaps and commodity derivative contracts.
The Group’s activities expose it to a variety of financial risks: market risk (including currency risk, interest rate risk and commodity price risk), credit risk and liquidity risk. The Group’s overall risk management programme focuses on the unpredictability of financial markets and seeks to minimise potential adverse effects on the Group’s financial performance. The Group uses derivative financial instruments to hedge certain risk exposures.
The Group owns 100% of the shares of Dairyworks Ltd (“Dairyworks”). The financial risks to Dairyworks are similar to the financial risks of the Group. Dairyworks currently has its own separate treasury policy from the Group’s policy with the need for its own risk management parameters to reflect the business and markets that it operates in. Any deviation in Dairyworks’ policy from the Group is made explicit in the notes below.
Market riskForeign exchange riskThe Group is exposed to foreign currency risk on its sales, which are predominantly denominated in US dollars. The Group is also exposed to foreign currency risk on the purchase of raw materials for production and capital equipment purchases from overseas. The Group enters into derivative arrangements in the ordinary course of business to manage foreign currency risk. These instruments include forward exchange contracts, option collars and vanilla options. These instruments enable the Group to mitigate the risk the variable exchange rates present to future cash flows for sales receipts or purchases by fixing or limiting the exchange rate at which these cash receipts or payments are exchanged into NZ dollars.
In relation to foreign exchange contracts that are entered into based on forecast cash receipts or payments, variability in the expected timing or amounts of future cash flows can lead to ineffective hedging. To mitigate the risk of ineffectiveness the Group’s policy is to hedge a decreasing proportion of the risk exposure the further into the future the exposure exists given the increasing uncertainty of cash flows. Additionally, the Group’s policy is that the proportion of risk exposure to be hedged changes on a monthly basis in response to the movement in market rates. As at 31 July 2021, the Group has hedged 40% of its exposure to forecast foreign exchange risk on sales, and 25% of its exposure to forecast foreign exchange risk on payables, over the following 2 years.
Interest rate riskInterest rate risk is the risk that the value of the Group’s assets and liabilities will fluctuate due to changes in market interest rates. The Group is exposed to interest rate risk primarily through its bank overdrafts and borrowings.
The Group manages its interest rate risk by using interest rate swaps to convert a portion of its floating rate debt to fixed interest rates in relation to the benchmark interest rate element. As interest rate swaps are entered into based on forecast debt levels, variability in future cash flows and debt levels can lead to ineffective hedging. To mitigate the risk of ineffectiveness the Group’s policy is to hedge a decreasing proportion of the risk exposure the further into the future the exposure exists given the increasing uncertainty of cash flows.
The Group has a Board approved treasury policy that sets the parameters to the extent of the cover taken. The policy requires the Group to hedge 30% to 80% of its exposure to interest rate risk that matures within 3 years, 20% to 60% of the risk that matures between 3 and 5 years, and 0% to 40% of the risk that matures between 5 and 10 years.
Commodity Price RiskDairy commodity price risk is the risk of volatility in profit and loss from the movement in dairy commodity prices to which the Group may be exposed. Volatility in global dairy commodity prices can have an adverse impact on the Groups earnings and milk price by eroding selling prices and increasing input costs.
The Group primarily manages its dairy commodity price risk by:
• Determining the most appropriate mix of products to manufacture based on the milk supply curve and global demand for dairy products;
• Governing the length and terms of sales contracts so that sales revenue is reflective of current market prices and is, where appropriate, linked to Global Dairy Trade (GDT) prices; and
• Using commodity derivative contracts to manage sales price volatility caused by fluctuations in GDT prices.
The Group has a Board approved treasury policy that sets the parameters under which commodity cover is to be taken, including permitted derivative types and volume limits.
PAGE 98 & 99 ANNUAL REPORT 2021

Credit riskThe Group’s exposure to credit risk is mainly influenced by its customer base and banking counterparties. Management has a credit policy in place under which each new customer is rigorously analysed for credit worthiness. Investments and derivatives are only entered into with reputable financial banks.
The carrying amount of financial assets represents the Group’s maximum credit exposure. The Group also retains all the late payment risk in the derecognition of financial assets, as described in note 5.
Synlait Milk Limited guarantees all facilities held by Synlait Milk Finance Limited.
Liquidity riskLiquidity risk represents the Group’s ability to meet its contractual obligations as they fall due. The Group evaluates its liquidity requirements on an ongoing basis and uses a variety of facilities to manage liquidity risk. The Group has negotiated banking facilities sufficient to meet its medium-term facility requirements.
The Group has internal limits in place in order to reduce exposure to liquidity risk, as well as having committed lines of credit. It is the Group’s policy to provide credit and liquidity enhancements only to wholly owned subsidiaries.
Market risk(i) Foreign exchange riskThe Group’s exposure to foreign currency risk at the reporting date was as follows:
2021 2020
USD AUD EUR RMB GBP SGD USD AUD EUR
$’000 $’000 $’000 $’000 $’000 $’000 $’000 $’000 $’000
Trade receivables 39,449 2,664 - - - - 23,039 3,479 -Trade payables (2,618) (179) (227) (95) (87) (4) (7,142) (605) (243)Working capital facility (38,260) - - - - - (22,487) - -Total (1,429) 2,485 (227) (95) (87) (4) (6,590) 2,874 (243)
2021 2020
Weighted average interest rate
Nominal balance
Weighted average interest rate
Nominal balance
% $’000 % $’000
Less than 1 year 4.36% 40,000 4.26% 57,2501 to 2 years 4.36% 40,000 4.36% 40,0002 to 3 years 4.20% 30,000 4.36% 40,0003 to 4 years 3.54% 15,000 4.20% 30,0004 to 5 years 3.56% 10,000 3.54% 15,0005 to 6 years -% - 3.56% 10,0006 to 7 years -% - -% -
(ii) Interest rate riskAs at the reporting date, the Group had the following interest rate swap contracts outstanding:
The above balances include forward start swap contracts for various periods and do not necessarily reflect the current active contracts held at any one point in time.
In managing interest rate risks, the Group aims to reduce the impact of short-term fluctuations on the Group’s earnings. Over the longer term, however, changes in interest rates will have an impact on profit.
2021 2020
Weighted average exchange rate
Nominal balance
Weighted average exchange rate
Nominal balance
USD$’000 USD$’000
USDExportsLess than 1 year 0.6694 362,390 0.6478 379,5001 to 2 years 0.7084 174,200 0.6318 192,050
ImportsLess than 1 year 0.7053 (37,671) 0.6368 (46,021)
AUDExportsLess than 1 year 0.9252 7,467 - -
The Group’s exposure to foreign currency in the period ended 31 July 2021 is limited to its sales of dairy products, purchases of raw materials for production and capital equipment purchases. As at the reporting date, the Group had the following foreign exchange derivative instruments outstanding in respect of future foreign currency transactions:
16. FINANCIAL RISK MANAGEMENT (CONTINUED)
PAGE 100 & 101 ANNUAL REPORT 2021

Post-tax impact on theIncome statement
Post-tax impact on cashFlow hedge reserve (equity)
2021 2020 2021 2020$’000 $’000 $’000 $’000
Interest rates100 basis point increase in interest rate (3,207) (2,879) 838 1,252100 basis point decrease in interest rate 3,207 2,879 (866) (1,303)
Foreign exchange rates5% increase in exchange rate 333 - 24,502 27,1275% decrease in exchange rate 357 - (27,067) (29,966)
(iv) Commodity derivativesDuring the reporting period the Group entered into a small number of commodity derivative contracts to further support the Group’s existing financial risk management strategy. The movement in the fair value of the commodity derivatives is included within the cash flow hedge reserve.
(iii) Sensitivity analysis The following table summarises the sensitivity of the Group’s profit and equity to interest rate risk and foreign exchange risk.
The sensitivity analysis below has been determined based on the mark to market impact on financial instruments of changing interest and foreign exchange rates at balance date. The analysis is prepared assuming the amount of the financial instrument outstanding at the balance sheet date was outstanding for the whole year, and by adjusting one input whilst keeping the others constant.
Liquidity riskThe total repayments and associated maturity of financial liabilities as at balance date is reported below:
Less than 12 months
Between 1 and 2 years
Between 2 and 5 years
Over 5 years
Total
$’000 $’000 $’000 $’000 $’000
At 31 July 2021Working capital facility - 115,423 - - 115,423Trade and other payables 264,068 - - - 264,068Loans and borrowings 32,569 32,594 312,331 - 377,494Derivative financial instruments 10,770 7,167 1,663 - 19,600Lease liabilities 3,243 3,089 7,275 1,411 15,018Total 310,650 158,273 321,269 1,411 791,603
At 31 July 2020Working capital facility 102,837 - - - 102,837Trade and other payables 238,771 - - - 238,771Loans and borrowings - 149,790 276,964 - 426,754Derivative financial instruments 14,148 835 2,782 1,188 18,953Lease liabilities 4,422 3,206 8,106 3,525 19,260Total 360,178 153,831 287,852 4,713 806,574
16. FINANCIAL RISK MANAGEMENT (CONTINUED)
PAGE 102 & 103 ANNUAL REPORT 2021
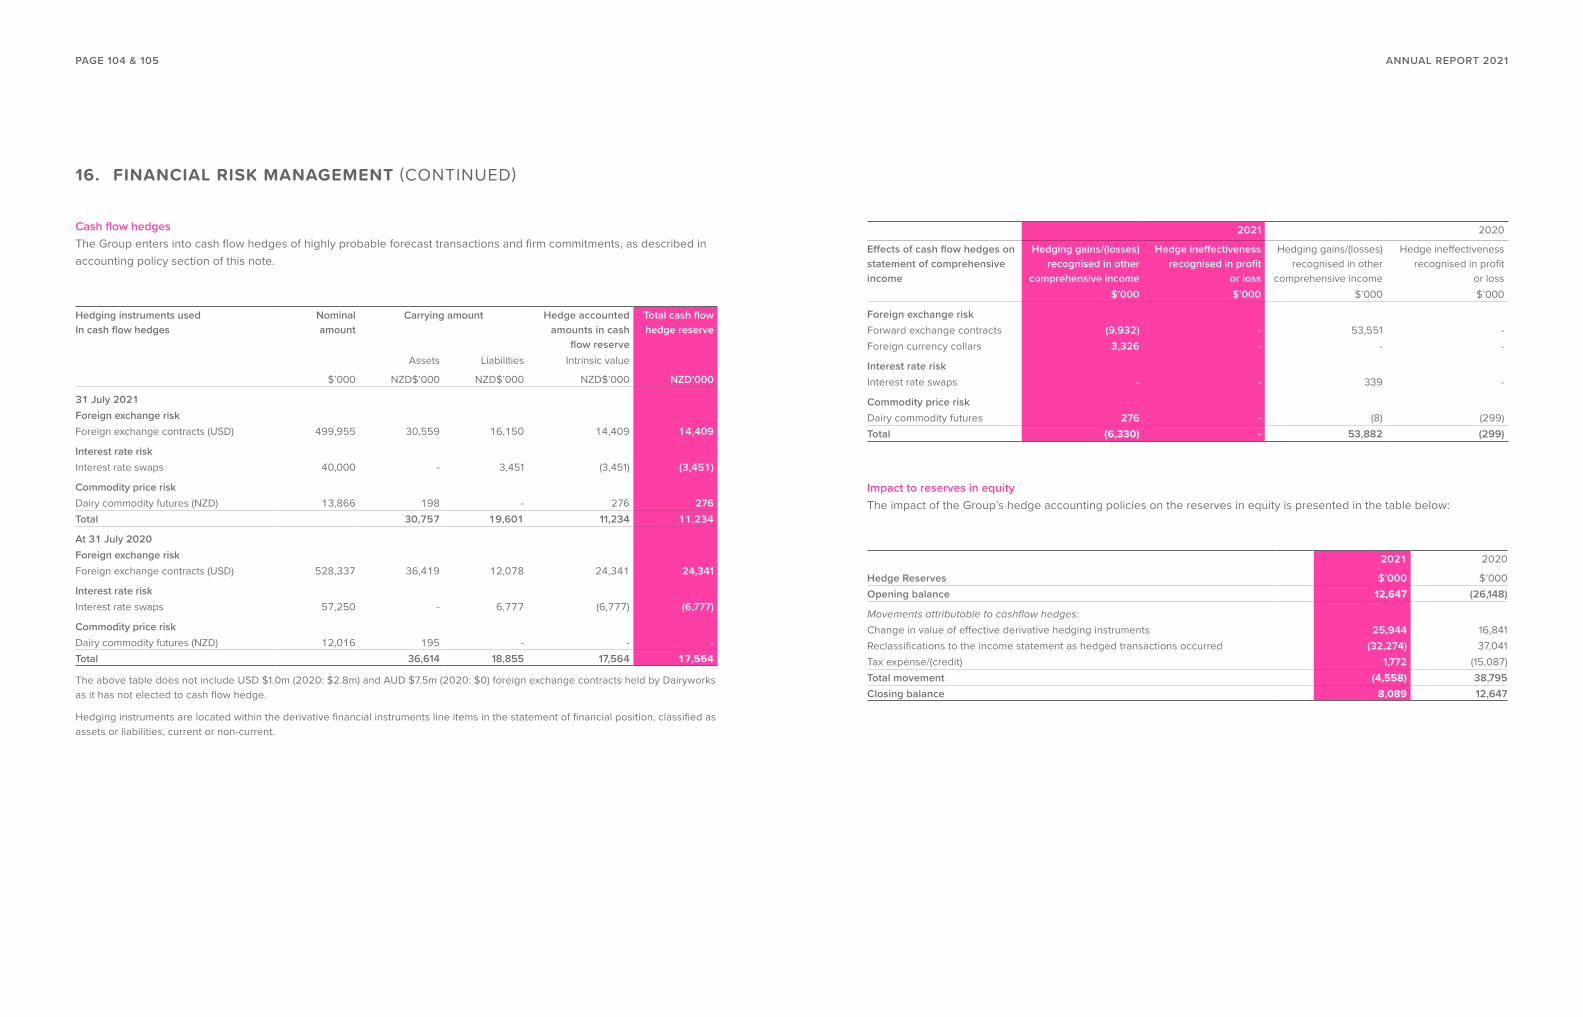
Hedging instruments usedIn cash flow hedges
Nominal amount
Carrying amount Hedge accounted amounts in cash
flow reserve
Total cash flow hedge reserve
Assets Liabilities Intrinsic value
$’000 NZD$’000 NZD$’000 NZD$’000 NZD’000
31 July 2021Foreign exchange riskForeign exchange contracts (USD) 499,955 30,559 16,150 14,409 14,409
Interest rate riskInterest rate swaps 40,000 - 3,451 (3,451) (3,451)
Commodity price riskDairy commodity futures (NZD) 13,866 198 - 276 276Total 30,757 19,601 11,234 11,234
At 31 July 2020Foreign exchange riskForeign exchange contracts (USD) 528,337 36,419 12,078 24,341 24,341
Interest rate riskInterest rate swaps 57,250 - 6,777 (6,777) (6,777)
Commodity price riskDairy commodity futures (NZD) 12,016 195 - - -Total 36,614 18,855 17,564 17,564
Cash flow hedgesThe Group enters into cash flow hedges of highly probable forecast transactions and firm commitments, as described in accounting policy section of this note.
The above table does not include USD $1.0m (2020: $2.8m) and AUD $7.5m (2020: $0) foreign exchange contracts held by Dairyworks as it has not elected to cash flow hedge.
Hedging instruments are located within the derivative financial instruments line items in the statement of financial position, classified as assets or liabilities, current or non-current.
2021 2020
Effects of cash flow hedges on statement of comprehensive income
Hedging gains/(losses) recognised in other
comprehensive income
Hedge ineffectiveness recognised in profit
or loss
Hedging gains/(losses) recognised in other
comprehensive income
Hedge ineffectiveness recognised in profit
or loss$’000 $’000 $’000 $’000
Foreign exchange riskForward exchange contracts (9,932) - 53,551 -Foreign currency collars 3,326 - - -
Interest rate riskInterest rate swaps - - 339 -
Commodity price riskDairy commodity futures 276 - (8) (299)Total (6,330) - 53,882 (299)
Impact to reserves in equityThe impact of the Group’s hedge accounting policies on the reserves in equity is presented in the table below:
2021 2020
Hedge Reserves $’000 $’000Opening balance 12,647 (26,148)
Movements attributable to cashflow hedges:Change in value of effective derivative hedging instruments 25,944 16,841Reclassifications to the income statement as hedged transactions occurred (32,274) 37,041Tax expense/(credit) 1,772 (15,087)Total movement (4,558) 38,795Closing balance 8,089 12,647
16. FINANCIAL RISK MANAGEMENT (CONTINUED)
PAGE 104 & 105 ANNUAL REPORT 2021

17. FINANCIAL INSTRUMENTS
ClassificationThe Group classifies its financial assets in three categories: at amortised cost, at fair value through other comprehensive income and at fair value through profit or loss. The classification of financial assets depends on the business model within which the financial asset is held and its contractual cash flow characteristics.
The Group classifies its financial liabilities in two categories: at amortised cost and at fair value through profit or loss.
(i) Financial instruments at amortised costFinancial assets are classified as measured at amortised cost if the Group’s intention is to hold the financial assets for collecting cash flows and the contractual terms give rise on specified dates to cash flows that are solely payments of principal and interest.
The Group currently classifies its cash and cash equivalents, restricted cash equivalents, accounts receivable and other receivables as financial assets measured at amortised cost.
Financial liabilities are classified as measured at amortised cost using the effective interest method, with the exception of those classified at fair value.
The Group currently classifies its accounts payable, accrued liabilities (excluding derivatives) and term debt as financial liabilities measured at amortised cost.
(ii) Financial instruments at fair value through other comprehensive income (“FVOCI”)The Group has elected to designate certain investments in equity instruments that are not held for trading as FVOCI at initial recognition and to present gains and losses in other comprehensive income. Dividends earned from such investments are recognised in profit or loss.
(iii) Financial instruments at fair value through profit or loss (“FVPL”)Financial assets that do not meet the criteria for classification as measured at either amortised cost or FVOCI are classified as FVPL.
Derivative financial instruments that are not in an effective hedge relationship are classified as FVPL.
Recognition and measurementThe Group recognises a financial asset or a financial liability when it becomes a party to the contractual provisions of the instrument.
Regular purchases and sales of financial assets are recognised on the trade date – the date on which the Group commits to purchase or sell the asset. Investments are initially recognised at fair value plus transaction costs for all financial assets not classified at fair value through profit or loss. Financial assets carried at fair value through profit or loss are initially recognised at fair value, and transaction costs are expensed in profit and loss.
Where financial assets are subsequently measured at amortised cost, interest revenue, credit losses and foreign exchange gains or losses are recognised in profit or loss. On derecognition, any gain or loss is recognised in profit or loss. Financial liabilities subsequently measured at amortised cost are measured using the effective interest method.
Where investments in equity instruments are designated as FVOCI, fair value gains and losses are recognised in other comprehensive income. Dividends earned from such investments are recognised in profit or loss.
Where financial assets are subsequently measured at FVPL, all gains and losses are recognised in profit or loss.
A key management judgement is the assessment that substantially all the risks and rewards of ownership have been transferred in the derecognition of financial assets.
Financial assets are derecognised when the rights to receive cash flows from the investments have expired or have been transferred and the Group has transferred substantially all risks and rewards of ownership.
Financial liabilities are derecognised when the contractual obligations are discharged, cancelled or expired.
Fair Value EstimationThe fair value of financial assets and financial liabilities must be estimated for recognition and measurement or for disclosure purposes.
As the Group’s financial instruments, with the exception of retail bonds, are not traded in active markets their fair value is determined using valuation techniques. The Group uses a variety of methods and makes assumptions that are based on market conditions existing at each balance date.
PAGE 106 & 107 ANNUAL REPORT 2021

All financial instruments held at fair value are included in level 2 of the valuation hierarchy as defined in NZ IFRS 13, with the exception of the retail bonds, which are included in level 1. The retail bonds are listed instruments on the NZDX and the Group is satisfied there is sufficient trading in these instruments to qualify as an active market.
The fair value of foreign currency forward contracts is determined using forward exchange rates at balance date. The fair value of foreign exchange option agreements is determined using forward exchange rates at balance date. The fair value of interest rate swaps is determined using forward interest rates as at reporting date. The fair value of commodity derivatives is determined using NZX settlement prices.
Offsetting financial instrumentsFinancial assets and liabilities are offset and the net amount reported in the statement of financial position when there is a current legally enforceable right to offset the recognised amounts and there is an intention to settle on a net basis or realise the asset and settle the liability simultaneously. There are master netting agreements in place for derivative financial instruments held, however these instruments have not been offset in the statement of financial position as they do not currently meet the criteria for offset.
Impairment of financial assetsThe Group has adopted the expected credit loss (“ECL”) model. For further detail please refer to note 5. The Group assesses whether there is evidence that a financial asset or group of financial assets is impaired, with the exception of assets that are fair valued through profit or loss. A financial asset or a group of financial assets can be impaired and the impairment losses are recognised in accordance with IFRS 9. The Group continues to assess if historical and future objective evidence of impairment exists after the initial recognition of the asset.
Derivative financial instruments - hedge accountingThe Group enters into a variety of derivative financial instruments to manage its exposure to interest rate risk, foreign exchange rate risk, and commodity price risk including forward exchange contracts, interest rate swaps, and commodity derivative contracts.
Derivatives are initially recognised at fair value at the date the derivative contact is entered into and are subsequently remeasured to fair value at each reporting date. For derivatives measured at fair value, the gain or loss that results from changes in fair value of the derivative is recognised in earnings immediately, unless the derivative is designated and effective as a hedging instrument. Hedges of highly probable forecast transactions or hedges of foreign currency risk of firm commitments are designated as cash flow hedges by the Group, with the exception for Dairyworks.
The full fair value of a hedging derivative is classified as a current asset or liability when the remaining term of the hedged item is 12 months or less from balance date, or when cash flows arising from the hedged item will occur within 12 months or less from balance date. The full fair value of a hedging derivative is classified as a non-current asset or liability when the remaining maturity of the hedged item is more than 12 months, and no cash flows will occur within 12 months of balance date.
(i) Hedge accountingThe Group designates certain hedging instruments in respect of foreign currency risk and interest rate risk as cash flow hedges. Hedges of risk on firm commitments and highly probably transactions are accounted for as cash flow hedges.
At the inception of the hedge relationship, the Group documents the relationship between the hedging instrument and the hedged item, along with its risk management objectives and its strategy for undertaking various hedge transactions. Furthermore, at the inception of the hedge and on an ongoing basis, the Group documents whether the hedging instrument that is used in a hedging relationship is highly effective in offsetting changes in fair values or cash flows of the hedged item.
(ii) Cash flow hedgeThe effective portion of changes in the fair value of derivatives that are designated and qualify as cash flow hedges are recognised in other comprehensive income and accumulated as a separate component of equity in the hedging reserve. The gain or loss relating to the ineffective portion and reclassification adjustments are recognised immediately in profit or loss, included in revenue for foreign exchange instruments and commodity price derivatives, and finance costs for interest rate swaps.
Amounts recognised in the hedging reserve are classified from equity to profit or loss (as a reclassification adjustment) in the periods when the hedged item is recognised in profit or loss, in the same line as the recognised hedged item.
Hedge accounting is discontinued when the Group revokes the hedging relationships, the hedging instrument expires or is sold, terminated, or exercised, or no longer qualifies for hedge accounting. Any cumulative gain or loss recognised in the hedging reserve at that time remains in equity and is recognised when the forecast transaction is ultimately recognised in profit or loss. When a forecast transaction is no longer expected to occur, the cumulative gain or loss that was recognised in the hedging reserve is immediately recorded in profit or loss.
The Group separates the intrinsic value and time value of vanilla option and collar contracts, designating only the intrinsic value as the hedging instrument. The time value, including any gains or losses, is recognised in other comprehensive income until the hedged transaction occurs and is recognised in profit or loss.
(iii) Derivatives that do not qualify for hedge accountingCertain derivative instruments do not qualify for hedge accounting. Changes in the fair value of any derivative instrument that does not qualify for hedge accounting are recognised immediately in the income statement.
17. FINANCIAL INSTRUMENTS (CONTINUED)
PAGE 108 & 109 ANNUAL REPORT 2021

At amortised cost At fair value through other comprehensive
income
At fair value through profit or loss
Total
Financial assets $’000 $’000 $’000 $’000
At 31 July 2021Cash and cash equivalents 16,020 - - 16,020Derivative financial instruments - - 30,996 30,996Trade and other receivables 108,380 - - 108,380Instruments in equity - 110 - 110Total 124,400 110 30,996 155,506
At 31 July 2020Cash and cash equivalents 5,887 - - 5,887Derivative financial instruments - - 36,614 36,614Trade and other receivables 63,057 - - 63,057Instruments in equity - 143 - 143Total 68,944 143 36,614 105,701
At amortised cost At fair value through profit or loss
Total
Financial liabilities $’000 $’000 $’000
At 31 July 2021Derivative financial instruments - 19,600 19,600Working capital facility 115,423 - 115,423Lease liabilities 15,018 - 15,018Trade and other payables 264,068 - 264,068Loans and borrowings 377,494 - 377,494Total 772,003 19,600 791,603
At 31 July 2020Derivative financial instruments - 18,953 18,953Working capital facility 102,837 - 102,837Lease liabilities 19,260 - 19,260Trade and other payables 238,771 - 238,771Borrowings 426,754 - 426,754Total 787,622 18,953 806,575
(a) Financial instruments by category
All derivative financial instruments are designated in effective hedge relationships, with exception for derivative financial instruments held by Dairyworks.
For instruments held at amortised cost, carrying amount is considered a reasonable approximation for fair value, with exception to the Retail Bond (the fair value of the Retail Bond is shown at note 12).
OTHER This section contains additional information regarding the performance of the group during the financial year. This section includes the following notes:
18 Income tax 112
19 Other investments 116
20 Related party transactions 118
21 Contingencies 120
22 Commitments 120
23 Events occurring after the reporting period 121
24 Other accounting policies 121
17. FINANCIAL INSTRUMENTS (CONTINUED)
PAGE 110 & 111 ANNUAL REPORT 2021

18. INCOME TAX
Tax expense for the period comprises current and deferred tax. Tax is recognised in the profit and loss component of the statement of comprehensive income, except to the extent that it relates to items recognised in other comprehensive income or directly in equity. In this case, tax is also recognised in other comprehensive income or directly in equity, respectively.
Current tax is the expected tax payable on taxable income for the year, using tax rates enacted or substantively enacted at the reporting date, and any adjustment to tax payable in respect of previous years.
Deferred tax is recognised using the balance sheet method, providing for temporary differences between the carrying amounts of assets and liabilities for financial reporting purposes and the amounts used for taxation purposes. Deferred tax is measured at the tax rates that are expected to be applied to the temporary differences when they reverse, based on the laws that have been enacted or substantively enacted by the reporting date.
A deferred tax asset is recognised to the extent that it is probable that future taxable profits will be available against which the temporary difference can be utilised. Deferred tax assets are reviewed at each reporting date and are reduced to the extent that it is no longer probable that the related tax benefit will be realised.
New Zealand tax consolidated groupSynlait Milk Limited and its wholly-owned New Zealand controlled entity, Synlait Milk Finance Limited, form a tax consolidated group. The New Zealand Dairy Company Limited, Eighty Nine Richard Pearse Drive Limited, Dairyworks Limited and Synlait Milk (Dunsandel Farms) Limited are not members of the tax consolidated group.
2021 2020
$’000 $’000 (restated)
(a) Income tax expense
Current tax expenseCurrent tax on loss/profit for the year 17,628 (21,614)Current tax on prior period adjustments 404 4,212Total 18,032 (17,402)
Deferred tax expenseTemporary differences (7,204) (6,721)Changes in tax rates and laws - 2,229Prior year adjustments (356) (4,473)Change in estimate 231 -Tax losses to carry forward - 23Total deferred tax (7,329) (8,942)Income tax benefit/(expense) 10,703 (26,344)
(b) Reconciliation of effective tax rate(Loss)/profit before income tax (39,154) 100,653Income tax using the Group’s domestic tax rate - 28% 10,963 (28,183)Non-deductible costs (1,245) (889)Total 9,718 (29,072)
Prior year adjustments 47 (261)Deferred tax credit relating to changes in tax rates and laws - 2,229Deferred tax credit relating to change in estimate 232 -Research and development tax credit 750 779Other tax effects for reconciliation between accounting profit and tax expense (44) (19)Total 985 2,728Income tax benefit/(expense) 10,703 (26,344)
2021 2020
$’000 $’000 (restated)
(c) Imputation credits
Imputation credits available directly and indirectly to the shareholders of the Group 84,590 98,009
As part of the New Zealand Government’s COVID-19: Economic Response Package, depreciation deductions were reintroduced for new and existing industrial and commercial buildings from the 2020/21 tax year. The Group determined that, as a result of this legislative change, the tax base of certain assets had increased, reducing a taxable temporary difference (deferred tax liability) previously recognised. The impact of these changes resulted in a reduction in deferred tax liabilities and a reduction in tax expense of $2.2m in the 2020 financial year as noted above.
PAGE 112 & 113 ANNUAL REPORT 2021

(d) Income tax recognised in other comprehensive incomeThe tax credit/(charge) relating to components of other comprehensive income is as follows:
(e) Deferred taxationThe balance comprises temporary differences attributable to:
Before tax Tax benefit/(expense) After tax$’000 $’000 $’000
31 July 2021Cash flow hedges (6,330) 1,772 (4,558)Other comprehensive income (6,330) 1,772 (4,558)
31 July 2020Cash flow hedges 53,882 (15,087) 38,795Other comprehensive income 53,882 (15,087) 38,795
2021 2020
$’000 $’000 (restated)
AssetsTax losses carried forward 49 23Other items 4,297 2,793Total deferred tax assets 4,346 2,816
LiabilitiesProperty, plant and equipment (55,995) (46,863)Derivatives (3,146) (4,918)Intangible assets (4,638) (4,913)Total deferred tax liabilities (63,779) (56,694)Total deferred tax (59,433) (53,878)
Balance1 Aug 2020
Recognised in profit or
loss
Recognised in other
comprehensive income
Recognised directly in
equity
Recognised from a
business combination
Prior year adjustment
Balance 31 July 2021
$’000 $’000 $’000 $’000 $’000 $’000 $’000
Property, plant and equipment (46,863) (8,823) - - - (309) (55,995)Derivatives (4,918) - 1,772 - - - (3,146)Other items 2,793 1,529 - - - (24) 4,298Tax losses carried forward 23 49 - - - (23) 49Intangible assets (4,913) 274 - - - - (4,639)Total (53,878) (6,971) 1,772 - - (356) (59,433)
Balance1 Aug 2019
Recognised in profit or
loss
Recognised in other
comprehensive income
Recognised directly in
equity
Recognised from a
business combination
Prior year adjustment
Balance 31 July 2020
$’000 (restated)
$’000 (restated)
$’000 $’000 $’000 $’000 $’000
Property, plant and equipment (37,023) (5,572) - - 227 (4,495) (46,863)Derivatives 10,169 - (15,087) - - - (4,918)Other items 2,128 1,080 - (389) (160) 134 2,793Tax losses carried forward 112 23 - - - (112) 23Intangible assets - - - - (4,913) - (4,913)Total (24,614) (4,469) (15,087) (389) (4,846) (4,473) (53,878)
The opening deferred tax balance relating to intangible assets and profit or loss impact for the year ended 31 July 2020 has been restated to reflect a change in accounting policy. Please refer to note 9 for further detail.
18. INCOME TAX (CONTINUED)
PAGE 114 & 115 ANNUAL REPORT 2021

19. OTHER INVESTMENTS
Investments in associatesAssociates are those entities in which the Group, either directly or indirectly, holds a significant but not a controlling interest, and has significant influence. Investments in associates are accounted for using the equity method and are measured in the statement of financial position at cost plus post acquisition changes in the Group’s share of net assets. Goodwill relating to associates is included in the carrying amount of the investment. Dividends reduce the carrying value of the investment.
2021 2020
$’000 $’000
Equity securities 110 110Investment in associates - 33Total other investments 110 143
Synlait Milk Limited held, either directly or indirectly, interests in the following entities at the end of the reporting period:
Equity holding
Name of entity
Country of incorporation
Class of shares
2021 %
2020 %
Synlait Milk Finance Limited (Subsidiary) New Zealand Ordinary 100 100The New Zealand Dairy Company Limited (Subsidiary) New Zealand Ordinary 100 100Eighty Nine Richard Pearse Drive Limited (Subsidiary) New Zealand Ordinary 100 100Sichuan New Hope Nutritional Foods Co. Ltd (Associate) China Ordinary 25 25Synlait Business Consulting (Shanghai) Limited (Subsidiary) China Ordinary 100 100Synlait Foods (Talbot Forest) Limited (Subsidiary)* New Zealand Ordinary - 100Dairyworks Limited (Subsidiary) New Zealand Ordinary 100 100Dairyworks (Australia) Pty Limited (Subsidiary) Australia Ordinary 100 100Synlait Milk (Dunsandel Farms) Limited (Subsidiary) New Zealand Ordinary 100 -
*In December 2020 Synlait Foods (Talbot Forest) Limited was amalgamated with Dairyworks Limited.
AssociatesIn January 2015, the Group acquired 25% of the shares of Sichuan New Hope Nutritionals, an infant formula company registered in China. This company owns and markets the “Akara” and “E-Akara” infant formula brands in the Chinese market, which are exclusively manufactured by Synlait Milk Limited.
The investment is not individually significant to the Group. The Group’s share of this equity accounted investment is as follows:
The carrying value of the investment in New Hope Nutritionals at balance date:
2021 2020
$’000 $’000
(Loss)/gain from continuing operations (33) 33Total (33) 33
2021 2020
$’000 $’000
Opening balance 33 -Share of (losses)/gains (33) 33Total - 33
PAGE 116 & 117 ANNUAL REPORT 2021
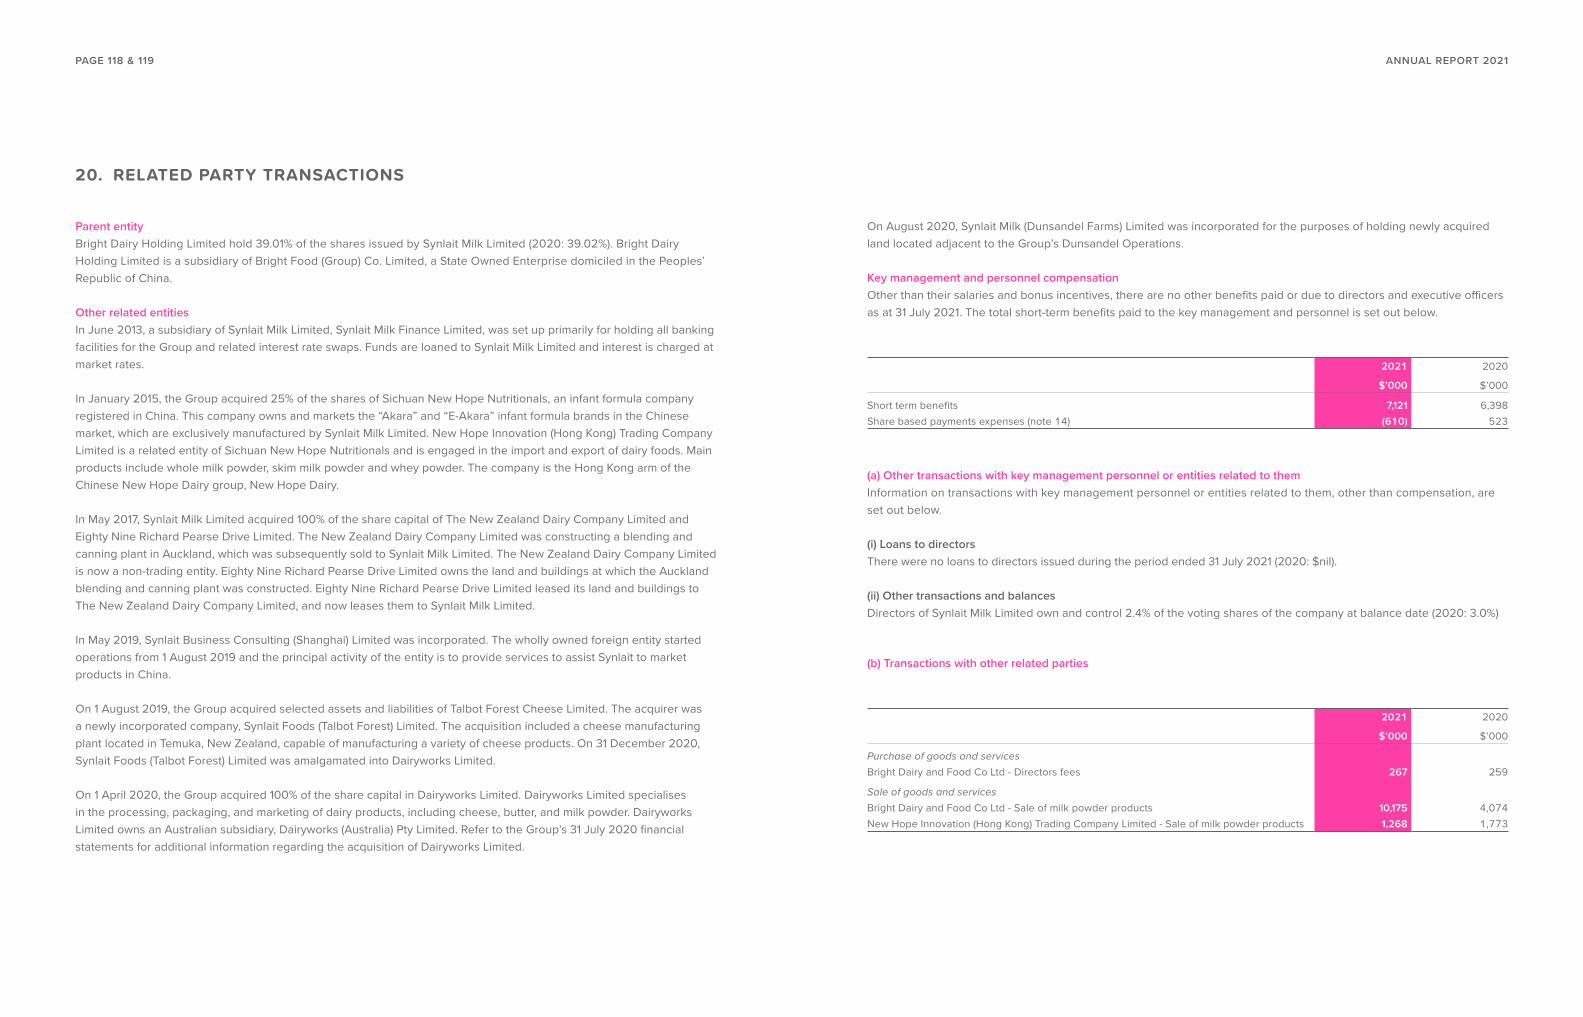
20. RELATED PARTY TRANSACTIONS
Parent entityBright Dairy Holding Limited hold 39.01% of the shares issued by Synlait Milk Limited (2020: 39.02%). Bright Dairy Holding Limited is a subsidiary of Bright Food (Group) Co. Limited, a State Owned Enterprise domiciled in the Peoples’ Republic of China.
Other related entitiesIn June 2013, a subsidiary of Synlait Milk Limited, Synlait Milk Finance Limited, was set up primarily for holding all banking facilities for the Group and related interest rate swaps. Funds are loaned to Synlait Milk Limited and interest is charged at market rates.
In January 2015, the Group acquired 25% of the shares of Sichuan New Hope Nutritionals, an infant formula company registered in China. This company owns and markets the “Akara” and “E-Akara” infant formula brands in the Chinese market, which are exclusively manufactured by Synlait Milk Limited. New Hope Innovation (Hong Kong) Trading Company Limited is a related entity of Sichuan New Hope Nutritionals and is engaged in the import and export of dairy foods. Main products include whole milk powder, skim milk powder and whey powder. The company is the Hong Kong arm of the Chinese New Hope Dairy group, New Hope Dairy.
In May 2017, Synlait Milk Limited acquired 100% of the share capital of The New Zealand Dairy Company Limited and Eighty Nine Richard Pearse Drive Limited. The New Zealand Dairy Company Limited was constructing a blending and canning plant in Auckland, which was subsequently sold to Synlait Milk Limited. The New Zealand Dairy Company Limited is now a non-trading entity. Eighty Nine Richard Pearse Drive Limited owns the land and buildings at which the Auckland blending and canning plant was constructed. Eighty Nine Richard Pearse Drive Limited leased its land and buildings to The New Zealand Dairy Company Limited, and now leases them to Synlait Milk Limited.
In May 2019, Synlait Business Consulting (Shanghai) Limited was incorporated. The wholly owned foreign entity started operations from 1 August 2019 and the principal activity of the entity is to provide services to assist Synlait to market products in China.
On 1 August 2019, the Group acquired selected assets and liabilities of Talbot Forest Cheese Limited. The acquirer was a newly incorporated company, Synlait Foods (Talbot Forest) Limited. The acquisition included a cheese manufacturing plant located in Temuka, New Zealand, capable of manufacturing a variety of cheese products. On 31 December 2020, Synlait Foods (Talbot Forest) Limited was amalgamated into Dairyworks Limited.
On 1 April 2020, the Group acquired 100% of the share capital in Dairyworks Limited. Dairyworks Limited specialises in the processing, packaging, and marketing of dairy products, including cheese, butter, and milk powder. Dairyworks Limited owns an Australian subsidiary, Dairyworks (Australia) Pty Limited. Refer to the Group’s 31 July 2020 financial statements for additional information regarding the acquisition of Dairyworks Limited.
On August 2020, Synlait Milk (Dunsandel Farms) Limited was incorporated for the purposes of holding newly acquired land located adjacent to the Group’s Dunsandel Operations.
Key management and personnel compensationOther than their salaries and bonus incentives, there are no other benefits paid or due to directors and executive officers as at 31 July 2021. The total short-term benefits paid to the key management and personnel is set out below.
2021 2020
$’000 $’000
Short term benefits 7,121 6,398Share based payments expenses (note 14) (610) 523
2021 2020
$’000 $’000
Purchase of goods and servicesBright Dairy and Food Co Ltd - Directors fees 267 259
Sale of goods and servicesBright Dairy and Food Co Ltd - Sale of milk powder products 10,175 4,074New Hope Innovation (Hong Kong) Trading Company Limited - Sale of milk powder products 1,268 1,773
(b) Transactions with other related parties
(a) Other transactions with key management personnel or entities related to themInformation on transactions with key management personnel or entities related to them, other than compensation, are set out below.
(i) Loans to directorsThere were no loans to directors issued during the period ended 31 July 2021 (2020: $nil).
(ii) Other transactions and balancesDirectors of Synlait Milk Limited own and control 2.4% of the voting shares of the company at balance date (2020: 3.0%)
PAGE 118 & 119 ANNUAL REPORT 2021

(c) Outstanding balancesThe following balances are outstanding at the reporting date in relation to transactions with related parties other than key management personnel:
2021 2020
$’000 $’000
Current receivables (sales of goods and services)Bright Dairy and Food Co Ltd - Sale of milk powder products 3,040 -Bright Dairy and Food Co Ltd - Reimbursement of costs (583) (492)Sichuan New Hope Nutritionals Ltd - Sale of milk powder products - (71)Sichuan New Hope Nutritionals Ltd - Other costs 559 292New Hope Innovation (Hong Kong) - Sale of milk powder products 272 -
22. COMMITMENTS
(a) Capital commitmentsCapital expenditure contracted for at the end of the reporting period but not yet incurred is as follows:
The above balances have been committed in relation to future expenditure on capital projects. Amounts already spent have been included as work in progress.
2021 2020
$’000 $’000
Pokeno modifications 16,094 -Pokeno processing plant 2,450 10,264Liquid dairy packaging facility - 1,188ERP Implementation 6,657 -Separator capacity upgrade - 419Dry Store 4 758 14,100Pokeno waste water Initiative - 571Dunsandel land and farm assets - 25,700Total 25,959 52,242
21. CONTINGENCIES
No significant contingent liabilities are outstanding at balance date (2020: indeterminable due to a range of possible outcomes for the Pokeno land covenant dispute which was settled in the year).
23. EVENTS OCCURRING AFTER THE REPORTING PERIOD
On 17 August 2021 the New Zealand Government, as part of its COVID-19 response, moved the country to Alert Level 4, subsequently moving to Level 3 on 31 August 2021 and Level 2 on 7 September 2021, except for Auckland which remained at Level 4 until 21 September 2021 when it moved to Level 3. The changes in domestic alert levels are not expected to result in any further material negative impact to the Group’s financial performance.
On 8 September 2021, the Group announced the proposed restructuring of its workforce. The proposal is not expected to result in any material restructuring related costs or liabilities.
On 9 September 2021 the Group announced the sale and leaseback of a building and related land located in Auckland. The sale price is $30.1m with settlement expected to occur on 4 October 2021. The book value of the building and related land as at 31 July 2021 was $12.2m.
There were no other events which occurred subsequent to balance date which require adjustment to or disclosure in the financial statements.
24. OTHER ACCOUNTING POLICIES
Cash and cash equivalentsCash and cash equivalents comprise cash balances, call deposits and cash held on trust by Tax Management New Zealand Ltd.
Goods and Services Tax (GST)The profit and loss components of the statement of comprehensive income have been prepared so that all components are stated exclusive of GST. All items in the financial position are stated net of GST, with the exception of receivables and payables, which include GST invoiced.
20. RELATED PARTY TRANSACTIONS (CONTINUED)
PAGE 120 & 121 ANNUAL REPORT 2021

INDEPENDENT AUDITOR’S REPORT TO THE SHAREHOLDERS OF SYNLAIT MILK LIMITED
KEY AUDIT MATTER
Opinion We have audited the consolidated financial statements of Synlait Milk Limited and its subsidiaries (the ‘Group’), which comprise the consolidated statement of financial position as at 31 July 2021, and the consolidated income statement, statement of comprehensive income, statement of changes in equity and statement of cash flows for the year then ended, and notes to the consolidated financial statements, including a summary of significant accounting policies.
In our opinion, the accompanying consolidated financial statements, on pages 51 to 121, present fairly, in all material respects, the consolidated financial position of the Group as at 31 July 2021, and its consolidated financial performance and cash flows for the year then ended in accordance with New Zealand Equivalents to International Financial Reporting Standards (‘NZ IFRS’) and International Financial Reporting Standards (‘IFRS’).
Basis for opinionWe conducted our audit in accordance with International Standards on Auditing (‘ISAs’) and International Standards on Auditing (New Zealand) (‘ISAs (NZ)’). Our responsibilities under those standards are further described in the Auditor’s Responsibilities for the Audit of the Consolidated Financial Statements section of our report.
We believe that the audit evidence we have obtained is sufficient and appropriate to provide a basis for our opinion.
We are independent of the Company in accordance with Professional and Ethical Standard 1 International Code of Ethics for Assurance Practitioners (including International Independence Standards) (New Zealand) issued by the New Zealand Auditing and Assurance Standards Board and the International Ethics Standards Board for Accountants’ International Code of Ethics for Professional Accountants (including International Independence Standards), and we have fulfilled our other ethical responsibilities in accordance with these requirements.
Other than in our capacity as auditor and the provision of other assurance and taxation compliance services, we have no relationship with or interests in the Company or any of its subsidiaries. These services have not impaired our independence as auditor of the Company and Group.
Audit materialityWe consider materiality primarily in terms of the magnitude of misstatement in the financial statements of the Group that in our judgement would make it probable that the economic decisions of a reasonably knowledgeable person would be changed or influenced (the ‘quantitative’ materiality). In addition, we also assess whether other matters that come to our attention during the audit would in our judgement change or influence the decisions of such a person (the ‘qualitative’ materiality). We use materiality both in planning the scope of our audit work and in evaluating the results of our work.
We determined materiality for the Group financial statements as a whole to be $4,600,000.
Key audit mattersKey audit matters are those matters that, in our professional judgement, were of most significance in our audit of the consolidated financial statements of the current period. These matters were addressed in the context of our audit of the consolidated financial statements as a whole, and in forming our opinion thereon, and we do not provide a separate opinion on these matters.
Goodwill and Brands Impairment Assessment At 31 July 2021 the Group has $64.2m of goodwill and $16.6m of brands on the balance sheet as outlined in Note 9.
The carrying values of goodwill and brands are dependent on the future cash flows expected to be generated by the underlying businesses, and there is a risk if these cash flows do not meet the Group’s expectations that the assets may be impaired.
The Group tests goodwill and brands at least annually by determining the recoverable amount (the higher of value-in-use or fair value less costs to sell) of the individual assets where possible, or otherwise the cash generating units, or groups of cash generating units, to which the assets belong and comparing the recoverable amounts of the assets to their carrying values.
The impairment calculations prepared by the Group contain a number of significant assumptions. Changes in these assumptions might lead to a change in the carrying value of brands and goodwill.
The Group has calculated the recoverable amount of brands based on fair value using the relief from royalty method. The key assumptions applied in the above model are:
• Annual revenue and expense growth rates for the 5 year forecast period;
• post-tax discount rates;
• royalty rates; and
• terminal growth rates.
The Group has calculated the recoverable amount of each cash generating unit (“CGU”) or group of CGU’s to which goodwill has been allocated based on value-in-use models. The key assumptions applied in the value-in-use models are:
• Annual revenue and expense growth rates for the 5 year forecast period;
• pre-tax discount rates; and
• terminal growth rates.
In addition, the outbreak of COVID-19 and the subsequent quarantine measures imposed by the New Zealand and other governments as well as the travel and trade restrictions imposed by New Zealand and other countries have caused disruption to business and economic activity. The impact (known or expected) as a result of the above for the Group needs to be factored in to the annual brand and goodwill impairment assessment.
HOW OUR AUDIT ADDRESSED THE KEY AUDIT MATTERWe considered whether the Group’s methodology for assessing impairment is compliant with NZ IAS 36: Impairment of Assets. We focused on testing and challenging the suitability of the models and reasonableness of the assumptions used by the Group in conducting their impairment reviews.
Our procedures included:
• Agreeing a sample of future cash flows to Board approved forecasts;
• Challenging the reliability of the Group’s revenue and expense growth rates by comparing the forecasts underlying the growth rates to historical forecasts and actual results of the underlying businesses (where applicable). This also included consideration of the impact of COVID-19 on both forecast revenue and profitability of the CGU’s and brands;
• Assessing the reasonableness of key assumptions and changes to them from previous years; and
• Assessing management’s determination of cash generating units and our understanding of the Group’s business and operating environment.
We used our internal valuation specialists to assist with evaluating the models and challenging the Group’s key assumptions. The procedures of the specialist included:
• Evaluating the appropriateness of the valuation methodologies;
• Testing the mathematical integrity of the models;
• Evaluating the Group’s determination of the post-tax discount rates and royalty rates used in the models through consideration of the relevant risk factors for each CGU and brands, the cost of capital for the Group, and market data on comparable businesses; and
• Comparing the terminal growth rates to market data for the industry sectors.
We evaluated the sensitivity analysis performed by management to consider the extent to which a change in one or more of the key assumptions could give rise to impairment in the goodwill and indefinite life intangible assets.
PAGE 122 & 123 ANNUAL REPORT 2021

KEY AUDIT MATTER
Capitalisation of Software Assets In April 2021 IFRIC released an agenda decision clarifying the capitalisation of certain costs related to software implementation, particularly in circumstances where entities use Software as a Service. The agenda decision disallows the capitalisation of costs for the implementation of software as a service arrangements except for costs relating to the development of customised software code where the customer maintains control of the code and its future benefits. As outlined in Note 9, during the year the Group has aligned its accounting policy to the IFRIC interpretation.
The Group has undertaken an assessment of its previously capitalised software assets, including those capitalised as part of the current year ERP implementation, in order to:
1. Determine whether each capitalised asset is within the scope of the IFRIC agenda decision;
2. Whether historical adjustments are necessary to align previously capitalised costs to the new accounting policy.
The work undertaken by the Group identified certain historical projects that did not meet the capitalisation criteria under the new accounting policy, and which have been adjusted as a restatement of the prior period financial statements as set out in note 9.
Given the significance of the current year ERP implementation a detailed assessment of this project has also been undertaken by management to identify the nature of all costs incurred for the ERP project and an assessment whether these are capital in nature. To the extent costs did not meet the capitalisation criteria these have been expensed in the year ending 31 July 2021 consistent with when the costs were incurred.
These items are considered a key audit matter due to the complexity in applying the change of accounting policy to historical projects, as we all the significance of the ERP implementation project. In particular we note the following judgements:
• The evaluation of whether historical and current software assets are within the scope of the IFRIC agenda decision; and
• The decision to capitalise or expense costs relating to the ERP implementation. This decision depends on whether the expenditure is considered to relate to development costs that are directly attributable to the design, testing and implementation of identifiable and unique software products controlled by the Group and is guided by the IFRIC agenda decision.
HOW OUR AUDIT ADDRESSED THE KEY AUDIT MATTEROur audit procedures included:
• Discussions with management to understand the process undertaken and context in which management performed its assessment of the historical capitalised software assets and current year ERP implementation.
• Reviewing the management assessment of previously capitalised costs, including the impact of the change in accounting policy.
• Selecting a sample of costs from the management assessment to ensure the nature of these costs were consistent with managements assessment and the decision to adjust / not adjust was aligned to the IFRIC agenda decision.
• Reviewing the fixed asset register to ensure that all material historical capitalised costs were included in the assessment.
• Reviewing the relevant contractual arrangements for capitalised assets including those relating to the current year ERP implementation.
• Reviewing and challenging key judgements in determining which costs are deemed to be in relation to Software as a Service arrangements.
• Obtaining breakdowns of costs incurred for the ERP implementation and performing substantive tests of details in relation to the costs capitalised to ensure such costs qualified as capital costs.
• Reviewing presentation and disclosure of the change in accounting policy, including the correction of previously capitalised costs in the current year.
Other informationThe directors are responsible on behalf of the Group for the other information. The other information comprises the information in the Annual Report that accompanies the consolidated financial statements and the audit report.
Our opinion on the consolidated financial statements does not cover the other information and we do not express any form of assurance conclusion thereon.
Our responsibility is to read the other information and consider whether it is materially inconsistent with the consolidated financial statements or our knowledge obtained in the audit or otherwise appears to be materially misstated. If so, we are required to report that fact. We have nothing to report in this regard.
Directors’ responsibilities for the consolidated financial statements The directors are responsible on behalf of the Group for the preparation and fair presentation of the consolidated financial statements in accordance with NZ IFRS and IFRS, and for such internal control as the directors determine is necessary to enable the preparation of consolidated financial statements that are free from material misstatement, whether due to fraud or error.
In preparing the consolidated financial statements, the directors are responsible on behalf of the Group for assessing the Group’s ability to continue as a going concern, disclosing, as applicable, matters related to going concern and using the going concern basis of accounting unless the directors either intend to liquidate the Group or to cease operations, or have no realistic alternative but to do so.
Auditor’s responsibilities for the audit of the consolidated financial statements Our objectives are to obtain reasonable assurance about whether the consolidated financial statements as a whole are free from material misstatement, whether due to fraud or error, and to issue an auditor’s report that includes our opinion. Reasonable assurance is a high level of assurance, but is not a guarantee that an audit conducted in accordance with ISAs and ISAs (NZ) will always detect a material misstatement when it exists. Misstatements can arise from fraud or error and are considered material if, individually or in the aggregate, they could reasonably be expected to influence the economic decisions of users taken on the basis of these consolidated financial statements.
A further description of our responsibilities for the audit of the consolidated financial statements is located on the External Reporting Board’s website at: xrb.govt.nz/standards-for-assurance-practitioners/auditors-responsibilities/ audit-report-1
This description forms part of our auditor’s report..
Restriction on useThis report is made solely to the Company’s shareholders, as a body. Our audit has been undertaken so that we might state to the Company’s shareholders those matters we are required to state to them in an auditor’s report and for no other purpose. To the fullest extent permitted by law, we do not accept or assume responsibility to anyone other than the Company’s shareholders as a body, for our audit work, for this report, or for the opinions we have formed.
Mike Hawken Partner for Deloitte LimitedChristchurch, New Zealand 24 September 2021
PAGE 124 & 125 ANNUAL REPORT 2021

Synlait Dunsandel’s pink health and safety walkway provides a healthy and efficient way for staff and contractors to get around site. The pathway gives staff moving between the administration building and our Advanced Dairy Liquid Packaging Facility – a distance of 420m – a choice of an internal corridor or external pathway, and the opportunity to walk or cycle to buildings along the pathway route.
The pink, three metre wide dual lane pathway is well defined, has right of way, and stands out from the road. The non-slip aggregate surface makes it suitable for alternate modes of transport as well as walkers, and the well thought-out road signs add another safety dimension. It continues to be a huge success.
KEEPING OUR PEOPLE SAFE
The pink pathway at Synlait Dunsandel provides a safe and healthy way for staff to get around site.
PAGE 126 & 127 ANNUAL REPORT 2021

The Synlait Dunsandel staff cafe provides ample space for staff to connect over their breaks.
STATUTORY INFORMATION
Synlait is a milk nutrition company. We combine expert farming with state-of-the-art processing to produce a range of nutritional milk products.
On 3 August 2020, Synlait Milk (Dunsandel Farms) Limited was incorporated to hold newly acquired farmland adjacent to our Dunsandel facility. The acquisition of the farmland enables us to pursue several strategic supply chain and sustainability initiatives that will support Synlait Dunsandel’s long-term operation and expansion.
On 31 December 2020, Synlait Foods (Talbot Forest) Limited was amalgamated into Dairyworks Limited to reflect the operational integration of the two companies.
There were no other changes to the Company or its subsidiaries during the year.
01. BUSINESS OPERATIONS
ANNUAL REPORT 2021PAGE 128 & 129

Synlait’s Directors are profiled on our website synlait.com/people/. This table sets out the directors of the Synlait group companies as at 31 July 2021, with changes during the financial year also noted:
Synlait has considered the independence of its three Independent Directors against the definition in the NZX Listing Rules, the commentary to Recommendation 2.4 in the Code, and its Board Charter and is satisfied that its Independent Directors meet the requirements for independence.
As permitted by waivers from the NZX Listing Rules, Bright Dairy Holding Limited, a shareholder in Synlait, is entitled to appoint four directors to Synlait’s Board. One of those Directors must ordinarily reside in New Zealand and have local commercial and governance experience appropriate for an NZX listed company. Currently that Director is the Hon. Ruth Richardson.
02. DIRECTORS
Company Directors Appointment Appointed
Synlait Milk LimitedSynlait Milk Finance Limited
Graeme Milne ONZM (Chair) Independent 23 March 2006Sam Knowles Independent 4 July 2013Simon Robertson Independent 25 November 20201
Dr John Penno Board Appointed 21 July 20132
Hon. Ruth Richardson Bright Dairy Appointed 16 November 20093
Sihang Yang Bright Dairy Appointed 11 November 2010Qikai Lu Bright Dairy Appointed 8 December 2015Min Ben Bright Dairy Appointed 29 November 2016Bill Roest Independent 8 May 20134
The following declarations of interest were made by Directors of Synlait and its subsidiaries under section 140(2) of the Companies Act 1993 during the year to 31 July 2021:
03. DIRECTOR INTERESTS
Graeme Roderick Milne ONZM
Chairman Synlait Milk LimitedChairman Pro-Form Limited Advisory Board until 28 February 2020Chairman Braemar Hospital Limited from 1 October 2020Director Synlait Milk Finance LimitedDirector Eighty Nine Richard Pearse DriveDirector The New Zealand Dairy Company LimitedDirector of Dairyworks Limited until 10 November 2020Chairman Terracare Fertilisers Limited Director Alliance Group LimitedDirector Elviti Holdings Limited until 14 August 2020Director NZP Holdings Limited until 14 August 2020Director New Zealand Pharmaceuticals Limited until 14 August 2020Director of Nyriad Limited until 21 October 2020Director Nyriad Trustee Services Limited from 21 October 2020Director of Nyriad Nominee LimitedChairman of PF Olsen LimitedDirector PF Olsen Group LtdChairman of Advisory Board Rimanui Farms LimitedCouncil member Waikato UniversityMember of Zespri Director Remuneration CommitteeTrustee Rockhaven TrustPartner GR & JA MilneShareholder in Synlait Milk LimitedReceipt of Directors' Fees from Synlait Milk Limited at approved rateInsurance cover arranged by Synlait Milk LimitedDeed of Indemnity and Access from Synlait Milk Limited
Company Directors
The New Zealand Dairy Company Limited
Graeme Milne ONZM (Chair) Deborah Marris
Eighty Nine Richard Pearse Drive Limited
Graeme Milne ONZM (Chair) Deborah Marris
Synlait Business Consulting (Shanghai) Co., Limited
Deborah MarrisMartijn Jager (Chair) Boyd Williams
Synlait Foods (Talbot Forest) Limited Leon Clement until 31 December 2020Dairyworks Limited Dr John Penno (Chair) until 10 November 2020, and then re-appointed on 28 April 2021
Graeme Milne until 10 November 2020Leon Clement until 28 April 2021Sam Knowles until 10 November 2020Tim Carter
Dairyworks Australia (Pty) Limited Craig StevensDeborah Marris
Synlait Milk (Dunsandel Farms) Limited Leon Clement until 28 April 2021Angela Dixon until 20 May 2021Deborah Marris
1 Simon was elected to the Board by Synlait’s shareholders at the Annual Meeting held on 25 November 2020.2 John had previously been a Director of Synlait Limited, which has since been removed from the Register of Companies. When first appointed
to the Board of Synlait Milk Limited, John was CEO and Managing Director. In November 2018, following stepping down as CEO, he became the Board Appointed Director. In May 2021 John became Interim CEO following the resignation of Leon Clement. John remains the Board Appointed Director.
3 When first appointed to Synlait Milk Limited, Ruth was an Independent Director. In 2013, she became a Bright Dairy appointed Director.4 Bill retired from the Board on 25 November 2020 at Synlait’s Annual Meeting.5 Synlait Foods (Talbot Forest) Limited was amalgamated with Dairyworks Limited on 31 December 2020.
PAGE 130 & 131 ANNUAL REPORT 2021

Simon Robertson
Director Synlait Milk Limited from 25 November 2020Director Synlait Milk Finance Limited from 25 November 2020Director Alliance Group Limited from 21 June 2021Director Ballance Agri-Nutrients LimitedDirector Independent Timber Merchants Co-operative LimitedTrustee Robertson Family TrustTrustee Norman Family TrustTrustee G R Foot TrustShareholder in Synlait Milk LimitedReceipt of Directors’ Fees from Synlait Milk Limited at approved rateInsurance cover arranged by Synlait Milk LimitedDeed of Indemnity and Access from Synlait Milk Limited
Dr John William Penno
Board Appointed Director Synlait Milk LimitedDirector Synlait Milk Finance LimitedDirector Dairyworks Limited until 10 November 2020, and then from 28 April 2021Director Sichuan New Hope Nutritional Foods Co., Limited until 24 August 2020Director Okuora Holdings Limited Director Wangapeka River Hops LimitedDirector The Pure Food Co LimitedDirector Leaft Foods LimitedDirector Thorndale Dairies Limited Director The New Zealand Merino Company Limited from 15 October 2020Trustee John Penno TrustShareholder in Okuora Holdings Limited (and through Okuora Holdings Limited, Pastoral Robotics Limited, Signum Holdings Limited and The Pure Food Co Limited)Shareholder Leaft Foods LimitedShareholder in Thorndale Dairies Limited Shareholder in Synlait Milk LimitedReceipt of Directors' Fees from Synlait Milk Limited at approved rateInsurance cover arranged by Synlait Milk LimitedDeed of Indemnity and Access from Synlait Milk Limited
Qikai Lu
Director Synlait Milk LimitedDirector Synlait Milk Finance LimitedReceipt of Directors' Fees from Synlait Milk Limited at approved rateInsurance cover arranged by Synlait Milk LimitedDeed of Indemnity and Access from Synlait Milk Limited
Hon. Ruth Margaret Richardson
Director Synlait Milk LimitedDirector Synlait Milk Finance LimitedDirector Ruth Richardson (NZ) LimitedChair New Zealand Merino Company Limited until 15 October 2020Director Bank of China (NZ) Limited until 11 March 2021Shareholder in Synlait Milk LimitedReceipt of Directors' Fees from Synlait Milk Limited at approved rateInsurance cover arranged by Synlait Milk LimitedDeed of Indemnity and Access from Synlait Milk Limited
Ian Samuel (Sam) Knowles
Director Synlait Milk LimitedDirector Synlait Milk Finance LimitedDirector of Dairyworks Limited until 10 November 2020Director Rangatira Limited Director Westpac New Zealand Limited from 20 September 2021Director Fire Security Services 2016 LimitedDirector Umajin Limited Chairman On-Brand Limited Director On-Brand Partners LimitedChairman CFB Group Inc from December 2020Chairman Adminis LimitedDirector Magritek Limited until 30 June 2021Director Com Investments Limited Director Growthcom Limited Director of Montoux LimitedTrustee Ruby Family Trust Trustee WWF NZTrustee Com Trust Trustee Ian Samuel Knowles Children’s TrustShareholder in Synlait Milk LimitedReceipt of Directors' Fees from Synlait Milk Limited at approved rateInsurance cover arranged by Synlait Milk LimitedDeed of Indemnity and Access from Synlait Milk Limited
PAGE 132 & 133 ANNUAL REPORT 2021
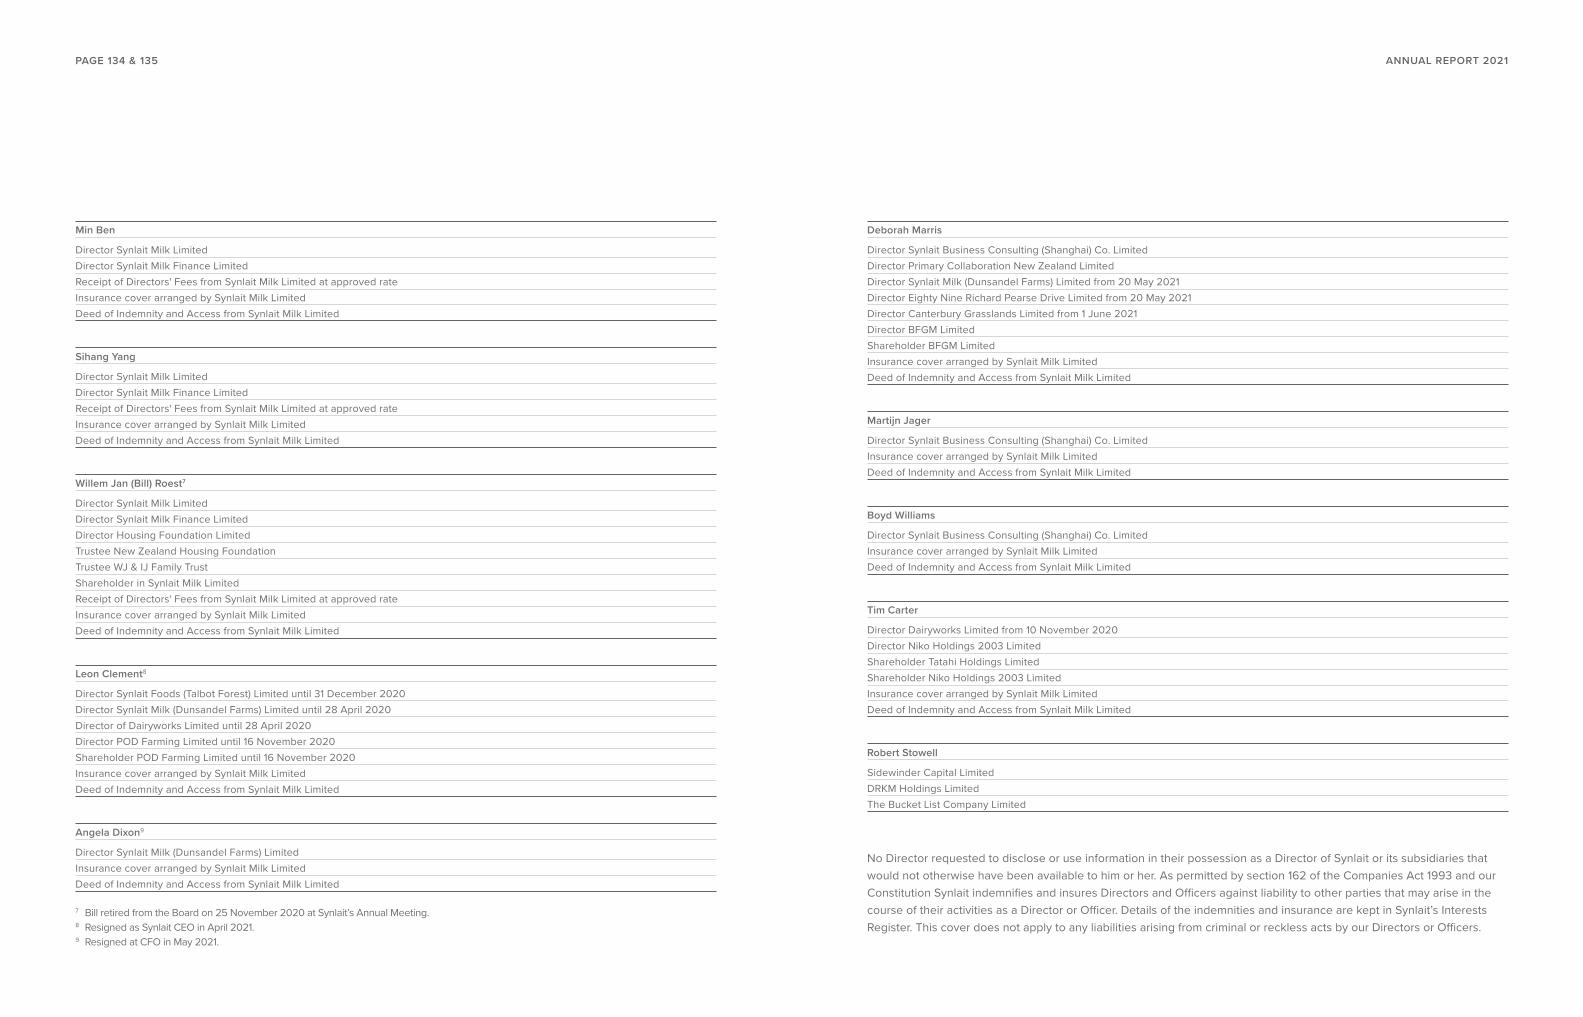
Leon Clement8
Director Synlait Foods (Talbot Forest) Limited until 31 December 2020 Director Synlait Milk (Dunsandel Farms) Limited until 28 April 2020Director of Dairyworks Limited until 28 April 2020Director POD Farming Limited until 16 November 2020Shareholder POD Farming Limited until 16 November 2020Insurance cover arranged by Synlait Milk LimitedDeed of Indemnity and Access from Synlait Milk Limited
Boyd Williams
Director Synlait Business Consulting (Shanghai) Co. LimitedInsurance cover arranged by Synlait Milk LimitedDeed of Indemnity and Access from Synlait Milk Limited
Angela Dixon9
Director Synlait Milk (Dunsandel Farms) LimitedInsurance cover arranged by Synlait Milk LimitedDeed of Indemnity and Access from Synlait Milk Limited
Martijn Jager
Director Synlait Business Consulting (Shanghai) Co. LimitedInsurance cover arranged by Synlait Milk LimitedDeed of Indemnity and Access from Synlait Milk Limited
Tim Carter
Director Dairyworks Limited from 10 November 2020Director Niko Holdings 2003 LimitedShareholder Tatahi Holdings LimitedShareholder Niko Holdings 2003 LimitedInsurance cover arranged by Synlait Milk LimitedDeed of Indemnity and Access from Synlait Milk Limited
Robert Stowell
Sidewinder Capital LimitedDRKM Holdings Limited The Bucket List Company Limited
Deborah Marris
Director Synlait Business Consulting (Shanghai) Co. LimitedDirector Primary Collaboration New Zealand LimitedDirector Synlait Milk (Dunsandel Farms) Limited from 20 May 2021Director Eighty Nine Richard Pearse Drive Limited from 20 May 2021Director Canterbury Grasslands Limited from 1 June 2021Director BFGM LimitedShareholder BFGM LimitedInsurance cover arranged by Synlait Milk LimitedDeed of Indemnity and Access from Synlait Milk Limited
No Director requested to disclose or use information in their possession as a Director of Synlait or its subsidiaries that would not otherwise have been available to him or her. As permitted by section 162 of the Companies Act 1993 and our Constitution Synlait indemnifies and insures Directors and Officers against liability to other parties that may arise in the course of their activities as a Director or Officer. Details of the indemnities and insurance are kept in Synlait’s Interests Register. This cover does not apply to any liabilities arising from criminal or reckless acts by our Directors or Officers.
7 Bill retired from the Board on 25 November 2020 at Synlait’s Annual Meeting.8 Resigned as Synlait CEO in April 2021.9 Resigned at CFO in May 2021.
Min Ben
Director Synlait Milk Limited Director Synlait Milk Finance LimitedReceipt of Directors' Fees from Synlait Milk Limited at approved rateInsurance cover arranged by Synlait Milk LimitedDeed of Indemnity and Access from Synlait Milk Limited
Sihang Yang
Director Synlait Milk Limited Director Synlait Milk Finance LimitedReceipt of Directors' Fees from Synlait Milk Limited at approved rateInsurance cover arranged by Synlait Milk LimitedDeed of Indemnity and Access from Synlait Milk Limited
Willem Jan (Bill) Roest7
Director Synlait Milk LimitedDirector Synlait Milk Finance LimitedDirector Housing Foundation LimitedTrustee New Zealand Housing FoundationTrustee WJ & IJ Family TrustShareholder in Synlait Milk LimitedReceipt of Directors' Fees from Synlait Milk Limited at approved rateInsurance cover arranged by Synlait Milk LimitedDeed of Indemnity and Access from Synlait Milk Limited
PAGE 134 & 135 ANNUAL REPORT 2021

This table sets out the relevant interests held by Directors in securities issued by Synlait:
05. DIRECTOR HOLDINGS
Directors Securities held (legally or beneficially) as at 31 July 2021 Securities held (legally or beneficially) as at 31 July 2020
Graeme Milne ONZM 82,556 ordinary shares 72,753 ordinary sharesSam Knowles 64,803 ordinary shares 55,000 ordinary sharesSimon Robertson 13,324 ordinary shares 0Dr John Penno 5,109,803 ordinary shares 5,100,000 ordinary sharesHon. Ruth Richardson 66,025 ordinary shares 56,222 ordinary sharesMin Ben 0 0Qikai Lu 0 0Sihang Yang 0 0Bill Roest12 30,495 ordinary shares 27,750 ordinary shares
This table sets out total remuneration and the value of other benefits received by Synlait Directors during the year ended 31 July 2021:
Directors Role Remuneration
Graeme Milne ONZM Director Board Chair
$178,000
Sam Knowles Director People, Environment and Governance Committee Chair
$100,900
Simon Robertson11 DirectorAudit and Risk Committee Chair
$71,169
Dr. John Penno Director $88,900Hon. Ruth Richardson Director $88,900Min Ben Director $88,900Qikai Lu Director $88,900Sihang Yang Director $88,900Bill Roest12 Director
Audit and Risk Committee Chair $33,186
The annual fees paid to Directors of Synlait, as approved by shareholders on 27 November 2019 and effective 1 April 2020, are:
04. DIRECTOR REMUNERATION
Directors, excluding the Chair and Committee Chairs $88,900Board Chair $178,000Audit and Risk Committee Chair $104,150People Environment and Governance Committee Chair $100,900
For the purposes of section 148(2) of the Companies Act 1993, the following disclosures were made by the Directors in respect of the increases in their shareholdings as part of the issue of new shares completed by Synlait on 1 December 2020:
Directors New ordinary shares subscribed for Price Transaction Date
Graeme Milne ONZM 9,803 ordinary shares $5.10 per ordinary share 1 December 2020Sam Knowles 9,803 ordinary shares $5.10 per ordinary share 1 December 2020Simon Robertson 3,325 ordinary shares $5.10 per ordinary share 1 December 2020Dr John Penno 9,803 ordinary shares $5.10 per ordinary share 1 December 2020Hon. Ruth Richardson 9,803 ordinary shares $5.10 per ordinary share 1 December 2020Sihang Yang 0 N/AQikai Lu 0 N/AMin Ben 0 N/ABill Roest10 2,745 ordinary shares $5.10 per ordinary share 1 December 2020
10 Bill retired from the Board on 25 November 2020 at Synlait’s Annual Meeting.
Fees are not paid to Directors or employees of Synlait for acting as a Director of any Synlait subsidiaries.
11 Simon was elected to the Board by Synlait’s shareholders at the Annual Meeting held on 25 November 2020.12 Bill retired from the Board on 25 November 2020 at Synlait’s Annual Meeting.
PAGE 136 & 137 ANNUAL REPORT 2021

In the year to 31 July 2021, Synlait’s total payments to its auditors, Deloitte, were as follows:
08. AUDITORS
Dairyworks Limited, a subsidiary of Synlait, made cheese donations to a value of $11,200 in the year to 31 July 2021. These were the only donations made by the Synlait group in the financial year.
07. DONATIONS
Chief Executive Officer RemunerationThe table below sets out remuneration paid to Synlait’s Chief Executive Officer in the year to 31 July 2021:
Remuneration Leon Clement13 Dr John Penno14
Salary $915,236 N/ATotal fees paid N/A $249,999 plus GSTKiwiSaver employer contribution $27,457 N/AMedical insurance employer contribution $1,096 N/AShort term incentive scheme15 N/A N/ALong term incentive scheme $109,828 N/ATotal remuneration $1,053,617 $249,999 plus GST
Audit and assurance fees $355,753Tax compliance and accounting fees $69,217Percentage non-audit 16%Percentage audit 84%
During the year ended 31 July 2021, 391 employees (including former employees) of Synlait and its subsidiaries (not being Directors) received remuneration and other benefits, in their capacity as employees, of $100,000 or more, as set out below:
06. EMPLOYEE REMUNERATION
Salary bracket ($) Number of employees
100,000 – 110,000 103110,000 – 120,000 66120,000 – 130,000 61130,000 – 140,000 21140,000 – 150,000 32150,000 – 160,000 25160,000 – 170,000 10170,000 – 180,000 16180,000 – 190,000 7190,000 – 200,000 3200,000 – 210,000 10210,000 – 220,000 8220,000 – 230,000 6240,000 – 250,000 1250,000 – 260,000 3260,000 – 270,000 2280,000 – 290,000 1340,000 – 350,000 2350,000 – 360,000 1380,000 – 390,000 1410,000 – 420,000 1430,000 – 440,000 3470,000 – 480,000 2480,000 – 490,000 2500,000 – 510,000 1550,000 – 560,000 21,050,000 – 1,060,000 1Total 391
These figures also include the value of shares issued to employees under the 2018 Long Term Incentive Scheme during the year to 31 July 2021.
Synlait’s Strategic Remuneration Policy is approved by Synlait’s People, Environment and Governance Committee. That Committee also reviews and recommends to the Board the remuneration of the Chief Executive Officer and the Executive Leadership Team.
13 Leon resigned as CEO with effect from 28 April 2021.14 John assumed the role of Interim CEO with effect from 1 May 2021.15 Synlait does not pay short term incentives.
PAGE 138 & 139 ANNUAL REPORT 2021

According to notices given under section 280(1)(b) of the Financial Markets Conduct 2013, the following are Synlait’s substantial product holders as at 31 July 2021. The number of shares owned is as advised by the shareholder in their last Substantial Security Holder Notice.
Substantial Product Holder Number of ordinary shares in which relevant interest is held
Percentage of 218,581,661 Ordinary Shares on issue owned as at 31 July 2021
Bright Dairy Holding Limited 85,266,605 39.0The a2 Milk Company Limited 43,352,509 19.8FIL Group Limited 18,462,877 8.4%Total 147,081,991 67.2%
Synlait had the following securities on issue as at 31 July 2021:
• 218,581,661 ordinary shares
• 180,000,000 subordinated bonds.
Set out below are Synlait’s 20 largest shareholders as at 31 July 2021:
10. TOP 20 SECURITY HOLDERS AND SUBSTANTIAL SECURITY HOLDERS
Number of shares held Percentage of ordinary shares
01. Bright Dairy Holding Limited 85,266,605 39.0% 02. The a2 Milk Company (NZ) Limited 43,352,509 19.8% 03. FIL Limited 18,462,877 8.4% 04. The Vanguard Group, Inc. 5,835,225 2.7% 05. John Penno 5,109,803 2.3%06. First NZ Capital Custodians Limited (Various Private Investors) 2,299,827 1.1%07. Salt Funds Management Limited 2,238,890 1.0%08. Oneroa Fish & Chip Family Trust 1,584,000 0.7%09. BlackRock, Inc. 1,559,438 0.7%10. Abu Dhabi Investment Authority 1,408,448 0.6%11. Smartshares Limited 1,407,509 0.6%12. Guardians of New Zealand Superannuation 1,283,902 0.6%13. Norges Bank Investment Management (NBIM) 1,227,827 0.6%14. Accident Compensation Corporation 1,167,666 0.5%15. Mitsubishi UFJ Financial Group, Inc. 1,070,568 0.5%16. Paul & Bronwyn Lancaster 1,055,623 0.5%17. Therese Roche 900,000 0.4%18. Dimensional Fund Advisors LP 883,113 0.4%19. Wilson Asset Management (International) Pty. Ltd. 729,646 0.3%20. Simplicity NZ Limited 699,383 0.3%Total 177,542,859 81.0%
Synlait’s ordinary shares have been listed on the NZX Main Board since 23 July 2013 (ticker code: SML). On 24 November 2016 Synlait completed a compliance listing on the ASX as a foreign exempt issuer (ticker code: SM1). As an ASX foreign exempt issuer, Synlait complies with the NZX Listing Rules (other than as waived by NZX Regulation) and is exempt from complying with most of the ASX Listing Rules, as set out in ASX Listing Rule 1.15. In November 2020, Synlait successfully completed a $200 million equity raising to complete the investment phase of its strategy and strengthen its balance sheet. The equity raise comprised a $180 million underwritten placement at a fixed price of NZ$5.10 per share and a $20 million underwritten share purchase plan at the same share price. In December 2019, Synlait issued $180 million of unsecured, subordinated, fixed rate bonds with an interest rate of 3.83% per annum. These securities are quoted and trade on the NZX Debt Market (ticker code: SML010).
09. STOCK EXCHANGE LISTINGS
Set out below are Synlait’s 20 largest bondholders as at 31 July 2021:
Number of bonds held Percentage of total bonds
01. Custodial Services Limited 41,587,000 23.1%02. Hobson Wealth Custodian Limited 28,406,000 15.9%03. FNZ Custodians Limited 23,146,000 12.6%04. Tea Custodians Limited Client Property Trust Account 22,115,000 12.3%05. Forsyth Barr Custodians Limited 9,514,000 5.3%06. Citibank Nominees (New Zealand) Limited 5,400,000 3.0%07. RGTKMT Investments Limited 3,275,000 1.8%08. Sierra Investments Limited 2,713,000 1.5%09. National Nominees Limited 2,639,000 1.5%10. JB Were (NZ) Nominees Limited 2,189,000 1.2%11. FNZ Custodians Limited 1,265,000 0.7%12. Hugh McCracken Ensor 994,000 0.6%13. JP Morgan Chase Bank NZ Branch 905,000 0.5%14. Francis Horton Tuck 800,000 0.4%15. Falstaff Investments Limited 768,000 0.4%16. FNZ Custodians Limited 766,000 0.4%17. Investment Custodial Services Limited 631,000 0.4%18. Sterling Holdings Limited 550,000 0.3%19. Zhuang Yin 550,000 0.3%20. JB Were (NZ) Nominees Limited 423,000 0.2%Total 148,636,000 82.4%
PAGE 140 & 141 ANNUAL REPORT 2021

Synlait does not have a credit rating.
The spread of Synlait’s bondholders as at 31 July 2021 is as follows:
12. CREDIT RATING
Size of holding Number of holders Percentage of holders Total number of bonds Percentage issued
1 – 1,000 0 0% 0 0%1,001 – 5,000 55 6.1% 275,000 0.1%5,001 – 10,000 163 18.1% 1,590,000 0.9%10,001 – 50,000 551 61.0% 15,544,000 8.6%50,001 – 100,000 77 8.5% 6,434,000 3.6%100,001 and over 57 6.3% 156,157,000 86.8%Total 903 100% 180,000,000 100%
The spread of Synlait’s ordinary shareholders as at 31 July 2021 is as follows:
11. SPREAD OF PRODUCT HOLDERS
Size of holding Number of investors Percentage of investors Total number of shares Percentage issued
1 – 1,000 3,359 43.8% 1,518,715 0.7%1,001 – 5,000 2,908 38.0% 7,493,525 3.4%5,001 – 10,000 733 9.6% 5,447,783 2.5%10,001 – 50,000 560 7.3% 10,829,767 4.9%50,001 – 100,000 46 0.6% 3,215,816 1.5%100,001 and over 50 0.7% 190,076,055 87.0%Total 7656 100% 218,581,661 100%
On 10 November 2020 Synlait was granted waivers by NZX Regulation in relation to the share offer completed in 2020 (“Share Offer”) comprising a NZ$180 million placement of shares (“Placement”) and a $20 million share purchase plan (“Share Purchase Plan”) (“Synlait Waiver”). A condition of the Synlait Waiver was that it was disclosed in the Share Offer document and in our Annual Report.
The Synlait Waiver provides waivers from Listing Rules 4.5.1, 4.5.1(e)(iii), 4.19.1 and 5.2.1 as set out below (with the conditions):
• Waiver from Rule 4.5.1 to the extent required to allow any shares offered in the Share Purchase Plan and not taken up by existing shareholders to be issued to other persons without requiring approval by ordinary resolution.
• Conditions: The waiver only applied to shares offered to existing shareholders under the Share Purchase Plan and as a result of the Share Purchase Plan being undersubscribed were offered to other persons and when aggregated with the number of shares under the Placement would exceed the 25% threshold in Rule 4.5.1. The Share Purchase Plan was required to be fully underwritten.
• Waiver from Rule 4.5.1(e)(iii) to the extent that the level of participation of Bright Dairy would be determined according to criteria applying to all persons participating in the Placement.
• Conditions: Two directors of Synlait (not associated with Bright Dairy) were required to certify to NZX that:
• Synlait was not unduly influenced by Bright in its decision to permit Bright to participate in the Placement at a higher level of participation than other persons;
• Bright will not be involved in or influence any allocation decision in relation to the Placement;
• Bright will not derive any benefit as a result of its higher level of participation other than to avoid its holding in Synlait being diluted as a consequence of the Share Offer.
• Waiver from Rule 4.19.1 to the extent that the allotment of shares to Bright in respect of the subscriptions received under the Placement to occur within 10 business days of the closing date for the Placement.
• Conditions: The allotment of shares to Bright occurs in part on the Placement allotment date and in part on the Share Purchase Plan allotment date.
• Waiver from Rule 5.2.1 to the extent that Synlait would otherwise require Synlait to obtain approval of shareholders to enter into a material transaction with any related party in connection with the Placement (referred to as a relevant party).
• Conditions: Two directors of Synlait (not associated with any relevant party) certifying to NZX that:
• Synlait was not unduly influenced in its decision to undertake the Placement by the relevant parties;
• The relevant parties who participate in the Placement will not be influence any allocation decision in the Placement;
13. NZX WAIVERS
PAGE 142 & 143 ANNUAL REPORT 2021

• The relevant party will not derive any benefit as a result of the related party relationship other than solely through participation in the Share Offer on the same terms as all other participants; and
• Entry into the Placement is in the best interests of Synlait’s shareholders.
• The effect of the NZX Waivers in the context of the Share Offer is to permit:
• an increased number of shares (from what is otherwise provided for under the Listing Rules) to be issued under the Share Offer without shareholder approval;
• the Share Offer to be fully underwritten, to allow any shares not taken up by eligible shareholders under the Share Offer to be issued to other persons without requiring shareholder approval (which when aggregated with the number of Shares issued under the Placement, may exceed the Placement threshold provided under the Listing Rules as modified by the Class Waiver);
• Bright, The a2 Milk Company Limited and other related parties to be issued Shares in the Placement having an aggregate value above 10% of Synlait’s average market capitalisation without shareholder approval; and
• Bright to be issued such number of shares under the Placement that will ensure it is not diluted as a result of the Share Offer, which would otherwise cause Bright to lose its director appointment rights under the Constitution. Further details of these director appointment rights are included in the Annual Report.
Synlait also made the Share Offer relying on the Class Waiver and ruling issued by NZX Regulation dated 30 September 2020 (Class Waiver). The Class Waiver provides a waiver from Listing Rule 4.5 and a ruling in relation to the definition of “share purchase plan”.
A copy of the Synlait Waiver and Class Waiver is are available at nzx.com and asx.com.au under the ticker code “SML” and “SM1”, respectively). All of the conditions in the Synlait Waiver have been met.
Synlait continues to rely on waivers granted on 27 November 2019 from various NZX Listing Rules, allowing our Constitution and Board composition to reflect our non-standard governance arrangements, as described below.
Synlait listed on the NZX on the basis that Bright Dairy and Food Co Limited would be able to continue to consolidate Synlait into its group financial statements (that are prepared under China GAAP). At the time, Bright Dairy agreed with Synlait that for so long as Bright Dairy continued to hold between the Initial Percentage (being 39.119%) and 50% (inclusive) of the shares in Synlait in each case calculated in accordance with clause 22.5 of the Constitution (so as to exclude shares issued under employee share schemes or director remuneration), the following governance arrangements will apply to Synlait:
The Board comprises eight directors, made up of the following:
• Four directors appointed by Bright Dairy (the Bright Dairy Directors):
• none of whom (i) are required to retire from rotation under the NZX Listing Rules, or (ii) are subject to removal by ordinary resolution of shareholders;
• one of whom must be ordinarily resident in New Zealand and be a director of such standing and with such commercial and governance experience in New Zealand as is appropriate for a director of a NZX listed company – the Hon. Ruth Richardson is the current Bright Dairy Director meeting this requirement; and
• all of whom are required to have appropriate skills and experience to ensure that Synlait has a suitable mix of skills and experience on the Board;
• Three directors who are not appointed by Bright Dairy and who must be Independent Directors; and
• One Managing Director, or, if a Managing Director is not appointed, a Board Appointed Director, who will be appointed by the Board. The current Managing Director or Board Appointed Director, and any Director proposed to fill that role, cannot vote on the appointment or replacement of the Managing Director or Board Appointed Director (as applicable). Consequently, Bright Dairy controls the composition of the majority of the Board as it has four out of seven votes on this appointment. Synlait does not currently have a Managing Director, but does have a Board Appointed Director, being Dr John Penno, (together, these are the Governance Arrangements).
A summary of the waivers permitting these Governance Arrangements is set out below:
• The NZX Listing Rules allow Bright Dairy to appoint representatives to the Board so long as the proportion of the Board made up by their representatives is not greater than the proportion of the total shares in Synlait that they own. A waiver was required to permit Bright Dairy to appoint four Directors, or 50% of the Board, as Bright Dairy owns less than 50% of the shares in Synlait.
• The NZX Listing Rules prevent Directors from appointing alternates to act for in their place if they cannot attend Board meetings unless a majority of their co-Directors agree. A waiver has been granted to permit Synlait’s Constitution to:
• allow a Bright Dairy Director to appoint another Bright Dairy Director to exercise their voting rights at a Board meeting they are unable to attend; and
• prohibit the non-Bright Dairy Directors from appointing alternate Directors. Synlait considers that it is important that Directors are encouraged to attend all meetings.
• The NZX Listing Rules require that Synlait’s constitution permit a Director to vote on a decision in which they are interested, where that matter is one in respect of which Directors are required by the Companies Act 1993 to sign a certificate or relates to an indemnity contemplated by section 162 of the Companies Act. A waiver has been granted to allow Synlait’s Constitution to prohibit the Managing Director (if it has one, which it doesn’t currently) from voting or being part of the quorum on matters relating to his/her remuneration under any circumstances.
PAGE 144 & 145 ANNUAL REPORT 2021

• The NZX Listing Rules prevent the imposing of conditions on who may be appointed as a Director, except as specifically contemplated by the Rules. A waiver has been granted so that Synlait is permitted to required that persons who may be appointed to the three non-Bright Dairy Director positions must be independent.
These waivers are subject to the conditions that:
• Bright Dairy continues to hold no less than 39.119% of Synlait’s shares, calculated in accordance with Synlait’s Constitution.
• the Governance Arrangements are contained in Synlait’s Constitution and will cease to apply when Bright Dairy ceases to own between 39.119% and 50% (inclusive) of the shares in Synlait, calculated in accordance with Synlait’s Constitution.
• Full and accurate disclosure of all material aspects of the Governance Arrangements and Synlait’s reliance on these waivers is made in any offer document, and in every annual report while these waivers are being relied on.
• Synlait continues to bear a non-standard designation to notify the market of its unique governance arrangements.
• The quorum for a Board meeting must include two Independent Directors, and Synlait must have three Independent Directors (compared to the two Independent Directors required by the NZX Listing Rules).
• Immediately on Bright Dairy ceasing to hold 39.119% of the shares in Synlait, Synlait comply with the provisions in its Constitution requiring that some of the Bright Dairy Directors must resign to keep the proportion of Bright Dairy Directors on the Board consistent with the proportion of the total shares in Synlait owned by Bright Dairy.
• Bright Dairy Directors must retire by rotation at the next annual meeting following the drop in shareholding below that threshold, irrespective of whether they have been the longest in office.
A copy of these waivers, and other waivers Synlait has obtained, or relied on can be found in the investor centre of Synlait’s website.
Synlait’s statement on the extent to which Synlait has followed the recommendations in the NZX Corporate Governance Code during the year to 31 July 2021 can be found at: synlait.com/investors/corporate-governance
Synlait’s operating subsidiaries operate largely independently from Synlait. Synlait does not require them to comply with the recommendations in the Corporate Governance Code.
14. NZX CORPORATE GOVERNANCE CODE
This table sets out the gender composition of Synlait’s Directors and Officers (CEO and direct reports to CEO) as at 31 July 2021. The prior year’s comparison is in brackets.
15. GENDER COMPOSITION
Group Female Male Total
Board 2 (2) 6 (6) 8 (8)Officer 2 (3) 7 (6) 9 (9)Total 4 (5) 13 (12) 17 (17)
Synlait’s Diversity and Inclusion Policy promotes a culture of diversity and inclusiveness, putting in place appropriate strategies and measurable objectives. We aim to achieve three main goals:
• Workforce diversity – employ, develop and retain more women and Māori.
• Diversity through leadership – empower and equip our people leaders to recruit, develop and retain a diverse and competent workforce.
• Workforce inclusion – foster a culture that encourages flexibility and fairness, to enable all employees to realise their potential, and thereby increase employee retention.
To help us meet these goals we have our Mātua (Parental Leave) Policy and our Tāwariwari (Flexible Working) Policy, and we offer unconscious bias training and report to the Board on candidate diversity. Our success will be measured against the following as at the end of 2023. The prior year’s comparison is in brackets:
16. PERFORMANCE AGAINST DIVERSITY POLICY
Measure Progress at 31 July 2021 – compared to FY20
Reduction of the gender pay gap to ≤ 5% 10% (13%)40-50% of leadership positions (people leaders, supervisors, specialist roles and senior leadership) held by women
36% (38%)
No regretted losses of high potential female employees 1 (0)
PAGE 146 & 147 ANNUAL REPORT 2021

DIRECTORY
Registered and head office 1028 Heslerton Road Rakaia, RD13 New Zealand
Contact us +64 3 373 3000 [email protected] synlait.com
You can also follow us on Facebook and LinkedIn
Share register Computershare Investor Services Limited Private Bag 92119 Auckland 1142 Level 2 159 Hurstmere Rd Takapuna Auckland 0622 0800 467 335 +64 9 488 8777 [email protected]
Auditor Deloitte Limited 80 Queen Street Auckland 1010 New Zealand +64 9 303 0700 [email protected]
A staff member plants out seedlings at our Whakapuāwai nursery at Synlait Dunsandel.
PAGE 148 & 149