Annual Review 2021 - Cision
102
Annual Review 2021 Raisio plc
-
Upload
khangminh22 -
Category
Documents
-
view
3 -
download
0
Transcript of Annual Review 2021 - Cision

Annual Review 2021Raisio plc

Raisio’s purpose is to make food which is good for Health, Heart and Earth. The growth of our business is based on three focus areas: Benecol® products and plant stanol ester solutions, plant-based food, as well as oat-based consumer products and oats as an industrial raw material.
Our well-known brands include Benecol®, Beanit®, Härkis®, Elovena®, Sunnuntai®, Torino® and Benella®. Raisio’s products emphasise well-being, healthiness, good taste and responsibility. Raisio’s values – courage, fairness and drive – guide us towards our goals. We operate in more than ten countries.
Raisio at a glance
Our production facilities are located in Finland. In 2021, the number of our own production facilities increased from four to six, as the acquisition of Verso Food Oy resulted in the Kauhava plant being incorporated into Raisio, and as the new plant for plant-based products opened in the Raisionkaari industrial area.
In 2021 the key offices were in Finland, the UK, Russia, Ireland, Ukraine and Poland. The Group’s head office is in Raisio, Southwest Finland. Raisio’s products are exported to some 40 countries. The key markets for fish feeds in 2021 were Finland and Russia. In addition, Raisio sells oat products to industrial and catering custo-mers, particularly in Finland and Europe.
1939established in
400number of
employees around
10countries
6production
facilities international
house of brands
Food for Health, Heart and
Earth.
Raisio’s purpose

Key figures
Net sales distribution by market area:
2021
Finland 39.4%
Great Britain 21.5%
Russia 13.0%
Other Europe 23.7%
Rest of the world 2.4%
2020 2019
38.3%
21.7%
14.1%
23.5%
2.4%
246.4
Comparable return on investment (ROIC) in 2021:
8.3 %11.1 (2020) | 13.9 (2019)
2021 2020 2019
Net sales M€ 246.4 233.6 236.3
Change in net sales % 5.5 -1.2 3.5
Comparable EBIT M€ 22.1 27.7 27.3
Comparable EBIT of net sales % 9.0 11.9 11.5
Comparable earnings/share € 0.12 0.14 0.16
Cash flow from operations after financial items and taxes M€ 34.5 34.7 23.3
Equity ratio % 79.3 85.7 87.9
Net gearing % -21.4 -30.8 -36.4
Net-interest bearing debt M€ -60.0 -83.0 -98.6
Investments M€ 24.2 28.5 19.5
Comparable return on investment (ROIC) % 8.3 11.1 13.9
Dividend/share 0.14* 0.13 0.13
* According to the Board of Director’s proposal 0.14 per share includes an extra dividend of EUR 0.04
Comparable EBIT in 2021:
22.1 M€27.7 (2020) | 27.3 (2019)
36.9%
23.4%
14.2%
23.4%
2.2%

Raisio focuses on healthy and responsible food
Benecol® andplant stanol
solutions
Plant-basedfoods
Value-added oats and
ingredients
Our Healthy Growth Strategy is built on three focus areas
and their unique combinations that enable growth.
Raisio published its updated strategy and responsibility programme for the coming years in spring 2021. Raisio’s most important goal for the new strategy period 2022–2025 is to grow boosted by the new capabilities and new product categories made possible by investments realised in recent years.
Raisio’s three strategic areas of focus are Benecol® and plant stanol ester solutions, value-added oat products and ingredients and plant-based foods.
The compound annual growth rate (CAGR) of the combined net sales from the three focus areas is 7% during the strategy period, and the CAGR for the entire Raisio Group is 5%.
Our goal is to expand across Europe and significantly strengt-hen our range of plant-based products. We will export to new countries and expand our product range in countries where we are already active.

Benecol® and plant stanol ester solutions
Raisio continues to invest in growing the international Bene-col® brand. Plant stanol ester in Benecol® products has been shown to lower cholesterol and the health claim has been approved by the EU commission. Furthermore, Raisio invests also in a research program to study other potential health beneficial properties of plant stanol ester.
Benecol® and plant stanol ester solutions are key contribu-tors to Raisio’s profitability. Our goal is to increase the net sales from these products by an average of 3 per cent annually (CAGR) in 2020–2025. This will be achieved through research, product development and increased brand awareness, as well as expansion into new product categories.
Value-added oats and ingredients
Raisio continues to expand internationally in the B2B as well as the consumer market based on the company’s strong expertise in oats. Our goal is to grow the net sales from these products faster than the market, i.e., by an average of 12 per cent annually (CAGR) in 2020–2025.
Plant-based foods
Consumer choices are increasingly directed towards healthy and sustainably produced, plant-based food. Raisio wants to streng-then its position in this promising and fast-growing market in Finland as well as internationally. Our goal is to increase the net sales from these products by an average of 38 per cent annually (CAGR) in 2021–2025. This will be achieved through technological innovation and by introducing our products to new markets.
Tailwind behind our backHealthy livingHealth is understood as holistic wellbeing. Awareness of the importance of mental health has increased during the pandemic.
SustainabilityConsumer expectations are higher than ever. Companies are expected to minimise the environmental impact throughout the whole product life cycle.
Plant-based eating Plant-based diets are becoming more common and expanding into new product categories. We want to be part of making plant-based food a commonplace and normal part of everyday life.

Responsibility is our strategy
Raisio’s strategy update in spring 2021 made responsibility a more central part of Raisio’s strategy. Our strategy responds to the food transition, where different operators in the food chain are working to build a more sustainable food system in terms of the environment and climate. Consumer behaviour is also under-going a change, with food choices increasingly influenced, not only by taste and health aspects, but also by sustainability topics.
In connection with Raisio’s strategy update, we also updated Raisio’s responsibility programme. At the same time, we aligned it with Raisio’s strategic period, so the Good Food Plan will now run until the end of 2025.
In our updated Good Food Plan 2022–2025 we also wanted to create a clearer link to the UN Sustainable Development Goals, which we support. To this end, we selected one UN Sustainable Development Goal for each project that we felt we could best contribute to through our activities.
Find out more about Raisio’s sustainability performance in our Corporate Responsiblity Report 2021 at raisio.com/responsibility.
We are passionate about ensuring that our products are tasty and healthy
We strive for the best possible combination of taste and healthiness in our product development. At the end of 2021, 81% of our consumer products were healthy alternatives in their own categories.
Our plant-based products fit well with consumers’ efforts to add plant-based products to their diets.
CourageWe have ambitious goals and the courage to boldly pursue them. We want to succeed together and we encourage each other. Close coopera-tion enables better results. We dare to seize opportunities, to make bold deci-sions and to learn through experience. We have a positive can-do attitude.
FairnessWe act fairly and honestly. Our open and consistent way of working reinforces trust. What we say is what we do. We also dare to address difficult issues, and know that feedback moves us forward. We respect each other and value each other’s work.
DriveWe have a desire to succeed. Oppor-tunities and challenges inspire us. A good working atmosphere is based on respect and humanity. Good leader-ship, engagement and commitment drive better performance. Our success motivates us, and we thank people for a job well done.
Our values – courage, fairness and drive – guide us towards our goals.

We promote the sustainability of the food chain
We pay close attention to sustainable raw material choices and require that operators in our supply chain commit to Raisio’s ethical principles.
The sustainability of the food chain is also influenced by the environmental and climate impacts of the value chain. In 2021, over 100 tonnes of phosphorus and over 500 tonnes of nitrogen were, once again, removed from the Baltic Sea in the form of herring and sprat to produce the fish meal used by Raisioaqua.
We strive for an excellent employee experience
Our aim is to be an attractive employer and support the healthy lifestyles and well-being of our employees. We support diversity and inclusion by offering equal opportunities for everyone.
Our goal is to make recycling easy
The recyclability of our packaging improved significantly during 2021, with as much as 97% (87%) of our packaging now recyclable. We are trying to find packaging options that can be recycled in all markets. We educate and inspire consumers on packaging recycling and sustai-nability.
Our aim is to continuously reduce the amount of packaging plastic and materials. Our long-term goal is to do away with plastic packaging altogether.
We will continue to work to reduce our carbon footprint
We take environmental impacts extensively into account across our operations, with a particular focus on carbon neutrality, environmental friendliness and material and energy efficiency. In 2021, carbon-neutral energy accounted for 97% (94 %) of all the energy we used.
We will report the (scope 3) CO2 emissions of Raisio’s value chain for 2022 and set a timetable and targets to reduce them.

Our recent journey
Raisio focuses on responsibly produced healthy food. Over the past ten years, we have changed both the direction of our busi-ness and the way we operate at Raisio. Our divestment of the confectionery and cattle feed businesses in 2017 and 2018 was a significant step in redirecting our business to focus on healthy food.
Raisio’s capability to respond to challenges raising from mega-trends and from food transition is good: over a three-year period we have invested in our capabilities approximately EUR 70 million.Our ability to meet the demand for plant-based food impro-ved significantly in 2021: in the spring, we acquired the Finnish company Verso Food Oy, adding the Beanit® and Härkis® fava bean
We have invested almost 70 million euros in our
capabilities over the last three years.
products to our range, and in the summer, our new food factory in Raisio started producing new plant-based Elovena® and Bene-col® products for consumers. Our new factory allows us to make extensive use of plant-based raw materials.
2016
2017–2018
2019
2020
2021
We started building a new bioenergy plant in Raisio and, with its completion, the area became carbon neutral
We divested the cattle feed and confectionery business and redirected our business to healthy food
We started building a modern production facility to manufacture plant-based products in Raisio, Finland
We started building a new heating plant using the by-products (oat hulls) generated in the mill’s production in Nokia
We acquired Verso Food to strengthen our plant-based product offering
values & purpose

The most significant new additions to our product range
Delicious new oat products for all of us
The Elovena® Kaurajuoma oat drink, the spoonable Elovena® Kauravälipala oat snack and Elovena® Kaura-ruoka, used in the style of cooking cream, are designed with consumers’ needs in mind.
These gluten-free and 100% plant-based products are made from Finnish oats in a carbon-neutral factory in Raisio and packed in recyclable packaging.
Plant-based and responsible food choices are becoming more and more popular among consumers. Raisio is responding to this growing demand by providing Finnish consumers with new domestic oat products produced in a new carbon-neutral factory that focuses on plant-based products. The new products for 2021 combine local origin, responsibility, healthiness and delicious taste.
The product family of Elovena®, Finland’s most valued and loved oat brand, was expanded with seven new products in the autumn. Delicious Finnish oats are offered in the form of drinks, snacks and cooking products. In the autumn, the first 100% plant-based Benecol® products also arrived in Finnish stores.
Our well-known and beloved brands are part of everyday life in
millions of households.
A unique family of oat-based products containing cholesterol-lowering plant stanol
Benecol® OAT products combine delicious taste with healthiness: their sweetness comes from the natural sugars of berries, fruit and oats.
The products are gluten-free and 100% plant-based, and they are made from Finnish oats in a carbon-neut-ral factory in Raisio. Benecol® OAT products come in recyclable cardboard packaging.
Plant stanol ester has been shown to lower cholesterol. High cholesterol is a risk factor in the development of coronary heart disease.

Board of Directors’ Report and Financial Statements 2021
Contents
Board of Directors’ Report 2021 ........................................11Shares and shareholders ........................................................ 24Key financial indicators and reconciliations ..............31Consolidated financial statements ...................................37Consolidated income statement (IFRS) .......................................................37Consolidated comprehensive income statement (IFRS) ......................37Consolidated balance sheet ............................................................................ 38Calculation of changes in shareholders’ equity .....................................39Consolidated cash flow statement ..............................................................40
Notes to the Consolidated Financial Statements ..................................................................................... 411 Accounting policies for the consolidated financial statements ...........................................................................................................411.1 Raisio Group ...................................................................................................411.2 Accounting policies for the financial statements ......................... 421.3 Consolidation principles .......................................................................... 421.4 Accounting policies calling for management’s judgement and main uncertainties related to the assessments ................... 431.5 Foreign currency transactions and translations ........................... 431.6 New and amended standards during the last financial period ............................................................................................441.7 New and revised standards and interpretations applicable to future financial periods ................................................441.8 Impacts of COVID-19 on Raisio’s financial reporting....................441.9 Events following the financial period ................................................442 Income and segment information ........................................................45
2.1 Information by segment ......................................................................... 452.2 Revenue ..........................................................................................................49 2.2.1 Nets sales .............................................................................................493 Group structure ...............................................................................................51
3.1 Business acquisitions and divestments ............................................. 513.2 Subsidiaries and the non-controlling interest ................................524 Invested capital ................................................................................................53
4.1 Goodwill ...........................................................................................................534.2 Intangible assets ..........................................................................................534.3 Research and development costs ..........................................................554.4 Impairment testing of goodwill and intangible assets with indefinite useful life .........................................................................554.5 Tangible assets ............................................................................................ 56 4.5.1 Tangible assets ................................................................................... 58 4.5.2 Depreciation and imparment .....................................................624.6 Impairment of intangible and tangible assets other than goodwill and assets with indefinite useful lives ................634.7 Equity investments ....................................................................................634.8 Inventories .....................................................................................................63
5 Financial items and risk management ...............................................65
5.1 Financial income and expenses ........................................................... 655.2 Financial assets and liabilities .............................................................. 655.3 Valuation of financial assets .................................................................. 67 5.3.1 Carrying values and fair values of financial assets and liabilities .......................................................................................68 5.3.2 Accounts receivable and other receivables ............................68 5.3.3 Accounts receivable based on age .............................................69 5.3.4 Financial assets at fair value through profit or loss ...........69 5.3.5 Liquid funds in the cash flow statement ................................69 5.3.6 Accounts payable and other liabilities .....................................69 5.3.7 Financial liabilities ............................................................................ 70 5.3.8 Lease liabilities ................................................................................... 70 5.3.9 Contingent liabilities and other commitments and contingent assets .................................................................... 705.4 Financial risk management .................................................................... 70 5.4.1 Currency risk ........................................................................................ 71 5.4.2 Liquidity and solvency risk .............................................................73 5.4.3 Interest rate risk .................................................................................74 5.4.4 Counterparty risk ..............................................................................746 Current taxes and deferred tax ...............................................................76
6.1 Income taxes ................................................................................................. 766.2 Deferred tax .................................................................................................. 766.3 Taxes related to the items of other comprehensive income ..... 797 Equity .....................................................................................................................80
7.1 Equity and equity funds ...........................................................................807.2 Dividends .........................................................................................................817.3 Earnings per share .......................................................................................818 Personnel and related parties ..................................................................82
8.1 Employee benefits ...................................................................................... 828.2 Share-based payments ............................................................................. 828.3 Related parties..............................................................................................84 8.3.1 Related party transactions ............................................................84 8.3.2 Management’s employee benefits ...........................................84 8.3.3 Pension and other benefits ..........................................................849 Other notes ..........................................................................................................85
9.1 Other notes .................................................................................................... 85 9.1.1 Other operating income and expenses ..................................... 85 9.1.2 Provisions .............................................................................................. 85
10 Parent company financial statement (FAS) ......... 86
Board’s proposal for the disposal of profitand signatures .............................................................................. 96Auditor’s Report .......................................................................... 97Statement of the Supervisory Board ...........................101

11BOARD OF DIRECTORS’ REPORT 2021
2021 2020
Healthy Food, M€ 143.4 135.3
Healthy Ingredients, M€ 132.9 125.6
Other operations, M€ 1.5 1.5
Between segments, M€ -31.4 -28.9
The Group total, M€ 246.4 233.6
Change in net sales, % 5.5 -1.2
Board of Directors’ Report 2021
Heading into the strategy period with strong growth
Financial reporting
The year 2021Raisio Group’s reportable operating segments are Healthy Food, Healthy Ingredients and Other Operations. The reported figu-res are comparable. The comparison figures in brackets refer to the corresponding period a year earlier unless otherwise stated. The Healthy Food Segment focuses on the consumer brands with Europe as its main market area. The Healthy Food Segment signifies a reporting segment, which consists of Northern Europe, Eastern and Central Europe and Western Europe. The Healthy Ingredients Segment includes the sale of fish feeds and the Benecol product ingredient as well as the sale of grain- and plant-based foods and their ingredients to industrial and catering companies. In addition, Operations, which includes production, procurement and the supply chain, are reported as part of the Healthy Ingredients Segment.
Financial development
Net salesRaisio Group’s net sales totalled EUR 246.4 (233.6) million. The Group’s net sales increased clearly from the comparison period. The strengthening of the key currency rates supported the posi-tive development of net sales. The Healthy Food Segment’s net sales totalled EUR 143.4 (135.3) million and Healthy Ingredients Segment’s net sales were EUR 132.9 (125.6) million. In terms of consumer products, the development of business in Finland and the UK was very strong. On the B2B front, the domestic and export demand for grain-based value-added products continued at an especially good level. Raisioaqua’s sales remained at the level of the comparison period. The Verso Food business, which was acquired on 1 April 2021, supported the growth in the net sales of the whole Group. The growth in the Group’s net sales, which began during the second quarter, continued evenly in relation to the comparison periods.
The conversion impact on the Group’s net sales was EUR 0.9 (-2.5) million. The share of the impact caused by the British pound was EUR 1.8 (-0.7) million, by the Russian ruble EUR -0.5 (-1.3) million and by other currencies EUR -0.3 (-0.5) million. The conversion impact refers to the impact arising when the subsidiaries’ net sales are converted into euro as part of the consolidated finan-cial statements.
The share of Raisio Group’s net sales representing net sales outside of Finland totalled EUR 149.3 (144.1) million, which
accounted for 60.6 (61.7) per cent of net sales. In terms of the breakdown of the Group’s net sales, Finnish operations accounted for 39.4 per cent, the UK and the rest of Europe for 21.5 and 36.7 per cent, respectively, and the rest of the world for 2.4 per cent.
Group net sales
ResultsRaisio Group’s comparable EBIT was EUR 22.1 (27.7) million, which accounted for 9.0 (11.9) per cent of net sales. EBIT was EUR 23.8 (28.9) million, which accounted for 9.7 (12.4) per cent of net sales. EBIT includes EUR 2.8 million in other operating income for the sale of the receivable, EUR 0.6 million in expenses related to the corporate acquisition and altogether EUR 0.5 million in expenses from the corporate reorganisation resulting from negotiations held in accordance with the Act on Co-operation within Under-takings (334/2007). The development of the EBIT within the Heal-thy Food Segment fluctuated greatly within our different key markets. At the beginning of the year, our reportable market areas fell below that of the comparison period. During the second half of the year, the EBIT in Eastern and Central Europe turned towards growth, while the growth in Western Europe conti-nued as initiated in the second quarter. The EBIT in Northern Europe weakened at the end of the year as a result of commercial investments made in keeping with the strategy.
The Healthy Food Segment’s comparable EBIT amounted to EUR 19.5 (18.6) million, which accounted for 13.6 (13.7) per cent of net sales. The Healthy Food Segment’s EBIT amounted to EUR 19.3 (18.6) million, which accounted for 13.4 (13.7) per cent of net sales. EBIT includes a total of EUR 0.2 million in expenses from the corporate reorganisation resulting from negotiations held in accordance with the Act on Co-operation within Undertakings (334/2007). In the UK, the demand for consumer products conti-nued its growth trend throughout the year with a clear accelera-tion in growth during the final quarter. As anticipated, EBIT was weighted down by stronger sales and marketing investments and cost pressures related to grain-based raw material prices.
The Healthy Ingredients Segment’s comparable EBIT amounted to EUR 6.1 (12.6) million, which accounted for 4.6 (10.0) per cent of net sales. EBIT was EUR 8.1 (12.6) million, accounting for 6.1 (10.0) per cent of net sales. EBIT includes EUR 2.8 million in other operating income for the sale of the receivable, EUR 0.6 million in

12 BOARD OF DIRECTORS’ REPORT 2021
2021 2020
Comparable EBIT
Healthy Food, M€ 19.5 18.6
Healthy Ingredients, M€ 6.1 12.6
Other operations, M€ -3.5 -3.4
Between segments, M€ 0.0 0.0
The Group total, M€ 22.1 27.7
Comparable EBIT of net sales, % 9.0 11.9
EBIT
Healthy Food, M€ 19.3 18.6
Healthy Ingredients, M€ 8.1 12.6
Other operations, M€ -3.6 -2.3
Between segments, M€ 0.0 0.0
The Group total, M€ 23.8 28.9
EBIT of net sales, % 9.7 12.4
Investments
The January–December investments totalled EUR 24.2 (28.5) million, or 9.8 (12.2) per cent of net sales. The most significant share of the investments carried out during the reporting period was for the new, modern production facility being built in Raisio’s industrial area. The investment was technically completed during the first quarter of 2021, and the project advanced, during the third quarter, from process testing to productive use as planned. The first consumer products to come out of the production faci-lity were in shops in Finland at the end of third quarter. Targets from the start-up of the production facility were achieved as expected during 2021.
In keeping with our strategy, we will continue with investments in value-added oat products and ingredients and plant-based products. During the second quarter, the decision was also made to renew the pasta line located in Raisio’s industrial area. This requires a replacement investment of approximately EUR 3.5
2021 2020
Equity ratio, % 79.3 85.7
Net gearing, % -21.4 -30.8
Net-interest bearing debt, M€ -60.0 -83.0
Equity per share, € 1.77 1.71
Cash flow from operations after financial items and taxes, M€ 34.5 34.7
Comparable return on investment (ROIC), % 8.3 11.1
Return on investment (ROIC), % 8.8 11.7
expenses related to the corporate acquisition and altogether EUR 0.2 million in expenses from the corporate reorganisation resul-ting from negotiations held in accordance with the Act on Co-ope-ration within Undertakings (334/2007). EBIT was supported by the increased sales of grain-based value-added products and improved sales mix within B2B business. The success achieved by Raisioaqua at the start of the year turned to decline during the exceptionally long period of hot weather during the peak season. This had a heavy impact on EBIT, which fell very signifi-cantly below the level of the comparison period. Furthermore, the new production facility built in Raisio’s industrial area accrued costs from the planned start-up of production before any actual net sales have been made and Verso Food’s business, which was acquired on 1 April 2021, is still unprofitable.
The conversion impact on the Group’s comparable EBIT and EBIT was EUR 0.3 (-0.4) million. The share of the impact caused by the British pound was EUR 0.4 (-0.1) million, by the Russian ruble EUR
-0.1 (-0.3) million and by other currencies EUR 0.0 (0.0) million.
The depreciations and impairments totalled EUR 8.4 (6.2) million. The Group’s net financial items were EUR 0.9 (0.5) million. The Group’s pre-tax result was EUR 24.7 (29.4) million. The Group’s post-tax result was EUR 20.9 (23.4) million. The taxes of the comparison period included EUR 2.3 million from the entry of a deferred tax asset. The Group’s earnings per share were EUR 0.13 (0.15) and the comparable figure was EUR 0.12 (0.14).
Group EBIT
Balance sheet, cash flow and financing
At the end of December, the Raisio Group’s balance sheet total-led EUR 354.4 (314.6) million. Shareholders’ equity was EUR 280.7 (269.5) million, while equity per share totalled EUR 1.77 (1.71). Chan-ges in equity are described in detail in the Table section below.
The Group’s cash flow from business operations after financial items and taxes totalled EUR 34.5 (34.7) million. The cash flow for the financial year of 2021 includes EUR 2.8 million in other opera-ting income for the sale of the receivable and EUR 2.3 million in
tax refunds related to the UK business. The cash flow for the financial period sustained an impact of EUR -1.6 million as a result of the business of Verso Food, which was acquired on 1 April during the review period.
At the end of December, working capital amounted to EUR 36.1 (36.8) million.
At the end of December, the Group’s interest-bearing debt was EUR 29.1 (10.2) million. For the review period, interest-bearing debts include an increase in lease liabilities of EUR 12.2 million in connection with the process equipment required for the new production facility being built in Raisio’s industrial area. Net inte-rest-bearing debt was EUR 60.0 (-83.0) million.
At the end of December, Raisio’s financial assets recognised at fair value through profit or loss, as well as cash and cash equiva-lents totalled EUR 89.0 (93.2) million. Cash reserves are primarily invested in low-risk, liquid investment objects.
At the end of December, the Group’s equity ratio totalled 79.3 (85.7) per cent and net gearing was -21.4 (-30.8) per cent. The return on investments (ROIC) was 8.8 (11.7) per cent and the comparable return on investments (ROIC) was 8.3 (11.1) per cent.
Raisio plc paid EUR 20.6 (20.5) million in dividends for 2020.
Key figures for the balance sheet and financing

13BOARD OF DIRECTORS’ REPORT 2021
2021 2020
Healthy Food, M€ 1.0 0.6
Healthy Ingredients, M€ 21.9 26.2
Other operations, M€ 1.4 1.7
The Group total, M€ 24.2 28.5
million. The investment will be completed in autumn 2022 and will facilitate a better collective use of different ingredients and new commercial product applications. The production facility in Kauhava is also planning measures to expand the processing of fava beans during spring 2022.
Investments
its spread closed down economies to a significant extent from the beginning of 2020. Towards the end of the year, the numbers of those infected in Finland and around the world rose to new heights. Our expectation for the near future is, however, cautiously positive, as the vaccination coverage continues to increase rapidly. The change in consumers’ purchase and shop-ping behaviours towards digital channels has, at the same time, remained strong. The role of traditional trade is being forced to adapt as the volumes of new sales channels continue their strong growth.
Global megatrends support Raisio’s growth strategy and its focus on responsibly produced healthy food. As the pandemic withdraws, more permanent changes in consumer behaviour may be seen. According to our estimates, value choices and consumption habits related to health will become even more prevalent. The ultimate duration and impacts of the pandemic continue, however, to be an uncertainty. In response to the pande-mic, online sales have become a strong and permanent form of consumer trade. Our strategic choices to focus on fewer but stronger brands support our success at a time when purchase behaviours are changing. Raisio contributes to this development through good co-operation with the store chains.
Strategy period 2022–2025
On 10 June 2021, Raisio published its updated strategy and respon-sibility programme for the coming years. Raisio’s most impor-tant goal for the new strategy period is to grow boosted by the new capabilities and new product categories made possible by investments realised in recent years. Raisio’s three strategic areas of focus are Benecol and plant stanol ester solutions, value-added oat products and ingredients and plant-based products.
The compound annual growth rate (CAGR) of the combined net sales from the three aforementioned focus areas is 7% during the strategy period, and the CAGR for the entire Raisio Group is 5%. The three areas of focus together provide for approximately two thirds of the total net sales of Raisio Group. In 2020, Raisio Group had net sales of EUR 246 (234) million and the combined net sales for the areas of focus amounted to EUR 169 (157) million.
Raisio aims to achieve a comparable EBIT of over 10 per cent of the Group’s net sales in 2025. The commissioning and commercialisa-tion stage of the new production facility and growth investments in Verso Food, acquired in spring 2021, put pressure on Raisio’s EBIT during the first years of the strategy period.
The composition of and areas of responsibility assumed by Raisio Group’s Executive Committee were reorganised to support the updated strategy published in early June. The goal of the change was to flatten the organisation and allocate responsibility more broadly. Raisio’s values of courage, fairness and enthusiasm will continue to be even more visible in the company culture.
The Executive Committee’s responsibilities were reorganised and it gained two new members. The changes entered into force on 4 August 2021. The change does not affect the reportable segments.
Research and development
In January–December, R&D expenses were EUR 3.7 (4.3) million, accounting for 1.5 (1.9) per cent of net sales. Raisio’s development expenses included an acquisition expense of EUR 0.2 (0.3) million for the new production facility being built in Raisio’s industrial area.
The priorities of our research activities are reflected particularly in gluten-free oats as raw material and the ongoing product and application developments of Benecol products, and, since the acquisition of Verso Food, in the research and development programme related to plant proteins and fava beans.
Elovena Gluten Free Instant Oatmeal, Elovena Voimakaura 100% Oat Snack Biscuits and Benecol Soft Cheese were all launched at the beginning of the year. Future launches of oat-based products for the dairy section were presented in connection with the stra-tegy update in June. At the end of the third quarter, the oat-based Elovena and Benecol OAT products produced at our new produc-tion facility reached consumers in Finland; as many as 13 new products were brought to the Finnish market at the same time. During the autumn, we expanded our plant protein category by adding two new natural product variants to the Beanit® product line. In the future, our new production facility will make it extre-mely flexible to launch new products and categories.
According to the Brand Value (Brändien arvostus) survey for 2021, published in August, Elovena had risen to be 9th on the list of the most valued brands in Finland. Our traditional Sunnuntai® and Nalle® brands also rose to assume higher positions on the list of valued brands. In the same survey, Beanit rose to be Finland’s most valued brand in the plant-protein category.
In accordance with Raisio’s strategy, we are working together with our research partners to clarify other benefits and properties of plant stanol esters in addition to their cholesterol-lowering property. We are interested in the possible connection between, for example, plant stanol and the immune response. The studies are still in the very early stages, nor are there any specific commer-cial plans for the research results as yet.
Operating environment and COVID-19
The coronavirus pandemic has significantly affected Raisio’s operational environment as COVID-19 and measures to prevent

14 BOARD OF DIRECTORS’ REPORT 2021
2021 2020
Net sales, M€ 143.4 135.3
Western Europe, M€ 63.1 59.1
Northern Europe, M€ 59.8 55.5
Eastern and Central Europe, M€ 20.5 20.8
Comparable EBIT total 19.5 18.6
Comparable EBIT of net sales, % 13.6 13.7
EBIT, M€ 19.3 18.6
EBIT, % 13.4 13.7
Net assets, M€ 91.1 82.4
Segment information
Healthy Food segment
The Healthy Food Segment includes Raisio’s consumer product businesses in the Western, Eastern, Central and Northern European markets.
Financial developmentThe Healthy Food Segment’s net sales totalled EUR 143.4 (135.3) million. Net sales clearly exceeded the level of the comparison period, as the top brands in the focus of Raisio’s strategy succee-ded brilliantly in our key markets. Net sales in Northern and Western Europe clearly exceeded those of the comparison period, while net sales in Eastern and Central Europe remained at the same level as during the comparison period. A turn was already seen during the first half of the year in the Northern and Western European markets, but the greatest positive turns were seen in the Eastern and Central European markets at the end of the year.
Altogether 42 per cent of the Healthy Food Segment’s net sales were generated in Northern Europe, where Raisio’s well-known brands are Elovena, Benecol, Sunnuntai, Nalle, Torino® and Beanit. Nearly 44 per cent of net sales were generated from the sale of Benecol products in the Western European markets. The rest of the net sales, more than 14 per cent, were generated in Eastern and Central Europe, where Benecol and Nordic are among Raisio’s well-known brands.
The Healthy Food Segment’s comparable EBIT amounted to EUR 19.5 (18.6) million, which accounted for 13.6 (13.7) per cent of net sales. EBIT was EUR 19.3 (18.6) million, which accounted for 13.4 (13.7) per cent of net sales. EBIT includes a total of EUR 0.2 million in expenses from the corporate reorganisation resulting from negotiations held in accordance with the Act on Co-operation within Undertakings (334/2007). EBIT held at a good level during the reporting period despite the increasing investments in sales and marketing. The prices of the most vital grain-based raw materials rose dramatically at the end of the year in response to a weak harvest season. Favourable net currency movements were reflected stronger in the development of euro-denominated sales, but, to some extent, in EBIT as well.
The currency conversion impact on the Healthy Food Segment’s net sales was EUR 0.9 (-2.5) million and EUR 0.3 (-0.4) million on comparable EBIT and EBIT.
Key figures for the Healthy Food segment
Business operations
Western EuropeNet sales for the Western European operations amounted to EUR 63.1 (59.1) million and EBIT increased significantly from the comparison period.
Net sales for the Benecol business in the UK increased clearly from the level of the comparison period and growth in the market share was strong. Growth was seen in both yogurt drinks and spreads. The sales and marketing costs decreased slightly from those of the comparison period. The impact of the currency rates on net sales and EBIT was positive during the reporting period. As a whole, EBIT improved significantly from the comparison period.
Consumers in the UK rapidly shifted the majority of their shop-ping towards online sources over the past two years. The online sales of Benecol products benefited greatly from this phenome-non, also during the current year. In the UK, already approxi-mately one quarter of Benecol products were being purchased online. In terms of online business, the older age groups were significantly faster than the younger age groups at increasing their share of online purchasing. The success during the last quar-ter was largely due to the biggest categories of Benecol products, namely yogurt drinks and spreads, which achieved significant growth in relation to the comparison period.
The lockdowns and restrictions to prevent the spread of the pandemic in the UK were extensive during the early part of the reporting period in comparison to Raisio’s other key markets, but the restrictions were mainly lifted early on during the third quar-ter. Raisio’s current categories succeeded well during the review period and sales in 2022 will be supported with the introduction of new Benecol OAT products.
In Ireland, net sales increased significantly in relation to the comparison period and the development of EBIT has also been positive. Marketing investments during the comparison period were successful and Benecol products acquired new consumers in these markets. Raisio’s marketing activities in Ireland increased the size of the market for cholesterol-lowering products within the country. The significance of online sales also continued to grow in Ireland. This was reflected as strong growth in both net sales and the market share. The net sales and EBIT in Belgium declined slightly from the level of the comparison period, prima-rily as a result of increased marketing costs. The increased marke-ting investments in Belgium did, however, bring about a contract with a new retail chain and new category listings in the market during the review period.
Northern Europe Net sales for the Northern European operations amounted to EUR 59.8 (55.5) million. EBIT weakened as anticipated as a result of commercial investments made in keeping with the strategy.
The clear growth in net sales was thanks to Raisio’s strong brands, Benecol, Elovena and Beanit, which Raisio acquired along with the Verso Food deal. The positive sales figures of Benecol and Elovena were particularly accelerated by plant-based product launches from the new production facility during the final

15BOARD OF DIRECTORS’ REPORT 2021
Healthy Ingredients segment
The Healthy Ingredients Segment includes the sale of fish feeds and the Benecol product ingredient, and the sale of grain-based products to industrial and catering companies.
Financial development The Healthy Ingredients Segment’s net sales totalled EUR 132.9 (125.6) million. Net sales were significantly higher than during the comparison period as a result of domestic and foreign sales of grain products to bakeries and industrial and catering custo-mers. Net sales dropped as a result of the strategy-based reduced volume of external grain trade. The overall sales of the entire Healthy Ingredients Segment increased clearly in relation to the comparison period.
The Healthy Ingredients Segment’s comparable EBIT amounted to EUR 6.1 (12.6) million, which accounted for 4.6 (10.0) per cent of net sales. EBIT was EUR 8.1 (12.6) million, which accounted for 6.1 (10.0) per cent of net sales. EBIT includes EUR 2.8 million in other operating income for the sale of the receivable, EUR 0.6 million in expenses related to the corporate acquisition and altogether EUR 0.2 million in expenses from the corporate reorganisation resulting from negotiations held in accordance with the Act on Co-operation within Undertakings (334/2007). Comparable EBIT was burdened by costs related to the start-up of our growth investments, the amount of which corresponded to our expec-tations and the levels earlier communicated by us. Also, the rise in the price of grain-based raw materials had a negative impact on EBIT. Raisioaqua’s EBIT declined as a result of the significant decrease in fish feed sales during the third quarter. Raisioaqua’s overall EBIT was unprofitable for the entire year. EBIT was also strained by the acquisition, on 1 April 2021, of Verso Food, whose business remains unprofitable.
Key figures for the Healthy Ingredients segment
quarter. The increased sales volumes during the final quarter were also an indication that the selected primary strategic areas of focus were functioning as intended. Sunnuntai, Torino and Nalle products had declining sales figures, primarily as a result of the record-high sales during the comparison period at the start of the pandemic, when baking and eating at home grew strongly in relation to previous years. EBIT was weighted down by stronger sales and marketing investments and cost pressures related to grain-based raw material prices. During the current reporting period, Raisio has carried out significant co-operation with different stakeholders as a means of controlling challenging cost developments and ensuring availability, and we expect that this beneficial co-operation will continue in the future as well.
Eastern and Central EuropeNet sales for the Eastern and Central European operations remained at the level of the comparison period for a total of EUR 20.5 (20.8) million. EBIT decreased significantly from the comparison period.
Euro-denominated net sales in Russia remained at the level of the comparison period, while EBIT saw a clear decrease from the comparison period. Volumes and net sales in local currencies, however, were on the rise. The result was lowered by increa-sed prices for transportation, packaging and grain-based raw materials. As a result of the purchase behaviours of consumers, Raisio’s online sales continued to grow in customer channels, particularly in large cities, which was in line with the develop-ment and change of purchasing behaviour seen within other markets. Within the Russian market, benefits have been deri-ved from the more expansive shop coverage and the increase in brand recognition in areas outside of Moscow and St. Petersburg. Annual contracts and price increases in Russia were negotiated for the year 2022 as a means of managing cost inflation.
Euro-denominated net sales in Ukraine remained at the level of 2020, but EBIT decreased slightly. The distribution agreements that were updated early last year and the resulting better shop coverage have facilitated a considerably better and more mana-geable entry into the market. As a result of the change in the purchase behaviours of consumers, Raisio’s online sales also increased in Ukraine. Development in terms of volume was already quite positive at the end of the final quarter, as net sales and the result were increasing from the comparison period.
Net sales in Poland grew clearly and EBIT remained at the level of the comparison period. The long-term plan to return business to a positive level in Poland was successful during the reporting period and, therefore, the business has good growth perspectives for the future as well. As a result of the persistent work, Bene-col strengthened its market position within its own category in Poland. The normalisation of conditions and consumer behaviour will, as we move forward from the pandemic, offer even better operational opportunities. In Poland, as well as in many of Raisio’s other markets, sales through the so-called discounter channel have increased, particularly during the pandemic. Raisio’s aim for the future is to gain a supportive foothold within these markets.
2021 2020
Net sales, M€ 132.9 125.6
Comparable EBIT, M€ 6.1 12.6
Comparable EBIT of net sales, % 4.6 10.0
EBIT, M€ 8.1 12.6
EBIT, % 6.1 10.0
Net assets, M€ 120.1 91.9
Business operations
Fish feedsThe overall sales for the first half of 2021 exceeded even the level reached during the first half of the company’s record year in 2019. The sales and demand for fish feed typically fall within the second and third quarters of the year. The second quarter was highly successful in the Russian market. In Finland, our other key market, the sales volume remained at the level of the comparison period.

16 BOARD OF DIRECTORS’ REPORT 2021
The historically record-high and long period of hot weather that started in early July significantly decreased the sales volumes of the key markets in Finland and especially in Russia. The rapid freeze in demand during the peak sales season was also challen-ging for profitability. No feeds were produced, but the fixed costs of production remained and the simultaneous rise in the price of raw materials had a very negative impact on EBIT. Demand and sales following the period of hot weather recovered at the end of the third quarter to the level seen towards the end of the comparison period, but it no longer had the power to improve EBIT. The final quarter of the year clearly exceeded the level of the comparison period.
Raisioaqua’s annual net sales remained at the level of the comparison period. Despite the good sales level, the long break in demand during the summer season left its mark on the annual EBIT. Raisioaqua retained its market position in all market areas and also succeeded to open up new market areas by signing new sales contracts with CIS countries.
During the reporting period, Raisioaqua advanced the provi-sion of value-added services for its customers. A new application version of the Growth Sonar resource planning system developed by Raisioaqua was launched at the start of the year. The develop-ment work brought farmer customers more streamlined applica-tion screen views for the monitoring of fish feeding and growth, which further enhances the optimisation and cost efficiency of the feeding process. The automated feeding control system was also renewed with the introduction of new AquaControl units. The new Growth Sonar technology was delivered and installed at tens of farm units during the past year. The renewed application provides customers with streamlined dashboard views that furt-her improve their possibilities to monitor their feed inventory in real-time and even to make feed orders based on their stock and feeding amounts. Users of the new application and AquaControl units have been satisfied with the functionality and ease of the system, equipment and clarity of the application.
BtoB sales of grain-based productsRaisio’s sales to Finnish bakeries and to industrial and catering customers increased significantly. Sales in wheat, oat products and gluten-free oat products developed particularly well. The sales mix continued its shift to products with a higher degree of processing and, at the same time, the export volumes increased strongly in relation to the comparison period. Success in our stra-tegy-related growth areas had a positive impact on EBIT at the start of the year, but, by the end of the year, the increase in grain prices caused by the poor harvest season put a strain on EBIT.
Raisio continued its determined efforts to raise awareness of the company’s oat products and oat expertise, particularly among international food industry operators. Growth in the demand for oat and its ingredients continued to be strong. In particu-lar, the demand for gluten-free oats within the domestic and export markets has increased to an extremely significant degree throughout the year. Raisio’s export customers are both industrial end-users and distributors. Additional new export customers were consistently gained throughout the year. The expansion of the customer base will provide Raisio with more comprehensive
recognition and a growing market position within this strategi-cally important business area.
Benecol product ingredient sales to license partnersRaisio’s plant stanol ester deliveries to license partners held at the comparison level. EBIT also remained at the same level as that of the comparison period. The business conditions for Raisio’s partner customers varied greatly, by continent, as local pande-mic situations affected the sales of products. Partners in Latin America had difficulties in their own business operations, while partners operating in Asia experienced fluctuations in their busi-ness development. During the reporting period, Benecol products were launched for the first time in Singapore through a new Benecol partner. In the short term, however, the delivery volumes to the new customer have been quite moderate. The traditional licensing model will continue to be a way of offering Benecol products in the markets where Raisio does not operate itself.
Grain procurementRaisio’s grain procurement primarily focuses on the acquisition of grain for the manufacturing of its own products. In accordance with our strategy, we are investing in the production and sales of value-added products. Actual external grain trade is part of Raisio’s grain trade activities, but because of its low profitability, it is not included as one of the company’s strategic areas of focus and its volumes are currently fairly modest.
The growth season in 2021 was exceptionally difficult. The heat and dryness weakened the grain harvest to the point at which it became the weakest seen in decades. The spring grain harvest in Raisio’s procurement area dropped by more than 30 per cent in comparison to 2020. The fava bean harvest was also excepti-onally poor. Altogether 97% of the grain used by Raisio is grown in Finland and we set the use of domestic raw materials as our priority, also within this challenging procurement situation. The use and procurement of grain for our own use increased by 2 per cent from the previous year. Due to international market deve-lopments and the exceptionally poor harvest, grain prices rose in Finland to a record high level at the end of the year.
Administration and management
Board of Directors and Supervisory Board Raisio’s Board of Directors had five members from the AGM of 13 April 2021 and six prior to that. Erkki Haavisto, Leena Niemistö, Ann-Christine Sundell, Pekka Tennilä and Arto Tiitinen served as Board members throughout the financial period 2021. Ilkka Mäkelä served as member of the Board and the Chairman of the Board until the AGM.
As from 13 April 2021 Arto Tiitinen was elected as Chairman of the Board and Ann-Christine Sundell as Deputy Chairman.
In 2021, all the Board members were independent of the company and its major shareholders. Paavo Myllymäki served as Chairman of the Supervisory Board and Holger Falck as Deputy Chairman for the financial year 2021.

17BOARD OF DIRECTORS’ REPORT 2021
Group Executive Committee The Group Executive Committee consisted of Chief Executive Officer Pekka Kuusniemi and Chief Operating Officer Virpi Aalto-nen; Chief Business Officer (Elovena, Beanit & Communications) Annika Boström-Kumlin (as of 4 August 2021); Chief Legal Officer Sari Koivulehto-Mäkitalo; Chief Business Officer (Benecol & New Business) Mikko Lindqvist (as of 4 August 2021); Chief Financial Officer Mika Saarinen (as of 2 June 2021); Chief Customer Officer Iiro Wester and Chief People Officer Taru Ämmälä. Toni Rannikko was the Chief Financial Officer and member of the Executive Committee until 2 June 2021.
Directed share issueThe Board of Directors of Raisio Plc resolved on 31 March 2021 of a directed share issue to Kavli Holding AS carried out as a part of the corporate acquisition of Verso Food Oy. In the directed share issue a total of 1,000,000 of the company’s free shares held by Raisio Plc were transferred to Kavli Holding AS on 1 April 2021. The subscription price EUR 3.910 per share for the free shares was based on the trade volume weighted average exchange price of the free shares as of 31 March 2021, and was EUR 3,910,000 in total. The subscription price for the free shares was paid by transferring receivables owed by Verso Food Oy to Kavli Holding AS correspon-ding to the aggregate subscription price of the free shares. The resolution on the directed share issue was made pursuant to the share issue authorisation given by the Annual General Meeting on 27 April 2020. The Board of Directors has concluded that there was a weighty financial reason to deviate from the pre-emptive right of the shareholders as the directed share issue enabled the completion of the acquisition and it was the Board of Directors’ opinion that the acquisition of Verso Food Oy supported the company’s strategy. Kavli Holding AS undertook to comply with a lock-up period for the free shares during which Kavli Holding AS may not sell or otherwise transfer more than 250,000 of the said shares within each three-month period during a 12-month period. The conveyed shares represented approximately 0.75 per cent of the company’s free shares and approximately 0.61 per cent of all shares in the company and 0.13 per cent of the votes in the company conferred by all shares. Since the issued free shares were held by the company, the directed share issue did not affect the total amount of shares in the company, which remains as 165,149,030 shares. After the directed share issue, the company held in total 6,490,445 free shares and 212,696 restricted shares.
Report on non-financial information
Business modelRaisio is an international company, and our purpose, “Food for Health, Heart and Earth”, guides our operations. The compa-ny’s key markets are in Europe and its six production plants are located in Finland.
Raisio’s strategy update in spring 2021 made responsibility a more central part of Raisio’s strategy. Our strategy responds to the food transition, where different operators in the food chain are working to build a more sustainable food system in terms of the environment and climate. Consumer behaviour is also under-going a change, with food choices increasingly influenced, not only by taste and health aspects, but also by various responsibility
topics. For Raisio, the food transition offers business opportu-nities: our updated strategy focuses on Benecol® products and plant stanol ester solutions, plant-based food, oat-based consu-mer products and oats as an industrial raw material. In conne-ction with Raisio’s strategy update, we also updated Raisio’s responsibility programme. At the same time, we aligned it with Raisio’s strategic period so the Good Food Plan will now run until the end of 2025. Before updating the responsibility programme, we conducted a stakeholder survey to find out our stakeholders’ thoughts on responsibility. The previous Raisio stakeholder survey was conducted in 2017. Based on the results of the survey, we updated our materiality assessment, which in turn guided us in updating the objectives of the responsibility programme.
Raisio’s corporate responsibility programme has five themes: Environmentally Friendly Packaging, Healthy Food, Food Profes-sionals, Sustainable Food Chain and Environment & Climate Action. We previously referred to the Environment & Climate Action project as Climate Change and Carbon Neutrality. The name was changed when the responsibility strategy was updated, as the new name better reflects our far-reaching goals.
Code of ConductThe Raisio Code of Conduct and complementary internal guide-lines and policies create a basis for profitable and responsible operations. Raisio’s Human Rights Policy complements our Code of Conduct and is also applied in all Group companies worldwide. We also require all our suppliers and subcontractors to monitor the implementation of human rights in their operations.
Raisio is committed to the UN Global Compact’s sustainabi-lity initiative and its ten principles concerning human rights, labour practices, environment and anti-corruption. We also examine our activities from the perspective of the UN Sustai-nable Development Goals, which we support. For each theme of our responsibility programme, we have identified one UN Sustai-nable Development Goal that we feel we can best contribute to through our activities. We identified the following goals as the most relevant for our business:
• Healthy Food: goal 3 – good health and well-being• Sustainable Food Chain: goal 9 – industry, innovation and
infrastructure• Food Professionals: goal 10 – reduced inequalities• Environmentally Friendly Packaging: goal 12 – responsible
consumption and production• Environment & Climate Action: goal 13 – climate action
In addition to this, Raisio’s responsible practices are developed in line with the ISO 9001 quality management system, ISO 14001 environmental management system as well as BRC and FSSC 22000 food safety certificates for food production plants. Sustai-nable raw material choices and the commitment of the supply chain to the Raisio Supplier Code of Conduct promote the respon-sibility of the food chain.
Risk management We have developed Raisio’s risk management and the related process during 2021. Efforts have been made to more comprehen-sively identify the categories of risks affecting our operations, as

18 BOARD OF DIRECTORS’ REPORT 2021
well as the associated risks and management measures. In this way, we aim to ensure that risks are examined comprehensively from different perspectives and that the most significant risk scenarios are genuinely identified, anticipated and managed.
Under the new risk management system, each member of the Executive Committee is responsible for the continuous control and monitoring of the risks within their area of responsibility and for assessing the adequacy of the management measures. The adequacy of management measures is assessed by using a three-tiered set of criteria. For each area of responsibility, the most significant risk scenarios are highlighted annually for furt-her assessment by the Executive Committee and an action plan for improving risk management methods is decided on. The progress of the action plans is regularly monitored by the Execu-tive Committee, and the progress is regularly reported to the Board of Directors’ Audit Committee.
The aim is to operate according to the new risk management system from the beginning of 2022.
EnvironmentWe take environmental impacts extensively into account across our operations, with a particular focus on carbon neutrality, envi-ronmental friendliness and material and energy efficiency.
Raisio’s operations underwent significant changes in terms of environmental objectives in 2021, when the new factory for plant-based products was commissioned in the Raisionkaari industrial area and when the Kauhava factory joined the Raisio Group through the acquisition of Verso Food Oy. Naturally, as the number of factories increased from four to six, the changes were also reflected in the environmental figures for 2021, as an increase in total energy, among other things. The operations of Verso Food Oy’s Kauhava factory are reflected in the environmental figu-res from the beginning of April 2021. The operations of the new Raisionkaari factory, on the other hand, are reflected in the envi-ronmental figures for the whole year. The new production facili-ties do not change the primary goals of our environmental work, but they do affect our overall environmental impact. We will set new target levels for our environmental indicators during 2022.
We have changed the way we calculate our energy consumption and carbon dioxide emissions to be more in line with the guideli-nes of the Global Reporting Initiative: previously we only included energy we used ourselves, but now we also include energy we sell and distribute to others, as well as losses due to the efficiency of the bioenergy plant. At the same time, the carbon dioxide emis-sion coefficients were also updated to comply with the Finnish fuel classifications. This is also reflected in changes in the figures for carbon dioxide emissions and energy use for 2019 and 2020. The revised reporting practice showed that carbon-neutral energy accounted for a slightly higher proportion in 2019 and 2020 than we have previously reported. In addition to this, our total carbon dioxide emissions are lower under the new reporting method than we have previously reported. Due to the changes, the 2021 figures are not fully comparable with those of previous years.
A primary goal of the Good Food Plan 2019–2023 was to make our own production carbon neutral by the end of 2023. The
Raisionkaari industrial area has already been carbon-neutral since 2018. The new factory for plant-based products, completed in the area, is also carbon-neutral, with heat and industrial steam from the area’s own bioenergy plant.
At the Nokia mill, a heat production plant utilising oat hulls, a side stream of the mill’s processes, was commissioned in early summer 2021, together with the energy and water company Adven. The plant now produces all the heat and steam needed to run the mill. It even produces more heat than is needed. There-fore, in autumn 2021, we agreed with Leppäkosken Lämpö Oy that the surplus waste heat from the Nokia mill will be utilised in Leppäkosken Lämpö’s district heating network in Nokia. From the beginning of 2022, the amount of district heat collected in this way will correspond to the annual heating needs of around 150 detached houses.
A year ago, we estimated that, with the completion of the Nokia mill’s heating plant, all of Raisio’s own production facilities would be carbon-neutral in terms of energy production, meaning that the goal would be achieved, as early as 2021. The assessment was correct from the point of view of the existing factories and the one under construction, but the situation changed with the addition of the Kauhava factory. The steam used in the Kauhava factory is produced with fossil fuels. The plan and decisions on the transition of the Kauhava plant to carbon-neutral production will be made during 2022. Therefore, making our own production carbon-neutral by the end of 2023 remains as our goal.
In 2021, we carried out a carbon footprint calculation for the whole supply chain (scope 3) in cooperation with an external operator. Based on the calculation, we identified the most signifi-cant sources of carbon dioxide emissions in the supply chain and will use it to define more specific reduction targets and measures during 2022.
Raisio promotes the use of environmentally friendly packaging. The recyclability of our packaging improved significantly during 2021, with as much as 97% of our packaging now recyclable. One of the key challenges related to packaging materials is that consu-mers’ opportunities to recycle packaging materials for consumer products varies from market to market. We are trying to find packaging options that can be recycled in all markets. In 2021, one of our priorities was to select and test environmentally friendly packaging materials for the products of the new factory in the Raisionkaari industrial area. The products of the new factory are packaged in cardboard-based packaging, made mainly from renewable materials. In Finland, all packaging for the new facto-ry’s products is recyclable. Work has also continued on the deve-lopment of the packaging of products already on the market.
Raisio’s most significant environmental risks are the impacts of climate change on, for example, energy prices and the quality, availability and prices of Raisio’s key raw materials, such as grains. The risk related to the energy price increase is managed by inves-ting in the use of renewable energy and using production side streams for energy production, among other measures. Raisio aims to manage risks related to the procurement of Finnish grains by expanding the procurement area geographically in Finland.

19BOARD OF DIRECTORS’ REPORT 2021
HR and social mattersRaisio’s strategic goal is to be an attractive employer. The Raisio Group’s continuing operations employed 388 people at the end of 2021 (2020: 342, 2019: 319). A total of 19 (2020: 19, 2019: 21) per cent of employees worked outside Finland. Raisio’s wages and fees for continuing operations in 2021 totalled 27.4 (2020: 24.8; 2019: 23.7) million including other personnel expenses.
At the beginning of August, we reformed the company’s organi-sation to reflect our strategic priorities, and we also launched a broader organisational reform in August, including cooperation negotiations. The aim of the reform is to promote the updated strategy by changing our ways of working and flattening the organisation. A joint change programme was also launched in the autumn, with the core idea of putting the company’s values into practice and implementing the change through the efforts of all our employees. The four-month programme will run until the end of March 2022.
According to the Raisio Code of Conduct, the Group complies with the regulations of the International Labour Organization (ILO) and with local collective agreements, regulations and laws related to work in the countries where the company operates. HR management is also guided by internal policies and plans for competence development and equality, for example.
In 2021, we have continued to create and develop a common culture of occupational safety. The safety steering group has continued to work systematically to increase safety cooperation and consistency within the company. A key part of strengthening occupational safety culture is proactive occupational safety work and early intervention in possible risks. As shared indicators of proactive occupational safety work, we have already been using safety observations, safety quarters and near misses. Further-more, the investigation process of each accident includes the definition of corrective actions, open communication within the organisation and peer learning. In 2021, we introduced safety rounds and work risk and hazard assessments as new, proactive safety indicators. The work done to develop a culture of occupa-tional safety is reflected in the number of proactive safety measu-res, which has tripled compared to the previous year. The most significant increase was in the number of safety observations and safety quarters. A total of 452 preventive safety measures were taken (2020: 152).
In terms of social and HR matters, we consider serious workplace accidents and the stability and availability of competent emplo-yees to be our main risks. The COVID-19 pandemic continues to pose a risk to the company’s employees and continuation of production. Risks are managed by developing the occupatio-nal safety culture and by determinedly promoting competence management and well-being at work. Raisio’s Pandemic Working Group, set up in 2020, has continued to work, monitor the situa-tion and instruct employees throughout 2021 and will continue its work in 2022.
Respect for human rightsThe Raisio Group complies with applicable international and local laws in all of its operating countries. We respect the UN
declaration of human rights and the fundamental rights at work as defined by the International Labour Organization (ILO). These rights cover freedom of association, the right to organise or not to organise, the right to collective bargaining, the prohibition of forced labour and child labour, and the employees’ right to equal treatment and opportunities. We are also committed to the ten principles of the UN Global Compact initiative regarding human rights, labour, environment and anti-corruption. The Raisio Group’s Global Human Rights Policy complements the company’s Code of Conduct and is applied in all companies of the Raisio Group globally.
Raisio is not aware of any human right violations related to its operations.
Raisio’s biggest human rights risks are typical for the food industry. The major risks are related to long procurement chains and procurement of labour-intensive raw materials. The risks are managed by the means mentioned in Raisio’s Global Human Rights Policy, for example, by taking the risks into account already when selecting a supplier and by monitoring more closely the acquisitions from potential risk countries. To ensure the respon-sibility of the entire procurement chain, all the chain operators have to work together.
Raisio’s single largest raw material group is grain, which accounts for 75 (2020: 74, 2019: 69) per cent of raw materials. 97 per cent of grain is Finnish. The supply chain of grain is short: we procure grains directly from contract farms in southwest Finland, and the grain is delivered to our production directly from the farmers’ grain warehouses without interim storage. Foreign labour is rarely used on Finnish grain farms, which further reduces the risk of human rights violations. In terms of the production of soy, palm oil and cocoa, risks related to, for example, employees’ rights and environmental responsibility are possible. We minimise this risk by procuring responsibility certified soy, palm oil and cocoa.
We acquire most of our raw materials from low-risk regions, such as Finland and the rest of Europe. Some raw materials are only available from higher-risk countries. In these cases, we pay special attention to the supplier’s procedures and certifications. We also use the BSCI risk country classification that guides to procure-ments from low-risk countries.
We expect our suppliers to commit to the Raisio Supplier Code of Conduct. By the end of 2021, 99.8 (2020: 95, 2019: 92) per cent of the value of all direct procurements was procured from supp-liers who have committed in writing to Raisio’s Supplier Code of Conduct or whose own ethical principles have been approved by Raisio. Most of the suppliers of Verso Food Oy, which joined the Group in April, have already committed to Raisio’s Supplier Code of Conduct. For some, Verso Food’s supplier principles are in place and will be updated to Raisio’s principles when the cont-ract is updated. As in the previous year, the COVID-19 pandemic hampered supplier audits. In 2021, we continued our work to further integrate social responsibility and human rights issues into our audits and revised the list of questions used in our audits, so that social responsibility issues are an explicit part of the audit question battery.

20 BOARD OF DIRECTORS’ REPORT 2021
Matters related to anti-corruption and briberyThe Raisio Code of Conduct and anti-corruption policy explicitly prohibit corruption and bribery. Employees are regularly trained in the Code of Conduct and anti-corruption policy, and the trai-ning is part of the induction programme of each new employee.
Measures against bribery and corruption are also taken into account in all agreements concluded by Raisio; they are required in the Raisio Supplier Code of Conduct.
In December, we introduced a new reporting channel to report any suspicions of abuse. The new electronic reporting channel is available not only to employees, but also to Raisio Group’s customers, partners and other stakeholders, as required by the European Union’s Whistleblowing Directive. The system replaced the reporting channel previously used by Raisio. The channel can be used to report suspicions of activities that do not comply with Raisio’s values, ethical guidelines or applicable laws. To ensure the anonymity of the reports, the reporting channel is managed by an external partner, WhistleB, Whistleblowing Centre. Instructions for reporting are available on the Raisio website at raisio.com.
Healthy foodConsumer behaviour is undergoing a change, with food choices increasingly influenced, not only by taste and health aspects, but also by sustainability topics. In line with our strategy, we focus on healthy and tasty food that is produced responsibly. Our view on healthy food is based on the generally approved concepts confirmed by the science of nutrition. To support product deve-lopment, the company has defined healthy criteria for all its
product categories. The criteria take issues essential to health into account in each category. Raisio’s criteria are available on our website.
While developing products, we pay special attention to good taste, the quality of fat and the amounts of fibre, sugar and salt – and strive for the best possible combination of taste and healthiness.
As for the healthiness of food, consumers face an information overflow that we identify as a risk, as it can lead to uncertainty about healthy choices. We communicate responsibly on nutri-tion and product healthiness in line with the nutrition recom-mendations.
Key goals and resultsThe goals of the first period of the Raisio Good Food Plan were defined for 2019–2023, and the table below looks at the achieve-ments from the perspective of that period.
The fact that the update of the Good Food Plan is aligned with Raisio’s strategic period, running from 2022 to 2025, means that we will also update the more specific indicators of the responsi-bility programme for this period and until the end of 2025. This update has started and will continue in early 2022. The indica-tors will also be influenced in the future by developments in EU taxonomy regulations, which we have been actively monitoring. Deeper analyses and conclusions on the impact of the EU taxo-nomy can only be drawn once the taxonomy classifications and criteria are finalised.

21BOARD OF DIRECTORS’ REPORT 2021
Goal by the end of 2023 Corporate Governance Results 2021
Environment
100% carbon-neutral energy in productions
• Systematic transition to the use of carbon-neutral energy
• Raisio defines carbon-neutral energy as energy produced without fossil fuels
• Carbon dioxide emissions 1000 (2020: 1400, 2019: 1100) t CO2e
• Of all the energy used by Raisio 97 (2020: 94, 2019: 95) % carbon neutral
• Total energy consumption, 1000 MWh: 95 (2020: 81, 2019: 76)
Environmentally friendly packaging: • 100% recyclable consumer
packaging• continuous reduction of the
amount of packaging plastic
• In consumer products, recyclable packaging and reducing the amount of packaging plastic
• Of consumer packaging, 97 (2020: 87, 2019: 83) % recyclable
• Of consumer packaging, 57 (2020: 58, 2019: 56) % cardboard or paper
• Of consumer packaging, 43 (2020: 42, 2019: 44) % plastic packaging
Social and HR matters
Promotion of wellbeing at work • Support for the personnel’s healthy lifestyles
• Development of virtual work skills
• Employee turnover 9 (2020: 10, 2019: 11)%• 78 (2020: 72, 2019: 68) % of employees completed
online training on values• 75 (2020: 60, 2019: 43) % of personnel completed
healthy food online training
Strengthening of work safety culture • Development of the common work safety culture and unification of common practices
• Encouragement of personnel to use preventive safety tools and to make safety observations
• Accidents (Lost time injury 1) 12 (2020: 10, 2019: 4)• Proactive work safety measures 452 (2020: 152,
2019: 135) pcs, including safety observations, near misses, safety quarters and, as new additions in 2021, work risk and hazard assessments and safety rounds
Human rights
Development of procurement responsibility
• Suppliers and subcontractors required to sign the Raisio Supplier Code of Conduct
• Raisio only uses responsibility certified palm oil, cocoa and soy
• 99.8 (2020: 95, 2019: 92) % of the value of direct procurements was procured from suppliers who have committed to Raisio’s Supplier Code of Conduct
• 100 (2020: 100, 2019: 100) % responsible palm oil• 100 (2020: 100, 2019: 100) % responsible soy• 94 (2020: 93, 2019: 78) % responsible cocoa
Increasing human rights expertise • Further integration of social responsibility and human rights issues into audits
• Social responsibility issues explicitly included in the set of questions used to audit suppliers
Matters related to corruption and bribery
100% of staff completed the online training on the Raisio Code of Conduct
• Online training, available in three languages, is part of the induction of new employees
• 85 (2020: 81, 2019: 81) % of employees completed online training
Healthy food
80% of consumer products healthy alternatives in their own product categories
• Raisio has defined health criteria for all its product categories; the criteria are based on European nutrition recommendations
• The criteria are used, e.g. to support Raisio’s product development
• Health criteria also available on the company’s website
• 81 (2020: 79, 2019: 77) % of consumer products were healthy alternatives in their own categories at the end of 2021

22 BOARD OF DIRECTORS’ REPORT 2021
EU taxonomy reporting The EU taxonomy aims to engage investors, companies and other business operators in working towards the EU’s carbon neutrality goals and, thereby, direct funding towards sustainable activities. At Raisio, we have a generally positive view of the reform, as we believe that a common set of criteria will facilitate comparisons and guide industries in the right direction. In our view, measures to promote the increased consumption of plant-based food have a major role to play in the food transition. We also believe that, in addition to consumer behaviour, another key issue is how the different operators in the food chain are able to take climate impacts into account in their own activities.
At Raisio, we followed the development of the EU taxonomy criteria in 2021. For 2021, the obligation to report in accordance with the taxonomy applies to organisations employing more than 500 people, so it does not yet apply to Raisio at this stage. In the future, however, the EU taxonomy will apply to practically all listed companies, including Raisio. However, for the food industry, the taxonomy is not yet fully complete and will require further work during 2022.
As responsibility is a key part of Raisio’s strategy, we consider it to be important for us to examine our activities in accordance with the EU taxonomy from the very beginning. That is why we have already voluntarily reviewed our business from the perspective of the first two criteria that have been completed, which are climate change mitigation and climate change adaptation. In addition to the EU taxonomy approach, we will continue to take into account the guidelines of the Global Reporting Initiative in our separate corporate responsibility report.
Share of net sales in 2021
Share of operating expenses in 2021
Share of investments in 2021
Activities eligible for EU taxonomy
Bioenergy plant in the Raisionkaari industrial area € 0.8 million (0.3%) € 0.3 million (3.5%) € 0.1 million (0.2%)
Activities not eligible for EU taxonomy € 245.6 million (97.7%) € 7.6 million (96.5%) € 24.1 million (99.8%)
Total € 246.4 million (100%) € 7.9 million (100%) € 24.2 million (100%)
The climate change mitigation and adaptation criteria do not include indicators directly applicable to food production. We believe that indicators related to food production will be better included in the other four EU criteria to be completed in the future: the sustainable use and protection of water and marine resources, the transition to a circular economy, pollution preven-tion and control, and the protection and restoration of biodiver-sity and ecosystems.
The climate change mitigation and adaptation criteria apply to the Raisio Group’s bioenergy plant located in the Raisionkaari industrial area, which produces heat and steam for the produc-tion facilities and buildings located in the area. Raisio also sells the energy from the bioenergy plant to other companies in the industrial area, which makes the bioenergy plant eligible for EU taxonomy. The main task of the bioenergy plant is to produce heat and steam for Raisio’s own production facilities. The bio- energy plant, commissioned in 2018, was an important step in our journey to make our own production carbon-neutral by the end of 2023.
The bioenergy plant accounted for 0.8 million euros of the Raisio Group’s net sales. Direct operating expenses under the EU taxo-nomy amounted to 0.3 million euros, i.e. 3.5% of the Group’s operating expenses. The operating expenses have been calcu-lated in accordance with the EU taxonomy. The expenses under the EU taxonomy differ from the operating expenses presented in the consolidated financial statements. Investments accounted for 0.1 million, which is 0.2% of the Group’s total investments.
Criteria: Climate change mitigation and climate change adaptation
Changes in group structure
Verso Food Oy acquisition 1 April 2021On 1 April 2021, Raisio Group announced it had acquired the entire share capital of Verso Food Oy from Kavli Holding AS and Kavli Oy. The debt-free total purchase price was EUR seven million and one million shares of the free shares held by Raisio plc. The share portion of the purchase was realised as a private placement.
Short-term risks and sources of uncertainty
During 2021 the pandemic continued to affect consumers seve-rely. The restrictions resulting from the pandemic and possible extensive sick leaves across the production and delivery chains may still have an impact on the company’s operational ability. Raisio has implemented widescale measures to reduce any possible risks and their impacts. The impacts of the COVID-19

23BOARD OF DIRECTORS’ REPORT 2021
pandemic have also been described in the section of this report entitled ‘Operating environment and COVID-19’.
Under normal conditions, Raisio’s most significant short-term business risks are related to general economic development and consumer demand. Extreme weather phenomena and changes in the availability, quality and price of the key raw materials, such as grains and sterols, are a major challenge for Raisio’s operations. Changes in key currencies relevant for Raisio and currency conver-sions affect Raisio’s net sales and EBIT both directly and indirectly. Their overall impact is explained in detail in the financial reports to provide a better and more comprehensive overall picture of the situation and related risks.
Events following the review periodRaisio had no reported events after the review period.
Outlook 2022Raisio’s guidelines: In 2022, Raisio estimates that net sales will increase by 5 % (net sales in 2021: EUR 246.4 million). Our stra-tegy-based growth investments place pressure on our relative profitability in comparison to the previous financial year.
Board of directors’ proposal for the distribution of profitsThe parent company’s distributable assets based on the balance sheet on 31 December 2021 totalled EUR 115,878,079.49.
The Board of Directors proposes that a dividend of EUR 0.14 per share, of which EUR 0.04 as an extra dividend, be paid from the parent company’s retained earnings. Hence, the proposed divi-dend will total EUR 23,120,902.00, and EUR 92,757,177.49 will be left in the profit account. No dividends will be paid on the shares held by the company on the record date 14 April 2022. The payment date of the dividend is proposed to be 26 April 2022.
No significant changes have taken place in the company’s finan-cial position after the end of the financial year. The company’s liquidity is good, and the Board’s view is that the proposed divi-dend payout does not endanger the company’s solvency.
In Raisio, 8 February 2022
Raisio PlcBoard of Directors
Information required in the Companies Act and Decree of the Ministry of Finance on the regular duty of disclosure of an issuer of a security, such as information regarding share classes, shareholders and share trading, close associates, company shares held by the company and their acquisitions and transfers as well as key figures, are presented on pages 24–36, part of the official Annual Report, as well as in the Notes to the Financial Statements.
The company’s Corporate Governance Statement has been issued as a separate report.

SHARES AND SHAREHOLDERS24
This section includes the Notes related to shares and shareholders as well as key figures per share and their calculation formulas.
Shares and shareholdersRaisio plc’s shares are listed on Nasdaq Helsinki Ltd. Raisio’s market value at the end of 2021 was EUR 557.8 million. Overall trading totalled nearly EUR 109.5 million. The closing price of free shares on 31 December 2021 was EUR 3.37, and that of restricted shares EUR 3.41. The Board of Directors will propose to the Annual General Meeting in spring 2022 that a dividend of EUR 0.14 will be paid per share, including an extra dividend of EUR 0.04 per share. Share capital and share classesThe fully paid-up share capital of Raisio plc is EUR 27,776,072.91, which on 31 December 2021 was divided into 30,960,624 restricted shares (series K) and 134,188,406 free shares (series V). No nominal value is quoted for the shares. Restricted shares accounted for 18.7 % of the share capital and 82.2 % of the votes, while the correspon-ding figures for free shares were 81.3 % and 17.8 % (on 31 December 2021). The company’s minimum share capital is EUR 25,000,000 and maximum share capital EUR 100,000,000. The share capital can be raised or lowered within these limits without amending the Articles of Association. There were no changes in the share capital during 2021. The company has not issued securities that entitle the holder to shares.
Raisio plc’s shares are listed on Nasdaq Helsinki Ltd (hereafter: Stock Exchange) in the public trading under the sector Consu-mer Goods and sub-industry of Food Products. The company’s free shares are quoted in the Mid Cap segment and its restricted shares on the Prelist. The trading code for free shares is RAIVV and the ISIN code FI 0009002943, and for restricted shares RAIKV and FI 0009800395. The company’s shares have been entered into the book-entry system.
Free and restricted shares have an equal entitlement to equity and profits. At the Annual General Meeting (AGM), each restricted share entitles the holder to 20 votes and each free share to one vote. At the AGM, no shareholder’s shares are entitled to vote with more votes than one tenth of the total number of votes of the shares represented at the Meeting.
The assignment of restricted shares must be approved by the Board of Directors (Board). The approval is required even if the party who the shares are assigned to already owns restricted shares in the company. The approval must be given if the share recipient is a natural person whose primary occupation is farming. If the approval is not given, the Board must convert the assigned restricted share into a free share.
The Board may also convert restricted shares into free shares on
Shares and shareholders
Content
request and likewise give advance information on whether the applicant will be granted permission to acquire restricted shares. In 2021, a total of 484,734 restricted shares were converted into free shares. In the book-entry system, restricted shares for which the approval procedure is in progress or the approval has not been sought, will be retained on the waiting list until they are ente-red as restricted shares in the share register following approval, assigned to another shareholder or converted into free shares. There were 8.6 million restricted shares on the waiting list on 31 December 2021.
Ownership structureAt the end of 2021, Raisio plc had 35,089 registered shareholders (31 December 2020: 36,879).
In 2021, foreign ownership in the Company amounted to 19.0 per cent at its highest, to 17.4 per cent at its lowest and was 18.4 per cent at the end of the year (31 December 2020: 17.6 %).
0.1 per cent of free shares and 1.9 per cent of restricted shares remain outside the book-entry system.
Shares held by managementThe members of the Board of Directors and Supervisory Board and Managing Director as well as the companies and foundations of which they have control held a total of 767,688 restricted shares and 450,766 free shares on 31 December 2021. This equals 0.74 per cent of all shares and 2.10 per cent of overall votes..
Shareholder agreementsThe Board is not aware of any valid agreements related to the ownership of the company’s shares and the use of voting power. Flagging notificationsIn 2021, the company received notifications of significant changes in holding and voting rights referred to in section 9 of the Securi-ties Markets Act as follows:
• 23 August 2021: According to a notification received by Raisio plc, the holding of Pendal Group Limited and entities under its control has exceeded the 5 % threshold for Raisio plc’s shares on 9 August 2021.
• 9 September 2021: According to a notification received by Raisio plc, the holding of Pendal Group Limited and entities under its control have fallen below the 5 % threshold for Raisio plc’s shares on 7 September 2021.
Dividend policy and dividendRaisio plc aims to pay an annual dividend of 50–100 per cent of earnings per share (EPS) for its continuing operations. In addi-tion, the Board of Directors may propose an extra dividend to be distributed. The payment of dividends under the dividend policy is subject to the condition that the payment does not compromise the company’s financial position or the achievement of strategic objectives.

SHARES AND SHAREHOLDERS 25
The AGM held in April 2021 decided on a dividend of EUR 0.13 per share, which was paid to shareholders on 22 April 2021. No divi-dend, however, was paid on the shares held by the company. The Board will propose a per-share dividend of EUR 0.14, of which EUR 0.04 as an extra dividend, at the AGM in spring 2022. The record date is 14 April 2022 and the payable date 26 April 2022.
Raisio shares traded on Stock Exchange in 2021The highest price of the series V share was EUR 4.49, the lowest EUR 3.20 and the average price EUR 3.80. The year-end price of the V share was EUR 3.37. A total of 26.9 million V shares were traded (35.7 million in 2020), which equals some 20.1 per cent of the total volume of V shares. The value of share trading was EUR 102.3 million (EUR 114.9 million in 2020).
The highest price of the series K share was EUR 4.40 and the lowest EUR 3.19. The average price was EUR 3.78. The year-end price of the K share was EUR 3.41. A total of 1.9 million K shares were traded (1.7 million in 2020), and the value of share trading was EUR 7.1 million (EUR 5.5 million in 2020).
At the end of 2021, the share capital had a market value of EUR 557.8 million (EUR 528.7 million in 2020) and EUR 535.2 million (EUR 504.1 million in 2020) excluding the shares held by the company.
Company sharesAt the end of the review period, Raisio plc held 6,480,341 free shares and 212,696 restricted shares. The number of free shares held by Raisio plc accounts for 4.8 per cent of all free shares and the votes they represent, while the corresponding figure for restricted shares is 0.7 per cent. In all, the shares held by the company represent 4.1 per cent of the entire share capital and 1.4 per cent of overall votes. Other Group companies hold no Raisio plc shares.
Raisio plc and its subsidiaries do not have any shares as collateral and did not have any in the review period.
Raisio plc’s Research Foundation holds 150,510 restricted shares, which is 0.49 per cent of the restricted shares and the votes they represent and, correspondingly, 0.09 per cent of the entire share capital and 0.40 per cent of the votes it represents.
Acquisition and conveyance of own sharesBased on the authorisation given by the AGM 2021, the Board can acquire and/or accept as pledge in one or more lots a maximum of 6,250,000 shares at a time; a maximum of 5,000,000 free shares and a maximum of 1,250,000 restricted shares. The authorisation will be valid until the conclusion of the following Annual General Meeting and at the latest 30 April 2022. The number of own shares that can be purchased and/or accepted as collateral based on this authorisation totals 3.8 per cent of all shares and 4.0 per cent of the votes they represent.
The shares may be acquired in order to develop the capital struc-ture of the company, to finance or carry out acquisitions or other arrangements, to implement share-based incentive schemes or to be otherwise further assigned or cancelled.
The Board has the right to repurchase own shares otherwise than
in proportion to the share classes and to decide on the order of repurchase of the shares. The shares may be purchased otherwise than in proportion to the holdings of the shareholders.
During the financial period, the Board has not exercised its autho-risation to repurchase own shares or accept own shares as colla-teral. Furthermore, the Board has not purchased or accepted as collateral any shares during the financial period based on the authorisation granted by AGM 2020 and expired on 13 April 2021.
In the review period, a total of 10,104 free shares were assigned to the Chairman and members of the Board as part of the compen-sation for managing their duties, in line with the decision taken by the AGM in 2021. The value of free shares assigned as fees to the Board was EUR 35,993.92 at the time of the assignment.
Under the Companies Act, the Board is also entitled to annul all the own shares held by the Company. No shares were annulled in the financial period.
Share issue authorisationThe AGM of 2021 authorised the Board to decide on the share issues by disposing any potentially repurchased own shares, a maximum total of 12,500,000 free shares and 1,460,000 restricted shares, and by issuing a maximum of 20,000,000 new free shares against payment.
Based on the authorisation, the number of the shares to be assigned and held by the Company on 31 December 2021 equals 4.1 per cent of the share capital and 1.4 per cent of the votes it represents. Furthermore, based on the authorisation, the number of issued new shares equals 12.1 per cent of the share capital and 2.7 per cent of the votes it represents.
The Board has been authorised to decide to whom and in what order the Company’s own shares are assigned and new shares given.
The Board can decide on the assignment of own shares and giving new shares in another proportion than that in which the share-holder has a preferential right to acquire the Company’s shares if there is a weighty financial reason for a deviation from the Company’s point of view. Development of the Company’s capital structure, financing or implementation of company acquisitions or other arrangements and realisation of share-based incentive schemes can be considered weighty financial reasons from the Company’s point of view.
The Board can also decide on the assignment of own shares in public trading on the Nasdaq Helsinki Ltd (Stock Exchange) for raising funds for the financing of investments and possible company acquisitions.
The shares can also be assigned against compensation other than money, against receipt or otherwise on certain terms and conditions.
The share issue authorisation will be valid until the conclusion of the following Annual General Meeting and at the latest 30 April 2022.

SHARES AND SHAREHOLDERS26
Directed share issueThe Board of Directors of Raisio Plc resolved on 31 March 2021 of a directed share issue to Kavli Holding AS carried out as a part of the corporate acquisition of Verso Food Oy. In the directed share issue a total of 1,000,000 of the company’s free shares held by Raisio Plc were transferred to Kavli Holding AS on 1 April 2021. The subscription price EUR 3.910 per share for the free shares was based on the trade volume weighted average exchange price of the free shares as of 31 March 2021, and was EUR 3,910,000 in total. The subscription price for the free shares was paid by transferring receivables owed by Verso Food Oy to Kavli Holding AS correspon-ding to the aggregate subscription price of the free shares. The resolution on the directed share issue was made pursuant to the share issue authorisation given by the Annual General Meeting on 27 April 2020. The Board of Directors has concluded that there was a weighty financial reason to deviate from the pre-emptive right of the shareholders as the directed share issue enabled the completion of the acquisition and it was the Board of Direc-tors’ opinion that the acquisition of Verso Food Oy supported the company’s strategy. Kavli Holding AS undertook to comply with a lock-up period for the free shares during which Kavli Holding AS may not sell or otherwise transfer more than 250,000 of the said shares within each three-month period during a 12-month period. The conveyed shares represented approximately 0.75 per cent of the company’s free shares and approximately 0.61 per cent of all shares in the company and 0.13 per cent of the votes in the company conferred by all shares. Since the issued free shares were held by the company, the directed share issue did not affect the total amount of shares in the company, which remains as 165,149,030 shares. After the directed share issue, the company held in total 6,490,445 free shares and 212,696 restricted shares.
Corporate Governance
Annual General Meeting and Company ManagementThe Annual General Meeting (AGM) is the Company’s highest decision-making body. It meets annually by the end of April to decide on the matters within its responsibilities, such as the adoption of the financial statements and consolidated financial statements, dividend distribution, discharge from liability, elec-tion of Board and Supervisory Board members and auditors, and the fees payable to them. Extraordinary General Meetings can be held if necessary.
The Board is responsible for the Company’s administration and the proper organization of its operations. The Board is responsible for ensuring that the monitoring of the Company’s accounting and asset management has been properly arranged.
The Board consists of a minimum of five and a maximum of eight members elected by the AGM. Their term begins at the end of the AGM at which the election takes place and lasts until the end of the following AGM.
The Supervisory Board supervises the corporate administration run by the Board and CEO and gives the AGM a statement on the financial statements and auditor’s report.
The members of the company’s Supervisory Board, who number 15 as a minimum and 25 as a maximum, are elected by the AGM, with the exception of personnel group representatives, for a term that begins at the AGM at which the election takes place and lasts until the end of the third AGM following the election. One-third of the members are replaced every year. The Supervisory Board also includes three members whom the personnel groups, formed by Raisio’s employees in Finland, have elected as their representati-ves. Their term is approximately three years.
The body that elects the members of the Supervisory Board and the Board of Directors may make a new appointment decision at any time, meaning that the duties of a member or all members may be terminated before the term comes to an end.
Managing Director runs the company’s day-to-day administra-tion in accordance with the Board’s guidelines and regulations and in line with the targets set by the Board (general authority), and is responsible for ensuring that the company’s accounting complies with legislation and asset management arrangements are reliable.
The Managing Director is appointed and discharged by the Board. The Managing Director is appointed for an indefinite term.
Amendments to the Articles of AssociationAs a rule, the amendment of the Articles of Association requires that the proposed amendment is supported by at least two-thirds of the votes given and the shares represented at the meeting. In order to change sections 6, 7, 8, 9 and 18 of the Articles of Associa-tion, such a decision is required which is made at two successive General Meetings, held with an interval of at least 20 days, by a majority of three fourths of the votes given and of the shares represented. In certain matters, the Companies Act requires a vote by classes of shares and shareholder approval. The Articles of Association have not been amended or proposed to be amen-ded during 2021.

SHARES AND SHAREHOLDERS 27
Shares registered under foreign ownership, including nominee registrations, totalled 30 457 986, or 18.4 % of the total and 22.7 % of free shares. Raisio plc owned 6 693 037 company shares, which represents 4.1% of the total.
The members of the Board of Directors and Supervisory Board and Managing Director as well as the companies and foundations of which they have control held a total of 767 688 restricted shares and 450 766 free shares on 31 December 2020. This equals 0.7 per cent of all shares and 2.1 per cent of overall votes.
Breakdown of share capital and votes as 31 December 2021
25 major shareholders 31 December 2021 according to shareholders’ register
Information on Raisio plc’s shares and shareholders
Shareholders Series K, no. Series V, no. Total no. % Votes, no. %
Varma Mutual Pension Insurance Company 5 252 083 5 252 083 3.18 5 252 083 0.70
The Central Union of Agricultural Producers and Forest Owners (MTK)
3 733 980 199 000 3 932 980 2.38 74 878 600 9.94
Ilmarinen Mutual Pension Insurance Company 3 010 907 3 010 907 1.82 3 010 907 0.40
Niemistö Kari Pertti Henrik 30 000 2 840 000 2 870 000 1.74 3 440 000 0.46
Veritas Pension Insurance Company Ltd. 2 580 051 2 580 051 1.56 2 580 051 0.34
Evli Finland Small Firms Fund 2 455 771 2 455 771 1.49 2 455 771 0.33
Aktia Capital Fund 2 250 000 2 250 000 1.36 2 250 000 0.30
OP Finland Small Firms Fund 1 913 037 1 913 037 1.16 1 913 037 0.25
Relander Pär-Gustaf 1 855 068 1 855 068 1.12 1 855 068 0.25
Elo Mutual Pension Insurance Company 1 741 793 1 741 793 1.05 1 741 793 0.23
The State Pension Fund 1 300 000 1 300 000 0.79 1 300 000 0.17
Nordea Finnish Stars Fund 1 084 754 1 084 754 0.66 1 084 754 0.14
Support for civil and water engineering r.y. 1 000 000 1 000 000 0.61 1 000 000 0.13
Oy Etra Invest Ab 1 000 000 1 000 000 0.61 1 000 000 0.13
Nordea Pro Finland Fund 852 064 852 064 0.52 852 064 0.11
Laakkonen Mikko 826 823 826 823 0.50 826 823 0.11
Svenska lantbruksproducenternas centralförbund SLC rf. 772 500 772 500 0.47 15 450 000 2.05
Special investment fund Aktia Mikro Markka 700 000 700 000 0.42 700 000 0.09
Langh Hans Christian 679 980 679 980 0.41 13 599 600 1.81
Middle Road Foundation 100 000 500 000 600 000 0.36 2 500 000 0.33
Haavisto Maija Helena 393 120 195 099 588 219 0.36 8 057 499 1.07
Haavisto Heikki Johannes 579 656 579 656 0.35 11 593 120 1.54
Mutual Fund Savings Bank Domestic 549 255 549 255 0.33 549 255 0.07
Saari Markku Samuel 505 573 1 810 507 383 0.31 10 113 270 1.34
Brotherus Ilkka Johannes 42 540 409 500 452 040 0.27 1 260 300 0.17
No of shares % of shares % of votes
Free shares 134 188 406 81.3 17.8
Restricted shares 30 960 624 18.7 82.2
Total 165 149 030 100.0 100.0

SHARES AND SHAREHOLDERS28
Breakdown of ownership structure on 31 December 2021
%
Households 44.1
Foreign owners 2) 18.4
Private enterprises 3) 8.5
Financial and insurance institutions 1) 9.1
Non-profit organizations 5.3
Waiting list and joint account 5.7
Public corporations 8.9
1) excluding nominee-registered2) including nominee-registered3) including the shares held by the company
By owner group
By shares held
31 December 2021 Raisio plc had a total of 35 089 registered shareholders (31.12.2020 total 36 879).
2
3
4
5
2019 2020 2021
Raisio’s free share OMX HELSINKI PI
2
3
4
5
2019 2020 2021
Raisio’s restricted share OMX HELSINKI PI
0
2
4
6
8Million shares
2019 2020 20210
100
200
300
400
1,000 shares
2019 2020 2021
Share price development, EUR, free share
Trading volume, free share
Share price development, EUR, restricted share
Trading volume, restricted share
Free shares Restricted shares
Shares Shareholders Shares Shareholders Shares
no. no. % no. % no. % no %
1–1 000 23 221 69.5 9 444 785 7.0 2 469 58.0 862 924 2.8
1 001–5 000 8 118 24.3 18 944 582 14.1 1 141 26.8 2 765 073 8.9
5 001–10 000 1 244 3.7 9 250 250 6.9 335 7.9 2 379 188 7.7
10 001–25 000 533 1.6 8 220 797 6.1 215 5.0 3 386 003 10.9
25 001–50 000 158 0.5 5 594 326 4.2 60 1.4 1 960 464 6.3
50 001– 119 0.4 82 555 396 61.5 38 0.9 10 431 807 33.7
waiting list 8 587 037 27.7
joint account 178 270 0.1 588 128 1.9
total 33 393 100.0 134 188 406 100.0 4 258 100.0 30 960 624 100.0

SHARES AND SHAREHOLDERS 29
Share indicators
1) Number of shares, excluding the company shares held by the Group2) According to the Board of Director’s proposal 0.14 per share includes an extra dividend of EUR 0.043) Dividend EUR 0.16 per share includes an extra dividend of EUR 0.04
2021 2020 2019 2018 2017
Undiluted earnings/share (EPS), € 1) 0.13 0.15 0.16 0.08 0.26
Diluted earnings/shares (EPS), € 1) 0.13 0.15 0.16 0.08 0.26
Undiluted comparable earnings/share, € 1) 0.12 0.14 0.16 0.12 0.17
Earnings/share, discontinued operations (EPS), € 1) 0.10 -0.37
Cash flow from business operations/share, € 1) 0.22 0.22 0.15 0.07 0.21
Equity/share, € 1) 1.77 1.71 1.72 1.68 1.68
Dividend/share, € 0.14 2) 0.13 0.13 0.16 3) 0.17
Dividend/earnings, % 105.7 87.4 80.1 200.0 65.4
Effective dividend yield, %
Free shares 4.2 4.1 3.8 6.8 4.4
Restricted shares 4.1 4.0 3.9 6.9 4.4
P/E ratio
Free shares 25.4 21.4 21.0 29.3 14.8
Restricted shares 25.7 21.9 20.7 29.0 14.8
Adjusted average quotation, €
Free shares 3.80 3.22 2.87 3.41 3.57
Restricted shares 3.78 3.26 3.03 3.26 3.59
Adjusted lowest quotation, €
Free shares 3.20 2.43 2.34 2.33 3.31
Restricted shares 3.19 2.47 2.31 2.30 3.31
Adjusted highest quotation, €
Free shares 4.49 3.87 3.69 4.59 3.88
Restricted shares 4.40 3.86 3.90 4.54 3.86
Adjusted quotation 31 December, €
Free shares 3.37 3.19 3.40 2.35 3.84
Restricted shares 3.41 3.25 3.36 2.32 3.84
Market capitalisation 31 December, M€ 1)
Free shares 430.4 402.6 428.8 294.9 480.1
Restricted shares 104.9 101.5 105.0 73.3 124.0
Total 535.2 504.1 533.8 368.2 604.1
Trading, M€
Free shares 102.3 114.9 77.6 131.3 122.8
Restricted shares 7.1 5.5 3.7 7.3 4.6
Total 109.5 120.4 81.3 138.7 127.4
Number of shares traded
Free shares, 1,000 shares 26 909 35 731 27 034 38 482 34 410
% of total 20.1 26.7 20.2 28.9 25.9
Restricted shares, 1,000 shares 1 885 1 673 1 214 2 252 1 280
% of total 6.1 5.3 3.9 7.1 3.9
Average adjusted number of shares, 1,000 shares 1)
Free shares 127 268 126 180 125 865 125 413 124 927
Restricted shares 30 933 31 236 31 480 31 917 32 436
Total 158 201 157 416 157 345 157 329 157 363
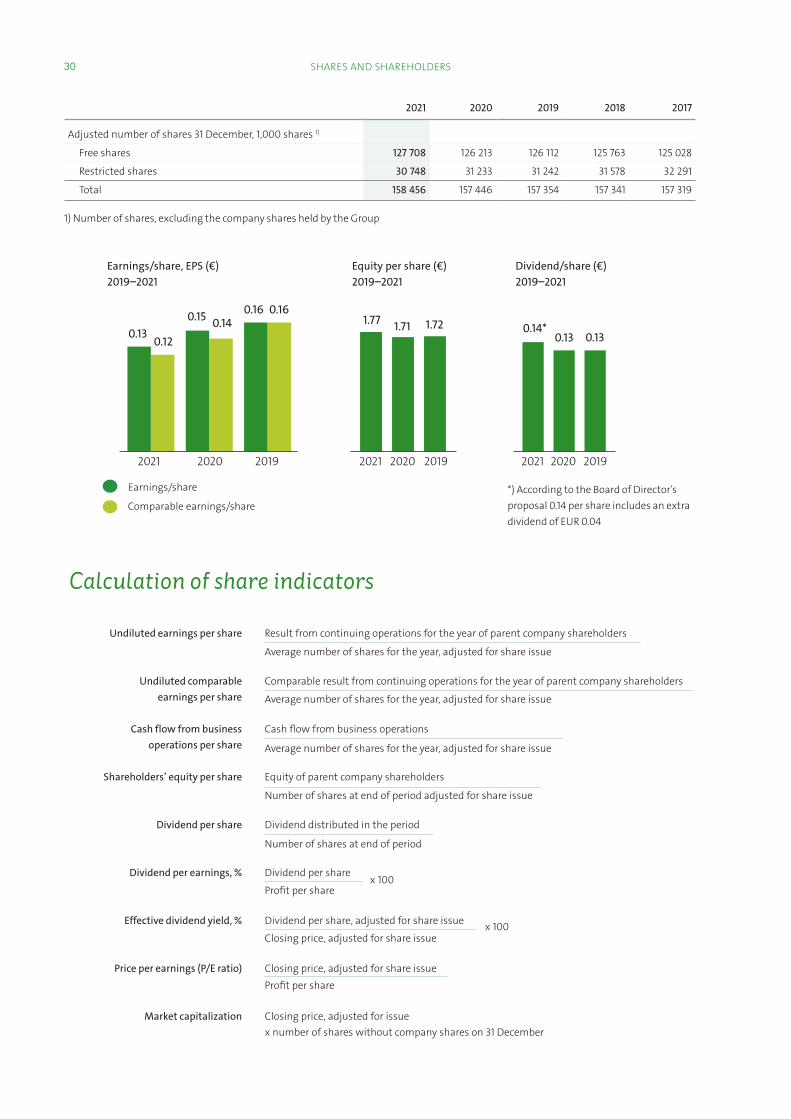
SHARES AND SHAREHOLDERS30
2021 2020 2019 2018 2017
Adjusted number of shares 31 December, 1,000 shares 1)
Free shares 127 708 126 213 126 112 125 763 125 028
Restricted shares 30 748 31 233 31 242 31 578 32 291
Total 158 456 157 446 157 354 157 341 157 319
1) Number of shares, excluding the company shares held by the Group
Calculation of share indicators
Undiluted earnings per share Result from continuing operations for the year of parent company shareholders
Average number of shares for the year, adjusted for share issue
Undiluted comparable earnings per share
Cash flow from businessoperations per share
Shareholders’ equity per share
Dividend per share
Dividend per earnings, %
Effective dividend yield, %
Price per earnings (P/E ratio)
Market capitalization
Comparable result from continuing operations for the year of parent company shareholders
Average number of shares for the year, adjusted for share issue
Cash flow from business operations
Average number of shares for the year, adjusted for share issue
Equity of parent company shareholders
Number of shares at end of period adjusted for share issue
Dividend distributed in the period
Number of shares at end of period
Dividend per share
Profit per share
Dividend per share, adjusted for share issue
Closing price, adjusted for share issue
Closing price, adjusted for share issueProfit per share
Closing price, adjusted for issuex number of shares without company shares on 31 December
x 100
Earnings/share, EPS (€)2019–2021
Earnings/share
0.16 0.160.15 0.14 1.721.711.77
Equity per share (€)2019–2021
0.130.130.14*
Dividend/share (€)2019–2021
0.130.12
2021 2020 2019
Comparable earnings/share
201920202021 201920202021
*) According to the Board of Director’s proposal 0.14 per share includes an extra dividend of EUR 0.04
x 100

KEY FINANCIAL INDICATORS AND RECONCILIATIONS 31
Key financial indicators and reconciliations
Key financial indicators
* ROIC of 2017 does not include the sales of the Southall property.
2021 2020 2019 2018 2017
Result and profitability
Net sales, M€ 246.4 233.6 236.3 228.2 234.6
change, % 5.5 -1.2 3.5 -2.7 -9.1
International net sales, M€ 149.3 144.1 149.0 142.1 156.2
% of net sales 60.6 61.7 63.1 62.3 66.6
Operating margin, M€ 32.2 35.1 33.6 31.0 68.1
% of net sales 13.1 15.0 14.2 13.6 29.0
Comparable operating margin, M€ 30.5 33.9 33.6 31.3 42.2
% of net sales 12.4 14.5 14.2 13.7 18.0
Deprecation and write-downs, M€ 8.4 6.2 6.4 14.4 14.0
EBIT, M€ 23.8 28.9 27.3 16.6 54.1
% of net sales 9.7 12.4 11.5 7.3 23.0
Comparable EBIT, M€ 22.1 27.7 27.3 25.6 35.9
% of net sales 9.0 11.9 11.5 11.2 15.3
Result before taxes, M€ 24.7 29.4 28.5 15.7 52.7
% of net sales 10.0 12.6 12.1 6.9 22.5
Return on equity, ROE, % 7.6 8.7 9.5 4.6 14.0
Return on investment, ROI, % 8.8 11.7 13.9 8.1 8.5*
Comparable return on investment, ROI, % 8.3 11.1 13.9
Financial and economical position
Shareholders' equity, M€ 280.7 269.5 271.3 264.8 264.0
Interest-bearing financial liabilities, M€ 29.1 10.2 1.1 23.0 45.9
Net interest-bearing financial liabilities, M€ -60.0 -83.0 -98.6 -119.2 -105.1
Balance sheet total, M€ 354.4 314.6 308.5 324.4 361.3
Equity ratio, % 79.3 85.7 87.9 81.7 73.4
Net gearing, % -21.4 -30.8 -36.4 -45.0 -39.8
Cash flow from business operations, M€ 34.5 34.7 23.3 11.5 33.3
Cash flow from business operations per share, M€ 0.2 0.2 0.15 0.07 0.21
Other indicators
Gross investments, M€ 24.2 28.5 19.5 5.6 10.1
% of net sales 9.8 12.2 8.3 2.4 4.3
R&D expenses, M€ -3.7 -4.3 -4.2 -2.9 -2.9
% of net sales 1.5 1.9 1.8 1.3 1.2
Average personnel 381 348 328 335 342

KEY FINANCIAL INDICATORS AND RECONCILIATIONS32
EBIT (M€) 2019–2021
2019
EBIT
Comparable EBIT
20202021
27.7
EBIT of net sales, %
11.511.5
27.3 27.328.9
87.985.7
Equity ratio (%)2019–2021
19.5
28.5
Investments (M€)2019–2021
12.2
8.3
% of net sales
Excluding acquisitions
-4.2-4.3
-3.7
R&D expenses (M€)2019–2021
1.51.81.9
% of net sales
-36.4
-30.8
Net gearing (%)2019–2021
11.912.4
9.09.7
22.123.8
201920202021
79.3
201920202021
-21.4
201920202021
24.2
9.8
201920202021

KEY FINANCIAL INDICATORS AND RECONCILIATIONS 33
Quarterly earnings
(EUR million) 10–12/2019 7–9/2019 4–6/2019 1–3/2019
Net sales by segment
Healthy Food 35.0 33.6 34.2 34.7
Healthy Ingredients 25.7 42.3 34.7 21.8
Other operations 0.5 0.3 0.3 0.4
Interdivisional net sales -6.7 -7.0 -6.5 -7.0
Total net sales 54.5 69.2 62.7 49.9
EBIT by segment
Healthy Food 4.1 5.6 4.5 4.0
Healthy Ingredients 1.8 5.4 3.9 1.3
Other operations -1.6 -0.3 -1.2 -0.3
Total EBIT 4.3 10.7 7.3 5.0
Financial income and expenses, net -0.2 0.6 0.6 0.3
Result before taxes 4.0 11.3 7.8 5.3
Income taxes -0.1 -2.3 0.6 -1.1
Result for the period 4.0 9.0 8.4 4.1
(EUR million) 10–12/2021 7–9/2021 4–6/2021 1–3/2021 10–12/2020 7–9/2020 4–6/2020 1–3/2020
Net sales by segment
Healthy Food 38.0 36.3 34.7 34.4 33.9 32.5 31.6 37.3
Healthy Ingredients 30.4 41.3 38.9 22.3 26.4 39.2 34.3 25.6
Other operations 0.4 0.3 0.3 0.4 0.5 0.3 0.3 0.4
Interdivisional net sales -8.5 -8.4 -7.3 -7.1 -6.9 -7.0 -6.4 -8.6
Total net sales 60.3 69.5 66.7 50.0 53.9 65.1 59.9 54.7
EBIT by segment
Healthy Food 4.9 5.6 3.9 4.8 4.2 5.1 4.0 5.3
Healthy Ingredients 0.0 2.9 1.7 3.5 1.8 4.8 3.7 2.2
Other operations -1.4 -0.3 -1.1 -0.8 -0.5 -0.1 -0.8 -0.9
Total EBIT 3.5 8.2 4.5 7.5 5.5 9.8 7.0 6.6
Financial income and expenses, net 0.1 0.0 0.5 0.3 1.1 0.8 2.5 -3.9
Result before taxes 3.6 8.3 5.1 7.8 6.7 10.6 9.5 2.7
Income taxes 0.5 -1.7 -1.1 -1.6 -1.1 -2.2 -2.1 -0.6
Result for the period 4.1 6.6 4.0 6.2 5.6 8.4 7.4 2.1

KEY FINANCIAL INDICATORS AND RECONCILIATIONS34
Calculation of indicators
EBIT Earnings before income taxes, financial income and expenses presented in the IFRS consolidated income statement.
Comparable EBIT
EBIT, %
Comparable EBIT, %
EBIT
Net sales
Alternative key figures
EBIT illustrates the economic profitability of operations and its development.
EBIT +/- items affecting comparability
Comparable EBIT shows economic profitability of the business operationsand its development without items affecting comparability.
Comparable EBITComparable net sales
The figure shows the relationship between EBIT and net sales withoutitems affecting comparability.
EBITDA EBIT + depreciations and impairment
EBITDA describes the earnings from business operations before depreciation, financial items and income taxes. It is an important indicator as it shows how much the margin is from net sales after deduction of operating expenses.
Comparable EBITDA EBIT +/- items affecting comparability + depreciations and impairment
Comparable EBITDA represents the earnings from business operations before depreciations, financial items, and income taxes without items affecting comparability.
Earnings before taxes Earnings before income taxes presented in the IFRS consolidated statements.
Return on equity (ROE), % Result before taxes – income taxes
Shareholders’ equity (average over the period)
Return on equity measures the earnings for the financial period in proportion to equity. The figure shows the Group’s ability to generate profits from the shareholders investments.
Return on investment (ROIC), % Result after taxes
“Operating cash* + net working capital + non-current assets(*Operating cash 4% of net sales)”
Return on investment (ROIC) is a profitability or performance ratio that measures how much investors earn on the capital invested.
Equity ratio, % Shareholders’ equity
Balance sheet total – advances received
Net interest-bearing financialliabilities
Interest-bearing financial liabilities – liquid funds and liquid finacial assets at fair value through profit or loss
Net gearing, % Net interest-bearing financial liabilities
Shareholders’ equity
x 100
x 100
x 100
x 100
x 100
x 100
The figure shows the relation between EBIT and net sales.

KEY FINANCIAL INDICATORS AND RECONCILIATIONS 35
Reconciliations
Reconciliations related to cash flow statement
Adjustments to business cash flowsIncome statement items containing no payment transaction and items presented elsewhere in the cash flow statement are adjusted.
The group Others representing adjustments to business cash flows contains the adjustments to exchange rate gains and losses related to unrealised purchases and sales as well as the adjustment of other non-payment-based items.
Acquisitions and disposals of fixed assets of cash flow from investing
Reconciliation of liabilities related to financing activities
Alternative key figures and items affecting comparability
Raisio presents alternative key figures to describe the financial performance and position of its businesses as well as cash flows as a means of improving the comparability between different periods and to increase understanding of the formation of the company’s earnings and its financial position.
The alternative figure is derived from the IFRS financial state-ments. It is possible to present items affecting comparabi-lity and to calculate alternative key figures without items affecting comparability in the Board of Directors’ report, Financial
Statements Bulletin, Half-Year Reports and Interim Reports. Items affecting comparability are income or expenses arising as rare events. Expenses of outside experts related to business acqui-sitions and business expansion, expenses related to business reorganisation and expenses related to the impairment of assets and their possible repayment are presented as items affecting comparability.
Items affecting comparability are recognised in the income state-ment according to the matching principle under the income or expense category. The management uses these key figures to monitor and analyse business development, profitability and financial position.
Non cash flow influenced changes
(EUR million) 31 Dec 2020 Cash flows IFRS 16Changes in
exchange ratesAcquired business
Other changes
31 Dec 2021
Non-current liabilities 0.0 -0.1 0.3 0.0 0.3
Lease liability 10.2 -1.5 13.8 0.0 6.3 28.8
Total liabilities for financing activities 10.2 -1.6 13.8 0.0 6.6 0.0 29.1
(EUR million) 2021 2020
Capital gains and losses of fixed asset -0.1 -0.1
Costs of share rewards 0.8 0.6
Provisions -1.1
Other 0.0 0.0
Total adjustments in cash flow statement 0.8 -0.6
(EUR million) 2021 2020
Acquisition of fixed assets total -24.2 -28.5
Payments for investments of earlier periods (change in account payable) 13.5 4.5
Agreement on financing of previous years' investments 3.9
Acquired businesses -7.0
Investments funded by lease liability or non-interest-bearing debt -1.5 -0.8
Fixed asset acquisitions funded by cash payments -19.2 -20.9
Capital gain and loss on fixed assets in the income statement 0.4 0.4
Balance sheet value of disposed asset 0.0 0.3
Consideration received from fixed asset divestments in the cash flow statement 0.4 0.7

KEY FINANCIAL INDICATORS AND RECONCILIATIONS36
Reconciliations of the alternative key figures
Items affecting comparable EBIT Items affecting comparable EBITDA
Items affecting comparable EBIT, Healthy Food segmentItems affecting comparable EBIT, Healthy ingredients segment
(EUR million) 2021 2020
Comparable EBIT 22.1 27.7
Release of a provision related to a previously sold business
1.1
+ Income from the sale of the receivable 2.8
- Expenses related to the reorganisation -0.5
- Expenses related to the acquired business -0.6
Items affecting comparability, in total 1.7 1.1
EBIT 23.8 28.9
(EUR million) 2021 2020
Comparable EBITDA 30.5 33.9
+/- Items affecting EBIT 1.7 1.1
Items affecting comparability, in total 1.7 1.1
EBITDA 32.2 35.1
+/- Impairment 0.0 0.0
+/- Depreciations -8.4 -6.2
EBITDA 23.8 28.9
(EUR million) 2021 2020
Comparable EBIT 19.5 18.6
- Expenses related to the reorganisation -0.2
Items affecting comparability, in total -0.2
EBIT 19.3 18.6
(EUR million) 2021 2020
Comparable EBIT 6.1 12.6
+ Income from the sale of the receivable 2.8
- Expenses related to the reorganisation -0.2
- Expenses related to the acquired business -0.6
Items affecting comparability, in total 2.0
EBIT 8.1 12.6

FINANCIAL STATEMENTS 2021 37
Consolidated income statement (IFRS)
Consolidated comprehensive income statement (IFRS)
(EUR million) Note 1–12/2021 1–12/2020
NET SALES 2.2.1 246.4 233.6
Cost of sales -185.3 -168.8
Gross profit 61.1 64.8
Sales and marketing expenses -23.3 -21.6
Administration expenses -13.0 -11.6
Research and development expenses -3.5 -4.0
Other income and expenses from business operations 9.1.1 2.5 1.3
EBIT 23.8 28.9
Financial income 5.1 2.8 2.0
Financial expenses 5.1 -1.9 -1.4
RESULT BEFORE TAXES 24.7 29.4
Income taxes 6.1 -3.9 -6.0
RESULT FOR THE FINANCIAL PERIOD 20.9 23.4
ATTRIBUTABLE TO:
Equity holders of the parent company 20.9 23.4
Non-controlling interests
20.9 23.4
EARNINGS PER SHARE CALCULATED FROM THE RESULT OF EQUITY HOLDERS OF THE PARENT COMPANY
Earnings per share (EUR) 7.3
Undiluted earnings per share 0.13 0.15
Diluted earnings per share 0.13 0.15
(EUR million) Note 1–12/2021 1–12/2020
RESULT FOR THE FINANCIAL PERIOD 20.9 23.4
OTHER COMPREHENSIVE INCOME ITEMS
Items that will not be reclassified to profit or loss
Change in equity investments 0.4 0.3
Change in tax impact 6.3 -0.1 -0.1
Items that will not be reclassified to profit or loss 0.3 0.2
Items that may be subsequently transferred to profit or loss
Change in value of cash flow hedging 0.0 0.2
Change in translation differences related to foreign companies 5.8 -5.8
Change in tax impact 6.3 0.0 0.0
Items that may be subsequently transferred to profit or loss 5.8 -5.6
TOTAL OTHER COMPREHENSIVE INCOME ITEMS 6.0 -5.4
COMPREHENSIVE INCOME FOR THE PERIOD 26.9 18.0
COMPONENTS OF COMPREHENSIVE INCOME
Equity holders of the parent company 26.9 18.0
Non-controlling interests
26.9 18.0

FINANCIAL STATEMENTS 202138
Consolidated balance sheet
(EUR million) Note 31.12.2021 31.12.2020
ASSETS
Non-current assets
Goodwill 4.1 49.6 45.9
Intangible assets 4.2 36.0 32.0
Tangible assets 4.5.1 102.1 73.1
Equity investments 4.7 2.8 2.8
Deferred tax assets 6.2 3.9 2.3
194.4 156.1
Current assets
Inventories 4.8 37.9 37.1
Accounts receivable and other receivables 5.3.2 33.1 28.0
Derivative contracts 5.3.4 0.0 0.1
Financial assets at fair value through
profit or loss 5.3.4 67.9 71.7
Cash equivalents 5.3.5 21.1 21.5
160.0 158.5
TOTAL ASSETS 354.4 314.6
SHAREHOLDERS' EQUITY AND LIABILITIES
SHAREHOLDERS' EQUITY 7.1
Equity attributable to equity holders of the parent company
Share capital 27.8 27.8
Premium fund 2.9 2.9
Reserve fund 88.6 88.6
Invested unrestricted equity fund 10.2 8.0
Other funds -0.6 -0.9
Own shares -17.8 -19.6
Translation differences -14.8 -20.6
Retained earnings 184.4 183.2
280.7 269.5
TOTAL SHAREHOLDERS' EQUITY 280.7 269.5
LIABILITIES
Non-current liabilities
Deferred tax liabilities 6.2 9.8 6.3
Non-current financial liabilities 5.3.6 25.9 9.6
35.7 15.9
Current liabilities
Accounts payable and other liabilities 5.3.7 34.2 28.0
Tax liability based on the taxable income for the period 6.1 0.4 0.2
Derivative contracts 0.2 0.3
Current financial liablities 3.2 0.6
38.0 29.1
TOTAL LIABILITIES 73.7 45.0
TOTAL SHAREHOLDERS' EQUITY AND LIABILITIES 354.4 314.6

FINANCIAL STATEMENTS 2021 39
(EUR million)Share
capital
Share premium
reserveReserve
fund
Invested unrestricted equity fund
Other reserves
Own shares
Translation differences
Retained earnings
Equity at- tributable to
equity holders of the parent
company
Shareholders’ equity on 1 Jan 2020 27.8 2.9 88.6 8.0 -1.3 -19.8 -14.8 179.7 271.3
Comprehensive income for the period
Result for the period 23.4 23.4
Other comprehensive income items
Change in equity investments 0.3 0.3
Change in tax impact of equity investments
-0.1 -0.1
Change in value of cash flow hedging 0.2 0.2
Change in translation differences related to foreign companies
-5.8 -5.8
Change in tax impact of cash flow hedging
0.0 0.0
Total comprehensive income for the period 0.0 0.0 0.0 0.0 0.4 0.0 -5.8 23.4 18.0
Business activities involving shareholders
Dividends -20.5 -20.5
Unclaimed dividends 0.1 0.1
Share-based payments 0.2 0.5 0.6
Total business activities involving shareholders
0.0 0.0 0.0 0.0 0.0 0.2 0.0 -19.9 -19.7
Shareholders’ equity on 31 Dec 2020 27.8 2.9 88.6 8.0 -0.9 -19.6 -20.6 183.2 269.5
(EUR million)Share
capital
Share premium
reserveReserve
fund
Invested unrestricted equity fund
Other reserves
Own shares
Translation differences
Retained earnings
Equity at- tributable to
equity holders of the parent
company
Shareholders’ equity on 1 Jan 2021 27.8 2.9 88.6 8.0 -0.9 -19.6 -20.6 183.2 269.5
Comprehensive income for the period
Result for the period 20.9 20.9
Other comprehensive income items
Change in equity investments 0.4 0.4
Change in tax impact of equity investments -0.1 -0.1
Change in value of cash flow hedging 0.0 0.0
Change in translation differences related to foreign companies 5.8 5.8
Change in tax impact of cash flow hedging 0.0 0.0
Total comprehensive income for the period 0.0 0.0 0.0 0.0 0.3 0.0 5.8 20.9 26.9
Business activities involving shareholders
Dividends -20.6 -20.6
Unclaimed dividends 0.1 0.1
Acquisition 2.1 1.8 3.9
Share-based payments 0.0 0.8 0.8
Total business activities involving shareholders 0.0 0.0 0.0 2.1 0.0 1.8 0.0 -19.7 -15.7
Shareholders’ equity on 31 Dec 2021 27.8 2.9 88.6 10.2 -0.6 -17.8 -14.8 184.4 280.7
Calculation of changes in shareholders’ equity

FINANCIAL STATEMENTS 202140
Consolidated cash flow statement
The cash flow for the financial year of 2021 includes EUR 2.8 million in other operating income for the sale of the receivable and EUR 2.3 million in tax refunds related to the UK business.
(EUR million) Note 1–12/2021 1–12/2020
CASH FLOW FROM BUSINESS OPERATIONS
Result before taxes 24.7 29.4
Adjustments:
Planned depreciation 8.4 6.2
Financial income and expenses -0.9 -0.5
Other adjustments 0.8 -0.6
Total adjustments Page 35 8.3 5.1
Cash flow before change in working capital 33.0 34.5
Change in working capital
Increase (-)/decrease (+) in current receivables -3.8 2.1
Increase (-)/decrease (+) in inventories 0.0 0.1
Increase (-)/decrease (+) in current interest-free liabilities 4.8 1.6
1.1 3.8
Cash flow from business operations before financial items and taxes 34.1 38.3
Interest paid and payments for other financial expenses from business operations -0.5 -0.6
Dividends received from business operations 0.2 0.2
Interest received and other financial income from business operations 0.4 0.5
Other financial items, net 0.7 0.3
Income taxes paid -0.4 -4.0
Net cash flow from business operations 34.5 34.7
CASH FLOW FROM INVESTMENTS
Investments in tangible assets Page 35 -9.7 -18.9
Investments in intangible assets Page 35 -1.0 -1.1
Acquired business 3.1 -7.0
Income from intangible and tangible commodities Page 35 0.4 0.7
Net cash flow from investments -17.3 -19.4
Cash flow after investments 17.2 15.3
CASH FLOW FROM FINANCIAL OPERATIONS
Other financial items, net 1.4 -0.3
Payments associated with the reduction in lease liability -1.5 -0.8
Repayment of non-current loans -0.1
Dividends paid to shareholders -20.5 -20.4
Net cash flow from investments -20.7 -21.6
CHANGE IN LIQUID FUNDS -3.5 -6.2
Liquid funds at the beginning of the period 93.2 99.8
Impact of changes in exchange rates 0.2 -0.8
Impact of changes in market value on liquid funds -0.9 0.4
Liquid funds at end of period 5.3.5 89.0 93.2

FINANCIAL STATEMENTS 2021 41
Notes to the Consolidated Financial Statements
The Notes to the Consolidated Financial Statements are grouped into sections according to their nature. In order to achieve better understanding of calculation principles, Raisio describes the accounting principles in connection with the related note. General accounting basis is described as part of the Notes to the Financial Statements while the accounting policies that are closely related to a particular Note are presented as part of this Note.
The Notes of each section include the contents of the section, accounting principles, essential financial information as well as key estimates and discretionary solutions if they had to be made
The symbol for the contents of the section.
The symbol for the accounting principles to the financial statements.
The symbol for the financial information.
The symbol for key estimates and discretionary solutions related to section of the financial statements.
1 Accounting policies for the consolidated financial statements
1.1 Raisio GroupRaisio plc is a Finnish public limited company. Raisio plc and its subsidiaries form the Raisio Group. Raisio plc focuses on heal-thy and responsibly produced food and ingredients. Raisio’s main products are food and food ingredients and fish feed. The Group is domiciled in Raisio, Finland, and its registered address is Raisionkaari 55, FI-21200 Raisio. The company’s shares are listed on NASDAQ OMX Helsinki Ltd.
Raisio Group has three reportable segments, namely Healthy Food, Healthy Ingredients and Other Operations. The Other Operations include service functions that support the operatio-nal segments. Raisio Group is a tradition-rich international and European company operating within the food industry whose activities and values are focused on the production of healthy and responsibly produced foods. Raisio Group has operations in eleven countries.
The Healthy Food Segment focuses on consumer brands. The Healthy Food Segment is a reportable segment that combines the operations of Western Europe, Northern Europe and Eastern and Central Europe. Of the consumer brands included in the Healthy Food Segment, the most international is Benecol, whose many different product variants meet the needs of Finnish and interna-tional consumers by providing a means of lowering cholesterol in a safe and proven way. The other wellknown consumer brands in this segment, such as Elovena, Nalle and Sunnuntai, emphasise the use of pure and healthy grains. Oat and its many uses are the future focus areas for Raisio.
The Healthy Ingredients Segment includes the sale of fish feeds and the Benecol product ingredient as well as the sale of grain-ba-sed foods and their ingredients to industrial and catering compa-nies. In addition, production, procurement and the supply chain are reported as part of the Healthy Ingredients segment.
The year 2021 marks the end of the 2019–2021 strategic period. During the strategic period, Raisio Group had a clear focus on healthy and responsibly produced food. During spring 2021, Raisio acquired Verso Food Oy, which is known for its Beanit and Härkis products, and published its new strategy for 2022–2025. The new strategy is built around three areas of focus: Namely Bene-col products and plant stanol ester solutions, oat-based consu-mer products and oats as a raw material for industry, as well as plant-based foods.
Raisio Group’s purpose and values guide the kind of future we build together – Food for Health, Heart and Earth. The company’s values are courage, fairness and drive.
The consolidated financial statements have been prepared for the financial year, 12 months, of 1 January–31 December 2021. These financial statements were authorised for issue by Raisio plc’s Board of Directors at its meeting on 8 February 2022. Under the Finnish Companies Act, shareholders are entitled to adopt or reject the financial statements at the Annual General Meeting held after the publication of the financial statements. The Annual General Meeting may also decide to amend the financial state-ments.

FINANCIAL STATEMENTS 202142
Copies of the financial statements are available on the internet, at www.raisio.com, or from the parent company’s head office in Raisio.
1.2 Accounting policies for the financial statements
Basis of presentationRaisio’s consolidated financial statements have been prepared according to the International Financial Reporting Standards (IFRS) and following the IAS and IFRS standards as well as SIC and IFRIC interpretations in effect on 31 December 2021. The Raisio Group has applied the standard requirements and interpreta-tions applicable to the Raisio Group that came into force during the financial period. The changes have not had a material impact on the Group’s result of the financial period, its financial position or the presentation of the financial statements. The changes are described in the section 1.6 New and amended standards during the last financial period.
Presentation currency and presentation of figuresThe currency used in the financial statements is the euro, and the statements are shown in EUR millions. The consolidated financial statements have been prepared based on original acquisition costs unless otherwise stated in the accounting principles. Figures presented in these financial statements have been rounded from exact figures and, consequently, the sum of figures presented individually can deviate from the presented sum figure. Key figu-res have been calculated using exact figures.
Income statement by function of expenseThe Group’s income statement is presented using the function of expense method. Separate functions include sales and marketing, administrative and R&D expenses. Costs of goods sold include wage, material, acquisition and other expenses incurred from the production and acquisition of products. Administrative expenses include general administrative costs and Group management costs. Administrative expenses have been allocated to functions according to the matching principle.
EBITIAS 1 Presentation of financial statements does not define the concept of EBIT. The Group has defined it as follows: EBIT is the net amount, which is formed when costs of goods sold and operations expenses are deducted from net sales as well as other operating income and expenses are added/deducted. All other except the above mentioned income statement items are presented below EBIT. Exchange rate differences, results due to derivatives and changes in their fair values are included in EBIT if they are incur-red from business-related items. Otherwise, they are presented under financial items.
Government grantsGovernment grants related to the purchase of tangible and intan-gible fixed assets are recognised as a deduction of the carrying amounts of fixed assets when the Group has reasonable assu-rance of receiving the grants and the Group complies with the conditions for receiving the grant. Grants are recognised as lower depreciations within the asset’s useful life. Other public
subsidies are recognised through profit or loss under income for the accounting periods in which the related expenses and the right to receive the subsidy are generated.
Assets held for sales and discontinued operationsNon-current assets as well as assets and liabilities related to discontinued operations are classified as held for sale if a value corresponding to their carrying amount will mainly be accumu-lated from the sale of the asset instead of from continuing use. In this case, the sale is considered to be highly probable, the asset is available for immediate sale in its current condition, management is committed to a plan to sell, and the sale is expected to take place within 12 months of classification. Assets held for sale and assets related to discontinued operations classified as held for sale are valued at the lower of the following: the carrying amount or the fair value less costs to sell. Depreciations from these assets are discontinued at the time of classification.
A discontinued operation is a part of the Group that has been disposed of or is classified as available for sale and meets one of the following requirements:
• It represents a separate major line of business or geographical area of operations;
• It is part of a single coordinated plan to dispose of a separate major line of business or geographical area of operations;
• It is a subsidiary acquired exclusively with a view to resale.
The result from discontinued operations is presented as a sepa-rate item in the income statement and in the statement of comp-rehensive income. The comparative information in the income statement is adjusted for those operations that have been clas-sified as discontinued during the most recent financial period. Assets available for sale together with the related liabilities are presented as a separate item in the balance sheet. If it is subse-quently found that criteria for an asset to be classified as held-for-sale are no longer met, the asset in question is transferred back to be presented and measured according to the applicable IFRS standards.
1.3 Consolidation principles
SubsidiariesIn addition to the parent company, the consolidated financial statements include the companies in which the parent company owns more than half of the voting rights, directly or indirectly, or otherwise exercises control. Control is acquired when the Group is exposed, or has rights, to variable returns from its involvement with the entity and has the ability to affect those returns through its power over the entity.
In the consolidated financial statements, mutual shareholding is eliminated using the acquisition method. The consideration tran-sferred and the acquired company’s identifiable assets and assu-med liabilities are measured at fair value at the acquisition date. Costs related to the acquisition are recognised as an expense. Purchase price debt is measured at fair value at the acquisition date and classified as a liability. The liability is measured at fair value at the end of each reporting period, and gains and losses

FINANCIAL STATEMENTS 2021 43
arising from the valuation are recognised through profit or loss.
Subsidiaries acquired during the financial period are included in the consolidated financial statements from the moment the Group acquires control, and the disposed subsidiaries until such control ends. Similarly, divested operations are included until the control ends.
Business transactions between the Group companies, internal receivables and liabilities, as well as internal distribution of profits and unrealised profits from the Group’s internal deliveries are eliminated when preparing the consolidated financial state-ments. Unrealised losses are not eliminated if the loss is due to impairment.
Non-controlling interests are valued at the amount correspon-ding to the proportionate share of the non-controlling interest. Comprehensive income for the period is allocated to parent company shareholders and the non-controlling interest even if the non-controlling interest was negative. The non-controlling interest in the shareholders’ equity is presented as a separate item in the balance sheet under shareholders’ equity. Changes in the parent company’s ownership interest in its subsidiary that do not result in a loss of control are treated as equity transactions.
In a business combination completed in stages, the prior owner-ship interest is measured at fair value, and gain or loss arising from this is recognised through profit or loss. When the Group loses control of a subsidiary, any remaining investment is measu-red at fair value at the date when control is lost and the difference arising is recognised through profit or loss.
1.4 Accounting policies calling for management’s judgement and main uncertainties related to the assessments
The preparation of financial statements according to the IFRS requires the management to use estimates and assumptions that affect the amounts of assets and liabilities and of income and expenses during the reporting period. The Group manage-ment may have to make judgement-based decisions relating to the choice and application of accounting policies for the financial statements. This particularly concerns the cases when effec-tive IFRSs allow alternative valuation, recording and presenting manners. Although estimates and assumptions are based on the management’s best knowledge of current events, actual results may differ from the estimates used in the financial statements.
Judgements and estimates made in the preparation of the finan-cial statements are based on the management’s best judgement at the balance sheet date. They are based on previous experience and future expectations considered to be most likely at the balance sheet date. These include, in particular, factors related to the Group’s financial operating environment affecting sales and cost levels. The Group monitors the realisation of these estimates and assumptions. Any changes in estimates and assumptions are entered in the period in which they have been detected.
For Raisio Group, the most significant estimates in which mana-gement has used discretion relate to the possible impairment of assets of goodwill and intangible assets with indefinite financially useful lives as well as unfinished intangible assets, and to the fair value determination of the assets acquired in the business combi-nation, to the amount of deferred tax asset and to what extent the tax asset can be recognised in the balance sheet, to the deter-mination of depreciation periods, to the assessment of accounts receivable and inventories, and determination of lease periods.
Key estimates and areas of discretion 1 January–31 December 2021
1.5 Foreign currency transactions and translationsItems included in the financial statements have initially been recognised in the functional currency determined for each Group company based on the primary economic environment in which they operate. The presentation currency in the financial state-ments is the euro, which is also the currency of the Group’s parent company.
Business transactions in foreign currencyForeign currency transactions are initially recognised in the func-tional currency using the transaction date exchange rate. In prac-tice, the rate closest to the transaction date rate is often used. Foreign currency receivables and liabilities outstanding at the end of the financial year are measured using the closing date exchange rates.
Exchange rate gains and losses related to the actual business operations are treated as adjustments to sales or purchases except for the exchange rate differences arising from unreali-sed derivative contracts taken to hedge foreign currency cash
Area of discretion Object of discretion
Business acquisitions Acquired business Verso Food Oy, determination of market values, items 3.1 and 4.2
Allocation of goodwill to the cash-generating unit
Acquired business Verso Food Oy, item 4.1
Impairment of assets with indefinite useful life
Western Europe’s goodwill and tra-demarks related to the Healthy Food Segment and the Healthy Ingredients Segment’s goodwill from the acquired business Verso Food Oy, item 4.4
Inventories Assessment of inventories, item 4.8
Financial risk management
Hedging against currency risk, item 5.4
Recognition of tax assets and liabilities
Current taxes based on taxable inco-me and deferred tax assets from subsidiary tax losses, items 6.1 and 6.2

FINANCIAL STATEMENTS 202144
flows. These exchange differences are recognised in other comp-rehensive income, and accumulated exchange differences are presented as a separate item in equity until they are realised. Foreign currency exchange differences are recognised under financial income and expenses except for the exchange diffe-rences of the liabilities that have been determined to hedge the net investments in foreign operations and that are effective in it. These exchange differences are recognised in other comprehen-sive income, and accumulated foreign exchange differences are presented as a separate line item in equity until the foreign entity is partially or completely disposed of.
Conversion of financial statements in foreign currencyIn the consolidated financial statements, income statements of foreign Group companies that do not have the euro as their functional currency are translated into euros using the average rate of the financial period. All balance sheet items, except for the result of the financial year, are translated into euros using the exchange rates at the balance sheet rates. Conversion of the financial year result and comprehensive income by using different exchange rates in the income statement, the statement of comp-rehensive income and the balance sheet result in a translation difference recorded under shareholders’ equity in the balance sheet; the change is recorded in other comprehensive income under “Translation differences”. Translation differences arising from the elimination of the acquisition cost of foreign entities and the conversion of items of equity accrued post-acquisition are recognised in other comprehensive income under ‘Translation differences’. If a foreign entity is disposed of during the reporting period, the accumulated translation differences are recognised through profit or loss as part of the sales profit or loss when recor-ding the corresponding disposal proceeds.
Goodwill generated by the acquisition of a foreign entity and adjustments related to fair values are treated as assets and liabi-lities in the local currency of the entity in question and converted using the reporting period’s closing date exchange rates.
1.6 New and amended standards during the last financial period
The Raisio Group has applied the standard amendments and interpretations concerning the Raisio Group that came into force during the financial year. The IFRS standards and their amend-ments that entered into effect on 1 January 2021 have had no material impact on the Group’s result for the financial year, finan-cial position or presentation of the financial statements.
1.7 New and revised standards and interpretations applicable to future financial periodsIASB has published the following revised standard, which is not yet effective and which the Group has not yet applied. The Group
adopts the standard from the effective date of the standard, or if the standard becomes effective in the middle of the financial year, from the beginning of the financial year following the effe-ctive date.
• Amendments to IAS 37 Provisions, Contingent Liabilities and Contingent Assets (effective for financial years beginning on or after 1 January 2022)
The amendments provide guidance on how to recognize a provision for an onerous contract. When an onerous contract is accounted for based on the costs of fulfilling the contract, the amendments clarify that these costs comprise both the incre-mental costs and an allocation of other direct costs.
Above or any other published amendments to standards that are expected do not have any impact on the Group’s result for the financial year, financial position or presentation of the financial statements.
1.8 Impacts of COVID-19 on Raisio’s financial reporting
Raisio’s operating environment changed considerably as the coro-navirus epidemic (COVID-19) and measures to prevent its spread closed down the economy to a significant extent from the begin-ning of 2020. The outlook towards more normal circumstances began to take a more positive turn at the end of the third quarter of 2021. Towards the end of the year 2021, the numbers of those infected in Finland and around the world rose to new heights. Raisio’s expectation for the near future is, however, cautiously positive, as the vaccination coverage continues to increase rapidly. The limitations resulting from the coronavirus epidemic and possible extensive sick leaves across the production and delivery chains may have an impact on the company’s operational ability. Within this current operational environment, Raisio Group endea-vours to prepare for the identified and likely impacts of the crisis as thoroughly as possible. The company’s Board and management monitor the development of the coronavirus situation and update their assessment of the impacts as the situation proceeds.
Raisio Group has not received any public grants as support related to the COVID-19 pandemic.
1.9 Events following the financial period
Raisio Group had no reported events after the review period.

FINANCIAL STATEMENTS 2021 45
2 Income and segment information
Content
The Note Income and Segment Information includes the notes on the income items related to net sales of continuing operations and the notes on the income and balance sheet items related to the segment information.
2.1 Information by segment
Raisio Group’s reportable segments, which have been reported as separate reportable segments since the beginning of the compa-rison period, are: Healthy Foods, Healthy Ingredients and Other Operations.
The products of the Healthy Food segment and the Healthy Ingre-dients segment are different, and the segments are managed as separate units, whose performance is regularly reviewed by the top management. The reportable segments are defined in accordance with the customer types and groups for the diffe-rent products and services. The customers of the reportable segments are different and require different distribution chan-nels and marketing strategies. The reporting for the Healthy Food Segment to the management is carried out also on the basis of geographical distribution: Western Europe, Northern Europe as well as Eastern and Central Europe.
Accounting principles
The segments are reported in a manner similar to internal repor-ting reviewed by the chief operating decision-maker. Manage-ment’s internal reporting is prepared in accordance with the IFRS principles.
The Group Executive Committee that makes strategic decisions has been nominated as the chief operating decision-maker. The Executive Committee is responsible for allocating resources to operating segments and evaluating their results. The reportable segments are based on the Group’s business segmentation.
The Group assesses the business performance of the segments according to their EBIT; decisions on the resource allocation to the segments are also based on EBIT. EBIT is also considered an appropriate meter when the segment performance is compared with other companies’ similar businesses. The Group Executive Committee is the chief decision-maker and as such, is responsible for allocating resources to operating segments and for evaluating their results.
The segments’ assets and liabilities are items that the segment uses in its business operations or that can be reasonably allocated to the segments. Unallocated items include tax and financial items and items common to the entire Group. Inter-segment pricing is based on current market prices. Investments consist of additions to intangible assets that are used in more than one financial year.
Key estimates and discretionary solutions
The segment information is based on the reporting to manage-ment and requires discretion-based solutions concerning, among other things, the application of the aggregation criteria to the segments. Comparison year the management has used discretion when determining that the Healthy Food Segment should be a single reportable segment. The net sales and EBIT of the segment in question is reported to the management, also on the basis of geographic distribution. The aggregation criteria for the segments is considered to have been met, however, since the revenue is comprised of sales of healthy products for consumers in all areas, utilising the same type of central wholesale business and other distribution channels. The long-term financial performance is not considered to differ significantly between the areas.

FINANCIAL STATEMENTS 202146
Income statement information by segments, 2021 and 2020
1.1.–31.12.2021 (EUR million)
Healthy Food
Healthy Ingredients
Other operations Eliminations Total
External sales
Goods 143.1 101.5 244.6
Services 0.0 1.1 1.1
Royalties 0.2 0.4 0.6
Total external sales 143.4 101.5 1.5 246.4
Internal sales 0.0 31.4 -31.4 0.0
Net sales 143.4 132.9 1.5 -31.4 246.4
Depreciation -0.6 -5.9 -1.9 -8.4
Value impairments -0.1 0.0 -0.1
Total depreciation and value impairment -0.7 -5.9 -1.9 0.0 -8.5
Segment EBIT 19.3 8.1 -3.6 0.0 23.8
Reconciliation
Segment EBIT 23.8
Financial income and expenses 0.9
Taxes -3.9
Discontinued operations
Result for the period 20.9
The Healthy Foods Segment’s EBIT includes a total of EUR 0.2 million in expenses from the corporate reorganisation resulting from negotiations held in accordance with the Act on Co-operation within Undertakings (334/2007). The Healthy Ingredients Segment’s EBIT includes EUR 2.8 million in other operating income for the sale of the receivable, EUR 0.6 million in expenses related to the corporate acquisition and altogether EUR 0.2 million in expenses from the corporate reorganisation resulting from negotiations held in accor-dance with the Act on Co-operation within Undertakings (334/2007). The Other operations Segment’s EBIT includes EUR 0.1 million in expenses from the corporate reorganisation resulting from negotiations held in accordance with the Act on Co-operation within Undertakings (334/2007).
1.1.–31.12.2020 (EUR million)
Healthy Food
Healthy Ingredients
Other operations Eliminations Total
External sales
Goods 135.1 96.7 231.8
Services 0.0 0.0 1.1 1.1
Royalties 0.3 0.4 0.7
Total external sales 135.3 96.7 1.5 233.6
Internal sales 0.0 28.8 -28.9 0.0
Net sales 135.3 125.6 1.5 -28.9 233.6
Depreciation -0.6 -3.7 -1.9 -6.2
Value impairments 0.0 0.0
Total depreciation and value impairment -0.7 -3.7 -1.9 0.0 -6.2
Segment EBIT 18.6 12.6 -2.3 0.0 28.9
Reconciliation
Segment EBIT 28.9
Financial income and expenses 0.5
Taxes -6.0
Discontinued operations
Result for the period 23.4

FINANCIAL STATEMENTS 2021 47
Balance sheet information by segments, 2021 and 2020
The EBIT achieved for the Other Operations Segment included the withdrawal of a EUR 1.1 million provision related to the sale of the confectionery business in 2017.
31.12.2021(EUR million)
HealthyFood
HealthyIngredients
OtherOperations
Eliminations
Total
Segment assets 104.9 138.6 18.8 -1.2 261.2
Including:
Increase in non-current assets 1.0 21.9 1.4 24.2
Reconciliation of assets to Group assets
Segment assets total 261.2
Deferred tax assets 3.9
Loans receivable and other receivables related to financing 0.0
Prepaid income taxes 0.2
Derivates 0.0
Financial asssets at fair value through profit or loss 67.9
Liquid funds 21.1
Assets total 354.4
Segment liabilities 13.8 18.5 2.6 -1.2 33.8
Reconciliation of liabilities to Group liabilities
Segment liabilities 33.8
Deferred tax liability 9.8
Derivates 0.2
Financial liabilities at fair value through profit or loss 29.1
Tax liability 0.4
Dividend liability 0.3
Liability related to financing 0.1
Liabilities total 73.7
Net assets 280.7

FINANCIAL STATEMENTS 202148
31.12.2020(EUR million)
HealthyFood
HealthyIngredients
OtherOperations
Eliminations
Total
Segment assets 94.2 105.5 19.6 -1.4 217.8
Including:
Increase in non-current assets 0.6 26.2 1.7 28.5
Reconciliation of assets to Group assets
Segment assets total 217.8
Deferred tax assets 2.3
Loans receivable and other receivables related to financing 0.1
Prepaid income taxes 1.1
Derivates 0.1
Financial asssets at fair value through profit or loss 71.7
Liquid funds 21.5
Assets total 314.6
Segment liabilities 11.8 13.6 3.6 -1.4 27.5
Reconciliation of liabilities to Group liabilities
Segment liabilities 27.5
Deferred tax liability 6.3
Derivates 0.3
Financial liabilities at fair value through profit or loss 10.2
Tax liability 0.2
Dividend liability 0.4
Liability related to financing 0.1
Liabilities total 45.0
Net assets 269.5

FINANCIAL STATEMENTS 2021 49
Non-current assets that do not include deferred tax assets or financial instruments
Non-current assets include long-term tangible assets and intan-gible rights, goodwill and other intangible assets. About 43 (50) per cent of the long-term assets are in the UK, i.e. in the Healthy Food segment’s Western European operating segment.
(EUR million) 2021 % 2020 %
Finland 106.1 56.5 76.7 50.8
UK 81.4 43.4 74.2 49.1
Rest of Europe 0.2 0.1 0.2 0.1
Total 187.7 100.0 151.0 100.0
2.2 Revenue
Accounting principles
The consideration is recognised as net sales that the Group expe-cts to be entitled to for transferred products and services. Indirect taxes are deducted from sales revenue. The effective portion of currency derivatives is recognized as an adjustment for sales revenue in case of cash flow hedging.
Revenues from the sale of goods are recorded when the customer has gained the ownership and when risks and benefits related to the ownership have been transferred to the purchaser whereby control is deemed to have passed to the customer. Sales revenues are recognised at a point in time and this date is dependent of the delivery terms used in the delivery. The considerations from customers can include variable considerations, such as volume discounts. The amount of the consideration is then recognised either in the probable amount of cash or expected value. Revenue from services is recognised over a period of time when the service has been completed.
For the Raisio Group, obtaining a customer contract has not resulted in additional costs that would meet the activation crite-ria. Additional costs are recognised as expenses when they are realised. The Group utilises the practical aid element included in IFRS 15 and does not disclose any performance obligations outs-tanding on the reporting date related to customer contracts with a maximum duration of one year.
Revenues from licences and royalties are recognised as income once the products have been sold to the final customer and the entitlement to the income has been established, as well as on the basis of contracts with customers.
2.2.1 Nets sales
Nets sales
The Raisio Group’s net sales mainly consist of sale of different type of products. Sales of services include, for example, renting of the property to customers outside the Group.
(EUR million) 1–12/2021 % 1–12/2020 %
Sales of goods 244.6 99.3 231.8 99.2
Sales of services 1.1 0.5 1.1 0.5
Royalties 0.6 0.3 0.7 0.3
Net sales, in total 246.4 100.0 233.6 100.0
Revenue
(EUR million) 1–12/2021 % 1–12/2020 %
Healthy Food 143.4 58.2 135.3 57.9
Healthy Ingredients 132.9 53.9 125.6 53.8
Others 1.5 0.6 1.5 0.6
Sales between segments -31.4 -12.7 -28.9 -12.4
Net sales, in total 246.4 100.0 233.6 100.0
Revenue by segment
The Group’s customer base consists of a relatively large number of customers in different market areas. In 2021 and 2020, the Group had no major customers, as defined in IFRS 8, whose revenue to the Group would have exceeded 10% of the entire Group’s net sales.
The Healthy Food Segment includes Raisio’s consumer product businesses in the Western, Northern, Eastern and Central Euro-pean markets. The main markets for the Western European busi-ness of the Healthy Food Segment include the UK, Ireland and Belgium. The main market area for Northern Europe is Finland, Scandinavia and the Baltic countries. The main market areas for Eastern and Central Europe include Poland, Russia, Ukraine, Spain and Hong Kong. The net sales of the Healthy Food Segment are comprised primarily of the sales of products under the Elovena, Benecol, Nordic, Sunnuntai, Nalle and Torino brands and Härkis products under the Beanit brand.
The Healthy Ingredients Segment includes the sale of fish feeds and the Benecol product ingredient, grain trade and the sale of plant and grain-based products to industrial and catering companies. The main market areas for fish feeds are Finland and Northwest Russia. The markets for Benecol product ingredient are global. The main market area for grain trade and grain-based products is Finland.
Income of the Other Operations operating segment mainly inclu-des rental and royalty income.
Net sales by country
(EUR million) 1–12/2021 % 1–12/2020 %
Finland 97.0 39.4 89.5 38.3
UK 53.0 21.5 50.6 21.7
Others 96.3 39.1 93.5 40.0
Total 246.4 100.0 233.6 100.0
The international share of the turnover was EUR 149.3 (144.1) million, which accounted for 60.6 (61.7) per cent of the overall turnover.

FINANCIAL STATEMENTS 202150
Net sales in different currenciesThe Raisio Group operates internationally and thus its business operations involve risks arising from exchange rate volatility. These risks consist of the income cash flows in different curren-cies (transaction risk) and the conversion of net sales of foreign subsidiaries into euros (translation risk).
Net sales in local functional currencies
(EUR million) 2021 2020
EUR 174.2 164.2
GBP 53.3 50.1
RUB 9.1 9.4
PLN 4.9 4.6
UAH 4.5 4.5
USD 0.5 0.8
246.4 233.6
The conversion of net sales of foreign subsidiaries into euros (translation risk)
(EUR million) 1–12/2021 1–12/2020
Net sales 0.9 -2.5
The conversion impact on the Group’s net sales was EUR 0.9 (-2.5) million. The share of the impact caused by the British pound was EUR 1.8 (0.7) million, by the Russian ruble EUR -0.5 (-1.3) million and by other currencies EUR -0.3 (-0.5) million. The conversion impact refers to the impact arising when the subsidiaries’ net sales are converted into euro as part of the consolidated financial statements.
Net sales by country (M€)2020–2021
2020
Finland 89.5
UK 50.6
Others 93.5
233.6246.4
2021
Finland 97.0
UK 53.0
Others 96.3
Net sales in different currencies (M€)2020–2021
20202021
EUR 164.2
GBP 50.1
RUB 9.4
PLN 4.6
UAH 4.5
USD 0.8
EUR 174.2
GBP 53.3
RUB 9.1
PLN 4.9
UAH 4.5
USD 0.5

FINANCIAL STATEMENTS 2021 51
3 Group structure
Content
This section includes the notes to financial statements describing the acquired businesses and the Group structure.
3.1 Business acquisitions and divestments
Key estimates and discretionary solutions
The identification of asset items and liabilities related to a busi-ness consolidation and the determination of their fair values require the use of discretion by the management. In connection with the acquisition of Verso Food Oy, the management separa-tely identified an intangible asset of EUR 1.8 million in total related to the Beanit and Härkis brands to be recognised as goodwill. Goodwill amounted to EUR 0.5 million after the market value adjustments. The determination of the financially useful lives of brands also required the use of discretion by the management.
Business acquisition
On 1 April 2021, Raisio Group acquired the entire share capital and control of Verso Food Oy.
Verso Food develops, processes and markets plant-based foods made from Finnish fava beans. The company operates primarily under the Beanit brand name and its sub-brand Härkis trademark. The company’s products include, for example, Beanit chunks and Beanit mince. At Verso Food’s near 4,000 m2 production facility in Kauhava, Finland, the company processes protein- and fibre-rich raw materials before manufacturing and packaging them as plant-based foods. The company’s customers include retail markets and industrial kitchens in Sweden and Finland.
The overall enterprise value for the acquisition-related arrange-ment was EUR 7 million and one million of the free shares held by Raisio plc for a total of EUR 10.9 million. The share portion of the purchase was realised as a private placement.
Summary of the total purchase price paid:
(EUR million)
Consideration paid for shares, settled in cash 3.9
Consideration paid for current liabilities, cash pool
Settled in cash 3.1
Settled in own shares (1 million pieces) 3.9
Total 10.9
The acquisition cost calculation is based on Verso Food’s interim accounts on 31 March 2021.
The following table presents a summary of the remuneration paid for Verso Food Oy as well as the recognised assets and liabilities measured at fair value at the time of acquisition.
(EUR million)
Consideration paid for shares on April 1, 2021 3.9
The assets and liabilities arising from the acquisitions are as follows
Intangible assets 1.8
Other intangible assets 0.5
Tangible assets 6.9
Deferred tax assets 1.2
Inventories 0.6
Accounts receivables and other receivables 1.3
Cash and bank receivables 0.1
Non-current financial liabilities -0.3
Accounts payables and other liabilities -0.3
Current liabilities, cash pool -1.2
Deferred tax liabilities -7.0
Current financial liabilities -0.1
Total identifiable net assets 3.4
Goodwill 0.5
The EUR 1.8 million in brand value and EUR 0.5 million in good-will for the acquisition are based on Raisio Group’s strengthened position within the plant protein market. The acquisition of Verso Food fits well with Raisio Group’s strategy, in which one key goal is growth derived from plant-based value-added products. With Verso Food’s help, Raisio Group became the market leader in the strongly emerging plant protein market in Finland.
No aspect of the entered goodwill and brand value are considered to be tax deductible.
A total of EUR 0.6 million in acquisition-related costs are included in the income statement concerning administrative expenses. The acquisition-related costs are presented as items affecting comparability.
Verso Food Oy was merged with the figures of Raisio Group as of 1 April 2021.
The impact of acquired businesses on the financial statements of Raisio Group:
(EUR million)Impact
1.4–31.12.2021Entire financial period
2021 pro forma
Net sales 5.7 7.8
EBIT -1.9 -2.7
The net sales for the acquired businesses, including the income statement for the financial period, showed a profit of EUR 5.7 million and loss of EUR -1.9 million.

FINANCIAL STATEMENTS 202152
Group
holding, %
Parentcompany
holding, %
SUBSIDIARY COMPANIES
Healthy Food
Benecol Limited, UK 100.00
Raisio Eesti AS, Estonia 100.00
OOO Raisio Nutrition, Russia 100.00
Raisio Sp. z o.o., Poland 100.00
Raisio Staest US Inc., USA 100.00
Raisio Sverige AB, Sweden 100.00
LLC Raisio Ukraine, Ukraine 100.00
Raisio Nutrition Ltd, Raisio 100.00 100.00
Raisio Ireland Limited, Ireland 100.00
Healthy Ingredients
Raisioaqua Ltd, Raisio 100.00 100.00
Verso Food Ltd, Kauhava 100.00 100.00
Others
Raisionkaari Industrial Park Ltd, Raisio 100.00 50.00
Benemilk Ltd, Turku 100.00
Big Bear Group Limited, UK 100.00
CentrIQ Corporation, USA 100.00
FDS Informal Foods Limited t/a Snacks Unlimited, UK
100.00
Glisten Limited, UK 100.00
The Glisten Confectionery Company Limited, UK
100.00
Honey Monster Foods Limited, UK 100.00
Nordic Feed Innovations Oy, Turku 100.00 100.00
Raisio UK Limited, UK 100.00 100.00
Reso Mejeri Produktion AB, Sweden 100.00
The pro forma figures for the entire financial period indicate the impact of acquired businesses if Verso Food Oy had been merged with Raisio Group from the beginning of 2021. In this case, the impact on the Group’s net sales would have been EUR 7.8 million and on EBIT -2.7 EUR million.
The impact of the acquired businesses on the Group’s cash flow was EUR -1.6 million.
There were no acquired businesses in 2020. There were no discon-tinued operations or assets held for sales during the financial period of 1 January–31 December 2021 or during 2020.
Accounting principles
The acquired subsidiaries have been consolidated from the date on which control is transferred to the Group and the divested subsidiaries are included in the consolidated financial statements until the control has been relinquished. The consideration tran-sferred and the identifiable assets and liabilities of the acquired business are valued at fair value at the time of acquisition. Expen-ses related to the acquisition are expensed in the period in which they are incurred. The consolidation principles are presented under 1.3. Consolidation principles.
3.2 Subsidiaries and the non-controlling interest
The Group structure on the balance sheet date
Number of wholly owned subsidiaries 2021 2020
Healthy Food 9 9
Healthy Ingredients 2 1
Other operations 11 11
The subsidiaries are wholly owned. On April 1, 2021, the Raisio Group acquired the entire share capital and control of Verso Food Oy. The subsidiary is included in the Healthy Ingredients segment.
Raisio Group Subsidiary companies

FINANCIAL STATEMENTS 2021 53
4 Invested capital
Content
This section includes notes on the intangible assets, including goodwill, and tangible assets, current assets, and depreciations and impairment of fixed assets for continuing operations.
4.1 Goodwill
Key estimates and discretionary solutions
For the purpose of impairment testing, goodwill shall be allocated to the Group’s cash-generating units that are deemed to benefit from synergies generated by the acquisition. Goodwill generated in connection with the business acquisition of Verso Food Oy on 1 April 2021 has been allocated to the Healthy Ingredients Segment.
Accounting principles
The business combinations are treated according to the purchase method. In business combinations, goodwill is recognised at the amount by which the acquisition cost exceeds the Group’s share of the fair value of the assets and liabilities acquired at the time of acquisition. Goodwill is mainly generated in the most signifi-cant acquisitions. Thus, goodwill typically reflects the value of acquired market share, business know-how and synergies. The carrying amount of goodwill is tested using the impairment tests.
The Group assesses goodwill balance sheet value annually or more frequently if there is any indication of impairment. Good-will is allocated to the Group’s cash flow generating units, which have been defined according to the country and business unit in which goodwill is monitored in internal management reporting. The recoverable amount of a cash flow generating unit is calcu-lated using the use value calculation. The cash-flow-based use value is determined by calculating the discounted current value of forecasted cash flows. The forecasted cash flows are based on the management’s estimates. The discount rate of calculations is based on the average cost of capital (WACC) that is applied in the currency area in which the cash flow generating unit can be considered to locate.
Possible impairment loss of goodwill is immediately recognised in the income statement. The previously recognised goodwill impairment loss is not reversed.
Goodwill reconciliation
(EUR million) 2021 2020
Acquisition price 1 January 49.1 51.7
Translation difference 3.2 -2.6
Acquired business 0.5
Acquisition cost 31 December 52.8 49.1
Accumulated depreciation and impairment 1 January 3.2 3.2
Book value 31 December 3.2 3.2
Carrying value 31 December 49.6 45.9
4.2 Intangible assets
Key estimates and discretionary solutions
In connection with the acquisition of the Verso Food Oy business, a total of EUR 1.8 million was recognised as a separate intangible asset related to the Beanit and Härkis brands and a finite useful life of 10 years was assigned for it. The identified intangible asset is entered in the income statement as an expense based on the straight-line depreciation method over its estimated useful life.
Accounting principles
An intangible assets is recognized in the balance sheet at origi-nal cost if it can be reliably measured and it is probable that the economic benefits attributable to the asset will flow to the Group.
The intangible assets with finite useful lives are entered in the income statement as an expense based on the straightline depre-ciation method over their known or estimated useful lives. Depre-ciations are not recorded for the intangible assets with indefinite useful lives. Instead, these assets are tested annually for possible impairment. The Group has trademarks whose useful lives are estimated to be indefinite.
Depreciation periods for intangible assets with finite useful lives are as follows:
Intangible rights 5–10 years Other intangible assets 5–20 years
Depreciations of intangible assets begins when the asset is available for use, i.e. when it is in such a location and condition that it is capable of operating in the manner intended by the management. Depreciation is ceased when the intangible fixed asset is classified as held for sale (or included within a disposal

FINANCIAL STATEMENTS 202154
group classified as held for sale) in accordance with IFRS 5 Non-current Assets Held for Sale and Discontinued Operations.
Sales profits and losses are determined as the difference between the selling price and the book value, and sales profits and losses are included in the income statement under other operating income and expenses.
Estimated useful lives and balance sheet values of assets are reviewed at each balance sheet date and whenever there is an indication of impairment of an asset. The impairment tests assess the recoverable amount of the asset in question. The recoverable
amount is the asset’s fair value less costs to sell, or a higher value in use. An impairment loss is recognised in the income state-ment if the carrying amount of the assets exceeds the recove-rable amount.
The impairment previously recognised in the income statement is reversed if the values used to determine the recoverable income change substantially. However, the value after the reversal of the impairment may not exceed the value that the asset would have had without the impairment of previous years less accumulated impairment.
Intangible rights include trademarks, related to the Healthy Food segment’s operations, whose useful lives are considered to be inde-finite. Their carrying value was EUR 30.1 million on 31 December 2021.
Carrying amount of trademarks with indefinite useful lives
(EUR million) 31.12.2021 31.12.2020
Honey Monster 1.1 1.0
Benecol UK 29.0 27.1
Total 30.1 28.2
Intangible assets 2021
(EUR million)Intangible
rightsOther long-term
expenditureAdvances paid and
incomplete acquisitions Intangible
assets total
Acquisition cost 1 January 54.2 19.0 0.1 73.4
Translation differences 3.4 0.0 3.4
Increase 0.2 0.7 0.1 1.0
Increase, acquired business 1.8 1.1 2.9
Divestment and other decreases 0.0 -0.6 -0.7
Reclassification between items 0.0 0.1 -0.1 0.0
Acquisition cost 31 December 59.6 20.3 0.1 80.1
Accumulated depreciation and write-downs 1 January -24.8 -16.5 -41.4
Translation differences -1.4 0.0 -1.4
Acquired business 0.0 -0.5 -0.5
Accumulated depreciation of decrease and transfers 0.0 0.6 0.6
Depreciation for the financial period -0.4 -0.9 -1.4
Accumulated depreciation 31 December -26.6 -17.4 0.0 -44.0
Book value 1 January 2021 29.4 2.5 0.1 32.0
Book value 31 December 2021 33.0 2.9 0.1 36.0

FINANCIAL STATEMENTS 2021 55
Intangible rights and assets 2020
Intangible rights include trademarks, related to the Healthy Food segment’s operations, whose useful lives are considered to be inde-finite. Their carrying value was EUR 28.2 million on 31 December 2020.
4.3 Research and development costs
Accounting principles
Research costs are recognised through profit or loss in the year they are incurred. Research costs related to new or significantly improved products are recognised in the balance sheet as intan-gible assets from the date after which the costs of the research phase can be reliably determined, the product can be techni-cally implemented and commercially utilised, and it is expected to generate financial benefit and the Group has the intention and resources to complete the research work and use or sell the product. Research costs previously entered as expenses cannot be recognised in the balance sheet as assets in later accounting periods.
An item is depreciated from the time it is ready for use. An item not yet ready for use is tested for impairment annually. After initial recognition, development expenses recognised in the balance sheet are measured at cost less accumulated depreciations and impairment losses.
The depreciation period of development expenses recognized in the balance sheet is 5–10 years.
Research and development costs
There are no capitalised research and product development expenses included as intangible assets in the 2020 and 2021 Financial Statements.
On the closing date of the Financial Statements, 31 December 2021, development costs totalling EUR 0.2 million (0.3 million in 2020) have been recognised for the acquisition cost of the new production plant built in Raisio’s industrial area. The development costs were incurred as a tangible asset related to property, plant and equipment.
4.4 Impairment testing of goodwill and intangible assets with indefinite useful lifeGoodwill is allocated to the cash-generating unit. In line with Raisio Group’s management system and structure, a cash-gene-rating unit is typically a country-specific unit where the acquired business operates. Goodwill has been allocated to the Healthy Food Segment’s Western European Benecol business as well as to the Healthy Ingredients Segment in connection with the acqui-sition of Verso Food Oy on 1 April 2021. The value of the goodwill was EUR 49.6 million (EUR 45.9 million in 2020) on the closing date of 31 December 2021.
(EUR million)Intangible
rightsOther long-term
expenditureAdvances paid and
incomplete acquisitionsIntangible
assets total
Acquisition cost 1 January 56.6 18.4 0.0 75.0
Translation differences -2.8 0.0 -2.8
Increase 0.4 0.7 0.1 1.1
Divestment and other decreases 0.0
Reclassification between items 0.0 0.0 0.0 0.0
Acquisition cost 31 December 54.2 19.0 0.1 73.4
Accumulated depreciation and write-downs 1 January -25.7 -15.9 -41.6
Translation differences 1.2 0.0 1.2
Accumulated depreciation of decrease and transfers 0.0
Depreciation for the financial period -0.3 -0.7 -1.0
Accumulated depreciation 31 December -24.8 -16.6 0.0 -41.4
Book value 1 January 2020 30.9 2.5 0.0 33.5
Book value 31 December 2020 29.4 2.5 0.1 32.0

FINANCIAL STATEMENTS 202156
In connection with the business combinations of the acquisitions included in the Healthy Food segment, the recognised trade-marks have been estimated to have indefinite useful lives. The reputation and long history of the trademarks support the mana-gement’s view that the trademarks will generate cash flows for an indefinite time. The value of the trademarks belonging to the Healthy Food Segment totalled EUR 30.1 million (EUR 28.2 million in 2020) on the closing date of 31 December 2021.
Key estimates and discretionary solutions
The drafting of calculations used for impairment testing requi-res the management to make forecasts and to determine the components concerning recoverable cash flow. These are related to uncertainties.
Impairments for intangible assets with indefinite useful lives, by operation
During the financial years of 2020 and 2021, the impairment testing of goodwill and trademarks with indefinite useful lives indicated that the recoverable amounts of the assets in question were higher than their carrying amounts and that there was no need for the impairment of assets with indefinite useful lives.
In the impairment testing, the recoverable amounts are deter-mined based on the value in use. Cash flow forecasts are based on estimates approved by management covering the next four years. The cash flows after the forecast period approved by mana-gement are extrapolated by using estimated growth factors, presented below, which do not exceed the average long-term growth rates of the Division’s business.
Basic assumptions used in the determination of use in value of goodwill are as follows:
(EUR million) 2021 2020
Healthy Food segment
UK operations, Benecol
Growth percentage *) 2.0 % 2.0 %
Discount rate, before taxes 5.5 % 5.5 %
Healthy Ingredients segment
Finnish operations, Verso plant protein
Growth percentage *) 3.0 %
Discount rate, before taxes 9.2 %
*) In the cash flows after forecast period
Sensitivity analysis of impairment testing:
Goodwill / Healthy Food segment UK operations, Western Europe
The entity’s recoverable amount is clearly above the carrying value of assets. The recoverable amount is less than the book value of assets when the discount rate increases above 14.0 (16.1 in 2020) per cent (before taxes) or when the EBIT level falls permanently more than 75.4 (76.5 in 2020) per cent of the management’s esti-mates.
Goodwill / Healthy Food segment Verso Food, acquired business 1.4.2021, Finland
The entity’s recoverable amount is clearly above the carrying amount of the assets. The recoverable amount is less than the book value of the asset when the discount rate increases above 10 percent (before tax). The sensitivity of the drop in operating profit levels has not been calculated because the Verso business is still in a growth phase.
4.5 Tangible assets
Accounting principles
Tangible assets are valued at the original purchase cost minus accumulated depreciation and impairment.
The purchase cost includes the costs resulting directly from the acquisition of tangible fixed asset. Borrowing costs arising from the acquisition, construction or manufacture of a qualifying asset, such as a production plant, are immediately included in the acqui-sition cost when it is likely that they will generate future financial benefit and when the costs can be determined reliably. Other borrowing costs are recorded as an expense in the period in which they are incurred. Since the Group did not acquire any qualifying assets, no borrowing costs were recognised in the balance sheet.
When part of an item of tangible assets is treated as a separate item, costs related to the replacement of the part are recognised in the balance sheet. Otherwise, any costs generated later are included in the carrying amount of the tangible assets only if it is likely that any future financial benefit related to the item will benefit the Group and that the purchase cost of the item can be determined reliably. Other repair and maintenance costs are recorded through profit or loss when they are realised.
Straight-line depreciations are made from tangible assets within the estimated useful life. No depreciations are made from land. The estimated useful lives are as follows:
buildings and structures 10–25 years machinery and equipment 4–15 years
The management has determined the EBIT of forecasts based on the previously realised results and on the expectations that the management has in terms of the market development. Discount rate has been determined before taxes and it reflects the risks related to the business segment in question.

FINANCIAL STATEMENTS 2021 57
Depreciations begin when the asset is available for use, i.e. when it is in a location and condition that it can operate as intended by the management.
Depreciations on tangible assets are discontinued when the item is classified as available for sale in accordance with IFRS 5 Non-cur-rent Assets Held for Sale and Discontinued Operations. Tangible assets held for sale are measured at their carrying value or at the lower fair value less costs to sell.
Sales profits and losses are determined as the difference between the selling price and the carrying value, and sales profits and losses are included in the income statement under other opera-ting income and expenses.
Estimated useful lives are reviewed on each balance sheet date, and the depreciation periods are adjusted accordingly if they differ significantly from the previous estimates. If the carrying amount of a commodity exceeds the amount of cash that is estimated to be recoverable, the carrying amount is immediately reduced to the recoverable amount. An impairment loss is recognised in the income statement if the value of the asset exceeds the recove-rable amount.
The impairment previously recognised in the income statement is reversed if the values used to determine the recoverable income change substantially. However, the value after the reversal of the impairment may not exceed the value that the asset would have had without the impairment of previous years less accumulated impairment.
Government grantsGovernment grants related to the purchase of tangible and intan-gible fixed assets are recognised as a deduction of the carrying amounts of fixed assets when the Group has reasonable assu-rance of receiving the grants and the Group complies with the conditions for receiving the grant. Grants are recognised as lower depreciations within the asset’s useful life.
Leases Raisio Group acts primarily only as lessee. The Group has leases concerning storage and office premises as well as vehicles.
The Group also has leases in which the Group is named as the lessor. The significance of these leases to Raisio Group’s consoli-dated financial statements is minimal. The leases are classified as operating leases, since the risks and rewards incidental to ownership of an underlying asset are not seen as transferring to the lessee. Rental income is recognised on a straight-line basis for the duration of the lease. The Group leases business premises to external parties.
When a lease is signed, the Group assesses whether the contract in question is or includes a rental agreement. The lease includes a rental agreement when it concerns an itemised asset and the related right to control the use of the said asset for a specific time period against compensation.
The lease period of the rental agreement is defined as the time period during which the lease cannot be cancelled. A possible extension or termination option will be included in the lease period, if it is reasonably certain that the Group will implement the extension option or not implement the termination option. Leases with a lease period of less than 12 months and for an asset that has a low value will be treated in accordance with the recognition exemption stipulated in the standard. For these leases, the lease payments payable to the contracting party are recognised as expenses on a straight-line basis in the income statement and are not included in the balance sheet.
The Group recognises the lease liability and corresponding right-of-use asset at the commencement date of the lease.
The lease liability is measured at an amount equal to the present value of the lease payments during the lease period that are not yet paid. The lease payments are discounted using the Group’s incremental borrowing rate of interest unless the lease already has an applicable internal interest rate. The interest rate is adjusted, if necessary, with consideration for the length of the lease period, the nature of the asset item and country-specific risk.
Right-of-use assets are valued at the acquisition cost on the commencement date of the lease and the acquisition cost inclu-des the amount of the initial valuation of the lease liability, possible initial direct costs and restoration costs estimated for the asset as well as lease payments made to the lessor at or before the commencement date less any lease incentives received.
The lease payments paid by Raisio Group comprise fixed fees and variable lease payments and amounts payable on the basis of the residual value guarantee. Possible residual value guarantees, purchase options and penalties for terminating the lease are only taken into consideration in the amount of the lease liability if it is reasonably certain that the option will be used or if it has been taken into consideration in the lease period that the Group will exercise the option to terminate the lease.
Variable lease payments that depend on an index or a rate are included in the determination of the lease liability. The index or rate that is valid on the commencement date of the lease is applied to the calculation of the amount of the variable lease payments. Other variable lease payments, such as future lease payments due on the basis of the return of the asset, are not included in the measurement of the lease liability.
The right-of-use asset is measured at acquisition cost less depre-ciations and impairment losses and is adjusted by a possible item resulting from the remeasurement of the lease liability. Right-of-use assets are depreciated within the asset’s useful life or during the lease period, depending on whichever is shorter. If the use of the purchase option included in the lease is reasonably certain, the right-of-use asset is depreciated during the asset’s useful life. The residual value and useful life of the right-of-use asset are reviewed at least in connection with the financial statements, and any impairment is recognised, if any changes will occur in terms of the expectations of economic benefits.

FINANCIAL STATEMENTS 202158
The Group measures the lease liability for future periods at amor-tised cost using the effective interest method.
The lease liability is remeasured if the actual lease payments differ essentially from the lease payments included in the lease liability determined in connection with the initial recognition, and if the change in the lease payments is based on clauses that were valid at the commencement date of the lease. Reassess-ment is carried out, for example, when a change occurs in future lease payments as a result of a change in the index or rate used to determine the payments in question, or if there is a change in the expected amounts payable under a residual value guarantee. Also, changes in the estimates related to the purchase option or extension or termination option for the asset can lead to a reassessment of the lease liability. The carrying amount of the right-of-use asset in question is adjusted by the amount due to the remeasurement of the lease liability, or if the value of the right-of-use asset is zero, it is recognised through profit or loss.
Key estimates and discretionary solutions
4.5.1 Tangible assets
Tangible right-of-use-assets 2021
The most significant investment of the financial period 1 January –31 December 2021 was the building of the new, modern production facility in Raisio’s industrial area, which was initiated in 2019 and completed during spring 2021. EUR 17.6 million of the acquisitions for the financial period were related to the building of this new production facility. The investment was technically completed during the first quarter of the financial period, and the project advanced, during the third quarter, from process testing to productive use. The first consumer products to come out of the production facility were in shops in Finland at the end of third quarter of the financial period.
Development expenses included an acquisition expense of EUR 0.2 million for the new production facility.
(EUR million)Total owned
right-of-use assetsTotal leased
right-of-use assetsTotal right-of-use
assets
Acquisition cost 1 January 306.2 11.7 317.9
Translation differences 0.1 0.0 0.1
Increase 9.2 14.0 23.2
Increase, acquired business 7.6 6.3 13.9
Divestment and other decreases 0.0 -0.6 -0.6
Reclassification between items 0.0 0.0
Acquisition cost 31 December 323.2 31.4 354.5
Accumulated depreciation and write-downs 1 January -243.3 -1.5 -244.8
Translation differences -0.1 0.0 -0.1
Accumulated depreciation of decrease and transfers -0.9 0.5 -0.4
Depreciation for the financial period -5.5 -1.6 -7.1
Accumulated depreciation 31 December -249.8 -2.6 -252.4
Book value 1 January 2021 63.0 10.2 73.1
Book value 31 December 2021 73.4 28.7 102.1
Determining the useful lives of tangible and intangible assets requires management to make estimates about the future. The estimated useful life of right-of-use assets is reviewed at each closing date.
In accordance with IFRS 16, the lease accounting requires the management to use estimates and assumptions when asses-sing, among other things, factors related to the determination of the lease period for leases of indefinite duration and leases that contain extension and termination options. The lease period of the right-of-use assets of the leases valid until further notice has been determined at the discretion of the management to be a four-year lease term in accordance with the strategy period of the Group’s strategy published on June 10, 2021.

FINANCIAL STATEMENTS 2021 59
Owned right-of-use assets
The investment acquisition expenditure does not include borrowing costs.
Leased right-of-use-assets
The increases to the right-of-use assets during the 2021 financial year included 12.1 million acquisitions of process equipment related to the new production plant built on Raisio’s factory site.
(EUR million)Land and
water areasBuildings andconstructions
Machinery andequipment
Other tangible assets
Advances paidand incomplete
acquisitionsTangible
assets total
Acquisition cost 1 January 3.4 105.4 172.9 0.4 24.3 306.2
Translation differences 0.1 0.0 0.0 0.1
Increase 1.4 7.0 0.8 9.2
Increase, acquired business 7.6 7.6
Divestment and other decreases 0.0 0.0
Reclassification between items 19.7 4.5 -24.1 0.0
Acquisition cost 31 December 3.4 126.5 192.0 0.4 0.9 323.2
Accumulated depreciation and write-downs 1 January -94.6 -148.6 -0.1 -243.3
Translation differences -0.1 0.0 0.0 -0.1
Accumulated depreciation of decrease and transfers -0.9 -0.9
Depreciation for the financial period -1.5 -4.0 0.0 -5.5
Accumulated depreciation 31 December 0.0 -96.1 -153.6 -0.1 0.0 -249.8
Book value 1 January 2021 3.4 10.8 24.3 0.3 24.3 63.0
Book value 31 December 2021 3.4 30.4 38.4 0.3 0.9 73.4
(EUR million)Buildings leased
for own useMachinery leased
for own useTotal right-of-use
assets
Acquisition cost 1 January 1.0 10.6 11.7
Translation differences 0.0 0.0 0.0
Increase 1.4 12.6 14.0
Increase, acquired business 6.3 6.3
Divestment and other decreases -0.3 -0.3 -0.6
Reclassification between items
Acquisition cost 31 December 8.5 22.8 31.4
Accumulated depreciation and write-downs 1 January -0.7 -0.8 -1.5
Translation differences 0.0 0.0 0.0
Accumulated depreciation of decrease and transfers 0.1 0.3 0.5
Depreciation for the financial period -0.7 -0.9 -1.6
Accumulated depreciation 31 December -1.3 -1.3 -2.6
Book value 1 January 2021 0.3 9.9 10.2
Book value 31 December 2021 7.2 21.5 28.7

FINANCIAL STATEMENTS 202160
Items from leases recognized in the statement
(EUR million) 2021 2020
Rental income 0.7 0.6
Depreciations for right-of-use assets -1.6 -0.7
Costs of short-term and low-value leases 0.0 0.0
Interest expenses related to leases -0.2 0.0
Total -1.1 -0.2
Outgoing cash flow resulting from leases 1.5 0.8
Tangible assets 2020
The most significant investment of 2020 was the new, modern production facility being built in Raisio’s industrial area. EUR 22.9 million of the acquisitions for the 2020 financial period were related to the building of the new production facility. Development expenses included an acquisition expense of EUR 0.3 million for the new production facility.
(EUR million)Total owned
right-of-use assetsTotal leased
right-of-use assetsTotal right-of-use
assets
Acquisition cost 1 January 291.7 2.1 293.8
Translation differences -0.4 0.0 -0.4
Increase 17.4 9.9 27.4
Divestment and other decreases -2.5 -0.3 -2.8
Reclassification between items 0.0
Acquisition cost 31 December 306.2 11.7 317.9
Accumulated depreciation and write-downs 1 January -241.7 -1.0 -242.7
Translation differences 0.4 0.0 0.4
Accumulated depreciation of decrease and transfers 2.4 0.3 2.7
Depreciation for the financial period -4.4 -0.8 -5.2
Accumulated depreciation 31 December -243.3 -1.5 -244.8
Book value 1 January 2020 50.0 1.1 51.1
Book value 31 December 2020 63.0 10.2 73.1

FINANCIAL STATEMENTS 2021 61
Owned right-of-use assets
(EUR million)Land and
water areasBuildings andconstructions
Machinery andequipment
Other tangible assets
Advances paidand incomplete
acquisitionsTangible
assets total
Acquisition cost 1 January 3.4 104.6 173.3 0.4 10.1 291.7
Translation differences -0.2 -0.2 0.0 -0.4
Increase 0.9 2.0 14.5 17.4
Divestment and other decreases -2.5 -2.5
Reclassification between items 0.1 0.2 -0.4 0.0
Acquisition cost 31 December 3.4 105.4 172.9 0.4 24.3 306.2
Accumulated depreciation and write-downs 1 January -93.7 -147.9 -0.1 -241.7
Translation differences 0.2 0.1 0.0 0.4
Accumulated depreciation of decrease and transfers 2.4 2.4
Depreciation for the financial period -1.1 -3.3 0.0 -4.4
Accumulated depreciation 31 December 0.0 -94.6 -148.6 -0.1 0.0 -243.3
Book value 1 January 2020 3.4 10.9 25.4 0.3 10.1 50.0
Book value 31 December 2020 3.4 10.8 24.3 0.3 24.3 63.0
The investment acquisition expenditure does not include borrowing costs.
Leased right-of-use-assets
The increases to the right-of-use assets during the 2020 financial year included 9.3 million acquisitions of process equipment related to the new production plant built on Raisio’s factory site.
(EUR million)Buildings leased
for own useMachinery leased
for own useTotal
right-of-use assets
Acquisition cost 1 January 1.1 1.0 2.1
Translation differences 0.0 0.0 0.0
Increase 9.9 9.9
Divestment and other decreases 0.0 -0.3 -0.3
Reclassification between items
Acquisition cost 31 December 1.0 10.6 11.7
Accumulated depreciation and write-downs 1 January -0.4 -0.6 -1.0
Translation differences 0.0 0.0 0.0
Accumulated depreciation of decrease and transfers 0.0 0.2 0.3
Depreciation for the financial period -0.4 -0.4 -0.8
Accumulated depreciation 31 December -0.7 -0.8 -1.5
Book value 1 January 2020 0.7 0.4 1.1
Book value 31 December 2020 0.3 9.9 10.2

FINANCIAL STATEMENTS 202162
4.5.2 Depreciation and impairment
Depreciation and impairment
(EUR million) 2021 2020
Depreciation by asset group
Depreciation on intangible assets
Intangible rights 0.4 0.3
Other intangible assets 0.9 0.7
Total 1.4 1.0
Depreciation on tangible assets
Buildings 2.1 1.5
Machinery and equipment 5.0 3.7
Other tangible assets 0.0 0.0
Total 7.1 5.2
Impairment by asset group
Machinery and equipment 0.0 0.0
Other intangible assets 0.0
Total 0.0 0.0
Total depreciation and impairment 8.4 6.2
Depreciation by activity
Cost of sales 6.2 4.1
Sales and marketing 0.6 0.4
Administration 1.5 1.4
Research and development 0.2 0.2
Total 8.4 6.2
Impairment
Sales and marketing 0.0 0.0
Administration 0.0 0.0
Research and development 0.0
Total 0.0 0.0
The total of EUR 8.4 (6.2) million in depreciation and impairment includes depreciation and impairments from right-of-use assets as follows:
(EUR million) 2021 2020
Depreciation for right-of-use assets by asset group
Depreciation for right-of-use assets by asset group
Buildings 0.7 0.4
Machinery and equipment 0.9 0.4
1.6 0.8
Impairment for right-of-use assets by asset group
Buildings
Machinery and equipment 0.0
Total 0.0 0.0
Total depreciation and impairment for right-of-use assets 1.6 0.8
Function-based depreciation and impairment for right-of-use assets
Cost of sales 1.1 0.2
Sales and marketing 0.3 0.3
Administration 0.2 0.2
Research and product development 0.0 0.0
Total function-based depreciation and impairment for right-of-use assets 1.6 0.8
Depreciations (M€)2020–2021
2020
Cost of sales 4.1
Administration 1.4
Sales and marketing 0.4
Research anddevelopment 0.2
6.28.4
2021
Cost of sales 6.2
Administration 1.5
Sales and marketing 0.6
Research anddevelopment 0.2

FINANCIAL STATEMENTS 2021 63
4.6 Impairment of intangible and tangible assets other than goodwill and assets with indefinite useful lives
Accounting principles
The balance sheet values of long-term intangible and tangible assets are assessed to determine possible impairment at the balance sheet date and whenever there is an indication of impair-ment of an asset. The impairment tests assess the recoverable amount of the asset in question. The recoverable amount is the asset’s fair value less costs to sell, or a higher value in use. An impairment loss is recognised in the income statement if the value of the asset exceeds the recoverable amount.
The impairment previously recognised in the income statement is reversed if the values used to determine the recoverable income change substantially. However, the value after the reversal of the impairment may not exceed the value that the asset would have had without the impairment of previous years less accumulated impairment.
Impairment by operations
The financial statements for 2021 and 2020 do not include signi-ficant impairment losses on long-term intangible and tangible assets.
4.7 Equity investments
Accounting principles
Equity investments are classified at fair value in the financial assets recognised through items of other comprehensive income. Of these investments, only dividends are recognised through profit or loss. Possible subsequent sales are not recognised through profit or loss and the fair value changes recognised in the fair value reserve are not reclassified through profit or loss.
Equity investments, which are publicly quoted, are valued at the bid prices quoted by NASDAQ OMX Helsinki Ltd on the balance sheet date. Part of the unquoted share investments have been recognised at fair value by applying, for instance, recent transac-tions between independent parties. If the valuation at fair value by using valuation methods has not been possible and fair value has not been reliably available, equity investments have been valuated at their acquisition cost.
Equity investments
(EUR million) 2021 2020
At the beginning of financial period 2.8 3.0
Decreases -0.4 -0.5
Profits and losses in the comprehensive income
0.4 0.3
At the end of financial period 2.8 2.8
4.8 Inventories
Accounting principles
Materials and supplies, unfinished and finished goods are recor-ded in inventories. Inventories are measured at acquisition cost or lower net realisable value. A net realisable value is the estimated selling price in the ordinary course of business less the estimated costs of the completion of the product and the costs of the sale.
The cost of inventories is determined using the FIFO method so that the weighted average price is used for the valuation of mate-rials and equipment and of acquired assets. Standard prices are used for the valuation of self-made products.
The cost of acquired assets comprises all costs of purchase inclu-ding direct transportation, handling and other costs. The acqui-sition cost of finished products and work in progress consists of raw materials, direct work-related costs, other direct costs and the appropriate part of variable and fixed production overheads based on the normal capacity of the production facilities. The acquisition cost does not include borrowing costs.
Key estimates and discretionary solutions
The valuation of inventories requires the assessment of mana-gement in determining write-offs or resale prices. There were no significant impairments for inventories during the 2021 financial period and comparison period.
Fixed production overheads are allocated to production costs in accordance with the normal production capacity of the facility. Normal production capacity refers to the average production amount that is expected to be achieved over several periods under normal conditions. During spring 2021, the new production faci-lity built in Raisio’s industrial area for the purpose of producing plant-based products in Finland was completed. The first products produced by the facility found their way to Finnish retail shelves in September. According to the assessment of the management, the new facility will reach normal production capacity in 2024. Fixed production overheads are allocated to production costs in accordance with the estimated production capacity of the facility in 2024.

FINANCIAL STATEMENTS 202164
Inventories
(EUR million) 2021 2020
Materials and supplies 23.1 24.0
Unfinished goods 4.7 4.8
Finished products/goods 9.5 8.0
Other inventories 0.3 0.2
Advance payments 0.2
Inventory, total 37.9 37.1

FINANCIAL STATEMENTS 2021 65
5 Financial items and risk management
Content
This section includes the notes to financial statements describing financial income and expenses, financial assets and liabilities, valuation of financial items, as well as financial risk management.
5.1 Financial income and expenses
(EUR million) 2021 2020
Finance income
Dividend income from equity investments 0.2 0.2
Interest income from derivatives 0.1 0.2
Other interest income 0.1 0.1
Change in value of financial assets at fair value through profit or loss 0.3 0.4
Gain on sale of financial assets at fair value through profit or loss 1.4 0.5
Exchange rate differences, net 0.5 0.4
Other financial income 0.2 0.2
Total 2.8 2.0
Finance expenses
Interest expenses from derivatives -0.3 -0.4
Interest expenses from lease liabilities -0.2 0.0
Other interest expenses 0.0 0.0
Change in value of financial assets at fair value through profit or loss -1.2
Loss on sale of financial assets at fair value through profit or loss 0.0 -0.8
Other financial expenses -0.2 -0.2
Total -1.9 -1.4
5.2 Financial assets and liabilities
Accounting principles
Raisio classifies the financial assets in three measurement cate-gories: financial assets recognised at amortised cost, financial assets recognised at fair value in other comprehensive income and financial assets at fair value through profit or loss. The clas-sification of financial assets is made in connection of the initial recognition, based on the cash flow characteristics of the assets.
Financial assets recognised at amortised cost include the financial assets that are to be held until the end of the contract and whose
cash flows consist solely of capital and interest. Raisio has classi-fied sales receivables and other held-to-maturity receivables that are non-derivatives assets as financial assets at amortised cost.
Equity investments previously included in the financial assets available-for-sale are classified in the financial assets at fair value through profit or loss through other comprehensive income items. The group mainly includes unquoted share investments and similar rights of ownership. They are included in non-cur-rent assets. Of these investments, only dividends are recognised through profit or loss. Possible subsequent sales are not recogni-sed through profit or loss and the fair value changes recognised in the fair value reserve are not reclassified through profit or loss.
Liquid investment funds that are used for cash management are classified as financial assets at fair value through profit or loss.
The Group’s financial liabilities are classified at amortised cost and as financial liabilities at fair value through profit or loss.
Financial liabilities recognised at amortised cost consist of inte-rest-bearing loans, lease liabilities and non-interest-bearing liabilities, such as accounts payable. Financial liabilities recor-ded at amortised cost are recorded at fair value on the basis of the compensation initially received. The financial liabilities in this category are measured at amortised cost using the effective interest method. Transaction costs have been included in the initial carrying amount of financial liabilities. Financial debts are included in current and non-current debts and may be either inte-rest-bearing or non-interest-bearing. The category includes bank loans, lease liabilities, accounts payable, advance payments, other liabilities and financial instruments included in accrued expenses.
Other financial liabilities are classified to be recorded at fair value through profit or loss.
Derivative contracts are classified as financial assets or liabilities at fair value through profit or loss. They are originally recorded at acquisition cost representing their fair value. Following the acqui-sition, derivative contracts are measured at fair value. Profits and losses generated from the measurement at fair value are treated according to the purpose of use of the derivative contract.
If hedge accounting is applied to derivatives, the change in their fair value is recognised at fair value through other comprehensive income items. Profit effects of changes in value are presented consistently with the hedged item. When a derivative contract is entered into, the Group processes it as hedging of a highly probable forecasted transaction (cash flow hedging). Hedge accounting is discontinued in case its conditions cease to meet the qualifying criteria, the hedged item is derecognized from the balance sheet, the hedging instrument expires or it is sold or exer-cised, the forecasted transaction is no longer expected to occur or the management decides to discontinue hedge accounting.
When starting hedge accounting, the Group documents the financial and hedging relationship between the hedged item and the hedging instrument and takes into account the impact of the credit risk. When initiating hedging, the Group documents

FINANCIAL STATEMENTS 202166
and assesses the effectiveness of hedging relationships by exami-ning the hedging instrument’s ability to offset the changes in fair value of the hedged item or in cash flows. Hedge effectiveness is reassessed on a monthly basis.
If the foreign currency derivatives do not meet the conditions of hedge accounting, their fair values are recognised in other opera-ting income and expenses when used to hedge actual business operations, and in financial income and expenses when they are hedging financial items. Effects of the interest element of foreign currency derivatives are recognised in financial income and expenses.
Change in fair value of the effective portion of derivative instru-ments meeting the conditions of cash flow hedging are recogni-sed in other comprehensive income and presented in the equity hedge fund. Gains and losses accrued in equity from the hedging instrument are transferred to profit or loss when the hedged item affects profit or loss. The ineffective portion for profit or loss on the hedging instrument is recorded in the income state-ment either in other operating income or expenses, or in financial income or expenses, depending on its nature.
The Group has no hedges of a net investment in a foreign entity. Profits and losses accumulated from the hedging of a net investment are transferred to profit or loss when net investment is partially or completely disposed of.
Notes
Classification and hierarchy of financial assets and liabilities
(EUR Million)
Fair value through profit or loss LEVEL 2
2021
Fair value through other
comprehensive income LEVEL 3
2021
Recorded at amortised
cost 2021Total 2021
Fair value through profit or loss LEVEL 2
2020
Fair value through other
comprehensiveincome LEVEL 3
2020
Recorded at amortised cost 2020
Total 2020
Financial assets
Equity investments 2.8 2.8 2.8 2.8
Accounts receivable and other receivables
32.1 32.1 26.9 26.9
Derivatives 0.0 0.0 0.1 0.1
Investments at fair value through profit or loss 67.9 67.9 71.7 71.7
Liquid funds 21.1 21.1 21.5 21.5
Total 67.9 2.8 53.2 123.9 71.8 2.8 48.5 123.1
Financial liabilities
Accounts payable and other liabilities 26.7 26.7 20.1 20.1
Derivatives 0.2 0.2 0.3 0.3
Capital loans 0.0 0.0 0.0
Other loans 0.3 0.3 0.0
Lease liabilities 28.8 28.8 10.2 10.2
Total 0.2 0.0 55.8 56.0 0.3 0.0 30.3 30.5
Of the financial assets and liabilities measured at fair value, all belong to level 2 with the exception of equity investments, which are on level 3. There were no items included in level 1. Fair value of the items on the level 2 is defined with valuation techniques using the valuations of an external service provider. Equity investments are on the level 3 as their fair value is not based on observable market data.

FINANCIAL STATEMENTS 2021 67
The reconciliation for the level 3 financial assets and liabilities
(EUR Million)
Opening balance for the fiscal year 2020 3.0
Deductions -0.5
Profits and losses, statement of comprehensive income 0.3
Final balance for the fiscal year 2020 2.8
Opening balance for the fiscal year 2021 2.8
Deductions -0.4
Profits and losses, statement of comprehensive income 0.4
Final balance for the fiscal year 2021 2.8
5.3 Valuation of financial assets
Accounting principles
At each balance sheet date, the Group assesses whether there is objective evidence of impairment of a financial asset or a group of financial assets. The impairment loss for loans and other receivab-les entered at amortised cost in the balance sheet is measured as the difference between the carrying amount of the item and the present value of estimated future cash flows discounted at the initial effective interest rate. Equity investments, which are not held for trading, are classified at fair value in the financial assets recognised through items of other comprehensive income. Of these investments, only dividends are recognised through profit or loss. Possible subsequent sales are not recognised through profit or loss and the fair value changes recognised in the fair value reserve are not reclassified through profit or loss.
Raisio assesses the expected credit losses related to assets measu-red at amortised cost proactively. Credit losses are recognised at an amount corresponding to the expected credit losses for the entire effective period. The Raisio Group recognises the credit loss provision based on the realised credit loss average for the previous three years in relation to the receivables for the end of the financial period preceding each year. Using the management’s judgement, it is possible to make, when necessary, a credit loss provision higher than mentioned above in case there is objective evidence of the customer’s financial difficulties.
Key estimates and discretionary solutions
The determination of the fair value of financial instruments requi-res the management to use estimates, if the instruments do not have available price quotations and values are based on valuation models. Raisio endeavours to utilise as much empirical exter-nal market data as possible in its valuations. When determining the fair values of financial assets and liabilities, the Group has used the following price quotations, assumptions and valuation models:
Investments in shares and financial securities Equity investments are valued based on the company’s balance sheet value or the acquisition cost of shares. Assets recognised at fair value through profit or loss are marketable and market prices at closing date or market interests corresponding to the length of the agreement have been used in their valuation.
DerivativesFair values of foreign currency derivatives are determined by using publicly quoted market prices of the balance sheet date. Fair values correspond to the prices that the Group should pay or receive if it closed a derivative contract in the ordinary course of business in the market conditions at the report period’s end date. Loan receivables, loans and lease liabilitiesFair values of loan receivables and financial loans are based on discounted cash flows. The discount rate used is the interest rate corresponding to the market rates corresponding to the rates defined in those agreements.
Accounts payable and other liabilitiesThe original carrying value of accounts payable and other liabili-ties or of accounts receivable and other receivables correspond to their fair value, because the effect of discounting is not material in view of the maturity of debts or receivables.
Key estimates and discretionary solutions
The recognition of expected credit losses from assets covered by sales agreements, rental leases and customer contracts requires the estimates of the management. For the receivables due over 60 days, Raisio recognises, using the management’s judgment, the items considered uncertain in credit loss provisions.

FINANCIAL STATEMENTS 202168
Notes
5.3.1 Carrying values and fair values of financial assets and liabilities
(EUR Million) NoteBook value
2021Fair value
2021Book value
2020Fair value
2020
Financial assets
Equity investments 2.8 2.8 2.8 2.8
Accounts receivable and other receivables 5.3.2 32.1 32.1 26.9 26.9
Derivatives 5.3.4 0.0 0.0 0.1 0.1
Investments at fair value through profit or loss 5.3.4 67.9 67.9 71.7 71.7
Liquid funds 5.3.5 21.1 21.1 21.5 21.5
Financial liabilities
Accounts payable and other liabilities 5.3.6 26.7 26.7 20.1 20.1
Derivatives 5.3.7 0.2 0.2 0.3 0.3
Capital loans 5.3.7 0.0 0.0
Other loans 5.3.7 0.3 0.3
Lease liabilities 5.3.8 28.8 28.8 10.2 10.2
The carrying amounts in the Table above correspond to the consolidated balance sheet values and they are further specified in the following Tables. Equity investments include unquoted share investments and similar rights of ownership.
5.3.2 Accounts receivable and other receivables
(EUR Million) 2021 2020
Accounts receivable and other receivables included in financial assets
Accounts receivable 30.2 24.3
Accrued income 0.3 1.2
Other receivables 1.5 1.4
Total 32.1 26.9
Other receivables not included in financial assets
Accrued income 0.7 0.8
Other receivables 0.3 0.2
Total 1.0 1.1
Total accounts receivable and other receivables 33.1 28.0
Sales receivables in the subsidiaries’ risk currencies are specified in Table ‘Balance sheet and transaction risk of the currency risk’ under 5.4.1. Significant items included in accrued income are amortisations of income, expenses and financing items of busi-ness operations. In accordance with IFRS 9, the fair values of recei-vables classified as financial assets are presented in Table 5.3.1.
Accounts receivable (M€)2020–2021
20202021
EUR 11.0
GBP 8.4
RUB 1.2
CHF 1.6
UAH 1.0
PLN 0.4
USD 0.7
SEK 0.1
24.330.2
EUR 14.6
GBP 9.7
RUB 1.6
CHF 1.5
UAH 1.3
PLN 0.7
USD 0.6
SEK 0.1

FINANCIAL STATEMENTS 2021 69
5.3.3 Accounts receivable based on age
(EUR Million) 2021 2020
Unexpired 25.9 21.9
Past due 1–60 days 4.2 2.2
Past due 61–180 days 0.1 0.2
Past due over 180 days 0.0 0.0
Accounts receivable in total 30.2 24.3
Impairment of sales receivables:
Value on 1 January 0.1 0.2
Increase 0.0 0.0
Decrease -0.1 -0.1
Impairment in total on 31 December 0.1 0.1
Accounts receivable and impairment in total 30.3 24.5
During the financial period 2021, the Group has recognised EUR 0.1 million (EUR 0.1 million in the financial period 2020) in credit losses. The Group has recognised EUR 0.1 million in credit losses during the financial period 2021 (EUR 0.0 million in the financial period 2020).
5.3.4 Financial assets at fair value through profit or loss
(EUR Million) 2021 2020
Derivatives 0.0 0.1
Investments at fair value through profit or loss 67.9 71.7
Total 67.9 71.8
Financial assets at fair value through profit or loss include liquid financial instruments for cash management purposes and deri-vatives. Table 5.1 in the Notes to the Financial Statements shows the gains, losses and changes in value on financial items at fair value through profit or loss.
5.3.5 Liquid funds in the cash flow statement
(EUR million) 2021 2020
Investments at fair value through profit or loss 67.9 71.7
Liquid funds 21.1 21.5
Liquid funds on the balance sheet and in cash flow statement 89.0 93.2
5.3.6 Accounts payable and other liabilities
(EUR Million) 2021 2020
Accounts payable and other liabilities included in financial liabilities
Accounts payable 25.7 19.6
Advances paid 0.5 0.1
Accrues liabilities and deferred income 0.1 0.1
Other liabilities 0.5 0.2
Total 26.7 20.1
Other liabilities not included in financial liabilities
Accrues liabilities and deferred income 6.4 6.9
Other liabilities 1.1 1.0
Total 7.5 7.9
Total accounts payable and other liabilities 34.2 28.0
Accrued liabilities include amortisations of operating expenses and financial items. Of them, the most significant are the amor-tisations of salaries, rewards and other personnel expenses total-ling EUR 4.0 million in 2021 (in 2020 EUR 3.9 million).
Accounts payable (M€) 2020–2021
20202021
EUR 16.6
GBP 0.9
CHF 1.4
USD 0.2
UAH 0.2
RUB 0.2
PLN 0.1
19.625.7
EUR 21.0
GBP 1.8
CHF 1.7
USD 0.6
UAH 0.2
RUB 0.2
PLN 0.1

FINANCIAL STATEMENTS 202170
5.3.7 Financial liabilities
(EUR million) 2021 2020
Long-term financial liabilities
Capital loans 0.0
Other loans 0.3
Lease liabilities 25.6 9.5
Total 25.9 9.6
Short-term financial liabilities
Accounts payable and other liabilities 26.7 20.1
Derivatives 0.2 0.3
Lease liabilities 3.2 0.6
Total 30.1 21.0
Table ‘The maturity breakdown’ under 5.4.2 in the Notes to the Financial Statements shows the maturity breakdown of financial liabilities.
5.3.8 Lease liabilities
(EUR million) 2021 2020
Non-current lease liabilities 1 January 10.2 1.1
Translation difference 0.0 0.0
Increase in lease liabilities, acquired business 6.3
Increase in lease liabilities 13.8 9.9
Payments related to decrease of lease liabilities -1.5 -0.8
Total 28.8 10.2
Current share of non-current lease liabilities 31 December 3.2 0.6
Non-current lease liabilities 31 December 25.6 9.5
Non-current lease liabilities 1 January 9.5 0.3
Non-current lease liabilities 31 December 25.6 9.5
Current lease liabilities 1 January 0.8 0.8
Current lease liabilities 31 December 3.2 0.6
The increases to lease liabilities during the review period include EUR 12.2 (9.3) million in right-of-use asset acquisitions for process equipment related to the new production facility in Raisio’s industrial area. Raisio Group has recognised approximately EUR 21.5 million as a lease liability in connection with its new produc-tion facility. In the future, the Group will be exposed to an annual outgoing cash flow of approximately EUR 2.0 million in connec-tion with the new production facility.
5.3.9 Contingent liabilities and other commitments and contingent assets
(EUR million) 31.12.2021 31.12.2020
Contingent off-balance sheet liabilities
Other liabilities 4.6 3.0
Guarantee liabilities on the Group companies’ commitments 1.5 2.2
Commitments to investment payments 2.4 5.7
Commitment to right-of-use assets 12.1
Off-balance sheet contingent assets
Compensation receivables based on arbitration award 2.9
The EUR 12.1. million commitment to right-of-use assets, on 31 December of the comparison period in 2020, is related to lease liabilities for the new production facility that have not yet commenced. There were no lease liabilities that had not commen-ced by the closing date, 31 December 2021, of the subsequent financial period.
At the end of the comparison period in 2020, Raisio Group received a positive arbitration award for the partial suspension of Raisio-aqua’s business activities in 2018. On the basis of the judgement, the supplier is obligated to pay Raisio Group EUR 2.9 million as compensation for damages including penalty interest. Due to the uncertainty concerning the compensation for damages, they were not recognized in the 2020 financial statements.
5.4 Financial risk management
Content
Key estimates and discretionary solutions
This section covers Raisio Group’s currency, liquidity, liquidity reserve, interest rate and counterparty risk and methods for their management. The purpose of risk management is to minimise the unfavourable effects of financial markets on the Group’s profits and equity and to maintain liquidity at a good level. The principles for managing financial risk are defined in the treasury policy approved by the Board of Directors of Raisio Group.
Raisio Group is exposed to transaction risks and risks that arise when leases made in different currencies are converted to euro amounts. The management has exercised discretion when signing derivative contracts as a means of hedging against currency risk. Hedging transactions are carried out in accordance with the treasury policy approved by the Board of Directors.

FINANCIAL STATEMENTS 2021 71
5.4.1 Currency risk
Raisio is an international Group which operates in several curren-cies. This structure causes foreign exchange risks produced by cash flows in various currencies (Transaction risk) and converting equities, assets, liabilities and income of foreign currency subsi-diaries to euro (Translation risk).
Transaction risk refers to the exchange rate risk that arises between the date of agreement and the payment transaction. Raisio Group hedges against foreign currency risks arising from the most significant foreign currency receivables and liabilities, off-balance-sheet purchase and sales agreements and, partly, from budgeted cash flows. The Group currently utilises currency forward contracts and options as a means of managing the tran-saction risks.
The most significant transaction risks
Notes
CompanyHome
currencyRisk
currencyNet
event
Benecol consumer product sales in UK GBP
CHF EUR
Purchases Purchases
Benecol consumer product sales in Ireland EUR CHF Purchases
Production and sales of plant stanol ester, sales of snack products EUR
CHF RUB USD
Sales Sales
Purchases
The Net event column of the Table describes whether the currency results more in purchases or sales in terms of the business in question, i.e. the type of risk the company carries for each currency.
Transaction risk of net sales 2021
(EUR million) USD CHF RUB SEK
+10% change in currency rate -0.4 -1.1 -0.4 -0.1
-10% change in currency rate 0.4 1.1 0.4 0.1
Transaction risk of net sales 2020
(EUR million) USD CHF RUB SEK
+10% change in currency rate -0.3 -0.9 -0.4 -0.1
-10% change in currency rate 0.3 0.9 0.4 0.1
Translation risk refers to the risk that arises when foreign currency items are converted to the domestic currency for the purposes of the Financial Statements. In accordance with the treasury policy of the Group, translation risk is not, as a rule, hedged with the currency derivatives. Of Raisio Group’s net sales for the financial year of 2021, altogether 29.3 per cent (29.7 per cent in the finan-cial period 2020) were generated in a functional currency other than the euro.
Translation risk of net sales 2021
(EUR million) USD GBP PLN RUB UAH
+10% change in currency rate 0.0 -4.8 -0.4 -0.8 -0.4
-10% change in currency rate 0.1 5.9 0.5 1.0 0.5
Translation risk of net sales 2020
(EUR million) USD GBP PLN RUB UAH
+10% change in currency rate -0.1 -4.6 -0.4 -0.9 -0.4
-10% change in currency rate 0.1 5.6 0.5 1.0 0.5
Balance sheet and transaction risk of the currency risk 31 December 2021
(EUR million) EUR USD GBP CHF PLN RUB SEK
Accounts receivable 0.2 0.6 0.0 1.5 0.2 0.2 0.1
Bank accounts -0.7 0.0 -0.1 -0.3 0.1 0.0 0.3
Accounts payable -3.6 -0.7 -0.1 -1.7 0.0 0.0 -0.2
Internal loans -1.0 0.2 1.0
Balance sheet risk, total -5.0 0.1 -0.2 -0.4 1.3 0.2 0.2
Forecast sales less than one year 0.0 3.7 0.0 10.9 0.0 3.8 1.2
Forecast purchases less than one year -15.9 -6.5 0.0 -22.3 0.0 0.0 -0.5
Forecast risk, total -15.9 -2.8 0.0 -11.4 0.0 3.8 0.8
Currency hedges, total 6.1 3.5 5.8 -0.9
Net risk, total -14.8 0.8 -0.2 -6.1 1.3 3.1 0.9
Forecasted sales and purchases are based on the forecasts reported by the Group’s operating segments. For these, the Table only shows foreign currency items that are significant from the Group’s standpoint. The negative values in the Table refer to purchases or debts while the positive values to sales or assets.

FINANCIAL STATEMENTS 202172
Balance sheet and transaction risk of the currency risk 31 December 2020
(EUR million) EUR USD GBP CHF PLN RUB SEK
Accounts receivable 1.0 0.5 0.0 1.6 0.0 0.1 0.1
Bank accounts -1.7 -0.2 0.0 -0.4 0.1 0.0 0.3
Accounts payable -2.9 -0.4 -0.1 -1.4 0.0 0.0 -0.2
Internal loans -1.0 0.2
Balance sheet risk, total -4.6 0.1 -0.1 -0.3 0.1 0.1 0.2
Forecast sales less than one year 0.0 3.0 0.0 9.2 0.0 3.9 1.0
Forecast purchases less than one year -12.3 -6.1 0.0 -20.0 0.0 0.0 -0.4
Forecast risk, total -12.3 -3.1 0.0 -10.7 0.0 3.9 0.6
Currency hedges, total 5.9 4.0 5.1 -1.8
Net risk, total -11.0 1.0 -0.1 -5.9 0.1 2.1 0.8
Currency sensitivity analysis in accordance with IFRS 7, 2021
The Table includes the currency hedges but no forecasted cash flows. Business transaction risks include sales receivables, accounts payable and currency forward contracts. Financial risks include internal currency loans and foreign currency bank balances. The calcu-lation does not take into account foreign currency funds or related currency hedges in investment portfolios managed by the Group’s asset managers. The figures in the Table above show what the risk of each currency is against all other currencies. Utilising the Group’s reporting system, the translation risks were defined by determining the foreign exchange rates against one euro at the end of the year and by changing them one at a time by +/-10%. Translation risk, EBT is the exchange rate risk that is allocated to the Group’s earnings before tax and translation risk, equity is the exchange rate risk that is allocated to the Group’s equity value.
Currency sensitivity analysis in accordance with IFRS 7, 2020
(EUR million)
Businesstransaction risk
(less than one year) +/-10%
Financial risk(less than one year)
+/-10%
Translation risk, EBT
+10%
Translation risk, EBT
-10%
Translation risk, equity
+10%
Translation risk, equity
-10%
EUR 0.3 0.2
USD 0.3 0.0 0.0 0.0 -0.1 0.2
GBP 0.0 0.0 -1.1 1.3 -10.0 12.2
CHF 0.6 0.0
PLN 0.0 0.1 0.0 0.0 0.1 -0.1
RUB 0.1 0.0 -0.1 0.1 -0.3 0.3
SEK 0.0 0.0 0.0 0.0 -0.3 0.3
UAH 0.0 0.0 0.0 0.0 -0.1 0.2
(EUR million)
Businesstransaction risk
(less than one year) +/-10%
Financial risk(less than one year)
+/-10%
Translation risk, EBT
+10%
Translation risk, EBT
-10%
Translation risk, equity
+10%
Translation risk, equity
-10%
EUR 0.4 0.3
USD 0.4 0.0 0.0 0.0 -0.1 0.1
GBP 0.0 0.0 -1.0 1.2 -9.6 11.8
CHF 0.5 0.0
PLN 0.0 0.0 0.0 0.0 0.3 0.0
RUB 0.2 0.0 -0.2 0.2 -0.1 0.5
SEK 0.0 0.0 0.0 0.0 -0.1 0.4
UAH 0.0 0.0 0.0 0.0 0.0 0.3

FINANCIAL STATEMENTS 2021 73
(EUR million) Totalunder 3 months
3–6 months
6–9 months
9–12 months
1–2 years
2–5 years
over 5 years
Financial liabilities
Accounts payable -25.7 -25.7
Lease liabilities -30.1 -0.6 -1.2 -0.6 -1.1 -3.4 -7.4 -15.9
Total -55.8 -26.3 -1.2 -0.6 -1.1 -3.4 -7.4 -15.9
Currrency derivatives, in hedge accounting
The amount to be received 42.0 19.9 11.3 7.9 2.9
The amount to be paid -42.3 -20.0 -11.4 -8.0 -2.9
Total -0.3 -0.1 -0.1 0.0 0.0
Currrency derivatives, not in hedge accounting
The amount to be received 1.0 0.1 0.9
The amount to be paid -1.1 -0.1 -1.0
Total 0.0 0.0 0.0 0.0 0.0
Guarantee contracts
Guarantees signed -1.5 -1.5
Nominal values of derivatives
(EUR million) 31.12.2021 31.12.2020
Currrency derivatives, in hedge accounting 43.4 46.4
Currrency derivatives, not in hedge accounting 1.1
Total 44.5 46.4
5.4.2 Liquidity and solvency risk
Liquidity risk refers to a situation in which the financial assets and additional financing options would not cover the future needs of business operations. In line with the risk management policy Raisio Group strives to maintain good liquidity in all circumstan-ces, keeping it at a level that guarantees the strategic operating freedom of the management. At the balance sheet date, the Group’s liquidity consisted of financial assets, overdraft facilities and non-binding commercial paper programme. In compliance with the treasury policy, any additional financing needs are cove-red with leasing, bank loans and financial market instruments. All significant borrowing decisions are taken by the Board. Short-term liquidity (EUR million)
The Table shows Raisio Group’s short-term liquidity position using undiscounted values. The Chart does not include currency deriva-tives, lease liabilities or signed guarantee contracts. The Group’s liquidity is at a good level also with these items.
The maturity breakdown 2021
Undiscounted values were use in the Table. Lease liabilities for leases of indefinite duration are taken into account in calculations for the new strategy period up until the end of 2025. Signed guarantee contracts refer to guarantees signed by the parent company on behalf of the subsidiaries. They are included in the earliest period in which a guarantee may be claimed. The Group does not view their realisation as being probable.
0
50
100
150
200
250
Cash in hand Investments at fair value through
profit or loss
Commercial paper
programme (non-binding)
Accounts receivable
Accounts payable
TotalShort-term lease liabilities
21.1
67.9
90.0
30.2
-25.7
180.1
-3.5

FINANCIAL STATEMENTS 202174
The maturity breakdown 2020
(EUR million) Totalunder 3 months
3–6 months
6–9 months
9–12 months
1–2 years
2–5 years
over 5 years
Financial liabilities
Accounts payable -19.6 -19.6
Lease liabilities -15.1 -0.2 -0.4 -0.4 -0.3 -2.2 -4.6 -7.0
Total -34.8 -19.8 -0.4 -0.4 -0.3 -2.2 -4.6 -7.0
Currrency derivatives, in hedge accounting
The amount to be received 40.1 21.4 15.9 1.5 1.5
The amount to be paid -40.2 -21.1 -16.1 -1.5 -1.5
Total -0.1 0.3 -0.2 -0.1 -0.1
Guarantee contracts
Guarantees signed -1.6 -1.6
5.4.3 Interest rate risk
Interest rate risk refers to the impact of interest rate fluctuations on Raisio Group’s net financial income and expenses, and on the market values of interest investments and interest derivatives over the following 12 months. In accordance with the treasury policy of the Group, the interest rate risk is managed by cont-rolling the structure, maturity and repayment structures of the credit portfolio and interest investments. The interest rate profile can be modified using interest rate swaps, futures and options. On the balance sheet date, the Group had a binding interest rate derivative of EUR 15.5 million related to equipment for the new production facility. The derivative falls due in March 2025 and its purpose is, throughout its validity, to eliminate the interest rate risk of the lease liability. As a result of the exceptional interest rate environment, the Group has invested its cash reserves in liquid interest rate instruments with a low credit and interest rate risk as a means of avoiding negative interest on deposits. On the balance sheet date, the duration of the investment portfolio was 1.55 years, and together, capital and unrealised change in value totalled EUR 67.9 million. With the aforementioned duration figure incorporated, a 100 basis point increase or decrease in the market interest would have a EUR +/-1.1 million impact on the Group’s EBIT before taxes.
5.4.4 Counterparty risk
Counterparty risk refers to a situation in which a contracting party is unable or unwilling to fulfil its obligations. Raisio Group is expo-sed to counterparty risk through the purchase and sales agree-ments and other contracts of the business units. Additionally, the Group is exposed to counterparty risk through the Treasury department’s derivative trading as well as funding, investment and cash management solutions. A careful selection of counter-parties with good credit rating is an important tool in the counter-party risk management.
Investment activitiesRaisio Group’s investment portfolio is regulated in accordance with treasury policy in terms of its investment allocation, maturity and counterparties. In addition to direct long- or short-term inte-rest-bearing investments, assets can be invested in fixed-income funds. In addition to the aforementioned, a minor part of the Group’s overall assets can be invested in alternative investment funds, shares and equity funds. Structured financial products are not permitted. In principle, counterparties may be member states of the European Monetary Union, large Finnish municipalities and alliances formed by them, financial institutions engaged in corpo-rate banking in Finland and companies with a good credit rating, registered in a member state of the European Monetary Union. On the balance sheet date, the investment portfolios managed by the Group’s two asset managers contained a total value of EUR 67.9 million that are diversified in fixed-income funds.
Credit risk in sales The principles for managing credit risk in sales are defined in the credit policy approved by the Board of Directors of Raisio Group. The operating segments make independent decisions on the counterparty risk, such as the criteria used to approve customers, the applicable terms and conditions for sales and necessary guarantees within the limits allowed by the Group’s credit policy. Sales receivables can also be secured with credit insurance policies.
Raisio Group operates in grocery trade markets and its accumu-lated credit risks result from the structure of these markets. A significant part of the Group’s earnings are generated by the Benecol business and particularly in the UK. A significant part of the revenue from food sales in the UK and Finland is from a few of the most significant retail chains. However, the Group has not detected any deterioration in the creditworthiness of its major customers in the UK or in Finland. The accumulated credit risks due to the market structure have been recognised and considered in the Group’s decision-making process.

FINANCIAL STATEMENTS 2021 75
(EUR million)Receivables
31/12/2021
Credit losses from previous years
with respect to receivables
Calculated mimimum credit
loss provision
Credit loss provision
2021
Credit loss provision
2020
All receivables, in total 30.3 0.1 % 0.0 0.1 0.1
Receivables past due, in total 4.4 0.4 % 0.0 0.1 0.1
More than 60 days past due receivables 0.2 4.2 % 0.0 0.1 0.1
Credit losses
The Table shows a comparison between the realised credit losses for the three previous financial periods and receivables at the begin-ning of each financial period. A provision matrix has been applied to the calculation based on historical data on past credit losses of the Group and on the Group’s assessment of future financial conditions.

FINANCIAL STATEMENTS 202176
6 Current taxes and deferred tax
Content
This Note contains the notes related to the income taxes and deferred taxes of continuing operations.
6.1 Income taxes
Accounting principles
The Group’s tax expense includes taxes based on the result of the Group companies for the financial year, adjustments to taxes for previous financial periods and a change in deferred taxes. Taxes are recognised through profit or loss except when they are related to the statement of comprehensive income or items directly recognised in shareholders’ equity. In this case, tax effe-cts are also recognised in the corresponding items. Current tax is calculated from the taxable income according to the valid tax rate of each country. The tax is adjusted by possible taxes related to previous accounting periods. The Group deducts current tax assets and tax liabilities from each other if the Group has a legally enforceable right to set off the recognised items from each other.
Key estimates and discretionary solutions
The Group is subject to taxation in several countries and the income tax calculation involves plenty of estimates and judge-ment. The amounts recorded as taxes correspond to the current perception and the interpretation of current tax laws. The mana-gement regularly estimates the statements made in tax calcula-tions in situations where tax provisions are interpretative.
Income taxes
(EUR million) 2021 2020
Tax based on the taxable income for the period -3.6 -2.4
Taxes for previous financial periods 2.2 -0.1
Deferred tax -2.5 -3.5
Total -3.9 -6.0
In 2021, the tax based on profit of continuing operations for the financial year totalled EUR 3.9 (in 2020: 6.0) million and effective tax rate was 15.6 per cent (in 2020: 20.3%). The effective tax rate for the comparison period was decreased by EUR 2.3 million with tax refunds related to the UK business.
A reconciliation between tax expense of the income statement and the Group’s tax calculated at the Finnish tax rate 20 per cent (20% in 2020):
(EUR million) 2021 2020
Taxes calculated on the basis of the domestic tax rate -4.9 -5.9
Impact of a deviating tax rate used in foreign subsidiaries 0.1 0.1
Change in tax rate -1.2 -0.3
Returns exempt from tax 0.1 0.3
Non-deductible expenses -0.1 -0.1
Losses for the period, for which no tax assets have been recognised 0.0
Utilisation of tax refund receivable from previously unrecognised tax losses 0.1 0.1
Deductions of previously recognised tax assets 0.0
Additional tax deductions 0.0 0.0
Tax from previous years 2.2 -0.1
Other items -0.1 -0.1
Total -3.9 -6.0
The revaluation of deferred taxes due to the change in the tax rate is related to the Western European business of the Healthy Foods Segment.
Income tax liabilities
(EUR million) 2021 2020
Income tax liability 0.4 0.2
Income tax liability 0.4 0.2
6.2 Deferred tax
Accounting principles
Deferred taxes are calculated from temporary differences between the carrying values and tax values of assets and liabili-ties and from unused tax losses to the extent that they are likely to be utilized against future taxable income.

FINANCIAL STATEMENTS 2021 77
Deferred taxes have been calculated using the tax rates set by the date of the financial statements or tax rates whose appro-ved content has been announced by the date of the financial statements.
The most significant temporary differences arise from the depre-ciation of tangible and intangible assets, provisions, measure-ment of derivative contracts at fair value and adjustments based on fair values made in connection with business combinations. No deferred tax is entered for non-deductible goodwill.
Key estimates and discretionary solutions
The recognition of deferred tax requires the management’s disc-retion as to whether the receivables are likely to be utilised or used in the foreseeable future against deferred tax liabilities. A defer-red tax asset has been recognized to the extent that it is probable that taxable income will be generated in the future, against which the temporary difference can be used. The recognition require-ments for deferred tax assets are assessed on the balance sheet date of each reporting period.
Deferred tax asset corresponding to tax losses for later use has been recognised to the extent that it is probable that it can be utilised based on cumulative future profits.
(EUR million) 31.12.2021 31.12.2020
Opening balance 1 January 41.3 56.0
Translation difference 1.7 -1.8
Increase 1 January–31 December , acquired business 12.4
Increase 1 January–31 Dececmber 1.4 0.0
Decrease 1 January–31 December -0.8 -12.9
31 December 56.0 41.3
Deductible losses, able to use 7.4 0.2
Deductible losses, unable to use 48.6 41.1
The Group’s accumulated losses total EUR 56.0 million on 31 December 2021 (31 December 2020: EUR 41.3 million). The majo-rity of them are aging over a period of more than five years. Accu-mulated losses per 31 December 2021 totalled EUR 7.4 million and were entered as tax assets. The accumulated losses are related to the Raisio Group’s foreign units and partially to the acquired business.
Deferred net tax liability
The amounts defined by netting in the consolidated balance sheet are as follows:
(EUR million) 2021 2020
Deferred tax assets 3.9 2.3
Deferred tax liabilities 9.8 6.3
Deferred net tax liability 5.9 4.0
Deferred tax assets and liabilities are offset when there is a legally enforceable right to offset current tax assets against current tax liabilities and when the deferred taxes relate to the same fiscal authority.
No deferred tax liability has been recognised for undistributed earnings of foreign subsidiaries.

FINANCIAL STATEMENTS 202178
(EUR million)
1 January2021
Recognisedin the income
statement
AcquiredBusiness
Recorded in othercomprehensive
income
Exchange ratedifferences
31 December2021
Deferred tax assets:
Provisions 0.2 0.2 0.0 0.4
Confirmed fiscal losses 0.1 0.3 1.2 1.5
Derivative contracts 0.0 0.0 0.0
Depreciation not deducted in taxation 1.0 -0.2 0.9
Other items 0.9 0.2 0.0 0.1 1.1
Total 2.3 0.4 1.2 0.0 0.1 3.9
Deferred tax liabilities:
Accumulated depreciation difference 4.0 2.9 0.3 7.2
Equity investments 0.5 0.0 0.5
Derivative contracts 0.0 0.0 0.0
Valuation at fair value of intangible and tangible assets in business combination
0.4 -0.2 0.2
Provisions 0.2 0.2
Other items 1.4 0.3 0.0 1.7
Total 6.3 2.9 0.3 0.0 0.3 9.8
Changes in deferred tax
Changes in deferred tax in the financial period 2021
Changes in deferred tax in the financial period 2020
(EUR million)1 January
2020
Recognisedin the income
statement
Recorded in othercomprehensive
incomeExchange rate
differences31 December
2020
Deferred tax assets:
Provisions 0.2 0.0 0.0 0.2
Confirmed fiscal losses 2.4 -2.3 0.1
Derivative contracts 0.1 0.0 0.0
Depreciation not deducted in taxation 1.2 -0.1 1.0
Other items 1.0 0.0 -0.1 -0.1 0.9
Total 4.8 -2.4 -0.1 -0.1 2.3
Deferred tax liabilities:
Accumulated depreciation difference 3.2 1.0 -0.1 4.0
Equity investments 0.5 0.0 0.5
Derivative contracts 0.0 0.0 0.0
Valuation at fair value of intangible and tangible assets in business combination
0.3 0.1 0.4
Other items 1.4 0.0 1.4
Total 5.3 1.1 0.0 -0.2 6.3
Change in deferred tax asset of EUR 2.3 million in confirmed tax losses relates to the losses of the previous financial periods.

FINANCIAL STATEMENTS 2021 79
6.3 Taxes related to the items of other comprehensive income
Taxes related to the items of other comprehensive income
(EUR million) Before taxes Tax impact After taxes
Year 2021
Change in equity investments 0.4 -0.1 0.3
Cash flow hedge 0.0 0.0 0.0
Translation differences 5.8 5.8
6.1 -0.1 6.0
Year 2020
Change in equity investments 0.3 -0.1 0.2
Cash flow hedge 0.2 0.0 0.2
Translation differences -5.8 -5.8
-5.3 -0.1 -5.4

FINANCIAL STATEMENTS 202180
7 Equity
Content
This section includes the notes on share capital and equity funds, translation differences, information on own shares and dividend distribution and notes on earnings per share of continuing opera-tions.
The parent company’s share capital is divided by share class as follows:
7.1 Equity and equity funds
(EUR million) 1,000 shares Share capital Company shares
Restricted shares converted into free shares 336
Disposal of company shares, free shares -13 0.0
31 December 2019
Restricted shares (20 votes/share) 31 455 5.3
Restricted shares, company shares -213 -0.4
Free shares (1 vote/share) 133 694 22.5
Free shares, company shares -7 582 -19.3
Total 157 354 27.8 -19.8
Restricted shares converted into free shares 10
Disposal of company shares, free shares -92 -0.2
31 December 2020
Restricted shares (20 votes/share) 31 445 5.3
Restricted shares, company shares -213 -0.4
Free shares (1 vote/share) 133 704 22.5
Free shares, company shares -7 490 -19.2
Total 157 446 27.8 -19.6
Restricted shares converted into free shares 485
Disposal of company shares, free shares -1 010 -1.8
31 December 2021
Restricted shares (20 votes/share) 30 961 5.2
Restricted shares, company shares -213 -0.4
Free shares (1 vote/share) 134 188 22.6
Free shares, company shares -6 480 -17.4
Total 158 456 27.8 -17.8
Translation differences The foreign currency translation reserve includes the translation differences arising from the translation of the financial state-ments of independent foreign entities. The gains and losses from the hedges of net investments made in independent foreign entities are also included in the translation differences when the requirements for hedge accounting are met.
(EUR million) 2021 2020
Translation differences on 1 January -20.6 -14.8
Change in translation difference 5.8 -5.8
Translation differences on 31 December -14.8 -20.6

FINANCIAL STATEMENTS 2021 81
Other reserves
(EUR million) 2021 2020
Other funds:
Equity investments 2.4 2.1
Hedge fund -3.0 -3.0
Other funds total -0.6 -0.9
Other funds include the fair value reserve for financial assets held for sale as well as a hedge fund. The hedge fund includes the effective portion of accrued fair value changes of derivative instruments used for cash flow hedging.
Company shares
At the end of the review period, Raisio plc held 6 480 341 free shares and 212 696 restricted shares acquired between 2005 and 2012 based on the authorisation given by the Annual General Meeting or obtained through the subsidiary merger in August 2014 or transferred to the company because the right to receive a merger consideration has expired.
Changes in own shares during the financial period 2021
(EUR million) Pieces
1 January 2021 7 703 141
Assignment of shares to the Chairman and members of the Board -10 104
Directed share issue, business acquisition -1 000 000
31 December 2021 6 693 037
Raisio plc and its subsidiaries do not have and have not held any treasury shares during the review period.
7.2 Dividends
Accounting principle
The dividends paid by the Group are recognised in the financial period during which the shareholders have approved the divi-dends for payment.
Dividends
In 2021, a dividend of EUR 0.13 per share was paid for 2020, i.e. a total of EUR 20.6 million (in 2020, EUR 0.13 per share for 2019, i.e. a total of EUR 20.5 million).
(EUR million) 2021 2020
Profit for the period for equity holders of the parent company,continuing operations (EUR million) 20.9 23.4
Undiluted weighted average of shares in the financial period 157 445 889 157 415 611
Dilution resulting from share-based compensation 669 117 543 850
Diluted weighted average of shares in the financial period 158 115 006 157 959 461
Undiluted earnings per share, continuing operations (EUR/share) 0.13 0.15
Earnings per share adjusted by the dillution effect, continuing operations (EUR/share) 0.13 0.15
7.3 Earnings per share
Earnings per share
Undiluted earnings per share have been calculated by dividing the profit for the period attributable to the shareholders of the parent company by the weighted average number of outstanding shares during the financial period.
When calculating the diluted earnings per share in the weighted average of the number of shares, the dilutive effect due to conver-sion of all dilutive potential shares into shares is taken into account.
After the balance sheet date, the parent company’s Board of Dire-ctors has proposed that a dividend of EUR 0.14 per share be paid, i.e. a total of EUR 23.1 million. The proposed dividends for 2021 comprise a base dividend of EUR 0.10 per share with an additional supplementary dividend of EUR 0.04 per share.

FINANCIAL STATEMENTS 202182
8 Personnel and related parties
Content
The section Personnel and Related Parties includes the notes related to personnel and related parties of continuing operations.
8.1 Employee benefits
Accounting principles
Employee benefits include short-term employee benefits termi-nation benefits and post-employment benefits.
Short-term employee benefits include, e.g., wages and salaries, fringe benefits, annual leave and bonuses. Termination benefits refer to benefits arising from the termination of employment and service.
Post-employment benefits consist of pensions and other post-employment benefits paid. Pension schemes are classified as defined contribution and benefit schemes. The Group only has defined contribution pension schemes.
Under defined contribution schemes, the Group makes payments to separate units. The Group has no legal or constructive obliga-tion to make further payments if the payment recipient does not have sufficient assets to pay the pension benefits in question. All arrangements not meeting these conditions are defined benefit schemes.
The Group’s pension schemes comply with the local regulations of each country. Pension schemes are usually man-aged by separate pension insurance companies. The Group’s foreign schemes, as well as the Finnish TyEL scheme, are defined contribution systems. Payments made to defined contribution pension schemes are recognised through profit or loss in the accounting period the charge applies to. The Group has no defined benefit schemes.
(EUR million) 2021 2020
Salaries 21.5 20.2
Termination benefits 0.3
Pension expenses, defined contribution plans
3.6 2.9
Share-based rewards 0.8 0.7
Other indirect personnel costs 1.2 1.1
Total 27.4 24.8
Expenses arising from employee benefits
Average number of people employed by the Group in the financial period
2021 2020
Healthy Food 134 130
Healthy Ingredients 200 169
Other operations 47 49
Total 381 348
The average number of employees increased compared to the comparison period due to the commissioning of a new production plant and the acquired business.
8.2 Share-based payments
Key estimates and discretionary solutions
Accounting principles
Under the share-based incentive scheme, the potential reward for each earnings period is based on the company’s Total Share-holder Return (TSR). In addition, the reward payment required the achievement of the Group’s cumulative profit target (EBT, earnings before taxes) in the corresponding period. The manage-ment changed the cumulative profit target (EBT) to be the EBIT profit target from 2022 onwards.
The shares issued under the share-based schemes are measured at fair value at grant date and recognised as expenses arising from employee benefits on a straight line over the vesting period. Cash-settled transactions are estimated using the share price of each closing date and amortised through profit or loss as emplo-yee benefit expenses from the grant date to the date on which the earnings period or a longer commitment period ends. The share in shares and cash are recognised in shareholders’ equity and the share of social costs in liabilities. Payments made on the basis of share-based schemes are paid as company shares previously acquired for the parent company, as cash or as a combination of these two.
Share-based payments
On 31 December 2021, the Raisio Group had four valid share-based incentive schemes approved by Raisio plc’s Board of Directors, which were directed at the Group management and designated key persons; the scheme 2019–2021, the scheme 2020–2022, the scheme 2021–2023 and the scheme 2022–2024. For each share- based incentive scheme, the rewards paid based on its earnings period correspond to the value of a maximum of 1,000,000 Raisio plc’s free share, including also the part paid in cash.

FINANCIAL STATEMENTS 2021 83
The earnings period of each share-based incentive scheme is three years. For each earnings period, Raisio plc’s Board of Dire-ctors decides on the earnings criteria, the target group and the maximum amounts of share reward per participant. The amount of reward and the number of Raisio plc’s transferred free shares based on the achievement of earnings criteria of the scheme are decided by the Board of Directors at the beginning of the year following the end of the earnings period.
In all schemes, potential reward for each earnings period is based on the company’s Total Shareholder Return (TSR). In addition, the reward payment requires the achievement of the Group’s cumu-lative profit target (EBT, earnings before taxes) in the correspon-ding period. Possible rewards are paid partly in the company’s free shares and partly in cash. The cash payment is made to cover
the key employee’s taxes and fiscal fees arising from the reward. In case the employment or service of a person ends before the reward payment, as a rule no reward is paid.
The Board recommends that the key employees within the scheme hold a substantial part of all shares they have received based on the scheme as long as the value of their holdings corres-ponds to their six months’ gross salary.
According to the decision made at the General Meetings, the members of the Board of Directors have been paid some 20% of their reward by assigning them the company’s own shares. A total of 148 426 shares were assigned during the years 2009–2020, a total of 10 104 shares in 2021.
Share-based schemes:
Share-based incentive scheme
(EUR million) 2018–2020 2019–2021 2020–2022 2021–2023 2022–2024
Original number of shares 1 000 000 1 000 000 1 000 000 1 000 000 1 000 000
Original grant date 15.3.2018 4.1.2019 21.1.2020 18.1.2021
Exercise date 30.04.2021 30.04.2022 30.04.2023 30.04.2024 30.04.2025
Vesting period, years 3.1 3.3 3.3 3.3 3.3
Remaining vesting period, years 0.3 1.3 2.3 3.3
Number of persons at the end of the period 16 19 26
Payment method Sharesand cash
Sharesand cash
Sharesand cash
Sharesand cash
Sharesand cash
Changes in 2021
2018–2020Number of
shares
2019–2021Number of
shares
2020–2022Number of
shares
2021–2023Number of
shares
2022–2024Number of
shares
1 January 2021
Number of shares at the beginning of the reporting period 465 000 545 000 585 000
In reserve at the beginning of the reporting period 535 000 455 000 415 000 1 000 000
Changes during the reporting period
Granted 820 000
Cancelled 60 000 50 000 50 000
Realised
Expired 1 000 000
31 December 2021
Number of shares at the end of the reporting period 485 000 535 000 770 000
In reserve at the end of the reporting period 515 000 465 000 230 000 1 000 000
Determination of fair valueFair value of the part paid in shares and in cash is determined at the grant date and amortised until the implementation date. Fair value of the social costs is determined at each reporting date until the possible reward has been paid. Thus, the amount of social cost debt will change as Raisio’s share price changes.

FINANCIAL STATEMENTS 202184
(EUR million) 2021 2020
Share price at grant date, euros 3.45 3.74
Share price on the closing date, euros 3.37 3.19
Share price increase assumption, p.a. 6.4 % 6.4 %
Expected dividends before bonus payment, euros 0.51 0.52
Discount rate 6.4 % 6.4 %
Years to maturity 3.2 3.3
Costs from employee benefits include equity-settled share-based payments:
(EUR million) 2021 2020
Equity-settled 0.8 0.7
Cash-settled 0.0 0.0
Total 0.8 0.7
Debt from cash-settled share-based plans 0.0 0.0
Estimate of future cash payments to the tax authorities from share-based payments in shares at the end of the period EUR 2.0 million (EUR 1.1 million).
8.3 Related parties
Related parties
Raisio Group’s related parties include its subsidiaries and the members of the Board of Directors and Supervisory Board, the Managing Director and other members of the Management Team, including close family members of the aforementioned as well as entities in which they have control or considerable influence.
8.3.1 Related party transactions
(EUR million) 2021 2020
Sales to key employees in management 3.6 1.0
Purchases from key employees in management 10.0 0.9
Short-term receivables from key employees in management
0.1 0.1
Payables to key management personnel 0.1 0.1
Sales to key management personnel are carried out at fair market price.
Auditors’ remuneration
(EUR million) 2021 2020
Auditors’ remuneration:
Audit 0.2 0.2
Other services 0.0 0.0
Total 0.2 0.2
8.3.2 Management’s employee benefits
(EUR million) 2021 2020
Wages and fees 2.0 2.0
Share-based payments 0.0 0.2
Total 2.0 2.2
Members of the Supervisory Board 0.0 0.0
Members of the Board of Directors 0.2 0.3
Managing Director and members of the Management team:
CEO 0.7 0.7
Other members of the Management team 1.1 1.2
Total 1.7 1.9
8.3.3 Pension and other benefits
The pensions of the CEO and members of the Group Executive Committee are determined in accordance with the employment pension scheme in Finland, and these individuals fall within the sphere of the group pension insurance policy for Raisio Group management. The annual contributions paid for the Group pension insurance policy are 15 per cent of a manager’s basic annual salary. From 2020 onward, the statutory pensionable age will be used in executive-level contracts. For members of the Executive Committee and the CEO appointed prior to 2020, the pensionable age is 62 years.
The notice period for the CEO’s executive contract is 6 months from both sides. If the contract is terminated by the company, CEO is entitled to compensation corresponding to 12 months’ pay, in addition to the pay for the period of notice.
Supplementary pension costs
(EUR million) 2021 2020
CEO 0.1 0.1
Other members of the Management team 0.2 0.1
Total 0.2 0.2
For the CEO, the cost of the supplementary pension insurance amounted to EUR 0.1 million in 2021 and for other Management Team members EUR 0.2 million, all totalling EUR 0.2 million. For the CEO, the cost of the supplementary pension insurance amounted to EUR 0.1 million in 2020 and for other Management Team members EUR 0.1 million, all totalling EUR 0.2 million.
Compulsory pension insurance
(EUR million) 2021 2020
CEO 0.1 0.1
Other members of the Management team 0.2 0.2
Total 0.3 0.2
For the CEO, expenditure of the compulsory pension insurance amounted to EUR 0.1 million in 2021 and for other Management Team members EUR 0.2 million, all totalling EUR 0.3 million. For the CEO, expenditure of the compulsory pension insurance amounted to EUR 0.1 million in 2020 and for other Management Team members EUR 0.2 million, all totalling EUR 0.2 million.
Parameters used in the calculation of share-based incentive schemes granted during the period:

FINANCIAL STATEMENTS 2021 85
9 Other notes
9.1. Other notes
Content
The section Other notes includes the notes for continuing opera-tions on the income and expenses as well as provisions
9.1.1 Other operating income and expenses
Accounting principles
Other operating income and expenses include income and expenses other than those related to actual sales. Other opera-ting income and expenses also include gains and losses on the disposal of tangible and intangible assets, other income or expen-ses, and realized and unrealized foreign exchange gains and losses related to trade receivables and account payables.
Other operating income and expenses
(EUR million) 2021 2020
Gains and losses on the sale of tangible and intangible fixed assets 0.1 0.1
Other income and expenses from business 2.5 1.2
Total 2.5 1.3
Other operating income includes the realised and unrealised exchange rate differences in sales and purchases as well as other various income and expenses. The operating income from the financial period of 1 January –31 December 2021 includes EUR 2.8 million for the sale of the receivable. The other operating income for the comparison period of 1 January–31 December 2020 also included a EUR 1.1 million withdrawal of provision, but there were no longer any future events related to the provision that would have affected the fulfilment of liabilities.
9.1.2 Provisions
Accounting principles
Provisions are recognised when the Group has a legal or actual liability due to a previous transaction, the realisation of the payment liability is likely and the amount of the liability can be reliably estimated. If part of the liability can be compensated
by a third party, the compensation is recognised as a separate asset, but only when the receipt of the compensation is virtually certain. Provisions are valued at the present value of expenditure required to settle the liability. The present value is calculated using a discount factor that has been selected to reflect the markets’ view of the time value of money at the time of calculation and the risk related to the liability. Provision amounts are reviewed at each balance sheet date and adjusted to reflect the current best estimate.
A rearrangement is entered when the Group has prepared a detailed rearrangement plan and started the implementation of the plan or informed on the matter. The rearrangement plan shall include at least the following: arrangement related busi-ness operations, main offices affected by the arrangement, the workplace location, tasks and estimated number of employees to whom compensations will be made for redundancy as well as expenses to be realised and implementation time of the plan.
A provision is entered for loss-making agreements when the necessary expenses required to fulfil the liabilities exceed the benefits to be obtained from the agreement.
A provision is entered for liabilities related to write-offs and resto-ration to an original state when, according to environmental legis-lation and the Group’s environmental responsibility principles, the Group has a liability related to the writing off of a production plant, rectification of environmental damage or the transporta-tion of equipment from one place to another.
Key estimates and discretionary solutions
The management regularly assesses the amount of the expense recognised as a provision, so that it corresponds to the liabilities needed to fulfil the current obligations at the end of each repor-ting period.
Provisions
At the end of the comparison year of 1 January–31 December 2020, the guarantee provision for trade receivables related to the discontinued confectionery business was dissolved, as there are no longer any future events related to the provision that would affect the fulfilment of liabilities.
(EUR million) 2021 2020
Provisions 1 January 0.0 1.2
Translation differences -0.1
Provisions used -1.1
Provisions 31 December 0.0 0.0

FINANCIAL STATEMENTS 202186
10 Parent company financial statement (FAS)
Parent company income statement
(EUR) Note 1.1.–31.12.2021 1.1.–31.12.2020
NET SALES 1 669 112.88 1 618 205.88
Other income from business operations
Personnel expenses 1. -4 389 817.98 -3 527 808.00
Depreciation and write-downs 2. -13 215.92 -13 313.99
Other expenses from business operations 3. -1 346 385.19 -1 476 612.97
PROFIT (LOSS) -4 080 306.21 -3 399 529.08
Financial income and expenses 4. +16 196 688.21 +10 938 592.74
PROFIT (LOSS) BEFORE APPROPRIATIONS AND TAXES 12 116 382.00 7 539 063.66
Appropriations 5. +10 060 601.82 +6 453 788.02
Income taxes 6. -1 623 702.03 -574 440.05
PROFIT (LOSS) FOR THE FINANCIAL PERIOD 20 553 281.79 13 418 411.63

FINANCIAL STATEMENTS 2021 87
Parent company balance sheet
(EUR) Note 31.12.2021 31.12.2020
ASSETS
NON-CURRENT ASSETS
Intangible assets 7. 35 139.09 39 230.02
Tangible assets 7. 370 460.46 375 869.69
Holdings in Group companies 8. 210 386 887.43 198 893 029.60
Receivables from Group companies 8.
Other investments 8. 944 978.29 944 978.29
211 737 465.27 200 253 107.60
CURRENT ASSETS
Current receivables 9. 17 740 603.29 34 128 292.91
Securities under financial assets 10. 67 033 996.48 69 896 000.71
Cash in hand and at banks 15 928 328.51 15 834 287.12
100 702 928.28 119 858 580.74
TOTAL ASSETS 312 440 393.55 320 111 688.34
LIABILITIES AND SHAREHOLDERS’ EQUITY
SHAREHOLDERS’ EQUITY 11.
Share capital 27 776 072.91 27 776 072.91
Premium fund 2 908 045.06 2 908 045.06
Reserve fund 88 586 879.98 88 586 879.98
Invested unrestricted shareholders’ equity fund 20 784 370.92 18 661 145.47
Retained earnings 74 540 426.78 79 791 197.59
Profit for the financial period 20 553 281.79 13 418 411.63
235 149 077.44 231 141 752.64
ACCUMULATED APPROPRIATIONS 12. 22 358.64 20 960.46
LIABILITIES
Current liabilities 13. 77 268 957.47 88 948 975.24
77 268 957.47 88 948 975.24
TOTAL LIABILITIES AND SHREHOLDERS’ EQUITY 312 440 393.55 320 111 688.34

FINANCIAL STATEMENTS 202188
Parent company cash flow statement
(EUR 1,000) 2021 2020
CASH FLOW FROM BUSINESS OPERATIONS
Profit (loss) before appropriations and taxes 12 118 7 539
Adjustments to EBIT:
Planned depreciation 13 13
Financial income and expenses -16 197 -10 939
Other income and expenses not involving disbursement 36 294
Cash flow before change in working capital -4 030 -3 092
Change in working capital
Increase (-)/decrease (+) in current receivables +128 +17
Increase (-)/decrease (+) in current interest-free liabilities +234 -267
362 -250
Cash flow from business operations before financial items and taxes -3 668 -3 342
Interest paid and payments for financial expenses from business operations -394 -266
Interest and other financial income 898 408
Income taxes paid -1 834 -383
-4 998 -3 583
CASH FLOW FROM BUSINESS OPERATIONS -4 998 -3 583
CASH FLOW FROM INVESTMENTS
Investments in tangible and intangible assets -4 -1
Investments in group company shares -7 584
Loans granted -2 500
Repayment of loan receivables 11 680
CASH FLOW FROM INVESTMENTS 1 592 -1
Cash flow after investments -3 405 -3 584
CASH FLOW FROM FINANCIAL OPERATIONS
Other financial items, net 1 385 -349
Dividends received from Group companies 14 483 11 103
Increase (-)/decrease (+) in current liabilities -1 188 -6 264
Group contributions received and paid 6 455 12 585
Dividend paid and other distribution of profit -20 498 -20 421
CASH FLOW FROM FINANCIAL OPERATIONS 637 -3 346
Change in liquid funds -2 768 -6 929
Liquid funds at beginning of period 85 730 92 660
Liquid funds at end of period 82 962 85 730

FINANCIAL STATEMENTS 2021 89
Raisio plc’s financial statements have been prepared in accor-dance with the Finnish Accounting Act. The financial statements have been prepared for the financial year, 12 months, 1 January–31 December 2021. The financial statements are presented in euros.
Foreign currency itemsForeign currency transactions are recorded using the exchange rate at the transaction date. Foreign currency receivables and liabilities are translated into euro at the average exchange rates quoted at the balance sheet date. Realised exchange rate diffe-rences as well as gains and losses arising from the valuation of receivables and liabilities are recorded in the income statement. Exchange rate gains and losses related to actual business opera-tions are treated as adjustment items on sales and purchases, and those related to financing are presented under financing income and expenses.
Changes in the value of foreign currency loans are recorded in the income statement under financial income and expenses. Raisio plc does not currently have foreign currency loans.
Derivative contractsIn line with its risk management policy, the company uses deriva-tives to hedge against currency and interest rate risks. Currency forward contracts are used to hedge receivables and liabilities in foreign currencies as well as future commercial cash flows. Derivative contracts are initially recognized at the date of the agreement at fair value and subsequently measured at fair value. Exchange rate differences arising from them are entered through profit or loss.
Revenue recognitionThe sale of a service is recognised when the service is completed or the work is done.
Pension arrangementsStatutory and voluntary pension security for the company person-nel is arranged through pension insurance companies. Pension expenditure is entered as an expense in the year it is accrued. The pensions of the CEO is determined according to the Finnish work pension plan.
LeasesPayments related to leases are amortised in the income state-ment as an expense over the lease term.
Net salesNet sales consist of product sales as well as income from the services that the parent company provides to Group companies.
Other operating incomeProfit from asset sales and other income not related to actual sales of goods and services are presented as other operating income.
Income taxesTaxes in the Company’s income statement include taxes paid in
Parent company’s accounting principles
the financial period, calculated on the basis of the taxable profit, and taxes paid in previous financial periods. The financial state-ments show accumulated appropriations in full on the balance sheet, and the included tax liability is not treated as debt. Defer-red taxes are not recorded.
Valuation of non-current assetsTangible and intangible assets are entered in the balance sheet at their acquisition cost less planned depreciation. Planned deprecia-tion is calculated using straight line depreciation method based on the useful life of tangible and intangible assets. Depreciation is made from the month of introduction of the asset.
The depreciation periods are as follows:
• buildings and structures 10–25 years• machinery and equipment 4–10 years• intangible rights 5–10 years • other long-term expenses 5–20 years.
Acquisition cost of non-current assets, whose probable useful life is less than three years, as well as small purchases (below EUR 1 200) are recorded as an expense in their entirety.
Sales profits and losses are determined by comparing the sales profit to the carrying amount. Sales profits and losses are inclu-ded in the income statement under other operating income and expenses.
Shares and investments in subsidiaries in the company’s fixed asset investments are valued at the acquisition cost or at the lower fair value
Valuation of receivables and liabilitiesReceivables are measured at their acquisition cost or their probable value lower than acquisition cost. Liabilities are measu-red at their nominal value.
ProvisionsProvisions are entered when the Group has a legal or constructive obligation following an event, the realisation of the obligation is likely and the amount of the obligation can be reliably estimated. If part of the obligation can be compensated by a third party, the compensation is entered as a separate asset, but only when it is virtually certain that the compensation will be received.
A rearrangement is entered when the Group has prepared a detai-led rearrangement plan and started its implementation or made an announcement of the issue.
Management of financial risks and instrumentsThe parent company’s financial risks do not differ materially from the Group’s financial risks, see Chapter 5 Financial items and risk management of the consolidated financial statements.
CashCash and bank receivables include money in bank accounts.

FINANCIAL STATEMENTS 202190
Share-based schemesOn 31 December 2021, the Raisio plc had four valid share-based incentive schemes approved by Raisio plc’s Board of Directors, which were directed at the Group management and designated key persons; the scheme 2019–2021, the scheme 2020–2022, the scheme 2021–2023 and the scheme 2022–2024.
The earnings period of each share-based incentive scheme is three years. For each earnings period, Raisio plc’s Board of Dire-ctors decides on the earnings criteria, the target group and the maximum amounts of share reward per participant. The amount of reward and the number of Raisio plc’s transferred free shares based on the achievement of earnings criteria of the scheme are decided by the Board of Directors at the beginning of the year following the end of the earnings period.
In all schemes, potential reward for each earnings period is based on the company’s Total Shareholder Return (TSR). In addition, the reward payment requires the achievement of the Group’s cumu-lative profit target (EBT, earnings before taxes) in the correspon-ding period. Possible rewards are paid partly in the company’s free shares and partly in cash. The cash payment is made to cover the key employee’s taxes and fiscal fees arising from the reward. In case the employment or service of a person ends before the reward payment, as a rule no reward is paid.
Dividends payableThe dividends paid by the Group are recorded in the financial period during which the shareholders have approved the divi-dend payment.
AppropriationsAppropriations consist of received and paid Group subsidies and of the change in depreciation difference.
Borrowing costsBorrowing costs are entered as an expense in the period in which they occur.
Company sharesAcquisition of the company shares and related costs are presented in the company’s financial statements as deduction from retained earnings. Conveyance of the company shares is presented as an addition to earnings except for the company shares assigned in the directed share issue. The subscription price of these shares is entered in the invested unrestricted equity fund and their acqui-sition cost is still presented in the earnings.
Cash flow statementCash flows for the financial period are categorised into cash flows from business operations, investments and financing. The cash flow statement is prepared using the indirect method.

FINANCIAL STATEMENTS 2021 91
Notes to the parent company income statement
1. Personel expenses
(EUR) 2021 2020
Wages and fees 3 644 559.92 2 949 597.02
Pension expenses 634 919.14 466 970.08
Other social security expenses 110 338.92 111 240.90
Total 4 389 817.98 3 527 808.00
Wages and fees paid to management
(EUR) 2021 2020
Payment criteria
Managing Director 662 414.28 731 732.42
Members of the Board of Directors
242 200.00 267 400.00
Members of the Supervisory Board
47 700.00 47 350.00
Total 952 314.28 1 046 482.42
Average number of parent company personnel
2021 2020
Office workers 30 30
Related party liabilitiesPension liability for members of the Board of Directors and Mana-ging Directors. The CEO of the parent company has the right and obligation to retire at the age of 62.
2. Depreciation and write-downs
(EUR) 2021 2020
Planned depreciation 13 215.92 13 313.99
3. Other expenses from business operations
(EUR) 2021 2020
KPMG Oy Ab
Audit 90 271.05 59 244.79
Tax consultation 1 810.40 0.00
Other services 11 657.00 17 645.00
Total 103 738.45 76 889.79
4. Financial income and expenses
(EUR) 2021 2020
Dividend received
From Group companies 14 483 316.75 11 091 326.25
Others 0.00 11 200.00
Total 14 483 316.75 11 102 526.25
Total income from long-terminvestment 14 483 316.75 11 102 526.25
Other interest and financial income
From Group companies 121 943.73 17 894.40
From others 1 659 114.28 838 257.25
Total other interest andfinancial income 1 781 058.01 856 151.65
Total financial income 16 264 374.76 11 958 677.90
Exchange rate differences
To Group companies 1 342 926.27 -859 635.13
To others -1 013 940.59 1 136 571.18
Total exchange rate differences 328 985.68 276 936.05
Interest paid and other financial expenses
To Group companies -11 450.66 -22 978.95
To others -385 221.57 -1 274 042.26
Total interest paid and other financial expenses -396 672.23 -1 297 021.21
Total financial expenses -67 686.55 -1 020 085.16
Total financial income and expenses 16 196 688.21 10 938 592.74
5. Appropriations
(EUR) 2021 2020
Difference between planned depreciations and depreciation made in taxation -1 398.18 -1 511.98
Group contributions paid -4 100 000.00 -11 699 700.00
Received Group subsidies 14 162 000.00 18 155 000.00
Total 10 060 601.82 6 453 788.02
6. Income taxes
(EUR) 2021 2020
Income taxes in appropriations -2 012 400.00 -1 291 060.00
Income tax on ordinary operations 400 767.03 717 491.89
Taxes on previous financial years -12 069.06 -871.94
Total -1 623 702.03 -574 440.05

FINANCIAL STATEMENTS 202192
(EUR)Land and
water areasBuildings andconstructions
Machinery andequipment
Other tangible assets
Tangible assets total
Acquisition cost 1 January 91 000.00 749 818.82 44 271.23 260 527.76 1 145 617.81
Increase 1 January–31 December 0.00
Hankintameno 31.12. 91 000.00 749 818.82 44 271.23 260 527.76 1 145 617.81
Accumulated depreciation and write-downs 1 January 0.00 725 476.89 44 271.23 0.00 769 748.12
Depreciation for the financial period 5 409.23 5 409.23
Accumulated depreciation 31 December
0.00 730 886.12 44 271.23 0.00 775 157.35
Book value 31 December 2021 91 000.00 18 932.70 0.00 260 527.76 370 460.46
Book value 31 December 2020 91 000.00 24 341.93 0.00 260 527.76 375 869.69
Book value of the production machinery and equipment
31 December 2021 0.00
31 December 2020 0.00
Notes to the parent company balance sheet
7. Intangible assets 2021
(EUR)Intangible
rightsOther long-term
expenditureIntangible
assets total
Acquisition cost 1 January 181 208.22 24 512.64 205 720.86
Increase 1 January–31 December 3 715.76 3 715.76
Acquisition cost 31 December 184 923.98 24 512.64 209 436.62
Accumulated depreciation and write-downs 1 January 141 978.20 24 512.64 166 490.84
Depreciation for the financial period 7 806.69 7 806.69
Accumulated depreciation 31 December 149 784.89 24 512.64 174 297.53
Book value 31 December 2021 35 139.09 0.00 35 139.09
Book value 31 December 2020 39 230.02 0.00 39 230.02
7. Tangible assets 2021
8. Investments 2021
(EUR) Group company shares Other shares Total investment
Acquisition cost 1 January 198 893 029.60 944 978.29 199 838 007.89
Increase 1 January–31 December 11 493 857.83 11 493 857.83
Acquisition cost 31 December 210 386 887.43 944 978.29 211 331 865.72
Book value 31 December 2021 210 386 887.43 944 978.29 211 331 865.72
Book value 31 December 2020 198 893 029.60 944 978.29 199 838 007.89

FINANCIAL STATEMENTS 2021 93
Shares and holdings 2021
9. Receivables
(EUR) 2021 2020
Long-term receivables
Receivables from Group companies
Capital loan receivables 11 680 000.00
Loan receivables 2 500 000.00
Total long-term receivables 2 500 000.00 11 680 000.00
Current receivable
Accounts receivable 220.41
Receivables from Group companies
Accounts receivable 36 141.87 3 735.79
Loan receivables 920 701.84 4 020 390.27
Other receivables 14 187 446.37 18 178 097.61
Accrued income 12 542.47 110 467.00
15 156 832.55 22 312 690.67
Other receivables 8 890.98 76 927.66
Accrued income 74 879.76 58 454.17
Total current receivables 15 240 603.29 22 448 292.91
Total receivables 17 740 603.29 34 128 292.91
Accrued income include items related to the timing of operational income and expenses, financial items and taxes.
Group
holding %
Parent company
holding %
Group companies
Raisionkaari Industrial Park Ltd, Raisio 100.00 50.00
Raisio UK Limited, UK 100.00 100.00
Raisio Nutrition Ltd, Raisio 100.00 100.00
Raisioaqua Ltd, Raisio 100.00 100.00
Nordic Feed Innovations Oy, Turku 100.00 100.00
Verso Food Oy, Kauhava 100.00 100.00
10. Marketable securites
(EUR) 2021 2020
Market value 67 894 093.29 71 675 622.91
Book value 67 033 996.48 69 896 000.71
Difference 860 096.81 1 779 622.20
(EUR) 2021 2020
Restricted shareholders’ equity
Share capital 1 January 27 776 072.91 27 776 072.91
Share capital 31 December 27 776 072.91 27 776 072.91
Premium fund 1 January 2 908 045.06 2 908 045.06
Premium fund 31 December 2 908 045.06 2 908 045.06
Reserve fund 1 January 88 586 879.98 88 586 879.98
Reserve fund 31 December 88 586 879.98 88 586 879.98
Total restricted shareholders’ equity 119 270 997.95 119 270 997.95
Unrestricted shareholders’ equity
Invested unrestricted shareholders’ equity fund 1 January 18 661 145.47 18 661 145.47
Disposal of company shares 2 123 225.45
Invested unrestricted shareholders’ equity fund 31 December 20 784 370.92 18 661 145.47
Retained earnings 1 January 93 209 609.22 99 835 163.65
Dividend distributed -20 597 965.57 -20 466 323.80
Unclaimed dividends 106 014.66 128 419.26
Disposal of company shares 1 786 774.55
Disposal of company shares 35 993.92 293 938.48
Retained earnings 31 December 74 540 426.78 79 791 197.59
Result for the year 20 553 281.79 13 418 411.63
Total unrestricted shareholders’ equity 115 878 079.49 111 870 754.69
Total shareholders’ equity 235 149 077.44 231 141 752.64
Distributable equity 115 878 079.49 111 870 754.69
11. Shareholders’ equity

FINANCIAL STATEMENTS 202194
Parent company share capital2021 2020
shares EUR 1,000 shares EUR 1,000
Restricted shares (20 votes/share) 30 960 624 5 207 31 445 358 5 289
Free shares (1 vote/share) 134 188 406 22 569 133 703 672 22 487
Total 165 149 030 27 776 165 149 030 27 776
Company shares held by parent company 2021 2020
shares EUR 1,000 shares EUR 1,000
Restricted shares (20 votes/share) 212 696 416 212 696 416
Free shares (1 vote/share) 6 480 341 34 639 7 490 445 36 442
Total 6 693 037 35 056 7 703 141 36 858
The probable assignment price of company shares held by the Group on the date of the financial statements was EUR 22,564 thousand (EUR 24,586 thousand in 2020).
12. Accumulated appropriations
Accumulated appropriations consist of the accumulated depreciation difference.
LIABILITIES
13. Current liabilities
(EUR) 2021 2020
Accounts payable 129 148.68 119 943.02
Liabilities to Group companies
Accounts payable 8 033.63 7.82
Other liabilities 4 102 329.38 11 699 700.00
Other interest-bearing liabilities, cash pool 71 111 518.96 75 398 945.93
75 221 881.97 87 098 653.75
Other liabilities 754 467.27 638 041.04
Accrued liabilities 1 163 459.56 937 234.16
Total current liabilities 77 268 957.48 88 793 871.97
Interest-fee debts 6 157 438.52 13 394 926.04
Accrued liabilities include accrued business expenses, financial items and taxes.

FINANCIAL STATEMENTS 2021 95
Other notes to the parent company accountsOff-balance sheet guarantees, contingent liabilities and other liabilities
(EUR) 2021 2020
Leasing liabilities
Amounts outstanding on leasing contracts
Falling due in started financial year 56 529.39 90 086.83
Payables at a later date 55 069.69 108 752.68
Total 111 599.08 198 839.51
Contingent liabilities for Group companies
Guarantees 20 872 006.00 2 153 614.00
Total 20 872 006.00 2 153 614.00
(EUR) 2021 2020
Currency options:
Fair value 10 080.00 190 266.00
Value of underlying instruments 11 464 274.00 11 858 110.00
Currency forward contracts:
Fair value 1 103.15 116 463.45
Value of underlying instruments 33 056 578.00 34 517 016.00
Interest rate swaps:
Value of underlying instruments 15 531 000
Derivative contractThe company uses derivative contracts for hedging. The values of underlying instruments for derivative contracts, stated below, indicate the scope of hedging measures. The fair values of deri-vative contracts show the result had the derivative position been closed at market price on the closing day.
The value of the underlying instrument in currency forward cont-racts is the sum of open forward contracts, converted into euros at the exchange rate of the closing day.
Other liabilities
Long-term incentive schemeThe company is committed to a long-term incentive scheme. The purpose of the scheme is to support the achievement of the compa-ny’s long-term objectives, to operate as a share-based incentive scheme for the company’s senior management and to commit the participants to work persistently for the company’s success.
Based on the earning period 2018–2020, no remuneration was paid in the financial year ended 31 December 2021 and no shares were transferred as the earning criteria set in the plan were not met.
Leasing contracts do not include substantial liabilities to termination and redemption terms.
Share-based schemes
Share-based incentive scheme
(EUR million) 2018–2020 2019–2021 2020–2022 2021–2023 2022–2024
Original number of shares 1 000 000 1 000 000 1 000 000 1 000 000 1 000 000
Original grant date 15.3.2018 4.1.2019 21.1.2020 18.1.2021
Exercise date 30.04.2021 30.04.2022 30.04.2023 30.04.2024 30.04.2025
Vesting period, years 3.1 3.3 3.3 3.3 3.3
Remaining vesting period, years 0.3 1.3 2.3 3.3
Number of persons at the end of the period 16 19 26
Payment method Shares and cash Shares and cash Shares and cash Shares and cash Shares and cash
Changes in 20212018–2020
Number of shares2019–2021
Number of shares2020–2022
Number of shares2021–2023
Number of shares2022–2024
Number of shares
1 January 2021
Number of shares at the beginningof the reporting period 465 000 545 000 585 000
31 December 2021
Number of shares at the endof the reporting period 485 000 535 000 770 000

FINANCIAL STATEMENTS 202196
Board’s proposal for the disposal of profit
Shareholders’ equity according to the balance at 31 December 2021 is EUR 115,878,079.49. The Board of Directors propose that a dividend of EUR 0.14 per share, of which EUR 0.04 per share as an extra dividend, be paid from the parent company’s earnings,
totalling 23,120,902.00carried over on the retained earnings accounts 92,757,177.49
No dividends will be paid on the shares held by the company on the record date 14 April 2022. The payment date of the dividend is proposed to be 26 April 2022.
There has not been any essential changes in the Group’s financial condition since the end of the financial period. The Group’s liquidity is good and the payment of the proposed dividend does not, in our opinion, endanger the company’s liquidity.
Raisio, 8 February 2022
Arto Tiitinen Erkki Haavisto
Leena Niemistö Ann-Christine Sundell Pekka Tennilä
Pekka KuusniemiCEO

FINANCIAL STATEMENTS 2021 97
Auditor’s ReportTo the Annual General Meeting of Raisio plc
Report on the Audit of the Financial Statements
Opinion
We have audited the financial statements of Raisio plc (business identity code 0664032-4) for the year ended 31 December 2021. The financial statements comprise the consolidated balance sheet, income statement, comprehensive income statement, statement of changes in shareholders’ equity, cash flow state-ment and notes, including a summary of significant accounting policies, as well as the parent company’s balance sheet, income statement, cash flow statement and notes.
In our opinion • the consolidated financial statements give a true and fair
view of the group’s financial position, financial performance and cash flows in accordance with International Financial Reporting Standards (IFRS) as adopted by the EU
• the financial statements give a true and fair view of the parent company’s financial performance and financial posi-tion in accordance with the laws and regulations gover-ning the preparation of financial statements in Finland and comply with statutory requirements.
Our opinion is consistent with the additional report submitted to the Audit Committee.
Basis for Opinion
We conducted our audit in accordance with good auditing prac-tice in Finland. Our responsibilities under good auditing practice are further described in the Auditor’s Responsibilities for the Audit of the Financial Statements section of our report.
We are independent of the parent company and of the group companies in accordance with the ethical requirements that are applicable in Finland and are relevant to our audit, and we have fulfilled our other ethical responsibilities in accordance with these requirements.
In our best knowledge and understanding, the non-audit services that we have provided to the parent company and group compa-nies are in compliance with laws and regulations applicable in Finland regarding these services, and we have not provided any
prohibited non-audit services referred to in Article 5(1) of regula-tion (EU) 537/2014. The non-audit services that we have provided have been disclosed in note 8.3.1. to the consolidated financial statements.
We believe that the audit evidence we have obtained is sufficient and appropriate to provide a basis for our opinion.
Materiality
The scope of our audit was influenced by our application of materiality. The materiality is determined based on our profes-sional judgement and is used to determine the nature, timing and extent of our audit procedures and to evaluate the effect of identified misstatements on the financial statements as a whole. The level of materiality we set is based on our assessment of the magnitude of misstatements that, individually or in aggregate, could reasonably be expected to have influence on the economic decisions of the users of the financial statements. We have also taken into account misstatements and/or possible misstate-ments that in our opinion are material for qualitative reasons for the users of the financial statements.
Key Audit Matters
Key audit matters are those matters that, in our professional judgment, were of most significance in our audit of the financial statements of the current period. These matters were addressed in the context of our audit of the financial statements as a whole, and in forming our opinion thereon, and we do not provide a separate opinion on these matters. The significant risks of mate-rial misstatement referred to in the EU Regulation No 537/2014 point (c) of Article 10(2) are included in the description of key audit matters below.
We have also addressed the risk of management override of inter-nal controls. This includes consideration of whether there was evidence of management bias that represented a risk of material misstatement due to fraud.

FINANCIAL STATEMENTS 202198
THE KEY AUDIT MATTER HOW THE MATTER WAS ADDRESSED IN THE AUDIT
Impairment of goodwill and trademarks (EUR 49.6 million and EUR 30.1 million) (Accounting policies for the consolidated financial statements and note 4.1, 4.2 and 4.4)
• The Group has expanded its activities through the acquisitions of companies and trademarks. As a result the consolidated balance sheet includes a significant amount of goodwill and trademarks. These assets are not amortised, but are tested at least annually for impairment.
• Any indications of a goodwill impairment loss of the Group may also affect the measurement of the shares in subsidiaries held by the parent company. Shares in subsidiaries are tested for impairment in connection with the goodwill impairment tests.
• Impairment testing is based on discounted future cash flow forecasts. Determining the underlying key assumptions requires management make judgments over, for example, net sales growth rate, discount rate and long-term growth rate.
• Due to the high level of judgement related to the forecasts used, and the significant carrying amounts involved, impairment of these assets is considered a key audit matter.
Our audit procedures included, among others:• We assessed the key assumptions used in impairment testing,
such as net sales growth rate and profitability level, by reference to the budgets approved by the Board of Directors of the parent company and our own views.
• We involved our own valuation specialists that assessed the technical accuracy of the calculations and compared the assumptions used to market and industry information.
• Furthermore, we considered the accounting treatment of the impairment losses recognised as well the appropriateness of the notes in respect of goodwill and trademarks.
Accuracy of revenues (EUR 246.4 million) (Accounting policies for the consolidated financial statements and note 2.2)
• The net sales of the Group consists of wide variety of different products, with invoice prices fluctuating during the financial year.
• Due to the large number of sales transactions, the accuracy of revenues is considered a key audit matter.
Our audit procedures included, among others:• In respect of those Group companies considered significant,
we assessed the IT systems relevant for recording revenues and the functionality of related general IT controls.
• We tested the effectiveness of internal controls over invoicing and recording of sales transactions as well as over recognising related revenues, among others.
• We tested the accuracy of invoicing data of the significant Group companies by comparing with external confirmations.
Accuracy and valuation of inventories (EUR 37.9 million) (Accounting policies for the consolidated financial statements and note 4.8)
• The Group measures inventories at the lower of cost and net realisable value.
• Measurement of inventories involves management judgements in respect of identifying inventories not fully recoverable, among others.
• Due to the high level of judgement related to inventory valuation and fluctuations in price, the accuracy and valuation of inventories are considered a key audit matter.
Our audit procedures included, among others:• In respect of the significant Group companies we assessed the
IT systems relevant for inventories and the functionality of related general IT controls.
• We tested the effectiveness of internal controls over accuracy of inventory amounts and valuation, and performed substantive procedures to assess the accuracy of inventory measurement.
• We attended inventory counts in significant Group companies.

FINANCIAL STATEMENTS 2021 99
Responsibilities of the Board of Directors and the Managing Director for the Financial Statements
The Board of Directors and the Managing Director are responsible for the preparation of consolidated financial statements that give a true and fair view in accordance with International Financial Reporting Standards (IFRS) as adopted by the EU, and of finan-cial statements that give a true and fair view in accordance with the laws and regulations governing the preparation of financial statements in Finland and comply with statutory requirements. The Board of Directors and the Managing Director are also respon-sible for such internal control as they determine is necessary to enable the preparation of financial statements that are free from material misstatement, whether due to fraud or error.
In preparing the financial statements, the Board of Directors and the Managing Director are responsible for assessing the parent company’s and the group’s ability to continue as a going concern, disclosing, as applicable, matters relating to going concern and using the going concern basis of accounting. The financial state-ments are prepared using the going concern basis of accounting unless there is an intention to liquidate the parent company or the group or cease operations, or there is no realistic alternative but to do so.
Auditor’s Responsibilities for the Audit of the Financial Statements
Our objectives are to obtain reasonable assurance about whether the financial statements as a whole are free from material miss-tatement, whether due to fraud or error, and to issue an auditor’s report that includes our opinion. Reasonable assurance is a high level of assurance, but is not a guarantee that an audit conducted in accordance with good auditing practice will always detect a material misstatement when it exists. Misstatements can arise from fraud or error and are considered material if, individually or in the aggregate, they could reasonably be expected to influence the economic decisions of users taken on the basis of the finan-cial statements.
As part of an audit in accordance with good auditing practice, we exercise professional judgment and maintain professional scepticism throughout the audit. We also:
• Identify and assess the risks of material misstatement of the financial statements, whether due to fraud or error, design and perform audit procedures responsive to those risks, and obtain audit evidence that is sufficient and appropriate to provide a basis for our opinion. The risk of not detecting a material misstatement resulting from fraud is higher than for one resulting from error, as fraud may involve collusion, forgery, intentional omissions, misrepresentations, or the override of internal control.
• Obtain an understanding of internal control relevant to the audit in order to design audit procedures that are appropriate
in the circumstances, but not for the purpose of expressing an opinion on the effectiveness of the parent company’s or the group’s internal control.
• Evaluate the appropriateness of accounting policies used and the reasonableness of accounting estimates and related disclosures made by management.
• Conclude on the appropriateness of the Board of Directors’ and the Managing Director’s use of the going concern basis of accounting and based on the audit evidence obtained, whether a material uncertainty exists related to events or conditions that may cast significant doubt on the parent company’s or the group’s ability to continue as a going concern. If we conclude that a material uncertainty exists, we are required to draw attention in our auditor’s report to the related disclosures in the financial statements or, if such disclosures are inadequate, to modify our opinion. Our conclusions are based on the audit evidence obtained up to the date of our auditor’s report. However, future events or conditions may cause the parent company or the group to cease to continue as a going concern.
• Evaluate the overall presentation, structure and content of the financial statements, including the disclosures, and whether the financial statements represent the underlying transactions and events so that the financial statements give a true and fair view.
• Obtain sufficient appropriate audit evidence regarding the financial information of the entities or business activities within the group to express an opinion on the consolidated financial statements. We are responsible for the direction, supervision and performance of the group audit. We remain solely responsible for our audit opinion.
We communicate with those charged with governance regarding, among other matters, the planned scope and timing of the audit and significant audit findings, including any significant deficien-cies in internal control that we identify during our audit.
We also provide those charged with governance with a statement that we have complied with relevant ethical requirements regar-ding independence, and communicate with them all relationships and other matters that may reasonably be thought to bear on our independence, and where applicable, related safeguards.
From the matters communicated with those charged with gover-nance, we determine those matters that were of most signi-ficance in the audit of the financial statements of the current period and are therefore the key audit matters. We describe these matters in our auditor’s report unless law or regulation preclu-des public disclosure about the matter or when, in extremely rare circumstances, we determine that a matter should not be communicated in our report because the adverse consequences of doing so would reasonably be expected to outweigh the public interest benefits of such communication.

FINANCIAL STATEMENTS 2021100
Other Reporting Requirements
Information on our audit engagementWe were first appointed as auditors by the Annual General Meeting on 23 March 2016, and our appointment represents a total period of uninterrupted engagement of 6 years.
Other InformationThe Board of Directors and the Managing Director are responsible for the other information. The other information comprises the report of the Board of Directors and the information included in the Annual Report, but does not include the financial statements and our auditor’s report thereon. We have obtained the report of the Board of Directors prior to the date of this auditor’s report, and the Annual Report is expected to be made available to us after that date. Our opinion on the financial statements does not cover the other information.
In connection with our audit of the financial statements, our responsibility is to read the other information identified above and, in doing so, consider whether the other information is mate-rially inconsistent with the financial statements or our knowledge
obtained in the audit, or otherwise appears to be materially miss-tated. With respect to the report of the Board of Directors, our responsibility also includes considering whether the report of the Board of Directors has been prepared in accordance with the applicable laws and regulations.
In our opinion, the information in the report of the Board of Direc-tors is consistent with the information in the financial statements and the report of the Board of Directors has been prepared in accordance with the applicable laws and regulations.
If, based on the work we have performed on the other informa-tion that we obtained prior to the date of this auditor’s report, we conclude that there is a material misstatement of this other information, we are required to report that fact. We have nothing to report in this regard.
Raisio, 8 February 2022
Esa Kailiala Kimmo AntonenAuthorised Public Authorised PublicAccountant, KHT Accountant, KHT

FINANCIAL STATEMENTS 2021 101
Statement of the Supervisory BoardAt its meeting today, the Supervisory Board studied the financial statement, the consolidated financial statement and auditors’ report for the financial period 1 January–31 December 2021.
The Supervisory Board gives its assent to the approval of the financial statements and the consolidated financial statements and concurs with the Board of Directors’ proposal for the alloca-tion of profits.
Raisio, 10 February 2022
For the Supervisory Board
Paavo MyllymäkiChairman

Raisio plc – Raisionkaari 55 - P.O. Box 101 – FI-21201 Raisio, FinlandTel. +358 2 443 2111
Business ID 0664032-4 – Domicile Raisio, Finland
www.raisio.com